Investigation of the dynamic interaction between the human ...
340
Investigation of the dynamic interaction between the human body and car seat using a unique simulation technique by Purnendu Mondal A thesis submitted in partial fulfilment of the requirements for the degree of Doctor of Philosophy University of East London School of Architecture, Computing and Engineering May 2020
-
Upload
khangminh22 -
Category
Documents
-
view
0 -
download
0
Transcript of Investigation of the dynamic interaction between the human ...
Investigation of the dynamic interaction between the human body and
car seat using a unique simulation technique
by
Purnendu Mondal
A thesis submitted in partial fulfilment of the requirements for the degree of Doctor of
Philosophy
University of East London
School of Architecture, Computing and Engineering
May 2020
Abstract
Page: i
Abstract
Numerical simulations and mathematical models have been developed over last many
years on the certain portions of human body, car seat or automobile to characterise,
monitor and assess the level of vibration and its effects on the human occupant inside the
automotive. Though, the numerical simulations can define the level and nature of
vibration and its transmissibility up to a certain stage, vibration measurement techniques
have also been gaining importance for last several years to fill the limitations of the
theoretical models. Efforts have also been made to carry out vibration related
investigations using combined numerical simulation and measurement procedure for the
car seat and the seated human body inside car, though the numbers of case studies carried
out with the combination of simulation and measurement procedure are very less. Some
technologies have been achieved to judge the level of vibration inside the car seat and its
human occupant, though those technologies cover only effects of vibration, dynamics or
measurement techniques on specific portions of the car or the human body without
considering all the real life factors, e.g., human gender, shape of the human portions, size
specific stiffness properties, in-vehicle operating conditions and damping factors.
Approaches to provide a comprehensive solution to estimate the level of vibration
without real life testing have not been carried out by the existing technologies very well.
More than that the existing technologies investigate only particular modules of the entire
human-car dynamic systems, e.g., a specific human part, seat and human interaction,
vibration transmission from seat to human body or the vibration measurement technique.
So, there is enormous scope of further improvement and the aim of this research work is
to provide a unique simulated system considering all the critical real life factors.
Outcome of this simulation study will evaluate the vibration levels inside the segments of
seated human body inside a car and car seat omitting the necessity of real-life practical
testing and provide the solution by linking module-wise investigations of human body
and car seat. Initiative has been taken to fill up the gaps in the existing technologies and
Abstract
Page: ii
offer a novel study on the comprehensive simulation model of the combined human body
and car seat bio-dynamic system to optimize the health, safety and comfort levels of the
car seated human body.
Present research work covered the tasks of establishing the simulations for non-linear
bio-dynamic model of the seated human body, feasibility and behaviour inspection of
polyurethane foam cushions, contact mechanism assignment between the human body
and the car seat and establishing the simulation of car seated human occupant under the
real life environment. Vertical displacements, vertical accelerations and frequencies at
designated points of human body and car seat have been extracted from the simulation
outcome and the obtained results have been validated though real-life vibration testing
data. This unique simulation methodology can successfully be implemented to predict the
final vibration levels inside the car seat and the car seated human body to optimize the
health, safety and comfort of the human-car seat system. The outlined novel technique
contributed knowledge to the entire human body and car seat dynamic system rather than
focusing only on a very specific portion of the system.
An industrial guideline has been presented to implement this unique simulation
methodology in similar sectors, which will lead various industries to avoid time
consuming and expensive bio-dynamic vibration testing methods and help to understand
the impact of vibration on the in-vehicle human body in a better way.
Acknowledgments
Page: iii
Acknowledgments
I would like to express my profound appreciation to Dr. Subramaniam Arunachalam,
Director of Studies and Professor Hassan Abdalla, second supervisor for their kind
assistance and support throughout the whole period of this research.
I would like to thank the University of East London for providing the comfortable
environment and the computing facilities to accomplish this research in the School of
Architecture, Computing and Engineering (ACE).
Special thanks are dedicated to Mr. Ian Black from m+p International (UK) Ltd, for
providing practical test data to validate the simulation results. I am indebted to m+p
International (UK) Ltd for all their helps and supports.

Declaration of Originality
Page: iv
Declaration of originality
I hereby declare that the work presented in this PhD thesis, is my own original work.
Information derived from other research works, have been appropriately cited.
Purnendu Mondal
May 2020
Lists of Contents, Figures and Tables
Page: v
Table of Contents
CHAPTER 1 INTRODUCTION ............................................................................................... 1 1.1. LITERATURE REVIEW .................................................................................................... 3
1.1.1. Numerical Simulation relating to Vibration ........................................................................ 3
1.1.2. Vibration Measurement ....................................................................................................... 7
1.1.3. Combined Numerical Simulation and Measurement of the Vibration for both the Human Body and Car Seat ............................................................................................................. 10
1.1.4. Matrix based comparative study on Literature Review ..................................................... 11
1.1.5. Research Gap in the Existing Technologies and Aims & Objectives of the Current Research Work .................................................................................................................. 21
1.1.6. Research Questions ........................................................................................................... 23 1.2. PROPOSAL OF A NOVEL TECHNIQUE AND RESEARCH METHODOLOGY ....... 23
1.2.1. Literature Review .............................................................................................................. 24
1.2.2. Biodynamic Simulation of Car-Seated Human Body ....................................................... 24
1.2.3. Simulation for Non-Linear Mechanical Behaviour of Car Seat ........................................ 25
1.2.4. Determine the Contact Mechanism between Human and Seat in the Analysis Environment ...................................................................................................................... 26
1.2.5. Simulation of combined Human Body and Car Seat under Real Life Scenario ............... 26
1.2.6. Collecting and Processing Test Data ................................................................................. 27
1.2.7. Comparison between Simulation Results and Test Data ................................................... 28
1.2.8. Developing Industrial Guideline to Implement the Unique Simulation Technique to Relevant Sectors ................................................................................................................ 28
CHAPTER 2 BIO-DYNAMIC MODEL FOR SEATED HUMAN BODY INSIDE A CAR 29 2.1. LUMPED MASS MODEL................................................................................................ 30
2.1.1. Past works on Lumped Mass Model related to Human Body Dynamics .......................... 31
2.1.2. Experimental Simulation work carried out on human bio-dynamics based on Lumped Mass Method to find out Natural Frequencies and Mode Shapes ..................................... 39
2.1.3. Discussion.......................................................................................................................... 43 2.2. FINITE ELEMENT MODEL............................................................................................ 44
2.2.1. Past works on Finite Element Model related to Human Body Dynamics ......................... 45
2.2.2. Experimental Simulation work carried out on Human Bio-Dynamics based on combined Lumped Mass and Finite Element Methods to find out Natural Frequencies and Mode Shapes ................................................................................................................................ 51
2.2.3. Discussion.......................................................................................................................... 60 2.3. MULTIBODY MODEL .................................................................................................... 61
Lists of Contents, Figures and Tables
Page: vi
2.3.1. Past works on Multi-body Model related to Human Body Dynamics .............................. 61
2.3.2. Discussion.......................................................................................................................... 64
CHAPTER 3 UNIQUE BIO-DYNAMIC SIMULATION MODEL DEVELOPED FOR SEATED HUMAN BODY INSIDE A CAR .................................................................... 65
3.1. Human Segmental Masses ................................................................................................. 66 3.2. Human Anthropometric Data ............................................................................................ 68 3.3. Representing the Human Segments by Ellipsoidal Bodies ............................................... 71 3.4. Preparation of CAD Assembly and Sitting Configuration for 50th percentile Male Human
constructed by Ellipsoidal Bodies ..................................................................................... 73
3.4.1. Human Sitting Posture ....................................................................................................... 73
3.4.2. Human Body Modelling .................................................................................................... 75 3.5. Setting up Simulation Model in Finite Element Environment for 50th percentile Male
Human constructed by Ellipsoidal Bodies ........................................................................ 75
3.5.1. Densities of the Body Segments ........................................................................................ 76
3.5.2. Evaluating Axial and Lateral Young’s Moduli of the Human Body Segments ................ 77
3.5.3. Evaluating Axial and Lateral Stiffness Values of the Human Body Segments ................ 80
3.5.4. Poisson’s Ratio .................................................................................................................. 81
3.5.5. Damping Co-efficient and Damping Ratio ........................................................................ 82 3.6. Analysis Details in ABAQUS for 50th percentile Male Human constructed by Ellipsoidal
Bodies ................................................................................................................................ 83
3.6.1. Interaction .......................................................................................................................... 83
3.6.2. Analysis Steps ................................................................................................................... 84
3.6.3. Boundary Conditions ......................................................................................................... 86
3.6.4. Acceleration and Load ....................................................................................................... 86
3.6.5. Element type and Mesh ..................................................................................................... 87 3.7. Results ............................................................................................................................... 88
3.7.1. Natural Frequencies ........................................................................................................... 88
3.7.2. Acceleration responses at the points of interest ................................................................ 90
3.7.3. Displacement responses at the points of interest ............................................................... 98
3.7.4. Frequencies at the points of interest ................................................................................ 104 3.8. Discussion on this Unique Simulation Technique........................................................... 110
CHAPTER 4 SIMULATION MODEL DEVELOPED FOR CAR SEAT ............................ 112 4.1. Past works on Vibration Investigation Techniques and Material Properties of Automotive
Seat .................................................................................................................................. 113 4.2. Preparation of CAD Assembly of the Car Seat ............................................................... 120 4.3. Setting up the Simulation Model of Car Seat in Finite Element Environment ............... 123
4.3.1. Seat Foam Material .......................................................................................................... 124
Lists of Contents, Figures and Tables
Page: vii
4.3.2. Density ............................................................................................................................. 130
4.3.3. Poisson’s Ratio ................................................................................................................ 131
4.3.4. Temperature Gradient ...................................................................................................... 131 4.4. Analysis Details in ABAQUS for the Car Seat ............................................................... 132
4.4.1. Analysis Steps ................................................................................................................. 132
4.4.2. Boundary Conditions ....................................................................................................... 132
4.4.3. Acceleration and Load ..................................................................................................... 133
4.4.4. Element type and Mesh ................................................................................................... 133 4.5. Results ............................................................................................................................. 134
4.5.1. Displacement responses at the point of interest .............................................................. 135 4.6. Discussion on the Simulation of Car Seat ....................................................................... 137
CHAPTER 5 SIMULATION MODEL DEVELOPED FOR COMBINED HUMAN BODY AND CAR SEAT ............................................................................................................ 138
5.1. Past works on Human Posture on Automotive Seat and Assembling Technique of Human Body and Automotive Seat Together .............................................................................. 139
5.2. Preparation of CAD Assembly of the Car Seat and Human Body .................................. 143 5.3. Setting up Simulation Model in Finite Element Environment for Human-Seat Assembly
......................................................................................................................................... 144
5.3.1. Analysis Details used from the Past Chapters ................................................................. 145
5.3.2. Establishing Contact Mechanism between Human Body and Car Seat .......................... 146 5.4. Results ............................................................................................................................. 155
5.4.1. Acceleration responses at the points of interest .............................................................. 156
5.4.2. Displacement responses at the points of interest ............................................................. 167
5.4.3. Frequencies at the points of interest ................................................................................ 174 5.5. Discussion on the Unique Simulation Technique ........................................................... 180
CHAPTER 6 VIBRATION MEASUREMENT AND TEST DATA ACQUISITION ......... 183 6.1. Past works on Vibration Measurement at Human-Vehicle Interface .............................. 184 6.2. Vibration Measuring Techniques and Instruments .......................................................... 191 6.3. Collection of Test Data .................................................................................................... 198
6.3.1. Instruments and Tools used ............................................................................................. 199
6.3.2. Measurement procedure .................................................................................................. 201
6.3.3. Data received from Testing ............................................................................................. 202
6.3.4. Simplified Data Extracted from Raw Test Data .............................................................. 214 6.4. Discussion on the Vibration Measurement and Test Data Acquisition ........................... 219
CHAPTER 7 COMPARISON OF SIMULATION RESULTS AND TEST DATA ............. 221 7.1. Comparison Matrix .......................................................................................................... 222 7.2. Comparison Graphs ......................................................................................................... 224
Lists of Contents, Figures and Tables
Page: viii
7.2.1. Human: Head ................................................................................................................... 224
7.2.2. Human: Chest .................................................................................................................. 225
7.2.3. Human: Waist .................................................................................................................. 225
7.2.4. Human: Upper Arm ......................................................................................................... 226
7.2.5. Human: Lower Arm ........................................................................................................ 226
7.2.6. Human: Thigh .................................................................................................................. 227
7.2.7. Human: Leg ..................................................................................................................... 227
7.2.8. Seat: Headrest .................................................................................................................. 228
7.2.9. Seat: Backrest .................................................................................................................. 228
7.2.10. Seat: Cushion ................................................................................................................... 229 7.3. Analytical Investigation of Simulation Results and Test Data ........................................ 229 7.4. Discussion on Comparison of Simulation Results and Test Data ................................... 232
CHAPTER 8 GUIDELINE FOR IMPLEMENTING THE UNIQUE SIMULATION TECHNIQUE IN RELEVANT INDUSTRIES ............................................................... 234
8.1. Required General Reference Documents ........................................................................ 235 8.2. Required Equipments and Tools ..................................................................................... 236 8.3. Assessing Operating Medium and type of Seat ............................................................... 237 8.4. Assessing Operating Environment .................................................................................. 239 8.5. Constructing CAD Model of Human Body ..................................................................... 241 8.6. Constructing CAD Model of Transportation Seat ........................................................... 242 8.7. Setting Up Assembly for Human Body and Transportation Seat .................................... 243 8.8. Evaluation of Analysis Parameters prior to Simulation .................................................. 245 8.9. Simulation Set Up and Running the Analysis ................................................................. 246 8.10. Simulation Result: Output and Extracted Data ............................................................... 249 8.11. Discrepancy Log .............................................................................................................. 250 8.12. Personnel Involved .......................................................................................................... 251 8.13. Approval of Simulation ................................................................................................... 251 8.14. Support Center ................................................................................................................. 252
CHAPTER 9 DISCUSSION, CONCLUSION AND SCOPE OF IMPROVEMENT ........... 253 9.1. Finite Element Simulations and Responses of Human Body, Car Seat and Human-Car
Seat Assembly under the Effect of Vertical Vibration .................................................... 254
9.1.1. Lumped Mass Parameter Method: Manual Intervention ................................................. 254
9.1.2. Combination of Lumped Mass Parameter and Finite Element Methods in Three-Dimensional Space: Computerized Simulation ............................................................... 256
9.1.3. Unique Bio-Dynamic Model Developed for Seated Human Body inside a Car: Finite Element Simulation ......................................................................................................... 257
9.1.4. Development of Car Seat Model: Finite Element Simulation ......................................... 259
9.1.5. Combined Human Body and Car Seat: A Comprehensive Finite Element Simulation .. 261
Lists of Contents, Figures and Tables
Page: ix
9.2. Validation of Simulation Results: Deviations from the Test Data .................................. 263 9.3. Guideline for implementing this Unique Simulation Methodology in similar Industries
......................................................................................................................................... 266 9.4. Overall Conclusions ........................................................................................................ 267 9.5. Scope of Improvement .................................................................................................... 270
REFERENCES................................................................................................................................. 272
APPENDIX A. AUTHOR’S PUBLICATIONS ....................................................................... 295
APPENDIX B. ABAQUS INPUT FILE FOR SIMULATION OF COMBINED HUMAN BODY AND CAR SEAT ................................................................................................ 296
APPENDIX C. ABAQUS INPUT FILE FOR SIMULATION OF HUMAN BODY .............. 314
List of Figures
Fig. 1. Biodynamic Model with 4- DOF (left and middle) and 7-DOF (right) (Abbas et al., 2010) ... 4 Fig. 2. Optimized parameters for human-seat system under the effect of vertical vibration (Abbas et al., 2010) .............................................................................................................................................. 5 Fig. 3. All the phases of the research study ....................................................................................... 24 Fig. 4. Methods for biodynamic human modelling ............................................................................ 30 Fig. 5. Simple lump mass model ........................................................................................................ 31 Fig. 6. 15 DOF lumped mass model (Nigam and Malik, 1987) ........................................................ 32 Fig. 7. 1, 2, 3 and 9 DOF Lumped Mass Models (Cho and Yoon, 2001) .......................................... 33 Fig. 8. Lumped Mass Model for seated human in both vertical and fore-and-aft directions (Zengkang et al., 2013) ...................................................................................................................... 33 Fig. 9. Lumped Mass Models used for comparative studies (Zengkang et al., 2013) ....................... 34 Fig. 10. Single DOF Model for mean vertical apparent mass subject (Fairley and Griffin, 1989) ... 35 Fig. 11. 2 DOF (Left) and 1 DOF (Right) Models (Wei and Griffin, 1998) ..................................... 35 Fig. 12. 7 DOF Non-Linear Lumped Mass Model (Muksian and Nash, 1974) ................................. 36 Fig. 13. 9 DOF two dimensional Lumped Mass Model (Harsha et al., 2014) ................................... 36 Fig. 14. 3 DOF Lumped Mass Model as per International standard on mechanical vibration and shock (ISO 5982, 2001) ..................................................................................................................... 37 Fig. 15. Representation of a human body with different configurations (Abbas et al., 2010) ........... 38 Fig. 16. Human head and torso represented through lumped mass model ........................................ 40 Fig. 17. Mode shapes ......................................................................................................................... 42 Fig. 18. Concepts of body, element and node in finite element modelling ....................................... 44 Fig. 19. Simple three node element.................................................................................................... 45 Fig. 20. Finite element model for human brain and skull (Shugar, 1977) ......................................... 46
Lists of Contents, Figures and Tables
Page: x
Fig. 21. Finite element model for human brain (DeMasi et al., 1991) .............................................. 46 Fig. 22. Finite element model for modal analysis of human body (Kitazaki and Griffin, 1997) ...... 47 Fig. 23. Finite element model for whole human body (Zheng et al., 2012) ...................................... 48 Fig. 24. Finite element model for deformation of buttocks (Sonenblum et al., 2015) ....................... 49 Fig. 25. VM stress and displacements on seat-buttocks interface (Todd and Thacker, 1994) .......... 49 Fig. 26. Pressure distribution at seat-buttocks interface (Wagnac et al., 2012) ................................. 50 Fig. 27. 50th percentile male models from GHBMC database (left-detailed, right-simplified) ......... 50 Fig. 28. Raw model collected from Grabcad database (Left) and modified model for experimental work (Right) ....................................................................................................................................... 51 Fig. 29. Dimensions of male mass body in 3D space ........................................................................ 53 Fig. 30. Human joint locations mounted in 3D space of ABAQUS .................................................. 54 Fig. 31. Lumped masses connected through connectors .................................................................... 56 Fig. 32. Mode shapes and associated vertical displacements under the effect of free vibration ....... 59 Fig. 33. 7 DOF multi-body human model with spring and damper (Zheng et al., 2011) .................. 62 Fig. 34. Multi-body model with spring and damper for studying apparent mass and transmissibility (Matsumoto and Griffin, 2001) .......................................................................................................... 63 Fig. 35. Hybrid multi-body modelling for car seat and human body (Prasad, 2005) ........................ 63 Fig. 36. Representing human limbs as ellipsoids and the scalar displacements (Hyun et al., 2003) . 71 Fig. 37. Representing human hand as an ellipsoid – a, b, c are the half lengths of ellipsoidal axes .. 72 Fig. 38. Male human driver of 77 kg mass seated on a car seat ........................................................ 74 Fig. 39. Standard car steering wheel dimensions in wheel diameter x grip diameter format (Carsoda. 2017) .................................................................................................................................................. 74 Fig. 40. Established 3D parametric CAD assembly in Solidworks ................................................... 75 Fig. 41. Human model imported into finite element environment..................................................... 76 Fig. 42. Matrix and fibre structure inside composite (left- axial, right- transverse) .......................... 78 Fig. 43. ‘Tie’ constrains (red coloured lines) (left- isometric view, right- back view) ...................... 84 Fig. 44. Concept of linear perturbation theory in ABAQUS (ABAQUS User's manual version 6.3) ............................................................................................................................................................ 85 Fig. 45. Concept of frequency range for modal dynamics analysis (ABAQUS user's manual version 6.3) ..................................................................................................................................................... 85 Fig. 46. 10-node tetrahedral element and meshed human body ......................................................... 88 Fig. 47. Deformed shapes for the natural frequency numbers 1, 25, 50, 75 and 100 (ordered from top left to bottom right horizontally).................................................................................................. 89 Fig. 48. Natural frequencies with respect to modes ........................................................................... 90 Fig. 49. Acceleration response at head .............................................................................................. 95 Fig. 50. Acceleration response at chest .............................................................................................. 95 Fig. 51. Acceleration response at waist.............................................................................................. 96 Fig. 52. Acceleration response at upper arm ...................................................................................... 96 Fig. 53. Acceleration response at lower arm ...................................................................................... 97 Fig. 54. Acceleration response at thigh .............................................................................................. 97 Fig. 55. Acceleration response at leg ................................................................................................. 98 Fig. 56. Displacement values at different human segments ............................................................. 104 Fig. 57. Frequencies at different segments ...................................................................................... 109 Fig. 58. Car seat segments (Seat rails underneath the seat is not shown) ........................................ 112
Lists of Contents, Figures and Tables
Page: xi
Fig. 59. Transmissibility study using different seat types (Griffin, 1990) ....................................... 114 Fig. 60. Behaviour of polyurethane foam material under compression (Haan, 2002) ..................... 115 Fig. 61. Stress-strain behaviour of polyurethane foam with respect to variable strain rate (Zhang et.al., 1998)....................................................................................................................................... 117 Fig. 62. Stress-strain relationship of polyurethane foam under the effect of uniaxial compression load (Camprubí et.al, 2007) ............................................................................................................. 118 Fig. 63. Contact stress distribution at seat-human interface (Williamson, 2005) ............................ 119 Fig. 64. Changes of the seat design concepts during 1971 – 2009 (Collected from Ricaro automotive seat design database) ........................................................................................................................ 121 Fig. 65. Overall dimensions (mm) of the car seat model ................................................................. 122 Fig. 66. Established three dimensional car seat model .................................................................... 123 Fig. 67. Imported car seat model in finite element environment ..................................................... 124 Fig. 68. Relationship between the stress and strain based on experimental data under different loading conditions (Grujicic et al., 2009) ........................................................................................ 125 Fig. 69. Estimated contact surfaces and boundary conditions ......................................................... 133 Fig. 70. 10-node tetrahedral element and mesh generated model of car seat .................................. 134 Fig. 71. Displacement response at headrest ..................................................................................... 135 Fig. 72. Displacement response at backrest ..................................................................................... 136 Fig. 73. Displacement response at seat cushion ............................................................................... 136 Fig. 74. Sitting posture (left) and contact definition (right) (Himmetoglu et al., 2009) .................. 140 Fig. 75. Anthropometric measurements of car seated human body (Kovacevc et al., 2010) .......... 141 Fig. 76. Optimized angles of driver body portions for comfortable sitting posture inside a car (Mircheski et al., 2014) .................................................................................................................... 141 Fig. 77. Model of human body made of fourteen segments and sitting comfort analysis (Choi et al., 2017) ................................................................................................................................................ 142 Fig. 78. Simulation set up of seated human body for the sensitivity study on vertical vibration (Verver, M.M., 2004) ....................................................................................................................... 143 Fig. 79. Established human-seat assembly ....................................................................................... 144 Fig. 80. Imported model in finite element environment .................................................................. 144 Fig. 81. Two layered seat cushion with the human buttock indenter (left) and pressure measurement (right) (Paul et al., 2012) .................................................................................................................. 146 Fig. 82. Pressure distributions at the interfaces of human buttocks and seat cushion (Mircheski et al., 2014) .......................................................................................................................................... 147 Fig. 83. Two dimensional contact in one dimensional lumped mass system (Choi et al., 2017) .... 147 Fig. 84. Simulation of human body and car seat (left), simulation of manikin and car seat (right) (Zhang, 2014) ................................................................................................................................... 148 Fig. 85. Contact establishment between the human thigh and seat cushion (Top- variable length, middle- variable width, bottom- variable thickness) (Verver, M.M., 2004) .................................... 149 Fig. 86. Concept of contact between surfaces (left) and types of contact formulations (right) ....... 151 Fig. 87. Diagram explaining pure penalty and pure Lagrangian method (ANSYS, Inc. Manual, 2004) ................................................................................................................................................ 152 Fig. 88. “Tie-up” constraints details for creating interactions ......................................................... 155 Fig. 89. Acceleration response at head ............................................................................................ 162 Fig. 90. Acceleration response at chest ............................................................................................ 162
Lists of Contents, Figures and Tables
Page: xii
Fig. 91. Acceleration response at waist............................................................................................ 163 Fig. 92. Acceleration response at upper arm .................................................................................... 163 Fig. 93. Acceleration response at lower arm .................................................................................... 164 Fig. 94. Acceleration response at thigh ............................................................................................ 164 Fig. 95. Acceleration response at leg ............................................................................................... 165 Fig. 96. Acceleration response at headrest ....................................................................................... 165 Fig. 97. Acceleration response at backrest ....................................................................................... 166 Fig. 98. Acceleration response at cushion ....................................................................................... 166 Fig. 99. Displacement responses at different segments of human body .......................................... 172 Fig. 100. Displacement responses at different segments of car seat ................................................ 173 Fig. 101. Frequencies at different segments of human body ........................................................... 178 Fig. 102. Frequencies at different segments of car seat ................................................................... 179 Fig. 103. Laboratory test set up for studying the seat dynamics (Zhang, 2014) .............................. 185 Fig. 104. Experimental set up for finding frequency and frequency graphs for seat bottom structure (a), backrest (b) and thigh (c) (Kim et al., 2003) ............................................................................. 185 Fig. 105. Experimental set up for the vibration assessment of human-seat system (Cho and Yoon, 2001) ................................................................................................................................................ 186 Fig. 106. Experimental set up for measuring the pressure distributions on car seat parts (Hong et al., 2003) ................................................................................................................................................ 186 Fig. 107. On road vehicle vibration set up and results (Lakušić et al., 2011) .................................. 187 Fig. 108. Virtual vibration testing using shaker table and sensors (Ittianuwat et al., 2014) ............ 188 Fig. 109. Set up for the on-road vibration measurement (Stein et al., 2011) ................................... 188 Fig. 110. Accelerometer mounted on car seat and the frequency levels (Qui and Griffin, 2004) ... 189 Fig. 111. Laboratory set up for human body vibration and the evaluated transfer functions (Ruetzel, and Woelfel, 2005) ........................................................................................................................... 190 Fig. 112. Laboratory set up for the resonance of human body and power spectral density (Verver, 2004) ................................................................................................................................................ 191 Fig. 113. Peak, average and rms values of vibration ....................................................................... 192 Fig. 114. Flow chart showing the processes involved in vibration measurement using digital sensor system .............................................................................................................................................. 193 Fig. 115. Typical transducer diagrams, left- accelerometer, middle- velocity transducer, right- displacement transducer (Reliability Direct Store, 2018) ................................................................ 194 Fig. 116. Different kinds of portable vibration measuring systems for in-house application .......... 195 Fig. 117. Third party testing facilities, top - m+p International, bottom - Element ........................ 196 Fig. 118. Vibration measuring instrument NI 9234 Module with CompactDAQ Chassis .............. 199 Fig. 119. Vibration measuring transducer Dytran 3055................................................................... 200 Fig. 120. Typical data signal displayed in “m+p Analyser” software tool ...................................... 200 Fig. 121. Transducer mounting method for measuring vibration in vertical direction at various locations of human body and car seat .............................................................................................. 201 Fig. 122. Sample test set up ............................................................................................................. 202 Fig. 123. Vibration data for human head (Top- acceleration vs time, bottom- power spectrum density vs frequency) ....................................................................................................................... 204 Fig. 124. Vibration data for human chest (Top- acceleration vs time, bottom- power spectrum density vs frequency) ....................................................................................................................... 205
Lists of Contents, Figures and Tables
Page: xiii
Fig. 125. Vibration data for human waist (Top- acceleration vs time, bottom- power spectrum density vs frequency) ....................................................................................................................... 206 Fig. 126. Vibration data for human upper arm (Top- acceleration vs time, bottom- power spectrum density vs frequency) ....................................................................................................................... 207 Fig. 127. Vibration data for human lower arm (Top- acceleration vs time, bottom- power spectrum density vs frequency) ....................................................................................................................... 208 Fig. 128. Vibration data for human thigh (Top- acceleration vs time, bottom- power spectrum density vs frequency) ....................................................................................................................... 209 Fig. 129. Vibration data for human leg (Top- acceleration vs time, bottom- power spectrum density vs frequency) .................................................................................................................................... 210 Fig. 130. Vibration data for seat headrest (Top- acceleration vs time, bottom- power spectrum density vs frequency) ....................................................................................................................... 211 Fig. 131. Vibration data for seat backrest (Top- acceleration vs time, bottom- power spectrum density vs frequency) ....................................................................................................................... 212 Fig. 132. Vibration data for seat cushion (Top- acceleration vs time, bottom- power spectrum density vs frequency) ....................................................................................................................... 213 Fig. 133. Simplified test data for human head ................................................................................. 214 Fig. 134. Simplified test data for human chest ................................................................................ 215 Fig. 135. Simplified test data for human waist ................................................................................ 215 Fig. 136. Simplified test data for human upper arm ........................................................................ 216 Fig. 137. Simplified test data for human lower arm ........................................................................ 216 Fig. 138. Simplified test data for human thigh ................................................................................ 217 Fig. 139. Simplified test data for human leg .................................................................................... 217 Fig. 140. Simplified test data for seat headrest ................................................................................ 218 Fig. 141. Simplified test data for seat backrest ................................................................................ 218 Fig. 142. Simplified test data for seat cushion ................................................................................. 219 Fig. 143. Vertical accelerations of human head from simulation and testing .................................. 224 Fig. 144. Vertical accelerations of human chest from simulation and testing ................................. 225 Fig. 145. Vertical accelerations of human waist from simulation and testing ................................. 225 Fig. 146. Vertical accelerations of human upper arm from simulation and testing ......................... 226 Fig. 147. Vertical accelerations of human lower arm from simulation and testing ......................... 226 Fig. 148. Vertical accelerations of human thigh from simulation and testing ................................. 227 Fig. 149. Vertical accelerations of human leg from simulation and testing .................................... 227 Fig. 150. Vertical accelerations of seat headrest from simulation and testing ................................. 228 Fig. 151. Vertical accelerations of seat backrest from simulation and testing ................................. 228 Fig. 152. Vertical accelerations of seat cushion from simulation and testing ................................. 229 Fig. 153. Spring-damper-mass system representing human and car seat ........................................ 231 Fig. 154. Various mediums of transportation .................................................................................. 238 Fig. 155. Different classes of the car ............................................................................................... 238 Fig. 156. Typical seats for car, train and airplane (left to right) ...................................................... 239 Fig. 157. Degrees of Freedom for water transportation system ....................................................... 240 Fig. 158. Typical human body represented by ellipsoidal segments ............................................... 242 Fig. 159. Typical transportation seat model ..................................................................................... 243 Fig. 160. Typical human-seat assembly ........................................................................................... 244
Lists of Contents, Figures and Tables
Page: xiv
Fig. 161. ABAQUS CAE steps ........................................................................................................ 248 Fig. 162. ANSYS Workbench hierarchy ......................................................................................... 248
List of Tables
Table 1. Estimated biomechanical parameters of Multi-DOF model (Cho and Yoon, 2001) ............. 9 Table 2. Comparative study of literature review on human body and car seat .................................. 12 Table 3. Estimated experimental set up and output ........................................................................... 27 Table 4. Measured co-ordinates of human joints ............................................................................... 53 Table 5. Calculated mass of each human body segment.................................................................... 55 Table 6. Calculated mass of lumped mass point ................................................................................ 55 Table 7. Axial stiffness values assigned to body segments ............................................................... 57 Table 8. Modal displacements and natural frequencies ..................................................................... 58 Table 9. Human segmental mass as a percentage of total body mass (left- Plagenhoef et al., 1983, right - Leva, 1996) ............................................................................................................................. 66 Table 10. Calculated human segmental mass data ............................................................................. 67 Table 11. Extracted and calculated dimensions for seated 50th percentile male human body ........... 69 Table 12. Calculated dimensions and masses of ellipsoids representing the human portions ........... 73 Table 13. Calculated ratios of two lateral axes, volumes and densities for the ellipsoids representing the human portions ............................................................................................................................. 76 Table 14. Evaluated values of stiffness for all the segments ............................................................. 80 Table 15. Measured values of vertical accelerations for all the segments ......................................... 90 Table 16. Measured values of vertical displacements for all the segments ....................................... 98 Table 17. Calculated values of frequencies for all the segments ..................................................... 104 Table 18. Average frequencies of human segments ........................................................................ 110 Table 19. Ogden coefficients used for hyper-elastic foams (Ju et al., 2014) ................................... 126 Table 20. Polynmial coefficients used for hyper-elastic foams (Ju et al., 2014) ............................. 126 Table 21. Ogden coefficients used for hyper-elastic soft foams (Top) and optimized Ogden coefficients used for hyper-elastic soft foams (Bottom) (Schrodt, 2005) ........................................ 127 Table 22. Stress-strain behaviour of polyurethane foam with respect to strain rate (Zhang et.al., 1998) ................................................................................................................................................ 128 Table 23. Hyper-elastic and visco-elastic parameters used ............................................................. 129 Table 24. Densities of different types of polyurethane foams (Jarfelt and Chemeng, 2006) .......... 130 Table 25. Measured values of vertical displacements for all the designated areas of seat .............. 135 Table 26. Summary of the simulation parameters used from previous chapters ............................. 145 Table 27. Contact formulation characteristics (ABAQUS User's manual version 6.3) ................... 150 Table 28. Advantages and disadvantages of different contact formulation methods (SAS IP, Inc.) .......................................................................................................................................................... 153 Table 29. Measured values of vertical accelerations for the human body and car seat ................... 156 Table 30. Measured values of vertical displacements for the human body and car seat ................. 167 Table 31. Calculated values of frequencies for all the human and car seat segments ..................... 174

Lists of Contents, Figures and Tables
Page: xv
Table 32. Average frequencies of all the human and car seat segments .......................................... 179 Table 33. Natural frequencies of different human organs (Cempel, 1989) ..................................... 180 Table 34. Advantages and disadvantages of different testing environments ................................... 197 Table 35. Comparison of vertical vibration in terms of acceleration ............................................... 222 Table 36. International standards related to vibration measurement ............................................... 235 Table 37. Equipments and tools required ......................................................................................... 237 Table 38. Deviations of the simulation results from the testing data ............................................... 264
Chapter 1
Page: 1
CHAPTER 1 INTRODUCTION
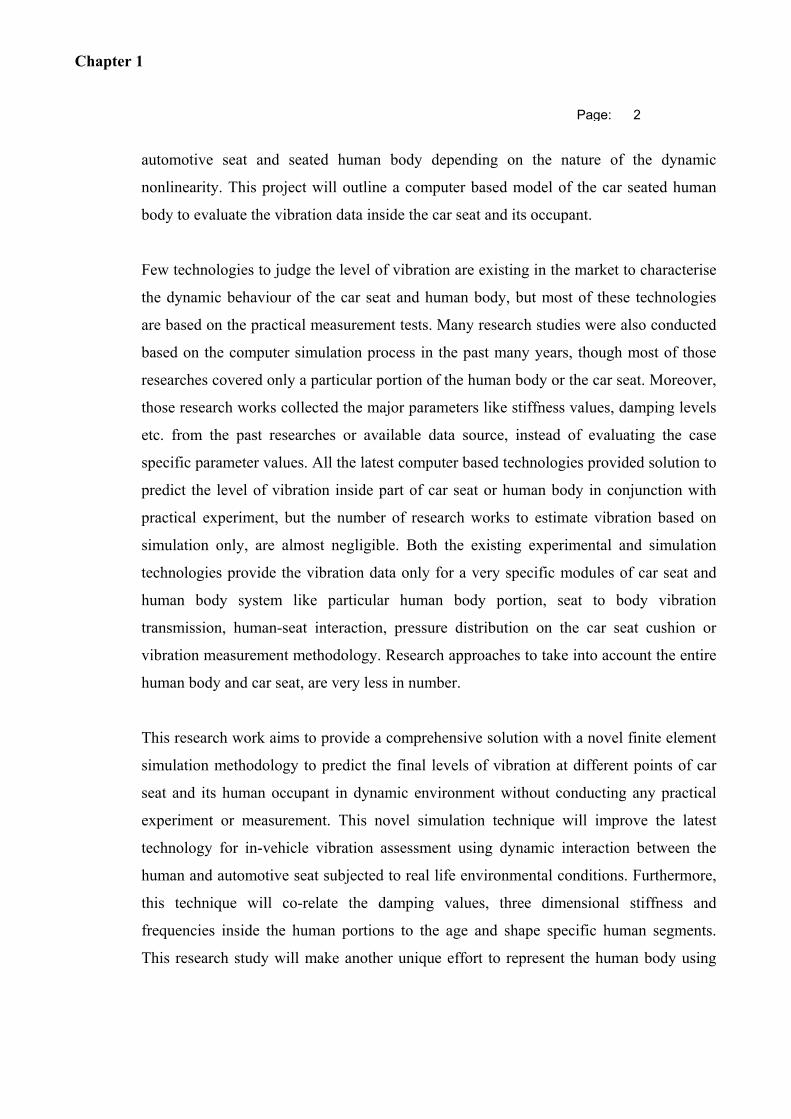
Over last many years, interaction between the dynamic automotive and its occupant
playing important role to characterise the levels of safety and comfort of the vehicle
system. Parts of the system or subsystem of the aviation, automotive, railway etc.
industries are exposed to unwanted vibration cause of the movement and it is necessary to
investigate the dynamic behaviour of the transportation medium under normal and
extreme operating conditions.
One of the primary means of transportation system worldwide is the automobile and any
kind of automobile must offer highest standard of the safety and comfort levels for the
occupants inside. The health, safety and comfort levels of the automotive systems are
mainly analysed through the complex mechanical phenomenon between the moving
object and human occupant, which demands a robust dynamic study. Automotive seats
are mainly made of polyurethane foam, which exhibits non-linear viscoelastic and hyper-
elastic material properties. So, the overall system of human body, moving vehicle and
foam seat constitute a complicated dynamic system with nonlinearities inside.
Health, safety and comfort of the dynamic vehicle, human body and transportation seat
are mainly determined by the level of the vibration generated inside the system and
random level of vibration plays the key role for producing uneven stresses inside the
human body and automotive seat through deformation and harmonic excitation. Thus, a
comprehensive evaluation is needed to characterise the level of vibration inside the
Chapter 1
Page: 2
automotive seat and seated human body depending on the nature of the dynamic
nonlinearity. This project will outline a computer based model of the car seated human
body to evaluate the vibration data inside the car seat and its occupant.
Few technologies to judge the level of vibration are existing in the market to characterise
the dynamic behaviour of the car seat and human body, but most of these technologies
are based on the practical measurement tests. Many research studies were also conducted
based on the computer simulation process in the past many years, though most of those
researches covered only a particular portion of the human body or the car seat. Moreover,
those research works collected the major parameters like stiffness values, damping levels
etc. from the past researches or available data source, instead of evaluating the case
specific parameter values. All the latest computer based technologies provided solution to
predict the level of vibration inside part of car seat or human body in conjunction with
practical experiment, but the number of research works to estimate vibration based on
simulation only, are almost negligible. Both the existing experimental and simulation
technologies provide the vibration data only for a very specific modules of car seat and
human body system like particular human body portion, seat to body vibration
transmission, human-seat interaction, pressure distribution on the car seat cushion or
vibration measurement methodology. Research approaches to take into account the entire
human body and car seat, are very less in number.
This research work aims to provide a comprehensive solution with a novel finite element
simulation methodology to predict the final levels of vibration at different points of car
seat and its human occupant in dynamic environment without conducting any practical
experiment or measurement. This novel simulation technique will improve the latest
technology for in-vehicle vibration assessment using dynamic interaction between the
human and automotive seat subjected to real life environmental conditions. Furthermore,
this technique will co-relate the damping values, three dimensional stiffness and
frequencies inside the human portions to the age and shape specific human segments.
This research study will make another unique effort to represent the human body using
Chapter 1
Page: 3
ellipsoidal segments to define the three dimensional stiffness for each part of human
body, hence, necessity of modelling the time consuming real anatomical shapes of the
human structures will be omitted. For the calculation of the three dimensional stiffness,
both the human muscle and bone properties will be taken into account. This unique study
will establish a novel idea about the entire human body and automotive seat system,
rather than concentrating only to a specific segment, hence, will fill up the gap in the
latest relevant technologies and avoid the cost burdening and time consuming practical
test methods. A cutting edge technology will be contributed by this unique study to the
modern transportation industry to estimate and understand the vibration data inside
automotive seat and seated human body, solely based on computer simulation method.
1.1. LITERATURE REVIEW
The purpose of this literature review is to explore some of the different variables of the
vibration, analysis techniques and measurement procedures which influence the final
outcome of the effect of the vibration inside the human body seated on a car seat, in terms
of human health, safety and comfort levels. Literature review in this section is a part of
the overall critical review conducted throughout this research study. Review in precise
details for appropriate subject has been carried out in the respective sections as needed.
1.1.1. Numerical Simulation relating to Vibration
Over past few decades, vibration along with its effect on the car seat and occupant human
body has been getting characterised, measured and assessed either by numerical model or
computerized simulation process. Finite element analysis of the whole vehicle using
dynamic environment in ABAQUS (Hellman, 2008) stated that because of the high cost
involved with the production process of a new vehicle model, computerized simulation
methods for dynamic analyses are gaining more importance for the development of the
automobile system.
Chapter 1
Page: 4
1.1.1.1. Multi Degrees of Freedom Bio-Dynamic Model of Seated Human inside a Car
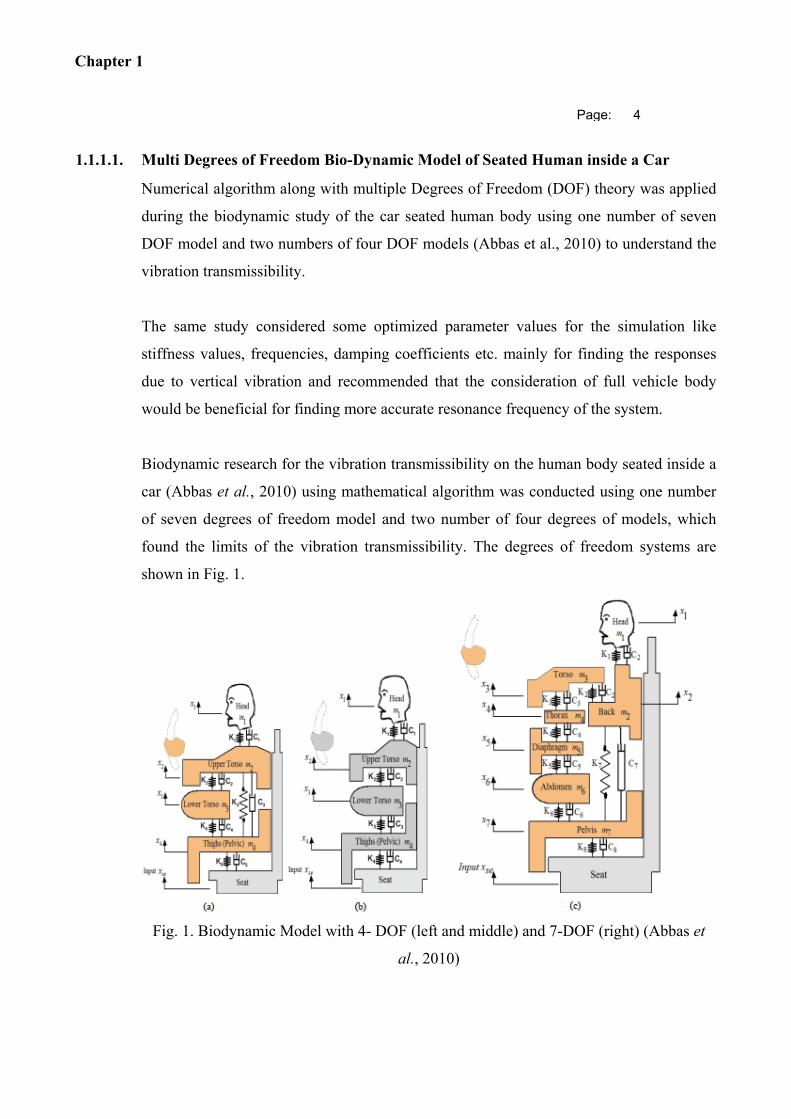
Numerical algorithm along with multiple Degrees of Freedom (DOF) theory was applied
during the biodynamic study of the car seated human body using one number of seven
DOF model and two numbers of four DOF models (Abbas et al., 2010) to understand the
vibration transmissibility.
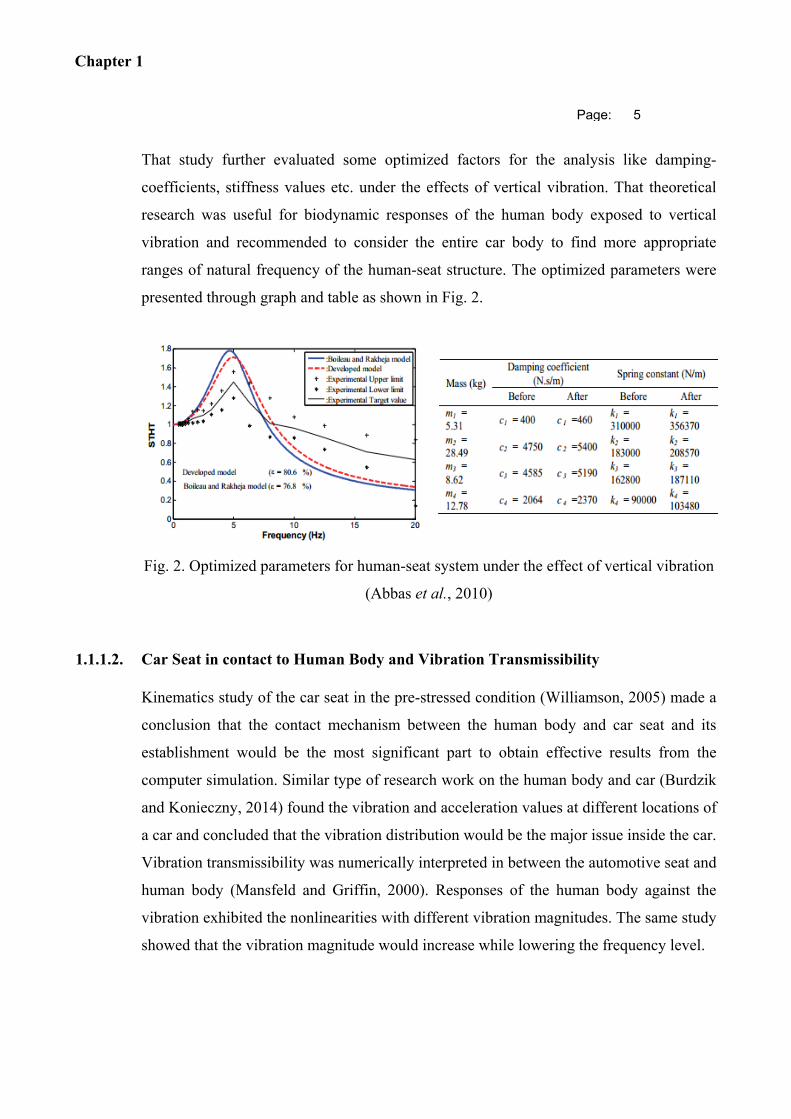
The same study considered some optimized parameter values for the simulation like
stiffness values, frequencies, damping coefficients etc. mainly for finding the responses
due to vertical vibration and recommended that the consideration of full vehicle body
would be beneficial for finding more accurate resonance frequency of the system.
Biodynamic research for the vibration transmissibility on the human body seated inside a
car (Abbas et al., 2010) using mathematical algorithm was conducted using one number
of seven degrees of freedom model and two number of four degrees of models, which
found the limits of the vibration transmissibility. The degrees of freedom systems are
shown in Fig. 1.
Fig. 1. Biodynamic Model with 4- DOF (left and middle) and 7-DOF (right) (Abbas et
al., 2010)
Chapter 1
Page: 5
That study further evaluated some optimized factors for the analysis like damping-
coefficients, stiffness values etc. under the effects of vertical vibration. That theoretical
research was useful for biodynamic responses of the human body exposed to vertical
vibration and recommended to consider the entire car body to find more appropriate
ranges of natural frequency of the human-seat structure. The optimized parameters were
presented through graph and table as shown in Fig. 2.
Fig. 2. Optimized parameters for human-seat system under the effect of vertical vibration
(Abbas et al., 2010)
1.1.1.2. Car Seat in contact to Human Body and Vibration Transmissibility
Kinematics study of the car seat in the pre-stressed condition (Williamson, 2005) made a
conclusion that the contact mechanism between the human body and car seat and its
establishment would be the most significant part to obtain effective results from the
computer simulation. Similar type of research work on the human body and car (Burdzik
and Konieczny, 2014) found the vibration and acceleration values at different locations of
a car and concluded that the vibration distribution would be the major issue inside the car.
Vibration transmissibility was numerically interpreted in between the automotive seat and
human body (Mansfeld and Griffin, 2000). Responses of the human body against the
vibration exhibited the nonlinearities with different vibration magnitudes. The same study
showed that the vibration magnitude would increase while lowering the frequency level.
Chapter 1
Page: 6
Car seat resonating characteristics were investigated using vibration energy theorem
(Batt, 2013) which stated that the loss in energy of the car seat system would mainly
occur cause of upper human part movement and not all the car seats would be appropriate
to absorb the vibration energy close to the primary natural frequency. Study on the car
seated human body for vibration analysis (Kitazaki and Griffin, 1998) suggested that the
forces responsible for the entire human body vibration could not be accurately predicted
unless the human motion and postures be not taken under consideration. That analysis
could further be improved by taking into account the nonlinear biodynamic responses to
the human body vibration.
Locations of the minimum and maximum level of vibrations in a car seat at the human-
seat interface with respect to variable frequency (Tang et al., 2010) were shown using
finite element analysis. That finite element method was useful for predicting the vibration
transmissibility in the two dimensional environment and could further be developed to
advance level by using three dimensional format.
1.1.1.3. Harmonic Vibration and Frequency
Car bonnet was simulated using finite element method for harmonic frequency (Nesaragi
et al., 2014) analysis to show the amplitude of vibration with respect to frequency. The
frequency range was considered from 1 Hz to 100 Hz, while the engine was assumed to
be in ideal condition and the operating speed of engine had been considered as 1000 rpm.
The bonnet frequency was found to be higher than 20 Hz, well distant from the engine
frequency of 16 Hz. Similar simulation based analysis on the car engine parts (Nesaragi
et al., 2014) had chosen the damping co-efficient and stiffness values from the
engineering data book and described that the mounting locations of the sensors during
vibration measurement would play very important role for assessing the vibration levels
inside the structure.
Chapter 1
Page: 7
1.1.1.4. Vibration generated inside Human Body Portions
Human spinal segments were investigated (Guo et al., 2011) for vibration analysis to find
out the natural frequencies and found that the amplitudes of vibration at different points
of a same human spine were different. Similar kinds of statements were made from the
investigation on the vibration characterizing of human portions (Goel et al., 1994) and
dynamic study of human intervertebral lumbar joints (Kasra et al., 1992).
1.1.1.5. Vibration inside Car Body or Portions
Lumped mass parameter method was implemented to one fourth of a car model for
vibration analysis (Thite, 2012) using the Maxwell’s theorem. That study co-related the
damping co-efficient, damping ratio and stiffness parameter and found the vibration
responses with respect to variable damping and series stiffness parameters. It was
concluded that the series stiffness would be beneficial for reducing the level of damping
inside the car.
1.1.2. Vibration Measurement
Mathematical or numerical simulation method for judging the level, nature and
transmissibility of vibration is based on the theoretical concepts, hence, got some
limitation from practical point of view. Vibration measurement techniques are more
practical based on exact real life scenarios and can fill the limitations of the theoretical
concepts. So, in the modern industries, vibration measurement techniques also got huge
importance to monitor and characterise the vibration level inside the dynamic structures.
1.1.2.1. Vibration Measurement and Resonant Frequencies
The significance of the vibration measuring system for the human body and the car seat
assembly was examined (Ittianuwat et al., 2014) in compliance with the international
standard of vibration ISO 2631-1 (1997). A comparative study was carried out further by
Chapter 1
Page: 8
measuring vibrations at different locations with respect to different mode shapes and
natural frequencies.
1.1.2.2. Vibration Transmissibility Measurement using Accelerometer and Mode Shape
The common practice for real life vibration measurement in car seat is to mount the
sensors or accelerometers at the central locations of the seat cushion and backrest. But
research showed (Tamaoki et al., 2012) that the vibration transmissibility measured as the
central location was based only on the fundamental frequencies in the range of 1 Hz to 10
Hz and the measured transmissibility of vibration from the seat to human body was not
accurate enough. Another experimental study (Lo et al., 2013) explored the structural
dynamics of the coupling of the car seat and human body and found the fundamental
frequency was ranged in between 10 Hz and 50 Hz. That analysis further found three
natural frequencies for three respective mode shapes, below 80 Hz. Experiment was
carried out to find out the relation between natural frequency and transmissibility of the
car seated human body (Cho and Yoon, 2001) and extracted one fundamental mode shape
of the human body at 4.2 Hz, while two mode shapes appeared for the head at 4.2 Hz and
7.7 Hz.
1.1.2.3. Vibration Peak Transmissibility with varying Weight, Posture and Car Speed
Observation made on an experimental car (Ford Focus, V817 LAR, Zetec, and 2.0L) at a
speed of 35 miles/ hour to 45 miles/ hour to investigate the vibration transmission (Qiu
and Griffin, 2004) from the seat to human body. Two number of sample masses of 70 kg
and 80 kg were used in the fourth gear of the running car and the primary peak
transmissibility occurred in-between 4 Hz and 5 Hz. Results from that study showed that
a single input and single output system would be sufficient for examining the vertical
vibration transmission, but not for the horizontal vibration transmission. Study on the car
seat backrest for fore-aft vibration transmissibility (Abdul and Griffin, 2007) and
nonlinear vertical vibration transmission of the car seat (Tufano and Griffin, 2012)
Chapter 1
Page: 9
reported that vertical inclination and position would play vital role for determining the
vibration transmissibility from seat to human object.
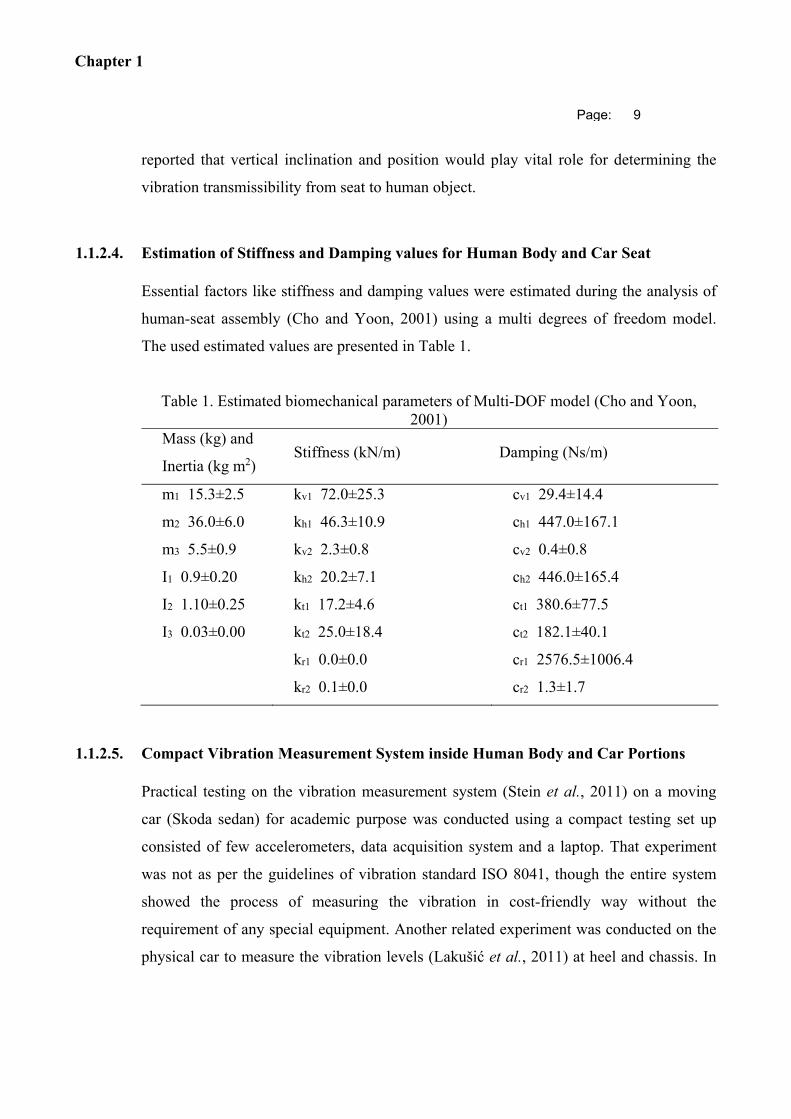
1.1.2.4. Estimation of Stiffness and Damping values for Human Body and Car Seat
Essential factors like stiffness and damping values were estimated during the analysis of
human-seat assembly (Cho and Yoon, 2001) using a multi degrees of freedom model.
The used estimated values are presented in Table 1.
Table 1. Estimated biomechanical parameters of Multi-DOF model (Cho and Yoon, 2001)
Mass (kg) and
Inertia (kg m2) Stiffness (kN/m) Damping (Ns/m)
m1 15.3±2.5 kv1 72.0±25.3 cv1 29.4±14.4
m2 36.0±6.0 kh1 46.3±10.9 ch1 447.0±167.1
m3 5.5±0.9 kv2 2.3±0.8 cv2 0.4±0.8
I1 0.9±0.20 kh2 20.2±7.1 ch2 446.0±165.4
I2 1.10±0.25 kt1 17.2±4.6 ct1 380.6±77.5
I3 0.03±0.00 kt2 25.0±18.4 ct2 182.1±40.1
kr1 0.0±0.0 cr1 2576.5±1006.4
kr2 0.1±0.0 cr2 1.3±1.7
1.1.2.5. Compact Vibration Measurement System inside Human Body and Car Portions
Practical testing on the vibration measurement system (Stein et al., 2011) on a moving
car (Skoda sedan) for academic purpose was conducted using a compact testing set up
consisted of few accelerometers, data acquisition system and a laptop. That experiment
was not as per the guidelines of vibration standard ISO 8041, though the entire system
showed the process of measuring the vibration in cost-friendly way without the
requirement of any special equipment. Another related experiment was conducted on the
physical car to measure the vibration levels (Lakušić et al., 2011) at heel and chassis. In
Chapter 1
Page: 10
between the time interval of 0 second and 48 second, the vibration values for wheel and
chassis were measured as 21.2 mm/s and 6.1 mm/s, respectively and in-between the time
interval of 48 second and 112 second, the vibration values for wheel and chassis were
measured as 12.7 mm/s and 4.5 mm/s, respectively.
1.1.3. Combined Numerical Simulation and Measurement of the Vibration for
both the Human Body and Car Seat
Numbers of research case studies to investigate the car seat and the human body using
combined simulation process and testing method, are found to be very rare. Effort had
been made to explore the literatures covering both the topics relevant to this study.
A comprehensive investigation had been conducted on the car seat and human object
(Verver, 2004) for the comfort analysis of the human body. That elaborative study used
finite element method for analyzing the human and seat assembly and mainly focused on
the vibration transmissibility. From the simulation result, it was concluded that the
acceleration transmission from seat to human body was strongly reliant on the human
body posture. During the stage of experimental process, the vibration transmissibility for
seat to human body and seat pressure distribution were evaluated, though the
international standard for seat pressure ISO 2631 was not followed and no seat frame and
cushion springs were taken into account. The outcome of that study recommended to
conduct a more in-depth investigation on the human model for accurate analysis of
vertical vibration. Dynamic behaviour of seat were examined to estimate the car seat
transmissibility (Zhang, 2014) using the mechanical modelling and measurement
methods. Seat foam properties, human shape, damping and stiffness were included inside
the finite element simulation and it was reported that the thickness of the automotive seat
cushion would be one of the primary factors to affect the vibration transmission from the
seat to the occupant. That study further investigated the sitting posture and suggested for
more comprehensive investigation on the contact condition between seat and human.
Chapter 1
Page: 11
Both the research works were restricted to the experiment and finite element simulation
without carrying out any sort of real life vibration testing.
Human body vibration responses with respect to various sitting postures were evaluated
using real testing method (Ruetzel and Woelfel, 2005) to provide a set of frequency and
damping data against the human body mass. Damping, frequency and mass data were
interlinked by two number case studies with 95 kg and 50 kg human masses. Later a
simulation model was established using the finite element tool to compare the results
obtained from the testing. That study advised for further research to optimize the
characteristics of vibration with respect to human sitting posture.
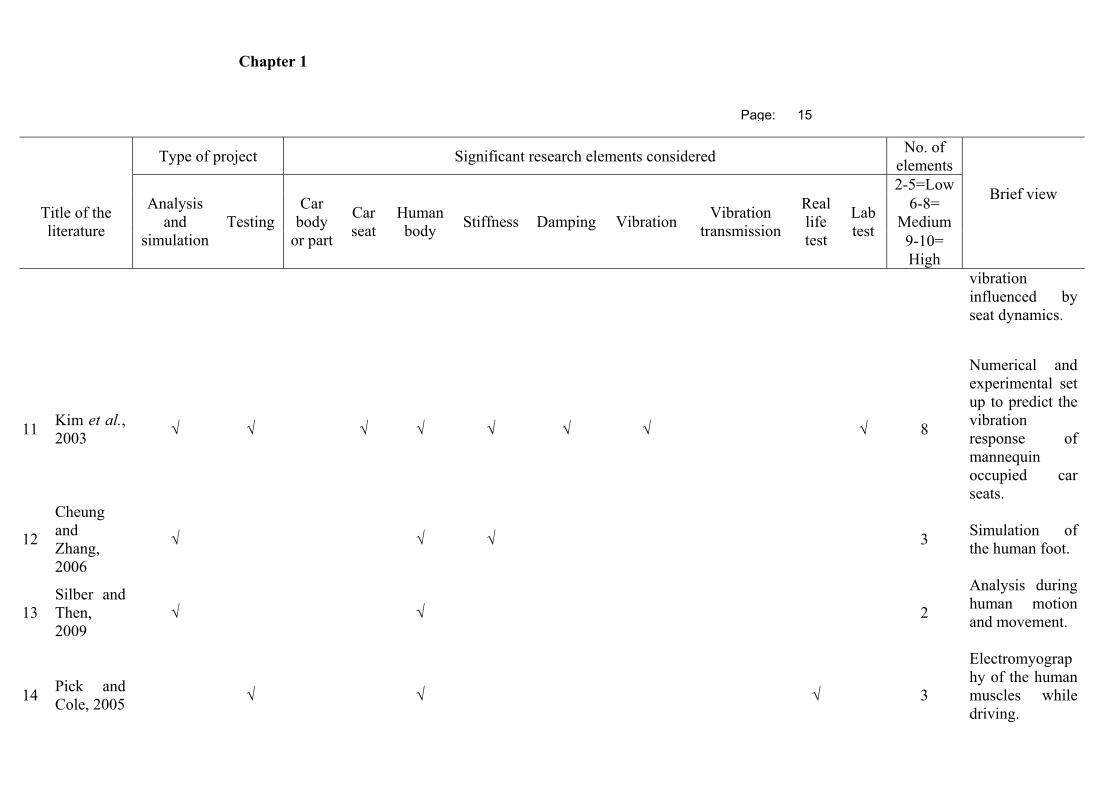
1.1.4. Matrix based comparative study on Literature Review
Based on whether the investigation type is analysis or testing based, the most important
key research literatures have been identified and a matrix based comparison model has
been developed in Table 2 with the importance levels assigned depending on the chosen
elements. In this matrix based study, each literature has been allocated with a score
between 2 and 10 depending on the number of key element considered during the
relevant research work, which helps to obtain a clear view on the existing technologies
and their specific areas of the work on the human body and car interfaces.
Chapter 1
Page: 12
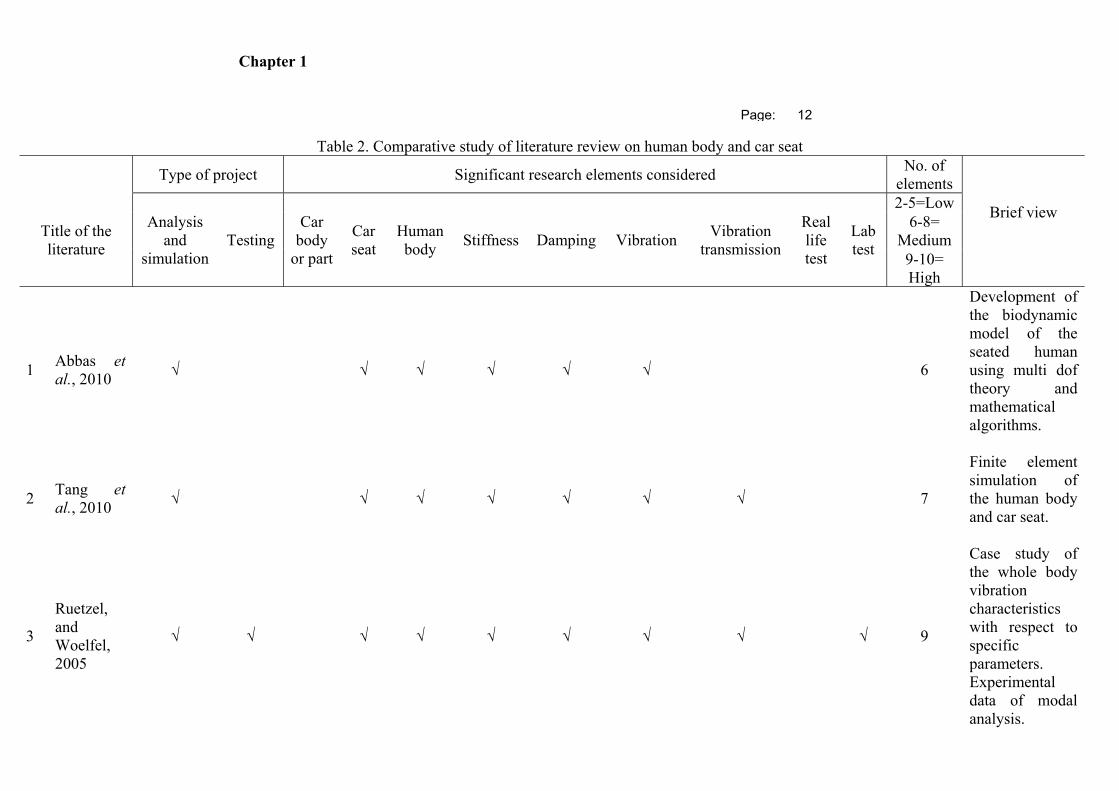
Table 2. Comparative study of literature review on human body and car seat
Type of project Significant research elements considered
No. of elements
Brief view Title of the
literature
Analysis and
simulation Testing
Car body
or part
Car seat
Human body
Stiffness Damping Vibration Vibration
transmission
Real life test
Lab test
2-5=Low6-8=
Medium 9-10= High
1 Abbas et al., 2010
√ √ √ √ √ √ 6
Development of the biodynamic model of the seated human using multi dof theory and mathematical algorithms.
2 Tang et al., 2010
√ √ √ √ √ √ √ 7
Finite element simulation of the human body and car seat.
3
Ruetzel, and Woelfel, 2005
√ √ √ √ √ √ √ √ √ 9
Case study of the whole body vibration characteristics with respect to specific parameters. Experimental data of modal analysis.
Chapter 1
Page: 13
Type of project Significant research elements considered
No. of elements
Brief view Title of the
literature
Analysis and
simulation Testing
Car body
or part
Car seat
Human body
Stiffness Damping Vibration Vibration
transmission
Real life test
Lab test
2-5=Low6-8=
Medium 9-10= High
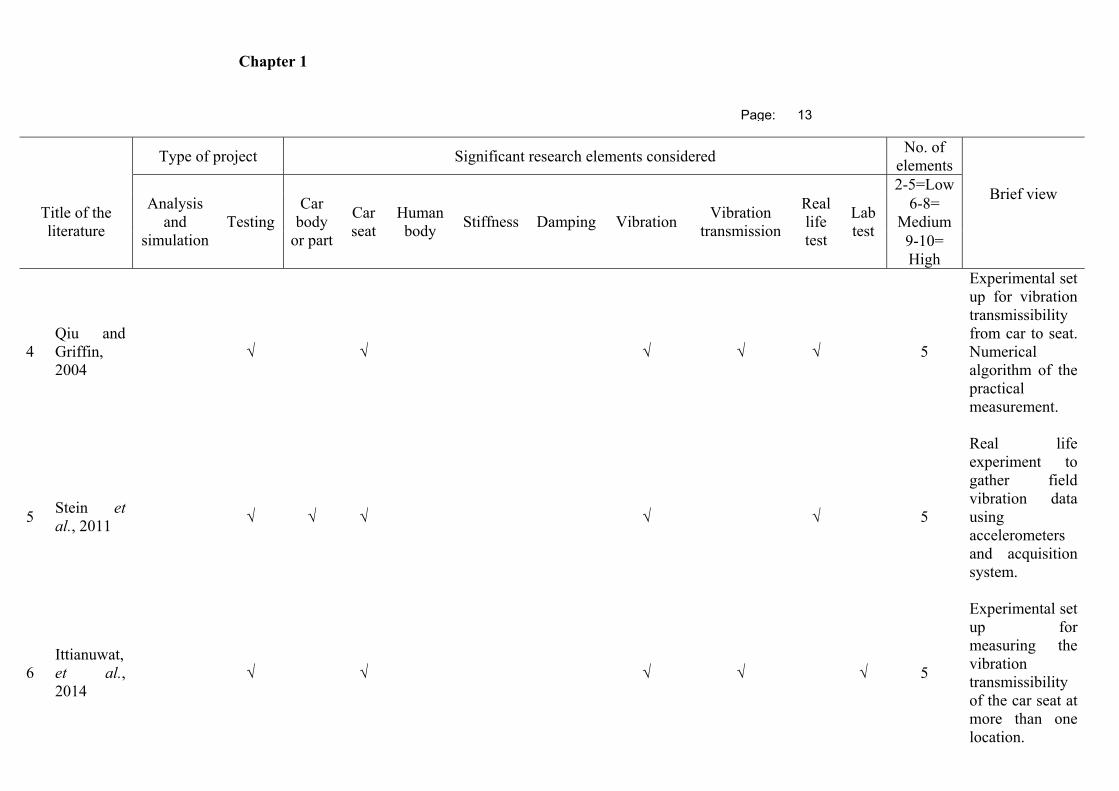
4 Qiu and Griffin, 2004
√ √ √ √ √ 5
Experimental set up for vibration transmissibility from car to seat. Numerical algorithm of the practical measurement.
5 Stein et al., 2011
√ √ √ √ √ 5
Real life experiment to gather field vibration data using accelerometers and acquisition system.
6 Ittianuwat, et al., 2014
√ √ √ √ √ 5
Experimental set up for measuring the vibration transmissibility of the car seat at more than one location.
Chapter 1
Page: 14
Type of project Significant research elements considered
No. of elements
Brief view Title of the
literature
Analysis and
simulation Testing
Car body
or part
Car seat
Human body
Stiffness Damping Vibration Vibration
transmission
Real life test
Lab test
2-5=Low6-8=
Medium 9-10= High
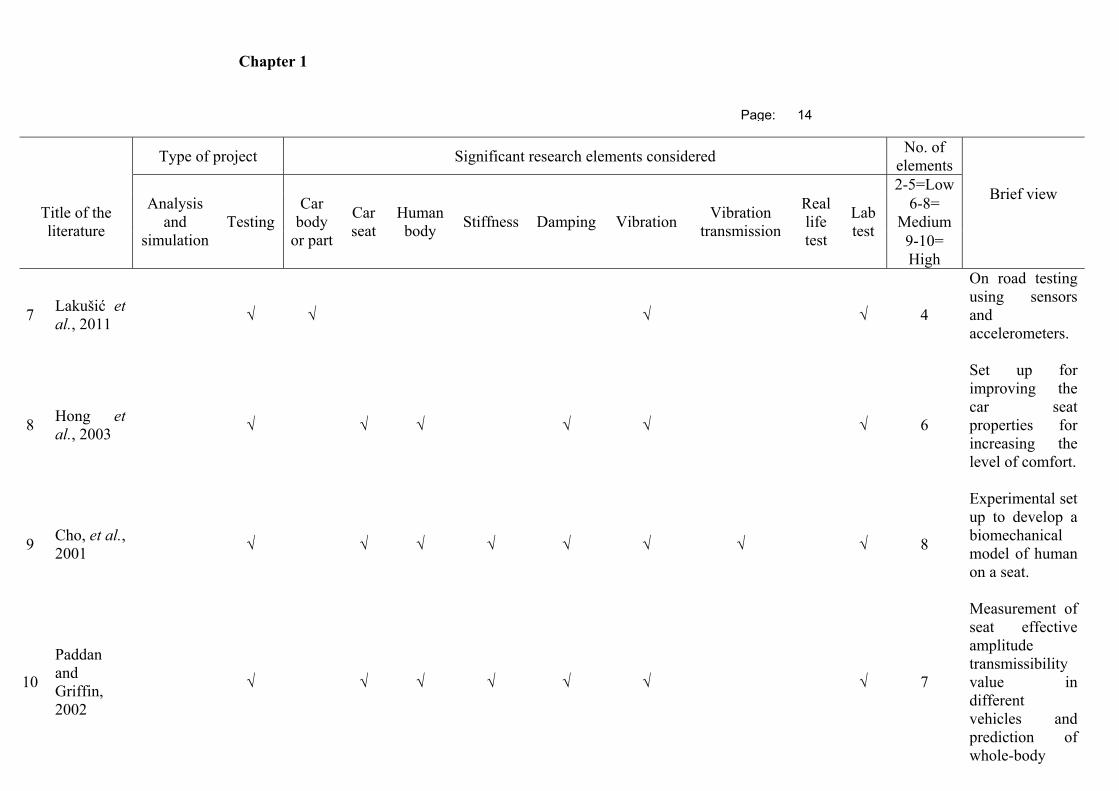
7 Lakušić et al., 2011
√ √ √ √ 4
On road testing using sensors and accelerometers.
8 Hong et al., 2003
√ √ √ √ √ √ 6
Set up for improving the car seat properties for increasing the level of comfort.
9 Cho, et al., 2001
√ √ √ √ √ √ √ √ 8
Experimental set up to develop a biomechanical model of human on a seat.
10
Paddan and Griffin, 2002
√ √ √ √ √ √ √ 7
Measurement of seat effective amplitude transmissibility value in different vehicles and prediction of whole-body
Chapter 1
Page: 15
Type of project Significant research elements considered
No. of elements
Brief view Title of the
literature
Analysis and
simulation Testing
Car body
or part
Car seat
Human body
Stiffness Damping Vibration Vibration
transmission
Real life test
Lab test
2-5=Low6-8=
Medium 9-10= High
vibration influenced by seat dynamics.
11 Kim et al., 2003
√ √ √ √ √ √ √ √ 8
Numerical and experimental set up to predict the vibration response of mannequin occupied car seats.
12
Cheung and Zhang, 2006
√ √ √ 3 Simulation of the human foot.
13 Silber and Then, 2009
√ √ 2
Analysis during human motion and movement.
14 Pick and Cole, 2005
√ √ √ 3
Electromyography of the human muscles while driving.
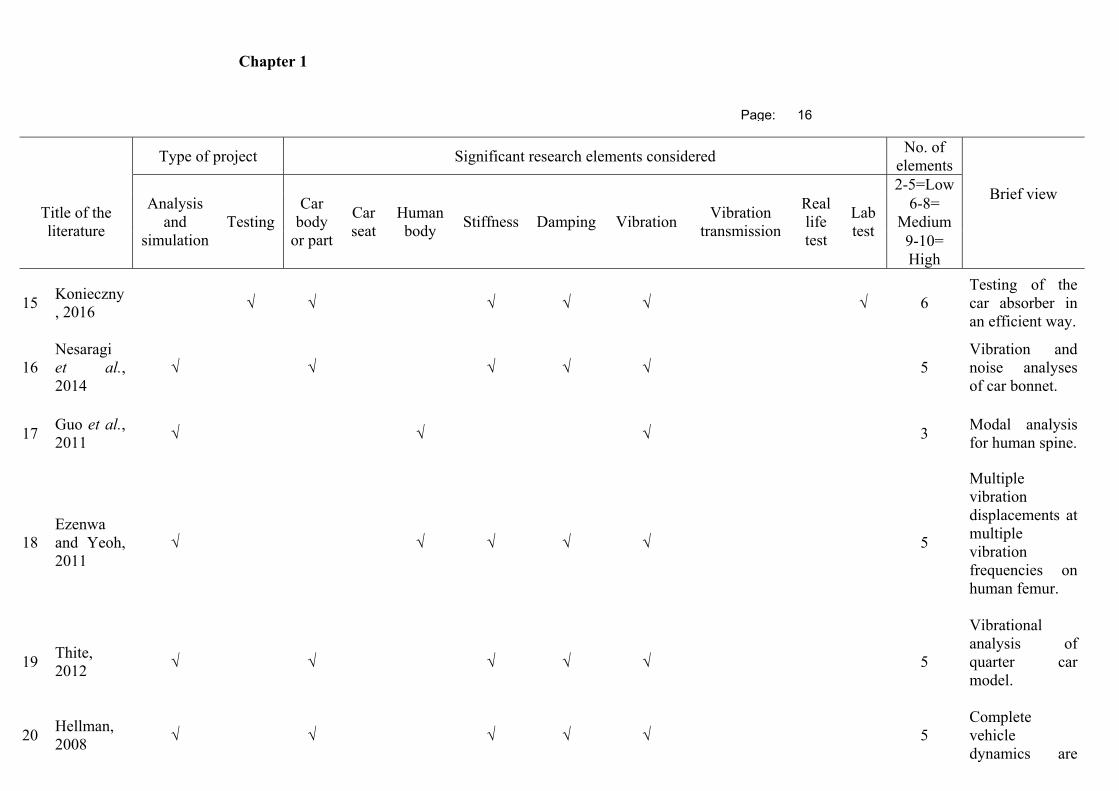
Chapter 1
Page: 16
Type of project Significant research elements considered
No. of elements
Brief view Title of the
literature
Analysis and
simulation Testing
Car body
or part
Car seat
Human body
Stiffness Damping Vibration Vibration
transmission
Real life test
Lab test
2-5=Low6-8=
Medium 9-10= High
15 Konieczny, 2016
√ √ √ √ √ √ 6 Testing of the car absorber in an efficient way.
16 Nesaragi et al., 2014
√ √ √ √ √ 5 Vibration and noise analyses of car bonnet.
17 Guo et al., 2011
√ √ √ 3 Modal analysis for human spine.
18 Ezenwa and Yeoh, 2011
√ √ √ √ √ 5
Multiple vibration displacements at multiple vibration frequencies on human femur.
19 Thite, 2012
√ √ √ √ √ 5
Vibrational analysis of quarter car model.
20 Hellman, 2008
√ √ √ √ √ 5 Complete vehicle dynamics are
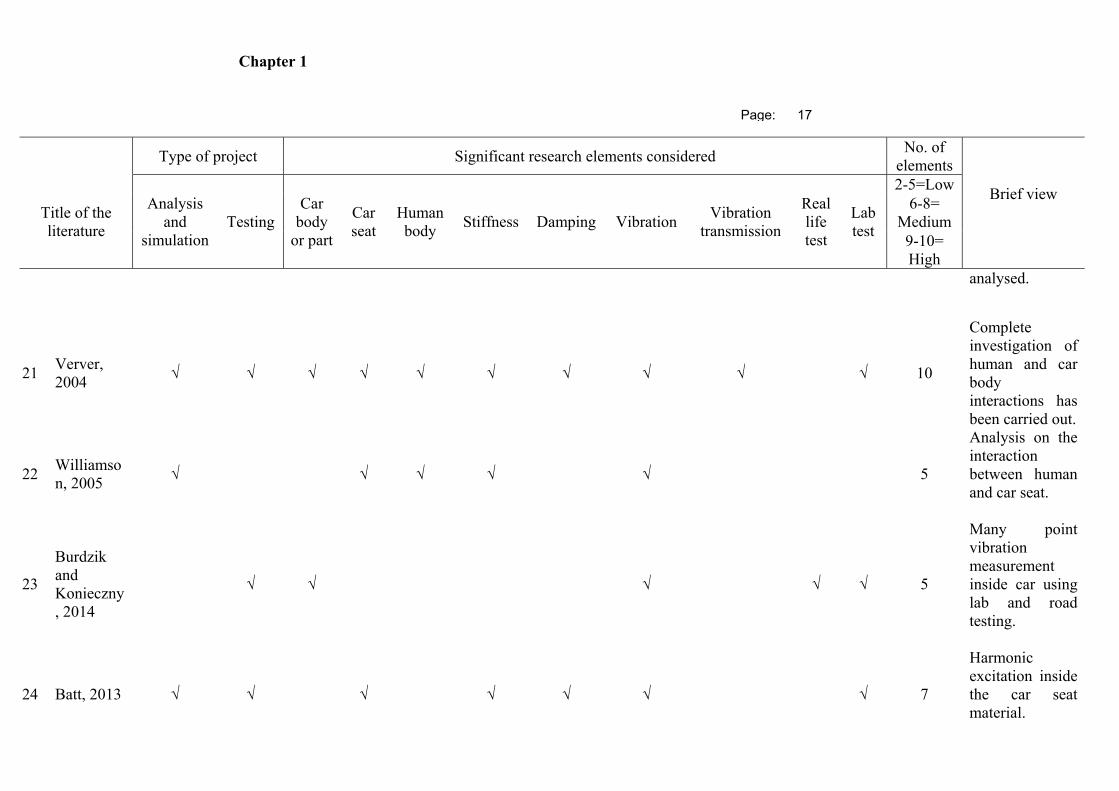
Chapter 1
Page: 17
Type of project Significant research elements considered
No. of elements
Brief view Title of the
literature
Analysis and
simulation Testing
Car body
or part
Car seat
Human body
Stiffness Damping Vibration Vibration
transmission
Real life test
Lab test
2-5=Low6-8=
Medium 9-10= High
analysed.
21 Verver, 2004
√ √ √ √ √ √ √ √ √ √ 10
Complete investigation of human and car body interactions has been carried out.
22 Williamson, 2005
√ √ √ √ √ 5
Analysis on the interaction between human and car seat.
23
Burdzik and Konieczny, 2014
√ √ √ √ √ 5
Many point vibration measurement inside car using lab and road testing.
24 Batt, 2013 √ √ √ √ √ √ √ 7
Harmonic excitation inside the car seat material.
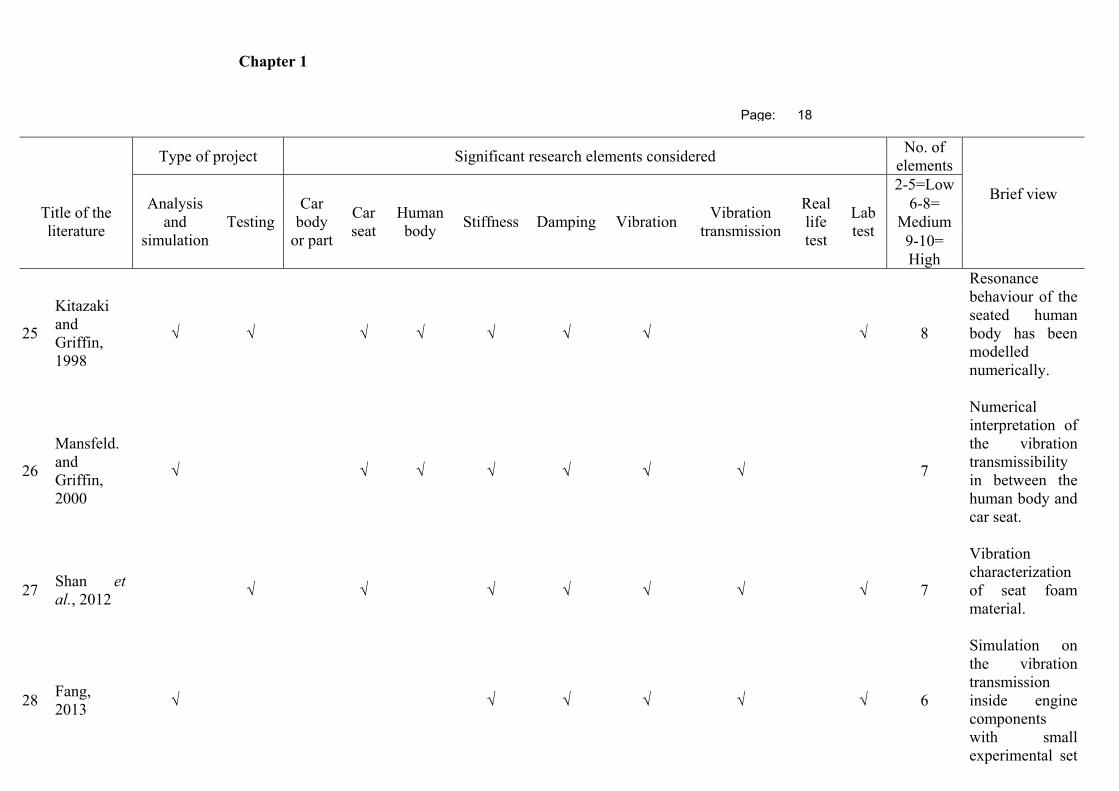
Chapter 1
Page: 18
Type of project Significant research elements considered
No. of elements
Brief view Title of the
literature
Analysis and
simulation Testing
Car body
or part
Car seat
Human body
Stiffness Damping Vibration Vibration
transmission
Real life test
Lab test
2-5=Low6-8=
Medium 9-10= High
25
Kitazaki and Griffin, 1998
√ √ √ √ √ √ √ √ 8
Resonance behaviour of the seated human body has been modelled numerically.
26
Mansfeld. and Griffin, 2000
√ √ √ √ √ √ √ 7
Numerical interpretation of the vibration transmissibility in between the human body and car seat.
27 Shan et al., 2012
√ √ √ √ √ √ √ 7
Vibration characterization of seat foam material.
28 Fang, 2013
√ √ √ √ √ √ 6
Simulation on the vibration transmission inside engine components with small experimental set
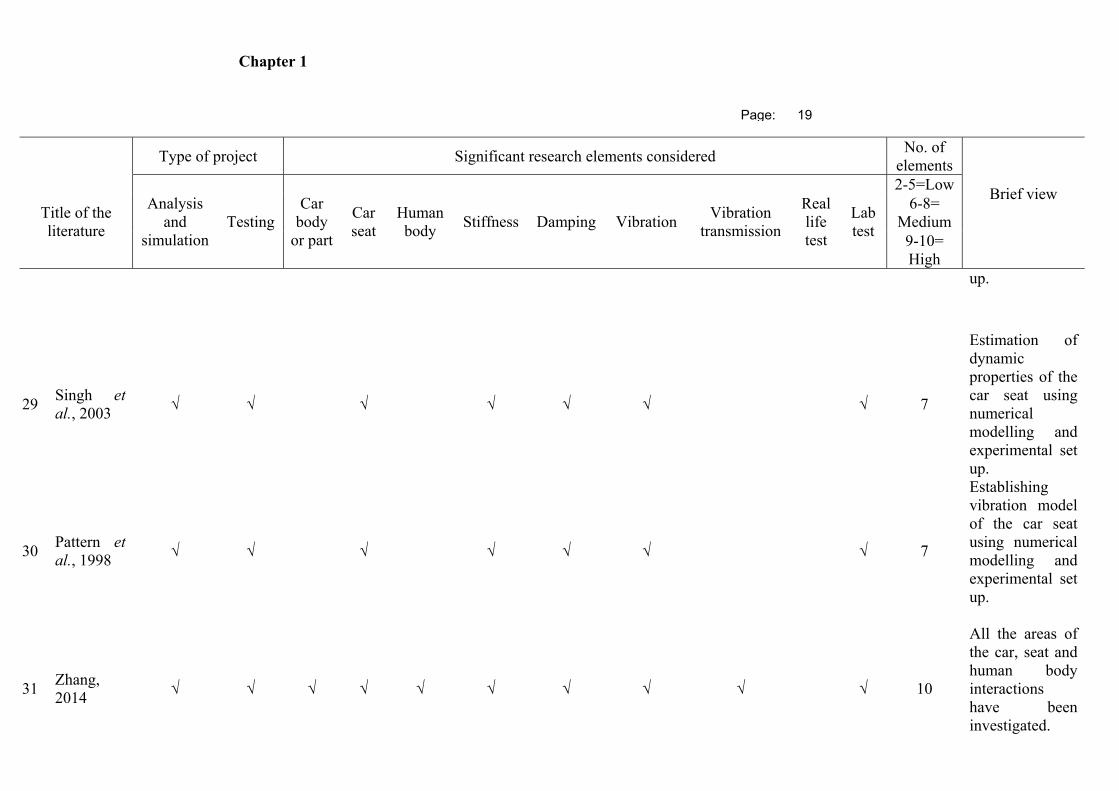
Chapter 1
Page: 19
Type of project Significant research elements considered
No. of elements
Brief view Title of the
literature
Analysis and
simulation Testing
Car body
or part
Car seat
Human body
Stiffness Damping Vibration Vibration
transmission
Real life test
Lab test
2-5=Low6-8=
Medium 9-10= High
up.
29 Singh et al., 2003
√ √ √ √ √ √ √ 7
Estimation of dynamic properties of the car seat using numerical modelling and experimental set up.
30 Pattern et al., 1998
√ √ √ √ √ √ √ 7
Establishing vibration model of the car seat using numerical modelling and experimental set up.
31 Zhang, 2014
√ √ √ √ √ √ √ √ √ √ 10
All the areas of the car, seat and human body interactions have been investigated.
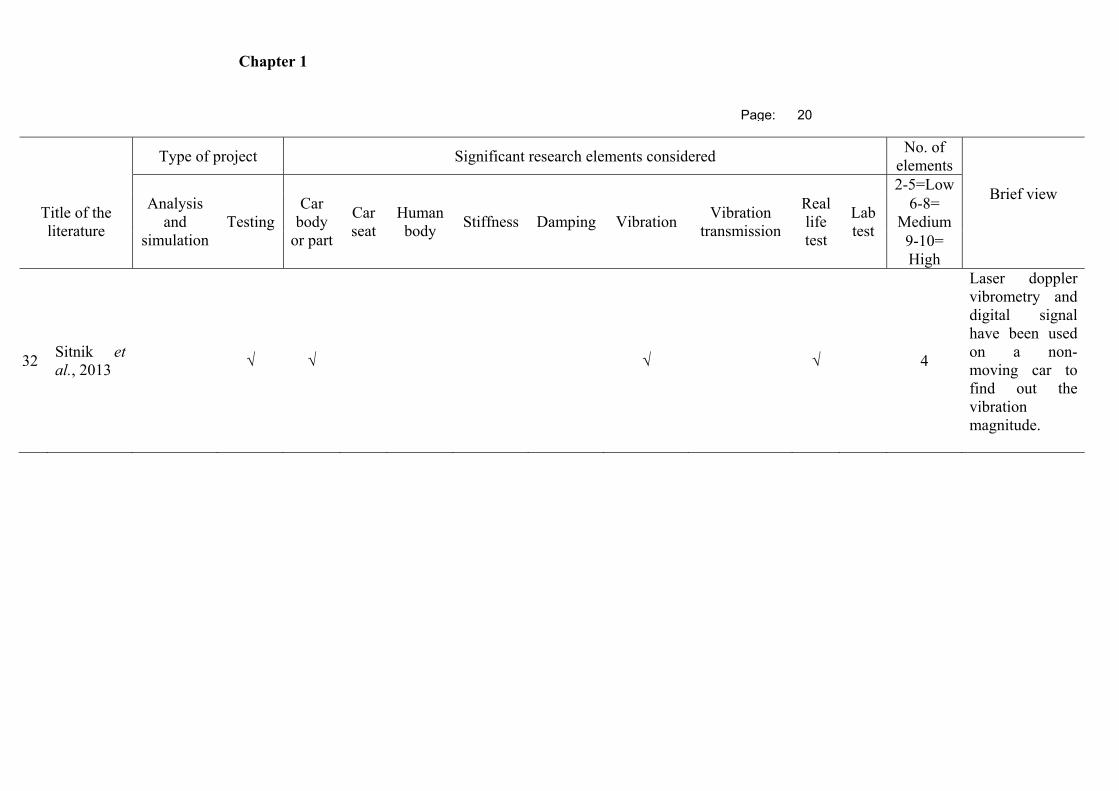
Chapter 1
Page: 20
Type of project Significant research elements considered
No. of elements
Brief view Title of the
literature
Analysis and
simulation Testing
Car body
or part
Car seat
Human body
Stiffness Damping Vibration Vibration
transmission
Real life test
Lab test
2-5=Low6-8=
Medium 9-10= High
32 Sitnik et al., 2013
√ √ √ √ 4
Laser doppler vibrometry and digital signal have been used on a non-moving car to find out the vibration magnitude.
Chapter 1
Page: 21
1.1.5. Research Gap in the Existing Technologies and Aims & Objectives of
the Current Research Work
From the critical review of the relevant literatures, it is inevitably clear that over past
many years, segments of automotive structures, car seats and human bodies have been
examined through the computerized simulation process to judge the level and nature of
vibration and associated effects on the health and safety of the human being. Aside of
simulation techniques, efforts have also been taken to monitor and characterise the level
of vibration using some measurement techniques and experimental methods. Both the
simulation technique and the measurement process got the distinct advantages and
disadvantages, though the usability of a certain method completely depends on the
application of the dynamic object of interest. In few cases, approaches have been taken to
combine the simulation and testing methods for evaluating the vibration inside human
body and car seat, though the existing numbers of research tasks with combined
simulation and testing are significantly less.
Technologies are available in the academic areas and industries to investigate the
dynamic nonlinear interaction between the automotive seats and the human occupant,
though most of the existing technologies cover only a very specific portion of the entire
human-car system or a very particular module of the vibration science. Typical
considerations by these present technologies for the human-seat system are mainly based
on an exact human part, seat-human contact interface, seat pressure distribution, human
and seat modal analysis, human and seat postures, seat to head transmissibility, frequency
response and power spectrum density, etc. Moreover, stiffness values of the human
portions have been taken from past research work, rather than trying to evaluate for a
definite case scenario. Simulation methods of these technologies also neglected the real
life conditions coming from dynamic vehicle.

Chapter 1
Page: 22
Initiatives to deliver a complete solution to predict and assess the vibration inside human-
car system without the need of real testing operation, have not been conducted by the
available techniques so well. So, enormous scope of future improvement in the field of
vibration measurement using computer based simulation technique is there and this
research project aims to provide a unique simulation methodology to predict the final
vibration level inside human and car seat by taking into account the car seat, human body,
calculated stiffness of each segment of the human body, damping parameters, ellipsoidal
bodies to represent human segments and acceleration-displacement-frequency functions
with respect to time. The outcome of this research will help to assess and monitor the
human health, safety and comfort against the automotive vibration, which will eventually
eliminate the necessity of the time consuming and expensive testing method in the
modern transportation industries. This study will conduct module-wise analyses of the
car-human system and propose a comprehensive novel simulation technique to estimate
vibration data inside the entire human body and car seat assembly by interconnecting all
the module based investigation.
The industrial market for estimating the accurate level of vibration inside the automotive-
human system has been growing worldwide in exponential rate and already a number of
organizations with excellent infrastructure are pre-existing in the market for providing the
vibration related solutions to the portions of the automotive and its occupant. Hence, a
cutting edge technique will be contributed to the modern industries by this unique
simulation methodology and this research study will fill the technical gaps existing in
present vibration measuring technologies by providing a comprehensive solution to
predict the level of vibration at various locations of the entire human body and car seat.
So, based on the discussion in this section, the objectives of this research project are
listed next.
1. To carry out literature review to understand the health, safety and comfort levels of a
seated human body whilst driving.
Chapter 1
Page: 23
2. To carry out a critical analysis of existing simulation techniques used in vibration study
of the car seat and human body.
3. Develop simulated models for seated human body, non-linear behaviour of car seat and
combination of both.
4. Validate the simulation model by comparing simulated results to real-life test data.
5. Propose guidelines to implement the developed simulation model in similar industries,
preferable automobile.
1.1.6. Research Questions
a. What will be the best technique to carry out simulation for the entire human-car seat
system to achieve real life results?
b. How the health, safety and comfort levels of the car seated human body can be
optimized?
c. How accurate will the simulation data be with respect to test data?
d. What will be the limitations of the finite element simulation to represent different
phases?
e. How the project outcome can be implemented to the similar industries?
1.2. PROPOSAL OF A NOVEL TECHNIQUE AND RESEARCH
METHODOLOGY
The steps for this unique methodology will be critical literature review followed by
computerized simulation of car seated human body, simulation set up of car seat,
establishing contact mechanism between car seat and human body, simulation of
combined human body and car seat to get desired output, collection of testing data from
similar real life environment, validation of simulation results with testing data and finally
outlining a guideline to implement this technique in similar industries. All the phases are
summarized in Fig. 3.
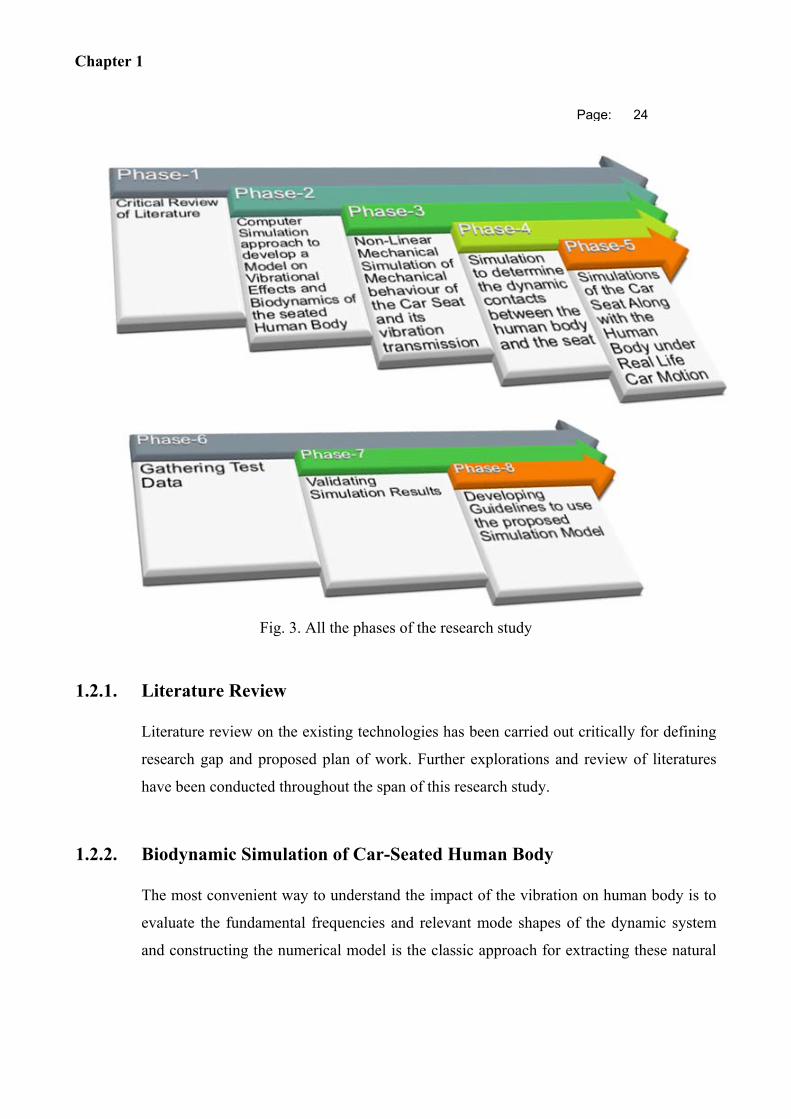
Chapter 1
Page: 24
Fig. 3. All the phases of the research study
1.2.1. Literature Review
Literature review on the existing technologies has been carried out critically for defining
research gap and proposed plan of work. Further explorations and review of literatures
have been conducted throughout the span of this research study.
1.2.2. Biodynamic Simulation of Car-Seated Human Body
The most convenient way to understand the impact of the vibration on human body is to
evaluate the fundamental frequencies and relevant mode shapes of the dynamic system
and constructing the numerical model is the classic approach for extracting these natural
Chapter 1
Page: 25
frequencies and associated mode shapes. From the main structure the assembly and sub-
assembly of interest can be isolated and the equations of motion based on stiffness and
damping can be established. From the set of equations generated, modal matrix can be
obtained through repetitive iteration process, which eventually will be the sign of the
biodynamic responses of the system. Cause of the human limitation of solving very
complex numerical equations, computerized tools are more preferable choice for
analyzing the robust structures.
For the biodynamic simulation of the human body, stiffness, damping, human muscle and
bone properties and real life loading condition will be taken into account which will yield
a complicated non-linear simulation set up. The simulation can be structured by using
either the finite element tool like ABAQUS CAE, ANSYS Workbench, etc. or numerical
computational programming tool like MATLAB.
Existing techniques for the human biodynamic analysis will be explored and the most
convenient and justified technique for this project will be implemented to the simulation
process.
1.2.3. Simulation for Non-Linear Mechanical Behaviour of Car Seat
Car seats are primarily made of polyurethane foam material, though different types of
materials can be used, too. These materials are non-linear in nature and exhibit hyper-
elastic and viscoelastic behaviour. The best possible material properties and simulation
technique will be explored and will be applied to the simulation of the car seat for this
project using preferable finite element tool like ABAQUS CAE, ANSYS Workbench,
etc.
Chapter 1
Page: 26
1.2.4. Determine the Contact Mechanism between Human and Seat in the
Analysis Environment
Establishing the contact interface between the car seat and human body and defining the
appropriate dynamic contact formulation will be the main aim of this phase. Different
kinds of contact formulations are available in the applied mechanics science, though
many of these formulations are not useable cause of the limitations of software and
computer system.
After exploring the past research works on the relevant contact interfaces and
understanding the timeframe for solving the analysis in accessible computer system, most
suitable contact mechanism will be chosen for this project.
1.2.5. Simulation of combined Human Body and Car Seat under Real Life
Scenario
Once the biodynamic model for the human body and the non-linear simulation of the car
seat will be established, the human and seat model will be combined together in the
analysis environment and all the possible real life input condition will be implemented.
Output from the this simulation will the vibration data at the designated points of the
human body and cat seat by means of acceleration, displacement or frequency. The type
of the output and the data to be extracted from the result, will be decided depending on
the facility available inside the analysis tool. This phase will give an idea of the level of
vibration occurring inside car seated human, hence, the health, safety and comfort levels
will be assessed.
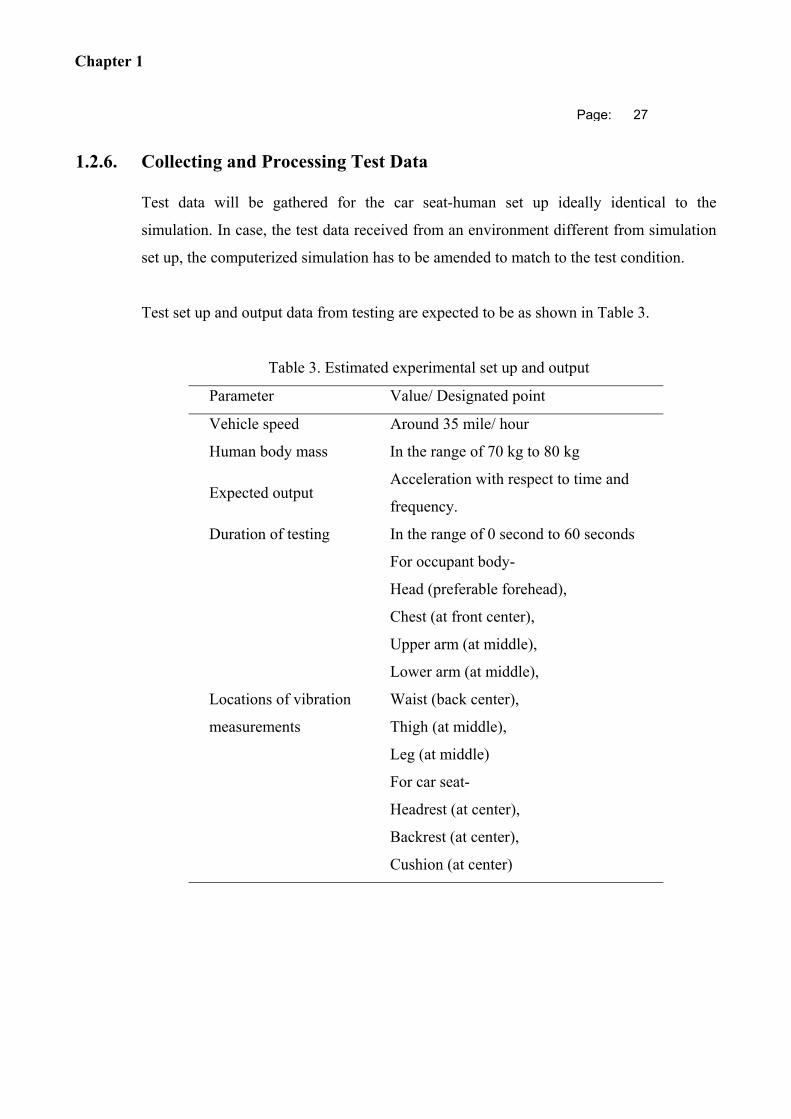
Chapter 1
Page: 27
1.2.6. Collecting and Processing Test Data
Test data will be gathered for the car seat-human set up ideally identical to the
simulation. In case, the test data received from an environment different from simulation
set up, the computerized simulation has to be amended to match to the test condition.
Test set up and output data from testing are expected to be as shown in Table 3.
Table 3. Estimated experimental set up and output
Parameter Value/ Designated point
Vehicle speed Around 35 mile/ hour
Human body mass In the range of 70 kg to 80 kg
Expected output Acceleration with respect to time and
frequency.
Duration of testing In the range of 0 second to 60 seconds
Locations of vibration
measurements
For occupant body-
Head (preferable forehead),
Chest (at front center),
Upper arm (at middle),
Lower arm (at middle),
Waist (back center),
Thigh (at middle),
Leg (at middle)
For car seat-
Headrest (at center),
Backrest (at center),
Cushion (at center)
Chapter 1
Page: 28
“m+p International (UK) Ltd” is a renowned international organization for measuring
noise, assessing vibration and data acquisition systems. The testing data for the human
body and car seat will be collected from them.
1.2.7. Comparison between Simulation Results and Test Data
Simulation results will be validated by the testing data. The formats of the testing data
received and the simulation results should be matching to each other in terms of
parameter, unit, duration, etc. In case of mismatch, the simulation results can be adjusted
to match to the simulation output parameters. Raw data received from the testing can be
processed to a convenient format, if needed.
A comparison table or matrix will be prepared to represent the contrast between test data
and simulation results.
1.2.8. Developing Industrial Guideline to Implement the Unique Simulation
Technique to Relevant Sectors
Though this simulation project is based on the seat and human object inside a car, the
unique simulation method outlined in this project work can also be used as a generic
guideline for the transportation seat and its occupant for other similar industries. So, a
comprehensive instruction manual will be presented which can be implemented to other
relevant transportation industries for judging the level of vibration and optimizing the
human occupant’s health, comfort and safety.
Chapter 2
Page: 29
CHAPTER 2 BIO-DYNAMIC MODEL FOR SEATED HUMAN BODY INSIDE A CAR
A human body can be considered as a complex mechanical system, the biodynamic
behaviour of which differ in many aspects. Biodynamic responses of the different
systems have been proposed with many different models and for different purposes. For a
better understanding of the biodynamic responses along with whole body vibration,
simulation model development became well accepted method for last many years. This
method became more reliable to judge the human body dynamics cause of rapid
improvement in the computer technologies, especially in the fields of Computer Aided
Design (CAD) and Computer Aided Engineering (CAE).
Biodynamic model may not necessarily take into account all the real life input
parameters, but should identify and implement the factors with highest priority. A wide
range of human biodynamic models has been explored for many years based on different
postures and input functions. The simulation modeling techniques for human dynamics
mainly have been classified in few categories like lumped mass model, finite element
model and multi-body dynamics model. Kinematic studies consider only the motion
without any accountable force, hence, kinematic models are not considered during the
current study. Different categories of biodynamic model for establishing simulation are
shown in Fig. 4.
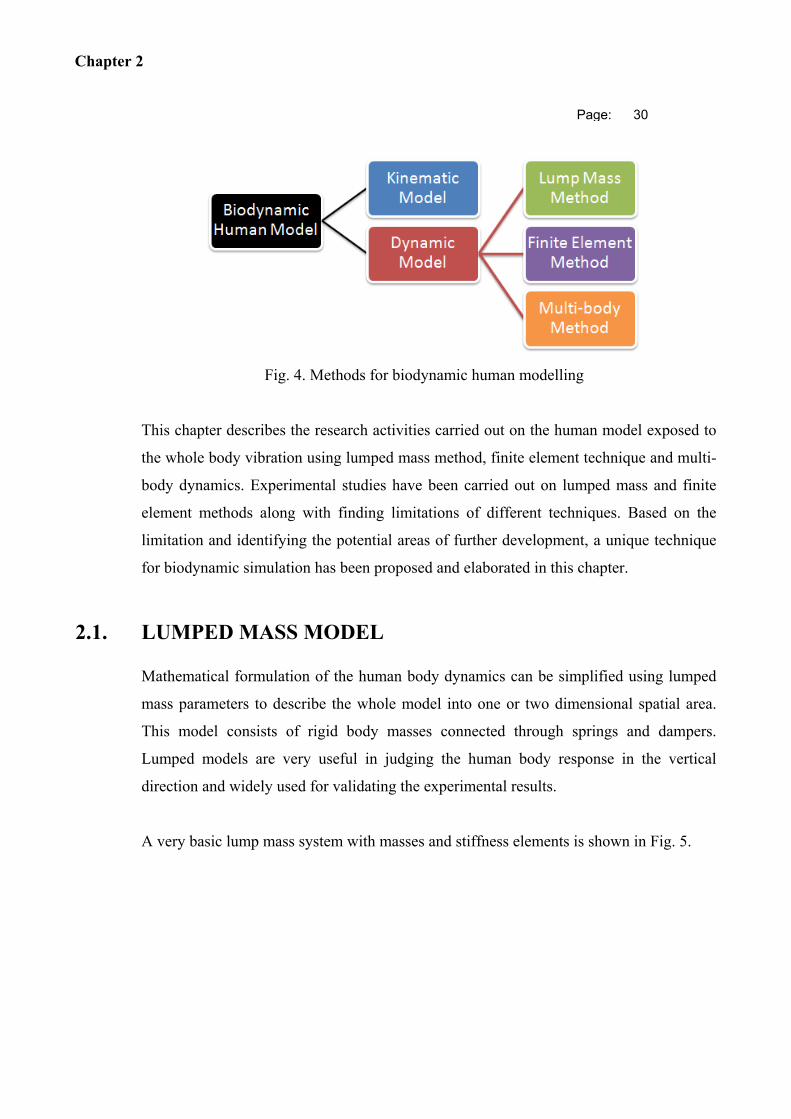
Chapter 2
Page: 30
Fig. 4. Methods for biodynamic human modelling
This chapter describes the research activities carried out on the human model exposed to
the whole body vibration using lumped mass method, finite element technique and multi-
body dynamics. Experimental studies have been carried out on lumped mass and finite
element methods along with finding limitations of different techniques. Based on the
limitation and identifying the potential areas of further development, a unique technique
for biodynamic simulation has been proposed and elaborated in this chapter.
2.1. LUMPED MASS MODEL
Mathematical formulation of the human body dynamics can be simplified using lumped
mass parameters to describe the whole model into one or two dimensional spatial area.
This model consists of rigid body masses connected through springs and dampers.
Lumped models are very useful in judging the human body response in the vertical
direction and widely used for validating the experimental results.
A very basic lump mass system with masses and stiffness elements is shown in Fig. 5.
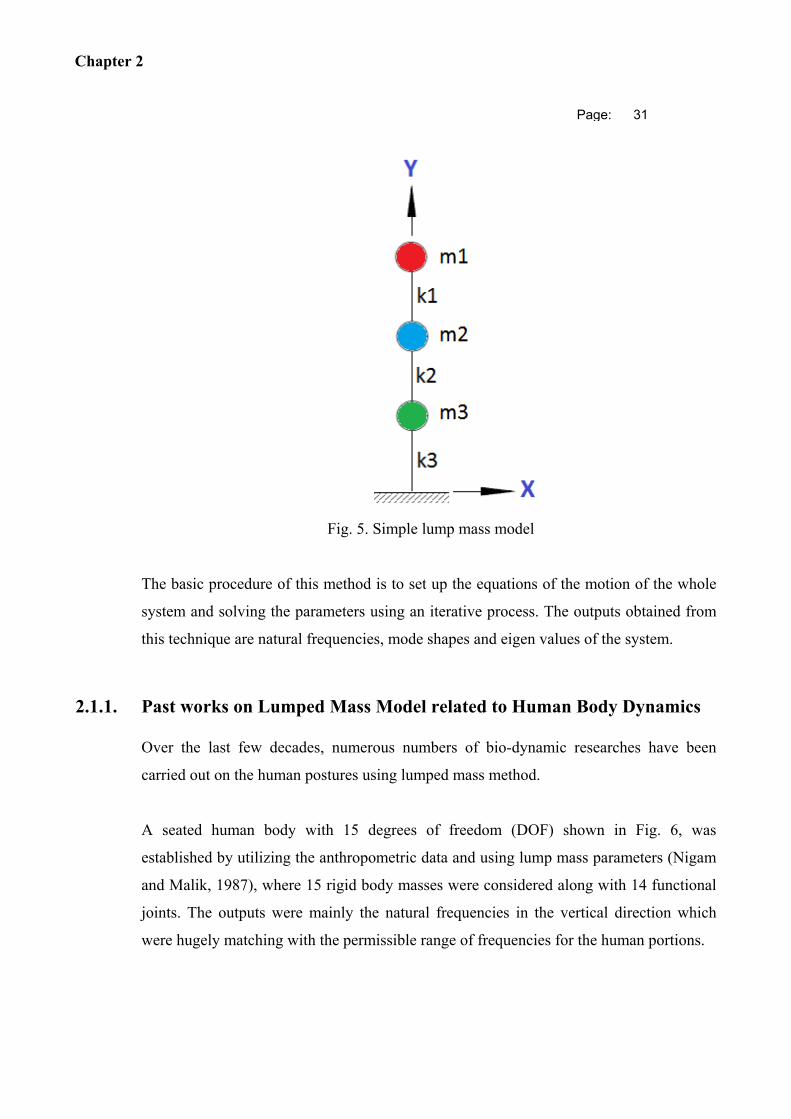
Chapter 2
Page: 31
Fig. 5. Simple lump mass model
The basic procedure of this method is to set up the equations of the motion of the whole
system and solving the parameters using an iterative process. The outputs obtained from
this technique are natural frequencies, mode shapes and eigen values of the system.
2.1.1. Past works on Lumped Mass Model related to Human Body Dynamics
Over the last few decades, numerous numbers of bio-dynamic researches have been
carried out on the human postures using lumped mass method.
A seated human body with 15 degrees of freedom (DOF) shown in Fig. 6, was
established by utilizing the anthropometric data and using lump mass parameters (Nigam
and Malik, 1987), where 15 rigid body masses were considered along with 14 functional
joints. The outputs were mainly the natural frequencies in the vertical direction which
were hugely matching with the permissible range of frequencies for the human portions.
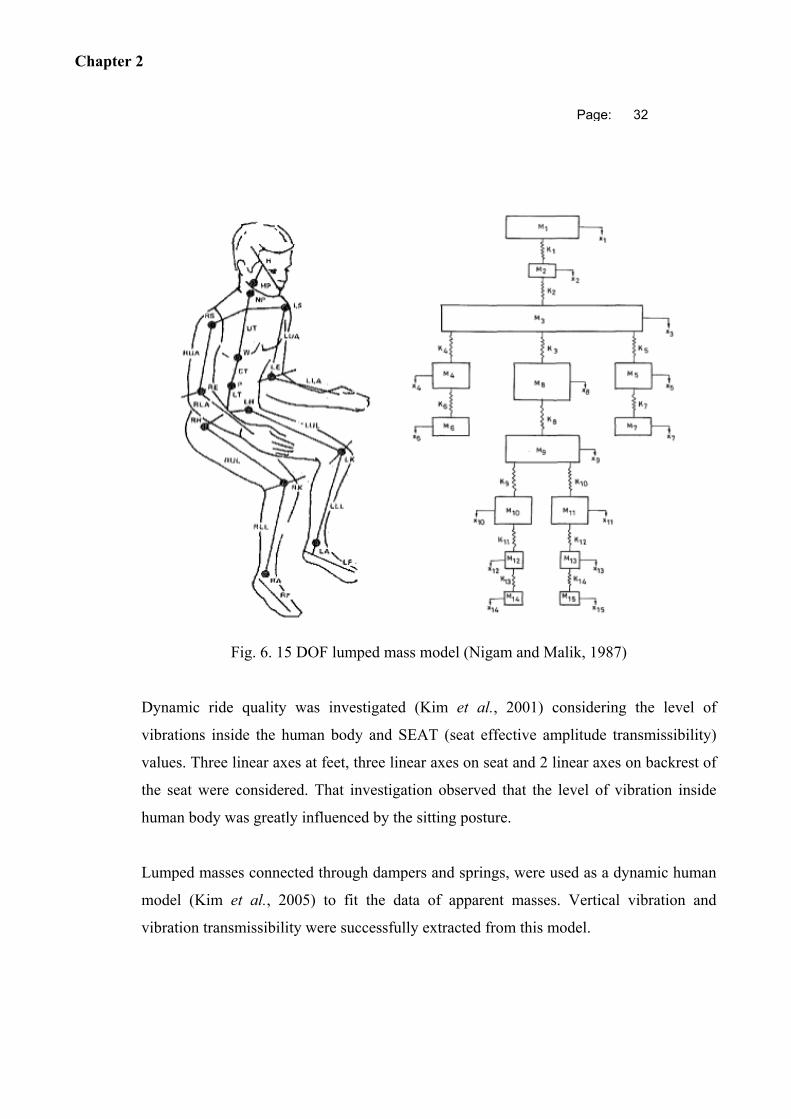
Chapter 2
Page: 32
Fig. 6. 15 DOF lumped mass model (Nigam and Malik, 1987)
Dynamic ride quality was investigated (Kim et al., 2001) considering the level of
vibrations inside the human body and SEAT (seat effective amplitude transmissibility)
values. Three linear axes at feet, three linear axes on seat and 2 linear axes on backrest of
the seat were considered. That investigation observed that the level of vibration inside
human body was greatly influenced by the sitting posture.
Lumped masses connected through dampers and springs, were used as a dynamic human
model (Kim et al., 2005) to fit the data of apparent masses. Vertical vibration and
vibration transmissibility were successfully extracted from this model.
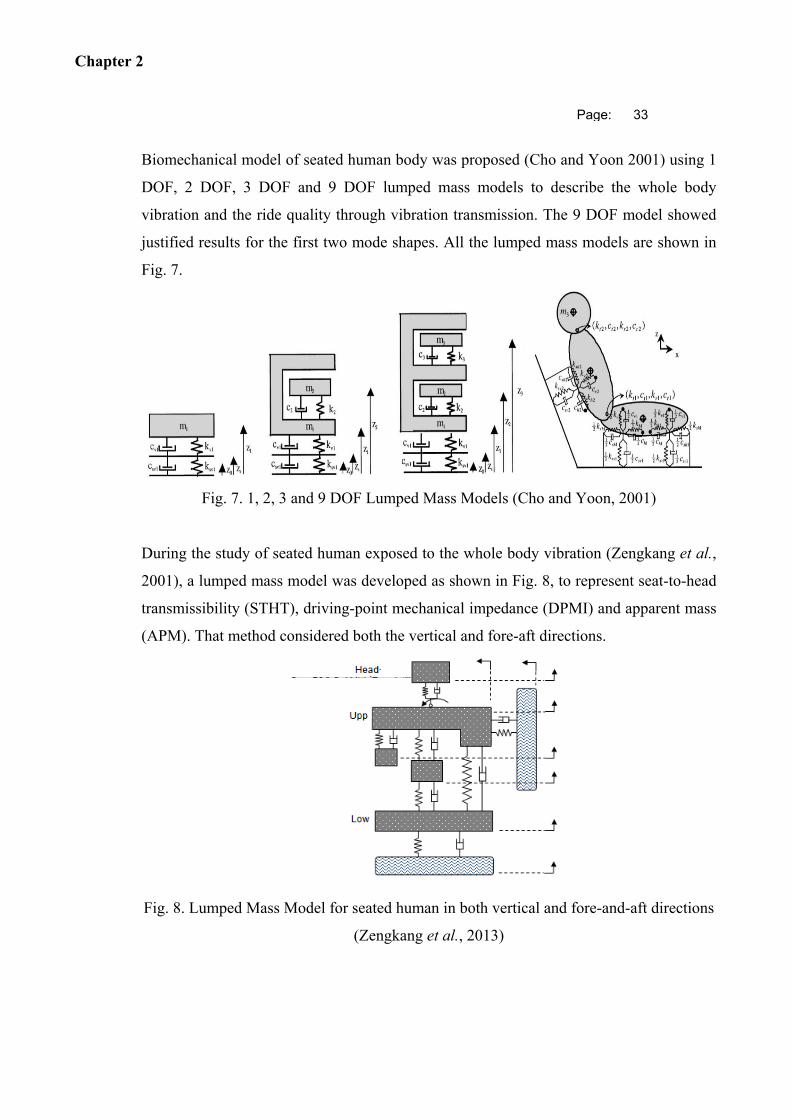
Chapter 2
Page: 33
Biomechanical model of seated human body was proposed (Cho and Yoon 2001) using 1
DOF, 2 DOF, 3 DOF and 9 DOF lumped mass models to describe the whole body
vibration and the ride quality through vibration transmission. The 9 DOF model showed
justified results for the first two mode shapes. All the lumped mass models are shown in
Fig. 7.
Fig. 7. 1, 2, 3 and 9 DOF Lumped Mass Models (Cho and Yoon, 2001)
During the study of seated human exposed to the whole body vibration (Zengkang et al.,
2001), a lumped mass model was developed as shown in Fig. 8, to represent seat-to-head
transmissibility (STHT), driving-point mechanical impedance (DPMI) and apparent mass
(APM). That method considered both the vertical and fore-aft directions.
Fig. 8. Lumped Mass Model for seated human in both vertical and fore-and-aft directions
(Zengkang et al., 2013)
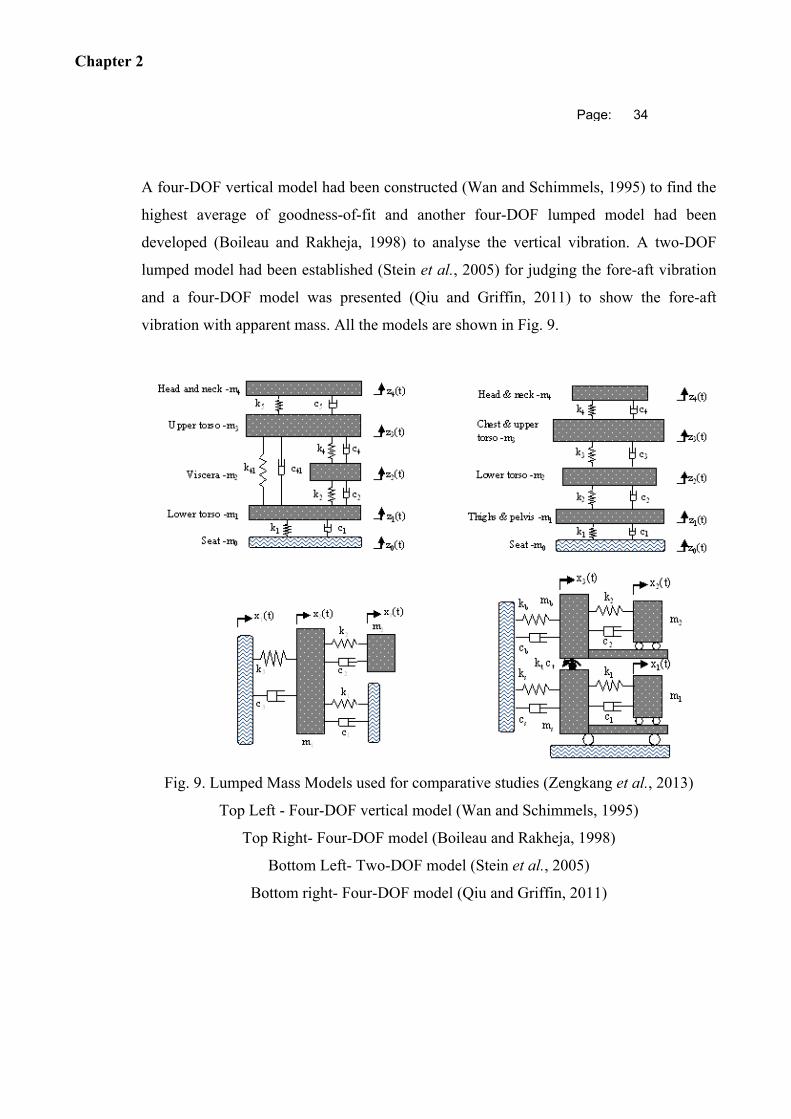
Chapter 2
Page: 34
A four-DOF vertical model had been constructed (Wan and Schimmels, 1995) to find the
highest average of goodness-of-fit and another four-DOF lumped model had been
developed (Boileau and Rakheja, 1998) to analyse the vertical vibration. A two-DOF
lumped model had been established (Stein et al., 2005) for judging the fore-aft vibration
and a four-DOF model was presented (Qiu and Griffin, 2011) to show the fore-aft
vibration with apparent mass. All the models are shown in Fig. 9.
Fig. 9. Lumped Mass Models used for comparative studies (Zengkang et al., 2013)
Top Left - Four-DOF vertical model (Wan and Schimmels, 1995)
Top Right- Four-DOF model (Boileau and Rakheja, 1998)
Bottom Left- Two-DOF model (Stein et al., 2005)
Bottom right- Four-DOF model (Qiu and Griffin, 2011)
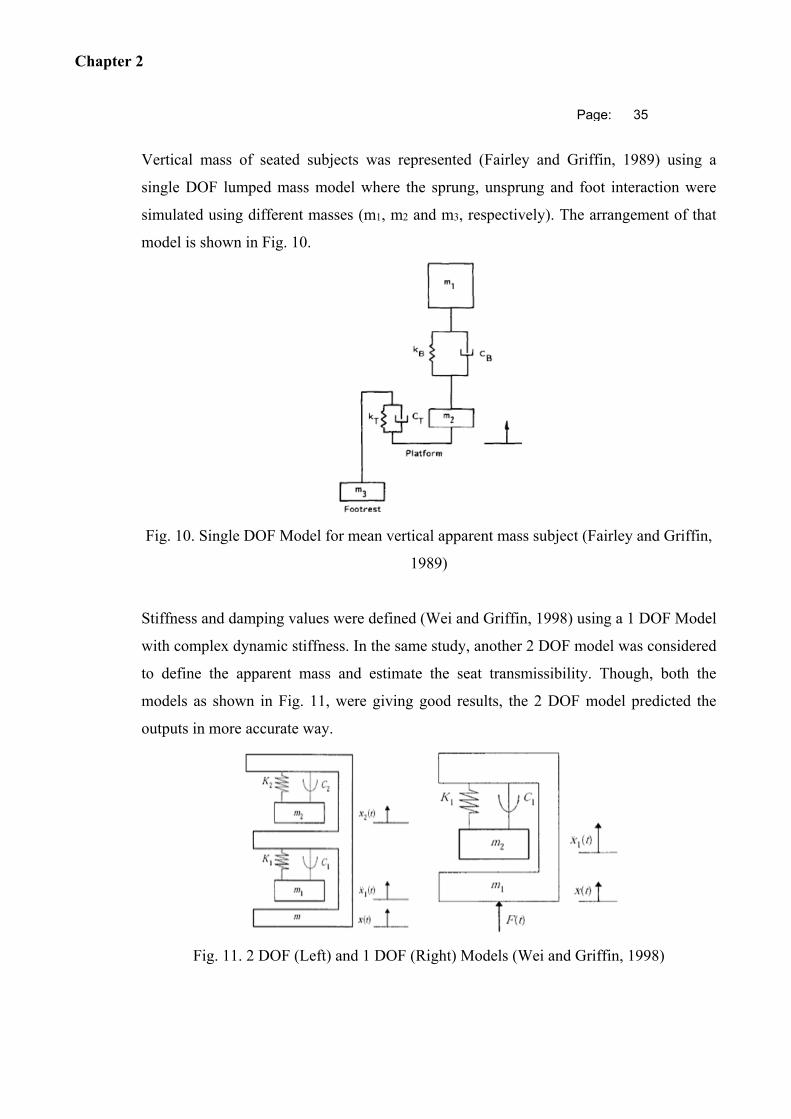
Chapter 2
Page: 35
Vertical mass of seated subjects was represented (Fairley and Griffin, 1989) using a
single DOF lumped mass model where the sprung, unsprung and foot interaction were
simulated using different masses (m1, m2 and m3, respectively). The arrangement of that
model is shown in Fig. 10.
Fig. 10. Single DOF Model for mean vertical apparent mass subject (Fairley and Griffin,
1989)
Stiffness and damping values were defined (Wei and Griffin, 1998) using a 1 DOF Model
with complex dynamic stiffness. In the same study, another 2 DOF model was considered
to define the apparent mass and estimate the seat transmissibility. Though, both the
models as shown in Fig. 11, were giving good results, the 2 DOF model predicted the
outputs in more accurate way.
Fig. 11. 2 DOF (Left) and 1 DOF (Right) Models (Wei and Griffin, 1998)
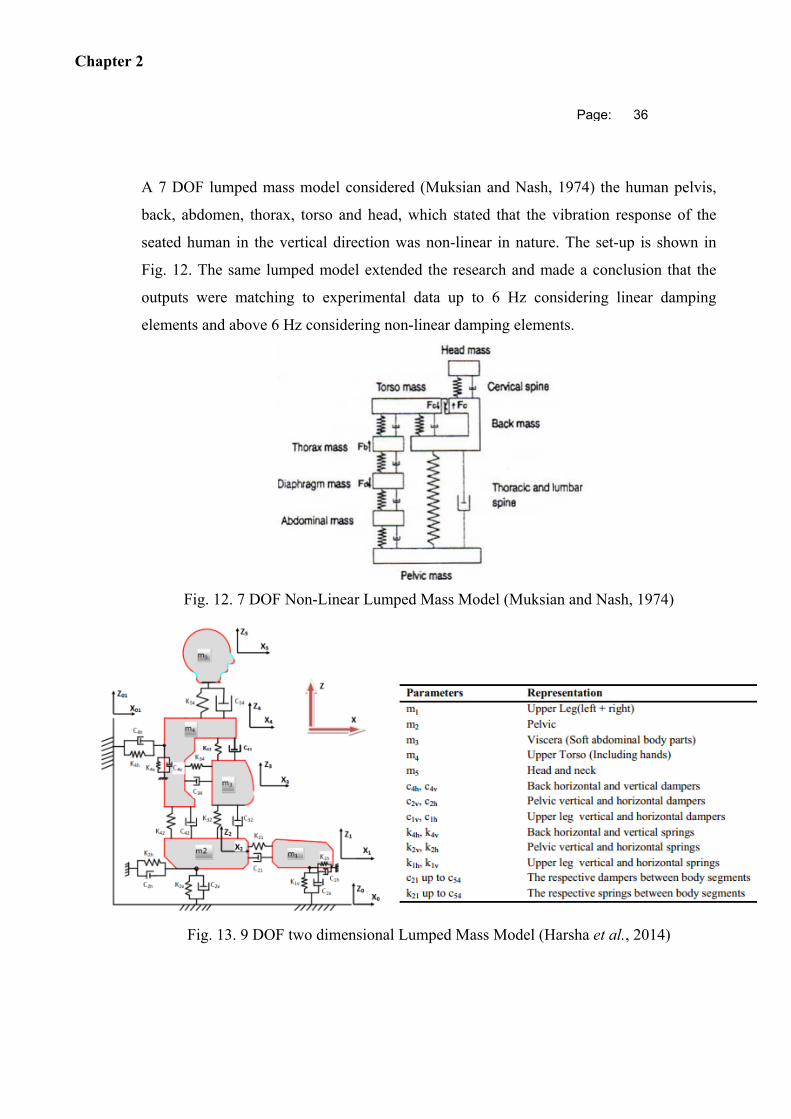
Chapter 2
Page: 36
A 7 DOF lumped mass model considered (Muksian and Nash, 1974) the human pelvis,
back, abdomen, thorax, torso and head, which stated that the vibration response of the
seated human in the vertical direction was non-linear in nature. The set-up is shown in
Fig. 12. The same lumped model extended the research and made a conclusion that the
outputs were matching to experimental data up to 6 Hz considering linear damping
elements and above 6 Hz considering non-linear damping elements.
Fig. 12. 7 DOF Non-Linear Lumped Mass Model (Muksian and Nash, 1974)
Fig. 13. 9 DOF two dimensional Lumped Mass Model (Harsha et al., 2014)
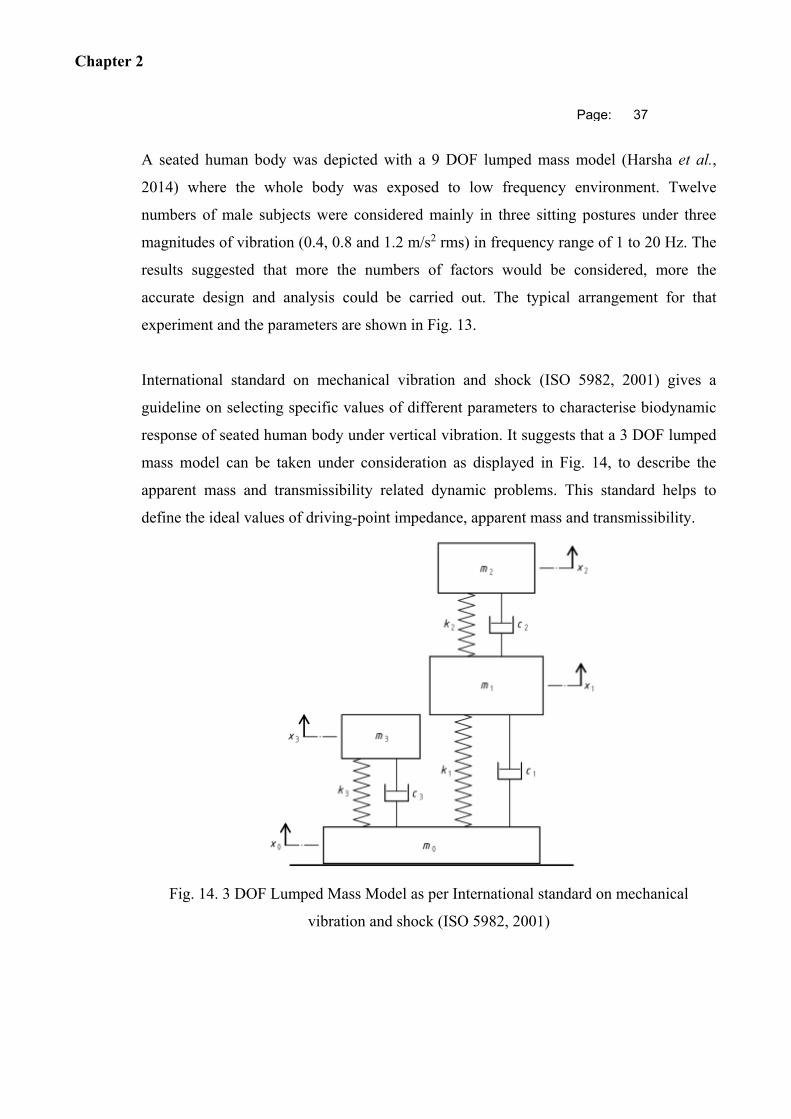
Chapter 2
Page: 37
A seated human body was depicted with a 9 DOF lumped mass model (Harsha et al.,
2014) where the whole body was exposed to low frequency environment. Twelve
numbers of male subjects were considered mainly in three sitting postures under three
magnitudes of vibration (0.4, 0.8 and 1.2 m/s2 rms) in frequency range of 1 to 20 Hz. The
results suggested that more the numbers of factors would be considered, more the
accurate design and analysis could be carried out. The typical arrangement for that
experiment and the parameters are shown in Fig. 13.
International standard on mechanical vibration and shock (ISO 5982, 2001) gives a
guideline on selecting specific values of different parameters to characterise biodynamic
response of seated human body under vertical vibration. It suggests that a 3 DOF lumped
mass model can be taken under consideration as displayed in Fig. 14, to describe the
apparent mass and transmissibility related dynamic problems. This standard helps to
define the ideal values of driving-point impedance, apparent mass and transmissibility.
Fig. 14. 3 DOF Lumped Mass Model as per International standard on mechanical
vibration and shock (ISO 5982, 2001)
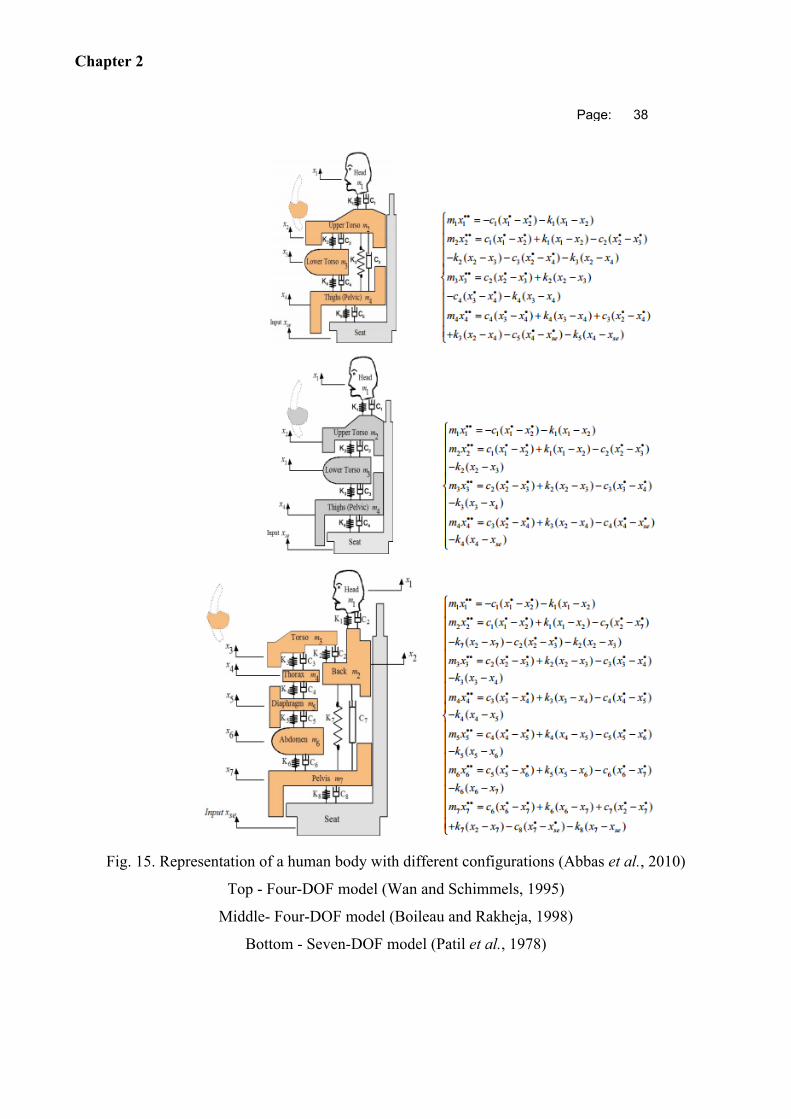
Chapter 2
Page: 38
Fig. 15. Representation of a human body with different configurations (Abbas et al., 2010)
Top - Four-DOF model (Wan and Schimmels, 1995)
Middle- Four-DOF model (Boileau and Rakheja, 1998)
Bottom - Seven-DOF model (Patil et al., 1978)
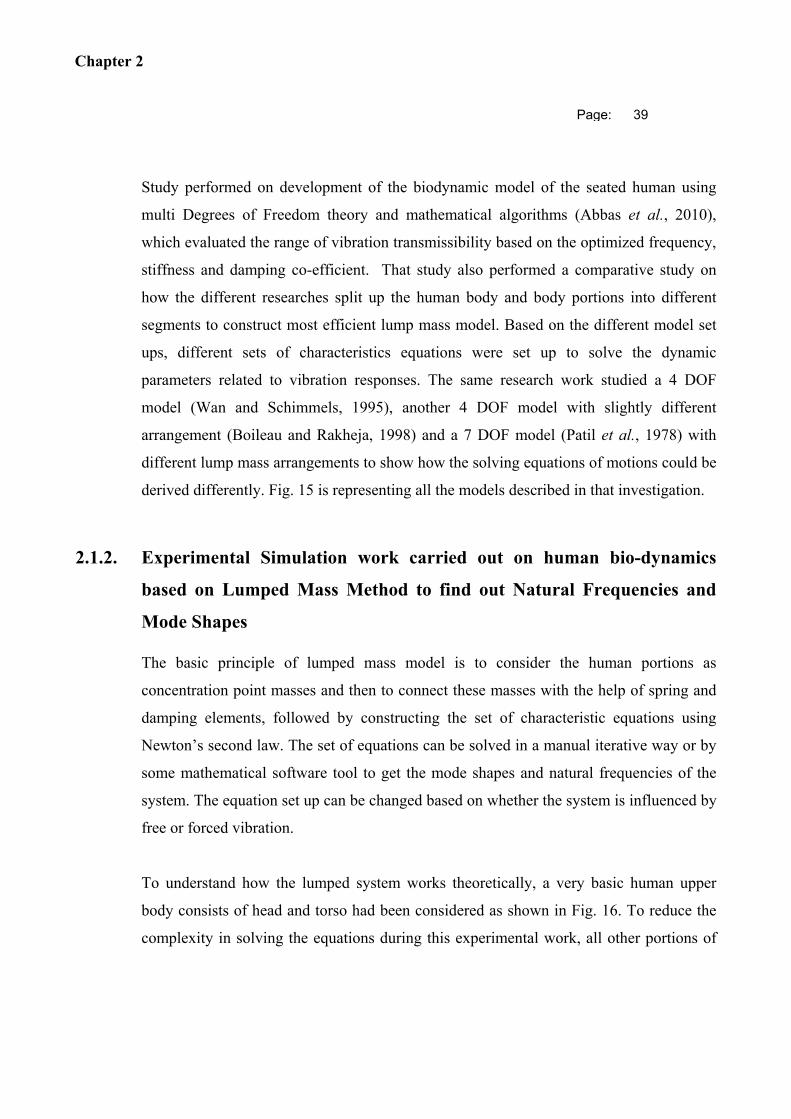
Chapter 2
Page: 39
Study performed on development of the biodynamic model of the seated human using
multi Degrees of Freedom theory and mathematical algorithms (Abbas et al., 2010),
which evaluated the range of vibration transmissibility based on the optimized frequency,
stiffness and damping co-efficient. That study also performed a comparative study on
how the different researches split up the human body and body portions into different
segments to construct most efficient lump mass model. Based on the different model set
ups, different sets of characteristics equations were set up to solve the dynamic
parameters related to vibration responses. The same research work studied a 4 DOF
model (Wan and Schimmels, 1995), another 4 DOF model with slightly different
arrangement (Boileau and Rakheja, 1998) and a 7 DOF model (Patil et al., 1978) with
different lump mass arrangements to show how the solving equations of motions could be
derived differently. Fig. 15 is representing all the models described in that investigation.
2.1.2. Experimental Simulation work carried out on human bio-dynamics
based on Lumped Mass Method to find out Natural Frequencies and
Mode Shapes
The basic principle of lumped mass model is to consider the human portions as
concentration point masses and then to connect these masses with the help of spring and
damping elements, followed by constructing the set of characteristic equations using
Newton’s second law. The set of equations can be solved in a manual iterative way or by
some mathematical software tool to get the mode shapes and natural frequencies of the
system. The equation set up can be changed based on whether the system is influenced by
free or forced vibration.
To understand how the lumped system works theoretically, a very basic human upper
body consists of head and torso had been considered as shown in Fig. 16. To reduce the
complexity in solving the equations during this experimental work, all other portions of

Chapter 2
Page: 40
the human body had been ignored. The equivalent lumped mass system is also shown in
Fig. 16. The stiffness values k1 and k3 can be considered as 0, while the stiffness value k2
is the stiffness between the human head and human torso.
Fig. 16. Human head and torso represented through lumped mass model
The masses of the head and torso are considered as 4.30 kg (42.169 N) and 29.03 kg
(284.687N), respectively while axial stiffness values for head and torso are considered as
623633236.74 N/m and 1545963178.02 N/m, respectively. The lengths of the head and
torso are taken as 15.66 cm and 29.90 cm, respectively. The details of these assumed data
are elaborated in the CHAPTER 3.
Starting from the equations of motion, the system has been solved using characteristics
equations. This small experimental work has been carried out using analytical software
tool Mathcad. First two natural frequencies and modes shapes have been evaluated.
The equations of motion are formed and presented in Equations 2.1 and 2.2.
m1 2x1
x1d
d
2 k1 x1 k2 x2 x1 0 ...
(Eq. 2.1)
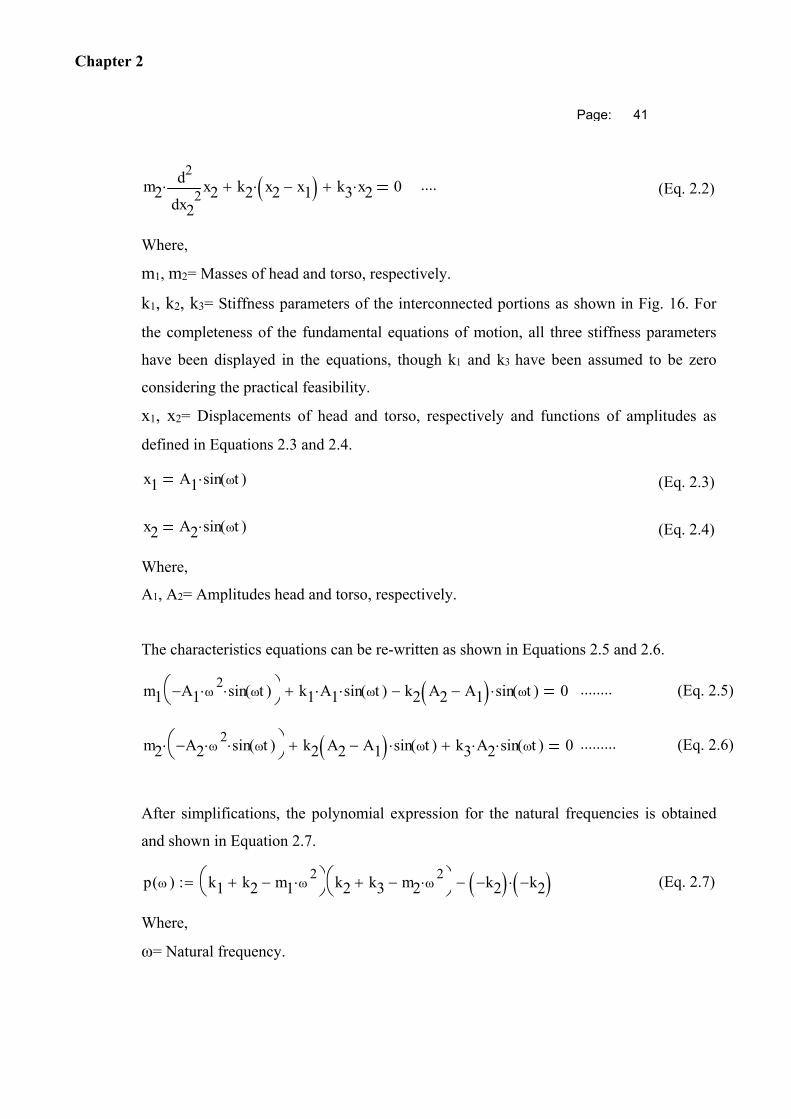
Chapter 2
Page: 41
m2 2x2
x2d
d
2 k2 x2 x1 k3 x2 0 ....
(Eq. 2.2)
Where,
m1, m2= Masses of head and torso, respectively.
k1, k2, k3= Stiffness parameters of the interconnected portions as shown in Fig. 16. For
the completeness of the fundamental equations of motion, all three stiffness parameters
have been displayed in the equations, though k1 and k3 have been assumed to be zero
considering the practical feasibility.
x1, x2= Displacements of head and torso, respectively and functions of amplitudes as
defined in Equations 2.3 and 2.4.
x1 A1 sin t( ) (Eq. 2.3)
x2 A2 sin t( ) (Eq. 2.4)
Where,
A1, A2= Amplitudes head and torso, respectively.
The characteristics equations can be re-written as shown in Equations 2.5 and 2.6.
m1 A1 2 sin t( )
k1 A1 sin t( ) k2 A2 A1 sin t( ) 0 ........
(Eq. 2.5)
m2 A2 2 sin t( )
k2 A2 A1 sin t( ) k3 A2 sin t( ) 0 .........
(Eq. 2.6)
After simplifications, the polynomial expression for the natural frequencies is obtained
and shown in Equation 2.7.
p ( ) k1 k2 m1 2
k2 k3 m2
2
k2 k2
(Eq. 2.7)
Where,
ω= Natural frequency.
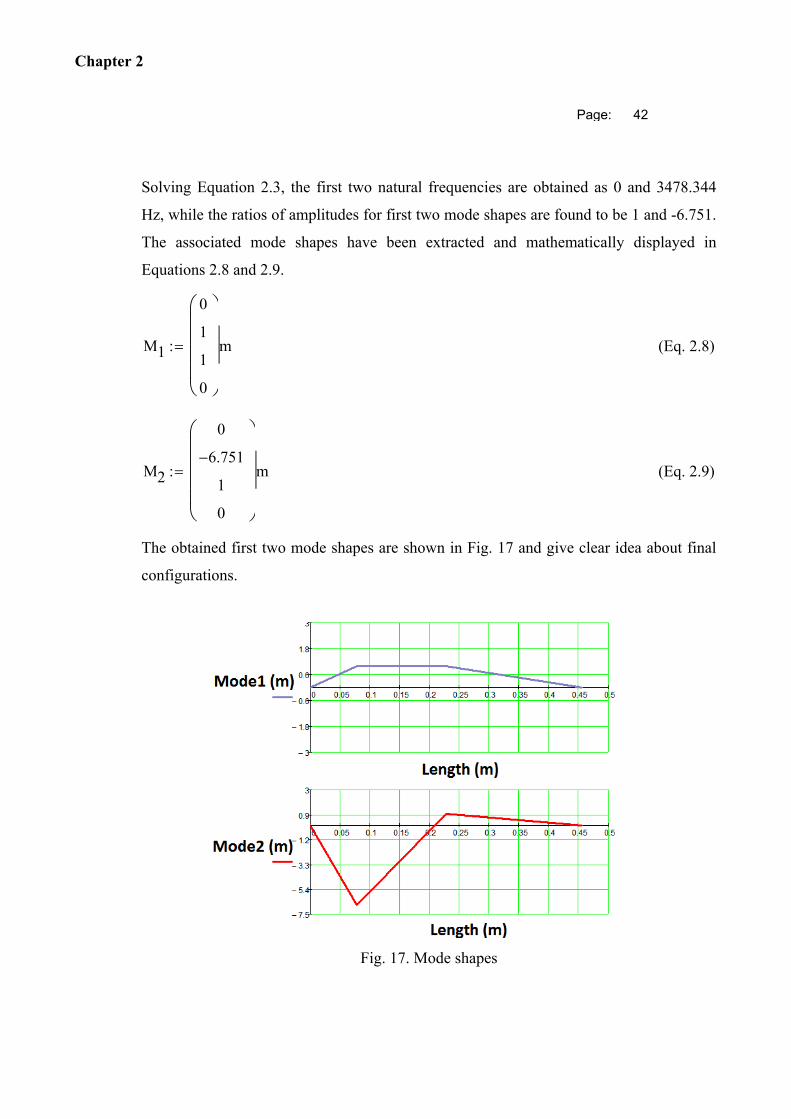
Chapter 2
Page: 42
Solving Equation 2.3, the first two natural frequencies are obtained as 0 and 3478.344
Hz, while the ratios of amplitudes for first two mode shapes are found to be 1 and -6.751.
The associated mode shapes have been extracted and mathematically displayed in
Equations 2.8 and 2.9.
M1
0
1
1
0
m
(Eq. 2.8)
M2
0
6.751
1
0
m
(Eq. 2.9)
The obtained first two mode shapes are shown in Fig. 17 and give clear idea about final
configurations.
Fig. 17. Mode shapes
Chapter 2
Page: 43
2.1.3. Discussion
The experimental work on the lumped mass method became successful in obtaining the
natural frequencies and the mode shapes. So, it can be concluded that the lumped mass
model is the simplest way to carry out the modal analysis for one or two directional
systems. Especially, this method is very useful for analyzing the vertical response under
the influence of whole body vibration. Vibration transmissibility can also be well defined
using this method.
The real problem for this method is the complicacy in defining equations while the
numbers of degrees of freedom are increased. The problem gets too complicated, while
the three dimensional environment is considered.
From the experimental work it is clear that the analytical lumped mass method became
outdated cause of the human capability to solve numerous number of equations manually.
For the simple structures e.g., beam and single body structures, this analytical method can
be very quick and efficient, but for the higher number of degrees of freedom systems,
ample equations need to be solved either by coding programs, for example FORTRAN or
by using the graphical interfaced mathematical tool like MATLAB.
Also, this method assumes the human portions to be rigid point masses, which actually is
not realistic. The mass of the human body is non-equally distributed and the mechanical
properties for each segment are different. The stiffness, damping co-efficient and density
also vary with the different parts of human body, which are not covered by lumped mass
method.
Last many years, many research works have been carried out on many fields of human
bio-dynamics based on lumped mass method. So, chances to obtain an innovative
solution using this method are very less. Cause of the very fast development of computer
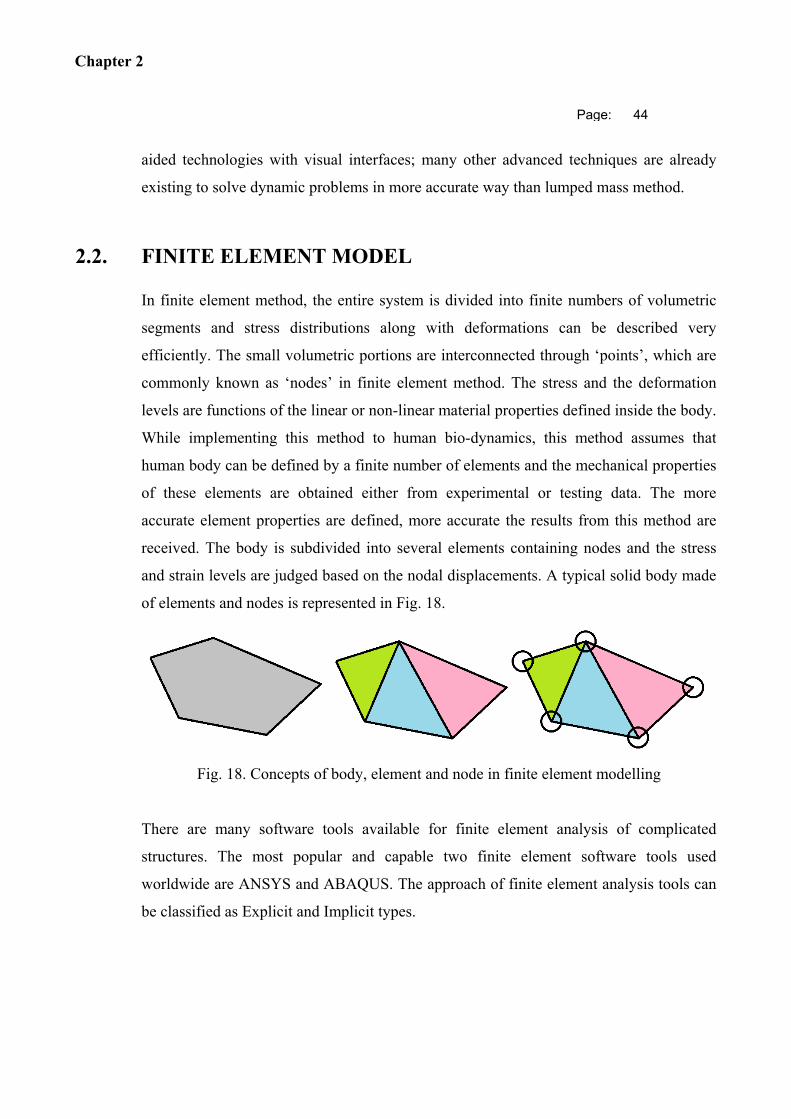
Chapter 2
Page: 44
aided technologies with visual interfaces; many other advanced techniques are already
existing to solve dynamic problems in more accurate way than lumped mass method.
2.2. FINITE ELEMENT MODEL
In finite element method, the entire system is divided into finite numbers of volumetric
segments and stress distributions along with deformations can be described very
efficiently. The small volumetric portions are interconnected through ‘points’, which are
commonly known as ‘nodes’ in finite element method. The stress and the deformation
levels are functions of the linear or non-linear material properties defined inside the body.
While implementing this method to human bio-dynamics, this method assumes that
human body can be defined by a finite number of elements and the mechanical properties
of these elements are obtained either from experimental or testing data. The more
accurate element properties are defined, more accurate the results from this method are
received. The body is subdivided into several elements containing nodes and the stress
and strain levels are judged based on the nodal displacements. A typical solid body made
of elements and nodes is represented in Fig. 18.
Fig. 18. Concepts of body, element and node in finite element modelling
There are many software tools available for finite element analysis of complicated
structures. The most popular and capable two finite element software tools used
worldwide are ANSYS and ABAQUS. The approach of finite element analysis tools can
be classified as Explicit and Implicit types.
Chapter 2
Page: 45
In the Explicit approach, after each incremental step the stiffness matrix is updated by the
system and a new stiffness matrix is formed to calculate the next step. This approach is
very useful if the increment levels are small. But as a result of many small increments,
obtaining solution is very much time consuming.
Implicit approach is same like Explicit with the addition of Newton-Raphson iterations
after each step. So, it is useful for big incremental steps and the problem can be solved
quicker than that of in explicit approach.
Field variables calculated at the nodes, can be interpreted by the formula of shape
functions. An example of simple three node element is shown in Fig. 19.
Fig. 19. Simple three node element
Equation 2.6 shows the field variables.
φ(x, y) = N1(x, y) φ 1 + N2(x, y) φ 2 + N3(x, y) φ 3 (2.6)
Where, φ 1, φ 2, and φ 3 are the field variable nodal values, and N1, N2, and N3 are the
shape functions.
2.2.1. Past works on Finite Element Model related to Human Body Dynamics
Finite element method was invented during the middle of last century from the necessity
of solving complicated structural problems and over the time this method became popular
worldwide cause of its interface with computerized visual effects.
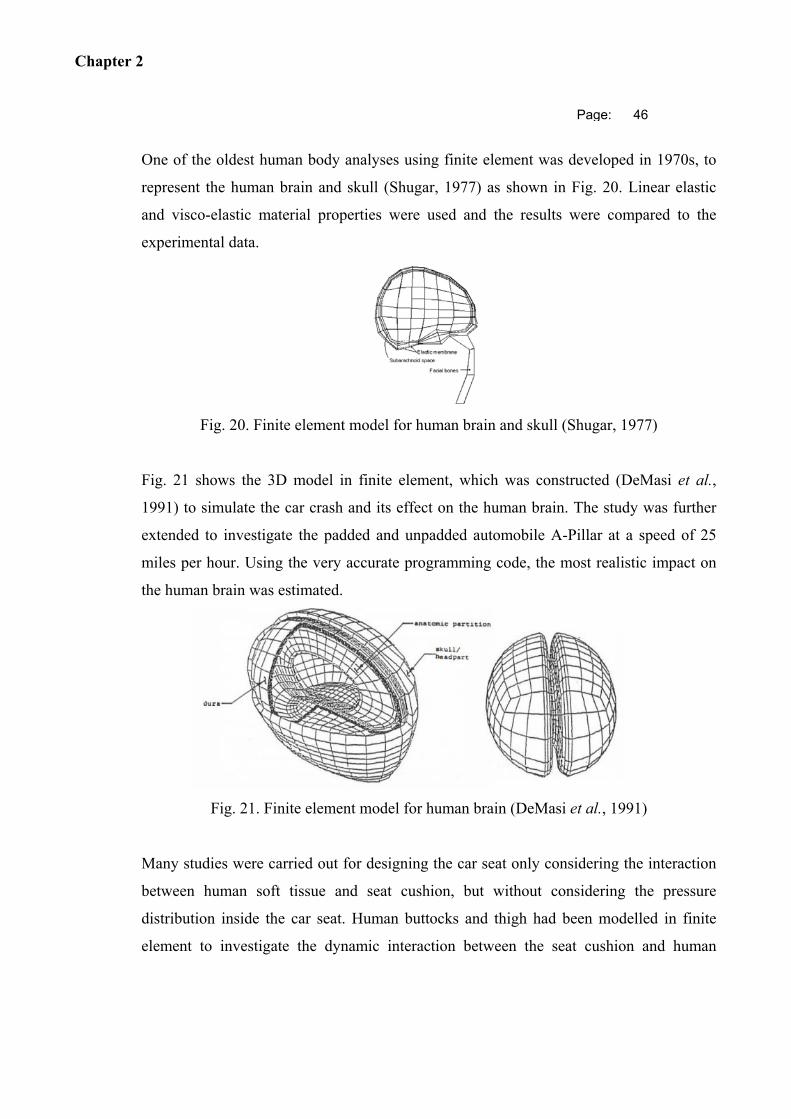
Chapter 2
Page: 46
One of the oldest human body analyses using finite element was developed in 1970s, to
represent the human brain and skull (Shugar, 1977) as shown in Fig. 20. Linear elastic
and visco-elastic material properties were used and the results were compared to the
experimental data.
Fig. 20. Finite element model for human brain and skull (Shugar, 1977)
Fig. 21 shows the 3D model in finite element, which was constructed (DeMasi et al.,
1991) to simulate the car crash and its effect on the human brain. The study was further
extended to investigate the padded and unpadded automobile A-Pillar at a speed of 25
miles per hour. Using the very accurate programming code, the most realistic impact on
the human brain was estimated.
Fig. 21. Finite element model for human brain (DeMasi et al., 1991)
Many studies were carried out for designing the car seat only considering the interaction
between human soft tissue and seat cushion, but without considering the pressure
distribution inside the car seat. Human buttocks and thigh had been modelled in finite
element to investigate the dynamic interaction between the seat cushion and human
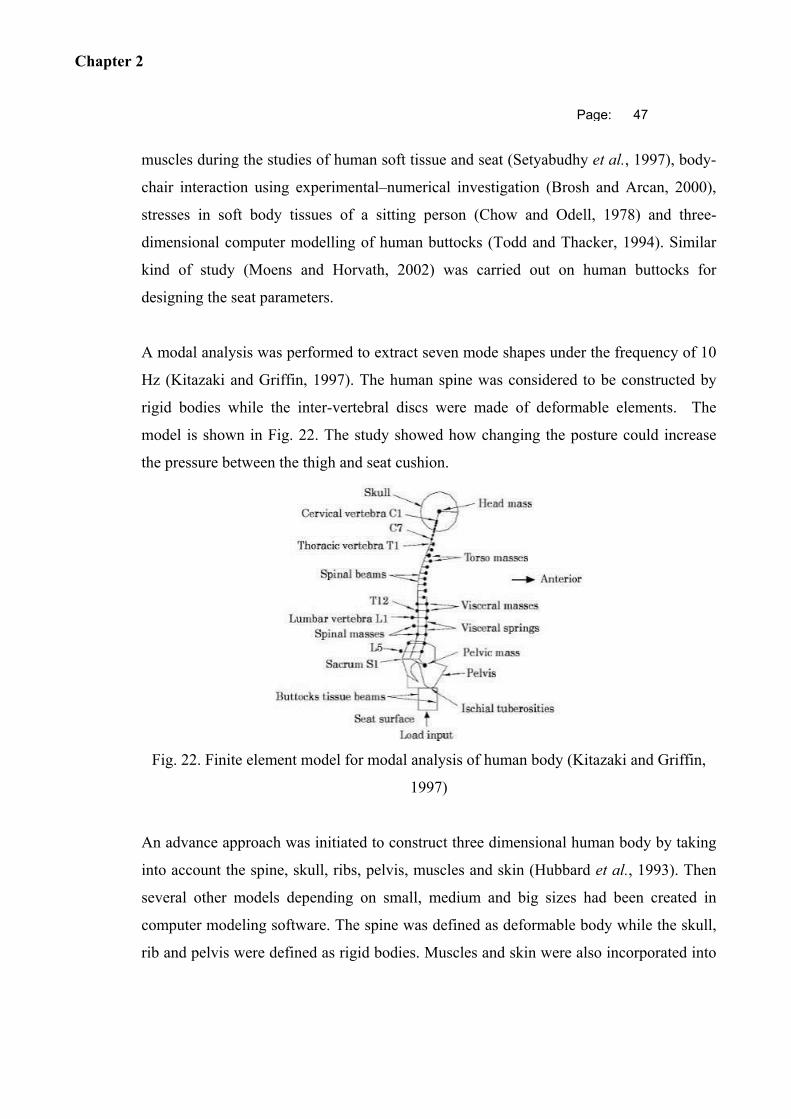
Chapter 2
Page: 47
muscles during the studies of human soft tissue and seat (Setyabudhy et al., 1997), body-
chair interaction using experimental–numerical investigation (Brosh and Arcan, 2000),
stresses in soft body tissues of a sitting person (Chow and Odell, 1978) and three-
dimensional computer modelling of human buttocks (Todd and Thacker, 1994). Similar
kind of study (Moens and Horvath, 2002) was carried out on human buttocks for
designing the seat parameters.
A modal analysis was performed to extract seven mode shapes under the frequency of 10
Hz (Kitazaki and Griffin, 1997). The human spine was considered to be constructed by
rigid bodies while the inter-vertebral discs were made of deformable elements. The
model is shown in Fig. 22. The study showed how changing the posture could increase
the pressure between the thigh and seat cushion.
Fig. 22. Finite element model for modal analysis of human body (Kitazaki and Griffin,
1997)
An advance approach was initiated to construct three dimensional human body by taking
into account the spine, skull, ribs, pelvis, muscles and skin (Hubbard et al., 1993). Then
several other models depending on small, medium and big sizes had been created in
computer modeling software. The spine was defined as deformable body while the skull,
rib and pelvis were defined as rigid bodies. Muscles and skin were also incorporated into
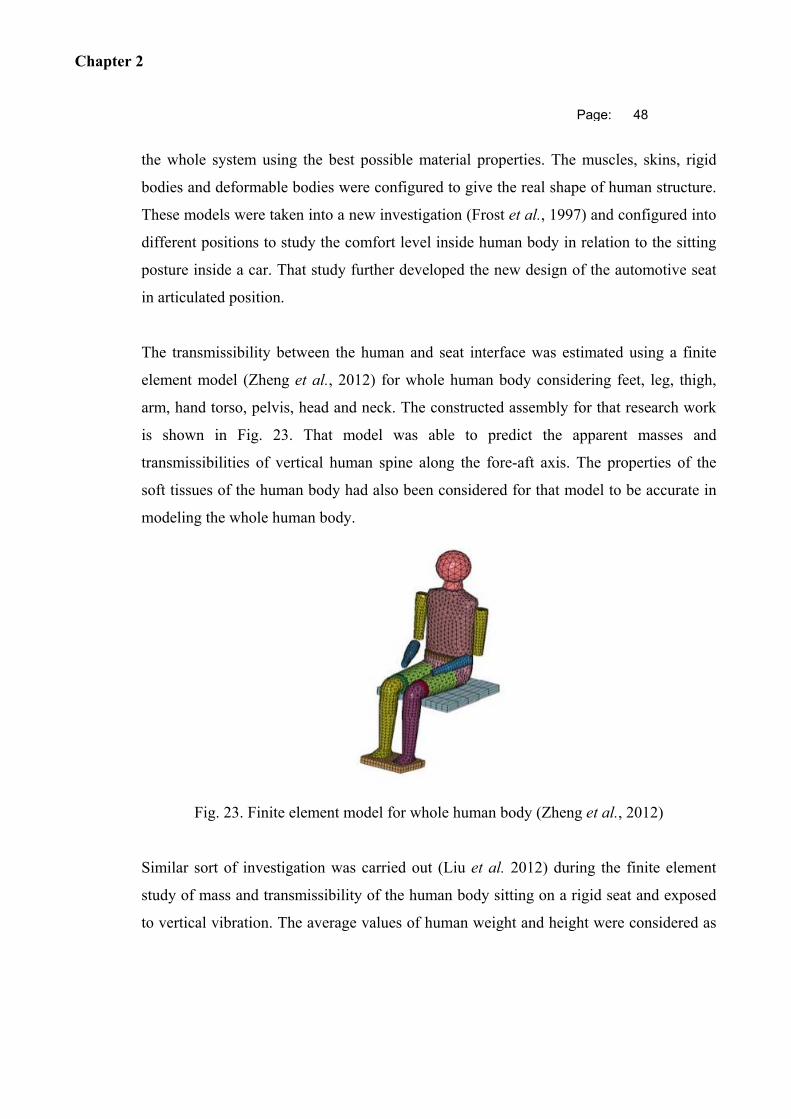
Chapter 2
Page: 48
the whole system using the best possible material properties. The muscles, skins, rigid
bodies and deformable bodies were configured to give the real shape of human structure.
These models were taken into a new investigation (Frost et al., 1997) and configured into
different positions to study the comfort level inside human body in relation to the sitting
posture inside a car. That study further developed the new design of the automotive seat
in articulated position.
The transmissibility between the human and seat interface was estimated using a finite
element model (Zheng et al., 2012) for whole human body considering feet, leg, thigh,
arm, hand torso, pelvis, head and neck. The constructed assembly for that research work
is shown in Fig. 23. That model was able to predict the apparent masses and
transmissibilities of vertical human spine along the fore-aft axis. The properties of the
soft tissues of the human body had also been considered for that model to be accurate in
modeling the whole human body.
Fig. 23. Finite element model for whole human body (Zheng et al., 2012)
Similar sort of investigation was carried out (Liu et al. 2012) during the finite element
study of mass and transmissibility of the human body sitting on a rigid seat and exposed
to vertical vibration. The average values of human weight and height were considered as
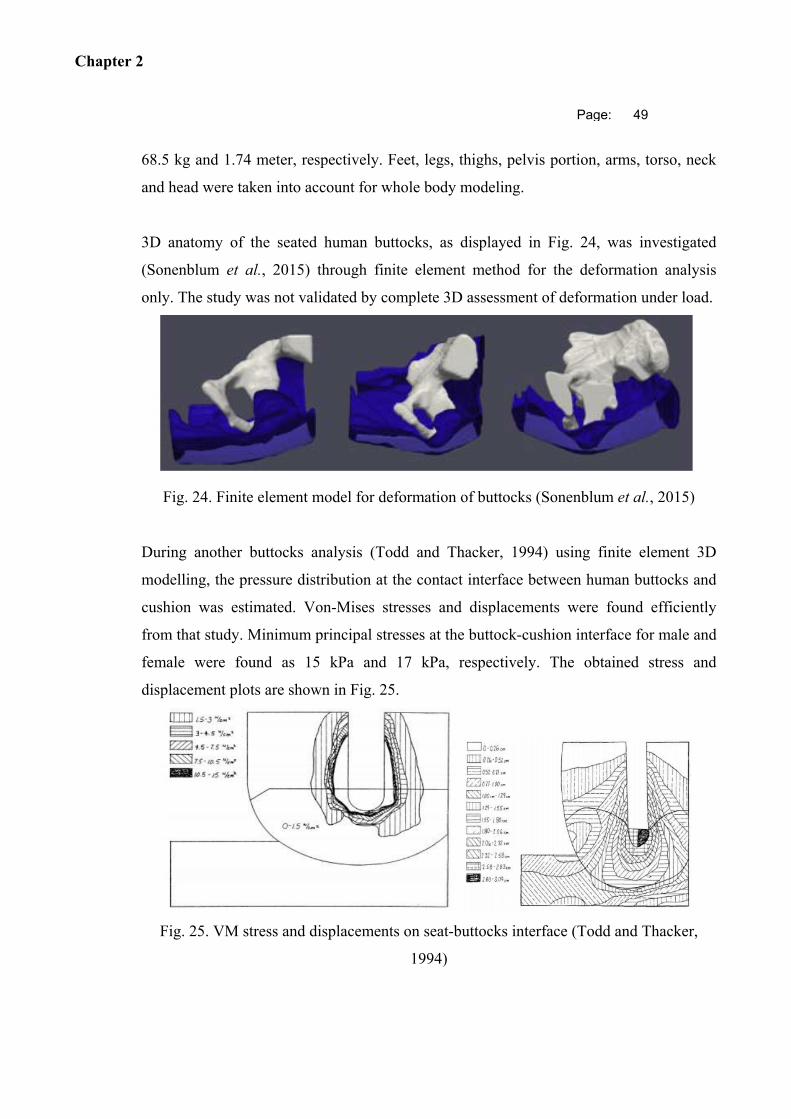
Chapter 2
Page: 49
68.5 kg and 1.74 meter, respectively. Feet, legs, thighs, pelvis portion, arms, torso, neck
and head were taken into account for whole body modeling.
3D anatomy of the seated human buttocks, as displayed in Fig. 24, was investigated
(Sonenblum et al., 2015) through finite element method for the deformation analysis
only. The study was not validated by complete 3D assessment of deformation under load.
Fig. 24. Finite element model for deformation of buttocks (Sonenblum et al., 2015)
During another buttocks analysis (Todd and Thacker, 1994) using finite element 3D
modelling, the pressure distribution at the contact interface between human buttocks and
cushion was estimated. Von-Mises stresses and displacements were found efficiently
from that study. Minimum principal stresses at the buttock-cushion interface for male and
female were found as 15 kPa and 17 kPa, respectively. The obtained stress and
displacement plots are shown in Fig. 25.
Fig. 25. VM stress and displacements on seat-buttocks interface (Todd and Thacker,
1994)
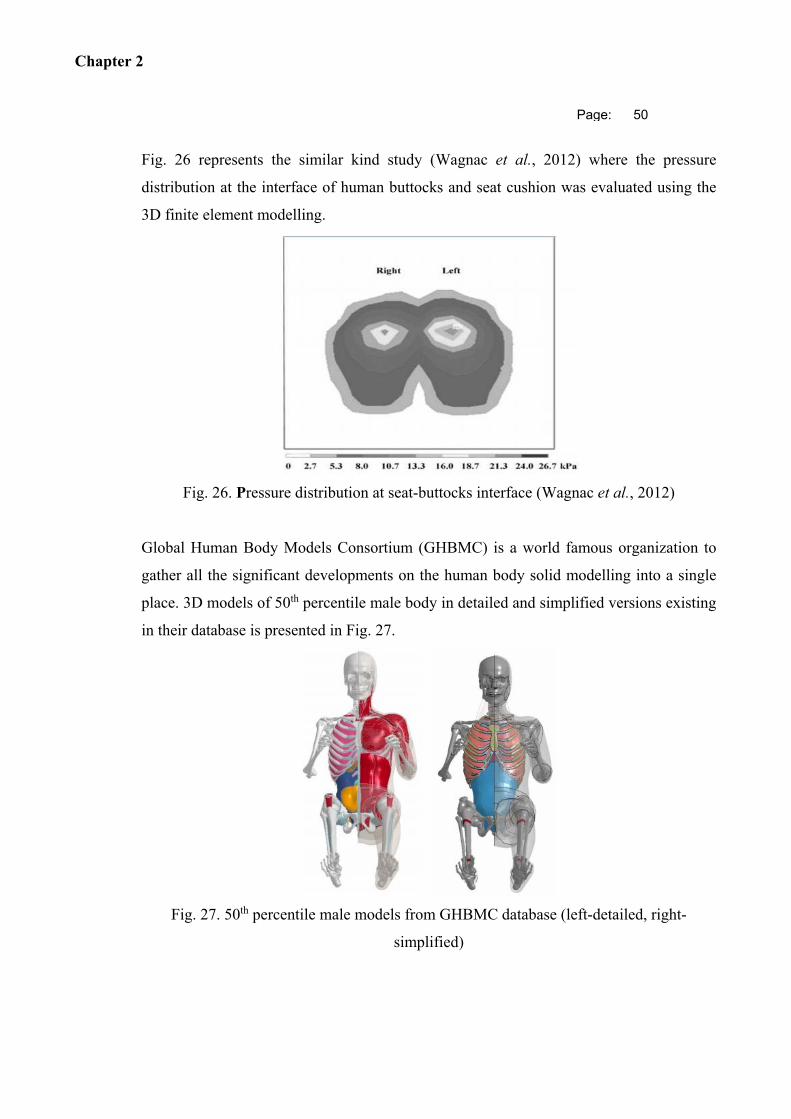
Chapter 2
Page: 50
Fig. 26 represents the similar kind study (Wagnac et al., 2012) where the pressure
distribution at the interface of human buttocks and seat cushion was evaluated using the
3D finite element modelling.
Fig. 26. Pressure distribution at seat-buttocks interface (Wagnac et al., 2012)
Global Human Body Models Consortium (GHBMC) is a world famous organization to
gather all the significant developments on the human body solid modelling into a single
place. 3D models of 50th percentile male body in detailed and simplified versions existing
in their database is presented in Fig. 27.
Fig. 27. 50th percentile male models from GHBMC database (left-detailed, right-
simplified)
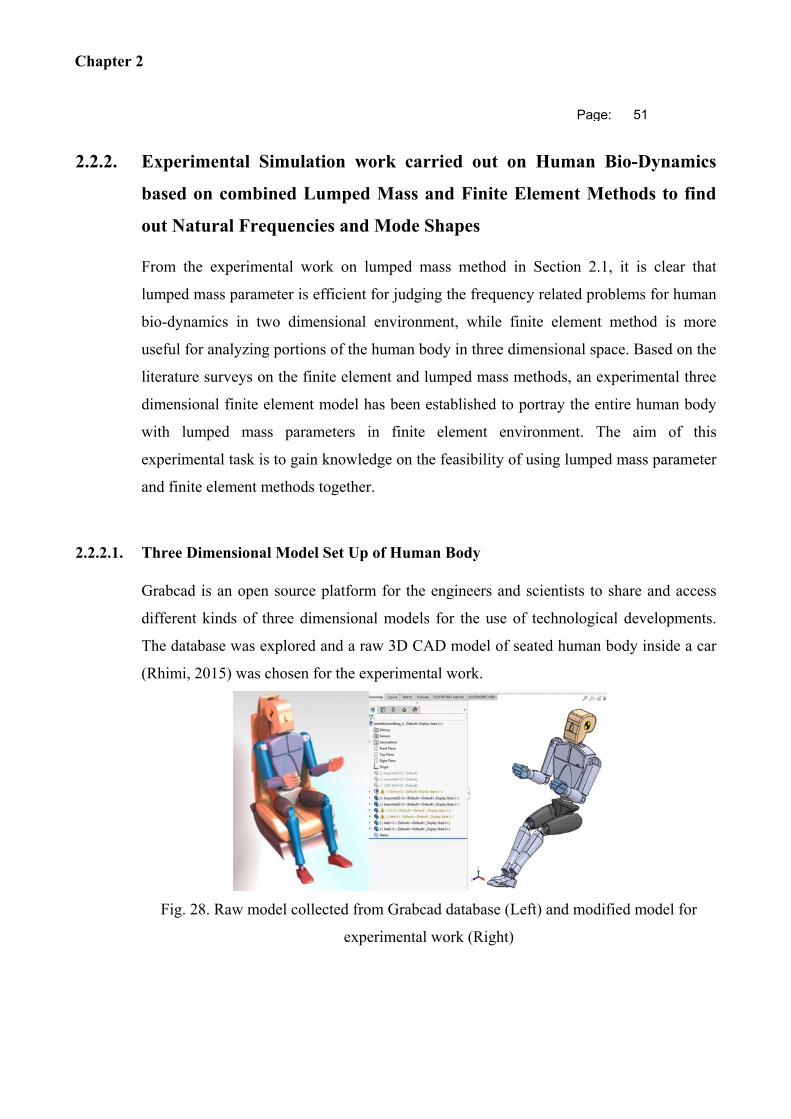
Chapter 2
Page: 51
2.2.2. Experimental Simulation work carried out on Human Bio-Dynamics
based on combined Lumped Mass and Finite Element Methods to find
out Natural Frequencies and Mode Shapes
From the experimental work on lumped mass method in Section 2.1, it is clear that
lumped mass parameter is efficient for judging the frequency related problems for human
bio-dynamics in two dimensional environment, while finite element method is more
useful for analyzing portions of the human body in three dimensional space. Based on the
literature surveys on the finite element and lumped mass methods, an experimental three
dimensional finite element model has been established to portray the entire human body
with lumped mass parameters in finite element environment. The aim of this
experimental task is to gain knowledge on the feasibility of using lumped mass parameter
and finite element methods together.
2.2.2.1. Three Dimensional Model Set Up of Human Body
Grabcad is an open source platform for the engineers and scientists to share and access
different kinds of three dimensional models for the use of technological developments.
The database was explored and a raw 3D CAD model of seated human body inside a car
(Rhimi, 2015) was chosen for the experimental work.
Fig. 28. Raw model collected from Grabcad database (Left) and modified model for
experimental work (Right)
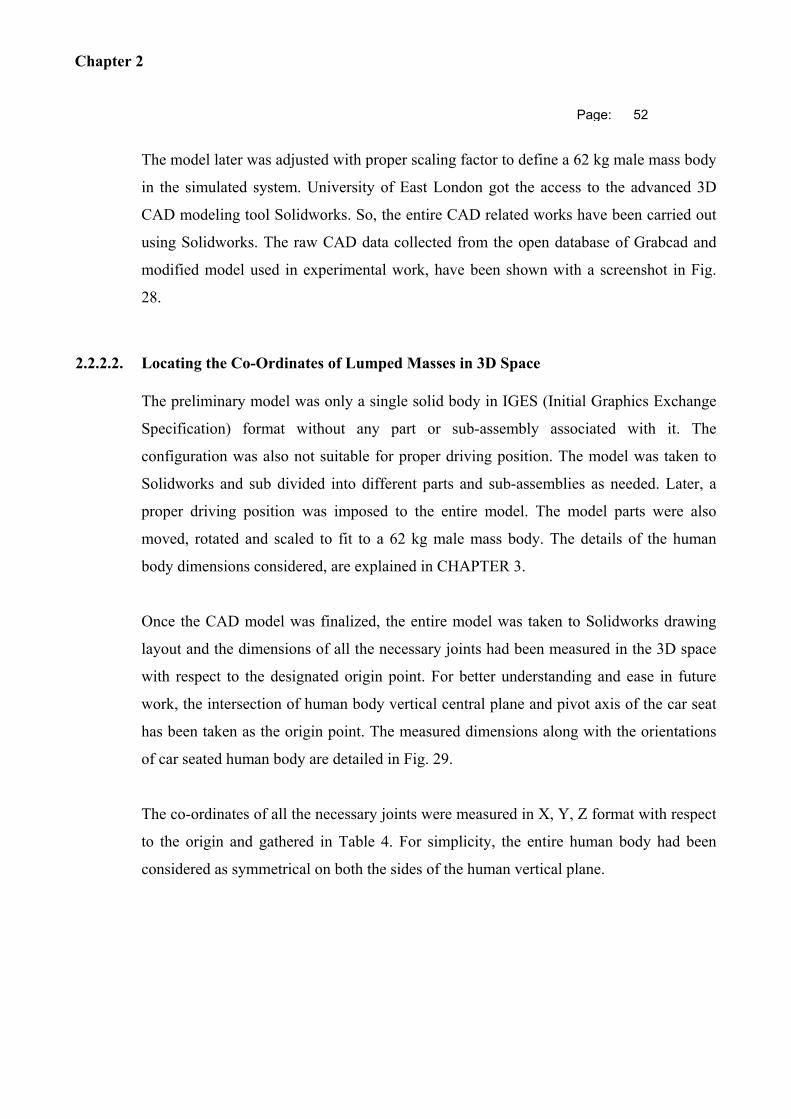
Chapter 2
Page: 52
The model later was adjusted with proper scaling factor to define a 62 kg male mass body
in the simulated system. University of East London got the access to the advanced 3D
CAD modeling tool Solidworks. So, the entire CAD related works have been carried out
using Solidworks. The raw CAD data collected from the open database of Grabcad and
modified model used in experimental work, have been shown with a screenshot in Fig.
28.
2.2.2.2. Locating the Co-Ordinates of Lumped Masses in 3D Space
The preliminary model was only a single solid body in IGES (Initial Graphics Exchange
Specification) format without any part or sub-assembly associated with it. The
configuration was also not suitable for proper driving position. The model was taken to
Solidworks and sub divided into different parts and sub-assemblies as needed. Later, a
proper driving position was imposed to the entire model. The model parts were also
moved, rotated and scaled to fit to a 62 kg male mass body. The details of the human
body dimensions considered, are explained in CHAPTER 3.
Once the CAD model was finalized, the entire model was taken to Solidworks drawing
layout and the dimensions of all the necessary joints had been measured in the 3D space
with respect to the designated origin point. For better understanding and ease in future
work, the intersection of human body vertical central plane and pivot axis of the car seat
has been taken as the origin point. The measured dimensions along with the orientations
of car seated human body are detailed in Fig. 29.
The co-ordinates of all the necessary joints were measured in X, Y, Z format with respect
to the origin and gathered in Table 4. For simplicity, the entire human body had been
considered as symmetrical on both the sides of the human vertical plane.
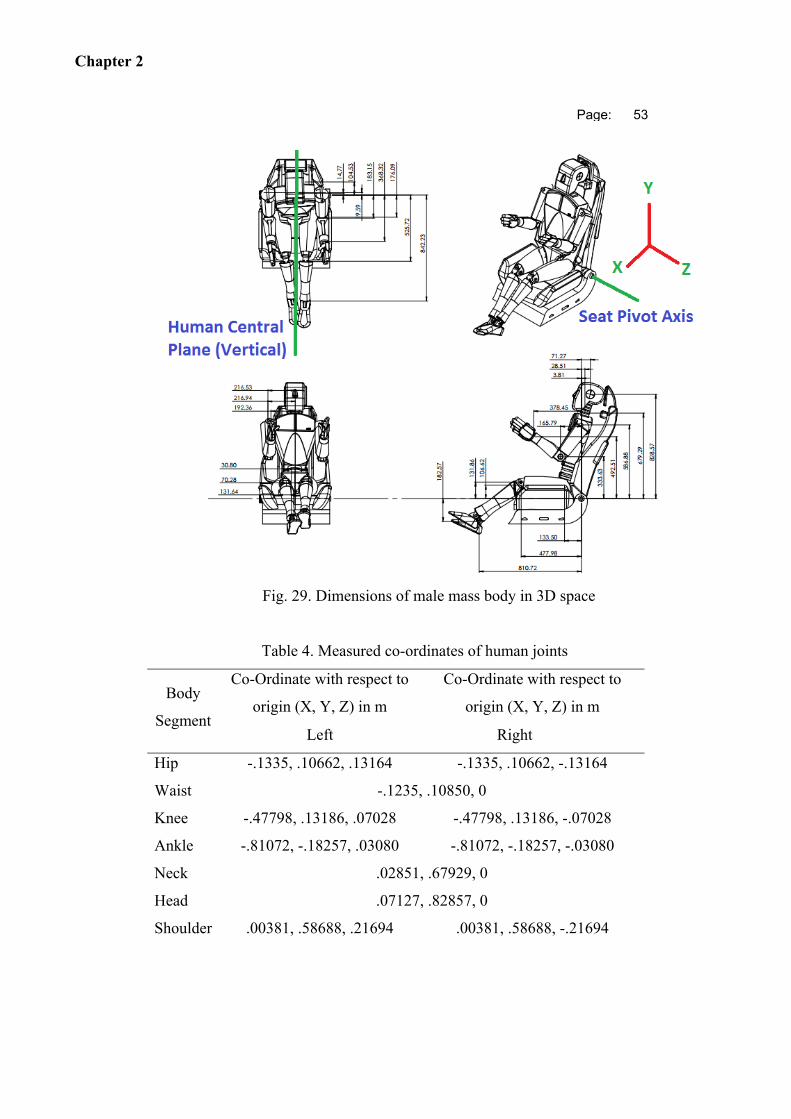
Chapter 2
Page: 53
Fig. 29. Dimensions of male mass body in 3D space
Table 4. Measured co-ordinates of human joints
Body
Segment
Co-Ordinate with respect to
origin (X, Y, Z) in m
Co-Ordinate with respect to
origin (X, Y, Z) in m
Left Right
Hip -.1335, .10662, .13164 -.1335, .10662, -.13164
Waist -.1235, .10850, 0
Knee -.47798, .13186, .07028 -.47798, .13186, -.07028
Ankle -.81072, -.18257, .03080 -.81072, -.18257, -.03080
Neck .02851, .67929, 0
Head .07127, .82857, 0
Shoulder .00381, .58688, .21694 .00381, .58688, -.21694
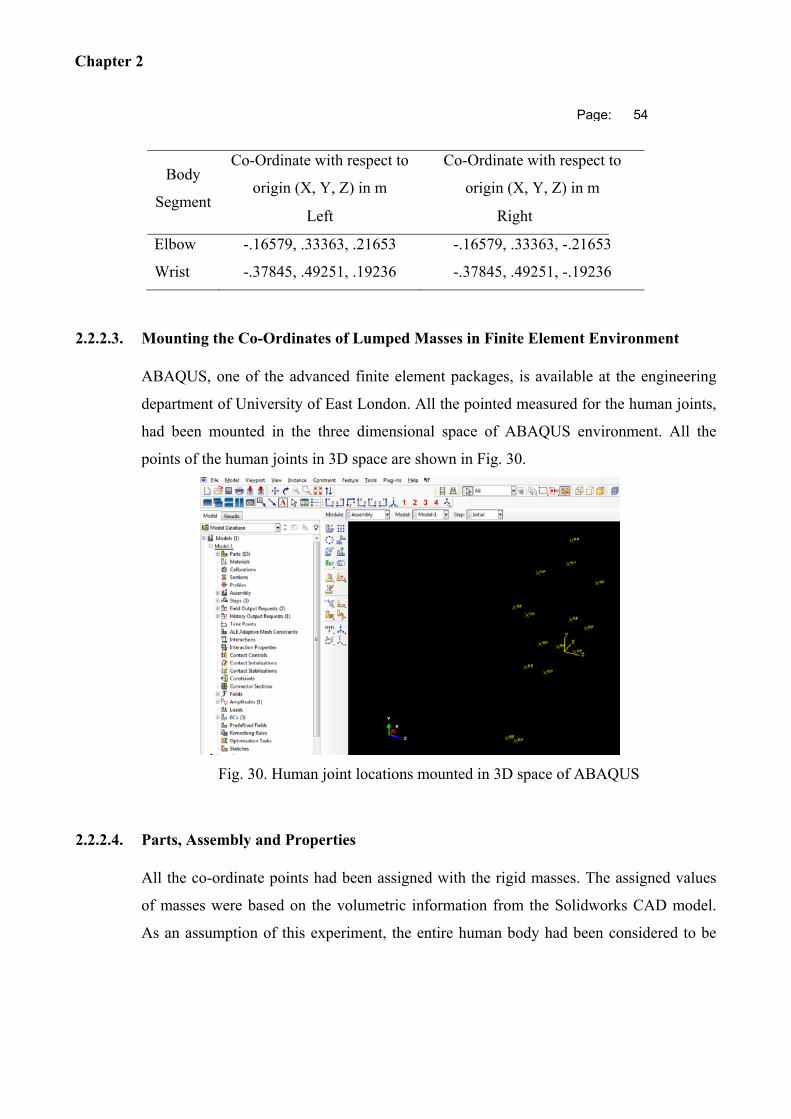
Chapter 2
Page: 54
Body
Segment
Co-Ordinate with respect to
origin (X, Y, Z) in m
Co-Ordinate with respect to
origin (X, Y, Z) in m
Left Right
Elbow -.16579, .33363, .21653 -.16579, .33363, -.21653
Wrist -.37845, .49251, .19236 -.37845, .49251, -.19236
2.2.2.3. Mounting the Co-Ordinates of Lumped Masses in Finite Element Environment
ABAQUS, one of the advanced finite element packages, is available at the engineering
department of University of East London. All the pointed measured for the human joints,
had been mounted in the three dimensional space of ABAQUS environment. All the
points of the human joints in 3D space are shown in Fig. 30.
Fig. 30. Human joint locations mounted in 3D space of ABAQUS
2.2.2.4. Parts, Assembly and Properties
All the co-ordinate points had been assigned with the rigid masses. The assigned values
of masses were based on the volumetric information from the Solidworks CAD model.
As an assumption of this experiment, the entire human body had been considered to be

Chapter 2
Page: 55
made of material with uniform density. Considering a male human body of 62 kg mass,
the volumetric percentages and masses of human segments were calculated. The
calculated masses of different human portions along with all the segmental parameters
are given in Table 5.
Table 5. Calculated mass of each human body segment
Segment Volume
(mm3)
Total Volume
(mm3)
% of Total
Volume
Total
Mass (Kg)
Mass of
Segment (Kg)
Head 2229970.07
30991651.97
7.20
62.00
4.46
Neck 130349.30 0.42 0.26
Upper Arm 1865987.58 6.02 3.73
Lower Arm 1325566.16 4.28 2.65
Hand 451071.59 1.46 0.90
Torso 15290604.99 49.34 30.59
Pelvis 2305471.46 7.44 4.61
Thigh 4259950.45 13.75 8.52
Leg 2104915.09 6.79 4.21
Foot 1027765.28 3.32 2.06
As the masses could only be introduced to the system through lumped masses, the
calculated segmental masses were required to be refined to average values. Except hands
and feet, all the other body component masses had been averaged at the respective
intersection points. All the rigid masses were taken to assembly level and no material
properties were assigned as the bodies were rigid for the experimental work. The
calculated masses are shown in Table 6.
Table 6. Calculated mass of lumped mass point
Segment Mass
(Kg)
Total Mass
(Kg)
Head 2.23 62.00
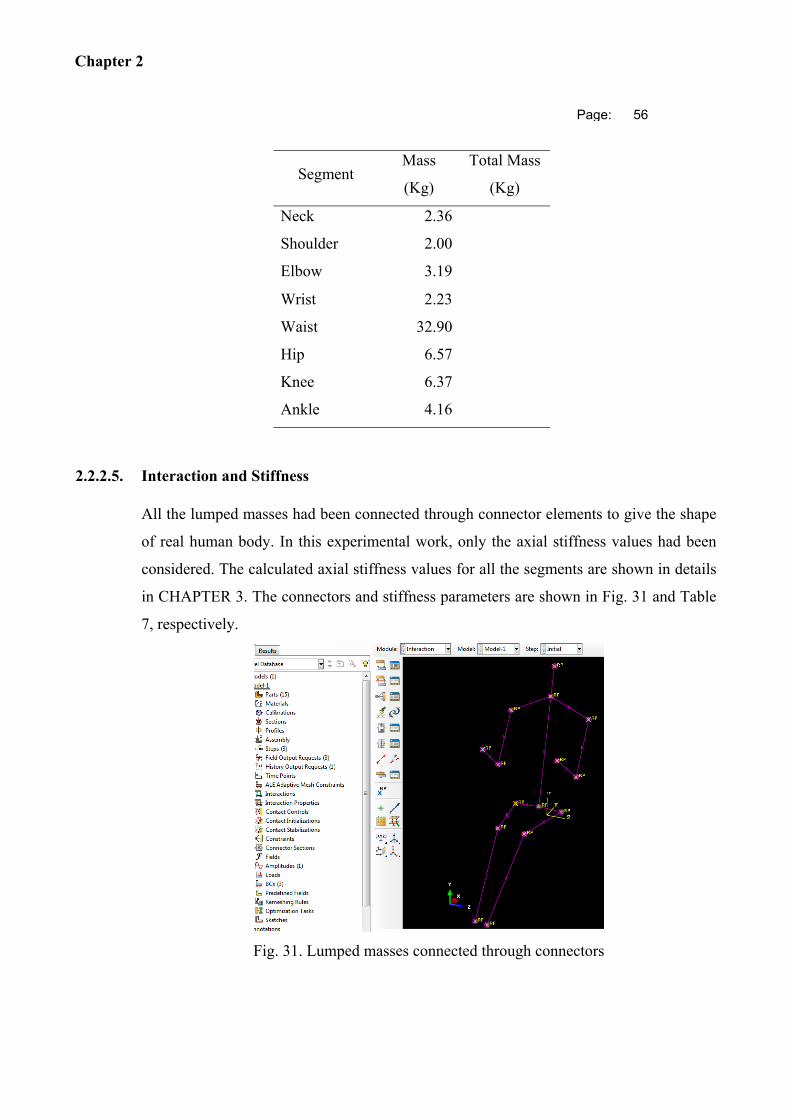
Chapter 2
Page: 56
Segment Mass
(Kg)
Total Mass
(Kg)
Neck 2.36
Shoulder 2.00
Elbow 3.19
Wrist 2.23
Waist 32.90
Hip 6.57
Knee 6.37
Ankle 4.16
2.2.2.5. Interaction and Stiffness
All the lumped masses had been connected through connector elements to give the shape
of real human body. In this experimental work, only the axial stiffness values had been
considered. The calculated axial stiffness values for all the segments are shown in details
in CHAPTER 3. The connectors and stiffness parameters are shown in Fig. 31 and Table
7, respectively.
Fig. 31. Lumped masses connected through connectors
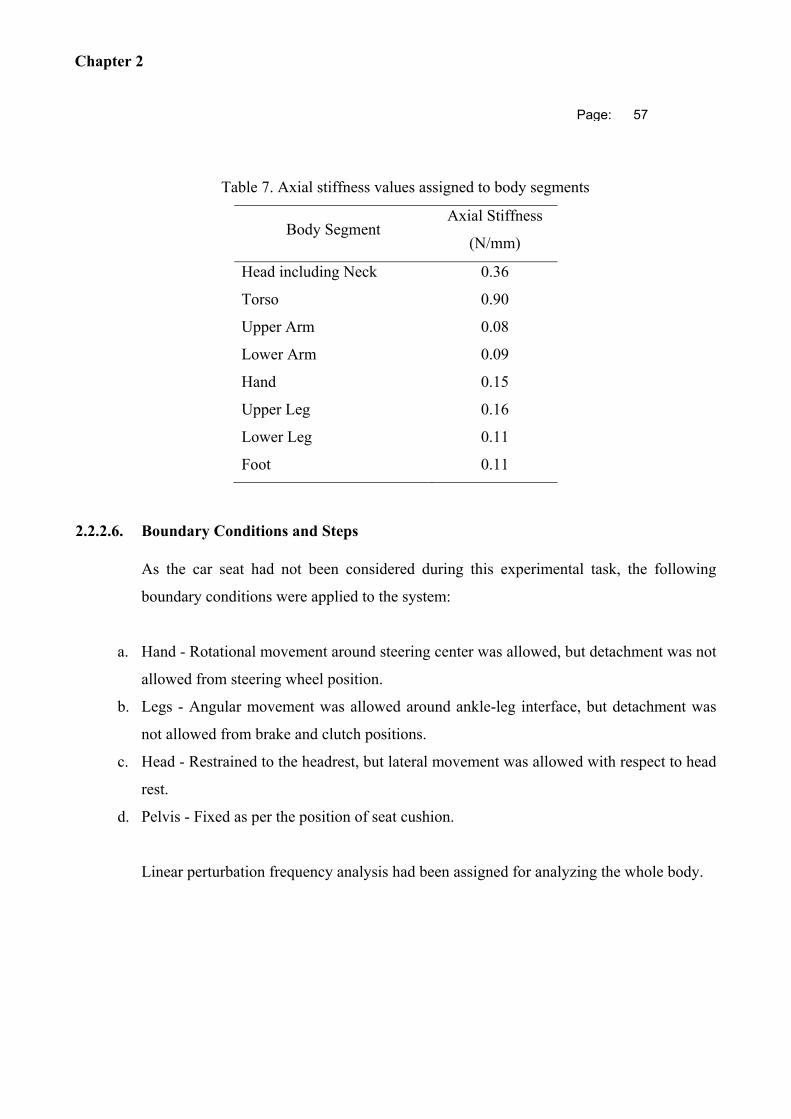
Chapter 2
Page: 57
Table 7. Axial stiffness values assigned to body segments
Body Segment Axial Stiffness
(N/mm)
Head including Neck 0.36
Torso 0.90
Upper Arm 0.08
Lower Arm 0.09
Hand 0.15
Upper Leg 0.16
Lower Leg 0.11
Foot 0.11
2.2.2.6. Boundary Conditions and Steps
As the car seat had not been considered during this experimental task, the following
boundary conditions were applied to the system:
a. Hand - Rotational movement around steering center was allowed, but detachment was not
allowed from steering wheel position.
b. Legs - Angular movement was allowed around ankle-leg interface, but detachment was
not allowed from brake and clutch positions.
c. Head - Restrained to the headrest, but lateral movement was allowed with respect to head
rest.
d. Pelvis - Fixed as per the position of seat cushion.
Linear perturbation frequency analysis had been assigned for analyzing the whole body.
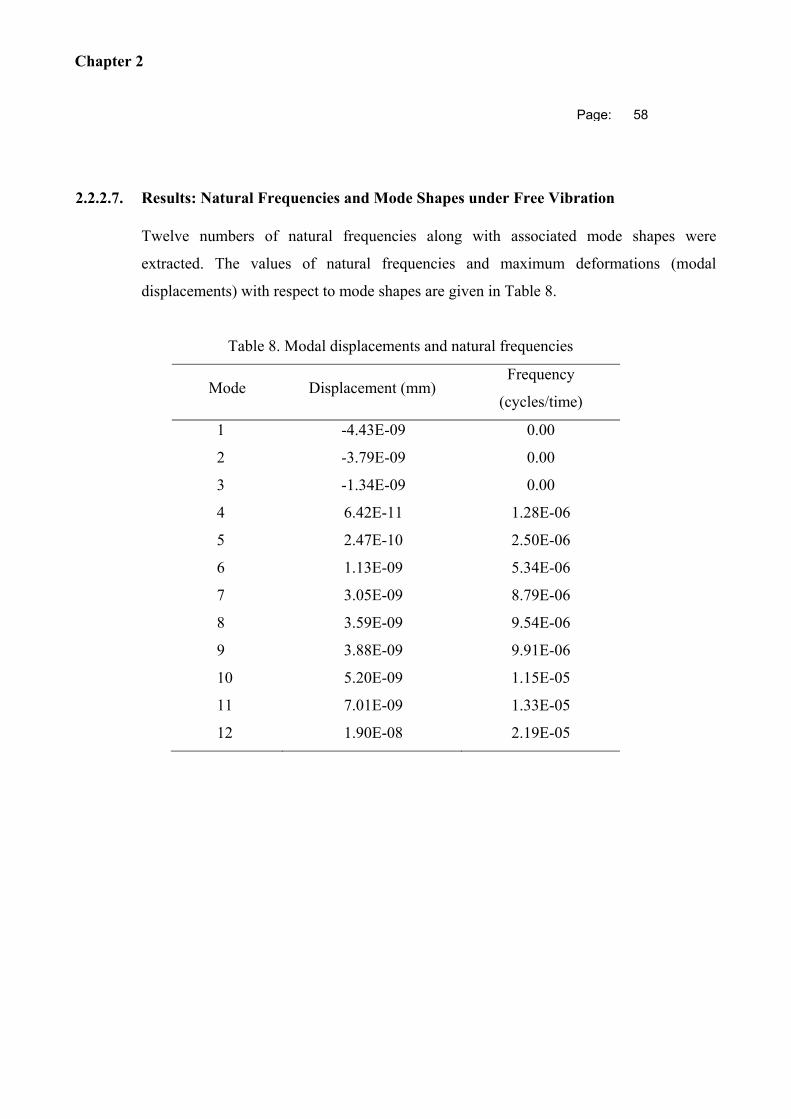
Chapter 2
Page: 58
2.2.2.7. Results: Natural Frequencies and Mode Shapes under Free Vibration
Twelve numbers of natural frequencies along with associated mode shapes were
extracted. The values of natural frequencies and maximum deformations (modal
displacements) with respect to mode shapes are given in Table 8.
Table 8. Modal displacements and natural frequencies
Mode Displacement (mm) Frequency
(cycles/time)
1 -4.43E-09 0.00
2 -3.79E-09 0.00
3 -1.34E-09 0.00
4 6.42E-11 1.28E-06
5 2.47E-10 2.50E-06
6 1.13E-09 5.34E-06
7 3.05E-09 8.79E-06
8 3.59E-09 9.54E-06
9 3.88E-09 9.91E-06
10 5.20E-09 1.15E-05
11 7.01E-09 1.33E-05
12 1.90E-08 2.19E-05
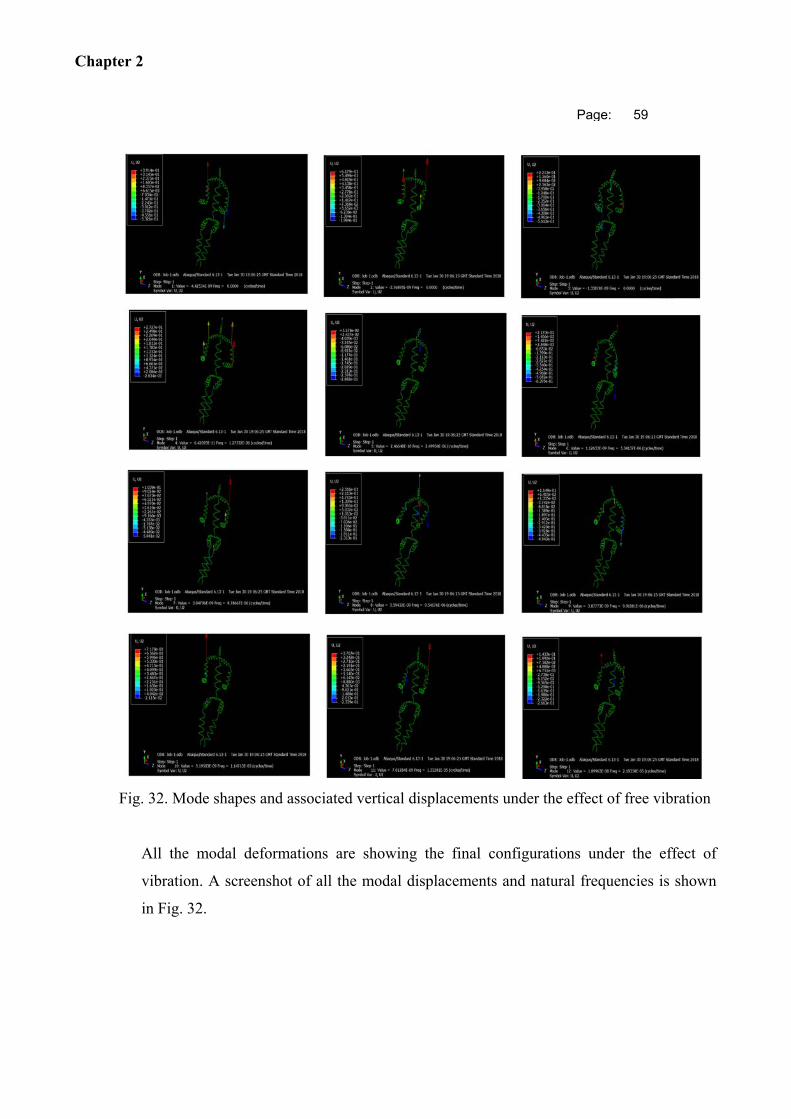
Chapter 2
Page: 59
Fig. 32. Mode shapes and associated vertical displacements under the effect of free vibration
All the modal deformations are showing the final configurations under the effect of
vibration. A screenshot of all the modal displacements and natural frequencies is shown
in Fig. 32.
Chapter 2
Page: 60
2.2.3. Discussion
The results are displaying very low level of natural frequencies, compared to the
permissible vibration ranges for human body portions. Consideration of the free vibration
without any external excitement is the primary reason behind this. If the car seat is
associated to the finite element model of human body with proper stiffness parameters
and the whole system is excited with forced vibration as per the real life scenario, the
natural frequencies will be much higher than what obtained from this experimental work.
Furthermore, only uni-directional stiffness values had been considered without any
damping properties. The result could be more accurate if three directional stiffness values
along with damping co-efficient values were considered.
The car seat can be associated to this experimental work as another lumped mass system.
But problem with this method is that the real life physical bodies cannot be represented
through this system. Both the human body and car seat are practically made of distributed
inhomogeneous masses instead of point masses. Generally, the stiffness values assigned
in this method, are also not functions of the human shapes and sizes, hence, not realistic.
This method greatly relies on experimental data or literature survey for assigning the
stiffness values.
From the output of the experimental work out, it is clear that the combination of the finite
element and lumped mass parameter methods can effectively be used to establish a bio-
dynamic model for vibration analysis. In the experimental work, the simulation set up
worked fine without any error and yielded desired results. So, this trial work can be
considered as successful to take it to next stage.
Chapter 2
Page: 61
2.3. MULTIBODY MODEL
Multi-body method is very effective to represent the whole human body and automotive
structures as a combination of different kinematic connections to solve the complex
problems. In the multi-body model method, the elements inside a system are considered
to be interconnected through different joints and these joints constrain the degrees of
freedom of the system to execute a certain motion or mechanism. The movement of the
whole system is caused by the external forces exerted to the system by means of spring,
damper, acceleration, contact, impact, impulse etc.
2.3.1. Past works on Multi-body Model related to Human Body Dynamics
Cause of the development of the computer graphics and hardware technologies, multi-
body analysis became very popular worldwide for analyzing complicated dynamic
problems. In past many years, different multi-body tools had been used to characterise the
human body by means of rigid and flexible parts representing head, arms, hands, thorax,
pelvis, thighs, legs and feet.
Two multi-body human models in seated condition had been constructed (Liang and
Chiang, 2008) to study the motion of a seated human body exposed to vertical vibrations
in various postures. One of the models was with backrest arrangement and the other one
was without backrest. The results obtained were greatly matched to the experimental
data. Similar kind of model was developed (Zheng et al., 2011) as shown in Fig. 33, for a
seven DOF multi-body human-seat assembly to understand the bio-dynamic responses
under the effect of vertical vibration in different sitting postures. That investigation
showed that the fore-aft and vertical apparent masses on the seat backrest were
significantly dependent on the stiffness values of the pelvis muscle.
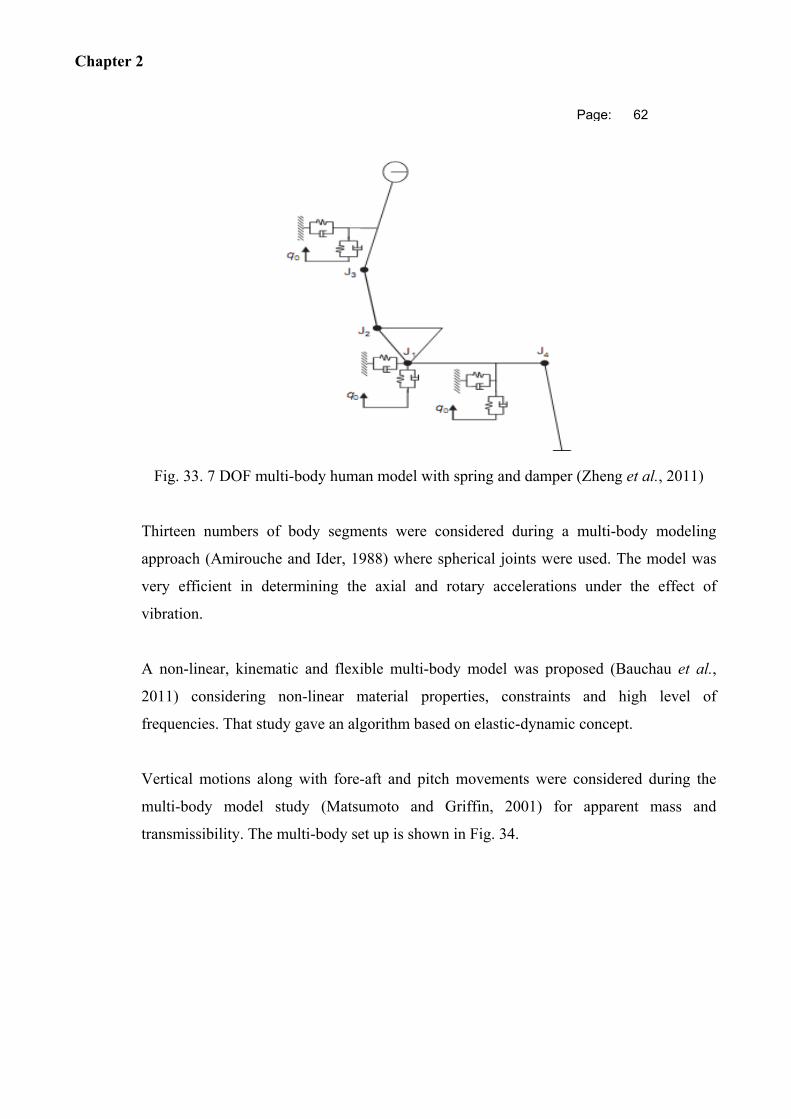
Chapter 2
Page: 62
Fig. 33. 7 DOF multi-body human model with spring and damper (Zheng et al., 2011)
Thirteen numbers of body segments were considered during a multi-body modeling
approach (Amirouche and Ider, 1988) where spherical joints were used. The model was
very efficient in determining the axial and rotary accelerations under the effect of
vibration.
A non-linear, kinematic and flexible multi-body model was proposed (Bauchau et al.,
2011) considering non-linear material properties, constraints and high level of
frequencies. That study gave an algorithm based on elastic-dynamic concept.
Vertical motions along with fore-aft and pitch movements were considered during the
multi-body model study (Matsumoto and Griffin, 2001) for apparent mass and
transmissibility. The multi-body set up is shown in Fig. 34.
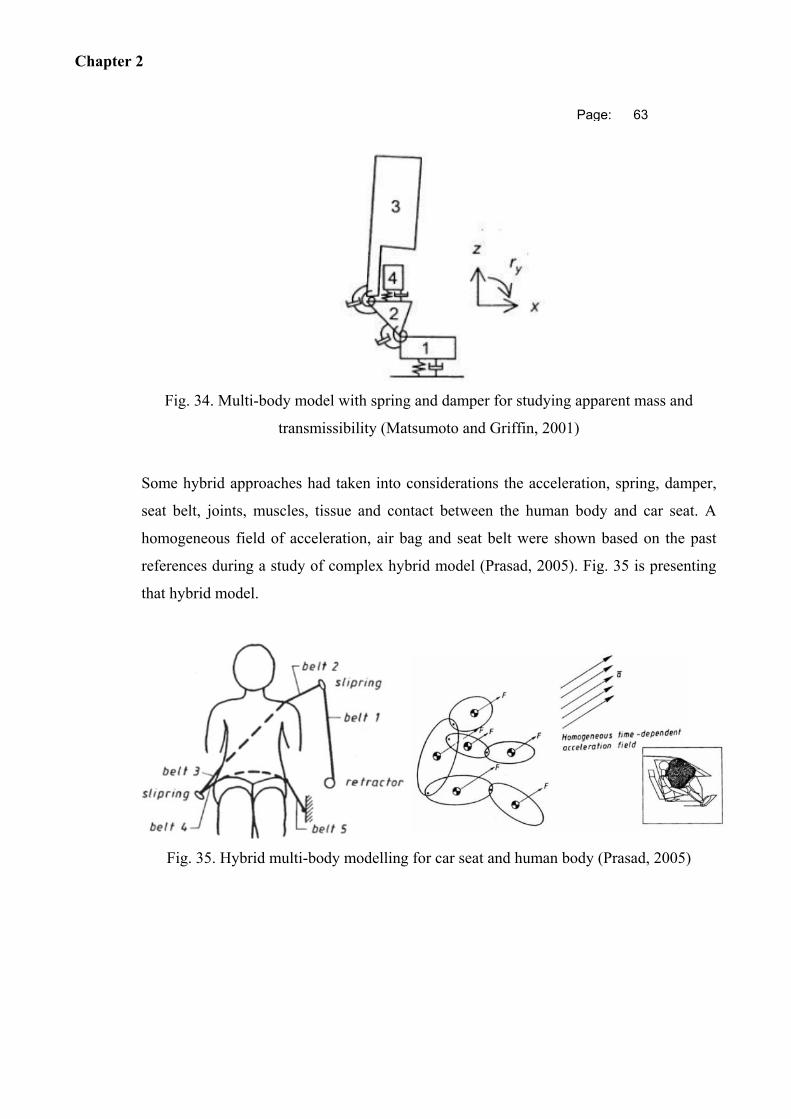
Chapter 2
Page: 63
Fig. 34. Multi-body model with spring and damper for studying apparent mass and
transmissibility (Matsumoto and Griffin, 2001)
Some hybrid approaches had taken into considerations the acceleration, spring, damper,
seat belt, joints, muscles, tissue and contact between the human body and car seat. A
homogeneous field of acceleration, air bag and seat belt were shown based on the past
references during a study of complex hybrid model (Prasad, 2005). Fig. 35 is presenting
that hybrid model.
Fig. 35. Hybrid multi-body modelling for car seat and human body (Prasad, 2005)
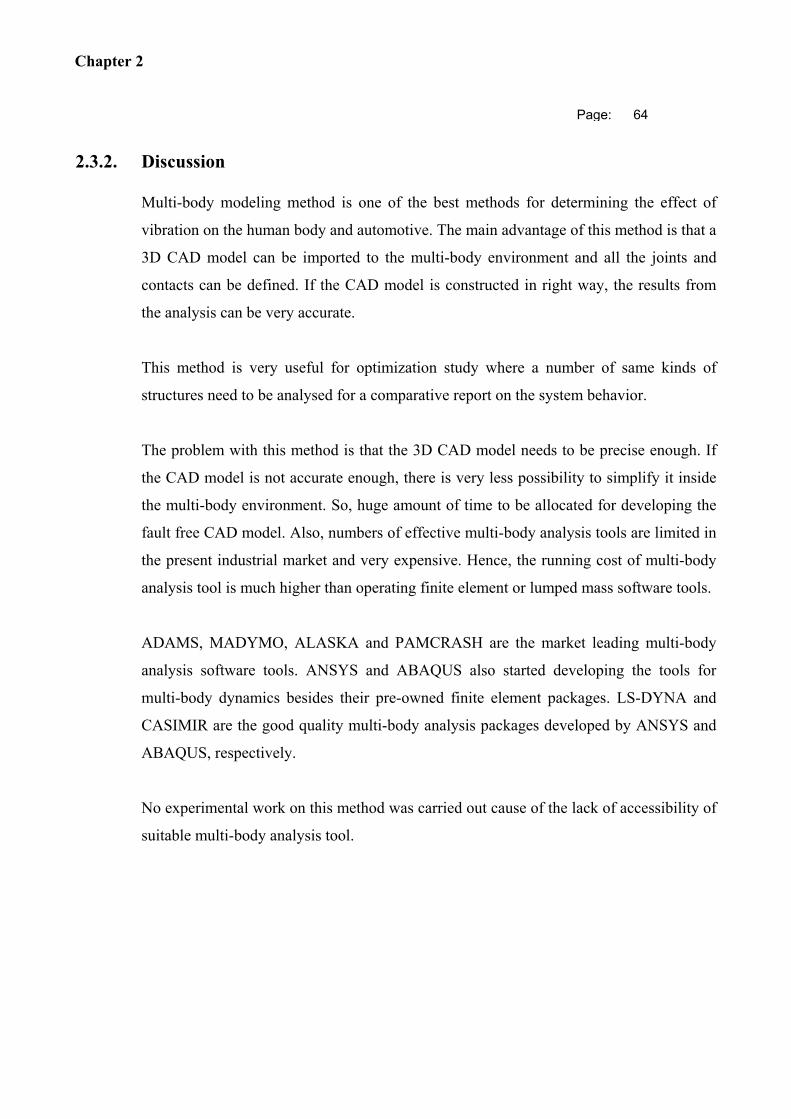
Chapter 2
Page: 64
2.3.2. Discussion
Multi-body modeling method is one of the best methods for determining the effect of
vibration on the human body and automotive. The main advantage of this method is that a
3D CAD model can be imported to the multi-body environment and all the joints and
contacts can be defined. If the CAD model is constructed in right way, the results from
the analysis can be very accurate.
This method is very useful for optimization study where a number of same kinds of
structures need to be analysed for a comparative report on the system behavior.
The problem with this method is that the 3D CAD model needs to be precise enough. If
the CAD model is not accurate enough, there is very less possibility to simplify it inside
the multi-body environment. So, huge amount of time to be allocated for developing the
fault free CAD model. Also, numbers of effective multi-body analysis tools are limited in
the present industrial market and very expensive. Hence, the running cost of multi-body
analysis tool is much higher than operating finite element or lumped mass software tools.
ADAMS, MADYMO, ALASKA and PAMCRASH are the market leading multi-body
analysis software tools. ANSYS and ABAQUS also started developing the tools for
multi-body dynamics besides their pre-owned finite element packages. LS-DYNA and
CASIMIR are the good quality multi-body analysis packages developed by ANSYS and
ABAQUS, respectively.
No experimental work on this method was carried out cause of the lack of accessibility of
suitable multi-body analysis tool.
Chapter 3
Page: 65
CHAPTER 3 UNIQUE BIO-DYNAMIC
SIMULATION MODEL
DEVELOPED FOR SEATED
HUMAN BODY INSIDE A CAR
After exploring the latest technologies on the human bio-dynamics and carrying out the
experimental works using different methods in CHAPTER 2, it is clear that simplification
must be done on the complex human body and car seat before carrying out the analysis
work. Moreover, none of the existing technologies are taking into account the stiffness
and damping values based on the shape and size of the human body, hence, lacking the
real life feasibility, though every technology got some pros and cons. In this chapter,
efforts have been made to achieve a bio-dynamic simulated model of car seated human
body as per real life environment, with the considerations of human shape and size
specific stiffness and damping values. This chapter elaborates a unique biodynamic
simulation technique for a car seated human body.
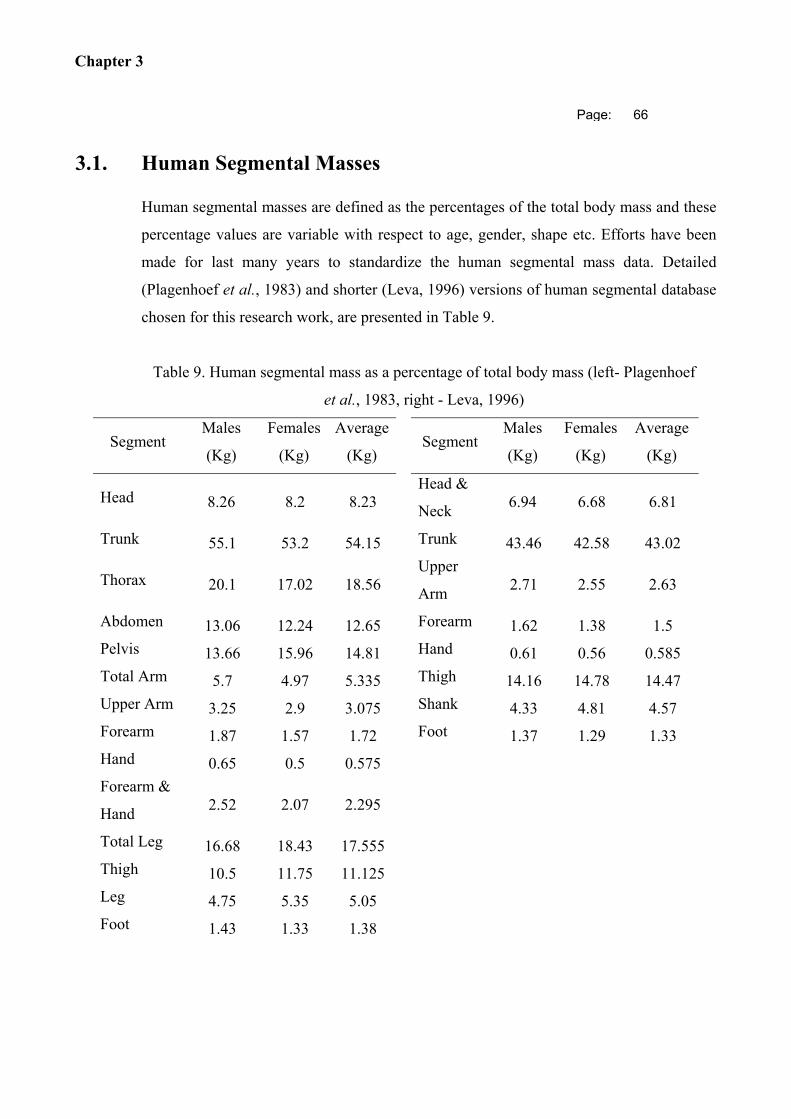
Chapter 3
Page: 66
3.1. Human Segmental Masses
Human segmental masses are defined as the percentages of the total body mass and these
percentage values are variable with respect to age, gender, shape etc. Efforts have been
made for last many years to standardize the human segmental mass data. Detailed
(Plagenhoef et al., 1983) and shorter (Leva, 1996) versions of human segmental database
chosen for this research work, are presented in Table 9.
Table 9. Human segmental mass as a percentage of total body mass (left- Plagenhoef
et al., 1983, right - Leva, 1996)
Segment Males
(Kg)
Females
(Kg)
Average
(Kg) Segment
Males
(Kg)
Females
(Kg)
Average
(Kg)
Head 8.26 8.2 8.23 Head &
Neck 6.94 6.68 6.81
Trunk 55.1 53.2 54.15 Trunk 43.46 42.58 43.02
Thorax 20.1 17.02 18.56 Upper
Arm 2.71 2.55 2.63
Abdomen 13.06 12.24 12.65 Forearm 1.62 1.38 1.5
Pelvis 13.66 15.96 14.81 Hand 0.61 0.56 0.585
Total Arm 5.7 4.97 5.335 Thigh 14.16 14.78 14.47
Upper Arm 3.25 2.9 3.075 Shank 4.33 4.81 4.57
Forearm 1.87 1.57 1.72 Foot 1.37 1.29 1.33
Hand 0.65 0.5 0.575
Forearm &
Hand 2.52 2.07 2.295
Total Leg 16.68 18.43 17.555
Thigh 10.5 11.75 11.125
Leg 4.75 5.35 5.05
Foot 1.43 1.33 1.38
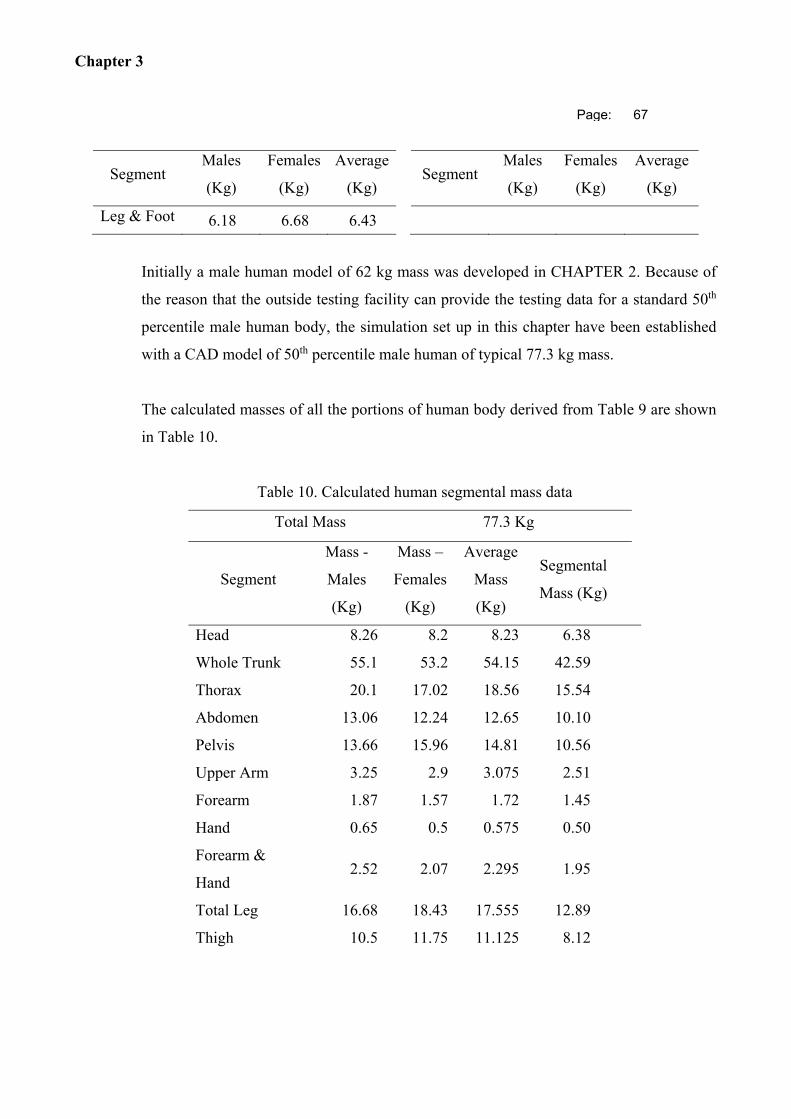
Chapter 3
Page: 67
Segment Males
(Kg)
Females
(Kg)
Average
(Kg) Segment
Males
(Kg)
Females
(Kg)
Average
(Kg)
Leg & Foot 6.18 6.68 6.43
Initially a male human model of 62 kg mass was developed in CHAPTER 2. Because of
the reason that the outside testing facility can provide the testing data for a standard 50th
percentile male human body, the simulation set up in this chapter have been established
with a CAD model of 50th percentile male human of typical 77.3 kg mass.
The calculated masses of all the portions of human body derived from Table 9 are shown
in Table 10.
Table 10. Calculated human segmental mass data
Total Mass 77.3 Kg
Segment
Mass -
Males
(Kg)
Mass –
Females
(Kg)
Average
Mass
(Kg)
Segmental
Mass (Kg)
Head 8.26 8.2 8.23 6.38
Whole Trunk 55.1 53.2 54.15 42.59
Thorax 20.1 17.02 18.56 15.54
Abdomen 13.06 12.24 12.65 10.10
Pelvis 13.66 15.96 14.81 10.56
Upper Arm 3.25 2.9 3.075 2.51
Forearm 1.87 1.57 1.72 1.45
Hand 0.65 0.5 0.575 0.50
Forearm &
Hand 2.52 2.07 2.295 1.95
Total Leg 16.68 18.43 17.555 12.89
Thigh 10.5 11.75 11.125 8.12
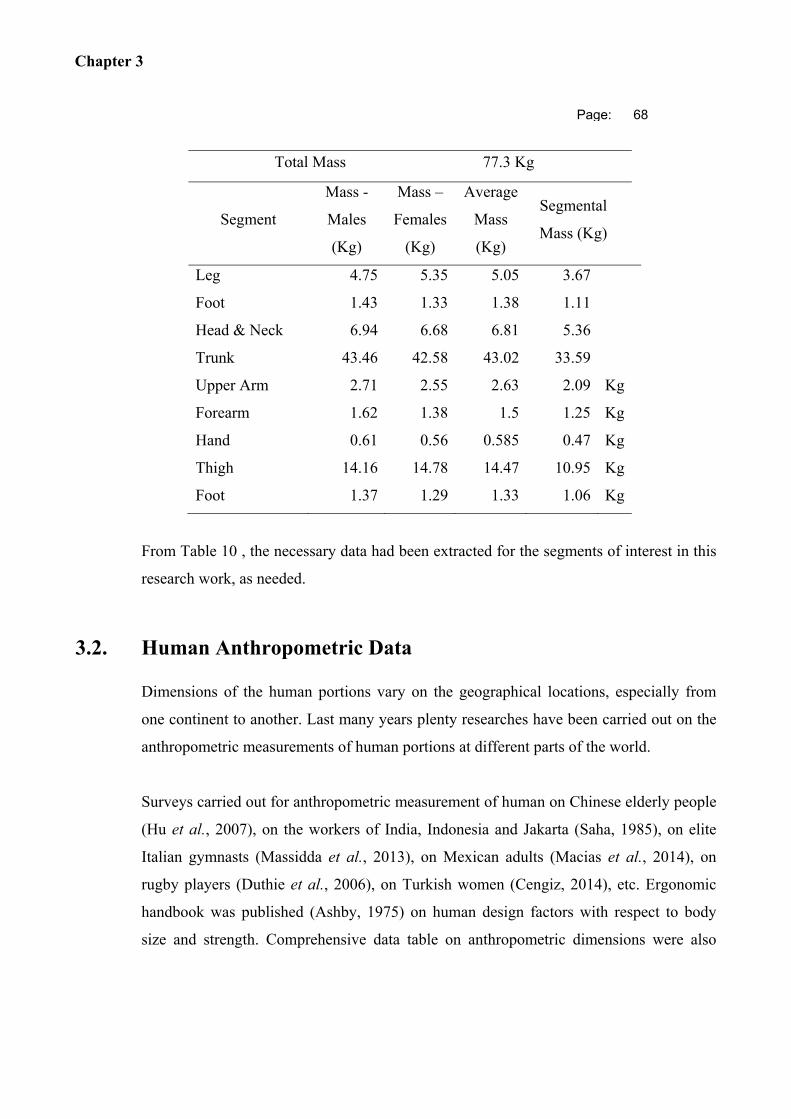
Chapter 3
Page: 68
Total Mass 77.3 Kg
Segment
Mass -
Males
(Kg)
Mass –
Females
(Kg)
Average
Mass
(Kg)
Segmental
Mass (Kg)
Leg 4.75 5.35 5.05 3.67
Foot 1.43 1.33 1.38 1.11
Head & Neck 6.94 6.68 6.81 5.36
Trunk 43.46 42.58 43.02 33.59
Upper Arm 2.71 2.55 2.63 2.09 Kg
Forearm 1.62 1.38 1.5 1.25 Kg
Hand 0.61 0.56 0.585 0.47 Kg
Thigh 14.16 14.78 14.47 10.95 Kg
Foot 1.37 1.29 1.33 1.06 Kg
From Table 10 , the necessary data had been extracted for the segments of interest in this
research work, as needed.
3.2. Human Anthropometric Data
Dimensions of the human portions vary on the geographical locations, especially from
one continent to another. Last many years plenty researches have been carried out on the
anthropometric measurements of human portions at different parts of the world.
Surveys carried out for anthropometric measurement of human on Chinese elderly people
(Hu et al., 2007), on the workers of India, Indonesia and Jakarta (Saha, 1985), on elite
Italian gymnasts (Massidda et al., 2013), on Mexican adults (Macias et al., 2014), on
rugby players (Duthie et al., 2006), on Turkish women (Cengiz, 2014), etc. Ergonomic
handbook was published (Ashby, 1975) on human design factors with respect to body
size and strength. Comprehensive data table on anthropometric dimensions were also
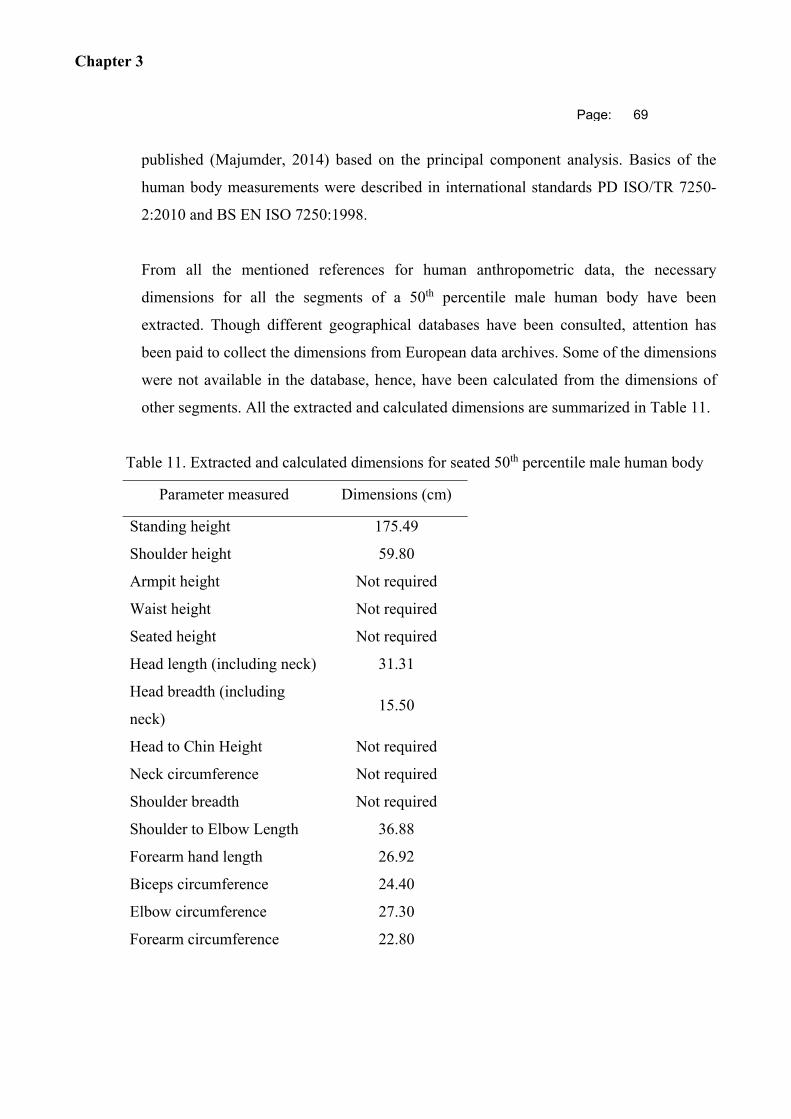
Chapter 3
Page: 69
published (Majumder, 2014) based on the principal component analysis. Basics of the
human body measurements were described in international standards PD ISO/TR 7250-
2:2010 and BS EN ISO 7250:1998.
From all the mentioned references for human anthropometric data, the necessary
dimensions for all the segments of a 50th percentile male human body have been
extracted. Though different geographical databases have been consulted, attention has
been paid to collect the dimensions from European data archives. Some of the dimensions
were not available in the database, hence, have been calculated from the dimensions of
other segments. All the extracted and calculated dimensions are summarized in Table 11.
Table 11. Extracted and calculated dimensions for seated 50th percentile male human body
Parameter measured Dimensions (cm)
Standing height 175.49
Shoulder height 59.80
Armpit height Not required
Waist height Not required
Seated height Not required
Head length (including neck) 31.31
Head breadth (including
neck) 15.50
Head to Chin Height Not required
Neck circumference Not required
Shoulder breadth Not required
Shoulder to Elbow Length 36.88
Forearm hand length 26.92
Biceps circumference 24.40
Elbow circumference 27.30
Forearm circumference 22.80
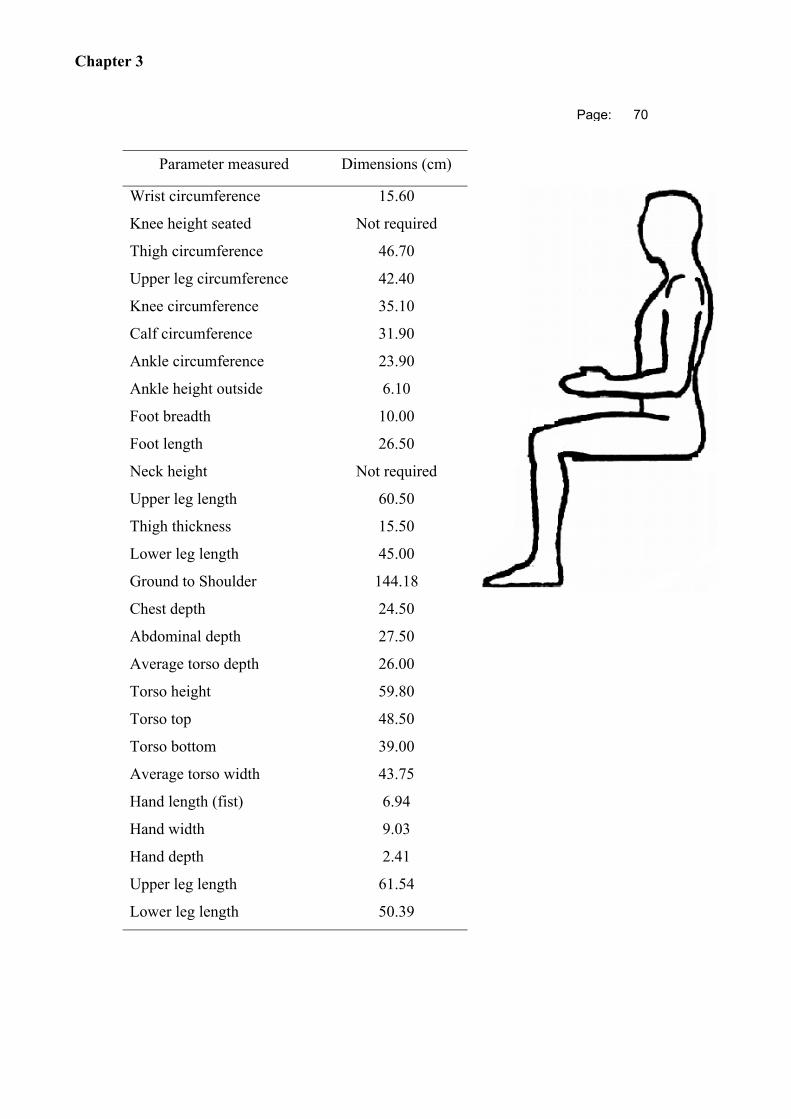
Chapter 3
Page: 70
Parameter measured Dimensions (cm)
Wrist circumference 15.60
Knee height seated Not required
Thigh circumference 46.70
Upper leg circumference 42.40
Knee circumference 35.10
Calf circumference 31.90
Ankle circumference 23.90
Ankle height outside 6.10
Foot breadth 10.00
Foot length 26.50
Neck height Not required
Upper leg length 60.50
Thigh thickness 15.50
Lower leg length 45.00
Ground to Shoulder 144.18
Chest depth 24.50
Abdominal depth 27.50
Average torso depth 26.00
Torso height 59.80
Torso top 48.50
Torso bottom 39.00
Average torso width 43.75
Hand length (fist) 6.94
Hand width 9.03
Hand depth 2.41
Upper leg length 61.54
Lower leg length 50.39
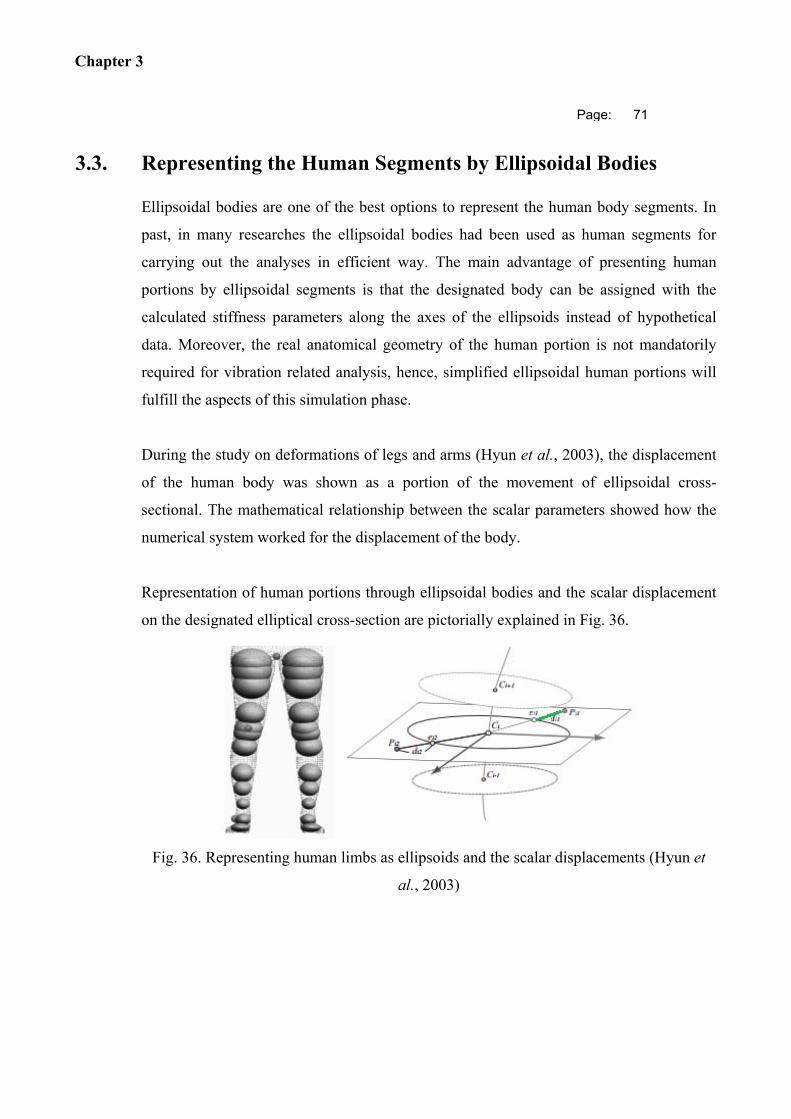
Chapter 3
Page: 71
3.3. Representing the Human Segments by Ellipsoidal Bodies
Ellipsoidal bodies are one of the best options to represent the human body segments. In
past, in many researches the ellipsoidal bodies had been used as human segments for
carrying out the analyses in efficient way. The main advantage of presenting human
portions by ellipsoidal segments is that the designated body can be assigned with the
calculated stiffness parameters along the axes of the ellipsoids instead of hypothetical
data. Moreover, the real anatomical geometry of the human portion is not mandatorily
required for vibration related analysis, hence, simplified ellipsoidal human portions will
fulfill the aspects of this simulation phase.
During the study on deformations of legs and arms (Hyun et al., 2003), the displacement
of the human body was shown as a portion of the movement of ellipsoidal cross-
sectional. The mathematical relationship between the scalar parameters showed how the
numerical system worked for the displacement of the body.
Representation of human portions through ellipsoidal bodies and the scalar displacement
on the designated elliptical cross-section are pictorially explained in Fig. 36.
Fig. 36. Representing human limbs as ellipsoids and the scalar displacements (Hyun et
al., 2003)
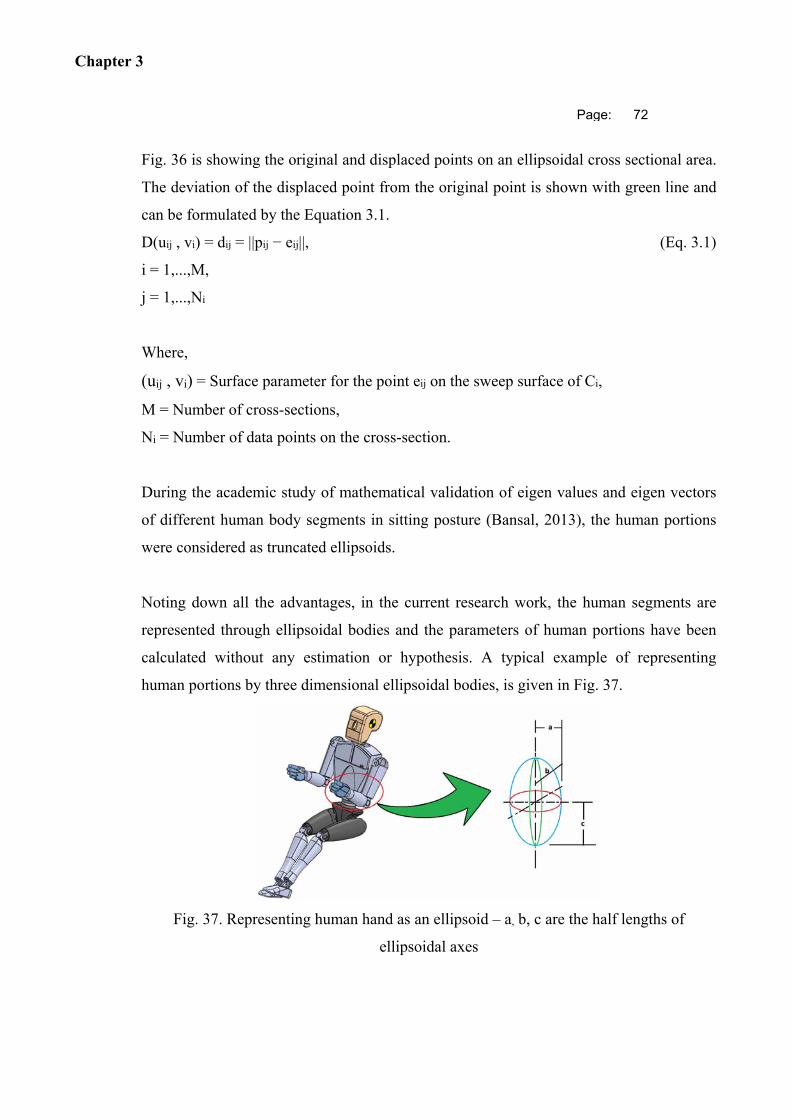
Chapter 3
Page: 72
Fig. 36 is showing the original and displaced points on an ellipsoidal cross sectional area.
The deviation of the displaced point from the original point is shown with green line and
can be formulated by the Equation 3.1.
D(uij , vi) = dij = ||pij − eij||, (Eq. 3.1)
i = 1,...,M,
j = 1,...,Ni
Where,
(uij , vi) = Surface parameter for the point eij on the sweep surface of Ci,
M = Number of cross-sections,
Ni = Number of data points on the cross-section.
During the academic study of mathematical validation of eigen values and eigen vectors
of different human body segments in sitting posture (Bansal, 2013), the human portions
were considered as truncated ellipsoids.
Noting down all the advantages, in the current research work, the human segments are
represented through ellipsoidal bodies and the parameters of human portions have been
calculated without any estimation or hypothesis. A typical example of representing
human portions by three dimensional ellipsoidal bodies, is given in Fig. 37.
Fig. 37. Representing human hand as an ellipsoid – a, b, c are the half lengths of
ellipsoidal axes
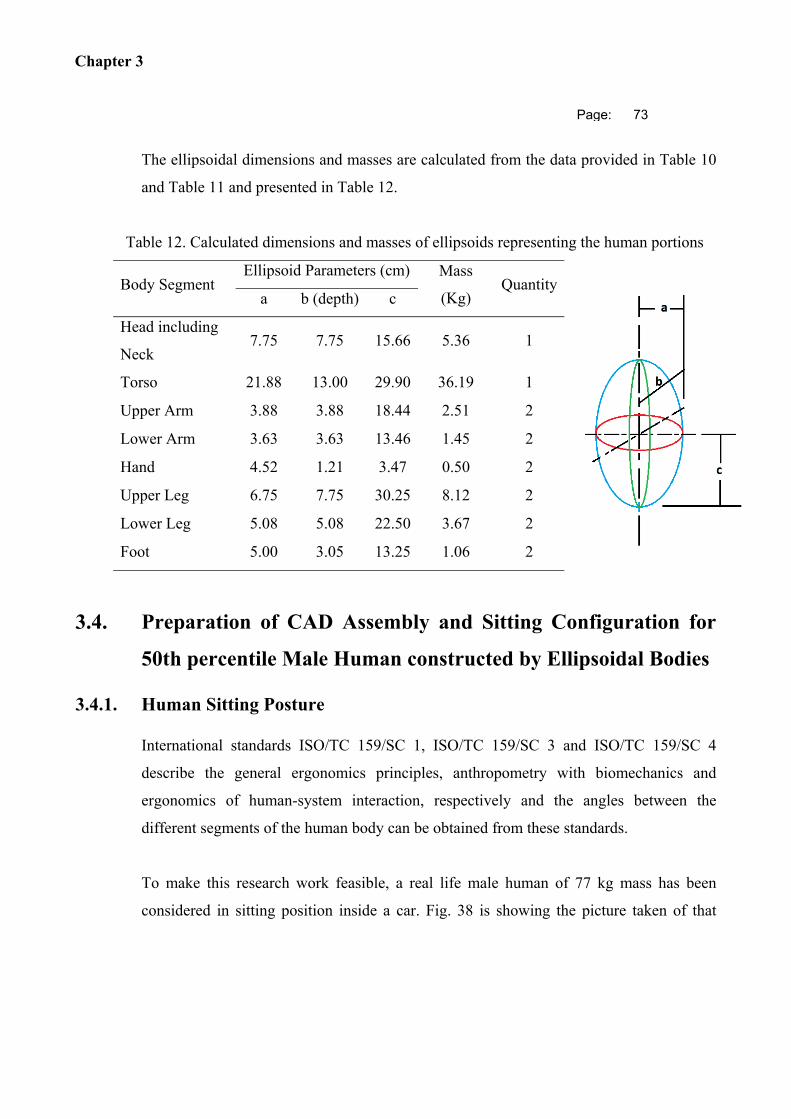
Chapter 3
Page: 73
The ellipsoidal dimensions and masses are calculated from the data provided in Table 10
and Table 11 and presented in Table 12.
Table 12. Calculated dimensions and masses of ellipsoids representing the human portions
Body Segment Ellipsoid Parameters (cm) Mass
(Kg) Quantity
a b (depth) c
Head including
Neck 7.75 7.75 15.66 5.36 1
Torso 21.88 13.00 29.90 36.19 1
Upper Arm 3.88 3.88 18.44 2.51 2
Lower Arm 3.63 3.63 13.46 1.45 2
Hand 4.52 1.21 3.47 0.50 2
Upper Leg 6.75 7.75 30.25 8.12 2
Lower Leg 5.08 5.08 22.50 3.67 2
Foot 5.00 3.05 13.25 1.06 2
3.4. Preparation of CAD Assembly and Sitting Configuration for
50th percentile Male Human constructed by Ellipsoidal Bodies
3.4.1. Human Sitting Posture
International standards ISO/TC 159/SC 1, ISO/TC 159/SC 3 and ISO/TC 159/SC 4
describe the general ergonomics principles, anthropometry with biomechanics and
ergonomics of human-system interaction, respectively and the angles between the
different segments of the human body can be obtained from these standards.
To make this research work feasible, a real life male human of 77 kg mass has been
considered in sitting position inside a car. Fig. 38 is showing the picture taken of that
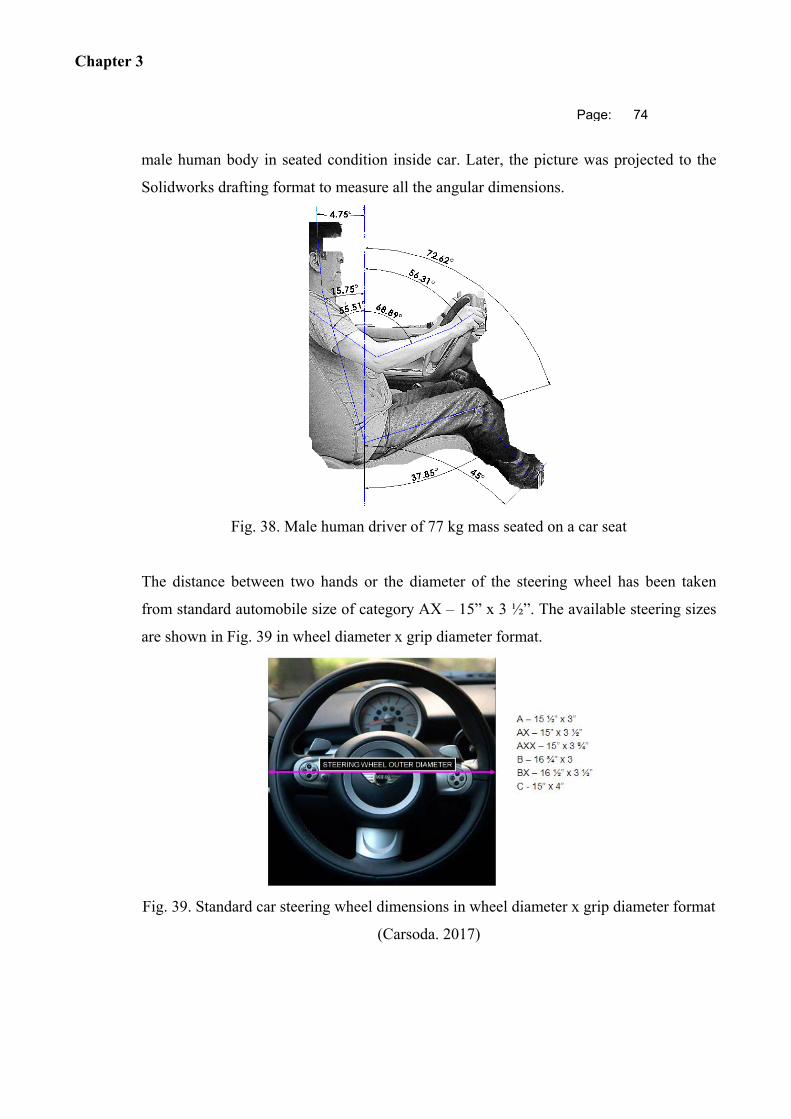
Chapter 3
Page: 74
male human body in seated condition inside car. Later, the picture was projected to the
Solidworks drafting format to measure all the angular dimensions.
Fig. 38. Male human driver of 77 kg mass seated on a car seat
The distance between two hands or the diameter of the steering wheel has been taken
from standard automobile size of category AX – 15” x 3 ½”. The available steering sizes
are shown in Fig. 39 in wheel diameter x grip diameter format.
Fig. 39. Standard car steering wheel dimensions in wheel diameter x grip diameter format
(Carsoda. 2017)
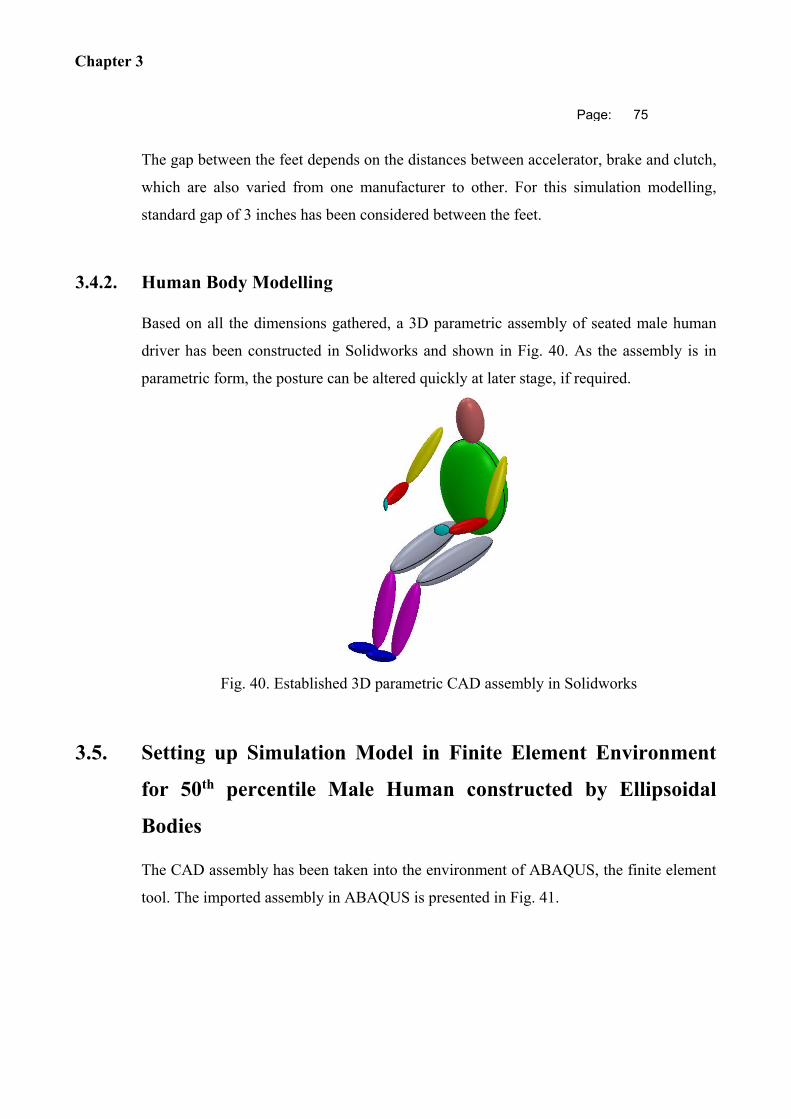
Chapter 3
Page: 75
The gap between the feet depends on the distances between accelerator, brake and clutch,
which are also varied from one manufacturer to other. For this simulation modelling,
standard gap of 3 inches has been considered between the feet.
3.4.2. Human Body Modelling
Based on all the dimensions gathered, a 3D parametric assembly of seated male human
driver has been constructed in Solidworks and shown in Fig. 40. As the assembly is in
parametric form, the posture can be altered quickly at later stage, if required.
Fig. 40. Established 3D parametric CAD assembly in Solidworks
3.5. Setting up Simulation Model in Finite Element Environment
for 50th percentile Male Human constructed by Ellipsoidal
Bodies
The CAD assembly has been taken into the environment of ABAQUS, the finite element
tool. The imported assembly in ABAQUS is presented in Fig. 41.
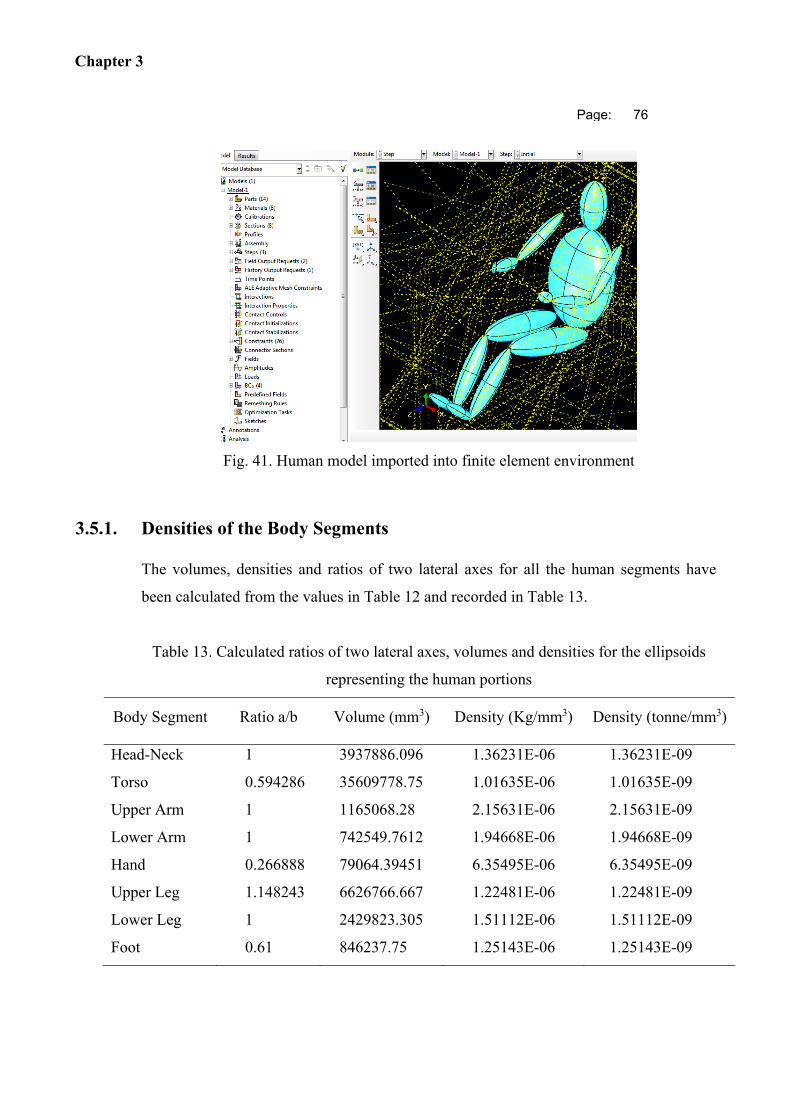
Chapter 3
Page: 76
Fig. 41. Human model imported into finite element environment
3.5.1. Densities of the Body Segments
The volumes, densities and ratios of two lateral axes for all the human segments have
been calculated from the values in Table 12 and recorded in Table 13.
Table 13. Calculated ratios of two lateral axes, volumes and densities for the ellipsoids
representing the human portions
Body Segment Ratio a/b Volume (mm3) Density (Kg/mm3) Density (tonne/mm3)
Head-Neck 1 3937886.096 1.36231E-06 1.36231E-09
Torso 0.594286 35609778.75 1.01635E-06 1.01635E-09
Upper Arm 1 1165068.28 2.15631E-06 2.15631E-09
Lower Arm 1 742549.7612 1.94668E-06 1.94668E-09
Hand 0.266888 79064.39451 6.35495E-06 6.35495E-09
Upper Leg 1.148243 6626766.667 1.22481E-06 1.22481E-09
Lower Leg 1 2429823.305 1.51112E-06 1.51112E-09
Foot 0.61 846237.75 1.25143E-06 1.25143E-09
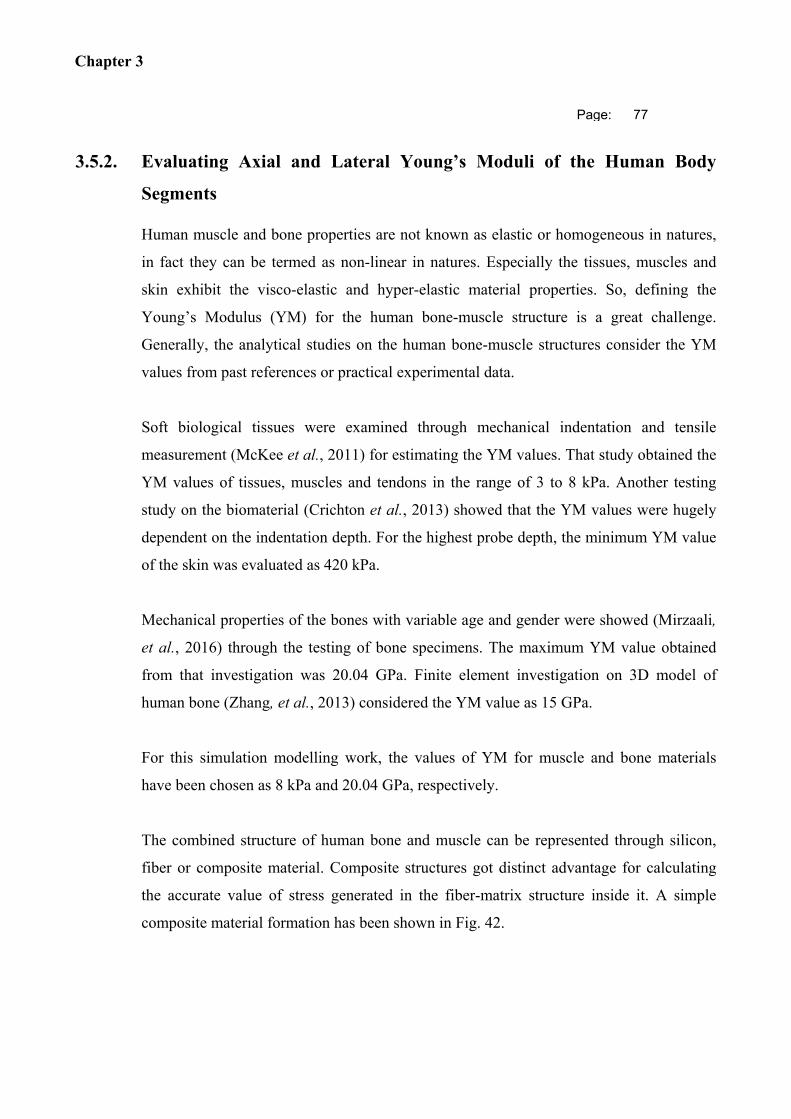
Chapter 3
Page: 77
3.5.2. Evaluating Axial and Lateral Young’s Moduli of the Human Body
Segments
Human muscle and bone properties are not known as elastic or homogeneous in natures,
in fact they can be termed as non-linear in natures. Especially the tissues, muscles and
skin exhibit the visco-elastic and hyper-elastic material properties. So, defining the
Young’s Modulus (YM) for the human bone-muscle structure is a great challenge.
Generally, the analytical studies on the human bone-muscle structures consider the YM
values from past references or practical experimental data.
Soft biological tissues were examined through mechanical indentation and tensile
measurement (McKee et al., 2011) for estimating the YM values. That study obtained the
YM values of tissues, muscles and tendons in the range of 3 to 8 kPa. Another testing
study on the biomaterial (Crichton et al., 2013) showed that the YM values were hugely
dependent on the indentation depth. For the highest probe depth, the minimum YM value
of the skin was evaluated as 420 kPa.
Mechanical properties of the bones with variable age and gender were showed (Mirzaali,
et al., 2016) through the testing of bone specimens. The maximum YM value obtained
from that investigation was 20.04 GPa. Finite element investigation on 3D model of
human bone (Zhang, et al., 2013) considered the YM value as 15 GPa.
For this simulation modelling work, the values of YM for muscle and bone materials
have been chosen as 8 kPa and 20.04 GPa, respectively.
The combined structure of human bone and muscle can be represented through silicon,
fiber or composite material. Composite structures got distinct advantage for calculating
the accurate value of stress generated in the fiber-matrix structure inside it. A simple
composite material formation has been shown in Fig. 42.
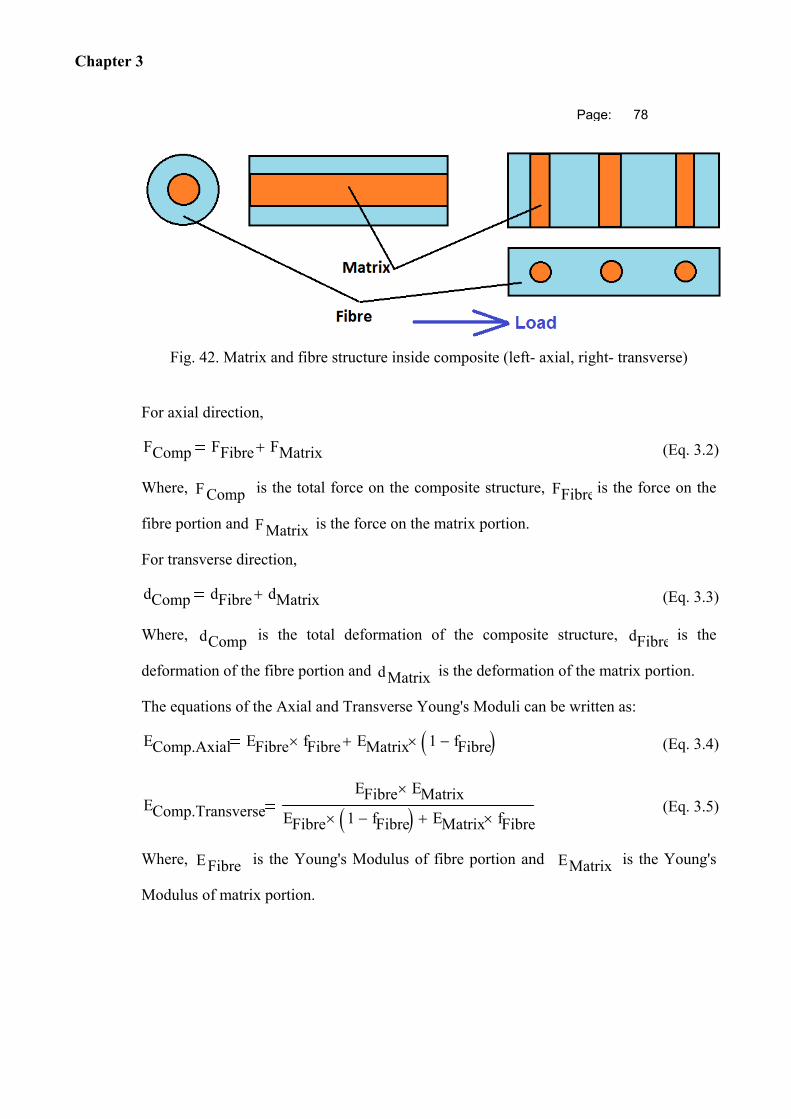
Chapter 3
Page: 78
Fig. 42. Matrix and fibre structure inside composite (left- axial, right- transverse)
For axial direction,
FComp FFibre FMatrix (Eq. 3.2)
Where, F Comp is the total force on the composite structure, FFibre is the force on the
fibre portion and FMatrix is the force on the matrix portion.
For transverse direction,
dComp dFibre dMatrix (Eq. 3.3)
Where, dComp is the total deformation of the composite structure, dFibre is the
deformation of the fibre portion and dMatrix is the deformation of the matrix portion.
The equations of the Axial and Transverse Young's Moduli can be written as:
EComp.Axial EFibre fFibre EMatrix 1 fFibre (Eq. 3.4)
EComp.Transverse
EFibre EMatrix
EFibre 1 fFibre EMatrix fFibre
(Eq. 3.5)
Where, EFibre is the Young's Modulus of fibre portion and EMatrix is the Young's
Modulus of matrix portion.
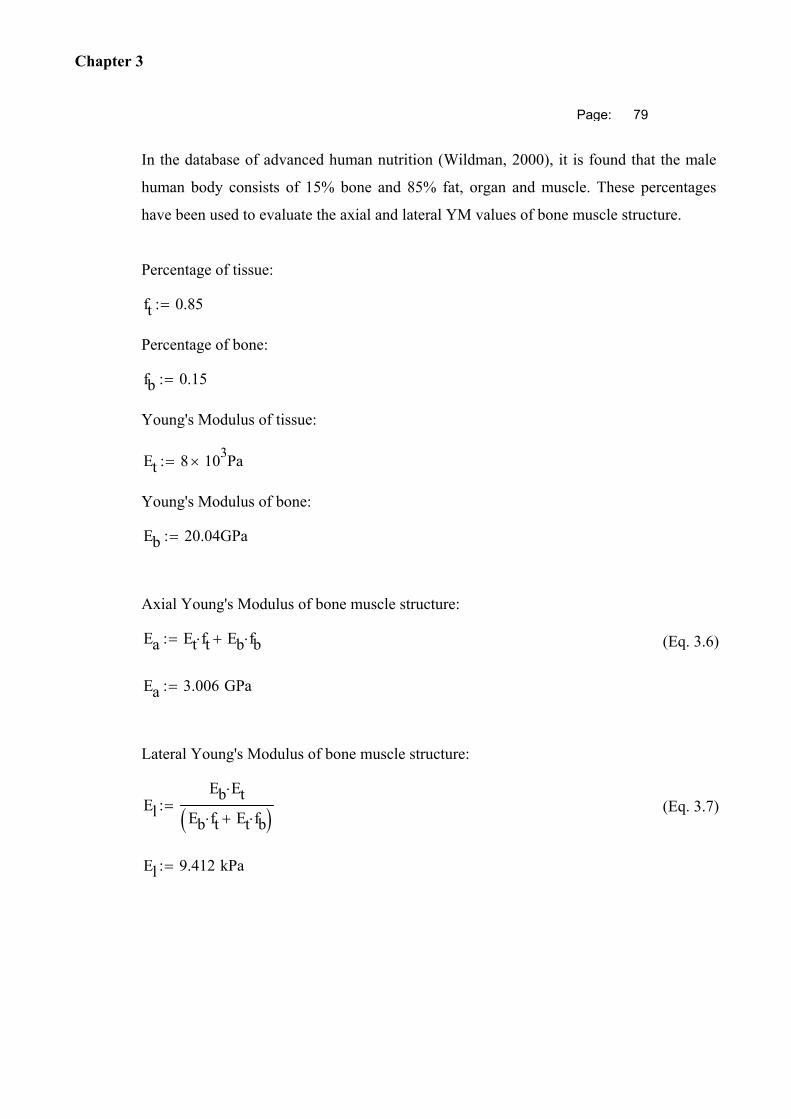
Chapter 3
Page: 79
In the database of advanced human nutrition (Wildman, 2000), it is found that the male
human body consists of 15% bone and 85% fat, organ and muscle. These percentages
have been used to evaluate the axial and lateral YM values of bone muscle structure.
Percentage of tissue:
ft 0.85
Percentage of bone:
fb 0.15
Young's Modulus of tissue:
Et 8 103 Pa
Young's Modulus of bone:
Eb 20.04GPa
Axial Young's Modulus of bone muscle structure:
Ea Et ft Eb fb (Eq. 3.6)
Ea 3.006 GPa
Lateral Young's Modulus of bone muscle structure:
El
Eb Et
Eb ft Et fb
(Eq. 3.7)
El 9.412 kPa
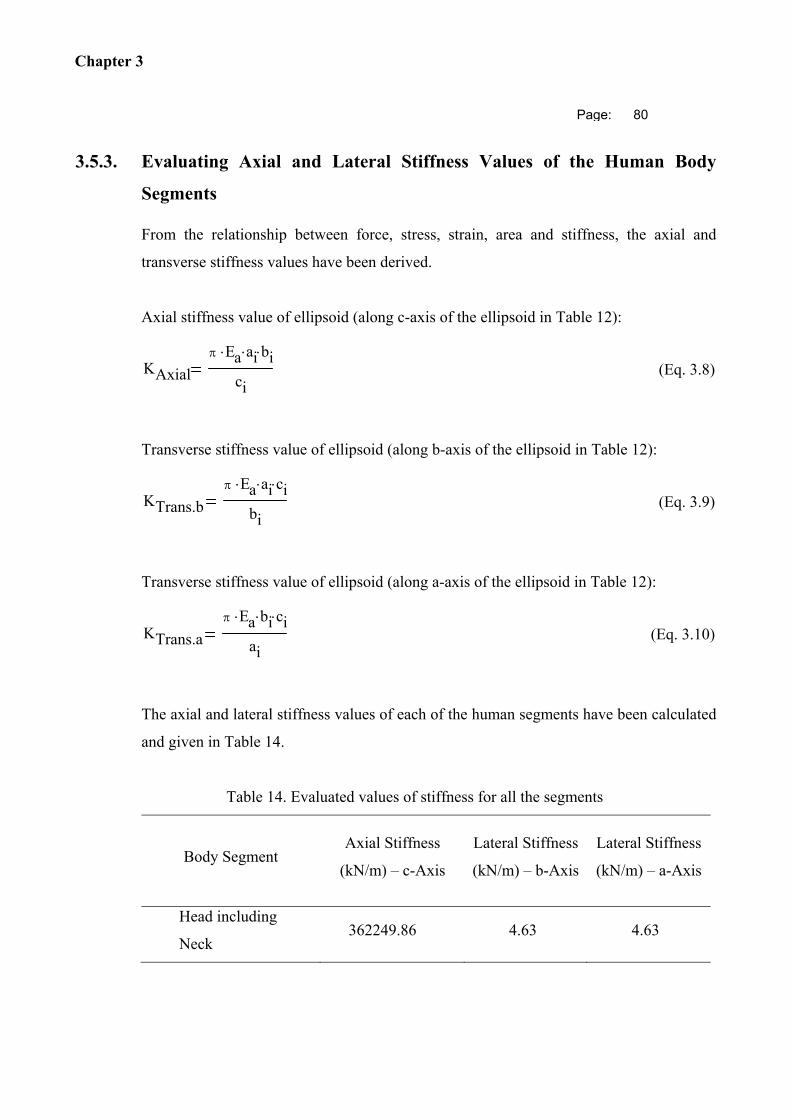
Chapter 3
Page: 80
3.5.3. Evaluating Axial and Lateral Stiffness Values of the Human Body
Segments
From the relationship between force, stress, strain, area and stiffness, the axial and
transverse stiffness values have been derived.
Axial stiffness value of ellipsoid (along c-axis of the ellipsoid in Table 12):
KAxial
Ea ai bi
ci (Eq. 3.8)
Transverse stiffness value of ellipsoid (along b-axis of the ellipsoid in Table 12):
KTrans.b
Ea ai ci
bi (Eq. 3.9)
Transverse stiffness value of ellipsoid (along a-axis of the ellipsoid in Table 12):
KTrans.a
Ea bi ci
ai (Eq. 3.10)
The axial and lateral stiffness values of each of the human segments have been calculated
and given in Table 14.
Table 14. Evaluated values of stiffness for all the segments
Body Segment Axial Stiffness
(kN/m) – c-Axis
Lateral Stiffness
(kN/m) – b-Axis
Lateral Stiffness
(kN/m) – a-Axis
Head including
Neck 362249.86 4.63 4.63

Chapter 3
Page: 81
Body Segment Axial Stiffness
(kN/m) – c-Axis
Lateral Stiffness
(kN/m) – b-Axis
Lateral Stiffness
(kN/m) – a-Axis
Torso 898003.69 14.87 5.25
Upper Arm 77246.85 5.45 5.45
Lower Arm 92403.13 3.98 3.98
Hand 148038.00 3.84 0.27
Upper Leg 163268.40 7.79 10.27
Lower Leg 108208.38 6.65 6.65
Foot 108670.55 6.42 2.39
The calculated stiffness parameters are falling within the ranges described in past studies
and literatures.
3.5.4. Poisson’s Ratio
Poisson’s ratio is the ratio of lateral strain to axial strain and theoretical value of it falls in
the range of 0 to 0.5. For the value of 0, the material is known as completely
compressible, while for the value of 0.5, the material is known as completely
incompressible. Most of the soft tissues are assumed to be fully incompressible in nature
and usually the Poisson’s ratio for fully incompressible materials is considered in
between 0.45 and 0.49 (Chen et al., 1996). The study on measuring the Young’s Modulus
(Chen et al., 1996) for the soft human tissue considered the Poisson’s Ratio value as 0.49.
Another similar study on computational modelling of human tissue in finite element
(Spyrou and Aravas, 2011) used the Poisson’s ratio value of 0.49995.
The human muscles are viable to be deformed more and faster than the bones inside.
Considering this fact, in many investigations in the past, the bones had been considered
as rigid bodies.
Chapter 3
Page: 82
For this simulation study, the Poisson’s ratio values for all the ellipsoidal human
segments have been considered as 0.49.
3.5.5. Damping Co-efficient and Damping Ratio
There are no specific values for damping parameters for the human bone-muscle
structures, though depending on the aspect of a particular research work, human segments
can be assigned with unique values of damping coefficients.
For a human body of 75 Kg mass exposed to whole-body vibration in both vertical and
fore-and-aft directions (Zengkang et al., 2013), the damping coefficients for lower torso,
arms, upper torso and hands were taken as 2376.4 Ns/m, 145.8 Ns/m, 1797.7 Ns/m and
1797.7 Ns/m, respectively. For a human body of 90 Kg mass, whole body vibration
analysis (Kamalakar et al., 2017) was carried out and the damping coefficients for head-
neck, chest-upper torso, lower torso and pelvis-thigh were considered as 620 Ns/m, 8550
Ns/m, 5685 Ns/m and 3564 Ns/m, respectively. Response of a seated human body of 80
Kg mass (Muksian et al., 1974) was investigated where the damping coefficients for
head, back, torso, thorax and abdomen were considered as 3575.506 Ns/m, 3575.506
Ns/m, 3575.506 Ns/m, 291.878 Ns/m and 291.878 Ns/m, respectively.
From the closest matching human mass criteria, the damping coefficients for human
segments used in this research work have been selected as 620 Ns/m, 1797.7 Ns/m, 145.8
Ns/m, 145.8 Ns/m, 1797.7 Ns/m, 2376.4 Ns/m, 2376.4 Ns/m and 2376.4 Ns/m for head,
torso, upper arms, lower arms, hands, thighs, legs and feet, respectively.
If ζ= Damping ratio, a system can be defined as:
Overdamped for ζ>1, where system comes back to equilibrium without oscillation and
with decay.
Critically damped for ζ=1, where system comes back to equilibrium without oscillation as
soon as possible.
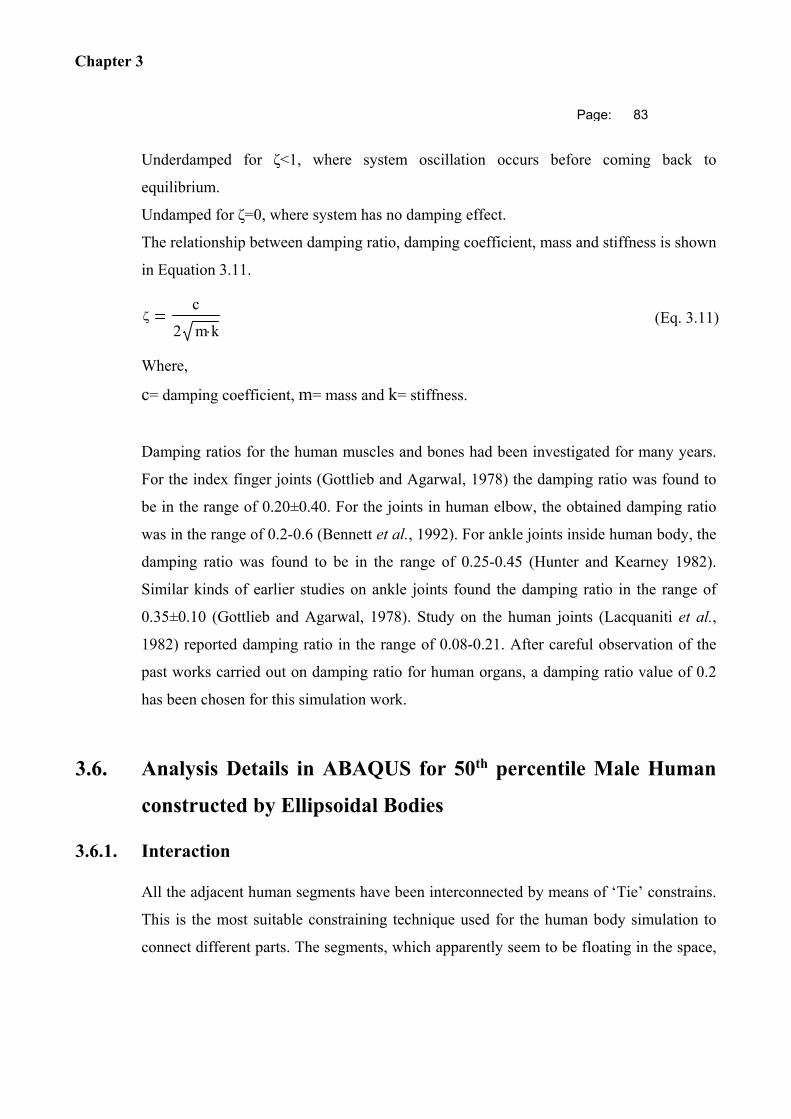
Chapter 3
Page: 83
Underdamped for ζ<1, where system oscillation occurs before coming back to
equilibrium.
Undamped for ζ=0, where system has no damping effect.
The relationship between damping ratio, damping coefficient, mass and stiffness is shown
in Equation 3.11.
c
2 m k (Eq. 3.11)
Where,
c= damping coefficient, m= mass and k= stiffness.
Damping ratios for the human muscles and bones had been investigated for many years.
For the index finger joints (Gottlieb and Agarwal, 1978) the damping ratio was found to
be in the range of 0.20±0.40. For the joints in human elbow, the obtained damping ratio
was in the range of 0.2-0.6 (Bennett et al., 1992). For ankle joints inside human body, the
damping ratio was found to be in the range of 0.25-0.45 (Hunter and Kearney 1982).
Similar kinds of earlier studies on ankle joints found the damping ratio in the range of
0.35±0.10 (Gottlieb and Agarwal, 1978). Study on the human joints (Lacquaniti et al.,
1982) reported damping ratio in the range of 0.08-0.21. After careful observation of the
past works carried out on damping ratio for human organs, a damping ratio value of 0.2
has been chosen for this simulation work.
3.6. Analysis Details in ABAQUS for 50th percentile Male Human
constructed by Ellipsoidal Bodies
3.6.1. Interaction
All the adjacent human segments have been interconnected by means of ‘Tie’ constrains.
This is the most suitable constraining technique used for the human body simulation to
connect different parts. The segments, which apparently seem to be floating in the space,
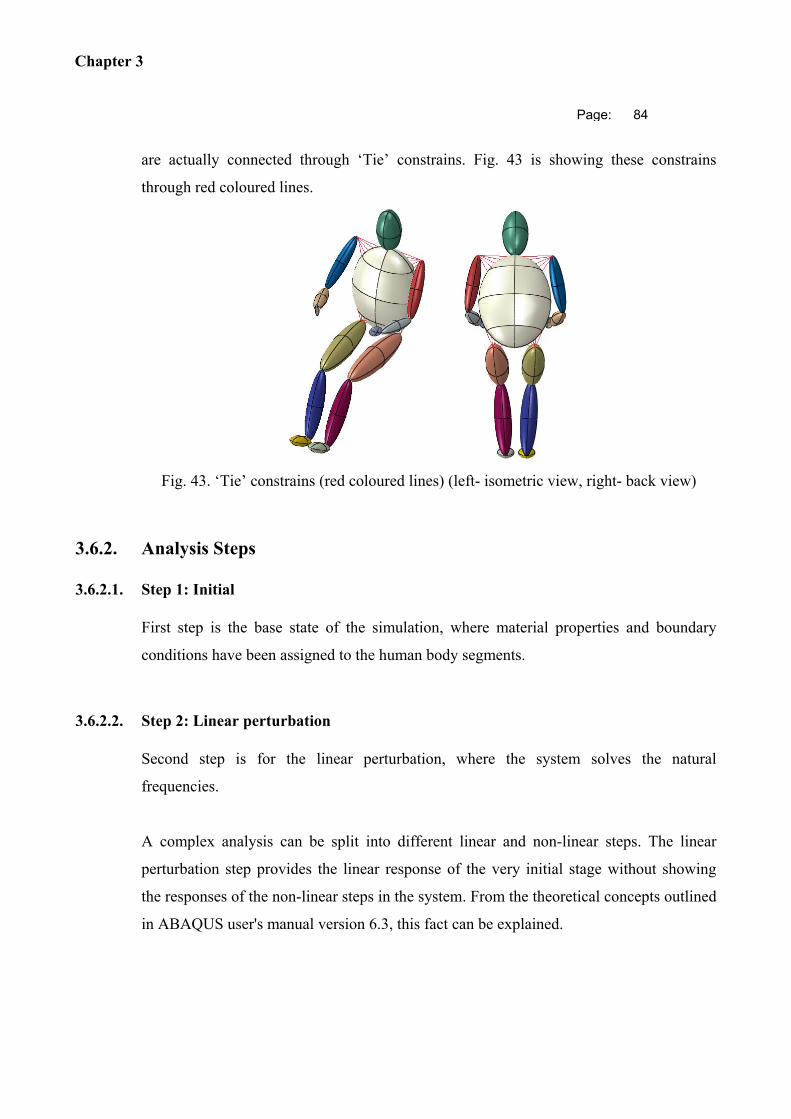
Chapter 3
Page: 84
are actually connected through ‘Tie’ constrains. Fig. 43 is showing these constrains
through red coloured lines.
Fig. 43. ‘Tie’ constrains (red coloured lines) (left- isometric view, right- back view)
3.6.2. Analysis Steps
3.6.2.1. Step 1: Initial
First step is the base state of the simulation, where material properties and boundary
conditions have been assigned to the human body segments.
3.6.2.2. Step 2: Linear perturbation
Second step is for the linear perturbation, where the system solves the natural
frequencies.
A complex analysis can be split into different linear and non-linear steps. The linear
perturbation step provides the linear response of the very initial stage without showing
the responses of the non-linear steps in the system. From the theoretical concepts outlined
in ABAQUS user's manual version 6.3, this fact can be explained.
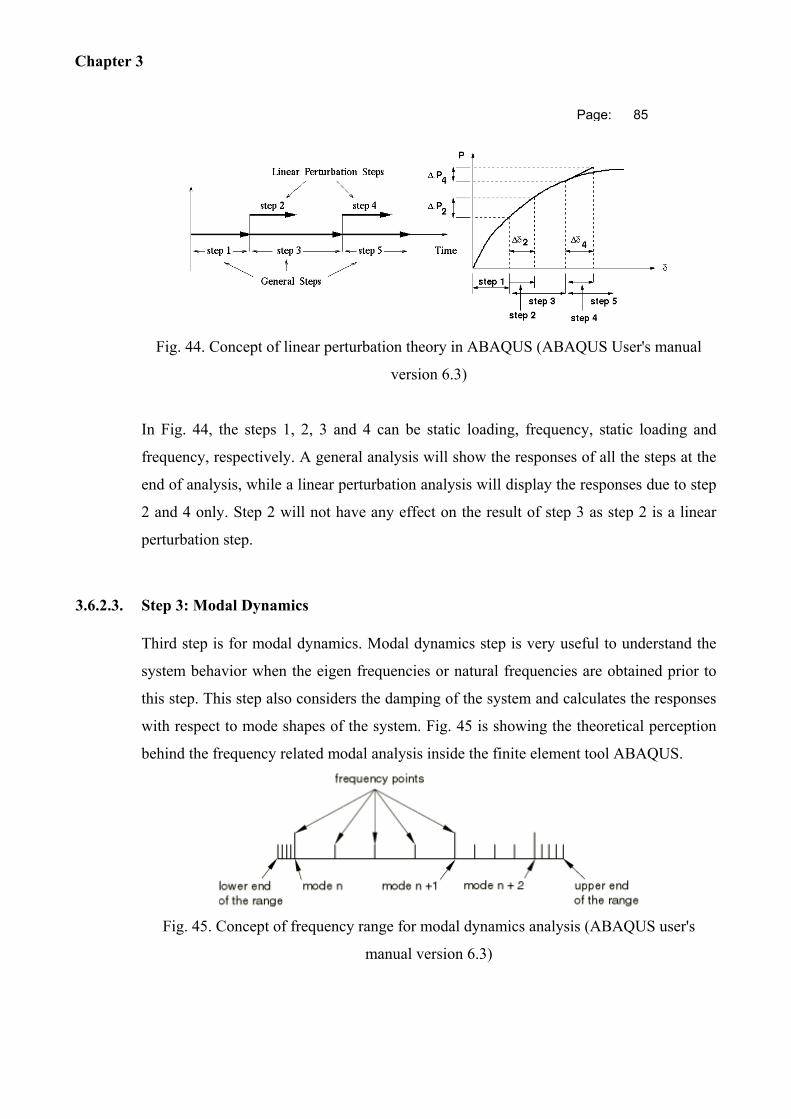
Chapter 3
Page: 85
Fig. 44. Concept of linear perturbation theory in ABAQUS (ABAQUS User's manual
version 6.3)
In Fig. 44, the steps 1, 2, 3 and 4 can be static loading, frequency, static loading and
frequency, respectively. A general analysis will show the responses of all the steps at the
end of analysis, while a linear perturbation analysis will display the responses due to step
2 and 4 only. Step 2 will not have any effect on the result of step 3 as step 2 is a linear
perturbation step.
3.6.2.3. Step 3: Modal Dynamics
Third step is for modal dynamics. Modal dynamics step is very useful to understand the
system behavior when the eigen frequencies or natural frequencies are obtained prior to
this step. This step also considers the damping of the system and calculates the responses
with respect to mode shapes of the system. Fig. 45 is showing the theoretical perception
behind the frequency related modal analysis inside the finite element tool ABAQUS.
Fig. 45. Concept of frequency range for modal dynamics analysis (ABAQUS user's
manual version 6.3)
Chapter 3
Page: 86
3.6.3. Boundary Conditions
As the car seat has not been considered in this stage, the following boundary conditions
have been applied to the human portions:
a. Hand - Rotational movement around steering center is allowed, but detachment is not
allowed from steering wheel position.
b. Legs - Angular movement is allowed around ankle-leg interface, but detachment is not
allowed from brake and clutch positions.
c. Head - Supported to the headrest position, but lateral movement is allowed without
detachment from headrest position.
d. Thighs – Bottom surfaces are fixed with respect to the seat cushion position.
3.6.4. Acceleration and Load
The load in a moving vehicle primarily comes from the acceleration, which is a function
of change of speed within a certain time frame. For a racer type car, the measured
acceleration was 28 m/sec2 (Zitzewitz, 1995), while Aston Martin DBS 2008 defined the
acceleration for their car as 6.5 m/sec2. For the Jaguar XK coupe (Wardell, 2007), Ferrari
Enzo (Ferrari Enzo Technical Specifications, 2002) and Bugati 2006 (Albee Digital,
2006), the measured acceleration values were 4.5 m/sec2, 7.6 m/sec2 and 11.59 m/sec2,
respectively. During the study on speed and acceleration characteristics of different types
of vehicles on multi-lane highways (Mehar et al., 2013), the acceleration values at 60
km/hour and 40 km/hour were calculated as 1.083 m/sec2 and 0.861 m/sec2, respectively.
For a passenger car operating in the rural area, the acceleration values were defined
(Brooks, R. M., 2012) by Equations 3.12 and 3.13 containing the speed factor and
constants.
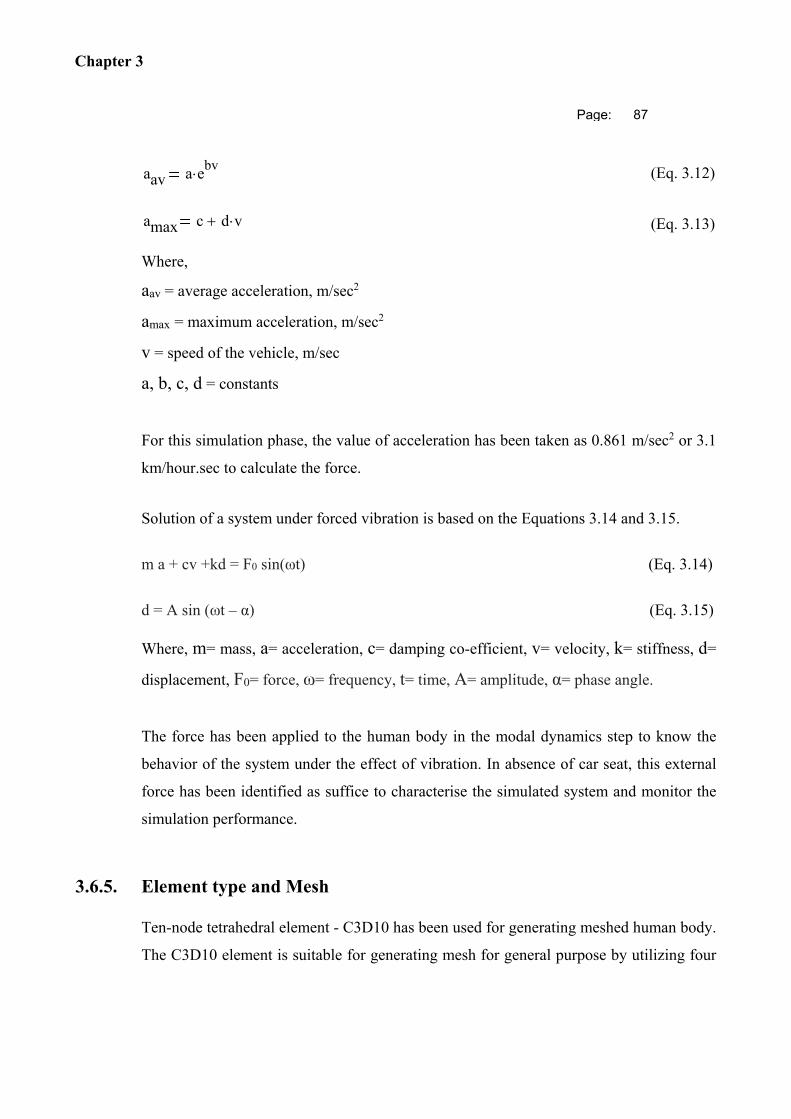
Chapter 3
Page: 87
aav a ebv
(Eq. 3.12)
amax c d v (Eq. 3.13)
Where,
aav = average acceleration, m/sec2
amax = maximum acceleration, m/sec2
v = speed of the vehicle, m/sec
a, b, c, d = constants
For this simulation phase, the value of acceleration has been taken as 0.861 m/sec2 or 3.1
km/hour.sec to calculate the force.
Solution of a system under forced vibration is based on the Equations 3.14 and 3.15.
m a + cv +kd = F0 sin(ωt) (Eq. 3.14)
d = A sin (ωt – α) (Eq. 3.15)
Where, m= mass, a= acceleration, c= damping co-efficient, v= velocity, k= stiffness, d=
displacement, F0= force, ω= frequency, t= time, A= amplitude, α= phase angle.
The force has been applied to the human body in the modal dynamics step to know the
behavior of the system under the effect of vibration. In absence of car seat, this external
force has been identified as suffice to characterise the simulated system and monitor the
simulation performance.
3.6.5. Element type and Mesh
Ten-node tetrahedral element - C3D10 has been used for generating meshed human body.
The C3D10 element is suitable for generating mesh for general purpose by utilizing four
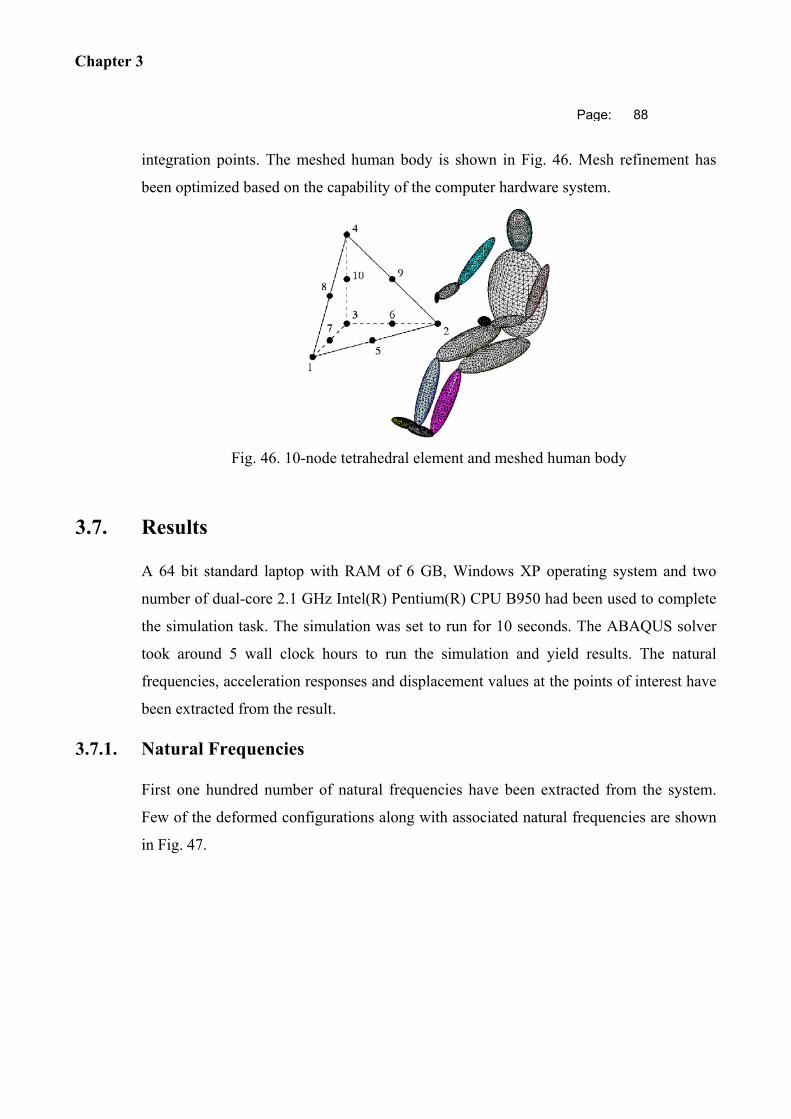
Chapter 3
Page: 88
integration points. The meshed human body is shown in Fig. 46. Mesh refinement has
been optimized based on the capability of the computer hardware system.
Fig. 46. 10-node tetrahedral element and meshed human body
3.7. Results
A 64 bit standard laptop with RAM of 6 GB, Windows XP operating system and two
number of dual-core 2.1 GHz Intel(R) Pentium(R) CPU B950 had been used to complete
the simulation task. The simulation was set to run for 10 seconds. The ABAQUS solver
took around 5 wall clock hours to run the simulation and yield results. The natural
frequencies, acceleration responses and displacement values at the points of interest have
been extracted from the result.
3.7.1. Natural Frequencies
First one hundred number of natural frequencies have been extracted from the system.
Few of the deformed configurations along with associated natural frequencies are shown
in Fig. 47.
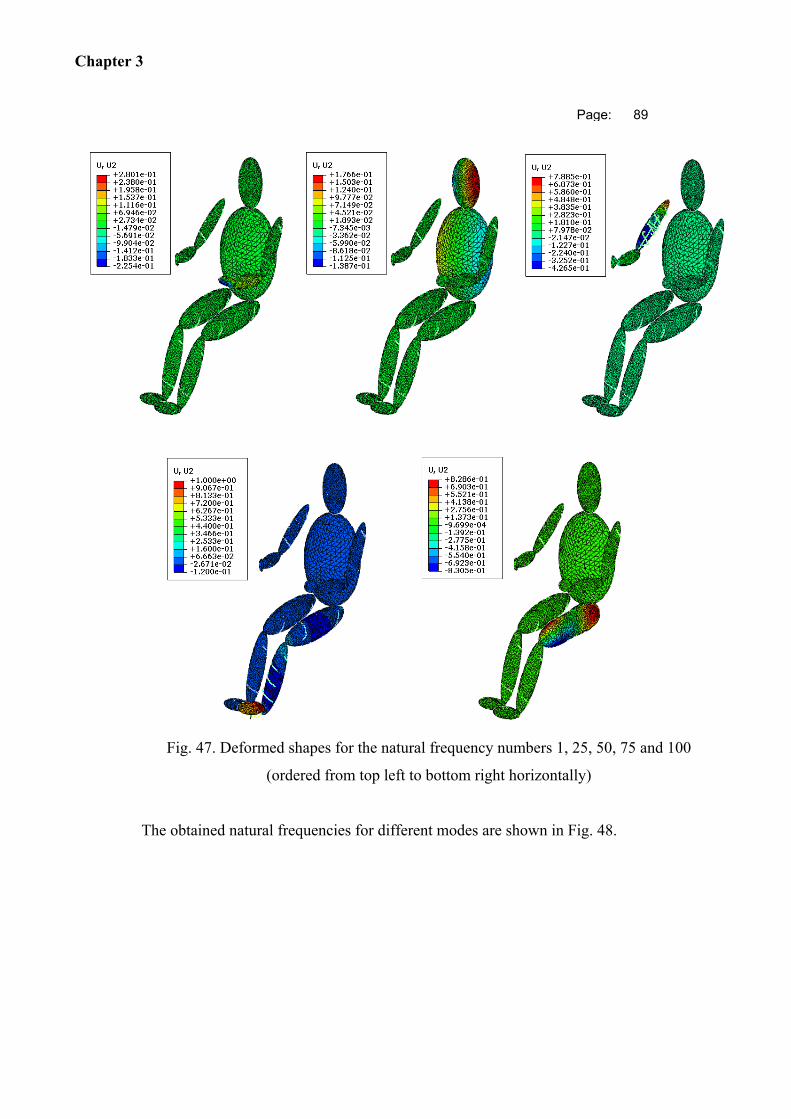
Chapter 3
Page: 89
Fig. 47. Deformed shapes for the natural frequency numbers 1, 25, 50, 75 and 100
(ordered from top left to bottom right horizontally)
The obtained natural frequencies for different modes are shown in Fig. 48.
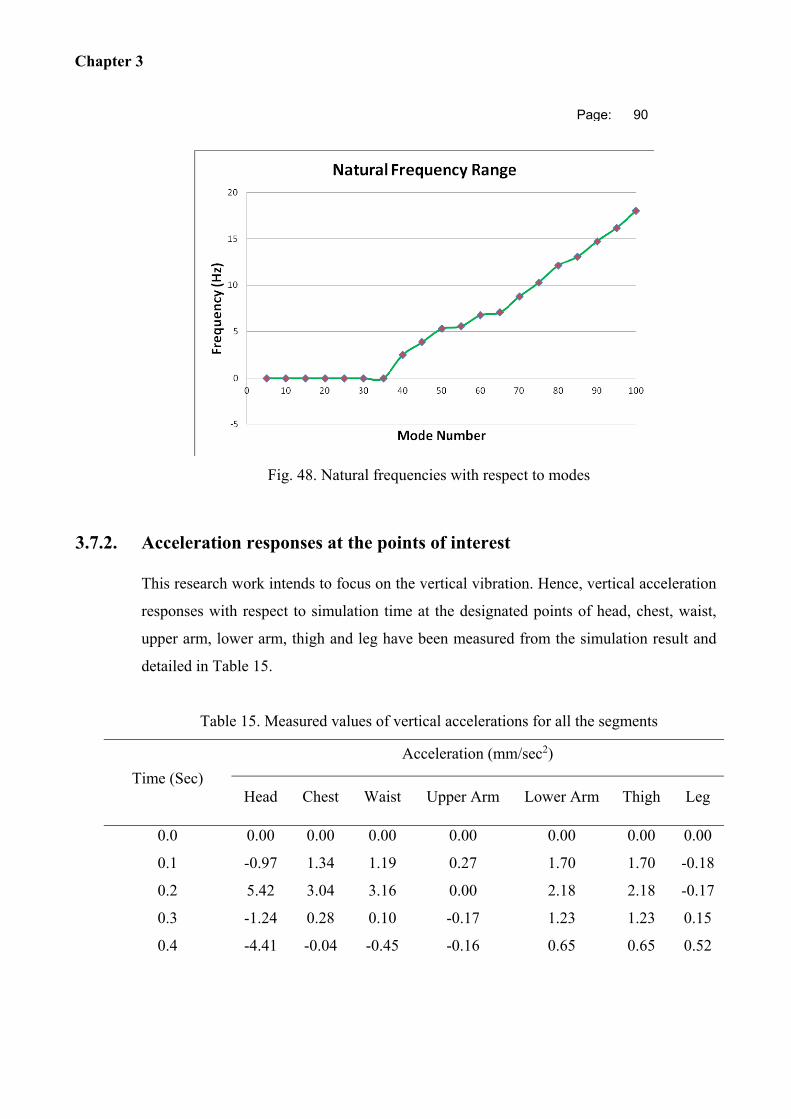
Chapter 3
Page: 90
Fig. 48. Natural frequencies with respect to modes
3.7.2. Acceleration responses at the points of interest
This research work intends to focus on the vertical vibration. Hence, vertical acceleration
responses with respect to simulation time at the designated points of head, chest, waist,
upper arm, lower arm, thigh and leg have been measured from the simulation result and
detailed in Table 15.
Table 15. Measured values of vertical accelerations for all the segments
Time (Sec)
Acceleration (mm/sec2)
Head Chest Waist Upper Arm Lower Arm Thigh Leg
0.0 0.00 0.00 0.00 0.00 0.00 0.00 0.00
0.1 -0.97 1.34 1.19 0.27 1.70 1.70 -0.18
0.2 5.42 3.04 3.16 0.00 2.18 2.18 -0.17
0.3 -1.24 0.28 0.10 -0.17 1.23 1.23 0.15
0.4 -4.41 -0.04 -0.45 -0.16 0.65 0.65 0.52
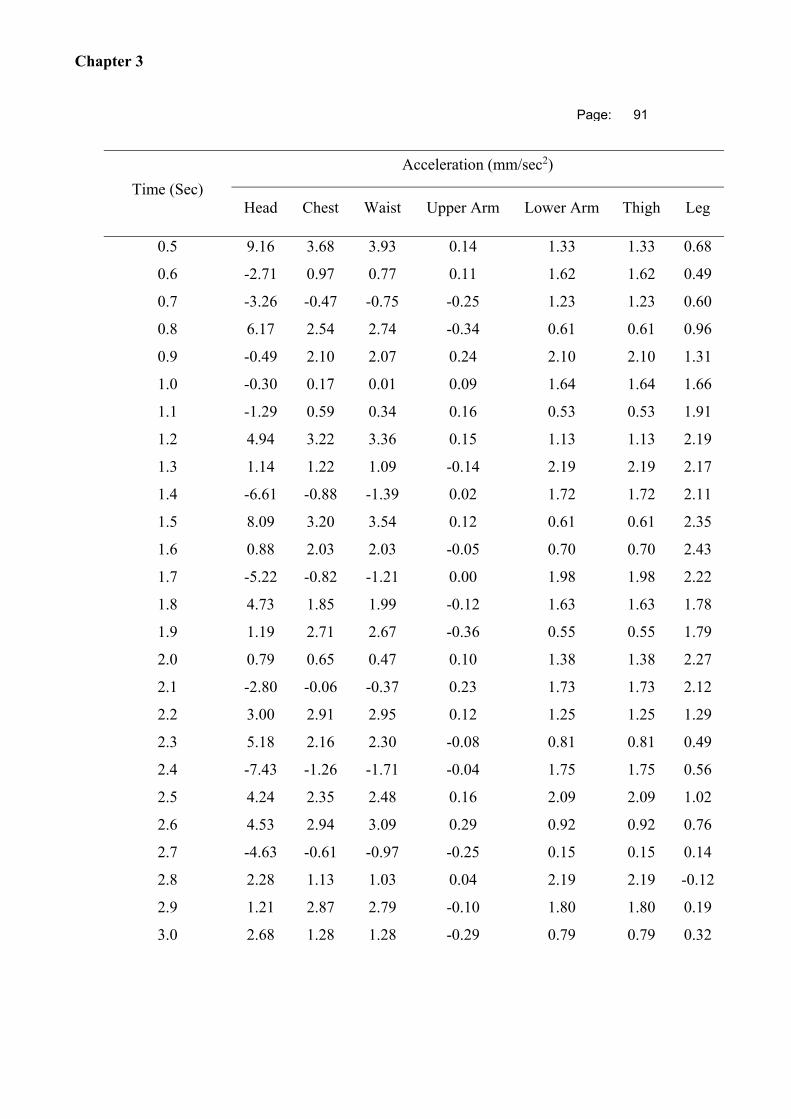
Chapter 3
Page: 91
Time (Sec)
Acceleration (mm/sec2)
Head Chest Waist Upper Arm Lower Arm Thigh Leg
0.5 9.16 3.68 3.93 0.14 1.33 1.33 0.68
0.6 -2.71 0.97 0.77 0.11 1.62 1.62 0.49
0.7 -3.26 -0.47 -0.75 -0.25 1.23 1.23 0.60
0.8 6.17 2.54 2.74 -0.34 0.61 0.61 0.96
0.9 -0.49 2.10 2.07 0.24 2.10 2.10 1.31
1.0 -0.30 0.17 0.01 0.09 1.64 1.64 1.66
1.1 -1.29 0.59 0.34 0.16 0.53 0.53 1.91
1.2 4.94 3.22 3.36 0.15 1.13 1.13 2.19
1.3 1.14 1.22 1.09 -0.14 2.19 2.19 2.17
1.4 -6.61 -0.88 -1.39 0.02 1.72 1.72 2.11
1.5 8.09 3.20 3.54 0.12 0.61 0.61 2.35
1.6 0.88 2.03 2.03 -0.05 0.70 0.70 2.43
1.7 -5.22 -0.82 -1.21 0.00 1.98 1.98 2.22
1.8 4.73 1.85 1.99 -0.12 1.63 1.63 1.78
1.9 1.19 2.71 2.67 -0.36 0.55 0.55 1.79
2.0 0.79 0.65 0.47 0.10 1.38 1.38 2.27
2.1 -2.80 -0.06 -0.37 0.23 1.73 1.73 2.12
2.2 3.00 2.91 2.95 0.12 1.25 1.25 1.29
2.3 5.18 2.16 2.30 -0.08 0.81 0.81 0.49
2.4 -7.43 -1.26 -1.71 -0.04 1.75 1.75 0.56
2.5 4.24 2.35 2.48 0.16 2.09 2.09 1.02
2.6 4.53 2.94 3.09 0.29 0.92 0.92 0.76
2.7 -4.63 -0.61 -0.97 -0.25 0.15 0.15 0.14
2.8 2.28 1.13 1.03 0.04 2.19 2.19 -0.12
2.9 1.21 2.87 2.79 -0.10 1.80 1.80 0.19
3.0 2.68 1.28 1.28 -0.29 0.79 0.79 0.32

Chapter 3
Page: 92
Time (Sec)
Acceleration (mm/sec2)
Head Chest Waist Upper Arm Lower Arm Thigh Leg
3.1 -2.48 -0.39 -0.67 -0.01 0.71 0.71 -0.25
3.2 -0.38 2.15 2.07 0.28 1.68 1.68 -0.59
3.3 7.53 2.94 3.28 -0.04 1.72 1.72 -0.32
3.4 -5.80 -0.99 -1.41 -0.11 1.12 1.12 0.25
3.5 0.71 1.36 1.26 -0.02 0.88 0.88 0.52
3.6 6.20 3.45 3.65 0.36 2.39 2.39 0.37
3.7 -3.75 0.02 -0.38 0.06 1.04 1.04 0.53
3.8 1.12 0.48 0.35 0.01 0.51 0.51 0.87
3.9 1.23 2.55 2.57 -0.09 1.61 1.61 1.16
4.0 2.80 1.90 1.92 -0.19 2.03 2.03 1.37
4.1 -1.49 -0.30 -0.48 0.00 1.07 1.07 1.52
4.2 -2.20 1.21 1.09 -0.03 0.52 0.52 1.84
4.3 8.46 3.48 3.74 -0.03 1.10 1.10 2.06
4.4 -4.48 -0.22 -0.64 0.07 2.37 2.37 2.31
4.5 -2.08 0.35 0.12 -0.16 1.22 1.22 2.58
4.6 8.08 3.50 3.72 0.02 0.66 0.66 2.48
4.7 -3.14 0.84 0.53 0.29 1.73 1.73 2.15
4.8 -0.80 -0.02 -0.12 0.14 1.69 1.69 1.78
4.9 2.01 1.94 1.97 0.12 0.98 0.98 1.90
5.0 3.22 2.49 2.55 -0.26 1.00 1.00 2.26
5.1 -0.93 0.19 0.06 -0.11 1.86 1.86 2.11
5.2 -4.17 0.26 -0.11 0.19 1.58 1.58 1.65
5.3 9.11 3.64 3.89 -0.04 0.41 0.41 1.21
5.4 -1.83 0.84 0.63 -0.30 0.77 0.77 1.10
5.5 -5.46 -0.57 -0.99 0.14 2.48 2.48 1.00
5.6 8.26 3.06 3.34 -0.13 1.48 1.48 0.57
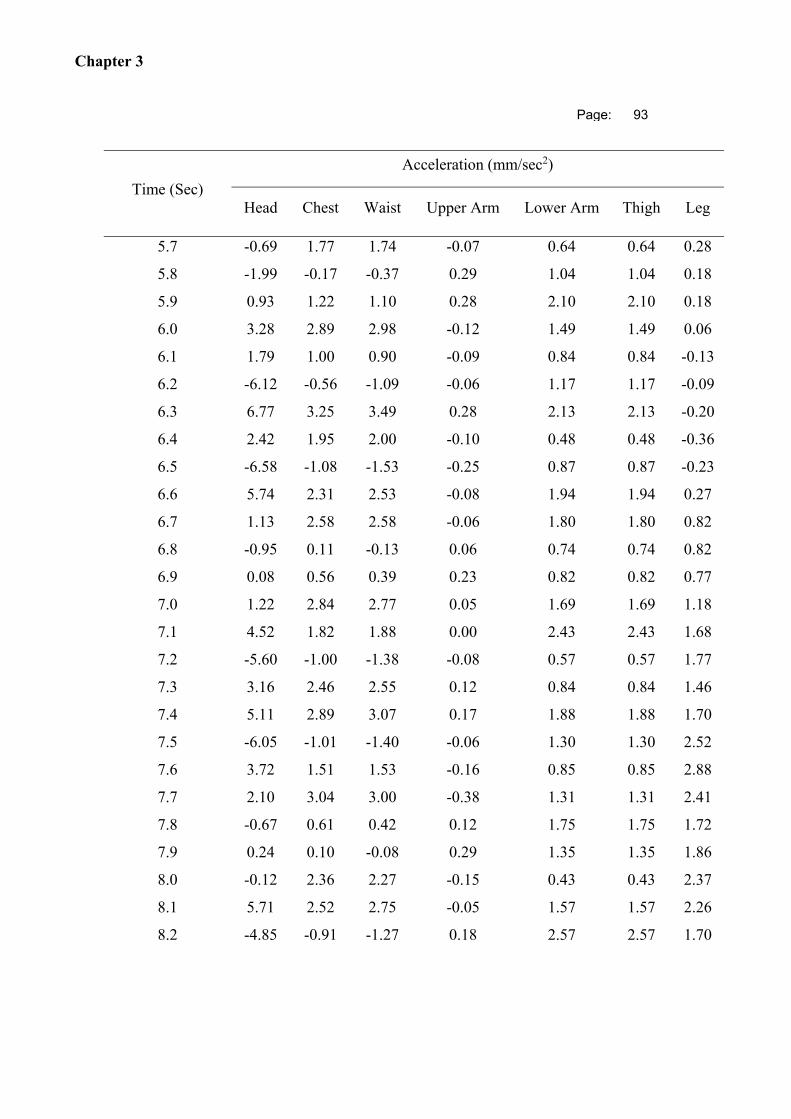
Chapter 3
Page: 93
Time (Sec)
Acceleration (mm/sec2)
Head Chest Waist Upper Arm Lower Arm Thigh Leg
5.7 -0.69 1.77 1.74 -0.07 0.64 0.64 0.28
5.8 -1.99 -0.17 -0.37 0.29 1.04 1.04 0.18
5.9 0.93 1.22 1.10 0.28 2.10 2.10 0.18
6.0 3.28 2.89 2.98 -0.12 1.49 1.49 0.06
6.1 1.79 1.00 0.90 -0.09 0.84 0.84 -0.13
6.2 -6.12 -0.56 -1.09 -0.06 1.17 1.17 -0.09
6.3 6.77 3.25 3.49 0.28 2.13 2.13 -0.20
6.4 2.42 1.95 2.00 -0.10 0.48 0.48 -0.36
6.5 -6.58 -1.08 -1.53 -0.25 0.87 0.87 -0.23
6.6 5.74 2.31 2.53 -0.08 1.94 1.94 0.27
6.7 1.13 2.58 2.58 -0.06 1.80 1.80 0.82
6.8 -0.95 0.11 -0.13 0.06 0.74 0.74 0.82
6.9 0.08 0.56 0.39 0.23 0.82 0.82 0.77
7.0 1.22 2.84 2.77 0.05 1.69 1.69 1.18
7.1 4.52 1.82 1.88 0.00 2.43 2.43 1.68
7.2 -5.60 -1.00 -1.38 -0.08 0.57 0.57 1.77
7.3 3.16 2.46 2.55 0.12 0.84 0.84 1.46
7.4 5.11 2.89 3.07 0.17 1.88 1.88 1.70
7.5 -6.05 -1.01 -1.40 -0.06 1.30 1.30 2.52
7.6 3.72 1.51 1.53 -0.16 0.85 0.85 2.88
7.7 2.10 3.04 3.00 -0.38 1.31 1.31 2.41
7.8 -0.67 0.61 0.42 0.12 1.75 1.75 1.72
7.9 0.24 0.10 -0.08 0.29 1.35 1.35 1.86
8.0 -0.12 2.36 2.27 -0.15 0.43 0.43 2.37
8.1 5.71 2.52 2.75 -0.05 1.57 1.57 2.26
8.2 -4.85 -0.91 -1.27 0.18 2.57 2.57 1.70
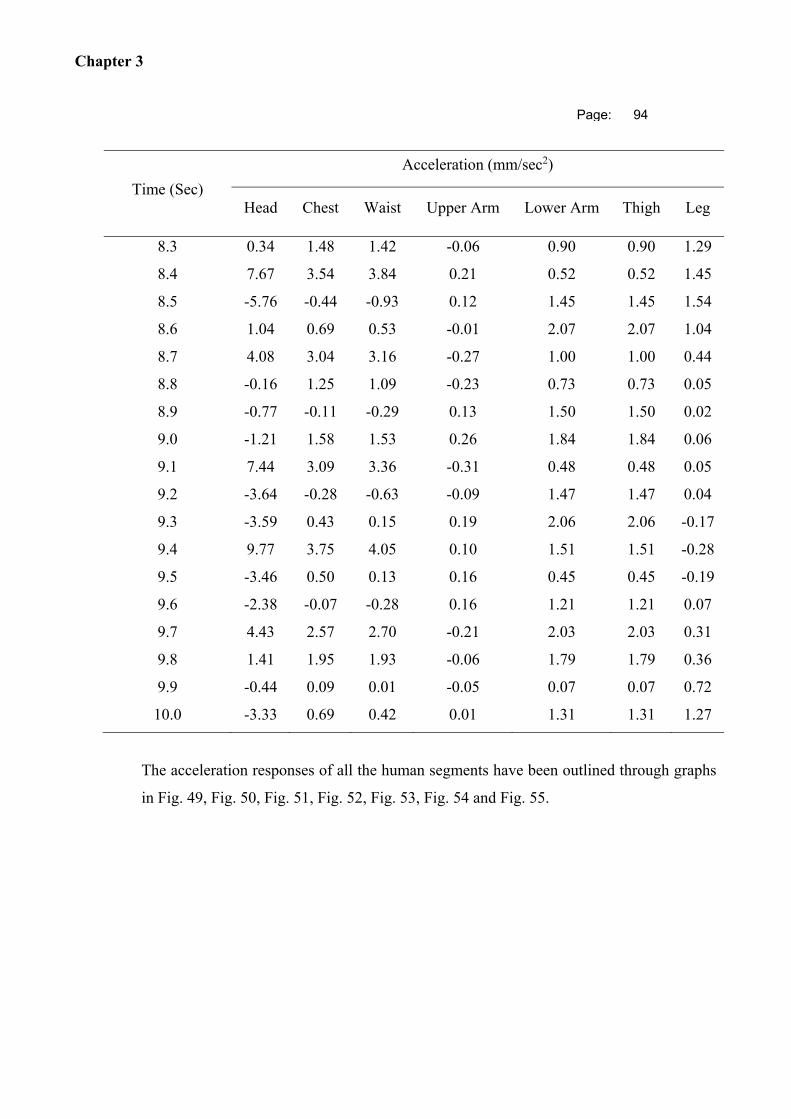
Chapter 3
Page: 94
Time (Sec)
Acceleration (mm/sec2)
Head Chest Waist Upper Arm Lower Arm Thigh Leg
8.3 0.34 1.48 1.42 -0.06 0.90 0.90 1.29
8.4 7.67 3.54 3.84 0.21 0.52 0.52 1.45
8.5 -5.76 -0.44 -0.93 0.12 1.45 1.45 1.54
8.6 1.04 0.69 0.53 -0.01 2.07 2.07 1.04
8.7 4.08 3.04 3.16 -0.27 1.00 1.00 0.44
8.8 -0.16 1.25 1.09 -0.23 0.73 0.73 0.05
8.9 -0.77 -0.11 -0.29 0.13 1.50 1.50 0.02
9.0 -1.21 1.58 1.53 0.26 1.84 1.84 0.06
9.1 7.44 3.09 3.36 -0.31 0.48 0.48 0.05
9.2 -3.64 -0.28 -0.63 -0.09 1.47 1.47 0.04
9.3 -3.59 0.43 0.15 0.19 2.06 2.06 -0.17
9.4 9.77 3.75 4.05 0.10 1.51 1.51 -0.28
9.5 -3.46 0.50 0.13 0.16 0.45 0.45 -0.19
9.6 -2.38 -0.07 -0.28 0.16 1.21 1.21 0.07
9.7 4.43 2.57 2.70 -0.21 2.03 2.03 0.31
9.8 1.41 1.95 1.93 -0.06 1.79 1.79 0.36
9.9 -0.44 0.09 0.01 -0.05 0.07 0.07 0.72
10.0 -3.33 0.69 0.42 0.01 1.31 1.31 1.27
The acceleration responses of all the human segments have been outlined through graphs
in Fig. 49, Fig. 50, Fig. 51, Fig. 52, Fig. 53, Fig. 54 and Fig. 55.
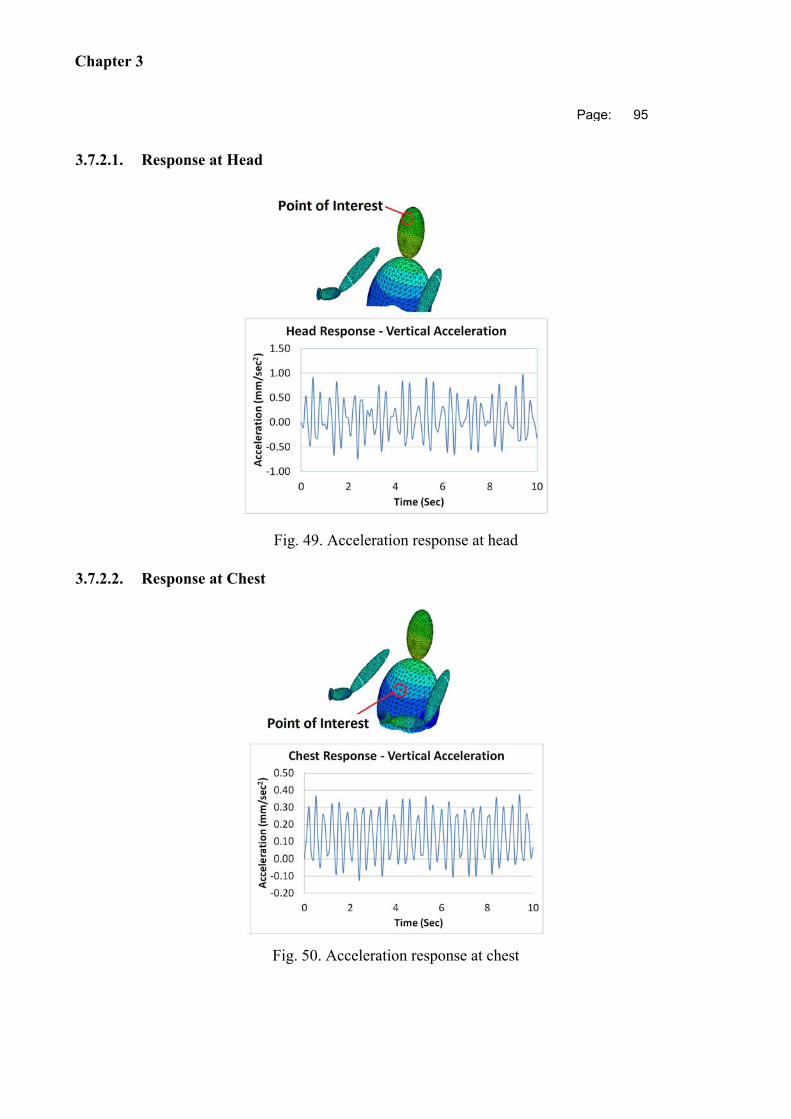
Chapter 3
Page: 95
3.7.2.1. Response at Head
Fig. 49. Acceleration response at head
3.7.2.2. Response at Chest
Fig. 50. Acceleration response at chest
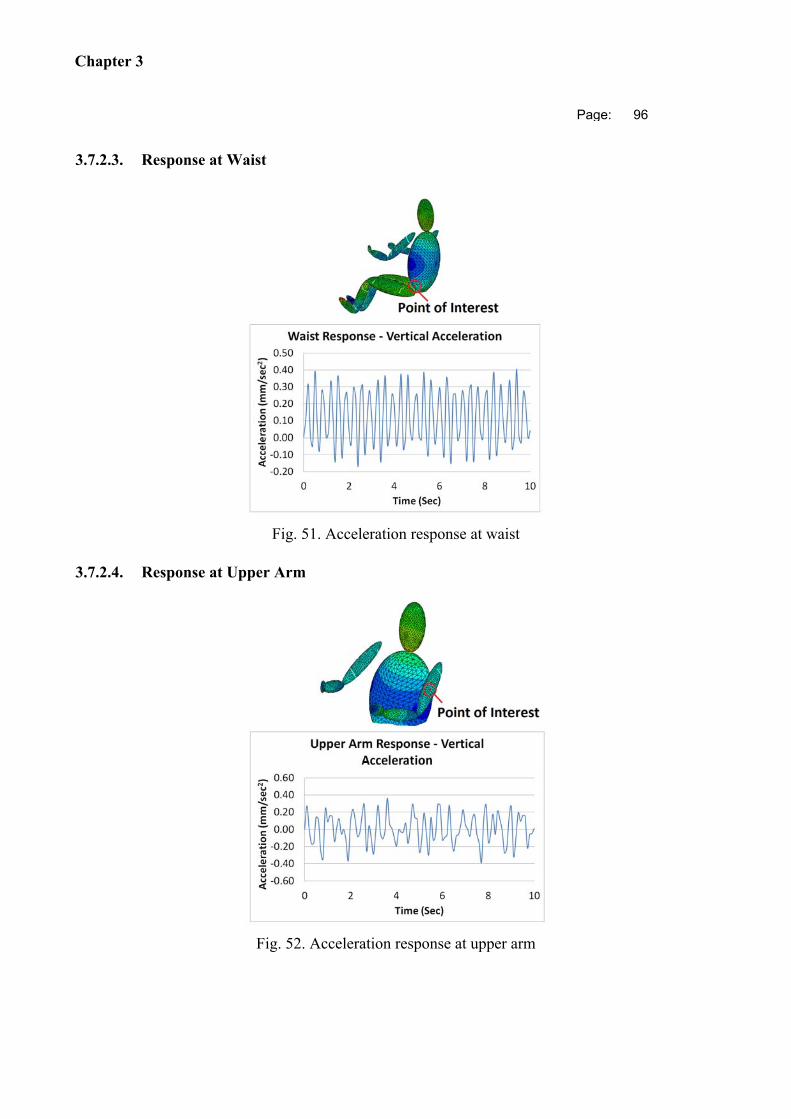
Chapter 3
Page: 96
3.7.2.3. Response at Waist
Fig. 51. Acceleration response at waist
3.7.2.4. Response at Upper Arm
Fig. 52. Acceleration response at upper arm
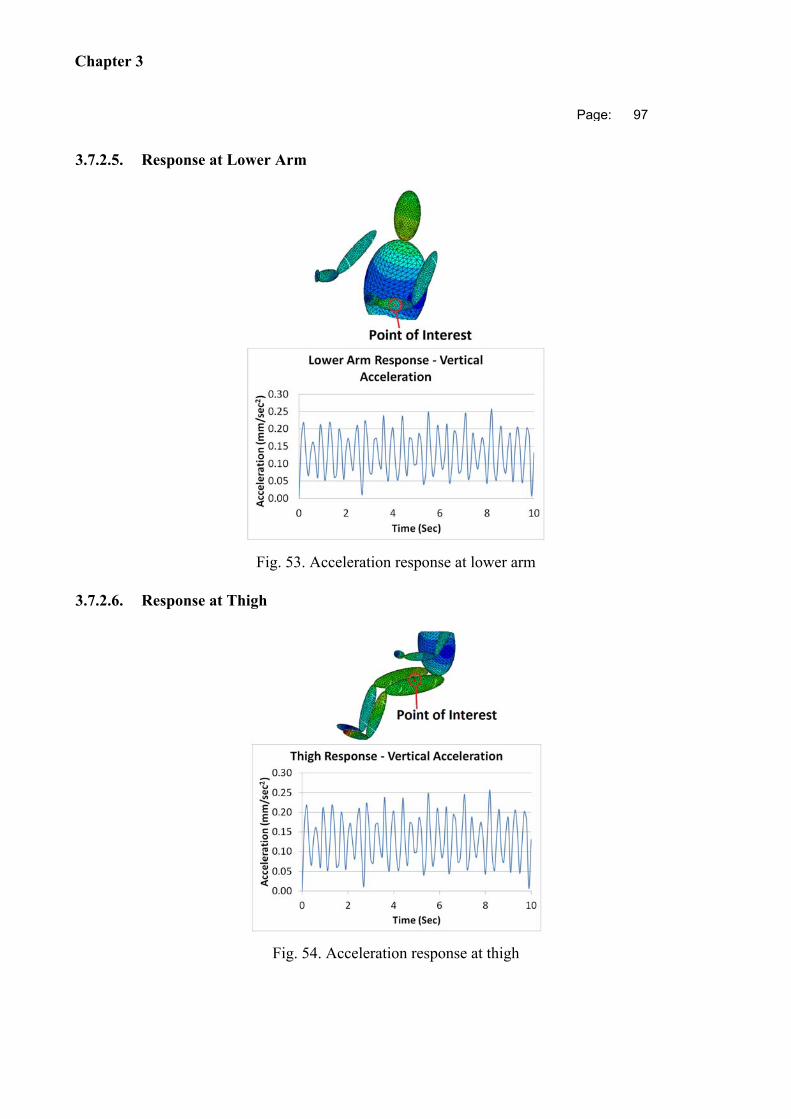
Chapter 3
Page: 97
3.7.2.5. Response at Lower Arm
Fig. 53. Acceleration response at lower arm
3.7.2.6. Response at Thigh
Fig. 54. Acceleration response at thigh
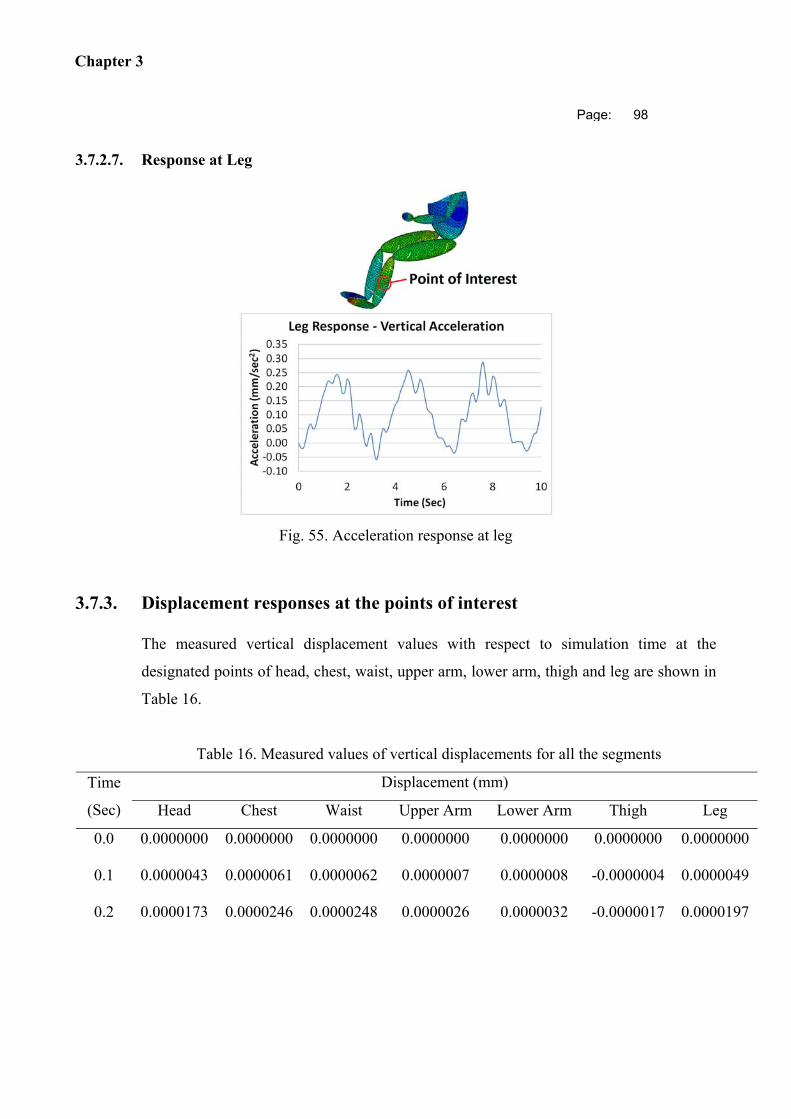
Chapter 3
Page: 98
3.7.2.7. Response at Leg
Fig. 55. Acceleration response at leg
3.7.3. Displacement responses at the points of interest
The measured vertical displacement values with respect to simulation time at the
designated points of head, chest, waist, upper arm, lower arm, thigh and leg are shown in
Table 16.
Table 16. Measured values of vertical displacements for all the segments
Time
(Sec)
Displacement (mm)
Head Chest Waist Upper Arm Lower Arm Thigh Leg
0.0 0.0000000 0.0000000 0.0000000 0.0000000 0.0000000 0.0000000 0.0000000
0.1 0.0000043 0.0000061 0.0000062 0.0000007 0.0000008 -0.0000004 0.0000049
0.2 0.0000173 0.0000246 0.0000248 0.0000026 0.0000032 -0.0000017 0.0000197
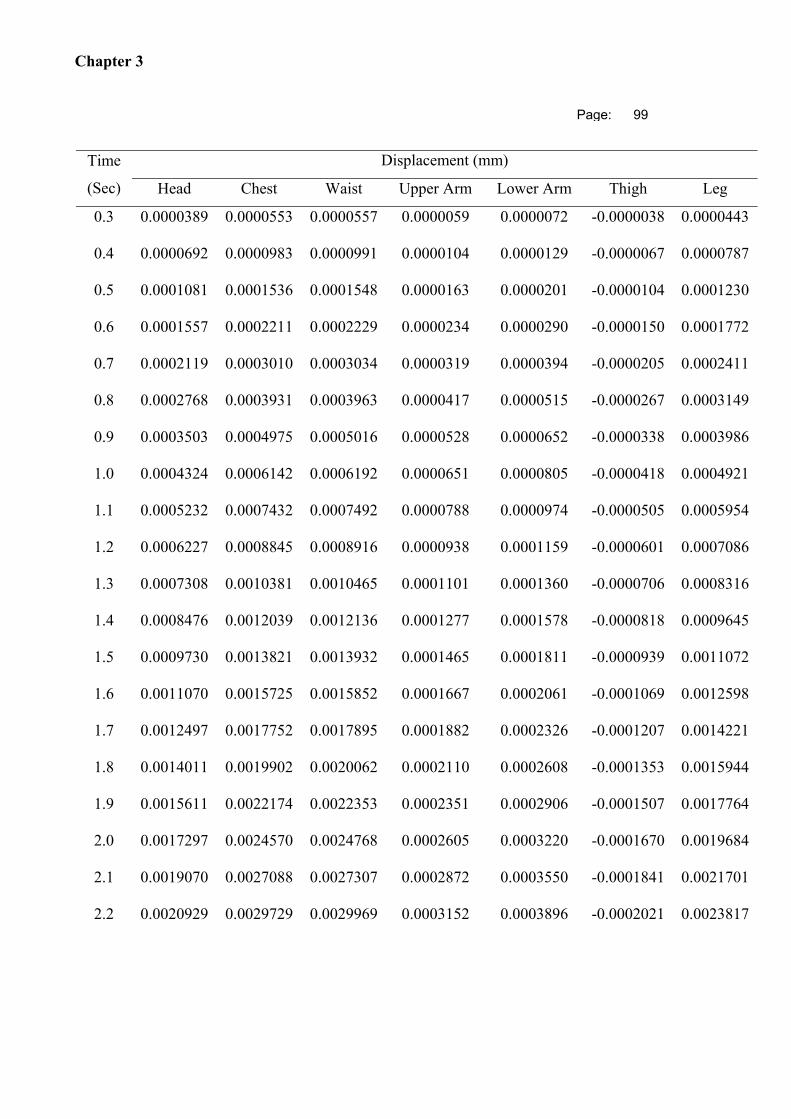
Chapter 3
Page: 99
Time
(Sec)
Displacement (mm)
Head Chest Waist Upper Arm Lower Arm Thigh Leg
0.3 0.0000389 0.0000553 0.0000557 0.0000059 0.0000072 -0.0000038 0.0000443
0.4 0.0000692 0.0000983 0.0000991 0.0000104 0.0000129 -0.0000067 0.0000787
0.5 0.0001081 0.0001536 0.0001548 0.0000163 0.0000201 -0.0000104 0.0001230
0.6 0.0001557 0.0002211 0.0002229 0.0000234 0.0000290 -0.0000150 0.0001772
0.7 0.0002119 0.0003010 0.0003034 0.0000319 0.0000394 -0.0000205 0.0002411
0.8 0.0002768 0.0003931 0.0003963 0.0000417 0.0000515 -0.0000267 0.0003149
0.9 0.0003503 0.0004975 0.0005016 0.0000528 0.0000652 -0.0000338 0.0003986
1.0 0.0004324 0.0006142 0.0006192 0.0000651 0.0000805 -0.0000418 0.0004921
1.1 0.0005232 0.0007432 0.0007492 0.0000788 0.0000974 -0.0000505 0.0005954
1.2 0.0006227 0.0008845 0.0008916 0.0000938 0.0001159 -0.0000601 0.0007086
1.3 0.0007308 0.0010381 0.0010465 0.0001101 0.0001360 -0.0000706 0.0008316
1.4 0.0008476 0.0012039 0.0012136 0.0001277 0.0001578 -0.0000818 0.0009645
1.5 0.0009730 0.0013821 0.0013932 0.0001465 0.0001811 -0.0000939 0.0011072
1.6 0.0011070 0.0015725 0.0015852 0.0001667 0.0002061 -0.0001069 0.0012598
1.7 0.0012497 0.0017752 0.0017895 0.0001882 0.0002326 -0.0001207 0.0014221
1.8 0.0014011 0.0019902 0.0020062 0.0002110 0.0002608 -0.0001353 0.0015944
1.9 0.0015611 0.0022174 0.0022353 0.0002351 0.0002906 -0.0001507 0.0017764
2.0 0.0017297 0.0024570 0.0024768 0.0002605 0.0003220 -0.0001670 0.0019684
2.1 0.0019070 0.0027088 0.0027307 0.0002872 0.0003550 -0.0001841 0.0021701
2.2 0.0020929 0.0029729 0.0029969 0.0003152 0.0003896 -0.0002021 0.0023817
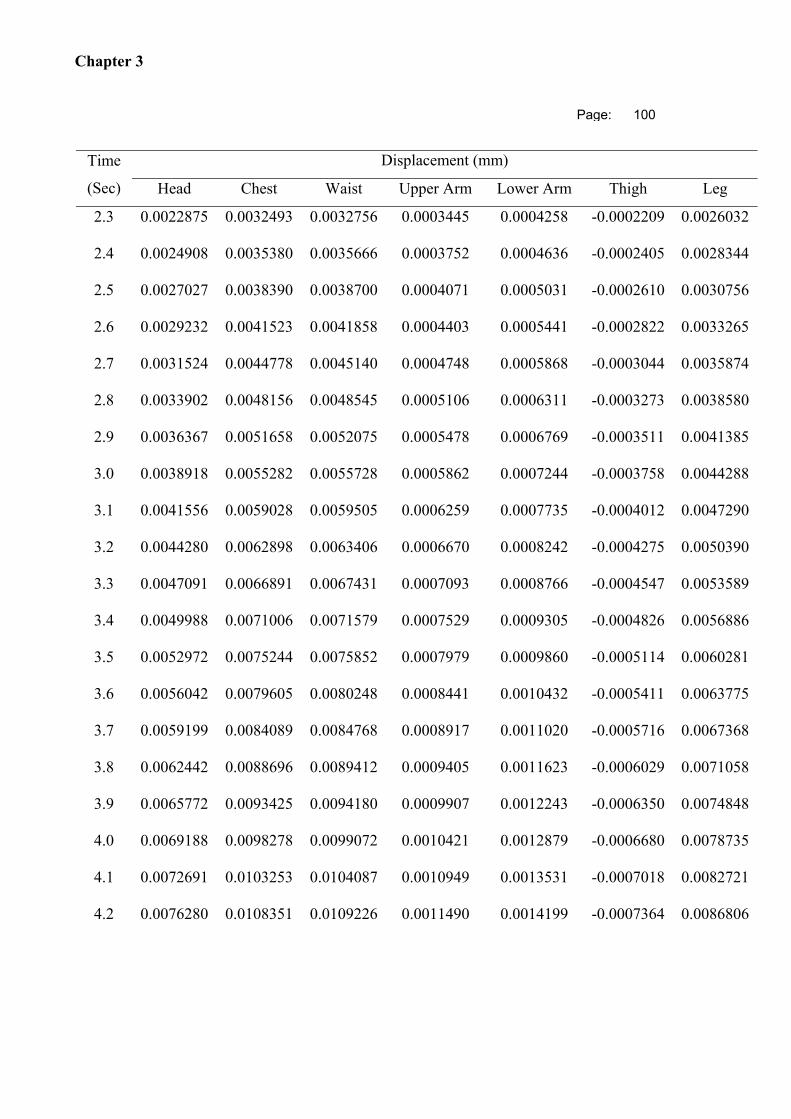
Chapter 3
Page: 100
Time
(Sec)
Displacement (mm)
Head Chest Waist Upper Arm Lower Arm Thigh Leg
2.3 0.0022875 0.0032493 0.0032756 0.0003445 0.0004258 -0.0002209 0.0026032
2.4 0.0024908 0.0035380 0.0035666 0.0003752 0.0004636 -0.0002405 0.0028344
2.5 0.0027027 0.0038390 0.0038700 0.0004071 0.0005031 -0.0002610 0.0030756
2.6 0.0029232 0.0041523 0.0041858 0.0004403 0.0005441 -0.0002822 0.0033265
2.7 0.0031524 0.0044778 0.0045140 0.0004748 0.0005868 -0.0003044 0.0035874
2.8 0.0033902 0.0048156 0.0048545 0.0005106 0.0006311 -0.0003273 0.0038580
2.9 0.0036367 0.0051658 0.0052075 0.0005478 0.0006769 -0.0003511 0.0041385
3.0 0.0038918 0.0055282 0.0055728 0.0005862 0.0007244 -0.0003758 0.0044288
3.1 0.0041556 0.0059028 0.0059505 0.0006259 0.0007735 -0.0004012 0.0047290
3.2 0.0044280 0.0062898 0.0063406 0.0006670 0.0008242 -0.0004275 0.0050390
3.3 0.0047091 0.0066891 0.0067431 0.0007093 0.0008766 -0.0004547 0.0053589
3.4 0.0049988 0.0071006 0.0071579 0.0007529 0.0009305 -0.0004826 0.0056886
3.5 0.0052972 0.0075244 0.0075852 0.0007979 0.0009860 -0.0005114 0.0060281
3.6 0.0056042 0.0079605 0.0080248 0.0008441 0.0010432 -0.0005411 0.0063775
3.7 0.0059199 0.0084089 0.0084768 0.0008917 0.0011020 -0.0005716 0.0067368
3.8 0.0062442 0.0088696 0.0089412 0.0009405 0.0011623 -0.0006029 0.0071058
3.9 0.0065772 0.0093425 0.0094180 0.0009907 0.0012243 -0.0006350 0.0074848
4.0 0.0069188 0.0098278 0.0099072 0.0010421 0.0012879 -0.0006680 0.0078735
4.1 0.0072691 0.0103253 0.0104087 0.0010949 0.0013531 -0.0007018 0.0082721
4.2 0.0076280 0.0108351 0.0109226 0.0011490 0.0014199 -0.0007364 0.0086806
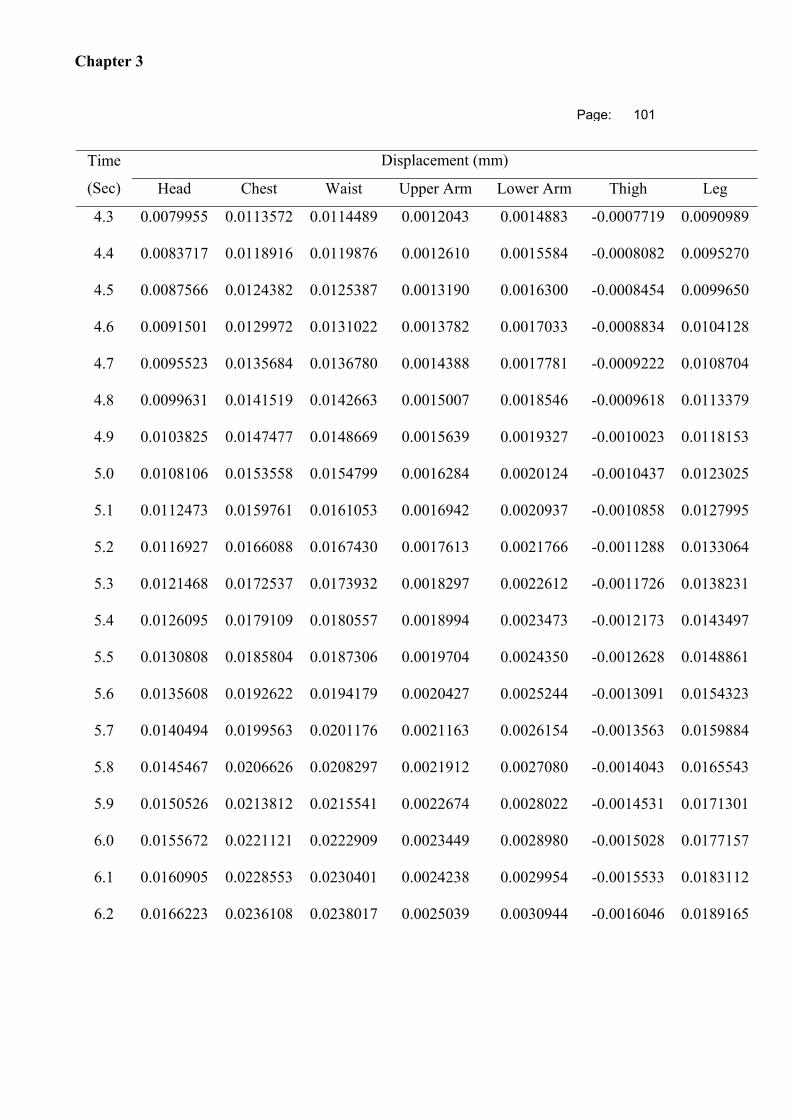
Chapter 3
Page: 101
Time
(Sec)
Displacement (mm)
Head Chest Waist Upper Arm Lower Arm Thigh Leg
4.3 0.0079955 0.0113572 0.0114489 0.0012043 0.0014883 -0.0007719 0.0090989
4.4 0.0083717 0.0118916 0.0119876 0.0012610 0.0015584 -0.0008082 0.0095270
4.5 0.0087566 0.0124382 0.0125387 0.0013190 0.0016300 -0.0008454 0.0099650
4.6 0.0091501 0.0129972 0.0131022 0.0013782 0.0017033 -0.0008834 0.0104128
4.7 0.0095523 0.0135684 0.0136780 0.0014388 0.0017781 -0.0009222 0.0108704
4.8 0.0099631 0.0141519 0.0142663 0.0015007 0.0018546 -0.0009618 0.0113379
4.9 0.0103825 0.0147477 0.0148669 0.0015639 0.0019327 -0.0010023 0.0118153
5.0 0.0108106 0.0153558 0.0154799 0.0016284 0.0020124 -0.0010437 0.0123025
5.1 0.0112473 0.0159761 0.0161053 0.0016942 0.0020937 -0.0010858 0.0127995
5.2 0.0116927 0.0166088 0.0167430 0.0017613 0.0021766 -0.0011288 0.0133064
5.3 0.0121468 0.0172537 0.0173932 0.0018297 0.0022612 -0.0011726 0.0138231
5.4 0.0126095 0.0179109 0.0180557 0.0018994 0.0023473 -0.0012173 0.0143497
5.5 0.0130808 0.0185804 0.0187306 0.0019704 0.0024350 -0.0012628 0.0148861
5.6 0.0135608 0.0192622 0.0194179 0.0020427 0.0025244 -0.0013091 0.0154323
5.7 0.0140494 0.0199563 0.0201176 0.0021163 0.0026154 -0.0013563 0.0159884
5.8 0.0145467 0.0206626 0.0208297 0.0021912 0.0027080 -0.0014043 0.0165543
5.9 0.0150526 0.0213812 0.0215541 0.0022674 0.0028022 -0.0014531 0.0171301
6.0 0.0155672 0.0221121 0.0222909 0.0023449 0.0028980 -0.0015028 0.0177157
6.1 0.0160905 0.0228553 0.0230401 0.0024238 0.0029954 -0.0015533 0.0183112
6.2 0.0166223 0.0236108 0.0238017 0.0025039 0.0030944 -0.0016046 0.0189165
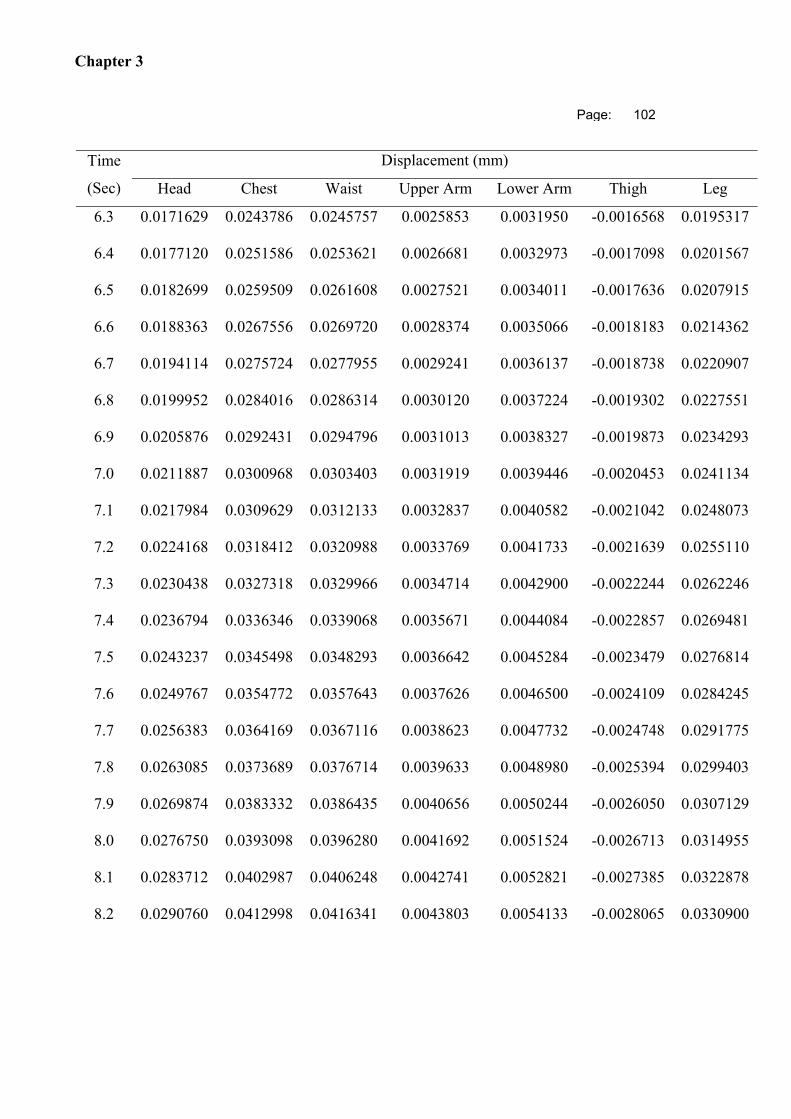
Chapter 3
Page: 102
Time
(Sec)
Displacement (mm)
Head Chest Waist Upper Arm Lower Arm Thigh Leg
6.3 0.0171629 0.0243786 0.0245757 0.0025853 0.0031950 -0.0016568 0.0195317
6.4 0.0177120 0.0251586 0.0253621 0.0026681 0.0032973 -0.0017098 0.0201567
6.5 0.0182699 0.0259509 0.0261608 0.0027521 0.0034011 -0.0017636 0.0207915
6.6 0.0188363 0.0267556 0.0269720 0.0028374 0.0035066 -0.0018183 0.0214362
6.7 0.0194114 0.0275724 0.0277955 0.0029241 0.0036137 -0.0018738 0.0220907
6.8 0.0199952 0.0284016 0.0286314 0.0030120 0.0037224 -0.0019302 0.0227551
6.9 0.0205876 0.0292431 0.0294796 0.0031013 0.0038327 -0.0019873 0.0234293
7.0 0.0211887 0.0300968 0.0303403 0.0031919 0.0039446 -0.0020453 0.0241134
7.1 0.0217984 0.0309629 0.0312133 0.0032837 0.0040582 -0.0021042 0.0248073
7.2 0.0224168 0.0318412 0.0320988 0.0033769 0.0041733 -0.0021639 0.0255110
7.3 0.0230438 0.0327318 0.0329966 0.0034714 0.0042900 -0.0022244 0.0262246
7.4 0.0236794 0.0336346 0.0339068 0.0035671 0.0044084 -0.0022857 0.0269481
7.5 0.0243237 0.0345498 0.0348293 0.0036642 0.0045284 -0.0023479 0.0276814
7.6 0.0249767 0.0354772 0.0357643 0.0037626 0.0046500 -0.0024109 0.0284245
7.7 0.0256383 0.0364169 0.0367116 0.0038623 0.0047732 -0.0024748 0.0291775
7.8 0.0263085 0.0373689 0.0376714 0.0039633 0.0048980 -0.0025394 0.0299403
7.9 0.0269874 0.0383332 0.0386435 0.0040656 0.0050244 -0.0026050 0.0307129
8.0 0.0276750 0.0393098 0.0396280 0.0041692 0.0051524 -0.0026713 0.0314955
8.1 0.0283712 0.0402987 0.0406248 0.0042741 0.0052821 -0.0027385 0.0322878
8.2 0.0290760 0.0412998 0.0416341 0.0043803 0.0054133 -0.0028065 0.0330900
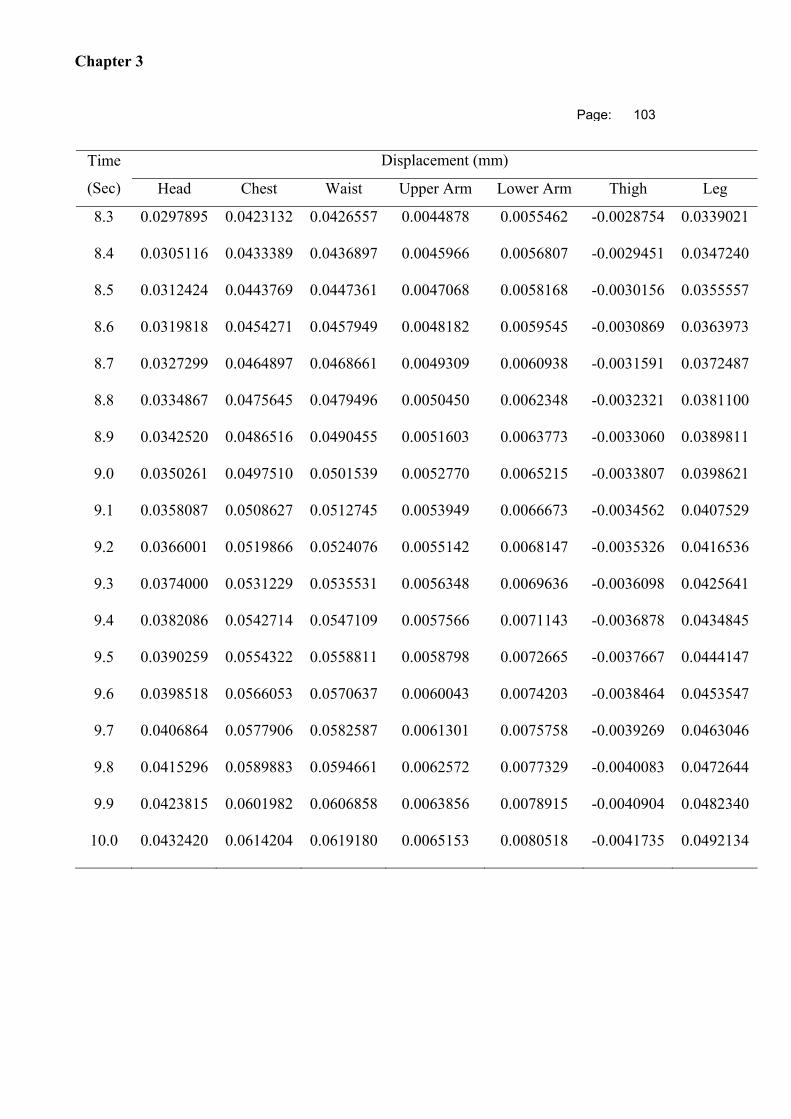
Chapter 3
Page: 103
Time
(Sec)
Displacement (mm)
Head Chest Waist Upper Arm Lower Arm Thigh Leg
8.3 0.0297895 0.0423132 0.0426557 0.0044878 0.0055462 -0.0028754 0.0339021
8.4 0.0305116 0.0433389 0.0436897 0.0045966 0.0056807 -0.0029451 0.0347240
8.5 0.0312424 0.0443769 0.0447361 0.0047068 0.0058168 -0.0030156 0.0355557
8.6 0.0319818 0.0454271 0.0457949 0.0048182 0.0059545 -0.0030869 0.0363973
8.7 0.0327299 0.0464897 0.0468661 0.0049309 0.0060938 -0.0031591 0.0372487
8.8 0.0334867 0.0475645 0.0479496 0.0050450 0.0062348 -0.0032321 0.0381100
8.9 0.0342520 0.0486516 0.0490455 0.0051603 0.0063773 -0.0033060 0.0389811
9.0 0.0350261 0.0497510 0.0501539 0.0052770 0.0065215 -0.0033807 0.0398621
9.1 0.0358087 0.0508627 0.0512745 0.0053949 0.0066673 -0.0034562 0.0407529
9.2 0.0366001 0.0519866 0.0524076 0.0055142 0.0068147 -0.0035326 0.0416536
9.3 0.0374000 0.0531229 0.0535531 0.0056348 0.0069636 -0.0036098 0.0425641
9.4 0.0382086 0.0542714 0.0547109 0.0057566 0.0071143 -0.0036878 0.0434845
9.5 0.0390259 0.0554322 0.0558811 0.0058798 0.0072665 -0.0037667 0.0444147
9.6 0.0398518 0.0566053 0.0570637 0.0060043 0.0074203 -0.0038464 0.0453547
9.7 0.0406864 0.0577906 0.0582587 0.0061301 0.0075758 -0.0039269 0.0463046
9.8 0.0415296 0.0589883 0.0594661 0.0062572 0.0077329 -0.0040083 0.0472644
9.9 0.0423815 0.0601982 0.0606858 0.0063856 0.0078915 -0.0040904 0.0482340
10.0 0.0432420 0.0614204 0.0619180 0.0065153 0.0080518 -0.0041735 0.0492134
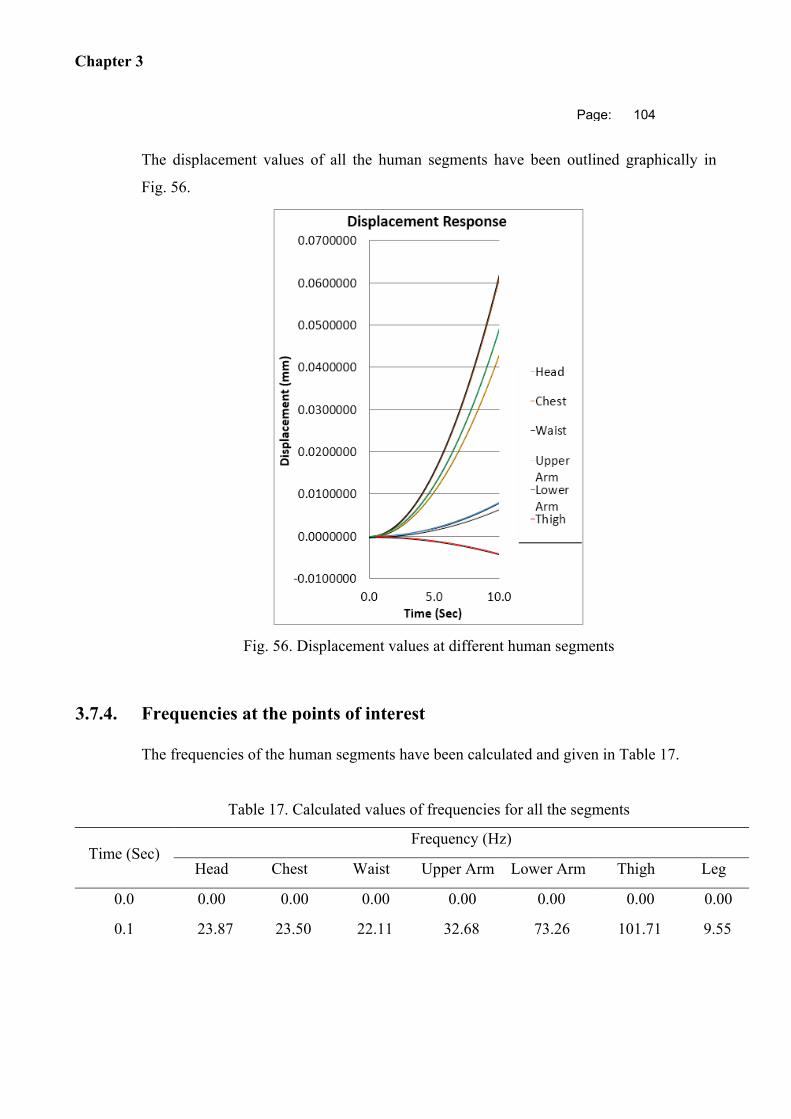
Chapter 3
Page: 104
The displacement values of all the human segments have been outlined graphically in
Fig. 56.
Fig. 56. Displacement values at different human segments
3.7.4. Frequencies at the points of interest
The frequencies of the human segments have been calculated and given in Table 17.
Table 17. Calculated values of frequencies for all the segments
Time (Sec) Frequency (Hz)
Head Chest Waist Upper Arm Lower Arm Thigh Leg
0.0 0.00 0.00 0.00 0.00 0.00 0.00 0.00
0.1 23.87 23.50 22.11 32.68 73.26 101.71 9.55
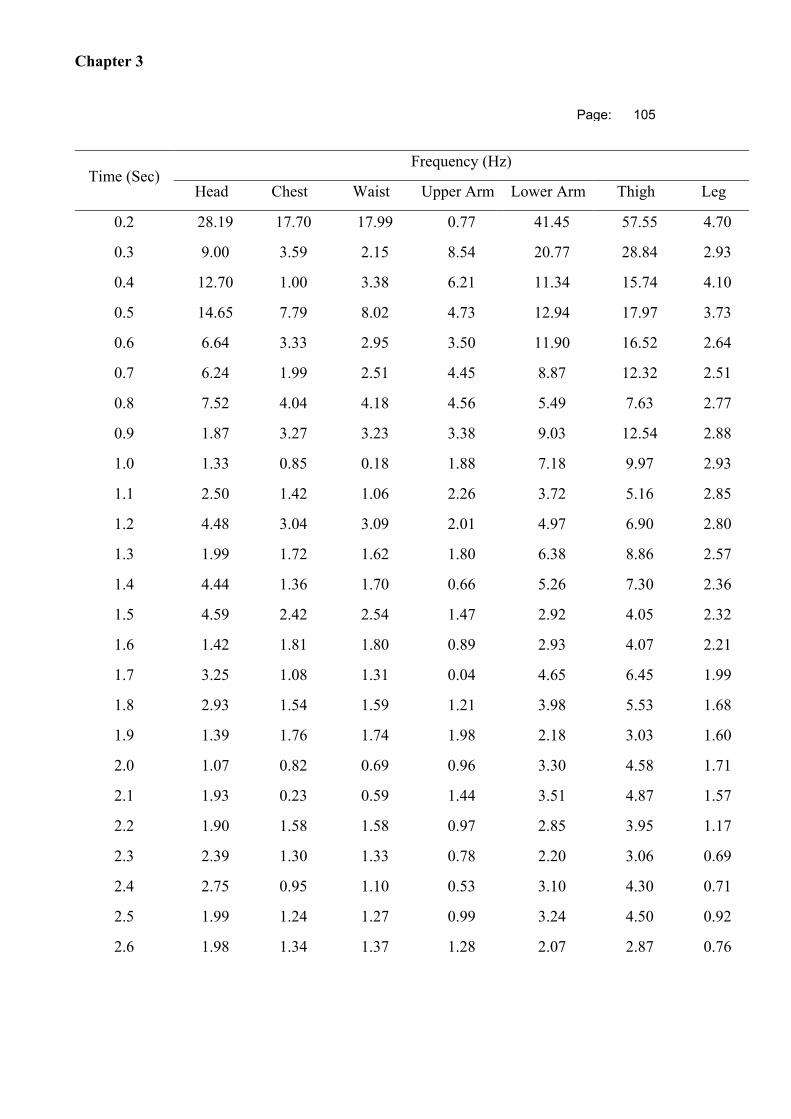
Chapter 3
Page: 105
Time (Sec) Frequency (Hz)
Head Chest Waist Upper Arm Lower Arm Thigh Leg
0.2 28.19 17.70 17.99 0.77 41.45 57.55 4.70
0.3 9.00 3.59 2.15 8.54 20.77 28.84 2.93
0.4 12.70 1.00 3.38 6.21 11.34 15.74 4.10
0.5 14.65 7.79 8.02 4.73 12.94 17.97 3.73
0.6 6.64 3.33 2.95 3.50 11.90 16.52 2.64
0.7 6.24 1.99 2.51 4.45 8.87 12.32 2.51
0.8 7.52 4.04 4.18 4.56 5.49 7.63 2.77
0.9 1.87 3.27 3.23 3.38 9.03 12.54 2.88
1.0 1.33 0.85 0.18 1.88 7.18 9.97 2.93
1.1 2.50 1.42 1.06 2.26 3.72 5.16 2.85
1.2 4.48 3.04 3.09 2.01 4.97 6.90 2.80
1.3 1.99 1.72 1.62 1.80 6.38 8.86 2.57
1.4 4.44 1.36 1.70 0.66 5.26 7.30 2.36
1.5 4.59 2.42 2.54 1.47 2.92 4.05 2.32
1.6 1.42 1.81 1.80 0.89 2.93 4.07 2.21
1.7 3.25 1.08 1.31 0.04 4.65 6.45 1.99
1.8 2.93 1.54 1.59 1.21 3.98 5.53 1.68
1.9 1.39 1.76 1.74 1.98 2.18 3.03 1.60
2.0 1.07 0.82 0.69 0.96 3.30 4.58 1.71
2.1 1.93 0.23 0.59 1.44 3.51 4.87 1.57
2.2 1.90 1.58 1.58 0.97 2.85 3.95 1.17
2.3 2.39 1.30 1.33 0.78 2.20 3.06 0.69
2.4 2.75 0.95 1.10 0.53 3.10 4.30 0.71
2.5 1.99 1.24 1.27 0.99 3.24 4.50 0.92
2.6 1.98 1.34 1.37 1.28 2.07 2.87 0.76
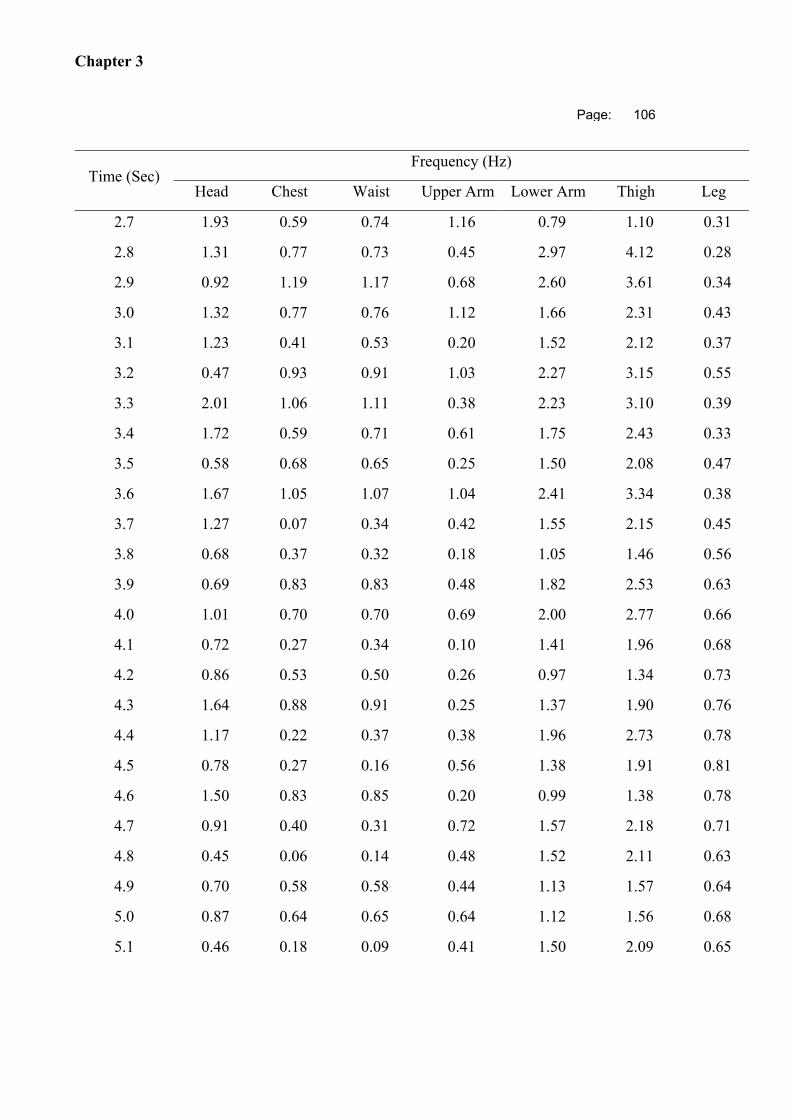
Chapter 3
Page: 106
Time (Sec) Frequency (Hz)
Head Chest Waist Upper Arm Lower Arm Thigh Leg
2.7 1.93 0.59 0.74 1.16 0.79 1.10 0.31
2.8 1.31 0.77 0.73 0.45 2.97 4.12 0.28
2.9 0.92 1.19 1.17 0.68 2.60 3.61 0.34
3.0 1.32 0.77 0.76 1.12 1.66 2.31 0.43
3.1 1.23 0.41 0.53 0.20 1.52 2.12 0.37
3.2 0.47 0.93 0.91 1.03 2.27 3.15 0.55
3.3 2.01 1.06 1.11 0.38 2.23 3.10 0.39
3.4 1.72 0.59 0.71 0.61 1.75 2.43 0.33
3.5 0.58 0.68 0.65 0.25 1.50 2.08 0.47
3.6 1.67 1.05 1.07 1.04 2.41 3.34 0.38
3.7 1.27 0.07 0.34 0.42 1.55 2.15 0.45
3.8 0.68 0.37 0.32 0.18 1.05 1.46 0.56
3.9 0.69 0.83 0.83 0.48 1.82 2.53 0.63
4.0 1.01 0.70 0.70 0.69 2.00 2.77 0.66
4.1 0.72 0.27 0.34 0.10 1.41 1.96 0.68
4.2 0.86 0.53 0.50 0.26 0.97 1.34 0.73
4.3 1.64 0.88 0.91 0.25 1.37 1.90 0.76
4.4 1.17 0.22 0.37 0.38 1.96 2.73 0.78
4.5 0.78 0.27 0.16 0.56 1.38 1.91 0.81
4.6 1.50 0.83 0.85 0.20 0.99 1.38 0.78
4.7 0.91 0.40 0.31 0.72 1.57 2.18 0.71
4.8 0.45 0.06 0.14 0.48 1.52 2.11 0.63
4.9 0.70 0.58 0.58 0.44 1.13 1.57 0.64
5.0 0.87 0.64 0.65 0.64 1.12 1.56 0.68
5.1 0.46 0.18 0.09 0.41 1.50 2.09 0.65

Chapter 3
Page: 107
Time (Sec) Frequency (Hz)
Head Chest Waist Upper Arm Lower Arm Thigh Leg
5.2 0.95 0.20 0.13 0.53 1.36 1.89 0.56
5.3 1.38 0.73 0.75 0.24 0.68 0.95 0.47
5.4 0.61 0.34 0.30 0.63 0.91 1.27 0.44
5.5 1.03 0.28 0.37 0.42 1.61 2.23 0.41
5.6 1.24 0.63 0.66 0.40 1.22 1.69 0.31
5.7 0.35 0.47 0.47 0.28 0.79 1.09 0.21
5.8 0.59 0.14 0.21 0.58 0.99 1.37 0.17
5.9 0.40 0.38 0.36 0.56 1.38 1.91 0.17
6.0 0.73 0.58 0.58 0.37 1.14 1.58 0.10
6.1 0.53 0.33 0.31 0.31 0.84 1.17 0.13
6.2 0.97 0.25 0.34 0.25 0.98 1.36 0.11
6.3 1.00 0.58 0.60 0.53 1.30 1.81 0.16
6.4 0.59 0.44 0.45 0.32 0.61 0.84 0.21
6.5 0.96 0.32 0.39 0.48 0.81 1.12 0.17
6.6 0.88 0.47 0.49 0.26 1.18 1.64 0.18
6.7 0.38 0.49 0.48 0.23 1.12 1.56 0.31
6.8 0.35 0.10 0.11 0.22 0.71 0.99 0.30
6.9 0.10 0.22 0.18 0.43 0.73 1.02 0.29
7.0 0.38 0.49 0.48 0.21 1.04 1.44 0.35
7.1 0.73 0.39 0.39 0.05 1.23 1.71 0.41
7.2 0.80 0.28 0.33 0.24 0.59 0.82 0.42
7.3 0.59 0.44 0.44 0.30 0.70 0.98 0.38
7.4 0.74 0.47 0.48 0.35 1.04 1.44 0.40
7.5 0.79 0.27 0.32 0.20 0.85 1.19 0.48
7.6 0.61 0.33 0.33 0.33 0.68 0.94 0.51
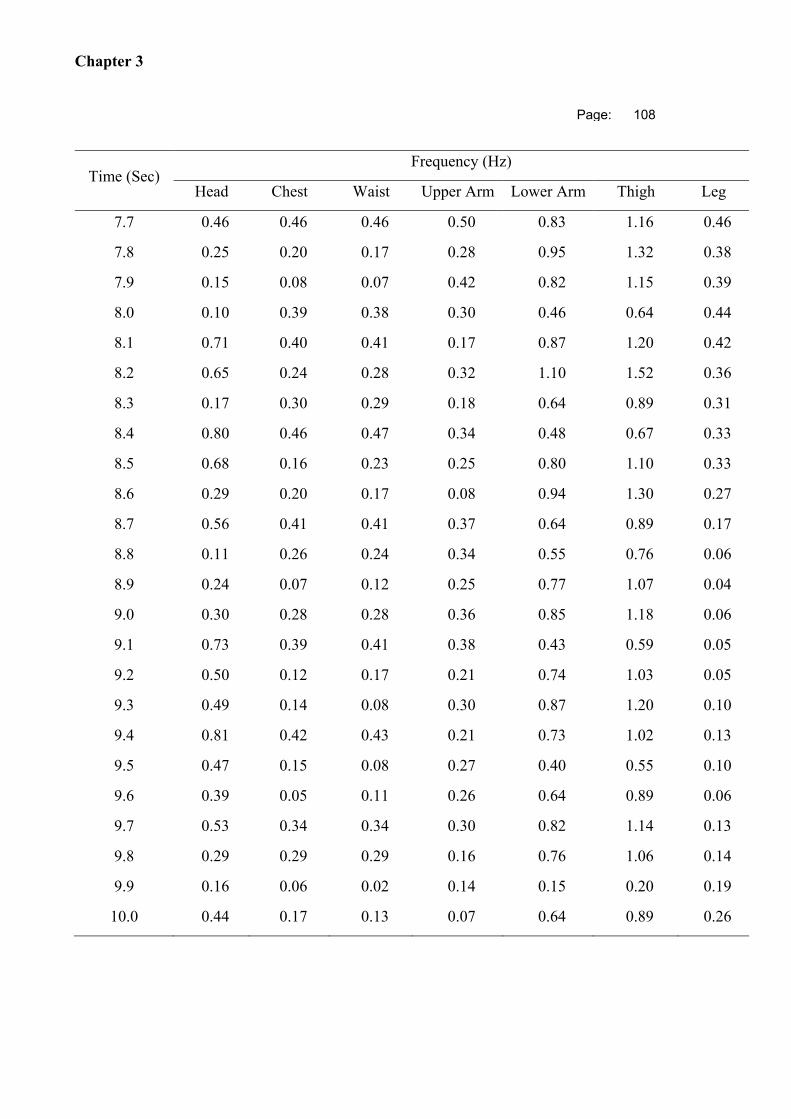
Chapter 3
Page: 108
Time (Sec) Frequency (Hz)
Head Chest Waist Upper Arm Lower Arm Thigh Leg
7.7 0.46 0.46 0.46 0.50 0.83 1.16 0.46
7.8 0.25 0.20 0.17 0.28 0.95 1.32 0.38
7.9 0.15 0.08 0.07 0.42 0.82 1.15 0.39
8.0 0.10 0.39 0.38 0.30 0.46 0.64 0.44
8.1 0.71 0.40 0.41 0.17 0.87 1.20 0.42
8.2 0.65 0.24 0.28 0.32 1.10 1.52 0.36
8.3 0.17 0.30 0.29 0.18 0.64 0.89 0.31
8.4 0.80 0.46 0.47 0.34 0.48 0.67 0.33
8.5 0.68 0.16 0.23 0.25 0.80 1.10 0.33
8.6 0.29 0.20 0.17 0.08 0.94 1.30 0.27
8.7 0.56 0.41 0.41 0.37 0.64 0.89 0.17
8.8 0.11 0.26 0.24 0.34 0.55 0.76 0.06
8.9 0.24 0.07 0.12 0.25 0.77 1.07 0.04
9.0 0.30 0.28 0.28 0.36 0.85 1.18 0.06
9.1 0.73 0.39 0.41 0.38 0.43 0.59 0.05
9.2 0.50 0.12 0.17 0.21 0.74 1.03 0.05
9.3 0.49 0.14 0.08 0.30 0.87 1.20 0.10
9.4 0.81 0.42 0.43 0.21 0.73 1.02 0.13
9.5 0.47 0.15 0.08 0.27 0.40 0.55 0.10
9.6 0.39 0.05 0.11 0.26 0.64 0.89 0.06
9.7 0.53 0.34 0.34 0.30 0.82 1.14 0.13
9.8 0.29 0.29 0.29 0.16 0.76 1.06 0.14
9.9 0.16 0.06 0.02 0.14 0.15 0.20 0.19
10.0 0.44 0.17 0.13 0.07 0.64 0.89 0.26
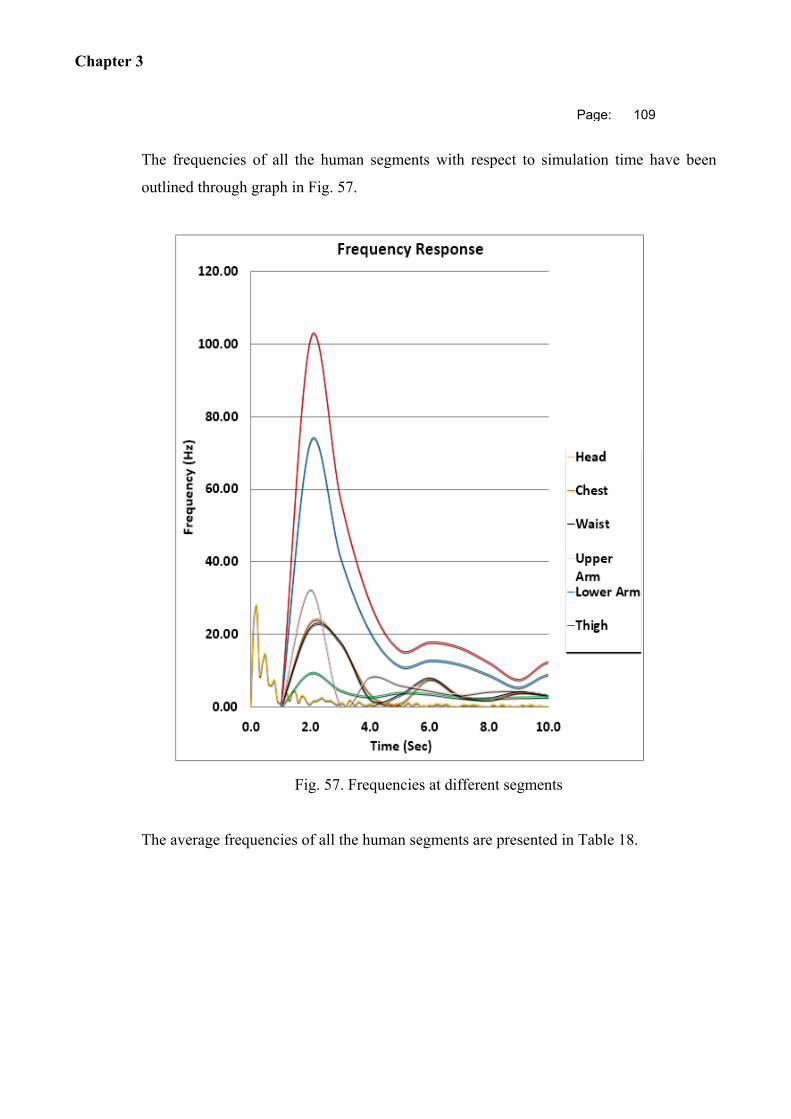
Chapter 3
Page: 109
The frequencies of all the human segments with respect to simulation time have been
outlined through graph in Fig. 57.
Fig. 57. Frequencies at different segments
The average frequencies of all the human segments are presented in Table 18.
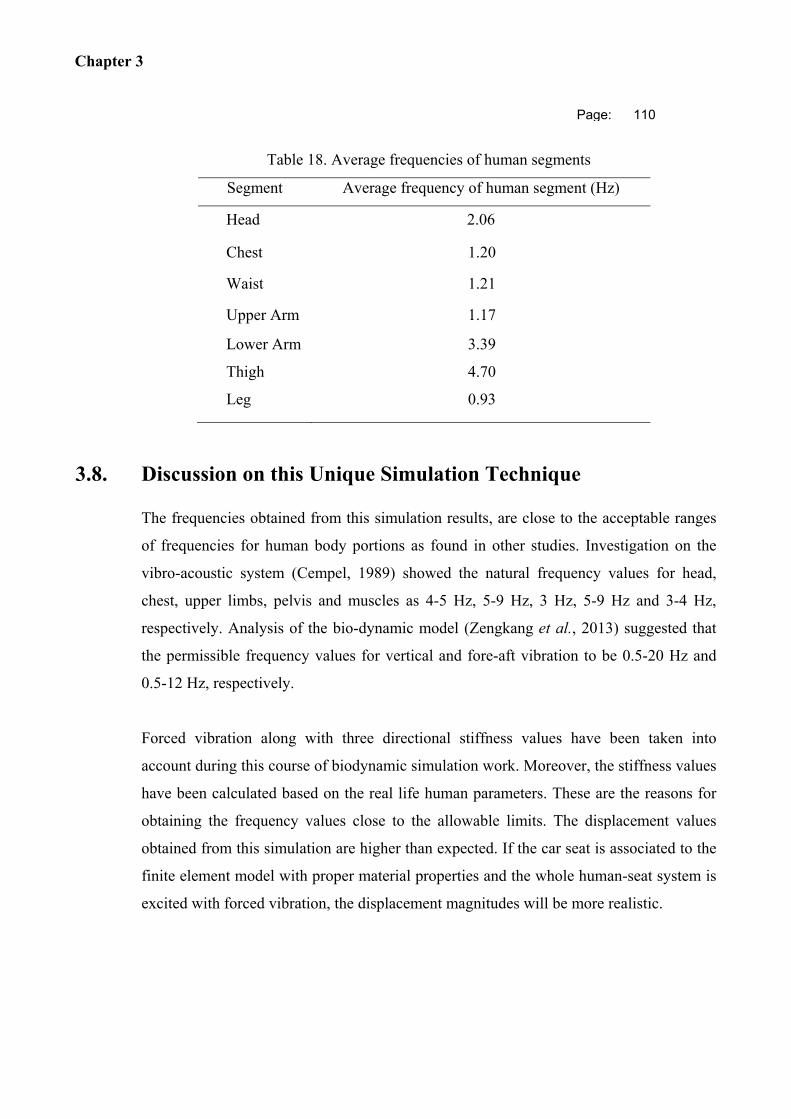
Chapter 3
Page: 110
Table 18. Average frequencies of human segments
Segment Average frequency of human segment (Hz)
Head 2.06
Chest 1.20
Waist 1.21
Upper Arm 1.17
Lower Arm 3.39
Thigh 4.70
Leg 0.93
3.8. Discussion on this Unique Simulation Technique
The frequencies obtained from this simulation results, are close to the acceptable ranges
of frequencies for human body portions as found in other studies. Investigation on the
vibro-acoustic system (Cempel, 1989) showed the natural frequency values for head,
chest, upper limbs, pelvis and muscles as 4-5 Hz, 5-9 Hz, 3 Hz, 5-9 Hz and 3-4 Hz,
respectively. Analysis of the bio-dynamic model (Zengkang et al., 2013) suggested that
the permissible frequency values for vertical and fore-aft vibration to be 0.5-20 Hz and
0.5-12 Hz, respectively.
Forced vibration along with three directional stiffness values have been taken into
account during this course of biodynamic simulation work. Moreover, the stiffness values
have been calculated based on the real life human parameters. These are the reasons for
obtaining the frequency values close to the allowable limits. The displacement values
obtained from this simulation are higher than expected. If the car seat is associated to the
finite element model with proper material properties and the whole human-seat system is
excited with forced vibration, the displacement magnitudes will be more realistic.

Chapter 3
Page: 111
From the outputs of the unique simulation work, it is clear that the finite element method
can effectively be used to establish a comprehensive bio-dynamic model for vibration
analysis using this unique technique. The boundary conditions, material properties and
load conditions used in this unique simulation methodology have worked flawless and
yielded realistic outputs. So, this bio-dynamic simulation set up can be taken to further
advanced level in association with the car seat.
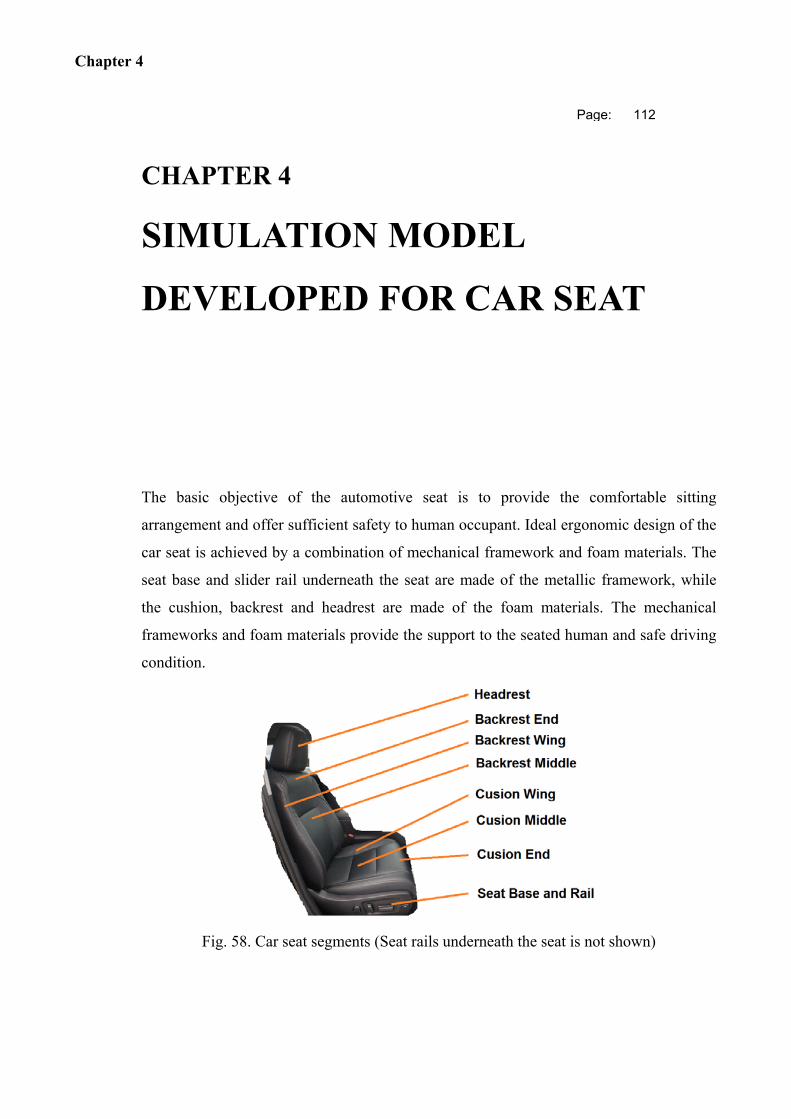
Chapter 4
Page: 112
CHAPTER 4 SIMULATION MODEL
DEVELOPED FOR CAR SEAT
The basic objective of the automotive seat is to provide the comfortable sitting
arrangement and offer sufficient safety to human occupant. Ideal ergonomic design of the
car seat is achieved by a combination of mechanical framework and foam materials. The
seat base and slider rail underneath the seat are made of the metallic framework, while
the cushion, backrest and headrest are made of the foam materials. The mechanical
frameworks and foam materials provide the support to the seated human and safe driving
condition.
Fig. 58. Car seat segments (Seat rails underneath the seat is not shown)
Chapter 4
Page: 113
The elementary structures of the car seats from various manufacturers are very similar to
each other and consist of seat base, seat rail, cushion, backrest and headrest. The cushion
and the backrest are further sub-divided into two ends, middle and wing portions. A
typical car seat and its major components are shown in Fig. 58. The car seat can be
adjusted to fit with the safe human posture by means of front-back sliding movement,
vertical height adjustment, backrest angular adjustment and headrest tilting adjustment.
Car seat design considers many design parameters which are related to the type of the car
seat and its material properties. Car seat properties have great influence on the human
health and safety and numerous number of seat design variables had been reported in the
studies over the past few decades. More the number of parameters are taken into
considerations, more the seat design procedure becomes complex and time consuming.
Car seat cushion, backrest and headrest are made of the polyurethane foam material and
during the design process of car seat the main challenge is to assess and define the
mechanical properties of this foam material. The level of vibration transmission from the
seat to the human body greatly depends on the automotive seat material, hence the
material modelling of the car seat should be accurate enough to match to the physical
foam material properties. The most realistic way of foam material modelling is to
consider it as hyper-elastic or viscoelastic material. For detailed investigation of car seat,
initiative can be taken to consider both the hyper-elastic and viscoelastic material
properties together.
4.1. Past works on Vibration Investigation Techniques and
Material Properties of Automotive Seat
Automobile seats can be classified into suspension and foam types. In the mechanical
suspension seats, the seat cushion is supported by a set of spring and damper
arrangements, while in the foam seats, a full depth foam cushion along with foam
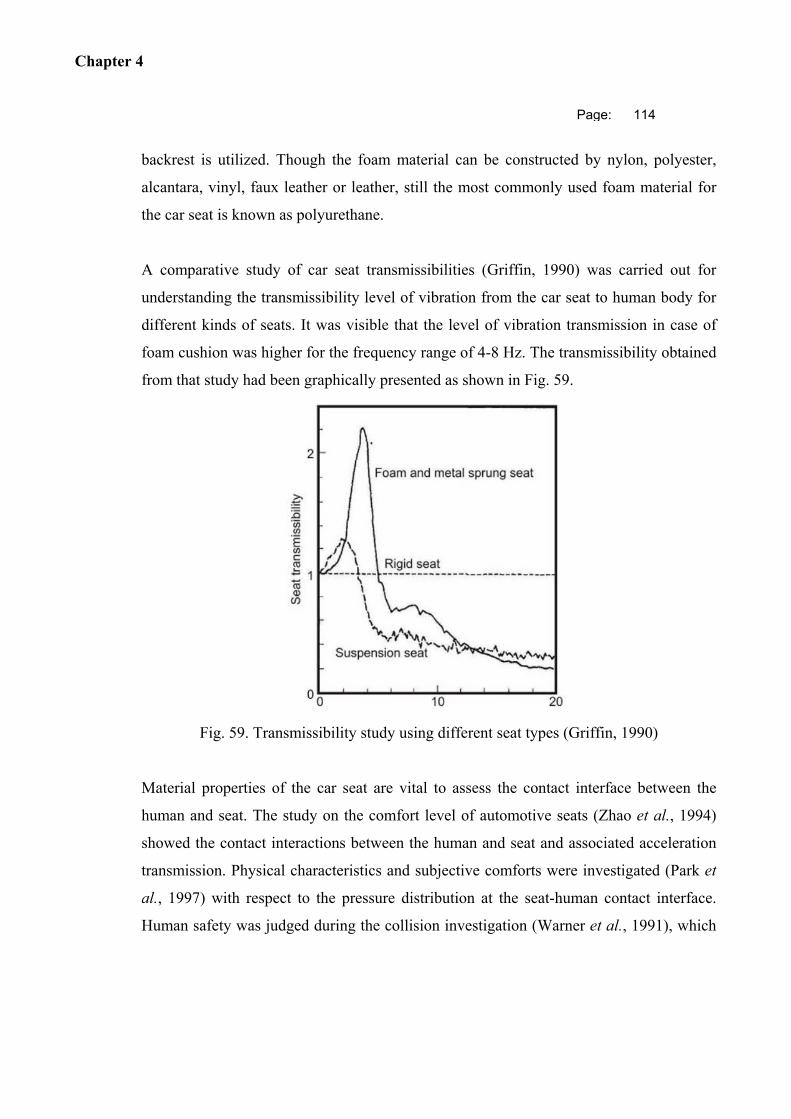
Chapter 4
Page: 114
backrest is utilized. Though the foam material can be constructed by nylon, polyester,
alcantara, vinyl, faux leather or leather, still the most commonly used foam material for
the car seat is known as polyurethane.
A comparative study of car seat transmissibilities (Griffin, 1990) was carried out for
understanding the transmissibility level of vibration from the car seat to human body for
different kinds of seats. It was visible that the level of vibration transmission in case of
foam cushion was higher for the frequency range of 4-8 Hz. The transmissibility obtained
from that study had been graphically presented as shown in Fig. 59.
Fig. 59. Transmissibility study using different seat types (Griffin, 1990)
Material properties of the car seat are vital to assess the contact interface between the
human and seat. The study on the comfort level of automotive seats (Zhao et al., 1994)
showed the contact interactions between the human and seat and associated acceleration
transmission. Physical characteristics and subjective comforts were investigated (Park et
al., 1997) with respect to the pressure distribution at the seat-human contact interface.
Human safety was judged during the collision investigation (Warner et al., 1991), which
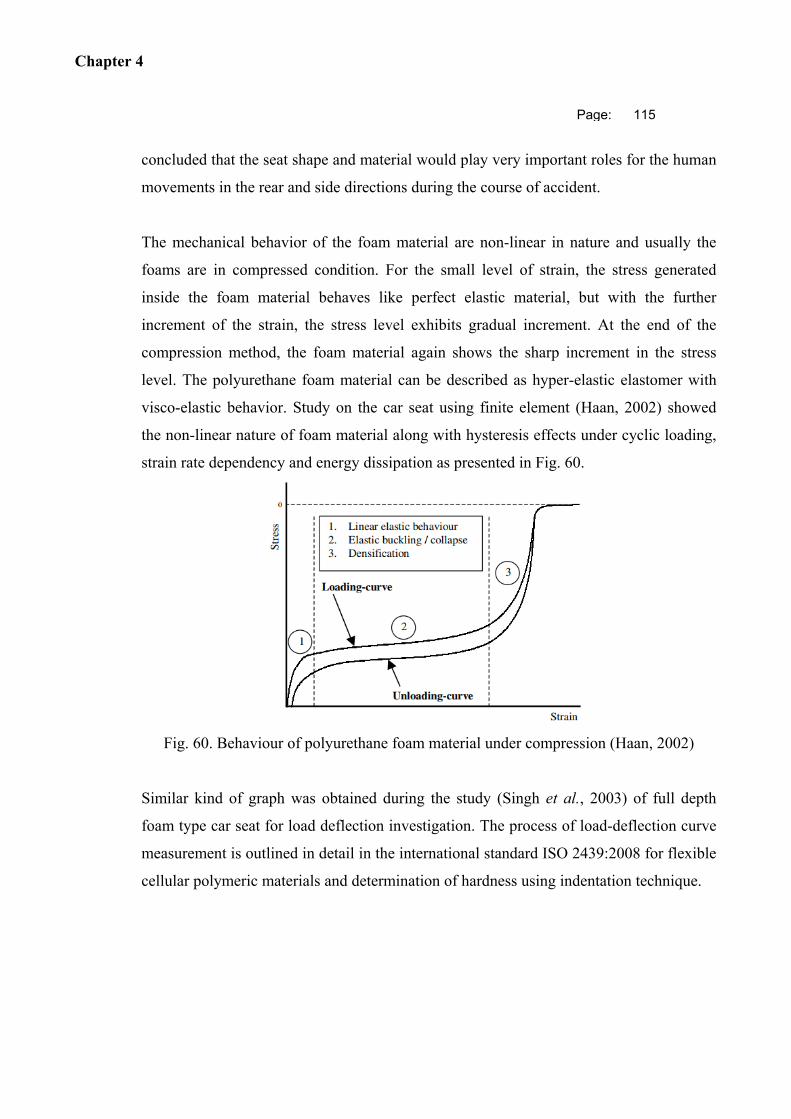
Chapter 4
Page: 115
concluded that the seat shape and material would play very important roles for the human
movements in the rear and side directions during the course of accident.
The mechanical behavior of the foam material are non-linear in nature and usually the
foams are in compressed condition. For the small level of strain, the stress generated
inside the foam material behaves like perfect elastic material, but with the further
increment of the strain, the stress level exhibits gradual increment. At the end of the
compression method, the foam material again shows the sharp increment in the stress
level. The polyurethane foam material can be described as hyper-elastic elastomer with
visco-elastic behavior. Study on the car seat using finite element (Haan, 2002) showed
the non-linear nature of foam material along with hysteresis effects under cyclic loading,
strain rate dependency and energy dissipation as presented in Fig. 60.
Fig. 60. Behaviour of polyurethane foam material under compression (Haan, 2002)
Similar kind of graph was obtained during the study (Singh et al., 2003) of full depth
foam type car seat for load deflection investigation. The process of load-deflection curve
measurement is outlined in detail in the international standard ISO 2439:2008 for flexible
cellular polymeric materials and determination of hardness using indentation technique.
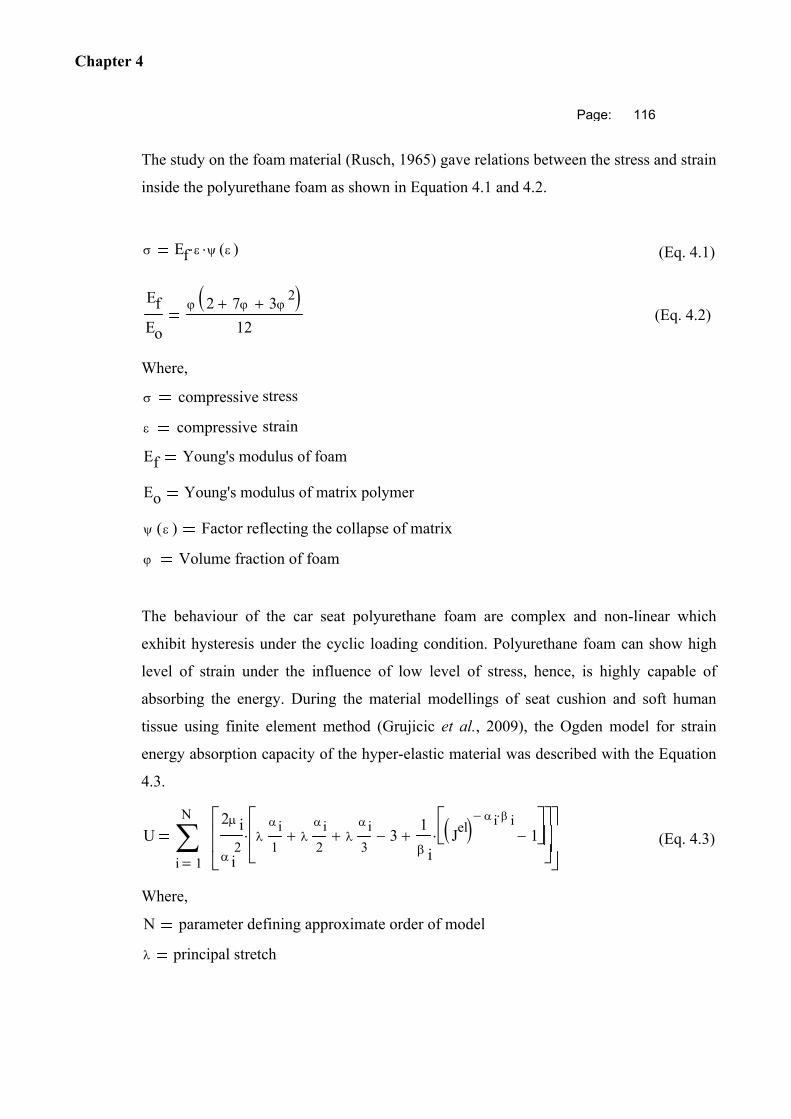
Chapter 4
Page: 116
The study on the foam material (Rusch, 1965) gave relations between the stress and strain
inside the polyurethane foam as shown in Equation 4.1 and 4.2.
Ef ( ) (Eq. 4.1)
Ef
Eo
2 7 32
12
(Eq. 4.2)
Where,
compressive stress
compressive strain
Ef Young's modulus of foam
Eo Young's modulus of matrix polymer
( ) Factor reflecting the collapse of matrix
Volume fraction of foam
The behaviour of the car seat polyurethane foam are complex and non-linear which
exhibit hysteresis under the cyclic loading condition. Polyurethane foam can show high
level of strain under the influence of low level of stress, hence, is highly capable of
absorbing the energy. During the material modellings of seat cushion and soft human
tissue using finite element method (Grujicic et al., 2009), the Ogden model for strain
energy absorption capacity of the hyper-elastic material was described with the Equation
4.3.
U
1
N
i
2 i
i2
i
1 i
2
i
3 3
1
iJel
i i1
(Eq. 4.3)
Where,
N parameter defining approximate order of model
principal stretch
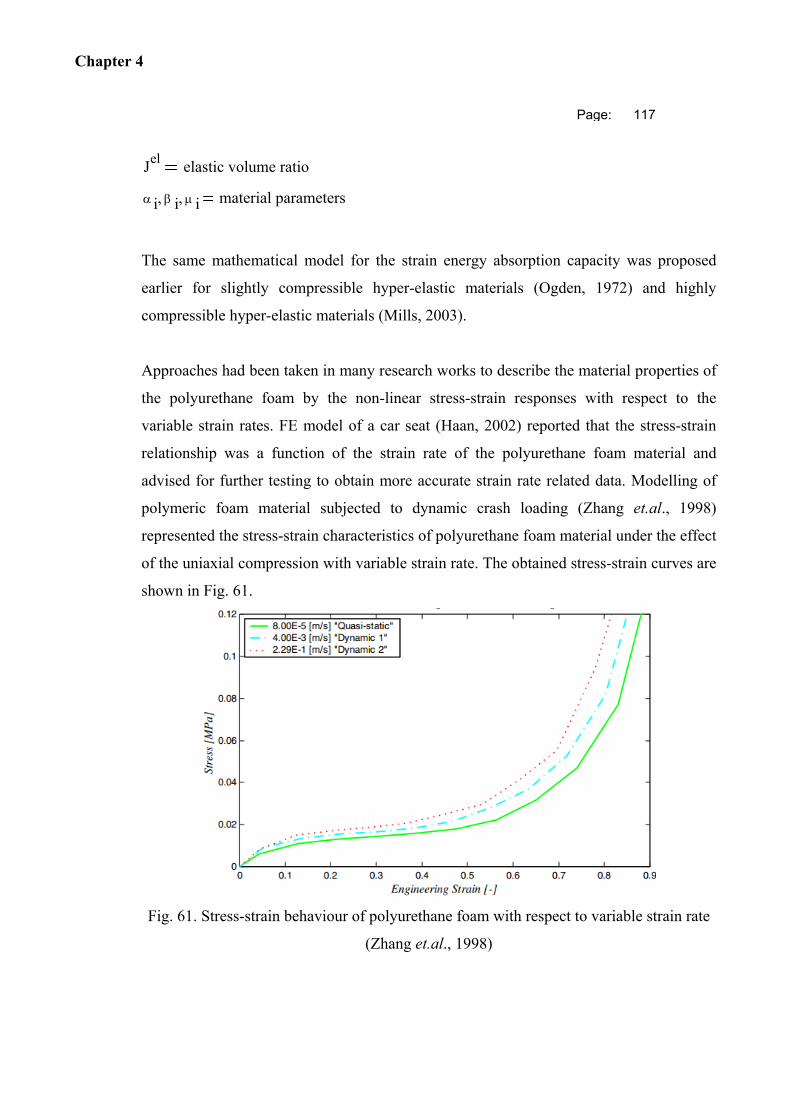
Chapter 4
Page: 117
Jel
elastic volume ratio
i i i material parameters
The same mathematical model for the strain energy absorption capacity was proposed
earlier for slightly compressible hyper-elastic materials (Ogden, 1972) and highly
compressible hyper-elastic materials (Mills, 2003).
Approaches had been taken in many research works to describe the material properties of
the polyurethane foam by the non-linear stress-strain responses with respect to the
variable strain rates. FE model of a car seat (Haan, 2002) reported that the stress-strain
relationship was a function of the strain rate of the polyurethane foam material and
advised for further testing to obtain more accurate strain rate related data. Modelling of
polymeric foam material subjected to dynamic crash loading (Zhang et.al., 1998)
represented the stress-strain characteristics of polyurethane foam material under the effect
of the uniaxial compression with variable strain rate. The obtained stress-strain curves are
shown in Fig. 61.
Fig. 61. Stress-strain behaviour of polyurethane foam with respect to variable strain rate
(Zhang et.al., 1998)
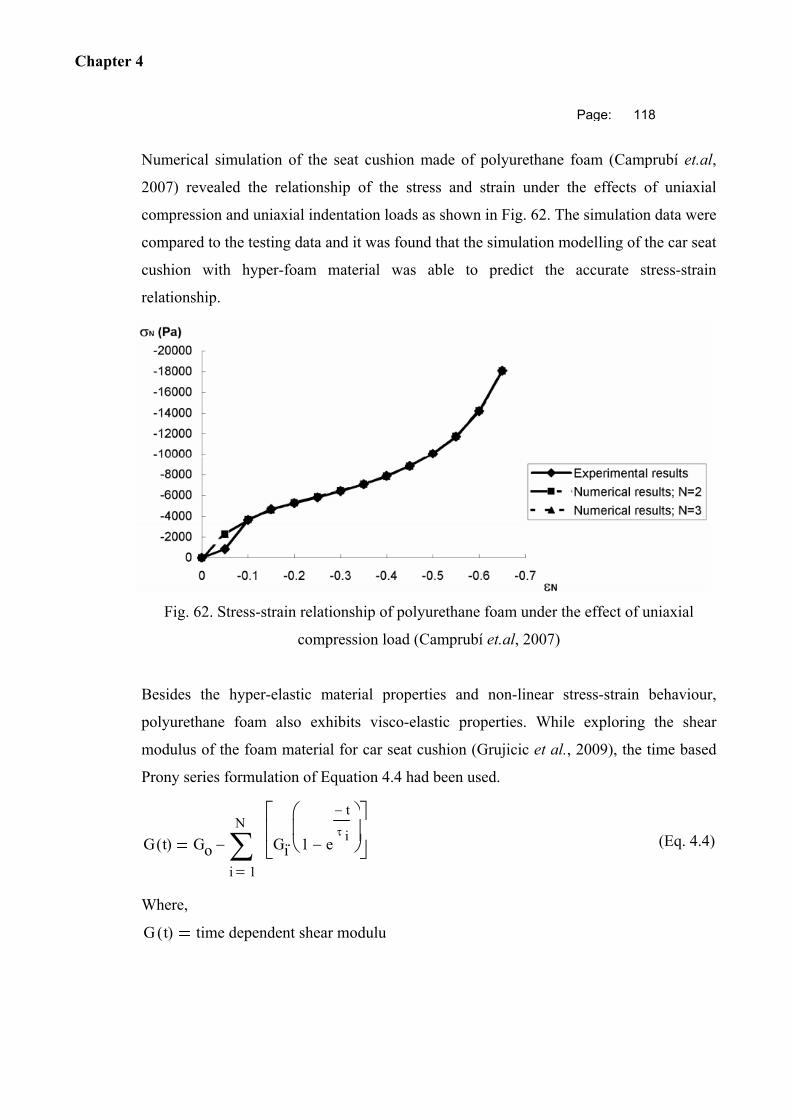
Chapter 4
Page: 118
Numerical simulation of the seat cushion made of polyurethane foam (Camprubí et.al,
2007) revealed the relationship of the stress and strain under the effects of uniaxial
compression and uniaxial indentation loads as shown in Fig. 62. The simulation data were
compared to the testing data and it was found that the simulation modelling of the car seat
cushion with hyper-foam material was able to predict the accurate stress-strain
relationship.
Fig. 62. Stress-strain relationship of polyurethane foam under the effect of uniaxial
compression load (Camprubí et.al, 2007)
Besides the hyper-elastic material properties and non-linear stress-strain behaviour,
polyurethane foam also exhibits visco-elastic properties. While exploring the shear
modulus of the foam material for car seat cushion (Grujicic et al., 2009), the time based
Prony series formulation of Equation 4.4 had been used.
G t( ) Go1
N
i
Gi 1 e
t i
(Eq. 4.4)
Where,
G t( ) time dependent shear modulus
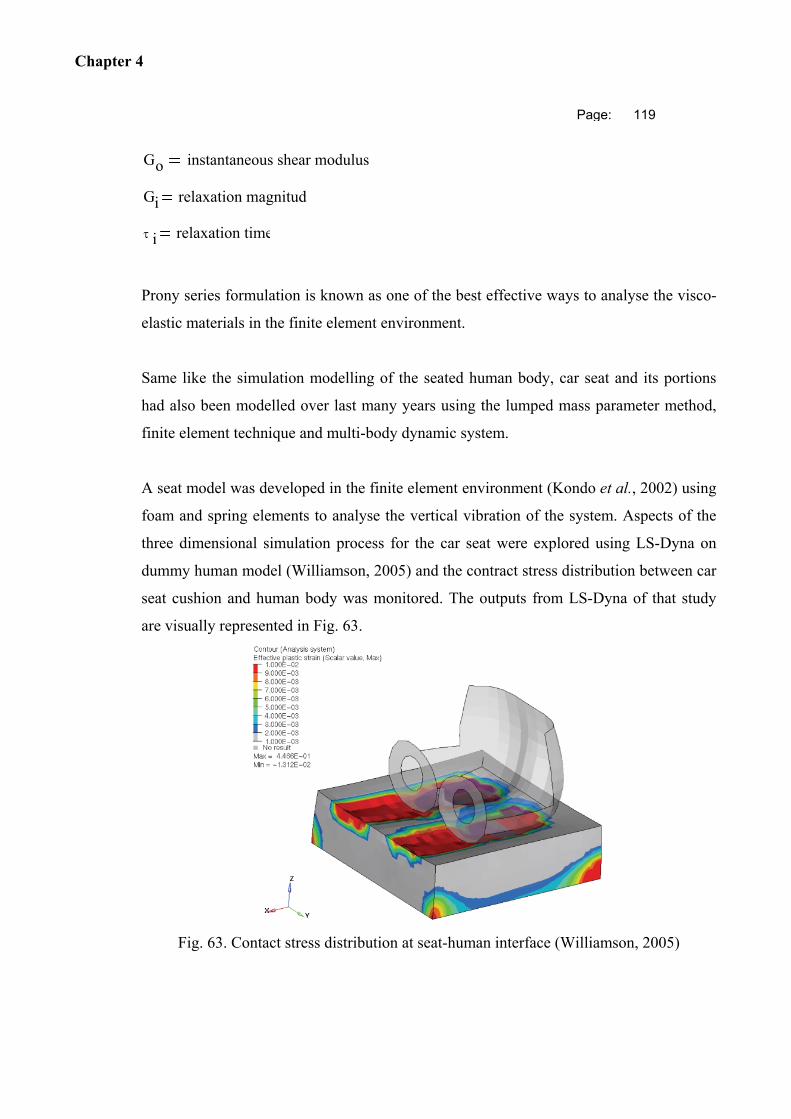
Chapter 4
Page: 119
Go instantaneous shear modulus
Gi relaxation magnitud
i relaxation time
Prony series formulation is known as one of the best effective ways to analyse the visco-
elastic materials in the finite element environment.
Same like the simulation modelling of the seated human body, car seat and its portions
had also been modelled over last many years using the lumped mass parameter method,
finite element technique and multi-body dynamic system.
A seat model was developed in the finite element environment (Kondo et al., 2002) using
foam and spring elements to analyse the vertical vibration of the system. Aspects of the
three dimensional simulation process for the car seat were explored using LS-Dyna on
dummy human model (Williamson, 2005) and the contract stress distribution between car
seat cushion and human body was monitored. The outputs from LS-Dyna of that study
are visually represented in Fig. 63.
Fig. 63. Contact stress distribution at seat-human interface (Williamson, 2005)
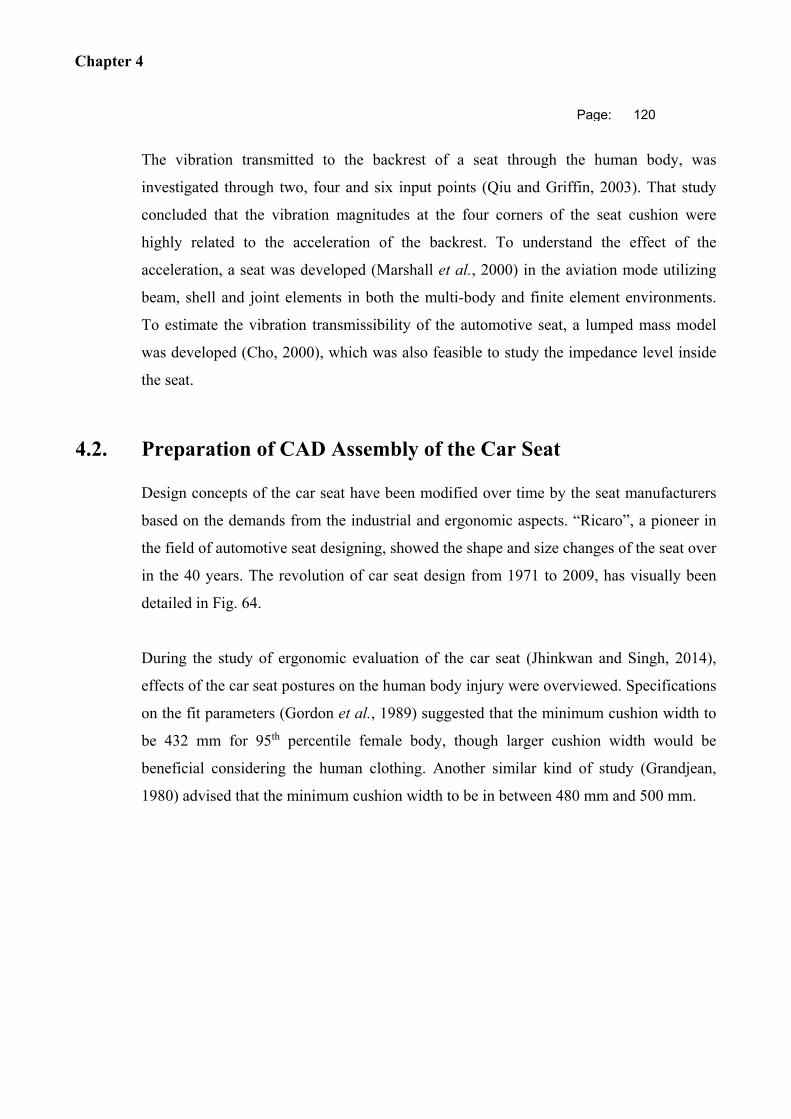
Chapter 4
Page: 120
The vibration transmitted to the backrest of a seat through the human body, was
investigated through two, four and six input points (Qiu and Griffin, 2003). That study
concluded that the vibration magnitudes at the four corners of the seat cushion were
highly related to the acceleration of the backrest. To understand the effect of the
acceleration, a seat was developed (Marshall et al., 2000) in the aviation mode utilizing
beam, shell and joint elements in both the multi-body and finite element environments.
To estimate the vibration transmissibility of the automotive seat, a lumped mass model
was developed (Cho, 2000), which was also feasible to study the impedance level inside
the seat.
4.2. Preparation of CAD Assembly of the Car Seat
Design concepts of the car seat have been modified over time by the seat manufacturers
based on the demands from the industrial and ergonomic aspects. “Ricaro”, a pioneer in
the field of automotive seat designing, showed the shape and size changes of the seat over
in the 40 years. The revolution of car seat design from 1971 to 2009, has visually been
detailed in Fig. 64.
During the study of ergonomic evaluation of the car seat (Jhinkwan and Singh, 2014),
effects of the car seat postures on the human body injury were overviewed. Specifications
on the fit parameters (Gordon et al., 1989) suggested that the minimum cushion width to
be 432 mm for 95th percentile female body, though larger cushion width would be
beneficial considering the human clothing. Another similar kind of study (Grandjean,
1980) advised that the minimum cushion width to be in between 480 mm and 500 mm.
Chapter 4
Page: 121
Fig. 64. Changes of the seat design concepts during 1971 – 2009 (Collected from Ricaro
automotive seat design database)
Recommendations had also been given on the optimized length of the seat cushion.
Suggested seat cushion lengths according to different investigations are 432 mm
(Keegan, 1964), in-between 440 mm and 550 mm (Grandjean, 1980), and 330 mm to 470
mm (Chaffin and Anderson, 1991), depending on the human body anthropometric
dimensions.
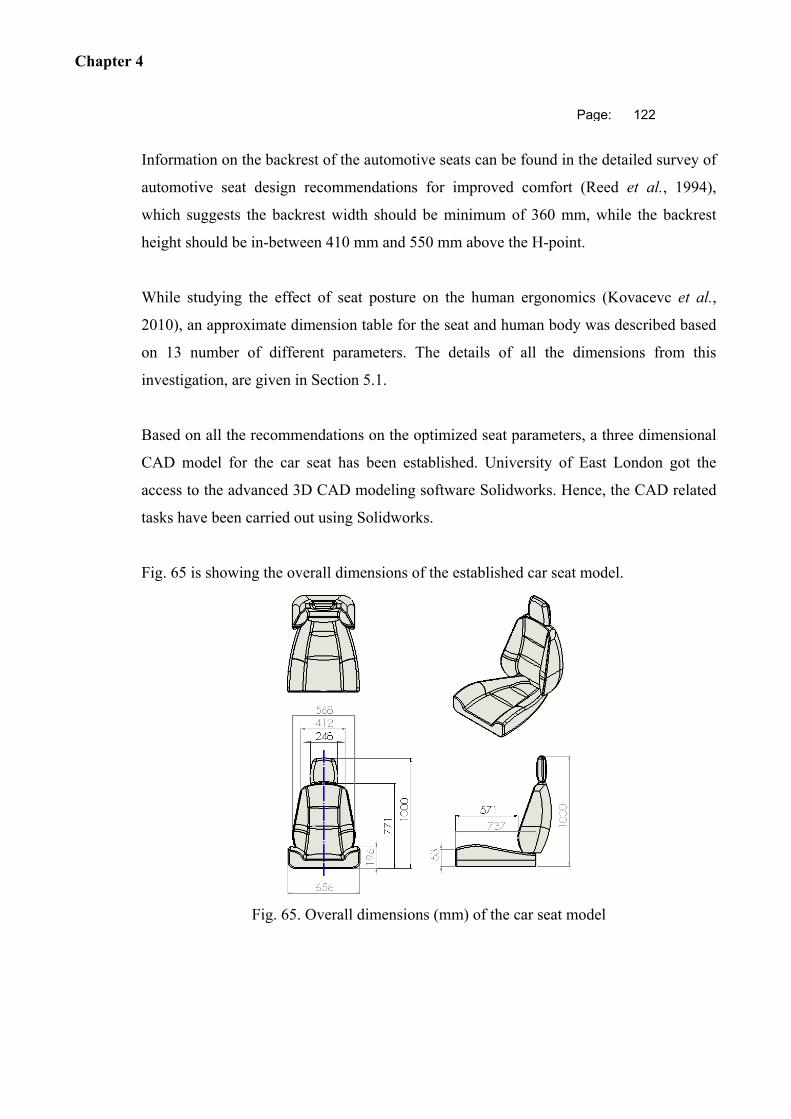
Chapter 4
Page: 122
Information on the backrest of the automotive seats can be found in the detailed survey of
automotive seat design recommendations for improved comfort (Reed et al., 1994),
which suggests the backrest width should be minimum of 360 mm, while the backrest
height should be in-between 410 mm and 550 mm above the H-point.
While studying the effect of seat posture on the human ergonomics (Kovacevc et al.,
2010), an approximate dimension table for the seat and human body was described based
on 13 number of different parameters. The details of all the dimensions from this
investigation, are given in Section 5.1.
Based on all the recommendations on the optimized seat parameters, a three dimensional
CAD model for the car seat has been established. University of East London got the
access to the advanced 3D CAD modeling software Solidworks. Hence, the CAD related
tasks have been carried out using Solidworks.
Fig. 65 is showing the overall dimensions of the established car seat model.
Fig. 65. Overall dimensions (mm) of the car seat model
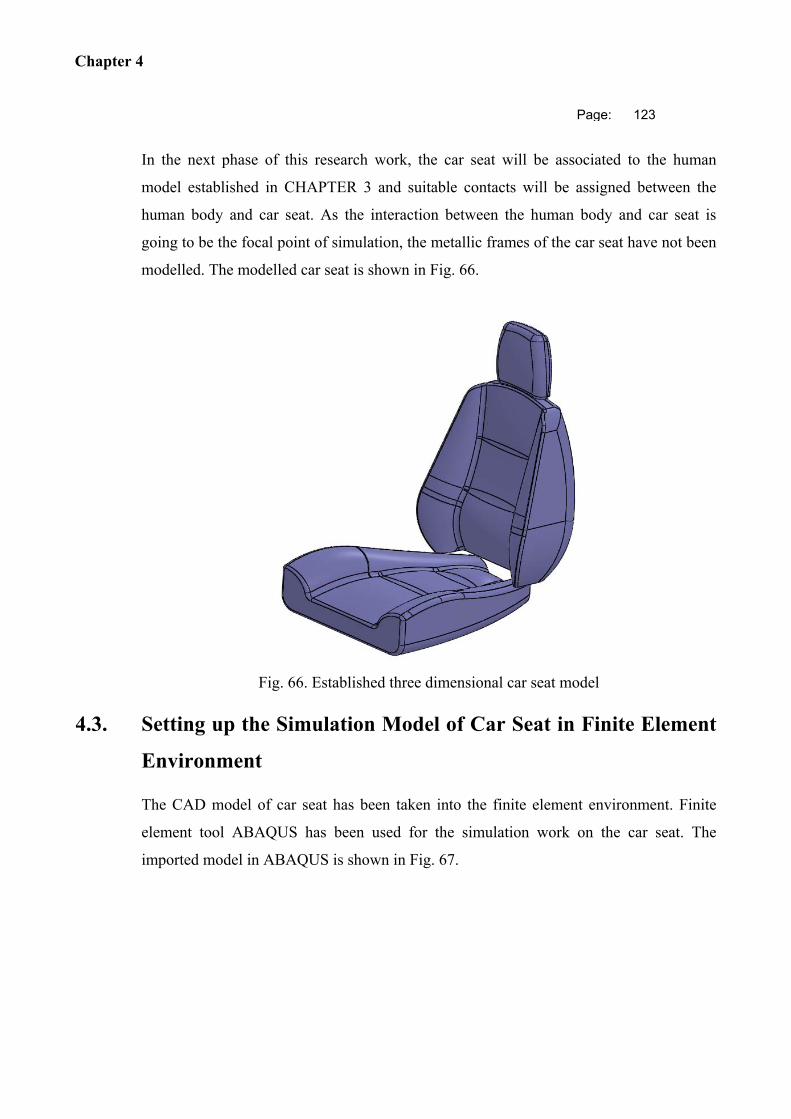
Chapter 4
Page: 123
In the next phase of this research work, the car seat will be associated to the human
model established in CHAPTER 3 and suitable contacts will be assigned between the
human body and car seat. As the interaction between the human body and car seat is
going to be the focal point of simulation, the metallic frames of the car seat have not been
modelled. The modelled car seat is shown in Fig. 66.
Fig. 66. Established three dimensional car seat model
4.3. Setting up the Simulation Model of Car Seat in Finite Element
Environment
The CAD model of car seat has been taken into the finite element environment. Finite
element tool ABAQUS has been used for the simulation work on the car seat. The
imported model in ABAQUS is shown in Fig. 67.
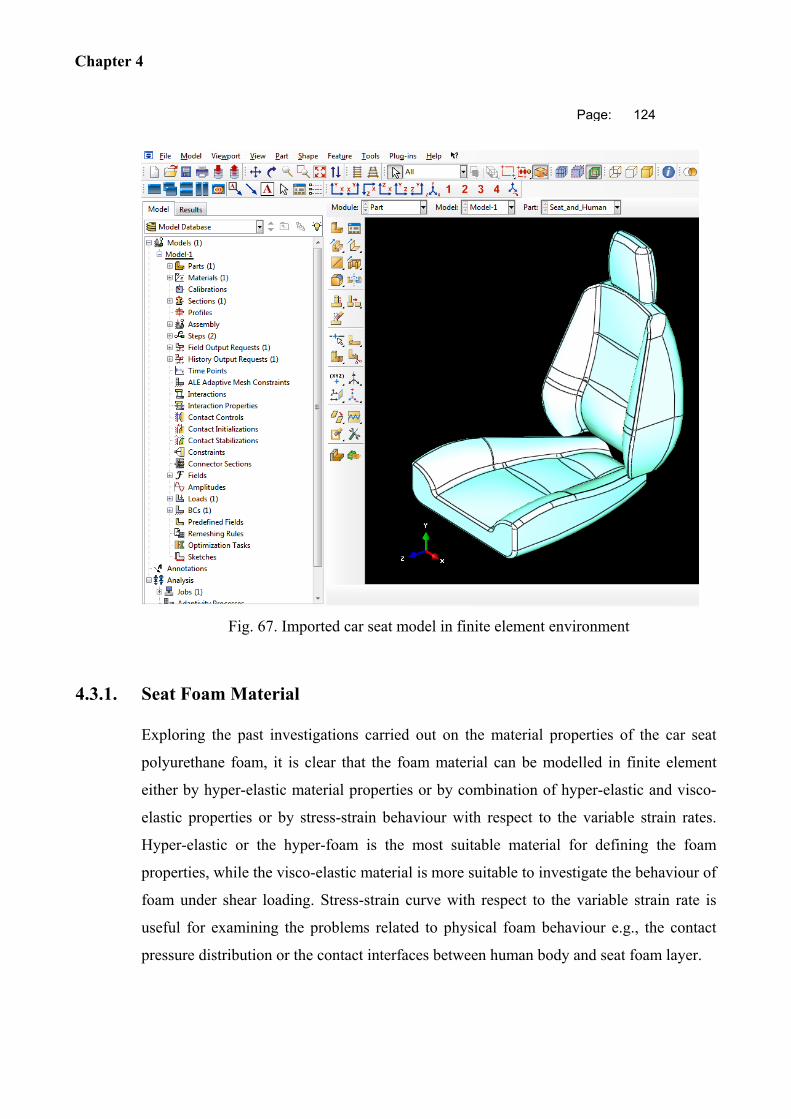
Chapter 4
Page: 124
Fig. 67. Imported car seat model in finite element environment
4.3.1. Seat Foam Material
Exploring the past investigations carried out on the material properties of the car seat
polyurethane foam, it is clear that the foam material can be modelled in finite element
either by hyper-elastic material properties or by combination of hyper-elastic and visco-
elastic properties or by stress-strain behaviour with respect to the variable strain rates.
Hyper-elastic or the hyper-foam is the most suitable material for defining the foam
properties, while the visco-elastic material is more suitable to investigate the behaviour of
foam under shear loading. Stress-strain curve with respect to the variable strain rate is
useful for examining the problems related to physical foam behaviour e.g., the contact
pressure distribution or the contact interfaces between human body and seat foam layer.
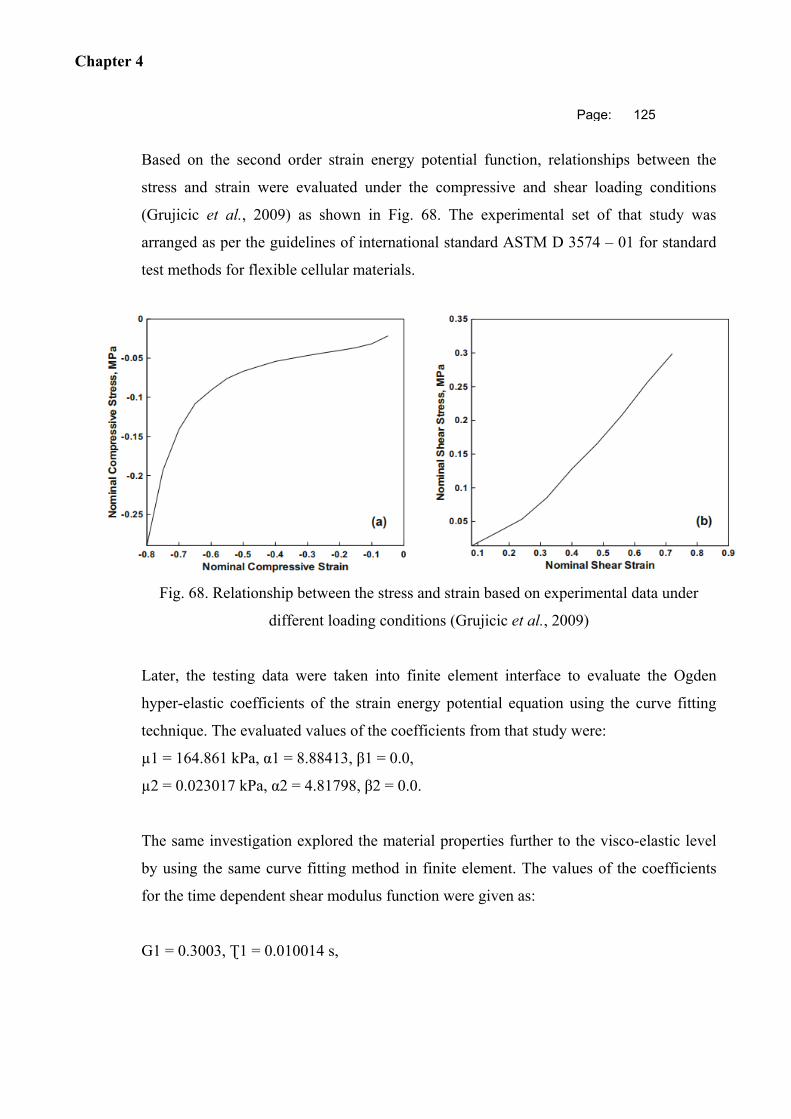
Chapter 4
Page: 125
Based on the second order strain energy potential function, relationships between the
stress and strain were evaluated under the compressive and shear loading conditions
(Grujicic et al., 2009) as shown in Fig. 68. The experimental set of that study was
arranged as per the guidelines of international standard ASTM D 3574 – 01 for standard
test methods for flexible cellular materials.
Fig. 68. Relationship between the stress and strain based on experimental data under
different loading conditions (Grujicic et al., 2009)
Later, the testing data were taken into finite element interface to evaluate the Ogden
hyper-elastic coefficients of the strain energy potential equation using the curve fitting
technique. The evaluated values of the coefficients from that study were:
µ1 = 164.861 kPa, α1 = 8.88413, β1 = 0.0,
µ2 = 0.023017 kPa, α2 = 4.81798, β2 = 0.0.
The same investigation explored the material properties further to the visco-elastic level
by using the same curve fitting method in finite element. The values of the coefficients
for the time dependent shear modulus function were given as:
G1 = 0.3003, Ʈ1 = 0.010014 s,
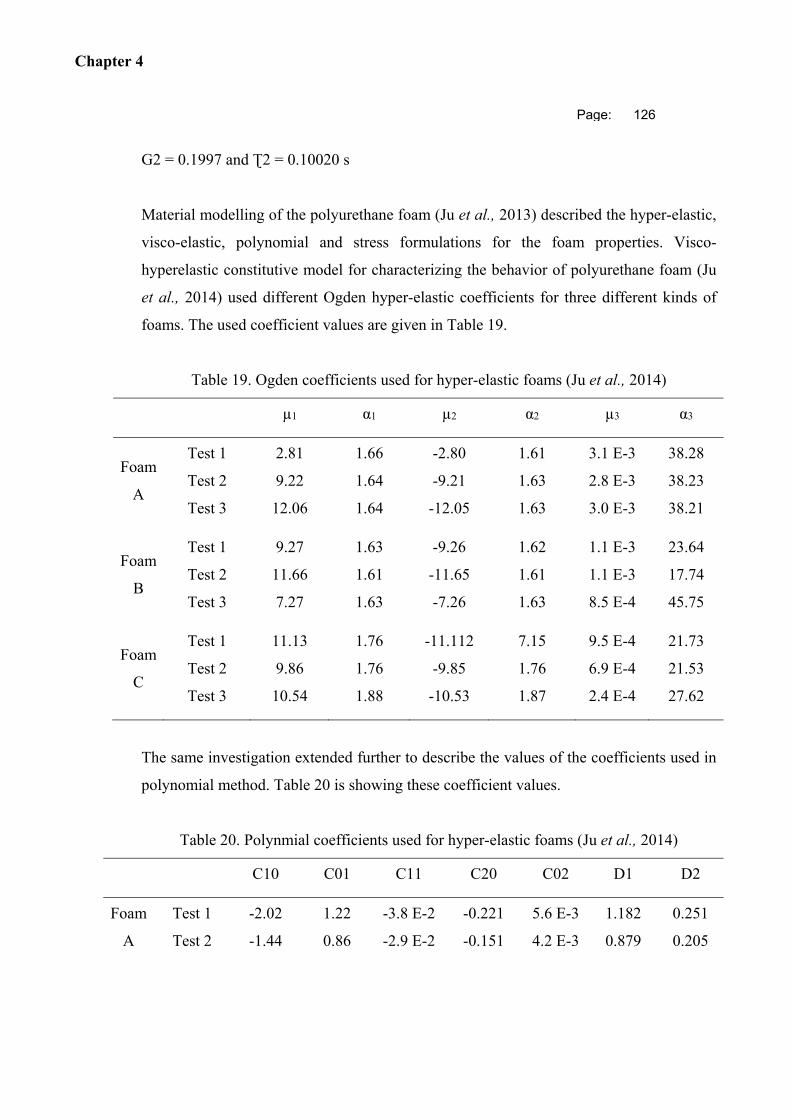
Chapter 4
Page: 126
G2 = 0.1997 and Ʈ2 = 0.10020 s
Material modelling of the polyurethane foam (Ju et al., 2013) described the hyper-elastic,
visco-elastic, polynomial and stress formulations for the foam properties. Visco-
hyperelastic constitutive model for characterizing the behavior of polyurethane foam (Ju
et al., 2014) used different Ogden hyper-elastic coefficients for three different kinds of
foams. The used coefficient values are given in Table 19.
Table 19. Ogden coefficients used for hyper-elastic foams (Ju et al., 2014)
µ1 α1 µ2 α2 µ3 α3
Foam
A
Test 1
Test 2
Test 3
2.81
9.22
12.06
1.66
1.64
1.64
-2.80
-9.21
-12.05
1.61
1.63
1.63
3.1 E-3
2.8 E-3
3.0 E-3
38.28
38.23
38.21
Foam
B
Test 1
Test 2
Test 3
9.27
11.66
7.27
1.63
1.61
1.63
-9.26
-11.65
-7.26
1.62
1.61
1.63
1.1 E-3
1.1 E-3
8.5 E-4
23.64
17.74
45.75
Foam
C
Test 1
Test 2
Test 3
11.13
9.86
10.54
1.76
1.76
1.88
-11.112
-9.85
-10.53
7.15
1.76
1.87
9.5 E-4
6.9 E-4
2.4 E-4
21.73
21.53
27.62
The same investigation extended further to describe the values of the coefficients used in
polynomial method. Table 20 is showing these coefficient values.
Table 20. Polynmial coefficients used for hyper-elastic foams (Ju et al., 2014)
C10 C01 C11 C20 C02 D1 D2
Foam
A
Test 1
Test 2
-2.02
-1.44
1.22
0.86
-3.8 E-2
-2.9 E-2
-0.221
-0.151
5.6 E-3
4.2 E-3
1.182
0.879
0.251
0.205
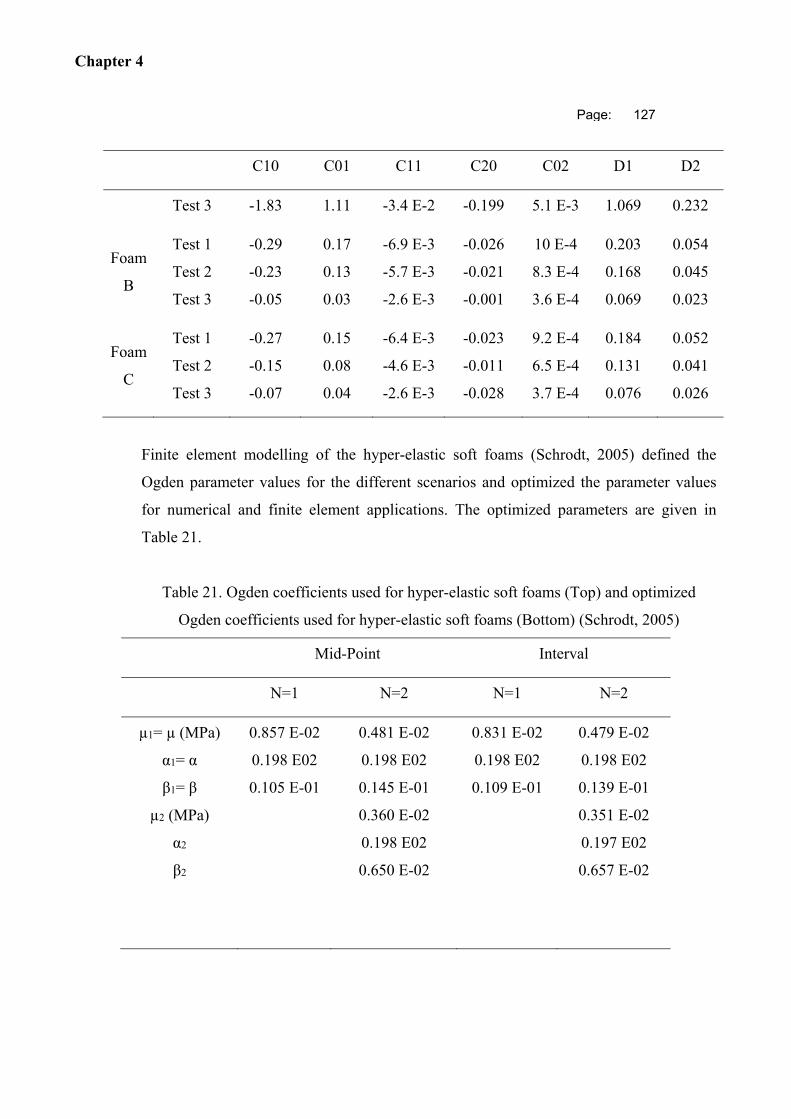
Chapter 4
Page: 127
C10 C01 C11 C20 C02 D1 D2
Test 3 -1.83 1.11 -3.4 E-2 -0.199 5.1 E-3 1.069 0.232
Foam
B
Test 1
Test 2
Test 3
-0.29
-0.23
-0.05
0.17
0.13
0.03
-6.9 E-3
-5.7 E-3
-2.6 E-3
-0.026
-0.021
-0.001
10 E-4
8.3 E-4
3.6 E-4
0.203
0.168
0.069
0.054
0.045
0.023
Foam
C
Test 1
Test 2
Test 3
-0.27
-0.15
-0.07
0.15
0.08
0.04
-6.4 E-3
-4.6 E-3
-2.6 E-3
-0.023
-0.011
-0.028
9.2 E-4
6.5 E-4
3.7 E-4
0.184
0.131
0.076
0.052
0.041
0.026
Finite element modelling of the hyper-elastic soft foams (Schrodt, 2005) defined the
Ogden parameter values for the different scenarios and optimized the parameter values
for numerical and finite element applications. The optimized parameters are given in
Table 21.
Table 21. Ogden coefficients used for hyper-elastic soft foams (Top) and optimized
Ogden coefficients used for hyper-elastic soft foams (Bottom) (Schrodt, 2005)
Mid-Point Interval
N=1 N=2 N=1 N=2
µ1= µ (MPa)
α1= α
β1= β
µ2 (MPa)
α2
β2
0.857 E-02
0.198 E02
0.105 E-01
0.481 E-02
0.198 E02
0.145 E-01
0.360 E-02
0.198 E02
0.650 E-02
0.831 E-02
0.198 E02
0.109 E-01
0.479 E-02
0.198 E02
0.139 E-01
0.351 E-02
0.197 E02
0.657 E-02
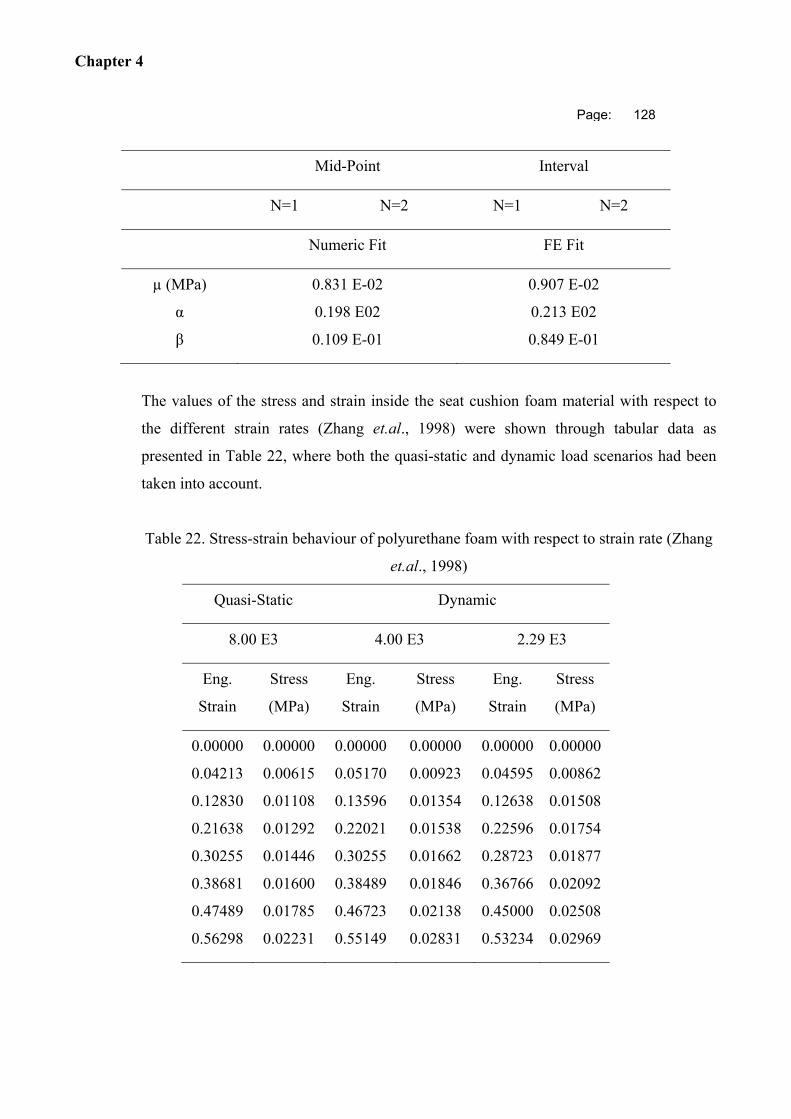
Chapter 4
Page: 128
Mid-Point Interval
N=1 N=2 N=1 N=2
Numeric Fit FE Fit
µ (MPa)
α
β
0.831 E-02
0.198 E02
0.109 E-01
0.907 E-02
0.213 E02
0.849 E-01
The values of the stress and strain inside the seat cushion foam material with respect to
the different strain rates (Zhang et.al., 1998) were shown through tabular data as
presented in Table 22, where both the quasi-static and dynamic load scenarios had been
taken into account.
Table 22. Stress-strain behaviour of polyurethane foam with respect to strain rate (Zhang
et.al., 1998)
Quasi-Static Dynamic
8.00 E3 4.00 E3 2.29 E3
Eng.
Strain
Stress
(MPa)
Eng.
Strain
Stress
(MPa)
Eng.
Strain
Stress
(MPa)
0.00000
0.04213
0.12830
0.21638
0.30255
0.38681
0.47489
0.56298
0.00000
0.00615
0.01108
0.01292
0.01446
0.01600
0.01785
0.02231
0.00000
0.05170
0.13596
0.22021
0.30255
0.38489
0.46723
0.55149
0.00000
0.00923
0.01354
0.01538
0.01662
0.01846
0.02138
0.02831
0.00000
0.04595
0.12638
0.22596
0.28723
0.36766
0.45000
0.53234
0.00000
0.00862
0.01508
0.01754
0.01877
0.02092
0.02508
0.02969
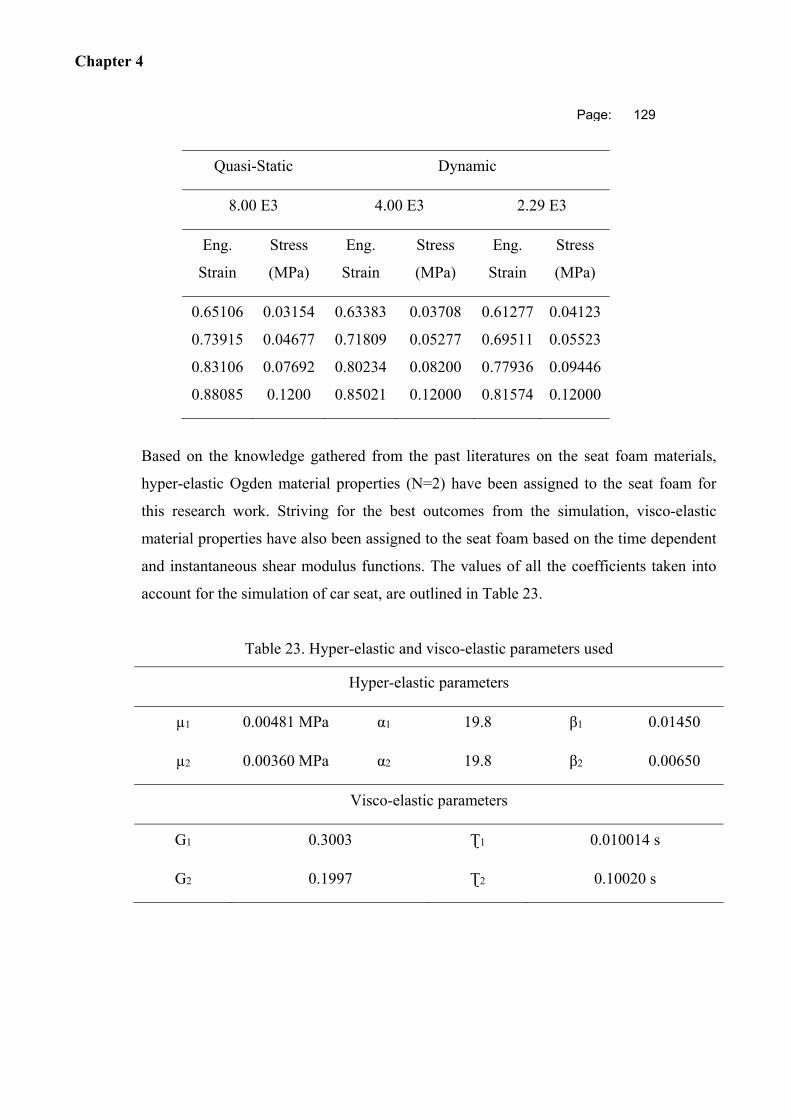
Chapter 4
Page: 129
Quasi-Static Dynamic
8.00 E3 4.00 E3 2.29 E3
Eng.
Strain
Stress
(MPa)
Eng.
Strain
Stress
(MPa)
Eng.
Strain
Stress
(MPa)
0.65106
0.73915
0.83106
0.88085
0.03154
0.04677
0.07692
0.1200
0.63383
0.71809
0.80234
0.85021
0.03708
0.05277
0.08200
0.12000
0.61277
0.69511
0.77936
0.81574
0.04123
0.05523
0.09446
0.12000
Based on the knowledge gathered from the past literatures on the seat foam materials,
hyper-elastic Ogden material properties (N=2) have been assigned to the seat foam for
this research work. Striving for the best outcomes from the simulation, visco-elastic
material properties have also been assigned to the seat foam based on the time dependent
and instantaneous shear modulus functions. The values of all the coefficients taken into
account for the simulation of car seat, are outlined in Table 23.
Table 23. Hyper-elastic and visco-elastic parameters used
Hyper-elastic parameters
µ1 0.00481 MPa α1 19.8 β1 0.01450
µ2 0.00360 MPa α2 19.8 β2 0.00650
Visco-elastic parameters
G1 0.3003 Ʈ1 0.010014 s
G2 0.1997 Ʈ2 0.10020 s
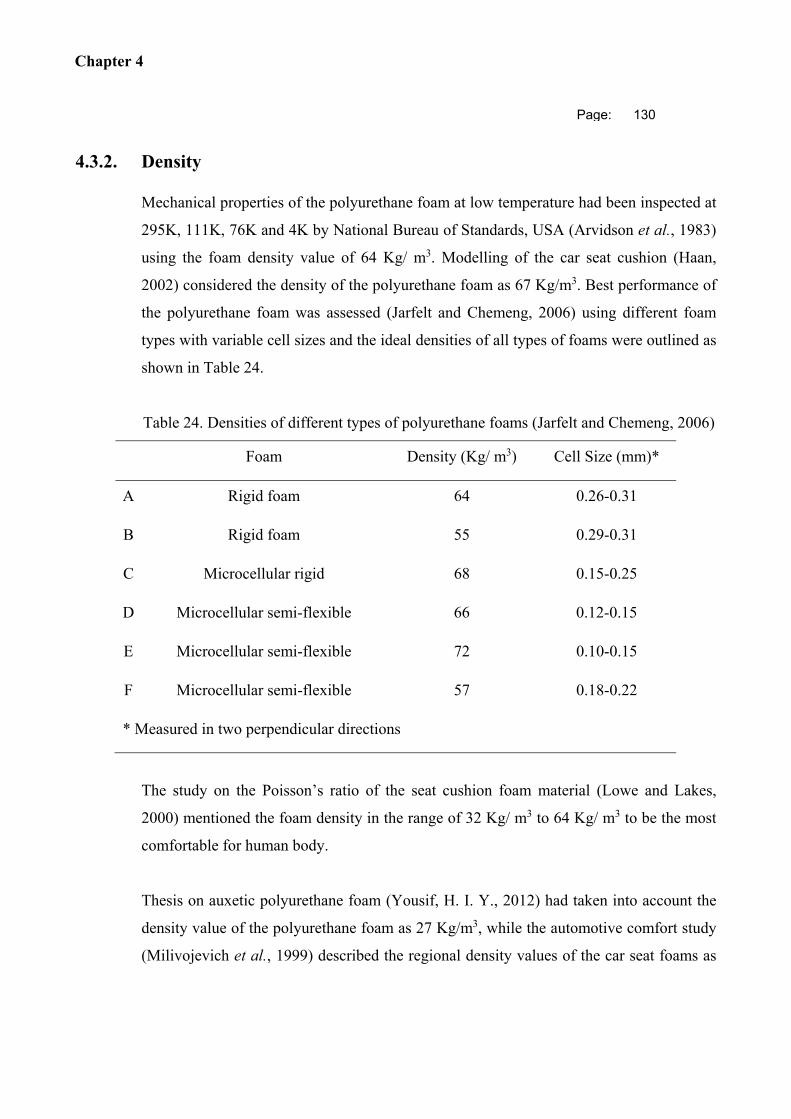
Chapter 4
Page: 130
4.3.2. Density
Mechanical properties of the polyurethane foam at low temperature had been inspected at
295K, 111K, 76K and 4K by National Bureau of Standards, USA (Arvidson et al., 1983)
using the foam density value of 64 Kg/ m3. Modelling of the car seat cushion (Haan,
2002) considered the density of the polyurethane foam as 67 Kg/m3. Best performance of
the polyurethane foam was assessed (Jarfelt and Chemeng, 2006) using different foam
types with variable cell sizes and the ideal densities of all types of foams were outlined as
shown in Table 24.
Table 24. Densities of different types of polyurethane foams (Jarfelt and Chemeng, 2006)
Foam Density (Kg/ m3) Cell Size (mm)*
A Rigid foam 64 0.26-0.31
B Rigid foam 55 0.29-0.31
C Microcellular rigid 68 0.15-0.25
D Microcellular semi-flexible 66 0.12-0.15
E Microcellular semi-flexible 72 0.10-0.15
F Microcellular semi-flexible 57 0.18-0.22
* Measured in two perpendicular directions
The study on the Poisson’s ratio of the seat cushion foam material (Lowe and Lakes,
2000) mentioned the foam density in the range of 32 Kg/ m3 to 64 Kg/ m3 to be the most
comfortable for human body.
Thesis on auxetic polyurethane foam (Yousif, H. I. Y., 2012) had taken into account the
density value of the polyurethane foam as 27 Kg/m3, while the automotive comfort study
(Milivojevich et al., 1999) described the regional density values of the car seat foams as
Chapter 4
Page: 131
37 Kg/m3, 47 Kg/m3 and 52 Kg/m3 for North America, Europe and Japan, respectively.
Visco-elastic material modelling (Ju et al., 2013) considered the density of the flexible
polyurethane foam as 28 Kg/m3.
After careful assessment of all the foam density values mentioned in the past related
research works, rigid foam has been chosen for this simulation task and the density value
of the car seat foam material has been taken as 64 Kg/ m3.
4.3.3. Poisson’s Ratio
Modern industries have been trying to develop car seat foam material which will bulge in
inward direction and exhibit the negative Poisson’s ratio. One of the cutting edge
technologies (Lowe and Lakes, 2000) on the car seat cushion showed that the cushion
polymer of density 18 Kg/m3 with a compression ratio of 2.2, had a Poisson's ratio of -
0.13, while the polymer of density 25 Kg/m3 with a compression ratio of 3.4, had a
Poisson's ratio of -0.26.
Practically, the car seat foam materials react mostly under the compression effects
without any sideway restraints, hence, the lateral strain and longitudinal strain are not co-
related to each other. Taking into account this fact, the computational analysis of car seat
along with human body (Grujicic et al., 2009) considered the Poisson’s ratio as 0. Finite
element modelling of the car seat (Haan, 2002) and design process of seat cushion
(Camprubí et.al, 2007) made of polyurethane materials ignored the Poisson’s ratio, too.
So, the effect of the Poisson’s ratio can be ignored and in this finite element simulation of
the car seat, the value of Poisson’s ratio has been considered as 0.
4.3.4. Temperature Gradient
Though the polyurethane foam properties vary with respect to the surrounding
temperature, this simulation work has been assumed to have constant thermal conditions
Chapter 4
Page: 132
throughout the short span of simulation running period. Hence, no effect due to the
temperature change has been considered.
4.4. Analysis Details in ABAQUS for the Car Seat
4.4.1. Analysis Steps
4.4.1.1. Step 1: Initial
First step is the base state of the simulation, where the car seat material properties and
boundary conditions have been applied.
4.4.1.2. Step 2: Static General
Second step is the static general step, where the deformations are evaluated. The main
aims of the simulation of the car seat are to verify the feasibilities of the material
properties assigned and gain a knowledge about the suitability of the developed car seat
for the next comprehensive simulation phase for entire car seat and human assembly.
Hence, the simulation has been set to run for 1 second in this step.
4.4.2. Boundary Conditions
The following boundary conditions have been applied to the car seat:
a. Bottom side of the car seat cushion - Fixed.
b. Backrest of the car seat cushion - Angular fore-aft movement is allowed around the seat
pivot point, but sidewise movements of the backend of the backrest are not allowed from
the initial position.
c. Headrest of the car seat cushion - Angular fore-aft movement is allowed around the
connecting point to the backrest, but sidewise movements of the backend of the headrest
are not allowed from the initial position.
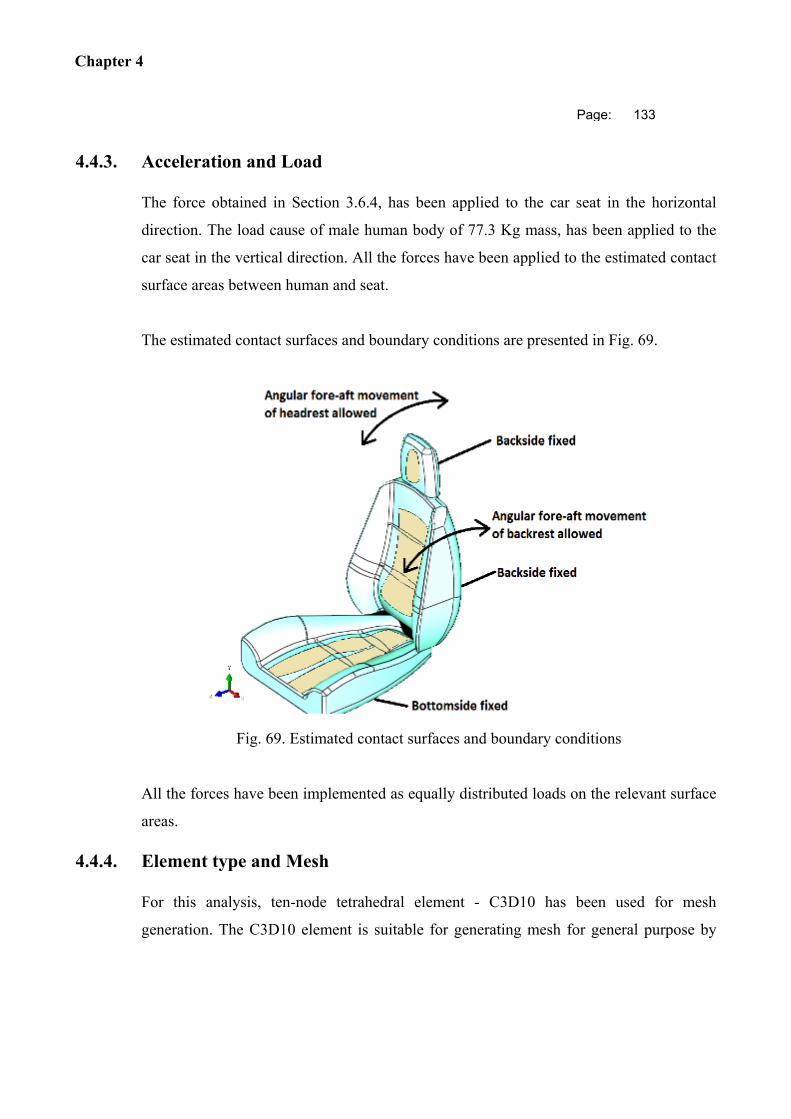
Chapter 4
Page: 133
4.4.3. Acceleration and Load
The force obtained in Section 3.6.4, has been applied to the car seat in the horizontal
direction. The load cause of male human body of 77.3 Kg mass, has been applied to the
car seat in the vertical direction. All the forces have been applied to the estimated contact
surface areas between human and seat.
The estimated contact surfaces and boundary conditions are presented in Fig. 69.
Fig. 69. Estimated contact surfaces and boundary conditions
All the forces have been implemented as equally distributed loads on the relevant surface
areas.
4.4.4. Element type and Mesh
For this analysis, ten-node tetrahedral element - C3D10 has been used for mesh
generation. The C3D10 element is suitable for generating mesh for general purpose by
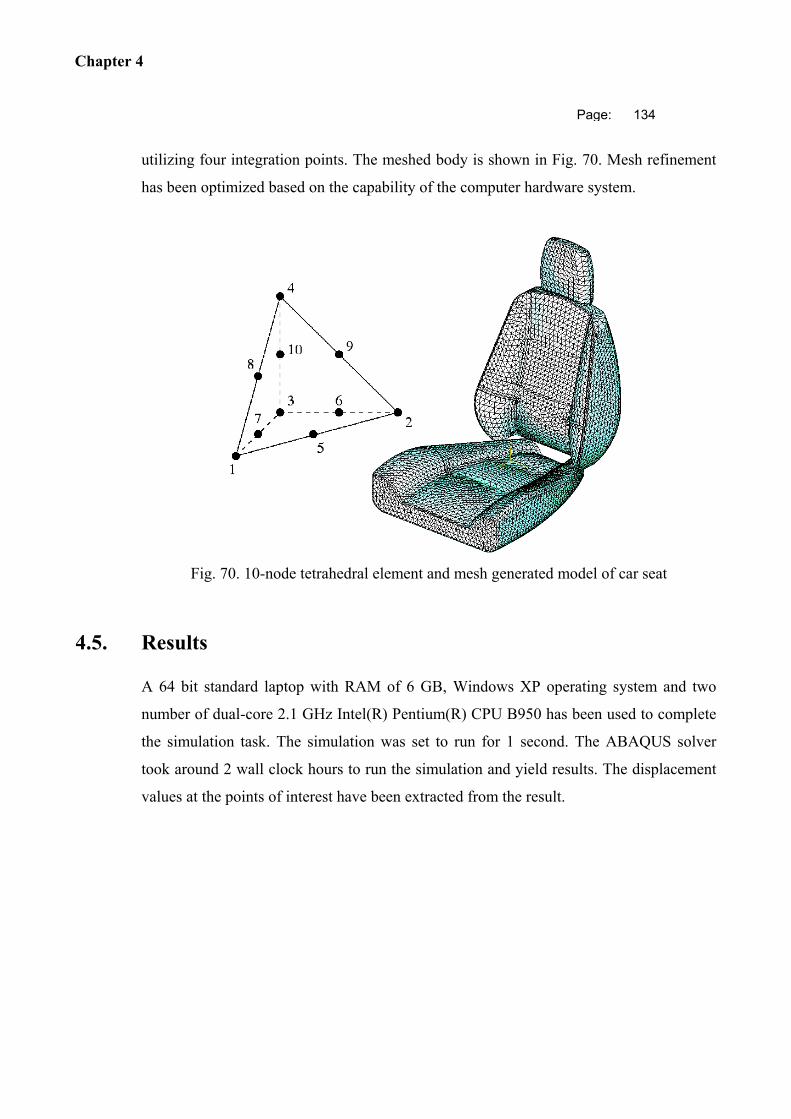
Chapter 4
Page: 134
utilizing four integration points. The meshed body is shown in Fig. 70. Mesh refinement
has been optimized based on the capability of the computer hardware system.
Fig. 70. 10-node tetrahedral element and mesh generated model of car seat
4.5. Results
A 64 bit standard laptop with RAM of 6 GB, Windows XP operating system and two
number of dual-core 2.1 GHz Intel(R) Pentium(R) CPU B950 has been used to complete
the simulation task. The simulation was set to run for 1 second. The ABAQUS solver
took around 2 wall clock hours to run the simulation and yield results. The displacement
values at the points of interest have been extracted from the result.
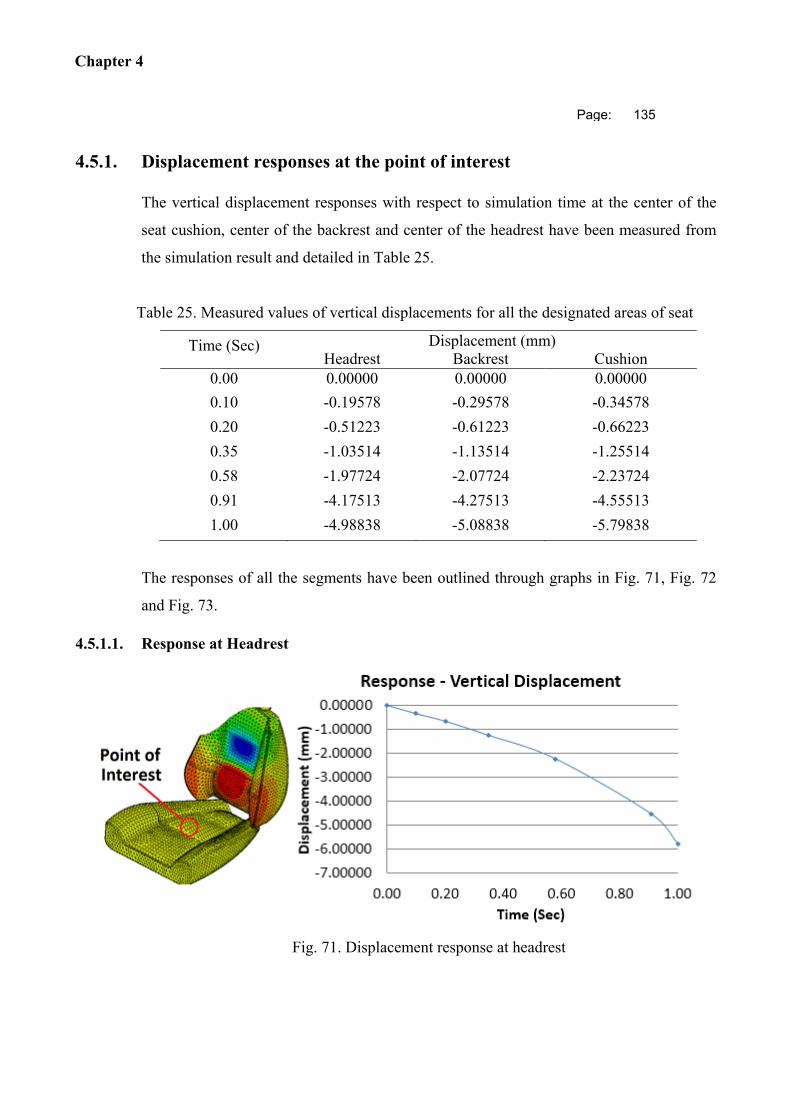
Chapter 4
Page: 135
4.5.1. Displacement responses at the point of interest
The vertical displacement responses with respect to simulation time at the center of the
seat cushion, center of the backrest and center of the headrest have been measured from
the simulation result and detailed in Table 25.
Table 25. Measured values of vertical displacements for all the designated areas of seat
Time (Sec) Displacement (mm)Headrest Backrest Cushion
0.00 0.00000 0.00000 0.00000
0.10 -0.19578 -0.29578 -0.34578
0.20 -0.51223 -0.61223 -0.66223
0.35 -1.03514 -1.13514 -1.25514
0.58 -1.97724 -2.07724 -2.23724
0.91 -4.17513 -4.27513 -4.55513
1.00 -4.98838 -5.08838 -5.79838
The responses of all the segments have been outlined through graphs in Fig. 71, Fig. 72
and Fig. 73.
4.5.1.1. Response at Headrest
Fig. 71. Displacement response at headrest
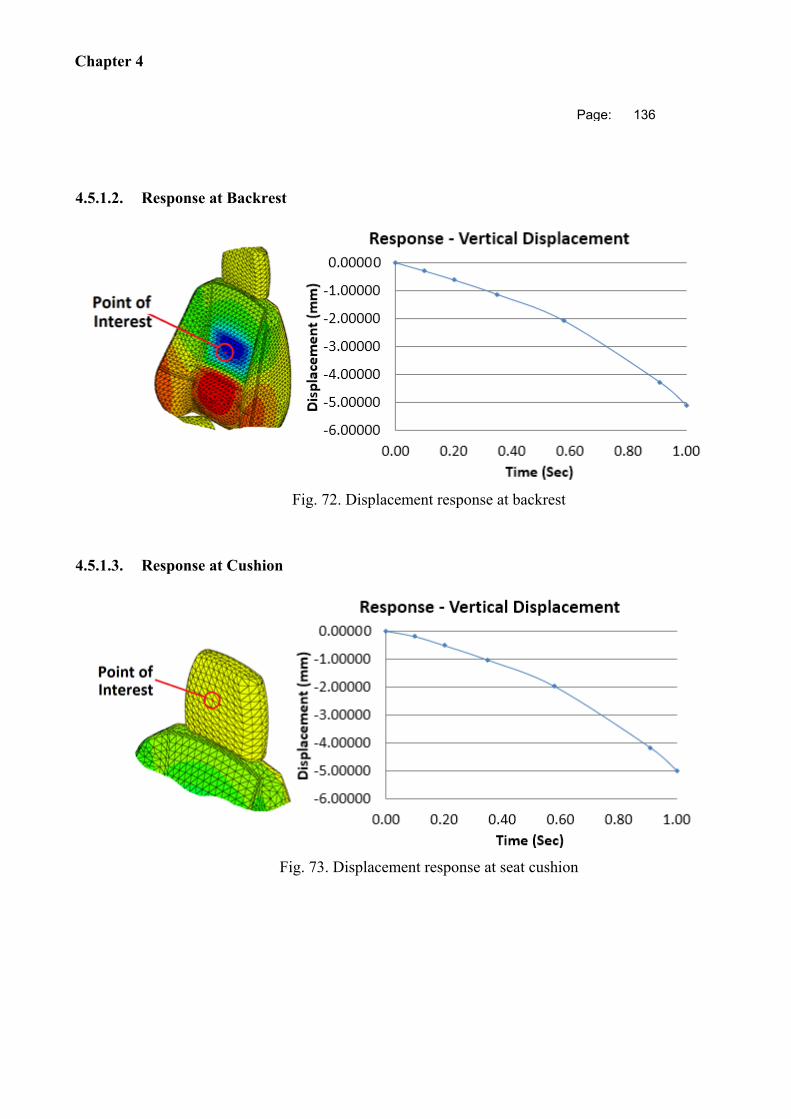
Chapter 4
Page: 136
4.5.1.2. Response at Backrest
Fig. 72. Displacement response at backrest
4.5.1.3. Response at Cushion
Fig. 73. Displacement response at seat cushion
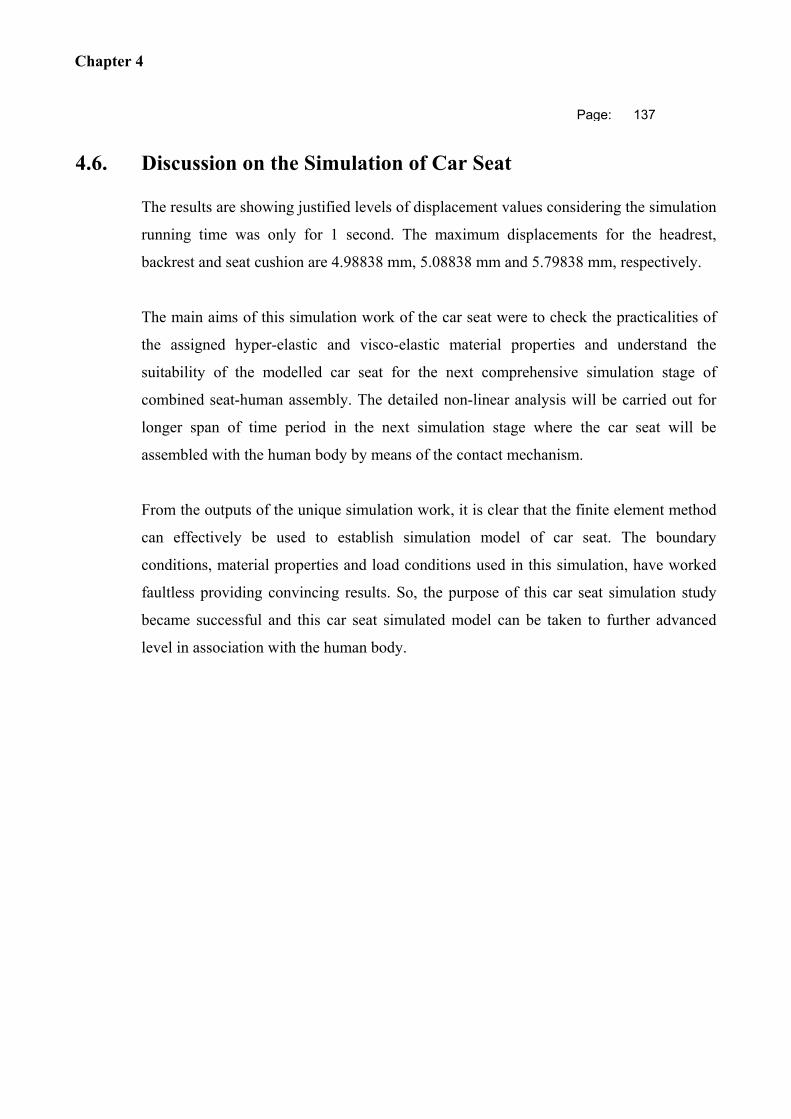
Chapter 4
Page: 137
4.6. Discussion on the Simulation of Car Seat
The results are showing justified levels of displacement values considering the simulation
running time was only for 1 second. The maximum displacements for the headrest,
backrest and seat cushion are 4.98838 mm, 5.08838 mm and 5.79838 mm, respectively.
The main aims of this simulation work of the car seat were to check the practicalities of
the assigned hyper-elastic and visco-elastic material properties and understand the
suitability of the modelled car seat for the next comprehensive simulation stage of
combined seat-human assembly. The detailed non-linear analysis will be carried out for
longer span of time period in the next simulation stage where the car seat will be
assembled with the human body by means of the contact mechanism.
From the outputs of the unique simulation work, it is clear that the finite element method
can effectively be used to establish simulation model of car seat. The boundary
conditions, material properties and load conditions used in this simulation, have worked
faultless providing convincing results. So, the purpose of this car seat simulation study
became successful and this car seat simulated model can be taken to further advanced
level in association with the human body.
Chapter 5
Page: 138
CHAPTER 5 SIMULATION MODEL
DEVELOPED FOR COMBINED
HUMAN BODY AND CAR SEAT
The posture of the car seated human body is one of the key factors to define the safety
and comfort of the occupant inside the moving car. Parts of the automobile seat are
adjustable to provide the comfortable sitting postures to human bodies of different shapes
and sizes. The smallest size of the human is 5th percentile female body, while the biggest
size is applicable for the 95th percentile male body and the car seats should be adjustable
to cope with this range of smallest and biggest sizes. The contact between the seat and the
human body plays important role for the vibration transmission and the level of vibration
generated inside the car seated human body is a function of many parameters including
shapes, sizes, masses etc. of human body and the adjusted final posture of the seat.
For the vibration to be generated inside human body within the permissible ranges,
suitable contact between the seat and human to be assigned in the simulation
environment. To develop an effective simulation model for the human body and car seat,
it is required to define comfortable sitting postures of the human portions in touch with
the seat. The sitting posture and human-seat interfaces are primarily tuned by the
Chapter 5
Page: 139
orientations of the human body segments, primarily; head, elbow, shoulder, torso, hip
joint, ankle and knee.
Once the postures for the seat and human body are confirmed, the contact mechanisms in
between all the mating surfaces need to be defined to get the vibration output data as
accurate as possible. The polyurethane foam material of the seat is non-linear in nature
and the human body segments are constructed by the ellipsoidal bodies with the damping
and calculated stiffness parameters inside. So, the addition of the contact mechanisms
makes the entire simulation more robust and time consuming and the chance for the
entire simulation to get failed increases while all the complex factors are combined
together. Hence, the real challenges of this simulation of the human body with car seat
are to define the real life input parameters, place the human body in suitable posture,
assign contact mechanisms at human-seat interfaces and obtain the desirable outputs
within justified span of simulation running time.
5.1. Past works on Human Posture on Automotive Seat and
Assembling Technique of Human Body and Automotive Seat
Together
The sitting posture of the human body inside a car and the orientations of the seat
segments should be in compliance with the industrial guidelines. General ergonomics
principles, anthropometry and biomechanics, ergonomics of human-system interaction
and ergonomics of the physical environment are elaborated in the standards ISO/TC
159/SC 1, ISO/TC 159/SC 3, ISO/TC 159/SC 4 and ISO/TC 159/SC 5, respectively.
Past research works on the human body bio-dynamics and car seat using different
techniques have already been explored in the previous chapters. So, this section is mainly
focusing on the earlier investigations related to the human posture on an automotive seat
and the assembling technique of the human and automotive seat together.
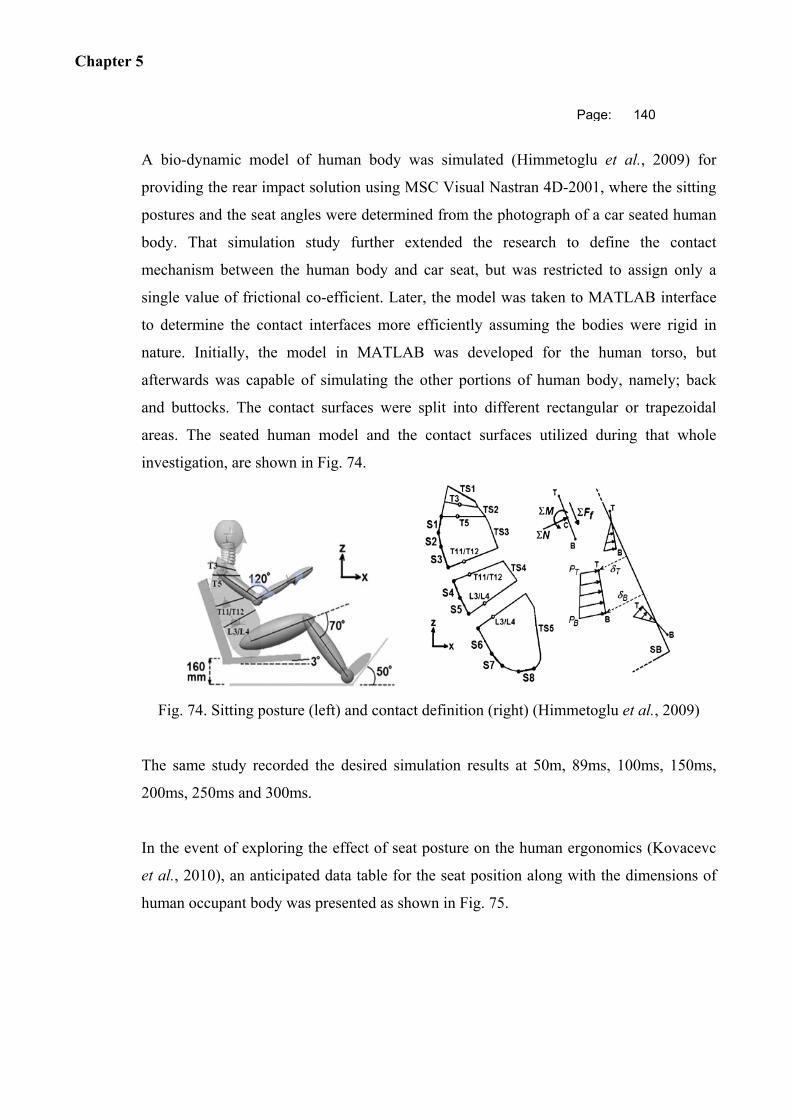
Chapter 5
Page: 140
A bio-dynamic model of human body was simulated (Himmetoglu et al., 2009) for
providing the rear impact solution using MSC Visual Nastran 4D-2001, where the sitting
postures and the seat angles were determined from the photograph of a car seated human
body. That simulation study further extended the research to define the contact
mechanism between the human body and car seat, but was restricted to assign only a
single value of frictional co-efficient. Later, the model was taken to MATLAB interface
to determine the contact interfaces more efficiently assuming the bodies were rigid in
nature. Initially, the model in MATLAB was developed for the human torso, but
afterwards was capable of simulating the other portions of human body, namely; back
and buttocks. The contact surfaces were split into different rectangular or trapezoidal
areas. The seated human model and the contact surfaces utilized during that whole
investigation, are shown in Fig. 74.
Fig. 74. Sitting posture (left) and contact definition (right) (Himmetoglu et al., 2009)
The same study recorded the desired simulation results at 50m, 89ms, 100ms, 150ms,
200ms, 250ms and 300ms.
In the event of exploring the effect of seat posture on the human ergonomics (Kovacevc
et al., 2010), an anticipated data table for the seat position along with the dimensions of
human occupant body was presented as shown in Fig. 75.
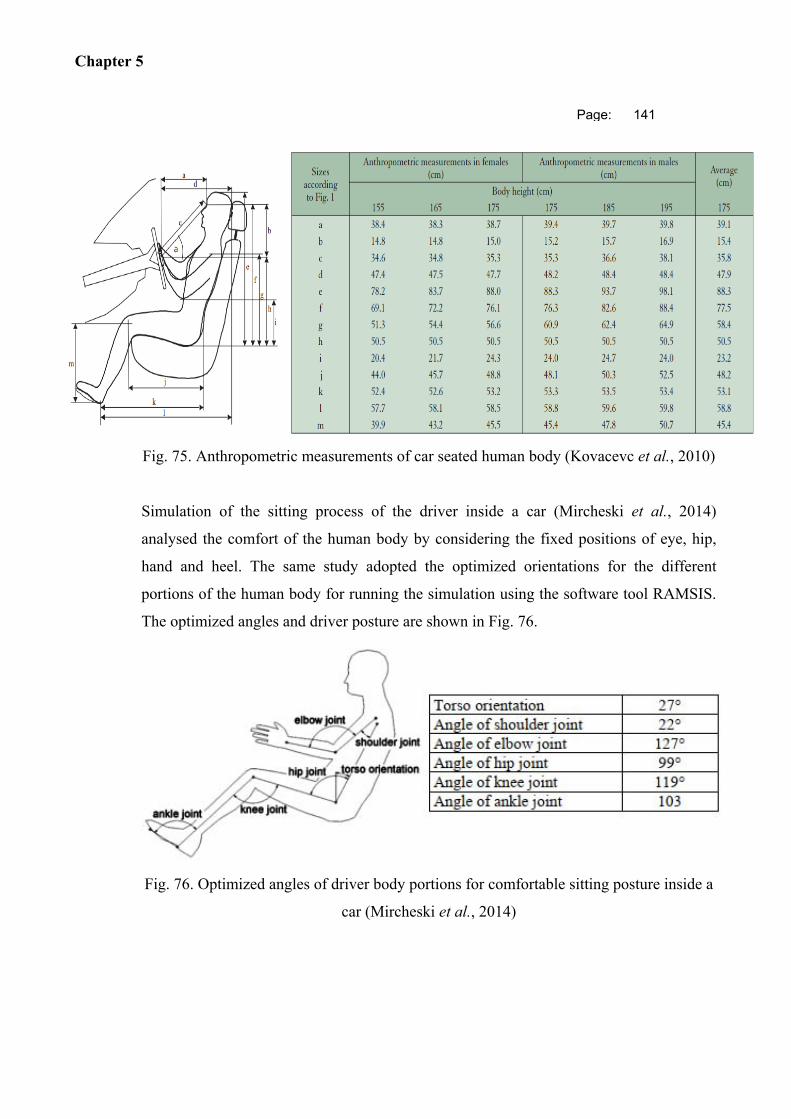
Chapter 5
Page: 141
Fig. 75. Anthropometric measurements of car seated human body (Kovacevc et al., 2010)
Simulation of the sitting process of the driver inside a car (Mircheski et al., 2014)
analysed the comfort of the human body by considering the fixed positions of eye, hip,
hand and heel. The same study adopted the optimized orientations for the different
portions of the human body for running the simulation using the software tool RAMSIS.
The optimized angles and driver posture are shown in Fig. 76.
Fig. 76. Optimized angles of driver body portions for comfortable sitting posture inside a
car (Mircheski et al., 2014)
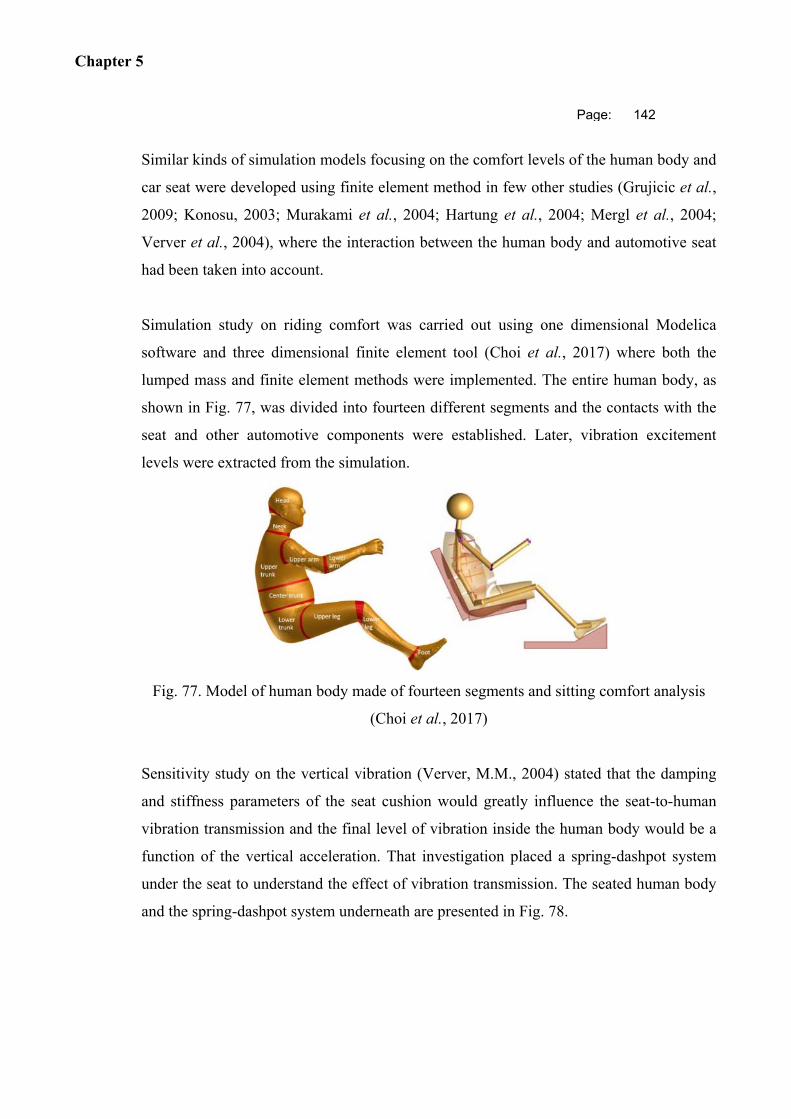
Chapter 5
Page: 142
Similar kinds of simulation models focusing on the comfort levels of the human body and
car seat were developed using finite element method in few other studies (Grujicic et al.,
2009; Konosu, 2003; Murakami et al., 2004; Hartung et al., 2004; Mergl et al., 2004;
Verver et al., 2004), where the interaction between the human body and automotive seat
had been taken into account.
Simulation study on riding comfort was carried out using one dimensional Modelica
software and three dimensional finite element tool (Choi et al., 2017) where both the
lumped mass and finite element methods were implemented. The entire human body, as
shown in Fig. 77, was divided into fourteen different segments and the contacts with the
seat and other automotive components were established. Later, vibration excitement
levels were extracted from the simulation.
Fig. 77. Model of human body made of fourteen segments and sitting comfort analysis
(Choi et al., 2017)
Sensitivity study on the vertical vibration (Verver, M.M., 2004) stated that the damping
and stiffness parameters of the seat cushion would greatly influence the seat-to-human
vibration transmission and the final level of vibration inside the human body would be a
function of the vertical acceleration. That investigation placed a spring-dashpot system
under the seat to understand the effect of vibration transmission. The seated human body
and the spring-dashpot system underneath are presented in Fig. 78.
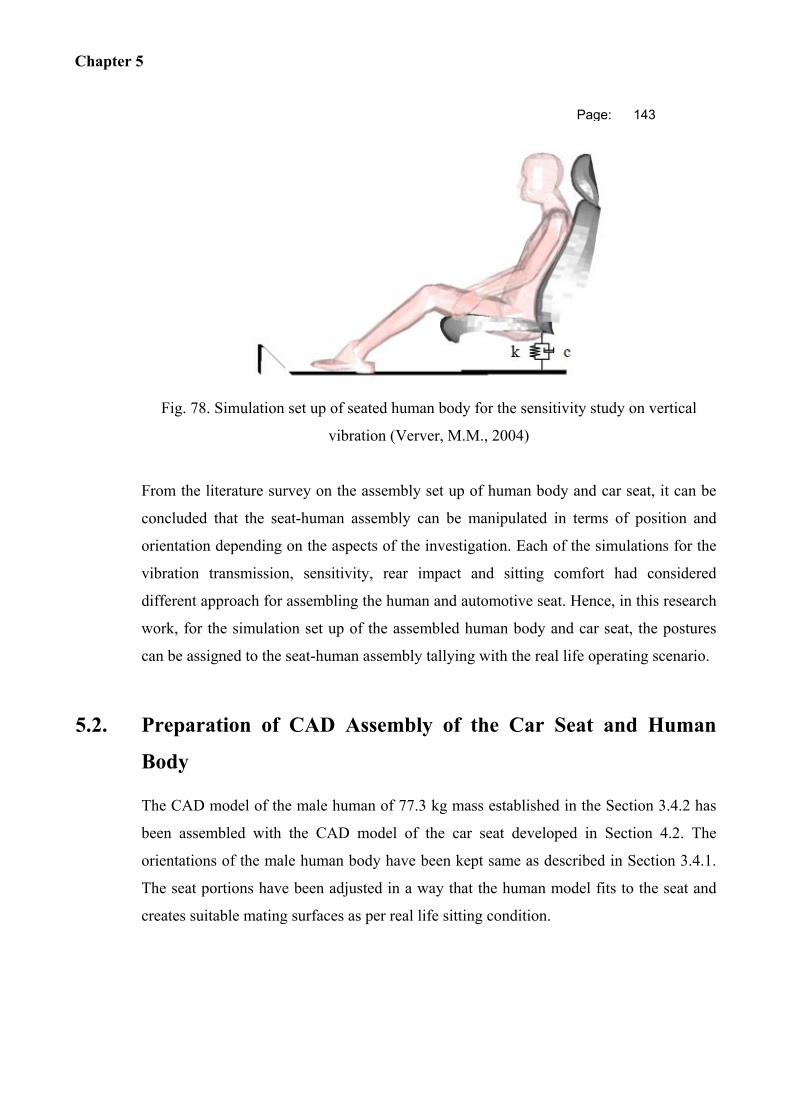
Chapter 5
Page: 143
Fig. 78. Simulation set up of seated human body for the sensitivity study on vertical
vibration (Verver, M.M., 2004)
From the literature survey on the assembly set up of human body and car seat, it can be
concluded that the seat-human assembly can be manipulated in terms of position and
orientation depending on the aspects of the investigation. Each of the simulations for the
vibration transmission, sensitivity, rear impact and sitting comfort had considered
different approach for assembling the human and automotive seat. Hence, in this research
work, for the simulation set up of the assembled human body and car seat, the postures
can be assigned to the seat-human assembly tallying with the real life operating scenario.
5.2. Preparation of CAD Assembly of the Car Seat and Human
Body
The CAD model of the male human of 77.3 kg mass established in the Section 3.4.2 has
been assembled with the CAD model of the car seat developed in Section 4.2. The
orientations of the male human body have been kept same as described in Section 3.4.1.
The seat portions have been adjusted in a way that the human model fits to the seat and
creates suitable mating surfaces as per real life sitting condition.
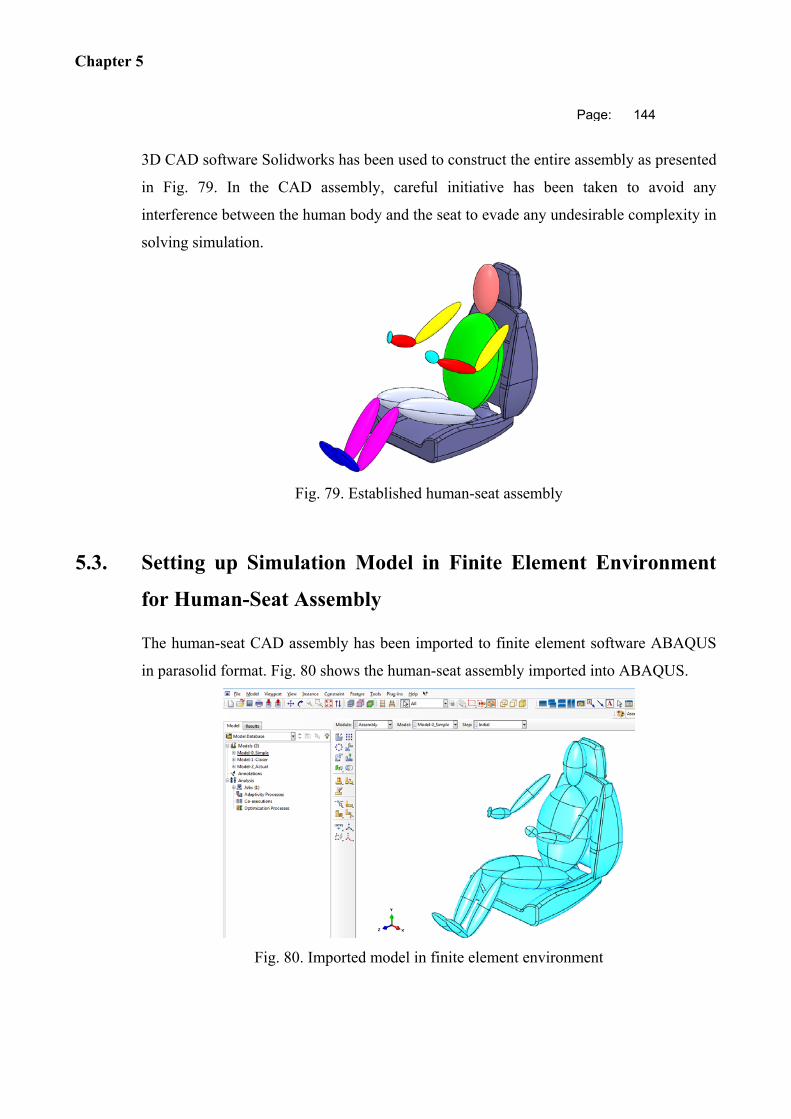
Chapter 5
Page: 144
3D CAD software Solidworks has been used to construct the entire assembly as presented
in Fig. 79. In the CAD assembly, careful initiative has been taken to avoid any
interference between the human body and the seat to evade any undesirable complexity in
solving simulation.
Fig. 79. Established human-seat assembly
5.3. Setting up Simulation Model in Finite Element Environment
for Human-Seat Assembly
The human-seat CAD assembly has been imported to finite element software ABAQUS
in parasolid format. Fig. 80 shows the human-seat assembly imported into ABAQUS.
Fig. 80. Imported model in finite element environment
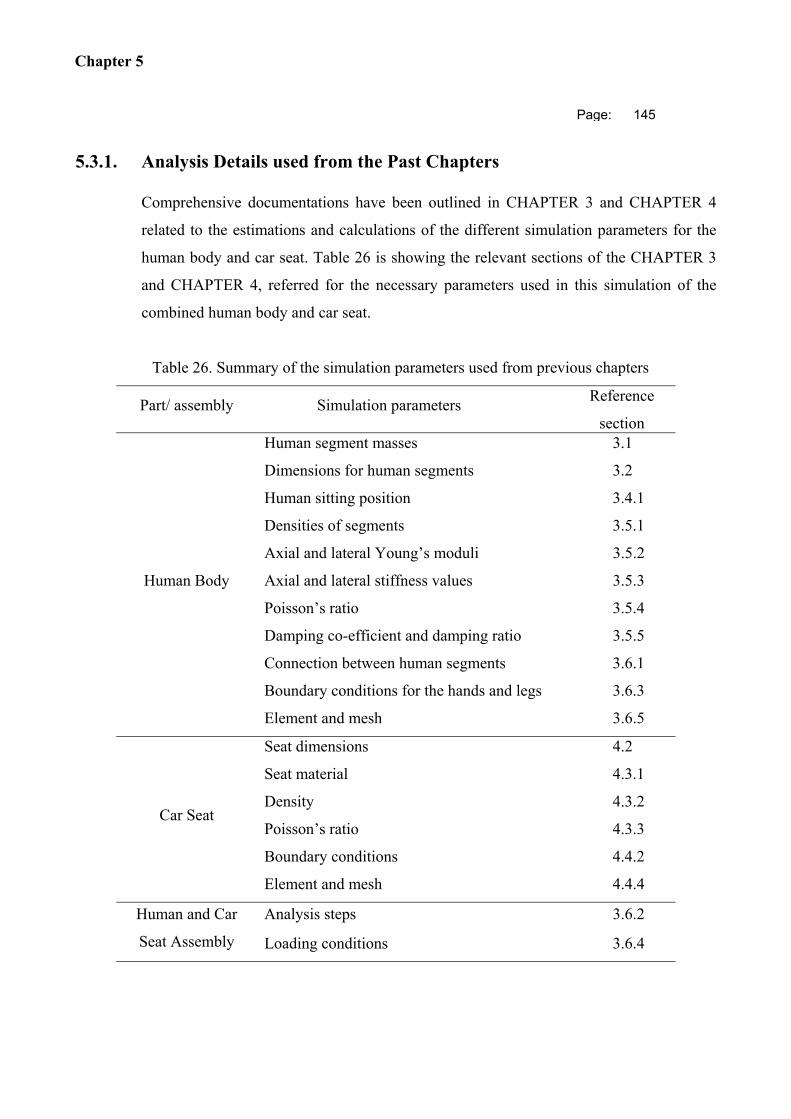
Chapter 5
Page: 145
5.3.1. Analysis Details used from the Past Chapters
Comprehensive documentations have been outlined in CHAPTER 3 and CHAPTER 4
related to the estimations and calculations of the different simulation parameters for the
human body and car seat. Table 26 is showing the relevant sections of the CHAPTER 3
and CHAPTER 4, referred for the necessary parameters used in this simulation of the
combined human body and car seat.
Table 26. Summary of the simulation parameters used from previous chapters
Part/ assembly Simulation parameters Reference
section
Human Body
Human segment masses 3.1
Dimensions for human segments 3.2
Human sitting position 3.4.1
Densities of segments 3.5.1
Axial and lateral Young’s moduli 3.5.2
Axial and lateral stiffness values 3.5.3
Poisson’s ratio 3.5.4
Damping co-efficient and damping ratio 3.5.5
Connection between human segments 3.6.1
Boundary conditions for the hands and legs 3.6.3
Element and mesh 3.6.5
Car Seat
Seat dimensions 4.2
Seat material 4.3.1
Density 4.3.2
Poisson’s ratio 4.3.3
Boundary conditions 4.4.2
Element and mesh 4.4.4
Human and Car
Seat Assembly
Analysis steps 3.6.2
Loading conditions 3.6.4
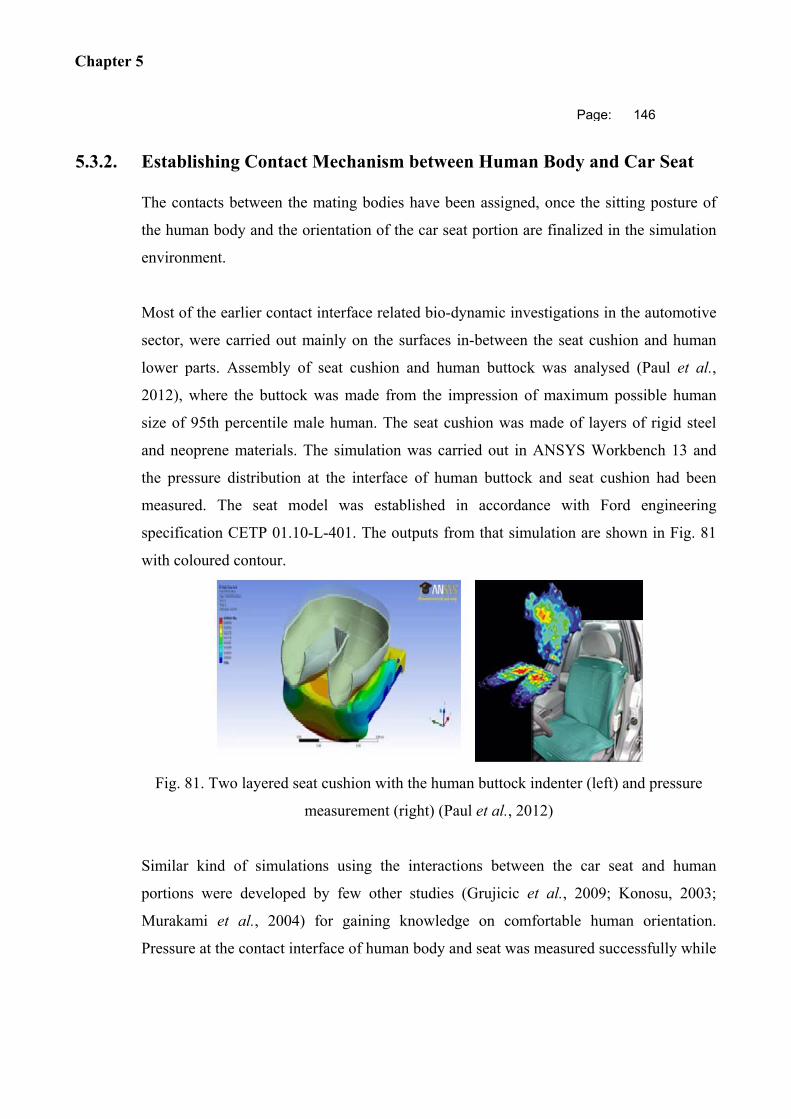
Chapter 5
Page: 146
5.3.2. Establishing Contact Mechanism between Human Body and Car Seat
The contacts between the mating bodies have been assigned, once the sitting posture of
the human body and the orientation of the car seat portion are finalized in the simulation
environment.
Most of the earlier contact interface related bio-dynamic investigations in the automotive
sector, were carried out mainly on the surfaces in-between the seat cushion and human
lower parts. Assembly of seat cushion and human buttock was analysed (Paul et al.,
2012), where the buttock was made from the impression of maximum possible human
size of 95th percentile male human. The seat cushion was made of layers of rigid steel
and neoprene materials. The simulation was carried out in ANSYS Workbench 13 and
the pressure distribution at the interface of human buttock and seat cushion had been
measured. The seat model was established in accordance with Ford engineering
specification CETP 01.10-L-401. The outputs from that simulation are shown in Fig. 81
with coloured contour.
Fig. 81. Two layered seat cushion with the human buttock indenter (left) and pressure
measurement (right) (Paul et al., 2012)
Similar kind of simulations using the interactions between the car seat and human
portions were developed by few other studies (Grujicic et al., 2009; Konosu, 2003;
Murakami et al., 2004) for gaining knowledge on comfortable human orientation.
Pressure at the contact interface of human body and seat was measured successfully while
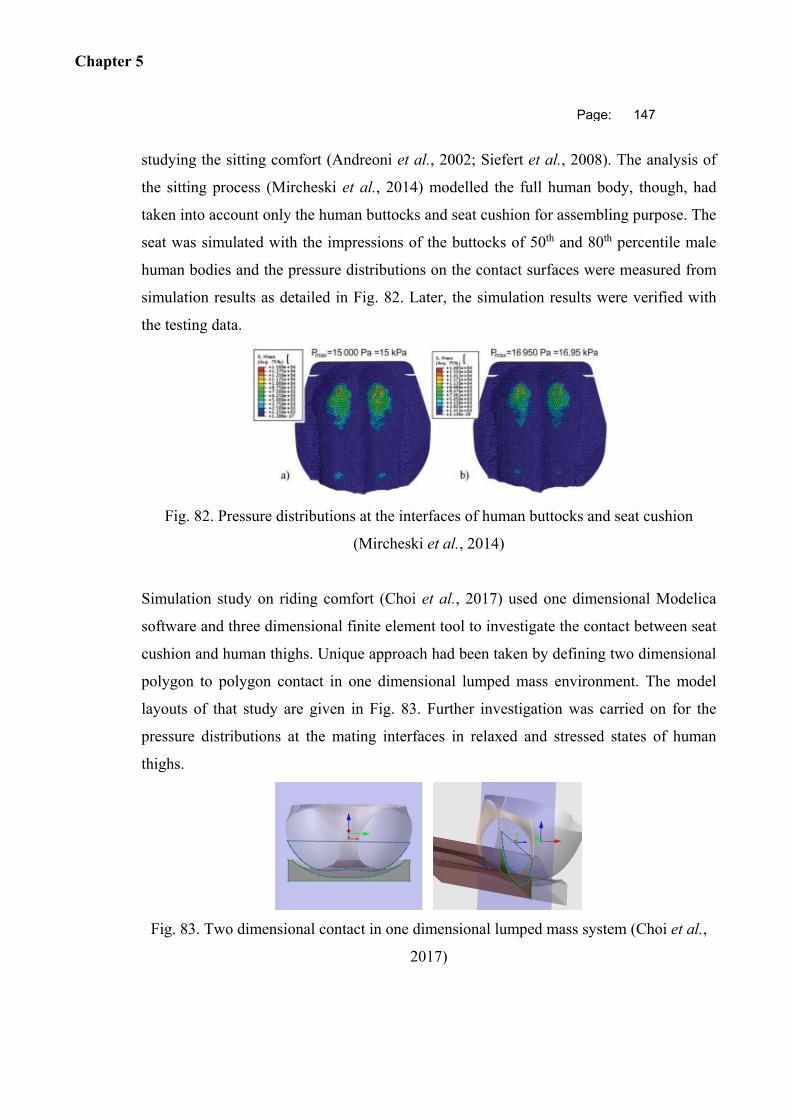
Chapter 5
Page: 147
studying the sitting comfort (Andreoni et al., 2002; Siefert et al., 2008). The analysis of
the sitting process (Mircheski et al., 2014) modelled the full human body, though, had
taken into account only the human buttocks and seat cushion for assembling purpose. The
seat was simulated with the impressions of the buttocks of 50th and 80th percentile male
human bodies and the pressure distributions on the contact surfaces were measured from
simulation results as detailed in Fig. 82. Later, the simulation results were verified with
the testing data.
Fig. 82. Pressure distributions at the interfaces of human buttocks and seat cushion
(Mircheski et al., 2014)
Simulation study on riding comfort (Choi et al., 2017) used one dimensional Modelica
software and three dimensional finite element tool to investigate the contact between seat
cushion and human thighs. Unique approach had been taken by defining two dimensional
polygon to polygon contact in one dimensional lumped mass environment. The model
layouts of that study are given in Fig. 83. Further investigation was carried on for the
pressure distributions at the mating interfaces in relaxed and stressed states of human
thighs.
Fig. 83. Two dimensional contact in one dimensional lumped mass system (Choi et al.,
2017)
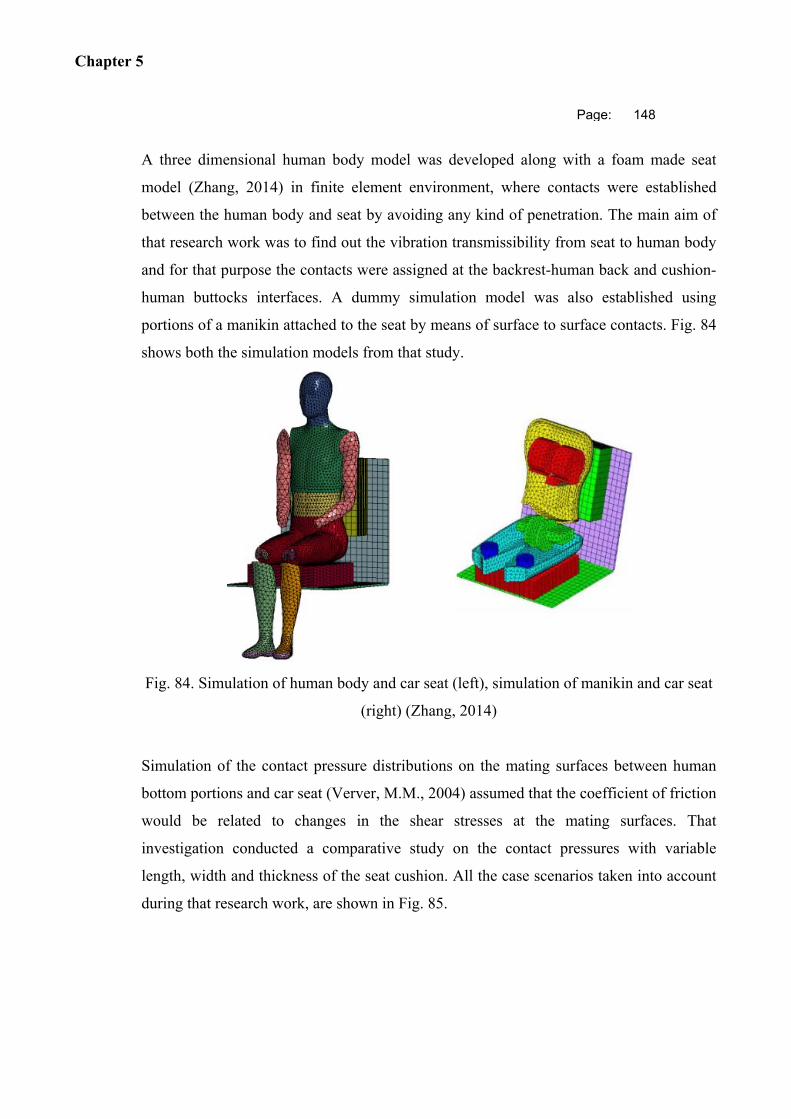
Chapter 5
Page: 148
A three dimensional human body model was developed along with a foam made seat
model (Zhang, 2014) in finite element environment, where contacts were established
between the human body and seat by avoiding any kind of penetration. The main aim of
that research work was to find out the vibration transmissibility from seat to human body
and for that purpose the contacts were assigned at the backrest-human back and cushion-
human buttocks interfaces. A dummy simulation model was also established using
portions of a manikin attached to the seat by means of surface to surface contacts. Fig. 84
shows both the simulation models from that study.
Fig. 84. Simulation of human body and car seat (left), simulation of manikin and car seat
(right) (Zhang, 2014)
Simulation of the contact pressure distributions on the mating surfaces between human
bottom portions and car seat (Verver, M.M., 2004) assumed that the coefficient of friction
would be related to changes in the shear stresses at the mating surfaces. That
investigation conducted a comparative study on the contact pressures with variable
length, width and thickness of the seat cushion. All the case scenarios taken into account
during that research work, are shown in Fig. 85.
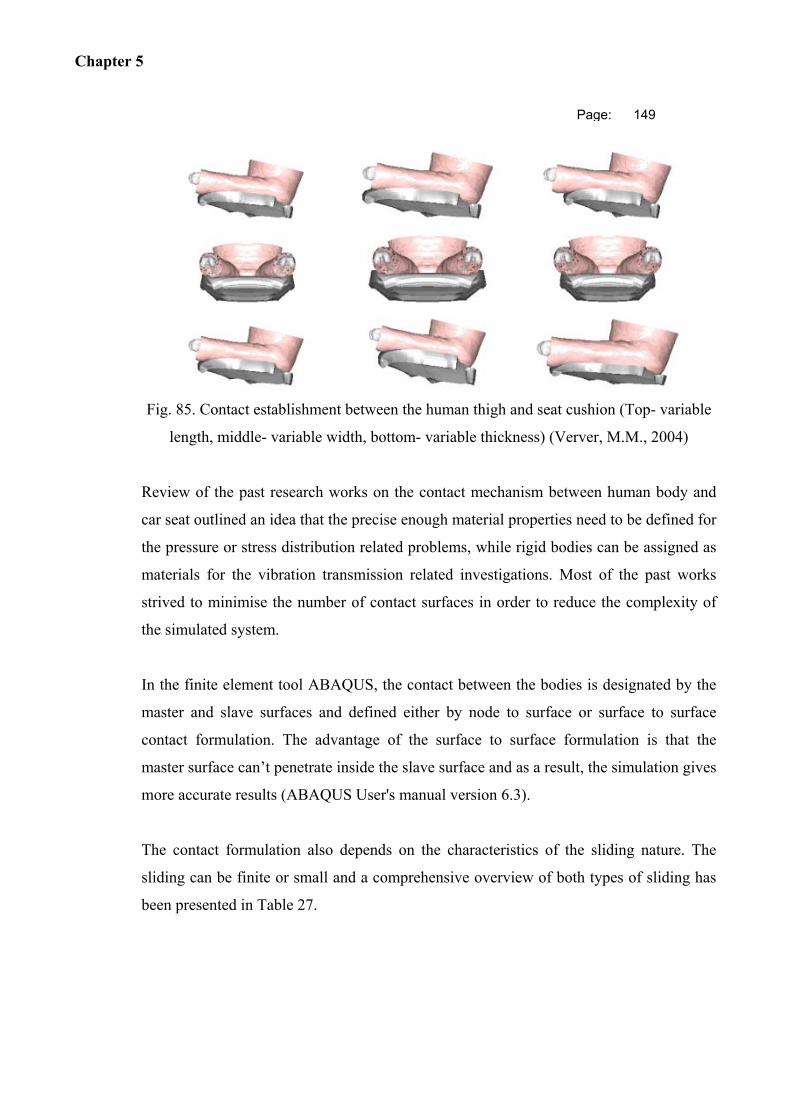
Chapter 5
Page: 149
Fig. 85. Contact establishment between the human thigh and seat cushion (Top- variable
length, middle- variable width, bottom- variable thickness) (Verver, M.M., 2004)
Review of the past research works on the contact mechanism between human body and
car seat outlined an idea that the precise enough material properties need to be defined for
the pressure or stress distribution related problems, while rigid bodies can be assigned as
materials for the vibration transmission related investigations. Most of the past works
strived to minimise the number of contact surfaces in order to reduce the complexity of
the simulated system.
In the finite element tool ABAQUS, the contact between the bodies is designated by the
master and slave surfaces and defined either by node to surface or surface to surface
contact formulation. The advantage of the surface to surface formulation is that the
master surface can’t penetrate inside the slave surface and as a result, the simulation gives
more accurate results (ABAQUS User's manual version 6.3).
The contact formulation also depends on the characteristics of the sliding nature. The
sliding can be finite or small and a comprehensive overview of both types of sliding has
been presented in Table 27.
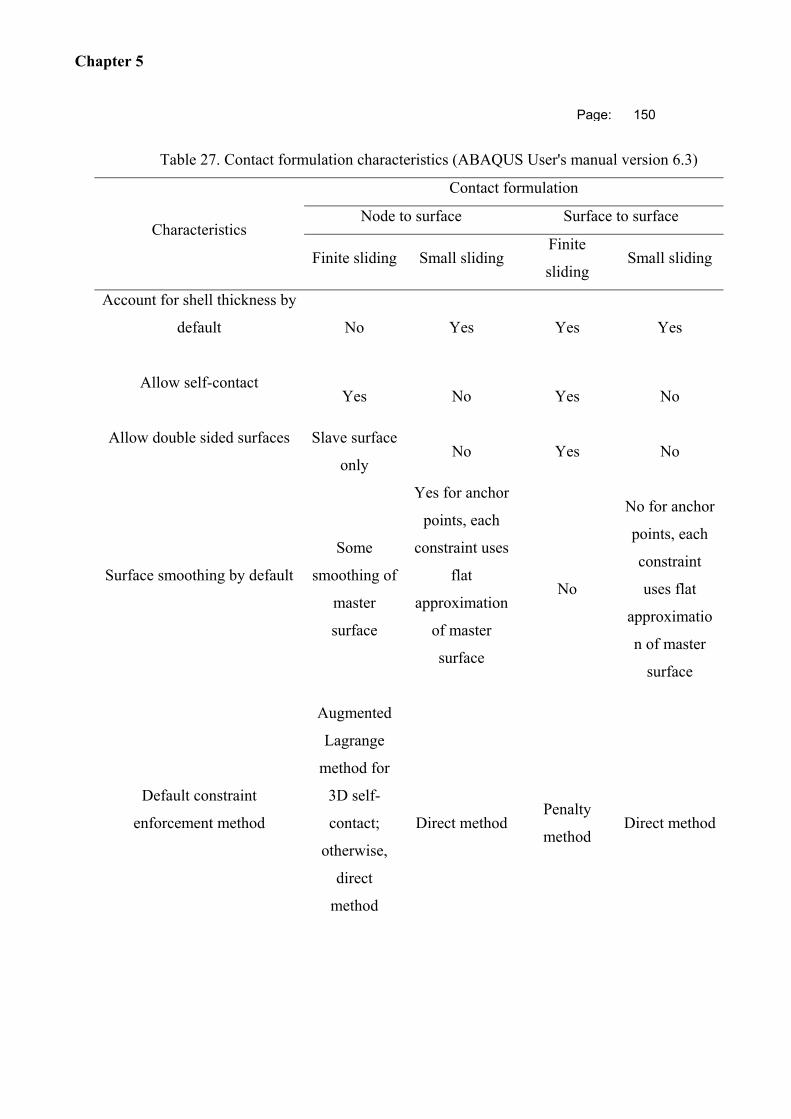
Chapter 5
Page: 150
Table 27. Contact formulation characteristics (ABAQUS User's manual version 6.3)
Characteristics
Contact formulation
Node to surface Surface to surface
Finite sliding Small sliding Finite
sliding Small sliding
Account for shell thickness by
default
No Yes Yes Yes
Allow self-contact
Yes No Yes No
Allow double sided surfaces
Slave surface
only No Yes No
Surface smoothing by default
Some
smoothing of
master
surface
Yes for anchor
points, each
constraint uses
flat
approximation
of master
surface
No
No for anchor
points, each
constraint
uses flat
approximatio
n of master
surface
Default constraint
enforcement method
Augmented
Lagrange
method for
3D self-
contact;
otherwise,
direct
method
Direct method Penalty
method Direct method
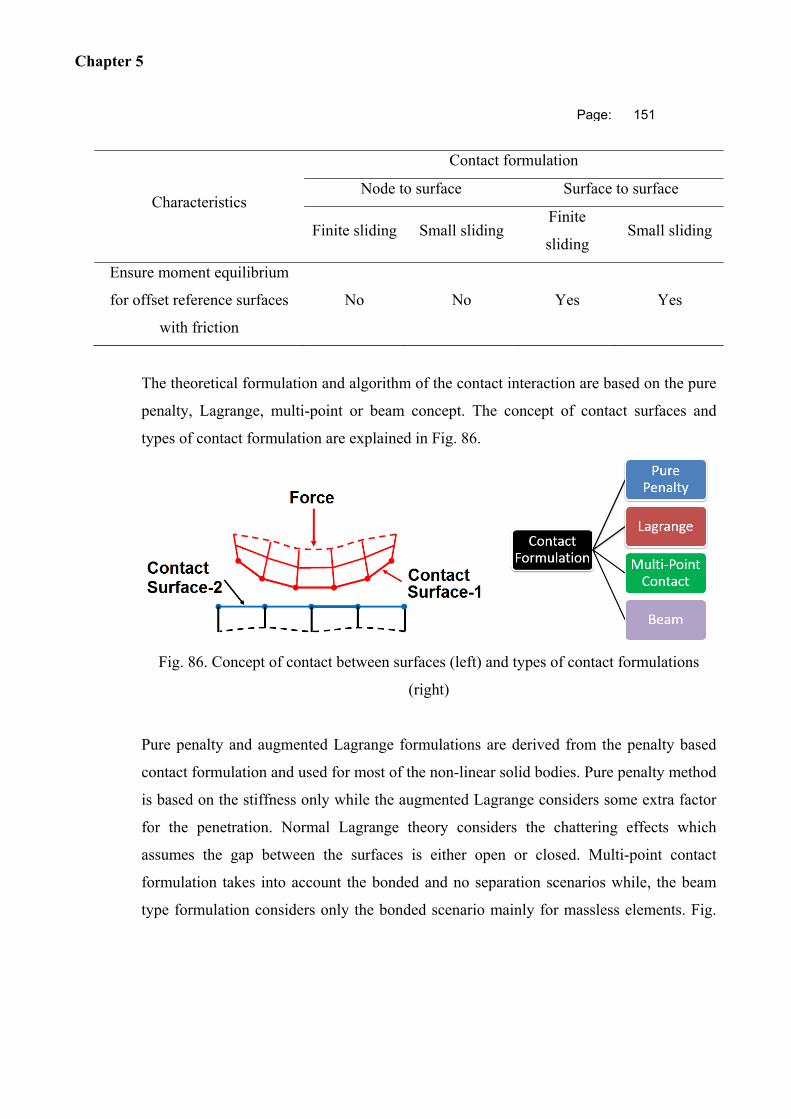
Chapter 5
Page: 151
Characteristics
Contact formulation
Node to surface Surface to surface
Finite sliding Small sliding Finite
sliding Small sliding
Ensure moment equilibrium
for offset reference surfaces
with friction
No No Yes Yes
The theoretical formulation and algorithm of the contact interaction are based on the pure
penalty, Lagrange, multi-point or beam concept. The concept of contact surfaces and
types of contact formulation are explained in Fig. 86.
Fig. 86. Concept of contact between surfaces (left) and types of contact formulations
(right)
Pure penalty and augmented Lagrange formulations are derived from the penalty based
contact formulation and used for most of the non-linear solid bodies. Pure penalty method
is based on the stiffness only while the augmented Lagrange considers some extra factor
for the penetration. Normal Lagrange theory considers the chattering effects which
assumes the gap between the surfaces is either open or closed. Multi-point contact
formulation takes into account the bonded and no separation scenarios while, the beam
type formulation considers only the bonded scenario mainly for massless elements. Fig.
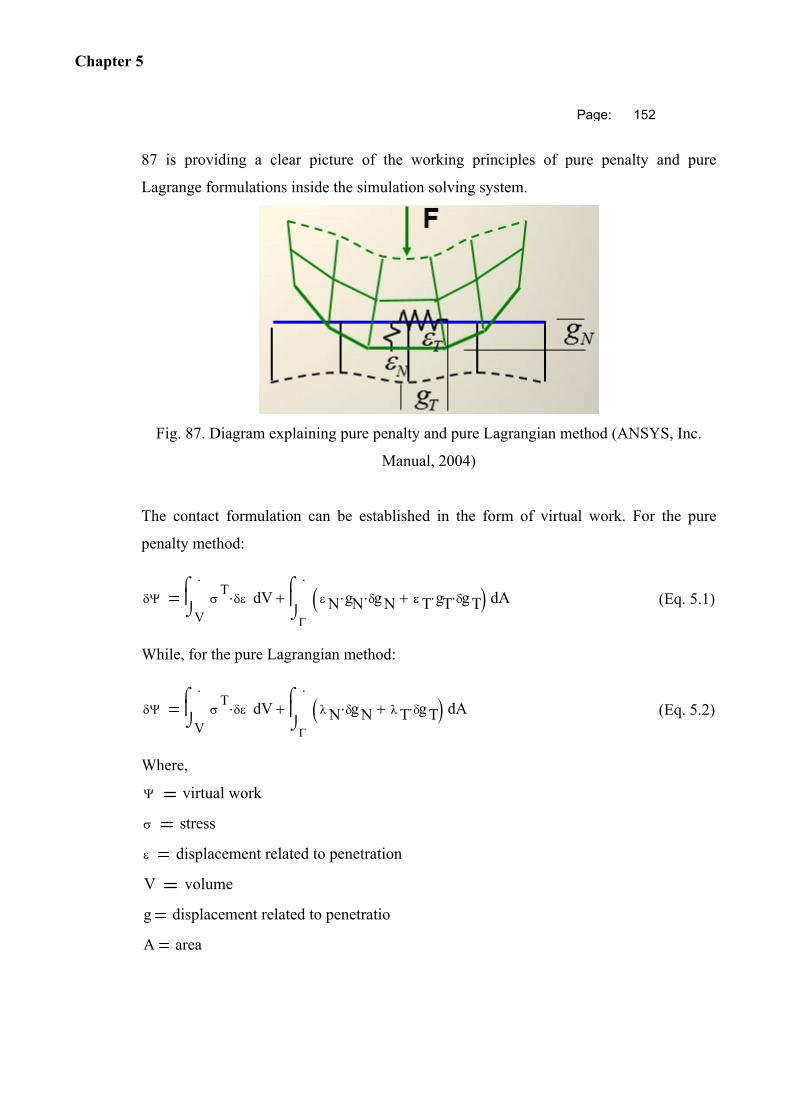
Chapter 5
Page: 152
87 is providing a clear picture of the working principles of pure penalty and pure
Lagrange formulations inside the simulation solving system.
Fig. 87. Diagram explaining pure penalty and pure Lagrangian method (ANSYS, Inc.
Manual, 2004)
The contact formulation can be established in the form of virtual work. For the pure
penalty method:
V
.
VT
d
.
AN gN gN T gT gT
d
(Eq. 5.1)
While, for the pure Lagrangian method:
V
.
VT
d
.
AN gN T gT
d
(Eq. 5.2)
Where,
virtual work
stress
displacement related to penetration
V volume
g displacement related to penetration
A area
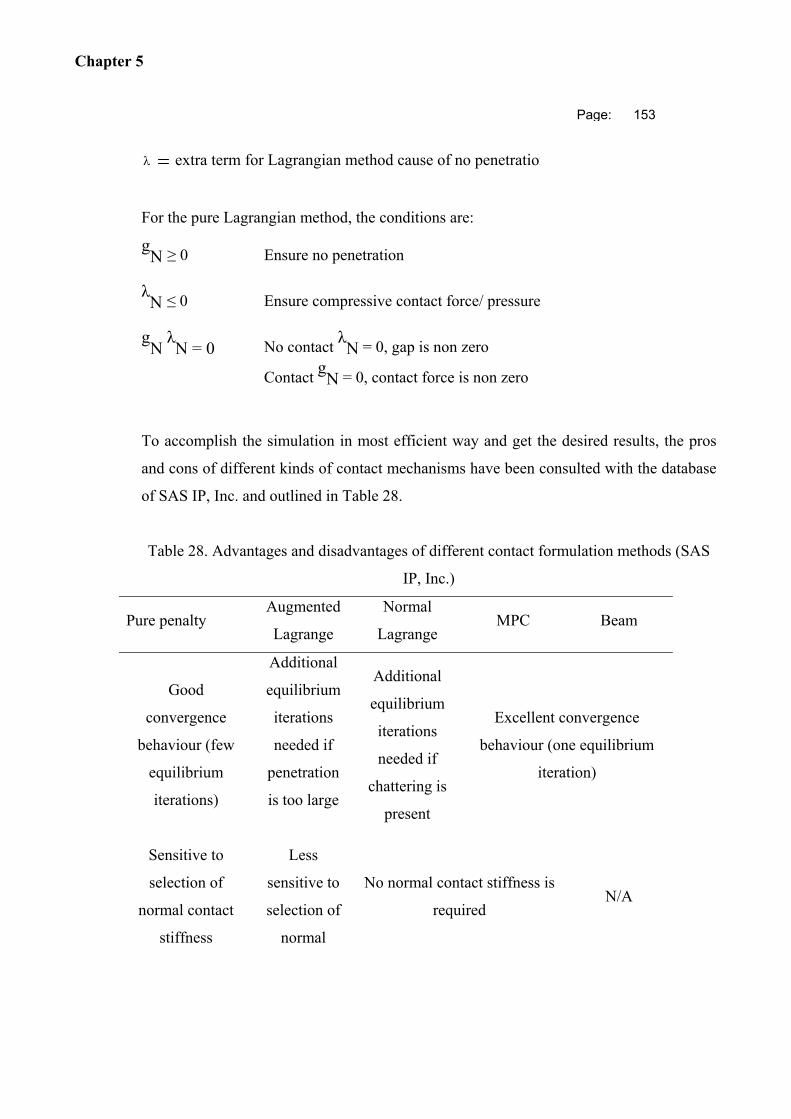
Chapter 5
Page: 153
extra term for Lagrangian method cause of no penetration
For the pure Lagrangian method, the conditions are:
gN ≥ 0 Ensure no penetration
λN ≤ 0 Ensure compressive contact force/ pressure
gN
λN = 0 No contact
λN = 0, gap is non zero
Contact g
N = 0, contact force is non zero
To accomplish the simulation in most efficient way and get the desired results, the pros
and cons of different kinds of contact mechanisms have been consulted with the database
of SAS IP, Inc. and outlined in Table 28.
Table 28. Advantages and disadvantages of different contact formulation methods (SAS
IP, Inc.)
Pure penalty Augmented
Lagrange
Normal
Lagrange MPC Beam
Good
convergence
behaviour (few
equilibrium
iterations)
Additional
equilibrium
iterations
needed if
penetration
is too large
Additional
equilibrium
iterations
needed if
chattering is
present
Excellent convergence
behaviour (one equilibrium
iteration)
Sensitive to
selection of
normal contact
stiffness
Less
sensitive to
selection of
normal
No normal contact stiffness is
required N/A
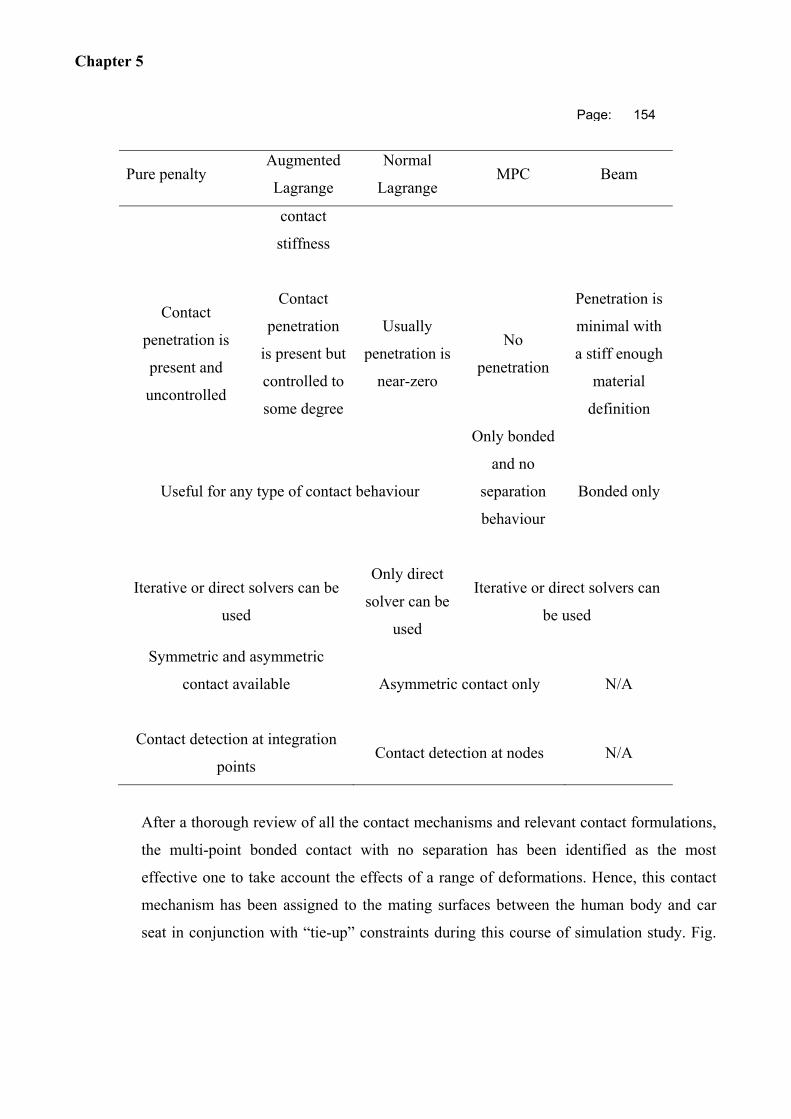
Chapter 5
Page: 154
Pure penalty Augmented
Lagrange
Normal
Lagrange MPC Beam
contact
stiffness
Contact
penetration is
present and
uncontrolled
Contact
penetration
is present but
controlled to
some degree
Usually
penetration is
near-zero
No
penetration
Penetration is
minimal with
a stiff enough
material
definition
Useful for any type of contact behaviour
Only bonded
and no
separation
behaviour
Bonded only
Iterative or direct solvers can be
used
Only direct
solver can be
used
Iterative or direct solvers can
be used
Symmetric and asymmetric
contact available
Asymmetric contact only N/A
Contact detection at integration
points Contact detection at nodes N/A
After a thorough review of all the contact mechanisms and relevant contact formulations,
the multi-point bonded contact with no separation has been identified as the most
effective one to take account the effects of a range of deformations. Hence, this contact
mechanism has been assigned to the mating surfaces between the human body and car
seat in conjunction with “tie-up” constraints during this course of simulation study. Fig.
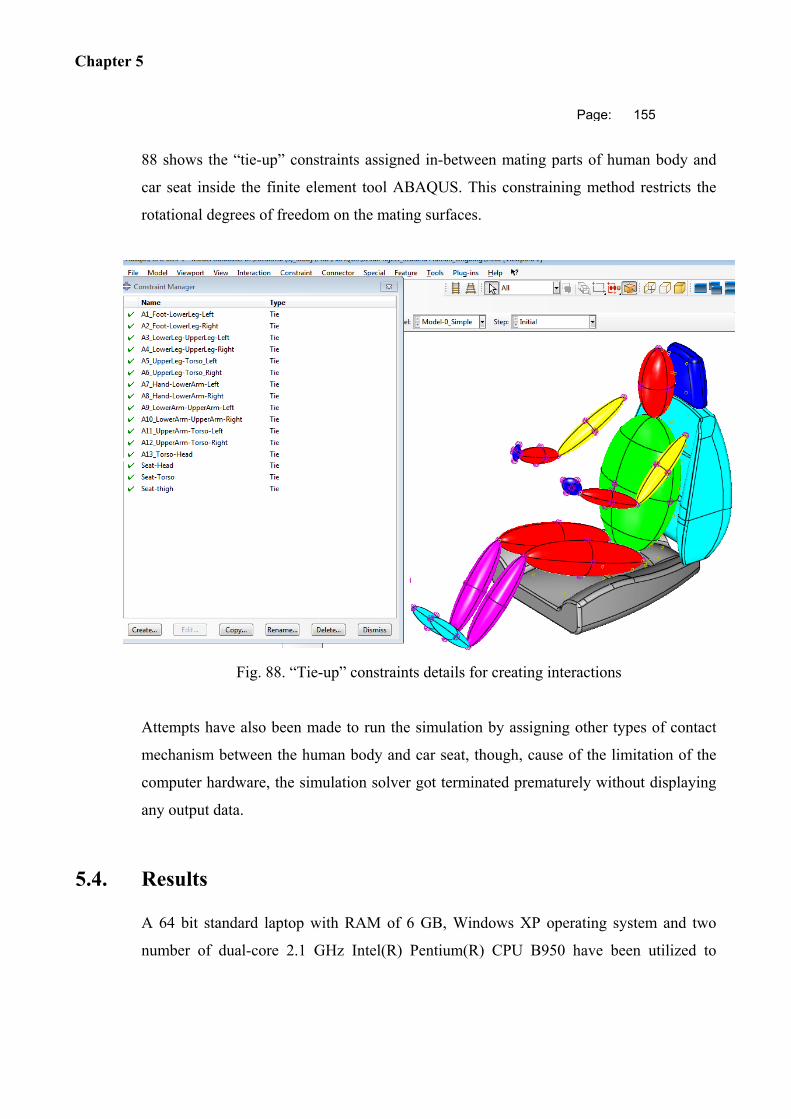
Chapter 5
Page: 155
88 shows the “tie-up” constraints assigned in-between mating parts of human body and
car seat inside the finite element tool ABAQUS. This constraining method restricts the
rotational degrees of freedom on the mating surfaces.
Fig. 88. “Tie-up” constraints details for creating interactions
Attempts have also been made to run the simulation by assigning other types of contact
mechanism between the human body and car seat, though, cause of the limitation of the
computer hardware, the simulation solver got terminated prematurely without displaying
any output data.
5.4. Results
A 64 bit standard laptop with RAM of 6 GB, Windows XP operating system and two
number of dual-core 2.1 GHz Intel(R) Pentium(R) CPU B950 have been utilized to
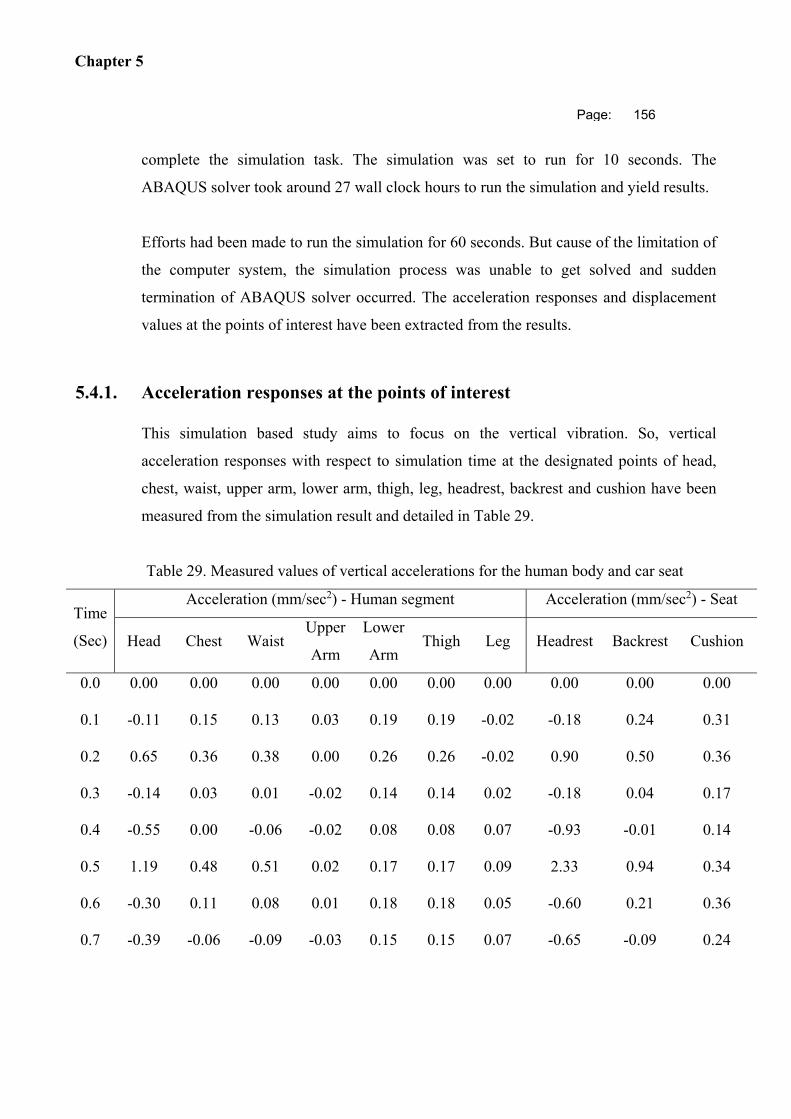
Chapter 5
Page: 156
complete the simulation task. The simulation was set to run for 10 seconds. The
ABAQUS solver took around 27 wall clock hours to run the simulation and yield results.
Efforts had been made to run the simulation for 60 seconds. But cause of the limitation of
the computer system, the simulation process was unable to get solved and sudden
termination of ABAQUS solver occurred. The acceleration responses and displacement
values at the points of interest have been extracted from the results.
5.4.1. Acceleration responses at the points of interest
This simulation based study aims to focus on the vertical vibration. So, vertical
acceleration responses with respect to simulation time at the designated points of head,
chest, waist, upper arm, lower arm, thigh, leg, headrest, backrest and cushion have been
measured from the simulation result and detailed in Table 29.
Table 29. Measured values of vertical accelerations for the human body and car seat
Time
(Sec)
Acceleration (mm/sec2) - Human segment Acceleration (mm/sec2) - Seat
Head Chest Waist Upper
Arm
Lower
Arm Thigh Leg Headrest Backrest Cushion
0.0 0.00 0.00 0.00 0.00 0.00 0.00 0.00 0.00 0.00 0.00
0.1 -0.11 0.15 0.13 0.03 0.19 0.19 -0.02 -0.18 0.24 0.31
0.2 0.65 0.36 0.38 0.00 0.26 0.26 -0.02 0.90 0.50 0.36
0.3 -0.14 0.03 0.01 -0.02 0.14 0.14 0.02 -0.18 0.04 0.17
0.4 -0.55 0.00 -0.06 -0.02 0.08 0.08 0.07 -0.93 -0.01 0.14
0.5 1.19 0.48 0.51 0.02 0.17 0.17 0.09 2.33 0.94 0.34
0.6 -0.30 0.11 0.08 0.01 0.18 0.18 0.05 -0.60 0.21 0.36
0.7 -0.39 -0.06 -0.09 -0.03 0.15 0.15 0.07 -0.65 -0.09 0.24
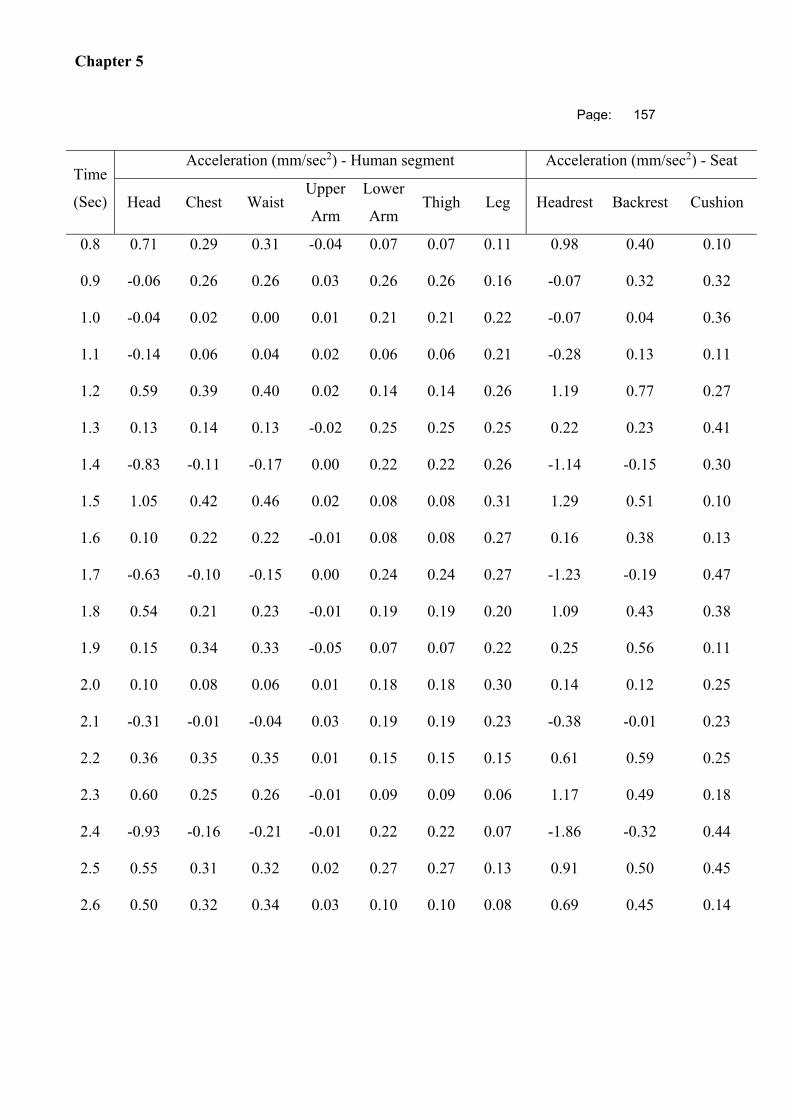
Chapter 5
Page: 157
Time
(Sec)
Acceleration (mm/sec2) - Human segment Acceleration (mm/sec2) - Seat
Head Chest Waist Upper
Arm
Lower
Arm Thigh Leg Headrest Backrest Cushion
0.8 0.71 0.29 0.31 -0.04 0.07 0.07 0.11 0.98 0.40 0.10
0.9 -0.06 0.26 0.26 0.03 0.26 0.26 0.16 -0.07 0.32 0.32
1.0 -0.04 0.02 0.00 0.01 0.21 0.21 0.22 -0.07 0.04 0.36
1.1 -0.14 0.06 0.04 0.02 0.06 0.06 0.21 -0.28 0.13 0.11
1.2 0.59 0.39 0.40 0.02 0.14 0.14 0.26 1.19 0.77 0.27
1.3 0.13 0.14 0.13 -0.02 0.25 0.25 0.25 0.22 0.23 0.41
1.4 -0.83 -0.11 -0.17 0.00 0.22 0.22 0.26 -1.14 -0.15 0.30
1.5 1.05 0.42 0.46 0.02 0.08 0.08 0.31 1.29 0.51 0.10
1.6 0.10 0.22 0.22 -0.01 0.08 0.08 0.27 0.16 0.38 0.13
1.7 -0.63 -0.10 -0.15 0.00 0.24 0.24 0.27 -1.23 -0.19 0.47
1.8 0.54 0.21 0.23 -0.01 0.19 0.19 0.20 1.09 0.43 0.38
1.9 0.15 0.34 0.33 -0.05 0.07 0.07 0.22 0.25 0.56 0.11
2.0 0.10 0.08 0.06 0.01 0.18 0.18 0.30 0.14 0.12 0.25
2.1 -0.31 -0.01 -0.04 0.03 0.19 0.19 0.23 -0.38 -0.01 0.23
2.2 0.36 0.35 0.35 0.01 0.15 0.15 0.15 0.61 0.59 0.25
2.3 0.60 0.25 0.26 -0.01 0.09 0.09 0.06 1.17 0.49 0.18
2.4 -0.93 -0.16 -0.21 -0.01 0.22 0.22 0.07 -1.86 -0.32 0.44
2.5 0.55 0.31 0.32 0.02 0.27 0.27 0.13 0.91 0.50 0.45
2.6 0.50 0.32 0.34 0.03 0.10 0.10 0.08 0.69 0.45 0.14
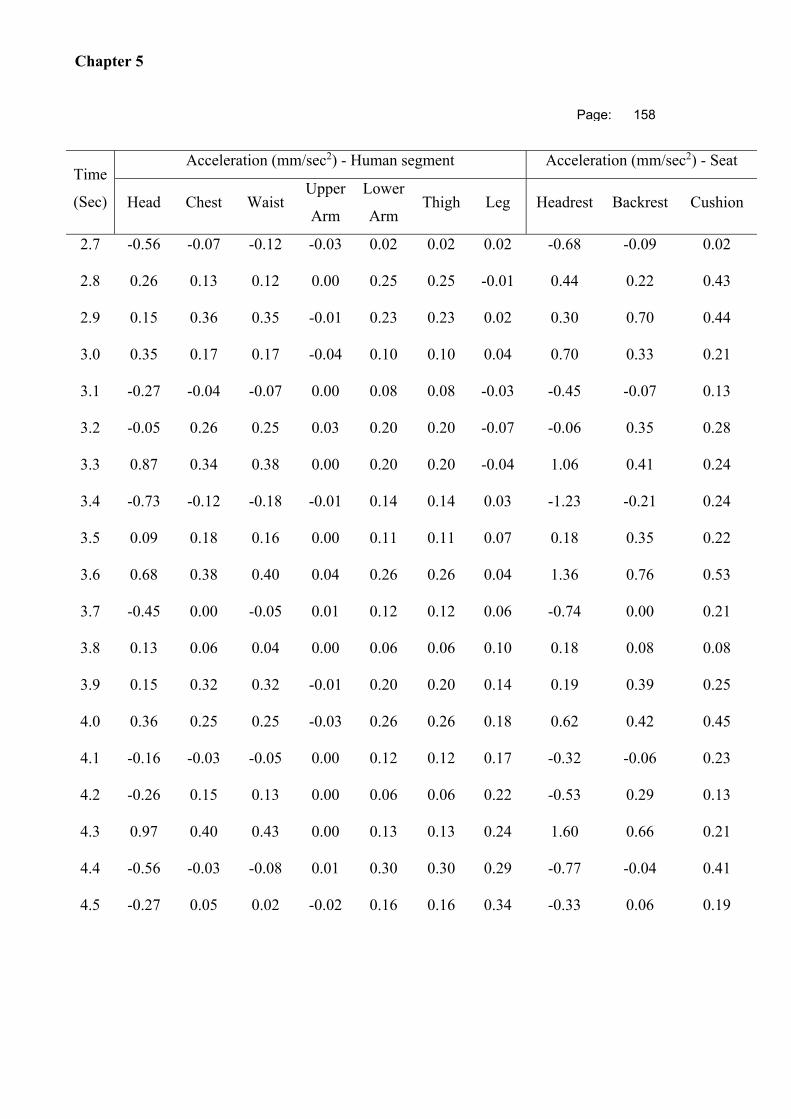
Chapter 5
Page: 158
Time
(Sec)
Acceleration (mm/sec2) - Human segment Acceleration (mm/sec2) - Seat
Head Chest Waist Upper
Arm
Lower
Arm Thigh Leg Headrest Backrest Cushion
2.7 -0.56 -0.07 -0.12 -0.03 0.02 0.02 0.02 -0.68 -0.09 0.02
2.8 0.26 0.13 0.12 0.00 0.25 0.25 -0.01 0.44 0.22 0.43
2.9 0.15 0.36 0.35 -0.01 0.23 0.23 0.02 0.30 0.70 0.44
3.0 0.35 0.17 0.17 -0.04 0.10 0.10 0.04 0.70 0.33 0.21
3.1 -0.27 -0.04 -0.07 0.00 0.08 0.08 -0.03 -0.45 -0.07 0.13
3.2 -0.05 0.26 0.25 0.03 0.20 0.20 -0.07 -0.06 0.35 0.28
3.3 0.87 0.34 0.38 0.00 0.20 0.20 -0.04 1.06 0.41 0.24
3.4 -0.73 -0.12 -0.18 -0.01 0.14 0.14 0.03 -1.23 -0.21 0.24
3.5 0.09 0.18 0.16 0.00 0.11 0.11 0.07 0.18 0.35 0.22
3.6 0.68 0.38 0.40 0.04 0.26 0.26 0.04 1.36 0.76 0.53
3.7 -0.45 0.00 -0.05 0.01 0.12 0.12 0.06 -0.74 0.00 0.21
3.8 0.13 0.06 0.04 0.00 0.06 0.06 0.10 0.18 0.08 0.08
3.9 0.15 0.32 0.32 -0.01 0.20 0.20 0.14 0.19 0.39 0.25
4.0 0.36 0.25 0.25 -0.03 0.26 0.26 0.18 0.62 0.42 0.45
4.1 -0.16 -0.03 -0.05 0.00 0.12 0.12 0.17 -0.32 -0.06 0.23
4.2 -0.26 0.15 0.13 0.00 0.06 0.06 0.22 -0.53 0.29 0.13
4.3 0.97 0.40 0.43 0.00 0.13 0.13 0.24 1.60 0.66 0.21
4.4 -0.56 -0.03 -0.08 0.01 0.30 0.30 0.29 -0.77 -0.04 0.41
4.5 -0.27 0.05 0.02 -0.02 0.16 0.16 0.34 -0.33 0.06 0.19
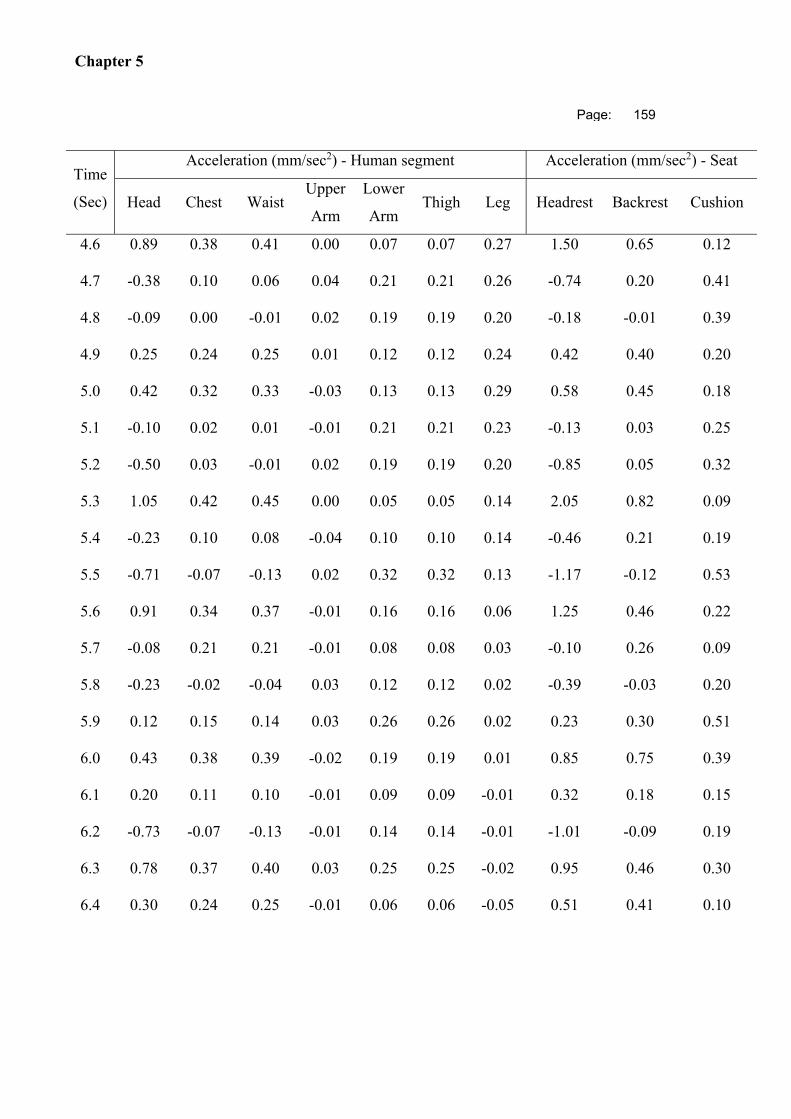
Chapter 5
Page: 159
Time
(Sec)
Acceleration (mm/sec2) - Human segment Acceleration (mm/sec2) - Seat
Head Chest Waist Upper
Arm
Lower
Arm Thigh Leg Headrest Backrest Cushion
4.6 0.89 0.38 0.41 0.00 0.07 0.07 0.27 1.50 0.65 0.12
4.7 -0.38 0.10 0.06 0.04 0.21 0.21 0.26 -0.74 0.20 0.41
4.8 -0.09 0.00 -0.01 0.02 0.19 0.19 0.20 -0.18 -0.01 0.39
4.9 0.25 0.24 0.25 0.01 0.12 0.12 0.24 0.42 0.40 0.20
5.0 0.42 0.32 0.33 -0.03 0.13 0.13 0.29 0.58 0.45 0.18
5.1 -0.10 0.02 0.01 -0.01 0.21 0.21 0.23 -0.13 0.03 0.25
5.2 -0.50 0.03 -0.01 0.02 0.19 0.19 0.20 -0.85 0.05 0.32
5.3 1.05 0.42 0.45 0.00 0.05 0.05 0.14 2.05 0.82 0.09
5.4 -0.23 0.10 0.08 -0.04 0.10 0.10 0.14 -0.46 0.21 0.19
5.5 -0.71 -0.07 -0.13 0.02 0.32 0.32 0.13 -1.17 -0.12 0.53
5.6 0.91 0.34 0.37 -0.01 0.16 0.16 0.06 1.25 0.46 0.22
5.7 -0.08 0.21 0.21 -0.01 0.08 0.08 0.03 -0.10 0.26 0.09
5.8 -0.23 -0.02 -0.04 0.03 0.12 0.12 0.02 -0.39 -0.03 0.20
5.9 0.12 0.15 0.14 0.03 0.26 0.26 0.02 0.23 0.30 0.51
6.0 0.43 0.38 0.39 -0.02 0.19 0.19 0.01 0.85 0.75 0.39
6.1 0.20 0.11 0.10 -0.01 0.09 0.09 -0.01 0.32 0.18 0.15
6.2 -0.73 -0.07 -0.13 -0.01 0.14 0.14 -0.01 -1.01 -0.09 0.19
6.3 0.78 0.37 0.40 0.03 0.25 0.25 -0.02 0.95 0.46 0.30
6.4 0.30 0.24 0.25 -0.01 0.06 0.06 -0.05 0.51 0.41 0.10

Chapter 5
Page: 160
Time
(Sec)
Acceleration (mm/sec2) - Human segment Acceleration (mm/sec2) - Seat
Head Chest Waist Upper
Arm
Lower
Arm Thigh Leg Headrest Backrest Cushion
6.5 -0.86 -0.14 -0.20 -0.03 0.11 0.11 -0.03 -1.67 -0.27 0.22
6.6 0.63 0.25 0.28 -0.01 0.21 0.21 0.03 1.26 0.51 0.43
6.7 0.14 0.31 0.31 -0.01 0.22 0.22 0.10 0.22 0.51 0.36
6.8 -0.11 0.01 -0.01 0.01 0.09 0.09 0.09 -0.15 0.02 0.12
6.9 0.01 0.07 0.05 0.03 0.10 0.10 0.10 0.01 0.09 0.12
7.0 0.16 0.37 0.36 0.01 0.22 0.22 0.15 0.27 0.62 0.37
7.1 0.50 0.20 0.21 0.00 0.27 0.27 0.18 0.97 0.39 0.52
7.2 -0.67 -0.12 -0.17 -0.01 0.07 0.07 0.21 -1.34 -0.24 0.14
7.3 0.36 0.28 0.29 0.01 0.10 0.10 0.17 0.60 0.47 0.16
7.4 0.64 0.36 0.38 0.02 0.23 0.23 0.21 0.88 0.50 0.32
7.5 -0.79 -0.13 -0.18 -0.01 0.17 0.17 0.33 -0.96 -0.16 0.21
7.6 0.41 0.17 0.17 -0.02 0.09 0.09 0.32 0.69 0.28 0.16
7.7 0.25 0.37 0.36 -0.05 0.16 0.16 0.29 0.49 0.71 0.31
7.8 -0.08 0.07 0.05 0.01 0.20 0.20 0.20 -0.15 0.14 0.40
7.9 0.03 0.01 -0.01 0.04 0.17 0.17 0.23 0.05 0.02 0.28
8.0 -0.02 0.31 0.30 -0.02 0.06 0.06 0.31 -0.02 0.42 0.08
8.1 0.63 0.28 0.30 -0.01 0.17 0.17 0.25 0.77 0.34 0.21
8.2 -0.58 -0.11 -0.15 0.02 0.31 0.31 0.20 -0.98 -0.18 0.52
8.3 0.04 0.17 0.16 -0.01 0.10 0.10 0.15 0.08 0.33 0.20
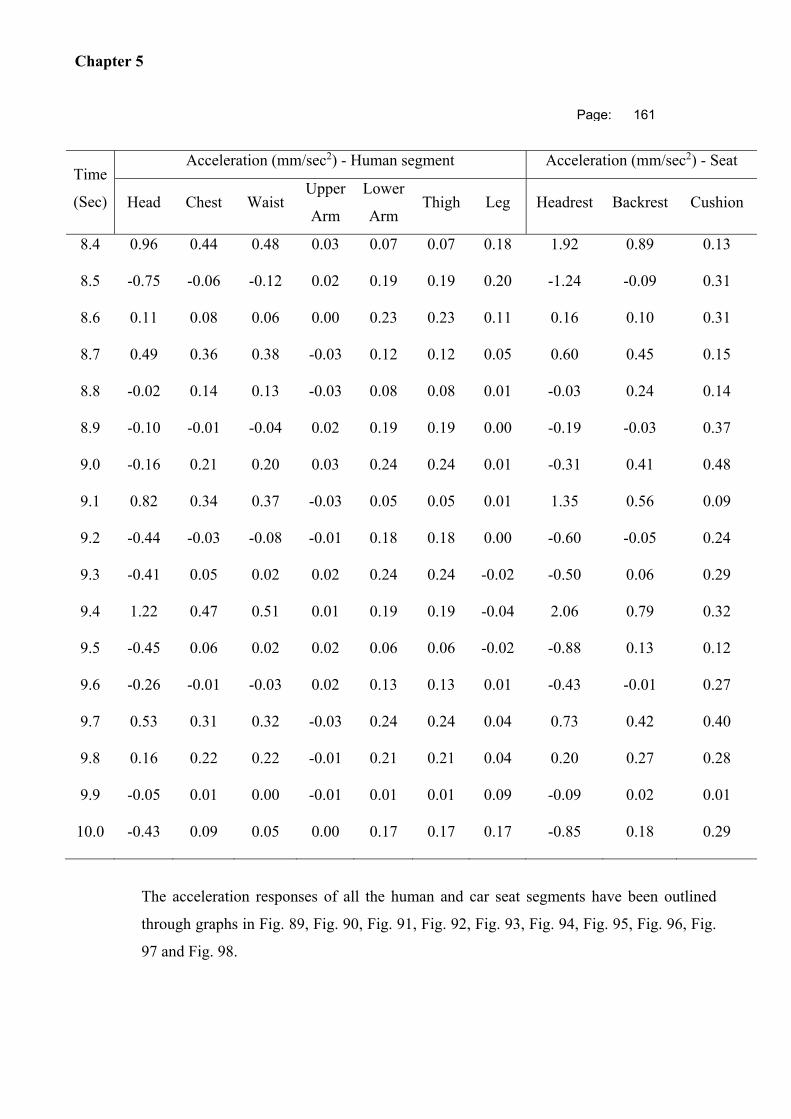
Chapter 5
Page: 161
Time
(Sec)
Acceleration (mm/sec2) - Human segment Acceleration (mm/sec2) - Seat
Head Chest Waist Upper
Arm
Lower
Arm Thigh Leg Headrest Backrest Cushion
8.4 0.96 0.44 0.48 0.03 0.07 0.07 0.18 1.92 0.89 0.13
8.5 -0.75 -0.06 -0.12 0.02 0.19 0.19 0.20 -1.24 -0.09 0.31
8.6 0.11 0.08 0.06 0.00 0.23 0.23 0.11 0.16 0.10 0.31
8.7 0.49 0.36 0.38 -0.03 0.12 0.12 0.05 0.60 0.45 0.15
8.8 -0.02 0.14 0.13 -0.03 0.08 0.08 0.01 -0.03 0.24 0.14
8.9 -0.10 -0.01 -0.04 0.02 0.19 0.19 0.00 -0.19 -0.03 0.37
9.0 -0.16 0.21 0.20 0.03 0.24 0.24 0.01 -0.31 0.41 0.48
9.1 0.82 0.34 0.37 -0.03 0.05 0.05 0.01 1.35 0.56 0.09
9.2 -0.44 -0.03 -0.08 -0.01 0.18 0.18 0.00 -0.60 -0.05 0.24
9.3 -0.41 0.05 0.02 0.02 0.24 0.24 -0.02 -0.50 0.06 0.29
9.4 1.22 0.47 0.51 0.01 0.19 0.19 -0.04 2.06 0.79 0.32
9.5 -0.45 0.06 0.02 0.02 0.06 0.06 -0.02 -0.88 0.13 0.12
9.6 -0.26 -0.01 -0.03 0.02 0.13 0.13 0.01 -0.43 -0.01 0.27
9.7 0.53 0.31 0.32 -0.03 0.24 0.24 0.04 0.73 0.42 0.40
9.8 0.16 0.22 0.22 -0.01 0.21 0.21 0.04 0.20 0.27 0.28
9.9 -0.05 0.01 0.00 -0.01 0.01 0.01 0.09 -0.09 0.02 0.01
10.0 -0.43 0.09 0.05 0.00 0.17 0.17 0.17 -0.85 0.18 0.29
The acceleration responses of all the human and car seat segments have been outlined
through graphs in Fig. 89, Fig. 90, Fig. 91, Fig. 92, Fig. 93, Fig. 94, Fig. 95, Fig. 96, Fig.
97 and Fig. 98.

Chapter 5
Page: 162
5.4.1.1. Response at Head
Fig. 89. Acceleration response at head
5.4.1.2. Response at Chest
Fig. 90. Acceleration response at chest

Chapter 5
Page: 163
5.4.1.3. Response at Waist
Fig. 91. Acceleration response at waist
5.4.1.4. Response at Upper Arm
Fig. 92. Acceleration response at upper arm

Chapter 5
Page: 164
5.4.1.5. Response at Lower Arm
Fig. 93. Acceleration response at lower arm
5.4.1.6. Response at Thigh
Fig. 94. Acceleration response at thigh
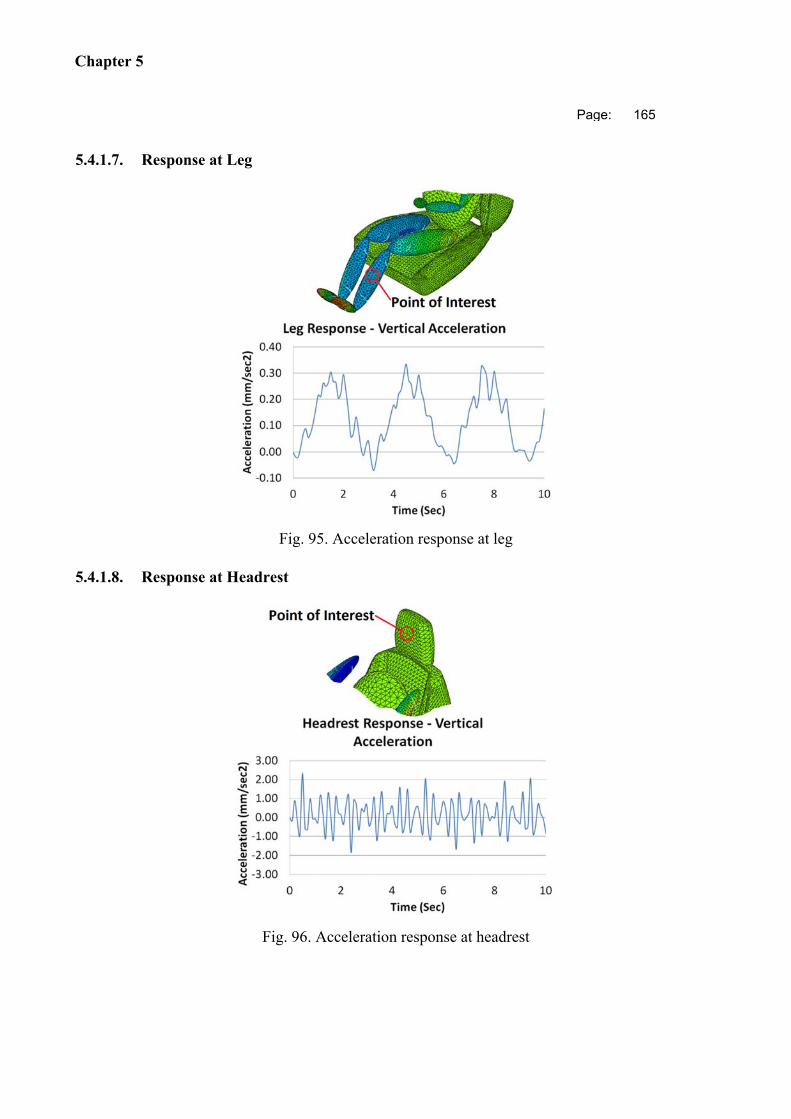
Chapter 5
Page: 165
5.4.1.7. Response at Leg
Fig. 95. Acceleration response at leg
5.4.1.8. Response at Headrest
Fig. 96. Acceleration response at headrest
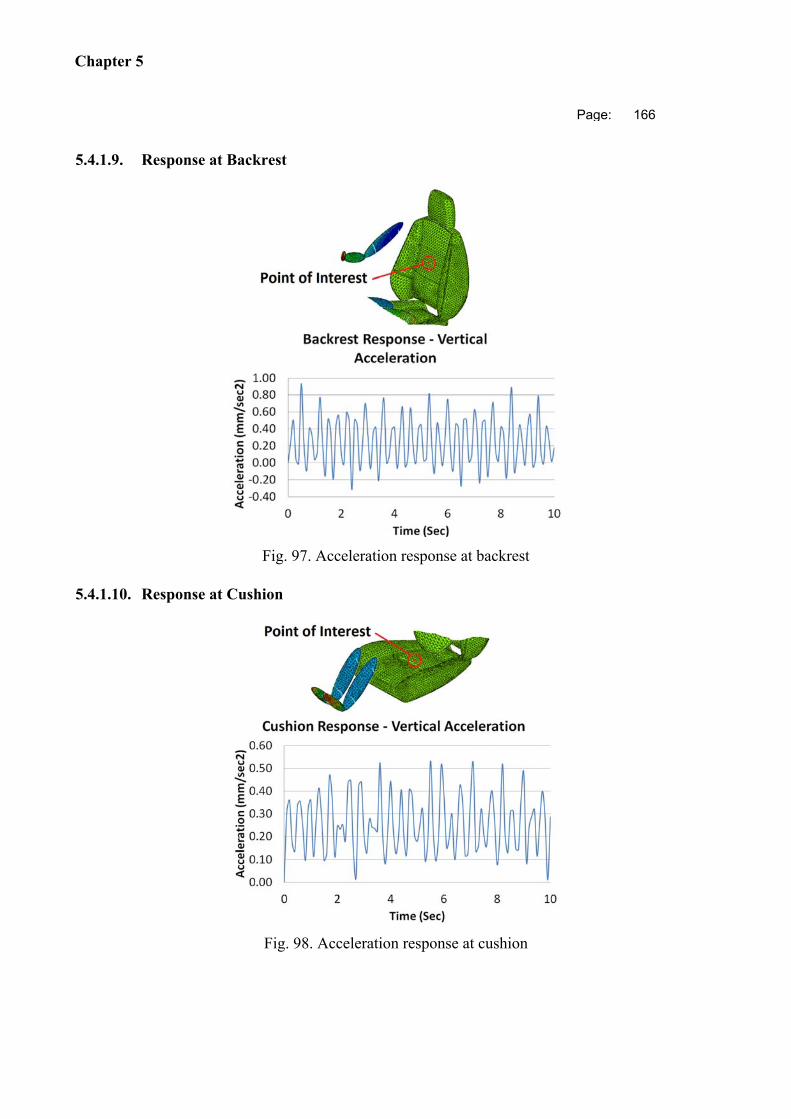
Chapter 5
Page: 166
5.4.1.9. Response at Backrest
Fig. 97. Acceleration response at backrest
5.4.1.10. Response at Cushion
Fig. 98. Acceleration response at cushion
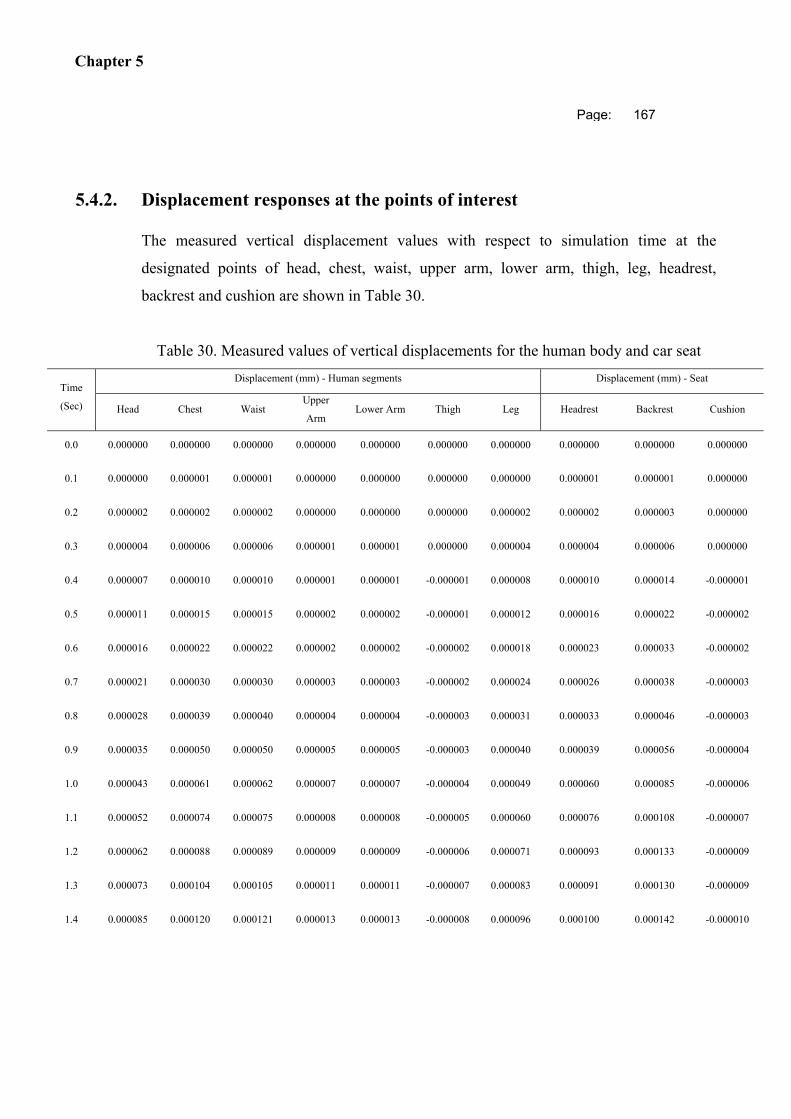
Chapter 5
Page: 167
5.4.2. Displacement responses at the points of interest
The measured vertical displacement values with respect to simulation time at the
designated points of head, chest, waist, upper arm, lower arm, thigh, leg, headrest,
backrest and cushion are shown in Table 30.
Table 30. Measured values of vertical displacements for the human body and car seat
Time
(Sec)
Displacement (mm) - Human segments Displacement (mm) - Seat
Head Chest Waist Upper
Arm Lower Arm Thigh Leg Headrest Backrest Cushion
0.0 0.000000 0.000000 0.000000 0.000000 0.000000 0.000000 0.000000 0.000000 0.000000 0.000000
0.1 0.000000 0.000001 0.000001 0.000000 0.000000 0.000000 0.000000 0.000001 0.000001 0.000000
0.2 0.000002 0.000002 0.000002 0.000000 0.000000 0.000000 0.000002 0.000002 0.000003 0.000000
0.3 0.000004 0.000006 0.000006 0.000001 0.000001 0.000000 0.000004 0.000004 0.000006 0.000000
0.4 0.000007 0.000010 0.000010 0.000001 0.000001 -0.000001 0.000008 0.000010 0.000014 -0.000001
0.5 0.000011 0.000015 0.000015 0.000002 0.000002 -0.000001 0.000012 0.000016 0.000022 -0.000002
0.6 0.000016 0.000022 0.000022 0.000002 0.000002 -0.000002 0.000018 0.000023 0.000033 -0.000002
0.7 0.000021 0.000030 0.000030 0.000003 0.000003 -0.000002 0.000024 0.000026 0.000038 -0.000003
0.8 0.000028 0.000039 0.000040 0.000004 0.000004 -0.000003 0.000031 0.000033 0.000046 -0.000003
0.9 0.000035 0.000050 0.000050 0.000005 0.000005 -0.000003 0.000040 0.000039 0.000056 -0.000004
1.0 0.000043 0.000061 0.000062 0.000007 0.000007 -0.000004 0.000049 0.000060 0.000085 -0.000006
1.1 0.000052 0.000074 0.000075 0.000008 0.000008 -0.000005 0.000060 0.000076 0.000108 -0.000007
1.2 0.000062 0.000088 0.000089 0.000009 0.000009 -0.000006 0.000071 0.000093 0.000133 -0.000009
1.3 0.000073 0.000104 0.000105 0.000011 0.000011 -0.000007 0.000083 0.000091 0.000130 -0.000009
1.4 0.000085 0.000120 0.000121 0.000013 0.000013 -0.000008 0.000096 0.000100 0.000142 -0.000010
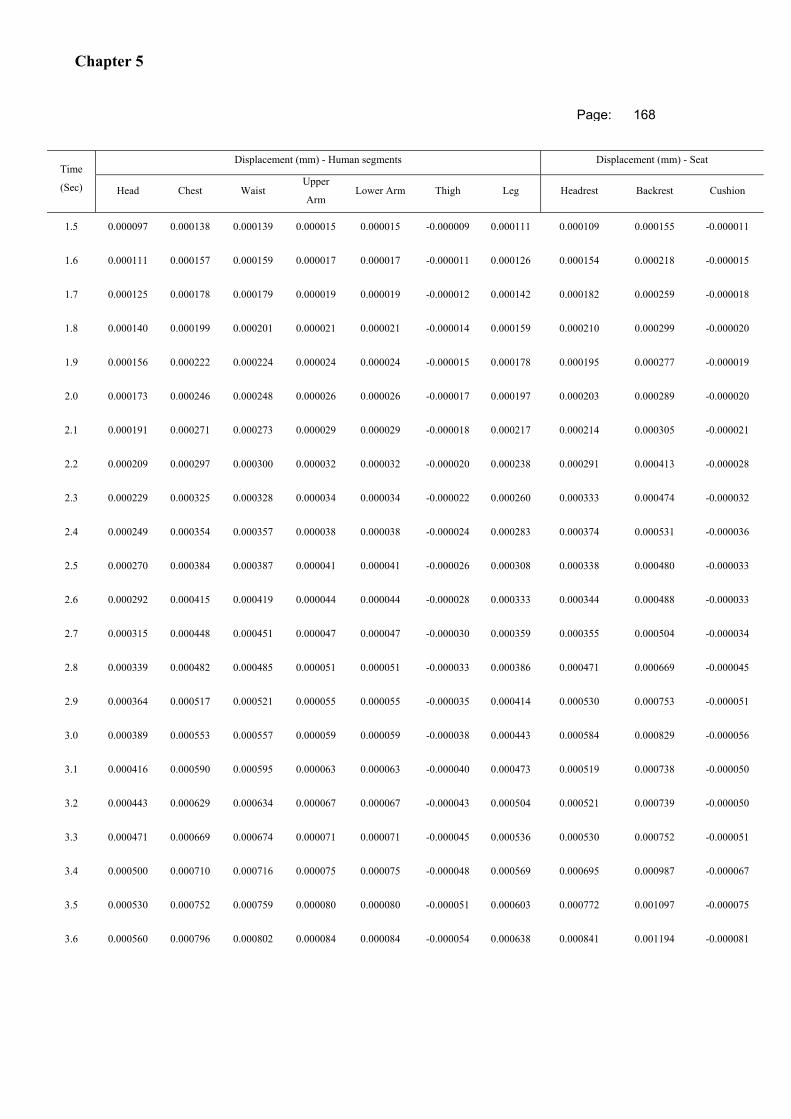
Chapter 5
Page: 168
Time
(Sec)
Displacement (mm) - Human segments Displacement (mm) - Seat
Head Chest Waist Upper
Arm Lower Arm Thigh Leg Headrest Backrest Cushion
1.5 0.000097 0.000138 0.000139 0.000015 0.000015 -0.000009 0.000111 0.000109 0.000155 -0.000011
1.6 0.000111 0.000157 0.000159 0.000017 0.000017 -0.000011 0.000126 0.000154 0.000218 -0.000015
1.7 0.000125 0.000178 0.000179 0.000019 0.000019 -0.000012 0.000142 0.000182 0.000259 -0.000018
1.8 0.000140 0.000199 0.000201 0.000021 0.000021 -0.000014 0.000159 0.000210 0.000299 -0.000020
1.9 0.000156 0.000222 0.000224 0.000024 0.000024 -0.000015 0.000178 0.000195 0.000277 -0.000019
2.0 0.000173 0.000246 0.000248 0.000026 0.000026 -0.000017 0.000197 0.000203 0.000289 -0.000020
2.1 0.000191 0.000271 0.000273 0.000029 0.000029 -0.000018 0.000217 0.000214 0.000305 -0.000021
2.2 0.000209 0.000297 0.000300 0.000032 0.000032 -0.000020 0.000238 0.000291 0.000413 -0.000028
2.3 0.000229 0.000325 0.000328 0.000034 0.000034 -0.000022 0.000260 0.000333 0.000474 -0.000032
2.4 0.000249 0.000354 0.000357 0.000038 0.000038 -0.000024 0.000283 0.000374 0.000531 -0.000036
2.5 0.000270 0.000384 0.000387 0.000041 0.000041 -0.000026 0.000308 0.000338 0.000480 -0.000033
2.6 0.000292 0.000415 0.000419 0.000044 0.000044 -0.000028 0.000333 0.000344 0.000488 -0.000033
2.7 0.000315 0.000448 0.000451 0.000047 0.000047 -0.000030 0.000359 0.000355 0.000504 -0.000034
2.8 0.000339 0.000482 0.000485 0.000051 0.000051 -0.000033 0.000386 0.000471 0.000669 -0.000045
2.9 0.000364 0.000517 0.000521 0.000055 0.000055 -0.000035 0.000414 0.000530 0.000753 -0.000051
3.0 0.000389 0.000553 0.000557 0.000059 0.000059 -0.000038 0.000443 0.000584 0.000829 -0.000056
3.1 0.000416 0.000590 0.000595 0.000063 0.000063 -0.000040 0.000473 0.000519 0.000738 -0.000050
3.2 0.000443 0.000629 0.000634 0.000067 0.000067 -0.000043 0.000504 0.000521 0.000739 -0.000050
3.3 0.000471 0.000669 0.000674 0.000071 0.000071 -0.000045 0.000536 0.000530 0.000752 -0.000051
3.4 0.000500 0.000710 0.000716 0.000075 0.000075 -0.000048 0.000569 0.000695 0.000987 -0.000067
3.5 0.000530 0.000752 0.000759 0.000080 0.000080 -0.000051 0.000603 0.000772 0.001097 -0.000075
3.6 0.000560 0.000796 0.000802 0.000084 0.000084 -0.000054 0.000638 0.000841 0.001194 -0.000081
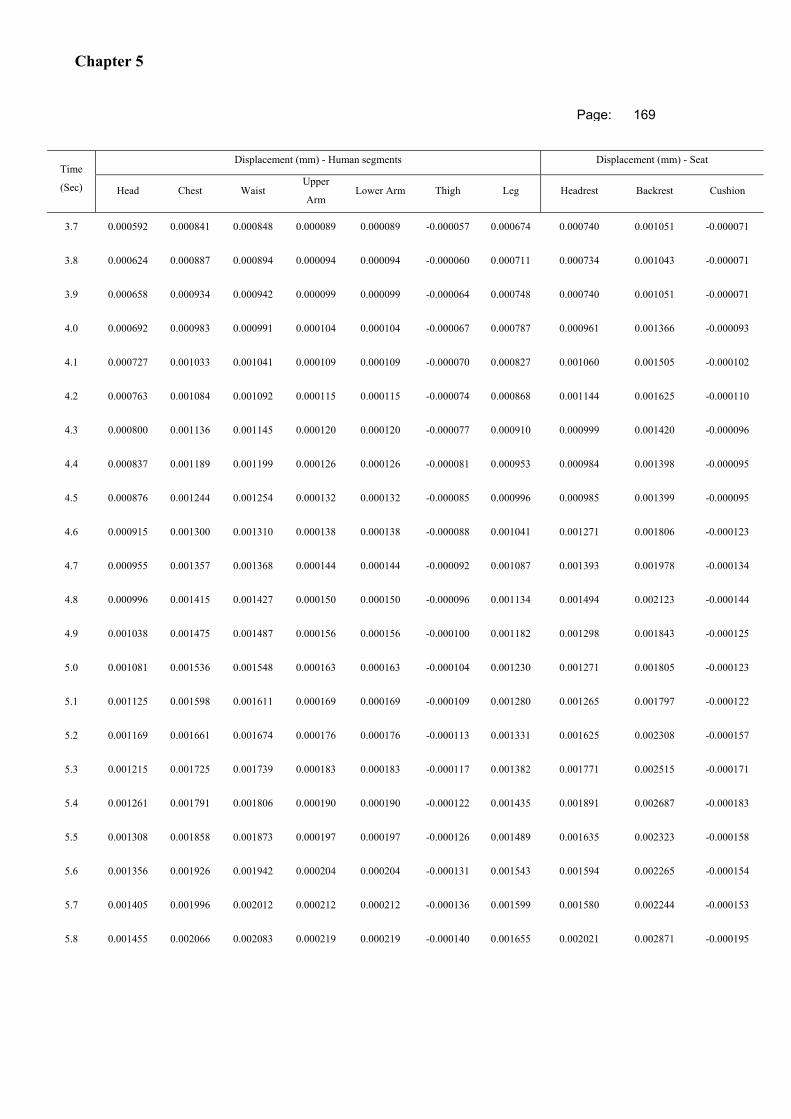
Chapter 5
Page: 169
Time
(Sec)
Displacement (mm) - Human segments Displacement (mm) - Seat
Head Chest Waist Upper
Arm Lower Arm Thigh Leg Headrest Backrest Cushion
3.7 0.000592 0.000841 0.000848 0.000089 0.000089 -0.000057 0.000674 0.000740 0.001051 -0.000071
3.8 0.000624 0.000887 0.000894 0.000094 0.000094 -0.000060 0.000711 0.000734 0.001043 -0.000071
3.9 0.000658 0.000934 0.000942 0.000099 0.000099 -0.000064 0.000748 0.000740 0.001051 -0.000071
4.0 0.000692 0.000983 0.000991 0.000104 0.000104 -0.000067 0.000787 0.000961 0.001366 -0.000093
4.1 0.000727 0.001033 0.001041 0.000109 0.000109 -0.000070 0.000827 0.001060 0.001505 -0.000102
4.2 0.000763 0.001084 0.001092 0.000115 0.000115 -0.000074 0.000868 0.001144 0.001625 -0.000110
4.3 0.000800 0.001136 0.001145 0.000120 0.000120 -0.000077 0.000910 0.000999 0.001420 -0.000096
4.4 0.000837 0.001189 0.001199 0.000126 0.000126 -0.000081 0.000953 0.000984 0.001398 -0.000095
4.5 0.000876 0.001244 0.001254 0.000132 0.000132 -0.000085 0.000996 0.000985 0.001399 -0.000095
4.6 0.000915 0.001300 0.001310 0.000138 0.000138 -0.000088 0.001041 0.001271 0.001806 -0.000123
4.7 0.000955 0.001357 0.001368 0.000144 0.000144 -0.000092 0.001087 0.001393 0.001978 -0.000134
4.8 0.000996 0.001415 0.001427 0.000150 0.000150 -0.000096 0.001134 0.001494 0.002123 -0.000144
4.9 0.001038 0.001475 0.001487 0.000156 0.000156 -0.000100 0.001182 0.001298 0.001843 -0.000125
5.0 0.001081 0.001536 0.001548 0.000163 0.000163 -0.000104 0.001230 0.001271 0.001805 -0.000123
5.1 0.001125 0.001598 0.001611 0.000169 0.000169 -0.000109 0.001280 0.001265 0.001797 -0.000122
5.2 0.001169 0.001661 0.001674 0.000176 0.000176 -0.000113 0.001331 0.001625 0.002308 -0.000157
5.3 0.001215 0.001725 0.001739 0.000183 0.000183 -0.000117 0.001382 0.001771 0.002515 -0.000171
5.4 0.001261 0.001791 0.001806 0.000190 0.000190 -0.000122 0.001435 0.001891 0.002687 -0.000183
5.5 0.001308 0.001858 0.001873 0.000197 0.000197 -0.000126 0.001489 0.001635 0.002323 -0.000158
5.6 0.001356 0.001926 0.001942 0.000204 0.000204 -0.000131 0.001543 0.001594 0.002265 -0.000154
5.7 0.001405 0.001996 0.002012 0.000212 0.000212 -0.000136 0.001599 0.001580 0.002244 -0.000153
5.8 0.001455 0.002066 0.002083 0.000219 0.000219 -0.000140 0.001655 0.002021 0.002871 -0.000195
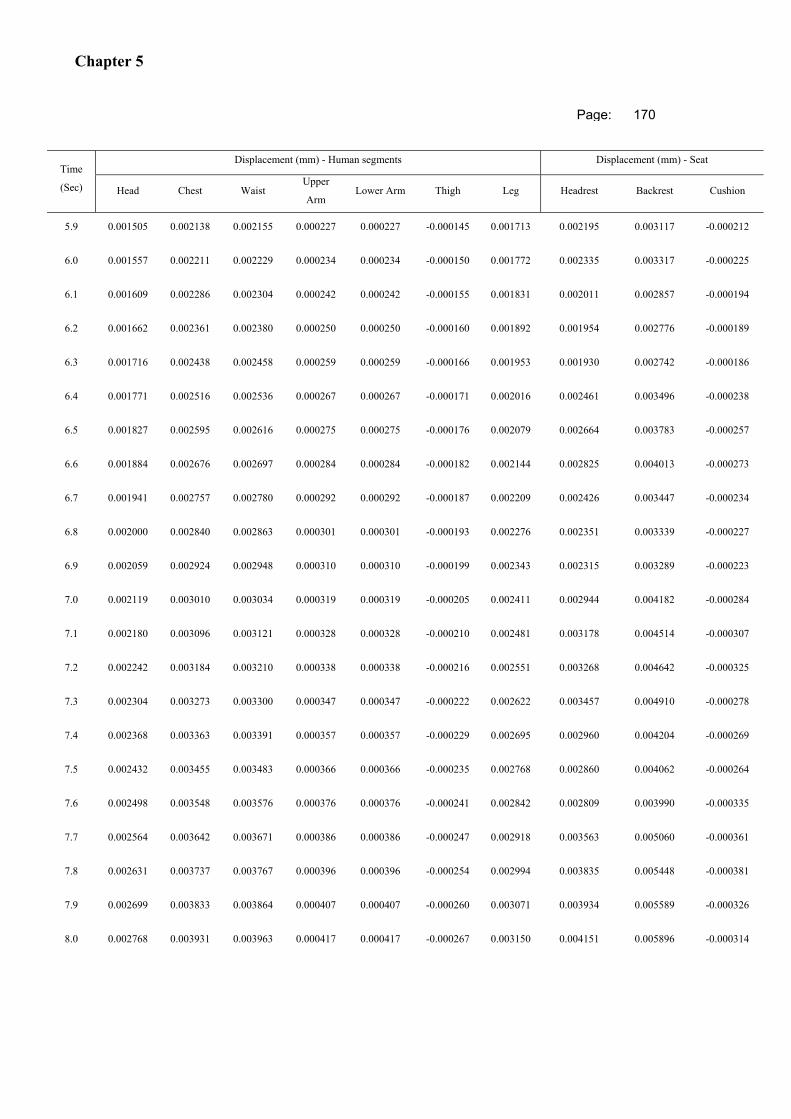
Chapter 5
Page: 170
Time
(Sec)
Displacement (mm) - Human segments Displacement (mm) - Seat
Head Chest Waist Upper
Arm Lower Arm Thigh Leg Headrest Backrest Cushion
5.9 0.001505 0.002138 0.002155 0.000227 0.000227 -0.000145 0.001713 0.002195 0.003117 -0.000212
6.0 0.001557 0.002211 0.002229 0.000234 0.000234 -0.000150 0.001772 0.002335 0.003317 -0.000225
6.1 0.001609 0.002286 0.002304 0.000242 0.000242 -0.000155 0.001831 0.002011 0.002857 -0.000194
6.2 0.001662 0.002361 0.002380 0.000250 0.000250 -0.000160 0.001892 0.001954 0.002776 -0.000189
6.3 0.001716 0.002438 0.002458 0.000259 0.000259 -0.000166 0.001953 0.001930 0.002742 -0.000186
6.4 0.001771 0.002516 0.002536 0.000267 0.000267 -0.000171 0.002016 0.002461 0.003496 -0.000238
6.5 0.001827 0.002595 0.002616 0.000275 0.000275 -0.000176 0.002079 0.002664 0.003783 -0.000257
6.6 0.001884 0.002676 0.002697 0.000284 0.000284 -0.000182 0.002144 0.002825 0.004013 -0.000273
6.7 0.001941 0.002757 0.002780 0.000292 0.000292 -0.000187 0.002209 0.002426 0.003447 -0.000234
6.8 0.002000 0.002840 0.002863 0.000301 0.000301 -0.000193 0.002276 0.002351 0.003339 -0.000227
6.9 0.002059 0.002924 0.002948 0.000310 0.000310 -0.000199 0.002343 0.002315 0.003289 -0.000223
7.0 0.002119 0.003010 0.003034 0.000319 0.000319 -0.000205 0.002411 0.002944 0.004182 -0.000284
7.1 0.002180 0.003096 0.003121 0.000328 0.000328 -0.000210 0.002481 0.003178 0.004514 -0.000307
7.2 0.002242 0.003184 0.003210 0.000338 0.000338 -0.000216 0.002551 0.003268 0.004642 -0.000325
7.3 0.002304 0.003273 0.003300 0.000347 0.000347 -0.000222 0.002622 0.003457 0.004910 -0.000278
7.4 0.002368 0.003363 0.003391 0.000357 0.000357 -0.000229 0.002695 0.002960 0.004204 -0.000269
7.5 0.002432 0.003455 0.003483 0.000366 0.000366 -0.000235 0.002768 0.002860 0.004062 -0.000264
7.6 0.002498 0.003548 0.003576 0.000376 0.000376 -0.000241 0.002842 0.002809 0.003990 -0.000335
7.7 0.002564 0.003642 0.003671 0.000386 0.000386 -0.000247 0.002918 0.003563 0.005060 -0.000361
7.8 0.002631 0.003737 0.003767 0.000396 0.000396 -0.000254 0.002994 0.003835 0.005448 -0.000381
7.9 0.002699 0.003833 0.003864 0.000407 0.000407 -0.000260 0.003071 0.003934 0.005589 -0.000326
8.0 0.002768 0.003931 0.003963 0.000417 0.000417 -0.000267 0.003150 0.004151 0.005896 -0.000314
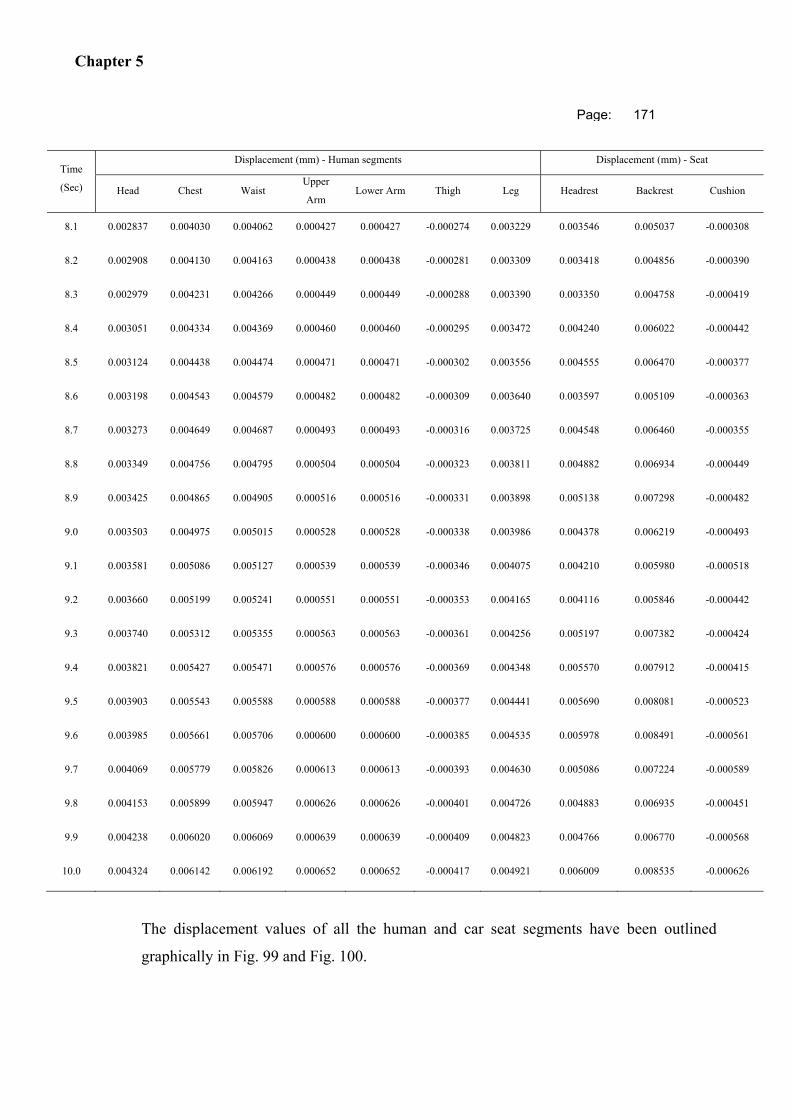
Chapter 5
Page: 171
Time
(Sec)
Displacement (mm) - Human segments Displacement (mm) - Seat
Head Chest Waist Upper
Arm Lower Arm Thigh Leg Headrest Backrest Cushion
8.1 0.002837 0.004030 0.004062 0.000427 0.000427 -0.000274 0.003229 0.003546 0.005037 -0.000308
8.2 0.002908 0.004130 0.004163 0.000438 0.000438 -0.000281 0.003309 0.003418 0.004856 -0.000390
8.3 0.002979 0.004231 0.004266 0.000449 0.000449 -0.000288 0.003390 0.003350 0.004758 -0.000419
8.4 0.003051 0.004334 0.004369 0.000460 0.000460 -0.000295 0.003472 0.004240 0.006022 -0.000442
8.5 0.003124 0.004438 0.004474 0.000471 0.000471 -0.000302 0.003556 0.004555 0.006470 -0.000377
8.6 0.003198 0.004543 0.004579 0.000482 0.000482 -0.000309 0.003640 0.003597 0.005109 -0.000363
8.7 0.003273 0.004649 0.004687 0.000493 0.000493 -0.000316 0.003725 0.004548 0.006460 -0.000355
8.8 0.003349 0.004756 0.004795 0.000504 0.000504 -0.000323 0.003811 0.004882 0.006934 -0.000449
8.9 0.003425 0.004865 0.004905 0.000516 0.000516 -0.000331 0.003898 0.005138 0.007298 -0.000482
9.0 0.003503 0.004975 0.005015 0.000528 0.000528 -0.000338 0.003986 0.004378 0.006219 -0.000493
9.1 0.003581 0.005086 0.005127 0.000539 0.000539 -0.000346 0.004075 0.004210 0.005980 -0.000518
9.2 0.003660 0.005199 0.005241 0.000551 0.000551 -0.000353 0.004165 0.004116 0.005846 -0.000442
9.3 0.003740 0.005312 0.005355 0.000563 0.000563 -0.000361 0.004256 0.005197 0.007382 -0.000424
9.4 0.003821 0.005427 0.005471 0.000576 0.000576 -0.000369 0.004348 0.005570 0.007912 -0.000415
9.5 0.003903 0.005543 0.005588 0.000588 0.000588 -0.000377 0.004441 0.005690 0.008081 -0.000523
9.6 0.003985 0.005661 0.005706 0.000600 0.000600 -0.000385 0.004535 0.005978 0.008491 -0.000561
9.7 0.004069 0.005779 0.005826 0.000613 0.000613 -0.000393 0.004630 0.005086 0.007224 -0.000589
9.8 0.004153 0.005899 0.005947 0.000626 0.000626 -0.000401 0.004726 0.004883 0.006935 -0.000451
9.9 0.004238 0.006020 0.006069 0.000639 0.000639 -0.000409 0.004823 0.004766 0.006770 -0.000568
10.0 0.004324 0.006142 0.006192 0.000652 0.000652 -0.000417 0.004921 0.006009 0.008535 -0.000626
The displacement values of all the human and car seat segments have been outlined
graphically in Fig. 99 and Fig. 100.
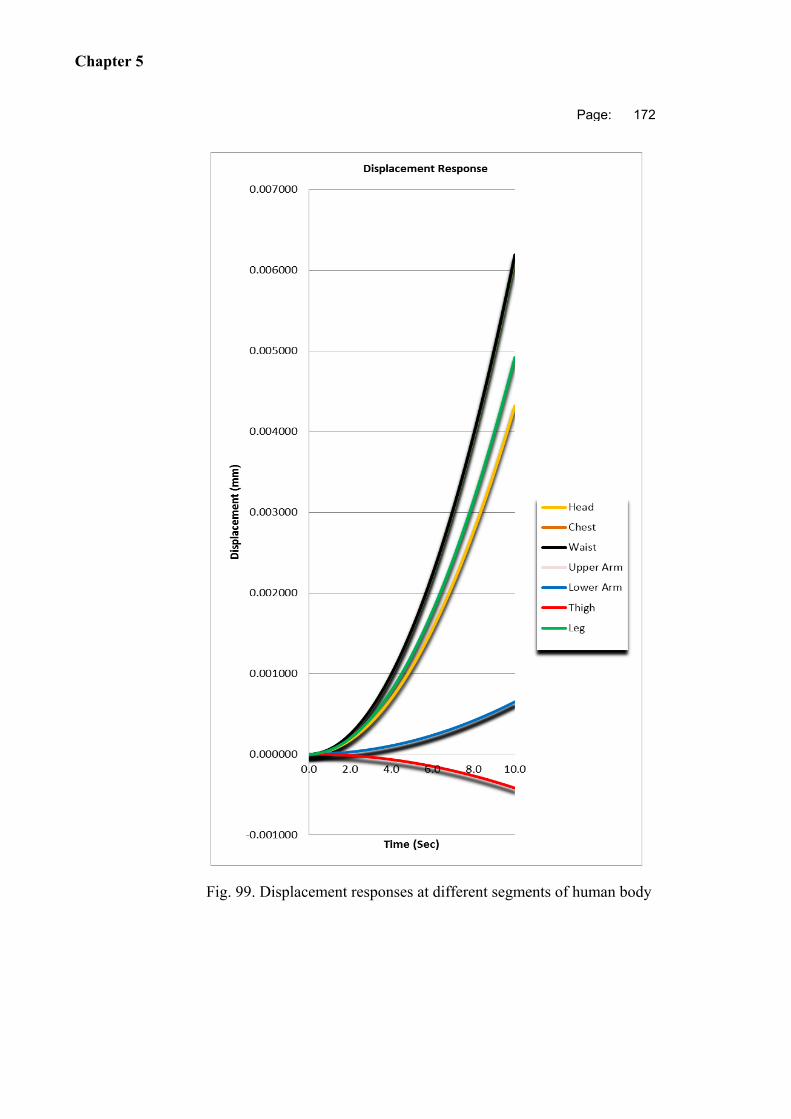
Chapter 5
Page: 172
Fig. 99. Displacement responses at different segments of human body
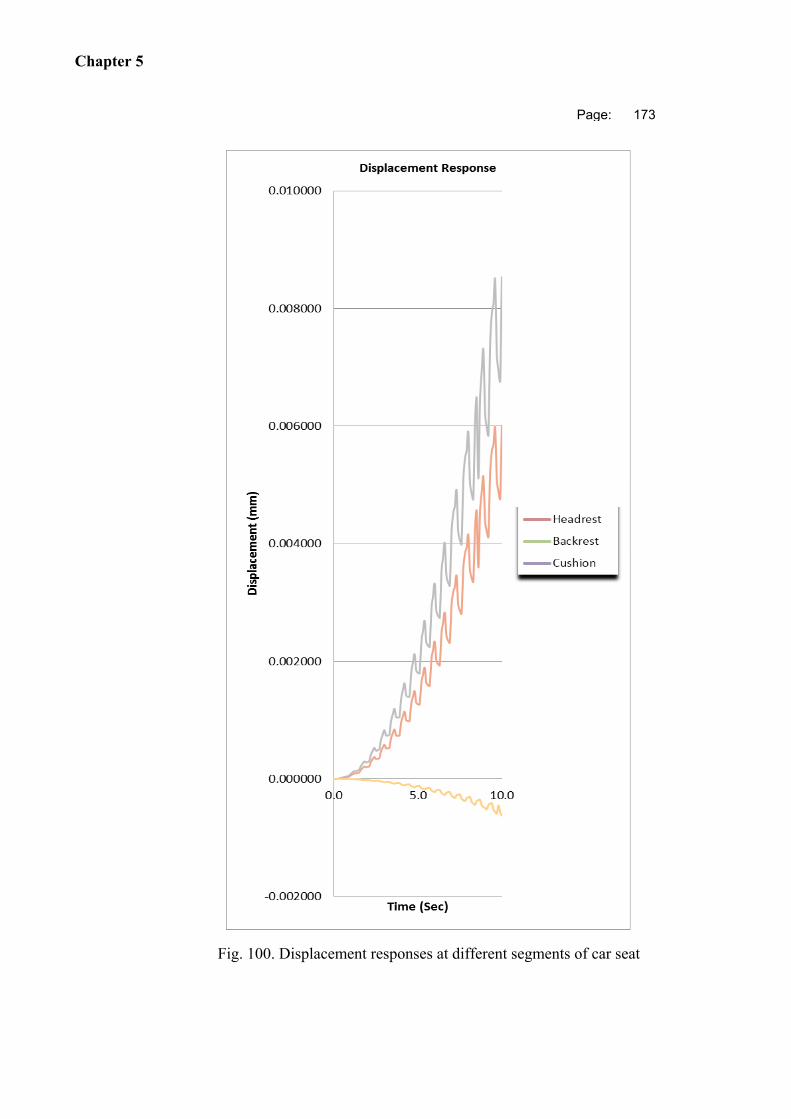
Chapter 5
Page: 173
Fig. 100. Displacement responses at different segments of car seat
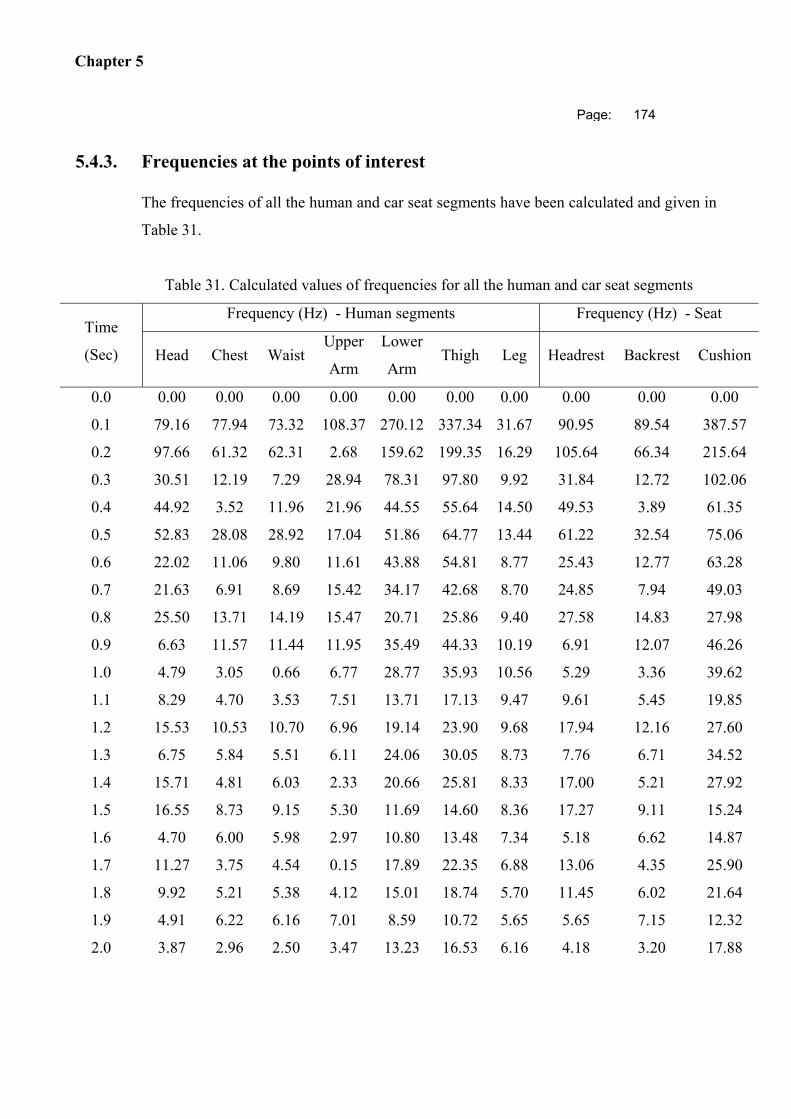
Chapter 5
Page: 174
5.4.3. Frequencies at the points of interest
The frequencies of all the human and car seat segments have been calculated and given in
Table 31.
Table 31. Calculated values of frequencies for all the human and car seat segments
Time
(Sec)
Frequency (Hz) - Human segments Frequency (Hz) - Seat
Head Chest Waist Upper
Arm
Lower
Arm Thigh Leg Headrest Backrest Cushion
0.0 0.00 0.00 0.00 0.00 0.00 0.00 0.00 0.00 0.00 0.00
0.1 79.16 77.94 73.32 108.37 270.12 337.34 31.67 90.95 89.54 387.57
0.2 97.66 61.32 62.31 2.68 159.62 199.35 16.29 105.64 66.34 215.64
0.3 30.51 12.19 7.29 28.94 78.31 97.80 9.92 31.84 12.72 102.06
0.4 44.92 3.52 11.96 21.96 44.55 55.64 14.50 49.53 3.89 61.35
0.5 52.83 28.08 28.92 17.04 51.86 64.77 13.44 61.22 32.54 75.06
0.6 22.02 11.06 9.80 11.61 43.88 54.81 8.77 25.43 12.77 63.28
0.7 21.63 6.91 8.69 15.42 34.17 42.68 8.70 24.85 7.94 49.03
0.8 25.50 13.71 14.19 15.47 20.71 25.86 9.40 27.58 14.83 27.98
0.9 6.63 11.57 11.44 11.95 35.49 44.33 10.19 6.91 12.07 46.26
1.0 4.79 3.05 0.66 6.77 28.77 35.93 10.56 5.29 3.36 39.62
1.1 8.29 4.70 3.53 7.51 13.71 17.13 9.47 9.61 5.45 19.85
1.2 15.53 10.53 10.70 6.96 19.14 23.90 9.68 17.94 12.16 27.60
1.3 6.75 5.84 5.51 6.11 24.06 30.05 8.73 7.76 6.71 34.52
1.4 15.71 4.81 6.03 2.33 20.66 25.81 8.33 17.00 5.21 27.92
1.5 16.55 8.73 9.15 5.30 11.69 14.60 8.36 17.27 9.11 15.24
1.6 4.70 6.00 5.98 2.97 10.80 13.48 7.34 5.18 6.62 14.87
1.7 11.27 3.75 4.54 0.15 17.89 22.35 6.88 13.06 4.35 25.90
1.8 9.92 5.21 5.38 4.12 15.01 18.74 5.70 11.45 6.02 21.64
1.9 4.91 6.22 6.16 7.01 8.59 10.72 5.65 5.65 7.15 12.32
2.0 3.87 2.96 2.50 3.47 13.23 16.53 6.16 4.18 3.20 17.88

Chapter 5
Page: 175
Time
(Sec)
Frequency (Hz) - Human segments Frequency (Hz) - Seat
Head Chest Waist Upper
Arm
Lower
Arm Thigh Leg Headrest Backrest Cushion
2.1 6.40 0.77 1.95 4.76 12.94 16.17 5.22 6.67 0.81 16.87
2.2 6.60 5.46 5.47 3.34 10.97 13.70 4.05 7.28 6.02 15.11
2.3 8.12 4.40 4.52 2.64 8.30 10.36 2.35 9.41 5.10 12.01
2.4 9.72 3.36 3.90 1.86 12.17 15.20 2.50 11.23 3.88 17.55
2.5 7.19 4.49 4.59 3.57 12.99 16.23 3.31 8.26 5.16 18.64
2.6 6.57 4.44 4.54 4.25 7.62 9.51 2.53 7.11 4.81 10.29
2.7 6.69 2.03 2.56 4.03 3.06 3.82 1.08 6.98 2.12 3.99
2.8 4.43 2.62 2.49 1.53 11.18 13.97 0.95 4.88 2.89 15.40
2.9 3.24 4.19 4.12 2.42 10.21 12.75 1.20 3.76 4.86 14.78
3.0 4.76 2.76 2.75 4.02 6.66 8.32 1.53 5.50 3.19 9.60
3.1 4.08 1.35 1.77 0.66 5.62 7.02 1.23 4.68 1.56 8.07
3.2 1.61 3.22 3.15 3.58 8.74 10.92 1.89 1.74 3.49 11.81
3.3 6.83 3.58 3.76 1.30 8.41 10.50 1.31 7.12 3.74 10.96
3.4 6.06 2.10 2.50 2.17 6.87 8.58 1.17 6.69 2.32 9.46
3.5 2.10 2.44 2.34 0.92 6.02 7.51 1.68 2.43 2.83 8.71
3.6 5.55 3.48 3.56 3.46 8.88 11.09 1.28 6.41 4.02 12.81
3.7 4.39 0.25 1.17 1.45 5.96 7.44 1.54 5.04 0.28 8.55
3.8 2.29 1.26 1.07 0.63 3.98 4.97 1.89 2.48 1.36 5.37
3.9 2.43 2.94 2.94 1.71 7.17 8.96 2.21 2.54 3.07 9.35
4.0 3.65 2.52 2.53 2.47 8.00 10.00 2.40 4.03 2.78 11.02
4.1 2.39 0.90 1.14 0.34 5.21 6.51 2.26 2.77 1.04 7.54
4.2 2.96 1.84 1.74 0.89 3.72 4.65 2.54 3.42 2.13 5.37
4.3 5.55 2.99 3.09 0.84 5.16 6.44 2.57 6.38 3.43 7.40
4.4 4.12 0.76 1.30 1.35 7.72 9.64 2.77 4.46 0.82 10.43
4.5 2.80 0.96 0.57 2.02 5.52 6.90 2.92 2.92 1.01 7.20
4.6 4.96 2.74 2.81 0.65 3.65 4.56 2.58 5.47 3.02 5.03
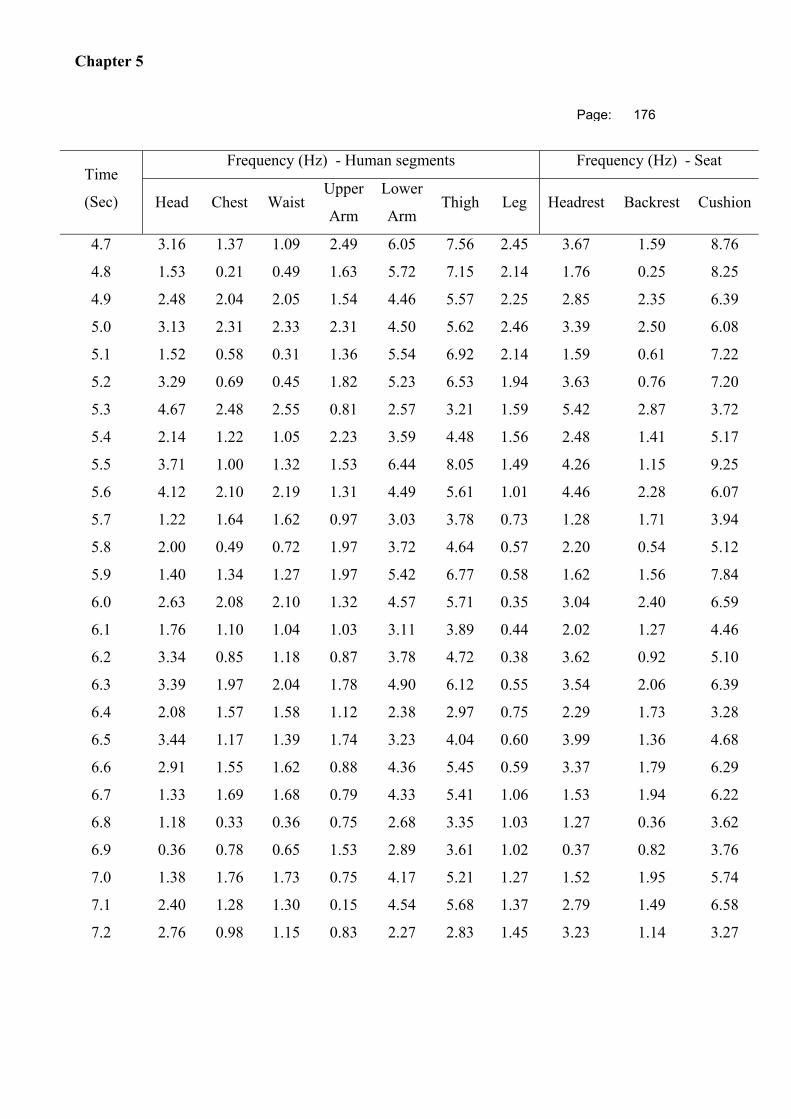
Chapter 5
Page: 176
Time
(Sec)
Frequency (Hz) - Human segments Frequency (Hz) - Seat
Head Chest Waist Upper
Arm
Lower
Arm Thigh Leg Headrest Backrest Cushion
4.7 3.16 1.37 1.09 2.49 6.05 7.56 2.45 3.67 1.59 8.76
4.8 1.53 0.21 0.49 1.63 5.72 7.15 2.14 1.76 0.25 8.25
4.9 2.48 2.04 2.05 1.54 4.46 5.57 2.25 2.85 2.35 6.39
5.0 3.13 2.31 2.33 2.31 4.50 5.62 2.46 3.39 2.50 6.08
5.1 1.52 0.58 0.31 1.36 5.54 6.92 2.14 1.59 0.61 7.22
5.2 3.29 0.69 0.45 1.82 5.23 6.53 1.94 3.63 0.76 7.20
5.3 4.67 2.48 2.55 0.81 2.57 3.21 1.59 5.42 2.87 3.72
5.4 2.14 1.22 1.05 2.23 3.59 4.48 1.56 2.48 1.41 5.17
5.5 3.71 1.00 1.32 1.53 6.44 8.05 1.49 4.26 1.15 9.25
5.6 4.12 2.10 2.19 1.31 4.49 5.61 1.01 4.46 2.28 6.07
5.7 1.22 1.64 1.62 0.97 3.03 3.78 0.73 1.28 1.71 3.94
5.8 2.00 0.49 0.72 1.97 3.72 4.64 0.57 2.20 0.54 5.12
5.9 1.40 1.34 1.27 1.97 5.42 6.77 0.58 1.62 1.56 7.84
6.0 2.63 2.08 2.10 1.32 4.57 5.71 0.35 3.04 2.40 6.59
6.1 1.76 1.10 1.04 1.03 3.11 3.89 0.44 2.02 1.27 4.46
6.2 3.34 0.85 1.18 0.87 3.78 4.72 0.38 3.62 0.92 5.10
6.3 3.39 1.97 2.04 1.78 4.90 6.12 0.55 3.54 2.06 6.39
6.4 2.08 1.57 1.58 1.12 2.38 2.97 0.75 2.29 1.73 3.28
6.5 3.44 1.17 1.39 1.74 3.23 4.04 0.60 3.99 1.36 4.68
6.6 2.91 1.55 1.62 0.88 4.36 5.45 0.59 3.37 1.79 6.29
6.7 1.33 1.69 1.68 0.79 4.33 5.41 1.06 1.53 1.94 6.22
6.8 1.18 0.33 0.36 0.75 2.68 3.35 1.03 1.27 0.36 3.62
6.9 0.36 0.78 0.65 1.53 2.89 3.61 1.02 0.37 0.82 3.76
7.0 1.38 1.76 1.73 0.75 4.17 5.21 1.27 1.52 1.95 5.74
7.1 2.40 1.28 1.30 0.15 4.54 5.68 1.37 2.79 1.49 6.58
7.2 2.76 0.98 1.15 0.83 2.27 2.83 1.45 3.23 1.14 3.27
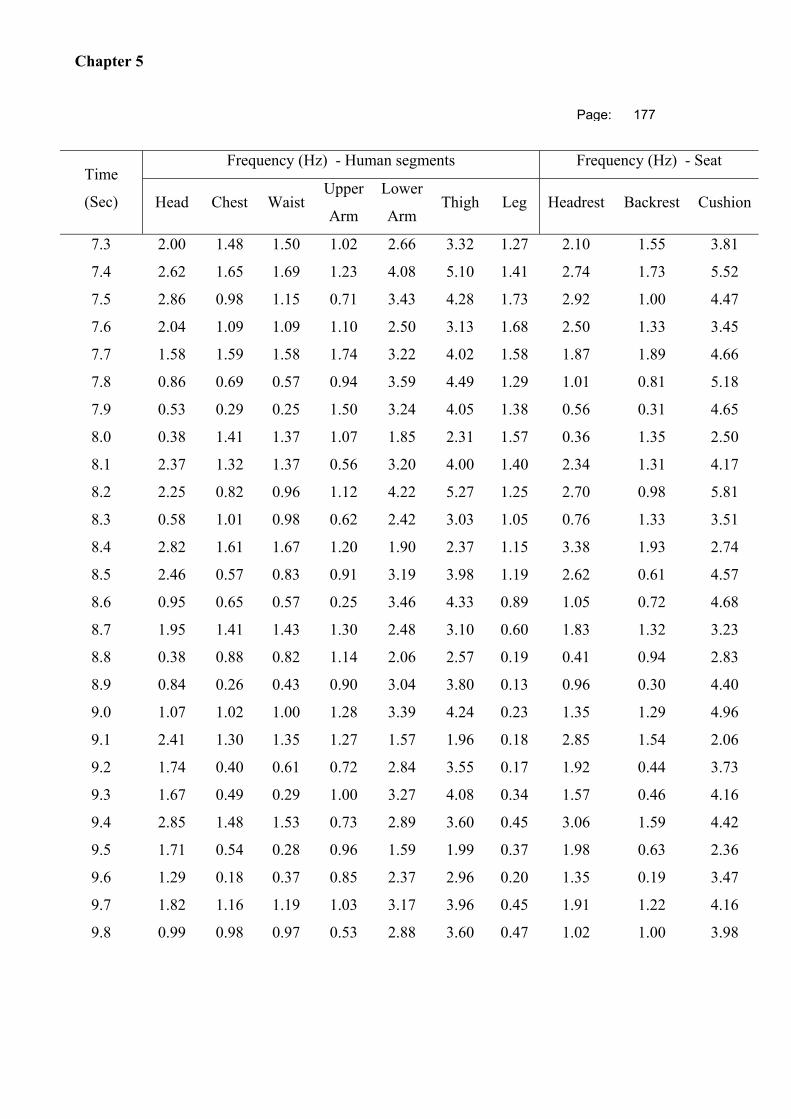
Chapter 5
Page: 177
Time
(Sec)
Frequency (Hz) - Human segments Frequency (Hz) - Seat
Head Chest Waist Upper
Arm
Lower
Arm Thigh Leg Headrest Backrest Cushion
7.3 2.00 1.48 1.50 1.02 2.66 3.32 1.27 2.10 1.55 3.81
7.4 2.62 1.65 1.69 1.23 4.08 5.10 1.41 2.74 1.73 5.52
7.5 2.86 0.98 1.15 0.71 3.43 4.28 1.73 2.92 1.00 4.47
7.6 2.04 1.09 1.09 1.10 2.50 3.13 1.68 2.50 1.33 3.45
7.7 1.58 1.59 1.58 1.74 3.22 4.02 1.58 1.87 1.89 4.66
7.8 0.86 0.69 0.57 0.94 3.59 4.49 1.29 1.01 0.81 5.18
7.9 0.53 0.29 0.25 1.50 3.24 4.05 1.38 0.56 0.31 4.65
8.0 0.38 1.41 1.37 1.07 1.85 2.31 1.57 0.36 1.35 2.50
8.1 2.37 1.32 1.37 0.56 3.20 4.00 1.40 2.34 1.31 4.17
8.2 2.25 0.82 0.96 1.12 4.22 5.27 1.25 2.70 0.98 5.81
8.3 0.58 1.01 0.98 0.62 2.42 3.03 1.05 0.76 1.33 3.51
8.4 2.82 1.61 1.67 1.20 1.90 2.37 1.15 3.38 1.93 2.74
8.5 2.46 0.57 0.83 0.91 3.19 3.98 1.19 2.62 0.61 4.57
8.6 0.95 0.65 0.57 0.25 3.46 4.33 0.89 1.05 0.72 4.68
8.7 1.95 1.41 1.43 1.30 2.48 3.10 0.60 1.83 1.32 3.23
8.8 0.38 0.88 0.82 1.14 2.06 2.57 0.19 0.41 0.94 2.83
8.9 0.84 0.26 0.43 0.90 3.04 3.80 0.13 0.96 0.30 4.40
9.0 1.07 1.02 1.00 1.28 3.39 4.24 0.23 1.35 1.29 4.96
9.1 2.41 1.30 1.35 1.27 1.57 1.96 0.18 2.85 1.54 2.06
9.2 1.74 0.40 0.61 0.72 2.84 3.55 0.17 1.92 0.44 3.73
9.3 1.67 0.49 0.29 1.00 3.27 4.08 0.34 1.57 0.46 4.16
9.4 2.85 1.48 1.53 0.73 2.89 3.60 0.45 3.06 1.59 4.42
9.5 1.71 0.54 0.28 0.96 1.59 1.99 0.37 1.98 0.63 2.36
9.6 1.29 0.18 0.37 0.85 2.37 2.96 0.20 1.35 0.19 3.47
9.7 1.82 1.16 1.19 1.03 3.17 3.96 0.45 1.91 1.22 4.16
9.8 0.99 0.98 0.97 0.53 2.88 3.60 0.47 1.02 1.00 3.98
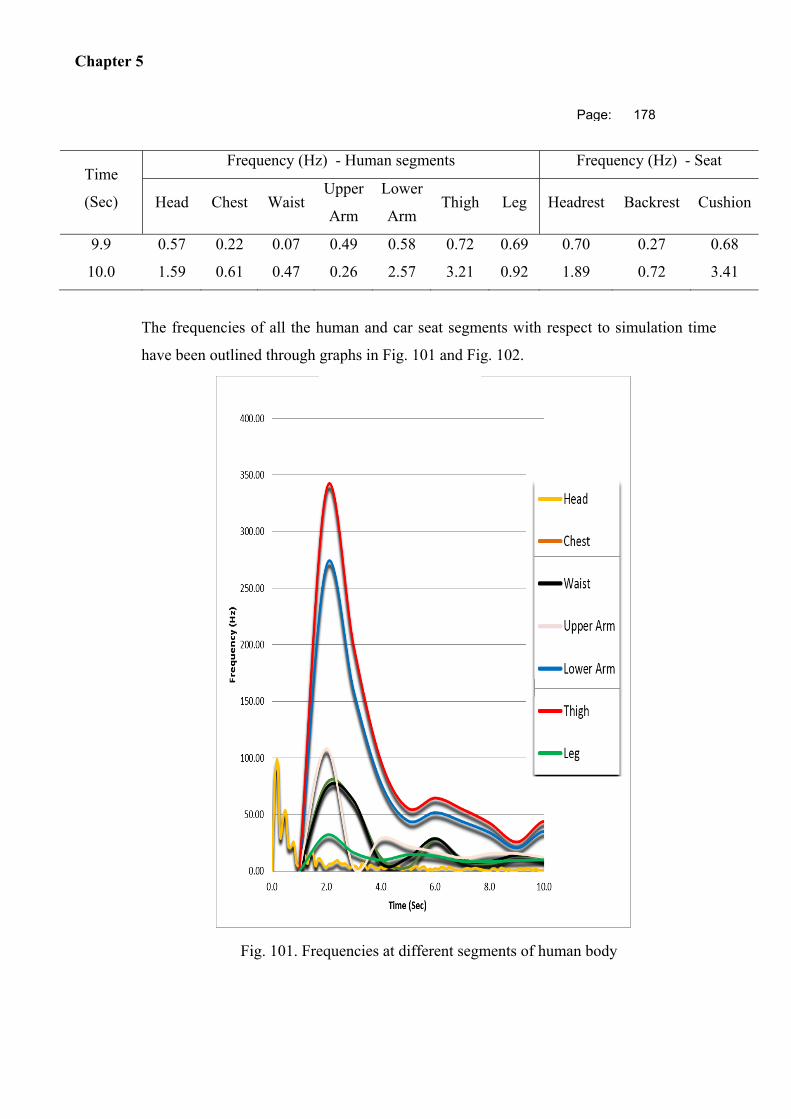
Chapter 5
Page: 178
Time
(Sec)
Frequency (Hz) - Human segments Frequency (Hz) - Seat
Head Chest Waist Upper
Arm
Lower
Arm Thigh Leg Headrest Backrest Cushion
9.9 0.57 0.22 0.07 0.49 0.58 0.72 0.69 0.70 0.27 0.68
10.0 1.59 0.61 0.47 0.26 2.57 3.21 0.92 1.89 0.72 3.41
The frequencies of all the human and car seat segments with respect to simulation time
have been outlined through graphs in Fig. 101 and Fig. 102.
Fig. 101. Frequencies at different segments of human body
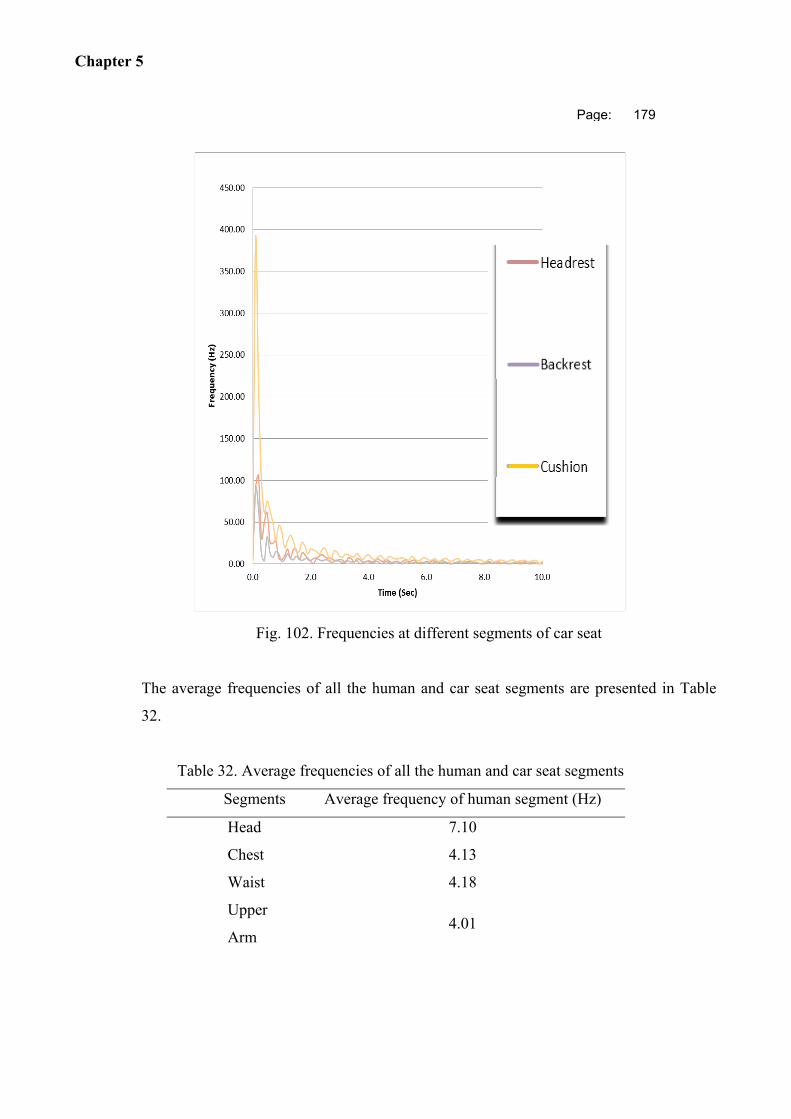
Chapter 5
Page: 179
Fig. 102. Frequencies at different segments of car seat
The average frequencies of all the human and car seat segments are presented in Table
32.
Table 32. Average frequencies of all the human and car seat segments
Segments Average frequency of human segment (Hz)
Head 7.10
Chest 4.13
Waist 4.18
Upper
Arm 4.01
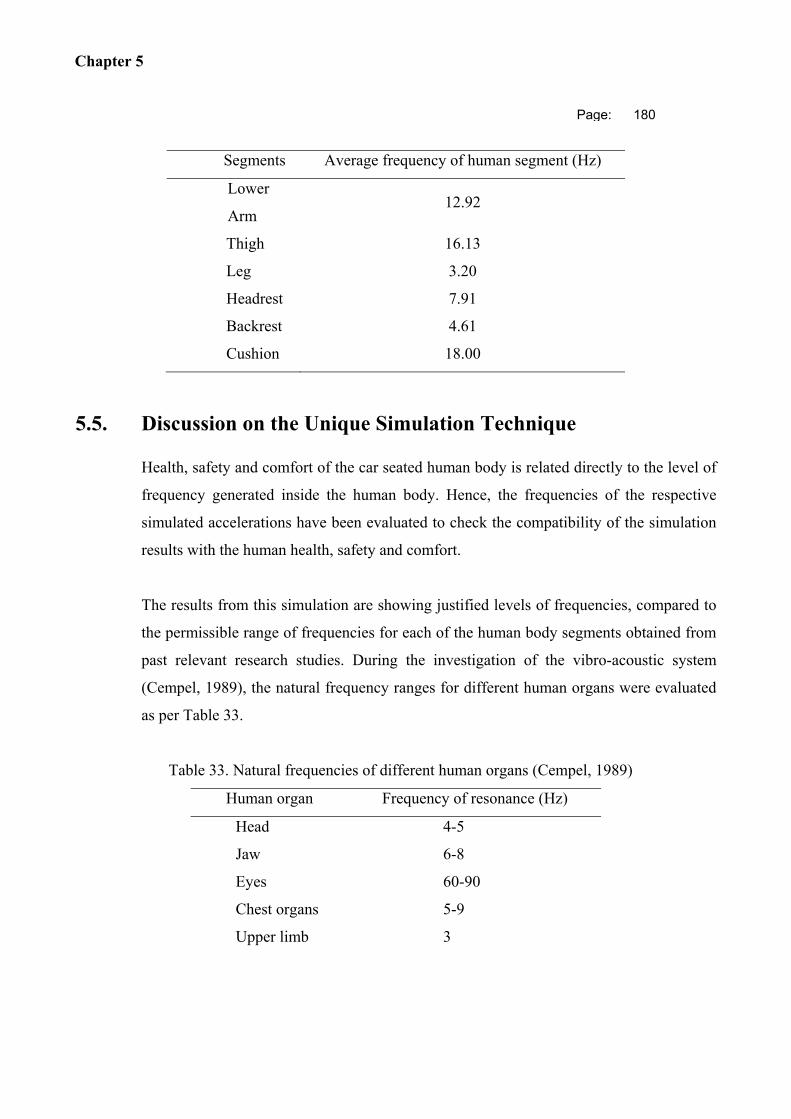
Chapter 5
Page: 180
Segments Average frequency of human segment (Hz)
Lower
Arm 12.92
Thigh 16.13
Leg 3.20
Headrest 7.91
Backrest 4.61
Cushion 18.00
5.5. Discussion on the Unique Simulation Technique
Health, safety and comfort of the car seated human body is related directly to the level of
frequency generated inside the human body. Hence, the frequencies of the respective
simulated accelerations have been evaluated to check the compatibility of the simulation
results with the human health, safety and comfort.
The results from this simulation are showing justified levels of frequencies, compared to
the permissible range of frequencies for each of the human body segments obtained from
past relevant research studies. During the investigation of the vibro-acoustic system
(Cempel, 1989), the natural frequency ranges for different human organs were evaluated
as per Table 33.
Table 33. Natural frequencies of different human organs (Cempel, 1989)
Human organ Frequency of resonance (Hz)
Head 4-5
Jaw 6-8
Eyes 60-90
Chest organs 5-9
Upper limb 3
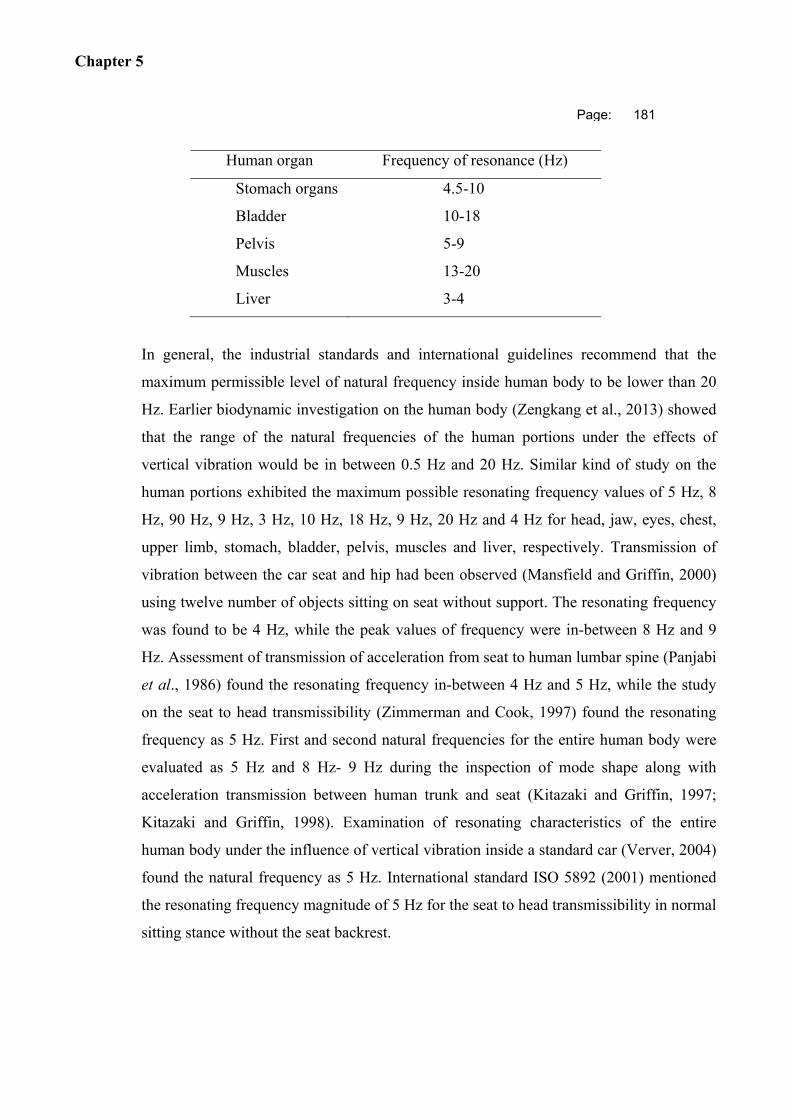
Chapter 5
Page: 181
Human organ Frequency of resonance (Hz)
Stomach organs 4.5-10
Bladder 10-18
Pelvis 5-9
Muscles 13-20
Liver 3-4
In general, the industrial standards and international guidelines recommend that the
maximum permissible level of natural frequency inside human body to be lower than 20
Hz. Earlier biodynamic investigation on the human body (Zengkang et al., 2013) showed
that the range of the natural frequencies of the human portions under the effects of
vertical vibration would be in between 0.5 Hz and 20 Hz. Similar kind of study on the
human portions exhibited the maximum possible resonating frequency values of 5 Hz, 8
Hz, 90 Hz, 9 Hz, 3 Hz, 10 Hz, 18 Hz, 9 Hz, 20 Hz and 4 Hz for head, jaw, eyes, chest,
upper limb, stomach, bladder, pelvis, muscles and liver, respectively. Transmission of
vibration between the car seat and hip had been observed (Mansfield and Griffin, 2000)
using twelve number of objects sitting on seat without support. The resonating frequency
was found to be 4 Hz, while the peak values of frequency were in-between 8 Hz and 9
Hz. Assessment of transmission of acceleration from seat to human lumbar spine (Panjabi
et al., 1986) found the resonating frequency in-between 4 Hz and 5 Hz, while the study
on the seat to head transmissibility (Zimmerman and Cook, 1997) found the resonating
frequency as 5 Hz. First and second natural frequencies for the entire human body were
evaluated as 5 Hz and 8 Hz- 9 Hz during the inspection of mode shape along with
acceleration transmission between human trunk and seat (Kitazaki and Griffin, 1997;
Kitazaki and Griffin, 1998). Examination of resonating characteristics of the entire
human body under the influence of vertical vibration inside a standard car (Verver, 2004)
found the natural frequency as 5 Hz. International standard ISO 5892 (2001) mentioned
the resonating frequency magnitude of 5 Hz for the seat to head transmissibility in normal
sitting stance without the seat backrest.
Chapter 5
Page: 182
The simulation results are showing that the average frequency values at seat headrest,
seat backrest and seat cushion as 7.91 Hz, 4.61 Hz and 18.0 Hz, respectively; while for
the head, chest, waist, upper arm, lower arm, thigh and leg, the values are 7.10 Hz, 4.13
Hz, 4.18 Hz, 4.01 Hz, 12.92 Hz, 16.13 Hz and 3.10 Hz, respectively. So, the frequency
values of these human portions are lower compared to the frequencies of the adjacent car
seat segments, which shows the sign of effective vibration transmission from seat to
human body. Furthermore, it gives an indication of correct functionalities of the assigned
material properties, calculated stiffness values, defined damping parameters, assigned
contact mechanism, implemented boundary conditions and applied loads during the
development of this unique simulation technique.
The simulation had been repeated few times by assigning different contact formulations
including coefficients of friction, though, cause of the lack of adequate memory inside the
computer, the ABAQUS solver got terminated after running for long time without
yielding any output. So, no frictional coefficients were assigned for the contact
mechanism and only the tie-up constrains had been used in this simulation.
Past research works on the similar biodynamic fields have suggested that the assignment
of frictional coefficients would be useful for the stress or pressure distribution related
simulation studies. As the current simulation methodology aims to find out the final
frequency levels at different points of human body and car seat, the use of tie-up
constrains instead of frictional coefficient doesn’t affect the primary objective of this
simulation based investigation.
This unique finite element simulation methodology for the entire assembly of human
body and car seat using the calculated three dimensional stiffness values for human
portions and the combined properties of viscoelastic and hyper-elastic materials for the
seat polyurethane foam, has become successful.
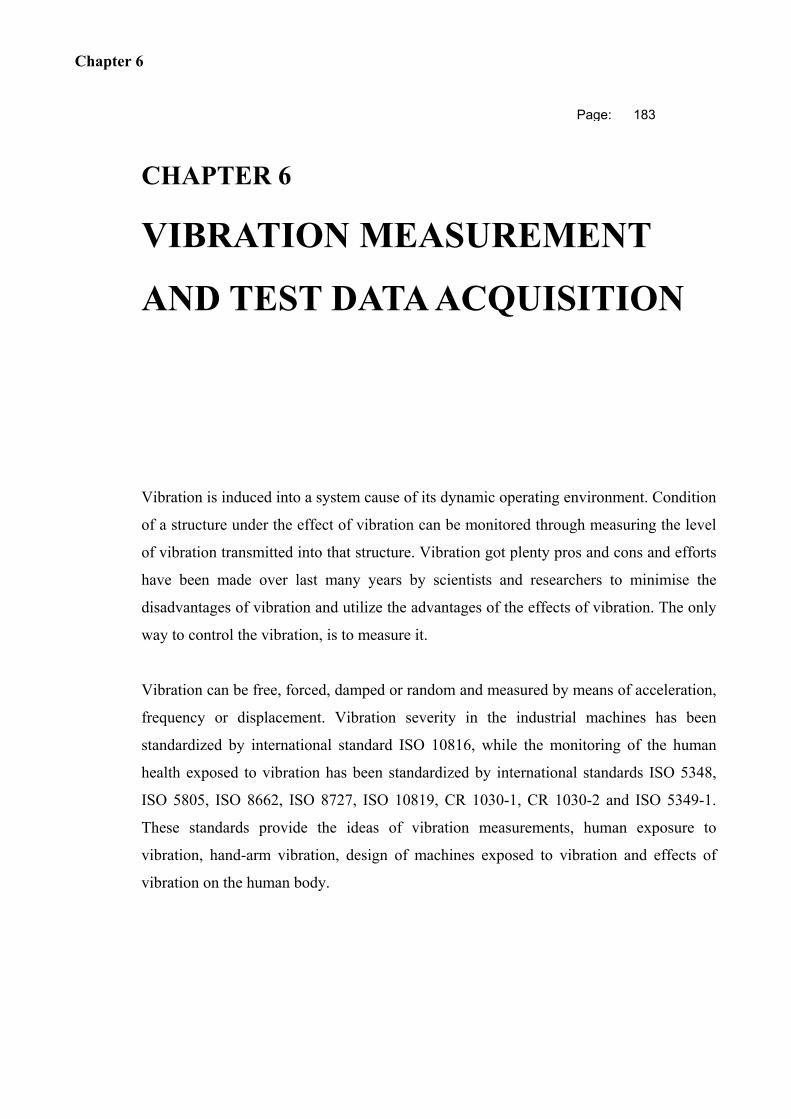
Chapter 6
Page: 183
CHAPTER 6 VIBRATION MEASUREMENT
AND TEST DATA ACQUISITION
Vibration is induced into a system cause of its dynamic operating environment. Condition
of a structure under the effect of vibration can be monitored through measuring the level
of vibration transmitted into that structure. Vibration got plenty pros and cons and efforts
have been made over last many years by scientists and researchers to minimise the
disadvantages of vibration and utilize the advantages of the effects of vibration. The only
way to control the vibration, is to measure it.
Vibration can be free, forced, damped or random and measured by means of acceleration,
frequency or displacement. Vibration severity in the industrial machines has been
standardized by international standard ISO 10816, while the monitoring of the human
health exposed to vibration has been standardized by international standards ISO 5348,
ISO 5805, ISO 8662, ISO 8727, ISO 10819, CR 1030-1, CR 1030-2 and ISO 5349-1.
These standards provide the ideas of vibration measurements, human exposure to
vibration, hand-arm vibration, design of machines exposed to vibration and effects of
vibration on the human body.
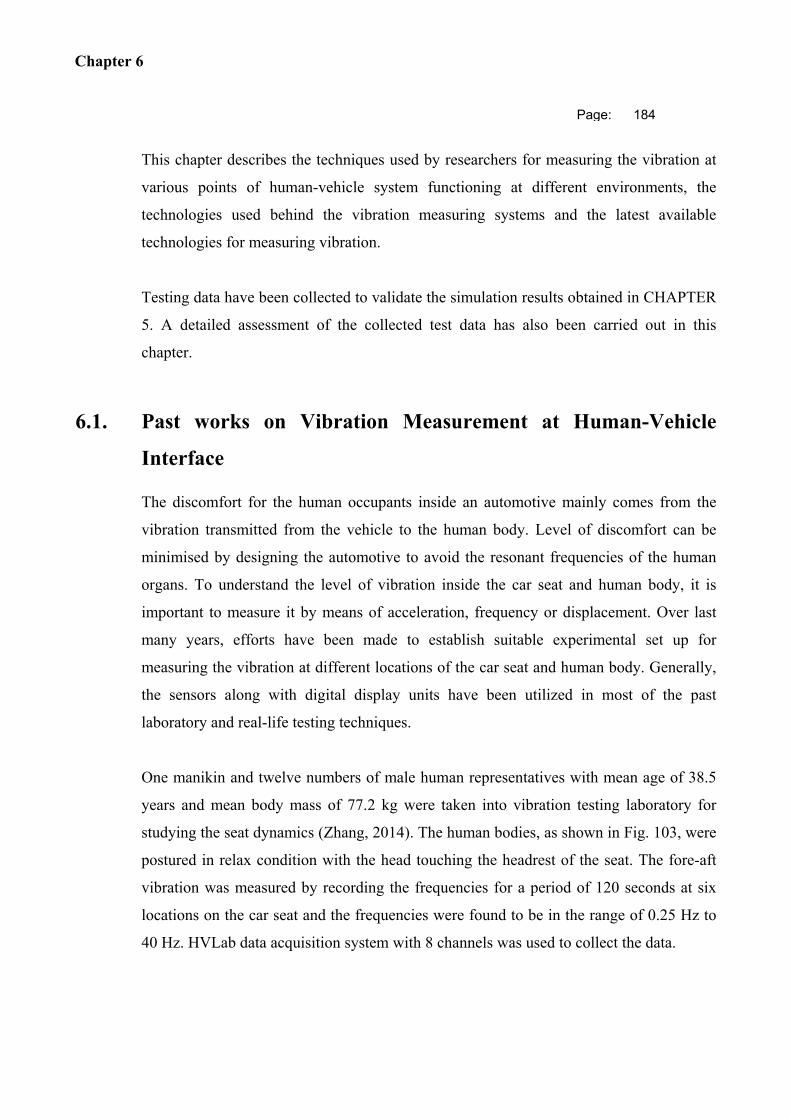
Chapter 6
Page: 184
This chapter describes the techniques used by researchers for measuring the vibration at
various points of human-vehicle system functioning at different environments, the
technologies used behind the vibration measuring systems and the latest available
technologies for measuring vibration.
Testing data have been collected to validate the simulation results obtained in CHAPTER
5. A detailed assessment of the collected test data has also been carried out in this
chapter.
6.1. Past works on Vibration Measurement at Human-Vehicle
Interface
The discomfort for the human occupants inside an automotive mainly comes from the
vibration transmitted from the vehicle to the human body. Level of discomfort can be
minimised by designing the automotive to avoid the resonant frequencies of the human
organs. To understand the level of vibration inside the car seat and human body, it is
important to measure it by means of acceleration, frequency or displacement. Over last
many years, efforts have been made to establish suitable experimental set up for
measuring the vibration at different locations of the car seat and human body. Generally,
the sensors along with digital display units have been utilized in most of the past
laboratory and real-life testing techniques.
One manikin and twelve numbers of male human representatives with mean age of 38.5
years and mean body mass of 77.2 kg were taken into vibration testing laboratory for
studying the seat dynamics (Zhang, 2014). The human bodies, as shown in Fig. 103, were
postured in relax condition with the head touching the headrest of the seat. The fore-aft
vibration was measured by recording the frequencies for a period of 120 seconds at six
locations on the car seat and the frequencies were found to be in the range of 0.25 Hz to
40 Hz. HVLab data acquisition system with 8 channels was used to collect the data.
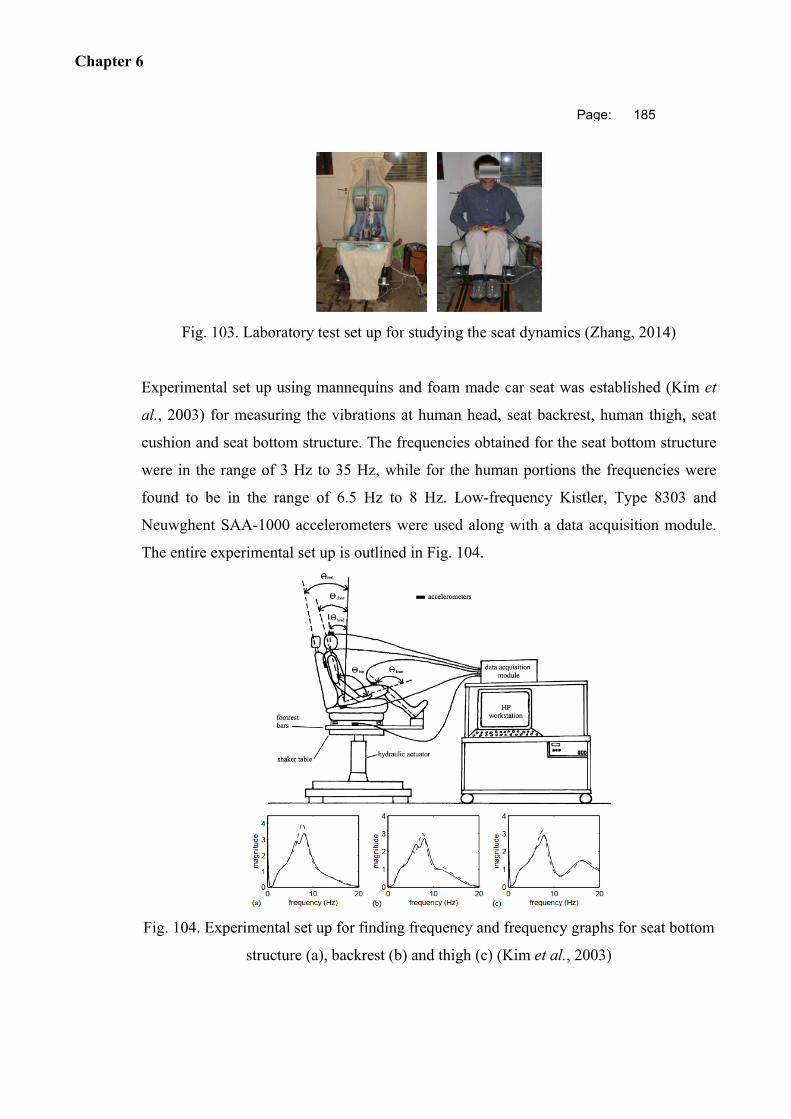
Chapter 6
Page: 185
Fig. 103. Laboratory test set up for studying the seat dynamics (Zhang, 2014)
Experimental set up using mannequins and foam made car seat was established (Kim et
al., 2003) for measuring the vibrations at human head, seat backrest, human thigh, seat
cushion and seat bottom structure. The frequencies obtained for the seat bottom structure
were in the range of 3 Hz to 35 Hz, while for the human portions the frequencies were
found to be in the range of 6.5 Hz to 8 Hz. Low-frequency Kistler, Type 8303 and
Neuwghent SAA-1000 accelerometers were used along with a data acquisition module.
The entire experimental set up is outlined in Fig. 104.
Fig. 104. Experimental set up for finding frequency and frequency graphs for seat bottom
structure (a), backrest (b) and thigh (c) (Kim et al., 2003)
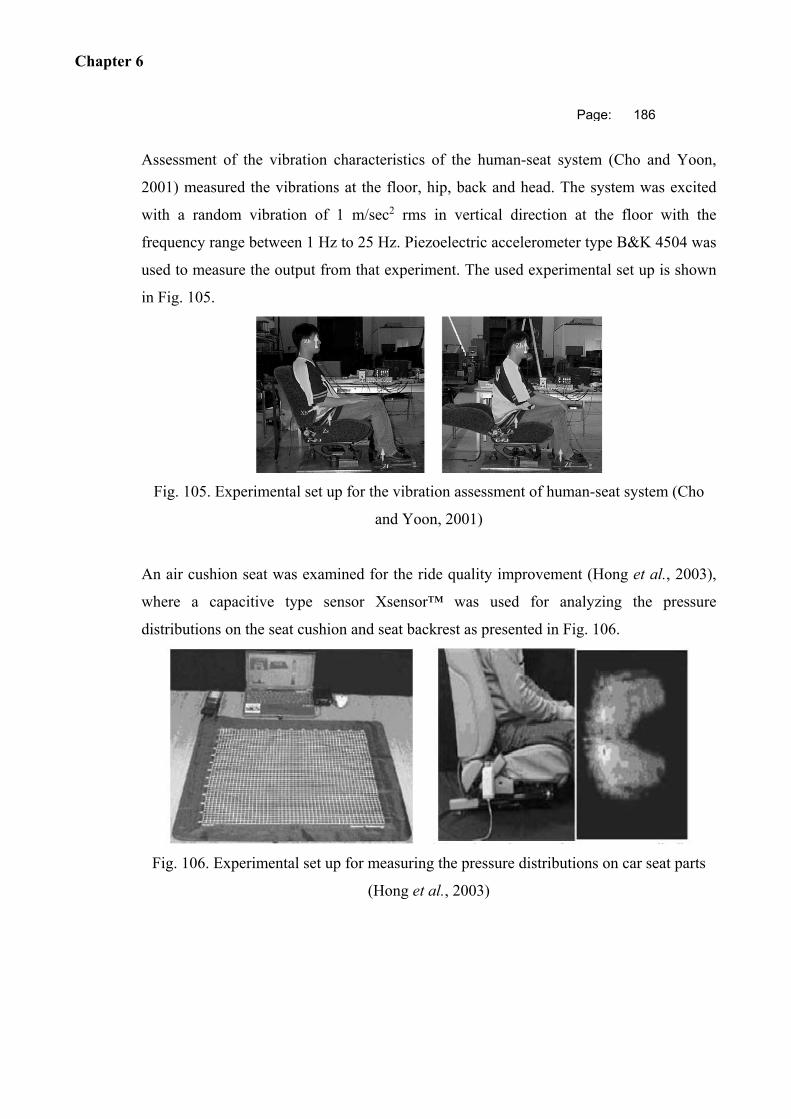
Chapter 6
Page: 186
Assessment of the vibration characteristics of the human-seat system (Cho and Yoon,
2001) measured the vibrations at the floor, hip, back and head. The system was excited
with a random vibration of 1 m/sec2 rms in vertical direction at the floor with the
frequency range between 1 Hz to 25 Hz. Piezoelectric accelerometer type B&K 4504 was
used to measure the output from that experiment. The used experimental set up is shown
in Fig. 105.
Fig. 105. Experimental set up for the vibration assessment of human-seat system (Cho
and Yoon, 2001)
An air cushion seat was examined for the ride quality improvement (Hong et al., 2003),
where a capacitive type sensor Xsensor™ was used for analyzing the pressure
distributions on the seat cushion and seat backrest as presented in Fig. 106.
Fig. 106. Experimental set up for measuring the pressure distributions on car seat parts
(Hong et al., 2003)
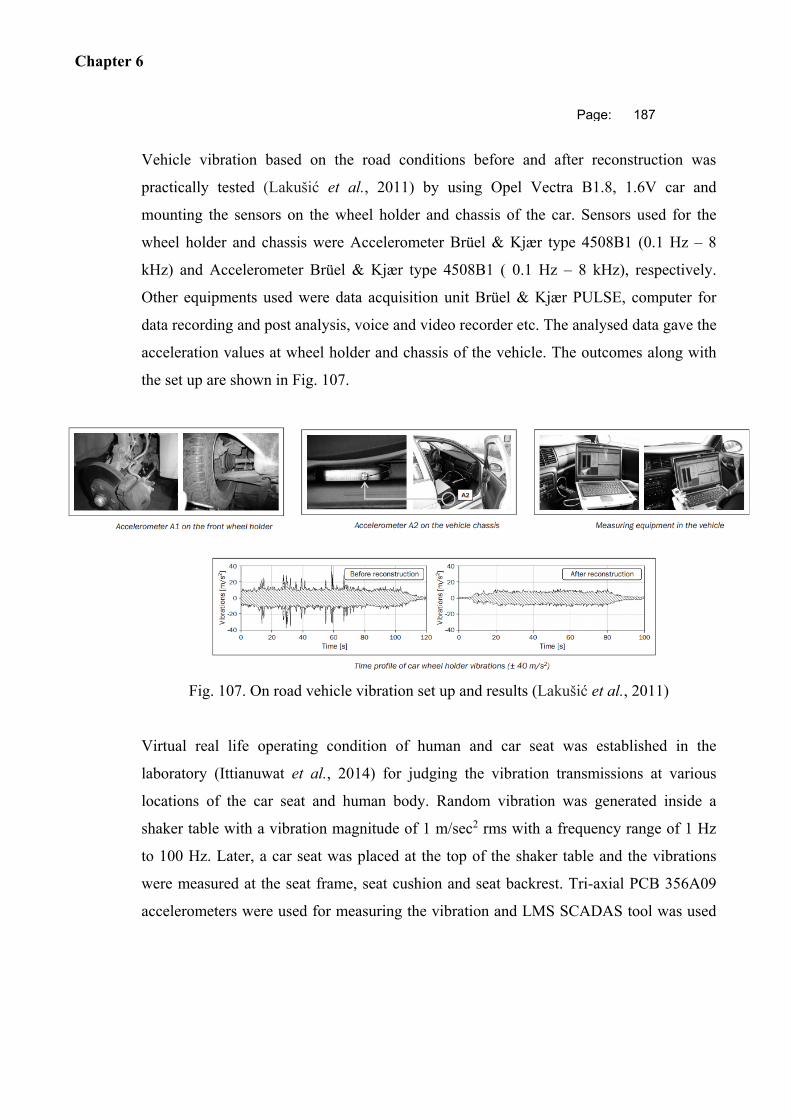
Chapter 6
Page: 187
Vehicle vibration based on the road conditions before and after reconstruction was
practically tested (Lakušić et al., 2011) by using Opel Vectra B1.8, 1.6V car and
mounting the sensors on the wheel holder and chassis of the car. Sensors used for the
wheel holder and chassis were Accelerometer Brüel & Kjær type 4508B1 (0.1 Hz – 8
kHz) and Accelerometer Brüel & Kjær type 4508B1 ( 0.1 Hz – 8 kHz), respectively.
Other equipments used were data acquisition unit Brüel & Kjær PULSE, computer for
data recording and post analysis, voice and video recorder etc. The analysed data gave the
acceleration values at wheel holder and chassis of the vehicle. The outcomes along with
the set up are shown in Fig. 107.
Fig. 107. On road vehicle vibration set up and results (Lakušić et al., 2011)
Virtual real life operating condition of human and car seat was established in the
laboratory (Ittianuwat et al., 2014) for judging the vibration transmissions at various
locations of the car seat and human body. Random vibration was generated inside a
shaker table with a vibration magnitude of 1 m/sec2 rms with a frequency range of 1 Hz
to 100 Hz. Later, a car seat was placed at the top of the shaker table and the vibrations
were measured at the seat frame, seat cushion and seat backrest. Tri-axial PCB 356A09
accelerometers were used for measuring the vibration and LMS SCADAS tool was used
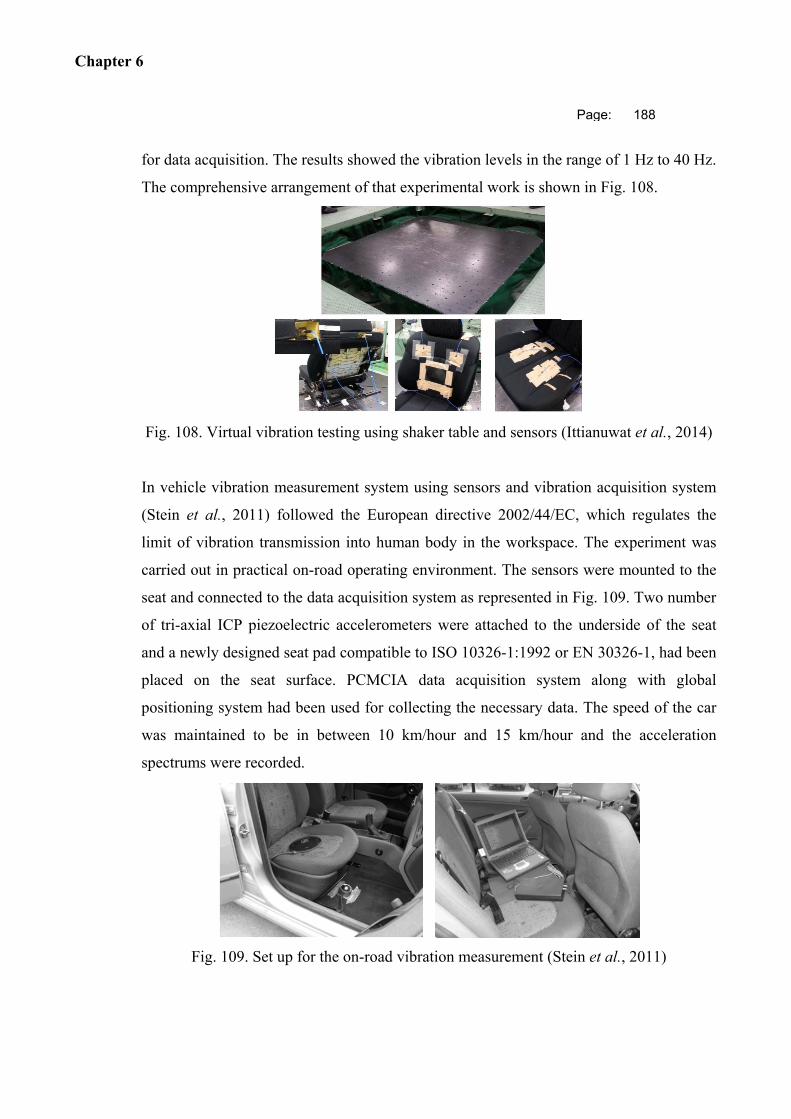
Chapter 6
Page: 188
for data acquisition. The results showed the vibration levels in the range of 1 Hz to 40 Hz.
The comprehensive arrangement of that experimental work is shown in Fig. 108.
Fig. 108. Virtual vibration testing using shaker table and sensors (Ittianuwat et al., 2014)
In vehicle vibration measurement system using sensors and vibration acquisition system
(Stein et al., 2011) followed the European directive 2002/44/EC, which regulates the
limit of vibration transmission into human body in the workspace. The experiment was
carried out in practical on-road operating environment. The sensors were mounted to the
seat and connected to the data acquisition system as represented in Fig. 109. Two number
of tri-axial ICP piezoelectric accelerometers were attached to the underside of the seat
and a newly designed seat pad compatible to ISO 10326-1:1992 or EN 30326-1, had been
placed on the seat surface. PCMCIA data acquisition system along with global
positioning system had been used for collecting the necessary data. The speed of the car
was maintained to be in between 10 km/hour and 15 km/hour and the acceleration
spectrums were recorded.
Fig. 109. Set up for the on-road vibration measurement (Stein et al., 2011)
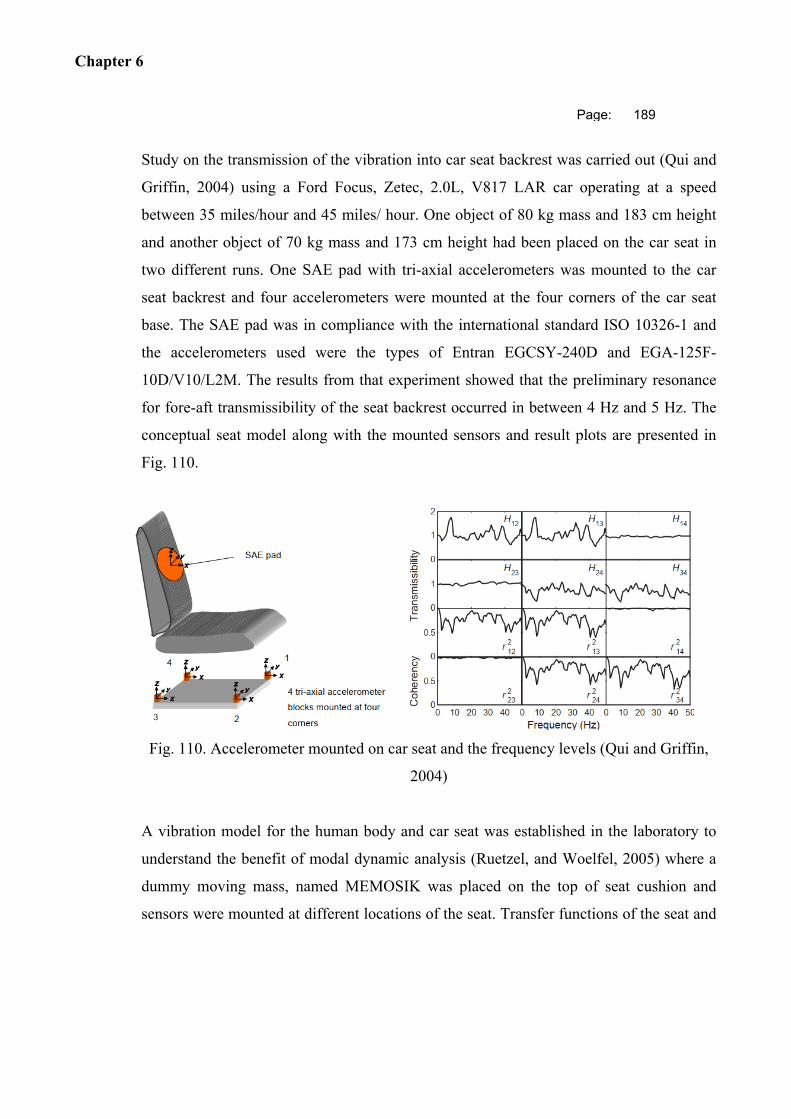
Chapter 6
Page: 189
Study on the transmission of the vibration into car seat backrest was carried out (Qui and
Griffin, 2004) using a Ford Focus, Zetec, 2.0L, V817 LAR car operating at a speed
between 35 miles/hour and 45 miles/ hour. One object of 80 kg mass and 183 cm height
and another object of 70 kg mass and 173 cm height had been placed on the car seat in
two different runs. One SAE pad with tri-axial accelerometers was mounted to the car
seat backrest and four accelerometers were mounted at the four corners of the car seat
base. The SAE pad was in compliance with the international standard ISO 10326-1 and
the accelerometers used were the types of Entran EGCSY-240D and EGA-125F-
10D/V10/L2M. The results from that experiment showed that the preliminary resonance
for fore-aft transmissibility of the seat backrest occurred in between 4 Hz and 5 Hz. The
conceptual seat model along with the mounted sensors and result plots are presented in
Fig. 110.
Fig. 110. Accelerometer mounted on car seat and the frequency levels (Qui and Griffin,
2004)
A vibration model for the human body and car seat was established in the laboratory to
understand the benefit of modal dynamic analysis (Ruetzel, and Woelfel, 2005) where a
dummy moving mass, named MEMOSIK was placed on the top of seat cushion and
sensors were mounted at different locations of the seat. Transfer functions of the seat and
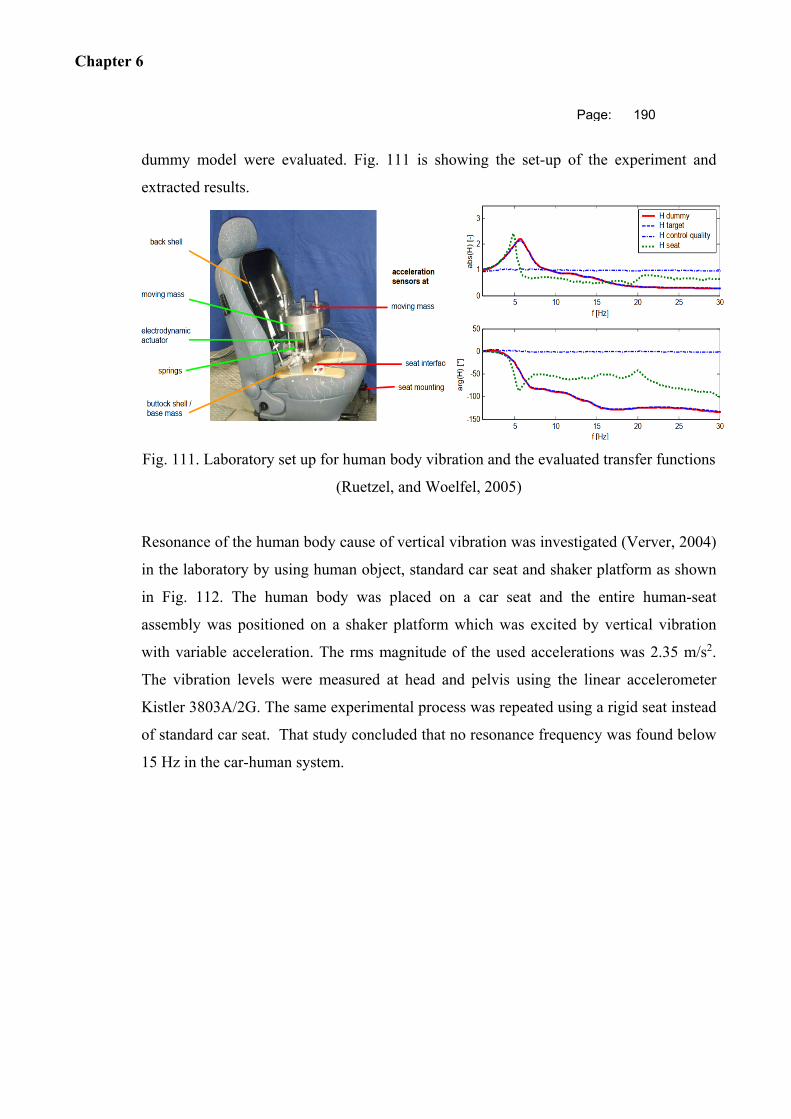
Chapter 6
Page: 190
dummy model were evaluated. Fig. 111 is showing the set-up of the experiment and
extracted results.
Fig. 111. Laboratory set up for human body vibration and the evaluated transfer functions
(Ruetzel, and Woelfel, 2005)
Resonance of the human body cause of vertical vibration was investigated (Verver, 2004)
in the laboratory by using human object, standard car seat and shaker platform as shown
in Fig. 112. The human body was placed on a car seat and the entire human-seat
assembly was positioned on a shaker platform which was excited by vertical vibration
with variable acceleration. The rms magnitude of the used accelerations was 2.35 m/s2.
The vibration levels were measured at head and pelvis using the linear accelerometer
Kistler 3803A/2G. The same experimental process was repeated using a rigid seat instead
of standard car seat. That study concluded that no resonance frequency was found below
15 Hz in the car-human system.
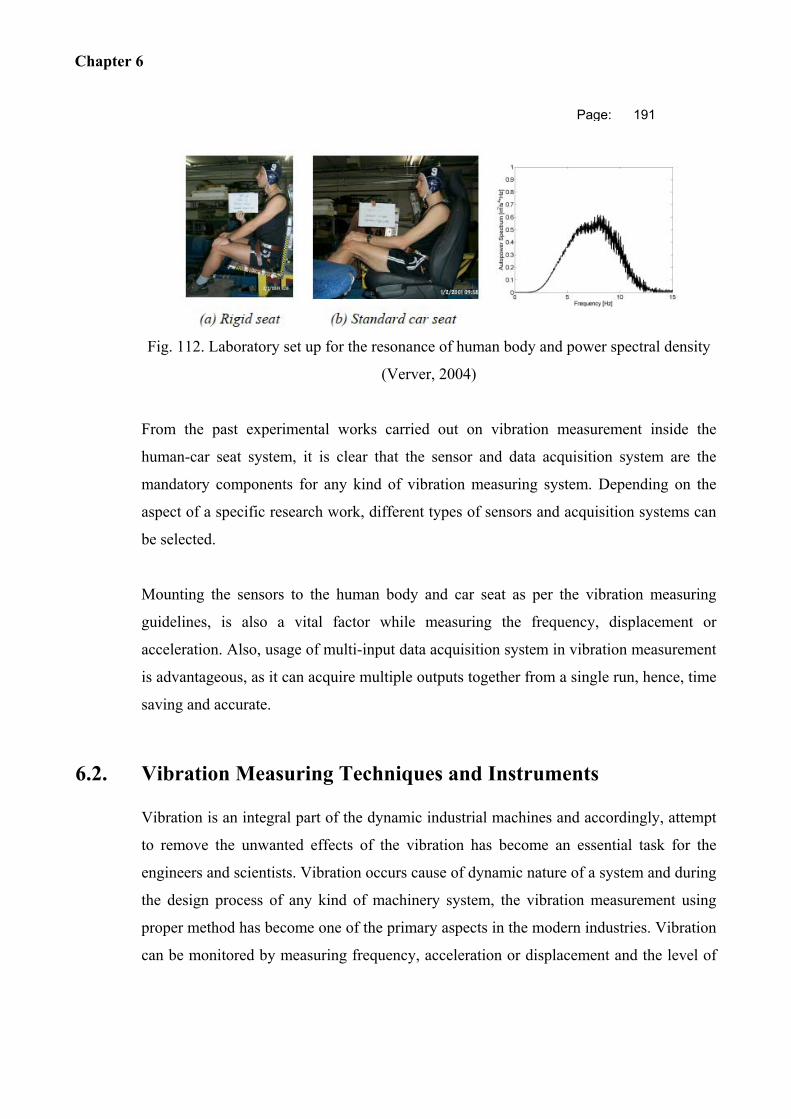
Chapter 6
Page: 191
Fig. 112. Laboratory set up for the resonance of human body and power spectral density
(Verver, 2004)
From the past experimental works carried out on vibration measurement inside the
human-car seat system, it is clear that the sensor and data acquisition system are the
mandatory components for any kind of vibration measuring system. Depending on the
aspect of a specific research work, different types of sensors and acquisition systems can
be selected.
Mounting the sensors to the human body and car seat as per the vibration measuring
guidelines, is also a vital factor while measuring the frequency, displacement or
acceleration. Also, usage of multi-input data acquisition system in vibration measurement
is advantageous, as it can acquire multiple outputs together from a single run, hence, time
saving and accurate.
6.2. Vibration Measuring Techniques and Instruments
Vibration is an integral part of the dynamic industrial machines and accordingly, attempt
to remove the unwanted effects of the vibration has become an essential task for the
engineers and scientists. Vibration occurs cause of dynamic nature of a system and during
the design process of any kind of machinery system, the vibration measurement using
proper method has become one of the primary aspects in the modern industries. Vibration
can be monitored by measuring frequency, acceleration or displacement and the level of
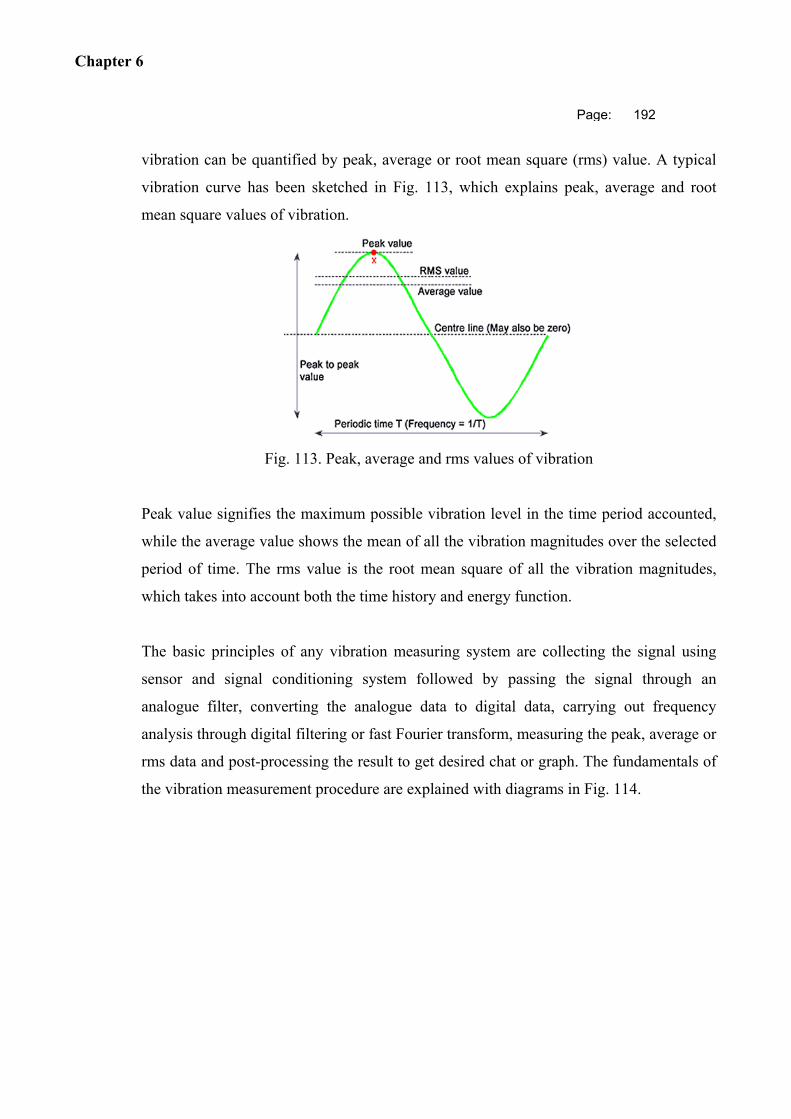
Chapter 6
Page: 192
vibration can be quantified by peak, average or root mean square (rms) value. A typical
vibration curve has been sketched in Fig. 113, which explains peak, average and root
mean square values of vibration.
Fig. 113. Peak, average and rms values of vibration
Peak value signifies the maximum possible vibration level in the time period accounted,
while the average value shows the mean of all the vibration magnitudes over the selected
period of time. The rms value is the root mean square of all the vibration magnitudes,
which takes into account both the time history and energy function.
The basic principles of any vibration measuring system are collecting the signal using
sensor and signal conditioning system followed by passing the signal through an
analogue filter, converting the analogue data to digital data, carrying out frequency
analysis through digital filtering or fast Fourier transform, measuring the peak, average or
rms data and post-processing the result to get desired chat or graph. The fundamentals of
the vibration measurement procedure are explained with diagrams in Fig. 114.
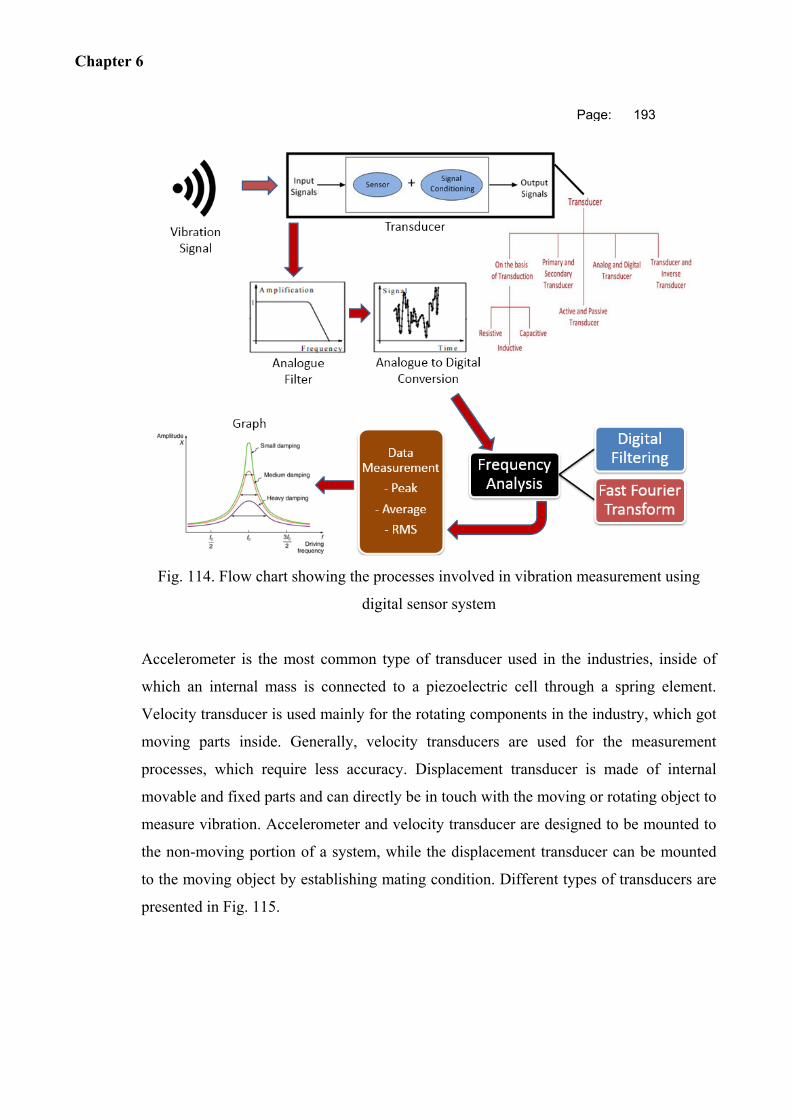
Chapter 6
Page: 193
Fig. 114. Flow chart showing the processes involved in vibration measurement using
digital sensor system
Accelerometer is the most common type of transducer used in the industries, inside of
which an internal mass is connected to a piezoelectric cell through a spring element.
Velocity transducer is used mainly for the rotating components in the industry, which got
moving parts inside. Generally, velocity transducers are used for the measurement
processes, which require less accuracy. Displacement transducer is made of internal
movable and fixed parts and can directly be in touch with the moving or rotating object to
measure vibration. Accelerometer and velocity transducer are designed to be mounted to
the non-moving portion of a system, while the displacement transducer can be mounted
to the moving object by establishing mating condition. Different types of transducers are
presented in Fig. 115.
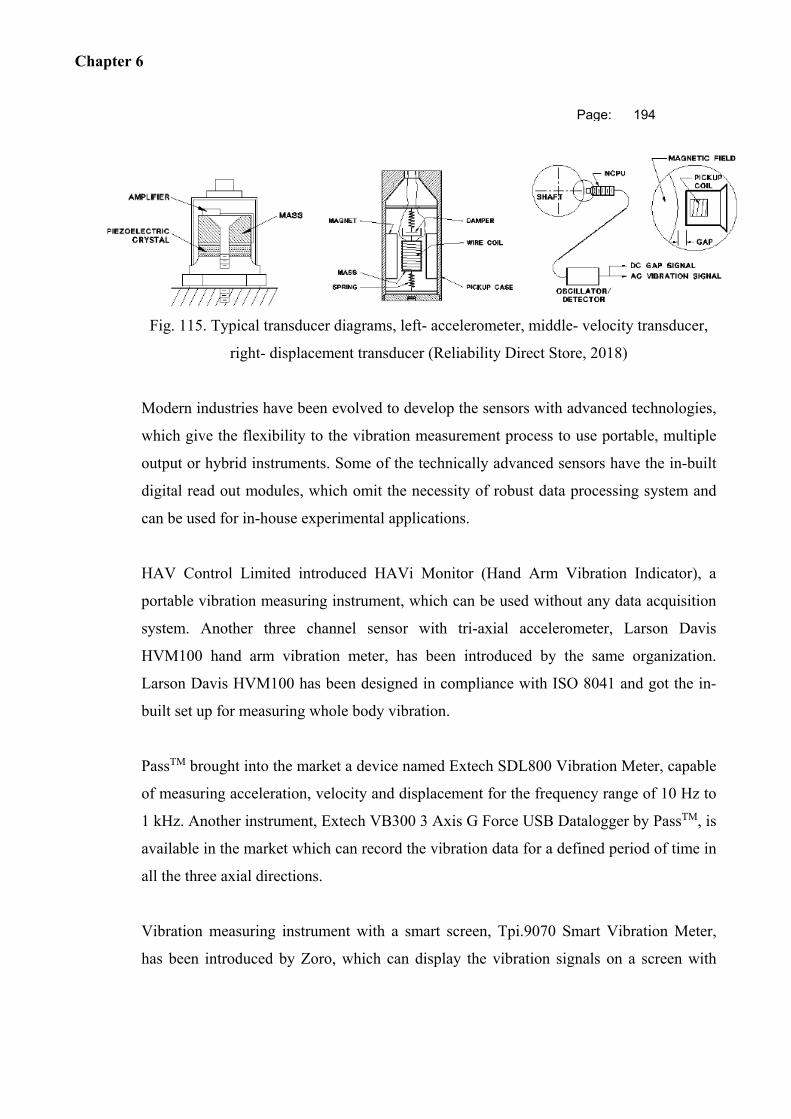
Chapter 6
Page: 194
Fig. 115. Typical transducer diagrams, left- accelerometer, middle- velocity transducer,
right- displacement transducer (Reliability Direct Store, 2018)
Modern industries have been evolved to develop the sensors with advanced technologies,
which give the flexibility to the vibration measurement process to use portable, multiple
output or hybrid instruments. Some of the technically advanced sensors have the in-built
digital read out modules, which omit the necessity of robust data processing system and
can be used for in-house experimental applications.
HAV Control Limited introduced HAVi Monitor (Hand Arm Vibration Indicator), a
portable vibration measuring instrument, which can be used without any data acquisition
system. Another three channel sensor with tri-axial accelerometer, Larson Davis
HVM100 hand arm vibration meter, has been introduced by the same organization.
Larson Davis HVM100 has been designed in compliance with ISO 8041 and got the in-
built set up for measuring whole body vibration.
PassTM brought into the market a device named Extech SDL800 Vibration Meter, capable
of measuring acceleration, velocity and displacement for the frequency range of 10 Hz to
1 kHz. Another instrument, Extech VB300 3 Axis G Force USB Datalogger by PassTM, is
available in the market which can record the vibration data for a defined period of time in
all the three axial directions.
Vibration measuring instrument with a smart screen, Tpi.9070 Smart Vibration Meter,
has been introduced by Zoro, which can display the vibration signals on a screen with
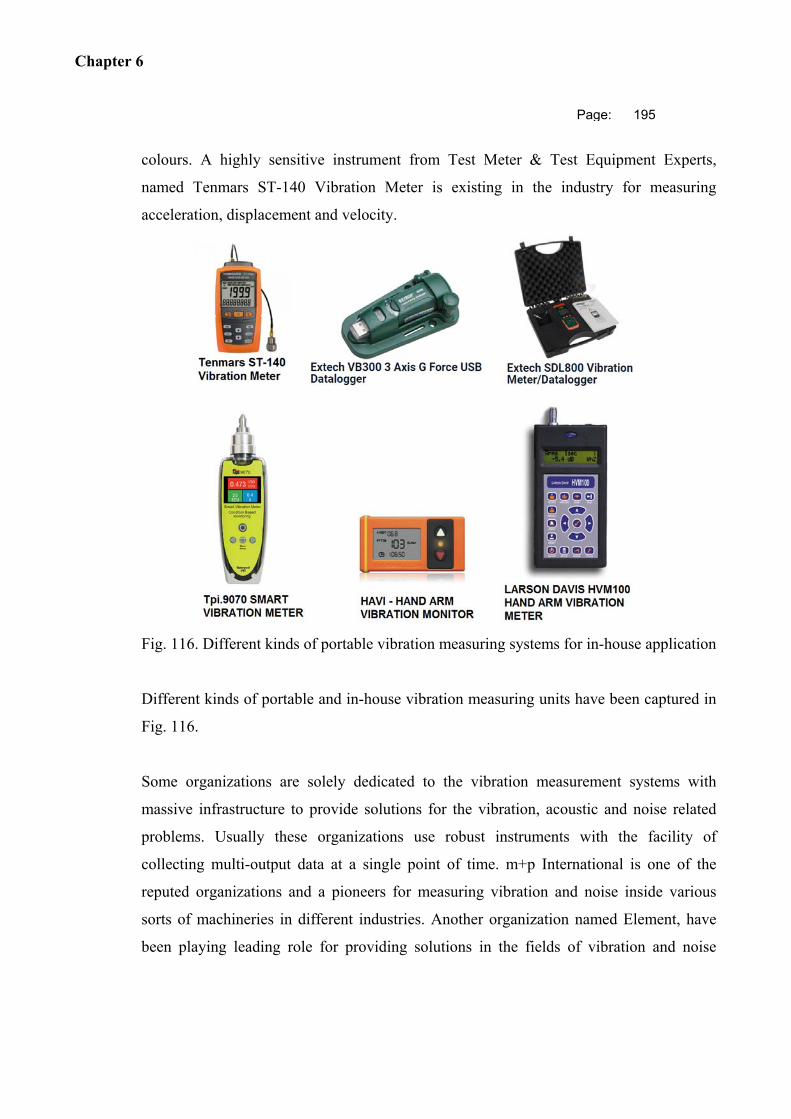
Chapter 6
Page: 195
colours. A highly sensitive instrument from Test Meter & Test Equipment Experts,
named Tenmars ST-140 Vibration Meter is existing in the industry for measuring
acceleration, displacement and velocity.
Fig. 116. Different kinds of portable vibration measuring systems for in-house application
Different kinds of portable and in-house vibration measuring units have been captured in
Fig. 116.
Some organizations are solely dedicated to the vibration measurement systems with
massive infrastructure to provide solutions for the vibration, acoustic and noise related
problems. Usually these organizations use robust instruments with the facility of
collecting multi-output data at a single point of time. m+p International is one of the
reputed organizations and a pioneers for measuring vibration and noise inside various
sorts of machineries in different industries. Another organization named Element, have
been playing leading role for providing solutions in the fields of vibration and noise
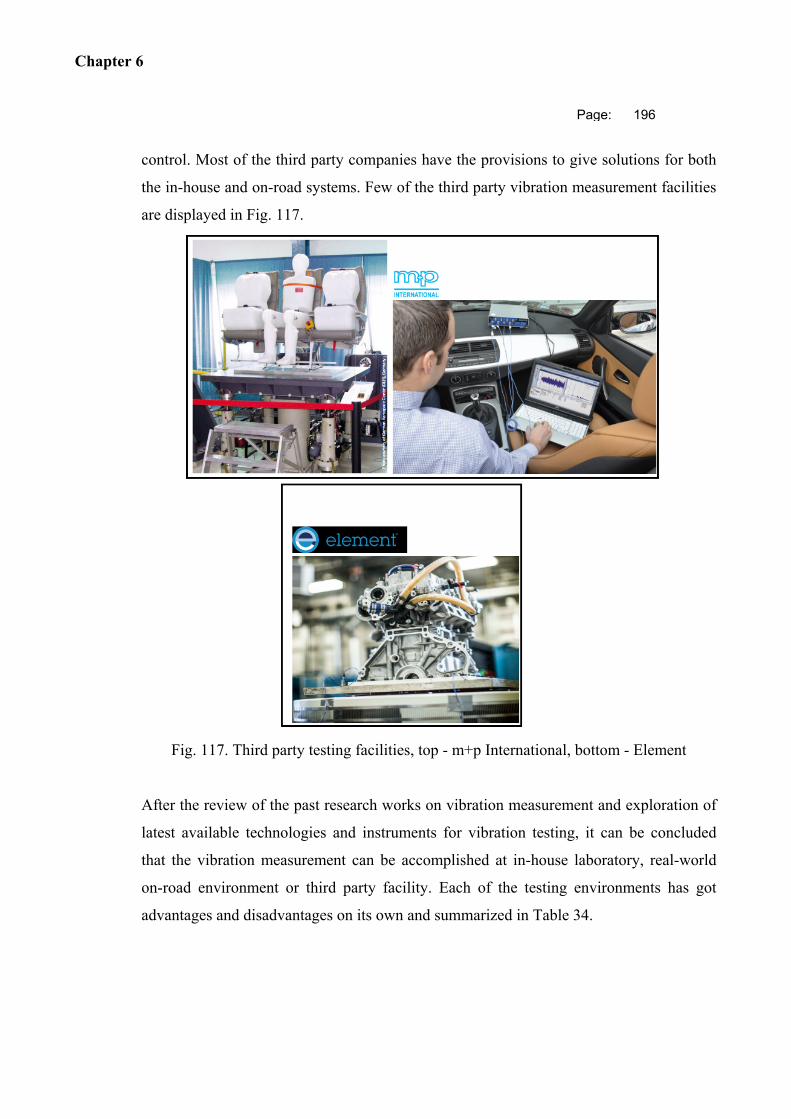
Chapter 6
Page: 196
control. Most of the third party companies have the provisions to give solutions for both
the in-house and on-road systems. Few of the third party vibration measurement facilities
are displayed in Fig. 117.
Fig. 117. Third party testing facilities, top - m+p International, bottom - Element
After the review of the past research works on vibration measurement and exploration of
latest available technologies and instruments for vibration testing, it can be concluded
that the vibration measurement can be accomplished at in-house laboratory, real-world
on-road environment or third party facility. Each of the testing environments has got
advantages and disadvantages on its own and summarized in Table 34.
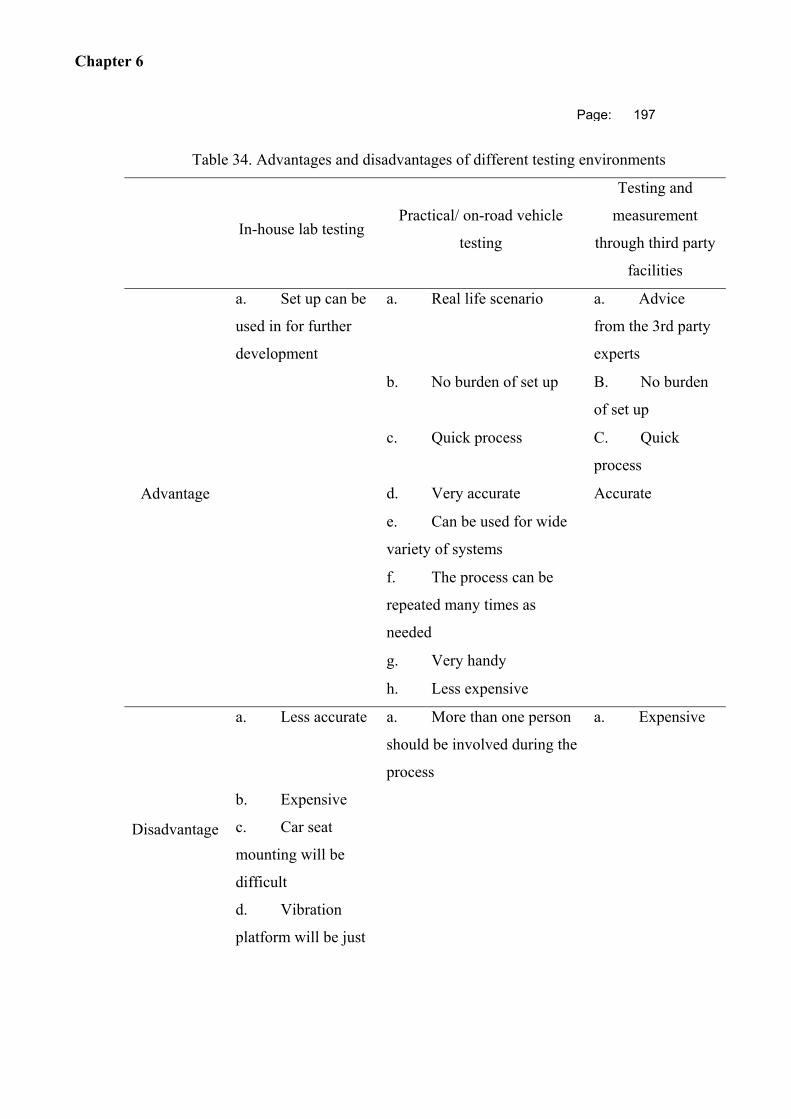
Chapter 6
Page: 197
Table 34. Advantages and disadvantages of different testing environments
In-house lab testing Practical/ on-road vehicle
testing
Testing and
measurement
through third party
facilities
Advantage
a. Set up can be
used in for further
development
a. Real life scenario a. Advice
from the 3rd party
experts
b. No burden of set up B. No burden
of set up
c. Quick process C. Quick
process
d. Very accurate Accurate
e. Can be used for wide
variety of systems
f. The process can be
repeated many times as
needed
g. Very handy
h. Less expensive
Disadvantage
a. Less accurate a. More than one person
should be involved during the
process
a. Expensive
b. Expensive
c. Car seat
mounting will be
difficult
d. Vibration
platform will be just
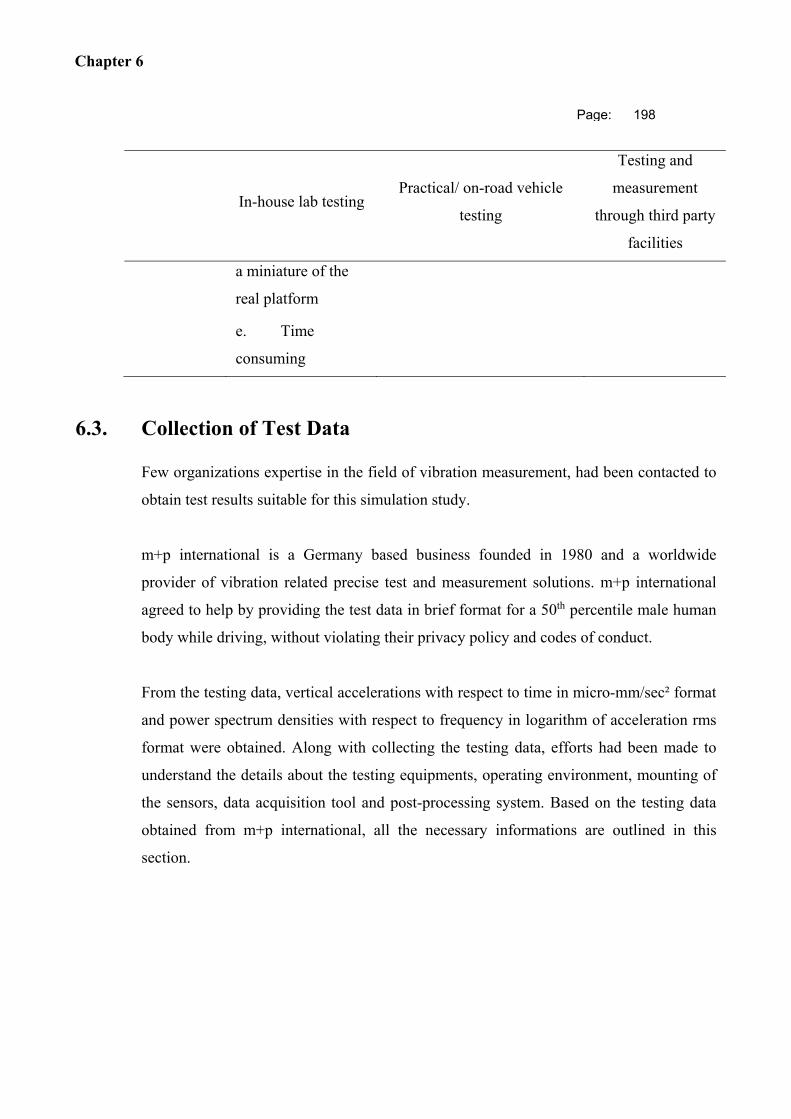
Chapter 6
Page: 198
In-house lab testing Practical/ on-road vehicle
testing
Testing and
measurement
through third party
facilities
a miniature of the
real platform
e. Time
consuming
6.3. Collection of Test Data
Few organizations expertise in the field of vibration measurement, had been contacted to
obtain test results suitable for this simulation study.
m+p international is a Germany based business founded in 1980 and a worldwide
provider of vibration related precise test and measurement solutions. m+p international
agreed to help by providing the test data in brief format for a 50th percentile male human
body while driving, without violating their privacy policy and codes of conduct.
From the testing data, vertical accelerations with respect to time in micro-mm/sec² format
and power spectrum densities with respect to frequency in logarithm of acceleration rms
format were obtained. Along with collecting the testing data, efforts had been made to
understand the details about the testing equipments, operating environment, mounting of
the sensors, data acquisition tool and post-processing system. Based on the testing data
obtained from m+p international, all the necessary informations are outlined in this
section.
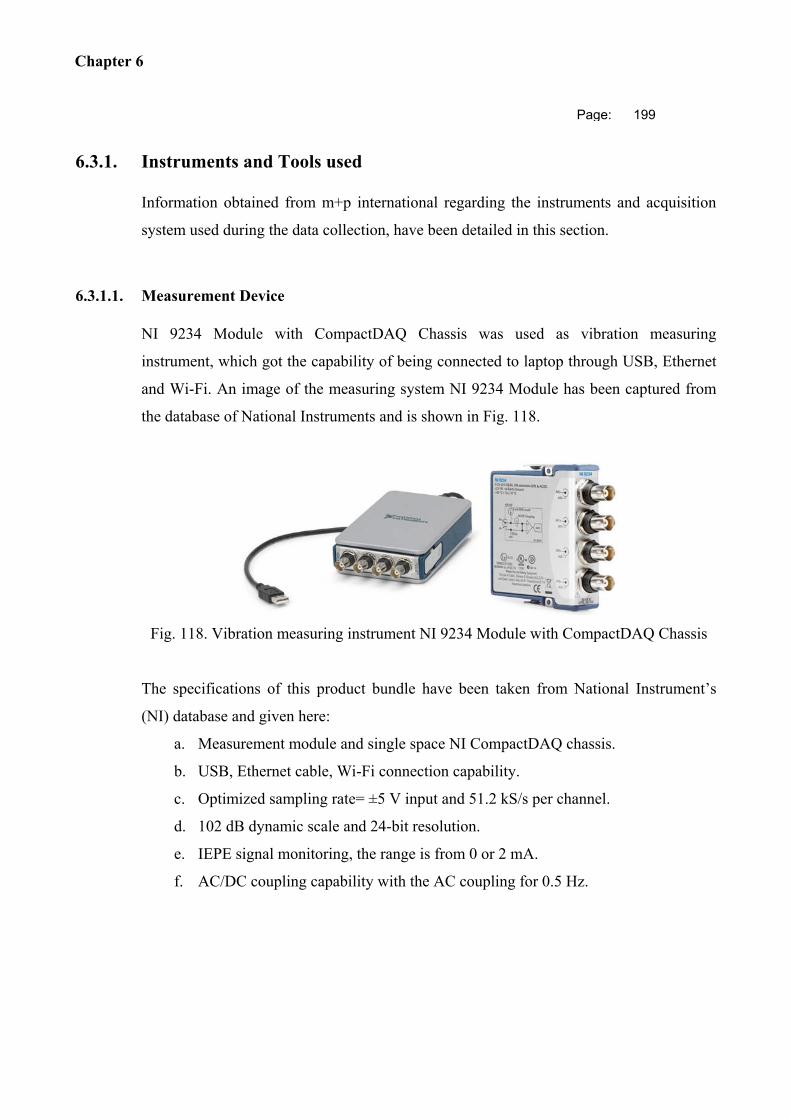
Chapter 6
Page: 199
6.3.1. Instruments and Tools used
Information obtained from m+p international regarding the instruments and acquisition
system used during the data collection, have been detailed in this section.
6.3.1.1. Measurement Device
NI 9234 Module with CompactDAQ Chassis was used as vibration measuring
instrument, which got the capability of being connected to laptop through USB, Ethernet
and Wi-Fi. An image of the measuring system NI 9234 Module has been captured from
the database of National Instruments and is shown in Fig. 118.
Fig. 118. Vibration measuring instrument NI 9234 Module with CompactDAQ Chassis
The specifications of this product bundle have been taken from National Instrument’s
(NI) database and given here:
a. Measurement module and single space NI CompactDAQ chassis.
b. USB, Ethernet cable, Wi-Fi connection capability.
c. Optimized sampling rate= ±5 V input and 51.2 kS/s per channel.
d. 102 dB dynamic scale and 24-bit resolution.
e. IEPE signal monitoring, the range is from 0 or 2 mA.
f. AC/DC coupling capability with the AC coupling for 0.5 Hz.
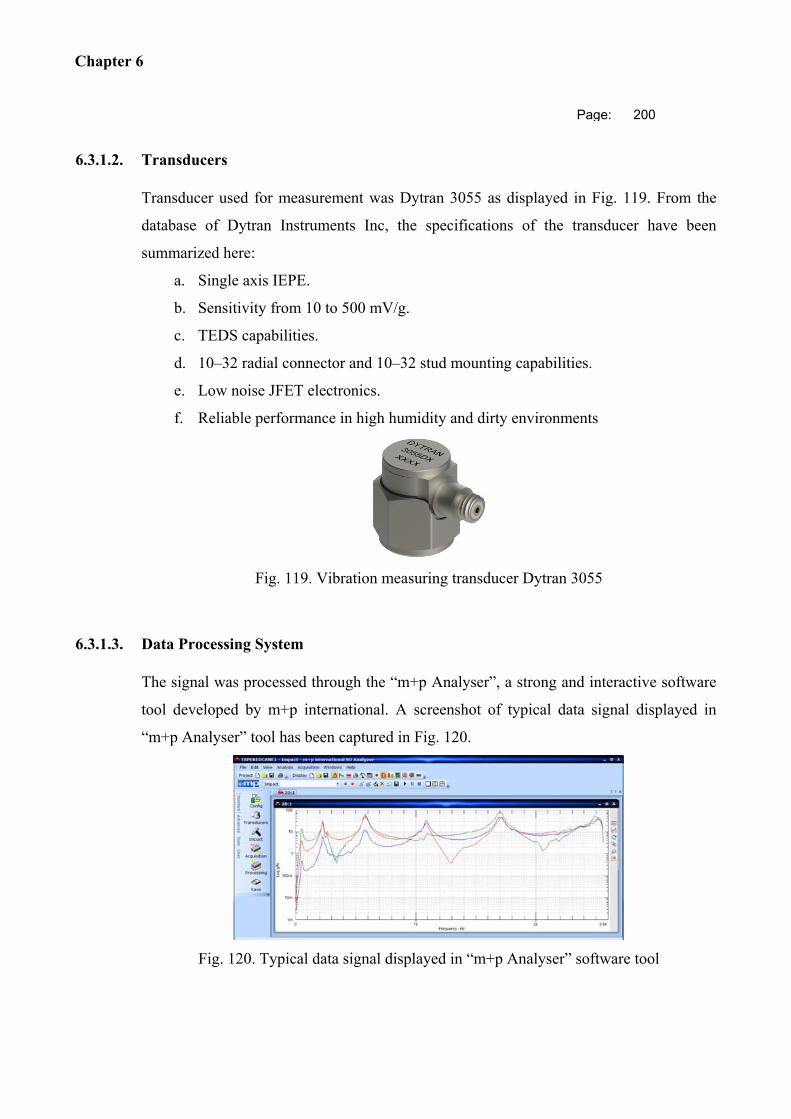
Chapter 6
Page: 200
6.3.1.2. Transducers
Transducer used for measurement was Dytran 3055 as displayed in Fig. 119. From the
database of Dytran Instruments Inc, the specifications of the transducer have been
summarized here:
a. Single axis IEPE.
b. Sensitivity from 10 to 500 mV/g.
c. TEDS capabilities.
d. 10–32 radial connector and 10–32 stud mounting capabilities.
e. Low noise JFET electronics.
f. Reliable performance in high humidity and dirty environments
Fig. 119. Vibration measuring transducer Dytran 3055
6.3.1.3. Data Processing System
The signal was processed through the “m+p Analyser”, a strong and interactive software
tool developed by m+p international. A screenshot of typical data signal displayed in
“m+p Analyser” tool has been captured in Fig. 120.
Fig. 120. Typical data signal displayed in “m+p Analyser” software tool
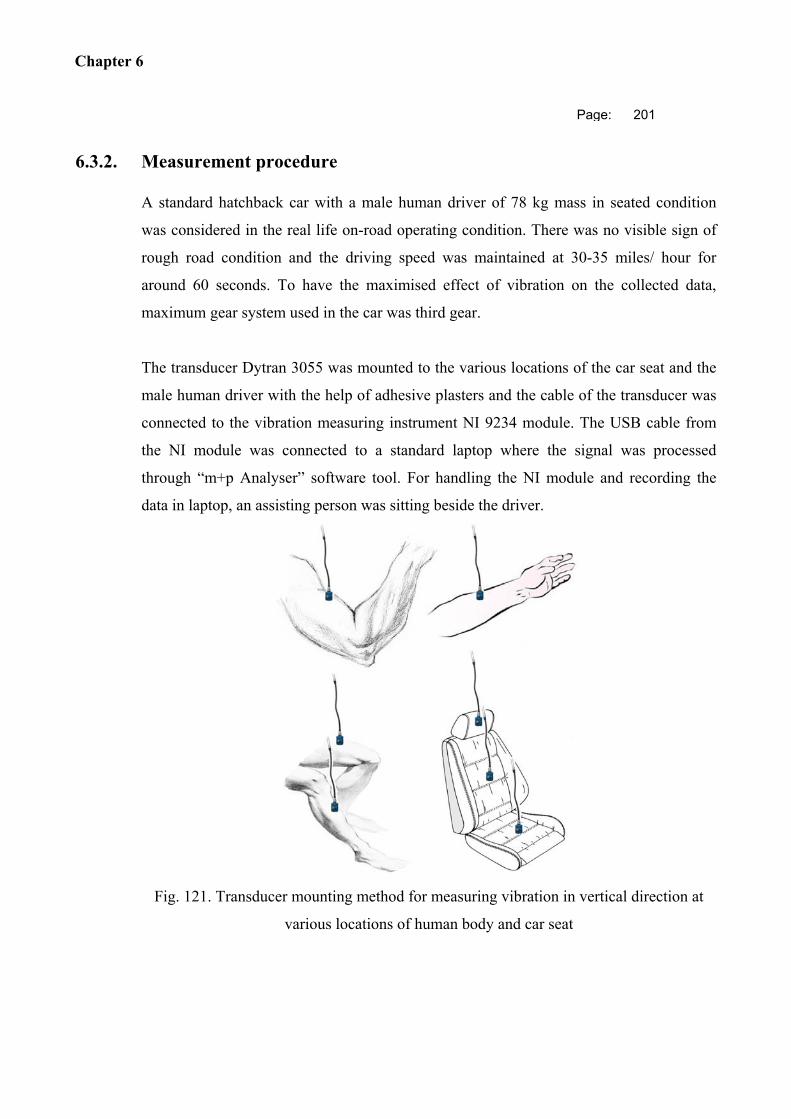
Chapter 6
Page: 201
6.3.2. Measurement procedure
A standard hatchback car with a male human driver of 78 kg mass in seated condition
was considered in the real life on-road operating condition. There was no visible sign of
rough road condition and the driving speed was maintained at 30-35 miles/ hour for
around 60 seconds. To have the maximised effect of vibration on the collected data,
maximum gear system used in the car was third gear.
The transducer Dytran 3055 was mounted to the various locations of the car seat and the
male human driver with the help of adhesive plasters and the cable of the transducer was
connected to the vibration measuring instrument NI 9234 module. The USB cable from
the NI module was connected to a standard laptop where the signal was processed
through “m+p Analyser” software tool. For handling the NI module and recording the
data in laptop, an assisting person was sitting beside the driver.
Fig. 121. Transducer mounting method for measuring vibration in vertical direction at
various locations of human body and car seat
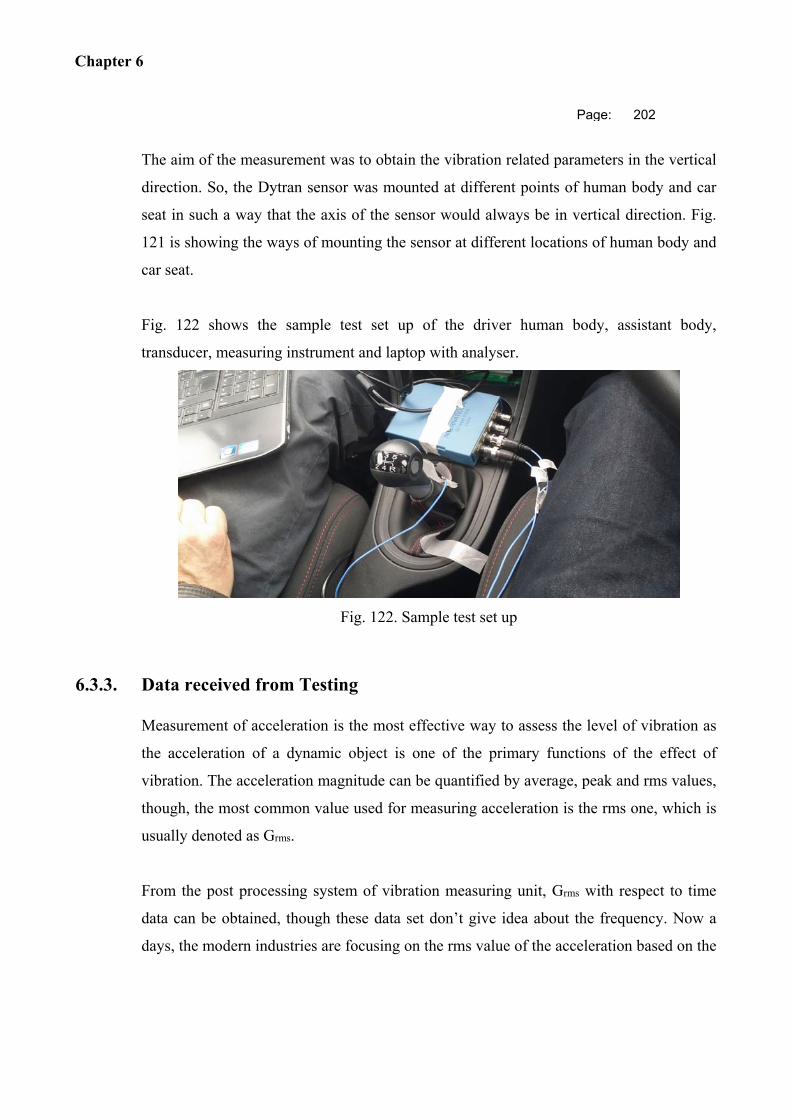
Chapter 6
Page: 202
The aim of the measurement was to obtain the vibration related parameters in the vertical
direction. So, the Dytran sensor was mounted at different points of human body and car
seat in such a way that the axis of the sensor would always be in vertical direction. Fig.
121 is showing the ways of mounting the sensor at different locations of human body and
car seat.
Fig. 122 shows the sample test set up of the driver human body, assistant body,
transducer, measuring instrument and laptop with analyser.
Fig. 122. Sample test set up
6.3.3. Data received from Testing
Measurement of acceleration is the most effective way to assess the level of vibration as
the acceleration of a dynamic object is one of the primary functions of the effect of
vibration. The acceleration magnitude can be quantified by average, peak and rms values,
though, the most common value used for measuring acceleration is the rms one, which is
usually denoted as Grms.
From the post processing system of vibration measuring unit, Grms with respect to time
data can be obtained, though these data set don’t give idea about the frequency. Now a
days, the modern industries are focusing on the rms value of the acceleration based on the
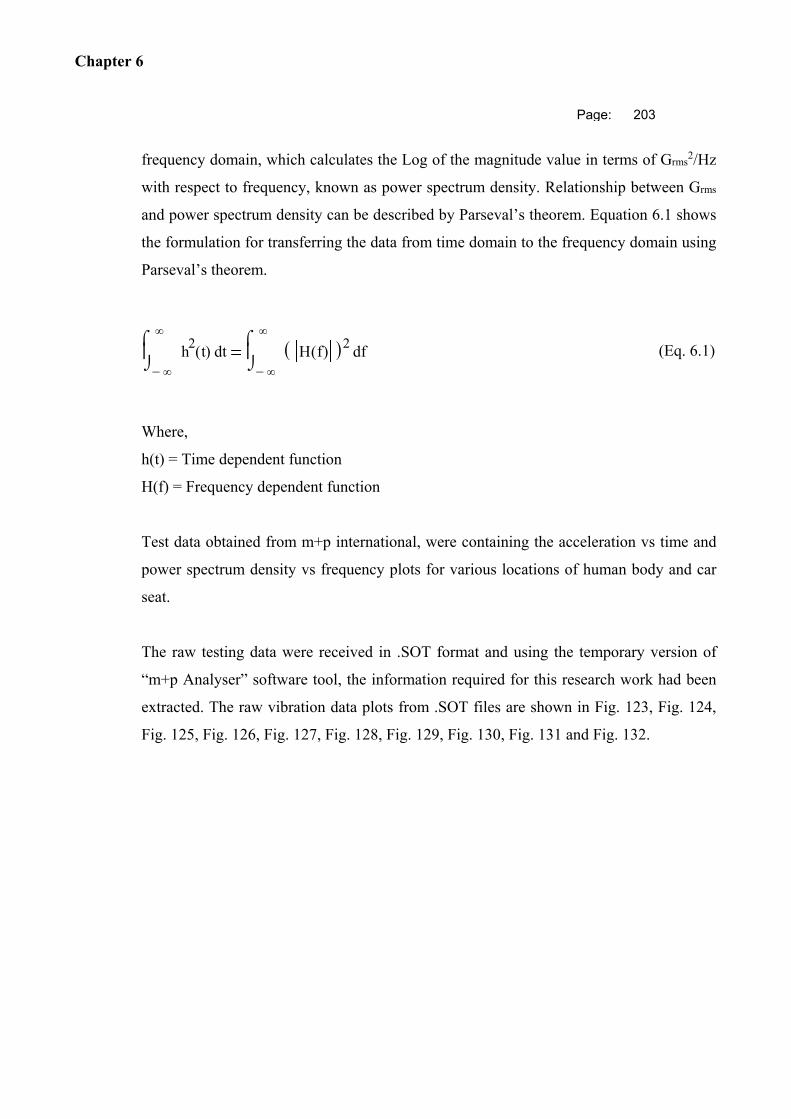
Chapter 6
Page: 203
frequency domain, which calculates the Log of the magnitude value in terms of Grms2/Hz
with respect to frequency, known as power spectrum density. Relationship between Grms
and power spectrum density can be described by Parseval’s theorem. Equation 6.1 shows
the formulation for transferring the data from time domain to the frequency domain using
Parseval’s theorem.
th2
t( )
d
fH f( ) 2
d
(Eq. 6.1)
Where,
h(t) = Time dependent function
H(f) = Frequency dependent function
Test data obtained from m+p international, were containing the acceleration vs time and
power spectrum density vs frequency plots for various locations of human body and car
seat.
The raw testing data were received in .SOT format and using the temporary version of
“m+p Analyser” software tool, the information required for this research work had been
extracted. The raw vibration data plots from .SOT files are shown in Fig. 123, Fig. 124,
Fig. 125, Fig. 126, Fig. 127, Fig. 128, Fig. 129, Fig. 130, Fig. 131 and Fig. 132.
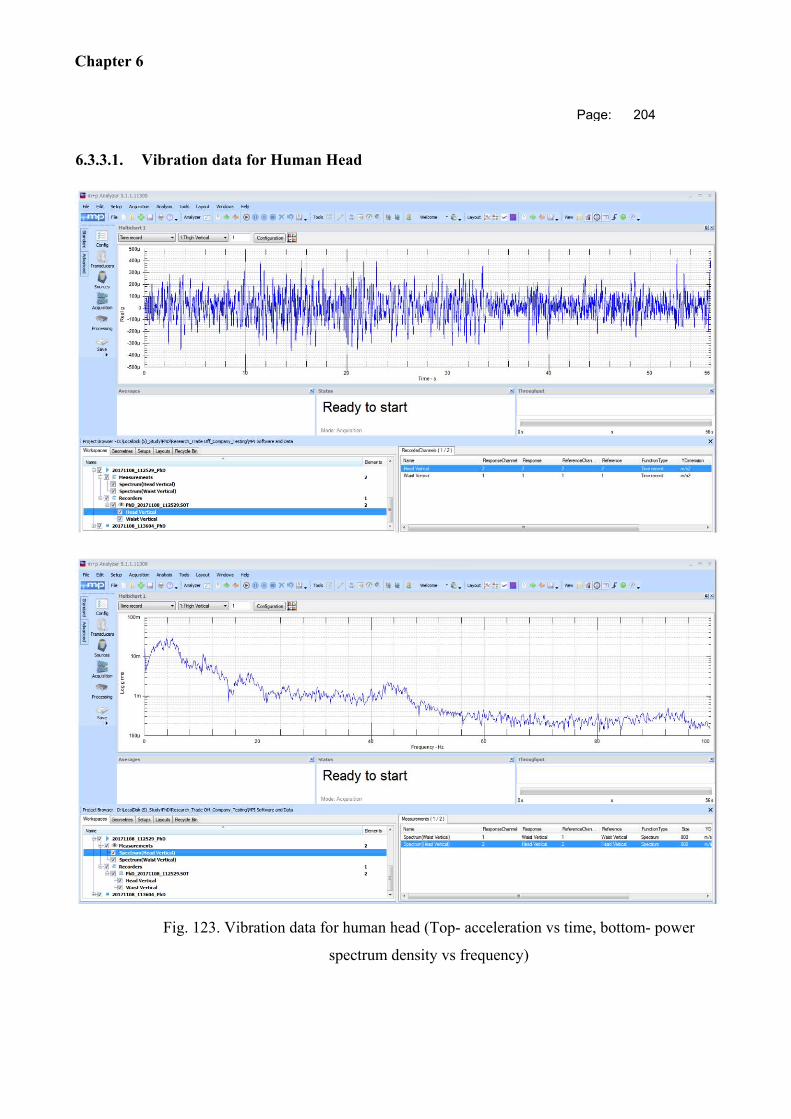
Chapter 6
Page: 204
6.3.3.1. Vibration data for Human Head
Fig. 123. Vibration data for human head (Top- acceleration vs time, bottom- power
spectrum density vs frequency)
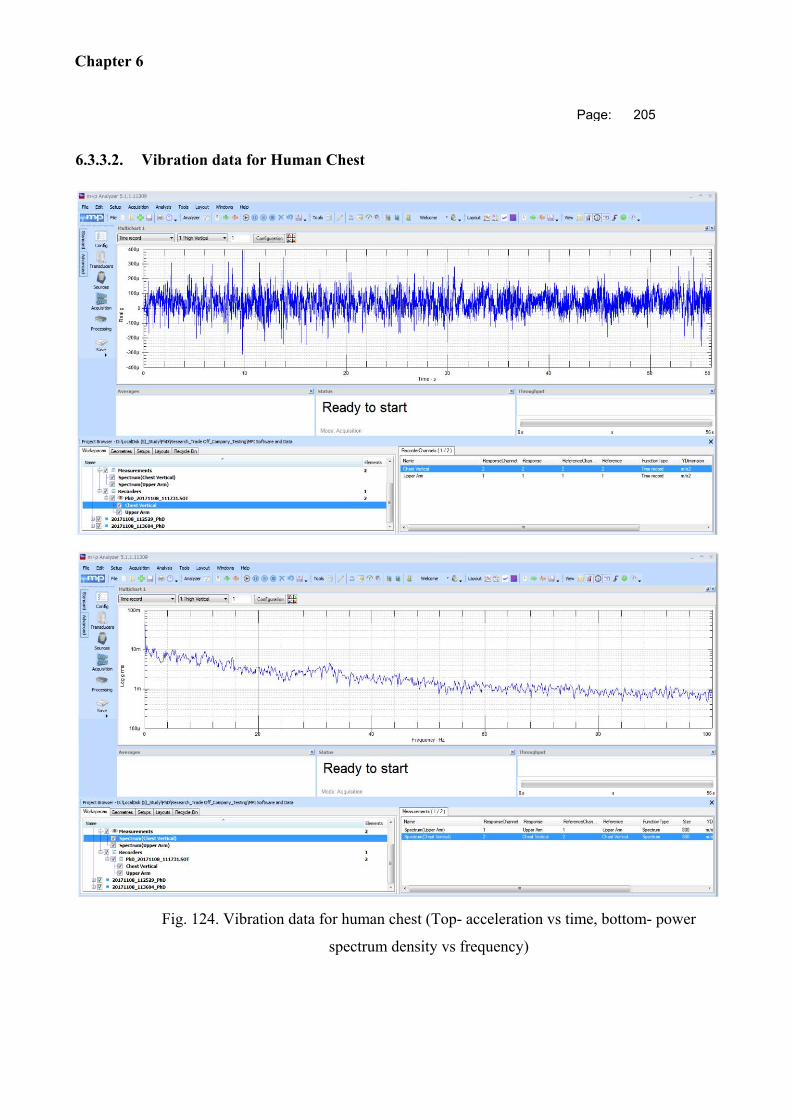
Chapter 6
Page: 205
6.3.3.2. Vibration data for Human Chest
Fig. 124. Vibration data for human chest (Top- acceleration vs time, bottom- power
spectrum density vs frequency)
Chapter 6
Page: 206
6.3.3.3. Vibration data for Human Waist
Fig. 125. Vibration data for human waist (Top- acceleration vs time, bottom- power
spectrum density vs frequency)
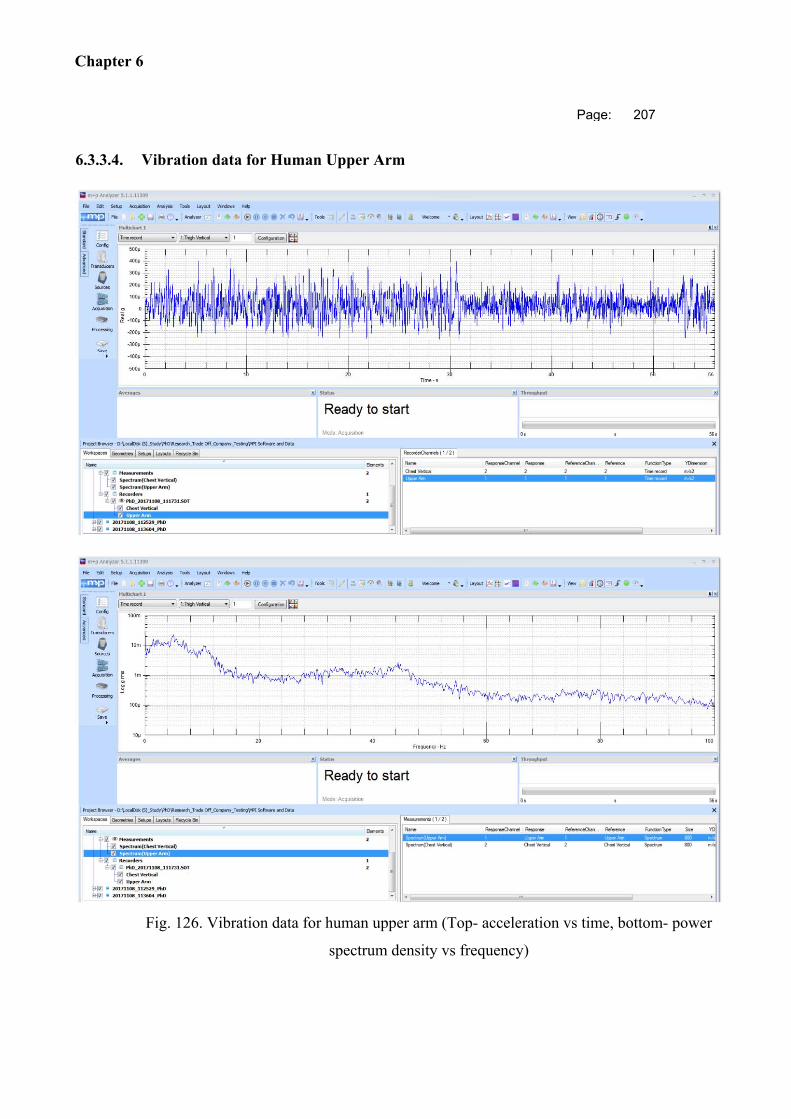
Chapter 6
Page: 207
6.3.3.4. Vibration data for Human Upper Arm
Fig. 126. Vibration data for human upper arm (Top- acceleration vs time, bottom- power
spectrum density vs frequency)
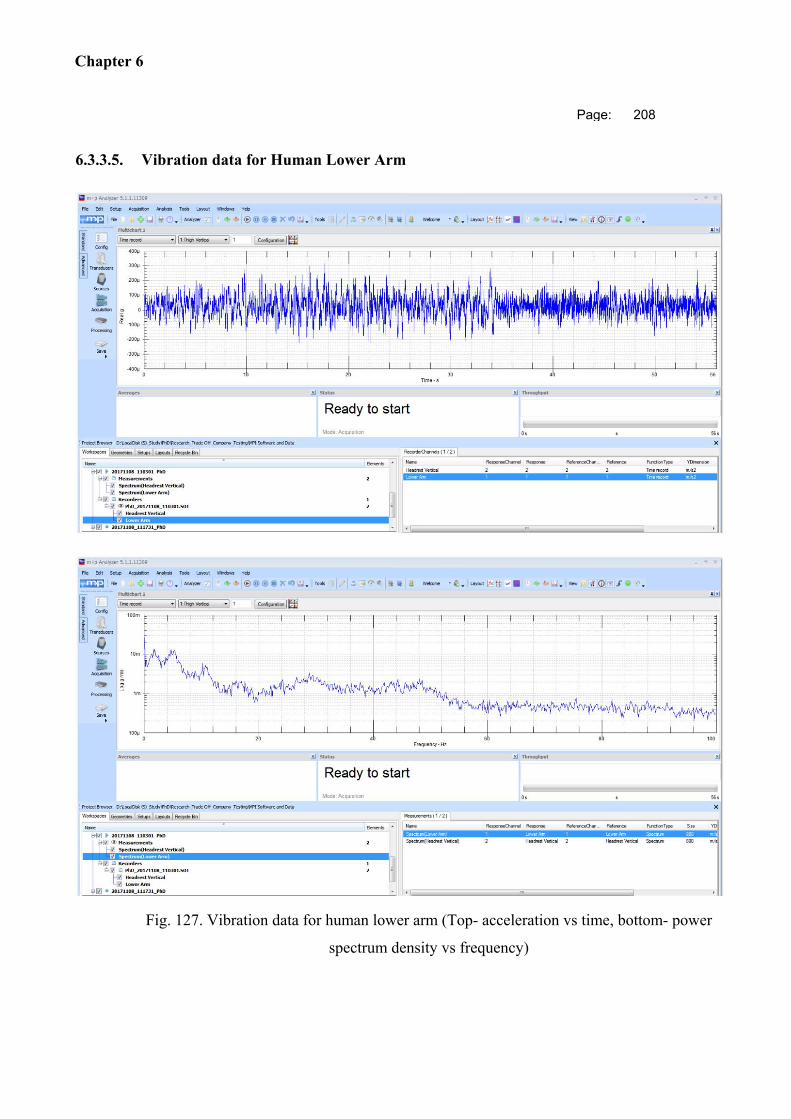
Chapter 6
Page: 208
6.3.3.5. Vibration data for Human Lower Arm
Fig. 127. Vibration data for human lower arm (Top- acceleration vs time, bottom- power
spectrum density vs frequency)
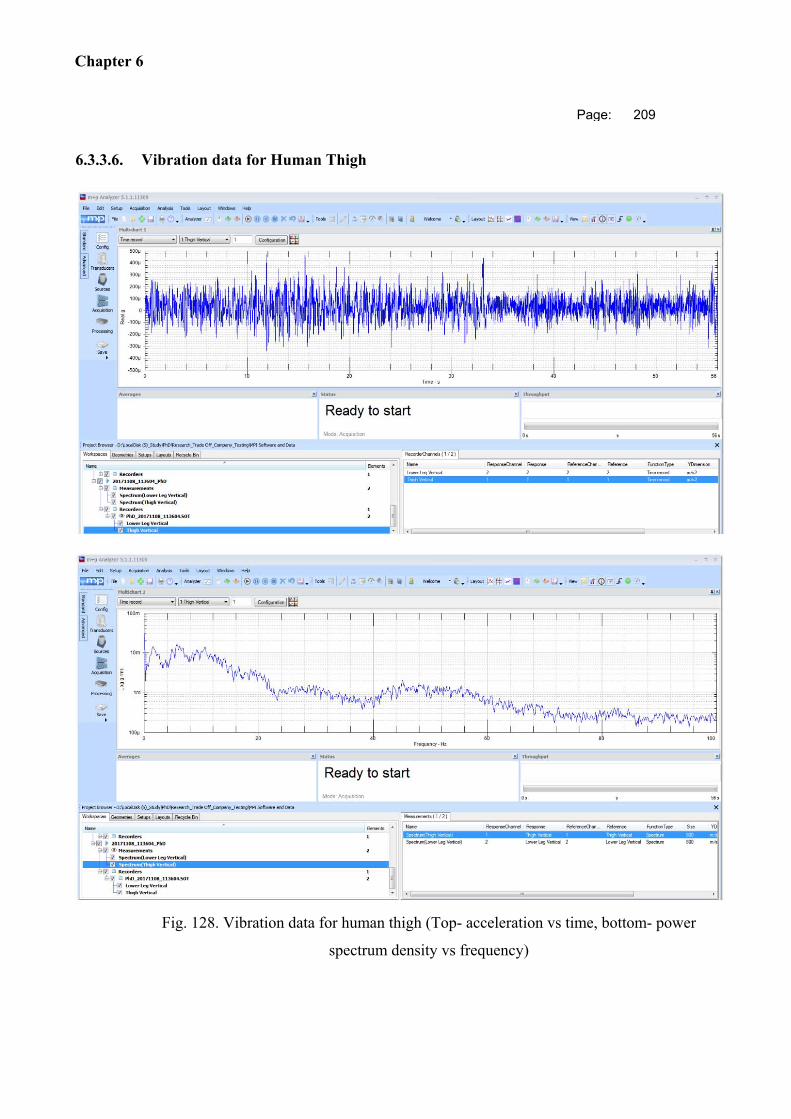
Chapter 6
Page: 209
6.3.3.6. Vibration data for Human Thigh
Fig. 128. Vibration data for human thigh (Top- acceleration vs time, bottom- power
spectrum density vs frequency)
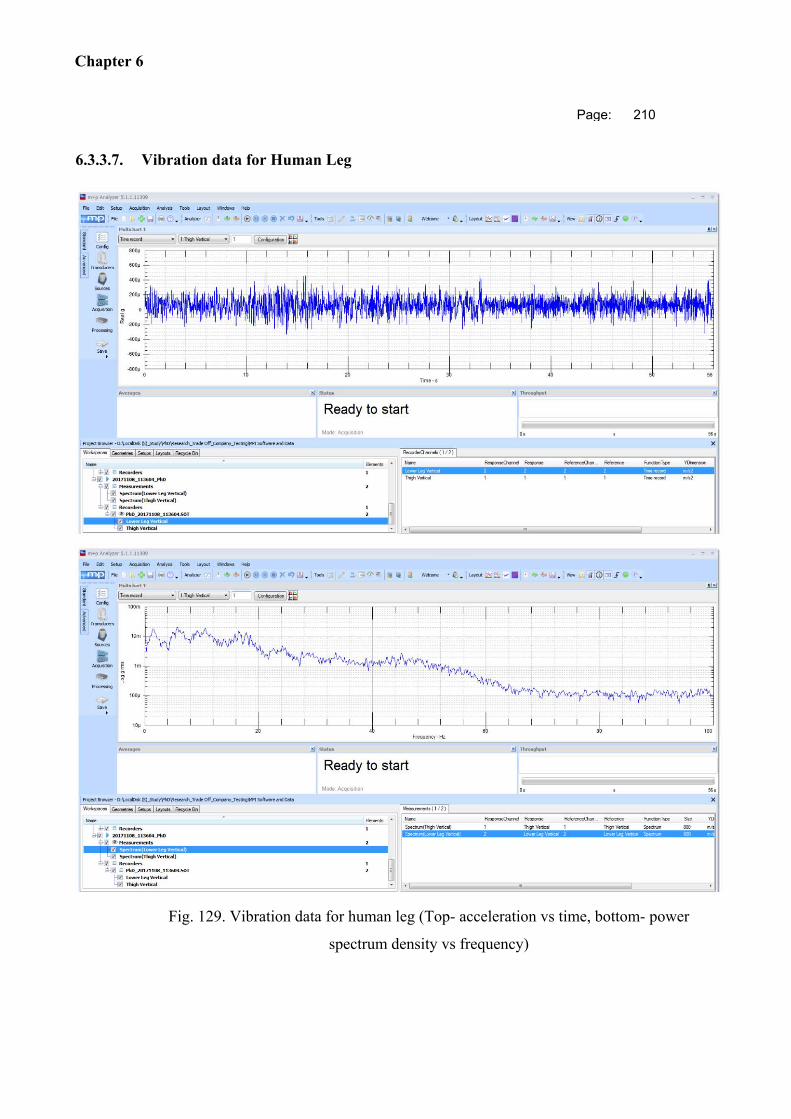
Chapter 6
Page: 210
6.3.3.7. Vibration data for Human Leg
Fig. 129. Vibration data for human leg (Top- acceleration vs time, bottom- power
spectrum density vs frequency)
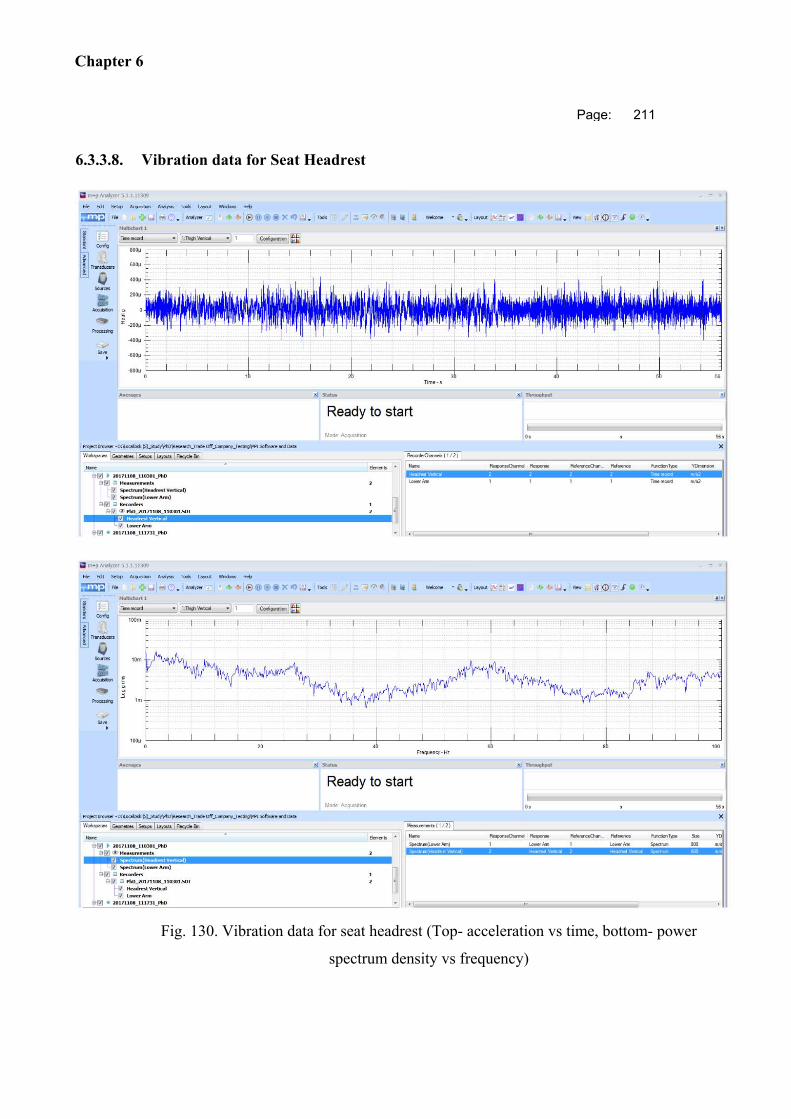
Chapter 6
Page: 211
6.3.3.8. Vibration data for Seat Headrest
Fig. 130. Vibration data for seat headrest (Top- acceleration vs time, bottom- power
spectrum density vs frequency)
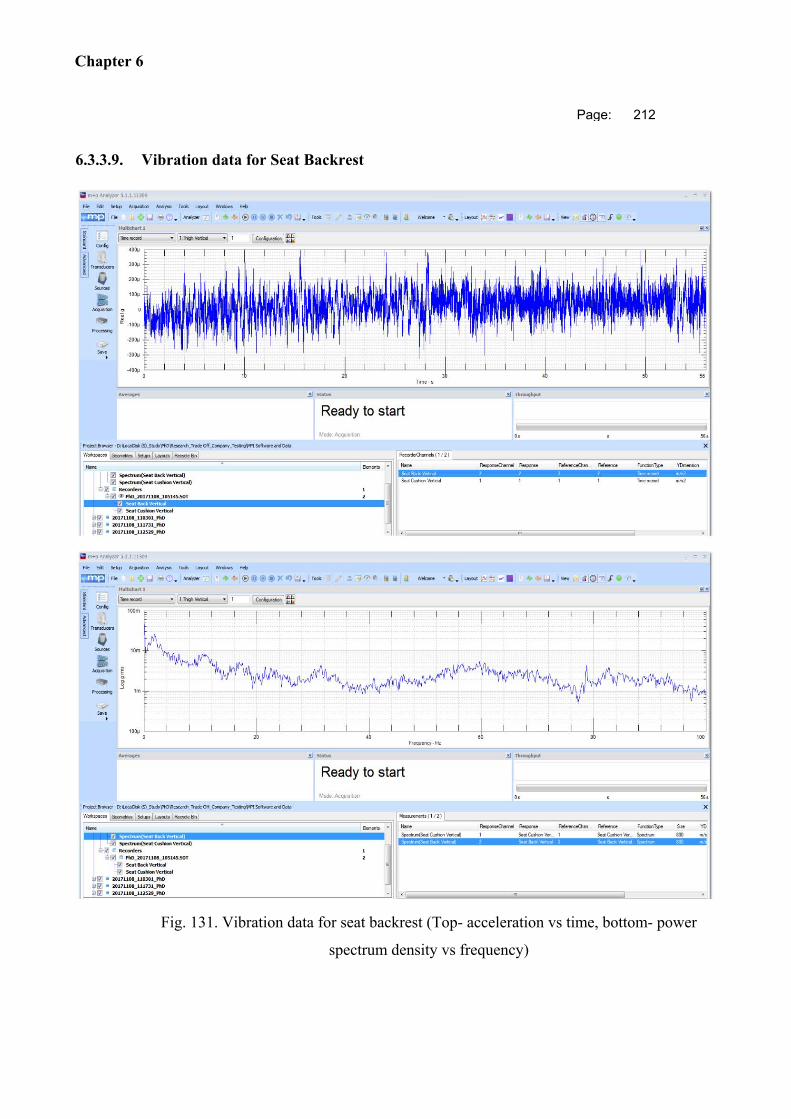
Chapter 6
Page: 212
6.3.3.9. Vibration data for Seat Backrest
Fig. 131. Vibration data for seat backrest (Top- acceleration vs time, bottom- power
spectrum density vs frequency)
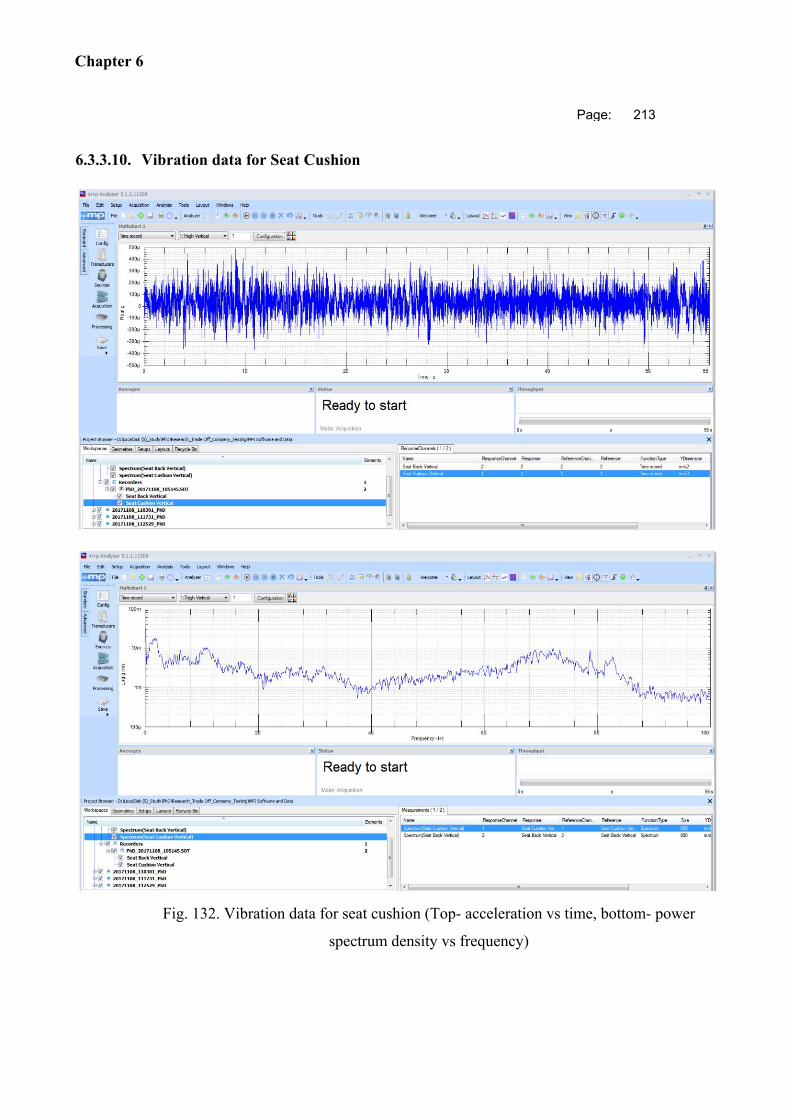
Chapter 6
Page: 213
6.3.3.10. Vibration data for Seat Cushion
Fig. 132. Vibration data for seat cushion (Top- acceleration vs time, bottom- power
spectrum density vs frequency)
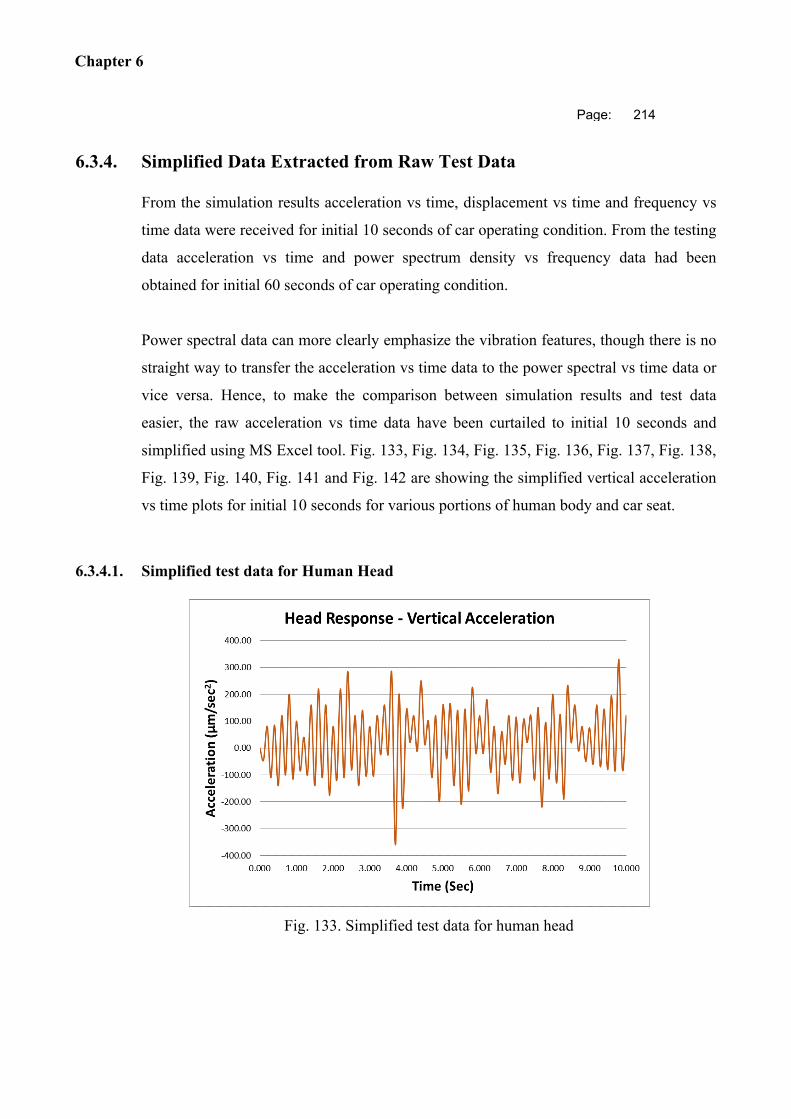
Chapter 6
Page: 214
6.3.4. Simplified Data Extracted from Raw Test Data
From the simulation results acceleration vs time, displacement vs time and frequency vs
time data were received for initial 10 seconds of car operating condition. From the testing
data acceleration vs time and power spectrum density vs frequency data had been
obtained for initial 60 seconds of car operating condition.
Power spectral data can more clearly emphasize the vibration features, though there is no
straight way to transfer the acceleration vs time data to the power spectral vs time data or
vice versa. Hence, to make the comparison between simulation results and test data
easier, the raw acceleration vs time data have been curtailed to initial 10 seconds and
simplified using MS Excel tool. Fig. 133, Fig. 134, Fig. 135, Fig. 136, Fig. 137, Fig. 138,
Fig. 139, Fig. 140, Fig. 141 and Fig. 142 are showing the simplified vertical acceleration
vs time plots for initial 10 seconds for various portions of human body and car seat.
6.3.4.1. Simplified test data for Human Head
Fig. 133. Simplified test data for human head
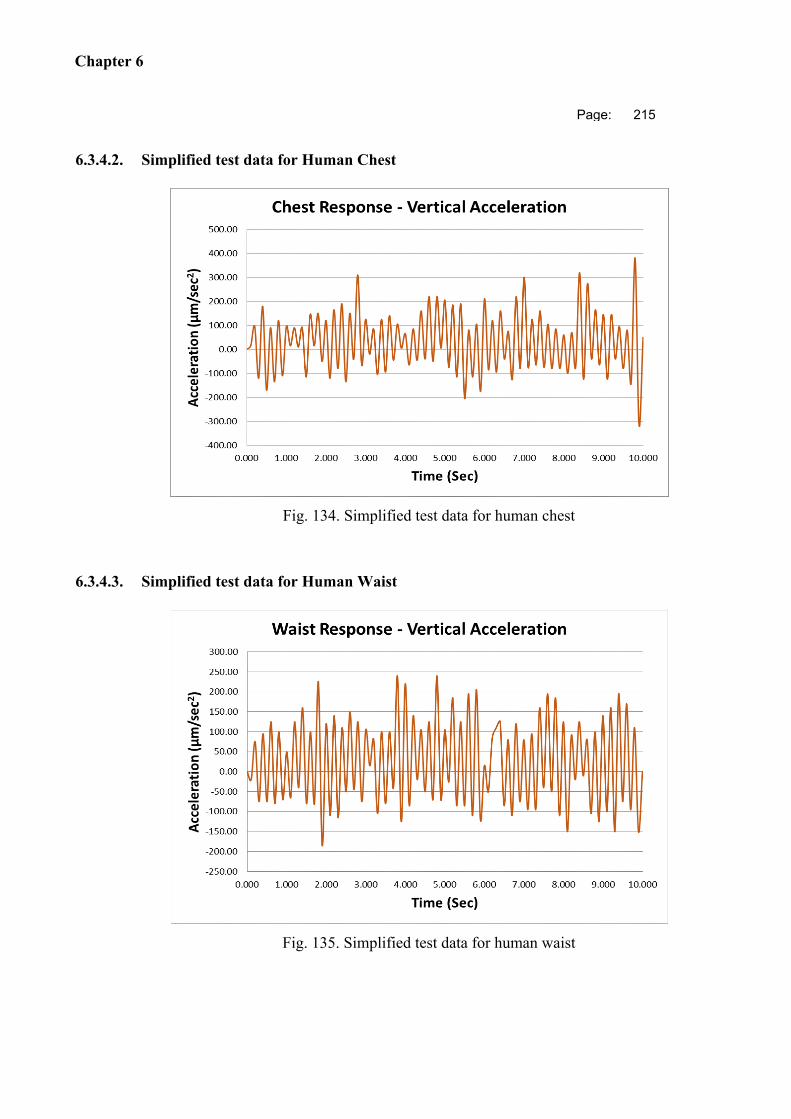
Chapter 6
Page: 215
6.3.4.2. Simplified test data for Human Chest
Fig. 134. Simplified test data for human chest
6.3.4.3. Simplified test data for Human Waist
Fig. 135. Simplified test data for human waist
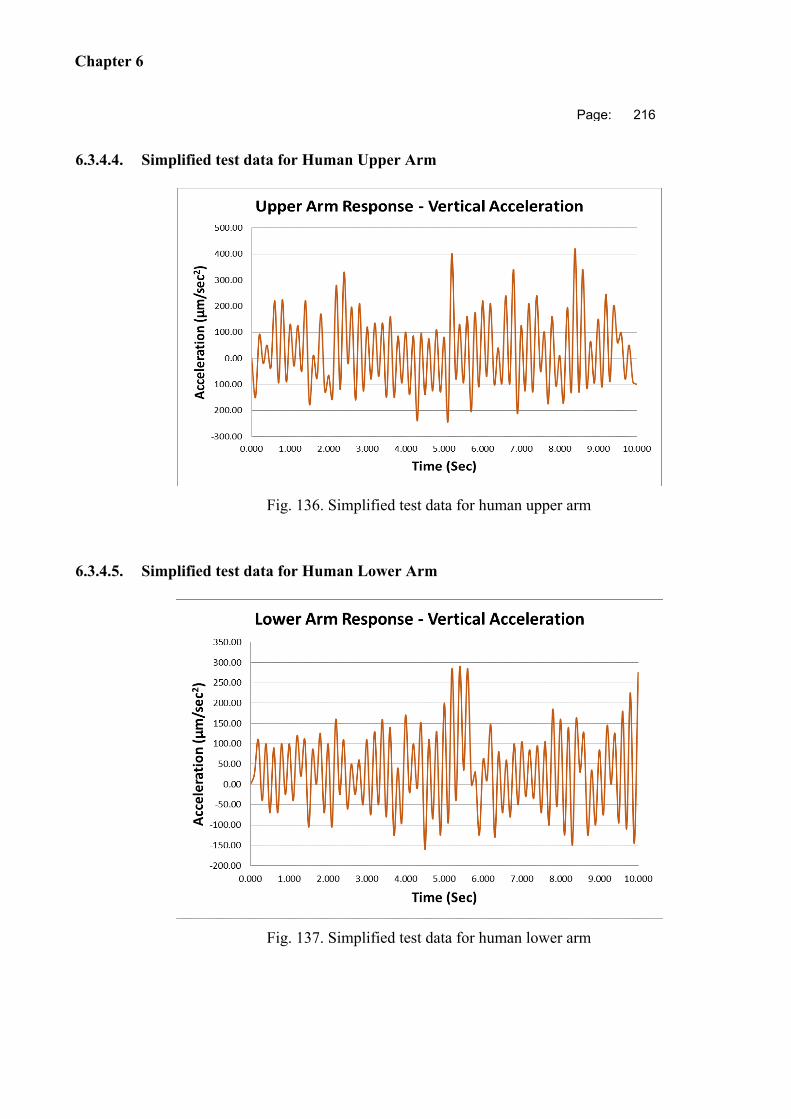
Chapter 6
Page: 216
6.3.4.4. Simplified test data for Human Upper Arm
Fig. 136. Simplified test data for human upper arm
6.3.4.5. Simplified test data for Human Lower Arm
Fig. 137. Simplified test data for human lower arm
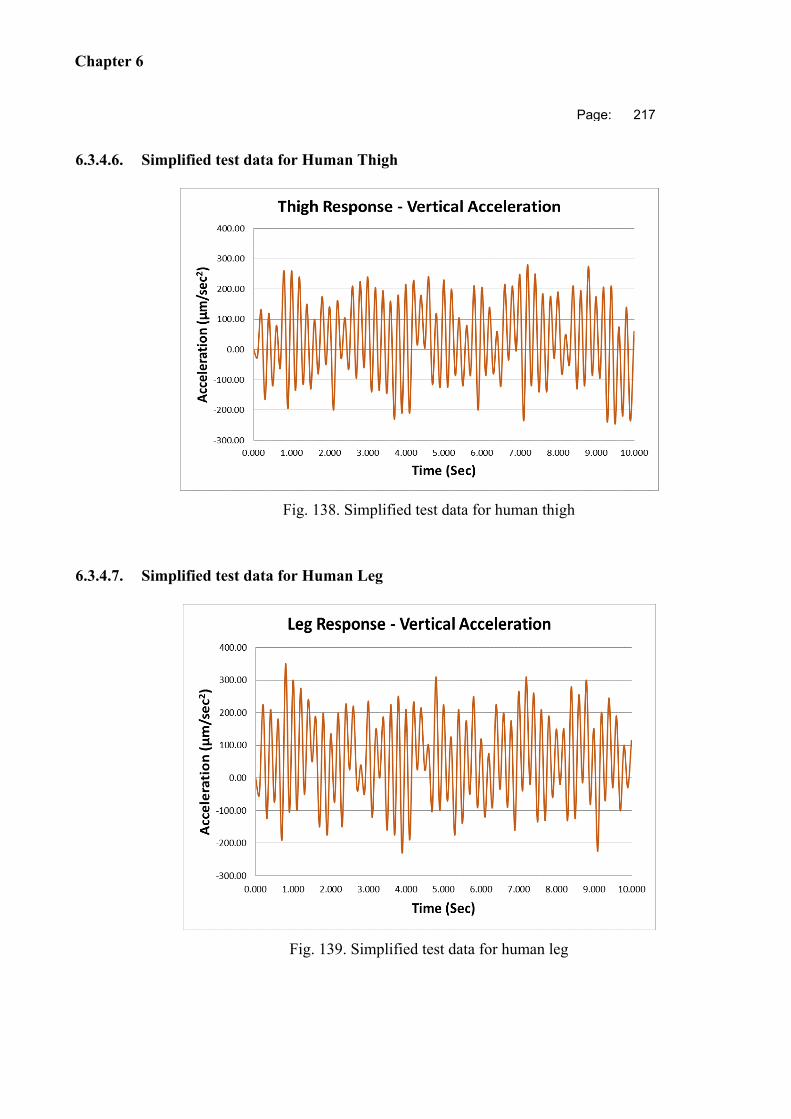
Chapter 6
Page: 217
6.3.4.6. Simplified test data for Human Thigh
Fig. 138. Simplified test data for human thigh
6.3.4.7. Simplified test data for Human Leg
Fig. 139. Simplified test data for human leg
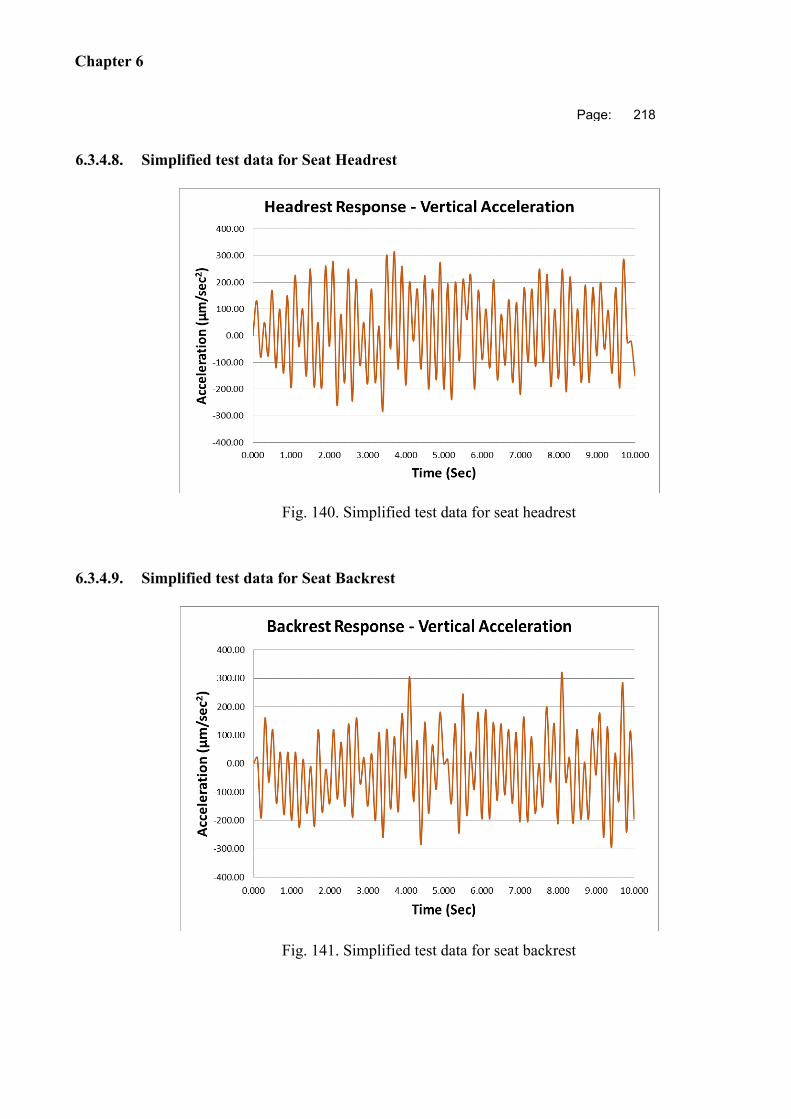
Chapter 6
Page: 218
6.3.4.8. Simplified test data for Seat Headrest
Fig. 140. Simplified test data for seat headrest
6.3.4.9. Simplified test data for Seat Backrest
Fig. 141. Simplified test data for seat backrest

Chapter 6
Page: 219
6.3.4.10. Simplified test data for Seat Cushion
Fig. 142. Simplified test data for seat cushion
6.4. Discussion on the Vibration Measurement and Test Data
Acquisition
The testing data had been collected for the initial 60 seconds after the car started moving
from standstill condition. Cause of the inaccessibility of computer system with adequate
hardware memory, the finite element simulation for the entire human body and car seat
assembly had to be limited to initial 10 seconds. Hence, for the effective comparison of
simulation outputs to the testing data ever an identical period of time, the testing data had
been curtailed to initial 10 seconds and refined in convenient format.
For a car operating in normal condition on smooth terrain, the worst case vibration
scenario occurs when the acceleration is at the highest level. From the literature survey
carried out in CHAPTER 3 on the acceleration values of different types of cars, it can be
stated that if the road surface doesn’t get changed, the pick acceleration for a car occurs
before initial 9-10 seconds. Hence, the processed test data and the simulation results for
Chapter 6
Page: 220
initial 10 seconds are effective enough to assess the vibration characteristics at different
locations of car seat and human body inside the dynamic car.
A comprehensive market research on the latest available technologies and instruments for
measuring vibration has been accomplished. Testing data have been collected, filtered to
appropriate format and condensed to match to the timeframe of finite element simulation.
Therefore, the process of validating the simulation results by comparing to the testing
data can be initiated.
Chapter 7
Page: 221
CHAPTER 7 COMPARISON OF SIMULATION
RESULTS AND TEST DATA
From the results of the finite element simulation, displacements, accelerations and
frequencies in the vertical direction with respect to time were obtained in the formats of
mm, mm/sec² and Hz, respectively. From the testing data, vertical accelerations with
respect to time in micro-mm/sec² format and power spectrum densities with respect to
frequency in logarithm of acceleration rms format were obtained.
Power spectrum data can be obtained from the finite element simulation by running the
simulation through additional modules or by incorporating time-dependent kinematic
excitation for non-linear systems. This process of extracting power spectrum data from
finite element tool increases the complexity and robustness of the simulation set up by
huge extent, which demands the simulation solving to be performed in a highly
configured computer system. Also, transformation of power spectrum plots obtained from
the testing data to the frequency vs time domain requires time consuming human effort to
perform huge amount of numerical analysis. Hence, for the comparison purpose, vertical
accelerations vs time data from the simulation results and testing data had been
accounted. For convenient interpretation, all the vertical acceleration values from testing
data have been transformed into mm/sec² format.
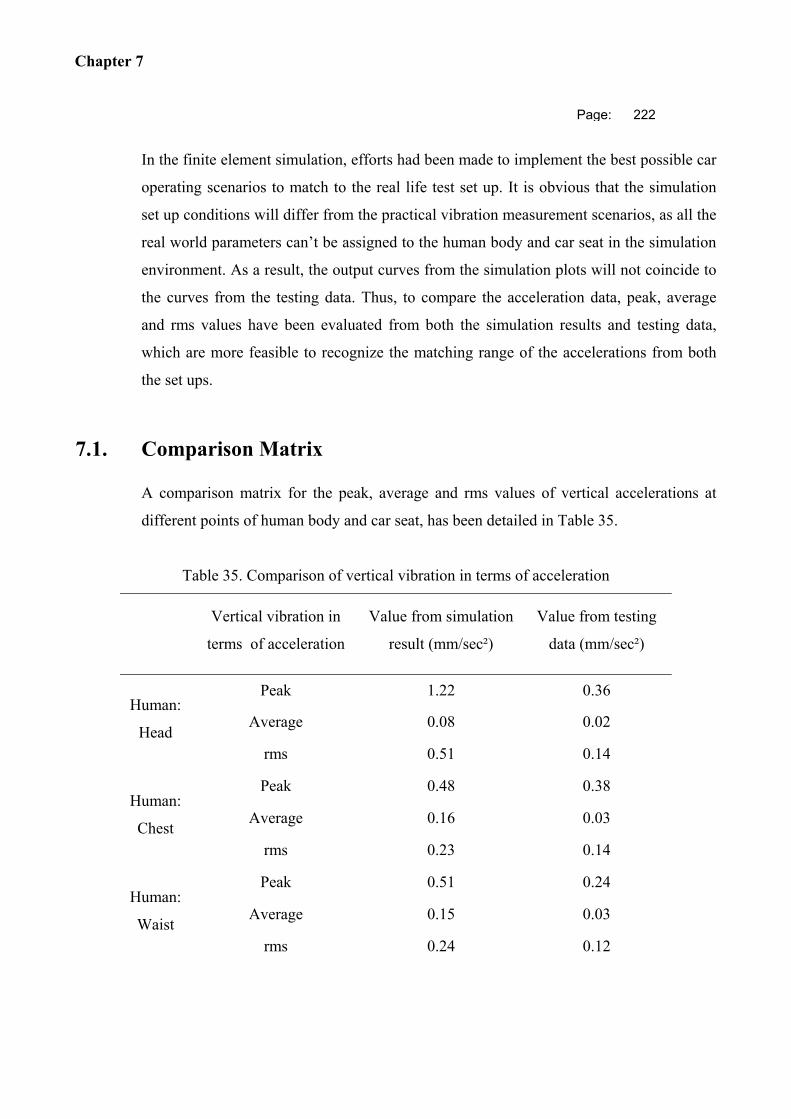
Chapter 7
Page: 222
In the finite element simulation, efforts had been made to implement the best possible car
operating scenarios to match to the real life test set up. It is obvious that the simulation
set up conditions will differ from the practical vibration measurement scenarios, as all the
real world parameters can’t be assigned to the human body and car seat in the simulation
environment. As a result, the output curves from the simulation plots will not coincide to
the curves from the testing data. Thus, to compare the acceleration data, peak, average
and rms values have been evaluated from both the simulation results and testing data,
which are more feasible to recognize the matching range of the accelerations from both
the set ups.
7.1. Comparison Matrix
A comparison matrix for the peak, average and rms values of vertical accelerations at
different points of human body and car seat, has been detailed in Table 35.
Table 35. Comparison of vertical vibration in terms of acceleration
Vertical vibration in
terms of acceleration
Value from simulation
result (mm/sec²)
Value from testing
data (mm/sec²)
Human:
Head
Peak 1.22 0.36
Average 0.08 0.02
rms 0.51 0.14
Human:
Chest
Peak 0.48 0.38
Average 0.16 0.03
rms 0.23 0.14
Human:
Waist
Peak 0.51 0.24
Average 0.15 0.03
rms 0.24 0.12
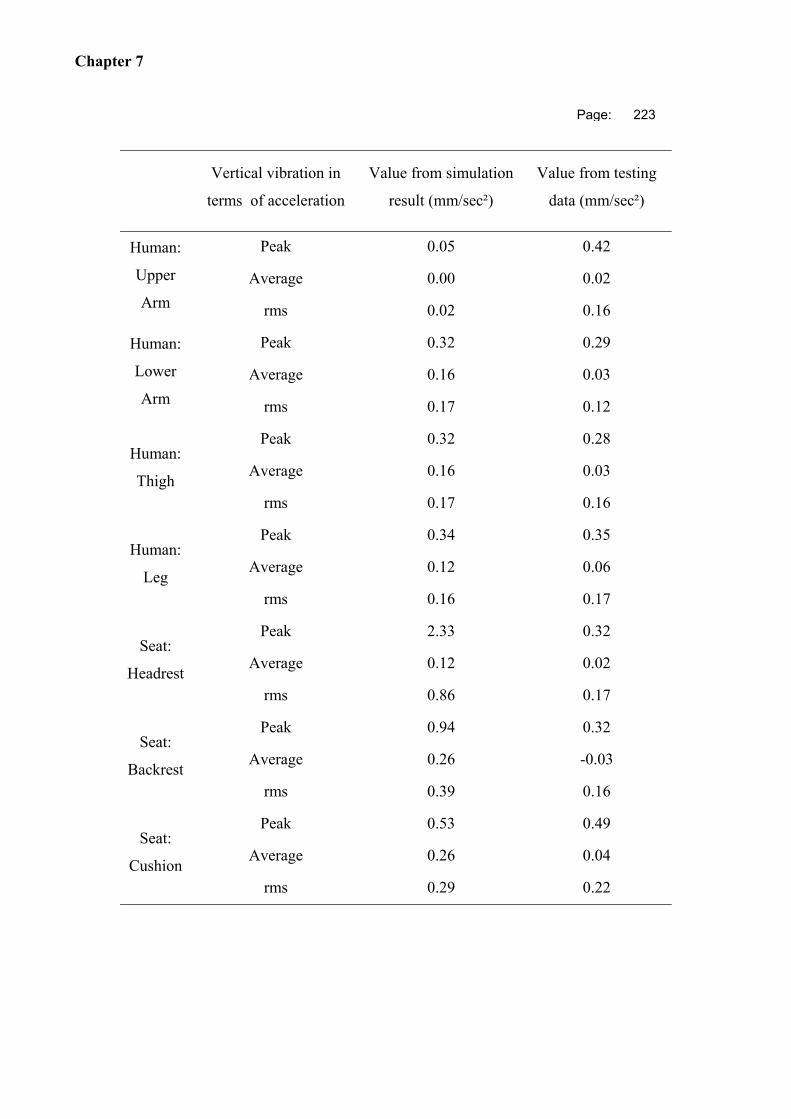
Chapter 7
Page: 223
Vertical vibration in
terms of acceleration
Value from simulation
result (mm/sec²)
Value from testing
data (mm/sec²)
Human:
Upper
Arm
Peak 0.05 0.42
Average 0.00 0.02
rms 0.02 0.16
Human:
Lower
Arm
Peak 0.32 0.29
Average 0.16 0.03
rms 0.17 0.12
Human:
Thigh
Peak 0.32 0.28
Average 0.16 0.03
rms 0.17 0.16
Human:
Leg
Peak 0.34 0.35
Average 0.12 0.06
rms 0.16 0.17
Seat:
Headrest
Peak 2.33 0.32
Average 0.12 0.02
rms 0.86 0.17
Seat:
Backrest
Peak 0.94 0.32
Average 0.26 -0.03
rms 0.39 0.16
Seat:
Cushion
Peak 0.53 0.49
Average 0.26 0.04
rms 0.29 0.22
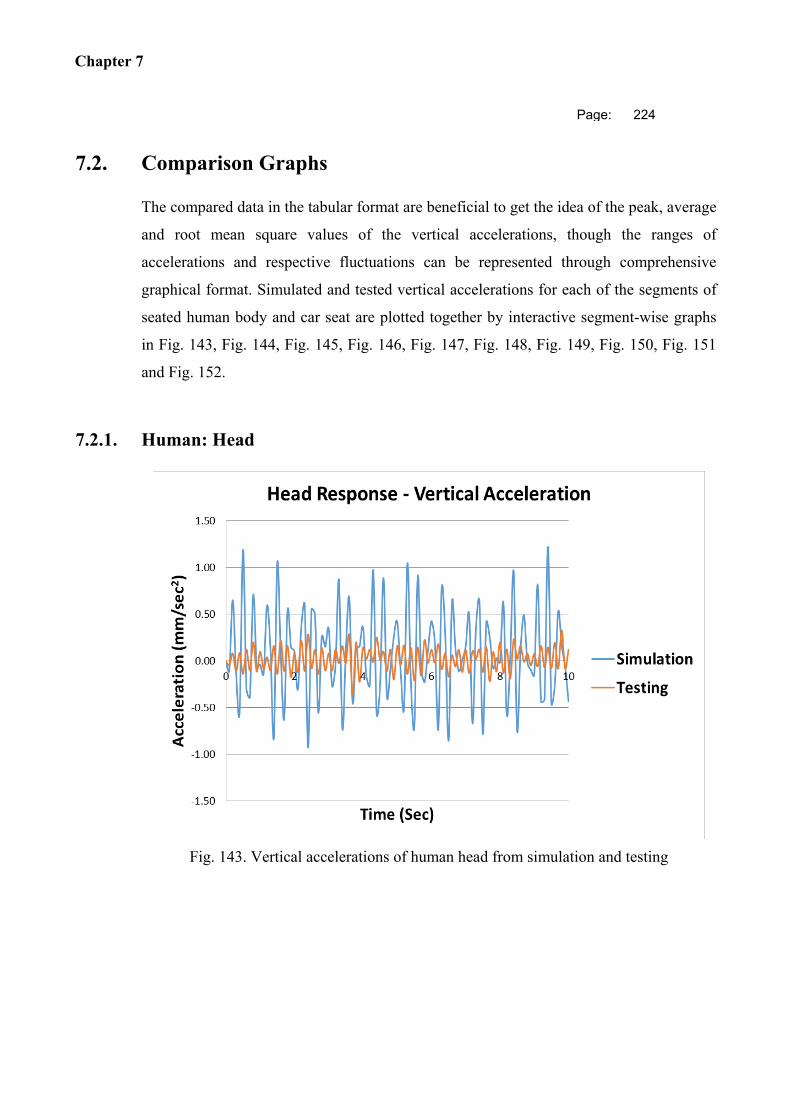
Chapter 7
Page: 224
7.2. Comparison Graphs
The compared data in the tabular format are beneficial to get the idea of the peak, average
and root mean square values of the vertical accelerations, though the ranges of
accelerations and respective fluctuations can be represented through comprehensive
graphical format. Simulated and tested vertical accelerations for each of the segments of
seated human body and car seat are plotted together by interactive segment-wise graphs
in Fig. 143, Fig. 144, Fig. 145, Fig. 146, Fig. 147, Fig. 148, Fig. 149, Fig. 150, Fig. 151
and Fig. 152.
7.2.1. Human: Head
Fig. 143. Vertical accelerations of human head from simulation and testing
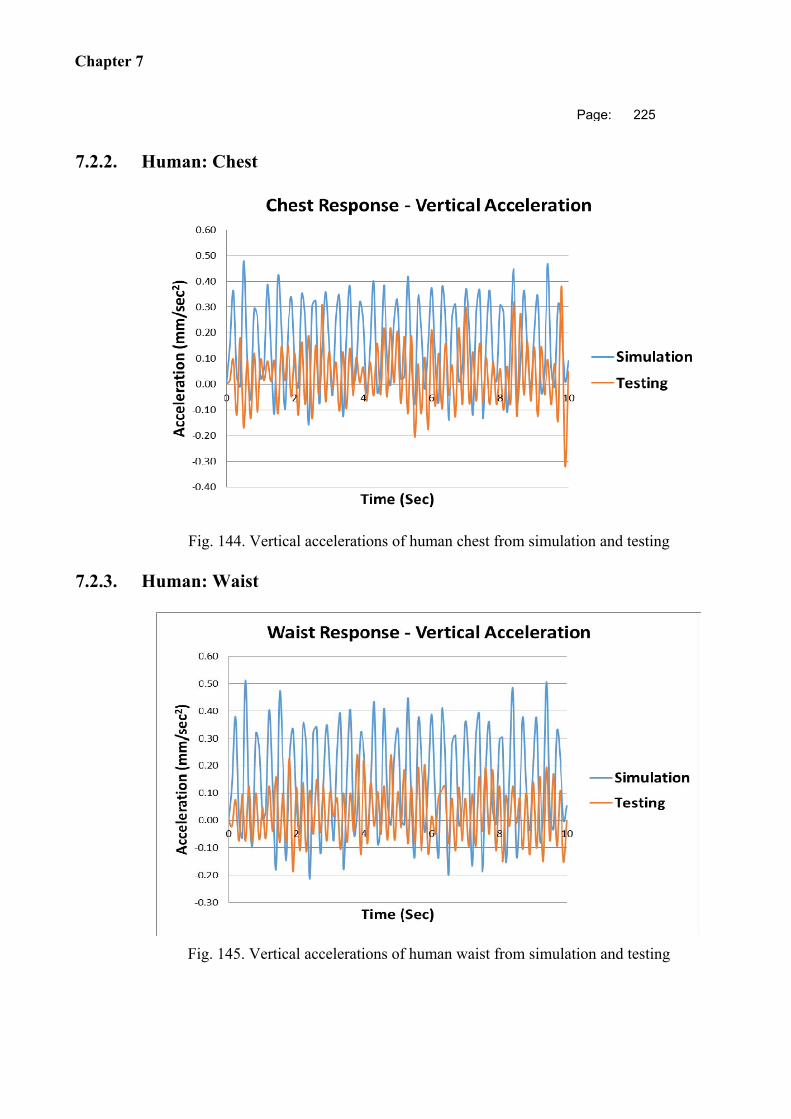
Chapter 7
Page: 225
7.2.2. Human: Chest
Fig. 144. Vertical accelerations of human chest from simulation and testing
7.2.3. Human: Waist
Fig. 145. Vertical accelerations of human waist from simulation and testing
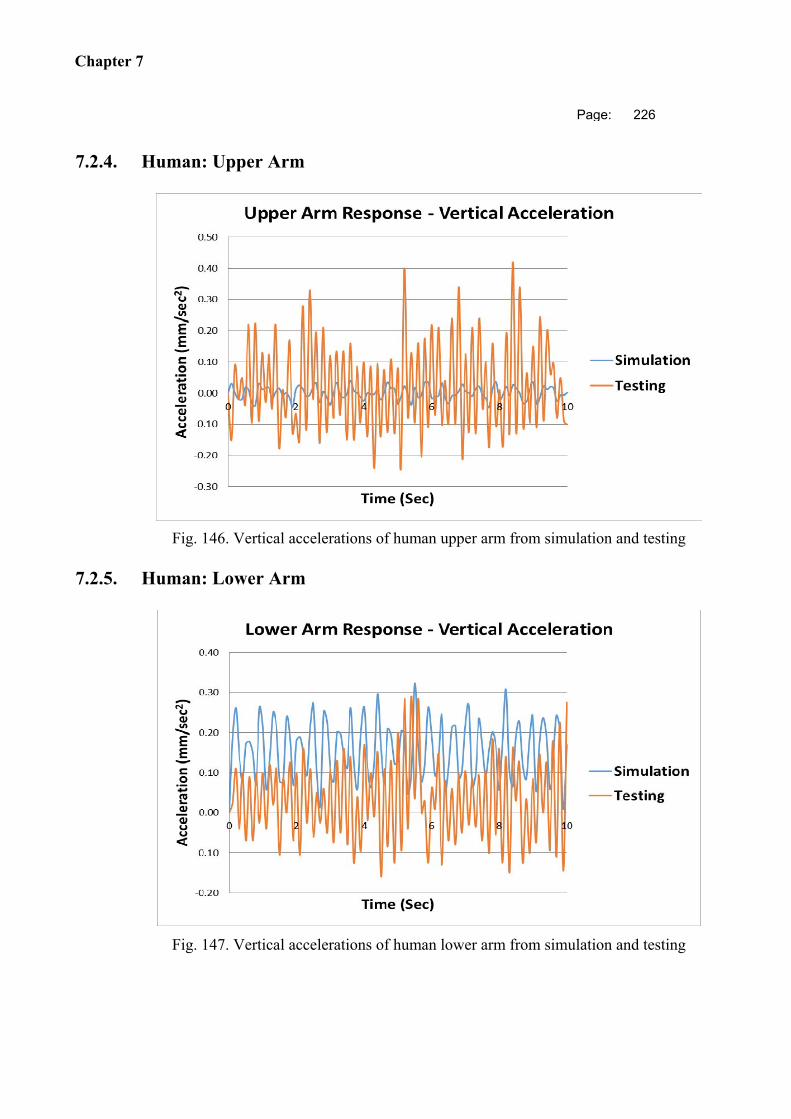
Chapter 7
Page: 226
7.2.4. Human: Upper Arm
Fig. 146. Vertical accelerations of human upper arm from simulation and testing
7.2.5. Human: Lower Arm
Fig. 147. Vertical accelerations of human lower arm from simulation and testing
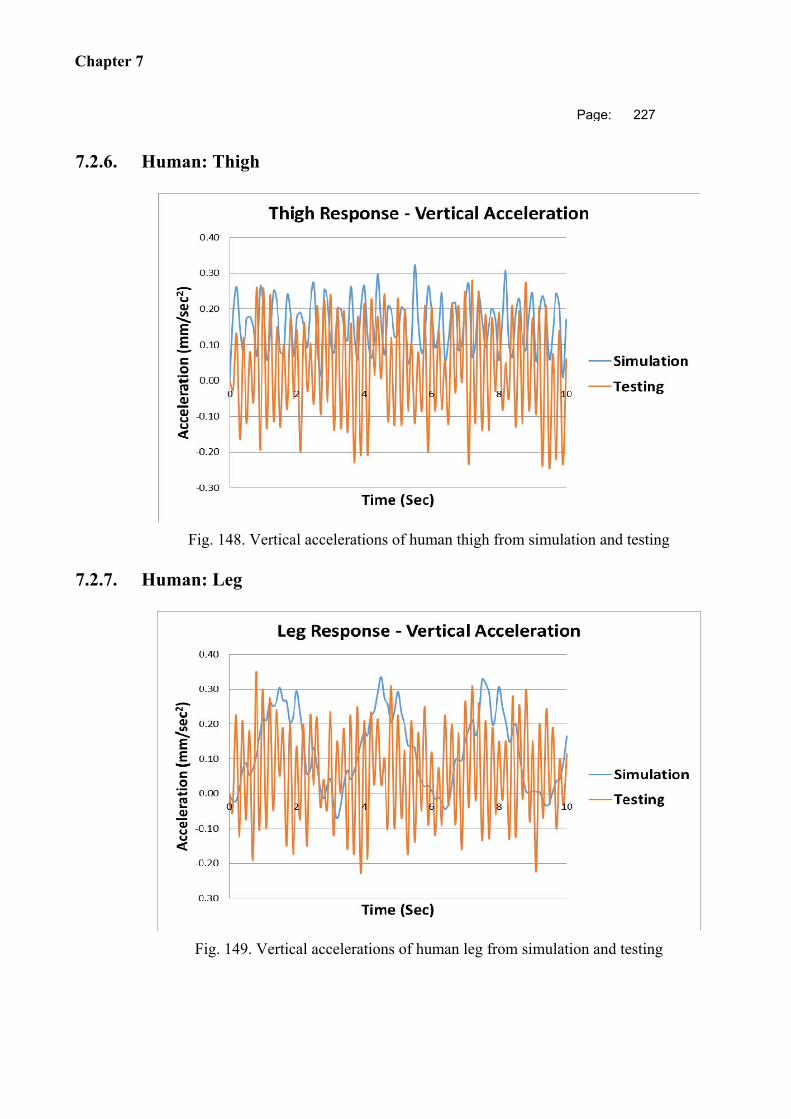
Chapter 7
Page: 227
7.2.6. Human: Thigh
Fig. 148. Vertical accelerations of human thigh from simulation and testing
7.2.7. Human: Leg
Fig. 149. Vertical accelerations of human leg from simulation and testing
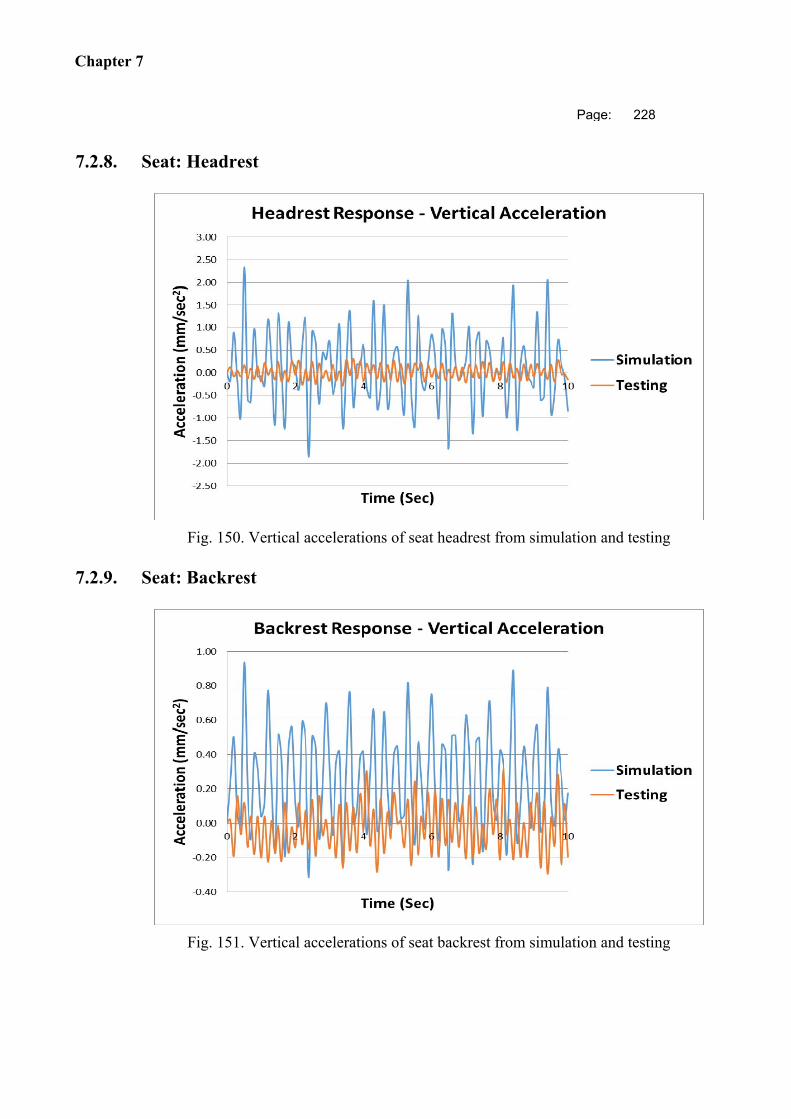
Chapter 7
Page: 228
7.2.8. Seat: Headrest
Fig. 150. Vertical accelerations of seat headrest from simulation and testing
7.2.9. Seat: Backrest
Fig. 151. Vertical accelerations of seat backrest from simulation and testing

Chapter 7
Page: 229
7.2.10. Seat: Cushion
Fig. 152. Vertical accelerations of seat cushion from simulation and testing
7.3. Analytical Investigation of Simulation Results and Test Data
All the tables and charts clearly show that the simulation results are more conservative
than those of obtained from the test data. Comparative data for the human head, human
waist, human upper arm, seat headrest and seat backrest are being shown through graphs
in Fig. 143, Fig. 145, Fig. 146, Fig. 150 and Fig. 151, respectively. From these graphs, it
is observed that the upper and lower peak limits of the vertical accelerations from the
testing data are well below the respective limits from the simulation results.
Comparative data of vertical accelerations for the human chest, human lower arm, human
thigh and seat cushion are represented by graphs in Fig. 144, Fig. 147, Fig. 148 and Fig.
152, respectively, where the upper limit points from testing data are below the respective
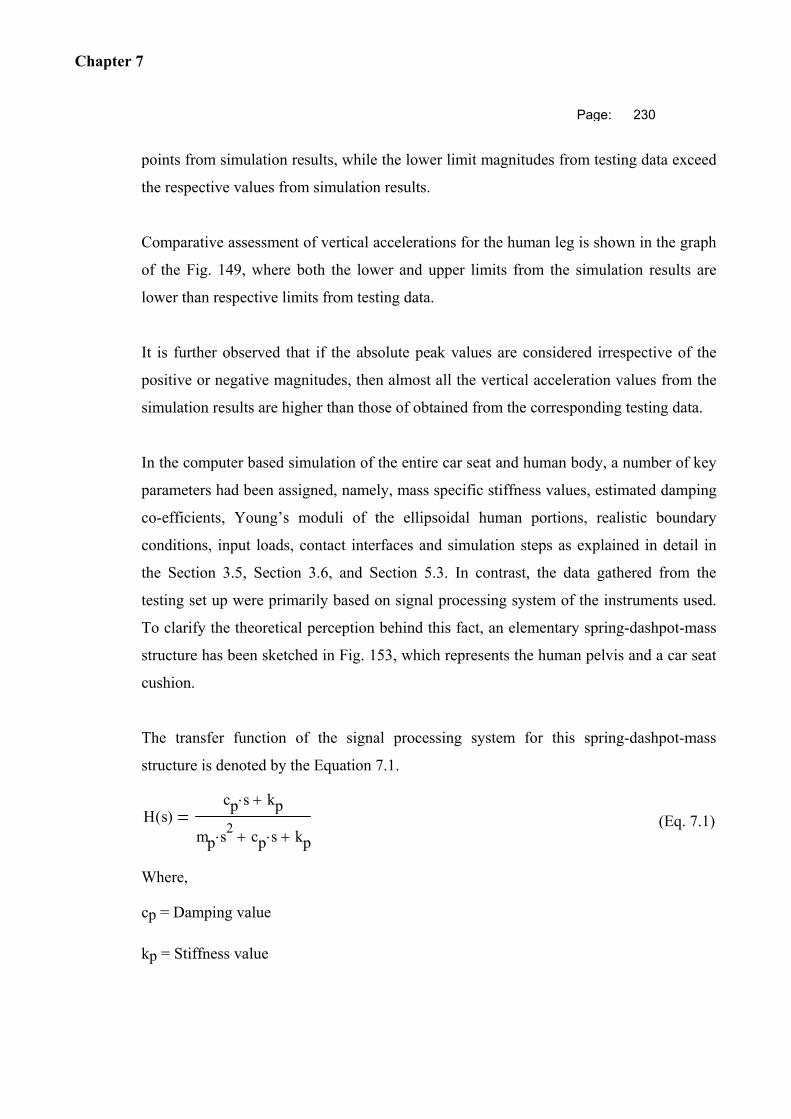
Chapter 7
Page: 230
points from simulation results, while the lower limit magnitudes from testing data exceed
the respective values from simulation results.
Comparative assessment of vertical accelerations for the human leg is shown in the graph
of the Fig. 149, where both the lower and upper limits from the simulation results are
lower than respective limits from testing data.
It is further observed that if the absolute peak values are considered irrespective of the
positive or negative magnitudes, then almost all the vertical acceleration values from the
simulation results are higher than those of obtained from the corresponding testing data.
In the computer based simulation of the entire car seat and human body, a number of key
parameters had been assigned, namely, mass specific stiffness values, estimated damping
co-efficients, Young’s moduli of the ellipsoidal human portions, realistic boundary
conditions, input loads, contact interfaces and simulation steps as explained in detail in
the Section 3.5, Section 3.6, and Section 5.3. In contrast, the data gathered from the
testing set up were primarily based on signal processing system of the instruments used.
To clarify the theoretical perception behind this fact, an elementary spring-dashpot-mass
structure has been sketched in Fig. 153, which represents the human pelvis and a car seat
cushion.
The transfer function of the signal processing system for this spring-dashpot-mass
structure is denoted by the Equation 7.1.
H s( )cp s kp
mp s2 cp s kp
(Eq. 7.1)
Where,
cp = Damping value
kp = Stiffness value
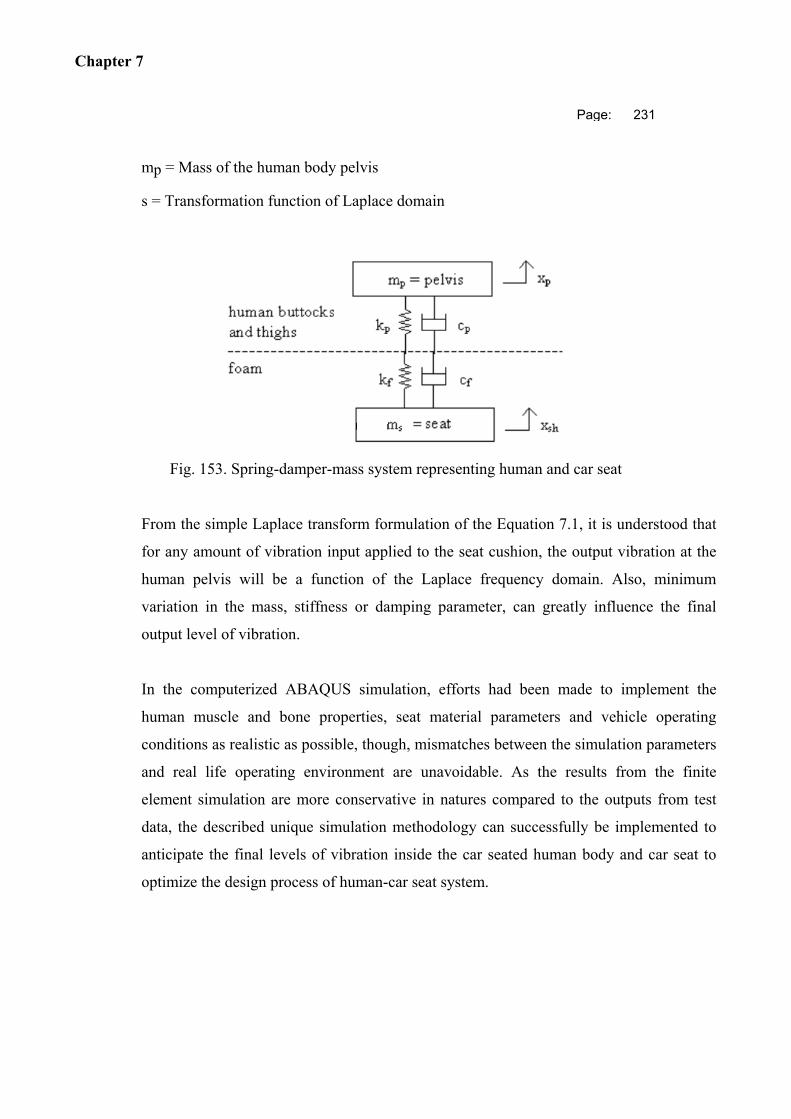
Chapter 7
Page: 231
mp = Mass of the human body pelvis
s = Transformation function of Laplace domain
Fig. 153. Spring-damper-mass system representing human and car seat
From the simple Laplace transform formulation of the Equation 7.1, it is understood that
for any amount of vibration input applied to the seat cushion, the output vibration at the
human pelvis will be a function of the Laplace frequency domain. Also, minimum
variation in the mass, stiffness or damping parameter, can greatly influence the final
output level of vibration.
In the computerized ABAQUS simulation, efforts had been made to implement the
human muscle and bone properties, seat material parameters and vehicle operating
conditions as realistic as possible, though, mismatches between the simulation parameters
and real life operating environment are unavoidable. As the results from the finite
element simulation are more conservative in natures compared to the outputs from test
data, the described unique simulation methodology can successfully be implemented to
anticipate the final levels of vibration inside the car seated human body and car seat to
optimize the design process of human-car seat system.
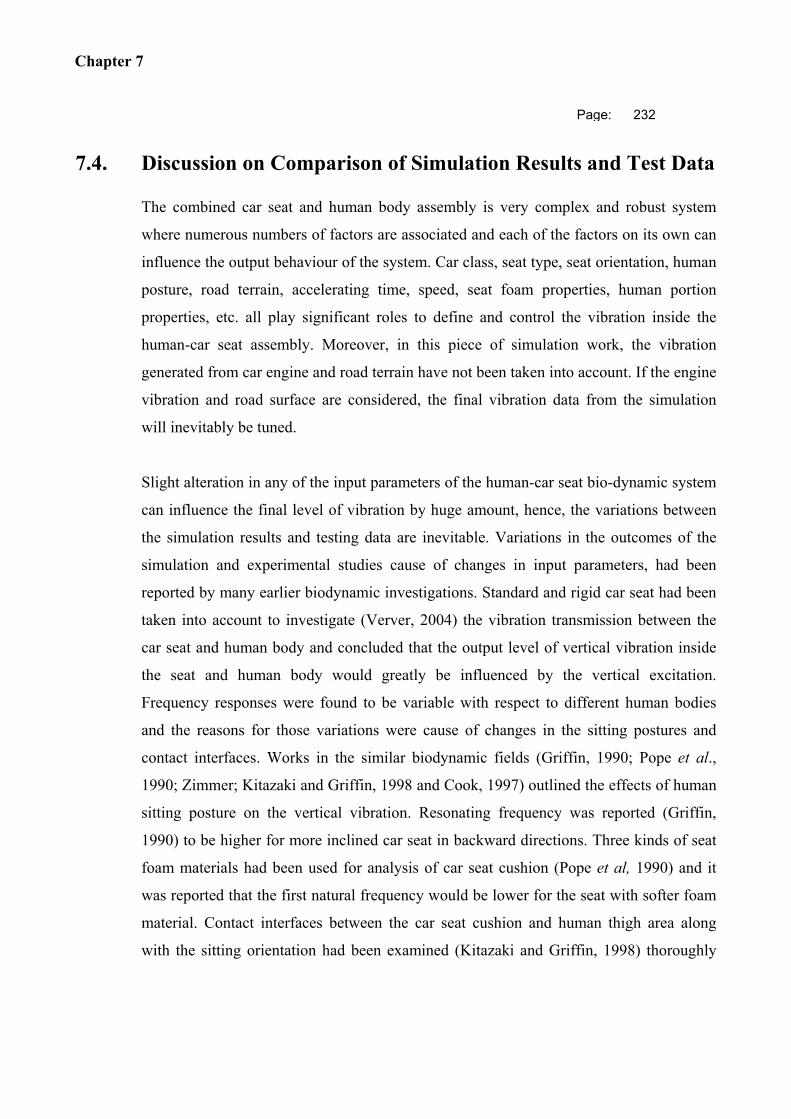
Chapter 7
Page: 232
7.4. Discussion on Comparison of Simulation Results and Test Data
The combined car seat and human body assembly is very complex and robust system
where numerous numbers of factors are associated and each of the factors on its own can
influence the output behaviour of the system. Car class, seat type, seat orientation, human
posture, road terrain, accelerating time, speed, seat foam properties, human portion
properties, etc. all play significant roles to define and control the vibration inside the
human-car seat assembly. Moreover, in this piece of simulation work, the vibration
generated from car engine and road terrain have not been taken into account. If the engine
vibration and road surface are considered, the final vibration data from the simulation
will inevitably be tuned.
Slight alteration in any of the input parameters of the human-car seat bio-dynamic system
can influence the final level of vibration by huge amount, hence, the variations between
the simulation results and testing data are inevitable. Variations in the outcomes of the
simulation and experimental studies cause of changes in input parameters, had been
reported by many earlier biodynamic investigations. Standard and rigid car seat had been
taken into account to investigate (Verver, 2004) the vibration transmission between the
car seat and human body and concluded that the output level of vertical vibration inside
the seat and human body would greatly be influenced by the vertical excitation.
Frequency responses were found to be variable with respect to different human bodies
and the reasons for those variations were cause of changes in the sitting postures and
contact interfaces. Works in the similar biodynamic fields (Griffin, 1990; Pope et al.,
1990; Zimmer; Kitazaki and Griffin, 1998 and Cook, 1997) outlined the effects of human
sitting posture on the vertical vibration. Resonating frequency was reported (Griffin,
1990) to be higher for more inclined car seat in backward directions. Three kinds of seat
foam materials had been used for analysis of car seat cushion (Pope et al, 1990) and it
was reported that the first natural frequency would be lower for the seat with softer foam
material. Contact interfaces between the car seat cushion and human thigh area along
with the sitting orientation had been examined (Kitazaki and Griffin, 1998) thoroughly
Chapter 7
Page: 233
and it was concluded that the increment in the contact surface area between the seat and
human thigh would lower the axial stiffness underneath the human pelvis because of the
non-linear relationship between the excited force and deflection. Investigations on the
seat-human assembly (Hinz and Seidel, 1987; Panjabi et al., 1986; Mansfield and Griffin,
2000) exhibited the alterations in the vibration transmissions and acceleration data with
different human representatives of variable sizes, shapes and sitting orientations. Studies
on vibration transmission (Kitazaki and Griffin, 1998; Zimmerman and Cook, 1997)
showed that the variations in the human pelvis location and human posture could change
the frequency response and transfer function of the seat-human assembly. Biodynamic
experimental study on vibration (Griffin, 1990) repeated the testing process for several
times using the same human object with identical test set up. The output vibration levels
for all the test runs were different from each other.
The ranges of the frequencies obtained from the computerized simulation results are
lower than the permissible frequency limit of 20 Hz for the human organs. Most of the
vertical acceleration values from simulation are higher in magnitudes than those received
from testing data. The magnitudes of the acceleration data from simulation can further be
lowered by applying prospective remedies suggested in past vibration related research
works (Griffin, 1990; Pope et al., 1990; Zimmer; Kitazaki and Griffin, 1998 and Cook,
1997). Regardless of the reasonable amount of mismatches between the simulation results
and testing data, it can be concluded that this simulation methodology can successfully be
implemented to anticipate the frequency levels at different points of human body and car
seat to optimize the human health, safety and comfort level.
Chapter 8
Page: 234
CHAPTER 8 GUIDELINE FOR
IMPLEMENTING THE UNIQUE
SIMULATION TECHNIQUE IN
RELEVANT INDUSTRIES
Upon completion of the validation process of the simulation results with testing data, it
can be stated that through some manipulations on the simulation set up, this unique
technique can successfully be implemented to similar kinds of transportation industries to
judge the level of vibrations inside the seat and its occupant.
This chapter describes the step by step instructions for using this unique simulation
methodology for the seat and human body assembly in other relevant industries. Each
section of this chapter is elaborating the specific guidelines to be followed for
anticipating the level of vibration inside human body and seat in an effective way.
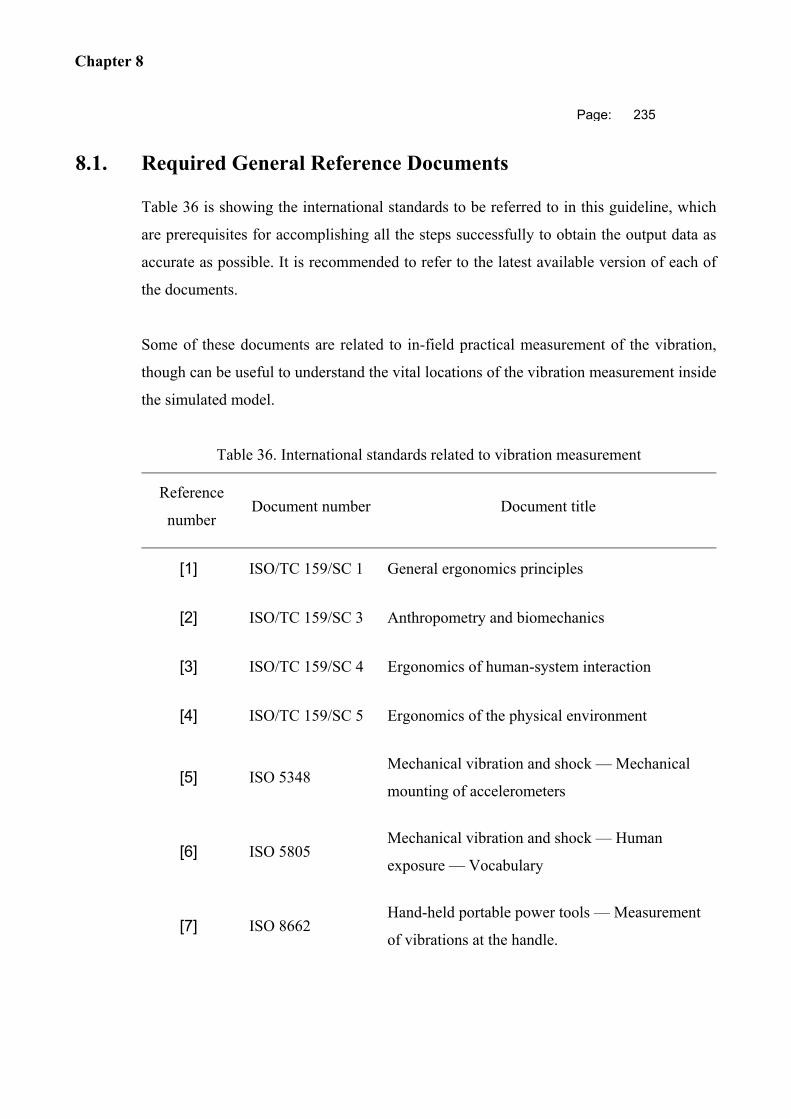
Chapter 8
Page: 235
8.1. Required General Reference Documents
Table 36 is showing the international standards to be referred to in this guideline, which
are prerequisites for accomplishing all the steps successfully to obtain the output data as
accurate as possible. It is recommended to refer to the latest available version of each of
the documents.
Some of these documents are related to in-field practical measurement of the vibration,
though can be useful to understand the vital locations of the vibration measurement inside
the simulated model.
Table 36. International standards related to vibration measurement
Reference
number Document number Document title
[1] ISO/TC 159/SC 1 General ergonomics principles
[2] ISO/TC 159/SC 3 Anthropometry and biomechanics
[3] ISO/TC 159/SC 4 Ergonomics of human-system interaction
[4] ISO/TC 159/SC 5 Ergonomics of the physical environment
[5] ISO 5348 Mechanical vibration and shock — Mechanical
mounting of accelerometers
[6] ISO 5805 Mechanical vibration and shock — Human
exposure — Vocabulary
[7] ISO 8662 Hand-held portable power tools — Measurement
of vibrations at the handle.
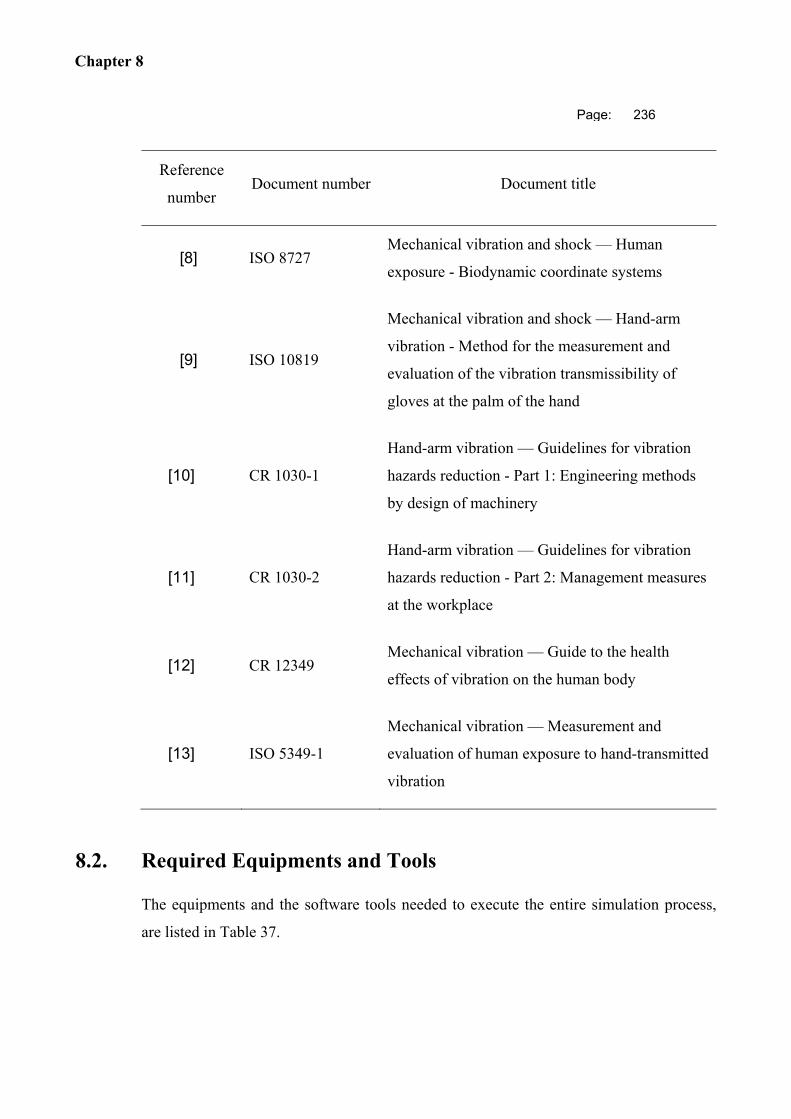
Chapter 8
Page: 236
Reference
number Document number Document title
[8] ISO 8727 Mechanical vibration and shock — Human
exposure - Biodynamic coordinate systems
[9] ISO 10819
Mechanical vibration and shock — Hand-arm
vibration - Method for the measurement and
evaluation of the vibration transmissibility of
gloves at the palm of the hand
[10] CR 1030-1
Hand-arm vibration — Guidelines for vibration
hazards reduction - Part 1: Engineering methods
by design of machinery
[11] CR 1030-2
Hand-arm vibration — Guidelines for vibration
hazards reduction - Part 2: Management measures
at the workplace
[12] CR 12349 Mechanical vibration — Guide to the health
effects of vibration on the human body
[13] ISO 5349-1
Mechanical vibration — Measurement and
evaluation of human exposure to hand-transmitted
vibration
8.2. Required Equipments and Tools
The equipments and the software tools needed to execute the entire simulation process,
are listed in Table 37.
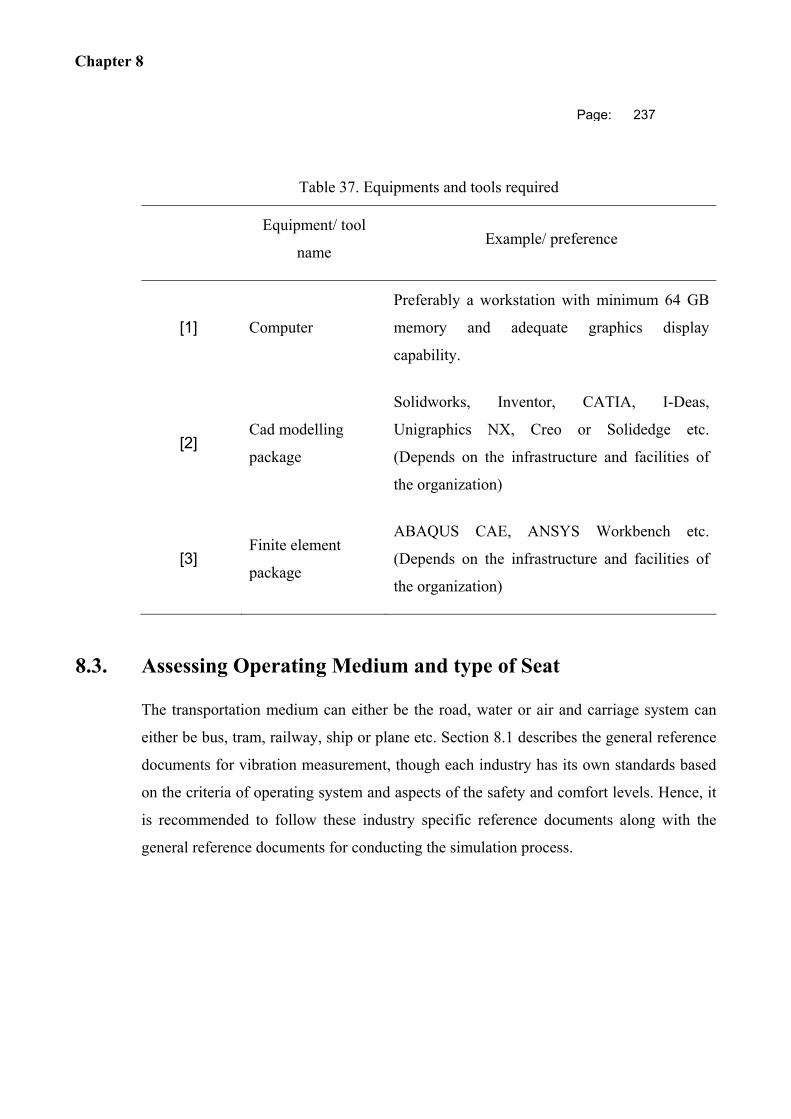
Chapter 8
Page: 237
Table 37. Equipments and tools required
Equipment/ tool
name Example/ preference
[1] Computer
Preferably a workstation with minimum 64 GB
memory and adequate graphics display
capability.
[2] Cad modelling
package
Solidworks, Inventor, CATIA, I-Deas,
Unigraphics NX, Creo or Solidedge etc.
(Depends on the infrastructure and facilities of
the organization)
[3] Finite element
package
ABAQUS CAE, ANSYS Workbench etc.
(Depends on the infrastructure and facilities of
the organization)
8.3. Assessing Operating Medium and type of Seat
The transportation medium can either be the road, water or air and carriage system can
either be bus, tram, railway, ship or plane etc. Section 8.1 describes the general reference
documents for vibration measurement, though each industry has its own standards based
on the criteria of operating system and aspects of the safety and comfort levels. Hence, it
is recommended to follow these industry specific reference documents along with the
general reference documents for conducting the simulation process.
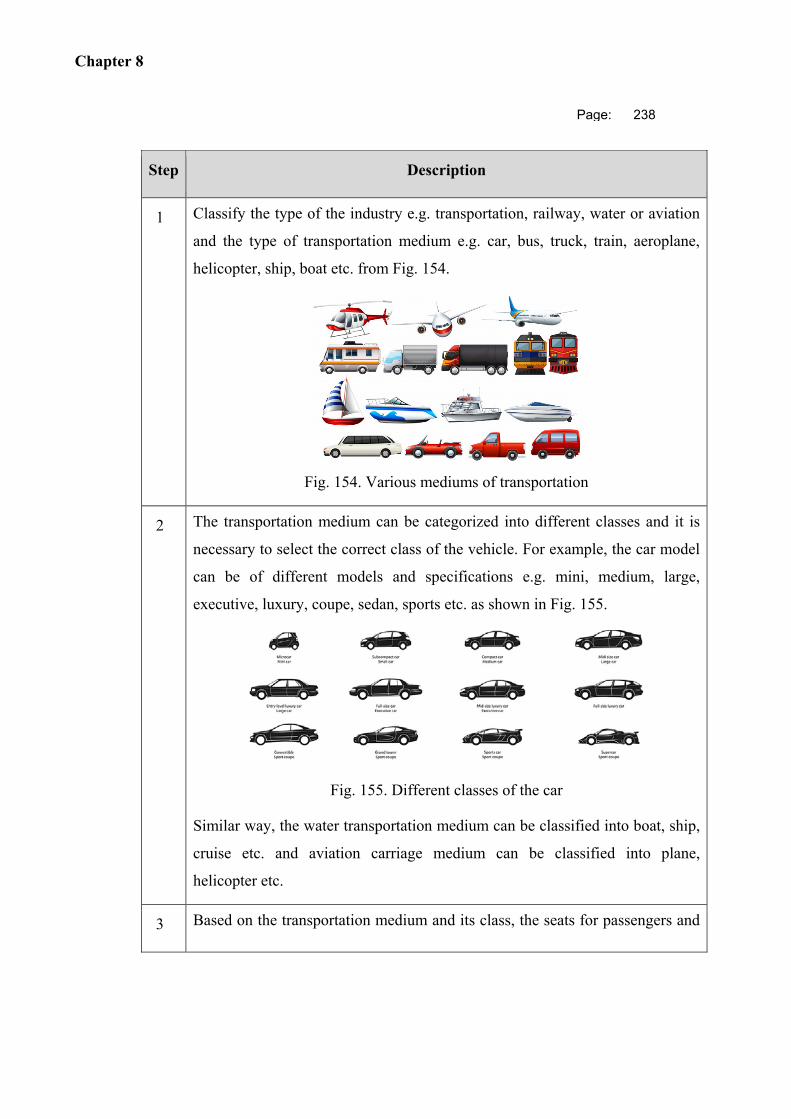
Chapter 8
Page: 238
Step Description
1 Classify the type of the industry e.g. transportation, railway, water or aviation
and the type of transportation medium e.g. car, bus, truck, train, aeroplane,
helicopter, ship, boat etc. from Fig. 154.
Fig. 154. Various mediums of transportation
2 The transportation medium can be categorized into different classes and it is
necessary to select the correct class of the vehicle. For example, the car model
can be of different models and specifications e.g. mini, medium, large,
executive, luxury, coupe, sedan, sports etc. as shown in Fig. 155.
Fig. 155. Different classes of the car
Similar way, the water transportation medium can be classified into boat, ship,
cruise etc. and aviation carriage medium can be classified into plane,
helicopter etc.
3 Based on the transportation medium and its class, the seats for passengers and
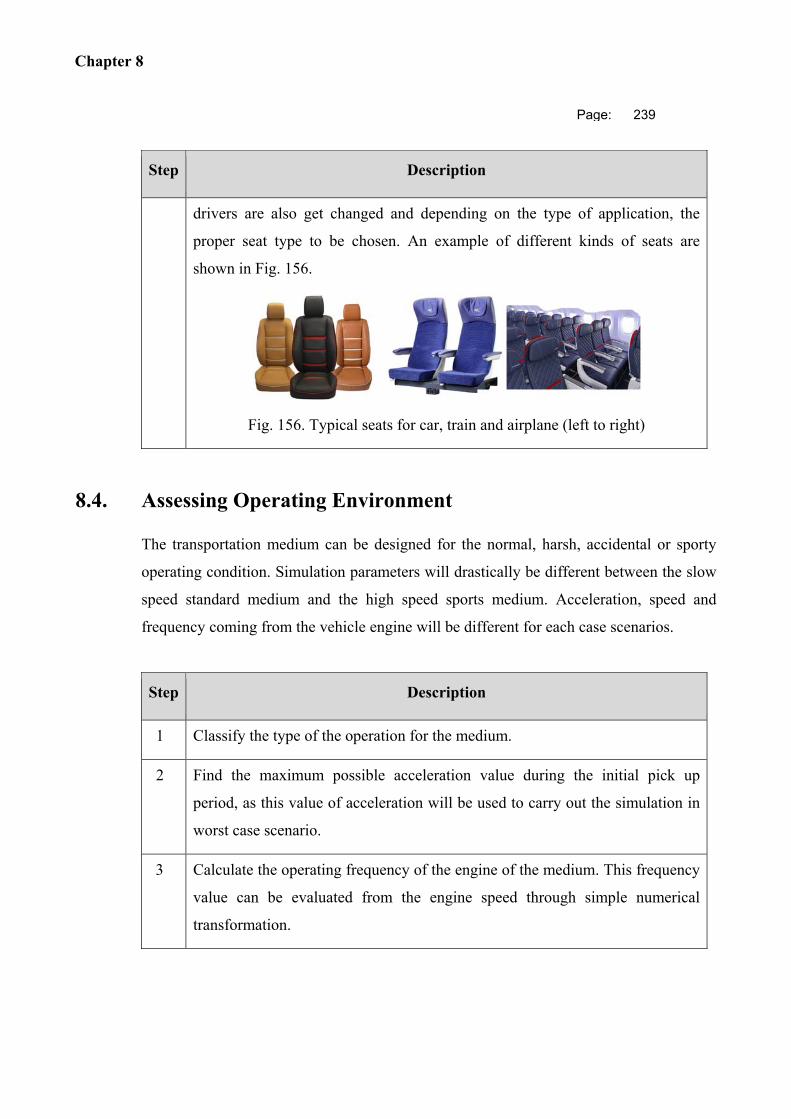
Chapter 8
Page: 239
Step Description
drivers are also get changed and depending on the type of application, the
proper seat type to be chosen. An example of different kinds of seats are
shown in Fig. 156.
Fig. 156. Typical seats for car, train and airplane (left to right)
8.4. Assessing Operating Environment
The transportation medium can be designed for the normal, harsh, accidental or sporty
operating condition. Simulation parameters will drastically be different between the slow
speed standard medium and the high speed sports medium. Acceleration, speed and
frequency coming from the vehicle engine will be different for each case scenarios.
Step Description
1 Classify the type of the operation for the medium.
2 Find the maximum possible acceleration value during the initial pick up
period, as this value of acceleration will be used to carry out the simulation in
worst case scenario.
3 Calculate the operating frequency of the engine of the medium. This frequency
value can be evaluated from the engine speed through simple numerical
transformation.
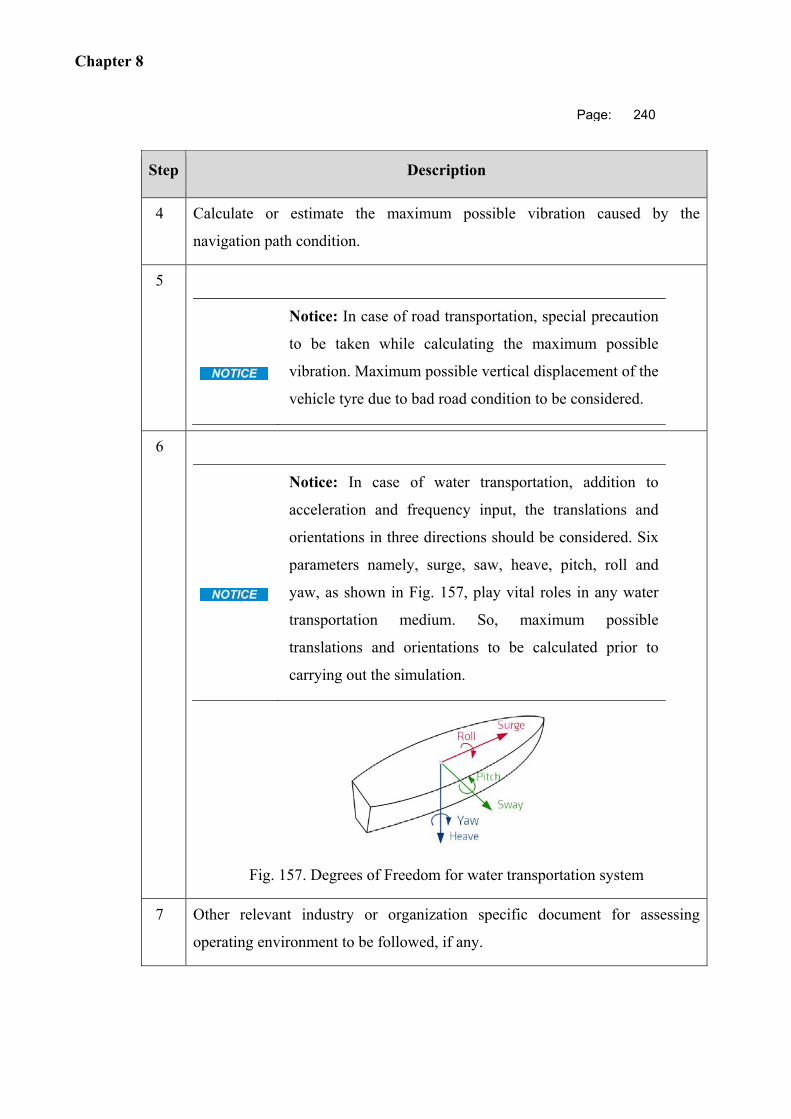
Chapter 8
Page: 240
Step Description
4 Calculate or estimate the maximum possible vibration caused by the
navigation path condition.
5
Notice: In case of road transportation, special precaution
to be taken while calculating the maximum possible
vibration. Maximum possible vertical displacement of the
vehicle tyre due to bad road condition to be considered.
6
Notice: In case of water transportation, addition to
acceleration and frequency input, the translations and
orientations in three directions should be considered. Six
parameters namely, surge, saw, heave, pitch, roll and
yaw, as shown in Fig. 157, play vital roles in any water
transportation medium. So, maximum possible
translations and orientations to be calculated prior to
carrying out the simulation.
Fig. 157. Degrees of Freedom for water transportation system
7 Other relevant industry or organization specific document for assessing
operating environment to be followed, if any.
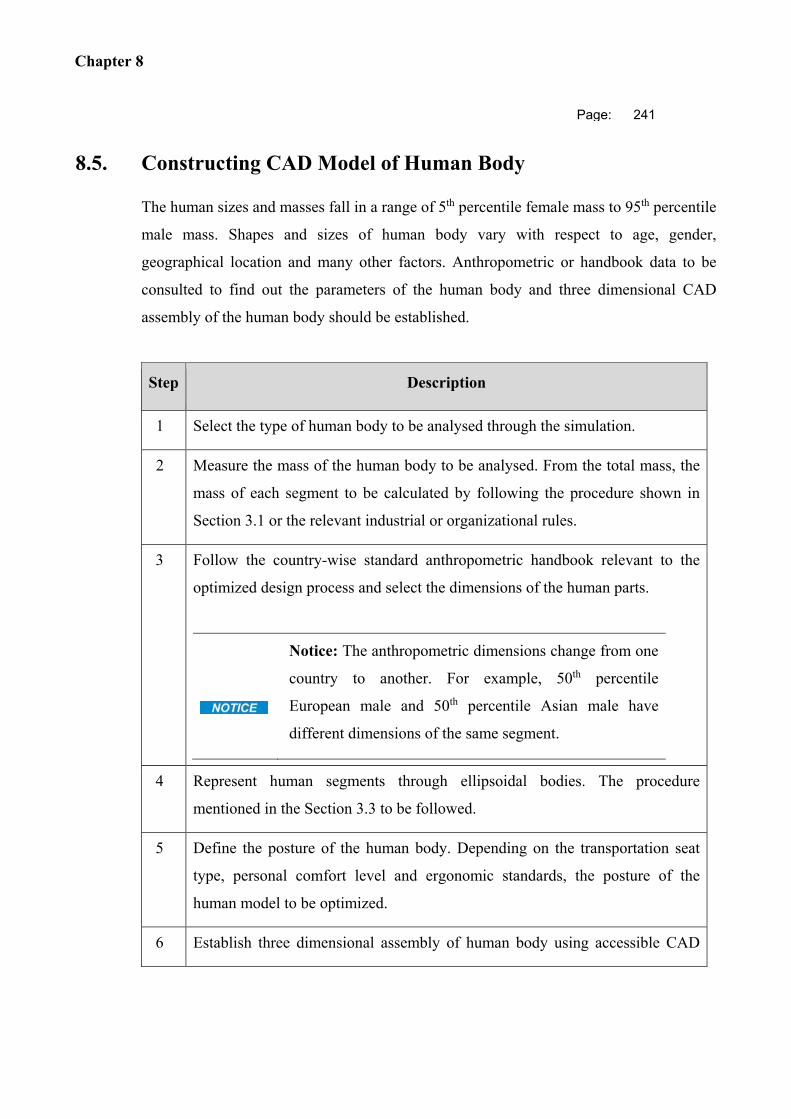
Chapter 8
Page: 241
8.5. Constructing CAD Model of Human Body
The human sizes and masses fall in a range of 5th percentile female mass to 95th percentile
male mass. Shapes and sizes of human body vary with respect to age, gender,
geographical location and many other factors. Anthropometric or handbook data to be
consulted to find out the parameters of the human body and three dimensional CAD
assembly of the human body should be established.
Step Description
1 Select the type of human body to be analysed through the simulation.
2 Measure the mass of the human body to be analysed. From the total mass, the
mass of each segment to be calculated by following the procedure shown in
Section 3.1 or the relevant industrial or organizational rules.
3 Follow the country-wise standard anthropometric handbook relevant to the
optimized design process and select the dimensions of the human parts.
Notice: The anthropometric dimensions change from one
country to another. For example, 50th percentile
European male and 50th percentile Asian male have
different dimensions of the same segment.
4 Represent human segments through ellipsoidal bodies. The procedure
mentioned in the Section 3.3 to be followed.
5 Define the posture of the human body. Depending on the transportation seat
type, personal comfort level and ergonomic standards, the posture of the
human model to be optimized.
6 Establish three dimensional assembly of human body using accessible CAD
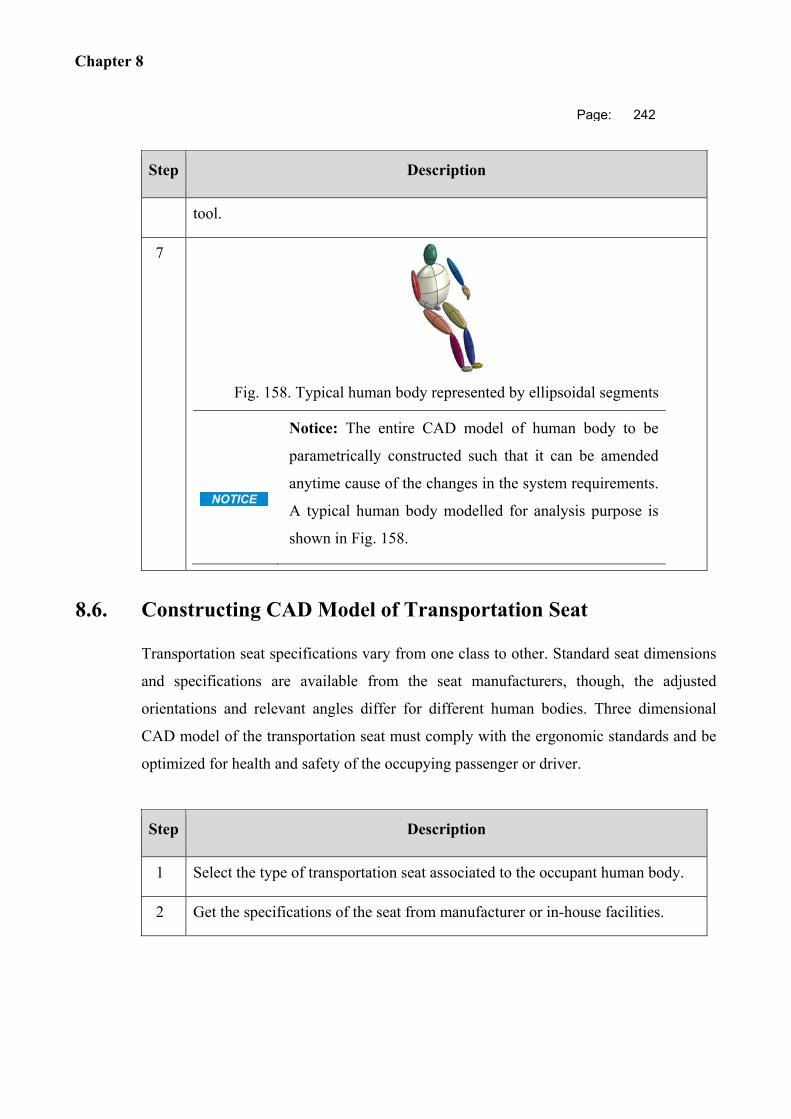
Chapter 8
Page: 242
Step Description
tool.
7
Fig. 158. Typical human body represented by ellipsoidal segments
Notice: The entire CAD model of human body to be
parametrically constructed such that it can be amended
anytime cause of the changes in the system requirements.
A typical human body modelled for analysis purpose is
shown in Fig. 158.
8.6. Constructing CAD Model of Transportation Seat
Transportation seat specifications vary from one class to other. Standard seat dimensions
and specifications are available from the seat manufacturers, though, the adjusted
orientations and relevant angles differ for different human bodies. Three dimensional
CAD model of the transportation seat must comply with the ergonomic standards and be
optimized for health and safety of the occupying passenger or driver.
Step Description
1 Select the type of transportation seat associated to the occupant human body.
2 Get the specifications of the seat from manufacturer or in-house facilities.
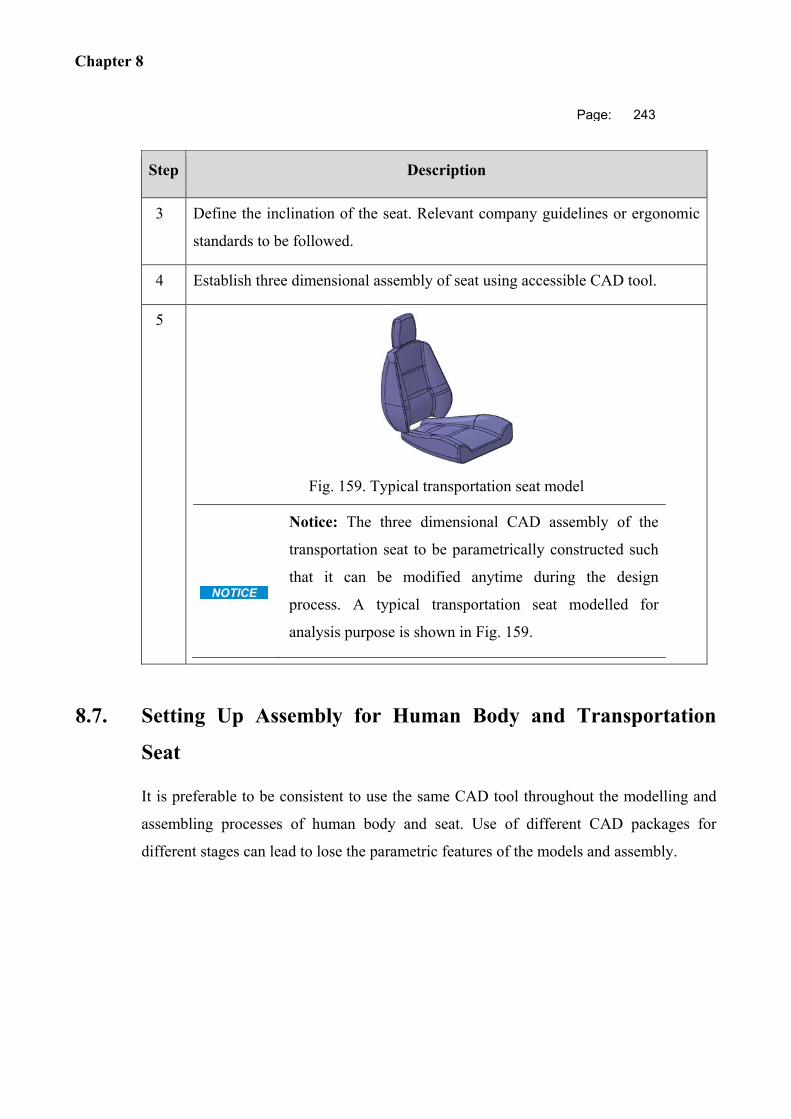
Chapter 8
Page: 243
Step Description
3 Define the inclination of the seat. Relevant company guidelines or ergonomic
standards to be followed.
4 Establish three dimensional assembly of seat using accessible CAD tool.
5
Fig. 159. Typical transportation seat model
Notice: The three dimensional CAD assembly of the
transportation seat to be parametrically constructed such
that it can be modified anytime during the design
process. A typical transportation seat modelled for
analysis purpose is shown in Fig. 159.
8.7. Setting Up Assembly for Human Body and Transportation
Seat
It is preferable to be consistent to use the same CAD tool throughout the modelling and
assembling processes of human body and seat. Use of different CAD packages for
different stages can lead to lose the parametric features of the models and assembly.
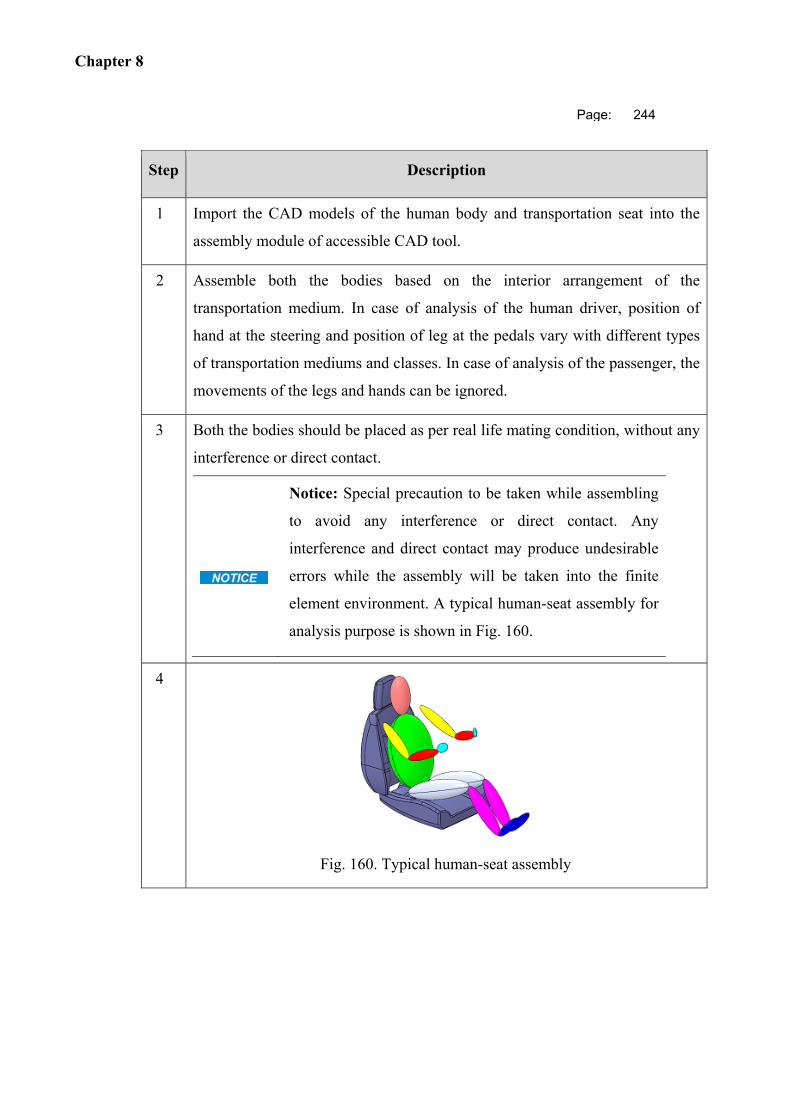
Chapter 8
Page: 244
Step Description
1 Import the CAD models of the human body and transportation seat into the
assembly module of accessible CAD tool.
2 Assemble both the bodies based on the interior arrangement of the
transportation medium. In case of analysis of the human driver, position of
hand at the steering and position of leg at the pedals vary with different types
of transportation mediums and classes. In case of analysis of the passenger, the
movements of the legs and hands can be ignored.
3 Both the bodies should be placed as per real life mating condition, without any
interference or direct contact.
Notice: Special precaution to be taken while assembling
to avoid any interference or direct contact. Any
interference and direct contact may produce undesirable
errors while the assembly will be taken into the finite
element environment. A typical human-seat assembly for
analysis purpose is shown in Fig. 160.
4
Fig. 160. Typical human-seat assembly
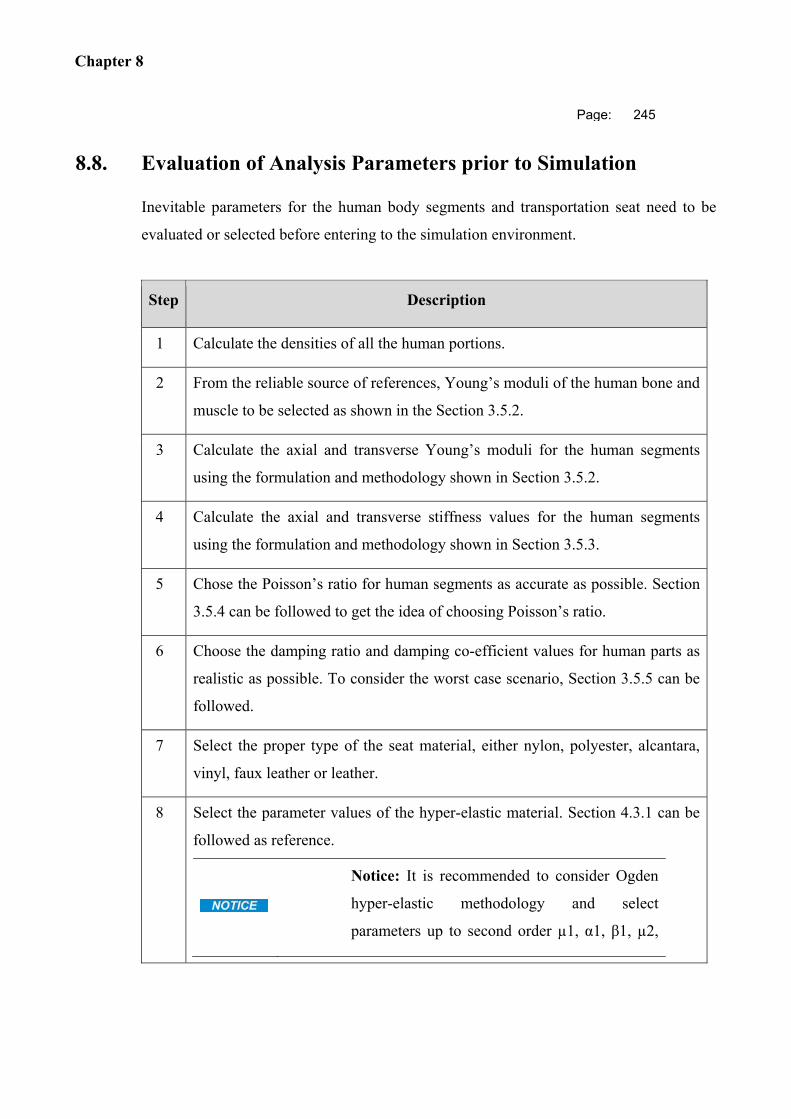
Chapter 8
Page: 245
8.8. Evaluation of Analysis Parameters prior to Simulation
Inevitable parameters for the human body segments and transportation seat need to be
evaluated or selected before entering to the simulation environment.
Step Description
1 Calculate the densities of all the human portions.
2 From the reliable source of references, Young’s moduli of the human bone and
muscle to be selected as shown in the Section 3.5.2.
3 Calculate the axial and transverse Young’s moduli for the human segments
using the formulation and methodology shown in Section 3.5.2.
4 Calculate the axial and transverse stiffness values for the human segments
using the formulation and methodology shown in Section 3.5.3.
5 Chose the Poisson’s ratio for human segments as accurate as possible. Section
3.5.4 can be followed to get the idea of choosing Poisson’s ratio.
6 Choose the damping ratio and damping co-efficient values for human parts as
realistic as possible. To consider the worst case scenario, Section 3.5.5 can be
followed.
7 Select the proper type of the seat material, either nylon, polyester, alcantara,
vinyl, faux leather or leather.
8 Select the parameter values of the hyper-elastic material. Section 4.3.1 can be
followed as reference.
Notice: It is recommended to consider Ogden
hyper-elastic methodology and select
parameters up to second order µ1, α1, β1, µ2,
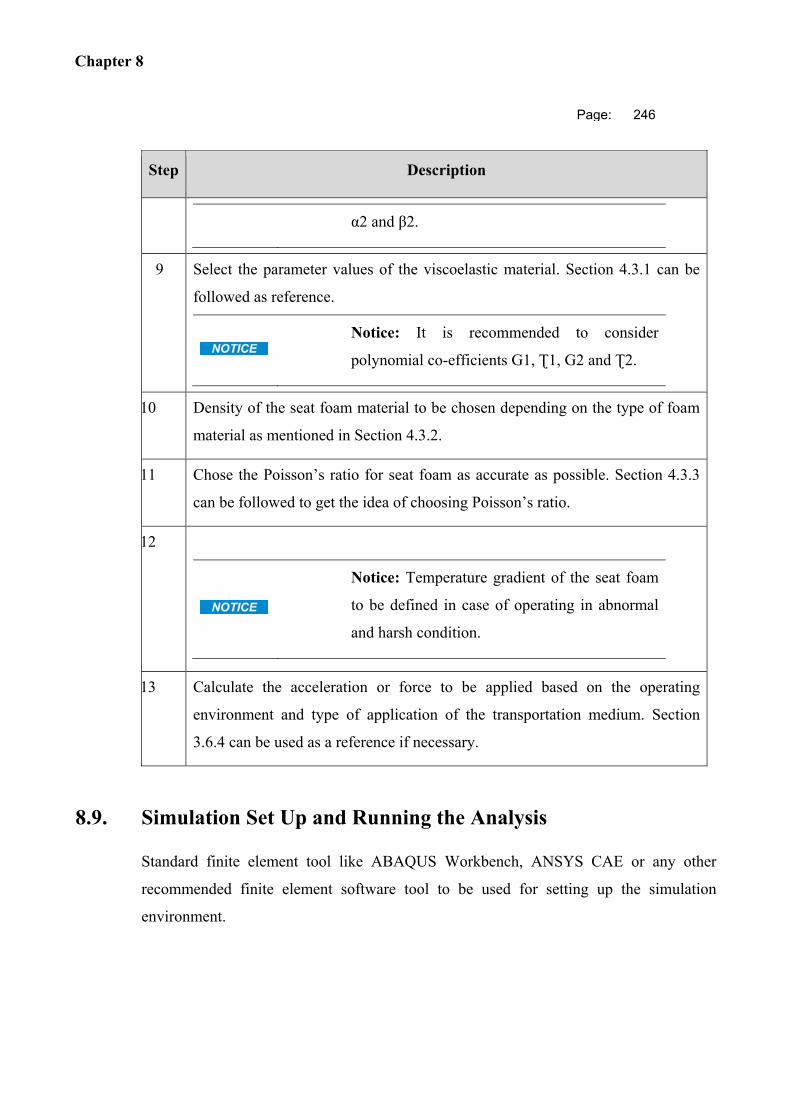
Chapter 8
Page: 246
Step Description
α2 and β2.
9 Select the parameter values of the viscoelastic material. Section 4.3.1 can be
followed as reference.
Notice: It is recommended to consider
polynomial co-efficients G1, Ʈ1, G2 and Ʈ2.
10 Density of the seat foam material to be chosen depending on the type of foam
material as mentioned in Section 4.3.2.
11 Chose the Poisson’s ratio for seat foam as accurate as possible. Section 4.3.3
can be followed to get the idea of choosing Poisson’s ratio.
12
Notice: Temperature gradient of the seat foam
to be defined in case of operating in abnormal
and harsh condition.
13 Calculate the acceleration or force to be applied based on the operating
environment and type of application of the transportation medium. Section
3.6.4 can be used as a reference if necessary.
8.9. Simulation Set Up and Running the Analysis
Standard finite element tool like ABAQUS Workbench, ANSYS CAE or any other
recommended finite element software tool to be used for setting up the simulation
environment.
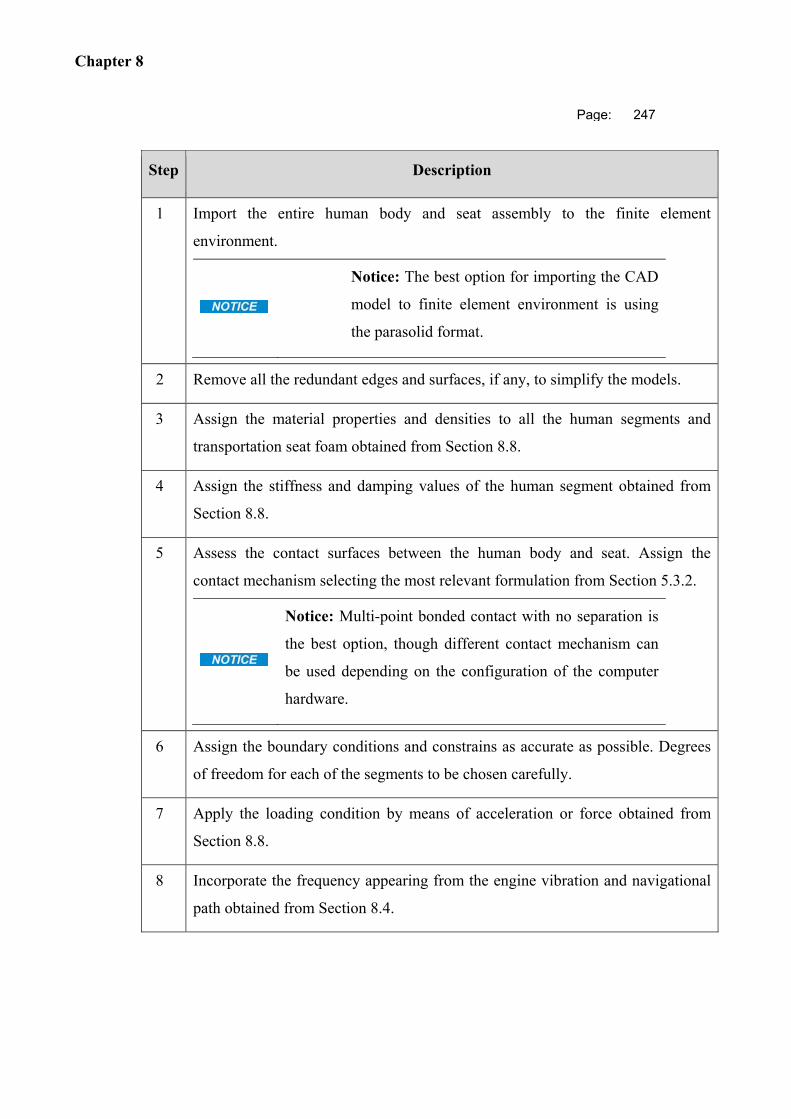
Chapter 8
Page: 247
Step Description
1 Import the entire human body and seat assembly to the finite element
environment.
Notice: The best option for importing the CAD
model to finite element environment is using
the parasolid format.
2 Remove all the redundant edges and surfaces, if any, to simplify the models.
3 Assign the material properties and densities to all the human segments and
transportation seat foam obtained from Section 8.8.
4 Assign the stiffness and damping values of the human segment obtained from
Section 8.8.
5 Assess the contact surfaces between the human body and seat. Assign the
contact mechanism selecting the most relevant formulation from Section 5.3.2.
Notice: Multi-point bonded contact with no separation is
the best option, though different contact mechanism can
be used depending on the configuration of the computer
hardware.
6 Assign the boundary conditions and constrains as accurate as possible. Degrees
of freedom for each of the segments to be chosen carefully.
7 Apply the loading condition by means of acceleration or force obtained from
Section 8.8.
8 Incorporate the frequency appearing from the engine vibration and navigational
path obtained from Section 8.4.
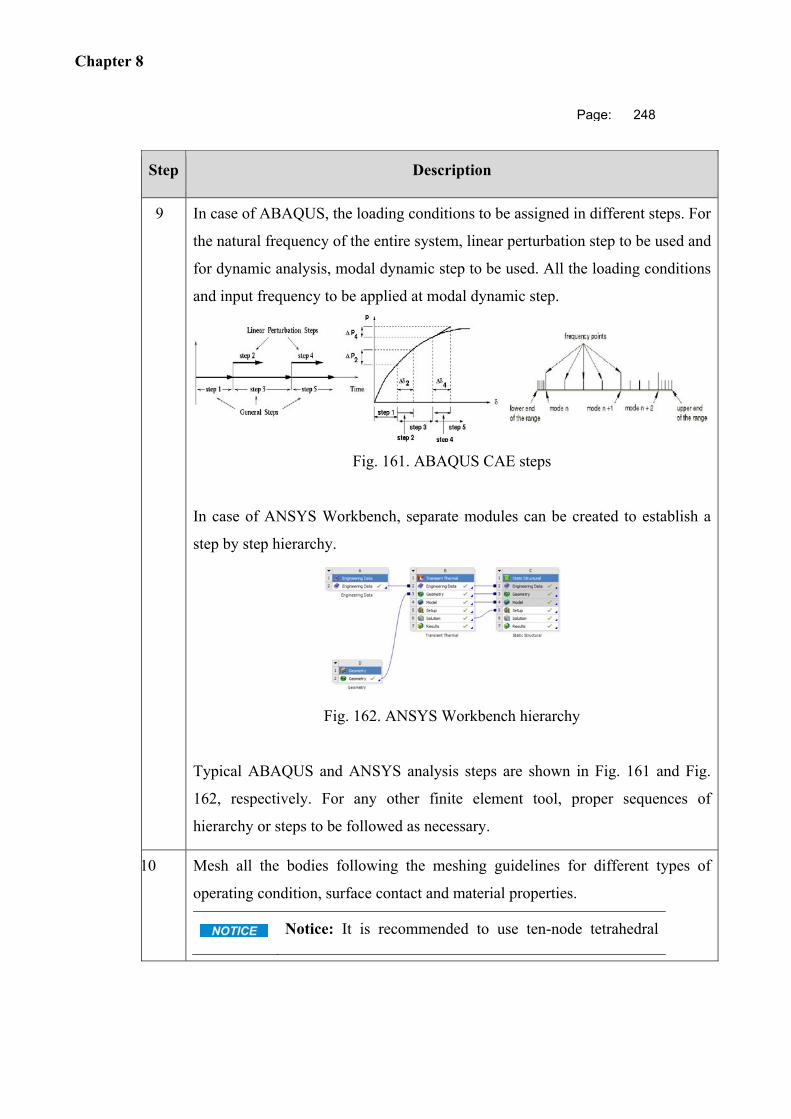
Chapter 8
Page: 248
Step Description
9 In case of ABAQUS, the loading conditions to be assigned in different steps. For
the natural frequency of the entire system, linear perturbation step to be used and
for dynamic analysis, modal dynamic step to be used. All the loading conditions
and input frequency to be applied at modal dynamic step.
Fig. 161. ABAQUS CAE steps
In case of ANSYS Workbench, separate modules can be created to establish a
step by step hierarchy.
Fig. 162. ANSYS Workbench hierarchy
Typical ABAQUS and ANSYS analysis steps are shown in Fig. 161 and Fig.
162, respectively. For any other finite element tool, proper sequences of
hierarchy or steps to be followed as necessary.
10 Mesh all the bodies following the meshing guidelines for different types of
operating condition, surface contact and material properties.
Notice: It is recommended to use ten-node tetrahedral
Chapter 8
Page: 249
Step Description
element C3D10 for the simulation using ABAQUS. In
case of ANSYS Workbench, the areas of interest to be
refined with higher mesh densities.
11 Depending on the capability of the computer system used, set the simulation
running time in between 10 seconds and 60 seconds.
8.10. Simulation Result: Output and Extracted Data
Approaches used and the facility available inside the simulation tool lead the type of the
data to be extracted from the simulation. The basic intention is to know the vertical
accelerations, vertical displacements and frequency levels which can be obtained directly
or through other sources of output.
Step Description
1 Evaluate the vertical accelerations and vertical displacements at the designated
points of human body and transportation seat.
For human body, the locations should ideally be head, chest, upper arm, lower
arm, waist, thigh and leg. For seat, the locations should ideally be center of the
headrest, center of the backrest and center of the cushion,
2 From the mathematical relationships between the frequency, displacement and
acceleration; frequency with respect to time should be evaluated.
3 Check if the frequency levels are under the permissible limit of human organs
as mentioned in the industrial standards or organization manual. For reference,
Section 5.5 can be followed.
Chapter 8
Page: 250
Step Description
4
Notice: If the obtained frequencies are not falling within
the permissible ranges of natural frequencies of human
body portions, the procedures from the Section 8.3 to
Section 8.10 to be repeated after adjusting and assessing
the system in a different way. The input parameters to be
tuned for revising the simulation.
8.11. Discrepancy Log
During the entire simulation process any kind of error, troubleshooting and possible
remedy should be recorded for future improvement of the simulation project.
Discrepancy Occurred During Procedure Yes No
Name of Simulation In-Charge Date
Section no. /
Step no. Discrepancy/Corrective Action Name Date
Chapter 8
Page: 251
8.12. Personnel Involved
A table should be used to record all the personnel involved during the simulation process.
The main person to organize the simulation or the lead person of the simulation project,
should be listed in the first row.
Employee No. Name (Print)
(Simulation In-Charge)
8.13. Approval of Simulation
Simulation results should be checked, verified and approved by the qualified and
knowledgeable personnel.
Signatures below verifies that:
The Simulation is according to standards, guideline and other relevant reference
document.
A discrepancy log has been created, filled out and documented.
Simulation In-Charge
Name (Print)
Date and Signature
Approver
Name (Print)
Date and Signature
Chapter 8
Page: 252
8.14. Support Center
In case of any kind of help or assistance needed for conducting the simulation process,
contact details of expertise are provided below:
Contact Details Postal address Purnendu Mondal/ Subramaniam Arunachalam School of Architecture, Computing & Engineering University of East London (Docklands Campus) London E16 2RD, UK Contact details E-mail: [email protected], [email protected], [email protected] Mobile: +44(0)7578738922
Chapter 9
Page: 253
CHAPTER 9 DISCUSSION, CONCLUSION
AND SCOPE OF IMPROVEMENT
The aim this research study was to develop a finite element simulation methodology to
predict the final level of vibration inside the car seated human body and car seat in
dynamic condition. Numerous research works to establish comprehensive simulation set
up for car-human system had been carried out over in past decades, though those
investigations focused only on very specific area of the entire human-car assembly. So,
initiative has been taken during this course of research work to fill up the gaps in the pre-
existing technologies by offering a novel finite element simulation technique to predict
the final level of vibrations at different locations of entire human-car seat system to
assess and optimize the health, comfort and safety of car seated human body. The
expensive and time consuming real life vibration measuring procedure can be omitted in
various industries by accurate anticipation of the final level of vibration data inside
human body though the implementation of this novel simulation methodology.
Detail discussion have been carried out in CHAPTER 1 on the objectives and findings of
this research work along with representing critical review of literatures and matrix based
comparison table of past investigations. The objectives of this simulation based study
were literature review and critical analysis of various existing simulation technologies for
Chapter 9
Page: 254
judging the vibration inside automotive-human system, establishing simulated models for
human body, car seat and human-car seat assembly, validating simulation results with
testing data and finally, proposing a guideline to implement the developed simulation tool
in similar industries.
Research questions outlined in CHAPTER 1, are based on the finding of the best suitable
technique for finite element simulation, procedure in simulation model for optimizing the
car seated human health, comfort and safety, accuracy of simulation results compared to
test data, limitations of the computerized finite element simulation and implementation of
the developed simulation technique in similar industries.
This chapter is summarizing the of findings from the different simulation phases,
validation of simulation results by comparing to test data and deviations of simulation
results from test data, general procedure to implement this simulation methodology in
similar industries, overall conclusion and finally, scope of improvement to take this novel
simulation methodology to further advanced level.
9.1. Finite Element Simulations and Responses of Human Body,
Car Seat and Human-Car Seat Assembly under the Effect of
Vertical Vibration
Biodynamic responses of the human body, car seat and human-car seat assembly under
the effects of vertical vibration had been investigated by developing simulation based
models in CHAPTER 2, CHAPTER 3, CHAPTER 4 and CHAPTER 5.
9.1.1. Lumped Mass Parameter Method: Manual Intervention
Before carrying out the detailed finite element simulation for the human body and car
seat, a preliminary theory based mathematical model using Mathcad formulations had
Chapter 9
Page: 255
been developed for human body constructed only by head and torso. Lumped mass
parameter method had been utilized to establish that experimental model and the first two
natural frequencies and mode shapes of the human body had been extracted. The masses
of the head and torso and stiffness value in between those two bodies had been taken
from the detailed evaluation of human parameters carried out in CHAPTER 3.
The lumped mass method is simple and effective way to obtain the fundamental
frequencies and mode shapes in bi-directional plane, though addition of more degrees of
freedom in three dimensional environment restricts the capability of this method because
of the limitation of human competency in solving numerous number of complex
equations manually. For the lumped mass model with higher number of degrees of
freedom, mathematical tool like FORTRAN or MATLAB is used to solve the equations
of the system. Furthermore, this method assumes that the human portions are made of
rigid point masses, though, in reality the human portions are constructed of non-
uniformly distributed masses and the properties for all the human segments are dissimilar
from each other.
Detail literature review in CHAPTER 1 showed that last many years numerous
investigations had been conducted using this lumped mass parameter method to analyse
various kinds of biodynamic problems. Thus, developing the simulation of human body
using this technique will have very less chance to have innovative outcome. Cause of the
enormous development in the computer technology over last few decades, lumped mass
parameter method aided by manual calculation has become almost obsolete to be used for
analyzing complex mechanical systems.
Chapter 9
Page: 256
9.1.2. Combination of Lumped Mass Parameter and Finite Element Methods
in Three-Dimensional Space: Computerized Simulation
Detail discussion in the CHAPTER 2 on the lumped mass parameter and finite element
methods clearly stated that the lumped mass parameter is well-organized for the
assessment of the mode shape related queries, while finite element analysis is more
suitable for judging the portion-wise human behaviour under the effect of vibration.
Based on the literature studies in CHAPTER 1 and CHAPTER 2, initiative had been
taken to simulate a car seated three-dimensional human body using lumped mass method
in finite element environment.
A three dimensional CAD model of seated human body inside a car had been taken from
open source web database, Grabcad to carry out the experimental simulation work as
described in Section 2.2. Raw data collection from open source, measurement of human
portions in three dimensional space, assignment of co-ordinate system to measure the
locations of human portions, mounting the connecting points of human portion in finite
element space, calculation of masses of human segments, average masses of lumped
parameters, lumped mass connections, axial stiffness values, modal displacement and
graphical plots of vertical displacements are shown in Fig. 28, Fig. 29, Table 4, Fig. 30,
Table 5, Table 6, Fig. 31, Table 7, Table 8 and Fig. 32, respectively. Boundary condition
had been incorporated to hands, legs, head and pelvis as realistic as possible and linear
perturbation frequency analysis under free vibration had been conducted.
The resonating frequencies obtained from this experimental work are of very low
magnitudes compared to the realistic permissible ranges of natural frequencies described
in Section 5.5. The reasons behind the very low levels of natural frequency values can be
pointed out as:
Free vibration has been considered during the simulation task. If the entire lumped
mass model would be excited under the effect of force vibration as per the real life
Chapter 9
Page: 257
driving condition, the natural frequencies would be much higher than those of
obtained from the experimental work.
Only the human body has been taken into account without the car seat.
Association of car seat by means of modeling another lumped mass model inside
the simulation space, would definitely yield much higher levels of natural
frequencies.
Only unidirectional stiffness parameters have been used in the simulation and no
damping factor have been considered. Assignment of three dimensional stiffness
parameters along with the damping co-efficients would certainly exhibit higher
levels of resonating frequencies.
From the outcome of this miniature simulation study, it is obviously clear that
combination of lumped mass parameter and finite element methods can be used for
carrying out bio-dynamic vibrational analysis. The main disadvantage of this
methodology is that the actual shapes and sizes of the human portions can’t be
represented, hence, lacking the real life feasibility.
9.1.3. Unique Bio-Dynamic Model Developed for Seated Human Body inside a
Car: Finite Element Simulation
After conducting the basic experimental simulation studies using lumped mass parameter
and finite element methods, a unique approach had been taken to generate bio-dynamic
three dimensional model of car seated 50th percentile male human body of 77.3 kg mass,
as explained in CHAPTER 3.
The extracted human segmental mass data are presented in Table 9 and Table 10 of
Section 3.1, while human segmental dimensions had been obtained from anthropometric
databases as shown in Table 11 of Section 3.2. For simplification, the human segments
had been represented through ellipsoidal entities. The advantages and numerical
Chapter 9
Page: 258
philosophy of representing human portions through ellipsoidal bodies had been outlined
in Section 3.3. Later, in Section 3.4 a CAD model had been established using Solidworks
modeling tool for the car seated human body based on a real life visual image of 50th
percentile male human. The three dimensional, age and shape specific stiffness
parameters for all the ellipsoidal bodies had been calculated using the formulations of
composite materials. The established human model had been imported into finite element
environment and bone-muscle material properties, three dimensional stiffness parameters,
damping co-efficient, boundary conditions and loads had been assigned to the human
segments.
Explorations and evaluations of many parameters were necessary to produce effective
simulation model for the human body. Detailed methods of obtaining the densities of the
human portions, axial and lateral young’s moduli of the human segments, axial and
lateral stiffness values of the body segments, Poisson’s ratios, damping co-efficients
along with damping ratios, contact interactions, analysis steps, boundary conditions,
loads, element types and results are discussed in Section 3.5.1, Section 3.5.2, Section
3.5.3, Section 3.5.4, Section 3.5.5, Section 3.6.1, Section 3.6.2, Section 3.6.3, Section
3.6.4, Section 3.6.5 and Section 3.7, respectively.
The unique natures of this simulation methodology can be listed as:
Modelling the human portions through ellipsoidal segments to evaluate size and
shape specific three dimensional stiffness data.
Constructing the ellipsoids with composite formulations for achieving realistic
bone-muscle properties.
Representing the entire human body through ellipsoidal objects which eventually
helps the finite element simulation to simplify the entire human model to yield
desired result data within a reasonable amount of simulation solving time.
Chapter 9
Page: 259
The simulation of the human body under forced vibration ran successfully yielding
acceleration and displacement data in the vertical direction. From the obtained data set,
frequency values had been evaluated, which were very close to the acceptable ranges of
frequencies for human organs as explained in Section 3.8.
Earlier studies, handbooks, standards and literatures showed the permissible ranges of
frequencies for human portions in between 0.5 Hz and 20 Hz, while this bio-dynamic
simulation displayed the minimum frequency value of 0.93 Hz at leg and maximum
frequency value of 4.7 Hz at thigh. The displacements obtained from the simulation are
higher than the expected levels and the potential reason behind it can be identified as
absence of car seat in the simulation set up. Association of foam made car seat underside
of the human thigh area will definitely show lower magnitudes of displacement values.
Although, this simulation methodology worked flawless, still, further improvement is
possible to get more accurate vibration data by involving car seat in the simulation
environment and assigning material properties to seat polyurethane foam.
9.1.4. Development of Car Seat Model: Finite Element Simulation
CHAPTER 4 outlined the development of a car seat made of polyurethane foam material.
The car seat had been modelled in Solidworks modeling tool after performing detailed
research on the types and dimensions of the existing car seats in the industry. Besides the
comprehensive survey of literatures on the similar fields, automotive seat design database
from Ricaro had been consulted.
To model the material properties of polyurethane foam as realistic as possible, both the
hyper-elastic and visco-elastic formulations had been implemented. Ogden model with
N=2 and second order Prony series had been applied for hyper-elastic and visco-elastic
properties , respectively as shown in Table 23.
Chapter 9
Page: 260
The main aims of this simulation work of the car seat were to verify the feasibilities of
the assigned visco-elastic and hyper-elastic material properties and get an idea of the
suitability of the car seat model to fit with the modelled human body in CHAPTER 3.
Because of this fact, the metallic frame underneath the seat had been ignored and the
underside of the seat cushion had been made to be fixed.
The loads had been implemented on the estimated contact surfaces between the human
body and respective mating portions of the car seat. The details of the loading and
boundary conditions have been explained in Section 4.4.3. Other necessary parameters
and analysis set ups had been elaborated in Section 4.3 and Section 4.4, respectively.
Vertical displacements at different location of the car seat were evaluated from the
simulation results. The maximum displacement values at headrest, backrest and cushion
had been found to be 4.98838 mm, 5.08838 mm and 5.79838 mm, respectively.
The simulation of car seat model shows that:
Both the hyper-elastic and visco-elastic properties can be assigned together to the
polyurethane foam material of car seat for getting effective results from finite
element simulation.
The levels of displacements are convincing over short period of simulation
running time. Longer span of simulation running time will obviously display more
accurate displacement magnitudes.
The car seat model can be associated to the human body developed in CHAPTER
3 for carrying out comprehensive analysis on car seated human bio-dynamics.
Chapter 9
Page: 261
9.1.5. Combined Human Body and Car Seat: A Comprehensive Finite
Element Simulation
The car seated bio-dynamic model of 50th percentile male human body developed in
CHAPTER 3 had been united to the car seat model established in CHAPTER 4.
Afterwards, a comprehensive finite element based simulation had been accomplished in
CHAPTER 5 for predicting the final levels of vibrations inside the portions of human
body and car seat. Main challenges during the association of the human model to the car
seat, were faced as:
Defining the suitable contact mechanisms between the ellipsoidal human portions
and car seat.
Implementing the real life driving conditions as realistic as possible along with
precise boundary conditions.
Assigning the acceptable posture of human body and orientation of car seat.
Setting up the simulation by avoiding unnecessary complexity to run and
complete the robust finite element analysis within justified time limit.
Obtaining the desirable outputs at the locations of interest for evaluating the
effects of vertical vibration on car seat and human body.
Techniques for assembling human driver body and car seat were studied from
anthropometry based configurations, biomechanics of seated human, ergonomics
principles and relevant international standards in Section 5.1. Simulation parameters had
been identified from the detailed investigations carried out in CHAPTER 3 and
CHAPTER 4. A summary of all the implemented simulation parameters have been
presented in Table 26.
Different kinds of contact interfaces had been studied from earlier research studies and
ABAQUS CAE manual as explained in Section 5.3.2. All types of contact formulations
along with their pros and cons had been summarized in Table 27 and Table 28.
Chapter 9
Page: 262
Theoretical formulations along with the associated algorithms of the contact interactions
for pure penalty, Lagrange, multi-point and beam concepts, had been observed in detail
and multi-point bonded contact with no separation had been recognized as the most
suitable formulation to be assigned between human body and car seat.
The simulation had been set to run from standstill condition of the car to a definite
accelerating period. Efforts were made to run the simulation for initial 60 seconds,
though, cause of the limitation of the computer capability to solve robust problem, the
simulation running time had to limit to initial 10 seconds. The vertical accelerations and
displacements at various points of human driver and car seat had been extracted from the
simulation results and recorded through tables and graphs in Section 5.4. Later, the
frequency values at different points of human body and car seat portions were evaluated
as detailed in Section 5.4.3. The average frequency magnitudes obtained for head, chest,
waist, upper arm, lower arm, thigh, leg, seat headrest, seat backrest and seat cushion were
7.10 Hz, 4.13 Hz, 4.18 Hz, 4.01 Hz, 12.92 Hz, 16.13 Hz, 3.20 Hz, 7.91 Hz, 4.61 Hz and
18.0 Hz, respectively. The observed key features of this unique simulation phase can be
highlighted as:
Frequency magnitudes of human segments are lower than those of the mating car
seat portions, which is a clear indication of the effective vibration transmission
from foam made car seat to human body. Moreover, it gives a sign of correct
functionalities of the calculated three dimensional stiffness values, assigned
material properties, defined damping parameters, allocated contact mechanism,
implemented boundary conditions and applied loads inside the unique simulation
set up.
Obtained frequency values are falling within the ranges of permissible natural
frequencies for human organs as per the past references detailed in Section 5.5.
During the assignment of contact mechanism, approaches had been taken to
implement different types of contact mechanisms by allocating frictional co-
Chapter 9
Page: 263
efficients. But, cause of the lack of adequate hardware memory in the available
computer system, the simulation got terminated prematurely without yielding any
output data. Past simulation studies on the similar biodynamic fields reported that
the assignment of frictional co-efficient would be beneficial for stress or pressure
distribution related problems. Furthermore, the goal of this novel simulation based
study mainly lies in the domain of predicting final levels of vibration data inside
car seat and human segments. Therefore, application of tie-up constrains at the
interfaces of human body and car seat, as detailed in Section 3.6.1 and Section
5.3.2, must not have any impact on the primary aim and outcome of this study.
Assignments of calculated three dimensional stiffness values to the human ellipsoidal
segments and combined hyper-elastic and viscoelastic material properties to the car seat
polyurethane foam performed flawless inside the simulation system. Hence, the finite
element based unique bio-dynamic simulation methodology became successful to
anticipate the final levels of vibration inside human body and car seat portions.
9.2. Validation of Simulation Results: Deviations from the Test
Data
Testing data had been collected from m+p international for a 50th percentile male human
driver under the condition similar to simulated environment, as detailed in CHAPTER 6.
NI 9234 Module with CompactDAQ Chassis and Dytran 3055 transducer had been used
as instruments for measuring the vertical acceleration with respect to time and power
spectrum density with respect to frequency at different segments of human driver and car
seat. The raw testing data were received in .SOT format, which were later operated in
“m+p Analyser” software tool to extract the necessary data plots in graphical format. The
simulation results were obtained for initial 10 seconds of accelerating period, while the
testing data had been gathered for initial 60 seconds. To compare the simulation results to
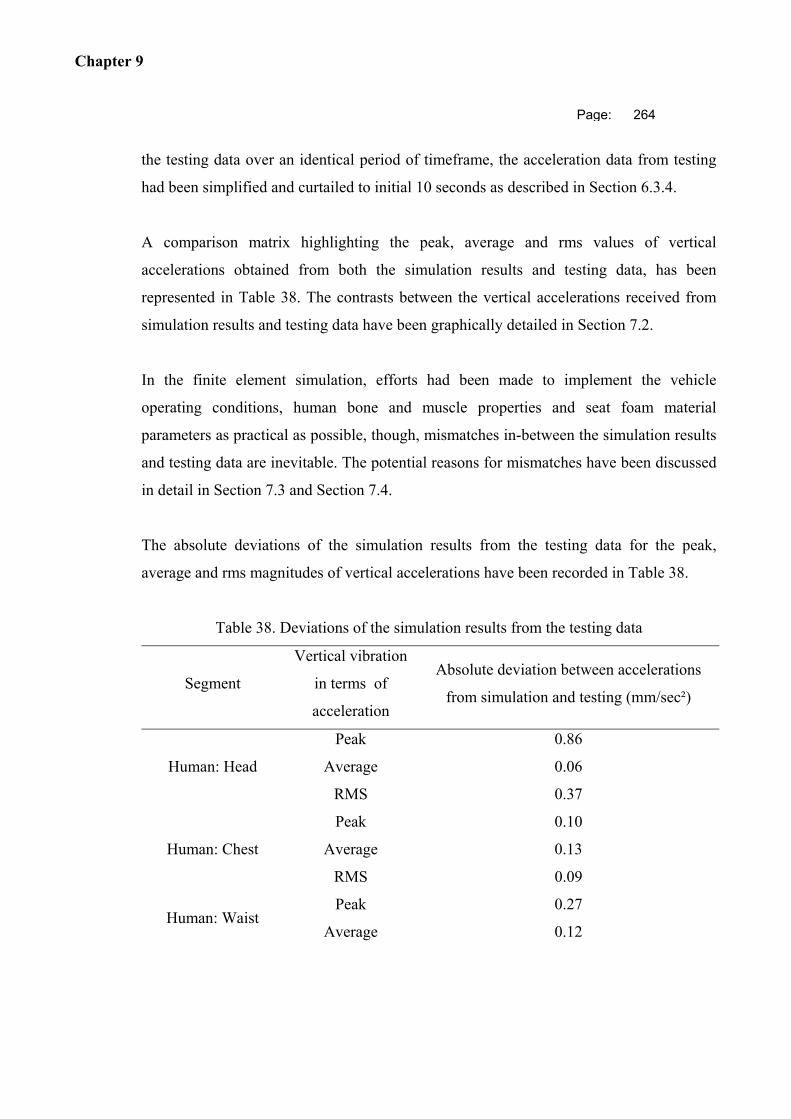
Chapter 9
Page: 264
the testing data over an identical period of timeframe, the acceleration data from testing
had been simplified and curtailed to initial 10 seconds as described in Section 6.3.4.
A comparison matrix highlighting the peak, average and rms values of vertical
accelerations obtained from both the simulation results and testing data, has been
represented in Table 38. The contrasts between the vertical accelerations received from
simulation results and testing data have been graphically detailed in Section 7.2.
In the finite element simulation, efforts had been made to implement the vehicle
operating conditions, human bone and muscle properties and seat foam material
parameters as practical as possible, though, mismatches in-between the simulation results
and testing data are inevitable. The potential reasons for mismatches have been discussed
in detail in Section 7.3 and Section 7.4.
The absolute deviations of the simulation results from the testing data for the peak,
average and rms magnitudes of vertical accelerations have been recorded in Table 38.
Table 38. Deviations of the simulation results from the testing data
Segment
Vertical vibration
in terms of
acceleration
Absolute deviation between accelerations
from simulation and testing (mm/sec²)
Human: Head
Peak 0.86
Average 0.06
RMS 0.37
Human: Chest
Peak 0.10
Average 0.13
RMS 0.09
Human: Waist Peak 0.27
Average 0.12
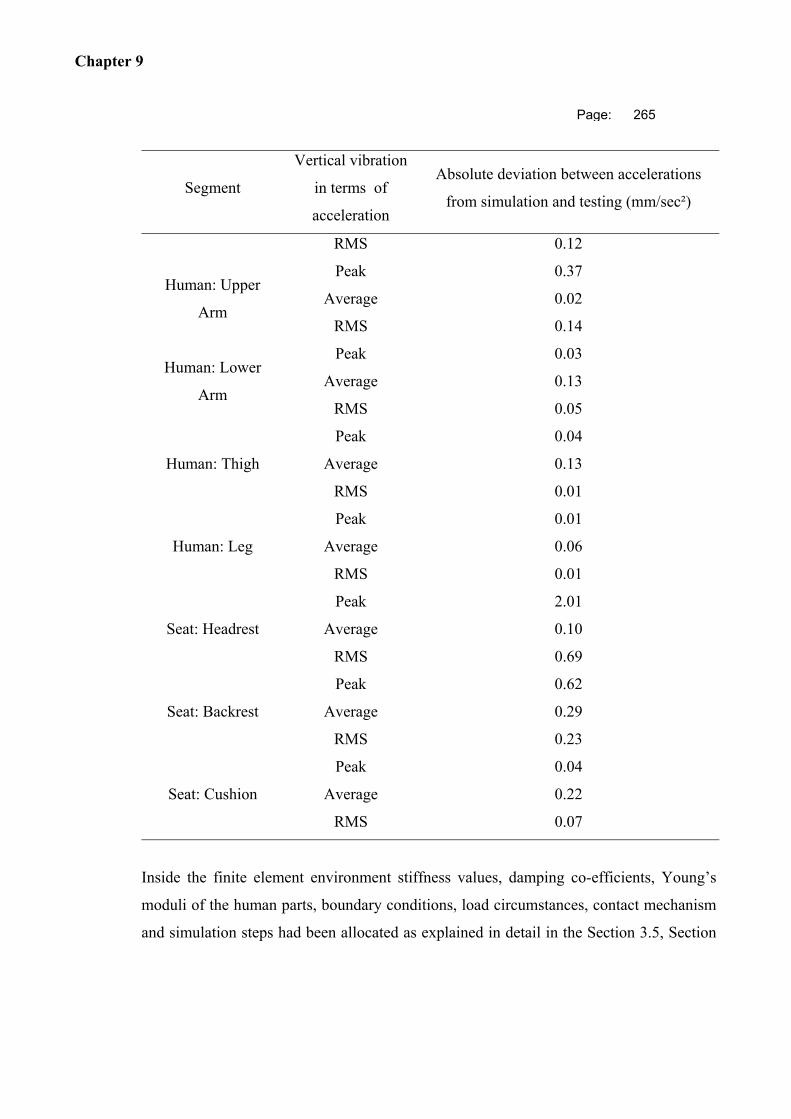
Chapter 9
Page: 265
Segment
Vertical vibration
in terms of
acceleration
Absolute deviation between accelerations
from simulation and testing (mm/sec²)
RMS 0.12
Human: Upper
Arm
Peak 0.37
Average 0.02
RMS 0.14
Human: Lower
Arm
Peak 0.03
Average 0.13
RMS 0.05
Human: Thigh
Peak 0.04
Average 0.13
RMS 0.01
Human: Leg
Peak 0.01
Average 0.06
RMS 0.01
Seat: Headrest
Peak 2.01
Average 0.10
RMS 0.69
Seat: Backrest
Peak 0.62
Average 0.29
RMS 0.23
Seat: Cushion
Peak 0.04
Average 0.22
RMS 0.07
Inside the finite element environment stiffness values, damping co-efficients, Young’s
moduli of the human parts, boundary conditions, load circumstances, contact mechanism
and simulation steps had been allocated as explained in detail in the Section 3.5, Section
Chapter 9
Page: 266
3.6, Section 5.3.1and Section 5.3.2. In contrast, testing data received from the real life
vibration measurement process are greatly dependent on the signal processing system of
the instruments used.
The reasons of the deviations occurred, have been theoretically investigated and
explained in Section 7.3. The hypothetical clarification clearly showed that any minute
amendment in any of the simulation parameters could alter the final output level of
vibration by a great extent. Thus, the deviations between the results from computerized
analysis and testing data are obvious. Similar kinds of mismatches have been found in
past similar research studies as detailed in Section 7.4.
It has been observed in Section 7.3 that the results from the computerized analysis are
more conservative in natures compared to the data gathered from testing. Hence,
regardless of the justified amounts of mismatches between the values from simulation
and testing, it can be concluded that this unique simulation methodology can successfully
be implemented to anticipate the final levels of vibration inside the car seated human
body and car seat to optimize the health, safety and comfort of human-car seat system.
9.3. Guideline for implementing this Unique Simulation
Methodology in similar Industries
The outlined unique simulation methodology can effectively be implemented to similar
kinds of industrial sectors to anticipate the final vibration levels inside human body
portions, though manipulations and adjustments will be required in the execution process
of simulation depending on the type of industry. Comprehensive stepwise instructions
have been provided in CHAPTER 8 to use this unique simulation technique in other
relevant fields. General international standards mentioned in Table 36 and basic
equipments detailed in Table 37, can be followed regardless of the industry type, though,
usage of industry specific guidelines and facilities will be more preferable. The main
Chapter 9
Page: 267
challenges to utilize this unique simulation technique in other relevant industries can be
pointed as:
Assessing the operating medium e.g. car, bus, truck, train, aeroplane, helicopter,
ship, boat etc. as detailed in Section 8.3.
Assessing the operating environment as elaborated in Section 8.4.
Assessing the type of seat as explained in Section 8.3
Starting from establishing CAD models for human body and seat up to the simulation
post-processing, an all-inclusive industrial instruction has been provided through Section
8.5, Section 8.6, Section 8.7, Section 8.8, Section 8.9 and Section 8.10.
9.4. Overall Conclusions
This section draws the conclusions of the overall research work carried out in conjunction
with the research questions highlighted in Section 1.1.6.
A unique finite element based simulation model has been developed for a car seated 50th
percentile male human driver in dynamic condition to predict the final levels of vibration
at different locations of human body and car seat. The unique features of this simulation
methodology are characterised as representing human portions through ellipsoidal bodies,
assigning shape specific stiffness data to human segments, predicting final vibration data
at various points of entire human-car seat assembly and eliminating the necessity of
practical vibration measurement. For the car seat foam material both the hyper-elastic and
viscoelastic properties had been assigned together and preferred contact mechanism at
seat-human interfaces were allocated.
Prior to initiating the research study on the unique simulation methodology, different
other methods e.g., theory based mathematical model using lumped mass method,
Chapter 9
Page: 268
combination of lumped mass and finite element methods etc. had been explored and
experimentally verified in CHAPTER 2. After comprehensive exploration of the existing
technologies and critical literature review of the earlier investigations in the similar fields,
a combination of most suitable practices have been implemented to develop the unique
biodynamic simulation methodology for the car seated human body.
Frequency magnitudes at the various segments of human body and car seat had been
evaluated from the simulation results to assess the effects of vertical vibration on the car
seated human body. The obtained frequency values were appearing to be within the
allowable ranges of natural frequencies of human organs as prescribed by ergonomic
standards and explored by earlier biodynamic investigations. The frequency related past
biodynamic research works have been detailed in Section 5.5, which show the evidence
of the acceptability of the frequencies obtained from this unique simulation model. The
input parameters of the simulation set up can be tuned as per recommendations given by
other case studies in Section 7.4 to lower the frequency levels, hence, to optimize the
health, comfort and safety of car seated human body.
Comparisons between the data received from finite element simulation and vibration
testing are shown in CHAPTER 7. The validation process are based on the vertical
accelerations values obtained from simulation and testing. For head, waist, upper arm,
headrest and backrest the peak limits of simulation outcomes are higher than the
corresponding limits of testing data. For chest, lower arm, thigh and cushion the upper
limits of simulation results are higher than respective upper limits of testing data, while
simulation bottom peaks are lower than respective testing data lower peaks. For human
leg both the lower and upper peaks of testing data are higher than corresponding
simulation results. Mismatches in-between the simulation results and testing data are
unavoidable as cited by other similar research outcomes presented in Section 7.4.
Absolute deviations of the simulation results from the testing data have been presented in
Table 35 and the potential reasons for deviations have been clarified in Section 7.3 and
Section 7.4. It has been observed that the vertical acceleration values from the finite
Chapter 9
Page: 269
element simulation are more conservative in natures compared to the vertical acceleration
values from practical testing, though, the frequencies related to the corresponding
acceleration values from simulation are falling within the permissible ranges of natural
frequencies of human body portions. This unique simulation methodology is yielding
satisfactory results, however, the deviations between simulation outcomes and testing
data can be minimised by further fine tunings of the simulation input parameters as
described in Section 7.4.
Efforts had been made to run the simulation for initial 60 seconds by assigning contact
mechanisms with frictional coefficients to mating the surfaces between human body and
car seat. But, cause of the inadequacy of computer hardware memory, the simulation
solver got terminated prematurely without providing any output. Therefore, the main
challenges during the simulation phases were to run it in a standard configured computer
system and obtain the desired results within reasonable timeframe. To avoid the necessity
of highly advanced computer hardware system, the simulation set up had been made to be
as non-robust as possible. For that purpose, human model had been simplified by
constructing its parts through ellipsoidal bodies and tie-up constraints had been
implemented to perform the contact mechanisms in between mating surfaces without the
need of frictional coefficient. Furthermore, the running time of the simulation had been
restricted to initial 10 seconds after the cars started moving from standstill state. The
simplified simulation model worked flawless and provided all the data of interest without
compromising the aim of this unique simulation based biodynamic research study.
This unique simulation methodology can be implemented in other similar industries with
minor manipulations in the simulation set up conditions. The main challenges will be to
assess the type of automotive, operating environment and type of seat. An industrial
guideline containing step by step instructions has been prepared in CHAPTER 8 to
execute this unique simulation technique in other relevant industries to anticipate
vibration data as different points of human-seat assembly.
Chapter 9
Page: 270
9.5. Scope of Improvement
This unique finite element based simulation technique accounts the vibration only in the
vertical direction. For the economic commuting cars, the vibration primarily comes from
the vertical direction, hence, this simulation methodology is very useful to monitor the
vibration levels inside the standard cars. For the sport or racer type cars, the fore-aft
vibration plays huge role on the health, safety and comfort of the human occupants
inside. In case of accidental scenarios, the sidewise vibration needs to be assessed for the
car to offer sufficient safety to the driver and passengers. For the completeness of this
unique simulation system, it will be beneficial to consider vibrations in fore-aft and
lateral directions, too. Combination of vertical, fore-aft and lateral vibrations will
obviously provide a more realistic and comprehensive simulation set up, which can be
implemented on any type of car and predict more accurate vibration data.
This simulation considers the vibration to be generated from the initial accelerating
period of the car operating in smooth terrain. Practically, the car engine will contribute
extra vibration and additional jerking from the interfaces of tyres and road will also
appear, especially for the rough road surfaces. Incorporation of engine excitation and
road surface condition is recommended to improve this finite element simulation to
further advanced level.
To avoid the complexity in the simulation environment, efforts have been made to
minimise the number of contact interfaces. To achieve this, the metallic frames
underneath the car seat and car body structure have been ignored and fixed boundary
condition has been implemented at the underside of the modelled seat. For more effective
vibration transmission from the car body to seat through the metallic frame, it is advised
to model the car body frame and metallic frame underneath the seat.
Currently, each human portion has been modelled using single ellipsoidal body to
calculate the shape and size specific three dimensional stiffness data. It is recommended
Chapter 9
Page: 271
to split each of the human ellipsoidal segments into multiple smaller ellipsoids to form
real anatomical human geometry and evaluate the three dimensional stiffness parameters
for each of the smaller ellipsoids separately. This method will involve time consuming
manual efforts, however, eventually will yield very accurate stiffness values for the
human portions.
Cause of the inaccessibility of the computer system with adequate hardware memory, the
simulation running time has been limited to initial 10 seconds. It suggested to run this
unique finite element simulation set up in a highly configured computer system for 60
seconds to investigate the vibration outcomes in more detail.
References
Page: 272
REFERENCES
Abbas, W., Abouelatta, O.B., El-Azab, M., Elsaidy, M. and Megahed, A.A. (2010). Optimization of Biodynamic Seated Human Models using Genetic Algorithms. Scientific Research, 2, pp. 710-719.
Adams, D., Morgan, G.B., Nghi, T., Salloum, M.J. and O’Bannon, T. (1999). Creating a biofidelic seating surrogate. SAE Conference, 1999-01-0627.
Ahmadian, M., Seigler, T.M., Clapper D. and Sprouse, A. (2002). Alternative test methods for long term dynamic effects of vehicle seats. SAE Conference, 2002-01-3082.
Alderson, K. L., Webber, R.S. and Evans, K.E. (2000). Novel variation in the microstructure of auxetic microporous ultra high molecular weight polyethylene, Part 2: Mechanical properties, Polymer Engineering & Science, 40 (8), pp.1906-1914.
American Society for Testing Materials. (2003). D3574 – 01. Standard Test Methods for Flexible Cellular Materials. In Annual Book of ASTM Standards. ASTM International, West Conshohocken, PA.
American Society for Testing Materials. (2008). D4168-95. Standard test methods for transmitted shock characteristics of foam-in-place cushioning materials. In Annual Book of ASTM Standards. ASTM International, West Conshohocken, PA.
American Society for Testing Materials. (2007). D5024: Standard test methods for plastics: Dynamic mechanical properties: In compression. In Annual Book of ASTM Standards. ASTM International, West Conshohocken, PA.
American Society for Testing Materials. (2009). D5112-98. Standard test method for vibration (horizontal linear motion) test of products. In Annual Book of ASTM Standards. ASTM International, West Conshohocken, PA.
American Society for Testing Materials. (2010). D3580-95. Standard test methods for vibration (vertical linear motion) test of products. In Annual Book of ASTM Standards. ASTM International, West Conshohocken, PA.

References
Page: 273
American Society for Testing Materials. (2011). D1596-97. Standard test method for dynamic shock cushioning characteristics of packaging material. In Annual Book of ASTM Standards. ASTM International, West Conshohocken, PA.
Amirouche, F. M. L. and Ider. S. K. (1988). Simulation and analysis of a biodynamic human model subjected to low accelerations – a correlation study. Journal of Sound and Vibration, 123 (4), pp. 281–292.
Andreoni, G., Santambrogio, G.C., Rabuffetti, M. and Pedotti, A, (2002). Method for the analysis of posture and interface pressure of car drivers. Applied Ergonomics, 33, pp.511–522.
Arvidson, J. M., Sparks, L. L. and Guobang, C. (1983). National Bureau of Standards. Tensile, compressive and shear properties of a 65-kg/m3 polyurethane foam at low temperatures.
Ashby, P. (1975) Ergonomics handbook 1: Human factors design data: Body size and strength. Pretoria: Tute Publication.
automotive.com/uploads/media/Schumacher_0_1311324313_rec_gp_am_gb.pdf [Accessed 22 Mar. 2018].
Bader, D.L. and Bowker, P. (1983). Mechanical characteristics of skin and underlying tissues in vivo. Biomaterials, 4, pp. 305-308.
Baik, S., Lee, J. and Suh, J. (2003). A study on the characteristics of vibration in seat system. SAE Paper, 3.
Banks, H., Negash, G. and Gaitens, M. (2007). Multiscale considerations in modeling of nonlinear elastomers. International Journal for Computational Methods in Engineering Science and Mechanics, 8(2), pp. 53-62.
Bansal, H. (2013). Mathematical validation of Eigen values and Eigen vectors of different human body segments in sitting posture. MEng. Thesis, Thapar University.
Basri, B, and Griffin, M. J. (2011).The vibration of inclined backrests: perception and discomfort of vibration applied normal to the back in the x–axis of the body, Journal of Sound and Vibration, 330, pp. 4646–4659.
Batt, G. (2013). Primary Resonance Behavior of Expanded Polymer Cushion Material under Low-Intensity Harmonic Excitations. A Dissertation Presented to the Graduate School of Clemson University, pp. 17-21.
Benson, B.R., Smith, G.C., Kent, K.W. and Monson, C.R. (1996). Effects of seat stiffness in out-of-position occupant response in rear-end collisions. Proceedings of the 40th Stapp Car Crash Conference 1996, SAE no 962423. pp 331-344.
References
Page: 274
Berkson, M.H., Nachemson, A. and Schultz, A.B. (1979). Mechanical properties of the human lumbar spine motion segments – Part II: Responses in compression and shear; influence of gross morphology. Journal of Biomechanical Engineering, 101, pp 53-57.
Besnault, B., Guillemot, H., Robin, S., Lavaste, F. and Le Coz, J-Y. (2008). A parametric finite element model of the human pelvis. Proceedings of the 42nd STAPP Car Crash Conference, SAE paper no 983147, pp. 33- 46.
Boileau, P.E. and Rakheja, S. (1998). Whole-body vertical biodynamic response characteristics of the seated vehicle driver measurement and model development. International Journal of Industrial Ergonomics, 22, pp. 449-472.
Bosboom, E.M.H., Hesselink, M.K.C., Oomens, C.W.J., Bouten, C.V.C., Drost, M.R. and Baaijens, F.P.T. (2001). Passive transverse mechanical properties of skeletal muscle under in vivo compression. Journal of Biomechanics, 34, pp. 1365-1368.
Boshuizen, H.C., Bongers, P.M. and Hulshof, C.T. (1992). Self reported back pain in forklift truck and freight container tractor drivers exposed to whole body vibrations. Spine, 17(1), pp. 59-65.
Bovenzi, M. and Zaidini, A. (1992). Self-reported low back pain symptoms in urban bus drivers exposed to whole body vibrations. Spine, 17(9), pp. 1048-1059.
Bovenzi, M. and Hulshof, C.T.J. (1998). An updated review of epidemiologic studies on the relationship between exposure to whole-body vibration and low back pain. Journal of Sound and Vibration, 215 (4), pp. 595-612.
Brooks, R. M. (2012). Acceleration characteristics of vehicles in rural Pennsylvania. IJRRAS, 12 (3), pp. 449-453.
Brienza, D., Chung, K., Brubaker, C., Wang, J., Karg, T. and Lin, C. (1996). A system for the analysis of seat pressure support surfaces using surface shape control and simultaneous measurement of applied pressures. IEEE transactions on rehabilitation engineering, 4(2), pp. 103-113.
Brosh T. and Arcan, M. (2000). Modeling the body/chair interaction – an integrative experimental–numerical approach. Clinical Biomechanics, 15, pp. 217-219.
Brouwn, G.G. (2000). Postural control of the human arm. PhD-thesis, Delft University of Technology.
Brown, N. & Keeley, S. (1997). Asking the Right Questions: A Guide to Critical Thinking. Pearson: London, ISBN: 0131829939.
Bubb, H. and Estermann, S. (2000). Influences of forces on comfort feeling in vehicles. SAE Conference, SAE no 2000-01-2171.
References
Page: 275
Buck, B. and Woelfel, H. P. (1998). Dynamic Three-Dimensional Finite Element Model of a Sitting Man with a Detailed Representation of the Lumbar Spine and Muscles. Computer Methods in Biomechanics and Biomedical Engineering, 2, pp. 379-386, 1998.
Burdzik, R. and Konieczny, L. (2014). Vibration Issues in Passenger Car. Silesian University of Technology, 9(3), p. 83-90.
Caddock, B.D. and Evans, K.E. (1989). Microporous materials with negative Poisson’s ratio: I. Microstructure and mechanical properties, Journal of Physics, 22(12), pp. 1877- 1882.
Camprubí, N. and Rueda, F. (2007). Comfort Evaluationof Foam SeatsUsing Realistic Simulation. Advanced Design & Analysis Division.
Camprubí, N., Rueda, F. and Alonso, I. (2007). Numerical Simulation in the Design Process of Foam Seats for the Automotive Industry. ABAQUS Users’ Conference, pp. 1-15.
carsoda.com, (2017). Steering Wheels Size Chart. [online] Available at: https://www.carsoda.com/blogs/news/92683075-steering-wheels-size-chart [Accessed 9 Oct. 2017].
Cempel, C. (1989). Applied vibroacustic. PWN, Warsaw.
Cengiz, T.G. (2014). A pilot study for defining characteristics of Turkish women via anthropometric measurements. Work, 49 (4), pp. 713–722.
Chaffm, D.B. and Anderson, G.B. (1991). Occupational Biomechanics (2nd ed.), Wiley-Interscience, New York, NY.
Chan, N. and Evans. (1997). Microscopic examination of the microstructure and deformation of conventional and auxetic foams, Journal of Materials Science, 32 (21), pp.5725-5736.
Chagnon, G., Marckmann, G., Verron, E., Gornet, L., Charrier, P. and Ostoja-Kuczynski, E. (2002). A new modelling of the Mullins effect and the viscoelasticity of elastomer based on a physical approach. Proceedings of the International Rubber Conference. Prague, Czech Republic.
Chen, E.J., Novakofski, J., Jenkins, W. K.and O’Brien, W.D. (1996). Young’s Modulus Measurements of Soft Tissues with Application to Elasticity Imaging. IEEE transactions on ultrasonics, ferroelectrics, and frequency control, 43(1), pp. 191-194.
Cheung, M. and Zhang, M. (2006). Finite Element Modeling of the Human Foot and Footwear. ABAQUS Users’ Conference, pp. 145-159.
References
Page: 276
Cho, Y. and Yoon, Y. S. (2001). Biomechanical model of human on seat with backrest for evaluating ride quality. International Journal of Industrial Ergonomics, 27 (2001), pp. 331–345.
Cho, Y., Yoon, Y. S. and Park, S.J. (2000). Determination of seat sponge properties with estimated biodynamic model. SAE Conference 2000, SAE no 2000-01-0640.
Choi, H. Y., Han, M, Hirao, A. and Matsuoka, H. (2017). Virtual Occupant Model for Riding Comfort Simulation. Proceedings of the 12th International Modelica Conference. pp. 27-34.
Chow, W.W. and Odell, E.I. (1978). Deformations and stresses in soft body tissues of a sitting person. Journal of Biomechanical Engineering, 100, pp. 79-87.
Corbridge, C, Griffin, M.J, and Harborough, P. (1989). Seat dynamics and passenger comfort. Institute of Mechanical Engineers Part F: Journal of Rail and Rapid Transit, 203, pp. 57–64.
Cottrell, S. (2005). Critical Thinking Skills. Palgrave: Basingstoke; ISBN: 1-4039-9685-7.
Crichton, M. L., Chen, X., Huang, H. and Kendall, M. A. F. (2013). Elastic modulus and viscoelastic properties of full thickness skin characterised at micro scales. Biomaterials, 34, pp. 2087-2097.
Cunningham, A., Huygens, E. and Leenslag, J. W. (1994). MDI comfort cushioning for automotive applications, Cellular Polymers, 13 (6), pp. 461–472.
Czysz, H. J. (1986). Experimentelle Untersuchungen an Polyurethan-Integralweichschaum zur Bestimmung von Kennwerten zu Berechnungsgrundlagen. PhD Thesis, Universitat der Bundeswehr Hamburg.
Dabnichki, P.A., Crocombe, A.D. and Hughes, S.C. (1994). Deformation and stress analysis of supported buttock contact. Proceedings of the Institution of Mechanical Engineers, Journal of Engineering in Medicine, 208, pp. 9-17.
Dae-Eun Hyun, Seung-Hyun Yoon, Myung-Soo Kim, and Bert Juttler. (2003). Modeling and Deformation of Arms and Legs Based on Ellipsoidal Sweeping. Proceedings of the 11th Pacific Conference on Computer Graphics and Applications.
Dalstra, M., Huiskes, R. and Erning, L. (1995). Development and validation of a three dimensional finite element model of the pelvis bone. Journal of Biomechanical Engineering, 117, pp. 272-278.
Delleman, N.J. (1999). Working postures – prediction and evaluation. PhD-thesis, Vrije Universiteit, Amsterdam (The Netherlands).
References
Page: 277
Deng, R., Davies. P. and Bajaj, A. K. (2002). Flexible polyurethane foam modelling and identification of viscoelastic parameters for automotive seating applications. Journal of Sound and Vibration, 264, pp. 391–417.
Duthie, G. M., Pyne, D. B., Hopkins, W. G., Livingstone, S. and Hooper, S. L. (2006). Anthropometry profiles of elite rugby players: quantifying changes in lean mass. Br J Sports Med, 40, pp. 202-207.
Ebe, K. and Griffin, M.J. (1994). Effect of polyurethane foam on dynamic sitting comfort. Proceedings of Inter Noise 94, Yokohama, Japan, pp. 9338926.
Ebe, K. and Griffin, M.J. (2001). Factors affecting static seat cushion comfort. Ergonomics, 44, pp. 901–921.
Ehlers, W. and Markert, B. (2001). Viscoelastic polyurethane foams at finite deformations. Trends in Computational Structural Mechanics, (2001), pp. 249–256.
element.com, (2018). Element's Official Website. [online] Available at: https://www.mpihome.com/en/industries/automotive.html [Accessed 13 Jul. 2018].
El-Khatib, A. and Guillon, F. Lumbar (2001). Intradiscal pressure and whole-body vibration –first results. Clinical Biomechanics, 16(1), pp. S127-S134.
Evans, K.E. (1990). Tailoring the negative Poisson’s ratio, Chemical Ind., 20, pp.654-657.
Evans, K.E., Nkansah, M.A., Hutchinson, I.J. and Rogers, S.C. (1991). Molecular network design, Nature, 353, pp.124.
Ezenwa, B. and Yeoh, H. T. (2011). Multiple vibration displacements at multiple vibration frequencies stress impact on human femur computational analysis. Journal of Rehabilitation Research & Development, 48(2), pp. 179-189.
Fairley, T.E. and Griffin, M.J. (1986). A test method for the prediction of seat transmissibility. Society of Automotive Engineers International Congress and Exhibition, 860047.
Fairley, T.E. and Griffin, M.J. (1989). The apparent mass of the seated human body: vertical vibration. Journal of Biomechanics, 22(2), pp. 81–94.
Fairley, T.E. and Griffin, M.J. (1990). The apparent mass of the seated human body in the fore–and–aft and lateral direction. Journal of Sound and Vibration, 139(2), pp. 299–306.
Fang, B. (2013). CAE Methods on Vibration-Based Health Monitoring Of Power Transmission Systems. A Thesis Presented to The Faculty of California Polytechnic State University, pp. 50-88.
References
Page: 278
Fritz, M. (2000). Description of the relation between the forces acting in the lumbar spine and whole-body vibrations by means of transfer functions. Clinical Biomechanics, 15, pp. 234-240.
Frost III, B.L., Hubbard, R.P. and Boughner, R.L. (1997). Development of back contours for automobile seat design. SAE Conference, SAE no 970590.
Fung, Y.C. (1968). Foundations of Solid Mechanics, Prentice-Hall.
Gibson, L.J. and Ashby, M.F. (1988). Cellular Solids: Structure and Properties, Pergamn Press, London.
Gibson, L. J., Ashby, M. F., Schajer, G. S. and Robertson, C. I. (1982). The mechanics of two dimensional cellular materials, Proceedings of The Royal Society of London, 382, pp.25-42.
Gordon, C. C., Churchill, T., Clauser, C. E., Bradtrniller, B., McConville, J. T., Tebbetts, I. and Walker, R. A. (1989).1988anthropometric survev of U.S. Army personnel: Methods and summary statistics. Final report (NATICWR- 891027).Natick, MA: U.S. Army Natick Research, Development and Engineering Center.
Gottlieb, G. L., Agarwal, G. C. and Penn, R. (1978). Sinusoidal oscillation of the ankle as a means of evaluating the spastic patient. J Neurol Neurosurg Psychiatry, 41(1), pp. 32-39.
Grandjean, E. (1980). Sitting posture of car drivers from the point of view of ergonomics. In D.J. Oborne and J.A. Levis (eds.), Human Factors in Transport Research. User Factors: Comfort, the Environmentand Behaviour, 2, pp. 205-213. New York: Academic Press.Gyi, D.E. and Porter, J.M. (1999). Interface pressure and the prediction of car seat discomfort. Applied Ergonomics, 30, pp. 99-107.
Green, A. E. and Adkins, J. E. (1970). Oxford University Press. Large Elastic Deformations, 2nd Ed.
Griffin, M. J. (1990). Handbook of human vibration. Academic press, London: Academic Press Limited. ISBN 0–12–303040–4.
Griffin, M. J. (2001). The validation of biodynamic models, Clinical Biomechanics, 16, pp. 81-92.
Grujicic, M., Pandurangan, B., Arakere, G., Bell, W.C., He, T. and Xie, X. (2009), Seat-cushion and soft-tissue material modeling and a finite element investigation of the seating comfort for passenger-vehicle occupants. Materials and Design, 30, pp. 4273-4285.
Grujicic, M., Bell, W. C., Arakere, G. and Haque, I. (2009). Finite element analysis of the effect of up-armouring on the off-road braking and sharp-turn performance of a high-
References
Page: 279
mobility multi-purpose wheeled vehicle. Proceedings of The Institution of Mechanical Engineers Part D-journal of Automobile Engineering - PROC INST MECH ENG D-J AUTO. 223. 1419-1434. 10.1243/09544070JAUTO1187.
Guo, L.X., Zhang, Y.M. and Zhang, M. (2011). Finite Element Modeling and Modal Analysis of the Human Spine Vibration Configuration. IEEE Transactions on Biomedical Engineering, 58(10), pp. 2987-2990.
Haan, R. (2002). FE model of a car seat. Netherlands Organisation for Applied Scientific Research, pp. 9-12.
Harsha, S. P., Desta, M., Prashanth, A. S. and Saran, V. H. (2014). Measurement and bio-dynamic model development of seated human subjects exposed to low frequency vibration environment. International Journal of Vehicle Noise and Vibration, 10 (1-2), pp. 1-24.
Hartmann, S.; Haupt, P. and Tschope, T. (2001). Parameter identification with a direct search method using finite elements. Constitutive Models for Rubber II, pp. 249–256.
Hartung, J., Mergl, C., Henneke, C., Madrid-Dusik, R and Bubb, H. (2004). Measuring Soft Tissue Compliance of the Human Thigh. SAE Technical Paper Series 2004-01-2158.
havcontrol.co.uk, (2018). HAV Control Limited's Official Website. [online] Available at: https://www.havcontrol.co.uk/havi-hand-arm-vibration-monitor.html?gclid=EAIaIQobChMI1Lvego6d3AIVSLDtCh3muAEPEAQYASABEgIXF_D_BwE [Accessed 13 Jul. 2018].
havcontrol.co.uk, (2018). HAV Control Limited's Official Website. [online] Available at: https://www.havcontrol.co.uk/larson-davis-hvm100-hav-meter.html [Accessed 13 Jul. 2018].
Hellman, A. (2008). Simulation of complete vehicle dynamics using FE code Abaqus. MSc Thesis- Luleå University of Technology, pp. 19-31.
Hendriks, F.M., Brokken, D., Oomens, C.W.J., Baaijens, F.P.T. and Horsten, J.B.A.M. (2003). A Numerical-experimental method to characterise the non-linear mechanical behaviour of human skin. Skin Research and Technology, 9, pp. 274-283.
Hertzberg, H.T.E. (1972). The human buttocks in sitting: pressures, patterns and palliatives. SAE Conference, SAE no 720005.
Hilyard, N. C., Collier, P. and Care, C. M. (1984). Influence of mechanical properties of cellular plastic cushioin materials on ride comfort. Conference on ‘Dynamics in Automotive Engineering’ held at Cranfield Institute of Technology, Cranfield, Bedford.
References
Page: 280
Himmetoglu, S., Acar, M., Bouazza-Marouf, K. and Taylor, A. (2009). A multi-body human model for rear-impact simulation. Proceedings of the IMechE, Part D: Journal of Automobile Engineering, 223(5), pp. 623-638.
Hin, B., Blüthner, R., Menzel, G., Rützel, S., Seidel, H. and Wölfel, H. P. (2006). Apparent mass of seated men – Determination with single– and multi–axis excitations at different magnitudes. Journal of Sound and Vibration, 298, pp. 788–809.
Hinz, B., Bluethner, R., Menzel, G. and Seidel, H. (1993). Estimation of disc compression during transient whole-body vibration. Clinical Biomechanics, 9(4), pp. 263-271.
Hinz, B. and Seidel, H. (1987). The non-linearity of the human body’s dynamic response during sinusoidal whole body vibration. Industrial Health, 25, pp. 169-181.
Hinz, B., Seidel, H., Braeuer, D., Menzel, G., Bluethner, R. and Erdman, U. (1988). Examination of spinal column vibrations: a non-invasive approach. European Journal of Applied Physiology, 57, pp. 707-713.
Holmlund, P., Lundstrom, R. and Lindberg, L. (2000). Mechanical impedance of the human body in vertical direction. Applied Ergonomics, 31 (4), pp. 415–422.
Hong, K.T., Hwang, S.H. and Hong, K.S. (2003). Automotive Ride-Comfort Improvement with an Air Cushion Seat. SICE Annual Conference, 1(3), pp. 2043-2048.
Horst, M.J. (2002). Human head neck response in frontal, lateral and rear end impact loading – modelling and validation. PhD-thesis, Eindhoven University of Technology.
Houghton, T. J. C. (2003). The effect of backrest inclination on the transmission of vertical vibration through an antomotive seat. In: Processdings of the 38th UK conference on the human response to vibration, 17–19 September, Institute of Naval Medicine, Gosport, England.
Huang, Y. and Griffin, M. J. (2006). Effect of voluntary periodic muscular activity on nonlinearity in the apparent mass of the seated human body during vertical random whole–body vibration. Journal of Sound and Vibration, 298 (3), pp. 824–840.
Hu, H., Li, Z., Yan, J., Xiao, H., Duan, J. and Zenga, Li. (2007). Anthropometric measurement of the Chinese elderly living in the Beijing area. Journal of Industrial Ergonomics, 37(4), pp. 303-311.
Huang, Y. and Griffin, M. J. (2008). Non–linear dual–axis biodynamic response of the semi–supine human body during vertical whole–body vibration. Journal of Sound and Vibration, 312 (1–2), pp. 296–315.
References
Page: 281
Hubbard, R.P., Haas, W.A., Boughner, R.L., Canole, R.A. and Bush, N.J. (1993). New biomechanical models for automobile seat design. SAE Technical Paper Series 930110.
Hulshof, C. and Zanten, B.V. (1987). Whole-body vibration and low back pain. A review of epidemiologic studies. International Archives of occupational and Environmental Health, 59, pp. 205-220.
Hilyard, N. C. (1982). Mechanics of Cellular Plastics. New York: Macmillan.
International Organization for Standardization. (1994). Mechanical vibration – aboratory method for evaluating vehicle seat vibration – Part 1: Basic requirements. ISO10326–1.
International Organisation for Standardization. (1997). Guide for the evaluation of human exposure to whole body vibration. ISO 2631–1.
International Organisation for Standardization. (2001). Mechanical vibration and shock— range of idealized values to characterise seated–body biodynamic response under vertical vibration. ISO 5982.
International Organisation for Standardization (2008) Flexible Cellular Polymeric Materials – Determination of Hardness (Indentation Technique). ISO 2439.
Ippili, R. K., Davies, P., Bajaj, A. K. and Hagenmeyer, L. (2008). Nonlinear multi–body dynamic model of seat–occupant system with polyurethane seat and H–point prediction. International Journal of Industrial Ergonomics, 38, pp. 368–383.
Ittianuwat, R, Fard, M. and Kato, K. (2014). The Transmission of Vibration at Various Locations on Vehicle Seat to Seated Occupant Body. Inter-Noise, pp. 1-12.
Jalil, N. A. A. and Griffin, M. J. (2007). Fore–and–aft transmissibility of backrests: Effect of backrest inclination, seat–pan inclination, and measurement location, Journal of Sound and Vibration, 299, pp. 99–108.
Jalil, N. A. A. and Griffin, M. J. (2007). Fore–and–aft transmissibility of backrests: Variation with height above the seat surface and non–linearity, Journal of Sound and Vibration, 299, pp. 109–122.
James, A. G. and Green, A. (1975). Strain energy functions of rubber. ii the characterization of filled vilcanisates. Journal of Applied Polymer Science, 19, pp. 2033–2058.
Jarfelt, U.; Ramnäs, O. (2006). Thermal conductivity of polyurethane foam Best performance. Proceedings of the 10th International Symposium on District Heating and Cooling, Hannover, Germany, 3–5 Sep; pp. 1–12.

References
Page: 282
Jhinkwan, A. and Singh, J. (2014). Design Specifications and Ergonomic Evaluation of Car Seat (A Review). International Journal of Engineering Research & Technology (IJERT), 3 (5), pp. 611-613.
Joshi, G., Bajaj, A. K. and Davies, P (2010). Whole–body Vibratory Response Study Using a Nonlinear Multi–body Model of Seat–occupant System with Viscoelastic Flexible polyurethane Foam. Industrial Health, 48, pp. 663–674.
Ju, M.L., Jmal, H., Dupuis, R. and Aubry, E. (2013). Visco-hyperelastic model for polyurethane foam: comparison among Polynomial, Reduced polynomial, and Ogden models. In: 21ème Congrès Français de Mécanique, 26 au 30 août, Laboratoire MIPS, Mulhouse, France.
Ju, M.L., Jmal, H., Dupuis, R. and Aubry, E. (2014). Visco-hyperelastic constitutive model for modeling the quasi-static behavior of polyurethane foam in large deformation. Polymer Engineering and Science, 55 (8), pp.1795-1804.
Kamalakar, G. B. and Mitra, A. c. (2017). Development and Analysis of Human Hand-Arm System Model for Anti-Vibration Isolators. Materialstoday, 5(2), pp. 3943-3952.
Kasra, M., Shirazi, A. and Drouin. A. (1992). Dynamics of human lumbar intervertebral joints. Experimental and finite-element investigations. Spine, 17(1), pp. 93-102.
Keegan, J. J. (1964). The medical problem of lumbar spine flattening in automobile seats. SAE Technical Paper 838A. New York, NY: Society of Automotive Engineers, Inc.
Kim, S.K., White, S.W., Bajaj, A.K. and Davies, P. (2003). Simplified models of the vibration of mannequins in car seats. Journal of Sound and Vibration, 264 (2003), pp. 49–90.
Kim, T., Cho, Y., Yoon, Y. and Park, S. (2001). Dynamic Ride Quality Investigation and DB of Ride Values for Passenger and RV Cars. SAE Technical Paper, 01, pp. 0384.
Kim, T. H., Kim, Y. T. and Yoon, Y. S. (2005). Development of a biomechanical model of the human body in a sitting posture with vibration transmissibility in the vertical direction. Industrial Ergonomics, 35 (9), pp. 817–829.
Kim, D., Yoon, W., Park, H., Kim, H. and Park, J. (2013). Measurement of dynamic viscoelastic properties of flexible polyurethane foam under compression for application to seat vibration analysis. The Journal of the Acoustical Society of America, 134, pp. 4103–4112
Kitazaki, S. and Griffin, M.J. (1995). A data correction method for surface measurement of vibration on the human body. Journal of Biomechanics, 28(7), pp. 885-890.
References
Page: 283
Kitazaki, S. and Griffin, M.J. (1997).A modal analysis of whole body vertical vibration, using a finite element model of the human body. Journal of Sound and Vibration, 200(1), pp. 83-103.
Kitazaki, S. and Griffin, M.J. (1998). Resonance behaviour of the seated human body and effects of posture. Journal of Biomechanics, 31(1998), pp. 143-149.
Kolich, M., Essenmacher, S. D. and McEvoy, J. T. (2005). Automotive seating: the effect of foam physical properties on occupied vertical vibration transmissibility. Journal of Sound and Vibration, 281, pp. 409–416.
Kondo, T. and Ito, Y. (2002). Predicting ride comfort on seat using explicit FEM code. SAEConference 2002, SAE no 2002-01-0779.
Konieczny, A. (2016). Analysis of Simplifications Applied in Vibration Damping Modelling for a Passive Car Shock Absorber. Hindawi Publishing Corporation Shock and Vibration, 2016(6182847), pp. 1-9.
Konosu, A. (2003). Development of a Biofidelic Human Pelvic FE-Model with Several Modifications onto a Commercial Use Model for Lateral Loading Conditions. SAE Technical Paper Series 2003-01-0163.
Kovacevc, S., Vucinic, J., Kirin, S. and Pejnovic, N. (2010). Impact of anthropometric measurements on ergonomic driver posture and safety. Periodicum Biologorum, 112 (1), pp. 51-54.
Lacquaniti, F., Licata, F. and Soechting, J. F. (1982). The mechanical behavior of the human forearm in response to transient perturbations. Journal of Biological Cybernetics, 44(1), pp. 35-46.
Lakes, R.S. (1987a). Foam structures with a negative Poisson's ratio, Science, 235, pp.1038-1040.
Lakes, R.S. (1987b). Polyhedron cell structure and method of making same, Int. Patent Publication Number- WO88/00523.
Lakes, R. S. and Lowe, A. (2000). "Negative Poisson's ratio foam as seat cushion material", CellularPolymers, 19, pp. 157-167.
Lakušić, S., Brčić, D. and Lakušić, V.T. (2011). Analysis of Vehicle Vibrations – New Approach to Rating Pavement Condition of Urban Roads. Promet – Traffic&Transportation, 23(6), pp. 485-494.
Leva, P. (1996). Adjustments to Zatsiorsky-Seluyanov's Segment Inertia Parameters. Journal of Biomechanics, 29 (9), pp. 1223-1230.
References
Page: 284
Lewis, C. H. and Griffin, M. J. (2002). Evaluating vibration isolation of soft seat cushions using an active anthropodynamic dummy. Journal of Sound and Vibration, 253, pp. 295–311.
Li, K., Zheng, L., Tashman, S., and Zhang, X. (2012). The inaccuracy of surface-measured model-derived tibiofemoral kinematics. Journal of Biomechanics, 45(15), pp. 2719-2723.
Liang, C. C. and Chiang, F. C. (2008). Modelling of a seated human body exposed to vertical vibrations in various automotive postures. Industrial Health, 46, pp. 125–167.
Liu, C., Qiu, Y. and Griffin, M. J. (2012). A finite–element model of the vertical in–line and fore–and–aft cross–axis apparent mass and transmissibility of the human body sitting on a rigid seat and exposed to vertical vibration. Proceedings of the 47th UK conference on the human response to vibration, 17–19 September, University of Southampton, Southampton, England.
Lo, L., Fard, M., Subic, A. and Jazar, R. (2013). Structural dynamic characterization of a vehicle seat coupled with human occupant. Journal of Sound and Vibration, 332, pp. 1141–1152.
Lowe, L. and Lakes, R. S. (2000). Negative Poisson's Ratio Foam as Seat Cushion Material. Cellular Polymers, 19, pp. 157-167.
Macias, N., Quezada, A. D., Flores, M., Valencia, M. E., Denova-Gutiérrez, E,,Quiterio-Trenado, M., Gallegos-Carrillo, K., Barquera, S. and Salmerón, J. (2014). Accuracy of body fat percent and adiposity indicators cut off values to detect metabolic risk factors in a sample of Mexican adults. BMC Public Health, 14(1), 341 doi: 10.1186/1471-2458-14-341.
Majumder, J. (2014). Anthropometric dimensions among Indian males — A principal component analysis. Euras J Anthropol, 5(2), pp. 54−62.
Mansfeld, N.J. and Griffin, M.J. (2000). Non-linearities in apparent mass and transmissibility during exposure to whole-body vertical vibration. Journal of Biomechanics, 33(2000), pp. 933-941.
Mansfield, N. J. and Griffin, M. J. (2002). Effects of posture and vibration magnitude on apparent mass and pelvis rotation during exposure to whole–body vertical vibration. Journal of Sound and Vibration, 253 (1), 93 – 107.
Mansfield, N. J., Lundstrom, R., Lenzuni, P. and Nataletti, P. (2006). Effect of vibration magnitude, vibration spectrum and muscle tension on apparent mass and cross axis transfer functions during whole–body vibration exposure. Journal of Biomechanics, 39, pp. 3062–3070.
References
Page: 285
Mansfield, N. J. and Maeda, S. (2006). Comparison of the apparent masses and cross–axis apparent masses of seated humans exposed to single and dual–axis whole–body vibration. Journal of Sound and Vibration, 298 (3), pp. 841–853.
Marshall, R.J., Altamore, P.F. and Hartley, D. (2000). Dynamic analysis of crew seats and cockpit interiors. SAE Conference 2000, SAE no 2000-01-1674.
Massidda, M., Toselli. S., Brasili, P. and Caló, M. C. (2013). Somatotype of elite Italian gymnasts. Collegium antropologicum - PubMed, 37(3), pp. 853-857.
Matsumoto, Y. and Griffin, M. J. (1998a), Movement of the upper–body of seated subjects exposed to vertical whole–body vibration at the principal resonance frequency. Journal of Sound and Vibration, 215 (4), pp. 743 –762.
Matsumoto, Y. and Griffin, M. J. (1998b). Dynamic response of the standing human body exposed to vertical vibration: influence of posture and vibration magnitude. Journal of Sound and Vibration, 212 (1), pp. 85–107.
Matsumoto, Y., Griffin, M.J. (2001). Modelling the dynamic mechanisms associated with the principal resonance of the seated human body. Clinical Biomechanics, Vol. 16, No. 1, pp. S31-S44.
Matsumoto, Y. and Griffin, M. J. (2002) Non–linear characteristics in the dynamic responses of seated subjects exposed to vertical whole–body vibration, Journal of Biomechanical Engineering, 124, pp. 527 – 532.
McKee, C.T., Last, J. A., Russell, P. and Murphy, C.J. (2011). Indentation Versus Tensile Measurements of Young’s Modulus for Soft Biological Tissues. Tissue Engineering: Part B, 17(3). pp. 155-164.
Mehar, A., Chandra, S. and Velmurugan, S. (2013). Speed and Acceleration Characteristics of Different Types of Vehicles on Multi-Lane Highways. European Transport \ Trasporti Europei, 55, pp. 1-12.
Mergl, C., Anton, T., Madrid-Dusik, R., Hartung, J., Librandi, A. and Bubb, H. (2004). Development of a 3D Finite Element Model of Thigh and Pelvis. SAE Technical Paper Series 2004-01-2132.
Milivojevich, A., Blair, G. R., Pageau, J. G. and Van-Heumen, J. D. (1999). Automtotive seating comfort; defining comfort properties in Polyurethane Foam. Society of Automotive Engineering, 01, pp. 1-10.
Mills N. J. (2007). Polymer Foams Handbook: Engineering and Biomechanics Applications and Design Guide. Butterworth-Heinemann.
References
Page: 286
Mills, N. J. and Gilchrist, A. (2000). Modelling the indentation of low density polymers foams. Cellular Polymers, 19, pp. 389–412.
Mircheski, I., Kandikjan, T. and Sidorenko, S. (2014). Comfort analysis of vehicle driver’s seat through simulation of the sitting process. Analiza udobnosti vozačeva sjedala simulacijom postupka sjedanja, 21(2), pp. 291-298.
Mirzaali, M. J., Schwiedrzik, J. J., Thaiwichai, S., Best, J.P. and Michler, J. (2016). Mechanical properties of cortical bone and their relationships with age, gender, composition and microindentation properties in the elderly. Bone, 93, pp. 196-211.
Moens, C.C.M. and Horvath, I. (2002). Finite elements model of the human body: geometry and non-linear material properties. Proceedings of the TMCE 2002.
Muksian, R. and Nash, C. D. (1974). A model for the response of seated humans to sinusoidal displacements of the seat. Journal of Biomechanics, 9, pp. 339–342.
Murakami, D., Kitagawa, Y., Kobayashi, S., Kent, R. and Crandall, J (2004). Development and Validation of a Finite Element Model of a Vehicle. SAE Technical Paper Series 2004-01-0325.
Nawayseh, N. and Griffin, M. J. (2003). Non–linear dual–axis biodynamic response to vertical whole–body vibration, Journal of Sound and Vibration, 268, pp. 503 – 523.
Nawayseh, N. and Griffin, M. J. (2004). Tri–axial forces at the seat and backrest during whole–body vertical vibration. Journal of Sound and Vibration, 277 (1–2), pp. 309 – 326.
Nawayseh, N. and Griffin, M. J. (2005). Non–linear dual–axis biodynamic response to fore–and–aft whole–body vibration. Journal of Sound and Vibration, 282 (3–5), pp. 831–862.
Nawayseh, N. and Griffin, M. J. (2009). A model of the vertical apparent mass and the fore–and–aft cross–axis apparent mass of the human body during vertical whole–body vibration. Journal of Sound and Vibration, 319 (1–2), pp. 719–730.
Nesaragi, V.V., Maruthi, B.H., Chandru, B. T. and Kumar, D. (2014). Design and noise, vibration, harshness analysis of engine bonnet of the car. Int. Journal of Engineering Research and Applications, 4(7). pp. 5-11.
Nigam, S.P. and Malik, M. (1987). A Study on a Vibratory Model of a Human Body. Journal of Biomechanical Engineering, 109, pp. 148-153.
Ogden, R. W. (1972). Large deformation isotropic elasticity – On the correlation of theoryand experiment for incompressible rubberlike solids. Proceedings of the RoyalSociety of London Series A, 1972, 326, pp. 565–584.
References
Page: 287
Paddan, G. S. and Griffin, M. J. (1988a). The transmission of translational seat vibration to the head – I. Vertical seat vibration. Journal of Biomechanics, 21 (3), pp. 191–197.
Paddan, G. S. and Griffin, M. J. (1988b). The transmission of translational seat vibration to the head – II. Horizontal seat vibration. Journal of Biomechanics, 21 (3), pp. 199–206.
Paddan, G.S. and Griffin, M. J. (1998). A review of the transmission of translational seat vibration to the head. Journal of Sound and Vibration, 215(4), pp. 863-882.
Paddan, G. S. and Griffin, M. J. (2002). Effect of Seating on Exposures to Whole-Body Vibration in Vehicles. Journal of Sound and Vibration, 253(1), pp. 215-241.
Panjabi, M. M., Andersson, G. B. J., Jorneus, L., Hult, E. and Mattsson, L. (1986). In vivo measurement of spinal column vibrations. Journal of Bone and Joint Surgery, 68(5), pp. 695-702.
Panjabi, M.M., Oxland, T.R., Yamamoto, I. and Crisco, J.J. (1994). Mechanical behaviour of the human lumbar and lumbosacral as shown by three-dimensional loaddisplacement curves. Journal of Bone and Joint Surgery, 76-A (3).
Pankoke, S. and Siefert, A. (2008). Latest development in occupant simulation techniques related to seating comfort and human response and human response to vibration: finite element occupant model CASIMIR, In: 43rd United Kingdom Conference on Human Responses to Vibration: Caterpillar Inc, Leicester, England.
Pankoke, S., Buck, B. and Woelfel, H. P, (1998). Dynamic FE model of sitting man adjustable to body height, body mass, body posture used for calculating internal forces in the lumbar vertebral disks. Journal of Sound and Vibration, 215, pp. 827–839.
Pankoke, S., Hofmann, J. and Wölfel, H.P. (2001). Determination of vibration-related spinal loads by numerical simulation. Clinical Biomechanics, 16(1), pp. S45-S56.
Park, S. and Kim, C. (1997). The evaluation of seating comfort by objective measurements, SAE970595, SAE Conference.
Paul, G., Pendlebury, J. and Miller, J. (2012). The contribution of seat components to seat hardness and the interface between human occupant and a driver seat. International Journal of Human Factors Modelling and Simulation (IJHFMS), 3(3/4), pp.378-397.
Pattern, W.N., Sha, S. and Mo, C. (1998). A Vibration Model of Open Celled Polyurethane Foam Automotive Seat Cushions. Journal of Sound and Vibration, 217(1), pp. 145-161.
Paul, G., Miller, J. and Pendlebury, J. (2013). A finite element model of seat cushion indentation with a soft tissue human occupant model. Proceedings, 2nd International
References
Page: 288
Digital Human Modeling Symposium, University of Michigan & Pennsylvania State University.
Pick, A. J. and Cole, D. J. (2005). Neuromuscular Dynamics in the Driver-Vehicle System. Vehicle System Dynamics, 00(00), pp. 1-10.
Pickles, A.P., Alderson, K.L. and Evans, K.E. (1996).The effects of powder morphology on the processing of auxetic polypropylene PP of negative Poisson’s ratio, Polymer Engineering & Science, 36 (5), pp. 636-642.
Plagenhoef, S., Evans, F.G. and Abdelnour, T. (1983). Anatomical data for analyzing human motion. Research Quarterly for Exercise and Sport, 54, pp. 169-178.
Pope, M.H., Broman, H. and Hansson, T. (1989). The dynamic response of a seated subject on various cushions. Ergonomics, 32(10), pp. 1155-1166.
Pope, M.H., Broman, H. and Hanson, T. (1990). Factors affecting the dynamic response of the seated subject. Journal of Spinal disorders. 3(2), pp. 135-142.
Qiu, Y. and Griffin, M. J. (2003). Transmission of fore–aft vibration to a car seat using field tests and laboratory simulation, Journal of Sound and Vibration, 264(1), pp. 135–155.
Qiu, Y. and Griffin, M. J. (2004). Transmission of vibration to the backrest of a car seat evaluated with multi–input models, Journal of Sound and Vibration, 274(1–2), pp. 297–321.
Qiu, Y. (2007). A seat–occupant model for the prediction of backrest transmissibility in the fore–and–aft direction. In: 42nd UK Conference on Human Responses to Vibration, Southampton.
Qiu, Y. and Griffin, M. J. (2010). Biodynamic responses of the seated human body to single–axis and dual–axis vibration. Industrial Health, 48 (5), pp. 615–627.
Qiu, Y. and Griffin, M. J. (2011). Modelling the fore-and-aft apparent mass of the human body and the transmissibility of seat backrests. Vehicle System Dynamics: International Journal of Vehicle Mechanics and Mobility, 49(5), pp. 703-722.
Qiu, Y. and Griffin, M. J. (2012). Biodynamic Response of the Seated Human Body to Single–axis and Dual–axis Vibration: Effect of Backrest and Non–linearity. Industrial Health, 50, pp. 37–51.
Rakheja, S., Stiharu, I. and Boileau, P. (2002). Seated occupant apparent mass characteristics under automotive postures and vertical vibration. Journal of Sound and Vibration, 253 (1), pp. 57–75.
References
Page: 289
Rakheja, S., Stiharu, I., Zhang, H. and Boileau, P. (2006). Seated occupant interactions with seat backrest and pan, and biodynamic responses under vertical vibration. Journal of Sound and Vibration, 298, pp. 651–671.
recaro-automotive.com, (2018). Recaro Automotive Seating's Official Website. [online] Available at:-https://www.recaro.
Reed, M. P., Schneider, L. W. and Ricci, L. L. (1994). Survey of auto seat design recommendations for improved comfort. UMTRI, 6. pp. 5-10.
reliabilitydirectstore.com, (2018). Reliability Direct Store's Official Website. [online] Available at: https://www.reliabilitydirectstore.com/kb_results.asp?ID=26 [Accessed 13 Jul. 2018].
Rhimi. (2015). Virtual dummy for ergonomical analysis. [online] Grabcad. Available at: https://grabcad.com/library/dummy-car-seat-1 [Accessed 17 Jul. 2017].
Ruetzel, S. and Woelfel, H.P. (2005). The Benefit of Modal Analysis for Whole Body Vibration Models. Darmstadt: Darmstadt University of Technology- Conference & Exposition on Structural Dynamics, pp. 1-11.
Rusch, K. C. (1965). Dynamic Behaviour of Flexible Open-cell Foams. Ph. D. Thesis, Engineering, general, University of Akron.
Saha, P. N. (1985). Anthropometric characteristics among industrial workers in India. Proceedings of International Symposium on Ergonomics in Developing Countries, Jakarta, Indonesia, pp. 158-161.
Schrodt, M., Benderoth, G., Kuhhorn, A. and Silber. G. (2005). Hyperelastic Description of Polymer Soft Foams at Finite Deformations. Technische Mechanik, 25, pp. 162-173.
Seidel, H., Bluethner, R. and Hinz, B. (2001). Application of finite-element models to predict forces acting on the lumbar spine during whole body vibration. Clinical Biomechanics, 16(1), pp. S57-S63.
Setyabudhy, R. H., Ali, A., Hubbard, R. P., Beckett, C. and Averill, R. C. (1997). Measuring and Modeling of Human Soft Tissue and Seat Interaction. SAE International Congress and Exposition, 10.4271/970593.
sharcnet.ca, (2018). SAS IP, Inc.'s Official Website. [online] Available at: https://www.sharcnet.ca/Software/Ansys/16.2.3/en-us/help/wb_sim/ds_contact_theory.html [Accessed 25 May. 2018].
Siefert A., Pankoke, S. and Wölfel, H-P. (2008). Virtual optimisation of car passenger seats: Simulation of static and dynamic effects on drivers’ seating comfort. International Journal of Industrial Ergonomics, 38, pp.410–424.
References
Page: 290
Silber, G and Then C. (2009). Numerical Analysis of the Interactions between Human Body Soft Tissue and Body Supports. SIMULIA Customer Conference, pp. 1-15.
Shan, C.W., Ghazali, M.I. and Idris, M.I. (2012). Improved Vibration Characteristics of Flexible Polyurethane Foam Via Composite Formation. International Journal of Automotive and Mechanical Engineering, 7, pp. 1031-1042.
Simo, B. (1986). On material representation and constitutive branching in finite compressible elasticity. J. Mechanics of Solids, 34(2), pp. 125–145.
Singh, R., Davies, P. and Bajaj, A.K. (2003). Estimation of the dynamical properties of polyurethane foam through use of Prony series. Journal of Sound and Vibration, 263(2003), pp. 1005-1043.
Singh, R., Davies, P. and Bajaj, A. K. (2003). Identification of nonlinear and viscoelastic properties of flexible polyurethane foam. Nonlinear Dynamics, 34, pp. 319–346.
Siefert, A., Pankoke, S. and Wolfel, H. P. (2008). Virtual optimisation of car passenger seats: Simulation of static and dynamic effects on drivers’ seating comfort. International Journal of Industrial Ergonomics, 38, pp. 410–424.
Sitnik, L.J., Magdziak-Toklowicz, M., Wróbel, R. and Kardasz, P. (2013). Vehicle Vibration in Human Health. Journal of KONES Powertrain and Transport, 20(4), pp. 411-418.
Smith, S.D. (1997). Cushions and suspensions: predicting their effects on the biodynamic responses of humans exposed to vertical vibration. Heavy vehicle systems, Int. J. of Vehicle Design, 4(2-4), pp. 296-316.
Smith, S.D. (2000). Modeling differences in the vibration response characteristics of the human body. Journal of Biomechanics, 33, pp. 1513-1516.
Sonenblum, S.E., Sprigle, S.H., Cathcart, J.M. and Winder, R. J. (2015). 3D anatomy and deformation of the seated buttocks. Journal of Tissue Viability, 24, pp. 51-61.
Spyrou, L. A. and Aravas, N. (2011). Muscle and Tendon Tissues: Constitutive Modeling and Computational Issues. Journal of Applied Mechanics, 78, pp. 1-10.
Stein, G. J., Chmúrny, R. and Rosík, V. (2011). Compact Vibration Measuring System for in-vehicle Applications. Measurement Science Review, 11(5), pp. 154-159.
Stein, G.J., Múčka, P., Chmúrny, R., Hinzb, B. and Blüthner, R. (2007). Measurement and modelling of x-direction apparent mass of the seated human body–cushioned seat system. Journal of Biomechanics, 40, pp. 1493-1503.
References
Page: 291
Tamaoki, G. Yoshimura, T. and Nakai, K. (2005). Multi–body Dynamics Modelling of Seated Human Body under Exposure to Whole–Body Vibration. Industrial Health, 43, pp. 441–447.
Tang, C, Y., Chan, W. and Tsui, C.P. (2010). Finite Element Analysis of Contact Pressures between Seat Cushion and Human Buttock-Thigh Tissue. Scientific Research, 2, pp. 720-726.
test-meter.co.uk, (2018). Test Meter & Test Equipment Experts's Official Website. [online] Available at: https://www.test-meter.co.uk/tenmars-st-140-vibration-meter/?utm_source=google_shopping&gclid=EAIaIQobChMI1Lvego6d3AIVSLDtCh3muAEPEAQYFCABEgKfDPD_BwE [Accessed 13 Jul. 2018].
tester.co.uk, (2018). PassTM's Official Website. [online] Available at: https://www.tester.co.uk/extech-vb300-3-axis-g-force-usb-datalogger?fee=3&fep=3396&gclid=EAIaIQobChMI1Lvego6d3AIVSLDtCh3muAEPEAQYAyABEgKny_D_BwE [Accessed 13 Jul. 2018].
tester.co.uk, (2018). PassTM's Official Website. [online] Available at: https://www.tester.co.uk/extech-sdl800-vibration-meter-datalogger?fee=3&fep=3395&gclid=EAIaIQobChMI1Lvego6d3AIVSLDtCh3muAEPEAQYByABEgJwKvD_BwE [Accessed 13 Jul. 2018].
Tewari, V.K. and Prasad, N. (2000). Optimum seat pan and back-rest parameters for a comfortable tractor seat. Ergonomics, 43(2), pp. 167-186.
Thite, A. N. (2012). Development of a Refined Quarter CarModel for the Analysis of Discomfort due to Vibration. Hindawi Publishing Corporation - Advances in Acoustics and Vibration, 2012(863061), pp. 1-7.
Tiemessen, I. J., Hulshof, C. T. J. and Frings–Dresen, M. H. W. (2007). An overview of strategies to reduce whole–body vibration exposure on drivers: A systematic review. International journal of industrial ergonomics, 37, pp. 245–256.
Todd, B. A. and Thacker, J.G. (1194). Three-dimensional computer model of the human buttocks, in vivo. The Journal of Rehabilitation Research and Development, 31(2). pp. 111-119.
Toward, M. G. R. and Griffin, M. J. (2009). Apparent mass of the human body in the vertical direction: Effect of seat backrest. Journal of Sound and Vibration, 327, pp. 657–669.
Toward, M. G. R. and Griffin, M. J. (2010). Apparent mass of the human body in the vertical direction: Effect of a footrest and a steering wheel. Journal of Sound and Vibration, 329, pp. 1586–1596.
References
Page: 292
Toward, M. G. R. and Griffin, M. J. (2011a). Apparent mass of the human body in the vertical direction: inter–subject variability. Journal of Sound and Vibration, 330 (4), pp. 827–841.
Toward, M. G. R. and Griffin, M. J. (2011b). The transmission of vertical vibration through seats: Influence of the characteristics of the human body. Journal of Sound and Vibration, 330 (26), pp. 6526–6543.
Tufano, S. and Griffin, M. J. (2013). Nonlinearity in the vertical transmissibility of seating: the role of the human body apparent mass and seat dynamic stiffness. Vehicle System Dynamics, 51 (1), pp. 122–138.
Van den Bogert, P. A. J. and DeBorst, R. (1994). On the behaviour of rubberlike materials in compression and shear. Arcive of. Applied Mechanics, 64, pp. 136–146.
Verver, M.M. (2004). Numerical tools for comfort analyses of automotive seating. Eindhoven: Technische Universiteit Eindhoven, pp. 7-70.
Wagnac, E.L., Aubin, C.E., C and Dansereau, J. (2008). A new method to generate a patient-specific finite element model of the human buttocks. Biomed. Eng. IEEE Trans, 55(2), pp. 774-783.
Wan, Y. and Schimmels, J.M. (1995). A simple model that captures the essential dynamics of a seated human exposed to whole body vibration. Advances in Bioengineering, ASME, BED, 31, pp. 333-334.
Wang, H. and Zhang, D. (2004). Modeling and simulation with finite element method in vehicle seats. Journal of Tongji University (Natural Science), 32 (7).
Wang, W., Rakheja, S. and Boileau, P. (2004). Effects of sitting postures on biodynamic response of seated occupants under vertical vibration. International Journal of Industrial Ergonomics, 34, pp. 289–306.
Wang, W., Rakheja, S. and Boileau, P. (2008). Relationship between measured apparent mass and seat–to–head transmissibility responses of seated occupants exposed to vertical vibration. Journal of Sound and Vibration, 314, pp. 907–922.
Wang, Y. and Cuitino, A. M. (2000). Three-dimensional nonlinear open-cell foams with large deformations. Journal of the Mechanics and Physics of Solids, 48, pp. 961–988.
Wardell, Gareth. (2007). Jaguar XK Coupe Review. The Auto Channel.
Warner, C.Y., Stother, C.E., James, M.B. and Decker, R.L. (1991). Occupant protection inrear-end collisions: II. The role of seat back deformation in injury reduction. Proceedings of the 35stStapp Car Crash Conference 1991, pp.379-390, SAE no912914.
References
Page: 293
Wei, L. and Griffin, M. J. (1998a). Mathematical models for the apparent mass of the seated human body exposed to vertical vibration. Journal of Sound and Vibration, 212 (5), pp. 855– 874.
Wei, L. and Griffin, M. J. (1998b). The prediction of seat transmissibility from measures of seat impedance. Journal of sound and vibration, 214 (1), pp. 121–137.
Wildman, E. C. (2000). Foundations of the Human Body. Advanced human nutrition, 1st ed.
Williamson, P. (2005). Aspects of Simulation of Automobile Seating Using LS-Dyna 3D. Bamberg: LS-DYNA Anwenderforum, pp. 53-60.
Wu, X., Rakheja, S. and Boileau, P.E. (1998). Study of human-seat interface pressure distribution under vertical vibration. International Journal of Industrial Ergonomics, 21, pp. 433-449.
Yousif, H. I. Y. (2012). Auxetic Polyurethane Foam (Fabrication, Properties and Applications). MSc Thesis- Helwan University, pp. 2-10.
Yun, M.H. Donges, L. and Freivalds, A. (1992). Using force sensitive resistors to evaluate the driver seating comfort. Advances in Industrial Ergonomics and Safety, 4, pp. 403-410.
Zengkang, G., Hillis, A.H. and Darling, J. (2013). Biodynamic modelling of seated human subjects exposed to whole-body vibration in both vertical and fore-and-aft directions. Centre for Power Transmission and Motion Control.
Zhang, J., Kikuchi, N., Li, V., Yee, A. and Nusholtz, G. (1998). Constitutive Modeling of Polymeric Foam Material Subjected to Dynamic Crash Loading. International Journal of Impact Engineering, 21(5), pp. 734-743.
Zhang, L. Z. and Dupuis, R. (2011). Measurement and identification of dynamic properties of flexible polyurethane foam. Journal of Vibration and Control, 17, pp. 517–526.
Zhang, L., Helander, M.G. and Drury, C.G. (1996). Identifying factors of comfort and discomfort in sitting. Human Factors, 38(3), pp. 377-389.
Zhang, X. (2014). Measurement and Modelling of Seating Dynamics to Predict Seat Transmissibility. Thesis for the degree of Doctor of Philosophy- Institute of Sound And Vibration Research, pp. 50-226.
Zhang, Y., Zhong, W., Zhu. H., Chen, Y., Xu, L. and Zhu, J. (2013). Establishing the 3-D finite element solid model of femurs in partial by volume rendering. International Journal of Surgery, 11, pp. 930-934.
References
Page: 294
Zheng, G., Qiu, Y. and Griffin. M. J. (2011). An analytic model of the in–line and cross–axisapparent mass of the seated human body exposed to vertical Vibration with and without a backrest. Journal of Sound and Vibration, 330, pp. 6509–6525.
Zengkang, G., Andrew J., Hillis, A.J. and Darling, J. (2013). Development of a Biodynamic Model of a Seated Human Body Exposed to Low Frequency Whole-body Vibration. 11th International Conference on Vibration ProblemsAt: Lisbon, Portugal.
Zimmermann, C. L. and Cook, T. M. (1997). Effects of vibration frequency and postural changes on human responses to seated whole-body vibration exposure. Int Arch Occup Environ Health, 69(3), pp. 165-79.
Zitzewitz, Paul. Merrill Physics Principles and Problems. New York: Glencoe, 1995: 91.
zoro.co.uk, (2018). Zoro's Official Website. [online] Available at: https://www.zoro.co.uk/shop/measuring-and-test-equipment/vibration-meters/9070-smart-vibration-meter/p/ZT1017797X?utm_campaign=pla-Measuring+%26+Test+Equipment+-+&utm_source=google&utm_medium=shopping-pla&utm_keyword=ZT1017797X&istCompanyId=6aa6787b-063e-4414-802d-129f235df603&istItemId=wtqixrlxqa&istBid=tztt&gclid=EAIaIQobChMI1Lvego6d3AIVSLDtCh3muAEPEAQYBCABEgL9PPD_BwE [Accessed 13 Jul. 2018].
Appendix A
Page: 295
APPENDIX A. AUTHOR’S PUBLICATIONS
Journal Papers
Mondal, P. and Arunachalam, S. (2020). Unique Finite Element Modeling of Human Body inside Accelerating Car to predict Accelerations and Frequencies at Different Human Segments. Applied Sciences, MDPI, 10(5), pp. 1861 (16 Pages).
Mondal, P. and Arunachalam, S. (2020). Finite Element Modelling of Car Seat with Hyperelastic and Viscoelastic Foam Material Properties to Assess Vertical Vibration in Terms of Acceleration. Engineering, Scientific Research Publishing, Vol. 12(3), pp. 177-193.
Mondal, P. and Arunachalam, S. (2020). Modelling the Car Seated Human Body using Composite Ellipsoidal Bodies and Evaluation of Size and Shape Specific Stiffness Data for Various Human Segments. SSRG International Journal of Mechanical Engineering, Seventh Sense Research Group®, 7(2), pp. 26-32.
Mondal, P. and Arunachalam, S. (2020). Compact System for Measuring Vibration at Different locations of Car Seat and Human Driver in Dynamic Condition. International Journal of Innovative Research in Science, Engineering and Technology, 9(2), pp. 13669-13676.
Mondal, P. and Arunachalam, S. (2018). Vibration Study in Human-Car Seat System: Overview and a Novel Simulation Technique. Journal of Material Sciences & Engineering, OMICS International, 7(1), pp. 1000421 (5 Pages).
Conference Articles
Mondal, P. and Arunachalam, S. (2019). Vibration in car seat- occupant system: Overview and proposal of a novel simulation method. AIP Conference Proceedings 2080, 040003 (2019), pp. 040003-1 - 040003-8 (8 Pages).
Appendix B
Page: 296
APPENDIX B. ABAQUS INPUT FILE FOR SIMULATION OF COMBINED HUMAN BODY AND CAR SEAT
*Heading
** Job name: Job-Final Model name: Model-0_Final
** Generated by: Abaqus/CAE 6.13-1
*Preprint, echo=NO, model=NO, history=NO, contact=NO
**
** PARTS
**
*Part, name=A_Head
*End Part
**
*Part, name=B_Torso
*End Part
**
*Part, name=C1_Arm-Upper_Left
*End Part
**
*Part, name=C2_Arm-Upper_Right
*End Part
Appendix B
Page: 297
**
*Part, name=D1_Arm-Lower_Left
*End Part
**
*Part, name=D2_Arm-Lower_Right
*End Part
**
*Part, name=E1_Hand_Left
*End Part
**
*Part, name=E2_Hand_Right
*End Part
**
*Part, name=F1_Upper-Leg_Left
*End Part
**
*Part, name=F2_Upper-Leg_Right
*End Part
**
*Part, name=G1_Lower-Leg_Left
*End Part
**
*Part, name=G2_Lower-Leg_Right
*End Part
**
*Part, name=H1_Foot_Left
*End Part
**
*Part, name=H2_Foot_Right
*End Part
Appendix B
Page: 298
**
*Part, name=Seat-Backrest
*End Part
**
*Part, name=Seat-Cushion
*End Part
**
*Part, name=Seat-Headrest
*End Part
**
**
** ASSEMBLY
**
*Assembly, name=Assembly
**
*Instance, name=H2_Foot_Right, part=H2_Foot_Right
*Node
1, -13.5, -81.1750183, 947.150146
2, -63.5, -102.741776, 968.716858
3, -63.5, -174.866669, 853.458496
4, -63.5, 12.5166321, 1040.8418
5, -113.5, -81.1750183, 947.150146
6, -63.5, -59.6082611, 925.583374
7, -16.3632259, -88.3684235, 954.343506
8, -23.3587856, -94.0334549, 960.008545
9, -32.3830833, -98.0563583, 964.031494
10, -42.3745422, -100.722237, 966.697327
11, -52.8382492, -102.245758, 968.220886
12, -63.5, -109.507454, 961.83667
13, -63.5, -116.155807, 954.843018
Appendix B
Page: 299
14, -63.5, -122.682129, 947.735413
15, -63.5, -129.079483, 940.511475
16, -63.5, -135.33812, 933.167053
17, -63.5, -141.44458, 925.695618
18, -63.5, -147.380203, 918.087891
19, -63.5, -153.118683, 910.330444
................................** Due to space constrain further list omitted**.......................
*Nset, nset=m_Set-1, instance=H1_Foot_Left
4,
*Nset, nset=m_Set-2, instance=H2_Foot_Right
3,
*Nset, nset=m_Set-3, instance=G1_Lower-Leg_Left
4,
*Nset, nset=m_Set-4, instance=G2_Lower-Leg_Right
4,
*Nset, nset=m_Set-5, instance=F1_Upper-Leg_Left
5,
*Nset, nset=m_Set-6, instance=F2_Upper-Leg_Right
3,
*Nset, nset=m_Set-7, instance=E1_Hand_Left
5,
*Nset, nset=m_Set-8, instance=E2_Hand_Right
1,
*Nset, nset=m_Set-9, instance=D1_Arm-Lower_Left
3,
*Nset, nset=m_Set-10, instance=D2_Arm-Lower_Right
3,
*Nset, nset=m_Set-11, instance=C1_Arm-Upper_Left

Appendix B
Page: 300
3,
*Nset, nset=m_Set-12, instance=C2_Arm-Upper_Right
2,
*Nset, nset=m_Set-13, instance=A_Head
6,
*Nset, nset=_PickedSet89, internal, instance=H1_Foot_Left
4,
*Nset, nset=_PickedSet90, internal, instance=G1_Lower-Leg_Left
3,
*Nset, nset=_PickedSet91, internal, instance=H2_Foot_Right
3,
*Nset, nset=_PickedSet92, internal, instance=G2_Lower-Leg_Right
3,
*Nset, nset=_PickedSet93, internal, instance=G1_Lower-Leg_Left
4,
*Nset, nset=_PickedSet94, internal, instance=F1_Upper-Leg_Left
1,
*Nset, nset=_PickedSet95, internal, instance=G2_Lower-Leg_Right
4,
*Nset, nset=_PickedSet96, internal, instance=F2_Upper-Leg_Right
4,
*Nset, nset=_PickedSet97, internal, instance=F1_Upper-Leg_Left
5,
*Nset, nset=_PickedSet99, internal, instance=F2_Upper-Leg_Right
3,
*Nset, nset=_PickedSet116, internal, instance=B_Torso
14,
*Nset, nset=_PickedSet117, internal, instance=B_Torso
9,
*Nset, nset=_PickedSet118, internal, instance=E1_Hand_Left
Appendix B
Page: 301
5,
*Nset, nset=_PickedSet119, internal, instance=D1_Arm-Lower_Left
4,
*Nset, nset=_PickedSet120, internal, instance=E2_Hand_Right
1,
*Nset, nset=_PickedSet121, internal, instance=D2_Arm-Lower_Right
4,
*Nset, nset=_PickedSet122, internal, instance=D1_Arm-Lower_Left
3,
*Nset, nset=_PickedSet123, internal, instance=C1_Arm-Upper_Left
4,
*Nset, nset=_PickedSet124, internal, instance=D2_Arm-Lower_Right
3,
*Nset, nset=_PickedSet125, internal, instance=C2_Arm-Upper_Right
6,
*Nset, nset=_PickedSet126, internal, instance=C1_Arm-Upper_Left
3,
*Nset, nset=_PickedSet127, internal, instance=B_Torso
4,
*Nset, nset=_PickedSet128, internal, instance=C2_Arm-Upper_Right
2,
*Nset, nset=_PickedSet129, internal, instance=B_Torso
1,
*Nset, nset=_PickedSet130, internal, instance=B_Torso
3,
*Nset, nset=_PickedSet131, internal, instance=A_Head
6,
*Elset, elset=_m_Surf-14_S3, internal, instance=Seat-3-1
86, 218, 281, 2492, 4351, 4355, 4409, 4425, 4429, 10076, 10812, 10842, 11586,
12351, 12490, 12525
Appendix B
Page: 302
12640, 13283, 13344, 13540, 14289, 14341, 14473, 14657, 14919, 14976, 15053, 15068,
15087, 15107, 15119, 15149
15178, 15181, 15197, 15255, 15324, 15347, 15495, 15584, 15870, 16082, 16142, 16746,
17030, 17082, 17238, 17583
17891, 17907, 18153, 18182, 18209, 18239, 18350, 18404, 18417, 18446, 18453, 18468,
18505, 18513, 18558, 19290
19409, 19432, 19475, 19503, 19508, 19749, 19752, 19887, 19970, 20076, 20217, 20222,
20320, 20700, 20703, 20818
21325, 21355, 21377, 21410, 21440, 21457, 21626, 21676, 21883, 21906, 21914, 21927,
21957, 21982, 22018, 22031
22038, 22048, 22049, 22068, 22078, 22080, 22105, 22116, 22137, 22139, 22140, 22157,
22198, 22212, 22225, 22229
22235, 22236, 22304, 22598, 22602, 22615, 22715, 22716, 22724, 22729, 22743, 22759,
22762, 22763, 22764, 22765
22772, 22773, 22779, 22820, 22821, 22823, 22827, 22839, 22844, 22849, 22857, 22861,
22868, 22875, 22879, 22893
22908, 22930, 22940, 22942, 22946, 22951, 22984, 22987, 22990, 22991, 22992, 22997,
23000, 23004, 23008, 23009
23016, 23017, 23022, 23160, 23162, 23238, 23247, 24596, 24709, 24784, 25288, 25290,
25554, 25651, 26438, 26687
26691, 26784, 26786, 27713, 27715, 28486, 28487, 28867, 29296, 29297, 29543, 30451,
30454, 30587, 31506, 31702
31868, 32108, 32197, 32604, 32605, 32705, 32737, 32848, 33063, 33072, 33792, 33914,
34057, 34180, 34585, 34586
34645, 34649, 34854, 35145, 35216, 35337, 36000, 37177, 37672, 38410, 38411, 39158,
39332, 39335, 41071, 41735
41751, 41873, 41875, 42902, 42961, 48874
*Elset, elset=_m_Surf-14_S1, internal, instance=Seat-3-1
11694, 20058, 20168, 20233, 22196, 22867
*Elset, elset=_m_Surf-14_S4, internal, instance=Seat-3-1
Appendix B
Page: 303
14979, 18254, 18441, 18550, 19959, 20059, 21264, 21645, 21941, 32103, 34778, 41874,
46869
*Elset, elset=_m_Surf-14_S2, internal, instance=Seat-3-1
15035, 18396, 22146, 22177, 22733, 22863, 22872, 32513
*Surface, type=ELEMENT, name=m_Surf-14
_m_Surf-14_S3, S3
_m_Surf-14_S1, S1
_m_Surf-14_S4, S4
_m_Surf-14_S2, S2
*Elset, elset=_m_Surf-16_S3, internal, instance=Seat-2-1
268, 301, 422, 774, 860, 1091, 1506, 1509, 1598, 1601, 1790, 2161, 2295, 2301,
2365, 2447
2467, 2553, 2583, 2587, 2630, 2709, 2767, 2890, 2984, 3136, 3208, 3279, 3292, 3412,
3432, 3472
3473, 3495, 3515, 3523, 3555, 3586, 3587, 3598, 3633, 3638, 3646, 3653, 3657, 3671,
3678, 3686
3689, 3694, 3702, 3719, 3731, 3733, 3737, 3748, 3770, 3782, 3852
*Elset, elset=_m_Surf-16_S4, internal, instance=Seat-2-1
1224, 1237, 2317, 3718, 3726, 3730, 3773
*Elset, elset=_m_Surf-16_S2, internal, instance=Seat-2-1
2275, 2475, 2717, 3542, 3564, 3606, 3630, 3634, 3664, 3674, 3681, 3778
*Elset, elset=_m_Surf-16_S1, internal, instance=Seat-2-1
3415, 3696, 3706, 3766, 3800, 3841
................................** Due to space constrain further list omitted**.......................
*Elset, elset=_s_Surf-14_S2, internal, instance=Seat-1-1
5283, 5287, 8458, 12258, 12723, 13940, 13942, 15594, 18719, 25044, 26501
*Elset, elset=_s_Surf-14_S3, internal, instance=Seat-1-1
Appendix B
Page: 304
5294, 7481, 11470, 12266, 12270, 12496, 13920, 13968, 14937, 14954, 14994, 15022,
15043, 15237, 15374, 15841
16008, 16013, 16016, 16045, 16110, 16134, 16626, 16824, 17037, 17043, 17682, 17867,
18225, 18242, 18283, 18722
18736, 18928, 23906, 24022, 25016, 25038, 25062, 25064, 25076, 25077, 25081, 25082,
25087, 25099, 25104, 25109
25110, 25114, 25117, 25129, 25133, 25140, 25144, 25155, 25157, 25164, 25179, 25182,
25185, 25186, 25197, 25199
25200, 25210, 25224, 25237, 25242, 25249, 25256, 25260, 25262, 25268, 25273, 25274,
25275, 25277, 25285, 25286
25292, 25296, 25299, 25301, 25308, 25319, 26944, 28817, 29120, 29655, 29658, 29660,
30055, 30822, 30823, 30825
31312, 31314, 31727, 31740, 32392, 34008, 34568, 34717, 35198, 35494, 36168, 36169,
39799, 41414, 41868, 42170
42532,
*Elset, elset=_s_Surf-14_S1, internal, instance=Seat-1-1
5432, 12501, 12726, 15346, 15907, 18231, 18342, 23989, 25142, 25153, 25214, 25254
*Elset, elset=_s_Surf-14_S4, internal, instance=Seat-1-1
14952, 15926, 16074, 18721, 22496, 22499, 23299, 25058, 25241, 34566, 42438, 47729
*Surface, type=ELEMENT, name=s_Surf-14
_s_Surf-14_S2, S2
_s_Surf-14_S3, S3
_s_Surf-14_S4, S4
_s_Surf-14_S1, S1
*Elset, elset=_s_Surf-16_S2, internal, instance=Seat-3-1
31, 4649, 5158
*Elset, elset=_s_Surf-16_S3, internal, instance=Seat-3-1
200, 3896, 4141, 4152, 4703, 4753, 4809, 4874, 4924, 4981, 5300, 5312, 5354,
5369, 5373, 5383
Appendix B
Page: 305
5385, 5392, 6036, 6264, 6268, 6270, 6278, 6286, 6304, 6314, 6343, 6346, 6356,
6363, 6365, 6368
6372, 6373, 6393, 6399, 6415, 6423, 6436, 6437, 6440, 6443, 6534, 8184, 8572,
9469, 11164, 11209
11255, 11277, 15644, 22433, 23028, 23032, 23384, 24612
*Elset, elset=_s_Surf-16_S4, internal, instance=Seat-3-1
37277,
................................** Due to space constrain further list omitted**.......................
*Surface, type=ELEMENT, name=s_Surf-28
_s_Surf-28_S3, S3
_s_Surf-28_S1, S1
_s_Surf-28_S4, S4
_s_Surf-28_S2, S2
*Surface, type=NODE, name=_PickedSet89_CNS_, internal
_PickedSet89, 1.
*Surface, type=NODE, name=_PickedSet90_CNS_, internal
_PickedSet90, 1.
*Surface, type=NODE, name=_PickedSet91_CNS_, internal
_PickedSet91, 1.
*Surface, type=NODE, name=_PickedSet92_CNS_, internal
_PickedSet92, 1.
*Surface, type=NODE, name=_PickedSet93_CNS_, internal
_PickedSet93, 1.
*Surface, type=NODE, name=_PickedSet94_CNS_, internal
_PickedSet94, 1.
*Surface, type=NODE, name=_PickedSet95_CNS_, internal
_PickedSet95, 1.
*Surface, type=NODE, name=_PickedSet96_CNS_, internal

Appendix B
Page: 306
_PickedSet96, 1.
*Surface, type=NODE, name=_PickedSet97_CNS_, internal
_PickedSet97, 1.
*Surface, type=NODE, name=_PickedSet116_CNS_, internal
_PickedSet116, 1.
*Surface, type=NODE, name=_PickedSet99_CNS_, internal
_PickedSet99, 1.
*Surface, type=NODE, name=_PickedSet117_CNS_, internal
_PickedSet117, 1.
*Surface, type=NODE, name=_PickedSet118_CNS_, internal
_PickedSet118, 1.
*Surface, type=NODE, name=_PickedSet119_CNS_, internal
_PickedSet119, 1.
*Surface, type=NODE, name=_PickedSet120_CNS_, internal
_PickedSet120, 1.
*Surface, type=NODE, name=_PickedSet121_CNS_, internal
_PickedSet121, 1.
*Surface, type=NODE, name=_PickedSet122_CNS_, internal
_PickedSet122, 1.
*Surface, type=NODE, name=_PickedSet123_CNS_, internal
_PickedSet123, 1.
*Surface, type=NODE, name=_PickedSet124_CNS_, internal
_PickedSet124, 1.
*Surface, type=NODE, name=_PickedSet125_CNS_, internal
_PickedSet125, 1.
*Surface, type=NODE, name=_PickedSet126_CNS_, internal
_PickedSet126, 1.
*Surface, type=NODE, name=_PickedSet127_CNS_, internal
_PickedSet127, 1.
*Surface, type=NODE, name=_PickedSet128_CNS_, internal
Appendix B
Page: 307
_PickedSet128, 1.
*Surface, type=NODE, name=_PickedSet129_CNS_, internal
_PickedSet129, 1.
*Surface, type=NODE, name=_PickedSet130_CNS_, internal
_PickedSet130, 1.
*Surface, type=NODE, name=_PickedSet131_CNS_, internal
_PickedSet131, 1.
** Constraint: A1_Foot-LowerLeg-Left
*Tie, name=A1_Foot-LowerLeg-Left, adjust=yes
_PickedSet90_CNS_, _PickedSet89_CNS_
** Constraint: A2_Foot-LowerLeg-Right
*Tie, name=A2_Foot-LowerLeg-Right, adjust=yes
_PickedSet92_CNS_, _PickedSet91_CNS_
** Constraint: A3_LowerLeg-UpperLeg-Left
*Tie, name=A3_LowerLeg-UpperLeg-Left, adjust=yes
_PickedSet94_CNS_, _PickedSet93_CNS_
** Constraint: A4_LowerLeg-UpperLeg-Right
*Tie, name=A4_LowerLeg-UpperLeg-Right, adjust=yes
_PickedSet96_CNS_, _PickedSet95_CNS_
** Constraint: A5_UpperLeg-Torso_Left
*Tie, name=A5_UpperLeg-Torso_Left, adjust=yes
_PickedSet116_CNS_, _PickedSet97_CNS_
** Constraint: A6_UpperLeg-Torso_Right
*Tie, name=A6_UpperLeg-Torso_Right, adjust=yes
_PickedSet117_CNS_, _PickedSet99_CNS_
** Constraint: A7_Hand-LowerArm-Left
*Tie, name=A7_Hand-LowerArm-Left, adjust=yes
_PickedSet119_CNS_, _PickedSet118_CNS_
** Constraint: A8_Hand-LowerArm-Right
*Tie, name=A8_Hand-LowerArm-Right, adjust=yes
Appendix B
Page: 308
_PickedSet121_CNS_, _PickedSet120_CNS_
** Constraint: A9_LowerArm-UpperArm-Left
*Tie, name=A9_LowerArm-UpperArm-Left, adjust=yes
_PickedSet123_CNS_, _PickedSet122_CNS_
** Constraint: A10_LowerArm-UpperArm-Right
*Tie, name=A10_LowerArm-UpperArm-Right, adjust=yes
_PickedSet125_CNS_, _PickedSet124_CNS_
** Constraint: A11_UpperArm-Torso-Left
*Tie, name=A11_UpperArm-Torso-Left, adjust=yes
_PickedSet127_CNS_, _PickedSet126_CNS_
** Constraint: A12_UpperArm-Torso-Right
*Tie, name=A12_UpperArm-Torso-Right, adjust=yes
_PickedSet129_CNS_, _PickedSet128_CNS_
** Constraint: A13_Torso-Head
*Tie, name=A13_Torso-Head, adjust=yes
_PickedSet131_CNS_, _PickedSet130_CNS_
** Constraint: Seat-Head
*Tie, name=Seat-Head, adjust=yes
s_Surf-28, m_Surf-28
** Constraint: Seat-Torso
*Tie, name=Seat-Torso, adjust=yes
s_Surf-24, m_Surf-24
** Constraint: Seat-thigh
*Tie, name=Seat-thigh, adjust=yes
s_Surf-26, m_Surf-26
*End Assembly
*Amplitude, name=Amp-1
0.001, -0.1, 0.002, -0.25, 0.003, -0.45, 0.004,
-0.5
Appendix B
Page: 309
0.005, -0.06, 0.006, -0.7, 0.007, -0.8, 0.008,
-0.82
0.009, -0.84, 0.01, -0.861
**
** MATERIALS
**
*Material, name="A_Head including Neck"
*Density
1.36231e-09,
*Elastic
3006.01, 0.49
*Material, name=B_Torso
*Density
1.01635e-09,
*Elastic
3006.01, 0.49
*Material, name="C_Upper Arm"
*Density
2.15631e-09,
*Elastic
3006.01, 0.49
*Material, name="D_Lower Arm"
*Density
1.94668e-09,
*Elastic
3006.01, 0.49
*Material, name=E_Hand
*Density
6.35495e-09,
*Elastic
Appendix B
Page: 310
3006.01, 0.49
*Material, name="F_Upper Leg"
*Density
1.22481e-09,
*Elastic
3006.01, 0.49
*Material, name="G_Lower Leg"
*Density
1.51112e-09,
*Elastic
3006.01, 0.49
*Material, name=H_Foot
*Density
1.25143e-09,
*Elastic
3006.01, 0.49
*Material, name=Seat
*Density
6.4e-11,
*Hyperfoam, n=2, moduli=LONG TERM
0.00481, 19.8, 0.0036, 19.8, 0.0145, 0.0065
*Viscoelastic, frequency=PRONY
0.3003, 0., 0.010014
0.1997, 0., 0.1002
**
** INTERACTION PROPERTIES
**
*Surface Interaction, name=Seat-Human-Contact
1.,
*Friction, rough
Appendix B
Page: 311
**
** BOUNDARY CONDITIONS
**
** Name: Foot Type: Displacement/Rotation
*Boundary
Set-15, 1, 1
Set-15, 2, 2
Set-15, 3, 3
Set-15, 5, 5
Set-15, 6, 6
** Name: Hand Type: Displacement/Rotation
*Boundary
Set-16, 1, 1
Set-16, 2, 2
Set-16, 3, 3
Set-16, 4, 4
Set-16, 6, 6
** Name: SeatCushionBottom Type: Displacement/Rotation
*Boundary
Set-48, 1, 1
Set-48, 2, 2
Set-48, 3, 3
Set-48, 4, 4
Set-48, 5, 5
Set-48, 6, 6
** ----------------------------------------------------------------
**
** STEP: A_NaturalFrequency
**
*Step, name=A_NaturalFrequency, nlgeom=NO, perturbation
Appendix B
Page: 312
*Frequency, eigensolver=Lanczos, acoustic coupling=off, normalization=displacement
25, , 50., , ,
**
** OUTPUT REQUESTS
**
*Restart, write, frequency=0
**
** FIELD OUTPUT: F-Output-1
**
*Output, field, variable=PRESELECT
*End Step
** ----------------------------------------------------------------
**
** STEP: B_Modal Dynamics
**
*Step, name="B_Modal Dynamics", nlgeom=NO, perturbation
*Modal Dynamic, continue=NO
0.001, 10.
*Modal Damping
1, 20, 0.2
**
** BOUNDARY CONDITIONS
**
** Name: Acceleration Type: Acceleration base motion
*Base Motion, type=ACCELERATION, dof=3, amplitude=Amp-2, scale=1.
1.40802e-07, -95.3873, -268.587
**
** LOADS
**
** Name: Load-3 Type: Gravity
Appendix B
Page: 313
*Dload
, GRAV, 981., 0., -1., 0.
**
** OUTPUT REQUESTS
**
**
** FIELD OUTPUT: F-Output-2
**
*Output, field
*Node Output
A, AT, TU, U, V
**
** HISTORY OUTPUT: H-Output-1
**
*Output, history, variable=PRESELECT
*End Step
Appendix C
Page: 314
APPENDIX C. ABAQUS INPUT FILE FOR SIMULATION OF HUMAN BODY
*Heading
** Job name: Job-1 Model name: Model-1
** Generated by: Abaqus/CAE 6.13-1
*Preprint, echo=NO, model=NO, history=NO, contact=NO
**
** PARTS
**
*Part, name=A_Head
*Node
1, 3.61502998e-07, 725.192749, -252.52298
2, 0., 887.672546, -188.256912
3, 77.5, 731.610413, -175.289154
4, -77.5, 731.610413, -175.289154
5, -3.61503453e-07, 738.028015, -98.0553284
6, 0., 575.548218, -162.321396
7, 3.59910501e-07, 739.715271, -253.393555
8, 3.55195539e-07, 754.262451, -253.587967
9, 3.47243173e-07, 768.802185, -253.085251
10, 3.35904446e-07, 783.297913, -251.850357
11, 3.2095366e-07, 797.705017, -249.830963
Appendix C
Page: 315
12, 3.02067491e-07, 811.964844, -246.952713
13, 2.78793948e-07, 825.995117, -243.111496
14, 2.50504854e-07, 839.672241, -238.16188
15, 2.16331301e-07, 852.797913, -231.900452
16, 1.75101277e-07, 865.031128, -224.046768
17, 1.25407666e-07, 875.752869, -214.246628
18, 6.63420749e-08, 883.84375, -202.211594
19, 14.2237844, 885.021606, -188.036652
20, 26.8875351, 877.97937, -187.451477
21, 37.5418739, 868.139893, -186.633881
22, 46.3815804, 856.638611, -185.678192
23, 53.7084007, 844.119751, -184.637955
24, 59.7735863, 830.944824, -183.543213
25, 64.7634354, 817.327759, -182.411713
26, 68.8126297, 803.403198, -181.254684
27, 72.0181046, 789.261597, -180.079605
28, 74.4491272, 774.967163, -178.89183
29, 76.1541138, 760.568665, -177.695404
30, 77.1650085, 746.105103, -176.493576
31, 76.0108566, 730.358398, -190.35672
32, 71.6006622, 729.15448, -204.845261
33, 64.4388962, 728.044922, -218.197968
34, 54.8007774, 727.072449, -229.901718
35, 43.056694, 726.274292, -239.506729
36, 29.6579666, 725.681274, -246.643906
37, 15.1195011, 725.31604, -251.038956
38, -15.1194983, 725.31604, -251.038956
39, -29.6579666, 725.681274, -246.643906
40, -43.0566902, 726.274292, -239.506729
41, -54.8007736, 727.072449, -229.901718
Appendix C
Page: 316
42, -64.4388962, 728.044922, -218.197968
43, -71.6006622, 729.15448, -204.845261
44, -76.0108566, 730.358398, -190.356735
45, -77.1650085, 746.105103, -176.493576
46, -76.1541138, 760.568665, -177.695404
47, -74.4491272, 774.967163, -178.89183
48, -72.0181046, 789.261536, -180.07959
49, -68.8126297, 803.403198, -181.254669
50, -64.7634354, 817.327698, -182.411713
51, -59.7735939, 830.944824, -183.543213
52, -53.7084122, 844.11969, -184.637955
53, -46.3815956, 856.638611, -185.678192
54, -37.5418968, 868.139832, -186.633881
55, -26.8875618, 877.979309, -187.451477
................................** Due to space constrain further list omitted**.......................
*Elset, elset=__PickedSurf114_S2, internal, instance=A_Head
1633, 1715, 3882, 4552, 4749, 4847, 4889, 5135, 5175, 5219, 5721, 5941, 5989, 6108,
6120, 7157
7231, 7264, 7650, 7903, 7995, 8392, 8451, 8620, 8647, 8729, 8942
*Elset, elset=__PickedSurf114_S4, internal, instance=A_Head
2299, 2435, 2850, 3069, 3212, 3235, 3953, 4076, 4360, 4453, 4846, 4897, 4951, 5522,
5593, 5709
5744, 5774, 5907, 6245, 6430, 6475, 7103, 7174, 7194, 7317, 7383, 7528, 7530, 7591,
7669, 7824
7940, 8258, 8339, 8466, 8468, 9132
*Elset, elset=__PickedSurf114_S1, internal, instance=A_Head
12, 1710, 2862, 3253, 3353, 4710, 4867, 8461, 8836, 8987, 9101, 9366, 9784
*Surface, type=ELEMENT, name=_PickedSurf114, internal
__PickedSurf114_S3, S3
__PickedSurf114_S2, S2

Appendix C
Page: 317
__PickedSurf114_S4, S4
__PickedSurf114_S1, S1
*Surface, type=NODE, name=_PickedSet89_CNS_, internal
_PickedSet89, 1.
*Surface, type=NODE, name=_PickedSet90_CNS_, internal
_PickedSet90, 1.
*Surface, type=NODE, name=_PickedSet91_CNS_, internal
_PickedSet91, 1.
*Surface, type=NODE, name=_PickedSet92_CNS_, internal
_PickedSet92, 1.
*Surface, type=NODE, name=_PickedSet93_CNS_, internal
_PickedSet93, 1.
*Surface, type=NODE, name=_PickedSet94_CNS_, internal
_PickedSet94, 1.
*Surface, type=NODE, name=_PickedSet95_CNS_, internal
_PickedSet95, 1.
*Surface, type=NODE, name=_PickedSet96_CNS_, internal
_PickedSet96, 1.
*Surface, type=NODE, name=_PickedSet97_CNS_, internal
_PickedSet97, 1.
*Surface, type=NODE, name=_PickedSet116_CNS_, internal
_PickedSet116, 1.
*Surface, type=NODE, name=_PickedSet99_CNS_, internal
_PickedSet99, 1.
*Surface, type=NODE, name=_PickedSet117_CNS_, internal
_PickedSet117, 1.
*Surface, type=NODE, name=_PickedSet118_CNS_, internal
_PickedSet118, 1.
*Surface, type=NODE, name=_PickedSet119_CNS_, internal
_PickedSet119, 1.

Appendix C
Page: 318
*Surface, type=NODE, name=_PickedSet120_CNS_, internal
_PickedSet120, 1.
*Surface, type=NODE, name=_PickedSet121_CNS_, internal
_PickedSet121, 1.
*Surface, type=NODE, name=_PickedSet122_CNS_, internal
_PickedSet122, 1.
*Surface, type=NODE, name=_PickedSet123_CNS_, internal
_PickedSet123, 1.
*Surface, type=NODE, name=_PickedSet124_CNS_, internal
_PickedSet124, 1.
*Surface, type=NODE, name=_PickedSet125_CNS_, internal
_PickedSet125, 1.
*Surface, type=NODE, name=_PickedSet126_CNS_, internal
_PickedSet126, 1.
*Surface, type=NODE, name=_PickedSet127_CNS_, internal
_PickedSet127, 1.
*Surface, type=NODE, name=_PickedSet128_CNS_, internal
_PickedSet128, 1.
*Surface, type=NODE, name=_PickedSet129_CNS_, internal
_PickedSet129, 1.
*Surface, type=NODE, name=_PickedSet130_CNS_, internal
_PickedSet130, 1.
*Surface, type=NODE, name=_PickedSet131_CNS_, internal
_PickedSet131, 1.
** Constraint: A1_Foot-LowerLeg-Left
*Tie, name=A1_Foot-LowerLeg-Left, adjust=yes
_PickedSet90_CNS_, _PickedSet89_CNS_
** Constraint: A2_Foot-LowerLeg-Right
*Tie, name=A2_Foot-LowerLeg-Right, adjust=yes
_PickedSet92_CNS_, _PickedSet91_CNS_
Appendix C
Page: 319
** Constraint: A3_LowerLeg-UpperLeg-Left
*Tie, name=A3_LowerLeg-UpperLeg-Left, adjust=yes
_PickedSet94_CNS_, _PickedSet93_CNS_
** Constraint: A4_LowerLeg-UpperLeg-Right
*Tie, name=A4_LowerLeg-UpperLeg-Right, adjust=yes
_PickedSet96_CNS_, _PickedSet95_CNS_
** Constraint: A5_UpperLeg-Torso_Left
*Tie, name=A5_UpperLeg-Torso_Left, adjust=yes
_PickedSet116_CNS_, _PickedSet97_CNS_
** Constraint: A6_UpperLeg-Torso_Right
*Tie, name=A6_UpperLeg-Torso_Right, adjust=yes
_PickedSet117_CNS_, _PickedSet99_CNS_
** Constraint: A7_Hand-LowerArm-Left
*Tie, name=A7_Hand-LowerArm-Left, adjust=yes
_PickedSet119_CNS_, _PickedSet118_CNS_
** Constraint: A8_Hand-LowerArm-Right
*Tie, name=A8_Hand-LowerArm-Right, adjust=yes
_PickedSet121_CNS_, _PickedSet120_CNS_
** Constraint: A9_LowerArm-UpperArm-Left
*Tie, name=A9_LowerArm-UpperArm-Left, adjust=yes
_PickedSet123_CNS_, _PickedSet122_CNS_
** Constraint: A10_LowerArm-UpperArm-Right
*Tie, name=A10_LowerArm-UpperArm-Right, adjust=yes
_PickedSet125_CNS_, _PickedSet124_CNS_
** Constraint: A11_UpperArm-Torso-Left
*Tie, name=A11_UpperArm-Torso-Left, adjust=yes
_PickedSet127_CNS_, _PickedSet126_CNS_
** Constraint: A12_UpperArm-Torso-Right
*Tie, name=A12_UpperArm-Torso-Right, adjust=yes
_PickedSet129_CNS_, _PickedSet128_CNS_
Appendix C
Page: 320
** Constraint: A13_Torso-Head
*Tie, name=A13_Torso-Head, adjust=yes
_PickedSet131_CNS_, _PickedSet130_CNS_
*End Assembly
**
** MATERIALS
**
*Material, name="A_Head including Neck"
*Density
1.09267e-09,
*Elastic
3006.01, 0.49
*Material, name=B_Torso
*Density
8.15181e-10,
*Elastic
3006.01, 0.49
*Material, name="C_Upper Arm"
*Density
1.72951e-09,
*Elastic
3006.01, 0.49
*Material, name="D_Lower Arm"
*Density
1.56138e-09,
*Elastic
3006.01, 0.49
*Material, name=E_Hand
*Density
5.09711e-09,
Appendix C
Page: 321
*Elastic
3006.01, 0.49
*Material, name="F_Upper Leg"
*Density
9.8238e-10,
*Elastic
3006.01, 0.49
*Material, name="G_Lower Leg"
*Density
1.21202e-09,
*Elastic
3006.01, 0.49
*Material, name=H_Foot
*Density
1.00374e-09,
*Elastic
3006.01, 0.49
**
** BOUNDARY CONDITIONS
**
** Name: Foot Type: Displacement/Rotation
*Boundary
Set-15, 1, 1
Set-15, 2, 2
Set-15, 3, 3
Set-15, 4, 4
Set-15, 5, 5
Set-15, 6, 6
** Name: Hand Type: Displacement/Rotation
*Boundary
Appendix C
Page: 322
Set-16, 1, 1
Set-16, 2, 2
Set-16, 3, 3
Set-16, 4, 4
Set-16, 5, 5
Set-16, 6, 6
** Name: TorsoBack Type: Displacement/Rotation
*Boundary
Set-18, 1, 1
Set-18, 2, 2
Set-18, 3, 3
Set-18, 5, 5
Set-18, 6, 6
** Name: UpperLeg Type: Displacement/Rotation
*Boundary
Set-17, 1, 1
Set-17, 2, 2
Set-17, 4, 4
Set-17, 6, 6
** ----------------------------------------------------------------
**
** STEP: A_NaturalFrequency
**
*Step, name=A_NaturalFrequency, nlgeom=NO, perturbation
*Frequency, eigensolver=Lanczos, acoustic coupling=on, normalization=displacement
100, , , , ,
**
** OUTPUT REQUESTS
**
*Restart, write, frequency=0
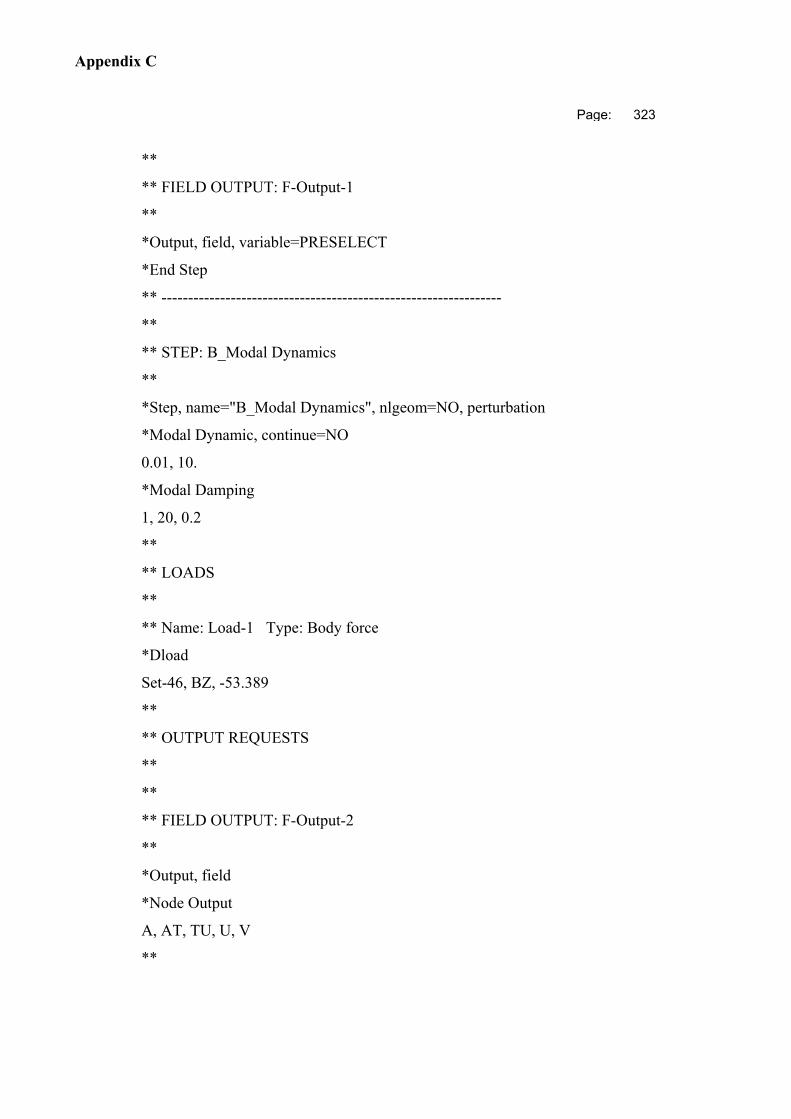
Appendix C
Page: 323
**
** FIELD OUTPUT: F-Output-1
**
*Output, field, variable=PRESELECT
*End Step
** ----------------------------------------------------------------
**
** STEP: B_Modal Dynamics
**
*Step, name="B_Modal Dynamics", nlgeom=NO, perturbation
*Modal Dynamic, continue=NO
0.01, 10.
*Modal Damping
1, 20, 0.2
**
** LOADS
**
** Name: Load-1 Type: Body force
*Dload
Set-46, BZ, -53.389
**
** OUTPUT REQUESTS
**
**
** FIELD OUTPUT: F-Output-2
**
*Output, field
*Node Output
A, AT, TU, U, V
**

Appendix C
Page: 324
** HISTORY OUTPUT: H-Output-1
**
*Output, history, variable=PRESELECT
*End Step