Analysis of diurnal and vertical microbial diversity of a hypersaline microbial mat
Upload
khangminh22Category
view
0download
0
Investigation of microbial diversity in an
acid tar lagoon and the effect of low pH on
two microorganisms isolated from an acid
tar lagoon
Leanne Sunter
PhD Thesis
Department of Molecular Biology and Biotechnology
University of Shemeld
January 2008
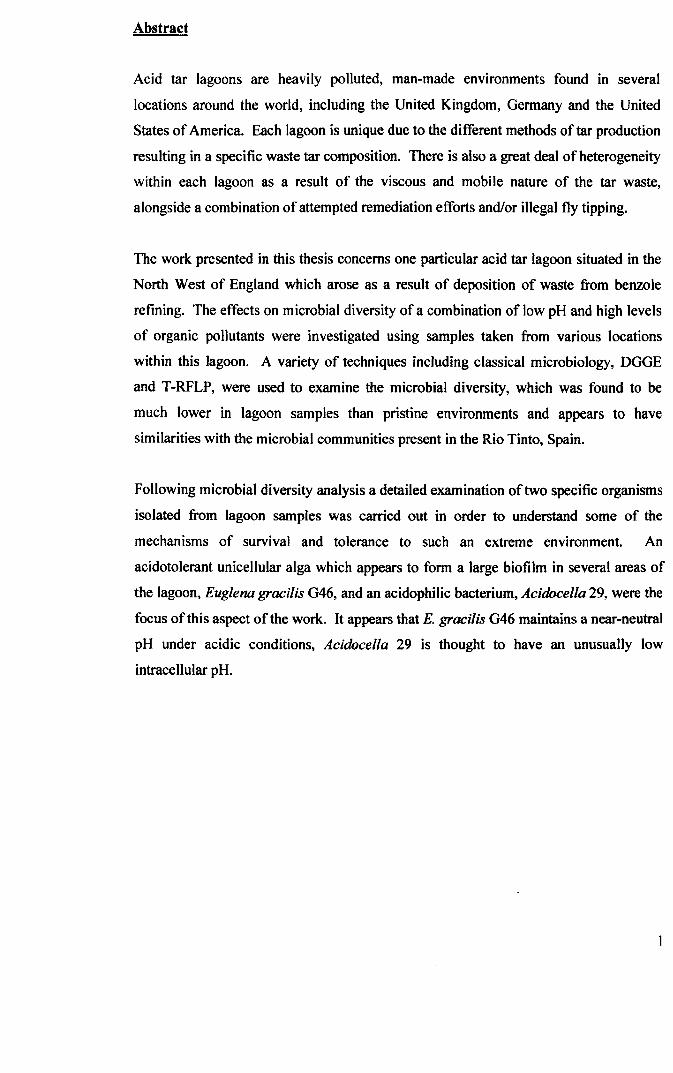
Abstract
Acid tar lagoons are heavily polluted, man-made environments found in several
locations around the world, including the United Kingdom, Germany and the United
States of America. Each lagoon is unique due to the different methods of tar production
resulting in a specific waste tar composition. There is also a great deal of heterogeneity
within each lagoon as a result of the viscous and mobile nature of the tar waste,
alongside a combination of attempted remediation efforts and/or illegal fly tipping.
The work presented in this thesis concerns one particular acid tar lagoon situated in the
North West of England which arose as a result of deposition of waste from benzole
refining. The effects on microbial diversity of a combination of low pH and high levels
of organic pollutants were investigated using samples taken from various locations
within this lagoon. A variety of techniques including classical microbiology, DGGE
and T -RFLP, were used to examine the microbial diversity, which was found to be
much lower in lagoon samples than pristine environments and appears to have
similarities with the microbial communities present in the Rio Tinto, Spain.
Following microbial diversity analysis a detailed examination of two specific organisms
isolated from lagoon samples was carried out in order to understand some of the
mechanisms of survival and tolerance to such an extreme environment. An
acidotolerant unicellular alga which appears to form a large biofilm in several areas of
the lagoon, Euglena gracilis G46, and an acidophilic bacterium, Acidocella 29, were the
focus ofthis aspect ofthe work. It appears that E. gracilis G46 maintains a near-neutral
pH under acidic conditions, Acidocella 29 is thought to have an unusually low
intracellular pH.
Acknowledgements
T would like to thank several individuals for their help and support throughout this work,
however none of this would have been possible had it not been for the financial support
of the University of Sheffield for both myself and this research. I would like to express
my deepest gratitude towards Dr. lim Gilmour, my supervisor, for all his help, guidance
and support throughout my PhD. I would also like to thank Dr. Colin Smith, in the
Department of Civil and Structural Engineering at the University of Sheffield, for
introducing Jim and myself to the problem of acid tar lagoons and for allowing us
access to Hoole Bank acid tar lagoon.
I would also like to take this opportunity to thank Dr. Ashley Houlden, for all his
technical help, know how, patience and equipment lending without which I don't quite
know where I'd be. Thanks also to Dr. Mark Osbom for allowing me generous access
to his Post-Doe and equipment. Dr. Malcolm Lock deserves a massive thank you for
his much used technical assistance and support throughout his time in the lab with me
and beyond, and for proofreading most of this thesis. I would also like to take this
opportunity to thank Vicky Porteous and other members of E24, who kindly donated
ultra-competent E. Coli (knowingly or not).
2
Page
Chapter One: General Introduction ............................................................................. 8
1.1: Microbial Diversity ............................................................................................. 8
1.2: Molecular Methods Used to Assess Diversity ................................................. 11
1.2.1: Terminal Restriction Fragment Length Polymorphisms (T -RFLP) ............. 16
1.2.2: Denaturing Gradient Gel Electrophoresis (DOGE) ..................................... 19
1.2.3: Amplified 16S Ribosomal DNA Restriction Analysis (ARDRA) ............... 20
1.2.4: Gene libraries and metagenomics ................................................................ 21
1.2.5: Fluorescence In Situ Hybridisation (FISH) .................................................. 23
1.2.6: Future prospects ........................................................................................... 23
1.3: Acidic Environments ......................................................................................... 24
1.3.1: Acid mine drainage (AMO) ......................................................................... 24
1.3.2: Acid tar lagoons ........................................................................................... 26
1.3.3: Hoole Bank acid tar lagoon, Cheshire, UK .................................................. 31
1.3.4: Remediation of acid tar lagoons ................................................................... 35
1.4: Survival of Microorganisms in Acidic Environments ................................... 36
1.5: Acidophiles ......................................................................................................... 40
1.5.1: Iron oxidising prokaryotes ........................................................................... 41
1.5.2: Sulphur oxidisers .......................................................................................... 41
1.5.3: Heterotrophic organisms .............................................................................. 42
1.5.4: Acidophilic eukaryotes ................................................................................. 44
1.6: Aims of the Project ............................................................................................ 45
Chapter Two: Materials and Methods ...................................................................... .46
2.1: Isolation of Microorganisms ............................................................................ 46
2.1.1: Sample collection ......................................................................................... 46
2.1.2: Growth media ............................................................................................... 46
2.1.3: Initial isolation of microorganisms using spread plating ............................ .47
2.1.4: Initial isolation of microorganisms using chemostat culture ...................... .47
2.2: Growth conditions ............................................................................................. 48
2.2.1: Euglena gracilis Z and G46 ......................................................................... 48
2.2.2: Acidocella sp. (29) ....................................................................................... 48
2.3: Chlorophyll Content ......................................................................................... 48
2.4: Protein Determination ...................................................................................... 48
2.5: Photosynthesis and Respiration Measurements ............................................. 49
2.5.1: Oxygen electrode preparation ...................................................................... 49
3
2.5.2: Algal pH shock experiments ..................................................................... 50
2.5.3: Bacterial pH shock experiments ............................................................... 51
2.5.4: Sodium orthovanadate inhibition of proton efflux in E. gracilis ................ 51
2.5.5: Sodium orthovanadate inhibition of proton efflux in Acidocella 29 .......... 51
2.6: Cell separation using the silicone oil technique ........................................... 52
2.6.1: Determination of cell volume ................................................................... 52
2.6.2: Determination of intracellular pH ............................................................. 54
2.6.3: Killed controls .......................................................................................... 55
2.6.4: Measurement of isotope uptake over time ................................................. 55
2.6.5: Measurement of membrane potentiaL ...................................................... 55
2.6.6: Measurement of the effect of valinomycin and gramicidin on membrane potential .............................................................................................................. 56
2.7: Fluorescence Activated Cell Sorting (FACS) ............................................... 57
2.7.1: Measurement of ~\jI in Acidocella 29 using F ACS .................................... 58
2.7.2: Measuring intracellular pH in Acidocella 29 using FACS ......................... 59
2.8: Nuclear Magnetic Resonance (NMR) ........................................................... 59
2.8.1: E. gracilis ................................................................................................. 59
2.8.2: Acidocella 29 ........................................................................................... 59
2.9: Malate Dehydrogenase Activity ................................................................... 60
2.9.1: Preparation of E. gracilis cell free extract.. ............................................... 60
2.9.2: Enzyme activity determination ................................................................. 60
2.10: Agarose Gel Electrophoresis ...................................................................... 61
2.11: Genomic DNA Extraction .......... : ................................................................ 61
2.11.1: Environmental samples .......................................................................... 61
2.11.2: E. gracilis 046 ....................................................................................... 62
2.11.3: Unknown microorganisms ...................................................................... 62
2.12: Phylogenetic Identification of Unknown Organisms ................................. 62
2.12.1: 16S rRNA PC:R ...................................................................................... 62
2.12.2: 18S rRNA PCR ...................................................................................... 63
2.13: Ribulose-1,S-bisphosphate Carboxylase/oxygenase PCR .......................... 63
2.14: Denaturing Gradient Gel Electrophoresis (DGGE) .................................. 64
2.14.1: PC:R ....................................................................................................... 64
2.14.2: Preparation of solutions .......................................................................... 65
2.14.3: Casting a gel. .......................................................................................... 65
2.14.4: Identification of bands ............................................................................ 66
2.1S: T-RFLP ....................................................................................................... 67
4

2.15.1: PCR ............................................................................................................ 67
2.15.2: Restriction digest ........................................................................................ 68
2.15.3: Fragment analysis ....................................................................................... 68
2.16: Phylogenetic Tree Construction .................................................................... 70
2.17: Photosystem 11 Fluorescence Measurements ................................................ 70
2.18: Characterisation of Acidocella ....................................................................... 70
2.19: LysoSensor Imaging of E. gracHis ................................................................. 71
Chapter Three: Characterisation of Microbial Diversity in Hoole Bank Acid Tar Lagoon ................................................................................................ , ........................... 72
3.1: Introduction ....................................................................................................... 72
3.2: Results ................................................................................................................ 72
3.2.1: Satnple collection ......................................................................................... 72
3.2.2: Classical microbiology analysis of microbial diversity ............................... 75
3.2.3: Microbial community analysis using Terminal Restriction Fragment Length Polymorphism (T -RFLP) ........................................................................................ 78
3.2.4: Microbial community analysis using Denaturing Gradient Gel Electrophoresis (DOGE) ......................................................................................... 99
3.3: General Discussion .......................................................................................... 104
Chapter Four: Characterisation of "Green 46" - Eu.glena gracHis G46 ............... 11 0
4.1: Introduction ..................................................................................................... 110
4.2: Results .............................................................................................................. 110
4.2.1: Identification of "Green 46" ....................................................................... 11 0
4.2.2: Intracellular pH .......................................................................................... 114
4.2.3: Rubisco analysis ......................................................................................... 119
4.2.4: Malate dehydrogenase acitivity .................................................................. 121
4.2.5: Maintenance of intracellular pH ................................................................. 122
4.2.5.1: Proton emux inhibition ....................................................................... 122
4.2.5.2: Reversed transmembrane potential ..................................................... 124
4.2.5.3: Effect of valinomycin and gramicidin on transmembrane potential ... 124
4.2.6: Effect of pH on photosynthesis and respiration ......................................... 125
4.2.7: Photosynthetic efficiency measurements ................................................... 127
4.2.8: Photo system 11 inhibition ........................................................................... 128
4.3: General DiscussioD .......................................................................................... 129
5
Chapter Five: Characterisation of Acidocella 29 .................................................... 136
5.1: Introduction ..................................................................................................... 136
5.2: Results .............................................................................................................. 136
5.2.1: Identification of Acidocella 29 ................................................................... 136
5.2.2: Biochemical characterisation ..................................................................... 138
5.2.3: Intracellular pH of Acidocella 29 ............................................................... 141
5.2.4: Measurement of membrane potential of Acidocella 29 ............................. 146
5.2.5: Effect of pH on respiration in Acidocella 29 ............................................. 148
5.2.6: Effect of sodium orthovanadate on respiration .......................................... 151
5.3: General Discussion .......................................................................................... 152
Chapter Six: Conclusions and Future Work ........................................................... 157
Chapter Seven: References ........................................................................................ 162
Appendices ........................................................... , ....................................................... 184
Appendix A - List of microbial strains used ............................................................. 184
Appendix B - List of suppliers .................................................................................. 184
Appendix C - Table of primers used ......................................................................... 185
Appendix D - List of solutions used ......................................................................... 186
Appendix E - Services at the University of Sheffield ............................................... 186
6
Abbreviations
Abbreviations used in this thesis, not including elemental symbols and SI units are as
follows:
ai: concentration inside the cell
AMD: Acid Mine Drainage
ao: concentration outside the cell
APS: Ammonium persulphate
ARDRA: Amplified Ribosomal DNA Restriction Analysis
BAC: Bacterial Artificial Chromosome
BSA: Bovine Serum Albumin
BTEX: Benzene, Toluene, Ethylbenzene and Xylene
CCCP: Carbonyl cyanide 3-chlorophenylhydrazone
Chi: Chlorophyll
DCMU: Diuron; 3-(3,4-dichlorophenyl)-l,l-dimethlyurea
DGGE: Denaturing Gradient Gel Electrophoresis
DMSO: Dimethylsulphoxide
dpm: Disintegrations per minute
ECV: extracellular volume
EDT A: ethylenediaminetetraacetic acid
ICV: intracellular volume
NAD: nicotinamide adenine dinucleotide (oxidised form)
NADH: nicotinamide adenine dinucleotide (reduced form) .
OD: Optical density
PAH: Polycyclic aromatic hydrocarbons
PCR: Polymerase Chain Reaction
pHi: Internal pH
pHo: External pH
rRNA: ribosomal Ribonucleic Acid
TAB: Tris Acetate BOT A
TEMED: N.N.N',N'-Tetramethylethylenediamine
TGGE: Temperature Gradient Gel Electrophoresis
T -RFLP: Terminal Restriction Fragment Length Polymorphism
T -RF(s): Terminal Restriction Fragment(s)
7
Chapter One: General Introduction
1.1: Microbial Diversity
Biodiversity can be defined in several ways ranging from "a popular term used in
scientific and media context to refer to the catalogue of living species that exist in a
certain habitat or ecosystem" (Rodriguez-Valera 2002) to "an attribute of an area and
specifically refers to the variety within and among living organisms, assemblages of
living organisms, biotic communities, and biotic processes, whether naturally occurring
or modified by humans. Biodiversity can be measured in tenns of genetic diversity and
the identity and number of different types of species, assemblages of species, biotic
communities and biotic processes, and the amount (e.g.: abundance, biomass, cover,
rate) and structure of each." (DeLong 1996). The term "BioDiversity" was first coined
in 1986 and since then the concept has been the subject of much research.
In 1998 the known biodiversity on Earth consisted of 1.5 million animal species, 0.3
million plant species (Cases and Lorenzo 2002) and half a million insects (Pace 1997),
compared to only 4500 prokaryotes (Torsvik et al. 2002). This number of prokaryotes
significantly less than 1 % of the total number of species on Earth, which is an
astonishingly small percentage when one considers that prokaryotes have been
estimated to contain between 60-100 % of the total carbon contained in plants
(Whitman et al. 1998).
This begs the question, why have so few microbial species been identified? There are
several reasons for our lack of knowledge regarding microbial diversity. One of the
most significant and well known reasons is the "Great Plate Count Anomaly", a phrase
coined by Staley and Konopka (1985) referring to the discrepancy between the large
number of ceIJs which are visible by microscopy or detectable by fluorescence
hybridisation compared to the numbers which can be cultured by traditional methods
(Staley and Konopka 1985). For example, Torsvik et al achieved a viable colony count
of 4.3 x 10⁷ compared to 1.5 x 10¹⁰ bacteria gram·[ from microscope observations of soil
samples (Torsvik et al. 1990).
This anomaly can be explained by cells which are viable but not culturable. These may
be cells which are unknown species for which no culturing method has been developed,
known species which have entered a dormant state or for which the culturing conditions
8
are not suitable (Amann et al. 1995). For instance, bacteria that are dominant in a
natural environment are not usually adapted to high concentrations of complex organic
carbon (Connon and Giovannoni 2002). Furthermore, many microorganisms require
complex nutritional requirements to grow successfully and can only then be cultured by
specialised techniques (Button et al. 1998; Driessen et al. 1996; Ferris et al. 1996;
Vancanneyt et al. 2001; Wirsen et al. 2002).
Modem microbiology relies on our ability to grow pure cultures, thus media are
specifically designed to promote the growth of one particular type of microorganism,
which usually means that the organisms which are capable of the fastest growth will out
compete all other organisms (Rawlings et al. 1999). This means that it is difficult to
retrieve more than a few organisms from an environmental sample using traditional
methods. Even if a range of media were used to culture organisms from an
environmental sample it is highly unlikely that more than a few species' of organisms
would be recovered from each medium.
Conventional cultivation methods are highly biased and selective, as well as time
consuming (Amann et al. 1995). Attempts to mimic natural conditions are often equally
unsuccessful, suggestions for the lack of success in each case ranging from quorum
sensing inhibition and lysogenic phages to the unknown effects of a microniche
(Rodriguez-Valera 2002).
In many cases there may be complex interactions between microbes growing in a
particular environment. For example, the breakdown of a compound by a particular
organism may remove an inhibiting substance and thus permit growth of other
organisms, as is the case for sulphate reducing bacteria. These organisms require
aerobic organisms to remove acetic acid, a toxic by-product of their anaerobic sulphate
reduction which would kill the cells if it was not removed by other microbial species
(Kimura et al. 2006). Attempts to grow microbes in pure culture may never succeed for
certain organisms which may rely on the presence and activities of other
microorganisms in order to grow. Therefore, isolating certain microorganisms from
environmental samples may not be possible unless other organisms are co-cultured,
which given our limited knowledge and inability to culture most organisms may not be
possible.
9
High throughput methods have been developed using very low nutrient media in an
attempt to isolate previously unknown organisms. Although these methods are
laborious a few organisms have been isolated and cultured. Some 2500 dilution
cultures screened over a three year period gave up to a 1400 fold increase in numbers
compared to traditional methods; however, only four unknown organisms were isolated
(Connon and Giovannoni 2002).
The addition of signalling molecules such as cyclic AMP (cAMP) to media containing a
low concentration of carbon substrate has been shown to increase cultivation
efficiencies when using the most-probable-number (MPN) technique for enumeration.
However, dot blot hybridisation revealed that the strains which had been most
successfully cultured represented only a small fraction of the bacterial community,
indicating limitations in the MPN method (Bruns et al. 2002).
With perseverance and patience there are some successes; with at least 16 of the 27 new
phyla identified since 1986 having cultured representatives (Leadbetter 2003). For
example, Sait and colleagues successfully cultured the first representative of the
previously uncultured subdivision three of the Acidobacteria phylum by waiting for 12
weeks for colonies to develop (Sait et al. 2002). Combined with the use of very dilute
nutrient broth and long incubation times the group also cultured strains representing six
new genera of subdivision I of the Acidobacteria phylum.
Estimates of true prokaryotic diversity range from 13000 (Torsvik et al. 1990) to 36000
(Dykhuizen 1998) species in one 30 cm3 soil sample, leading to one suggestion that
there are more than a thousand million species of bacteria worldwide (Dykhuizen 1998).
Furthermore, evidence suggests that there is a far greater number of organisms present
in the subsurface of the Earth yet to be discovered (pace 1997). Microbial diversity is
extremely rich and for the most part unexplored. The potential for exploitation for
biotechnology given the genetic and biochemical diversity which exists, and which we
have little knowledge of, is enormous (Horkioshi 1995).
One of the reasons why there is such a range in estimates of microbial diversity is the
controversy surrounding what is a species, and more importantly, what is defined as a
species. Traditionally, taxonomists have used visible characteristics to classify higher
organisms such as plants and animals, however this was not particularly suitable when
10
applied to microorganisms which do not exhibit a great deal of morphology and thus
their limited morphologies and biochemistry were used to classify them. This
undoubtedly resulted in many mistakes and it was not until the development of
molecular sequencing that the true phylogenetic perspective was resolved.
By tradition, higher organisms have been defined as species if they interbred and were
able to produce viable offspring. Unfortunately, given the mode of replication. and
genetic exchange in prokaryotes this definition does not apply. One of the most
commonly used and accepted defmitions of a prokaryotic species is DNA-DNA
hybridisation of more than 70 % combined with S 5 °C difference in melting
temperature of DNA, where both units are considered (Wayne et al. 1987). Dykhuizen
(1998) discusses this and concludes that defining species in terms of DNA homology
will underestimate the number of species.
More recently still an operational definition of bacterial species nas been described as "a
monophyletic and genomically coherent cluster of individual organisms that show a
high degree of overall similarity in many independent characteristics, and is diagnosable
by a discriminative phenotypic property" (Rossello-Mora and Amann 200 I). Despite
the discrepancies which arise as a result of species definition there is still exists a large
number of bacterial species to be discovered and characterised. But, how do we resolve
this deficit in our knowledge? Recent work has focused on molecular methods in order
to identify species diversity using 16S rRNA as a molecular marker in many cases.
1.2: Molecular Methods Used to Assess Diversity
Molecular markers are much more reliable for relating and classifying organisms than
phenotypic information because they are more informative with regard to evolutionary
relationships and they are also more readily available (Woese 1987). Molecular
markers were the basis of one of the most significant discoveries in modem biology;
namely that life on Earth consists of three evolutionary lines and not two as had been
thought previously. Based on work with 16S rRNA Carl Woese, and colleagues,
proposed that there should be a new level of taxon above the 5 kingdoms, known as a
domain, and that there would be three domains, comprising archaea, bacteria and
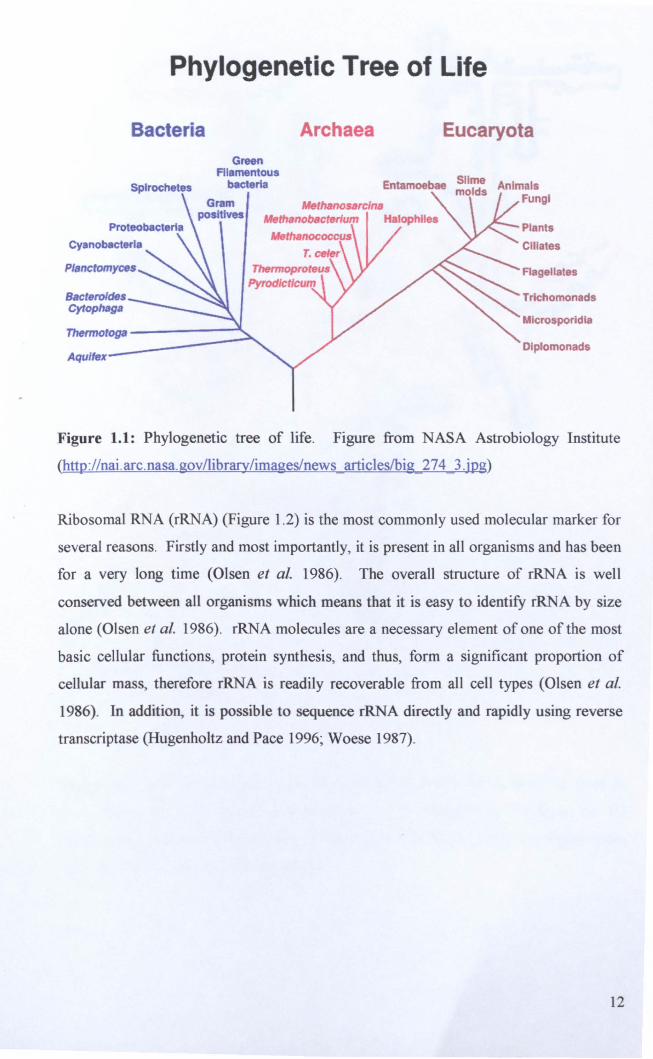
eucarya (Woese et al. 1990) (Figure 1.1). However, almost 20 years on from this
proposal there are still those who do not accept this classification, such as Lyon
Margulis and Michael Dolan (Margulis and Dolan 1999).
11
Phylogenetic Tree of Life
Bacteria Archaea Eucaryota
Bacteroides Cytophaga
Splrochetes
Green Fllamentous
bacteria Entamoebae
MethMJosarcln. Methsnobacterlum Halophile.
Therrnotoga ------,
Aqulfex
Animals Fungi
Plants
Clllates
Flagellates
Trkhornonads
Mlcrosporldla
Dlplomonads
Figure 1.1: Phylogenetic tree of life. Figure from NASA Astrobiology Institute
(http://nai.arc.nasa.gov/library/imageslnews articIes/big 274 3.jpg)
Ribosomal RNA (rRNA) (Figure 1.2) is the most commonly used molecular marker for
several reasons. Firstly and most importantly, it is present in all organisms and has been
for a very long time (Olsen et al. 1986). The overall structure of rRNA is well
conserved between all organisms which means that it is easy to identify rRNA by size
alone (Olsen et al. 1986). rRNA molecules are a necessary element of one of the most
basic cellular functions, protein synthesis, and thus, form a significant proportion of
cellular mass, therefore rRNA is readily recoverable from all cell types (Olsen et al.
1986). In addition, it is possible to sequence rRNA directly and rapidly using reverse
transcriptase (Hugenholtz and Pace 1996; Woese 1987).
12

Figure 1.2: Two dimensional secondary structure of a 16S rRNA molecule from E.
coli. Figure taken from Behrens et al. (2003). The magenta oval highlights the V3
region; the green oval highlights the V9 region whilst the blue circle highlights bases
180-197, the V2.2 hypervariable region.
13
16S rRNA molecules are large (approximately 13 times larger than 5S rRNA) and
consist of many domains which also facilitates their use as molecular markers (Figure
1.2). Certain stretches of rRNA are highly conserved, showing little if any variation
between species, whereas other stretches vary greatly, meaning that sequences can be
aligned by matching invariable stretches and analysed on the basis of differences in
highly variable loop regions. For example, archaeal 16S rRNA molecules are easily
identified from bacterial 16S rRNA or eukaryal 18S rRNA by their unique structure
between positions 180 and 197 (Johnson et al. 2001; Ma et al. 2004; Woese et al.
1990). Furthermore, the length of rRNA is sufficient to permit statistically significant
comparisons (Olsen et al. 1986).
In 1987 over 500 species had been characterised in terms of their rRNA. As of
November 8th 2007 there were 451545 16S rRNA sequences in the Ribosomal Database
Project (Cole et al. 2005; Olsen et al. 1992). Improvements in molecular methods,
sequencing and the genomics revolution have resulted in a vast expansion in our
phylogenetic knowledge of both culturable and non-culturable microorganisms.
Furthermore, as a result of 16S rRNA sequencing from environmental samples, there
has been an increase in the number of phyla from 12 to 52. Only 26 of the putative 52
phyla have cultured representatives (Rappe and Giovanoni 2003). thus we must bear in
mind the limitations of this resource. For instance, whilst 16S rRNA is a good
molecular marker it comprises on average only 0.05 % of the total genome and
therefore is not completely representative (Rodriguez-Valera 2002). Additionally, if an
organism is less than 95 % similar to a cultured organism as assessed by rRNA. very
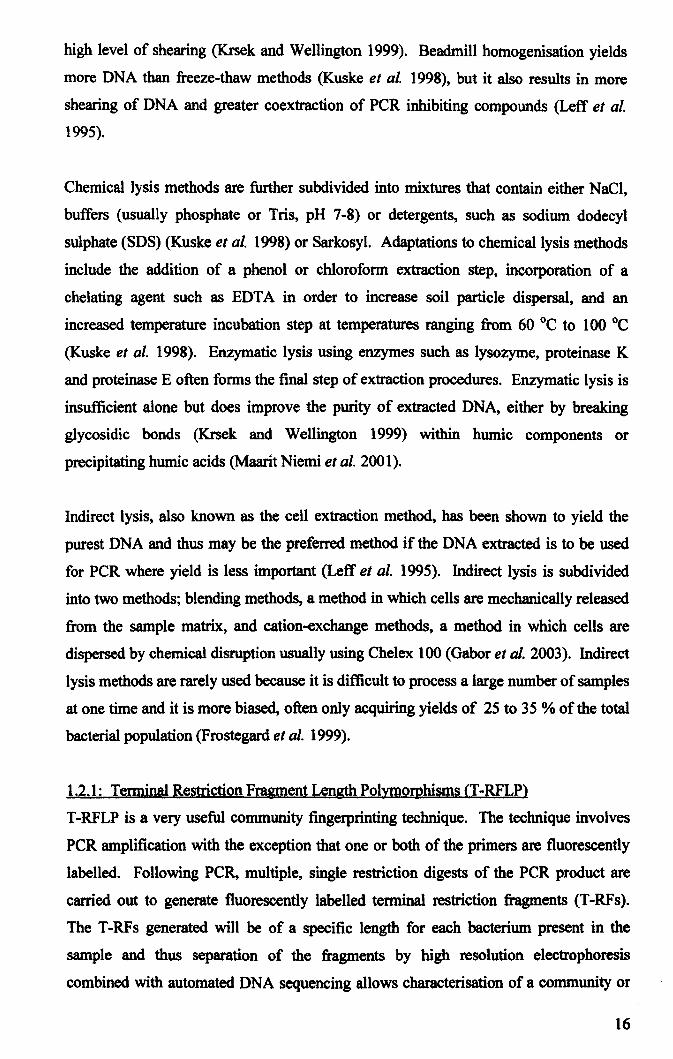
little can be predicted about its characteristics (Rodriguez-Valera 2002). The methods
used to correlate the data gathered from sequencing are variable, each with advantages
and disadvantages, with the most commonly used method being cluster analysis (Olsen
et al. 1986). resulting in dendrograms such as Figure 1.3.
Several of the techniques described below rely on the extraction of total genomic DNA
from environmental samples. As a starting point for all the molecular techniques
described below it is essential that this process is efficient and results not only in
suitable yields of DNA but also suitably sized DNA. Shearing and damage of DNA
often occurs which can result in DNA which is too small to be used in the techniques
described.
14

I L. ferrooxidans OSM270S'
,.----~ Iron Mountain done TRA 1-10
'- L. f"rrooxidans strain Parys
Leptospirilfum sp. DSM2391'
L. ferriphilum strain Warwick
Leptospirillum sp. OSM9468
L. ferr/phl/um strain Falrview
L. ferriphilum ATCC 49881 T
Leptospifl11um sp. MT6 __ r Iron Mountain snottite Clone SC07
L Iron Mountain done BA29
0.05
Group 2
Figure 1.3: A typical dendrogram showing three phylogenetic groups of
Leptospirillum. Figure taken from Johnson et al (2003).
DNA purity is also a concern, especially when dealing with soil samples where levels of
peR inhibitors, such as humic acids, are high. Furthermore, certain extraction
procedures can result in a bias towards recovery of DNA from specific microorganisms
and are not always truly representative. Therefore several extraction and purification
methods have been developed and optimised in order to achieve suitably sized DNA.
There are two main methods of DNA extraction from sediments and soils; direct and
indirect. Direct extraction encompasses all methods which lyse cells within the
sediment or soil, whereas indirect methods are those methods which remove cells from
the soil or sediment before lysis. Direct lysis techniques yield more DNA and are
thought to yield a less biased sample of the microbial community diversity than indirect
cell extraction techniques, where certain cells are much more difficult to remove from
soil colloids for example (Leff et al. 1995).
Direct methods can be further subdivided into three basic elements, including physical
disruption, enzymatic lysis and chemical lysis, of which one, two or all three
components may be involved. Physical disruption methods include ultrasonication,
grinding under liquid nitrogen, freeze-thawing and beadmill homogenisation with the
latter two methods being the most common. Sonication is used infrequently due to a
15
high level of shearing (Krsek and Wellington 1999). Beadmill homogenisation yields
more DNA than freeze-thaw methods (Kuske et al. 1998), but it also results in more
shearing of DNA and greater coextraction of PCR inhibiting compounds (Leff et al.
1995).
Chemical lysis methods are further subdivided into mixtures that contain either NaCI,
buffers (usually phosphate or Tris, pH 7-8) or detergents, such as sodium dodecyl
sulphate (SDS) (Kuske et al. 1998) or Sarkosyl. Adaptations to chemical lysis methods
include the addition of a phenol or chloroform extraction step, incorporation of a
chelating agent such as EDT A in order to increase soil particle dispersal, and an
increased temperature incubation step at temperatures ranging from 60°C to 100°C
(Kuske et al. 1998). Enzymatic lysis using enzymes such as lysozyme, proteinase K
and proteinase E often forms the final step of extraction procedures. Enzymatic lysis is
insufficient alone but does improve the purity of extracted DNA, either by breaking
glycosidic bonds (Krsek and Wellington 1999) within humic components or
precipitating humic acids (Maarit Niemi et al. 2001).
Indirect lysis, also known as the cell extraction method, has been shown to yield the
purest DNA and thus may be the preferred method if the DNA extracted is to be used
for PCR where yield is less important (Leff et al. 1995). Indirect lysis is subdivided
into two methods; blending methods, a method in which cells are mechanically released
from the sample matrix, and cation-exchange methods, a method in which cells are
dispersed by chemical disruption usually using Chelex 100 (Gabor et al. 2003). Indirect
lysis methods are rarely used because it is difficult to process a large number of samples
at one time and it is more biased, often only acquiring yields of 25 to 35 % of the total
bacterial population (Frostegard et al. 1999).
1.2.1: Terminal Restriction Fragment Length Polymorphisms (T -RFLP)
T -RFLP is a very useful community fmgerprinting technique. The technique involves
PCR amplification with the exception that one or both of the primers are fluorescently
labelled. Following PCR, multiple, single restriction digests of the PCR product are
carried out to generate fluorescently labelled terminal restriction fragments (T-RFs).
The T-RFs generated will be of a specific length for each bacterium present in the
sample and thus separation of the fragments by high resolution electrophoresis
combined with automated DNA sequencing allows characterisation of a community or
16

environment. 168 rRNA is the most commonly used marker however any genetic
marker with conserved sequence domains which would allow appropriate primer design
could be utilised.
A wide range of restriction enzymes can be selected, however studies have been
undertaken which revealed that AluI, HhaI and ThaI are preferential since they are most
discriminatory in terms of the number and size of different T-RFs generated (Osbom et
al. 2000). Osbom et al (2000) assessed a range of variables which contribute to
reproducibility including the initial template concentration, number of peR cycles,
choice of Taq polymerase, annealing temperature, restriction enzyme concentration,
injection time and 168 rRNA primer sequences. The outcome of which is a highly
optimised procedure which should provide reliable, reproducible results.
Using sequence information it is also possible to design a multitude of primers for
specific phyla, genera or species and to analyse communities using genes other than 168
rRNA, such as those involved with degradation or a particular kind of metabolism. For
example, Bruce (1997) used mer genes in order to analyse community diversity in terms
of mercury resistance, whilst more recently Castro et al (2005) used dsr A genes to study
the distribution of sulphate-reducing organisms in nutrient-impacted regions.
The procedure has several advantages over other molecular community. analysis
techniques such as denaturing gradient gel electrophoresis (DOGE) and other
electrophoretic separation methods in that it is highly sensitive, reliable and rapid
(Marsh 1999). A greater resolution can be obtained using T -RFLP than DOGE,
temperature gradient gel electrophoreis (TGGE) or single strand conformational
polymorphism (S8CP) with the added benefit that the output is digital. Combining this
technique with the large amount of sequence information available in sequence
databases it is possible to infer vhylogeny of T -RFs since the position of the restriction
site is not random but has a phylogenetic component; however unlike DOGE it is not
possible to identify the organism responsible for each T-RF.
T-RFLP analysis has been successfully employed on a variety of samples including
fungal communities in soils (Edel-Hermann et al. 2004), monitoring nutrient impact on
contaminated soils (Mills et al. 2003), community structure in marine sediments (Braker
et al. 2001), solar salterns (Cassamayor et al. 2002) and bioreactor sludge (Liu et al.
17
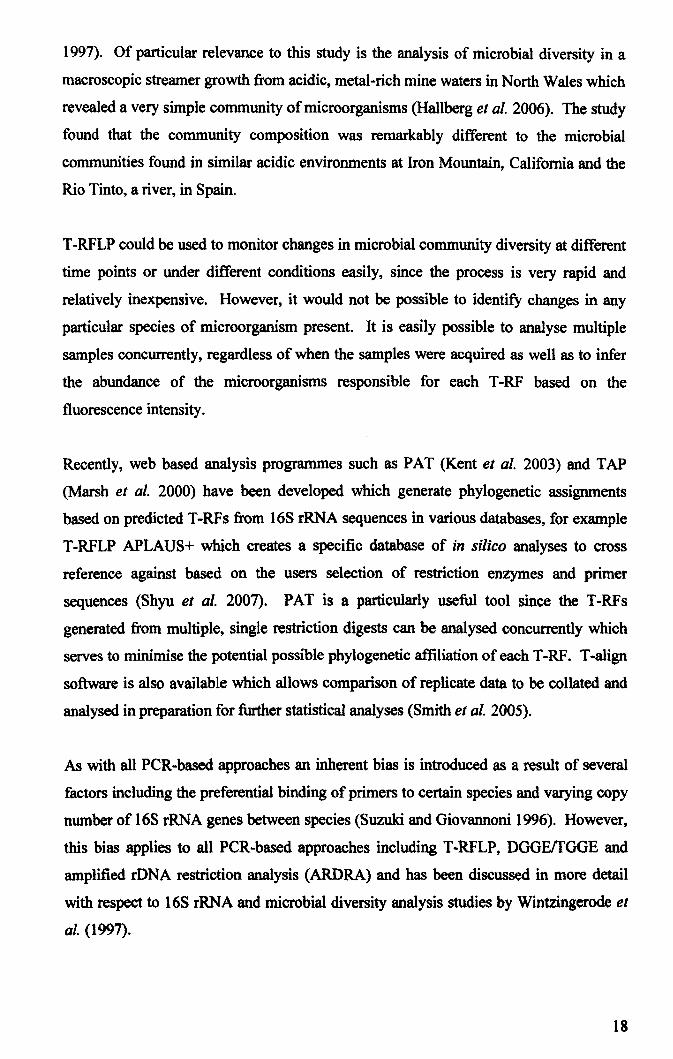
1997). Of particular relevance to this study is the analysis of microbial diversity in a
macroscopic streamer growth from acidic, metal-rich mine waters in North Wales which
revealed a very simple community of microorganisms (Hallberg et al. 2006). The study
found that the community composition was remarkably different to the microbial
communities found in similar acidic environments at Iron Mountain, California and the
Rio Tinto, a river, in Spain.
T -RFLP could be used to monitor changes in microbial community diversity at different
time points or under different conditions easily, since the process is very rapid and
relatively inexpensive. However, it would not be possible to identify changes in any
particular species of microorganism present. It is easily possible to analyse multiple
samples concurrently, regardless of when the samples were acquired as well as to infer
the abundance of the microorganisms responsible for each T -RF based on the
fluorescence intensity.
Recently, web based analysis programmes such as PAT (Kent et al. 2003) and TAP
(Marsh et al. 2000) have been developed which generate phylogenetic assignments
based on predicted T-RFs from 16S rRNA sequences in various databases, for example
T-RFLP APLAUS+ which creates a specific database of in silico analyses to cross
reference against based on the users selection of restriction enzymes and primer
sequences (Shyu et al. 2007). PAT is a particularly useful tool since the T -RFs
generated from mUltiple, single restriction digests can be analysed concurrently which
serves to minimise the potential possible phylogenetic affiliation of each T -RF. T -align
software is also available which allows comparison of replicate data to be collated and
analysed in preparation for further statistical analyses (Smith et al. 2005).
As with all PCR-based approaches an inherent bias is introduced as a result of several
factors including the preferential binding of primers to certain species and varying copy
number of 16S rRNA genes between species (Suzuki and Giovannoni 1996). However,
this bias applies to all PCR-based approaches including T-RFLP, DGGErrOOE and
amplified rDNA restriction analysis (ARDRA) and has been discussed in more detail
with respect to 16S rRNA and microbial diversity analysis studies by Wintzingerode et
al. (1997).
18
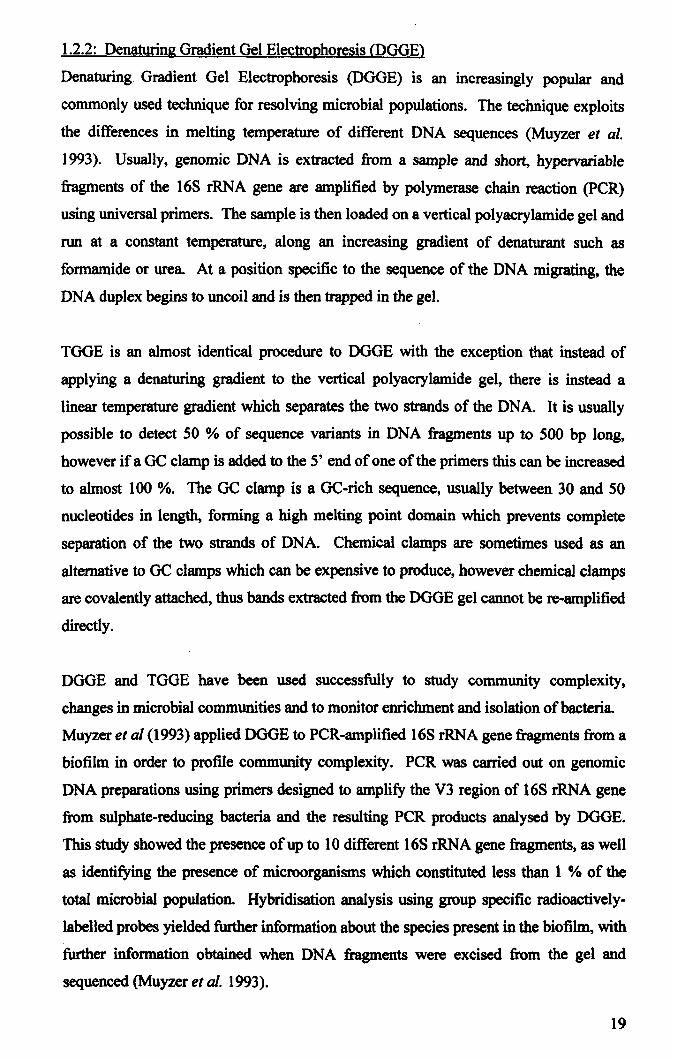
1.2.2: Denaturing Gradient Gel Electrophoresis (DGGE)
Denaturing Gradient Gel Electrophoresis (DOGE) is an increasingly popular and
commonly used technique for resolving microbial populations. The technique exploits
the differences in melting temperature of different DNA sequences (Muyzer et al.
1993). Usually, genomic DNA is extracted from a sample and short, hypervariable
fragments of the 168 rRNA gene are amplified by polymerase chain reaction (PCR)
using universal primers. The sample is then loaded on a vertical polyacrylamide gel and
run at a constant temperature, along an increasing gradient of denaturant such as
formamide or urea. At a position specific to the sequence of the DNA migrating, the
DNA duplex begins to uncoil and is then trapped in the gel.
TOGE is an almost identical procedure to DGGE with the exception that instead of
applying a denaturing gradient to the vertical polyacrylamide gel, there is instead a
linear temperature gradient which separates the two strands of the DNA. It is usually
possible to detect 50 % of sequence variants in DNA fragments up to 500 bp long,
however if a GC clamp is added to the 5' end of one of the primers this can be increased
to almost 100 %. The GC clamp is a GC-rich sequence, usually between 30 and 50
nucleotides in length, fonning a high melting point domain which prevents complete
separation of the two strands of DNA. Chemical clamps are sometimes used as an
alternative to GC clamps which can be expensive to produce, however chemical clamps
are covalently attached, thus bands extracted from the DOGE gel cannot be re-amplified
directly.
DGGE and TGGE have been used successfully to study community complexity,
changes in microbial communities and to monitor enrichment and isolation of bacteria.
Muyzer et al (1993) applied DOGE to PeR-amplified 168 rRNA gene fragments from a
biofilm in order to profile community complexity. PCR was carried out on genomic
DNA preparations using primers designed to amplify the V3 region of 168 rRNA gene
from sulphate-reducing bacteria and the resulting PCR products analysed by DOGE.
This study showed the presence of up to 10 different 168 rRNA gene fragments, as well
as identifying the presence of microorganisms which constituted less than 1 % of the
total microbial population. Hybridisation analysis using group specific radioactively
labelled probes yielded further information about the species present in the biofilm, with
further information obtained when DNA fragments were excised from the gel and
sequenced (Muyzer et al. 1993).
19
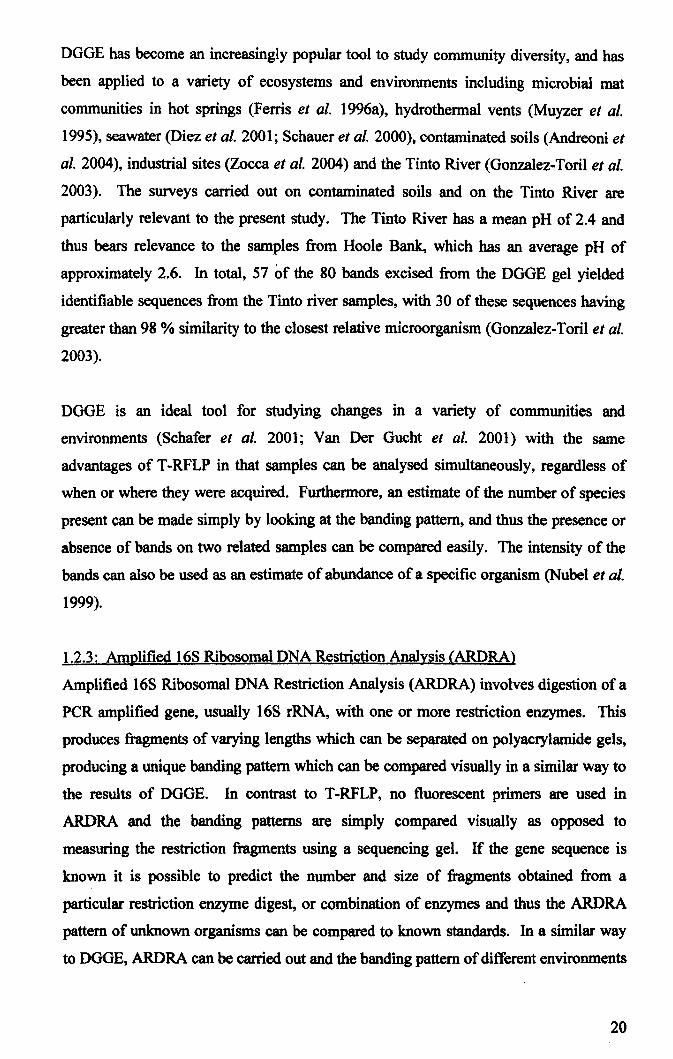
DGGE has become an increasingly popular tool to study community diversity, and has
been applied to a variety of ecosystems and environments including microbial mat
communities in hot springs (Ferris et al. 1996a), hydrothermal vents (Muyzer et al.
1995), seawater (Diez et al. 2001; Schauer et al. 2000), contaminated soils (Andreoni et
al. 2004), industrial sites (Zocca et al. 2004) and the Tinto River (Gonzalez-Toril et al.
2003). The surveys carried out on contaminated soils and on the Tinto River are
particularly relevant to the present study. The Tinto River has a mean pH of 2.4 and
thus bears relevance to the samples from Hoole Bank, which has an average pH of
approximately 2.6. In total, 57 of the 80 bands excised from the DGGE gel yielded
identifiable sequences from the Tinto river samples, with 30 of these sequences having
greater than 98 % similarity to the closest relative microorganism (Oonzalez-Toril et al.
2003).
DOGE is an ideal tool for studying changes in a variety of communities and
environments (Schafer et al. 2001; Van Der Oucht et al. 2001) with the same
advantages of T-RFLP in that samples can be analysed simultaneously, regardless of
when or where they were acquired. Furthermore, an estimate of the number of species
present can be made simply by looking at the banding pattern, and thus the presence or
absence of bands on two related samples can be compared easily. The intensity of the
bands can also be used as an estimate of abundance of a specific organism (Nubel et al.
1999).
1.2.3: Amplified 16S Ribosomal DNA Restriction Analysis (ARDRA)
Amplified 16S Ribosomal DNA Restriction Analysis (ARDRA) involves digestion of a
peR amplified gene, usually 168 rRNA, with one or more restriction enzymes. This
produces fragments of varying lengths which can be separated on polyacrylamide gels,
producing a unique banding pattern which can be compared visually in a similar way to
the results of DOGE. In contrast to T -RFLP, no fluorescent primers are used in
ARDRA and the banding patterns are simply compared visually as opposed to
measuring the restriction fragments using a sequencing gel. If the gene sequence is
known it is possible to predict the number and size of fragments obtained from a
particular restriction enzyme digest, or combination of enzymes and thus the ARDRA
pattern of unknown organisms can be compared to known standards. In a similar way
to DOGE, ARDRA can be carried out and the banding pattern of different environments
20
compared, thus it is useful in detecting changes in a population or differences in
communities in different environments (Smit et al. 1997).
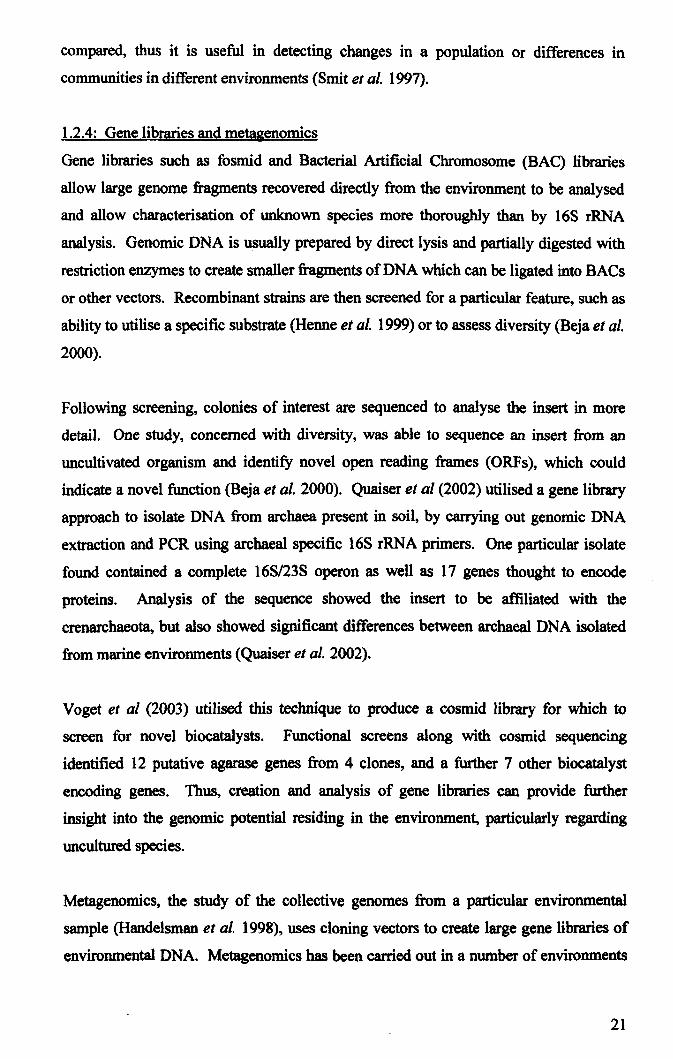
1.2.4: Gene libraries and metagenomics
Gene libraries such as fosmid and Bacterial Artificial Chromosome (BAC) libraries
allow large genome fragments recovered directly from the environment to be analysed
and allow characterisation of unknown species more thoroughly than by 16S rRNA
analysis. Genomic DNA is usually prepared by direct lysis and partially digested with
restriction enzymes to create smaller fragments of DNA which can be ligated into BACs
or other vectors. Recombinant strains are then screened for a particular feature, such as
ability to utilise a specific substrate (Henne et al. 1999) or to assess diversity (Beja et al.
20oo).
Following screening, colonies of interest are sequenced to analyse the insert in more
detail. One study, concerned with diversity, was able to sequence an insert from an
uncultivated organism and identify novel open reading frames (ORFs), which could
indicate a novel function (Beja et al. 2000). Quaiser et al (2002) utilised a gene library
approach to isolate DNA from archaea present in soil, by carrying out genomic DNA
extraction and peR using archaeal specific 168 rRNA primers. One particular isolate
found contained a complete 168/238 operon as well as 17 genes thought to encode
proteins. Analysis of the sequence showed the insert to be affiliated with the
crenarchaeota, but also showed significant differences between archaeal DNA isolated
from marine environments (Quaiser et al. 2002).
Voget et al (2003) utilised this technique to produce a cosmid library for which to
screen for novel biocatalysts. Functional screens along with cosmid sequencing
identified 12 putative agarase genes from 4 clones, and a further 7 other biocatalyst
encoding genes. Thus, creation and analysis of gene libraries can provide further
insight into the genomic potential residing in the environment, particularly regarding
uncultured species.
Metagenomics, the study of the collective genomes from a particular environmental
sample (Handelsman et al. 1998), uses cloning vectors to create large gene libraries of
environmental DNA. Metagenomics has been carried out in a number of environments
21
of increasing community complexity ranging from acid mine drainage communities at
Iron Mountain, California (Tyson et al. 2004) to the Sargasso Sea (Venter et al. 2004).
Metagenomic libraries are usually screened using functional-driven analysis or
sequence-driven analysis (Handelsman 2004). Functional analysis identifies clones
expressing a particular function and has led to the identification of novel antibiotics,
antibiotic resistance genes, degradative genes and catalytic genes (V oget et al. 2003).
The main disadvantage of function-driven analysis is that it relies upon heterologous
expression. Whilst DNA from several organisms has been successfully expressed in E.
coli, one of the most commonly used host species. it is unlikely that most genes will be
successfully expressed. This is especially likely given that most screens are trying to
identify novel genes or motifs. most probably from unusual microorganisms. and yet the
host used is a very common bacterium. Development of high-throughput methods and
appropriate screening techniques is necessary in order to further optimise the
identification of novel genes. especially when the frequency of active clones is so low
(Rondon et al. 2000). New methods are continually being developed in order to screen
metagenomic libraries (Uchiyama et al. 2005) as the potential for biotechnological
application is significant.
Sequence-based analysis utilises phylogenetic anchors which indicate phylogenetic
groups in order to identify the most likely source of the inserted fragment.
Alternatively, random sequencing is conducted and the phylogenetic anchor identified
in the flanking sequence of any interesting genes identified. A promising application of
sequence-based analysis is that in simple communities it is possible to assemble whole
genomes from both cultured and uncultured organisms, something which has been
applied to Iron Mountain samples and has led to two near...complete genome sequences
and three partial genome sequences (Tyson et al. 2004). Large scale sequencing
projects using metagenomic libraries have begun in recent years beginning with samples
from the Sargasso Sea (Venter et al. 2004) which individually generated more than 1
million base pairs of sequence data. Further shotgun sequencing has been carried out in
other environments resulting in an overwhelming amount of data generated already.
The capacity of metagenomics to yield vast amounts of data about many aspects of
microorganisms is clearly huge and is an extremely promising area of research which
can only expand our understanding of microbial life.
22
1.2.5: Fluorescence In Situ Hybridisation (FISH)
Whole cell hybridisation is a method which can be used to identify the presence, or
absence, of a specific organism or phylum. Fluorescently labelled probes bind to
specific target sequences within the cell and can then be visualised by microscopic
techniques. The most commonly used probe for both whole cell and in situ
hybridisation is a fluorescently labelled sequence targeted to 16S rRNA. Probes can be
designed to detect a specific species, genus or domain. A major advantage of FISH is
that it can be carried out in situ, therefore no bias is introduced as a result of DNA
preparation method or peR. FISH can also be semi-quantitative, if the number of cells
which fluoresce from a specific probe is compared to the total number of cells stained
by DAPI (4',6-diamidino-2-phenylindole). It is also possible to detect organisms which
comprise a very low percentage of a microbial population if the probe is well designed
or chosen carefully. FISH has been applied to many environmental samples including
acidic environments such as the Rio Tinto (Garcia-Moyano et al. 2007) and acid mine
drainage in North Wales (Hallberg et al. 2006) and Iron Mountain, California (Baker et
01.2004).
1.2.6: Future prospects
Improvements in culturing methods have increased the number of species which have
been isolated in pure culture, and will continue to do so in the future. At present
molecular methods allow us to identify the closest related genetic ancestor to a
particular microorganism, but little more. Perhaps with a greater understanding of
genomics it may be possible to deduce what conditions we could provide which may
allow us to culture the organism and thus learn more directly. This has already proven
at least partially successful since Teske et al (1996) used DGGE analysis to identify the
nature of two organisms present in co-culture and went on to improve the culturing
conditions in order to isolate both organisms in pure culture (Teske et al. 1996). In the
future it may be possible to successfully predict characteristics such as substrate
utilisation, biochemical pathways or other cellular features such as biodegradative
enzymes. The vast amounts of genetic information generated by large scale sequencing
projects and the increasing number of environments subject to metagenomic analysis
will provide a greater understanding of many facets of microbial life.
23
1.3: Acidic Environments
In the past many environments were considered far too harsh to harbour any life,
however in recent years we have realised that "where there is liquid water on Earth,
virtually no matter what the physical conditions, there is life." (Rothschild and
Manicinelli 2001). Extremes of temperature, salinity, pH and pressure are commonly
regarded as extreme environments, but other less typical environments such as those
contaminated by heavy metals or other pollutants are also extreme. Most extreme
environments are dominated by prokaryotes, both bacteria and archaea, but some
extremophilic eukaryotes are known. Extreme environments of particular relevance to
this research include acid mine drainage (AMD) and of most relevance, other acid tar
lagoons found in various locations around the world.
1.3 .1: Acid mine drainage (AMD)
Acid mine drainage refers to the waters which are discharged from abandoned metal
and coal mines and is an increasing problem in many areas of the world. It is likely to
continue to be a problem for many years to come as water continues to leach from
abandoned mines. These waters are usually high in soluble iron and sulphate as a result
of oxidative dissolution of sulphidic minerals, most prevalently pyrite (FeS2) (Hallberg
and Johnson 2003). AMD has several major effects on the environment including
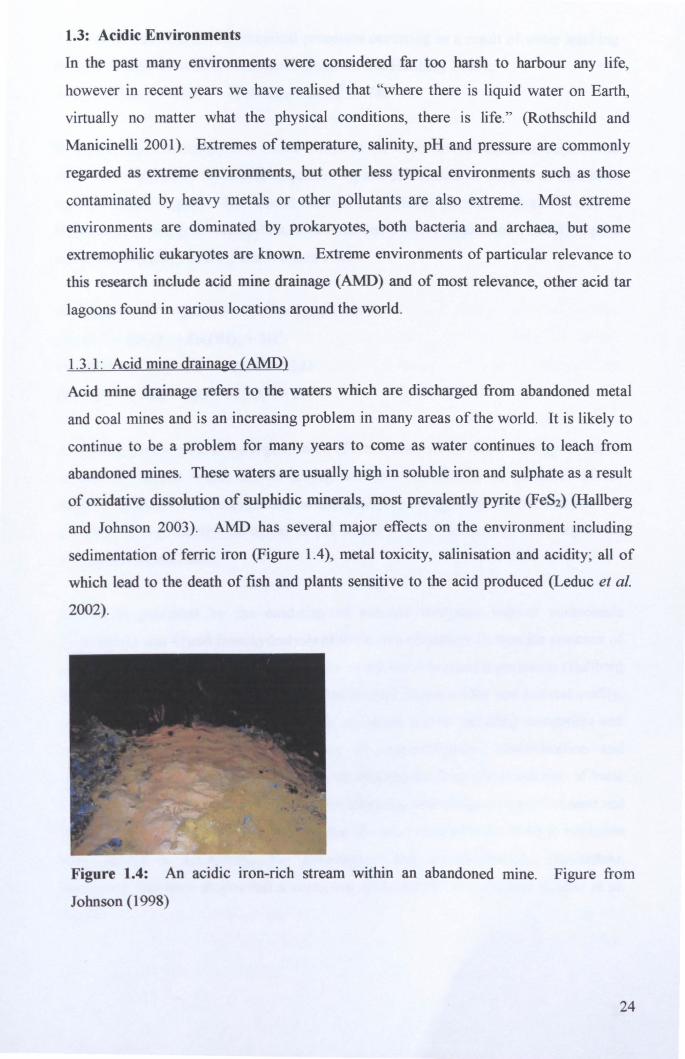
sedimentation of ferric iron (Figure 1.4), metal toxicity, salinisation and acidity; all of
which lead to the death of fish and plants sensitive to the acid produced (Leduc et al.
2002).
Figure 1.4: An acidic iron-rich stream within an abandoned mme. Figure from
Johnson (1998)
24

The overall equation for the chemical processes occurring as a result of water leaching
from coal or metal mines is as follows (Johnson and Hallberg 2005):
4FeS2 + 1502 + 14H20 -+ 4Fe(OH)3 + 8S0/-+ 16W
However, the four step process which results in the above overall equation begins with
oxidation of pyrite by ferric iron (Equation 1), and not molecular oxygen as the above
equation might suggest. The second reaction in the series (Equation 2) also occurs in
the absence of oxygen. Meanwhile, both reactions 3 and 4 (Equations 3 and 4) require
molecular oxygen (Hallberg and lohnson 2003).
(1) FeS2 + 6Fe3+ + 3H20 -+ 7Fe2+ + s20l- + 6W
(2) Fe3+ + 3H20 -+ Fe(OH)3 + 3W (3) 2Fe2+ + 0.502 +2W -+ 2Fe3
+ + H20
(4) S20l" + 202 + H20 -+ 2S0/- + 2W
A key step in this cycle is the regeneration of ferric iron, which reacts with pyrite and is
reduced to ferrous, which allows propagation and continuation of oxidation of the
sulphide mineral. This reaction can be chemically or biologically catalysed at pH > 4,
however, it is primarily biological at pH levels < 4 (lohnson and Hallberg 2003;
Savage and Tyrrel 2005).
Acidity is generated by the oxidation of reduced inorganic sulphur compounds
(Equations 1 and 4) and from hydrolysis of ferric iron (Equation 2), thus the presence of
molecular oxygen effects the proton acidity of the water leached from mines (Hallberg
and Johnson 2003). Net acidity is comprised of both proton acidity and mineral acidity,
where mineral acidity is the concentration of soluble metals including manganese and
aluminium. Biological processes such as ammonification, denitrification and
methanogenesis along with the fonnation of bicarbonate from the dissolution of basic
minerals offsets net acidity and can increase alkalinity in drainage streams (Johnson and
Hallberg 2005). Initially it was thought that the microorganisms involved in oxidation
were limited to Acidithiobacillus ferrooxidans and Acidithiobacillus thiooxidans,
however it has been shown that a collection of organisms are involved (Leduc et al.
2002).
25
1.3.2: Acid tar lagoons
Acid tar is a waste residue of coal and petrochemical processing technologies
originating from the end of the 19th Century (Milne et al. 1986), which have now been
abandoned. Acid tar production is a result of three chemical processes; benzoIe
refining, white oil production and oil re-refming (Nancarrow et al. 2001). All of the
processes use concentrated sulphuric acid as a washing liquid to purify organic material,
resulting in a residual tar which contains a high proportion of sulphuric acid.
Historically, this waste was simply disposed to landfill, existing holes or lined lagoons,
usually in close proximity to chemical plants.
Generally, acid tars are "dark-coloured liquid with a strong acrid odour" (Milne et al.
1986) with a varying odour between each type of acid tar production. However, all tars
produce a persistent, penetrating and noxious odour; initially it is a very acrid smell due
to the release of large amounts of sulphur dioxide. Sulphur dioxide release decreases
after time resulting in different odours according to the method of tar production with
benzole refinery acid tars possessing a strongly aromatic smell. In 1972, the "Disposal
of Poisonous Wastes Act" (DPWA) was introduced which led to more regulated
treatment and control of acid tar waste, however the scale of acid tar treatment and
disposal prior to this legislation is unclear. Furthermore, whilst the introduction of
DPW A greatly improved the waste disposal situation, the treatment and disposal of acid
tar waste still followed a disorganised route, with a number of unsuccessful methods
used for technical and economical reasons.
Attempts to treat acid tar waste varied according to the method of production; with the
benzole refinery industry preferring to mix the tar with water or steam in an attempt to
remove or dilute sulphuric acid resulting in a less acidic, tarry substance which was
usually tipped on-site or in close proximity. Several other methods were used in an
attempt to treat the acid tar waste however there are strong indications that none of these
methods were successful, ultimately resulting in the disposal of potentially dangerous
waste to an unknown number of contaminated sites. In some cases in South Yorkshire
the contaminated area was covered in order to mask the disposal site; however this
caused further problems in the future. Ground movements, heat and the weight of the
overlying material caused the waste to begin to appear at the surface of the site, causing
a danger to local residents and animals who may come into contact with the waste
(Milne et al. 1986).
26
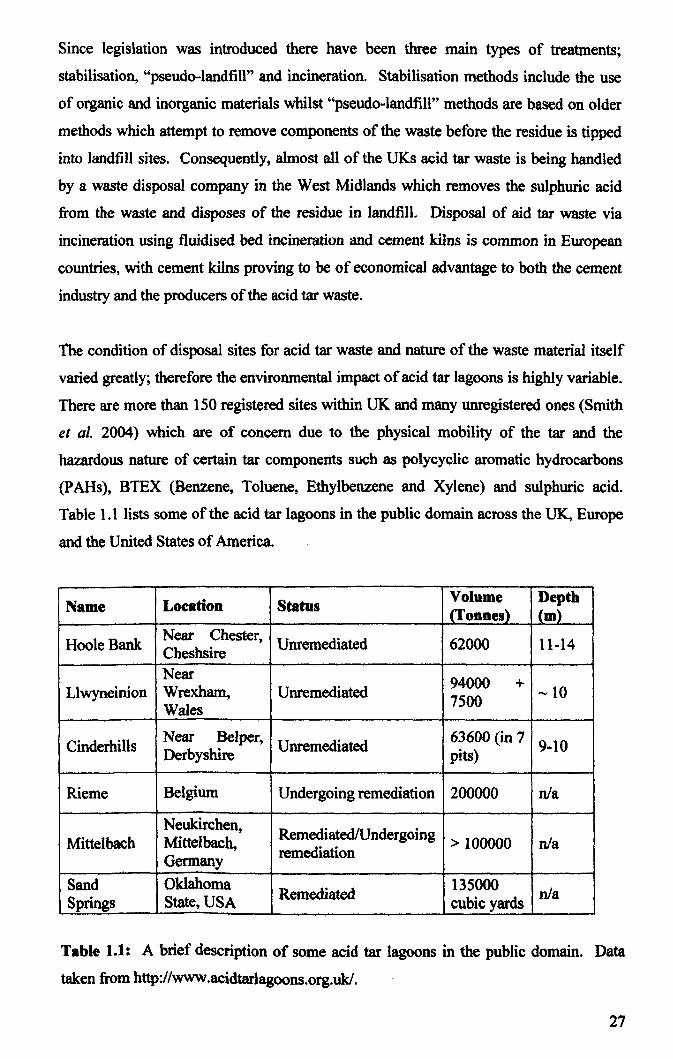
Since legislation was introduced there have been three main types of treatments;
stabilisation, "pseudo-Iandfill" and incineration. Stabilisation methods include the use
of organic and inorganic materials whilst "pseudo-landfiU" methods are based on older
methods which attempt to remove components of the waste before the residue is tipped
into landfill sites. Consequently, almost all of the UKs acid tar waste is being handled
by a waste disposal company in the West Midlands which removes the sulphuric acid
from the waste and disposes of the residue in landfill. Disposal of aid tar waste via
incineration using fluidised bed incineration and cement kilns is common in EW'Opean
countries, with cement kilns proving to be of economical advantage to both the cement
industry and the producers of the acid tar waste.
The condition of disposal sites for acid tar waste and nature of the waste material itself
varied greatly; therefore the environmental impact of acid tar lagoons is highly variable.
There are more than 150 registered sites within UK and many unregistered ones (Smith
et al. 2004) which are of concern due to the physical mobility of the tar and the
hazardous nature of certain tar components such as polycyclic aromatic hydrocarbons
(PAHs), BTEX (Benzen~ Toluene, Ethylbenzene and Xylene) and sulphuric acid.
Table 1.1 lists some of the acid tar lagoons in the public domain across the UK, Europe
and the United States of America.
Name Location Status Volume Depth . (1'oDnes) (m)
Hoole Bank Near Chester,
Unremediated 62000 11-14 Cheshsire Near 94000 + Llwyneinion Wrexham, Unremediated
7500 -10 Wales
Cinderhills Near Belper,
Unremediated 63600 (in 7
9-10 Derbyshire pits)
Rieme Belgium Undergoing remediation 200000 nla
Neukirchen, RemediatedlUndergoing
Mittelbach Mittelbach, > 100000 nla Germany remediation
Sand Oklahoma Remediated
135000 nla Springs State, USA cubic yards
Table 1.1: A brief description of some acid tar lagoons in the public domain. Data
taken from http://www.acidtarlagoons.org.ukJ.
27
There is a great deal of heterogeneity within each acid tar lagoon and between each acid
tar lagoon. The acid tar is not homogeneous, with each particular acid tar characteristics
highly dependent on its production process, age, disposal environment and the presence
of any co-disposed material. Most acid tars are quite viscous, and are able to migrate on
the surface, through fissures and in the sub-surface. This allows acid tar to seep and
leak from the lagoon and further contaminate the immediate environment. Due to the
relatively high density of acid tar, water will always pool on top of tars which can cause
further problems since attempts to cap several lagoons have been unsuccessful due to
instability problems. The heavier capping layer pressurises the lighter tar causing it to
migrate through fissures wherever possible and in acid tar lagoons which have been
capped this has been shown to be one of the biggest factors for tar migration.
Acid tar lagoons which are in the public domain in the UK include Cinderhills
(Derbyshire), Llwyneinion (North Wales) and Hoole Bank (Cheshire), the site at the
centre of this research. Llwyneinion Lagoon (Figure 1.5) is considered the most serious
tar waste disposal problem in North Wales, with estimates ofremediation costs at more
than £ 100 million. This acid tar lagoon is the sister site to Hoole Bank acid tar lagoon,
with acid tar waste from the same chemical plant disposed at both sites, and as such is
probably the most similar acid tar lagoon to Hoole Bank acid tar lagoon.
The site is divided into three tipping locations, containing a total of 94000 tonnes of
liquid acid tar, covered by ponded rainwater. Within the tar body is distributed an
unknown number of steel drums containing unidentified chemical waste material. The
Llwyneinion site also has a long history of industrial use, including mining of a coal
seam known to outcrop beneath the present location of the waste lagoon. Records
indicate the presence of potentially uncapped, unfilled disused mine shafts beneath the
lagoon floor.
In 1980 planning for site remediation began, following a major fire at the lagoon which
burned on the surface of the lagoon for two days. It is thought that the fire began when
a drum containing a sodium product decayed, causing the sodium to ignite when it came
into contact with water. This caused the 75 mm layer of volatile hydrocarbons which
floated on the 0.5 m of rainwater to ignite and burn (Reynolds 2002). The fire burnt off
the volatile hydrocarbon, which also resulted in the evaporation of the acid water due to
the heat of the fire eventually leading to the acid tar beneath the rainwater setting on
28
fire. Since the fire the Llwyneinion Lagoon has been covered by approximately 0.5 m
of rainwater except in unusually hot dry weather when this evaporated allowing
hydrocarbon fumes to be produced, causing a health risk to local residents and an odour
nuisance. The seepage of volatile hydrocarbons up through the acid tar is shown in
Figure 1.6 where the hydrocarbons have caused snow-covered ice to melt in certain
areas of the lagoon.
29

Figure 1.5: Llwyneinion Lagoon, Wrexham. Figure from Reynolds (2002).
Figure 1.6: Areas of snow-covered ice melt out due to uprising gas bubbles and
hydrocarbons at Llwyneinion Lagoon. Figure from Reynolds (2002)
30
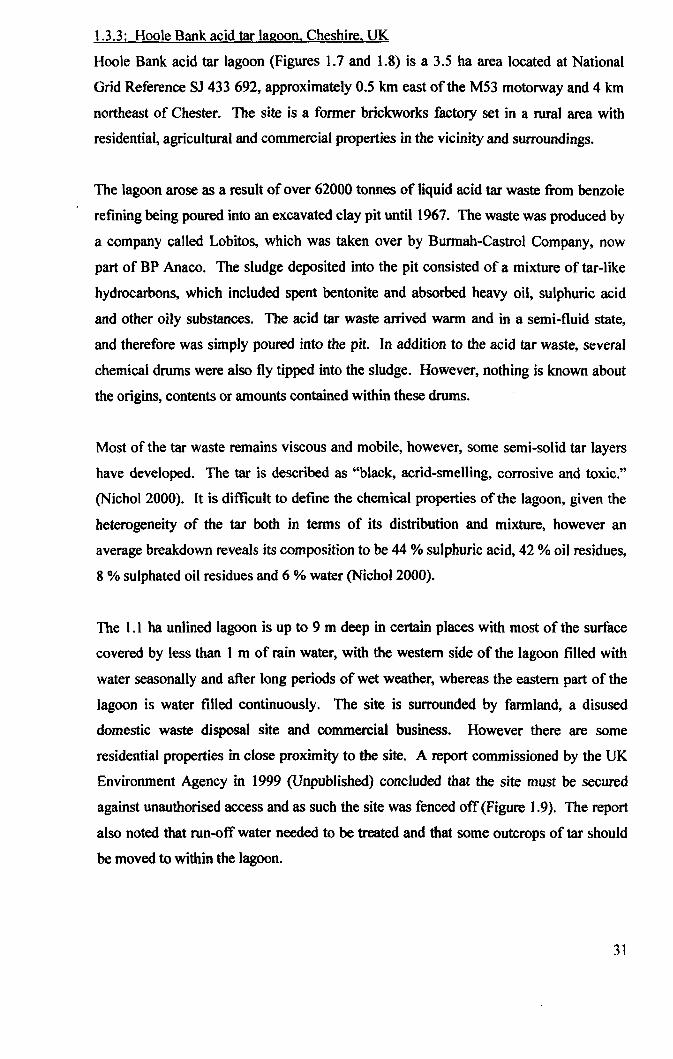
1.3.3: Hoole Bank acid tar lagoon. Cheshire. UK
Hoole Bank acid tar lagoon (Figures 1.7 and 1.8) is a 3.5 ha area located at National
Grid Reference SJ 433692, approximately 0.5 km east of the MS3 motorway and 4 km
northeast of Chester. The site is a former brickworks factory set in a rural area with
residential, agricultural and commercial properties in the vicinity and surroundings.
The lagoon arose as a result of over 62000 tonnes of liquid acid tar waste from benzole
refining being poured into an excavated clay pit until 1967. The waste was produced by
a company called Lobitos, which was taken over by Burmah-Castrol Company, now
part of BP Anaco. The sludge deposited into the pit consisted of a mixture of tar-like
hydrocarbons. which included spent bentonite and absorbed heavy oil, sulphuric acid
and other oily substances. The acid tar waste arrived warm and in a semi-fluid state,
and therefore was simply poured into the pit. In addition to the acid tar waste, several
chemical drums were also fly tipped into the sludge. However, nothing is known about
the origins, contents or amounts contained within these drums.
Most of the tar waste remains viscous and mobile, however, some semi-solid tar layers
have developed. The tar is described as "black, acrid-smelling, corrosive and toxic."
(NichoI2000). It is difficult to define the chemical properties of the lagoon, given the
heterogeneity of the tar both in terms of its distribution and mixture, however an
average breakdown reveals its composition to be 44 % sulphuric acid, 42 % oil residues,
8 % sulphated oil residues and 6 % water (Nichol 2000).
The 1.1 ha unlined lagoon is up to 9 m deep in certain places with most of the surface
covered by less than 1 m of rain water, with the western side of the lagoon filled with
water seasonally and after long periods of wet weather, whereas the eastern part of the
lagoon is water filled continuously. The site is surrounded by farmland, a disused
domestic waste disposal site and commercial business. However there are some
residential properties in close proximity to the site. A report commissioned by the UK
Environment Agency in 1999 (Unpublished) concluded that the site must be secured
against unauthorised access and as such the site was fenced off (Figure 1.9). The report
also noted that run-off water needed to be treated and that some outcrops of tar should
be moved to within the lagoon.
31
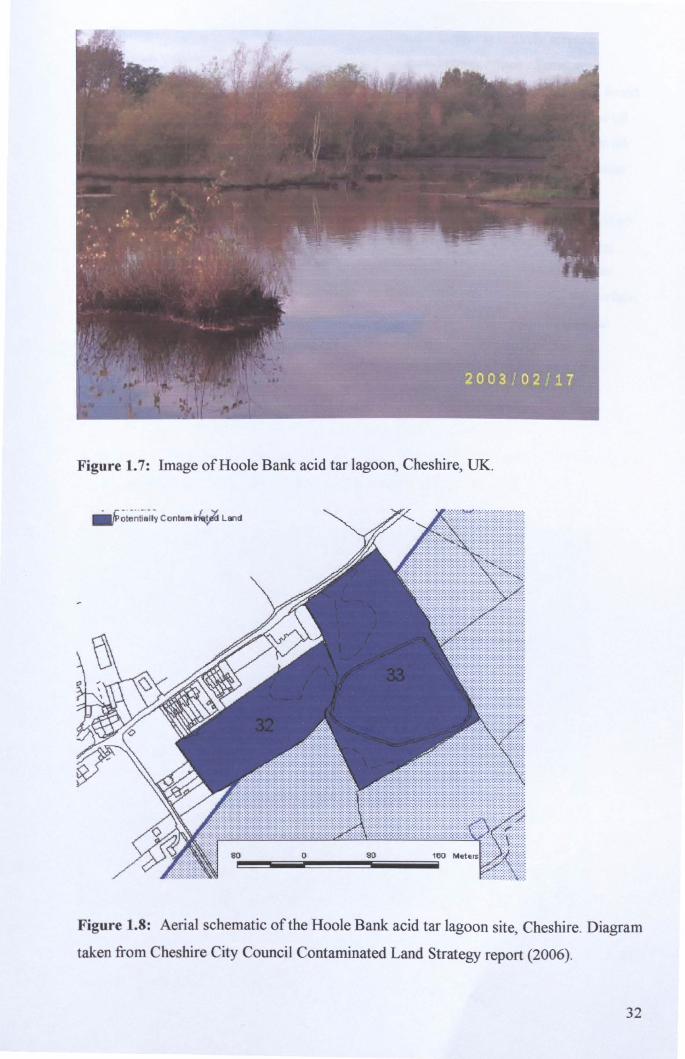
Figure 1.7: Image of Hoole Bank acid tar lagoon, Cheshire, U.K.
Figure 1.8: Aerial schematic of the Hoole Bank acid tar lagoon site, Cheshire. Diagram
taken from Cheshire City Council Contaminated Land Strategy report (2006).
32
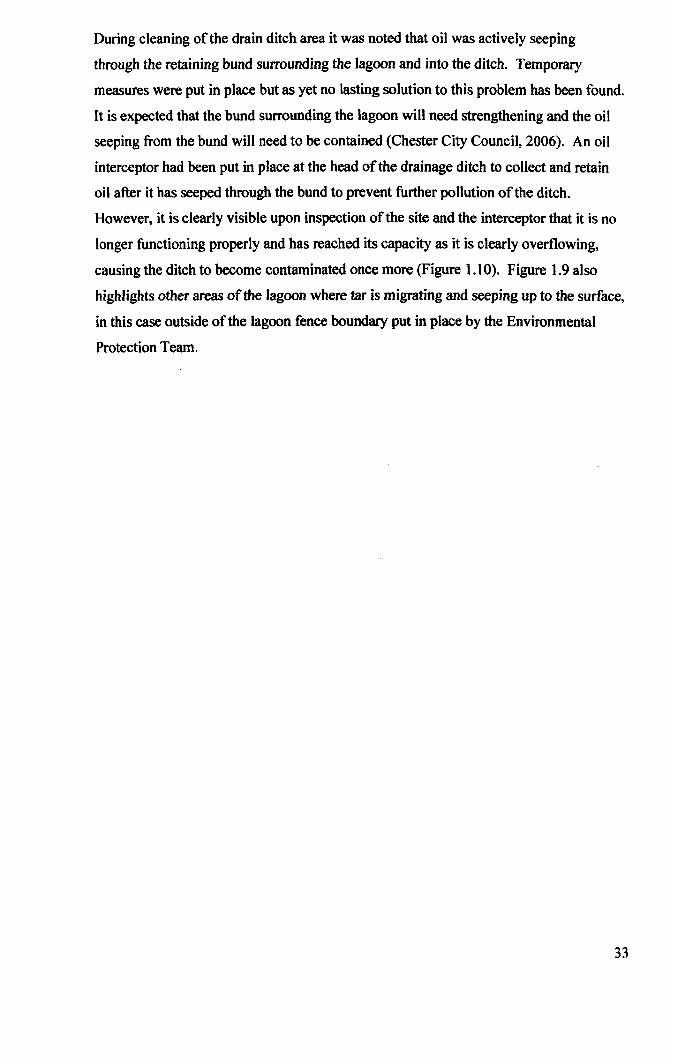
During cleaning of the drain ditch area it was noted that oil was actively seeping
through the retaining bund surrounding the lagoon and into the ditch. Temporary
measures were put in place but as yet no lasting solution to this problem has been found.
It is expected that the bund surrounding the lagoon will need strengthening and the oil
seeping from the bund will need to be contained (Chester City Council, 2006). An oil
interceptor had been put in place at the head ofthe drainage ditch to collect and retain
oil after it has seeped through the bund to prevent further pollution ofthe ditch.
However, it is clearly visible upon inspection of the site and the interceptor that it is no
longer functioning properly and has reached its capacity as it is clearly overflowing,
causing the ditch to become contaminated once more (Figure 1.10). Figure 1.9 also
highlights other areas of the lagoon where tar is migrating and seeping up to the surface,
in this case outside of the lagoon fence boundary put in place by the Environmental
Protection Team.
33
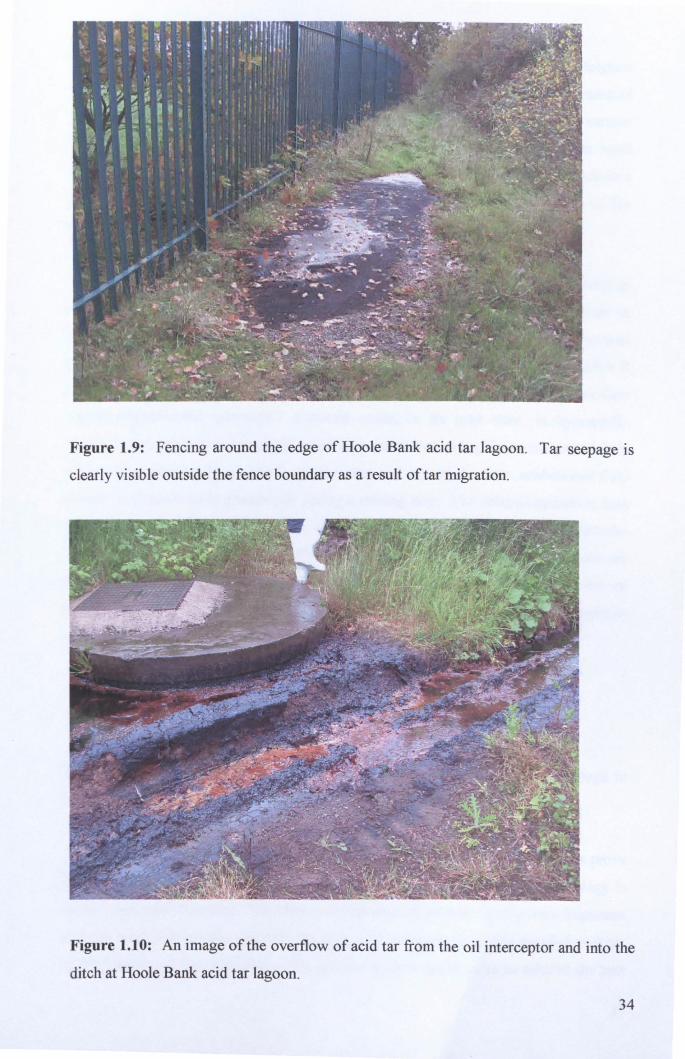
Figure 1.9: Fencing around the edge of Hoole Bank acid tar lagoon. Tar seepage is
clearly visible outside the fence boundary as a result of tar migration.
Figure 1.10: An image of the overflow of acid tar from the oil interceptor and into the
ditch at Hoole Bank acid tar lagoon.
34
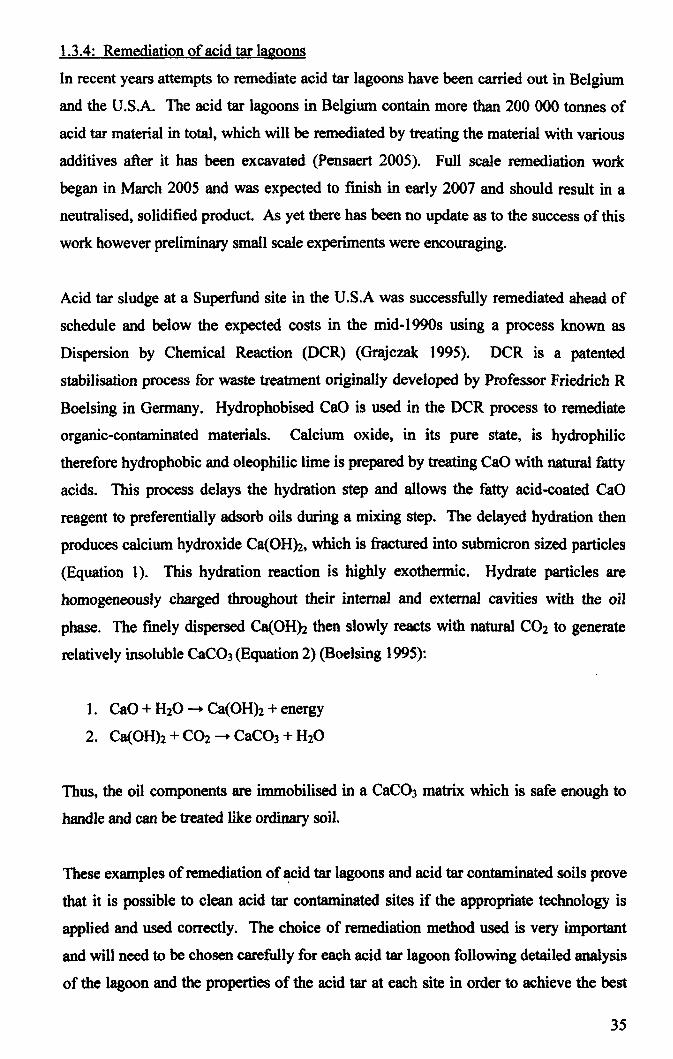
1.3.4: Remediation of acid tar lagoons
In recent years attempts to remediate acid tar lagoons have been carried out in Belgium
and the D.S.A. The acid tar lagoons in Belgium contain more than 200 000 tonnes of
acid tar material in totalt which will be remediated by treating the material with various
additives after it has been excavated (Pensaert 2005). Full scale remediation work
began in March 2005 and was expected to finish in early 2007 and should result in a
neutralised, solidified product. As yet there has been no update as to the success of this
work however preliminary small scale experiments were encouraging.
Acid tar sludge at a Superfund site in the D.S.A was successfully remediated ahead of
schedule and below the expected costs in the mid-1990s using a process known as
~ispersion by Chemical Reaction (OCR) (Grajczak 1995). OCR is a patented
stabilisation process for waste treatment originally developed by Professor Friedrich R
Boelsing in Germany. Hydrophobised CaO is used in the OCR process to remediate
organic-contaminated materials. Calcium oxide, in its pure state, is hydrophilic
therefore hydrophobic and oleophilic lime is prepared by treating CaO with natural fatty
acids. This process delays the hydration step and allows the fatty acid-coated CaO
reagent to preferentially adsorb oils during a mixing step. The delayed hydration then
produces calcium hydroxide Ca(OHh, which is fractured into submicron sized particles
(Equation 1). This hydration reaction is highly exothermic. Hydrate particles are
homogeneously charged throughout their internal and external cavities with the oil
phase. The finely dispersed Ca(OH)2 then slowly reacts with natural C02 to generate
relatively insoluble CaC03 (Equation 2) (Boelsing 1995):
1. CaO + H20 -+ Ca(OHh + energy
2. Ca(OHh + C02 -+ CaC03 + H20
Thus, the oil components are immobilised in a CaC03 matrix which is safe enough to
handle and can be treated like ordinary soil.
These examples of remediation of ~id tar lagoons and acid tar contaminated soils prove
that it is possible to clean acid tar contaminated sites if the appropriate technology is
applied and used correctly. The choice of remediation method used is very important
and will need to be chosen carefully for each acid tar lagoon following detailed analysis
of the lagoon and the properties of the acid tar at each site in order to achieve the best
35

possible results. The remediation of such large, contaminated sites is time consuming
and may not be possible in all cases, given the differences and complexities of each acid
tar lagoon. Therefore, further remediation methods. such as bioremediation or the
production of activated charcoal from acid tar waste provide alternative avenues for
further research. Research into bioremediation of acidic environments has been carried
out for several years, with the main focus of research on acid mine drainage (Johnson
and Hallberg 2005) however more recently some research on bioremediation of acidic,
hydrocarbon polluted environments has been carried out (GemmeU and Knowles 2000;
Hallberg et al. 1999)
1.4: Survival of Microorganisms in Acidic Environments
The survival of microorganisms in acidic environments is a highly complex process
which varies from species to species. Intracellular pH homeostasis is one of the most
important factors to the survival of any cell, regardless of the external pH, therefore
growth of acidophilic microorganisms in external pH as low as - 0.7 requires stringent
control and regulation of internal pH in order for the cell to function. In most cases,
acidophiles must maintain a near-neutral intracellular pH, which can be several pH units
higher than the pH of the external environment (Matin 1990).
Proton motive force (PMF) is a key factor in energy generation and pH homeostasis for
all microorganisms. The PMF describes the energised state of the cell membrane, and
is composed of membrane potential, AV, which is the difference in charge separation
between the membrane and the external medium, and A pH, the difference in pH
between the internal (cytoplasm) and external environment (A pH = pH in - pHout).
PMF is calculated as follows: PMF (m V) = A\jI - 60A pH (at 25 OC)
In most neutraIophiles, PMF is approximately - 200 m V (inside negative), which results
from a slightly negative A pH, in the approximate range -0.1 to -1.5 for most
microorganisms, and a AV around 100 mV. However, acidophiles have a much greater
A pH. This could be seen as advantageous as it allows the formation of a larger PMF
and therefore for a greater proton influx though FoFt-ATPases and consequently
increased A TP generation. However, uncontrolled influx of protons into a cell can be
extremely harmful, potentially leading to cell death. An increased proton concentration
within the cell inhibits protein function and stability of nucleic acids, impedes
enzymatic activity, protein synthesis and transcription of DNA, ultimately resulting in
36
the complete dissipation of ~ pH which would result in a much decreased PMF
incapable of meeting the cells energy requirements (Baker-Austin and Dopson 2007).
There are several known mechanisms by which acidophiles can minimise or prevent
proton influx into the cell, as well as other mechanisms which allow the cell to tolerate
and survive a small influx of protons into the cell. Mechanisms which inhibit or prevent
proton influx into the cell include reversing the membrane potential (i\'I'), possessing a
highly impermeable cell membrane and proton pumping. Meanwhile, cytoplasmic
buffering, along with the presence of chemicals and enzymes which sequester protons
within the cell and an increased number of secondary transporters help the cell to cope
with proton influx (Matin 1990).
One of the most commonly observed adaptations in acidophiles is a reversal of
membrane potential. All neutralophilic microorganisms have an inside negative i\'I'
whereas most acidophiles possess an inside positive i\'I', a reversal of the normal
membrane potential (Figure 1.11). A reversed membrane potential is a mechanism for
decreasing proton influx into the cell as it forms a chemiosmotic barrier which deflects
positively charged protons, preventing them from entering the cell. It is thought that the
reversed i\'I' is generated by a Donnan potential (Donnan 1924) of positively charged
molecules, particularly accumulation of K+ ions. The creation of a reversed L\'I' by an
accumulation of K+ ions is supported by evidence that there is an increased number of
potassium-transporting ATPases found in acidophile genomes (Futterer et al. 2004;
Tyson et al. 2004). Reversal of L\'I' results in a decrease in the overall proton motive
force; however the reversed i\'I' detracts from such a large A pH that the flnal PMF is
large enough to meet the cells energy demands.
Further difficulties are encountered as a result of the reversed membrane potential.
When the cell is in a reenergised state, such as in acidic media, the positive inside
membrane potential results in the exclusion of permeant cations and the accumulation of
penneant anions, which can begin to poison the cell. Whilst this is true there is one
exception, sol- , the most common anion in acidic environments. Acidophiles are able
to tolerate higher levels of sol- than other anions for two reasons. The flrst reason is
that acidophiles have adapted systems to remove S042-from inside the cell, whilst the
37
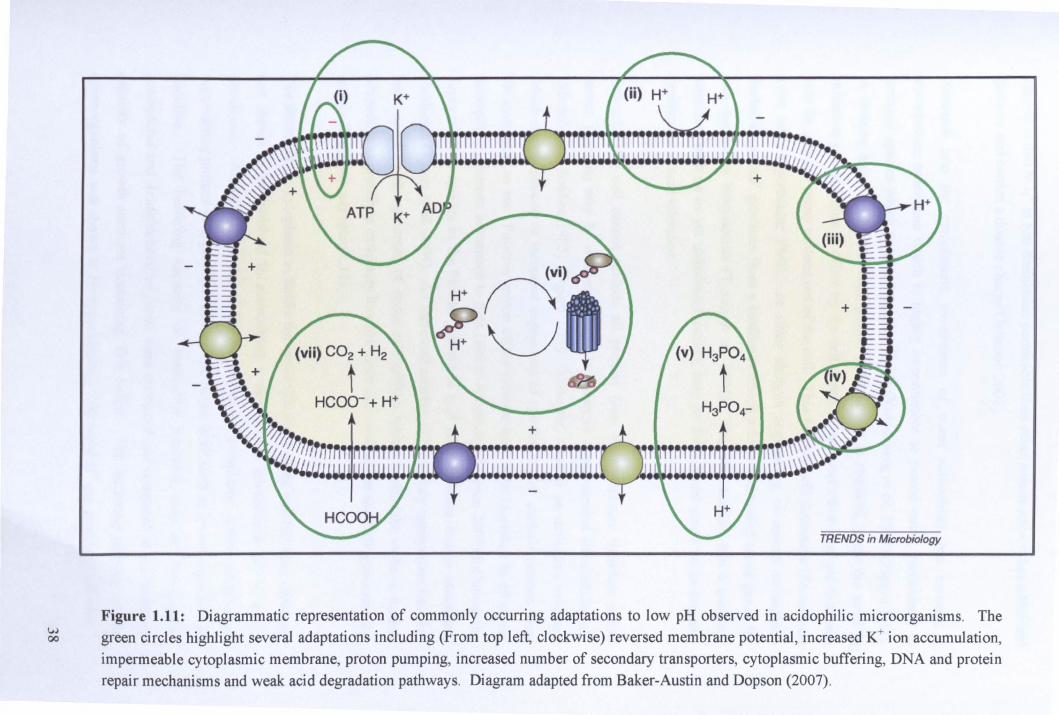
(vii) CO2 + H2
t HCOO- + H+
nil \J
TRENDS in Microbiology
Figure 1.11: Diagrammatic representation of commonly occurring adaptations to low pH observed in acidophilic microorganisms. The
~ green circles highlight several adaptations including (From top left, clockwise) reversed membrane potential, increased K+ ion accumulation,
impermeable cytoplasmic membrane, proton pumping, increased number of secondary transporters, cytoplasmic buffering, DNA and protein repair mechanisms and weak: acid degradation pathways. Diagram adapted from Baker-Austin and Dopson (2007).

second is that sol- is less membrane penneable than other anions since it has additional
polarity and carries a double charge (Johnson 2006).
Research into the cytoplasmic membranes of some acidophiles has revealed a
cytoplasmic membrane which is highly impenneable to proton entry, particularly in
archaeal species which possess tetraether lipids (V ossenberg et al. 1998) (Figure 1.11).
A delicate balance of membrane proton permeability is required, since the need to
minimise proton influx is offset by the cells need to transport other ions and nutrients
into the cell and pump protons out of the cell. This balance will determine if a cell can
cope with a particular PMF. In silico shotgun sequencing of several acidophilic
bacterial species' genomes from a biofilm revealed a large and varied set of genes for
cell membrane biosynthesis (Tyson et al. 2004). This data implies that a complex
structure, with an as yet unknown function, may be fonned and could be an intrinsic
component in acid tolerance.
Inevitably the cell cannot exclude all protons from the cytoplasm, therefore active
proton pumping may be utilised in order to maintain a near-neutral intracellular pH
(Michels and Bakker 1985) (Figure 1.11). However, there is no definitive evidence
which shows induced or increased expression of systems which exclude protons from
the cytoplasm as yet. Putative proton eftlux systems have been identified in all of the
acidophilic genomes sequenced to date (Baker-Austin and Dopson 2007) including the
Leptospirillum species in the biofilm present in acid mine drainage at Iron Mountain,
California (Tyson et al. 2004). An increased number of secondary transporters has also
been noted in the genomes of some acidophiles, which is thought to be a further
adaptation to growth in extremely low pH. since cells will utilise the PMF generated for
metabolic purposes (Figure 1.11).
The ability of the cytoplasm to buffer the intracellular pH of the cell has been observed
and shown to be involved in maintaining a near-neutral intracellular pH in acidic
conditions. All cells have the ability to buffer the cytoplasm, either releasing or
sequestering protons as appropriate using basic amino acids such as lysine, arginine and
histidine. The buffering capacity of respiration inhibited cells of Thiobacillus
acidophilus and Acidithiobacillus facile were measured and compared to the buffering
capacity of growth medium containing Tris buffer. The buffering capacity of the
microorganisms was shown to be approximately 100 nmol W mg protein ·1 pH unit -I
39

(Matin 1990), showing a much smaller decrease in cytoplasmic acidification than would
be expected given the net W influx into the cells compared to the butTered medium.
Comparisons of the butTering capacity between E. coli and Acidithiobacillus
acidophilum were also carried out, with buffering capacities of 85 nmol It mg protein -
I and 97 nmol H+ mg protein -I respectively (Zychlinsky and Matin 1983) (Figure 1.11).
Of particular concern to acidophiles is the uptake of weak acids (HA) as they function
as uncouplers of the respiratory chain, which shuttle the net uniport of protons and
'uncouple' proton transport from cellular processes (Ciaramella et al. 2005). These
compounds can cross the cell wall in their undissociated form as they are uncharged at
acidic pH (the external pH) but once they enter the cell, near-neutral pH, they become
undissociated (It and K) and can no longer leave the cell in their charged form.
Accumulation of weak acids by this process is problematic for cells, as protonation of
the cytoplasm can occur quickly, therefore some acidophiles have developed active
mechanisms of weak acid degradation in order to overcome this problem (Ciaramella et
al. 2005) (Figure 1.11).
Other mechanisms involved in pH homeostasis include the use of DNA and protein
repair chaperones and the use of iron to stabilise enzymes and enzyme complexes
(Baker-Austin and Dopson 2007). However, after comparisons of the genomes of
several acidophilic microorganisms there appears to be no definitive individual
adaptation or set of adaptations present in every acidophile which enables growth in low
pH environments.
1.5: AcidopbiJes
Acidophiles are most commonly defined as organisms with an optimum growth at pH 3
or below, however organisms which can grow sub-optimally at pH 4 or below may be
considered moderate acidophiles. Acidic environments capable of sustaining life are
usually dominated by sulphate anions, and there is usually only a low concentration of
dissolved organic matter, with as little as 20 mg I -I dissolved carbon in some
environments (Johnson 1998). Thus, the most commonly found organisms are
chemolithotrophic bacteria and archaea, however some heterotrophic acidophiles can be
supported from organic matter fixed by chemolithotrophic organisms. Acidophiles are
most commonly grouped according to their carbon source and method of energy
generation and further subdivided based on their optimum temperature for growth
(Table 1.2). The following discussion includes several subdivisions of acidophiles since
it is likely that any microorganisms isolated from Hoole Bank: acid tar lagoon samples
will be acidophiles.
1.5.1: Iron oxidising prokaryotes
One of the best studied and well characterised acidophilic microorganisms is the
chemolithotroph Acidithiobacillus ferrooxidans (formerly known as Thiobacillus
ferrooxidans). Acidithiobacillus ferrooxidans is a mesophilic non-motile, iron oxidising
rod which attacks pyrite by oxidising Fe2+ to Fe3
+ and has an optimum growth pH
between 1.8 and 2.5 (Rawlings et al. 1999). Acidithiobacillusferrooxidans, affiliated to
the P/r-proteobacteria, was one of the first acidophiJes to be discovered and thus has
been the subject of much study, however data suggests that it is not actually the most
dominant organism in some acidic environments (Rawlings et at. 1999).
Mesophilic organisms belonging to the phyla Nitrospira and Thermoplasmales compose
a significant majority of the iron oxidising bacteria. Leptospirillum species are
prominent within this group of acidophiJes, notably including L. ferrooxidans, a
particularly acid tolerant organism capable of growth at pH 1.2 which uses Fe2+ as its
sole electron donor (Johnson 1998; Rawlings et al. 1999). Leptospirillum ferrooxidans
has a higher affinity for Fe2+ than other bacteria, which may explain why it is more
dominant in environments with lower iron concentrations.
Ferroplasma isolates are also part of this group and include an organism of particular
interest, "Ferroplasma acidarmanus". Ferroplasma acidarmanus is a facultatively
anaerobic acidophilic archaeon which is able to grow between pH 0 and 1.5, but most
interestingly it grows chemoorganotrophically, combining oxidation of yeast extract to
iron (III) reduction (Dopson et al. 2004). There are also some extremely thermophilic
iron oxidising prokaryotes including the obligate aerobe Su/folobacil/us yellowstonii
and the facultative anaerobe Acidianus brierleyi (Table 1.2).
1.5.2: Sulphur oxidisers
Several sulphur oxidising prokaryotes are moderately or extremely thermophilic, with
optimum growth temperatures above 40 °C and 60 °C respectively. Acidithiobacillus
caldus is an aerobic moderate thermophile capable of growth up to 55 °C, known to be
found in hot springs in Iceland, New Zealand and the United States and has recently
41
been isolated from hot springs in Monsterrat (Button and Norris 2000). Extreme
thermophiles utilising sulphur oxidation include the autotroph Sulfolohus metallicus and
the mixotrophic S. halwnesis, both of which belong to the order Sulfolohales within the
crenarchaeotal branch of the domain archaea.
Acidithiohacillus ferrooxidans is also capable of oxidising sulphur, along with other
mesophilic sulphur oxidisers such as the mixotroph Thiobacillus acidophilus, also a
member of the pty-proteobacteria. However, with a maximum growth temperature of
70 °C, Hydrogenohacter acidophlius, a sulphur oxidising bacterium, has the highest
known growth temperature of any sulphur oxidising acidophile.
1.5.3: Heterotrophic organisms
Heterotrophic organisms are important to the ecology of acidic environments, as some
species contribute to mineral dissolution both directly and indirectly. Acidiphilium spp.
is an Fe3+ reducer which increases the rate of iron dissolution in geothite and jarosite.
Heterotrophs such as Thermoplasma and Acidocella may utilise the natural organic
compounds produced by chemolithotrophic iron- and sulphur- oxidising organisms
thereby detoxitying the environment of inhibitory substances such as organic acids
which would otherwise prevent growth of organisms sensitive to such compounds
(Johnson and Hallberg 2003).
Many acidophilic heterotrophs are archaea, including the moderate thermophiles
Picrophilus torrid us and P. oshimae, both of which are strict anaerobes but most
importantly, they have the lowest recorded pH optimum of any acidophile at pH 0.7.
(Schleper et al. 1995). As of January 2003, there was only one fully documented
strictly heterotrophic thermophilic acidophile, Alicylc/obacillus sp (Johnson et al.
2003).
42
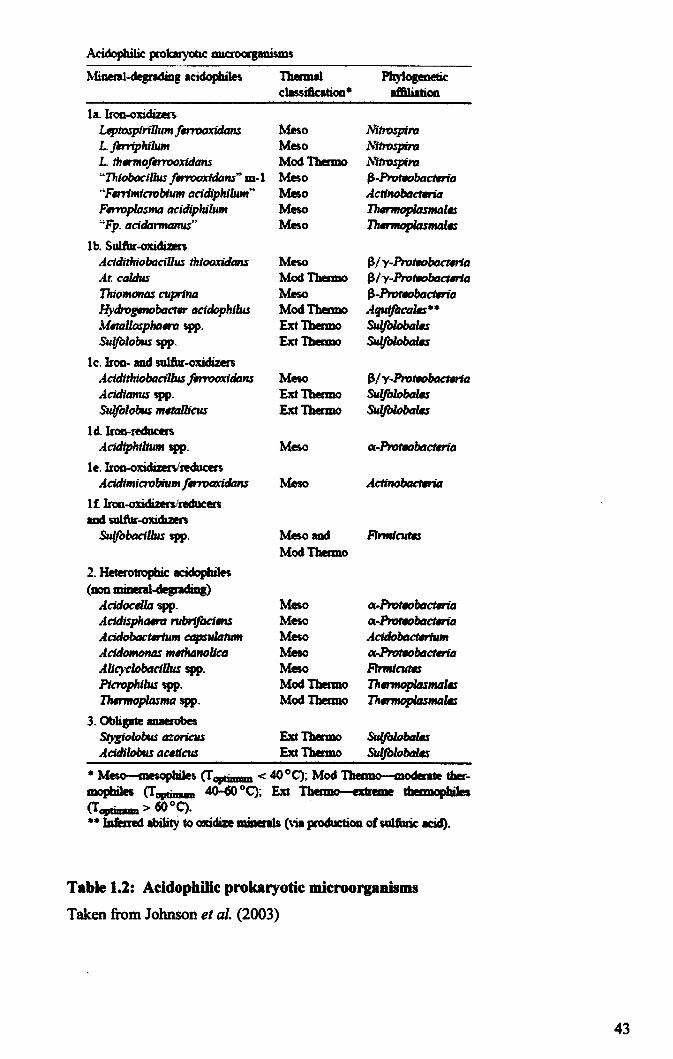
MJ.aem-depading acidopbilfl Tbermal
la. Irco-oxidizen LlplospiriUu", f.mJOXidtms L forriphilwn L th""ofmwxidans "11riobacillus ftrrrxnJdan:s" m-1 "Fmt",iC70biu", addiphilu"," Fwroplas",a addiphilu", "Fp. addarmanus"
lb. Sulfbr-oxicben Addithiobadllus thtooxidans At. caldus Thio",OfIos C'IIprina Hydropnobact. addophilus .\/mllosphatIrQ 'PP. Sulfolobus spp.
le. :&on- and sulfur-oxidizen Addithiobadllus fwrooxtdan:s Addianus spp. Sulfolobus ",ml1iC'llS
1 cl Iron-reducers Addiphtltum spp.
le. ~'Ieducen Addi",icrobiu", flfT'Otlxidtms
1 f Jroo-oxidizerslreducers and sulibr-oxidizlers
Sulfobadllus spp.
2. Heterotropbic acidopbilft (non miDenl-degradiog)
AddocMla spp. Addtsphtwd l1Ibrl/adlrlS AddobtJct.-tu", capsulatum Addomonas "'MMIIOliCd AItC):clobadllus spp. Piaophilus spp. n.~plasmQ spp.
3. Oblipte aaaerobes
ellssiftcatioo*
Meso MtrospiIYJ Meso Mtrospira ModTbmno ]t,"itrospiIYJ
Mesa ~-l'rr1tfJobactma
Mesa Acthrcbacteria Meso Thmrtoplas",alc Meso n..""opIasmalflS
Meso ~I y-l'rr1tf1Obactma ModTbmno ~I Y-l'rr1tf1Obacm1a Mesa ~-Pror.obactma ModTbmno A.quijacalc*· ExtThenno Sulfolobalcs ExtlbeJmo Sulfolobaw
Mesa ~/y-ProtflObactma
ExtThenno Su{fblobalflS ExtThenno Sulfolobaw
Meso C(..ProtfJobactma
Mesa Acttnobacter1a
Meso aocl FlrmiClltG ModTberm.o
Meso Mesa Mesa Mao ModTbetmo ModTbermo
C(..ProtfJobactma C(..ProtfJobactwria
A.cidobacte'lu'" Cf,.ProtfJobactma FlrmtClltG n..""oplasmaw n..""oplasmalcs
Stygiolobus azoriC'llS Ext l'bermo ~ Addiiobus acdC'llS Ext Tbermo SulfolobaW
• ~s (Taptimum < 40°C); Mod'Ilaamo--modera theemopbi1es (Taptimum ~ 0C); Ext Thenno eldiCdK tbermopbi1es (TCJptimam > 60 ° C) . •• lDfmect ability to oxidize aUaen1s (\;. productioo of ,UUbriC acid).
Table 1.2: Acidophilic prokaryotic microorganisms
Taken from Johnson et al. (2003)
43
1.5.4: Acidophilic eukaryotes
Surviving at low pH is arguably more difficult for eukaryotic cells than prokaryotic
cells since the problems encountered by prokaryotic acidophiles (as discussed in Section
1.4) are equally applicable to eukaryotes, yet the cellular processes of a eukaryote are
considerably more complex. For example, eukaryotes must cope with acid conditions
on the surface of the plasma membrane. Ion channels and transporters are in contact
with the low pH of the external environment, which would minimally require molecular
modifications compared to the equivalent proteins of neutralophilic organisms (Messerli
et al. 2005). Nevertheless, several algal, yeast and fungal species thrive in acidic
environments, often playing key roles in the microbial communities present in these
environments, particularly when biofilms are present.
A high degree of eukaryotic diversity has been reported in the Rio Tinto, Spain, with
eukaryotic organisms forming up to 60 % ofthe biomass in some cases (Lopez-Archilla
et al. 1993). Lineages previously undetected in the Rio Tinto such as ciliates,
cercomonads, vahlkampfiid, amoebae, stramenopiles and fungi were identified by
Zettler et al (2002), alongside the discovery of taxa never previously found in extreme
habitats before. Eukaryotic organisms have also been implicated in the development
and structure of biolftms present in the Rio Tinto, with 14 taxa identified from Rio
Tinto biofilms in total. Algal species belonging to the genera Dunaliella and
Cyanidium were found to dominate during biofilm formation (Aguilera et al. 2007)
whilst other algal genera present in the biofilms throughout their development include
Zygnemopsis, Klebsormidium (filamentous algae), Chlamydomonas, Euglena
(flagellated algae) and Chlorella (sessile algae). Other eukaryotic organisms detected in
the biofilms also included amoebae, diatoms, and several fungi (Aguilera et al. 2007).
Nixdorf et a/ (200 I) report at least six classes of algae with acidophilic representatives
found in acidic mining lakes, and their closest neutralophilic relatives (Table 1.3). The
diversity of diatoms in acidic environments has also been reviewed (DeNicola 2000).
At least 124 different taxa detected in acidic environments, of which 19 have been
found in more than one environment and are considered abundant. However, this
includes taxa detected between pH 4.5 and 5.0, whilst reports suggest that diatom
diversity is significantly decreased at pH ~ 3.5 (DeNicola 2000). Some of the abundant
diatom taxa identified in the DeNicola (2000) review include Achnanthes minutissima,
Eunotia pectinalis, Frustulia rhomboides, Nitzschia communis and Pinnuiaria.
44
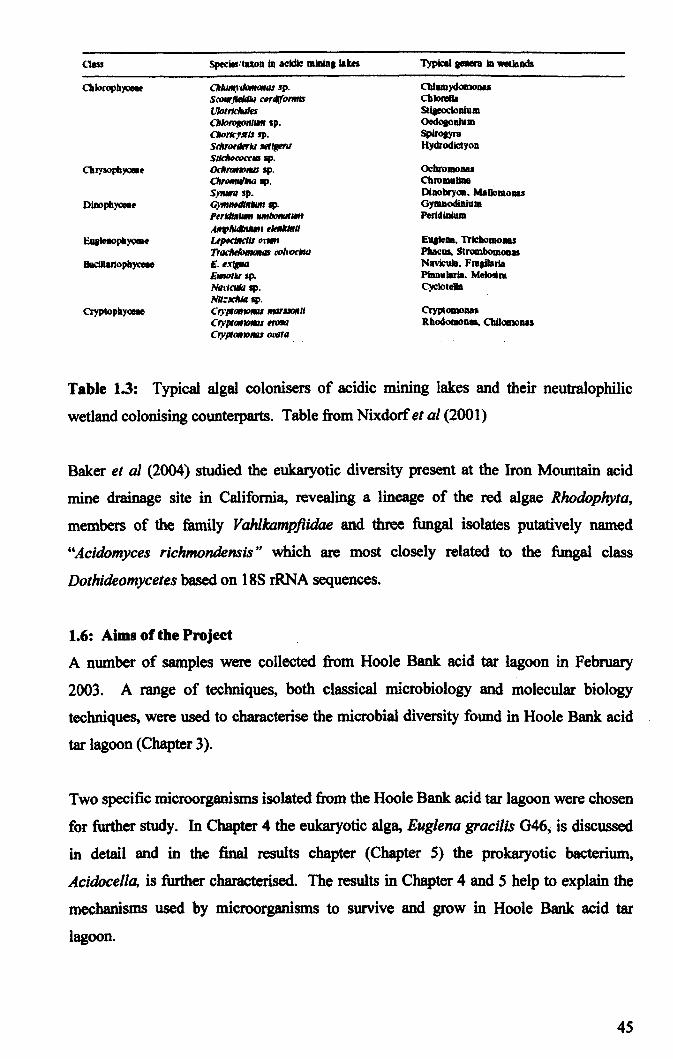
Oass Sl*iIt :tuon In ACidic IIlI111na labs 1)p1cal .... In wetIonds
CbJoropb)'ONf ClrIatrl,rdo"fOIUlI JP. C"bIlDlydomoU& SCOW_Ill ~rl(formlS CbIoRllla lIlotl1dlllkl SUaeocloniUIIl ClrlofOROll/_ ,po Oedoaontulll CItol1qlltl Sp. Spiroeyra SrllrMtlt!r1ll M/f.WtI Hydrodictyon Sttdt#t:OCf.'''' lIP.
CbrySOpb)Qllf OcfIrotnOftlI Ip. OcbrolllOb4& CIr,.""IIItul lIP. Cbromullna syrrwa Sp. DinobryOll. MaIloIllOIllS
Dlbopbyaef GymtNdlrlllm sp. GymIIodiAiUIIl Ptrltll1ll_ "",botaII,." Perldwum
MfJllUllrlUtt' t#trfklllU Euateaopb)Qllf Ltfl«llld1S """" Euattaa. nicbolllOnu
~IOhlO('tul PbaC1II, StromboDlOllaS BIIdIlariopbyceee E. ex",", NI\IicuIa. Fl'lailari4
~tIllSP. PiDIIularia. MfIotil'l Nat1cv1a lIP. C)cIotella Ntt:X'IIItIIp.
OyptopbYa!8e Cf)'ptamotllU IfItIfJl(lff/l ClyptomoUI Cf)'/IIamotIIU tf/JIIQ Rb04011lOn .. Cbilomous CryptotrllHllU mlQla
Table 1.3: Typical algal colonisers of acidic mining lakes and their neutralophilic
wetland colonising counterparts. Table from Nixdorf et al (2001)
Baker et al (2004) studied the eukaryotic diversity present at the Iron Mountain acid
mine drainage site in California, revealing a lineage of the red algae Rhodophyta,
members of the family Vahllw.mpflidae and three fungal isolates putatively named
"Acidomyces richmondensis" which are most closely related to the fungal class
Dothideomycetes based on 18S rRNA sequences.
1.6: Aims of the Projeet
A number of samples were collected from Hoote Bank acid tar lagoon in February
2003. A range of techniques, both classical microbiology and molecular biology
techniques, were used to characterise the microbial diversity found in Hoole Bank acid
tar lagoon (Chapter 3).
Two specific microorganisms isolated from the Hoole Bank acid tar lagoon were chosen
for further study. In Chapter 4 the eukaryotic alga, Euglena gracilis 046, is discussed
in detail and in the final results chapter (Chapter S) the prokaryotic bacterium,
Acidocella, is further characterised. The results in Chapter 4 and 5 help to explain the
mechanisms used by microorganisms to survive and grow in Hoole Bank acid tar
lagoon.
4S

Chapter Two: Materials and Methods
All chemicals were purchased from Sigma (Appendix B) unless otherwise stated.
2.1: Isolation of Microorganisms
2.1.1: Sample collection
Various samples were collected from around Hoole Bank acid tar lagoon into sterile 500
ml Nalgene bottles or sterile 50 ml Falcon tubes. Each sample was labelled at the time
and a photograph taken at each sampling location. The pH of samples was measured
using a Mettler Toledo MP225 pH meter. Samples were stored at 4 °c until required.
2.1.2: Growth media
Y2 Buffered Luria Broth (BLB) plates were prepared by adding 5 g yeast extract (Oxoid
L21), 2.5 g tryptone (Oxoid, LP0042) and 1.5 g NaCt to 500 mt of disti11ed water,
adjusting the pH to 3.0 with 1 M H2S04 and autoclaving. A separate gelling solution
was prepared by adding 10 g of agar no. 1 (Oxoid, LPOOll) to 500 ml of distilled water
and autoclaving at 121°C for 20 minutes. After autoclaving, both solutions were
allowed to cool to approximately 50°C, combined aseptically and gently inverted to
mix before being poured into sterile plastic Petri dishes and left to set.
Acidiphilium medium (AC) plates were prepared by adding the following chemicals to
500 ml of distilled water: 0.5 g MgS04.7H20, 0.1 g (N14)2S04, 50 mg KH2P04, 50 mg
KCI, 14.4 mg Ca(N03)2.2H20, 1.0 g mannitol, 0.1 g tryptone soy broth. The pH was
adjusted to pH 3.0 with 1 M H2S04 and the solution autoclaved at 121°C for 20
minutes. A separate gelling solution was prepared by adding 109 of agar no. 1 to 500
ml distilled water and autoclaving at 121 OC for 20 minutes. After autoclaving,
solutions were cooled to approximately 50°C, combined aseptically and inverted gently
to mix. poured into sterile plastic Petri dishes and left to set. Liquid media was
prepared simply by dissolving all the reagents except agar in 1 litre of distilled water
and autoclaving at 121°C for 20 minutes. The pH value of liquid media was checked
after autoclaving and shown not to alter 'by more than 0.05 pH units.
During initial isolation of microorganisms from environmental samples, nystatin was
added to all AC and Y2 BLB media at 100 J.l8 mrl in order to inhibit fungal growth.
46
M6 medium consisted of 1 g CH3COONa.2H20, 2 g yeast extract, 2 g of tryptone
(Oxoid, UK) and 10 ml of CaCh stock solution (1 g CaCh in 1 litre of distilled water) in
1 litre of distilled water. The pH was adjusted as necessary with 1 M H2S04 or 1 M
NaOH prior to autoclaving at 121 OC for 20 minutes. Solid medium was produced by
adding 109 agar no 1 directly to the pH 7 medium. whilst pH 3 plates were made by
making a separate gelling solution and a 2X concentrate of the medium and mixing after
autoclaving as described above for AC and Y2 BLB solid media.
Luria-Bertani (LB) medium consisted of 5 g yeast extract, 10 g tryptone, 5 g NaCI and
109 Oxoid Agar No 1 in 1 litre of distilled water to produce solid medium. Liquid
medium consisted of 5 g yeast extract, 109 tryptone and 5 g NaCI per litre. Ampicillin
was also added to LB in some cases, either at 100 f.18 ml-1 in solid medium or 50 IJ.g ml-1
in liquid medium.
M9 minimal media were prepared by dissolving 109 M9 minimal salts in 1 litre
distilled water and adjusting the pH as necessary with 1 M H2S04 or I M NaOH.
Phosphate-free minimal medium was prepared as follows: 5 g NaCI, 5 g (N~)2S04' 5
g KCI and 6 g Trizma base in 1 litre of water. The pH was adjusted to pH 3 or pH 7
with 1 M H2S04 or 1 M NaOH as necessary.
2.1.3: Initial isolation of microorganisms using spread plating
Approximately 200 IJ.l of raw environmental sample was spread plated onto both AC
and Y2 BLB plates. Each plate was labelled, sealed and incubated at 25°C. Growth was
monitored daily for 14 days and any colonies arising were streaked onto fresh plates in
order to isolate pure cultures. After the third generation of plate growth, a single colony
from each isolate was inoculated into approximately 10 ml of the appropriate liquid
medium and sub-cultured into 250 ml flasks, containing 50 ml of medium, and shaken
at 250 rpm at 26 OC.
2.1.4: Initial isolation of microorganisms using chemostat culture
A chemostat with a working volume of I litre was used to isolate microorganisms from
environmental samples. Temperature was maintained at 25°C with an aeration rate of
500 ml minute .1. Samples were taken on a daily basis over the 7 - 10 day incubation
period.
47
2.2: Growth conditions
2.2.1: Euglena gracilis Z and 046
Wild-type Euglena gracilis Z (CCAP 1224/SZ) and E. gracilis 046 (CCAP 1224/46)
were routinely grown in M6 medium, at pH 7 and pH 3 respectively. Both organisms
were grown under 8 hours light and 16 hours darkness at approximately 27 ± 2 OC.
2.2.2: Acidocella sO. (29)
Acidocella 29 was routinely grown in batch culture in AC medium at pH 3 (Section
2.1.1) at 26 °C and shaken at 250 rpm.
2.3: Chloropbyll Content
Chlorophyll content of algal cultures was determined by centrifuging a 5 ml sample at
3000 g for 10 minutes. Following centrifugation, the supematant was removed and the
pellet resuspended in 80 % acetone (Fisher Scientific) for 5 minutes. The sample was
then centrifuged again for 10 minutes at 3000 g and the absorbance of the resulting
supernatant measured against an 80 % acetone blank at 645 and 663 nm (Bruinsma
1961).
The chlorophyll concentration was then calculated as follows:
(Absoroance at 645 om x 202) + (Absorbance at 663 om x 80.2) = ~ chlorophyll mrl
5
2.4: Protein Determination
Determination of the amount of protein in a sample was measured using the Bradford
Assay (Bradford 1976). 0.1 ml of the sample was placed into a test tube and 0.9 ml of 1
M NaOH added. The sample was then vortexed and heated at 90 °C for 10 minutes.
The test tube was cooled on ice for 5 minutes prior to centrifugation at 3000 g for 10
minutes. 0.1 ml of the resulting supernatant was added to 3 ml of Bradford's reagent,
vortexed and the optical density measured in the Unicam Helios« spectrophotometer
against 0.1 ml water plus 3 ml Bradford's reagent blank at 595 nm after a minimum of 5
minutes incubation.
48
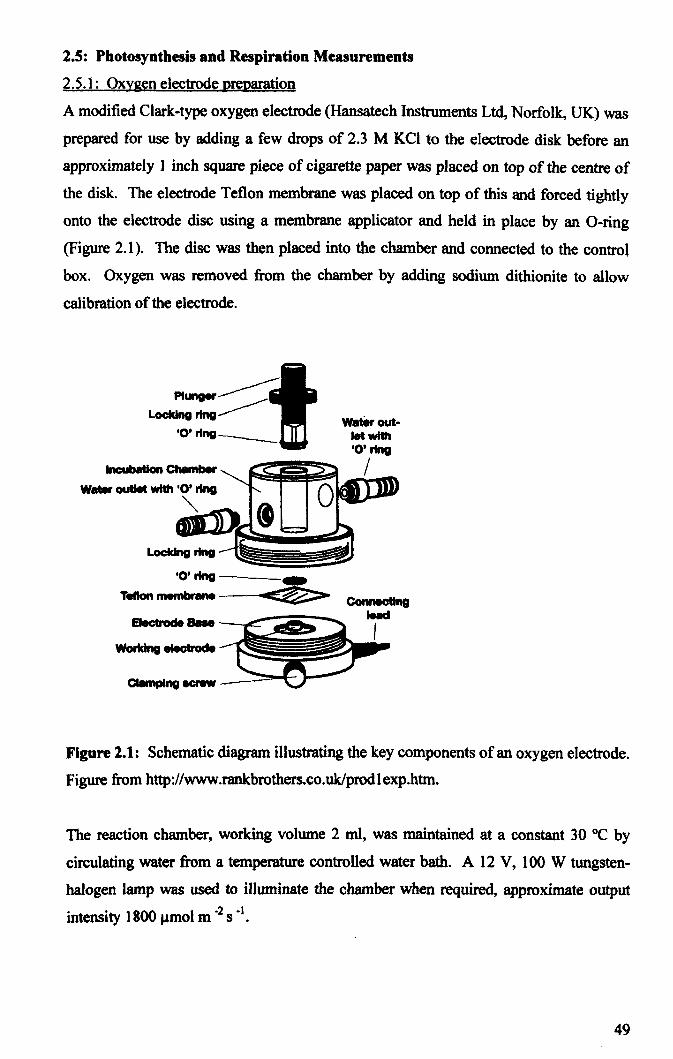
2.5: Photosynthesis and Respiration Measurements
2.5.1: Oxygen electrode preparation
A modified Clark-type oxygen electrode (Hansatech Instruments Ltd, Norfolk, UK) was
prepared for use by adding a few drops of 2.3 M KCI to the electrode disk before an
approximately I inch square piece of cigarette paper was placed on top of the centre of
the disk. The electrode Teflon membrane was placed on top of this and forced tightly
onto the electrode disc using a membrane applicator and held in place by an O-ring
(Figure 2.1). The disc was then placed into the chamber and connected to the control
box. Oxygen was removed from the chamber by adding sodium dithionite to allow
calibration of the electrode.
Locking ring
'0' ring WIder out
IetwHh
Figure 2.1: Schematic diagram illustrating the key components of an oxygen electrode.
Figure from http://www.rankbrothers.co.ukiprodlexp.htm.
The reaction chamber, working volume 2 ml, was maintained at a constant 30°C by
circulating water from a temperature controlled water bath. A 12 V, 100 W tungsten
halogen lamp was used to illuminate the chamber when required. approximate output
intensity 1800 J.lmol m ·2 s .1.
49
2.5.2: Algal pH shock experiments
Rates of oxygen evolution and uptake were measured in E. gracilis 046 cells grown in
M6 medium at pH 3 and in E. gracilis Z cells grown in M6 medium at pH 7 using the
oxygen electrode. Rates of oxygen evolution and uptake were also measured after pH
shock experiments in which cells were resuspended in medium of a different pH to the
growth medium. In steady state experiments cells were resuspended in fresh medium of
the same pH as that of the growth medium. In shock experiments, cells were
resuspended in different pH media ranging from pH 2 to pH 9 and rates of oxygen
evolution and uptake were measured immediately. In all cases chlorophyll content of
the cells was determined (Section 2.3) and samples adjusted to 30 ~g chlorophyll ml,t.
In all cases, 2 ml of the concentrated cells were pipetted into the chamber and left in the
dark for 2 minutes. After the 2 minutes acclimatisation the samples were illuminated
for approximately 2 minutes until oxygen evolution was linear, followed by
approximately 2 minutes in the dark until oxygen uptake was linear. At the end of each
experiment, the sample was carefully removed using a plastic pasteur pipette and the
chamber rinsed several times with distilled water before the next sample was applied.
Each sample was repeated in triplicate.
The rate of oxygen evolution or uptake was calculated as follows:
Respiration rate = standard x
range
number of units
time
x
mg chlorophyll per sample
Standard: Oxygen solubility (0.406 ~oles <h ml ,I at 30 °C)
Range: Units taken from calibration
Number of units: Number of units covered in a certain period time, either with or
without light
Time: The length of time in minutes for which the sample was measured
60: This converts the time from minutes to hours
mg chlorophyll present in sample: This relates to the chlorophyll content of the sample
for example 30 ~g chlorophyll ml,t = 0.060 mg
The rate of respiration was taken as being the rate of oxygen uptake in the dark. To
calculate the rate of photosynthesis it was assumed that the rate of respiration in the
50
light was equal to dark respiration. Therefore, the rate of photosynthesis was equal to
oxygen evolution in the light plus oxygen uptake in the dark. This assumption is
unlikely to be completely valid, however since the rate of respiration is generaJly a smaJl proportion of the photosynthetic rate the error involved is likely to be smaJl
(Jackson and Volk 1970).
2.5.3: Bacterial pH shock experiments
5 to 10 ml of overnight Acidocella 29 culture were concentrated and resuspended in 2
ml M9 minimal medium at various pH values over the range pH 2 - 7. 2 ml samples
were placed in the electrode chamber and the rate of respiration measured for 5 minutes
after a linear decrease in oxygen was recorded. The electrode chamber was rinsed
thoroughly with distilled water between samples. The rate of respiration was calculated
using the equations in Section 2.5.2, with the exception that "mg chlorophyJl present in
the sample" is replaced by "J.lg of protein present in the sample", which was measured
using the Bradford assay as described in Section 2.4.
2.5.4: Sodium orthovanadate inhibition of proton eftlux in E. gracilis
Sodium orthovanadate, Na3V04, was used as an inhibitor of Non-F,Fo ATP-ases in
order to inhibit active proton eftlux. Sodium orthovanadate was prepared in 100 mM
stocks and used at 1 mM concentrations (20 J.lI of 100 mM stock added to 2 ml
samples). E. gracilis 046 and E. gracilis Z were prepared by measuring chlorophyll
concentration (Section 2.3) and concentrating the cells to 30 J.Lg chlorophyll mr'.
Concentrated cells were resuspended in pH 3 and pH 7 phosphate-free minimal media
(Section 2.1.2) and the rate of respiration was measured immediately. After 5 minutes
of a linear respiration rate, 20 J.Ll of 100 mM sodium vanadate was added and the
respiration rate recorded for a further 5 minutes after a linear rate was achieved. This
was carried out for both pH 3 and pH 7 resuspended cells. A further two sets of
duplicate samples were also prepared; incubating the cells in phosphate-free minimal
medium for 60 minutes with and without 1 mM sodium vanadate, both at pH 3 and pH
7, and the rates of respiration measured as previously described.
2.5.5: Sodium orthovanadate inhibition of proton eftlux in Acidocella 29
15 - 25 ml samples of overnight Acidocella 29 culture were centrifuged at 3000 g in the
bench centrifuge for 10 minutes. Concentrated cells were re suspended in pH 3 and pH
51

7 phosphate-free minimal media (Section 2.1.2) and the rate of respiration measured
after immediate resuspension. After 5 minutes of a linear respiration rate 20 1.11 of 100
mM sodium vanadate was added and the respiration rate recorded for a further 5
minutes after a linear rate was achieved. This was carried out for both pH 3 and pH 7
resuspended cells. A further two sets of duplicate samples were also prepared;
incubating the cells in phosphate-free minimal medium for 60 minutes with and without
1 mM sodium vanadate, both at pH 3 and pH 7, and the rates of respiration measured as
previously described. At least 1 mt of Acidocella 29 culture was retained for protein
determination as described in Section 2.4. Rates of respiration were calculated as
described in Section 2.5.2.
2.6: Cell separation using the silicone oil technique
Centrifugation through silicone oil was used to completely separate cells from the
medium. A range of Dow Coming silicone oils (Fisher Scientific, UK) were used to
obtain a range of different density oils by mixing individual oils in specific ratios. In
order to determine the density of silicone oil required, cell samples of the desired
chlorophyll or protein content as appropriate, were applied to the oil and centrifuged. E.
gracilis samples were concentrated to 30 ~g chlorophyll ml -I, whilst Acidocella 29
samples were adjusted to an OD595 of 0.5. Oil of the correct density produced a pellet
separated from the medium by a layer of oil with a non-inverted meniscus (Figure 2.2).
Both E. gracilis G46 and Acidocefla 29 required a 3:1 mix of 550 and 200 oils
respectively to separate cells.
2.6.1: Determination of cell volume
Chlorophyll content of the cells was measured according to Section 2.3. Cells were
then adjusted to 30 J.tg chlorophyll mrl. 5 J.tl of 14C-dextran (1.85 MBq mr!) (MW =
70000 Da) was added to a 1 mt sample of concentrated cells and 10 J.tl of 3H20 (1.85
MBq ml -I) added to a further 1 ml sample before both samples were vortexed
thoroughly. After 5 minutes the microcentrifuge tubes were vortexed again. 300 J.tlof
cell suspension were then layered onto 300 J.tl of 3: 1 550:200 silicone oil in
microcentrifuge tubes, and this process repeated twice to result in triplicate samples
from each initial 1 ml sample.
52
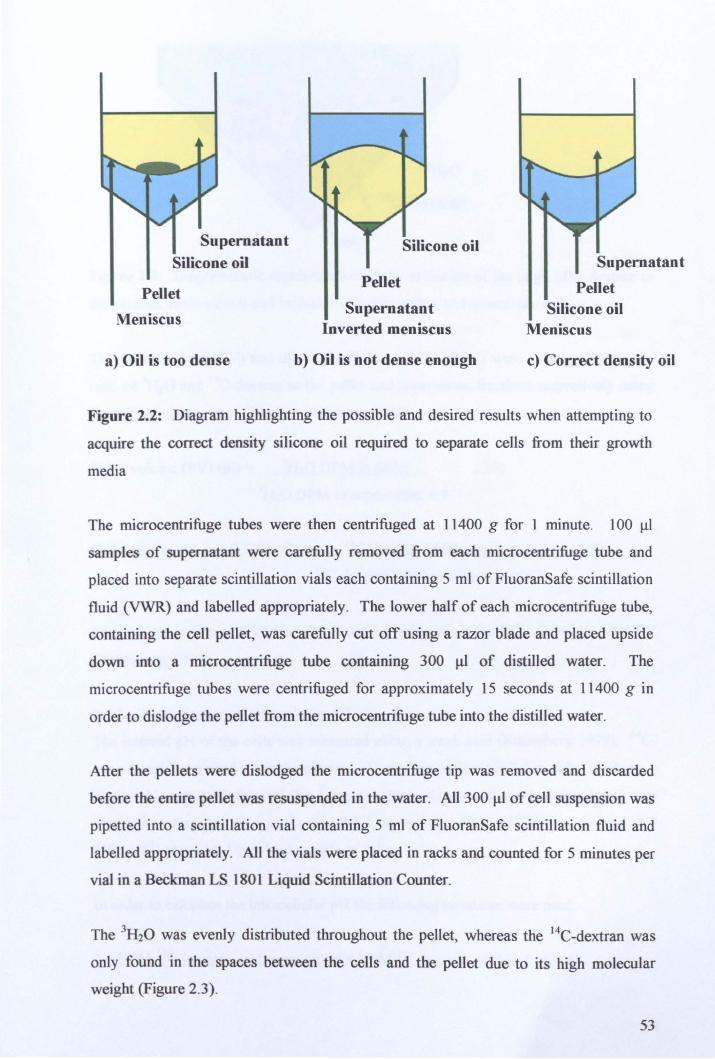
Supernatant
Silicone oil
Pellet
Meniscus
a) Oil is too dense
Silicone oil
Pellet
Supernatant Inverted meniscus
b) Oil is not dense enough
Supernatant
Pellet Silicone oil
Meniscus
c) Correct density oil
Figure 2.2: Diagram highlighting the possible and desired results when attempting to
acquire the correct density silicone oil required to separate cells from their growth
media
The microcentrifuge tubes were then centrifuged at 11400 g for I minute. 1 00 ~I
samples of supematant were carefully removed from each microcentrifuge tube and
placed into separate scintillation vials each containing 5 ml of FluoranSafe scintillation
fluid (VWR) and labelled appropriately. The lower half of each microcentrifuge tube,
containing the cell pellet, was carefully cut off using a razor blade and placed upside
down into a microcentrifuge tube containing 300 ~ of distilled water. The
microcentrifuge tubes were centrifuged for approximately 15 seconds at 11400 g in
order to dislodge the pellet from the rnicrocentrifuge tube into the distilled water.
After the pellets were dislodged the microcentrifuge tip was removed and discarded
before the entire pellet was resuspended in the water. All 300 ~l of cell suspension was
pipetted into a scintillation vial containing 5 ml of FluoranSafe scintillation fluid and
labelled appropriately. All the vials were placed in racks and counted for 5 minutes per
vial in a Beckman LS 1801 Liquid Scintillation Counter.
The 3H20 was evenly distributed throughout the pellet, whereas the 14C-dextran was
only found in the spaces between the cells and the pellet due to its high molecular
weight (Figure 2.3).
53
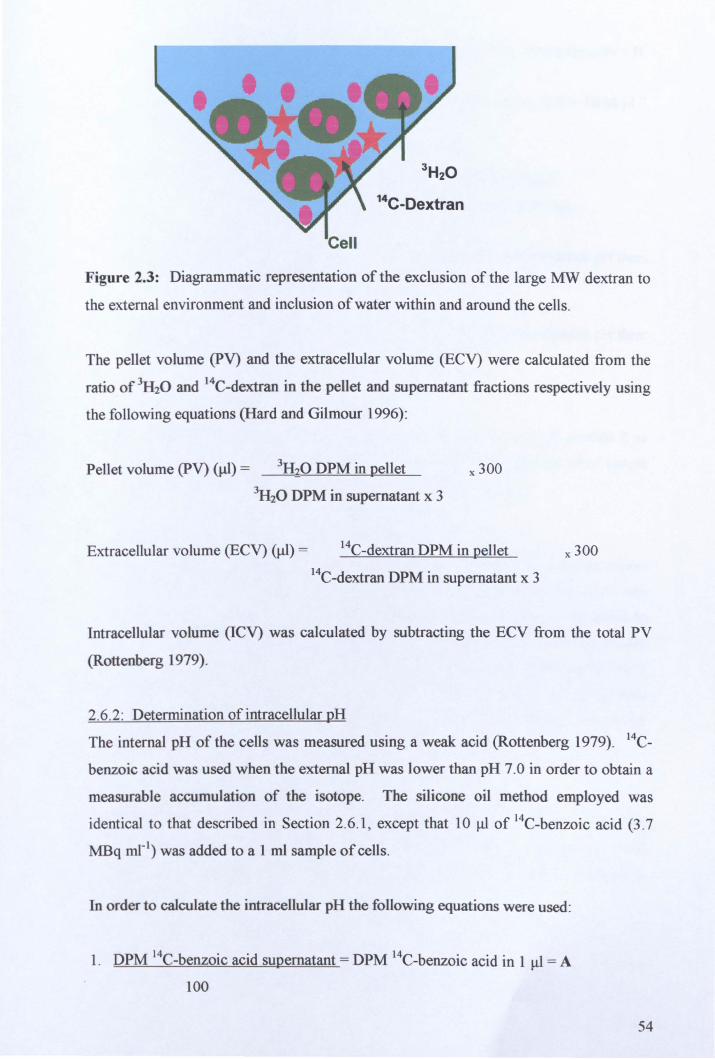
Figure 2.3: Diagrammatic representation of the exclusion of the large MW dextran to
the external environment and inclusion of water within and around the cells.
The pellet volume (PV) and the extracellular volume (ECV) were calculated from the
ratio of ~20 and l4C-dextran in the pellet and supematant fractions respectively using
the following equations (Hard and Gilmour 1996):
Pellet volume (PV) (~) = ~O DPM in pellet x 300
~20 DPM in supernatant x 3
Extracellular volume (ECV) (~) = l4C-dextran DPM in pellet x 300
l4C-dextran DPM in supernatant x 3
Intracellular volume (ICV) was calculated by subtracting the ECV from the total PV
(Rottenberg 1979).
2.6.2: Determination of intracellular pH
The internal pH of the cells was measured using a weak acid (Rottenberg 1979). l4C_
benzoic acid was used when the external pH was lower than pH 7.0 in order to obtain a
measurable accumulation of the isotope. The silicone oil method employed was
identical to that described in Section 2.6.1, except that 10 III of 14C-benzoic acid (3 .7
MBq mrl) was added to a 1 ml sample of cells.
In order to calculate the intracellular pH the following equations were used:
1. DPM 14C-benzoic acid supernatant = DPM 14C-benzoic acid in 1 III = A
100
54
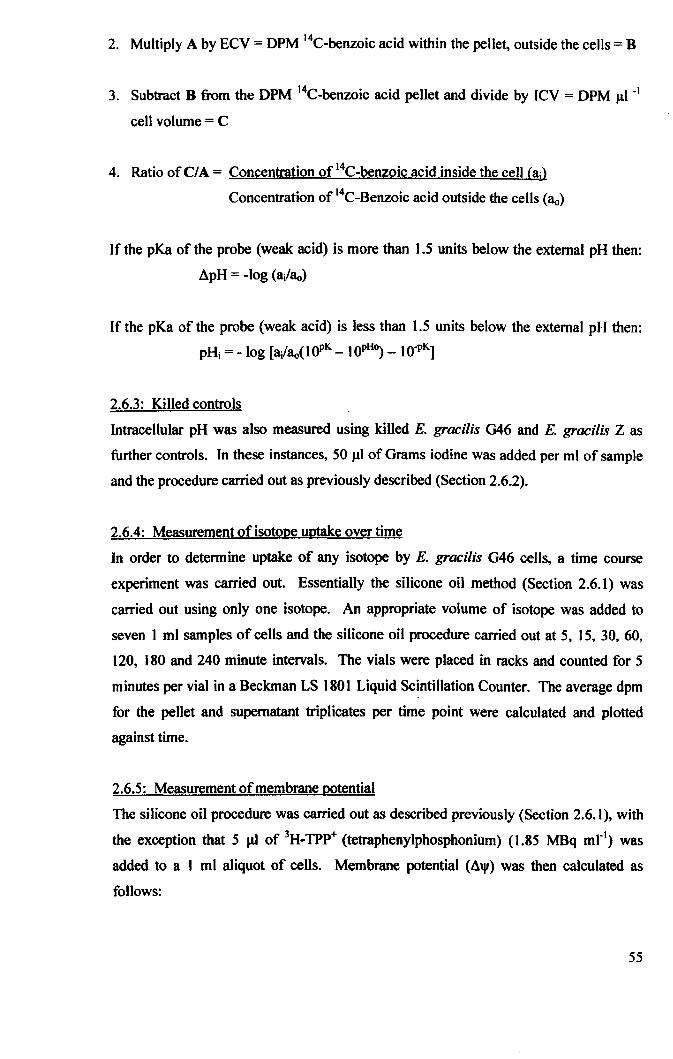
2. Multiply A by ECV = DPM 14C-benzoic acid within the pellet, outside the cells = B
3. Subtract B from the DPM 14C-benzoic acid pellet and divide by ICV = DPM J11 -I
cell volume = C
4. Ratio of CIA = Concentration of 14C-benzoic acid inside the cell (ail
Concentration of 14C-Benzoic acid outside the cells ("0)
If the pKa of the probe (weak acid) is more than 1.5 units below the external pH then:
ApH = -log (a/80)
If the pKa of the probe (weak acid) is less than 1.5 units below the external pH then:
pHi = -log [a/80(I()pK - lOP",) - lO-PK]
2.6.3: Killed controls
Intracellular pH was also measured using killed E. gracilis G46 and E. gracilis Z as
further controls. In these instances, 50 J11 of Grams iodine was added per ml of sample
and the procedure carried out as previously described (Section 2.6.2).
2.6.4: Measurement of isotope uptake over time
In order to determine uptake of any isotope by E. gracilis G46 cells. a time course
experiment was carried out. Essentially the silicone oil method (Section 2.6.1) was
carried out using only one isotope. An appropriate volume of isotope was added to
seven 1 ml samples of cells and the silicone oil procedure carried out at 5, 15, 30, 60,
120, 180 and 240 minute intervals_ The vials were placed in racks and counted for 5
minutes per vial in a Beckman LS 1801 Liquid Scintillation Counter. The average dpm
for the pellet and supernatant triplicates per time point were calculated and plotted
against time.
2.6.5: Measurement of membrane potential
The silicone oil procedure was carried out as described previously (Section 2.6.1), with
the exception that 5 J.1l of 3H_TPp+ (tetraphenylphosphonium) (1.85 MOq mrl) was
added to a 1 ml aliquot of cells. Membrane potential (A",) was then calculated as
follows:
55
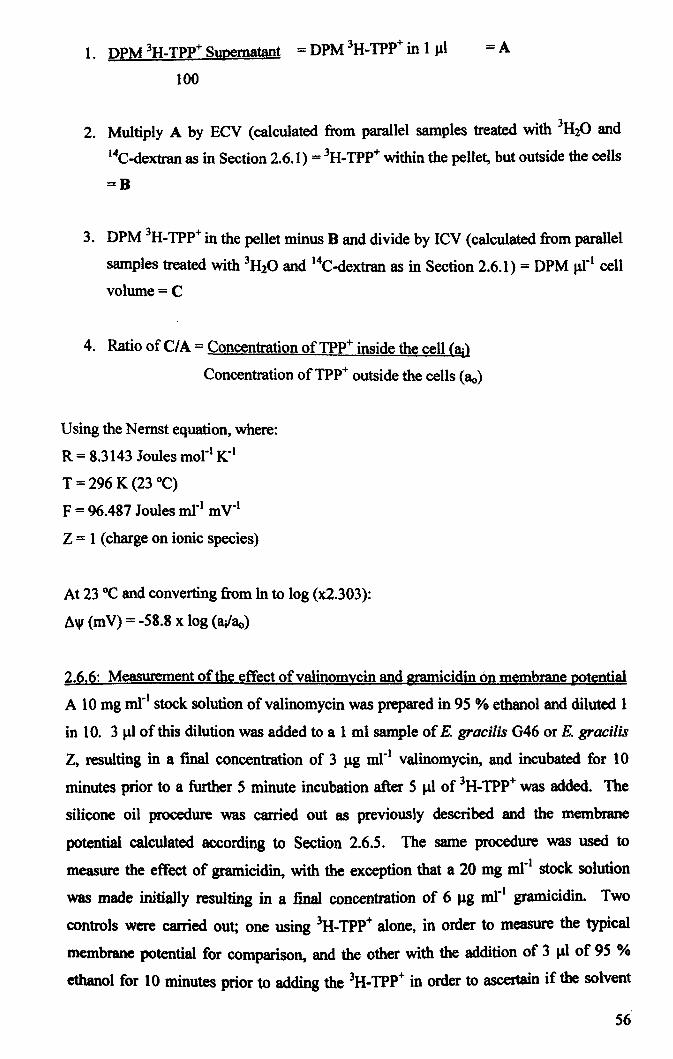
1. DPM 3H_ TPP+ Supernatant = DPM 3H_ TPP+ in 1 ~l = A
100
2. Multiply A by ECV (calculated from parallel samples treated with 3H20 and
14C-dextran as in Section 2.6.1) = 3H_ TPP+ within the pellet, but outside the cells
=B
3. DPM 3H_ TPP+ in the pellet minus B and divide by ICV (calculated from parallel
samples treated with 3H20 and 14C-dextran as in Section 2.6.1) = DPM ~rl cell
volume=C
4. Ratio of CIA = Concentration of TPP+ inside the cell (ail
Concentration ofTPP+ outside the cells (ao)
Using the Nemst equation, where:
R = 8.3143 Joules mort K- t
T = 296 K (23 QC)
F = 96.487 Joules ml- t m V-t
Z = 1 (charge on ionic species)
At 23 QC and converting from In to log (x2.303):
6", (mV) = -58.8 x log (a/80)
2.6.6: Measurement of the effect of valinomycin and gramicidin on membrane potential
A 10 mg ml-} stock solution of valinomycin was prepared in 95 % ethanol and diluted 1
in 10. 3 ~ of this dilution was added to a 1 ml sample of E. gracilis G46 or E. gracilis
Z, resulting in a final concentration of 3 ~g ml-t valinomycin, and incubated for 10
minutes prior to a further 5 minute incubation after 5 ~l of 3H_ TPP+ was added. The
silicone oil procedure was carried out as previously described and the membrane
potential calculated according to Section 2.6.5. The same procedure was used to
measure the effect of gramicidin, with the exception that a 20 mg ml-t stock solution
was made initially resulting in a final concentration of 6 J1g ml- t gramicidin. Two
controls were carried out; one using 3H_ TPP+ alone, in order to measure the typical
membrane potential for comparison, and the other with the addition of 3 ~ of 95 %
ethanol for 10 minutes prior to adding the 3H_ TPP+ in order to ascertain if the solvent
56
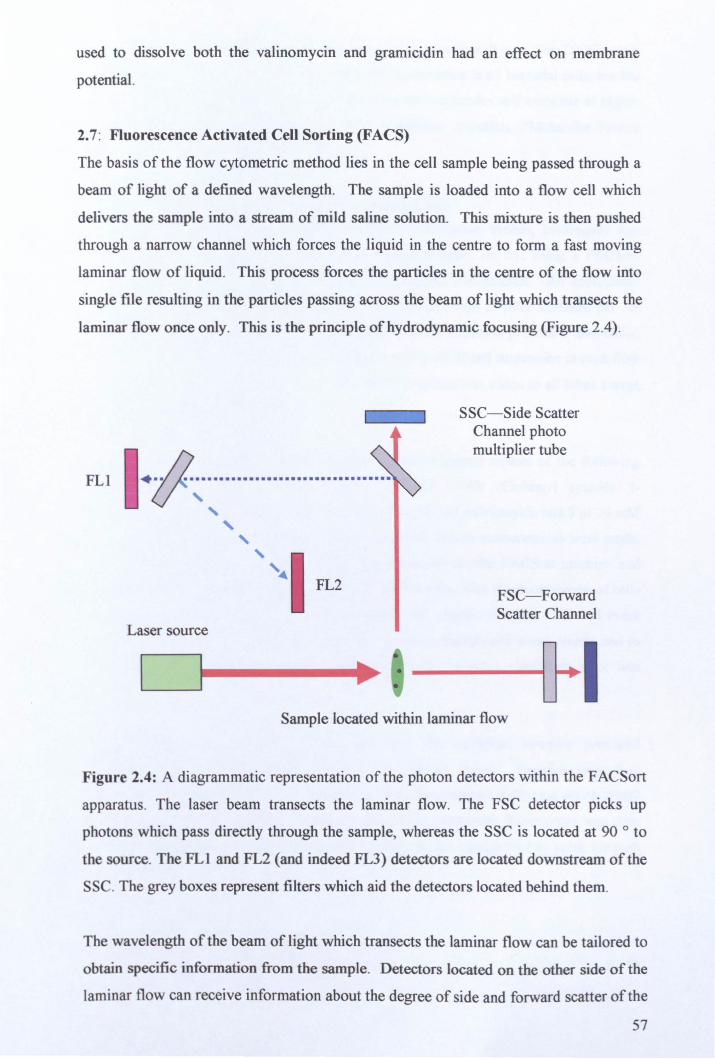
used to dissolve both the valinomycin and gramicidin had an effect on membrane
potential.
2.7 : Fluorescence Activated Cell Sorting (FACS)
The basis of the flow cytometric method lies in the cell sample being passed through a
beam of light of a defined wavelength. The sample is loaded into a flow cell which
delivers the sample into a stream of mild saline solution. This mixture is then pushed
through a narrow channel which forces the liquid in the centre to form a fast moving
laminar flow of liquid. This process forces the particles in the centre of the flow into
single file resulting in the particles passing across the beam of light which transects the
laminar flow once only. This is the principle of hydrodynamic focusing (Figure 2.4).
FLl .. ~~ .......••.•••...........••......
, , ,
"·1 FL2
Laser source
SSC- Side Scatter Channel photo multiplier tube
FSC- Forward Scatter Channel
Sample located within laminar flow
Figure 2.4: A diagrammatic representation of the photon detectors within the F ACSort
apparatus. The laser beam transects the laminar flow. The FSC detector picks up
photons which pass directly through the sample, whereas the SSC is located at 90 0 to
the source. The FLI and FL2 (and indeed FL3) detectors are located downstream of the
SSc. The grey boxes represent filters which aid the detectors located behind them.
The wavelength of the beam of light which transects the laminar flow can be tailored to
obtain specific information from the sample. Detectors located on the other side of the
laminar flow can receive information about the degree of side and forward scatter of the
57
light beam by the particles within the core of the laminar flow. The OiOC2 stain
component of the BacLight kit exhibits green fluorescence in all bacterial cells, but the
fluorescence shifts towards red emission as the dye molecules self associate at higher
cytosolic concentrations caused by larger membrane potentials ("Molecular Probes
Product Infonnation Sheet MP34950").
2.7.1: Measurement of &'1' in Acidocella 29 using F ACS
The BacLight Bacterial Membrane potential kit (Molecular Probes, Invitrogen) was
used in order to detennine the effect of various reagents on A'I', using a F ACSort
machine in order to determine the ratio of red:green fluorescence. An appropriate
volume of cells were centrifuged and resuspended in 18 ml of filter sterilised pH 3.0
phosphate buffered saline (PBS) (Sambrook and Russell 200 I) to produce a final 00595
of approximately 0.5. Samples were prepared with 1 ml of cell suspension in each flow
cytometry tube, to which 10 J.1l of 3 mM DiOC2 solution was added to all tubes except
for the three unstained controls.
To the remaining samples containing DiOC2 stain triplicate repeats of the following
treatments were also prepared: 10 pJ 500 J.1M CCCP (Carbonyl cyanide 3-
chlorophenylhydrazone); 3 JLI 100 % ethanol, 3 ,.d 10 mM valinomycin and 3 J.1l 20 mM
gramicidin. Samples were incubated for 15 minutes before measurements were made.
A 1 ml sample of filter sterilised PBS was mounted onto the F ACSort machine and
compared to 1 ml samples of unstained and stained cells, with the fluorescence of cells
in both the FLl-H and FL2-H axes confinning the position of cells. The cell event
count region, known as "RI", was located to reduce background event counts and to
contain as much of the cell population as possible before a significant error was
incurred.
Instrument settings were adjusted such that the unstained samples produced
approximately equivalent FL I-H and FL2-H median values. Samples were then
stabilised for approximately 30 seconds before the three repeats, following which 20000
events in the RI region were counted. The ratio of red:green fluorescence was then
calculated using the median FL2-H value divided by the median FL I-H value for each
sample.
58
2.7.2: Measuring intracellular pH in Acidocella 29 using FACS
The fluorescent probe LysoSensor Green DND-189 (Molecular Probes, Invitrogen) was
employed as an alternative method to NMR for determination of intracellular pH in
Acidocella 29. Cells were adjusted to an OD595 of 0.5 log, resuspending the pellets in
AC pH 3 medium containing 1 J.lM LysoSensor Green DND-189 before returning cell
samples to their normal growth conditions for 2 hours. After 2 hours cells were pelleted
and the supernatant removed completely before resuspending in fresh filter sterilised
AC pH 3 medium without any probe immediately prior to F ACS.
1 ml samples of cells were mounted onto the F ACSort and a gated popUlation of cells
assigned based on comparisons between filter sterilised AC pH 3 and stained cells as
described in Section 2.7. E. coli were used as a negative control, in order to ensure that
any fluorescence observed, was not due to aberrant binding of the probe. Intracellular
pH was measured as a function of the median FL I-H.
2.8: Nuclear Magnetic Resonance (NMR)
2.8.1: E. gracilis
100 ml of7 day old (approximately 25 - 35 ~g chi mr') E. gracilis G46 or E. gracilis Z
culture were centrifuged at 3000 g for 10 minutes and the pellet resuspended in 2 ml of
10 mM Tris pH 3 or pH 7 for Jlp_NMR experiments. Cells were then added to 5 mm
NMR tubes (WilmadlLab glass, Buena, NJ.) and deuterium oxide added to a final
concentration of 10 % v/v before being pelleted further in a hand centrifuge. NMR
measurements were recorded in a Bruker Avance DRX-500 (11.7 T) at 202.45 MHz
with a 10 J.IS pulse (90 0) with an acquisition time of 0.68 s and a relaxation delay of 1 s,
typically using 128 transients, giving a total time per measurement of 4 minutes.
Spectra were processed by Fourier Transformation using a 5 Hz exponential broadening
using FELIX (Accelrys Inc, San Diego, CA). Chemical shifts are reported relative to 1
M phosphoric acid in ppm. Calibration samples of 50 mM sodium phosphate were
prepared at pH values 2.91, 3.64,4.03, 4.54,4.96, 5.52, 5.99,6.53 and 8.3. The pH of
test samples was determined by interpolation.
2.8.2: Acidocella 29
100 rnl of Acidocella 29, OD595 = 0.5, were centrifuged and resuspended in ] rnl of ] 0
mM Tris pH 3 or pH 7. 31p_NMR experiments were carried out exactly as described
above (Section 2.9.1) with the exception that 4096 transients were recorded.
59
IH NMR measurements were carried out in a Broker Avance DRX-500 (11-.7 T) at 500
MHz using a 90 0 pulse approximately 12 ~ calibrated for each sample with an
acquisition time of 0.7 s and a relaxation delay of 1.5 s, during which time the water
signal was suppressed by saturation. Spectra were typically acquired using 200
transients. Chemical shifts are reported relative to DSS (2,2-Dimethyl-2-silapentane- 5-
sulfonate sodium salt) in ppm. Calibration samples of 50 mM lactic acid in 50 mM
sodium phosphate were prepared at pH values: 8.3, 6.53, 5.99, 5.52, 4.96, 4.54, 4.03,
3.64,2.91 and 2.27. The pH of test samples was determined by interpolation.
2.9: Malate Dehydrogenase Activity
2.9.1: Preparation of E. gracilis cell free extract
E. gracilis G46 and E. gracilis Z were grown in batch culture (Section 2.2.1) and the
chlorophyll content of the cells determined (Section 2.3). E. gracilis G46 and E.
gracilis Z cells were harvested by centrifugation at 3000 g for 10 minutes and
resuspended in pH 7 M9 minimal medium. Cells were disrupted using a French
Pressure Cell Press (Simoamico, SLM Instruments, INC). The crude extract was then
centrifuged in 1 m1 samples in a microcentrifuge at 11400 g for 1 minute and the
resulting supernatant removed into a fresh microcentrifuge tube and kept on ice.
2.9.2: Enzyme activity determination
Malate dehydrogenase is an enzyme found in the tricarboxylic acid (TCA) cycle which
catalyses the following reaction:
L- Malate + NAD+ +-+ Oxaloacetate + NADH + It"
The assay mixture contained:
2.0 m1 M9 (minimal salts medium)
0.3 ml 1.5 mM NADH
0.2 m17.5 mM oxaloacetate, pH 7.5
0.1 m1 cell free extract
0.4 ml distilled water
Absorbance was measured in a Heliosa Spectrophotometer at room temperature (-20-
25 OC) in 4.0 m1 cuvettes with a 1 cm light path in all cases. All reagents, with the
exception of oxaloacetate, were added to the cuvette and the background rate of reaction
60
measured at 340 nm for 1 minute. Positive rates were reduced to zero, whilst any
negative background rate was recorded and subtracted from the final rate. The reaction
was started by the addition of oxaloacetate and the decrease in absorbance at 340 nrn
measured for 1 minute against a water blank. Enzyme activity is expressed as J.Ulloles
NADH oxidised min-t mg-t of protein.
Enzyme assays were carried out as both shock experiments, where cell free extract was
added into the cuvette and the rate of reaction measured immediately, and incubated
experiments where the rate of reaction was measured after 120 minutes incubation of
the cell-free extract in M9 minimal medium at the appropriate pH at room temperature.
Oxaloacetate and NADH solutions were prepared fresh daily due to their instability.
The extinction coefficient ofNADH at 340 nm is 6.22 x 10³ litre mole-\ cm-I.
2.10: Agarose Gel Electrophoresis
All DNA samples were analysed by electrophoresis using 0.8 - 1.3 % T AE gels. These
comprised 0.8 -1.3 g low melting point agarose (Roche), 2 mlSOX TAB (Appendix D)
and distilled water to 100 ml. This solution was then heated in a microwave until the
agarose had melted, after which it was allowed to cool whilst being stirred, and 5 J.Ll of
ethidium bromide (Biorad #161-0433) was added prior to pouring into a Biorad Subcell
GT electrophoretic tank with a 14, 20 or 30 well comb. Once the gel had set, it was
covered with IX TAE buffer (Appendix D) and run at 90 - 120 V using a Biorad
PowerPack 300. Gels were visualised using the Uvitec "Uvidoc" mounted camera
system.
2.11: Genomic DNA Extraction
2.11.1: Environmental samples
Direct extraction of total community genomic DNA was carried out using the
commercially available PowerSoil kit (Mo Bio Laboratories Inc, California) following
the manufacturers guidelines with the following exceptions: 500 ~l of each sample was
used instead of 0.25 g and an additional 5 minute incubation at 70 OC was carried out
after the addition of solution Cl and prior to the 10 minute vortex, as suggested by the
protocol in order to increase cell lysis. Successful extraction of genomic DNA was
verified by resolving a 2 ~l sample of the eluate by gel electrophoresis (Section 2.10)
against 1 J.Ll of GeneRuler 1 kb ladder (Fermentas International Inc, Canada). Samples
containing conununity genomic DNA were labelled and stored at - 20°C until required.
61

2.11.2: E. gracilis 046
The method used for genomic DNA extraction from E. gracilis 046 was adapted from
Chen et al (2001). Cells were grown in M6 medium, initially at pH 3, for 7 days before
four 1 ml samples were centrifuged at 11400 g for 10 minutes. The supernatant was
poured off immediately and each pellet resuspended in 250 J!l of
cetyltrimethylammonium bromide (CTAB) solution (2% CTAB w/v, 0.1 M Tris-HCl
pH 8.0, 1.4 M NaCI, 20 mM EDTA).
The samples were then combined into two microcentrifuge tubes, each containing 500
J.1l, and incubated at 65°C for 60 minutes. DNA was recovered using phenol
chloroform isoamylalcohol and ethanol precipitation (Sambrook and Russell 2001)
before resuspending air-dried DNA pellets in 50 III of MilliQ water.
2.11.3: Unknown microorganisms
Oenomic DNA was extracted from cells using the commercially available QIAgen
genomic Tip 20/0 kit following the manufacturer's protocol. Genomic DNA was
resuspended at 55°C for 2 hours before a 2 J,11 sample was resolved by agarose gel
electrophoresis (Section 2.10) against 1 III of GeneRuler 1 kb ladder (Fennentas
International Inc, Canada).
2.12: Phylogenetic Identification of Unknown Organisms
2.12.1: 16S rRNA PCR
Following extraction of genomic DNA from a particular microorganism, polymerase
chain reaction (PCR) was carried out in order to amplify the 16S rRNA gene. The
primers used to amplify the 16S rRNA gene were 27F and 1492R (Lane 1991)
(Appendix C). The reaction mixture contained the following reagents in a 0.2 m1 thin
walled PCR tube: 39 J,11 Distilled Water,S J.1l10X Buffer, 2.5 J.1l 50 mM MgCh, 0.5 J.1l
Forward Primer, 0.5 J.1l Reverse Primer, 1 11125 mM dNTPs, IJ.1l genomic DNA and 0.5
J.1l Taq polymerase (Bioline).
Amplifications were carried out in a MyCycler thermocycler (BioRad) and began with
an initial denaturation step consisting of 94 °C for 3 minutes followed by 30 cycles
consisting of 1 minute at 94 °C, 1 minute at 50°C, and 2 minutes at 72 °C followed by a
final extension at 72 DC for 5 minutes.
62
2111 ofthe peR reaction was added to 2 J.l1 of Orange G loading dye and analysed on a 1
% agarose gel against 1 J.lI of 1 kb GeneRuler ladder (Fermentas) to confirm the correct
sized product had been amplified. PCR reactions were then cleaned up using QIAgen
PCR purification kit as per the manufacturer's protocol.
2.12.2: 18S rRNA PeR
The algal 18S rRNA gene was amplified using primers 18SF and 18SR (Sittenfeld et al.
2002) in a MyCycler Thermocycler (BioRad) using the following programme: 4
minutes at 94 QC, followed by 25 cycles of 30 seconds at 94 QC, 30 seconds at 50 QC
and 6 minutes at 72 QC, with a single 15 minute extension at 72 QC. The reaction
mixture contained the following reagents: 39 J.lI Distilled Water, 5 III 10X Buffer, 2.5 J.lI
50 mM MgCh, 0.5 J.lI Forward Primer, 0.5 J.lI Reverse Primer, 1 J.lI 25 mM dNTPs, 1 III
genomic DNA and 0.5 JlI Taq polymerase (Bioline).
The yeast 18S rRNA gene was amplified using NS I (White 1990) and 18L (Ham by and
Zimmer 1991) primers. The reaction mixture contained 39 III Distilled Water, 5 J.lI 10X
Buffer, 2.5 JlI 50 mM MgCh, 0.5 III Forward Primer, 0.5 .u Reverse Primer, 1 J.Ll25 mM
dNTPs, I JlI genomic DNA and 0.5 III Taq polymerase (Bioline). Amplification was
carried out using an initial denaturation at 94°C for 3 minutes followed by 30 cycles of
94 °C for 1 minute, 50°C for 1 minute and 72 °C for 2 minutes, with a final extension at
72 °C for 5 minutes.
Amplification products were purified with a QIAquick-spin kit (Qiagen, Germany) and
their expected size verified by agarose gel electrophoresis (Section 2.10).
2.13: Ribulose-l,S-bisphosphate Carboxylase/oxygenase PCR
Amplification of ex on 5 of the large subunit ofthe Ribulose-l,5-bisphosphate
carboxylase/oxygenase gene (363 bp) from E. gracilis G46 was carried out using
RbcL5F and RbcL5R primers (Appendix C). The reaction mixture contained the
following reagents in a 0.2 mt thin walled PeR tube: 39 .u Distilled Water, 5 J.Lll OX
Buffer, 2.5 JlI 50 mM MgCh, 0.5 J1I Forward Primer, 0.5 J1I Reverse Primer, 1 .u 25 mM
dNTPs, IJ.Ll genomic DNA and 0.5 J.Ll Taq polymerase (Bioline).
Amplifications were carried out in a MyCycler thermocycler (BioRad) and began with
an initial denaturation step consisting of94 °C for 3 minutes followed by 30 cycles
63
consisting of 1 minute at 94°C, 1 minute at 58 QC, and 2 minute at 72 °C followed by a
final extension at 72 °C for 5 minutes. Successful amplification was verified by agarose
gel electrohoresis (Section 2.10) and sequenced externally by Cogenics (Appendix B).
2.14: Denatnring Gradient Gel Electrophoresis (DGGE)
2.14.1: PCR
Following direct extraction of community DNA from environmental samples PCR was
carried out to amplify short, highly variable fragments of the 16S rRNA gene in order to
assess the microbial diversity present at the lagoon using Denaturing Gradient Gel
Electrophoresis (DGGE). Two different primer sets were used; primers P2 and P3
amplify the 202 bp hypervariable V3 region of the bacterial 16S rRNA gene from
position 341 to 543 on the E. coli 16S rRNA gene (Muyzer et al. 1993) and a second
pair of primers, 1055F and 1406R, amplify a 323 bp region of the bacterial 16S rRNA
gene which incorporates the hypervariable V9 region from position 1070 to 1392 of the
E. coli 16S rRNA gene (Ferris et al. 1996a).
PCR conditions for P2 and P3 primers were as follows: 37.5 III of distilled water, 5 III
10X reaction buffer, 2.5 ,.d 50 mM MgCh, 1 ~I 25 mM dNTPs, 1 ~ forward primer, 1
~I reverse primer, 0.5 ~I lOng ~rl BSA, 1 ~ community DNA and 0.5 ~l Taq
polymerase (Bioline). Touchdown PCR began with an initial denaturation step of94 °C
for 2 minutes followed by cycles of denaturation at 94°C for 1 minute, an annealing
temperature of 65 °C for 1 minute, which was decreased by 0.5 OC per cycle until
touchdown at 55 OC was reached, and extension at 72 °C for 30 seconds. This cycle was
then repeated a further 5 times with a constant annealing temperature of 55 OC. A final
extension at 72 °C for 3 minutes completed the reaction.
The temperature cycle for V9 PCR was 5 minutes of denaturation at 94 OC, followed by
10 cycles of denaturation at 94 OC for 1 minute, 1 minute of annealing at 53 OC, with a
decrease in annealing temperature of 1 °C per cycle, and extension at 72 °C for 3
minutes. This was followed by 20 cycles of 94 OC for 1 minute, 43°C for I minute, 72
OC for 3 minutes and a final extension at 72 OC for 10 minutes. Agarose gel
electrophoresis against 1 ~l of Fermentas 100 bp GeneRuler ladder was carried out in
order to verify the correct size product was amplified in each instance.
64
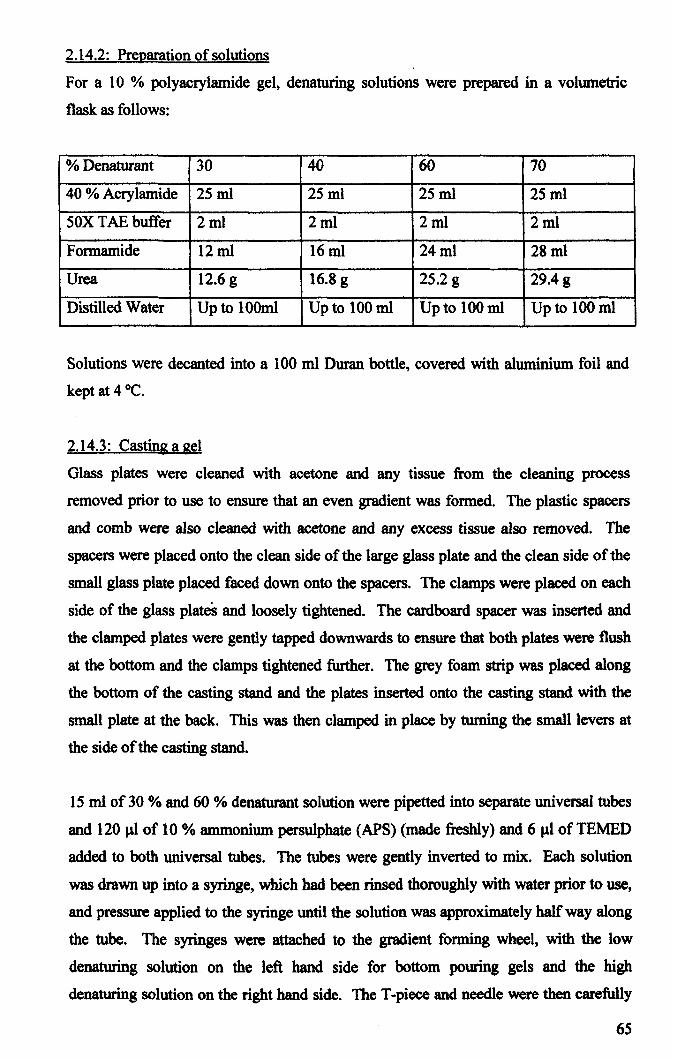
2.14.2: Preparation of solutions
For a 10 % polyacrylamide gel, denaturing solutions were prepared in a volumetric
flask as follows:
% Denaturant 30 40 60 70
40 % Acrylamide 25ml 25ml 25 ml 25 ml
50X T AE buffer 2ml 2ml 2ml 2ml
Formamide 12ml 16ml 24ml 28ml
Urea 12.6 g 16.8 g 25.2 g 29.4g
Distilled Water Up to 100ml Up to 100ml Up to 100ml Up to 100ml
Solutions were decanted into a 100 ml Duran bottle, covered with aluminium foil and
kept at 4°C.
2.14.3: Casting a gel
Glass plates were cleaned with acetone and any tissue from the cleaning process
removed prior to use to ensure that an even gradient was formed. The plastic spacers
and comb were also cleaned with acetone and any excess tissue also removed. The
spacers were placed onto the clean side of the large glass plate and the clean side of the
small glass plate placed faced down onto the spacers. The clamps were placed on each
side of the glass plates and loosely tightened. The cardboard spacer was inserted and
the clamped plates were gently tapped downwards to ensure that both plates were flush
at the bottom and the clamps tightened further. The grey foam strip was placed along
the bottom of the casting stand and the plates inserted onto the casting stand with the
small plate at the back. This was then clamped in place by turning the small levers at
the side of the casting stand.
15 ml of30 % and 60 % denaturant solution were pipetted into separate universal tubes
and 120 tll of 10 % ammonium persulphate (APS) (made freshly) and 6 tllofTEMED
added to both universal tubes. The tubes were gently inverted to mix. Each solution
was drawn up into a syringe, which had been rinsed thoroughly with water prior to use,
and pressure applied to the syringe until the solution was approximately half way along
the tube. The syringes were attached to the gradient forming wheel, with the low
denaturing solution on the left hand side for bottom pouring gels and the high
denaturing solution on the right hand side. The T -piece and needle were then carefully
65
attached to both syringe tubes and the needle placed between the two glass plates in the
centre. The gradient wheel was then very gently pushed to pour the gel. Once the gel
was full the comb was eased in between the two plates and left to set for approximately
60 minutes.
Whilst the gel was setting 7 litres of 1 X T AE Was prepared and poured into the gel tank.
The core was added to the tank and set to heat to 65°C. Once the gel was set the comb
was carefully removed and the wells very gently rinsed with IX TAE to remove any
excess material. The gel plates were then clamped into the core, inserted into the tank,
the temperature decreased to 60°C and T AE added to the top buffer reservoir. Samples
were prepared by adding 2 ,.u of loading buffer II (Appendix D) to 8 ,.u of PCR product
and all 10 J.l.1 of each sample loaded onto the geL Electrophoresis was carried out at 80
V for 16 hours at 60°C. After electrophoresis the gel was removed from the tank and
stained with a solution containing 2 J.lI of SYBR Gold (Invitrogen) in 20 ml of IX T AE
for 20 minutes under aluminium foil. After 20 minutes the stain was gently rinsed from
the gel using distilled water and the gel placed into the UV transilluminator for
visualisation using Lab Works Image Analysis Software (UVP Inc, California).
2.14.4: Identification of bands
Small fragments of individual bands were excised by pressing a cut-off 200 J.ll pipette
tip onto the band and placing this into a microcentrifuge tube. 10 J.ll of ultrapure
DNAse, RNAse-free water was added and the sample incubated at 4 °C overnight to
allow DNA to diffuse from the gel fragment. 5 J.lI of this solution was then used as a
template for PCR using the appropriate primers and PCR programme for the sample
(Section 2.14.1). Successful amplification products were gel excised using a QIAgen
gel extraction kit followed by a further PCR step using only dA TP to add a Poly-A tail
to the fragment and finally purified using a QIAgen kit as per the manufacturer's
protocol. Excised fragments were then ligated into the cloning vector pCR2.1 (Figure
2.5) (Invitrogen) using the following conditions: 4.5 J.lI insert, 1 ,.u pCR2.1 (0.025 ng J.lI
-I), 1 J.lI T4 DNA ligase (Roche) , IJ.lI ligase buffer and 2.5 J11 ultrapure water. The
ligation reaction was incubated at 4 °C overnight and used to transform competent E.
coli strain DH5a cells.
66
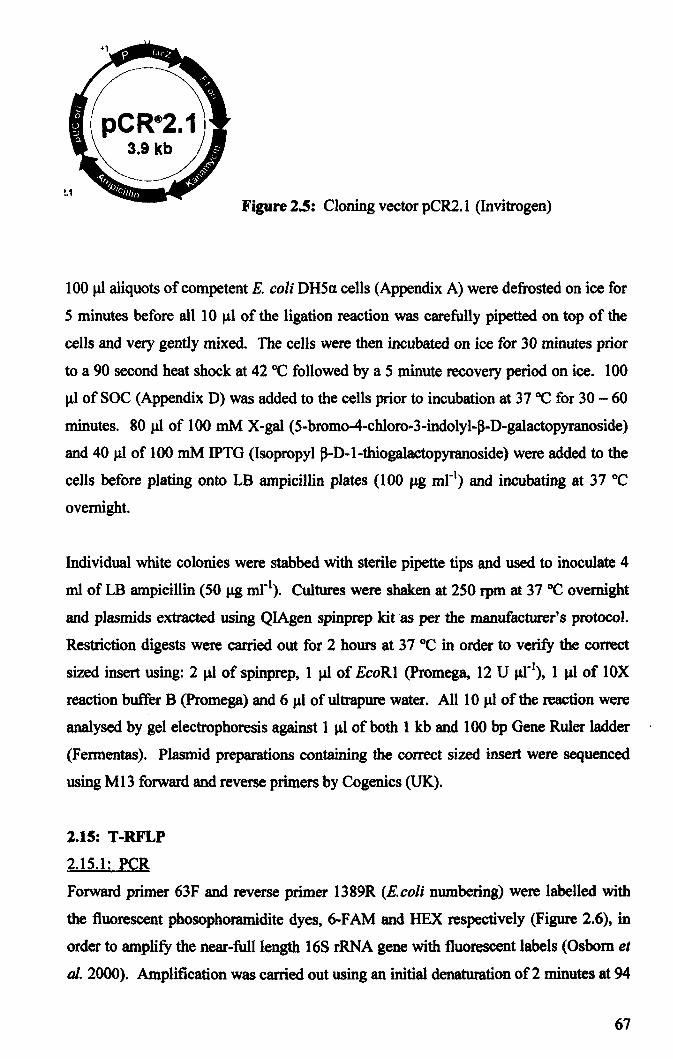
Figure 2.5: Cloning vector pCR2.1 (Invitrogen)
100 J.11 aliquots of competent E. coli DHSa cells (Appendix A) were defrosted on ice for
5 minutes before all 10 J.11 of the ligation reaction was carefully pipetted on top of the
cells and very gently mixed. The cells were then incubated on ice for 30 minutes prior
to a 90 second heat shock at 42 CC followed by a S minute recovery period on ice. 100
J.1l of SOC (Appendix D) was added to the cells prior to incubation at 37 CC for 30 - 60
minutes. 80 J.11 of 100 mM X-gal (S-bromo-4-chloro-3-indolyl-P-D-galactopyranoside)
and 40 J.11 of 100 mM IPTG (Isopropyl P-D-l-thiogalactopyranoside) were added to the
cells before plating onto LB ampicillin plates (100 J.1g ml-l) and incubating at 37°C
overnight.
Individual white colonies were stabbed with sterile pipette tips and used to inoculate 4
ml ofLB ampicillin (50 J.1g mrl). Cultures were shaken at 250 rpm at 37 CC overnight
and plasmids extracted using QIAgen spinprep kit as per the manufacturer's protocol.
Restriction digests were carried out for 2 hours at 37°C in order to verify the correct
sized insert using: 2 J.1l of spinprep, 1 J.1l of EcoRl (Promeg&, 12 U J.1l-I), 1 J.11 of 10X
reaction buffer B (Promega) and 6 J.1l of ultrapure water. All 10 J.1l of the reaction were
analysed by gel electrophoresis against 1 J.11 of both 1 kb and 100 bp Gene Ruler ladder
(Fennentas). Plasmid preparations containing the correct sized insert were sequenced
using M13 forward and reverse primers by Cogenics (UK).
2.1S: T -RFLP
2.15.1: peR
Forward primer 63F and reverse primer 1389R (E.coli numbering) were labelled with
the fluorescent phosophoramidite dyes, 6-F AM and HEX respectively (Figure 2.6), in
order to amplify the near-full length 16S rRNA gene with fluorescent labels (Osbom et
al. 2000). Amplification was carried out using an initial denaturation of 2 minutes at 94
67
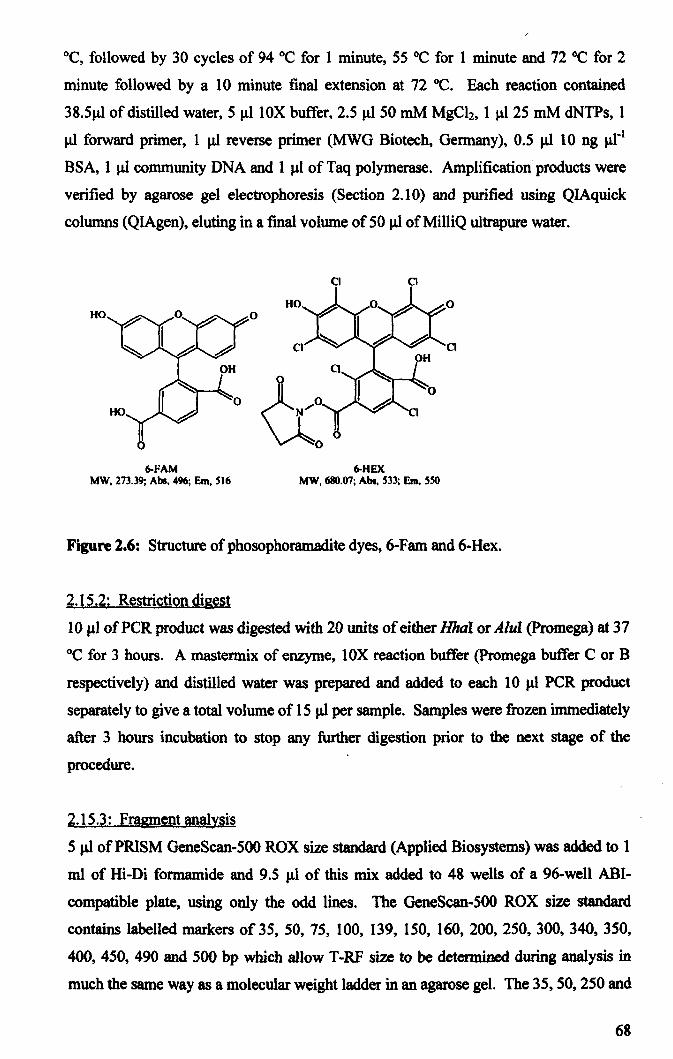
GC, followed by 30 cycles of 94°C for 1 minute, 55°C for 1 minute and 72 °C for 2
minute followed by a 10 minute final extension at 72°C. Each reaction contained
38.5~ of distilled water, 5 III 10X buffer, 2.5 III 50 mM MgCh, 1 III 25 mM dNTPs, 1
III forward primer, 1 ~ reverse primer (MWG Biotech, Gennany), 0.5 III 10 ng Ilrl
BSA, 1 J.Ll community DNA and 1 III of Taq polymerase. Amplification' products were
verified by agarose gel electrophoresis (Section 2.10) and purified using QIAquick
columns (QIAgen), eluting in a final volume of 50 J.Ll of MilliQ ultrapure water.
Cl Cl
HO o HO
Cl
HO &: ~fAM ~HEX
MW. 273.39; Abs. 496; Em. SI6 MW. 680.07; Abs. S33; Em. SSO
Figure 2.6: Structure of phosophoramadite dyes, 6-Fam and 6-Hex.
2.15.2: Restriction digest
10,.ll ofPCR product was digested with 20 units of either HhaI or AluI (Promega) at 37
°C for 3 hours. A mastermix of enzyme, 10X reaction buffer (Promega buffer C or B
respectively) and distilled water was prepared and added to each 10 ~ peR product
separately to give a total volume of 15 III per sample. Samples were frozen immediately
after 3 hours incubation to stop any further digestion prior to the next stage of the
procedure.
2.15.3: Fragment analysis
5 J.Ll of PRISM GeneScan-500 ROX size standard (Applied Biosystems) was added to 1
ml of Hi-Di fonnamide and 9.5 ~ of this mix added to 48 wells of a 96-well ABI
compatible plate, using only the odd lines. The GeneScan-500 ROX size standard
contains labelled markers of 35, 50, 75, 100, 139, 150, 160, 200, 250, 300, 340, 350,
400, 450, 490 and 500 bp which allow T -RF size to be determined during analysis in
much the same way as a molecular weight ladder in an agarose gel. The 35, 50, 250 and
68
340 bp markers are excluded when assigning the size markers due to their inconsistent
migration.
0.5 III of sample was added into each well, with unused wells made up to 10 III with
ultrapure water. The plate was then covered with a grey septa and checked for air
bubbles. If any air bubbles were present the plate was spun to remove these. The
samples were then denatured for 3 minutes at 94 °C using a thermocycler and placed
into the black and white clips before being put into the input stack of the ABI3730 48-
well capillary sequencer. A 10 second injection time was used. The laboratory work
was assisted by protocols provided by the Sheffield Molecular Genetics Facility which
is funded by the Natural Environment Research Council, VK.
Samples were analysed using GeneMapper v 4.0 software (Applied Biosystems) using a
standard protocol prepared by the Sheffield Molecular Genetics Facility. This involves
importing sample data into the GeneMapper programme and choosing the "AFLP"
analysis protocol. The raw data from several samples was viewed in order to determine
the position of the primer flare; for Hoole Bank acid tar lagoon samples the average
position was approximately 1650 bp therefore this was input into the analysis
parameters. Green, Red and Blue dyes were selected in order to analyse forward and
reverse terminal restriction fragments (T-RFs) and in order to include the ROX size
markers. The analysis range was set from 50-500 bp; although some samples contained
T -RFs larger than 500 bp the largest ROX size standard is 500 bp therefore this sets the
cut off point. Once the analysis parameters were set, the analysis method was applied to
the raw sample data and both blue (Forward) and green (Reverse) T-RF profiles
generated for each sample.
The GeneMapper programme then generated a bin set based on the analysis parameters.
However, the generated bin set was deleted and replaced by manually scanning each
sample and adding bins appropriately. This was carried out for each dye with each
digest, generating four separate panel and bin sets per sample. The panel and bin sets
were saved and added into the initial anlaysis settings in order to generate a table of T
RFs, including size (in bp), peak height and peak intensity. This data was then exported
into an Excel workbook and analysed using T -align (Smith et al. 2005) for further
statistical analysis using the software package MVSP. SigmaPlot was used to draw
graphs.
69
2.16: Phylogenetic Tree Construction
Phylogenetic trees were constructed in several stages. Initially the query sequence was
subjected to BlastN comparison provided by NCBI (Altschul et al. 1990) and the
sequences from the highest identity matches obtained from the NCBI database for
further comparison. The sequences were then aligned using ClustalW (1.83) (Chenna et
al. 2003) with all parameters set at their default values.
2.17: Photosystem 11 Fluorescence Measurements
Chlorophyll content of E. gracilis G46 and E. gracilis Z cultures was measured
according to Section 2.3 and adjusted to 15 ~ chlorophyll mrl, resuspending the pellets
in M6 medium at pH 3 or 7 as appropriate. A Walz Fluorometer was used to measure
the fluorescence produced from photosystem II (PSII) using WPI Duo 18 software.
Cells were placed into a quartz cuvette and dark adapted for 1 minute before the
measuring beam was switched on (300 J.U1loles m-2 S-I) which determined Fo. 30
seconds later a high intensity flash of light determined the Fm value. A further 30
seconds later the actinic light was switched on (450 J.UTIoles m-2 S-I) and the fluorescence
trace followed for 4 minutes. During this time the high intensity pulse was switched on
every 60 seconds. After switching off the actinic light the high intensity pulse was used
to measure Fm for a further 3 minutes at 60 second intervals.
2.18: Characterisation of Acidocella
Characterisation of Acidocel/a 29 was carried out using the API 20 NE kit from
bioMerieux (NC, USA) as directed in the manufacturer's protocol. Carbon source
utilisation was determined by inoculating a 96-well microtitre plate containing 197.5 J.1l
of pH 3 M9 minimal media plus 2.5 Jd of 1 M carbon source in each well with 50 J.1l of
Acidocella 29. Each carbon source was tested in triplicate. The 96-well plate was
incubated at 26°C for 7 days to allow any growth which may occur to be detected. The
plate was read using a plate reader at 600 nm and growth in each well recorded as
present (+) or absent (-).
The effect of aluminium, cadmium, copper, nickel and zinc sulphates on the growth of
Acidocella 29 was also tested. 175 Jil ofM9 minimal media was pipetted into each well
of a 96 well micro titre plate, to which 4 wells out of each row of eight, 2.5 J.1l of 1 M
stock solution of metal sulphate was added, whilst 25 Jil of the same 1 M stock solution
was added into the remaining four wells. 50 Jil of Acidocella 29 was added to three out
70

of four wells for both 10 mM and 100 mM metal concentrations, with the remaining
well acting as a control for metal precipitation. An extra 22.5 ~l of M9 minimal media
was then added to the wells in which only 2.5 ~l of metal solution was added.
Utilisation of volatile hydrocarbons was tested by preparing 1 %. 0.1 % and 0.01 %
(v/v) solutions of benzene. toluene, ethylbenzene. xylene, decane, and hexadecane. 100
JA.l of Acidocella 29 was added to 1 ml samples of each solution in a microcentrifuge
tube and sealed with parafilm. 100 III of AcidocelJa 29 was also added to a 1 ml sample
of M9 minimal media and a 1 ml sample of AC29 media, as negative and positive
controls respectively. Sealed microcentrifuge tubes were then placed in a sealed jar to
ensure no volatile hydrocarbons escaped in order to protect other cultures from harm.
2.19: LysoSensor Imaging of E. gracUis
The LysoSensor YellowlBlue DND-160 probe (Molecular Probes, Invitrogen) was
employed to visualise E. gracilis G46 cells. The probe fluoresces at different
wavelengths dependent on its pH; therefore it can be used to detennine intracellular pH.
However, it was used in this instance simply to visualise the compartmentalisation of
eukaryotic cells and to identify if different compartments of the cell had different pH
values.
1 Jil of the probe was added to 1 ml aliquots of M6 medium at pH 3 and pH 7 and this
media incubated at 37 OC for 1 hour. 2 ml of E. gracilis 046 or E. gracilis Z were
centrifuged at 11400 g for 10 minutes and the resulting pellets resuspended in 1 m1 of
the probe containing medium. Cells were then incubated under normal growth
conditions for 3 hours before being centrifuged at 11400 g for 10 minutes. Pellets were
then resuspended in 1 ml of M6 medium pH 3 or 7 as appropriate. One drop of the
sample was placed onto a glass slide using a pasteur pipette and covered with a cover
slip for visualisation using a CCMI Deltavision Deconvolution Microscope.
71
Chapter Three: Characterisation of Microbial Diversity in Hoole
Bank Acid Tar Lagoon
3.t: Introduction
The aims of this work were to analyse the microbial diversity present in samples from
Hoole Bank acid tar lagoon in order both to compare the results of classical and
molecular techniques and to further our knowledge of the microbial community present
in this environment. The work was carried out in two distinct branches; classical
microbiology analysis using batch and continuous culture techniques and molecular
microbial analysis using Terminal Restriction Fragment Length Polymorphism (T
RFLP) and Denaturing Gradient Gel Electrophoresis (DOGE), as discussed in Sections
1.2.1, 1.2.2, 2.14 and 2.15. Classical culture methods used to isolate microorganisms
for further study were chosen such that microorganisms which were isolated could be
grown readily.
3.2: Results
3.2.1: Sample collection
A total of 21 samples were collected from Hoole Bank acid tar lagoon. Samples were
numbered according to their corresponding photograph taken during sampling at the
lagoon. The pH of samples was measured upon returning to the laboratory and not on
site. Samples were also categorised into 4 groups based on the sample type. The
sample groups were (Figures 3.1a-d respectively):
• Group 1 - Thick Sludge external to Lagoon
• Group 2 - Lagoon edge
• Group 3 - Green Biofilm
• Group 4 - Surface water
Table 3.1 gives further details of each of the samples.
72
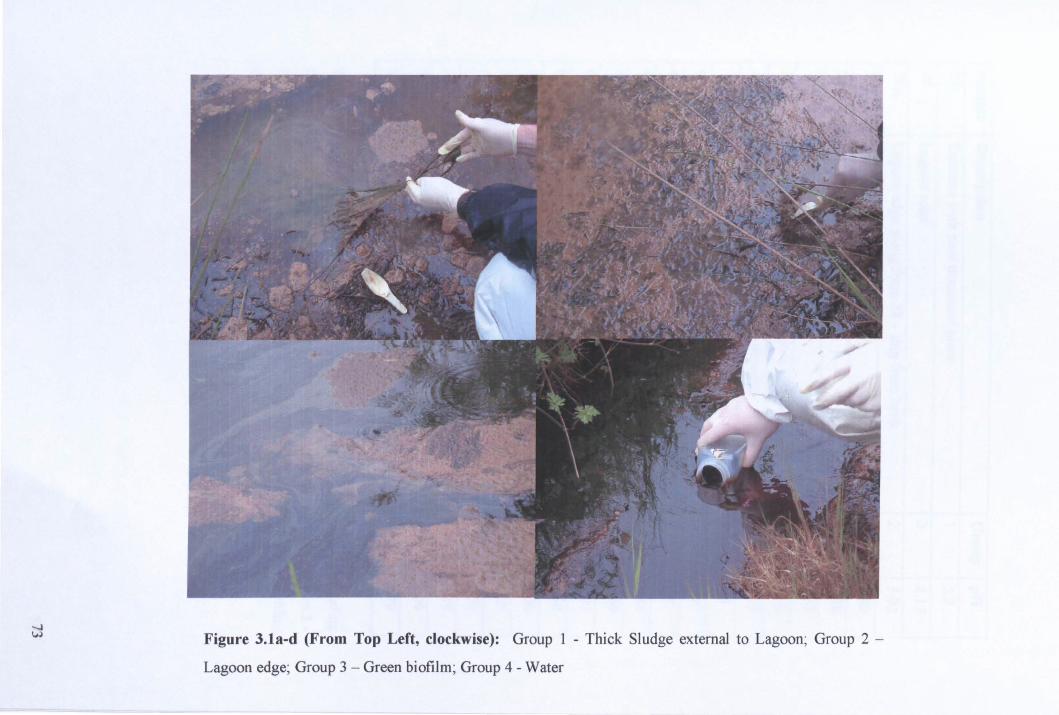
-...I W Figure 3.1a-d (From Top Left, clockwise): Group 1 - Thick Sludge external to Lagoon; Group 2 -
Lagoon edge; Group 3 - Green biofilm; Group 4 - Water
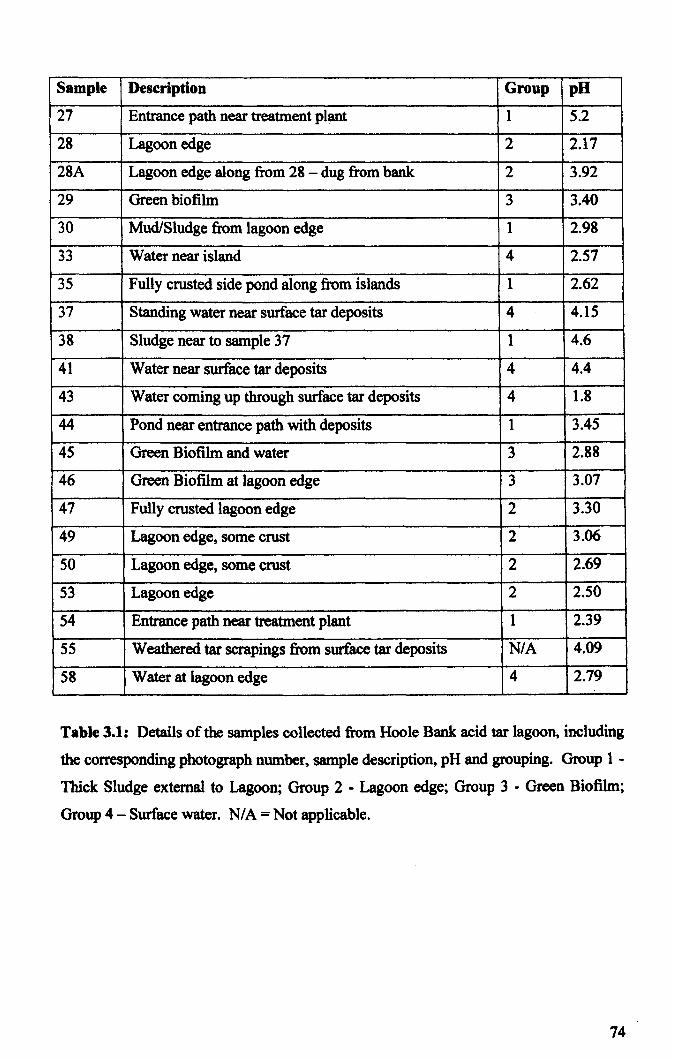
Sample Description Group pH
27 Entrance path near treatment plant 1 5.2
28 Lagoon edge 2 2.17
28A Lagoon edge along from 28 - dug from bank 2 3.92
29 Green biofilm 3 3.40
30 Mud/Sludge from lagoon edge 1 2.98
33 Water near island 4 2.57
35 Fully crusted side pond along from islands 1 2.62
37 Standing water near surface tar deposits 4 4.15
38 Sludge near to sample 37 1 4.6
41 Water near surface tar deposits 4 4.4
43 Water coming up through surface tar deposits 4 1.8
44 Pond near entrance path with deposits 1 3.45
4S Green Biofilm and water 3 2.88
46 Green Biofilm at lagoon edge 3 3.07
47 Fully crusted lagoon edge 2 3.30
49 Lagoon edge, some crust 2 3.06
50 Lagoon edge, some crust 2 2.69
53 Lagoon edge 2 2.50
54 Entrance path near treatment plant 1 2.39
55 Weathered tar scrapings from surface tar deposits N/A 4.09
58 Water at lagoon edge 4 2.79
Table 3.1: Details of the samples collected from Hoole Bank acid tar lagoon, including
the corresponding photograph number, sample description, pH and grouping. Group 1 -
Thick Sludge external to Lagoon; Group 2 - Lagoon edge; Group 3 - Green Biofilm;
Group 4 - Surface water. N/A = Not applicable.
74
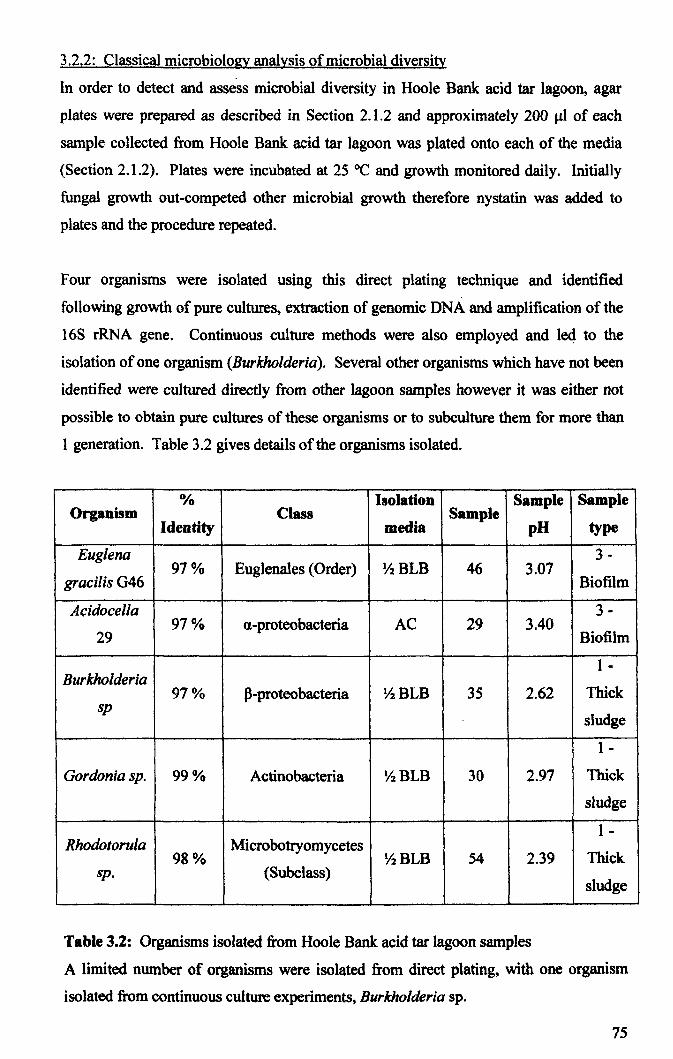
3.2.2: Classical microbiology analysis of microbial diversity
In order to detect and asse"ss microbial diversity in Hoole Bank acid tar lagoon, agar
plates were prepared as described in Section 2.1.2 and approximately 200 .... 1 of each
sample collected from Hoole Bank acid tar lagoon was plated onto each of the media
(Section 2.1.2). Plates were incubated at 25°C and growth monitored daily. Initially
fungal growth out-competed other microbial growth therefore nystatin was added to
plates and the procedure repeated.
Four organisms were isolated using this direct plating technique and identified
following growth of pure cultures, extraction of genomic DNA and amplification of the
16S rRNA gene. Continuous culture methods were also employed and led to the
isolation of one organism (Burkholderia). Several other organisms which have not been
identified were cultured directly from other lagoon samples however it was either not
possible to obtain pure cultures of these organisms or to subculture them for more than
1 generation. Table 3.2 gives details of the organisms isolated.
0/'0 Isolation Sample Sample Organism Class Sample
Identity media pH type
Euglena 3-97% Euglenales (Order) YlBLB 46 3.07
gracilis G46 Biofilm
Acidocella 3-97% a-proteobacteria AC 29 3.40
29 Biofilm
1 -Burkholderia
97% p-proteobacteria YlBLB 35 2.62 Thick sp
sludge
1 -
Gordonia sp. 99% Actinobacteria YlBLB 30 2.97 Thick
sludge
1 -Rhodotorula Microbotryomycetes
Thick 98% YlBLB 54 2.39 sp. (Subclass)
sludge
Table 3.2: Organisms isolated from Hoole Bank acid tar lagoon samples
A limited number of organisms were isolated from direct plating, with one organism
isolated from continuous culture experiments, Burkholderia sp.
75
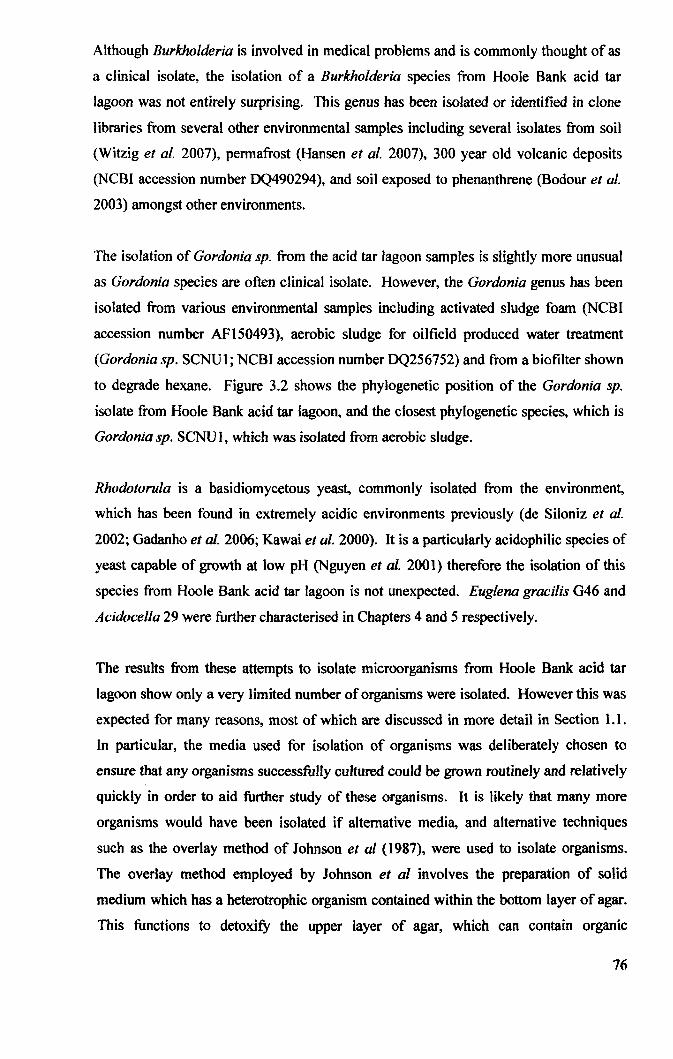
Although Burkholderia is involved in medical problems and is commonly thought of as
a clinical isolate, the isolation of a Burkholderia species from Hoole Bank acid tar
lagoon was not entirely surprising. This genus has been isolated or identified in clone
libraries from several other environmental samples including several isolates from soil
(Witzig et al. 2007), permafrost (Hansen et al. 2007), 300 year old volcanic deposits
(NeBI accession number DQ490294), and soil exposed to phenanthrene (Bodour et al.
2003) amongst other environments.
The isolation of Gordonia sp. from the acid tar lagoon samples is slightly more unusual
as Gordonia species are often clinical isolate. However, the Gordonia genus has been
isolated from various environmental samples including activated sludge foam (NCBI
accession number AFI50493), aerobic sludge for oilfield produced water treatment
(Gordonia sp. SeNU1; NeBT accession number DQ256752) and from a biofitter shown
to degrade hexane. Figure 3.2 shows the phylogenetic position of the Gordonia sp.
isolate from Hoole Bank acid tar lagoon, and the closest phylogenetic species, which is
Gordonia sp. SCNUI, which was isolated from aerobic sludge.
Rhodotorula is a basidiomycetous yeast, commonly isolated from the environment,
which has been found in extremely acidic environments previously (de Siloniz et al.
2002; Gadanho et al. 2006; Kawai et al. 2000). It is a partiCUlarly acidophilic species of
yeast capable of growth at low pH (Nguyen et al. 2001) therefore the isolation of this
species from Hoole Bank acid tar lagoon is not unexpected. Euglena gracilis G46 and
Acidocella 29 were further characterised in Chapters 4 and 5 respectively.
The results from these attempts to isolate microorganisms from Hoole Bank acid tar
lagoon show only a very limited number of organisms were isolated. However this was
expected for many reasons, most of which are discussed in more detail in Section 1.1.
[n particular, the media used for isolation of organisms was deliberately chosen to
ensure that any organisms successfully cultured could be grown routinely and relatively
quickly in order to aid further study of these organisms. It is likely that many more
organisms would have been isolated if alternative media, and alternative techniques
such as the overlay method of Johnson et al (1987), were used to isolate organisms.
The overlay method employed by Johnson et al involves the preparation of solid
medium which has a heterotrophic organism contained within the bottom layer of agar.
This functions to detoxify the upper layer of agar, which can contain organic
76
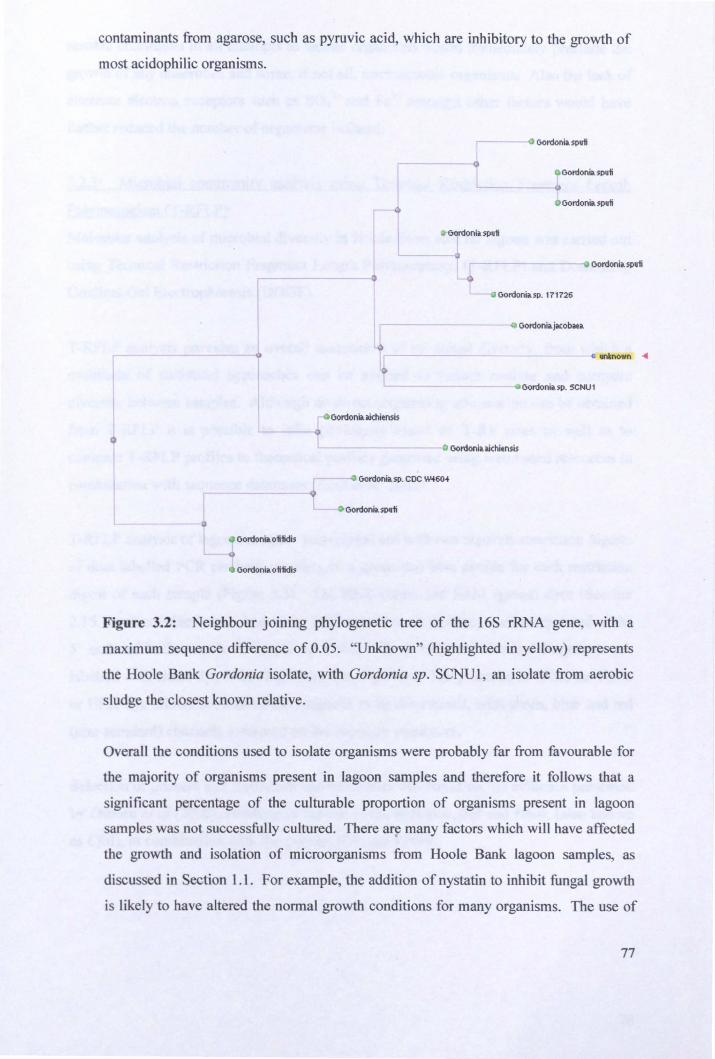
contaminants from agarose, such as pyruvic acid, which are inhibitory to the growth of
most acidophilic organisms.
o
I
.-------9
I !t1:;ordoniiSpufi
----~
- Gordoniil. spufi
• Gordoniuputi
o • Gordonia spufi
~ Gordonia spufi
I -t~ .,.", .. ". ",no
r-------- ... Gordoniil.j~obil.U ~ 'tr---- • ..-.known ...
- Gordoniasp. 5CNUl
-0 Gordoni& iichiensis
'----- ~
~
l · Gordoniil. otitidis
- 0
• uordonia o1ifidis
L __ _ cO Gordoniil. aichiensis
.... Gordonii. SP. CDC W460.
-0 Gordoniil. SPQfi
Figure 3.2: Neighbour joining phylogenetic tree of the 16S rRNA gene, with a
maximum sequence difference of 0.05. "Unknown" (highlighted in yellow) represents
the Hoole Bank Gordonia isolate, with Gordonia sp. SCNU1, an isolate from aerobic
sludge the closest known relative.
Overall the conditions used to isolate organisms were probably far from favourable for
the majority of organisms present in lagoon samples and therefore it follows that a
significant percentage of the culturable proportion of organisms present in lagoon
samples was not successfully cultured. There are many factors which will have affected
the growth and isolation of microorganisms from Hoole Bank lagoon samples, as
discussed in Section 1.1. For example, the addition of nystatin to inhibit fungal growth
is likely to have altered the normal growth conditions for many organisms. The use of
77

aerobic conditions in all attempts to isolate organisms would immediately preclude the
growth of any anaerobes and some, if not all, microaerobic organisms. Also the lack of
alternate electron acceptors such as sol and Fe3+ amongst other factors would have
further reduced the number of organisms isolated.
3.2.3: Microbial community analysis using Tenninal Restriction Fragment Length
Polymorphism (T -RFLP)
Molecular analysis of microbial diversity in Hoole Bank acid tar lagoon was carried out
using Terminal Restriction Fragment Length Polymorphism (T-RFLP) and Denaturing
Gradient Gel Electrophoresis (DOGE).
T·RFLP analysis provides an overall assessment of microbial diversity, from which a
multitude of statistical approaches can be applied to further analyse and compare
diversity between samples. Although no direct sequencing information can be obtained
from T -RFLP it is possible to infer phylogeny based on T -RF sizes as well as to
compare T -RFLP profiles to theoretical profiles generated using web based resources in
combination with sequence databases (Kent et aJ. 2003).
T ·RFLP analysis of lagoon samples was carried out with two separate restriction digests
of dual labelled peR product, resulting in a green and blue profile for each restriction
digest of each sample (Figure 3.3). The HEX (blue) and FAM (green) dyes (Section
2.15.1) are covalently attached to the peR primer such that they are incorporated at the
5' ends of both strands of amplified DNA. Thus, only the terminal fragments are
labelled with either dye following restriction digestion. The presence of either the F AM
or HEX dye allows the size of the fragment to be determined, with gree~ blue and red
(size standard) channels measured on the capillary sequencer.
Selection of primers and restriction endonucleases was based on the evidence presented
by Osborn et al (2000), resulting in the use of the enzymes AluI and HhaI, (also known
as Clol), in combination with the primers 63F and 1389R.
78
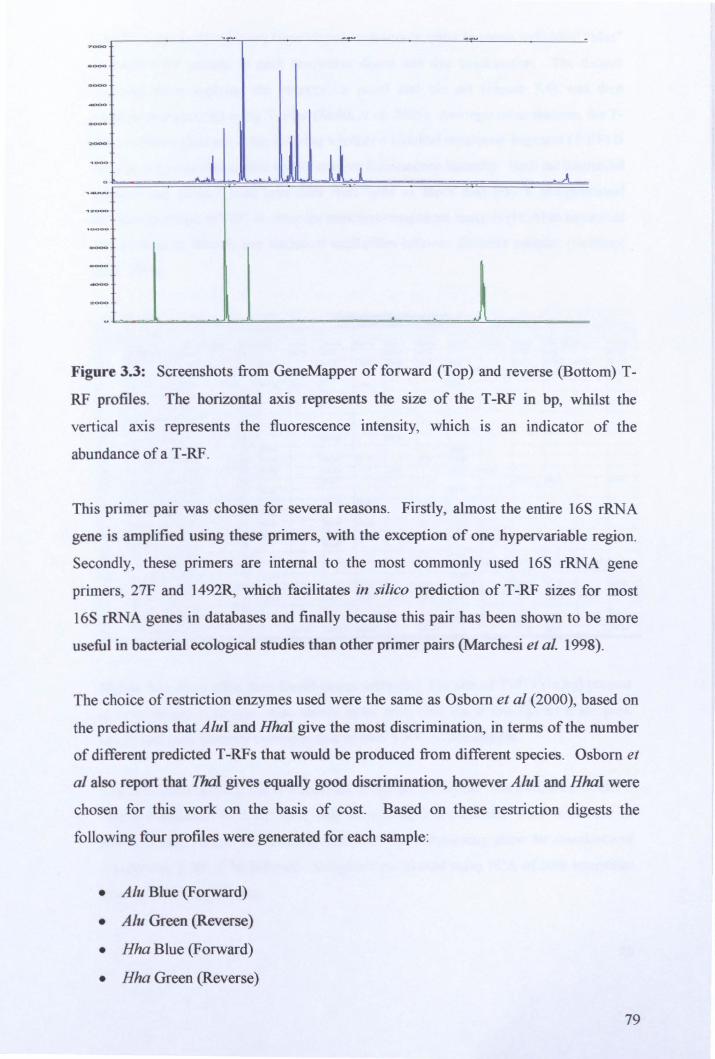
~-- --- .
J lJ l J . - -- - -
Figure 3.3: Screenshots from GeneMapper of forward (Top) and reverse (Bottom) T
RF profiles_ The horizontal axis represents the size of the T -RF in bp, whilst the
vertical axis represents the fluorescence intensity, which is an indicator of the
abundance ofa T-RF_
This primer pair was chosen for several reasons_ Firstly, almost the entire 16S rRNA
gene is amplified using these primers, with the exception of one hypervariable region_
Secondly, these primers are internal to the most commonly used 16S rRNA gene
primers, 27F and 1492R, which facilitates in silico prediction of T -RF sizes for most
16S rRNA genes in databases and finally because this pair has been shown to be more
useful in bacterial ecological studies than other primer pairs (Marchesi et aL 1998)_
The choice of restriction enzymes used were the same as Osborn et al (2000), based on
the predictions that Alul and Hhal give the most discrimination, in terms of the number
of different predicted T -RFs that would be produced from different species_ Osborn et
al also report that ThaI gives equally good discrimination, however Alul and Hhal were
chosen for this work on the basis of cost Based on these restriction digests the
following four profiles were generated for each sample:
• Alu Blue (Forward)
• Alu Green (Reverse)
• Hha Blue (Forward)
• Hha Green (Reverse)
79
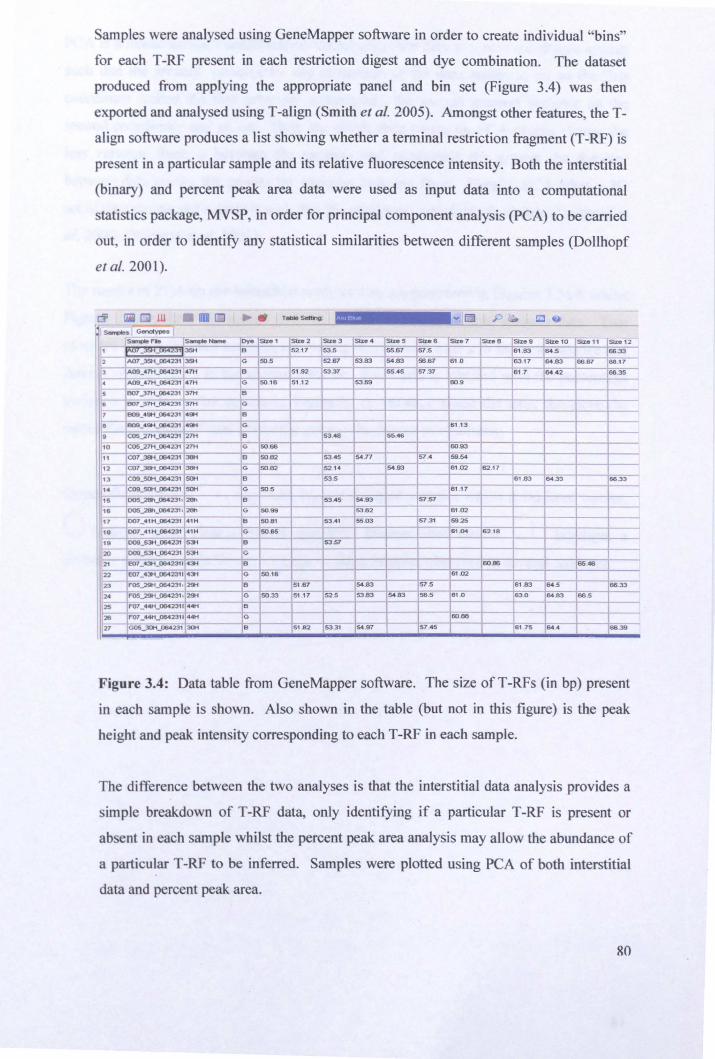
Samples were analysed using GeneMapper software in order to create individual "bins"
for each T-RF present in each restriction digest and dye combination. The dataset
produced from applying the appropriate panel and bin set (Figure 3.4) was then
exported and analysed using T-align (Smith et al. 2005). Amongst other features, the T
align software produces a list showing whether a terminal restriction fragment (T -RF) is
present in a particular sample and its relative fluorescence intensity. Both the interstitial
(binary) and percent peak area data were used as input data into a computational
statistics package, MVSP, in order for principal component analysis (PCA) to be carried
out, in order to identify any statistical similarities between different samples (Dollhopf
et al. 2001).
,-,j,,8'·, .. -- ------_ .....
,_ Name Dye SIze' Sb:e2 ~ sae . S ze5 SIze 6 SIze 7 SIze. sae . Stte1 0 Size 11 Size 12
~r-u'_"""_-""'I35H B 52.17 53.5 SS.S7 57.5 61 .83 64.5 66.33
~ [..07_35><_06423' 135H G SO.5 52.67 53.83 54 .83 56.67 6 1 .0 63 .17 64 .83 66.67 68 .17
AOO_47H_064231 47H - B - - 5 1 .92 5337 55.45 !i1 .37 6' .7 64.42 66.35
~ 4 A09_47H_064231 i.i7H - G 5iJ.1s 51 .12 53.69 60.9
~ s B07 _37H_064-----zi1" 37H B - r-• 907 _37H_084231 ~7H - - "" -
17 009_ 49H_064231 49H B -:8 809_ 49H_064231 49H G 61 .1 3 -- -:. COS_27H_064231 27H B 53.48 55.46
~ ~ f==:~:: 27H G SO.66 60.93
38H B SO.82 53." 54.77 57 .• 59.54
12 tC07 _381"'C064231 38H - fG SO.82 '---' 52.« 54.93 61 .02 62.17
/13 , C09_SOH_064231 SOH B 53.5 6'.83 64.33 66.33
". C09_SCl"'U164 231 SiiH G SO.5 61 .17
005..;28h_064231, :>eh - B r--- ...
53.45 54 .93 57.57 1'5 ,'. OOS~_064231 1 :>eh la ~99 53.82 61 .02
[17 D07_4 1 H_064231 41 H - B SOB' t-- ~ 55.03 57.31 59.25
['8 007_4' H_064231 ~H - G SO.65 ", DO 62 .18 - 'e -f: 009_53H_0S4231 53H 5357 009_S3H_064231 ,53H G -, ~-~'~ B 60.86 65." ' 21
[22 E07_43t U1S4 231143H - G SO .18 61 .02
I" FOS .... ;291"'U1S4 231 , 29tt - B 51 .67 -1s4:a3 57.5 61 .83 64.5 86.33
[24 ~_064231. 29H - er 5033 51T7 52.5 53.83 54.83 58.5 61 .0 63.0 64.63 66.5
I~ tro7 _44H_0642311 44H " - r--
r,;;- { 07 _ 44H_06423',' ~4H - G 6iiB8 ~27 IGOS_3OH_064231 30H - B 51:82 53.31 54.97 57.45 61 .75 j64 .4 66.39
Figure 3.4: Data table from GeneMapper software. The size ofT-RFs (in bp) present
in each sample is shown. Also shown in the table (but not in this figure) is the peak
height and peak intensity corresponding to each T-RP in each sample.
The difference between the two analyses is that the interstitial data analysis provides a
simple breakdown of T-RF data, only identifying if a particular T-RF is present or
absent in each sample whilst the percent peak area analysis may allow the abundance of
a particular T -RP to be inferred. Samples were plotted using PCA of both interstitial
data and percent peak area.
RO
PCA is a mathematical transformation that changes the data to a new coordinate system
such that the greatest variance by any projection of the data comes to lie on the first
coordinate (called the firsf principal component), the second greatest variance on the
second coordinate, and so on. Thus, the closer data points on PCA graphs cluster the
less variance there is between the samples and conversely the greater the distance
between data points, the greater the variance between them. Simply, PCA takes a 3D
set of data points and rotates it such that the maximum variability is visible (Dollhopf et
al. 2004; Dollhopf et al. 2001)
The results of PC A on the interstitial analysis data are presented in Figures 3.5a-h whilst
Figures 3.6a-h show the results of PCA on the percent peak area analysis data. Two
plots are shown for each analysis, comparing Axis 1 with Axis 2 in the first instance and
Axis 2 versus Axis 3 in the second instance. Each axis is labelled with the percentage
variance to indicate the degree of similarity or variance along the axis, therefore the
closer the grouping of data points the greater the degree of similarity.
Dotted-lined circles, : .. ) , represent loosely grouped samples whilst solid-lined circles,
o indicate more closely linked samples. Dashed-lined circles, C) , highlight a
diversity pattern within Group 1 - Lagoon Edge samples observed in several analyses.
81
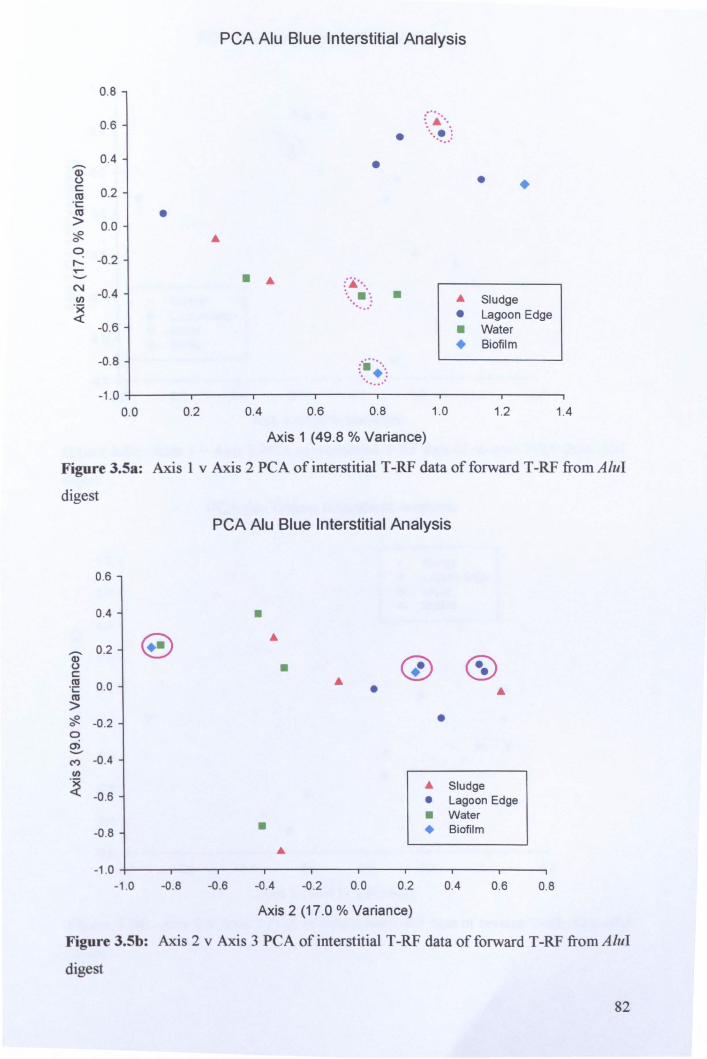
PGA Alu Blue Interstitial Analysis
0.8
0.6 •
0.4 ........ • Q) (.) c 0.2 ro
• • ·c ro • > 0.0
::R 0
0 I"- -0.2 ~
'-" . .. N -0.4 !/)
·x «
-0.6
.. Sludge
• Lagoon Edge
• Water • Biofilm
-0.8 :·ii~· . .......
-1.0 0.0 0.2 0.4 0.6 0.8 1.0 1.2 1.4
Axis 1 (49.8 % Variance)
Figure 3.5a: Axis 1 v Axis 2 PCA of interstitial T -RF data of forward T -RF from AluI
digest
PGA A1u Blue Interstitial Analysis
0.6
0.4 • @) .. - 0.2
Q) (j) <:!) u • c: C'Il .. ·c 0.0 • .. C'Il > ~ -0.2 • 0
0 a) ......-('t) -0.4 !/)
~ .. Sludge -0.6 • Lagoon Edge
• Water
-0.8 • • Biofilm
... -1.0
-1.0 -0.8 -0.6 -0.4 -0.2 0.0 0.2 0.4 0.6 0.8
Axis 2 (17.0 % Variance)
Figure 3.5b: Axis 2 v Axis 3 PCA of interstitial T -RF data of forward T -RF from AluI
digest
82
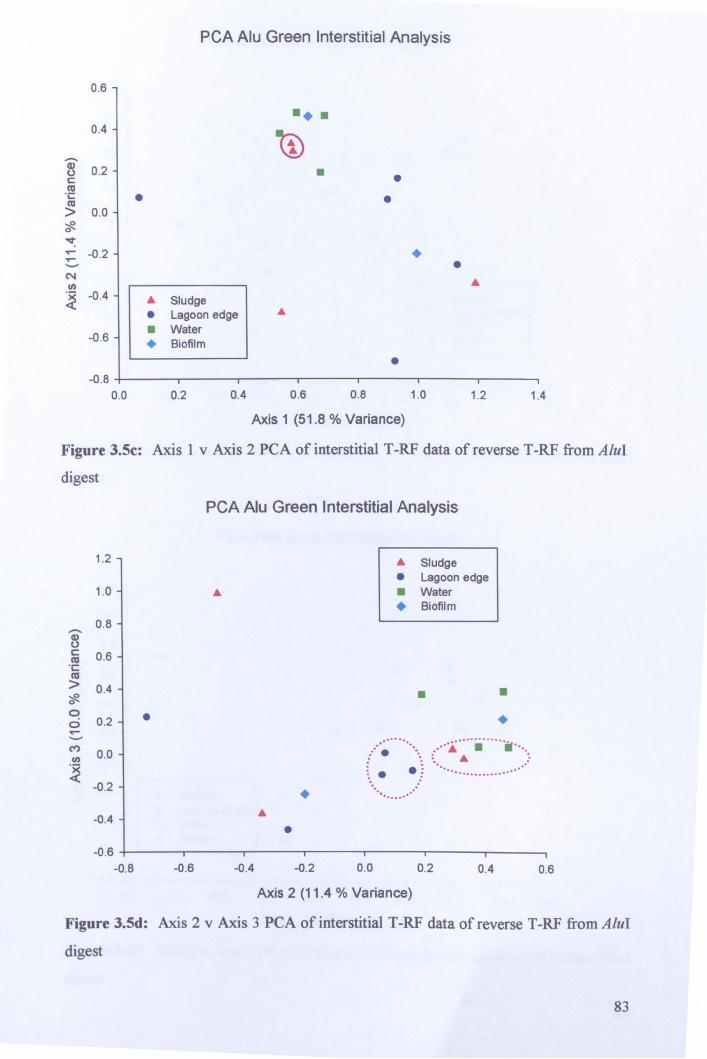
PCA Alu Green Interstitial Analysis
0.6
•• • 0.4
1V -Q) 0.2 • 0 • c: ca .;:: • • ca > 0.0 ~ 0
v .... -0.2 • .... - • N
.& m
~ -0.4 .& Sludge
• Lagoon edge
-0.6 • Water
• Biofilm
• -0.8
0.0 0.2 0.4 0.6 0.8 1.0 1.2 1.4
Axis 1 (51 .8 % Variance)
Figure 3.5e: Axis 1 v Axis 2 peA of interstitial T -RF data of reverse T -RF from AluI
digest
PCA Alu Green Interstitial Analysis
1.2 .& Sludge
• Lagoon edge 1.0 • Water
• Biofilm 0.8 -Q)
0 c: 0.6 ca .;:: ca > 0.4 ~ 0 • • 0 • 0 0.2 • .... -C")
0.0 m :"'~"""'" .. ···. ····ii······. ·· ...
:. .&
~ -0.2 •
~ . . ; ....................... . ~ .......... .
-0.4 .&
• -0.6
-0.8 -0.6 -0.4 -0.2 0.0 0.2 0.4 0.6
Axis 2 (11.4 % Variance)
Figure 3.5d: Axis 2 v Axis 3 peA of interstitial T -RF data of reverse T -RF from AluI
digest
83
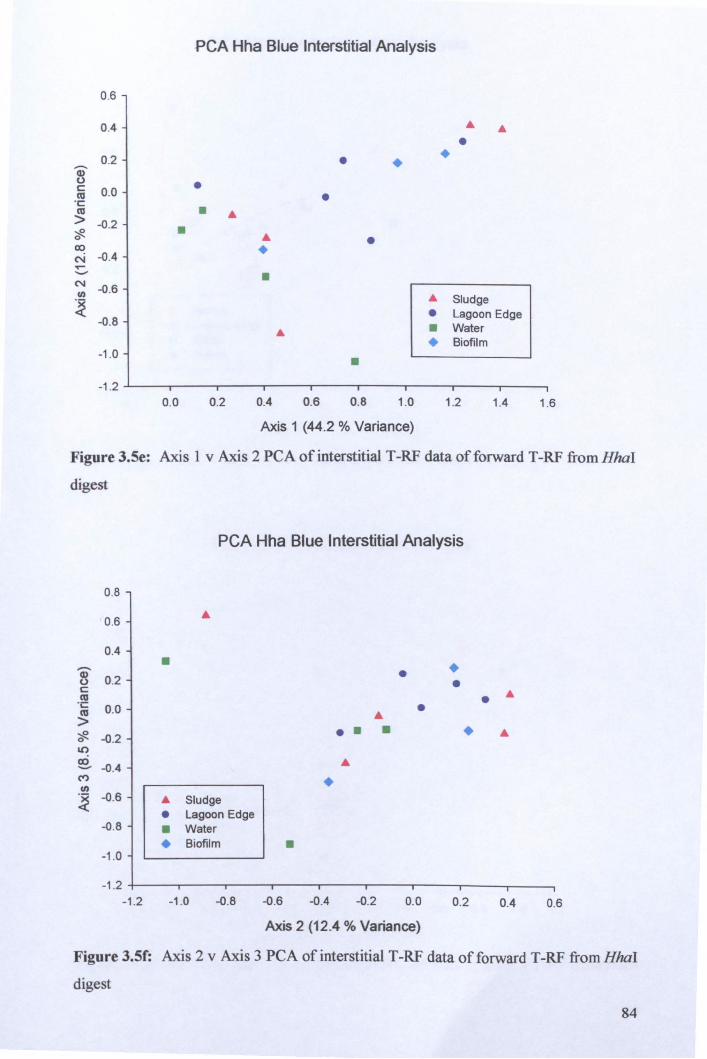
PCA Hha Blue Interstitial Analysis
0.6
0.4 • • • 0.2 • •
Q) • 0 • c 0.0 ca • ·c ca • • > -0.2
:::R • • 0 • co • N -0.4 T"' '-' • N -0.6 Cl) • Sludge ~ • Lagoon Edge
-0.8 • Water
• Biofilm -1.0 • -1 .2
0.0 0.2 0.4 0.6 0.8 1.0 1.2 1.4 1.6
Axis 1 (44.2 % Variance)
Figure 3.5e: Axis 1 v Axis 2 PCA of interstitial T -RF data of forward T -RF from HhaI
digest
0.8
0.6
0.4 ,,-... Q)
0.2 0 c ca ·c 0.0 C\l > ~ 0 -0.2 1.0 a::)
-0.4 ---(") Cl)
~ -0.6
-0.8
-1 .0
-1 .2 -1 .2
PCA Hha Blue Interstitial Analysis
•
• Sludge • Lagoon Edge
• Water • Biofilm •
-1 .0 -0.8 -0.6
•
-0.4
• • • •
-0.2
• •
0.0
Axis 2 (12.4 % Variance)
• • •
0.2
• •
0.4 0.6
Figure 3.5f: Axis 2 v Axis 3 PCA of interstitial T -RF data of forward T -RF from HhaI
digest
84
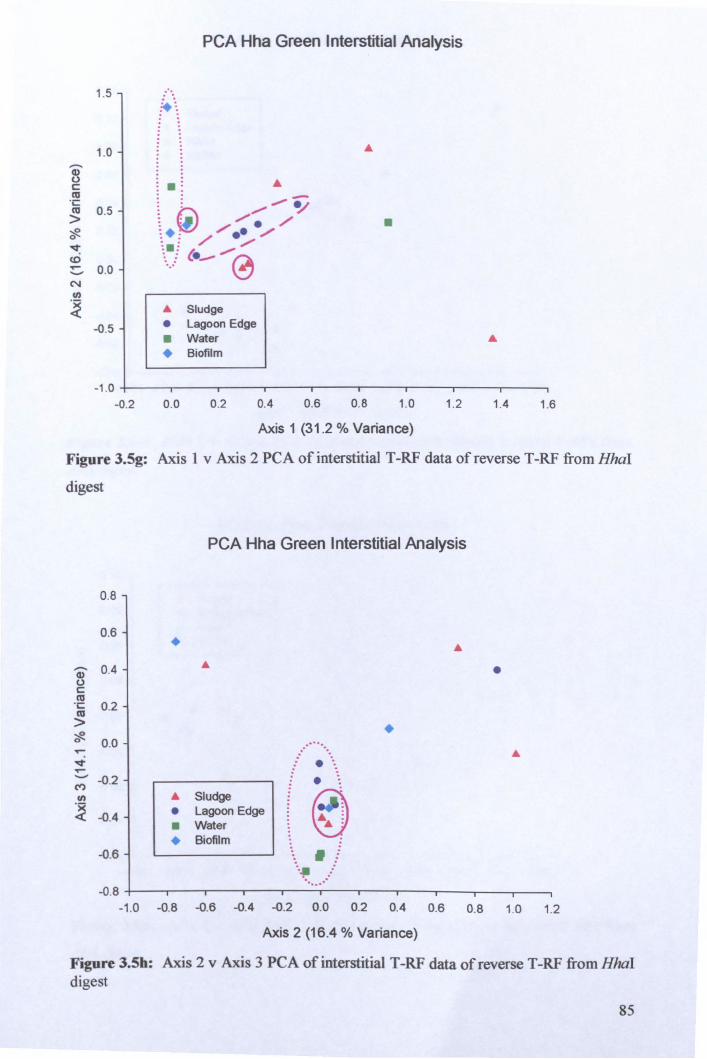
,-... Q) 0 c as ·c as > ~ 0
-.:t: CD ...... '-" N Cl)
~
1.5
1.0
0.5
0.0
-0.5
PGA Hha Green Interstitial Analysis
4\ , ' , ' , ' , ' , ' , . , ' , '
, '
: . : . , ..".-
: b "" ~ : \lI "" . /' \+; /''''' •• ~'''' '.' ., \j {._..". 0
• Sludge • Lagoon Edge
• Water + Biofilm
•
• -1 .0 +--~----r---r---'----.-----'r---~---r----.
-0.2 0.0 0.2 0.4 0.6 0.8 1.0 1.2 1.4 1.6
Axis 1 (31.2 % Variance)
Figure 3.5g: Axis 1 v Axis 2 PCA of interstitial T -RF data of reverse T -RF from HhaI
digest
,-... Q) 0 c as ·c as > cf. ...... -.:t ...... '-"
M Cl)
~
0.8
0.6
0.4
0.2
0.0
-0.2
-0.4
-0.6
PGA Hha Green Interstitial Analysis
• ...
... Sludge
• Lagoon Edge
• Water • Biofilm • ', . ........
•
•
-0.8 +--.,---,----r--,----,,--.--.----,----,-----r---,
-1 .0 -0.8 -0.6 -0.4 -0.2 0.0 0.2 0.4 0.6 0.8 1.0 1.2
Axis 2 (16.4 % Variance)
Figure 3.5b: Axis 2 v Axis 3 PCA of interstitial T -RF data of reverse T -RF from HhaI digest
85
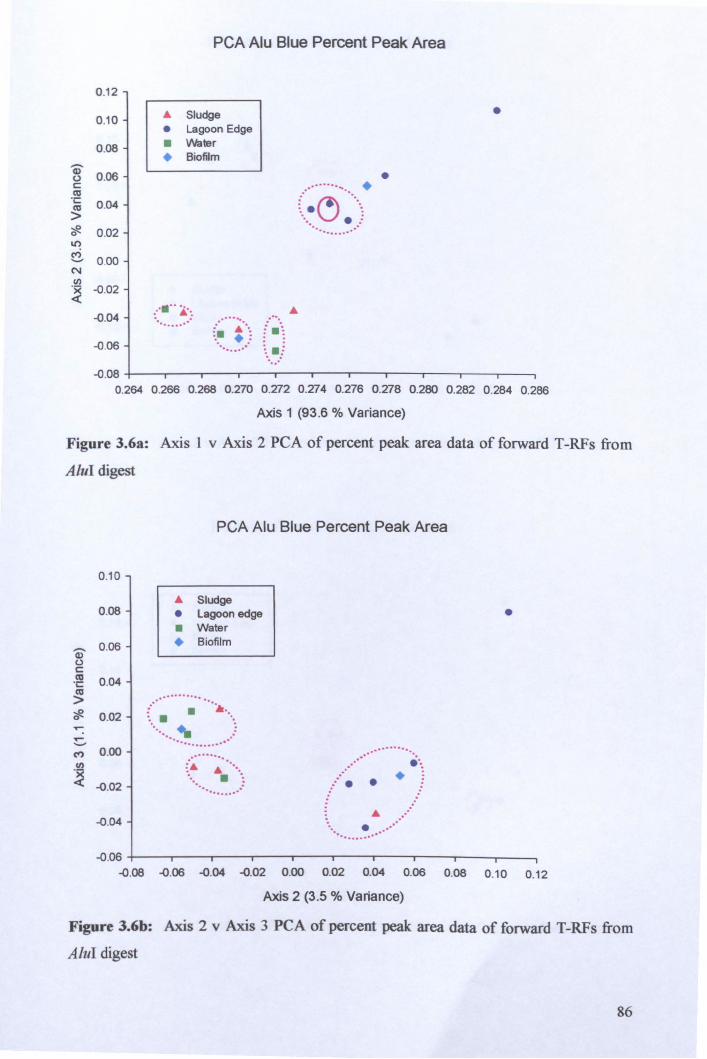
-Q) 0 c: tU .;:: tU > ;$!, 0
1.0 (") -N (/)
~
0.12
0.10
0.08
0.06
0.04
0.02
0 .00
-0.02
-0.04
-0.06
PCA Alu Blue Percent Peak Area
'" Sludge • Lagoon Edge • \/Vater + Biofilm
...... •... ......... :.......... . ..... .. "' . : . : ... + .: .. ...... \ . j
....
• ............. + ( .~ .... ~ '. V . : .................
•
-0.08+---.----.---.---.---.----.---.---.----.---.---. 0.264 0.266 0.268 0.270 0.272 0.274 0.276 0.278 0.280 0.282 0 .284 0.286
Axis 1 (93.6 % Variance)
Figure 3.6a: Axis 1 v Axis 2 PCA of percent peak area data of forward T -RFs from
AluI digest
-Q) 0 c: tU .;:: tU > ;$!, 0
.....
..... '-' (")
(/)
~
0.10
0.08
0.06
0.04
0.02
0 .00
-0.02
-0.04
PCA Alu Blue Percent Peak Area
'" Sludge • lagoon edge • Water + Biofilm
.................. • ••••• \ - ~ ... .. . . .................. . (;. .... ~ ..... .... - "-: ..............
............. ..... . .. ./ + ~ • •
'" ....... ~ ........ .
•
-O .06+----.---,r---.----.----r---.----.----.---.---~
-0.08 -0.06 -0.04 -0.02 0.00 0.02 0.04 0.06 0.08 0.10 0.12
Axis 2 (3.5 % Variance)
Figure 3.6b: Axis 2 v Axis 3 PCA of percent peak area data of forward T-RFs from
AluI digest
86
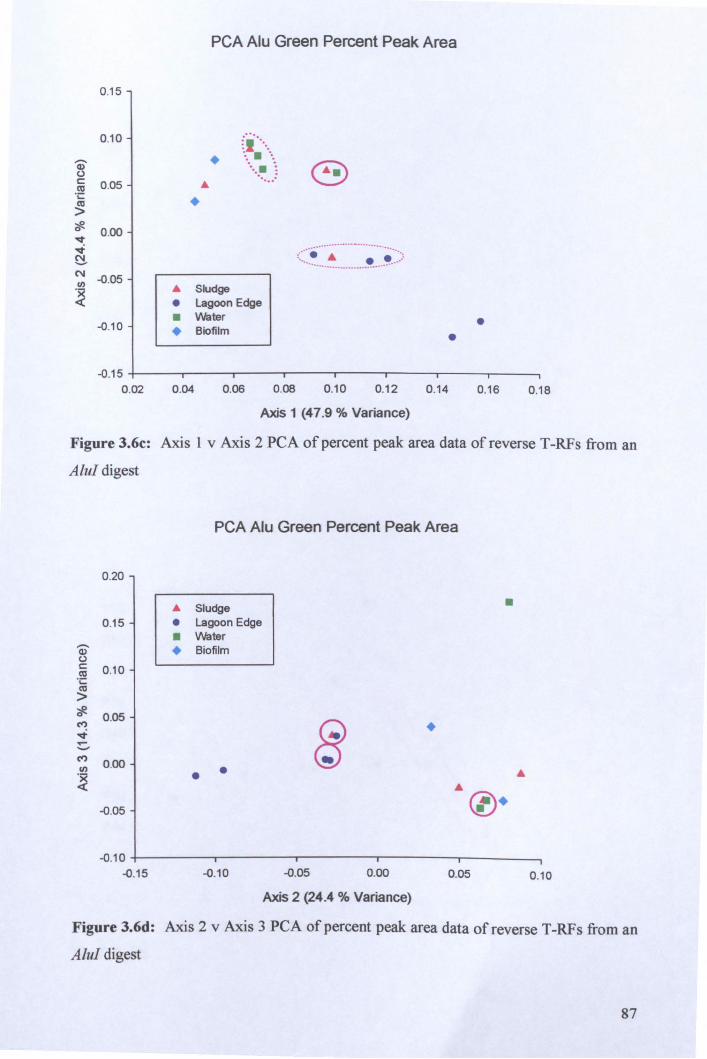
PCA Alu Green Percent Peak Area
0.15
0.10
,.... Cl) 0 c: 0.05 ttI
• :., ..... . . \ . ....
' .. : ...... : .~
ttI • > ~ 0 0.00 ~ ........... _-_ .. . ~
t:! (::~ .... ~ ........... ! .... ! .. ) C\I -0.05 IJ)
~ ... Sludge
• Lagoon Edge
-0.10 • Water • Biofilm
• • -O .15+-----~----.-----._---,r---_,r_--_,r_--_,----_.
0 .02 0 .04 0.06 0.08 0.10 0.12 0.14 0.16 0 .18
Axis 1 (47.9 % Variance)
Figure 3.6c: Axis 1 v Axis 2 PCA of percent peak area data of reverse T -RFs from an
AluI digest
PCA Alu Green Percent Peak Area
0.20
... Sludge • 0 .15 • Lagoon Edge
• Water -Cl) • Biofilm 0 c: 0 .10 ttI
.~
ttI > #. 0.05 et)
~ • ~ -et)
0.00 IJ)
~ • • -0.05
-0.10 -0.15 -0.10 -0.05 0.00 0.05 0.10
Axis 2 (24.4 % Variance)
Figure 3.6d: Axis 2 v Axis 3 PCA of percent peak area data of reverse T -RFs from an
AluI digest
87
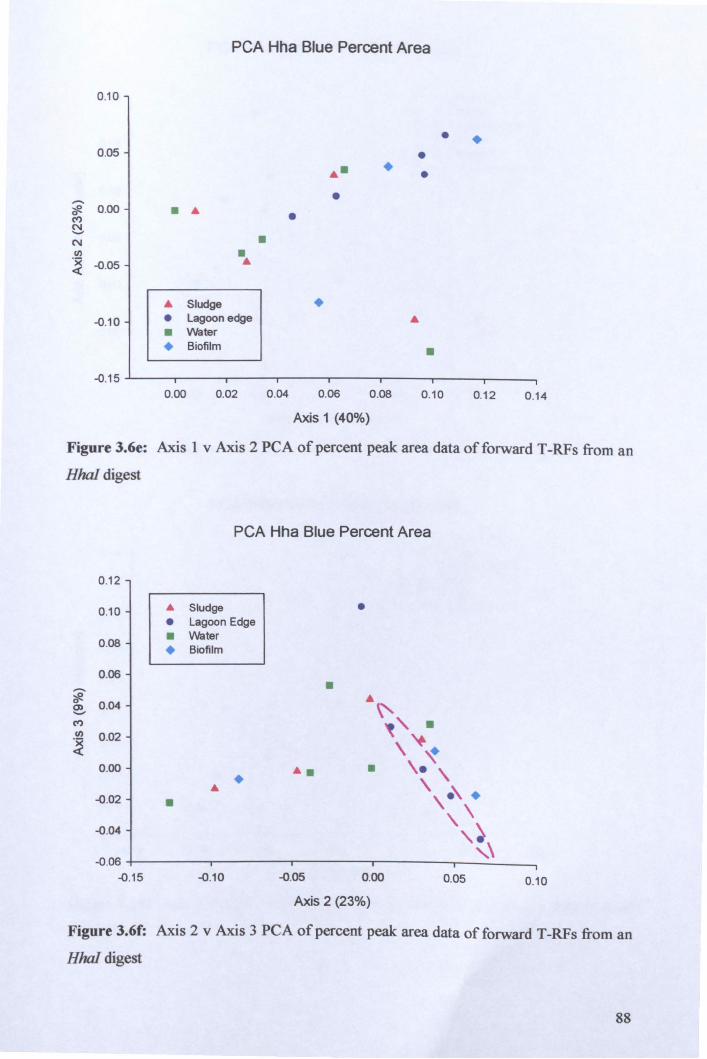
0.10
0.05
,.... ~ 0 0.00 M N '-" N I/)
~ -0.05
-0.10
-0 .15
PCA Hha Blue Percent Area
• • • -.
A Sludge
• Lagoon edge
• water
• Biofilm
0.00 0.02
• • •
•
•
0 .04 0.06
Axis 1 (40%)
•
0.08
• •
• •
•
0.10
•
0.12 0 .14
Figure 3.6e: Axis 1 v Axis 2 PCA of percent peak area data of forward T -RFs from an
HhaI digest
PCA Hha Blue Percent Area
0.12
0.10 • Sludge • • Lagoon Edge
• water 0.08 • Biofilm
0.06 ,.... • ~ A 0 0.04 \' CD '-" M ~, . I/) 0.02 ~ '+
\ ~ 0.00 • • • \ . , • \ • ,.' . -0.02 •
" -0.04 ,~\ -0.06
-0.15 -0.10 -0.05 0.00 0.05 0.10
Axis 2 (23%)
Figure 3.6(: Axis 2 v Axis 3 PCA of percent peak area data of forward T -RFs from an
HhaI digest
88

PGA Hha Green Percent Peak Area
0.20
• A Sludge
• Lagoon Edge
0 .15 • Water
• Biofilm
- • <I.l () 0.10 c: cc • .;:: A cc > ~ 0 0.05 0 ........... N '-' . . N
.. A ··
:(:!2 ) ...... III 0.00 • . -: ~ .... .
.... . :"# .... .... . . -0.05 ~ . : .......
-0.10 0.00 0.05 0.10 0.15 0.20 0.25
Axis 1 (57% variance)
Figure 3.6g: Axis 1 v Axis 2 PCA of percent peak area data of reverse T-RFs from an
Hhal digest
0.14
0.12
0.10
-<I.l () 0.08 c: <'Cl . ;:: <'Cl 0.06 >
:::R 0
co 0.04 '-' M III 0.02 ~
0 .00
-0.02
-0.04 -0.10
PGA Hha Green Percent Peak Area
•
• • •
-0.05
: ...... . : e. . : . \ . : 18 1 . :
\ . .......
0 .00
A Sludge
• Lagoon Edge
• Water • Biofilm
•
A •
0.05 0.10 0.15
Axis 2 (20 %Variance)
• 0.20
Figure 3.6h: Axis 2 v Axis 3 PCA of percent peak area data of reverse T-RFs from an
Hhal digest
89
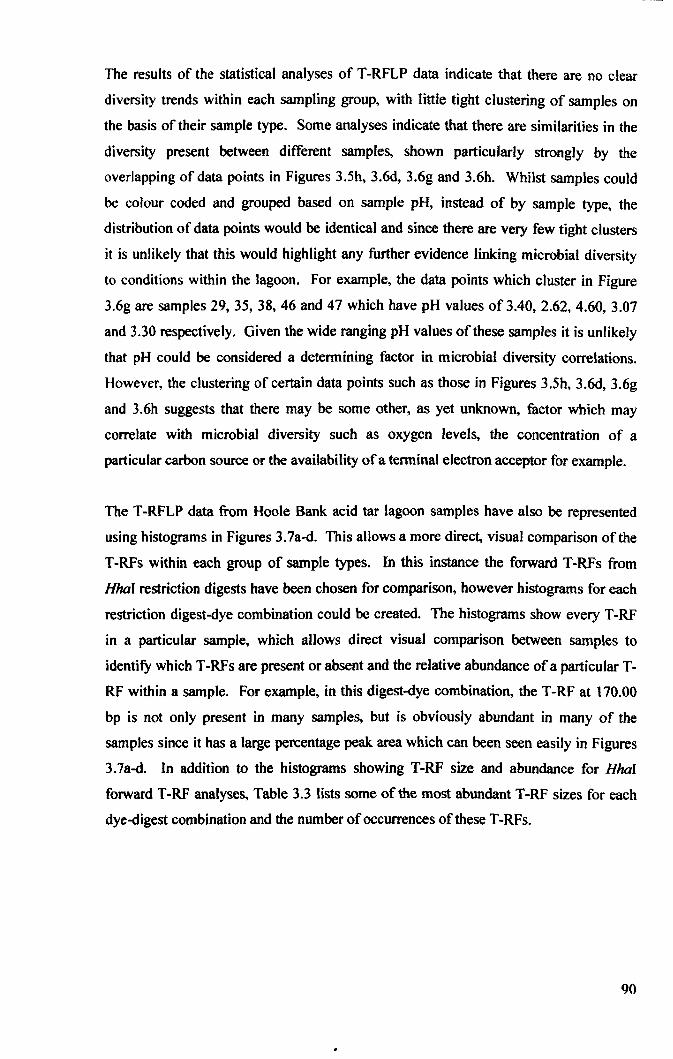
The results of the statistical analyses of T-RFLP data indicate that there are no clear
diversity trends within each sampling group, with little tight clustering of samples on
the basis of their sample type. Some analyses indicate that there are similarities in the
diversity present between different samples, shown particularly strongly by the
overlapping of data points in Figures 3.5h, 3.6d, 3.6g and 3.6h. Whilst samples could
be colour coded and grouped based on sample pH, instead of by sample type, the
distribution of data points would be identical and since there are very few tight clusters
it is unlikely that this would highlight any further evidence linking microbial diversity
to conditions within the lagoon. For example, the data points which cluster in Figure
3.6g are samples 29, 35, 38, 46 and 47 which have pH values of 3.40, 2.62, 4.60, 3.07
and 3.30 respectively. Given the wide ranging pH values of these samples it is unlikely
that pH could be considered a determining factor in microbial diversity correlations.
However, the clustering of certain data points such as those in Figures 3.Sh, 3.6d, 3.6g
and 3.6h suggests that there may be some other, as yet unknown, factor which may
correlate with microbial diversity such as oxygen levels, the concentration of a
particular carbon source or the availability of a terminal electron acceptor for example.
The T-RFLP data from Hoole Bank acid tar lagoon samples have also be represented
using histograms in Figures 3.7a-d. This allows a more direct, visual comparison of the
T-RFs within each group of sample types. In this instance the forward T-RFs from
Hhal restriction digests have been chosen for comparison, however histograms for each
restriction digest-dye combination could be created. The histograms show every T-RF
in a particular sample, which allows direct visual comparison between samples to
identify which T -RFs are present or absent and the relative abundance of a particular T
RF within a sample. For example, in this digest-dye combination, the T -RF at 170.00
bp is not only present in many samples, but is obviously abundant in many of the
samples since it has a large percentage peak area which can been seen easily in Figures
3.7a-d. In addition to the histograms showing T-RF size and abundance for HhaI
forward T-RF analyses, Table 3.3 lists some of the most abundant T-RF sizes for each
dye-digest combination and the number of occurrences of these T-RFs.
90
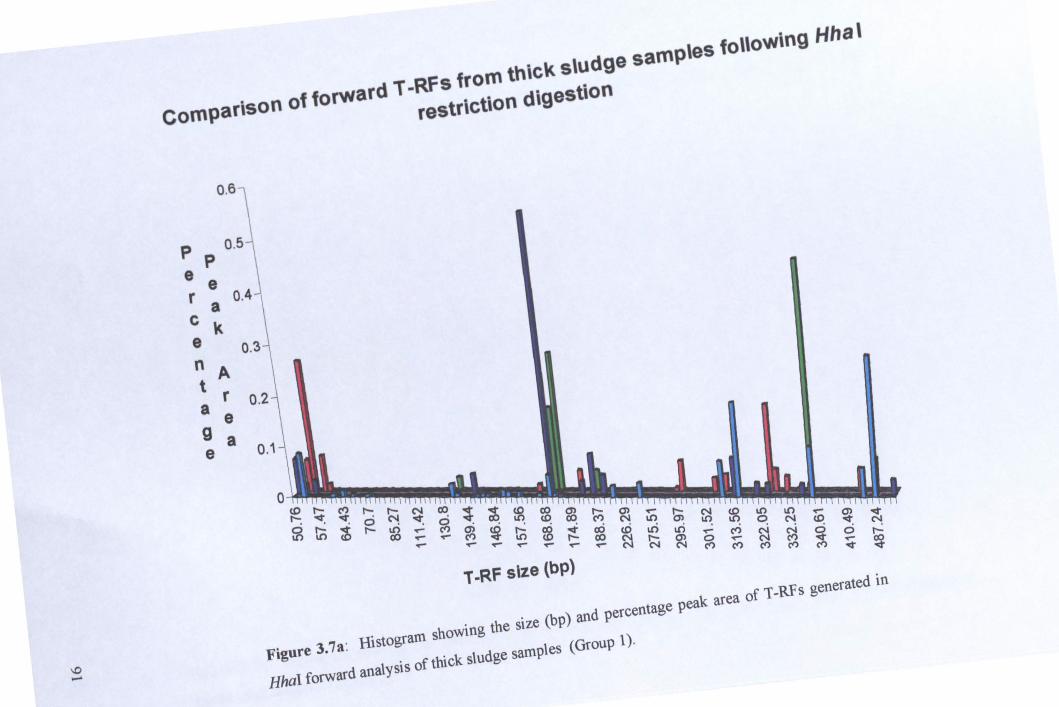
\0 ~
compariSon of forward T -Rfs from thic\( sludge samples following Hha I restriction digestion
0.6
o. p p
e e 4 r o. a C k e n A t a 9 e
r e a
0.3
0.2
0.1
0 cD ~ ~ .
to ~
~ «I ~ ~ ~
~ ~
~ ~ 00 ~ ID
~ to $ -.:t t-
~ ~ ~ ~
c:.O u:i Lri oo ~ 'N ~
U;j ~
~ 0 et)
-.:t C'! t-
~ 00 -.:t -.:t
,. -Rf size (bP)
F.gure 3.7.: I-listogralll showing the size (bp) and percentage peak are. of T-JU's generated in
HhaIforward
analysis of thick sludge salllples (Group 1).
10 N
Comparison of forward T -RFs from lagoon edge samples following Hha I restriction digestion
0.6
P 0.5 e P
e r a 0.4 C e k
0.3 n t A a r 0.2
e 9 a e 0.1
o ci Lt)
~ .q: <0
I'-0 I'-
I'- N C'! ~ Il) ...... co ...... ......
co
~ v, 0
""~ ~ M m
~ I'- co ...,. ...... ("I) Il) <0 ,.... ...... ...... ...... ...... ......
T -RF size (bp)
I'- m C":! C'! co co Lt) Il) co N ,.... m ...... N N N
...... ('") 0 ...... M M
Lt) ...... v, ...,. NCO...,. N N 0 0 ~ M ...,. ...... co ("I) ("') ...,. ...,.
Figure 3.7b: Histogram showing the size (bp) an percentage peak area of T -RFs generated in HhaI forward analysis of
lagoon edge samples (Group 2).

\0 w
Comparison of forward T -RFs in green biofilm samples following Hha I restriction digestion
0.6
: p 0.5
r e a 0.4
C k e
0.3 n A t
r 0.2 a e
9 a e 0.1
0 co ,....
"~I "': ~ • 0 ,.... ii. Lt) Lt)
,.... ,.... ~ co 0 C'!
0 ,....
Lt) .... (") co .... .... .... ~ • ~ co co
~ 0> ~ ,.... co (")
Lt) co ..... ..... .... .... T·RF Size (bp)
..... ..... o .... (") (")
~ ~ co •
Figure 3.6c: Histogram showing the size (bp) and percentage peak area of T -RFs generated in HhaI forward analysis of
green biofilm samples (Group 3).
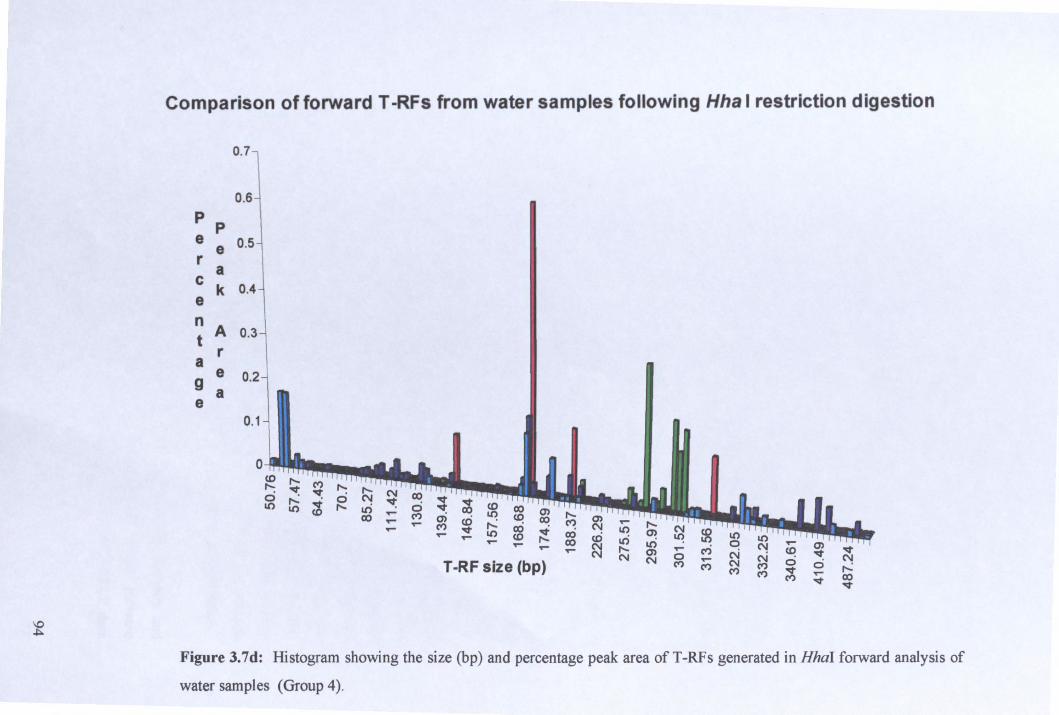
':f
Comparison of forward T -RFs from water samples following Hha I restriction digestion
0.7
0.6
P P e e 0.5 r a c k 0.4 e
n A 0.3 t
r a e
0.2 9 a e
0.1
0
T"" T""
T-RF size (bp) ..... o ..... et) et) o
~ T"" et) ~
~ C\I ,..: IX) ~
Figure 3.7d: Histogram showing the size (bp) and percentage peak area of T-RFs generated in HhaI forward analysis of
water samples (Group 4).
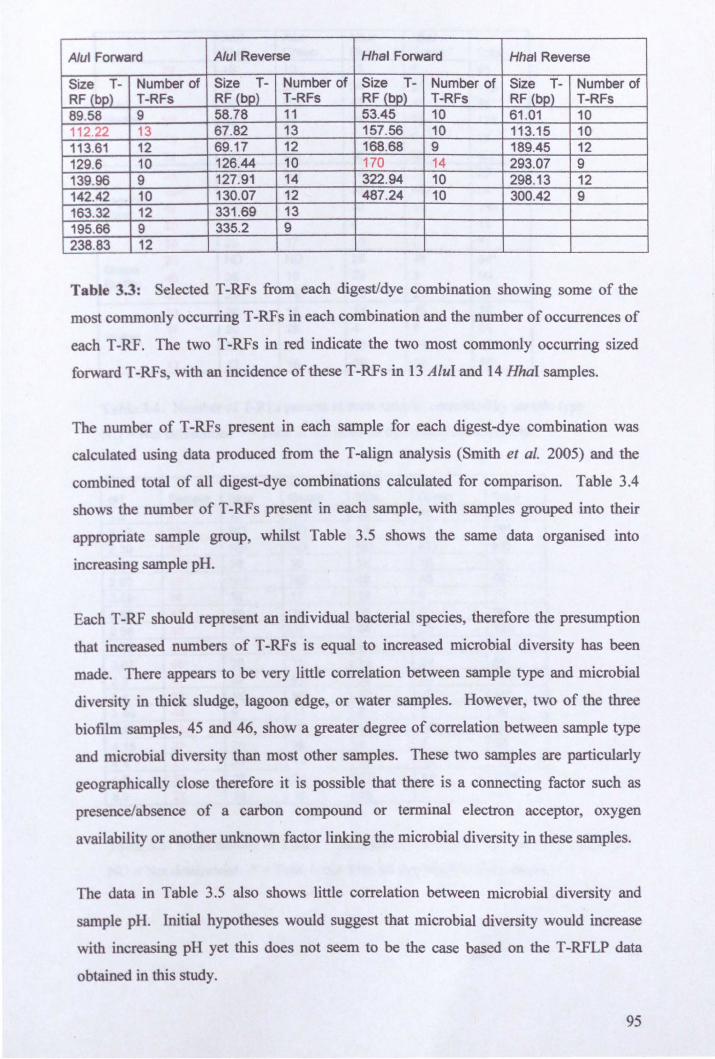
A/ul Forward A/ul Reverse Hhal Forward Hhal Reverse
Size T- Number of Size T- Number of Size T- Number of Size T- Number of RF (bp) T-RFs RF (bp) T-RFs RF (bp) T-RFs RF (bp) T-RFs 89.58 9 58.78 11 53.45 10 61.01 10 11222 13 67.82 13 157.56 10 113.15 10 113.61 12 69.17 12 168.68 9 189.45 12 129.6 10 126.44 10 170 14 293.07 9 139.96 9 127.91 14 322.94 10 298.13 12 142.42 10 130.07 12 487.24 10 300.42 9 163.32 12 331 .69 13 195.66 9 335.2 9 238.83 12
Table 3.3: Selected T -RFs from each digest/dye combination showing some of the
most commonly occurring T -RFs in each combination and the number of occurrences of
each T-RF. The two T-RFs in red indicate the two most commonly occurring sized
forward T-RFs, with an incidence of these T-RFs in 13 AluI and 14 HhaI samples.
The number of T -RFs present in each sample for each digest-dye combination was
calculated using data produced from the T -align analysis (Smith et al. 2005) and the
combined total of all digest-dye combinations calculated for comparison. Table 3.4
shows the number of T-RFs present in each sample, with samples grouped into their
appropriate sample group, whilst Table 3.5 shows the same data organised into
increasing sample pH.
Each T -RF should represent an individual bacterial species, therefore the presumption
that increased numbers of T-RFs is equal to increased microbial diversity has been
made. There appears to be very little correlation between sample type and microbial
diversity in thick sludge, lagoon edge, or water samples. However, two of the three
biofilm samples, 45 and 46, show a greater degree of correlation between sample type
and microbial diversity than most other samples. These two samples are particularly
geographically close therefore it is possible that there is a connecting factor such as
presence/absence of a carbon compound or terminal electron acceptor, oxygen
availability or another unknown factor linking the microbial diversity in these samples.
The data in Table 3.5 also shows little correlation between microbial diversity and
sample pH. Initial hypotheses would suggest that microbial diversity would increase
with increasing pH yet this does not seem to be the case based on the T-RFLP data
obtained in this study.
95
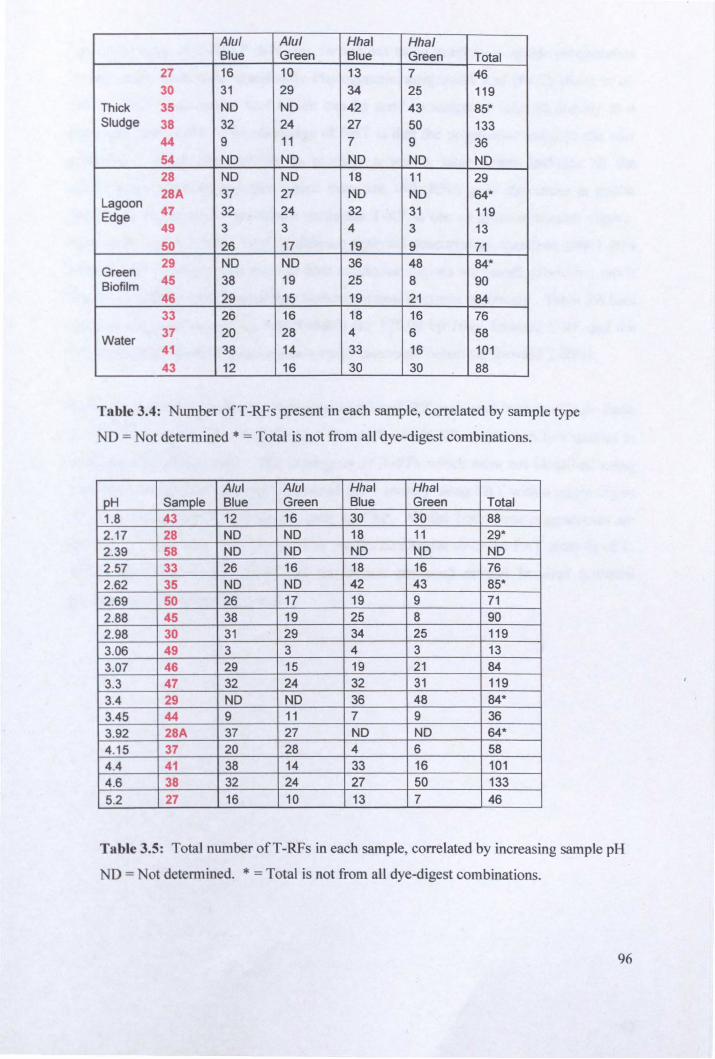
Alul Alul Hhal Hhal Blue Green Blue Green Total
27 16 10 13 7 46 30 31 29 34 25 119
Thick 35 NO NO 42 43 85* Sludge 38 32 24 27 50 133
44 9 11 7 9 36 54 NO NO NO NO NO 28 NO NO 18 11 29 28A 37 27 NO NO 64*
Lagoon 47 32 24 32 31 119 Edge 49 3 3 4 3 13 50 26 17 19 9 71
Green 29 NO NO 36 48 84*
Biofilm 45 38 19 25 8 90 46 29 15 19 21 84 33 26 16 18 16 76
Water 37 20 28 4 6 58 41 38 14 33 16 101 43 12 16 30 30 88
Table 3.4: Number ofT-RFs present in each sample, correlated by sample type
ND = Not determined * = Total is not from all dye-digest combinations.
Alul Alul Hhal Hhal pH Sample Blue Green Blue Green Total 1.8 43 12 16 30 30 88 2.17 28 NO NO 18 11 29* 2.39 58 NO NO NO NO NO 2.57 33 26 16 18 16 76 2.62 35 NO NO 42 43 85* 2.69 50 26 17 19 9 71 2.88 45 38 19 25 8 90 2.98 30 31 29 34 25 119 3.06 49 3 3 4 3 13 3.07 46 29 15 19 21 84 3.3 47 32 24 32 31 119 3.4 29 NO NO 36 48 84* 3.45 44 9 11 7 9 36 3.92 28A 37 27 NO NO 64* 4.15 37 20 28 4 6 58 4.4 41 38 14 33 16 101 4.6 38 32 24 27 50 133 5.2 27 16 10 13 7 46
Table 3.5: Total number ofT-RFs in each sample, correlated by increasing sample pH
NO = Not detennined. * = Total is not from all dye-digest combinations.
96

Further analysis of T -RFLP data was carried out using publicly available programmes
on the world wide web, specifically Phylogenetic assignment tool (PAT) (Kent et al.
2003). PAT is an online tool which can be used to assign or infer phylogeny to a
particular sized T-RF. The advantage of PAT is that the programme employs the user
uploaded T -RFLP data directly to produce a results table which includes all the
potential microbial species (for which there are 168 rRNA gene sequences in public
databases) which would generate a particular T-RF in one or more restriction digests.
Thus, bothAlul and HhaI T-RFLP data are analysed concurrently, therefore only T-RFs
present with corresponding sizes in both restriction digests are found, producing much
fewer possibilities than considering both restriction enzymes separately. Table 3.6 lists
some of the possible species which match the 170.00 bp Hhal forward T-RF and the
112.22 bp AluI forward T-RF (the two most commonly occurring forward T-RFs).
It was not possible to infer the phylogeny of every T -RF generated from the Hoole Bank
T -RFLP data or to infer the phylogeny of a particular T -RF to less than five species in
some instances using PAT. The phylogeny of T-RFs which were not identified using
both HhaI and AluI data could be inferred more loosely using PAT with a single digest
or using an alternative programme such as TAP. Whilst both these programmes are
extremely useful tools, they also provide further challenges since the PAT analysis of T -
RFLP data from Hoole Bank acid tar lagoon produced several hundred potential
phylogenetic assignments in total.
97
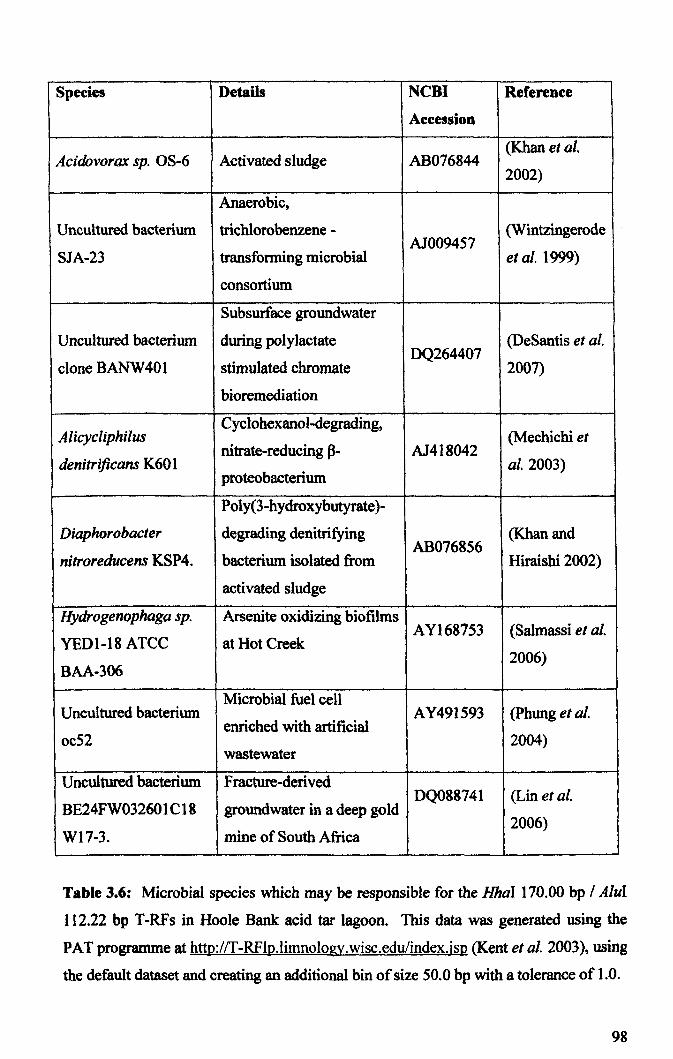
Species Details NCBI Reference
Accession
Acidovorax sp. OS-6 Activated sludge AB076844 (Khan et al.
2002)
Anaerobic,
Uncultured bacterium trichlorobenzene - (Wintzingerode AJ009457
SJA-23 transfonning microbial et al. 1999)
consortium
Subsurface groundwater
Uncultured bacterium during polylactate (DeSantis et al.
clone BANW401 stimulated chromate DQ264407
2007)
bioremediation
Alicycliphilus Cyclohexanol-degrading,
(Mechichi et nitrate-reducing fJ- AJ418042
denitrificans K60 I proteobacterium
al. 2003)
Poly(3-hydroxybutyrate )-
Diaphorobacter degrading denitrifying AB076856
(Khan and
nitroreducens KSP4. bacterium isolated from Hiraishi 2002)
activated sludge
Hydrogenophaga sp. Arsenite oxidizing biofilms AY168753 (Salmassi et al.
YEDI-18 ATCC at Hot Creek
BAA-306 2006)
Microbial fuel cell Uncultured bacterium AY49 I 593 (Phung et al.
enriched with artificial oc52 2004)
wastewater
Uncultured bacterium Fracture-derived
BE24FW032601 C 18 groundwater in a deep gold DQ088741 (Lin et al.
WI7-3. mine of South Africa 2006)
Table 3.6: Microbial species which may be responsible for the HhaI 170.00 bp I AluI
112.22 bp T-RFs in Hoole Bank acid tar lagoon. This data was generated using the
PAT programme at http://T-RFlp.limnology.wisc.edulindex.jsp(Kentetal.2003),using
the default dataset and creating an additional bin of size 50.0 bp with a tolerance of 1.0.
98
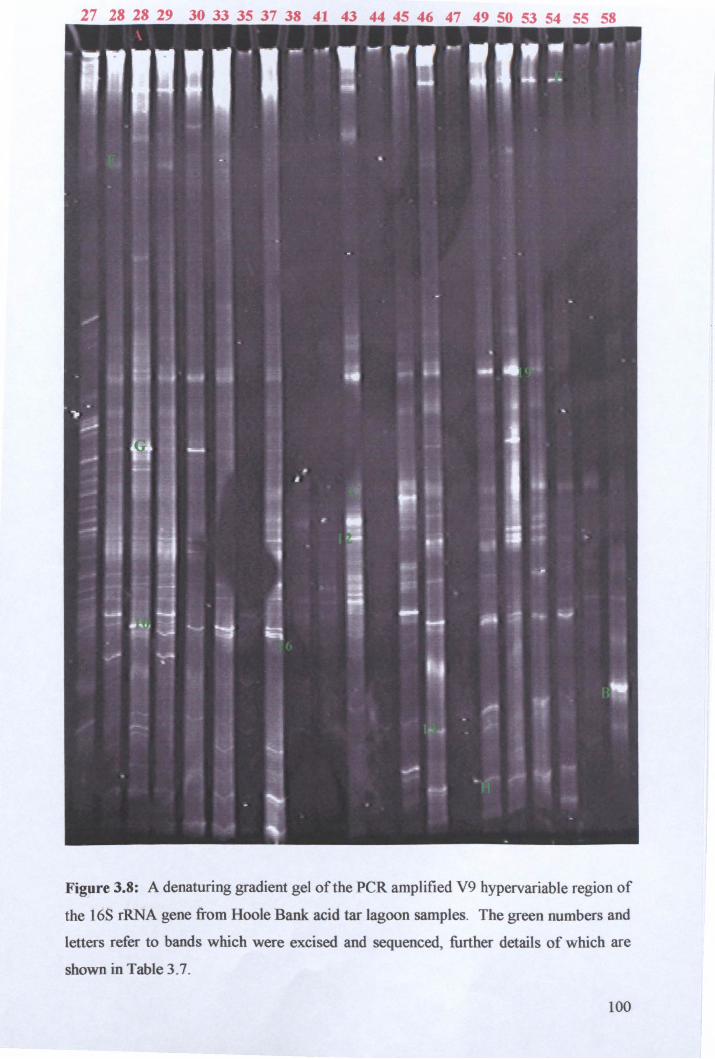
27 28 28 29 30 33 35 37 38 41 43 44 45 46 47 49 50 53 54 55 58
Figure 3.8: A denaturing gradient gel of the peR amplified V9 hypervariable region of
the 16S rRNA gene from Hoole Bank acid tar lagoon samples. The green numbers and
letters refer to bands which were excised and sequenced, further details of which are
shown in Table 3.7.
100
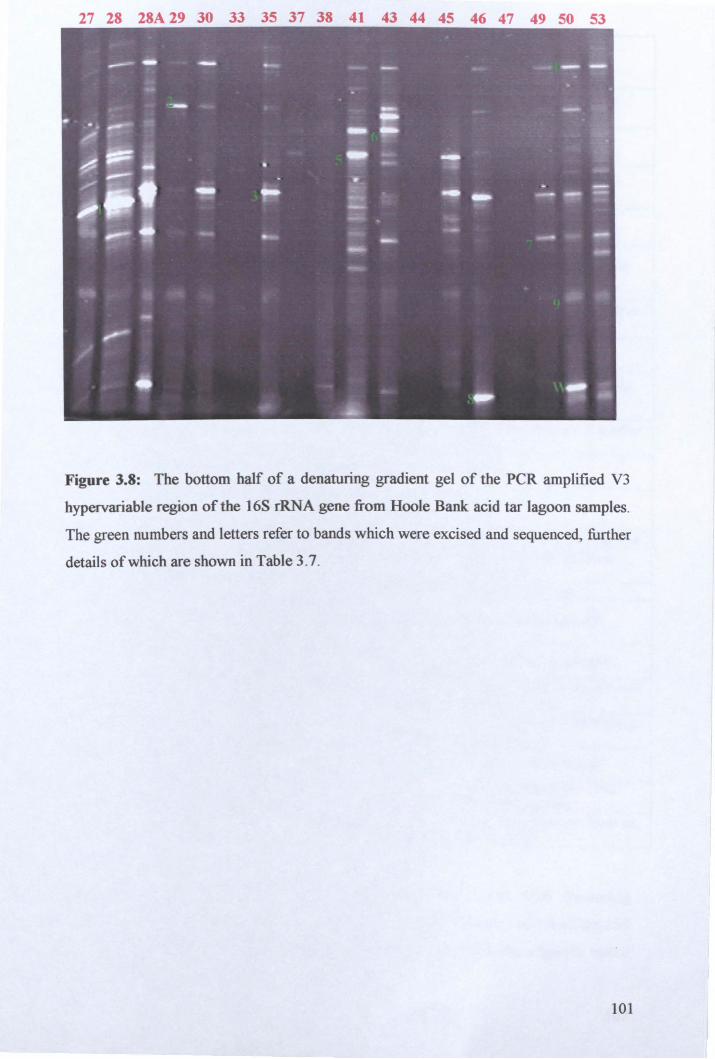
27 28 28A 29 30 33 35 37 38 41 43 44 45 46 47 49 50 53
Figure 3.8: The bottom half of a denaturing gradient gel of the peR amplified V3
hypervariable region of the 16S rRNA gene from Hoole Bank acid tar lagoon samples.
The green numbers and letters refer to bands which were excised and sequenced, further
details of which are shown in Table 3.7.
101
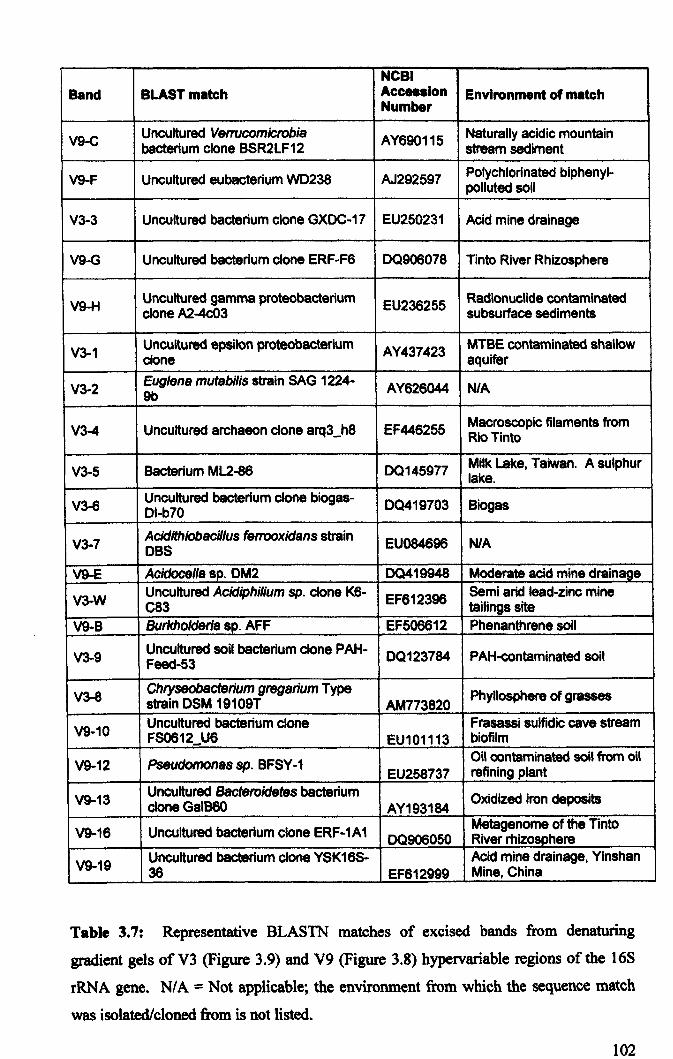
NeBI Band BLAST match Acceaalon Environment of match
Number
V9-C Uncultured Verrucomicrobia AY690115 Naturally acidic mountain bacterium clone BSR2LF12 stream sediment
V9-F Uncultured eubacterium 00238 AJ292597 Polychlorinated blphenyl-polluted soli
V3-3 Uncultured bacterium clone GXOC-17 EU250231 Acid mine drainage
V9-G Uncultured bacterium clone ERF-F6 OQ906078 Tinto River Rhizosphere
V9-H Uncultured gamma proteobacterlum EU236255 Radionuclide contaminated clone A2-4c03 subsurface sediments
V3-1 Uncultured epsilon proteobacterlum AY437423 MTBE contaminated shallow clone aquifer
V3-2 Euglena mutabilis strain SAG 1224- AY626044 N/A 9b
V3-4 Uncultured archaeon clone arq3_h8 EF446255 Macroscopic filaments from Rio Tinto
V3-5 Bacterium ML2-86 DQ145977 Milk Lake, Taiwan. A sulphur lake.
V3-6 Uncultured bacterium clone biogas- Da419703 Blogas DI-b70
V3-7 Acidithiobaclllus ferrooxidans strain
EU084696 N/A DBS
V9-E AcJdocella sp. DM2 Da419948 Moderate acid mine drainage
V3-W Uncultured Acidiphilium sp. clone K6- EF612396 Semi arid lead-zinc mine C83 tailings site
V9-B Burkholderia sp. AFF EF506612 Phenanthrene soil
V3-9 Uncultured soil bacterium clone PAH- DQ123784 PAH-contaminated soil Feed-53
V3-8 Chryseobacterium gregarium Type Phyllosphere of grasses strain DSM 19109T AM773820
V9-10 Uncultured bacterium clone Frasassi sulfidic cave stream FS0612_U6 EU101113 blofilm
V9-12 Pseudomonas sp. BFSY-1 Oil contaminated soli from 011 EU258737 refining plant
V9-13 Uncultured Bacteroidetes bacterium Oxidized iron deposits clone GalB60 AY193184
V9-16 Uncultured bacterium clone ERF-1A1 Metagenome of the Tlnto 00906050 River rhizosDhere
V9-19 Uncultured bacterium clone YSK16S- Acid mine drainage, Yinshan 36 EF612999 Mine, China
Table 3.7: Representative BLASTN matches of excised bands from denaturing
gradient gels of V3 (Figure 3.9) and V9 (Figure 3.8) hypervariable regions of the 16S
rRNA gene. NI A = Not applicable; the environment from which the sequence match
was isolated/cloned from is not listed.
102

The results of BLASTN using the megablast algorithm on the NCBI website (Altschul
et al. 1990) revealed a wide variety of microorganisms present in Hoole Bank acid tar
lagoon samples. including a species of alga and an archaeaon. Each band produced
many matches with percentage identities greater than 97 %. with most bands having 99
% or 100 % identity over the 200-300 bp sequenced region to other sequences in the
NCBI database. In several cases where the excised DOGE band sequence matched
multiple sequences with equal identity the highest matching. most appropriate organism
or clone was selected. For example. band V9-16 is listed in Table 3.7 as a sequence
match with an uncultured bacterium clone from the Rio Tinto rhizosphere, yet this band
also matched accession numbers AY683287 (clone from beech and spruce litter).
EF221112 (vegetated soil from Antarctica). AY425773 (volcanic deposit) and
DQ528761 (a novel Acidobacterium species) amongst several others with equal
sequence identity.
DGGE bands V9-E (Figure 3.8) and V9-B (Figure 3.8) are of particular interest as these
bands were identified through BLASTN as Acidocella sp. DM2 and Burkholderia sp.
AFF respectively (Table 3.7); both of which are very closely related species to
microorganisms which were isolated using classical culture methods (Section 3.2.2 and
Table 3.2). Furthermore, given the short region of the 168 rRNA gene used for
identification it is extremely likely that the organisms isolated using classical culture
techniques are the same microorganisms responsible for bands V9-E and V9-B
respectively.
Band 2 of the V3 gel (Figure 3.9) was identified as Euglena mutabilis strain SAG 1224-
9b using the megablast algorithm. Identification of a species of the genus Euglena is
noteworthy since previous attempts to characterise eukaryotic diversity in the Rio Tinto
failed to identify Euglena using 18S rRNA DOGE despite microscopic observations of
this genus in the samples analysed (Aguilera et al. 2006). It is of further interest since
Euglena mutabilis is well known to tolerate acidic conditions (Lane and Burris 1981;
Olaveson and Nalewajko 2000) yet a closely related species, Euglena gracilis, was
isolated from Hoole Bank acid tar lagoon samples using classical techniques. As has
been mentioned previously, the reliability of 16S rRNA to distinguish between different
species is not totally reliable, further proven by the remaining BLASTN matches to V3-
2 which included Euglena viridis, Euglena deses and Euglena stellata amongst other
species of Euglena and other uncultured clones.
103
Therefore it remains a possibility that band V3-2 may be affiliated to Euglena gracilis,
as opposed to Euglena mutabilis. In order to quantify this further, the V3-2 DGGE
band sequence was aligned against the chloroplast 168 rRNA gene sequence obtained
from the Hoole Bank Euglena gracilis isolate using the bl2seq alignment tool on the
NCBI website (Tatusova and Madden 1999). The alignment was strong, with an 88 %
identity over 171 residues which means that the possibility remains that the DGGE band
is a result of the presence of Euglena gracilis in Hoole Bank acid tar lagoon samples.
However, there also remains the possibility that both organisms are present in Hoole
Bank acid tar lagoon samples, with one species isolated using classical culture
techniques and the other species identified through molecular analyses.
Of the two remaining cultured isolates it would not be possible to detect the eukaryotic
yeast isolate Rhodotorula using 168 rRNA DGGE since it possesses no 168 rRNA.
However, detection of the bacterial Gordonia species would be possible using 168
rRNA DOGE, yet this organism was not detected on either V9 or V3 DOGE gels. The
absence of a Gordonia species from either 168 rRNA DGGE may simply be that the
band affiliated with this microbial species was not sufficiently visible for excision, as
was the case for several bands which were visible in a closed UV transilluminator dark
box but not using an open UV transilluminator. It is also possible that this species
comprised such a small minority of the microbial population in Hoole Bank samples
that PCR amplification was biased against this or that little or no genomic DNA was
obtained from this organism irrelevant of its abundance within the microbial population.
Acidithiohacillus je"ooxidans was also identified as present in Hoole Bank acid tar
lagoon samples (V3-7; Figure 3.9). This is not unusual given that this organism is a
known acidophile and has been identified in many acidic environments previously
(Gonzalez-Toril et al. 2003; Johnson et al. 2001; Mabmoud et al. 2005). A.
ferrooxidans is often readily cultured from acidic samples, despite not always being the
dominant species (Rawlings et al. 1999), yet this organism was not detected using the
classical culture techniques employed in this study. This is most likely because specific
growth media and long incubation period is required to culture this species.
3.3: General Discussion
The results of microbial diversity analysis at Hoole Bank acid tar lagoon are in
agreement with previous studies which reveal a much greater microbial diversity using
104
molecular techniques than classical culturing techniques (Amann et al. 1995). A total
of five microorganisms were isolated and identified from 21 samples from Hoole Bank
acid tar lagoon, which would indicate a very low level of microbial diversity present. It
is important to consider that the classical culture techniques emplyed were chosen
specifically to isolate microorganisms which could be cultured readily and using a very
limited pH range. Therefore, the limited diversity which was cultured does not
represent the likely culturable population. Furthermore, results from molecular
microbial community analysis using T -RFLP and DOGE indicate a much higher level
of diversity present in some of the samples that that found using classical culture
techniques.
There are several reasons for the discrepancy between the number of cultured organisms
and the estimates of the number of species produced from T -RFLP and DOGE data,
which were discussed earlier (Section 1.2.1 and 1.2.2). Underestimates of microbial
diversity based on cultured organisms occur because many of the species present in
environmental samples cannot be cultivated using the particular set of culture
techniques employed. The lack or over abundance of certain nutrients, cofactors,
terminal electron acceptors, synergies and levels of oxygen are just some ofthe reasons
which may cause a particular organism to resist being cultured.
Many microorganisms may rely on the presence of another organism in some way in
order for them to grow and survive, yet this study prevented the growth of fungi since
these organisms out-competed the growth of other microorganisms. It is highly likely
that the inhibition of fungal growth from Hoole Bank acid tar lagoon samples reduced
the number of other microorganisms isolated from the samples. Similarly, a very
narrow range of growth media were used in attempts to isolate organisms therefore the
proportion of organisms present in samples which could grow using the media provided
was considerably reduced compared to the total microbial population. All attempts to
culture microorganisms were carried out under aerobic conditions, thus excluding a
further proportion of the microbial population which were micro-aerophilic or
anaerobes.
Of the five species of organisms isolated from Hoole Bank acid tar lagoon samples only
one, Acidocella 29, would have been considered a likely candidate for isolation prior to
CUlturing. Acidocella are known acidophiles and have been found in other acidic
105
environments previously (John son et al. 2001; Kimura et al. 2006), as well as exhibiting
the potential to degrade a range of carbon compounds which are likely to be present at
Hoole Bank acid tar lagoon (Dore et al. 2003; Roling et al. 2006). Of the remaining
four isolates, Rhodotorula are known to be acidotolerant (Gadanho et al. 2006) whilst
Burkholderia (TiIlmann et aI. 2005) and Gordonia (Chatterjee and Dutta 2003; Kim and
Pagilla 2003) species have previously been found in environments similar to Hoole
Bank acid tar lagoon.
The isolation ofthese microbial species, as opposed to the type of acidophilic organisms
discussed in Section 1.5 which are commonly isolated from similar environments would
suggest that the culture regime employed to isolate organisms was not yielding the
maximum number of culturable isolates. However, the methodology employed to
isolate organisms was chosen such that any microorganisms which were cultured could
be readily grown in order to aid further studies.
A greater number of organisms could have been isolated from Hoole Bank acid tar
lagoons relatively simply by using a greater number of growth media and conditions
such as overlay plates (Johnson et al. 1987), minimal medium supplemented with
carbon sources present in Hoole Bank acid tar lagoon samples, using a wider range of
pH during media preparation and by using anaerobic growth conditions for example.
Preparation of overlay plates (John son 1995), a commonly used technique for isolating
microorganisms using the removal of toxic organic chemicals from the top. agar by an
underlayer containing another microorganism, are time consuming in their preparation
and do not produce colonies for approximately 7-14 days, therefore they were not used
in this study due to time constraints.
The isolation of a unicellular alga was not surprising since visibly green biofilms were
present at Hoole Bank acid tar lagoon. However, it was surprising that the species
apparently responsible for much of this biomass was Euglena gracilis, as opposed to the
more acidophilic species Euglena mutabilis. It is thought that E. gracilis is in fact
equally acid tolerant but is far less resistant to heavy metals, and since the presence of
heavy metals is often found in highly acidic environments, E. mutabilis is the most
commonly isolated euglenoid from acid environments (Olaveson and Nalewajko 2000).
Isolation of E. gracilis is not that surprising since Hoole Bank acid tar lagoon does not
contain high levels of heavy metals despite its acidity (Nichol 2000).
106
All of the organisms isolated were from different Hoole Bank acid tar lagoon samples,
with pH ranging from 2.62 to 3.40. However three of the five isolates were from
sample group 1, thick sludge external to the lagoon, and the remaining two isolates from
sample group 3, green biofilm. However, it is important to mention at this point that
several other organisms were cultured from Hoole Bank samples but could not be
maintained for more than two generations and therefore could not be successfully
identified.
Of note is the isolation of two organisms from Group 3 samples, compared to the
relatively low microbial diversity detected using DOGE in these samples' (Lanes 29, 45
and 46, Figu~s 3.8 and 3.9). Initially the limited microbial diversity detected using
DOGE was thought to be a result of inefficient genomic DNA extraction due to the
biofilm structure. However, these samples produced a greater or comparable number of
T-RFs when compared to water samples (Table 3.4) which would suggest that this is not
the true reason for the limited diversity seen using DOGE. One possibility is that bands
which comprised only a small proportion of the population in these samples were not
detected using DGGE due to the limited sensitivity of staining and visualisation but
were detected using T-RFLP.
No microorganisms were isolated from sample 27, despite this sample having the
highest pH, at 5.2. The most likely reason for the absence of cultured organisms from
this sample and several others is that all the media used for isolation were adjusted to
pH 3 in order to isolate acidophilic or acidotolerant species for further study. Based on
V9-DGGE, sample 27 appears to have the highest level of microbial diversity compared
to all the other samples (Figure 3.8). However, this considerably higher level of
microbial diversity observed in V9 and V3 DOGE gels does not correspond with T
RFLP data which shows comparable levels of microbial diversity between sample 27
and the remaining 20 samples. One possible explanation for this discrepancy is that T
RFLP data is simply much more sensitive. For example, Figures 3.7a-d show many T
RFs with very small percentage peak areas and only approximately four to six columns
with high percentage areas, which more than likely represent species comprising only a
minority of the microbial population and predominant, abundant species within the
population respectively. Thus, the most prevalent and abundant species with large
percentage peak areas seen in the histograms of Figures 3.7a-d are likely to be
represented by the brightest bands visible in the DOGE gels, whilst the species which
107
comprise a minority of the microbial population may only produce faint bands or bands
which are not visualised at all.
The T -RFLP profiles generated from Hoole Bank acid tar lagoon samples did not show
any strong correlation between sample grouping and microbial diversity, or pH and
microbial diversity. Statistical analyses using principal component analysis of
interstitial data (Figures 3.5a-h), peak area data (Figures 3.6a-h) and correspondence
analysis of both interstitial and peak area data (data not shown) indicate few trends
within sample groupings or sample pH. Certain samples cluster closely in Figures 3.5h,
3.6d, 3.6g and 3.6h which may indicate some as yet unknown linking factor but this
factor was not determined.
There are advantages and disadvantages of both molecular methods, therefore using
both methods has provided a broader picture of the microbial diversity present in Hoole
Bank acid tar lagoon. Whilst T -RFLP is more sensitive and provides a greater insight
into the number of probable microbial species present in the acid tar lagoon there is no
defmitive sequence information obtained using this technique. Although in si/ico
analyses such as PAT (Kent et al. 2003) and TAP (Marsh et al. 2000) allow the
phylogeny of T -RFs to be inferred, the information obtained from these programmes is
purely theoretical. A large number of results were obtained using the T -RFLP profiles
from Hoole Bank acid tar lagoon llsing PAT. For example. sample 46 produced a total
of 5600 potential phylogenetic affiliations. Whilst inference of phylogeny is useful,
analysis of these data is time consuming given the large number of potential matches
which arise as a result of the high number of matches for each T-RF combination, the
number of different T -RF combinations which produce matches to species within the
database used and the high number of repetitive sequence information contained within
the databases. The latter point is particularly relevant to sequences from clone libraries
and metagenomic libraries which produce vast amounts of sequence data which is added
to the database which ultimately resulted in 20-40 matches to duplicate or slight variants
of a clone insert from a particular clone or metagenomic library in some instances.
DOGE is advantageous in this respect since bands can be excised and sequenced in
order to determine the phylogeny of the organism responsible for a particular band;
however the disadvantage is that staining and visualisation of the gels is less sensitive
than T-RFLP, therefore the proportion of OOGE bands which can be identified is
108
always likely to be significantly less than 100 % of the microbial diversity present as the
technique is not sufficiently sensitive. Furthermore, it is known that one band can
consist of the 16S rRNA gene fragment from more than one organism (Gafan and Spratt
200~), therefore the level of microbial diversity may also be underestimated using
DGGE. Optimisation and alteration of the denaturing gradient may allow detection of
species which are less abundant or allow the separation of two closely migrating
species.
The multitude of high percentage identity sequence matches using BLASTN highlights
several potential pitfalls of molecular microbial diversity analysis using DGGE. Firstly,
the phylogenetic identification of organisms present in environmental samples based on
the short sequences (200-300 bp) obtained from excised DGGE bands is not definitive.
The results also highlight the limits of the 16S rRNA gene as a phylogenetic marker,
since the regions of the 16S rRNA gene used in these experiments were both
hypervariable regions yet sequences from excised DGGE bands matched several species
of microorganisms. Limitations in our current knowledge and data also affect the
results obtained, since it is not possible to match a query sequence to any sequences
from organisms or clone libraries which have not been entered into the NCBI, or any
other database, being used for cross-referencing. Finally, as demonstrated in the
example above, the results are also open to user bias and selectivity, particularly when
there are multiple equal identity matches. Although, in some circumstances it may be
argued that selection of the most appropriate sequence match may be justified.
109
Chapter Four: Characterisation of "Green 46" - Euglena gracilis G46
4.1: Introduction
The following chapter describes some the effects of low pH on an organism which grew
on Yz BLB pH 3 medium following inoculation with sample number 46 from Hoole
Bank acid tar lagoon. This organism has been deposited in the Culture Collection of
Algae and Protozoa (CCAP) under strain number E. gracilis G46 1224/46. Sample 46
was from a biofilm present in shallow lagoon water, approximately 20 - 30 cm deep,
close to the edge of the lagoon with a pH of 3.07 (Figure 3.1c). This organism was
chosen for further study since the biofilm was visibly abundant within several areas of
the lagoon and thought to constitute a significant feature of the microbial community
present at Hoole Bank acid tar lagoon.
4.2: Results
4.2.1: Identification of "Green 46"
A unicellular alga was cultured from lagoon sample 46, initially on solid Y2 BLB
medium. Initial microscopic observations showed cells to be approximately 40 J.lffi in
length by 6 J.lffi wide. Liquid cultures of this organism were grown at approximately 27
±2 °C in diurnal conditions prior to phylogenetic identification (Section 2.12.2).
Genomic DNA preparations were made from liquid cultures and both 16S and 18S
rRNA genes amplified by PCR and sequenced for phylogenetic identification of the
organism. Phylogenetic analysis of the "Green 46" chloroplast 16S rRNA gene (NCBI
accession number EU263908) using the BlastN algorithm at NCBI showed a 95 %
identity to Euglena gracilis chloroplast genes, whilst BlastN comparison of the "Green
46" 18S rRNA gene (NCBI accession number EU263909) revealed a 97 % identity to
Euglena gracilis small subunit rRNA (Figures 4.1 and 4.2).
Stackebrandt and Goebel (1994) suggested that> 97 % homology between 16S rRNA
genes is a strong indication that two organisms are the same species, therefore the 97 %
sequence identity between the "Green 46" 18S rRNA gene and the E. gracilis 18S
rRNA gene would suggest that "Green 46" is Euglena gracilis. Therefore, from this
point onwards "Green 46" will be referred to as E. gracilis G46. Following the
identification of E. gracilis 046 using BlastN, the type strain Euglena gracilis Z (CCAP
1224/5Z) was used as a control organism for most experiments involving E. gracilis
G46. Initially growth was monitored over a range of pH using chlorophyll content as a
110
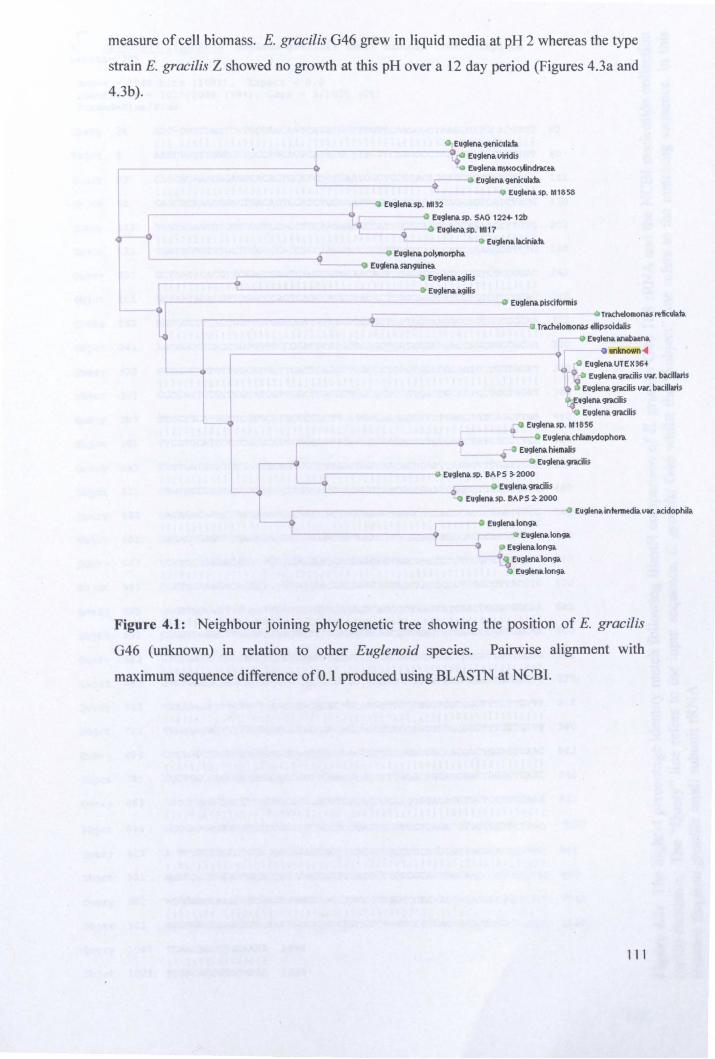
measure of cell biomass. E. gracilis G46 grew in liquid media at pH 2 whereas the type
strain E. gracilis Z showed no growth at this pH over a ) 2 day period (Figures 4.3a and
4.3b).
• 9
I
or 1_
l
~
• E,'l1eN. 5p. 111132
• Eugltni. ~niculi.1a.
<) ..o Eugleni. viridi5
• Eug1en. _oc\AindBCu
• EU'l1eni. 'lenic,Ii.1a.
• Eugleni.5p. 1111858
4 EugltnUP. SAG 122+ 12b
• EU'l1eni.liCinii.1a.
-0 EU'l1eni. pol~lPtu.
• Eu9!tnUi.n'luinti.
• Eugltnu.'li~5
• EU9leno. .gili.
4 EU9ltno. pi5cifonni5
r-----------------------O
1 • Tl'i.Clulomon;15 tllip50idili5
I
• EIgltni. ini.bMno.
r--------------------------------------. [ .~~ o ,e Eugltni.UTEX36.
I ..
Ll I
r • - 0
I
0 ... Eug!tni. gmili5 Vif. biCil~5 o 'I Eug1tni. 'l1'iC~i5 Vif. biCillari.
~Igltno. gBCili.
• Eugltni. 'l1'iCili5 -Q. Eugleno.sp. 1111856
• Eugltni. chliNIWdophori.
• -0 EU91eni. hitmili • • Eugltno. gmili •
~ Euglenup. 8APS ~2000
~ • EIgltni. gBCili. • Eugltni.5jl. MPS 2-2000
• Eugleni. inftnnedii. Vif. iCidophili.
~ r - .... Eugltni.longi. L..-~--------O -- Eugltno.long;t.
L-
Figure 4.1: Neighbour joining phylogenetic tree showing the position of E. gracilis
G46 (unknown) in relation to other Euglenoid species. Pairwise alignment with
maximum sequence difference of 0.1 produced using BLASTN at NCBl.
111
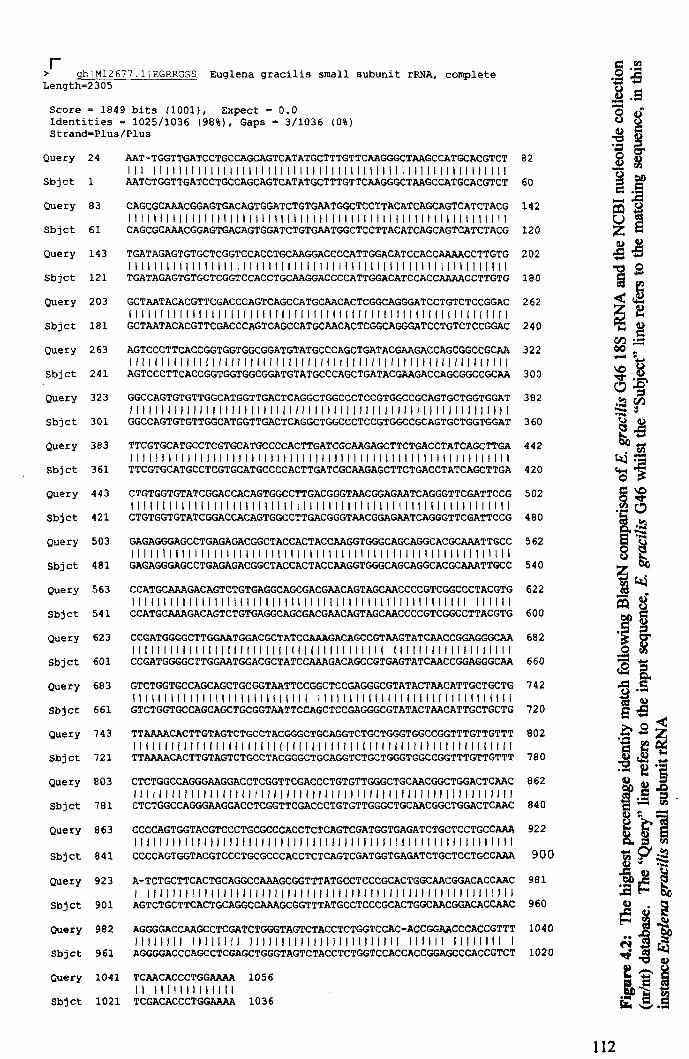
r > gbIM12677.1IEGRRGSS Euglena gracilis small subunit rRNA, complete Length=2305
Score ~ 1849 bits (1001), Expect = 0.0 Identities = 1025/1036 (98%), Gaps - 3/1036 (0%) Strand-Plus/Plus
Query 24
Sbjct 1
Query 83
Sbjct 61
AAT-TGGTTGATCCTGCCAGCAGTCATATGCTTTGTTCAAGGGCTAAGCCATGCACGTCT 82 I I I 11 I I 11 I I I I 11 I I I I I I I " I I I I I 11 I 11 I 11 I I I I I I I 11 I I 11 I I I I 11 I 11 AATCTGGTTGATCCTGCCAGCAGTCATATGCTTTGTTCAAGGGCTAAGCCATGCACGTCT 60
CAGCGCAAACGGAGTGACAGTGGATCTGTGAATGGCTCCTTACATCAGCAGTCATCTACG 142 111111111111111111111111111111111111111111111111111111111111 CAGCGCAAACGGAGTGACAGTGGATCTGTGAATGGCTCCTTACATCAGCAGTCATCTACG 120
Query 143 TGATAGAGTGTGCTCGGTCCACCTGCAAGGACCCCATTGGACATCCACCAAAACCTTGTG 202 I I I I 11 I I " 11 1 I " I I I 1 I I I 1 I I 11 I I I I I I I I 11 I I I 1 11 11 I I I I I 11 I I 11 I I I
Sbjct 121 TGATAGAGTGTGCTCGGTCCACCTGCAAGGACCCCATTGGACATCCACCAAAACCTTGTG 180
Query 203 GCTAATACACGTTCGACCCAGTCAGCCATGCAACACTCGGCAGGGATCCTGTCTCCGGAC 262 111111111111111111111111111111111111111111111111111111111111
Sbjct 181 GCTAATACACGTTCGACCCAGTCAGCCATGCAACACTCGGCAGGGATCCTGTCTCCGGAC 240
Query 263 AGTCCCTTCACCGGTGGTGGCGGATGTATGCCCAGCTGATACGAAGACCAGCGGCCGCAA 322 111111111111111111111111111111111111111111111111111111111111
Sbjct 241 AGTCCCTTCACCGGTGGTGGCGGATGTATGCCCAGCTGATACGAAGACCAGCGGCCGCAA 300
Query 323 GGCCAGTGTGTTGGCATGGTTGACTCAGGCTGGCCCTCCGTGGCCGCAGTGCTGGTGGAT 382 111111111111111111111111111111111111111111111111111111111111
Sbjct 301 GGCCAGTGTGTTGGCATGGTTGACTCAGGCTGGCCCTCCGTGGCCGCAGTGCTGGTGGAT 360
Query 383 TTCGTGCATGCCTCGTGCATGCCCCACTTGATCGCAAGAGCTTCTGACCTATCAGCTTGA 442 111111111111111111111111111111111111111111111111111111111111
Sbjct 361 TTCGTGCATGCCTCGTGCATGCCCCACTTGATCGCAAGAGCTTCTGACCTATCAGCTTGA 420
Query 443 CTGTGGTGTATCGGACCACAGTGGCCTTGACGGGTAACGGAGAATCAGGGTTCGATTCCG 502 I " 11 I I I I I 11 11 I I I I I 11 I 11 I I I I I 11 I 11 I 11 I 11 I I I I 1 I I I I I 11 I I 11 I I I I
Sbjct 421 CTGTGGTGTATCGGACCACAGTGGCCTTGACGGGTAACGGAGAATCAGGGTTCGATTCCG 480
Query 503 GAGAGGGAGCCTGAGAGACGGCTACCACTACCAAGGTGGGCAGCAGGCACGCAAATTGCC 562 I 11 11 I I 11 I I I I 11 I 11 I I I I 11 I I 11 I I I I 11 \I I I I I I 11 I 11 I 11 I 11 11 11 11 I I
Sbjct 481 GAGAGGGAGCCTGAGAGACGGCTACCACTACCAAGGTGGGCAGCAGGCACGCAAATTGCC 540
Query 563 CCATGCAAAGACAGTCTGTGAGGCAGCGACGAACAGTAGCAACCCCGTCGGCCCTACGTG 622 11 I 11 I I " 11 I I I I I 11 I \I I 11 I 11 " 11 11 I I 11 I I 11 I " 11 I I I I 11 I "" I I
Sbjct 541 CCATGCAAAGACAGTCTGTGAGGCAGCGACGAACAGTAGCAACCCCGTCGGCCTTACGTG 600
Query 623 CCGATGGGGCTTGGAATGGACGCTATCCAAAGACAGCCGTAAGTATCAACCGGAGGGCAA 682 I 11 I f I I I I 11 I I 11 I f 11 f f I I I I 11 I filII I I 11 I I I 1\ I 11 " I 11 I I I I I 11 I I
Sbjct 601 CCGATGGGGCTTGGAATGGACGCTATCCAAAGACAGCCGTGAGTATCAACCGGAGGGCAA 660
Query 683 GTCTGGTGCCAGCAGCTGCGGTAATTCCGGCTCCGAGGGCGTATACTAACATTGCTGCTG 742 11 I I I I 11 I 11 I I 11 11 I I I 11 I 11 "I I 11 I 1\ " \I I 1\ I " 11 11 I 11 I " I 1\ 1 1
Sbjct 661 GTCTGGTGCCAGCAGCTGCGGTAATTCCAGCTCCGAGGGCGTATACTAACATTGCTGCTG 720
Query 743 TTAAAACACTTGTAGTCTGCCTACGGGCTGCAGGTCTGCTGGGTGGCCGGTTTGTTGTTT 802 111111111111111111111111111111111111 fill f I11 I 111111111111111
Sbjct 721 TTAAAACACTTGTAGTCTGCCTACGGGCTGCAGGTCTGCTGGGTGGCCGGTTTGTTGTTT 780
Query 803 CTCTGGCCAGGGAAGGACCTCGGTTCGACCCTGTGTTGGGCTGCAACGGCTGGACTCAAC 862 11 I 11 I I I 1111111111 I 111I1111111111111111111 f 11111111111111111
Sbjct 781 CTCTGGCCAGGGAAGGACCTCGGTTCGACCCTGTGTTGGGCTGCAACGGCTGGACTCAAC 840
Query 863 CCCCAGTGGTACGTCCCTGCGCCCACCTCTCAGTCGATGGTGAGATCTGCTCCTGCCAAA 922 I I I f fill I I I I I " I I I 11 I 1 I " I I I I I 1 I I I11 I " I 1 I I I I I I I1 I I 1 I 11 I I I I I
Sbjct 841 CCCCAGTGGTACGTCCCTGCGCCCACCTCTCAGTCGATGGTGAGATCTGCTCCTGCCAAA 900
Query 923 A-TCTGCTTCACTGCAGGCCAAAGCGGTTTATGCCTCCCGCACTGGCAACGGACACCAAC 981 I I I I I 1 I 1 I I 1 I I I 1 I I I I I 11 I I I I I 11 I I I I 11 I I I I I I I 11 I I I I I I I I I I I I I I I
Sbjct 901 AGTCTGCTTCACTGCAGGCCAAAGCGGTTTATGCCTCCCGCACTGGCAACGGACACCAAC 960
Query 982 AGGGGACCAAGCCTCGATCTGGGTAGTCTACCTCTGGTCCAC-ACCGGAACCCACCGTTT 1040 1111111111111111 1111111"11111""""" 111111 11111111 I
Sbjct 961 AGGGGACCCAGCCTCGAGCTGGGTAGTCTACCTCTGGTCCACCACCGGAGCCCACCGTCT 1020
Query 1041 TCAACACCCTGGAAAA 1056 11 1111111111111
Sbjct 1021 TCGACACCCTGGAAAA 1036
112
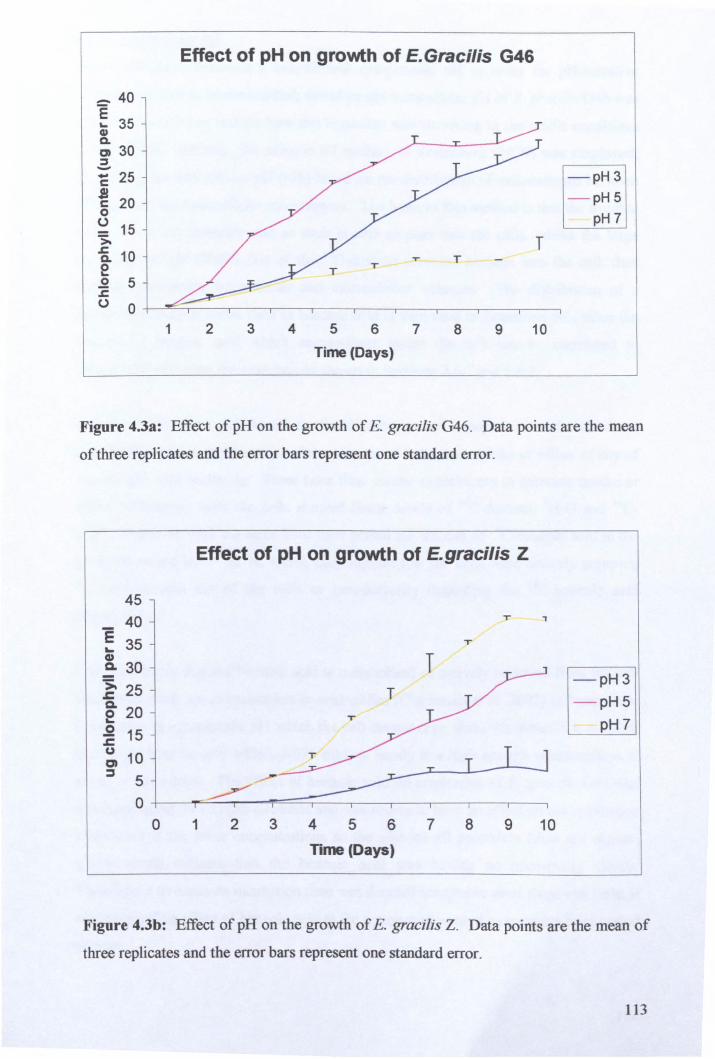
_ 40
~ 35 Cl) Q. D 30 ::::J -C 25
~ 20 o () 15 >. -a 10 e .2 5 s:.
Effect of pH on growth of E.Graci/is G46
o 0 +-~.----,---,---,----.---~--.----,---,---,
1 2 3 4 5 6 7 8 9 10
Time (Days)
- pH3
- pH5
pH 7
Figure 4.3a: Effect of pH on the growth of E. gracilis G46. Data points are the mean
of three replicates and the error bars represent one standard error.
Effect of pH on growth of E.graci/is Z
45
40 T , E 35 T ~ Cl)
Q. 30 - pH3 -
~ 25 e 20 - pH5
pH? .2 15 ~ u
10 et ~
5 ~ 0
0 1 2 3 4 5 6 ? 8 9 10
Time (Days)
Figure 4.3b: Effect of pH on the growth of E. gracilis Z. Data points are the mean of
three replicates and the error bars represent one standard error.
113
4.2.2: Intracellular pH
Most acidophiles maintain a near-neutral cytoplasmic pH in order for pH-sensitive
cellular functions to be maintained; therefore the intracellular pH of E. gracilis 046 was
measured in order to deduce how this organism was surviving in the acidic conditions
of the lagoon. Initially, the silicone oil method of Rottenberg (1979) was employed,
calculating the intracellular pH (PHi) based on the distribution of radioisotopes between
the cells and the extracellular environment. The basis of this method is that the tritiated
water is a small molecule and as such is able to pass into the cells, whilst the large
molecular weight (70000 Da) of the 14C_dextran prevents passage into the cell, thus
creating measurable intracellular and extracellular volumes. The distribution of a
further radioisotope probe such as benzoic acid is then used to determine pHi, since the
amount of benzoic acid which accumulates inside the cell can be correlated to
intracellular pH using the calculations shown in Sections 2.6.1 and 2.6.2.
In order to measure pHi based on the distribution of isotopes, control timecourse
experiments were carried out in order to ensure no erroneous uptake or eftlux of any of
the isotopes was occurring. Three hour time course experiments to measure uptake or
effiux of isotopes from the cells showed linear levels of 14C-dextran, 3H20 and 14C_
TPP+. However, over the three hour time period the amount of 14C_benzoic acid in the
pellet decreased by > 50 %, which may suggest that the cells were actively pumping
14C_benzoic acid out of the cells or metabolically degrading the 14C_benzoic acid
(Figure 4.4).
It is quite likely that the benzoic acid is metabolised or actively removed from the cell
since weak acids act as uncouplers in acidophiles (Ciaramella et al. 2005) and can cause
a reduction in cytoplasmic pH which the cell cannot cope with. However, the minimal
amount of benzoic acid added, 0.075 mM, is barely at a high enough concentration to
act as an uncoupler. The effect of benzoic acid on respiration of E. gracilis 046 was
measured using the oxygen electrode and was shown to have no effect on the respiration
when used at the same concentrations as the silicone oil procedure (data not shown)
which would indicate that the benzoic acid was having no uncoupling effects.
Therefore, a five minute incu~tion time was deemed acceptable since there was little, if
any. uncoupling effect of benzoic acid at the concentration used over such a brief period
of time.
114
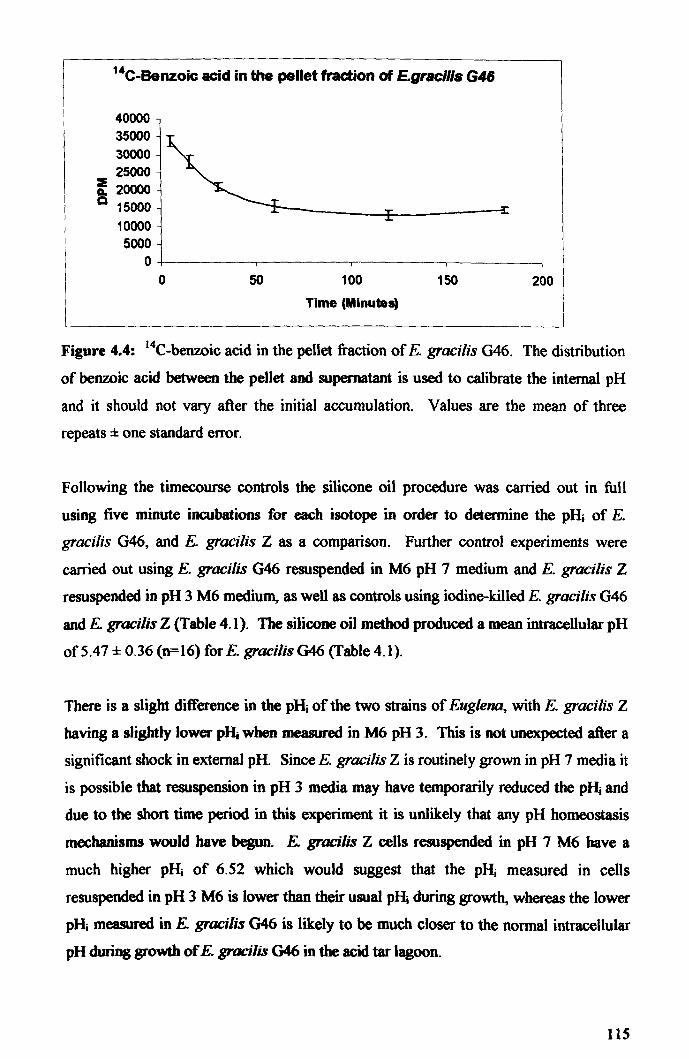
14C-Benzoic acid in the pellet fraction of E.gracilis G.f.6
40000 35000 30000 25000
l 20000 Q 15000
10000 5000
0 0 50 100 150 200
Time (Minutes)
Figure 4.4: 14C_benzoic acid in the pellet fraction of E. gracilis G46. The distribution
of benzoic acid between the pellet and supernatant is used to calibrate the internal pH
and it should not vary after the initial accumulation. Values are the mean of three
repeats ± one standard error.
Following the timecourse controls the silicone oil procedure was carried out in full
using five minute incubations for each isotope in order to determine the pHi of E.
gracilis G46, and E. graciliS Z as a comparison. Further control experiments were
carried out using E. gracilis G46 resuspended in M6 pH 7 medium and E. gracilis Z
resuspended in pH 3 M6 medium, as well as controls using iodine-killed E. gracilis G46
and E. gracilis Z (Table 4.1). The silicone oil method produced a mean intracellular pH
of 5.47 ± 0.36 (n=16) for E. gracilisG46 (Table 4.1).
There is a slight difference in the pHj of the two strains of Euglena, with E. gracilis Z
having a slightly lower pl\ when measured in M6 pH 3. This is not unexpected after a
significant shock in external pH. Since E. gracilis Z is routinely grown in pH 7 media it
is possible that resuspension in pH 3 media may have temporarily reduced the pHi and
due to the short time period in this experiment it is unlikely that any pH homeostasis
mechanisms would have begun. E. gracilis Z cells resuspended in pH 7 M6 have a
much higher pHi of 6.52 which would suggest that the pHi measured in cells
resuspended in pH 3 M6 is lower than their usual pHi during growth, whereas the lower
pHi measured in E. gracilis G46 is likely to be much closer to the normal intracellular
pH during growth of E. gracilis G46 in the acid tar lagoon.
115
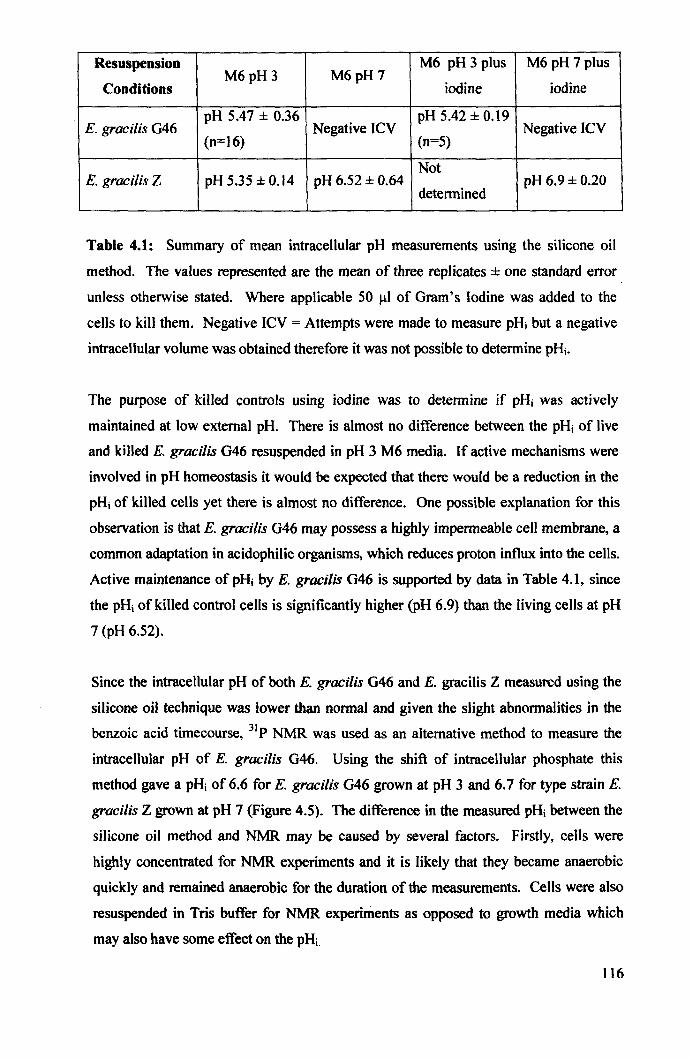
Resuspension M6pH3 M6pH7
M6 pH 3 plus M6 pH 7 plus
Conditions iodine iodine
E. gracilis G46 pH 5.47 ± 0.36
Negative ICV pH 5.42 ± 0.19
Negative ICV (n=16) (n=5)
Not E. gracilis Z pH 5.35 ± 0.14 pH 6.52 ± 0.64
determined pH 6.9±0.20
Table 4.1: Summary of mean intracellular pH measurements using the silicone oil
method. The values represented are the mean of three replicates ± one standard error
unless otherwise stated. Where applicable 50 J.lI of Gram's Iodine was added to the
cells to kill them. Negative ICV = Attempts were made to measure pHj but a negative
intracellular volume was obtained therefore it was not possible to determine pHi.
The purpose of killed controls using iodine was to determine if pHi was actively
maintained at low external pH. There is almost no difference between the pHi of live
and killed E. gracilis G46 resuspended in pH 3 M6 media. If active mechanisms were
involved in pH homeostasis it would be expected that there would be a reduction in the
pHj of killed cells yet there is almost no difference. One possible explanation for this
observation is that E. gracilis G46 may possess a highly impermeable cell membrane, a
common adaptation in acidophilic organisms, which reduces proton influx into the cells.
Active maintenance of pHi by E. gracilis G46 is supported by data in Table 4.1, since
the pHi of killed control cells is significantly higher (PH 6.9) than the living cells at pH
7 (pH 6.52),
Since the intracellular pH of both E. gracilis G46 and E. gracilis Z measured using the
silicone oil technique was lower than normal and given the slight abnormalities in the
benzoic acid timecourse, 31p NMR was used as an alternative method to measure the
intracellular pH of E. gracilis G46. Using the shift of intracellular phosphate this
method gave a pHi of 6.6 for E. gracilis G46 grown at pH 3 and 6.7 for type strain E.
gracilis Z grown at pH 7 (Figure 4.5). The difference in the measured pHi between the
silicone oil method and NMR may be caused by several factors. Firstly, cells were
highly concentrated for NMR experiments and it is likely that they became anaerobic
quickly and remained anaerobic for the duration of the measurements. Cells were also
resuspended in Tris buffer for NMR experiments as opposed to growth media which
may also have some effect on the pHi.
116
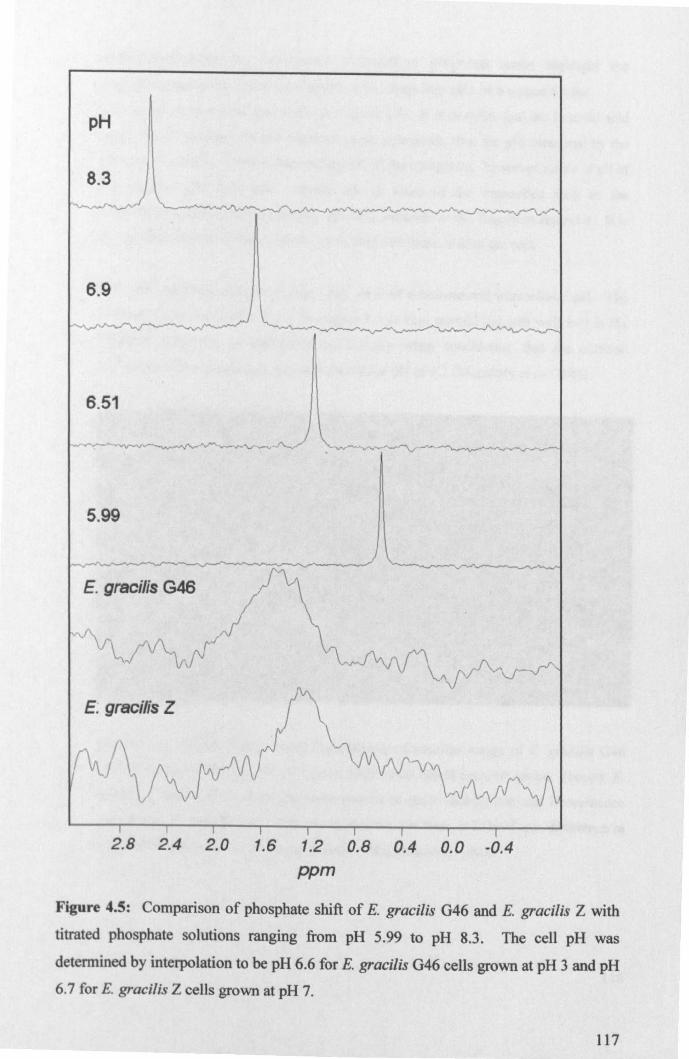
pH
6.9
6.51
5.99
E. gracilis G46
E. gracilis Z
2.8 2.4 2.0 1.6 1.2 0.8 0.4 0.0 -0.4
ppm
Figure 4.5: Comparison of phosphate shift of E. gracilis G46 and E. gracilis Z with
titrated phosphate solutions ranging from pH 5.99 to pH 8.3. The cell pH was
detennined by interpolation to be pH 6.6 for E. gracilis G46 cells grown at pH 3 and pH
6.7 for E. gracilis Z cells grown at pH 7.
117
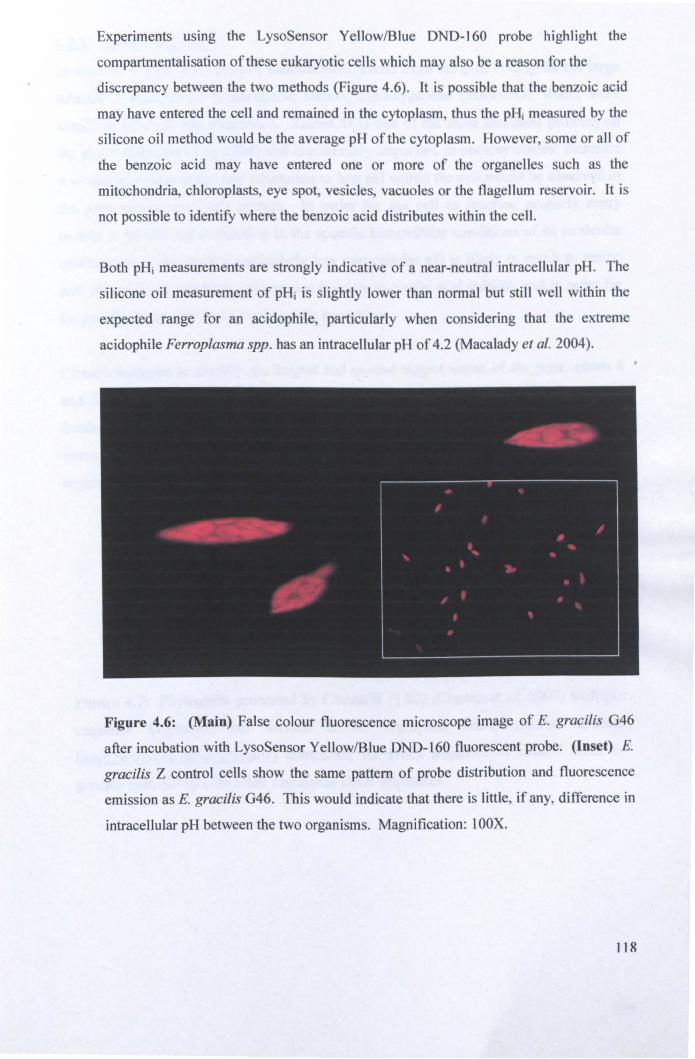
Experiments using the LysoSensor Yellow/Blue DND-160 probe highlight the
compartmentalisation of these eukaryotic cells which may also be a reason for the
discrepancy between the two methods (Figure 4.6). It is possible that the benzoic acid
may have entered the cell and remained in the cytoplasm, thus the pH measured by the
silicone oil method would be the average pH of the cytoplasm. However, some or all of
the benzoic acid may have entered one or more of the organelles such as the
mitochondria, chloroplasts, eye spot, vesicles, vacuoles or the flagellum reservoir. It is
not possible to identify where the benzoic acid distributes within the cell.
Both pH measurements are strongly indicative of a near-neutral intracellular pH. The
silicone oil measurement of pHi is slightly lower than normal but still well within the
expected range for an acidophile, particularly when considering that the extreme
acidophile Ferroplasma spp. has an intracellular pH of 4.2 (Macalady et af. 2004).
Figure 4.6: (Main) False colour fluorescence microscope image of E. gracilis G46
after incubation with LysoSensor Yellow/Blue DND-160 fluorescent probe. (Inset) E.
gracilis Z control cells show the same pattern of probe distribution and fluorescence
emission as E. gracilis G46. This would indicate that there is little, if any, difference in
intracellular pH between the two organisms. Magnification: loOX.
118
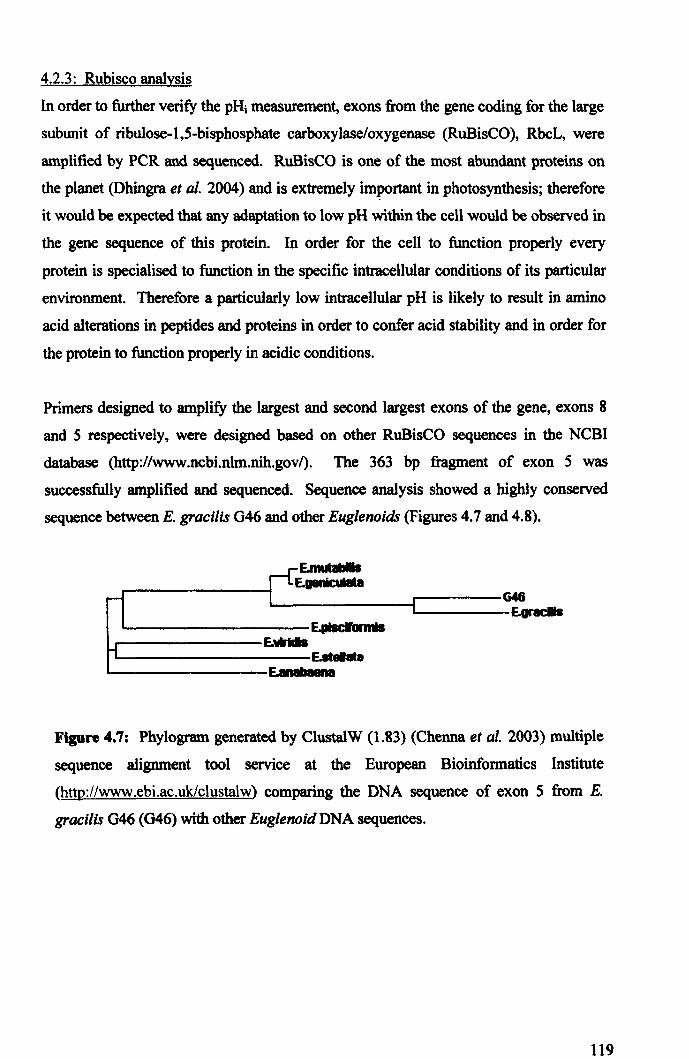
4.2.3: Rubisco analysis
In order to further verify the pHi measurement, exons from the gene coding for the large
subunit of ribulose-l,5-bisphosphate carboxylase/oxygenase (RuBisCO), RbcL, were
amplified by PCR and sequenced. RuBisCO is one of the most abundant proteins on
the planet (Dhingra et al. 2004) and is extremely important in photosynthesis; therefore
it would be expected that any adaptation to low pH within the cell would be observed in
the gene sequence of this protein. In order for the cell to function properly every
protein is specialised to function in the specific intracellular conditions of its particular
environment. Therefore a particularly low intracellular pH is likely to result in amino
acid alterations in peptides and proteins in order to confer acid stability and in order for
the protein to function properly in acidic conditions.
Primers designed to amplify the largest and second largest exons of the gene, exons 8
and 5 respectively, were designed based on other RuBisCO sequences in the NCBI
database (http://www.ncbLnlm.nih.gov/). The 363 bp fragment of exon 5 was
successfully amplified and sequenced. Sequence analysis showed a highly conserved
sequence between E. gracilis 046 and other Euglenoids (Figures 4.7 and 4.8).
L---------c:====~~ ~-------------------------------~mmB ,.--------E. ..... '--------------E ....... ~-------------------E~
Figure 4.7: Phylogram generated by ClustalW (1.83) (Chenna et al. 2003) multiple
sequence alignment tool service at the European Bioinformatics Institute
(http://www.ebi.ac.ukJclustalw) comparing the DNA sequence of exon 5 from E.
gracilis 046 (046) with other Euglenoid DNA sequences.
119
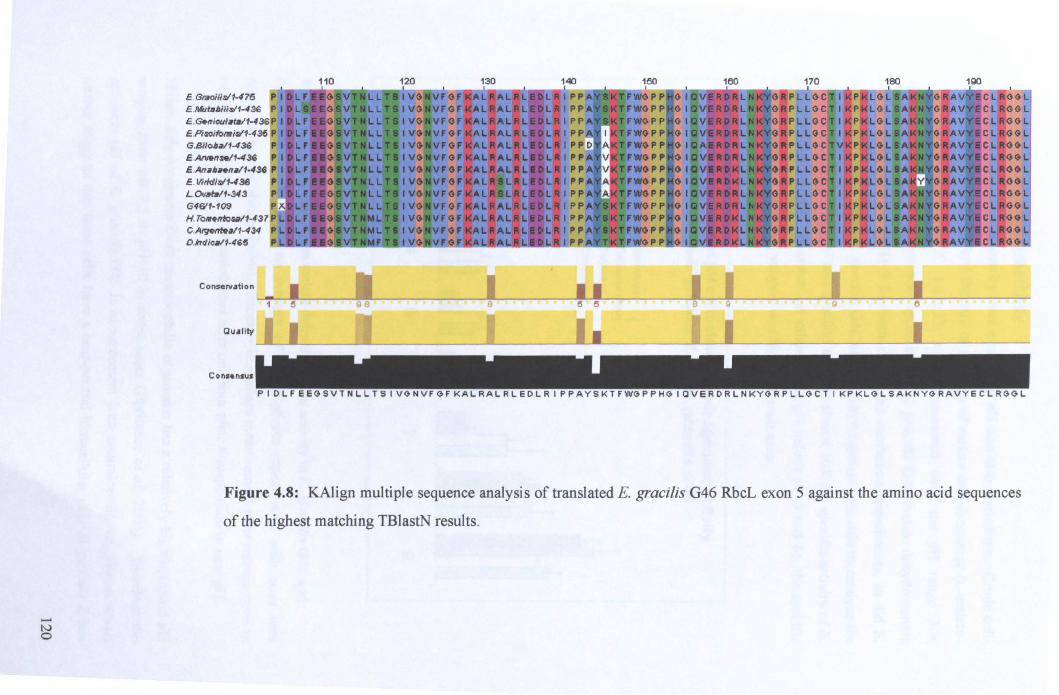
-N o
E .GracJliS>'1-475
E .Arwnftl1-43f. E .An .... nM/1-43. E. . VirldlS>'1-436 L.O".t./1-343 G"6'1-109 H. TOlnntoutf-"37 C.A~nt .. /1-"3" D.krdlul1-4GS
Conserv.tion
Cu.llty
Cons.nsus
SIVGNVFGFKALRALRLEDLRIPPAYSKTFWGPPHGICVERDRLNKYGRPLLGCT I KPKLGLSAKNYGRAVYE
Figure 4.8: KAlign multiple sequence analysis of translated E. gracilis G46 RbcL exon 5 against the amino acid sequences
of the highest matching TBlastN results.
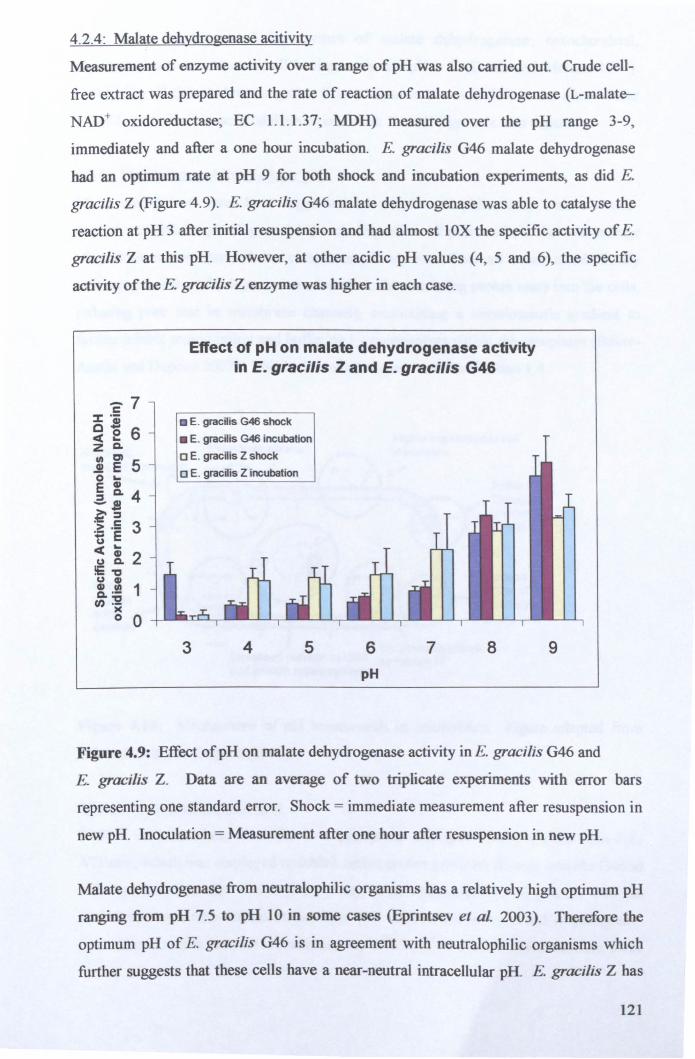
4.2.4: Malate dehydrogenase acitivity
Measurement of enzyme activity over a range of pH was also carried out. Crude celI
free extract was prepared and the rate of reaction of malate dehydrogenase CL-malate
NAD+ oxidoreductase~ EC 1.1.1.37~ MDH) measured over the pH range 3-9,
immediately and after a one hour incubation. E. gracilis G46 malate dehydrogenase
had an optimum rate at pH 9 for both shock and incubation experiments, as did E.
graCilis Z (Figure 4.9). E. gracilis G46 malate dehydrogenase was able to catalyse the
reaction at pH 3 after initial resuspension and had almost laX the specific activity of E.
gracilis Z at this pH. However, at other acidic pH values (4, 5 and 6), the specific
activity of the E. gracilis Z enzyme was higher in each case.
c 7 % .;
Q'" 6 or( e zCo
III Cl 5 J! E o .. E & 4 as f.~ 3 ~ E or( ;U u Co 2 !E"O U CII CII III 1 Co .-cn:'S!
)(
o 0
Effect of pH on malate dehydrogenase activity in E. gracilis Z and E. gracilis G46
• E. gracilis G46 shock
• E. gracilis G46 incubation
o E. gracilis Z shock
DE. gracilis Z incubation
3 4 5 6
pH
7 8 9
Figure 4.9: Effect of pH on malate dehydrogenase activity in E. gracilis G46 and
E. gracilis Z. Data are an average of two triplicate experiments with error bars
representing one standard error. Shock = immediate measurement after resuspension in
new pH. Inoculation = Measurement after one hour after resuspension in new pH.
Malate dehydrogenase from neutralophilic organisms has a relatively high optimum pH
ranging from pH 7.5 to pH 10 in some cases (Eprintsev et al. 2003). Therefore the
optimum pH of E. gracilis G46 is in agreement with neutralophilic organisms which
further suggests that these cells have a near-neutral intracellular pH. E. gracilis Z has
121
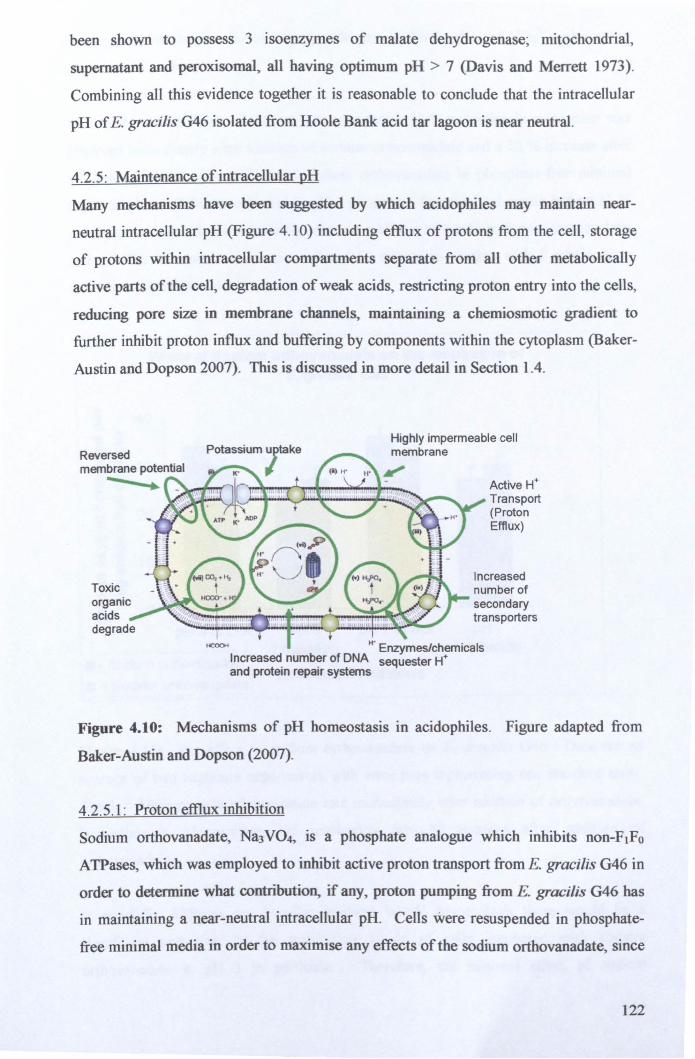
been shown to possess 3 isoenzymes of malate dehydrogenase~ mitochondrial,
supematant and peroxisomal, all having optimum pH > 7 (Davis and Merrett 1973).
Combining all this evidence together it is reasonable to conclude that the intracellular
pH of E. gracilis G46 isolated from Hoole Bank acid tar lagoon is near neutral.
4.2.5: Maintenance of intracellular pH
Many mechanisms have been suggested by which acidophiles may maintain near
neutral intracellular pH (Figure 4.10) including efflux of protons from the cell, storage
of protons within intracellular compartments separate from all other metabolically
active parts of the cell, degradation of weak acids, restricting proton entry into the cells,
reducing pore size in membrane channels, maintaining a chemiosmotic gradient to
further inhibit proton influx and buffering by components within the cytoplasm (Baker
Austin and Dopson 2007). This is discussed in more detail in Section 1.4.
Reversed membrane potential
-.~-....
Toxic organiC acids degrade
Highly impermeable cell membrane
Active H+ Transport (Proton Efflux)
Increased number of secondary transporters
HCOC>< H" Enzymes/chemicals Increased number of DNA sequester H+ and protein repair systems
Figure 4.10: Mechanisms of pH homeostasis in acidophiles. Figure adapted from
Baker-Austin and Dopson (2007).
4.2.5.1: Proton efflux inhibition
Sodium orthovanadate, Na3 V04, is a phosphate analogue which inhibits non-F IFo
ATPases, which was employed to inhibit active proton transport from E. gracilis G46 in
order to determine what contribution, if any, proton pumping from E. gracilis G46 has
in maintaining a near-neutral intracellular pH. Cells were resuspended in phosphate
free minimal media in order to maximise any effects of the sodium orthovanadate, since
122
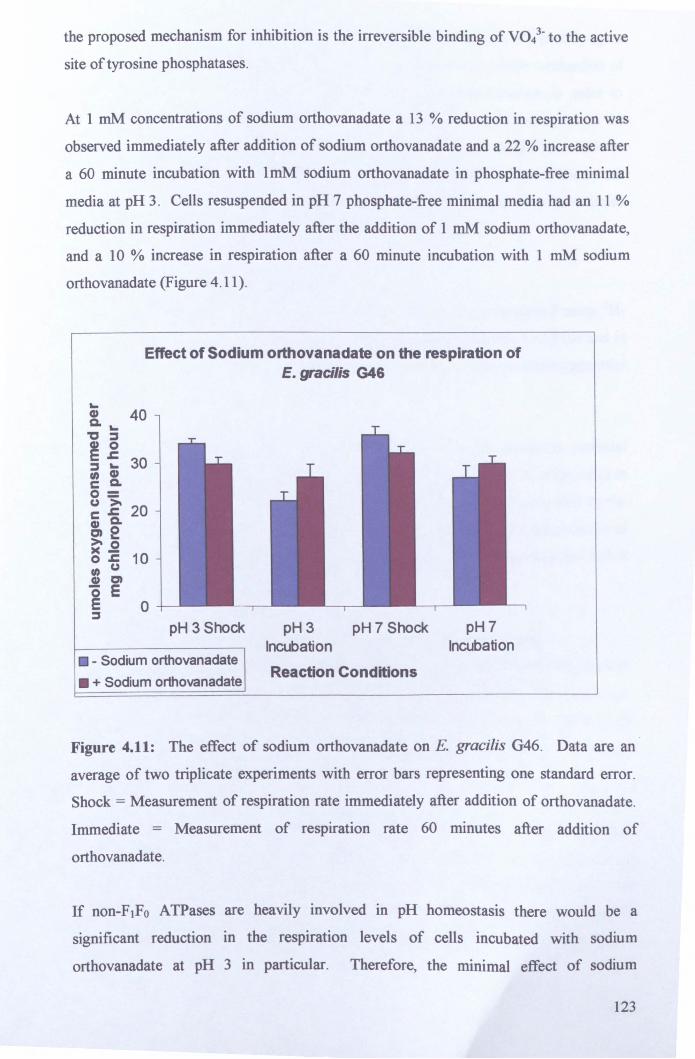
the proposed mechanism for inhibition is the irreversible binding of vol-to the active
site of tyrosine phosphatases.
At 1 mM concentrations of sodium orthovanadate a 13 % reduction in respiration was
observed immediately after addition of sodium orthovanadate and a 22 % increase after
a 60 minute incubation with ImM sodium orthovanadate in phosphate-free minimal
media at pH 3. Cells resuspended in pH 7 phosphate-free minimal media had an 11 %
reduction in respiration immediately after the addition of 1 mM sodium orthovanadate,
and a 10 % increase in respiration after a 60 minute incubation with 1 mM sodium
orthovanadate (Figure 4.11).
.. Cl) Q. .. "C ::::I
~~ ::::I .. fI) Cl) C Q. 0= CJ >-c~ Cl) Q. e»2 >-0 )(-o~ fI) CJ Cl) at '0 E E ::::I
Effect of Sodium orthovanadate on the respiration of E. gracilis G46
40
30
20
10
0 pH 3 Shock pH 3 pH 7 Shock
Incubation pH7
Incubation • - Sodium orthovanadate
Reaction Conditions • + Sodium orthovanadate
Figure 4.11: The effect of sodium orthovanadate on E. gracilis G46. Data are an ·
average of two triplicate experiments with error bars representing one standard error.
Shock = Measurement of respiration rate immediately after addition of orthovanadate.
Immediate = Measurement of respiration rate 60 minutes after addition of
orthovanadate.
If non-F IFo ATPases are heavily involved in pH homeostasis there would be a
significant reduction in the respiration levels of cells incubated with sodium
orthovanadate at pH 3 in particular. Therefore, the minimal effect of sodium
123
orthovanadate at both pH suggests that either E. gracilis G46 does not rely heavily upon
active proton transport to maintain intracellular pH or that an alternative mechanism of
pH homeostasis is induced upon the addition of sodium orthovanadate in order to
compensate for the reduction of proton efflux. If the latter is true this could account for
the initial decrease in respiration since any alternative mechanism would have little or
no time to take effect and the increase in respiration observed after incubation with
sodium orthovanadate may occur as a result of increased cellular activity in order to
compensate for the loss of proton export via non-F 1 F 0 ATPases.
4.2.5.2: Reversed transmembrane potential
The membrane potential of E. gracilis 046 and E. gracilis Z was measured using 3H_
TPP+. Membrane potential is an essential component of the proton motive force and is
usually inside negative in bacteria and algae. Table 4.2 shows the membrane potential
of E. gracilis G46 at pH 3 and E. gracilis Z at pH 7.
The results very clearly indicate that E. gracilis G46 has a reversed membrane potential
at pH 3. A reversed membrane potential (see Figure 4.10) is common in acidophiles in
order to restrict proton entry into the cells. The chemiosmotic barrier generated by the
inside positive A'V inhibits proton influx. The A'V is generated by a Donnan potential of
positively charged molecules and may be produced by a greater potassium ion influx
than proton eftlux (Donnan 1924).
4.2.5.3: Effect of valinomycin and gramicidin on transmembrane potential
After measuring A'II the effects of valinomycin and gramicidin on AV were measured as
described in Section 2.6.6, the results of which are shown in Table 4.2. Valinomycin is
a potassium specific ionophore, whilst gramicidin increases the permeability of the cell
membrane allowing inorganic cations to travel through unrestricted, thereby destroying
the ion gradient between the cytoplasm and the extracellular environment.
The effect of Valinomycin on E. gracilis Z is negligible, with only a slight decrease in
membrane potential after treatment which would suggest that the contribution of
potassium ions to A'II in E. gracilis Z is minimal. The effect of gramicidin is also very
minimal which may be because Eug/ena lack a cell wall and instead have a flexible
pellicle covering their cell membrane thus the usual target of gramicidin is not present.
124
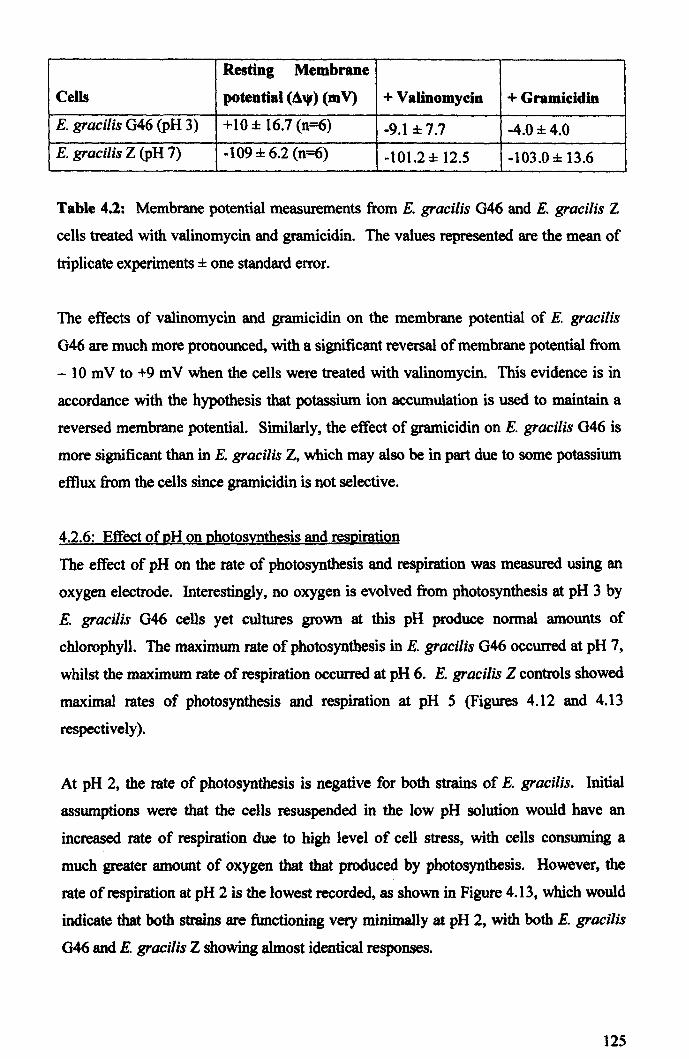
Resting Membrane
Cells potential (A.) (m V) + Valinomycin + Gramicidin
E. gracilis G46 (PH 3) +10± 16.7 (n=6) -9.1 ± 7.7 -4.0±4.0 E. gracilis Z (PH 7) -109 ± 6.2 (n=6) -101.2 ± 12.5 -103.0 ± 13.6
Table 4.2: Membrane potential measurements from E. gracilis 046 and E. gracilis Z
cells treated with valinomycin and gramicidin. The values represented are the mean of
triplicate experiments ± one standard error.
The effects of valinomycin and gramicidin on the membrane potential of E. gracilis
G46 are much more pronounced, with a significant reversal of membrane potential from
- 10 m V to +9 m V when the cells were treated with valinomycin. This evidence is in
accordance with the hypothesis that potassium ion accumulation is used to maintain a
reversed membrane potential. Similarly, the effect of gramicidin on E. gracilis 046 is
more significant than in E. gracilis Z, which may also be in part due to some potassium
efflux from the cells since gramicidin is not selective.
4.2.6: Effect of pH on photosynthesis and remiration
The effect of pH on the rate of photosynthesis and respiration was measured using an
oxygen electrode. Interestingly, no oxygen is evolved from photosynthesis at pH 3 by
E. gracilis 046 cells yet cultures grown at this pH produce nonnal amounts of
chlorophyll. The maximum rate of photosynthesis in E. gracilis 046 occurred at pH 7,
whilst the maximum rate of respiration occurred at pH 6. E. gracilis Z controls showed
maximal rates of photosynthesis and respiration at pH 5 (Figures 4.12 and 4.13
respectively).
At pH 2. the rate of photosynthesis is negative for both strains of E. gracilis. Initial
assumptions were that the cells resuspended in the low pH solution would have an
increased rate of respiration due to high level of cell stress, with cells consuming a
much greater amount of oxygen that that produced by photosynthesis. However, the
rate of respiration at pH 2 is the lowest recorded, as shown in Figure 4.13, which would
indicate that both strains are functioning very minimally at pH 2, with both E. gracilis
046 and E. gracilis Z showing almost identical responses.
125
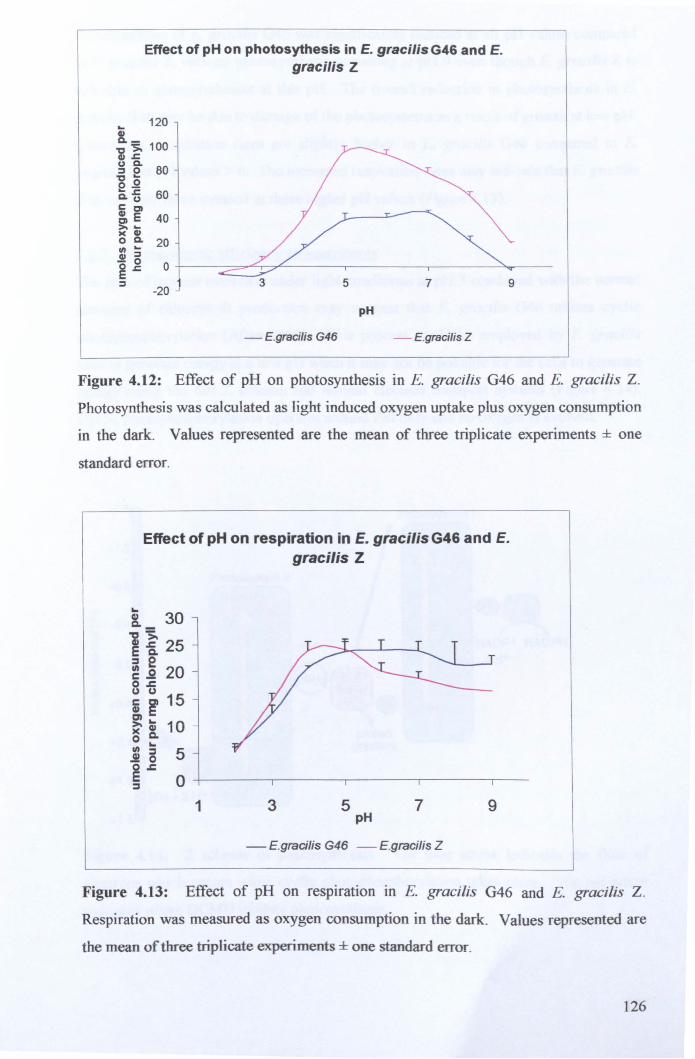
Effect of pH on photosythesis in E. gracilis G46 and E. gracilis Z
.. 120
i~ 100
g g- 80 '8.Q a."5 60 C Cl & E 40 » .. )( GI o Do 20 ell ..
~ ~ 0 +-----~~r7~-----,--------_.------~~----7 9
-20
pH
-- E.gracilis G46 -- E.gracilis Z
Figure 4.12: Effect of pH on photosynthesis in E. gracilis G46 and E. gracilis Z.
Photosynthesis was calculated as light induced oxygen uptake plus oxygen consumption
in the dark. Values represented are the mean of three triplicate experiments ± one
standard error.
Effect of pH on respiration in E. gracilis G46 and E. gracilis Z
1 3 5 7 9 pH
- E.graci/is G46 - E.gracilis Z
Figure 4.13: Effect of pH on respiration in E. gracilis G46 and E. gracilis Z.
Respiration was measured as oxygen consumption in the dark. Values represented are
the mean of three triplicate experiments ± one standard error.
126
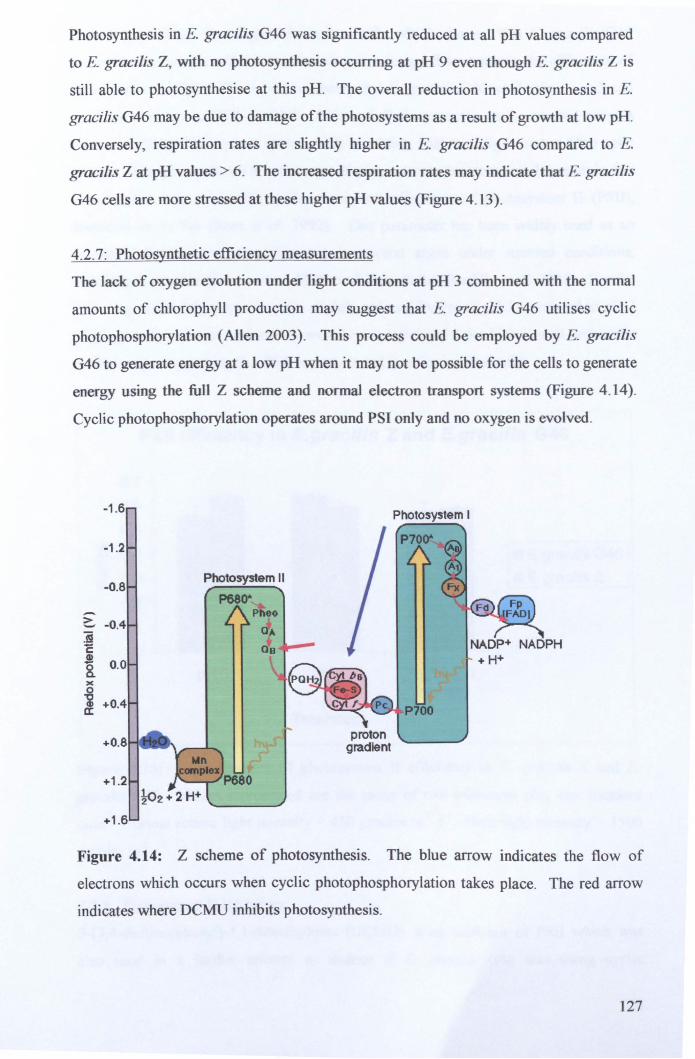
Photosynthesis in E. gracilis G46 was significantly reduced at all pH values compared
to E. gracilis Z, with no photosynthesis occurring at pH 9 even though E. gracilis Z is
still able to photosynthesise at this pH. The overall reduction in photosynthesis in E.
gracilis G46 may be due to damage of the photosystems as a result of growth at low pH.
Conversely, respiration rates are slightly higher in E. gracilis G46 compared to E.
gracilis Z at pH values > 6. The increased respiration rates may indicate that E. gracilis
G46 cells are more stressed at these higher pH values (Figure 4.13).
4.2.7: Photosynthetic efficiency measurements
The lack of oxygen evolution under light conditions at pH 3 combined with the nonnal
amounts of chlorophyll production may suggest that E. gracilis G46 utilises cyclic
photophosphorylation (Alien 2003). This process could be employed by E. gracilis
G46 to generate energy at a low pH when it may not be possible for the cells to generate
energy using the fun Z scheme and normal electron transport systems (Figure 4.14).
Cyclic photophosphorylation operates around PSI only and no oxygen is evolved.
-> -:i c i
+1 .6
Figure 4.14: Z scheme of photosynthesis. The blue arrow indicates the flow of
electrons which occurs when cyclic photophosphorylation takes place. The red arrow
indicates where DCMU inhibits photosynthesis.
127
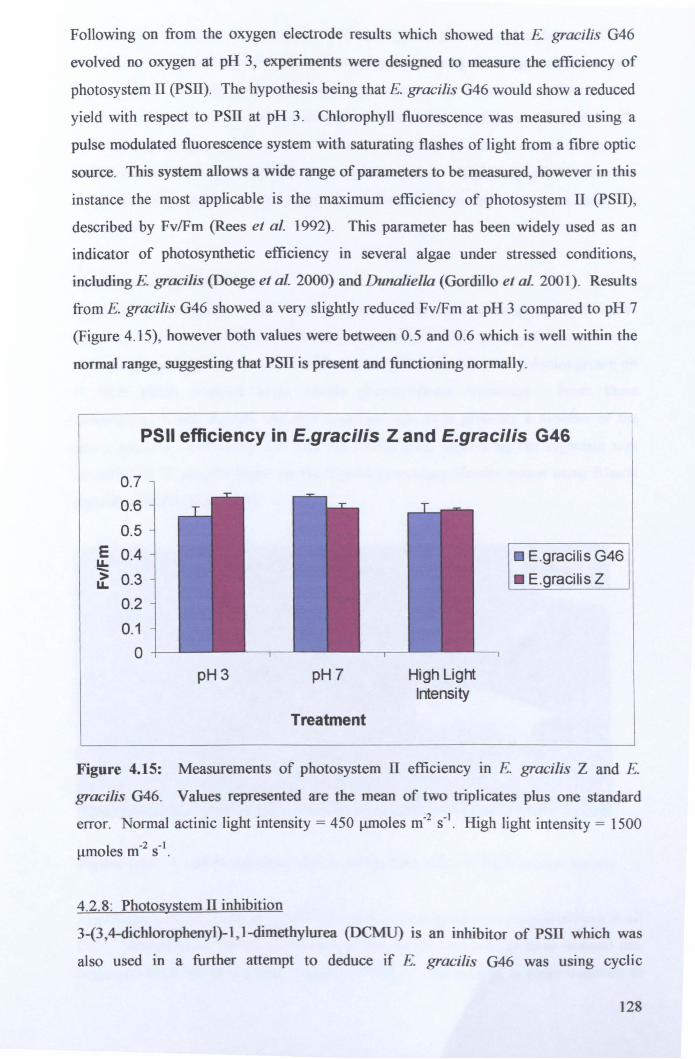
Following on from the oxygen electrode results which showed that E. gracilis G46
evolved no oxygen at pH 3, experiments were designed to measure the efficiency of
photo system IT (pSIT). The hypothesis being that E. gracilis G46 would show a reduced
yield with respect to PSII at pH 3. Chlorophyll fluorescence was measured using a
pulse modulated fluorescence system with saturating flashes of light from a fibre optic
source. This system allows a wide range of parameters to be measured, however in this
instance the most applicable is the maximum efficiency of photosystem IT (pSII),
described by FvIFm (Rees et al. 1992). This parameter has been widely used as an
indicator of photosynthetic efficiency in several algae under stressed conditions,
including E. gracilis (Doege et al. 2000) and Dunaliella (Gordillo et al. 2001). Results
from E. gracilis G46 showed a very slightly reduced FvIFm at pH 3 compared to pH 7
(Figure 4.15), however both values were between 0.5 and 0.6 which is well within the
normal range, suggesting that PSIT is present and functioning normaJly.
PSII efficiency in E.gracilis Z and E.graci/is G46
0.7 0.6
0.5 E 0.4 u. '> 0.3 u.
0.2
0.1
0 pH3 pH7
Treatment
High Light Intensity
• E.gracilis G46
• E.gracilis Z
Figure 4.15: Measurements of photo system II efficiency in E. gracilis Z and E.
gracilis G46. Values represented are the mean of two triplicates plus one standard
error. Normal actinic light intensity = 450 J.lllloles m-2 S-l . High light intensity = 1500
I -2 -1 ~mo es m s .
4.2.8: Photosystem IT inhibition
3-(3,4-dichlorophenyl)-1 ,1-dimethylurea (DCMU) is an inhibitor of PSIT which was
also used in a further attempt to deduce if E. gracilis G46 was using cyclic
128
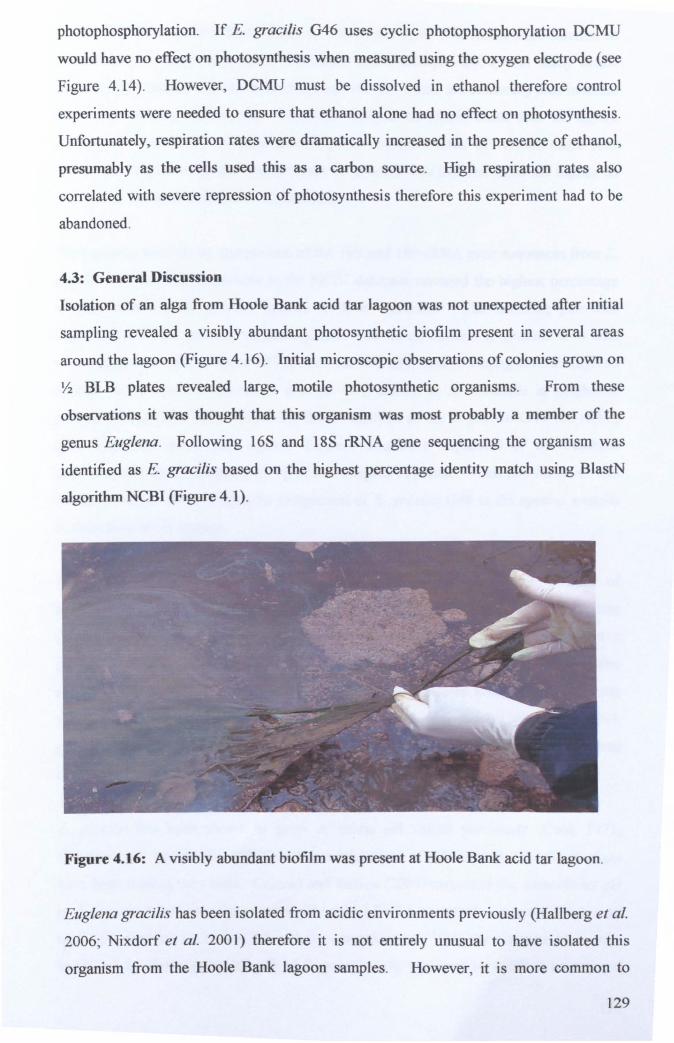
photophosphorylation. If E. gracilis G46 uses cyclic photophosphorylation DCMU
would have no effect on photosynthesis when measured using the oxygen electrode (see
Figure 4.14). However, DCMU must be dissolved in ethanol therefore control
experiments were needed to ensure that ethanol alone had no effect on photosynthesis.
Unfortunately, respiration rates were dramatically increased in the presence of ethanol,
presumably as the ce1ls used this as a carbon source. High respiration rates also
correlated with severe repression of photosynthesis therefore this experiment had to be
abandoned.
4.3: General Discussion
Isolation of an alga from Hoole Bank acid tar lagoon was not unexpected after initial
sampling revealed a visibly abundant photosynthetic biofilm present in several areas
around the lagoon (Figure 4.16). Initial microscopic observations of colonies grown on
'l1 BLB plates revealed large, motile photosynthetic organisms. From these
observations it was thought that this organism was most probably a member of the
genus Euglena. Following 16S and 18S rRNA gene sequencing the organism was
identified as E. gracilis based on the highest percentage identity match using BlastN
algorithm NCBI (Figure 4.1).
Figure 4.16: A visibly abundant biofilm was present at Hoole Bank acid tar lagoon.
Euglena gracilis has been isolated from acidic environments previously (Hallberg et al.
2006; Nixdorf et al. 2001) therefore it is not entirely unusual to have isolated this
organism from the Hoole Bank lagoon samples. However, it is more common to
129
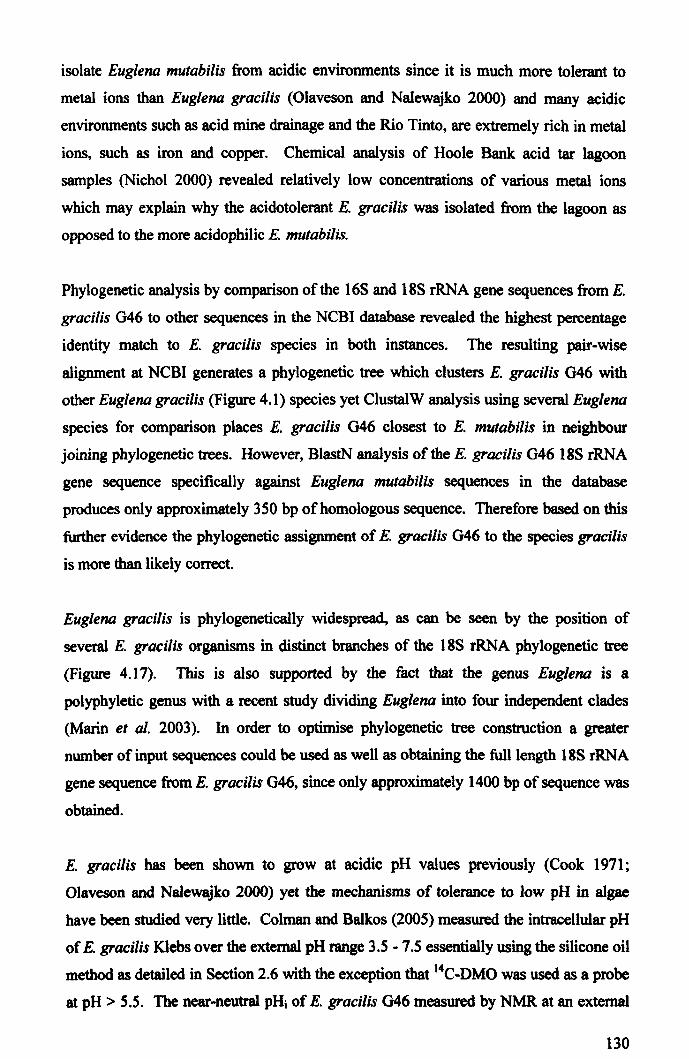
isolate Euglena mutabilis from acidic environments since it is much more tolerant to
metal ions than Euglena gracilis (Olaveson and Nalewajko 2000) and many acidic
environments such as acid mine drainage and the Rio Tinto, are extremely rich in metal
ions, such as iron and copper. Chemical analysis of Hoole Bank acid tar lagoon
samples (Nichol 2000) revealed relatively low concentrations of various metal ions
which may explain why the acidotolerant E. gracilis was isolated from the lagoon as
opposed to the more acidophilic E. mutabilis.
Phylogenetic analysis by comparison of the 16S and 18S rRNA gene sequences from E.
gracilis 046 to other sequences in the NCBI database revealed the highest percentage
identity match to E. gracilis species in both instances. The resulting pair-wise
alignment at NCBI generates a phylogenetic tree which clusters E. gracilis 046 with
other Eug/ena gracilis (Figure 4.1) species yet ClustalW analysis using several Euglena
species for comparison places E. gracilis 046 closest to E. mutabilis in neighbour
joining phylogenetic trees. However, BlastN analysis of the E. gracilis 046 18S rRNA
gene sequence specifically against Euglena mutabilis sequences in the database
produces only approximately 350 bp of homologous sequence. Therefore based on this
further evidence the phylogenetic assignment of E. gracilis 046 to the species gracilis
is more than likely correct.
Eug/ena gracilis is phylogenetically widespread, as can be seen by the position of
several E. gracilis organisms in distinct branches of the 188 rRNA phylogenetic tree
(Figure 4.17). This is also supported by the fact that the genus Euglena is a
polyphyletic genus with a recent study dividing Euglena into four independent clades
(Marin et al. 2003). In order to optimise phylogenetic tree construction a greater
number of input sequences could be used as well as obtaining the full length 188 rRNA
gene sequence from E. gracilis 046, since only approximately 1400 bp of sequence was
obtained.
E. gracilis has been shown to grow at acidic pH values previously (Cook 1971;
Olaveson and Nalewajko 2000) yet the mechanisms of tolerance to low pH in algae
have been studied very little. Colman and Balkos (2005) measured the intracellular pH
of E. gracilis Klebs over the external pH range 3.5 - 7.S essentially using the silicone oil
method as detailed in Section 2.6 with the exception that 14C_DMO was used as a probe
at pH > 5.5. The near-neutral pHi of E. gracilis 046 measured by NMR at an external
130
pH of3 .0 is in agreement with the measurements of pH made by Colman of E. gracilis
Klebs which was also shown to maintain a near-neutral intracellular pH over the
external pH range 3.5-7.5 (Colman and Balkos 2005).
I -0
\1 '---_
I Q
EugltN.sp. l1li32
'Eugltna geniculali. ~~ Euglenaviridis
Ye Euglena mltloqAindrocu .. Euglena genicul~li.
9 Euglenup. hl1858
- 0 ,- --0 Eugltnup. SAC; 122~ 12b ~ L- -4 • Eug!enup. hlI17
-0 EUglenali£iniali. _ ____ ~ ... E'9Itni.poIIo'ftOJ1)hl
_ EugleN. sM9uinu
--- Eaglenaagitis E.glenugi~s
--0 Euglenlpjsci~nnis o Trachelomoni.S ",iiculali.
~L ___________ III Tnchelotftoni.SeHipsoidilis
LI ?
:1 I LI r------~
:9 Euglena gncilis rlI Evglenup. hll ,....-----qt
r-~ L J
-- EugtenlChllm~ophora.
.... 1 ______ _
• E,gleN. in_nnedii. Vii'. i£idophili. r-- -0 Ell9lenalooga
... EugltN.lon9i. Ll. Eugleni.lon91
l\ EU91enalon9l o Euglenllongl
Figure 4.17: Phylogenetic tree based on 18S rRNA with organisms representing E.
gracilis highlighted by red circles. ' 'Unknown" highlighted in yellow represents E.
gracilis G46.
Other algal specIes have been isolated from acidic environments including a new
species of Euglena isolated from an acidic hot mud pool from a volcanic area (Sittenfeld
et al. 2002). The Rio Tinto has abundant photosynthetic biofilms which contain E.
gracilis amongst other algal species including Dunaliella, Cyanidium, Zygnemopsis,
Chlamydomonas, Chlorella and Klebsormidium (Aguilera et al. 2007; Amaral Zettler et
al. 2(02). The presence ofbiofilms is also very common in acid mine drainage systems
where the growth of algae has been shown to support growth of other microorganisms
(Rowe et al. 2007).
13]
The effects of intracellular compartmentalisation on measured pHi of E. gracilis G46
have already been discussed briefly in Section 4.5.2. However, it is of note that
.Euglena gracilis possess a contractile vacuole which is usually used to prevent the cells
from bursting in osmotically stressful conditions (Kivic and Vesk 1974). However it
may be possible that in E. gracilis G46 this vacuole is used to store excess protons
within the cell without causing harmful effects to other cellular compartments or on
their functions, as has been suggested previously as an adaptation of acidophilic algae
(Nixdorf et al. 200 I). Although Eug/ena do not have a cell wall, protection against
proton influx may be provided by the extracellular matrix produced by the cells and also
by the pellicle which surrounds the cell membrane.
There were some difficulties measuring pHi both with radioisotope distribution and
NMR, and there are also disadvantages associated with both of these methods. For
example, the decrease in benzoic acid level in the pellet over time and the inabiJity to
aerate cells whilst they are in NMR tubes. Alternative methods which can be used to
measure intracellular pH include the use of microelectrodes and pH sensitive
fluorescent indicators. The main advantage of microelectrode measurement is that the
intracellular pH can be measured directly, without disturbing or affecting the
intracellular pH in any way, whilst the disadvantages include the high cost of the
electrodes and that penetration of the electrodes into the cell can cause cell death.
Fluorescent indicators such as carboxyfluorescein and its derivatives, including SNARF
and BCECF, can be used to measure pH over the physiological pH range using dual
emission or dual-excitation ratiometric techniques (Bassnett et al. 1990; Rottenberg
1979). The use of fluorescent indicators requires a fluorescence spectrophotometer or
flow cytometer as well as approximate knowledge of the pH being measured in order to
choose the most suitable indicator. Difficulties may also arise as a result of the natural
fluorescence from chloroplasts.
The cell membrane potential of E. gracilis G46 measured at pH 3 and was found to be +
10 mY compared to -109 mY in E. gracilis Z at pH 7. Again, intracellular
compartmentalisation may have some effect on the measurement of ~'I' in E. gracilis as
the 3H_TPP+ may distribute across some cellular compartments including the
mitochondria and chloroplasts. However, any intracellular compartmentalisation is
highly likely to be the same in both strains of Euglena, therefore the contrasting .1'1'
132
measurements is certainly significant. The reversed membrane potential is a common
adaptation in acidophiles in order to reduce proton influx into the cell (Konings et al.
2002). One hypothesis regarding the genesis of the inside positive membrane potential
is the accumulation of potassium ions within the cell (Baker-Austin and Dopson 2007).
The genome sequences of several extreme acidophiles have revealed an increased
number of membrane bound cation transporters which further supports this theory
(Futterer et al. 2004; Tyson et al. 2004).
The reversal of membrane potential in E. gracilis G46 after treatment with valinomycin
also supports this hypothesis. If the accumulation of potassium ions was not involved in
maintenance of the reversed membrane potential (inside positive) in E. gracilis G46 it
would be predicted that valinomycin would have no effect on the membrane potential
yet the membrane potential is flipped from + 10 m V to - 9 m V after treatment with
valinomycin. Gramicidin also has some effect on membrane potential in E. gracilis
G46 which may also be due to potassium efflux from the cells through the channels
created by gramicidin activity.
Exon 5 of RuBisCO from E. gracilis G46 shows a high degree of conservation with
other Euglenoid species, which again concurs with the evidence for a near-neutral
intracellular pH as there are no obvious adaptations to acidic conditions. Malate
dehydrogenase from E. gracilis G46 showed a high optimum pH in agreement with
previous studies from Euglena and with other neutralophilic bacteria further confirming
the measurement of intracellular pH. Also noticeable was a comparatively reduced
activity over the pH range 3 to 7 in E. gracilis G46 compared to E. gracilis Z.
Interestingly, the specific activity of malate dehydrogenase from E. gracilis G46 at pH 3
was 10 times higher than malate dehydrogenase from E. gracilis Z under shock
conditions. This may imply that E. gracilis G46 is able to stabilise intracellular proteins
for a short time at low pH. At slightly less acidic pH values there is an indication that
malate dehydrogenase from E. gracilis Z is more active than malate dehydrogenase
from E. gracilis G46 at the slightly less acidic values.
The overall effect of pH on photosynthesis and respiration is a much reduced rate in E.
gracilis G46 when compared to the wild-type strain E. gracilis Z, with no oxygen
evolution from E. gracilis G46 during light conditions at pH 3. The reduced rates of
photosynthesis and respiration may be due to cell stress, however there is no indication
133

of a reduction in growth at this pH; in fact growth of E. gracilis G46 at pH 3 is
comparable to the growth of E. gracilis Z at pH 7. Therefore, it is possible that the
reduced rates of respiration and photosynthesis may intimate the use of cyclic
photophosphorylation alongside non-cyclic photophosphorylation. This would mean
cells were generating some A TP without producing oxygen through cyclic
photophosphorylation which may also lead to a reduction in normal respiration via the
electron transport chain and thus a low oxygen uptake (Figure 4.14).
Clearly, cyclic photophosphorylation and "classical" respiration are still occurring in E.
gracilis G46 under most conditions since oxygen levels within the oxygen electrode
decrease under dark conditions and at pH > 3 oxygen is evolved under light conditions.
Cyclic photophosphorylation generates ATP without consuming oxygen however non
cyclic photophosphorylation is necessary in order to generate NADPW therefore this is
some explanation for the compromise between the two photosynthetic pathways
occurring at pH > 3. However, there is a clear switch at pH 3 when non-cyclic
photophosphorylation is completely switched off. This observation led to the
measurement of photosystem II (PSII) efficiency using a pulse modulated fluorescence
system since PSII is not required during cyclic photophosphorylation. The hypothesis
being that proteins or other components involved in photosystem n may be damaged by
the low external pH.
The maximum photosynthetic efficiency, Fv/Fm, measured in E. gracilis G46 and E.
gracilis Z were within the normal expected range for healthy cells (Doege et al. 2000),
and only show a slight decrease when exposed to high light intensity conditions. The
normal values for Fv/Fm indicate that E. gracilis G46 do not utilise cyclic
photophosphorylation out of necessity since PSlI is present and functional. However,
the data does not provide sufficient evidence to unequivocally determine if cyclic
photophosphorylation is occurring or not.
The lack of oxygen evolution under light conditions at pH 3 may also be explained by
increased respiration at this pH due to the slight pH shock after resuspension in fresh
media. The pH of cultures was measured regularly and found to be approximately pH
4.0 after 7 days of growth. Although the increase in the pH of the culture medium may
be a deliberate or an accidental effect of metabolism, it does mean that cells
resuspended in fresh culture medium will be exposed to some pH shock which could
134
cause an increase in respiration greater than that caused by resuspension in culture
medium of a higher pH.
Attempts to inhibit PSII in order to ascertain more information on the effect of low pH
on respiration and photosynthesis were unsuccessful due to the lack of suitable solvent
for the inhibitor DCMU. Therefore, the exact mechanisms behind the lack of oxygen
evolution at pH 3 remain unclear.
135
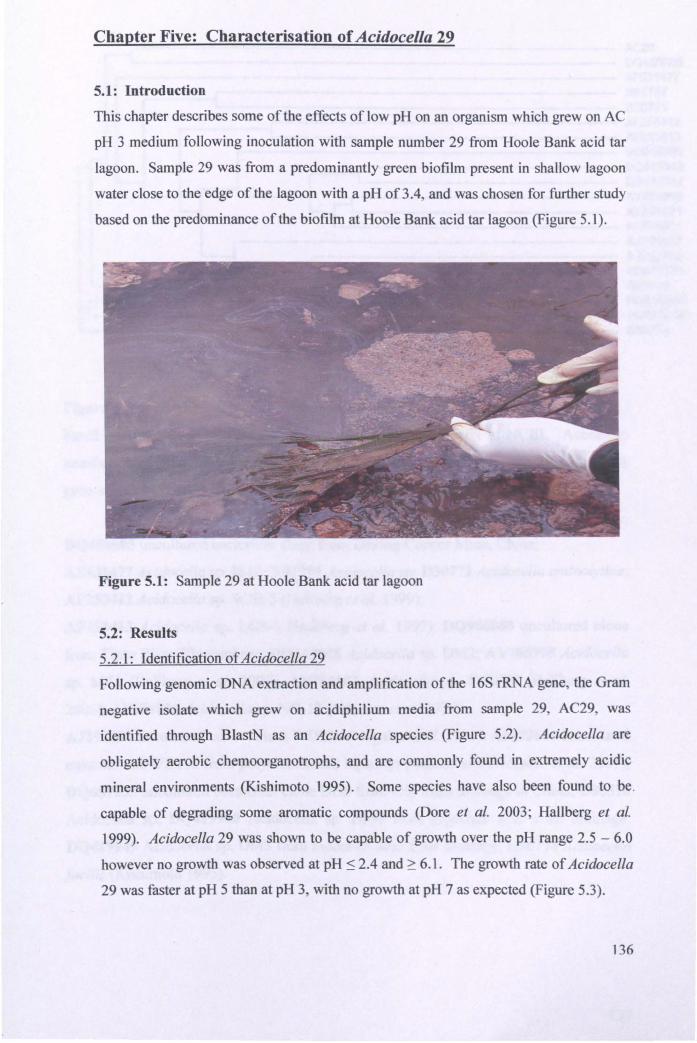
Chapter Five: Characterisation of Acidocella 29
5.1: Introduction
This chapter describes some ofthe effects of low pH on an organism which grew on AC
pH 3 medium following inoculation with sample number 29 from Hoole Bank acid tar
lagoon. Sample 29 was from a predominantly green biofilm present in shallow lagoon
water close to the edge of the lagoon with a pH of3.4, and was chosen for further study
based on the predominance of the biofilm at Hoole Bank acid tar lagoon (Figure 5.1).
Figure 5.1: Sample 29 at Hoole Bank acid tar lagoon
5.2: Results
5.2.1: Identification of Acidocella 29
Following genomic DNA extraction and amplification of the 16S rRNA gene, the Gram
negative isolate which grew on acidiphilium media from sample 29, AC29, was
identified through BlastN as an Acidocella species (Figure 5.2). Acidocella are
obligately aerobic chemoorganotrophs, and are commonly found in extremely acidic
mineml environments (Kishimoto 1995). Some species have also been found to be.
capable of degrading some aromatic compounds (Do re et al. 2003; Hallberg et al.
1999). Acidocella 29 was shown to be capable of growth over the pH range 2.5 - 6.0
however no growth was observed at pH :s 2.4 and ~ 6.1. The growth rate of Acidocella
29 was faster at pH 5 than at pH 3, with no growth at pH 7 as expected (Figure 5.3).
136
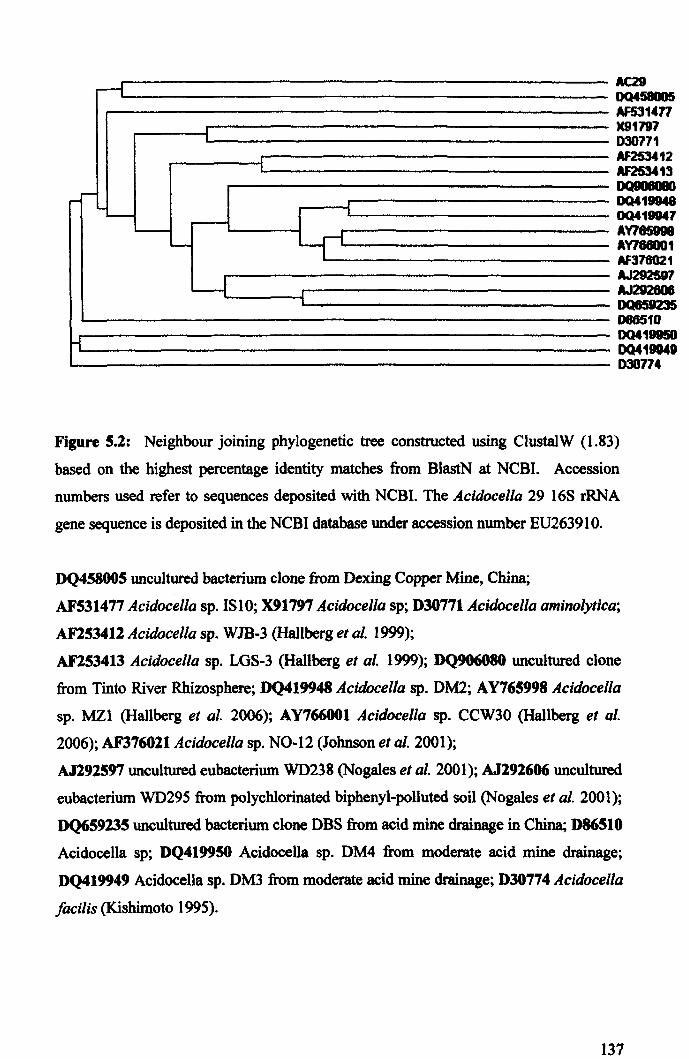
r-i
r-r-L..I.....--
'---
H
r----
~
L--l
Lfi
AC29 00458005 AF531477 )(91791 D30771 AF253412 AF2534t3 DQ9(NMB) DQ419948 DQ419947 AY765998 AY186001 AF378021 AJ292597 AJ292608 DQ659235 086510 DQ419950 DQ419049 030174
Figure S.2: Neighbour joining phylogenetic tree constructed using ClustalW (1.83)
based on the highest percentage identity matches from BlastN at NCBI. Accession
numbers used refer to sequences deposited with NCBI. The Acidocella 29 16S rRNA
gene sequence is deposited in the NCBI database under accession number EU26391 O.
DQ45800S uncultured bacterium clone from Dexing Copper Mine, China;
AF531477 Acidocella sp. ISI0; X91797 Acidocella sp; D30771 Acidocella aminolytica;
AF2S3412 Acidocel/a sp. WJB-3 (Hallberg et al. 1999);
AF253413 Acidocella sp. LOS-3 (Hallberg et al. 1999); DQ906OSO uncultured clone
from Tinto River Rhizosphere; DQ419948 Acidocella sp. OM2; AY765998 Acidocella
Sp. MZ1 (Hallberg et al. 2006); AY766001 Acidocella sp. CCW30 (Hallberg et al.
2006); AF376021 Acidocella sp. NO-12 (Johnson et al. 2001);
AJ292597 uncultured eubacterium WD238 (Nogales et al. 2001); AJ292606 uncultured
eubacterium WD295 from polychlorinated biphenyl-polluted soil (Nogales et al. 2001);
DQ659235 uncultured bacterium clone OBS from acid mine drainage in China; D86S10
Acidocella sp; DQ419958 Acidocella Sp. OM4 from moderate acid mine drainage;
DQ419949 Acidocella sp. OM3 from moderate acid mine drainage; D30774 Acidocella
facilis (Kishimoto 1995).
137

E 0.45 c 0.4 It)
~ 0.35 ftj 0.3 ~ 0.25 ~ 0.2 CD c 0.15
~ 0.1 a 0.05
Effect of pH on growth of Acidocel/a 29
o 0 +---'--'~-'---'---'--'---'---.--.---'---r--~ 13 14 15 16 17 18 19 20 21 22 23 24
Time (Hours)
~~ - pH3 pH7
Figure 5.3: Growth curve of Acidocella 29. Values shown are the mean of three
triplicates plus one standard error of the mean.
5.2.2: Biochemical characterisation
Biochemical characterisation of Acidocella 29 was carried out using an API 20NE
Biochemical Identification Kit. Acidocella 29 was shown to be oxidase negative,
catalase positive and esculin was not hydrolysed (Table 5.1). In order to further
compare Acidocella 29 to other Acidocella species, Acidocella 29 was grown on M9
minimal media supplemented with various carbon sources to determine which carbon
substrates could support growth ofAcidocella 29 (Table 5.1).
The results shown in Table 5.1 indicate that Acidocella 29 is biochemically similar to A.
faciUs and A. aminoiytica in all key traits. There is more diversity in the pattern of
carbon source utilisation in the three species of Acidocella. Since other strains of
Acidocella have been shown to degrade hydrocarbons and use these as carbon sources
(Dore et al. 2003), the ability of Acidocella 29 to utilise several hydrocarbons including
benzene, toluene, xylene, ethylene, decane, and hexadecane was tested (Table 5.2).
Although the results of this experiment showed no growth on these substrates at any of
the three concentrations (1 %,0.1 % and 0.01 %) tested, there is a strong possibility that
the growth environment was anaerobic. Sealing the cultures was necessary to prevent
toxic hydrocarbons escaping, which may have prevented growth of the obligately
aerobic AcidoceIla 29 (Section 2.18).
138
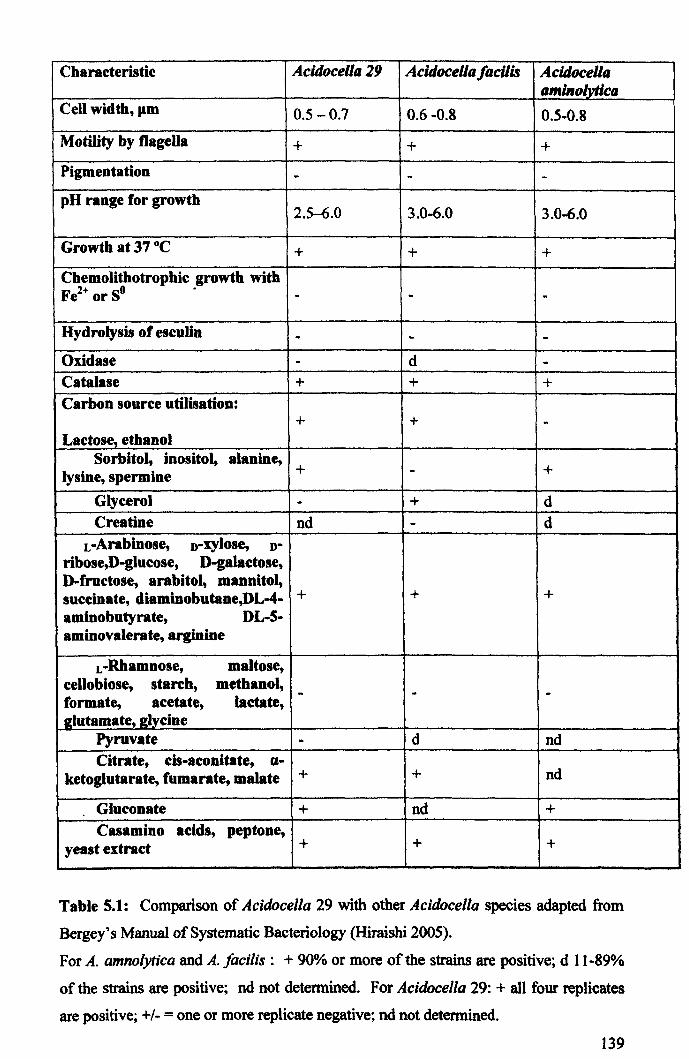
Characteristic Acidocella 29 AcidocellajacUis AcidoceUa aminolytica
Cell width, pm 0.5-0.7 0.6 -0.8 0.5-0.8
Motility by flagella + + + Pigmentation - - -pH range for growth
2.5-6.0 3.0-6.0 3.0-6.0
Growth at 37°C + + + Chemolithotrophic growth with Fe1+ or SO . - - -Hydrolysis of esculin - - -Oxidase - d -Catalase + + + Carbon source utilisation:
+ + -Lactose, ethanol
Sorbitol, inositol, alanine, + + lysine, spermine -
Glycerol - + d Creatine nd - d
L -Arabinose, D-xylose, D-ribose,D-glucose, D-galactose, D-fructose, arabitol, mannitol, succinate, diaminobutane,DL-4- + + + aminobutyrate, DL-S-aminovalerate, arginine
L-Rhamnose, maltose, cellobiose, starch, methanol, - - -formate, acetate, lactate, idutamate, glycine
Pyruvate - d nd Citrate, cis-aconitate, CI-
ketoglutarate, fumarate, malate + + nd
Gluconate + nd + Casamino acids, peptone,
yeast extract + + +
Table 5.1: Comparison of Acidocella 29 with other Acidocella species adapted from
Bergey's Manual of Systematic Bacteriology (Hiraishi 2005).
For A. amnolytica and A. facilis: + 90% or more of the strains are positive; d 11-89%
of the strains are positive; nd not detennined. For Acidocella 29: + all four replicates
are positive; +/- = one or more replicate negative; nd not detennined.
139
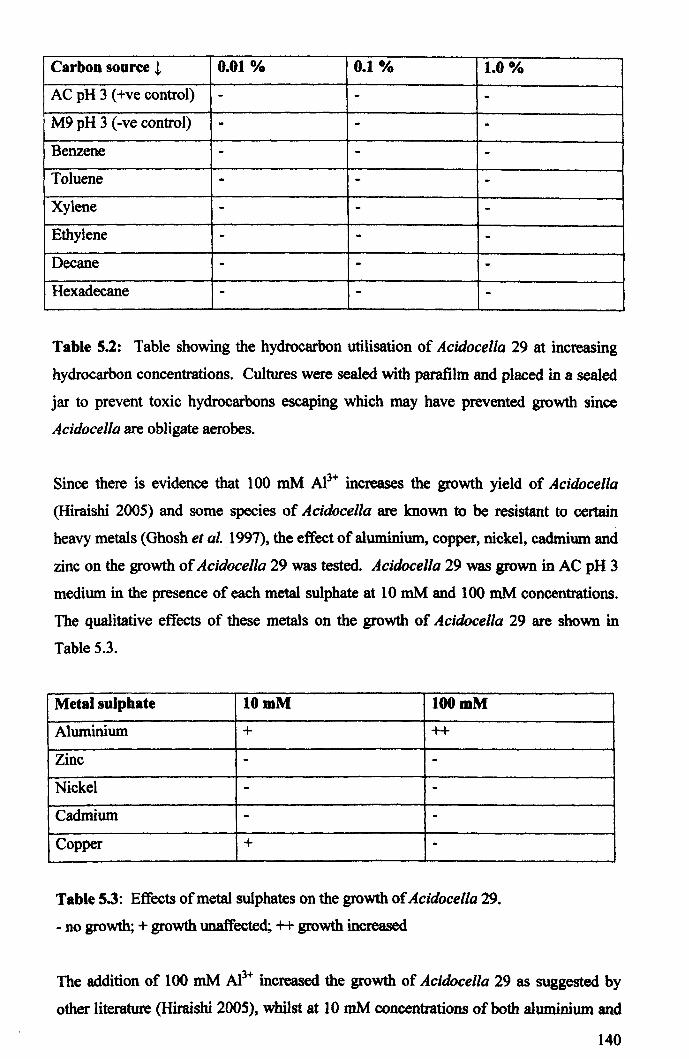
Carbon source ~ 0.01 % 0.1 % 1.0 GA.
AC pH 3 (+ve control) - - -M9 pH 3 (-ve control) - - -Benzene - - -Toluene . - -Xylene - - -Ethylene - - -Decane - - -Hexadecane - - -
Table S.2: Table showing the hydrocarbon utilisation of Acidocella 29 at increasing
hydrocarbon concentrations. Cultures were sealed with parafilm and placed in a sealed
jar to prevent toxic hydrocarbons escaping which may have prevented growth since
Acidocella are obligate aerobes.
Since there is evidence that 100 mM A13+ increases the growth yield of Acidocella
(Hiraishi 2005) and some species of Acidocella are known to be resistant to certain
heavy metals (Ghosh et al. 1997), the effect of aluminium, copper, nickel, cadmium and
zinc on the growth of Acidocella 29 was tested. Acidocella 29 was grown in AC pH 3
medium in the presence of each metal sulphate at 10 mM and 100 mM concentrations.
The qualitative effects of these metals on the growth of Acidocella 29 are shown in
Table 5.3.
Metal sulphate 10 mM 100 mM
Aluminium + ++
Zinc - -Nickel - -Cadmium - -Copper + -
Table 5.3: Effects of metal sulphates on the growth of Acidocella 29.
- no growth; + growth unaffected; ++ growth increased
The addition of 100 mM Al3+ increased the growth of Acidocella 29 as suggested by
other literature (Hiraishi 2005), whilst at 10 mM concentrations of both aluminium and
140
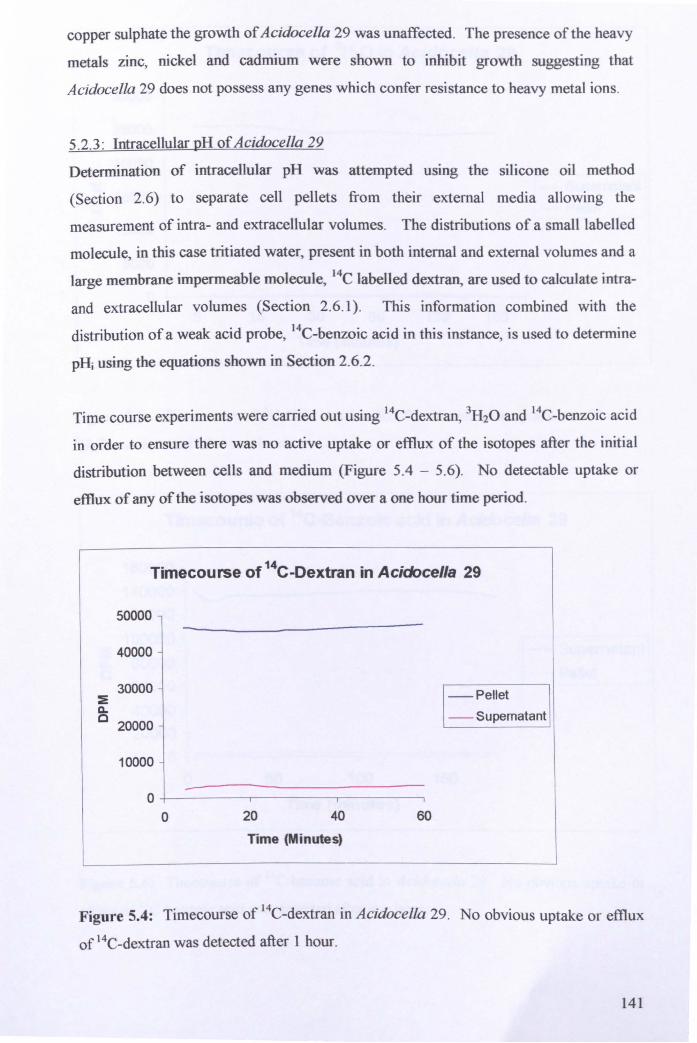
copper sulphate the growth of Acidocella 29 was unaffected. The presence of the heavy
metals zinc, nickel and cadmium were shown to inhibit growth suggesting that
Acidocella 29 does not possess any genes which confer resistance to heavy metal ions.
5.2.3: Intracel1ular pH of Acidocella 29
Determination of intracellular pH was attempted usmg the silicone oil method
(Section 2.6) to separate cell pellets from their external media al10wing the
measurement of intra- and extracellular volumes. The distributions of a small labelled
molecule, in this case tritiated water, present in both internal and external volumes and a
large membrane impermeable molecule, 14C labelled dextran, are used to calculate intra
and extracellular volumes (Section 2.6.1). This information combined with the
distribution of a weak acid probe, l4C-benzoic acid in this instance, is used to determine
pH; using the equations shown in Section 2.6.2.
Time course experiments were carried out using 14C-dextran, 3H20 and 14C-benzoic acid
in order to ensure there was no active uptake or efflux of the isotopes after the initial
distribution between cells and medium (Figure 5.4 - 5.6). No detectable uptake or
efflux of any of the isotopes was observed over a one hour time period.
Timecourse of 14C-Dextran in Acidocel/a 29
50000 -40000
30000 - Pellet :E c.. - Supernatant C 20000
10000
--0 0 20 40 60
Time (Minutes)
Figure 5.4: Timecourse of 14C-dextran in Acidocella 29. No obvious uptake or efflux
of 14C-dextran was detected after 1 hour.
141
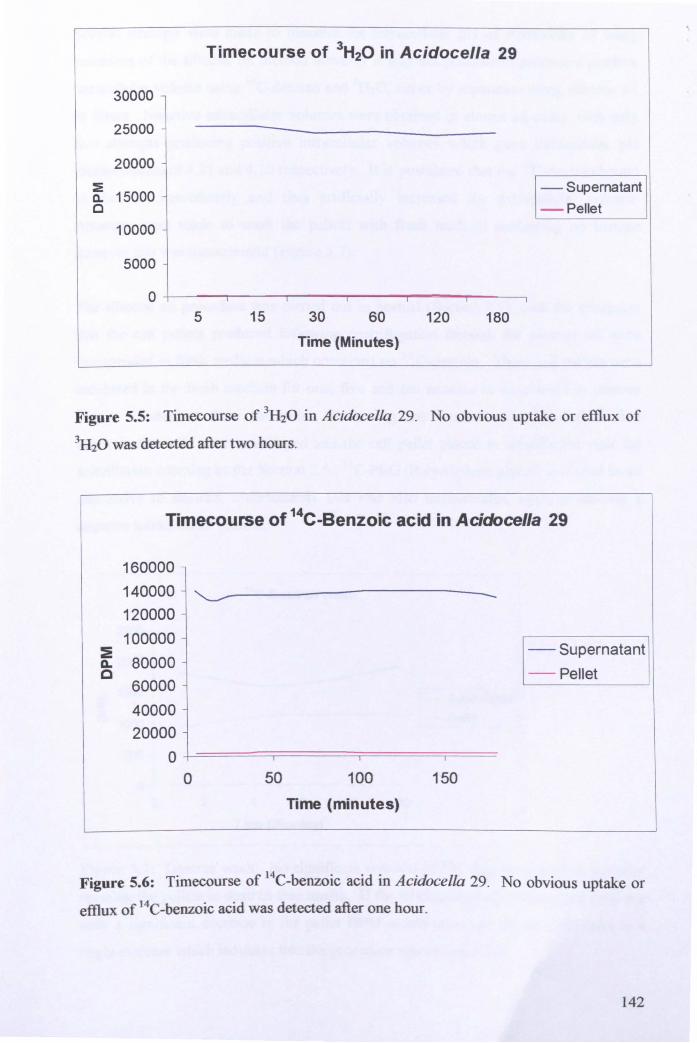
Timecourse of 3H20 in Acidocella 29
30000
25000
20000
~ 15000
- Supernatant a. 0 - Pellet
10000
5000
0 5 15 30 60 120 180
Time (Minutes)
Figure 5.5: Timecourse of 3H20 in Acidocella 29. No obvious uptake or efflux of
3H20 was detected after two hours.
Timecourse of 14C-Benzoic acid in Acidoce//a 29
160000 140000 "--" --120000 100000
- Supernatant :E 80000 Q.
- Pellet c 60000
40000 20000
0 0 50 100 150
Time (minutes)
Figure 5.6: Timecourse of 14C-benzoic acid in Acidocella 29. No obvious uptake or
efflux of 14C-benzoic acid was detected after one hour.
142
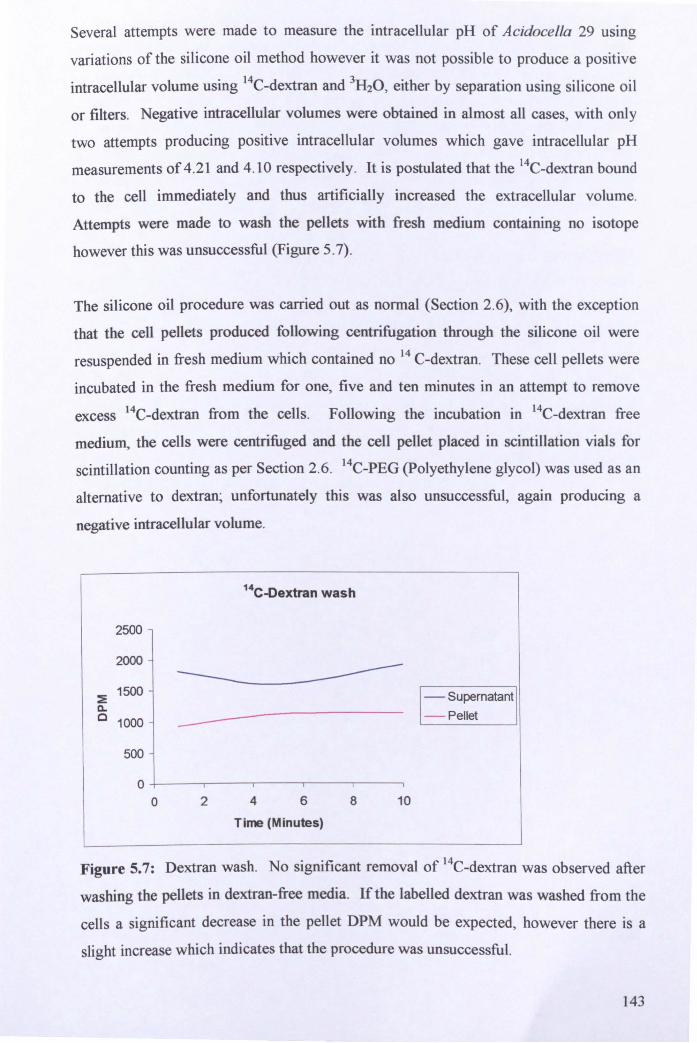
Several attempts were made to measure the intracellular pH of Acidocella 29 using
variations of the silicone oil method however it was not possible to produce a positive
intracellular volume using 14C-dextran and 3H20, either by separation using silicone oil
or filters. Negative intracellular volumes were obtained in almost all cases, with only
two attempts producing positive intracellular volumes which gave intracellular pH
measurements of 4.21 and 4.10 respectively. It is postulated that the 14C-dextran bound
to the cell immediately and thus artificially increased the extracellular volume.
Attempts were made to wash the pellets with fresh medium containing no isotope
however this was unsuccessful (Figure 5.7).
The silicone oil procedure was carried out as normal (Section 2.6), with the exception
that the cell pellets produced following centrifugation through the silicone oil were
resuspended in fresh medium which contained no 14 C-dextran. These cell pellets were
incubated in the fresh medium for one, five and ten minutes in an attempt to remove
excess 14C-dextran from the cells. Following the incubation in 14C-dextran free
mediu~ the cells were centrifuged and the cell pellet placed in scintillation vials for
scintillation counting as per Section 2.6. 14C_PEG (polyethylene glycol) was used as an
alternative to dextran; unfortunately this was also unsuccessful, again producing a
negative intracellular volume.
14C-Dextran wash
2500
2000
~ 1500 - Supernatant
- Pellet ~ c 1000
500
0 0 2 4 6 8 10
Time (Minutes)
Figure 5.7: Dextran wash. No significant removal of 14C-dextran was observed after
washing the pellets in dextran-free media. If the labelled dextran was washed from the
cells a significant decrease in the pellet DPM would be expected, however there is a
slight increase which indicates that the procedure was unsuccessful.
143

Therefore, the intracellular pH of Acidocella 29 was measured using both 31 p and IH
NMR (Section 2.8) and determined to be approximately 4.0 (Figures 5.8 and 5.9). The
intracellular pH was also measured in cells resuspended in pH 7 buffer in order to
eliminate the possibility that the signal observed was not due to cells which have lysed
or become leaky. Figure 5.8 clearly shows the phosphate peak at the same shift in both
instances, which also infers that intracellular pH is maintained at approximately pH 4.0
during higher external pH. Following NMR experiments the respiration of cells was
measured in an oxygen electrode to ensure their viability and was shown to be normal.
In order to validate or contradict this evidence a further measurement of intracellular pH
was attempted using a fluorescent probe in combination with flow cytometry (discussed
in more detail in Section 2.7). Although not specificaJly designed to measure
intracellular pH the probe chosen was the LysoSensor Green DND-189 since this was
suitable for use with a F ACSort machine as it is excited at 490 nm and because it had a
relatively low pKa at 5.2. Since this stain is almost non-fluorescent except when inside
acidic compartments and should not fluoresce at pH ~ 5, E. coli were used as a negative
control. However, negative control samples had a greater median fluorescence than the
stained AcidocelJa 29 samples at pH 3, 5 and 7, therefore it was not possible to
determine a pH; for Acidocella 29 using this method (Figure 5.10).
144
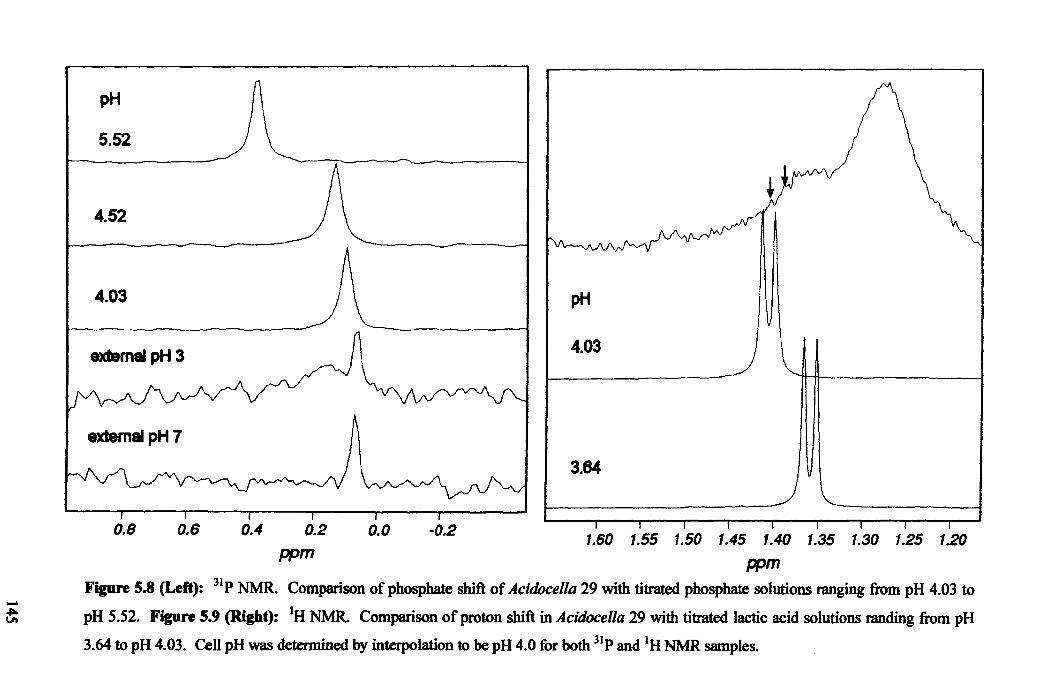
-~ lA
pH
5.52
4.52
4.03 pH
external pH 3 4.03
3.64
O.B 0.6 0.4 0.2 0.0 -0.2 1.60 1.55 1.50 1.45 1.40 1.35 1.30 1.25 120
ppm ppm
Figure 5.8 (Left): IIp NMR. Comparison ofpbosphate shift of Acidocella 29 with titrated phosphate solutions ranging from pH 4.03 to
pH 5.52. Figure 5.9 (Right): IH NMR. Comparison of proton shift in Acidocella 29 with titrated lactic acid solutions randing from pH
3.64 to pH 4.03. Cell pH was detennined by interpolation to be pH 4.0 for both lip and IH NMR samples.

g __ ----~00~~~07~.0~1~0------~ N
C> oD File: 060907.010
Sample ID: E.coIi 1
Acquisition Date: 06-Se1Hl7 Gate: G1
Total Events: 24990
Marker Left, Right % Gated % Total Gee Mean Median
All 1, 991C 100.00 80.96 5.52 8.44 M1 3, 991C n.62 62.84 8.14 8.00
Figure 5.10: Screenshots from Cell Quest Pro acquisition software used with F ACSort
showing fluorescence with the negative E. coli control stained with LysoSensor Green
DND-189
5.2.4: Measurement of membrane potential of Acidocella 29
It was not possible to determine a value for 6'1' in Acidocella 29 using the silicone oil
method since a positive intracellular volume could not be determined, as discussed
earlier in Section 5.2.3. Therefore fluorescence activated cell sorting (FACS) was used
in combination with the BacLight membrane potential kit in order to provide an
indication of the membrane potential.
Although the BacLight kit (DiOC2 stain) is designed to determine membrane potential,
the fluorescence intensity response does not appear to be proportional to proton gradient
density in Gram-negative organisms ("Molecular Probes Product Information Sheet
MP34950"), E. coli were used as a control organism in order to compare the responses
of Acidocella 29 to another Gram negative organism. Stained cells were compared to
stained cells treated with CCCP, which abolishes the membrane potential by eliminating
any proton gradient (Figure 5.11).
146

o ., 2
l'! C 1.5 8 I c ... Q) C) 1 ~i:i Q) Q) g ~ 0.5 u::
o
Measurement of membrane potential in Acidocella 29 and E. coli
Treatment
o Acidocella 29 • E.coli
Figure 5.11: Membrane potential of Acidocella 29 and E. coli when subjected to
various conditions. Values shown are the mean of three triplicate experiments plus one
standard error.
The addition of DiOC2 stain results in a significant shift and a decrease in the
fluorescence ratio compared to unstained cells (Figures 5.11 and 5.12). This effect may
be due to the solvent, DMSO, used with the stain as the DMSO may have an
independent effect on Acidocella 29. Alternatively, it may be possible that the DiOC2 is
exerting an effect on the membrane potential of the cells in some way.
CCCP is a lipid soluble weak acid which is able to diffuse freely into the cell. Once in
the cell CCCP enters the mitochondria in its protonated form and leaves in its anionic
form thus destroying any 8",. Acidocella 29 exhibit a much smaller decrease in
fluorescence ratio upon addition of CCCP compared to E. coli. This may suggest that
the membrane potential in Acidocella 29 is close to zero or reversed. The contrasting
effect seen upon addition of the stain between Acidocella 29 and E. coli may also
indicate a reversed membrane potential in Acidocella 29, since the fluorescence ratio
decreases considerably in Acidocella 29 compared to the considerable increase in E. coli
after stain is added to the cells (Figure 5.12).
Valinomycin functions as a potassium-specific transporter and facilitates the movement
of potassium ions through lipid membranes across an electrochemical potential gradient,
suggesting that a potassium gradient may also be involved in the composition of 8", in
Acidocella 29. Attempts were made to calibrate the membrane potential of Acidocella .
147
29 and E. coli to the potassium concentration in order to quantify the membrane
potential measurements further.
The fluorescence ratio of stained cells resuspended in pH 3.0 PBS was compared to the
fluorescence ratio of stained cells treated with valinomycin and resuspended in pH 3.0
Tris with potassium concentrations over the range 0 - 60 mM. In theory, the addition of
valinomycin should abolish ~'" therefore the potassium concentration which has the
same fluorescence ratio as unstained cells can be used to correlate the membrane
potential. However, no significant change in fluorescence ratio was detected over the
range of potassium concentrations tested for Acidocella 29 or E. coli therefore it was not
possible to quantify the membrane potential of Acidocella 29 (Figure 5.13).
Gramicidin increases the permeability of the bacterial cell wall in some
microorganisms, allowing inorganic cations to travel through unrestricted, thereby
destroying the ion gradient between the cytoplasm and the extracellular environment.
The effects of valinomycin and gramicidin on Acidocella 29 are similar, with a 10 %
decrease in fluorescence ratio in cells treated with valinomycin and an 8 % decrease in
the fluorescence ratio in cells treated with gramicidin (Figure 5.11). More significantly,
valinomycin caused a greater decrease in the fluorescence ratio than CCCP, which may
suggest that a proton gradient is not the only component of the membrane potential in
Acidocella 29. The reduction in the fluorescence ratio in cells treated with gramicidin is
approximately equal to cells treated'with CCCP.
5.2.5: Effect of pH on respiration in Acidocella 29
The effect of pH on respiration in Acidocella 29 was tested using a Clark type oxygen
electrode. Respiration rate was highest at pH 4, close to the optimum pH for growth
(PH 5) of Acidocella 29 (See Figure 5.3). Respiration rates at pH 2 and 3 were also
relatively high, which is in agreement with the growth data at these pH values whilst
there was a significant decrease in respiration rate at pH > 5 which is in agreement with
the lack of growth which occurs at pH > 6 (Figure 5.14). In some samples, no
respiration occurred after resuspension in pH 7 AC media, further evidence for the lack
of viability of Acidocella 29 at pH > 6.0. The reduced rates of respiration above pH 5
may suggest that cells quickly become inviable and die, therefore the decrease in
respiration may be due to cell death at higher pH.
148
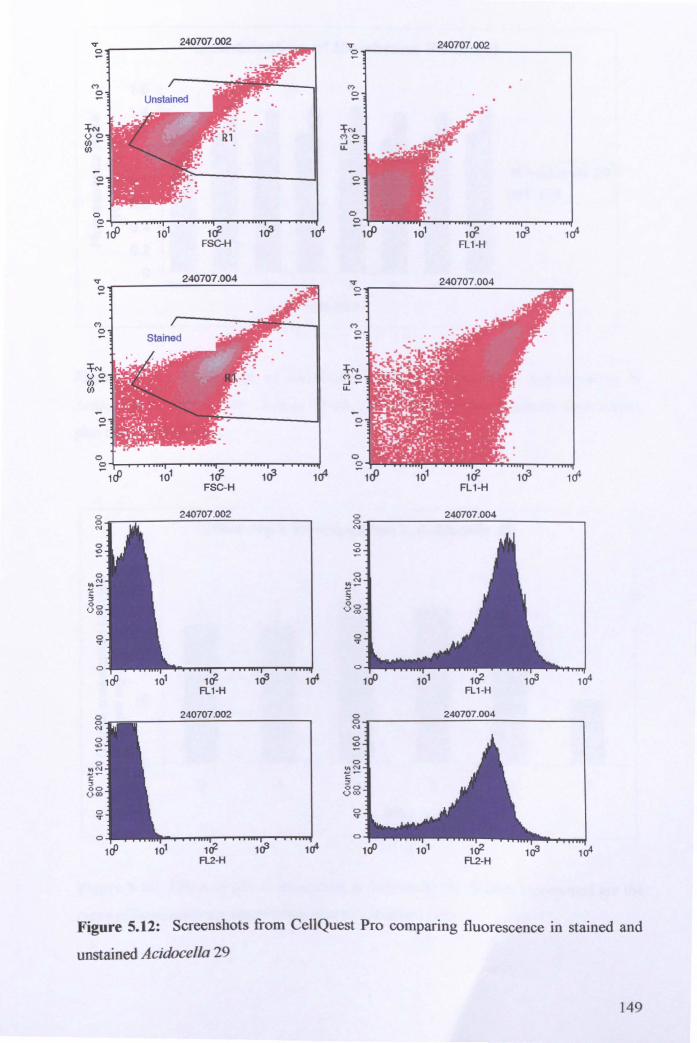
~ 240707.002 ~ 240707.002 e e
M M
e 0 -0 .
f", f N 0 0 M O 00- ...J-(J) U.
e e
0
~ 101 1ft 10'3 104 10'3 104
FSC-H FL1 -H
~ 240707.004 v 240707.004 e C·
M 0
f'" 00 (J)-(J)
- -e e
0 0 0 0
-HP 101 1cf 10'3 104 - 1<fl 101 1cf 10'3 104 FSC-H FL1-H
0 240707.002 <:> 240707.004 0 0
'" N
0 0
~ ~
0 0
~~ N
OIl-
s: § :> 0 0
0 0 0'J) v",
0 0 v v
0 0
1cP 1cf 10'3 1(1l 1cP 101 1r? 103 104 FL1-H FL1-H
0 240707.002 0 240707.004 0 0
'" N
0 0
~ ~
0 0 .. ", ~~ c- § :3 00 00
0 0> vro
0 0 v ~
0 0
10'3 1(1l 1cP 101 FL2-H
1r? FL2-H
103 104
Figure 5.12: Screenshots from Cell Quest Pro comparing fluorescence in stained and
unstained Acidocella 29
149
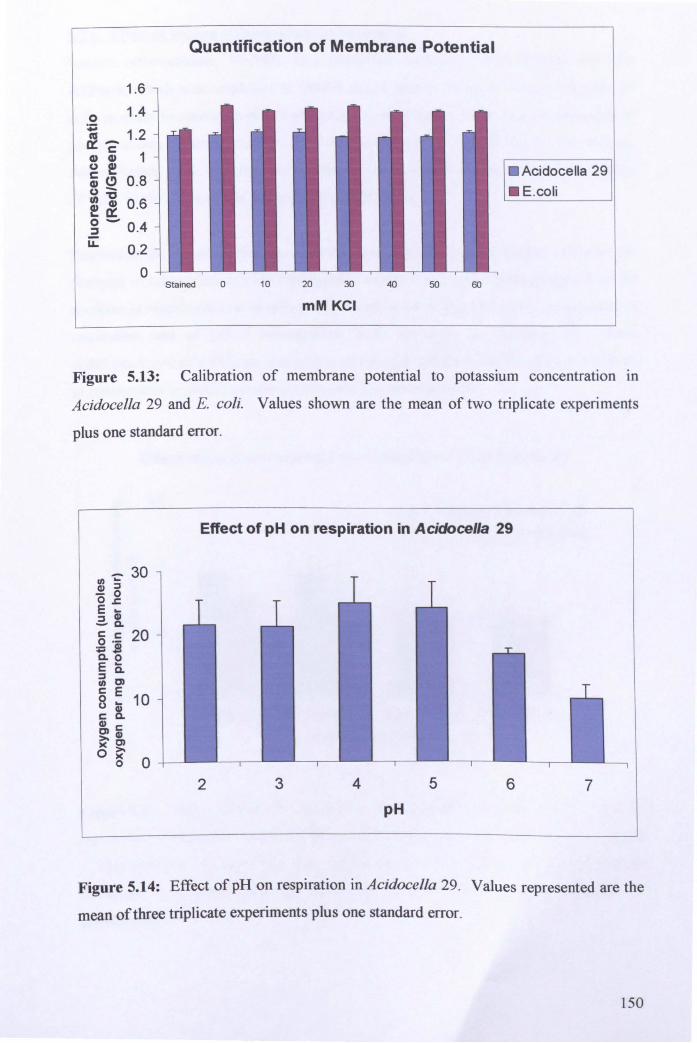
1.6
o 1.4
~ _ 1.2 c
Cl) Cl) 1 (,) e c Cl) Cl 0.8 (,)-11)'0 ! &. 0.6 g - 0.4
u.. 0 .2
o
Quantification of Membrane Potential
Stained 0 10 20 30 40 50 60
mMKCI
• Acidocella 29
. E.coli
Figure 5.13: Calibration of membrane potential to potassium concentration In
Acidocella 29 and E. coli. Values shown are the mean of two triplicate experiments
plus one standard error.
.- 30 III ...
~ ~ O.c E ... .:..~ E.: 20 +IS c.o E Q. ; t»
8 : 10 c: 8-Cl) c: t»CI) ~t» o~
o 0
Effect of pH on respiration in Acidoce//a 29
2 3 4 5 6 7
pH
Figure 5.14: Effect of pH on respiration in Acidocella 29. Values represented are the
mean of three triplicate experiments plus one standard error.
150

5.2.6: Effect of sodium orthovanadate on respiration
Sodium orthovanadate, Na3 V04 , is a phosphate analogue which inhibits non-F I Fo
ATPases, which was employed to inhibit active proton transport from Acidocella 29
cells in order to determine if any proton pumping occurs. Cells were resuspended in
phosphate-free minimal medium in order to maximise any effects of the sodium
orthovanadate, since the proposed mechanism for inhibition is the irreversible binding
ofvOl- tothe active site of the tyrosine phosphatases.
Respiration decreased in all cases upon addition of sodium orthovanadate, however the
decrease in respiration of cells resuspended at pH 7 was very slight compared to the
decrease in respiration rate of cells resuspended in pH 3 (Figure 5.15). The decrease in
respiration rate of pH 3 resuspended cells following the addition of sodium
orthovanadate would indicate that proton pumping is inhibited and therefore is involved
to some extent in proton pumping and possibly pH homeostasis.
Effect of sodium vanadate on respiration in Acidocella 29
E 30 ... Cl) Q.
"C
~ :; = 0 20 1/1': C ... o Cl) U Q.
C .S Cl) S ~ e 10 ~ Q.
1/1 J!
~ 0
• - Sodium orthovanadate
• + Sodium orthovanadate
pH 3 Shock pH 3 ncubation pH 7 Shock pH 7 Incubation
Reaction Conditions
Figure 5.15: Effect of sodium vanadate on the respiration of Acidocella 29. Values
represented are the mean of three triplicate experiments plus one standard error. Shock
= Measurement of respiration rate immediately after addition of orthovanadate.
Immediate = Measurement of respiration rate 60 minutes after addition of
orthovanadate.
151
5.3: General Discussion
The isolation of a species of AcidocelJa from Hoole Bank acid tar lagoon is not
surprising given that Acidocella have been found in several moderately acidic
environments previously including acidic drainage waters from copper mines (Johnson
et al. 2001), coal storage piles (DoTe et al. 2003), natural petroleum seeps (Roling et al.
2006) and acidic sediment (Kimura et al. 2006). In this instance Acidocella 29 was
isolated from an abundant green biofilm present in several shallow areas around the
edge of the acid tar lagoon.
Acidocella 29 isolated from Hoole Bank acid tar lagoon appears to be characteristic of
the genus, showing very similar morphological and biochemical characteristics and
growth requirements to other characterised species (Table 5.1). Acidocella 29 can
tolerate a lower pH than A. aminolytica and A. facilis but does not appear to show any
further unique characteristics.
Unlike some other species of Acidocella isolated from hydrocarbon containing.
environments such as Acidocella PFBC and "Acidocella aromaticd' (Hallberg et al.
1999), Acidocella 29 did not use any of the hydrocarbons tested as a carbon source. It
is not surprising that Acidocella 29 did not utilise any of the hydrocarbons tested since
the concentration of the compounds used was most probably significantly lower within
the lagoon than the concentrations tested. Therefore, the possibility remains that
Acidocella 29 may utilise certain hydrocarbons, which is further emphasises by the
nutritional versatility of the Acidocella genus and evidence that other Acidocella isolates
have been shown to degrade some of these hydrocarbons (Hallberg et al. 1999)
The most likely initial explanation for this is that the experimental method used was not
suitable. The need to prevent other cultures from exposure to volatile hydrocarbons
meant that cultures of Acidocella 29 were incubated with the hydrocarbons in sealed
microcentrifuge tubes in an anaerobic jar. Although the jar was flooded with oxygen, it
is highly likely that the cultures were anaerobic since the microcentrifuge tubes were
sealed with parafilm. It is also possible that the abundance of such hydrocarbons is
limited in the biofilm from which this species of Acidocella was isolated. Alternatively,
these hydrocarbon compounds may undergo chemical transformation within the lagoon
or the biofilm specifically and Acidocella 29 may be adapted to utilise these
transformed hydrocarbons.
152
The growth yield of Acidocella 29 was higher in the presence of 100 mM Ae+ in
agreement with studies on other Acidocella species (Hiraishi 2005); however Acidocella
29 appears to have little or no resistance to heavy metal ions. Heavy metal resistance is
thought to be mediated through one or more plasmids (Ghosh et al. 1997; Ghosh et al.
2005), therefore the evidence presented would suggest that Acidocella 29 does not
possess any of these plasmids. Measurements of the levels of various metal species
from Hoole Bank acid tar lagoon are within normal limits therefore the absence of metal
ion resistance is not unexpected. Maintenance of plasmids is energetically costly
therefore it is highly unlikely that Acidocella 29 would maintain a plasmid which did
not confer any benefits. Despite the fact that Acidocella 29 does not appear to require
heavy metal resistance, it is obvious that the cell needs to survive in a low pH
environment.
Survival in a low pH environment most commonly requires maintenance of a neutral
intracellular pH in order for cell machinery to function properly. Maintenance of pHi is
thought to occur through several mechanisms which have been discussed previously
(Section 1.4). Although maintenance of a near neutral pHi is the most common way to
survive in acidic conditions, it is not the only way, with some acidophiles adapting their
intracellular components in order to function at a low pH (Dopson et al. 2004).
Therefore the intracellular pH of Acidocella 29 was measured in order to determine if
Acidocella 29 actively maintained a near neutral pHi or had adapted its intracellular
components to function at a low pH.
Initial attempts to measure pHi using the distribution of radioisotopes with the silicone
oil method for separation were unsuccessful. Negative intracellular volumes were
obtained in almost all cases, with only two attempts producing positive intracellular
volumes which gave intracellular pH measurements of 4.21 and 4.10 respectively.
Attempts to overcome this problem using alternative isotopes, washing steps and tilters
instead of separation through silicone oil, were all unsuccessful. Various alternative
methods were considered in order to try to obtain the intracellular and extracellular
volumes. These included measuring the volume of the cells by observing the cells by
eye through a microscope and measuring cell dimensions using a haemocytometer,
using a cytocrit tube to determine the volume of a specific number of cells and calculate
the volume of a single cell, measuring the dry weight of a known number of cells and
calculating the intracellular volume based on known weight assumptions and finally
153
using an alternative organism of similar size and shape with the silicone oil method in
order to produce values for the ICV and ECV. Unfortunately. only the last method
described would provide an extracellular volume and although it was the most feasible
option no suitable organism was available at the time therefore 31p and IH NMR were
employed as an alternative method.
The intracellular pH measured with 31p NMR was estimated to be below pH 4.0,
therefore 1 H NMR was carried out as the shift in lactate peak is more accurate in this
range of pH than the shift in the phosphate peak in 31p NMR since the PlC. of lactate is
much lower than that of phosphate. Measurements with IH NMR. were in agreement
with the 31p NMR, estimating the intracellular pH at approximately 4.0 (Figures 5.8 and
5.9). This is highly unusual, therefore the respiration rate of the cells was monitored
following NMR to ensure that cells were viable and had not lysed. The results of
oxygen electrode experiments showed normal respiration for AcidoceIJa 29. The
intracellular pH of further samples resuspended in pH 7 buffer was measured using 31 P
NMR to demonstrate that the shift in the phosphate peak was not a result. of cell lysis or
leakage.
Because the pHi estimated by NMR was unusually low further efforts were made to
measure intracellular pH using another method to ensure the measurement made was
indeed true. Fluorescent probes can be used as indicators of pH. however these are
usually designed to function over a "normal" pH range, between pH 6.0 and 8.0.
Therefore. a probe used to measUJ'e the pH of lysosomes was chosen due to its low pK.
of 5.2. Unfortunately the LysoSensor Green DND-189 was not suitable for pHi
measurements in Acidocella 29 since it fluoresced in negative control samples therefore
the only measurement of intracellular pH in Acidocella 29 is from NMR measurements.
Although Acidocella species have been the subject of some investigation there are
currently no records of intracellular pH measurement in this genus. The lowest
recorded intracellular pH to date is that of the thermoacidophilic archaea Picrophilus
to"idus and P. oshimae. with an intracellular pH of 4.6 (Vossenberg et al. 1998) which
was measured using the distribution of radioisotopes in a similar technique to the
silicone oil method (Section 2.6). The intracellular pH of Acidiphilium acidophilum
(formerly Thiobacillw acidophilus), a species of the most closely related genus to
154
Acidocel/a, has been measured. A. acidophilum is reported to have a pHi of 6.0 (Bond
and Banfield 2001).
NMR has been used to measure the intracellular pH of several organisms including
Ferroplasma spp. which has an estimated pHi of 5.6 (Macalady et al. 2004). the
acidophiJic alga Cyanidium caldarium (Enami et al. 1986), and Saccharomyces
cerevisiae (Gillies et al. 1981). The method used in this work was very similar to the
method used by Macalady et al., therefore the pHi of Acidocella 29 may simply be as
low as measured. There is almost no shift in the phosphate peak between cells
resuspended in pH 3 buffer and cells resuspended in pH 7 buffer which confirms that
the phosphate peak observed in initial 31p experiments is intracellular phosphate and
that the cells have not lysed. Although the results from 'H NMR are slightly less
conclusive given the high noise level of the signal the lactate peaks are distinguishable
following computational adjustments and are in agreement with the pHi measurements
from 31p NMR (Figures 5.8 and 5.9).
Microorganisms which have been shown to have a low intracellular pH as opposed to
those which maintain a near-neutral intracellular pH are often inviable above a certain
pH and have been shown to lyse. The reduction in respiration rate of Acidocella 29
above pH 5 may be caused as a result of cell lysis at these higher pH values or because
the higher external pH is damaging the intracellular components which are adapted to
low pH (Figure 5.14). This evidence combined with the inability of cells to grow above
pH 6 provides further supportive evidence for the low intracellular pH of Acidocella 29.
The effect of sodium vanadate on Acidocella 29 suggests that it may utilise proton
pumping at pH 3 since the decrease in respiration after treatment with sodium
orthovanadate is significantly greater at pH 3 at than at pH 7. There is also a greater
percentage reduction in respiration at pH 3 following incubation with sodium
orthovanadate than the shock experiments at the same pH which is indicative of
continued and increased proton pumping inhibition. There is a very slight decrease in
respiration rate at pH 7 when cells are treated with sodium orthovanadate, however the
decrease is extremely small and almost identical in shock treated cells and cells
incubated with sodium orthovanadate which would infer that the sodium orthovanadate
has little if any effect on proton pumping at pH 7. This further supports the use of
155
proton pumping in pH homeostasis in Acidocella 29 since little, or no, effect of sodium
orthovanadate is expected at higher pH values.
The evidence from sodium orthovanadate experiments which suggests that proton
pumping has a' role within Acidocella 29 may conflict with the intracellular pH
measurements of Acidocella 29 since it is less likely that intracellular pH mechanisms
are utilised in an organism with a pHi of approximately 4.0. However, Acidocella 29 is
routinely grown in pH 3 medium yet the pHi of Acidocella 29 is not pH 3, which is what
would be expected if no pH homeostasis occurred. Therefore it is possible that removal
of protons from the cell by proton pumping is one of the few pH homeostasis
mechanisms utilised by Acidocella 29.
156

Chapter Six: Conclusions and Future Work
Characterisation of the microbial diversity present at Hoole Bank acid tar lagoon
represents the first work of its kind in this particular environment. Whilst the microbial
diversity of similar environments such as acid mine drainage, the Rio Tinto and
hydrocarbon-polluted sites have been studied previously there is a distinct difference
between these sites and Hoole Bank acid tar lagoon. Hoole Bank acid tar lagoon
comprises extremes of low pH and high hydrocarbon content, compared to the single
extreme of either acidity or hydrocarbon pollution of other environments.
As expected, the microbial diversity present at Hoole Bank acid tar lagoon was shown
to be much higher when measured with the molecular techniques ofT-RFLP (Table 3.4)
and DOGE (Figures 3.8 and 3.9) than the classical culturing methods employed which
isolated only five microorganisms from 21 samples (Table 3.2). Yet, this is a somewhat
unfair comparison between the methods since the classical culture techniques employed
in this study were far from extensive. A wide range of alterations and improvements
can be made to the isolation process in order to increase the number of microorganisms
cultured from Hoole Bank acid tar lagoon samples. Using a wider range of solid media
such as overlay plates and medium supplemented with appropriate carbon sources
present at Hoole Bank acid tar lagoon are likely to improve the culture efficiency.
Overlay plates contain an acidophilic heterotroph within their bottom layer which
removes compounds which are toxic to oligotrophic acidophiles from the top layer of
the agar (Johnson 1995). Similarly, supplementing growth media with a greater range
of carbon sources such as volatile hydrocarbons including toluene, benzene,
ethylbenzene and xylene and CWC30 hydrocarbons may facilitate the growth of
organisms adapted to utilise the carbon sources present in Hoole Bank acid tar lagoon.
Increasing the pH of growth media used to include solid medium at pH 4 and pH 5 may
also increase the number of isolates from Hoole Bank acid tar lagoon samples, since
several lagoon samples had pH values ~ 3.
An increased number of organisms may have been isolated from Hoole Bank acid tar
lagoon samples by using micro-aerophilic and anaerobic growth conditions in order to
isolate organisms with different requirements for oxygen. Changing the growth
medium and conditions used to specifically isolate sulphate reducing organisms is also
likely to lead to an increased number of cultured microorganisms from Hoole Bank acid
157
tar lagoon samples given the high sulphur content and anaerobic conditions found
within the lagoon.
Denaturing gradient gel electrophoresis (DGGE) enabled the identification of a number
of microorganisms present within Hoole Bank acid tar lagoon which were not cultured,
along with further confirmation of the presence of some organisms which were isolated
using culturing techniques (Table 3.7). Indeed, this is the first identification of the
genus Euglena using either 18S or 16S rRNA DOGE, which represents a step forward
in molecular microbial diversity analysis and also provides an alternative route for
molecular microbial analysis of algal populations using 16S rRNA from chloroplasts as
opposed to 18S rRNA. Previous attempts to use DGGE to assess the algal community
present in the Rio Tinto where species of Euglena were identified using microscopy
failed to reveal the presence of Euglena using 18S rRNA DOGE (Aguilera et al. 2006).
The identification of organisms from excised DOGE bands also allows CUlturing
techniques to be designed specifically to isolate organisms known to be present at Hoole
Bank acid tar lagoon such as Acidithiobacillusferrooxidans.
DOGE estimates of microbial diversity were lower than those produced using Terminal
Restriction Fragment Length Polymorphism (T -RFLP) and could be improved further
by optimising the denaturing gradient and gel conditions further. UnfQrtunately it was
not possible to visualise as many bands on the DOGE gels using an open
transilluminator and the naked eye as it was to visualise bands in a closed
transilluminator system and a digital camera due to limitations of the equipment used.
This meant that many ofthe bands present on OOGE gels were not excised and thus not
identified. Therefore, further optimisation of this process, including the narrowing the
denaturing gradient used or utilising different PCR primers for specific microorganisms
such as nitrate reducers, would yield a greater amount of information, particularly
regarding microbial species which are likely to represent a smaller proportion of the
microbial population.
Whilst comparisons between Hoole Bank acid tar lagoon and other acidic environments
such as acid mine drainage and the Rio Tinto have been made previously, the microbial
community at Hoole Bank acid tar lagoon was shown to comprise a much greater
number of bacterial species than other acidic environments, using both DOGE and T
RFLP.
158
T -RFLP provided the most detailed understanding of the total number of microbial
species present within each Hoole Bank acid tar lagoon sample. The abundance and
proportion of each microorganism within the total microbial community was also
inferred based on the data directly obtained from T-RFLP (FigUres 3.7a-d). However,
no phylogenetic information can be determined directly from T -RFLP data. The
number ofT-RFs in each sample according to T-RFLP varied from as little as 4 to 50 in
samples 49 and 50 respectively (Table 3.4). Two methods were used to analyse T
RFLP data in order to statistically compare microbial diversity present within Hoole
Bank acid tar lagoon. T -align (Smith et al. 2005) was followed by principal component
analysis (PCA) and correspondence analysis in order to reveal any patterns in microbial
diversity which could be displayed in a visual format. PeA of both interstitial and
percentage area data indicated very little correlation between sample groups and
microbial diversity or sample pH and microbial diversity as shown in Figures 3.5a-h
and Figures 3.6a-h. However, certain samples do group more tightly in certain figures
(Figures 3.5h, 3.6d, 3.6g and 3.6h) which may indicate a linking factor between these
samples. Further analysis of the samples obtained from Hoole Bank acid tar lagoon,
including analysis of the chemicals and metals present and their concentration, may
provide further information which may suggest a relationship between the microbial
diversity present in these samples and a common component present in these sampling
locations at Hoole Bank acid tar lagoon.
The phylogeny of one particularly abundant T-RF (170.00 bp forward HhaI) was
inferred using the phylogenetic assignment tool (PAT) (Kent et al. 2003) based on the
combination of that T -RF with the 112.22 bp fragment produced from AluI forward
digest as this was equally abundant, both in terms of percentage peak area and number
of occurrences. Several possible phylogenetic affiliations were made based on in silico
analysis of the 16S rRNA gene sequences in the database and included Acidovorax sp.
OS-6, Alicyc/iphilus denitrificans and Diaphorobacter nitroreducens KSP4 (Table 3.6).
Although this information is useful as it may allow future culture techniques to be
tailored in order to try and isolate these organisms, the vast amount of information
produced by PAT is time consuming to analyse and does not provide defmitive
confirmation of phylogenetic assignment in most cases. Improvements to the T-RFLP
data obtained could be made by carrying out a greater number of repeats in order to
provide a greater amount of data for T -align and peA which would allow improved
159
statistical analysis. A third restriction digest would also significantly improve the
ability to reduce the number of possible phylogenetic affiliations generated by PAT.
A clone library of 16S rRNA genes or a metagenomic library of total genomic DNA
obtained from Hoole Bank acid tar lagoon would provide a great deal more information
than T -RFLP or DOGE. Whilst phylogeny cannot be assigned directly from T -RFLP
and only bands which are visible for excision can be identified with DOGE, a 16S
rRNA clone library would provide a greater insight into the phylogeny of all
microorganisms present at Hoole Bank acid tar lagoon. This could also be extended to
include 18S rRNA genes such that eukaryotic diversity including yeasts, algae and fungi
could be assessed. Similarly, a metagenomic library of genomic DNA from Hoole
Bank acid tar lagoon could be screened for functionality such as degradation of a
specific compound. Fluorescence in situ hybridisation would also be useful to identify
samples which contain specific organisms, such as those already isolated, in order to
ascertain interactions of particular species with other organisms. This would be
especially useful in the biofilms, where more complex interactions may be occurring.
Of the five microorganisms which were isolated from Hoole Bank acid tar lagoon, the
unicellular alga Euglena gracilis G46 was chosen for further study due to the
predominance of the visibly green biofilms from which this organism was isolated at
Hoole Bank acid tar lagoon. Unlike the type strain of E. gracilis Z which was used as a
control. E. gracilis G46 was capable of growth at pH 2 (Figure 4.3a) and possessed a
lower optimum pH for growth (Figure 4.3a). The effect of pH on photosynthesis and
respiration was measured (Figures 4.12 and 4.13 respectively), with E. gracilis 046
showing significantly decreased levels of photosynthesis compared to the wild type
organism at pH values ~ 3.
The intracellular pH of E. gracilis G46 was measured and compared to the wild type
strain, E. gracilis Z, in order to determine how E. gracilis 046 survives in such acidic
conditions. The pHi measured using the distribution of radioisotopes with the silicone
oi I technique was estimated at pH 5.47 at an external pH of 3 (Table 4. t), whilst NMR
estimated the intracellular pH of E. gracilis 046 at pH 6.6 (Figure 4.5). Although there
is some discrepancy between these values, both methods indicate that E. gracilis 046
actively maintains a near-neutral intracellular pH, as opposed to adapting its
intracellular components to function in an acidic environment. This is further supported
160
by the conserved sequence of ribulose-l ,5-bisphosphate carboxylase/oxygenase (Figure
4.8) which does not exhibit any adaptations to low pH. In order to further clarify the
intracellular pH of E. gracilis G46 the use of microelectrodes which can be directly
inserted into the cells would provide a value for pHi during normal cellular conditions.
The use of a more advanced fluorimeter would also provide a greater insight into the
effect of pH on photosynthesis of E. gracilis G46, particularly if the fluorescence of
photosystem I was measurable, at cryogenic temperatures. .
The second organism chosen for further study from the five organisms isolated from
Hoole Bank acid tar lagoon was the acidophilic bacterium Acidocella 29, which like E.
gracilis G46, was also isolated from a biolfiJm sample from Hoole Bank acid tar
lagoon. Although Acidocella 29 exhibited similar traits to other Acidocella species
(Table 5.1). attempts to demonstrate utilisation of various hydrocarbons present at
Hoole Bank acid tar lagoon were negative (Table 5.2). Whilst it may be the case that
Acidocella 29 does not utilise any of the hydrocarbons tested, limitations in the
experimental set up may have influenced the outcome of this test. The outcome of this
experiment may be different if repeats were carried out in an Therefore, repeats of this
aerobic environment.
Attempts to measure the intracellular pH of Acidocella were made using the silicone oil
technique but were ultimately unsuccessful, continually producing negative intracellular
volumes. Therefore, IH and 31p_NMR were used to measure pHi. producing an
unexpectedly low pHi of 4.0 (Figures 5.8 and 5.9) in an external pH of 3.0. Further
investigation into this is warranted given the unusually low intracellular pH, perhaps
using alternative fluorescent dyes in combination with flow cytometry as attempted in
the experiment reported in Figure 5.10. Attempts to measure the specific activity of
malate dehydrogenase from Acidocella 29 were unsuccessful (data not included);
however further investigation into the effect of pH on activity of intracellular enzymes
such as malate dehydrogenase may provide more information about the internal pH of
Acidocella 29. Similarly. DNA or amino acid sequence analysis of intracellular
proteins may also allow some inference of intracellular pH based on the presence or
absence of adaptations to an acidic environment.
161
Chapter Seven: References
Aguilera, A., Gomez, F., Lospitao, E. and Amils, R. (2006). "A molecular approach to
the characterization of the eukaryotic communities of an extreme acidic environment:
methods for DNA extraction and denaturing gradient gel electrophoresis analysis."
Systematic and Applied Microbiology 29: 593-605.
Aguilera, A., Souza-Egipsy, V., Gomez, F. and Amils, R. (2007). "Development and
structure of eukaryotic biofilms in an extreme acidic environment, rio tinto (SW,
Spain)." Microbiology Ecology 53: 294-305.
Alien, J. F. (2003). "Cyclic, pseudocyclic and noncyclic photophosphorylation: new
links in the chain." Trends in Plant Science 8: 15-9.
Altschul, S. F., Gish, W., Miller, W., Myers, E. W. and Lipman, D. J. (1990). "Basic
local alignment search tooL" Journal of Molecular Biology 215: 403-10.
Amann, R. I., Ludwig, W. and Schleifer, K. H. (1995). "Phylogenetic identification and
in situ detection of individual microbial cells without cultivation." Microbiological
Reviews 59: 143-69.
Amaral Zettler. L. A., Gomez, F .• Zettler, E., Keenan, B. G., Amils, R. and Sogin, M. L.
(2002). "Microbiology: eukaryotic diversity in Spain's River of Fire." Nature 417: 137.
Andreoni. V., Cavalca, L., Rao, M. A., Nocerino, G., Bernasconi, S., Dell'Arnico, E.,
Colombo, M. and Gianfreda, L. (2004). "Bacterial communities and enzyme activities
ofPAHs polluted soils." Chemosphere 57: 401-12.
Baker-Austin. C. and Dopson, M. (2007). "Life in acid: pH homeostasis in acidophiles."
Trends in Microbiology 15: 165-71.
Baker, B. J., Lutz, M. A., Dawson, S. C., Bond, P. L. and Banfield, J. F. (2004).
"Metabolically active eukaryotic communities in extremely acidic mine drainage."
Applied and Environmental Microbiology 70: 6264-71.
162
Baker. G. c.. Smith. J. J. and Cowan, D. A. (2003). "Review and re-analysis of domain
specific 16S primers." Journal of Microbiological Methods 55: 541-555.
Bassnett. S., Reinisch, L. and Beebe, D. C. (1990). "Intracellular pH measurement using
single excitation-dual emission fluorescence ratios." American Journal of Physiology
258: CI71-8.
Behrens. S .. Fuchs. B. M., Mueller, F. and Amann, R. (2003). "Is the in situ
accessibility of the 16S rRNA of Escherichia coli for Cy3-1abeled oligonucleotide
probes predicted by a three-dimensional structure model of the 30S ribosomal subunit?"
Applied and Environmental Microbiology 69: 4935-41.
Beja. 0., Suzuki, M. T., Koonin, E. V., Aravind, L., Hadd, A., Nguyen, L. P.,
ViIlacorta. R.. Amjadi, M., Garrigues, C., Jovanovich, S. B., Feldman, R. A. and
DeLong, E. F. (2000). "Construction and analysis of bacterial artificial chromosome
libraries from a marine microbial assemblage." Environmental Microbiology 2: 516-29.
Bodour. A. A .• Wang, J. M .• Brusseau, M. L. and Maier, R. M. (2003). 'Temporal
change in culturable phenanthrene degraders in response to long-tenn exposure to
phenanthrene in a soil column system." Environmental Microbiology 5: 888-95.
Boelsing. F. (1995). OCR technology in the field of environmental remediation
Remediation of Hazardous Waste Contaminated Soils. D. L. Wise. New York, Marcel
Dekker Ine: 869-923.
Bond. P. L. and Banfield, J. F. (2001). "Design and Performance of rRNA Targeted
Oligonucleotide Probes for in Situ Detection and Phylogenetic Identification of
Microorganisms Inhabiting Acid Mine Drainage Environments." Microbiology Ecology
41: 149-161.
Bradford. M. M. (1976). "A rapid and sensitive method for the quantitation of
microgram quantities of protein utilizing the principle of protein-dye binding."
Analytical Biochemistry 71: 248-54.
Braker. G., Ayala-del-Rio. H. L.. Devol, A. H., Fesefeldt, A. and Tiedje, J. M. (2001).
"Community structure of denitriflers, bacteria, and archaea along redox gradients in
163

Pacific Northwest marine sediments by tenninal restriction fragment length
polymorphism analysis of amplified nitrite reductase (nieS) and 16S rRNA genes."
Applied and Environmental Microbiology 67: 1893-901.
Bruce. K. D. (1997). "Analysis of mer Gene Subclasses within Bacterial Communities
in Soils and Sediments Resolved by Fluorescent-PeR-Restriction Fragment Length
Polymorphism Profiling." Applied and Environmental Microbiology 63: 4914-4919.
Bruinsma. J. ( 1961 ). "A comment on the spectrophotometric detennination of
chlorophyll." Biochimica et Biophysics Acta 52: 576-8.
Bruns, A .• Cypionka. H. and Ovennann, J. (2002). "Cyclic AMP and acyl homoserine
lactones increase the cultivation efficiency of heterotrophic bacteria from the central
Baltic Sea." Applied and Environmental Microbiology 68: 3978-87.
Burton. N. P. and Norris. P. R. (2000). "Microbiology of acidic. geothennal springs of
Montserrat: environmental rDNA analysis." Extremophiles 4: 315-20.
Button. D. K .• Robcrtson. B. R .• Lepp, P. W. and Schmidt, T. M. (1998). "A small,
dilute-cytoplasm. high-affinity. novel bacterium isolated by extinction culture and
having kinetic constants compatible with growth at ambient concentrations of dissolved
nutrient~ in seawater." Applied and Environmental Microbiology 64: 4467-76.
Cases. l. and Lorenzo. V. d. (2002). "The grammar of (micro)biological diversity."
Environmental MicrobioloGY 4: 623-7.
Cassamayor. E. 0., Massana, R .• Benlloch. S., Ovreas, L .• Diez, B .• Goddard, V. J. t
Gasol. J. M .• Joint, I .. Rodriguez-Valera, F. and Pedros-Allo, C. (2002). "Changes in
archaeal. bacterial and eukaryal assemblages along a salinity gradient by comparison of
genetic fingerprinting methods in a multi pond solar saltem." Environmental
MicrobiolW 4: 338-348.
Castro. H .• Newman. S .• Reddy. K. R. and Ogram. A. (2005). "Distribution and stability
of sulfate-reducing prokaryotic and hydrogenotrophic methanogenic assemblages in
nutrient-impacted regions of the Florida Everglades." Applied and Environmental
MicrobiolW 71: 2695-704.
164
Chatterjee, S. and Dutta, T. K. (2003). "Metabolism of butyl benzyl phthalate by
Gordonia sp. strain MTCC 4818." Biochemical and Biophysical Research
Communications 309: 36-43.
Chen. Y., Wang. Y., Sun, Y., Zhang, L. and Li, W. (2001). "Highly efficient expression
of rabbit neutrophil peptide-I gene in Chlorella ellipsoidea cells." Current Genetics 39:
365-70.
Chenna, R.. Sugawara, H., Koike, T., Lopez, R., Gibson, T. J., Higgins, D. G. and
Thompson, 1. D. (2003). "Multiple sequence alignment with the Clustal series of
programs." Nucleic Acids Research 31: 3497-500.
Chester City Council (2006). Contaminated Land: Implementation of Part HA of the
Environmental Protection Act 1990.
Ciaramella, M., Napoli, A. and Rossi, M. (2005). "Another extreme genome: how to
live at pH 0." Trends in Microbiology 13: 49-51.
Cole. J. R., Chai, B., Farris, R. J., Wang, Q., Kulam, S. A., McGarrell, D. M., Ganity,
G. M. and Tiedje, J. M. (2005). "The Ribosomal Database Project (RDP-II): sequences
and tools for high-throughput rRNA analysis." Nucleic Acids Research 33: D294-6.
Col man, B. and Balkos, K. D. (2005). "Mechanisms of inorganic carbon acquisition in
two Euglena species." Canadian Journal of Botany 83: 865-71.
Connon, S. A. and Giovannoni, S. J. (2002). "High-throughput methods for CUlturing
microorganisms in very-low-nutrient media yield diverse new marine isolates." Ap'plied
and Environmental Microbiology 68: 3878-85.
Cook, J. R. (1971). "Influence of culture pH and phosphate on synchrony of Euglena
gracilis." Experimental Cell Research 69: 207-211.
Davis, B. and Merrett, M. J. (1973). "Malate Dehydrogenase Isoenzymes in Division
Synchronized Cultures of Euglena." Plant Physiology 51: 1127-1132.
165
de Siloniz. M. I.. Payo. E. M .• CalJejo. M. A .• Marquina. D. and Peinado, J. M. (2002).
"Environmental adaptation factors of two yeasts isolated from the leachate of a uranium
mineral heap." FEMS MicrobiolOGY Letters 110: 233-7.
DeLong. D. C. (1996). "Defining Biodiversity." Wildlife Society Bulletin 24.
DeNicola. D. M. (2000). "A review of diatoms found in highly acidic environments."
Hydrobiologia 4JJ: 111-122.
DeSantis. T. Z .. Brodie. E. L.. Moberg. J. P .• Zubieta. I. X., Piceno, Y. M. and
Andersen. G. L. (2007). "High-density universal 16S rRNA microarray analysis reveals
broader diversity than typical clone library when sampling the environment."
Microbiology Ecology 53: 371-83.
Dhingra. A.. Portis. A. R .• Jr. and Daniell, H. (2004). "Enhanced translation of a
chloroplast-expressed RbcS gene restores small subunit levels and photosynthesis in
nuclear RbcS anti sense plants." Proceedings of the National Academy of Sciences of the
United States of America 101: 6315-20.
Diel~ B .• Pedros-Alio. C .. Marsh. T. L. and Massana, R. (2001). "Application of
denaturing gradient gel electrophoresis (DOGE) to study the diversity of marine
picoeukaryotic assemblages and comparison of DOGE with other molecular
techniques." Applied and Environmental Microbiolo&y 67: 2942-2951.
Doege. M .. Ohmann. E. and Tschiersch. H. (2000). "Chlorophyll fluorescence
quenching in the alga Euglena gracili.f." Photosynthesis Research 63: 159-70.
Dollhopf, S. L.. Ayala-Del-Rio. H. L., Hasham. S. A. and Tiedje. J. (2004). Multivariate
statistical methods and artificial neural networks for analysis of microbial community
molecular fingerprints. Molecular Microbial Ecology Manual. G. A. Kowalchuk, F. J. d.
Bruijn. J. D. v. Elsas.. I. M. Head and A. D. L. Akkermans. New Jersey. Kluwer
Academic PubJishing.l: 1447-1487.
Dollhopf, S. L.. Hashsham. S. A. and Tiedje. J. M. (2001). "Interpreting 16S rDNA T
RFLP Data: Application of Self-Organizing Maps and Principal Component Analysis to
166
Describe Community Dynamics and Convergence." Microbiology Ecology 42: 495-
505.
Donnan. F. G. (1924). "The theory of membrane equilibria." Chemical Reviews 1: 73-
90.
Dopson. M .• Baker-Austin. C., Hind. A., Bowman, J. P. and Bond, P. L. (2004).
"Characterization of Ferrop/asma isolates and Ferrop/asma acidarmanus sp. nov.,
extreme acidophiles from acid mine drainage and industrial bioleaching environments."
Applied and Environmental Microbiology 70: 2079-88.
Dore. S. Y .• Clancy, Q. E., Rylee, S. M. and Kulpa, C. F., Jr. (2003). "Naphthalene
utilizing and mercury-resistant bacteria isolated from an acidic environment." Applied
Microbiolo&y and Biotechnology 63: 194-9.
Driessen. A. J. M., Vossenberg, J. L. C. M. v. d. and Konings, W. N. (1996).
"Membrane composition and ion-permeability in extremophiles." FEMS Microbiology
Reviews 18: 139-48.
Dykhuizen, D. E. (1998). "Santa Rosalia revisited: Why are there so many species of
bacteria?" Antonie van Leeuwenhoek 73: 25-33.
Edel-Hennann, V., Dreumont, C .• Perez-Piqueres, A. and Steinberg. C. (2004).
"Terminal restriction fragment length polymorphism analysis of ribosomal RNA genes
to assess changes in fungal community structure in soils." FEMS Microbiology Ecology
47: 397-404.
Enami, I., Akutsu, H. and Kyogoku, Y. (1986). "Intracellular pH Regulation in an
Acidophilic Unicellular Alga, Cyanidium caldarium: 31 P-NMR Determination of
Intracellular pH." Plant and Cell Physiology 27: 1351-1359.
Eprintsev, A. T., Falaleeva, M. I., Stepanova, I. Y. and Parfenova, N. V. (2003).
"Purification and physicochemical properties of malate dehydrogenase from bacteria of
the genus Begg;atoa." Biochemistry 68: 172-6.
167
Fenis, M. 1., Muyzer, G. and Ward, D. M. (1996a). "Denaturing gradient gel
electrophoresis profiles of 16s rRNA-defined populations inhabiting a hot spring
microbial mat community." Applied and Environmental Microbiology 62: 340-346.
Ferris, M. 1., Ruff-Roberts, A. L., Kopczynski, E. D., Bateson, M. M. and Ward, D. M.
(1996b). "Enrichment culture and microscopy conceal diverse thermophilic
Synechococcus populations in a single hot spring microbial mat habitat." Applied and
Environmental Microbiology 62: 1045-50.
Frostegard, A., Courtois, S., Ramisse, V., Clerc, S., Bemillon, D., Gall, F. L., Jeanin, P.,
Nesme, X. and Simonet, P. (1999). "Quantification of Bias Related to the Extraction of
DNA Directly from Soils." Applied and Environmental Microbiology 65: 5409-5420.
Futterer, 0., Angelov, A., Liesegang, H., Gottschalk, G., Schleper, C., Schepers, B.,
Dock, c., Antranikian, G. and Liebl, W. (2004). "Genome sequence of Picrophilus
torrid us and its implications for life around pH 0." Proceedings of the National
Academy of Sciences of the United States of America 101: 9091-6.
Gabor, E. M., Vries, E. 1. d. and Janssen, D. B. (2003). "Efficient recovery of
enviornmental DNA for expression cloning by indirect extraction method." FEMS
Microbiology Ecology 44: 153-163.
Gadanho, M., Libkind, D. and Sampaio, J. P. (2006). "Yeast diversity in the extreme
acidic environments of the Iberian Pyrite Belt." Microbial Ecology 52: 552-63.
Gafan, G. P. and Sprau, D. A. (2005). "Denaturing gradient gel electrophoresis gel
expansion (DGGEGE)-an attempt to resolve the limitations of co-migration in the
DGGE of complex polymicrobial communities." FEMS Microbiology Letters 253: 303-
7.
Garcia-Moyano, A., Gonzalez-Toril, E., Aguilera, A. and Amils, R. (2007).
"Prokaryotic community composition and ecology of floating macroscopic filaments
from an extreme acidic environment, Rio Tinto (SW, Spain)." Systematic and Applied
Microbiology 30: 601-14.
168
Gemmell, R. T. and Knowles, C. J. (2000). "Utilisation of aliphatic compounds by
acidophilic heterotrophic bacteria. The potential for bioremediation of acidic
wastewaters contaminated with toxic organic compounds and heavy metals." FEMS
Microbiology Letters 192: 185-90.
Ghosh, S., Mahapatra, N. R. and Banerjee, P. C. (1997). "Metal resistance in Acidocella
strains and plasmid-mediated transfer of this characteristic to ACidiphilium multivorum
and Escherichia coli." Applied and Environmental Microbiology 63: 4523-7.
Ghosh, S., Mahapatra, N. R., Nandi, S. and Banerjee, P. C. (2005). "Integration of
metal-resistant determinants from the plasmid of an Acidocella strain into the
chromosome of Escherichia coli DH5a.." Current Microbiology SO: 28-32.
Gillies, R. J., Ugurbil, K., den Hollander, J. A. and Shulman, R. G. (1981). "31P NMR
studies of intracellular pH and phosphate metabolism during cell division cycle of
Saccharomyces cerevisiae." Proceedings of the National Academy of Sciences of the
United States of America 78: 2125-9.
Gonzalez-Toril, E., Llobet-Brossa, E., Casamayor, E. 0., Amann, R. and Amils, R.
(2003). "Microbial ecology of an extreme acidic environment, the Tinto River." Applied
and Environmental Microbiology 69: 4853-65.
Gordillo, F. J., Jimenez, C., Chavarria, J. and Xavier Niell, F. (2001). "Photosynthetic
acclimation to photon irradiance and its relation to chlorophyll fluorescence and carbon
assimilation in the halotolerant green alga Dunaliella viridis." Photosynthesis Research
68: 225-35.
Grajczak, P. (1995). "Remediation of acid tar sludge at a superfund site." Superfund
Proceedings 1: 243-44.
Hallberg, K. B., Coupland, K., Kimura, S. and Johnson, D. B. (2006). "Macroscopic
streamer growths in acidic, metal-rich mine waters in north wales consist of novel and
remarkably simple bacterial communities." Applied and Environmental Microbiology
72: 2022-30.
169
Hallberg, K. B. and Johnson, D. B. (2003). "Novel acidophiles isolated from moderately
acidic mine drainage waters." Hydrometallurgy 71: 139-148.
Hallberg, K. B., Kolmert, A. K., Johnson, D. B. and Williams, P. A. (1999). A novel
metabolic phenotype among acidophilic bacteria: aromatic degradation and the potential
use of these organisms for the treatment of waste water containing organic and inorganic
pollutants. Biohydrometallurgy and the environment toward the mining of the 21st
century. R. Amils and A. Ballester. Amsterdam, Netherlands, Elsevier. Process
Metallurgy,9A: 719-728.
Hamby, R. K. and Zimmer, E. A. (1991). Ribosomal RNA as a phylogenetic tool in
plant systematics. Molecular Systematics in Plants. P. Soltis, Soltis, D. & Doyle, J. New
York, Routledge, Chapman & Hall: 50-91.
Handelsman, J. (2004). "Metagenomics: application of genomics to uncultured
microorganisms." Microbiology and Molecular Biology Reviews 68: 669-85.
Handelsman, J., Rondon, M. R., Brady, S. F., Clardy, J. and Goodman, R. M. (1998).
"Molecular biological access to the chemistry of unknown soil microbes: a new frontier
for natural products." Chemistry and Biology 5: R245-9.
Hansen, A. A., Herbert, R. A., Mikkelsen, K., Jensen, L. L., Kristoffersen, T., Tiedje, J.
M., Lomstein, B. A. and Finster, K. W. (2007). "Viability, diversity and composition of
the bacterial community in a high Arctic pennafrost soil from Spitsbergen, Northern
Norway." Environmental Microbiology 9: 2870-84.
Hard, B. C. and Gilmour, D. J. (1996). "The uptake of organic compunds by Dunaliella
parva CCAP 19/9." European Journal ofPhycology 31: 217-224.
Henne, A., Daniel, R., Schmitz, R. A. and Gottschalk, G. (1999). "Construction of
environmental DNA libraries in Escherichia coli and screening for the presence of
genes conferring utilization of 4-hydroxybutyrate." Applied and Environmental
Microbiology 65: 3901-7.
Hiraishi, A. (2005). Genus IV: Acidocella. Bergey's Manual® of Systematic
Bacteriology. G. M. Garrity. New York, Springer US: 65-68.
170
Horkioshi, K. (1995). "Discovering novel bacteria, with an eye to biotechnological
applications." Current Opinion in Biotechnology 6: 292-297.
Hugenholtz, P. and Pace, N. R. (1996). "Identifying microbial diversity in the natural
environment: a molecular phylogenetic approach." Trends in Biotechnology 14: 190-7.
Jackson, W. A. and Volk, R. J. (1970). "Photorespiration." Annual Reviews of Plant
Physiology 21: 385-432.
Johnson, D. B. (1995). "Selective solid media for isolating and enumerating acidophilic
bacteria." Journal of Microbiological Methods 23: 205-218.
Johnson, D. B. (1998). "Biodiversity and ecology of acidophilic microorganisms."
FEMS Microbiology Ecology 27: 307-17.
Johnson, D. B. (2006). "Biohydrometallurgy and the environment: Intimate and
important interplay." Hydrometallurgy 83: 153-66.
Johnson, D. B. and Hallberg, K. B. (2003). "The microbiology of acidic mine waters."
Research in Microbiology 154: 466-73.
Johnson, D. B. and Hallberg, K. B. (2005). "Acid mine draingage remediation options: a
review." Science of the Total Environment 338: 3-14 .
. Johnson, D. B., Macvicar, 1. H. M. and Rolfe, S. (1987). "A new solid medium for the
isolation and enumeration of Thiobacillus ferrooxidans and acidophilic heterotrophic
bacteria." Journal of Microbiological Methods 7: 9-18.
Johnson, D. B., Okibe, N. and Roberto, F. F. (2003). "Novel thermo-acidophiIic bacteria
isolated from geothermal sites in Yellowstone National Park: physiological and
phylogenetic characteristics." Archives of Microbiology 180: 60-8.
Johnson, D. B., Rolfe, S., Hallberg, K. B. and Iversen, E. (2001). "Isolation and
phylogenetic characterization of acidophilic microorganisms indigenous to acidic
drainage waters at an abandoned Norwegian copper mine. " Environmental
Microbiology 3: 630-7.
171

Kawai, F., Zhang, D. and Sugimoto, M. (2000). "Isolation and characterization of acid
and AI-tolerant microorganisms." FEMS Microbiology Letters 189: 143-7.
Kent, A. D., Smith, D. J., Benson, B. J. and TripJett, E. W. (2003). "Web-based
phylogenetic assignment tool for analysis of tenninal restriction fragment length
polymorphism profiles of microbial communities." Applied and Environmental
Microbiology 69: 6768-76.
Khan, S. T. and Hiraishi, A. (2002). "Diaphorobacter nitroreducens gen nov, sp nov, a
poly(3-hydroxybutyrate )-degrading denitritying bacterium isolated from activated
sludge." Journal of General and Applied Microbiology 48: 299-308.
Khan, S. T., Horiba, Y., Yamamoto, M. and Hiraishi, A. (2002). "Members of the
family Comamonadaceae as primary poly(3-hydroxybutyrate-co-3-hydroxyvalerate)
degrading denitrifiers in activated sludge as revealed by a polyphasic approach."
Applied and Environmental Microbiology 68: 3206-14.
Kim, H. and Pagilla, K. R. (2003). "Competitive growth of Gordonia and Acinetobacter
in continuous flow aerobic and anaerobic/aerobic reactors." Journal of Bioscience and
Bioengineering 95: 577-82.
Kimura, S., Hallberg, K. B. and Johnson, D. B. (2006). "Sulfldogenesis in Low pH (3.8-
4.2) Media by a Mixed Population of Acidophilic Bacteria." Biodegradation 17: 57-65.
Kishimoto, N., Kosako,Y., Wakao,N., Tano,T. and Hiraishi,A. (1995). "Transfer of
Acidiphilium facilis and Acidiphilium aminolytica to the genus Acidocella gen. nov.,
and emendation of the genus Acidiphilium." Systematic and Applied Microbiology 18:
85-91.
Kivic, P. A. and Vesk, M. (1974). "Pinocytotic uptake of protein from the reservoir in
Euglena." Archives of Microbiology 96: 155-9.
Konings, W. N., Albers, S. V., Koning, S. and Driessen, A. J. (2002). "The cell
membrane plays a crucial role in survival of bacteria and archaea in extreme
environments." Antonie Van Leeuwenhoek 81: 61-72.
172
Krsek., M. and Wellington. E. M. (1999). "Comparison of different methods for the
isolation and purification of total community DNA from soil." Journal of
Microbiological Methods 39: 1-16.
Kuske, C. R., Banton, K. L.. Adorada, D. L.. Stark., P. C .• Hill. K. K. and Jackson, P. J.
(1998). "Small-scale sample preparation method for field PCR detection of microbial
cells and spores in soil." Applied and Environmental Microbiology 64: 2463-2472.
Lane, A. E. and Burris, J. E. (1981). "Effects of environmental pH on the internal pH of
Chlorellapyrenoidsa, Scenedesmus quadricauda. and Euglena mutabilis." Plant
Physiology 68: 439-442.
Lane, D. 1. (1991). 16S/23S rRNA sequencing. Nucleic acid techniques in bacterial
systematics. E. Stackebrandt and M. Goodfellow. New York., NY, John Wiley and
Sons: 115-175.
Leadbetter, J. R. (2003). "Cultivation of recalcitrant microbes: cells are alive, well and
revealing their secrets in the 21st century laboratory." Current Opinion in Microbiology
6: 274-81.
Leduc, D., Leduc, L. G. and Ferroni, G. D. (2002). "Quantification of bacterial
populations indigenous to acidic mine drainage streams." Water, Air and Soil Pollution
135: 1-21.
Leff, L. G., Dana, J. R., McArthur, J. V. and Shimkets, L. J. (1995). "Comparison of
DNA extraction from stream sediments." Applied and Environmental Microbiology 61:
1141-1143.
Lin, L.-H., Hall, 1., Onstott, T. C., Gihring, T., LoBar, B. S., Boice, E., Pratt, L.,
Lippmann-Pipke, 1. and Bellamy, R. E. S. (2006). "Planktonic microbial communities
associated with fracture-derived groundwater in a deep gold mine of South Africa"
Geomicrobiology Joumal23: 475-497.
Liu, W. T., Marsh, T. L., Cheng, H. and Fomey, L. J. (1997). "Characterization of
microbial diversity by determining terminal restriction fragment length polymorph isms
of genes encoding 16S rRNA." Applied and Environmental Microbiology 63: 4516-22.
173
Lopez-Archilla, A. I., Marin, I. and Amils, R. (1993). "Bioleaching and interrelated
acidophilic microorganisms from Rio Tinto, Spain." Geomicrobiology Joumalll: 223-
233.
Ma, Y., Zhang, W., Xue, Y., Zhou, P., Ventosa, A. and Grant, W. D. (2004). "Bacterial
diversity of the Inner Mongolian Baer Soda Lake as revealed by 16S rRNA gene
sequence analyses." Extremophiles 8: 45-51.
Maarit Niemi. R.. Heiskanen, I., Wallenius, K. and Lindstrom, K. (2001). "Extraction
and purification of DNA in rhizosphere soil samples for PCR-DGGE analysis of
bacterial consortia." Journal of Microbiological Methods 45: 155-65.
Macalady, 1. L., Vestling, M. M., Baumler, D., Boekelheide, N., Kaspar, C. W. and
Banfield, J. F. (2004). "Tetraether-linked membrane monolayers in Ferroplasma spp: a
key to survival in acid." Extremophiles 8: 411-9.
Mahmoud, K. K., Leduc, L. G. and Ferroni, G. D. (2005). "Detection of
Acidithiobacillus ferrooxidans in acid mine drainage environments using fluorescent in
situ hybridization (FISH)." Journal of Microbiological Methods 61: 33-45.
Marchesi, J. R., Sato, T., Weightman, A. J., Martin, T. A., Fry, J. C., Hiom, S. J.,
Dymock, D. and Wade, W. G. (1998). "Design and evaluation of useful bacterium
specific PCR primers that amplify genes coding for bacterial 16S rRNA." Applied and
Environmental Microbiology 6: 795-9.
Margulis, L. and Dolan, M. (1999). Diversity of Life: The Illustrated Guide to Five
Kingdoms, Jones and Bartlett Publishers International
Marin, B., Palm, A., Klingberg, M. and Melkonian, M. (2003). "Phylogeny and
taxonomic revision of plastid-containing euglenophytes based on SSU rDNA sequence
comparisons and synapomorphic signatures in the SSU rRNA secondary structure."
Protist 154: 99-145.
Marsh, T. L. (1999). "Terminal restriction fragment length polymorphism (T-RFLP): an
emerging method for characterizing diversity among homologous populations of
amplification products." Current Opinion in Microbiology 2: 323-1.
174
Marsh, T. L., Saxman, P. P., Cole, J. and Tiedje, J. (2000). "Terminal restriction
fragment length polymorphism analysis program, a web-based research tool for
microbial community analysis." Applied and Environmental Microbiology 66: 3616-
3620.
Matin, A. (1990). "Keeping a neutral cytoplasm; the bioenergetics of obligate
acidophiles." FEMS Microbiology Reviews 75: 307-18.
Mechichi, T., Stackebrandt, E. and Fuchs, G. (2003). "Alicycliphilus denitrificans gen.
nov., sp. nov., a cyclohexanol-degrading, nitrate-reducing beta-proteobacterium."
International Journal of Systematic and Evolutionary Microbiology 53: 147-52.
Messerli, M. A., Amaral-Zettler, L. A., Zettler, E., Jung, S. K., Smith, P. J. and Sogin,
M. L. (2005). "Life at acidic pH imposes an increased energetic cost for a eukaryotic
acidophile." Journal of Experimental Biology 208(13): 2569-79.
Michels, M. and Bakker, E. P. (1985). "Generation of a large, protonophore-sensitive
proton motive force and pH difference in the acidophilic bacteria Thermop/asma
acidophilum and Bacillus acidocaldarius." Journal of Bacteriology 161: 231-7.
Mills, D. K., Fitzgerald, K., Litchfield, C. D. and Gillevet, P. M. (2003). "A comparison
of DNA profiling techniques for monitoring nutrient impact on microbial community
composition during bioremediation of petroleum-contaminated soils." Journal of
Microbiological Methods 54: 57-74.
Milne, D. D., Clark, A. I. and Perry, R (1986). "Acid tars: Their production, treatment
and disposal in the UK." Waste Management and Research 4: 407-18.
"Molecular Probes Product Information Sheet MP34950." from
http://probes.invitrogen.com/media/pis/mp34950.pdf.
Muyzer, G., Teske, A., Wirsen, C. O. and Jannasch, H. W. (1995). "Phylogenetic
relationships of Thiomicrospira species and their identification in deep-sea
hydrothermal vent samples by denaturing gradient gel electrophoresis of 16S rDNA
fragments." Archives of Microbiology 164: 165-72.
175
Muyzer, G., Waal, E. C. D. and Uitterlinden, A. G. (1993). "Profiling of complex
microbial populations by denaturing gradient gel electrophoresis analysis of polymerase
chain recti on-amplified genes coding for 16s rRNA." Applied and Environmental
Microbiology 59: 695-700.
Nancarrow, N. 1., Slade, N. J. and Steed, J. E. (2001). Land contamination: Technical
Guidance on Special Sites: Acid Tar Lagoons. R&D Technical Report P5-042ffR104,
Environment Agency.
Nguyen, V. A., Senoo, K., Mishima, T. and Hisamatsu, M. (2001). "Multiple tolerance
of Rhodotorula g/utinis R-l to acid, aluminum ion and manganese ion, and its unusual
ability of neutralizing acidic medium." Journal of Bioscience and Bioengineering 92:
366-71.
Nichol, D. (2000). "Geo-engineering Problems at Hoole Bank Acid Tar Lagoon,
Cheshire, UK." Land Contamination and Reclamation 8: 167-173.
Nixdorf, B., Fyson, A. and Krumbeck, H. (2001). "Review: plant life in extremely
acidic waters." Environmental and Experiental Botany 46: 203-11.
Nogales, B., Moore, E. R., Llobet-Brossa, E., Rossello-Mora, R., Amann, R. and
Timrnis, K. N. (2001). "Combined use of 16S ribosomal DNA and 16S rRNA to study
the bacterial community of polychlorinated biphenyl-polluted soil." Applied and
Environmental Microbiology 67: 1874-84.
Nubel, U., Garcia-Pichel, F., Kuhl, M. and Muyzer, G. (1999). "Quantifying microbial
diversity: morphotypes, 16S rRNA genes, and carotenoids of oxygenic phototrophs in
microbial mats." Applied and Environmental Microbiology 65: 422-430.
Olaveson, M. M. and Nalewajko, C. (2000). "Effects of acidity on the growth of two
Euglena species." Hydrobiologia 433: 39-56.
Olsen, G. J., Lane, D. J., Giovannoni, S. J. and Pace, N. R. (1986). "Microbial Ecology
and Evolution: A Ribosomal RNA Approach." Annual Reviews in Microbiology 40:
337-65.
176
Olsen, G. 1., Overbeek, R., Larsen, N., Marsh, T. L., McCaughey, M. J., Maciukenas,
M. A., Kuan, W. M., Macke, T. J., Xing, Y. and Woese, C. R. (1992). "The Ribosomal
Database Project." Nucleic Acids Research 20: 2199-2200.
Osborn, A. M., Moore, E. R. and Timmis, K. N. (2000). "An evaluation of tenninal
restriction fragment length polymorphism (T -RFLP) analysis for the study of microbial
community structure and dynamics." Environmental Microbiology 2: 39-50.
Pace, N. R. (1997). "A Molecular View of Microbial Diversity In The Biosphere."
Science 276: 734-740.
Pensaert, S. (2005). The remediation of acid tar lagoons. Rieme Belgium. International
conference on stabilisationlsolidification treatment and remediation. Advances in S/S
for Waste and Contaminated Land. Cambridge University, England, UK.
Phung, N. T., Lee, J., Kang, K. H., Chang, I. S., Gadd, G. M. and Kim, B. H. (2004).
"Analysis of microbial diversity in oJigotrophic microbial fuel cells using ) 6S rDNA
sequences." FEMS Microbiology Letters 233: 77-82.
Quaiser, A., Ochsenreiter, T., Klenk, H. P., Kletzin, A., Treusch, A. H., Meurer, G.,
Eck, J., Sensen, C. W. and Schleper, C. (2002). "First insight into the genome of an
uncultivated crenarchaeote from soil." Environmental Microbiology 4: 603-11.
Rappe, M. S. and Giovanoni, S. J. (2003). "The uncultured microbial majority." Annual
Reviews in Microbiology 57: 369-94.
Rawlings, D. E., Tributsch, H. and Hansford, G. S. (1999). "Reasons why
'Leptospirillum'-like species rather than Thiobacillus ferrooxidans are the dominant
iron-oxidizing bacteria in many commercial processes for the biooxidation of pyrite and
related ores." Microbiology 145: 5-13.
Rees, D., Lee, C. B., Gilmour, D. J. and Horton, P. (1992). "Mechanisms for controlling
balance between light input and utilisation in the salt tolerant alga Dunaliella C9AA."
Photosynthesis Research 32: 181-91.
177
Reynolds, J. M. (2002). "The role of environmental geophysics in the investigation of
an acid tar lagoon, Llwyneinion, North Wales, UK." First Break: 20: 630-6.
Rodriguez-Valera, F. (2002). "Approaches to prokaryotic biodiversity: a population
genetics perspective." Environmental Microbiology 4: 628-633.
Roling, W. F., Ortega-Lucach, S., Larter, S. R. and Head, I. M. (2006). "Acidophilic
microbial communities associated with a natural, biodegraded hydrocarbon seepage."
Journal of Applied Microbiology 101: 290-9.
Rondon, M. R., August, P. R., Betterman, A. D., Brady, S. F., Grossman, T. H., LUes,
M. R., Loiacono, K. A., Lynch, B. A., MacNeil, I. A., Minor, C., Tiong, C. L., Gilman,
M., Osburne, M. S., Clardy, 1., Handelsrnan, J. and Goodman, R. M. (2000). "Cloning
the Soil Metagenome: a Strategy for Accessing the Genetic and Functional Diversity of
Uncultured Microorgansisms." Applied and Environmental Microbiology 66: 2541-47.
Rossello-Mora, R. and Amann, R. (200 t). "The species concept for prokaryotes."
FEMS Microbiology Reviews 25: 39-67.
Rothschild, L. 1. and Manicinelli, R. L. (2001). "Life in extreme environments." Nature
409: 1092-1101.
Rottenberg, H. (1979). "The measurement of membrane potential and delta pH in cells,
organelles, and vesicles." Methods in Enzymology 55: 547-69.
Rowe, O. F., Sanchez-Espana, J., Hallberg, K. B. and Johnson, D. B. (2007). "Microbial
communities and geochemical dynamics in an extremely acidic, metal-rich stream at an
abandoned sulfide mine (Huelva, Spain) underpinned by two functional primary
production systems." Environmental Microbiology 9: 1761-71.
Sail, M., Hugenholtz, P. and Janssen, P. H. (2002). "Cultivation of globally distributed
soil bacteria from phylogenetic lineages previously only detected in cultivation
independent surveys." Environmental Microbiology 4: 654-66.
178
Salmassi, T. M., Walker, J. J., Newman, D. K., Leadbetter, J. R., Pace, N. R. and
Hering, J. G. (2006). "Community and cultivation analysis of arsenite oxidizing
biofilms at Hot Creek." Environmental Microbiology 8: 50-9.
Sambrook, J. and Russell, D. W. (2001). Molecular Cloning: A Laboratory Manual.
Cold Spring Harbor, New York, USA, Cold Spring Harbor Laboratory Press.
Savage, A. 1. and Tyrrel, S. F. (2005). "Compost liquor bioremediation using waste
materials as biofiltration media." Bioresource Technology 96: 557-564.
Schafer, H., Bernard, L., Courties, C., Lebaron, P., Servais, P., Pukall, R., Stackebrandt,
E., Troussellier, M., Guindulain, T., Vives-Rego, J. and Muyzer, G. (2001). "Microbial
community dynamics in Mediterranean nutrient-enriched seawater mesocosms: changes
in the genetic diversity of bacterial populations." FEMS Microbiology Ecolpgy 34: 243-
253.
Schauer, M., Massana, R. and Pedros-Alio, C. (2000). "Spatial differences in
bacterioplankton composition along the Catalan coast (NW Mediterranean) assessed by
molecular fingerprinting." FEMS Microbiology Ecology 33: 51-59.
Schleper, C., Puehler, G., B, K. and ZilIig, W. (1995). "Life at extremely low pH."
Nature 375: 741-2.
Shyu, c., Soule, T., Bent, S. J., Foster, J. A. and Forney, L. J. (2007). "MiCA: a web
based tool for the analysis of microbial communities based on terminal-restriction
fragment length polymorphisms of 16S and 18S rRNA genes." Microbial Ecology 53:
562-70.
Sittenfeld, A., Mora, M., Ortega, J. M., Albertazzi, F., Cordero, A., Roncel, M.,
Sanchez, E., Vargas, M., Femandez, M., Weckesser, J. and Serrano, A. (2002).
"Characterisation of a photsynthetic Euglena strain isolated from an acidic hot mud pool
of a volcanic area of Costa Rica." FEMS Microbiology Ecology 42: 151-61.
Smit, E., Leeflang, P. and Wemars, K. (1997). "Detection of shifts in microbial
community structure and diversity in soil caused by copper contamination using
amplified ribosomal DNA analysis." FEMS Microbiology Ecology 23: 249-61.
179
Smith, C., Xu, H. and Brown, M. (2004). Restoration of Acid Tar lagoons: SUBR:IM
Work Package H. CL:AlRE Annual Project Conference Cruciform Building, University
College London.
Smith, C. J., Danilowicz, B. S., Clear, A. K., Costello, F. J., Wilson, B. and Meijer, W.
G. (2005). "T-Align, a web-based tool for comparison of multiple terminal restriction
fragment length polymorphism profiles." FE MS Microbiology Ecology 54: 375-80.
Stackebrandt, E. and Goebel, B. (1994). "Taxonomic note: a place for DNA-DNA
reassociation and 16S rRNA sequence analysis in the present species defmition in
bacteriology." International Journal of Systematic Bacteriology 44: 846-9.
Staley, J. T. and Konopka, A. (1985). "Measurements of in situ activities of
nonphotosynthetic microorganisms in aquatic and terrestrial habitats." Annual Reviews
of Microbiology 39: 321-346.
Suzuki, M. T. and Giovannoni, S. 1. (1996). "Bias caused by template annealing in the
amplification of mixtures of 16S rRNA genes by PCR." Applied and Environmental
Microbiology 62: 625-30.
Tatusova, T. A. and Madden, T. L. (1999). "BLAST 2 Sequences, a new tool for
comparing protein and nucleotide sequences." FEMS Microbiology Letters 174: 247-50.
Teske, A., Sigalevich, P., Cohen, Y. and Muyzer, G. (1996). "Molecular identification
of bacteria from a coculture by denaturing gradient gel electrophoresis of 16S ribosomal
DNA fragments as a tool for isolation in pure cultures." Applied and Environmental
Microbiology 62: 4210-5.
Tillmann, S., Strompl, C., Timmis, K. N. and Abraham, W.-R. (2005). "Stable isotope
probing reveals the dominant role of Burkholderia species in aerobic degradation of
PCBs." FEMS Microbiology Ecology 52: 207-217.
Torsvik, V., Goksoyr, 1. and Daae, F. L. (1990). "High diversity in DNA of soil
bacteria." Applied and Environmental Microbiology 56: 782-7.
180
Torsvik, V., Ovreas, L. and Thingstad, T. F. (2002). "Prokaryotic diversity--magnitude,
dynamics, and controlling factors." Science 296: 1064-6.
Tyson, G. W., Chapman, J., Hugenholtz, P., Alien, E. E., Ram, R. l., Richardson, P. M.,
Solovyev, V. V., Rubin, E. M., Rokhsar, D. S. and Banfield, J. F. (2004). "Community
structure and metabolism through reconstruction of microbial genomes from the
environment." Nature 428: 37-43.
Uchiyama, T., Abe, T., Ikemura, T. and Watanabe, K. (2005). "Substrate-induced gene
expression screening of environmental metagenome libraries for isolation of catabolic
genes." Nature Biotechnology 23(1): 88-93.
Van Der Gucht, K., Sabbe, K., De Meester, L., Vloemans, N., Zwart, G., Gillis, M. and
Vyverman, W. (2001). "Contrasting bacterioplankton community composition and
seasonal dynamics in two neighbouring hypertrophic freshwater lakes." Environmental
Microbiology 3: 680-90.
Vancanneyt, M., Schut, F., Snauwaert, C., Goris, 1., Swings, J. and Gottschal, J. C.
(2001). "Sphingomonas alaskensis sp. nov., a dominant bacterium from a marine
oJigotrophic environment." International Journal of Systematic and Evolutionary
Microbiology 51: 73-9.
Venter, J. C., Remington, K., Heidelberg, 1. F., Halpern, A. L., Rusch, D., Eisen, J. A.,
Wu, D., Paulsen, I., Nelson, K. E., Nelson, W., Fouls, D. E., Levy, S., Knap, A. H.,
Lomas, M. W., Nealson, K., White, 0., Peterson, J., Hoffinan, J., Parsons, R., Baden
Tillson, H., Pfannkoch, C., Rogers, Y. H. and Smith, H. O. (2004). "Environmental
genome shotgun sequencing of the Sargasso Sea." Science 304: 66-74.
Voget, S., Leggewie, C., Uesbeck, A., Raasch, C., Jaeger, K. E. and Streit, W. R.
(2003). "Prospecting for novel biocatalysts in a soil metagenome." Applied and
Environmental Microbiology 69: 6235-42.
Vossenberg, V. D., Driessen, A. 1., Zillig, W. and Konings, W. N. (1998).
"Bioenergetics and cytoplasmic membrane stability of the extremely acidophilic,
thermophilic archaeon Picrophilus oshimae." Extremophiles 2: 67-74.
t8t
Wayne, L. G., Brenner, D. J., Colwell, R R, Grimont, P. A. D., Kandler, 0.,
Krichevsky, L., Moore, L. H., Moore, W. C., Murray, R G. E., Stackebrandt, E., Starr,
M. P. and TrUper, H. G. (1987). "Report of the ad hoc committee on reconciliation of
approaches to bacterial systematics." International Journal of Systematic Bacteriology
37: 463-4.
White, T. J., Bruns, T., Lee, S., Taylor, J. (1990). Amplification and direct sequencing
of fungal ribosomal RNA genes for phylogenetics. PCR Protocols: A Guide to Methods
and Applications. M. A. Innis, Gelfand, D. H., Sninsky, J. J. and White, T. J. San Diego,
Academic Press, 315-322.
Whitman, W. 8., Coleman, D. C. and Wiebe, W. J. (1998). "Prokaryotes: The unseen
majority." Proceedings of the National Academy of Sciences of the United States of
America 95: 6578-6583.
Wintzingerode, F. v., Go€!bel, U. B. and Stackebrandt, E. (1997). "Detennination of
microbial diversity in environmental samples: pitfalls of PCR-based rRNA analysis."
FEMS Microbiology Reviews 21: 213-299.
Wintzingerode, F. v., Se lent, B., Hegemann, W. and Gobel, U. B. (1999). "Phylogenetic
analysis of an anaerobic, trichlorobenzene-transfonning microbial consortium." Applied
and Environmental Microbiology 65: 283-6.
Wirsen, C. 0., Sievert, S. M., Cavanaugh, C. M., Molyneaux, S. J., Ahmad, A., Taylor,
L. T., DeLong, E. F. and Taylor, C. D. (2002). "Characterization of an autotrophic
sulfide-oxidizing marine Arcobacter sp. that produces filamentous sulfur." Applied and
Environmental Microbiology 68: 316-25.
Witzig, R., Aly, H. A., Strompl, C., Wray, V., Junca, H. and Pieper, D. H. (2007).
"Molecular detection and diversity of novel diterpenoid dioxygenase DitAl genes from
proteobacterial strains and soil samples." Environmental Microbiology 9: 1202-18.
Woese, C. R. (1987). "Bacterial Evolution." Microbiology Reviews 51: 221-271.
182
Woese, C. R., Kandler, o. and Wheelis, M. L. (1990). "Towards a natural system of
organisms: Proposal of the domains Archaea, Bacteria and Eucarya." Proceedings of
the National Academy of Sciences of the United States of America 87: 4576-4579.
Zettler, L. A. A., Gomez, F., Zettler, E., Keenan, B. G., Amils, R. and Sogin, M. L.
(2002). "Eukaryotic diversity in Spain's River of Fire." Nature 417: 137.
Zocca, C., Di Gregorio, S., Visentini, F. and VaIlini, G. (2004). "Biodiversity amongst
cultivable polycyclic aromatic hydrocarbon-transfonning bacteria isolated from an
abandoned industrial site." FEMS Microbiology Letters 238: 375-82.
Zychlinsky, E. and Matin, A. (1983). "Cytoplasmic pH homeostasis in an acidophilic
bacterium, Thiobacillus acidophilus." Journal of Bacteriology 156: 1352-5.
183
Copyright © 2022 FDOKUMEN