Investigation of crystallinity, molecular weight change, and mechanical properties of PLA/PBG...
25
Investigation of Crystallinity, Molecular Weight Change, and Mechanical Properties of PLA/PBG Bioresorbable Composites as Bone Fracture Fixation Plates REDA M. FELFEL, 1,2, *IFTY AHMED, 1 ANDREW J. PARSONS, 1 PAPIA HAQUE, 1 GAVIN S. WALKER 1 AND CHRIS D. RUDD 1 1 Faculty of Engineering, Division of Materials, Mechanics and Structures University of Nottingham, Nottingham NG7 2RD, UK 2 Faculty of Science, Physics Department, Mansoura University, Mansoura 35516, Egypt ABSTRACT: In this study, bioresorbable phosphate-based glass (PBG) fibers were used to reinforce poly(lactic acid) (PLA). PLA/PBG random mat (RM) and unidirectional (UD) composites were prepared via laminate stacking and compression molding with fiber volume fractions between 14% and 18%, respectively. The percentage of water uptake and mass change for UD composites were higher than the RM composites and unreinforced PLA. The crystallinity of the unreinforced PLA and composites increased during the first few weeks and then a plateau was seen. XRD analysis detected a crystalline peak at 16.68 in the unreinforced PLA sample after 42 days of immersion in phosphate buffer solution (PBS) at 378C. The initial flexural strength of RM and UD composites was 106 and 115 MPa, whilst the modulus was 6.7 and 9 GPa, respectively. After 95 days immersion in PBS at 378C, the strength decreased to 48 and 52 MPa, respectively as a result of fiber–matrix interface degradation. There was no significant change in flexural modulus for the UD composites, whilst the RM composites saw a decrease of 45%. The molecular weight of PLA alone, RM, and UD composites decreased linearly with time during degradation *Author to whom correspondence should be addressed. E-mail: [email protected] Figures 1, 8 and 9 appear in color online: http://jba.sagepub.com JOURNAL OF BIOMATERIALS APPLICATIONS Vol. 26 — March 2012 765 0885-3282/12/07 0765–25 $10.00/0 DOI: 10.1177/0885328210384532 ß The Author(s), 2010. Reprints and permissions: http://www.sagepub.co.uk/journalsPermissions.nav at University of Nottingham on March 28, 2015 jba.sagepub.com Downloaded from
-
Upload
independent -
Category
Documents
-
view
1 -
download
0
Transcript of Investigation of crystallinity, molecular weight change, and mechanical properties of PLA/PBG...

Investigation of Crystallinity,Molecular Weight Change, and
Mechanical Properties of PLA/PBGBioresorbable Composites as Bone
Fracture Fixation Plates
REDA M. FELFEL,1,2,* IFTY AHMED,1 ANDREW J. PARSONS,1 PAPIA
HAQUE,1 GAVIN S. WALKER1
AND CHRIS D. RUDD1
1Faculty of Engineering, Division of Materials, Mechanics and Structures
University of Nottingham, Nottingham NG7 2RD, UK2Faculty of Science, Physics Department, Mansoura University, Mansoura
35516, Egypt
ABSTRACT: In this study, bioresorbable phosphate-based glass (PBG) fiberswere used to reinforce poly(lactic acid) (PLA). PLA/PBG random mat (RM) andunidirectional (UD) composites were prepared via laminate stacking andcompression molding with fiber volume fractions between 14% and 18%,respectively. The percentage of water uptake and mass change for UDcomposites were higher than the RM composites and unreinforced PLA. Thecrystallinity of the unreinforced PLA and composites increased during the firstfew weeks and then a plateau was seen. XRD analysis detected a crystalline peakat 16.68 in the unreinforced PLA sample after 42 days of immersion in phosphatebuffer solution (PBS) at 378C. The initial flexural strength of RM and UDcomposites was �106 and �115 MPa, whilst the modulus was �6.7 and �9 GPa,respectively. After 95 days immersion in PBS at 378C, the strength decreased to48 and 52 MPa, respectively as a result of fiber–matrix interface degradation.There was no significant change in flexural modulus for the UD composites,whilst the RM composites saw a decrease of �45%. The molecular weight of PLAalone, RM, and UD composites decreased linearly with time during degradation
*Author to whom correspondence should be addressed.E-mail: [email protected] 1, 8 and 9 appear in color online: http://jba.sagepub.com
JOURNAL OF BIOMATERIALS APPLICATIONS Vol. 26 — March 2012 765
0885-3282/12/07 0765–25 $10.00/0 DOI: 10.1177/0885328210384532� The Author(s), 2010. Reprints and permissions:http://www.sagepub.co.uk/journalsPermissions.nav
at University of Nottingham on March 28, 2015jba.sagepub.comDownloaded from

due to chain scission of the matrix. Short fiber pull-out was seen from SEMmicrographs for both RM and UD composites.
KEY WORDS: phosphate glass fiber, bioresorbable composite, crystallinity,mechanical properties.
INTRODUCTION
Metals and alloys are commonly used materials for internalfracture fixation of bone. Use of metallic devices for bone fixation
has been known to cause problems such as stress shielding, whichcan result in bone atrophy. This effect occurs due to the elasticmodulus mismatch between bone and metal (Ebone �6–20 GPa andEmetal �100–200 GPa). In addition, metal corrosion can potentiallyrelease ions that cause inflammation and infection [1,2]. Bioresorbablebone fixation devices have three main advantages over metallicimplants: (i) removal surgery is not required, (ii) the degradationproducts can be biocompatible and secreted through the naturalpathways of the body, and (iii) the mechanical properties can be tailoredto match that of bone and can be engineered to decrease over time,allowing gradual stress transfer to the healing bone [3].
Over the last few decades, biodegradable polymers such as poly-e-caprolactone (PCL), poly(glycolic acid) (PGA), and poly(lactic acid)(PLA) have attracted huge interest for use in biomedical applications.PLA is one of the most widely investigated bioresorbable materials dueto its use in many different applications such as sutures, pins, plates,screws, and drug delivery systems. However, the mechanical propertiesof PLA alone are not sufficient for some load bearing applications suchas screws and plates [4]. Therefore, reinforcement is essential toovercome these limitations, which can be obtained via fabrication of acomposite consisting of bioresorbable polymer (as matrix) and biocera-mics (as reinforcement) [5].
Composites made from PLA reinforced with bioactive glass andhydroxylapatite (HA) were investigated as potential candidates [6,7].The initial flexural strength and modulus of the PLLA-BG compositewas 153.9 MPa and 3.59 GPa respectively, whilst values of 233 MPa and3.25 GPa for PLA alone were achieved. The flexural properties droppedby 20% for strength and 62% for modulus after soaking in phosphatebuffer solution (PBS) at 378C for 20 weeks. The initial flexural strengthand modulus of an 80 wt% HA composite was 130 MPa and 10 GPa,respectively. The strength decreased rapidly to 60 MPa after 1 day
766 R. M. FELFEL ET AL.
at University of Nottingham on March 28, 2015jba.sagepub.comDownloaded from

immersion in Hank’s Balanced Salt Solution, whilst after 20 days themodulus slightly decreased to 9 GPa.
It is well known that particulate composites have relatively weakermechanical properties as compared to other reinforcement morpholo-gies. Ahmed et al. [8] produced a phosphate-based glass (PBG) fiber-reinforced PLA composite, with 14% fiber volume fraction. Its initialflexural properties were 90 MPa for strength and 5 GPa for modulus.The strength and modulus decreased to 40 MPa and 1 GPa, respectively,after degradation in deionized water at 378C for 6 weeks. However,properties at intermediate time points were not evaluated.
Preliminary mechanical properties of a binary calcium phosphateglass fiber/PCL composite were also investigated. The flexural strengthof the composite was similar to PCL alone (25–30 MPa), whilst themodulus increased with increasing fiber volume fraction to 1 and2.4 GPa for a 6.4% and 17% volume fraction composite. Mass loss wasalso monitored and shown to increase from 8% for the lower fiber Vfcomposite to 20% for the higher Vf samples over a 350-h time period indeionized water. No mass loss was observed for PCL alone over thecourse of this study [9].
Mechanical properties of b-Ca(PO3)2 fiber-reinforced PLA compositesdegraded in simulated body fluid (SBF) were investigated by Kasugaet al. [10]. Prior to degradation, the bending strength of the compositewas the same as PLA (�50 MPa), whilst the modulus increased from3 GPa for PLA alone to 5–6 GPa for the composite. After 90 daysdegradation in SBF, the flexural strength of PLA and the compositedecreased to �10 and �25 MPa, respectively.
Ideally for load-bearing bone repair applications, implants/devicesshould have mechanical properties superior or similar to that for corticalbone. They must then be able to degrade gradually over time to allow forstress transfer to the healing bone.
PBGs offer a unique range of materials, as they can be tailored togive degradation rates (of weeks, months, years) to suit the endapplication. In addition, their chemical composition is close to that ofnatural bone [11]. In this study, PBG fiber-reinforced PLA compositeswith different fiber geometries (random mat vs. unidirectional fibers)were produced and evaluated. Their degradation and mechanicalproperties were investigated over 95 days along with the effect ofdegradation on thermal properties and density. Composites based onfixed 50 mol% P2O5 PBG glasses have previously been investigated, andwere shown to degrade too quickly for application. In this study, fibersfrom PBG’s with fixed 40 mol% P2O5 were produced which have beenshown to have superior mechanical and biocompatible properties as
Investigation of Properties of PLA/PBG Bioresorbable Composites 767
at University of Nottingham on March 28, 2015jba.sagepub.comDownloaded from

compared to the 50 mol% P2O5 glass formulations previously investi-gated [12,13].
MATERIALS AND METHODOLOGY
Phosphate Glass and Fiber Production
Phosphate glass was prepared using sodium dihydrogen phosphate(NaH2PO4), Calcium hydrogen phosphate (CaHPO4), magnesium hydro-gen phosphate trihydrate (MgHPO4 � 3H2O), and iron phosphate dihydrate(FePO4 � 2H2O) (Sigma Aldrich, UK) as starting salts. The precursors wereweighed according to the composition (40 P2O5-24 MgO-16 CaO-16Na2O-4 Fe2O3 in mol% – denoted as P40). The salt mixtures were loadedinto a 100 mL volume Pt/5% Au crucible type BC 18, and placed into afurnace for 30 min at 3508C (for drying). The crucible was then transferredto another furnace at 11008C for 90 min (for melting). The molten glasswas poured directly onto a steel plate and left to cool to room temperature.The glass was kept in a desiccator until fiber production.
Continuous fibers with �15mm diameter were produced by melt-drawspinning using a dedicated in-house facility. Pulling temperature andspeed were adjusted to �11008C and �1600 rpm. The fibers wereannealed for 90 min at �58C below the glass transition temperature Tg
(Tg¼ 4798C) prior to use.
Preparation of Nonwoven Random and ContinuousUnidirectional Fiber Mats
Random nonwoven mats (RM) were prepared from 10 mm choppedfibers. The fibers were separated into 3 g batches and dispersed in aCellosize (hydroxyethyl cellulose) (Univar Ltd, UK) solution (prepared bydissolution of 11 g of powder into 4 L of deionized water and agitated at600 rpm for 30 min). The solution was strained through a fine metallicmesh in order to remove residual cellosize granules. Fibers were then addedto the solution and stirred for 10 min at the same rate before extraction bythe mesh strainer. The RMs formed were rinsed with deionised water toremove any residual binder before being dried at 508C for 30 min.
The unidirectional (UD) fiber mats were produced from continuous180 mm fiber bundles aligned together (manually) on a steel platecovered with a Teflon sheet. Cellosize solution was added gently using asyringe, to bind the fibers together. The UD mats produced were rinsedwith deionised water to remove any residual binder before being dried toconstant temperature at 508C for 30 min.
768 R. M. FELFEL ET AL.
at University of Nottingham on March 28, 2015jba.sagepub.comDownloaded from

Composite Production
PLA films (�0.2 mm thick) were prepared by compression molding 5 gbatches of PLA resin pellets (Resin 3251-D NatureWorks
�average Mw
�90,000–120,000, PDI¼ 1.636, melting temperature Tm¼ 170.98C,Tg¼ 61.38C). The pellets were placed between two metallic plates andheated to 2108C in a press for 10 min, before being pressed at 3 bar for30 s. The plates were then cooled immediately by transferring to a roomtemperature press at the same pressure. The PLA pellets were dried in avacuum oven at 508C for 48 h before use. The PLA films prepared forproduction of the UD composites were made using 5 g of pellets.
Both RM and UD composites were prepared via a film stackingprocess. The PLA films were stacked alternately with RMs in a 170 mmdiameter, 1.6 mm thick mold cavity between two metallic plates. Thisstack was then heated in the press for 15 min at 2108C and pressed for15 min at 38 bar. The plates were transferred to a second press forcooling to room temperature at 38 bar for 15 min. The same protocol wasapplied for the UD composite except that the mold cavity haddimensions of 160 mm� 160 mm� 2 mm. The resulting laminatedcomposites were cut using a band saw into 40 mm length� 15 mmwidth samples for physical testing. The fiber volume and mass fractionsof the composites were obtained using the matrix burn off method,according to the standard test method ASTM D2584-94 [14]. (SeeTable 1 for details of the composites produced in this study.) The targetfiber volume fraction of the composites was between 18% and 20%;however, actual values obtained from the burn off test revealed thevolume fraction to be lower than expected. This was attributed to somepolymer leakage during the composite preparation process.
Single Fiber Tensile Test
The tensile properties of the fibers produced were obtained bysingle filament testing using a Series S Hounsfield machine,
Table 1. Fiber volume fractions, mass fractions, and sample codes for thecomposites investigated in this study.
Composite code Fiber volume fraction (%) Fiber mass fraction (%)
PLA N/A N/AP40 RM 18� 3 34� 4P40 UD 14� 2 26� 3
P40 RM refers to a PLA-PBG random mat composite and P40 UD a PLA-PBG unidirectional composite.
Investigation of Properties of PLA/PBG Bioresorbable Composites 769
at University of Nottingham on March 28, 2015jba.sagepub.comDownloaded from

following the international standard BS ISO 11566 [15]. Thecrosshead speed of the machine was 1 mm/min and the load cellcapacity was 5 N. PBG fibers are essentially brittle and Weibulldistribution is an accepted statistical tool used to characterize thefailure mode of brittle fibers. In this study, Weibull parameters wereobtained from the tensile strength data calculated using Minitab
�15
(version 3.2.1).
Differential Scanning Calorimetry
Differential scanning calorimetry (DSC) analysis was performedusing a DSC Q10 (TA Instrument, USA), which was calibratedusing indium. Approximately 6 mg of the polymer and compositespecimens were placed in aluminium pans and heated undernitrogen between 408C and 1908C at a rate of 108C/min. Two heatingscans were applied on the samples. After the first heating, thesample was quenched and the second scan performed immediately.The first run was applied to remove the thermal history of thesamples [16].
The resulting thermograms were analyzed using TA instrumentuniversal analysis 2000 software version 4.3A to determine thepercentage of crystallinity (Xc%). The crystallinity percentage wascalculated using the enthalpy for 100% crystalline PLA (93.1 J/g). Forthe case of composites, the heat of fusion (�Hf) was recalculatedaccording to the mass fraction of matrix in the composite Xp:�Hf¼�Hfc/Xp, where �Hfc is the composite enthalpy [4].
X-Ray Diffraction
The X-ray diffraction (XRD) measurements were performed for PLAand the RM/UD composites using a D500 diffractometer (SIEMENS).CuKa radiation (�¼ 0.154 nm) was used at voltage of 40 kV and currentof 25 mA. The samples were scanned using a step-scanning method witha step-size of 0.058 and 2 s intervals in the range from 28 to 508 of thediffraction angle (2�).
Pycnometry
Density of the specimens was measured using a MicromeriticsAccuPyc 1330 helium pycnometer (Norcross, GA, USA). During thetest, the helium pressure was set to 21 psi with a purging time ofapproximately 15 min. The measurements were conducted at room
770 R. M. FELFEL ET AL.
at University of Nottingham on March 28, 2015jba.sagepub.comDownloaded from

temperature and a relative humidity of 50%. Triplicate specimens wererun for each sample (Figure 1).
Degradation Studies
Specimens of RM and UD composites were placed individually into30 mL glass vials. The vials were filled with PBS (pH¼ 7.4� 0.2) andmaintained at a temperature of 378C. At various time points thespecimens were extracted and blot dried before weight and thicknessmeasurements were recorded. The samples were placed back into vialswith fresh PBS solution. At each time point, replicates (n¼ 6–10) of eachsample were measured and the average reported. The data was plottedas percentage water uptake (W), dry mass change (Md), and wet mass(Mw) change against time (Figures 1 and 2).
The percentage mass and water uptake change was determined usingthe following equations:
Md ¼md�mi
mi� 100%
Mw ¼m�mi
mi� 100%
W ¼m�md
md� 100%
Probability plot of control-1 fibersWeibull – 95% CI
Per
cent
99.999
90
706050403020
10
5
32
1
80
150 200 300
Tensile strength (MPa)
400 500
Shape 6.336340.6
48
0.7140.059
Scale
N
AD
p-Value
Figure 1. Weibull parameters obtained for phosphate glass fibers in the system 40 P2O5-
24 MgO-16 CaO-16 Na2O-4 Fe2O3 (in mol%) (thirty repeat samples were tested).
Investigation of Properties of PLA/PBG Bioresorbable Composites 771
at University of Nottingham on March 28, 2015jba.sagepub.comDownloaded from

Where m is the mass of degraded sample measured at time t, mi is theinitial mass of the sample, and md is the mass of degraded sample afterdrying at 508C for 3 days.
Mechanical Properties
The initial flexural strength and modulus were evaluated by flexural(three-point bending) tests using a Hounsfield Series S testing machine.These measurements were done according to the standards BS ENISO 14125:1998 [17] and BS 2782-10:1977 [18]. A crosshead speed of1 mm/min and a 1 kN load cell was used. The measurements wereconducted on wet samples for two reasons:
1. drying of wet samples rapidly destroys their structure leading to adecrease of their strength in measurement conditions [2], and
2. toget the mechanical properties of the composite within in vitro conditions.
The measurements were carried out in triplicate (n¼ 3).
Gel Permeation Chromatography
The weight average molecular weight (Mw) of PLA in thespecimens (PLA, RM, and UD composites) was determined using
Figure 2. SEM micrograph of as-prepared P40 PBG fibers.
772 R. M. FELFEL ET AL.
at University of Nottingham on March 28, 2015jba.sagepub.comDownloaded from

Gel Permeation Chromatography (GPC), which was performedusing a refractive index detector with HPLC grade chloroform(Fisher Scientific, U.K.) as the eluent. Analysis was performedat 408C with a flow rate of 1 mL/min through two PLgel Mixed-Ccolumns with a calibration range of 5000–300,000 Da calibratedwith polystyrene narrow standards. All GPC equipment andstandards were supplied by Polymer Laboratories (Varian Inc). GPCdata was analyzed using the Cirrus GPC Offline software packageversion 3.0.
Scanning Electron Microscope
Specimens were sputter-coated with carbon and examined using aJEOL 6400 SEM with an accelerating voltage of 10 kV in secondaryelectron mode.
RESULTS
Tensile Properties
The average tensile strength and modulus of the fibers used were318 MPa and 73 GPa with a standard error of 46 MPa and 10 GPa,respectively. The high standard errors for the tensile strength andmodulus observed were probably due to the presence of flaws on thefiber surface. A system compliance value of 0.2253 was obtained andused to calculate the properties obtained. The Weibull scale and shapeparameters of the fibers used were 340 and 6.3, respectively (Figure 3).As-prepared P40 PBG fibers exhibited a clean smooth surface (Figure 4).
Crystallinity and Density
DSC traces were carried out for all samples and Figure 5 showsthermograms for PLA alone, P40 RM, and P40 UD composites beforedegradation. The crystallinity of PLA alone, RM, and UD compositeswas measured using DSC during the degradation period as shown inFigure 6. The initial crystallinity of the RM and UD composites washigher than that of PLA alone. The crystallinity of PLA alone and theRM composite increased from �26% and �31% to �44% and �49%,respectively, after degradation for 2 weeks in PBS. Subsequently, theirvalues plateaued at around 45%. For the UD composite, the crystallinityincreased from �34% to �38% after 2 weeks and maintained this valuefor the duration of the study.
Investigation of Properties of PLA/PBG Bioresorbable Composites 773
at University of Nottingham on March 28, 2015jba.sagepub.comDownloaded from

Hea
t flo
w (
W/g
)Temperature (°C)
40E
xo U
p60 80 100 120 140 160 180 200
PLA
P40 UD
P40 RM
Figure 3. DSC traces for PLA alone, P40 RM, and P40 UD composites before
degradation.
60
50
40
30
Cry
stal
linity
(%
)
20
10
00 200 400 600 800
Degradation time (h)
1000 1200 1400 1600
PLA P40 RM P40 UD
Figure 4. The percentage change of PLA crystallinity (measured using DSC) with timefor pure PLA, RM, and UD composites during degradation in PBS at 378C.
774 R. M. FELFEL ET AL.
at University of Nottingham on March 28, 2015jba.sagepub.comDownloaded from

Inte
nsity
(C
PS
)
6 8 10 12 14 16 18 20 22 24 26 28
2q (deg)
30 32 34 36 38 40 42 44 46 48 50
(200)/(100)
95 days
42 days
0 day
Figure 5. XRD patterns of PLA before and after degradation in PBS at 378C.
1.5
1.46
1.42
1.38
Den
sity
(g/
cm3 )
1.3
1.34
1.26
1.22
1.180 200 400 600 800
Degradation time (h)
1000 1200 1400 1600
PLA
P40 RM
P40 UD
Figure 6. The density change of PLA, RM, and UD composites with time during
degradation in PBS at 378C.
Investigation of Properties of PLA/PBG Bioresorbable Composites 775
at University of Nottingham on March 28, 2015jba.sagepub.comDownloaded from
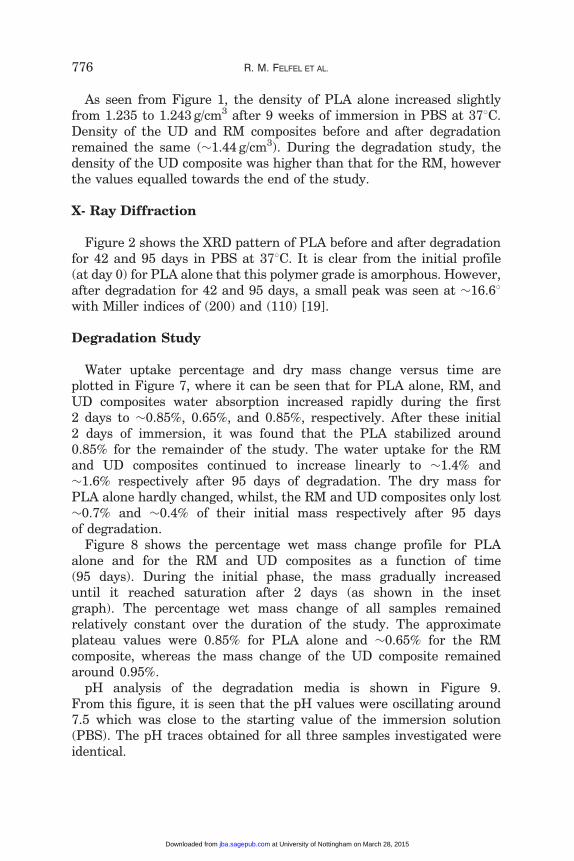
As seen from Figure 1, the density of PLA alone increased slightlyfrom 1.235 to 1.243 g/cm3 after 9 weeks of immersion in PBS at 378C.Density of the UD and RM composites before and after degradationremained the same (�1.44 g/cm3). During the degradation study, thedensity of the UD composite was higher than that for the RM, howeverthe values equalled towards the end of the study.
X- Ray Diffraction
Figure 2 shows the XRD pattern of PLA before and after degradationfor 42 and 95 days in PBS at 378C. It is clear from the initial profile(at day 0) for PLA alone that this polymer grade is amorphous. However,after degradation for 42 and 95 days, a small peak was seen at �16.68with Miller indices of (200) and (110) [19].
Degradation Study
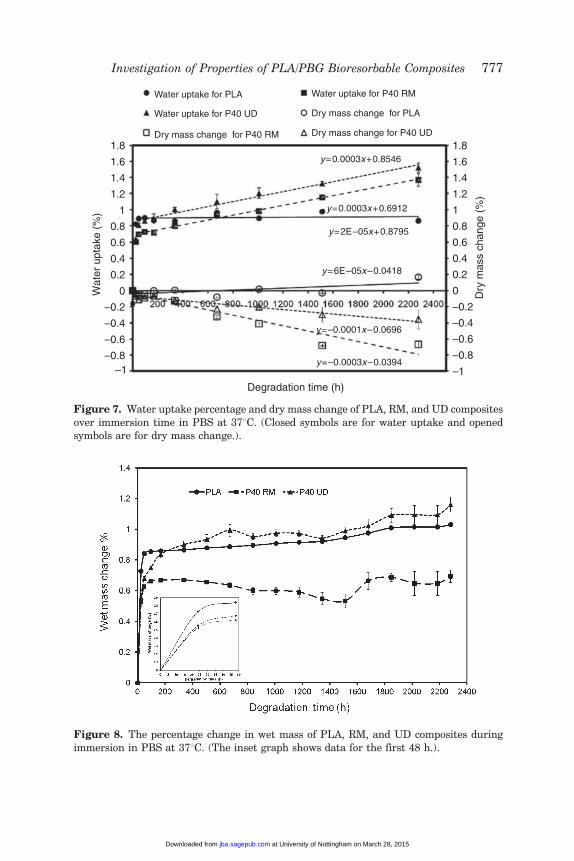
Water uptake percentage and dry mass change versus time areplotted in Figure 7, where it can be seen that for PLA alone, RM, andUD composites water absorption increased rapidly during the first2 days to �0.85%, 0.65%, and 0.85%, respectively. After these initial2 days of immersion, it was found that the PLA stabilized around0.85% for the remainder of the study. The water uptake for the RMand UD composites continued to increase linearly to �1.4% and�1.6% respectively after 95 days of degradation. The dry mass forPLA alone hardly changed, whilst, the RM and UD composites only lost�0.7% and �0.4% of their initial mass respectively after 95 daysof degradation.
Figure 8 shows the percentage wet mass change profile for PLAalone and for the RM and UD composites as a function of time(95 days). During the initial phase, the mass gradually increaseduntil it reached saturation after 2 days (as shown in the insetgraph). The percentage wet mass change of all samples remainedrelatively constant over the duration of the study. The approximateplateau values were 0.85% for PLA alone and �0.65% for the RMcomposite, whereas the mass change of the UD composite remainedaround 0.95%.
pH analysis of the degradation media is shown in Figure 9.From this figure, it is seen that the pH values were oscillating around7.5 which was close to the starting value of the immersion solution(PBS). The pH traces obtained for all three samples investigated wereidentical.
776 R. M. FELFEL ET AL.
at University of Nottingham on March 28, 2015jba.sagepub.comDownloaded from
Wat
er u
ptak
e (%
)
1.8
1.6
1.4
1.2
1
0.8
0.6
0.4
0.2
0
–0.2
–0.4
–0.6
–0.8
Degradation time (h)
1.8
1.6
1.4
1.2
1
0.8
0.6
0.4
0.2
Dry
mas
s ch
ange
(%
)
0
–0.2
–0.4
–0.6
–0.8
–1
Water uptake for PLA
Water uptake for P40 UD
Dry mass change for P40 RM
Water uptake for P40 RM
Dry mass change for P40 UD
Dry mass change for PLA
y=0.0003x+0.8546
y=0.0003x+0.6912
y=2E–05x+0.8795
y=6E–05x–0.0418
y=–0.0001x–0.0696
y=–0.0003x–0.0394–1
Figure 7. Water uptake percentage and dry mass change of PLA, RM, and UD composites
over immersion time in PBS at 378C. (Closed symbols are for water uptake and openedsymbols are for dry mass change.).
Figure 8. The percentage change in wet mass of PLA, RM, and UD composites during
immersion in PBS at 378C. (The inset graph shows data for the first 48 h.).
Investigation of Properties of PLA/PBG Bioresorbable Composites 777
at University of Nottingham on March 28, 2015jba.sagepub.comDownloaded from

Flexural Properties
Flexural strength is plotted against time in Figure 10, where it can beseen that the initial flexural strength of PLA alone improved by theinclusion of PGF reinforcement. Un-reinforced PLA provided a strengthvalue of �90 MPa, with RM providing �106 MPa and UD �115 MPa.The flexural modulus also increased from �3.8 GPa for unreinforcedPLA to �6.8 GPa and �9 GPa for RM and UD composites, respectively(Figure 11).
The PLA, RM, and UD composite specimens were degraded in PBS for95 days at 378C. Flexural tests were conducted on these samples atvarying time points to ascertain mechanical property retention.
For the UD composite, it was seen that the flexural strength remainedconstant upto the 200-h time point after which the strength declinedsuddenly by 30% to �75 MPa. A further decline in the flexural strengthfor the UD composite was observed and reached a value of �50 MPaafter 95 days immersion in PBS at 378C. During the first 2 weeks, theflexural strength of PLA alone and the RM composite dropped from93 MPa and 106 MPa to 85 MPa and 75 MPa, respectively. An additionalgradual reduction in their strength was seen to �60 MPa and �50 MParespectively, by the end of the study (95 days).
Figure 9. pH value change for PBS during the degradation process in PBS at 378C for
PLA alone, RM, and UD composites.
778 R. M. FELFEL ET AL.
at University of Nottingham on March 28, 2015jba.sagepub.comDownloaded from
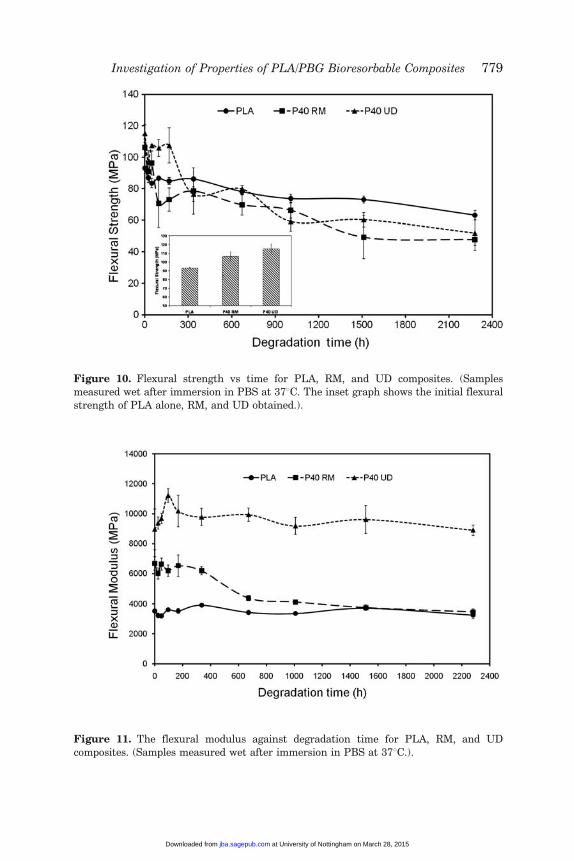
Figure 10. Flexural strength vs time for PLA, RM, and UD composites. (Samplesmeasured wet after immersion in PBS at 378C. The inset graph shows the initial flexural
strength of PLA alone, RM, and UD obtained.).
Figure 11. The flexural modulus against degradation time for PLA, RM, and UD
composites. (Samples measured wet after immersion in PBS at 378C.).
Investigation of Properties of PLA/PBG Bioresorbable Composites 779
at University of Nottingham on March 28, 2015jba.sagepub.comDownloaded from

The initial flexural modulus for the UD specimens was �9 GPa afterwhich an increase to �10 GPa was observed till the 200-h time point.After 2 weeks the modulus plateaus to around 10 GPa for the duration ofthe study. The flexural modulus of PLA alone remained constant at�3.8 GPa during the study period. However, the modulus for the RMcomposite maintained a value of 6.8 GPa for 2 weeks before reducing by30% to �4.5 GPa, after which it remained relatively constant. Figure 12shows stress–strain curves for P40 UD and P40 RM composites. Beforedegradation, the fracture of the samples was regarded as brittle due to asharp break. After 95 days of degradation in PBS at 378C, the samplesbecame more ductile as a result of the plastization effect of water andshort fiber pull out at the fracture surface is seen.
Molecular Weight Change with the Time
Figure 13 shows molecular weight profiles for the three samplesinvestigated over time. The molecular weight percentage of PLA alone,RM, and UD composites decreased linearly during the degradation
Str
ess
(MP
a)120
110
100
90
80
70
60
50
40
30
20
10
00 0.002 0.004 0.006 0.008 0.01 0.012 0.014
Strain
0.016 0.018 0.02 0.022 0.024
P40 UD 0d
P40 UD 95d
P40 RM 0d
P40 RM 95d
Figure 12. Stress–strain curves for P40 UD and P40 RM composites before and after
95 days of degradation in PBS at 378C.
780 R. M. FELFEL ET AL.
at University of Nottingham on March 28, 2015jba.sagepub.comDownloaded from

process. From the linear fitting, it was found that the gradientswere �0.0117, �0.0093, and �0.0124 for PLA alone, RM, and UDcomposites, respectively.
SEM Analysis
Figure 14 shows the fractured surface for PLA, RM, and UDcomposite specimens. Figure 14(a), (c), and (e) represent the samplesbefore degradation and Figure 14(b), (d), and (f) illustrate the specimensafter 95 days of degradation in PBS at 378C.
DISCUSSION
The ideal material for bone fracture fixation would be bioresorbableto obviate the need for surgical removal if required, which wouldthen also allow for stress to be transferred to the healing bone in orderto prevent bone atrophy. It should also be robust enough towithstand the implantation process. Fiber reinforcement of polymersis known to increase their mechanical properties and make thecomposite more ductile than the polymer alone. This ductile behaviorof fiber-reinforced composites (FRC) is able to prevent sudden failure of
Figure 13. The change in weight average molecular weight of PLA, RM, and UDcomposites, over time.
Investigation of Properties of PLA/PBG Bioresorbable Composites 781
at University of Nottingham on March 28, 2015jba.sagepub.comDownloaded from

the implants which can create serious consequences for the patient [5].In addition, if the reinforcing phase (i.e., fibers) were made frombioresorbable PBG, they could promote bone healing via the release ofspecific ions [20].
Ahmed et al. [11] investigated a range of ternary PBGs with fixed 45,50, and 55 mol% P2O5 and the degradation rates obtained ranged from2.83� 10�6 g/cm2/h1 to 3.45� 10�7 g/cm2/h1. Quaternary phosphateglasses containing iron oxide (which has a strong reinforcing effect inthese glasses) were also investigated [21] with degradation rates forthese glasses ranging from 4.5� 10�7 g/cm2/h1 to 2.5� 10�8 g/cm2/h1.The P40 PBG formulation investigated in this study (40P2O5-24MgO-16CaO-16Na2O-4Fe2O3 in mol%) has a degradation rate of approximately3� 10�6 g/cm2/h1. However, obtaining fibers from fixed 40 mol% P2O5
formulations was not straightforward. The reason for this and for thedifferences in their degradation profiles is suggested to be due to theirstructure. PBG formulations with fixed 50 mol% P2O5 are reported tohave an infinite chain structure (i.e., Q2’s), whereas the fixed 45 mol%P2O5 glasses have much shorter chains (i.e., a mixture of Q1’s and Q2’swith reported ratios of� 20 to �80, respectively) [11]. These shorterchains are able to pack together tighter creating more durable glasses.
(a) (c) (e)
(b) (d) (f)
Figure 14. SEM micrographs of a fractured surface of (a) PLA before degradation,
(b) PLA after 95days of degradation in PBS at 378C, (c) RM composite before degradation,(d) RM composite after 95 days of degradation in PBS at 378C, (e) UD composite before
degradation, (d) UD composite after 95 days of degradation in PBS at 378C.
782 R. M. FELFEL ET AL.
at University of Nottingham on March 28, 2015jba.sagepub.comDownloaded from
It is also suggested that due to this mixture of Q1’s and Q2’s within theirstructure, fibers are difficult to produce as during the draw process fiberscontinuously break, probably after having reached the end of a (Q1) chain.
Prior studies [22] have shown that osteoblasts responded well tophosphate glasses containing as much as 20 mol% iron oxide. As such wedid not anticipate any adverse cell response due to 5% iron oxide in theglasses used in this study. Furthermore, Ahmed et al. [21] also showedthat up to 5 mol% Fe2O3 addition to PBG revealed a favorablecytocompatible response.
PBG sustain little or no plastic deformation up to the point of failure,signifying their brittle nature. The failure stress mostly depends on thepresence of flaws, which occur randomly along the length of the fibers,where a large variation in strength is observed.
Polymer and Composite Degradation Studies
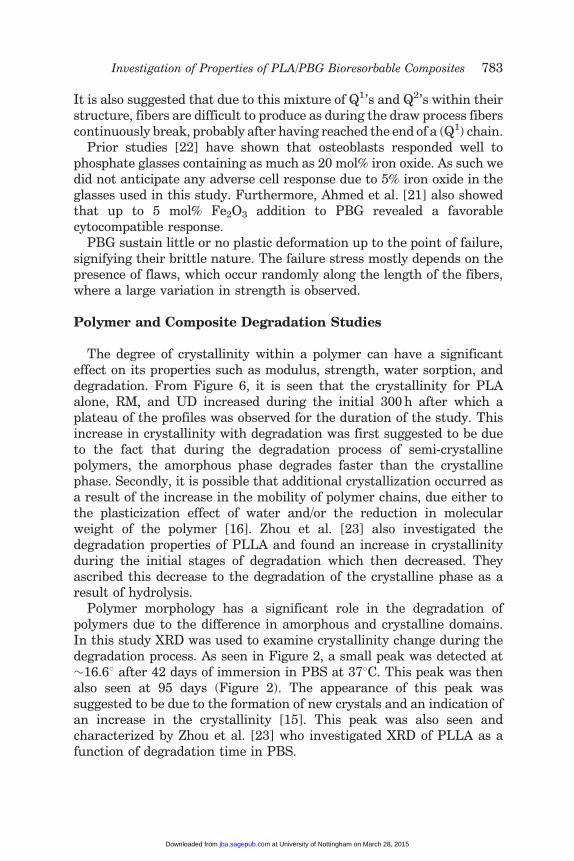
The degree of crystallinity within a polymer can have a significanteffect on its properties such as modulus, strength, water sorption, anddegradation. From Figure 6, it is seen that the crystallinity for PLAalone, RM, and UD increased during the initial 300 h after which aplateau of the profiles was observed for the duration of the study. Thisincrease in crystallinity with degradation was first suggested to be dueto the fact that during the degradation process of semi-crystallinepolymers, the amorphous phase degrades faster than the crystallinephase. Secondly, it is possible that additional crystallization occurred asa result of the increase in the mobility of polymer chains, due either tothe plasticization effect of water and/or the reduction in molecularweight of the polymer [16]. Zhou et al. [23] also investigated thedegradation properties of PLLA and found an increase in crystallinityduring the initial stages of degradation which then decreased. Theyascribed this decrease to the degradation of the crystalline phase as aresult of hydrolysis.
Polymer morphology has a significant role in the degradation ofpolymers due to the difference in amorphous and crystalline domains.In this study XRD was used to examine crystallinity change during thedegradation process. As seen in Figure 2, a small peak was detected at�16.68 after 42 days of immersion in PBS at 378C. This peak was thenalso seen at 95 days (Figure 2). The appearance of this peak wassuggested to be due to the formation of new crystals and an indication ofan increase in the crystallinity [15]. This peak was also seen andcharacterized by Zhou et al. [23] who investigated XRD of PLLA as afunction of degradation time in PBS.
Investigation of Properties of PLA/PBG Bioresorbable Composites 783
at University of Nottingham on March 28, 2015jba.sagepub.comDownloaded from

The increase in crystallinity was also suggested as the main reason forthe increase in density observed for PLA alone. Ruiyun and Peter [24]found that the density of the crystalline phase in PLA was higher thanthat of the amorphous phase. However, there was a large difference inthe density between PLA alone and the FRCs, due to the addition ofglass fiber (2.7 g/cm3). The variation seen between the RM and UDcomposites may be due to variation in the fiber distribution within thecomposites.
The water uptake percentage of UD composites was higher than thatfor the RM (Figure 7). This suggested that the RM composite wasimpregnated better than the UD composite within the matrix.Composites usually absorb more water than pure polymers and waterabsorption of poorly impregnated FRCs can be higher than wellimpregnated fiber composites. Four types of degradation for FRCs inwater are known: physical degradation, such as swelling; degradation ofthe matrix; degradation of the bonding interfaces between the fibers andmatrix; and weakening of the fiber strength [25]. Wicking (a form ofcapillary action between fiber and matrix as a result of interfacedegradation) is also known to play a significant role in the degradation ofcomposites, especially resorbable FRCs. These capillaries can decreasethe mechanical strength of FRCs and a negative relationship betweenfiber volume fraction and water uptake suggests that as fiber volumefraction increases, the impregnation of the fibers will improve and thuswater uptake will decrease [3,26–28].
The water uptake of PLA showed saturation at around 0.9% after4 days of immersion in PBS at 378C, whilst for the composites;a continual increase was seen. It was suggested that this increase andthe mass loss observed (Figure 2) was due to the continuousdegradation of the interface between the fibers and matrix [29].Figure 8 showed that the wet mass change of the UD composite washigher than that for the RM composite and this was suggested to bedue to the discontinuous nature of the fibers, making them less proneto wicking [30].
There was not a significant change in the pH of PBS for PLA alone,RM, and UD during the degradation process (Figure 9). The pH of thedegradation media for PLA alone and the composites remainedrelatively neutral for the duration of the study. Ahmed et al. [12]studied the degradation behavior of PBGs of similar formulations(i.e., fixed 40 mol% P2O5), and found that the pH of the immersionsolution remained relatively neutral for the duration of the study(700 h). Ruffieux et al. [31] prepared composite rods from PDLLA andb-tri-calcium phosphate and studied the degradation in PBS at 378C.
784 R. M. FELFEL ET AL.
at University of Nottingham on March 28, 2015jba.sagepub.comDownloaded from

They also did not observe a considerable change in the pH up to30 weeks of degradation time.
Mechanical Testing
As seen from Figures 8 and 9 the flexural strength decreased withtime during the degradation process, whilst no significant change in themodulus was observed. Similar observations were also seen by Bunselland Renard [32] as well as Shao and Kouadio [33] who studied theeffect of hydrolysis of polyethylene terephthalate/E-glass fiber compo-sites on mechanical properties. They found that the strength decreaseddramatically with time, whilst the modulus was not affected.
The reduction in flexural strength for the RM and UD composites, andPLA alone in this study was suggested to be due to the existence of waterwithin the sample which can act as a plasticizer. In addition, it can alsocause degradation of the fiber–matrix interface creating poor stresstransfer efficiency. Flexural strength is also known to depend on thefailure mode. The strength will be lower if the failure involvedcompression, micro-buckling, or shear splitting [27,34].
The reduction in mechanical strength can also be due to polymerchain scission caused by hydrolysis. Plotting the flexural strengthproperties against molecular weight change, a linear relationship wasseen. As molecular weight decreased, the strength decreased. However,the modulus profiles did not show any specific relationship withmolecular weight which agreed with Kajorncheappunngam et al. [35]who also saw the strength of glass-reinforced epoxy decrease as a resultof chain scission and the modulus was not affected.
Increase in chain scission during degradation is clear from the reductionin molecular weight with time as seen in Figure 13. The molecular weightloss for the UD composite was slightly higher than for the RM and PLAalone. The UD composite absorbed water more than the RM and alsodegraded faster, potentially increasing the rate of chain scission.
Figure 14(a) and (b) show the fractured surface morphology of PLAalone. After degradation (Figure 14(b)), some ripples were observed [36].The fiber–matrix interface can be seen in the SEM micrographs of thecomposites before and after degradation in Figures 14(c) and (f). For theRM and UD composites, the fractured surfaces before degradation showno fiber pull-out whereas after degradation, short fiber pull-out wasobserved which is indicative of loss of interface due to de-bonding of thefibers from the matrix [35,37].
PLA composites reinforced with P40 PBG fibers have shown retentionof their properties for much longer periods than previously investigated
Investigation of Properties of PLA/PBG Bioresorbable Composites 785
at University of Nottingham on March 28, 2015jba.sagepub.comDownloaded from

composites produced using PBG fibers with fixed 50 mol% P2O5
(i.e., P50’s) [8]. Thus, P40 PBG fibers composites are much moresuitable for bone fixation applications than the previously investigatedcomposites. However, further work is required here to control thedegradation process, which could be made possible with the use ofcoupling/sizing agents to improve the fiber–matrix interface.
CONCLUSION
Mechanical and degradation properties were investigated for PLAalone and RM plus UD composites reinforced with PBG fibers. Fiberdistributions for the RM and UD composites contained �18% and �14%fiber volume fractions respectively.
Degradation studies in PBS at 378C revealed water uptake for the RMand UD was �1.4% and 1.5%, respectively after 95 days. Mass changestudies showed a plateau for PLA alone, whereas for the RM and UDcomposite at �0.85%, �0.65%, and �0.95%, respectively. The densityprofiles for the composites were around 1.44 g/cm3.
The crystallinity increased with time during the degradationprocess and a small peak was detected by XRD as indication for theincrease in crystallinity. The composites absorbed more water than thePLA alone due to loss of the interface between matrix and fibers. Thisdegradation of the fiber–matrix interface was also seen from the SEMmicrographs.
The strength of the composites decreased from �115 MPa for UD and�106 MPa for RM to �50 MPa after immersion in PBS at 378C for95 days whilst the modulus remained constant.
Retention of properties from P40 PBG FRCs was observed for muchlonger periods as compared to previously investigated P50 PBG fibercomposites.
ACKNOWLEDGMENTS
The authors would like to acknowledge the financial support of theEgyptian Government and the EPSRC. The authors would also like tothank Dr Derek Irvine, Ms Natasha Birkin, and Mr Ian Barker for theirhelp with the GPC.
REFERENCES
1. Shetty, V., Caputo, A.A. and Kelso, I. Torsion-Axial Force Characteristics ofSR-PLLA Screws, J. Craniomaxillofac. Surg., 1997: 25: 19–23.
786 R. M. FELFEL ET AL.
at University of Nottingham on March 28, 2015jba.sagepub.comDownloaded from

2. Tormala, P., Vasenius, J., Vainionpaa, S., Laiho, J., Pohjonen, T. andRokkanen, P. Ultra-High-Strength Absorbable Self-reinforced Polyglycolide(SR-PGA) Composite Rods for Internal Fixation of Bone Fractures: In Vitroand In Vivo Study, J. Biomed. Mater. Res., 1991: 25: 1–22.
3. Michael, A.S. and Chu, C.C. Fiber-Matrix Interface Studies onBioabsorbable Composite Materials for Internal Fixation of BoneFractures. II. A New Method Using Laser Scanning Confocal Microscopy,J. Biomed. Mater. Res., 1997: 37: 353–362.
4. Navarro, M., Ginebra, M.P., Planell, J.A., Barrias, C.C. and Barbosa, M.A. InVitro Degradation Behavior of a Novel Bioresorbable Composite Material Basedon PLA and a Soluble CaP Glass, Acta Biomater., 2005: 1: 411–419.
5. Brauer, D., Russel, C., Vogt, S., Weisser, J. and Schnabelrauch, M.Degradable Phosphate Glass Fiber-reinforced Polymer Matrices:Mechanical Properties and Cell Response, J. Mater. Sci. Mater. Med.,2008: 19: 121–127.
6. Zhou, Z., Yi, Q., Liu, X., Liu, L. and Liu, Q. In Vitro Degradation Behaviorsof Poly-l-lactide/Bioactive Glass Composite Materials in Phosphate-bufferedSolution, Polym. Bull., 2009: 63: 575–586.
7. Russias, J., Saiz, E., Nalla, R.K., Gryn, K., Ritchie, R.O. and Tomsia, A.P.Fabrication and Mechanical Properties of PLA/HA Composites: A Study ofIn Vitro Degradation, Mater. Sci. Eng. C, 2006: 26: 1289–1295.
8. Ahmed, I., Cronin, P.S., Neel, E.A.A., Parsons, A.J., Knowles, J.C. and Rudd,C.D. Retention of Mechanical Properties and Cytocompatibility of aPhosphate-based Glass Fiber/Polylactic Acid Composite, J. Biomed. Mater.Res. B Appl. Biomater., 2009: 89B: 18–27.
9. Ahmed, I., Parsons, A.J., Palmer, G., Knowles, J.C. Walker, G.S. and Rudd,C.D. Weight Loss, Ion Release, and Initial Mechanical Properties of a BinaryCalcium Phosphate Glass Fiber/PCL Composite, Acta Biomater., 2008: 4:1307–1314.
10. Kasuga, T., Ozaki, S.-Y., Hayakawa, T., Nogami, M., Abe, Y. and Ota, Y.Mechanical Properties of Polylactic Acid Composites Containing b-Ca(PO3)2 Fibers in Simulated Body Fluid, J. Mater. Sci. Lett., 1999: 18:2021–2023.
11. Ahmed, I., Lewis, M., Olsen, I. and Knowles, J.C. Phosphate Glasses forTissue Engineering: Part 1. Processing and Characterisation of a Ternary-based P2O5-CaO-Na2O Glass System, Biomaterials, 2004: 25: 491–499.
12. Ahmed, I., Parsons, A., Jones, I., Walker, G., Scotchford, C. and Rudd, C.Cytocompatibility and Effect of Increasing MgO Content in a Range ofQuaternary Invert Phosphate-based Glasses, J. Biomater. Appl., 2009: 24:555–575.
13. Parsons, A.J., Ahmed, I., Haque, P. et al. Phosphate Glass Fiber Compositesfor Bone Repair, J. Bionic Eng., 2009: 6: 318–323.
14. ASTM Standard D2584-94. (1994) Test Method for Ignition Loss of CuredReinforced Resins, West Conshohocken, PA, ASTM International.
15. ISO 11566. BS ISO 11566 (1996). Carbon Fiber – Determination of theTensile Properties of Single-filament Specimens, Geneva, Switzerland,International Standard.
Investigation of Properties of PLA/PBG Bioresorbable Composites 787
at University of Nottingham on March 28, 2015jba.sagepub.comDownloaded from

16. Buchanan, F.J. (ed.) (2008). Degradation Rate of BioresorbableMaterials: Prediction and Evaluation, Boca Raton, Woodhead andManey Publishers on behalf of the Institute of Materials, Minerals, &Mining, CRC Press.
17. BS EN ISO 14125 (1998). Fiber Reinforced Plastic Composites—Determination of Flexural Properties, Geneva, Switzerland, InternationalStandard.
18. BS 2782 – 10: Method 1005 (1977). Methods of Testing Plastics: GlassReinforced Plastics - Deterimination of FPlxural properties. Three PointMethod. Geneva, Switzerland, International Standard.
19. Iannace, S., Maffezzoli, A., Leo, G. and Nicolais, L. Influence of Crystaland Amorphous Phase Morphology on Hydrolytic Degradation ofPLLA Subjected to Different Processing Conditions, Polymer, 2001: 42:3799–3807.
20. Knowles, J.C. and Hastings, G.W. In Vitro and In Vivo Investigation of aRange of Phosphate Glass-reinforced Polyhydroxybutyrate-basedDegradable Composites, J. Mater. Sci. Mater. Med., 1993: 4: 102–106.
21. Ahmed, I., Collins, C.A., Lewis, M.P., Olsen, I. and Knowles, J.C. Processing,Characterisation, and Biocompatibility of Iron-Phosphate Glass Fibers forTissue Engineering, Biomaterials, 2004: 25: 3223–3232.
22. Parsons, A.J., Evans, M., Rudd, C.D. and Scotchford, C.A. Synthesis andDegradation of Sodium Iron Phosphate Glasses and their In Vitro CellResponse, J. Biomed. Mater. Res. A, 2004: 71A: 283–291.
23. Zhou, Z., Yi, Q., Liu, L., Liu, X. and Liu, Q. Influence of Degradation ofPoly-L-lactide on Mass Loss, Mechanical Properties, andCrystallinity in Phosphate-Buffered Solution, J. Macromol. Sci. B., 2009:48: 309–317.
24. Ruiyun, Z. and Peter, X.M. Synthetic Nano-Fibrillar Extracellular Matriceswith Predesigned Macroporous Architectures, J. Biomed. Mater. Res., 2000:52: 430–438.
25. Sekine, H., Shimomura, K. and Hamana, N. Strength Deterioration andDegradation Mechanism of Glass Chopped Reinforced Plastics in WaterEnvironment, JSME Int. J. Ser. 1 – Solid Mech Strength Mater., 1988: 31:619–626.
26. Marju, V. and Pekka, K.V. Flexural Properties of Glass Fiber-reinforcedComposite with Partially Biodegradable Polymer Matrix, Macromol. Symp.,2007: 253: 88–93.
27. Lassila, L.V.J., Nohrstrom, T. and Vallittu, P.K. The Influence of Short-Term Water Storage on the Flexural Properties of Unidirectional GlassFiber-reinforced Composites, Biomaterials, 2002: 23: 2221–2229.
28. Wan, Y.Z., Wang, Y.L., Xu, X.H. and Li, Q.Y. In Vitro DegradationBehaviour of Carbon Fiber-reinforced PLA Composites and Influenceof Interfacial Adhesion Strength, J. Appl. Polym. Sci. Symp., 2001: 82:150–158.
29. Shen, L., Yang, H., Ying, J., Qiao, F. and Peng, M. Preparation andMechanical Properties of Carbon Fiber-reinforced Hydroxyapatite/Polylactide Biocomposites, J. Mater. Sci. Mater. Med., 2009: 20: 2259–2265.
788 R. M. FELFEL ET AL.
at University of Nottingham on March 28, 2015jba.sagepub.comDownloaded from

30. Zimmerman, M., Alexander, H., Parsons, J.A. and Bajpai, P. The Design andAnalysis of Laminated Degradable Composite Bone Plates for FractureFixation, J. Biomed. Mater. Res., 1987: 21: 345–361.
31. Ruffieux, K., Dell’Agosti, A., Riesen, B. and Wintermantel, E. Influence ofCalcium Phosphates on the Degradation of Poly Lactic Acid for MedicalImplants, Biomed. Tech. (Berl)., 1996: 41: 420–421.
32. Bunsell, A.R. and Renard, J. (2005). Fundamentals of Fiber ReinforcedComposite Materials, Series in Materials Science and Engineering, Bristol,Institute of Physics Publishing.
33. Shao, Y. and Kouadio, S. Durability of Fiberglass Composite Sheet Piles inWater, J. Compos. Constr., 2002: 6: 280–287.
34. Dhakal, H.N., Zhang, Z.Y. and Richardson, M.O.W. Effect of WaterAbsorption on the Mechanical Properties of Hemp Fiber-reinforcedUnsaturated Polyester Composites, Compos. Sci. Technol., 2007: 67:1674–1683.
35. Kajorncheappunngam, S., Gupta, R.K. and Ganga Rao, H.V.S. Effect ofAging Environment on Degradation of Glass-reinforced Epoxy, J. Compos.Constr., 2002: 6: 61–69.
36. Debra, D.W.-C., Julia, A.K., Darinda, M.M. and Cho Hui, L. In Vitro FlexuralProperties of Hydroxyapatite and Self-reinforced poly(L-lactic acid),J. Biomed. Mater. Res. A., 2006: 78A: 541–549.
37. Liao, K., Schultheisz, C.R. and Hunston, D.L. Effects of EnvironmentalAging on the Properties of Pultruded GFRP, Compos. Part B-Eng., 1999: 30:485–493.
Investigation of Properties of PLA/PBG Bioresorbable Composites 789
at University of Nottingham on March 28, 2015jba.sagepub.comDownloaded from