Crystallization and Thermal Properties of Biofiber-Polypropylene Composites
Real-Time Orientation and Crystallinity Measurementsduring the Isotactic Polypropylene Film-Casting Process
GAETANO LAMBERTI, VALERIO BRUCATO
Department of Chemical and Food Engineering, University of Salerno, I-84084 Fisciano (SA), Via Ponte don Melillo, Italy
Received 8 August 2002; revised 22 October 2002; accepted 1 December 2002
ABSTRACT: A method based on Fourier transform infrared (FTIR) transmission spectrais proposed to measure the crystallinity of isotactic polypropylene (iPP) samples. Themethod parameters were tuned as compared with wide-angle X-ray scattering mea-surements performed on test samples characterized by different crystallinity valuesobtained by solidification of thin iPP films under several cooling rates in a homemadedevice. The FTIR dichroic ratio measurements were adopted to measure crystalline andaverage Hermans’ orientation factors of iPP samples obtained by film casting. Thecrystalline orientation measurement method was validated as compared with thebirefringence measurement. The techniques were successfully used in real time duringsome film-casting runs with a suitably modified FTIR system made of a spectrometerequipped with two optical guidelines and an external detector. Real-time measure-ments are reported and discussed. © 2003 Wiley Periodicals, Inc. J Polym Sci Part B: PolymPhys 41: 998–1008, 2003Keywords: crystallinity; orientation; real-time measurements; FT-IR; poly(pro-pylene) (PP)
INTRODUCTION
The degree of crystallinity and orientation arefeatures that play a fundamental role in deter-mining the macroscopic behavior of polymericproducts.1–4 Reliable methods for measuringthese properties are therefore highly desirable tomanage and optimize polymer-transformationprocesses. In particular, methods to monitor poly-mer orientation and crystallinity developmentduring transformation processes are very attrac-tive for industrial process quality control and re-search in polymer science.5–7
Although many experimental methods are nowadopted to determine crystallinity such as den-sity,1,4 wide-angle X-ray scattering (WAXS),7–9
dilatometry,1 and to determine orientation as bi-refringence,2,3,5 dichroism,2,3,10 and WAXS,3,7,8
their applicability is affected by two of the follow-ing problems:
1. The result of the measure often leads todifferent values depending on the methodadopted.
2. It is impossible or very difficult to performmeasurements during processes (i.e., real-time measurements).
This work seeks to develop and test fast andreliable methods to measure crystallinity andorientation of isotactic polypropylene (iPP)with Fourier transform infrared (FTIR) spec-troscopy to realize a suitable apparatus able togather real-time FTIR transmission spectraand apply these to monitor the evolution ofboth variables during the film-casting process.
Correspondence to: G. Lamberti (E-mail: glamberti@ unisa.it)Journal of Polymer Science: Part B: Polymer Physics, Vol. 41, 998–1008 (2003)© 2003 Wiley Periodicals, Inc.
998

MATERIAL AND METHODS
Material
The resin used along this work was a commercialiPP supplied by Montell [T30G, weight-averagemolecular weight (Mw): 481,000, number-averagemolecular weight (Mn): 75,000, and tacticity:87.6% mmmm].
Sample Preparation
Two different methods were adopted to obtainboth oriented and nonoriented samples.
The homemade device shown in Figure 1 wasused to produce nonoriented samples.11 Thinpolymer samples were molten and subsequentlycooled at several cooling rates, resulting in sam-ples characterized by large differences in crystal-linity levels.
Oriented polymer film samples were producedby film casting (Fig. 212,13). During polymer filmcasting, if the path in air is long enough, crystal-lization takes place before chill rolls contact, thatis, while macromolecules are subject to flow, lead-ing to oriented films. Usually the polymer film-casting process leads to uniaxial orientaton.Guadagno et al.14 found the uniaxial orientationof syndiotactic polypropylene films obtained bycasting by analyzing WAXS patterns collectedalong three directions (through/edge/end, i.e., re-spectively, with an X-ray beam directed along thenormal direction, transverse direction, and ma-chine direction). Gregory and Samuels15 obtaineduniaxial oriented polyaniline films by casting; theuniaxial orientation was revealed by the analysisof the birefringence tensor. Rhee and White16 con-
firmed the uniaxial orientation in cast films ofpolyamide by WAXS analysis.
Cast film extrusion was performed with a lab-oratory-scale extruder equipped with a take-upunit. Tests were performed with two differentrectangular dies (having the same width, L0� 0.20 m, and different thicknesses, S0 � 300 and500 �m) as well as several values of both extru-sion screw revolutions per minute (�) and take-up velocity [vx(x � X)]. The distance X betweenthe extrusion head and take-up rolls was alsokept constant (X � 0.4 m). All runs and relatedmeasured parameters are reported in Table 1.
Mass flow rate m was measured by weighingthe extrudate, and the extrusion velocity vx (x� 0) was calculated from the mass flow rate andmelt density, evaluated at the die temperature.The take-up velocity vx (x � X) was simply eval-uated from the collected film length. Finally, thedraw ratio was determined as the ratio of thesetwo velocity values.
FTIR Measurements (Offline and Online)
A modified M2000 FTIR spectrometer (by MidacCo.), equipped with two optical guides (AXIOT, byAxiom Analytical Inc.), was adopted to collect IRspectra online. The device was mounted on a ver-tical traveling table to perform measurements atdifferent heights. A scheme of the device is shownin Figure 3; obviously the same spectrometer wasalso used to perform offline measurements.
Crystallinity
The crystallinity index was determined by analy-sis of the FTIR absorbance spectra applying Lam-bert and Beer’s law to selected peaks. Considering
Figure 2. Film-casting process.
Figure 1. Quenching device.
REAL-TIME ORIENTATION AND CRYSTALLINITY 999

a crystalline, an amorphous, and a reference peakand assuming that the absorbance of both theamorphous and crystalline phases does not de-pend on phase-content distribution, Lambert andBeer’s law provides, respectively
Acr � acrXcS (1)
Aam � aam�1 � Xc�S (2)
Ar � arS (3)
where Acr, Aam, and Ar are the absorbancies; acr,aam, and ar are the absorption coefficients of the
crystalline and amorphous phases and the refer-ence peak, respectively; Xc is the volumetric crys-tallinity index; and S is the sample thickness.
Eliminating S from eqs 1 and 2
Xc �Acr
Acr �acr
aamAam
(4)
or from eqs 1 and 3
Xc �ar
acr
Acr
Ar(5)
with eq 4 or 5 crystallinity evaluation requiresonly absorbancy measurements (Acr and Ar orAam) if the absorption coefficients ratio (acr/aam orar/aam) is known.
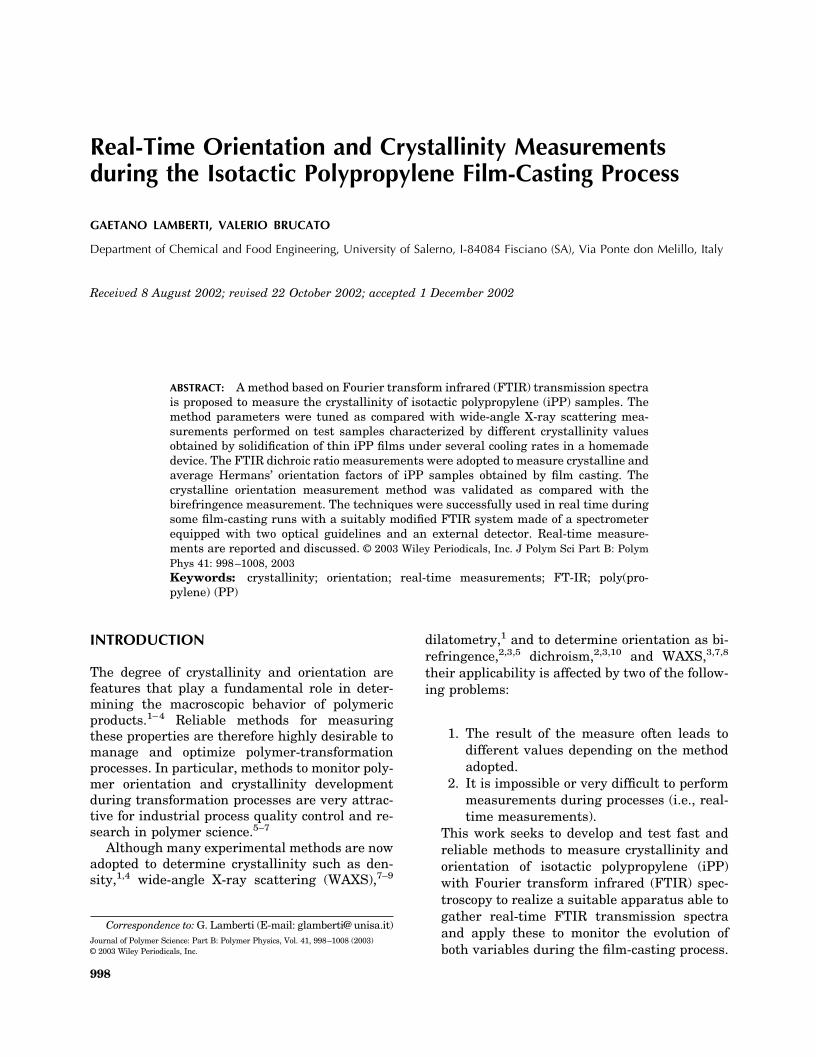
Because the spectra are the weighted superpo-sition of single absorption peaks, all the absor-bancies were obtained by fitting the experimentalspectra with a weighted combination of singlepeaks, with Gaussian/Lorentzian peak functions.Figure 4 reports a typical spectrum of a partiallycrystalline quenched iPP sample as well as singlepeaks obtained by the fitting procedure.
The crystalline nature of the absorbance peaklocated at wave number 841 cm�1 was easily
Table 1. Operating Conditions of the Experimental Runs
Number�
(rpm)m 10�4 �
kg � s�1
�x(x � 0)10�3 �m � s�1
�x(x � X)10�3 �m � s�1
X(m)
T0
(°C)S0
(�m)
DR ��x�x � X�
�x�x � 0�(dimensionless)
I1 60 4.04 5.37 81.3 0.4 200 500 15.2I2 50 3.23 4.28 79.3 0.4 200 500 18.5I3 40 2.61 3.46 81.0 0.4 200 500 23.4I4 35 2.13 2.83 77.3 0.4 200 500 27.3I5 30 1.77 2.35 72.0 0.4 200 500 30.6I6 25 1.58 2.09 77.3 0.4 200 500 36.9I7 20 1.23 1.63 77.7 0.4 200 500 47.7I8 15 0.99 1.32 76.0 0.4 200 500 57.6I9 10 0.73 0.97 80.3 0.4 200 500 82.5U1 20 1.33 2.97 71.8 0.4 220 300 24.1U2 15 1.04 2.33 68.8 0.4 220 300 29.6U3 12 0.76 1.70 69.7 0.4 220 300 41.1V3 25 1.55 2.08 57.0 0.4 220 500 27.4V1 20 1.3 1.75 57.0 0.4 220 500 32.6V2 15 0.91 1.22 55.0 0.4 220 500 45.1W1 10 0.603 0.812 49.3 0.4 220 500 60.7W2 15 0.84 1.12 45.0 0.4 220 500 40.2W3 20 1.23 1.66 47.7 0.4 220 500 28.7
Figure 3. FTIR spectra-collection device.
1000 LAMBERTI AND BRUCATO
identified and is well referenced in the litera-ture3,18,19 (Acr � A841). The absorbance peak at1153 cm�1 was recognized by the amorphousphase content18 (Aam � A1153). The literature re-ports a controversial assignation of the 973 cm�1
peak. Painter et al.19 and Ward3 attribute thispeak to the superposition of two very close peaks,one located at 972 cm�1 (crystalline) and theother at 974 cm�1 (amorphous). Tadokoro et al.18
reports the 973 cm�1 absorbance peak as an in-ternal standard; as a consequence, its heightshould be essentially insensitive to structure,that is, to the amorphous/crystalline ratio (Ar
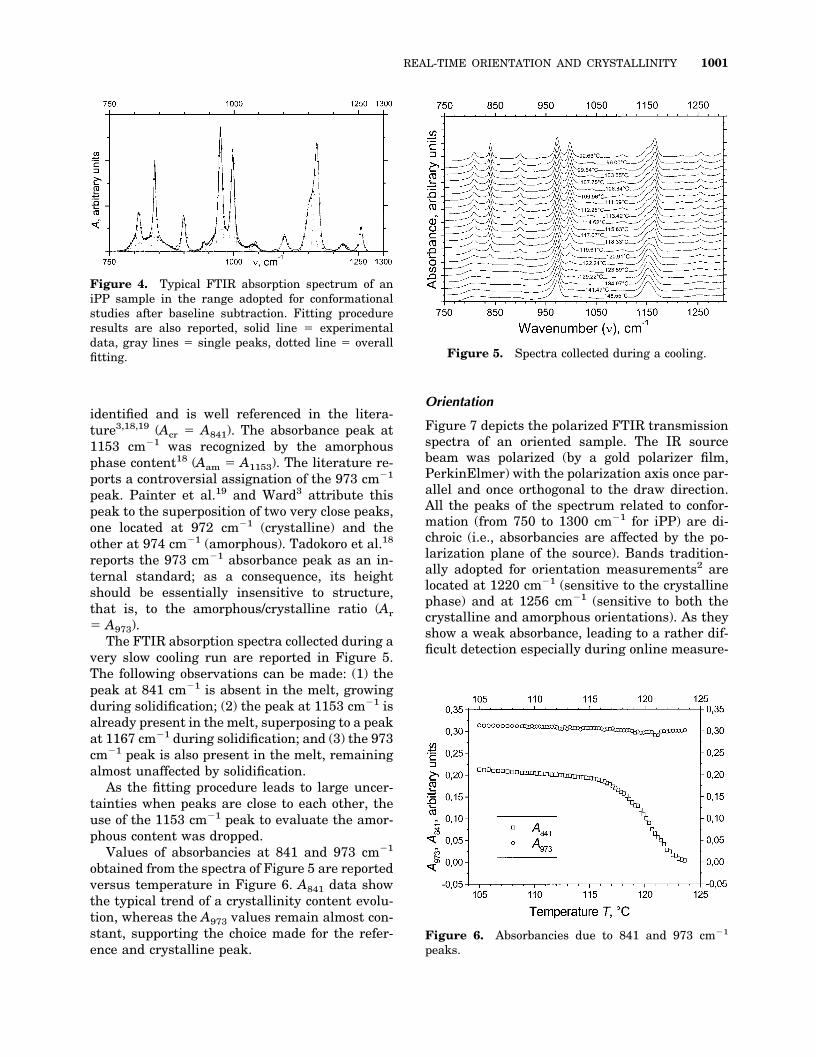
� A973).The FTIR absorption spectra collected during a
very slow cooling run are reported in Figure 5.The following observations can be made: (1) thepeak at 841 cm�1 is absent in the melt, growingduring solidification; (2) the peak at 1153 cm�1 isalready present in the melt, superposing to a peakat 1167 cm�1 during solidification; and (3) the 973cm�1 peak is also present in the melt, remainingalmost unaffected by solidification.
As the fitting procedure leads to large uncer-tainties when peaks are close to each other, theuse of the 1153 cm�1 peak to evaluate the amor-phous content was dropped.
Values of absorbancies at 841 and 973 cm�1
obtained from the spectra of Figure 5 are reportedversus temperature in Figure 6. A841 data showthe typical trend of a crystallinity content evolu-tion, whereas the A973 values remain almost con-stant, supporting the choice made for the refer-ence and crystalline peak.
Orientation
Figure 7 depicts the polarized FTIR transmissionspectra of an oriented sample. The IR sourcebeam was polarized (by a gold polarizer film,PerkinElmer) with the polarization axis once par-allel and once orthogonal to the draw direction.All the peaks of the spectrum related to confor-mation (from 750 to 1300 cm�1 for iPP) are di-chroic (i.e., absorbancies are affected by the po-larization plane of the source). Bands tradition-ally adopted for orientation measurements2 arelocated at 1220 cm�1 (sensitive to the crystallinephase) and at 1256 cm�1 (sensitive to both thecrystalline and amorphous orientations). As theyshow a weak absorbance, leading to a rather dif-ficult detection especially during online measure-
Figure 5. Spectra collected during a cooling.
Figure 6. Absorbancies due to 841 and 973 cm�1
peaks.
Figure 4. Typical FTIR absorption spectrum of aniPP sample in the range adopted for conformationalstudies after baseline subtraction. Fitting procedureresults are also reported, solid line � experimentaldata, gray lines � single peaks, dotted line � overallfitting.
REAL-TIME ORIENTATION AND CRYSTALLINITY 1001
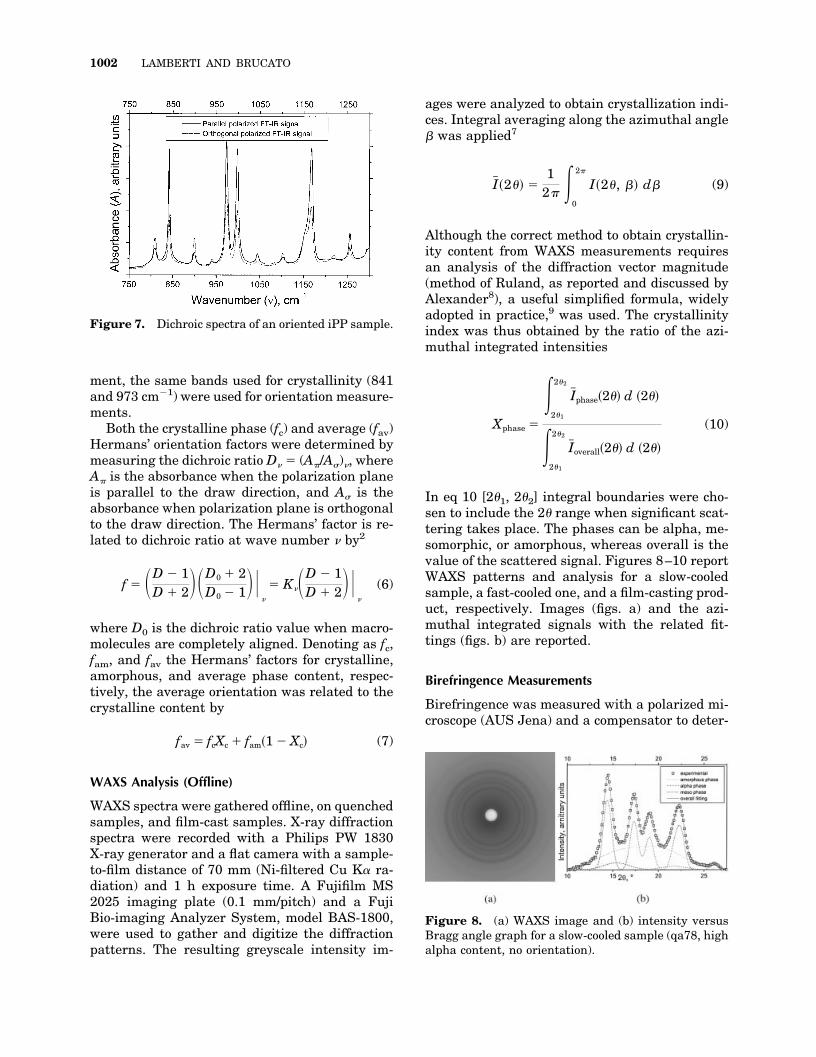
ment, the same bands used for crystallinity (841and 973 cm�1) were used for orientation measure-ments.
Both the crystalline phase (fc) and average (fav)Hermans’ orientation factors were determined bymeasuring the dichroic ratio D� � (A�/A�)�, whereA� is the absorbance when the polarization planeis parallel to the draw direction, and A� is theabsorbance when polarization plane is orthogonalto the draw direction. The Hermans’ factor is re-lated to dichroic ratio at wave number � by2
f � �D � 1D � 2��D0 � 2
D0 � 1���
� K��D � 1D � 2��
�
(6)
where D0 is the dichroic ratio value when macro-molecules are completely aligned. Denoting as fc,fam, and fav the Hermans’ factors for crystalline,amorphous, and average phase content, respec-tively, the average orientation was related to thecrystalline content by
fav � fcXc � fam�1 � Xc� (7)
WAXS Analysis (Offline)
WAXS spectra were gathered offline, on quenchedsamples, and film-cast samples. X-ray diffractionspectra were recorded with a Philips PW 1830X-ray generator and a flat camera with a sample-to-film distance of 70 mm (Ni-filtered Cu K� ra-diation) and 1 h exposure time. A Fujifilm MS2025 imaging plate (0.1 mm/pitch) and a FujiBio-imaging Analyzer System, model BAS-1800,were used to gather and digitize the diffractionpatterns. The resulting greyscale intensity im-
ages were analyzed to obtain crystallization indi-ces. Integral averaging along the azimuthal angle was applied7
I��2� �1
2� �0
2�
I�2, � d (9)
Although the correct method to obtain crystallin-ity content from WAXS measurements requiresan analysis of the diffraction vector magnitude(method of Ruland, as reported and discussed byAlexander8), a useful simplified formula, widelyadopted in practice,9 was used. The crystallinityindex was thus obtained by the ratio of the azi-muthal integrated intensities
Xphase �
�21
22
I�phase�2� d �2�
�21
22
I�overall�2� d �2�
(10)
In eq 10 [21, 22] integral boundaries were cho-sen to include the 2 range when significant scat-tering takes place. The phases can be alpha, me-somorphic, or amorphous, whereas overall is thevalue of the scattered signal. Figures 8–10 reportWAXS patterns and analysis for a slow-cooledsample, a fast-cooled one, and a film-casting prod-uct, respectively. Images (figs. a) and the azi-muthal integrated signals with the related fit-tings (figs. b) are reported.
Birefringence Measurements
Birefringence was measured with a polarized mi-croscope (AUS Jena) and a compensator to deter-
Figure 7. Dichroic spectra of an oriented iPP sample.
Figure 8. (a) WAXS image and (b) intensity versusBragg angle graph for a slow-cooled sample (qa78, highalpha content, no orientation).
1002 LAMBERTI AND BRUCATO

mine the optical retardation of green-filtered (�� 551 nm) light. Birefringence is another methodof measuring average orientation. It can be easilyrelated to phase content and the orientation levelby
�n � �cfcXc � �amfam�1 � Xc� (11)
where the values �c � 0.030 and �am � 0.060 foriPP were taken from Samuels.2
RESULTS AND DISCUSSION
Crystallinity Method Tuning
Several cooling runs were performed with the de-vice shown in Figure 1 to obtain samples withdifferent levels of crystallinity. The cooling histo-ries were characterized by the value of dT/dt@70 °C,that is, the cooling rate measured when the tem-perature is 70 °C, as suggested by Piccarolo etal.20 WAXS and FTIR measurements were per-formed on the same samples. The phase content
of each sample, obtained from WAXS patterns, isreported as a function of the cooling rate (Fig. 11).According to the literature,9,20 the alpha phasecontent decreases, whereas the mesomorphicphase increases with increasing cooling rates.The amorphous content slightly increases thecooling rate.
Although WAXS analysis discriminates be-tween different ordered phases (alpha and meso-morphic), FTIR analysis does not. “Crystallinity”FTIR peaks are indeed sensitive to the molecularorder characteristic of both ordered phases re-gardless of which one. However, the absorptivityratio appearing in eq 2 can be evaluated by com-parison between the WAXS and FTIR results onthe basis of the total crystalline (or, equivalently,of the amorphous) content. The best agreementwas obtained by setting a973/a841 � 0.79. Figure12 reports the amorphous phase fraction drawnform both methods.
WAXS spectra gathered offline on cast filmswere also analyzed, applying the previous proce-dure to evaluate their phase content. Figure 13reports phase content values versus draw ratio.The increase of DR, here obtained by reducing themass flow rate, causes a stronger cooling of thefilm.12,13 The alpha phase content is expected todecrease with a stronger cooling rate, and theamorphous and mesomorphic contents are ex-pected to increase with an increasing cooling rate.However, the opposite trend was found becauseflow induces a crystallization kinetics enhance-ment that counteracts and overcomes the effect of
Figure 9. (a) WAXS image and (b) intensity versusBragg angle graph for a fast-cooled sample (qa100, highmeso content, no orientation).
Figure 10. (a) WAXS image and (b) intensity versusBragg angle graph for a film-casting product (I8, highalpha content, oriented).
Figure 11. Phase content (of quenched samples) asderived from WAXS analysis.
REAL-TIME ORIENTATION AND CRYSTALLINITY 1003

the increased cooling rate because of the higherDR applied. The flow enhances crystallization ki-netics raising the crystallization temperature andleading to the formation of a content of alphaphase higher than the value expected for a sam-ple experiencing the same cooling rate but underquiescent conditions.
An abrupt increase of the alpha phase contentand decrease of the mesomorphic and amorphousphase contents could be observed in the low DRzone close to a value of 25, followed by smoothchanges of all phase contents for DR values largerthan 30. The very low alpha phase content valuesobserved at a DR lower than 25, typical of astrongly quenched sample, is due to the fact that,
in these cases, the film crystallizes after contactwith chill rolls, under the effect of a much stron-ger cooling rate. Above this critical DR value crys-tallization occurs in air.
The amorphous phase content was also evalu-ated by FTIR measurements applying eq 5, withthe absorptivity ratio reported before. Results arealso given in Figure 13. Agreement between thetwo methods is observed.
Orientation Method Tuning
A series of oriented iPP films denoted by I1–I9(see Table 1) was produced by film casting byapplying several increasing draw ratios. Theywere analyzed by WAXS, birefringence, and FTIRdichroism.
Figure 14. Hermans’ factor for a series of film-cast-ing products.
Figure 15. Dichroic orientation measurement valida-tion.
Figure 12. FTIR crystallinity measurement methodtuning.
Figure 13. Phase content (of cast film samples) asderived from WAXS analysis.
1004 LAMBERTI AND BRUCATO
The use of weakly absorbing bands suggestedby Samuels2 (1220 and 1256 cm�1) for cast film-orientation measurements can lead to erroneousmeasurements because of the very thin samplesinvolved. Offline analysis, performed in the frameof previous work,21 leads to orientation values toohigh and incompatible with birefringence mea-surements carried out in the frame of this work.Therefore, bands of medium intensity, that is, 841and 973 cm�1 peaks (chosen before for crystallin-ity) were adopted in this work for orientationmeasurement.
The K� value of eq 6 was assumed equal to 1 for841 and 973 cm�1 peaks because the polarizationmoment vector is completely aligned with the mo-lecular chain for those bands, that is, D0 3 �.10
After collection and analysis of three FTIR spec-tra for each sample (not polarized, parallel, andorthogonal polarized), the crystalline and average
orientation factor were obtained by applying eq 6to polarized absorbancies measured at 841 and973 cm�1. Crystallinity was evaluated applyingeq 2 to absorbancies measured at 841 and 973cm�1, whereas the amorphous orientation factorwas obtained with eq 7. The results are given inFigure 14. Crystalline and orientation increaseswith increasing draw ratio, whereas the amor-phous orientation Hermans’ factor value is almostconstant and low.
A comparison was also made with birefrin-gence measurements coupled to the crystallinityindex drawn from WAXS analysis (by eqs 9 and10). Neglecting amorphous orientation, from eq11 we can draw the crystalline orientation
fc ��n
�cXc(12)
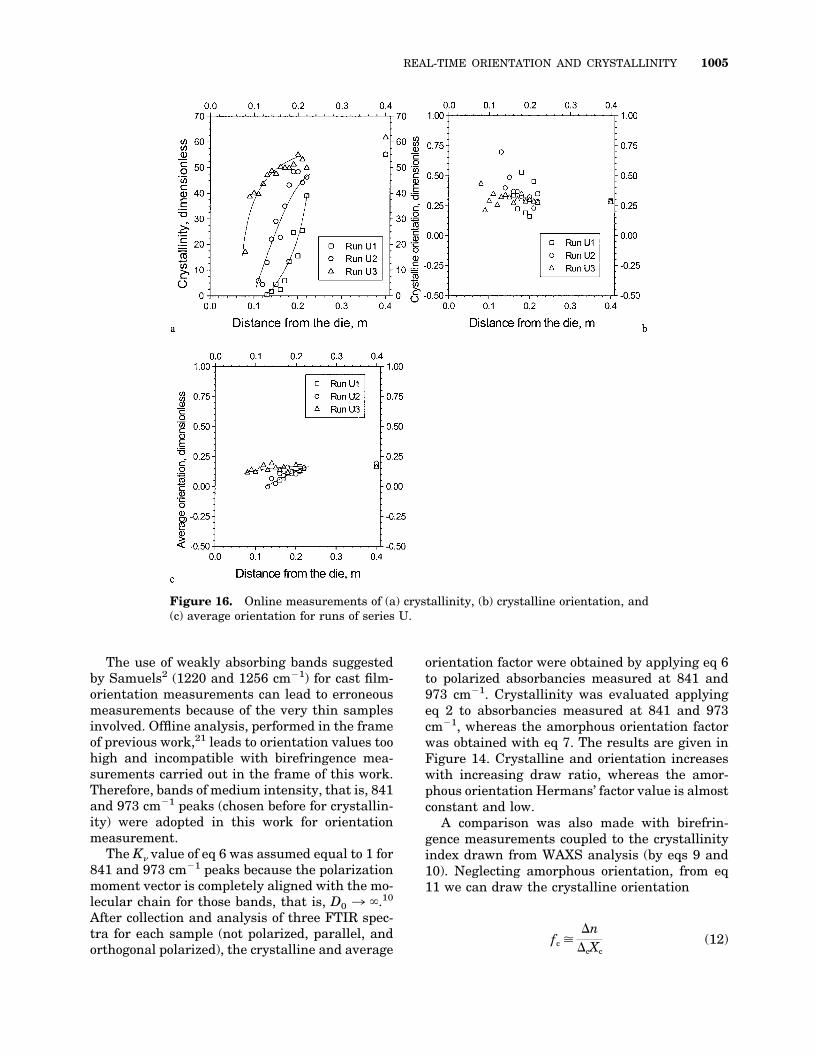
Figure 16. Online measurements of (a) crystallinity, (b) crystalline orientation, and(c) average orientation for runs of series U.
REAL-TIME ORIENTATION AND CRYSTALLINITY 1005

Figure 15 reports fc obtained by birefringencemeasurements versus fc from FTIR dichroismmeasurements. A substantial validation of crys-talline orientation measurements is stated. Crys-talline orientation from IR dichroism compareswell with the results from independent measure-ments (birefringence and WAXS). However, thelatter overestimate somewhat the orientation,probably from assuming fam � 0.
Online Measurements
Techniques discussed in previous sections wereapplied online during the film-casting process.Results of three series of runs denoted as U, V,and W (see Table 1) are reported in Figures 16–18in terms of crystallinity, crystalline orientationfactor, and average orientation factor evolution
versus the distance from the die for each series ofruns.
The cast-film draw ratio for the different runswas increased by reducing the extruder flow rate;consequently the crystallization onset (freezingline) moves toward the die exit.12,13 This experi-mental feature was correctly detected by our mon-itoring systems (see Fig. 3) at least qualitatively.The first reason of the freezing line height rise isthe faster cooling rate caused by the flow-ratedecrease. Moreover, the higher draw ratio in-creases elongation rates enhancing the crystalli-zation kinetics. Solidification is thus attained athigher temperature, and this mechanism contrib-utes to the freezing line height rise.
Although the film-casting process is stationary,small instabilities occurring during the collectioncan cause distortion in each collected spectrum.
Figure 17. Online measurements of (a) crystallinity, (b) crystalline orientation, and(c) average orientation for runs of series V.
1006 LAMBERTI AND BRUCATO

The crystallinity measurement uses data drawnfrom the same spectrum, and this reduces errors(external perturbation affects in the same waythe entire spectrum). On the contrary, orientationevaluation is based on dichroic analysis that usesthe ratio between the absorbancies read on twodifferent spectra (with the IR beam polarized par-allel and orthogonal to the draw direction). Exter-nal perturbation can affect differently the twospectra, emphasizing errors, particularly in thezone of the film where crystallization takes place.Because of those uncertainties, orientation dataare more scattered than crystallinity ones.
Despite data scattering, however, Figures 16–18(b,c) confirm that oriented crystals are formedfrom a very low oriented melt. In fact, before thecrystallization onset the melt-orientation factorvalues, which coincide with average orientationfactor, are very low. After crystallization onset,
average orientation evolutions trend maps thecrystallinity evolution trend. The crystalline ori-entation level remains almost constant along thedraw direction and looks quite insensitive to thedraw ratio applied. As a consequence film orien-tation is only due to crystalline orientation duringthe solidification as well as in final films. Resultscompletely agree with those reported by Kolb etal.7 obtained by melt-spinning of iPP and detectedonline by WAXS. A synchrotron radiation sourcethat is much more expensive and difficult to setup was, however, used in that work.
CONCLUSIONS
Fast and reliable techniques based on FTIR andIR dichroism that can also be applied online wereproposed and tuned.
Figure 18. Online measurements of (a) crystallinity, (b) crystalline orientation, and(c) average orientation for runs of series W.
REAL-TIME ORIENTATION AND CRYSTALLINITY 1007

An apparatus able to collect spectra online dur-ing film casting was designed and built.
The results indicated that an inexpensive de-vice, that is, a modified FTIR spectrometer, can besuccessfully used to monitor and control crystal-linity and orientation in cast film processing.
This work was supported by the Italian Ministry ofUniversity (PRIN 1999-2001, “Flow induced crystalli-zation of polymers. Impact on processing and manufac-turing properties”).
REFERENCES AND NOTES
1. Sperling, L. H. Introduction to Physical PolymerScience; Wiley: New York, 1992, pp 198–278.
2. Samuels, R. J. Structured Polymer Properties;Wiley: New York, 1974, pp 15–81.
3. Ward, I. M. Structure and Properties of OrientedPolymers; Chapman & Hall: London, 1997, pp 44–141.
4. Vittoria, V. Properties of Isotactic Polypropylene.In Handbook of Polymer Science and Technology;Cheremisinoff, N. P., Ed.; Marcel Dekker: NewYork, 1989; Chapter 15.
5. Bansal, V.; Shambaugh, R. L. Polym Eng Sci 1996,36, 2785–2798.
6. Batur, C.; Hanif Vhora, M.; Cakmak, M.; Serhat-kulu, T. ISA Trans 1999, 38, 139–148.
7. Kolb, R.; Seifert, S.; Stribeck, N.; Zachmann, H. G.Polymer 2000, 41, 1497–1505.
8. Alexander, L. E. X-ray Diffraction Methods in Poly-mer Science; Wiley: New York, 1985, pp 137–199.
9. Martorana, A.; Piccarolo, S.; Scichilone, F. Macro-mol Chem Phys 1997, 198, 597–604.
10. Bayer, G.; Hoffmann, W.; Siesler, H. W. Polymer1980, 21, 235–238.
11. Brucato, V.; De Santis, F.; Lamberti, G.; Titoman-lio, G. Polym Bull 2002, 48, 207–212.
12. Lamberti, G.; Titomanlio, G.; Brucato, V. ChemEng Sci 2001, 56, 5749–5761.
13. Lamberti, G.; Titomanlio, G.; Brucato, V. ChemEng Sci 2002, 57, 1993–1996.
14. Guadagno, L.; Naddeo, C.; D’Aniello, C.; Di Maio,L.; Vittoria, V.; Acierno, D. Macromol Symp 2002,180, 23–31.
15. Gregory, R. V.; Samuels, R. J. Annual Report ofNational Textile Center, 1997, project M95–C4,available on NTC website (http://www.ntcresearch.org).
16. Rhee, S.; White, J. L. Polymer 2002, 43, 5903–5914.17. Lamberti, G.; Titomanlio, G. Macromol Symp 2002,
185, 167–180.18. Tadokoro, H.; Kobayashi, M.; Ukita, M.; Yasufuku,
K.; Murahashi, S.; Torii, T. J Chem Phys 1965, 4,1432–1449.
19. Painter, P. C.; Watzek, M.; Koenig, J. L. Polymer1977, 18, 1169–1172.
20. Piccarolo, S.; Alessi, S.; Brucato, V.; Titomanlio, G.Crystallization Behavior at High Cooling Rates ofTwo Polypropylenes. In Crystallization of Poly-mers, NATO ASI Series; Dosiere, M., Ed.; KluwerAcademic: Boston, 1993; pp 475–480.
21. Lamberti, G.; Brucato, V.; Titomanlio, G. J ApplPolym Sci 2002, 84, 1981–1992.
1008 LAMBERTI AND BRUCATO
Copyright © 2022 FDOKUMEN