Investigation of a Helicopter Individual Blade Control (IBC ...
214
NASA/TP-20205003457 Vol I Investigation of a Helicopter Individual Blade Control (IBC) System in Two Full-Scale Wind Tunnel Tests: Volume I Stephen A. Jacklin and Stephen Swanson Ames Research Center, Moffett Field, California Achim Blaas and Peter Richter ZF Luftfahrttechnik GmbH, Kassel, Germany Dietrich Teves and Georg Niesl Eurocopter Deutschland GmbH, Munich, Germany Roland Kube and Bernd Gmelin DLR Institute for Flight Mechanics, Braunschweig, Germany David L. Key U.S. Army AVRDEC Ames Research Center, Moffett Field, California Click here. Press F1 key (Windows) or Help key (Mac) for help July 2020
-
Upload
khangminh22 -
Category
Documents
-
view
1 -
download
0
Transcript of Investigation of a Helicopter Individual Blade Control (IBC ...

NASA/TP-20205003457 Vol I
Investigation of a Helicopter Individual Blade Control
(IBC) System in Two Full-Scale Wind Tunnel Tests:
Volume I
Stephen A. Jacklin and Stephen Swanson
Ames Research Center, Moffett Field, California
Achim Blaas and Peter Richter
ZF Luftfahrttechnik GmbH, Kassel, Germany
Dietrich Teves and Georg Niesl
Eurocopter Deutschland GmbH, Munich, Germany
Roland Kube and Bernd Gmelin
DLR Institute for Flight Mechanics, Braunschweig, Germany
David L. Key
U.S. Army AVRDEC
Ames Research Center, Moffett Field, California
Click here. Press F1 key (Windows) or Help key (Mac) for help
July 2020

NASA STI Program ... in Profile
Since its founding, NASA has been dedicated
to the advancement of aeronautics and space
science. The NASA scientific and technical
information (STI) program plays a key part in
helping NASA maintain this important role.
The NASA STI program operates under the
auspices of the Agency Chief Information
Officer. It collects, organizes, provides for
archiving, and disseminates NASA’s STI. The
NASA STI program provides access to the NTRS
Registered and its public interface, the NASA
Technical Reports Server, thus providing one of
the largest collections of aeronautical and space
science STI in the world. Results are published in
both non-NASA channels and by NASA in the
NASA STI Report Series, which includes the
following report types.
TECHNICAL PUBLICATION. Reports of
completed research or a major significant
phase of research that present the results of
NASA Programs and include extensive data
or theoretical analysis. Includes compilations
of significant scientific and technical data
and information deemed to be of continuing
reference value. NASA counterpart of peer-
reviewed formal professional papers but has
less stringent limitations on manuscript length
and extent of graphic presentations.
TECHNICAL MEMORANDUM.
Scientific and technical findings that are
preliminary or of specialized interest,
e.g., quick release reports, working
papers, and bibliographies that contain
minimal annotation. Does not contain
extensive analysis.
CONTRACTOR REPORT. Scientific and
technical findings by NASA-sponsored
contractors and grantees.
CONFERENCE PUBLICATION.
Collected papers from scientific and
technical conferences, symposia, seminars,
or other meetings sponsored or co-
sponsored by NASA.
SPECIAL PUBLICATION. Scientific,
technical, or historical information from
NASA programs, projects, and missions,
often concerned with subjects having
substantial public interest.
TECHNICAL TRANSLATION.
English-language translations of foreign
scientific and technical material pertinent to
NASA’s mission.
Specialized services also include organizing
and publishing research results, distributing
specialized research announcements and feeds,
providing information desk and personal search
support, and enabling data exchange services.
For more information about the NASA STI
program, see the following.
Access the NASA STI program home page
at http.//www.sti.nasa.gov
E-mail your question to [email protected]
Phone the NASA STI Information Desk at
757-864-9658
Write to.
NASA STI Information Desk
Mail Stop 148
NASA Langley Research Center
Hampton, VA 23681-2199
This page is required and contains approved text that cannot be changed.

NASA/TP-20205003457 Vol I
Investigation of a Helicopter Individual Blade Control
(IBC) System in Two Full-Scale Wind Tunnel Tests:
Volume I
Stephen A. Jacklin and Stephen Swanson
Ames Research Center, Moffett Field, California
Achim Blaas and Peter Richter
ZF Luftfahrttechnik GmbH, Kassel, Germany
Dietrich Teves and Georg Niesl
Eurocopter Deutschland GmbH, Munich, Germany
Roland Kube and Bernd Gmelin
DLR Institute for Flight Mechanics, Braunschweig, Germany
David L. Key
U.S. Army AVRDEC
Ames Research Center, Moffett Field, California
National Aeronautics and
Space Administration
Ames Research Center
Moffett Field, CA 94035-1000
National Aeronautics and
Space Administration
Ames Research Center
Moffett Field, CA 94035-1000
July 2020

ACKNOWLEDGMENTS
Full-scale wind tunnel tests of a helicopter individual blade control (IBC) system were
performed under the auspices of the U.S./German Memorandum of Understanding in Helicopter
Aeromechanics in 1993 and 1994. The participating organizations were NASA Ames Research
Center, ZF Luftfahrttechnik GmbH, the U.S. Army Aeroflightdynamics Directorate, the DLR
Institute for Flight Mechanics, and Eurocopter Deutschland GmbH. The wind tunnel testing was
conducted in the 40- by 80-Foot Wind Tunnel at NASA Ames Research Center using a full-scale
BO-105 rotor. ZF Luftfahrttechnik GmbH manufactured the IBC system and actuators.
NASA personnel directly involved in the IBC testing were Stephen Jacklin (project director),
Stephen Swanson (deputy project director, acoustics), Khanh Nguyen (deputy project director,
dynamics), Robert Fong (test director), Scott Larwood (test director), Al Lizak (lead, mechanical
systems), Jeff Johnson (mechanical systems), Ted Hart (mechanical systems), Alex Sheikman
(instrumentation), Rod David (software), Cynthia Freedman (software), and Lee Helmle
(software).
ZF Luftfahrttechnik personnel directly involved in the IBC testing were Achim Blaas (program
manager), Karl-Heinz Bock (control systems), Hans-Juergen Goette (mechanical systems),
Thomas Schreiber (analyst), and Michael Platzer (mechanical design).
Participating in the IBC wind tunnel test program from Eurocopter Deutschland were Dietrich
Teves (dynamics) and Georg Niesl (acoustics).
Participating in the IBC wind tunnel test program from the DLR at Braunschweig was Roland
Kube (research engineer).
Available from.
NASA STI Support Services National Technical Information Service
Mail Stop 148 5301 Shawnee Road
NASA Langley Research Center Alexandria, VA 22312
Hampton, VA 23681-2199 [email protected]
757-864-9658 703-605-6000
This report is also available in electronic form at
http.//ntrs.nasa.gov
iii
TABLE OF CONTENTS
VOLUME I
LIST OF FIGURES .............................................................................................................................. vi
LIST OF TABLES ........................................................................................................................... xviii
SUMMARY .......................................................................................................................................... 1
INTRODUCTION ............................................................................................................................... 2
TEST HARDWARE ............................................................................................................................. 5
BO-105 Rotor............................................................................................................................ 6
Rotor Test Apparatus (RTA) .................................................................................................... 7
IBC Actuators ........................................................................................................................... 8
Installation of the IBC System ................................................................................................ 12
IBC Actuator Control System ................................................................................................. 17
INSTRUMENTATION AND MEASUREMENTS ........................................................................ 19
IBC INPUTS, TEST CONDITIONS, AND ACQUIRED DATA .................................................. 21
Definition of IBC Inputs for Wind Tunnel Testing ................................................................ 22
Selection of IBC Inputs ........................................................................................................... 23
Summary of the IBC Inputs Evaluated ................................................................................... 26
Rotor Trim States .................................................................................................................... 26
Test Conditions ....................................................................................................................... 28
VIBRATORY HUB LOADS DATA ................................................................................................. 29
Vibratory Hub Loading Spectra .............................................................................................. 29
Presentation of Vibration Data................................................................................................ 34
Effect of IBC on Low-Speed Vibration (Test Condition 1). .................................................. 35
Effect of IBC on Cruise-Speed Vibration (Test Condition 4). ............................................... 40
Vibration Polar Plots ............................................................................................................... 42
Polar Plots of Vibration for Test Condition 1 (43 Knots) ................................................. 42
Polar Plots of Vibration for Test Condition 4 (127 Knots) ............................................... 44
Effect of Rotor Trim State on Vibration Reduction With IBC ............................................... 70
Effect of IBC on the Full Vibration Spectrum ........................................................................ 74
ACOUSTIC DATA ............................................................................................................................ 76
Acoustic Measurement Hardware ........................................................................................... 76
Acoustic Test Conditions ........................................................................................................ 78
Effect of 2/Rev IBC on BVI Noise at Test Conditions 2 and 3 .............................................. 81
Effect of 3/Rev IBC on BVI Noise at Test Conditions 2 and 3 .............................................. 85
Effect of 4/Rev IBC on BVI Noise at Test Conditions 2 and 3 .............................................. 88
Effect of 5/Rev IBC on BVI Noise at Test Conditions 2 and 3 .............................................. 92
Effect of 6/Rev IBC on BVI Noise at Test Conditions 2 and 3 .............................................. 94
Effect of Root-Pitch Pulse and Wavelet Inputs on BVI Noise ............................................... 97
Effect of IBC on BVI Noise at Test Condition 1 .................................................................. 101

iv
SIMULTANEOUS BVI NOISE AND VIBRATION REDUCTION DATA .............................. 104
Effect of 2/Rev IBC on Noise and Vibration at Test Conditions 2 and 3 ............................. 106
Effect of 3/Rev IBC on Noise and Vibration at Test Conditions 2 and 3 ............................. 109
Effect of 4/Rev IBC on Noise and Vibration at Test Conditions 2 and 3 ............................. 112
Effect of 5/Rev IBC on Noise and Vibration at Test Conditions 2 and 3 ............................. 115
Effect of 6/Rev IBC on Noise and Vibration at Test Conditions 2 and 3 ............................. 118
Noise and Vibration Reduction Using Combined 2/Rev and 5/Rev IBC ............................ 121
Effect of Pulse and Wavelet Inputs ....................................................................................... 127
ROTOR PERFORMANCE DATA ................................................................................................. 130
Study of Rotor Performance Improvement Using 2/Rev IBC .............................................. 130
2/Rev IBC at Transition Speed (43 Knots, Test Condition 1). ....................................... 131
2/Rev IBC at Cruise Speed (127 Knots, Test Condition 4) ............................................ 131
2/Rev IBC at 170 Knots (μ = 0.40, Test Condition 5) .................................................... 132
2/Rev IBC at 190 Knots (μ = 0.45, Test Condition 6) .................................................... 132
2/Rev IBC at High Thrust at 85 Knots............................................................................ 133
Effect of IBC Inputs for Noise and Vibration Control on Performance ............................... 133
ROTOR CONTROL SYSTEM LOADS DATA .......................................................................... 145
Pitch Link Loads With 2/Rev IBC ........................................................................................ 146
Pitch Link Loads With 3/Rev IBC ........................................................................................ 151
Pitch Link Loads With 4/Rev IBC ........................................................................................ 153
Pitch Link Loads With 5/Rev and 6/Rev IBC. ..................................................................... 156
Half-Peak-to-Peak Pitch Link Loads With IBC.................................................................... 158
ROTOR BLADE LOADS DATA ................................................................................................... 159
Effect of IBC Inputs on Blade Loads at Low-Speed Test Conditions .................................. 160
Effect of IBC on Blade Loads at 170 Knots (Test Condition 5) ........................................... 161
Half-Peak-to-Peak Versus Mean Blade Loads ..................................................................... 170
ROTOR BLADE MOTION DATA ................................................................................................ 173
Comparison of LVDT and Blade Root Pitch Measurements................................................ 173
Blade Elastic Deformation .................................................................................................... 177
Blade Torsional Moment Data ........................................................................................ 177
Flapwise Blade Acceleration Data .................................................................................. 177
Estimation of Blade Tip Angle from Accelerometer Data ................................................... 180
Comparison of Blade Tip Pitch Angle with Blade Torsion Data ......................................... 182
HYDRAULIC POWER REQUIREMENTS FOR IBC .................................................................. 183
IBC Actuator Hydraulic Power ............................................................................................. 183
IBC System Power Requirements. ........................................................................................ 185
CONCLUSIONS .............................................................................................................................. 187
REFERENCES ........................................................................................................................... 189
v
VOLUME II
APPENDIX A. Rotor Balance Weight Tare Corrections, Aerodynamic Tare Corrections,
and Transformations .......................................................................................... A-1
APPENDIX B. List of Measurements ......................................................................................... B-1
APPENDIX C. List of Computed Data ....................................................................................... C-1
APPENDIX D. List of IBC Data Points Acquired ..................................................................... D-1
APPENDIX E. Rotor Trim State Data ......................................................................................... E-1
APPENDIX F. Wind Tunnel Test Section Steady Data ........................................................... F-1
APPENDIX G. Rotor Balance 4/Rev Vibration Data (Magnitude) ......................................... G-1
APPENDIX H. Rotor Balance Vibratory Data (Harmonics 1–12/Rev) .................................. H-1
APPENDIX I. Rotor Balance Mean and Oscillatory Loads Data. .......................................... I-1
APPENDIX J. Microphone BL-SPL (BVI) Acoustic Data ........................................................ J-1
APPENDIX K. Control Loads Mean and Oscillatory Data ..................................................... K-1
APPENDIX L. Control Loads 1–12/Rev Harmonic Data ......................................................... L-1
APPENDIX M. Mean and Oscillatory Blade Bending Loads Data ........................................ M-1
APPENDIX N. Blade Bending 1–12/Rev Harmonic Data ....................................................... N-1
APPENDIX O. Rotor Blade Acceleration Data .......................................................................... O-1

vi
LIST OF FIGURES
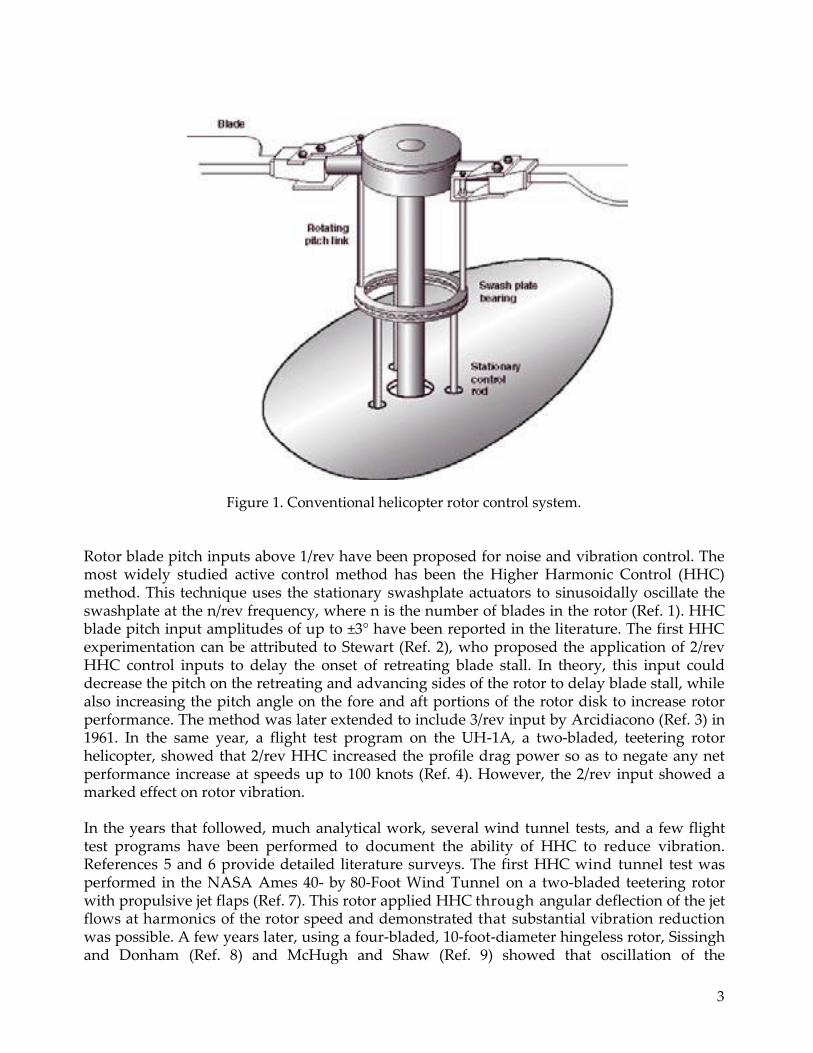
Figure 1. Conventional helicopter rotor control system .......................................................... 3
Figure 2. Natural frequencies of the BO-105 rotor (from Ref. 37). .......................................... 6
Figure 3. Installation of the RTA and BO-105 rotor in the NASA Ames 40- by 80-Foot
Wind Tunnel. ................................................................................................................. 7
Figure 4. Main components of the RTA...................................................................................... 8
Figure 5. IBC Actuator .................................................................................................................. 9
Figure 6. BO-105 rotor hub and swashplate with IBC actuators installed ............................ 9
Figure 7. IBC actuator schematic diagram ............................................................................... 11
Figure 8. Amplitude of IBC harmonics tested in the wind tunnel compared to the
maximum actuator motion possible ......................................................................... 12
Figure 9. General arrangement of the IBC hydraulic system components installed
on the RTA ................................................................................................................... 13
Figure 10. Hydraulic pipe assembly and wire harness prior to insertion through the
rotor shaft. .................................................................................................................... 14
Figure 11. Schematic drawing of the hydraulic Glyco slipring ............................................... 15
Figure 12. Cross section through the rotor shaft showing the hydraulic lines, electrical
instrumentation, and control wires .......................................................................... 15
Figure 13. Detail of the BO-105 hub area showing the rotating shaft hydraulic lines,
electrical lines, hub adapter, and IBC actuators ..................................................... 16
Figure 14. Instrumentation terminal hat mounted to top of the rotor hub ........................... 17
Figure 15. IBC control loop and primary controller ................................................................. 18
Figure 16. IBC actuator hydraulic control circuit diagram ...................................................... 19
Figure 17. Example IBC input, ±1.0° of 2/rev at a phase angle of 270°................................... 23
Figure 18. Fourier synthesis of IBC harmonics to create a negative 1.0° blade root
pulse input (Pitch link trails the blade.) ................................................................... 25
Figure 19. Fourier synthesis of IBC harmonics to create negative 1.0° wavelet input......... 25
Figure 20. Baseline (no IBC) vibratory hub loads with the rotor held in hub moment
trim at 43 kts. Pitch = 1400 ft-lb, roll = -300 ft-lb, CT/σ = 0.074, shaft angle
= -2.4° ............................................................................................................................. 30
Figure 21. Vibratory hub loads at Test Condition 1 (43 kts) without IBC. Pitch moment
= 2,300 ft-lb, roll moment = -250 ft-lb, CT/σ = 0.074, shaft angle = -2.4° ................ 31
Figure 22. Rotor balance thrust force response to thrust force loading ................................. 31
Figure 23. Rotor balance pitch moment response to pitch moment loading ........................ 32
Figure 24. Rotor balance roll moment response to roll moment loading .............................. 32
Figure 25. Rotor balance side force response to side force loading ........................................ 33
Figure 26. Rotor balance axial force response to axial force loading ..................................... 33

vii
Figure 27. Effect of 1.0° of 2/rev IBC on the vibratory hub loads at 43 kts with pitch
moment = 3,200 ft-lb, roll moment = -500 ft-lb, CT/σ = 0.078, shaft
angle = -2.5° .................................................................................................................. 36
Figure 28. Effect of 2/rev IBC amplitude at 60° phase angle on the vibratory hub
loads at 43 kts with pitch moment = 2,400 ft-lb, roll moment = –300 ft-lb,
CT/σ = 0.074, shaft angle = -2.4° ................................................................................. 36
Figure 29. Effect of 1.0° of 3/rev IBC on the vibratory hub loads at 43 kts with pitch
moment = 3,200 ft-lb, roll moment = -500 ft-lb, CT/σ = 0.078, shaft
angle = -2.5° .................................................................................................................. 37
Figure 30. Effect of 3/rev IBC amplitude at 150° phase angle on the vibratory hub
loads at 43 kts with pitch moment = 2,450 ft-lb, roll moment = –350 ft-lb,
CT/σ = 0.074, shaft angle = -2.4° ................................................................................. 37
Figure 31. Effect of 0.5° of 4/rev IBC on the vibratory hub loads at 43 kts with pitch
moment = 3,100 ft-lb, roll moment = -500 ft-lb, CT/σ = 0.077, shaft
angle = -2.5 .................................................................................................................... 38
Figure 32. Effect of 4/rev IBC amplitude at 240° phase angle on the vibratory hub
loads at 43 kts with pitch moment = 2,400 ft-lb, roll moment = –400 ft-lb,
CT/σ = 0.074, shaft angle = -2.4° ................................................................................. 38
Figure 33. Effect of 1.0° of 5/rev IBC on the vibratory hub loads at 43 kts with pitch
moment = 3,500 ft-lb, roll moment = -400 ft-lb, CT/σ = 0.077, shaft
angle = -2.5 .................................................................................................................... 39
Figure 34. Effect of 1.0° of 6/rev IBC on the vibratory hub loads at 43 kts with pitch
moment = 3,500 ft-lb, roll moment = -300 ft-lb, CT/σ = 0.077, shaft
angle = -2.5 .................................................................................................................... 39
Figure 35. Effect of 1.0° of 2/rev IBC on the vibratory hub loads at 127 kts with pitch
moment = 1,650 ft-lb, roll moment = -900 ft-lb ........................................................ 41
Figure 36. Effect of 1.0° of 3/rev IBC on the vibratory hub loads at 127 kts with pitch
moment = 1,450 ft-lb, roll moment = -950 ft-lb ........................................................ 41
Figure 37. Effect of 1.0° of 4/rev IBC on the vibratory hub loads at 127 kts with pitch
moment = 1,500 ft-lb, roll moment = -900 ft-lb ........................................................ 42
Figure 38. Effect of 1.0° of 2/rev IBC (and amplitude sweep at 60° phase angle) on the
4/rev pitch moment at 43 kts, with pitch moment = 2,450 ft–lb, roll moment
= -350 ft-lb ..................................................................................................................... 46
Figure 39. Effect of 1.0° of 2/rev IBC (and amplitude sweep at 60° phase angle) on the
4/rev roll moment at 43 kts, with pitch moment = 2,450 ft–lb, roll moment
= -350 ft-lb ..................................................................................................................... 46
Figure 40. Effect of 1.0° of 2/rev IBC (and amplitude sweep at 60° phase angle) on the
4/rev pitch moment at 43 kts, with side force = 2,450 ft-lb, roll moment
= -350 ft-lb ..................................................................................................................... 47
viii
Figure 41. Effect of 1.0° of 2/rev IBC (and amplitude sweep at 60° phase angle) on the
4/rev pitch moment at 43 kts, with drag force = 2,450 ft-lb, roll moment
= -350 ft-lb ..................................................................................................................... 47
Figure 42. Effect of 1.0° of 2/rev IBC (and amplitude sweep at 60° phase angle) on
the 4/rev pitch moment at 43 kts, with lift force = 2,450 ft-lb, roll moment
= -350 ft-lb ..................................................................................................................... 48
Figure 43. Effect of 1.0° of 2/rev IBC (and amplitude sweep at 60° phase angle) on
the 4/rev pitch moment at 43 kts, with torque = 2,450 ft–lb, roll moment
= -350 ft-lb ..................................................................................................................... 48
Figure 44. Effect of 1.0° of 3/rev IBC (and amplitude sweep at 150° phase angle) on the
4/rev pitch moment components at 43 kts, with pitch moment = 2,450 ft-lb,
roll moment = -350 ft-lb .............................................................................................. 49
Figure 45. Effect of 1.0° of 3/rev IBC (and amplitude sweep at 150° phase angle) on the
4/rev roll moment components at 43 kts, with pitch moment = 2,450 ft-lb,
roll moment = -350 ft-lb .............................................................................................. 49
Figure 46. Effect of 1.0° of 3/rev IBC (and amplitude sweep at 150° phase angle) on the
4/rev side force components at 43 kts, with pitch moment = 2,450 ft-lb, roll
moment = -350 ft-lb .................................................................................................... 50
Figure 47. Effect of 1.0° of 3/rev IBC (and amplitude sweep at 150° phase angle) on the
4/rev drag force components at 43 kts, with pitch moment = 2,450 ft-lb, roll
moment = -350 ft-lb ..................................................................................................... 50
Figure 48. Effect of 1.0° of 3/rev IBC (and amplitude sweep at 150° phase angle) on the
4/rev lift force components at 43 kts, with pitch moment = 2,450 ft-lb, roll
moment = -350 ft-lb ..................................................................................................... 51
Figure 49. Effect of 1.0° of 3/rev IBC (and amplitude sweep at 150° phase angle) on the
4/rev torque components at 43 kts, with pitch moment = 2,450 ft-lb, roll
moment = -350 ft-lb ..................................................................................................... 51
Figure 50. Effect of 0.5° of 4/rev IBC (and amplitude sweep at 240° phase angle) on the
4/rev pitch moment components at 43 kts, with pitch moment = 2,400 ft-lb,
roll moment = -400 ft-lb .............................................................................................. 52
Figure 51. Effect of 0.5° of 4/rev IBC (and amplitude sweep at 240° phase angle) on the
4/rev roll moment components at 43 kts, with pitch moment = 2,400 ft-lb, roll
moment = -400 ft-lb ..................................................................................................... 52
Figure 52. Effect of 0.5° of 4/rev IBC (and amplitude sweep at 240° phase angle) on the
4/rev side force components at 43 kts, with pitch moment = 2,400 ft-lb, roll
moment = -400 ft-lb ..................................................................................................... 53
Figure 53. Effect of 0.5° of 4/rev IBC (and amplitude sweep at 240° phase angle) on the
4/rev drag force components at 43 kts, with pitch moment = 2,400 ft-lb, roll
moment = -400 ft-lb ..................................................................................................... 53
ix
Figure 54. Effect of 0.5° of 4/rev IBC (and amplitude sweep at 240° phase angle) on the
4/rev lift force components at 43 kts, with pitch moment = 2,400 ft-lb, roll
moment = -400 ft-lb ..................................................................................................... 54
Figure 55. Effect of 0.5° of 4/rev IBC (and amplitude sweep at 240° phase angle) on
the 4/rev torque components at 43 kts, with pitch moment = 2,400 ft-lb,
roll moment = -400 ft-lb .............................................................................................. 54
Figure 56. Effect of 0.5° of 5/rev IBC on the 4/rev pitch moment components at 43 kts,
with pitch moment = 2,400 ft-lb, roll moment = -400 ft-lb ..................................... 55
Figure 57. Effect of 0.5° of 5/rev IBC on the 4/rev roll moment components at 43 kts,
with pitch moment = 2,400 ft-lb, roll moment = -400 ft-lb ..................................... 55
Figure 58. Effect of 0.5° of 5/rev IBC on the 4/rev side force components at 43 kts,
with pitch moment = 2,400 ft-lb, roll moment = -400 ft-lb ..................................... 56
Figure 59. Effect of 0.5° of 5/rev IBC on the 4/rev drag force components at 43 kts,
with pitch moment = 2,400 ft-lb, roll moment = -400 ft-lb ..................................... 56
Figure 60. Effect of 0.5° of 5/rev IBC on the 4/rev lift force components at 43 kts,
with pitch moment = 2,400 ft-lb, roll moment = -400 ft-lb ..................................... 57
Figure 61. Effect of 0.5° of 5/rev IBC on the 4/rev torque components at 43 kts,
with pitch moment = 2,400 ft-lb, roll moment = -400 ft-lb ..................................... 57
Figure 62. Effect of 1.0° of 6/rev IBC on the 4/rev pitch moment components at 43 kts,
with pitch moment = 2,400 ft-lb, roll moment = -400 ft-lb ..................................... 58
Figure 63. Effect of 1.0° of 6/rev IBC on the 4/rev roll moment components at 43 kts,
with pitch moment = 2,400 ft-lb, roll moment = -400 ft-lb ..................................... 58
Figure 64. Effect of 1.0° of 6/rev IBC on the 4/rev side force components at 43 kts,
with pitch moment = 2,400 ft-lb, roll moment = -400 ft-lb ..................................... 59
Figure 65. Effect of 1.0° of 6/rev IBC on the 4/rev drag force components at 43 kts,
with pitch moment = 2,400 ft-lb, roll moment = -400 ft-lb ..................................... 59
Figure 66. Effect of 1.0° of 6/rev IBC on the 4/rev lift force components at 43 kts,
with pitch moment = 2,400 ft-lb, roll moment = -400 ft-lb ..................................... 60
Figure 67. Effect of 1.0° of 6/rev IBC on the 4/rev torque components at 43 kts,
with pitch moment = 2,400 ft-lb, roll moment = -400 ft-lb ..................................... 60
Figure 68. Effect of 1.0° of 2/rev IBC on the 4/rev pitch moment components at 127 kts,
with pitch moment = 1,650 ft-lb, roll moment = -900 ft-lb ..................................... 61
Figure 69. Effect of 1.0° of 2/rev IBC on the 4/rev roll moment components at 127 kts,
with pitch moment = 1,650 ft-lb, roll moment = -900 ft-lb ..................................... 61
Figure 70. Effect of 1.0° of 2/rev IBC on the 4/rev side force components at 127 kts,
with pitch moment = 1,650 ft-lb, roll moment = -900 ft-lb ..................................... 62
Figure 71. Effect of 1.0° of 2/rev IBC on the 4/rev drag force components at 127 kts,
with pitch moment = 1,650 ft-lb, roll moment = -900 ft-lb ..................................... 62
Figure 72. Effect of 1.0° of 2/rev IBC on the 4/rev lift force components at 127 kts,
with pitch moment = 1,650 ft-lb, roll moment = -900 ft-lb ..................................... 63
x
Figure 73. Effect of 1.0° of 2/rev IBC on the 4/rev torque components at 127 kts, with
pitch moment = 1,650 ft-lb, roll moment = -900 ft-lb .............................................. 63
Figure 74. Effect of 1.0° of 3/rev IBC on the 4/rev pitch moment components at 127 kts,
with pitch moment = 1,400 ft-lb, roll moment = -900 ft-lb ..................................... 64
Figure 75. Effect of 1.0° of 3/rev IBC on the 4/rev roll moment components at 127 kts,
with moment = 1,400 ft-lb, roll moment = -900 ft-lb ............................................... 64
Figure 76. Effect of 1.0° of 3/rev IBC on the 4/rev side force components at 127 kts,
with pitch moment = 1,400 ft-lb, roll moment = -900 ft-lb ..................................... 65
Figure 77. Effect of 1.0° of 3/rev IBC on the 4/rev drag force components at 127 kts,
with pitch moment = 1,400 ft-lb, roll moment = -900 ft-lb ..................................... 65
Figure 78. Effect of 1.0° of 3/rev IBC on the 4/rev lift force components at 127 kts,
with pitch moment = 1,400 ft-lb, roll moment = -900 ft-lb ..................................... 66
Figure 79. Effect of 1.0° of 3/rev IBC on the 4/rev torque components at 127 kts, with
pitch moment = 1,400 ft-lb, roll moment = -900 ft-lb .............................................. 66
Figure 80. Effect of 1.0° of 4/rev IBC on the 4/rev pitch moment components at 127 kts,
with pitch moment = 1,400 ft-lb, roll moment = -900 ft-lb ..................................... 67
Figure 81. Effect of 1.0° of 4/rev IBC on the 4/rev roll moment components at 127 kts,
with moment = 1,400 ft-lb, roll moment = -900 ft-lb ............................................... 67
Figure 82. Effect of 1.0° of 4/rev IBC on the 4/rev side force components at 127 kts,
with pitch moment = 1,400 ft-lb, roll moment = -900 ft-lb ..................................... 68
Figure 83. Effect of 1.0° of 4/rev IBC on the 4/rev drag force components at 127 kts,
with pitch moment = 1,400 ft-lb, roll moment = -900 ft-lb ..................................... 68
Figure 84. Effect of 1.0° of 4/rev IBC on the 4/rev lift force components at 127 kts, with
pitch moment = 1,400 ft-lb, roll moment = -900 ft-lb .............................................. 69
Figure 85. Effect of 1.0° of 4/rev IBC on the 4/rev torque components at 127 kts, with
pitch moment = 1,400 ft-lb, roll moment = -900 ft-lb .............................................. 69
Figure 86. Comparison of percent 4/rev hub shear reductions obtained using 1.0° of
2/rev IBC at Test Condition 1 (43 kts) at three rotor trim states ........................... 71
Figure 87. Comparison of percent 4/rev hub moment reductions obtained using 1.0°
of 2/rev IBC at Test Condition 1 (43 kts) at three rotor trim states ...................... 71
Figure 88. Comparison of percent 4/rev hub shear reductions obtained using 1.0° of
3/rev IBC at Test Condition 1 (43 kts) at three rotor trim states ........................... 72
Figure 89. Comparison of percent 4/rev hub moment reductions obtained using 1.0°
of 3/rev IBC at Test Condition 1 (43 kts) at three rotor trim states ...................... 72
Figure 90. Comparison of percent 4/rev hub shear reductions obtained using 0.5° of
4/rev IBC at Test Condition 1 (43 kts) at three rotor trim states ........................... 73
Figure 91. Comparison of percent 4/rev hub moment reductions obtained using 0.5°
of 4/rev IBC at Test Condition 1 (43 kts) at three rotor trim states ...................... 73
xi
Figure 92. Resultant vibratory hub loads at 43 kts with 2° amplitude 2/rev IBC input
at 60° phase. Pitch moment = 2,500 ft-lb, roll moment = –350 ft-lb,
CT/σ = 0.075, shaft angle = –2.4° ................................................................................. 75
Figure 93. Resultant vibratory hub loads at 43 kts with 1° amplitude 3/rev IBC input
at 150° phase. Pitch moment = 2,416 ft-lb, roll moment = –261 ft-lb,
CT/σ = 0.075, shaft angle = –2.4° ................................................................................. 75
Figure 94. Top view schematic showing microphone positions ............................................. 77
Figure 95. Frequency spectra comparing background noise and baseline rotor noise.
Test condition 2, microphone 3, Xtrav = 8.20 ft ....................................................... 79
Figure 96. Averaged time history trace of baseline BO-105 rotor with and without
band-pass filtering from microphone 3 @ Xtrav = 8.20 ft, at Test Condition 3
with minimum flap bending trim and no IBC input ............................................. 79
Figure 97. Contour plot of BL-SPL BVI noise metric for the case of no IBC input at
Test Condition 2 (43 kts)............................................................................................. 80
Figure 98. Contour plot of BL-SPL BVI noise metric for the case of no IBC input at
Test Condition 3 (65 kts)............................................................................................. 80
Figure 99. Advancing side changes in BL-SPL values for phase sweep of 2/rev IBC
input at 1.5° amplitude, Xtrav = 8.20 ft, Test Condition 2 (43 kts) with
minimum flap bending trim ...................................................................................... 82
Figure 100. Advancing side changes in BL-SPL values for phase sweep of 2/rev IBC
input at 1.0° amplitude, Xtrav = 8.20 ft, Test Condition 3 (65 kts) with
minimum flap bending trim ...................................................................................... 82
Figure 101. Contour plot of BL-SPL BVI noise metric at Test Condition 2 (43 kts) for
2/rev input at 1.5° amplitude and 60° phase ........................................................... 83
Figure 102. Contour plot of BL-SPL BVI noise metric at Test Condition 3 (65 kts) for
2/rev input at 1.0° amplitude and 60° phase ........................................................... 83
Figure 103. Retreating side changes in BL-SPL values for a phase sweep of 1.5° of
2/rev IBC input at Test Condition 2 (43 kts) ............................................................ 84
Figure 104. Retreating side changes in BL-SPL values for a phase sweep of 1.0° of
2/rev IBC input at Test Condition 3 (65 kts) ............................................................ 84
Figure 105. Advancing side changes in BL-SPL values for a phase sweep of 3/rev IBC
input at 1.0° amplitude at Test Condition 2 (43 kts) .............................................. 85
Figure 106. BL-SPL contour plot for a microphone traverse sweep with 1.0° of 3/rev
IBC input at 135° phase angle, at Test Condition 2 (43 kts) .................................. 86
Figure 107. Retreating side changes in BL-SPL values for a phase sweep of 3/rev IBC
input at 1.0° amplitude at Test Condition 2 (43 kts) .............................................. 86
Figure 108. Advancing side changes in BL-SPL values for a phase sweep of 3/rev IBC
input at 0.5° amplitude at Test Condition 3 (65 kts) .............................................. 87
Figure 109. Retreating side changes in BL-SPL values for a phase sweep of 3/rev IBC
input at 0.5° amplitude at Test Condition 3 (65 kts) .............................................. 87
xii
Figure 110. BL-SPL contour plot for a microphone traverse sweep with 0.5° of 3/rev IBC
input at 135° phase angle, at Test Condition 3 (65 kts) .......................................... 88
Figure 111. Advancing side changes in BL-SPL values for phase sweep of 4/rev IBC
input at 0.5° amplitude, Xtrav = 16.41 ft, Test Condition 2 (43 kts) ..................... 89
Figure 112. Retreating side changes in BL-SPL values for phase sweep of 4/rev IBC
input at 0.5° amplitude, Test Condition 2 (43 kts) .................................................. 89
Figure 113. Contour plot of BL-SPL BVI noise metric for the case of 4/rev IBC (0.5°
amplitude at 45° phase angle) at Test Condition 2 (43 kts) ................................... 90
Figure 114. Advancing side changes in BL-SPL values for phase sweep of 4/rev IBC
input at 1.0° amplitude, Xtrav = 8.20 ft, Test Condition 3 (65 kts) ....................... 90
Figure 115. Contour plot of BL-SPL BVI noise metric for the case of 4/rev IBC (1.0°
amplitude at 90° phase angle) at Test Condition 3 (65 kts) ................................... 91
Figure 116. Retreating side changes in BL-SPL values for a phase sweep of 4/rev IBC
input at 1.0° amplitude, Test Condition 3 (65 kts) .................................................. 91
Figure 117. Advancing side changes in BL-SPL values for phase sweep of 5/rev IBC
input at 1.0° amplitude, Xtrav = 16.41 ft, Test Condition 2 (43 kts) ..................... 92
Figure 118. Retreating side changes in BL-SPL values for phase sweep of 5/rev IBC
input at 1.0° amplitude, Test Condition 2 (43 kts) .................................................. 93
Figure 119. Advancing side changes in BL-SPL values for a phase sweep of 5/rev IBC
input at 1.0° amplitude, Xtrav = 8.20 ft, Test Condition 3 (65 kts) ....................... 93
Figure 120. Retreating side changes in BL-SPL values for a phase sweep of 5/rev IBC
input at 1.0° amplitude, Test Condition 3 (65 kts) .................................................. 94
Figure 121. Advancing side changes in BL-SPL values for a phase sweep of 6/rev IBC
input at 0.5° amplitude, Xtrav = 8.20 ft, Test Condition 2 (43 kts) ....................... 95
Figure 122. Retreating side changes in BL-SPL values for a phase sweep of 5/rev IBC
input at 0.5° amplitude, Test Condition 2 (43 kts) ................................................. 95
Figure 123. Advancing side changes in BL-SPL values for a phase sweep of 6/rev IBC
input at 1.0° amplitude, Xtrav = 8.20 ft, Test Condition 3 (65 kts) ....................... 96
Figure 124. Retreating side changes in BL-SPL values for a phase sweep of 6/rev IBC
input at 1.0° amplitude, Test Condition 3 (65 kts) .................................................. 96
Figure 125. Contour plot of BL-SPL BVI noise metric for the case of 6/rev IBC (1.0° at
240° phase angle) at Test Condition 3 (65 kts) ........................................................ 97
Figure 126. Changes in BL-SPL values (Xtrav = 8.2 ft) for a phase sweep of a 1.0°
amplitude negative pulse IBC input at Test Condition 3 (65 kts) ........................ 98
Figure 127. Changes in BL-SPL values from acoustic traverse sweep for 1.0° amplitude
negative pulse IBC input at an input phase of 300° for Test Condition 3
(65 kts) ........................................................................................................................... 98
Figure 128. Changes in BL-SPL values (Xtrav = 8.2 ft) for a 1.0° amplitude negative
wavelet input at Test Condition 3 with minimum flap bending trim ............... 100
xiii
Figure 129. Changes in BL-SPL values (traverse sweep) for a 1.0° amplitude negative
wavelet input at 300° phase at Test Condition 3 with minimum flap
bending trim .............................................................................................................. 100
Figure 130. Changes in BL-SPL values (Xtrav = 8.2 ft) for a 1.0° amplitude positive
wavelet input at Test Condition 3 with minimum flap bending trim ............... 101
Figure 131. Changes in BL-SPL values (Xtrav = 16.3 ft) for a 1.0° of 2/rev input at Test
Condition 1 with minimum flap bending trim ..................................................... 102
Figure 132. Changes in BL-SPL values (Xtrav = 16.3 ft) for a 1.0° of 3/rev input at Test
Condition 1 with minimum flap bending trim ..................................................... 102
Figure 133. Changes in BL-SPL values (Xtrav = 16.3 ft) for a 0.5° of 4/rev input at Test
Condition 1 with minimum flap bending trim ..................................................... 103
Figure 134. Changes in BL-SPL values (Xtrav = 16.3 ft) for a 0.5° of 5/rev input at Test
Condition 1 with minimum flap bending trim ..................................................... 103
Figure 135. Changes in BL-SPL values (Xtrav = 16.3 ft) for a 1.0° of 6/rev input at Test
Condition 1 with minimum flap bending trim ..................................................... 104
Figure 136. Baseline (no IBC) vibratory hub load spectrum at Test Condition 2 (43 kts),
446 ft/min descent rate .............................................................................................. 105
Figure 137. Changes in 4/rev vibratory hub loads and BVI noise with introduction of
1.5° of 2/rev IBC at Test Condition 2 (43 kts)......................................................... 107
Figure 138. Changes in 4/rev vibratory hub loads and BVI noise with introduction of
1.0° of 2/rev IBC at Test Condition 3 (65 kts)......................................................... 108
Figure 139. Changes in 4/rev vibratory hub loads and BVI noise with introduction of
1.0° of 3/rev IBC at Test Condition 2 (43 kts)......................................................... 110
Figure 140. Changes in 4/rev vibratory hub loads and BVI noise with introduction of
0.5° of 3/rev IBC at Test Condition 3 (65 kts)......................................................... 111
Figure 141. Changes in 4/rev vibratory hub loads and BVI noise with introduction of
0.5° of 4/rev IBC at Test Condition 2 (43 kts)......................................................... 113
Figure 142. Changes in 4/rev vibratory hub loads and BVI noise with introduction of
1.0° of 4/rev IBC at Test Condition 3 (65 kts)......................................................... 114
Figure 143. Polar plot of 4/rev pitch moment in response to 1.0° of 4/rev IBC at Test
Condition 3 (65 kts) ................................................................................................... 115
Figure 144. Changes in 4/rev vibratory hub loads and BVI noise with introduction of
1.0° of 5/rev IBC at Test Condition 2 (43 kts)......................................................... 116
Figure 145. Changes in 4/rev vibratory hub loads and BVI noise with introduction of
1.0° of 5/rev IBC at Test Condition 3 (65 kts)......................................................... 117
Figure 146. Changes in 4/rev vibratory hub loads and BVI noise with introduction of
0.5° of 6/rev IBC at Test Condition 2 (43 kts)......................................................... 119
Figure 147. Changes in 4/rev vibratory hub loads and BVI noise with introduction of
1.0° of 6/rev IBC at Test Condition 3 (65 kts)......................................................... 120
xiv
Figure 148. Polar plot of 4/rev pitch moment in response to 1.0° of 6/rev IBC at Test
Condition 3 (65 kts) ................................................................................................... 121
Figure 149. Changes in 4/rev vibratory hub loads and BVI noise with 1.5° of 2/rev
IBC held at 60° phase and varying the phase of 0.5° of 5/rev input at Test
Condition 2 (43 kts) ................................................................................................... 123
Figure 150. Changes in 4/rev vibratory hub loads and BVI noise with 1.5° of 2/rev
IBC held at 60° phase while varying 5/rev input amplitude at 210° phase,
at Test Condition 2 (43 kts) ...................................................................................... 124
Figure 151. Vibratory hub load spectrum at condition 2 with combination of 1.5° of
2/rev at 60° phase and 0.25° of 5/rev at 210° phase .............................................. 125
Figure 152. Traverse sweep showing changes in advancing side BVI noise with 1.5°
of 2/rev IBC at 60° phase and 0.25° of 5/rev IBC at 210° phase at Test
Condition 2 (43 kts) ................................................................................................... 125
Figure 153. Change in BL-SPL values at Test Condition 2 produced by input of 5/rev
IBC at 0.25° amplitude and 210° phase, with 2/rev IBC at 1.5° amplitude
and 60 phase ............................................................................................................... 126
Figure 154. Averaged pressure time history trace from microphone 4, Xtrav = 16.41 ft,
with no IBC at Test Condition 2 (43 kts) ................................................................ 126
Figure 155. Averaged pressure time history trace from microphone 4, Xtrav = 16.41 ft,
with combination of 1.5° of 2/rev at 60° phase and 0.25° of 5/rev at 210°
phase at Test Condition 2 (43 kts) ........................................................................... 127
Figure 156. Changes in 4/rev vibratory hub loads and BVI noise with introduction of
a 1.0° negative pitch pulse at Test Condition 3 (65 kts) ....................................... 128
Figure 157. Changes in 4/rev vibratory hub loads and BVI noise with input of a 1.0°
negative pitch wavelet at Test Condition 3 (65 kts) ............................................. 129
Figure 158. Effect of 1.0° of 2/rev IBC on rotor performance with the rotor trimmed to
minimize blade flapping at Test Condition 1 (43 kts) .......................................... 134
Figure 159. Effect of 1.0° of 2/rev IBC on rotor performance with the rotor trimmed to
maintain constant hub moment and propulsive force at Test Condition 1
(43 kts) ......................................................................................................................... 135
Figure 160. Effect of 1.0° of 2/rev IBC on rotor performance with the rotor trimmed to
minimize blade flapping at Test Condition 4 (127 kts) ........................................ 136
Figure 161. Effect of 1.0° of 2/rev IBC on rotor performance with the rotor trimmed to
maintain constant hub moment and propulsive force at Test Condition 4
(127 kts) ....................................................................................................................... 137
Figure 162. Effect of 2.0° of 2/rev IBC on rotor performance with the rotor trimmed to
maintain constant hub moment and propulsive force at Test Condition 4
(127 kts) ....................................................................................................................... 138
xv
Figure 163. Effect of 1.0° of 2/rev IBC on rotor performance with the rotor trimmed to
maintain constant hub moment and propulsive force at Test Condition 5
(170 kts) ....................................................................................................................... 139
Figure 164. Effect of 2/rev IBC input at 190° on rotor performance with the rotor
trimmed to maintain constant hub moment and propulsive force at Test
Condition 5 (170 kts) ................................................................................................ 140
Figure 165. Effect of 1.0° of 2/rev IBC on rotor performance with the rotor trimmed to
maintain constant hub moment and propulsive force at Test Condition 5
(190 kts) ....................................................................................................................... 141
Figure 166. Effect of 1.0° of 2/rev IBC on rotor performance with the rotor trimmed to
maintain minimum blade flapping trim at 85 kts and CT/σ = 0.12 ..................... 142
Figure 167. Effect of 1.0° of 3/rev IBC on rotor performance with the rotor trimmed to
maintain constant hub moment trim at 43 kts ...................................................... 143
Figure 168. Effect of 1.5° of 2/rev IBC on rotor performance with the rotor trimmed
to maintain constant hub moment at 43 kts .......................................................... 144
Figure 169. Mean and oscillatory pitch link loads without IBC .............................................. 145
Figure 170. Effect of 1.0° of 2/rev IBC on mean pitch link loads with rotor thrust and
hub moment held constant ...................................................................................... 147
Figure 171. Effect of 1.0° of 2/rev IBC on pitch link half-peak-to-peak loads for
constant hub moment trim state ............................................................................. 147
Figure 172. Effect of 2/rev IBC amplitude on pitch link mean loads for constant hub
moment trim state ..................................................................................................... 148
Figure 173. Effect of 2/rev IBC amplitude on pitch link half-peak-to-peak loads
for constant hub moment trim state ....................................................................... 148
Figure 174. Effect of the rotor trim state on the mean pitch link loads with 1.0° of
2/rev IBC at 43 and 127 kts ....................................................................................... 149
Figure 175. Effect of the rotor trim state on the half-peak-to-peak pitch link loads
with 1.0° of 2/rev IBC at 43 and 127 kts.................................................................. 149
Figure 176. Effect of 1.0° of 2/rev IBC input at 120° phase on the pitch link loads at
Test Condition 4 (127 kts) with the rotor trimmed to minimize blade
flapping ....................................................................................................................... 150
Figure 177. Effect of 1.0° of 2/rev IBC input at 120° on the pitch link loads at Test
Condition 4 (127 kts) with the rotor trimmed to maintain constant hub
moment ....................................................................................................................... 150
Figure 178. Effect of 1.0° of 3/rev IBC on the mean pitch link loads at 43 and 128 kts ........ 151
Figure 179. Effect of 1.0° of 3/rev IBC on the half oscillatory pitch link loads at Test
Conditions 1 and 4 (43 and 128 kts) ........................................................................ 152
Figure 180. Time trace of pitch link load from actuator No. 1 with application of 1.0°
of 3/rev IBC at 150° input phase angle at Test Condition 1 and with the
rotor held to minimize blade flapping ................................................................... 152
xvi
Figure 181. Effect of 3/rev IBC amplitude on the oscillatory pitch link loads at 43 kts
at shaft angles of -2.4° and 4.0° ................................................................................ 153
Figure 182. Effect of 4/rev IBC on the mean pitch link loads at 43 and 128 kts .................... 154
Figure 183. Effect of 4/rev IBC on the oscillatory pitch link loads at 43 and 128 kts ........... 154
Figure 184. Time trace of pitch link load from actuator No. 1 with application of 1.0°
of 4/rev IBC at 120° input phase angle at Test Condition 4 (127 kts), and
with the rotor trimmed to keep constant hub moment ....................................... 155
Figure 185. Effect of 4/rev IBC amplitude at 240° IBC phase on the half-peak- to-peak
pitch link loads at 43 kts ........................................................................................... 155
Figure 186. Effect of 1.0° of 5/rev IBC on the oscillatory pitch link loads at 43 kts .............. 156
Figure 187. Effect of 1.0° of 6/rev IBC on the oscillatory pitch link loads at 43 kts with
minimum flapping trim and constant moment trim ........................................... 157
Figure 188. Effect of 5/rev and 6/rev IBC amplitude on the oscillatory and mean pitch
link loads at 43 kts and constant moment trim ..................................................... 157
Figure 189. Envelop of pitch link loads (all runs) ..................................................................... 158
Figure 190. Envelop of pitch link loads showing all data points from 1993 and 1994
IBC tests with rotor trimmed to maintain constant moments, except those
marked MF to denote minimum flapping trim .................................................... 159
Figure 191. Mean flap and chord bending loads with 1.0° of 2/rev IBC at Test
Condition 1 (43 kts, -2.4° shaft angle) for constant moment trim ...................... 162
Figure 192. Mean torsion loads with 1.0° of 2/rev IBC at Test Condition 1 (43 kts,
–2.4° shaft angle) for constant moment trim ......................................................... 162
Figure 193. Mean flap and chord bending loads with 1.0° of 3/rev IBC at Test
Condition 1 (43 kts, -2.4° shaft angle) for constant moment trim ...................... 163
Figure 194. Mean torsion loads with 1.0° of 3/rev IBC at Test Condition 1 (43 kts,
–2.4° shaft angle) for constant moment trim ......................................................... 163
Figure 195. Oscillatory flap and chord bending loads with 1.0° of 2/rev IBC at Test
Condition 1 (43 kts, -2.4° shaft angle) for constant moment trim ...................... 164
Figure 196. Oscillatory torsion loads with 1.0° of 2/rev IBC at Test Condition 1
(43 kts, -2.4° shaft angle) for constant moment trim ............................................ 164
Figure 197. Oscillatory flap and chord bending loads with 1.0° of 3/rev IBC at Test
Condition 1 (43 kts, -2.4° shaft angle) for constant moment trim ...................... 165
Figure 198. Oscillatory torsion loads with 1.0° of 3/rev IBC at Test Condition 1 (43 kts,
-2.4° shaft angle) for constant moment trim .......................................................... 165
Figure 199. Oscillatory blade loads with 0.5° of 4/rev IBC at Test Condition 1 (43 kts,
-2.4° shaft angle) for constant moment trim .......................................................... 166
Figure 200. Oscillatory blade loads with 0.5° of 5/rev IBC at Test Condition 1 (43 kts,
-2.4° shaft angle) for constant moment trim .......................................................... 166
Figure 201. Oscillatory blade loads with 1.0° of 6/rev IBC at Test Condition 1 (43 kts,
-2.4° shaft angle) for constant moment trim .......................................................... 167

xvii
Figure 202. Oscillatory flap, chord, and torsion bending load increases with 2/rev IBC
amplitude at 30° phase angle at Test Condition 1 (43 kts, –2.4° shaft angle)
for constant moment trim ........................................................................................ 167
Figure 203. Mean flap and chord bending loads with 1.0° of 2/rev IBC at Test
Condition 5 (170 kts, -9.0° shaft angle) for constant moment trim .................... 168
Figure 204. Mean torsion loads with 1.0° of 2/rev IBC at Test Condition 5 (170 kts,
-9.0° shaft angle) for constant moment trim .......................................................... 168
Figure 205. Oscillatory flap and chord bending loads with 1.0° of 2/rev IBC at Test
Condition 5 (170 kts, -9.0° shaft angle) for constant moment trim .................... 169
Figure 206. Oscillatory torsion loads with 1.0° of 2/rev IBC at Test Condition 5 (170 kts,
-9.0° shaft angle) for constant moment trim .......................................................... 169
Figure 207. Effect of 2/rev IBC amplitude on blade loads at 190° phase angle for Test
Condition 5 (170 kts) ................................................................................................. 170
Figure 208. Time traces of station 20 flap bending, station 28 chord bending, and
station 65 torsion bending with 2.0° of 2/rev at 190° phase at 170 kts and
constant hub moment trim ...................................................................................... 171
Figure 209. Flap and chord bending mean and oscillatory load data for flap bending
station 20 and chord bending station 28 ................................................................ 172
Figure 210. Torsion mean and oscillatory data load data for torsion bending
station 65 ..................................................................................................................... 172
Figure 211. Blade 1 IBC pitch angle as measured by IBC actuator 1 primary LVDT
for 0.5 and 2.0° of 2/rev IBC excitation at 60° IBC input phase angle, at
Test Condition 2 (43 kts)........................................................................................... 174
Figure 212. Blades 1-4 IBC pitch angles as measured by IBC actuators 1-4 primary
LVDTs for 2.0° IBC 2/rev excitation at 60° IBC input phase angle, 43 kts,
and -2.4° shaft angle .................................................................................................. 174
Figure 213. Blade root pitch angles of all blades measured by wiper assemblies
(without IBC) showing example of bad transducer signal on blade 3 at
Test Condition 1 (43 kts)........................................................................................... 178
Figure 214. Blade torsion data obtained at Test Condition 2 (43 kts) without IBC
input ............................................................................................................................ 178
Figure 215. Blade torsion data obtained for 1.5° of 2/rev IBC input (60° phase)
combined with 0.25° of 5/rev IBC (210° phase) at Test Condition 2 (43 kts) .... 178
Figure 216. Flapwise accelerations at radial station 58 obtained for the baseline case
(no IBC) and for multi-harmonic input of 1.5° of 2/rev IBC input (60°
phase) combined with 0.25° of 5/rev IBC (210° phase) at Test Condition 2
(43 kts) ......................................................................................................................... 179

xviii
Figure 217. Flapwise accelerations at radial station 97 obtained for the baseline case
(no IBC) and for multi-harmonic input of 1.5° of 2/rev IBC input (60°
phase) combined with 0.25° of 5/rev IBC (210° phase) at Test Condition 2
(43 kts) ......................................................................................................................... 179
Figure 218. Schematic end-view of rotor blade tip showing the accelerometer
placement at the leading and trailing edges and depicting the acceleration
forces caused by blade motion ................................................................................ 181
Figure 219. Calculated blade tip pitch angle from blade tip accelerometers (with root
pitch angle removed) for no IBC and for two, 60°-wide wavelets at 0° and
180° phase at Test Condition 2 (43 kts) .................................................................. 182
Figure 220. Blade torsion moment at r/R = 0.4 for no IBC and for two, 60°–wide
wavelet inputs at 0° and 180° phase angles, at Test Condition 2 (43 kts) ......... 183
xix
LIST OF TABLES
Table 1. BO-105 Rotor Characteristics ........................................................................................... 6
Table 2. RTA Balance Static Calibration Accuracy and Loading Capacity ................................. 8
Table 3. IBC Actuator Technical Data .......................................................................................... 10
Table 4. List of IBC Research Measurements .............................................................................. 20
Table 5. Azimuth Location of IBC Peak Pitch Inputs ................................................................... 22
Table 6. Summary of Acquired IBC Data ...................................................................................... 27
Table 7. Wind Tunnel and Rotor Operating Conditions................................................................ 29
Table 8. Variance in the Trim State With IBC at 127 Knots ........................................................ 40
Table 9. Trim States at Test Condition 1 ........................................................................................ 70
Table 10. Microphone Locations for 1993 IBC Test. ...................................................................... 76
Table 11. Microphone Locations for 1994 IBC Test ...................................................................... 77
Table 12. Rotor Trim Precision With IBC at Test Conditions 1, 4, 5, and 6 ............................... 131
Table 13. Rotor Blade Strain Gage Names and Locations ........................................................... 160
Table 14. IBC Pitch Inputs Measured From Resistive Wiper Data .............................................. 175
Table 15. Harmonic Content of Flapwise Acceleration From Stations 58 and 97 ...................... 180
Table 16. Representative IBC Actuator loads, Flow Rates, and Required Horsepower. ............ 186
Table 17. Approximate Ship Horsepower Required to Drive an IBC Hydraulic Pump ............. 186

xx
1
INVESTIGATION OF A HELICOPTER INDIVIDUAL BLADE
CONTROL (IBC) SYSTEM IN TWO FULL-SCALE
WIND TUNNEL TESTS: VOLUME I
Stephen A. Jacklin, Stephen Swanson, Achim Blaas,* Peter Richter,* Dietrich Teves,†
Georg Niesl,† Roland Kube,‡ Bernd Gmelin,‡ and David L. Key§
Ames Research Center
SUMMARY
This report presents the data acquired during the testing of an individual blade control (IBC) system on a full-scale helicopter rotor in two test entries in the NASA Ames 40- by 80-Foot Wind Tunnel. The objective of these investigations was to evaluate the potential benefits of using IBC to improve rotor performance, reduce blade vortex interaction (BVI) noise, and alleviate helicopter vibrations. The wind tunnel tests were an international, collaborative effort between NASA, the U.S. Army Aeroflightdynamics Directorate, ZF Luftfahrttechnik GmbH, Eurocopter Deutschland GmbH, and the German Aerospace Laboratory (DLR). They were conducted as a task of the U.S./German Memorandum of Understanding (MOU) on Helicopter Aeromechanics.
The IBC tests were performed using a full-scale BO-105 helicopter rotor mounted to the NASA/U.S. Army Rotor Test Apparatus (RTA). The first test, performed in 1993, was the first full-scale wind tunnel test to explore the effects of an IBC system on rotor vibration, noise, and performance. In this test, the pitch links of the rotor were replaced by servo-actuators. The servo-actuators and IBC control system were designed and manufactured by ZF Luftfahrttechnik GmbH. This control system allowed the pitch of each rotor blade to be changed independently of the other blades. The IBC inputs had large effects on the hub vibrations and BVI noise. However, the rotor hub moments were not retrimmed with each new IBC input. This resulted in an out-of-trim rotor configuration. The same IBC system was used in the second IBC test performed in 1994. This test more carefully investigated the potential of IBC to simultaneously reduce noise and vibration and also investigated the effect of IBC on rotor performance in high-speed-cruise flight. In the 1994 test, the hub moment and rotor thrust were readjusted to maintain rotor trim as the IBC inputs were applied. For this reason, the data taken from the second test are considered to be more accurate, except for some unique IBC input combinations not repeated in the second test.
IBC controls that were evaluated were single-frequency inputs from 2/rev to 6/rev and multi-harmonic combinations of these frequencies to form pulses, wavelets, and doublets. Extensive data were acquired for each IBC data point. These data included rotor performance, average
* ZF Luftfahrttechnik GmbH, Flughafen Kassel-Calden, 34379 Calden, Germany. † Eurocopter Deutschland GmbH, Munich, Germany. ‡ DLR Institute for Flight Mechanics, Braunschweig, Germany. § U.S. Army Aviation, Research, Development and Engineering Center (AVRDEC).
2
and time-varying hub loads, rotor blade bending loads, control system loads, inboard and outboard blade pitch motions, and BVI noise data. The rotor balance hub force and moment data included the mean values, half-peak-to-peak values, and sine/cosine harmonics up to the 20th rotor harmonic. The time history and averaged Fourier spectrum for each measurement are available electronically from NASA Ames Research Center.
The data indicate that significant reduction in both BVI noise and hub vibration can be obtained using IBC. The 2/rev input produced the best single-frequency results. At a typical descent flight condition, 2/rev IBC combined with other IBC harmonics reduced the BVI noise up to 12 dB (85 percent) at some microphone locations. At the same time, this input could also reduce the dominant 4/rev vibratory hub loads by up to 75 percent. The data also show that performance improvements of up to 7 percent were obtained using 2/rev IBC at high-speed forward flight conditions. An analysis of the hydraulic power requirements for BVI noise suppression, vibration reduction, and rotor performance improvement is included in this report. This analysis shows that the power required by the IBC system is negligible at low-speed flight conditions, and that a net gain of 3 percent of rotor horsepower can be achieved at high-speed flight conditions.
INTRODUCTION
No other helicopter problems are more annoying to helicopter passengers and urban communities than noise and vibration. Whereas excessive vibration levels diminish passenger comfort and degrade handling qualities, external noise levels place restrictions on helicopter operations, especially near densely populated urban areas or in various military situations. For this reason, passive noise and vibration control methods have been widely employed by the helicopter industry. These methods employ the use of vibration dampers, vibration and noise absorption material, and optimized placement of the blade and fuselage structural frequencies. Although much improvement in ride quality has resulted using these methods for vibration control, these techniques have not been fully effective. While low-noise rotor designs have met with some success, the decrease in noise has been only moderate at best. For this reason, much research in recent years has focused on the use of active rotor control technologies in which the rotor blade pitch angles are changed at frequencies above the normal flight control inputs. The development of such an active control system may provide the opportunity to address both problems with one technology, and perhaps improve rotor performance as well.
Most production helicopters are controlled through collective and cyclic modulation of the rotor blade pitch angles. Such modulation is generally achieved by moving fuselage actuators that hold the position of the swashplate bearing, as shown in Figure 1. The rotor blade pitch control links are attached to the rotating part of the swashplate so that the blade pitch is controlled by the position and attitude of the stationary swashplate. For no swashplate tilt angle, all blades have equal pitch angles. Extension or retraction of the pitch links by equal amounts changes the rotor thrust. With the introduction of swashplate tilt, the blade pitch angle can be made to vary sinusoidally, once per rotor revolution (1/rev), around the rotor azimuth. The 1/rev blade pitch inputs produce the pitch and roll moments needed to control the helicopter in forward flight and to tilt the thrust vector to produce propulsive force.
3
Figure 1. Conventional helicopter rotor control system.
Rotor blade pitch inputs above 1/rev have been proposed for noise and vibration control. The most widely studied active control method has been the Higher Harmonic Control (HHC) method. This technique uses the stationary swashplate actuators to sinusoidally oscillate the swashplate at the n/rev frequency, where n is the number of blades in the rotor (Ref. 1). HHC blade pitch input amplitudes of up to ±3° have been reported in the literature. The first HHC experimentation can be attributed to Stewart (Ref. 2), who proposed the application of 2/rev HHC control inputs to delay the onset of retreating blade stall. In theory, this input could decrease the pitch on the retreating and advancing sides of the rotor to delay blade stall, while also increasing the pitch angle on the fore and aft portions of the rotor disk to increase rotor performance. The method was later extended to include 3/rev input by Arcidiacono (Ref. 3) in 1961. In the same year, a flight test program on the UH-1A, a two-bladed, teetering rotor helicopter, showed that 2/rev HHC increased the profile drag power so as to negate any net performance increase at speeds up to 100 knots (Ref. 4). However, the 2/rev input showed a marked effect on rotor vibration. In the years that followed, much analytical work, several wind tunnel tests, and a few flight test programs have been performed to document the ability of HHC to reduce vibration. References 5 and 6 provide detailed literature surveys. The first HHC wind tunnel test was performed in the NASA Ames 40- by 80-Foot Wind Tunnel on a two-bladed teetering rotor with propulsive jet flaps (Ref. 7). This rotor applied HHC through angular deflection of the jet flows at harmonics of the rotor speed and demonstrated that substantial vibration reduction was possible. A few years later, using a four-bladed, 10-foot-diameter hingeless rotor, Sissingh and Donham (Ref. 8) and McHugh and Shaw (Ref. 9) showed that oscillation of the
4
swashplate at the 4/rev frequency substantially diminished test stand vibrations and the rotor balance vibratory hub loads. Using the closed-loop algorithms developed by Molusis, Hammond, and Cline in 1981 (Refs. 10 and 11), Wood et al. (Ref. 12) and Straub et al. (Ref. 13) demonstrated 70 and 90 percent vibration reduction in a flight test using an OH-6A helicopter. In 1985, similar vibration reductions were achieved using HHC on an S-76 helicopter (Ref. 14). In the same year, Aerospatiale demonstrated 70 to 90 percent vibration reduction using a closed-loop HHC controller on a three-bladed SA 349 helicopter (Ref. 15), and Shaw et al. demonstrated 80 to 90 percent vibration suppression on a dynamically scaled, one-sixth-size model CH-47D rotor system in the wind tunnel (Ref. 16).
Beginning in the late 1980s and continuing through the 1990s, HHC was studied as a means of reducing helicopter blade vortex interaction (BVI) noise. This noise is produced primarily in descent flight when a helicopter rotor blade impacts the trailed vortices of preceding rotor blades. The mechanisms by which HHC might reduce BVI noise include moving the trailed vortices away from the blades, moving the blades to miss the vortices, or creating a motion trajectory to diminish the vortex strength before blade impact. In 1988, Brooks et. al. (Ref. 17) showed that 1.0° of 4/rev HHC applied to a four-bladed, articulated, 9-foot-diameter model rotor in the NASA Langley Transonic Dynamics Tunnel produced up to 4.7 dB of BVI noise reduction. However, this input, and all other HHC inputs that reduced BVI noise, substantially increased the rotor vibration measured by a six-component rotor balance. Similar results were obtained during subsequent testing in the Deutsch-Niederländischer WindKanal (DNW) using a 40-percent-scaled BO-105 rotor (Refs. 18-21). These tests showed that each HHC harmonic, applied separately, could reduce BVI noise from 3 to 5 dB, but that the best HHC inputs for noise reduction also increased the vibration level and vice versa.
During the last decade, an interest in the IBC method began to develop (Refs. 22-31). In this approach, actuators are placed in the rotating system, one per blade, so that the rotor blade pitch angles may be controlled individually. While this approach of introducing higher- frequency blade pitch inputs is similar to the HHC method, for rotors having four or more blades, IBC can change the pitch of one blade without changing the pitch of the other blades. HHC can do this only for two- and three-bladed rotors because the 3 degrees of freedom defining the plane of the swashplate cannot be used to independently control the pitch angle of four or more rotor blades.
This report documents the wind tunnel test results of an IBC system in which the rotor pitch links were replaced by actuators to achieve active, individual blade root pitch control in the rotating system. ZF Luftfahrttechnik GmbH first developed this system in the 1980s, and then flight-tested it in 1990 on a BO-105 helicopter in a joint program with Eurocopter Deutschland (Ref. 24). The maximum IBC amplitude tested was ±0.25°. In a second flight test conducted in 1991, the IBC input amplitude was increased to ±0.49°. While these flight tests showed some vibration reduction, the small IBC inputs did not suppress the low-speed vibration to the same extent previously shown possible using HHC.
In order to explore the benefits of larger IBC inputs without risk to aircraft personnel, a full-scale wind tunnel test program was conducted as part of an MOU between NASA, the U.S. Army Aeroflightdynamics Directorate, ZF Luftfahrttechnik GmbH, Eurocopter Deutschland GmbH, and the DLR Institute for Flight Mechanics. An IBC system having greater control authority and increased frequency response was designed for testing in the NASA Ames
5
40- by 80-Foot Wind Tunnel on a full-scale BO-105 rotor (Refs. 32 and 33). In 1993, the first of two IBC wind tunnel tests was performed. The IBC control inputs studied were single-frequency inputs from 2/rev to 6/rev and multi-harmonic combinations of these frequencies. A second entry was conducted in 1994 to more carefully examine the use of IBC to simultaneously reduce noise and vibration, and also to examine the effect of IBC on high-speed rotor performance (Refs. 34–36). The second IBC test repeated the test conditions of the first test, but with the rotor moment and thrust retrimmed with each IBC input before the data were recorded.
The resulting data show the importance of IBC, and particularly 2/rev IBC, to simultaneously control noise and vibration, as well as to improve high-speed rotor performance. This was the first full-scale wind tunnel test to evaluate the effect of using an IBC system to make each blade of a four-bladed rotor execute the same 2/rev root pitch perturbation around the azimuth. Several previous research efforts had studied the effect of 3/rev, 4/rev, and 5/rev inputs using the HHC approach as discussed above. However, the HHC method cannot apply the same 2/rev blade pitch schedule to each blade of a four-bladed rotor through the swashplate. If the swashplate of a four-bladed rotor is oscillated at 2/rev, each blade moves in phase with its opposing side blade, but 180° out of phase with the blades leading and trailing it. The same is true for 6/rev HHC input through the swashplate of a four-bladed rotor. It is only by using actuators placed in the rotating system, one-per-blade, that the same 2/rev harmonic motion can be enforced for all blades of a rotor having four or more blades. The 2/rev input appears to be crucial towards obtaining large BVI noise and vibration reductions.
This report documents the findings of the IBC wind tunnel testing for both the 1993 and 1994 wind tunnel test campaigns, presents an analysis of the IBC data and discussion of the key findings, and contains the tabulated data. These data include rotor performance, average and time-varying hub loads, rotor blade bending loads, control system loads, inboard and outboard blade pitch motion, and BVI noise data. Mean, half-peak-to-peak, and harmonic data have been included for the rotor balance forces and moments, blade strain gages, and control system loads.
TEST HARDWARE
The NASA Ames Research Center 40- by 80-Foot Wind Tunnel was used for the IBC testing. The test section is 40 feet high, 80 feet wide, and has 20-foot-radius semi-circular sides. The tunnel was operated with a closed-circuit air return path. Power is provided by six 22,000-HP motors, each one driving 40-foot-diameter fans. At the time of the IBC test, the test section was lined with 6-inch-thick sound absorptive material to permit near-anechoic acoustic measurements above 500 Hz. Significant motor drive noise is present at some frequencies below 150 Hz. The rotor system, rotor test stand, and IBC system hardware and installation are described in this section.
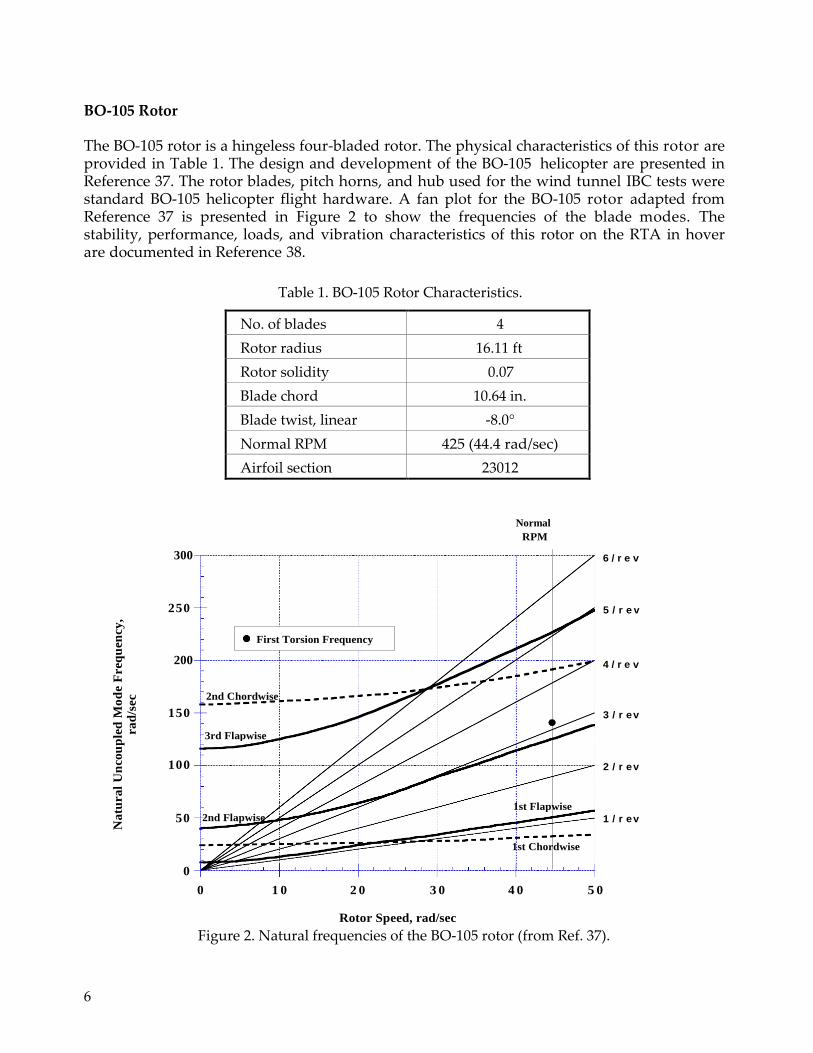
6
1st Flapwise 2nd Flapwise
1st Chordwise
3rd Flapwise
2nd Chordwise
First Torsion Frequency
BO-105 Rotor
The BO-105 rotor is a hingeless four-bladed rotor. The physical characteristics of this rotor are provided in Table 1. The design and development of the BO-105 helicopter are presented in Reference 37. The rotor blades, pitch horns, and hub used for the wind tunnel IBC tests were standard BO-105 helicopter flight hardware. A fan plot for the BO-105 rotor adapted from Reference 37 is presented in Figure 2 to show the frequencies of the blade modes. The stability, performance, loads, and vibration characteristics of this rotor on the RTA in hover are documented in Reference 38.
Table 1. BO-105 Rotor Characteristics.
No. of blades 4
Rotor radius 16.11 ft
Rotor solidity 0.07
Blade chord 10.64 in.
Blade twist, linear -8.0°
Normal RPM 425 (44.4 rad/sec)
Airfoil section 23012
300
Normal
RPM
6 / r e v
250 5 / r e v
200
4 / r e v
150 3 / r e v
100 2 / r e v
50 1 / r e v
0
0 1 0 2 0 3 0 4 0 5 0
Rotor Speed, rad/sec
Figure 2. Natural frequencies of the BO-105 rotor (from Ref. 37).
Na
tura
l U
nco
up
led
Mo
de F
req
uen
cy
, ra
d/s
ec
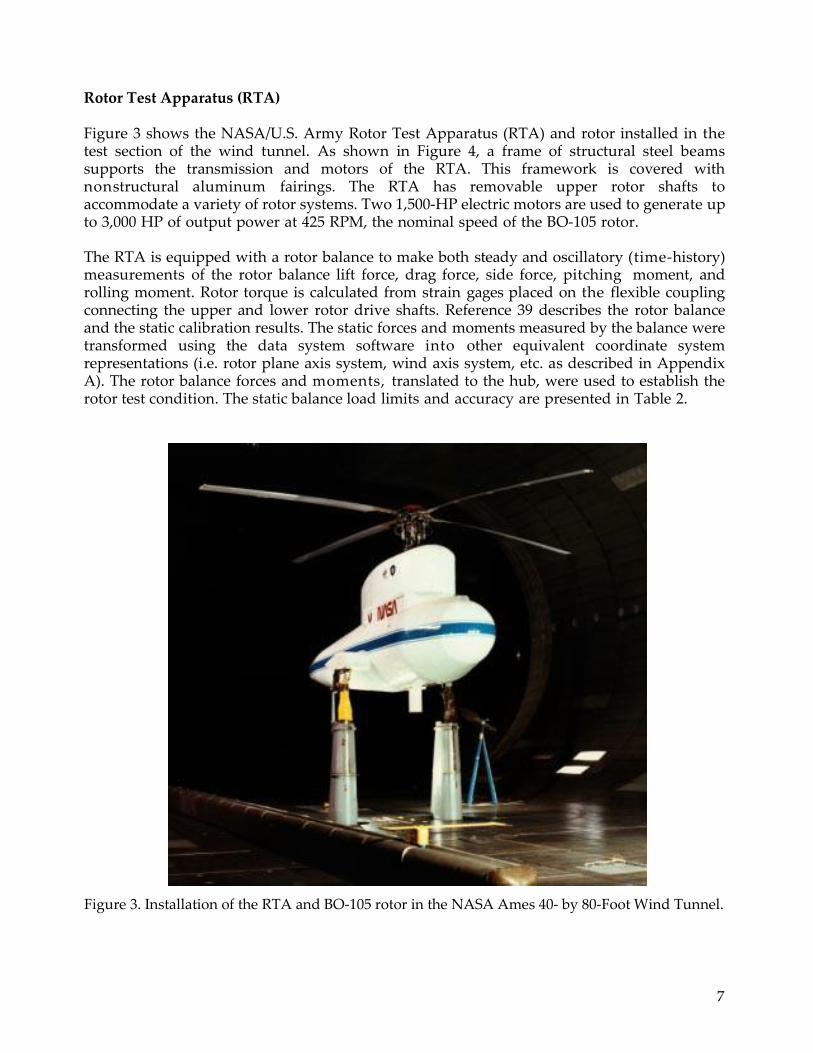
7
Rotor Test Apparatus (RTA)
Figure 3 shows the NASA/U.S. Army Rotor Test Apparatus (RTA) and rotor installed in the test section of the wind tunnel. As shown in Figure 4, a frame of structural steel beams supports the transmission and motors of the RTA. This framework is covered with nonstructural aluminum fairings. The RTA has removable upper rotor shafts to accommodate a variety of rotor systems. Two 1,500-HP electric motors are used to generate up to 3,000 HP of output power at 425 RPM, the nominal speed of the BO-105 rotor.
The RTA is equipped with a rotor balance to make both steady and oscillatory (time-history) measurements of the rotor balance lift force, drag force, side force, pitching moment, and rolling moment. Rotor torque is calculated from strain gages placed on the flexible coupling connecting the upper and lower rotor drive shafts. Reference 39 describes the rotor balance and the static calibration results. The static forces and moments measured by the balance were transformed using the data system software into other equivalent coordinate system representations (i.e. rotor plane axis system, wind axis system, etc. as described in Appendix A). The rotor balance forces and moments, translated to the hub, were used to establish the rotor test condition. The static balance load limits and accuracy are presented in Table 2.
Figure 3. Installation of the RTA and BO-105 rotor in the NASA Ames 40- by 80-Foot Wind Tunnel.
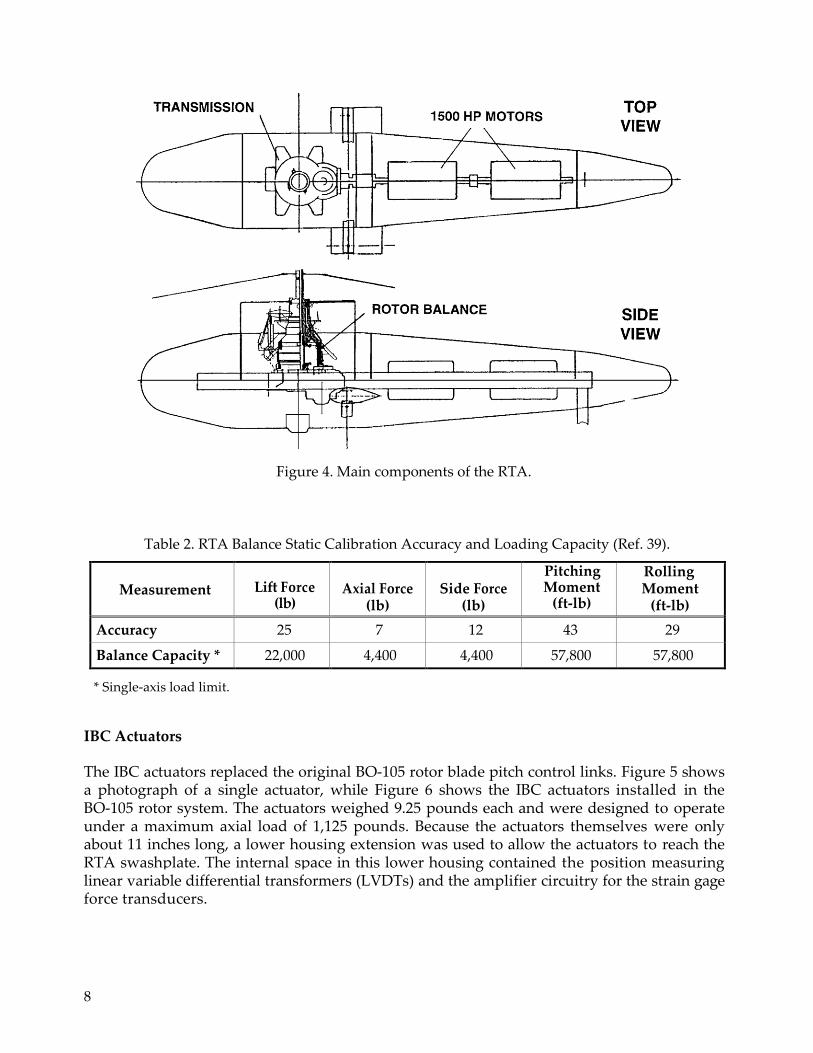
8
Figure 4. Main components of the RTA.
Table 2. RTA Balance Static Calibration Accuracy and Loading Capacity (Ref. 39).
Measurement
Lift Force
(lb)
Axial Force
(lb)
Side Force
(lb)
Pitching Moment
(ft-lb)
Rolling Moment
(ft-lb)
Accuracy 25 7 12 43 29
Balance Capacity * 22,000 4,400 4,400 57,800 57,800
* Single-axis load limit.
IBC Actuators
The IBC actuators replaced the original BO-105 rotor blade pitch control links. Figure 5 shows a photograph of a single actuator, while Figure 6 shows the IBC actuators installed in the BO-105 rotor system. The actuators weighed 9.25 pounds each and were designed to operate under a maximum axial load of 1,125 pounds. Because the actuators themselves were only about 11 inches long, a lower housing extension was used to allow the actuators to reach the RTA swashplate. The internal space in this lower housing contained the position measuring linear variable differential transformers (LVDTs) and the amplifier circuitry for the strain gage force transducers.
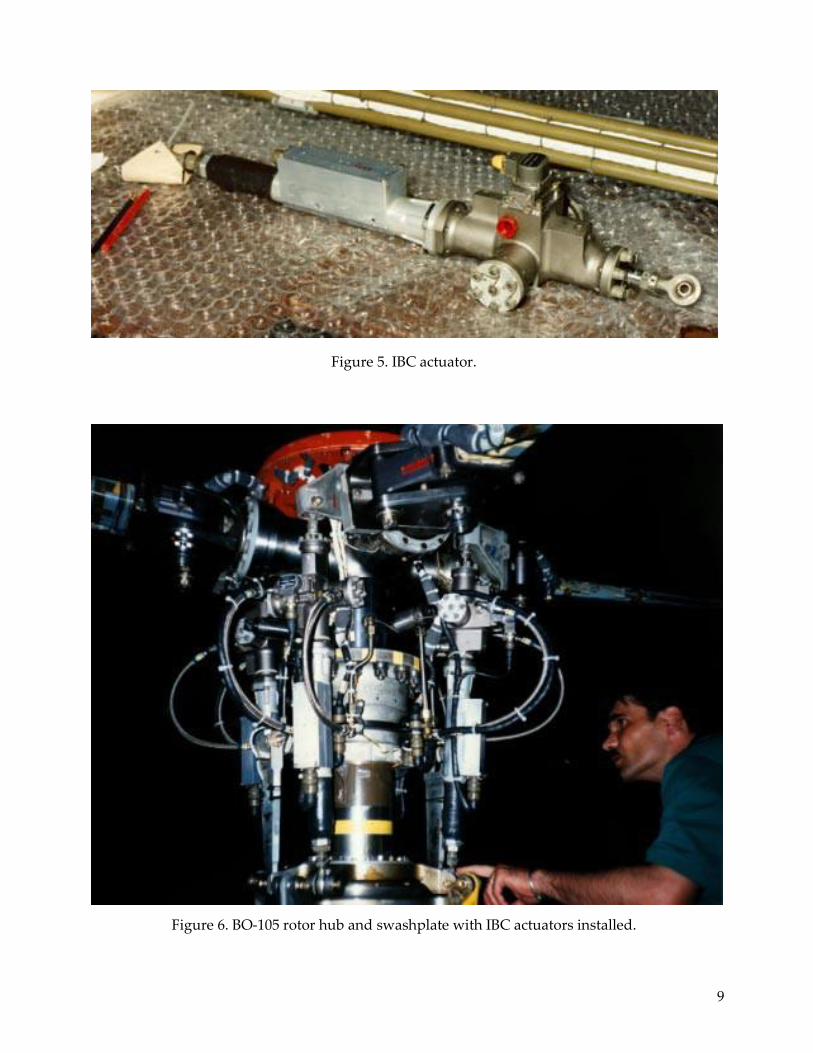
9
Figure 5. IBC actuator.
Figure 6. BO-105 rotor hub and swashplate with IBC actuators installed.
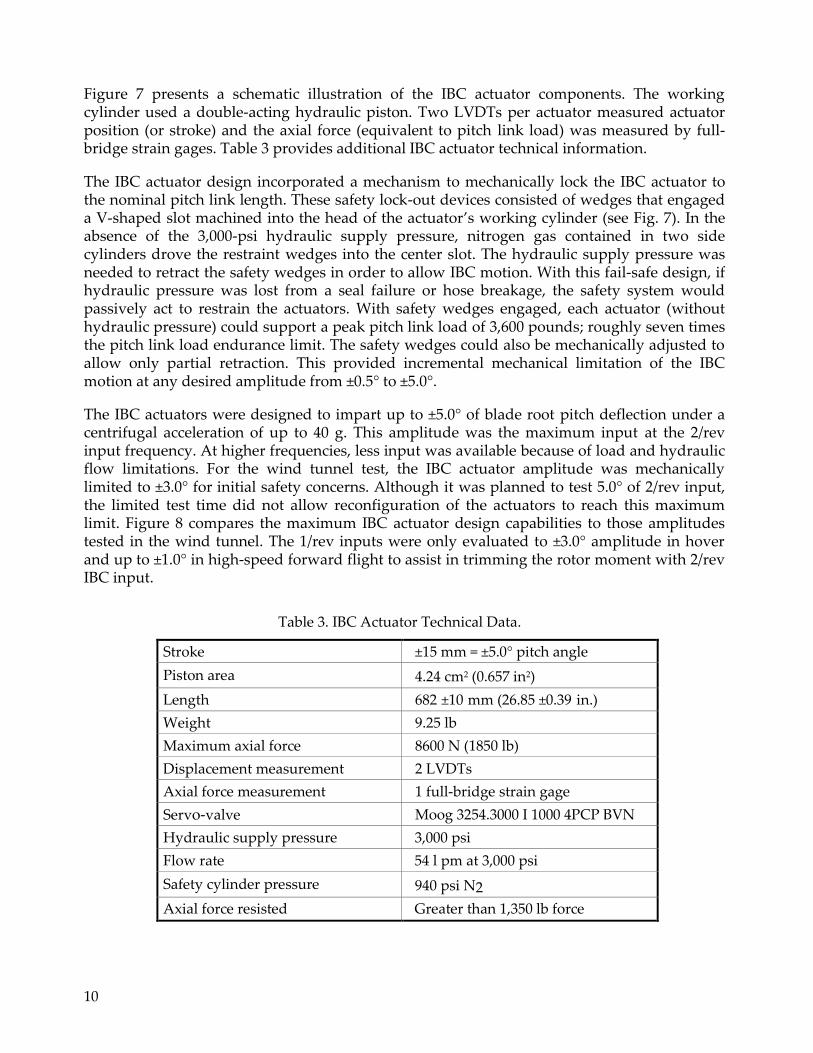
10
Figure 7 presents a schematic illustration of the IBC actuator components. The working cylinder used a double-acting hydraulic piston. Two LVDTs per actuator measured actuator position (or stroke) and the axial force (equivalent to pitch link load) was measured by full-bridge strain gages. Table 3 provides additional IBC actuator technical information.
The IBC actuator design incorporated a mechanism to mechanically lock the IBC actuator to the nominal pitch link length. These safety lock-out devices consisted of wedges that engaged a V-shaped slot machined into the head of the actuator’s working cylinder (see Fig. 7). In the absence of the 3,000-psi hydraulic supply pressure, nitrogen gas contained in two side cylinders drove the restraint wedges into the center slot. The hydraulic supply pressure was needed to retract the safety wedges in order to allow IBC motion. With this fail-safe design, if hydraulic pressure was lost from a seal failure or hose breakage, the safety system would passively act to restrain the actuators. With safety wedges engaged, each actuator (without hydraulic pressure) could support a peak pitch link load of 3,600 pounds; roughly seven times the pitch link load endurance limit. The safety wedges could also be mechanically adjusted to allow only partial retraction. This provided incremental mechanical limitation of the IBC motion at any desired amplitude from ±0.5° to ±5.0°.
The IBC actuators were designed to impart up to ±5.0° of blade root pitch deflection under a centrifugal acceleration of up to 40 g. This amplitude was the maximum input at the 2/rev input frequency. At higher frequencies, less input was available because of load and hydraulic flow limitations. For the wind tunnel test, the IBC actuator amplitude was mechanically limited to ±3.0° for initial safety concerns. Although it was planned to test 5.0° of 2/rev input, the limited test time did not allow reconfiguration of the actuators to reach this maximum limit. Figure 8 compares the maximum IBC actuator design capabilities to those amplitudes tested in the wind tunnel. The 1/rev inputs were only evaluated to ±3.0° amplitude in hover and up to ±1.0° in high-speed forward flight to assist in trimming the rotor moment with 2/rev IBC input.
Table 3. IBC Actuator Technical Data.
Stroke ±15 mm = ±5.0° pitch angle
Piston area 4.24 cm2 (0.657 in2)
Length 682 ±10 mm (26.85 ±0.39 in.)
Weight 9.25 lb
Maximum axial force 8600 N (1850 lb)
Displacement measurement 2 LVDTs
Axial force measurement 1 full-bridge strain gage
Servo-valve Moog 3254.3000 I 1000 4PCP BVN
Hydraulic supply pressure 3,000 psi
Flow rate 54 l pm at 3,000 psi
Safety cylinder pressure 940 psi N2
Axial force resisted Greater than 1,350 lb force
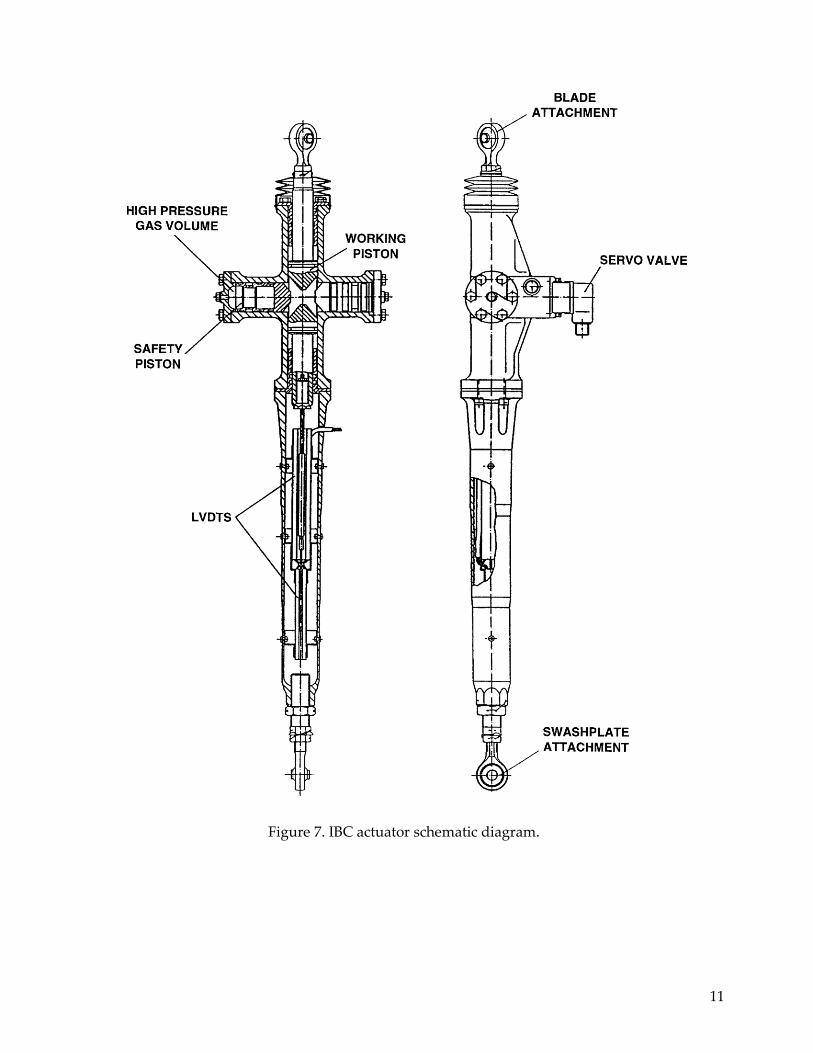
11
Figure 7. IBC actuator schematic diagram.
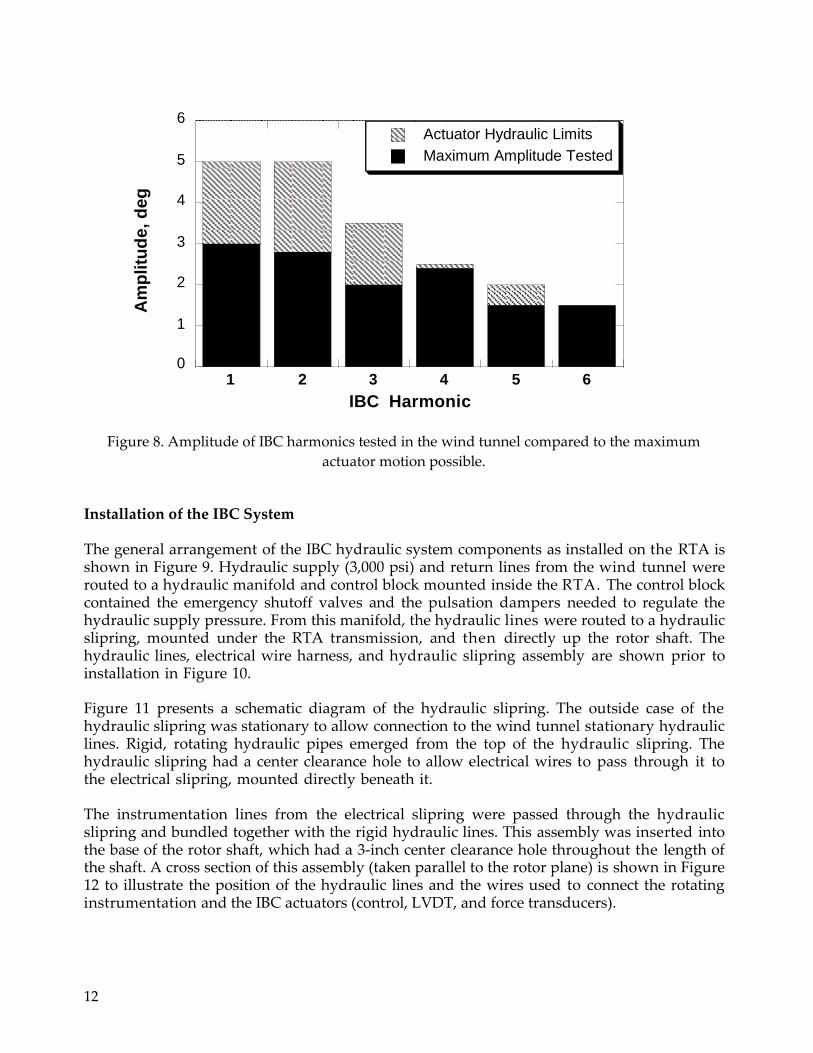
12
6
5
4
3
2
1
0 1 2 3 4 5 6
IBC Harmonic
Figure 8. Amplitude of IBC harmonics tested in the wind tunnel compared to the maximum
actuator motion possible.
Installation of the IBC System
The general arrangement of the IBC hydraulic system components as installed on the RTA is shown in Figure 9. Hydraulic supply (3,000 psi) and return lines from the wind tunnel were routed to a hydraulic manifold and control block mounted inside the RTA. The control block contained the emergency shutoff valves and the pulsation dampers needed to regulate the hydraulic supply pressure. From this manifold, the hydraulic lines were routed to a hydraulic slipring, mounted under the RTA transmission, and then directly up the rotor shaft. The hydraulic lines, electrical wire harness, and hydraulic slipring assembly are shown prior to installation in Figure 10.
Figure 11 presents a schematic diagram of the hydraulic slipring. The outside case of the hydraulic slipring was stationary to allow connection to the wind tunnel stationary hydraulic lines. Rigid, rotating hydraulic pipes emerged from the top of the hydraulic slipring. The hydraulic slipring had a center clearance hole to allow electrical wires to pass through it to the electrical slipring, mounted directly beneath it.
The instrumentation lines from the electrical slipring were passed through the hydraulic slipring and bundled together with the rigid hydraulic lines. This assembly was inserted into the base of the rotor shaft, which had a 3-inch center clearance hole throughout the length of the shaft. A cross section of this assembly (taken parallel to the rotor plane) is shown in Figure 12 to illustrate the position of the hydraulic lines and the wires used to connect the rotating instrumentation and the IBC actuators (control, LVDT, and force transducers).
Actuator Hydraulic Limits
Maximum Amplitude Tested A
mp
litu
de
, d
eg
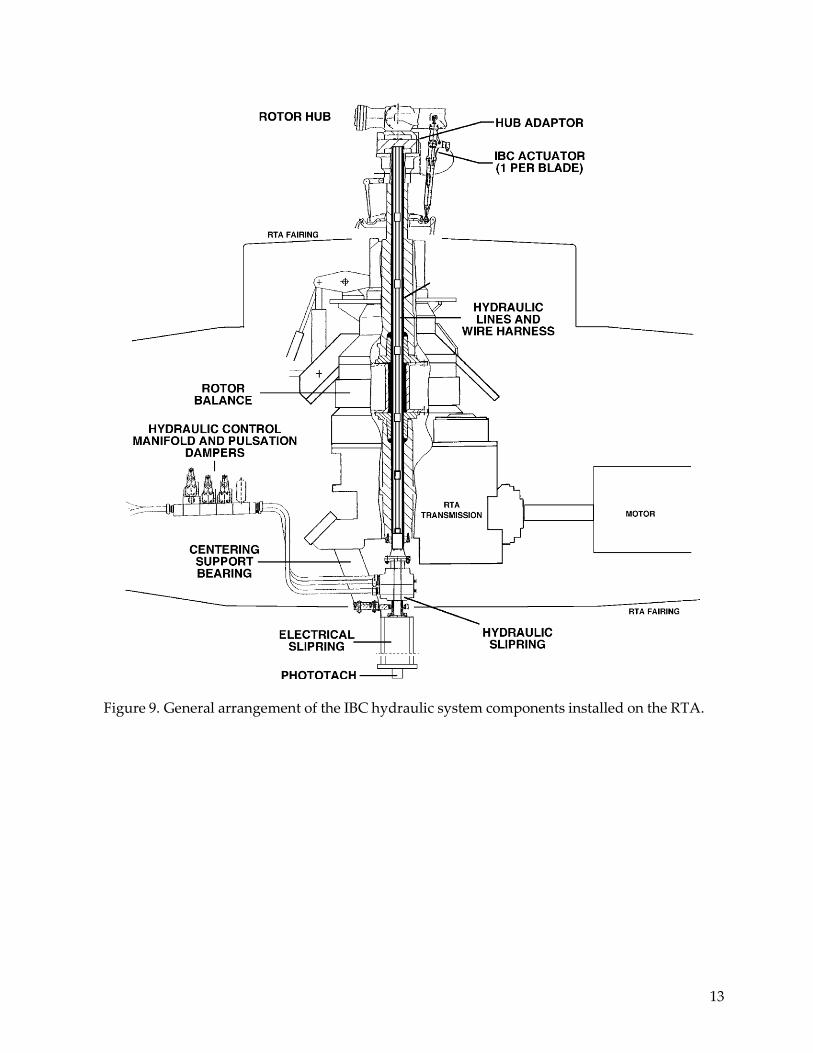
13
Figure 9. General arrangement of the IBC hydraulic system components installed on the RTA.
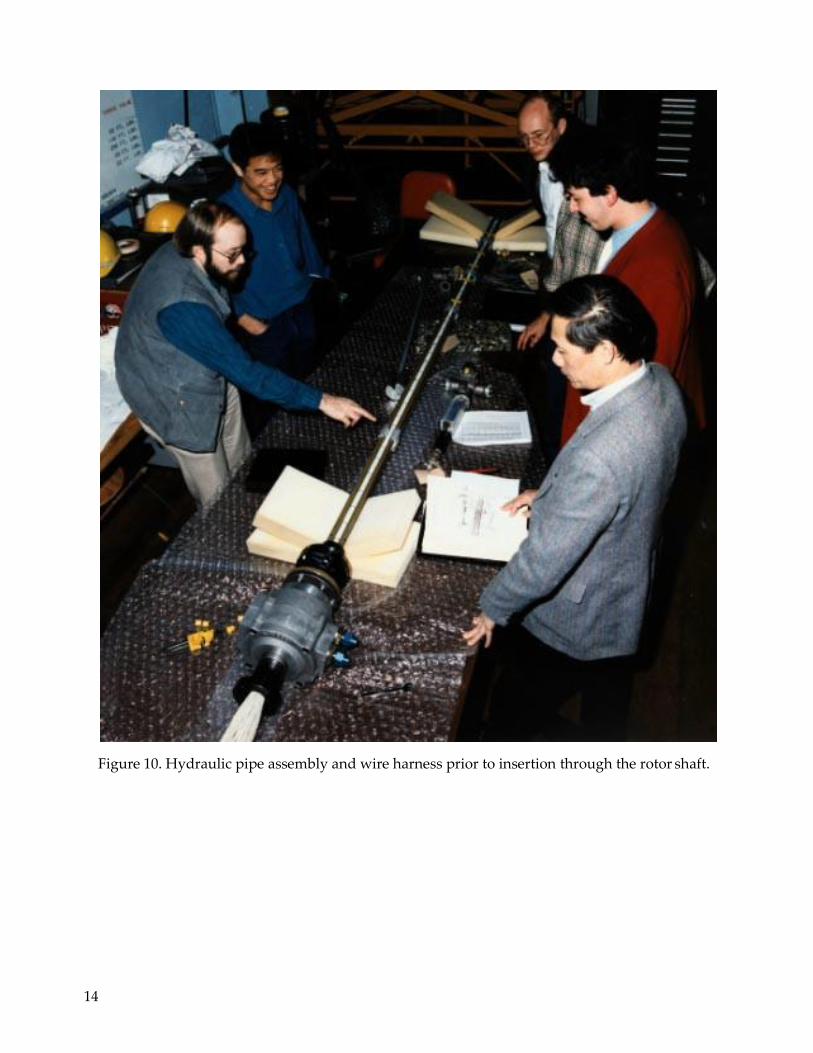
14
Figure 10. Hydraulic pipe assembly and wire harness prior to insertion through the rotor shaft.
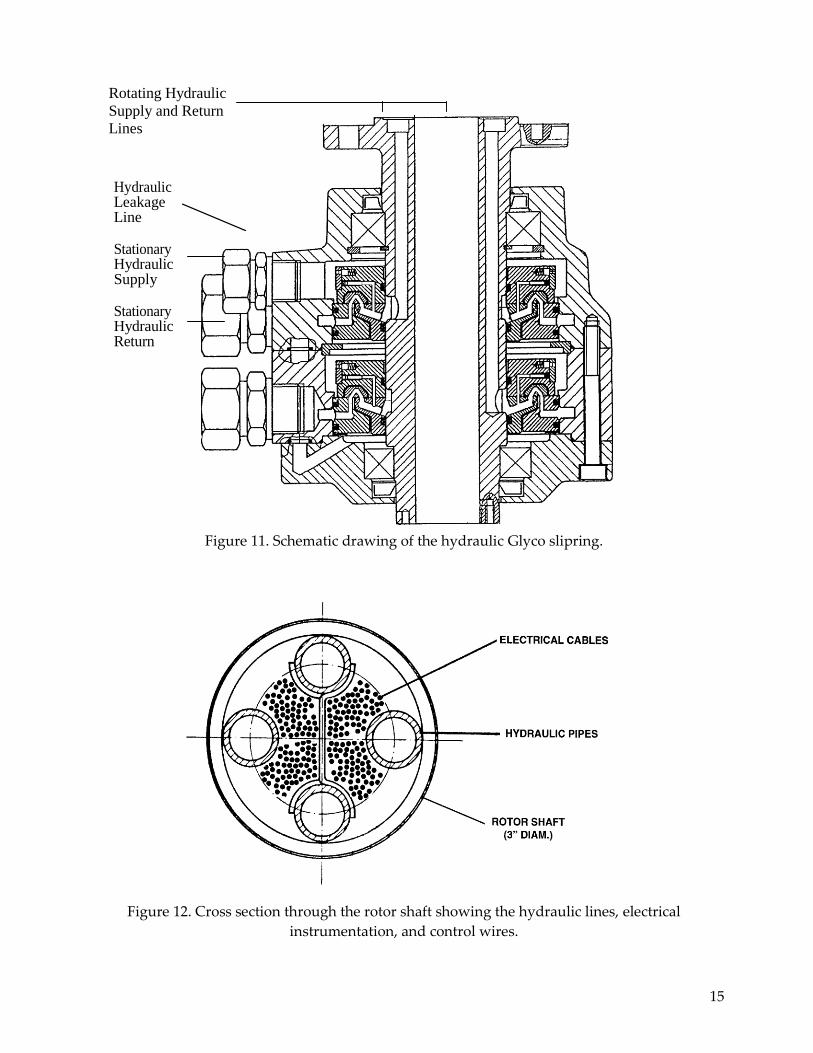
15
Rotating Hydraulic
Supply and Return
Lines
Hydraulic Leakage Line
Stationary Hydraulic Supply Stationary Hydraulic Return
Figure 11. Schematic drawing of the hydraulic Glyco slipring.
Figure 12. Cross section through the rotor shaft showing the hydraulic lines, electrical
instrumentation, and control wires.
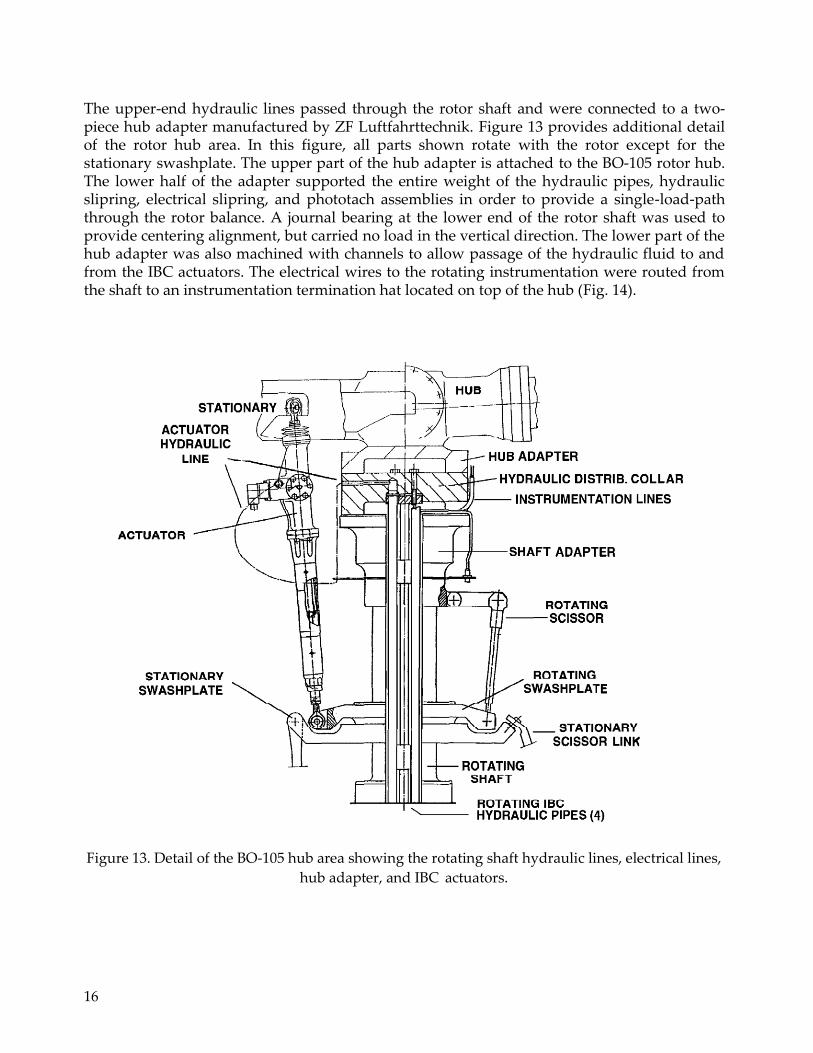
16
The upper-end hydraulic lines passed through the rotor shaft and were connected to a two-piece hub adapter manufactured by ZF Luftfahrttechnik. Figure 13 provides additional detail of the rotor hub area. In this figure, all parts shown rotate with the rotor except for the stationary swashplate. The upper part of the hub adapter is attached to the BO-105 rotor hub. The lower half of the adapter supported the entire weight of the hydraulic pipes, hydraulic slipring, electrical slipring, and phototach assemblies in order to provide a single-load-path through the rotor balance. A journal bearing at the lower end of the rotor shaft was used to provide centering alignment, but carried no load in the vertical direction. The lower part of the hub adapter was also machined with channels to allow passage of the hydraulic fluid to and from the IBC actuators. The electrical wires to the rotating instrumentation were routed from the shaft to an instrumentation termination hat located on top of the hub (Fig. 14).
Figure 13. Detail of the BO-105 hub area showing the rotating shaft hydraulic lines, electrical lines,
hub adapter, and IBC actuators.

17
Figure 14. Instrumentation terminal hat mounted on top of the rotor hub.
IBC Actuator Control System
The IBC actuator commands were entered from a personal computer interfaced to the Motorola 6000 inner-loop actuator controllers. The general feedback loop is shown in Figure 15. The inner controllers computed the sinusoidal signals for each IBC harmonic amplitude and phase commanded by the personal computer. These IBC harmonics were then combined using Fourier synthesis to produce the output actuator command signals. Two LVDTs per actuator provided redundant measurement of the actuator stroke positions. The position measurements were sampled at 2,048 Hz using a 1/rev pulse signal to index the measurements to the rotor azimuth position. Using Fourier decomposition on the LVDT inputs, the inner-loop controllers computed the measured amplitude and phase of each IBC harmonic. The differences between the (1/rev to 6/rev) harmonic content of the position measurements and the harmonic content of the command signals were used to generate proportional correction signals at each frequency to correct the actuator motion. This process was implemented for each IBC actuator to ensure that each actuator obtained the desired pitch motion.
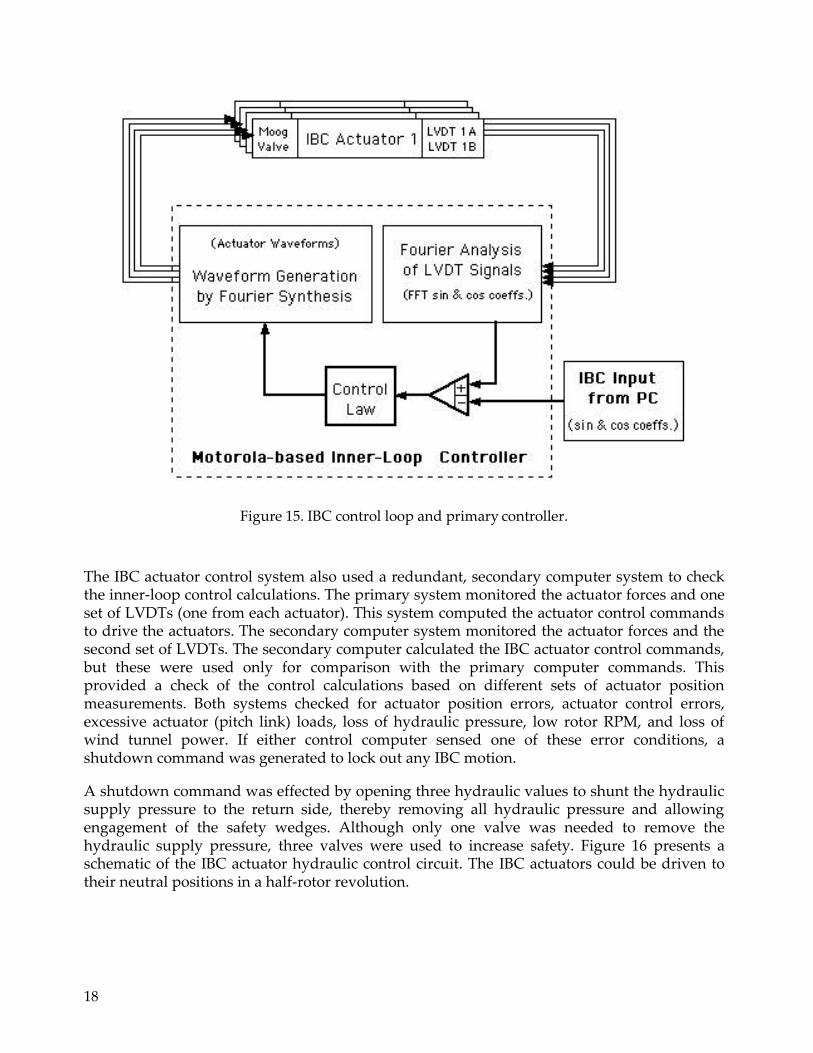
18
Figure 15. IBC control loop and primary controller.
The IBC actuator control system also used a redundant, secondary computer system to check the inner-loop control calculations. The primary system monitored the actuator forces and one set of LVDTs (one from each actuator). This system computed the actuator control commands to drive the actuators. The secondary computer system monitored the actuator forces and the second set of LVDTs. The secondary computer calculated the IBC actuator control commands, but these were used only for comparison with the primary computer commands. This provided a check of the control calculations based on different sets of actuator position measurements. Both systems checked for actuator position errors, actuator control errors, excessive actuator (pitch link) loads, loss of hydraulic pressure, low rotor RPM, and loss of wind tunnel power. If either control computer sensed one of these error conditions, a shutdown command was generated to lock out any IBC motion.
A shutdown command was effected by opening three hydraulic values to shunt the hydraulic supply pressure to the return side, thereby removing all hydraulic pressure and allowing engagement of the safety wedges. Although only one valve was needed to remove the hydraulic supply pressure, three valves were used to increase safety. Figure 16 presents a schematic of the IBC actuator hydraulic control circuit. The IBC actuators could be driven to their neutral positions in a half-rotor revolution.
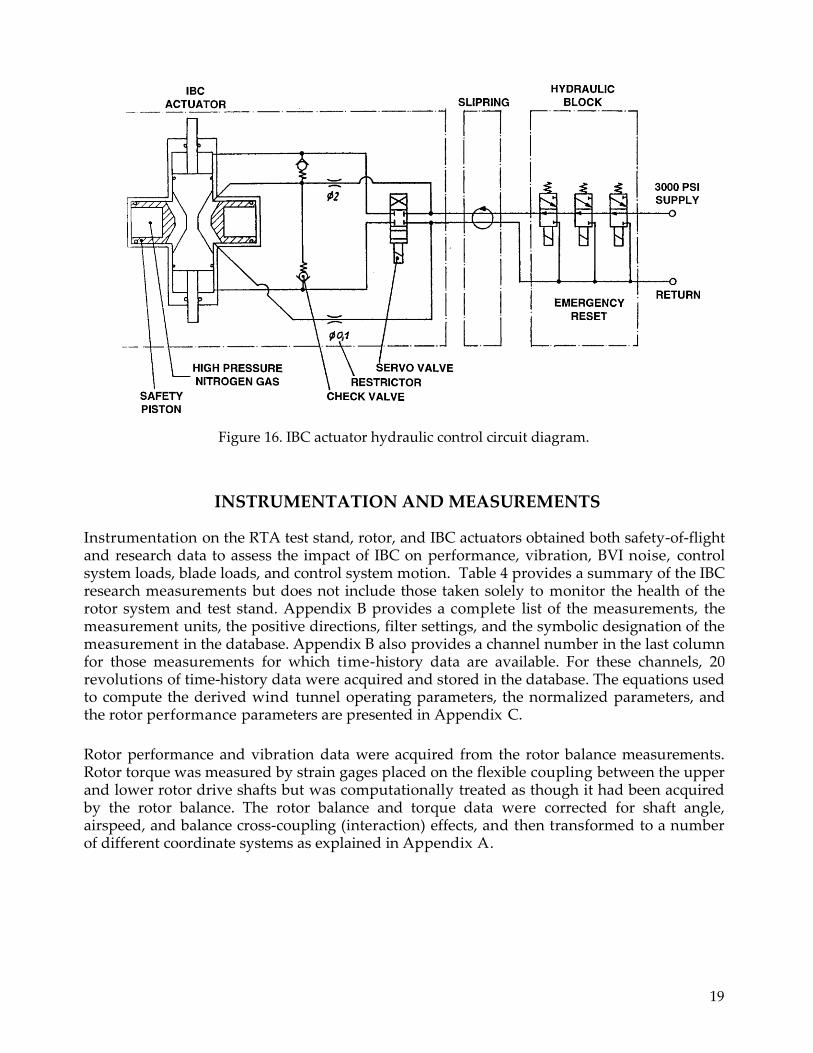
19
Figure 16. IBC actuator hydraulic control circuit diagram.
INSTRUMENTATION AND MEASUREMENTS
Instrumentation on the RTA test stand, rotor, and IBC actuators obtained both safety-of-flight and research data to assess the impact of IBC on performance, vibration, BVI noise, control system loads, blade loads, and control system motion. Table 4 provides a summary of the IBC research measurements but does not include those taken solely to monitor the health of the rotor system and test stand. Appendix B provides a complete list of the measurements, the measurement units, the positive directions, filter settings, and the symbolic designation of the measurement in the database. Appendix B also provides a channel number in the last column for those measurements for which time-history data are available. For these channels, 20 revolutions of time-history data were acquired and stored in the database. The equations used to compute the derived wind tunnel operating parameters, the normalized parameters, and the rotor performance parameters are presented in Appendix C.
Rotor performance and vibration data were acquired from the rotor balance measurements. Rotor torque was measured by strain gages placed on the flexible coupling between the upper and lower rotor drive shafts but was computationally treated as though it had been acquired by the rotor balance. The rotor balance and torque data were corrected for shaft angle, airspeed, and balance cross-coupling (interaction) effects, and then transformed to a number of different coordinate systems as explained in Appendix A.

20
Table 4. List of IBC Research Measurements.
Measurement Type Number
Rotor Performance and Vibration
RTA rotor balance Thrust, side force, drag force, pitch
moment, and roll moment
Flex coupling Shaft torque
BVI Noise
Stationary microphones 3, retreating side (1 in 1993 test)
Traverse microphones 4, advancing side (2 in 1993 test)
Blade and Control System Motion
Swashplate position 3 (1 per control rod)
IBC actuator position 8 (2 per IBC actuator)
Blade pitch transducers 4 (1 per blade)
Blade accelerometers 3 spanwise and 2 tip locations
Control System Forces
IBC actuator (pitch link) forces Axial force (1 per IBC actuator)
Swashplate control rod Axial force (1 per control rod)
Rotating scissors 2 (1 per link, bending)
Stationary scissors 1 (bending)
Blade Loads
Blade flap bending At 2 radial stations
Blade chord bending At 2 radial stations
Blade torsion moment At 4 radial stations
In addition to the direct rotor balance measurements, the rotor balance forces and moments were combined by analog circuitry to continuously compute the net hub shear force and hub moment. These outputs are listed in Appendix B as SHERA for the shear force at the balance center, MBALA for the hub moment at the balance center, and MHUBA for the balance moment translated to the hub center. These three measurements were used primarily for monitoring the rotor operating safety. The rotor balance center was located 6.041 feet below the hub center.
Acoustic measurements were made using both fixed-position and traversing microphones. The fixed-position microphones were located below and behind the retreating side of the rotor. A movable traverse system was used to acquire data on the side of the rotor below the advancing rotor blades. Details of the microphone position and data processing are provided in the Acoustic Data section of this report.
21
Blade and control system motions were measured by a variety of transducers on the IBC actuators, the blade root, and the blade itself to quantify the motion imparted by the IBC actuators. The IBC actuator displacements were measured by two LVDTs per actuator. In addition, the pitch angle of each blade was directly measured at the blade root immediately outboard of the pitch bearing. The blade tip pitch angle was computed from accelerometers positioned for and aft of the pitch axis at the blade tip. A detailed discussion of these computations is provided in the Rotor Blade Motion Data section of this report.
An extensive set of instrumentation was used to measure the effect of IBC on the control system and blade loads. The flapwise, chordwise, and torsional blade loads produced by IBC excitation were measured by strain gages placed at several locations on the rotor blades. The locations of the blade strain gages are listed in the Rotor Blade Loads Data section of this report. The IBC actuators were instrumented with strain gages to measure the axial force developed in each actuator. These measurements were the equivalent of pitch link load forces. The bending moments on the stationary and rotating scissors were also measured. The axial forces produced in the stationary swashplate control rods were measured for safety. The swashplate control rods were located at azimuth angles 120°, 210°, and 300°, measured in the direction of rotor rotation, with 0° being over the tail.
All data (except acoustic data) were acquired using the wind tunnel data acquisition system. For every run, a reference point was acquired with the collective pitch set to 10.6°, the IBC hydraulics turned on, zero wind speed, zero rotor shaft angle, zero RPM, and zero cyclic pitch. This point (called the "zero" point) was subtracted from all subsequent data points to remove any pre-load from the measurements. Data were taken at the rate of 64 samples per rotor revolution, with the exception of the microphone data. The microphone data were recorded at a rate of 2,048 samples per rotor revolution. The mean values were computed using 32 revolutions of data. As indicated in Appendix B, most of the data channels were low-pass filtered using a single-stage filter having a 3-dB attenuation at 100 Hz.
IBC INPUTS, TEST CONDITIONS, AND ACQUIRED DATA
The evaluation of the IBC system was challenging because of the large number of possible IBC motions. Having one actuator per blade, the pitch angle of each blade could be any function of azimuth angle or time. Unlike HHC inputs, which are constrained by the common motion of the mechanical swashplate, the IBC inputs for each blade could be independent of each other. For example, blade one could introduce 2/rev IBC, blade two could introduce 3/rev IBC, blade three could introduce pitch changes proportional to the blade flapping acceleration, while blade four could change its pitch angle as some function of the rotor azimuth angle. However, since the aerodynamics, vibration, and BVI noise events are periodic and repeatable, it seems to make good physical sense to test IBC inputs that are periodic and repeatable. (Of course, one can envision a scenario, such as gust avoidance, in which the blades would require different pitch schedules around the azimuth to avoid the gust, depending on their spatial proximity to the gust.)
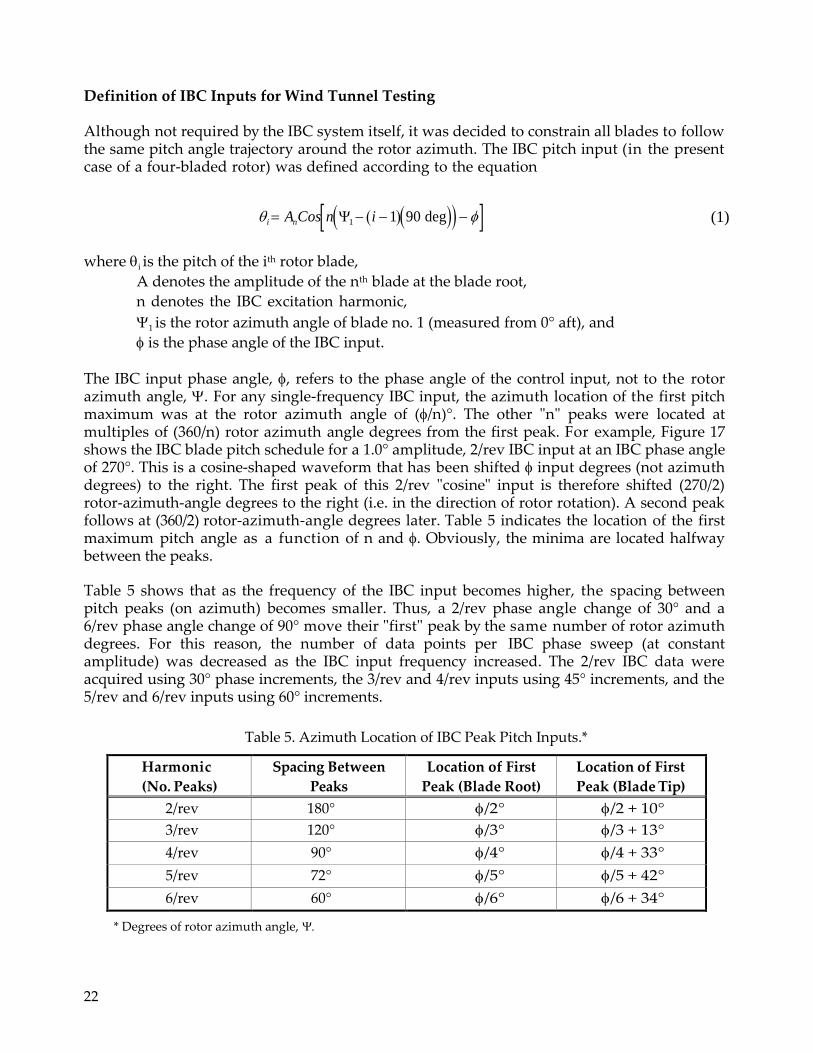
22
Definition of IBC Inputs for Wind Tunnel Testing
Although not required by the IBC system itself, it was decided to constrain all blades to follow the same pitch angle trajectory around the rotor azimuth. The IBC pitch input (in the present case of a four-bladed rotor) was defined according to the equation
i AnCosn1 i 190 deg (1)
where i is the pitch of the ith rotor blade,
A denotes the amplitude of the nth blade at the blade root,
n denotes the IBC excitation harmonic,
1 is the rotor azimuth angle of blade no. 1 (measured from 0° aft), and
is the phase angle of the IBC input.
The IBC input phase angle, , refers to the phase angle of the control input, not to the rotor azimuth angle, . For any single-frequency IBC input, the azimuth location of the first pitch maximum was at the rotor azimuth angle of (/n)°. The other "n" peaks were located at multiples of (360/n) rotor azimuth angle degrees from the first peak. For example, Figure 17 shows the IBC blade pitch schedule for a 1.0° amplitude, 2/rev IBC input at an IBC phase angle of 270°. This is a cosine-shaped waveform that has been shifted input degrees (not azimuth degrees) to the right. The first peak of this 2/rev "cosine" input is therefore shifted (270/2) rotor-azimuth-angle degrees to the right (i.e. in the direction of rotor rotation). A second peak follows at (360/2) rotor-azimuth-angle degrees later. Table 5 indicates the location of the first maximum pitch angle as a function of n and . Obviously, the minima are located halfway between the peaks.
Table 5 shows that as the frequency of the IBC input becomes higher, the spacing between pitch peaks (on azimuth) becomes smaller. Thus, a 2/rev phase angle change of 30° and a 6/rev phase angle change of 90° move their "first" peak by the same number of rotor azimuth degrees. For this reason, the number of data points per IBC phase sweep (at constant amplitude) was decreased as the IBC input frequency increased. The 2/rev IBC data were acquired using 30° phase increments, the 3/rev and 4/rev inputs using 45° increments, and the 5/rev and 6/rev inputs using 60° increments.
Table 5. Azimuth Location of IBC Peak Pitch Inputs.*
Harmonic
(No. Peaks)
Spacing Between
Peaks
Location of First
Peak (Blade Root)
Location of First
Peak (Blade Tip)
2/rev 180° /2° /2 + 10°
3/rev 120° /3° /3 + 13°
4/rev 90° /4° /4 + 33°
5/rev 72° /5° /5 + 42°
6/rev 60° /6° /6 + 34°
* Degrees of rotor azimuth angle,
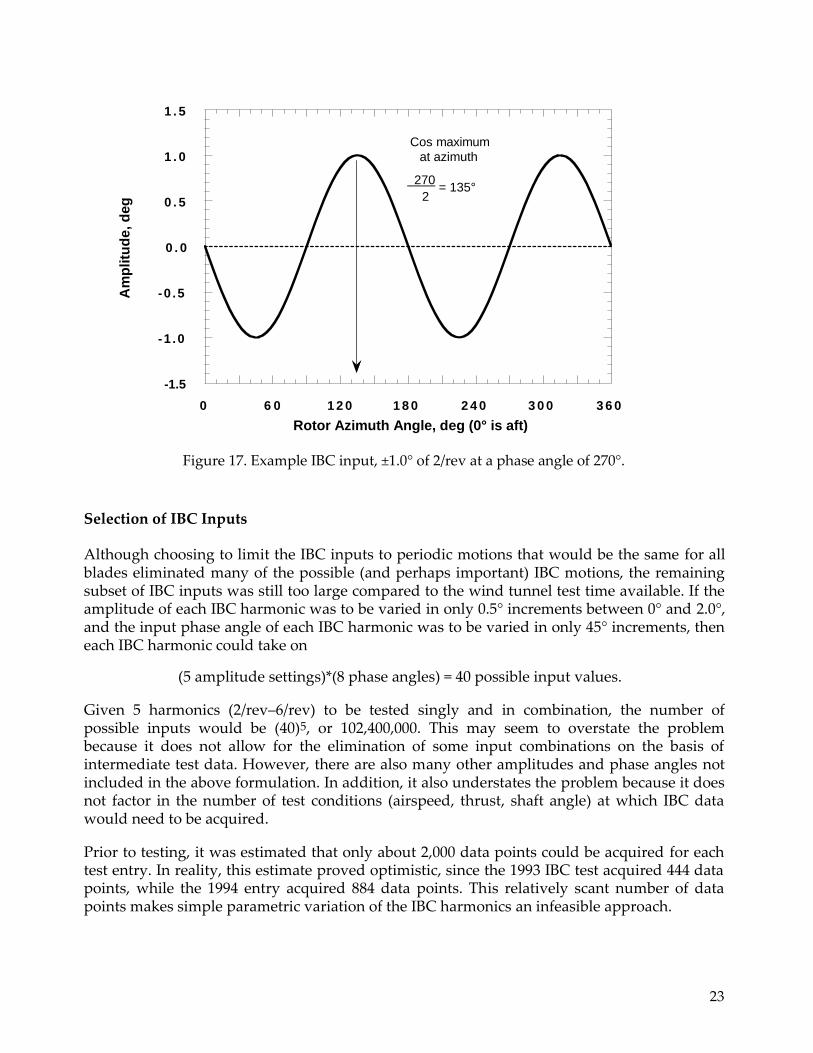
23
1 . 5
1 . 0
0 . 5
0 . 0
-0 .5
-1 .0
-1.5
0 6 0 1 2 0 1 8 0 2 4 0 3 0 0 3 6 0
Rotor Azimuth Angle, deg (0° is aft)
Figure 17. Example IBC input, ±1.0° of 2/rev at a phase angle of 270°.
Selection of IBC Inputs
Although choosing to limit the IBC inputs to periodic motions that would be the same for all blades eliminated many of the possible (and perhaps important) IBC motions, the remaining subset of IBC inputs was still too large compared to the wind tunnel test time available. If the amplitude of each IBC harmonic was to be varied in only 0.5° increments between 0° and 2.0°, and the input phase angle of each IBC harmonic was to be varied in only 45° increments, then each IBC harmonic could take on
(5 amplitude settings)*(8 phase angles) = 40 possible input values.
Given 5 harmonics (2/rev–6/rev) to be tested singly and in combination, the number of possible inputs would be (40)5, or 102,400,000. This may seem to overstate the problem because it does not allow for the elimination of some input combinations on the basis of intermediate test data. However, there are also many other amplitudes and phase angles not included in the above formulation. In addition, it also understates the problem because it does not factor in the number of test conditions (airspeed, thrust, shaft angle) at which IBC data would need to be acquired.
Prior to testing, it was estimated that only about 2,000 data points could be acquired for each test entry. In reality, this estimate proved optimistic, since the 1993 IBC test acquired 444 data points, while the 1994 entry acquired 884 data points. This relatively scant number of data points makes simple parametric variation of the IBC harmonics an infeasible approach.
Cos maximum
at azimuth
270 = 135°
2
Am
plitu
de
, d
eg

24
Nevertheless, a search strategy was adopted that allowed IBC input combinations to be found that produced large reductions in vibration and noise at descent flight conditions, and offered moderate performance improvements at high-speed flight conditions. The strategy was to first input each harmonic separately at constant amplitude (usually 0.5° or 1.0°), and then vary the IBC input phase angle. This allowed identification of phase angles that produced noise reduction, vibration reduction, or performance improvement. At these phase angles the amplitude was then varied to find the most beneficial input level. A personal computer was used to acquire and display the rotor balance and microphone data using the LabVIEW software from National Instruments. By displaying the noise and vibration metrics in real time, the optimum input phase angle to reduce noise or vibration was immediately available after the phase variation.
This method greatly reduced the number of inputs needed to evaluate the single-frequency inputs. However, the assumption was made that the best phase angle for any single harmonic input would be the same at all input levels. While this assumption proved to be a good one in most cases, it very likely caused the optimum IBC input for vibration reduction at cruise speed to be missed (see discussion in the Effect of IBC on Cruise-Speed Vibration section of this report). As shown later in this report, the optimum phase angle for vibration suppression may change with amplitude for some IBC inputs.
For multi-harmonic IBC combinations, it was decided to input one harmonic at an amplitude and phase angle found beneficial for some purpose (e.g., noise reduction), while then adding another harmonic at fixed amplitude, but varying its phase. Triple combinations were evaluated by keeping two inputs constant while varying the phase of a third IBC input held at constant amplitude. This approach to select multi-harmonic input combinations could well have allowed the best IBC combinations to be missed. Nevertheless, using this method, some IBC combinations were found that produced very large noise and vibration reductions.
Two other types of multi-harmonic inputs tested were pulse and wavelet inputs. The pulse inputs were studied for their ability to reduce BVI noise. The idea was to move the blades upward or downward in order to increase the blade-to-vortex distance. Figure 18 shows a negative-pulse waveform that was created using a mixture of IBC harmonics. Although this input produced a pulse at the blade root, the blade torsional dynamic response made the pitch at the blade tip somewhat different. (Using the accelerometer data from the blade tip, the approximate phase shifts for each harmonic from root to blade tip were calculated and are presented in the last column of Table 5.) To obtain a pulse in pitch at the blade tip, a pitch input like that of Figure 19 was applied at the blade root. This pitch schedule was called a wavelet input. Similarly, a doublet input is the root pitch waveform needed to generate two pulses at the blade tip. These inputs were tested in the 1993 IBC test.
The 1994 test did not perform pulse or wavelet testing. In that test it was decided to keep the rotor trim constant with the application of the IBC (see discussion in the Rotor Trim States section of this report). Consequently, the 1/rev harmonic was used to maintain trim, rather than to create pulse or wavelet inputs. Therefore, the 1994 test considered only parametric variations of the IBC harmonics.

25
1 . 2
1
0 . 8
0 . 6
0 . 4
0 . 2
0
-0 . 2
-0.4
0
6 0 1 2 0 1 8 0 2 4 0 3 0 0 3 6 0
Rotor Azimuth Angle, deg
Figure 18. Fourier synthesis of IBC harmonics to create a negative 1.0° blade root pulse input.
(Pitch link trails the blade.)
1 . 2
1
0 . 8
0 . 6
0 . 4
0 . 2
0
-0 . 2
-0.4 0 6 0 1 2 0 1 8 0 2 4 0 3 0 0 3 6 0
Rotor Azimuth Angle, deg
Figure 19. Fourier synthesis of IBC harmonics to create negative 1.0° wavelet input.
Sum of:
-0.21 1P @ 60° phase -0.19 2P @ -60° phase 0.17 3P @ 0° phase
-0.14 4P @ 60° phase -0.10 5P @ -60° phase 0.07 6P @ 0° phase
Sum of: -0.21 1P @ 60° phase -0.19 2P @ -50° phase 0.17 3P @ 13° phase
-0.14 4P @ 93° phase -0.21 5P @ -18° phase 0.29 6P @ 34° phase
Ch
an
ge
in
Bla
de
Ro
ot
Pit
ch
, d
eg
C
ha
ng
e i
n B
lad
e R
oo
t P
itc
h,
de
g
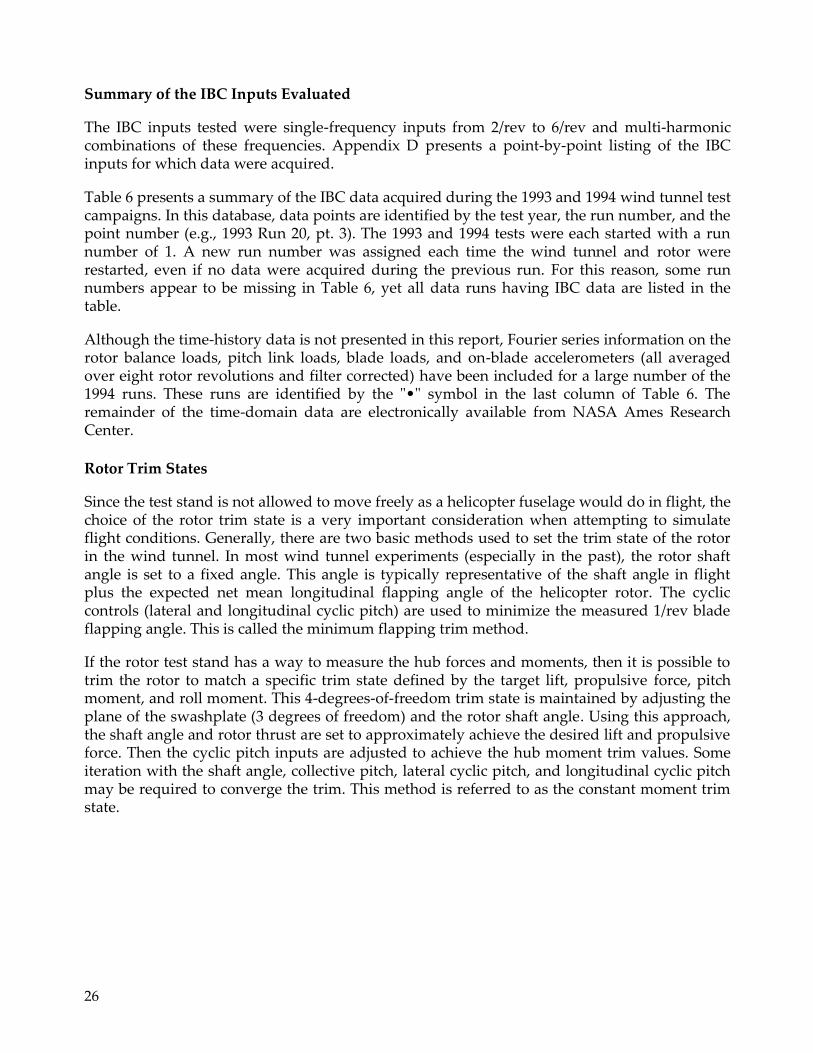
26
Summary of the IBC Inputs Evaluated
The IBC inputs tested were single-frequency inputs from 2/rev to 6/rev and multi-harmonic combinations of these frequencies. Appendix D presents a point-by-point listing of the IBC inputs for which data were acquired.
Table 6 presents a summary of the IBC data acquired during the 1993 and 1994 wind tunnel test campaigns. In this database, data points are identified by the test year, the run number, and the point number (e.g., 1993 Run 20, pt. 3). The 1993 and 1994 tests were each started with a run number of 1. A new run number was assigned each time the wind tunnel and rotor were restarted, even if no data were acquired during the previous run. For this reason, some run numbers appear to be missing in Table 6, yet all data runs having IBC data are listed in the table.
Although the time-history data is not presented in this report, Fourier series information on the rotor balance loads, pitch link loads, blade loads, and on-blade accelerometers (all averaged over eight rotor revolutions and filter corrected) have been included for a large number of the 1994 runs. These runs are identified by the "•" symbol in the last column of Table 6. The remainder of the time-domain data are electronically available from NASA Ames Research Center.
Rotor Trim States
Since the test stand is not allowed to move freely as a helicopter fuselage would do in flight, the choice of the rotor trim state is a very important consideration when attempting to simulate flight conditions. Generally, there are two basic methods used to set the trim state of the rotor in the wind tunnel. In most wind tunnel experiments (especially in the past), the rotor shaft angle is set to a fixed angle. This angle is typically representative of the shaft angle in flight plus the expected net mean longitudinal flapping angle of the helicopter rotor. The cyclic controls (lateral and longitudinal cyclic pitch) are used to minimize the measured 1/rev blade flapping angle. This is called the minimum flapping trim method.
If the rotor test stand has a way to measure the hub forces and moments, then it is possible to trim the rotor to match a specific trim state defined by the target lift, propulsive force, pitch moment, and roll moment. This 4-degrees-of-freedom trim state is maintained by adjusting the plane of the swashplate (3 degrees of freedom) and the rotor shaft angle. Using this approach, the shaft angle and rotor thrust are set to approximately achieve the desired lift and propulsive force. Then the cyclic pitch inputs are adjusted to achieve the hub moment trim values. Some iteration with the shaft angle, collective pitch, lateral cyclic pitch, and longitudinal cyclic pitch may be required to converge the trim. This method is referred to as the constant moment trim state.
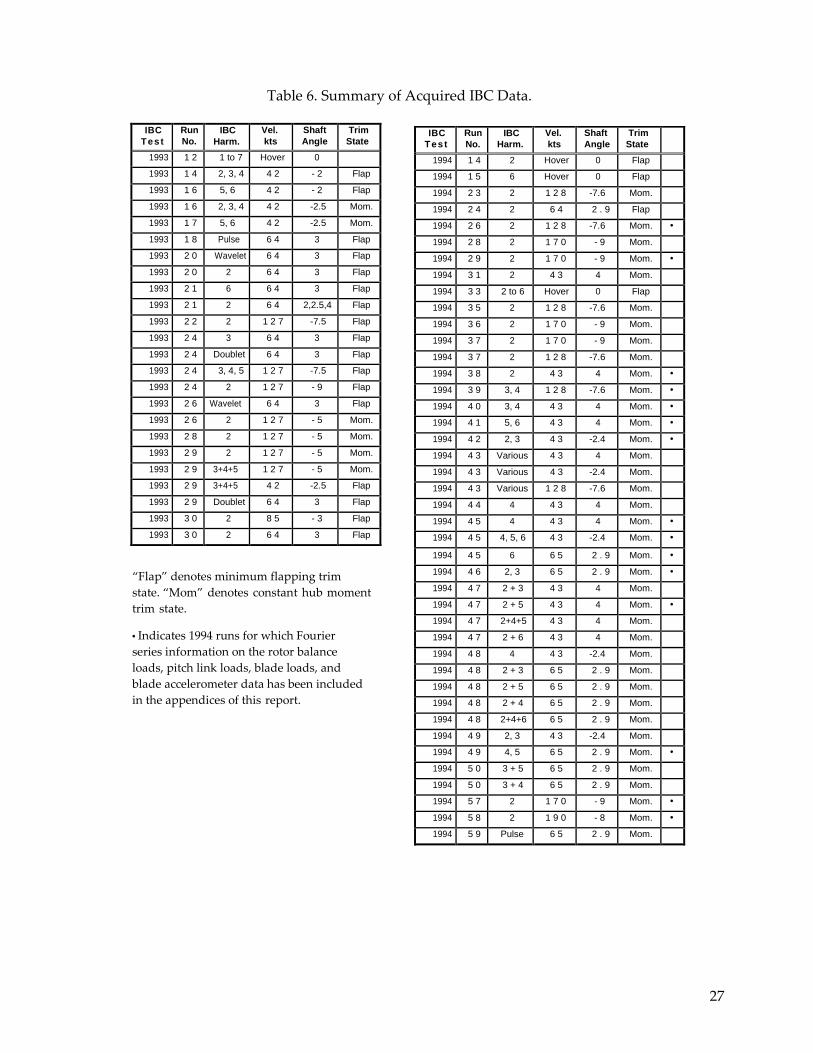
27
Table 6. Summary of Acquired IBC Data.
IBC
Tes t
Run
No.
IBC
Harm.
Vel.
kts
Shaft
Angle
Trim
State
1993 1 2 1 to 7 Hover 0
1993 1 4 2, 3, 4 4 2 - 2 Flap
1993 1 6 5, 6 4 2 - 2 Flap
1993 1 6 2, 3, 4 4 2 -2.5 Mom.
1993 1 7 5, 6 4 2 -2.5 Mom.
1993 1 8 Pulse 6 4 3 Flap
1993 2 0 Wavelet 6 4 3 Flap
1993 2 0 2 6 4 3 Flap
1993 2 1 6 6 4 3 Flap
1993 2 1 2 6 4 2,2.5,4 Flap
1993 2 2 2 1 2 7 -7.5 Flap
1993 2 4 3 6 4 3 Flap
1993 2 4 Doublet 6 4 3 Flap
1993 2 4 3, 4, 5 1 2 7 -7.5 Flap
1993 2 4 2 1 2 7 - 9 Flap
1993 2 6 Wavelet 6 4 3 Flap
1993 2 6 2 1 2 7 - 5 Mom.
1993 2 8 2 1 2 7 - 5 Mom.
1993 2 9 2 1 2 7 - 5 Mom.
1993 2 9 3+4+5 1 2 7 - 5 Mom.
1993 2 9 3+4+5 4 2 -2.5 Flap
1993 2 9 Doublet 6 4 3 Flap
1993 3 0 2 8 5 - 3 Flap
1993 3 0 2 6 4 3 Flap
“Flap” denotes minimum flapping trim
state. “Mom” denotes constant hub moment
trim state.
• Indicates 1994 runs for which Fourier
series information on the rotor balance
loads, pitch link loads, blade loads, and
blade accelerometer data has been included
in the appendices of this report.
IBC
Tes t
Run
No.
IBC
Harm.
Vel.
kts
Shaft
Angle
Trim
State
1994 1 4 2 Hover 0 Flap
1994 1 5 6 Hover 0 Flap
1994 2 3 2 1 2 8 -7.6 Mom.
1994 2 4 2 6 4 2 . 9 Flap
1994 2 6 2 1 2 8 -7.6 Mom. •
1994 2 8 2 1 7 0 - 9 Mom.
1994 2 9 2 1 7 0 - 9 Mom. •
1994 3 1 2 4 3 4 Mom.
1994 3 3 2 to 6 Hover 0 Flap
1994 3 5 2 1 2 8 -7.6 Mom.
1994 3 6 2 1 7 0 - 9 Mom.
1994 3 7 2 1 7 0 - 9 Mom.
1994 3 7 2 1 2 8 -7.6 Mom.
1994 3 8 2 4 3 4 Mom. •
1994 3 9 3, 4 1 2 8 -7.6 Mom. •
1994 4 0 3, 4 4 3 4 Mom. •
1994 4 1 5, 6 4 3 4 Mom. •
1994 4 2 2, 3 4 3 -2.4 Mom. •
1994 4 3 Various 4 3 4 Mom.
1994 4 3 Various 4 3 -2.4 Mom.
1994 4 3 Various 1 2 8 -7.6 Mom.
1994 4 4 4 4 3 4 Mom.
1994 4 5 4 4 3 4 Mom. •
1994 4 5 4, 5, 6 4 3 -2.4 Mom. •
1994 4 5 6 6 5 2 . 9 Mom. •
1994 4 6 2, 3 6 5 2 . 9 Mom. •
1994 4 7 2 + 3 4 3 4 Mom.
1994 4 7 2 + 5 4 3 4 Mom. •
1994 4 7 2+4+5 4 3 4 Mom.
1994 4 7 2 + 6 4 3 4 Mom.
1994 4 8 4 4 3 -2.4 Mom.
1994 4 8 2 + 3 6 5 2 . 9 Mom.
1994 4 8 2 + 5 6 5 2 . 9 Mom.
1994 4 8 2 + 4 6 5 2 . 9 Mom.
1994 4 8 2+4+6 6 5 2 . 9 Mom.
1994 4 9 2, 3 4 3 -2.4 Mom.
1994 4 9 4, 5 6 5 2 . 9 Mom. •
1994 5 0 3 + 5 6 5 2 . 9 Mom.
1994 5 0 3 + 4 6 5 2 . 9 Mom.
1994 5 7 2 1 7 0 - 9 Mom. •
1994 5 8 2 1 9 0 - 8 Mom. •
1994 5 9 Pulse 6 5 2 . 9 Mom.
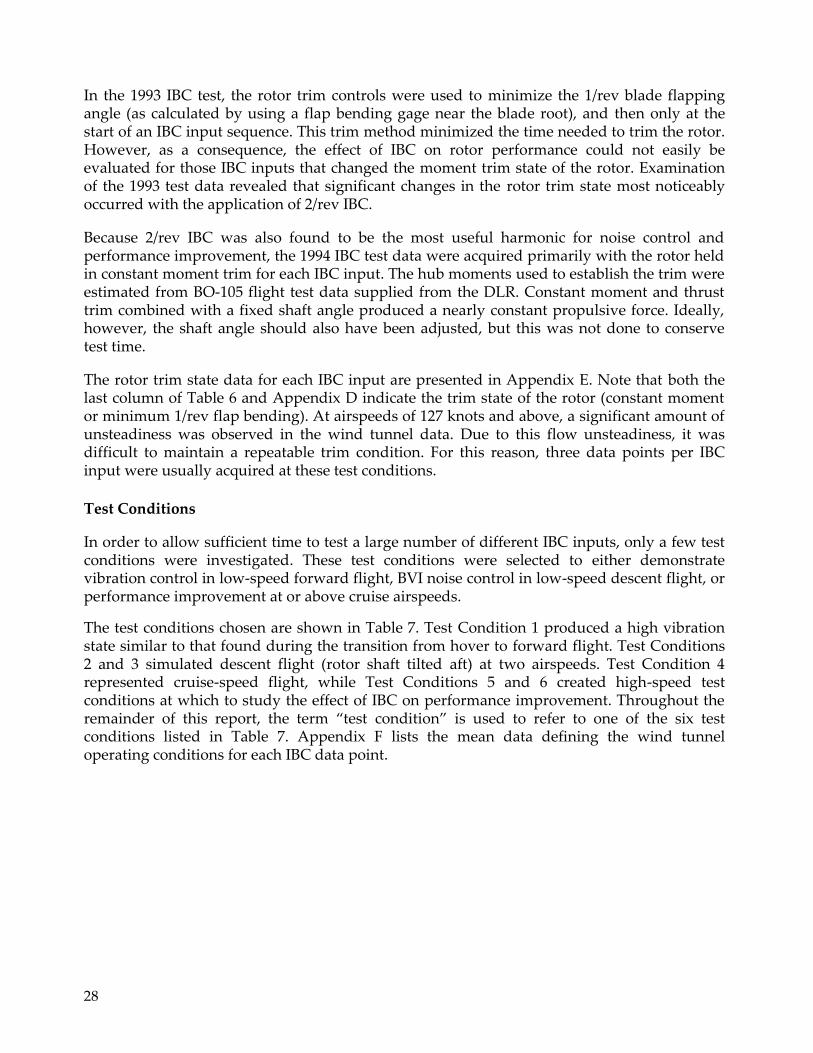
28
In the 1993 IBC test, the rotor trim controls were used to minimize the 1/rev blade flapping angle (as calculated by using a flap bending gage near the blade root), and then only at the start of an IBC input sequence. This trim method minimized the time needed to trim the rotor. However, as a consequence, the effect of IBC on rotor performance could not easily be evaluated for those IBC inputs that changed the moment trim state of the rotor. Examination of the 1993 test data revealed that significant changes in the rotor trim state most noticeably occurred with the application of 2/rev IBC.
Because 2/rev IBC was also found to be the most useful harmonic for noise control and performance improvement, the 1994 IBC test data were acquired primarily with the rotor held in constant moment trim for each IBC input. The hub moments used to establish the trim were estimated from BO-105 flight test data supplied from the DLR. Constant moment and thrust trim combined with a fixed shaft angle produced a nearly constant propulsive force. Ideally, however, the shaft angle should also have been adjusted, but this was not done to conserve test time.
The rotor trim state data for each IBC input are presented in Appendix E. Note that both the last column of Table 6 and Appendix D indicate the trim state of the rotor (constant moment or minimum 1/rev flap bending). At airspeeds of 127 knots and above, a significant amount of unsteadiness was observed in the wind tunnel data. Due to this flow unsteadiness, it was difficult to maintain a repeatable trim condition. For this reason, three data points per IBC input were usually acquired at these test conditions.
Test Conditions
In order to allow sufficient time to test a large number of different IBC inputs, only a few test conditions were investigated. These test conditions were selected to either demonstrate vibration control in low-speed forward flight, BVI noise control in low-speed descent flight, or performance improvement at or above cruise airspeeds.
The test conditions chosen are shown in Table 7. Test Condition 1 produced a high vibration state similar to that found during the transition from hover to forward flight. Test Conditions 2 and 3 simulated descent flight (rotor shaft tilted aft) at two airspeeds. Test Condition 4 represented cruise-speed flight, while Test Conditions 5 and 6 created high-speed test conditions at which to study the effect of IBC on performance improvement. Throughout the remainder of this report, the term “test condition” is used to refer to one of the six test conditions listed in Table 7. Appendix F lists the mean data defining the wind tunnel operating conditions for each IBC data point.
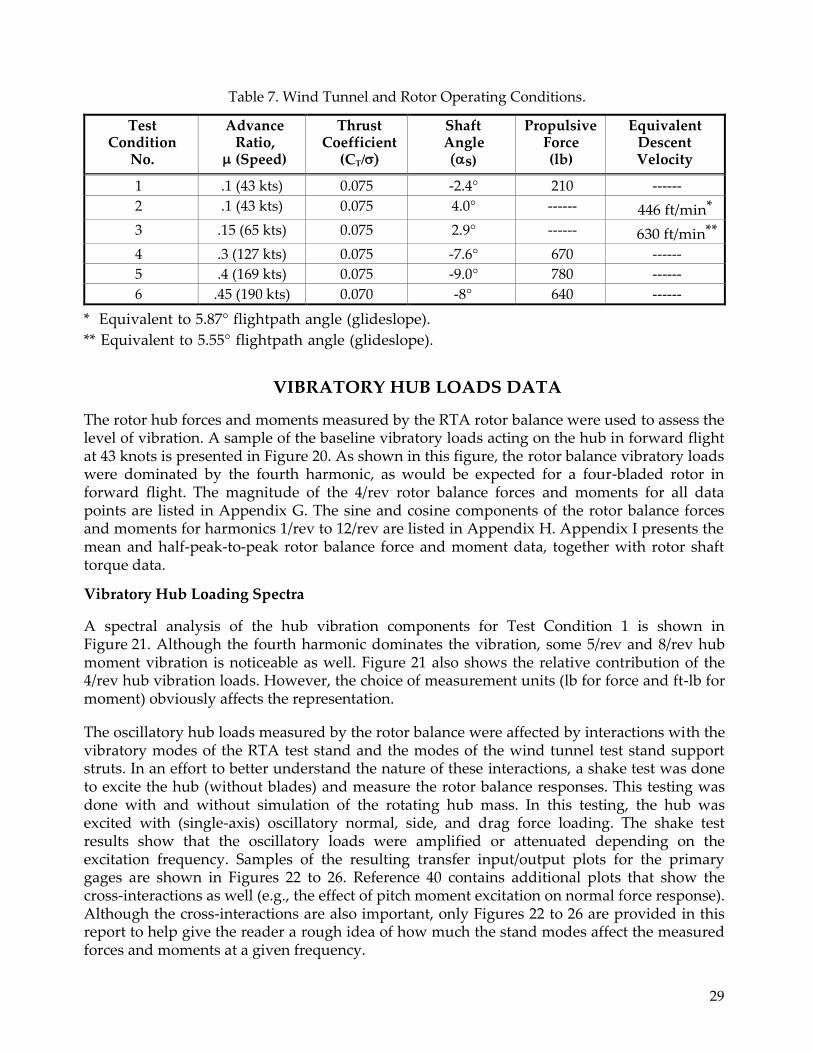
29
Table 7. Wind Tunnel and Rotor Operating Conditions.
Test Condition
No.
Advance Ratio,
(Speed)
Thrust Coefficient
(CT/
Shaft Angle s)
Propulsive Force (lb)
Equivalent Descent Velocity
1 .1 (43 kts) 0.075 -2.4° 210 ------
2 .1 (43 kts) 0.075 4.0° ------ 446 ft/min*
3 .15 (65 kts) 0.075 2.9° ------ 630 ft/min**
4 .3 (127 kts) 0.075 -7.6° 670 ------
5 .4 (169 kts) 0.075 -9.0° 780 ------
6 .45 (190 kts) 0.070 -8° 640 ------
* Equivalent to 5.87° flightpath angle (glideslope).
** Equivalent to 5.55° flightpath angle (glideslope).
VIBRATORY HUB LOADS DATA
The rotor hub forces and moments measured by the RTA rotor balance were used to assess the level of vibration. A sample of the baseline vibratory loads acting on the hub in forward flight at 43 knots is presented in Figure 20. As shown in this figure, the rotor balance vibratory loads were dominated by the fourth harmonic, as would be expected for a four-bladed rotor in forward flight. The magnitude of the 4/rev rotor balance forces and moments for all data points are listed in Appendix G. The sine and cosine components of the rotor balance forces and moments for harmonics 1/rev to 12/rev are listed in Appendix H. Appendix I presents the mean and half-peak-to-peak rotor balance force and moment data, together with rotor shaft torque data.
Vibratory Hub Loading Spectra
A spectral analysis of the hub vibration components for Test Condition 1 is shown in Figure 21. Although the fourth harmonic dominates the vibration, some 5/rev and 8/rev hub moment vibration is noticeable as well. Figure 21 also shows the relative contribution of the 4/rev hub vibration loads. However, the choice of measurement units (lb for force and ft-lb for moment) obviously affects the representation.
The oscillatory hub loads measured by the rotor balance were affected by interactions with the vibratory modes of the RTA test stand and the modes of the wind tunnel test stand support struts. In an effort to better understand the nature of these interactions, a shake test was done to excite the hub (without blades) and measure the rotor balance responses. This testing was done with and without simulation of the rotating hub mass. In this testing, the hub was excited with (single-axis) oscillatory normal, side, and drag force loading. The shake test results show that the oscillatory loads were amplified or attenuated depending on the excitation frequency. Samples of the resulting transfer input/output plots for the primary gages are shown in Figures 22 to 26. Reference 40 contains additional plots that show the cross-interactions as well (e.g., the effect of pitch moment excitation on normal force response). Although the cross-interactions are also important, only Figures 22 to 26 are provided in this report to help give the reader a rough idea of how much the stand modes affect the measured forces and moments at a given frequency.
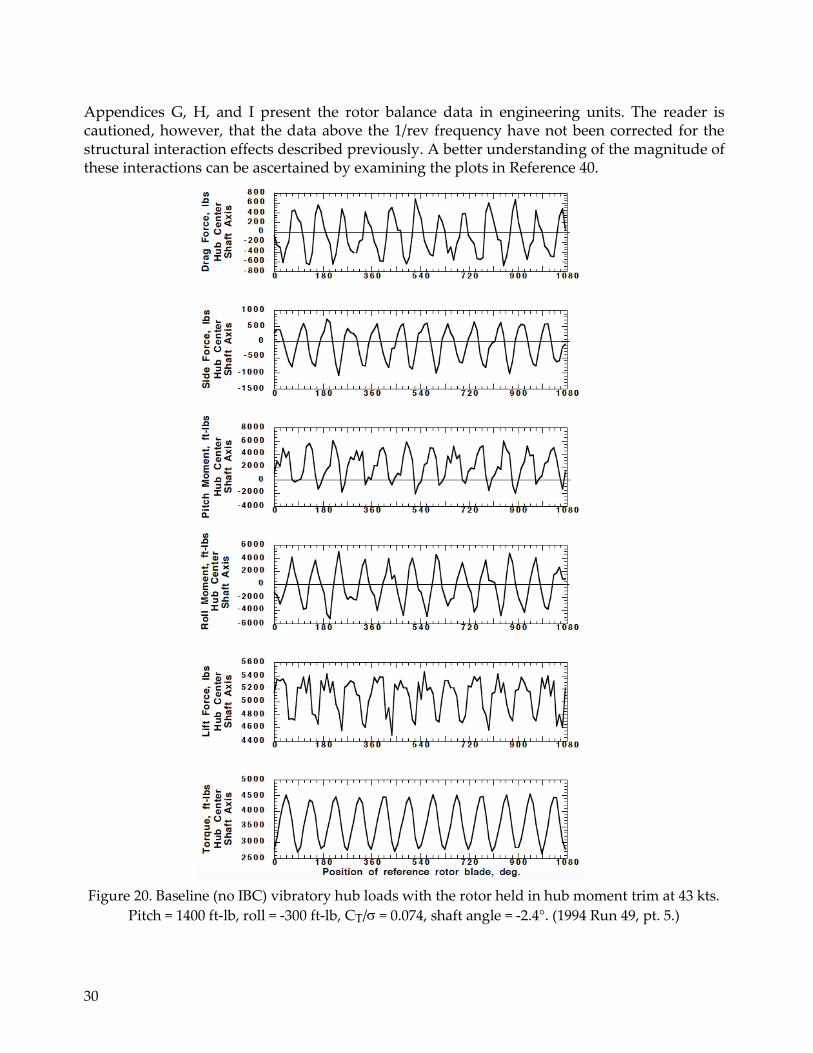
30
Appendices G, H, and I present the rotor balance data in engineering units. The reader is cautioned, however, that the data above the 1/rev frequency have not been corrected for the structural interaction effects described previously. A better understanding of the magnitude of these interactions can be ascertained by examining the plots in Reference 40.
Figure 20. Baseline (no IBC) vibratory hub loads with the rotor held in hub moment trim at 43 kts.
Pitch = 1400 ft-lb, roll = -300 ft-lb, CT/ = 0.074, shaft angle = -2.4°. (1994 Run 49, pt. 5.)

31
4 0 0 0
3 5 0 0
3 0 0 0
2 5 0 0
2 0 0 0
1 5 0 0
1 0 0 0
5 0 0
0
1 2 3 4 5 6 7 8
Frequency, /rev
Figure 21. Vibratory hub loads at Test Condition 1 (43 kts) without IBC. Pitch moment = 2,300 ft-lb,
roll moment = -250 ft-lb, CT/ = 0.074, shaft angle = -2.4°. (1994 Run 49, pt. 5.)
Figure 22. Rotor balance thrust force response to thrust force loading.
Lift
Drag Force
Side Force
Pitch Moment
Roll Moment
Torque
Fo
rce
, lb
M
om
en
t,
ft-l
b

32
Figure 23. Rotor balance pitch moment response to pitch moment loading.
Figure 24. Rotor balance roll moment response to roll moment loading.
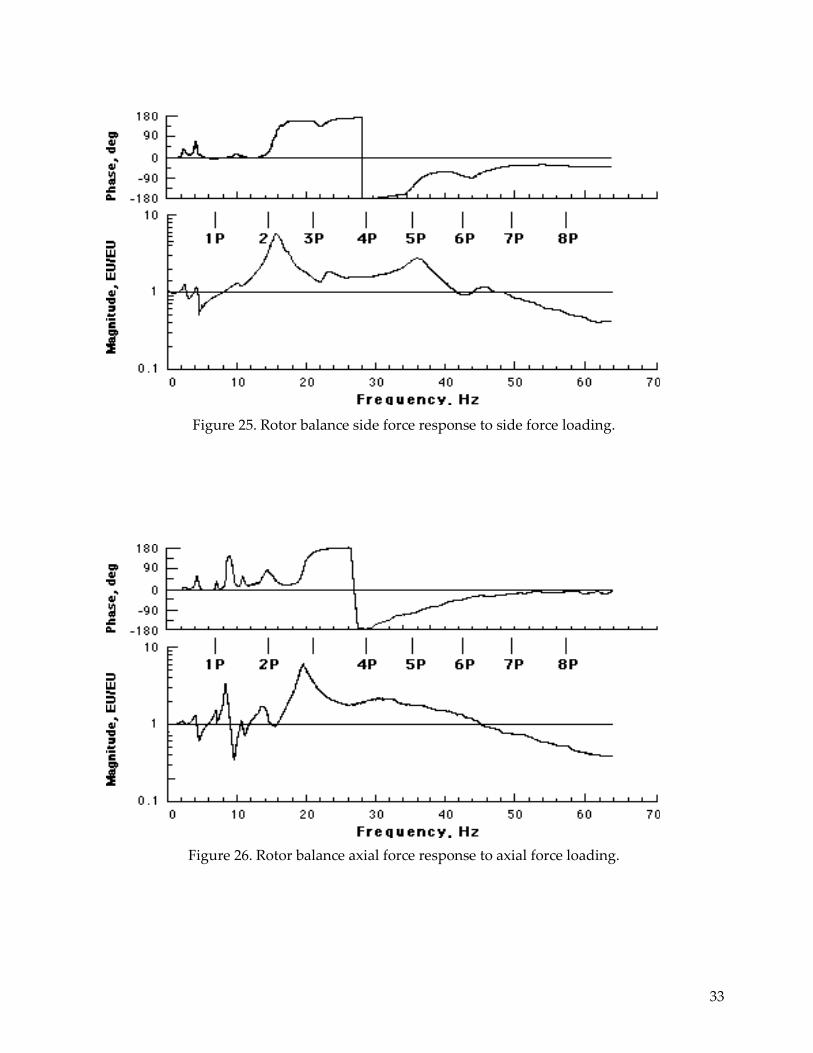
33
Figure 25. Rotor balance side force response to side force loading.
Figure 26. Rotor balance axial force response to axial force loading.

34
Side Force Drag Force2 2
Pitch Moment Roll Moment2 2
Presentation of Vibration Data
In this section, the amount of vibration increase or decrease with IBC applied is shown as a percentage of the change from the baseline level of vibration (i.e. without IBC). The vibration data were acquired with the rotor held in trim (either minimum blade flapping or constant lift and hub moment). The advantage of this approach is that it avoids the need to show the level of baseline vibration for each component of the vibration. This also avoids the issue of the rotor balance data not having been calibrated at frequencies above 1/rev, since the effect of the structural modes should affect both the baseline vibration and the vibration with IBC the same.
One difficulty with plotting percentages, however, is that it makes a given percent reduction in one vibratory parameter seem equal to the same percentage reduction of another. However, this might not be true. As shown in Figure 21, the hub moments appear to make larger contributions to vibration than the hub forces. Yet, if the hub forces were measured in ounces of force (instead of pounds), then the hub forces would appear to dominate the vibration. But, if the hub moments were then shown in inch-pounds, rather than foot-pounds, hub moments would then appear more important once again. For this reason, it was decided that creating a single vibration index as the sum of the six hub forces and moments was inappropriate.
Instead, this report combines only the 4/rev side force with the drag force, and the pitch moment with the roll moment. Since the hub side force and hub drag force (hub axial force in Appendix A) are both components of the in-plane hub shear force, it makes sense to combine these forces by vector summation to form a single index of the hub shear force,
Shear (2)
Similarly, the 4/rev pitch moment and roll moment are combined in the same manner, since they are both components of the hub moment about an axis located in the rotor plane,
Moment (3)
The 4/rev hub lift force and rotor shaft torque measurements were treated as vibration indices in themselves. Appendix G presents the magnitude of the 4/rev hub forces and moments, as well as the resolved hub shear and hub moment indices defined by Eqs. (2) and (3).
Since the majority of the hub vibration was at the 4/rev frequency, the following plots show only the effect of IBC on the 4/rev vibration components. This makes the plots much less cluttered. However, data for harmonics 1/rev to 12/rev are presented in Appendix H. In addition, plots of the vibration spectral content for two IBC inputs showing large 4/rev vibration reductions are presented later as a direct comparison to Figure 21. These plots show that the other frequencies do not markedly increase if the 4/rev harmonic of vibration is reduced by IBC.
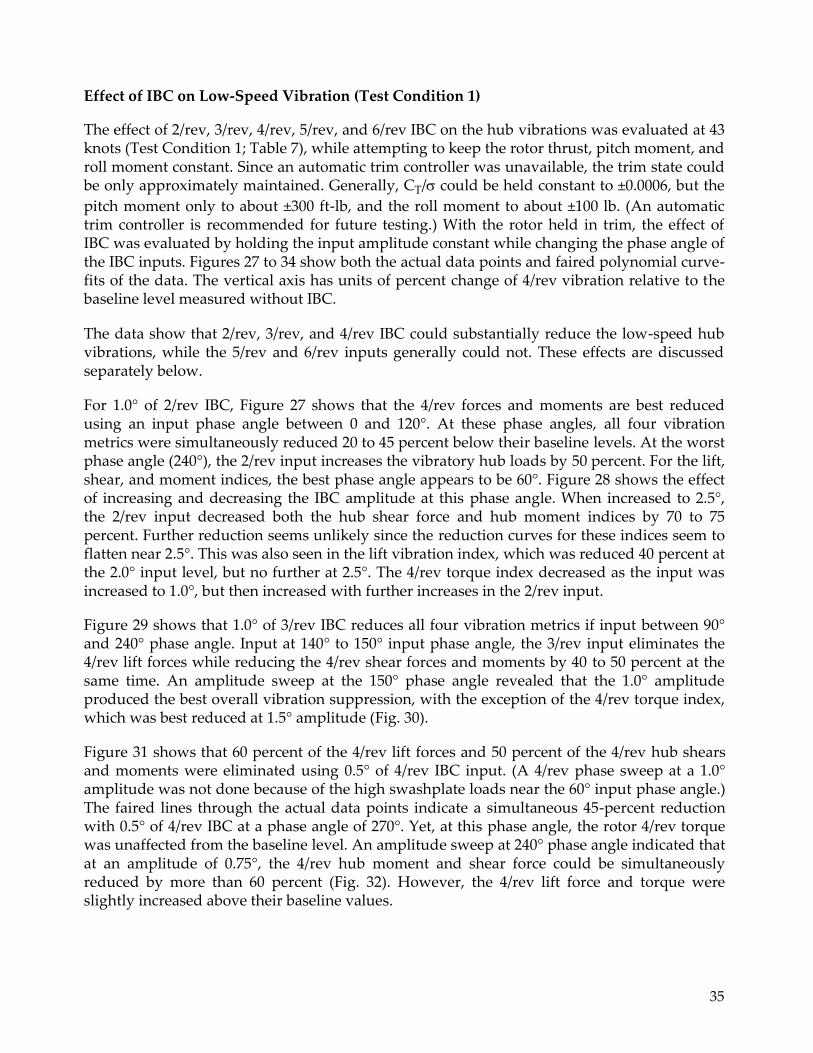
35
Effect of IBC on Low-Speed Vibration (Test Condition 1)
The effect of 2/rev, 3/rev, 4/rev, 5/rev, and 6/rev IBC on the hub vibrations was evaluated at 43 knots (Test Condition 1; Table 7), while attempting to keep the rotor thrust, pitch moment, and roll moment constant. Since an automatic trim controller was unavailable, the trim state could be only approximately maintained. Generally, CT/ could be held constant to ±0.0006, but the
pitch moment only to about ±300 ft-lb, and the roll moment to about ±100 lb. (An automatic trim controller is recommended for future testing.) With the rotor held in trim, the effect of IBC was evaluated by holding the input amplitude constant while changing the phase angle of the IBC inputs. Figures 27 to 34 show both the actual data points and faired polynomial curve-fits of the data. The vertical axis has units of percent change of 4/rev vibration relative to the baseline level measured without IBC.
The data show that 2/rev, 3/rev, and 4/rev IBC could substantially reduce the low-speed hub vibrations, while the 5/rev and 6/rev inputs generally could not. These effects are discussed separately below.
For 1.0° of 2/rev IBC, Figure 27 shows that the 4/rev forces and moments are best reduced using an input phase angle between 0 and 120°. At these phase angles, all four vibration metrics were simultaneously reduced 20 to 45 percent below their baseline levels. At the worst phase angle (240°), the 2/rev input increases the vibratory hub loads by 50 percent. For the lift, shear, and moment indices, the best phase angle appears to be 60°. Figure 28 shows the effect of increasing and decreasing the IBC amplitude at this phase angle. When increased to 2.5°, the 2/rev input decreased both the hub shear force and hub moment indices by 70 to 75 percent. Further reduction seems unlikely since the reduction curves for these indices seem to flatten near 2.5°. This was also seen in the lift vibration index, which was reduced 40 percent at the 2.0° input level, but no further at 2.5°. The 4/rev torque index decreased as the input was increased to 1.0°, but then increased with further increases in the 2/rev input.
Figure 29 shows that 1.0° of 3/rev IBC reduces all four vibration metrics if input between 90° and 240° phase angle. Input at 140° to 150° input phase angle, the 3/rev input eliminates the 4/rev lift forces while reducing the 4/rev shear forces and moments by 40 to 50 percent at the same time. An amplitude sweep at the 150° phase angle revealed that the 1.0° amplitude produced the best overall vibration suppression, with the exception of the 4/rev torque index, which was best reduced at 1.5° amplitude (Fig. 30).
Figure 31 shows that 60 percent of the 4/rev lift forces and 50 percent of the 4/rev hub shears and moments were eliminated using 0.5° of 4/rev IBC input. (A 4/rev phase sweep at a 1.0° amplitude was not done because of the high swashplate loads near the 60° input phase angle.) The faired lines through the actual data points indicate a simultaneous 45-percent reduction with 0.5° of 4/rev IBC at a phase angle of 270°. Yet, at this phase angle, the rotor 4/rev torque was unaffected from the baseline level. An amplitude sweep at 240° phase angle indicated that at an amplitude of 0.75°, the 4/rev hub moment and shear force could be simultaneously reduced by more than 60 percent (Fig. 32). However, the 4/rev lift force and torque were slightly increased above their baseline values.
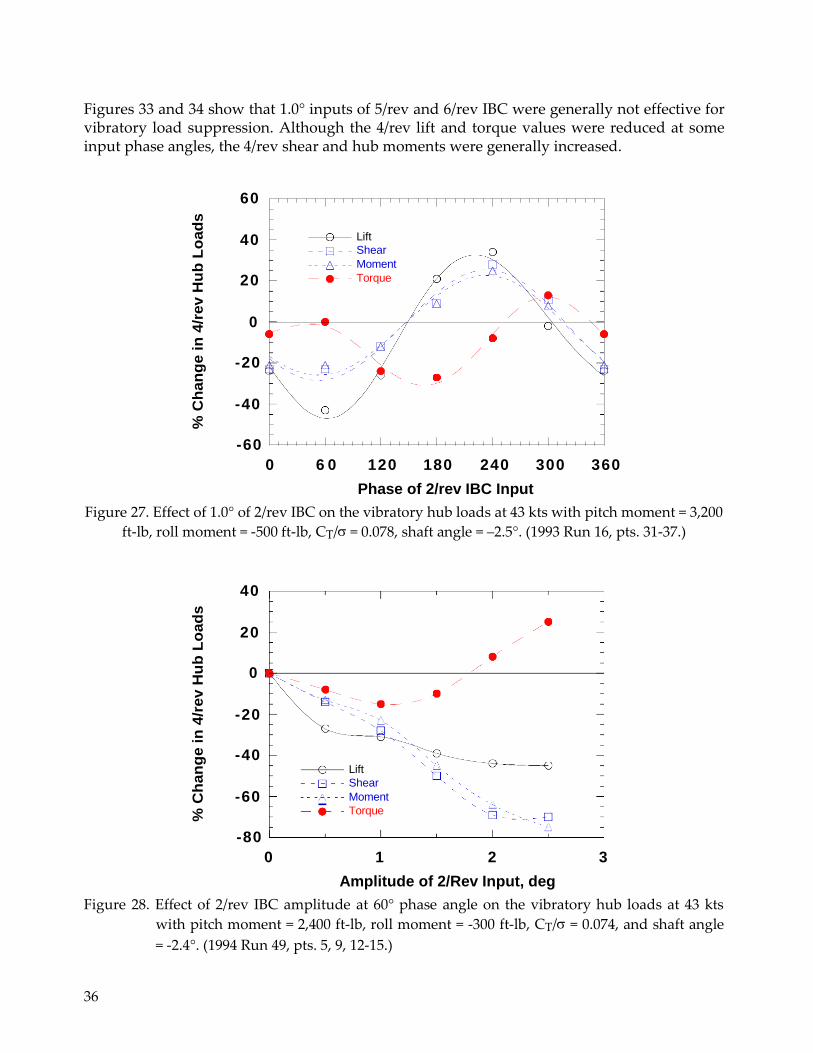
36
Figures 33 and 34 show that 1.0° inputs of 5/rev and 6/rev IBC were generally not effective for vibratory load suppression. Although the 4/rev lift and torque values were reduced at some input phase angles, the 4/rev shear and hub moments were generally increased.
60
40
20
0
-20
-40
-60
0 6 0 120 180 240 300 360
Phase of 2/rev IBC Input
Figure 27. Effect of 1.0° of 2/rev IBC on the vibratory hub loads at 43 kts with pitch moment = 3,200
ft-lb, roll moment = -500 ft-lb, CT/ = 0.078, shaft angle = –2.5°. (1993 Run 16, pts. 31-37.)
40
20
0
-20
-40
-60
-80
0 1 2 3
Amplitude of 2/Rev Input, deg
Figure 28. Effect of 2/rev IBC amplitude at 60° phase angle on the vibratory hub loads at 43 kts
with pitch moment = 2,400 ft-lb, roll moment = -300 ft-lb, CT/ = 0.074, and shaft angle
= -2.4°. (1994 Run 49, pts. 5, 9, 12-15.)
Lift
Shear
Moment
Torque
% C
han
ge i
n 4
/rev H
ub
Lo
ad
s
Lift
Shear
Moment
Torque
% C
han
ge i
n 4
/rev H
ub
Lo
ad
s
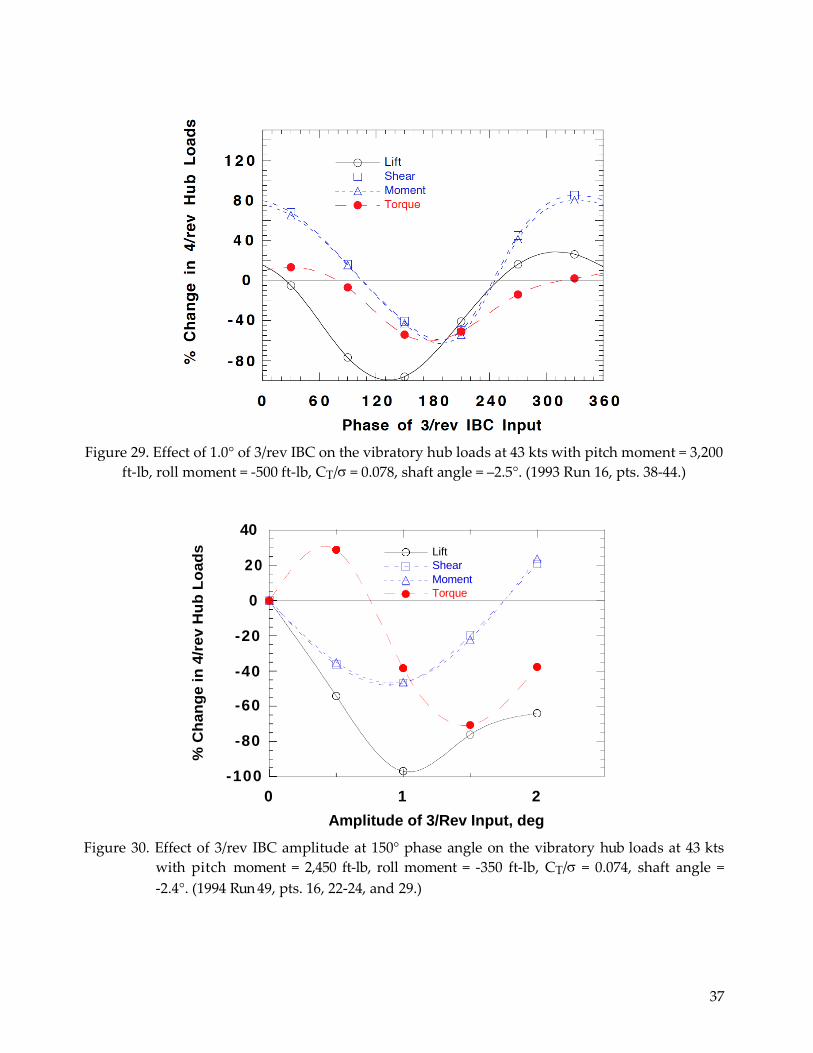
37
Figure 29. Effect of 1.0° of 3/rev IBC on the vibratory hub loads at 43 kts with pitch moment = 3,200
ft-lb, roll moment = -500 ft-lb, CT/ = 0.078, shaft angle = –2.5°. (1993 Run 16, pts. 38-44.)
40
20
0
-20
-40
-60
-80
-100
0 1 2
Amplitude of 3/Rev Input, deg
Figure 30. Effect of 3/rev IBC amplitude at 150° phase angle on the vibratory hub loads at 43 kts
with pitch moment = 2,450 ft-lb, roll moment = -350 ft-lb, CT/ = 0.074, shaft angle =
-2.4°. (1994 Run 49, pts. 16, 22-24, and 29.)
Lift
Shear
Moment
Torque
% C
han
ge i
n 4
/rev H
ub
Lo
ad
s
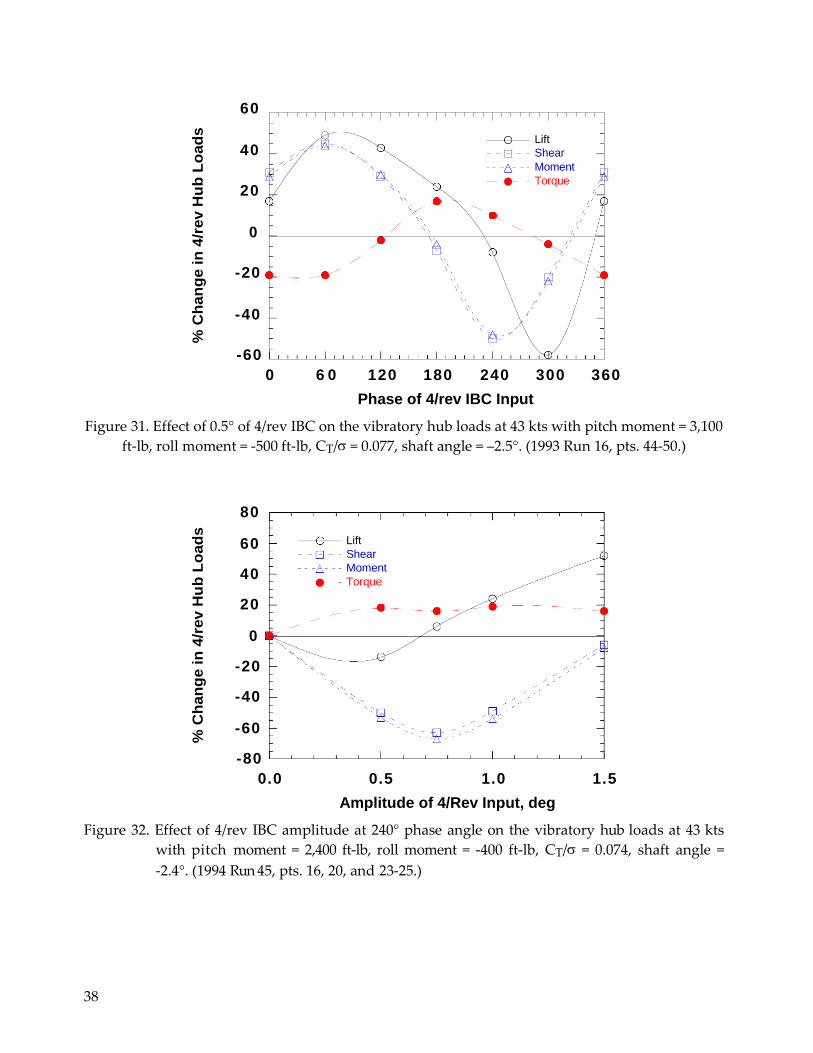
38
60
40
20
0
-20
-40
-60
0 6 0 120 180 240 300 360
Phase of 4/rev IBC Input
Figure 31. Effect of 0.5° of 4/rev IBC on the vibratory hub loads at 43 kts with pitch moment = 3,100
ft-lb, roll moment = -500 ft-lb, CT/ = 0.077, shaft angle = –2.5°. (1993 Run 16, pts. 44-50.)
80
60
40
20
0
-20
-40
-60
-80
0.0 0.5 1.0 1.5
Amplitude of 4/Rev Input, deg
Figure 32. Effect of 4/rev IBC amplitude at 240° phase angle on the vibratory hub loads at 43 kts
with pitch moment = 2,400 ft-lb, roll moment = -400 ft-lb, CT/ = 0.074, shaft angle =
-2.4°. (1994 Run 45, pts. 16, 20, and 23-25.)
Lift
Shear
Moment
Torque
% C
han
ge i
n 4
/rev H
ub
Lo
ad
s
Lift
Shear
Moment
Torque
% C
han
ge i
n 4
/rev H
ub
Lo
ad
s
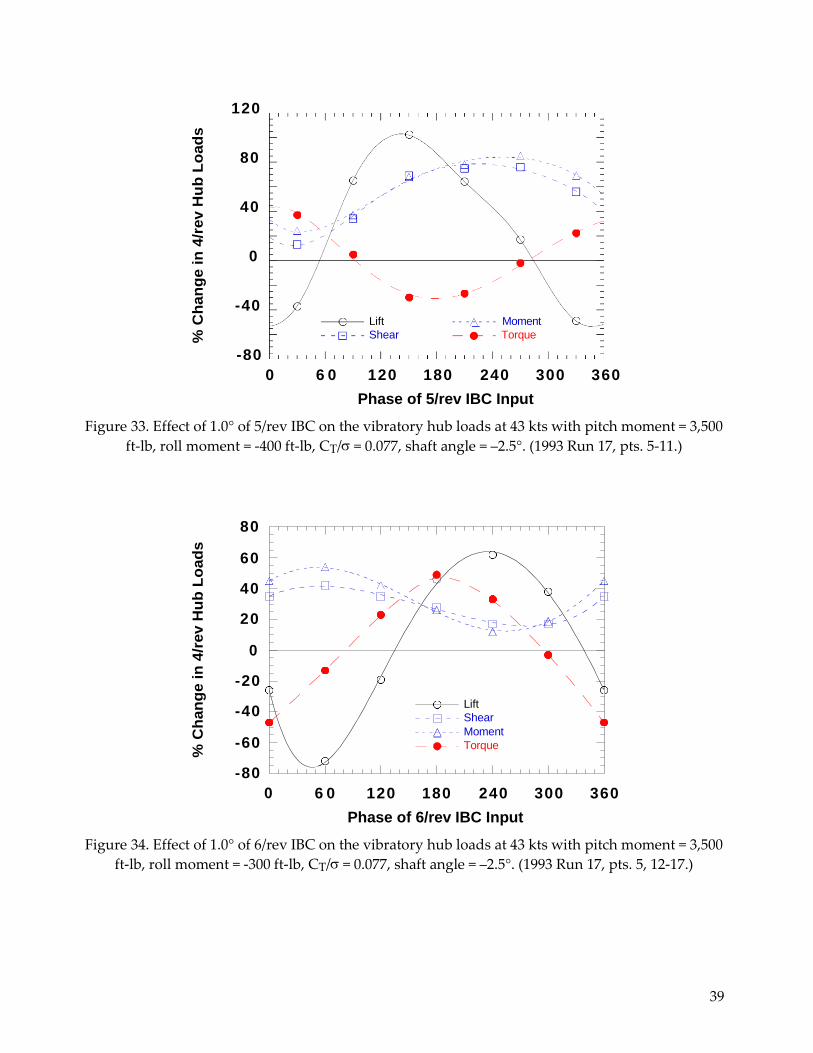
39
120
80
40
0
-40
-80
0 6 0 120 180 240 300 360
Phase of 5/rev IBC Input
Figure 33. Effect of 1.0° of 5/rev IBC on the vibratory hub loads at 43 kts with pitch moment = 3,500
ft-lb, roll moment = -400 ft-lb, CT/ = 0.077, shaft angle = –2.5°. (1993 Run 17, pts. 5-11.)
80
60
40
20
0
-20
-40
-60
-80
0
6 0 120 180 240 300 360
Phase of 6/rev IBC Input
Figure 34. Effect of 1.0° of 6/rev IBC on the vibratory hub loads at 43 kts with pitch moment = 3,500
ft-lb, roll moment = -300 ft-lb, CT/ = 0.077, shaft angle = –2.5°. (1993 Run 17, pts. 5, 12-17.)
Lift
Shear
Moment
Torque % C
han
ge i
n 4
/rev H
ub
Lo
ad
s
Lift
Shear
Moment
Torque
% C
han
ge i
n 4
/rev H
ub
Lo
ad
s
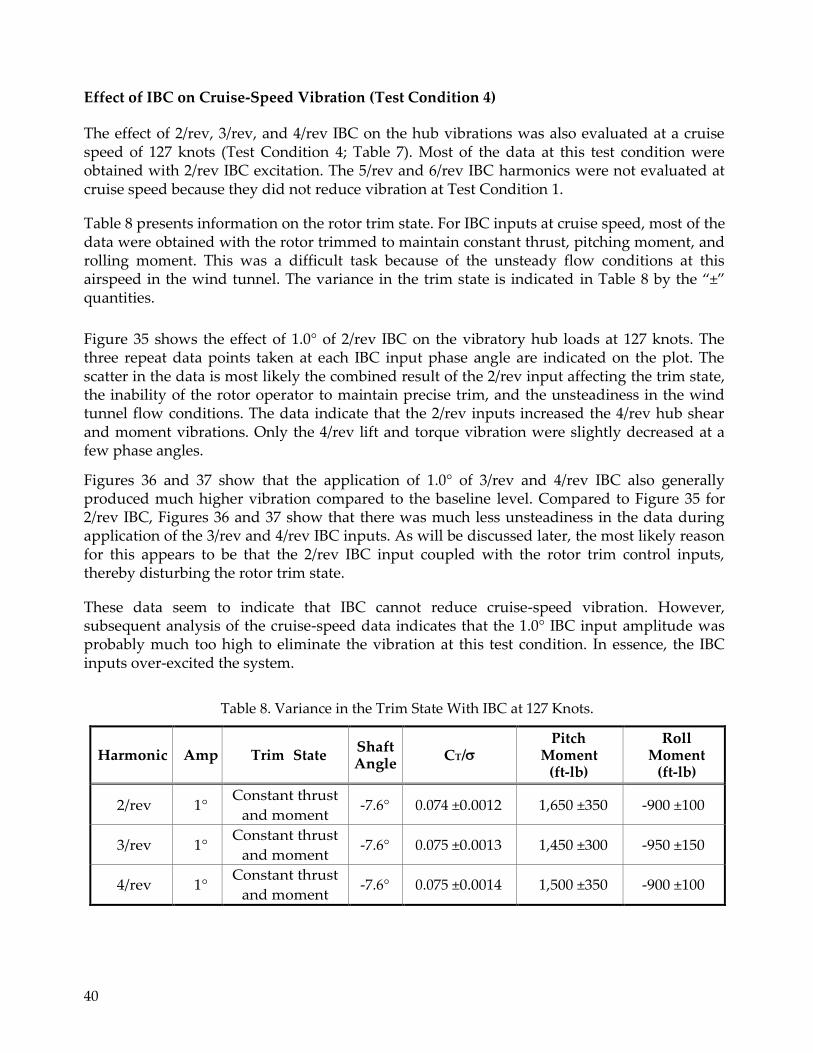
40
Effect of IBC on Cruise-Speed Vibration (Test Condition 4)
The effect of 2/rev, 3/rev, and 4/rev IBC on the hub vibrations was also evaluated at a cruise speed of 127 knots (Test Condition 4; Table 7). Most of the data at this test condition were obtained with 2/rev IBC excitation. The 5/rev and 6/rev IBC harmonics were not evaluated at cruise speed because they did not reduce vibration at Test Condition 1.
Table 8 presents information on the rotor trim state. For IBC inputs at cruise speed, most of the data were obtained with the rotor trimmed to maintain constant thrust, pitching moment, and rolling moment. This was a difficult task because of the unsteady flow conditions at this airspeed in the wind tunnel. The variance in the trim state is indicated in Table 8 by the “±” quantities.
Figure 35 shows the effect of 1.0° of 2/rev IBC on the vibratory hub loads at 127 knots. The three repeat data points taken at each IBC input phase angle are indicated on the plot. The scatter in the data is most likely the combined result of the 2/rev input affecting the trim state, the inability of the rotor operator to maintain precise trim, and the unsteadiness in the wind tunnel flow conditions. The data indicate that the 2/rev inputs increased the 4/rev hub shear and moment vibrations. Only the 4/rev lift and torque vibration were slightly decreased at a few phase angles.
Figures 36 and 37 show that the application of 1.0° of 3/rev and 4/rev IBC also generally produced much higher vibration compared to the baseline level. Compared to Figure 35 for 2/rev IBC, Figures 36 and 37 show that there was much less unsteadiness in the data during application of the 3/rev and 4/rev IBC inputs. As will be discussed later, the most likely reason for this appears to be that the 2/rev IBC input coupled with the rotor trim control inputs, thereby disturbing the rotor trim state.
These data seem to indicate that IBC cannot reduce cruise-speed vibration. However, subsequent analysis of the cruise-speed data indicates that the 1.0° IBC input amplitude was probably much too high to eliminate the vibration at this test condition. In essence, the IBC inputs over-excited the system.
Table 8. Variance in the Trim State With IBC at 127 Knots.
Harmonic Amp Trim State Shaft Angle
CT/ Pitch
Moment (ft-lb)
Roll Moment
(ft-lb)
2/rev 1° Constant thrust
and moment -7.6° 0.074 ±0.0012 1,650 ±350 -900 ±100
3/rev 1° Constant thrust
and moment -7.6° 0.075 ±0.0013 1,450 ±300 -950 ±150
4/rev 1° Constant thrust
and moment -7.6° 0.075 ±0.0014 1,500 ±350 -900 ±100
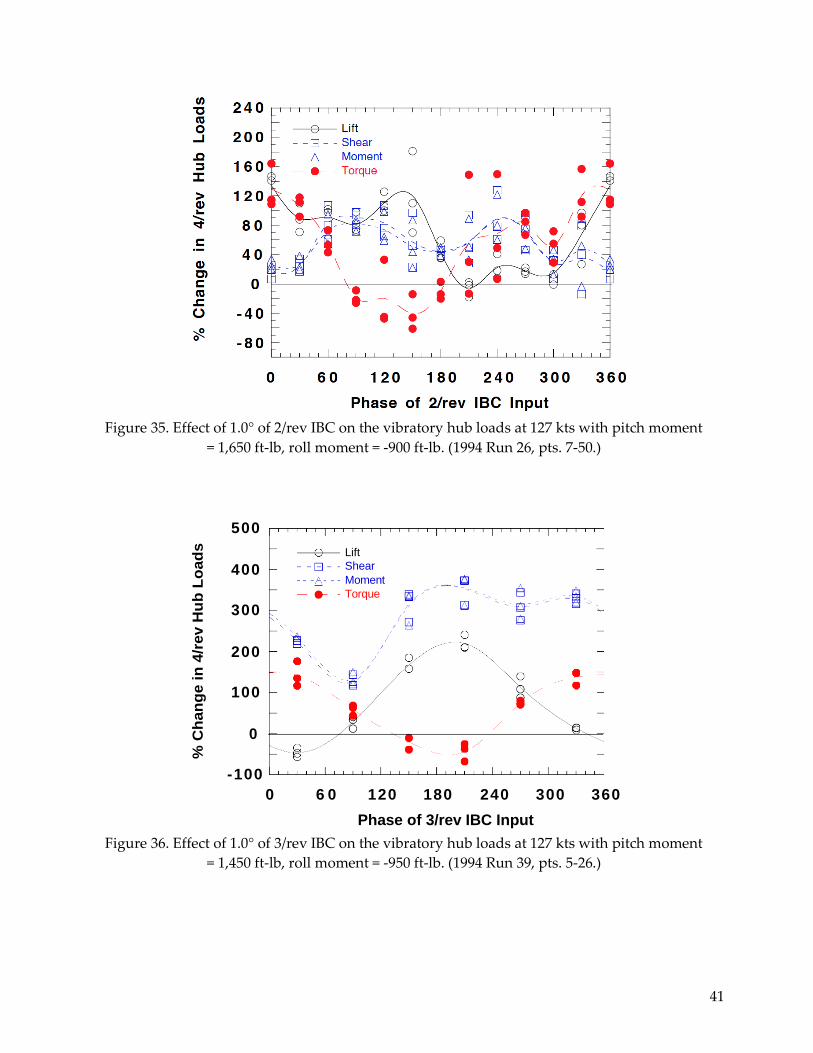
41
Figure 35. Effect of 1.0° of 2/rev IBC on the vibratory hub loads at 127 kts with pitch moment
= 1,650 ft-lb, roll moment = -900 ft-lb. (1994 Run 26, pts. 7-50.)
500
400
300
200
100
0
-100
0 6 0 120 180 240 300 360
Phase of 3/rev IBC Input
Figure 36. Effect of 1.0° of 3/rev IBC on the vibratory hub loads at 127 kts with pitch moment
= 1,450 ft-lb, roll moment = -950 ft-lb. (1994 Run 39, pts. 5-26.)
Lift
Shear
Moment
Torque
% C
han
ge i
n 4
/rev H
ub
Lo
ad
s
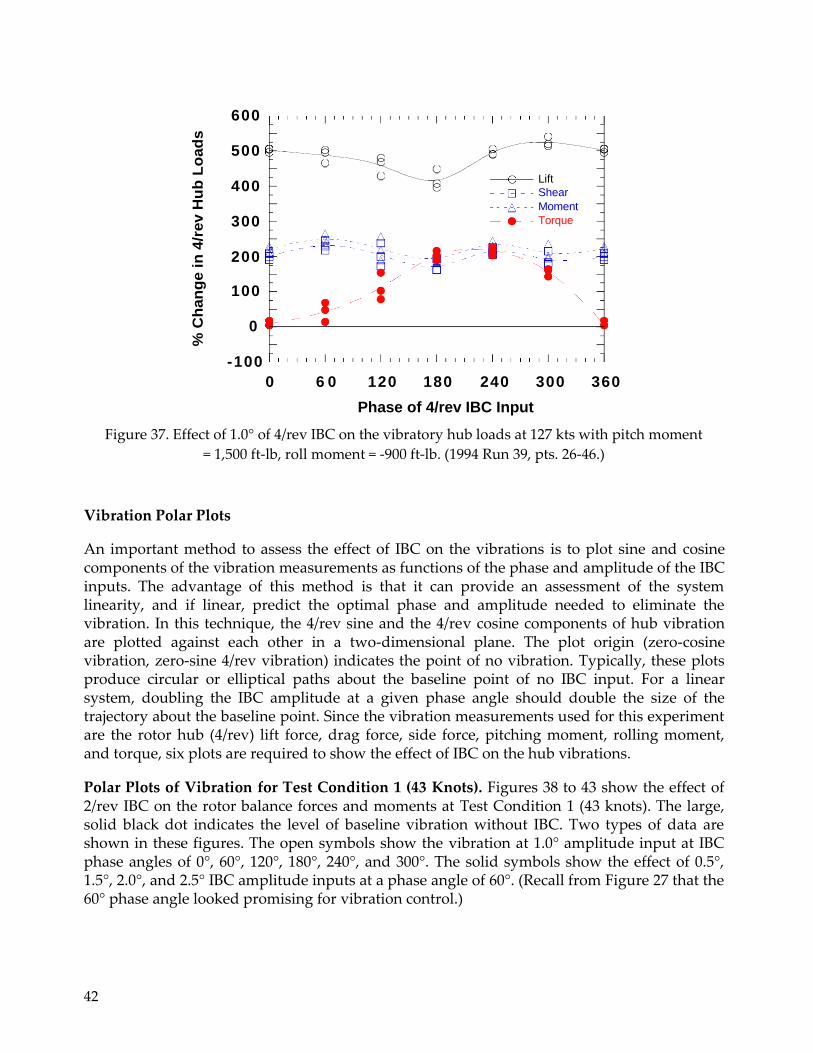
42
600
500
400
300
200
100
0
-100
0 6 0 120 180 240 300 360
Phase of 4/rev IBC Input
Figure 37. Effect of 1.0° of 4/rev IBC on the vibratory hub loads at 127 kts with pitch moment
= 1,500 ft-lb, roll moment = -900 ft-lb. (1994 Run 39, pts. 26-46.)
Vibration Polar Plots
An important method to assess the effect of IBC on the vibrations is to plot sine and cosine components of the vibration measurements as functions of the phase and amplitude of the IBC inputs. The advantage of this method is that it can provide an assessment of the system linearity, and if linear, predict the optimal phase and amplitude needed to eliminate the vibration. In this technique, the 4/rev sine and the 4/rev cosine components of hub vibration are plotted against each other in a two-dimensional plane. The plot origin (zero-cosine vibration, zero-sine 4/rev vibration) indicates the point of no vibration. Typically, these plots produce circular or elliptical paths about the baseline point of no IBC input. For a linear system, doubling the IBC amplitude at a given phase angle should double the size of the trajectory about the baseline point. Since the vibration measurements used for this experiment are the rotor hub (4/rev) lift force, drag force, side force, pitching moment, rolling moment, and torque, six plots are required to show the effect of IBC on the hub vibrations.
Polar Plots of Vibration for Test Condition 1 (43 Knots). Figures 38 to 43 show the effect of 2/rev IBC on the rotor balance forces and moments at Test Condition 1 (43 knots). The large, solid black dot indicates the level of baseline vibration without IBC. Two types of data are shown in these figures. The open symbols show the vibration at 1.0° amplitude input at IBC phase angles of 0°, 60°, 120°, 180°, 240°, and 300°. The solid symbols show the effect of 0.5°, 1.5°, 2.0°, and 2.5° IBC amplitude inputs at a phase angle of 60°. (Recall from Figure 27 that the 60° phase angle looked promising for vibration control.)
Lift
Shear
Moment
Torque
% C
han
ge i
n 4
/rev H
ub
Lo
ad
s

43
In Figures 38 to 43, for 1° of 2/rev input, the data (open symbols) do not form elliptical paths about the baseline vibration points, but are scattered irregularly. Because the origin is outside the cluster of data points, it appears that an IBC input having a larger amplitude would be needed to reach the origin, assuming it could be reached at all. The irregularities of the data make it difficult to see that a 60° phase angle input might be best. Nevertheless, at this phase angle, the solid black symbols show that the origin is nearly reached for pitch moment, roll moment, side force, and drag force as the amplitude is increased to 2.5°. At that amplitude, the vibration suppression is better than 90 percent. As the amplitude is increased, the progression toward the origin is not a straight line, but rather an arc. This curved path and the nonproportional relationship between vibration amplitude and IBC amplitude are clear indications of system nonlinearity. It is also interesting to note that the amplitude sweep at the 60° phase angle did not suppress the 4/rev lift force vibration by more than 50 percent (Fig. 42). In addition, the 4/rev shaft torque moment vibration increases as the input amplitude increases (Fig. 43) indicating a very different behavior than the other hub vibration components.
Figures 44 to 49 show the vibration polar plots for 1.0° of 3/rev IBC input at the same test condition (43 knots). Figure 44 shows the pitch moment vibration response. An ellipse has been drawn through the data points. This ellipse encompasses the origin, indicating that the 1.0° amplitude was too high and that the system was being overdriven by the excitation. A 3/rev input of about 0.75° amplitude, input at a phase angle of 180° (halfway between the 150° and 210° data points) would likely eliminate the 4/rev pitch vibration. However, Figures 45 and 46 (for the same 3/rev inputs) show that the 4/rev roll moment and side force respond in a nonlinear manner to amplitude variation. Since the origin is slightly outside of the data points, an amplitude slightly greater than 1.0° appears to be needed to alleviate the vibration. These plots indicate that the best phase angle for vibration reduction is 150°. However, Figure 47 indicates that the amplitude needed to eliminate the 4/rev drag force should be less than 1.0° since the ellipse contains the zero-vibration origin. The phase angle for best vibration reduction appears to be 180°. Figure 48 shows that the 4/rev lift force response was also nonlinear. The data point near the origin makes it clear that 1.0° of 3/rev applied at 150° eliminates the 4/rev lift force. However, the polar plot for the 4/rev torque response (Fig. 49) suggests an input amplitude of 1.5° input at about 180° phase angle could eliminate that component of the vibration.
This data shows that 3/rev IBC input of about 1.0° amplitude at 150° to 180° phase angle reduces the total 4/rev vibration 80 to 100 percent, depending on the measurement. An amplitude of 1.0° nearly eliminates all of the 4/rev lift force, side force, and roll moment. However, the 4/rev pitch moment and drag force appear to require only about 0.75°, and the 4/rev torque appears to need 1.5°. The effect of increasing amplitude on the vibration response is also interesting in that there appears to be both linear and nonlinear regions. For example, the solid black symbols shown in Figure 44 show a linear variation from the baseline vibration for amplitudes up to 1.0°. But for higher inputs (1.5° and 2.0°), both the phase angle and the amplitude of the response do not follow the same linear progression found for the 0.5° and 1.0° inputs. This is shown in the other plots (Figs. 45–49) as well.

44
Figures 50 to 55 show the polar plots obtained from introducing 4/rev IBC at 0.5° amplitude. In these plots, the data points for constant amplitude lie on elliptical paths about the baseline vibration points. (Three baseline data points were available and are plotted on each graph to indicate the level of data repeatability.) The amplitude sweep data taken at a phase angle of 240° also indicate a linear system, except for the 4/rev torque response (Fig. 55) that shows the same output response at different input forcing levels. Since the plot origins lie outside of the ellipses, an amplitude larger than 0.5° appears to be needed to reach the origin (or cancel the vibration). The plots for the hub moments and in-plane shear forces (Figs. 50–53) indicate that an amplitude of about 0.75° at a phase angle of about 260° would likely eliminate almost all of these 4/rev vibration components. However, the plot for 4/rev lift (Fig. 54) indicates an amplitude of 1.0° at a phase angle of 300°, and Figure 55 indicates a phase angle of 30° for 4/rev torque and the notion that the origin might not be reached at any amplitude.
Figures 56 and 57 show the hub vibration responses to 0.5° of 5/rev IBC at Test Condition 1 (43 knots). These data form nearly circular ellipses about the baseline vibration points. The amplitude needed for vibration suppression is not clear. Figures 56 and 59 indicate that a 5/rev input, slightly greater than 0.5°, at a phase angle of about 30° would eliminate all of the 4/rev pitch moment and drag force vibration, since that phase angle nearly places the ellipse through the origin. However, Figures 57, 58, 60, and 61 indicate that a 5/rev input between 1.0° and 2.0° would be needed to cancel the vibration. The roll force and side force (Figs. 57, 58) appear to require a phase angle of 210° for vibration suppression. However, the 4/rev lift force vibration polar plot (Fig. 60) indicates the best phase angle to be about 0°, while the plot for torque response shown in Figure 61 indicates a phase angle of 180° is best. In conclusion, therefore, it appears that no single 5/rev input would likely be able to alleviate all of the 4/rev hub vibration components.
In the same manner, Figures 62 to 67 indicate that no single 6/rev input can fully eliminate all of the 4/rev hub force and moment vibration. Figures 62 and 65, for pitch moment and drag force, respectively, indicate that a 6/rev input of about 1.5° amplitude introduced at a phase angle between 120° and 130° could eliminate the vibration. However, Figures 63 and 64, for roll moment and side force, respectively, indicate the best input to be a 1.0° of 6/rev input at 280°. Since the phase angle needed to reduce the 4/rev pitch moment and drag force is 160° different than the phase angle needed to reduce the 4/rev roll moment and side force, it is evident that no single 6/rev input will reduce these simultaneously. To make matters worse, Figures 66 and 67 show that the phase angles needed to eliminate the 4/rev lift and torque are 90° and 20°, respectively.
The data taken at Test Condition 1 (43 knots) show that finding an IBC input that can cancel all six components of the 4/rev hub vibration is not always possible for any single IBC harmonic.
Polar Plots of Vibration for Test Condition 4 (127 Knots). Figures 68 to 73 show the effect of 1.0° of 2/rev IBC introduced at Test Condition 4 (127 knots). Seven repeat points have been plotted (as large, solid black dots) to indicate the baseline vibration level. The scatter in these baseline data points show that the data repeatability error is high at this test condition. The plot origins are very close to the baseline data points, indicating that the 4/rev vibration
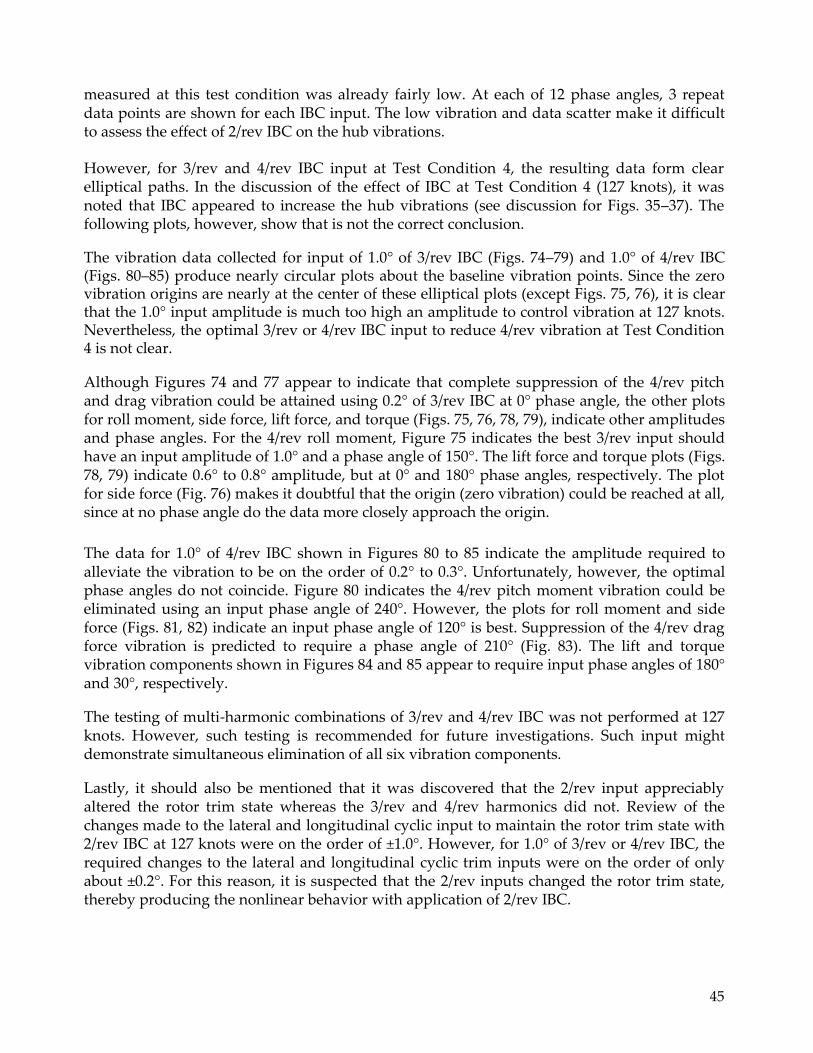
45
measured at this test condition was already fairly low. At each of 12 phase angles, 3 repeat data points are shown for each IBC input. The low vibration and data scatter make it difficult to assess the effect of 2/rev IBC on the hub vibrations. However, for 3/rev and 4/rev IBC input at Test Condition 4, the resulting data form clear elliptical paths. In the discussion of the effect of IBC at Test Condition 4 (127 knots), it was noted that IBC appeared to increase the hub vibrations (see discussion for Figs. 35–37). The following plots, however, show that is not the correct conclusion.
The vibration data collected for input of 1.0° of 3/rev IBC (Figs. 74–79) and 1.0° of 4/rev IBC (Figs. 80–85) produce nearly circular plots about the baseline vibration points. Since the zero vibration origins are nearly at the center of these elliptical plots (except Figs. 75, 76), it is clear that the 1.0° input amplitude is much too high an amplitude to control vibration at 127 knots. Nevertheless, the optimal 3/rev or 4/rev IBC input to reduce 4/rev vibration at Test Condition 4 is not clear.
Although Figures 74 and 77 appear to indicate that complete suppression of the 4/rev pitch and drag vibration could be attained using 0.2° of 3/rev IBC at 0° phase angle, the other plots for roll moment, side force, lift force, and torque (Figs. 75, 76, 78, 79), indicate other amplitudes and phase angles. For the 4/rev roll moment, Figure 75 indicates the best 3/rev input should have an input amplitude of 1.0° and a phase angle of 150°. The lift force and torque plots (Figs. 78, 79) indicate 0.6° to 0.8° amplitude, but at 0° and 180° phase angles, respectively. The plot for side force (Fig. 76) makes it doubtful that the origin (zero vibration) could be reached at all, since at no phase angle do the data more closely approach the origin.
The data for 1.0° of 4/rev IBC shown in Figures 80 to 85 indicate the amplitude required to alleviate the vibration to be on the order of 0.2° to 0.3°. Unfortunately, however, the optimal phase angles do not coincide. Figure 80 indicates the 4/rev pitch moment vibration could be eliminated using an input phase angle of 240°. However, the plots for roll moment and side force (Figs. 81, 82) indicate an input phase angle of 120° is best. Suppression of the 4/rev drag force vibration is predicted to require a phase angle of 210° (Fig. 83). The lift and torque vibration components shown in Figures 84 and 85 appear to require input phase angles of 180° and 30°, respectively.
The testing of multi-harmonic combinations of 3/rev and 4/rev IBC was not performed at 127 knots. However, such testing is recommended for future investigations. Such input might demonstrate simultaneous elimination of all six vibration components.
Lastly, it should also be mentioned that it was discovered that the 2/rev input appreciably altered the rotor trim state whereas the 3/rev and 4/rev harmonics did not. Review of the changes made to the lateral and longitudinal cyclic input to maintain the rotor trim state with 2/rev IBC at 127 knots were on the order of ±1.0°. However, for 1.0° of 3/rev or 4/rev IBC, the required changes to the lateral and longitudinal cyclic trim inputs were on the order of only about ±0.2°. For this reason, it is suspected that the 2/rev inputs changed the rotor trim state, thereby producing the nonlinear behavior with application of 2/rev IBC.
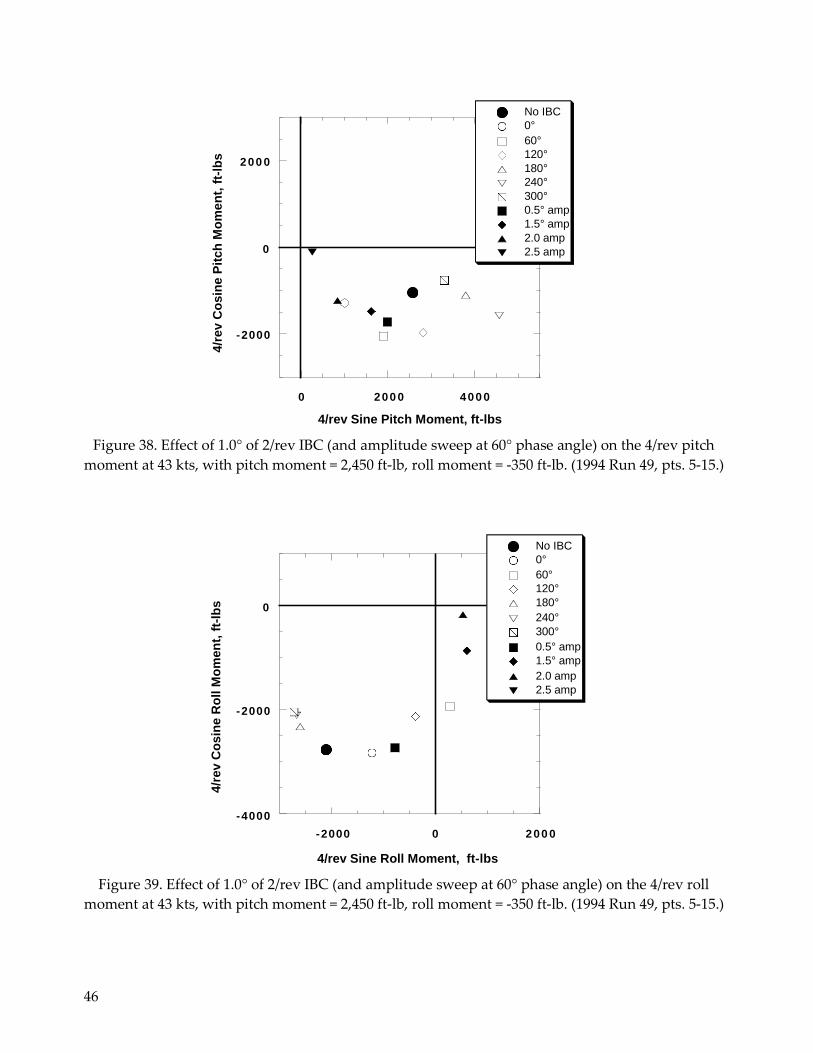
46
200 0
0
-2000
0 200 0 400 0
4/rev Sine Pitch Moment, ft-lbs
Figure 38. Effect of 1.0° of 2/rev IBC (and amplitude sweep at 60° phase angle) on the 4/rev pitch
moment at 43 kts, with pitch moment = 2,450 ft-lb, roll moment = -350 ft-lb. (1994 Run 49, pts. 5-15.)
0
-2000
-4000
-2000 0 200 0
4/rev Sine Roll Moment, ft-lbs
Figure 39. Effect of 1.0° of 2/rev IBC (and amplitude sweep at 60° phase angle) on the 4/rev roll
moment at 43 kts, with pitch moment = 2,450 ft-lb, roll moment = -350 ft-lb. (1994 Run 49, pts. 5-15.)
No IBC
0°
60°
120°
180°
240°
300°
0.5° amp
1.5° amp
2.0 amp
2.5 amp
No IBC
0°
60°
120°
180°
240°
300°
0.5° amp
1.5° amp
2.0 amp
2.5 amp
4/r
ev C
osin
e R
oll M
om
en
t, f
t-lb
s
4/r
ev C
osin
e P
itch
Mo
me
nt,
ft-
lbs
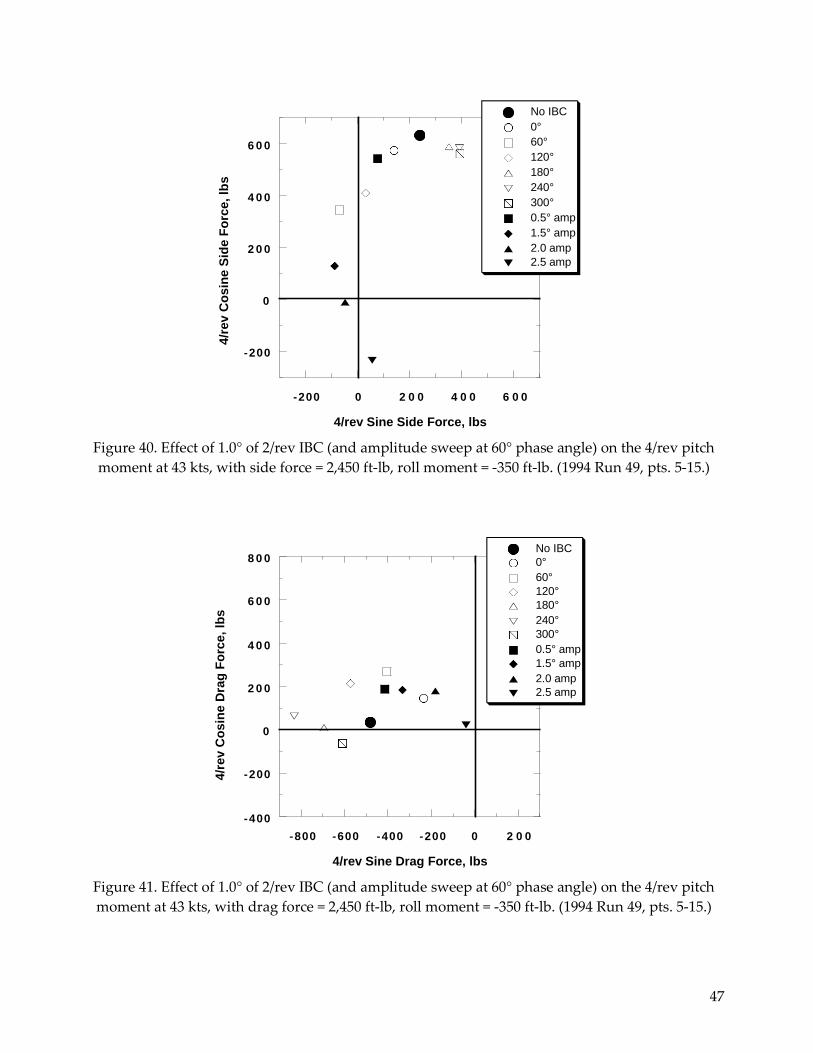
47
6 0 0
4 0 0
2 0 0
0
-200
-200 0 2 0 0 4 0 0 6 0 0
4/rev Sine Side Force, lbs
Figure 40. Effect of 1.0° of 2/rev IBC (and amplitude sweep at 60° phase angle) on the 4/rev pitch
moment at 43 kts, with side force = 2,450 ft-lb, roll moment = -350 ft-lb. (1994 Run 49, pts. 5-15.)
8 0 0
6 0 0
4 0 0
2 0 0
0
-200
-400
-800 -600 -400 -200 0 2 0 0
4/rev Sine Drag Force, lbs
Figure 41. Effect of 1.0° of 2/rev IBC (and amplitude sweep at 60° phase angle) on the 4/rev pitch
moment at 43 kts, with drag force = 2,450 ft-lb, roll moment = -350 ft-lb. (1994 Run 49, pts. 5-15.)
No IBC
0°
60°
120°
180°
240°
300°
0.5° amp
1.5° amp
2.0 amp
2.5 amp
No IBC
0°
60°
120°
180°
240°
300°
0.5° amp
1.5° amp
2.0 amp
2.5 amp
4/r
ev C
osin
e D
rag
Fo
rce, lb
s
4/r
ev C
osin
e S
ide F
orc
e, lb
s
48
6 0 0
4 0 0
2 0 0
0
0 2 0 0 4 0 0 6 0 0
4/rev Sine Lift Force, lbs
Figure 42. Effect of 1.0° of 2/rev IBC (and amplitude sweep at 60° phase angle) on the 4/rev pitch
moment at 43 kts, with lift force = 2,450 ft-lb, roll moment = -350 ft-lb. (1994 Run 49, pts. 5-15.)
0
-400
-800
-1200
0 4 0 0 8 0 0 120 0
4/rev Sine Torque, ft-lbs
Figure 43. Effect of 1.0° of 2/rev IBC (and amplitude sweep at 60° phase angle) on the 4/rev pitch
moment at 43 kts, with torque = 2,450 ft-lb, roll moment = –350 ft-lb. (1994 Run 49, pts. 5-15.)
No IBC 0° 60° 120°
180° 240° 300° 0.5° amp 1.5° amp
2.0 amp 2.5 amp
No IBC
0°
60°
120°
180°
240°
300°
0.5° amp
1.5° amp
2.0 amp
2.5 amp
4/r
ev C
osin
e L
ift
Fo
rce, lb
s
4/r
ev C
osin
e T
orq
ue,
ft-l
bs
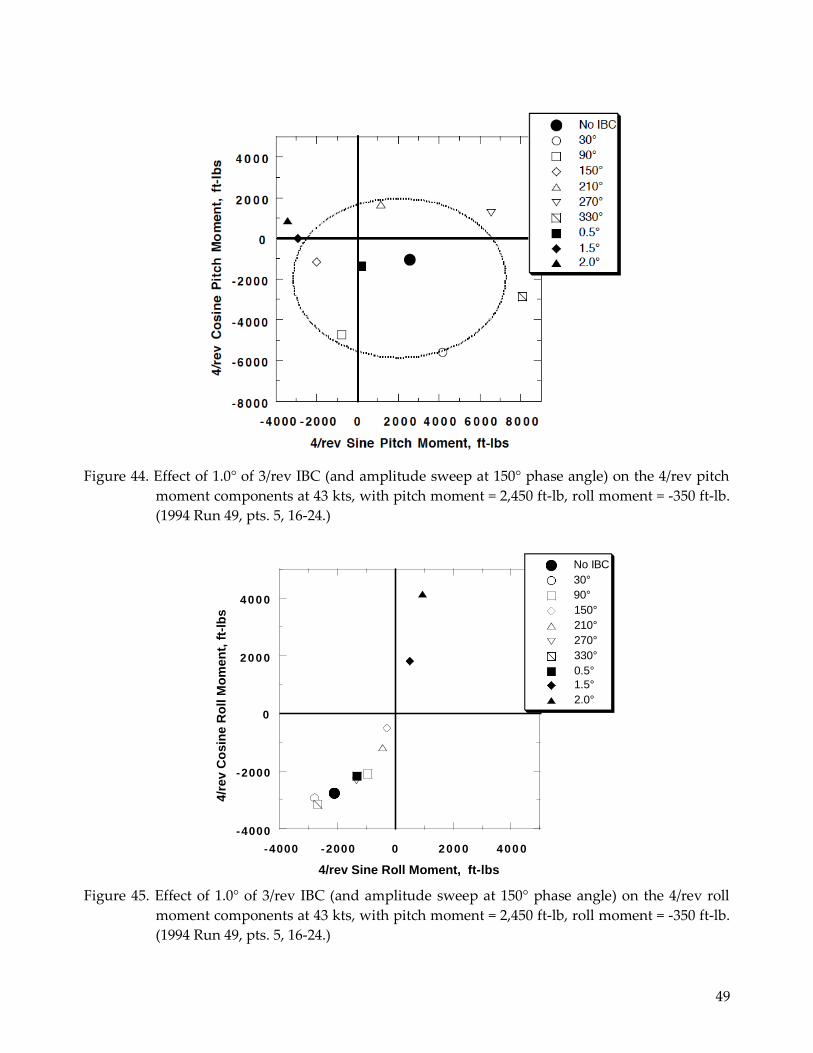
49
Figure 44. Effect of 1.0° of 3/rev IBC (and amplitude sweep at 150° phase angle) on the 4/rev pitch
moment components at 43 kts, with pitch moment = 2,450 ft-lb, roll moment = -350 ft-lb.
(1994 Run 49, pts. 5, 16-24.)
400 0
200 0
0
-2000
-4000
-4000 -2000 0 200 0 400 0
4/rev Sine Roll Moment, ft-lbs
Figure 45. Effect of 1.0° of 3/rev IBC (and amplitude sweep at 150° phase angle) on the 4/rev roll
moment components at 43 kts, with pitch moment = 2,450 ft-lb, roll moment = -350 ft-lb.
(1994 Run 49, pts. 5, 16-24.)
No IBC
30°
90°
150°
210°
270°
330°
0.5°
1.5°
2.0°
4/r
ev C
osin
e R
oll M
om
en
t, f
t-lb
s
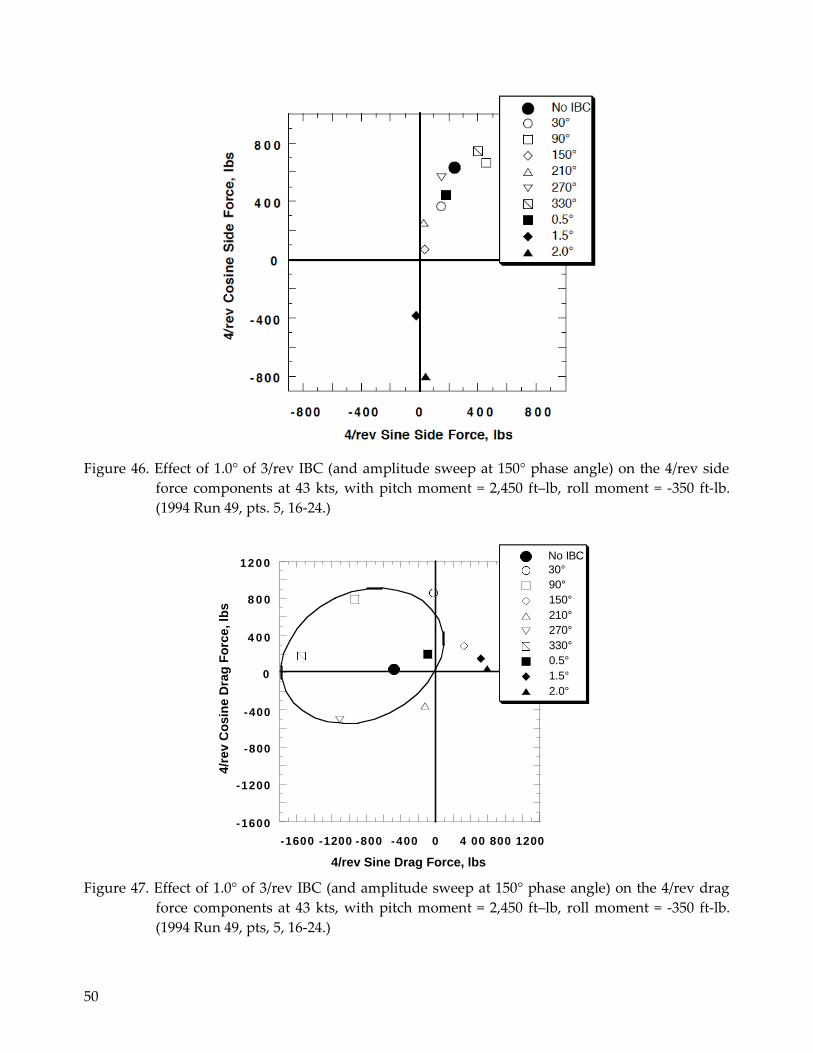
50
Figure 46. Effect of 1.0° of 3/rev IBC (and amplitude sweep at 150° phase angle) on the 4/rev side
force components at 43 kts, with pitch moment = 2,450 ft–lb, roll moment = -350 ft-lb.
(1994 Run 49, pts. 5, 16-24.)
120 0
8 0 0
4 0 0
0
-400
-800
-1200
-1600
-1600 -1200 -800 -400 0 4 00 800 1200
4/rev Sine Drag Force, lbs
Figure 47. Effect of 1.0° of 3/rev IBC (and amplitude sweep at 150° phase angle) on the 4/rev drag
force components at 43 kts, with pitch moment = 2,450 ft–lb, roll moment = -350 ft-lb.
(1994 Run 49, pts, 5, 16-24.)
No IBC
30°
90°
150°
210°
270°
330°
0.5°
1.5°
2.0°
4/r
ev C
osin
e D
rag
Fo
rce, lb
s
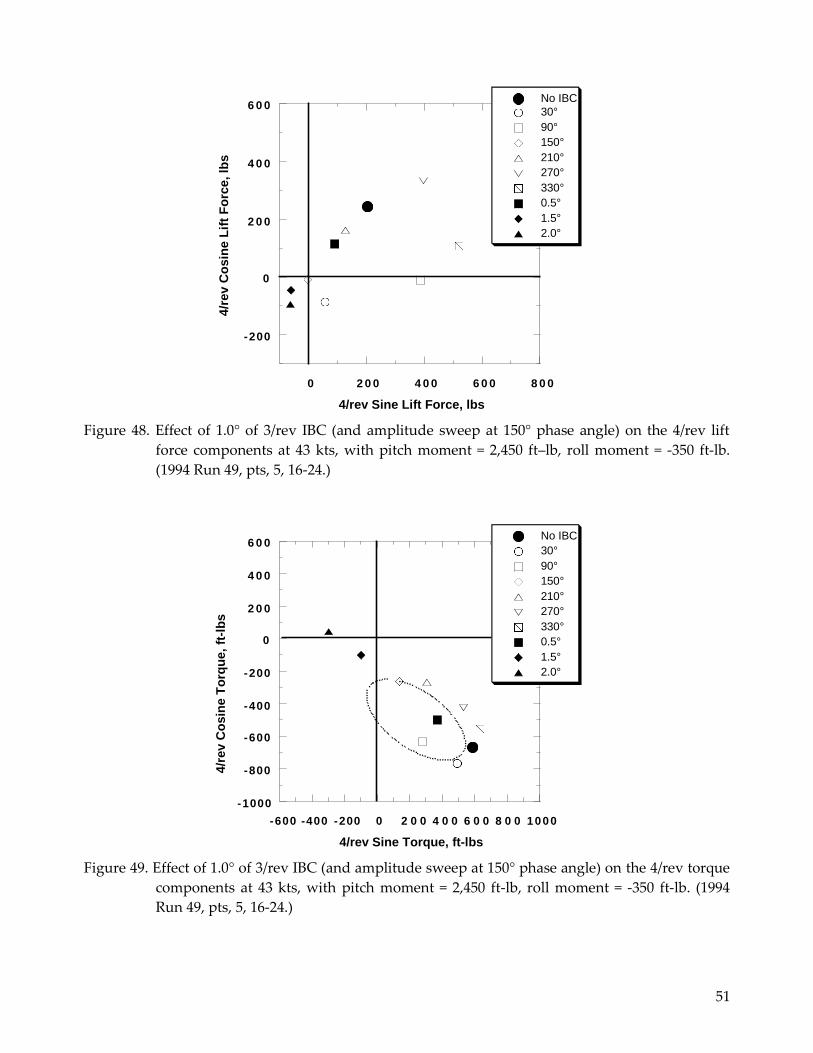
51
6 0 0
4 0 0
2 0 0
0
-200
0 2 0 0 4 0 0 6 0 0 8 0 0
4/rev Sine Lift Force, lbs
Figure 48. Effect of 1.0° of 3/rev IBC (and amplitude sweep at 150° phase angle) on the 4/rev lift
force components at 43 kts, with pitch moment = 2,450 ft–lb, roll moment = -350 ft-lb.
(1994 Run 49, pts, 5, 16-24.)
6 0 0
4 0 0
2 0 0
0
-200
-400
-600
-800
-1000
-600 -400 -200 0 2 0 0 4 0 0 6 0 0 8 0 0 1000
4/rev Sine Torque, ft-lbs
Figure 49. Effect of 1.0° of 3/rev IBC (and amplitude sweep at 150° phase angle) on the 4/rev torque
components at 43 kts, with pitch moment = 2,450 ft-lb, roll moment = -350 ft-lb. (1994
Run 49, pts, 5, 16-24.)
No IBC
30°
90°
150°
210°
270°
330°
0.5°
1.5°
2.0°
No IBC
30°
90°
150°
210°
270°
330°
0.5°
1.5°
2.0°
4/r
ev C
osin
e T
orq
ue,
ft-l
bs
4/r
ev C
osin
e L
ift
Fo
rce, lb
s
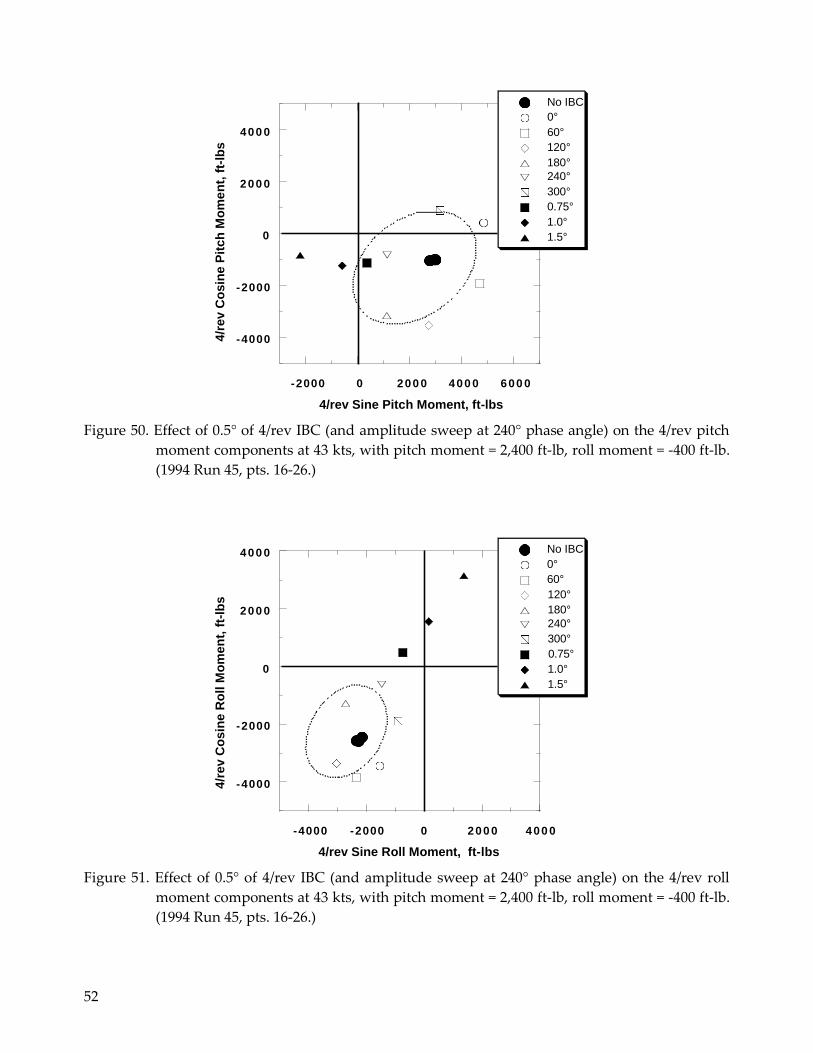
52
400 0
200 0
0
-2000
-4000
-2000 0 200 0 400 0 600 0
4/rev Sine Pitch Moment, ft-lbs
Figure 50. Effect of 0.5° of 4/rev IBC (and amplitude sweep at 240° phase angle) on the 4/rev pitch
moment components at 43 kts, with pitch moment = 2,400 ft-lb, roll moment = -400 ft-lb.
(1994 Run 45, pts. 16-26.)
400 0
200 0
0
-2000
-4000
-4000 -2000 0 200 0 400 0
4/rev Sine Roll Moment, ft-lbs
Figure 51. Effect of 0.5° of 4/rev IBC (and amplitude sweep at 240° phase angle) on the 4/rev roll
moment components at 43 kts, with pitch moment = 2,400 ft-lb, roll moment = -400 ft-lb.
(1994 Run 45, pts. 16-26.)
No IBC
0°
60°
120°
180°
240°
300°
0.75°
1.0°
1.5°
No IBC
0°
60°
120°
180°
240°
300°
0.75°
1.0°
1.5°
4/r
ev C
osin
e R
oll M
om
en
t, f
t-lb
s
4/r
ev C
osin
e P
itch
Mo
me
nt,
ft-
lbs
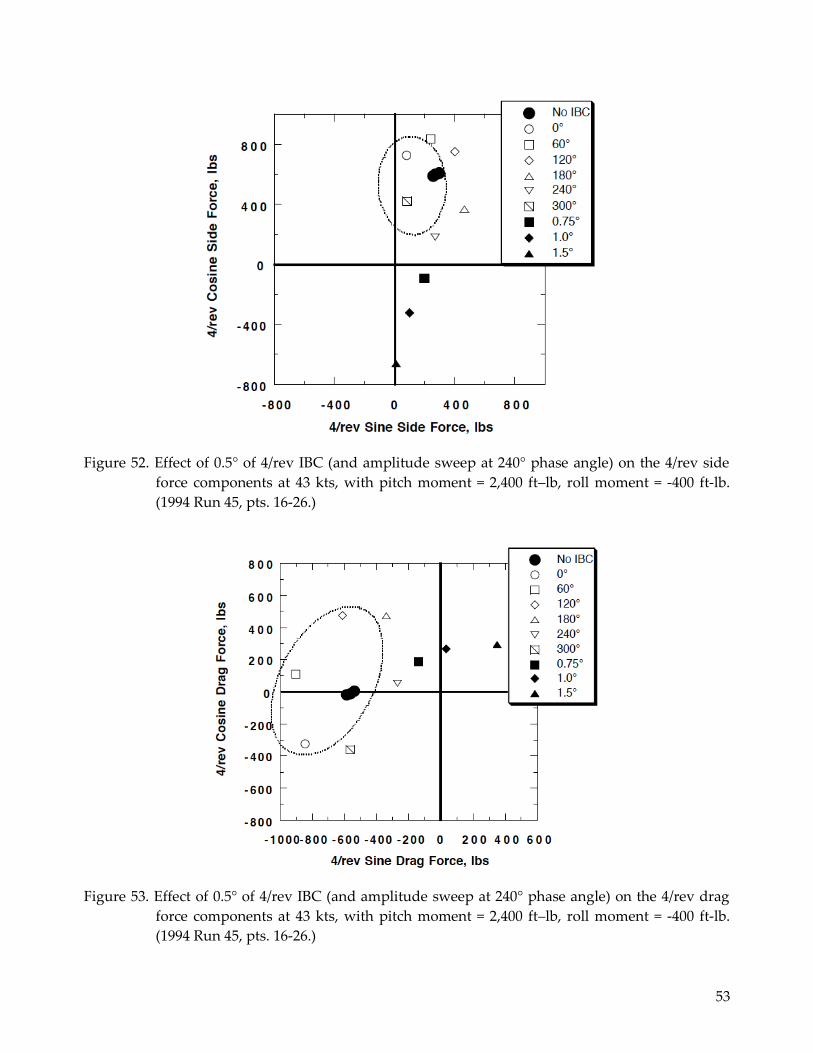
53
Figure 52. Effect of 0.5° of 4/rev IBC (and amplitude sweep at 240° phase angle) on the 4/rev side
force components at 43 kts, with pitch moment = 2,400 ft–lb, roll moment = -400 ft-lb.
(1994 Run 45, pts. 16-26.)
Figure 53. Effect of 0.5° of 4/rev IBC (and amplitude sweep at 240° phase angle) on the 4/rev drag
force components at 43 kts, with pitch moment = 2,400 ft–lb, roll moment = -400 ft-lb.
(1994 Run 45, pts. 16-26.)
4/r
ev C
osin
e D
rag
Fo
rce, lb
s
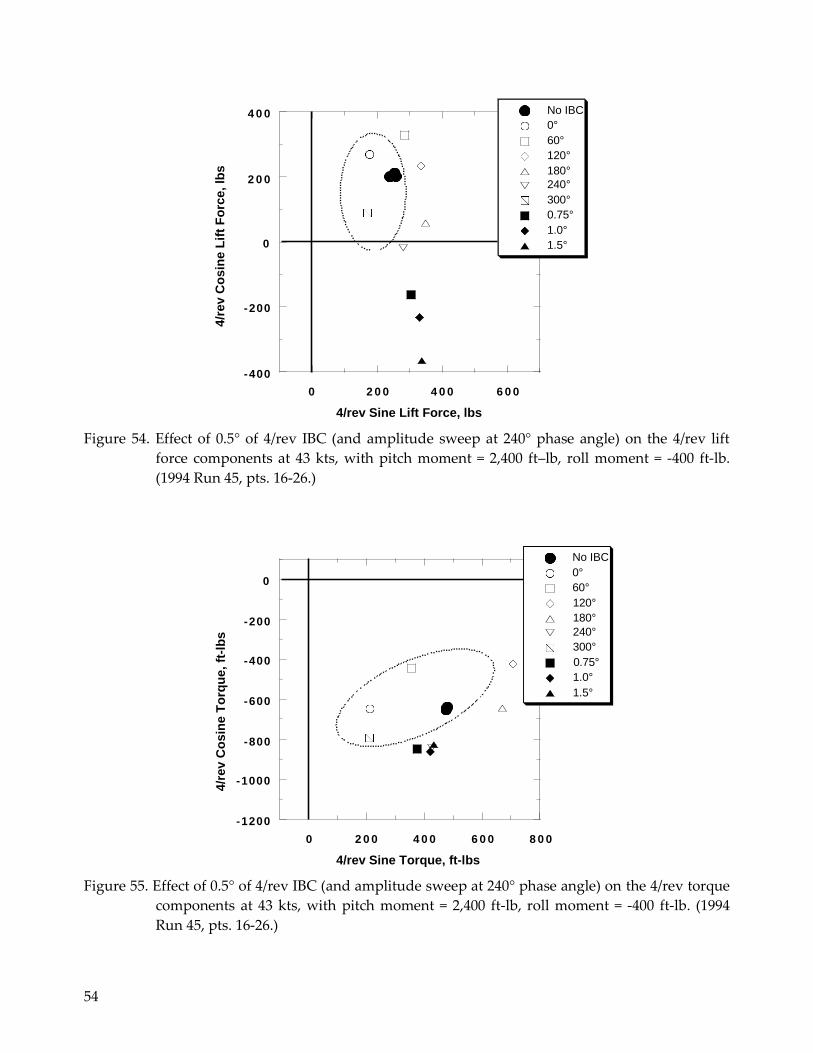
54
4 0 0
2 0 0
0
-200
-400
0 2 0 0 4 0 0 6 0 0
4/rev Sine Lift Force, lbs
Figure 54. Effect of 0.5° of 4/rev IBC (and amplitude sweep at 240° phase angle) on the 4/rev lift
force components at 43 kts, with pitch moment = 2,400 ft–lb, roll moment = -400 ft-lb.
(1994 Run 45, pts. 16-26.)
0
-200
-400
-600
-800
-1000
-1200
0 2 0 0 4 0 0 6 0 0 8 0 0
4/rev Sine Torque, ft-lbs
Figure 55. Effect of 0.5° of 4/rev IBC (and amplitude sweep at 240° phase angle) on the 4/rev torque
components at 43 kts, with pitch moment = 2,400 ft-lb, roll moment = -400 ft-lb. (1994
Run 45, pts. 16-26.)
No IBC
0°
60°
120°
180°
240°
300°
0.75°
1.0°
1.5°
No IBC
0°
60°
120°
180°
240°
300°
0.75°
1.0°
1.5°
4/r
ev C
osin
e L
ift
Fo
rce, lb
s
4/r
ev C
osin
e T
orq
ue,
ft-l
bs
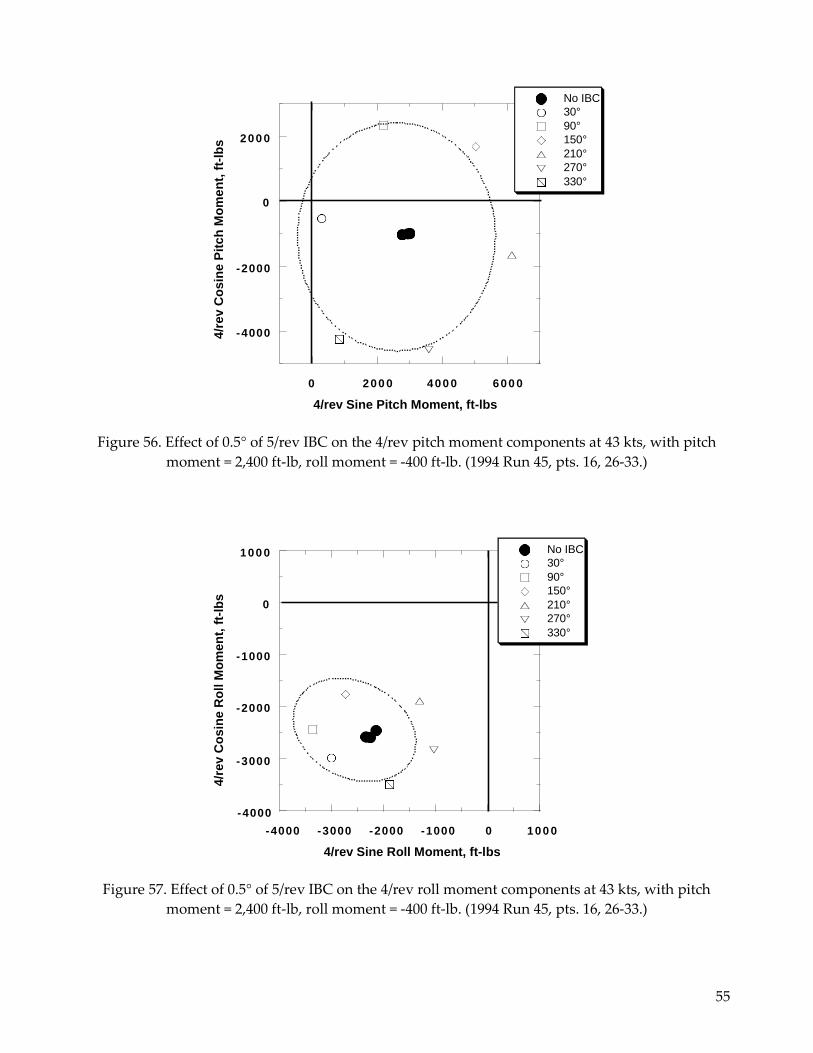
55
200 0
0
-2000
-4000
0 200 0 400 0 600 0
4/rev Sine Pitch Moment, ft-lbs
Figure 56. Effect of 0.5° of 5/rev IBC on the 4/rev pitch moment components at 43 kts, with pitch
moment = 2,400 ft-lb, roll moment = -400 ft-lb. (1994 Run 45, pts. 16, 26-33.)
100 0
0
-1000
-2000
-3000
-4000
-4000 -3000 -2000 -1000 0 100 0
4/rev Sine Roll Moment, ft-lbs
Figure 57. Effect of 0.5° of 5/rev IBC on the 4/rev roll moment components at 43 kts, with pitch
moment = 2,400 ft-lb, roll moment = -400 ft-lb. (1994 Run 45, pts. 16, 26-33.)
No IBC
30°
90°
150°
210°
270°
330°
No IBC
30°
90°
150°
210°
270°
330°
4/r
ev C
osin
e R
oll M
om
en
t, f
t-lb
s
4/r
ev C
osin
e P
itch
Mo
me
nt,
ft-
lbs
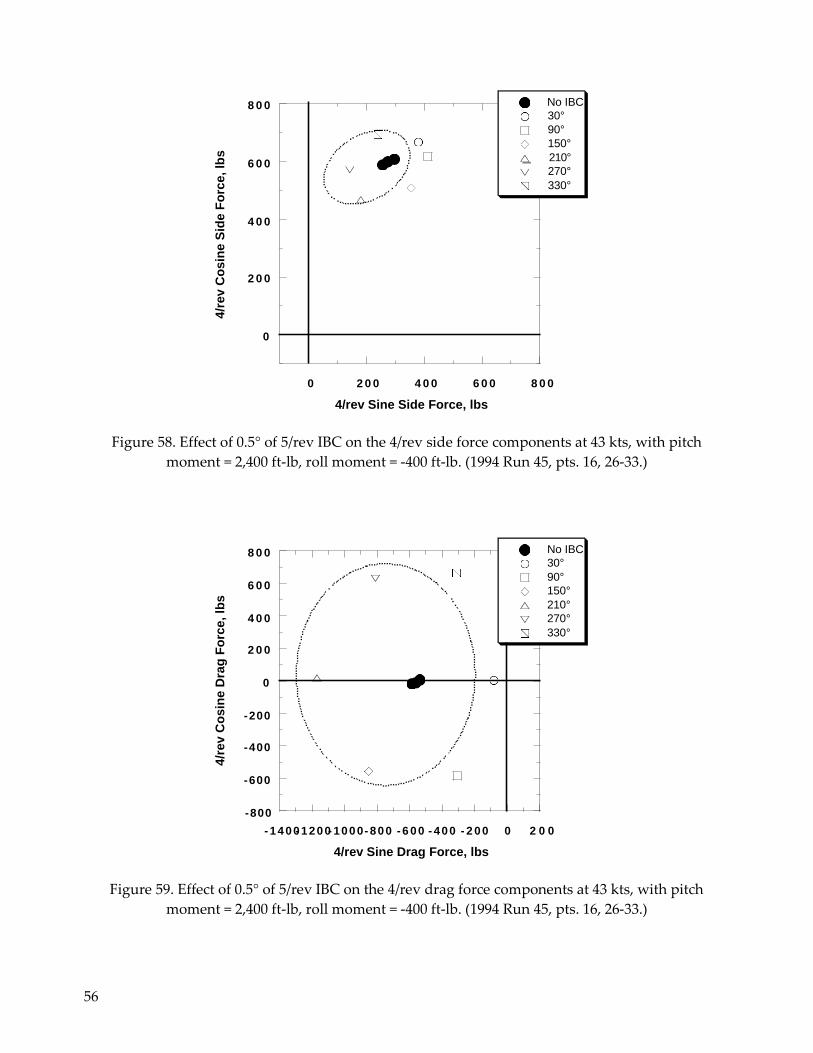
56
8 0 0
6 0 0
4 0 0
2 0 0
0
0 2 0 0 4 0 0 6 0 0 8 0 0
4/rev Sine Side Force, lbs
Figure 58. Effect of 0.5° of 5/rev IBC on the 4/rev side force components at 43 kts, with pitch
moment = 2,400 ft-lb, roll moment = -400 ft-lb. (1994 Run 45, pts. 16, 26-33.)
8 0 0
6 0 0
4 0 0
2 0 0
0
-200
-400
-600
-800
- 140 0- 120 0- 1000 - 800 - 6 00 - 400 - 2 00 0 2 0 0
4/rev Sine Drag Force, lbs
Figure 59. Effect of 0.5° of 5/rev IBC on the 4/rev drag force components at 43 kts, with pitch
moment = 2,400 ft-lb, roll moment = -400 ft-lb. (1994 Run 45, pts. 16, 26-33.)
No IBC
30°
90°
150°
210°
270°
330°
No IBC
30°
90°
150°
210°
270°
330°
4/r
ev C
osin
e D
rag
Fo
rce, lb
s
4/r
ev C
osin
e S
ide F
orc
e, lb
s
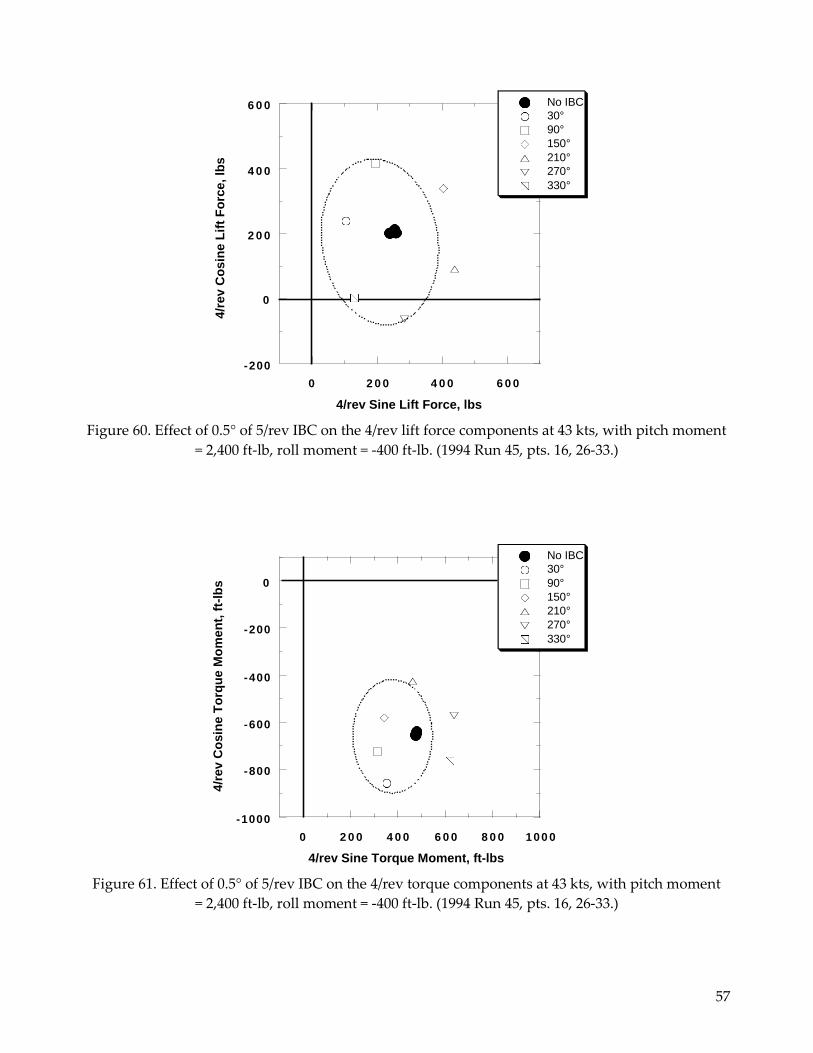
57
6 0 0
4 0 0
2 0 0
0
-200
0 2 0 0 4 0 0 6 0 0
4/rev Sine Lift Force, lbs
Figure 60. Effect of 0.5° of 5/rev IBC on the 4/rev lift force components at 43 kts, with pitch moment
= 2,400 ft-lb, roll moment = -400 ft-lb. (1994 Run 45, pts. 16, 26-33.)
0
-200
-400
-600
-800
-1000
0 2 0 0 4 0 0 6 0 0 8 0 0 100 0
4/rev Sine Torque Moment, ft-lbs
Figure 61. Effect of 0.5° of 5/rev IBC on the 4/rev torque components at 43 kts, with pitch moment
= 2,400 ft-lb, roll moment = -400 ft-lb. (1994 Run 45, pts. 16, 26-33.)
No IBC
30°
90°
150°
210°
270°
330°
No IBC
30°
90°
150°
210°
270°
330°
4/r
ev C
osin
e T
orq
ue M
om
en
t, f
t-lb
s
4/r
ev C
osin
e L
ift
Fo
rce, lb
s
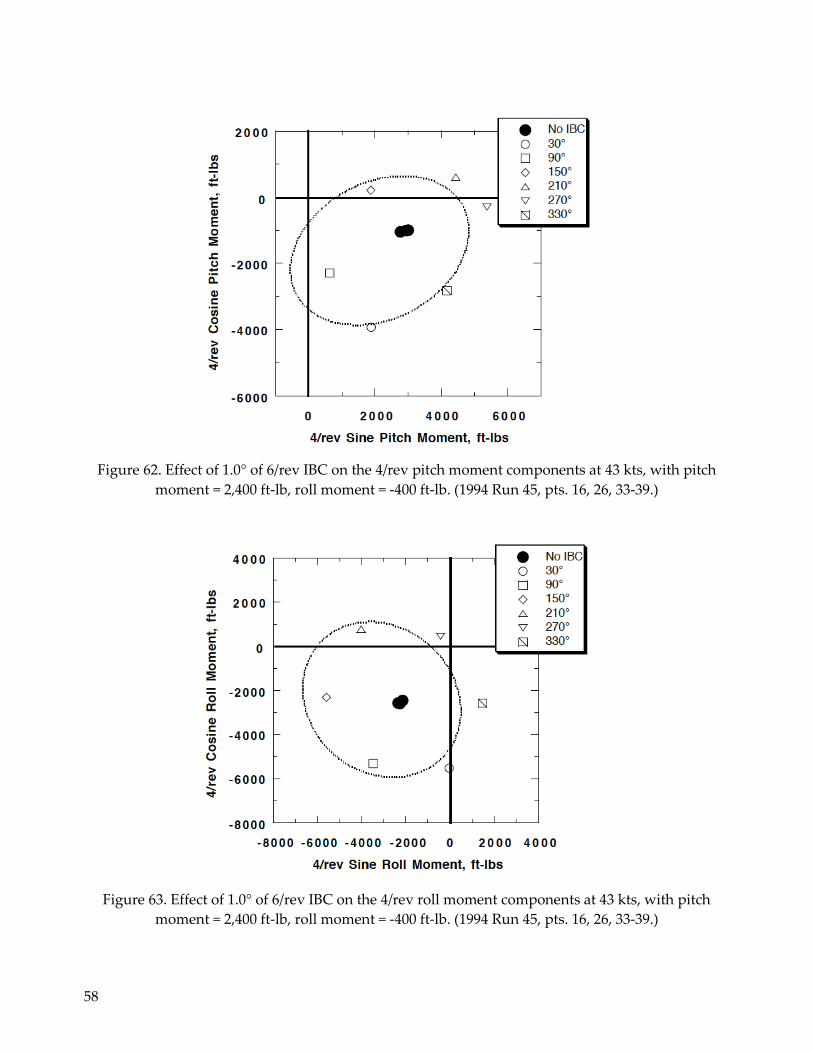
58
Figure 62. Effect of 1.0° of 6/rev IBC on the 4/rev pitch moment components at 43 kts, with pitch
moment = 2,400 ft-lb, roll moment = -400 ft-lb. (1994 Run 45, pts. 16, 26, 33-39.)
Figure 63. Effect of 1.0° of 6/rev IBC on the 4/rev roll moment components at 43 kts, with pitch
moment = 2,400 ft-lb, roll moment = -400 ft-lb. (1994 Run 45, pts. 16, 26, 33-39.)
4/r
ev C
osin
e R
oll M
om
en
t, f
t-lb
s
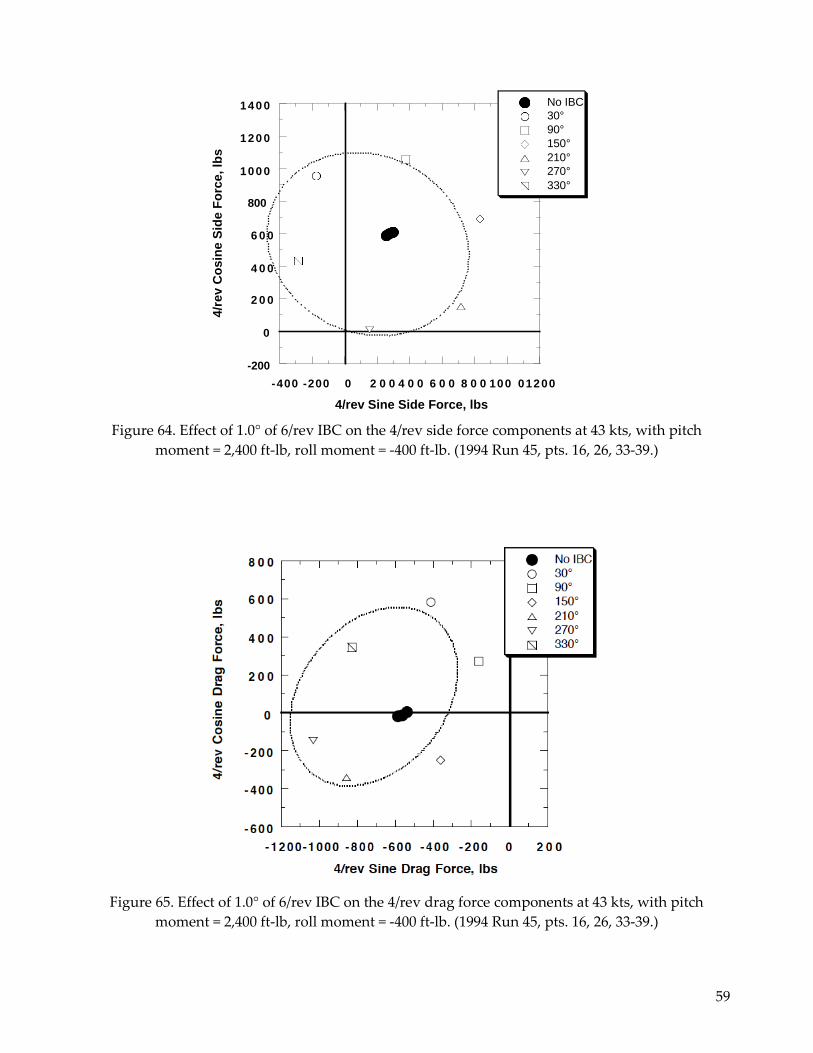
59
140 0
120 0
100 0
No IBC
30°
90°
150°
210°
270°
330°
800
6 0 0
4 0 0
2 0 0
0
-200
-400 -200 0 2 0 0 4 0 0 6 0 0 8 0 0 100 01200
4/rev Sine Side Force, lbs
Figure 64. Effect of 1.0° of 6/rev IBC on the 4/rev side force components at 43 kts, with pitch
moment = 2,400 ft-lb, roll moment = -400 ft-lb. (1994 Run 45, pts. 16, 26, 33-39.)
Figure 65. Effect of 1.0° of 6/rev IBC on the 4/rev drag force components at 43 kts, with pitch
moment = 2,400 ft-lb, roll moment = -400 ft-lb. (1994 Run 45, pts. 16, 26, 33-39.)
4/r
ev C
osin
e S
ide F
orc
e, lb
s

60
Figure 66. Effect of 1.0° of 6/rev IBC on the 4/rev lift force components at 43 kts, with pitch moment
= 2,400 ft-lb, roll moment = -400 ft-lb. (1994 Run 45, pts. 16, 26, 33-39.)
Figure 67. Effect of 1.0° of 6/rev IBC on the 4/rev torque components at 43 kts, with pitch moment
= 2,400 ft-lb, roll moment = -400 ft-lb. (1994 Run 45, pts. 16, 26, 33-39.)

61
Figure 68. Effect of 1.0° of 2/rev IBC on the 4/rev pitch moment components at 127 kts, with pitch
moment = 1,650 ft-lb, roll moment = -900 ft-lb. (1994 Run 26, pts. 7-50.)
100 0
0
-1000
-2000
-1000 0 100 0 200 0
4/rev Sine Roll Moment, ft-lbs
Figure 69. Effect of 1.0° of 2/rev IBC on the 4/rev roll moment components at 127 kts, with pitch
moment = 1,650 ft-lb, roll moment = -900 ft-lb. (1994 Run 26, pts. 7-50.)
No IBC
0°
30°
60°
90°
120°
150°
180°
210°
240°
270°
300°
330°
4/r
ev C
osin
e R
oll M
om
en
t, f
t-lb
s

62
4 0 0
3 0 0
2 0 0
1 0 0
0
-100
-200
-300
-400 -300 -200 -100 0 1 0 0 2 0 0 3 0 0
4/rev Sine Side Force, lbs
Figure 70. Effect of 1.0° of 2/rev IBC on the 4/rev side force components at 127 kts, with pitch
moment = 1,650 ft-lb, roll moment = -900 ft-lb. (1994 Run 26, pts. 7-50.)
4 0 0
2 0 0
0
-200
-400
-600
-400 -200 0 2 0 0 4 0 0 6 0 0
4/rev Sine Drag Force, lbs
Figure 71. Effect of 1.0° of 2/rev IBC on the 4/rev drag force components at 127 kts, with pitch
moment = 1,650 ft-lb, roll moment = -900 ft-lb. (1994 Run 26, pts. 7-50.)
No IBC
0°
30°
60°
90°
120°
150°
180°
210°
240°
270°
300°
330°
No IBC
0°
30°
60°
90°
120°
150°
180°
210°
240°
270°
300°
330°
4/r
ev C
osin
e D
rag
Fo
rce, lb
s
4/r
ev C
osin
e S
ide F
orc
e, lb
s
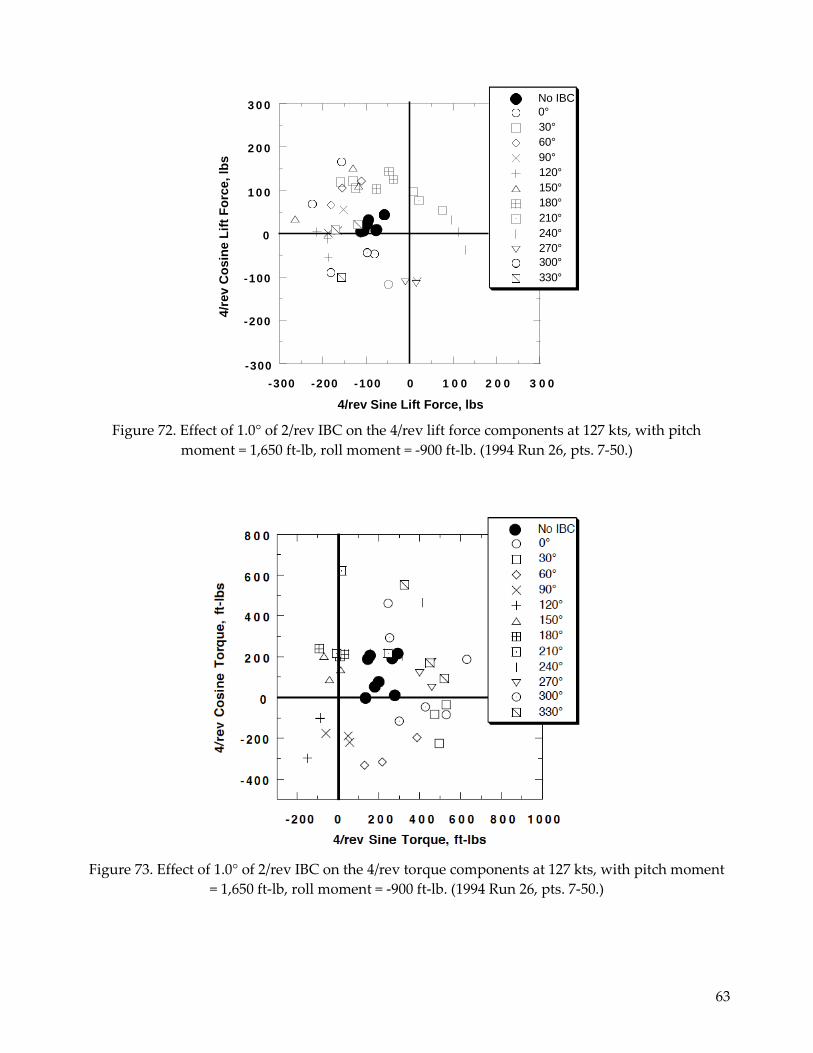
63
3 0 0
2 0 0
1 0 0
0
-100
-200
-300
-300 -200 -100 0 1 0 0 2 0 0 3 0 0
4/rev Sine Lift Force, lbs
Figure 72. Effect of 1.0° of 2/rev IBC on the 4/rev lift force components at 127 kts, with pitch
moment = 1,650 ft-lb, roll moment = -900 ft-lb. (1994 Run 26, pts. 7-50.)
Figure 73. Effect of 1.0° of 2/rev IBC on the 4/rev torque components at 127 kts, with pitch moment
= 1,650 ft-lb, roll moment = -900 ft-lb. (1994 Run 26, pts. 7-50.)
No IBC
0°
30°
60°
90°
120°
150°
180°
210°
240°
270°
300°
330°
4/r
ev C
osin
e T
orq
ue,
ft-l
bs
4/r
ev C
osin
e L
ift
Fo
rce, lb
s
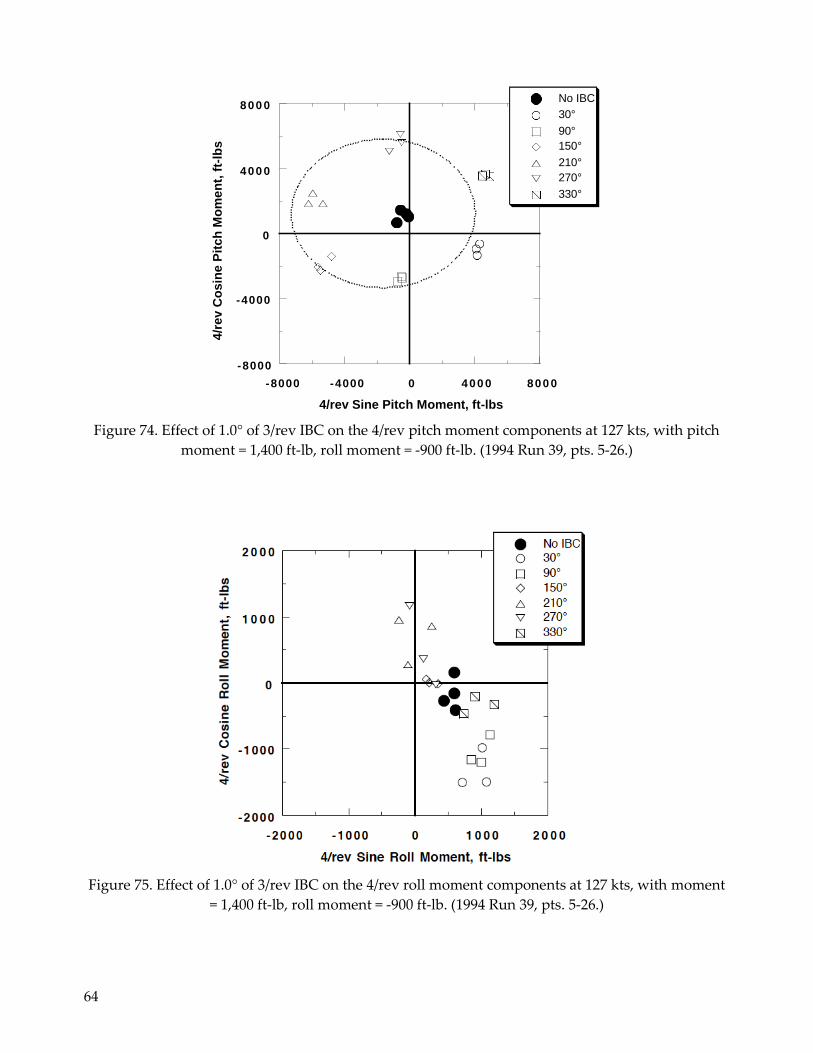
64
800 0
400 0
0
-4000
-8000
-8000 -4000 0 400 0 800 0
4/rev Sine Pitch Moment, ft-lbs
Figure 74. Effect of 1.0° of 3/rev IBC on the 4/rev pitch moment components at 127 kts, with pitch
moment = 1,400 ft-lb, roll moment = -900 ft-lb. (1994 Run 39, pts. 5-26.)
Figure 75. Effect of 1.0° of 3/rev IBC on the 4/rev roll moment components at 127 kts, with moment
= 1,400 ft-lb, roll moment = -900 ft-lb. (1994 Run 39, pts. 5-26.)
No IBC
30°
90°
150°
210°
270°
330°
4/r
ev C
osin
e P
itch
Mo
me
nt,
ft-
lbs
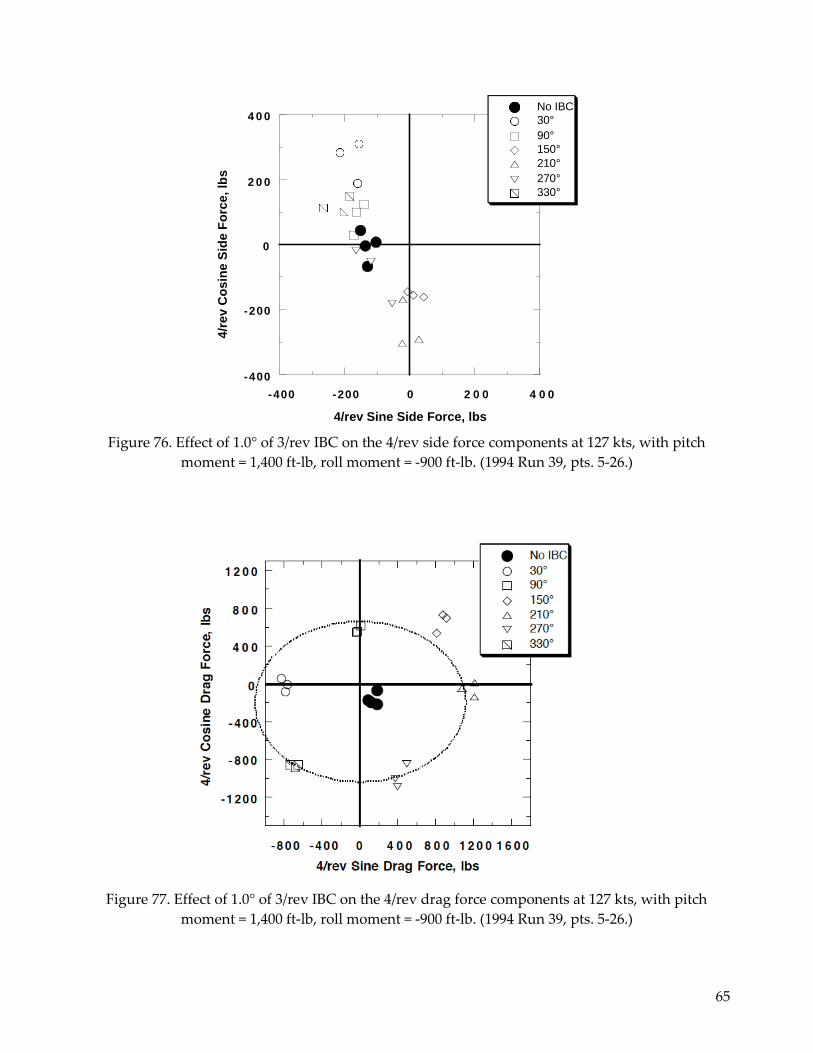
65
4 0 0
2 0 0
0
-200
-400
-400 -200 0 2 0 0 4 0 0
4/rev Sine Side Force, lbs
Figure 76. Effect of 1.0° of 3/rev IBC on the 4/rev side force components at 127 kts, with pitch
moment = 1,400 ft-lb, roll moment = -900 ft-lb. (1994 Run 39, pts. 5-26.)
Figure 77. Effect of 1.0° of 3/rev IBC on the 4/rev drag force components at 127 kts, with pitch
moment = 1,400 ft-lb, roll moment = -900 ft-lb. (1994 Run 39, pts. 5-26.)
No IBC
30°
90°
150°
210°
270°
330°
4/r
ev C
osin
e S
ide F
orc
e, lb
s
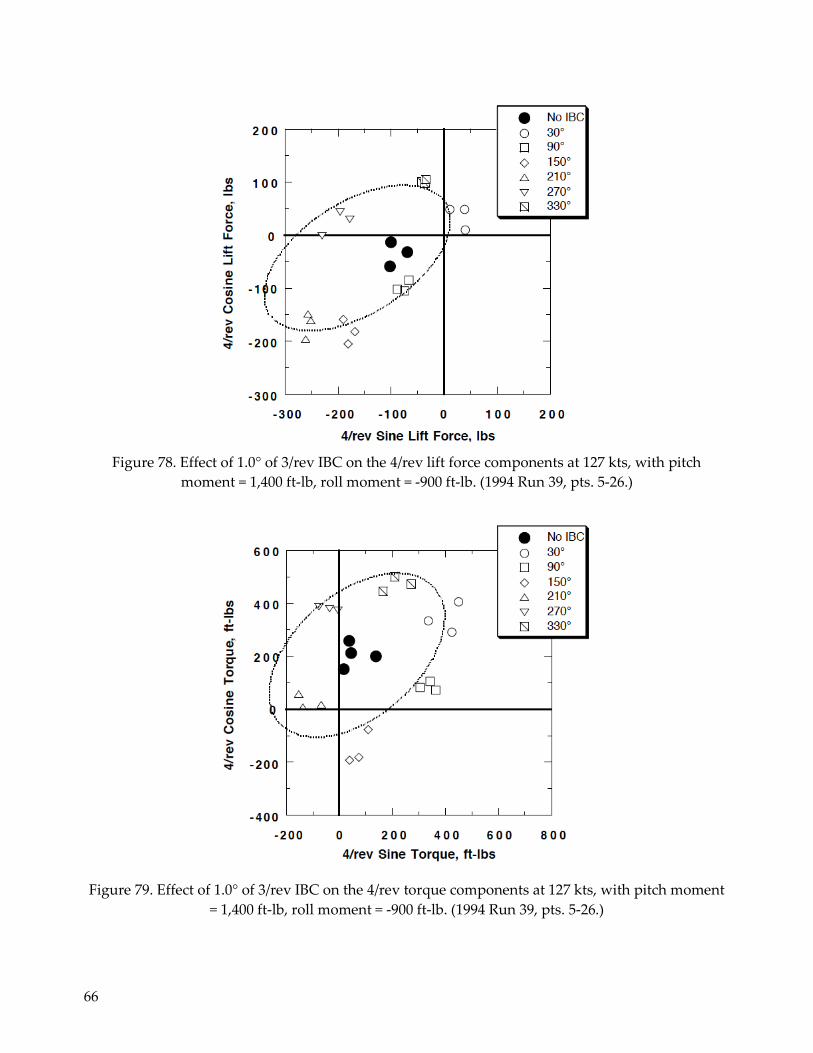
66
Figure 78. Effect of 1.0° of 3/rev IBC on the 4/rev lift force components at 127 kts, with pitch
moment = 1,400 ft-lb, roll moment = -900 ft-lb. (1994 Run 39, pts. 5-26.)
Figure 79. Effect of 1.0° of 3/rev IBC on the 4/rev torque components at 127 kts, with pitch moment
= 1,400 ft-lb, roll moment = -900 ft-lb. (1994 Run 39, pts. 5-26.)
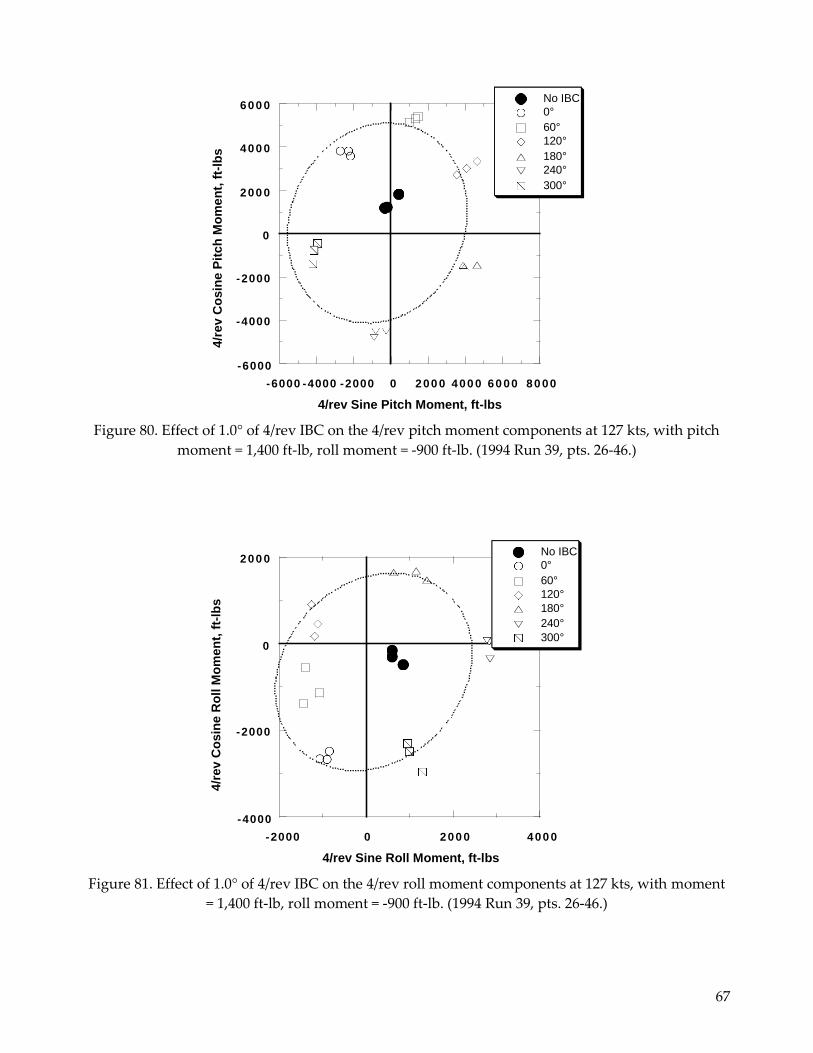
67
600 0
400 0
200 0
0
-2000
-4000
-6000
-6000 -4000 -2000 0 200 0 400 0 60 00 80 00
4/rev Sine Pitch Moment, ft-lbs
Figure 80. Effect of 1.0° of 4/rev IBC on the 4/rev pitch moment components at 127 kts, with pitch
moment = 1,400 ft-lb, roll moment = -900 ft-lb. (1994 Run 39, pts. 26-46.)
200 0
0
-2000
-4000
-2000 0 200 0 400 0
4/rev Sine Roll Moment, ft-lbs
Figure 81. Effect of 1.0° of 4/rev IBC on the 4/rev roll moment components at 127 kts, with moment
= 1,400 ft-lb, roll moment = -900 ft-lb. (1994 Run 39, pts. 26-46.)
No IBC
0°
60°
120°
180°
240°
300°
No IBC
0°
60°
120°
180°
240°
300°
4/r
ev C
osin
e R
oll M
om
en
t, f
t-lb
s
4/r
ev C
osin
e P
itch
Mo
me
nt,
ft-
lbs
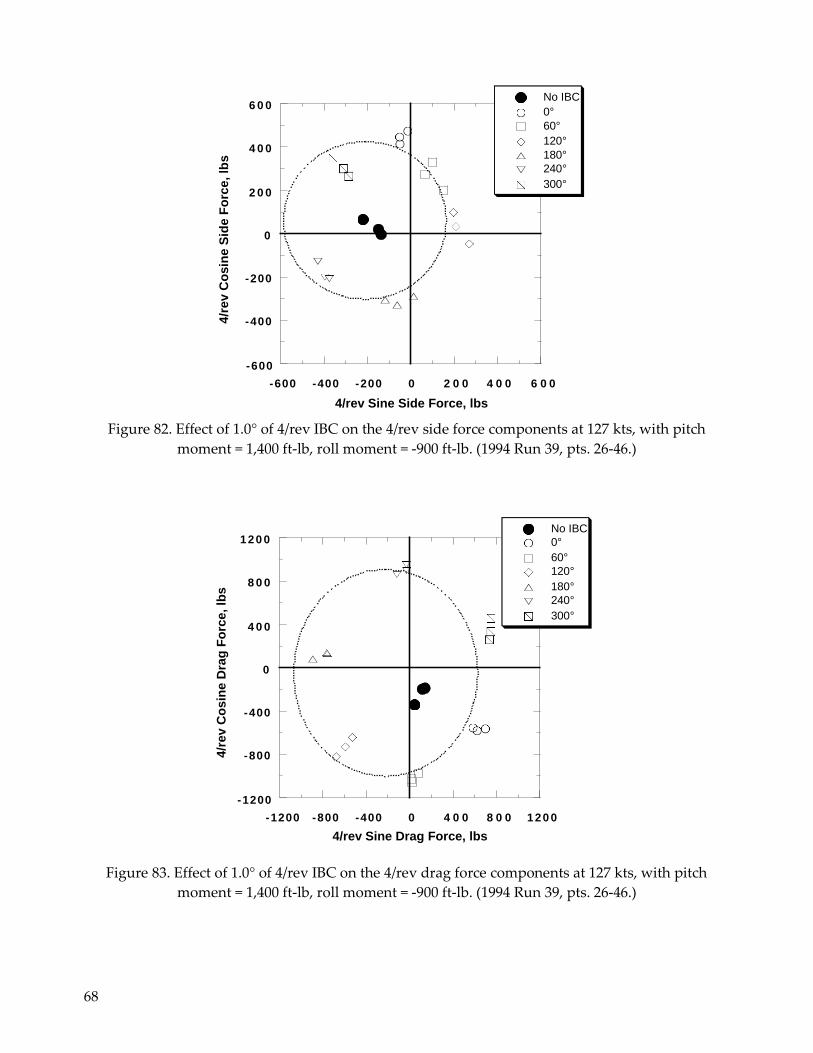
68
6 0 0
4 0 0
2 0 0
0
-200
-400
-600
-600 -400 -200 0 2 0 0 4 0 0 6 0 0
4/rev Sine Side Force, lbs
Figure 82. Effect of 1.0° of 4/rev IBC on the 4/rev side force components at 127 kts, with pitch
moment = 1,400 ft-lb, roll moment = -900 ft-lb. (1994 Run 39, pts. 26-46.)
120 0
8 0 0
4 0 0
0
-400
-800
-1200
-1200 -800 -400 0 4 0 0 8 0 0 120 0
4/rev Sine Drag Force, lbs
Figure 83. Effect of 1.0° of 4/rev IBC on the 4/rev drag force components at 127 kts, with pitch
moment = 1,400 ft-lb, roll moment = -900 ft-lb. (1994 Run 39, pts. 26-46.)
No IBC
0°
60°
120°
180°
240°
300°
No IBC
0°
60°
120°
180°
240°
300°
4/r
ev C
osin
e D
rag
Fo
rce, lb
s
4/r
ev C
osin
e S
ide F
orc
e, lb
s
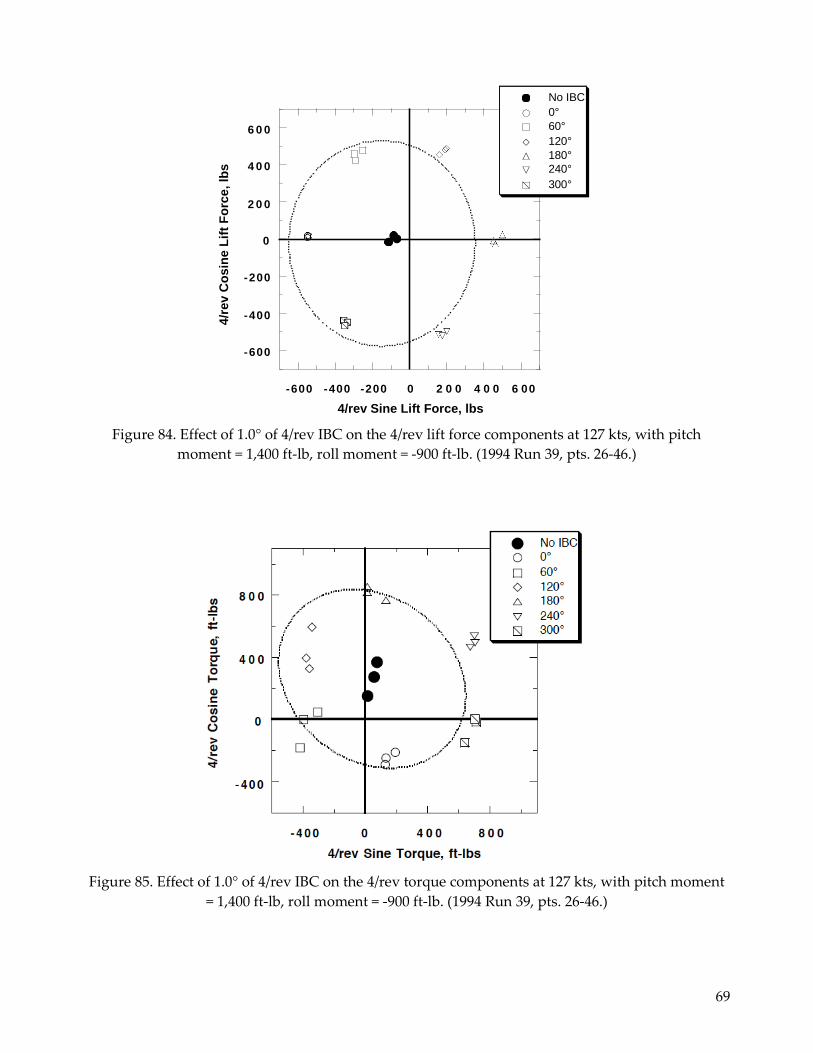
69
6 0 0
4 0 0
2 0 0
0
-200
-400
-600
-600 -400 -200 0 2 0 0 4 0 0 6 0 0
4/rev Sine Lift Force, lbs
Figure 84. Effect of 1.0° of 4/rev IBC on the 4/rev lift force components at 127 kts, with pitch
moment = 1,400 ft-lb, roll moment = -900 ft-lb. (1994 Run 39, pts. 26-46.)
Figure 85. Effect of 1.0° of 4/rev IBC on the 4/rev torque components at 127 kts, with pitch moment
= 1,400 ft-lb, roll moment = -900 ft-lb. (1994 Run 39, pts. 26-46.)
No IBC
0°
60°
120°
180°
240°
300°
4/r
ev C
osin
e L
ift
Fo
rce, lb
s
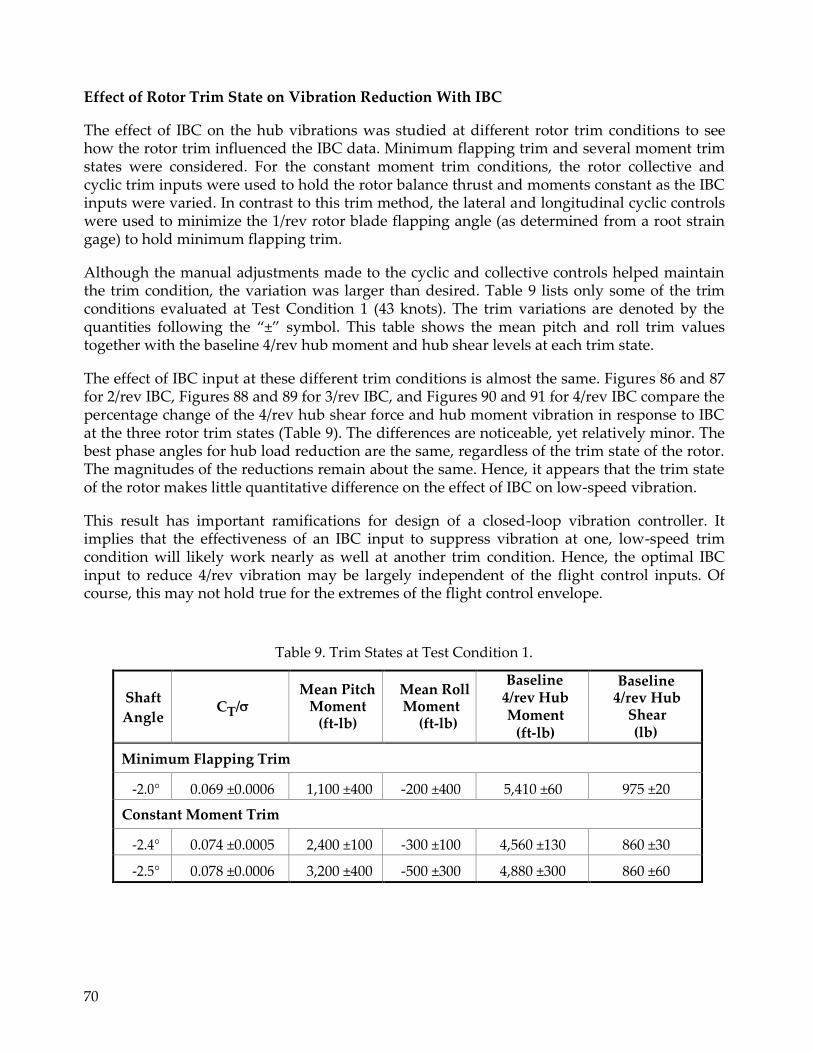
70
Effect of Rotor Trim State on Vibration Reduction With IBC
The effect of IBC on the hub vibrations was studied at different rotor trim conditions to see how the rotor trim influenced the IBC data. Minimum flapping trim and several moment trim states were considered. For the constant moment trim conditions, the rotor collective and cyclic trim inputs were used to hold the rotor balance thrust and moments constant as the IBC inputs were varied. In contrast to this trim method, the lateral and longitudinal cyclic controls were used to minimize the 1/rev rotor blade flapping angle (as determined from a root strain gage) to hold minimum flapping trim.
Although the manual adjustments made to the cyclic and collective controls helped maintain the trim condition, the variation was larger than desired. Table 9 lists only some of the trim conditions evaluated at Test Condition 1 (43 knots). The trim variations are denoted by the quantities following the “±” symbol. This table shows the mean pitch and roll trim values together with the baseline 4/rev hub moment and hub shear levels at each trim state.
The effect of IBC input at these different trim conditions is almost the same. Figures 86 and 87 for 2/rev IBC, Figures 88 and 89 for 3/rev IBC, and Figures 90 and 91 for 4/rev IBC compare the percentage change of the 4/rev hub shear force and hub moment vibration in response to IBC at the three rotor trim states (Table 9). The differences are noticeable, yet relatively minor. The best phase angles for hub load reduction are the same, regardless of the trim state of the rotor. The magnitudes of the reductions remain about the same. Hence, it appears that the trim state of the rotor makes little quantitative difference on the effect of IBC on low-speed vibration.
This result has important ramifications for design of a closed-loop vibration controller. It implies that the effectiveness of an IBC input to suppress vibration at one, low-speed trim condition will likely work nearly as well at another trim condition. Hence, the optimal IBC input to reduce 4/rev vibration may be largely independent of the flight control inputs. Of course, this may not hold true for the extremes of the flight control envelope.
Table 9. Trim States at Test Condition 1.
Shaft
Angle CT/
Mean Pitch Moment
(ft-lb)
Mean Roll Moment
(ft-lb)
Baseline 4/rev Hub Moment
(ft-lb)
Baseline 4/rev Hub
Shear (lb)
Minimum Flapping Trim
-2.0° 0.069 ±0.0006 1,100 ±400 -200 ±400 5,410 ±60 975 ±20
Constant Moment Trim
-2.4° 0.074 ±0.0005 2,400 ±100 -300 ±100 4,560 ±130 860 ±30
-2.5° 0.078 ±0.0006 3,200 ±400 -500 ±300 4,880 ±300 860 ±60
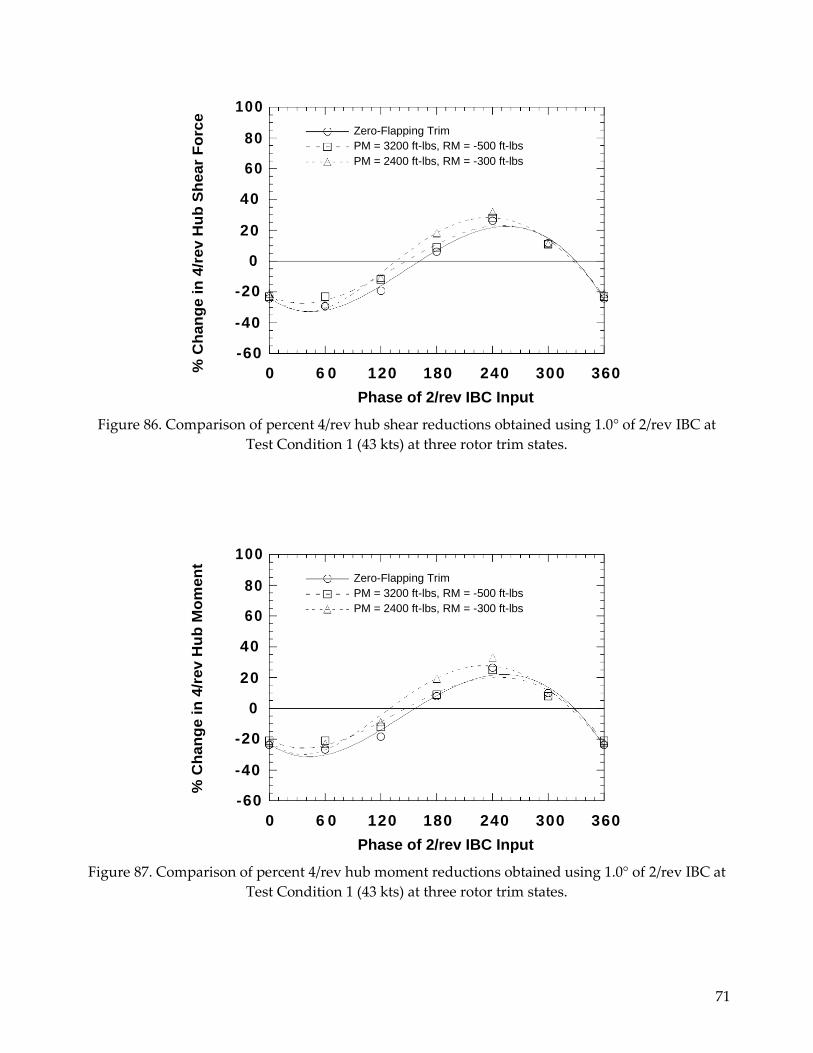
71
100
80
60
40
20
0
-20
-40
-60
0 6 0 120 180 240 300 360
Phase of 2/rev IBC Input
Figure 86. Comparison of percent 4/rev hub shear reductions obtained using 1.0° of 2/rev IBC at
Test Condition 1 (43 kts) at three rotor trim states.
100
80
60
40
20
0
-20
-40
-60
0 6 0 120 180 240 300 360
Phase of 2/rev IBC Input
Figure 87. Comparison of percent 4/rev hub moment reductions obtained using 1.0° of 2/rev IBC at
Test Condition 1 (43 kts) at three rotor trim states.
Zero-Flapping Trim
PM = 3200 ft-lbs, RM = -500 ft-lbs
PM = 2400 ft-lbs, RM = -300 ft-lbs
Zero-Flapping Trim
PM = 3200 ft-lbs, RM = -500 ft-lbs
PM = 2400 ft-lbs, RM = -300 ft-lbs
% C
han
ge i
n 4
/rev H
ub
Mo
men
t %
Ch
an
ge i
n 4
/rev H
ub
Sh
ear
Fo
rce
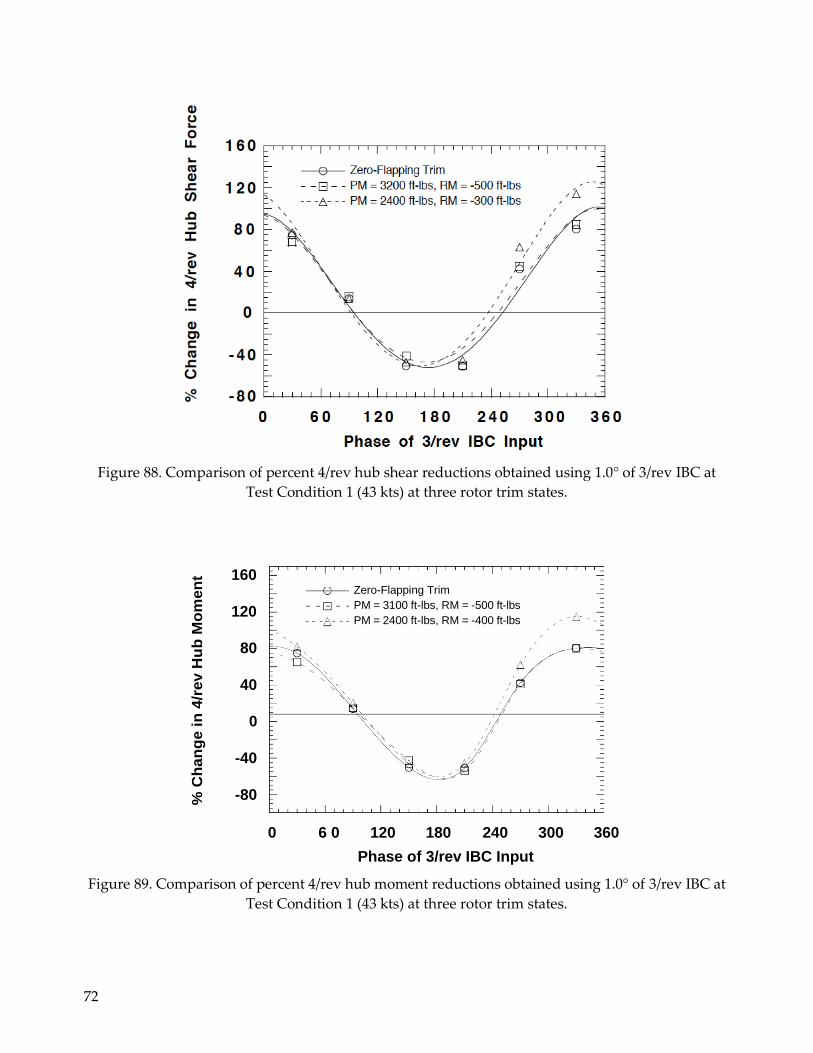
72
Figure 88. Comparison of percent 4/rev hub shear reductions obtained using 1.0° of 3/rev IBC at
Test Condition 1 (43 kts) at three rotor trim states.
160
120
80
40
0
-40
-80
0 6 0 120 180 240 300 360
Phase of 3/rev IBC Input
Figure 89. Comparison of percent 4/rev hub moment reductions obtained using 1.0° of 3/rev IBC at
Test Condition 1 (43 kts) at three rotor trim states.
Zero-Flapping Trim
PM = 3100 ft-lbs, RM = -500 ft-lbs
PM = 2400 ft-lbs, RM = -400 ft-lbs
% C
han
ge i
n 4
/rev H
ub
Mo
men
t

73
120
80
40
0
-40
-80
0 60 120 180 240 300 360
Phase of 4/rev IBC Input
Figure 90. Comparison of percent 4/rev hub shear reductions obtained using 0.5° of 4/rev IBC at
Test Condition 1 (43 kts) at three rotor trim states.
120
80
40
0
-40
-80
0 60 120 180 240 300 360
Phase of 4/rev IBC Input
Figure 91. Comparison of percent 4/rev hub moment reductions obtained using 0.5° of 4/rev IBC at
Test Condition 1 (43 kts) at three rotor trim states.
Zero-Flapping Trim
PM = 3100 ft-lbs, RM = -500 ft-lbs PM = 2400 ft-lbs, RM = -400 ft-lbs
Zero-Flapping Trim
PM = 3100 ft-lbs, RM = -500 ft-lbs
PM = 2400 ft-lbs, RM = -400 ft-lbs
% C
han
ge i
n 4
/rev H
ub
Mo
men
t %
Ch
an
ge i
n 4
/rev H
ub
Sh
ear
Fo
rce

74
Effect of IBC on the Full Vibration Spectrum
Figure 92 shows the vibration spectrum for the application of 2/rev IBC at a 60° phase angle. This input produced very significant reductions of the 4/rev vibration components (see Fig. 27). Figure 92 indicates that both the 4/rev and the 8/rev vibrations were reduced by about the same amount shown in Figure 27. The only feature that cannot be seen from Figure 27 is that the 5/rev hub moment, although small, was not affected by the 4/rev IBC input. Nevertheless, comparing Figure 92 to the baseline vibration (Fig. 21) shows that this IBC input did not increase the vibration at the other harmonics.
Figure 93 shows the vibration spectrum for 1.0° of 3/rev IBC input at a 150° phase angle. This input also produced very significant reductions of the 4/rev vibration components (see Fig. 29). In this plot, both the 5/rev and 8/rev vibration components were reduced together with the 4/rev vibration. Also of interest is that whereas Figure 29 indicates a 40-percent decrease in the 4/rev hub moments, Figure 93 shows only a 15-percent reduction in the hub pitching moment. This is because the 4/rev hub rolling moment was reduced by 85 percent at the same time. This validates the utility of using the total hub moment index (Eq. 3) rather than plotting the hub moment components separately. Once again, compared to the baseline vibration (Fig. 21), the IBC input did not increase the vibration at the other harmonics.
Appendix H presents the hub load data in terms of the cosine and sine coefficients for the six rotor balance components. These data contain up to the 12th harmonic for the runs identified in Table 6. The electronically combined shear and moment outputs of the rotor balance have also been included in Appendix H. The energy contained in harmonics higher than 12/rev was usually much less than 5 percent of the total energy. Therefore, using Appendix H, the effect of IBC on the total vibration spectrum can be determined, if desired. The user is cautioned to remember, however, that the rotor balance was not dynamically calibrated beyond the 1/rev frequency.
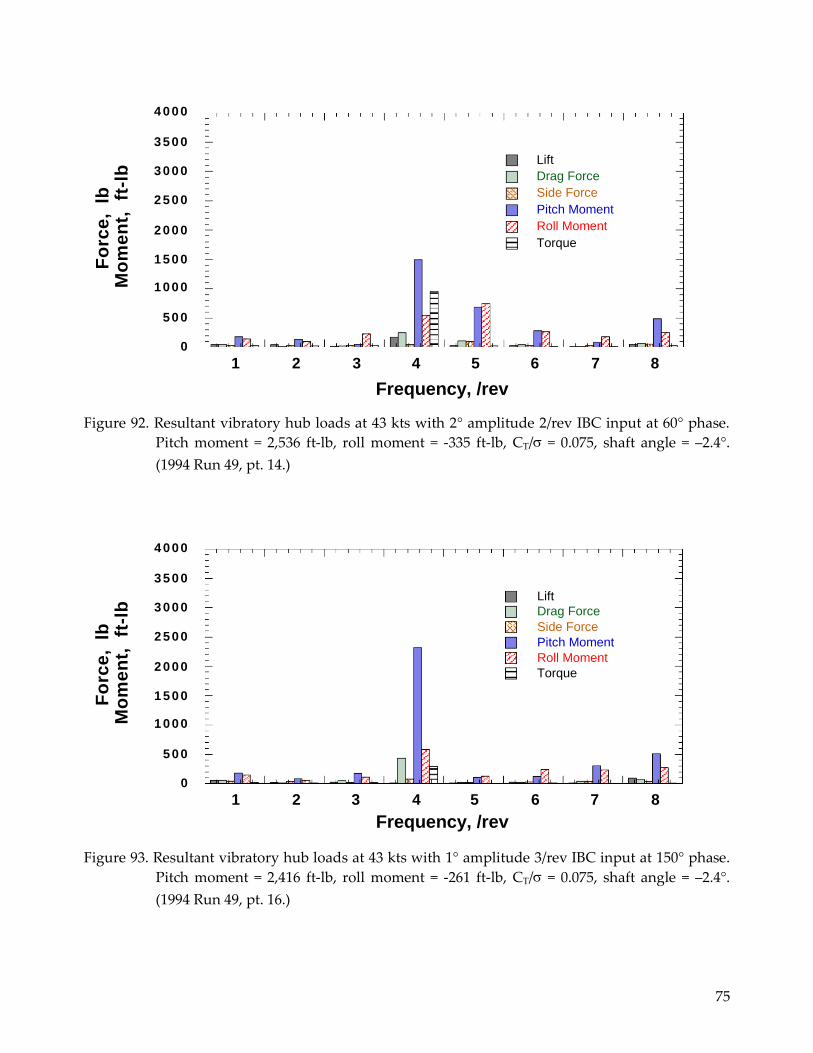
75
4 0 0 0
3 5 0 0
3 0 0 0
2 5 0 0
2 0 0 0
1 5 0 0
1 0 0 0
5 0 0
0
1 2 3 4 5 6 7 8
Frequency, /rev
Figure 92. Resultant vibratory hub loads at 43 kts with 2° amplitude 2/rev IBC input at 60° phase.
Pitch moment = 2,536 ft-lb, roll moment = -335 ft-lb, CT/ = 0.075, shaft angle = –2.4°.
(1994 Run 49, pt. 14.)
4 0 0 0
3 5 0 0
3 0 0 0
2 5 0 0
2 0 0 0
1 5 0 0
1 0 0 0
5 0 0
0
1 2 3 4 5 6 7 8
Frequency, /rev
Figure 93. Resultant vibratory hub loads at 43 kts with 1° amplitude 3/rev IBC input at 150° phase.
Pitch moment = 2,416 ft-lb, roll moment = -261 ft-lb, CT/ = 0.075, shaft angle = –2.4°.
(1994 Run 49, pt. 16.)
Lift
Drag Force
Side Force
Pitch Moment
Roll Moment
Torque
Lift
Drag Force
Side Force
Pitch Moment
Roll Moment
Torque
Fo
rce
, lb
M
om
en
t,
ft-l
b
Fo
rce
, lb
M
om
en
t,
ft-l
b
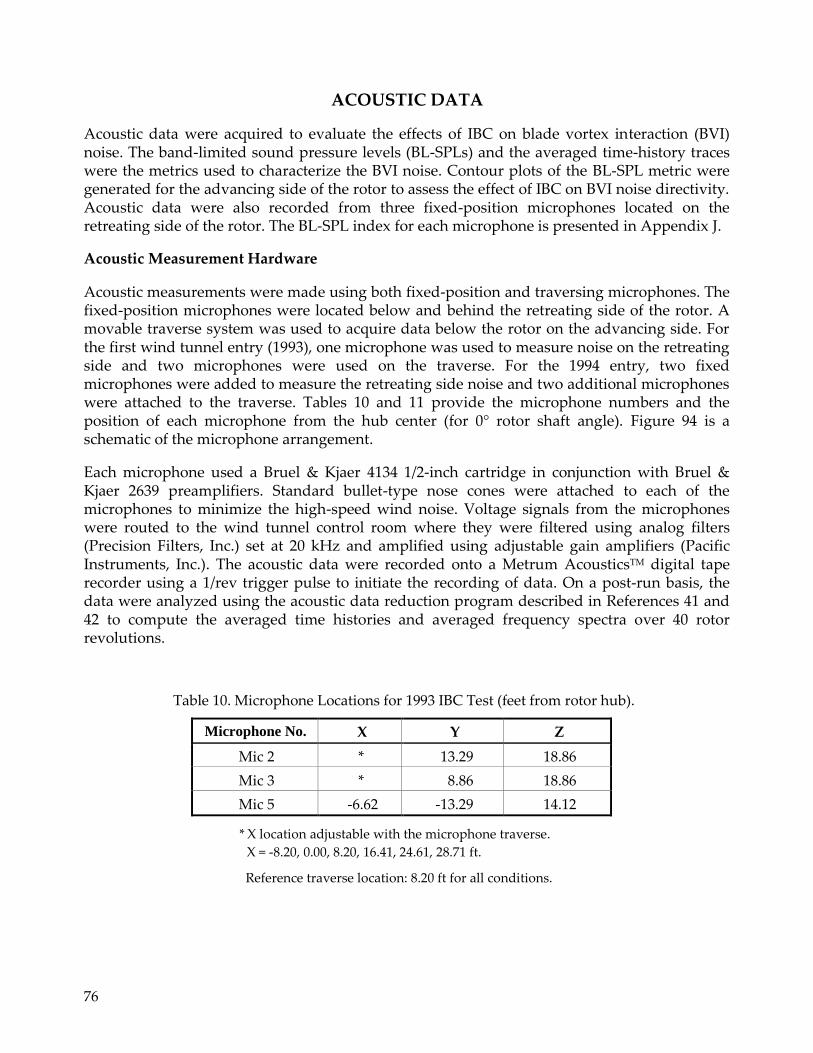
76
ACOUSTIC DATA
Acoustic data were acquired to evaluate the effects of IBC on blade vortex interaction (BVI) noise. The band-limited sound pressure levels (BL-SPLs) and the averaged time-history traces were the metrics used to characterize the BVI noise. Contour plots of the BL-SPL metric were generated for the advancing side of the rotor to assess the effect of IBC on BVI noise directivity. Acoustic data were also recorded from three fixed-position microphones located on the retreating side of the rotor. The BL-SPL index for each microphone is presented in Appendix J.
Acoustic Measurement Hardware
Acoustic measurements were made using both fixed-position and traversing microphones. The fixed-position microphones were located below and behind the retreating side of the rotor. A movable traverse system was used to acquire data below the rotor on the advancing side. For the first wind tunnel entry (1993), one microphone was used to measure noise on the retreating side and two microphones were used on the traverse. For the 1994 entry, two fixed microphones were added to measure the retreating side noise and two additional microphones were attached to the traverse. Tables 10 and 11 provide the microphone numbers and the position of each microphone from the hub center (for 0° rotor shaft angle). Figure 94 is a schematic of the microphone arrangement.
Each microphone used a Bruel & Kjaer 4134 1/2-inch cartridge in conjunction with Bruel & Kjaer 2639 preamplifiers. Standard bullet-type nose cones were attached to each of the microphones to minimize the high-speed wind noise. Voltage signals from the microphones were routed to the wind tunnel control room where they were filtered using analog filters (Precision Filters, Inc.) set at 20 kHz and amplified using adjustable gain amplifiers (Pacific Instruments, Inc.). The acoustic data were recorded onto a Metrum AcousticsTM digital tape recorder using a 1/rev trigger pulse to initiate the recording of data. On a post-run basis, the data were analyzed using the acoustic data reduction program described in References 41 and 42 to compute the averaged time histories and averaged frequency spectra over 40 rotor revolutions.
Table 10. Microphone Locations for 1993 IBC Test (feet from rotor hub).
Microphone No. X Y Z
Mic 2 * 13.29 18.86
Mic 3 * 8.86 18.86
Mic 5 -6.62 -13.29 14.12
* X location adjustable with the microphone traverse.
X = -8.20, 0.00, 8.20, 16.41, 24.61, 28.71 ft.
Reference traverse location: 8.20 ft for all conditions.
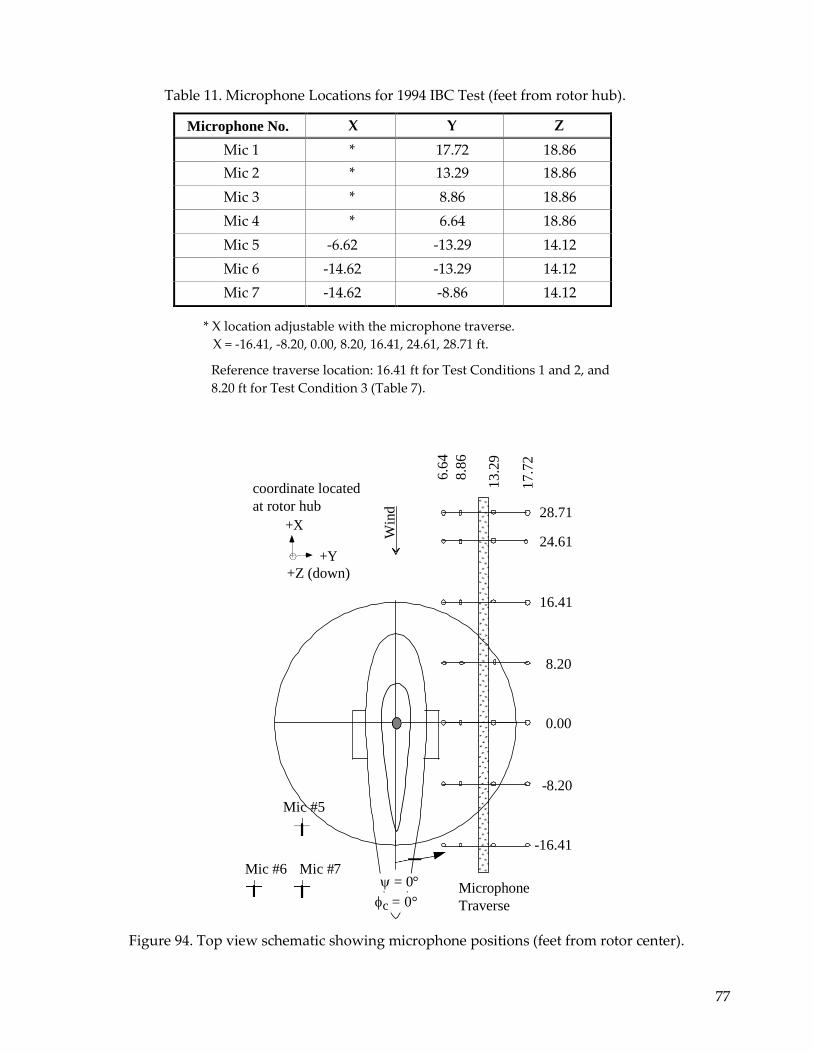
77
Table 11. Microphone Locations for 1994 IBC Test (feet from rotor hub).
Microphone No. X Y Z
Mic 1 * 17.72 18.86
Mic 2 * 13.29 18.86
Mic 3 * 8.86 18.86
Mic 4 * 6.64 18.86
Mic 5 -6.62 -13.29 14.12
Mic 6 -14.62 -13.29 14.12
Mic 7 -14.62 -8.86 14.12
* X location adjustable with the microphone traverse.
X = -16.41, -8.20, 0.00, 8.20, 16.41, 24.61, 28.71 ft.
Reference traverse location: 16.41 ft for Test Conditions 1 and 2, and
8.20 ft for Test Condition 3 (Table 7).
coordinate located
at rotor hub
+X
28.71
24.61 +Y
+Z (down)
16.41
8.20
0.00
-8.20
Mic #5
Mic #6
Mic #7
= 0°
c = 0°
Microphone
Traverse
-16.41
Figure 94. Top view schematic showing microphone positions (feet from rotor center).
W
ind
6.6
4
8.8
6
13.2
9
17.7
2
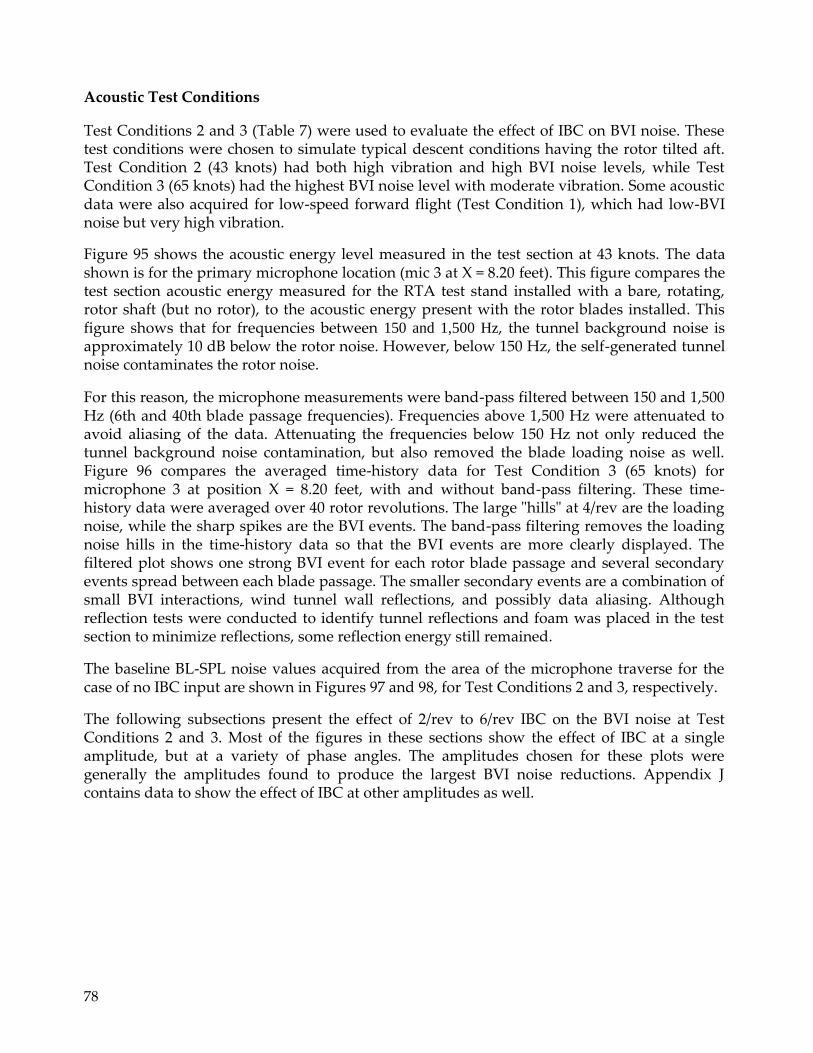
78
Acoustic Test Conditions
Test Conditions 2 and 3 (Table 7) were used to evaluate the effect of IBC on BVI noise. These test conditions were chosen to simulate typical descent conditions having the rotor tilted aft. Test Condition 2 (43 knots) had both high vibration and high BVI noise levels, while Test Condition 3 (65 knots) had the highest BVI noise level with moderate vibration. Some acoustic data were also acquired for low-speed forward flight (Test Condition 1), which had low-BVI noise but very high vibration.
Figure 95 shows the acoustic energy level measured in the test section at 43 knots. The data shown is for the primary microphone location (mic 3 at X = 8.20 feet). This figure compares the test section acoustic energy measured for the RTA test stand installed with a bare, rotating, rotor shaft (but no rotor), to the acoustic energy present with the rotor blades installed. This figure shows that for frequencies between 150 and 1,500 Hz, the tunnel background noise is approximately 10 dB below the rotor noise. However, below 150 Hz, the self-generated tunnel noise contaminates the rotor noise.
For this reason, the microphone measurements were band-pass filtered between 150 and 1,500 Hz (6th and 40th blade passage frequencies). Frequencies above 1,500 Hz were attenuated to avoid aliasing of the data. Attenuating the frequencies below 150 Hz not only reduced the tunnel background noise contamination, but also removed the blade loading noise as well. Figure 96 compares the averaged time-history data for Test Condition 3 (65 knots) for microphone 3 at position X = 8.20 feet, with and without band-pass filtering. These time-history data were averaged over 40 rotor revolutions. The large "hills" at 4/rev are the loading noise, while the sharp spikes are the BVI events. The band-pass filtering removes the loading noise hills in the time-history data so that the BVI events are more clearly displayed. The filtered plot shows one strong BVI event for each rotor blade passage and several secondary events spread between each blade passage. The smaller secondary events are a combination of small BVI interactions, wind tunnel wall reflections, and possibly data aliasing. Although reflection tests were conducted to identify tunnel reflections and foam was placed in the test section to minimize reflections, some reflection energy still remained.
The baseline BL-SPL noise values acquired from the area of the microphone traverse for the case of no IBC input are shown in Figures 97 and 98, for Test Conditions 2 and 3, respectively.
The following subsections present the effect of 2/rev to 6/rev IBC on the BVI noise at Test Conditions 2 and 3. Most of the figures in these sections show the effect of IBC at a single amplitude, but at a variety of phase angles. The amplitudes chosen for these plots were generally the amplitudes found to produce the largest BVI noise reductions. Appendix J contains data to show the effect of IBC at other amplitudes as well.
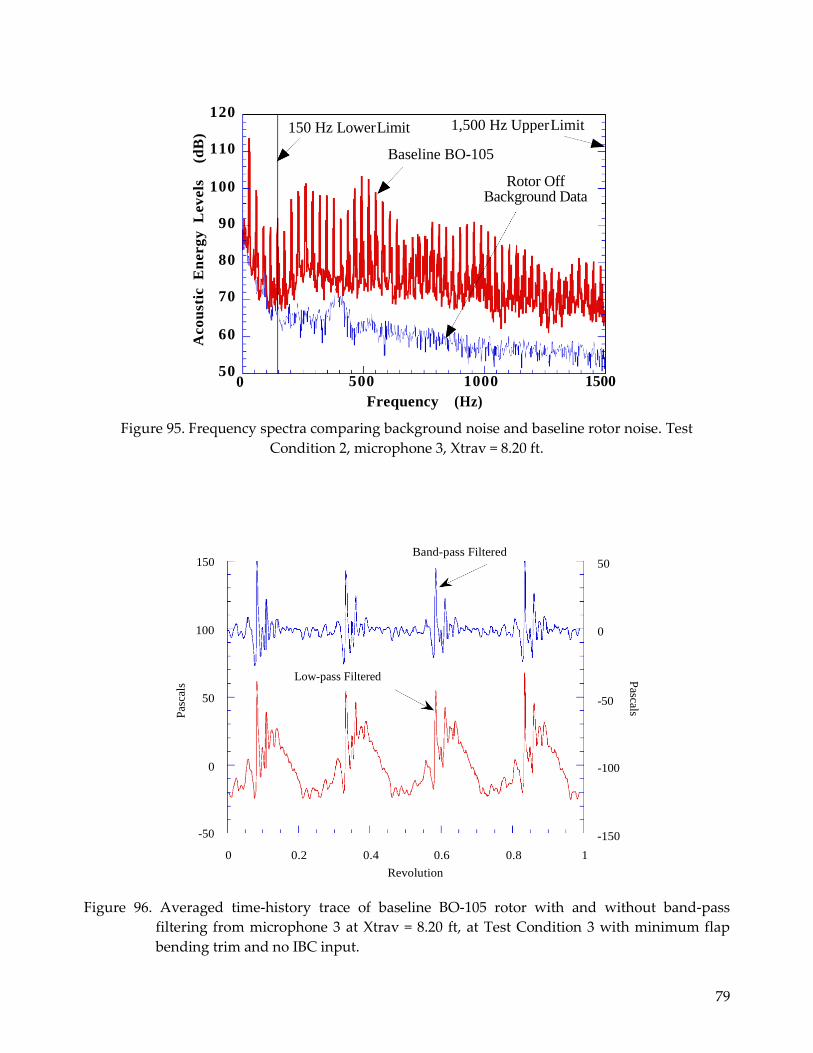
79
150 Hz Lower Limit 1,500 Hz Upper Limit
Baseline BO-105
Rotor Off Background Data
Low-pass Filtered
0
120
110
100
90
80
70
60
50 500 1000
Frequency (Hz)
1500
Figure 95. Frequency spectra comparing background noise and baseline rotor noise. Test
Condition 2, microphone 3, Xtrav = 8.20 ft.
150 Band-pass Filtered
50
100 0
50 -50
0 -100
-50
0 0.2 0.4 0.6 0.8 1
Revolution
-150
Figure 96. Averaged time-history trace of baseline BO-105 rotor with and without band-pass
filtering from microphone 3 at Xtrav = 8.20 ft, at Test Condition 3 with minimum flap
bending trim and no IBC input.
Pascals P
asca
ls
Aco
ust
ic E
nerg
y
Lev
els
(d
B)
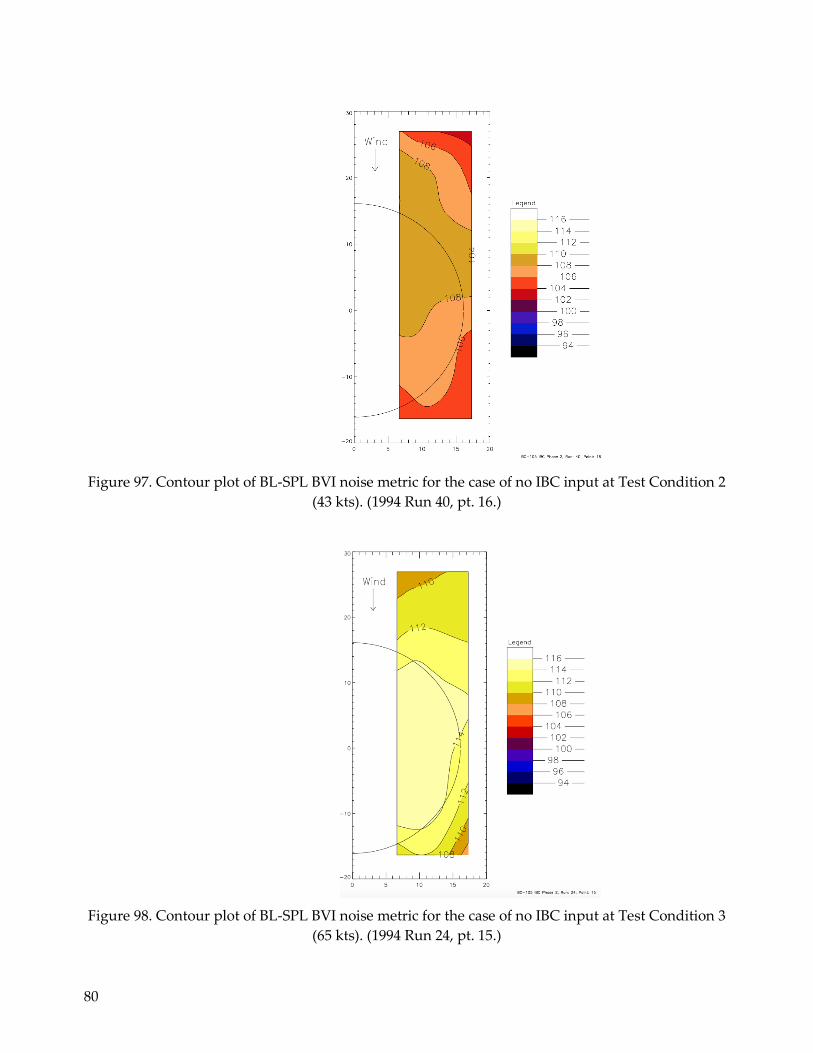
80
Figure 97. Contour plot of BL-SPL BVI noise metric for the case of no IBC input at Test Condition 2
(43 kts). (1994 Run 40, pt. 16.)
Figure 98. Contour plot of BL-SPL BVI noise metric for the case of no IBC input at Test Condition 3
(65 kts). (1994 Run 24, pt. 15.)
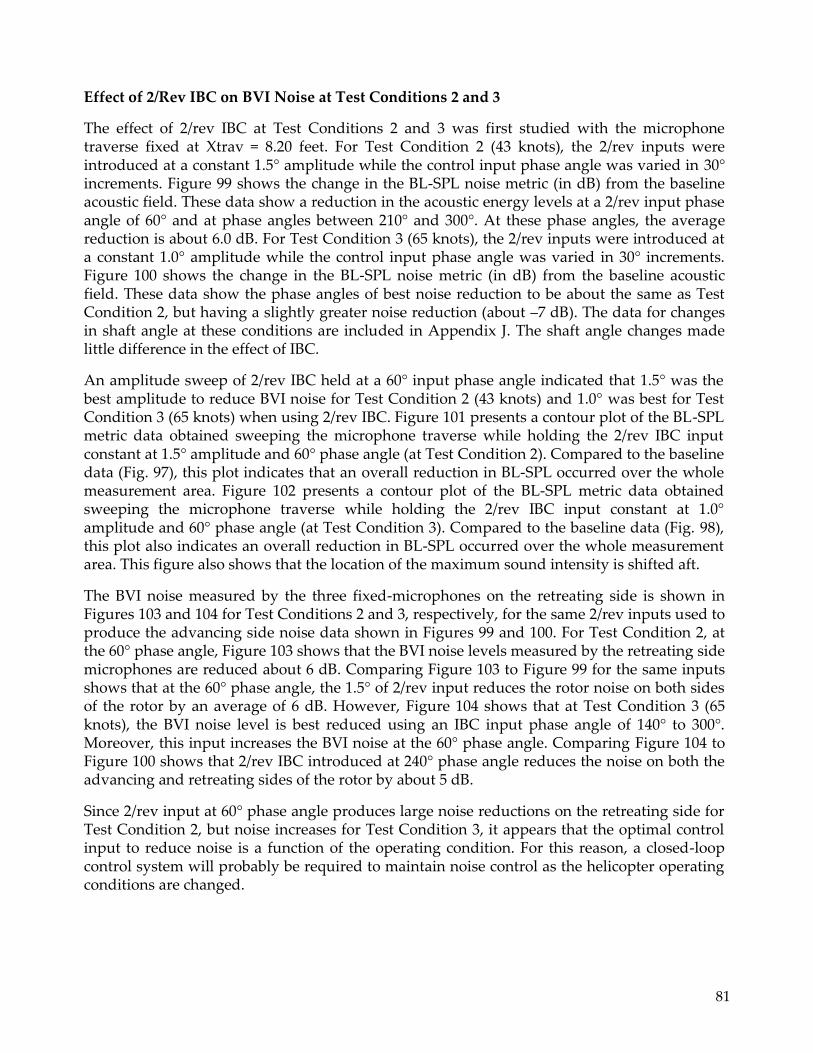
81
Effect of 2/Rev IBC on BVI Noise at Test Conditions 2 and 3
The effect of 2/rev IBC at Test Conditions 2 and 3 was first studied with the microphone traverse fixed at Xtrav = 8.20 feet. For Test Condition 2 (43 knots), the 2/rev inputs were introduced at a constant 1.5° amplitude while the control input phase angle was varied in 30° increments. Figure 99 shows the change in the BL-SPL noise metric (in dB) from the baseline acoustic field. These data show a reduction in the acoustic energy levels at a 2/rev input phase angle of 60° and at phase angles between 210° and 300°. At these phase angles, the average reduction is about 6.0 dB. For Test Condition 3 (65 knots), the 2/rev inputs were introduced at a constant 1.0° amplitude while the control input phase angle was varied in 30° increments. Figure 100 shows the change in the BL-SPL noise metric (in dB) from the baseline acoustic field. These data show the phase angles of best noise reduction to be about the same as Test Condition 2, but having a slightly greater noise reduction (about –7 dB). The data for changes in shaft angle at these conditions are included in Appendix J. The shaft angle changes made little difference in the effect of IBC.
An amplitude sweep of 2/rev IBC held at a 60° input phase angle indicated that 1.5° was the best amplitude to reduce BVI noise for Test Condition 2 (43 knots) and 1.0° was best for Test Condition 3 (65 knots) when using 2/rev IBC. Figure 101 presents a contour plot of the BL-SPL metric data obtained sweeping the microphone traverse while holding the 2/rev IBC input constant at 1.5° amplitude and 60° phase angle (at Test Condition 2). Compared to the baseline data (Fig. 97), this plot indicates that an overall reduction in BL-SPL occurred over the whole measurement area. Figure 102 presents a contour plot of the BL-SPL metric data obtained sweeping the microphone traverse while holding the 2/rev IBC input constant at 1.0° amplitude and 60° phase angle (at Test Condition 3). Compared to the baseline data (Fig. 98), this plot also indicates an overall reduction in BL-SPL occurred over the whole measurement area. This figure also shows that the location of the maximum sound intensity is shifted aft.
The BVI noise measured by the three fixed-microphones on the retreating side is shown in Figures 103 and 104 for Test Conditions 2 and 3, respectively, for the same 2/rev inputs used to produce the advancing side noise data shown in Figures 99 and 100. For Test Condition 2, at the 60° phase angle, Figure 103 shows that the BVI noise levels measured by the retreating side microphones are reduced about 6 dB. Comparing Figure 103 to Figure 99 for the same inputs shows that at the 60° phase angle, the 1.5° of 2/rev input reduces the rotor noise on both sides of the rotor by an average of 6 dB. However, Figure 104 shows that at Test Condition 3 (65 knots), the BVI noise level is best reduced using an IBC input phase angle of 140° to 300°. Moreover, this input increases the BVI noise at the 60° phase angle. Comparing Figure 104 to Figure 100 shows that 2/rev IBC introduced at 240° phase angle reduces the noise on both the advancing and retreating sides of the rotor by about 5 dB.
Since 2/rev input at 60° phase angle produces large noise reductions on the retreating side for Test Condition 2, but noise increases for Test Condition 3, it appears that the optimal control input to reduce noise is a function of the operating condition. For this reason, a closed-loop control system will probably be required to maintain noise control as the helicopter operating conditions are changed.
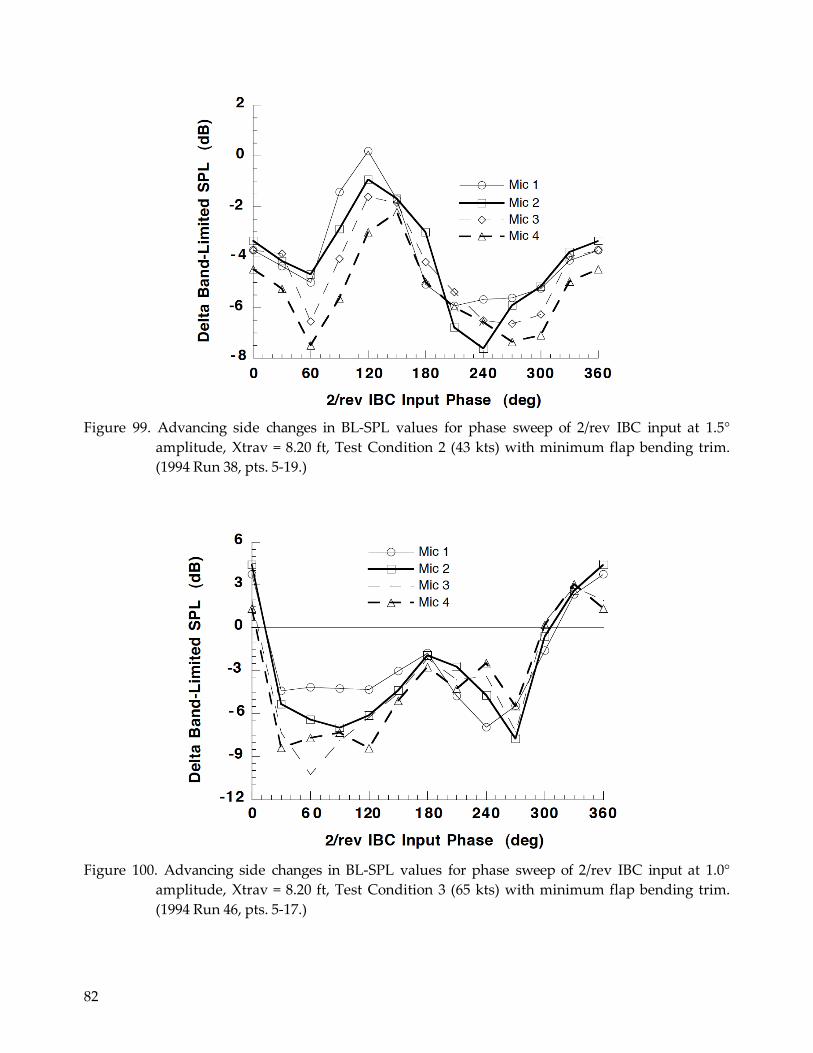
82
Figure 99. Advancing side changes in BL-SPL values for phase sweep of 2/rev IBC input at 1.5°
amplitude, Xtrav = 8.20 ft, Test Condition 2 (43 kts) with minimum flap bending trim.
(1994 Run 38, pts. 5-19.)
Figure 100. Advancing side changes in BL-SPL values for phase sweep of 2/rev IBC input at 1.0°
amplitude, Xtrav = 8.20 ft, Test Condition 3 (65 kts) with minimum flap bending trim.
(1994 Run 46, pts. 5-17.)
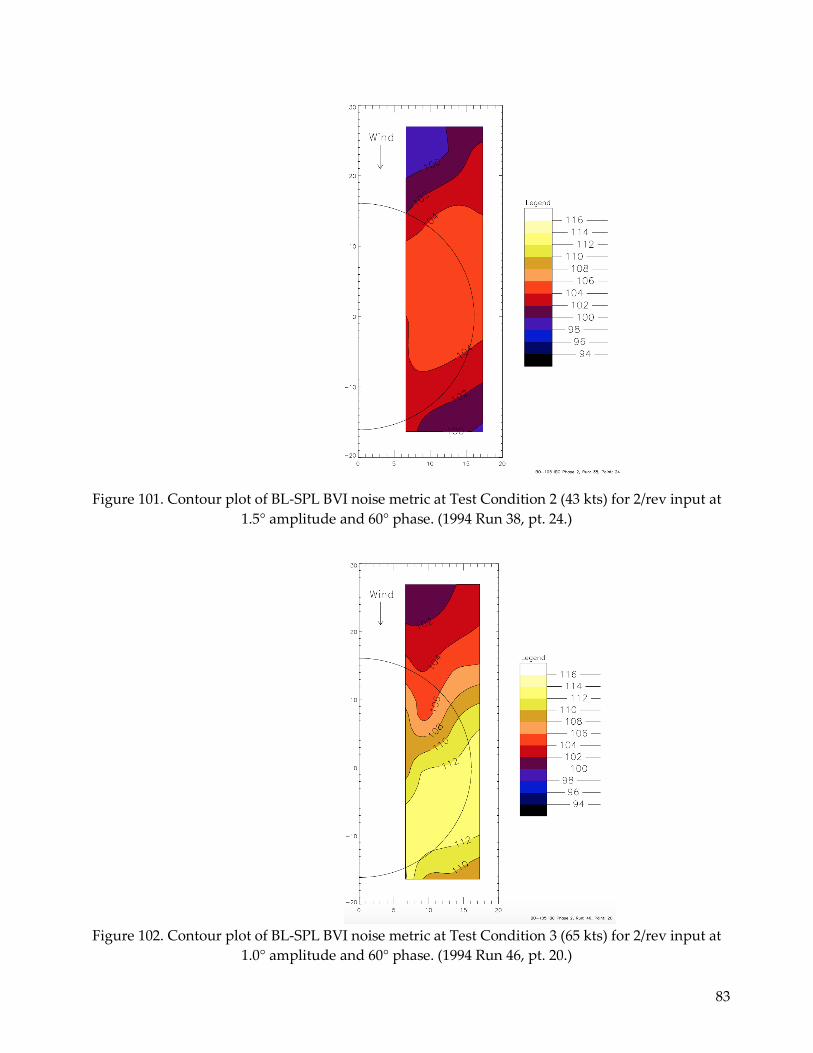
83
Figure 101. Contour plot of BL-SPL BVI noise metric at Test Condition 2 (43 kts) for 2/rev input at
1.5° amplitude and 60° phase. (1994 Run 38, pt. 24.)
Figure 102. Contour plot of BL-SPL BVI noise metric at Test Condition 3 (65 kts) for 2/rev input at
1.0° amplitude and 60° phase. (1994 Run 46, pt. 20.)
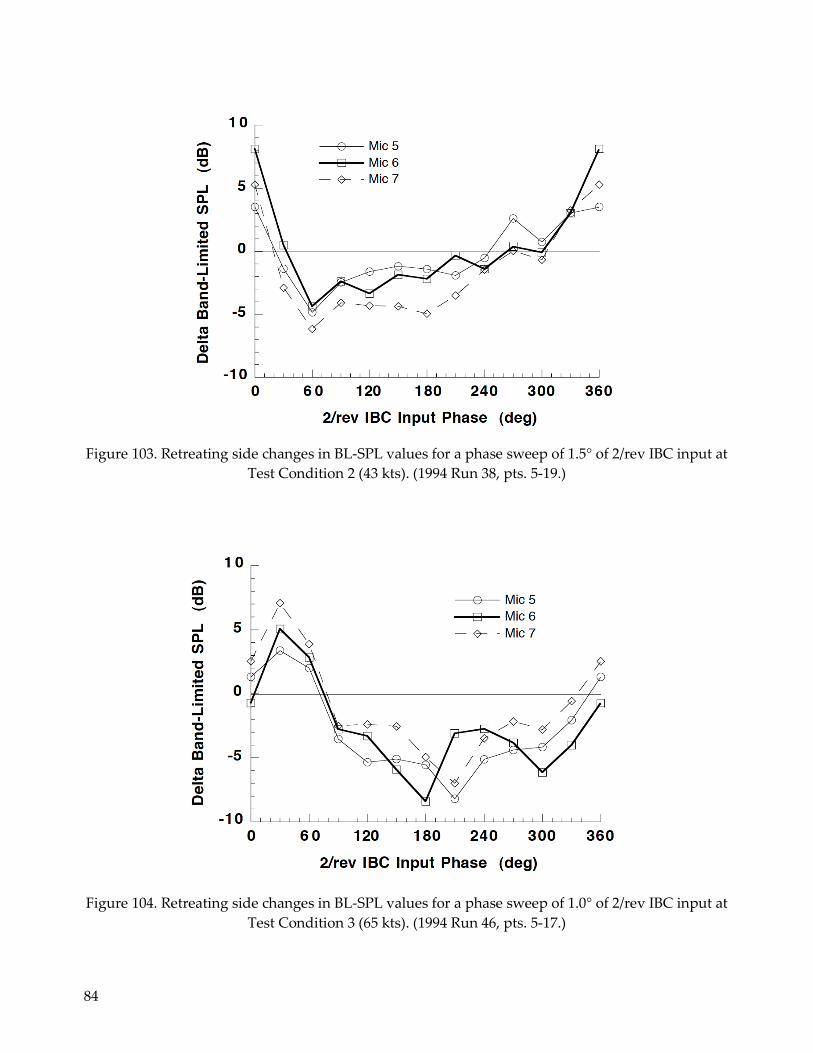
84
Figure 103. Retreating side changes in BL-SPL values for a phase sweep of 1.5° of 2/rev IBC input at
Test Condition 2 (43 kts). (1994 Run 38, pts. 5-19.)
Figure 104. Retreating side changes in BL-SPL values for a phase sweep of 1.0° of 2/rev IBC input at
Test Condition 3 (65 kts). (1994 Run 46, pts. 5-17.)
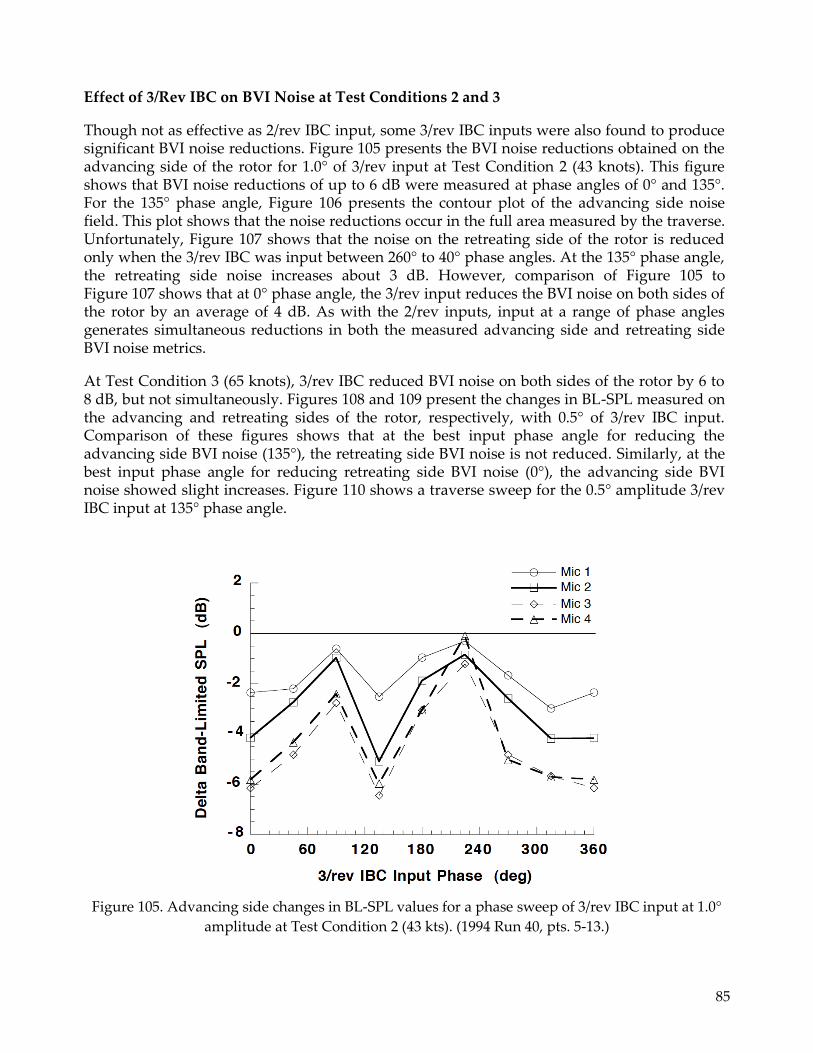
85
Effect of 3/Rev IBC on BVI Noise at Test Conditions 2 and 3
Though not as effective as 2/rev IBC input, some 3/rev IBC inputs were also found to produce significant BVI noise reductions. Figure 105 presents the BVI noise reductions obtained on the advancing side of the rotor for 1.0° of 3/rev input at Test Condition 2 (43 knots). This figure shows that BVI noise reductions of up to 6 dB were measured at phase angles of 0° and 135°. For the 135° phase angle, Figure 106 presents the contour plot of the advancing side noise field. This plot shows that the noise reductions occur in the full area measured by the traverse. Unfortunately, Figure 107 shows that the noise on the retreating side of the rotor is reduced only when the 3/rev IBC was input between 260° to 40° phase angles. At the 135° phase angle, the retreating side noise increases about 3 dB. However, comparison of Figure 105 to Figure 107 shows that at 0° phase angle, the 3/rev input reduces the BVI noise on both sides of the rotor by an average of 4 dB. As with the 2/rev inputs, input at a range of phase angles generates simultaneous reductions in both the measured advancing side and retreating side BVI noise metrics.
At Test Condition 3 (65 knots), 3/rev IBC reduced BVI noise on both sides of the rotor by 6 to 8 dB, but not simultaneously. Figures 108 and 109 present the changes in BL-SPL measured on the advancing and retreating sides of the rotor, respectively, with 0.5° of 3/rev IBC input. Comparison of these figures shows that at the best input phase angle for reducing the advancing side BVI noise (135°), the retreating side BVI noise is not reduced. Similarly, at the best input phase angle for reducing retreating side BVI noise (0°), the advancing side BVI noise showed slight increases. Figure 110 shows a traverse sweep for the 0.5° amplitude 3/rev IBC input at 135° phase angle.
Figure 105. Advancing side changes in BL-SPL values for a phase sweep of 3/rev IBC input at 1.0°
amplitude at Test Condition 2 (43 kts). (1994 Run 40, pts. 5-13.)
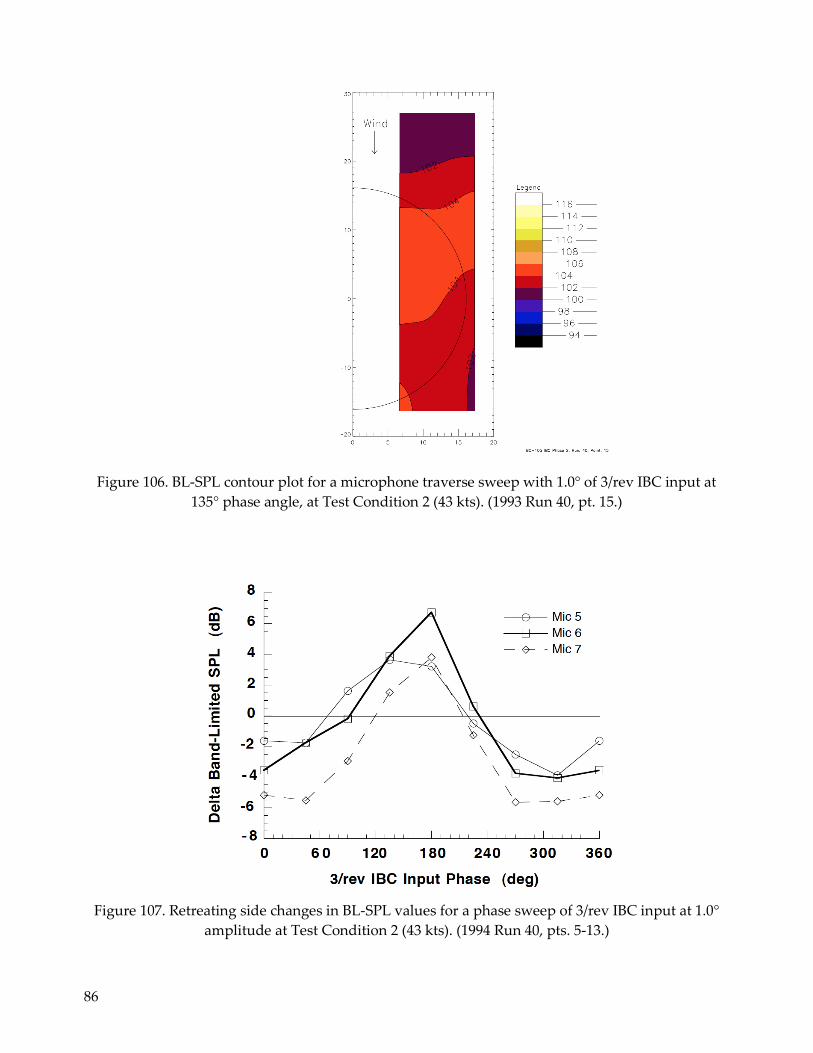
86
Figure 106. BL-SPL contour plot for a microphone traverse sweep with 1.0° of 3/rev IBC input at
135° phase angle, at Test Condition 2 (43 kts). (1993 Run 40, pt. 15.)
Figure 107. Retreating side changes in BL-SPL values for a phase sweep of 3/rev IBC input at 1.0°
amplitude at Test Condition 2 (43 kts). (1994 Run 40, pts. 5-13.)
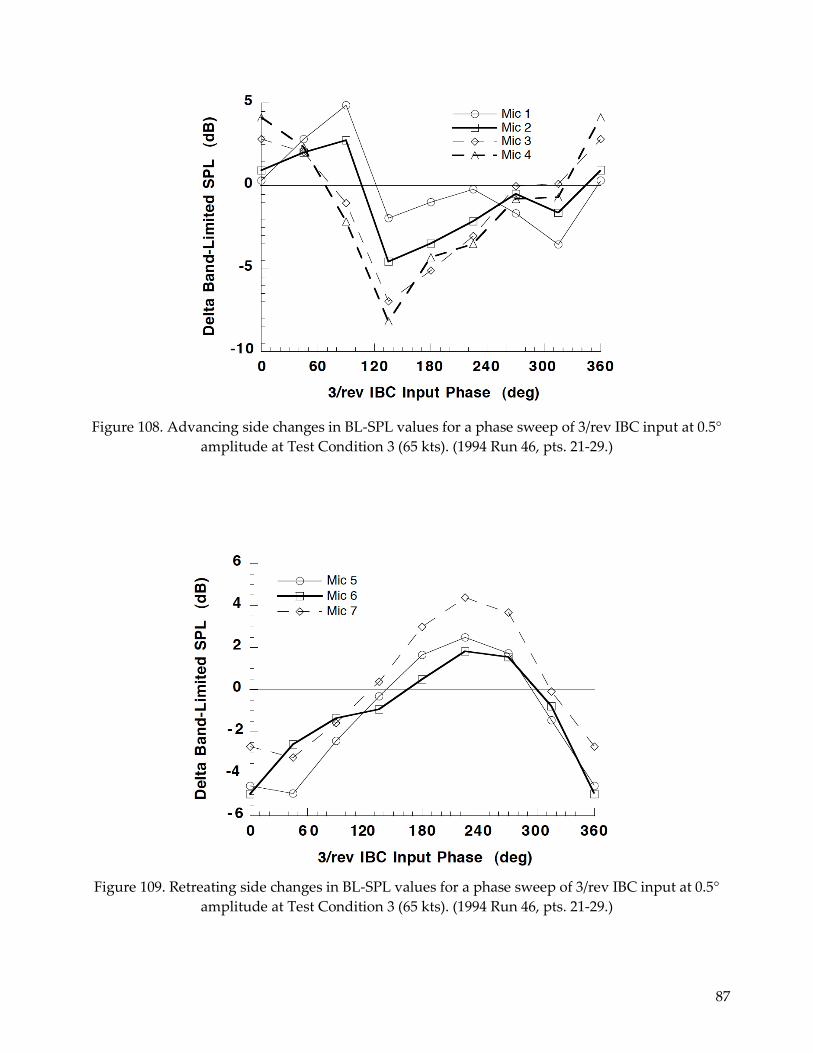
87
Figure 108. Advancing side changes in BL-SPL values for a phase sweep of 3/rev IBC input at 0.5°
amplitude at Test Condition 3 (65 kts). (1994 Run 46, pts. 21-29.)
Figure 109. Retreating side changes in BL-SPL values for a phase sweep of 3/rev IBC input at 0.5°
amplitude at Test Condition 3 (65 kts). (1994 Run 46, pts. 21-29.)
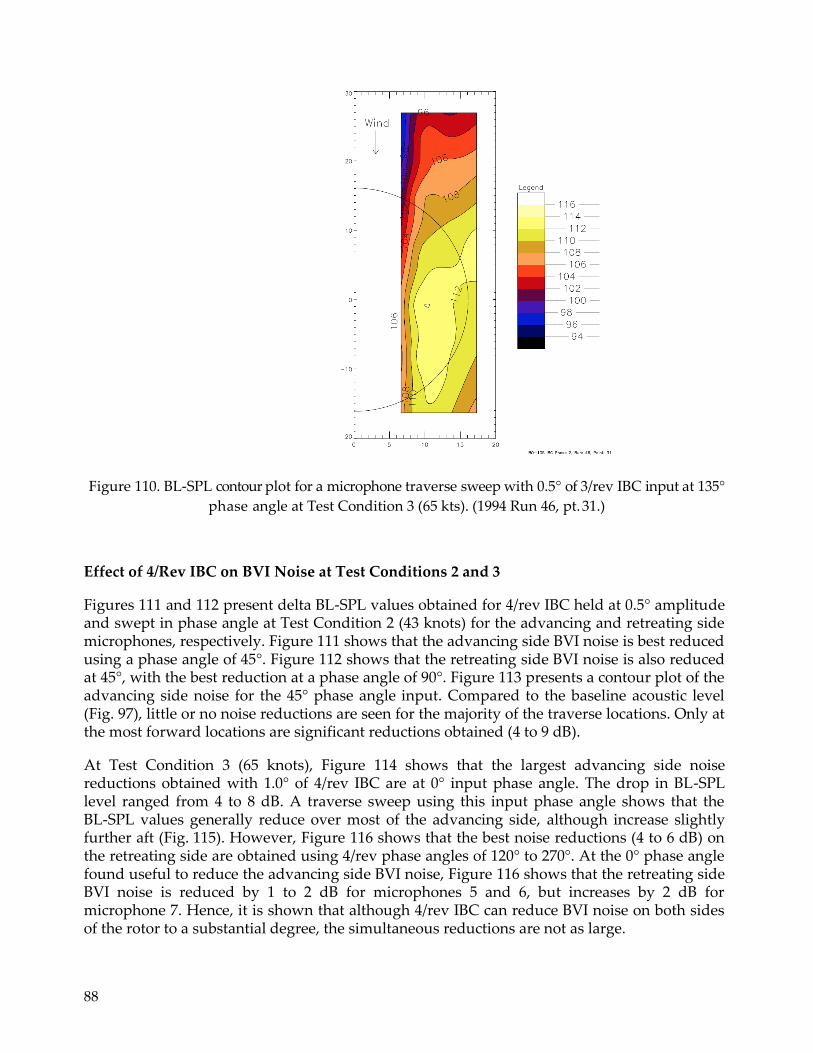
88
Figure 110. BL-SPL contour plot for a microphone traverse sweep with 0.5° of 3/rev IBC input at 135°
phase angle at Test Condition 3 (65 kts). (1994 Run 46, pt. 31.)
Effect of 4/Rev IBC on BVI Noise at Test Conditions 2 and 3
Figures 111 and 112 present delta BL-SPL values obtained for 4/rev IBC held at 0.5° amplitude and swept in phase angle at Test Condition 2 (43 knots) for the advancing and retreating side microphones, respectively. Figure 111 shows that the advancing side BVI noise is best reduced using a phase angle of 45°. Figure 112 shows that the retreating side BVI noise is also reduced at 45°, with the best reduction at a phase angle of 90°. Figure 113 presents a contour plot of the advancing side noise for the 45° phase angle input. Compared to the baseline acoustic level (Fig. 97), little or no noise reductions are seen for the majority of the traverse locations. Only at the most forward locations are significant reductions obtained (4 to 9 dB).
At Test Condition 3 (65 knots), Figure 114 shows that the largest advancing side noise reductions obtained with 1.0° of 4/rev IBC are at 0° input phase angle. The drop in BL-SPL level ranged from 4 to 8 dB. A traverse sweep using this input phase angle shows that the BL-SPL values generally reduce over most of the advancing side, although increase slightly further aft (Fig. 115). However, Figure 116 shows that the best noise reductions (4 to 6 dB) on the retreating side are obtained using 4/rev phase angles of 120° to 270°. At the 0° phase angle found useful to reduce the advancing side BVI noise, Figure 116 shows that the retreating side BVI noise is reduced by 1 to 2 dB for microphones 5 and 6, but increases by 2 dB for microphone 7. Hence, it is shown that although 4/rev IBC can reduce BVI noise on both sides of the rotor to a substantial degree, the simultaneous reductions are not as large.

89
Figure 111. Advancing side changes in BL-SPL values for phase sweep of 4/rev IBC input at 0.5°
amplitude, Xtrav = 16.41 ft, Test Condition 2 (43 kts). (1994 Run 45, pts. 5-13.)
Figure 112. Retreating side changes in BL-SPL values for phase sweep of 4/rev IBC input at 0.5°
amplitude, Test Condition 2 (43 kts). (1994 Run 45, pts. 5-13.)
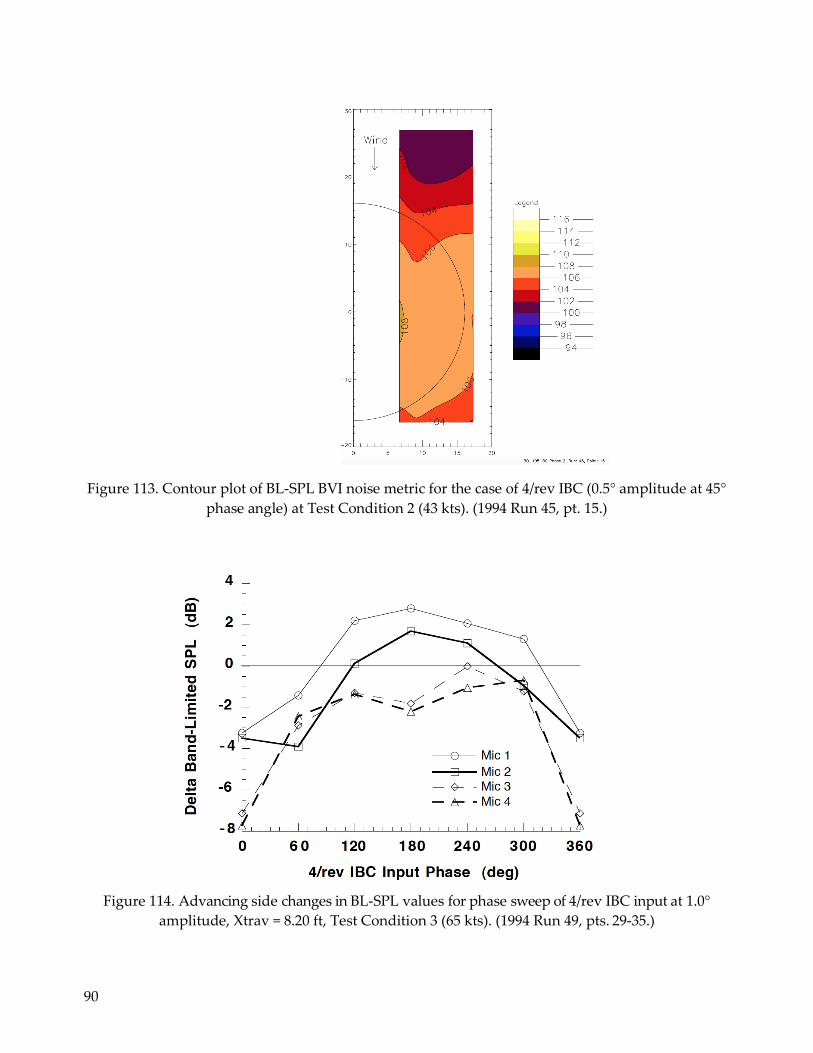
90
Figure 113. Contour plot of BL-SPL BVI noise metric for the case of 4/rev IBC (0.5° amplitude at 45°
phase angle) at Test Condition 2 (43 kts). (1994 Run 45, pt. 15.)
Figure 114. Advancing side changes in BL-SPL values for phase sweep of 4/rev IBC input at 1.0°
amplitude, Xtrav = 8.20 ft, Test Condition 3 (65 kts). (1994 Run 49, pts. 29-35.)
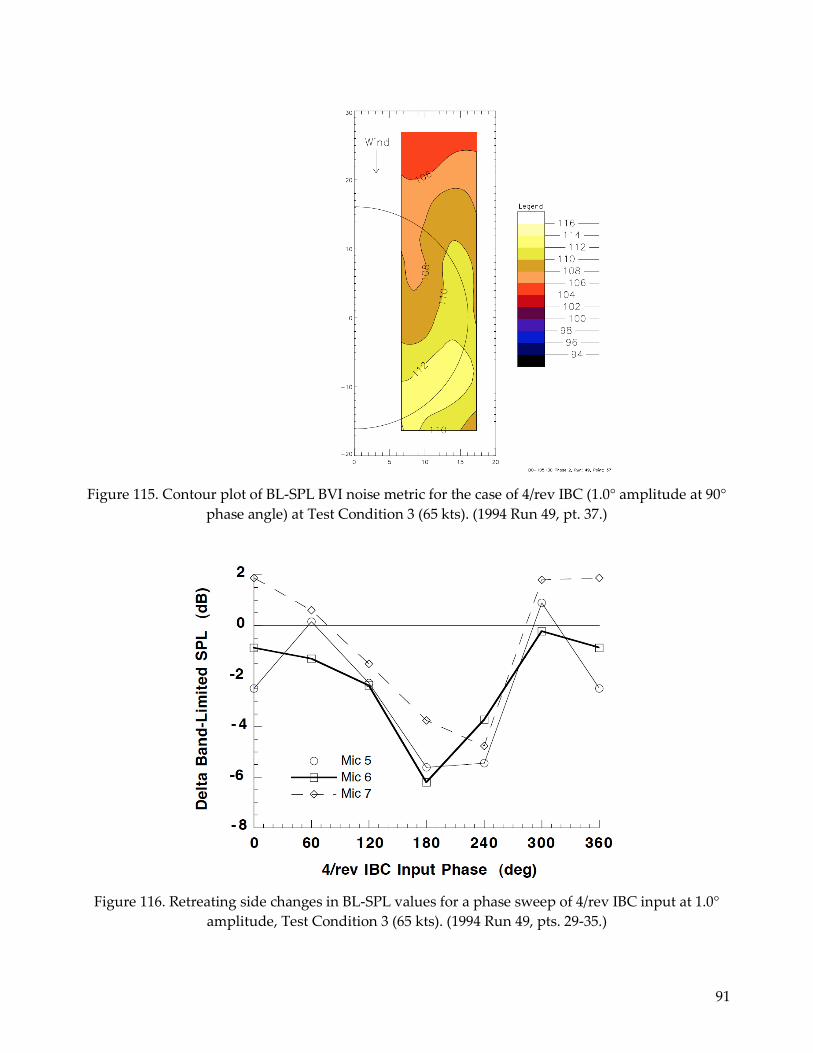
91
Figure 115. Contour plot of BL-SPL BVI noise metric for the case of 4/rev IBC (1.0° amplitude at 90°
phase angle) at Test Condition 3 (65 kts). (1994 Run 49, pt. 37.)
Figure 116. Retreating side changes in BL-SPL values for a phase sweep of 4/rev IBC input at 1.0°
amplitude, Test Condition 3 (65 kts). (1994 Run 49, pts. 29-35.)
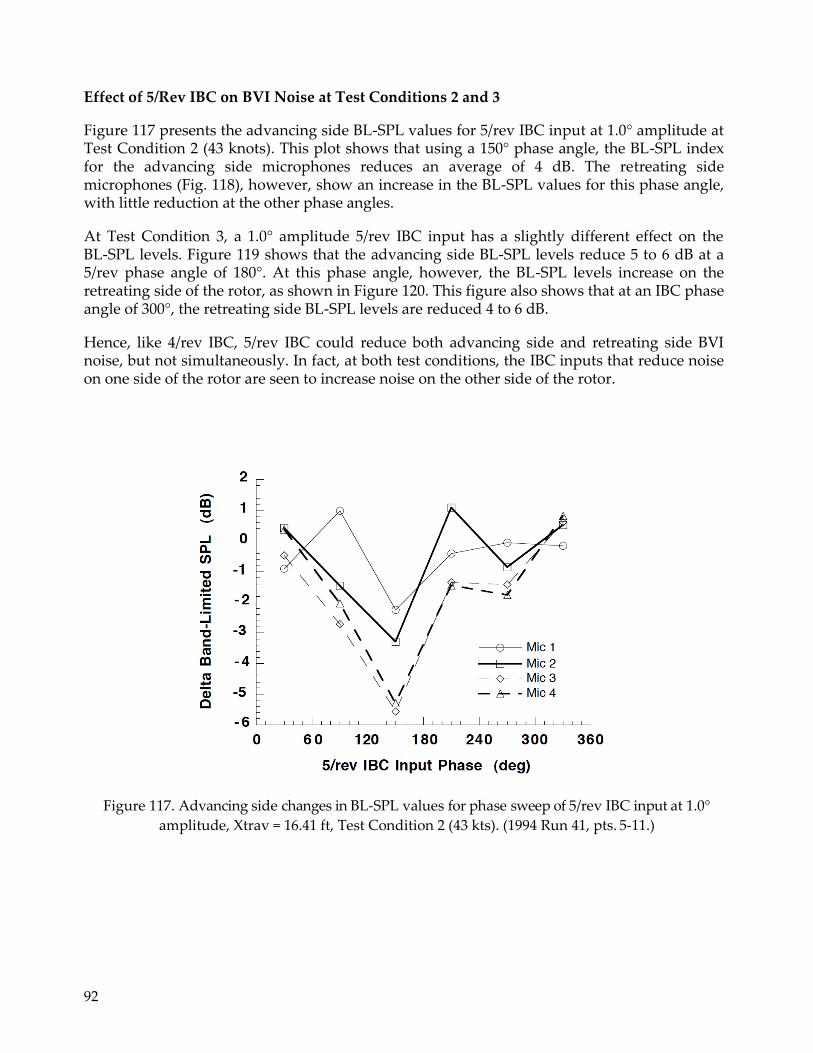
92
Effect of 5/Rev IBC on BVI Noise at Test Conditions 2 and 3
Figure 117 presents the advancing side BL-SPL values for 5/rev IBC input at 1.0° amplitude at Test Condition 2 (43 knots). This plot shows that using a 150° phase angle, the BL-SPL index for the advancing side microphones reduces an average of 4 dB. The retreating side microphones (Fig. 118), however, show an increase in the BL-SPL values for this phase angle, with little reduction at the other phase angles.
At Test Condition 3, a 1.0° amplitude 5/rev IBC input has a slightly different effect on the BL-SPL levels. Figure 119 shows that the advancing side BL-SPL levels reduce 5 to 6 dB at a 5/rev phase angle of 180°. At this phase angle, however, the BL-SPL levels increase on the retreating side of the rotor, as shown in Figure 120. This figure also shows that at an IBC phase angle of 300°, the retreating side BL-SPL levels are reduced 4 to 6 dB.
Hence, like 4/rev IBC, 5/rev IBC could reduce both advancing side and retreating side BVI noise, but not simultaneously. In fact, at both test conditions, the IBC inputs that reduce noise on one side of the rotor are seen to increase noise on the other side of the rotor.
Figure 117. Advancing side changes in BL-SPL values for phase sweep of 5/rev IBC input at 1.0°
amplitude, Xtrav = 16.41 ft, Test Condition 2 (43 kts). (1994 Run 41, pts. 5-11.)
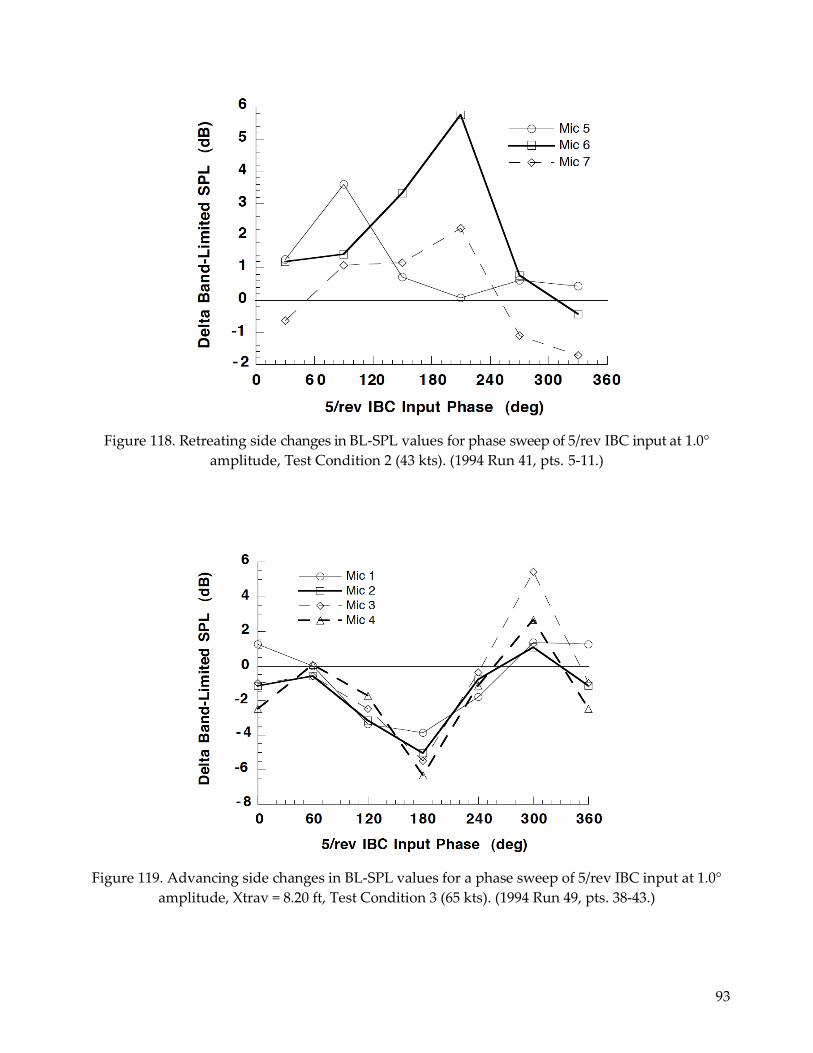
93
Figure 118. Retreating side changes in BL-SPL values for phase sweep of 5/rev IBC input at 1.0°
amplitude, Test Condition 2 (43 kts). (1994 Run 41, pts. 5-11.)
Figure 119. Advancing side changes in BL-SPL values for a phase sweep of 5/rev IBC input at 1.0°
amplitude, Xtrav = 8.20 ft, Test Condition 3 (65 kts). (1994 Run 49, pts. 38-43.)
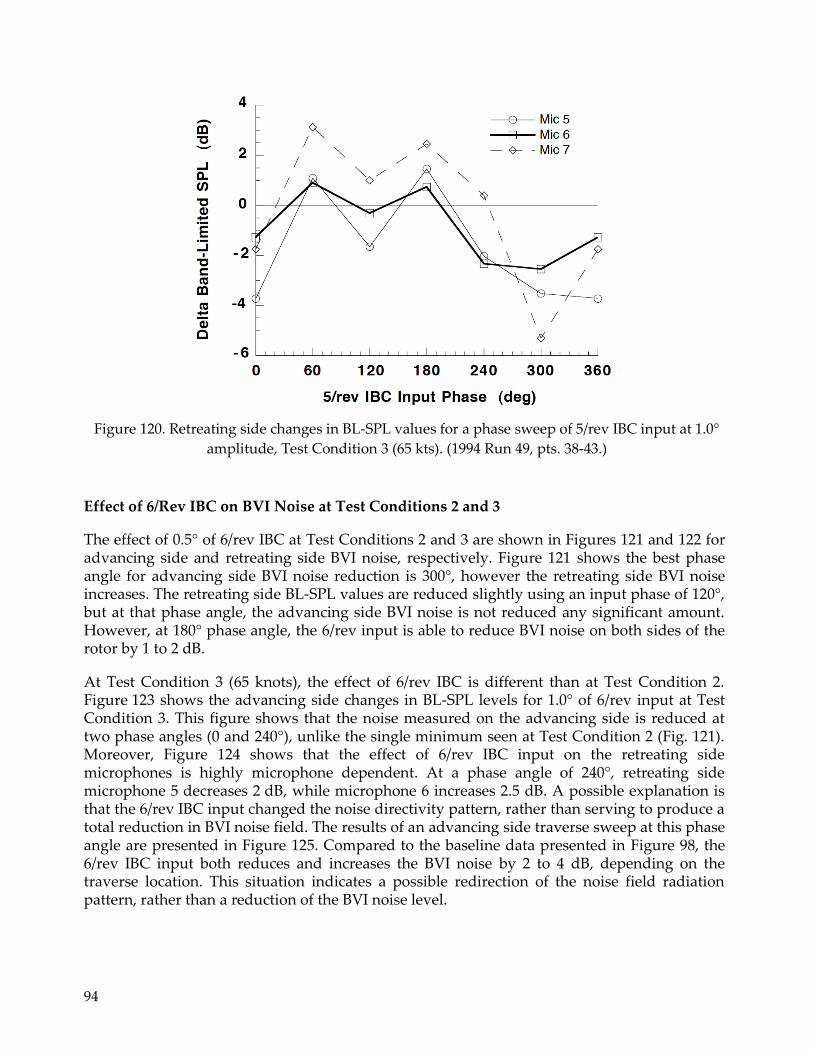
94
Figure 120. Retreating side changes in BL-SPL values for a phase sweep of 5/rev IBC input at 1.0°
amplitude, Test Condition 3 (65 kts). (1994 Run 49, pts. 38-43.)
Effect of 6/Rev IBC on BVI Noise at Test Conditions 2 and 3
The effect of 0.5° of 6/rev IBC at Test Conditions 2 and 3 are shown in Figures 121 and 122 for advancing side and retreating side BVI noise, respectively. Figure 121 shows the best phase angle for advancing side BVI noise reduction is 300°, however the retreating side BVI noise increases. The retreating side BL-SPL values are reduced slightly using an input phase of 120°, but at that phase angle, the advancing side BVI noise is not reduced any significant amount. However, at 180° phase angle, the 6/rev input is able to reduce BVI noise on both sides of the rotor by 1 to 2 dB.
At Test Condition 3 (65 knots), the effect of 6/rev IBC is different than at Test Condition 2. Figure 123 shows the advancing side changes in BL-SPL levels for 1.0° of 6/rev input at Test Condition 3. This figure shows that the noise measured on the advancing side is reduced at two phase angles (0 and 240°), unlike the single minimum seen at Test Condition 2 (Fig. 121). Moreover, Figure 124 shows that the effect of 6/rev IBC input on the retreating side microphones is highly microphone dependent. At a phase angle of 240°, retreating side microphone 5 decreases 2 dB, while microphone 6 increases 2.5 dB. A possible explanation is that the 6/rev IBC input changed the noise directivity pattern, rather than serving to produce a total reduction in BVI noise field. The results of an advancing side traverse sweep at this phase angle are presented in Figure 125. Compared to the baseline data presented in Figure 98, the 6/rev IBC input both reduces and increases the BVI noise by 2 to 4 dB, depending on the traverse location. This situation indicates a possible redirection of the noise field radiation pattern, rather than a reduction of the BVI noise level.
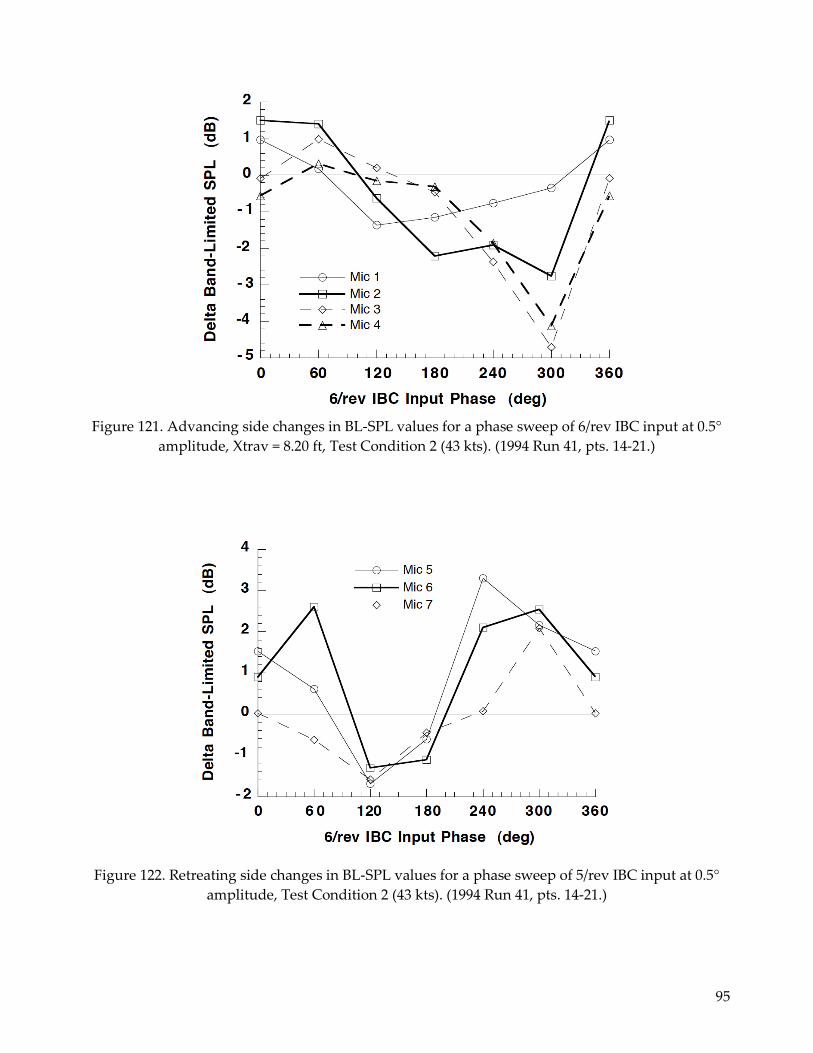
95
Figure 121. Advancing side changes in BL-SPL values for a phase sweep of 6/rev IBC input at 0.5°
amplitude, Xtrav = 8.20 ft, Test Condition 2 (43 kts). (1994 Run 41, pts. 14-21.)
Figure 122. Retreating side changes in BL-SPL values for a phase sweep of 5/rev IBC input at 0.5°
amplitude, Test Condition 2 (43 kts). (1994 Run 41, pts. 14-21.)
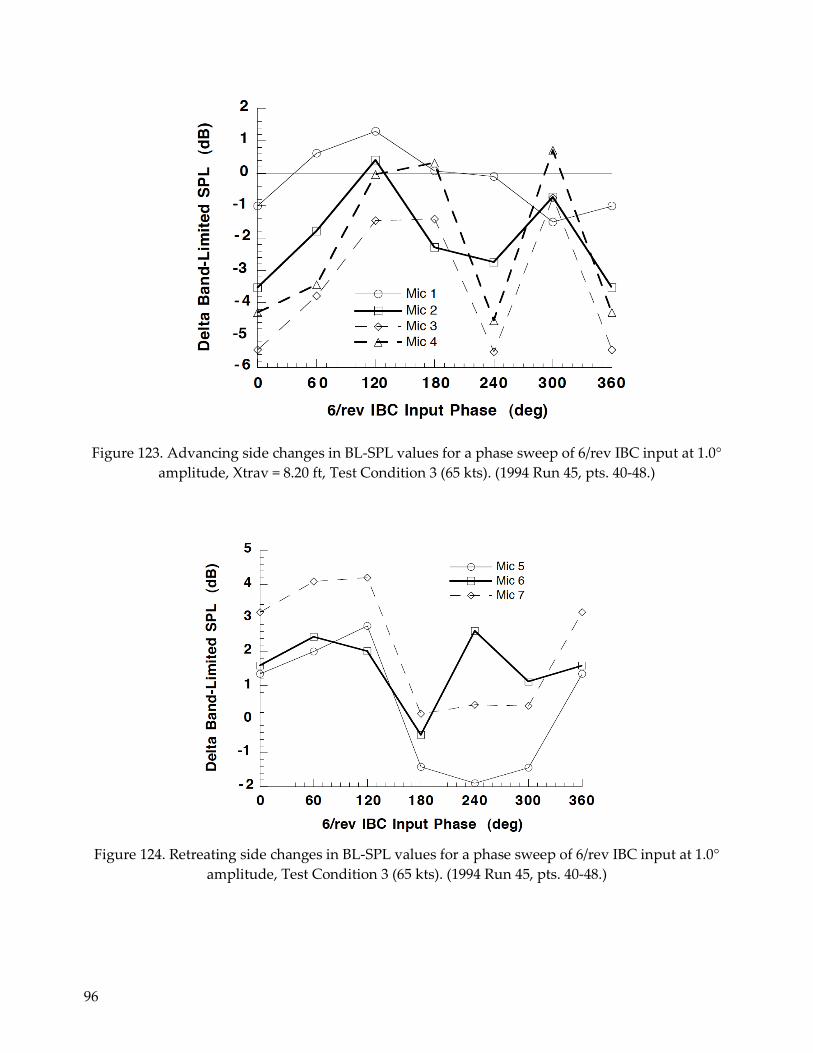
96
Figure 123. Advancing side changes in BL-SPL values for a phase sweep of 6/rev IBC input at 1.0°
amplitude, Xtrav = 8.20 ft, Test Condition 3 (65 kts). (1994 Run 45, pts. 40-48.)
Figure 124. Retreating side changes in BL-SPL values for a phase sweep of 6/rev IBC input at 1.0°
amplitude, Test Condition 3 (65 kts). (1994 Run 45, pts. 40-48.)
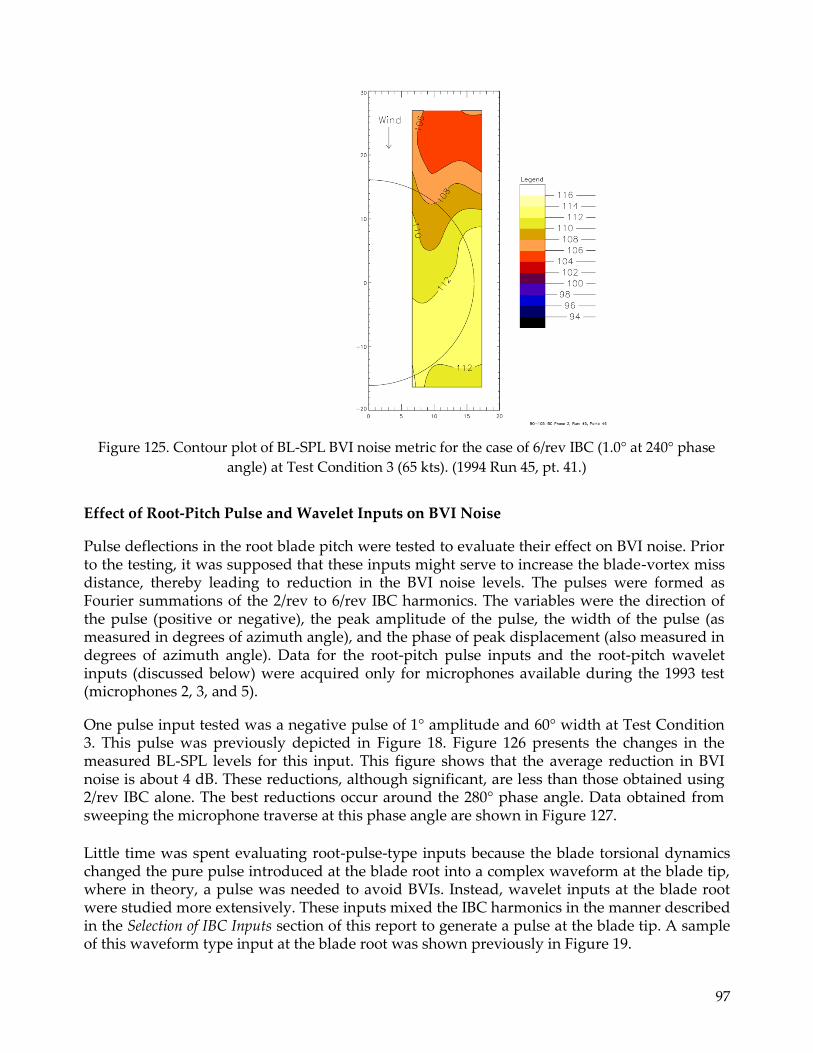
97
Figure 125. Contour plot of BL-SPL BVI noise metric for the case of 6/rev IBC (1.0° at 240° phase
angle) at Test Condition 3 (65 kts). (1994 Run 45, pt. 41.)
Effect of Root-Pitch Pulse and Wavelet Inputs on BVI Noise
Pulse deflections in the root blade pitch were tested to evaluate their effect on BVI noise. Prior to the testing, it was supposed that these inputs might serve to increase the blade-vortex miss distance, thereby leading to reduction in the BVI noise levels. The pulses were formed as Fourier summations of the 2/rev to 6/rev IBC harmonics. The variables were the direction of the pulse (positive or negative), the peak amplitude of the pulse, the width of the pulse (as measured in degrees of azimuth angle), and the phase of peak displacement (also measured in degrees of azimuth angle). Data for the root-pitch pulse inputs and the root-pitch wavelet inputs (discussed below) were acquired only for microphones available during the 1993 test (microphones 2, 3, and 5).
One pulse input tested was a negative pulse of 1° amplitude and 60° width at Test Condition 3. This pulse was previously depicted in Figure 18. Figure 126 presents the changes in the measured BL-SPL levels for this input. This figure shows that the average reduction in BVI noise is about 4 dB. These reductions, although significant, are less than those obtained using 2/rev IBC alone. The best reductions occur around the 280° phase angle. Data obtained from sweeping the microphone traverse at this phase angle are shown in Figure 127.
Little time was spent evaluating root-pulse-type inputs because the blade torsional dynamics changed the pure pulse introduced at the blade root into a complex waveform at the blade tip, where in theory, a pulse was needed to avoid BVIs. Instead, wavelet inputs at the blade root were studied more extensively. These inputs mixed the IBC harmonics in the manner described in the Selection of IBC Inputs section of this report to generate a pulse at the blade tip. A sample of this waveform type input at the blade root was shown previously in Figure 19.
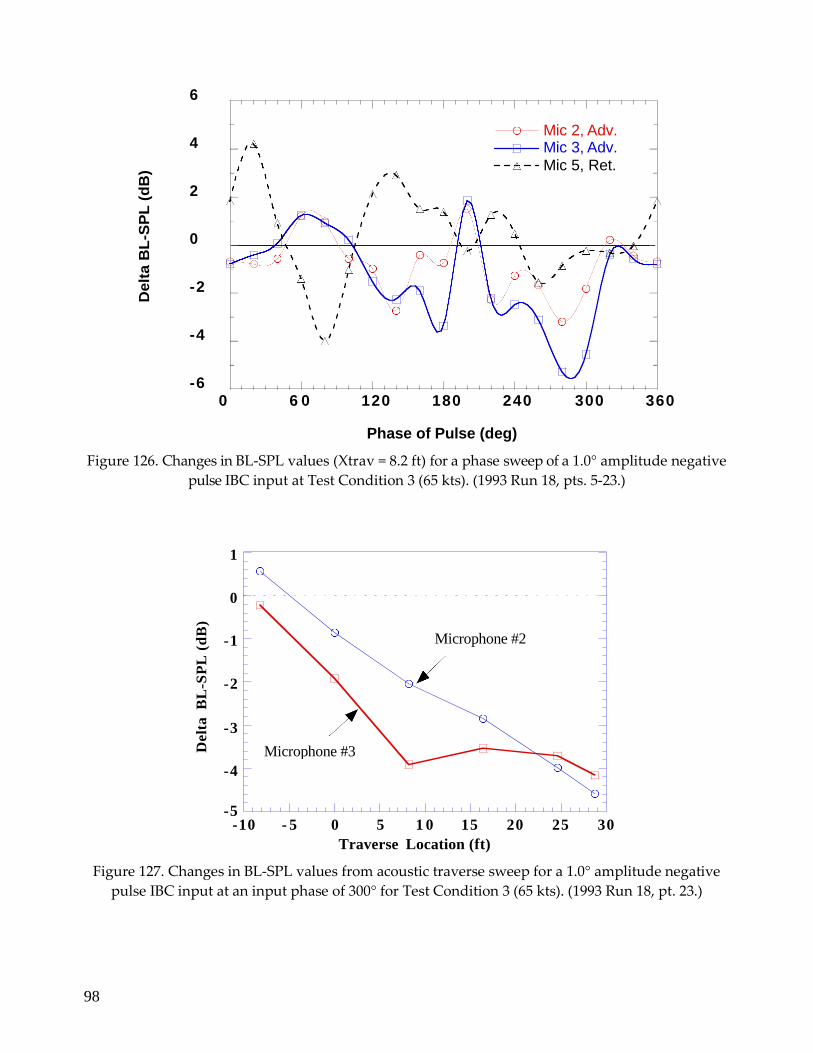
98
6
4
2
0
-2
-4
-6 0 6 0 120 180 240 300 360
Phase of Pulse (deg)
Figure 126. Changes in BL-SPL values (Xtrav = 8.2 ft) for a phase sweep of a 1.0° amplitude negative
pulse IBC input at Test Condition 3 (65 kts). (1993 Run 18, pts. 5-23.)
1
0
-1
-2
-3
-4
-5
-10 - 5 0 5 1 0 15 20 25 30
Traverse Location (ft)
Figure 127. Changes in BL-SPL values from acoustic traverse sweep for a 1.0° amplitude negative
pulse IBC input at an input phase of 300° for Test Condition 3 (65 kts). (1993 Run 18, pt. 23.)
Mic 2, Adv. Mic 3, Adv. Mic 5, Ret.
Microphone #2
Microphone #3
Delt
a B
L-S
PL
(d
B)
Delt
a B
L-S
PL
(d
B)
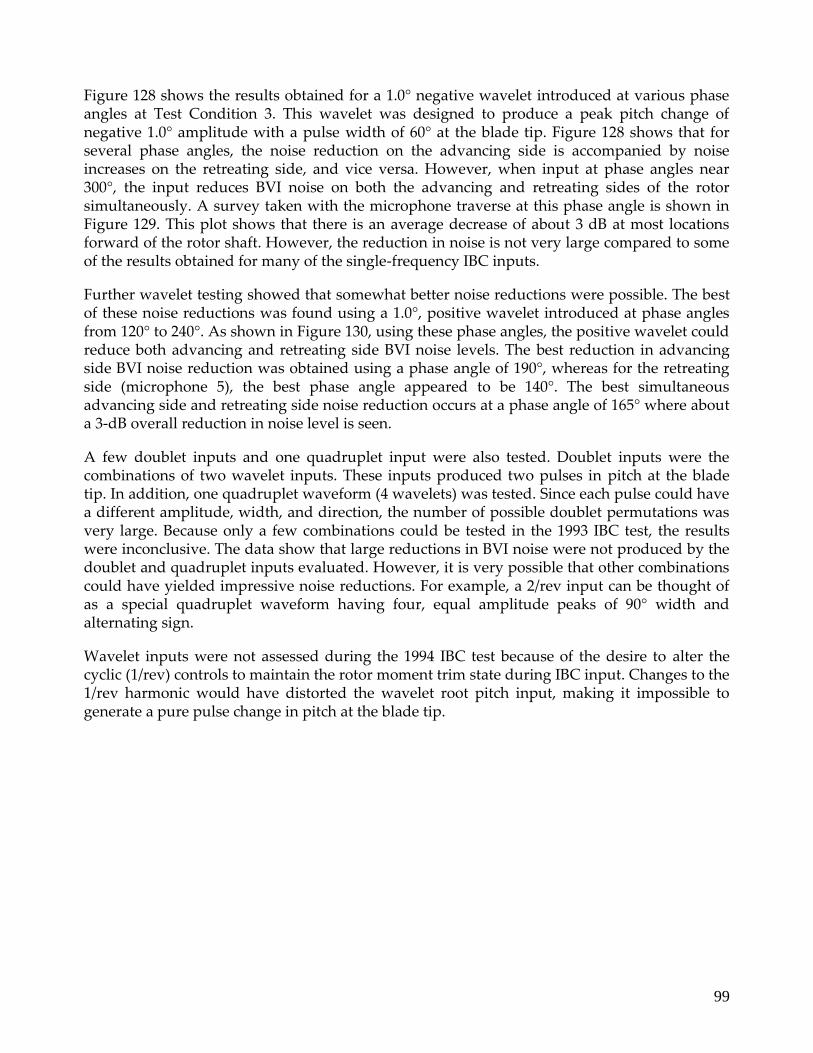
99
Figure 128 shows the results obtained for a 1.0° negative wavelet introduced at various phase angles at Test Condition 3. This wavelet was designed to produce a peak pitch change of negative 1.0° amplitude with a pulse width of 60° at the blade tip. Figure 128 shows that for several phase angles, the noise reduction on the advancing side is accompanied by noise increases on the retreating side, and vice versa. However, when input at phase angles near 300°, the input reduces BVI noise on both the advancing and retreating sides of the rotor simultaneously. A survey taken with the microphone traverse at this phase angle is shown in Figure 129. This plot shows that there is an average decrease of about 3 dB at most locations forward of the rotor shaft. However, the reduction in noise is not very large compared to some of the results obtained for many of the single-frequency IBC inputs.
Further wavelet testing showed that somewhat better noise reductions were possible. The best of these noise reductions was found using a 1.0°, positive wavelet introduced at phase angles from 120° to 240°. As shown in Figure 130, using these phase angles, the positive wavelet could reduce both advancing and retreating side BVI noise levels. The best reduction in advancing side BVI noise reduction was obtained using a phase angle of 190°, whereas for the retreating side (microphone 5), the best phase angle appeared to be 140°. The best simultaneous advancing side and retreating side noise reduction occurs at a phase angle of 165° where about a 3-dB overall reduction in noise level is seen.
A few doublet inputs and one quadruplet input were also tested. Doublet inputs were the combinations of two wavelet inputs. These inputs produced two pulses in pitch at the blade tip. In addition, one quadruplet waveform (4 wavelets) was tested. Since each pulse could have a different amplitude, width, and direction, the number of possible doublet permutations was very large. Because only a few combinations could be tested in the 1993 IBC test, the results were inconclusive. The data show that large reductions in BVI noise were not produced by the doublet and quadruplet inputs evaluated. However, it is very possible that other combinations could have yielded impressive noise reductions. For example, a 2/rev input can be thought of as a special quadruplet waveform having four, equal amplitude peaks of 90° width and alternating sign.
Wavelet inputs were not assessed during the 1994 IBC test because of the desire to alter the cyclic (1/rev) controls to maintain the rotor moment trim state during IBC input. Changes to the 1/rev harmonic would have distorted the wavelet root pitch input, making it impossible to generate a pure pulse change in pitch at the blade tip.
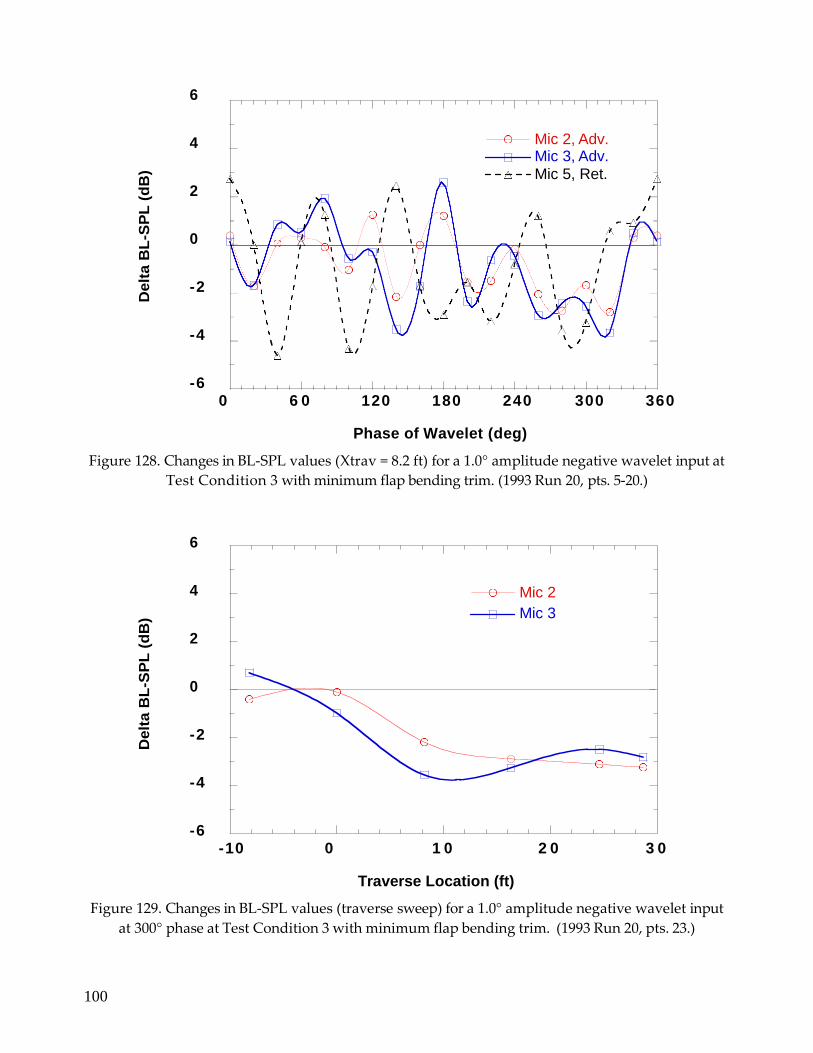
100
6
4
2
0
-2
-4
-6 0 6 0 120 180 240 300 360
Phase of Wavelet (deg)
Figure 128. Changes in BL-SPL values (Xtrav = 8.2 ft) for a 1.0° amplitude negative wavelet input at
Test Condition 3 with minimum flap bending trim. (1993 Run 20, pts. 5-20.)
6
4
2
0
-2
-4
-6 -10 0 1 0 2 0 3 0
Traverse Location (ft)
Figure 129. Changes in BL-SPL values (traverse sweep) for a 1.0° amplitude negative wavelet input
at 300° phase at Test Condition 3 with minimum flap bending trim. (1993 Run 20, pts. 23.)
Mic 2, Adv. Mic 3, Adv. Mic 5, Ret.
Mic 2
Mic 3
Delt
a B
L-S
PL
(d
B)
Delt
a B
L-S
PL
(d
B)
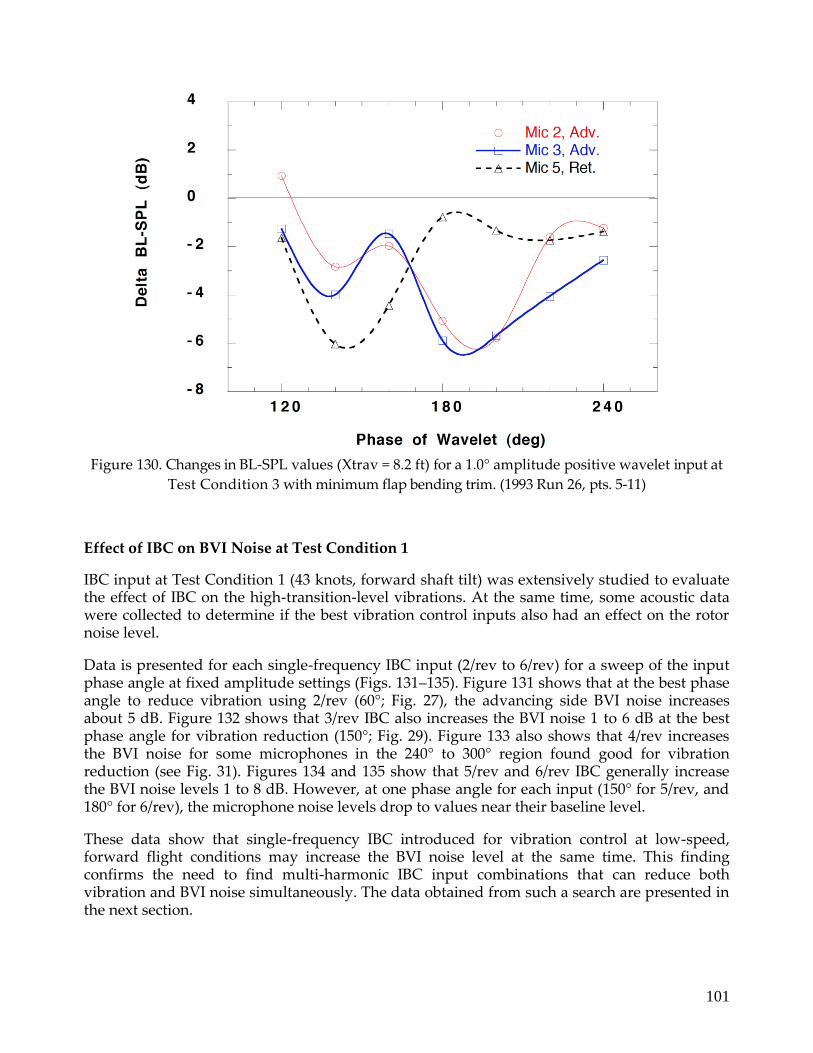
101
Figure 130. Changes in BL-SPL values (Xtrav = 8.2 ft) for a 1.0° amplitude positive wavelet input at
Test Condition 3 with minimum flap bending trim. (1993 Run 26, pts. 5-11)
Effect of IBC on BVI Noise at Test Condition 1
IBC input at Test Condition 1 (43 knots, forward shaft tilt) was extensively studied to evaluate the effect of IBC on the high-transition-level vibrations. At the same time, some acoustic data were collected to determine if the best vibration control inputs also had an effect on the rotor noise level.
Data is presented for each single-frequency IBC input (2/rev to 6/rev) for a sweep of the input phase angle at fixed amplitude settings (Figs. 131–135). Figure 131 shows that at the best phase angle to reduce vibration using 2/rev (60°; Fig. 27), the advancing side BVI noise increases about 5 dB. Figure 132 shows that 3/rev IBC also increases the BVI noise 1 to 6 dB at the best phase angle for vibration reduction (150°; Fig. 29). Figure 133 also shows that 4/rev increases the BVI noise for some microphones in the 240° to 300° region found good for vibration reduction (see Fig. 31). Figures 134 and 135 show that 5/rev and 6/rev IBC generally increase the BVI noise levels 1 to 8 dB. However, at one phase angle for each input (150° for 5/rev, and 180° for 6/rev), the microphone noise levels drop to values near their baseline level.
These data show that single-frequency IBC introduced for vibration control at low-speed, forward flight conditions may increase the BVI noise level at the same time. This finding confirms the need to find multi-harmonic IBC input combinations that can reduce both vibration and BVI noise simultaneously. The data obtained from such a search are presented in the next section.
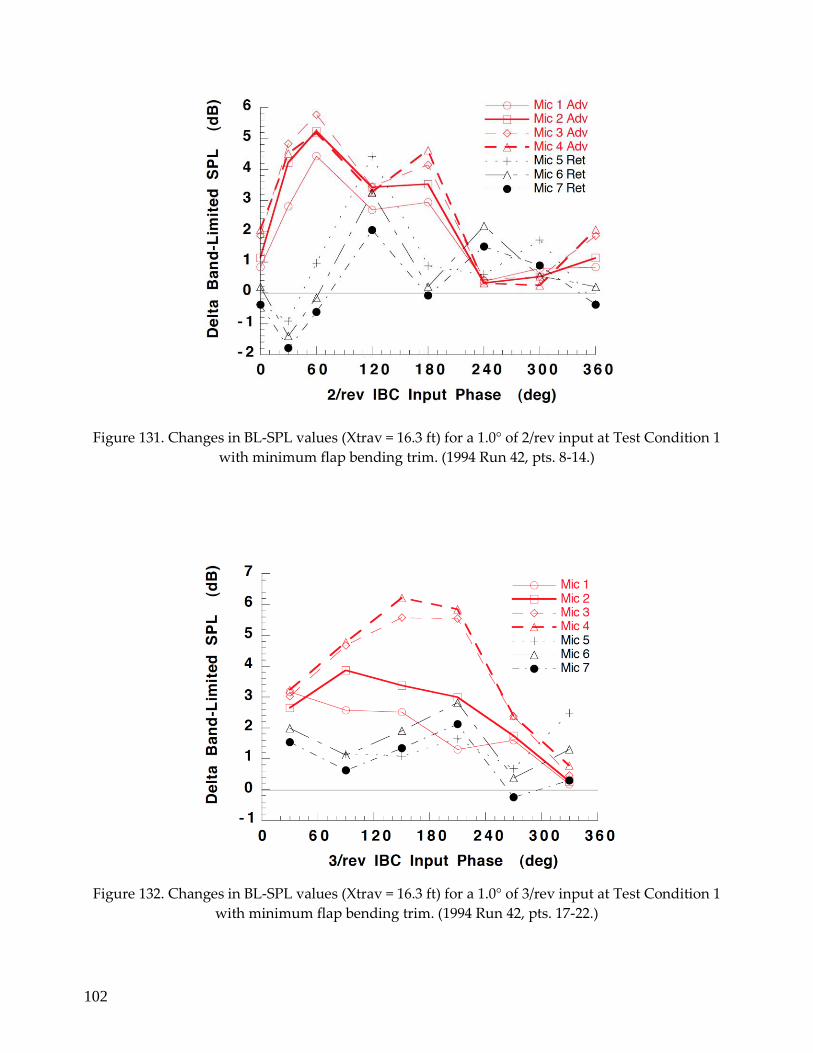
102
Figure 131. Changes in BL-SPL values (Xtrav = 16.3 ft) for a 1.0° of 2/rev input at Test Condition 1
with minimum flap bending trim. (1994 Run 42, pts. 8-14.)
Figure 132. Changes in BL-SPL values (Xtrav = 16.3 ft) for a 1.0° of 3/rev input at Test Condition 1
with minimum flap bending trim. (1994 Run 42, pts. 17-22.)
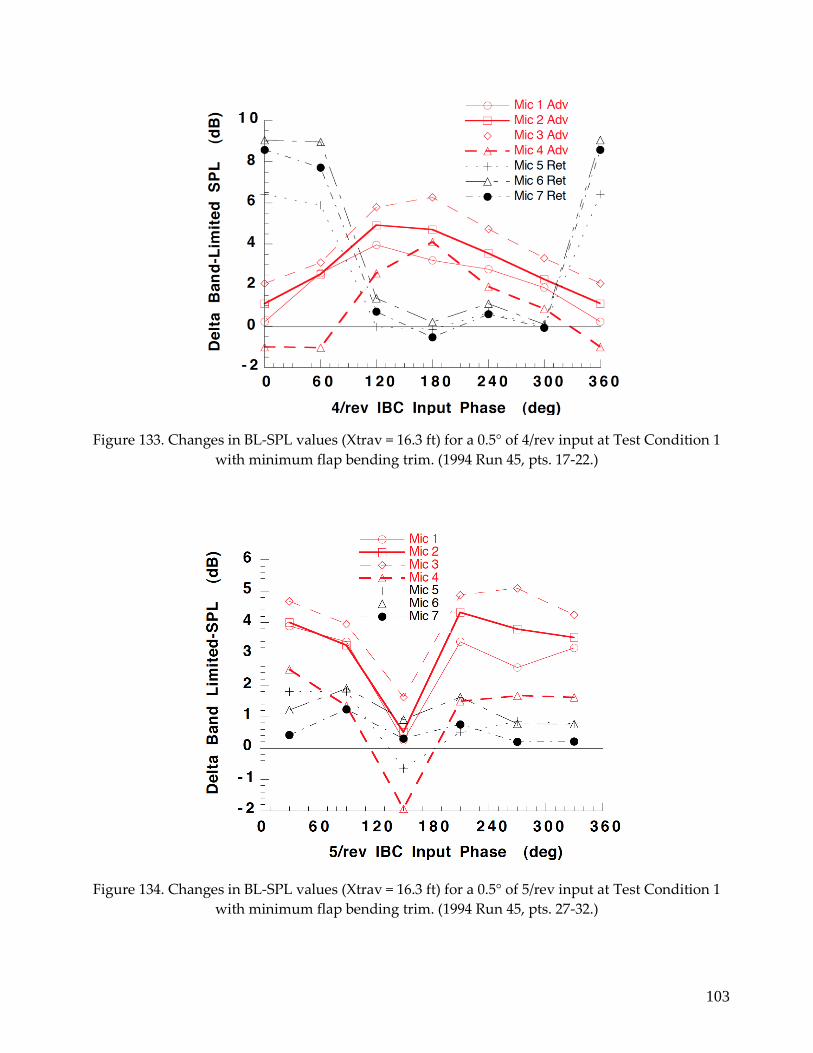
103
Figure 133. Changes in BL-SPL values (Xtrav = 16.3 ft) for a 0.5° of 4/rev input at Test Condition 1
with minimum flap bending trim. (1994 Run 45, pts. 17-22.)
Figure 134. Changes in BL-SPL values (Xtrav = 16.3 ft) for a 0.5° of 5/rev input at Test Condition 1
with minimum flap bending trim. (1994 Run 45, pts. 27-32.)
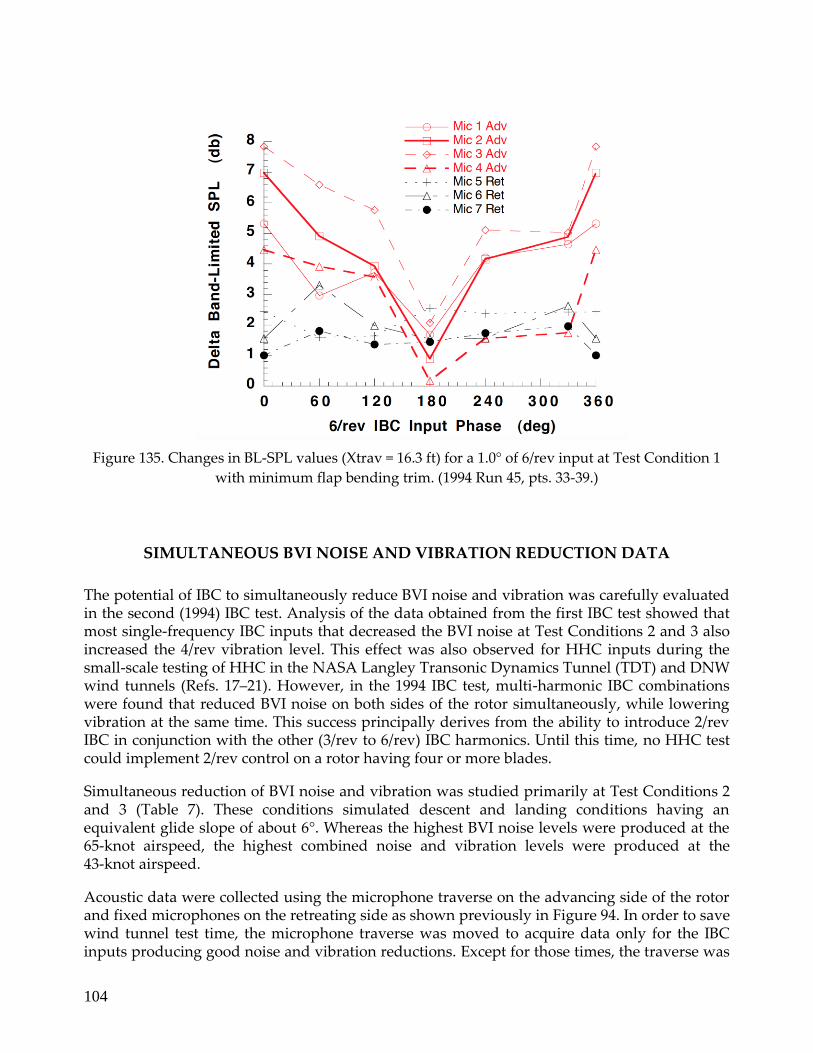
104
Figure 135. Changes in BL-SPL values (Xtrav = 16.3 ft) for a 1.0° of 6/rev input at Test Condition 1
with minimum flap bending trim. (1994 Run 45, pts. 33-39.)
SIMULTANEOUS BVI NOISE AND VIBRATION REDUCTION DATA
The potential of IBC to simultaneously reduce BVI noise and vibration was carefully evaluated in the second (1994) IBC test. Analysis of the data obtained from the first IBC test showed that most single-frequency IBC inputs that decreased the BVI noise at Test Conditions 2 and 3 also increased the 4/rev vibration level. This effect was also observed for HHC inputs during the small-scale testing of HHC in the NASA Langley Transonic Dynamics Tunnel (TDT) and DNW wind tunnels (Refs. 17–21). However, in the 1994 IBC test, multi-harmonic IBC combinations were found that reduced BVI noise on both sides of the rotor simultaneously, while lowering vibration at the same time. This success principally derives from the ability to introduce 2/rev IBC in conjunction with the other (3/rev to 6/rev) IBC harmonics. Until this time, no HHC test could implement 2/rev control on a rotor having four or more blades.
Simultaneous reduction of BVI noise and vibration was studied primarily at Test Conditions 2 and 3 (Table 7). These conditions simulated descent and landing conditions having an equivalent glide slope of about 6°. Whereas the highest BVI noise levels were produced at the 65-knot airspeed, the highest combined noise and vibration levels were produced at the 43-knot airspeed.
Acoustic data were collected using the microphone traverse on the advancing side of the rotor and fixed microphones on the retreating side as shown previously in Figure 94. In order to save wind tunnel test time, the microphone traverse was moved to acquire data only for the IBC inputs producing good noise and vibration reductions. Except for those times, the traverse was
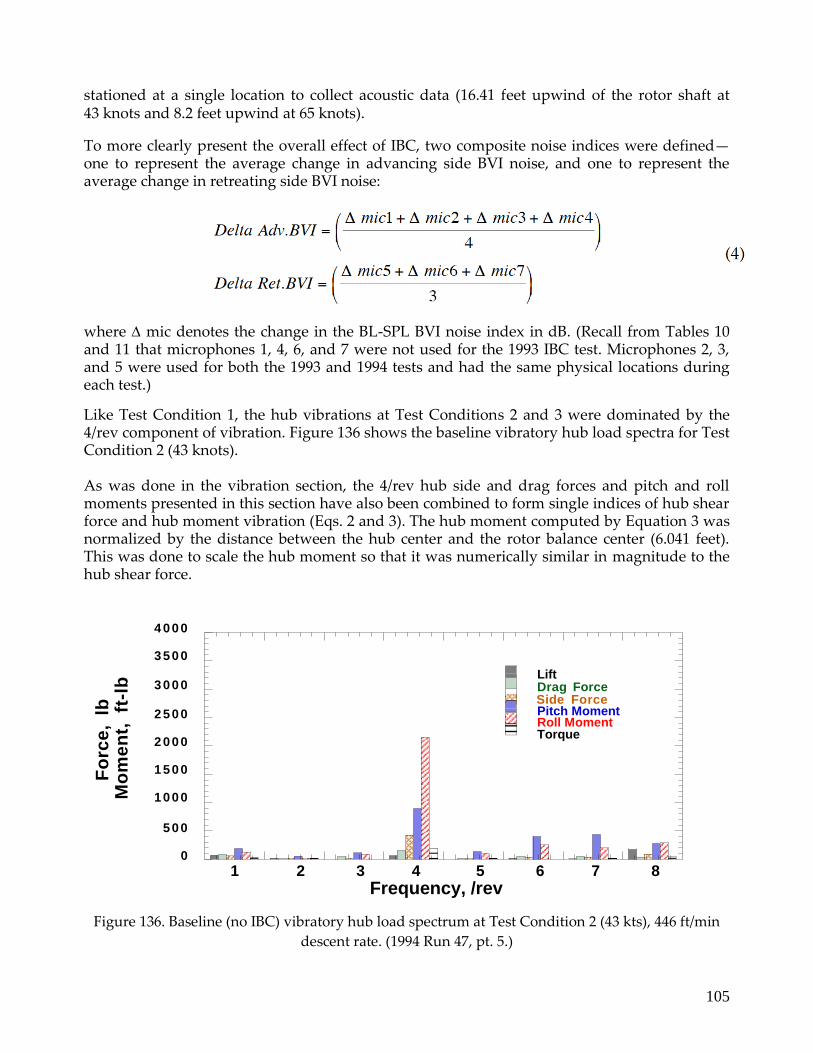
105
stationed at a single location to collect acoustic data (16.41 feet upwind of the rotor shaft at 43 knots and 8.2 feet upwind at 65 knots).
To more clearly present the overall effect of IBC, two composite noise indices were defined— one to represent the average change in advancing side BVI noise, and one to represent the average change in retreating side BVI noise:
where mic denotes the change in the BL-SPL BVI noise index in dB. (Recall from Tables 10 and 11 that microphones 1, 4, 6, and 7 were not used for the 1993 IBC test. Microphones 2, 3, and 5 were used for both the 1993 and 1994 tests and had the same physical locations during each test.)
Like Test Condition 1, the hub vibrations at Test Conditions 2 and 3 were dominated by the 4/rev component of vibration. Figure 136 shows the baseline vibratory hub load spectra for Test Condition 2 (43 knots). As was done in the vibration section, the 4/rev hub side and drag forces and pitch and roll moments presented in this section have also been combined to form single indices of hub shear force and hub moment vibration (Eqs. 2 and 3). The hub moment computed by Equation 3 was normalized by the distance between the hub center and the rotor balance center (6.041 feet). This was done to scale the hub moment so that it was numerically similar in magnitude to the hub shear force.
4 0 0 0
3 5 0 0
3 0 0 0
2 5 0 0
2 0 0 0
1 5 0 0
1 0 0 0
5 0 0
0
1 2 3 4 5 6 7 8
Frequency, /rev
Figure 136. Baseline (no IBC) vibratory hub load spectrum at Test Condition 2 (43 kts), 446 ft/min
descent rate. (1994 Run 47, pt. 5.)
Lift Drag Force
Side Force Pitch Moment Roll Moment Torque
Fo
rce
, lb
M
om
en
t, ft
-lb

106
Effect of 2/Rev IBC on Noise and Vibration at Test Conditions 2 and 3
Figure 137 presents a pair of plots that show the effect of 1.5° of 2/rev IBC on the 4/rev hub loads and BVI noise at Test Condition 2 (43 knots). The upper plot shows the change in the 4/rev vibratory hub load vibration indices while the lower plot shows the change in the BVI noise indices. For the vibration, the actual units of load change in units of lbs or ft-lbs are shown in the upper plot. The baseline vibration levels are shown in the plot legend for each index.
The top plot of Figure 137 shows that 2/rev IBC reduces the 4/rev hub forces, moments, and torque together at 0° phase angle. The 4/rev hub shears and moments reduce about 40 percent at the 60° IBC input phase angle. The 4/rev lift force, though small, is increased at every phase angle.
The lower plot of Figure 137 shows that the advancing side BVI noise is reduced at all IBC input phase angles. Therefore, the best 2/rev phase angle for BVI noise and vibration reduction is 60°. At this phase angle, the average advancing side and retreating side BVI noise are both reduced by 5 to 6 dB, and the 4/rev hub shears and moments are also reduced. However, the 4/rev lift force, 4/rev torque, and retreating side BVI noise are increased.
At Test Condition 3 (65 knots), 2/rev IBC simultaneously reduces all vibration indices and the advancing side BVI noise by 8 dB, as shown in Figure 138. However, for this same input, the retreating side BVI noise index increases by 5 dB. Simultaneous reduction of BVI noise on both sides of the rotor is seen for several phase angles (lower plot of Figure 138). However, the top plot of Figure 138 shows that at these phase angles (90° to 300°), the 4/rev vibration indices generally increase. At a phase angle of approximately 130°, the BVI noise on both sides of the rotor is driven down an average of 5 dB without increasing the 4/rev hub load vibrations.
These data show that finding a 2/rev input phase angle to reduce noise on both sides of the rotor (or all around the radiation field) is more difficult than finding an IBC input to reduce noise on only one side of the rotor. Moreover, finding an IBC input to reduce noise on both sides of the rotor and vibration simultaneously is more difficult.
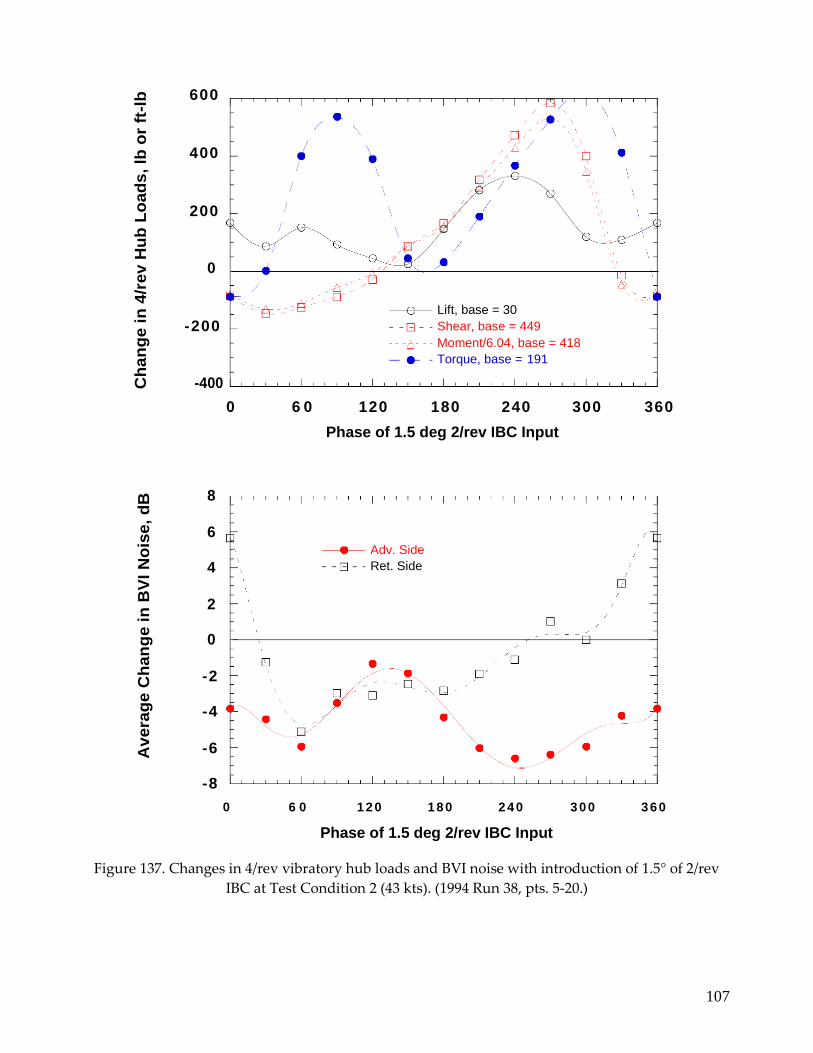
107
600
400
200
0
-200
-400
0 6 0 120 180 240 300 360
Phase of 1.5 deg 2/rev IBC Input
8
6
4
2
0
-2
-4
-6
-8
0 6 0 1 2 0 1 8 0 2 4 0 3 0 0 3 6 0
Phase of 1.5 deg 2/rev IBC Input
Figure 137. Changes in 4/rev vibratory hub loads and BVI noise with introduction of 1.5° of 2/rev
IBC at Test Condition 2 (43 kts). (1994 Run 38, pts. 5-20.)
Lift, base = 30
Shear, base = 449
Moment/6.04, base = 418
Torque, base = 191
Adv. Side
Ret. Side
Ch
an
ge
in
4/r
ev
Hu
b L
oa
ds
, lb
or
ft-l
b
Av
era
ge
Ch
an
ge
in
BV
I N
ois
e,
dB
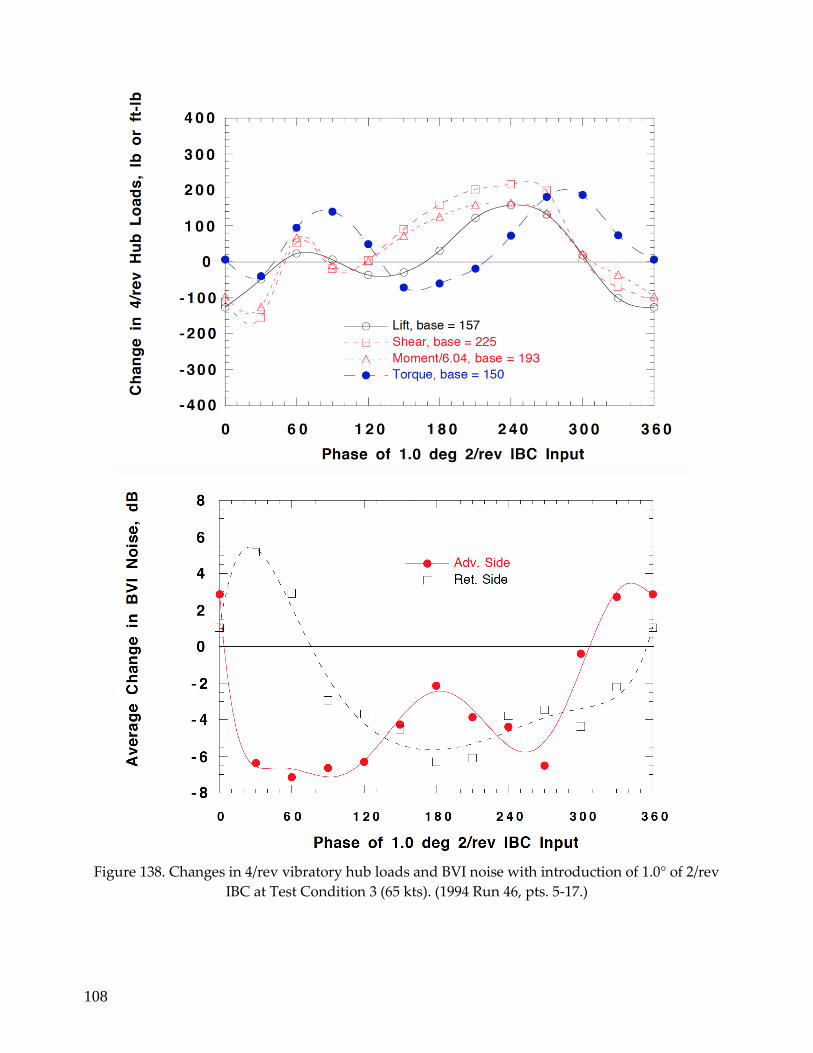
108
Figure 138. Changes in 4/rev vibratory hub loads and BVI noise with introduction of 1.0° of 2/rev
IBC at Test Condition 3 (65 kts). (1994 Run 46, pts. 5-17.)

109
Effect of 3/Rev IBC on Noise and Vibration at Test Conditions 2 and 3
Simultaneous noise and vibration reductions were not observed for 3/rev IBC input at Test Condition 2 (43 knots). The top plot of Figure 139 shows that 1.0° of 3/rev IBC input generally increases the 4/rev vibratory hub loads at most phase angles. However, between 120° and 180° phase input, the 4/rev vibration indices decrease. As shown by the lower plot of Figure 139, for these phase angles the advancing side BVI noise is reduced an average of 4 dB, but the retreating side BVI noise is increased 4 dB. At the other phase angles, the BVI noise levels are reduced by about 4 dB on both sides of the rotor. However, at those phase angles, the 4/rev vibratory hub loads are substantially increased.
The effect of 0.5° of 3/rev IBC at Test Condition 3 (65 knots) is shown in Figure 140. Comparing the effect on the 4/rev vibratory hub loads to that shown in Figure 139 for 43 knots (although at 1.0° input), shows that the vibrations are lowest at approximately the same phase angle (150°). However, only the 4/rev lift vibration is reduced at this phase angle; the other three indices remain at their baseline levels. The lower plot of Figure 140 shows that the advancing and retreating side BVI noise indices are not reduced appreciably at the same time for any single 3/rev IBC input. At the best 3/rev phase angle for advancing side BVI noise suppression at 65 knots (140°), the retreating side BVI noise is not decreased. Yet, at this phase angle, 3/rev IBC simultaneously reduces the 4/rev lift vibration and the advancing side BVI noise but does not increase the other vibration components or the retreating side BVI noise.
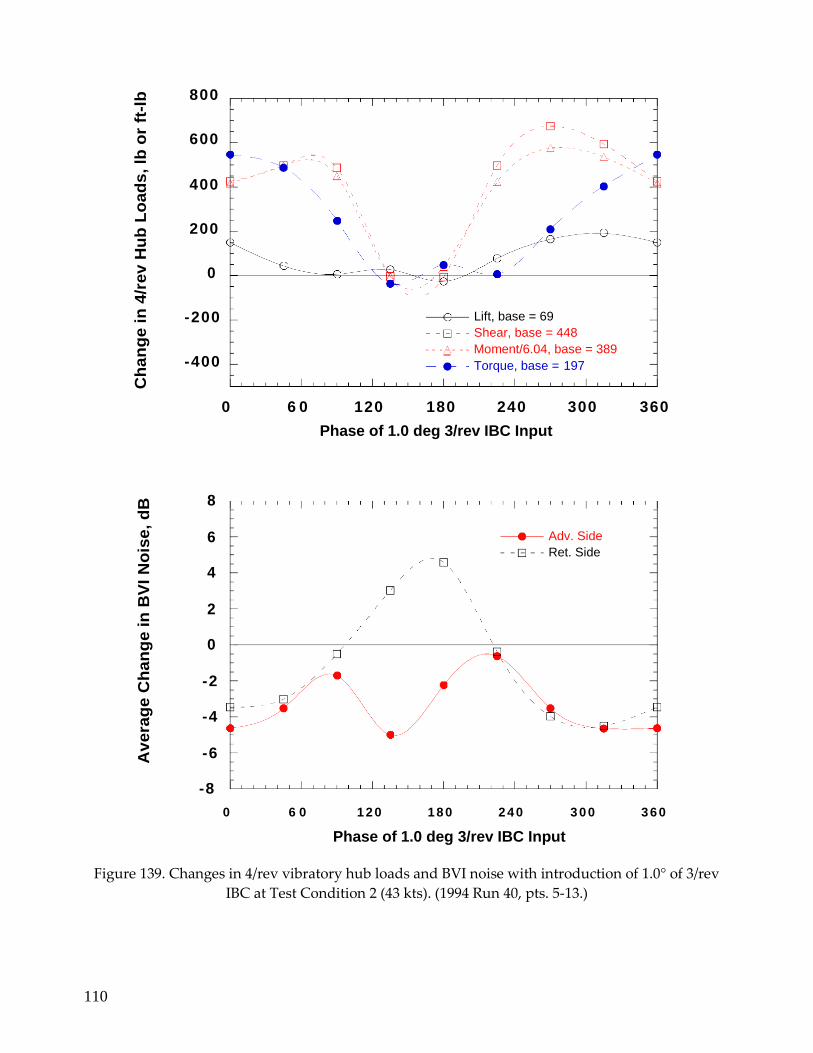
110
800
600
400
200
0
-200
-400
0 6 0 120 180 240 300 360
Phase of 1.0 deg 3/rev IBC Input
8
6
4
2
0
-2
-4
-6
-8
0 6 0 1 2 0 1 8 0 2 4 0 3 0 0 3 6 0
Phase of 1.0 deg 3/rev IBC Input
Figure 139. Changes in 4/rev vibratory hub loads and BVI noise with introduction of 1.0° of 3/rev
IBC at Test Condition 2 (43 kts). (1994 Run 40, pts. 5-13.)
Lift, base = 69
Shear, base = 448
Moment/6.04, base = 389
Torque, base = 197
Adv. Side
Ret. Side
Ch
an
ge
in
4/r
ev
Hu
b L
oa
ds
, lb
or
ft-l
b
Av
era
ge
Ch
an
ge
in
BV
I N
ois
e,
dB
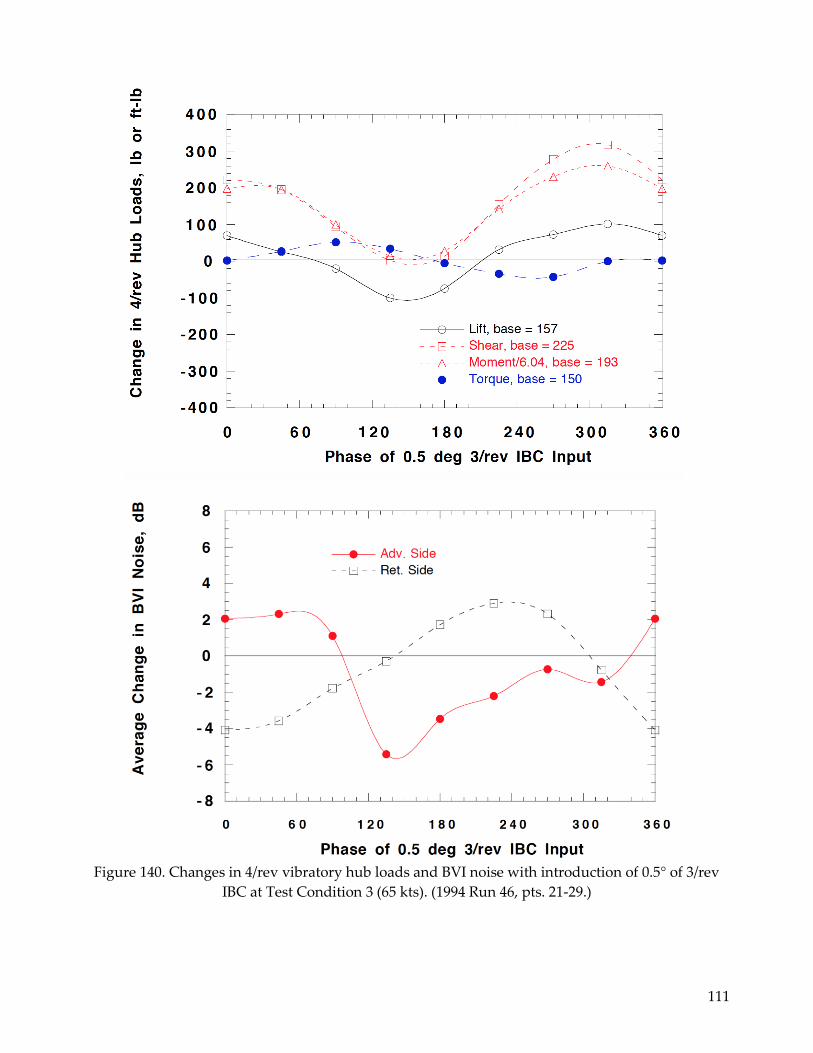
111
Figure 140. Changes in 4/rev vibratory hub loads and BVI noise with introduction of 0.5° of 3/rev
IBC at Test Condition 3 (65 kts). (1994 Run 46, pts. 21-29.)

112
Effect of 4/Rev IBC on Noise and Vibration at Test Conditions 2 and 3
The effect of 0.5° of 4/rev IBC input on BVI noise and vibration at Test Condition 2 (43 knots) is shown in Figure 141. The top plot shows that the effect of IBC on the 4/rev hub vibrations is similar, though not identical, to that seen applying 4/rev IBC at Test Condition 1 (Fig. 31). At an IBC input phase angle of 240°, significant reductions in the 4/rev hub shears and moments are shown, but not the 4/rev torque and lift force. The bottom plot of Figure 141 shows that at the 240° phase angle, the noise is not reduced. Although the noise is reduced by 2 to 3 dB on both sides of the rotor for a phase angle of 90°, the 4/rev vibratory loads are significantly increased for that input.
Figure 142 shows the effect of 1.0° of 4/rev IBC at Test Condition 3 (65 knots). The top plot shows increased vibration at all phase angles. However, a polar plot of the 4/rev pitch moment (Fig. 143) shows that the 1.0° input is much too high and over-drove the system. Figure 143 indicates that the optimal phase angle to suppress the vibration is approximately 230°. At that phase angle, the bottom plot of Figure 142 shows that the retreating side noise decreases 5 dB; but with 1.0° input. The advancing side noise is unaffected at 240°. The bottom plot also shows that either the advancing side BVI or the retreating side BVI noise can be reduced (up to 6 dB for 1.0° input), but not at the same IBC input phase angle. Hence, it appears that 4/rev IBC, input singly, cannot simultaneously reduce vibration and noise on both sides of the rotor.
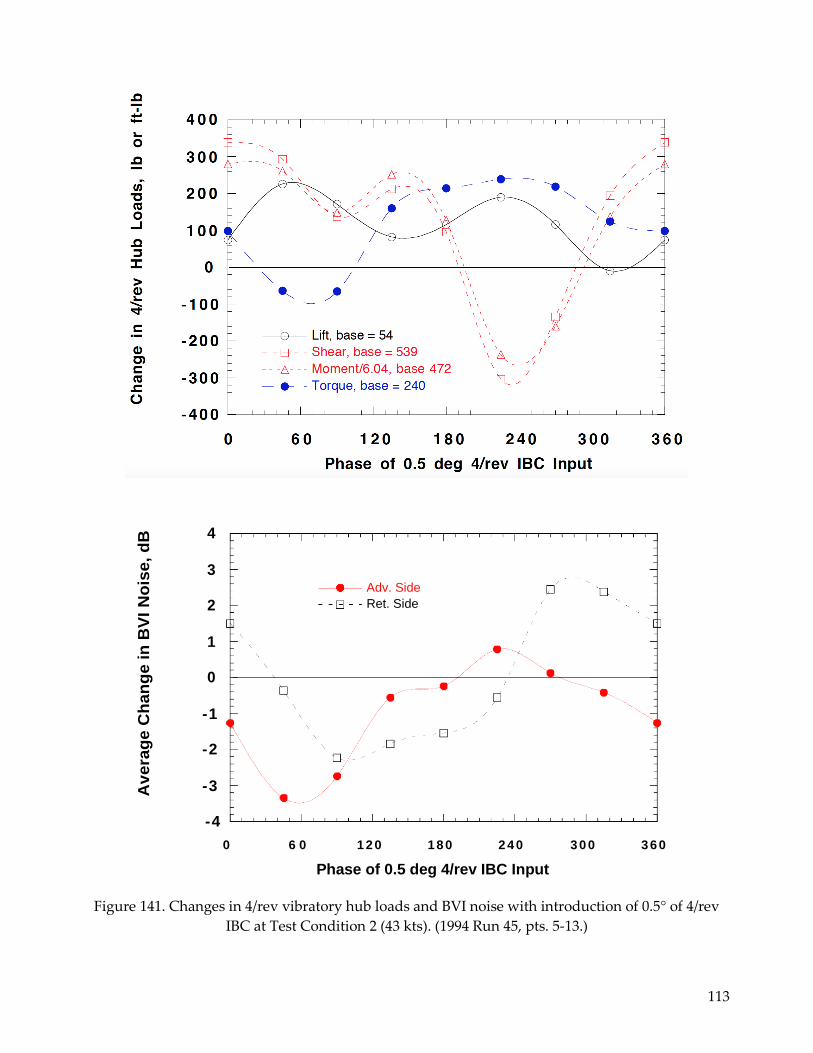
113
4
3
2
1
0
-1
-2
-3
-4
0 6 0 1 2 0 1 8 0 2 4 0 3 0 0 3 6 0
Phase of 0.5 deg 4/rev IBC Input
Figure 141. Changes in 4/rev vibratory hub loads and BVI noise with introduction of 0.5° of 4/rev
IBC at Test Condition 2 (43 kts). (1994 Run 45, pts. 5-13.)
Adv. Side
Ret. Side
Av
era
ge
Ch
an
ge
in
BV
I N
ois
e,
dB
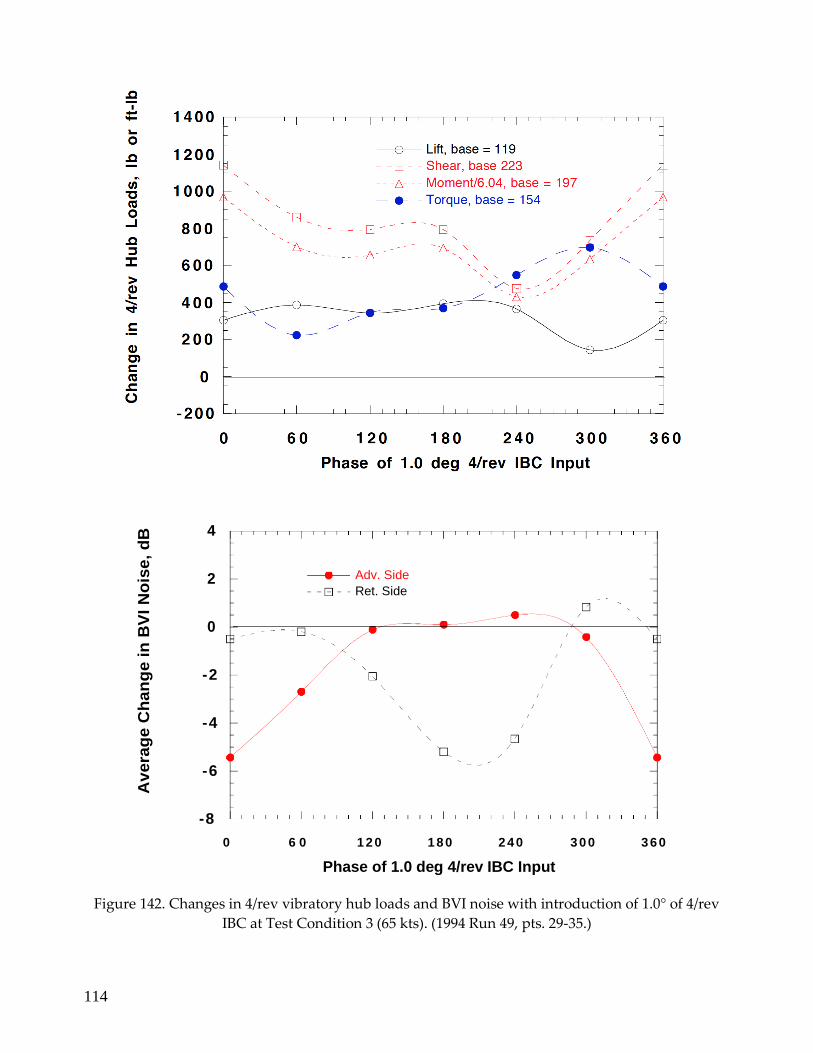
114
4
2
0
-2
-4
-6
-8
0 6 0 1 2 0 1 8 0 2 4 0 3 0 0 3 6 0
Phase of 1.0 deg 4/rev IBC Input
Figure 142. Changes in 4/rev vibratory hub loads and BVI noise with introduction of 1.0° of 4/rev
IBC at Test Condition 3 (65 kts). (1994 Run 49, pts. 29-35.)
Adv. Side
Ret. Side
Ch
an
ge in
4/r
ev H
ub
Lo
ad
s, lb
or
ft-l
b
Av
era
ge
Ch
an
ge
in
BV
I N
ois
e,
dB
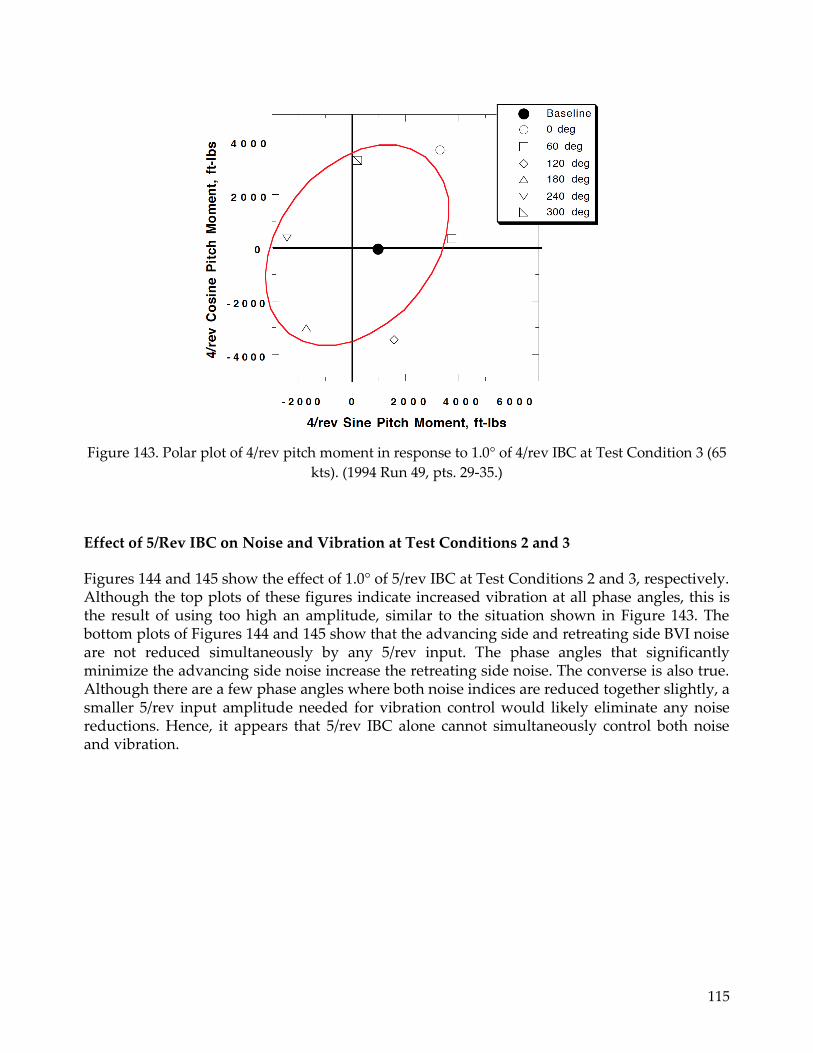
115
Figure 143. Polar plot of 4/rev pitch moment in response to 1.0° of 4/rev IBC at Test Condition 3 (65
kts). (1994 Run 49, pts. 29-35.)
Effect of 5/Rev IBC on Noise and Vibration at Test Conditions 2 and 3
Figures 144 and 145 show the effect of 1.0° of 5/rev IBC at Test Conditions 2 and 3, respectively. Although the top plots of these figures indicate increased vibration at all phase angles, this is the result of using too high an amplitude, similar to the situation shown in Figure 143. The bottom plots of Figures 144 and 145 show that the advancing side and retreating side BVI noise are not reduced simultaneously by any 5/rev input. The phase angles that significantly minimize the advancing side noise increase the retreating side noise. The converse is also true. Although there are a few phase angles where both noise indices are reduced together slightly, a smaller 5/rev input amplitude needed for vibration control would likely eliminate any noise reductions. Hence, it appears that 5/rev IBC alone cannot simultaneously control both noise and vibration.
4/r
ev C
osin
e P
itch
Mo
me
nt,
ft-
lbs
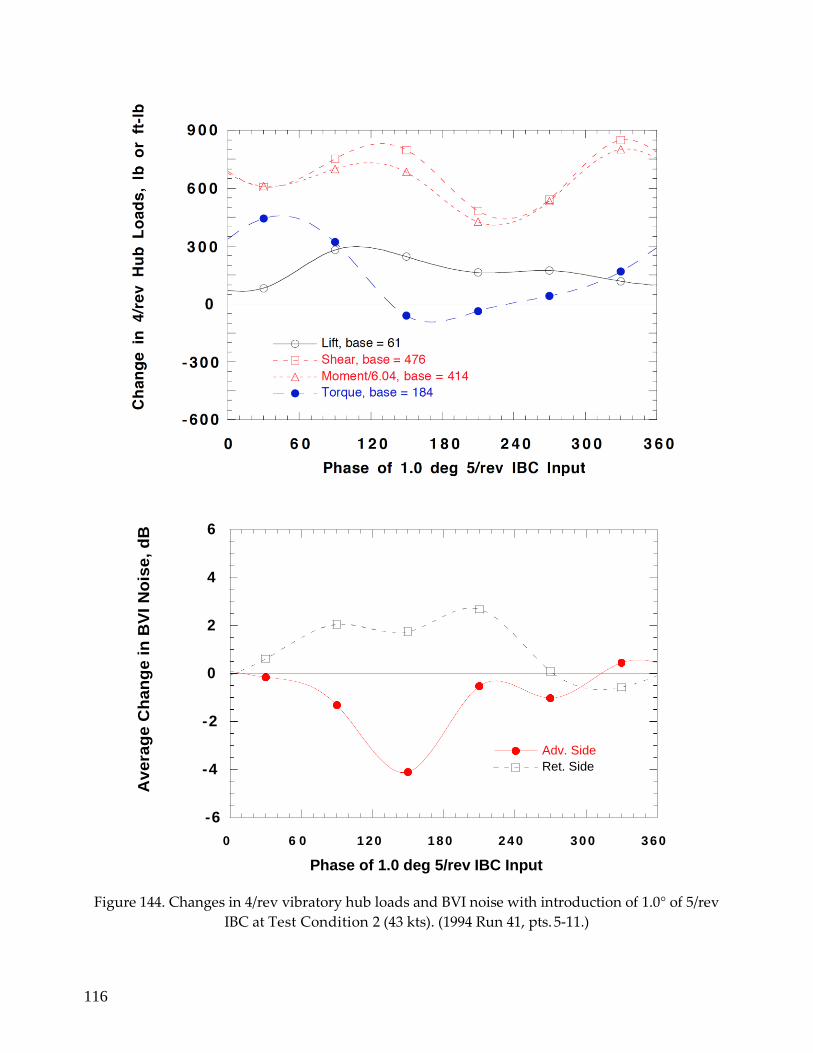
116
6
4
2
0
-2
-4
-6
0 6 0 1 2 0 1 8 0 2 4 0 3 0 0 3 6 0
Phase of 1.0 deg 5/rev IBC Input
Figure 144. Changes in 4/rev vibratory hub loads and BVI noise with introduction of 1.0° of 5/rev
IBC at Test Condition 2 (43 kts). (1994 Run 41, pts. 5-11.)
Adv. Side
Ret. Side
Av
era
ge
Ch
an
ge
in
BV
I N
ois
e,
dB
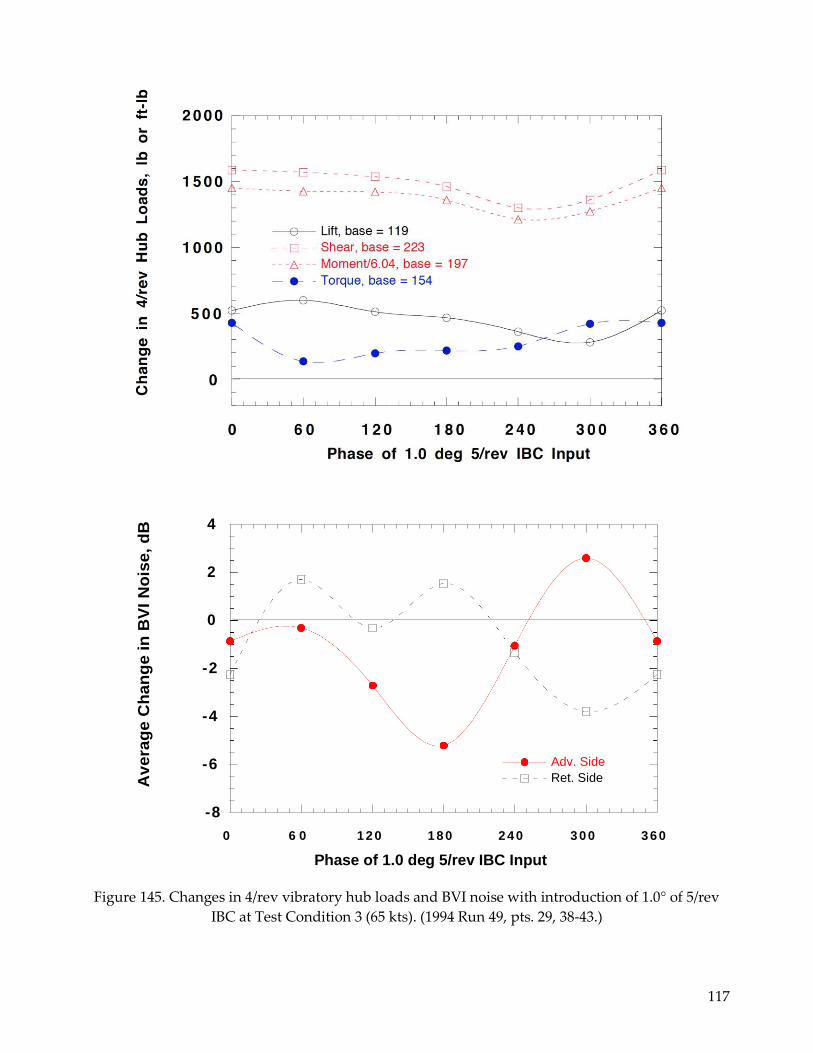
117
4
2
0
-2
-4
-6
-8
0 6 0 1 2 0 1 8 0 2 4 0 3 0 0 3 6 0
Phase of 1.0 deg 5/rev IBC Input
Figure 145. Changes in 4/rev vibratory hub loads and BVI noise with introduction of 1.0° of 5/rev
IBC at Test Condition 3 (65 kts). (1994 Run 49, pts. 29, 38-43.)
Adv. Side
Ret. Side Av
era
ge
Ch
an
ge
in
BV
I N
ois
e,
dB

118
Effect of 6/Rev IBC on Noise and Vibration at Test Conditions 2 and 3
The top plot of Figure 146 shows that at Test Condition 2 (43 knots), 0.5° of 6/rev IBC decreases the 4/rev hub shears and moments by about 30 percent at an input phase angle of 240°. Yet at this phase angle, the 4/rev lift and torque vibration are greatly increased. At 0° phase angle, the torque and lift are slightly reduced, but the hub shear and moment vibration are increased. Hence, simultaneous control of all hub vibration components seems impossible using 6/rev IBC applied by itself. Moreover, it is unlikely that the system has been over-driven since each vibration index crosses zero at some point. The bottom plot of Figure 146 shows that the advancing side and retreating side BVI noise are simultaneously reduced about 1 dB for input phase angles between 110° to 190°. However, the best reductions in advancing side BVI noise occur at the phase angle that increases the retreating side BVI noise the most (290°).
At Test Condition 3 (65 knots), input of 1.0°, 6/rev IBC greatly increases all of the 4/rev hub loads, except for the lift at a few phase angles, as shown by the top plot of Figure 147. However, the hub moment and shear force indices appear to be over-driven by the 1.0° amplitude. A polar plot of the pitch moment (from the data contained in Appendix G) is shown in Figure 148. This ellipse contains both the origin and baseline vibration data point, thereby indicating that the 1.0° amplitude is too large to suppress the vibration. This figure also shows that the best phase angle to reduce the 4/rev pitch moment is about 90°. The bottom plot of Figure 147 shows that at 90° phase, the advancing side BVI noise index is decreased 1 dB. However, the retreating side BVI noise index is increased 2 dB for the same input. Thus it seems that 6/rev IBC cannot be used to simultaneously control BVI noise and vibration.
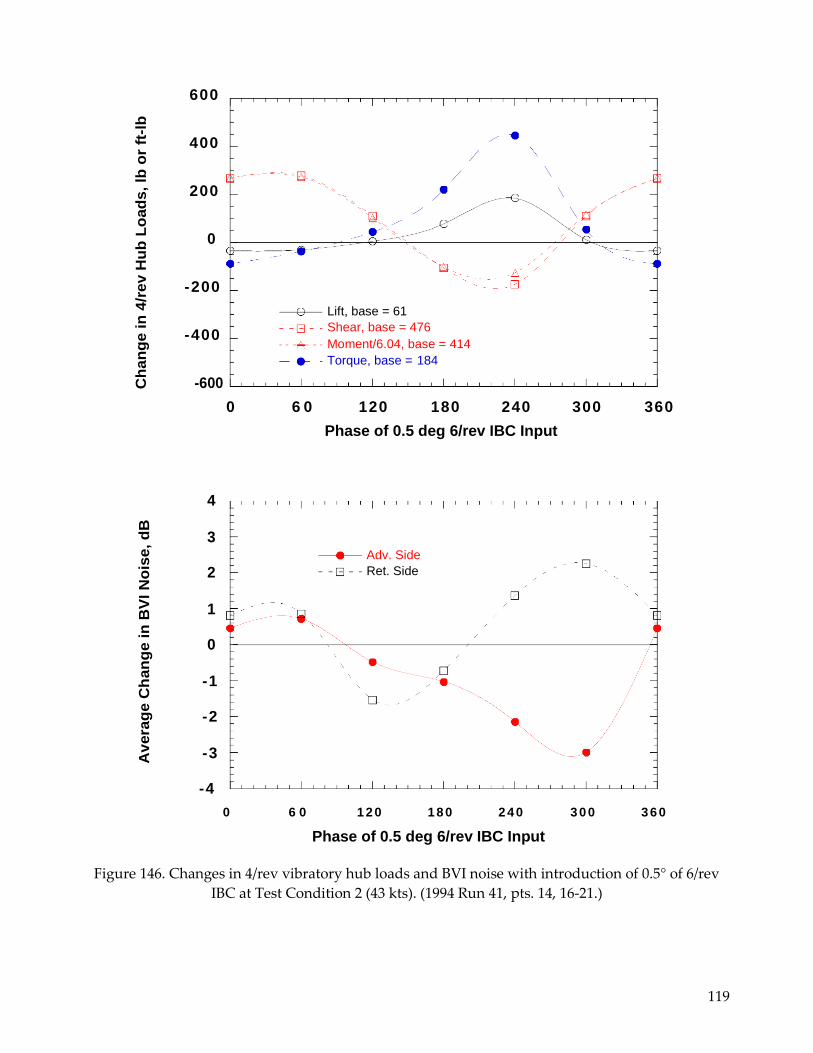
119
600
400
200
0
-200
-400
-600
0 6 0 120 180 240 300 360
Phase of 0.5 deg 6/rev IBC Input
4
3
2
1
0
-1
-2
-3
-4
0 6 0 1 2 0 1 8 0 2 4 0 3 0 0 3 6 0
Phase of 0.5 deg 6/rev IBC Input
Figure 146. Changes in 4/rev vibratory hub loads and BVI noise with introduction of 0.5° of 6/rev
IBC at Test Condition 2 (43 kts). (1994 Run 41, pts. 14, 16-21.)
Lift, base = 61
Shear, base = 476 Moment/6.04, base = 414
Torque, base = 184
Adv. Side
Ret. Side
Ch
an
ge in
4/r
ev H
ub
Lo
ad
s, lb
or
ft-l
b
Av
era
ge C
han
ge i
n B
VI
No
ise,
dB

120
600
400
200
0
-200
-400
0 6 0 120 180 240 300 360
Phase of 1.0 deg 6/rev IBC Input
4
3
2
1
0
-1
-2
-3
-4
0 6 0 1 2 0 1 8 0 2 4 0 3 0 0 3 6 0
Phase of 1.0 deg 6/rev IBC Input
Figure 147. Changes in 4/rev vibratory hub loads and BVI noise with introduction of 1.0° of 6/rev
IBC at Test Condition 3 (65 kts). (1994 Run 45, pts. 40-46.)
Lift, base = 152
Shear, base = 220
Moment/6.04, base = 188
Torque, base = 155
Adv. Side
Ret. Side
Ch
an
ge in
4/r
ev H
ub
Lo
ad
s, lb
or
ft-l
b
Av
era
ge C
han
ge i
n B
VI
No
ise,
dB
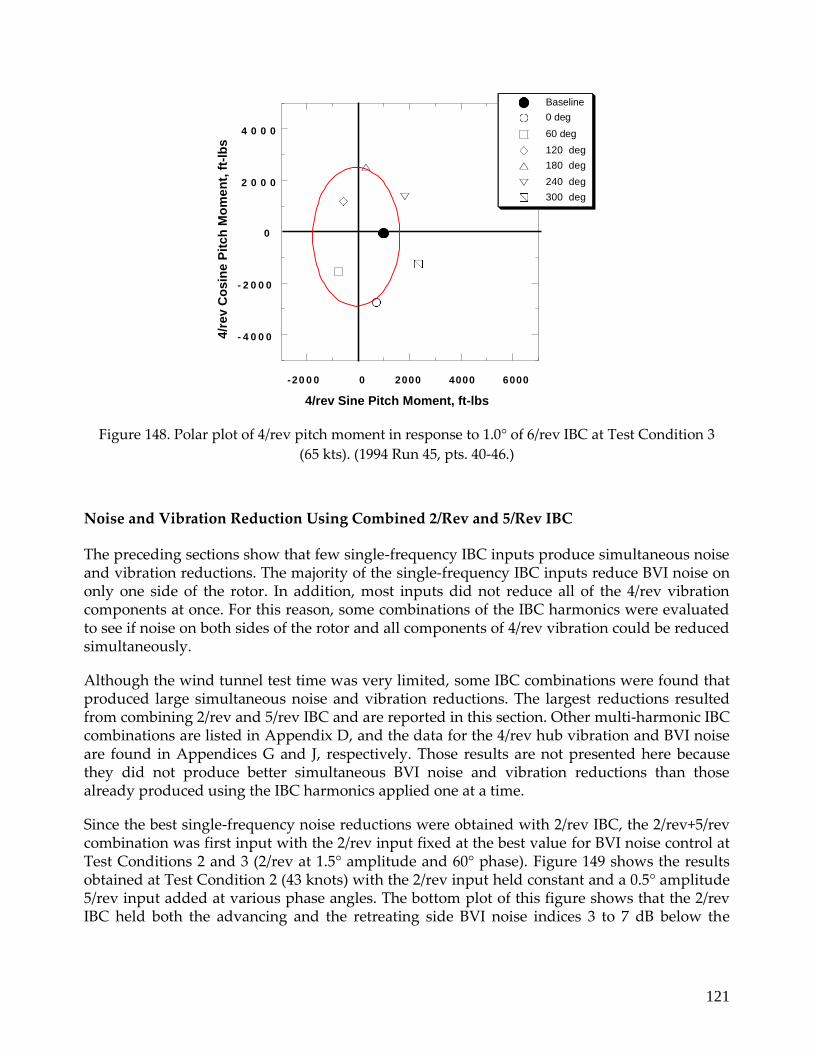
121
4 0 0 0
2 0 0 0
0
- 2 0 0 0
- 4 0 0 0
-20 0 0 0 2000 4000 6000
4/rev Sine Pitch Moment, ft-lbs
Figure 148. Polar plot of 4/rev pitch moment in response to 1.0° of 6/rev IBC at Test Condition 3
(65 kts). (1994 Run 45, pts. 40-46.)
Noise and Vibration Reduction Using Combined 2/Rev and 5/Rev IBC
The preceding sections show that few single-frequency IBC inputs produce simultaneous noise and vibration reductions. The majority of the single-frequency IBC inputs reduce BVI noise on only one side of the rotor. In addition, most inputs did not reduce all of the 4/rev vibration components at once. For this reason, some combinations of the IBC harmonics were evaluated to see if noise on both sides of the rotor and all components of 4/rev vibration could be reduced simultaneously.
Although the wind tunnel test time was very limited, some IBC combinations were found that produced large simultaneous noise and vibration reductions. The largest reductions resulted from combining 2/rev and 5/rev IBC and are reported in this section. Other multi-harmonic IBC combinations are listed in Appendix D, and the data for the 4/rev hub vibration and BVI noise are found in Appendices G and J, respectively. Those results are not presented here because they did not produce better simultaneous BVI noise and vibration reductions than those already produced using the IBC harmonics applied one at a time.
Since the best single-frequency noise reductions were obtained with 2/rev IBC, the 2/rev+5/rev combination was first input with the 2/rev input fixed at the best value for BVI noise control at Test Conditions 2 and 3 (2/rev at 1.5° amplitude and 60° phase). Figure 149 shows the results obtained at Test Condition 2 (43 knots) with the 2/rev input held constant and a 0.5° amplitude 5/rev input added at various phase angles. The bottom plot of this figure shows that the 2/rev IBC held both the advancing and the retreating side BVI noise indices 3 to 7 dB below the
Baseline
0 deg
60 deg
120 deg
180 deg
240 deg
300 deg
4/r
ev C
osin
e P
itch
Mo
me
nt,
ft-
lbs
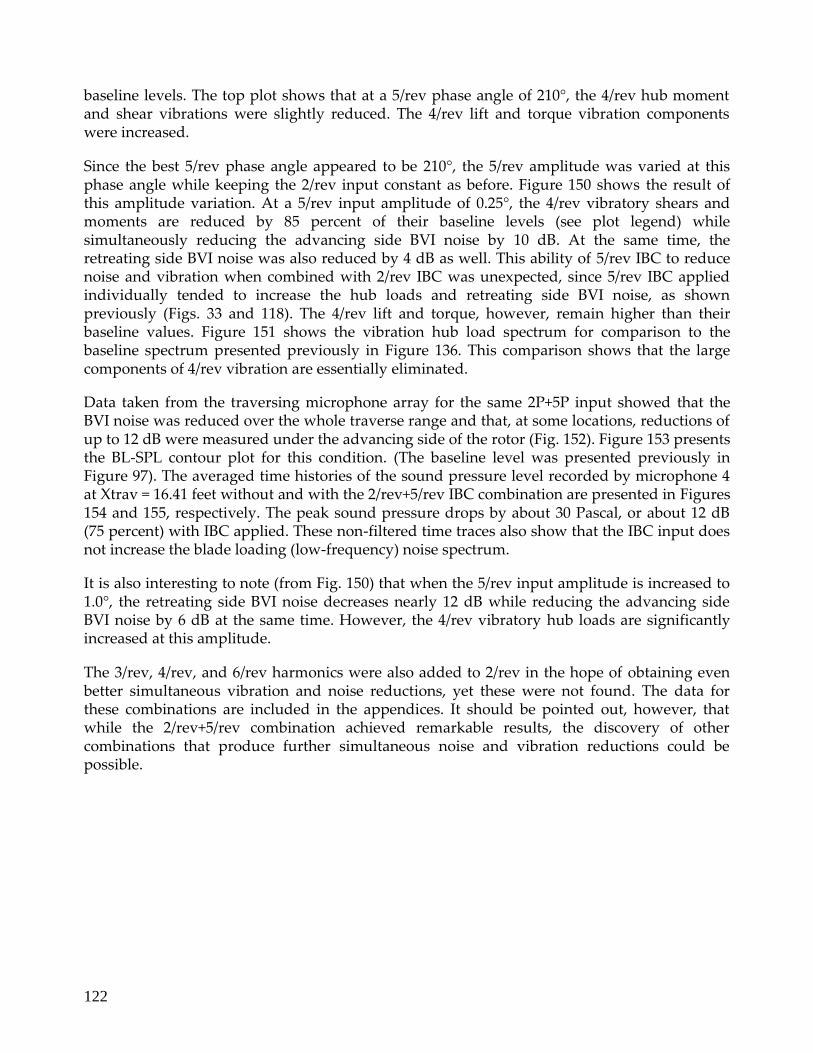
122
baseline levels. The top plot shows that at a 5/rev phase angle of 210°, the 4/rev hub moment and shear vibrations were slightly reduced. The 4/rev lift and torque vibration components were increased.
Since the best 5/rev phase angle appeared to be 210°, the 5/rev amplitude was varied at this phase angle while keeping the 2/rev input constant as before. Figure 150 shows the result of this amplitude variation. At a 5/rev input amplitude of 0.25°, the 4/rev vibratory shears and moments are reduced by 85 percent of their baseline levels (see plot legend) while simultaneously reducing the advancing side BVI noise by 10 dB. At the same time, the retreating side BVI noise was also reduced by 4 dB as well. This ability of 5/rev IBC to reduce noise and vibration when combined with 2/rev IBC was unexpected, since 5/rev IBC applied individually tended to increase the hub loads and retreating side BVI noise, as shown previously (Figs. 33 and 118). The 4/rev lift and torque, however, remain higher than their baseline values. Figure 151 shows the vibration hub load spectrum for comparison to the baseline spectrum presented previously in Figure 136. This comparison shows that the large components of 4/rev vibration are essentially eliminated.
Data taken from the traversing microphone array for the same 2P+5P input showed that the BVI noise was reduced over the whole traverse range and that, at some locations, reductions of up to 12 dB were measured under the advancing side of the rotor (Fig. 152). Figure 153 presents the BL-SPL contour plot for this condition. (The baseline level was presented previously in Figure 97). The averaged time histories of the sound pressure level recorded by microphone 4 at Xtrav = 16.41 feet without and with the 2/rev+5/rev IBC combination are presented in Figures 154 and 155, respectively. The peak sound pressure drops by about 30 Pascal, or about 12 dB (75 percent) with IBC applied. These non-filtered time traces also show that the IBC input does not increase the blade loading (low-frequency) noise spectrum.
It is also interesting to note (from Fig. 150) that when the 5/rev input amplitude is increased to 1.0°, the retreating side BVI noise decreases nearly 12 dB while reducing the advancing side BVI noise by 6 dB at the same time. However, the 4/rev vibratory hub loads are significantly increased at this amplitude.
The 3/rev, 4/rev, and 6/rev harmonics were also added to 2/rev in the hope of obtaining even better simultaneous vibration and noise reductions, yet these were not found. The data for these combinations are included in the appendices. It should be pointed out, however, that while the 2/rev+5/rev combination achieved remarkable results, the discovery of other combinations that produce further simultaneous noise and vibration reductions could be possible.

123
2
0
-2
-4
-6
-8
0 6 0 120 180 240 300 360
Phase of 0.5 deg 5/rev IBC Input
Figure 149. Changes in 4/rev vibratory hub loads and BVI noise with 1.5° of 2/rev IBC held at 60°
phase and varying the phase of 0.5° of 5/rev input at Test Condition 2 (43 kts). (1994 Run
47, pts. 17-22.)
Adv. Side
Ret. Side
BV
I N
ois
e,
De
lta
dB
124
Figure 150. Changes in 4/rev vibratory hub loads and BVI noise with 1.5° of 2/rev IBC held at 60°
phase while varying 5/rev input amplitude at 210° phase, at Test Condition 2 (43 kts).
(1994 Run 47, pts. 5, 19, 23-24.)

125
4 0 0 0
3 5 0 0
3 0 0 0
2 5 0 0
2 0 0 0
1 5 0 0
1 0 0 0
5 0 0
0
1 2 3 4 5 6 7 8
Frequency, /rev
Figure 151. Vibratory hub load spectrum at condition 2 with combination of 1.5° of 2/rev at 60°
phase and 0.25° of 5/rev at 210° phase. (1994 Run 47, pt. 24.)
Figure 152. Traverse sweep showing changes in advancing side BVI noise with 1.5° of 2/rev IBC at 60°
phase and 0.25° of 5/rev IBC at 210° phase at Test Condition 2 (43 kts). (1994 Run 47.)
Lift
Drag Force
Side Force
Pitch Moment
Roll Moment
Torque
Fo
rce
, lb
M
om
en
t,
ft-l
b
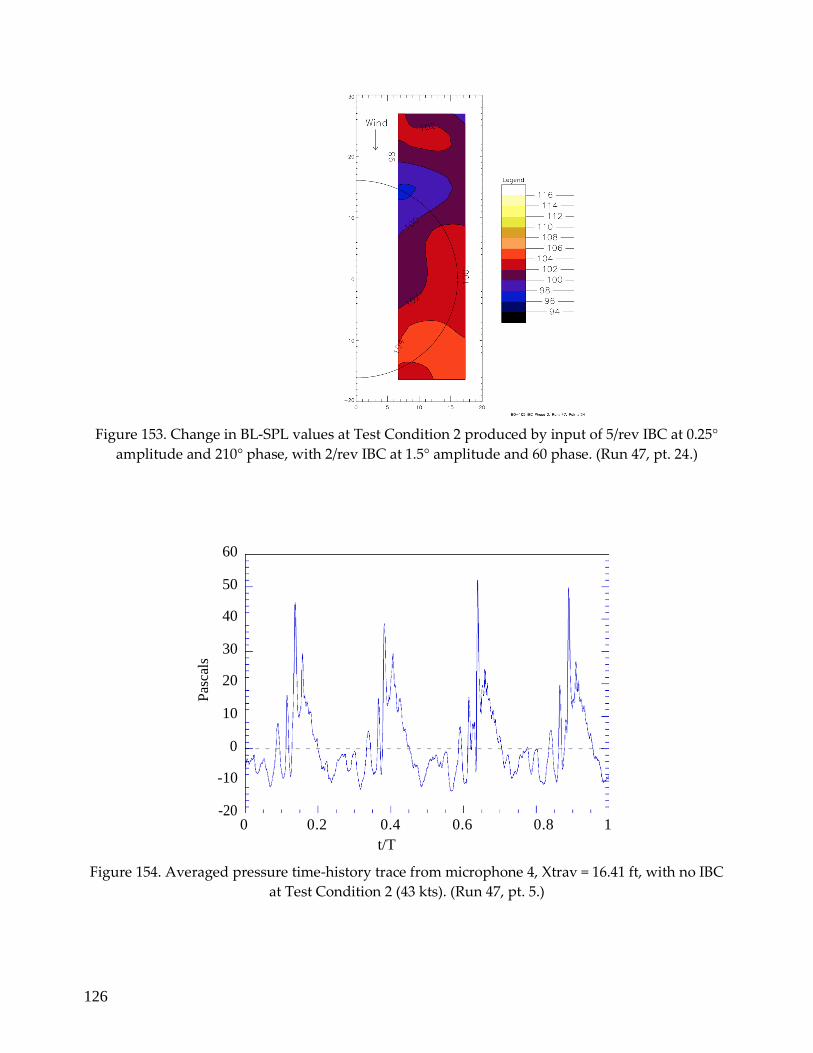
126
Figure 153. Change in BL-SPL values at Test Condition 2 produced by input of 5/rev IBC at 0.25°
amplitude and 210° phase, with 2/rev IBC at 1.5° amplitude and 60 phase. (Run 47, pt. 24.)
60
50
40
30
20
10
0
-10
-20
0 0.2 0.4 0.6 0.8 1
t/T
Figure 154. Averaged pressure time-history trace from microphone 4, Xtrav = 16.41 ft, with no IBC
at Test Condition 2 (43 kts). (Run 47, pt. 5.)
Pas
cals
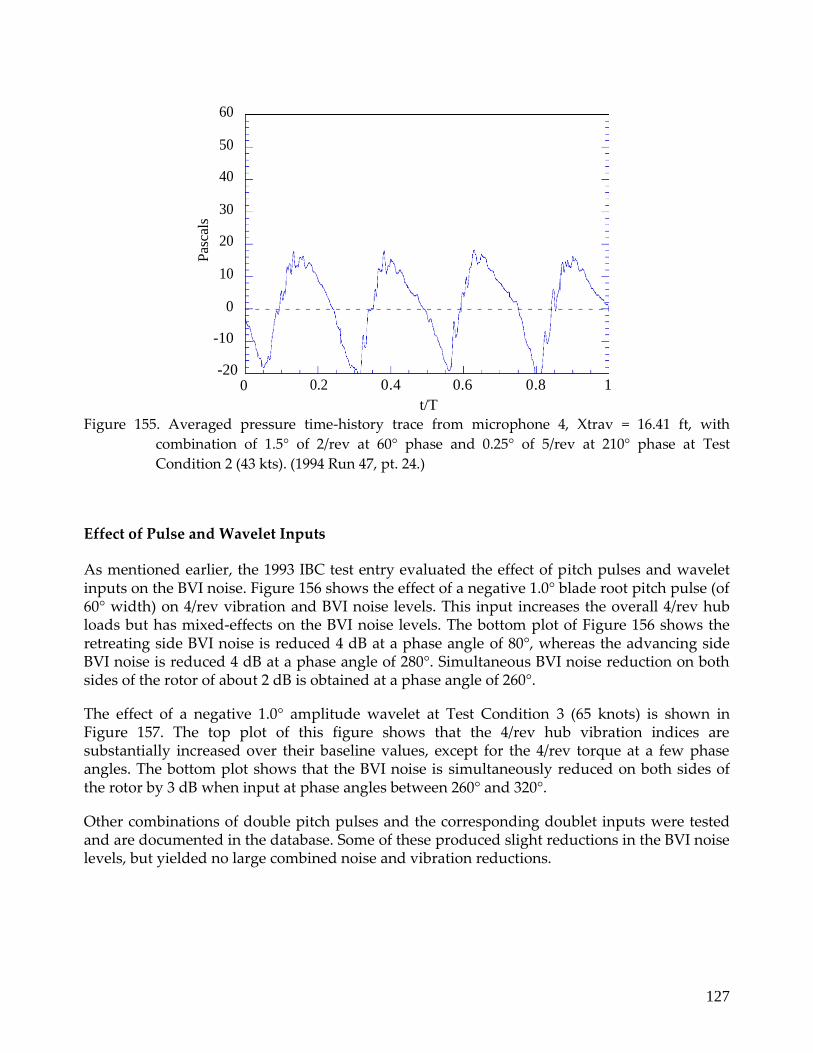
127
60
50
40
30
20
10
0
-10
-20 0
0.2
0.4 0.6
t/T
0.8 1
Figure 155. Averaged pressure time-history trace from microphone 4, Xtrav = 16.41 ft, with
combination of 1.5° of 2/rev at 60° phase and 0.25° of 5/rev at 210° phase at Test
Condition 2 (43 kts). (1994 Run 47, pt. 24.)
Effect of Pulse and Wavelet Inputs
As mentioned earlier, the 1993 IBC test entry evaluated the effect of pitch pulses and wavelet inputs on the BVI noise. Figure 156 shows the effect of a negative 1.0° blade root pitch pulse (of 60° width) on 4/rev vibration and BVI noise levels. This input increases the overall 4/rev hub loads but has mixed-effects on the BVI noise levels. The bottom plot of Figure 156 shows the retreating side BVI noise is reduced 4 dB at a phase angle of 80°, whereas the advancing side BVI noise is reduced 4 dB at a phase angle of 280°. Simultaneous BVI noise reduction on both sides of the rotor of about 2 dB is obtained at a phase angle of 260°.
The effect of a negative 1.0° amplitude wavelet at Test Condition 3 (65 knots) is shown in Figure 157. The top plot of this figure shows that the 4/rev hub vibration indices are substantially increased over their baseline values, except for the 4/rev torque at a few phase angles. The bottom plot shows that the BVI noise is simultaneously reduced on both sides of the rotor by 3 dB when input at phase angles between 260° and 320°.
Other combinations of double pitch pulses and the corresponding doublet inputs were tested and are documented in the database. Some of these produced slight reductions in the BVI noise levels, but yielded no large combined noise and vibration reductions.
Pas
cals
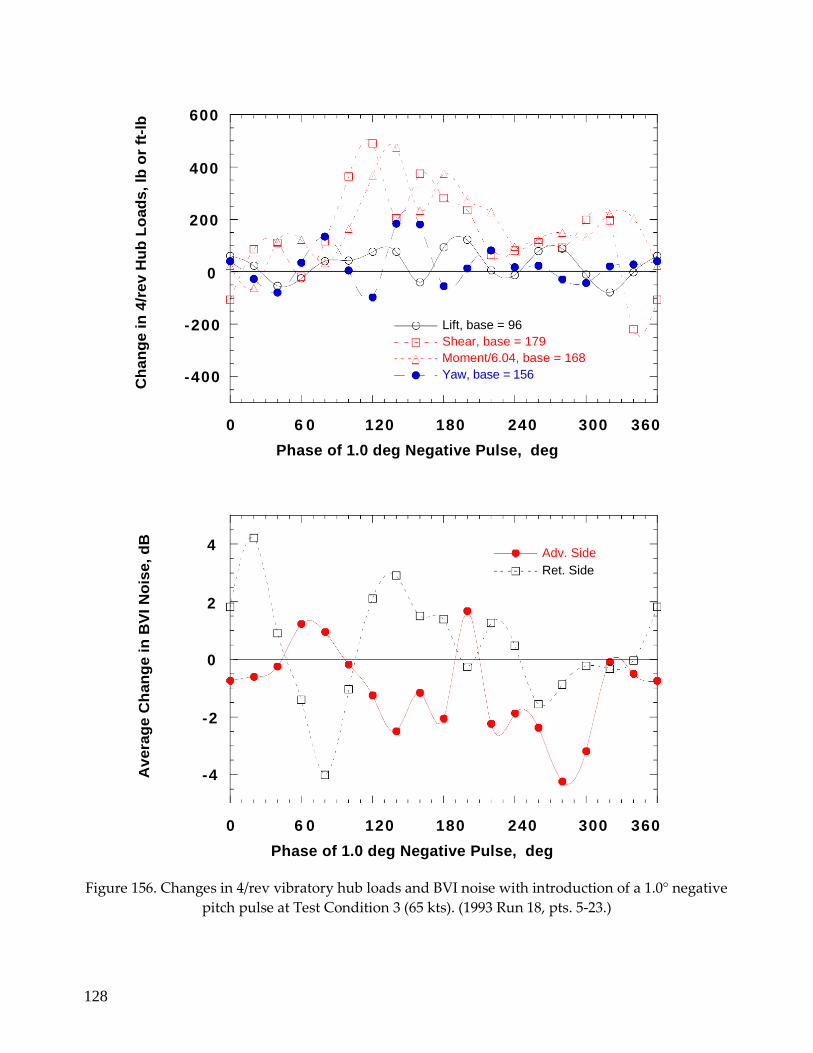
128
600
400
200
0
-200
-400
0 6 0 120 180 240 300 360
Phase of 1.0 deg Negative Pulse, deg
4
2
0
-2
-4
0 6 0 120 180 240 300 360
Phase of 1.0 deg Negative Pulse, deg
Figure 156. Changes in 4/rev vibratory hub loads and BVI noise with introduction of a 1.0° negative
pitch pulse at Test Condition 3 (65 kts). (1993 Run 18, pts. 5-23.)
Lift, base = 96
Shear, base = 179
Moment/6.04, base = 168
Yaw, base = 156
Adv. Side
Ret. Side
Ch
an
ge in
4/r
ev H
ub
Lo
ad
s, lb
or
ft-l
b
Av
era
ge C
han
ge i
n B
VI
No
ise,
dB
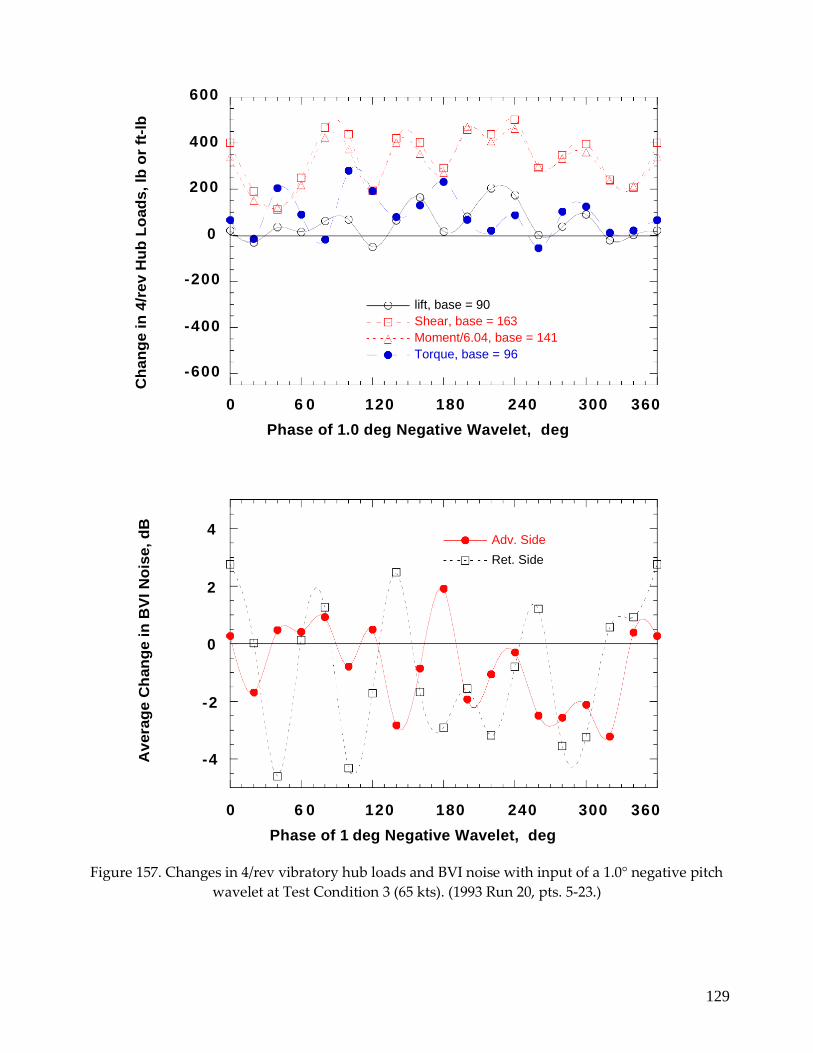
129
600
400
200
0
-200
-400
-600
0 6 0 120 180 240 300 360
Phase of 1.0 deg Negative Wavelet, deg
4
2
0
-2
-4
0 6 0 120 180 240 300 360
Phase of 1 deg Negative Wavelet, deg
Figure 157. Changes in 4/rev vibratory hub loads and BVI noise with input of a 1.0° negative pitch
wavelet at Test Condition 3 (65 kts). (1993 Run 20, pts. 5-23.)
lift, base = 90
Shear, base = 163
Moment/6.04, base = 141
Torque, base = 96
Adv. Side
Ret. Side
Ch
an
ge in
4/r
ev H
ub
Lo
ad
s, lb
or
ft-l
b
Av
era
ge C
han
ge i
n B
VI
No
ise,
dB
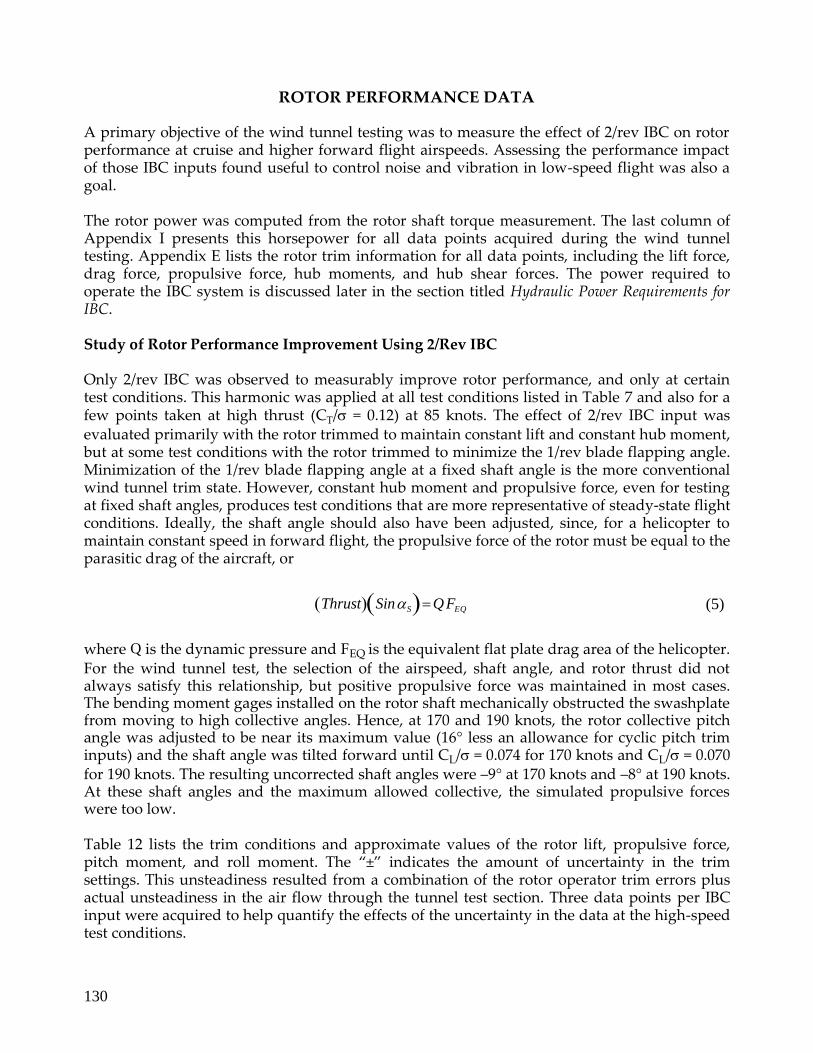
130
ROTOR PERFORMANCE DATA
A primary objective of the wind tunnel testing was to measure the effect of 2/rev IBC on rotor performance at cruise and higher forward flight airspeeds. Assessing the performance impact of those IBC inputs found useful to control noise and vibration in low-speed flight was also a goal.
The rotor power was computed from the rotor shaft torque measurement. The last column of Appendix I presents this horsepower for all data points acquired during the wind tunnel testing. Appendix E lists the rotor trim information for all data points, including the lift force, drag force, propulsive force, hub moments, and hub shear forces. The power required to operate the IBC system is discussed later in the section titled Hydraulic Power Requirements for IBC.
Study of Rotor Performance Improvement Using 2/Rev IBC
Only 2/rev IBC was observed to measurably improve rotor performance, and only at certain test conditions. This harmonic was applied at all test conditions listed in Table 7 and also for a few points taken at high thrust (CT/ = 0.12) at 85 knots. The effect of 2/rev IBC input was evaluated primarily with the rotor trimmed to maintain constant lift and constant hub moment, but at some test conditions with the rotor trimmed to minimize the 1/rev blade flapping angle. Minimization of the 1/rev blade flapping angle at a fixed shaft angle is the more conventional wind tunnel trim state. However, constant hub moment and propulsive force, even for testing at fixed shaft angles, produces test conditions that are more representative of steady-state flight conditions. Ideally, the shaft angle should also have been adjusted, since, for a helicopter to maintain constant speed in forward flight, the propulsive force of the rotor must be equal to the parasitic drag of the aircraft, or
ThrustSin S Q FE Q (5)
where Q is the dynamic pressure and FEQ is the equivalent flat plate drag area of the helicopter. For the wind tunnel test, the selection of the airspeed, shaft angle, and rotor thrust did not always satisfy this relationship, but positive propulsive force was maintained in most cases. The bending moment gages installed on the rotor shaft mechanically obstructed the swashplate from moving to high collective angles. Hence, at 170 and 190 knots, the rotor collective pitch angle was adjusted to be near its maximum value (16° less an allowance for cyclic pitch trim inputs) and the shaft angle was tilted forward until CL/ = 0.074 for 170 knots and CL/ = 0.070 for 190 knots. The resulting uncorrected shaft angles were –9° at 170 knots and –8° at 190 knots. At these shaft angles and the maximum allowed collective, the simulated propulsive forces were too low.
Table 12 lists the trim conditions and approximate values of the rotor lift, propulsive force, pitch moment, and roll moment. The “±” indicates the amount of uncertainty in the trim settings. This unsteadiness resulted from a combination of the rotor operator trim errors plus actual unsteadiness in the air flow through the tunnel test section. Three data points per IBC input were acquired to help quantify the effects of the uncertainty in the data at the high-speed test conditions.

131
Table 12. Rotor Trim Precision With IBC at Test Conditions 1, 4, 5, and 6.
Test
Condition VKT Trim
S
Corr*
Mean Rotor
Power
(HP)
Lift
(lb)
Propulsive
Force
(lb)
Pitch
Moment
(ft-lb)
Roll
Moment
(ft-lb)
1 4 3 Min Flap -0.1 3 0 0 4,770 ±10 212 ±6 1,050 ±800 -275 ±1,300
1 4 3 Moment -0.3 3 2 0 5,089 ±10 147 ±12 1,350 ±50 -350 ±25
* * 85 Min Flap -2.1 7 4 0 8,390 ±20 244 ±26 100 ±600 -200 ±850
4 127 Min Flap -7.3 4 3 6 4,540 ±50 35 ±24 50 ±1,400 -200 ±1,600
4 127 Moment -7.3 4 8 5 4,870 ±50 -112 ±35 1,700 ±250 -850 ±100
5 170 Moment -8.8 7 1 5 5,050 ±10 -238 ±19 1,075 ±500 -1,650 ±250
6 190 Moment -7.9 7 5 0 4,585 ±30 -292 ±8 825 ±250 -1,700 ±100
* Corrected shaft angle.
** High-thrust data points.
2/Rev IBC at Transition Speed (43 Knots, Test Condition 1). The effect of IBC on rotor performance was evaluated both with the rotor trimmed to maintain minimum blade flapping angle and with the rotor trimmed to maintain constant moment and propulsive force. Figure 158 shows the effect of 1.0° of 2/rev IBC input on rotor power, rotor lift, and rotor drag in the upper plot, and propulsive force, pitching moment, and rolling moment in the lower plot. This plot shows that inputs at all phase angles increased the required rotor power. The increase was less near the 150° phase angle. The lower plot shows the large variation in pitching and rolling moment produced using the minimum flapping trim approach. This plot also shows that positive propulsive force was not produced for this data set.
Figure 159, also for Test Condition 1, shows the effect of 1° of 2/rev input with the rotor held in constant moment trim. For this case, the lower plot shows that a positive propulsive force was maintained. The upper plot shows an increase in the baseline rotor power required. Once again, the power with IBC is always greater than the baseline power. The phase angle of least power increase was 210°, where the power was increased by 2.5 percent. The test database contains other 2/rev amplitude data at 43 knots. However, regardless of the trim state or IBC amplitude, 2/rev IBC at 43 knots did not reduce rotor power consumption.
2/Rev IBC at Cruise Speed (127 Knots, Test Condition 4). The effect of 2/rev IBC on rotor performance at 127 knots ( = 0.30) was also evaluated both with the rotor trimmed to maintain minimum blade flapping angle and with the rotor trimmed to maintain constant hub moment. Figure 160 shows that with the rotor trimmed to minimize the blade 1/rev flapping angle, 1° of 2/rev IBC reduced the rotor shaft power below that of the baseline level by about 22 HP, or 5 percent, at an IBC phase angle of 210°. Interestingly, although the lift and propulsive forces vary as smooth functions of the IBC input phase angle, at the phase angle of largest power reduction (210°), the lift and propulsive forces are nearly the same as their baseline values without IBC. Hence, the power reduction with IBC appears to be real.
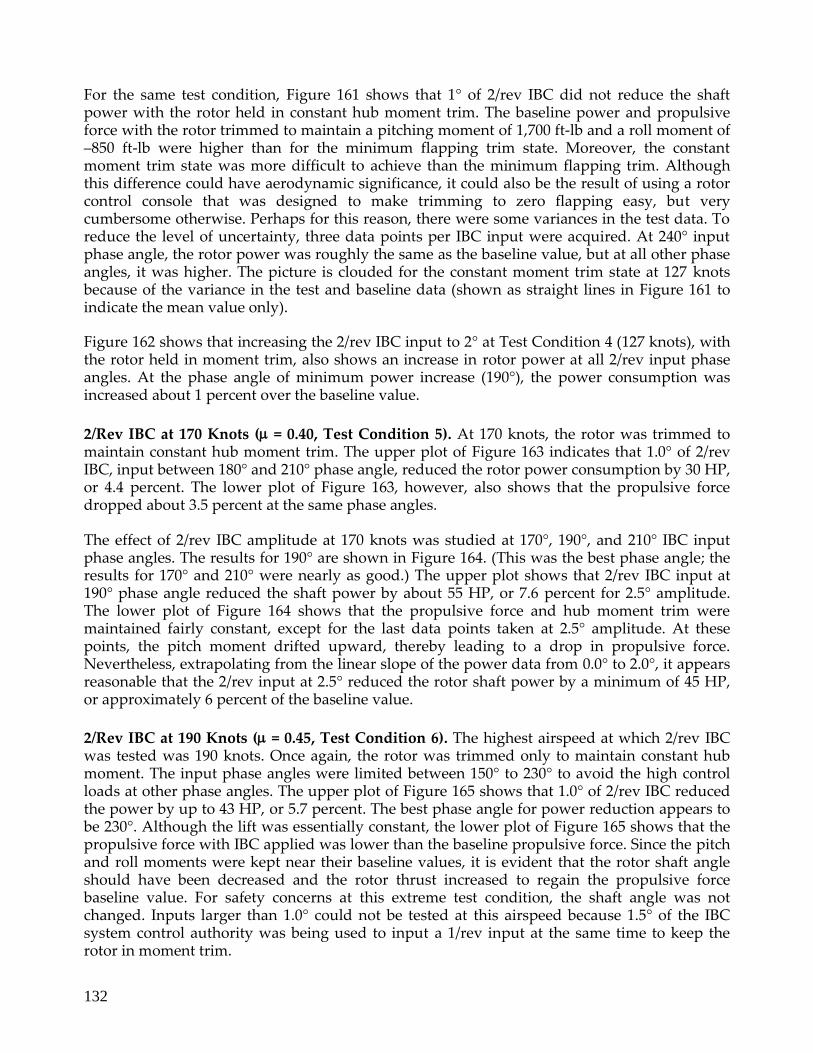
132
For the same test condition, Figure 161 shows that 1° of 2/rev IBC did not reduce the shaft power with the rotor held in constant hub moment trim. The baseline power and propulsive force with the rotor trimmed to maintain a pitching moment of 1,700 ft-lb and a roll moment of –850 ft-lb were higher than for the minimum flapping trim state. Moreover, the constant moment trim state was more difficult to achieve than the minimum flapping trim. Although this difference could have aerodynamic significance, it could also be the result of using a rotor control console that was designed to make trimming to zero flapping easy, but very cumbersome otherwise. Perhaps for this reason, there were some variances in the test data. To reduce the level of uncertainty, three data points per IBC input were acquired. At 240° input phase angle, the rotor power was roughly the same as the baseline value, but at all other phase angles, it was higher. The picture is clouded for the constant moment trim state at 127 knots because of the variance in the test and baseline data (shown as straight lines in Figure 161 to indicate the mean value only).
Figure 162 shows that increasing the 2/rev IBC input to 2° at Test Condition 4 (127 knots), with the rotor held in moment trim, also shows an increase in rotor power at all 2/rev input phase angles. At the phase angle of minimum power increase (190°), the power consumption was increased about 1 percent over the baseline value.
2/Rev IBC at 170 Knots ( = 0.40, Test Condition 5). At 170 knots, the rotor was trimmed to maintain constant hub moment trim. The upper plot of Figure 163 indicates that 1.0° of 2/rev IBC, input between 180° and 210° phase angle, reduced the rotor power consumption by 30 HP, or 4.4 percent. The lower plot of Figure 163, however, also shows that the propulsive force dropped about 3.5 percent at the same phase angles.
The effect of 2/rev IBC amplitude at 170 knots was studied at 170°, 190°, and 210° IBC input phase angles. The results for 190° are shown in Figure 164. (This was the best phase angle; the results for 170° and 210° were nearly as good.) The upper plot shows that 2/rev IBC input at 190° phase angle reduced the shaft power by about 55 HP, or 7.6 percent for 2.5° amplitude. The lower plot of Figure 164 shows that the propulsive force and hub moment trim were maintained fairly constant, except for the last data points taken at 2.5° amplitude. At these points, the pitch moment drifted upward, thereby leading to a drop in propulsive force. Nevertheless, extrapolating from the linear slope of the power data from 0.0° to 2.0°, it appears reasonable that the 2/rev input at 2.5° reduced the rotor shaft power by a minimum of 45 HP, or approximately 6 percent of the baseline value.
2/Rev IBC at 190 Knots ( = 0.45, Test Condition 6). The highest airspeed at which 2/rev IBC was tested was 190 knots. Once again, the rotor was trimmed only to maintain constant hub moment. The input phase angles were limited between 150° to 230° to avoid the high control loads at other phase angles. The upper plot of Figure 165 shows that 1.0° of 2/rev IBC reduced the power by up to 43 HP, or 5.7 percent. The best phase angle for power reduction appears to be 230°. Although the lift was essentially constant, the lower plot of Figure 165 shows that the propulsive force with IBC applied was lower than the baseline propulsive force. Since the pitch and roll moments were kept near their baseline values, it is evident that the rotor shaft angle should have been decreased and the rotor thrust increased to regain the propulsive force baseline value. For safety concerns at this extreme test condition, the shaft angle was not changed. Inputs larger than 1.0° could not be tested at this airspeed because 1.5° of the IBC system control authority was being used to input a 1/rev input at the same time to keep the rotor in moment trim.
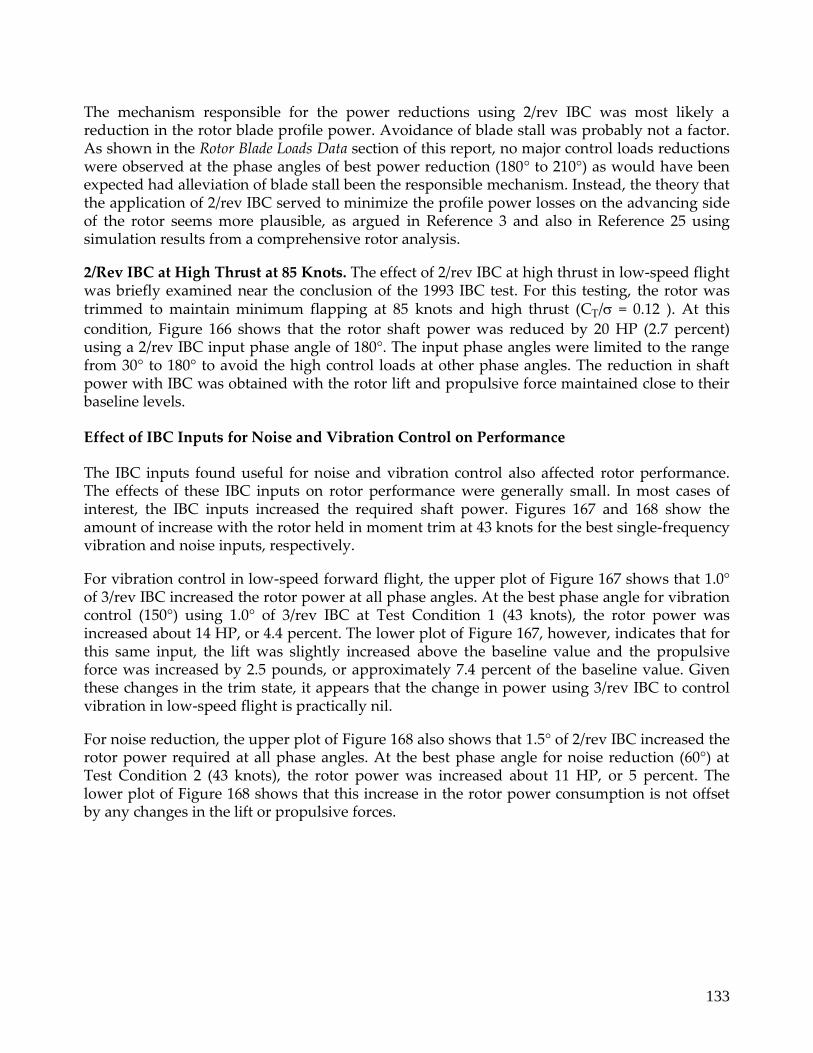
133
The mechanism responsible for the power reductions using 2/rev IBC was most likely a reduction in the rotor blade profile power. Avoidance of blade stall was probably not a factor. As shown in the Rotor Blade Loads Data section of this report, no major control loads reductions were observed at the phase angles of best power reduction (180° to 210°) as would have been expected had alleviation of blade stall been the responsible mechanism. Instead, the theory that the application of 2/rev IBC served to minimize the profile power losses on the advancing side of the rotor seems more plausible, as argued in Reference 3 and also in Reference 25 using simulation results from a comprehensive rotor analysis.
2/Rev IBC at High Thrust at 85 Knots. The effect of 2/rev IBC at high thrust in low-speed flight was briefly examined near the conclusion of the 1993 IBC test. For this testing, the rotor was trimmed to maintain minimum flapping at 85 knots and high thrust (CT/ = 0.12 ). At this
condition, Figure 166 shows that the rotor shaft power was reduced by 20 HP (2.7 percent) using a 2/rev IBC input phase angle of 180°. The input phase angles were limited to the range from 30° to 180° to avoid the high control loads at other phase angles. The reduction in shaft power with IBC was obtained with the rotor lift and propulsive force maintained close to their baseline levels.
Effect of IBC Inputs for Noise and Vibration Control on Performance
The IBC inputs found useful for noise and vibration control also affected rotor performance. The effects of these IBC inputs on rotor performance were generally small. In most cases of interest, the IBC inputs increased the required shaft power. Figures 167 and 168 show the amount of increase with the rotor held in moment trim at 43 knots for the best single-frequency vibration and noise inputs, respectively.
For vibration control in low-speed forward flight, the upper plot of Figure 167 shows that 1.0° of 3/rev IBC increased the rotor power at all phase angles. At the best phase angle for vibration control (150°) using 1.0° of 3/rev IBC at Test Condition 1 (43 knots), the rotor power was increased about 14 HP, or 4.4 percent. The lower plot of Figure 167, however, indicates that for this same input, the lift was slightly increased above the baseline value and the propulsive force was increased by 2.5 pounds, or approximately 7.4 percent of the baseline value. Given these changes in the trim state, it appears that the change in power using 3/rev IBC to control vibration in low-speed flight is practically nil.
For noise reduction, the upper plot of Figure 168 also shows that 1.5° of 2/rev IBC increased the rotor power required at all phase angles. At the best phase angle for noise reduction (60°) at Test Condition 2 (43 knots), the rotor power was increased about 11 HP, or 5 percent. The lower plot of Figure 168 shows that this increase in the rotor power consumption is not offset by any changes in the lift or propulsive forces.

134
Prop. Force with IBC
Baseline Prop. Force
Pitch Moment with IBC
Baseline Pitch Moment
Roll Moment with IBC
Baseline Roll Moment
2 0 2 0 0 0
1 5
1 0 1 0 0 0
5
0
0
-5
-10
-1000
-15 -2000
-20 0
6 0 1 2 0 1 8 0 2 4 0 3 0 0 3 6 0
Phase of 1.0° 2/rev IBC input, deg
Figure 158. Effect of 1.0° of 2/rev IBC on rotor performance with the rotor trimmed to minimize blade
flapping at Test Condition 1 (43 knots). (1993 Run 14, pts. 5, 12-17.)
Pitc
h a
nd
Ro
ll Mo
men
ts, ft-lb
s
Pro
pu
lsiv
e F
orc
e,
lbs
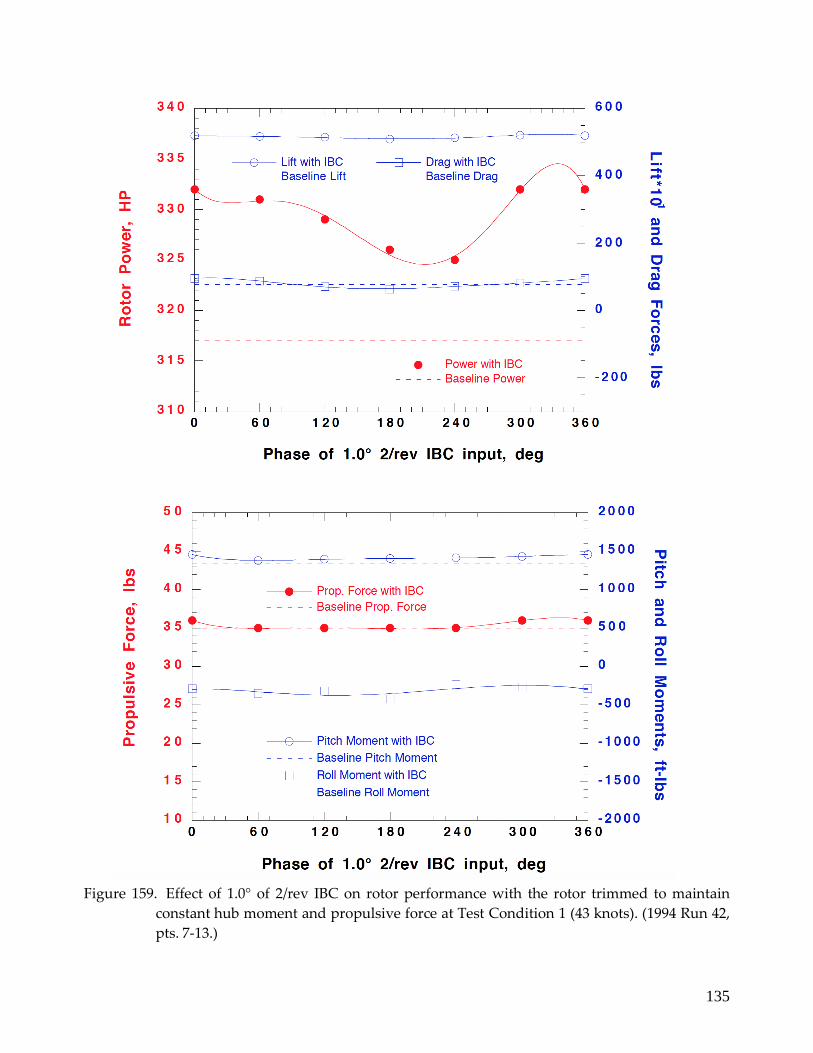
135
Figure 159. Effect of 1.0° of 2/rev IBC on rotor performance with the rotor trimmed to maintain
constant hub moment and propulsive force at Test Condition 1 (43 knots). (1994 Run 42,
pts. 7-13.)
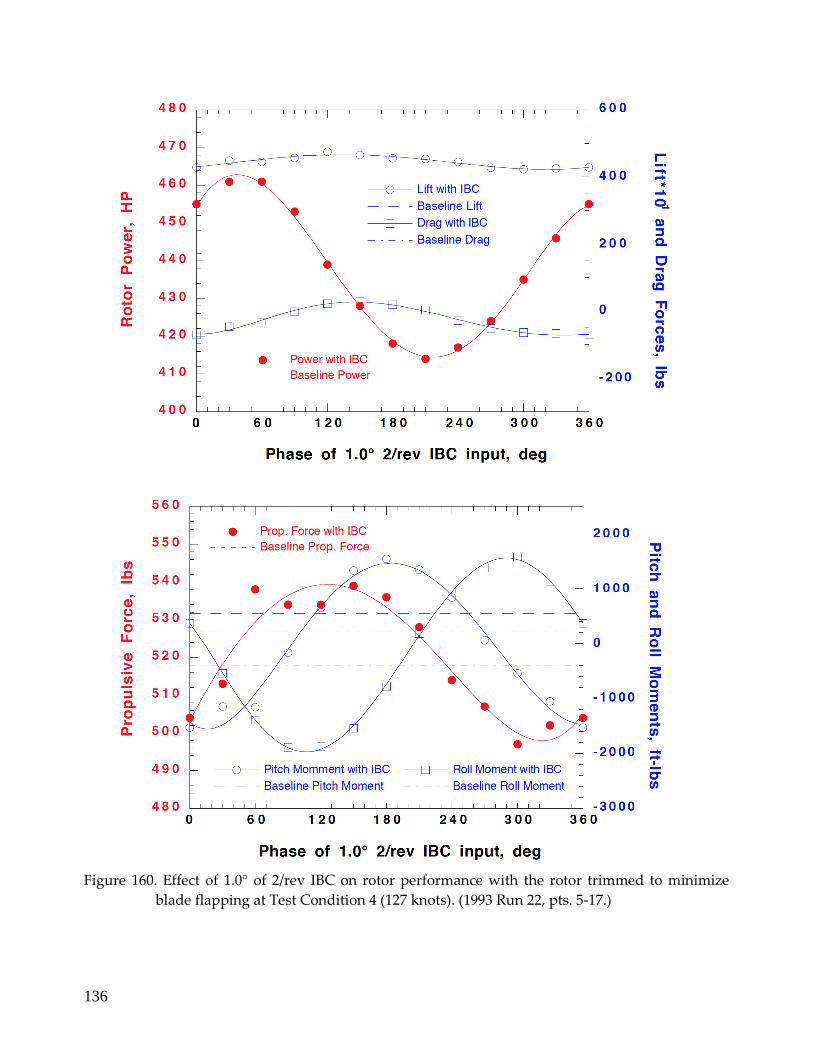
136
Figure 160. Effect of 1.0° of 2/rev IBC on rotor performance with the rotor trimmed to minimize
blade flapping at Test Condition 4 (127 knots). (1993 Run 22, pts. 5-17.)
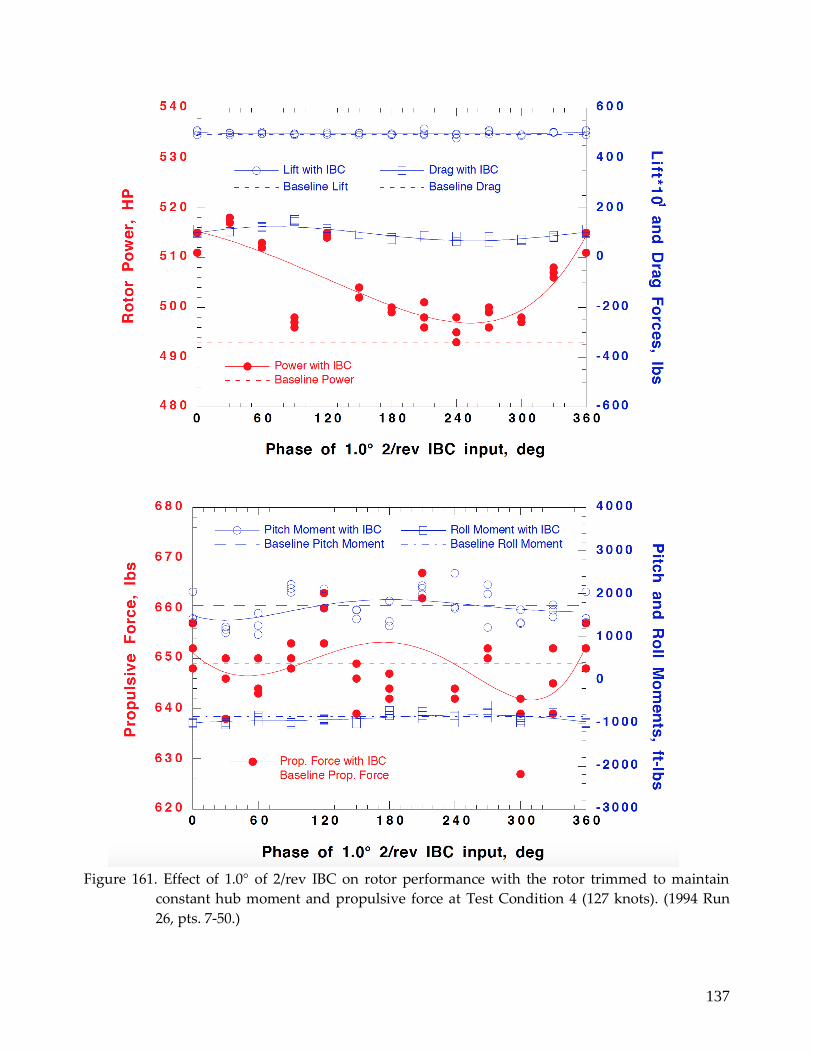
137
Figure 161. Effect of 1.0° of 2/rev IBC on rotor performance with the rotor trimmed to maintain
constant hub moment and propulsive force at Test Condition 4 (127 knots). (1994 Run
26, pts. 7-50.)
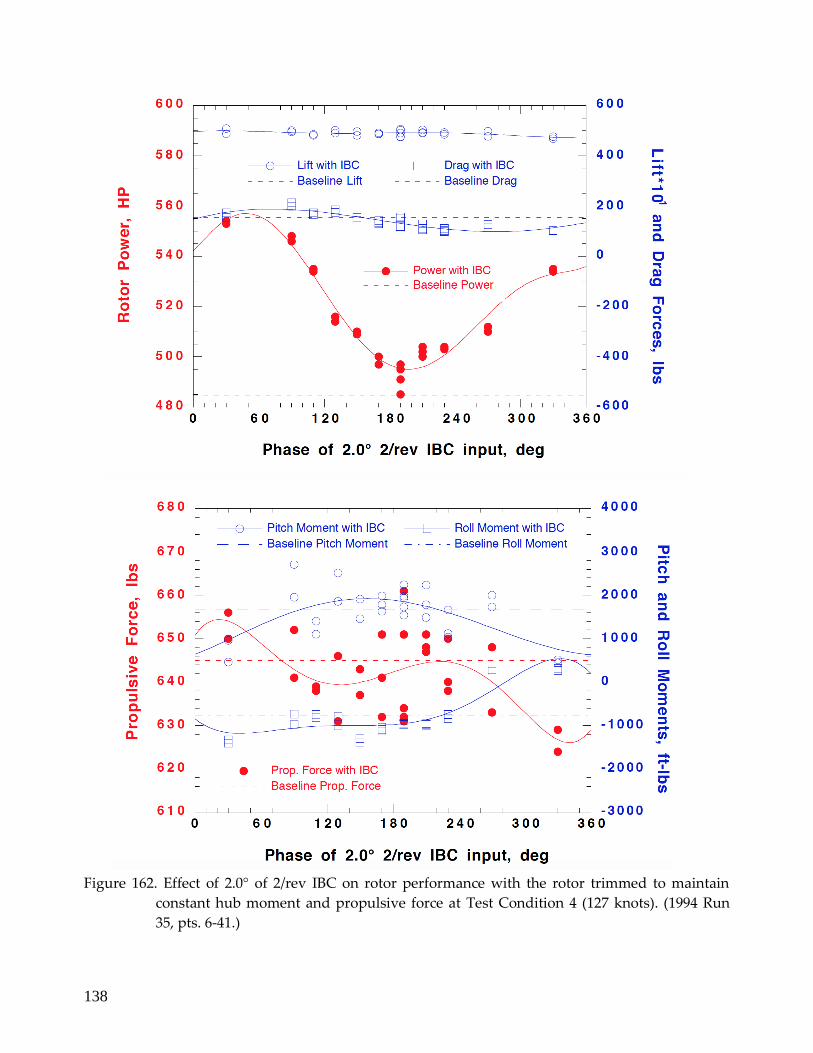
138
Figure 162. Effect of 2.0° of 2/rev IBC on rotor performance with the rotor trimmed to maintain
constant hub moment and propulsive force at Test Condition 4 (127 knots). (1994 Run
35, pts. 6-41.)
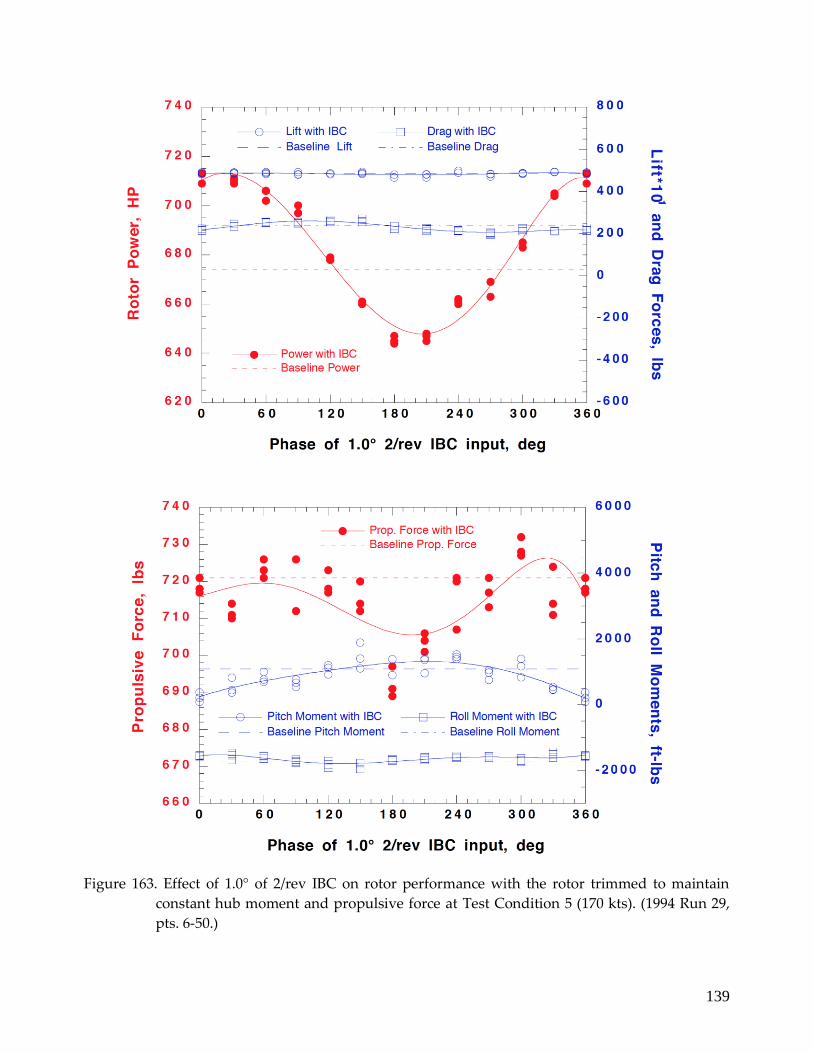
139
Figure 163. Effect of 1.0° of 2/rev IBC on rotor performance with the rotor trimmed to maintain
constant hub moment and propulsive force at Test Condition 5 (170 kts). (1994 Run 29,
pts. 6-50.)
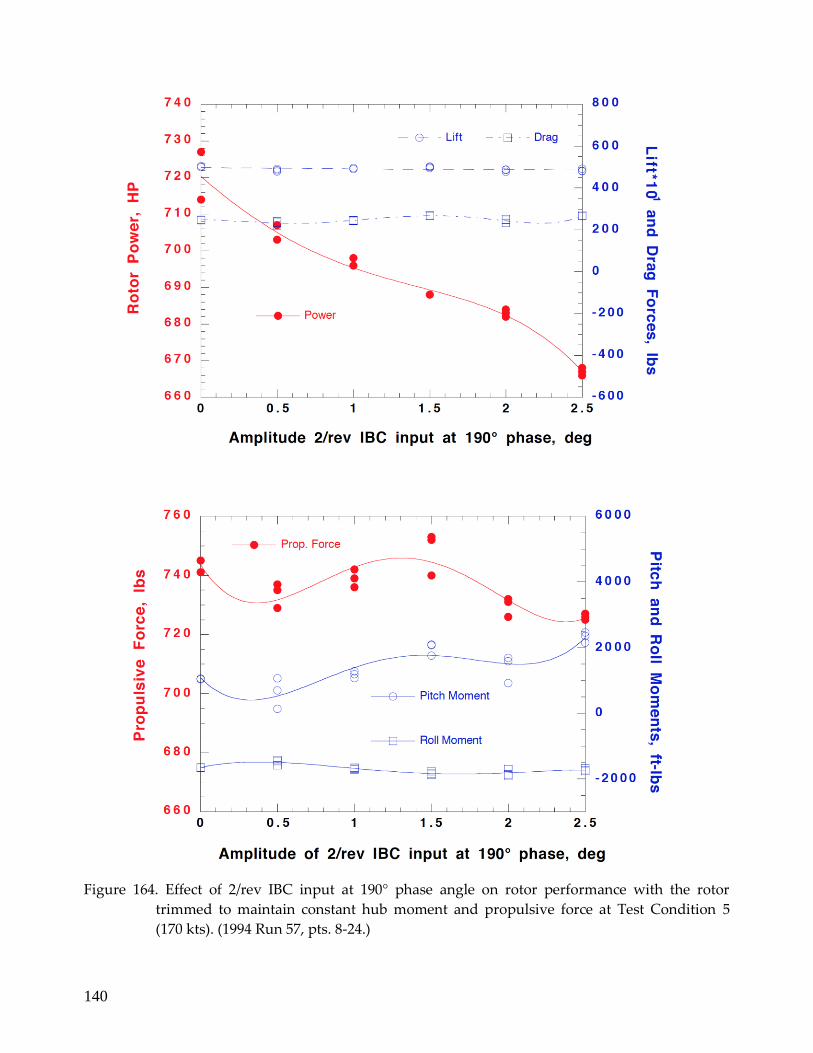
140
Figure 164. Effect of 2/rev IBC input at 190° phase angle on rotor performance with the rotor
trimmed to maintain constant hub moment and propulsive force at Test Condition 5
(170 kts). (1994 Run 57, pts. 8-24.)
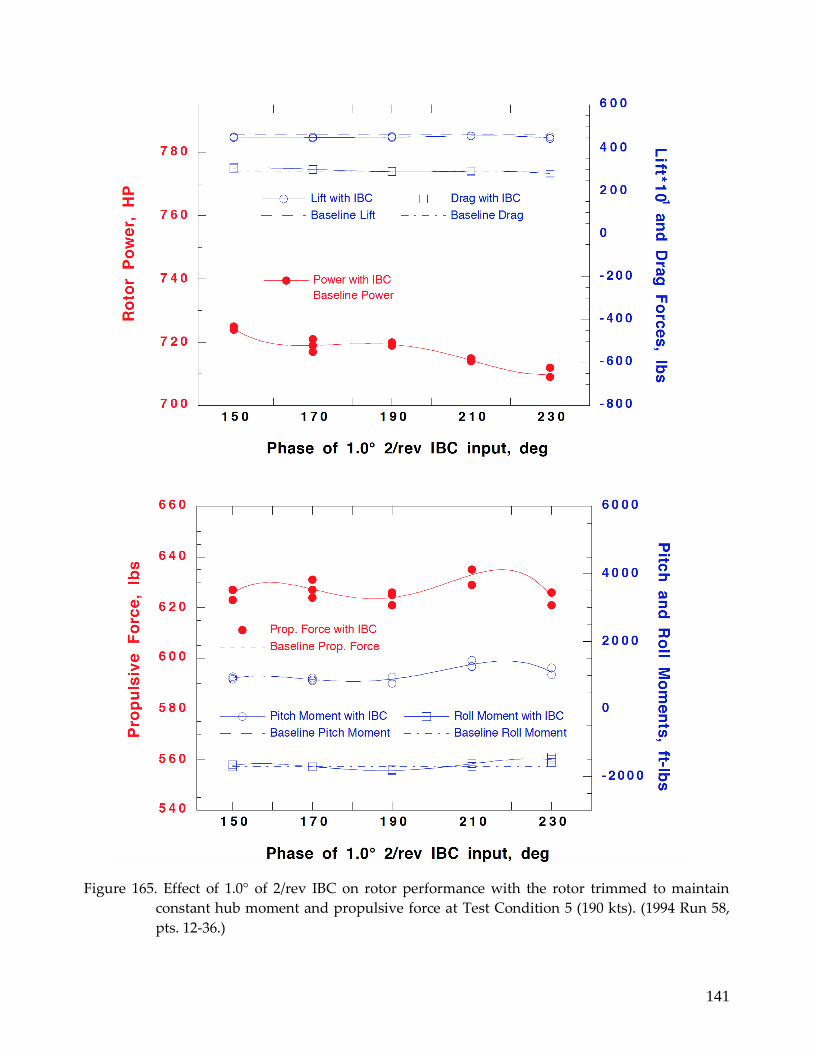
141
Figure 165. Effect of 1.0° of 2/rev IBC on rotor performance with the rotor trimmed to maintain
constant hub moment and propulsive force at Test Condition 5 (190 kts). (1994 Run 58,
pts. 12-36.)
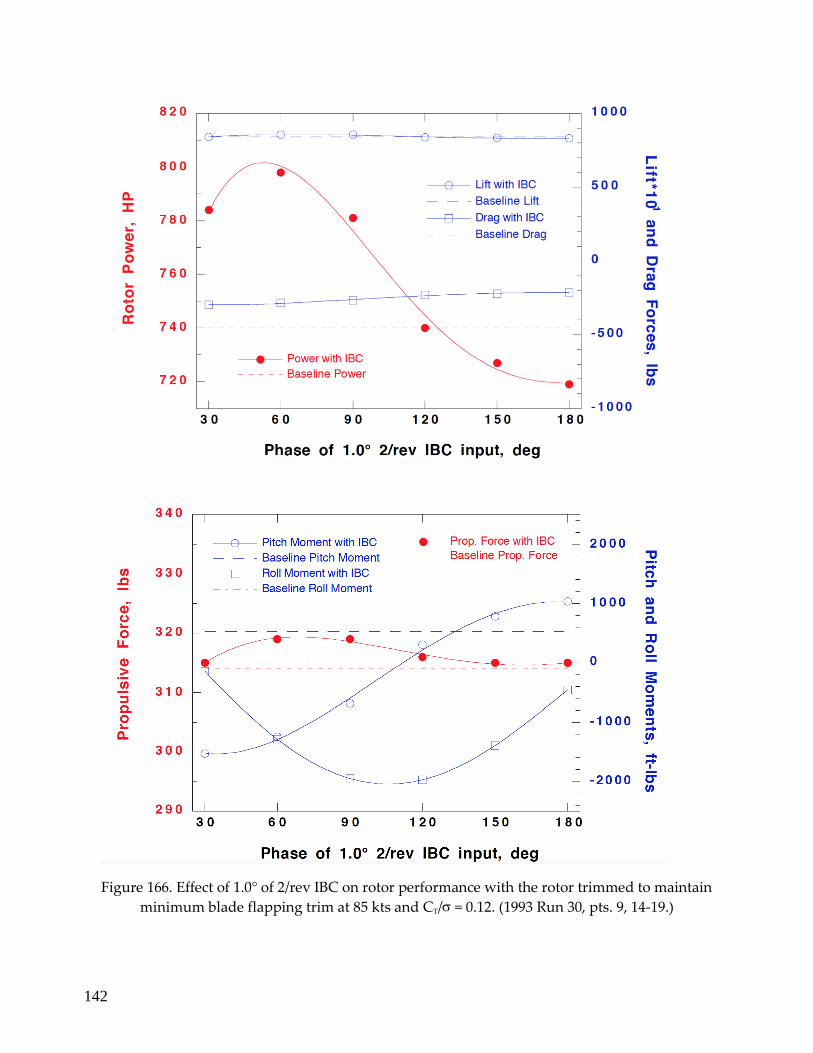
142
Figure 166. Effect of 1.0° of 2/rev IBC on rotor performance with the rotor trimmed to maintain
minimum blade flapping trim at 85 kts and CT/ = 0.12. (1993 Run 30, pts. 9, 14-19.)
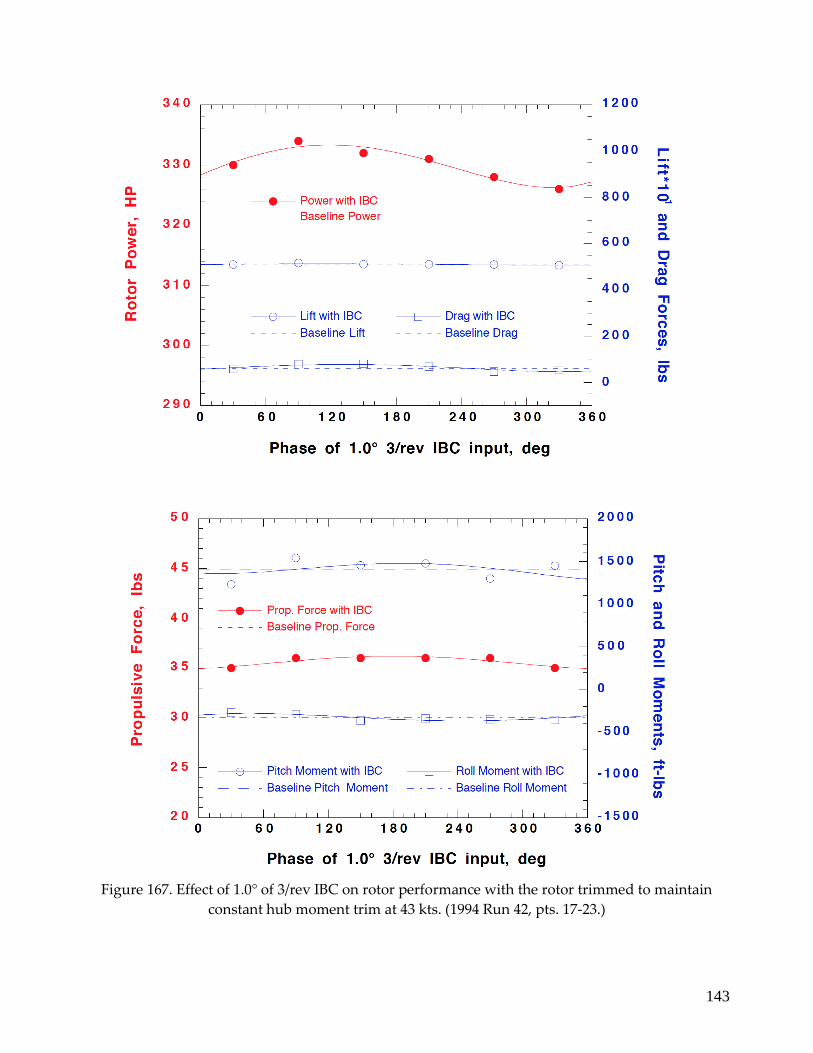
143
Figure 167. Effect of 1.0° of 3/rev IBC on rotor performance with the rotor trimmed to maintain
constant hub moment trim at 43 kts. (1994 Run 42, pts. 17-23.)
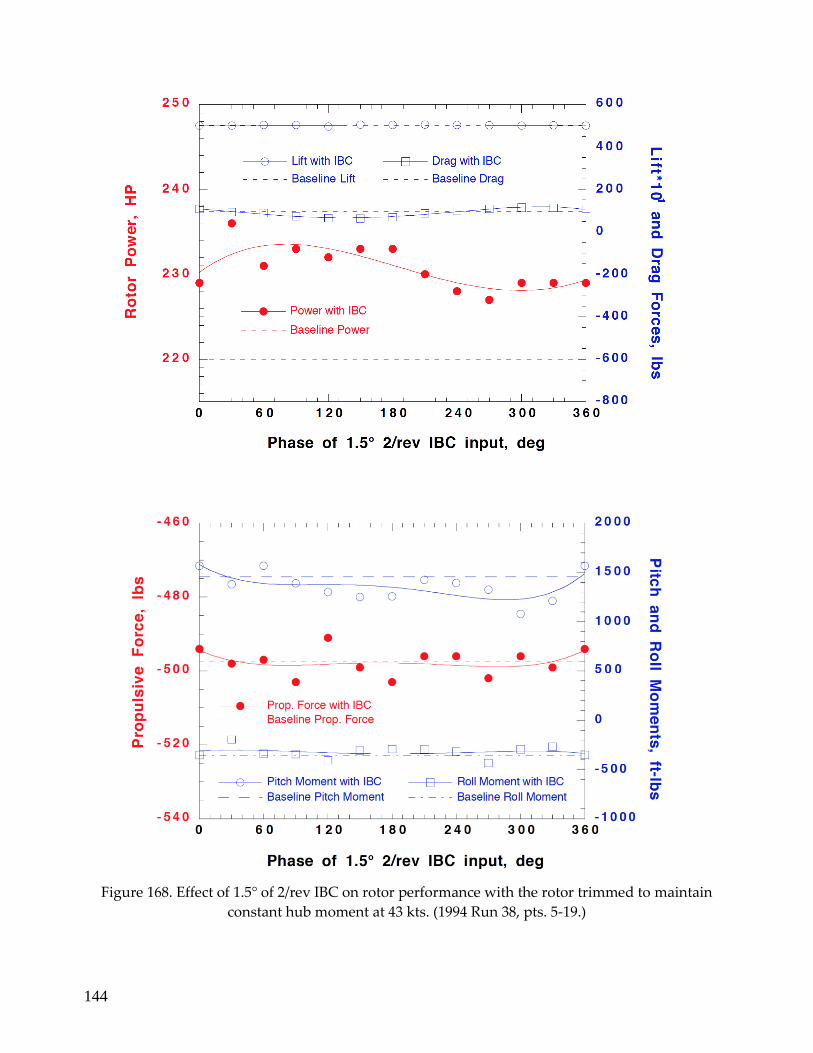
144
Figure 168. Effect of 1.5° of 2/rev IBC on rotor performance with the rotor trimmed to maintain
constant hub moment at 43 kts. (1994 Run 38, pts. 5-19.)
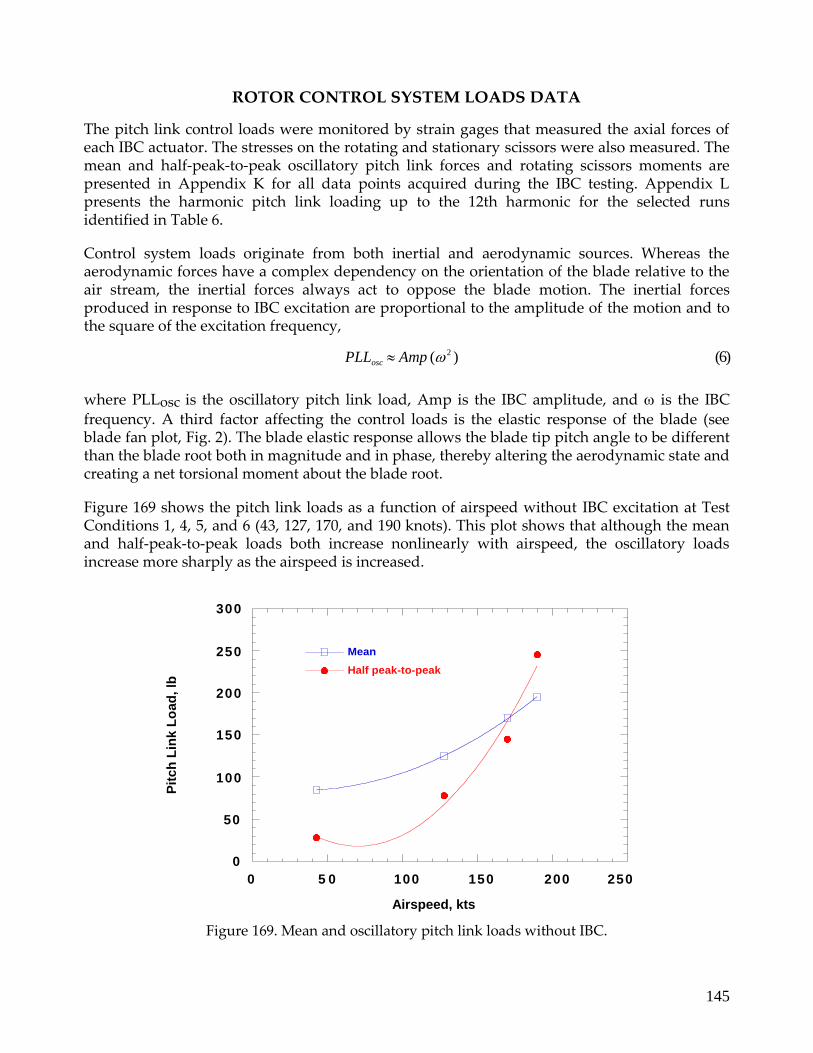
145
ROTOR CONTROL SYSTEM LOADS DATA
The pitch link control loads were monitored by strain gages that measured the axial forces of each IBC actuator. The stresses on the rotating and stationary scissors were also measured. The mean and half-peak-to-peak oscillatory pitch link forces and rotating scissors moments are presented in Appendix K for all data points acquired during the IBC testing. Appendix L presents the harmonic pitch link loading up to the 12th harmonic for the selected runs identified in Table 6.
Control system loads originate from both inertial and aerodynamic sources. Whereas the aerodynamic forces have a complex dependency on the orientation of the blade relative to the air stream, the inertial forces always act to oppose the blade motion. The inertial forces produced in response to IBC excitation are proportional to the amplitude of the motion and to the square of the excitation frequency,
PLLosc Amp ( 2 ) (6)
where PLLosc is the oscillatory pitch link load, Amp is the IBC amplitude, and is the IBC
frequency. A third factor affecting the control loads is the elastic response of the blade (see blade fan plot, Fig. 2). The blade elastic response allows the blade tip pitch angle to be different than the blade root both in magnitude and in phase, thereby altering the aerodynamic state and creating a net torsional moment about the blade root.
Figure 169 shows the pitch link loads as a function of airspeed without IBC excitation at Test Conditions 1, 4, 5, and 6 (43, 127, 170, and 190 knots). This plot shows that although the mean and half-peak-to-peak loads both increase nonlinearly with airspeed, the oscillatory loads increase more sharply as the airspeed is increased.
300
250
200
150
100
50
0
0 5 0 100 150 200 250
Airspeed, kts
Figure 169. Mean and oscillatory pitch link loads without IBC.
Mean
Half peak-to-peak
Pit
ch
Lin
k L
oad
, lb
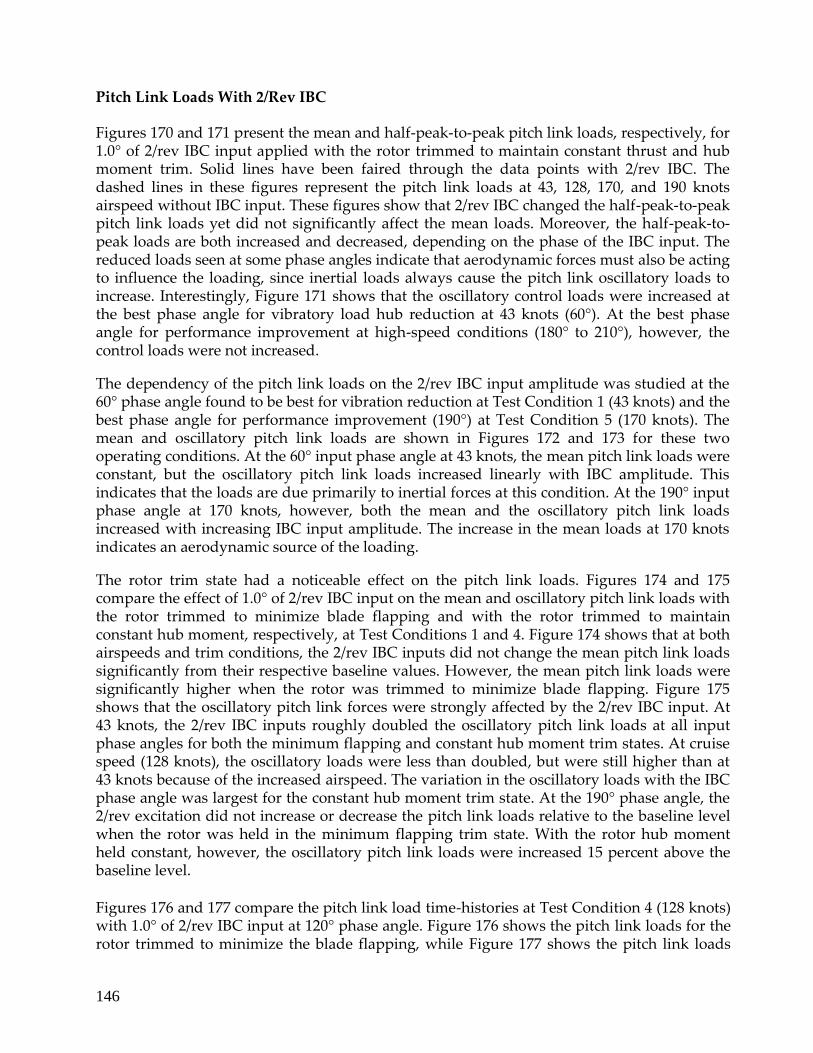
146
Pitch Link Loads With 2/Rev IBC
Figures 170 and 171 present the mean and half-peak-to-peak pitch link loads, respectively, for 1.0° of 2/rev IBC input applied with the rotor trimmed to maintain constant thrust and hub moment trim. Solid lines have been faired through the data points with 2/rev IBC. The dashed lines in these figures represent the pitch link loads at 43, 128, 170, and 190 knots airspeed without IBC input. These figures show that 2/rev IBC changed the half-peak-to-peak pitch link loads yet did not significantly affect the mean loads. Moreover, the half-peak-to-peak loads are both increased and decreased, depending on the phase of the IBC input. The reduced loads seen at some phase angles indicate that aerodynamic forces must also be acting to influence the loading, since inertial loads always cause the pitch link oscillatory loads to increase. Interestingly, Figure 171 shows that the oscillatory control loads were increased at the best phase angle for vibratory load hub reduction at 43 knots (60°). At the best phase angle for performance improvement at high-speed conditions (180° to 210°), however, the control loads were not increased.
The dependency of the pitch link loads on the 2/rev IBC input amplitude was studied at the 60° phase angle found to be best for vibration reduction at Test Condition 1 (43 knots) and the best phase angle for performance improvement (190°) at Test Condition 5 (170 knots). The mean and oscillatory pitch link loads are shown in Figures 172 and 173 for these two operating conditions. At the 60° input phase angle at 43 knots, the mean pitch link loads were constant, but the oscillatory pitch link loads increased linearly with IBC amplitude. This indicates that the loads are due primarily to inertial forces at this condition. At the 190° input phase angle at 170 knots, however, both the mean and the oscillatory pitch link loads increased with increasing IBC input amplitude. The increase in the mean loads at 170 knots indicates an aerodynamic source of the loading.
The rotor trim state had a noticeable effect on the pitch link loads. Figures 174 and 175 compare the effect of 1.0° of 2/rev IBC input on the mean and oscillatory pitch link loads with the rotor trimmed to minimize blade flapping and with the rotor trimmed to maintain constant hub moment, respectively, at Test Conditions 1 and 4. Figure 174 shows that at both airspeeds and trim conditions, the 2/rev IBC inputs did not change the mean pitch link loads significantly from their respective baseline values. However, the mean pitch link loads were significantly higher when the rotor was trimmed to minimize blade flapping. Figure 175 shows that the oscillatory pitch link forces were strongly affected by the 2/rev IBC input. At 43 knots, the 2/rev IBC inputs roughly doubled the oscillatory pitch link loads at all input phase angles for both the minimum flapping and constant hub moment trim states. At cruise speed (128 knots), the oscillatory loads were less than doubled, but were still higher than at 43 knots because of the increased airspeed. The variation in the oscillatory loads with the IBC phase angle was largest for the constant hub moment trim state. At the 190° phase angle, the 2/rev excitation did not increase or decrease the pitch link loads relative to the baseline level when the rotor was held in the minimum flapping trim state. With the rotor hub moment held constant, however, the oscillatory pitch link loads were increased 15 percent above the baseline level.
Figures 176 and 177 compare the pitch link load time-histories at Test Condition 4 (128 knots) with 1.0° of 2/rev IBC input at 120° phase angle. Figure 176 shows the pitch link loads for the rotor trimmed to minimize the blade flapping, while Figure 177 shows the pitch link loads

147
with the rotor trimmed to maintain constant hub moment. These plots indicate flapping trim state produced a higher mean load. The oscillatory load increase was similar for both trim states.
2 4 0
2 0 0
1 6 0
1 2 0
80
4 0
0 6 0 120 180 240 300 360
Phase of 1.0 deg 2/rev IBC Input, deg
Figure 170. Effect of 1.0° of 2/rev IBC on mean pitch link loads for constant hub moment trim
state. (1994 Runs 26, 29, 49, and 58.)
2 8 0
2 4 0
2 0 0
1 6 0
1 2 0
80
40
0
0 6 0 120 180 240 300 360
Phase of 1.0 deg 2/rev IBC Input, deg
Figure 171. Effect of 1.0° of 2/rev IBC on pitch link half-peak-to-peak loads for constant hub
moment trim state. (1994 Runs 26, 29, 49, and 58.)
190 kts
170 kts
128 kts
43 kts - - - - baselines
- - - - baselines 190 kts
170 kts
128 kts
43 kts Pit
ch
Lin
k L
oa
d,
lb
Pit
ch
Lin
k L
oa
d,
lb
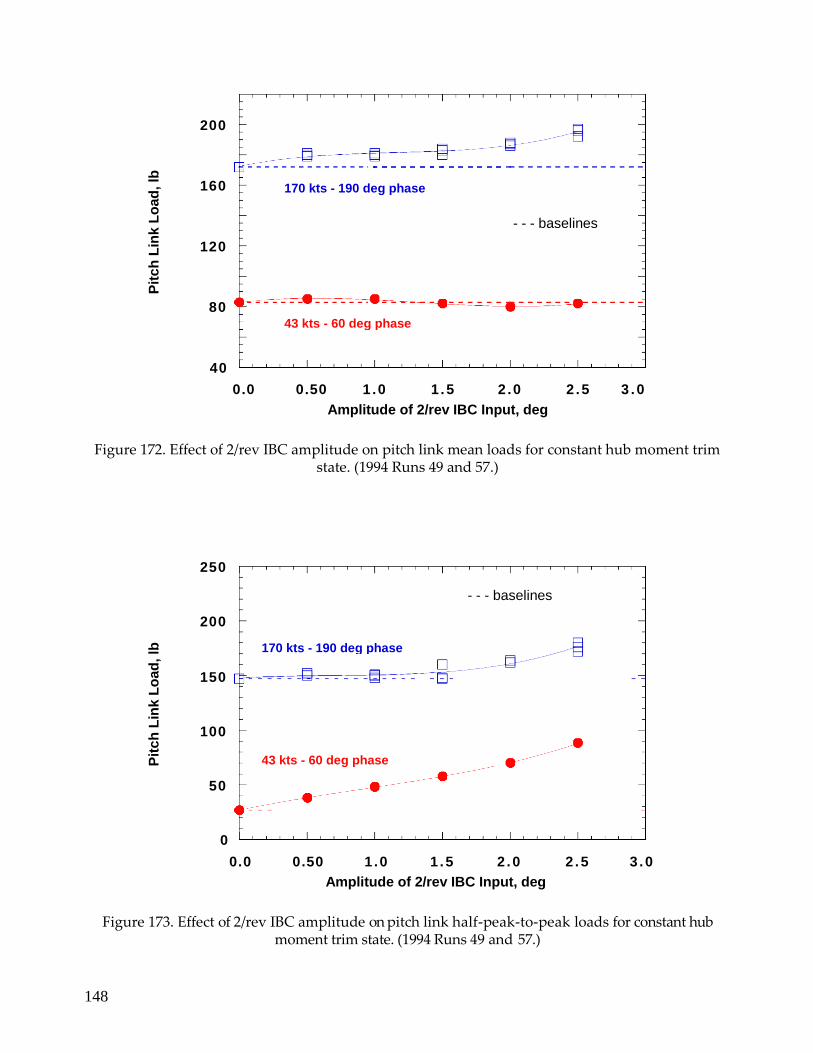
148
200
160
120
80
40
0.0 0.50 1 . 0 1 . 5 2 . 0 2 . 5 3 . 0
Amplitude of 2/rev IBC Input, deg
Figure 172. Effect of 2/rev IBC amplitude on pitch link mean loads for constant hub moment trim state. (1994 Runs 49 and 57.)
250
200
150
100
50
0
0.0 0.50 1 . 0 1 . 5 2 . 0 2 . 5 3 . 0
Amplitude of 2/rev IBC Input, deg
Figure 173. Effect of 2/rev IBC amplitude on pitch link half-peak-to-peak loads for constant hub moment trim state. (1994 Runs 49 and 57.)
170 kts - 190 deg phase
- - - baselines
43 kts - 60 deg phase
- - - baselines
170 kts - 190 deg phase
43 kts - 60 deg phase Pit
ch
Lin
k L
oad
, lb
P
itc
h L
ink
Lo
ad
, lb
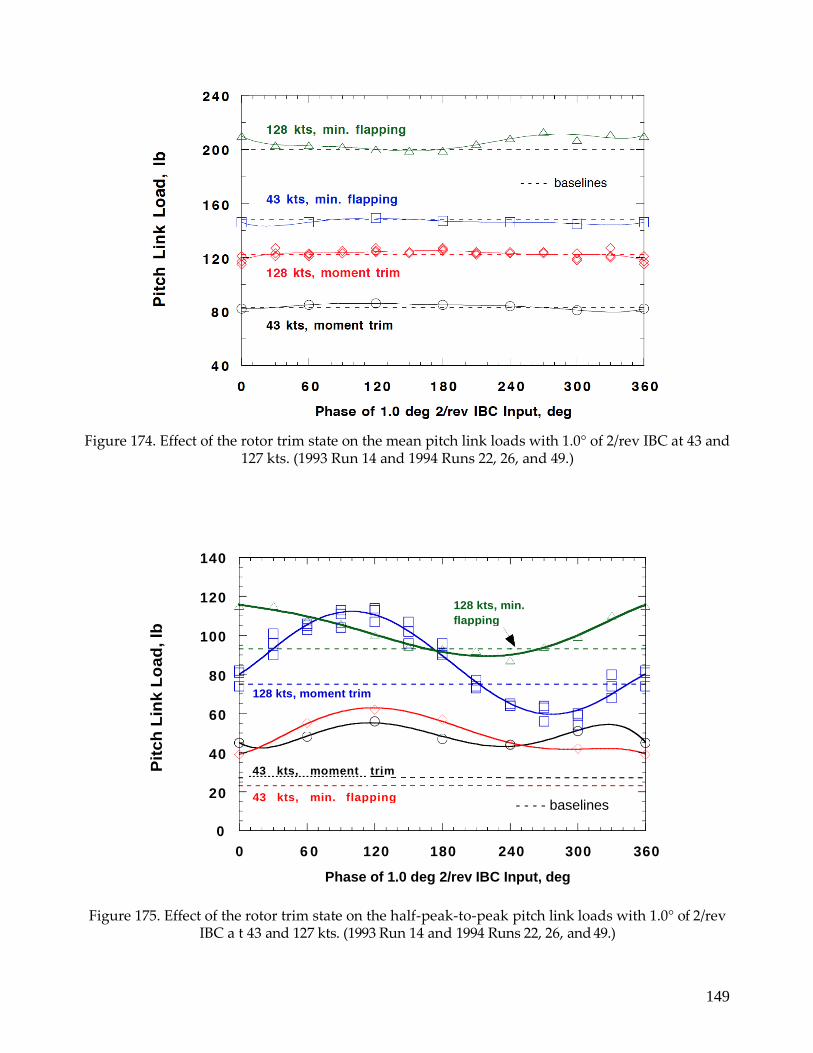
149
Figure 174. Effect of the rotor trim state on the mean pitch link loads with 1.0° of 2/rev IBC at 43 and 127 kts. (1993 Run 14 and 1994 Runs 22, 26, and 49.)
140
120
100
80
60
40
20
0
0 6 0 120 180 240 300 360
Phase of 1.0 deg 2/rev IBC Input, deg
Figure 175. Effect of the rotor trim state on the half-peak-to-peak pitch link loads with 1.0° of 2/rev IBC a t 43 and 127 kts. (1993 Run 14 and 1994 Runs 22, 26, and 49.)
128 kts, min.
flapping
128 kts, moment trim
43 kts, moment trim
43 kts, min. flapping - - - - baselines
Pit
ch
Lin
k L
oa
d,
lb
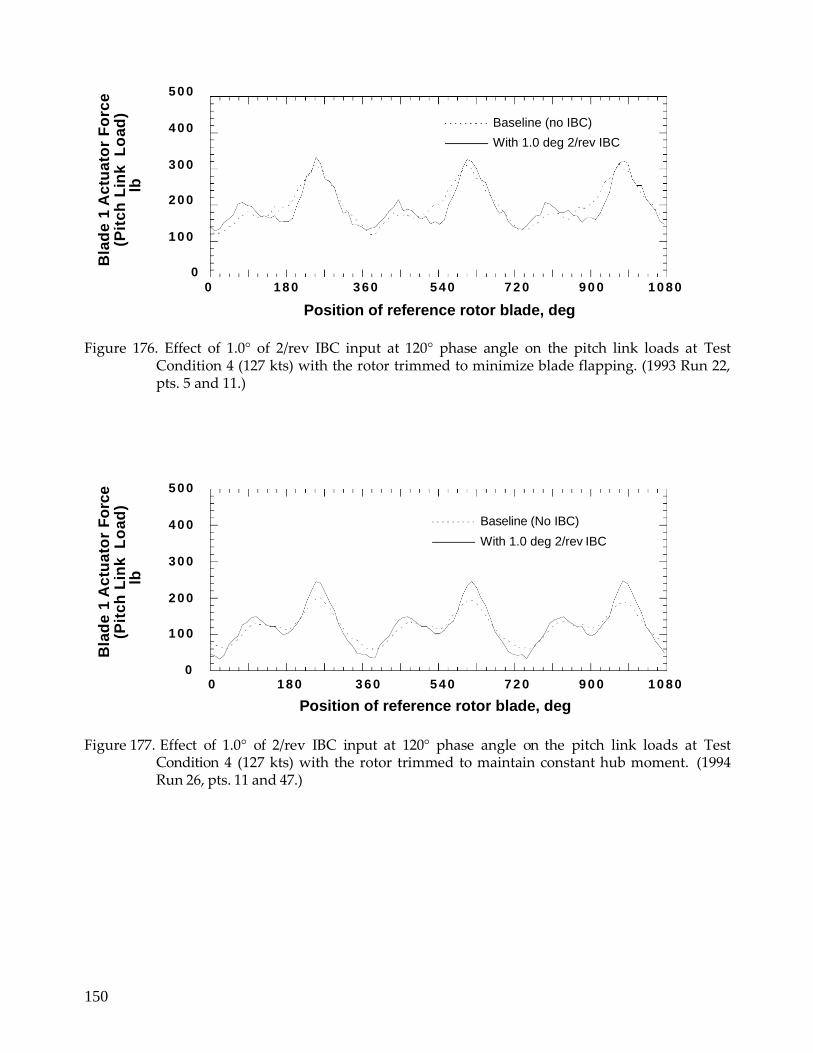
150
5 0 0
4 0 0
3 0 0
2 0 0
1 0 0
0
0 1 8 0 3 6 0 5 4 0 72 0 90 0 10 80
Position of reference rotor blade, deg
Figure 176. Effect of 1.0° of 2/rev IBC input at 120° phase angle on the pitch link loads at Test Condition 4 (127 kts) with the rotor trimmed to minimize blade flapping. (1993 Run 22, pts. 5 and 11.)
5 0 0
4 0 0
3 0 0
2 0 0
1 0 0
0 0 1 8 0 3 6 0 5 4 0 72 0 90 0 10 80
Position of reference rotor blade, deg
Figure 177. Effect of 1.0° of 2/rev IBC input at 120° phase angle on the pitch link loads at Test Condition 4 (127 kts) with the rotor trimmed to maintain constant hub moment. (1994 Run 26, pts. 11 and 47.)
Baseline (no IBC)
With 1.0 deg 2/rev IBC
Baseline (No IBC)
With 1.0 deg 2/rev IBC
Bla
de
1 A
ctu
ato
r F
orc
e
(Pit
ch
Lin
k
Lo
ad
) lb
Bla
de
1 A
ctu
ato
r F
orc
e
(Pit
ch
Lin
k
Lo
ad
) lb
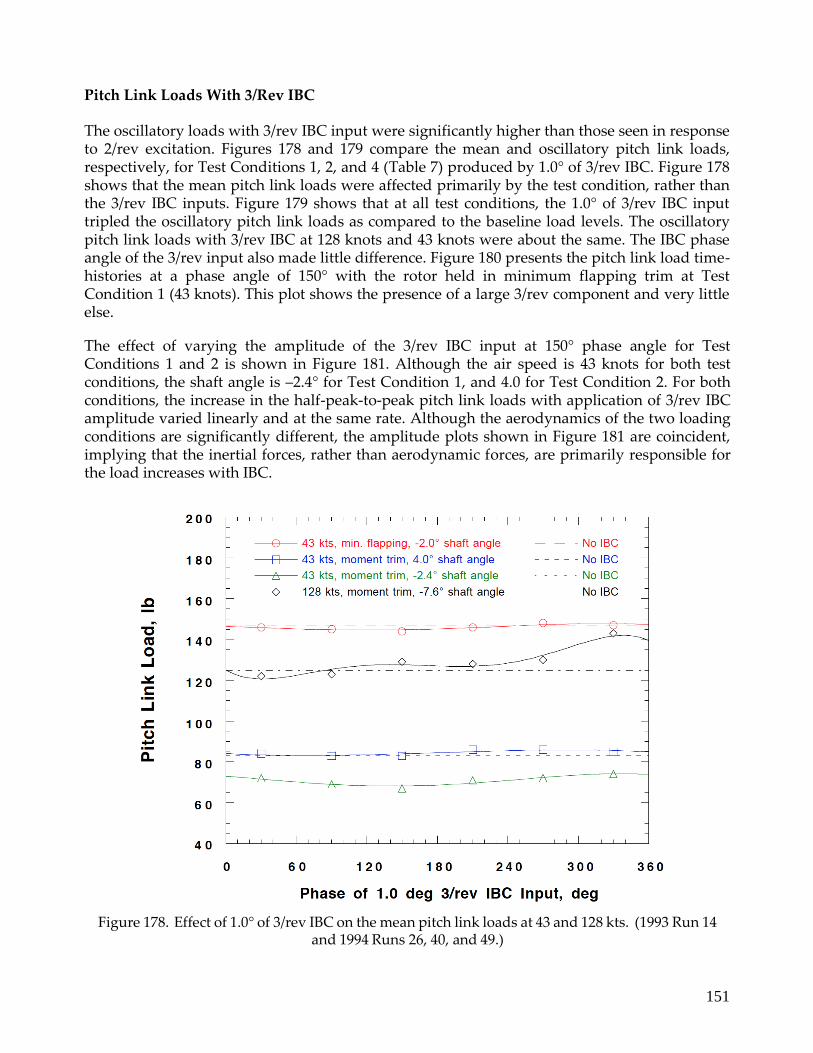
151
Pitch Link Loads With 3/Rev IBC
The oscillatory loads with 3/rev IBC input were significantly higher than those seen in response to 2/rev excitation. Figures 178 and 179 compare the mean and oscillatory pitch link loads, respectively, for Test Conditions 1, 2, and 4 (Table 7) produced by 1.0° of 3/rev IBC. Figure 178 shows that the mean pitch link loads were affected primarily by the test condition, rather than the 3/rev IBC inputs. Figure 179 shows that at all test conditions, the 1.0° of 3/rev IBC input tripled the oscillatory pitch link loads as compared to the baseline load levels. The oscillatory pitch link loads with 3/rev IBC at 128 knots and 43 knots were about the same. The IBC phase angle of the 3/rev input also made little difference. Figure 180 presents the pitch link load time-histories at a phase angle of 150° with the rotor held in minimum flapping trim at Test Condition 1 (43 knots). This plot shows the presence of a large 3/rev component and very little else.
The effect of varying the amplitude of the 3/rev IBC input at 150° phase angle for Test Conditions 1 and 2 is shown in Figure 181. Although the air speed is 43 knots for both test conditions, the shaft angle is –2.4° for Test Condition 1, and 4.0 for Test Condition 2. For both conditions, the increase in the half-peak-to-peak pitch link loads with application of 3/rev IBC amplitude varied linearly and at the same rate. Although the aerodynamics of the two loading conditions are significantly different, the amplitude plots shown in Figure 181 are coincident, implying that the inertial forces, rather than aerodynamic forces, are primarily responsible for the load increases with IBC.
Figure 178. Effect of 1.0° of 3/rev IBC on the mean pitch link loads at 43 and 128 kts. (1993 Run 14 and 1994 Runs 26, 40, and 49.)
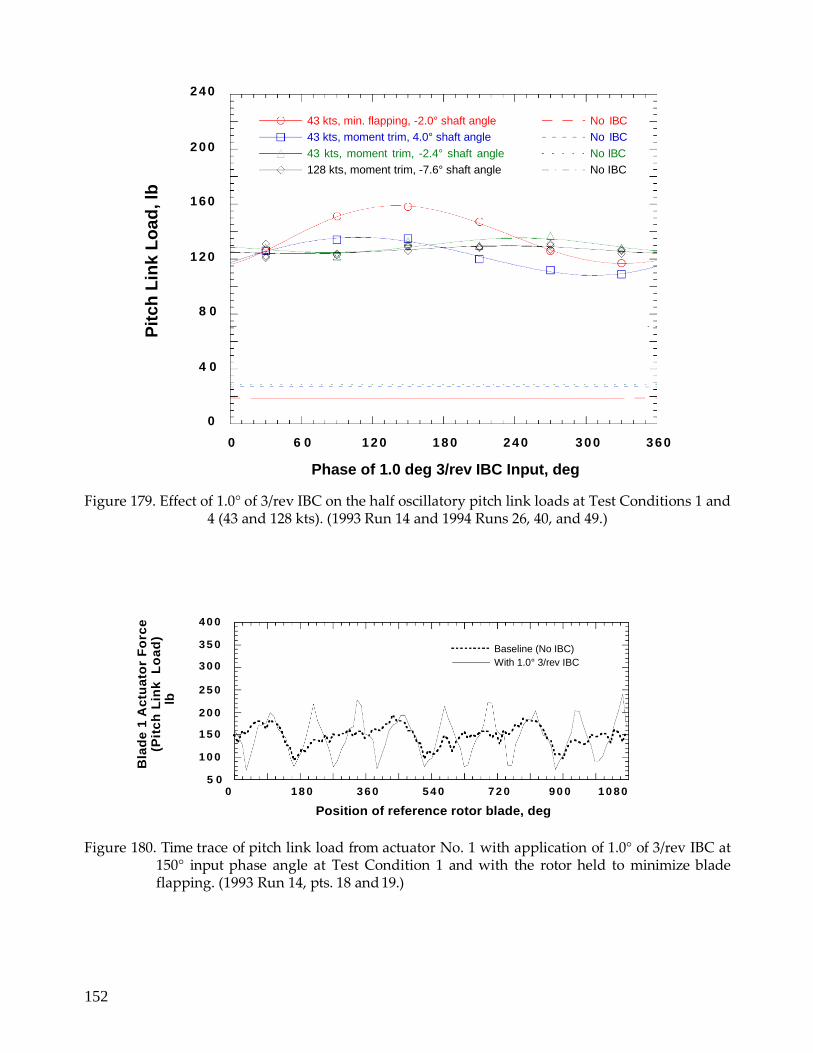
152
2 4 0
2 0 0
1 6 0
1 2 0
8 0
4 0
0
0 6 0 1 2 0 1 8 0 2 4 0 3 0 0 3 6 0
Phase of 1.0 deg 3/rev IBC Input, deg
Figure 179. Effect of 1.0° of 3/rev IBC on the half oscillatory pitch link loads at Test Conditions 1 and 4 (43 and 128 kts). (1993 Run 14 and 1994 Runs 26, 40, and 49.)
40 0
35 0
30 0
25 0
20 0
15 0
10 0
5 0 0 18 0 36 0 54 0 72 0 90 0 10 80
Position of reference rotor blade, deg
Figure 180. Time trace of pitch link load from actuator No. 1 with application of 1.0° of 3/rev IBC at 150° input phase angle at Test Condition 1 and with the rotor held to minimize blade flapping. (1993 Run 14, pts. 18 and 19.)
43 kts, min. flapping, -2.0° shaft angle
43 kts, moment trim, 4.0° shaft angle
43 kts, moment trim, -2.4° shaft angle
128 kts, moment trim, -7.6° shaft angle
No IBC
No IBC
No IBC
No IBC
Baseline (No IBC)
With 1.0° 3/rev IBC
Bla
de
1 A
ctu
ato
r F
orc
e
(Pit
ch
Lin
k
Lo
ad
) lb
Pit
ch
Lin
k L
oa
d, lb

153
250
200
150
100
50
0 0 0.5 1 1.5 2 2.5
Amplitude of 3/rev IBC Input, deg
Figure 181. Effect of 3/rev IBC amplitude on the oscillatory pitch link loads at 43 kts at shaft angles
of -2.4° and 4.0°. (1994 Runs 40 and 49.)
Pitch Link Loads With 4/Rev IBC
Similar to 2/rev and 3/rev IBC, 4/rev IBC has little effect on the mean pitch link loads. Figure 182 shows that the choice of test condition influences the mean pitch link loads much more than the 4/rev IBC inputs. This plot compares the mean pitch link loads for 0.5° of 4/rev input at 43 knots for constant moment trim at Test Condition 1, minimum flap trim at Test Condition 1, and constant moment trim at Test Condition 2. The mean pitch link loads for 1.0° of 4/rev input at 128 knots are also shown in Figure 182.
For the same 4/rev inputs used to make the plots of Figure 182, Figure 183 shows that 4/rev IBC increases the pitch link load at all phase angles. Compared to the baseline loads (dashed lines), the pitch link loads more than double at all phase angles. Because the amount of increase is not a strong function of phase angle, it appears that the pitch link load increase is the result of primarily overcoming inertial loads. Figure 184 presents a time history of the pitch link loading with and without 1.0° IBC input at 120° phase angle at 128 knots. Although the change in the oscillatory load component is very noticeable, the mean load is essentially unchanged.
Figure 185 shows that the oscillatory pitch link loads increase with 4/rev IBC amplitude at 240° input phase angle at Test Condition 1 (43 knots). This phase angle was the best for vibration reduction using 4/rev IBC. Similar to the results found for 3/rev IBC, the 4/rev load increase is very linear with amplitude, implying inertial forces as the load source. However, comparing this plot with Figure 181 shows that the 4/rev oscillatory loads were not increased by the (42/32) factor that would be expected on the basis of inertial load with a frequency increase of 3/rev to 4/rev. One possibility is that the 3/rev loads were increased to a greater degree because of the presence of the first torsional blade mode (22.3 Hz) near the 3/rev frequency, 21.25 Hz (Fig. 2). In any event, the load increase was linear with 4/rev amplitude.
Shaft angle -2.4 deg
3/rev IBC at 150 deg
Shaft angle 4.0 deg
3/rev IBC at 135 deg
Pit
ch
Lin
k L
oad
, lb
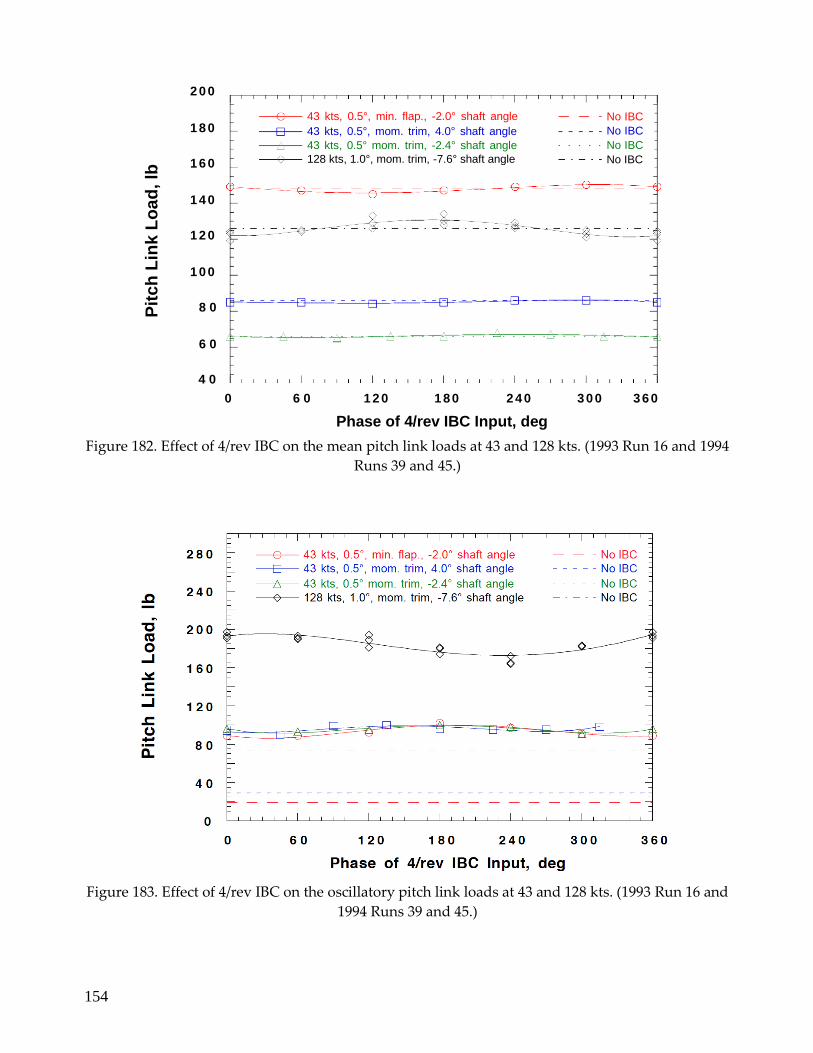
154
2 0 0
1 8 0
1 6 0
1 4 0
1 2 0
1 0 0
8 0
6 0
4 0
0 6 0 1 2 0 1 8 0 2 4 0 3 0 0 3 6 0
Phase of 4/rev IBC Input, deg
Figure 182. Effect of 4/rev IBC on the mean pitch link loads at 43 and 128 kts. (1993 Run 16 and 1994
Runs 39 and 45.)
Figure 183. Effect of 4/rev IBC on the oscillatory pitch link loads at 43 and 128 kts. (1993 Run 16 and
1994 Runs 39 and 45.)
43 kts, 0.5°, min. flap., -2.0° shaft angle
43 kts, 0.5°, mom. trim, 4.0° shaft angle
43 kts, 0.5° mom. trim, -2.4° shaft angle
128 kts, 1.0°, mom. trim, -7.6° shaft angle
No IBC
No IBC
No IBC
No IBC P
itch
Lin
k L
oa
d, lb
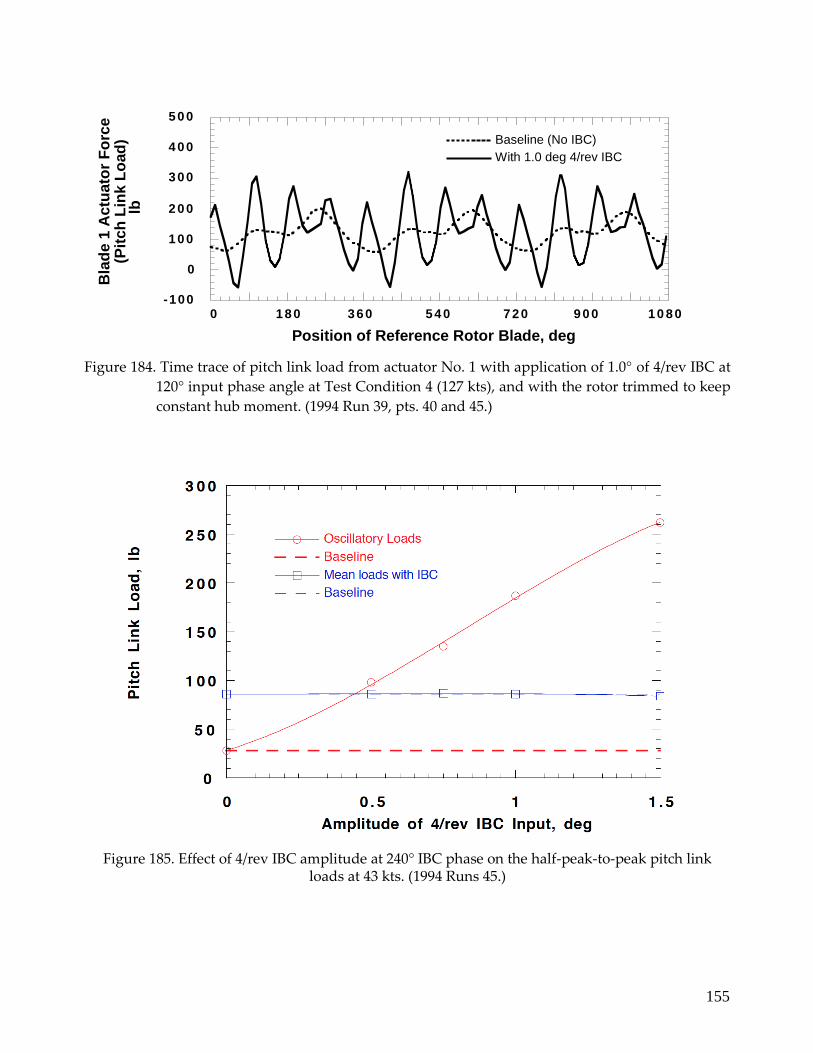
155
5 0 0
4 0 0
3 0 0
2 0 0
1 0 0
0
-100 0 1 8 0 3 6 0 5 4 0 7 2 0 9 0 0 10 80
Position of Reference Rotor Blade, deg
Figure 184. Time trace of pitch link load from actuator No. 1 with application of 1.0° of 4/rev IBC at
120° input phase angle at Test Condition 4 (127 kts), and with the rotor trimmed to keep
constant hub moment. (1994 Run 39, pts. 40 and 45.)
Figure 185. Effect of 4/rev IBC amplitude at 240° IBC phase on the half-peak-to-peak pitch link loads at 43 kts. (1994 Runs 45.)
Baseline (No IBC)
With 1.0 deg 4/rev IBC
Bla
de 1
Actu
ato
r F
orc
e
(Pit
ch
Lin
k L
oad
) lb
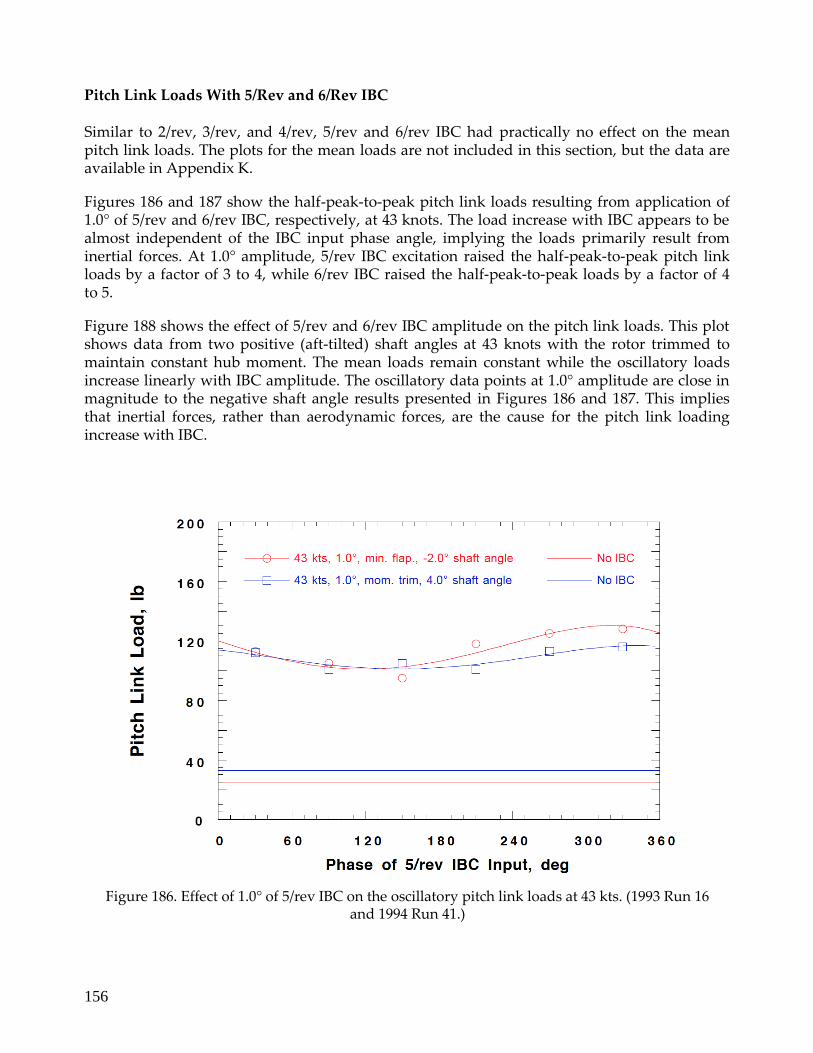
156
Pitch Link Loads With 5/Rev and 6/Rev IBC Similar to 2/rev, 3/rev, and 4/rev, 5/rev and 6/rev IBC had practically no effect on the mean pitch link loads. The plots for the mean loads are not included in this section, but the data are available in Appendix K.
Figures 186 and 187 show the half-peak-to-peak pitch link loads resulting from application of 1.0° of 5/rev and 6/rev IBC, respectively, at 43 knots. The load increase with IBC appears to be almost independent of the IBC input phase angle, implying the loads primarily result from inertial forces. At 1.0° amplitude, 5/rev IBC excitation raised the half-peak-to-peak pitch link loads by a factor of 3 to 4, while 6/rev IBC raised the half-peak-to-peak loads by a factor of 4 to 5.
Figure 188 shows the effect of 5/rev and 6/rev IBC amplitude on the pitch link loads. This plot shows data from two positive (aft-tilted) shaft angles at 43 knots with the rotor trimmed to maintain constant hub moment. The mean loads remain constant while the oscillatory loads increase linearly with IBC amplitude. The oscillatory data points at 1.0° amplitude are close in magnitude to the negative shaft angle results presented in Figures 186 and 187. This implies that inertial forces, rather than aerodynamic forces, are the cause for the pitch link loading increase with IBC.
Figure 186. Effect of 1.0° of 5/rev IBC on the oscillatory pitch link loads at 43 kts. (1993 Run 16 and 1994 Run 41.)
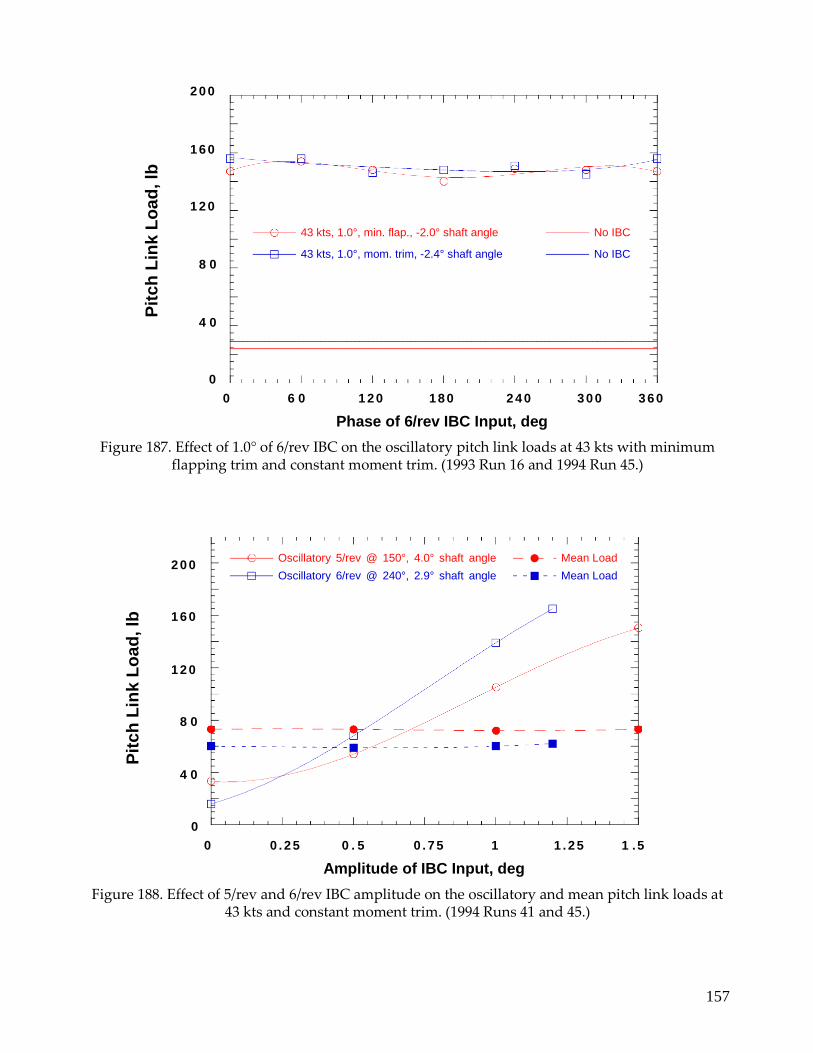
157
2 0 0
1 6 0
1 2 0
8 0
4 0
0
0 6 0 1 2 0 1 8 0 2 4 0 3 0 0 3 6 0
Phase of 6/rev IBC Input, deg
Figure 187. Effect of 1.0° of 6/rev IBC on the oscillatory pitch link loads at 43 kts with minimum flapping trim and constant moment trim. (1993 Run 16 and 1994 Run 45.)
2 0 0
1 6 0
1 2 0
8 0
4 0
0
0 0 . 2 5 0 . 5 0 . 7 5 1 1 . 2 5 1 . 5
Amplitude of IBC Input, deg
Figure 188. Effect of 5/rev and 6/rev IBC amplitude on the oscillatory and mean pitch link loads at 43 kts and constant moment trim. (1994 Runs 41 and 45.)
43 kts, 1.0°, min. flap., -2.0° shaft angle
43 kts, 1.0°, mom. trim, -2.4° shaft angle
No IBC
No IBC
Oscillatory 5/rev @ 150°, 4.0° shaft angle
Oscillatory 6/rev @ 240°, 2.9° shaft angle
Mean Load
Mean Load
Pit
ch
Lin
k L
oa
d, lb
P
itch
Lin
k L
oa
d, lb
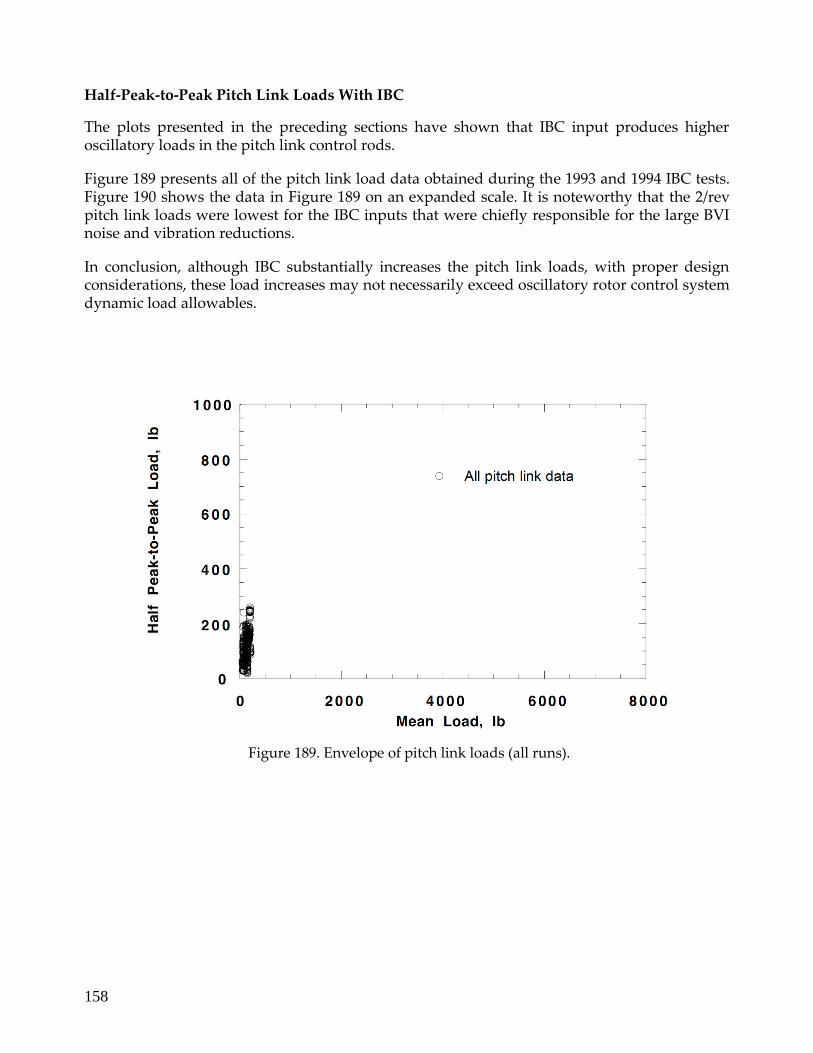
158
Half-Peak-to-Peak Pitch Link Loads With IBC
The plots presented in the preceding sections have shown that IBC input produces higher oscillatory loads in the pitch link control rods.
Figure 189 presents all of the pitch link load data obtained during the 1993 and 1994 IBC tests. Figure 190 shows the data in Figure 189 on an expanded scale. It is noteworthy that the 2/rev pitch link loads were lowest for the IBC inputs that were chiefly responsible for the large BVI noise and vibration reductions.
In conclusion, although IBC substantially increases the pitch link loads, with proper design considerations, these load increases may not necessarily exceed oscillatory rotor control system dynamic load allowables.
Figure 189. Envelope of pitch link loads (all runs).

159
300
240
180
120
60
0
0 6 0 120 180 240
Mean Load, lb
Figure 190. Envelope of pitch link loads showing all data points from 1993 and 1994 IBC tests with rotor trimmed to maintain constant moments, except those marked MF to denote minimum flapping trim.
ROTOR BLADE LOADS DATA
The effects of IBC on the blade flapwise, chordwise, and torsional bending loads were assessed by strain gages placed on the rotor blades at the locations shown in Table 13. In this table, the nomenclature such as “FB20” means “flap bending at station 20 inches from the hub center.” The percent radial station is also indicated in the table for convenience. For the 1993 test, the flap bending gage at station 110 and the chord bending gage at station 28 were not installed.
The mean and half-peak-to-peak blade loads for all data points are tabulated in Appendix M. Appendix N presents the harmonic content of the blade bending load data up to 12/rev for the subset of data points identified by “•” in Table 6. The blade load data, while judged to be valuable for comparing the effect of IBC on the blades within a given run, unfortunately are not always consistent when compared run to run. The problem is most noticeable for the chord bending gages. The cause of these discrepancies is not known. Temperature effects on the strain gages and zero adjustments made prior to rotor spin-up are possible sources of this problem.
3P,2°,43kts 1.0°,43kts 2P,190kts
3P
3P,1.0°,BVI 6P
2P
170kts
4P,0.5°,BVI 3P
2P
2P,1.0°,BVI
4P,MF
3P,MF
2P
128kts
MF
2P 2P,MF
1.0°,128kts
Half
Pe
ak-t
o-P
eak L
oa
d,
lb
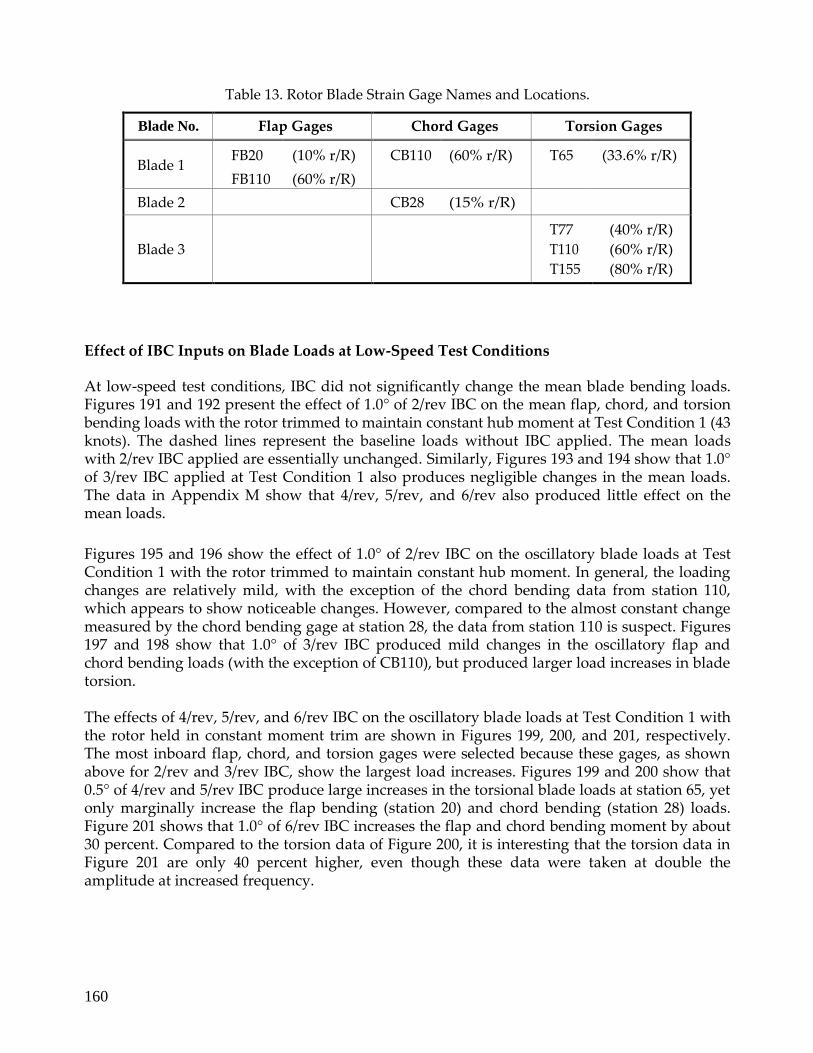
160
Table 13. Rotor Blade Strain Gage Names and Locations.
Blade No. Flap Gages Chord Gages Torsion Gages
Blade 1 FB20
FB110
(10% r/R)
(60% r/R)
CB110 (60% r/R) T65 (33.6% r/R)
Blade 2 CB28 (15% r/R)
Blade 3
T77
T110
T155
(40% r/R)
(60% r/R)
(80% r/R)
Effect of IBC Inputs on Blade Loads at Low-Speed Test Conditions
At low-speed test conditions, IBC did not significantly change the mean blade bending loads. Figures 191 and 192 present the effect of 1.0° of 2/rev IBC on the mean flap, chord, and torsion bending loads with the rotor trimmed to maintain constant hub moment at Test Condition 1 (43 knots). The dashed lines represent the baseline loads without IBC applied. The mean loads with 2/rev IBC applied are essentially unchanged. Similarly, Figures 193 and 194 show that 1.0° of 3/rev IBC applied at Test Condition 1 also produces negligible changes in the mean loads. The data in Appendix M show that 4/rev, 5/rev, and 6/rev also produced little effect on the mean loads.
Figures 195 and 196 show the effect of 1.0° of 2/rev IBC on the oscillatory blade loads at Test Condition 1 with the rotor trimmed to maintain constant hub moment. In general, the loading changes are relatively mild, with the exception of the chord bending data from station 110, which appears to show noticeable changes. However, compared to the almost constant change measured by the chord bending gage at station 28, the data from station 110 is suspect. Figures 197 and 198 show that 1.0° of 3/rev IBC produced mild changes in the oscillatory flap and chord bending loads (with the exception of CB110), but produced larger load increases in blade torsion. The effects of 4/rev, 5/rev, and 6/rev IBC on the oscillatory blade loads at Test Condition 1 with the rotor held in constant moment trim are shown in Figures 199, 200, and 201, respectively. The most inboard flap, chord, and torsion gages were selected because these gages, as shown above for 2/rev and 3/rev IBC, show the largest load increases. Figures 199 and 200 show that 0.5° of 4/rev and 5/rev IBC produce large increases in the torsional blade loads at station 65, yet only marginally increase the flap bending (station 20) and chord bending (station 28) loads. Figure 201 shows that 1.0° of 6/rev IBC increases the flap and chord bending moment by about 30 percent. Compared to the torsion data of Figure 200, it is interesting that the torsion data in Figure 201 are only 40 percent higher, even though these data were taken at double the amplitude at increased frequency.
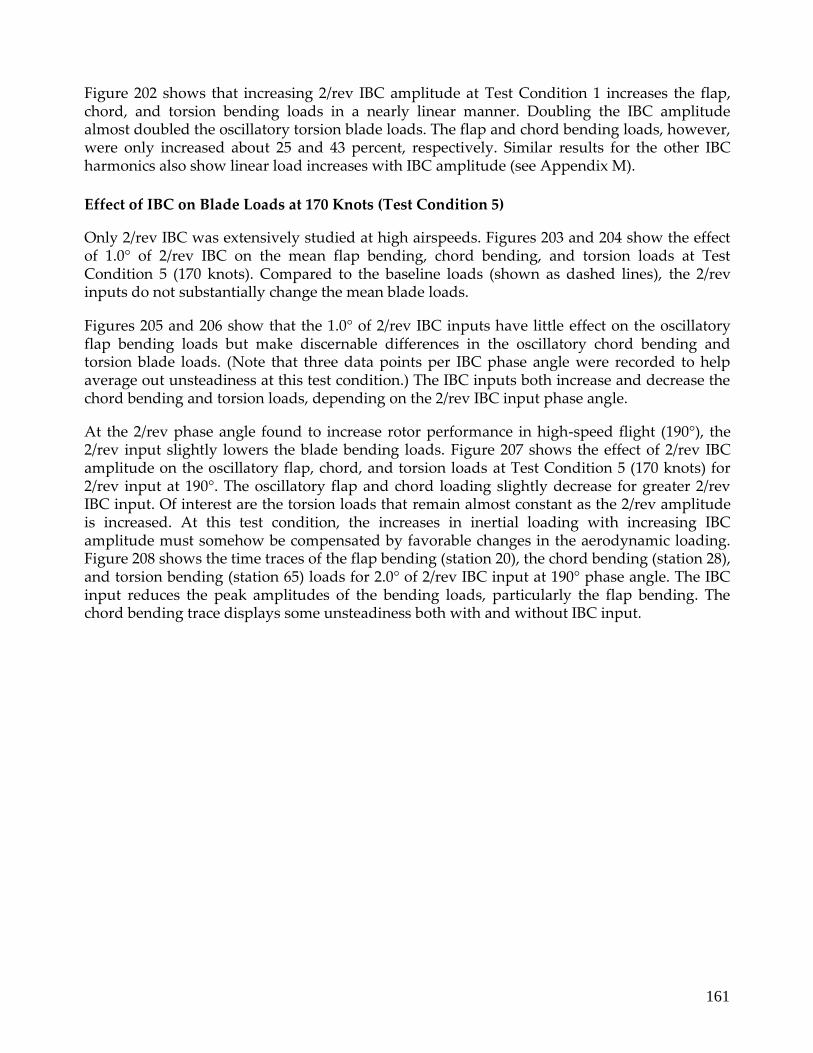
161
Figure 202 shows that increasing 2/rev IBC amplitude at Test Condition 1 increases the flap, chord, and torsion bending loads in a nearly linear manner. Doubling the IBC amplitude almost doubled the oscillatory torsion blade loads. The flap and chord bending loads, however, were only increased about 25 and 43 percent, respectively. Similar results for the other IBC harmonics also show linear load increases with IBC amplitude (see Appendix M).
Effect of IBC on Blade Loads at 170 Knots (Test Condition 5)
Only 2/rev IBC was extensively studied at high airspeeds. Figures 203 and 204 show the effect of 1.0° of 2/rev IBC on the mean flap bending, chord bending, and torsion loads at Test Condition 5 (170 knots). Compared to the baseline loads (shown as dashed lines), the 2/rev inputs do not substantially change the mean blade loads.
Figures 205 and 206 show that the 1.0° of 2/rev IBC inputs have little effect on the oscillatory flap bending loads but make discernable differences in the oscillatory chord bending and torsion blade loads. (Note that three data points per IBC phase angle were recorded to help average out unsteadiness at this test condition.) The IBC inputs both increase and decrease the chord bending and torsion loads, depending on the 2/rev IBC input phase angle.
At the 2/rev phase angle found to increase rotor performance in high-speed flight (190°), the 2/rev input slightly lowers the blade bending loads. Figure 207 shows the effect of 2/rev IBC amplitude on the oscillatory flap, chord, and torsion loads at Test Condition 5 (170 knots) for 2/rev input at 190°. The oscillatory flap and chord loading slightly decrease for greater 2/rev IBC input. Of interest are the torsion loads that remain almost constant as the 2/rev amplitude is increased. At this test condition, the increases in inertial loading with increasing IBC amplitude must somehow be compensated by favorable changes in the aerodynamic loading. Figure 208 shows the time traces of the flap bending (station 20), the chord bending (station 28), and torsion bending (station 65) loads for 2.0° of 2/rev IBC input at 190° phase angle. The IBC input reduces the peak amplitudes of the bending loads, particularly the flap bending. The chord bending trace displays some unsteadiness both with and without IBC input.
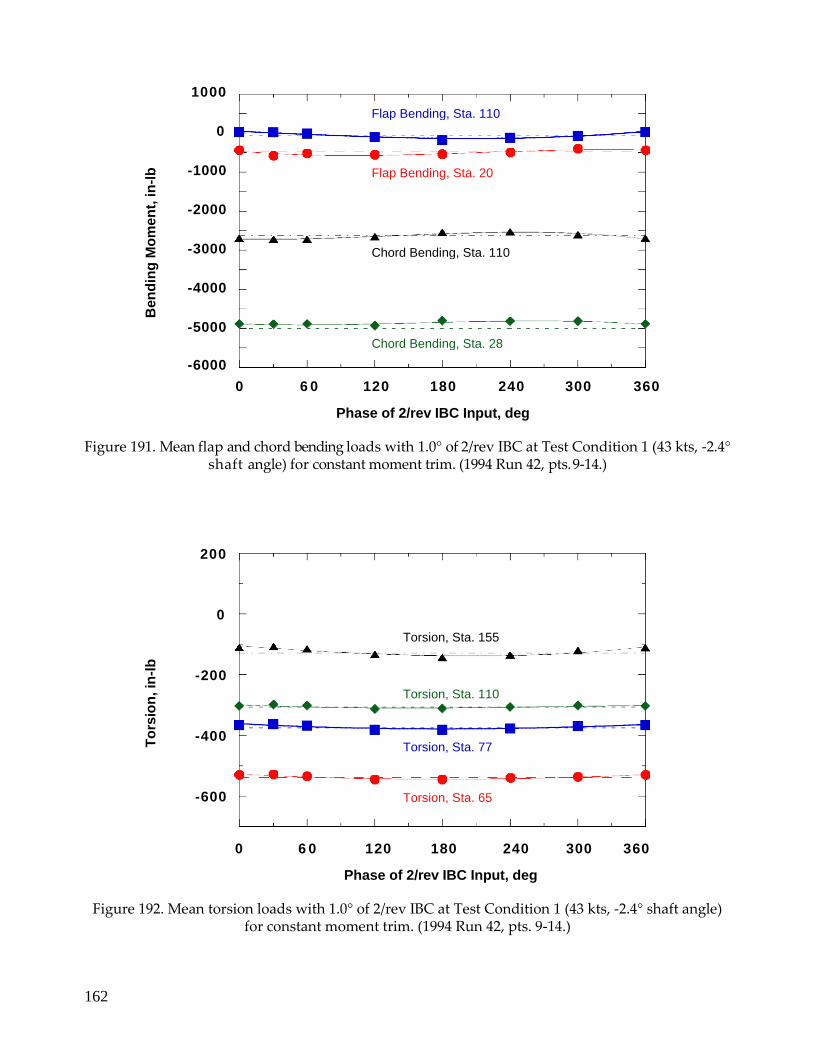
162
1000
0
-1000
-2000
-3000
-4000
-5000
-6000
0 6 0 120 180 240 300 360
Phase of 2/rev IBC Input, deg
Figure 191. Mean flap and chord bending loads with 1.0° of 2/rev IBC at Test Condition 1 (43 kts, -2.4° shaft angle) for constant moment trim. (1994 Run 42, pts. 9-14.)
200
0
-200
-400
-600
0 6 0 120 180 240 300 360
Phase of 2/rev IBC Input, deg
Figure 192. Mean torsion loads with 1.0° of 2/rev IBC at Test Condition 1 (43 kts, -2.4° shaft angle) for constant moment trim. (1994 Run 42, pts. 9-14.)
Flap Bending, Sta. 110
Flap Bending, Sta. 20
Chord Bending, Sta. 110
Chord Bending, Sta. 28
Torsion, Sta. 155
Torsion, Sta. 110
Torsion, Sta. 77
Torsion, Sta. 65
To
rsio
n, in
-lb
B
en
din
g M
om
en
t, in
-lb
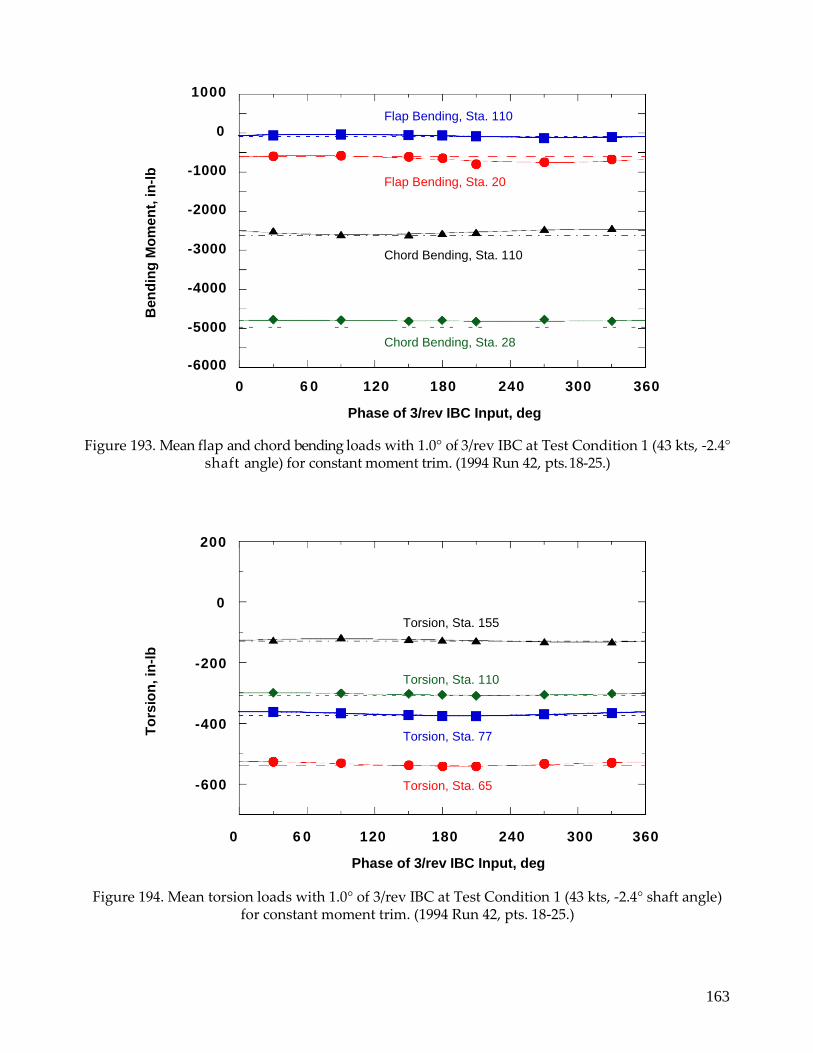
163
1000
0
-1000
-2000
-3000
-4000
-5000
-6000
0 6 0 120 180 240 300 360
Phase of 3/rev IBC Input, deg
Figure 193. Mean flap and chord bending loads with 1.0° of 3/rev IBC at Test Condition 1 (43 kts, -2.4° shaft angle) for constant moment trim. (1994 Run 42, pts. 18-25.)
200
0
-200
-400
-600
0 6 0 120 180 240 300 360
Phase of 3/rev IBC Input, deg
Figure 194. Mean torsion loads with 1.0° of 3/rev IBC at Test Condition 1 (43 kts, -2.4° shaft angle) for constant moment trim. (1994 Run 42, pts. 18-25.)
Flap Bending, Sta. 110
Flap Bending, Sta. 20
Chord Bending, Sta. 110
Chord Bending, Sta. 28
Torsion, Sta. 155
Torsion, Sta. 110
Torsion, Sta. 77
Torsion, Sta. 65
To
rsio
n, in
-lb
B
en
din
g M
om
en
t, in
-lb

164
4000
3000
2000
1000
0
0 6 0 120 180 240 300 360
Phase of 2/rev IBC Input, deg
Figure 195. Oscillatory flap and chord bending loads with 1.0° of 2/rev IBC at Test Condition 1 (43 kts, -2.4° shaft angle) for constant moment trim. (1994 Run 42, pts. 9-14.)
500
400
300
200
100
0
0 6 0 120 180 240 300 360
Phase of 2/rev IBC Input, deg
Figure 196. Oscillatory torsion loads with 1.0° of 2/rev IBC at Test Condition 1 (43 kts, -2.4° shaft angle) for constant moment trim. (1994 Run 42, pts. 9-14.)
Chord Bending, Sta. 110
Chord Bending, Sta. 28
Flap Bending, Sta. 20
Flap Bending, Sta. 110
Torsion, Sta. 65
Baseline, Sta. 65
Torsion, Sta. 77
Baseline, Sta. 77
Torsion, Sta. 110
Baseline, Sta. 110
Torsion, Sta. 155
Baseline, Sta. 155
Ha
lf p
-t-p
Be
nd
ing
Mo
me
nt,
in
-lb
H
alf
p-t
-p T
ors
ion
, in
-lb
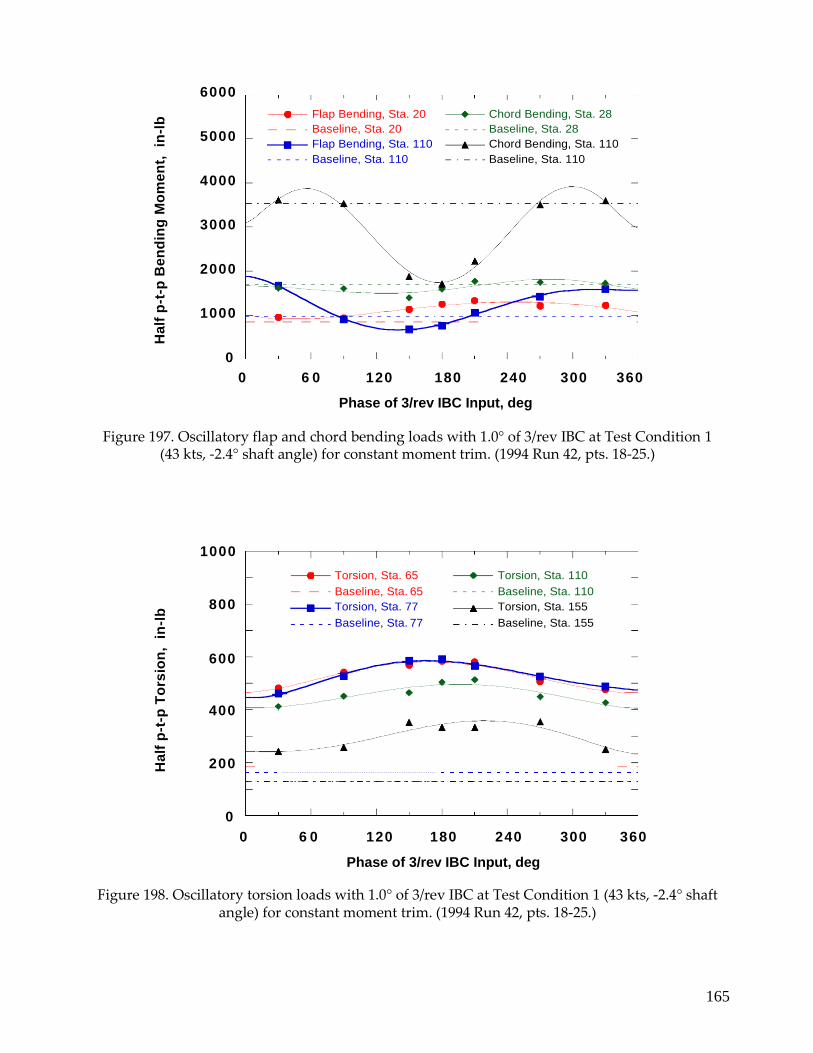
165
6000
5000
4000
3000
2000
1000
0
0 6 0 120 180 240 300 360
Phase of 3/rev IBC Input, deg
Figure 197. Oscillatory flap and chord bending loads with 1.0° of 3/rev IBC at Test Condition 1 (43 kts, -2.4° shaft angle) for constant moment trim. (1994 Run 42, pts. 18-25.)
1000
800
600
400
200
0
0 6 0 120 180 240 300 360
Phase of 3/rev IBC Input, deg
Figure 198. Oscillatory torsion loads with 1.0° of 3/rev IBC at Test Condition 1 (43 kts, -2.4° shaft angle) for constant moment trim. (1994 Run 42, pts. 18-25.)
Flap Bending, Sta. 20
Baseline, Sta. 20
Flap Bending, Sta. 110
Baseline, Sta. 110
Chord Bending, Sta. 28
Baseline, Sta. 28
Chord Bending, Sta. 110
Baseline, Sta. 110
Torsion, Sta. 65
Baseline, Sta. 65
Torsion, Sta. 77
Baseline, Sta. 77
Torsion, Sta. 110
Baseline, Sta. 110
Torsion, Sta. 155
Baseline, Sta. 155
Ha
lf p
-t-p
To
rsio
n,
in-l
b
Ha
lf p
-t-p
Be
nd
ing
Mo
me
nt,
in
-lb
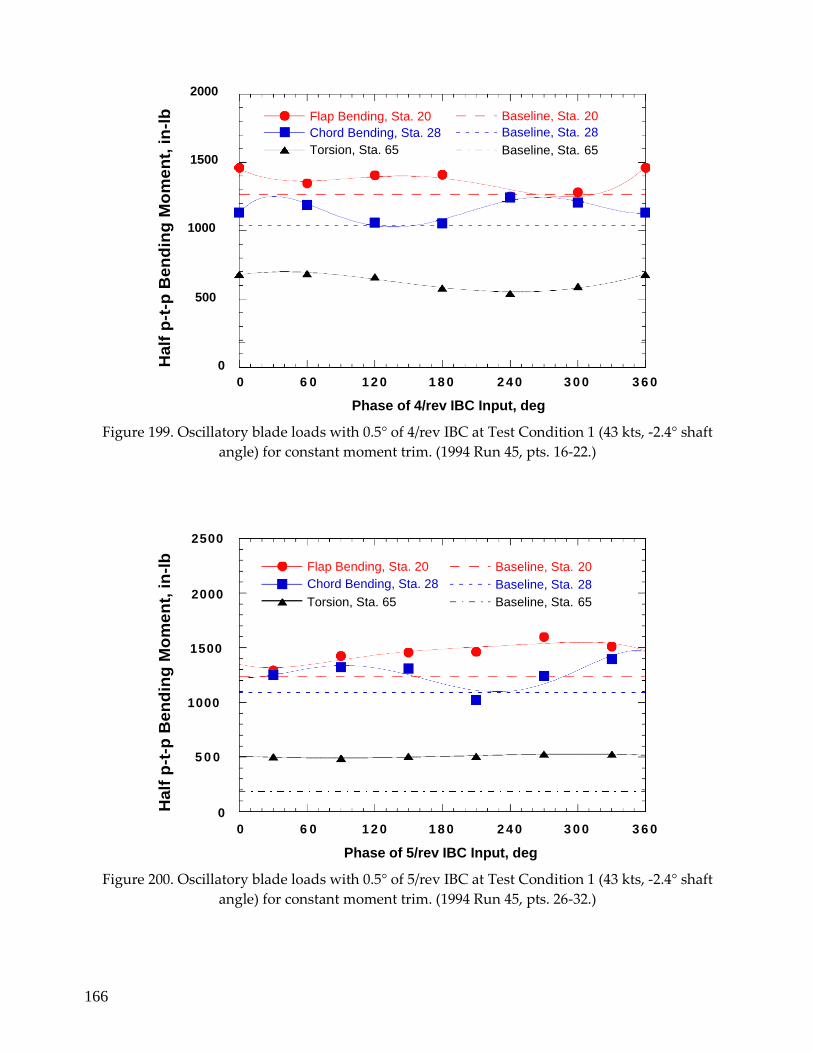
166
2000
1500
1000
500
0
0 6 0 1 2 0 1 8 0 2 4 0 3 0 0 3 6 0
Phase of 4/rev IBC Input, deg
Figure 199. Oscillatory blade loads with 0.5° of 4/rev IBC at Test Condition 1 (43 kts, -2.4° shaft
angle) for constant moment trim. (1994 Run 45, pts. 16-22.)
2500
2000
Flap Bending, Sta. 20
Chord Bending, Sta. 28
Torsion, Sta. 65
Baseline, Sta. 20
Baseline, Sta. 28
Baseline, Sta. 65
1500
1000
5 0 0
0
0 6 0 1 2 0 1 8 0 2 4 0 3 0 0 3 6 0
Phase of 5/rev IBC Input, deg
Figure 200. Oscillatory blade loads with 0.5° of 5/rev IBC at Test Condition 1 (43 kts, -2.4° shaft
angle) for constant moment trim. (1994 Run 45, pts. 26-32.)
Flap Bending, Sta. 20
Chord Bending, Sta. 28
Torsion, Sta. 65
Baseline, Sta. 20
Baseline, Sta. 28
Baseline, Sta. 65
Ha
lf p
-t-p
Be
nd
ing
Mo
me
nt,
in
-lb
H
alf
p-t
-p B
en
din
g M
om
en
t, i
n-l
b
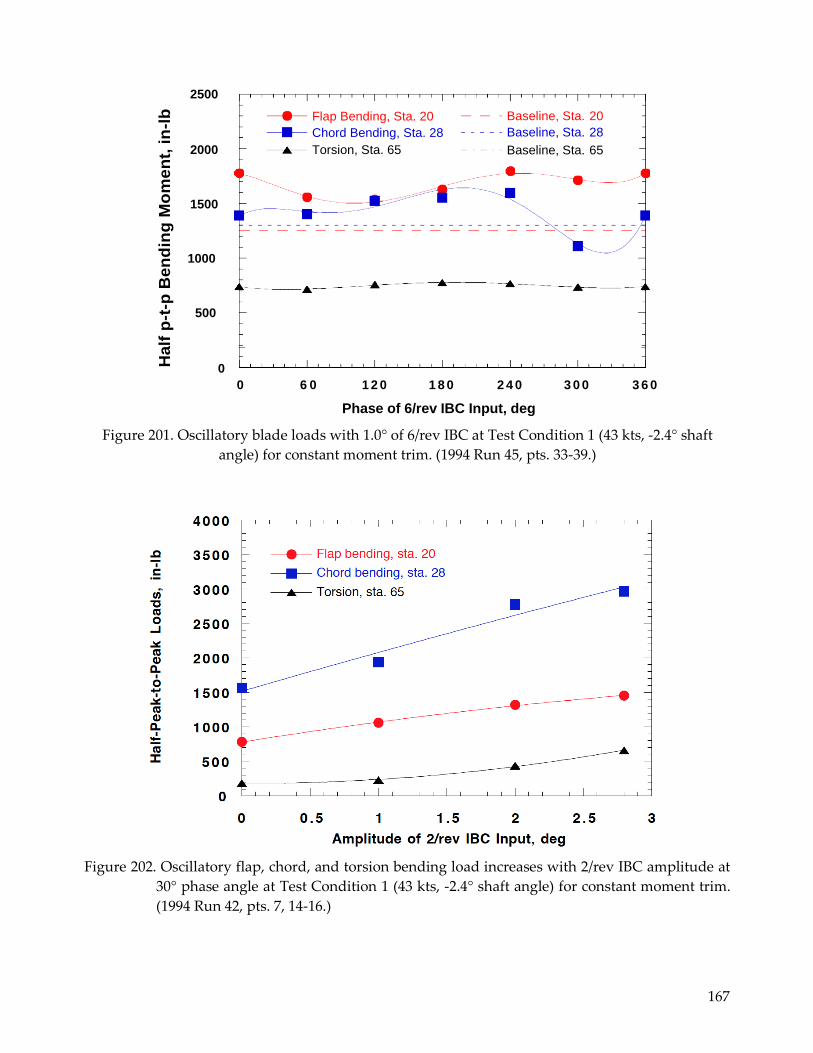
167
2500
2000
1500
1000
500
0
0 6 0 1 2 0 1 8 0 2 4 0 3 0 0 3 6 0
Phase of 6/rev IBC Input, deg
Figure 201. Oscillatory blade loads with 1.0° of 6/rev IBC at Test Condition 1 (43 kts, -2.4° shaft
angle) for constant moment trim. (1994 Run 45, pts. 33-39.)
Figure 202. Oscillatory flap, chord, and torsion bending load increases with 2/rev IBC amplitude at
30° phase angle at Test Condition 1 (43 kts, -2.4° shaft angle) for constant moment trim.
(1994 Run 42, pts. 7, 14-16.)
Flap Bending, Sta. 20
Chord Bending, Sta. 28
Torsion, Sta. 65
Baseline, Sta. 20
Baseline, Sta. 28
Baseline, Sta. 65
Ha
lf p
-t-p
Be
nd
ing
Mo
me
nt,
in
-lb
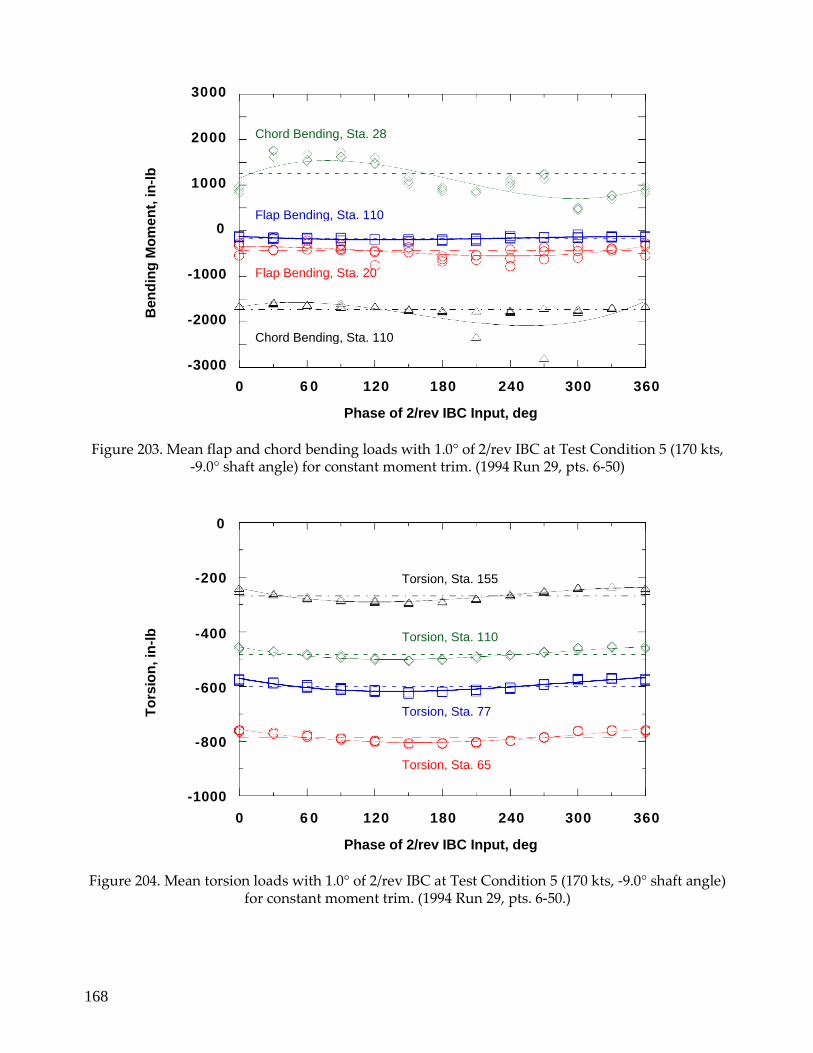
168
3000
2000
1000
0
-1000
-2000
-3000
0 6 0 120 180 240 300 360
Phase of 2/rev IBC Input, deg
Figure 203. Mean flap and chord bending loads with 1.0° of 2/rev IBC at Test Condition 5 (170 kts, -9.0° shaft angle) for constant moment trim. (1994 Run 29, pts. 6-50)
0
-200
-400
-600
-800
-1000
0 6 0 120 180 240 300 360
Phase of 2/rev IBC Input, deg
Figure 204. Mean torsion loads with 1.0° of 2/rev IBC at Test Condition 5 (170 kts, -9.0° shaft angle) for constant moment trim. (1994 Run 29, pts. 6-50.)
Chord Bending, Sta. 28
Flap Bending, Sta. 110
Flap Bending, Sta. 20
Chord Bending, Sta. 110
Torsion, Sta. 155
Torsion, Sta. 110
Torsion, Sta. 77
Torsion, Sta. 65
To
rsio
n, in
-lb
B
en
din
g M
om
en
t, in
-lb

169
6000
4000
2000
0
-2000
0 6 0 120 180 240 300 360
Phase of 2/rev IBC Input, deg
Figure 205. Oscillatory flap and chord bending loads with 1.0° of 2/rev IBC at Test Condition 5 (170 kts, -9.0° shaft angle) for constant moment trim. (1994 Run 29, pts. 6-50.)
1200
1000
800
600
400
200
0
0 6 0 120 180 240 300 360
Phase of 2/rev IBC Input, deg
Figure 206. Oscillatory torsion loads with 1.0° of 2/rev IBC at Test Condition 5 (170 kts, -9.0° shaft angle) for constant moment trim. (1994 Run 29, pts. 6-50.)
Flap Bending, Sta. 20 Baseline, Sta. 20
Flap Bending, Sta. 110
Baseline, Sta. 110
Chord Bending, Sta. 28
Baseline, Sta. 28
Chord Bending, Sta. 110
Baseline, Sta. 110
Torsion, Sta. 65
Baseline, Sta. 65
Torsion, Sta. 77
Baseline, Sta. 77
Torsion, Sta. 110
Baseline, Sta. 110
Torsion, Sta. 155
Baseline, Sta. 155
Ha
lf p
-t-p
Be
nd
ing
Mo
me
nt,
in
-lb
H
alf
p-t
-p T
ors
ion
, in
-lb
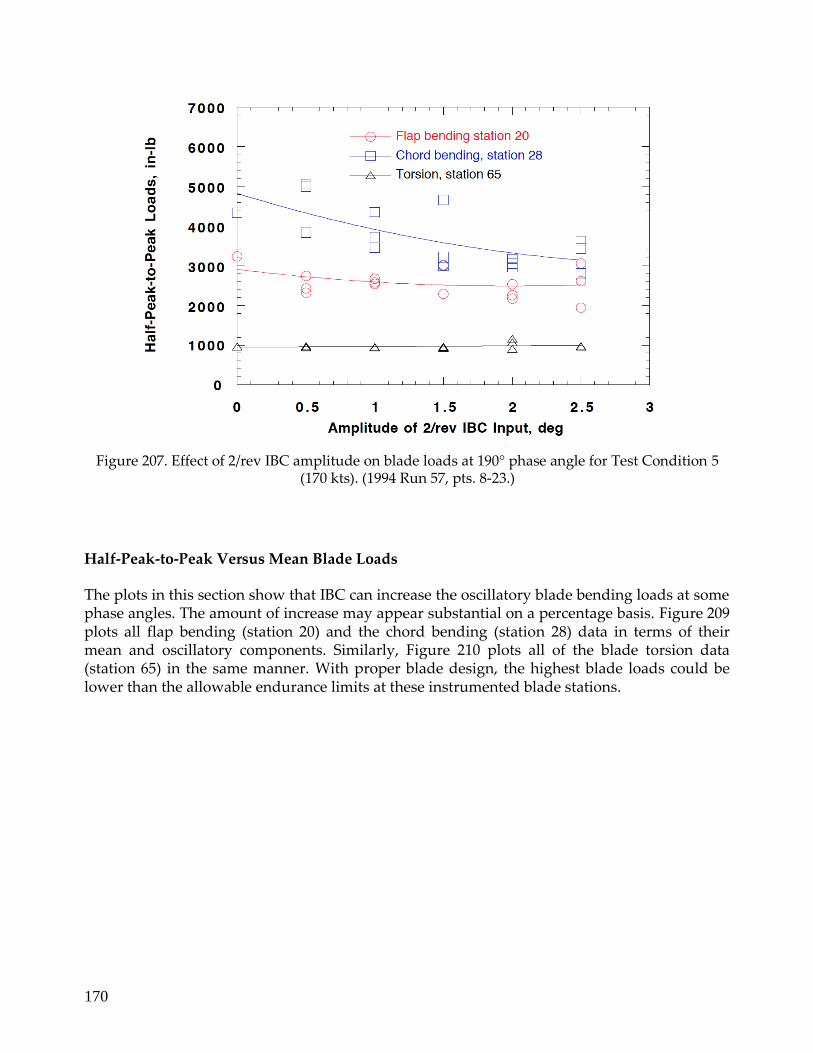
170
Figure 207. Effect of 2/rev IBC amplitude on blade loads at 190° phase angle for Test Condition 5 (170 kts). (1994 Run 57, pts. 8-23.)
Half-Peak-to-Peak Versus Mean Blade Loads
The plots in this section show that IBC can increase the oscillatory blade bending loads at some phase angles. The amount of increase may appear substantial on a percentage basis. Figure 209 plots all flap bending (station 20) and the chord bending (station 28) data in terms of their mean and oscillatory components. Similarly, Figure 210 plots all of the blade torsion data (station 65) in the same manner. With proper blade design, the highest blade loads could be lower than the allowable endurance limits at these instrumented blade stations.
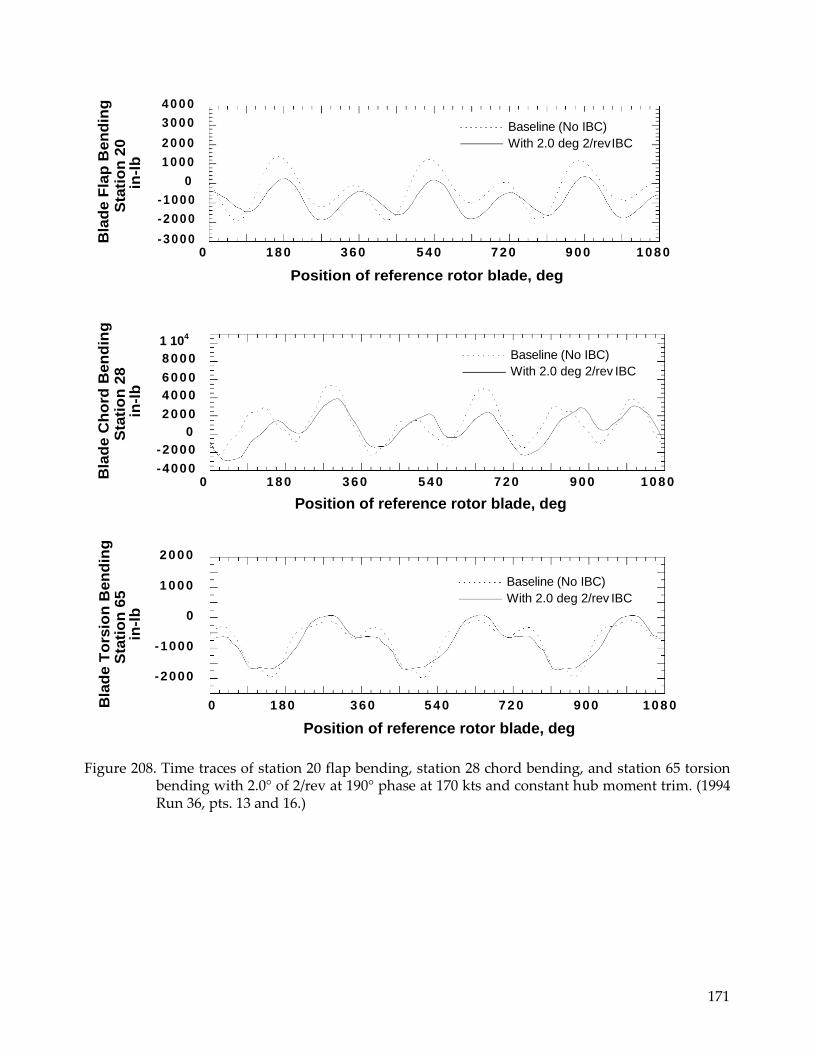
171
4 0 0 0
3 0 0 0
2 0 0 0
1 0 0 0
0
-1 0 0 0
-2 0 0 0
-3 0 0 0
0 1 8 0 3 6 0 5 4 0 7 2 0 9 0 0 1 0 8 0
Position of reference rotor blade, deg
1 10
4
8 0 0 0
6 0 0 0
4 0 0 0
2 0 0 0
0
-2000
-4000
0 1 8 0 3 6 0 5 4 0 7 2 0 9 0 0 1 0 8 0
Position of reference rotor blade, deg
2 0 0 0
1 0 0 0
0
-1000
-2000
0 1 8 0 360 5 4 0 72 0 9 0 0 108 0
Position of reference rotor blade, deg
Figure 208. Time traces of station 20 flap bending, station 28 chord bending, and station 65 torsion bending with 2.0° of 2/rev at 190° phase at 170 kts and constant hub moment trim. (1994 Run 36, pts. 13 and 16.)
Baseline (No IBC)
With 2.0 deg 2/rev IBC
Baseline (No IBC)
With 2.0 deg 2/rev IBC
Baseline (No IBC)
With 2.0 deg 2/rev IBC
Bla
de T
ors
ion
Ben
din
g
Sta
tio
n 6
5
in-l
b
Bla
de C
ho
rd B
en
din
g
Sta
tio
n 2
8
in-l
b
Bla
de F
lap
Ben
din
g
Sta
tio
n 2
0
in-l
b
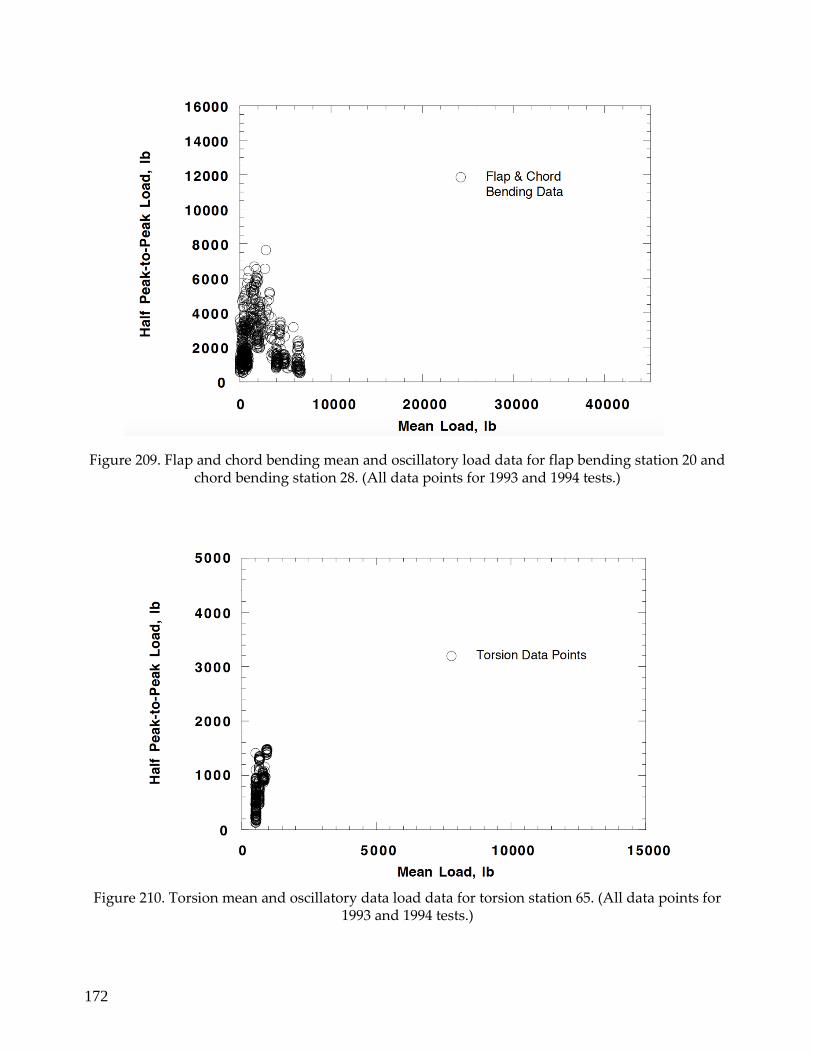
172
Figure 209. Flap and chord bending mean and oscillatory load data for flap bending station 20 and chord bending station 28. (All data points for 1993 and 1994 tests.)
Figure 210. Torsion mean and oscillatory data load data for torsion station 65. (All data points for 1993 and 1994 tests.)
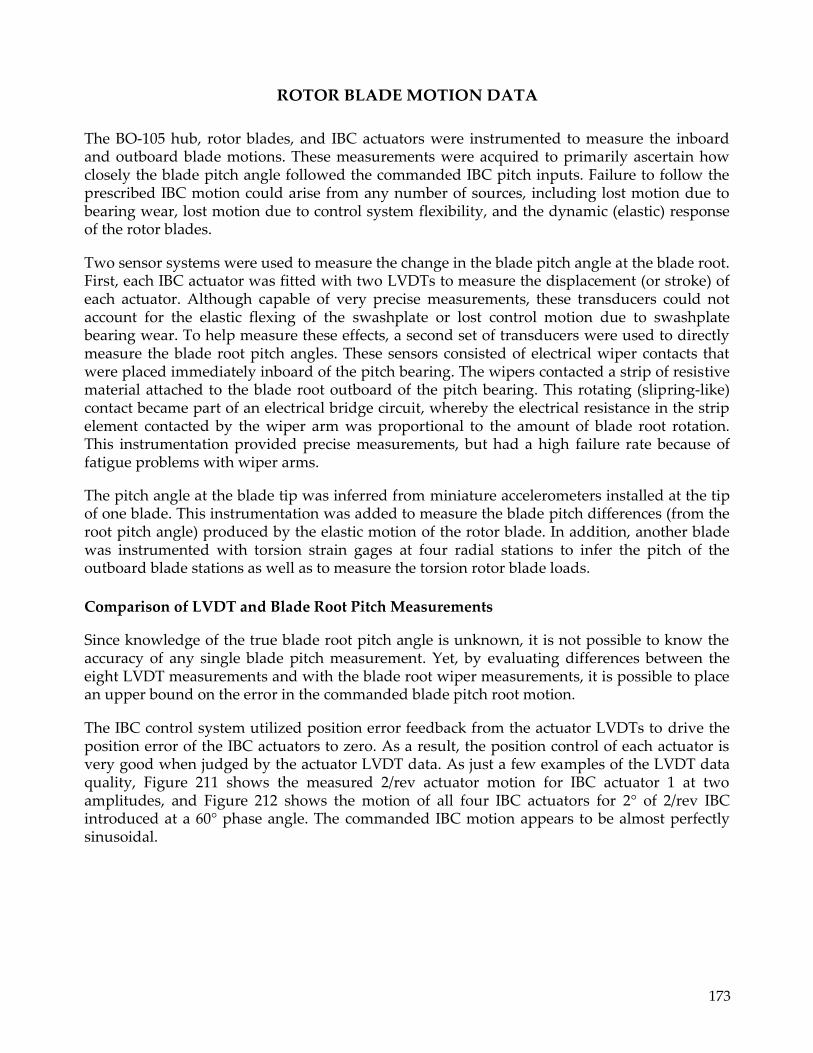
173
ROTOR BLADE MOTION DATA
The BO-105 hub, rotor blades, and IBC actuators were instrumented to measure the inboard and outboard blade motions. These measurements were acquired to primarily ascertain how closely the blade pitch angle followed the commanded IBC pitch inputs. Failure to follow the prescribed IBC motion could arise from any number of sources, including lost motion due to bearing wear, lost motion due to control system flexibility, and the dynamic (elastic) response of the rotor blades.
Two sensor systems were used to measure the change in the blade pitch angle at the blade root. First, each IBC actuator was fitted with two LVDTs to measure the displacement (or stroke) of each actuator. Although capable of very precise measurements, these transducers could not account for the elastic flexing of the swashplate or lost control motion due to swashplate bearing wear. To help measure these effects, a second set of transducers were used to directly measure the blade root pitch angles. These sensors consisted of electrical wiper contacts that were placed immediately inboard of the pitch bearing. The wipers contacted a strip of resistive material attached to the blade root outboard of the pitch bearing. This rotating (slipring-like) contact became part of an electrical bridge circuit, whereby the electrical resistance in the strip element contacted by the wiper arm was proportional to the amount of blade root rotation. This instrumentation provided precise measurements, but had a high failure rate because of fatigue problems with wiper arms.
The pitch angle at the blade tip was inferred from miniature accelerometers installed at the tip of one blade. This instrumentation was added to measure the blade pitch differences (from the root pitch angle) produced by the elastic motion of the rotor blade. In addition, another blade was instrumented with torsion strain gages at four radial stations to infer the pitch of the outboard blade stations as well as to measure the torsion rotor blade loads.
Comparison of LVDT and Blade Root Pitch Measurements
Since knowledge of the true blade root pitch angle is unknown, it is not possible to know the accuracy of any single blade pitch measurement. Yet, by evaluating differences between the eight LVDT measurements and with the blade root wiper measurements, it is possible to place an upper bound on the error in the commanded blade pitch root motion.
The IBC control system utilized position error feedback from the actuator LVDTs to drive the position error of the IBC actuators to zero. As a result, the position control of each actuator is very good when judged by the actuator LVDT data. As just a few examples of the LVDT data quality, Figure 211 shows the measured 2/rev actuator motion for IBC actuator 1 at two amplitudes, and Figure 212 shows the motion of all four IBC actuators for 2° of 2/rev IBC introduced at a 60° phase angle. The commanded IBC motion appears to be almost perfectly sinusoidal.
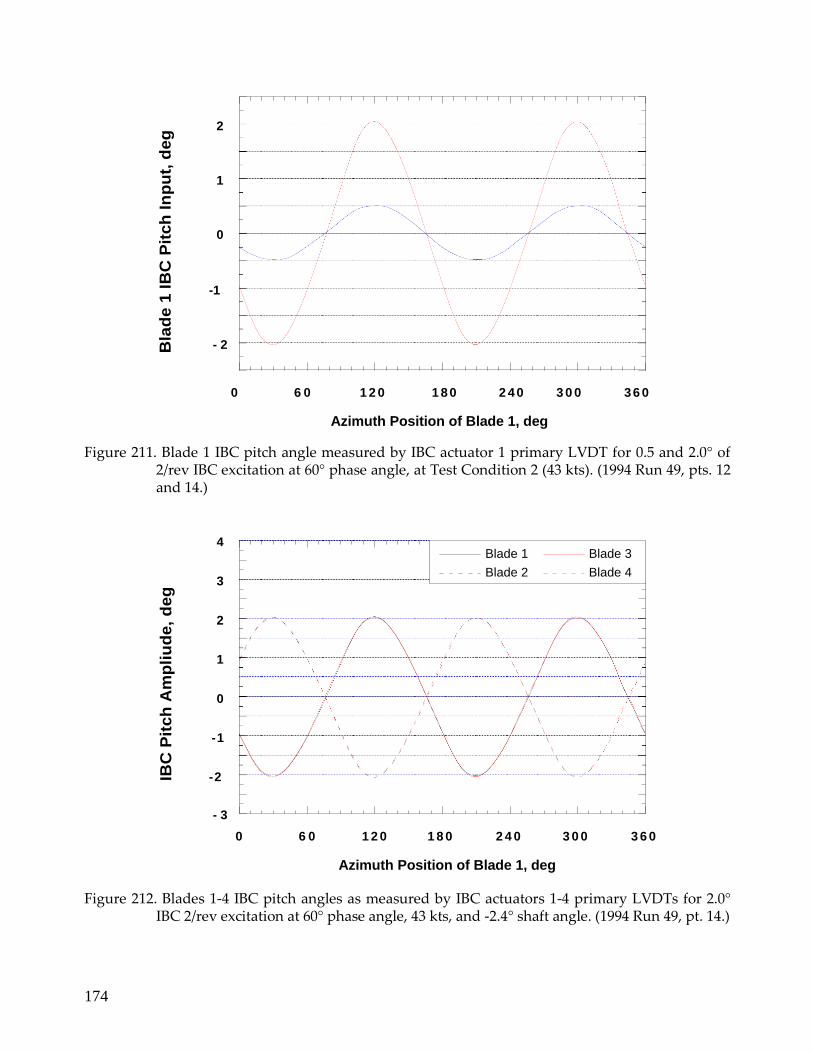
174
2
1
0
-1
- 2
0 6 0 1 2 0 1 80 2 40 3 0 0 36 0
Azimuth Position of Blade 1, deg
Figure 211. Blade 1 IBC pitch angle measured by IBC actuator 1 primary LVDT for 0.5 and 2.0° of 2/rev IBC excitation at 60° phase angle, at Test Condition 2 (43 kts). (1994 Run 49, pts. 12 and 14.)
4
3
2
1
0
-1
-2
- 3
0 6 0 1 2 0 1 8 0 2 4 0 3 0 0 3 6 0
Azimuth Position of Blade 1, deg
Figure 212. Blades 1-4 IBC pitch angles as measured by IBC actuators 1-4 primary LVDTs for 2.0° IBC 2/rev excitation at 60° phase angle, 43 kts, and -2.4° shaft angle. (1994 Run 49, pt. 14.)
Blade 1
Blade 2
Blade 3
Blade 4
IBC
Pit
ch
Am
pli
ud
e,
de
g
Bla
de
1 I
BC
Pit
ch
In
pu
t, d
eg
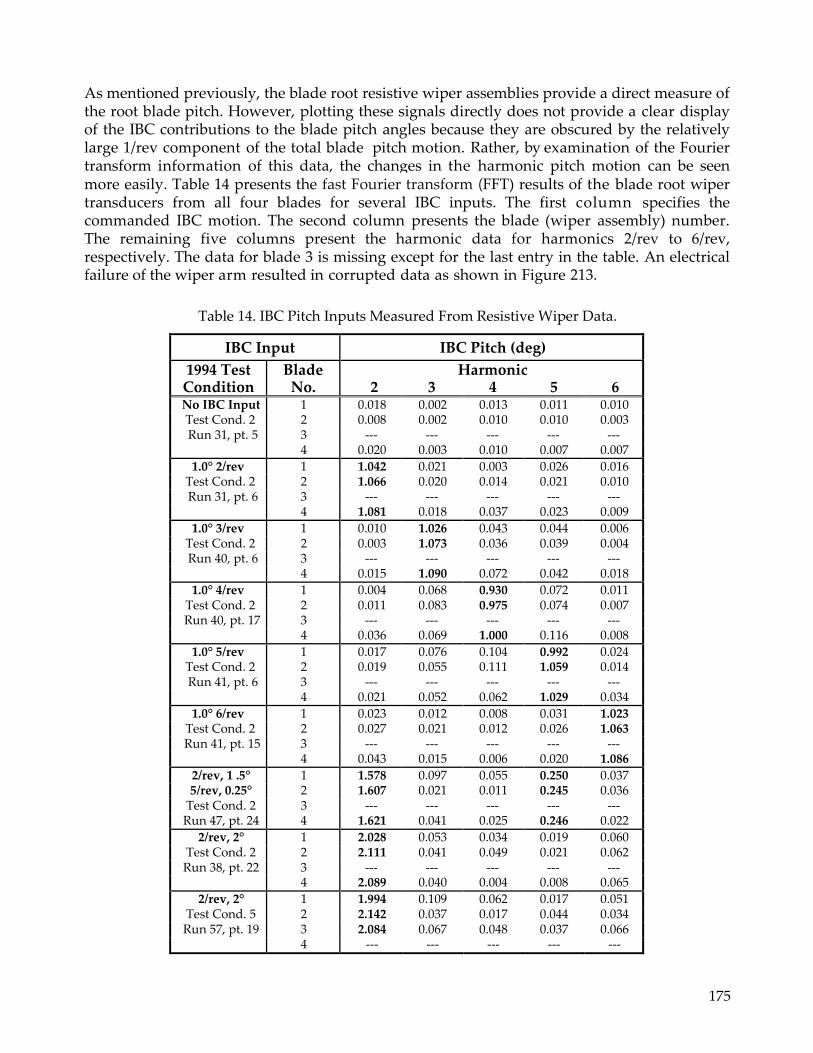
175
As mentioned previously, the blade root resistive wiper assemblies provide a direct measure of the root blade pitch. However, plotting these signals directly does not provide a clear display of the IBC contributions to the blade pitch angles because they are obscured by the relatively large 1/rev component of the total blade pitch motion. Rather, by examination of the Fourier transform information of this data, the changes in the harmonic pitch motion can be seen more easily. Table 14 presents the fast Fourier transform (FFT) results of the blade root wiper transducers from all four blades for several IBC inputs. The first column specifies the commanded IBC motion. The second column presents the blade (wiper assembly) number. The remaining five columns present the harmonic data for harmonics 2/rev to 6/rev, respectively. The data for blade 3 is missing except for the last entry in the table. An electrical failure of the wiper arm resulted in corrupted data as shown in Figure 213.
Table 14. IBC Pitch Inputs Measured From Resistive Wiper Data.
IBC Input IBC Pitch (deg)
1994 Test Condition
Blade No.
Harmonic 2 3 4 5 6
No IBC Input 1 0.018 0.002 0.013 0.011 0.010 Test Cond. 2 2 0.008 0.002 0.010 0.010 0.003 Run 31, pt. 5 3 --- --- --- --- ---
4 0.020 0.003 0.010 0.007 0.007
1.0° 2/rev 1 1.042 0.021 0.003 0.026 0.016 Test Cond. 2 2 1.066 0.020 0.014 0.021 0.010 Run 31, pt. 6 3 --- --- --- --- ---
4 1.081 0.018 0.037 0.023 0.009
1.0° 3/rev 1 0.010 1.026 0.043 0.044 0.006 Test Cond. 2 2 0.003 1.073 0.036 0.039 0.004 Run 40, pt. 6 3 --- --- --- --- ---
4 0.015 1.090 0.072 0.042 0.018
1.0° 4/rev 1 0.004 0.068 0.930 0.072 0.011 Test Cond. 2 2 0.011 0.083 0.975 0.074 0.007 Run 40, pt. 17 3 --- --- --- --- ---
4 0.036 0.069 1.000 0.116 0.008
1.0° 5/rev 1 0.017 0.076 0.104 0.992 0.024 Test Cond. 2 2 0.019 0.055 0.111 1.059 0.014 Run 41, pt. 6 3 --- --- --- --- ---
4 0.021 0.052 0.062 1.029 0.034
1.0° 6/rev 1 0.023 0.012 0.008 0.031 1.023 Test Cond. 2 2 0.027 0.021 0.012 0.026 1.063 Run 41, pt. 15 3 --- --- --- --- ---
4 0.043 0.015 0.006 0.020 1.086
2/rev, 1 .5° 1 1.578 0.097 0.055 0.250 0.037 5/rev, 0.25° 2 1.607 0.021 0.011 0.245 0.036
Test Cond. 2 3 --- --- --- --- --- Run 47, pt. 24 4 1.621 0.041 0.025 0.246 0.022
2/rev, 2° 1 2.028 0.053 0.034 0.019 0.060 Test Cond. 2 2 2.111 0.041 0.049 0.021 0.062 Run 38, pt. 22 3 --- --- --- --- ---
4 2.089 0.040 0.004 0.008 0.065
2/rev, 2° 1 1.994 0.109 0.062 0.017 0.051 Test Cond. 5 2 2.142 0.037 0.017 0.044 0.034 Run 57, pt. 19 3 2.084 0.067 0.048 0.037 0.066
4 --- --- --- --- ---

176
12
10
8
6
4
2
0 6 0 1 2 0 1 8 0 2 40 3 0 0 36 0
Blade 1 (Rotor) Azimuth Angle, deg
Figure 213. Blade root pitch angles of all blades measured by wiper assemblies (without IBC)
showing example of bad transducer signal on blade 3 at Test Condition 1 (43 kts). (1994
Run 41, pt. 5.)
Table 14 shows that the blade pitch angle changes measured by the wiper assemblies were approximately ±0.05° different from the commanded blade root pitch angle commanded by the IBC actuators. This difference could be the result of lost motion due to bearing wear, hysteresis, or control system flexibility. However, a large amount of this difference could also be attributed to the accuracy of the wiper transducers. There is no way to know to what extent each of these factors are true. The data does add credence, though, to the belief that the IBC commanded pitch errors are very small. For example, the seventh line of Table 14 shows that for the 2/rev+5/rev IBC combination at Test Condition 2, the deviance measured by the wiper assemblies for both the 2/rev and 5/rev components were on the order of ±0.01°.
Blade 1
Blade 2
Blade 3
Blade 4
To
tal B
lad
e P
itc
h A
ng
le, d
eg
.

177
Blade Elastic Deformation
The rotor blades were instrumented with flap, chord, and torsion strain gages to not only measure the blade loads, but also to infer elastic deformation of the blades with IBC input. In addition, five miniature surface-mounted Entran EGA-125-100 accelerometers were placed on blade no. 2 at 0.3, 0.5, 0.7, and 1.0 radial station to measure flapwise acceleration. Using this data, it is possible to identify the torsional modal amplitude with moments (Ref. 43) or accelerations (Ref. 44), or both. Similarly, the flap modal coordinates can be identified with accelerations (Ref. 45) or moments (Ref. 46), or both.
Blade Torsional Moment Data. Blade torsion data were obtained at radial stations 65, 77, 110, and 155 (Table 13). As an example of this data, Figure 214 shows blade torsion moment data obtained at the four stations with the rotor trimmed to Test Condition 2 (Table 7). The gage at station 155 indicated a higher modal frequency at the most outboard station. Upon application of the best IBC input to reduce noise and vibration (1.5° of 2/rev at 60° phase and 0.25° of 5/rev at 210° phase), the blade torsional loading was increased substantially (Fig. 215), but the high-frequency torsional oscillations at station 155 were eliminated.
The Fourier series data (harmonics 1/rev to 12/rev) for all the blade strain gages are contained in Appendix N. Note that because the gage at station 65 is located on blade no. 1, but the other stations are located on blade no. 3, the data on blade no. 1 must be shifted 180° to make comparisons with the blade no. 3 strain gage data.
Flapwise Blade Acceleration Data. The accelerometers installed at radial stations 58, 97, and 135 (30, 50, and 70 percent r/R) were mounted on the upper surface at the quarter-chord location to sense flapwise acceleration. Figures 216 and 217 show the acceleration measured at radial stations 58 and 97 without IBC input and with 2/rev+5/rev IBC input. (Station 135 functioned only for the 1993 test.) This IBC combination was the same input that lowered noise and vibration by 85 percent at Test Condition 2 (1.5° of 2/rev input at 60° phase and 0.25° of 5/rev input at 210° phase). Without IBC, a significant amount of 5/rev acceleration existed, which was largely eliminated with the application of IBC. This reduction was undoubtedly due to the 5/rev part of the IBC input and was responsible for the vibratory hub load reductions that 2/rev alone could not obtain. The 2/rev part of the IBC input, useful for BVI noise suppression, doubled the 2/rev blade flapwise accelerations. The FFT of the acceleration data for these two data points is presented in Table 15 to clarify the change in the harmonic content of the blade acceleration response. The FFT data for these accelerometers for other data points is presented in Appendix O up to the 12th harmonic.
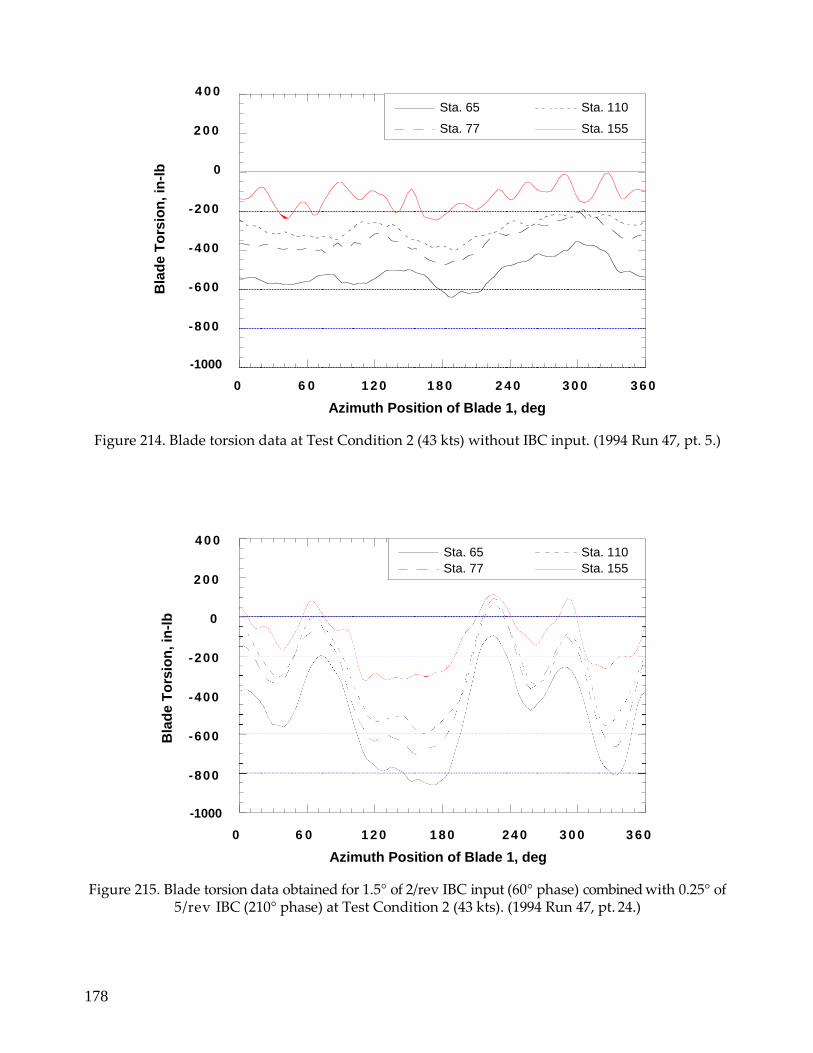
178
4 0 0
2 0 0
0
-200
-400
-600
-800
-1000
0 6 0 1 2 0 1 8 0 2 4 0 3 0 0 3 6 0
Azimuth Position of Blade 1, deg
Figure 214. Blade torsion data at Test Condition 2 (43 kts) without IBC input. (1994 Run 47, pt. 5.)
4 0 0
2 0 0
0
-200
-400
-600
-800
-1000
0 6 0 1 2 0 1 80 24 0 3 0 0 3 6 0
Azimuth Position of Blade 1, deg
Figure 215. Blade torsion data obtained for 1.5° of 2/rev IBC input (60° phase) combined with 0.25° of 5/rev IBC (210° phase) at Test Condition 2 (43 kts). (1994 Run 47, pt. 24.)
Sta. 65
Sta. 77
Sta. 110
Sta. 155
Sta. 65
Sta. 77
Sta. 110
Sta. 155
Bla
de
To
rsio
n, in
-lb
B
lad
e T
ors
ion
, in
-lb
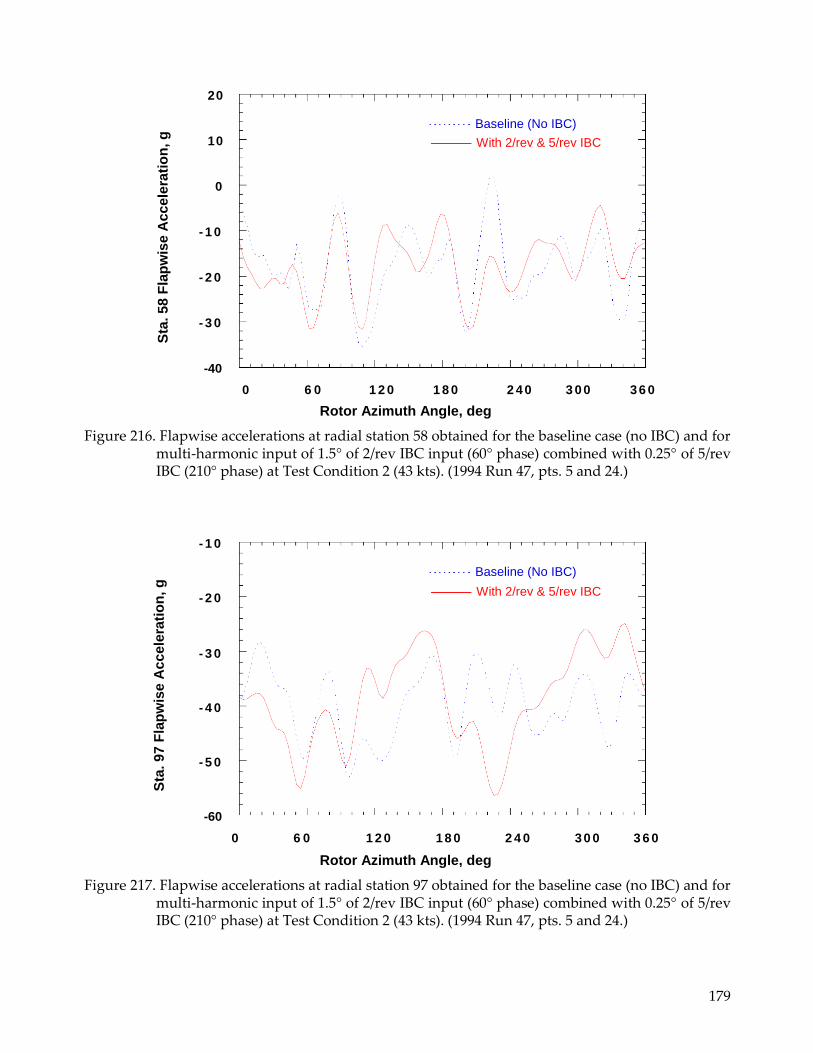
179
20
10
0
- 1 0
- 2 0
- 3 0
-40
0 6 0 1 2 0 1 8 0 2 40 3 00 36 0
Rotor Azimuth Angle, deg
Figure 216. Flapwise accelerations at radial station 58 obtained for the baseline case (no IBC) and for multi-harmonic input of 1.5° of 2/rev IBC input (60° phase) combined with 0.25° of 5/rev IBC (210° phase) at Test Condition 2 (43 kts). (1994 Run 47, pts. 5 and 24.)
- 1 0
- 2 0
- 3 0
- 4 0
- 5 0
-60
0 6 0 1 2 0 18 0 2 4 0 30 0 3 6 0
Rotor Azimuth Angle, deg
Figure 217. Flapwise accelerations at radial station 97 obtained for the baseline case (no IBC) and for multi-harmonic input of 1.5° of 2/rev IBC input (60° phase) combined with 0.25° of 5/rev IBC (210° phase) at Test Condition 2 (43 kts). (1994 Run 47, pts. 5 and 24.)
Baseline (No IBC)
With 2/rev & 5/rev IBC
Baseline (No IBC)
With 2/rev & 5/rev IBC
Sta
. 9
7 F
lap
wis
e A
cc
ele
rati
on
, g
S
ta. 5
8 F
lap
wis
e A
cc
ele
rati
on
, g
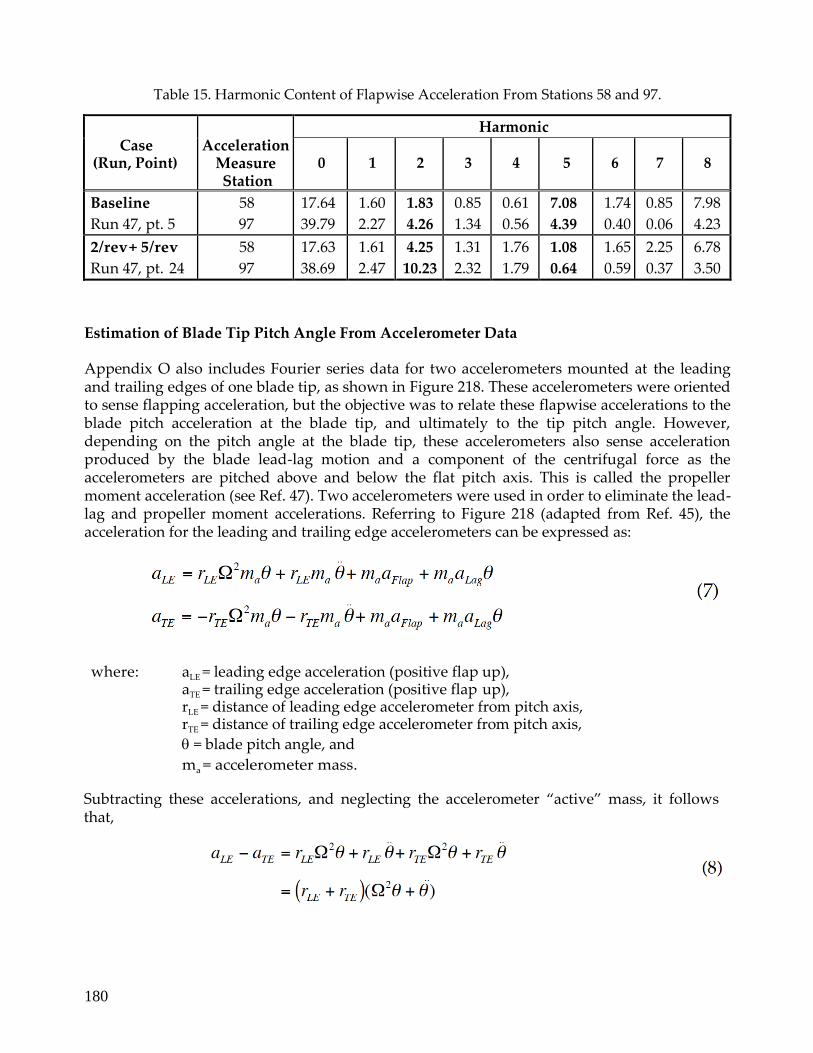
180
Table 15. Harmonic Content of Flapwise Acceleration From Stations 58 and 97.
Case
(Run, Point)
Acceleration
Measure Station
Harmonic
0 1 2 3 4 5 6 7 8
Baseline
Run 47, pt. 5
58
97
17.64
39.79
1.60
2.27
1.83
4.26
0.85
1.34
0.61
0.56
7.08
4.39
1.74
0.40
0.85
0.06
7.98
4.23
2/rev + 5/rev
Run 47, pt. 24
58
97
17.63
38.69
1.61
2.47
4.25
10.23
1.31
2.32
1.76
1.79
1.08
0.64
1.65
0.59
2.25
0.37
6.78
3.50
Estimation of Blade Tip Pitch Angle From Accelerometer Data
Appendix O also includes Fourier series data for two accelerometers mounted at the leading and trailing edges of one blade tip, as shown in Figure 218. These accelerometers were oriented to sense flapping acceleration, but the objective was to relate these flapwise accelerations to the blade pitch acceleration at the blade tip, and ultimately to the tip pitch angle. However, depending on the pitch angle at the blade tip, these accelerometers also sense acceleration produced by the blade lead-lag motion and a component of the centrifugal force as the accelerometers are pitched above and below the flat pitch axis. This is called the propeller moment acceleration (see Ref. 47). Two accelerometers were used in order to eliminate the lead-lag and propeller moment accelerations. Referring to Figure 218 (adapted from Ref. 45), the acceleration for the leading and trailing edge accelerometers can be expressed as:
where: aLE = leading edge acceleration (positive flap up), aTE = trailing edge acceleration (positive flap up), rLE = distance of leading edge accelerometer from pitch axis, rTE = distance of trailing edge accelerometer from pitch axis,
= blade pitch angle, and
ma = accelerometer mass.
Subtracting these accelerations, and neglecting the accelerometer “active” mass, it follows that,

181
LE TE
Figure 218. Schematic end-view of rotor blade tip showing the accelerometer placement at the leading and trailing edges and depicting the acceleration forces caused by blade motion.
However, if the blade pitch angle is expressed as
CCos(it) S Sin(it) (9)
then the second derivative is ..
2 2
i CCosit i S Sinit (10)
where “i” is the i/rev IBC harmonic. By substituting Eqs. 9 and 10 into Eq. 8, and combining terms, it follows that the blade tip pitch angle may be computed as
aLE aTE
(11)
r r 1 i2 2
or, in terms of cosine and sine components, as
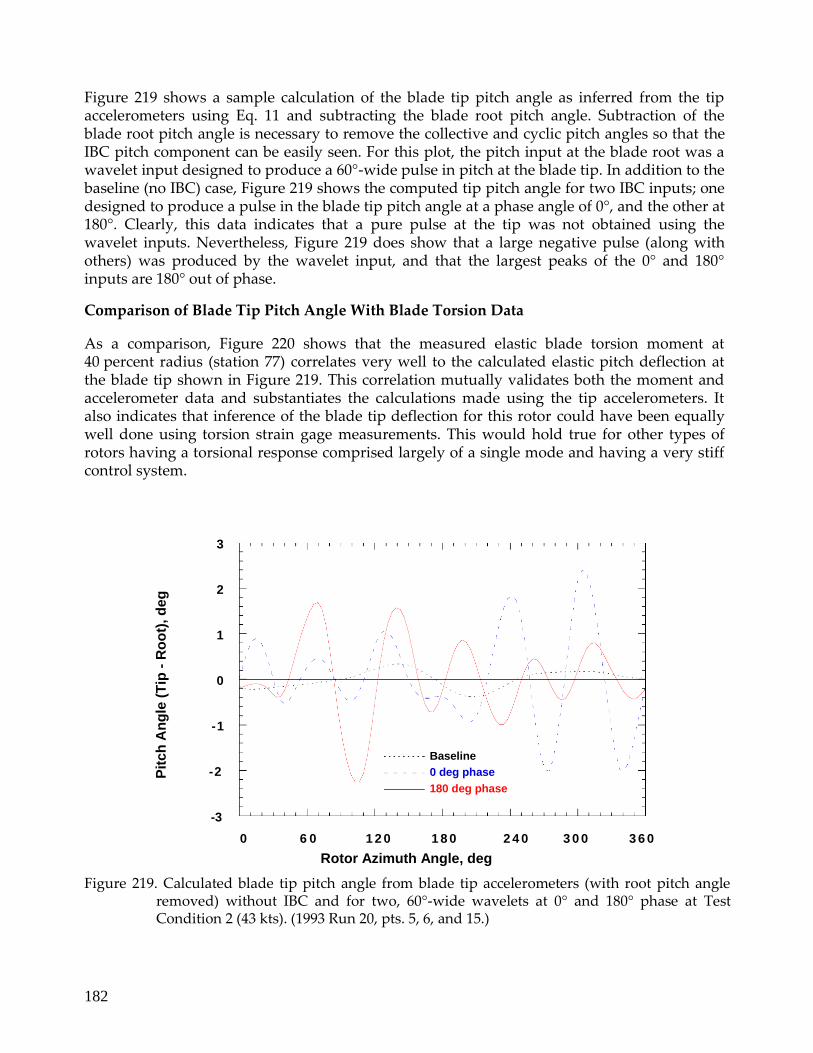
182
Figure 219 shows a sample calculation of the blade tip pitch angle as inferred from the tip accelerometers using Eq. 11 and subtracting the blade root pitch angle. Subtraction of the blade root pitch angle is necessary to remove the collective and cyclic pitch angles so that the IBC pitch component can be easily seen. For this plot, the pitch input at the blade root was a wavelet input designed to produce a 60°-wide pulse in pitch at the blade tip. In addition to the baseline (no IBC) case, Figure 219 shows the computed tip pitch angle for two IBC inputs; one designed to produce a pulse in the blade tip pitch angle at a phase angle of 0°, and the other at 180°. Clearly, this data indicates that a pure pulse at the tip was not obtained using the wavelet inputs. Nevertheless, Figure 219 does show that a large negative pulse (along with others) was produced by the wavelet input, and that the largest peaks of the 0° and 180° inputs are 180° out of phase.
Comparison of Blade Tip Pitch Angle With Blade Torsion Data
As a comparison, Figure 220 shows that the measured elastic blade torsion moment at 40 percent radius (station 77) correlates very well to the calculated elastic pitch deflection at the blade tip shown in Figure 219. This correlation mutually validates both the moment and accelerometer data and substantiates the calculations made using the tip accelerometers. It also indicates that inference of the blade tip deflection for this rotor could have been equally well done using torsion strain gage measurements. This would hold true for other types of rotors having a torsional response comprised largely of a single mode and having a very stiff control system.
3
2
1
0
-1
-2
-3
0 6 0 1 2 0 1 8 0 2 4 0 3 0 0 3 6 0
Rotor Azimuth Angle, deg
Figure 219. Calculated blade tip pitch angle from blade tip accelerometers (with root pitch angle removed) without IBC and for two, 60°-wide wavelets at 0° and 180° phase at Test Condition 2 (43 kts). (1993 Run 20, pts. 5, 6, and 15.)
Baseline
0 deg phase
180 deg phase
Pit
ch
An
gle
(T
ip -
Ro
ot)
, d
eg
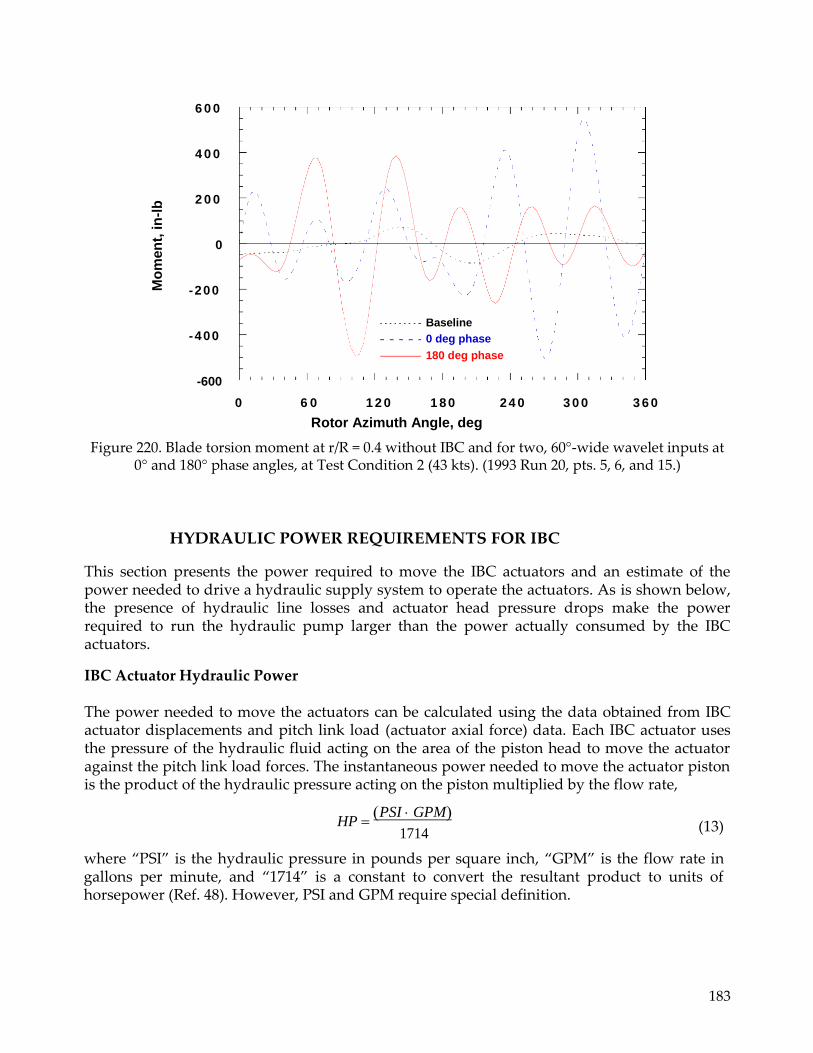
183
6 0 0
4 0 0
2 0 0
0
-200
-400
-600
0 6 0 1 2 0 1 80 24 0 3 0 0 3 6 0
Rotor Azimuth Angle, deg
Figure 220. Blade torsion moment at r/R = 0.4 without IBC and for two, 60°-wide wavelet inputs at 0° and 180° phase angles, at Test Condition 2 (43 kts). (1993 Run 20, pts. 5, 6, and 15.)
HYDRAULIC POWER REQUIREMENTS FOR IBC
This section presents the power required to move the IBC actuators and an estimate of the power needed to drive a hydraulic supply system to operate the actuators. As is shown below, the presence of hydraulic line losses and actuator head pressure drops make the power required to run the hydraulic pump larger than the power actually consumed by the IBC actuators.
IBC Actuator Hydraulic Power The power needed to move the actuators can be calculated using the data obtained from IBC actuator displacements and pitch link load (actuator axial force) data. Each IBC actuator uses the pressure of the hydraulic fluid acting on the area of the piston head to move the actuator against the pitch link load forces. The instantaneous power needed to move the actuator piston is the product of the hydraulic pressure acting on the piston multiplied by the flow rate,
HP PSI GPM
1714 (13)
where “PSI” is the hydraulic pressure in pounds per square inch, “GPM” is the flow rate in gallons per minute, and “1714” is a constant to convert the resultant product to units of horsepower (Ref. 48). However, PSI and GPM require special definition.
Baseline
0 deg phase
180 deg phase
Mo
men
t, in
-lb
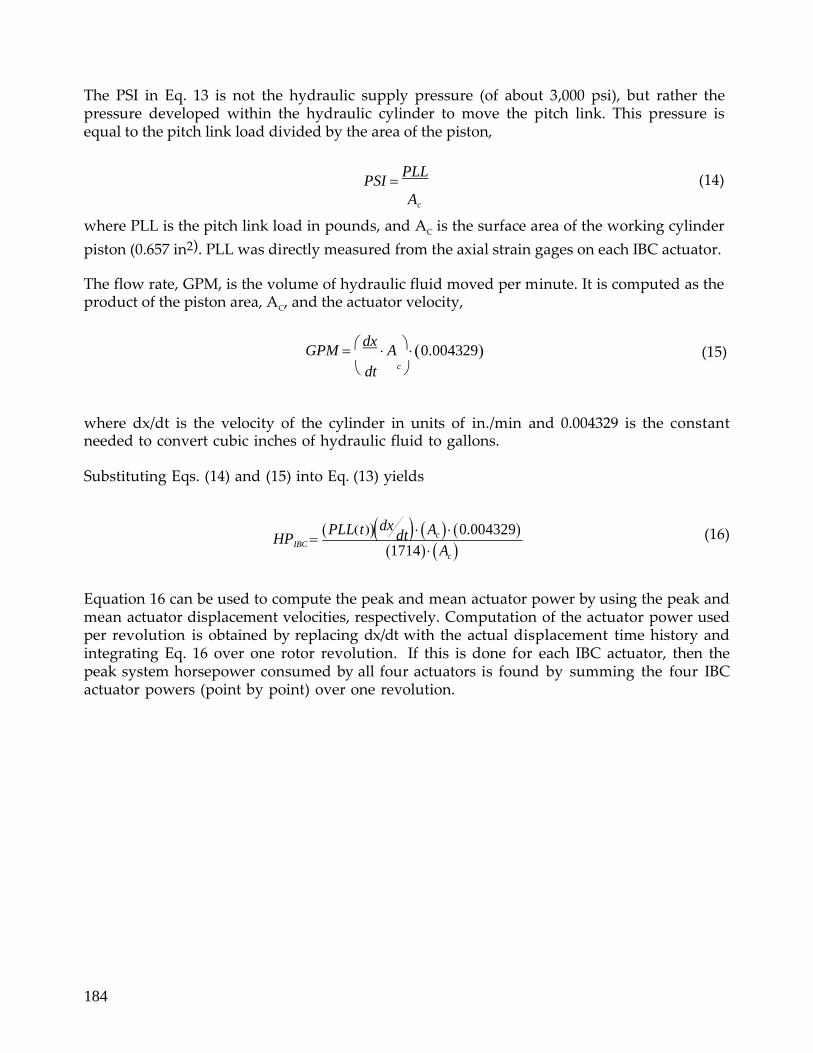
184
PLLtdx dt Ac 0.004329
The PSI in Eq. 13 is not the hydraulic supply pressure (of about 3,000 psi), but rather the pressure developed within the hydraulic cylinder to move the pitch link. This pressure is equal to the pitch link load divided by the area of the piston,
PSI PLL
Ac
(14)
where PLL is the pitch link load in pounds, and AC is the surface area of the working cylinder
piston (0.657 in2). PLL was directly measured from the axial strain gages on each IBC actuator.
The flow rate, GPM, is the volume of hydraulic fluid moved per minute. It is computed as the product of the piston area, AC, and the actuator velocity,
GPM dx
A 0.004329 (15) dt
c
where dx/dt is the velocity of the cylinder in units of in./min and 0.004329 is the constant needed to convert cubic inches of hydraulic fluid to gallons.
Substituting Eqs. (14) and (15) into Eq. (13) yields
HPIBC 1714 Ac
(16)
Equation 16 can be used to compute the peak and mean actuator power by using the peak and mean actuator displacement velocities, respectively. Computation of the actuator power used per revolution is obtained by replacing dx/dt with the actual displacement time history and integrating Eq. 16 over one rotor revolution. If this is done for each IBC actuator, then the peak system horsepower consumed by all four actuators is found by summing the four IBC actuator powers (point by point) over one revolution.
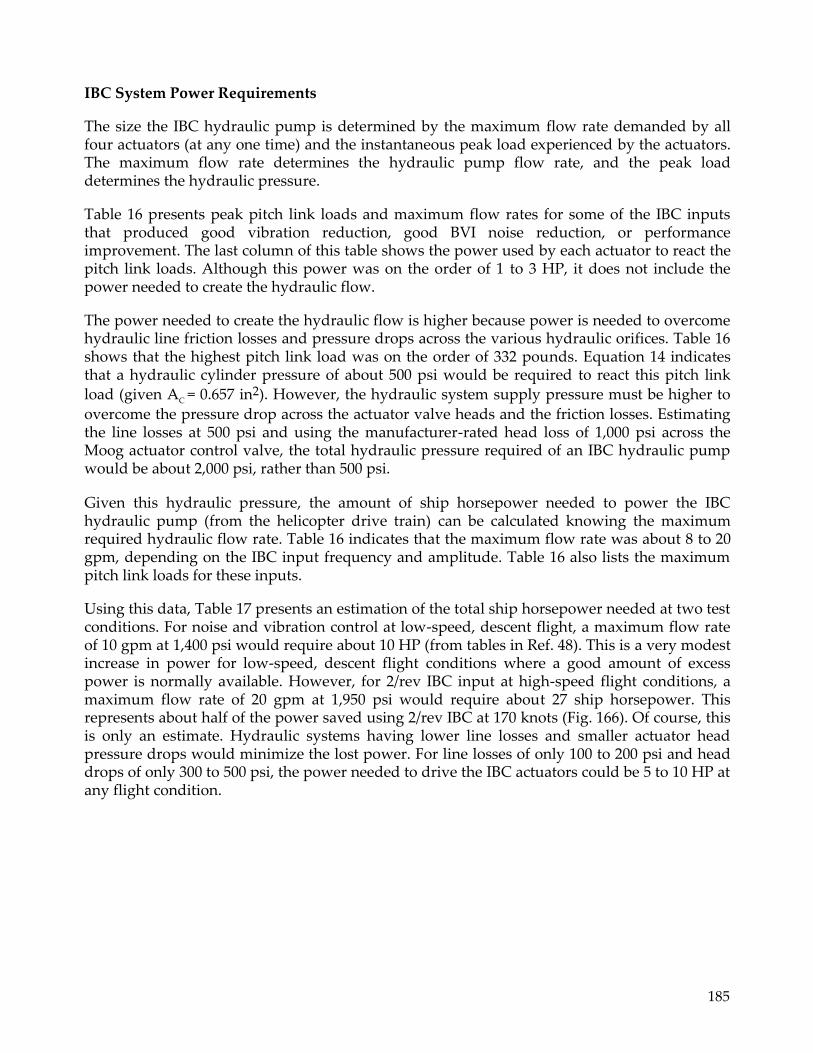
185
IBC System Power Requirements
The size the IBC hydraulic pump is determined by the maximum flow rate demanded by all four actuators (at any one time) and the instantaneous peak load experienced by the actuators. The maximum flow rate determines the hydraulic pump flow rate, and the peak load determines the hydraulic pressure.
Table 16 presents peak pitch link loads and maximum flow rates for some of the IBC inputs that produced good vibration reduction, good BVI noise reduction, or performance improvement. The last column of this table shows the power used by each actuator to react the pitch link loads. Although this power was on the order of 1 to 3 HP, it does not include the power needed to create the hydraulic flow.
The power needed to create the hydraulic flow is higher because power is needed to overcome hydraulic line friction losses and pressure drops across the various hydraulic orifices. Table 16 shows that the highest pitch link load was on the order of 332 pounds. Equation 14 indicates that a hydraulic cylinder pressure of about 500 psi would be required to react this pitch link
load (given AC = 0.657 in2). However, the hydraulic system supply pressure must be higher to
overcome the pressure drop across the actuator valve heads and the friction losses. Estimating the line losses at 500 psi and using the manufacturer-rated head loss of 1,000 psi across the Moog actuator control valve, the total hydraulic pressure required of an IBC hydraulic pump would be about 2,000 psi, rather than 500 psi.
Given this hydraulic pressure, the amount of ship horsepower needed to power the IBC hydraulic pump (from the helicopter drive train) can be calculated knowing the maximum required hydraulic flow rate. Table 16 indicates that the maximum flow rate was about 8 to 20 gpm, depending on the IBC input frequency and amplitude. Table 16 also lists the maximum pitch link loads for these inputs.
Using this data, Table 17 presents an estimation of the total ship horsepower needed at two test conditions. For noise and vibration control at low-speed, descent flight, a maximum flow rate of 10 gpm at 1,400 psi would require about 10 HP (from tables in Ref. 48). This is a very modest increase in power for low-speed, descent flight conditions where a good amount of excess power is normally available. However, for 2/rev IBC input at high-speed flight conditions, a maximum flow rate of 20 gpm at 1,950 psi would require about 27 ship horsepower. This represents about half of the power saved using 2/rev IBC at 170 knots (Fig. 166). Of course, this is only an estimate. Hydraulic systems having lower line losses and smaller actuator head pressure drops would minimize the lost power. For line losses of only 100 to 200 psi and head drops of only 300 to 500 psi, the power needed to drive the IBC actuators could be 5 to 10 HP at any flight condition.
186
Table 16. Representative IBC Actuator loads, Flow Rates, and Required Horsepower.
Test Condition
No. IBC Input
Actuator Peak PLL
(lb)
Actuator Peak Flow (gpm)
Peak IBC Actuator
(HP)
1 2/rev, 2.5° at 60° phase 158 18.2 1.5
1 3/rev, 1.0° at 150° phase 199 7.6 0.8
2 2/rev, 1.5° at 60° phase 104 10.2 0.6
2 3/rev, 1.0° at 135° phase 195 7.6 .7
2 6/rev, 0.5° at 135° phase 216 19.4 1.7
2 6/rev, 1.0° at 135° phase 139 9.7 .8
5 2/rev, 2.5° at 190° phase 332 16.5 3.1
Table 17. Approximate Ship Horsepower Required to Drive an IBC Hydraulic Pump.
Condition
Flow Required
(gpm)
PLL/AC Load (psi)
Est. Line Losses
(psi)
Pressure 1 Required
(psi)
Ship HP Required
Low Speed
Moderate Amplitude 2
10 150 250 1,400 10
High Speed
High Amplitude 3
20 450 500 1,950 27
1) Sum of PLL load, line losses, and 1,000-psi actuator head drop. 2) 2/rev or 3/rev IBC input at 1.0° to 1.5° amplitude at 43 knots (transition or 450 ft/min descent rate). 3) 2/rev IBC input at 2.0° amplitude at airspeeds of 170 knots.
187
CONCLUSIONS
The Individual Blade Control (IBC) concept was evaluated in two wind tunnel tests at NASA Ames Research Center using a full-scale BO-105 hingeless rotor. By replacing the normal pitch links of the rotor with the IBC servo-actuators, the pitch of each rotor blade was controlled independently of the other blades. The ability of IBC to improve rotor performance, to reduce blade vortex interaction (BVI) noise, and to alleviate helicopter vibration was evaluated at a range of test conditions. The most significant findings of this research program are as follows:
1) Applied to a four-bladed, hingeless rotor, 2/rev IBC produced large noise and vibration reductions at low-speed flight conditions typical of descent flight. Applied alone, 2/rev IBC was found to be capable of simultaneously suppressing advancing and retreating side BVI noise levels. These inputs produced a maximum of 10 dB BVI noise reduction as measured by the microphone traverse on the advancing side of the rotor while simultaneously reducing the retreating side BVI noise by 4 dB.
2) At descent flight conditions, multi-harmonic combinations of 2/rev and 5/rev IBC
suppressed the 4/rev hub vibrations by 85 percent while simultaneously reducing the peak advancing side BVI noise by 12 dB and the retreating side BVI noise by 4 dB in the peak BVI noise locations.
3) The rotor power required at high-speed flight conditions (advance ratios 0.40 to 0.45) was
reduced by 7 percent using 2/rev IBC. 4) In the low-speed-transition region (advance ratio = 0.1), 2/rev, 3/rev, and 4/rev IBC, applied
separately, significantly reduced the predominant 4/rev vibratory hub forces and moments. Whereas up to 80 percent simultaneous suppression of the in-plane hub forces and moments could be obtained using 2.5° of 2/rev IBC, up to 99 percent of the 4/rev vertical shear forces could be suppressed using 1.0° of 3/rev IBC.
5) Reductions in the BVI noise levels were achieved for all single-frequency IBC inputs.
Applied individually, 2/rev and 3/rev IBC inputs could simultaneously reduce the advancing side and retreating side BVI noise levels an average of 5 dB for at least one input phase angle. IBC harmonics 4/rev, 5/rev, and 6/rev, applied individually, could simultaneously reduce the advancing side and retreating side BVI noise levels an average 1 to 2 dB.
6) Simultaneous reduction of advancing side BVI noise, retreating side BVI noise, and 4/rev
hub vibration was not possible using 3/rev, 4/rev, or 5/rev IBC applied alone or in combination with each other. For these harmonics, the phase angles producing the best vibration reductions were different from those required for BVI noise suppression.
7) Only 2/rev and 6/rev IBC inputs were observed to reduce the vibratory hub loads and BVI
noise on both sides of the rotor simultaneously. The reductions produced by 6/rev IBC inputs, however, were very modest compared to those obtained using 2/rev IBC. Although the vibratory hub loads and BVI noise on the advancing side could be simultaneously reduced using 3/rev IBC input, the retreating side BVI noise levels were increased.
188
8) The data indicated that almost total vibration suppression at cruise speed ( = 0.3) could be obtained using 3/rev and 4/rev IBC input at amplitudes significantly less than 1.0°.
9) The data indicated that 2/rev IBC had a strong tendency to alter the hub moment trim equilibrium, and hence alter the flight trim control characteristics. The other IBC harmonics had little effect on the trim state.
10) The IBC inputs increased the oscillatory pitch link loads, while leaving the mean loads largely unaffected. The increases in the oscillatory loading were produced in response to the inertial forces opposing the IBC motion. Nevertheless, the highest measured pitch link load with IBC applied was still less than half of the endurance load limit. The percent increases in the oscillatory loading were greatest at low-speed conditions, where the baseline pitch link loads were low compared to the pitch link loads found at the high-speed flight conditions. At high airspeeds, the oscillatory pitch link loads were increased an average of 50 to 100 percent.
11) The flap, chord, and torsional blade oscillatory bending loads were strongly affected by IBC. Depending on the phase angle of the IBC input, the bending loads were either increased or decreased. The 2/rev inputs producing performance improvements at high-speed flight conditions also produced slight decreases in the blade loads. The highest blade loads obtained during the IBC test program were less than 50 percent of the endurance blade load limits.
12) The measured elastic blade torsion moment at r/R = 0.40 correlated very well to the calculated blade tip pitch angle deflection inferred from the accelerometer measurements. This correlation validates both the blade torsion moment and blade tip accelerometer data. The tip accelerometer data show that the pitch at the blade tip was substantially different from the pitch input introduced at the blade root.
13) At airspeeds below cruise speed (127 knots), the IBC inputs used to reduce noise and vibration generally increased the required rotor power on the order of 1 percent, as measured by rotor shaft torque.
14) Using the measured actuator displacement and axial force data, the power consumed by the IBC actuators was calculated to be on the order of 1 to 3 HP, depending on the test condition and IBC input. With consideration of hydraulic line losses and pressure drops across the actuator heads, it is estimated that 5 to 10 HP would be required to control noise and vibration at low-speed, descent flight conditions. The power needed to operate the IBC system in high-speed flight could be as low as 5 HP, or as much as 25 HP, depending on the line losses and head pressure drops of the IBC system installation.

189
REFERENCES
1) Biggers, J. C., and McCloud, J. L. III, "A Note on Multicyclic Control by Swashplate Oscillation," NASA Technical Memorandum Number 78475, April 1978.
2) Stewart, W., "Second Harmonic Control on the Helicopter Rotor," Aeronautical Research Council, Reports and Memoranda Number 2997, Aug. 1952.
3) Arcidiacono, P. J., "Theoretical Performance of Helicopters having Second and Higher Harmonic Feathering Control," Journal of the American Helicopter Society, vol. 6, no. 2, April 1961.
4) Wernicke, R. K., and Drees, J. M., "Second Harmonic Control," 19th Annual Forum of the American Helicopter Society, May 1963.
5) Johnson, W., "Self-Tuning Regulators for Multicyclic Control of Helicopter Vibrations," NASA Technical Paper 1996, March 1982.
6) Nguyen, K. Q., "Higher Harmonic Control Analysis for Vibration Reduction of Helicopter Rotor Systems," NASA Technical Memorandum 103855, Oct. 1994.
7) McCloud, J. L., III, and Kretz, M., "Multicyclic Jet-Flap Control for Alleviation of Helicopter Blade Stresses and Fuselage Vibration," NASA SP-352, 1974.
8) Sissingh, G. J., and Donham, R. E., "Hingeless Rotor Theory and Experiment on Vibration Reduction by Periodic Variation of Conventional Controls," Proceedings of the AHS/NASA Ames Specialists’ Meeting on Rotorcraft Dynamics, NASA SP-352, Mt. View, CA, Feb. 1974.
9) McHugh, F. J., and Shaw, J., "Helicopter Vibration Reduction with Higher Harmonic Blade Pitch," Journal of the American Helicopter Society, vol. 23, no. 4, Oct. 1978.
10) Molusis, J. A., Hammond, C. E., and Cline, J. H., "A Unified Approach to the Optimal Design of Adaptive an Gain Scheduled Controllers to Achieve Minimum Helicopter Rotor Vibration," 37th Annual Forum of the American Helicopter Society, New Orleans, LA, May 17-20, 1981.
11) Hammond, C. E., "Wind Tunnel Results Showing Rotor Vibratory Loads Reduction Using Higher Harmonic Blade Pitch," Journal of the American Helicopter Society, vol. 28, no. 1, Jan. 1983.
12) Wood, E. R., Powers, R. W., Cline, J. H., and Hammond, C. E., "On Developing and Flight Testing a Higher Harmonic Control System," Journal of the American Helicopter Society, vol. 30, no. 1, Jan. 1985.
13) Straub, F., and Byrns, E., "Application of Higher Harmonic Blade Feathering on the OH-6A Helicopter for Vibration Reduction," NASA CR 4031, 1986.

190
14) Miao, W., Kottapalli, S. B. R., and Frye, M. M., "Flight Demonstration of Higher Harmonic Control (HHC) on S-76," 42nd Annual Forum of the American Helicopter Society, Washington, D.C., June 1986.
15) Polychroniadis, M., and Achache, M., "Higher Harmonic Control: Flight Tests of an Experimental System on SA 349 Research Gazelle," 42nd American Helicopter Society Forum, Washington, D.C., June 1986.
16) Shaw, J., Albion, N., Hanker, E. J., and Teal, R. S., "Higher Harmonic Control: Wind Tunnel Demonstration of Fully Effective Vibratory Hub Force Suppression," 41st Annual Forum of the American Helicopter Society, Fort Worth, TX, May 1985.
17) Brooks, T. F., Booth, E. R. Jr., Jolly, J. R. Jr., Yeager, W. T. Jr., and Wilbur, M. L., "Reduction of Blade-Vortex Interaction Noise Using Higher Harmonic Pitch Control," NASA Technical Memorandum 101624, July 1989.
18) Splettstoesser, W. R., Lehmann, G., and Van der Wall, B., "Initial Results of a Model Rotor Higher Harmonic Control (HHC) Wind Tunnel Experiment on BVI Impulsive Noise Reduction," 15th European Rotorcraft Forum, Amsterdam, The Netherlands, Sept. 1989.
19) Splettstoesser, W. R., Schultz, K.-J., Kube, R., Brooks, T. F., Booth E. R. Jr., Niesl, G., and Streby, O., "A Higher Harmonic Control Test in the DNW to Reduce Impulsive BVI Noise," Journal of the American Helicopter Society, vol. 39, no. 4, Oct. 1994.
20) Kube, R., Achache, M., Niesl, G., and Splettstoesser, W. "A Closed-loop Controller for BVI Noise Reduction by Higher Harmonic Control," 48th Annual Forum of the American Helicopter Society, Washington, D.C., June 1992.
21) Yu, Y. H., Gmelin, B., Heller, H., Philippe, J. J., Mercker, E., and Preisser, J. S., "HHC Aeroacoustics Rotor Test at the DNW - The Joint German/French/US HART Project," 12th European Rotorcraft Forum, Amsterdam, The Netherlands, Oct. 1994.
22) Guinn, K. F., "Individual Blade Control Independent of a Swashplate," Journal of the American Helicopter Society, vol. 27, no. 3, July 1982.
23) Ham, N. D., "Helicopter Individual Blade Control and Its Applications," 39th Annual Forum of the American Helicopter Society, St. Louis, MO, May 1983.
24) Richter, P., Eisbrecher, M.-D., and Kloppel, V., "Design and First Flight Test of Individual Blade Control Actuators," 16th European Rotorcraft Forum, Glasgow, Scotland, Sept. 1990.
25) Teves, D., Kloppel, V., and Richter, P., "Development of Active Control Technologies in the Rotating System, Flight Testing and Theoretical Investigations," 18th European Rotorcraft Forum, Avignon, France, Sept. 1992.

191
26) Millot, T. A., and Friedmann, P. P., "The Practical Implementation of an Actively Controlled Flap to Reduce Vibrations in Helicopter Rotors," 49th Annual Forum of the American Helicopter Society, St. Louis, MO, May 1993.
27) Dawson, S., and Straub, F., "Design, Validation, and Test of a Model Rotor with Tip Mounted Active Flaps," 50st Annual Forum of the American Helicopter Society, Washington, D.C., May 1994.
28) Straub, F. K., "Active Flap Control for Vibration Reduction and Performance Improvement," 51st Annual Forum of the American Helicopter Society, Fort Worth, TX, May 1995.
29) Derham, R. C., and Hagood, N. W., "Rotor Design Using Smart Materials to Actively Twist Blades," 52nd Annual Forum of the American Helicopter Society, Washington, D.C., June 1996.
30) Fulton, M. V., and Ormiston, R. A., "Hover Testing of a Small-Scale Rotor with On-Blade Elevons," 53rd Annual Forum of the American Helicopter Society, Virginia Beach, VA, April 1997.
31) Bernhard, A. P. F., and Chopra, I., "Development of a Smart Moving-Blade Tip and an Active-Twist Rotor Blade Driven by a Piezo-Induced Bending-Torsion Coupled Beam," 53rd Annual Forum of the American Helicopter Society, Virginia Beach, VA, April 1997.
32) Richter, P., and Blaas, A., "Full-Scale Wind Tunnel Investigation of an Individual Blade Control System for the BO-105 Hingeless Rotor," 19th European Rotorcraft Forum, Como, Italy, Sept. 1993.
33) Jacklin, S. A., Nguyen, K. Q., Blaas, A., and Richter, P., "Full-Scale Wind Tunnel Test of a Helicopter Individual Blade Control System," 50th Annual Forum of the American Helicopter Society, Washington, D.C., May 1994.
34) Jacklin, S. A., Blaas, A., Teves, D., and Kube, R., "Reduction of Helicopter BVI Noise, Vibration, and Power Consumption Through Individual Blade Control," 51th Annual Forum of the American Helicopter Society, Fort Worth, TX, May 1995.
35) Jacklin, S. A., Blaas, A., Swanson, S. M., and Teves, D., "Second Test of a Helicopter Individual Blade Control System in the NASA Ames 40- by 80-Foot Wind Tunnel," Proceedings of the American Helicopter Society 2nd International Aeromechanics Specialists' Conference, Bridgeport, CT, Oct. 1995.
36) Swanson, S. M., Jacklin, S. A., Blaas, A., Niesl, G., and Kube, R., "Acoustic Results From a Full-Scale Wind Tunnel Test Evaluating Individual Blade Control," 51th Annual Forum of the American Helicopter Society, Fort Worth, TX, May 1995.
37) Weiland, E. F., "Development and Test of the BO-105 Rigid Rotor Helicopter," Proceedings of the 24th Annual Forum of the American Helicopter Society, Washington, D.C., May 1968.

192
38) Peterson, R. L., and Warmbrodt, W., "Hover Test of a Full-Scale Hingeless Helicopter Rotor: Aeroelastic Stability, Performance, and Loads Data," NASA Technical Memorandum 85892, Jan. 1984.
39) van Aken, J. M., Peterson, R. L., and Freedman, C. J., "Calibration Results of the NASA Ames Rotor Test Apparatus Steady/Dynamic Rotor Balance," Proceedings of the American Helicopter Society Aeromechanics Specialists’ Conference, San Francisco, CA, Jan. 1994.
40) Peterson, R. L., and van Aken, J. M., "Dynamic Calibration of the NASA Ames Rotor Test Apparatus Steady/Dynamic Rotor Balance," NASA TM 110393, April 1996.
41) Watts, M. E., "ALDAS User's Manual," NASA TM 102381, April 1991.
42) Watts, M. E., and St. Jean, M. M., "Data Acquisition and Analysis on a Macintosh," American Helicopter Society International Specialists’ Meeting on Rotorcraft Acoustics and Rotor Dynamics, Philadelphia, PA, Oct. 1991.
43) Tourjansky, N., and Szechenyi, E., "The Measurement of Blade Deflections," Paper No. 6, 18th European Rotorcraft Forum, Avignon, France, Sept. 1992.
44) McKillip, Jr., R. M., "An Accelerometer-Based Instrumentation System for Measurement of Helicopter Motion and Loads," 52nd Annual Forum of the American Helicopter Society, Washington, D.C., June 1996.
45) Ham, N. D., "Measurement of Helicopter Blade Flapping and Torsional Deflections Using Three Accelerometers," MIT VTL TR 198-6, March 1993.
46) Bousman, W. G., "Estimation of Blade Airloads from Rotor Blade Bending Moments," NASA TM 100020, Aug. 1987.
47) Johnson, W., Helicopter Theory, Princeton University Press, New Jersey, 1980, pp. 405-406.
48) NTT, Fluid Power Data Book, Womack Educational Publications, Dallas, TX, 1994, p. 32.