investigating the level of application/education of - OAKTrust
499
INVESTIGATING THE LEVEL OF APPLICATION/EDUCATION OF PASSIVE/NATURAL SYSTEMS IN THE DESIGN OF SUSTAINABLE BUILDINGS IN THE US A Dissertation by MEHDI AZIZKHANI Submitted to the Office of Graduate and Professional Studies of Texas A&M University in partial fulfillment of the requirements for the degree of DOCTOR OF PHILOSOPHY Chair of Committee, Jeff Haberl Committee Members, Liliana Beltran Zofia Rybkowski Wei Yan Head of Department, Robert Warden May 2019 Major Subject: Architecture Copyright 2019 Mehdi Azizkhani
-
Upload
khangminh22 -
Category
Documents
-
view
0 -
download
0
Transcript of investigating the level of application/education of - OAKTrust

ii
INVESTIGATING THE LEVEL OF APPLICATION/EDUCATION OF
PASSIVE/NATURAL SYSTEMS IN THE DESIGN OF SUSTAINABLE BUILDINGS
IN THE US
A Dissertation
by
MEHDI AZIZKHANI
Submitted to the Office of Graduate and Professional Studies of Texas A&M University
in partial fulfillment of the requirements for the degree of
DOCTOR OF PHILOSOPHY
Chair of Committee, Jeff Haberl Committee Members, Liliana Beltran
Zofia Rybkowski Wei Yan
Head of Department, Robert Warden
May 2019
Major Subject: Architecture
Copyright 2019 Mehdi Azizkhani

ii
ABSTRACT
The purpose of this research is to examine the degree of adoption and education of the
concepts of natural systems for heating, cooling, and lighting (i.e., passive systems)
versus artificial/mechanical systems (i.e., active systems) in the design of sustainable
buildings by practitioners and educators. In addition, this research investigates the
variables that may increase/reduce the application of these systems in architectural
designs. Natural systems use renewable energies or ambient conditions, while
mechanical systems often use non-renewable energies to heat, cool, ventilate, and
illuminate buildings. Although an extensive list of publications about natural systems
exist, there are very few studies about the approaches/tools used by professionals for the
design of natural systems in sustainable buildings. This research seeks to fill this gap
through three methodologies, including: a content analysis, a case study, and a survey
questionnaire to practitioners/educators.
The findings show that there is a low percentage of the application of passive/natural
systems in architecture design in the US. To promote the application of passive systems,
the clients’ desire/collaboration, building code/rating systems, and simulation tools for
passive design are the most influential factors according to a survey of the practitioners
in the US. The findings also indicate that the education of passive/natural systems in the
US architecture schools are mainly focused on discussions at the conceptual level, which

iii
needs to be further developed to include the teaching of the simulation of these systems
as well.
Overall, the findings suggest that investment in several areas can facilitate the
application of passive systems in the US, which include: better educational focus on the
simulation/calculation of passive systems; stronger connection between academia and
the building industry focused on passive design; providing user-friendly tools for the
design of passive systems; better collaboration between architects, clients, and
engineers; reducing the work experience gap between retiring faulty and new faculty;
better focus on passive design in integrated design studios; and strong inclusion of
passive systems in building codes/rating systems. The long term goal of this study is to
pave the way for reducing a building’s energy consumption by shifting society’s
dependency from non-renewable energies to renewable energies.

iv
DEDICATION
Dedicated to All Who Care About the Built Environment and Global Warming

CONTRIBUTORS AND FUNDING SOURCES
Contributors
This work was supervised by a dissertation committee consisting of Dr. Jeff Haberl
[advisor], Dr. Liliana Beltran, and Dr. Wei Yan of the Department of Architecture and
Dr. Zofia Rybkowski of the Department of Construction Science.
Part of the survey distribution was conducted through the author’s communication with
AIA and ASHRAE Chapters in the US, who kindly distributed the survey questionnaire
to their members on behalf of the author. All of the work conducted for the dissertation
was completed by the student independently.
Funding Sources
This work was partly supported by the dissertation fellowship award from the Office of
Graduate and Professional Studies (OGAPS) at Texas A&M University.
v

vi
TABLE OF CONTENTS
Page
ABSTRACT .......................................................................................................................ii
DEDICATION .................................................................................................................. iv
CONTRIBUTORS AND FUNDING SOURCES .............................................................. v
TABLE OF CONTENTS .................................................................................................. vi
LIST OF FIGURES ............................................................................................................ x
LIST OF TABLES .......................................................................................................... xiv
1. INTRODUCTION .......................................................................................................... 1
1.1. Background and Problem Statement ......................................................... 1 1.2. Research Goals and Task Objectives ........................................................ 7 1.3. Significance and Limitations of the Study ................................................ 8 1.4. Overview of the Dissertation ................................................................... 10 1.5. Definition ................................................................................................ 12
2. LITERATURE REVIEW ............................................................................................. 17
2.1. Sustainable Architectural Design ............................................................ 17 2.1.1. Trends in Sustainable Architectural Design ................................... 17 2.1.2. Conceptual Trends in Sustainable Design: Nature/Passive
Versus Active Systems .................................................................... 22 2.1.3. Natural/Passive Systems and Human Well-being .......................... 35
2.2. Brief History of Passive Building Design in the US ............................... 49 2.2.1. From Early Attempts until the 1940s ............................................. 49 2.2.2. From the 1940s until 2010 ............................................................. 53 2.2.3. Passive House Institute US (PHIUS) ............................................. 59
2.3. Models and Approaches of Passive Building Design ............................. 66 2.3.1. Natural/Passive Heating of Buildings ............................................ 67 2.3.2. Natural/Passive Cooling and Natural Ventilation .......................... 91 2.3.3. Building Envelope ........................................................................ 108 2.3.4. Daylighting ................................................................................... 112
2.4. Factors Influential in Passive Systems Applications ............................. 117 2.4.1. Building Standards and Rating Systems: The Status Que ............ 117

vii
2.4.2. Climate ......................................................................................... 132 2.4.3. Simulation and Modeling Tools ................................................... 139 2.4.4 Construction Cost and Construction Complexity .......................... 156 2.4.5. Design Team and Client Collaboration ........................................ 158 2.4.6 Knowledge and Experience for Simulating and Integrating
Passive Systems ............................................................................. 163 2.4.7. Architectural Curriculum and Natural/Passive systems ............... 172
2.5. Case Studies: Practitioners’ Application of Passive Systems ............... 176 2.5.1. Practitioners’ Approach Toward the Use of Passive
Systems .......................................................................................... 176 2.5.2. Three Case Studies on The Approach of Using Passive
Systems .......................................................................................... 180 2.5.3. Best Practices: AIA COTE Top 10 Awards ................................. 187
3. RESEARCH METHODS ........................................................................................... 190
3.1. Introduction ........................................................................................... 190 3.2. Qualitative Methods Applied ................................................................ 191
3.2.1. Case Study .................................................................................... 191 3.2.2. Content Analysis .......................................................................... 199
3.3. Quantitative Methods Applied .............................................................. 201 3.3.1. Survey Questionnaire Design Principles ...................................... 202 3.3.2. Reducing Survey Measurement Errors ........................................ 203 3.3.3. Reducing Nonresponse Error ....................................................... 204 3.3.4. Reducing Survey Sampling and Survey Coverage Errors............ 205
3.4. Research with Human Subject .............................................................. 216 3.5. Summary of the Applied Research Methodologies and Strategies ....... 216
4. PRACTITIONERS SURVEY: RESULTS AND DATA ANALYSIS ...................... 218
4.1. Introduction ........................................................................................... 218 4.2. Procedure ............................................................................................... 219 4.3. Survey Tools and Analysis Procedure .................................................. 223 4.4. Demographic Information (Practitioners) ............................................. 227
4.4.1. Primary Professional Role (Practitioners) .................................... 227 4.4.2. Affiliations (Practitioners) ............................................................ 228 4.4.3. Professional Work Experience (Practitioners) ............................. 233 4.4.4. Age Group (Practitioners) ............................................................ 234 4.4.5. Location (Practitioners) ................................................................ 236 4.4.6. Professional Registration (Practitioners) ...................................... 236 4.4.7. Location of Education (Practitioners) .......................................... 241
4.5. Professionals Projects ............................................................................ 242 4.5.1. Projects Typologies (Practitioners) .............................................. 242 4.5.2. Climates of the Practitioners’ Passive Projects ............................ 245

viii
4.6. Passive/Natural Systems (Practitioners) ................................................ 249 4.6.1. Renewable Energy (Practitioners) ................................................ 249 4.6.2. Passive/Natural Cooling Systems (Practitioners) ......................... 251 4.6.3. Passive/Natural Heating Systems (Practitioners) ......................... 257 4.6.4. Daylighting Systems (Practitioners) ............................................. 261 4.6.5. Passive Building Envelope Strategies (Practitioners) .................. 264
4.7. Phase of Analyzing the Use of Passive Systems by Practitioners ......... 266 4.8. Practitioners’ Tools ............................................................................... 268 4.9. Phase of the Calculation of Passive Strategy Savings
(Practitioners)........................................................................................ 274 4.10. Influential Factors in Increasing/Reducing the Use of
Passive/Natural Systems (Practitioners) ............................................... 276 4.11. The Open-Ended Question for Practitioners ....................................... 282 4.12. Major Findings of the Practitioners’ Survey ....................................... 293
5. EDUCATORS SURVEY: RESULTS AND DATA ANALYSIS ............................. 298
5.1. Introduction ........................................................................................... 298 5.2. Demographic Information (Educators) ................................................. 298
5.2.1. Professional Role (Educators) ...................................................... 298 5.2.2. Affiliations (Educators) ................................................................ 302 5.2.3. Teaching Experience .................................................................... 304 5.2.4. Age Groups (Educators) ............................................................... 305 5.2.5. Location (Educators) .................................................................... 307 5.2.6. Professional Registration (Educators) .......................................... 308 5.2.7. Location of Education (Educators)............................................... 311 5.2.8. Teaching Specialty ....................................................................... 313
5.3. Educators’ Projects ................................................................................ 319 5.3.1. Project Typologies (Educators) .......................................................... 320 5.3.2. Climates of the Educators’ Passive Projects ...................................... 321 5.4. Passive/Natural Systems ....................................................................... 325
5.4.1. Renewable Energy Systems (Educators) ...................................... 326 5.4.2. Passive/Natural Cooling Systems (Educators) ............................. 331 5.4.3. Passive/Natural Heating Systems (Educators) ............................. 336 5.4.4. Daylighting Systems (Educators) ................................................. 338 5.4.5. Passive Building Envelope Strategies (Educators) ...................... 341
5.5. Phase of Analyzing the Use of Passive Systems (Educators) ............... 343 5.6. Educators Tools ..................................................................................... 345 5.7. Phase of the Calculation of Passive Strategies’ Savings
(Educators) ............................................................................................ 351 5.8. Factors Influencing the Use of Passive/Natural Systems
(Educators) ............................................................................................ 353 5.9. Open-ended Question (Educators) ........................................................ 359 5.10. Major Findings (Educators) ................................................................ 363

ix
6. SUMMARY AND CONCLUSION ........................................................................... 369
6.1. Scope of the Section .............................................................................. 369 6.2. Summary ............................................................................................... 369 6.3. Recommendations ................................................................................. 380 6.4. Discussion of the Research Limitations ................................................ 386 6.5. Path for the Future Research ................................................................. 389 6.6. Conclusion ............................................................................................. 391
REFERENCES ............................................................................................................... 393
APPENDIX A IRB REVIEW LETTER ........................................................................ 424
APPENDIX B SURVEY INVITATION LETTER ....................................................... 425
APPENDIX C SURVEY QUESTIONNAIRE FOR EDUCATORS AND PRACTITIONERS ......................................................................................................... 427
APPENDIX D PARTICIPANTS’ RESPONSES TO THE OPEN-ENDED TEXT QUESTION .................................................................................................................... 446
APPENDIX E RADAR CHARTS FOR 2017 AIA COTE TOP TEN CASE STUDIES ....................................................................................................................... 455
APPENDIX F TABULAR ANALYSIS OF AIA COTE TOP TEN 2017 AND 2010 AWARDS .............................................................................................................. 461

x
LIST OF FIGURES
Page
Figure 1.1 Estimated US energy consumption in 2016: 97.3 Quads (LLNL, 2016; Department of Energy) ............................................................. 1
Figure 2.1 Level of worldwide green building activity based on (Dodge Data and Analytics, 2016) ................................................................. 19
Figure 2.2 Operation of an in-vent passive intelligent system, adapted from (Ventive, 2018) ............................................................................................... 48
Figure 2.3 Passive cooling strategies on a building bioclimatic chart (adapted from Milne and Givoni, 1979; Kwok and Grondzik, 2015) ............ 91
Figure 2.4 Passive cooling and heating design strategies for Las Vegas, Nevada using Climate Consultant ............................................... 94
Figure 4.1 Survey duration for practitioners (amount of time respondents spent completing the survey) ......................... 222
Figure 4.2 Percentage of the respondents’ primary profession among practitioners .................................................................................................. 227
Figure 4.3 Respondents’ affiliations among practitioners ............................................. 229
Figure 4.4 Respondents’ affiliations among practitioners with the expansion of the “other” category ................................................................................. 232
Figure 4.5 Respondents’ years of professional experience ............................................ 233
Figure 4.6 Practitioners’ age group ................................................................................ 235
Figure 4.7 Locations of the survey respondents on the US map .................................... 237
Figure 4.8 Distribution of professional registration among the participants .................. 238
Figure 4.9 Number of states where a respondent is professionally registered as an architect or engineer ............................................................................ 239
Figure 4.10 Respondents’ Architectural Licensure or PE with their distribution in each state ................................................................................................. 240
Figure 4.11 Percentage of respondents with Architectural Licensure or PE in each state ................................................................................................. 240

xi
Figure 4.12 Location of education that the respondents earned their degree(s) most related to their current profession ...................................................... 241
Figure 4.13 Areas for which respondents were asked about their earned degree(s) most related to their current profession ...................................... 242
Figure 4.14 Mean percentage of professionals projects in different categories for the last 10 years ..................................................................................... 243
Figure 4.15 Mean percentage of the projects in only the “other” project category for the last 10 years .......................................................................... 244
Figure 4.16 Areas defined on ASHRAE climate map to be selected by practitioners as the location of their projects in the last ten years .............. 247
Figure 4.17 Total number of times each area on the map in Figure 4.16 was selected by practitioners ...................................................................... 247
Figure 4.18 Areas selected by practitioners on the US climate map as the locations of their projects with passive design strategies in the last ten years (top, selection of a group of 120 practitioners, and bottom, selection of a group of 15 practitioners) ..................................................... 248
Figure 4.19 Practitioners’ use of renewable energy in the last 10 years’ projects ......... 249
Figure 4.20 Renewable energy usage in the last 10 years categorized by professional registration .............................................................................. 251
Figure 4.21 Practitioners use of passive cooling strategies in the US in the last 10 years ................................................................................................ 252
Figure 4.22 Passive cooling strategies categorized by professional registration ........... 256
Figure 4.23 Frequency of the use of passive heating strategies by practitioners in the last 10 years ...................................................................................... 257
Figure 4.24 Frequency of the application of passive heating strategies categorized by practitioner’ professional registration ................................ 260
Figure 4.25 Application of daylighting strategies by practitioners ................................ 263
Figure 4.26 Application of daylighting strategies categorized by professional registration .................................................................................................. 263
Figure 4.27 Application of passive building envelope strategies broken out by professional licensure ................................................................................. 265
xii
Figure 4.28 Practitioners passive systems’ analysis phase categorized by professional registration .............................................................................. 267
Figure 4.29 Professionals tools for analyzing the feasibility of passive systems on their projects .......................................................................................... 271
Figure 4.30 Tools used for analyzing the feasibility of passive systems categorized by professionals registrations .................................................. 272
Figure 4.31 Phase of calculating passive systems savings broken out by professional registration .............................................................................. 274
Figure 4.32 Factors influential in the use of passive/natural systems broken out by professional registrations of the respondents ......................................... 280
Figure 4.33 Factors influential in increasing the use of passive/natural systems in buildings categorized by respondents’ years of work experience .......... 281
Figure 5.1 Educators additional current professional role ............................................. 299
Figure 5.2 Educators previous professional role ............................................................ 301
Figure 5.3 Educators’ affiliations ................................................................................... 303
Figure 5.4 Educators teaching experience ...................................................................... 305
Figure 5.5 Educators’ age group .................................................................................... 306
Figure 5.6 Educators locations ....................................................................................... 307
Figure 5.7 Professional registration of the educators ..................................................... 309
Figure 5.8 Professional registration of the educators broken by their states of professional registration ............................................................................... 310
Figure 5.9 Location that the educators earned their degree(s) most related to their current profession ............................................................................... 312
Figure 5.10 Educators degrees most related to their current profession ........................ 313
Figure 5.11 Teaching specialty of the respondents ........................................................ 317
Figure 5.12 Teaching specialty of the educators based on their professional registrations ................................................................................................. 318

xiii
Figure 5.13 Educators contribution to projects design/construction broken by professional registrations ............................................................................ 319
Figure 5.14 Mean percentage of educators projects in different categories for the last 10 years........................................................................................... 320
Figure 5.15 Location of the educators’ passive projects for the last 10 years reflected on ASHRAE Climate Map. ......................................................... 322
Figure 5.16 Location of educators’ passive projects for the last 10 years ..................... 323
Figure 5.17 Location of the educators’ passive projects for the last 10 years categorized by their professional registration ............................................. 324
Figure 5.18 The most taught renewable energy systems in the US by educators .......... 329
Figure 5.19 The teaching level of passive/natural cooling systems by educators and their frequency ..................................................................................... 335
Figure 5.20 The frequency for teaching levels of passive heating systems ................... 338
Figure 5.21 The frequency for teaching levels of daylighting systems.......................... 340
Figure 5.22 The frequency of teaching levels for building envelope systems ............... 342
Figure 5.23 The frequency/frequency percentage of the phase of teaching passive design in a class project ................................................................. 345
Figure 5.24 Tools that educators use for analyzing the feasibility of passive systems on their projects ............................................................................. 350
Figure 5.25 Phase of calculating passive systems’ savings categorized by professional registration of the educators ................................................... 352
Figure 5.26 Factors influential in the use of passive/natural systems categorized by professional registration of the educators .............................................. 357
Figure 5.27 Factors influential in increasing the use of passive/natural systems in buildings categorized by educators’ years of teaching experience ......... 358
xiv
LIST OF TABLES
Page
Table 1.1 Comparison of passive and active solar systems for cooling and heating based on (Chan et al., 2010). ............................................................... 15
Table 2.1 Simple active and passive home energy saving strategies (Casey, 2016; Ref. DOE, 2016) ....................................................................... 21
Table 2.2 Examples of groups that apply biomimetic design strategies, adapted from (Badarnah and Kadri, 2015) .................................................................... 27
Table 2.3 Problem based steps for biomimetic design (Badarnah and Kadri, 2015) ....... 28
Table 2.4 Solution-based steps (Badarnah and Kadri, 2015) ........................................... 28
Table 2.5 System Ventilation Efficiency and primary outdoor air fraction ..................... 45
Table 2.6 Performance requirements for PHIUS Certification adapted from (PHIUS, 2015) ................................................................................................. 63
Table 2.7 DOE High-Performance Home Staircase, adapted from (PHIUS, 2015) ........ 64
Table 2.8 Overall heat loss criteria for passive solar design byBalcomb et al. (1980); SI conversion by Grondzik and Kwok (2015) ............ 71
Table 2.9 Rules for estimating optimum areas of south-facing glazing area for Trombe’ wall and direct gains (Lechner, 2015) ............................................... 72
Table 2.10 Design guidelines for passive solar thermal mass from Balcomb et al. (1980) and Grondzik and Kwok (2015) ......................................................... 74
Table 2.11 Rules for Estimating Required Thermal Mass in Direct-Gain Systems (Lechner, 2015) .............................................................................................. 74
Table 2.12 Comparison of glass and plastic as the exterior surface in a Trombe’ wall .................................................................................................. 81
Table 2.13 Several examples of indirect solar gain systems and their features, particularly Trombe’ walls ............................................................................. 82
Table 2.14 Indoor ∆t swing based on 45 Btu/ft2F thermal storage mass capacity (Balcomb et al., 1980; Grondzik and Kwok, 2015) ....................................... 90

xv
Table 2.15 Different types of roof ponds in the literature ................................................ 98
Table 2.16 Table for vertical fins slanted to the north and installed on east/west façade (Lechner, 2009) ................................................................................. 102
Table 2.17 Examples of the types of DSFs used in different locations and their findings (Ghaffarianhoseini et al., 2016). .................................................... 110
Table 2.18 Possibilities for the design of adaptive façades ............................................ 112
Table 2.19 Strengths and weaknesses of light guiding systems by previous researchers (Wong, 2017)............................................................................. 116
Table 2.20 Examples of Green Building Rating Systems and their features ................. 119
Table 2.21 Pros and cons of simulations validation techniques (NREL, 2008) ............. 143
Table 2.22 Stages of the design process in which first energy model is created (Athienitis et al., 2010) ................................................................................. 143
Table 2.23 Features of the NZESB design tools that are lacking .................................. 144
Table 2.24 Building performance simulation tool criteria (Attia et al., 2012) ............... 148
Table 2.25 Participants’ professional background (Attia et al., 2012) ........................... 149
Table 2.26 The important parameters of a simulation tool (Attia et al., 2012) .............. 149
Table 2.27 Usability and graphical visualization importance of simulation tools (Attia et al., 2012) ........................................................................................ 149
Table 2.28 Importance of the items for intelligence of knowledge base and adaptability to design process in simulation tools (Attia et al, 2012) .......... 150
Table 2.29 Architects versus engineers in BPS priorities and tool ranking ................... 150
Table 2.30 Architects versus engineers ranking of ten simulation tools (Attia et al, 2012). ........................................................................................ 150
Table 2.31 Building envelope, daylighting, and solar analysis capabilities of twenty simulation tools by Crawley et al. (2008) ........................................ 154
Table 2.32 Classification of analysis methods for building energy use: steady state methods ..................................................................................... 166

xvi
Table 2.33 Classification of analysis methods for building energy use: dynamic methods ........................................................................................................ 167
Table 2.34 Academic credit grouped into six subject areas required to become a NAAB accredited program in the US (NCARB, 2018) ............................... 175
Table 2.35 The three-tier design approach with the highlighted tier of passive design for achieving a high performance sustainable building................... 179
Table 3.1 List and region of the AIA Chapters who were contacted to participate in the survey ................................................................................................... 209
Table 3.2 List and region of the ASHRAE Chapters who were contacted to participate in the survey ................................................................................. 211
Table 3.3 List of the top ten sustainable design firms in the US ranked by ................... 213
Table 3.4 List of top ten design firms in the US ranked byArchitectural Record (2017) .......................................................................... 214
Table 3.5 List of top 50 Architecture Schools in the US ranked by Niche (2019) ........ 214
Table 4.1 Percentage of the respondents’ primary profession among practitioners .................................................................................................. 228
Table 4.2 Respondents’ affiliations among practitioners ............................................... 230
Table 4.3 Respondents’ years of professional experience ............................................. 234
Table 4.4 Practitioners’ age group ................................................................................. 235
Table 4.5 Distribution of professional registration among the participants ................... 238
Table 4.6 Mean percentage of the projects in only the “other” project category for the last 10 years ......................................................................................... 244
Table 4.7 Areas selected by practitioners as the location of their projects in the last ten years ................................................................................................... 246
Table 4.8 Use of renewable energy in the last 10 years by practitioners ....................... 250
Table 4.9 Practitioners use of passive cooling strategies in the US in the last 10 years ........................................................................................................... 253
Table 4.10 The total number of cooling strategies in the questionnaire selected by each practitioner ...................................................................................... 254

xvii
Table 4.11 Selection of the passive cooling strategies in four states with higher participation and four different humid climates (4A, 5A, and 2-3A) .......... 255
Table 4.12 Frequency of the application of passive heating strategies by practitioners .................................................................................................. 258
Table 4.13 Application of daylighting strategies by practitioners ................................. 262
Table 4.14 Application of passive building envelope strategies by professional licensure ....................................................................................................... 265
Table 4.15 Practitioners’ phase of analysis of passive systems ..................................... 267
Table 4.16 Passive systems’ analysis tools, their application frequency, and percentage ..................................................................................................... 273
Table 4.17 passive systems’ saving calculation frequency in each phase...................... 275
Table 4.18 Items ranked based on the practitioners’ top three choices to increase the use of passive systems in the US .............................................. 277
Table 4.19 Major findings of the survey from practitioners .......................................... 294
Table 5.1 Educators additional current professional role ............................................... 299
Table 5.2 Educators’ previous professional role ............................................................ 301
Table 5.3 Educators’ affiliations .................................................................................... 303
Table 5.4 Educators teaching experience ....................................................................... 304
Table 5.5 Educators’ age group ...................................................................................... 306
Table 5.6 professional registration of the educators ...................................................... 309
Table 5.7 Number of states for the professional registration of the educator ................ 309
Table 5.8 Location of the respondents’ degree(s) most related to their current profession ....................................................................................................... 312
Table 5.9 Teaching specialty of the respondents ........................................................... 316
Table 5.10 Location of educators’ passive project for the last 10 years ........................ 322
Table 5.11 The most taught renewable energy systems in the US by educators ........... 326

xviii
Table 5.12 The level of most taught renewable energy systems in the US by educators ..................................................................................................... 328
Table 5.13 The teaching level of renewable energy systems categorized by educators’ professional registration ............................................................ 330
Table 5.14 The teaching level of passive/natural cooling systems and their frequency percentage .................................................................................. 333
Table 5.15 The frequency for teaching level of passive cooling systems categorized by professional registration ....................................................... 334
Table 5.16 The frequency and frequency percentage for teaching levels of passive heating systems .............................................................................. 336
Table 5.17 The frequency and frequency percentage for teaching levels of daylighting systems ...................................................................................... 339
Table 5.18 The frequency and frequency percentage for teaching levels of building envelope systems .............................................................................. 341
Table 5.19 The frequency and frequency percentage of the phase of teaching passive design in a class project ................................................................... 344
Table 5.20 Tools that educators use for analyzing the feasibility of passive systems on their projects .............................................................................. 349
Table 5.21 Phase of calculating passive systems savings broken out by professional registration of educators........................................................... 351
Table 5.22 Items ranked based on the educators’ top three choices to increase the use of passive systems in the US ............................................................ 354
Table 5.23 Major findings from educators’ survey results ............................................ 363

1
Figure 1.1 Estimated US energy consumption in 2016: 97.3 Quads (LLNL, 2016; Department of Energy)
1. INTRODUCTION
1.1. Background and Problem Statement
Buildings consume a large portion of the total United States energy use. A recent report
by Lawrence Livermore National Laboratory (LLNL, 2016) shows that the total United
States (U.S.) energy use in 2016 was approximately 97.3 Quads Btu (1 Quad = 1015
Btu). In this study by Lawrence Livermore National Laboratory (LLNL), the three main
energy end-use sectors included: buildings (i.e., residential and commercial), industrial,
and transportation, which consumed 20.02 QBtu (27.7%), 24.5 QBtu (33.8%) and 27.9
QBtu (38.5%), respectively.

2
In the LLNL 2016 study (Figure 1.1), the buildings sector (i.e., residential and
commercial) accounted for 20.02 QBtu energy consumption or about one-third of the
end-use energy consumption in the US in 2016. However, a large portion of the energy
provided to the residential and commercial end-use sectors is electricity. Therefore, if
the energy waste from converting source energy into electricity is considered and
proportioned for the building sector according to the end-use, then the buildings sector is
responsible for 38.6 QBtu of the total U.S. source energy. On this basis, the building
sector represents almost 40% of the total U.S. source energy consumption. 1
Therefore, designing energy efficient buildings that utilize passive/natural systems is an
important goal for designers. Sustainable design strategies in buildings include energy
saving and energy efficiency measures that can contribute to this goal. A case in point is
the set of sustainable design strategies defined through the three categories or tiers
described by Norbert Lechner (2015). Lechner’s approach toward sustainable heating,
cooling, ventilation and lighting (HCVL) of buildings proposes a brief, though
comprehensive, illustration of design strategies from simple to more advanced. The
first/bottom tier includes “basic building design strategies” for heat rejection, retention,
1 The following calculations demonstrate the breakdown of reaching this number for the reported 24.9 QBtu waste of source electricity: Residential and Commercial sections portion of waste= (Received input portions of electricity for Residential and Commercial) / (Received input portions of electricity for all sectors) (4.8 + 4.64) QBtu / (4.8+ 4.64+3.19 + 0.03) QBtu = 74.9% 74.9% × 24.9 QBtu = 18.65 QBtu Total source energy= 20.2 Q Btu + 18.65 Q Btu = 38.6 Q Btu 38.6 Q Btu / 97.3 Q Btu = 39.7%

3
or avoidance depending on the climate or season. This tier includes large-scale strategies
such as site design or building location as well as design strategies at the scale of a
building such as air tightness, orientation, color, insulation, construction materials and
glazing features (Lechner, 2015, p. 9).
The second tier includes “passive systems” for the application of natural energies in the
design process. The third/top tier of the three-tier design approach includes active system
strategies, renewable energies, and mechanical systems such as photovoltaics, wind
turbines, low-energy artificial lighting, and heating/cooling equipment. The focus of this
study is on the second tier, which is the “passive system” tier utilizing the ambient
conditions or natural energy for HCVL in buildings and has been referred to in the study
as passive/natural systems. Design strategies such as light shelves, earth contact,
direct/indirect solar gain systems, and natural ventilation are a few examples included in
the second tier.
A brief review of the history of passive design strategies show that each period of
interest in their application was usually followed by an era of indifference (Grondzik and
Kwok, 2015). In the US, active and passive solar heating has received more attention
than other passive design strategies, though historical interest in solar energy has also
occurred in cyclical trends. Unfortunately, the low energy prices of the1960s in the US
dampened enthusiasm for solar energy.

4
In response to the oil embargo of the early 1970s, interest exploded again and lasted
until the mid-1980s when political changes claimed that the energy crisis had been
solved, which reduced public interest in energy saving (Balcomb, 1992). The year 1976
was the beginning of the promotion of the application of passive solar energy when the
first passive solar conference was held in Albuquerque, New Mexico (Balcomb, 1987).
At the conference, the major focus was on passive solar heating in single-family houses.
Although projects were reported in multifamily housing, commercial buildings, natural
cooling, and daylighting, the majority of the reported projects included single-family
residential buildings.
At the beginning of the 1990s, a new wave of interest in renewable energy and passive
design emerged and gained momentum following the worldwide spread of the concept
of sustainability. However, during the early years of the 21st century, interest in passive
design strategies gradually faded again. Issues such as the heavy material weight of
passive systems, complexity of their implementation, and unfamiliarity of the occupants
in combining these systems with their lifestyles were some of the reported issues (Strong
& Burrows, 2017, p.33).
Beginning about 2010, interests in the application of passive design strategies started to
make a come-back to the forefront of sustainable design approaches as in the case of net
zero/net positive energy buildings and high performance building components. During
this new resurgence, the main goal was to reduce the carbon footprint of buildings by

5
reducing their usage of non-renewable energies resulting in the reduction of carbon
emissions from the power plants that would have provided the electricity that the passive
natural systems could save. In the US, the legislative initiative called Architecture
Challenge 2030 became a catalyst in 2010 for further rekindling the interests in the
application of passive systems by setting specific targets for fossil fuel reductions in
buildings to 60% in 2010, 70% in 2015, 80% in 2020, 90% in 2025, and finally carbon
neutral (100%) in 2030 (Architecture Challenge 2030, 2015).
However, many of these designs used legacy analysis methods and concepts of passive
design strategies that were developed in the 1970s and the 1980s. Some of these
concepts now have reappeared under the guise of new terms and concepts such as
biomimetic designs, double-skin buildings, and kinetic facades. In most cases, the
emergence of new materials/technologies in the building industry as well as the
inclination toward interdisciplinary design collaborations, such as biology and
architecture/engineering in biomimetics, were key factors contributing to this change of
terminology.
Therefore, to save on time and cost, there is no need to start research studies about
passive/natural systems from scratch; rather the examining of previous research/work on
passive design, their developments through time, and their current applications on a
practical scale may yield valuable information. Consequently, there is a need to examine
the architects’ and engineers’ use of natural/passive versus artificial/mechanical energy

6
systems in buildings to find opportunities and challenges to reduce our dependency on
non-renewable energies by increasing the contribution of nature to our building designs.
Therefore, the purpose of this research is twofold: first, to examine the degree of
adoption of the concepts of natural HCVL systems (i.e., passive, biomimetic) versus
artificial/mechanical systems (i.e., active) in the design of sustainable buildings by
practitioners; and second, to investigate the variables that may increase/reduce the
application of these systems in future designs.
In a building’s annual operating budget, energy is often the single largest cost
representing about 30% of the total expenses. Data and reports regarding annual building
costs are prepared by several entities including the Building Owners & Managers
Association (BOMA, 2017), Commercial Buildings Energy Consumption Survey
(CBECS, 2012), the Northwest Energy Efficiency Alliance (NEEA, 2014), and the US
Energy Information Administration (EIA, 2018). Most noticeable of these reports is the
lack of attention to the inclusion of data related to natural/passive systems’ contributions
to reducing energy and operating costs in commercial buildings.
Sporadic data that is available usually addresses daylighting, which tends to indicate a
low priority within the building industry for the contribution of natural/passive systems
toward building performance. For example, according to CBECS data (2012), only 9%
of large buildings draw significantly on daylight harvesting. While a lack of data related
to the use of natural HCVL systems in buildings makes it difficult to evaluate the

7
contribution of passive systems for energy savings, it reinforces the problem statement
by showing how designers and the construction industries have ignored the importance
of natural/passive systems in buildings/designs in more recent years.
1.2. Research Goals and Task Objectives
The goal of this research is twofold: First, to promote sustainability by reducing the use
of non-renewable energy through a better understanding of how/why building
professionals choose or do not choose to incorporate natural systems into their designs.
Second, to increase educational awareness toward professionals’ application of natural
systems in the design of sustainable buildings to better inform the content of
architectural course curriculums in the future. Toward this end, the tasks related to the
research include:
1) Review the existing strategies and tools for designing natural heating, cooling, and
lighting systems in buildings to identify/demonstrate the relevant passive/natural design
strategies as well as tools and methods for calculating the annual contribution of natural
systems in buildings.
2) Review best sustainable design practices in the application of passive/natural systems
in the US:
2.1) Review cases studies of the approaches and tools used by professionals for
making decisions on choosing or not choosing the application of passive/natural
systems in their projects.

8
2.2) Review case studies of the AIA COTE (American Institute of Architects
Committee on the Environment) TOP 10 Awards for the design firms within the
last 10 years, which are representative of best practices.
2.3) Decompose and analyze the buildings of Task 2.2 based on their natural
systems/sub-systems contribution to HCVL versus active systems’ contributions
to the performance of the buildings.
3) Conduct survey questionnaires, analyze the results, and develop recommendations:
3.1) Review the results of the previous surveys, such as the AIA survey on the
habits of high-performance firms (AIA, 2017).
3.2) Provide a sample group for the survey questionnaires to practitioners2
3.3) Provide a sample group for the survey questionnaires to educators
3.4) Design and conduct IRB-approved survey questionnaires to collect data
from practitioners and educators to analyze their approaches/challenges in the
application or education of passive/natural systems.
3.5) Summarize the results of the previous tasks and develop recommendations.
1.3. Significance and Limitations of the Study
Although the list of publications on the use of passive systems is extensive, there are
very few studies that have analyzed the approaches and the passive system analysis tools
2 For example, see TOP Contractors list in http://www.enr.com/Top_Lists/Top_Contractors1 or TOP Design Firms list in http://www.enr.com/toplists/2016_Top_500_Design_Firms1 and http://www.architecturalrecord.com/top300/2014-Top-300-Architecture-Firms-6.

9
utilized by professionals to determine the annual contribution natural systems provide in
sustainable buildings. As described in the background and problem statement, such
studies could pave the way for reducing the total US energy consumption by reducing
building energy consumption, particularly through the reduction of the use of non-
renewable fossil fuels. This reduction will be compensated by the contribution of natural
HCVL to improve the efficiency of buildings in using non-renewable energies.
Improving the efficiency of buildings is important because buildings in the US utilize
65% of the electricity produced and cause 30% of carbon emissions (Syed, 2012;
WBDG, 2017).
Reduction of the use of fossil fuels will also reduce air pollution and improve the
ambient air quality. Therefore, this study is significant because it intends to fill a gap in
the literature resulting from the unknown extent that natural systems are actually being
incorporated into the design of sustainable buildings. On this basis, the original
contribution of this research is to determine the current degree and approaches to the use
of natural systems in professional architectural design, and to determine what reasons, if
any, exist for their deficiencies.
This study can also provide recommendations for the improvement of the use of natural
systems in the future. Particularly, the results will be significant for educators and
students in architecture who seek to include in their course curriculum the incorporation
of natural systems in buildings. Lastly, this study will draw a parallel comparison

10
between old and new terms/concepts with respect to the use of natural systems to
provide an enriched repertoire for today’s designers; thereby, future design ideas would
not need to be created from scratch. Additionally, this comparison may help better
understand why many of the new design terms and concepts that are being used are
rephrasing the passive design concepts used in the past through the application of new
materials and technological concepts.
Because the research scope excludes design and engineering firms outside the US, the
generalizability of the findings should be limited to the US. This study is also limited to
the extent that full access to architectural drawings and specifications was limited.
1.4. Overview of the Dissertation
This dissertation has been organized through the following sections:
Section 1. Introduction: this section provides information on the background of this
study and outlines its goals and task objectives. The introduction section also addresses
the significance of the study and its limitations. To help readers better perceive the
content of the following sections, the first section also contains definitions of technical
terminology.
Section 2. Literature Review: this section includes a review of the literature about
sustainable design trends and methods with respect to the inclusion of active and
passive/natural systems in design. It also reviews green building rating systems and
codes/standards in relation to the use of natural systems in buildings. Other aspects of

11
the literature review include: review of the advanced and legacy passive/natural system
strategies; the impact of natural/passive systems on health and wellbeing; a brief history
of the evolution of passive design in the US; professionals’ tools and methods for the
application of natural systems; the issues that have not been addressed properly in the
literature for the application of passive systems such as architectural education, client-
designer’s collaboration, and simulation tools; and most importantly a review of the AIA
TOP Ten Award case studies.
Section 3. Methods: this section offers a detailed description of the methods used to
conduct this research and develop the survey questionnaire as well as the theoretical
framework supporting the application of these methods.
Section 4. Results and Data Analysis of Practitioners’ Survey: this section explains the
data collection/analysis procedures focused on practitioners’ survey along with the
findings.
Section 5. Results and Data Analysis of Educators’ Survey: similar to the previous
section, this section explains the data collection/analysis procedures focused on the
educators’ survey along with the findings.

12
Section 6. Summary and Conclusion: this section includes a discussion summary of the
main findings of this research and provides recommendations for the incorporation of
passive/natural systems in buildings.
In addition, in the Appendix the readers will find supporting materials such as requests
approved by the Institutional Review Board for the research field survey and the analysis
charts and tables of the AIA TOP Ten Award case studies.
1.5. Definition
Active systems are systems that use non-renewable energy such as electricity to heat,
cool, ventilate, or illuminate buildings (Strong & Burrows, 2017; Ewing, 2006).
Active solar systems use electrical or mechanical equipment, such as pumps and fans, to
increase the usable heat in a system. These systems are active solar power setups that
rely on external energy sources—or backup systems, such as radiators and heat pumps
— to capture, store, and then convert solar energy into electricity. Depending on the
complexity of their design, active solar systems can heat, cool, or ventilate buildings or
provide power to an entire neighborhood (CEF, 2018).
Biomimicry has been defined as the abstraction of good design from nature (Vincent,
2010) and the conscious emulation of nature’s genius (Benyus, 2002).
High performance building uses a “whole-building design approach to achieve energy,
economic, and environmental performance that is substantially better than standard

13
practice” (NREL, 2005). Whole-building design creates energy efficient buildings that
save actual operating costs and produces healthy places for work and life. (NREL,
2005). Federal Research and Development Agenda for Net Zero and High Performance
Buildings considers a building high performance if it “integrates and optimizes on a life
cycle basis all major high-performance attributes, including energy conservation,
environment, security, safety, durability, cost-benefit, productivity, sustainability,
functionality, and operational considerations” (FRDAZ, 2008; EPA, 2005). The Agenda
considers differences between high performance buildings and green high performance
buildings as defined below.
High performance green building is a building that during its life cycle, compared with
data of similar buildings collected by Commercial or Residential Buildings Energy
Consumption Surveys data from the EIA (Energy Information Administration) fulfills
several objectives including: reduction of energy use, water use, and material resource
consumption; improvement of Indoor Environmental Qualities (IEQ) by reducing indoor
pollution, improving thermal comfort, and improving lighting quality and acoustics that
affect occupants’ health and productivity; reduction of negative impacts on the
environment such as air/water pollution and waste generation; increase of application of
environmentally friendly materials such as bio-based recycled content and non-toxic
products with lower life cycle impacts; promotion of reuse and recycling; integration of
systems; reduction of environmental and energy impacts of transportation choices for
occupants; consideration of its indoor/outdoor effects on human health and environment
14
including workers productivity, life cycle impacts of materials and operations, and other
factors that the Federal Director/Commercial Director consider to be appropriate.
Life cycle: in a high performance green building, includes all stages of a building’s
useful life, embracing components, equipment, systems, and controls, beginning at the
conception of the building project and extending through site selection, design,
construction, landscaping, commissioning, operation, maintenance, renovation,
deconstruction/demolition, removal, and recycling (FRDAZ, 2008; EPA, 2005).
Passive systems, coined in the early 1970s (Balcomb,1992), refers to the systems that
use ambient conditions or renewable energies to heat, cool, and ventilate buildings.
Natural systems include passive systems and in a broader sense embrace the illumination
of buildings through daylighting (Strong & Burrows, 2017; Ewing, 2006). These two
terms will be used together as passive/natural systems in the dissertation.
Passive solar systems in contrast to active solar systems, are those systems that operate
without reliance on external energy sources (e.g. pumps and fans). By using only
ambient conditions, passive solar systems capture solar energy to heat a space, or store
the heat for release at a later time (CEF, 2018). Table 1.1 shows a comparison of passive
and active solar systems for cooling and heating according to Chan et al. (2010). Using
Chen et al.’s definition, passive solar systems relate to building envelope design while

15
the active solar systems relate to the application of solar collectors to heat a fluid that
then heats a space.
Table 1.1 Comparison of passive and active solar systems for cooling and heating based on (Chan et al., 2010).
Type of solar system Heating Cooling
Active solar:
Uses electrical or mechanical equipment, such as pumps and fans, to increase the usable heat in a system
• The solar collector is used in which the absorber component absorbs solar radiation energy, converts it to heat, and transfers the heat to a transport medium or fluid. The fluid flows through the collector. The collected solar energy is carried from the fluid to a storage tank or heat exchanger to provide heating.
• Devices: examples include flat plate, parabolic trough or evacuate tube collectors.
• The collected solar heat is used as the source energy for air-conditioners, which are recognized as solar assisted air-conditioning systems.
• Devices: examples include absorption and adsorption chillers, solid or liquid desiccant systems.
Passive solar:
Works without using active mechanical devices; the system does not use or uses only small amount of external energy
• Heat is gained through passive solar energy. Heat from solar radiation is absorbed, stored or used to preheat ventilation air.
• Devices: examples include façade or roof building components.
• The airflow is generated and channeled to create cooling effects by removing the heat; natural ventilation is the most typical passive cooling.
• Devices: examples include facade or roof building components.
Sustainability as defined by ASHRAE provides “for the needs of the present without
detracting from the ability to fulfill the needs of the future” (ASHRAE, 2013, p. 35.1).
Accordingly, sustainable buildings are designed and constructed in accordance with
practices that significantly reduce or eliminate the cradle-to-grave negative impacts of

16
buildings on the environment and occupants in five broad categories: Sustainable Site
Planning, Safeguarding Water and Water Efficiency, Energy Efficiency and Renewable
Energy, Conservation of Materials and Resources, and Indoor Environmental Quality
(ASHRAE Green Guide, 2010).

17
2. LITERATURE REVIEW
2.1. Sustainable Architectural Design
2.1.1. Trends in Sustainable Architectural Design
Creating buildings that meet the needs of the present without compromising the ability
of the future generations to use natural resources is one of the fundamental definitions of
sustainable design (Hawken et al., 1999). History reveals many examples about different
civilizations that vanished when they outnumbered their resources (Iyengar, 2015).
Uncontrolled use of fossil fuels in buildings section since the industrial revolution has
increased the atmospheric concentration of greenhouse gases (GHG) incessantly. Due to
heat trapping, GHG emissions can cause unwanted environmental effects such as global
warming. Unfortunately, CO2 levels have climbed from 280 parts per million (ppm) in
1760 to 403.3 ppm in 2016. These changes accelerated in the last decade in which the
global daily CO2 concentration hit a record of 412.63 parts per million (ppm) on April
26, 2017. As a result, in the current decade the Earth has experienced the fifth warmest
January in 2018 with 1.28°F (0.71°C) increase in temperature (NOAA-ESRL, 2018).
A question to ask at this point is can green buildings slow down the process of climate
change and provide solutions for preserving natural resources for future generations?
Edward Mazria has contested that the building industry is responsible for almost 50% of
the total GHG emissions (Brown, 2009). However, beyond this claim, answering the
question demands a deeper investigation of the current and future trends of green
18
building design. The website interestingengineering.com has listed the top five global
trends of green building design in 2017 (Nichols, 2017). These trends include: solar
panels in all shapes and sizes, home energy storage, energy management systems,
passive building design, and sustainable building materials. From another perspective,
which considers solar panels and energy storage systems together as one trend, the net
zero energy buildings were also included in the top five trends of sustainable building
design (DBSG, 2017).
All of these top five trends of sustainable design revolve around the theme of energy
usage in which the main environmental motivation behind green construction can be
identified as the reduction of carbon emissions. Therefore, using clean renewable
energies in buildings can considerably contribute to the project of sustainability through
both reducing the use of non-renewable energies and delaying the fast pace of unwanted
environmental changes due to carbon emissions. Additionally, it is understandable that
natural systems and passive design strategies alongside active system/building
technologies are under serious consideration among the top recent trends of green
building designs.
A portion of this rise of green building trends worldwide is a result of the United Nations
2030 Agenda for Sustainable Development (UN, 2016). Although the growth rate of
green building certification practices is slowing down (BDC, 2015), based on the report
on World Green Building Trends (DODGE, 2016) from 2015 to 2018 the percentage of

19
12
2623
2118
0
5
10
15
20
25
30
35
40
Exploring (NoGreen
Involvement)
1%-15% GreenProjects
16%-30% GreenProjects
31%-60% GreenProjects
More Than 60%Green Projects
PERC
ENTA
GE O
F AC
TIVI
TY
2015: Level of worldwide green building activity
8
13
2022
37
0
5
10
15
20
25
30
35
40
Exploring (NoGreen
Involvement)
1%-15% GreenProjects
16%-30% GreenProjects
31%-60% GreenProjects
More Than 60%Green Projects
PERC
ENTA
GE O
F AC
TIVI
TY
2018: Level of worldwide green building activity
Figure 2.1 Level of worldwide green building activity based on (Dodge Data and Analytics, 2016)

20
global builders with minimum 60 percent certified green projects will be doubled
(Figure 2.1). The United Nations 2030 Agenda has been followed by other agendas on
local scales such as the Architecture 2030 Challenge in the US, which challenges the
design and construction community to reduce fossil fuel consumptions.
According to the 2030 Challenge, new constructions and major renovations should be
designed to reach a 70% reduction of fossil fuel use and GHG emissions as well as
energy consumption performance below the regional averages for that building type.
This fossil fuel reduction should reach to 80% in 2020, 90% in 2025, and carbon-neutral
in 2030. The 2030 Challenge extends that these targets may be accomplished by
implementing innovative sustainable design strategies, generating on-site renewable
power, and/or purchasing (20% maximum) off-site renewable energy (Architecture
2030, 2015).
The 2030 Challenge proposes a two-step approach to reach net-zero carbon buildings.
The first step is to integrate sustainable and passive design with low-cost or no-cost
strategies to reach a 70%-80% reduction of carbon use. Examples include orienting a
building, shading the glass, incorporating daylighting and passive heating/cooling
strategies, and using specific materials and systems. “The second step is to provide
fossil-fuel-free energy, ideally from on-site renewables, or from off-site district or
utility-scale renewable energies” (Challenge 2030 Solution, 2015).
21
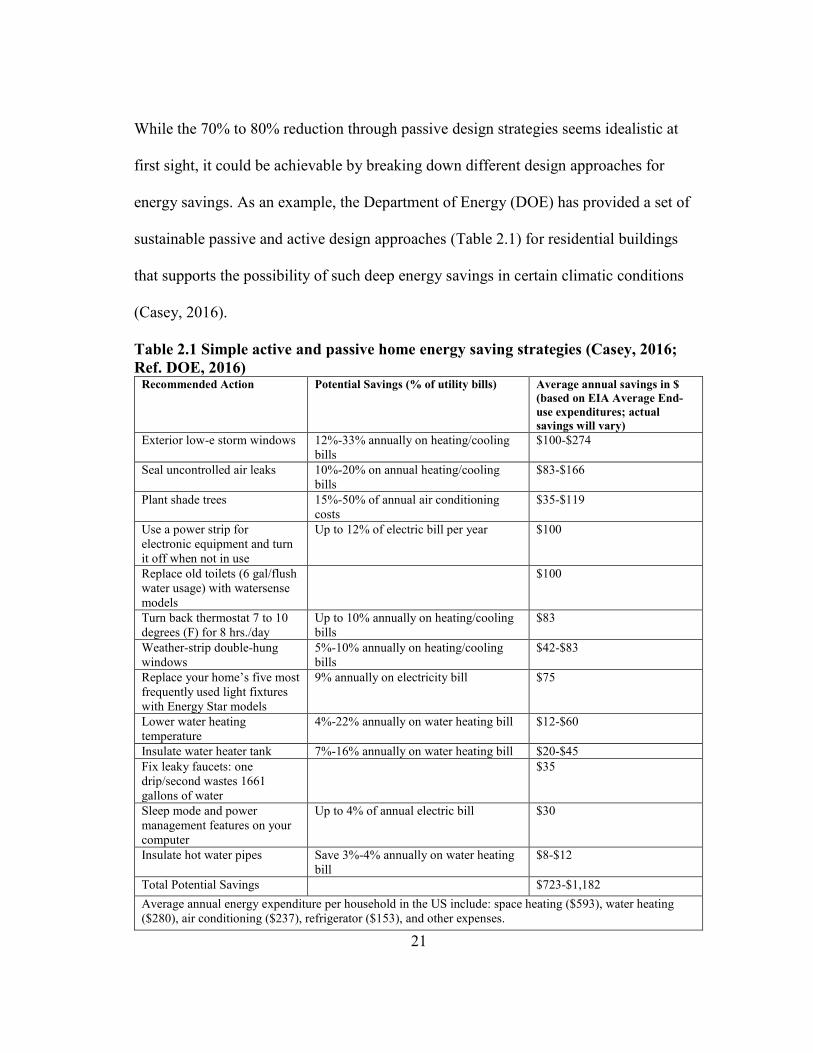
While the 70% to 80% reduction through passive design strategies seems idealistic at
first sight, it could be achievable by breaking down different design approaches for
energy savings. As an example, the Department of Energy (DOE) has provided a set of
sustainable passive and active design approaches (Table 2.1) for residential buildings
that supports the possibility of such deep energy savings in certain climatic conditions
(Casey, 2016).
Table 2.1 Simple active and passive home energy saving strategies (Casey, 2016; Ref. DOE, 2016)
Recommended Action Potential Savings (% of utility bills) Average annual savings in $ (based on EIA Average End-use expenditures; actual savings will vary)
Exterior low-e storm windows 12%-33% annually on heating/cooling bills
$100-$274
Seal uncontrolled air leaks 10%-20% on annual heating/cooling bills
$83-$166
Plant shade trees 15%-50% of annual air conditioning costs
$35-$119
Use a power strip for electronic equipment and turn it off when not in use
Up to 12% of electric bill per year $100
Replace old toilets (6 gal/flush water usage) with watersense models
$100
Turn back thermostat 7 to 10 degrees (F) for 8 hrs./day
Up to 10% annually on heating/cooling bills
$83
Weather-strip double-hung windows
5%-10% annually on heating/cooling bills
$42-$83
Replace your home’s five most frequently used light fixtures with Energy Star models
9% annually on electricity bill $75
Lower water heating temperature
4%-22% annually on water heating bill $12-$60
Insulate water heater tank 7%-16% annually on water heating bill $20-$45 Fix leaky faucets: one drip/second wastes 1661 gallons of water
$35
Sleep mode and power management features on your computer
Up to 4% of annual electric bill $30
Insulate hot water pipes Save 3%-4% annually on water heating bill
$8-$12
Total Potential Savings $723-$1,182 Average annual energy expenditure per household in the US include: space heating ($593), water heating ($280), air conditioning ($237), refrigerator ($153), and other expenses.

22
2.1.2. Conceptual Trends in Sustainable Design: Nature/Passive Versus Active
Systems
The trends toward green building design can be also scrutinized from the perspective of
architectural design approaches. In this case, biomimetic and technological solutions
define two fundamentally different notions of sustainable design approaches. The debate
over the last decade over the applicability of the biologically or technologically inspired
concepts in fashioning the built environment (Cohen and Naginski, 2014), while
substantiating their flaws and potentials, has led to the formation of two extremes:
designers who are subversive to nature or subservient to technology. In some cases,
designers idolize the role of nature in a design to the point of neglecting any
accompanying technological achievements. In other cases, human design creativity is
restricted because of imposed technological constraints to the point of repetitive
boredom.
Therefore, a vision integrating the two extremes seems to be a plausible approach toward
sustainable design. Here, biomimicry, defined as the abstraction of good design from
nature and “…the conscious emulation of nature’s genius…” (Benyus, 2002), can be
compared with the technological approach that represents applied engineering
(Kaplinsky, 2006). The former designs a building like nature would build, with the aim
of continuity, while the latter may interrupt or transcend natural design by joining parts
together into a unique structure without pursuing continual evolution (Kiesler, 1939).
Both approaches have unique features that can be combined to develop a more
23
comprehensive method for designing improved building envelope, lighting, and HVAC
systems.
However, attempts to identify and connect these two domains have not been properly
addressed in the previous literature. Although, in practice, technological solutions have
been responsive to human needs for centuries, the new designs resulting from
biomimetic approaches in architecture have rarely reached the implementation phase or
mass productions. Yet, beneath the surface of many of today’s technologies are
biologically similar systems. For example, a quick review of the U.S. National
Aeronautic and Space Administrative (NASA) and Science Journal websites helps
substantiate this claim, because each website shows de facto and potential biomimetic
achievements.3 Examples are numerous, ranging from highly efficient LEDs inspired by
fireflies to the strong metal materials inspired by skeleton bones to the bio-inspired
exploration systems emulating aerial fliers. These examples could point to one reason
why biomimicry has been predicted to be one of the main tools in our transition between
now and 2050 from an industrial age to an ecological age (Pawlyn, 2011).
However, very few biologically inspired architecture projects have been built
(Mazzoleni and Price, 2013) reflecting a gap in the architectural design world where
3 NASA's Jet Propulsion Laboratory, Pasadena, California. (2003, May 01). NASA's Jet Propulsion Laboratory, Pasadena, California. Retrieved December 03, 2017, from http://www.techbriefs.com/component/content/article/ntb/tech-briefs/mechanics-and-machinery/961

24
biological concepts rarely turn into built functional forms (Spiller, 2007). A critical
review/synthesis of the previous studies in biomimetic architecture, outlined in the
following paragraphs, reveals that despite any theoretical connection there is no well-
accepted, practical method to connect the findings from an example at the scale of nature
to the application at the scale of building envelopes and HVAC systems.
In contrast, the prevailing belief is that technological solutions rather than biological
solutions provide the most effective response for our design problems: in other words,
biological languages and analogies that idolize nature might hinder the real achievement
of today’s designers (Kaplinsky, 2006). Not considering combinations of technology and
biomimicry as an integrated approach could be one reason for such a loose connection
between nature-inspired concepts and their practical application. This loose connection
usually gives way to designers for selecting technological solutions over biomimetic
solutions.
A more practical approach in the design of building components lies at the intersection
of biomimetic/natural and technological solutions. Such an approach would not only be
guided by the laws of physics, but also would learn from nature including biological
forms, functions, and processes, where appropriate, to produce an improved architectural
design.

25
A review of four areas of the previous research reveals the limitations of each approach
as well as the advantage of their integration. These include:
1- A review of the existing biomimetic methodologies from Badarnah & Kadri (2015),
Biomimicry 3.8 (2010), Vincent et al. (2006), Vakili and Shu (2001), PBG (2011), and
Goel, Rotter, and Vattam (2009)
2- A review of an example of biomimetic design for a building envelope component
(Badarnah, 2015)
3- A brief analysis of the mechanism of a cooling system utilized in the EastGate Mixed-
use Center in Zimbabwe, Africa, which claims to have been inspired by termite mounds
(Turner and Soar, 2008)
4- A brief review of specific physical laws that form the basis for today’s technological
solutions found in building envelope and HVAC systems.
In general, existing biomimetic design approaches are divided into two categories of
solution-based (Table 2.4) and problem-based (Table2.3) approaches used by different
groups who study biomimicry (Badarnah & Kadri, 2015). Solution-based approaches are
those approaches inspired by an observation of nature, which leads to a design product.
In contrast, problem-based approaches are those approaches that are seeking a solution
from nature for a specific engineering problem.
Table 2.2 shows five groups (abbreviated with G1 to G5) of biomimicry advocates who
have used solution-based and problem-based approaches:
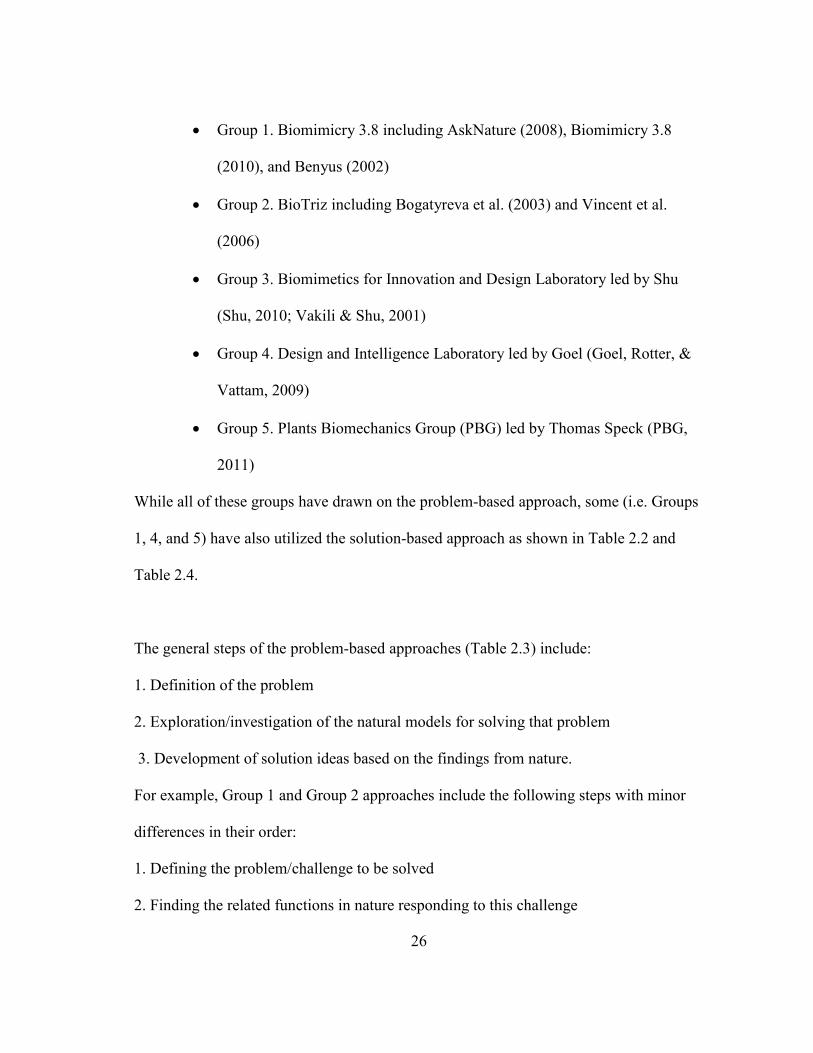
26
• Group 1. Biomimicry 3.8 including AskNature (2008), Biomimicry 3.8
(2010), and Benyus (2002)
• Group 2. BioTriz including Bogatyreva et al. (2003) and Vincent et al.
(2006)
• Group 3. Biomimetics for Innovation and Design Laboratory led by Shu
(Shu, 2010; Vakili & Shu, 2001)
• Group 4. Design and Intelligence Laboratory led by Goel (Goel, Rotter, &
Vattam, 2009)
• Group 5. Plants Biomechanics Group (PBG) led by Thomas Speck (PBG,
2011)
While all of these groups have drawn on the problem-based approach, some (i.e. Groups
1, 4, and 5) have also utilized the solution-based approach as shown in Table 2.2 and
Table 2.4.
The general steps of the problem-based approaches (Table 2.3) include:
1. Definition of the problem
2. Exploration/investigation of the natural models for solving that problem
3. Development of solution ideas based on the findings from nature.
For example, Group 1 and Group 2 approaches include the following steps with minor
differences in their order:
1. Defining the problem/challenge to be solved
2. Finding the related functions in nature responding to this challenge

27
3. Developing an analogy between nature and the required functions in reality
4. Abstracting the functions found in nature and extracting their identified principles to
be used for design concept generation
5. Developing a design concept by emulating these principles and evaluating them
against life’s principles. Examples of nature’s life principles include running on sunlight;
using only the energy you need; fitting form to function; recycling everything; rewarding
cooperation; relying on diversity; and demanding local expertise (Benyas, 2002).
Table 2.2 Examples of groups that apply biomimetic design strategies, adapted from (Badarnah and Kadri, 2015)
Groups Strategies Problem
based
Solution
based
G1 Biomimicry 3.8 ■ ■
G2 BioTriz ■
G3 Biomimetics for Innovation and Design Lab led by L. H. Shu
■
G4 Design and Intelligence Lab led by Goel ■ ■
G5 Plants Biomechanics Group led by Thomas Speck ■ ■
The solution-based approach follows the same steps of the problem-based approach,
only in reverse (Table 2.4):
1. Biological domain investigation for finding a natural system, model, or solution
2. Transferring the findings into solutions and design principles
3. Trying to connect to the technological domain by defining the corresponding problem,
emulating the nature’s design principles, and testing/prototyping solutions.

28
Table 2.3 Problem based steps for biomimetic design (Badarnah and Kadri, 2015) Steps Group 1 Group 2 Group 3 Group 4 Group 5
Definition of the problem
Identifying function; defining context; integrating life’s principles into brief design
Defining and analyzing the problem/challenge to be solved
Problem definition
Problem definition; reframe problem
Formulating the problem
Exploration/investigation of the natural models
Discovering natural models; abstracting biological strategies into design principles
Finding functional analogy from nature; comparing solution from nature and TRIZ
Search for biological analogies; assessing biological analogies
Searching biological solution; defining the biological solution; principle extraction
Seeking biological analogies; finding corresponding principles; abstracting the biological model
Development of solution ideas
Brainstorming bioinspired ideas; emulating design principles; evaluating through life’s principles
Listing principles from both nature and technological domains; developing ideas
Applying biological analogies
Principle application
Implementing technology through prototyping and testing
Table 2.4 Solution-based steps (Badarnah and Kadri, 2015) Steps Group1 Group4 Group5 Biological domain Discover nature models Biological
solution identification; define the biological solution; extract principles
Identifying a biological system; analyze biomechanics, functional morphology, and anatomy; perceiving the principles
Transfer phase Abstract nature strategies into design principles; identify function and define context; brainstorm bioinspired ideas
Solution reframing
Abstracting biological models
Technological domain Integrate life’s principles; emulate design principles; evaluate using life’s principles
Searching and defining problems; applying principles
Implementation through prototyping and testing
29
Badarnah and Kadri (2015) took issue with these biomimetic approaches (i.e. Table 2.3
and Table 2.4), summarize their systematic design mechanisms as was explained. In
their article A Methodology for The Generation of Biomimetic Design Concepts they
maintained that the transition of a function found in nature to a function appropriate for
architectural design concept generation, was a vague and challenging process. Therefore,
they proposed the BioGen methodology to generate biomimetic design solutions (Figure
1). Their BioGen methodology follows six steps to reach its outcome:
1. Defining the design challenge; 2. Exploring possible scenarios and identifying
exemplary
organism/system in nature for a particular adaptation strategy (i.e., pinnacles); 3.
Analyzing selected pinnacles 4. Deriving imaginary pinnacles (i.e. the most appropriate
pinnacles related to the required functions for mimicking); 5. Outlining the design
concept, which is the superposition of the imaginary pinnacles to determine the
dominant features to be addressed in the next step; 6. Generating a preliminary design
concept.
Although BioGen seems to be a comprehensive design tool and, according to the
authors, is easier to be used for biomimetic design, in the end, its outcome is still
conceptual and challenging to be converted into a real product. The authors themselves
mention this shortage: “…the main limitation of the BioGen methodology is that it does
not provide a transition from the concept phase to the emulation phase.” (Badarnah &
Kadri, 2015, p.131). This shortage of the trending biomimetic design approaches,

30
including the most recent BioGen method, indicates the first gap in the literature: that the
current methods and approaches of biomimicry are very general leaving the result at a
level of rough conceptualization.
A review of the application of these methods in architecture reinforces this flaw and
their methodological inefficiency in practice. For example, several studies employing the
BioGen method have focused on the optimization of the building envelope’s
performance.4 However, because of overly simplified vision they seem to be too
idealistic to reach the implementation phase in the building industry.
To analyze one of these studies in detail, in the article Solutions from nature for building
envelope thermoregulation Badarnah, Farchi, and Knaack (2010) after discussing a
performance taxonomy of organisms for thermoregulation, present a possible application
to building envelopes through an assembly of bio-inspired components. The main
component of this assembly is the stoma brick made of a porous material, which also is
supposed to mimic the human eyelids at the outer layer to remove the dust from the air
passing through the envelope. Few details for this component have been provided by the
authors. Inspired by the pinecone skin, a veneer shutter controls opening/closing of the
envelope modules in accordance to a humidity gradient. Although the pinecone skin
4 These studies include: bio-inspired ventilating envelopes mimicking the human lung system (Badarnah et al., 2008); shading and energy generating skins emulating the features of plants leafs (Badarnah and Knaack, 2008); water harvesting envelope inspired by the Namib Beetle (Badarnah and Knaack, 2015); and evaporative cooling systems inspired by plant’s stomata, pine cones, and human skin (Badarnah et al., 2010).

31
usually opens due to dryness to pop up the seeds, the idea applied here is that its skin
reacts to both lack and presence of humidity to retake its original or new shapes after
falling from the tree. The inner layer of the stoma brick uses a HEPA filter for air
cleaning and the innermost layer is spongy to hold moisture for evaporation in dry
climates or absorption in humid climates. An irrigation cycle in dry climates will be
added to the system to irrigate the bricks. Would this system in reality perform as
described here?
The authors claim this system can operate at different climates: “…in hot and humid
weather, the veneer shutter deforms when humidified to allow the air to get inside
passing through the spongy structure.” (Badarnah et al., 2010, p.10). Clearly, the authors
did not fully consider the impact of humidity on this system. In the most idealistic
condition, when the spongy component absorbs the moisture in the air at some point it
will be saturated with 100% humidity. Then, after no more moisture absorption, the
additional humidity leads to the formation of water droplets on the walls’ surfaces: the
result will be an indoor environment with too much moisture as well as deterioration of
the building envelope due to moisture accumulation. Additionally, the HEPA filter
performance depends on the key factor of face velocity of the air flow through the filter
and requires a large pressure difference to force air through the filter. Therefore, in

32
conditions with normal wind speed, the HEPA filter may not perform effectively to
remove the unwanted particles from the incoming air.5
This example epitomizes two flaws traceable to other similar biomimetic designs: First,
focusing on one influential environmental impact (i.e., air circulation) to the point of
neglecting other important factors (i.e., humidity, pressure drop, etc.); and second,
proposing inefficient envelope components because of a literal translation of a design
concept to a physical product following the existing biomimetic design methods. These
methods do not link their conceptual products, at the last step, to the resulting building
system/envelope component through a visibly systematic and scientifically grounded
process.
5 The most five common types of air purifiers include: HEPA Technology, Activated Carbon Technology, UV Technology, Negative Ion, and Ozone (Koo, 2017). High efficiency particulate air (HEPA), originally called high-efficiency particulate absorber, is a type of air filter with many applications such as clean rooms for IC fabrication, medical facilities, automobiles, aircrafts, and homes. The filter must satisfy certain standards of efficiency such as those set by the United States Department of Energy (DOE) To qualify as HEPA by industry standards, an air filter must remove (from the air that passes through) 99.97% of particles that have a size greater-than-or-equal-to 0.3 µm (ASME AG-1a–2004). The HEPA filter is a very fine fiber-like material that has been folded back and forth to create the shape of an accordion. This accordion shape creates a maze of randomly arranged fibers and presents a very large surface for air to be pushed through by the air purifier fan. Airflow must have an opportunity to pass through the filter in order for it to be cleaned. The more times airflow passes through the filter in an hour, the cleaner the air will become. As the HEPA filter becomes full, air will no longer be able to pass through and a new filter will be needed; however, a HEPA filter will typically last 2 to 4 years. Large particles will not be able to pass through the openings of the fibers and will immediately get caught. The smaller particles will get caught by one of three mechanisms. The first is when particles come within one radius of a fiber and stick to it. This mechanism is called interception. The second mechanism, called impaction, is when larger particles collide with fibers and embed into them. Finally, they get caught by a mechanism called diffusion. Diffusion is when the smallest particles collide with gas molecules. This, however, slows down their velocity and makes the first two mechanisms more likely (Koo, 2017).

33
In one example, that shows promise as a real application of biomimicry, the cooling
system of the Eastgate Mixed-Use Centre, in Zimbabwe, Africa, cools the outside air to
save on energy consumption by 90% compared with a conventional air conditioning
system. It is claimed that large termite mounds inspired this building’s cooling system
(ArchDaily, 2011). The reason is that a large termite mound includes an elaborate matrix
of ventilation holes, air passages, and air pockets, which enhance natural ventilation
through convection. This process keeps the termite mound temperature between 84.2 and
89.6°F in a hostile climate with fluctuating temperature of 35°F at night to 104°F during
the day.
Two models for the termite mound ventilation are commonly accepted: thermosiphon air
flow driven by heat and induced air flow driven by wind (Abou-Houly, 2010). In the
case of capped mounds, which rely on thermosiphon flows, the hot air created by the
nest rises to the top of the mound where it is evaporatively cooled with water vapor
through the porous mound walls. This denser, moist air then drops down to the nest
below, where the cycle is repeated.
The induced air flow also applies to mounds with a chimney at the top and uses the stack
effect: since the chimney helps to accelerate the buoyancy-driven flow. The
unidirectional flow draws fresh air from near the ground into the nest, where it passes
through the chimney and ultimately to the outside through the top of the mound. In the
Eastgate Center building, both buoyancy-driven and wind-driven flows used through an
34
extensive tube system within the walls and floors, moves the air through the building. In
the Eastgate Center internal heat gains along with the stored heat within the structure
creates a thermosiphon-effect that draws air up toward the rooftops where large
chimneys are located to help to induce air flow.
Although termite mounds inspired part of the concept behind the design of the Eastgate
Center, which is highly admired as a biomimetic design, other mechanisms, such as its
air conditioning system that draw on technology, have been ignored in the existing
analyses. For example, the building uses low speed fans during the day, and high speed
fans during the night to keep the air from being too stagnant. This process effectively
replaces the hot air that builds up during the day with cool air during the night. Smaller
fans run during daytime hours to keep the indoor environment comfortable while the
walls store the heat from the outside. Larger fans run during the nighttime, pulling the
stored heat out of the walls, and push the heat out through the ducting in the ceiling and
walls. By the next morning, the walls are ready to release the stored cooling again.
Although the combination of passive and active systems here saves on using expensive
air conditioning technology, clearly, no termite mound utilizes fans (Turner and Soar,
2008). Therefore, this building in the absence of technological contribution could not
perform effectively and cannot materialize its biomimetic design concept. This brings
into mind that a sustainably high performance building is a result of integrating both
technological solutions and biologically inspired solutions.
35
2.1.3. Natural/Passive Systems and Human Well-being
The impact of the application of natural systems and passive design strategies on human
wellbeing can be also studied from the perspective of the possible positive/negative
outcomes for the occupants in residential/commercial buildings. The purpose of this
section is to discuss some of these outcomes, with a focus on residential buildings and
healthcare facilities as two examples of building typologies, since they are more in direct
relationship with human health. In a healthcare facility, patients and staff can use nature
and natural systems for a beneficial experience. For example, increased productivity and
well-being, shorter length of stay, better infection control, lower level of stress, and
lower energy consumption.
Building occupants also spend a considerable part of our daily life at home where
accessibility to daylighting and fresh air through natural/passive strategies can affect
both the energy cost and the health of the occupants. Therefore, daylighting and natural
ventilation are two important passive strategies contributing to these beneficial
experiences which have been discussed in the following paragraphs.
2.1.3.1. Daylighting and Human Well-being
The impact of daylighting can be analyzed from two perspectives: the impact on
human’s well-being and the impact on infection control/prevention. In regards to well-
being, research has shown a close relationship between exposure to daylight and the
adjustment of human circadian rhythms. Studies have shown that exposure to ultraviolet

36
light causes melatonin production to control circadian rhythms, sleep cycles, work
productivity, and cancer cell development (Bullough et al., 2006). A lack of ultra violet
light reduces melatonin production and can cause circadian imbalance, which is
followed by negative outcomes, such as depression and disease vulnerability. Laboratory
research shows that artificial lighting with features similar to sunlight can improve
alertness, cognitive function, and vigilance (Zadeh et al., 2014).
Such an effect can benefit both hospital staff and patients. In one study conducted by
Alzubaidi et al. (2013), 134 hospital staff members were asked for their preference about
daylighting. Among the participants 79% identified daylight in patient rooms as a work-
facilitating factor. The same participants mentioned that daylight availability in patient
rooms helps them in examining the patient recovery based on the changes of the skin
color. All the participating doctors in the survey claimed faster recovery and a reduced
length of stay for patients through exposure to sunlight. This impact of daylighting on
patients’ Average Length Of Stay (ALOS) has also been investigated in several other
studies. In one study researchers evaluated the ALOS in relation to the physical,
environmental, and daylighting conditions of a general hospital in Incheon, Korea (Choi
et al., 2012). The collection and categorization of data in this study was based on
patients’ positions of the head and rooms’ orientations. The results showed that rooms
with more sunlight, such as in southeast orientation, had 16% to 40% shorter ALOS
compared to other rooms, such as in rooms with northwest orientation.

37
In another study 174 patients were observed in a hospital in Edmondo, Alberta, Canada
(Beauchemin and Hays, 1996). The researchers found a reduction of 2.6 days in the
length of stay among seasonal affective disorder patients in sunny rooms compared with
sunless rooms of the hospital. The benefits of sunlight on patients with psychological
disorders have also been identified, where the findings show a 30% reduction in ALOS
in the summer and a 26% reduction in the autumn for patients with bipolar depression in
eastern rooms versus western rooms (Benedetti et al., 2001). West-side sunlight in
northern hemisphere is usually more intense than other directions and reduces visual
comfort due to glare. Additionally, the western sunlight is accessible in the afternoon
until evening, which limits daylight benefits for the occupants. Further research is
required to find out if there is any correlation between these features of the western
sunlight and increase/reduction of the ALOS.
The impact of sunlight on health can go beyond circadian rhythm adjustments, length of
stay reductions, and psychological disorder improvements. Sunlight may even contribute
positively to the task of infection control and prevention. Some historic experiments
conducted in the late 19th and early 20th century reported that sunlight projecting
through exterior glazing can stop the growth of bacteria (Hobday & Dancer, 2013).
However, these experiments have not been verified. The WHO guidelines for preventing
infections mention the use of sunlight, although it does not provide further information
for its reasons (2002).

38
Hobday and Dancer elaborate the positive role of sunlight on preventing several
infection types of bacterial growth related to tuberculosis, streptococci, meningococci,
and staphylococci. In this elaboration both the direct and diffuse daylight were
influential in killing bacteria. However, the impact of direct sunlight is usually more
powerful than the diffuse daylight. For example, according to Buchbinder streptococci
cannot survive more than five minutes in the direct sunlight, or more than an hour in
diffuse daylight (1942). However, in these studies the potency of this bacteria remain
unchanged for a long period in indoor conditions away from daylight (Buchbinder,
1942).
The general impact of sunlight on health and wellbeing can also contribute to the
improvement of comfort conditions. For example, the use of sunlight for direct solar
gain can bring the cold indoor temperature into the comfort zone without drying our skin
which is usually the consequence of temperature adjustment by mechanical systems
decoupled from seasonal and daily variations (Loftness and Synder, 2011). However,
further research is required to systematically analyze such an impact on physiological
conditions of the human body.
2.1.3.2. Natural Ventilation and Human Well-being
The use of natural ventilation in hospitals was more common in the era before the
emergence of mechanical systems. Florence Nightingale was one of the pioneers who
underlined the importance of air quality and natural ventilation in the treatment of

39
hospital patients through her book in 1863 (Nightingale, 1863). In the book she criticized
mechanical systems that created constant indoor temperature that decoupled buildings
from seasonal variations. In the book she felt that the air temperature variation was a
requirement for human health and that the unhealthy conditions in hospitals, to some
extent, were linked with the inefficient ward space layout lacking natural ventilation
(Iddon, 2017).
In 1864, John Simon used natural ventilation in hospital wards, where, similar to
Florence Nightingale, oblong wards had sash windows reaching to the ceiling along the
two long sides of the wards. Each bed in the hospital wards would be located between
these windows (Hobday & Dancer, 2013). Most recently, in 2007 the WHO (World
Health Organization) in its guidelines for the infection control, introduced natural
ventilation among the effective measures of infection control/prevention in health care
facilities (WHO, 2007).
Natural ventilation can contribute to infection control through its microbicidal impact on
the airborne transmission of pathogens. Thus far, four mechanisms of pathogen
transmission have been identified: contact; dust; respiratory droplets, and droplet nuclei.
The WHO guideline defines droplet nuclei as “dried-out residuals of droplets less than 5
μm in diameter” (WHO, 2007, p. xxi). In this report, droplets are respirable particles
larger than 5 μm in diameter, which can be deposited on upper respiratory tract levels
and mucosa. Depending on the size of the particles, respirable droplets can be divided

40
into large droplets, fine inhalable aerosols, and droplet nuclei (WHO, 2007, p. xxv).
Large droplets usually fall on horizontal surfaces and can be transmitted with dust,
which can be suspended as the result of indoor activities such as dressing or sweeping.
Such droplets have a travel range less than 1 meter and usually do not affect any person
standing beyond this distance.
Small droplets are more prone to causing infection. These airborne particles can actively
transmit infection for a longer time ranging from minutes to hours (Hobday & Dancer,
2013). Therefore, special ventilation controls are usually required to prevent diseases
from being transmitted over a long distance by droplet nuclei (Gardner, 1996). However,
some recent researches indicate that, independent of the size of the droplets, airborne
infection control should be considered in healthcare facilities (Gralton et al., 2011).
Influenza, common colds, smallpox, tuberculosis, methicillin resistant staphylococcus
aureus (MRSA), norovirus, hantavirus, severe acute respiratory syndrome (SARS) all are
examples of the possible pathogens infecting hospitals through airborne transmission
(Hobday & Dancer, 2013).
Factors such as temperature, humidity, atmospheric pollutants, UV (ultra violet)
radiation, ventilation airflow, air changes per hour, and thermal gradients can affect the
existence and dispersion of these pathogens (Hobday & Dancer, 2013; Nielsen, 2009).
For example, many of the microbes causing airborne infections cannot survive outdoors
temperature variations. This fact could be a reason for making the indoor condition

41
similar to the outdoor condition in Nightingale wards. Another example, discovered at
the end of the19th century, is the reduction of the malignant effect of tubercle bacillus
(TB) in the case of exposure to fresh air.
The tuberculosis used to be the number one killer in the U.S in the 19th century. The
tuberculosis could spread through sneezing and coughing. Therefore, by the early 19th
century, large hospitals or sanatoriums were built across the US to isolate patients and
provide a place to offer the best treatment of the day: fresh air and sunlight (Doucleff,
2013). Tubercle bacillus is killed relatively quickly by sunlight, and therefore,
transmission usually occurs indoors. Tubercle bacillus can live in the air for only a short
time, about 4 hours, and therefore, fresh air or increased air changes per hour can
reduces the risk of TB infection (DOH, 2018). In summary, these findings about the
microbicidal impact of outside air led to the introduction of new terms such as “open air
factor” (OAF) in the 1960s. (Hobday & Dancer, 2013; Ransom & Delepine, 1894).
To discuss another example with more details, Wells-Riley equation can be used to
explain the impact of ventilation rate on the cross infection of airborne transmitted
diseases. Per Wells’ idea of quantal infection, a certain dose of pathogens is necessary to
cause infection to a new susceptible (Wells, 1948; Qian and Zheng, 2018).
42
On this basis and using the Poisson distribution6, Riley predicted the risk of airborne
infection through Wells-Riley equation (Riley, 1978): P=C/S= 1-exp(-Iqpt/Q)
The nomenclature for this equation is as follows: P= risk of cross infection; C=number
of case to develop infection; S=number of the susceptible; I=number of infectors;
p=pulmonary ventilation rate of each susceptible (m3/h); Q=room airflow rate (m3/h);
q=the quanta produced by one infector (quanta/h); and t=duration of exposure (h).
According to Wells-Riley equation the risk of infection can be reduced considerably
through ventilation rate. Natural ventilation can contribute to delivering large ventilation
rates with lower energy consumption and in higher rates compared with mechanical
ventilation, thereby reducing the airborne infection risk (Qian and Zheng, 2018).
However, it is still a point of discussion among professionals either the increase in the
level of outside air could be more effective using mechanical systems or using natural
ventilation systems such as operable windows (Loftness & Synder, 2011). There are
many studies using the Sick Building Syndrome (SBS) as an index of measuring the
human health and well-being related to indoor ventilation. These studies compared
mechanical systems with natural systems to reveal the benefits of natural ventilation in
reducing headaches, mucosal symptoms, colds, coughs, circulatory problems, and SBS
(Robertson et al., 1990; Kelland, 1992; Seppanen & Fisk, 2002; Preziosi, 2004). Beyond
6 Named after French mathematician Siméon Denis Poisson, Poisson distribution is a discrete probability distribution thaexpresses the probability of a given number of events occurring in a fixed interval of time or space if these events occur with a known constant rate and independently of the time since the last event. The Poisson distribution can also be used for the number of events in other specified intervals such as distance, area, or volume (Haight, 1967).

43
SBS symptoms, newer studies about respiratory illness question which strategy could be
more effective: the increased rates of outside air for diluting the indoor air or the higher
level of oxygen and other gases indoors. These studies give more credit to the natural
delivery of the outside air, which is fresher than the mechanically delivered outside air
mixed with returned air or delivered through sometimes less clean ducts (Loftness and
Synder, 2011).
There is evidence that natural ventilation can be effective compared with mechanical
ventilation for preventing pathogens transmissions. For example, during the 1918
influenza pandemic the number of survived patients in outdoor spaces exceeded the
number of patients who survived in hospital wards (Hobday and Dancer, 2013; Brooks,
1918). The effectiveness of natural ventilation versus mechanical ventilation has been
investigated in several previous studies (Hobday and Dancer, 2013). Based on a study in
2007, tuberculosis patients who were in naturally ventilated rooms were compared with
mechanically-ventilated, negative-pressure, isolation rooms, which used a tuberculosis
infection airborne model. In this study the highest risk of infection was found in rooms
with mechanical ventilation and sealed windows, although these rooms used the low
recommended air changes per hour. The findings showed that among the studied rooms
the pre-1950 hospitals with partially-opened windows had the best infection protection.
Another reason for the advantage of using natural ventilation is its higher air change
rates. Normally twelve air changes per hour (ACH) have been measured for isolation

44
rooms in general wards while in wards with open doors and windows it can reach as
high as 14 ACH and 31.6 ACH, and with cross ventilation can reach up to 69 ACH
(Hobday & Dancer, 2013). Such a high rate of air change with cross ventilation has been
found to be successful in controlling SARS transmission (WHO, 2009).
Natural ventilation can be also reviewed in relation to the concept of Passive House
(PH), which was first introduced in Europe and then in the US, as described in the
section 2.2 Brief History of Passive Building Design in the US. The PH concept
advocates extremely high levels of airtightness and high levels of insulation to achieve
very high standards of energy efficiency as part of their efforts to meet carbon reduction
targets. Air tightness of residential buildings can decrease air leakage and heat loss/gain
which in turn reduces heating/cooling demands.
However, it is important to provide enough ventilation to maintain a healthy indoor
environment due to the variety of indoor chemical emissions through interior materials
and furniture (Ürge-Vorsatz et al., 2012). ASHRAE has proposed a range of allowable
CO2 concentrations from 1000 ppm to 2500 ppm, as well as ventilation requirements of
10 liters/sec (about 20 cfm) per person to address these health issues. Some of the
revised building standards stipulate that air change rate in the living rooms of new
constructed buildings must be at least 0.5/h (Ürge-Vorsatz et al., 2012). In this case,
ASHRAE Standard 62.1-2013 mentions that primary outdoor air fraction (Zp) should be
determined for ventilation zones based on the following equation: Zp = Voz/Vpz

45
Voz is the zone outdoor airflow (i.e., the outdoor airflow rate that must be provided
to the ventilation zone by the supply air distribution system) and Vpz is the zone primary
air flow rate. This ASHRAE Standard explains that max Zp refers to the largest value of
Zp in Table 2.5 with the corresponding Ev, which is the mechanical system ventilation
efficiency.
Table 2.5 System Ventilation Efficiency and primary outdoor air fraction. Reprinted with Permission ©ASHRAE www.ashrae.org Standard 62.1-2013
Due to the high levels of airtightness, PH requires the installation of a mechanical
ventilation system, particularly a Mechanical Ventilation Heat Recovery system
(MVHR) for maximum energy efficiency. The energy required to run the MVHR system
is low. However, the heat recovered through such a system will reduce the need for
heating systems (PHIUS, 2018). In this case it is important to be cautious that MVHR
systems will not necessarily resolve Indoor Air Quality (IAQ) problems. Relatively low
levels of air change may be sufficient to provide enough air to comply with building
regulations and for occupants to breathe but this may not be enough to remove
Max (ZP) Ev
≤0.15 1.0
≤0.25 0.9
≤0.35 0.8
≤0.45 0.7
≤0.55 0.6

46
concentrations of Volatile Organic Compounds (VOCs) or hazardous chemicals and
particles. Therefore, these systems should be accompanied with appropriate exhaust
systems, which usually are not provided in residential buildings due to additional costs
for implementing these systems.
PH advocates claim that mechanical ventilation with heat recovery systems are adequate
to maintain good IAQ, despite possible emissions from new construction materials
(PHIUSP, 2018). Most certified PH projects are built with conventional masonry or
timber-frame construction using non-breathable petrochemical insulation materials,
synthetic materials, and plastic membranes. It has not been possible to find anything in
the PH standards about safeguarding occupants from indoor pollution emissions such as
formaldehyde, VOCs, and other hazardous materials. There are some examples of PH
projects that have been built using ecological and natural materials7, but under the
current PH standard, IAQ is usually dependent on MVHR.
The literature includes evidence that the PH approach might be problematic because
occupants do not manage the system well or fail to understand it (Woolley, 2016). The
MVHR outdoor air systems are usually noisy and, if used without mufflers, occupants
tend to switch off the MVHR fans because of not understanding the operation concept of
the system. When this occupants’ behavior becomes regular, a passive house can be
7 Examples of these certified Passive Houses with straw panels, wood, cellulose insulation and clay plaster can be found at http://www.createrra.sk/page/19/straw-panels-ecococon.html Retrieved February 2019.

47
actually too air-tight. Tenants have also been found to be concerned about the
maintenance and the cost of running the fans. MVHR systems and filters that are not
changed regularly can get clogged, which reduces the fresh air (Woolley, 2016).
Overheating is also another issue associated with the airtightness of passive houses.
Research has found that even in temperate climates, such as Netherlands, the increasing
number of highly insulated and air-tight buildings can lead to a concern about
overheated indoor conditions and related comfort/health issues (Barbosa et al., 2015).
On the other hand, there is a belief among many architects and engineers that natural
ventilation cannot ensure sufficient air changes or an adequate supply of fresh air.
Although natural ventilation has worked for centuries in hot climates by combining
thermal mass with roof vents, shading, and courtyards for cooling; the long term, stable,
climatic patterns of the past are changing today due to issues such as air pollution and
global warming. Still today some effective modern passive ventilation systems can be
found to be used in passive buildings. These intelligent systems should not be considered
completely passive because their monitoring/controlling components need electricity for
operation. These systems, beyond natural ventilation, also offer capabilities such as
passive heat recovery, passive night-time cooling, and low energy comfort cooling
without using mechanical systems. These systems can be integrated with a building’s
design depending on the required ventilation model such as the “wind-hive” models for
stack ventilation and “in-vent” passive and “in-vent” active for façade integrated systems

48
Figure 2.2 Operation of an in-vent passive intelligent system, adapted from (Ventive, 2018)
using both cross and stack ventilations (Ventive, 2018). Figure 2.2 shows an example of
the operation of an in-vent passive intelligent system.
Another option to increase natural ventilation is humidity sensitive mechanical hybrid
ventilation systems. A range of these systems are now available which are claimed to be
more energy efficient than MVHR. Many of these systems avoid the need for expensive
and complicated ducting components. Demand controlled ventilation is a case in point in
which the mechanical system extract only runs when humidity rises. Such hybrid
arrangements provide possibilities for a ventilation stack to operate in either a
completely passive mode or mechanical mode in the same system.

49
2.2. Brief History of Passive Building Design in the US
2.2.1. From Early Attempts until the 1940s
There exists a rich history of passive heating traditions throughout the world. While
passive heating strategies have been used for thousands of years, their application
appears to follow a cyclical trend in which periods of great interest are followed by
periods of indifference (Grondzik & Kwok, 2014). Historically there is evidence of a
widespread application of passive design strategies in the pre-modern era. For example,
to keep out the cold winter winds, Aristotle mentioned that builders sheltered the north
side of the house. Socrates, who experienced living in a solar-heated house, observed
that for houses looking facing the south, the sun penetrates the portico in winter (Perlin,
2013). In Roman architecture, solar design was also of high importance such that sun-
right laws were passed to prohibit builders from blocking access to the winter sun in
solar-designed structures. Additionally, Vitruvius advised builders in the Italian
peninsula that “buildings should be thoroughly shut in rather than exposed toward the
north, and the main portion should face the warmer south side” (Purlin, 2013).
Native American communities in the American Southwest applied passive heating
strategies in their pueblos and cliff‐dwellings in search of appropriate building
orientation. The Ancient Pueblos at the Mesa Verde cliff dwellings, Colorado today,
captured the free heating and cooling of nature without electricity or modern building
techniques. (Dodge, 2014). Acoma as the North America’s oldest continuously inhabited
city represents a case in point, where each unit is tiered such that all dwellings could

50
catch the winter sun while the summer solar gain is minimized (Murgula et al., 2015). In
another example, closer to the time of Industrial Revolution interests in passive heating
flourished and concepts such as greenhouse became a necessity for the upper-class
Europeans (Lechner, 2009). Although these interests diminished during the Industrial
Revolution, the early twentieth century again witnessed a surge in the application of
passive strategies (Perlin, 2013).
In the early 20th century, architects such as William Atkinson, a fellow of Boston Society
of Architects, conducted research on solar heating in buildings. Similar to the polymath
Horace B. de Saussure’s hot box model , Atkinson used a “sun box” model for his solar
studies with the exception that Atkinson’s box built was to simulate a window and a
room.8 He observed from summer tests that the east and west windows of the box would
admit too much summer sunlight. His most interesting observation was that on
December 22, when the outdoor temperature was only 24°F, the temperature of a south-
facing box rose up to 114°F. From these observations Atkinson concluded that sun’s
rays can impact with different values the heating of our houses with proper locations and
orientations (Perlin, 2013).
8 In 1767, the Swiss polymath Horace B. de Saussure started to study the effectiveness of glass in trapping solar heat. Saussure built a rectangular box from wood, which was insulated with black cork and covered at the top with glass. A similar but smaller glass-covered box was placed inside. By tilting the box toward the sun, the temperature of the inner box rose above the boiling point of water. This device became known as a Hot Box. The hot box became the prototype for solar thermal collectors used to heat water and homes. Saussure’s hot boxes also modeled the dynamics of global-warming with considerable precision. He used glass acting as an atmosphere soaked with excess carbon dioxide which would play the role of stopping solar heat absorbed by the earth from re-radiating into the sky (Perlin, 2013).

51
Atkinson tried to promote the findings of his hot box studies as well as solar building
design in America. He built a “sun house” near Boston which would reach high indoor
temperature during freezing days and also wrote a book to show how most builders
ignore the possibilities of using the sun energy in buildings (Mckinley, 1995). Such
sporadic efforts on solar designs/studies were followed later by the presence of the
avant-gardes of modern architecture such as Marcel Breuer and Walter Gropius of the
Bauhaus school in Germany who brought similar design concepts to America prior to
WWII. For example, Walter Gropius House (1938) was designed by Walter Gropius to
reflect the traditions of New England architecture while adhering to Bauhaus principles.
The result was a combination of locally popular materials with new concepts like glass
block in an avant-garde design, which included design concepts such as passive solar
heating and natural ventilation (Alexander, 2009).
The modern architecture movement led to the generation of new architectural interests in
passive solar design which were practiced by architects such as George Fred Keck in
Chicago and Frank Lloyd Wright (Derez, 2013). Therefore, while the majority of the
findings related to passive design strategies stem from the events and activities of the
1970s and the 1980s, the origin of the modern passive building design should be
attributed to the architectural design practice of the 1940s and earlier in a few cases,
such as Atkinson’s sun house as explained above. In 1940, the Chicago architect George
Fred Keck built the Sloan House in Glenview, Illinois, to pioneer the modern solar

52
design through simple strategies in a building that could save 40% on the heating bill
(Derez, 2013).
The Chicago Tribune used the term “solar house” to describe the Sloan House which
was the first modern use of the term (Denzer, 2013). The applied passive strategy of an
all- glass, south-facing wall was the result of Keck’s earlier unconscious effort for the
design of the House of Tomorrow with two key model structures for the Century of
Progress Exhibition in Chicago in 1933 (Roth, 2003). He found that this house is warm
inside on sunny winter days prior to installing a furnace and this observation became a
basis for his other passive house designs (Boyce, 1993).
After the war, Keck was hired by a nation-wide construction firm, which advertised solar
house as “The most talked about home in America.” The family occupying one of
Keck’s solar houses, for example, reported in 1979, according to the Chicago Sun
Times, “The temperature can dip to zero [outside], but if the sun is shining, the family
turns off their furnace as soon as they get out of bed in the morning. Otherwise the house
gets too warm.” The Sun Times reported later that during a visit on a hot day in August
the indoor temperature was pleasant in the living room without any of the air
conditioners operating (Perlin, 2013).

53
2.2.2. From the 1940s until 2010
Other famous architects were also contributing to the foundational practice of solar
design in the 1940s. In 1943 Frank Lloyd Wright designed the Hemicycle House in
Madison, Wisconsin. He called this house “Solar Hemicycle” since it incorporated the
fundamental elements of passive solar design such as orientating the long façade to the
south with large glasses for harvesting solar energy, using concrete floor slabs for
thermal mass, minimizing the window openings on the other sides of the building,
utilizing broad overhangs to shade the south glazing in summer, and insulating the
exterior walls.
The research on solar heating of buildings funded at MIT by Godfrey Lowell Cabot, a
wealthy Bostonian, added scientifically to the professional achievements of individual
architects. One of the first projects funded by Cabot was Solar I, a structure built in 1939
to be the first house in the United States heated with solar energy and the first of six
“solar houses” designed and constructed by the MIT faculty between 1939 and 1978
(Levy, 2016). In the first project, the roof was covered with solar water heater collectors.
The water would go into a 17,400-gallon storage tank and the air blown over the tank
could warm and circulate the hot air into the house when it cooled down.
In another attempt at MIT, in search of a more cost-effective system, the functions of
collecting, storing, and distributing solar heat were combined into a single unit. Water
cans were stacked behind a south-facing glass façade of a long narrow laboratory

54
envelope including ten cubicles. The water in the cans would be heated during the day.
Insulating curtains separated the interior of the cubicles from the warm water cans when
the interior was too hot and could be opened when any of the cubicles needed heat. In
between the glass and the heated cans, the insulating shades were shut at night to avoid
heat loss through radiation into the night sky. These water walls, though simple, could
supply up to 48% of a cubicle’s heating demand throughout the very cold New England
winter (Perlin, 2013; MIT Solar History, 2018).
Equations related to solar energy collectors derived from such attempts to calculate the
useful heat energy from the incident solar radiation. The most famous equation is the
Hottel-Whillier-Bliss equation to express the thermal performance of a collector under a
steady state (Struckmann, 2008): Qu= FR A [Iτα − UL(Ti-Ta)]
In this equation A is the collector area (m2); FR is the collector heat removal factor; I is
the intensity of solar radiation (W/m2), Qu is the useful energy gain (W); Ti is the inlet
fluid temperature (°C); Ta is the ambient temperature (°C); UL is the collector overall
heat loss coefficient (W/m2); τ is the transmission coefficient of glazing; and α is the
absorption coefficient of the plate. Hottle, Whillier, and Bliss (Hottel and Willier, 1958;
Bliss, 1959; Willier, 1977) explained the relationships for the design of tube and sheet
case collectors through the application of a collector efficiency factor (η). In this case,
the equation below (Norton, 2018; Goudarzi et al., 2014) explains the relationships
between the collector efficiency factor, the absorbed energy (FR(τα)e) and the loss
energy (−FRUL): η =FR (τα)e - FR UL(Ti-Ta)/I

55
The climax of the MIT research activities in combining solar heating with architectural
design was not to be realized until late 1970s when Solar V and later Solar VI structures
were built. For example, Solar V, was a structure erected in 1978 on the MIT campus
used as an experimental studio/classroom by the Department of Architecture. Different
from the previous solar houses studied, Solar V would work with no requirements for
mechanical equipment such as solar collectors, pumps, or fans. In the Solar V project all
elements of solar heating were incorporated into the building materials (MIT Solar
History, 2018).
Although, interest in solar homes peaked in the early 1950s, following the cyclical trend
of interest in passive building design, the low price fossil‐fuel after the end of World
War II resulted in a lack of interest in passive solar heating systems. However, the
energy crisis of the 1970s became an enormous catalyst for an architectural movement
that was focused on energy efficiency in buildings. In this decade, demonstration houses
such as Doug Balcomb’s house in Santa Fe, New Mexico, and Doug Kelbaugh’s solar
house in Princeton, New Jersey, explored the potential of integrating a variety of
different passive solar components. For example, in Balcomb’s house integration of
adobe materials with a hybrid system of fans passing the hot air through underfloor rock
beds along with a large sunspace would keep the temperature swing inside the house
small within the comfort zone. In this house while the outdoor temperature fluctuates
between 18F to 55F in sunny winter days, the indoor temperature swings between 65°F
and 74°F (Lechner, 2009).

56
In another example, Dough Kelbaugh’s passive house design in 1975 in Princeton was
the first case to utilize a Trombe’ wall.9 In addition, alongside the practice of passive
solar building design in the 1970s, publications such as Edward Mazria’s Passive Solar
Energy book in 1979 assisted other designers in mastering the basics of solar design.
Mazria’s book, although an important contribution, was more focused on the general
picture of passive solar design and its rules of thumb for designers. Therefore, a
guideline with detailed procedures and calculations in passive solar design was needed.
Mazria’s book was followed in the early 1980s by publication of other important solar
design researches and guidelines. For example, in 1983 passive solar design guidelines
for sizing direct and indirect solar gains such as Trombe’ walls were developed by
Balcomb for locations inside the US at Los Alamos National Laboratories. The goal of
this work was to assist in reducing homeowners’ heating bills through the proper sizing
of glazing and window openings that used the solar energy for passive heating of
buildings. Some of these concepts had been pursued sporadically in the 1960s, but did
not produce a systematic approach to provide design guidelines. An example is the
Trombe’ wall named after the French Professor Felix Trombe’ in 1966. 10 In this indirect
9 The top of the wall could be opened in the summer to help boost ventilation and prevent from overheating. The house originally designed as a rectangular plan, was modified in 1976 with a south-facing greenhouse. For further information please see Kelbaugh Solar House at https://centralnjmodern.wordpress.com/princeton-modern/kelbaugh-solar-house/ last accessed February 2018. 10 Similarly, some other solar concepts were studied earlier by European researchers from the 1760s until the end of the 1800s. Examples include studies about the first solar motors by the French mathematics professor, Augustine Mouchot, or the “solar hot box” by the Swiss polymath Horace B. de Saussure (Perlin, 2013).

57
solar gain system, the thermal mass consists of a concrete wall just inside the south-
facing glazing. The blackened wall surface facing the sun gets hot during the day that
causes heat flow into the wall and the adjacent indoor space during the evening (Iyengar,
2015).
The research and development activities of the 1970s and the 1980s for passive solar
building designs could not have occurred if the vital 1974 Solar Energy Act had not been
approved (H.R.16276 — 93rd Congress, 1974). Prior to that the depth of knowledge
about solar radiation in the US was limited because the data collected by the National
Weather Service (NWS) was not recorded in units that facilitated a solar thermal
analysis. The Solar Energy Act of 1974 led to a solar energy determination and
assessment program to prepare national and regional appraisal of all solar energy
resources including data on solar insolation, wind, ocean thermal gradients, and the
potential for photosynthesis conversion (Balcomb, 1992).
Once these data had been compiled it became possible to establish a National Radiation
Data Base (NSRDB) for the US, which provided hourly solar radiation and
meteorological data for sites throughout the United States from 1961 to 1990 and from
1991 until 2010 (NREL, 2018). The 1961-1990 NSRDB contained 30 years of solar
radiation data and supplementary meteorological data from 237 NWS sites in the U.S.,
Guam, and Puerto Rico. The updated 1991-2010 National Solar Radiation Database

58
holds solar and meteorological data for 1,454 locations in the US and its territories.11
The latest version of solar data is the NSRDB 1998-2014 Update which includes 30-
minute solar and meteorological data. These data were developed using the Physical
Solar Model (PSM) for about 2 million surface pixels—nominally of about 4 km2
divided in 0.038-degree latitude by 0.038-degree longitude increments (NREL, 2018).
The up and down of passive building design continued until the surge of the green
building movements such as Net Zero Energy (NZE) and Net Positive Energy (NPE)
which have rekindled interest in passive/natural systems. Beginning in the late 1990s a
number of new technological changes were introduced to the design of NZE and NPE,
which had limited impact on the NZE/NPE components/concepts. However, the scale of
the buildings being designed and constructed to use them increased (Grondzik and
Kwok, 2015). Between 2008 and 2013, researchers from different countries, including
US, collaborated under the International Energy Agency (IEA) Solar Heating and
Cooling Program Task 40 / Energy in Buildings and Communities (EBC) in the research
“Towards Net Zero Energy Solar Buildings” Annex 52 to promote the Net Zero Energy
Building feasibility on the market.12 These newer green building design trends will not
be discussed here, since they have been already discussed in earlier sections of this
11 For further information, please see National Solar Radiation Data Base at https://rredc.nrel.gov/solar/old_data/nsrdb/ accessed February 2018 12 These countries include Australia, Austria, Belgium, Canada, Denmark, Finland, France, Germany, Italy, Republic of Korea, New Zealand, Norway, Portugal, Singapore, Spain, Sweden, Switzerland, United Kingdom and the US.

59
thesis. However, one of the important trends that need to be addressed here with respect
to the historical trend of national green building design interests is the establishment of
the Passive House Institute US (PHIUS).
2.2.3. Passive House Institute US (PHIUS)
The root of the PHIUS goes back to 2003, when a passive single family residence in
Urbana, Illinois was designed and built by Katrin Klingenberg (PHIUS Mission, 2018).
This was one of the very first homes in the US built following the passive building
energy standards similar to those in Europe, in particular Germany. To further
investigate the viability of her experience in applying passive design principles in the
US, Klingenberg cofounded a construction laboratory in Urbana, Illinois with the builder
Mike Kernagis in 2003 as a non-profit affordable housing developer. Working in
partnership with the City of Urbana, the lab became a Community Home Development
Organization (CHDO) to build single-family passive house projects as affordable
housing units. Following the growth of passive building design in the US, this lab was
expanded into the Passive House Institute US (PHIUS) in 2007. PHIUS is now a leading
passive building standard setting, research and information provider, training, and
certification institute in North America, that supports the growth of the community of
passive building professionals.
However, the concept of passive house pursued by the US institutions today, such as
PHIUS, is very different from the legacy passive building systems, which required

60
installation of add-on systems to save energy through the ambient conditions. Instead, in
a PHIUS certified house, the focus is more on the design or selection of individual
building envelope components such as glazing materials, insulation types, and thermal
bridges to reduce a building’s energy consumption. In this perception of passive design,
“the Passive House is a quantitative, performance-based energy concept for buildings
based on the understanding of the relationship between the influence of the thermal
quality of the envelope and the resulting sizing of the mechanical system” (Antretter et
al, 2013). One of the goals of the PHIUS is to reach the concept of low energy homes.
The current International Energy Conservation Code (IECC) recognizes extremely-low-
load homes, defining them as homes with a peak load smaller than 1 W/ft2 for heating in
Section 101.5.2 Low Energy Building (ICC 2018). It is interesting to note that many of
the concepts practiced by the PHIUS were similar to the concepts promoted by William
Shurcliff in late 1970s and early 1980s.
William Shurcliff, a physicist at Harvard at the time, published many books on the
passive solar and superinsulation concept in the late 1970s and early 1980s (Antretter et
al, 2013). Shurcliff first used the term passive house in his 1982 self-published book
“The Saunders-Shrewsbury House.” In his later writings he defined the same set of
principles and metrics that define today’s five principles of passive house design
recognized by the PHIUS. These principles were defined at the same time that the
concept of superinsulation began to emerge. Shurcliff’s five main principles

61
of superinsulation, also known as passive housing in his 1986 article in the Energy
Review journal, include:
1) thick insulation,
2) airtight construction,
3) prevention of moisture migration into cold regions within the walls, and other regions
where much condensation could occur,
4) optimum sizing of window areas, and
5) a steady supply of fresh air
The last two principles have been further expanded by PHIUS: first, in addition to the
specification of window sizes, the area of high-performance windows should be
specified according to climate; and second, constant fresh air supply, in most climates
via a mechanical ventilation system with heat and/or moisture recovery is required
(PHIUS, 2016). It should be mentioned that Shurcliff had provided additional details
about the components resulting from these principles such as triple pane windows, heat
recovery ventilators, thermal bridge free designs, airtightness design strategies, vapor
retarders, and wood stove as the house heat source (Antretter et al, 2013). In his book
Superinsulated Houses and Air-To-Air Heat Exchangers (1988) Shurcliff explains that
in the future further improvements in window technologies, vapor retarders, and
compact minimized mechanical systems will occur.
62
In the early1990s the German physicists Wolfgang Feist conducted research that was a
further development of Shurcliff’s work in Europe. He codified the impact of highly
improved envelope components (including triple-pane windows) on minimizing the
potential of the heat load in low-energy buildings (Feist 1992). Feist used the same US
energy metrics of 1 W/ft2 peak load and realized that an energy efficient construction in
Central Europe should have a maximum of 15 kWh/m2-yr annual heating demand. This
metric soon became a standard across Europe for energy efficient homes.
In 2002 Katrin Klingenberg used these principles and the Passive House tools to build
the first residential building in Urbana, Illinois. Since then many projects have been built
across all U.S. climates that are not listed in the 300 buildings on the PHIUS database
(2016). This collective experience from the passive house certification has proved that
its principles work in all climatic locations. However, its standards require climate-based
adjustments (Klingenberg, 2013). For example, the superinsulated external walls in
Alaska’s cold climate do not need to be applied the same way in California where,
comparatively, little insulation is required. The resulted in the Climate-Specific Passive
Building Standards (Wright and Klingenberg, 2015), which are now used as criteria for
PHIUS+ project certification and Quality Assurance/Quality Control (QA/QC)
measures.

63
The PHIUS+ passive building certification is a voluntary program. ENERGY STAR13,
EPA Indoor airPLUS14, and Zero Energy Ready Home (ZERH)15 specifications are the
program’s prerequisites for the residential sector.
Table 2.6 Performance requirements for PHIUS Certification adapted from(PHIUS, 2015)
13 Energy Star is a voluntary program launched by the U.S. Environmental Protection Agency (EPA). It is now managed by the EPA and U.S. Department of Energy to help businesses and individuals save money and protect the environment through superior energy efficiency. A ccessed February 2018 from https://www.energystar.gov 14 Indoor airPLUS is a voluntary partnership/labeling program to help home builders improve the indoor air quality by requiring construction practices and product specifications that minimize exposure to airborne pollutants and contaminants. Accessed February 2018 from https://www.epa.gov/indoorairplus 15 A DOE Zero Energy Ready Home (ZERH) is a home that meets all of the criteria found in the DOE Zero Energy Ready Home National Program Requirements. Examples of these criteria include: thermal enclosure, HVAC quality installation, water management, and comprehensive indoor air quality. DOE Zero Energy Ready Homes are verified by a qualified third-party and are at least 40%-50% more energy efficient than a typical new home. This generally corresponds to a Home Energy Rating System (HERS) Index Score in the low to mid-50s, depending on the size of the home and its region. Accessed February 2018 from https://www.energy.gov/eere/buildings/doe-zero-energy-ready-home-partner-central
Building Type
Heating Demand/Load
(maximum climate specific)
Cooling Demand/Load
(maximum climate specific)
Air Tightness
Source Energy Demand
Renewable Generation for Source
Zero
Single family 1-16.8 kBtu/ft2-yr 0-7.6 Btu/hr-ft2
1-23.4 kBtu/ft2-yr
1.3-9.5 Btu/hr-ft2
0.05 6200 kWh/person-yr
>Source energy demand
Commercial 38kBtu/ft2-yr Multifamily 0.08* 6200
kWh/person-yr; 38kBtu/ft2-yr
Retrofit As above, plus allowance for
existing thermal bridges
As above, plus allowance for
existing thermal bridges
0.05;0.08*
* For buildings with more than five stories and with noncombustible construction Other considerations include window U values: 0.4-0.08 Btu/hr-ft2°F (varies by climate); HRV or MHRV with 53%-95% efficiency and fan efficiency of 0.27-2.23 W/cfm (varies by climate); and thermal bridge-free construction <0.006 Btu/hr-ft °F.

64
PHIUS+ 2015 and Source Zero Certification define the next steps in the DOE High-
Performance Home Staircase as shown in Table 2.7 Key requirements beyond those
programs include: 1. Space conditioning maximum requirements which is set to
optimize the building enclosure; 2. Source energy requirement which is set to minimize
overall energy use and carbon footprint; 3. Air-tightness requirement and moisture
design criteria which is set to ensure building durability. Table 2.6 summarizes the
specific performance requirements for PHIUS.
Table 2.7 DOE High-Performance Home Staircase, adapted from (PHIUS, 2015)
PHIUS+ SourceZero
PHIUS+
Source zero renewable energy system
ZERH Balanced ventilation HRV/ERV
Balanced ventilation HRV/ERV
Solar Ready depends on climate
Solar Ready Always
Solar Ready Always
Efficient Comps. & H2O Distribution
Efficient Comps. & H2O Distribution
Efficient Comps. & H2O Distribution
EPA Indoor Air Package
EPA Indoor Air Package
EPA Indoor Air Package
ENERGY STAR v3
ENERGY STAR v3.1
Ducts in Conditioned Space
Ducts in Conditioned Space
Ducts in Conditioned Space
HVAC QI w/WHV
HVAC QI w/WHV
HVAC QI w/WHV
Micro-load HVAC QI
Micro-load HVAC QI
Water Management
Water Management
Water Management
Water Management
Water Management
IECC 2009
IECC 2012
Independent Verification
Independent Verification
Independent Verification
Independent Verification
Independent Verification
IECC 2009 Enclosure
IECC 2012 Enclosure
IECC 2009 Enclosure
IECC 2012 Enclosure
IECC 2012/15 Encl./ES Win.
Ultra-Efficient Enclosure
Ultra-Efficient Enclosure
HERS 85-90
HERS 70-80
HERS 65-75 HERS 55-65 HERS 48-55 HERS 35-45 HERS < 0

65
Currently the PHIUS+ 2018 is under a pilot study. Based on the current information the
PHIUS+ 2018 remains a pass/fail passive building standard, serving as an update to
replace PHIUS+ 2015. It remains a “performance-based” energy standard that includes
prescriptive quality assurance requirements based on three pillars: Limits on
heating/cooling loads (both peak and annual); Limits on overall source energy use; Air-
tightness and other prescriptive quality assurance requirements. PHIUS+ 2015
recognized that there are diminishing returns on investment in energy-conserving
measures, and an optimum level in a life-cycle cost sense.
Climate plays a large role in determining where the point of diminishing return is. For
PHIUS+ 2015, researchers studied optimization in 110 cities, and developed
interpolation formulas to set heating and cooling (space-conditioning) energy targets for
1000+ cities across the US and Canada. The same criteria applied to buildings of all
sizes. The probable changes under the current pilot release of PHIUS+ 2018, includes
the space-conditioning targets which are less granular in terms of climate. Instead, these
targets will be set by climate zone including the 17 climate zones referenced in the
International Energy Conservation Code (IECC). Additionally, due to the impact of size
and occupant density on the optimal path to a low energy building, the new space-
conditioning criteria implement continuous adjustments for a range of different building
sizes and occupant densities.

66
Today the PHIUS 2018 guidelines and certification requirements are the most notable
use of passive building design in the US. According to PHIUS 2018 a passive building is
designed and built in compliance with these five building-science principles:
1-Employs continuous insulation throughout its entire envelope without any thermal
bridging.
2-Uses an extremely airtight envelope to prevent infiltration of outside air and loss of
conditioned air.
3-Employs high-performance windows (typically triple-paned) and doors.
4-Uses some form of balanced heat- and moisture-recovery ventilation and a minimal
space conditioning system.
5-Manages to exploit the sun's energy for heating purposes in the heating season and to
minimize overheating during the cooling season.
2.3. Models and Approaches of Passive Building Design
In this section models and approaches used for designing passive systems or estimating
their performance will be reviewed. In this process, the focus will be more on resources
that are used in university education since the review can also demonstrate the level and
content of the education about passive systems to architecture students. Such a review
can be better linked with the findings of the research survey from educators in the field
of passive design, which will be discussed in section 5. Additionally, the source books
which are the focus of this review, in fact use the same design models that are also
applied by professionals. Examples of these books include Mechanical and Electrical

67
Equipment for Buildings (Grondzik and Kwok, 2015), Heating, Cooling, and Lighting
for Architects (Lechner,2009; Lechner, 2014), and The Building Environment Active
and Passive Control Systems (2006). Meanwhile a wide range of other articles and
online professional resources were used to enrich the content of the literature review.
2.3.1. Natural/Passive Heating of Buildings
Natural heating in buildings usually occur through solar radiation which in turn could
lead to natural energy flows including radiation, conduction, and natural convection.
These energy flows may directly or indirectly occur in the occupied space. On this basis,
passive solar systems are divided into two broad categories of direct gain and indirect
gain systems (Athienitis and Santamouris, 2013). The direct gain system would let
sunlight into the space to warm up the exposed thermal mass surfaces, while in indirect
gain system solar radiation first warms the thermal mass and then only heat is passed to
the adjacent occupied space (Grondzik and Kwok, 2015). If in the indirect gain system,
the heated space becomes insulated and separated from the system, then it may be called
isolated gain system (Athienitis and Santamouris, 2013) such as in the case of sunspaces
and greenhouses.
Athienitis and Santamouris have listed the basic principles that should be addressed by
passive solar design techniques as follows (2013):

68
• Transmission and/or absorption of the maximum possible quantity of solar
radiation during winter to minimize or reduce the heating energy
consumption to zero
• Utilization of received solar gains to cover instantaneous heating load and
storage of the remaining heat in embodied thermal mass or specialty built
thermal mass storage devices
• Reduction of heat losses to the environment through the use of insulation
and windows with high solar heat gain factors.
• Utilization of natural ventilation to transfer heat from hot to cool zones in
winter
• Ground heating to transfer heat to/from the deep underground surface
which stays at more or less a constant temperature
• Strategically planted deciduous trees or shading devices which allow solar
gains in winter but would block them in summer
• Application of solar radiation for daylighting through effective distribution
of daylight into the work plane
• Developing building integrated envelope devices such as windows with
integrated photovoltaics (PV) for shading or roofs with PV integrated
shingles to increase the cost-effectiveness of the system through dual
energy roles (electricity production and thermal gain prevention)
• Integration of passive solar systems with active heating/cooling systems in
the design and operation phases of a building

69
The authors maintain that the last principle is the most important one, which is usually
overlooked due to lack of design integration and collaboration between architects
applying qualitative passive solar design principles and mechanical engineers
overestimating the HVAC system sizing by ignoring the passive solar design potentials.
The key factors of passive solar design include the area, orientation, and type of
fenestrations; amount of insulation; type location, and area of shading devices; and
effective thermal storage area/amount which is insulated from outdoor and could be
applied in two types (i.e. sensible heat storage such as in concrete materials or latent heat
storage such as in phase change materials).
The following paragraphs explain about each of these systems and the advantages and
issues of their application.
2.3.1.1. Natural/Passive Heating Design/Calculation
Grondzik and Kwok (2015) propose a detailed process for the design of a passive solar
building which builds upon the method proposed by Stein and Reynolds (2000). Stein
and Reynold’s method, also explained by Grondzik and Kwok, can be explained in four
steps. In their procedure, the first step is to consider a passive solar building’s rate of
heat loss compared to a conventional building. The reason is that there is no advantage
in heating a leaky building no matter if it uses active or passive systems. Balcomb et al
(1980) proposed a whole building heat loss criteria to check if the heat loss of a small
passive building in early design phase is less than a conventional building heat loss rate.
70
The U value and area of each building envelope component is multiplied and added to
find the UA of the envelope. For heat loss through infiltration the number of air change
per hour (ACH) and a constant representing the density and specific heat of air can
determine the UA of infiltration as follows:
ACH volume m3 × 0.33= UA infiltration (SI)
ACH volume ft3 × 0.018= UA infiltration (PI)
The UA results will be used in the equation below to determine the whole heat loss for a
conventional building and its corresponding passive solar design.
(UA envelope + UA infiltration) × 24 h/ total heated floor area (ft2) =Btu / DD ft2
(UA envelope, except for south glass + UA infiltration) × 24 h/ total heated floor area
(ft2) =Btu / DD ft2
An ACH of 0.75 is usually considered for a passive solar building, but with careful air
barrier installation and crack sealing it can reach 0.33 ACH. By comparing the results
from the last two equations and by using Table 2.8 one can determine if the passive
design would work properly or not. Looking at the equations above there is a trade-off
between higher solar heating energy and higher heating loss through infiltration since
these two factors are very dependent on glass area and sealing. Additionally, a solar
building has a higher indoor temperature swing compared to usual buildings.
In the second step, this design process estimates the solar saving fraction (SSF) which
shows a building’s solar heating performance. The SSF is a comparison of the auxiliary
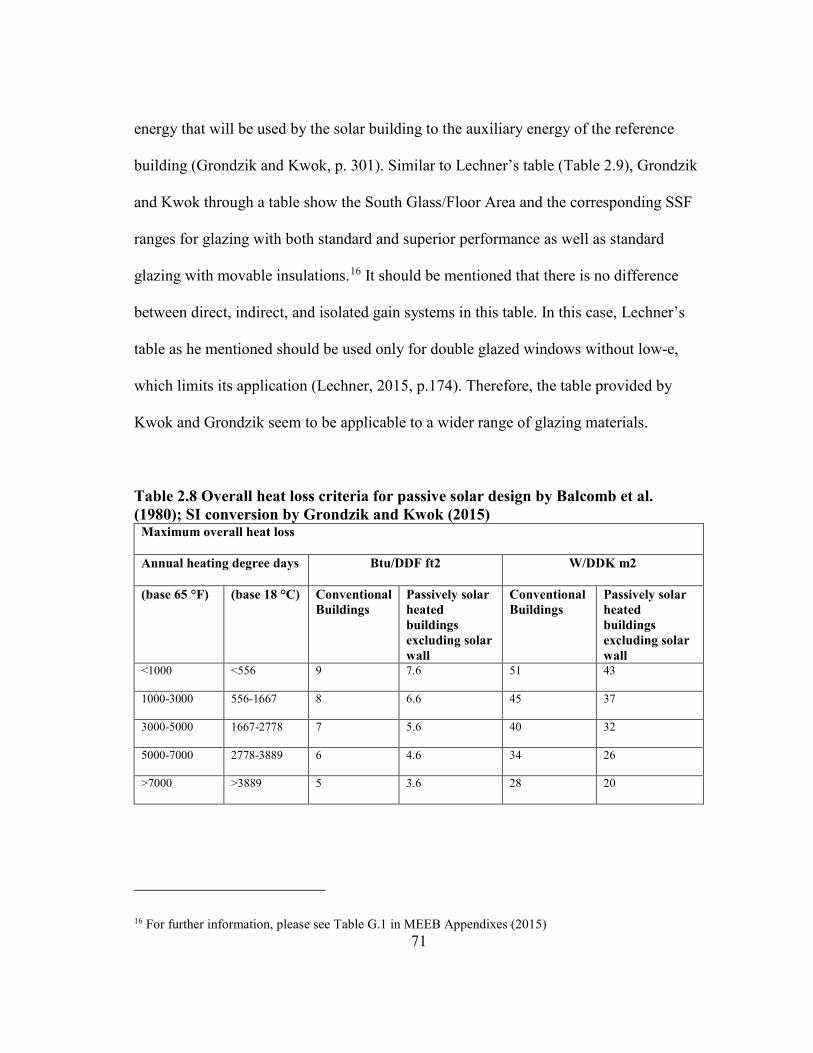
71
energy that will be used by the solar building to the auxiliary energy of the reference
building (Grondzik and Kwok, p. 301). Similar to Lechner’s table (Table 2.9), Grondzik
and Kwok through a table show the South Glass/Floor Area and the corresponding SSF
ranges for glazing with both standard and superior performance as well as standard
glazing with movable insulations.16 It should be mentioned that there is no difference
between direct, indirect, and isolated gain systems in this table. In this case, Lechner’s
table as he mentioned should be used only for double glazed windows without low-e,
which limits its application (Lechner, 2015, p.174). Therefore, the table provided by
Kwok and Grondzik seem to be applicable to a wider range of glazing materials.
Table 2.8 Overall heat loss criteria for passive solar design by Balcomb et al. (1980); SI conversion by Grondzik and Kwok (2015)
Maximum overall heat loss
Annual heating degree days Btu/DDF ft2 W/DDK m2
(base 65 °F) (base 18 °C) Conventional Buildings
Passively solar heated buildings excluding solar wall
Conventional Buildings
Passively solar heated buildings excluding solar wall
<1000 <556 9 7.6 51 43
1000-3000 556-1667 8 6.6 45 37
3000-5000 1667-2778 7 5.6 40 32
5000-7000 2778-3889 6 4.6 34 26
>7000 >3889 5 3.6 28 20
16 For further information, please see Table G.1 in MEEB Appendixes (2015)
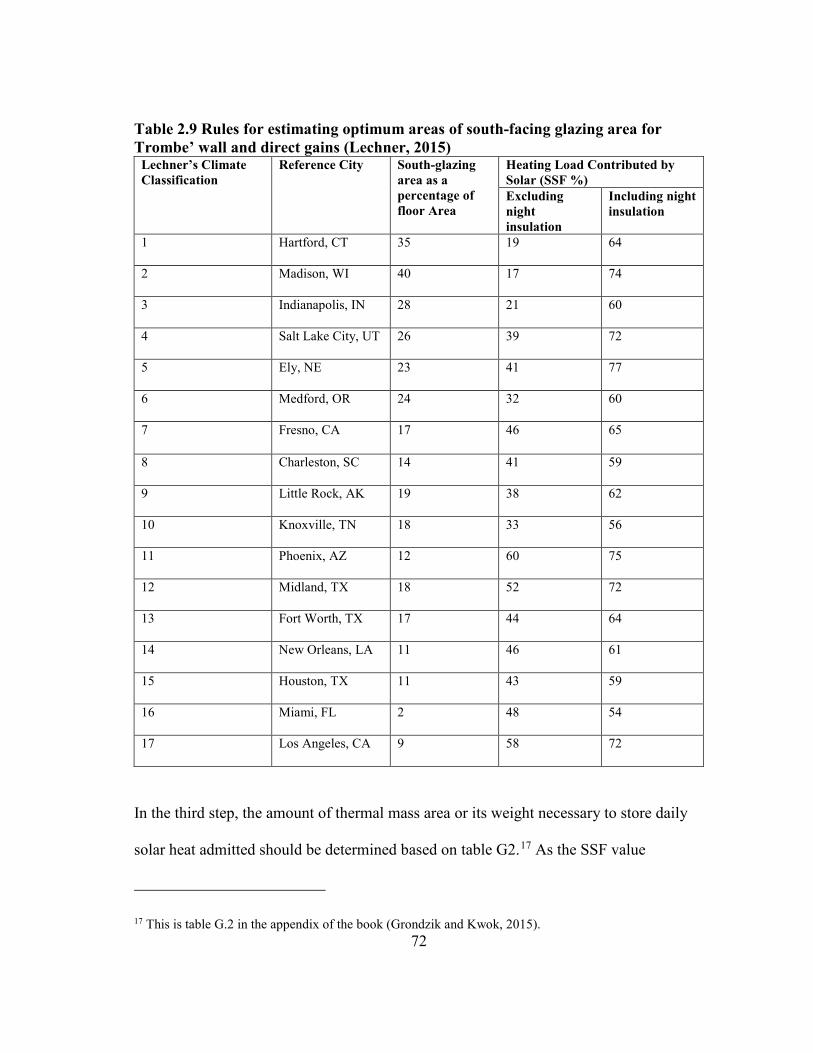
72
Table 2.9 Rules for estimating optimum areas of south-facing glazing area for Trombe’ wall and direct gains (Lechner, 2015)
Lechner’s Climate Classification
Reference City South-glazing area as a percentage of floor Area
Heating Load Contributed by Solar (SSF %) Excluding night insulation
Including night insulation
1 Hartford, CT 35 19 64
2 Madison, WI 40 17 74
3 Indianapolis, IN 28 21 60
4 Salt Lake City, UT 26 39 72
5 Ely, NE 23 41 77
6 Medford, OR 24 32 60
7 Fresno, CA 17 46 65
8 Charleston, SC 14 41 59
9 Little Rock, AK 19 38 62
10 Knoxville, TN 18 33 56
11 Phoenix, AZ 12 60 75
12 Midland, TX 18 52 72
13 Fort Worth, TX 17 44 64
14 New Orleans, LA 11 46 61
15 Houston, TX 11 43 59
16 Miami, FL 2 48 54
17 Los Angeles, CA 9 58 72
In the third step, the amount of thermal mass area or its weight necessary to store daily
solar heat admitted should be determined based on table G2.17 As the SSF value
17 This is table G.2 in the appendix of the book (Grondzik and Kwok, 2015).
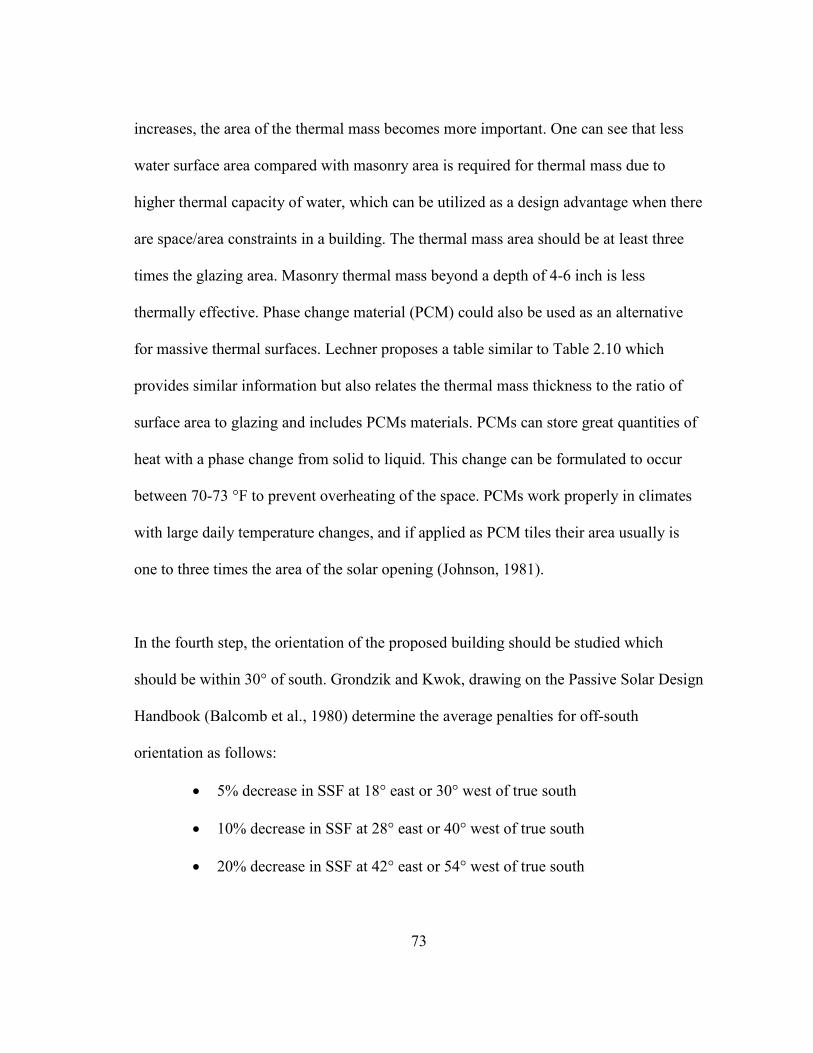
73
increases, the area of the thermal mass becomes more important. One can see that less
water surface area compared with masonry area is required for thermal mass due to
higher thermal capacity of water, which can be utilized as a design advantage when there
are space/area constraints in a building. The thermal mass area should be at least three
times the glazing area. Masonry thermal mass beyond a depth of 4-6 inch is less
thermally effective. Phase change material (PCM) could also be used as an alternative
for massive thermal surfaces. Lechner proposes a table similar to Table 2.10 which
provides similar information but also relates the thermal mass thickness to the ratio of
surface area to glazing and includes PCMs materials. PCMs can store great quantities of
heat with a phase change from solid to liquid. This change can be formulated to occur
between 70-73 °F to prevent overheating of the space. PCMs work properly in climates
with large daily temperature changes, and if applied as PCM tiles their area usually is
one to three times the area of the solar opening (Johnson, 1981).
In the fourth step, the orientation of the proposed building should be studied which
should be within 30° of south. Grondzik and Kwok, drawing on the Passive Solar Design
Handbook (Balcomb et al., 1980) determine the average penalties for off‐south
orientation as follows:
• 5% decrease in SSF at 18° east or 30° west of true south
• 10% decrease in SSF at 28° east or 40° west of true south
• 20% decrease in SSF at 42° east or 54° west of true south

74
These four steps for passive heating design were also proposed earlier by Stein and
Reynold (2000). However, all of these methods are in fact inspired by Balcomb et al.
(1980) method for passive heating design.
Table 2.10 Design guidelines for passive solar thermal mass. From Balcomb et al. (1980) and Grondzik and Kwok (2015)
Expected SSF %
Thermal Storage by Weight/Collector Area
Recommended Effective Thermal Storage Area Per Unit Area of Solar Collection Area
Water Masonry Water Surface Area Collector Surface Area
Masonry Surface Area Collector Surface Area
lb/ft2 kg/m2 lb/ft2 kg/m2
10 6 29 30 147 0.1 0.7
20 12 59 60 293 0.2 1.5
30 18 88 90 440 0.3 2.2
40 24 117 120 586 0.4 2.9
50 30 147 150 733 0.5 3.7
60 36 176 180 879 0.6 4.4
70 42 205 210 1026 0.7 5.1
80 48 234 240 1172 0.8 5.9
90 54 264 270 1319 0.9 6.6
Table 2.11 Rules for Estimating Required Thermal Mass in Direct-Gain Systems (Lechner, 2015)
Thermal Mass Thickness in inches (cm)
Surface Area to Glazing Area Ratio
Masonry or concrete exposed to direct solar radiation (dark color)
4–6 (10–15) 3
Masonry or concrete exposed to reflected solar radiation (light color)
2–4 (5–10) 6
Water exposed to direct solar radiation 6–12 (15–30) About 1/2 Phase change material exposed to direct solar radiation 1–4 (2.4–10) 1

75
Grondzik and Kwok expand the method proposed by Stein and Reynold through a
discussion on more detailed information of the applied passive design strategies
including CLR and glazing performance. For this purpose, their focus is on worst hourly
heat loss in buildings as a concept connected to the design of any building including a
solar building. Since a solar building aims to provide part of a conventional heating need
as much as it can, they continue the above four steps by calculating the worst hourly heat
loss and comparing it with worst hourly heat loss for a solar building.
A conventional building heat loss calculation assumes no internal heat gains (lights,
people, etc.), no solar gains for the indoor condition, and the design lowest temperature
for the outdoor condition. A solar building heat loss assumptions are the same except for
the inclusion of solar gains in the calculation. By adding heat transfer through building
envelope’s exposed components (q) and through air infiltration (qv) the total heat loss
can be calculated. Equations below show this process. ∆t shows the difference between
indoor temperature and outdoor design temperature.
q total = q + qv, in which q = (ΣUA)∆t and qv = 1.1 V ∆t (PI units) =1.2V ∆t (SI units)
The worst hourly heat loss calculations can help in sizing the heating equipment for both
conventional and solar buildings. It identifies opportunities for energy saving and better
thermal comfort. For example, in the case of a high qv, inserting a heat exchanger
between ingoing and outgoing air or educing mechanical ventilation rate can save on
energy.

76
The hourly heat loss from a building also helps in estimating the hourly rate of fuel
consumption thereby calculating the heating season fuel consumption.
Fuel consumption rate (gal/h) = Btu/h capacity or heat loss/ (heat value of fuel in Btu/gal
× furnace efficiency)
A particular outdoor temperature called “balance point” defines the basis of calculating
heating season fuel consumption. In balance point the heat lost through the building’s
skin and infiltration matches the heat gained through solar load plus internal loads. This
point defines the temperature at which space heating/cooling is required and can be
determined through the following equation:
Tb=Ti -Qi/ UA total
Tb = balance point temperature
Ti = average interior temperature over 24 hours, winter
Qi = internal gains + solar gains (Btu/h or W)
Qi = internal gains (Btu/day)/24h + [January insolation (Btu/ft2 day average) × vertical
south glass area]/24h
In skin-dominated buildings with SSF less than 10%, the above equations are applicable
for calculating heating season fuel consumption. Since Qi at Tb equals qtotal then Qi can
also be estimated by combining the envelope/skin losses and the infiltration/ventilation
losses. Tb is useful also to find the relative importance of heating versus cooling for a
specific building and climate by plotting it on a graph of monthly outdoor temperatures.

77
Additionally, Tb of individual zones in a building can help understand how these zones
interact in terms of the possibility of using one zone’s surplus heating for heating
another zone.
Using the concept of DD (degree days) an estimate of the average yearly heating fuel
energy (E) is achievable through the following equation:
E (kWh or Therm) = UA (DD balance point) (24h)/AFUE (V)
In this equation UA is the total heat loss rate from envelope and infiltration in Btu/h°F,
or W/°C); DD is based on the balance point; and AFUE is the annual fuel utilization
efficiency.
Thus far, besides calculation of worst hourly heat loss and annual heating fuel
consumption, passive solar heating was based on the concept of SSF which distinguishes
only between standard and superior system performance. Grondzik and Kwok, drawing
on passive solar heating analysis by Balcomb et al. (1984), introduce the concept of LCR
(Load Collector Ratio) as a more detailed approach through 9 steps for calculating
annual SSF and auxiliary energy needs in solar building design. These steps include:
1. Finding a location from a reference table closest to the design site
2. Selecting a tentative size for the solar opening based on ventilation, daylighting,
and SSF design guideline

78
3. Calculating the rate of heat loss through building envelope and infiltration, which
excludes the southern solar opening (UAns), to determine the Building Load
Coefficient (BLC): UAns ×24 h = BLC (Btu/DD)
4. Dividing BLC by floor area as Btu/DD ft=BLC/floor area (ft) and comparing it
with Table p3 to determine the poor or proper solar performance of the building.
The result can reveal if you need design changes such as increased insulation,
reduced infiltration, or reduced non-south glazing areas
5. Find the vertical projection of the solar opening (AP)
6. Find the LCR as Btu/DD ft2 through BLC/ AP
7. According to the found LCR, consult a reference table for the desired passive
system (i.e. direct, isolated, indirect gain systems) close to your design idea and
location. This step gives you the annual SSF from the reference table.18
8. Use the following equation to determine the annual auxiliary heat:
Q =(1-SSF) ×BLC×DD
9. Compare the design guideline predicted relationship between collector size and
SSF to the actual one calculated. If the SSF is smaller, by decreasing BLC
(improve conservation), increasing the collector size, or choosing another passive
system with a better SSF for the same LCR. If the SSF is larger, then the decision
will be between selecting more fuel savings, smaller collector size, or a less‐
efficient passive system with other architectural design advantages.
18 Table I.3 in the MEEB Appendices (Grondizk and Kwok, 2015).

79
2.3.1.2. Direct Natural/Passive Solar Gain systems
A building with south facing glazing surfaces could simply be a direct gain system. Solar
radiation will hit the thermal mass of the interior space components, such as walls,
floors, and furniture, which directly receives much of this incoming radiation as heat.
The minimum thickness of the thermal mass is 4 inches and its area should be three
times the area of the south facing glass to keep the space from overheating during sunny
hours (Grondzik and Kwok, 2015). Following outdoor temperature changes, a low-mass
passive solar building experiences a wider span of indoor temperature swing while a
high-mass passive solar building will experience a smaller indoor temperature swing
(Lechner, 2015). The solar scientist Doug Balcomb has said that “orientation is 80% of
passive solar design” which signifies the importance of building orientation in direct
gain system (Lechner, 2009, p.147).
The key factors in the design of a direct gain system include window type, glazing area,
and thermal mass quantity (Athienitis and Santamouris, 2013). AS explained in the
previous section, Lechner after dividing US and Canada into 17 climatic regions
proposes two tables for the design of a direct gain system (2015): one for estimating
optimum areas of south-facing glazing (Table 2.9) and one for estimating required
thermal mass quantities (Table 2.11).
The main advantage of a direct gain system is its simplicity for implementation. The
solar energy is directly absorbed through a room’s thermal mass and will be distributed

80
through convection/conduction. No heat transfer medium is required which in turn will
reduce the heat loss through removing any inefficient heat transfer medium from the
system. Based on Table o3 a direct gain system can contribute from 19% up to 72% to
energy savings during winter. The system requires large amount of interior thermal mass
to absorb solar radiation in winter, and therefore, it will also work effectively in most
climates in summer to cool the building through night ventilation with thermal mass.
Examples of the drawbacks in using direct gain systems include overheating and glare
on sunny days, large amount of radiant heat loss at night toward the glazing area and
sky, change of the color of the interior materials, and fading of the furniture exposed to
direct sunlight.
2.3.1.3. Indirect and Isolated Natural/Passive Solar Gain Systems
In addition to direct gain solar systems, which use the direct sunlight to heat the interior
of a building or utilizes the roofs, walls, or floors to store the heat, indirect and isolated
solar are the other two solar energy gain systems, indirect and isolated solar gain systems
can have a variety of types. The indirect solar gain systems manly include Trombe’
walls with water and their variations, Trombe’ walls without water and their variations,
and transpired solar wall system. Trombe’ walls are thermally more stable with less
diurnal temperature swing. Many of other passive systems such as solar chimney or
glass double-skin facades use the same mechanism of the Trombe’ wall to heat or cool
their adjacent zones. Therefore, the current review will be more exhaustive of Trombe’
walls compared to other passive systems.

81
Cleanliness of the space near the Trombe’ wall’s solar-gain surface, and loss of view and
daylight could be the most significant challenges of using Trombe’ walls. Since they
transfer heat mostly through radiation, there should not be an object to intercept this
process within the occupied living space. Because of the stack effect in ventilation, the
vented Trombe’ wall deliver warmer air sooner than an identical Trombe’ wall which is
unvented. The vented Trombe’ wall is also more efficient because it does not lose the
heat trapped between the thermal mass and glass through thermal connection with the
outdoor environment.
Table 2.12 Comparison of glass and plastic as the exterior surface in a Trombe’ wall
The performance of the glazing material of a Trombe’ wall is also important for the
Trombe’ wall whole performance. The glazing surface should be able to trap heat from
the incoming solar radiation; should allow maximum transmission of solar (short wave)
radiation; should keep heat loss to a minimum by preventing long-wave transmission;
Glass Plastic
Advantages: 1. Excellent transmissivity (above 90%) 2.Superior thermal stability (Up to 400 F) 3.Low thermal contraction/Expansion 4.Resistant to abrasions(wear and tear)
Advantages: 1. Reasonable transmissivity (above 85%) 2.Superior weather conditions 3.Light weight (compared to glass) 4.High impact resistance
Disadvantage: 1. Low impact resistance 2 .cost
Disadvantages: 1. Susceptible to abrasions 2.High thermal contraction/absorption Examples: Polycarbonates, fluorocarbons, and polyvinyl fluorides

82
and should possess good thermal stability. The glazing surface could be even made of
plastic which has its own advantages and disadvantages as shows in Table 2.12.
Two important design considerations in a Trombe’ wall include preventing the reverse
airflow process at night and overheating during daytime. This consideration can be
implemented by including seasonal switches at the top of the wall, which even can
provide building ventilation via the Trombe’ wall in summer. Avoiding overheating of
the space can be achieved through an appropriate design of a shading device to block the
sunlight in summer, but not in winter, from reaching the Trombe’ wall (Gan, 1998).
Table 2.13 shows several examples of indirect solar gain systems and their features,
particularly Trombe’ walls.
Table 2.13 Several examples of indirect solar gain systems and their features, particularly Trombe’ walls
Type of The Passive Heating System
Features of the System Reference
Vented Trombe’ wall
-Vents on the upper and lower side of the wall provides direct connection between air gap and living space to increase heat transfer in day times. -Assists the natural ventilation during summer. -Provides winter ventilation by warmed air: thermo-circulation.
(Jaber, 2011)
Non-vented Trombe’ wall
-The heating energy is stored in thermal mass during daytime to be radiated/conducted into the living space. -There is no direct convection of air between air gap and living space. -Could be suitable for homes where thermal storage is required for night heating.
(Saadatian, 2012)

83
Table 2.13 Continued Type of The Passive Heating System
Features of the System Reference
Zigzag Trombe’ Wall
-Designed to reduce the excessive heat gain and glare of sunny days. -Its walls should face three directions:
-South: to perform as a Trombe’ wall system -Southeast: to provide heat and light in the cold morning when immediate heating is required - Southwest to store heat for redistribution during the cold night hours
(Saadatian, 2012)
Insulated-Trombe’ Wall
-Includes a transparent outer cover, an enclosed air layer, a storage wall, a ventilated air layer, and finally an insulation layer in which two vents have been drilled. -Traps the majority of the gained solar beams through the glazing; this energy transfers into the room by radiation and convection through the ventilated channel. -Solves two deficiencies of typical Trombe’ walls:(1) heat loss during cloudy winter days and nights; (2) avoids unwanted heat inputs in hot weather conditions. -Good heat resistance due to the presence of the insulation layer and the air layers -Little infiltration of cool air through the outside cover -Users can control the rate of heating by controlling the airflow into the ventilated channel -Requires a mechanism to prevent reverse thermo-circulation, which occurs when the storage wall becomes colder than the ambient air of the building’s internal space -The insulation material is heated up slowly, and at night the heat stored in the heat storage cannot be effectively supplied to heat the room
(Zalewski, 2002)
Porous Trombe’ wall
-From outside to the inside of the room includes a glass cover, an air gap, a porous absorber, an air flow channel, and a thermal mass wall with vents at the top and bottom of the wall. -Solar radiation, absorbed by the porous layer, is used to raise the air temperature and the temperature of the thermal storage wall. -During the heating period, the surface of the porous absorber has a comparatively higher temperature -When solar radiation is not available, as the heat has already been stored in the massive thermal storage wall, the porous layer could serve as an insulated layer. - The porous Trombe’ wall can prevent overheating in hot days; reduce heat loss at nights and winter days; absorb more heat; perform as a semi-thermal insulator when solar radiation is not available; reduce the convection of the thermal storage wall and outside environment
(Chen and Liu, 2004)

84
Table 2.13 Continued Type of The Passive Heating System
Features of the System Reference
Transpired Solar Wall
-Uses a perforated steel skin with prefinished treatment to enhance its absorbance of solar energy - An air cavity is created between the metal skin and the wall/roof surface - The heat in the system comes mainly from three sources including: the exterior surrounding areas of perforations, the edges of the perforations, which heat up the passing air, and the cavity-facing side of the steel skin - Can also have a summer by-pass vent on the top to let the hot air out in summer - has a low maintenance/operation costs and a long life span
(NREL, 2019; Van Decker et al., 2001; Kutscher, 1994)
Fluidized Trombe’ wall system
-Works based on the classic Trombe’ wall but the gap between the Trombe’ wall and glazing is filled with a highly absorbent, low-density fluid. -A fan transfers the solar energy gained by the absorptive fluid by moving the heated air to the room.
(Tunc and Uysal, 1991)
Trombe’–Michell wall
-Is similar to vented Trombe’ wall, but designed for cold climatic conditions has a steel panel backed with polystyrene
(Chan et al., 2010)
Trans Wall -Is built on a metal frame that holds a water container constructed from glass walls and a semi-transparent absorbing plate positioned between the walls -Partially absorbs and partially transmits the solar radiation -Combines features of direct gain and indirect gain -Suitable for location where daytime temperature is high Advantage:
-Installation of transparent baffles overcomes this deficiency of convective heat transfer. -Rapid heat transfer due to convective heat transfer through water and direct heat gain -Reduced heat loss as most of the solar radiation is absorbed in center (through absorber) and close to/at the living space by direct gain, heat loss to ambient air is less. -It allows the visual transmission thereby reducing the lighting load (during day times).
Disadvantage: -The transmission of light through water may cause glare. -There may be a problem of overheating due to direct gain in day times -Inefficient for night heating since time/phase shift between heat flux and solar flux.
(Saadatian, 2012)

85
Table 2.13 Continued Type of The Passive Heating System
Features of the System Reference
PV-integrated Trombe’ Wall
- Is constructed by attaching the PV cells to the back of a glass panel -The thermal energy on the surface of PV cells is removed by the air flow between the glass panel and the wall. Therefore, the temperature of PV cells decreases and the PV system efficiency in producing electricity increases. -The PV-Trombe’ wall could be considered an aesthetic approach in designing Trombe’ walls
(Jie 2007)
Solar wall -Similar to Trombe’ wall, consists of glass cover, air gap, black metallic plate, and insulator - Its temperatures increase with increased wall height and decreased gap. - In very hot season, providing residents’ comfort is insufficient by natural ventilation but it is able to reduce the heat gains which in turn reduces the cooling load.
(Hirunlabh et al., 1999)
Solar chimney
-Works similar to Trombe’ wall systems - Solar radiation increases temperature rises and air velocities -Temperature rise decreases with air gap depth -No reverse air flow circulation has been observed even at a large gap of 0.3 m. - Solar chimney can also reduce indoor temperature by 1.0–3.5 C compared to the ambient temperature of 32–40 C. - Indoor temperature can be further reduced by 2.0–6.2 8C with combination of spraying of water on the roof.
(Ong and Chow, 2003; Chungloo and
Single-sided heated solar chimney
-Adjacent walls are insulated. -The optimized height can be determined according to the optimized section ratio of breath to height and available practical field conditions.
Limmeechokchai, 2007)
Table 2.13 Several examples of indirect solar gain systems and their features, particularly Trombe’ walls (continued)

86
Table 2.13 Continued Type of The Passive Heating System
Features of the System Reference
Water wall or water Trombe’ wall
-The structure includes water contained in drums/pipes as a storage medium. -Water (0.55 w/m K) has lower thermal conductivity compared to brick (0.77 w/m K) -The water Trombe’ wall transfers the heat into the room through radiation -A Drum water wall system with a thin concrete layer behind it can have a higher efficiency, since this insulated film increases the wall’s efficiency. Advantage:
-higher specific heat capacity compared to normal brick wall -due to convection process in water the transfer of heat to the interior space occurs faster than classic Trombe’ walls without water
Disadvantage: -the wall thickness/volume increases for the given amount of storage requirement -difficulty in containment and maintenance of liquids such as water compared with masonry materials
(Li et al., 2004)
Transpired solar wall systems is one of these systems which is made of a perforated steel
skin with prefinished treatment to enhance its absorbance of solar energy. The steel skins
will be installed on south-facing walls or roofs to create a cavity between the metal skin
and the wall/roof surface areas. The exterior area surrounding perforations on the face of
the steel skin heats up the air before it is drawn through the perforations (Kutscher,
1994). The heat in the system comes mainly from three sources including: the exterior
surrounding areas of perforations, the edges of the perforations, which heat up the
passing air, and the cavity facing side of the steel skin (Van Decker et al., 2001). Similar
to the vent switches described in the Trombe’ wall, the transpired wall can also have a
summer by-pass vent on the top to let the hot air out in summer. In this case, the system

87
works similar to a solar chimney to cool the building by intensifying the buoyancy
effect.
The low maintenance/operation costs and a long life span can make transpired solar
walls more favorable choices, particularly for commercial buildings (NREL, 2019).
Additionally, on the wall that the transpired solar system is installed the steel skin can
block the interior heat loss and return it with the hot air provided within the cavity back
to the building. This system operates usually in combination with a fan or HVAC system
to reduce the energy required for heating the air before blowing it to the adjacent zones.
The air cavity with hot air behind the steel skin also reduces heating requirements by
providing an extra layer of insulation.
Another type of Trombe’ wall include water walls, which can have different variations
based on the type/content of the water containers applied in the wall. The containers
should have space for water expansion and in the case of using steel containers they
should be treated with rust inhibiting materials. Preventing the growth of algae in water
due to daylight passing through immovable water is another design consideration in
water walls. Algaecide is one solution to consider in this case. In some cases, the
container might be painted black on the exterior face to better absorb short-wave solar
radiation.

88
Although roof ponds are usually sized for their summer cooling effects, they can also be
used as an indirect gain system similar to water walls. The difference is their locations
on rooftops which can prevent the installation of skylights and roof monitors. This
system is more applicable in southern less humid and warm climates of the US, because
higher sun altitude during daytime and lack of snow facilitate the absorption of sun
radiation and movements of roof insulation panels. For roof pounds with double glazed
cover and movable night insulation panels Mazria (1979) recommends roof pond area
about 85% to 100% of floor area for 25° to 35°F winter average outdoor temperatures
(−4° to +2°C) and 60% to 90% of floor area for 35° to 45°F winter average outdoor
temperatures (2 to 7°C).
The time lag for heat transfer from outside to the occupied space is an important design
consideration in indirect gain systems. Time lag could be the result of material and
thickness of the tombe wall. For example, a 12 inch Trombe’ wall made of stone can
delay the arrival of maximum solar gain to the interior about 8 hours (Olgay, 1963).
Isolated gain systems are usually in the form of sunspace or greenhouses in buildings.
These systems are called isolated systems because they can store and isolate the solar
energy from adjacent living spaces to be used when needed. Isolated systems can also be
in the form of unoccupied storage spaces to integrate with direct gain systems. One
example is the rock beds usually placed directly beneath a concrete floor slab to store the
additional generated heat in a direct gain system. The disadvantage of rock beds below

89
grade includes potential mold growth due to condensation or groundwater surfaces and
difficulty in cleaning such locations. According to Mazria (1979) Rock bed volume (ft3)
per ft2 of solar opening is ¾ to 1½ in cold climates and 1½ to 3 in temperate climates. If
the rock bed surface area is in contact with the floor above then its recommended area is
75% to 100% of floor area above in cold climates, and 50% to 75% in temperate
climates (Grondzik and Kwok, 2015).
The heat stored in a sunspace can be transferred to living spaces next to it through
immediate doors and windows. However, a common wall between the sunspace and
living space can provide a better control over comfort condition in the living space. Both
masonry and insulated common wall sunspace system should include top and bottom
vents with 8ft distance from each other and area of about 3% of the common wall for
thermos-circulation (Grondzik and Kwok, 2015). Sunspaces should have a thermally
massive, perimeter‐insulated slab on grade floor. The shape of the sunspace rather than
its dimensions influences the sunspace performance.
2.3.1.4. Temperature Swing in Passive Heating Design
Temperature swing and the extent that indoor temperature will be higher than outdoor
temperature on a clear winter day (∆t solar) are of high importance to a passive solar
design. ∆t solar can be approximated from reference graphs in relation to LCR and
latitude of a design site (Balcomb et al., 1980).

90
After finding the ∆t internal from the below equation, the winter indoor temperature can
be determined by adding up the average January outdoor temperature, ∆t internal from
heat gains, and ∆t solar:
∆t internal= total internal gains (Btu/day) / BLC+ (UAs × 24)
In this equation UAs is for the solar area only. Usually ∆t internal is 5-7 F for residential
buildings. ∆t swing can be determined based on ∆t solar and Table 2.14 (Balcom et al.,
1980; Grondzik and Kwok, 2015).
Table 2.14 Indoor ∆t swing based on 45 Btu/ft2F thermal storage mass capacity (Balcomb et al., 1980; Grondzik and Kwok, 2015)
Passive solar system ∆t swing
Direct gain system with mass to glass area ratio of 1.5 1.11 × ∆t solar
Direct gain system with mass to glass area ratio of 3 0.74 × ∆t solar
Direct gain system with mass to glass area ratio of 9 0.37 × ∆t solar
Water wall 0.39 × ∆t solar
Trombe’ wall vented for 3% of wall area 0.65 × ∆t solar
Trombe’ wall unvented 0.13 × ∆t solar
It seems that our bodies are so used to the limited span of temperature swing and
comfort condition provided by modern day mechanical systems that it is difficult to
accept the passive systems’ temperature swings anymore. Therefore, calculation of
temperature swings in a passive solar building and its impact on the occupants’ comfort

91
range of temperature is of high importance in the design and implementation of a solar
building.
2.3.2. Natural/Passive Cooling and Natural Ventilation
The extent of design strategies for natural cooling of buildings is more diverse compared
to natural heating. The general approach for the adoption of passive cooling design
strategies begin with plotting the average monthly data on the building bioclimatic chart
(Figure 2.3) prepared by Milne and Givoni (1979). The maximum and minimum dry
bulb temperature and their corresponding relative humidity will be plotted on the chart
with a line connecting these two points. Each zone for the four passive cooling design
strategies covering the line can be a potential cooling design strategy.
Figure 2.3 Passive cooling strategies on a building bioclimatic chart (adapted from Milne and Givoni, 1979; Kwok and Grondzik, 2015)

92
Also locating a point on this chart corresponding to the summer DB and mean coincident
WB temperature, based on the available climate data, can reveal the applicable cooling
design strategies. The boundaries of the proposed strategies in this chart can vary to
some extent based on different factors such as physiological, behavioral, and cultural
factors. Today software programs such as Climate Consultant tailor this chart to each
climate with potential passive cooling and heating design strategies. One example of
using this software along with potential passive cooling/heating design strategies is
shown in Figure 2.4 for Las Vegas, Nevada.
The rest of this section will briefly review different passive/natural cooling strategies:
Cross ventilation is a well-known natural cooling strategy which also provides fresh air
and if needed can help increase the rate of air changes per hour at no cost. Grondzik and
Kwok through a reference graph chart explain how the inlet area as a percentage of total
floor area is related to wind speed and heat removal capacity in cross ventilation
(Grondzik and Kwok, 2015, p.344). The graph assumptions include: 3F° (1.7C°) internal
temperature above the exterior temperature(∆t), a wind direction not quite perpendicular
to the openings, and a wind effectiveness factor of 0.4. On this basis, for an inlet area
which is between 0 to 15% of the floor area and for a wind speed between 0 to 15 mph,
the cross ventilation capacity can vary from 15 to 150 Btu/ ft2-hr. A key factor in cross
ventilation design is to have outlet openings equal or larger than the inlet. The same can
be said for internal partitions. If the temperature difference of more than 3F was found

93
appropriate then the actual percentage of inlet area can be determined by multiplying the
percentage found from the mentioned graph with the ratio of 3F°/ ∆t.
Stack ventilation, or gravity ventilation, similar to cross-ventilation is related to stack
inlet area as a percentage of total floor area. The stack height also impacts the ventilation
capacity. These relationships can be shown on a similar chart for a 3F° differential when
indoor temperature is 83°F and an exterior temperature is 80°F (Grondzik and Kwok,
2015, p.344). Accordingly, for a stack area of 0 to 30% of the floor area and for 0 to 50
ft stack height difference the stack ventilation heat removal capacity can vary from 15
Btu/ ft2-hr to 75 Btu/ ft2-hr. For a higher temperature difference the same multiplying
ratio of 3F°/∆t is applicable. A good example of stack ventilation is solar chimney which
was also shown in the table Trombe’-1 for passive heating systems. The reason is that
gravity ventilation works based on thermal buoyancy effect. Therefore, when it is used
for connecting an air inlet in lower levels to heat the air through the chimney, before
reaching to the diffusers in upper level floors, it can be a heating system. The solar
chimney performs as a cooling system when through the buoyancy effect it exhausts the
hot air from an outlet to be replaced by the cold air from the surrounding inlet
vents/openings.
The rate of air circulation is a dependent of air temperature, height difference between
the inlet/outlet vents (H), and areas of the vent (Bradshaw, 2006): Q= 9.4 A (H.∆T)1/2

94
Figu
re 2
.4 P
assi
ve c
oolin
g an
d he
atin
g de
sign
stra
tegi
es fo
r L
as V
egas
, Nev
ada
usin
g C
limat
e C
onsu
ltant

95
Q is the air flow rate in CFM (L/sec), A is the smaller free area of the inlet or outlet
vents ft2 (m2), ∆T is the temperature difference between in incoming and outgoing air F
(C), and 9.4 is a proportionality constant (116 for SI units). For effective stack
ventilation the outlet area and its cross-sectional passage area should be at least equal to
the inlet area. The air inlet should be located as low as possible in areas with lower
temperature such as on the north side of the building (Bradshaw, 2006).
The airflow induced by stack effect has also been expressed through the equation below
(Iyengar,2015): Q stack=Cd × A × (2gh × ∆T/Ti)1/2
Q stack is the ventilation rate (m3/s), Cd equals 0.65 as a discharge coefficient, g is the
gravity acceleration (9.8 m/s2), A is the smaller free inlet/outlet opening, h is the height
difference between the inlet and outlet midpoints (m), ∆T is the difference between
average indoor and outdoor temperatures (K), and Ti is the average indoor temperature
(K).
Natural ventilation without thermal mass could be the only dependable natural cooling
approach in hot and humid climates as the temperature difference between day and night
is not considerable due to high relative humidity. The thermal mass is not required in
such climates and the building should be made of lightweight materials because the night
breeze is not cool enough to remove the heat stored during the daytime. This strategy
can be a type of cross ventilation but it occurs during night time when the wind is cool
enough to remove the heat from a building.
96
Natural ventilation with thermal mass or night flushing can be used in climates that
night time temperature falls below comfort zone to store coolth through natural
ventilation in the thermal mass of the building. The thermal mass will act as a heat sink
compared to the indoor condition of the building during daytime until it becomes warm
gradually when the night arrives to repeat the storage of coolth. Since night time hours
are less than daytime hours in summer the ventilation should occur quickly at night to
make the thermal mass cool enough for application during the day. In this case the night
purge (night flushing) could be assisted with fans to expedite the wind speed at night
which is usually lower than wind speed in daytime.
Courtyard has been a long-established natural cooling strategy in vernacular buildings
which is also used in contemporary building typologies. In climates with warm dry
summers this strategy, in combination with high thermal mass, is very effective. The
thermal mass of the floors/walls and the courtyard with open windows will store the
coolth during night time when the temperature is much lower than daytime. During the
day the windows are closed to keep the heat outside and the stored coolth inside the
building. The high thermal mass of the building will delay the heat transfer through the
envelope until night time when again the temperature is low. In some places the
courtyard might be covered with movable shading devices during daytime that can be
opened to sky for night time radiation.

97
Evaporative cooling is a useful strategy in hot and dry climates where adding humidity
to the air is a necessity to reduce the air dryness while reducing the dry bulb air
temperature. In this case the water added to the air will bring a point on a bioclimatic
chart to left along the constant wet bulb temperature. Evaporative cooling might be
applied to a hot dry condition through different designs and devices such as wind
blowing over a pool or wind blowing through wetted vegetation. In some cases, a fan
might be used to blow through a moistened material which is being constantly wetted
with water to introduce moist cool air into an occupied space. This fan driven cooling is
usually seen in evaporative coolers which is more an active design strategy than passive.
Radiant cooling is a natural cooling strategy in which radiation from a heat source to a
heat sink can occur directly or indirectly to reduce the temperature of the heat source.
The direct radiant cooling occurs through radiation of a building’s envelope components,
in particular its roof and yard, to the night sky. If a medium such as a heat transfer fluid
is added to this system, the fluid will cool down by radiating the heat back to sky which
in a next step can also cool the building. This cooling process is called indirect radiant
cooling (Lechner, 2015).
Roof ponds which were explained in passive heating systems can also cool a building
through the use of passive radiant cooling method in summer. During summer nights,
roof ponds lose heat through heat radiating to sky since the sky becomes a heat sink with
lower temperature. During daytime, roof ponds are covered with an insulation layer to

98
avoid sun exposure and to be used as a heat sink for the indoor environment. In winter,
roof ponds work similar to Trombe’ walls with the additional capacity of storing heat to
be used later at night. During daytime in winter roof pond is exposed to sunlight, but at
night an insulation layer covers the roof pond to avoid losing its heat through sky
radiation. Due to cosine law this system works better for non-flat roofs and in latitudes
below 30°. Roof ponds can have different configurations as shown in Table 2.15 (Sharifi
and Yamagata, 2015).
Table 2.15 Different types of roof ponds in the literature (Sharifi and Yamagata, 2015) Type Sub-type Open roof ponds Open pond with sprays
Open pond without sprays Roof ponds with movable insulation (covered daytime)
Pond with continuous spray Pond with nighttime spray Pond without spray Skytherm
Roof pond with floating insulation Energy roof (Roof pond with floating insulation) Cool roof
Walkable roof ponds -Roof pond with insulation embedded within the pond -Walkable roof pond with night water circulation
Roof ponds with gunny bags -Roof pond with wet gunny bags -Shaded roof pond with wet gunny bags
Shaded roof ponds -Shaded pond with water enclosed in watertight bags -Shaded pond with water spray -Shaded pond without water spray -Cool-pool
Ventilated roof ponds - Closed roof ponds
-Evapo-reflective roof pond -Roof pond with additional insulation layer
Earth contact can increase the coolth of a building in summer as in earth sheltered
buildings. Solar radiation will be blocked and temperature swing will be dampened due
to a more stable temperature and high-mass cooling of the earthen material. The earth

99
contact can directly or indirectly be used as a natural cooling strategy. In direct contact
with earth a building can lose heat directly to the earth while in indirect contact the air
passing through an earth tube reaches lower temperature before entering the building. In
some cases, for this strategy the term earth coupling has been used instead of earth
contact (Lechner, 2014).
Green roofs similar to soil materials in earth sheltering create an insulation layer on
rooftops, reduce ambient air temperatures, and decrease building energy consumption.
Green roofs besides reducing energy consumption provide water retention, green space,
and improved water and air quality. Up to 30% of nitrogen and phosphorus released into
receiving waterways come from the accumulated dust on rooftops. Acting as natural bio-
filtration materials, green roofs can also reduce this water contamination (WBDG,
2017).
Green roofs may be implemented in three different categories from extensive green roofs
with 2.5”-8” thickness to semi-intensive green roofs with 4.5”-10” thickness and
intensive green roofs with 6”-39” thickness. The level of maintenance and the depth of
vegetation’s roots increase with the increase of the green roof thickness (Palette 2030,
2018).
Green roofs reduce their ambient temperatures, since grass and vegetation absorb part of
the solar radiation for photosynthesis. In an experiment the temperatures of five ground

100
covering materials were measured at 10 am and 2 pm on the campus of Frostburg State
University in Maryland. The results showed the lowest temperature for grass surfaces.
Rankings from coolest to hottest surfaces included: grass surface, concrete surface, brick
surface, filed track surface, asphalt surface, and Astroturf surface. In another experiment
summertime data recorded showed significantly lower peak roof surface temperatures
and higher nighttime surface temperatures for the green roof. The maximum average day
temperature for the green roof surface in this experiment was 91°F (33°C), or 39°F
(22°C) lower than the conventional roof surface temperature (Sonne, 2006).
While vegetation on green roofs reduces the ambient temperature, there are some
discussions about green roofs’ effectiveness compared with roof insulation materials
(Lstiburek, 2011). The same comparison between reflective membranes on rooftops and
green roofs may indicate that green roofs are not necessarily the least expensive and
most efficient passive cooling strategies available (Lstiburek, 2011).
Shading: shading a building from direct and diffuse sunlight can considerably reduce
the cooling load of a building. With the same logic if the shading design is not properly
matched with the location/latitude of the site it can considerably increase the heating
load of a building. For example, any fixed overhang deep enough to shade a southern
window during the overheating season can also shade the window more than needed
during the under-heated period (Lechner, 2014). In this case blocking the direct and

101
reflected sunlight in hot and dry climates and blocking the diffuse radiation in hot and
humid climates are important.
Therefore, a variety of shading devices may be more appropriate in different climates.
For example, removable overhangs are more useful in hot and dry climates to block the
direct sunlight when needed, while different types of louver systems in hot and humid
climate may better block the diffuse radiation and allow the direct sunlight when needed.
Use of deciduous and evergreen plants is another possibility to consider for shading.
Particularly when a shading device needs to be removable in winter to allow for
harvesting the direct solar radiation, deciduous trees if planted in the right place may
better fulfil this requirement.
The orientation of a building façade can also determine which shading device should be
selected. Typically fixed shading devices can be in the form of vertical fins, horizontal
fins, or their combination as in the case of eggcrate shading devices. Vertical fins are
more appropriate for eastern and western sides of a building while horizontal shading
devices are more usable on the southern face to avoid under-heating or low level of
daylighting. The overhangs and fins in some cases may be slanted to better shade the
windows in overheating period. Proper design of a shading device needs the sun path of
a certain location and then reflecting the performance of the shading device on the sun
path. Lechner has discussed the procedure for such a design (Lechner, 2009, p.228).

102
Lechner has provided several tables for the design of shading devices in different
latitude of the US and for both skin dominated and internal load dominated buildings
(Lechner, 2009, p230-p236). Table 2.16 is one example showing the relationship of the
angle between the projected shade line and the normal vector on the east/west façade of
a building in plan (Angle D) and the latitude of the building. Use of this angle for
slanting the vertical fins on east/west of a building towards the north can provide shade
from the direct sunlight for the whole year between 7 AM and 5 PM (Lechner, 2009,
P.236).
Table 2.16 Table for vertical fins slanted to the north and installed on east/west façade (Lechner, 2009)
Latitude Angle D
24 18
28 15
32 12
36 10
40 9
44 8
48 7
The location of installing a shading device as being an interior or exterior device can
also change the energy performance of building. Interior shading devices such as louver
systems can cause heat built up between the louvers and the glazing inside the building
thereby increasing the cooling load. However, installing the same louver system outside
as an exterior shading system can resolve this issue. In this case, other design factors
such as exposure of the louver slats to the outdoor weather condition and durability of

103
the system should be considered in selecting between an interior or exterior shading
system.
With the advance of the technology, dynamic shading devices have emerged which in
fact are integrated parts of building components. A case in point are windows with
electrochromic shade or sensor control. In electrochromic windows materials change
color or switch from transparent to opaque through the application of an electric voltage.
A blue electrochromic window glazing can gradually become transparent over a few
minutes when the electric current passes through it. Such smart windows can
considerably save on a building’s total energy consumption. In a building performance
simulation, the electrochromic windows reduced electricity consumption for cooling by
49%; reduced the peak electrical demand by16%; and lowered the lighting costs by 51%
(Verrengia, 2010). A drawback of these glazing systems is their cost which is currently
several times more expensive than the usual type of glazing materials.19 Additionally,
the durability of the electrochromic materials are questionable.
Finally, it should be kept in mind that shading a building is not only a matter of design
for energy and comfort, but also is a matter of integration with other design factors such
as visual comfort and architectural aesthetics. Double roof as a passive cooling design
19 A single large smart window typically comes in at around $500–1000 dollars (about $50–100 per square foot). For further information, please see https://www.explainthatstuff.com/electrochromic-windows.html accessed December 2018.

104
strategy in hot climates is one example, which can be used to not only shade a building
but also to add to the formal features of a building through a floating structure above the
actual occupied building. In this case, the second roof structure located immediately
above the actual roof shades the roof. This structure allows the buildup warm air
between the roof and the structure to escape through the air cavity through natural
ventilation. This structure can also become a design opportunity to integrate the cooling
function with formal aesthetics. In hot climates direct sunlight is the major cause of
increased building cooling load, and therefore, shading a roof as the major recipient of
direct sunlight in a building will reduce cooling requirements (Palette 2030, 2018). The
extend roofline can shade exterior walls, and cross ventilation or ridge vents can
ventilate the air cavity between the roofs.
Downdraft cooling strategies usually are based on the evaporation of water at the top of
a cooling tower to create a downdraft of cooled air for circulation inside a building. The
increased moisture density of the air at the top of the cooling tower along with the force
of the desired winds will push the air down the tower to replace the stale warm air,
which is sometimes exhausted through the tower because of a solar chimney effect. The
amount of cool air from the tower depends on the outdoor humidity, tower height, and
the amount of evaporated water (Palette 2030, 2018). The general rule of thumb in
designing a cooling tower is to consider its height at least two times the height of the
building with a cross-sectional area of about 33 ft2 (3 m2) for residential buildings and
64 ft2 (6 m2) for commercial buildings. The outlet opening should be as large as the

105
cross-section of the cooling tower. As the height of the tower increases the amount of its
air delivery increases as well (Palette 2030, 2018; Givoni,1994).
The airflow of a cooling tower can be predicted through the equation below:
Vwind= KAV
Vwind is the volume of airflow (m3/h), K is a constant as the coefficient of
effectiveness, A is the area of smaller opening (m2), and V is the outdoor wind speed
(mph). K depends on the angle of the wind and the relative size of inlet/outlet openings:
it varies from 0.4 for wind blowing at a 45° angle of incidence at the inlet to 0.8 for wind
blowing directly at 90° (Iyengar, 2015).
To conclude the review of passive cooling design strategies and to have a flow of
decision making, Grondzik and Kwok provided a table, which summarizes the steps to
be taken for design and calculation of the set of passive cooling strategies. Below is a
synopsis of these considerations. In selecting these strategies, the right match between a
climate and a design strategy should be studied first (Grondzik and Kwok, 2015).
Design Guidelines and Detailed Calculations Considerations:
Cross‐Ventilation
• Assume 3F° [1.6C°] Δt
• Assume window is oriented to wind
• Use actual Δt
• Use actual window orientation to wind
Stack Ventilation

106
• Assume 3F° (1.6C°) Δt • Use actual Δt
Night Ventilation of Thermal Mass
• Assume ratio of mass area/floor area
• Assume cooling during hour of maximum Δt
• Assume maximum Δt for natural ventilation estimation
• Find total cooling and required air flow rate
• Use actual exposed mass area
• Use actual mass heat capacity
• Use actual hourly chart of air and mass temperatures
Evaporative Cooling (Active)
• Assume 2.67 cfm/ft2 floor area (13.6 L/s m2)
• Assume 83°F (28.3°C) exhaust air
• Find allowable Δt as air passes through indoors
• Then cfm = (Btu/h)/(1.1) (Δt) [L/s = W/(1.2)(Δt]
• Use actual outdoor temperature for analysis
• Determine actual indoor air temperature
Cool towers (Passive, Evaporative)
• Find approximate exit air temperature
• Find approximate flow rate
• Then Btu/h = (cfm) (1.1) (Δt) [W = (L/s) (1.2) (Δt)]
• Use actual outdoor temperature and wet‐bulb depression
• Find actual exit air (supply) temperature

107
• Find actual exit airflow rate
• Then Btu/h = (cfm) (1.1) (Δt) [W = (L/s) (1.2) (Δt)]
Roof Ponds
• Assume pond maximum temperature of 80°F (26.7oC)
• Estimate pond minimum temperature
• Assume 30% gain through roof insulation
• Assume pond depth from 3 in. to 6 in. (75–150 mm)
• Find pond depth and area
• Use actual outdoor temperature, resulting pond temperature
• Use actual heat gain through roof insulation
• Consider actual hours of internal heat gains
• Find pond depth and area
• Determine size of backup cooling
Earth Tubes
• Assume 65°F (18.3°C) soil temperature
• Assume soil conductivity
• Does not specify depth
• Assume 85°F (29.4°C) outdoor air
• Assume 500 fpm (2.5 m/s) velocity
• Choose diameter and length to match cooling load
• Actual underground temperature; assume resulting tube temperature is within 4F° (2.2
C°)

108
• Actual soil conductivity
• Actual depth
• Actual outdoor air temperature
• Assume 500 fpm (2.5 m/s) velocity
• Calculate actual cooling capacity
2.3.3. Building Envelope
It seems that today the phrase “passive design” has expanded its boundary of definition
to include building envelope features, such as air-tightness, thermal bridges, R-Values,
and U-Values of building envelope components, as passive design strategies. This
expansion of the definition of passive design even in some cases has rendered the use of
legacy passive systems obsolete as was reviewed in the section 2.2 on the history of
passive design.
Meanwhile, the inclusion of building envelope design as a passive system strategy seem
to be more plausible if we consider its integration with legacy passive design strategies.
Use of Phase Change Materials (PCM) in building walls or roofs is one example of this
kind, which was explained earlier in the design of Trombe’ walls in section 2.3.1. A
good example of integrating legacy passive systems with building envelope components
could be double skin facades. Double Skin Facades (DSF) have a mechanism similar to
indirect or isolated solar gain systems. This type of facades, in fact, with a layer of air
cavity behind the first glazing skin can form compact sunspace areas in front of the
109
second skin of a building. In the case of using an opaque material for the first outside
skin, the system will perform more as a Trombe’ wall. Transpired solar wall systems are
examples of this kind where active systems, such as fans and HVAC components, are
integrated with the passive system. This performance integration was explained in
section 2.3.1.
DSFs might be categorized in four different types depending on the form of their air
cavity between the two skins (Barbosa and Ip, 2014). These categories include: Box
window (i.e. air cavity is divided to smaller cubic forms by vertical and horizontal
elements of the facade) shaft-box (i.e. air cavity is divided to vertical cubic forms by
façade elements) corridor (i.e. air cavity is divided to horizontal cubic forms divided by
façade elements) multi-story double skin façade (air cavity is connected and expanded
throughout the whole façade). Table 2.17 shows different types of DFS along with
design comments developed through studies conducted in specific locations/climates on
DSFs (Ghaffarianhoseini et al, 2016).
The issue of overheating and fire safety could be two of the main design considerations
in using double skin facades. With the exception of box-window DSFs, the air cavity in
other types of DSFs can accelerate fire distribution throughout the whole building.

110
Table 2.17 Examples of the types of DSFs used in different locations and their findings (Ghaffarianhoseini et al., 2016).
Type of DSF design Location/climate
Comments
Naturally ventilated DSF Sub-tropical Hong Kong A set of correction factors for OTTV calculation of air-conditioned commercial buildings constructed with naturally ventilated DSF
Novel photovoltaic DSF Sub-tropical climate Ventilated PV-DSF provides the lowest solar heat gain coefficient (SHGC), while the non-ventilated PV-DSF better reduces heat loss
Multistory DSF Sunny summer day, Uccle, Belgium
The night natural ventilation is highly effective
Single floor DSF equipped with a venetian blind
Not specified The distance between the blind and the external glazing has significant influence on the velocity profiles inside the facade channel.
DSF with thermal mass Not specified Mechanically ventilated DSFs can save energy from 21% to 26% in summer and 41–59% in winter
Typical DSF (clear, absorptive or reflective glass)
Hong Kong DSF system with single clear glazing as the inner pane and double reflective glazing as the outer pane results in an annual saving of approximately 26% in building cooling energy. (other energy saving studies: clear glazing 4.8%, reflective single glazing 22.1%, clear double glazing 0.3%)
Typical DSF Seoul, Korea Use of DSF is credited with providing 5.62% reduction in energy consumption. Decreasing the cavity depth of the DSF resulted in decreasing the energy consumption
DSF with plants Not specified Temperature of each layer of the DSF was approximately twice lower forthe case with plants than with blinds. Use of plants in the DSFs (in naturally ventilated buildings) decreases the operation time of ventilation in the warm period and increases the operation time in the cold period.

111
Table 2.17 Continued Type of DSF design
Location/climate Comments
Typical DSF
Kitakyushu of Japan 10–15% energy saving for cooling in summer plus 20% to 30% energy saving for heating in winter
Typical DSF
Central European moderate climate
7% cooling energy saving compared to double/triple glazed façades.
Ventilated opaque DSF Not specified Exhaust air facade configuration (EAF): heat loss reduction between 43% to 68%, Supply air facade configuration (SAF): pre-heating efficiency between 9%-20%
Mechanical DSF Summer time, Tokyo, Japan
Temperature reduction of double-skin space by 1 °C
Double skin Glazed Façade (DGF)
Sunny Mediterranean climates, Northwest region of Argentina, spring/summer
Well-designed DGFs can decrease the summer energy consumption of buildings, even using West DGFs, in sunny climates.
Multi-story naturally ventilated DSF
Belgrade, Serbia DSF does not necessarily decrease energy consumption
Typical DSF Hot and dry climate, Iran
Increasing airflow velocity within the cavity solves the overheating problem and allows DSFs to perform in hot and dry climates.
Another type of advanced use of passive systems could be found in adaptive facades,
which can include different technologies for reaction through the use of ambient
conditions. Kinetic facades and curtain walls with switchable glazing materials could be
two examples of this kind. Adaptive facades can be categorized based on their purpose
of use, response function, operation mechanism, components, response time, installation
integration, and degree of adaptability. Table 2.18 shows examples of the possibilities
for designing adaptive facades based on these categories.

112
Table 2.18 Possibilities for the design of adaptive façades
Adaptive facades can react based on a change in environmental conditions such as wind
velocity, air pollution, temperature, humidity, noise, or solar radiation. In a review study
conducted by Aeleneia et al. (2016) solar radiation together with outdoor temperature
found to be the most common external factors associated with the reaction of adaptive
façades. Meanwhile, it should be kept in mind that adaptive facades could not be
considered passive systems if they use active systems, such as mechanically-assisted
actuators or non-renewable energy sources, for reaction in different environmental
conditions.
2.3.4. Daylighting
About 40% of commercial buildings energy consumption is associated with electric
lighting (Lechner, 2015). Daylighting can significantly reduce this percentage of energy
consumption as a free natural system. The importance of daylighting is such that it is the
Category Design Consideration Possibilities Purpose Thermal comfort, energy performance, IAQ, visual comfort, acoustic
performance, control Responsive function Prevent, reject, modulate, and collect
Operation Intrinsic and extrinsic
Components (materials and systems)
Shading, insulation, PCM, switchable glazing, solar tubes, integrated solar systems, and shape memory alloys
Response time Seconds, minutes, hours, day, seasons, years
Installation integration Building material, façade element, wall, window, roof, and whole building
Degree of adaptability
On-off or gradual

113
only natural system strategy recognized by LEED rating system with 1 point if 75% of
the building is daylit and 2 points if 95% of the building is daylit (LEED BD+C, 2017).
Additionally, a major part of cooling loads and heating loads in buildings can be
compensated through a well-integrated design for daylighting and solar radiation control.
Lechner has proposed a three-tier approach in lighting design which includes: tier one
for color/material of finishes and lighting geometry such as building orientation or
opening dimension; tier two, daylighting; and tier three, electric lighting (2015).
Unfortunately, issues such as glare, overheating, and shallow depth of sunlight
penetration in buildings limit the usability of daylighting as a natural design strategy. For
example, only the first 15 ft. distance from a window can be fully daylit. The next 15 ft
will be only partially daylit and beyond that the use of artificial light is necessary to
illuminate the interior space (Reinhart, 2014). This depth of illumination can be changed
through small changes in the exterior form or the interior layout of a building. For
example, inserting an atrium in the core of a building larger than 30’ by 30’ can fully
illuminate the whole interior with the help of sidelights. A variety of light guiding
systems such as skylights exist which similar to an atrium can contribute to the
promotion of the interior illumination. Table 2.19 represents a summary of examples of
light guiding systems in buildings along with their strength/weakness.
Other approaches to bring daylighting to the core of a building include: roof light, light
shaft, light duct, light pipe, skylights, light shelves, light louvers, and external reflectors.

114
Roof lights can have different form as skylights, roof monitors, clerestory windows, or
saw-tooth rooftop skylights. Meanwhile, the percentage of rooftop openings usually is
kept between 3 to 5% of the roof area (ASHRAE 90.1-2013) due to issues such as
overheating or air infiltration/leakage, which can increase a building’s energy
consumption.
Light shelves are more useful if installed outside of a window than inside, since they can
collect more daylighting to be reflected to the indoor space. Additionally, outdoor light
shelves can better shade a window is summer and their impact on limiting the field of
view through a window for occupants is less tangible. Light shelves not only expand the
light penetration distance through reflection, but also they can reduce glare by turning
the direct sunlight to diffuse sunlight.
Louver systems can have different functions such as blocking views, reducing glare, or
distrusting the direct sunlight through reflections inside a building. The performance of
louver system depends on the shape and form of its blind modules. Concave, convex, or
flat blind modules can have different impact on the level of illumination inside a
building. In some cases, a combination of these forms can shape a profile section for
each blind module to block the intense summer daylight while allowing the winter
daylight to the inside for better passive heating.

115
A criterion to measure the appropriateness of the level of daylighting inside is
daylighting factor (DF) which is expressed as a percentage ratio of the interior
illuminance to the outdoor unobstructed horizontal illuminance (Grondzik and Kwok,
2015). However, in the last years, new metrics have been added to daylighting studies
and are being developed due to insufficiency of the DF for daylighting analysis. Metrics
such as Annual Solar Exposure (ASE) and Spatial Daylight Autonomy (SDA) are
examples on this ground.
Light shafts or light wells or. Light wells become more efficient as the ratio between the
width of the light well to its height increases because less light is absorbed by the
reduced number of reflections (Lechner, 2015). Using reflective materials for the
finishes of the light well/shaft can increase the transmission of light to the bottom of the
light well/shaft. Light ducts similar to light shafts use the light reflection mechanism to
transmit/guide the light to a desired point usually located at the core of a building. The
difference between light ducts and light shafts is in their transmission direction: light
ducts usually guide the reflected light horizontally and light shaft guide the light
vertically to the depth of the shaft.
Light pipe is the most recent technology for light guiding systems, and also the last
system to be reviewed here. In some cases, light pipes’ and light tubes’ terminologies
might be used interchangeably. Different from light tubes or tubular skylights, which use
surface reflection, light pipes are hollow and made of prismatic plastic films to transmit
light by total internal reflections. Light pipes can also work as active systems if they use

116
electric sources of energy and integrate with fiber optics to transmit the light (Grondzik
and Kwok, 2015).
Table 2.19 Strengths and weaknesses of light guiding systems by previous researchers. (Wong, 2017)
Light guiding system
Tilt-able Solar Shading
Ease of application
Ease of maintenance
Thermal reduction
Allow view
Light guiding shade
No Yes Window Easy Yes Yes
Reflective blinds Yes Yes Window Easy Yes Limited Venetian blinds Yes Yes Window Easy Yes Limited
Movable blinds Yes Yes Window Easy Yes Limited
Light shelves No Yes Window Easy Yes Yes
Prismatic louvers
Yes Potential Window Easy Yes Limited
Mirror systems No Yes Fixed louvre Difficult Yes Limited Prismatic glazing
No Potential Window & roof
Difficult Yes Limited
Translucent louvers
Yes Yes Window Difficult Yes Limited
Transparent insulated glazing
No Potential Inside double glazing
Easy Potential Limited
Toplight on roof No No Roof Difficult Potential Limited
Solar screens No Yes Window Difficult Yes Limited
Skylight on roof No No Roof Difficult Potential Limited
Lightscoop skylight
No No Roof Difficult Potential Limited
Shed-type rooflight
No No Roof Difficult Potential Yes
Holographic films
No Yes Inside double glazing
Easy Potential Yes
Active modular glazing panel
No Yes Window Easy Yes Yes
Three-layered rooflight
No No Roof Difficult Potential Limited
Façade panels with PCM
No Potential Inside double glazing
Easy Potential Limited

117
2.4. Factors Influential in Passive Systems Applications
The increase or reduction in the application of passive/natural systems in buildings in the
US can be assigned to a number of institutional and implementation factors. Examples
include: building standards and rating systems, simulation tools, client and design team
collaboration, knowledge for integrating mechanical and passive systems, climate, and
experience of the design team. This section will discuss these factors and their possible
impacts on the use of passive systems with a focus on the US geography.
2.4.1. Building Standards and Rating Systems: The Status Que
One of the obstacles for the implementation of passive/natural systems in buildings
could be the low level of attention for providing incentive credits for the application of
passive/natural systems. Although the passive design approach has been recognized in
recent years in the latest green building rating systems worldwide, it seems that the focus
of these ratings systems is mostly on building envelope features including: walls, roofs,
fenestration, insulation materials, and air-tightness, versus any treatment of add-on
passive systems.
2.4.1.1. Rating Systems and Codes in Relation to Active/Passive Design Strategies
Consideration of the growth of the number of rating systems in the world can better
indicate the scale of the unutilized potential energy saving from the incorporation of
assessment categories for passive design in rating systems. These rating systems began
with BREEAM (Building Research Establishment Environmental Assessment

118
Methodology) in 1990 in UK and spread worldwide, such as is the case of BREEAM
CH for Switzerland in 2014. The World Green Building Council currently lists 45 green
rating systems from across the world from which Table 2.20 lists some examples with
their first year of establishment and relevant assessment categories (WGBC, 2018).
Most of the rating systems in Table 2.20 evaluate the synthesized performance of a
building by considering their fulfilment of prerequisite credits and summing up the
weighted set of other credits achieved for all performance categories. There are some
exceptions such as in the case of Green Globes rating system, which does not include
any prerequisite credits or CASBEE which calculates the ratio of environmental quality
to environmental load reduction through its rating system. Among these rating systems,
LEED v4 is the green building rating system in the US, which has also been adopted on
an international scale. While the LEED program has promoted its assessment of the use
of renewable energy in buildings in version 4, compared with other global rating systems
it still has very few credit scores assigned to the use of passive systems in buildings.
A comparative examination of five representative rating systems selected from Table
2.20 will better indicate the lack of LEED’s attention to the use of passive systems in
buildings. These rating systems include BREEAM (Building Research Establishment
Environmental Assessment Method), LEED (Leadership in Energy and Environmental
Design), CASBEE (Comprehensive Assessment System for Building Environmental
Efficiency), BEAM (Building Environmental Assessment Method) Plus and GBL-
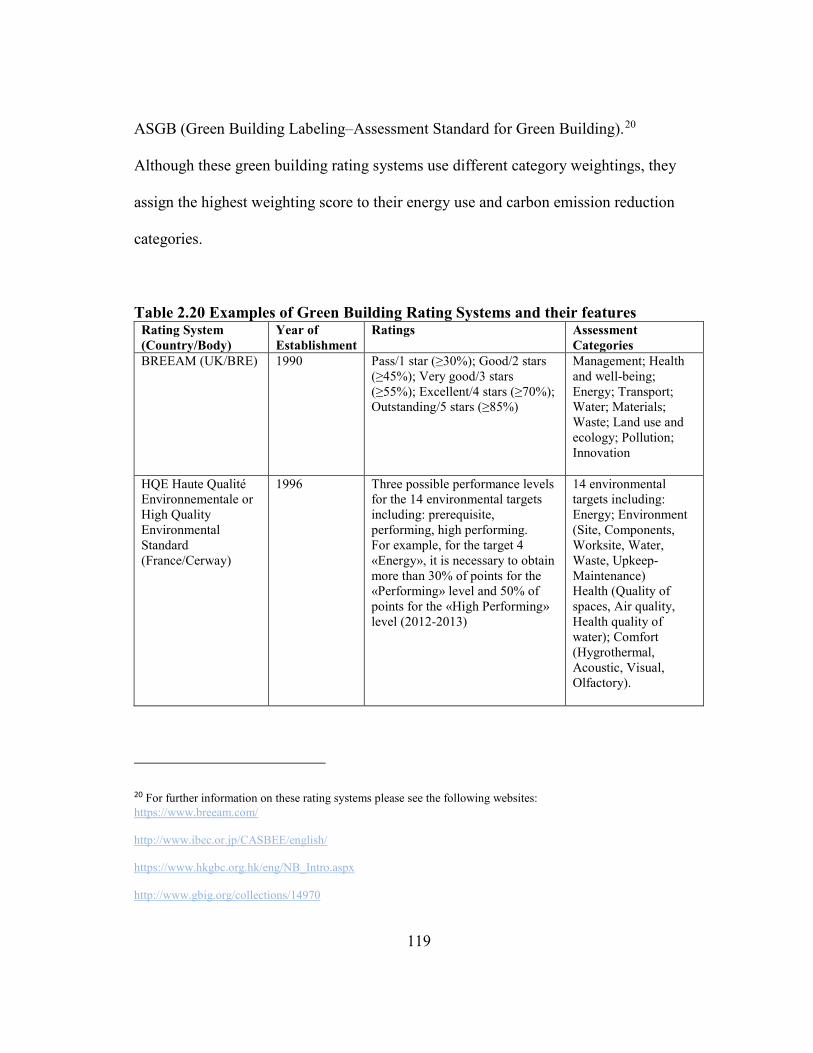
119
ASGB (Green Building Labeling–Assessment Standard for Green Building).20
Although these green building rating systems use different category weightings, they
assign the highest weighting score to their energy use and carbon emission reduction
categories.
Table 2.20 Examples of Green Building Rating Systems and their features Rating System (Country/Body)
Year of Establishment
Ratings Assessment Categories
BREEAM (UK/BRE) 1990 Pass/1 star (≥30%); Good/2 stars (≥45%); Very good/3 stars (≥55%); Excellent/4 stars (≥70%); Outstanding/5 stars (≥85%)
Management; Health and well-being; Energy; Transport; Water; Materials; Waste; Land use and ecology; Pollution; Innovation
HQE Haute Qualité Environnementale or High Quality Environmental Standard (France/Cerway)
1996 Three possible performance levels for the 14 environmental targets including: prerequisite, performing, high performing. For example, for the target 4 «Energy», it is necessary to obtain more than 30% of points for the «Performing» level and 50% of points for the «High Performing» level (2012-2013)
14 environmental targets including: Energy; Environment (Site, Components, Worksite, Water, Waste, Upkeep-Maintenance) Health (Quality of spaces, Air quality, Health quality of water); Comfort (Hygrothermal, Acoustic, Visual, Olfactory).
20 For further information on these rating systems please see the following websites: https://www.breeam.com/
http://www.ibec.or.jp/CASBEE/english/
https://www.hkgbc.org.hk/eng/NB_Intro.aspx
http://www.gbig.org/collections/14970

120
Table 2.20 Continued
Rating System (Country/Body)
Year of Establishment
Ratings Assessment Categories
BEAM Plus (Hong Kong)
1996 The Overall Assessment Grade is determined by the percentage (%) of the credits gained under each performance category and its weighting factor. It is necessary to obtain a minimum percentage (%) of credits for the three categories of SA, EU and IEQ, in order to qualify for the overall grade as follows. Platinum/Excellent (≥75% with min 70% for the above 3 categories); Gold/Very Good (≥65% with minimum 60% for the 3 categories); Silver/Good (≥55% with minimum 50% for the 3 categories); Bronze/Above Average (≥40% with minimum 50% for the 3 categories)
Management; Site Aspects; Materials and Waste Aspects; Energy Use; Water Use; and Indoor Environmental Quality
LEED (US/USGBC) 1998 Platinum (≥80 points); Gold (60-79 points); Silver (50-59 points); Certified (0-49 points)
Sustainable sites; Water efficiency; Energy and atmosphere; Materials and resources; Indoor environmental quality; Innovation and design process; Regional priority
Green Globes (Canada/GBI)
2000 To become Green Globes-certified, each project must achieve a minimum of 35% of the total applicable points. Certified projects are assigned a rating of 1 to 4 Green Globes. 4 Globes (85-100%); 3 Globes (70-84%); 2 Globes (55-69%); 1 Globe (35-54%)
Project Management; Site; Energy; Water; Materials & Resources; Emissions; Indoor Environment
CASBEE (Japan/IBEC)
2001 Poor C (0-0.5); Slightly poor (0.5-1); Good B+ (1-1.5); Very good A (1.5-3); Superior S (≥3)
Energy efficiency; Resource efficiency; Local environment; Indoor environment

121
Table 2.20 Continued
Rating System (Country/Body)
Year of Establishment
Ratings Assessment Categories
Green Star (Australia/GBCA)
2003 One star (10-19 points); Two star (20-29 points); Three star (30-44 points); Four star (45-59 points); Five star (60-74 points); Six star (≥75 points)
Management; Indoor environment quality; Energy; Transport; Water; Materials; Land use and ecology; Emissions; Innovation
Green Mark (Singapore/BCA)
2005 Platinum (≥90 points); Gold Plus (85-89 points); Gold (75-84 points); Certified (50-74 points)
Energy Efficiency; Water Efficiency; Environmental Protection; Indoor Environmental Quality; Other Green Features and Innovation
LiderA (Portugal)
2005 From A++ to E: Class E is the common practice, and other ratings will be assigned based on how it surpasses this performance, for example: 25% will be a C class, 50% an A class, four times an E class is an A+ Class, and ten times an E class is an A++ Class.
Site and Integration; Resources; Environmental Loads; Environmental comfort; Socio-economic adaptability; Environmental Management and Innovation
GBL–ASGB (China)
2006 Three-Star (Overall≥80, Each Category≥40), Two-Star (Overall≥60, Each Category≥40), and One-Star (Overall≥50, Each Category≥40)
Energy saving and utilization; Water saving and utilization; Material saving and utilization; Land saving and outdoor environment; Indoor environment quality
DGNB (Germany) 2009 Bronze (≥35% points); Silver (≥50% points); Gold (≥65% points); Platinum (≥80% points)
Environmental quality; Economic quality; Sociocultural and functional quality; Technical quality; Process quality; Site quality

122
Table 2.20 Continued
Rating System (Country/Body)
Year of Establishment
Ratings Assessment Categories
IGBC (India) 2009 Certified (40-49 points); Silver (50-59 points); Gold (60-74); Platinum (75-100)
Sustainable Architecture and Design; Site Selection and Planning; Water Conservation; Energy Efficiency; Building Materials and Resources; Indoor Environmental Quality; Innovation and Development.
Green Building Index (Malaysia)
2009 Certified (50-65 points); Silver (66-75 points); Gold (76-85 points); Platinum (86-100 points)
Energy Efficiency (EE); Indoor Environment Quality (EQ); Sustainable Site Planning & MANAGEMENT (SM); Materials & Resources (MR); Water Efficiency (WE); Innovation (IN)
GreenShip (Indonesia)
2010 For level of Design Recognition (DR) achievement includes Platinum (Minimum 73% with 56 points); Gold (Minimum 57% with 43 points); Silver (Minimum 46% with 35 points); Bronze (Minimum 35% with 27 points)
For level of Final Achievements (FA) includes Platinum (Minimum 73% with 74 points); Gold (Minimum 57% with 58 points); Silver (Minimum 46% with 47 points) Bronze (Minimum 35% with 35 points)
Appropriate Site Development; Energy Efficiency and Conservation; Water Conservation; Material Resources and Cycle; Indoor Health and Comfort; Building Environment Management

123
Most of the credits of energy categories are associated with building performance
assessments that are conducted through whole-building energy simulations by
comparing the predicted energy use of a new building with a reference basecase energy
consumption. A simpler approach for gaining credits in energy categories through green
building rating systems is the prescriptive approach, in which each component of the
building should be built to a certain standard (e.g. roof R-value 20). Chen et al. (2015)
have considered this contribution of the building envelope components to energy saving
through the prescriptive approach as passive design. These passive design strategies
could be classified into building layout, envelope thermophysics, building geometry, and
air-tightness/infiltration.
Comparison of the weighting score of the five rating systems based on the contribution
of their passive design strategies indicates that LEED has the lowest weighting score for
passive design relative to its total credit scores in energy categories. On this basis,
passive design weighting in energy section is 50%, 47.7%, 22.1%, 13.3%, and 9.1% for
CASBEE, BEAM Plus, GBL-ASGB, BREEAM, and LEED rating systems respectively
(Chen et al., 2015). The low percentage of LEED contribution to passive energy saving
calls for further attention considering that two-thirds of the occupants’ discomfort could
be eliminated by using simple passive designs such as proper envelope thermophysical
properties and envelope configurations (Ralegaonkar and Gupta, 2010).

124
A closer look at the credits achievable through passive design shows that, first, in all the
rating systems there is a potential for introducing credits for passive systems beyond
building envelope features and airtightness; and second this potential is much higher for
the LEED rating system which focuses mainly on building envelope features.
For example, BREEAM passive design credits include 2 points for the two assessment
criteria of “passive design analysis” and “free cooling.” Passive design analysis criterion
can achieve one point by meeting the thermal comfort requirements, identification of
opportunities for passive design solutions in concept design, and demonstrating a
reduction of total energy consumption as a result of passive design.
If the BREEAM criterion of passive design analysis is met, then the free cooling
criterion can also achieve one point either through identifying opportunities for the
implementation of free cooling solution or by demonstrating the consideration of
appropriate technologies from the followings strategies:
• night-time cooling, which could include the use of exposed thermal mass
• ground-coupled air cooling
• displacement ventilation not linked to any active cooling system
• ground water cooling
• surface water cooling
• direct or indirect evaporative cooling
• desiccant dehumidification and evaporative cooling using waste heat, and

125
• absorption cooling using waste heat
• the applied technology could also show that the building does not require
any significant form of active cooling or mechanical ventilation (i.e. is
naturally ventilated).
Among the five rating systems, CASBEE seems to consider the highest level of
importance for the incorporation of passive/natural systems in buildings. This rating
system assigns 2.5 points to passive design through two assessment criteria including
building thermal load and direct use of natural energy. Building thermal load can
achieve credits through the use of:
• appropriate building site plan
• high insulation construction methods and materials in buildings such as in
roofs/walls
• sun-shading methods
• measures such as high insulation multi-pane windows, airflow windows,
and double skin facades.
Direct achievement of natural energy credit in CASBEE is also possible through the use
of natural light, natural ventilation, geothermal energy, and other natural energy sources
excluding mechanical systems.
BREEAM Plus 16, similar to CASBEE promotes the use of passive design strategies
through its assessment criteria. BEAM assessment criteria includes:

126
• Site planning/building orientation including site permeability compared to
PNAP-APP 152 requirement21 by Building Department of Hong Kong
(BDHK) or calculation of solar radiation on a building’s façade
• Building envelope including Overall Thermal Transfer Value (OTTV)
calculation22
• Natural ventilation: prescriptive approach of single sided or cross
ventilation room design or performance based approach according to Area-
Weighted Average Wind Velocity (AAWV)
• Daylighting: compliance of the Vertical Daylight Factor (VDF) of the
habitable rooms and kitchens with PNAP APP-13023 requirement by
BDHK
21 Practice Note for Authorized Persons (PNAP) is a set of building and construction requirements by the Building Department of Hong Kong for registered practitioners in Hong Kong. The related requirement documents include appendices to consider in design and construction such as APP-150. Further description of these documents can be found here at https://www.bd.gov.hk/en/resources/codes-and-references/practice-notes-and-circular-letters/index_pnap.html 22 OTTV is a measure of heat transfer into the building through its envelope. It can be an index to compare the thermal performance of buildings if the same method is used for calculating OTTV. The concept of OTTV assumes that the building envelope is completely enclosed. OTTV is composed of two values: Envelope Thermal Transfer Value (ETTV) and Roof Transfer Value (RTTV). ETTV is a measure of heat transfer through the walls or envelope of the building, while RTTV is a measure of heat transfer through the roof of the building. The total sum of ETTV and RTTV defines OTTV (Hui, 1997; Vijayalaxmi, 2010). 23 PNAP APP-130 describes the lighting and ventilation requirements as a performance-based approach in which the Building Authority of Hong Kong accepts a vertical daylighting factor (VDF) of 8% for habitable rooms and 4% for kitchens. As for natural ventilation the acceptable numbers include 1.5 ACH for habitable rooms and 1.5 for kitchen (Plus 5 ACH for mechanical).
127
GBL-ASGB, ranked third among the five rating systems, considers 5.3 credits for
passive design, which is about 22.1% of the possible energy saving. These credits can be
achieved through three assessment criteria including:
• Site condition appraisal and building design optimization such as building
form, orientation, window to wall ratio, etc.
• Operable glazing ratio: over required percentage of window or curtain wall
area
• Thermodynamic properties of the building envelope: beyond the reference
value required by national building energy saving standard
Among these rating systems passive design strategies are not granted the same credit
value as a traditional whole-building energy simulation approach except for BEAM Plus
and CASBEE. Even LEED indirectly discourages passive design by reducing the credits
available through prescriptive approaches, which do not need whole-building
simulations. With 9.1% of energy saving from passive design measures, LEED receives
the lowest weighting score for passive design. For energy efficiency measures in
building envelopes and fenestrations LEED considers an option of prescriptive
compliance with Chapter 4 of ASHRAE 50% Advanced Energy Design Guide, and
introduces three methods for achieving daylighting credits including measurement or
simulation of a building’s sDA and ASE (LEED BD+C, 2017).

128
Except for daylighting and selected building envelope components, LEED does not
offer credits exclusive to the use of passive or natural systems in buildings (LEED
BD+C, 2017; ASHRAE 90.1, 2013, 2016). For example, throughout the whole LEED
BD+C 2017 document (LEED for Building Design and Construction) the term/concept
“passive” is used only two times. In the first case, for the Energy Performance
Optimization Credit (1-20 points) LEED mentions “Analyze efficiency measures,
focusing on load reduction and HVAC-related strategies (passive measures are
acceptable) appropriate for the facility” (LEED BD+C, 2017, p.74). In the second case,
for Thermal Comfort Credit to achieve one point LEED requires compliance with
Option 1, ASHRAE Standard 55-2010, or Option 2, ISO and CEN Standards. LEED
extends that for warehouses, where one point is achievable by meeting the thermal
comfort compliance for office portions of the building, and for the regularly occupied
areas of the building’s bulk storage, sorting, and distribution areas, it can include one or
more of six design alternatives. One of these alternatives can be “passive systems, such
as nighttime air, heat venting, or wind flow” (LEED BD+C, 2017, p.129).
In relation to codes and guidelines, the PHIUS (Passive House Institute US) is probably
the most recognized institute in the US in charge of a certification process that contains
guidelines for passive buildings. PHIUS introduces seven principles for the design of
passive buildings along with built/certified examples in the US (Klingenberg et. al.,
2009). As reviewed in section 2.2 of this thesis, these principles include:
129
• superinsulation
• airtightness
• thermal bridge elimination
• heat and energy recovery ventilation
• high performance fenestration
• passive solar and internal heat gains optimization, and
• modeling of energy gains/losses using PHPP (Passive House Planning
Package)
Among the PHIUS certified built examples, the passive design strategies applied focus
only on building envelope features, insulation/airtightness, and direct solar gain while
other potential passive design strategies are not used or have been left to neglect.
Most recently, PHIUS has published PHIUS+ 2015 Certification Guidebook V.1.03 in
July 2016.24 Unfortunately, as a guide for commissioning and certification the scope of
the strategies discussed does not go beyond building envelope and ventilation, and
considers active photovoltaic systems as part of passive design. However, the guide
elaborates more on the role of modeling software WUFI25 for passive certification and
24 Currently PHIUS is conducting a pilot study for its PHIUS+ 2018 Certification Guidebook which has not been officially published. 25 WUFI performs dynamic simulations of coupled heat and moisture transfer in buildings/building components under actual climate conditions. For boundary conditions, measured outdoor climates including driving rain and solar radiation are used. WUFI Passive allows a double assessment of buildings based on the same building model: a monthly energy balance method is used for the design and verification of buildings meeting the passive house criteria following EN 13790. WUFI Plus is used for the detailed dynamic assessment of the hygrothermal behavior of buildings or their components meeting the passive house criteria. For more information, please see https://wufi.de/en/software/wufi-passive.

130
design. PHIUS has also provided a certified project database of passive buildings
through its PHIUS +2015 Certification process. The database currently includes 350
buildings, though less than ten of them are commercial buildings, and all of them use
only direct solar gain and building envelope insulation as passive design strategies
(PHIUS Project Database, 2017).
2.4.1.2. Standards and Codes: IECC and ASHRAE
The energy efficiency standards and codes for residential and commercial buildings can
play an important role to promote or limit the application of passive systems in practice.
The two most important examples in the US include ASHRAE standard 90.1 and IECC
2018 (International Energy Conservation Code) which provide performance codes and
prescriptive codes for practitioners to build energy efficient buildings.
Prescriptive codes require that building components including its envelope and systems
meet certain standards such as R-value for the walls or COP for mechanical
heating/cooling systems. Performance codes require that a building’s whole performance
meets or exceeds the performance of a building built based on prescriptive codes.
Both ASHRAE and IECC include mandatory provisions for residential and commercial
buildings that should be fulfilled for a building to be constructed. Examples include
proper mechanical equipment sizing and thermal envelope properties in different
climatic zones of the US. However, a brief overview of the contents of both references
on building codes and standards indicates underestimating the inclusion of passive

131
design strategies in buildings through codes or standards. In this case, IECC 2018 has
better addressed the inclusion of incentives for passive building design, though
indirectly, through its section C402.1.1 Low-energy buildings.
Section C402.1.1. mentions that three categories of low-energy buildings are exempted
from the requirements of section C402 for thermal envelope provisions. This incentive is
also applicable, as IECC mentions, for portions of a building which is separated by
building thermal envelopes complying with IECC section 402 requirements. The three
exemption categories include:
• Buildings with a peak design of less than 1 watt/ft2 (10 W/m2) for space
conditioning
• Those that do not include conditioned spaces, and
• Greenhouses
Other than this explanation there is not any specific code or section assigned to passive
building design in IECC 2018, since it considers only four code compliance
requirements for building envelopes. These include: roof solar reflectance and thermal
emittance (C402.3), fenestration in building envelope assemblies (C402.4), air leakage
(C402.5), and thermal envelope compliance for the opaque portions of a building
(C402.2 for insulation; C402.1.3 for R-value; C402.1.4 for U-, C-, and F-factor, or
C402.1.5 for a component’s performance alternative).

132
Similarly, the manual of ASHRAE standard 90.1 version 2017 considers no incentive or
prescriptive path for passive heating/cooling design strategies. The only exception is in
the explanation of the relationship between fenestration and energy use, in which the
manual mentions the possibility of passive solar gains for buildings with lower internal
heat gains (ASHRAE manual 2017, p.82). Other than this point, the ASHRAE standard
90.1 only has a focus on R- values or U- values of different building envelope
assemblies for different US climates. Therefore, it is concluded that the exiting manuals,
standards, and codes for the energy efficiency of buildings in the US do not invest on
providing exclusive requirements for passive building design compliance. Therefore,
there is an opportunity for the incorporation of compliance path for passive design
strategies in buildings in the US.
2.4.2. Climate
The word climate comes from the Greek term klima meaning the slope of the earth in
regards to the sun. The Greeks on this basis divided the world into tropic, temperate, and
arctic zones. Therefore, it would not be inappropriate to say that the climate or average
weather is primarily a function of the sun. (Lecnner, 2009). In other words, while there
are factors such as topography, altitude, and land-water relationships, latitude of a
geographic location has the dominant role in determining the climatic character of that
location. A low latitude usually has a warm/tropic climate due to its location closer to
the equator. With the same logic middle latitudes have seasonal/temperate climates and
high latitudes have arctic climates. Today the influential components of a climate are

133
broader and better recognized. These components may include, but are not limited to:
solar radiation, temperature and its fluctuations, precipitation, humidity, air movement,
air pollution, sand and dust (Fislisbach and Zollikon, 1993).
These components together can form an outdoor climatic condition as either hostile or
friendly for a design that pursues the occupants’ comfort. “Design for climate requires
that homes be designed or modified to ensure that the occupants remain thermally
comfortable with minimal auxiliary heating or cooling in the climate where they are
built” (Reardon and Downton, 2016, p.90). The authors of this guide added that passive
design is the significant component of this type of design, which is working with the
climate, but not against it.26
There are different design terms which reveal the close relationships between a climate
and the use of passive systems, such as in “bioclimatic design” and “climate-responsive
design.” The role of climate in design is such important that the word “design” in many
cases comes after the phrase “climate-responsive” as in “climate-responsive design.”
Climate-responsive design is based on the way form and structure of a building can
moderate a climate for human well-being and comfort (Hyde, 2000, p.3). Therefore,
there is a pragmatic component in a climate-responsive design which is based on the
architectural form of a building and its features, which are separated from active systems
26 Based on the authors’ notes other components include energy efficient heating/cooling systems and smart behavior by the occupants.

134
such as mechanical equipment. In this regard, Hyde maintains that climate-responsive
design aims to reduce environmental impacts while responding to human well-being by
reducing the use of non-renewable energies. (Hyde, 2000, p.5). This environmental
concern in a climate-responsive design or a bioclimatic design directs us again toward
the use of passive systems, which draw on the ambient condition and renewable energy
sources to function. 27
A climate-responsive design considers the condition of different seasons for a building
including sun direction, natural shades, climate data, and environmental factors. All of
these conditions indicate the importance of passive strategies as they can utilize the
outdoor condition for the purpose of indoor occupants’ comfort. Therefore, passive
design strategies are integrated components in the steps of a climate-responsive design.
Evans has proposed a ten-step design guide for a climate responsive design as follows
(Evans, 2018):
• perform a site analysis
• layout the building on the site
• consider building orientation toward the sun
• choose appropriate window areas and glazing materials
• consider the geographic location for weather features
27 Hyde considers difference between bioclimatic design and climate-responsive design. In bioclimatic design the procedure is to start with climatic analysis before moving to the design phase. However, climate-responsive design is focused on the synthesis of selected climate-responsive design strategies (Hyde, 2000, p.8).
135
• reduce the building foot-print
• design for natural ventilation
• consider some flexibility in comfort standards
• conduct energy and lighting modeling/analysis, and
• iterate this process until reaching the desired result
Despite all the advantages that climate can bring to a building through passive design
strategies, there are two issues with respect to the use of these strategies in different
climates, particularly in the US. These issues include: climatic suitability and building
typology.
2.4.2.1. Climate Suitability
The first issue is the fact that the passive strategies applied in the US mostly address
heating but not the cooling of buildings, which limits their application across all
climates. This issue is evident in the Climate Specific Passive Building Standards as a
document published by Passive House Institute US for passive house project
certification in North America (Wright & Klingenberg, 2015). The strategies and
discussions in this document only focus on passive solar heating and do not consider
passive cooling strategies. Passive heating is achievable through direct, indirect, or
isolated solar gain systems. However, among these three solar gain systems, the indirect
or isolated gain systems, such as Trombe’ wall or solarium, have not been discussed.

136
With the exception of direct solar gain systems, the lack of attention in this document
could come from the rare application of passive design strategies in the US.
One assumption is that climate is a significant obstacle in the application of passive
cooling systems in buildings in the US. ASHRAE Standard 169-2013 has defined eight
climatic zones for the US and considers three subtypes for these zones (i.e. zone A or
moist, zone B or dray, and zone C or marine). Accordingly, a majority of the US cities
with a hot climate are also highly humid. Therefore, passive cooling design strategies in
these climates could be used for a very short period of the year when the outdoor
air/operative temperature and humidity is within the comfort zone. However, a
considerable area of the US, particularly on the West Coast, can benefit from the free
cooling that passive design strategies can offer. The rare application of indirect and
isolated solar gain systems in the US could be more a matter of complexity of the
implementation and/or maintenance of these systems, rather than the condition of cold
humid or cold dry climates of the US.
2.4.2.2. Climate and Building Typology
The second issue is that the passive strategies applied in the US mainly address
residential buildings, while only a few parallel studies exist for commercial buildings. A
large factor in this difference comes from the different priorities designers consider
between the thermal performance of the building envelopes in skin-dominated and load-
dominated buildings. In a skin-dominated building, such as a detached house, heat-loss

137
or heat-gain occurs across the building envelope components including openings, floors,
roofs, and walls (Hemsath and AlagheBandhosseini, 2018). For example, in a house if
the outdoor temperature is lower than the indoor temperature, the heat will flow from
inside of the house to the outside. In such a skin-dominated building passive design
strategies can considerably reduce the site energy consumption as they mostly have a
focus on the features of the exterior envelope of the house where most of the heat is
gained in summer or lost in winter. Therefore, the use of thermal mass, shading devices,
south-facing orientation with appropriate glazing size/material represent a few example
of the possible passive design strategies to be adopted for these situations.
Compared to commercial buildings, the smaller building footprints and usually compact
forms of skin-dominated residential buildings also facilitates the implementation of
passive cooling strategies. For example, natural ventilation in these buildings can often
be accomplished because the distance between the inlet and outlet of the air streams is
small and in most cases unobstructed. Nevertheless, design factors related to the
hygrothermal features of a building skin’s, such as air leakage and vapor barriers,
become important in implementing passive design strategies since they can interact with
or contradict the performance of the passive systems.
On the other hand, internal-load dominated buildings have a high density of occupants
and equipment inside that results in heat gain from equipment, lights, or occupants’
activities, which demands cooling as the first priority for the building all year around.

138
These buildings’ large footprints make the use of artificial light a necessity during
daytimes because daylight cannot reach deeply into the inner zones of this building
(Grondzik and Kwok, 2015). Commercial buildings and hospitals represent two
examples of this typology. Therefore, a general belief/misbelief is that since commercial
buildings are internal-load dominated their performance should be decoupled from
seasonal variations (Hastings, 1999).
As such, independent from the outdoor weather conditions, whether it is cold, cool, or
warm outside, the indoor condition is set to be cooled and dehumidified through the use
of mechanical systems. Other than a sporadic implementation of daylighting strategies in
commercial buildings, as in the case of atriums, avoiding the application of passive
strategies in commercial buildings seems to be the general design trend. However, the
high energy usage of commercial buildings suggests an opportunity for a great potential
in energy saving both in cold and hot climates. Increasing the well-insulated surface area
in cold climates, increasing the well-insulated roof area in hot climates, and changing the
building geometry for better natural ventilation represent three examples of possible
design strategies for energy savings.
However, the possible passive design strategies for commercial buildings can make a
long list. Hastings (1999) reviewed twenty-two commercial/institutional case studies as
well as their simulations/validations conducted by experts from twelve countries. In this
review he examined the possibility and benefit of using passive heating and passive

139
cooling strategies in commercial/institutional buildings.28 The range of proposed
strategies in Hasting’s review include direct gain systems, air-collector systems, air flow
windows, mass wall systems, transparent insulations, absorber walls, solar radiation
controls, heat avoidance, envelope cooling, natural radiative cooling, natural
air/evaporative cooling, and convective and conductive cooling. Therefore, despite the
general misconception of the usefulness of passive systems in commercial buildings
(Bradshaw, 2006), Hasting’s review shows that there is a great potential for the
application of passive design strategies in commercial buildings to save on energy.
In summary, climate of a particular location and building typology may limit the
potential of using passive design strategies. However, at the same time they open new
opportunities for creative designers and energy-efficiency engineers to harvest the free
natural and renewable energies through their designs.
2.4.3. Simulation and Modeling Tools
Since late 2014 the Department of Energy has delegated the task of managing the
directory of building simulation tools to the International Building Performance
Simulation Association (IBPSA). Therefore, IBPSA is now managing the Building
Energy Simulation Tools web directory (BEST Directory) which includes software with
28 The actual number of case studies was 45, but 25 of them have been examined through simulation validation. This study was part of the Task XI of International Energy Agency (EIA) Solar Heating and Cooling Program.

140
a wide-array of capabilities--from whole-building energy simulation to water use
analysis.29 Currently the directory lists 197 simulation tools of which 67 tools have
capabilities for whole-building simulations. While some of these tools, such as
TRNSYS, greater capabilities for analyzing passive systems, there is no single tool
exclusive for the analysis of multiple passive design strategies among the IBPSA tools’
directory.30
There are also other considerations that can make a tool appropriate for a building
specialist to choose or not to choose for a passive building performance analysis. For
example, the simplicity or sophistication of using a simulation tool or whether an
architect or an engineer are using the tool can make a considerable difference in the
criteria of selecting a simulation tool. Such a difference is perceptible from several
previous surveys and studies about simulation tools, which are discussed in the
following section.
One of the earliest surveys was conducted by the US Department of Energy in 1985
(Rittelmann and Ahmed, 1985) as the Task 8 of International Energy Agency (IEA) for
the Passive and Hybrid Solar Low-Energy Buildings. The purpose of this report was to
29 For further information, please see the IBPSA-USA website at https://www.buildingenergysoftwaretools.com. 30 In this case, Climate Consultant is an exception with capabilities for analyzing a location’s weather data for proposing passive design strategies, qualitatively speaking. However, the tool is not capable of analyzing a building’s passive performance.

141
inform designers and builders about the availability of a wide variety of design tools for
passive and hybrid solar buildings. The report presented key information on the
characteristics of these tools to aid the tool selection process. A number of different
individual experts in different countries completed a set of the tools’ survey forms. Some
of the findings from the survey included (Rittelmann and Ahmed, 1985, p.12):
• Many design tools had little or no credible verification undertaken
• The number of design tools have proliferated from 164 to 230 between
1982 and 1984
• Most of the design tools for active solar energy use the F-chart method or a
component based simulation method. Most of the design tools for passive
solar energy systems use the Solar Load Ratio (SLR) or a thermal network
method.
• When design tools are developed for simplicity and ease of use during
design process, they are generally incapable of evaluating the more
sophisticated strategies that an energy-conscious designer is interested in
investigating. Consequently, the desire for accuracy in analyzing unusual
design features and the need for fast, easy-to-use, inexpensive design tools
have been incompatible features.
The results of this survey exclusively talks about the use of SLR method in simulation
tools for passive solar design, which indicates in the past there was a greater passion for
passive design and therefore identification of its required simulation tools. Another

142
important finding of this survey, which is still applicable today to simulation tools, is the
lack of verification studies for many of the existing simulation tools. This issue is more
intense for tools with capabilities in simulating passive building systems, because of the
complexity of passive building simulation and verification methods. Table 2.21 provides
information about the pros and cons of simulations validation techniques (NREL, 2008)
which is based on the ANSI/ASHRAE Standard 140 for validation of the building
energy use analysis. For example, a comparative study involves a direct comparison of
the results obtained from two or more building energy analysis simulations using
equivalent inputs. In empirical validation a real building or test cell is instrumented and
the calculated results from building energy analysis simulations are compared to the
measured results obtained from the instrumentation (NREL, 2008).
Another survey, which was conducted by Athienitis et al., has established an
understanding of how design tools are applied to the design of Net Zero Energy Solar
Buildings (NZESBs). This survey was conducted within the IEA SHC Task 40/ECBCS
Annex 52 project Towards Net Zero Energy Solar Buildings (2010). The objective of the
survey was to determine which and how many tools are being used and to determine
gaps of current tools or of the design process. In total 32 national experts from the Task
40 responded. The findings showed that about 60% of respondents create an energy
model of the building at the conceptual stage of the design process. The survey has also
identified NZESB design tools’ shortages as well as the desired future of these tools.
Table 2.22 and Table 2.23 outline the key findings of this survey.

143
Table 2.21 Pros and cons of simulations validation techniques (NREL, 2008)
Table 2.22 Stages of the design process in which first energy model is created (Athienitis et al., 2010)
Stages of Design Use of Simulation tools Conceptual/early stage design
59%
After a design is complete, but opportunities remain for improvement
34%
After a design has been finalized
6 %
Technique Advantages Disadvantages Comparative Relative test of model and solution process
- No input uncertainty - Any level of complexity - Inexpensive - Quick: many comparisons
possible
- No truth standard
Analytical Test of numerical solution
- No input uncertainty - Exact truth standard given
the simplicity of the model - Inexpensive
- No test of model - Limited to cases for which
analytical solutions can be derived
Empirical Test of model and solution process
- Approximate truth
standard within accuracy of measurements
- Any level of complexity
- Measurement involves some degree of input uncertainty
- Detailed measurements of high quality are expensive and time consuming
- A limited number of data sites are economically practical

144
Table 2.23 Features of the NZESB design tools that are lacking (Athienitis et al., 2010)
The most important outcome of the survey was mapping the future needs of simulation
tools (Athienitis et al., 2010), which include:
• Faster feedback
• Guidance towards better designs
• Design evolution
• Facility for batch runs with optimization
• Direct calculation of primary energy, emissions, and costs.
• Design day output
• Better user interface with more examples
• Better contextual help for each feature
• Sensitivity analysis for each input
• Explanation of limitations of each model
• Include parameters such as: thermal admittance, time constants
Technical features Other features
- Building-integrated solar
technologies - Phase-change materials - Adiabatic cooling - Thermal bridges - Coupling of thermal and
daylighting performance for double facades
- User-friendliness for integration
of renewables. - Optimization - GUI for HVAC in EnergyPlus - Should identify key parameters
and opportunities for decoupled models
- Solar potential analysis - Simple models for complex
integrated systems (e.g., SDHW with GSHP)

145
• Faster feedback, at cost of accuracy, since we mainly care about relative performance
• Offer method for managing multiple designs
• Better post-processing (e.g., export to Excel)
• Include electricity demands of different plug loads
• Explanation of limitations of model
• Flags for inappropriate inputs
• Cost data/input
• Financial analysis
• Better interoperability between tools
• Rules of thumb built in Simplify them to allow architects to use the
Today after almost a decade, many of these features are incorporated to the current
simulation tools, which is indicative of the importance of such surveys as well as the fast
growing capabilities of simulation tools and the practitioner’s demand for this growth.
Crawley et al. has provided a comparison of the features and capabilities of twenty major
building energy simulation programs based on information provided by the program
developers in several categories (2008). These categories include: general modeling
features; zone loads; building envelope, daylighting, and solar; infiltration, ventilation
and multizone airflow; renewable energy systems; electrical systems and equipment;
HVAC systems; HVAC equipment; environmental emissions; economic evaluation;
climate data availability, results reporting; validation; user interface, links to other
programs, and availability. Table 2.31 shows the result of this comparison for

146
capabilities of the tools in simulating passive features including building envelope,
daylighting, and solar gain. Among the twenty tools compared, TRNSYS, ESP-r, IES
VE, and Energy Plus seem to have more capabilities for such passive design simulations.
An important factor in selecting a simulation tool is having an appropriate match
between the user’s profession and the tool’s features and analytical capabilities. This
factor has been studied through a set of online surveys (Attia and Beltran, et al., 2009;
Attia et al., 2012) The survey presents the results of comparing ten major Building
Performance Simulation (BPS) tools. The following programs were compared through
the results of surveys: ECOTECT, HEED, Energy 10, Design Builder, eQUEST, DOE-2,
Green Building Studio, IES VE, Energy Plus, and OpenStudio.
The researchers defined five selection criteria to analyze the results of their surveys.
These criteria are defined through table 2.24 and are as follows:
• Usability and information management (UIM) of interface
• Integration of intelligent design knowledgebase (IIKB)
• Accuracy of tools and ability to simulate detailed and complex building
components (AADCC)
• Interoperability of building modelling (IBM)
• Integration of tools in building design process (IBDP)
The survey revealed that architects seek the IIKB above the UIM of the interface (Attia
and Beltran et al., 2009). Attia et al (2012) by means of a literature review and two

147
online surveys have conducted an intergroup comparison between architects and
engineers. Table 2.25 to Table 2.30 show the major findings of the survey indicating a
wide gap between architects’ and engineers’ priorities in tool ranking. Particularly a
majority of passive design strategies that are ranked highly by architects are considered
last priorities in tool selection by engineers. For example, while shading, solar heating,
building orientation, natural ventilation, and geometry were ranked as third to seventh
items by architects, engineers ranked these items as 10th to 14th among the 15 parameters
asked in the survey (Table 13z). Despite this gap, there is evidence that architecture,
engineering, and construction are moving towards convergence and building service
disciplines are merging because of the mandatory codes and rating systems (Attia and
Beltran et al., 2009).
The findings of these surveys from the past until more recently shows that further
research is required to develop genuine environmental building design toolkits that
integrates an intelligent knowledge-base (IIKB). Additionally, many of the major
simulation tools that are very powerful and trending were not included in the previous
surveys, particularly those enriched with capabilities for the design of passive systems.
Examples include DesignBuilder and TRNSYS as a verified simulation tool for tax
credits (DOE, 2017) and WUFI, which is used for passive house certification process of
buildings (PHIUS, 2017). One reason could be that software capabilities are updated
every year or new tools completely replace some earlier tools. The latest survey
conducted seems to be a survey from eight years ago (Attia & Beltran et al., 2009).

148
Therefore, the surveys may not reflect the features of the newer versions of simulation
tools or the tools emerging in recent years. In this regards, a new survey about building
simulation tools with a focus on passive design is needed.
Table 2.24 Building performance simulation tool criteria (Attia et al., 2012) Simulation tool selection criteria
Definition and keywords
Usability and information management (UIM) of interface
The ‘usability’ incorporates the functional operation of a tool. Keywords: output and input representation, navigation, control, learnability, documentation, online help, error diagnostics. The ‘information management’ is responsible for allowing assumptions, facilitate data entry and control the input quality. Keywords: input quality control, comparative reports creation, performance benchmarking, data storage, user customization, input review & modification
Integration of intelligent design knowledge- base (IIKB)
The knowledge-base supports decision making and provides quantitative and qualitative advice regarding the influence of design decisions. Keywords: preset building templates & building components, heuristic/ prescriptive rules, procedural methods, building codes compliance, design guidelines, case studies, design strategies. The intelligence entails finding quantifiable answers to design questions in order to optimize the design. Keywords: context analysis, design solutions & strategies optimization, parametric & sensitivity analysis, ‘what if’ scenarios, compliance verification, life cycle and economic analysis
Accuracy of tools and ability to simulate detailed and complex building components (AADCC)
The accuracy of tools includes analytical verification, empirical validation and comparative testing of simulation. Keywords: BESTEST procedure, quality assurance, calibration, post-construction monitoring, and error range. The other part of this criterion deals with the ability to simulate complex building components with high model resolutions. Keywords: passive technologies, renewable energy systems, HVAC systems, energy associated emissions, green roofs, double skin facades, chilled beams, atria, concrete core conditioning, etc.
Interoperability of building modelling (IBM)
Interoperability corresponds to the ability multidisciplinary storing and sharing of information with one virtual representation. Keywords: gbXML, CAD, IFC, BIM, design phases, design team, model representation
Integration with building design process (IBDP)
IBDP corresponds to the integrating of BPS tools during the whole building design delivery process. Keywords: multidisciplinary interfaces, design process centric, early & late design stages

149
Table 2.25 Participants’ professional background (Attia et al., 2012) Participants Survey 1 Survey 2 Architects 249 196 Engineers 232 221
Table 2.26 The important parameters of a simulation tool (Attia et al., 2012)
Table 2.27 Usability and graphical visualization importance of simulation tools (Attia et al., 2012) Items Architects Engineers Graphical representation of output results 23% 26% Flexible use and navigation 17% 22% Graphical representation of results in 3D 16% 17% Easy follow-up structure 15% 15% Graphical representation of input data 15% 12% Easy learnability and short learning curve 14% 8%
Architects’ Ranked Parameters Engineers’ Ranked Parameters 1. Energy Consumption 1.Energy Consumption 2. Comfort 2.HVAC 3. Shading 3.Controls 4. Solar Heating 4.Comfort 5. Orientation 5.Glazing and Opening 6. Natural Ventilation 6.Insulation 7. Geometry 7.Energy Efficient Lighting 8. Insulation 8.Environmental Tightness 9. Glazing and Opening 9.Daylighting 10. Daylighting 10.Shading 11. Solar systems 11. Solar Heating 12. HVAC 12. Orientation 13. Energy Efficient Lighting 13. Natural Ventilation 14. Environmental Tightness 14. Geometry 15. Controls 15. Solar systems

150
Table 2.28 Importance of the items for intelligence of knowledge base and adaptability to design process in simulation tools (Attia et al, 2012)
Items Architects Engineers Provide quick energy analysis that supports decision making
33% 23%
Allows examining sensitivity and uncertainty of key design parameters
29% 55%
Analyze weather data and suggest suitable climatic design strategies
13% 15%
Embrace overall design during most design strategies 17% 7%
Table 2.29 Architects versus engineers in BPS priorities and tool ranking (Attia et al, 2012).
Priorities for selecting simulation tools
IIKB (interrogation of intelligent design knowledge base to assist in decision making)
UIM (friendliness of the interface concerning usability and information management)
IBM (interoperability of building modeling e.g. exchange of 3D models with other programs)
AADCC (Accuracy and ability to simulate detailed and complex components)
Architects 1 2 3 4 Engineers 3 2 4 1
Table 2.30 Architects versus engineers ranking of ten simulation tools (Attia et al, 2012).
Simulation tool priority Architects Engineers
IESVE 1 5 ECOTECT 2 9 Design Builder 3 1 Green Building Studio 4 7
Energy 10 5 8 eQuest 6 3 HEED 7 10 Open Studio 8 6 Energy Plus 9 2 DOE2 10 4

151
To find the new simulation tools that are required to be the subject of a new survey, the
author has used several sources to identify the most popular and regularly-used
simulation tools. These sources include the IBPSA-USA BEST Directory as explained
before, Survey of high performance firms by AIA (2017), The Architect’s Guide to
Integrating Energy Modeling in the Design Process by AIA (AIA, 2012), and the
Architect Magazine website. 31 For example, Architect magazine identifies Revit Plugins
such as Green Building Studio, Sefaira, Open Studio, and IES-VE as digital tools for
architects to test building performance of their designs. The AIA survey indicates that
architects in high performance firms are moving towards using in-house simulation tools
for receiving fast feedback on design decisions, instead of relying only on outside
consultants.
AIA survey indicates that Sefaira is the most popular tool, which has been used widely
by 80% of architects in 2015. This tool is a cloud-based program, which was introduced
in 2009, to evaluate carbon, daylight, energy, water, thermal comfort, and renewables.
The AIA survey identifies Sefaira, Climate Consultant, DIVA, Ecotect, Vasari,
Radiance, and COMFEN-Energy Plus as the most popular building simulation tools for
architects. Today, some of these tools are no longer supported by their producers or have
been replaced with more powerful performance analysis tools introduced by their
producers. Therefore, in a new survey these tools should be replaced with their successor
31 For further information, please see https://www.architectmagazine.com/technology/five-digital-tools-for-architects-to-test-building-performance_ o

152
tools. One example is Vasari as a plugin for Revit, which is replaced today by the
Autodesk Flow Plugin for Revit or the more powerful computational fluid dynamic
program/package of Autodesk CFD.
The Architect’s Guide to Integrating Energy Modeling in the Design Process by AIA
(2012) lists COMFEN, DesignBuilder, eQuEst, Green Building Studio/Vasari, HAP,
IES-VE, OpenStudio, Sefaira Concept, Simergy, Energy Pro, Energy 10, EMIT 1.2,
TAS, TRACE, and TRNSYS as the available simulation tools at the time. These tools
mostly use EnergyPlus or DOE-2 as their simulation engines, but some of them utilize
other simulation engines including TRNSYS, TAS, and TRACE. Some of these tools do
not use any of these engines and may only use a simple calculation method or a
spreadsheet. Examples include the Hourly Analysis Program (HAP) tool, which uses a
transfer function method to design HVAC systems.32
The result of the author’s investigations about the mostly used tool for building
performance analysis resulted in the following list of simulation tools in an alphabetic
order:
• Ansys Flow
• Autodesk CFD
32 Today, the Hourly Analysis Program (HAP) assists engineers in designing HVAC systems for commercial buildings and is, in fact, two tools in one. First, it estimates loads and designs systems, and second, it simulates building energy use and calculates energy costs for buildings.

153
• Autodesk Flow
• BeOpt
• Climate Consultant
• COMFEN
• Daysim
• DesignBuilder
• Diva for Rhino
• Energy Plus
• eQuest/DOE2
• F-Chart
• HAP
• HEED
• IES VE
• Ladybug/Honeybee plugins for Rhino
• Manual tables, charts, and protractors
• OpenStudio
• Personal or In-house Software
• PHPP (Passive House Planning Package)
• Radiance
• Revit Tools/Plugins
• Sefaira

154
• Solidwork Flow Plugins
• Spreadsheets
• TAS
• Therm
• TRNSYS
• WUFI
Table 2.31 Building envelope, daylighting, and solar analysis capabilities of twenty simulation tools by Crawley et al. (2008)
Too
ls
BL
AST
BSI
M
DeS
T
DO
E 2
.1E
EC
OTE
CT
Ene
r-W
in
Ene
rgy
Expr
ess
Ene
rgy
10
Ene
rgyP
lus
eQU
EST
ESP
-r
IDA
ICE
IES-
VE
HA
P
HE
ED
Pow
er D
omus
SUN
RE
L
TA
S
TR
AC
E
TR
NSY
S
Features
Outside surface convection algorithm:
-BLAST/TARP X X X -DOE-2 X X X X -MoWiTT X X X -ASHRAE simple X X X X X X X X -Ito, Kimura, andOka correlation
X X
-User-selectable X X X X X X X X X Inside radiation view factors
X X X X X X P X
Radiation-to-air component separate from detailed convection (exterior)
X X X X X X X X X P X
Solar gain and daylighting calculation account for inter-reflections from external building component and other buildings
P X X X X P X
Note that X means available feature; P means partially available; O means optional feature; R means research feature; E means expert-needed feature; I means feature with difficulty to obtain input

155
Table 2.31 Continued
Too
ls
BL
AST
BSI
M
DeS
T
DO
E 2
.1E
EC
OTE
CT
Ene
r-W
in
Ene
rgy
Expr
ess
Ene
rgy
10
Ene
rgyP
lus
eQU
EST
ESP
-r
IDA
ICE
IES-
VE
HA
P
HE
ED
Pow
er D
omus
SUN
RE
L
TA
S
TR
AC
E
TR
NSY
S
Features
Single zone infiltration
X X X X X X X X X X X X X X X X X X X
Automatic calculation of wind pressure coefficient
X P P X X X
Natural ventilation (pressure buoyancy driven)
X P X P X X X X X X O
Multi-zone airflow (pressure network model)
X P X X X X X X O
Hybrid natural and mechanical ventilation
X P X I X X X X O
Control window opening based on zone or external conditions
X X X X X P X O
Displacement ventilation
X X X X X O
Mix of flow networks and CFD domains
X E
Contaminants, mycotoxins (mold growth)
P R P
Note that X means available feature; P means partially available; O means optional feature; R means research feature; E means expert-needed feature; I means feature with difficulty to obtain input

156
2.4.4 Construction Cost and Construction Complexity
Any technological or design intervention, which is different from the business-as-usual
practices, will be seen by clients as an additional cost for a project. This difference even
during building occupancy might be perceived by the occupants as a new challenge
because of their unfamiliarity with the required training for operating the building. These
issues of construction cost and operation/implementation complexity represent two
typical obstacles that may prevent realization of any design idea, including passive
systems, in practice.
Between the 1980s and the beginning of the current century green designs and
constructions had a tendency to incorporate a variety of overly complex technological
components to a building. Examples include different forms of solar chimneys, bermed
walls, tombe walls, water walls, heat storage bedrocks, wind turbines, PV panels, or
geothermal heat pumps design (Cook, 1984; Galloway, 2004; Strong and Burrows,
2017). In many cases these components would not contribute to energy saving, which
was caused by a variety of reasons, such as maintenance problems, incomplete
implementation of a complex passive system, unintegrated functions of mechanical and
passive systems, or occupants’ lack of training in running these systems.
A benefit associated with the application of sustainable design strategies in buildings,
such as passive systems, is the perception of an added property value. For example, data
show buildings that are certified with green rating systems, such as LEED, will have a
157
higher property value. In 2014, the DOE reported in its Energy Efficiency & Financial
Performance study that customers pay 10%-31% more for LEED-certified properties
(Weinschenk, 2015). Therefore, the perceived benefits of a sustainable design strategy or
green certification process can convince designers to invest more for the design and
construction of a building.
These benefits are not limited to monetary savings, such as energy saving, and can
expand to include environmental benefits and occupants’ well-being. The impact of
using natural/passive systems in buildings goes beyond energy saving since it affects the
health and productivity of building occupants. Many of modern society’s chronic health
issues correlate with the poor indoor environmental qualities since we spend almost 90
percent of our time inside buildings. Decoupling buildings from nature and its seasonal
variations can result in poor daylighting and air qualities (Bessoudo, 2017). Researches
have linked improved ventilation with up to 11% gains in employees’ productivity
because of increased outside air rates and delivery of fresh air. Similarly, improved
daylighting shows an increase of 10% to 25% in occupants’ productivity and wellbeing
in work environments (Grange, 2016).
Likewise, the cost of investment is not limited to capital costs and may include other
long-term costs. These costs are usually identified through a process of life cycle
assessment (LCA). LCA includes four evaluation aspects (Edwards and Naboni, 2013):

158
- manufacturer’s environmental impacts and transportation costs for construction
materials and products
-lifetime maintenance of a building
-building operation costs such as energy consumption and other impacts
-end of building life (usually 50 years) and its construction products
For example, to achieve the Passive House Standard of 15 kWh/m2-yr large amounts of
insulation, highly engineered construction products, and sophisticated details should be
used, which considerably increase the construction cost as well as the environmental
impact of demolishing the building.
To minimize these costs, therefore, an approach should be taken in design that can
reduce the complexity of implementing a passive/natural system. Simplifying the
technological aspects of the design/construction of a passive system will not only reduce
the construction/demolition costs and operation/maintenance costs, but also will increase
the potential health benefits for occupants due to easier understanding in running the
passive.
2.4.5. Design Team and Client Collaboration
“Ask any architect who has produced a building to be proud of, and he or she will tell
you that the client contributed significantly to nurturing its conception and ensuring the
quality of its implementation. Conversely, the same architect probably could talk about
aesthetically disappointing projects compromised by clients short on design aspiration or

159
unwilling to go the distance financially” (Lewsi, 1998). This quote from an article on
Washington Post can best summarize the types of relationship between architects and
clients and their results. The same types of relationship can happen if we focus on the
use and implementation of passive systems in buildings.
Most of the times a client’s complaint about an architectural design idea or a client’s
refusal in implementing an idea is resulting from the client’s lack of information about
that idea’s potential benefits. Economically baseless ideas that are insensitive to budget
limitations or ideas that are complex for implementation will render any design proposal
unacceptable for a client (Lewsi, 1998). Therefore, to convince a client for the inclusion
of passive design strategies in the construction budget, it is necessary for the design team
to be able to prove the return of investment on the implementation of any passive design
strategy.
Demonstrating the economic feasibility of a design idea, including a passive design idea,
should be through a method that is both transparent and understandable for the client.
Most clients accept what has been tried before and is also predictable, particularly
predictable in terms of the construction costs (Lewsi, 1998). That would be easier for a
client to understand how much can be saved annually through the use of passive systems
if the design team predicts the energy savings in dollars than in words. That will most
probably convince the client, for example, to collaborate with the architect to include a
Trombe’ wall with a shading device on the south façade. That being said, other design
factors such as maintenance or aesthetics of using a passive system should be also
160
considered by the design team such that the client understand the benefits of their
implementation. Therefore, a holistic integrated design approach is required, which can
consider many factors such as capital/operative costs, design aesthetics, and construction
budget of the design and implementation of passive design strategies.
The collaboration between architect and engineer is also of high importance for a
successful implementation of a passive design strategy. Kjell Anderson in the book
Design Energy Simulation for Architects by interviewing 20 architectural firms showed
they face challenges connecting their design simulation program with each project team
at the optimum time. “Project schedules are tight, the right people are not available when
needed, and some individuals are leery of an energy-based critique of their designs”
(Anderson, 2014, p .563). The interview has shown most firms voiced frustration with
their lack of interaction with mechanical engineers. In most cases, clients do not allow
their hiring until most of the geometric decisions have been made. In other cases, the
engineers do not have the fee or interest in performing quick, iterative studies, running
models without detailed inputs, or looking at non-standard options.
Anderson’s other findings showed that only three of the interviewed firms with in-house
mechanical engineers also had a group that specializes in early analysis and acts as
translators between architects and engineers. The individuals who make up this group
include architects who have learned simulation, daylighting specialists, and others who
are skillful enough to deal with the unknowns of early design. Four of the architect-only

161
firms employed at least one individual to do Whole Building Energy Simulation
(WBES) in-house. This individual does not design mechanical systems, but can set up
and run the rigorous shoebox and compliance energy models that later design stages and
LEED submittals will require. Beyond those four, some other firms had an individual
with eQuest experience who could perform quick, specific shoebox energy models on
projects (Anderson, 2014).
That would be helpful to compare also the organization of the traditional design teams
and the integrated design teams in relation to their clients. The organization of
traditional design teams is usually linear and treelike with the client at the top rank who
is communicating with the architect. The architect, in turn, will collaborate/communicate
with the branches of the contractor and the design/engineering specialists, such as the
landscape architect and the mechanical engineer. Therefore, a specialist, who
communicates with the architect as the leader of the design team, rarely communicates
directly with the client or other specialists to inform them about his expert views and
thoughts.
In contrast, the organization of an integrated design team is such that the clients and all
design/engineering specialties are communicating/collaborating through the contribution
of a facilitator, who could be one of the specialists as well. The facilitator is someone
who is able to play the role of a team leader in the direction of sustainability (Busby

162
Perkins+Will and Stantec Consulting, 2007, p.17). The facilitator manages the integrated
design Process and is responsible
for keeping the team on time and on target. He/she will link and coordinate the thoughts
and wants of the project’s core team members including the architect, engineer, project
manager, contractor, client, and primary consultant team members such as the
mechanical engineer. The core team, as needed, will be linked closely with other experts
such as energy analysts and daylighting simulators. An expert may join the core team for
a short period during the design/construction process, but makes valuable insights about
the project.
Therefore, integrating the design team and the delivery team is a key component of a
whole-system design approach (Strong and Burrows, 2017). Traditional methods of
building design and procurement usually lead to a divergence between the design and
construction team in implementation. These traditional methods also cause a
collaboration/communication gap between clients and design team members due to
clients’ lack of direct connection with the specialists as well as lack of familiarity with
designers’ specialties. Therefore, major savings can be achieved by bringing together not
only the clients and designers at an early stage of design, but also to add to this cohort of
clients and designers the experts who are in charge of construction as well as building
maintenance and operation (Strong and Burrows, 2017). Accordingly, collaboration
between the client and the design team members, including the architect, is as important
as the collaboration between the architect and the engineer experts. Such a collaboration

163
is the foundation of any successful design that can respond to the needs of all the
stakeholders.
2.4.6 Knowledge and Experience for Simulating and Integrating Passive Systems
As discussed in section 2.4.3, not only it is required to have simulation tools with
capabilities in simulating passive design strategies, but also it is required to have the
knowledge for analyzing the performance of these passive strategies through
simulations. In most cases, passive strategies’ simulations are complicated due to
difficulty in controlling a variety of factors that change in reality and are difficult to
control in simulations. Therefore, existing tools for passive design simulation or
calculation, such as Passive House Planning Package (PHPP) developed by PHIUS, in
fact simplify the building physics to a steady-state energy balance condition as a useful
strategy to be able to predict the passive performance of usual buildings.
However, to reach acceptable simulation results that can match the actual energy
consumption of innovative buildings, a more detailed analysis of the thermal processes
should be conducted. Such analysis can include, for example, buildings with large
glazing areas, special wall-structures, extremely large or small storage capacities, special
indoor condition requirements, and heating loads that fluctuate greatly over time.
Therefore, for passive building simulations there is a need for simulation tools with
dynamic simulation capabilities and a high temporal resolution. These capabilities can
help in predicting the time-based varying temperatures in space as well as the integration

164
of spatial temperature variation with the impact of other environmental factors such as
moisture, wind, and humidity for thermal comfort.33
Therefore, for a designer who wants to simulate the performance of a passive building it
is required to have the knowledge of different energy use models that are applied by
simulation tools. This knowledge can help the designer to choose the proper simulation
tool and be able to analyze or predict the final outcomes with respect to the shortages of
a simulation tool.
In this regard, ASHRAE Handbook of Fundamentals (2013) defines two general
simulation modeling approaches for estimating energy usage: modeling for building and
HVAC system design and associated design optimization (forward modeling), and
modeling energy use of existing buildings for establishing baselines, calculating retrofit
savings, and implementing model predictive control (data-driven modeling) (ASHRAE
Handbook of Fundamentals 2013, 19.4). Table 2.32 and Table 2.33 show classification
of the modeling/analysis methods as steady-state and dynamic methods. It seems that the
second part of the table including dynamic methods are more appropriate for passive
33 More recently tools such as Dynbil has been developed by the German Passive House Institute (PHI) which claims can run dynamic building simulations and predictions for passive designs. This tool seems to be stronger than other known passive simulation tools due to considering a dynamic method of simulation. However, the author could not find any validation/verification study by recognized energy institutes for this simulation tool. For further information about the tool please see https://passivehouse.com/01_passivehouseinstitute/02_expertise/02_simulations/01_buildingsimulations/01_buildingsimulations.html, last accessed February 2019.

165
simulation tools. TRNSYS is one of these tools which uses a transient simulation
method.
Passive strategies perform based on natural phenomena, and because in the real world
everything is always changing tools supported by dynamic simulation methods are more
appropriate for the simulation of passive buildings. In comparison, steady-state
simulation tools provide faster feedback and are more convenient for work because they
do not require the knowledge of complex and different input variables of dynamic
simulations. With the improvement of computer processor speeds, it is expected that in
the near future dynamic simulation methods which take more time for simulation replace
the steady methods applied in simulation tools (Da Silva, 2015). However, such a
change also needs promotion of the users’ knowledge in a large scale about these
simulation tools and their energy modeling methods.
The simulation knowledge of passive design strategies per se is insufficient to design a
successful passive building, because these buildings need auxiliary systems for heating
and cooling to provide comfort conditions all year around. This knowledge of integrating
passive and active systems is one of the key issues in designing passive buildings that do
not suffer from cold in winter or overheating in summer.

166
Table 2.32 Classification of analysis methods for building energy use: steady state methods. Reprinted with permission from ASHRAE ©ASHRAE www.ashrae.org (ASHRAE Handbook of Fundamentals, 2013)
Method Forward Data Driven Comments Empirical or Black-Box
Calibrated Simulation
Physical or Gray-Box
Steady State Methods Simple linear regression (Kissock et al. 1998; Ruch and Claridge 1991)
- X - - One dependent parameter, one independent parameter. May have slope and y-intercept.
Multiple linear regression (Ali et al. 2011 Dhar 1995; Dhar et al. 1998, 1999a, 1999b; Katipamula et al. 1998; Sonderegger 1998)
- X - - One dependent parameter, multiple independent parameters.
Modified degree-day method
X - - - Based on fixed reference temperature of
Variable-base degree-day method, or 3-1) change point models (Fels 1986; Reddy et al. 1997; Sonderegger 1998)
X X - X Variable base reference temperatures.
Change-point models: 4-1), 5-1) (Fels 1986; Kissock el al. 1998)
- X - X Uses daily or monthly Utility billing data and average period temperatures.
ASHRAE bin method and data-driven bin method (Thamilseran and Haberl 1995)
X X - - (Hours in temperature bin) x (Load for thal bin).
ASHRAE TC 4.7 modified bin method (Knebel 1983)
X - - - Modified bin method with cooling load factors.
Multistep parameter identification (Reddy et al. 1999)
- - - X Uses daily data to determine overall heat loss and ventilation of large buildings.

167
Table 2.33 Classification of analysis methods for building energy use: dynamic methods. Reprinted with permission from ASHRAE ©ASHRAE www.ashrae.org (ASHRAE Handbook of Fundamentals, 2013)
Method Forward Data Driven Comments Empirical or Black-Box
Calibrated Simulation
Physical or Gray-Box
Dynamic Methods Thermal network (Rabi 1988; Reddy 1989; Sonderegger 1977)
x - - x Uses equivalent thermal parameters (data-driven mode).
Response factors (Kusuda 1969; Mitalas 1968; Mitalas and Stephenson 1967; Stephenson and Mitalas 1967)
x - - - Tabulated or as used in simulation programs.
Frequency-domain analysis (Shurcliff 1984; Subbarao 1988)
X - X X Frequency domain analysis convertible to time domain.
ARMA model (Armstrong et al. 2006b; Rabl 1988; Reddy 1989; Seem and Hancock 1985; Subbarao 1986)
- - - X Autoregressive moving average (ARMA) model.
PSTAR (Subbarao 1988) X - X X Combination of ARMA and
Modal analysis (Bacot et al. 1984; Rabi 1988)
X - - X Fourier series; includes loads in time domain.
Differential equation (Rabi 1988)
- - - X Building described by diagonalized differential equation using nodes.
Computer simulation: DOE-2, EnergyPlus, ESP-r (Crawley et al. 2001; ESRU 2012; Haberl and BouSaada 1998; Manke et al. 1996; Norford et al. 1994)
X - X - Analytical linear differential equation.
Transient simulation: TRNSYS, HVACSIM+ (Clark 1985; Klein et al. 1994; TRNSYS 2012)
X - - - Hourly and sub-hourly simulation programs with system models. Sub-hourly simulation programs.
Artificial neural networks (Kreider and Haberl 1994; Kreider and wang 1991)
- X - - Connectionist models.
Equation based (Wetter et al. 2011)
X - - X -

168
The major objective of passive design is the reduction of auxiliary heating/cooling.
Heating systems can be defined in two main categories: convective heating systems that
mainly heat the room air and radiant or panel heating systems with the source of heat
integrated to the building envelope components. To reduce the auxiliary load several
points should be considered (Athienitis and Santamouris, 2013). First, for sizing the
heating system, a sequence of cloudy days should be considered with the thermal mass
being utilized to minimize the peak loads. Second, the cooling system should be sized
based on a sunny hot day in which natural ventilation and shading devices are applied.
Third, to reduce the peak loads the set point temperature should be considered variable.
And fourth, in the case of using a convective heating/cooling system, the design of the
air distribution system becomes important to provide the acceptable thermal comfort
condition.
In most cases sizing the heating/cooling system becomes an issue in an integrated design
process of passive buildings. The main reason is underestimating or overestimating the
passive or active system sizing by either the architect or the engineer. Architects, for
example, may consider a high percentage of glazing in their designs or may consider
insufficient spaces for the installation of mechanical systems’ components. On the other
hand, mechanical engineers usually apply their long-term normal workflow for sizing
the active systems in buildings without considering the incorporation of passive design
strategies by the architect. The result of such a design could be lack of thermal comfort
due to underestimating or overestimating the contribution of passive/active systems. For

169
example, cooling load temperature difference (CLTD) as a method for calculating
heating systems uses a steady-state peak heat loss calculation technique which may
result in an oversized system (ASHRAE, 1997).
In passive solar systems that use radiant heating systems the thermal storage of the
building envelope and its integration with the heating system, which is embedded in the
wall or floor, becomes important. In other words, the floor or the wall becomes both a
matter of design for storing the direct solar gain while hosting, for example, the hot
water pipes of the heating system. The only difference is that the solar gain is absorbed
at the top surface while the auxiliary heat is supplied at the bottom of the slab.
Therefore, there is a thermal lag difference for each heating system (i.e. passive solar
gains and active heating system) to be released to the space, which needs a delicate
design and integration of the heating system and the thermal storage mass of the
floor/walls. This design integration should focus on the required maximum auxiliary
heating, thickness and material properties of the thermal mass hosting the heating
system, and appropriate control strategies to prevent overheating of the floor surface
above 84.2 °F (29 °C) (Athienitis and Santamouris, 2013).
In addition to the integration of passive and active systems, the knowledge of integrating
different passive design strategies is important to realize a successful project. For
example, overly large glazing areas for the increase of direct solar gain may cause glare
and visual discomfort for the occupants. Gorndzik and Kwok (2015) suggest ten steps to

170
be considered for the integration of passive design strategies. It should be kept in mind
that these steps are not considered linearly in a passive design process. Findings from
one of these design steps may influence the design considerations of the another step.
These steps for the integration of passive systems include:
• Daylighting Design: to employ sidelights and skylights on the building
envelope. Daylighting Factor, Spatial Daylighting Autonomy (SDA), and
Annual Solar Exposure (ASE) are example of the items that need to be
reviewed to ensure the appropriate level of illumination inside the building.
• Overall Heat Loss: in a passive solar building by calculating the total U × A
of the south façade without including the glazing area the overall heat loss
can be estimated in Btu/DD ft2 and be added with the effects of required
ventilation (ACH). Comparing the results with reference tables will
determine if the existing design can promote energy conservation of the
building.
• Approximate Solar Savings Fraction (SSF): to determine if the glass
area/floor area ratio is appropriate.
• Approximate Heat Gain: which finds the approximate heat gains from
people, lighting, building envelope, and ventilation.
• Cross‐Ventilation Guidelines: to find the appropriate inlet areas for cross‐
ventilation
• Night Ventilation of Thermal Mass Guidelines: to find out if potentials for
night ventilation of thermal mass exist.

171
• January Balance Point Temperature
• Annual SSF Based upon the Load Collector Ratio (LCR): which determines
through reference tables which of the direct or indirect solar gain systems
are appropriate.
• Clear January Day Indoor Temperature Swing, and
• Detailed Night‐Cooling of Mass Calculation
The purpose of the discussion in the above paragraphs on integrating passive systems or
passive and active systems was to elaborate the importance of the knowledge for
integrating these systems. It should be now perceptible why, for example, a passive solar
building due to overheating might actually use more energy to reach thermal comfort.
Therefore, the knowledge of passive design is a combined knowledge of calculation,
simulation, collaboration, and other design considerations for spatial, thermal, visual,
and even acoustic comfort.
This knowledge of design integration is followed by the knowhow for implementing
passive and active systems. Certainly, experience in building your passive designs and
evaluating their energy and comfort performance after occupancy can promote the
design of the next passive building project. That is the undeniable role of experience in
any type of design including passive buildings for both architects and engineers.

172
2.4.7. Architectural Curriculum and Natural/Passive systems
The NCARB Education Standard is the approximation of the requirements of a
professional degree from a degree program which is accredited by NAAB (National
Architectural Accrediting Board). It includes a minimum of 150 semester credit hours in
six subject areas of General Education; History and Theory and Human Behavior;
Building Practices; Design; Professional Practice; and Optional Studies. Table 2.34
shows these required subject areas in detail.
Among these subjects, courses in Environmental Control Systems with a minimum of 6
credit hours and Building Service and Building Enclosure Systems with a minimum of 3
credit hours are part of the requirements for a NAAB-accredited program.
Environmental Control Systems are defined as “the study of building elements that
pertain to the modification of the microclimate for purposes of human use and comfort.”
Acceptable topics based on NCARB (2018) include “acoustics, air conditioning,
building core systems, energy, energy efficiency, energy transmission, environmental
systems, active and passive heating and cooling systems, lighting (natural and artificial),
solar geometry, natural ventilation, indoor air quality, solar energy utilization, and
sustainability.” NCARB also defines Building Service and Building Enclosure Systems
as “the study of the appropriate selection and application of building service systems
including lighting mechanical, plumbing, electrical, communication, vertical
transportation, security, fire protection, non-thermal mechanical, control, circulation, and

173
signal systems and application of building enclosure systems relative to fundamental
performance, aesthetics, moisture transfer, durability, and energy. Acceptable topics
include curtain wall systems, sustainability, construction methods, facades, plumbing,
electrical, vertical transportation, security, control, communication, and fire protection
and life safety systems” (NCARB, 2018).
These two course subjects (ie. Environmental Control Systems and Building Service and
Building Enclosure Systems) comprise about 6% of the total 150 credit hours. Since
these course subjects are the only courses that can be related to passive systems and with
respect to the variety of the topics that need to be covered in environmental systems, it
seems that educators have a very limited opportunity to teach about the concept,
calculation, and simulation of passive system design to students. In response to this
shortage, design studios can provide more opportunities for students to learn about the
use of passive systems and their integration with other design features including active
systems. However, such a learning process is usually a matter of the instructors’ interests
in choosing an appropriate design studio topic or a matter of the specialty areas
supported by architecture schools. Integrated design studios may fulfil this requirement
to some extent. However, these studios may not necessarily go beyond daylighting and
simple passive building envelope strategies to embrace add-on passive systems and their
integration with active systems.

174
With recent moves towards defining architecture as a STEM field (Science, Technology,
Engineering, and Mathematics), an in-depth inclusion of courses on design, calculation,
and simulation of passive systems and their integration with active systems in
architectural curriculums needs to be considered. In particular, such an inclusion is more
in line with architecture students’ interests and educational background, who compared
with engineering students are learning more about the design of passive building
components/systems rather than active building components/systems. While education
and knowledge about active systems in buildings is essential for architecture students,
this education needs to have a deeper focus on the integration of active systems with
passive systems. Architecture students will be more dealing with this design integration
and the design of passive building components in their future profession, and therefore,
including a specific course in their curriculums addressing passive design seems not
inappropriate.
A quick search for the existing course catalogues in architecture schools in the US
suggests that passive design is not being taught beyond conceptual levels. Therefore,
learning about calculation/simulation of passive systems’ performance as well as
implementation of passive systems remains to be experienced after graduation. This
experience will not happen for all architecture graduates and will be for architects who
are interested in passive design. Due to lack of knowledge about passive systems, many
of architecture graduates may avoid design opportunities for the inclusion of passive
systems in their design, thereby losing an important chance of design for reducing

175
carbon emissions. However, a systematic survey is required to reveal the level of
teaching in passive design in architecture schools with respect to conceptual perception,
calculation approaches, and simulation skills focused on passive design.
Table 2.34 Academic credit grouped into six subject areas required to become a NAAB accredited program in the US (NCARB, 2018)
Subject Area and Category Semester Credit Hour Requirement
General Education 45 Hours
A. Communication Skills in English Composition 3 Hours Min.
B. Humanities and Arts N/A
C. Quantitative Reasoning N/A
D. Natural Sciences N/A
E. Social Sciences N/A
History and Theory, and Human Behavior 12 Hours
A. History and Theory 6 Hours Min.
B. Human Behavior 3 Hours Min.
Building Practices 27 Hours
A. Structural Systems 6 Hours Min.
B. Environmental Control Systems 6 Hours Min.
C. Construction Materials and Assemblies 6 Hours Min.
D. Building Service and Building Enclosure Systems 3 Hours Min.
E. Technical Documentation 3 Hours Min.
F. Financial Considerations 3 Hours Min
Design 42 Hours
A. Fundamental Design 8 Hours Min.
B. Programming and Site Design 8 Hours Min.
C. Research and Investigative Based Design 8 Hours Min.
D. Integrated Design 8 Hours Min.
Professional Practice 12 Hours
A. Stakeholder Roles in Architecture 3 Hours Max.
B. Project Management 3 Hours Max.
C. Business Management 3 Hours Max.
D. Laws and Regulations 3 Hours Min.
E. Ethics and Professional Conduct 3 Hours Min.
Optional Studies 12 Hours
Total 150 Hours

176
2.5. Case Studies: Practitioners’ Application of Passive Systems
In this section, first, a description of the professionals’ general approach for choosing/or
not choosing natural systems in their projects is provided. Then three case studies will
illustrate this description to understand better the practitioners’ design approaches for
using passive systems. This section then will be expanded to an overview of the best
sustainable design practices in the US. For this purpose, twenty projects selected from
the AIA COTE TOP 10 awards will be studied in the form of tables and charts to find
out about the practitioners’ extent of the application of passive/natural systems in the US
in the contemporary practice.
Considering the categories/questions of the AIA TOP 10 Award selection criteria, which
have a focus on sustainability factors such as energy, water, well-being, ecology, and
design integration, a review of its award-receiving projects can reveal if passive/natural
systems are used in the US in best sustainable practices, and if yes, which strategies are
used more regularly. The AIA categories and selection criteria for case study analysis
will be further discussed in the section on research methodology.
2.5.1. Practitioners’ Approach Toward the Use of Passive Systems
Although, each architect or engineer may have a personal approach towards design and
each project could have its exclusive design path, it is possible to find a general design
process among specific types of design projects. The design of high performance
buildings with passive systems is no exception to this rule. Hayter et al. (2001) defines

177
nine steps for the design of low-energy buildings including the decision making process
on the use of natural systems. On this basis, generally location/climate, type of the
building load (i.e. skin-dominated or internal-load dominated), and simulation tools
provide the basis for professionals to decide for using/not using natural systems in a
design process (Atkins, 2017).
For example, for a small, skin-load dominated building in cold and temperate climates,
natural system design often involves using solar energy to provide space heating. For
other types of structures, such as internal-load dominated buildings in warm climates,
responsible passive solar design is more likely to emphasize cooling avoidance using
shading devices, high performance glazing, and daylighting. In these internal-load
dominated buildings, for cooling the building, high efficiency mechanical systems will
be utilized rather than natural systems (WBDG, 2017).
Therefore, for skin-load dominated buildings professionals draw in very first steps on
climatic analysis for the inclusion of natural systems. They start with the use of climate
analysis tools such as climate consultant, weather tools, building bioclimatic and
psychometric charts, or tables in standards such as ASHRAE standards (e.g. ASHRAE
90.1-2016, ASHRAE 169-2013, and ASHRAE Standard 55-2013) for determining the
appropriate climate zone based on weather data and the possible natural system
strategies.

178
The climate provides a basis for receiving design feedback about the feasibility of
utilizing natural/passive system strategies in that climate zone through software
programs with interactive psychometric charts or manual tabulated charts. These charts
can show the hours and zones of thermal comfort with/without utilizing natural systems
(e.g. natural ventilation or solar gain) and the hours/zones of discomfort where
mechanical systems are required, because passive strategies are not effective. A good
example of a software program including these charts is Climate Consultant as a tool for
feedback on climatic data, passive design strategies, and the hours that active systems
should operate to reach thermal comfort. The tool is connected to the Architecture
Challenge Palette 2030. The Palette 2030 proposes mostly passive design strategies for
the design of zero-net-carbon and resilient built environments from a building scale to a
regional scale.
To calculate the effectiveness of the received design feedback/strategies in more details,
the designers draw on building simulation tools or spreadsheets by making a baseline
model and incorporating those strategies to find about the possible energy savings or
adverse effects of the strategies (e.g. glare or increased energy consumption) through
parametric simulation runs.
In the next step, practitioners integrate the possible passive strategies with other systems
of the building (i.e. active systems) in a whole-building simulation to find out about their
interrelation/interaction in terms of reducing/increasing energy consumption and indoor

179
thermal, visual, spatial, and in some cases acoustic comfort. This step can help
practitioners to prioritize the natural/passive system strategies, found in previous steps,
based on the functional requirements of the building, its energy consumption, cost, and
thermal/visual comfort priorities.
Table 2.35 The three-tier design approach with the highlighted tier of passive design for achieving a high performance sustainable building, based on (Lechner, 2015)
Tier/Step Type of Strategy Possible examples to consider in design 1 Climate Responsiveness:
Heat avoidance, rejection, retention
• Building: location; site design; landscaping; form; orientation; color; insulation; exterior shading; construction materials; air tightness
• Windows: orientation; size;
glazing type; insulation; shading 2 Passive systems • Heating with direct gain, Trombe’
wall, or sunspace • Cooling with comfort ventilation,
night flush cooling, earth coupling, and cooling tower system
• Daylighting with light shelves or clerestories
3 Active Systems: Heating& cooling equipment, renewable energy, lighting equipment
• Efficient lighting and appliances: Task ambient lighting fixtures, LEDS, and fluorescent
• Renewables: photovoltaics, wind
turbines, solar domestic hot water, active solar swimming pool water
• Heat pump, furnace, boiler, spot
electric heating, active solar space heating, heat pump, air conditioners, evaporative coolers, fans (whole house, ceiling, spot)

180
Probably, a brief description of where or when practitioners draw on the use of passive
systems is the three-tier approach proposed by Lechner (2009). Table 2.35 shows the
possible considerations in each tier/step which also include passive systems. To illustrate
this process with examples I draw briefly on three case studies including HKS design for
Dadeng Island Convention Center in Xiamen, China (HKS, 2013), National Renewable
Energy Lab Research Support Facility (NREL RSF) in Golden, Colorado (Athienitis and
O'Brien, 2015), and Zion National Park Visitor Center in Utah (Hayter et al., 2001).
2.5.2. Three Case Studies on The Approach of Using Passive Systems
The first case study is HKS designs for Dadeng Island Convention Center in Xiamen,
China. The design process of the convention center included early design analysis using
the Ecotect software and its Weather tool for finding climatic classification, optimum
orientation of the building, shading design, and insolation on the building’s envelope. In
addition, using the psychometric charts in the Weather tool HKS recommended active
cooling along with possible passive strategies including thermal mass effect, passive
solar heating, and natural ventilation for this building and climate.
In the second step, using eQuest for the whole-building energy simulation, a baseline
model has been developed and the individual effect of skylight, improved glass type, and
building orientation for energy saving were analyzed. In a final step the useful energy
efficiency measures, which were compared individually with the baseline, were
collected together and simulated resulting in 20% energy savings compared to the
181
basecase energy model. This project has received awards, though in the category of
unbuilt projects. In sum, we can say the design of the convention center began with a
study about the individual impact of the passive strategies found through Climate
Consultant. These strategies then were input to eQuest for a whole-building simulation
study to compare the savings with the basecase model.
National Renewable Energy Lab Research Support Facility (NREL RSF), in Golden,
Colorado, is the second case study. This facility’s plan and its thermal zones are realized
through three rectangular shapes: two unparalleled and one crossing these two
rectangles. Some of the applied natural system energy saving strategies in this facility
center included high performance building envelope, daylighting, thermal storage
labyrinth, natural ventilation, and thermal mass. In NREL RSF computer modeling has
played an important role throughout the design process and in ensuring that the energy
goals would be met within the scope of the specified budget. eQuest, a whole-building
energy simulation program, has been used as the main simulation tool in the design
process.
Other programs have been used in this project to provide more detailed information or to
complement the whole-building simulation tool. Hirsch et al. (2011) has described the
models used in the design process in details as well as how the models informed
important design decisions on the path from preliminary design to the completed
building. Specialized simulation tools have been used independently for the project to

182
design the major innovative components of the building, which were later integrated into
the whole-building simulation program.
A brief summary of the major tools and design approaches applied include (Hirsch et al.,
2011):
• RADIANCE for daylighting analysis such as light redirection and shading
analysis as well as electric light control analysis
• IES VE for natural ventilation analysis and its thermal effects
• Separate modeling of the data center for its cooling and heat recovery design,
including the electric consumption of information technology (IT), fan energy,
cooling energy, and heat recovery. The resulting information defined the input
for the thermal labyrinth model and the eQuest software.
• eQuest for the whole-building energy simulation and the integration of various
components of the energy model
• Numerical models for further investigation/validation of the advantage of
including or not including natural systems. Examples include a numerical
thermal network model with explicit finite differencing approach, which was
created using Mathcad for a typical section of the office area. Additionally, for
heat flow between thermal zones and its surroundings convective and radiant
heat transfer modeling were coupled, but modeled within two enclosures:
physical and radiosity. Solar heat gains and daylighting due to transmitted solar
radiation were calculated in the radiosity model with the radiosity approach.
183
In sum, we can say what distinguishes the design of the NREL RSF from other similar
projects is the integration of different simulation tools and the use of numerical models.
Particularly, the numerical models were developed to validate the findings from
computer simulations or for the time that computer simulation tools are not sufficient to
reach a correct design solution.
The third case, Zion National Park (ZNP) Visitor Center in Southwest Utah, USA, draws
vastly on natural/passive systems. For this reason, this project has been further discussed
here compared with the two other case studies.
The key steps in the design process for choosing/or not choosing the natural systems in
this project included:
This project began with a series of design charrettes to brainstorm about the project’s
goals including energy issues and natural systems in design. During the charrettes, the
energy consultant through observing the natural cooling and heating effects of the
National Park’s canyon was inspired for a similarly climatically adaptable design. In this
region, daily high summer temperatures easily exceed 38°C (100°F). The Virgin River in
the region has cut a deep narrow slot (about 2000 ft. deep) through many rock layers.
Water seeping through the rocks wet the canyon walls. Hot air rising from the wider
canyon below passes through the narrow passage of the slot canyon. In many parts of the

184
slot canyon, direct sunlight on the lower walls and canyon floor lasts less than an hour
per day.
The combination of the evaporating water from the walls of the canyon due to hot air
and the high-mass walls in the canyon provides comfortable temperatures. In other
words, a cool microclimate is provided in this harsh climate through integrated natural
strategies such as solar load avoidance, evaporative cooling, thermal mass, and natural
ventilation. Additionally, inside the slot canyon, the predominantly diffuse daylighting
makes a building feel cooler since it avoids the solar gain usually caused by direct
sunlight.
The wider areas of the canyon have an opposite effect. The east canyon walls are heated
due to evening sun, which stays warm into the night despite the average temperature
drop to 15°C (60°F) at summer nights. The heat absorbed by the massive stone materials
will be slowly released during the evening and night times. Therefore, the stored heat is
reradiated from these rocks to keep the temperature at comfort range.
These observations resulted from understanding the features of the natural environment
in which the building was to be designed and analyzing the programmatic needs of the
building. On this basis, the integrated design of the building established natural systems
including natural ventilation, evaporative cooling, daylighting, solar gain avoidance with
building shape/envelope features in summer, passive solar heating in winter with direct

185
and indirect solar gains, massive building materials to stabilize indoor temperatures, and
location in relation to the shade of trees and newly constructed outdoor structures.
Before incorporating all of these natural systems, hourly base-case simulations of the
building were conducted to determine building energy loads and to calculate the energy
performance of a code-compliant building (LBNL, 1994; Palmiter, 1984). After realizing
the code compliance of the ZNP Visitor Center base-case (ASHRAE 90.1, 1989),
parametric analysis was performed. This analysis used the base-case building
simulations to find out the impact of the changes of certain building envelope
components. Examples include the U-value of the wall, floor, roof, and windows which
were minimized to reach zero heat transfer across these components. The resulting
building energy simulations of these parameters could show that daylighting, shading,
natural ventilation, evaporative cooling, and passive solar heating more than other
strategies reduced total building energy consumptions. By combining the parametric
analysis results with elements used to keep the canyon comfortable, the design team of
the ZNP analyzed strategies to address primary energy loads.
Therefore, computer simulations were conducted to assess the usefulness of these
strategies quantitatively. In this case, architectural requirements and energy-efficient
strategies were merged. For example, the team chose downdraft cool towers as the
primary cooling system, which is covered in a material in harmony with the stone
material of the canyon. For cooling the building no mechanical fan is required. The

186
location of the building’s windows, including clerestory windows, promote daylighting
by reducing the depth of the building for lighting and improve natural ventilation by
moving the cool air inside.
Cost analysis were used in this project to show the usefulness of the selected natural
system strategies. The energy cost savings, excluding the savings from the PV system,
were approximately 80% based on the simulation results. The integration of the energy
features into the envelope increased the cost of the building, however, due to the
reduction of infrastructure and mechanical systems cost the total cost was reduced. A
post occupancy evaluation (POE) also helped the designers to decide about the
usefulness of the applied natural systems for their future designs. The POE showed that
the downdraft cooling towers and the natural ventilation work best in open floor plans.
Since the occupants of the office rooms in ZNP building preferred to keep the
doors/windows closed for privacy and security reasons, it was impossible for natural
ventilation/cooling to take place in these areas.
In sum, what distinguished ZNP from the other two case study projects is its application
of a variety of natural/passive systems which has been followed by cost evaluation and
post occupancy evaluation to inform the future application of these systems.

187
2.5.3. Best Practices: AIA COTE Top 10 Awards
This section evaluates exemplary buildings in the US, which are claimed to be highly
sustainable and high performance. For this purpose, the buildings that are awarded each
year by the AIA Committee of The Environment were selected. As mentioned earlier,
these buildings should achieve high scores in terms of design integration and their
impacts on other factors such as community, ecology, water use, economy, energy
saving, wellness, and material resources. An analysis of these buildings’ use of passive
systems can determine to some extent if passive systems are being used in best
sustainable designs in the US, and, if yes, which systems are being use more regularly.
For the ease of analysis, the passive strategies used in these buildings were analyzed
through twenty tables and charts. Table 1-passive to Table 20-passive include columns
for the location/climate of the projects and their design strategies for building envelope,
natural heating, natural cooling, daylighting, natural ventilation, active systems, and
water conservation. One column also outlines the milestones of each project. The case
study selection included the buildings from the year 2010 and the year 2017. The cases
from the year 2017 represent the latest at the time of analyzing the AIA COTE TOP 10
awards. Additionally, analyzing buildings from the year 2010 for the AIA Award, will
show if passive systems were being used more in the earlier awarded projects compared
to the present time. Among these AIA awarded projects, two buildings are located
outside the US, though they have taken part in the AIA Award program. These two

188
buildings include the Green Mark Platinum-certified Ng Teng Fong General Hospital
(NTFGH) in Singapore, and Manitoba Hydro Place in Canada.
Ten radar charts in Appendix D summarizes an analysis of the mainly passive
performance of these buildings. For this purpose, the performance data available for
each building, such as the percentage of the floor area achieving adequate light without
artificial lighting (PWF/O), was considered. This analysis was limited to the projects
awarded in the year 2017, since compared to the 2010 projects they provided more
quantitative data as well as qualitative descriptions for building performance evaluation.
This increase in building performance data availability could be a result of higher code
compliance requirements and AIA’s demand for providing more measurable
sustainability metrics in daylighting, water, and energy design.
Review of the charts and tables for the passive performance of the selected buildings
reveals that in passive cooling and heating the building performance rarely goes beyond
5 score on a scale of 10. While in daylighting and establishment of the Domestic Hot
Water (DHW) through solar thermal collectors most of the buildings achieve an
acceptable range of score from five to ten, with few exceptions that have not passive
strategies for providing the domestic hot water at all.
The passive survival of the buildings more than passive design strategies depends highly
on the production of energy through renewable energy sources such as wind and solar

189
energy. Therefore, those buildings with higher solar power capacity, such as the Stanford
University Plant Facility, will have a higher chance of continual building performance
without interruption in the case of power outage.
All in all, the case study analyses of AIA COTE TOP 10 Awards show that there is more
opportunities in the application of passive heating and cooling in sustainable buildings.
This is perceptible from the low score of passive heating and cooling and also very rare
application of passive design strategies. The Tables Passive 1-20 show that almost none
of the add-on passive systems are applied in the awarded buildings and their passive
design strategies mainly include building envelope design such as superinsulation or
natural ventilation/cooling such as through strategically located windows. A few
buildings have expanded their use of passive design such as NOAA center, which had
applied downdraft cooling strategies or the Stanford University Facility center, which
had applied phase change materials.
190
3. RESEARCH METHODS
3.1. Introduction
The literature review in the previous section revealed some of the issues of passive
design in the US, which led to the construction of several themes that have ushered the
current research investigation. This section will explain the methodologies that were
applied in this dissertation research to investigate and measure qualitatively and
quantitatively these themes through four main constructs including:
• The factors influencing the increase/reduction of the use of passive/natural
systems in buildings
• The design tools being used for the education/application of passive design
• The most and least recurring types of passive/natural system strategies, and
• The importance of incorporating passive/natural system strategies in a practical
design process with respect to their integration with mechanical systems
Due to the qualitative and quantitative nature of these themes/constructs a mixed-method
research methodology will be adopted which included both qualitative and quantitative
research methodologies. These research methodologies include: case study, survey
questionnaire, and content analysis. While each of these methods has been discussed in
their own exclusive sections tied to the findings of that method, the following sections
will explain further about the logic and philosophy of adopting these research
methodologies.

191
The logic of integrating the three methods in this research is using their results for
comparison to find out if they are converging or diverging. In the proposed research,
survey and case study results support the content analysis as in a mixed method research.
Content analyses are not necessarily stand-alone methods and might be an integral part
of the data analysis in other types of studies (Wennick et. al, 2009). This may result in a
mixed method research, with both qualitative and quantitative elements, which also
reduces research biases (Leedy and Ormrod, 2013). Therefore, in this dissertation
research, case study and content analysis respond to the qualitative investigation of the
research, while the survey methodology contributes to the quantitative findings of the
research.
3.2. Qualitative Methods Applied
3.2.1. Case Study
A case study approach was applied as one of the two qualitative approaches in the
research. Case studies included buildings selected by the American Institute of
Architects Committee of the Built Environment to be awarded as the Top Ten high
performance sustainable buildings in the US. AIA COTE TOP 10 is the American
Institute of Architects’ Committee of the Environment award which is given every year
to the best ten new green projects in the US, that are sustainably high performance. The
author neither confirms nor rejects the AIA TOP 10 Awards as the best sustainable
practices in the US. However, these buildings were selected because they are selected by

192
AIA as a nationally recognized institution in architecture in the US. Launched in 1997,
the AIA annual awards are the longest running recognition program for sustainable
design excellence by AIA.
Another reason for the selection of the AIA TOP 10 Award as best building practices
was four criteria that were pursued by this research for case study selection and analysis.
First, the buildings to be selected for case study analysis should be mainly nonresidential
or commercial buildings that have received sustainable design certifications such as
LEED, NZEB, Living Building Challenge, and Passive House Certification. Second, the
buildings’ Energy Use Intensity (EUI) should be less than the national median EUI.
Third, buildings should have been built in the last ten years to reflect a recent snapshot
of the sustainable design practice. And fourth, preference will be given to buildings that
have post-occupancy evaluation with measured data along with predicted data. The
majority of AIA TOP Ten Awards, particularly those buildings which received awards in
recent years, have post occupancy evaluation information as an optional requirement to
take part in the AIA TOP 10 Award Competition, while they also fulfil the other four
selection criteria.
As such, the AIA COTE TOP 10 Toolkit (AIA, 2018) evaluates built projects in ten
categories including:
• Design for integration: what is the big idea behind this project—and how
did the approach toward sustainability inform the design concept?

193
• Design for community: how do community members, inside and outside the
building, benefit from the project? The focus is on walkability, human
scale, alternative transportation, community engagement and buy-in, and
social equity.
• Design for ecology: In what ways does the design respond to the ecology of
this place?
• Design for water: how does the project use water wisely and handle rainfall
responsibly?
• Design for economy: how does the project provide “more with less”?
• Design for energy: how much energy does the project use? Is any of that
energy generated on-site from renewable sources, and what is the net
carbon impact?
• Design for wellness: how does the design promote the health of the
occupants? The answer should describe strategies for optimizing daylight,
indoor air quality, connections to the outdoors, and thermal, visual, and
acoustical comfort inside and outside the building.
• Design for resources: what are the efforts to optimize the amount of
material used on the project to reduce product-cycle environmental impacts
while enhancing building performance?
• Design for change: how the project is designed to facilitate adaptation for
other uses and/or how an existing building was repurposed?

194
• Design for discovery: is there post-occupancy evaluation of the building in
terms of its actual performance? What lessons have learned from design to
the occupancy phase and post-occupancy evaluation, and how have these
been incorporated in subsequent project?
The cases selected from the top ten awards included buildings from the year 2010 and
2017. Year 2017 was the latest year with available top ten awards by AIA and the year
2010 compared with the first years of launching the award competition had a stronger
database and more information to evaluate any selected case study. A tabular format was
used to analyze the selected case studies in Table 1-passive to Table 2-passive in the
appendix. The analysis of the buildings included information in nine main columns
about the project completion year, the project team members, location and climate of the
project, passive building envelope strategies, natural heating, natural cooling,
daylighting, natural ventilation, active systems, and milestones of the project.
Passive design concepts and technical/performance metrics were used to analyze the
buildings and to score their passive building performance. Selected buildings’ data were
collected online through the AIA website (AIA, 2018). Efforts were made to collect
performance data as much as possible, beyond the available data on the AIA website, by
searching for building performance information in other sources for the awarded
projects. One example of these efforts is searching for the websites of the firms who
contributed to an award-winning project.

195
The metrics used to analyze the case studies were based on the metrics provided by the
majority of the case study projects for energy, daylighting, visual comfort, water, carbon
emission, and resiliency. For example, these metrics for daylighting and visual comfort
analysis included PFVO, PFW/O, SDA, and the percentage of area which is daylit with
more than 300 lux at 3pm on March 21(equinox). Other applied building
technical/performance metrics include the followings: Site EUI, SDA (Spatial
Daylighting Autonomy), annual carbon emission reduction, heating /cooling loads
reduction, renewable energy, active systems’ energy consumption, passive survivability,
and natural systems energy savings. While there are other building performance metrics
for evaluating a building’s performance, the case study focused on the metrics that had a
corresponding data available in the AIA TOP Ten Projects.
Description of some of the applied metrics for the case study analyses is as follows
(Sterner, 2015; AIA, 2018):
• PFVO is the percentage of floor area or percentage of occupant work
stations with direct views of the outdoors.
• PWF/O is the percentage of floor area or percentage of occupant work
stations achieving adequate light without the use of artificial lighting.
• PFW30 is the percentage of floor area or percentage of occupant work
stations within 30 feet of operable windows.

196
• EUI or Energy Use Intensity is a building’s annual energy use per unit area.
It is typically measured in thousands of BTU per square foot per year
(kBTU/ft2/yr) or kWh/m2/yr. EUI can measure “site” energy use (what the
building consumes) or “source” energy use (the amount of fuel the power
plant burns to produce that much energy). Unless otherwise specified, EUI
typically refers to “site” energy use.
• Annual carbon emissions measure the carbon emissions associated with a
building’s energy consumption. To calculate carbon, we have to follow the
energy back to where it was produced. This means that the carbon intensity
of electricity depends on the mix of power sources in a region. Other (non-
carbon) greenhouse gasses (e.g., methane) are assigned a standard carbon
equivalency. Therefore, the final result is in terms of carbon.
• SDA or Spatial Daylight Autonomy describes how much of a space
receives sufficient daylight. Specially, it describes the percentage of floor
area that receives a minimum illumination level for a minimum percentage
of annual occupied hours — for instance, the area that receives at least 300
lux for at least 50% of occupied hours (which would be notated as
sDA300/50%). It is a climate-based daylighting metric, meaning that it is
simulated using a location-specific weather file.
• A heating or cooling load is the amount of heat that needs to be
added/removed from a space to maintain the desired temperature. The
“peak load” is the worst hour over the span of a year. Therefore, a

197
building’s “peak heating load” is the largest amount of heat that needs to be
added to a space in a single hour.
• Energy saving is the percentage of energy savings compared to the base
case model through active or passive systems
• Passive survivability is the number of days that a building can function
normally without access to electricity, such as in the case of power outage.
As for the passive design concepts which were considered for the evaluating the passive
performance of case studies, factors such as the percentage of operable windows for
natural ventilation, or passive design concepts such as solar chimney, downdraft cooling,
or proper application of phase change materials were considered in scoring the passive
performance of the buildings on a scale of 1 to 10. Therefore, a combination of
objective weighting scores (i.e. scores based on technical building performance metrics)
and subjective weighting scores (i.e. scores based on passive design concepts) was used
to analyze/score the passive performance of the selected buildings. analysis The findings
of the case study beyond tables, were also presented through radar charts for the ease of
analysis.
The radar charts scored the passive performance of the buildings in terms of heating,
cooling, ventilation, domestic hot water, renewables, lighting, and passive survival.
These charts were only provided for the Top 10 Awards of the year 2017, due to the

198
limited building performance data that were provided for the Top 10 Awards of the year
2010.
Because usually there is a difference between theory and actual practice, the findings of
the case study of the TOP 10 COTE AIA Awards can show to what extent passive
systems are being used in practice. The case study findings in fact can support the
findings of the survey/interview by showing if natural system strategies proposed in the
books/guidelines reflect the way sustainable designers are using them their actual
practice, and if yes to what extent.
Therefore, the case study of exemplary sustainable buildings representative of best
practices will provide a snapshot of the actually applied strategies for the incorporation
of natural systems to buildings. This snapshot will provide a ground to compare the case
study results with the results of the survey questionnaire to seek any
commonality/discrepancy between these methods’ findings in using tools and strategies
for natural/passive system designs in the US. This ground will be reinforced with the
findings of the content analysis in which practitioners may reflect on their attitude about
passive design strategies and tools as well as their relevant issues.
However, case study cannot alone reveal information about the passive design tools
applied by practitioners or the challenges that practitioners have dealt with for the
incorporation or implementation of these systems in buildings. Therefore, other

199
methodologies including survey questionnaire and content analysis will be utilized to
reveal such information.
3.2.2. Content Analysis
A content analysis is a detailed and systematic examination of the contents of a
particular body of material for the purpose of identifying patterns, themes, or biases
(Leedy and Ormrod, 2013). Content analyses are typically performed on forms of human
communication such as books, journals, written text, and internet blogs. Therefore,
content analysis determines the presence of certain words, themes, or concepts within a
set of collected qualitative data (i.e. text). Although it may count the number of times a
pattern appears in a context, here content analysis will be used as a qualitative approach
to categorized the patterns in the context of the written responses to a text question in the
survey questionnaire.
According to Columbia University description of content analysis (2018) it can be used
to identify the intentions, focus, or communication trends of an individual, group, or
institution; to describe behavioral responses to communications; to determine
psychological or emotional state of persons or groups; to reveal international differences
in communication content; to reveal patterns in communication content; or to analyze
focus group interviews and open-ended questions to complement quantitative data.

200
On this basis, content analysis in the current research was adopted as a methodology to
analyze part of the findings of the survey questionnaire and to supplement the survey
findings. In other words, content analysis will be used to analyze the findings of an
open-ended text question in the survey questionnaire. The open-ended text question in
the survey questionnaire will ask participants if there is any comment or point that was
not included in the survey questions, which they want to share. This question, in fact,
plays the role of a face-to-face interview question. This strategy was adopted to
overcome the time/budget constraints for face-to-face interviews or issues such as
participants’ hesitation in revealing sensitive information in a face-to-face interview.
Although a face-to-face interview can establish rapport between the interviewer and the
interviewee to gain more information, this type of interview may bias the findings if the
interviewer is not skilled enough to avoid influencing the conversation with personal
opinions.
The intent of the applied content analysis method was to make replicable and valid
inferences by interpreting and coding textual material (Columbia University, 2018).
Using the format proposed by Leedy and Ormrod (2013) for content analysis, this
research follows these steps:
First, the specific body of the materials for content analysis needs to be identified, which
in the case of the current research include the responses to the last text question in the
survey.

201
Second, the characteristics or qualities of strategies to be examined in precise, concrete
terms will be defined. To connect the findings of the content analysis to the constructs of
the survey (e.g. challenges in the use of passive design or tools applied by practitioners)
and based on the responses that will be collected several themes/categories will be
defined to assign relevant responses or part of the responses to each category/theme. To
facilitate the analysis process, a color-coding approach will be adopted in which each
category has a certain color and all the responses that share the same theme/category will
be highlighted in the text responses with the same color.
Third, the color-coded text materials will be extracted to find the shared patterns
between the responses and if needed change their category/theme in the previous step.
Since the judgments are entirely objective for the studies that involve looking for the
appearance of certain words/concepts (e.g. simulation tools) in a text, only one
judge/rater (here the researcher) is enough.
3.3. Quantitative Methods Applied
This research uses a survey methodology for its quantitative approach to
measure/evaluate the constructs mentioned in the introduction section of this section.
Qualtircs software will be used to design the survey questionnaire and to distribute it
online among the participants. The use of Qualtircs software also facilities the analysis
of the collected data in the next step through its possibilities for exporting the collected
data in an excel file format.

202
3.3.1. Survey Questionnaire Design Principles
One principle which was used to design the survey questionnaire was developing
questions with respect to the types of expected responses from the survey. These
responses with respect to their measurement tools can be divided into four sets: one set
with ordinal scales (e.g. ranking as first, second, third, etc.), one set with nominal scales
(e.g. male/female or educational region), and one set with ratio scale (e.g. percentage of
residential projects). These measurement scales then were developed to the form
questions with respect to types of expected responses from the questionnaire. These
questions should shed light on the four constructs of the survey: the tools being used for
passive design; the most and least recurring types of natural system strategies including
cooling strategies (if any), heating strategies, and daylighting strategies; the challenges
and opportunities which will increase/reduce the use of natural systems in design; and
the importance of natural system strategies in a practical design process with respect to
the use of mechanical systems.
More importantly, the main principle which was maintained in designing the survey
questionnaire was to reduce the survey errors/biases. In this case questions were
designed with respect to reducing the four typical types of survey errors as explained in
the following sections. Conducting surveys that produce accurate information to reflect
the views and experiences of a given population requires developing procedures to
minimize all four types of survey error. These types of error include coverage, sampling,
nonresponse, and measurement errors (Dillman, 2014). Therefore, the logic of the

203
questionnaire design in this research is to reduce these errors to the feasible extent with
respect to time and cost. This logic is briefly explained here by discussing these types of
survey errors and the strategies which will be adopted to reduce their effects on the
survey findings. In addition, before launching the survey, a pilot study can reveal any
issue in the content of the survey questionnaire. This strategy will be used to correct any
potential issue/error with respect to the potential four types of survey errors discussed in
the following sections.
3.3.2. Reducing Survey Measurement Errors
Reducing measurement error: this error is often the result of poor question wording or
that the questions are not unidirectional in measuring one construct/concept (Dillman,
2014). There are methods such as factor analysis or focus group to ensure the questions
are measuring the desired construct. Conducting focus group with a group of
professional experts across the states does not seem feasible. Instead of focus group, the
research will use an approach similar to Delphi communication method to ask experts
about their feedback on a set of questions that are intended to be used in the survey
questionnaire. In Delphi method the process begins by sending a survey questionnaire to
the experts in the panel and receiving their response/feedback about that. The survey will
continue by a facilitator (the author) in a second run to ask about the shortages/issues in
the questions that need to be addressed. This process continues until the responses
received from the expert panels are convergent to confirm the appropriateness of the
questions (Linstone & Turoff, 1975). This process was tailored to the needs of the

204
current research survey from practitioners/educators and will be further discussed in the
survey procedure in section four.
For choosing the proper wording of the questionnaire, the readability of the questions
will be checked using Word software readability statistics. A readability level between 9
and 5 for Flesch-Kincaid Grade Level is used. This level of readability makes the
meaning of the questions understandable for a wider group of respondents to avoid
interpreting the questions by respondents in ways other than intended.
3.3.3. Reducing Nonresponse Error
The nonresponse error occurs when the individuals selected for the survey who do not
respond are different from those who do respond in a way that is important to the study
(e.g., expertise, experience, etc.) (Dillman, 2014). Minimizing nonresponse error
involves motivating most of the individuals sampled to respond. To reduce the
nonresponse error, the survey will be short and concise not to take more than 9 minutes
to answer. Additionally, the visual appearance of the survey is important such that it
looks simple and attractive. Therefore, constructing survey questions involves both
choosing words to form the questions and deciding how to visually present the
questions, including each of the component parts, to respondents. Besides the use of
readability index in word software, avoiding open-ended questions, using multiple
choice answers, and Likert scale (if appropriate) can help the survey to be simply
understandable.

205
Meanwhile having one open-ended question at the end, as was explained in the content
analysis methodology, will reduce the nonresponse error if there was an answer not
covered in the questionnaire. The survey avoids expanding an open-ended question
theme to all the questions because codifying/classifying the answers will be difficult
later. The order of questions will be from simple questions to questions that are more
detailed such that answering each question helps answering the next question.
In the case of measuring sub-constructs of one larger construct, the questions will be
grouped together. In grouping multiple questions, the logic is to select questions that are
related. For instance, the survey can be structured into four parts including the
background, tools, strategies, and influential factors with their related questions to
survey the degree of adopting natural/passive systems and factors influential in their
design process. Additionally, the survey questionnaire design is after conducting a well-
informed literature review to use the findings for designing the survey.
3.3.4. Reducing Survey Sampling and Survey Coverage Errors
Sampling and survey coverage errors can bias the research findings in addition to the
two types of survey errors discussed above (i.e. nonresponse error and measurement
error). Based on the Design intelligence survey in 2012, the number of architectural
firms established in the US equals 20,836 design firms (Design Intelligence, 2017). If
Np=population, B = acceptable margin of error (for example, .03 = ± 3% of the true

206
population value), C = Z score associated with the confidence level (1.96 corresponds to
the 95% level) and p= the proportion of the population expected to choose one of the
two response categories (SurveyMonkey, 2017), the required sample number (Ns) in a
rough estimate based on the equation below will be 1000:
1015=20836 (.25)/ ((20836-1) (.03/1.96)2 + .25)
Distributing survey questionnaires to collect about 1000 responses is not reasonable with
respect to cost and time. Therefore, to reduce the sampling error through a feasible
approach, a purposeful sampling process can be applied in which a fair mix of architects
and engineers, who have contributed to both business-as-usual and best building
practices, will be included in the survey. Through this approach different lists of
architects and engineers’ professional organizations as well as top design firms in the US
can be surveyed as needed to expand the range of the sample group with a variety of
professional backgrounds to increase the external validity of the research. Examples
include the AIA Chapters, ASHRAE Chapters, and top sustainable design firms in the
US ranked by Architect 50 Magazine, or top design firms ranked by Architectural
Record. Meanwhile, for increasing the internal validity of the research the focus can be
on the design strategies and architects/engineers inside the country for sampling. The
(Np) (p) (1-p)
(Np-1) (B/C)2 + (p) (1-p) Ns =

207
survey will also focus only on passive design strategies, instead of both passive and
active systems, to increase the internal validity of the findings.
To implement the explained sampling logic, a survey link will be distributed among
architecture and engineering practitioners in the US through each state’s AIA and
ASHRAE Chapters. Online accessibility to these organizations’ chapter information for
a preliminary contact as well as their high level of impact on the design and construction
of buildings in the US are two main reasons for their inclusion in the survey sample.
Each chapter will be contacted to ask for the possibility of distributing the survey among
their members for participation.
To manage the survey distribution process among architects and engineers through each
state’s AIA and ASHRAE Chapters, an excel spreadsheet will be prepared. The
spreadsheet will include the name of the executive/vice president of each chapter or the
director of communication to be contacted to distribute the survey among their chapters’
members. Table 3.1 shows the list of the AIA Chapters and their region, which will be
contacted to participate in the survey. Table 3.2 shows the list of the ASHRAE Chapters
who will be contacted for participation in the survey. This sample of AIA and ASHRAE
members will be supplemented by distributing the survey directly to the lists of top
designers and engineers in the US. These lists include top ten sustainable design firms in
the US recognized by Architecture 50 magazine34 (Table 3.3), top ten architecture and
34 For further information please see https://www.architectmagazine.com/practice/architect-50/2017-architect-50-top-50-firms-in-sustainability_o

208
design firms in the US recognized by Architectural Record 35(Table 3.4), and
professionals who contributed to preparing the high performance building standard
ASHRAE 189.1.
The target groups of the survey will include educators in addition to practitioners in the
in the areas related to passive building design. However, a separate survey will be sent to
educators to measure the same four constructs discussed in the introduction of the
current chapter. In this case, the focus of the survey will be more on class projects
related to passive/natural systems rather than professional projects. Using a separate
survey for educators will increase the validity of the findings. The selection of educators
in architecture schools will be based on the list of top 50 architecture colleges and
schools in the US according to the NICHE 2019 ranking.36 Table 3.5 shows the list of
these schools. Since there is a possibility that not all of these school have educators in
the area of passive design, therefore the actual list of universities receiving the survey
could be less than fifty schools. The top graduate architecture schools, not included in
this list, were also added to the list of survey recipients including: Harvard, MIT,
Columbia University, Yale University, SCI-Arc, and the University of Michigan.
35 For further information, please see TOP 300 Architecture Firms in the US rank by Architectural Record at https://www.architecturalrecord.com/Top300/2017-Top-300-Architecture-Firms-1 36 The 2019 Best Colleges for Architecture ranking by NICHE is based on key statistics and student reviews using data from the U.S. Department of Education. The ranking compares the top architecture programs in the U.S. For further information and the list of schools please see https://www.niche.com/colleges/search/best-colleges-for-architecture/
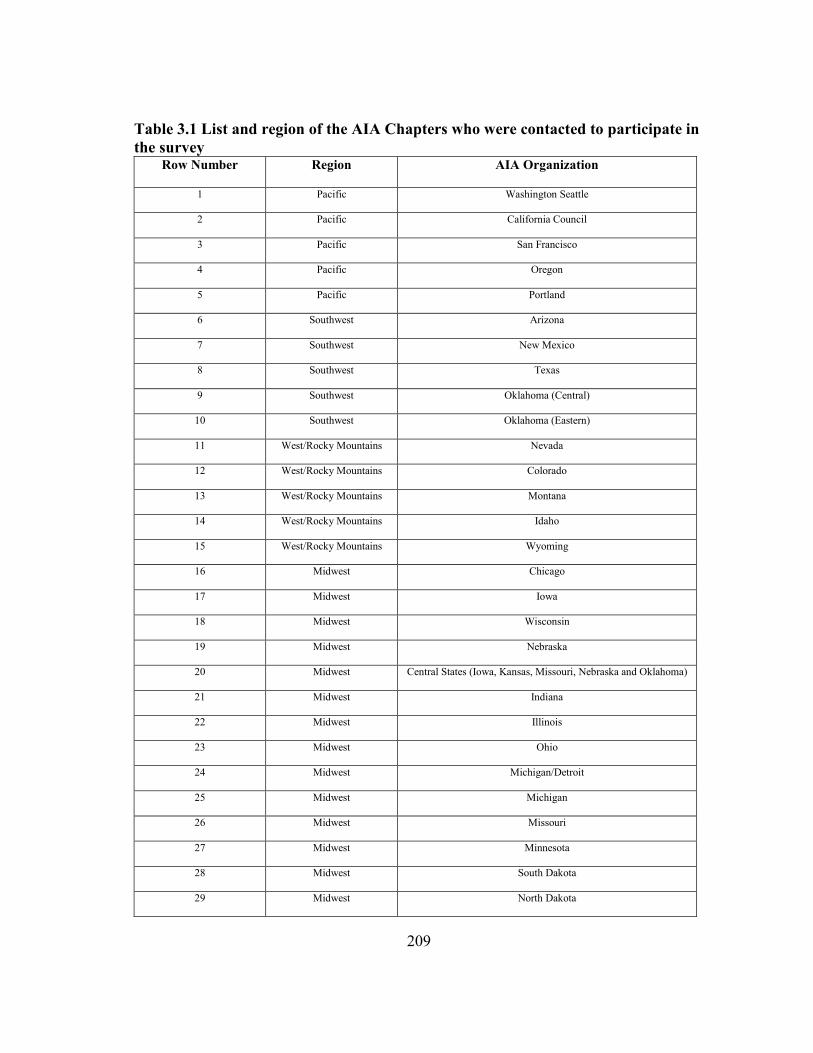
209
Table 3.1 List and region of the AIA Chapters who were contacted to participate in the survey
Row Number Region AIA Organization
1 Pacific Washington Seattle
2 Pacific California Council
3 Pacific San Francisco
4 Pacific Oregon
5 Pacific Portland
6 Southwest Arizona
7 Southwest New Mexico
8 Southwest Texas
9 Southwest Oklahoma (Central)
10 Southwest Oklahoma (Eastern)
11 West/Rocky Mountains Nevada
12 West/Rocky Mountains Colorado
13 West/Rocky Mountains Montana
14 West/Rocky Mountains Idaho
15 West/Rocky Mountains Wyoming
16 Midwest Chicago
17 Midwest Iowa
18 Midwest Wisconsin
19 Midwest Nebraska
20 Midwest Central States (Iowa, Kansas, Missouri, Nebraska and Oklahoma)
21 Midwest Indiana
22 Midwest Illinois
23 Midwest Ohio
24 Midwest Michigan/Detroit
25 Midwest Michigan
26 Midwest Missouri
27 Midwest Minnesota
28 Midwest South Dakota
29 Midwest North Dakota

210
Table 3.1 Continued Row Number Region AIA Organization
30 Midwest Kansas
31 Southeast Tennessee
32 Southeast Arkansas
33 Southeast Louisiana
34 Southeast Mississippi
35 Southeast Alabama
36 Southeast Alabama
37 Southeast Florida
38 Southeast Georgia
39 Southeast Kentucky
40 Southeast West Virginia
41 Southeast Virginia
42 Southeast North Carolina
43 Southeast South Carolina
44 Southeast Maryland
45 Southeast Delaware
46 Northeast New Jersey
47 Northeast BSA Massachusetts
48 Northeast New England
49 Northeast Connecticut
50 Northeast Maine
51 Northeast Rhode Island
52 Northeast Vermont
53 Northeast New Hampshire
54 Northeast New York
55 Northeast Pennsylvania
56 Northeast AIA DC
57 - Alaska
58 - AIA Honolulu (Hawaii)

211
Table 3.2 List and region of the ASHRAE Chapters who were contacted to participate in the survey
Row Number Region ASHRAE Chapter Name
1 Region I Boston
2 Region I Long Island
3 Region I New York
4 Region I New York
5 Region I Rochester
6 Region I Champlain Valley
7 Region I Maine
8 Region I Twin Tiers
9 Region I Granite State
10 Region III Central Pennsylvania
11 Region III Pittsburgh
12 Region III Hampton Roads
13 Region III Richmond
14 Region III Roanoke
15 Region III Anthracite
16 Region IV North Piedmont
17 Region IV Atlanta
18 Region IV Triangle
19 Region V Columbus
20 Region V Columbus
21 Region V Dayton
22 Region V Detroit
23 Region VI Illinois
24 Region VI Iowa
25 Region VI Iowa

212
Table 3.2 Continued Row Number Region ASHRAE Chapter Name
26 Region VI St Louis
27 Region VI Madison
28 Region VII Louisville
29 Region VII Memphis
30 Region VII New Orleans
31 Region VII Nashville
32 Region VII East Tennessee
33 Region VII West Virginia
34 Region VIII Houston
35 Region VIII Houston
36 Region VIII Alamo
37 Region VIII Austin
38 Region VIII Austin
39 Region VIII Dallas
40 Region VIII Dallas
41 Region VIII Dallas
42 Region VIII Central Oklahoma
43 Region VIII Northeastern Oklahoma
44 Region VIII Fort Worth
45 Region IX Kansas City
46 Region IX Rocky Mountain
47 Region IX Utah
48 Region IX Utah
49 Region IX Nebraska
50 Region IX Nebraska
51 Region IX South Dakota

213
Table 3.2 Continued Row Number Region ASHRAE Chapter Name
52 Region IX Black Hills
53 Region IX Big Sky
54 Region IX Pikes Peak
55 Region X San Joaquin
56 Region X Southern California
57 Region X San Diego
58 Region X Central Arizona
59 Region X Central Arizona
60 Region X Tucson
61 Region X Tucson
62 Region X Northern Nevada
63 Region XI Oregon
64 Region XII Miami
65 Region XII Miami
Table 3.3 List of the top ten sustainable design firms in the US ranked by Architect 50 in Architect Magazine (Architect 50, 2017)
Rank Organization Architect 50 Magazine Score
1 ZGF Architects 100
2 ZeroEnergy Design 94
3 EYP Architecture & Engineering 84.8
4 Perkins+Will 84
5 Skidmore, Owings & Merrill 83.6
6 Lake|Flato Architects 82.1
7 Leddy Maytum Stacy Architects 80.1
8 The Miller Hull Partnership 79.9
9 Touloukian Touloukian Inc. 79.8
10 Mithun 79.3

214
Table 3.4 List of top ten design firms in the US ranked by Architectural Record (2017)
Ran
k 20
17/
2016
Com
pany
U.S
. H
eadq
uart
ers
Typ
e of
Fir
m
Tot
al
Arc
hite
ctur
al
Rev
enue
Dom
estic
A
rchi
tect
ural
R
even
ue
Inte
rnat
iona
l A
rchi
tect
ural
R
even
ue
% D
esig
n R
even
ue fr
om
Arc
hite
ctur
e
Tot
al D
esig
n R
even
ue in
M
illio
ns o
f D
olla
rs
1/1 Gensler San Francisco A $1,192.37 $981.02 $211.35 100% $1,192.37
2/2 AECOM Los Angeles, Calif.
EAC $595.50 $245.80 $349.70 8% $7,429.97
3/3 Perkins + Will
Chicago, Ill. A $562.33 $423.43 $138.90 100% $562.33
4/4 Jacobs Dallas, Texas EAC $426.07 $243.24 $182.83 7% $6,387.25
5/6 HOK St. Louis, Mo. AE $384.74 $288.31 $96.43 89% $430.00
6/7 HKS Dallas, Texas A $376.68 $338.13 $38.55 100% $376.68
7/8 CH2M Englewood, Colo.
E $357.63 $197.56 $160.07 10% $3,551.16
8/9 HDR Omaha, Neb. EA $354.30 $238.20 $116.10 18% $1,927.60
9/13 IBI Group Westerville, Ohio
AE $318.89 $106.39 $212.50 89% $358.30
10/12 Stantec Inc.
Irvine, Calif. EAL $258.53 $258.53 $- 16% $1,621.93
(A = Architect; AE = Architect-Engineer; AP = Architect Planner; EAL = Engineer Architect Landscape; AEC = Architect-Engineer-Contractor)
Table 3.5 List of top 50 Architecture Schools in the US ranked by Niche (2019) Ranking School of Architecture 1 Washington University in St. Louis, Saint Louis, MO 2 Rice University, Houston, TX 3 Cornell University, Ithaca, NY 4 University of Southern California, Los Angeles, CA 5 University of Notre Dame, Notre Dame, IN 6 University of California – Berkeley, Berkeley, CA 7 The Cooper Union for the Advancement of Science and Art, New York, NY 8 Tulane University, New Orleans, LA 9 University of Virginia, Charlottesville, VA 10 Virginia Tech, Blacksburg, VA 11 Northeastern University, Boston, MA 12 Carnegie Mellon University, Pittsburgh, PA 13 California Polytechnic State University - San Luis Obispo, San Luis Obispo, CA

215
Table 3.5 Continued Ranking School of Architecture 14 University of Texas – Austin, Austin, TX 15 Syracuse University, Syracuse, NY 16 Rhode Island School of Design, Providence, RI 17 Pratt Institute, Brooklyn, NY 18 Rensselaer Polytechnic Institute, Troy, NY 19 Illinois Institute of Technology, Chicago, IL 20 Georgia Institute of Technology, Atlanta, GA 21 University of Michigan - Ann Arbor, Ann Arbor, MI 22 University of Miami, Coral Gables, FL 23 University of Minnesota - Twin Cities, Minneapolis, MN 24 University of Washington, Seattle, WA 25 University of California - Los Angeles, Los Angeles, CA 26 University of Cincinnati, Cincinnati, OH 27 Texas A&M University, College Station, TX 28 University of Illinois at Urbana-Champaign, Champaign, IL 29 Clemson University, Clemson, SC 30 The Ohio State University, Columbus, OH 31 Penn State, University Park, PA 32 University of Maryland - College Park, College Park, MD 33 University of Massachusetts – Amherst, Amherst, MA 34 Iowa State University, Ames, IA 35 University of Wisconsin, Milwaukee, WI 36 Woodbury University, Burbank, CA 37 University of Georgia, Athens, GA 38 Miami University, Oxford, OH 39 Hobart and William Smith Colleges, Geneva, NY 40 Judson University, Elgin, IL 41 Catholic University of America, Washington, DC 42 University of Florida, Gainesville, FL 43 Jefferson (Philadelphia University + Thomas Jefferson University), Philadelphia, PA 44 Auburn University, Auburn, AL 45 Lawrence Technological University, Southfield, MI 46 SUNY College of Environmental Science & Forestry, Syracuse, NY 47 University of Oregon, Eugene, OR 48 North Carolina State University, Raleigh, NC 49 Kent State University, Kent, OH 49 California State Polytechnic University – Pomona, Pomona, CA 50 University of Kansas, Lawrence, KS

216
3.4. Research with Human Subject
The U.S. Department of Health and Human Services (2011) regulations (45 CFR 46)
requires that all studies related to human subjects receive approval from an Institutional
Review Board (IRB). An application for this study was submitted to the Texas A&M
University IRB office since it included a survey targeting the practitioners and educators
in the US. The IRB reviewed the application with the required materials including the
survey questionnaire and determined that the proposed activity is not a research
involving human subjects as defined by DHHS and FDA regulations. The IRB protocol
number for this approval was IRB2018-0262, which is included in Appendix A.
3.5. Summary of the Applied Research Methodologies and Strategies
In summary, this research started with a broad review of the literature on passive
systems and the potential issues for their application in the US. This review informed the
content of the required research methodologies including case study and survey/content
analysis. The case study and content analysis will respond to the qualitative nature of
the research while survey questionnaire will respond to the quantitative nature of the
research constructs. Therefore, the use of both quantitative and qualitative approaches
paves the ground for applying a triangulation approach to reveal more accurate
information on the practice and education of passive design in the US and their
challenges.

217
As explained in this section the following approaches and research methodologies will
be adopted to avoid/reduce research bias and errors in the research:
• Use of a mixed method research: content analysis, case study, and survey
methods can form a mixed method research to reduce biases through
comparing the findings of the three methods.
• Use of Delphi communication method with a panel of experts: receiving
feedback from experts in several rounds of review will reduce the bias from
the content of the questions based on the Delphi method explained earlier.
• Use of a pilot study: conducting a pilot study may reveal some of the biases
in the survey questionnaire, such as measurement errors, which can be
corrected before the actual survey. Time and cost are crucial factors in
using/or not using this strategy.
• Minimizing the number of constructs/concepts: minimizing the number of
constructs to be measured in the survey will increase the homogeneity of
the survey and its internal validity.
• Reducing the coverage bias: this error/bias occurs when not all members of
the population have a known, nonzero chance of being included in the
sample for the survey and when those who are excluded are different from
those who are included (Dillman, 2014). Because the link of the survey will
be sent directly through email to the sample group members, all of the
members will have an equal chance to respond which will reduce the
coverage bias/error.

218
4. PRACTITIONERS SURVEY: RESULTS AND DATA ANALYSIS
4.1. Introduction
This section will present and analyze the results of the data that was collected through
two online survey questionnaires. The purpose of the surveys was to obtain a more
accurate perception of the education and practice of passive system design across
different disciplines in academia and the building industry in the US. The two survey
questionnaires were designed to find answers in response to the issues found in the
literature on the application of passive design in buildings. Additionally, each question
was designed to address these issues, which are summarized through the following
constructs:
• The factors influencing the increase/reduction of the use of passive/natural
systems in buildings
• The design tools being used for the education/application of passive design
• The most and least recurring types of passive/natural system strategies
• The importance of incorporating passive/natural system strategies in a practical
design process with respect to their integration with mechanical systems
To begin the survey, its first draft was sent to academics and professionals in the field to
ask for their feedback on the content of the survey. In some cases, phone conversations
with professionals about the content of the survey replaced correspondence through
email. Using this process, the content of the survey was revised based on the feedback

219
received from academics and professionals. In addition, some pilot tests were conducted
to adjust the content of the survey as well as the required time for answering its
questions. To increase the rate of response to the survey, the questionnaire began with 12
questions and, through several revisions, reached 22 questions at the end of the pilot
tests. Final survey used 22 questions for professionals and 26 questions for educators to
keep an optimum balance between the required time to answer the questions and the
comprehensiveness of the survey in measuring the desired constructs.
4.2. Procedure
In the overall process it was determined that one survey would target building
practitioners while the other survey would focus on academics in the field of sustainable
design and building performance in architecture schools. The survey link was distributed
to architect and engineering practitioners in the US through each state’s AIA and
ASHRAE Chapters. Prior to the distribution each chapter was contacted to determine the
possibility of distributing the survey among their members for their participation. Before
the survey started, it was difficult to determine how many survey participants there
would be. However, based on the author’s communication with number of members in
each chapter is not known, but based on the author’s communication with chapters it was
estimated that 100 to 3,000 members per chapter were partially available to take the
survey depending on the location and size of the chapters.

220
To increase external validity and generalizability of the survey findings within the US,
the sample of AIA and ASHRAE members was supplemented by distributing the survey
directly to the lists of top architectural designers and engineers in the US. These lists
include the top ten sustainable design firms in the US recognized by Architecture 50
magazine37, top ten architecture and design firms in the US by Architectural Record38,
and ASHRAE professionals influential in preparing high performance building standards
189.1. The selection of the survey recipients in the top firms was based on a purposeful
sampling process. In this process design and/or engineering members/directors of each
firm practicing in the field of sustainability and green building design were selected to
respond to the survey. The selection of educators in architecture schools was from the
top 50 architecture colleges and schools in the US based on the NICHE 2019 ranking.39
Over the course of two and a half months a total of 168 responses were collected from
practitioners in the building industry from which 138 responses were usable. In addition,
a total of 39 responses were collected from educators, with 37 responses out of the 39
responses considered for the analysis. The remaining two responses were not used
37 For further information please see https://www.architectmagazine.com/practice/architect-50/2017-architect-50-top-50-firms-in-sustainability_o 38 For further information, please see TOP 300 Architecture Firms in the US rank by Architectural Record at https://www.architecturalrecord.com/Top300/2017-Top-300-Architecture-Firms-1 39 The 2019 Best Colleges for Architecture ranking by NICHE is based on key statistics and student reviews using data from the U.S. Department of Education. The ranking compares the top architecture programs in the U.S. For further information and the list of schools please see https://www.niche.com/colleges/search/best-colleges-for-architecture/

221
because they were incomplete. The selection of the building educators was through a
purposeful sampling of the top 50 architecture schools with the selected instructors
and/or professors who indicated on their websites’ profiles they used passive systems in
their studio or course syllabi.
The survey contained in Appendix B shows the invitation that was sent to participants
either directly or through the AIA and ASHRAE chapters in the US. In some cases, the
content of this email along with the survey link was posted by the chapters’ director on
the local chapters monthly/weekly digital newsletter. The content of the email was meant
to explain the goals and target groups of the research. In all cases the survey was
anonymous and did not reveal the identity of the respondents through its collected
information. In the first month after the invitations were sent, only 35 complete
responses were received from practitioners. Therefore, multiple attempts were made to
encourage the AIA and ASHRAE Chapters to participate in the survey. This process
increased the number of usable collected responses to 163. After a review of the
responses, 138 responses were determined to be appropriate for use in the analysis,
yielding a 138/168 or 82.1% response rate.
In the final analysis only finished surveys with a 100% survey completion were
considered. The reported time spent by the participation answering the survey for those
participants with a 100% survey completion was in a range from a minimum of 3

222
0
1000
2000
3000
4000
5000
Respondents
Seco
nds
minutes and 50 seconds to a maximum of 86 minutes (Figure 4.1). Ignoring the outliers
in this time spent for analysis, the average response time was 8 minutes and 47 seconds.
The average time spent by educators to respond to the survey questionnaire (26
questions) was about 21 minutes and 20 seconds. From these 26 questions five questions
were contingent upon the respondents’ answers to other questions giving a range of 21 to
26 questions overall. Compared with professionals’ response time, the response time of
educators was longer. This longer time was due to having more questions for educators
and the inclusion of cross table questions for educators where several questions were
asked for the same topic.
Figure 4.1 Survey Duration for Practitioners (Amount of Time respondents Spent Completing the Survey)

223
4.3. Survey Tools and Analysis Procedure
The survey consisted of 22 items for practitioners, including 18 short answer questions,
1 image question, and 1 narrative question. In addition, the display of two of the
questions was contingent upon the respondents’ answers. These two questions inquired
about their primary professions and professional registrations in the US. The short-
answer questions used a multiple choice format or a percent slider format. A dropdown
answer format was selected for questions that allowed only one applicable answer from
the possible choices. This strategy reduced the time and length of the survey visually and
made it easier to read.
Demographic information was determined primarily through multiple-choice questions,
including: the individual’s primary professional role, location of their education, years of
work experience, geographic location of their licensure if applicable, and their
affiliations. The survey also included a visual question through which respondents would
click on the ASHRAE climate map to determine the location of their projects with
passive design strategies in the last 10 years.40 The slider question included different
project categories such as residential, office, and commercial projects with a slider for
each category to be used by the respondents for determining the percentage of their
projects in the last 10 years in that category.
40 This question was designed by redrawing and overlaying the associated polygon area for each climate zone on the map of the ASHRAE climate zones.

224
The multiple choice questions, which focused on the respondents’ last 10 years of
professional experience, included:
• Applied passive/natural heating strategies
• Applied passive/natural cooling strategies
• Applied renewable energy systems
• Applied daylighting strategies
• Applied passive building envelope strategies
The reason for focusing on the last 10 years of professional experience was to define a
time span large enough to include a variety of passive/natural system strategies, but not
too much retrospective to be hard for the respondents to remember. The observed
decline in the application of passive/natural systems in buildings at the beginning of the
21st century was another reason for such a time span definition in the survey.
• The multiple choice questions regarding the practitioners’ performance analysis
tools and approaches for the design of passive/natural systems included:
• The simulation or calculation tools for the design/analysis of passive/natural
systems
• The design to construction phase used to analyze the application of
passive/natural systems
• The phase used to calculate savings from the passive/natural systems with respect
to the inclusion of the mechanical systems in an analysis

225
In difference to the questions used for the practitioners’ survey, the questions for
educators instead of professional projects focused on their class projects in terms of
applied strategies, tools, and approaches. For the passive/natural system strategies,
questions were reformatted in a multiple choice cross table where answer to each
question would include three levels of teaching: level of concept, level of calculation,
and level of simulation. Meanwhile the survey asked educators if they have been
involved in a design or construction of a passive building project including the location
of their projects and percentage of their professional work in each category.
Finally, a multiple choice question asked all respondents to select the top three factors
from a list of eleven items which can increase the use of passive/natural systems in
buildings. This list of items was developed based on the issues found through the
literature review and its analysis. These issues include:
• Building codes and rating systems
• Simulation tools with capabilities for analyzing passive systems
• Knowledge of the modeling and simulation of passive system strategies
• Avoiding complexity and simplifying the implementation of passive system
strategies
• Occupants’ training for the use and maintenance of the passive systems
• Architect-engineer collaboration
• Client's desire and collaboration to include passive systems
• Cost of material and construction of passive systems

226
• Climate of the location where a passive system should be designed
• Knowledge integrating mechanical and passive systems performance
• Experience of the project team in the design, implementation, and integration of
passive systems
In addition, in the survey to educators, three questions were added to the content of the
survey:
• one additional question in the survey asked about their degrees and the
universities they earned the degrees,
• one question asked about their current and previous professional role in addition
to their academic role, and
• one question asked about the courses they teach.
In all of the survey questions, wherever appropriate, the answer choice “other” was
included with an inquiry about “specifying” in a following text question or embedded
text box. These responses, which increased the time for data classification during the
survey response analysis, ensured the inclusiveness of all possible responses for the
survey. In analyzing the collected data, the Pareto chart format was used to display the
data from largest to smallest in each category for easier and faster perception of the
results for analysis. In the analysis, the mean, count, and percentage of the collected data
were used wherever appropriate. In the following paragraphs the focus would be on the
survey from practitioners. The results of the survey from educators will be analyzed in
an individual section.
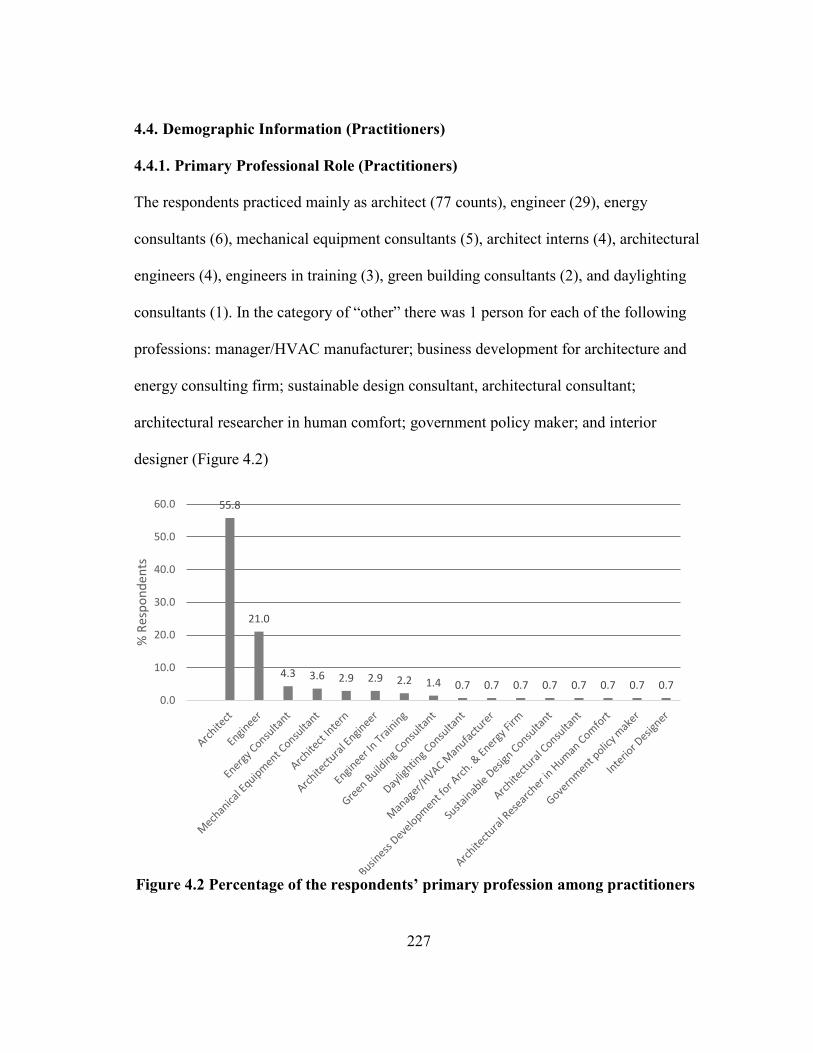
227
55.8
21.0
4.3 3.6 2.9 2.9 2.2 1.4 0.7 0.7 0.7 0.7 0.7 0.7 0.7 0.70.0
10.0
20.0
30.0
40.0
50.0
60.0
% R
espo
nden
ts4.4. Demographic Information (Practitioners)
4.4.1. Primary Professional Role (Practitioners)
The respondents practiced mainly as architect (77 counts), engineer (29), energy
consultants (6), mechanical equipment consultants (5), architect interns (4), architectural
engineers (4), engineers in training (3), green building consultants (2), and daylighting
consultants (1). In the category of “other” there was 1 person for each of the following
professions: manager/HVAC manufacturer; business development for architecture and
energy consulting firm; sustainable design consultant, architectural consultant;
architectural researcher in human comfort; government policy maker; and interior
designer (Figure 4.2)
Figure 4.2 Percentage of the respondents’ primary profession among practitioners

228
Table 4.1 Percentage of the respondents’ primary profession among practitioners
Among the respondents, 7 people were also certified as passive house consultants
(CPHC) which is about 5% of the total number of the participants.
4.4.2. Affiliations (Practitioners)
AIA, LEED AP, and ASHRAE were the first three choices of the participants’
affiliations. 84 respondents (61% of the total respondents) were AIA, 64 respondents
(46%) were LEED AP, and 45 respondents (33%) were ASHRAE members (Figure 4.3).
Respondents' Primary Profession Percent % Number of
Participants
Architect 55.8 77
Engineer 21.0 29
Energy Consultant 4.3 6
Mechanical Equipment Consultant 3.6 5
Architect Intern 2.9 4
Architectural Engineer 2.9 4
Engineer In Training 2.2 3
Green Building Consultant 1.4 2
Daylighting Consultant 0.7 1
Manager/HVAC Manufacturer 0.7 1
Business Development for Architecture & Energy Consulting firm
0.7 1
Sustainable Design Consultant 0.7 1
Architectural Consultant 0.7 1
Architectural Researcher in Human Comfort 0.7 1
Government policy maker 0.7 1
Interior Designer 0.7 1
Total 100.0 138

229
84
64
45
28
5 4 4 3 2 10
10
20
30
40
50
60
70
80
90
AIA LEED AP ASHRAEMember
Other PHIUS ASHRAEBEMP
SBSE HBDP Well AP IESNA
Num
ber o
f Res
pons
esThe ratio between AIA and ASHRAE members’ affiliations is about 2 to 1, which
reflects higher number of architects compared to engineers in the actual building
industry. Skipping the “other” category, the next most selected affiliation was the
PHIUS with 3.6%. About 2.9% of the participants were also members of the Society of
Building Science Educators (SBSE). From respondents 2.9% were also ASHRAE
Building Energy Modeling Professionals (BEMP). About 2.2% were High Performance
Building Design Professionals (HPBDP) and 1.4% were Well AP.41
41 The WELL Building Standard is a performance-based system for measuring, certifying, and monitoring features of the built environment that impact human health and wellbeing, through air, water, nourishment, light, fitness, comfort, and mind. For further information please see https://www.usgbc.org/articles/what-well
Figure 4.3 Respondents’ affiliations among practitioners

230
Table 4.2 Respondents’ affiliations among practitioners Affiliation Count %From Total
Affiliations
% From
Respondents
AIA 84 35.0% 61%
LEED AP 64 26.7% 46%
ASHRAE Member 45 18.8% 33%
Other (please specify) 28 11.7% 20%
PHIUS (Passive House Institute US) 5 2.1% 4%
ASHRAE BEMP 4 1.7% 3%
SBSE (Society of Building Science Educators)
4 1.7% 3%
HBDP (High Performance Building Design Professional)
3 1.3% 2%
Well AP 2 0.8% 1%
IESNA (Illumination Engineering Society of North America)
1 0.4% 1%
Total number of affiliations 240 100% NA
Affiliations specified in the “other” category by the respondents were in a wide range,
which was analyzed and redefined as shown in Figure 4.4. In this case, 1.5% of the
respondents had affiliations with IBPSA, NCARB, and CSI, which were extracted from
the “other” category as the most mentioned affiliations.
Participants’ other affiliations included the followings: Connecticut Green Building
Council (CTGBC), Certified Building Commissioning Professional (CBCP), ASHRAE
Building Energy Assessment Professional (BEAP), Energy Management Professional

231
(EMP), USGBC Member, International Interior Design Association (IIDA),
International Living Building Institute (ILBI), Envision Sustainability Professional
(ENV SP), Building Enclosure Commissioning (BECx), Architectural Engineering
Institute (AEI), Association of Energy Engineers (AEE), Architectural Lighting Alliance
(ALA), Design-Build Institute of America (DBIA), American Society of Civil Engineers
(ASCE), American Council of Engineering Companies (ACEC), American Society of
Landscape Architects(ASLA), Construction Document Technology (CDT), Association
for Preservation Technology International (APT), Illumination Engineering Society of
North America (IESNA).

232
84
64
45
5
4
4
3
3
2
2
2
2
1
1
1
1
1
1
1
1
1
1
1
1
1
1
1
1
1
1
1
1
0 10 20 30 40 50 60 70 80 90
AIA
LEED AP
ASHRAE Member
PHIUS (Passive House Institute US)
ASHRAE BEMP
SBSE (Society of Building Science Educators)
HBDP (High Performance Building Design Professional)
PHI (Passive House Institute)
Well AP
NCARB (National Council of Architectural Registration…
CSI (Construction Specification Institute)
IBPSA member
IESNA (Illumination Engineering Society of North America)
APT ( Association for Preservation Technology…
CDT (Construction Document Technology)
ASLA (American Society of Landscape Architects)
ACEC (American Council of Engineering Companies)
ASCE (American Society of Civil Engineers)
DBIA ( Design-Build Institute of America)
ALA (Architectural Lighting Alliance)
AEE (Association of Energy Engineers)
AEI (Architectural Engineering Institute)
BECx (Building Enclosure Commissioning)
ENV SP (Envision Sustainability Professional)
ILBI (International Living Building Institute)
IIDA (International Interior Design Association )
USGBC Member
EMP Energy Mangemant Professional
ASHRAE BEAP
CBCP (Certified Building Commissioning Professional)
CTGBC Connecticut Green Building Council)
Other (unspecified)
Affiliation (choice count)
Figure 4.4 Respondents’ affiliations among practitioners with the expansion of the “other” category

233
33
25
1715 14
12 1210
0
5
10
15
20
25
30
35
Over 34years
10 to 14years
20 to 24years
5 to 9years
30 to 34years
Under 5years
25 to 29years
15 to 19years
Num
ber o
f Res
pond
ents
4.4.3. Professional Work Experience (Practitioners)
The majority of the participants had 34 or more years of work experience (23.9%). After
that 18.1% of the participants had 10 to 14 years, 12.3% with 20 to 24 years, 10.9% with
5 to 9 years, 10.1% with 30 to 34 years, 8.7% under 5 years, 8.7% with 25 to 29 years,
and 7.3% with 15 to 19 years of work experience (Figure 4.5 and Table 4.3). One
finding could be that passive/natural systems appeal to all age ranges in terms of work
experience from young to old professionals. Meanwhile, older professionals and
professionals who are in the middle of their career with 10-14 years of work experience
might have a greater passion for passive designs. This outcome might be the result of the
trends of these generations education and practice when passive/natural systems were of
greater interest and focus in universities and design firms in the 1970s and the 1980s and
the beginning of the 21st century.
Figure 4.5 Respondents’ years of professional experience

234
Table 4.3 Respondents’ years of professional experience
4.4.4. Age Group (Practitioners)
The majority of the responding practitioners were 59 years old (25.5%). The smallest
age groups were professionals who were 40-44 years old (5.1%) or under 25 years old
age (1.5%). From largest to smallest, 18.3% of the participants were 35-39 years old,
11% of participants were 45-49 years old, 11% of participant were 55-59 years old,
10.2% of participants were 30-34, 9.5% of participants were 25-29, and 8% were 50-54
years old. Therefore, for age groups other than 40-44 years old, over 59, and under 25,
the collected data show almost a uniform distribution (Figure 4.6 and Table 4.4).
Work experience Percentage Count
30 to 34 years 10.1% 14
25 to 29 years 8.7% 12
20 to 24 years 12.3% 17
15 to 19 years 7.3% 10
10 to 14 years 18.1% 25
5 to 9 years 10.9% 15
Under 5 years 8.7% 12
Over 34 years 23.9% 33
Total 100% 138

235
35
25
15 15 14 1311
7
2
0
5
10
15
20
25
30
35
40
Over 59 35-39 45-49 55-59 30-34 25-29 50-54 40-44 Under 25
Num
ber o
f Res
pond
ents
Age Group
Figure 4.6 Practitioners’ age group
Table 4.4 Practitioners’ age group Age group Percentage Count
Under 25 1.5% 2
25-29 9.5% 13
30-34 10.2% 14
35-39 18.3% 25
40-44 5.1% 7
45-49 11.0% 15
50-54 8.0% 11
55-59 11.0% 15
Over 59 25.5% 35
Total 100% 137

236
Having a large percentage of the participants in the age group of 55 or more (36%) could
be indicative of their educational background in the heyday of passive system
design/education in the 1980s.
4.4.5. Location (Practitioners)
Figure 4.7 shows the locations of the respondents in the US. Accordingly, there are no
participants from Wyoming, New Mexico, North Dakota, South Dakota, Montana,
Minnesota, Nevada, Colorado, and Kansas states. This lack of participation from the
mentioned states is compensated to some extent by the participants who, although not
located in these states at the time of survey, were also certified as either professional
architects or engineers to practice in these states. As it is visible from the map, a
majority of the participants either live or were located in the North East area at the time
of responding to the survey.
4.4.6. Professional Registration (Practitioners)
Figure 4.8 shows that the majority of respondents were licensed architects. Seventy-five
of the 138 respondents (54.4%) were licensed architects while 26.8% of the participants
were Professional Engineers (P.E.). Therefore 81.2% of the total respondents have
professional registration in the US either as an architect or engineer. Among the
respondents 18.8% did not have either an architectural licensure or a P.E. As shown in
Figure 4.9, most of the registered professionals (65%) have Architectural Licensure or

237
Figure 4.7 Locations of the survey respondents on the US map
P.E. in only one state, with very few having professional registration in more than 6 up
to 15 states.
Note that a pin only stands for the city, but not the exact location or the number of the participants in that city

238
75
37
26
0
10
20
30
40
50
60
70
80
Licensed Architect Professional Engineer(PE)
Neither ProfessionalEngineer (PE) norLicensed Architect
Num
ber o
f Res
pond
ents
Figure 4.8 Distribution of professional registration among the participants
Table 4.5 Distribution of professional registration among the participants Licensure/PE %of Total
Participants
Count
Licensed Architect 54.4% 75
Professional Engineer (PE) 26.8% 37
Neither Professional Engineer (PE) nor Licensed Architect 18.8% 26
Both Professional Engineer (PE) and Licensed Architect 0.0% 0
Total 100% 138

239
64.9
8.1 8.1 7.2 5.42.7 0.9 0.9 0.9 0.9
0.0
10.0
20.0
30.0
40.0
50.0
60.0
70.0
1 State 3 States 2 States 5 States 4 States 6 States 15 States11 States 8 States 7 States
Perc
enta
ge fr
om T
otal
Lic
ense
d Re
spon
dent
s
As shown by Figure 4.10 states that were selected by practitioners for P.E. registration
was 42.6% (72/169) of the times that states were selected for Architectural Licensure. In
this case Connecticut (27 architectural licensure counts), New York (16), Illinois (12),
Massachusetts (9), and Texas (9) had the highest number of selection for architectural
licensure. Texas (12), Illinois (5), Wisconsin (5), and California (5) were the states with
highest number of selections for PE registration.
Figure 4.9 Number of states where a respondent is professionally registered as an architect or engineer

240
TXNY IL PAMAWICA RI MIME FL VT TNOKWVNHMDIN GAWAVAUTSC NCMOKY IA HIDC COAZORNJ NEMNKSNM ID DELicensed Architect 9 16 12 6 9 4 3 6 4 6 5 4 1 2 2 4 3 2 4 3 1 3 3 1 2 1 2 3 1 3 2 2 2 0 1 1 0 1 1
PE 12 3 5 4 1 5 5 1 3 0 1 1 4 3 2 0 1 2 0 0 2 0 0 2 1 2 1 0 2 0 1 0 0 2 1 1 1 0 0
0
5
10
15
20
25
Num
ber O
f Res
pond
ents
Figure 4.10 Respondents’ Architectural Licensure or PE with their distribution in each state
15.2
13.8
12.3
7.2
7.2
6.5
5.8
5.1
5.1
4.3
4.3
3.6
3.6
3.6
2.9
2.9
2.9
2.9
2.9
2.2
2.2
2.2
2.2
2.2
2.2
2.2
2.2
2.2
2.2
2.2
2.2
1.4
1.4
1.4
1.4
1.4
0.7
0.7
0.7
0.0
2.0
4.0
6.0
8.0
10.0
12.0
14.0
16.0
TX T
exas
NY
New
Yor
kIL
Illin
ois
PA P
enns
ylva
nia
MA
Mas
sach
uset
tsW
I Wisc
onsin
CA C
alifo
rnia
RI R
hode
Isla
ndM
I Mic
higa
nM
E M
aine
FL F
lorid
aVT
Ver
mon
tTN
Ten
ness
eeO
K O
klah
oma
WV
Wes
t Virg
inia
NH
New
Ham
pshi
reM
D M
aryl
and
IN In
dian
aG
A G
eorg
iaW
A W
ashi
ngto
nVA
Virg
inia
UT
Uta
hSC
Sou
th C
arol
ina
NC
Nor
th C
arol
ina
MO
Miss
ouri
KY K
entu
cky
IA Io
wa
HI H
awai
iDC
Dist
rict o
f Col
umbi
aCO
Col
orad
oAZ
Ariz
ona
OR
Ore
gon
NJ N
ew Je
rsey
NE
Neb
rask
aM
N M
inne
sota
KS K
ansa
sN
M N
ew M
exic
oID
Idah
oDE
Del
awar
e
Perc
enta
ge o
f the
Reg
ister
ed P
rofe
ssio
nals
Figure 4.11 Percentage of respondents with Architectural Licensure or PE in each state

241
27
2422
1614
10 10 108
4 3 3 2 2 1 1
0
5
10
15
20
25
30
Num
ber o
f Res
pond
ents
Figure 4.12 Location of education that the respondents earned their degree(s) most related to their current profession
4.4.7. Location of Education (Practitioners)
The largest percentage of the participants who have earned the degree(s) most related to
their current profession were from the New England Area. Texas and the Great Lakes
regions come next in this regard. Figure 4.12 and 4.13 show all the locations selected by
respondents with respect to the map shown to them within the survey. Three of
respondents who are practicing in the US earned their degrees abroad in France,
Belgium, and the UK. None of the respondents selected the Gulf Coast as the location of
their education.

242
4.5. Professionals Projects
4.5.1. Projects Typologies (Practitioners)
The highest average percentage of the professionals’ projects in the last ten years was for
educational projects with 27.6% of the total projects. Office projects (21.8%), Single
family residential projects (14%), and Multi-family residential projects (8%) were the
next types of projects with the highest mean percentage as shown in Figure 4.14.
Among the “other” types of projects which were specified by professionals, healthcare
(26.2%) and civic/governmental (16.3%) projects composed the highest percentage of
the other projects (Figure 4.15 and Table 4.6). Healthcare projects, with 4.7%, and
civic/governmental projects, with 4.7%, define the fifth and sixth types of projects
among all the project types in the survey. About 12.4% of the projects selected by
Figure 4.13 Areas for which respondents were asked about their earned degree(s) most related to their current profession

243
27.6
21.8
14.0
8.0 7.5
4.73.5
2.1 2.1 1.9 1.7 1.2 1.0 0.9 0.9 0.7 0.50.0
5.0
10.0
15.0
20.0
25.0
30.0
Mea
n% fr
om a
ll ca
tego
ries
Figure 4.14 Mean percentage of professionals projects in different categories for the last 10 years
professionals in the “other” category were not specified, which is equal to 3.5% of the
total projects. Other types of practitioners projects included lab and data centers (2.1%),
public, library, and religious (2.1%), cultural, recreational, and mixed-use (1.9%),
industrial (1.7%), institutional (1.2%), hospitality and restaurant (1%), water treatment,
breweries, and warehouse (0.9%), historic preservation (0.7%), and sports (0.5%).

244
26.2
16.3
12.4
7.5 7.2 6.7 5.94.2 3.5 3.1 3 2.3 1.7
0
5
10
15
20
25
30
Mea
n% i
n th
e ca
tego
ry o
f "O
ther
"
Table 4.6 Mean percentage of the projects in only the “other” project category for the last 10 years
Project Category Mean% in the "Other" category
Mean% from all categories
Educational NA 27.6 Office NA 21.8 Single-family Residential NA 14.0 Multi-family Residential NA 8.0 Healthcare 26.2 7.5 Civic and governmental 16.3 4.7 Unspecified 12.4 3.5 Lab and data centers 7.5 2.1 Public, civic, library, & religious 7.2 2.1 Cultural, recreational, & mixed use 6.7 1.9 Industrial 5.9 1.7 Institutional 4.2 1.2 Hospitality-restaurant 3.5 1.0 Water treatment, warehouse & breweries 3.1 0.9 Commercial 3 0.9 Historic preservation 2.3 0.7 Sports 1.7 0.5 Total 100 100
Figure 4.15 Mean percentage of the projects in only the “other” project category for the last 10 years
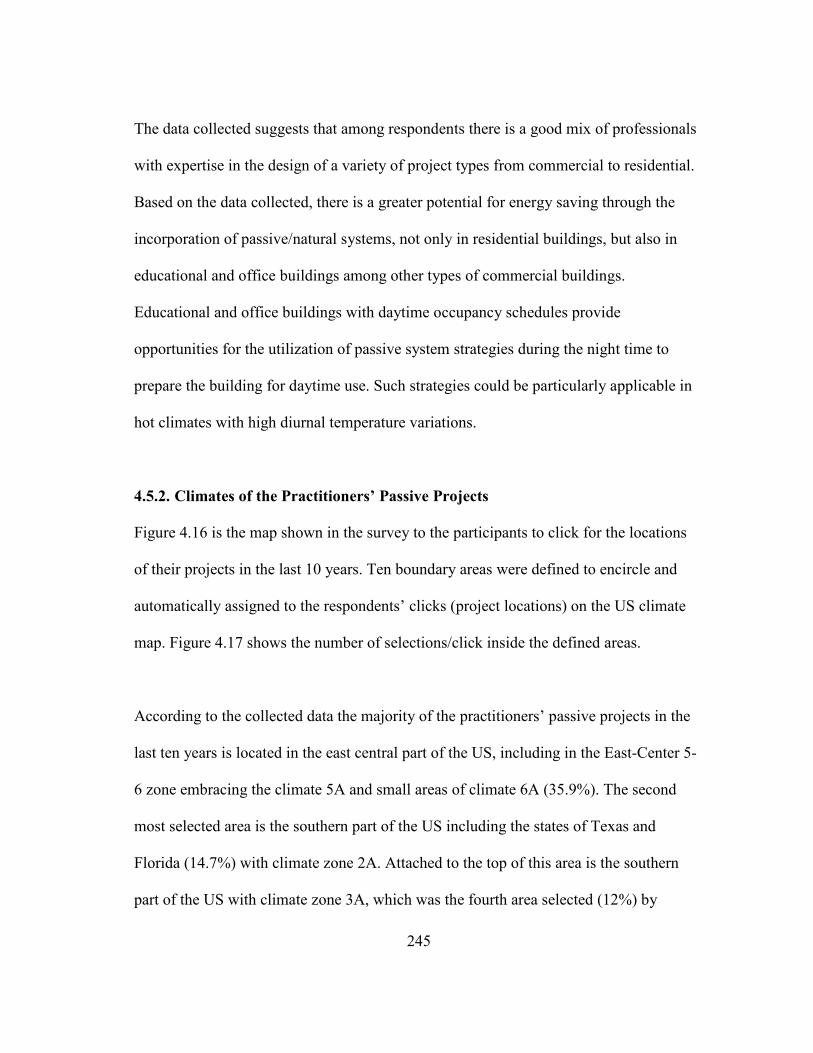
245
The data collected suggests that among respondents there is a good mix of professionals
with expertise in the design of a variety of project types from commercial to residential.
Based on the data collected, there is a greater potential for energy saving through the
incorporation of passive/natural systems, not only in residential buildings, but also in
educational and office buildings among other types of commercial buildings.
Educational and office buildings with daytime occupancy schedules provide
opportunities for the utilization of passive system strategies during the night time to
prepare the building for daytime use. Such strategies could be particularly applicable in
hot climates with high diurnal temperature variations.
4.5.2. Climates of the Practitioners’ Passive Projects
Figure 4.16 is the map shown in the survey to the participants to click for the locations
of their projects in the last 10 years. Ten boundary areas were defined to encircle and
automatically assigned to the respondents’ clicks (project locations) on the US climate
map. Figure 4.17 shows the number of selections/click inside the defined areas.
According to the collected data the majority of the practitioners’ passive projects in the
last ten years is located in the east central part of the US, including in the East-Center 5-
6 zone embracing the climate 5A and small areas of climate 6A (35.9%). The second
most selected area is the southern part of the US including the states of Texas and
Florida (14.7%) with climate zone 2A. Attached to the top of this area is the southern
part of the US with climate zone 3A, which was the fourth area selected (12%) by

246
practitioners. This area includes parts of Texas, Louisiana, Mississippi, Georgia,
Alabama, Oklahoma, and South Carolina. Climate zone 4A, which includes states such
as Virginia, Kentucky, Missouri, and Kansas was the third selected area (13.4%) for the
application of passive design strategies based on the survey results.
The word of caution about the survey results is that since the survey participation was
higher from New England and Texas (Figure 4.18) the results should not be interpreted
as having a lower interest for passive design in other areas of the US. However, based on
the survey results, the high percentage of passive design projects in the eastern and
southern areas of the US give evidence, despite the general misbelief, of the high
possibility of applying passive design strategies in harsh hot humid or cold humid US
climates. Finally, it should be kept in mind that some states, such as the northern states,
as mentioned earlier did not take part in the survey, which could be a reason for the low
level of selection of these areas in the final results.
Table 4.7 Areas selected by practitioners as the location of their projects in the last ten years
Area Counts of the zone selection Selection % East-Center 5-6 78 35.9 South-2-1 32 14.7 Center-4 29 13.4 South-3 26 12.0 Southwest-3-2-4 16 7.4 North-Center-6-7 13 6.0 West-5 8 3.7 West-4 8 3.7 Northeast-6-7 5 2.3 North-7 2 0.9 Total 217 100.0

247
North-Center-6-7 North-7
East-Center 5-6 West-5
Center-4
South-
Northeast-6-7
South-2-1
West-4
Southwest-3-2-4
78
32 29 26
16 138 8 5 2
0
10
20
30
40
50
60
70
80
Tota
l tim
es a
zone
was
sele
cted
Climatic Zones
Figure 4.16 Areas defined on ASHRAE climate map to be selected by practitioners as the location of their projects in the last ten years. The climate map was reprinted with permission from ASHRAE ©ASHRAE www.ashrae.org (ASHRAE 90.1 Manual, 2016)
Figure 4.17 Total number of times each area on the map in Figure 4.16 was selected by practitioners

248
Figure 4.18 Areas selected by practitioners on the US climate map as the locations of their projects with passive design strategies in the last ten years (top, selection of a group of 120 practitioners, and bottom, selection of a group of 15 practitioners). The climate map was reprinted with permission from ASHRAE.

249
8774
49
32
1813
0102030405060708090
Photovoltaics(PV panels)
Geothermal Solar thermalcollectors
(DHW)
None Solar thermalcollectors forspace heating
Wind turbines
Choi
ce F
requ
ency
4.6. Passive/Natural Systems (Practitioners)
4.6.1. Renewable Energy (Practitioners)
The practitioners’ top choice for the use of renewable energy was PV panels
(Photovoltaics) with 31.5% of count choices (Figure 4.19). Among practitioners 63%
selected this choice as the type of renewable energy system used in their projects during
the last 10 years. Geothermal (52.9%) and solar thermal collectors for domestic hot
water (35.5%) were the next most selected types of renewable systems used by
practitioners in their projects. Solar thermal collectors for space heating (13%) and wind
turbines (9.4%) are other types of renewable energy systems used by practitioners.
About 23% of the participating practitioners have not used any renewable energy system
in their projects. This number seems to be high with respect to the Architecture
Challenge 2030 aiming to get to net zero carbon emission by the year 2030. In other
words, to reach that target there should be more incentives to encourage all practitioners
to incorporate renewable energy systems to their designs. Other types of renewables
applied by practitioners included hydro and biomass/biogas systems (2.2%).
Figure 4.19 Practitioners’ use of renewable energy in the last 10 years’ projects

250
Figure 4.20 shows the number of professionally registered architects or engineers
choosing each renewable system. A comparison shows that the ratio of engineers using
solar collectors for domestic hot water (i.e. 20 choices out of 85 total choices by
engineers) is higher than the ratio of licensed architects using the same system (i.e. 21
choices out of 139 choices by licensed architects). Similarly, a comparison shows a
higher ratio for engineers in the use of solar collectors for space heating. One reason for
such a difference could be a more detailed calculation needed for the implementation of
solar collectors, which is usually more appealing to engineers rather than architects.
Table 4.8 Use of renewable energy in the last 10 years by practitioners Renewable System Count % Choice
Count
%From
Practitioners
Photovoltaics (PV panels) 87 31.5% 63%
Geothermal 74 26.5% 53.6%
Solar thermal collectors for Domestic Hot
Water (DHW)
49 17.8% 35.5%
None 32 11.6% 23.2%
Solar thermal collectors for space heating 18 6.5% 13%
Wind turbines 13 4.7% 9.4%
Other (Hydro, Biomass/BioGas) 3 1.5% 2.2%
Total 276 100%

251
Photovoltaics (PVpanels)
Geothermal
Solarthermal
collectorsfor DHW
None
Solarthermal
collectorsfor spaceheating
Windturbines Other
Neither PE nor Licensed Architect 14 12 8 10 4 3 1
PE 28 20 20 6 9 2 0
Licensed Architect 45 41 21 16 5 8 3
0102030405060708090
Choi
ce C
ount
/Fre
quen
cy
4.6.2. Passive/Natural Cooling Systems (Practitioners)
External shading device (70.3%), green roof (53.6%), and cross ventilation (47.8%) are
the practitioners top three choices for the incorporation of passive cooling strategies in
buildings (Figure 5.21). This is followed by the use of plants/vegetation (42.8%),
internal shading device (41.3%), cool roof (39.1%), courtyard (33.3%), evaporative
cooling (26.8%), radiant cooling (24.6%), stack ventilation (22.5%), and dynamic
shading (21%) strategies in their projects. The survey showed 14.5% of the practitioners
have not used any passive cooling strategy in their designs. The last nine choices of the
practitioners included night ventilation with mass (13%), earth contact (8.7%), solar
chimney (8%), night ventilation without mass (6.5%), downdraft cooling (3.6%), earth
tube (2.9%), double roof (2.9%), roof pond (0.7%), and super insulation (0.7%).
Figure 4.20 Renewable energy usage in the last 10 years categorized by professional registration

252
97
7466
59 57 5446
37 34 31 2920 18
12 11 9 5 4 4 1 10
102030405060708090
100
Choi
ce C
ount
/Fre
quen
cy
The results showed that the use of simple passive systems on new buildings were
preferred over complex passive systems or add-on passive systems. As a result, external
shading devices integrated with buildings façades, green roofs on the idle roof surfaces,
and the appropriate location of building openings for cross ventilation are more likely to
be applied by practitioners for the passive cooling of a building compared with strategies
such as complex earth tubes or roof ponds, which are more difficult to maintain. The
findings also showed that, despite the general misbelief that passive solar is more
appealing to practitioners in the US, passive cooling strategies in the US are widely
being applied. Table 4.11 better indicates a wide application of passive cooling by
practitioners in four different humid climates including the climate of Texas.
Figure 4.21 Practitioners use of passive cooling strategies in the US in the last 10 years

253
Table 4.9 Practitioners use of passive cooling strategies in the US in the last 10 years
Natural/Passive Cooling System Count %Count % From Number of
Practitioners
External shading devices 97 14.5% 70.3%
Green roof 74 11.1% 53.6%
Cross ventilation 66 9.9% 47.8%
Plants and vegetation (for shadow casting or
evapotranspiration)
59 8.8% 42.8%
Internal shading devices 57 8.5% 41.3%
Cool roof 54 8.1% 39.1%
Courtyard 46 6.9% 33.3%
Evaporative cooling 37 5.5% 26.8%
Radiant cooling 34 5.1% 24.6%
Stack ventilation 31 4.6% 22.5%
Dynamic shading devices 29 4.3% 21.0%
None 20 3.0% 14.5%
Night ventilation with mass 18 2.7% 13.0%
Earth contact 12 1.8% 8.7%
Solar chimney 11 1.6% 8.0%
Night ventilation without mass 9 1.4% 6.5%
Downdraft cooling 5 0.8% 3.6%
Earth tube 4 0.6% 2.9%
Double roof (second roof casting shadow) 4 0.6% 2.9%
Roof pond 1 0.2% 0.7%
Other (superinsulation) 1 0.2% 0.7%
Total 669 100%

254
Finally, the complexity and cost of the selected passive cooling systems, such as for
earth tube, solar chimney, night ventilation with thermal mass, or downdraft cooling
seemed not to hinder their selection (3% to 13%). Table 4.10 shows the total number of
cooling strategies in the questionnaire selected by each practitioner. Based on this table,
the median number (average number) of the strategies used by each practitioner is four
(occurred 12 times). The most frequently selected cooling strategies was no passive
cooling strategy (None in the questionnaire), which was selected by 20 times. In other
words, the “mode” of this table is 20 which is for applying no strategy per practitioner.
Table 4.10 The total number of cooling strategies in the questionnaire selected by each practitioner
Total number of cooling strategies applied by one practitioner Frequency Percentage
0 20 14.5%
3 19 13.8%
2 14 10.1%
8 13 9.4%
4 12 8.7%
7 12 8.7%
1 11 8.0%
6 10 7.2%
9 8 5.8%
5 6 4.3%
11 4 2.9%
10 3 2.2%
12 2 1.4%
15 2 1.4%
13 1 0.7%
14 1 0.7%
Total 138 100%

255
However, for 19 times practitioners have selected a combination of three passive cooling
strategies in the questionnaires, which is very close to the “mode” of the table (i.e. 20 for
no passive cooling strategy).
Table 4.11 Selection of the passive cooling strategies in four states with higher participation and four different humid climates (4A, 5A, and 2-3A)
Cooling Strategy
Number of registered architects/engineers in each state
selecting the strategy
Connecticut Illinois New York Texas
Evaporative cooling 4 3 2 7
None 3 2 2 3
Radiant cooling 6 2 4 2
Roof pond 0 0 0 0
Downdraft cooling 2 0 3 1
Cool roof 11 5 7 8
Solar chimney 2 1 3 3
Earth tube 0 1 0 0
Double roof (with the second roof casting
shadow on the actual roof)
0 1 0 0
Stack ventilation 6 2 4 5
External shading devices 20 13 14 14
Night ventilation with mass 4 1 4 1
Green roof 12 10 10 7
Other (please specify) 1 0 1 0
Plants and vegetation (for shadow casting or
evapotranspiration)
19 9 8 4
Dynamic shading devices 2 3 3 4
Internal shading devices 10 6 8 10
Courtyard 12 3 7 4
Night ventilation without mass 5 1 4 1
Cross ventilation 20 7 11 6
Earth contact 3 2 3 1

256
Response count
Fi
gure
4.2
2 Pa
ssiv
e co
olin
g st
rate
gies
cat
egor
ized
by
prof
essi
onal
reg
istr
atio
n

257
63 61
51
1813 12 12
6 5 4 2 2 1 1 10
10
20
30
40
50
60
70
Choi
ce C
ount
/Fre
quen
cy
Figure 4.23 Frequency of the use of passive heating strategies by practitioners in the last 10 years
4.6.3. Passive/Natural Heating Systems (Practitioners)
About half of the practitioners (45.7%) did not use any passive heating strategy in their
designs. Application of direct solar gain (44.2%), deciduous plants (37%), and isolated
solar gain throughout the sunspace/greenhouse space (13%) defined the practitioners top
three applied passive heating strategies. Earth contact (9.4%), solar chimney (8.7%),
indirect solar gain through the Trombe’ wall variations without water (8.7%), transpired
solar wall system (4.3%), indirect solar gain through variations of Trombe’ wall with
water (3.6%), and earth tube (2.9%) are other passive heating strategies used by
practitioners. Strategies mentioned by the respondents in the other category included:
super-insulation (1.4%), thermal mass (1.4%), roof pond (0.7%), solar screen tuned with
sun angles (0.7%), and stack ventilation (0.7%). Figure 4.23 shows the frequency of the
application of passive heating strategies by practitioners in the last ten years.

258
Table 4.12 Frequency of the application of passive heating strategies by practitioners Passive heating strategy Count %Count % of
practitioners
None 63 25.0% 45.7%
Direct solar gain 61 24.2% 44.2%
Deciduous plants (shed leaves in the fall) 51 20.2% 37.0%
Isolated solar gain (sunspace/greenhouse
space)
18 7.1% 13.0%
Earth contact 13 5.2% 9.4%
Solar chimney 12 4.8% 8.7%
Indirect solar gain (Trombe’ wall without water and its variations)
12 4.8% 8.7%
Transpired solar wall system 6 2.4% 4.3%
Indirect solar gain (Trombe’ wall including water and its variations)
5 2.0% 3.6%
Earth tube 4 1.6% 2.9%
Superinsulation 2 0.8% 1.4%
Thermal mass 2 0.8% 1.4%
Roof pond 1 0.4% 0.7%
Solar screen tuned sun angles 1 0.4% 0.7%
Stack ventilation 1 0.4% 0.7%
Total 252 100%

259
The findings of the survey suggest that the majority of practitioners do not use passive
heating strategies. While the climate of the US is more accommodating for the
application of passive heating rather than passive cooling strategies, the percentage of
practitioners who do not apply passive heating versus passive cooling in their designs is
much higher (45.7% versus 14.5%). Additionally, as visible in Figure 4.24, architects are
more interested in passive heating systems compared with engineers. In this case, other
than direct solar gain, engineers show more interest in the use of Trombe’ wall variations
without water and earth tube. However, architects are more interested in the use of direct
solar gain, deciduous plants, and isolated solar gain (i.e. sunspace or greenhouse).

260
Figu
re 4
.24
Freq
uenc
y of
the
appl
icat
ion
of p
assi
ve h
eatin
g st
rate
gies
cat
egor
ized
by
prac
titio
ner’
pro
fess
iona
l re
gist
ratio
n

261
4.6.4. Daylighting Systems (Practitioners)
The top four choices of practitioners for daylighting included: skylights (73.9%),
clerestory windows (73.2%), sidelights (57.2%), and atriums (50.7%). Among
practitioners 13.8% do not use any daylighting design strategies. In the case of
respondents who did not apply daylighting strategies, the number of registered architects
(1.4%) as shown in figure 1p is less than the number of registered engineers (5.8%). The
remaining respondents were not registered architects or engineers (6.6%). Compared to
add-on systems for passive heating or cooling, add-on daylighting systems were more
appealing to practitioners. For instance, 39.9% use light shelves and 24.6% use light
shafts. In addition, light louvers (13.8%), light pipes (12.3%), light ducts (10.1%), and
external reflectors (3.6%) were the next four types of strategies that appealed to
professionals.
Strategies such as light pipes and light ducts (10% of the applications) suggest that
innovative and costly daylighting solutions could be more favored by practitioners,
particularly by architects, compared to passive heating/cooling add-on systems. A higher
percentage of the application of skylights and clerestory windows compared with
sidelights might be indicative of a change in building envelope design in which the
desire to bring daylight from the ceiling is replacing the desire to bring in daylight from
the sidewalls. In this case, issues such as safety/security and outdoor views should be
examined/considered to balance the desire for rooftop lighting with sidelight lighting.

262
Considering the frequency (count) of the application of skylights (19.7%) clerestory
window (19.5%) light pipe (3.3%) and light duct (2.7%) together, about 60.4% of the
professionals preferred daylighting from the ceiling compared with daylighting from the
sidewalls (15.2%). This is without considering the choices in which atrium was
considered (13.5% frequency) which may not necessarily draw light inside from only the
ceiling. Issues such as glare, controllability, energy saving, and privacy could be
hypothetical reasons for such a change.
Electronic light control (0.7%) was the only specified strategy in the other category.
Dynamic daylighting, although very efficient for both comfort and energy saving, was
rarely being applied by professionals (2.2%). The only type of dynamic daylighting
strategy specified by respondents was in the form of sensors and controllers integrated
into light fixtures (in NEEC required daylighting zones).
Table 4.13 Application of daylighting strategies by practitioners Daylighting strategy Count %Count % Practitioners Skylights 102 19.7% 73.9% Clerestory windows 101 19.5% 73.2% Sidelights 79 15.2% 57.2% Atrium 70 13.5% 50.7% Light shelves 55 10.6% 39.9% Light shaft 34 6.6% 24.6% Light louvers 19 3.7% 13.8% None 19 3.7% 13.8% Light pipe 17 3.3% 12.3% Light duct 14 2.7% 10.1% External reflector 5 1.0% 3.6% Dynamic daylighting (sensors integrated to light fixtures) 3 0.6% 2.2% Other (Electronic light control) 1 0.2% 0.7% Total 519 100%

263
102 101
7970
55
34
19 19 17 145 3 1
0
20
40
60
80
100
120
Choi
ce C
ount
/Fre
quen
cy
Skylights
Clerestory
windows
Sidelights Atrium Light
shelvesLightshaft None Light
louversLightpipe
Lightduct
External
reflector
Dynamic
daylighting
(pleasespecify
)
Other(pleasespecify
)
Neither PE nor Licensed Architect 15 12 15 9 7 4 9 3 1 1 1 0 0
PE 23 22 15 17 16 9 8 4 5 4 0 1 1
Licensed Architect 64 67 49 44 32 21 2 12 11 9 4 2 0
0
20
40
60
80
100
120
Choi
ceCo
unt/
Freq
uenc
y
Figure 4.25 Application of daylighting strategies by practitioners
Figure 4.26 Application of daylighting strategies categorized by professional registration

264
4.6.5. Passive Building Envelope Strategies (Practitioners)
This question was asked to find out at what level nontraditional or more advanced
passive building envelope, design approaches have been pursued by practitioners. The
survey results showed that the double-skin façade strategy with 20.83% choice count has
been used by 21.7% of the practitioners in their projects during the last ten years. Other
strategies including phase change materials, movable insulations, and non-motorized
kinetic façades have been used by only 2.9%, 1.4%, and 0.7% of the practitioners,
respectively (Figure 4.27).
Based on the survey results about 77.5% of the practitioners have not used any of these
passive building envelope strategies in their projects. This low level of the application of
unorthodox passive building envelope strategies might be an indicator of several issues:
the lack of professionals’ familiarity with the design and performance analysis of these
strategies, the lack of special tools and approaches appropriate for their simulation, the
lack of demand in the market for their application, and the complexity of their
implementation with respect to the required cooperation between different members
involved in a certain project.

265
None Doubleskin facade
Phasechange
materials
Movableinsulation
Non-motorized
kineticfacade
Total 107 30 4 2 1Neither PE nor Licensed
Architect 18 8 2 1 1
PE 34 3 0 0 0Licensed Architect 55 19 2 1 0
0
20
40
60
80
100
120
Choi
ce C
ount
/Fre
quen
cy
Table 4.14 Application of passive building envelope strategies by professional licensure
Strategy Count %Count % Practitioners
None 107 74.31% 77.5%
Double skin façade 30 20.83% 21.7%
Phase change materials 4 2.78% 2.9%
Movable insulation 2 1.39% 1.4%
Non-motorized kinetic façade 1 0.69% 0.7%
Total 144 100%
Figure 4.27 Application of passive building envelope strategies broken out by professional licensure

266
4.7. Phase of Analyzing the Use of Passive Systems by Practitioners
In the next question the seven phases of a project, based on AIA definitions was
discussed (i.e. programming through project close-out). In this question professionals
were asked to choose the phase(s) that they analyze the use of passive systems in
buildings.42 Figure 4.28 and Table 4.15 show the distribution of the analysis phase(s)
among practitioners as well as their professional registrations. With the exception of
13.8% of the practitioners who never analyze the use of passive systems in a design-to-
construction phase, the passive system analysis was the highest in the schematic phase
(77.5% of professionals). The remaining choices reduced as we move toward the project
close-out phase.
The percentage of professionals analyzing passive systems in each phase included
programming (52.2%), schematic (77.5%), design development (66.7%), preparation of
construction documents (26.1%), hiring the contractor (7.2%), construction
administration (10.1%), and project close-out (11.6%). In the results it is important to
note that there is a sharp drop in the analysis of passive systems beginning from the
preparation of construction documents phase which indicates that the majority of
analyses is conducted in earlier phases of programming, schematic, and design
development. The fact that about 14% of professionals do not have any interest in
42 These phases include programming, schematic, design development, preparation of construction documents, hiring the contractor, construction administration, and project close-out.

267
SchematicDesign
Development
Programming
Preparation of
Construction
Documents
Never ProjectClose Out
Construction
Administration
Hiring theContracto
r
Total 107 92 72 36 19 16 14 10
Neither Professional Engineer (PE) norLicensed Architect 17 15 12 8 7 5 4 4
Licensed Architect 63 58 43 26 6 10 10 5
Professional Engineer (PE) 27 19 17 2 6 1 0 1
0
20
40
60
80
100
120
Choi
ce C
ount
/Fre
quen
cy
Figure 4.28 Practitioners passive systems’ analysis phase categorized by professional registration
analyzing the use of passive systems could partially be explained by the lack of the
application of these systems in general.
Table 4.15 Practitioners’ phase of analysis of passive systems
Analysis Phase Count %Count % Practitioners Schematic 107 29.2% 77.5% Design Development 92 25.1% 66.7% Programming 72 19.7% 52.2% Preparation of Construction Documents 36 9.8% 26.1% Never 19 5.2% 13.8% Project Close Out 16 4.4% 11.6% Construction Administration 14 3.8% 10.1% Hiring the Contractor 10 2.7% 7.2% Total 366 100.0%
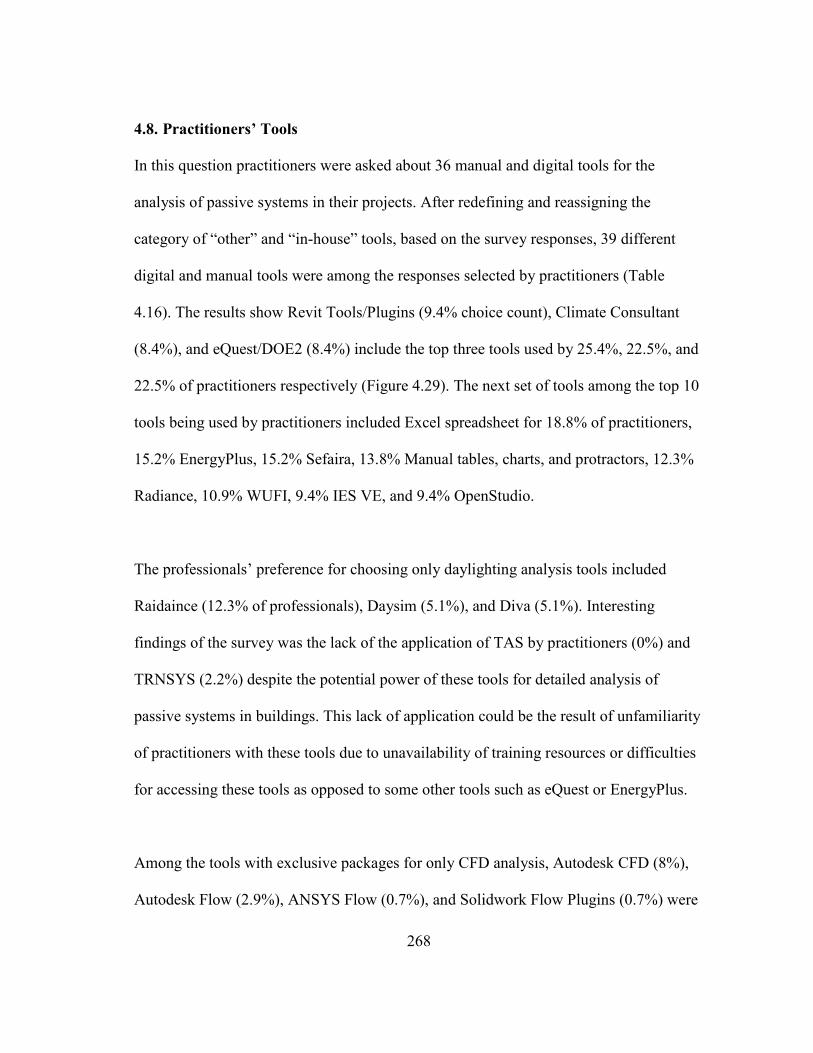
268
4.8. Practitioners’ Tools
In this question practitioners were asked about 36 manual and digital tools for the
analysis of passive systems in their projects. After redefining and reassigning the
category of “other” and “in-house” tools, based on the survey responses, 39 different
digital and manual tools were among the responses selected by practitioners (Table
4.16). The results show Revit Tools/Plugins (9.4% choice count), Climate Consultant
(8.4%), and eQuest/DOE2 (8.4%) include the top three tools used by 25.4%, 22.5%, and
22.5% of practitioners respectively (Figure 4.29). The next set of tools among the top 10
tools being used by practitioners included Excel spreadsheet for 18.8% of practitioners,
15.2% EnergyPlus, 15.2% Sefaira, 13.8% Manual tables, charts, and protractors, 12.3%
Radiance, 10.9% WUFI, 9.4% IES VE, and 9.4% OpenStudio.
The professionals’ preference for choosing only daylighting analysis tools included
Raidaince (12.3% of professionals), Daysim (5.1%), and Diva (5.1%). Interesting
findings of the survey was the lack of the application of TAS by practitioners (0%) and
TRNSYS (2.2%) despite the potential power of these tools for detailed analysis of
passive systems in buildings. This lack of application could be the result of unfamiliarity
of practitioners with these tools due to unavailability of training resources or difficulties
for accessing these tools as opposed to some other tools such as eQuest or EnergyPlus.
Among the tools with exclusive packages for only CFD analysis, Autodesk CFD (8%),
Autodesk Flow (2.9%), ANSYS Flow (0.7%), and Solidwork Flow Plugins (0.7%) were

269
the most frequent tools used by practitioners respectively. The public availability of a
building performance analysis tools and its training resources as well as having a
platform possible to be easily shared with other design/BIM tools, such as Revit, could
be a main reason for the professionals’ higher interest in using Autodesk simulation tools
such as Autodesk CFD.
Among the tools being used for passive solar design, HEED and F-Chart, were the least
frequently applied tools selected by only 1.4% of practitioners. In the survey results
2.9% of the practitioners mentioned that they select a specialty consultant for the
analysis of passive systems in their projects. In addition, 5.1% of the practitioners have
developed their own in-house or personal tools for passive system analyses. Some of
these tools, which have been specified by respondents, included the Weidt group tools
and Chayya43, which are used by individuals or top sustainable engineering and design
firms. In the “other” category Passive House Planning Package (PHPP) was a tool that
was mentioned for passive performance analysis by practitioners (2.9%). A lack of
training resources available to practitioners may be the reason for this low usage.
Another reason for the low level of PHPP application could be the focus of the tool on
only the five criteria of the Passive House Institute in defining a passive building, which
includes: air-tightness, continuous superinsulation, high performance windows for solar
43 For further information about the simulation tool please see http://theweidtgroup.com.

270
heating, MHRV, and minimized air conditioning. These criteria were discussed in earlier
sections.
About 20.3% of practitioners mentioned they do not use any tools for analyzing the
feasibility of passive systems on a project. With respect to the answers to other
questions, particularly the last question on the phase of analysis, the interpretation is that
they are either part of a team of designers and the analysis of passive systems is
delegated to other members of the team or they analyze the use of passive systems in
terms of cost/savings other than energy such as in the case of construction cost. Given
this assumption, the lack of a cost analysis capability in existing simulation tools or the
unfamiliarity of some practitioners with the analysis capability of these tools could be a
reason for not using them.
It should be also kept in mind that by categorizing the application of tools based on
professional registration the result will be to some extent different as shown in Figure
4.30. In this case Revit tools/plugins, Climate Consultant, and Sefaira are the architects
top three tools, while engineers’ top three tools include eQuest/DOE2, Spreadsheets, and
IES EV.

271
Figu
re 4
.29
Prof
essi
onal
s too
ls fo
r an
alyz
ing
the
feas
ibili
ty o
f pas
sive
syst
ems o
n th
eir
proj
ects

272
Figu
re 4
.30
Too
ls u
sed
for
anal
yzin
g th
e fe
asib
ility
of p
assi
ve sy
stem
s cat
egor
ized
by
prof
essi
onal
s reg
istr
atio
ns

273
Table 4.16 Passive systems’ analysis tools, their application frequency, and percentage
Tools Count % Count % Professionals
Revit Tools/Plugins 35 9.4% 25.4%
Climate Consultant 31 8.4% 22.5%
eQuest/DOE2 31 8.4% 22.5%
None 28 7.6% 20.3%
Spreadsheets 26 7.0% 18.8%
Energy Plus 21 5.7% 15.2%
Sefaira 21 5.7% 15.2%
Manual tables, charts, and protractors 19 5.1% 13.8%
Radiance 17 4.6% 12.3%
WUFI 15 4.0% 10.9%
IES VE 13 3.5% 9.4%
OpenStudio 13 3.5% 9.4%
Therm 12 3.2% 8.7%
Autodesk CFD 11 3.0% 8.0%
HAP 8 2.2% 5.8%
Ladybug/Honeybee plugins for Rhino 8 2.2% 5.8%
Daysim 7 1.9% 5.1%
Diva for Rhino 7 1.9% 5.1%
Personal or In-house Software 7 1.9% 5.1%
DesignBuilder 5 1.4% 3.6%
Trane Trace 5 1.3% 3.6%
Autodesk Flow 4 1.1% 2.9%
PHPP 4 1.1% 2.9%
Specialty consultant 4 1.1% 2.9%
BeOpt 3 0.8% 2.2%
TRNSYS 3 0.8% 2.2%
COMFEN 2 0.5% 1.4%
F-Chart 2 0.5% 1.4%
HEED 2 0.5% 1.4%
Other (unspecified) 1 0.3% 0.7%
Ansys Flow 1 0.3% 0.7%
Solidwork Flow Plugins 1 0.3% 0.7%
CONTAM 1 0.3% 0.7%
Autodesk Maya 1 0.3% 0.7%
RETscreen 1 0.3% 0.7% TAS 0 0.0% 0.0% Total 371 100%

274
Early designPhase
Beforeanalyzingthe use of
mechanicalsystems
Afteranalyzingthe use of
mechanicalsystems
Never After designis finalized
Total 75 57 46 39 22Neither Professional Engineer (PE)
nor Licensed Architect 15 13 5 8 2
Licensed Architect 34 30 26 24 18Professional Engineer (PE) 26 14 15 7 2
0
10
20
30
40
50
60
70
80
Choi
ce C
ount
/Fre
quen
cy
Figure 4.31 Phase of calculating passive systems savings broken out by professional registration
4.9. Phase of the Calculation of Passive Strategy Savings (Practitioners)
A major finding of the survey was that 28.3% of professionals (24 architects,7 engineers,
and 8 without professional registrations) never calculate the savings from passive
systems (Figure 4.31 and Table 4.17). This finding could help explain the lack of the
implementation of passive systems because the clients were not allowed to understand
potential savings from passive design strategies to provide the required cost in their
projects.
Most of the practitioners (54.3%) calculate the savings of passive systems in the early
design phase. Based on the survey results, this response was given by both engineers and
architects. The use of calculations is reduced as we move toward the final phases of

275
design. Engineers responded that they calculated passive system savings mostly after
analyzing the use of the mechanical system (15 counts) rather than before analyzing the
mechanical systems application (14 counts). However, for architects the use of a passive
system saving analysis was more before the choice of mechanical systems (30 counts)
versus after the use of mechanical systems (26 counts). It seems that architects are
adopting a more reasonable design method in analyzing passive systems before active
systems with respect to Lechner’s three-tier approach of sustainable design, which was
discussed in section 2.1 of the literature review.
Finally, the survey results showed that 15.9% of the professionals calculated the savings
after design was finalized, which shows the importance of continuous monitoring and
evaluation of the passive system performance until the end of the project. The group of
professionals that chose this response was mainly architects (28 counts) rather than
engineers (2 counts).
Table 4.17 passive systems’ saving calculation frequency in each phase Design Phase Count %Count %Professionals
Early design Phase 75 31.4% 54.3%
Before analyzing the use of mechanical systems
57 23.9% 41.3%
After analyzing the use of mechanical systems 46 19.3% 33.3%
Never 39 16.3% 28.3%
After design is finalized 22 9.2% 15.9%
Total 239 100.0%

276
4.10. Influential Factors in Increasing/Reducing the Use of Passive/Natural Systems
(Practitioners)
One of the important questions of the survey, if not the most important question, was to
find out about the top three challenges/opportunities that practitioners select from
proposed eleven choices that increase the use of passive systems in buildings. The top
three selected choices (Table 4.18) included “clients desire and collaboration to include
passive systems” (19.1% count), “building codes and rating systems” (16.4% count), and
“simulation tools with capabilities for analyzing passive systems” (9.7% count).
The next eight items were ranked based on the frequency of selections including: fourth,
“experience of the project team in the design, implementation, and integration of passive
systems (8.2% count); fifth, “cost of material and construction of passive systems” (8%);
sixth, “avoiding complexity and simplifying the implementation of passive systems”
(7.7%); seventh, “climate of the location of the project with passive systems” (7.5%);
eights, “architect-engineer collaboration” (7.2%); ninth, “knowledge of the modeling
and simulations of passive system strategies” (6.8%); tenth, “knowledge integrating
mechanical and passive systems performance” (4.8%); and eleventh, “Occupants
training for the use and maintenance of the passive systems” (4.6%).
While the first rank (client’s desire) and second rank choices have only 2.7% percent
selection difference, there is a sharp reduction of about 6.7% from selecting the second
choice (i.e., building codes) to the third choice (i.e., simulation tools) by practitioners.

277
Again the reduction between choices of the third rank up to the ninth rank is minor
(1.5% to 2.9%). Therefore, it is more logical to claim that the first and second item (i.e.
building code and client’s desire) are of the same importance.
Table 4.18 Items ranked based on the practitioners’ top three choices to increase the use of passive systems in the US
Rank Influential factor Count %Count % Practitioners
1
Client's desire and collaboration to include passive systems
79 19.1% 57.2%
2 Building codes and rating systems such as those from USGBC (LEED), ASHRAE, Passive House, and ICC
68 16.4% 49.3%
3 Simulation tools with capabilities for analyzing passive systems
40 9.7% 29.0%
4 Experience of the project team in the design, implementation, and integration of passive systems
34 8.2% 24.6%
5 Cost of material and construction of passive systems
33 8.0% 23.9%
6 Avoiding complexity and simplifying the implementation of passive system strategies
32 7.7% 23.2%
7 Climate of the location where a passive system should be designed
31 7.5% 22.5%
8 Architect-engineer collaboration 30 7.2% 21.7%
9 Knowledge of the modeling and simulation of passive system strategies
28 6.8% 20.3%
10 Knowledge integrating mechanical and passive systems performance
20 4.8% 14.5%
11 Occupants training for the use and maintenance of the passive systems
19 4.6% 13.8%
Total 414 100%

278
Next, comes the importance of the simulation tools’ capability in passive systems
simulation, and on a lower importance comes experience, cost, simplification, climate,
architect-engineer collaboration, and knowledge of passive strategies simulations. The
10th item (i.e., knowledge integrating passive and mechanical systems) and the 11th item
(occupant training) have also a close selection count (only 0.2% percent difference) and
therefore it should be logical to consider their importance on an equal footing.
Figure 4.32. Shows all the eleven factors in a chart with a breakout based on the
respondents’ professional registration. Comparing the first and the second choice by
registered architects and engineers reveals a difference in prioritizing clients desire and
building codes to increase the use of passive systems. Accordingly, while architects
consider the clients desire for passive systems the most important factor (55 to 33),
engineers have given priority to building codes and rating systems (19 to 15 counts).
One reason for such a difference could be the fact that most architects manage and direct
projects and therefore they are more directly in contact with the clients, compared to
engineers who might be working as a third party entity or through an
architect/architecture firm with the clients. Also, in a similar manner, engineers are more
dealing with energy and code requirements of building in building which support the
reason for their difference with architects in selecting the important factor.
The number of years of professional experience could also be an important factor in
selecting the most influential factor in increasing the application of passive systems as

279
shown in Figure 4.33. On this basis, “building codes” item has been selected by
practitioners with less than 5 years or 15-19 years of work experience, and “client’s
desire and collaboration” item was selected by the rest of the practitioners who have 5-9,
10-14, or from 20 to over 34 years of work experience. Simulation tools and clients
desire for the practitioners with 25-29 years of work experience both are of the same
importance as the first ranked choice for increasing the use of passive systems in
buildings.
A very interesting finding of the survey is that despite the general belief, climate, as
ranked seventh among eleven items, does not play a key role in using or not using
passive design strategies in the US. The role of occupants training in increasing the use
of passive systems although ranked last, needs further analysis to be more inclusive. In
particular, a survey should focus on occupants rather than designers to ask how
important to building occupants is the use of passive systems.

280
Fig
ure
4.32
Fac
tors
influ
entia
l in
the
use
of p
assi
ve/n
atur
al sy
stem
s bro
ken
out b
y pr
ofes
sion
al r
egis
trat
ions
of t
he
resp
onde
nts

281
Figu
re 4
.33
Fact
ors i
nflu
entia
l in
incr
easi
ng th
e us
e of
pas
sive
/nat
ural
syst
ems i
n bu
ildin
gs c
ateg
oriz
ed b
y re
spon
dent
s’ y
ears
of w
ork
expe
rien
ce

282
4.11. The Open-Ended Question for Practitioners
In order to find out about other factors that can reduce or increase the contribution of
passive systems into the design of buildings in the US as well as its other unknown
aspects an open ended text question was included in the survey. The logic of this
question was that instead of having interviews with a few number of practitioners, which
usually imposes additional cost and demands more time, a text question can provide
opportunities for the participants to include any information relevant to the content of the
survey. The advantage of this inclusion is twofold: first, it reduces the cost and time
required for interviews while increasing the number of participants to embrace a wider
scope of opinions; and second it reduces the possibility of influencing the participants’
opinions by removing the interviewer’s physical presence. This open ended question
asked practitioners to write their comments or notes if there is anything not addressed in
the survey about the application of passive/natural systems in buildings.
The results included several findings about practitioners’ opinions on the application of
passive systems, which will be summarized here. A color coding approach was used to
categorize the participants’ responses. As such, responses with similar or shared themes
were colored the same. At the end of color coding process, the following classifications
along with their findings were realized:
• Actions needed to increase the use of passive design:
To increase the use of passive systems, it was mentioned by one of the respondents that
the issue is not on the supply side or is not an issue of knowledge/capabilities. The issue
283
is demand by owners and clients. It was suggested by this practitioner to adopt three
strategies to increase this demand: first, by legislation (i.e. code requirements); second,
by incentivizing it as in tax incentives or development incentives; and three, by
decreasing the cost, since high-performance buildings generally cost more even if a well-
integrated design process has been applied.
One of the respondents had a different view towards the role of clients in passive design
compared to the practitioner’s view who claimed that the issue is the client’s demand for
including passive systems: “Most of our clients want buildings which include passive
solar or active solar strategies. However, almost none of them want to pay for it.”
Therefore, it might be possible that the major issue is not the supply/demand side, but
more the additional cost which could be foisted on the design team without any
compensation.
Sometime the design team may not approach the inclusion of passive systems in
buildings due to concerns about building codes or the clients’/occupants’ satisfaction
after building occupancy. One of the practitioners mentioned that: “Fear of potential
owner/user dissatisfaction with the comfort delivered by the HVAC system, and
compliance with ASHRAE guidelines as now referenced in building codes, are a great
disincentive in the use of passive systems in commercial/institutional projects.” In this
case, design tools and protocols can be developed to help designers deal with such
circumstances in the process of designing and implementing passive systems.

284
For example, building protocols or codes can be developed with a focus on the function
of buildings in power outages or natural disasters. One of the practitioners with a focus
on healthcare facilities wrote about this issue: “How does a building react during an
outage at various weather conditions? We're developing tools and protocols to simulate
failures of mechanical systems and determine the impact on the occupied space.”
Another solution proposed by a practitioner was to ask for collaboration with the power
companies and to review the exiting incentives in different states: “Finding out what
incentive states are providing would also help. Getting the power company to be more
collaborative, so we can show the financial benefit to the owner and also reviewing
agency to learn about it.” Another practitioner added in this regard that “certain states
are behind the times in innovations and technology use. This drives the cost of new
systems or construction styles way up, making it nearly impossible to get clients on
board.”
Some of the practitioners indicated that consideration of the architectural aesthetics and
their integration with passive systems and the whole building could be an important
factor in increasing the use of passive systems: “You left off the most important single
criteria for the adoption of passive strategies in building design and construction:
Beauty. For decades we have concentrated on the savings, cost benefits and justification
of passive strategies when in reality the customer usually only wants a beautiful building
and becomes suspicious when we begin justifying a design. They will even pay more
for a beautiful design. That beauty should include at least four of the five senses. They

285
should feel better, smell better, sound better, and look better. And they usually do. But
above all they should look better, because that is what the public sees in magazines,
films, and on the internet.”
A comment from a practitioner mentioned that for increasing the use of passive systems
we need better definitions of passive design/systems. Today by using the term “passive”
it is ambiguous what can be counted or not counted as a passive design strategy. In
some cases, “it is not even clear how passive design may differ from existing terms such
as high-performance buildings.” As was explained in the literature review, such a
confusion in limiting/delimiting the inclusion of passive design through its definitions
even exists in green building rating systems. Most of the rating systems consider
superinsulation and airtightness as passive design strategies, which along with the
advocacy of some influential institutions in passive design such as PHIUS, may not
necessarily consider the usefulness of add-on passive systems such as Trombe’ walls or
downdraft cooling systems. 44
Another Practitioner mentioned that we evaluate passive systems frequently but almost
never employ them. This practitioner mentioned that longer than ten years ago was using
44 During the author’s informal conversation with some experts this confusion in the definition of passive design was also perceptible. For example, in the course of designing the survey questionnaire on passive systems the author came across conversations such as this one: “do you mean passive design such as insulation and air tightness, or do you mean like for example roof ponds, Trombe’ walls, etc.”

286
some passive systems, but practically have not used any passive system since then. Such
a response could be indicative of the interests in the past for using passive systems,
which almost have disappeared today. Building codes and rating systems could play a
key role in rekindling this interest as mentioned by another respondent: “the factors
influencing the increase/reduction of the use of passive/natural systems in buildings [is]
building code.” Another practitioner added to this quotes by emphasizing the greater role
of codes versus rating systems in increasing the use of passive systems in buildings: “I
would like to specify that I believe codes have a greater impact on the increase in [the]
use of passive systems than rating systems. Rating systems are not practical for smaller
scale projects due to cost. They serve as great guidelines, but codes need to be stricter.”
• Usefulness of passive system strategies:
“A majority of the strategies listed in this survey are simply not useful. The primary
passive tactics to improve energy performance in a high heating climate are continuous
insulation and exceptional air-tightness-neither of which are mentioned. Plus, exterior
shading is good for cooling to avoid overheating.” This is one of the practitioners’
responses, who is also PHIUS certified consultant, with respect to the usefulness of the
passive design strategies in the survey. This practitioner mentioned that “the most
recurring types of passive/natural system strategies are continuous insulation,
superinsulation, and exceptional air-tightness.”

287
Another practitioner in contrast to this response mentioned that: “Much of the earliest
energy analytical work done in residential passive systems is documented in the
publications (e.g. Passive Solar Design Handbook, Jan. 1980) of Dr. Doug Balcomb et
al. working at the Los Alamos National Lab. In my estimation, those publications are
the most significant contributions in the current field of passive/natural system design.”
This discrepancy in considering passive systems useful, as described above, could be the
result of unclear definitions of what is or is not included in passive design categories.
More importantly, this difference could be the result of the institutions’ roles, such as
PHIUS, in defining passive design/systems.
Another practitioner mentioned that “the usual problem is that passive systems don't do
the whole annual job, and are not able to displace much of the required capacity of active
systems.” This practitioner extended that “insulation, proper use of glazing, orientation
and building tightness are the real winners in passive construction.” Some of the
practitioners added to these strategies by providing creative ideas on how passive
systems incorporated to a building can become more functional: “Perhaps a
RED/GREEN light to tell people they can open up or not [the windows] is the best
solution.”
Therefore, what is perceptible from the usefulness of passive design strategies is that
some practitioners do not consider the traditional add-on passive design strategies useful,
although some of the practitioners are still using these strategies, as showed in the survey

288
results about passive cooling/heating systems used in the US. It seems that passive
design today is diverging to two categories: in one category for most practitioners today
passive design boils down to only typical building envelope solutions such as R values,
superinsulation, and airtightness; for another category of designers a design which is
only focused on these building envelope features without considering traditional add-on
passive systems cannot be counted as a passive design. Some practitioner’s responses
emphasize this importance of the traditional passive systems in design: “Passive systems
are actually part of indigenous design that existed prior to modern mechanical systems.
The renewed interest in using passive heating and cooling as well as humidification
strategies for buildings comes from the need for long term cost saving solutions as well
as the aesthetic value of natural building modeling,” or “our firm has been designing
passive buildings since 1970s.”
• Useful design tools for passive design:
Based on the practitioners’ responses it seems that: first, the range of design tools for
passive design are very limited. Second, in some cases, the same limitations imposed by
institutions on the definition of passive design strategies have also influenced
consideration of what can be a passive design tool. Third, the knowledge of passive
building simulation is limited among professionals. And forth, the tools existing do not
satisfy the practitioners’ needs for the analysis of passive systems.

289
For instance, a PH certified consultant mentioned that “the design tools being used for
passive design [are] PHPP or WUFI Passive,” which limits the range of passive design
tools to the tools recognized by PHIUS. However, tools such as Climate Consultant or
IES-VE have partial capabilities for the simulation of passive design strategies. This lack
of attention to other tools’ capabilities in some cases could lead to overestimating or
underestimating some of the tools capabilities in simulating or analyzing passive
systems. For example, one of the practitioners mentioned that: “I believe that DOE2 is
the most powerful building energy analysis tool to use when integrating passive and
mechanical system design in commercial and institutional buildings.”
Finally, some of the practitioners expressed concerns about the unavailability of the
simulation tools that can only analyze a passive system’s performance. For example, one
the practitioners wrote that: “I have asked Autodesk for years to allow me to model the
temperature swing in my buildings without taking into effect HVAC in an effort to judge
efficacy of passive measures. Need a “naked” button, haven’t seen it.”
• The importance of an integrated design:
A practitioner responded that “[…for] incorporating passive/natural system strategies in
a practical design process with respect to their integration with mechanical systems
building form, orientation, layout, and percentage of glazing are important. So during
schematic design. Then insulation and window selections during design development.
Then construction details for thermal bridging, continuous insulation, and air tightness.”
290
Therefore, the general perception is that the majority of design integration for a passive
design for some practitioners happens in its schematic phase.
Another practitioner mentioned that because passive systems cannot fulfil the whole
annual heating/cooling “you have to buy two systems. If the building is well insulated,
shaded and oriented, the active systems are not too expensive to deploy and operate,
leaving little to save from passive systems.” Therefore, design integration is not only
about technical design features, but also is a matter of proper integration between
passive and active systems costs. Accordingly, it should be shown to the practitioners
that both capital costs and operational costs should be considered in cost evaluations to
include or exclude passive systems in buildings. Currently, the practice seems lacking a
transparent approach in calculating these costs and savings from passive systems.
Lastly, design integration should be considerate of not only active and passive systems,
but also of integration with a building’s function. This point was understandable from
one of the practitioners’ comments: “For example, what happens in a building is
important and often can present opportunities if those operational systems are integrated
with the building systems; we do a lot of this with brewery projects.” This brings us to
the importance of the role of building typology in passive design.
• The role of building typology in using passive systems:
One of the practitioners mentioned that “passive/natural systems are largely applicable to
new buildings, and particularly buildings with substantial lots. [Therefore] more focus is

291
needed on existing buildings and building compactly.” However, it could be actually
contrary to this claim, since passive heating of small buildings seems to be easier if they
have an appropriately wide glazing area facing south. The reason being a small depth for
the sunlight to reach the interior of the building and a proper ratio between the glazing
area and the floor area for accumulating solar heat. Increasing the size of a building may
make the maximum glazing area not sufficient for direct solar gains to be stored in the
thermal mass of the floors and walls.
In some cases, even the size of a building may become of secondary importance
compared to the form and geometry of its floor plan for passive heating if all of its sides
can receive the proper amount of solar radiation during the day. This practitioner’s
comment suggests that a better education about the use/design of passive systems is
necessary, as some of the practitioners avoid using passive design just because they are
not properly informed about the potential benefits and opportunities for the contribution
of these systems to energy savings.
Some of the practitioners mentioned that the use of passive systems in certain building
typologies is difficult. One of the participants wrote that it is “difficult to do [passive
design] in heavy commercial applications such as healthcare architecture.” This response
was similarly expressed by another practitioner who wrote that “I was educated in
California but now practice in Connecticut and focus on healthcare projects where the
environment is highly regulated and mechanical systems are not intended to include

292
passive systems. Furthermore, healthcare projects tend to be hospitals with large
footprints (limited perimeter) or developer projects where little thought goes into the
core and shell.” Therefore, as mentioned in the previous category of findings about
passive systems, a building’s functions can expand or limit opportunities for the
incorporation of passive systems in practice: “what happens in a building is important
and often can present opportunities if those operational systems are integrated with the
building systems; we do a lot of this with brewery projects.”
Finally, it seems that passive design is more becoming a matter of design resiliency
rather than energy saving when it comes to building typologies other than residential
buildings. In this regard, one of the practitioners mentioned this point: “Passive design is
not commonly applied in healthcare facilities. However, from a resilience perspective,
passive design is starting to pick up. For some healthcare facilities, evacuation is not
possible.”
• The drawbacks of using passive systems
Similar to any kind of design intervention, there are pros and cons in using a passive
design strategy. Some of the practitioners explained their concerns over the drawbacks
of using passive systems: “The negatives we have seen with passive systems are: one,
Europeans pushing it in the USA when their summers have similar Dry Bulb
temperatures, but much lower Wet Bulb temperatures and then our clients hate it; two,
occupants who have no understanding of controlling operable windows in passive

293
systems. It takes a fair amount of education to make a person understand weather,
psychrometrics, and the [potential] effects [of passive design] on the building. One open
window can humidify an entire building.”
Therefore, lack of occupants’ training and climate incompatibility could be two of the
main drawbacks of using passive systems, which may result in dissatisfaction and more
energy consumption if not properly addressed in design. The same practitioner
mentioned that using simple methods, such as a red/green light to open the window
when the weather outdoor is appropriate for natural ventilation, could be a solution to
occupants’ lack of training.
Finally, to conclude this section, one of the practitioners’ comments seem to be
appropriate at this point who mentioned that “the construction of energy efficient
buildings need not be so over thought.”
4.12. Major Findings of the Practitioners’ Survey
Table 4.19, which concludes this section, shows some of the major findings of the
survey from practitioners.
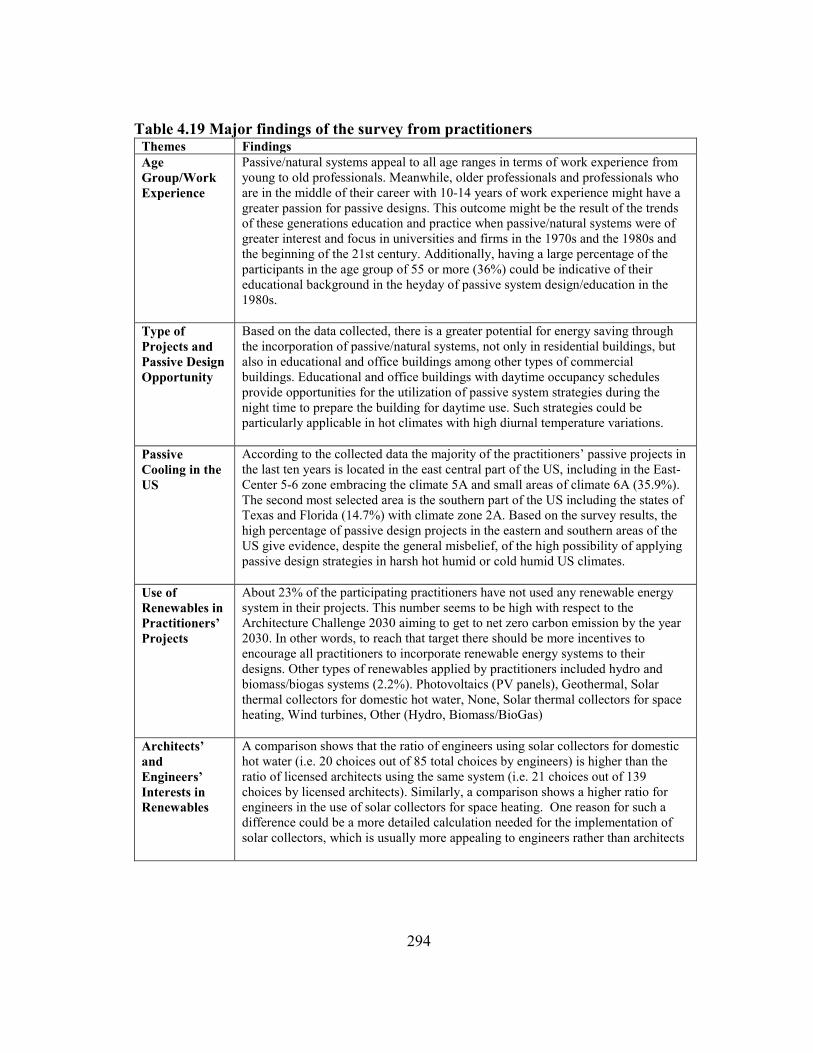
294
Table 4.19 Major findings of the survey from practitioners Themes Findings Age Group/Work Experience
Passive/natural systems appeal to all age ranges in terms of work experience from young to old professionals. Meanwhile, older professionals and professionals who are in the middle of their career with 10-14 years of work experience might have a greater passion for passive designs. This outcome might be the result of the trends of these generations education and practice when passive/natural systems were of greater interest and focus in universities and firms in the 1970s and the 1980s and the beginning of the 21st century. Additionally, having a large percentage of the participants in the age group of 55 or more (36%) could be indicative of their educational background in the heyday of passive system design/education in the 1980s.
Type of Projects and Passive Design Opportunity
Based on the data collected, there is a greater potential for energy saving through the incorporation of passive/natural systems, not only in residential buildings, but also in educational and office buildings among other types of commercial buildings. Educational and office buildings with daytime occupancy schedules provide opportunities for the utilization of passive system strategies during the night time to prepare the building for daytime use. Such strategies could be particularly applicable in hot climates with high diurnal temperature variations.
Passive Cooling in the US
According to the collected data the majority of the practitioners’ passive projects in the last ten years is located in the east central part of the US, including in the East-Center 5-6 zone embracing the climate 5A and small areas of climate 6A (35.9%). The second most selected area is the southern part of the US including the states of Texas and Florida (14.7%) with climate zone 2A. Based on the survey results, the high percentage of passive design projects in the eastern and southern areas of the US give evidence, despite the general misbelief, of the high possibility of applying passive design strategies in harsh hot humid or cold humid US climates.
Use of Renewables in Practitioners’ Projects
About 23% of the participating practitioners have not used any renewable energy system in their projects. This number seems to be high with respect to the Architecture Challenge 2030 aiming to get to net zero carbon emission by the year 2030. In other words, to reach that target there should be more incentives to encourage all practitioners to incorporate renewable energy systems to their designs. Other types of renewables applied by practitioners included hydro and biomass/biogas systems (2.2%). Photovoltaics (PV panels), Geothermal, Solar thermal collectors for domestic hot water, None, Solar thermal collectors for space heating, Wind turbines, Other (Hydro, Biomass/BioGas)
Architects’ and Engineers’ Interests in Renewables
A comparison shows that the ratio of engineers using solar collectors for domestic hot water (i.e. 20 choices out of 85 total choices by engineers) is higher than the ratio of licensed architects using the same system (i.e. 21 choices out of 139 choices by licensed architects). Similarly, a comparison shows a higher ratio for engineers in the use of solar collectors for space heating. One reason for such a difference could be a more detailed calculation needed for the implementation of solar collectors, which is usually more appealing to engineers rather than architects

295
Table 4.19 Continued
Themes Findings
Simplicity versus Complexity of Passive Systems
The results showed that the use of simple passive systems on new buildings were preferred over complex passive systems or add-on passive systems. As a result, external shading devices integrated with buildings façades, green roofs on the idle roof surfaces, and the appropriate location of building openings for cross ventilation are more likely to be applied by practitioners for the passive cooling of a building compared with strategies such as complex earth tubes or roof ponds, which are more difficult to maintain. The findings also showed that, despite the general misbelief that passive solar is more appealing to practitioners in the US, passive cooling strategies in the US are widely being applied. Finally, the complexity and cost of the selected passive cooling systems, such as for earth tube, solar chimney, night ventilation with thermal mass, or downdraft cooling seemed not to hinder their selection (3% to 13%).
Passive Heating Systems for Architects and Engineers
About half of the practitioners (45.7%) did not use any passive heating strategy in their designs. Application of direct solar gain (44.2%), deciduous plants (37%), and isolated solar gain throughout the sunspace/greenhouse space (13%) defined the practitioners top three applied passive heating strategies. The findings of the survey suggest that the majority of practitioners do not use passive heating strategies. While the climate of the US is more accommodating for the application of passive heating rather than passive cooling strategies, the percentage of practitioners who do not apply passive heating versus passive cooling in their designs is much higher (45.7% versus 14.5%). Additionally, architects are more interested in using passive heating systems compared with engineers. In this case, other than direct solar gain, engineers showed more interest in the use of Trombe’ wall variations without water and earth tube. However, architects are more interested in the use of direct solar gain, deciduous plants, and isolated solar gain (i.e. sunspace or greenhouse).
Daylighting The top four choices of practitioners for daylighting included: skylights (73.9%), clerestory windows (73.2%), sidelights (57.2%), and atriums (50.7%). Compared to add-on systems for passive heating or cooling, add-on daylighting systems were more appealing to practitioners. For instance, 39.9% use light shelves and 24.6% use light shafts. Among practitioners 13.8% do not use any daylighting design strategies. Strategies such as light pipes and light ducts (10% of the applications) suggest that innovative and costly daylighting solutions could be more favored by practitioners, particularly by architects, compared to passive heating/cooling add-on systems. A higher percentage of the application of skylights and clerestory windows compared with sidelights might be indicative of a change in building envelope design in which the desire to bring daylight from the ceiling is replacing the desire to bring in daylight from the sidewalls. about 60.4% of the professionals preferred daylighting from the ceiling compared with daylighting from the sidewalls (15.2%). This is without considering the choice of atrium (13.5% frequency) which may not necessarily draw light inside from only the ceiling. Issues such as glare, controllability, energy saving, and privacy could be hypothetical reasons for such a change. Dynamic daylighting, although very efficient for both comfort and energy saving, was rarely being applied by professionals (2.2%).

296
Table 4.19 Continued
Themes Findings
Passive House Planning Package Tool (PHPP)
Passive House Planning Package (PHPP) as an exclusively designed tool for passive performance analysis is used by a small fraction of practitioners (2.9%). This small percentage of application seems to be due to lack of training resources available to all practitioners. Another reason for the low level of PHPP application could be the focus of the tool on only the five criteria of the Passive House Institute US in defining a passive building including air-tightness, continuous superinsulation, high performance windows for solar heating, MHRV, and minimized air conditioning. The shortages in these criteria were discussed in earlier sections. About 20.3% of practitioners mentioned they do not use any tools for analyzing the feasibility of passive systems on a project. With respect to the answers to other questions, particularly the last question on the phase of analysis, the interpretation is that they are either part of a team of designers and the analysis of passive systems is delegated to other members of the team or they analyze the use of passive systems in terms of cost/savings other than energy such as in the case of construction cost. Given this assumption, the lack of a cost analysis capability in existing simulation tools or the unfamiliarity of some practitioners with the analysis capability of these tools could be a reason for not using them.
Calculating the Savings From Passive Design Strategies
A major finding of the survey was that 28.3% of professionals never calculate the savings from passive systems. This finding could help explain the lack of the implementation of passive systems because the clients were not allowed to understand the potential savings from passive design strategies to provide the required cost in their projects. Most of the practitioners (54.3%) calculate the savings of passive systems in the early design phase. Based on the survey results, this response was given by both engineers and architects. The use of calculations is reduced as we move toward the final phases of design. Engineers responded that they calculated passive system savings mostly after analyzing the use of the mechanical system (15 counts) rather than before analyzing the mechanical systems application (14 counts). However, for architects the use of a passive system saving analysis was more before the choice of mechanical systems (30 counts) versus after the use of mechanical systems (26 counts).
Influential Factors in Passive Design
Building codes and client’s desire are of the highest and same importance in increasing the use of passive systems. Next, comes the importance of the simulation tools’ capability in passive systems simulation, and on a lower importance comes experience, cost, simplification, climate, architect-engineer collaboration, and knowledge of passive strategies simulations. The knowledge integrating passive and mechanical systems and the occupant training should be considered with equal importance as the last items based on the survey results. However, another survey targeting the occupants and their roles in using passive systems is needed to better support this last result.

297
Table 4.19 Continued
Themes Findings
Advanced Passive Building Envelope Systems
The double-skin façade strategy with 20.83% choice count has been used by 21.7% of the practitioners in their projects during the last ten years. Other strategies including phase change materials, movable insulations, and non-motorized kinetic façades have been used by only 2.9%, 1.4%, and 0.7% of the practitioners, respectively. This low level of the application of unorthodox passive building envelope strategies might be an indicator of several issues: the lack of professionals’ familiarity in large with the design and performance analysis of these strategies, the lack of exclusive tools and approaches appropriate for their simulation, the lack of demand in the market for their mass application, and complexity in their implementation with respect to the required cooperation between different members involved in a certain project.
Phase of Analysis for Using Passive Systems
With the exception of 13.8% of the practitioners who never analyze the use of passive systems in a design-to-construction phase, the passive system analysis was the highest in the schematic phase (77.5% of professionals). The remaining choices reduced as we move toward the project close-out phase. There is a sharp drop in the analysis of passive systems beginning from the preparation of construction documents phase which indicates that the majority of analyses is conducted in earlier phases of programming, schematic, and design development. The fact that about 14% of professionals do not have any interest in analyzing the use of passive systems could partially be explained by the lack of the application of these systems in general.
Passive Design/Analysis Tools
The professionals’ interests in choosing simulation tools included in order: Revit Tools/Plugins, Climate Consultant, eQuest/DOE2, No Tools, Spreadsheets, Energy Plus, Sefaira, Manual tables, charts, and protractors; Radiance; WUFI; IES VE; OpenStudio; Therm; Autodesk CFD; HAP; Ladybug/Honeybee plugins for Rhino; Daysim; Diva for Rhino; Personal or In-house Software; DesignBuilder; Trane Trace; Autodesk Flow; PHPP; Specialty consultant; BeOpt; TRNSYS; COMFEN; F-Chart; HEED; Other (unspecified); Ansys Flow, Solidwork Flow Plugins,CONTAM, Autodesk Maya, RETscreen, and TAS. The public availability of abuilding performance analysis tools and its training resources as well as having aplatform possible to be easily shared with other design/BIM tools such as Revitcould be a main reason for the professionals’ higher interest in using Autodesksimulation tools such as Autodesk CFD.

298
5. EDUCATORS SURVEY: RESULTS AND DATA ANALYSIS
5.1. Introduction
This chapter will present and analyze the results of the data that was collected through
the online survey questionnaires focused on educators. To add to the findings of the
practitioners’ survey, the purpose of this survey was to obtain a more accurate
perception of the level of education of passive systems in the US architecture schools as
well as the background and experience of the educators. A key reason for conducting
this survey was that the building industry practitioners usually build their expertise upon
the knowledge and skills that they gain in the academic institutions. The survey
procedure and tools were previously explained in the chapter four.
5.2. Demographic Information (Educators)
5.2.1. Professional Role (Educators)
5.2.1.1. Primary Additional Professional Role (Educators)
Among educators, as shown in Table 5.1 and Figure 5.1, 50% also practice mainly as an
architect (18 counts) and 16.7% practice as an architectural engineer (6 counts). 11.1%
of educators did not practice as an architect or engineer (4 counts). Sustainable design
consultant is the third highest selected additional role (3 counts; 8.3%). In other
categories there was 1 person (2.8%) for the following professions: Sustainable Design
Consultant, Daylighting Consultant, Energy Consultant, Energy Lab Researcher,
Engineer, and Researcher. Therefore, about 78% of the educators are either architects,

299
18
64
31 1 1 1 1
02468
101214161820
Choi
ce C
ount
architectural engineers, or sustainability experts. This high percentage of educators who
also practiced indicates that there is a great potential to inform the building industry
through educators who practiced in the building industry and vice versa.
Table 5.1 Educators additional current professional role Primary professional role in addition to being an educator %Count Count Architect 50% 18 Architectural Engineer 16.7% 6 Not Applicable 11.1% 4 Sustainable Design Consultant 8.3% 3 Daylighting Consultant 2.8% 1 Energy Consultant 2.8% 1 Energy Lab Researcher 2.8% 1 Engineer 2.8% 1 Researcher 2.8% 1 Total 100.0% 36
Figure 5.1 Educators additional current professional role

300
5.2.1.2. Primary Previous Professional Role (Educators)
This question was asked to find out about the background of the educators who currently
do not have any additional professional roles. Similar to the responses of the previous
question, 50% of the respondents were previously an architect (18 counts) and 11.1% did
not have any previous roles other than being an educator (4 counts). The percentage of
the respondents who were previously practicing as an architectural engineer was 13.9%
(5 counts). Since 16.7% of the current educators were also architectural engineers, there
appears to be a 3% increase toward hiring architectural engineers to teach courses on
passive/natural systems in universities.
However, the results show architecture schools still hire architects rather than
engineers/architectural engineers as evidenced by 50% of the educators having
architecture as their current and previous professional roles. Table 5.2 shows other
previous professional roles including engineer (5.6%), sustainable design consultant
(5.6%), energy consultant (2.8%) and lighting consultant (2.8%). The three respondents
in the category of “other” (8.3%) were previously practicing as designers, marketing
professors, or facility planners. Considering the number of architects and engineers,
there is a 3 to 1 ratio in terms of the educators’ background being an architect versus an
engineer. This finding implies that very few architectural engineers are teaching at
architecture schools.

301
18
54
32 2
1 1
0
2
4
6
8
10
12
14
16
18
20Co
unt
Figure 5.2 Educators previous professional role
Table 5.2 Educators’ previous professional role Professional Role %Educators Number of Educators
Architect 50% 18
Architectural Engineer 13.9% 5
Not Applicable 11.1% 4
Other 8.3% 3
Engineer 5.6% 2
Sustainable Design Consultant 5.6% 2
Energy Consultant 2.8% 1
Lighting Consultant 2.8% 1
Total 100% 36

302
5.2.2. Affiliations (Educators)
The SBSE, ACSA, and LEED AP define the first three affiliations chosen by the
educators. Of these choices about 66.7% of the respondents are SBSE, 50% are ACSA,
and 47.2% are LEED AP members (Table 5.3). The AIA and ASHRAE affiliations,
which were among the top three choices for the practitioners in the previous survey, now
stand on the fourth and fifth ranking and are selected by 44.4% and 33.3% of the
educators, respectively. However, considering the fact that SBSE and ACSA are
educational affiliations rather than professional affiliations, we can say that LEED AP,
AIA, and ASHRAE still represent the top three professional affiliations for educators
similar to practitioners. The difference is that LEED AP becomes the top choice for
educators compared to AIA for practitioners.
About 22.2% of the participants were also members of the Building Technology
Educators’ Society (BTES). ASES and IESNA affiliations each define 16.7% of the
respondents’ affiliations. About 13.9% of the respondents are IBPSA members and
13.9% of them are members of the PHIUS. Table 5.3 and Figure 5.3 show the
distribution of the affiliations among educators. In the category of “other” (6 counts)
which was selected by 16.7% of educators, the following affiliations were mentioned:
ICC (International Code Council), NFPA (National Fire Protection Association), ARCC
(Architectural Research Centers Consortium), AEI (Architectural Engineering Institute),
ASCE (American Society of Civil Engineers), SCUP (Society of College and University

303
24
18 17 16
12
86 6 6 5 5
0
5
10
15
20
25
Coun
ts
Planning) AASHE (The Association for Advancement of Sustainability in Higher
Education), ISCN (International Sustainable Campus Network), and A+CA.
Table 5.3 Educators’ affiliations Affiliations % Out of
Total Affiliations
Count % of Educators
SBSE (Society of Building Science Educators) 19.5% 24 66.7% ACSA (Association of Collegiate Schools of Architecture) 14.6% 18 50.0%
LEED AP 13.8% 17 47.2% AIA 13.0% 16 44.4% ASHRAE Member 9.8% 12 33.3% BTES (Building Technology Educators' Society) 6.5% 8 22.2%
ASES (American Solar Energy Society) 4.9% 6 16.7% IESNA (Illumination Engineering Society of North America)
4.9% 6 16.7%
Other (please specify) 4.9% 6 16.7% IBPSA (International Building Performance Simulation Association)
4.1% 5 13.9%
PHIUS (Passive House Institute US) 4.1% 5 13.9% Total 100.0% 123
Figure 5.3 Educators’ affiliations

304
5.2.3. Teaching Experience
The majority of the respondents (55.6%) had less than 20 years teaching experience.
About 27.8% of the educators had 10-14 years teaching experience, which represent the
most selected group (Table 5.4 and Figure 5.4). Educators with 5-9 years and over 34
years of teaching experience were the second most selected group each defining 13.9%
of the total respondents. Other groups, in order, included 25-29 years (11.1%), 30-34
(11.1%), under 5 years (8.3%), 20-24 (8.3%), and 15-19 (5.6%). The results showed that
the combination of old educators who had over 34 years teaching experience with young
educators who had 5-14 years teaching experiences define the majority of the educators
in the sample group. With this in mind, there seems to be a large experience gap between
those who are about to retire and those who are starting their career as educators in
higher education. On the other hand, the shift toward new passive concepts in higher
education, such as adaptive facades or biomimetic design of building envelope
components, could be the result of the replacement of the retiring educators with
younger educators.
Table 5.4 Educators teaching experience Years of teaching experience % of educators Number of educators
Under 5 years 8.3% 3 5 to 9 years 13.9% 5 10 to 14 years 27.8% 10 15 to 19 years 5.6% 2 20 to 24 years 8.3% 3 25 to 29 years 11.1% 4 30 to 34 years 11.1% 4 Over 34 years 13.9% 5 Total 100.0% 36

305
10
5 5
4 4
3 3
2
0
2
4
6
8
10
12
10 to 14years
5 to 9 years Over 34years
25 to 29years
30 to 34years
Under 5years
20 to 24years
15 to 19years
Num
ber o
f res
pond
ents
Years of teaching experience
5.2.4. Age Groups (Educators)
About 51.4% of the educators are more than 55 years old, which implies that they had
the opportunity of developing their educational or professional experience during the
peak periods of the 1980s and the 1970s passive design. More precisely, 31.4% of the
respondents are over 59 years old, 20% of them are between 55 and 59 years old, and
20% are 45-49 years old (Table 5.5 and Figure 5.5). If we sum up the percentage of the
age groups beyond 45 years old, 74.3% are above 45 years old. The age groups for 40-44
years, 35-39 years, and 30-34 years each represent 8.6% of the respondents age groups
and share the fourth most selected age groups. The least selected age group is 50-54
years old with only 2.9% selection. Due to the nature of this question, the answer in the
Figure 5.4 Educators teaching experience

306
11
7 7
3 3 3
1
0
2
4
6
8
10
12
Over 59 55-59 45-49 40-44 35-39 30-34 50-54
Num
ber o
f res
pond
ents
Age GroupFigure 5.5 Educators’ age group
survey was set as optional, and therefore the total responses of this question was less
than the totals of other questions.
Table 5.5 Educators’ age group Age groups %Respondents Respondents
Over 59 31.4% 11
55-59 20.0% 7
50-54 2.9% 1
45-49 20.0% 7
40-44 8.6% 3
35-39 8.6% 3
30-34 8.6% 3
Total 100% 35

307
5.2.5. Location (Educators)
Figure 5.6 shows the locations of the respondents in the US. Accordingly, most of the
participants were from the East Coast and West coast of the country. However, it could
not be determined from this survey if the respondents had been teaching in other areas of
the country before their current teaching position. As shown on the map, a majority of
the participants either teach or were located in the North East, Mid-lands, Great lakes,
Pacific Northwest and West Coast of the country. Since the survey was distributed to the
top 40 architecture colleges and schools in the US, the results indicate that
passive/natural systems are receiving much more attention and education in universities
in the East Coast and West Coast, which is also evidenced by the participation interests
from educators in these areas.
Figure 5.6 Educators locations

308
5.2.6. Professional Registration (Educators)
Table 5.6 and Figure 5.7 show that the majority of respondents were licensed architects.
About 61.8% of the participants were licensed architects while 11.8% of the participants
were professional engineers (PE), and 2.9% of them had both PE and architectural
licensure. Therefore 76.5 % of the total educators had professional registration in the
US, which is only about 6% less than the total number of registered practitioners found
from the practitioners’ survey results (81.2%). This number indicates that the majority of
educators are informed with the building industry’s practice regarding passive systems.
This same majority can also have an influence with their educational practice on the
building industry. Among respondents 23.5% did not have either architectural licensure
or PE. As shown in Table 5.7, most of the registered professionals (64.3%) have
Architectural Licensure or PE in only one state, 32.1% in one state, and 3.6% (only one
person) have professional registration in 26 states.
Based on Figure 5.8 the number of times that states were selected by educators for PE
registration (28 times) was almost equal to the times that states were selected for
Architectural Licensure (29 times). In this case Massachusetts (4 times) had the highest
number of educators with architectural licensure while Michigan and Delaware (each
two times) had the highest number of educators with PE registration.

309
22
9
4
1
0
5
10
15
20
25
Licensed Architect Neither ProfessionalEngineer (PE) norLicensed Architect
Professional Engineer(PE)
Both ProfessionalEngineer (PE) andLicensed Architect
Resp
onde
nts
Professional Registration
Figure 5.7 Professional registration of the educators
Table 5.6 professional registration of the educators Answer %Respondents Respondents
Licensed Architect 61.8% 22
Neither Professional Engineer (PE) nor Licensed
Architect
23.5% 9
Professional Engineer (PE) 11.8% 4
Both Professional Engineer (PE) and Licensed
Architect
2.9% 1
Total 100% 36
Table 5.7 Number of states for the professional registration of the educator Number of states Number of respondents % Respondents 1 state 18 64.3% 2 states 9 32.1% 26 states 1 3.6% Total 28 100.0%

310
Figu
re 5
.8 P
rofe
ssio
nal r
egis
trat
ion
of th
e ed
ucat
ors b
roke
n by
thei
r st
ates
of p
rofe
ssio
nal r
egist
ratio
n

311
5.2.7. Location of Education (Educators)
Similar to practitioners’ survey results, most of the educators have earned the degree(s)
related to their current profession from the New England area. The survey results show
that 15.8% of the earned degrees were from the New England area. The Mid Atlantic
(East Coast) was the second most selected location with 12.3% of the degrees earned by
educators in this area. The West Coast, Texas, and Pacific Northwest each shared 10.5%
of the third place in this regard. Table 5.8 shows all the locations selected by the
respondents for their degrees. Two of respondents who are teaching in the US earned
their degrees abroad in Switzerland and UK. Based on the survey results, it seems that
graduates from New England, Mid Atlantic, Pacific Northwest, Texas, and West Coast
have a higher chance of being employed by universities in faculty positions focused on
building technology including passive systems.
Figure 5.10 shows that Masters of Architecture (27.9%), Bachelors of Architecture
(26.2%), and PhD Degrees (16.4%) form the first top three degrees earned by educators
who are active in the field of passive/natural systems. Master of Science 14.8% and
Bachelor of Science with 8.2% of degrees represent the fourth and fifth type of degrees
pursued by educators. Given the third rank for PhD degrees in the results, there is a
potential to increase the number of faculty members in higher education who have PhD
degrees related to the field of passive/natural systems if research, update, and promotion
of the old passive literature is desirable.

312
9
7
6 6 6
5
3 3 3
2 2
1 1 1 1 1
0
1
2
3
4
5
6
7
8
9
10
Num
ber o
f Deg
rees
Figure 5.9 Location that the educators earned their degree(s) most related to their current profession
Table 5.8 Location of the respondents’ degree(s) most related to their current profession
Degree Location %Count Count New England 15.8% 9 Mid Atlantic (East Coast) 12.3% 7 Pacific Northwest 10.5% 6 Texas 10.5% 6 West Coast 10.5% 6 Great Lakes 8.8% 5 Algonquin 5.3% 3 Mid Lands 5.3% 3 Midwest 5.3% 3 Florida 3.5% 2 Mountain 3.5% 2 Aborad (UK) 1.8% 1 Abroad (Switzerland) 1.8% 1 Appalachia 1.8% 1 Gulf Coast (South Coast) 1.8% 1 South 1.8% 1 Total 100% 57

313
27.9%26.2%
16.4%14.8%
8.2%
3.3%1.6% 1.6%
0.0%
5.0%
10.0%
15.0%
20.0%
25.0%
30.0%
M. Arch B.Arch PhD MS BS Master B.Des M.Des
% o
f Deg
rees
Degrees
Figure 5.10 Educators degrees most related to their current profession
5.2.8. Teaching Specialty
The majority of the educators have a specialty in courses focused on sustainable building
technologies (8.5%), which seems reasonable due to the current and growing interests in
sustainability in architecture programs. The same can be said for courses in
environmental control for passive systems (7.3%), building envelope (7%), and
environmental control for active systems (6.7%). The fact that environmental control
passive systems is the second most selected area of specialty reflects the current interests
in architecture schools for passive design. Table 5.9 and Figure 5.11 show the fields of
specialty and the number of experts in that field in the top 40 architecture
colleges/schools.

314
A major finding of the survey is the areas of specialty that need further attention in
architecture schools. These specialty areas have a low percentage based on the survey’s
results. Among the 20 areas of specialty included in the survey questionnaire, the last ten
areas of specialty with lower percentage based on the survey results in order include:
Building energy optimization (5.6%), Building simulation (5%), Building physics
(4.7%), Building performance optimization (4.4%), Building performance measurement
(3.8%), Green building design studios (3.8%), Energy systems (3.8%), Building services
(3.2%), Building rating systems (2.6%), and Design engineering studios (0.6%).
In particular, with respect to the shift of architecture majors toward
interdisciplinary/transdisciplinary architecture and sustainability, teaching areas such as
design engineering studios and building rating systems need to be filled with more
expert faculty. It seems that in some cases, this low percentage is due to issue in
architecture curriculums rather than the lack of expert educators in architecture schools.
For example, the LEED AP affiliation was among the top three choices of educators’
affiliations, however, courses focused on building rating systems did not receive a high
response rate in the survey. This low response rate indicates that most of the educators
are not integrating their professional experience with their teaching. However, based on
the survey results, there is a potential for them to bring their professional experience,
such as building rating systems, into their education.

315
The category of other teaching areas (2.3%) is another example of this issue. This
category included one response for the following teaching areas: Green building topics
in theory and professional practice, Parametric Design, Lighting and Acoustics,
Sustainable Design Theory, Integral Theory, Architectural lighting, Environmental
Sustainability (Co-major), Competition Courses on Net-Zero, and Commissioning.
Although some of these courses are not directly related to passive/natural systems, the
majority of them are rarely being taught at schools as a course. For example, courses
focused on post-occupancy evaluation such as commissioning can considerably promote
the students’ learning to a professional level and make them familiar with the real
measured performance of buildings and its evaluation. This finding suggests that there is
a need for a stronger emphasis in architecture schools on courses related to passive
systems as well as integrated courses with respect to passive systems, active systems,
and design studios, rather than pursuing each of these courses only in isolation.
Figure 5.12 shows the areas of teaching specialty for educators, the number of expert
educators in each filed of specialty, and their professional registration as architects or
engineers. One finding from this figure is that there is space to improve the quality of
teaching in these courses in architecture schools by assigning them an appropriate mix of
educators with architectural background and with engineering background. The reason is
the low percentage of educators with PE indicative of a lack of knowledge for teaching
courses related to active systems and their integration with passive systems. For
example, educators with backgrounds in engineering might be able to supplement the

316
teaching materials being taught by architects in passive/active environmental control
systems. Probably, an educator’s best professional affiliation for teaching courses on
passive systems and their integration with active systems could be having both P.E. and
architectural licensure, which may rarely happen (2.9% based on Table 5.7).
Table 5.9 Teaching specialty of the respondents Rank Teaching Specialty %Specialty Count
1 Sustainable building technologies 8.5% 29
2 Environmental control systems (passive systems) 7.3% 25
3 Building enclosure/envelope 7.0% 24
4 Environmental control systems (active systems) 6.7% 23
5 High performance buildings 6.7% 23
6 Daylighting systems 6.1% 21
7 Design studio 6.1% 21
8 Architectural systems 5.8% 20
9 Design studio/Integrated studio 5.8% 20
10 Building energy optimization 5.6% 19
11 Building simulation 5.0% 17
12 Building physics 4.7% 16
13 Building performance optimization 4.4% 15
14 Building performance measurement 3.8% 13
15 Design studio/Green building studio 3.8% 13
16 Energy systems 3.8% 13
17 Building services 3.2% 11
18 Building rating systems 2.6% 9
19 Other (please specify) 2.3% 8
20 Design studio/Design engineering 0.6% 2
Total 100% 342

317
Figu
re 5
.11
Tea
chin
g sp
ecia
lty o
f the
res
pond
ents

318
Figu
re 5
.12
Tea
chin
g sp
ecia
lty o
f the
edu
cato
rs b
ased
on
thei
r pr
ofes
sion
al r
egis
trat
ions

319
Yes, I havecontributed to
both designand
construction ofbuildings
Yes, I havecontributed tothe design of
buildings
No, I have notcontributed tothe design or
construction ofbuildings
Yes, I havecontributed to
theconstruction of
buildings
Neither PE nor LicensedArchitect 4 2 1 1
PE and Licensed Architect 1 0 0 0PE 2 2 1 0Licensed Architect 12 8 2 0
02468
101214161820
Resp
onse
Cou
nt
Licensed Architect PE PE and Licensed Architect Neither PE nor Licensed Architect
5.3. Educators’ Projects
One questioned was asked to educators to find out if they have also contributed to the
design or construction of buildings in the last ten years. If the answer was positive to
both or either of these two choices (i.e., design or construction of buildings) two
questions would follow with a focus on the type and climatic location of their projects.
Figure 5.13 shows the results of this question categorized by the professional registration
of the educators. Only about 11% of the educators (4 respondents) have not contributed
to the design or construction of buildings in the last ten years. Therefore, the educational
atmosphere regarding the use of passive systems in the US universities, in most cases, is
also informed by practical experience.
Figure 5.13 Educators contribution to projects design/construction broken by professional registrations
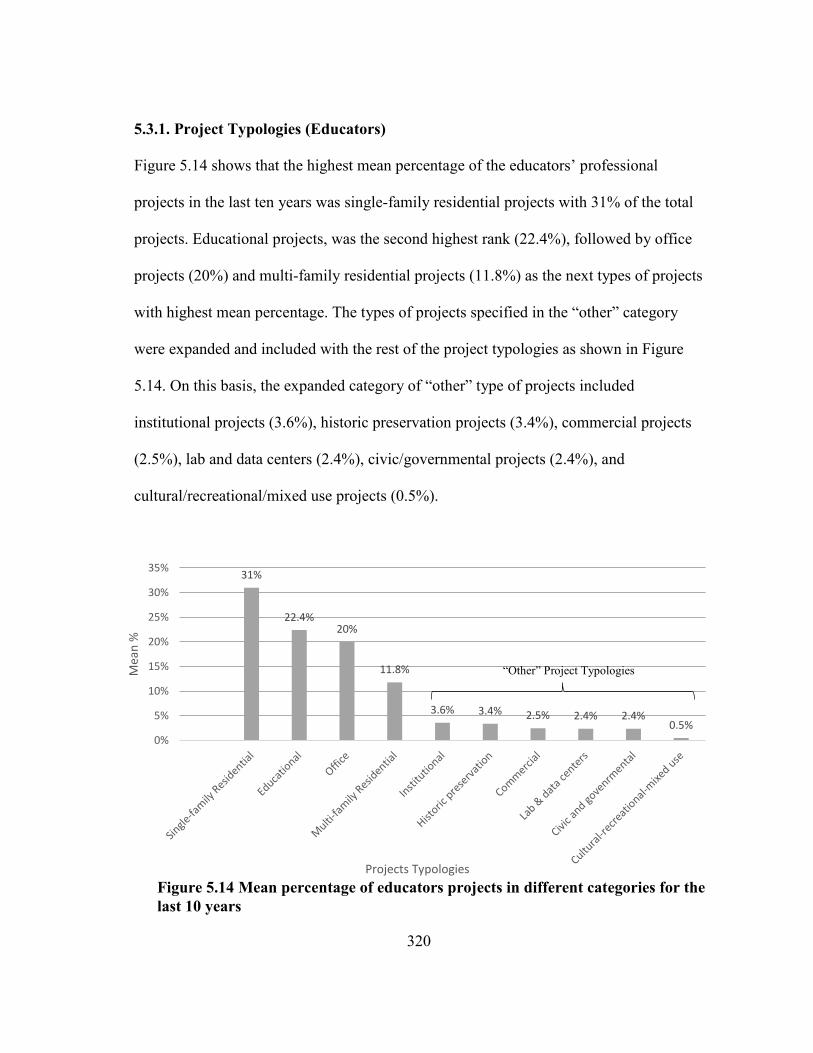
320
31%
22.4%20%
11.8%
3.6% 3.4% 2.5% 2.4% 2.4%0.5%
0%
5%
10%
15%
20%
25%
30%
35%
Mea
n %
Projects Typologies
“Other” Project Typologies
Figure 5.14 Mean percentage of educators projects in different categories for the last 10 years
5.3.1. Project Typologies (Educators)
Figure 5.14 shows that the highest mean percentage of the educators’ professional
projects in the last ten years was single-family residential projects with 31% of the total
projects. Educational projects, was the second highest rank (22.4%), followed by office
projects (20%) and multi-family residential projects (11.8%) as the next types of projects
with highest mean percentage. The types of projects specified in the “other” category
were expanded and included with the rest of the project typologies as shown in Figure
5.14. On this basis, the expanded category of “other” type of projects included
institutional projects (3.6%), historic preservation projects (3.4%), commercial projects
(2.5%), lab and data centers (2.4%), civic/governmental projects (2.4%), and
cultural/recreational/mixed use projects (0.5%).
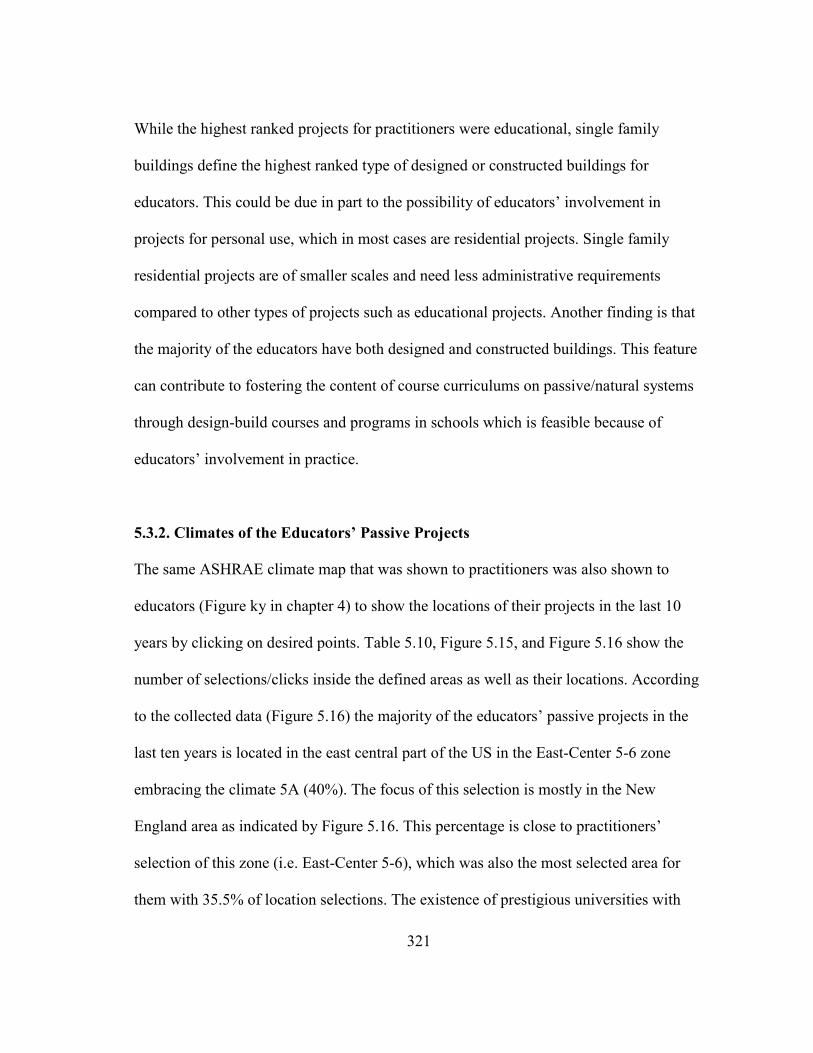
321
While the highest ranked projects for practitioners were educational, single family
buildings define the highest ranked type of designed or constructed buildings for
educators. This could be due in part to the possibility of educators’ involvement in
projects for personal use, which in most cases are residential projects. Single family
residential projects are of smaller scales and need less administrative requirements
compared to other types of projects such as educational projects. Another finding is that
the majority of the educators have both designed and constructed buildings. This feature
can contribute to fostering the content of course curriculums on passive/natural systems
through design-build courses and programs in schools which is feasible because of
educators’ involvement in practice.
5.3.2. Climates of the Educators’ Passive Projects
The same ASHRAE climate map that was shown to practitioners was also shown to
educators (Figure ky in chapter 4) to show the locations of their projects in the last 10
years by clicking on desired points. Table 5.10, Figure 5.15, and Figure 5.16 show the
number of selections/clicks inside the defined areas as well as their locations. According
to the collected data (Figure 5.16) the majority of the educators’ passive projects in the
last ten years is located in the east central part of the US in the East-Center 5-6 zone
embracing the climate 5A (40%). The focus of this selection is mostly in the New
England area as indicated by Figure 5.16. This percentage is close to practitioners’
selection of this zone (i.e. East-Center 5-6), which was also the most selected area for
them with 35.5% of location selections. The existence of prestigious universities with

322
expertise in sustainability and passive design could be a reason for such an overlap
between the findings from practitioners and educators’ surveys.
Table 5.10 Location of educators’ passive project for the last 10 years Answer %Count Count of the zone selection East-Center 5-6 40.0% 18 Southwest-3-2-4 17.8% 8 West-4 6.7% 3 North-Center-6-7 6.7% 3 Center-4 6.7% 3 South-3 6.7% 3 South-2-1 6.7% 3 West-5 4.4% 2 Northeast-6-7 4.4% 2 North-7 0.0% 0 Other 0.0% 0 Total 100% 45
Figure 5.15 Location of the educators’ passive projects for the last 10 years reflected on ASHRAE Climate Map. The climate map was reprinted with permission from ASHRAE.

323
18
8
3 3 3 3 32 2
02468
101214161820
Num
ber o
f Pro
ject
s
Climatic Zones of the US
Figure 5.16 Location of educators’ passive projects for the last 10 years
Second selected area is the southwest part of the US with California selected the most
(17.8%). The West-4 zone which includes the States of Portland is the third most
selected area (6.7%). North-center-6-7, Center-4, South-3, and South-2-1 (including
Texas and Florida with selection concentration in Texas) are also the third most selected
climatic zones each having 6.7% of selections. Zone South-3A is on the top of this area
with climate zone 3A. While the focus of selectin is around the State of Alabama, this
zone includes parts of Texas, Louisiana, Mississippi, Georgia, Alabama, Oklahoma, and
South Carolina. In general, the findings of this map supplement the findings of the map
produced from practitioners’ survey results. Practitioners’ location of their projects were
indicating very few or no passive projects in zones such as West-4 and Southwest-3-2-4
due to lower participations by practitioners from these states which included California
and Portland.

324
Figu
re 5
.17
Loc
atio
n of
the
educ
ator
s’ p
assi
ve p
roje
cts f
or th
e la
st 1
0 ye
ars c
ateg
oriz
ed b
y th
eir
prof
essi
onal
reg
istr
atio
n

325
To compensate for this low level of participation, educators’ responses show that a high
percentage of passive projects have been implemented in these areas which evidence that
lack of practitioners passive projects in these states were more a matter of survey
participation than reality. Since most of the educators’ projects are located in mild
climates or climates with low level of humidity (e.g. California, New England, and
Portland) it may seem at first sight that for educators the appropriateness between a
climate and the use of passive strategies is more of importance compared with
practitioners. However, this pattern is resulting from the fact that many of the top ranked
universities in sustainability, as selected in this survey focused on top 40 schools, are
located in these states. This interpretation is only based on an assumption that educators’
projects are mostly located in the same states in which their academic institutions are
located.
5.4. Passive/Natural Systems
The survey asked educators in what levels they teach about passive/natural systems to
students in their class projects. The levels of teaching included conceptual, calculation,
and simulation. The following sub-sections include the results of educators’ responses
with respect to renewable energy systems as well as passive/natural cooling, heating,
lighting, and ventilation systems.

326
5.4.1. Renewable Energy Systems (Educators)
The mots taught renewable systems by educators in the US, in order, include
Photovoltaics (33.5%), solar thermal collectors for domestic hot water (17.9%),
geothermal (18.4%), solar thermal collectors for space heating (16.8%), and wind
turbines (10.6%) as shown in Table 5.11. However, the distribution of the level of
teaching varies for each system from conceptual to simulation and calculation. In
particular, except for photovoltaics, the majority of teaching level selections remain in
the conceptual level as shown in figure 5.18. One reason for such a large difference
could be the availability of many simulation tools exclusively tuned for the design of PV
systems. Most of these tools are accessible online or in cloud-based formats.
Additionally, the concept of PV panels seems to be more familiar for architecture
students, and probably educators, due to its currently widespread application as well as
easier installation procedures.
Table 5.11 The most taught renewable energy systems in the US by educators Renewable Systems Taught Percentage of Selection in Total
for All Levels of Teaching Photovoltaics (PV panels) 33.5% Solar thermal collectors for domestic hot water 17.9% Geothermal 18.4% Solar thermal collectors for space heating 16.8% Wind turbines 10.6% Other (please specify) 2.2% None 0.6%

327
Table 5.12 shows the breakout of the total percentage in each level of teaching, which
clearly shows a sharp drop from conceptual teaching level to calculation and simulation
levels for renewable systems other than photovoltaics. For example, solar thermal
collectors are taught in 12.8% of total teaching levels for conceptual level, in 3.4% for
calculation level, and in 1.7% for simulation. Meanwhile, the conceptual, calculation,
and simulation levels of teaching photovoltaics include 16.2%, 10.1%, and 7.3% of the
total teaching levels respectively. Therefore, there is about 9.4% difference from the
conceptual level to the calculation level for DHW solar thermal collectors, while this
difference for PV panels is about 6.1%, which is much lower.
Two other major finding of the survey is that, first, educators with PE registration do not
teach the simulation level of renewable systems, however, licensed architects teach in all
three levels of concept, simulation, and calculation. Second, the drop from conceptual
level of teaching to calculation level is much lower for PE professionals compared with
licensed architects. In reading both of these findings it should be kept in mind that a total
number of respondents with PE registration is much less than educators with
architectural licensure as shown in Table 5.13.
About 0.6% of the participating educators have not taught any renewable energy systems
in their classes which is very low. This low percentage means that virtually all the
respondents teach renewable energy systems in their courses. In the category of “other,”
the respondents specified topics such as net-zero and water catchment. Finally,

328
comparing the practitioners’ survey results with educators’ survey results, the priority in
teaching the renewable energy systems by educators reflects the priority of the selection
of renewable energy systems by practitioners. In other words, for both educators and
practitioners the selection frequency shows that PV systems, DHW solar thermal
collectors, geothermal, space heating solar thermal collectors, and wind turbines are the
most selected renewable systems in order.
Table 5.12 The level of most taught renewable energy systems in the US by educators Renewable systems Concept Calculation Simulation
Photovoltaics (PV panels) 16.2% 10.1% 7.3%
Solar thermal collectors for domestic hot water
12.8% 3.4% 1.7%
Geothermal 14.0% 2.8% 1.7%
Solar thermal collectors for space heating 12.8% 2.8% 1.1%
Wind turbines 10.1% 0.6% 0.0%
Other (please specify) 1.1% 0.6% 0.6%
None 0.6% 0.0% 0.0%

329
Photovoltaics (PV
panels)
Solarthermal
collectorsfor
domestichot water
Geothermal
Solarthermal
collectorsfor spaceheating
Windturbines
Other(pleasespecify)
None
Total 60 32 33 30 19 4 1Simulation 13 3 3 2 0 1 0Calculation 18 6 5 5 1 1 0Concept 29 23 25 23 18 2 1
0
10
20
30
40
50
60
Resp
onse
Cou
nt
Renewable Systems
Figure 5.18 The most taught renewable energy systems in the US by educators

330
Table 5.13 The teaching level of renewable energy systems categorized by educators’ professional registration
Professional Engineer (PE) Renewable systems Concept Calculation Simulation Total Photovoltaics (PV panels) 3 2 0 5 Solar thermal collectors for space heating 3 2 0 5 Solar thermal collectors for domestic hot water 3 2 0 5 Wind turbines 4 0 0 4 Geothermal 3 1 0 4 Other (please specify) 0 0 0 0 None 0 0 0 0 Licensed Architect Renewable systems Concept Calculation Simulation Total Photovoltaics (PV panels) 18 12 9 39 Solar thermal collectors for domestic hot water 14 3 2 19 Solar thermal collectors for space heating 14 2 1 17 Geothermal 17 1 1 19 Other (please specify) 2 1 1 4 Wind turbines 9 1 0 10 None 0 0 0 0 Both Professional Engineer (PE) and Licensed Architect Renewable systems Concept Calculation Simulation Total Photovoltaics (PV panels) 1 0 0 1 Solar thermal collectors for space heating 1 0 0 1 Solar thermal collectors for domestic hot water 0 0 0 0 Wind turbines 0 0 0 0 Geothermal 0 0 0 0 Other (please specify) 0 0 0 0 None 0 0 0 0 Neither Professional Engineer (PE) nor Licensed Architect Renewable systems Concept Calculation Simulation Total Photovoltaics (PV panels) 6 3 2 11 Geothermal 4 2 2 8 Solar thermal collectors for space heating 4 1 1 6 Solar thermal collectors for domestic hot water 5 1 1 7 Wind turbines 4 0 0 4 Other (please specify) 0 0 0 0 None 1 0 0 1

331
5.4.2. Passive/Natural Cooling Systems (Educators)
External shading devices (9.5%), cross ventilation (7.6%), and stack ventilation (6.9%)
are the educators top three most taught topics in passive cooling strategies (Figure 5.19).
External shading devices and stack ventilation were also among the top three choices of
practitioners’ survey which indicate that there is an overlap between practitioners and
educators’ interests in the case of passive cooling strategies. Educators’ other passive
cooling topics that were taught include night ventilation with mass (6.8%), internal
shading devices (6.3%), dynamic shading devices (6.5%), evaporative cooling (5.9%),
green roof (5.2%), radiant cooling (5.2%), plants and vegetation for shadow casting or
evapotranspiration (5.3%), courtyard (4.8%), night ventilation without mass (4.8%),
solar chimney (4.6%), cool roof (4.6%), earth contact (3.7%), earth tube (3.5%), double
roof with the second roof casting shadow on the actual roof (3.3%), downdraft cooling
(2.7%), roof pond (2.4%), and other strategies (0.3%). Combination of natural sources of
sun, wind, and light were specified in the other category as another passive/natural
cooling strategy.
All of the educators selected at least one of the passive/natural cooling strategy topics
and the “none” choice was not selected by any of the respondents. Evidenced by the
results, as shown in table 5.14 the simulation and calculation teaching levels of a system
reduce as the system becomes more complex. For example, roof pond or downdraft
cooling systems are not simulated at all by the respondents. On the other hand, shading
devices and natural ventilation systems in a range from external/internal to dynamic

332
shading or cross/natural ventilation to natural ventilation with thermal mass are the most
taught systems in the simulation and calculation levels. Double roof and earth contact
are two of the passive cooling strategies which are not being taught at the calculation
level which could be due to the complexity of the calculation of, for example, the ground
temperature.
Based on the respondents’ professional registration as an architect or engineer (Table
5.15), the results show that licensed architects do not teach simulation of the passive
cooling strategies that contain earth as one of their design elements as in the case of
earth tube or earth contact. Roof pond is one of the strategies which is only being taught
at the conceptual level by both engineers and architects. Overall, the survey result shows
that calculation and simulation of passive cooling strategies, except for shading devices
and cross ventilation, are receiving a low level of attention in education.

333
Table 5.14 The teaching level of passive/natural cooling systems and their frequency percentage
Passive/Natural Cooling system
Concept Calculation Simulation Total
External shading devices
28 4.0% 18 2.6% 20 2.9% 66 9.5%
Cross ventilation 28 4.0% 11 1.6% 14 2.0% 53 7.6% Stack ventilation 28 4.0% 10 1.4% 10 1.4% 48 6.9% Night ventilation with mass
27 3.9% 9 1.3% 11 1.6% 47 6.8%
Internal shading devices 25 3.6% 9 1.3% 10 1.4% 44 6.3% Dynamic shading devices
26 3.7% 9 1.3% 10 1.4% 45 6.5%
Evaporative cooling 28 4.0% 7 1.0% 6 0.9% 41 5.9% Green roof 30 4.3% 5 0.7% 1 0.1% 36 5.2% Radiant cooling 28 4.0% 4 0.6% 4 0.6% 36 5.2% Plants and vegetation (for shadow casting or evapotranspiration)
27 3.9% 4 0.6% 6 0.9% 37 5.3%
Courtyard 26 3.7% 2 0.3% 5 0.7% 33 4.8% Night ventilation without mass
18 2.6% 7 1.0% 8 1.2% 33 4.8%
Solar chimney 23 3.3% 2 0.3% 7 1.0% 32 4.6% Cool roof 26 3.7% 3 0.4% 3 0.4% 32 4.6% Earth contact 23 3.3% 0 0.0% 3 0.4% 26 3.7% Earth tube 21 3.0% 1 0.1% 2 0.3% 24 3.5% Double roof (with the second roof casting shadow on the actual roof)
19 2.7% 0 0.0% 4 0.6% 23 3.3%
Downdraft cooling 16 2.3% 3 0.4% 0 0.0% 19 2.7% Roof pond 16 2.3% 1 0.1% 0 0.0% 17 2.4% Other (please specify) 1 0.1% 1 0.1% 0 0.0% 2 0.3%

334
Table 5.15 The frequency for teaching level of passive cooling systems categorized by professional registration
Professional Engineer (PE) Teaching Levels Concept Calculation Simulation Total
Cool roof 3 1 0 4
Courtyard 3 0 0 3
Cross ventilation 2 2 1 5
Double roof (with the second roof casting shadow on the actual roof) 3 0 0 3
Downdraft cooling 2 1 0 3
Dynamic shading devices 4 0 1 5
Earth contact 4 0 1 5
Earth tube 4 0 1 5
Evaporative cooling 3 1 2 6
External shading devices 3 2 1 6
Green roof 3 1 0 4
Internal shading devices 4 1 1 6
Night ventilation with mass 3 2 0 5
Night ventilation without mass 2 1 0 3
Other (please specify) 0 0 0 0
Plants and vegetation (for shadow casting or evapotranspiration) 4 0 2 6
Radiant cooling 3 1 1 5
Roof pond 4 0 0 4
Solar chimney 3 1 0 4
Stack ventilation 3 2 0 5
Licensed Architects Teaching Levels Concept Calculation Simulation Total
Cool roof 17 0 1 18
Courtyard 19 1 3 23 Cross ventilation 19 5 6 30 Double roof (with the second roof casting shadow on the actual roof) 11 0 3 14
Downdraft cooling 10 1 0 11 Dynamic shading devices 16 4 5 25 Earth contact 13 0 0 13 Earth tube 12 0 0 12 Evaporative cooling 16 1 2 19 External shading devices 18 8 11 37 Green roof 19 2 1 22 Internal shading devices 14 4 4 22 Night ventilation with mass 17 4 4 25
Night ventilation without mass 12 4 2 18
Other (please specify) 1 1 0 2
Plants and vegetation (for shadow casting or evapotranspiration) 17 1 3 21
Radiant cooling 18 1 2 21
Roof pond 8 0 0 8
Solar chimney 15 0 3 18
Stack ventilation 19 4 4 27

335
Figu
re 5
.19
The
teac
hing
leve
l of p
assi
ve/n
atur
al c
oolin
g sy
stem
s by
educ
ator
s and
thei
r fr
eque
ncy

336
5.4.3. Passive/Natural Heating Systems (Educators)
Direct solar gain (20.2%), isolated solar gain (12.5%), indirect solar gain in Trombe’
wall with water (11.3%), and indirect solar gain in Trombe’ wall with non-water thermal
mass (11.3%) represent the most selected teaching topics respectively. Solar chimney
(11%), deciduous plants (10.7%), earth contact (10.1%), earth tube (7.3%), and
transpired solar wall system (4.3%) are the next most selected topics in teaching
passive/natural heating systems.
Table 5.16 The frequency and frequency percentage for teaching levels of passive heating systems
Passive/Natural Heating Strategies
Concept Calculation Simulation Total
Direct solar gain 31 9.5% 19 5.8% 16 4.9% 66 20.2% Isolated solar gain (sunspace) 24 7.3% 8 2.4% 9 2.8% 41 12.5% Indirect solar gain (Trombe’ wall including water and its variations)
24 7.3% 7 2.1% 6 1.8% 37 11.3%
Indirect solar gain (Trombe’ wall without water and its variations)
25 7.6% 7 2.1% 5 1.5% 37 11.3%
Solar chimney 25 7.6% 6 1.8% 5 1.5% 36 11.0% Deciduous plants (shed leaves in the fall)
28 8.6% 1 0.3% 6 1.8% 35 10.7%
Earth contact 25 7.6% 2 0.6% 6 1.8% 33 10.1% Earth tube 21 6.4% 1 0.3% 2 0.6% 24 7.3% Transpired solar wall system 12 3.7% 1 0.3% 1 0.3% 14 4.3% Other (please specify) 1 0.3% 1 0.3% 2 0.6% 4 1.2%
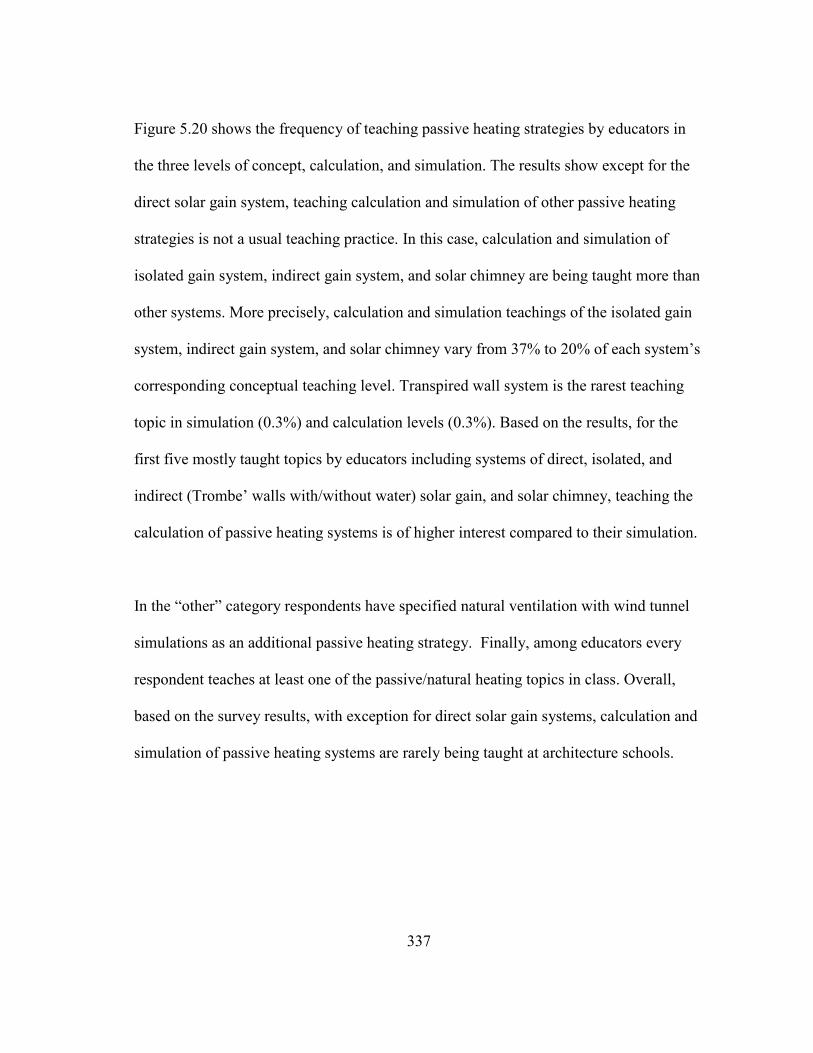
337
Figure 5.20 shows the frequency of teaching passive heating strategies by educators in
the three levels of concept, calculation, and simulation. The results show except for the
direct solar gain system, teaching calculation and simulation of other passive heating
strategies is not a usual teaching practice. In this case, calculation and simulation of
isolated gain system, indirect gain system, and solar chimney are being taught more than
other systems. More precisely, calculation and simulation teachings of the isolated gain
system, indirect gain system, and solar chimney vary from 37% to 20% of each system’s
corresponding conceptual teaching level. Transpired wall system is the rarest teaching
topic in simulation (0.3%) and calculation levels (0.3%). Based on the results, for the
first five mostly taught topics by educators including systems of direct, isolated, and
indirect (Trombe’ walls with/without water) solar gain, and solar chimney, teaching the
calculation of passive heating systems is of higher interest compared to their simulation.
In the “other” category respondents have specified natural ventilation with wind tunnel
simulations as an additional passive heating strategy. Finally, among educators every
respondent teaches at least one of the passive/natural heating topics in class. Overall,
based on the survey results, with exception for direct solar gain systems, calculation and
simulation of passive heating systems are rarely being taught at architecture schools.

338
Directsolar gain
Isolatedsolar gain(sunspac
e)
Indirectsolar gain(Trombe
wallincluding
waterand its
variations)
Indirectsolar gain(Trombe
wallwithoutwaterand its
variations)
Solarchimney
Deciduous plants(shed
leaves inthe fall)
Earthcontact
Earthtube
Transpired solar
wallsystem
Other(pleasespecify)
Total 66 41 37 37 36 35 33 24 14 4
Simulation 16 9 6 5 5 6 6 2 1 2
Calculation 19 8 7 7 6 1 2 1 1 1
Concept 31 24 24 25 25 28 25 21 12 1
0
10
20
30
40
50
60
70Re
spon
se c
ount
5.4.4. Daylighting Systems (Educators)
As show in Table 5.17 and Figure 5.21 the top choices of educators for teaching
daylighting systems included skylights (12.9%), light shelves (12.9%), clerestory
windows (12.2%), sidelights (12%), and atriums (9.8%). This selection, excluding the
light shelves, is similar to practitioners’ top choices for the use of daylighting systems.
Other daylighting strategies being taught included light shafts (9.3%), light louvers
(9%), external reflectors (7.8%), light pipe (5.6%), light duct (4.6%), and dynamic
daylighting (2.4%). Among educators only one respondent does not teach any of the
daylighting design strategies. Similar to other passive/natural design strategies,
Figure 5.20 The frequency for teaching levels of passive heating systems

339
calculation and simulation of daylighting systems are being taught with a lower
frequency compared to their conceptual teaching level. Frequency percentage of
teaching simulation and calculation of light pipe, light duct, and dynamic daylighting
systems are the lowest with 0.2% selection for calculation in each case and 1% to 0.7%
selection for their simulations.
Table 5.17 The frequency and frequency percentage for teaching levels of daylighting systems Daylighting System Concept Calculation Simulation Total Skylights 26 6.3% 10 2.4% 17 4.1% 53 12.9%
Light shelves 30 7.3% 6 1.5% 17 4.1% 53 12.9%
Clerestory windows 25 6.1% 8 2.0% 17 4.1% 50 12.2%
Sidelights 26 6.3% 7 1.7% 16 3.9% 49 12.0%
Atrium 25 6.1% 4 1.0% 11 2.7% 40 9.8%
Light shaft 27 6.6% 2 0.5% 9 2.2% 38 9.3%
Light louvers 20 4.9% 3 0.7% 14 3.4% 37 9.0%
External reflector 18 4.4% 3 0.7% 11 2.7% 32 7.8%
Light pipe 18 4.4% 1 0.2% 4 1.0% 23 5.6%
Light duct 14 3.4% 1 0.2% 4 1.0% 19 4.6%
Dynamic daylighting 6 1.5% 1 0.2% 3 0.7% 10 2.4%
Other 2 0.5% 1 0.2% 1 0.2% 4 1.0%
None 1 0.2% 1 0.2% 0 0.0% 2 0.5%

340
Skylights Lightshelves
Clerestory
windows
Sidelights Atrium Light
shaftLight
louversExternalreflector
Lightpipe
Lightduct
Dynamicdaylighti
ng(pleasespecify)
Other(pleasespecify)
None
Total 53 53 50 49 40 38 37 32 23 19 10 4 2
Simulation 17 17 17 16 11 9 14 11 4 4 3 1 0
Calculation 10 6 8 7 4 2 3 3 1 1 1 1 1
Concept 26 30 25 26 25 27 20 18 18 14 6 2 1
0
10
20
30
40
50
60
In the category of “other,” respondents mentioned topics such as DA, SDA, ASE,
contrast ratio, responsive control, EC glazing (electro chromic glazing), controls, and
interior/exterior dynamic shading systems. Overall, the survey results show a low level
of teaching for the calculation of daylighting systems in architectural education.
Compared with the education of other passive systems, calculation and simulation of
daylighting systems has been more taught in architecture schools. The concept,
calculation, and simulation of skylights, light shelves, clerestory windows, and sidelights
are better taught in all of these three levels in architectural schools compared with other
daylighting systems.
Figure 5.21 The frequency for teaching levels of daylighting systems

341
5.4.5. Passive Building Envelope Strategies (Educators)
This question was asked to find out at what levels nontraditional or more advanced
passive building envelope design approaches have been taught by educators. The double
skin façade (34.8%), phase change materials (26.1%), movable insulation (24.3%), and
non-motorized kinetic façade (12.2%) were the educators’ choices respectively (Table
5.18 and Figure 5.22). Three of the respondents have not taught any of these topics in
their courses during the last ten years. Among these topics, use of phase change material
is the most taught strategy in the calculation level and the double skin facade system is
the most taught strategy in the simulation level. Non-motorized kinetic façade is the least
taught topic in all three levels of concept, calculation, and simulation. The selection
priority of teaching topics in building envelope systems by educators reflects the same
priority of practitioners’ choice of passive building envelopes in their related survey. In
this case, the only difference is that educators by large are teaching these topics in their
academic institutions, however, practitioners by large (77.5% of practitioners) are not
using any of these systems.
Table 5.18 The frequency and frequency percentage for teaching levels of building envelope systems
Passive Building Envelopes
Concept Calculation Simulation Total
Double skin facades 26.1% 30 2.6% 3 6.1% 7 34.8% 40 Phase change materials 18.3% 21 5.2% 6 2.6% 3 26.1% 30 Movable insulation 16.5% 19 3.5% 4 4.3% 5 24.3% 28 Non-motorized kinetic facades 8.7% 10 1.7% 2 1.7% 2 12.2% 14 None 2.6% 3 0.0% 0 0.0% 0 2.6% 3

342
Double skinfacades
Phase changematerials
Movableinsulation
Non-motorizedkinetic facades None
Total 40 30 28 14 3Simulation 7 3 5 2 0Calculation 3 6 4 2 0Concept 30 21 19 10 3
0
5
10
15
20
25
30
35
40
45
50
Resp
onse
cou
nt
Figure 5.22 The frequency of teaching levels for building envelope systems

343
5.5. Phase of Analyzing the Use of Passive Systems (Educators)
Based on AIA’s seven project phases from programming to project close-out, educators
were asked about the phase of their class projects in which they teach analysis of the use
of passive systems. These phases in order include programming, schematic, design
development, preparation of construction documents, hiring the contractor, construction
administration, and project close-out. Table 5.19 shows the frequency distribution of the
phases in which educators teach the analysis of passive design strategies. Figure 5.23
shows this distribution based on educators’ professional registrations.
Accordingly, educators teach the analysis of passive design in all phases except for the
phases of “hiring the contractor” and “project close-out.” Teaching passive system
analysis is the highest in the schematic phase (36.2%) and reduces as we move towards
later phases of design with a sharp drop at the phase of preparing the construction
documents (7.4%) and the phase of construction administration (2.1%). Design
development phase (29.8%) and programming phase (25.5%) follow the schematic
phase as the second and third choices in which passive design analysis is being taught
more often in class projects.
As it was expected, and shown by figure t26, educators with architectural registration
contribute more to teaching at the programming phase (15 out of 55; 28%) compared
with educators who have only PE registrations (1 out of 8 selections; 12%). In addition,
preparation of construction documents and construction administration phases are only

344
taught by educators with architectural licensure or those without either PE or
architectural registrations. The low to zero percentage of teaching about passive systems
in the phases of construction documents preparation, hiring the contractor, construction
administration, and project close-out indicates that students before graduation will not
learn about the required analysis and administration for the implementation of
passive/natural systems or their related post occupancy evaluation.
Table 5.19 The frequency and frequency percentage of the phase of teaching passive design in a class project Phase of teaching passive design analysis %Count Count
Schematic 36.2% 34
Design Development 29.8% 28
Programming 25.5% 24
Preparation of Construction Documents 7.4% 7
Construction Administration 2.1% 2
Hiring the Contractor 0.0% 0
Project Close Out 0.0% 0
Never 0.0% 0
Total 100% 95

345
SchematicDesign
Development
Programming
Preparationof
Construction
Documents
Construction
Administration
Hiring theContractor
ProjectClose Out Never
Neither PE nor Licensed Architect 8 6 7 1 0 0 0 0
Both PE and Licensed Architect 1 0 1 0 0 0 0 0
PE 4 3 1 0 0 0 0 0
Licensed Architect 21 19 15 6 2 0 0 0
0
5
10
15
20
25
30
35
Figure 5.23 The frequency/frequency percentage of the phase of teaching passive design in a class project
5.6. Educators Tools
Educators were asked about more than 36 manual and digital tools for the analysis of the
feasibility of passive systems in their class projects. After redefining and reassigning the
category of “other” tools based on the survey responses, a variety of 43 different digital
and manual tools were among the responses selected by educators (Table 5.20 and
Figure 5.24). Climate Consultant (10.4%), Sefaira (7.4%), Manual tables, charts, and
protractors (7.0%) were the top three choices mostly used by educators in their class
projects. Such a selection only shares Climate Consultant with the three top tool choices
of practitioners (i.e. Revit Tools/Plugins, Climate Consultant, and eQuest/DOE2) based
on the practitioners’ survey results. Additionally, some of the practitioners’ top ten tools,
such as IES VE, are not being used by educators frequently. The high frequency of using

346
Climate Consultant and Sefaira by educators could be due to their friendly fast grasping
interface as well as the possibility of integrating them with modeling software such as
SktechUp which are easier for students to learn. The high use of manual tools by
educators in class shows that the majority of educators consider it a requirement for
students to learn manual tools. The additional time required for instructors/students to
learn a new software could be another reason for the inclusion of manual tools among
the educators’ top three tools.
The next set of tools among the top ten tools being used by educators include Diva for
Rhino (6.5%) Energy Plus (6.1%), Ladybug/Honeybee plugins for Rhino (6.1%),
Spreadsheets (6.1%), Radiance (4.3%), WUFI (3.9%), Therm (3.9%), Revit
Tools/Plugins (3.5%), eQuest/DOE2 (3.0%), HEED (3.0%) OpenStudio (3.0%),
COMFEN (3.0%), Daysim (3.0%), DesignBuilder (3.0%), and Autodesk Flow (1.7%).
Perceptible from these numbers, some of the top ten tools mentioned have similar
application frequency.
Other tools being used by educators included BeOpt (1.3%) Autodesk CFD (0.9%), HAP
(0.9%), PHPP or Passive House Planning Package (0.9%), TRNSYS (0.9%), Personal or
In-house Software (0.9%), and Archsim (0.9%). F-Chart and Ansys Flow with 0.4% are
the least frequently used tools by educators. None of the educators use TAS and
Solidwork Flow Plugins (0%). Similar to practitioners’ survey results, educators rarely
use TRNSYS (0.9%) despite the potential power of this tool for exclusive analysis of

347
passive systems in buildings. This lack of tool application or low application could be
the result of educators’ and students’ unfamiliarity with the tools due to difficult
accessibility to open source and comprehensive training resources.
Each of the tools that educators specified in the “other” category had 0.4% application
frequency and included: Trane Trace, SWL Tools Excel workbook, Students software
selection, REM/Rate, LBNL Optics 6, HTflux, Elum tools, Licaso, Velux Daylight
Visualizer, CoolVent, 35-foot Boundary Layer Wind Tunnel, and physical model for
daylight modeling. Among the daylighting tools, Diva for Rhino, Ladybug/Honeybee
plugins for Rhino, Radiance, and Daysim were the educators most selected tools
respectively. These tools were followed by the tools specified in the other category
including LBNL Optics 6, Licaso, Elum tools, Velux Daylight Visualizer and physical
model for daylight modeling. Among tools exclusive to CFD analysis Autodesk Flow,
Autodesk CFD, and Ansys Flow were selected respectively. Availability of Autodesk
performance analysis tools, their publicly available training resources, and their possible
integration with other design/BIM tools such as Revit could be a main reason for their
higher selection by educators for exclusive CFD analysis. However, due to the expertise
required for using the interface of these CFD exclusive software packages, it seems that
students and educators use mostly plugin tools such as those for Rhino for natural
ventilation simulations.

348
Among the tools with exclusive packages for only CFD analysis, Autodesk CFD,
Autodesk Flow, ANSYS Flow, and Solidwork Flow Plugins, are the most frequent tools
used by 8%, 2.9%, 0.7%, and 0.7% of practitioners respectively. The public availability
of a building performance analysis tools and its training resources as well as having a
platform possible to be easily shared with other design/BIM tools such as Revit could be
a main reason for the professionals’ higher interest in using Autodesk simulation tools.

349
Table 5.20 Tools that educators use for analyzing the feasibility of passive systems on their projects
Tools %Count Count
Climate Consultant 10.4% 24 Sefaira 7.4% 17 Manual tables, charts, and protractors 7.0% 16
Diva for Rhino 6.5% 15
Energy Plus 6.1% 14
Ladybug/Honeybee plugins for Rhino 6.1% 14
Spreadsheets 6.1% 14
Radiance 4.3% 10
WUFI 3.9% 9
Therm 3.9% 9
Revit Tools/Plugins 3.5% 8 eQuest/DOE2 3.0% 7 HEED 3.0% 7 OpenStudio 3.0% 7
COMFEN 3.0% 7 Daysim 3.0% 7
DesignBuilder 3.0% 7
Autodesk Flow 1.7% 4
IES VE 1.7% 4
BeOpt 1.3% 3
Autodesk CFD 0.9% 2 HAP 0.9% 2 PHPP (Passive House Planning Package) 0.9% 2 TRNSYS 0.9% 2 Personal or In-house software 0.9% 2
Archsim 0.9% 2 F-Chart 0.4% 1 Ansys Flow 0.4% 1 Trane Trace 0.4% 1 SWL Tools Excel workbook 0.4% 1 Students software selection 0.4% 1
REM/Rate 0.4% 1 LBNL Optics 6 0.4% 1 HTflux 0.4% 1 Elum tools 0.4% 1 Licaso 0.4% 1
Velux Daylight Visualizer 0.4% 1 CoolVent 0.4% 1 35 foot Boundary Layer Wind Tunnel 0.4% 1
Physical model daylight modeling 0.4% 1 None 0.4% 1 Solidwork Flow Plugins 0.0% 0 TAS 0.0% 0 Total 100% 230

350
Figu
re 5
.24
Too
ls th
at e
duca
tors
use
for
anal
yzin
g th
e fe
asib
ility
of p
assiv
e sy
stem
s on
thei
r pr
ojec
ts

351
5.7. Phase of the Calculation of Passive Strategies’ Savings (Educators)
Only 8.1% of the educators (1 engineer and 2 architects) did not calculate savings of the
use of passive systems in their class projects (Table 5.21). This is considerably lower
compared with practitioners’ survey in which 28.3% of professionals (24 architects,7
engineers, and 8 without professional registrations) mentioned that they never calculate
the savings from passive systems.
Table 5.21 Phase of calculating passive systems savings broken out by professional registration of educators
Analysis Phase %Count Count % Educators
Early design Phase 43.2% 32 86.5%
Before analyzing the use of mechanical systems 31.1% 23 62.2%
After analyzing the use of mechanical systems 13.5% 10 27.0%
After design is finalized 8.1% 6 16.2%
Never 4.1% 3 8.1%
Total 100% 74
Most of the educators (86.5%) calculate the savings of passive systems in the early
design phase. Based on the survey results, this claim is true for both engineers and
architects. Such a calculation is reduced as we move toward the final phases of design
(Figure 5.25). None of the educators with PE registration (4 counts) responded that they
would calculate passive systems savings after analyzing the use of mechanical system.
This finding is different from practitioners’ responses in which mostly passive
calculation by PE practitioners were conducted (15 counts) after rather than before

352
Early designPhase
Beforeanalyzing the
use ofmechanical
systems
After analyzingthe use of
mechanicalsystems
After design isfinalized Never
Total 32 23 10 6 3
Neither PE nor Licensed Architect 8 6 1 1 0
Both PE and Licensed Architect 1 1 0 0 0
PE 3 1 0 0 1
Licensed Architect 20 15 9 5 2
0
5
10
15
20
25
30
35
analyzing mechanical systems applications (14). The percentage of educators calculating
passive savings of their class projects include early design phase (86.5%), before
analyzing the use of mechanical systems (62.2%), after using mechanical systems
(27%), and after design is finalized (16.2%).
Educators’ responses to earlier questions of the survey showed low percentages of the
calculation level of teaching passive systems, as discussed in Section 5.4.1 through
Section 5.4.5 of this dissertation. However, it should be kept in mind that in those
questions “design” calculation of passive systems was asked, which is different from
passive systems’ “saving” calculations.
Figure 5.25 Phase of calculating passive systems’ savings categorized by professional registration of educators

353
5.8. Factors Influencing the Use of Passive/Natural Systems (Educators)
To find out the top three challenges/opportunities that can increase the use of passive
systems in buildings educators were asked to select three choices from a proposed list of
eleven challenges/opportunities in the application/implementation of passive systems.
The educators’ top three choices (Table 5.22) included “simulation tools with
capabilities for analyzing passive systems” (16.7%) “building codes and rating systems
such as those from USGBC (LEED), ASHRAE, Passive House, and ICC” (15.7%), and
“experience of the project team in the design, implementation, and integration of passive
systems” (10.2%). Another choice sharing the third place was “clients desire and
collaboration to include passive systems” with 10.2% selection. A major difference
between educators and practitioners is that clients desire and collaboration choice,
previously ranked first by practitioners, has being selected as the third choice by
educators who give the first priority to simulation tools.
The next eight items ranked based on the counts of selections included: fourth, avoiding
complexity and simplifying the implementation of passive system strategies (9.3%) fifth
as shared between three choices, “knowledge integrating mechanical and passive
systems performance” (7.4%) “climate of the location where a passive system should be
designed” (7.4%), and “knowledge of the modeling and simulation of passive system
strategies” (7.4%), sixth “architect-engineer collaboration” (6.5%), seventh, cost of the
“material and construction of passive systems” (5.6%), and eighth “occupants' training
for the use and maintenance of the passive systems” (3.7%).

354
Table 5.22 Items ranked based on the educators’ top three choices to increase the use of passive systems in the US
Rank Influential Factor Count %Count % Educators 1
Simulation tools with capabilities for analyzing passive systems
18 16.7% 48.6%
2 Building codes and rating systems such as those from USGBC (LEED), ASHRAE, Passive House, and ICC
17 15.7% 45.9%
3 Experience of the project team in the design, implementation, and integration of passive systems
11 10.2% 29.7%
3 Client's desire and collaboration to include passive systems
11 10.2% 29.7%
4 Avoiding complexity and simplifying the implementation of passive system strategies
10 9.3% 27.0%
5 Knowledge integrating mechanical and passive systems performance
8 7.4% 21.6%
5 Climate of the location where a passive system should be designed
8 7.4% 21.6%
5 Knowledge of the modeling and simulation of passive system strategies
8 7.4% 21.6%
6 Architect-engineer collaboration 7 6.5% 18.9%
7 Cost of material and construction of passive systems
6 5.6% 16.2%
8 Occupants' training for the use and maintenance of the passive systems
4 3.7% 10.8%
NA Total 108 100%
While the first rank (client’s desire) and second rank choices have only 1% difference in
selection, there is a sharp reduction of about 5.5% from selecting the second choice (i.e.
building codes) to the third choice (i.e. implementation experience) by practitioners.
The reduction after the third choice to the end is gradual with minor differences of about

355
1% to 2%. Therefore, it is more logical to claim that the first and second items (i.e.
simulation tools and building code) are of the same importance, next comes the
importance of the experience of the project team as well as the client’s desire in
implementing passive systems, and on a lower importance comes simplification,
knowledge for integrating mechanical and passive systems, climate, passive systems
simulation knowledge, architect-engineer collaboration, cost, and occupants training.
The least important item (i.e. occupants training) is as same as the least selected item by
practitioners in the previous survey. Therefore, it seems logical to consider occupants
training of the lowest importance by architects and engineers. However, as mentioned
earlier, the role of occupants training in increasing the use of passive systems needs
further analysis to be inclusive of more than only designers’ opinions. In particular, a
survey should focus on occupants rather than designers and also post occupancy
evaluations to ask how important the role of training and designers could be in the use of
passive systems.
Figure 5.26. Shows all the eleven factors in a chart with a breakout based on the
respondents’ professional registration. A comparison of the registered architects’ and
engineers’ choices reveals several points. First, engineers consider architect-engineer
collaboration to be the most important factor in increasing the use of passive systems,
but this item has the least selection choice among other factors by the architects. Second,
while engineers do not consider occupants training to be important in the use of passive
systems, architects consider it to be the fourth important item in the list. Third, after the

356
importance of simulation tools for architects as the first item, other items are of almost
the same importance for architects. In this case, except for cost, occupants training,
integrating mechanical and passive systems, and architect-engineer collaboration have
the same selection percentage for architects.
The number of years of teaching experience could also be an important factor in
selecting the most influential factor in increasing the application of passive systems as
shown in Figure 5.27. For example, those with over 34 years of teaching experience do
not consider the simplification of passive systems to be important at all. This indicates
that educators who have been trained in schools in the 1980s have probably dealt with
the implementation of such systems and therefore, due to their higher chance of being
involved in teaching, learning, or implementing passive systems, do not consider them to
be complicated.
Finally, similar to practitioners’ survey results and despite the general belief, climate
does not play the key role in using or not using passive design strategies in the US. This
claim is evidenced by ranking the importance of climate fifth among the eleven items in
the survey questionnaire.

357
Figu
re 5
.26
Fact
ors i
nflu
entia
l in
the
use
of p
assi
ve/n
atur
al sy
stem
s cat
egor
ized
by
prof
essi
onal
reg
istr
atio
ns o
f th
e ed
ucat
ors

358
Figu
re 5
.27
Fact
ors i
nflu
entia
l in
incr
easi
ng th
e us
e of
pas
sive
/nat
ural
syst
ems i
n bu
ildin
gs c
ateg
oriz
ed b
y ed
ucat
ors’
yea
rs o
f tea
chin
g ex
peri
ence

359
5.9. Open-ended Question (Educators)
In order to find out about other factors that can reduce or increase the contribution of
passive systems into the design of buildings in the US an open ended text question was
included in the survey. This question asked educators to write their comments or notes if
there is anything not addressed in the survey about the education/application of
passive/natural systems in buildings. A content analysis approach, similar to the
approach taken for the analysis of practitioners’ responses, was adopted. The results
included several findings about educators’ opinions on the education and application of
passive systems, which will be summarized through the following themes
• Level of teaching:
Some of the educators believe that learning the concepts, in comparison to calculation
and simulation, is the key in teaching passive systems to architecture students. Some

360
other educators added to this by expressing that learning/teaching basic rules of thumb
for various passive design strategies with respect to overall limits on the size, massing,
scale, and other features of a building or its zones is a critical first step in seriously
implementing many passive design strategies.
• Design studio and passive systems:
A majority of educators’ responses dealt with the scope of architectural design studio
and its relation or impact on teaching passive design strategies. Some of the educators
mentioned that while their teaching focus has varied considerably over the years, but in
recent years they have covered the scope of the passive systems primarily in their design
studios. Some other educators mentioned that because students are very preoccupied
with design studios it is difficult to implement any sort of intensive calculation or
simulation methods unless it directly relates to their studio projects. Even in dealing with
this issue in the context of a design studio class, educators believe there needs to be a
greater opportunity for a nimble analysis of design options as student designs rapidly
evolve in a design studio.
• Courses focused on passive systems:
In addition to the limited time in a studio class for a deep immersion in the application of
passive/natural systems in buildings, even the class time for other courses seems to be
insufficient. Some educators mentioned that very little time exists to delve into details
about any particular passive system. In other words, in just 15 weeks the class time for

361
an environmental technology course is taken by the need to cover topics such as site
design, HVAC, plumbing, fire protection and detection, electrical, lighting, vertical
transportation, acoustics, and life cycle cost analysis.
• Role of the architects in practice:
Some of the answers had a focus on the perception of the responsibility expected from
architects and clients in regards to the design of passive systems. The results of this
group’s responses can be explained in two themes. First, in general, architects seem not
to feel comfortable to include substantive passive systems in their projects. The
respondents believe that architects’ lack of the application of passive systems is probably
due to lack of actionable design knowledge, which is partly due to lack of readily
accessible analysis tools and lack of appreciation for the carbon-reduction potential of
even part-season use of passive systems.
Second, some of the respondents mentioned that it should be kept in mind that architects,
with some rare exceptions, are responsible to design and integrate systems, but not to
calculate their performance. This group maintained that, generally, engineers are
responsible for calculations regarding the heating and cooling of buildings. They
extended that the use of passive systems is driven partly by the client's responsiveness to
include these systems, such as sunshades, since they all come with cost premiums.
Therefore, the client’s responsiveness is also tied to the proven effectiveness of the
systems, which is generally evaluated through the consulting engineer's energy models.

362
In this case, as mentioned by some of the educators, simulations need to consider the
lifecycle costing associated with energy benefits to find the value over a client’s
interested period of time. This cost usually must pay back in less than maximum five to
seven years, and if it is less than two years it will be adopted.
• Perception/definition of passive systems and its importance:
Some of the responses raised concerns about the way passive systems are defined by
professionals and from what view we should approach the scope of passive system
design issues. One of the respondents mentioned that the survey seems to take a
technological approach to the problem, but non-technological issues should also receive
the same significance. Narrow comfort standards and the drift in modern expectations
are part of a cultural issue which needs attention. Passive design can run across the
architectural curriculum, but it is rarely addressed in a theory or history class.
Department of Energy funding rarely engages passive design issues, because of
investment interests in commercialization products and not embodied intelligent
architectural configuration. The respondent continued that Passive House claiming the
term passive is also a problem in defining and designing passive systems. This
vagueness in defining passive systems in the field has been addressed also in some of
other responses in the survey: “It’s not clear what's included or not included, and how it
differs from existing terms like high-performance buildings."
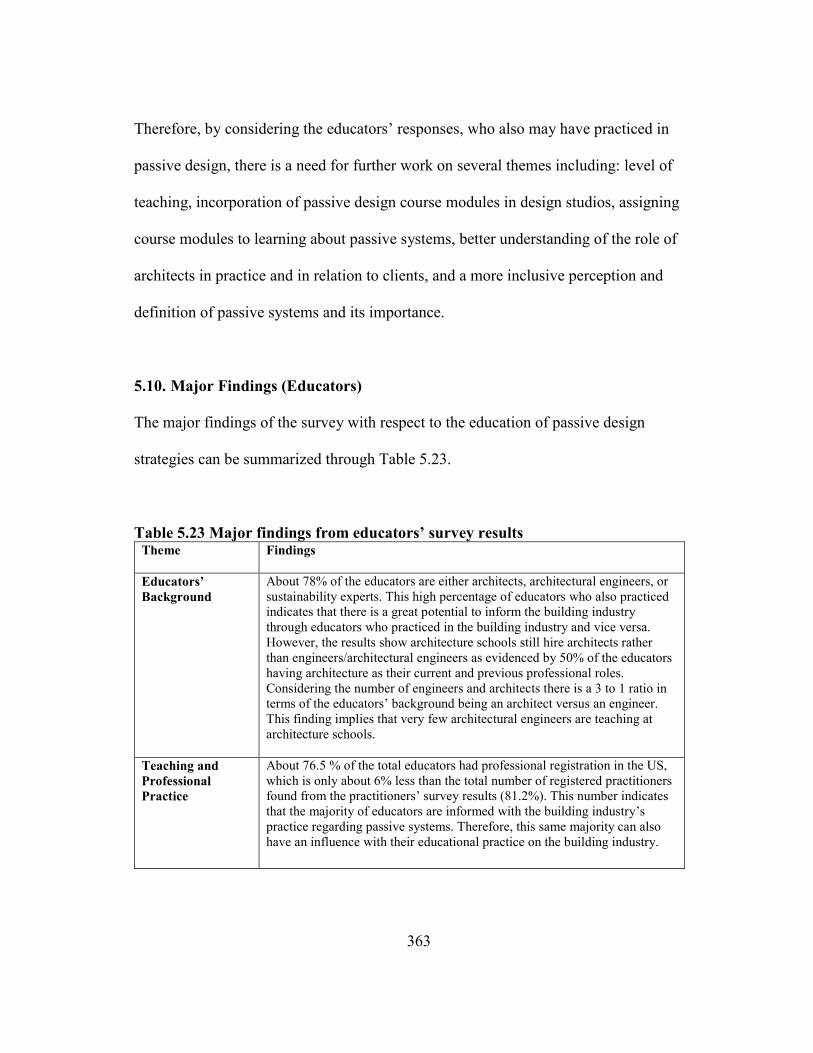
363
Therefore, by considering the educators’ responses, who also may have practiced in
passive design, there is a need for further work on several themes including: level of
teaching, incorporation of passive design course modules in design studios, assigning
course modules to learning about passive systems, better understanding of the role of
architects in practice and in relation to clients, and a more inclusive perception and
definition of passive systems and its importance.
5.10. Major Findings (Educators)
The major findings of the survey with respect to the education of passive design
strategies can be summarized through Table 5.23.
Table 5.23 Major findings from educators’ survey results Theme Findings
Educators’ Background
About 78% of the educators are either architects, architectural engineers, or sustainability experts. This high percentage of educators who also practiced indicates that there is a great potential to inform the building industry through educators who practiced in the building industry and vice versa. However, the results show architecture schools still hire architects rather than engineers/architectural engineers as evidenced by 50% of the educators having architecture as their current and previous professional roles. Considering the number of engineers and architects there is a 3 to 1 ratio in terms of the educators’ background being an architect versus an engineer. This finding implies that very few architectural engineers are teaching at architecture schools.
Teaching and Professional Practice
About 76.5 % of the total educators had professional registration in the US, which is only about 6% less than the total number of registered practitioners found from the practitioners’ survey results (81.2%). This number indicates that the majority of educators are informed with the building industry’s practice regarding passive systems. Therefore, this same majority can also have an influence with their educational practice on the building industry.

364
Table 5.23 Continued
Theme Findings
Teaching Experience
The results showed that the combination of old educators who had over 34 years teaching experience with young educators who had 5-14 years teaching experiences define the majority of the educators in the top 50 architecture school. Therefore, there seems to be a large experience gap between those who are about to retire and those who are starting their career as educators in higher education. On the other hand, the shift toward new passive concepts in higher education, such as adaptive facades or biomimetic design of building envelope components, could be the result of the replacement of the retiring educators with younger educators. Additionally, about 51.4% of the educators are more than 55 years old, which implies that they had the opportunity of developing their educational or professional experience during the peak periods of passive design in the 1980s and the 1970s.
Educators’ Degrees
Given the third rank for educators with PhD degrees in the survey results, there is a potential to increase the number of faculty members in higher education who have PhD degrees related to the field of passive/natural systems if research for updating and promotion the old passive literature is desirable.
Educators Projects’ Typology
While the highest ranked projects for practitioners were educational, single family buildings define the highest ranked type of designed or constructed buildings for educators. Another finding is that the majority of the educators have both designed and constructed buildings. This feature can contribute to fostering the content of course curriculums on passive/natural systems through design-build courses and programs in schools which is feasible because of educators’ involvement in practice.

365
Table 5.23 Continued
Theme Findings
Teaching Renewable Systems
Except for photovoltaics, the majority of teaching level selections remain in the conceptual level. One reason for such a large difference could be the availability of many simulation tools exclusively tuned for the design of PV systems. Most of these tools are accessible online or in cloud-based formats. Additionally, the concept of PV panels seems to be more familiar for architecture students, and probably educators, due to its currently widespread application as well as easier installation procedures. The breakout of the total percentage in each level of teaching clearly shows a sharp drop from conceptual teaching level to calculation and simulation levels for renewable systems other than photovoltaics. Two other major finding of the survey is that, first, educators with PE registration do not teach the simulation level of renewable systems, however, licensed architects teach in all three levels of concept, simulation, and calculation. Second, the drop from conceptual level of teaching to calculation level is much lower for PE professionals compared with licensed architects. In reading both of these findings it should be kept in mind that a total number of respondents with PE registration is much less than educators with architectural licensure. For both educators and practitioners, the selection frequency shows that PV systems, DHW solar thermal collectors, geothermal, space heating solar thermal collectors, and wind turbines are the most selected renewable systems in order.
Teaching Passive Cooling
External shading devices (9.5%), cross ventilation (7.6%), and stack ventilation (6.9%) are the educators top three teaching topics in passive cooling strategies. External shading devices and stack ventilation were also among the top three choices of practitioners’ survey which indicate that there is an overlap between practitioners and educators’ interests in the case of passive cooling strategies. Overall, the survey result shows that calculation and simulation of passive cooling strategies, except for shading devices and cross ventilation, are receiving a low level of attention in education.
Teaching Passive Heating
Overall, based on the survey results, with exception for direct solar gain systems, calculation and simulation of passive heating systems are rarely being taught at architecture schools.
Teaching Daylighting
The top choices of educators for teaching daylighting systems included skylights (12.9%), light shelves (12.9%), clerestory windows (12.2%), sidelights (12%), and atriums (9.8%). This selection, excluding the light shelves, is similar to practitioners’ top choices for the use of daylighting systems. Compared with other daylighting systems The teaching of skylights, light shelves, clerestory windows, and sidelights are better expanded in all three levels of concept, calculation, and simulation in architectural schools. Overall, the survey results show a low level of teaching for the calculation of daylighting systems in architectural education. Compared with the education of other passive systems, calculation and simulation of daylighting systems has been more considered to be taught in architecture schools. Concepts such as light pipes and dynamic daylighting systems are the least taught concepts in terms of calculation and simulation.

366
Table 5.23 Continued
Themes Findings Advanced Passive Building Envelope Systems
Among these topics, use of phase change materials is the most taught strategy in the calculation level and the double skin facade system is the most taught strategy in the simulation level. Non-motorized kinetic façade is the least taught topic in all three levels of concept, calculation, and simulation. The selection priority of teaching topics in building envelope systems by educators reflects the same priority of practitioners’ choice of passive building envelopes in their related survey. In this case, the only difference is that educators by large are teaching these topics in their academic institutions, however, practitioners by large (77.5% of practitioners) are not using any of these systems.
Teaching Passive Systems for Different Phases of a Project
The low to zero percentage of teaching about passive systems in the phases of construction documents preparation, hiring the contractor, construction administration, and project close-out indicates that students before graduation will not learn about the required analysis and administration for the implementation of passive/natural systems or their related post occupancy evaluation.
Level of Teaching for Passive Systems
Overall passive systems in architecture schools are being taught only in conceptual level, to some extent at the simulation level, and rarely at the level of calculation.
Tools for Passive Design in Education
Climate Consultant (10.4%), Sefaira (7.4%), Manual tables, charts, and protractors (7.0%) were the top three choices mostly used by educators in their class projects. Such a selection only shares Climate Consultant with the three top tool choices of practitioners (i.e. Revit Tools/Plugins, Climate Consultant, and eQuest/DOE2) based on the practitioners’ survey results. Therefore, there is a considerable difference between the design tools students learn about at school and the tools being applied in the actual architectural profession. Additionally, some of the practitioners’ top ten tools, such as IES VE, are not being used by educators frequently. The high frequency of using Climate Consultant and Sefaira by educators could be due to their friendly fast grasping interface as well as the possibility of integrating them with modeling software such as SketchUP which are easier for students to learn. The high use of manual tools by educators in class shows that the majority of educators consider it a requirement for students to learn manual tools. The additional time required for instructors/students to learn a new software could be another reason for the inclusion of manual tools among the educators’ top three tools. Also, this lack of tool application or low application could be the result of educators’ and students’ unfamiliarity with the tools due to difficult accessibility to open source tutorials and comprehensive training resources. Availability of Autodesk performance analysis tools, their publicly available training resources, and their possible integration with other design/BIM tools such as Revit could be a main reason for their higher selection by educators for exclusive CFD analysis. However, due to the expertise required for using the interface of these CFD exclusive software packages, it seems that students and educators use mostly plugin tools such as those for Rhino for natural ventilation simulations.

367
Table 5.23 Continued
Themes Findings
Calculating Savings from Passive Systems in Class Projects
Only 8.1% of the educators do not calculate savings of the use of passive systems in their class projects. This is considerably lower compared with practitioners’ (28.3%). Most of the educators (86.5%) calculate the savings of passive systems in the early design phase and this calculation reduces towards “after design is finalized.”
Courses Related/Connected to Passive Systems
The majority of the educators have a specialty in courses focused on sustainable building technologies (8.5%), which shows growing interests in sustainability in architecture programs. The same can be said for courses in environmental control for passive systems (7.3%), building envelope (7%), and environmental control for active systems (6.7%). The fact that environmental control for passive systems is the second most selected area of specialty reflects the current interests in architecture schools for passive design. A major finding of the survey is the areas of specialty that needs further attention in architecture schools: Building energy optimization (5.6%), Building simulation (5%), Building physics (4.7%), Building performance optimization (4.4%), Building performance measurement (3.8%), Green building design studios (3.8%), Energy systems (3.8%), Building services (3.2%), Building rating systems (2.6%), and Design engineering studios (0.6%). It seems that these cases, the low percentage is due to two issues in architecture curriculums:
• First, for example, the LEED AP affiliation was among the top three choices of educators’ affiliations, however, courses focused on building rating systems did not receive a high response rate in the survey. This low response rate indicates that most of the educators are not integrating their professional experience with their teaching practice. However, based on the survey results, there is a potential for them to incorporate their professional experience, such as building rating systems, into their education.
• Second, some of the courses are not directly related to passive/natural systems, but they are important for the integration of passive systems with other design considerations. However, the majority of them are rarely being taught at architecture schools. For example, courses focused on post-occupancy evaluation such as commissioning can considerably promote the students’ learning to a professional level and make them familiar with the real measured performance of buildings and its evaluation. This finding suggests that there is a need for a stronger emphasis in architecture schools on courses related to passive systems as well as integrated courses with respect to passive systems, active systems, and design studios, rather than pursuing each of these courses only in isolation

368
Table 5.23 Continued
Themes Findings
Factors Influential in Increasing or Reducing the Use of Passive Systems in the US From the of Perspective Educators
The factors ranked by educators in increasing/reducing the use of passive systems in buildings, in order, included: 1. Simulation tools with capabilities for analyzing passive systems; 2. Building codes and rating systems such as those from USGBC (LEED), ASHRAE, Passive House, and ICC; 3. Experience of the project team in the design, implementation, and integration of passive systems; 4. Client's desire and collaboration to include passive systems; 5. Avoiding complexity and simplifying the implementation of passive system strategies; 6. Knowledge integrating mechanical and passive systems performance; 7. Climate of the location where a passive system should be designed; 8. Knowledge of the modeling and simulation of passive system strategies; 9. Architect-engineer collaboration; 10. Cost of material and construction of passive systems; 11. Occupants' training for the use and maintenance of the passive systems
Influential Factors in Passive Design From the Perspective of Educators with Engineering Background Versus Architectural Background
In this case, there are two major findings. First, educators with engineering background consider architect-engineer collaboration to be the most important factor in increasing the use of passive systems, but this item has the least selection choice among other factors by the architects. Second, while engineers do not consider occupants training to be important in the use of passive systems, architects consider it to be the fourth important item in the list. Third, after the importance of simulation tools for architects as the first item, other items are of almost the same importance for architects. In this case, except for cost, occupant training, integrating mechanical and passive systems, and architect-engineer collaboration have the same selection percentage for architects.
Impact of Teaching Experience in Selecting the Influential Factors in Passive Design
Educators’ years of teaching experience can impact the selection of the factors influential in passive design. For example, those with over 34 years of teaching experience do not consider the simplification of passive systems to be important at all. This indicates that educators who have been trained in schools in the 1980s have probably dealt with the implementation of such systems and therefore, due to their higher chance of being involved in teaching, learning, or implementing passive systems, do not consider them to be complicated.
Climate and Passive Design
Finally, similar to practitioners’ survey results and despite the general belief, climate does not play the key role in using or not using passive design strategies in the US. This claim is evidenced by ranking the importance of climate fifth among the eleven items in the survey questionnaire.
Opportunities for Further Work in Education
By considering the educators’ responses, who also may have practiced in passive design, there is a need for further work on several areas including: level of teaching, incorporation of passive design course modules in design studios, assigning course modules to learning about passive systems, better understanding of the role of architects in practice and in relation to clients, and a more inclusive perception/definition of passive systems and its importance.

369
6. SUMMARY AND CONCLUSION
6.1. Scope of the Section
This section contains a summary of the research, recommendations, discussion of the
research limitations, and providing a path for the future research.
6.2. Summary
This research was an examination of the level of practice and education of
passive/natural systems in the US to find the opportunities and challenges for promoting
the application/education of these systems. To perform this research a survey
questionnaire was used to collect data from practitioners and educators, which was also
supported through the findings of a content analysis and case study methodologies. The
case studies of AIA COTE Top Ten Awards indicated that the majority of the well-
documented add-on or legacy passive systems have not been used in the US in the last
ten years. If we move further backward in time (i.e. about ten years), as in the case of
earlier AIA COTE TOP 10 Awards, more of the legacy passive systems have been
applied by designers.
The case study results showed that projects related to the 2017 AIA COTE TOP Ten
Awards mainly applied the following passive/natural system strategies:
• Daylighting such as solar tubes, atriums, reflective light louvers, skylights,
light wells, and light shelves;

370
• Building envelope strategies such as super insulated and air-tight building
envelopes as well as double-skin facades;
• Natural cooling and heating through stack/cross ventilation with operable
windows in double skin facades and clerestory windows, appropriate
orientation for direct solar gain with fixed shading devices to prevent
overheating, and superinsulation measures, which are integrated in some
cases with green roofs; and
• Renewable systems including mainly PV systems, solar thermal collectors
geo-exchange systems, and in some cases wind turbines.
In the earlier examples associated with AIA COTE Top Ten Awards 2010, in addition to
the above approaches, other strategies were applied. These strategies included: natural
cooling through fixed or operable shading devices and night-flushing, and natural
heating through direct gain systems with appropriate building orientation and thermal
mass. This broader range of passive system strategies for the AIA 2010 Awards showed
that design teams were more successful and interested in the implementation of such
passive/natural systems in earlier projects (i.e. 2004-2010) versus the more recently
awarded projects (i.e. 2014-2017).
The case study analysis showed that buildings designed by US firms or their branches
outside the country have been more successful regarding the application of passive
systems. The two cases that were studied included the King Abdullah University of

371
Science and Technology (KAUST) in KSA, which uses two large solar chimneys on the
university campus among many other applied passive cooling strategies, and the Ng
Teng Fong General Hospital (NTFGH) in Singapore where 70% of the hospital is
naturally ventilated.
In contrast, the AIA 2017 Awards it was only the NOAA Daniel K. Inouye Regional
Center (built in 2014) that applied passive/natural systems including a passive downdraft
cooling system and a partially passive geo-thermal system.
The findings of the survey of building practitioners in the US supported the same
findings from different case studies. This survey was designed to address the issues that
are summarized through the following constructs with their findings:
• The factors influencing the increase/reduction of the use of passive/natural systems
in buildings, which included “client’s desire and collaboration” and “building codes
and building rating systems” were the first and second most important items with
considerably higher votes (almost two times their next item, which was “simulation
tools”). Other influential factors, almost of equal importance, included: experience
of the project team in design, implementation, and integration of passive systems;
material and construction cost; avoiding complexity and simplifying the
implementation of passive systems; climate; architect-engineer collaboration; passive
systems’ modeling and simulation knowledge; knowledge integrating mechanical
and passive systems; and occupant training.

372
• The design tools that were currently used for the application of passive design, in
descending order included: Revit tools/plugins, Climate Consultant, eQuest/DOE2,
No Tools at all, Spreadsheets, EnergyPlus, Sefaira, Manual tables and
charts/protractors, Radiance, Wufi, IES VE, OpenStudio, Therm, Autodesk CFD,
HAP, Ladybug/Honey bee plugins for Rhino, Daysim, Diva for Rhino, Personal/In-
house Software, DesignBuilder, Trane Trace, Autodesk Flow, PHPP, Specialty
Consultant, BeOpt, TRNSYS, COMFEN, F-Chart, HEED, Ansys Flow, Solidwork
Flow Plugins, CONTAM, and RET Screen. The tools used for daylighting analysis
in descending order included: Radiance, Daysim, and Diva for Rhino. The most
popular CFD tools in descending order were Autodesk CFD, Autodesk Flow, Ansys
Flow, and Solidwork Flow Plugins.
• The most and least recurring types of passive/natural system strategies, which
included the followings for each type of systems:
o Renewables: PV panels and geothermal were the most frequent types
and wind turbine was the least frequently used renewable system. About
23% of the practitioners did not use renewable systems in their projects.
o Passive cooling systems: external shading devices, green roofs, and
cross ventilation were the top three cooling systems used. Earth tubes,
double roofs for shading, and roof ponds were the three least used
systems. About 15% of the practitioners do not use passive cooling
systems in their projects.

373
o Passive heating systems: Direct solar gain, deciduous plants, and
isolated solar gain systems were the most frequently used natural
heating systems, and roof pound and stack ventilation were the least
recurring types. The majority of practitioners do not use any passive
heating systems (48%).
o Daylighting: skylights, clerestory windows, and sidelights were the
three most used systems. Light duct, external reflector, and dynamic
daylighting systems were the least recurring types of daylighting
systems.
o Advanced building envelope systems: with the exception of super-
insulation and airtightness measures, the most frequent system was
double skin facades and the least frequent system was non-motorized
kinetic facades. The majority of practitioners did not apply any of the
advanced building envelope systems in their projects (77.5%).
• The importance of incorporating passive/natural system strategies in a practical
design process with respect to the integration with mechanical systems:
o Only about 33% of the practitioners calculated the energy savings from
passive systems after they analyzed the use of mechanical systems.
About 16% of the practitioners took this step and also analyzed the
savings from passive systems’ integration with mechanical systems

374
after design was finalized. About 28% of the practitioners never
calculated the saving from passive systems.
o The phases of analyzing passive systems by practitioners included
mostly schematic design, design development, and programming. In
most architectural designs this analysis falls short of the steps in which
mechanical systems’ operation are being considered for a project (e.g.,
construction documents and project close-out). About 14% of the
practitioners never analyze the use of passive systems in their projects.
• Additionally, the findings from the content analysis of the open-ended question in
the practitioners’ survey showed five criteria should be considered in order to
increase the use of passive design:
1. Usefulness of passive system strategies. This is influenced by different
perceptions of passive design including the perception of new
practitioners and the perception of older practitioners
2. Usefulness of design tools for passive design
3. The importance of an integrated design such as the economic
justification and the function of a building to allow the integration of
passive systems with mechanical systems
4. The role of building typology in using passive systems, such as the size
of the building or difficulty in incorporating passive systems to
healthcare facilities

375
5. The drawbacks of using passive systems, such as the lack of occupant
training and climate incompatibility
The findings from educators indicated that there is a great opportunity to promote the
quality of education about passive/natural systems in the US architecture schools:
• The factors influencing the increase/reduction of the use of passive/natural systems
in buildings, which included “simulation tools with capabilities for analyzing passive
systems” and “building codes and rating systems” were the top two influential
factors (with almost 1.5 times more votes compared with the third voted items,
which were clients’ collaboration and experience of the project team). The following
items have equal importance, among which there is only minor voting differences:
o Experience of the project team in the design, implementation, and integration
of passive systems;
o Client's desire and collaboration to include passive systems;
o Avoiding complexity and simplifying the implementation of passive system
strategies;
o Knowledge integrating mechanical and passive systems performance;
o Climate of the location where a passive system should be designed;
o Knowledge of the modeling and simulation of passive system strategies; and
o Architect-engineer collaboration.
• Accordingly, client desire and collaboration which was of the highest importance to
practitioners is not considered important by educators. Cost of the material and

376
construction of passive systems and occupant training are of lowest importance to
educators for promoting the use of passive systems.
• The top three design tools used by educators in their class projects for analyzing the
application of passive design, in descending order included: Climate Consultant,
Sefaira, and Manual tables or charts/protractors.
• The educators’ top three tools for class projects only shares Climate Consultant with
the three top tools of practitioners (i.e. Revit Tools/Plugins, Climate Consultant, and
eQuest/DOE2). Therefore, there is a considerable difference between the design
tools students learn about at school and the tools being applied in the actual
architectural profession. Additionally, some of the practitioners’ top ten tools, such
as IES VE, were not being used by educators.
• The most and least taught types of passive/natural system strategies and their level of
teaching in architecture schools included the followings for each type of systems:
o Renewables: except for photovoltaics, the majority of the teaching of
renewable systems remained at the conceptual level. One reason for such a
large difference could be the availability of simulation tools capable of
analyzing PV systems. Also, architecture students and educators were more
familiar with PV systems. In addition, except for photovoltaics, there was a
sharp drop from conceptual level of teaching to the calculation and

377
simulation of renewable systems. The least taught renewable system concept
was wind turbines.
o Passive cooling systems: external shading devices, cross ventilation, and
stack ventilation were the educators top three teaching topics in passive
cooling strategies. External shading devices and stack ventilation were also
among the top three choices of practitioner’s cooling strategies indicating an
overlap between practitioner’s and educator’s interests. Overall, the
calculation and simulation of passive cooling strategies, except for shading
devices and cross ventilation, received a low level of attention in education.
o Passive Heating systems: with exception of direct solar gain systems, the
calculation and simulation of passive heating systems are rarely being taught
at architecture schools. In combination of all the three levels of teaching (i.e.,
conceptual, simulation, and calculation) direct solar gain system with a
considerable difference is the first most taught passive system, followed by
isolated solar gain systems (i.e., sunspace and greenhouses) and indirect solar
gain systems (i.e., Trombe’ wall including water walls and their variations).
Other concepts, of almost equal importance, included: indirect solar gain
(Trombe’ wall without water and its variations), solar chimney, deciduous
plants (that shed their leaves in the fall), earth contact, and earth tube.
Transpired solar wall systems were the least taught passive heating systems
in architecture schools.

378
• The importance of incorporating passive/natural system strategies in a practical
design process with respect to their integration with mechanical systems:
o Only 8.1% of the educators did not calculate savings of the use of passive
systems in their class projects. This is considerably lower compared with
practitioners (28.3%). Therefore, although educators rarely taught the
“design” calculation of passive systems in their classes (e.g., thermal mass
area/volume needed or cooling towers’ design features), they had a better
focus on teaching the passive systems saving calculations. However, most of
the educators (86.5%) only calculate the savings of passive systems in the
early design phase, which would not consider the integration of passive and
active systems.
o Some of the courses were not directly related to passive/natural systems, but
they were important for the integration of passive systems with other design
considerations including mechanical systems. However, the majority of these
courses were rarely being taught at architecture schools. Courses focused on
post-occupancy evaluation, such as commissioning, can considerably
promote the students’ learning to a professional level with the teaching of
methods that use real measured performance of passive and active building
systems and their integration. Therefore, there is a need for a stronger
emphasis in architecture schools on courses related to passive systems as well

379
as integrated courses with respect to passive systems, active systems, and
design studios.
o The low to zero percentage of the teaching of passive systems in the phases
of “construction documents preparation,” “hiring the contractor,”
“construction administration,” and “project close-out” indicates that students
will not learn about the required analysis and administration needed for the
implementation of passive/natural systems or their related post occupancy
evaluation.
• Additionally, the findings of the content analysis of the open-ended question in the
educators’ survey suggested that several areas in education need further work, which
include:
o Increasing the level of teaching to include simulation and, in some
cases, design calculation and saving calculation for passive
systems,
o Incorporation of passive design course modules in design studios,
o Assigning course modules to learning about passive systems,
o Better understanding of the role of architects in practice and in
relation to clients, and
o Promoting an inclusive perception/definition of passive systems
and its importance.

380
6.3. Recommendations
To integrate the findings of this mixed-method research, several strategies are
recommended to increase the application of passive systems by practitioners and to
promote its level of education in architecture schools.
1. Building codes and building rating systems need to provide specific incentives
and credits for the incorporation of these systems in buildings. As it was
reviewed in Section 2.4.1. building standards and rating systems in the US are
considerably behind comparable global rating systems for the inclusion of
passive systems in their codes or rating criteria. This inclusion of passive systems
in codes/rating systems requires funding by US organizations for research to find
opportunities for the promotion of the use of these systems, which can bring both
financial and health benefits to the community.
2. Practitioners, particularly architects are eagerly looking for user-friendly tools to
analyze the use of passive systems in their projects. Certainly, these tools need to
be simple, but need to have strong simulation capabilities, to avoid time
consuming simulations that are not usually paid for by the clients. In this case,
the integration of such simulation tools with BIM platforms could be a strategy to
consider, which also facilitates the path for the integration of passive systems
with mechanical systems due the integrated design nature of BIM tools.

381
3. ASHRAE Standard 90.1-2016 and IECC 2018 both use performance-based
analysis of new designs for buildings to meet the code/standard requirements.
Such an analysis can be performed by a number of different simulation programs.
ASHRAE developed Standard 140-2017 which specifies a standard test method
for evaluating the capabilities of software tools used for calculating the
performance of buildings and their HVAC systems. Currently, this standard does
not cover test methods for evaluating the simulation of passive systems.
Therefore, ASHRAE Standard 140 needs to be expanded to include the
evaluation procedure of the tools used for analyzing the performance of passive
systems as well.
4. Climate, although it is an important factor for passive design, should not become
an excuse for avoiding the use of passive systems. As evidenced by case studies
and the survey findings, climate does not play the key role of passive design.
However, it can limit the choices, for example, in a hot humid climate versus a
hot dry climate. Meanwhile, consideration of auxiliary systems in a passive
design is a necessity. In this case, better collaborations between architects and
engineers are required to avoid issues such as oversized/undersized active
systems for auxiliary heating/cooling or passive design issues such as over-
heated/under-heated buildings. Such issues show that there is a need for further
investment on the promotion of integrated design in both practice and education.
382
5. As the survey results showed, in most cases the passive systems that are most
frequently taught in architecture schools are also most frequently used by
practitioners and vice versa. Therefore, this would imply that promoting the
education of passive systems in architecture schools can also promote their use in
practice. In this case, beyond conceptual education, the calculation and
simulation of passive systems needs to be taught through both individual course
modules and courses integrated with topics of active systems. Passive systems
should also be taught as a part of integrated design studios. Teaching the
calculation and simulation of passive systems to architecture students needs to be
through simple methods to be easily understood. Therefore, the teaching
approaches used should avoid asking architecture students to calculate the
complicated equations of these systems, which can be better conducted by
engineers. In this case, simple tools such as SLR methods (explained as LCR in
Section 2.3) or the PHPP can make considerable contributions if they become
available to architecture students similar to Autodesk tools.
6. The calculation of the savings from passive systems is important, since it can
show the clients a way of justifying the additional one-time cost of the
incorporation of a passive system. Almost one-third of the professionals surveyed
never calculated the savings from passive systems, and in architecture schools for
more than eighty percent of the educators this calculation is limited to the
schematic phase of a class project (also about eighty percent of the professionals
383
conduct this calculation in the schematic design phase). Therefore, to improve
this situation, there can be incentives or requirements in building codes and
rating systems to ask exclusively for the calculation of such energy savings from
passive systems.
7. Based on the survey results, the majority of educators practiced architecture
before or are still practicing in architecture and engineering firms. Therefore,
educators need to bring more of their professional work experience in passive
design to their classroom environments to reinforce the link between education
and practice, which might also include the role of building codes and building
rating systems in passive design.
8. The survey results showed that educators holding PhD degrees were ranked third
compared with educators holding other level of degrees (i.e., Bachelors and
Maters). Therefore, there is also a potential to increase the number of educators
in higher education who both have PhD degrees in the field of
building/environmental technologies and have practiced in the field of
passive/natural systems. Such a recruitment can also open new opportunities for
research on updating the old literature and software used to analyze passive
systems.

384
9. In recruiting new faculty members in architecture schools, it should be kept in
mind that based on the survey results a wide age/experience gap currently exist
between new faculty members and retiring faculty in the field of sustainable
design. Therefore, a proper conduit of transferring the knowledge of passive
design from retiring faculty to the new faculty should be considered in
architecture schools to reinforce the concept of institutional memory.
10. In the case of advanced building envelope systems, there is a need to better
connect academic institutions with the building industry. Almost eighty percent
of the practitioners are not using any of the advanced building envelope systems
(i.e. kinetic facades, double skin facades, and PCMs). It seems that architecture
schools currently have a great passion for including such topics in their design
studios and digital design tools are becoming more user-friendly for the inclusion
of such themes in architectural projects. However, without a connection to the
building industry to receive support or to inform its general design trends
advanced building envelope systems may take a long time to become popular in
practice.
11. In the case of renewable systems, there are factors other than education and
practice which more strongly can influence the use of these systems. For
example, PV systems are being used on a larger utility scale compared with other
types of renewable systems, not only because of the variety of available open

385
source tools to study their implementation, but also because of their lower cost
and easier implementation/maintenance. However, it should be kept in mind that
PV systems several years ago were offered at a much higher prices compared to
their price today.45 Therefore, there is the same opportunity for other renewable
systems if they can be installed at a lower price and their maintenance be kept at
a reasonable level (e.g. wind turbines). One way to promote renewable systems,
which are not currently designed, is to provide the required calculation and
simulation tools in architecture schools. Therefore, students will become familiar
with their application, which should accelerate the inclusion of such systems in
practice, thereby reducing their cost in long term.
Overall, the followings are recommended as the major strategies to map a better future
for the use of passive systems in buildings in the US.
• better educational focus on the calculation and simulation of passive systems;
• stronger connection between the academic and the building industry with a focus
on passive design;
• providing user-friendly tools for the design of passive systems;
• better collaboration between architects, clients, and engineers;
45 For example, the cost of silicon PV cells from $76.67 per watt in 1977 reduced to $0.36 per watt in 2014. For further information please see https://avc.com/2015/07/the-bull-case-for-solar/, accessed January 2019.

386
• reducing the work experience/ age gap between retiring faulty and new faculty
by reinforcing the institutional memory;
• better focus on passive design in integrated design studios; and
• strong inclusion of passive systems in building codes/rating systems
6.4. Discussion of the Research Limitations
Similar to all research studies, this study had some limitations. This study was focused
on the US, and therefore, the findings cannot be immediately generalized beyond the US
boundaries. Despite the researcher’s consistent efforts, some of the AIA and ASHRAE
chapters in the US preferred not to participate in the survey. However, the number of the
states with no AIA or ASHRAE chapter representatives in the survey were less than 5
and the lack of response in certain regions was compensated by the responses of the
participants who were registered architects and/or engineers in these regions. Therefore,
at least a minimum sample of the respondents was provided for these regions.
Furthermore, the increase of the number of survey responses (educators’ number=36,
practitioners’ number=138) could provide a more accurate perception of the practice and
education of passive/natural systems. The same can be said in the case of content
analysis of the limited number of responses to the last text question in the two survey
questionnaires (i.e. the last text question in the survey for educators and in the survey for
practitioners had 11 responses out of 37 participants for educators and 25 responses out
of 138 participants for practitioners). In the case of having more participants answering

387
this open-ended text question, the result of the content analysis could be more accurate.
Having the required budget and time for conducting face-to-face interviews could also
add to the findings of the three research methodologies already applied (i.e. case study,
survey questionnaire, and content analysis).
Additionally, this research had a focus on passive systems in the original definition of
legacy passive systems, in which building envelope features such as insulation R-value,
air-tightness, and free thermal-bridge envelopes were not necessarily considered as
passive design. Therefore, the findings of the current research do not address the use of
these systems and their current level of practice. A separate study is needed to focus on
these aspects of building envelope design.
Confounding variables imposed some limitations on the findings of the research.
Examples include the size and scale of the participants’ projects in addition to their
projects’ typologies. While some of these confounding variables such as the extent of the
education, professional background, and affiliation of the respondents were controlled
through the survey questions, controlling all of these variables in some cases was outside
the control of the researcher. However, measures can be adopted to reduce these
variables impact on the findings. One example, was the tool that participants would use
to answer the survey questions. In this case, the survey questionnaire and its display on
both small and large screens of digital devices such as smartphones and desktop
computer was evaluated. This evaluation resulted in redesigning the tabular format

388
questions and the appearance of the answer choices to the participants for better display
and readability on smartphone screens.
The case study of the AIA COTE TOP Ten Award buildings also had some limitations
for accessibility to the resources related to buildings’ performance measurements both
before and after their construction. In this case, in addition to the available database of
the AIA Awards, other online sources such as the design firms’ websites and library
resources were also investigated. This investigation could unfold qualitative and
quantitative building performance data such as energy production through renewable
energy systems or daylighting design features. Meanwhile, a review of green buildings
other than those awarded by AIA could better reflect the best practices of passive design
in the US.
Some of the research limitations come from the number of the questions in the survey
questionnaires. To increase the response rate, the survey questionnaire was kept brief
and short, which did not allow the inclusion of many detailed questions in the
questionnaire. Even in this case, the survey went beyond the usually accepted range of
ten questions and reached 26 and 22 questions for educators and practitioners
respectively. One example is the question about the practitioners’ types of projects and
their percentage in each category in the last ten years (e.g. educational, office,
residential, etc.). Certainly, the inclusion of more detailed questions about the square
footage of each project category, the level of involvement, and the distribution of the

389
type of projects within a ten-year span of time would better help the analysis of the final
results.
Lastly, in this research the survey questionnaire asked respondents about the use of
passive design strategies without considering the suitability of these strategies for
different climates. For example, a respondent who usually practices in a cold and dry
climate and a respondent who practices in a hot and humid climate both were asked the
same questions about the types of passive strategies they have applied. It should be kept
in mind that almost all of the passive systems from cooling to heating in most of the US
climates are applicable, since most of these systems can have a double function. For
example, a trombe wall can heat a building in winter and, if provided with a vent on the
top, in summer can also cool a building with a function similar to the function of a solar
chimney. However, it is either the heating function or the cooling function of a passive
system that defines its main purpose depending on the length of the cold or hot season
(i.e. heating degree days or cooling degree days). Therefore, in the future instead of one
survey for the whole US, several surveys can each focus individually on a selected
number of similar climates in the US to gain a better perception of the frequently used
passive systems appropriate in each set of similar climates.
6.5. Path for the Future Research
The limitations of the current study and the findings of this study provides a path for a
future research to conduct a more comprehensive study by addressing these limitations.

390
Therefore, future research should focus on several areas to expand the findings of this
study. These research areas include:
• A survey that covers non-legacy passive design measures and practitioners’
approaches for their application
• Interviews with experts of passive design to find out more about the
practitioners’ approaches in their application and the areas in need of more
work
• The role of building codes, building rating systems, and building institutions
that define the meaning of passive design and its application
• Developing simulation and modeling tools that are simple and user-friendly
for passive designers, particularly architects, or incorporating such features
into existing tools
• Exploring methods for incorporating the education of passive design in
architecture school course curriculums particularly with a focus on passive
design simulation and calculation
• Exploring the level of architectural education with a focus on passive design
in integrated design studios
• Exploring new approaches for promoting collaboration between project team
members including architects, engineers, and clients, with a focus on passive
design
• Incorporating new design methods and technologies such as nature-inspired
architecture into the existing legacy passive design systems

391
• Developing better methods for distributing the knowledge of passive design
or its implementation among designers and clients as well as educators
6.6. Conclusion
This study showed that a majority of legacy passive heating/cooling systems are not used
by practitioners in the US, although they are still taught by educators in architecture
schools. Therefore, there is a potential for better research collaborations between the
academia and the building industry to fill this gap. Even within the academia the
teaching of passive systems at the simulation and calculation levels needs to be
improved. Developing user-friendly design tools with passive simulation/calculation
capabilities and updating the legacy passive systems with today technologies can
facilitate this process.
Building codes and building rating systems can play a key role in promoting the use of
passive/natural systems by directing the interests of practitioners and clients in the
building industry for the inclusion of passive systems in their projects. Educating clients
and designers about these systems for better collaborations can accelerate the impact of
these potential building codes and rating systems on passive design. Otherwise, much of
the valuable information about the legacy passive systems, which can significantly
contribute to energy saving and human well-being, will remain unutilized. Therefore,
further investment and research in the area of passive design is needed in order to fully

392
realize these potential contributions. The research areas proposed in Section 6.5 outlined
this path of investment for future research about passive/natural systems.
393
REFERENCES
Abel, C. (2004). Architecture, technology and process. Oxford: Architectural Press c/o
Elsevier.
Abou-Houly, H. (2010). Investigation of flow through and around the Macrotermes
michaelseni termite mound skin, Loughborough University Institutional Repository.
Retrieved April 24, 2016, from https://dspace.lboro.ac.uk/dspace-
jspui/handle/2134/8466
Aeleneia, D., Aeleneic, L., Catarina, P. V. (2016). Adaptive façade: concept,
applications, research questions, International Conference on Solar Heating and
Cooling for Buildings and Industry, Energy Procedia 91: 269-275.
AIA (2012). An architect’s guide to integrating energy modeling in the design process.
Retrieved January 2018 from http://aiad8.prod.acquia-
sites.com/sites/default/files/2016-04/Energy-Modeling-Design-Process-Guide.pdf
AIA (2017). The habits of high-performance firms. Retrieved from
https://www.aia.org/resources/72031-thehabits-of-high-performance-firms
AIA (2018), AIA Committee on the Environment (COTE) Top Ten Toolkit accessed
July 2018 from
https://network.aia.org/HigherLogic/System/DownloadDocumentFile.ashx?Document
FileKey=3b309447-1472-66d9-f689-283d66865779

394
Alexander, C. M. (2009), Early Modern Architecture in Lincoln, Massachusetts,
Retrieved February 9, 2019, from https://www.oldhouseonline.com/web-
exclusives/early-modern-architecture-in-lincoln-massachusetts
Allyn and Bacon Crawley, D. B., et al. 2008. Contrasting the capabilities of building
energy performance simulation programs. Building and Environment, 43(4), 661‐673.
Alzubaidi, S., Roaf, B., Talib, R., Al-Ansari, A. (2013). Survey of Hospitals Lighting:
Daylight and Staff Preferences. 10.5923/j.ijee.20130306.02.
Anagnostopoulos, G. (2009) A companion to Aristotle, Hoboken: Wiley-Blackwell.
Anderson, B. (1990). Solar Building Architecture, edited by Bruce Anderson.
Cambridge, Mass.: MIT Press
Anderson, K. (2014) Design Energy Simulation for Architects: Guide to 3D Graphics,
New York: Routledge.
Antretter, F, Klingenberg, K, and Pazold M. (2013), ASHRAE Conference Proceedings
2013, Retrieved March 2018 from https://www.techstreet.com/ashrae/standards/all-in-
one-design-tool-solution-for-passive-houses-and-buildings-monthly-energy-balance-
and-hygrothermal-simulation?gateway_code=ashrae&product_id=1868089#product
ArchDaily (2013). CH2 Melbourne city council house 2. Design Inc., Retrieved June 20,
2017, from http://www.archdaily.com/395131/ch2-melbourne-city-council-house-2-
designinc
ArchDaily (2017). five passive cooling alternatives using robotics and smart materials.
Retrieved September 15, 2017 from http://www.archdaily.com/877693/iaac-develops-

395
five-passive-coolingalternatives-using-robotics-and-smart
materials?utm_medium=email&utm_source=ArchDaily%20List
ArchDaily, (2011). Interview: Michael Pawlyn on Biomimicry. (2011, November 17).
Retrieved April 25, 2016, from http://www.archdaily.com/185128/interview-michael-
pawlyn-on-biomimicry
Architect 50 (2017) Retrieved April 25, 2017, from
https://www.architectmagazine.com/practice/architect-50/2017-architect-50-top-50-
firms-in-sustainability_o
Architectural Record (2017). Retrieved June 20, 2017, from
http://www.architecturalrecord.com/Top300/2017-Top-300-Architecture-Firms-1
Architecture Challenge 2030 (2015). Retrieved February 2017 from
http://architecture2030.org/2030_challenges/2030-challenge/
ASHRAE (1989). ASHRAE Standard 90.1-1989. American Society of Heating,
Refrigerating, and Air-Conditioning Engineers. Atlanta, Georgia.
ASHRAE (2010). ASHRAE green guide: The design, construction, and operation of
sustainable buildings, J.M. Swift and T. Lawrence (eds.).
ASHRAE (2013) 2013 ASHRAE Handbook of Fundamentals. SI edition. (2013).
Atlanta, GA: ASHRAE.
ASHRAE 189 (2014). ANSI/ASHRAE/IES Standard 189-2014: Standard for the design
of high performance buildings, ASHRAE.
ASHRAE 189 (2014). ANSI/ASHRAE/IES Standard 189-2014: Standard for the design
of high performance buildings, ASHRAE.

396
ASHRAE 90.1 (2013). ANSI/ASHRAE/IES Standard 90.1-2013: Energy standard for
buildings except low-rise residential buildings, ASHRAE.
ASHRAE 90.1 (2016). ANSI/ASHRAE/IES Standard 90.1-2016: Energy standard for
buildings except low-rise residential buildings, ASHRAE.
ASHRAE Handbook of Fundamentals (2013), ASHRAE, Atlanta, Georgia U.S.A.
ASHRAE Standard 140. (2007) Standard method of test for the evaluation of building
energy analysis computer programs. ASHRAE.
ASME AG-1a–2004, American Society of Mechanical Engineers, ASME AG-1a–2004,
Addenda to ASME AG-1–2003 Code on Nuclear Air and Gas Treatment, 2004
Athienitis, A. and O'Brien, W. (2015) Modeling, Design, and Optimization of Net-Zero
Energy Buildings, Wilhelm Ernst & Sohn Verlag fur Architektur und Technische.
Athienitis, A. K. and Santamouris, M. (2013) Thermal Analysis and Design of Passive
Solar Buildings, Routledge/earthscan.
Athienitis, A. Torcellini, P, Hirsch, A., O'Brien, W., Cellura, M., Klein, R., Delisle, V.,
Attia, S., Bourdoukan, P., Carlucci, S. (2010). Design, Optimization, and Modelling
Issues of Net-Zero Energy Solar Buildings. 1-8.
Atkins (2017) Passive & Active Design of CIBSE Building Simulations Group. Retrieved
September 17, 2017 from http://www.cibse.org/getmedia/22be4d3b-2b5f-410d-bda4-
79ce098baf66/Peter-Brown-(Atkins)-Passive-and-Active-Design(1).pdf.aspx
Attia, S., Beltrán, L., De Herde, A., and Hensen, J. (2009) Architect Friendly: A
comparison of ten different building performance simulation tools. 11th International
IBPSA Conference, Glasgow, Scotland.

397
Attia, S., Hensen, J., Beltrán, L. & DeHerde, A. (2012) Selection criteria for building
performance simulation tools: contrasting architects' and engineers' needs, Journal of
Building Performance Simulation, 5:3, 155-169, doi: 10.1080/19401493.2010.549573
Badarnah, L. and Kadri, U. (2015) A methodology for the generation of biomimetic
design concepts, Architectural Science Review, 58(2), 120-133.
doi:10.1080/00038628.2014.922458
Badarnah, L. and Knaack, U. (2008). Shading/energy generating skin inspired from
natural systems. Proceedings of the 2008 World Sustainable Building Conference:
SB08, eds. G. Floiente and P. Paevere, pp. 305-312.
Badarnah, L., Kadri, U., and Knaack, U. (2008) A bio-inspired ventilating envelope
optimized by airflow simulations. Proceedings of the World Sustainable Building
Conference: SB08, eds. G. Floiente and P. Paevere, pp. 230-237.
Badarnah, L., Nachman, F. Y., and Knaack, U. (2010) Solutions from nature for building
envelope thermoregulation Proc. of the fifth Design & Nature Conference: Comparing
Design and Nature with Science and Engineering Carpi, A. and Brebbia, C.A. (eds)
Southampton: WIT Press.
Bailes, A. A. (2014). The Principles, uses, and limitations of WUFI. Retrieved August
10, 2017, from http://www.greenbuildingadvisor.com/blogs/dept/building-
science/principles-uses-and-limitations-wufi
Balcomb (1987): Solar Energy Research Institute, SERIIRR-254-3059 UC Categories:
59, 59a, 59c DE87001136 Passive Solar in the United States: 1976-1986 J. Douglas
Balcomb Los Alamos National Laboratory, January 1987 Prepared under Task No.
http://www.greenbuildingadvisor.com/blogs/dept/building-science/principles-uses-and-limitations-wufi
http://www.greenbuildingadvisor.com/blogs/dept/building-science/principles-uses-and-limitations-wufi
http://www.greenbuildingadvisor.com/blogs/dept/building-science/principles-uses-and-limitations-wufi
http://www.greenbuildingadvisor.com/blogs/dept/building-science/principles-uses-and-limitations-wufi
http://www.greenbuildingadvisor.com/blogs/dept/building-science/principles-uses-and-limitations-wufi
http://www.greenbuildingadvisor.com/blogs/dept/building-science/principles-uses-and-limitations-wufi
http://www.greenbuildingadvisor.com/blogs/dept/building-science/principles-uses-and-limitations-wufi
http://www.greenbuildingadvisor.com/blogs/dept/building-science/principles-uses-and-limitations-wufi
http://www.greenbuildingadvisor.com/blogs/dept/building-science/principles-uses-and-limitations-wufi
http://www.greenbuildingadvisor.com/blogs/dept/building-science/principles-uses-and-limitations-wufi

398
3050.10 FTP No. 623 Solar Energy Research Institute A Division of Midwest
Research Institute. Retrieved May 2018 from
https://www.nrel.gov/docs/legosti/old/3059.pdf
Balcomb, J. D. (1992). Passive solar buildings, edited by J. Douglas Balcomb.
Cambridge, Mass.: MIT Press.
Balcomb, J. D., Barley, D., McFarland, R. J., Perry, Jr., and Wray, W. (1980). Passive
Solar Design Handbook, Vol.2, Passive Solar Design Analysis. U.S. Department of
Energy. Washington, DC.
Balcomb, J. D., Jones R., McFarland, R., and Wray., W. (1984). Passive Solar Heating
Analysis. American Society of Heating, Refrigerating and Air‐Conditioning
Engineers, Inc. Atlanta, GA.
Barbosa and Ip, (2014). Barbosa S, Ip K. Perspectives of double skin façades for
naturally ventilated buildings: a review. Renew Sustain Energy Rev 2014; 40:1019–
29.
Barbosa, R., Loomans, M.G.L.C., Hensen, J.L.M. and Barták, M. (2015) The impact of
increased airflow rates on indoor temperatures of passive house in the Netherlands,
Healthy Buildings Europe Conference Proceedings May 2015
Baumeister, D. (2012). Biomimicry Resource Handbook: A Seed Bank of Knowledge and
Best Practices. Missoula: Biomimicry 3.8.
BDC (2015). Building Design + Construction: 10 megatrends shaping the future of
green building. Retrieved February 2017 from https://www.bdcnetwork.com/10-
megatrends-shaping-future-green-building

399
Beauchemin, K.M., & Hays, P. (1996). Sunny hospital rooms expedite recovery from
severe and refractory depression. Journal of Affective Disorders (40): pp. 49-51.
Bejan, A. (1997). Advanced engineering thermodynamics (2nd ed.), New York: Wiley.
Bejan, A. (2016) Life and evolution as physics, Communicative & Integrative Biology,
9:3, e1172159, doi: 10.1080/19420889.2016.1172159
Bejan, A. and Lorente, S. (2008) Design with constructal theory, Hoboken: Wiley.
Beltrán, L., Lee, E., Papamichael K., Selkowitz, S. (1994). The design and evaluation of
three advanced daylighting systems: light shelves, light pipes, and skylights.
Proceedings of the Solar 94, 19th National Passive Solar Conference, San Jose,
California, pp. 229-234 (June).
Benyus, J. (2002) Biomimicry: innovation inspired by nature, Morrow, New York.
Bessoudo, M. (2017) Health, wellness, and experience in the built environment: from
green buildings to Conscious Cities. Retrieved October, 2018 from
https://www.ccities.org/health-wellness-experience-built-environment-green-
buildings-conscious-cities/
Bhushan B. (2009). Review Biomimetics: lessons from nature--an overview,
Philosophical Transactions of Royal Society a Mathematical Physical Engineering
Sciences. 367(1893):1445-86.
Biomimicry 3.8. (2010). Retrieved September 2016 from http://biomimicry.net/
Bliss, R. W. (1959). The derivations of several plate efficiency factors useful in the
design of flat plate solar heat collectors, Solar energy 3, 55-63

400
Bogatyreva, O., Pahl, A.K., Bowyer, A., and Vincent J. F. V. (2003). Data gathering for
putting biology in TRIZ. Proceedings of TRIZcon 2003, Altshuller Institute, USA,
16–18 March.
BOMA (2006). Retrieved June 20, 2017, from
http://www.mlgw.com/images/content/files/pdf/greenstarts.pdf
Boyce, R. (1993). Keck & Keck: The Poetics of Comfort. Princeton, NJ: Princeton
Architectural Press.
Bradshaw, V. (2006) The Building Environment Active and Passive Control Systems. 3rd
edition. New York: McGraw‐Hill.
Bradshaw, V. (2006). The building environment: active and passive control systems. 3rd
ed. Hoboken, N.J.: Wiley
Braham, W. (2005) Biotechniques: Remarks on the intensity of conditioning in
Performative Architecture: Beyond instrumentality. New York: Spon Press.
BREAM (2018). Building research establishment environmental assessment
methodology. Retrieved January 2018 from https://www.breeam.com
Brinkworth, B.J., Cross, B. M., Marshall, R. H., Yang, H. (1997). Thermal regulation of
photovoltaic cladding. Solar Energy 1997;61(3):169–78.
Brooks W.A. (1918). The open air treatment of influenza. American Journal of Public
Health (8): pp. 746-750.
Brown, L. (2009). Future at risk on a hotter planet, New York: W.W. Norton &
Company.

401
Buchbinder, L. (1942). The bactericidal effects of daylight and sunlight on chained
Grampositive cocci in simulated room environment: theoretical and practical
considerations. In Moulton FR (Ed). Washington, DC: American Association for the
Advancement of Science, Smithsonian Institute. pp. 267-270.
Bullough. D., Rea, M. S., Figueriro, M. G. (2006). Of mice and women: light as a
circadian stimulus in breast cancer research. Cancer Causes and Control 17(4): pp.
375-383.
Busby Perkins+Will and Stantec Consulting (2007), Roadmap for The Integrated Design
Process, BC Green Building Roundtable.
Kutscher, C.F. (1994). Heat Exchange Effectiveness and Pressure Drop for Air Flow
Through Perforated Plates with and without Crosswind”, Journal of Heat Transfer,
vol. 116, pp. 391-399.
Caperna A., Serafini S. (2015). Biourbanism as new epistemological perspective
between Science, Design and Nature. Architecture & Sustainability: Critical
Perspectives, Belgium: KU Leuven, Faculty of Engineering.
Carpi, A., and Brebbia, C. A. (eds.) (2010) Design and nature: comparing design in
nature with science and engineering, Volume V (pp. 251-262). Southampton: WIT.
CASBEE (2018). Comprehensive Assessment System for Built Environment Efficiency.
Retrieved January 2018 from http://www.ibec.or.jp/CASBEE/english
CASEY, A. (2016) Retrieved February 2017 from
https://www.energy.gov/energysaver/articles/how-much-can-you-really-save-energy-
efficient-improvements

402
CBECS (2012). Retrieved June 20, 2017, from
https://www.eia.gov/consumption/commercial/data/2012/
CBECS (2012a). https://www.eia.gov/todayinenergy/detail.php?id=31272
CEF (2018) Conserve Energy for Future, https://www.conserve-energy-
future.com/difference-between-active-and-passive-solar-systems.php
CH2 (2017). CH2 design snapshot 11. Retrieved June 20, 2017, from
https://www.melbourne.vic.gov.au/SiteCollectionDocuments/ch2-snapshot-11-
biomimicry.pdf
Challenge 2030 Solution (2015). Retrieved February 2017 from
http://architecture2030.org/buildings_problem_why/the-solution/
Chan, H. Y., Riffat, S. B., Zhu, J. (2010) Review of passive solar heating and cooling
technologies, Renewable and Sustainable Energy Reviews 14, 781–789.
Chen, X., Yang, H., Lu, L. (2015). A comprehensive review on passive design
approaches in green building rating tools, Renewable and Sustainable Energy Reviews
50: p1425–p1436.
Choi, J., Beltran, L. O., & Kim, H. (2012). Impacts of indoor daylight environments on
patient average length of stay (ALOS) in a healthcare facility. Building and
Environment, 50, 6575. doi: 10.1016/j.buildenv.2011.10.010.
Chungloo, S., and Limmeechokchai, B. (2007). Application of passive cooling systems
in the hot and humid climate: the case study of solar chimney and wetted roof in
Thailand. Building and Environment; 42: 3341–3351.
403
Cohen, P. S., & Naginski, E. (2014). The return of nature: sustaining architecture in the
face of sustainability. London: Routledge.
Collins, M. W., Atherton, M. A., & Bryant, J. A. (2005). Nature and design.
Southampton; Boston: WIT.
Collins, P. (1959) The biological analogy, in W.W. Braham, J.S. Sadar and J. Hale,
(eds.) (2007) Rethinking technology: a reader in architectural theory, Routledge,
New York, 129-137.
Columbia University (2018). Content Analysis. Retrieved February 10, 2018, from
https://www.mailman.columbia.edu/research/population-health-methods/content-
analysis
CoM (2004). City of Melbourne website Retrieved June 20, 2016, from
http://www.melbourne.vic.gov.au/info.cfm?top=171&pa=1943&pg=1934
Cook, J. (1984). Award-Winning Passive Solar House Designs, Garden Way Pub Co.
Cook, P., and Archigram (Group). (1999). Archigram. New York: Princeton
Architectural Press.
Da Silva, F. J. (2015). Process simulation and optimization Technical articles, Process
Ecology. Retrieved February, 2019, from http://processecology.com/articles/dynamic-
process-simulation-when-do-we-really-need-it
DBSG (2017) Sustainable Building Design Trends. Retrieved January 2017 from
http://www.dbsg.com/blog/sustainable-building-design-top-trends
Denzer, A. (2013) The Solar House: Pioneering Sustainable Design. New York: Rizzoli.

404
Design Intelligence (2017). Retrieved June 20, 2017, from
http://www.di.net/almanac/stats/firm-statisticsarchitecture/
Dillman, D. A., Smyth, J. D., and Christian, L. M. (2014). Internet, phone, mail, and
mixed-mode surveys: the tailored design method. Fourth edition. Hoboken, New
Jersey: Wiley.
DODGE Data and Analytics (2016). World Green Building Trends report Retrieved
February 2017 from
http://fidic.org/sites/default/files/World%20Green%20Building%20Trends%202016
%20SmartMarket%20Report%20FINAL.pdf
Dodge, D. (2014). The Power of Passive Solar and Thermal Mass. Retrieved February 9,
2019, from https://www.huffingtonpost.ca/david-dodge/passive-solar-
heat_b_4809638.html
DOE (2017). List of approved software for calculating the energy efficient home credit.
Retrieved September 2017 from https://energy.gov/eere/buildings/list-approved-
software-calculating-energyefficient-home-credit
DOE (2017). List of approved software for calculating the energy efficient home credit.
Retrieved September 2017 from https://energy.gov/eere/buildings/list-approved-
software-calculating-energy-efficient-home-credit
DOH (2018). Questions and Answers about Tuberculosis (TB), Department of Health,
County of Albany, NY. Retrieved February 2019 from
https://www.albanyschools.org/district/Programs/HealthServices/Docs/TB%20Q-
A%202-08.pdf

405
Doucleff, M. (2013) Medicines to Fight White Plague Are Losing Their Punch, Health
News From NPR. Retrieved Feb 2019 from https://www.npr.org/sections/health-
shots/2013/06/05/188906912/tuberculosis-white-plague-doctors-modern-medicine
Duffie, J., Beckman, W., 2006. Solar Engineering of Thermal Processes. John Wiley and
Sons, Inc.
Edwards, B., and Naboni, E. (2013). Green buildings pay: design, productivity and
ecology. Third Edition. London; New York: Routledge.
EIA (2018). US Energy Information Administration Annual Energy Outlook 2018.
Retrieved April 2018 from https://www.eia.gov/outlooks/aeo/pdf/AEO2018.pdf
ENR (2017). Retrieved June 20, 2017, from http://www.enr.com/toplists/2017-Top-500-
Design-Firms1
EPA, 2005. Program needs from indoor environments research (PNIER). US EPA 420-
B05-00. Retrieved February, 2018, from www.epa.gov/iaq/pdfs/pnier.pdf
Evans, M. (2018) 10 Steps to Design Climate-Responsive Architecture, Retrieved
January 2019 from Sustainable Business from
https://www.thebalancesmb.com/designing-climate-responsive-architecture-3157812
Ewing, R. A. (2006). Power with nature: alternative energy solutions for homeowners.
Masonville, CO: PixyJack Press.
Ewing, R. A. (2006). Power with nature: alternative energy solutions for homeowners.
Masonville, CO: PixyJack Press.

406
Federal Research and Development Agenda for net-zero energy high performance
buildings. (2008), Retrieved January 2018 from
https://www.wbdg.org/files/pdfs/fedird_netzero_energy_hp_green_buildings.pdf
Feenberg, A. and Hannay, A. (1995). Technology and the politics of knowledge.
Bloomington: Indiana University Press.
Feist, W. (1992) Passivhäuser in Mitteleuropa. Dissertation, University of Kassel.
Feist, W., et.al. (2007). PHPP Handbook. Darmstadt, Germany: Passivhaus Institute.
Fernandeź-Galiano, L. (2000) Fire and memory: on architecture and energy, MIT Press,
Cambridge.
Fislisbach P.G., and Zollikon, D.A. (1993) Climate Responsive Building-Appropriate
Building Construction in Tropical and Subtropical Regions. SKAT: Swiss Centre for
Development Cooperation in Technology and Management.
Franssen, M. (2009). Philosophy of Technology. Retrieved November 2014 from
http://plato.stanford.edu/entries/technology/
Frostburg State University RMSC (2008). Retrieved January 2019 from
https://www.frostburg.edu/fsu/assets/File/clife/mscenter/FinalPapers/2008/Heat.pdf
Gallowa, T. (2004). Solar House: A Guide for the Solar Designer, Elsevier;
Architectural Press.
Galvin, R. (2014). Are passive houses economically viable? A reality-based, subjectivist
approach to costbenefit analyses. Energy & Buildings, 80149-157. doi:
10.1016/j.enbuild.2014.05.025

407
Gan, G. (1998). A parametric study of Trombe’ walls for passive cooling of buildings.
Energy and Building 27 (1998) 37-43.
Gardner J. (1996). Centers for disease control: guideline for isolation precautions in
hospitals. American Journal of Infection Control 24:2–52.
GBIG (2018). Green Building Labeling-Assessment Standard for Green Building.
Retrieved January 2018 from http://www.gbig.org/collections/14970
Gebeshuber, I. C., and Drack, M. (2008). An attempt to reveal synergies between
biology and mechanical engineering. Proceedings of the IMECHE, Part C: Journal of
Mechanical Engineering Science 222 (7): 1281–1287.
Givoni, B. (1994). Passive Low Energy Cooling of Buildings, John Wiley & Sons, 1994
Gonzalo, R., and Habermann, K. J. (2006). Energy-efficient architecture: basics for
planning and construction. Basel; Boston: Birkhäuser-Publishers for Architecture.
Goudarzi, K., Asadi-Yousefabad, S. K., Shojaeizadeh, E., Hajipour, A. (2014).
Experimental Investigation of Thermal Performance in an Advanced Solar Collector
with Spiral Tube. IJE Transactions A: Basics Vol. 27, No. 7, 1149-1154.
Gralton, J., Tovey, E., McLaws, M.L., and Rawlinson, W.D. (2011). The role of particle
size in aerosolized pathogen transmission: a review. J Infect 62:1-13.
Grange, L. (2016) Impact of Office Daylighting & Fresh Air On Employee Productivity.
Retrieved October, 2018 from https://hammerandhand.com/field-notes/impact-of-
office-daylighting-on-employee-productivity
Grondzik, W. T., and Kwok, A. G. (2015). Mechanical and Electrical Equipment for
Buildings. 12th edition. Hoboken, New Jersey: John Wiley & Sons, Inc. eBook.

408
H.R.16276 — 93rd Congress (1973-1974) H.R.16276 - Solar Energy Research,
Development and Demonstration Act. Retrieved February 2018 from
https://www.congress.gov/bill/93rd-congress/house-bill/16276
Haight, F.A. (1967). Handbook of the Poisson Distribution. New York: John Wiley &
Sons.
Hastings, R. (1999). Passive solar commercial and institutional buildings: a sourcebook
of examples and design insights. International Energy Agency, S.R. Hastings (ed).
Chichester; New York: Wiley.
Hawken, P., Lovins, A., Lovins, H. (1999). Natural Capitalism Boston, MA: Little,
Brown, and Company
Hayter, S. J. and Torcellini, P. A. (2001). The energy design process for designing and
constructing high-performance buildings. CLIMA 2000. Naples, Italy.
Hemsath, T., and AlagheBandhosseini, K. (2018). Energy modeling in architectural
design. New York: Routledge.
Hirunlabh, J., Kongduang, W., Namprakai, P., Khedari, J. (1999). Study of natural
ventilation of houses by a metallic solar wall under tropical climate, Renewable
Energy; 18:109–19.
HKGBC (2018). Hong Kong Green Building Council (HKGBC). Retrieved January
2018 from https://www.hkgbc.org.hk/eng/
HKS (2013). Convention Center in Xiamen, China. Retrieved September 2015 from
http://www.hksinc.com/insight/concept-of-balance-captures-aia-dallas-unbuilt-
design-award/
409
Hobday, R., and Dancer, S. (2013). Roles of sunlight and natural ventilation for
controlling infection: historical and current perspectives. Journal of Hospital
Infection, 84(4), 271-282. doi: 10.1016/j.jhin.2013.04.011
Hordeski, M. F. (2011). New technologies for energy efficiency. New York. The Fair-
mont Press.
Hottel, H. C., and Willier, A. (1958). Evaluation of flat plate collector performance.
Trans. of the conference on the use of solar energy, University of Arizona Press, 2, 1-
74.
Hui, S. C. M. (1997) Overall thermal transfer value (OTTV): how to improve its control
in Hong Kong, In Proc. of the One-day Symposium on Building, Energy and
Environment, Hong Kong, pp. 12-1 to 1211.
Hyde, R. (2000). Climate responsive design: a study of buildings in moderate and hot
humid climates. Richard Hyde. London; New York: E & FN Spon.
IBPSA Tools Directory (2017). Retrieved September 5 2017 from
https://www.ibpsa.us/building-energysoftware-tools-best-directory
IBPSA Tools Directory (2017). Retrieved September 5 2017 from
https://www.ibpsa.us/buildingenergy-software-tools-best-directory
Iddon, C. (2017). Florence Nightingale: nurse and building engineer. CIBSE Journal.
Available Retrieved 2017 from https://www.cibsejournal.com/general/florence-
nightingale-nurse-andbuilding-engineer
IECC (2012). International Energy Conservation Code. Washington, DC: International
Code Council.

410
IECC (2018). International Energy Conservation Code. Washington, DC: International
Code Council.
Jie, J., Hua, Y., Wei, H., Gang, P., Jianping, L., Bin, J. (2007). Modeling of a novel
Trombe’ wall with PV cells. Building and Environment 42 (2007) 1544–1552
Johnson, T. (1981). Solar Architecture: The Direct Gain Approach.
Kaplinsky, J. (2006). Biomimicry versus humanism. Architectural Design, 76(1), 66-71.
doi:10.1002/ad.212
Kelland, P. (1992). Sick building syndrome, working environments and hospital staff.
Indoor Environment 1:335-340.
Kellert, S. R., (2008). Dimensions, elements, and attributes of biophilic design. In J.H.
Heerwagen, S. Kellert, & M. L. Mador (Ed.), Biophilic design: the theory, science,
and practice of bringing buildings to life. (pp. 3-19). Hoboken, NJ: Wiley.
Kellert, S. R., Heerwagen, J. H., & Mador, M. L. (2011). Biophilic design: the theory,
science, and practice of bringing buildings to life. Hoboken, NJ: Wiley.
Kiesler, F. (1939) On correalism and biotechnique: a definition and test of a new
approach to building design, The Architectural Record, September, 60-75.
Klingenberg, K., Kernagis, M., and James, M. (2009). Homes for a changing climate:
passive houses in the U.S. Chelsea Green Pub Co.
Koo, D. (2017). 5 Common Types of Air Purifiers. Retrieved May 2018, from
https://learn.allergyandair.com/types-of-air-purifiers
Kubota, T., Hooi, C. and Toe, D. (2015) Application of passive cooling techniques in
vernacular houses to modern urban houses: A case study of Malaysia. International

411
Conference Green Architecture for Sustainable Living and Environment, 29
November 2014, Social and Behavioural Sciences 179, 29–39
LBNL (1994). Lawrence Berkeley National Laboratory and Hirsch & Associates. DOE-2
version 2.1e. Lawrence Berkeley National Laboratory. Berkeley, California, U.S.A.
Lechner, N. (2009). Heating, cooling, lighting: sustainable design methods for
architects. 3rd edition. Hoboken, New Jersey: Wiley.
Lechner, N. (2015). Heating, Cooling, Lighting: Design Methods for Architects. 2nd
edition. New York: John Wiley & Sons, Inc. eBook Collection (EBSCOhost)
LEED BD+C (2017). LEED v4 for building design and construction, USGBC.
Leedy, P. D., & Ormrod, J. E. (2013). Practical research: planning and design. Boston:
Pearson.
Lengsfeld, K., and Holm, A. (2007) Entwicklung und Validierungeiner
hygrothermischen Raumklima-Simulationssoftware WUFI®-Plus. Bauphysik 29,
Magazin 3.
Levy, B. (2016). Sunrise on Vassar Street: the birth of the MIT solar research program.
Retrieved March 2018, from https://scopeweb.mit.edu/sunrise-on-vassar-street-the-
birth-of-the-mit-solar-research-program-8d603e21e73b
Lewis, R. K. (1998). Architect-client collaboration is the foundation of great design. The
Washington Post. Retrieved January 2018 from Nexis Uni.
Li, A., Jones, P., Zhao, P., and Wang, L. Heat transfer and natural ventilation airflow
rates from single-sided heated solar chimney for buildings. Journal of Asian
Architecture and Building Engineering 2004; 3:233–8.
412
Linstone, H. A., and Turoff, M. (1975). The Delphi Method: Techniques and
Applications. Mass: Addison-Wesley.
LLNL (2016). Estimated energy consumption in 2016. Lawrence Livermore National
Laboratory and DOE, Retrieved September 2018 from
https://flowcharts.llnl.gov/content/assets/images/energy/us/Energy_US_2016.png
Loftness, V., and Snyder, M. (2011). Where windows become doors. In S. Kellert, J.H.
in Heerwagen, & M. L. Mador (Ed.), Biophilic design: the theory, science, and
practice of bringing buildings to life. (pp. 107-131). Hoboken, NJ: Wiley
Loonen, R., Rico-Martinez, J.M., Favoino, F., Brzezicki, M., Menezo, C., La Ferla, G.,
et al. (2015) Design for façade adaptability – towards a unified and systematic
characterization. Proc. 10th Energy Forum-Advance Building Skin, Bern,
Switzerland: 2015, p. 1274–84.
Lstiburek, J. W. (2011). Seeing red over green roofs, ASHRAE Journal, June 2011.
McHarg, I. L. (1969). Design with nature. New York: J. Wiley.
Mckinley, A. (1995). Calumet Roots. Solar power has its own home in history. Retrieved
March 21, 2018, from http://www.nwitimes.com/uncategorized/calumet-roots-solar-
power-has-its-own-home-in-history/article_185aed6f-3df1-52f7-b04a-
5a1aad7b18b2.html
Megan Ray Nichols, 2017 : Top 5 Global Green Building Trends of 2017
https://interestingengineering.com/top-5-green-building-trends-2017

413
MIT (2017). MIT open courseware. Retrieved from
https://ocw.mit.edu/courses/architecture/4-430daylighting-spring-
2012/assignments/MIT4_430S12_hw4.pdf
MIT Solar History (2018). Retrieved April, 2018, from
http://web.mit.edu/solardecathlon/history.html
Monsen, W.A., Klein, S.A., and Beckman, W.A. (1982). The Un-utilizability method for
collector-storage walls. Solar Energy, Vol. 28, pp. 421-430, (1982)
Murgula, V., Vatina, N., and Zayats, I. (2015). The role of the solar light quantity in the
architectural forming of buildings, International Scientific Conference Urban Civil
Engineering and Municipal Facilities, Procedia Engineering SPbUCEMF-2015
Nagy, G., and Osam, N. (2016). Biomimicry, an approach for energy efficient building
skin design. Procedia Environmental Sciences, 34, 178-189. doi:
10.1016/j.proenv.2016.04.017
NCARB (2018). Education Guidelines. Retrieved January 2019 from
https://www.ncarb.org/sites/default/files/Main%20Website/Data%20%26%20Resourc
es/Guidelines/EducationGuidelines.pdf
NEEA (2014). Retrieved June 2017, from https://neea.org/docs/default-
source/reports/2014-cbsa-finalreport_05-dec-2014.pdf?sfvrsn=12
Nielsen P.V. (2009). Control of airborne infectious diseases in ventilated spaces. J R
Social Interface; 6: pp.747-755.
Nightingale F. (1863). Notes on hospitals. 3rd ed. London: Longman, Roberts & Green.

414
NOAA-ESRL (2017). Daily CO2. Retrieved February 2017 from
https://www.co2.earth/daily-co2
Norton, B., (2018) Solar Energy. Retrieved September 2018 from
http://www.thermopedia.com/content/1136/ doi: 10.1615/AtoZ.s.solar_energy
NREL (2008) A Methodology for Validating Building Energy Analysis Simulations.
(Ed.) R. Judkoff, D. Wortman, B. O’Doherty, and J. Burch. National Renewable
Energy Laboratory.
NREL (2008). A Methodology for Validating Building Energy Analysis Simulations.
(Ed.) R. Judkoff, D. Wortman, B. O’Doherty, and J. Burch. National Renewable
Energy Laboratory.
NREL (2018). National Solar Radiation Data Base (NSRDB). Retrieved February, 2018,
from http://rredc.nrel.gov/solar/old_data/nsrdb/
NREL (2019). Transpired Solar Walls for Commercial Buildings. Retrieved February
2019 from https://www.nrel.gov/docs/fy01osti/30176.pdf
Oh, S. & Haberl, J. (2015). Origins of analysis methods used to design high performance
commercial buildings: Solar energy analysis. Science and Technology for the Built
Environment. 22. 87-106. 10.1080/23744731.2015.1090277.
Olgyay, V. (1963) Design with Climate: Bioclimatic Approach to Architectural
Regionalism. Princeton University Press.
Ong, K.S. and Chow, C. C. (2003), Performance of a solar chimney. Solar Energy;
74:1–17.

415
Oxtoby, B., McGuinness, T., and Morgan, R.E. (2002). Developing organizational
change capability. European Management Journal, 20 (3), 310–320.
Palette 2030 (2018). A database of sustainable design tools and resources at your
fingertips by AIA, Retrieved September 2018 from http://2030palette.org
Palmiter, L. (1984). SUNCODE-PC Building Load Simulation Program. Ecotope, Inc.
Perlin, J. (2013) Let It Shine: The 6000 Year Story of Solar Energy, New World Library;
Revised edition.
PHIUS (2013). Certified PHIUS Projects. Passive House Institute US, Urbana, IL.
www.passivehouse.us/projects.php
PHIUS Certification Overview (2017). Retrieved June 20, 2017, from
http://www.phius.org/phiuscertification-for-buildings-products/phius-2015-project-
certification/phius-certification-overview
PHIUS Certification Overview (2017). Retrieved June 20, 2017, from
http://www.phius.org/phius-certificationfor-buildings-products/phius-2015-project-
certification/phius-certification-overview
PHIUS History (2018), Retrieved May 2018 from http://www.phius.org/about/mission-
history
PHIUS Mission (2018), About Passive House Institute US: Where we're going and
where we've been Retrieved January 2018 from http://www.phius.org/about/mission-
history

416
PHIUS Project Database (2017). Retrieved June 20, 2017, from
http://www.phius.org/phiuscertification-for-buildings-products/certified-projects-
database
PHIUS Project Database (2017). Retrieved June 20, 2017, from
http://www.phius.org/phius-certification-forbuildings-products/certified-projects-
database
PHIUS+ 2015 Certification Guidebook _v1.03 (2016). Retrieved June 20, 2017, from
http://www.phius.org/PHIUSplusdocs/PHIUS+CertificationGuidebook_v1.03.pdf
PHIUS+ 2015 Certification Guidebook _v1.03 (2016). Retrieved June 20, 2017, from
http://www.phius.org/PHIUSplusdocs/PHIUS+CertificationGuidebook_v1.03.pdf
PHIUSP (2018) http://www.phius.org/what-is-passive-building/passive-house-principles
Preziosi, P. (2004). Workplace air-conditioning and health services attendance among
French middle-aged women: a prospective cohort study. International Journal of
Epidemiology, 33(5), pp.1120-1123.
Qian, H. and Zheng, X. (2018). Ventilation control for airborne transmission of human
exhaled bio-aerosols in buildings. J Thorac Dis. 2018 Jul; 10 (19): 2295–2304. doi:
10.21037/jtd.2018.01.24
Ralegaonkar, R.V., and Gupta, R. (2010) Review of intelligent building construction: a
passive solar architecture approach, Renewable and Sustainable Energy Reviews, 14:
p2238–p2242 2239.
Raman P., Mande S., and Kishore, V. V. N. (2001). A passive solar system for thermal
comfort conditioning of buildings in composite climates. Solar Energy; 70:319–29.
417
Ransome, A., and Delepine. S. (1894) On the influence of certain natural agents on the
virulence of the tubercle-bacillus. Proc R Soc. Lond.;56: pp.51-56.
Reardon, C., and Downton, P. (2016) Passive design: design for climate, in Your Home:
Australia's Guide to Environmentally Sustainable Homes, Australia Department of
the Environment and Energy, 5th edition, Australian Government-Department of
Industry and Science. Retrieved September 2018 from
http://www.yourhome.gov.au/passive-design/design-climate
Reinhart, C., and Stein, R. (2014). Daylighting handbook. Volume I, Fundamentals,
designing with the sun. [Place of publication not identified]: [publisher not identified].
Riley, E. C., Murphy, G., and Riley, R. L. (1978) Airborne spread of measles in a
suburban elementary-school. American Journal Epidemiolology,107:421-32. doi:
10.1093/oxfordjournals.aje.a112560
Rittelmann, P. R., and Ahmed, S. F. (1985) Task 8 of International Energy Agency (IEA)
for the Passive and Hybrid Solar Low-Energy Buildings. Burt Hill Kosar Rittelmann
Assoc. Butler, PA. Retrieved September 15, 2017 from
http://task08.ieashc.org/data/sites/1/publications/Task%208Design%20Tool%20Surve
y%20Vol%201-May%201985.pdf
Robertson, A. S., Roberts, K. T., Burge, P., & Raw, G. (1990). The effect of change in
building ventilation category on sickness absence rates and the prevalence of sick
building syndrome. Proceedings of Indoor Air 901: pp. 237-242.
Roth, L. M. (2003) American Architecture: A History, Westview Press, 2003, p. 361
418
Saadatian, O., Sopian, K., Lim, C.H., Asim, N., Sulaiman, M.Y., 2012. Trombe’ walls:
A review of opportunities and challenges in research and development. Renewable
and Sustainable Energy Reviews.
Sadineni, S. B., Madala, S., and Boehm, R. F. (2011). Passive building energy savings:
A review of building envelope components. Renewable and Sustainable Energy
Reviews, 153617-3631. doi: 10.1016/j.rser.2011.07.014
Seppanen, O., and Fisk, W.J. (2002). Association of ventilation system type with SB
symptoms in office workers. Indoor Ail 12 (2): pp. 98-112.
Sharifi, A., and Yamagata, Y. (2015). Roof ponds as passive heating and cooling
systems: A systematic review, Applied Energy, Volume 160, 2015, Pages 336-357
Shurcliff, W. (1982). The Saunders-Shrewsbury House. Selfpublished.
Shurcliff, W. (1986). Superinsulated houses. Annual Reviews Energy 11:1-24.
Shurcliff, W. (1988). Superinsulated Houses and Air-To-Air Heat Exchangers. Andover,
MA: Brickhouse Publishing Company.
Sonne, J. (2006) Evaluating Green Roof Energy Performance, American Society of
Heating, Refrigerating and Air-Conditioning Engineerrs. ASHRAE Journal, Vol. 48.
Stein, B., and Reynolds, J. S. (2000) Mechanical and Electrical Equipment for
Buildings. 9th edition, John Wiley and Sons, Inc., New York, 455-475.
Sterner, C. (2015) Six Metrics Every Architect Should Know. Retrieved 18 September
2017, from http://sefaira.com/resources/six-metrics-every-architect-should-know-and-
how-to-use-them

419
Strong, D. & Burrows, V. (2017). A whole-system approach to high-performance green
buildings. Boston: Artech House.
Strong, D., and Burrows, V. (2017). A Whole-System Approach to High-Performance
Green Buildings. Boston: Artech House.
Struckmann, F. (2008). Analysis of a Flat-plate Solar Collector, Heat and Mass
Transport Project Report, Department of Energy Sciences, Faculty of Engineering,
Lund University, Sweden.
Stunkel, K. R. (2004). Understanding Lewis Mumford: a guide for the perplexed, Edwin
Mellen Press, Lewiston.
Sun, W., Ji, J., Luo, C., and He, W. (2011). Performance of PV-Trombe’ wall in winter
correlated with south facade design. Applied Energy 2011; 88:224–31.
Syed, A. (2012). Advanced building technologies for sustainability. Hoboken: John
Wiley & Sons.
Tittmann, J. (2018) AIA, Albert, Righter, Tittmann Architects. Retrieved April 2018
from http://www.artarchitects.com/sustainability/
Tsoroti, S. (2014). What's that building? Eastgate Mall. Retrieved June 20, 2017, from
http://www.hararenews.co.zw/2014/05/whats-that-building-eastgate-mall/#comments
Tunc¸ M, Uysal M. Passive solar heating of buildings using a fluidized bed plus
Trombe’ wall system. Applied Energy 1991;38(3):199–213.
Turner, S. and Rupert, S. (2008). Beyond biomimicry. What termites can tell us about
realizing the living building. First International Conference on Industrialized,
Intelligent Construction (I3CON) Loughborough University, (14-16 May).

420
UNS (2016) Transforming our world: the 2030 agenda for sustainable development.
Retrieved January 2018 from development
http://ec.europa.eu/environment/sustainable-development/SDGs/index_en.htm
Ürge-Vorsatz, D., N. Eyre, P. Graham, D. Harvey, E. Hertwich, Y. Jiang, C. Kornevall,
M. Majumdar, J. E. McMahon, S. Mirasgedis, S. Murakami and A. Novikova, (2012).
Global Energy Assessment - Toward a Sustainable Future, Cambridge University
Press, Cambridge, UK and New York, NY, USA and the International Institute for
Applied Systems Analysis, Laxenburg, Austria, pp. 649-760. Retrieved May 2018
from http://www.iiasa.ac.at/web/home/research/Flagship-Projects/Global-Energy-
Assessment/Chapte10.en.html
USGVMT, (1995) Code of Federal Regulations 10 – Energy. Office of the Federal
Register National Archives and Records Administration. Washington, D.C. U.S.A.
Van Decker, G.W.E., Hollands, K.G.T. and A.P. Brunger, “Heat-Exchange Relations for
Unglazed Transpired Solar Collectors with Circular Holes on a Square or Triangular
Pitch”, Solar Energy, 2001, vol. 71, No. 1, pp. 33-45.
Ventive (2018). Facade integrated passive ventilation. Retrieved September 2018 from
https://www.ventive.co.uk/passive.html
Verrengia, J. (2010). Smart windows: energy efficiency with a view. Retrieved
November 2016 from
https://web.archive.org/web/20111017071503/https://www.nrel.gov/news/features/fea
ture_detail.cfm/feature_id=1555
http://www.iiasa.ac.at/web/home/research/Flagship-Projects/Global-Energy-Assessment/Chapte10.en.html

421
Vijayalaxmi, J. (2010) Concept of Overall Thermal Transfer Value (OTTV) in design of
building envelope to achieve energy efficiency. International Journal of Thermal &
Environmental Engineering, 1 (2010) 75-80.
WBDG (2017) Whole Building Design Guide. Passive solar heating. Retrieved
September 22, 2017, from https://www.wbdg.org/resources/passive-solar-heating
WBDG. (2017.). Whole Building Design Guide. Optimize energy use. Retrieved June
28, 2017, from http://wbdg.org/design-objectives/sustainable/optimize-energy-use
Wei Chen, Wei Liu, 2004. Numerical analysis of heat transfers in a composite wall
solar-collector system with a porous absorber. Applied Energy 78 (2004) 137–149.
Weinschenk, C. (2015). LEED certification, energy efficiency increase property value.
Retrieved October, 2018, from https://www.energymanagertoday.com/leed-
certification-increases-property-value-0115986/
Wells, W.F. (1948) On the mechanics of droplet nuclei infection: apparatus for the
quantitative study of droplet nuclei infection of animals. Am Journal of
Hygiene 1948; 47:1-10.
Wennick, A., Lundqvist, A., & Hallstrom, I. (2009). Everyday experience of families
three years after diagnosis of Type 1 diabetes in children: a research paper. Journal of
Pediatric Nursing. 24. 222-230.
Wennick, A., Lundqvist, A., and Hallstrom, I. (2009). Everyday experience of families
three years after diagnosis of Type 1 diabetes in children: A research paper. Journal
of Pediatric Nursing. 24. 222-230.

422
WGBC (2018). Green Building Rating Tools. World Green Building Council Retrieved
May 2018 from http://www.worldgbc.org/rating-tools
WHO (2002). Guidelines on prevention and control of hospital associated infections.
New Delhi: WHO Regional Office for South-East Asia.
WHO. (2007) Infection prevention and control of epidemic- and pandemic-prone acute
respiratory diseases in health care — WHO interim guidelines. Geneva, World Health
Organization.
WHO. (2009) natural ventilation for infection control in health-care settings — WHO
interim guidelines. Geneva, World Health Organization.
Willier, A. (1977). Prediction of Performance of solar collectors, in Application of Solar
Energy for Heating and Cooling of Buildgins, ASHRAE, New York.
Wilson, E. O. (1984). Biophilia: The Human Bond with Other Species. Cambridge, MA:
Harvard University Press.
Wong, I. L. (2017). A review of daylighting design and implementation in buildings,
Renewable and Sustainable Energy Reviews, Volume 74, 2017: 959-968.
Woolley, T. (2016). Building materials, health and indoor air quality: no breathing
space, CRC Press, 2016. ProQuest eBook Central.
Wright, G., and Klingenberg, K. (2015). Climate-Specific Passive Building Standards.
Building America Report -1405 July 2015. Retrieved from
https://buildingscience.com/sites/default/files/ba-
1405_climatespecific_passive_building_standards.pdf
423
Zadeh, R. S., Shepley, M. M., Williams, G., and Chung, S. S. (2014). The impact of
windows and daylight on acute-care nurses' physiological, psychological, and
behavioral health. HERD: Health Environments Research & Design Journal, 7(4),
35-61. doi:10.1177/193758671400700405
Zalewski, L., Joulin, A., Lassue, S., Dutil, Y., and Rousse, D. (2012). Experimental
study of small-scale solar wall integrating phase change material. Solar Energy.
Zalewski, L., Lassue, S., Duthoit, B., Butez, M., Study of solar walls: validating a
numerical simulation model, International Review on Building and Environment 37
(1) (2002) 109–121.

424
APPENDIX A
IRB REVIEW LETTER

425
APPENDIX B
SURVEY INVITATION LETTER
Dear [Contact Name],
I hope this email finds you well. I am a PhD candidate at the Department of Architecture at Texas A&M University and I am conducting my dissertation research in collaboration with Professor Jeff Haberl on the education/application of passive/natural systems in buildings in the US. As a part of this research I am conducting a survey with 22 questions. It takes less than 15 minutes to answer the questions.
I greatly appreciate it if there is a possibility to take the survey and/or if you could suggest it to your colleagues interested in the education/application of passive/natural systems. Below is a brief description of the research/survey along with the survey link at the end of the email. This survey is anonymous and has been approved by Texas A&M Institutional Review Board (IRB ID: IRB2018-0262/ Ref. Number: 074600). Please let me know about the possibility of taking the survey or if you need any additional information.
Best regards, Mehdi Azizkhani
PhD Candidate Department of Architecture College of Architecture Texas A&M University 512.363.8056 [email protected]
Please take the survey here: https://tamu.qualtrics.com/jfe/form/SV_4ZRSlmU64RN9ipT
--------------------------------------------------------------------------------------------------------------------
Dear Participant,
My name is Mehdi Azizkhani and I am a Doctoral Candidate and researcher at the College of Architecture at Texas A&M University. In collaboration with Professor Jeff Haberl I am conducting research on the application of passive/natural systems in buildings in the US to find opportunities/challenges that could increase/reduce the frequency of their use on a national scale in the US. The incorporation of natural/passive systems in buildings is in line with programs such as Architecture 2030

426
Challenge. Such programs can reduce the energy consumption of buildings, the associated cost, and preserve our natural resources for future generations.
As a part of the current study I am conducting a survey to find out about the education and application of passive/natural systems in addition to usual passive design strategies such as airtightness and continuous insulation. The intended target audience of this survey include professors/instructors who have taught or practiced in the US. The purpose of this survey is to obtain a more accurate perception of the education and practice of passive system design across different disciplines in academia and the building industry in the US to better measure the followings:
•The factors influencing the increase/reduction of the use of passive/natural systems inbuildings•The design tools being used for the education/application of passive design•The most and least recurring types of passive/natural system strategies•The importance of incorporating passive/natural system strategies in a practical designprocess with respect to their integration with mechanical systems
Your participation in this survey is greatly appreciated. The opinions of academics and professionals like you are an important component to better understand the current education and practice in universities and the building industry across the country.
The link below will direct you to a survey questionnaire which takes about 15 minutes to answer. This survey has been approved by Texas A&M Institutional Review Board (IRB ID: IRB2018-0262/ Ref. Number: 074600). If you have received the link from other organizations, please take the survey only once. The survey is anonymous and your responses to the survey questions will be kept confidential. The results of the survey will be sent back to you at the end of the research study.
Please take the survey here: https://tamu.qualtrics.com/jfe/form/SV_4ZRSlmU64RN9ipT
Thank you in advance for your time. Sincerely,
Mehdi Azizkhani Dr. Jeff Haberl PhD Candidate Professor
Department of Architecture College of Architecture Texas A&M University 512.363.8056 [email protected]

427
APPENDIX C
SURVEY QUESTIONNAIRE FOR EDUCATORS AND PRACTITIONERS
Survey Questionnaire for Educators

428

429

430

431
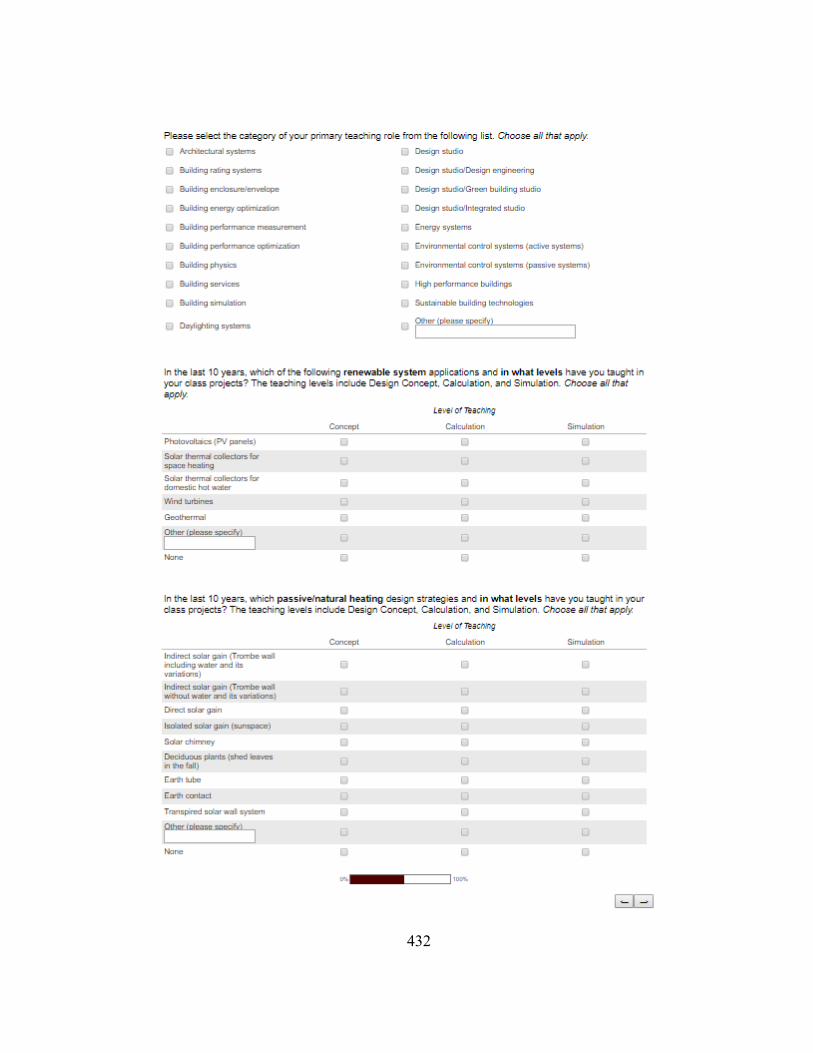
432

433

434

435
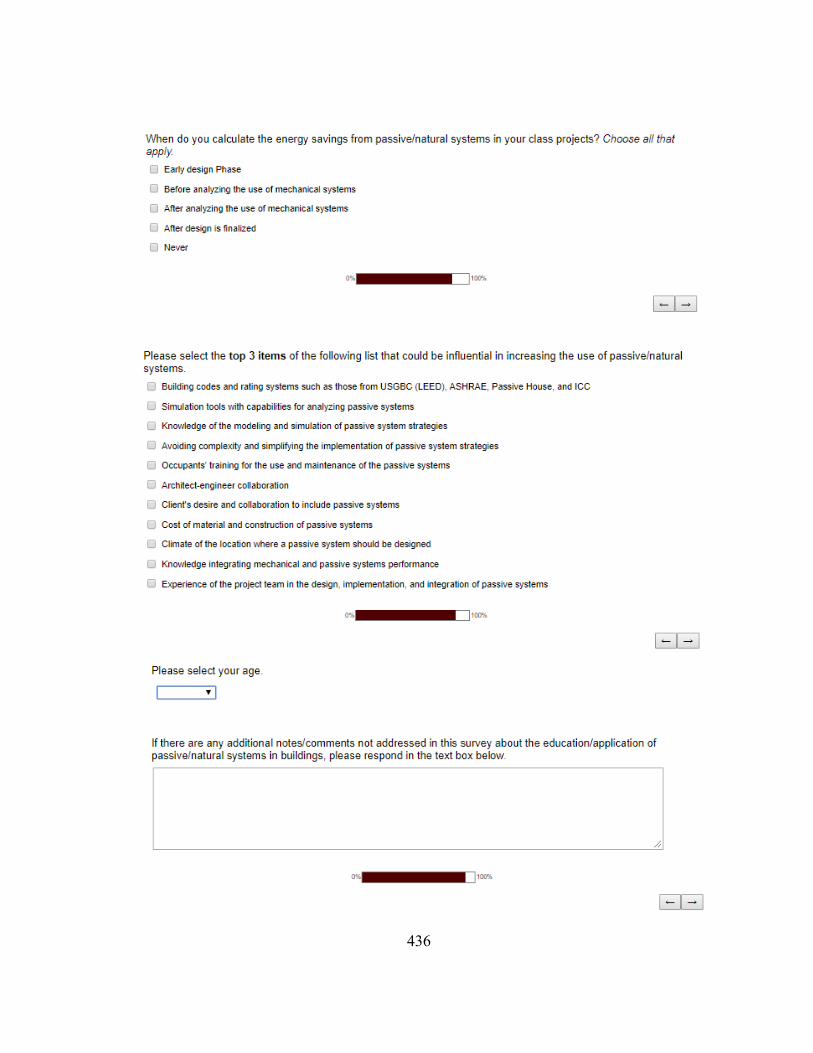
436

437
Survey Questionnaire for Practitioners

438

439

440

441

442

443

444

445

446
APPENDIX D
PARTICIPANTS’ RESPONSES TO THE OPEN-ENDED TEXT QUESTION
Practitioners' open-ended text question and responses:
If there are any additional notes/comments not addressed in this survey about
the application of passive/natural systems in buildings, please respond in the
text box below.
We evaluate passive systems frequently but almost never employ them. I have done
some longer than 10 years ago, and practically none since. The usual problem is that
passive systems don't do the whole annual job, and are not able to displace much of
the required capacity of active systems. You have to buy two systems. If the
building is well insulated, shaded and oriented, the active systems are not too
expensive to deploy and operate, leaving little to save from passive systems. Note
that insulation, proper use of glazing, orientation and building tightness are the real
winners in passive construction.
Passive/natural systems are largely applicable to new buildings, and particularly
buildings with substantial lots. More focus is needed on existing buildings and
building compactly.
The negatives we have seen with passive systems are:
1 - Europeans pushing in in the USA when their summers have similar DB
temperatures, but much lower WB temperatures and then our clients hate it

447
2 - Occupants who have no understanding of controlling operable windows in
passive systems. It takes a fair amount of education to make a person understand
weather, psychrometrics, and the effects on the building. One open window can
humidify an entire building. Perhaps a RED/GREEN light to tell people they can
open up or not is the best solution.
A majority of the strategies listed in this survey are simply not useful. The primary
passive tactics to improve energy performance in a high heating climate are
continuous insulation and exceptional air-tightness - neither of which are even
mentioned. Plus, exterior shading is good for cooling (to avoid overheating). Notes
below.
-The factors influencing the increase/reduction of the use of passive/natural systems
in buildings [building code]
-The design tools being used for passive design [PHPP or WUFI Passive]
-The most and least recurring types of passive/natural system strategies [continuous
insulation + superinsulation and exceptional air-tightness]
-The importance of incorporating passive/natural system strategies in a practical
design process with respect to their integration with mechanical systems [building
form, orientation, layout, and percentage of glazing are important. So during
schematic design. Then insulation and window selections during design
development. Then construction details for thermal bridging, continuous insulation,
and air tightness.]
Good luck!

448
I am mainly and R&D project manager. I do no specifying or managing of actual
building projects.
This survey would benefit from better defining "passive/natural systems". It's not
clear what's included or not included, and how it differs from existing terms like
"high-performance buildings."
Regarding the question "How can we increased use of good passive design?" The
issue is not on the supply side. It's not an issue of knowledge or capabilities. The
issue is demand (by owners / clients). Demand can increase (1) by legislation, i.e. if
code requires it, (2) by incentivizing it (tax incentives; development incentives,
etc.), or (3) by decreasing cost (even with good integrative design, high-performance
buildings generally cost more).
Passive design is not commonly applied in healthcare facilities. However, from a
resilience perspective, passive design is starting to pick up. How does a building
react during an outage at various weather conditions? We're developing tools and
protocols to simulate failures of mechanical systems and determine the impact on
the occupied space. For some healthcare facilities, evacuation is not possible.
Much of the earliest energy analytical work done in residential passive systems is
documented in the publications (e.g. Passive Solar Design Handbook, Jan. 1980) of
Dr. Doug Balcomb et al. working at the Los Alamos National Lab. In my
estimation, those publications are the most significant contributions in the current
field of passive/natural system design. Additionally, I believe that DOE-2 is the
most powerful building energy analysis tool to use when integrating passive and

449
mechanical system design in commercial and institutional buildings. I would hope
that Dr. Haberl would agree with me.
Difficult to do in heavy commercial applications such as healthcare architecture.
It seems like there are built in assumptions about what the 'acceptable' strategies
should be...
There are a lot of passive strategies and systems that can be implemented beyond the
traditional building strategies. For example, what happens in a building is important
and often can present opportunities if those operational systems are integrated with
the building systems - we do a lot of this with brewery projects.
Our office has designed passive systems since the earliest 1970s
I'm probably not the best example: I was educated in California but now practice in
Connecticut and focus on healthcare projects where the environment is highly
regulated and mechanical systems are not intended to include passive systems.
Furthermore, healthcare projects tend to be hospitals with large footprints (limited
perimeter) or developer projects where little thought goes into the core and shell.
Fear of potential Owner/user dissatisfaction with the comfort delivered by the
HVAC system, and compliance with ASHRAE guidelines as now referenced in
building codes, are a great disincentive in the use of passive systems in
commercial/institutional projects.
apparently I am a luddite, the construction of energy efficient buildings need not be
so over thought.

450
Most of our clients want buildings which include passive solar or active solar
strategies. However, almost none of them want to pay for it.
You left off the most important single criteria for the adoption of Passive strategies
in building design and construction: Beauty. For decades we have concentrated on
the savings, cost benefits and justification of passive strategies when I reality the
customer usually only wants a beautiful building and becomes suspicious when we
begin justifying a design. They will even pay more for a beautiful design. That
beauty should include at least four of the five senses. They should feel better, smell
better, sound better, and look better. And they usually do. But above all they should
look better, because that is what the public sees in magazines films and on the
internet.
I have asked Autodesk for years to allow me to model the temperature swing in my
buildings without taking into effect HVAC in an effort to judge efficacy of passive
measures. Need a naked button, haven't seen it.
Finding out what incentive states are providing would also help.
Getting the power company to be more collaborative, so we can show the financial
benefit to the owner and also reviewing agency to learn about it.
Passive systems are actually part of indigenous design that existed prior to modern
mechanical systems. The renewed interest in using passive heating and cooling as
well as humidification strategies for buildings comes from the need for long term
cost saving solutions as well as the aesthetic value of natural building modeling.

451
Certain states are behind the times in innovations and technology use. This drives
the cost of new systems or construction styles way up, making it nearly impossible
to get clients on board.
Best of Luck with your studies.
I would like to specify that I believe CODES have a greater impact on the increase
in use of passive systems than rating systems. Rating systems are not practical for
smaller scale projects due to cost. They serve as great guidelines, but codes need to
be more strict.
I trust that "passive systems" are any type of construction system for building
enclosure and not just specialized systems that are proprietary or add-ons.

452
Educators' open-ended text question and responses
If there are any additional notes/comments not addressed in this survey about
the education/application of passive/natural systems in buildings, please
respond in the text box below.
I teach a survey course to third year architecture students. Learning the concepts is
key.
Very little time to delve into much detail about any particular system - need to cover
site design, HVAC, plumbing, fire protection & detection, electrical, lighting,
vertical transportation, acoustics and LCCA in 15 weeks
It is implied here, but learning and teaching basic rules of thumb for various passive
design strategies with respect to overall limits on building or zone
size/massing/scale, etc. is a critical first step in seriously implementing many
passive design strategies.
I would also like to see the results of this survey...looking forward to you sharing
this with the participants.
The focus of my teaching has varied greatly over the years. In the last ten years this
has meant that I have covered the issues of the survey primarily in the design studio.
Keep in mind that architects are generally responsible to design and integrate
systems, but not to calculate their performance (with some rare exceptions).
Generally, engineers are responsible for calculations regarding the heating &
cooling of buildings. The use of passive systems are driven partly by the client's
responsiveness to them (sunshades, etc. all come with cost premiums) and the

453
proven effectiveness of the systems (generally evaluated through the consulting
engineer's energy model).
The students are so preoccupied with design studios that it's difficult to implement
any sort of intensive calculation or simulation methods unless it directly relates to
their studio projects.
Simulations need lifecycle costing associated with energy benefits to find the value
over an owner interested period of time - usually it must pay back in less than 5-7
years max and if less than 2 years it will be adopted.
The survey seems to take a technological only approach to the problem. Narrow
comfort standards and the drift in Modern expectations are part of a cultural issue.
Passive design can run across the curriculum, but is rarely addressed as theory or in
history classes. DOE funding almost never engages passive issues. They want
commercialization products, not embodied intelligent architectural configuration.
Passive House claiming the term passive is also a problem.
There is a long and rich history of passive solar design, both in the southwest but in
other part of the country where the climate requires less obvious strategies. A
retrospective survey of some of the earlier iconic passive solar buildings to see how
they are performing now would be a great addition to the literature.
There needs to be a greater opportunity for a nimble analysis of design options as
student designs rapidly evolve in the design studio.

454
In general, architects seem to not feel comfortable including substantive passive
systems in their projects. This is probably partly due to lack of actionable design
knowledge, partly due to lack of readily accessible analysis tools, and partly due to
lack of appreciation for the carbon-reduction potential of even part season use of
passive systems.

455
0123456789
10Lighting
Cooling
Heating
Ventilation
DHW
Potable Water
Renewables
Passive Survival
APPENDIX E
RADAR CHARTS FOR 2017 AIA COTE TOP TEN CASE STUDIES
1.Passive Performance of the Stanford University Central Energy Facility,Stanford, California, Climate Zone 3C

456
0123456789
10Lighting
Cooling
Heating
Ventilation
DHW
Potable Water
Renewables
Passive Survival
0123456789
10Lighting
Cooling
Heating
Ventilation
DHW
Potable Water
Renewables
Passive Survival
2. Passive Performance of the Bristol Community College John J. Sbrega Healthand Science Building, Fall River, Massachusetts, Climate Zone 6A
3. Passive Performance of the Brock Environmental Center Virginia Beach,Virginia, Climate Zone 3A

457
0123456789
10Lighting
Cooling
Heating
ventilation
DHW
Potable Water
Renewables
Passive Survival
0123456789
10Lighting
Cooling
Heating
ventilationDHW
Potable Water
Renewables
4. Passive Performance of Chatham University Eden Hall Campus, RichlandTownship, Pennsylvania, Climate Zone 5A
5. Passive Performance of the Discovery Elementary School (Passive Survivalinformation was insufficient), Arlington, Virginia, Climate Zone 4A

458
0123456789
10Lighting
Cooling
Heating
ventilation
DHW
Potable Water
Renewables
Passive Survival
0123456789
10Lighting
Cooling
Heating
Ventilation
DHW
Potable Water
Renewables
Passive Survival
6. George Washington University, Milken Institute School of Public Health,Washington DC, Climate Zone 4A
7. Manhattan Districts 1/2/5 Garage & Spring Street Salt Shed, New York, ClimateZone 4A

459
0123456789
10Lighting
Cooling
Heating
ventilation
DHW
Potable Water
Renewables
Passive Survival
0123456789
10Lighting
Cooling
Heating
Ventilation
DHW
Potable Water
Renewables
Passive Survival
8. Green Mark Platinum-certified Ng Teng Fong General Hospital (NTFGH),Singapore, Climate Zone 1A
9. NOAA Daniel K. Inouye Regional Center, Honolulu, Hawaii, Climate Zone 1A

460
0123456789
10Lighting
Cooling
Heating
Ventilation
DHW
Potable Water
Renewables
Passive Survival
10. R.W. Kern Center for Hampshire College Campus, Amherst, Massachusetts,
Climate Zone 5A

461
APPENDIX F
TABULAR ANALYSIS OF AIA COTE TOP TEN 2017 AND 2010 AWARDS
In the following pages each awarded project from the year 2017 (Table F.1) and the year
2010 (Table F.2) has been analyzed based on its passive and active performance
achievements and design strategies. The tables related to the analysis of projects inside
the US are shown in gray and the tables related to projects outside the US are shown in
coral color. These projects were studied and analyzed mainly based on the data available
on AIA website at https://www.aia.org/resources/73026-cote-top-ten-2017 and http://
www.aiatopten.org/taxonomy/term/5.

462
Table
F.1
. 201
7 A
IA C
OT
E T
op T
en A
war
d C
ase
Stud
ies
Proj
ect
Yea
r of
co
mpl
etio
n
Proj
ect t
eam
L
ocat
ion
/Clim
ate
E
nvel
ope/
Wat
er
Nat
ural
Hea
ting
N
atur
al C
oolin
g D
aylig
htin
g
Nat
ural
V
entil
atio
n
Act
ive
syst
ems
Wat
er
Mile
ston
es
Stanford University Central Energy Facility
2015
Indu
stria
l/ In
stitu
tiona
l
-des
ign
com
plet
ion
in 2
013
Gro
ss
cond
ition
ed:
9,53
0 SF
G
ross
un
cond
ition
ed: 1
16,0
84
SF
Num
ber o
f oc
cupa
nts/
visit
ors:
42
Arc
hite
ct:
ZGF
Prim
e co
ntra
ctor
/lea
d mec
hani
cal/e
lect
rica
l/plu
mbi
ng
engi
neer
: Affi
liat
ed E
ngin
eers
In
c.
Con
stru
ctio
n co
ntra
ctor
: Th
e W
hitin
g-Tu
rner
C
ontra
ctin
g C
ompa
ny
Civ
il en
gine
er: B
KF
Engi
neer
s St
ruct
ural
en
gine
er: R
uth
erfo
rd +
C
heke
ne
Lan
dsca
pe
arch
itect
: Tom
Le
ader
Stu
dio
http
s://w
ww
.zg
f.com
/con
tact
/
Func
tion:
O
ffice
and
O
ther
(pow
er
plan
t and
te
achi
ng
faci
lity)
Stanford, California/ 3C
- Will
be
conn
ecte
dto
a fu
ture
mun
icip
al
syst
em th
at w
ill
prov
ide
non-
pota
ble
wat
er fo
r pro
cess
co
olin
g an
d irr
igat
ion
of n
ativ
e la
ndsc
apin
g. n
ativ
e pl
ants
and
por
ous
grav
el to
ass
ist in
re
char
ging
the
grou
nd w
ater
tabl
e
- Bio
swal
es w
ill
colle
ct st
orm
wat
er
runo
ff. D
rip
irrig
atio
n, ra
ther
th
an sp
ray,
wat
ers
the
plan
ts.
- Low
-flo
w fi
xtur
esw
ill m
inim
ize
pota
ble
wat
er u
se
(lava
tory
fauc
ets:
0.
35 g
pm; k
itche
n fa
ucet
s: 1
.5 g
pm;
toile
ts: 1
.28
gpf;
urin
als:
0.1
25 g
pf)
- 67 %
redu
ctio
n fro
m th
e pr
evio
us
co-g
ener
atio
n fa
cilit
y, w
hich
is
equi
vale
nt to
m
akin
g 55
7 ty
pica
l of
fice
build
ings
net
-ze
ro w
ater
.
-Use
of B
ioPC
M(a
pha
se-c
hang
e m
ater
ial)
loca
ted
in th
e ce
iling
pr
ovid
es
addi
tiona
l th
erm
al m
ass t
o m
edia
te
tem
pera
ture
s
-Ext
ensi
ve
shad
ing
roof
w
hich
is
inte
grat
ed w
ith
175
kW P
V a
rray
prov
ides
four
tim
es th
e bu
ildin
g’s
inte
rnal
ene
rgy
need
s
-Max
imiz
esda
ylig
htin
g w
ith fl
oor t
o ce
iling
gla
ss p
anes
-Nar
row
27
ft.
floor
for o
ffice
bu
ildin
g, a
long
w
ith sh
adin
g of
the
PV c
anop
y, o
ffers
gl
are-
free
dayl
ight
an
d vi
ews
-Ind
ustri
al a
reas
of
the
build
ing,
ho
usin
g ch
iller
and
boile
rs, h
ave
trans
luce
nt
skyl
ight
s and
gr
ound
leve
l cu
rtain
wal
ls to
pr
ovid
e am
bien
t lig
ht d
urin
g da
ytim
e ho
urs
PFV
O1 : 1
00%
PF
W/O
2 : 10
0%>3
00 lu
x at
3p
m M
arch
21
SDA
: 100
%
-The
ope
n-ai
rpl
an w
ith h
igh
ceili
ngs,
fans
, an
d op
erab
le
win
dow
s per
mits
natu
ral
vent
ilatio
ns
PFW
303 : 1
00%
-68
MW
sola
r far
m(1
5000
0 PV
pan
els)
pr
oduc
ing
65%
of
the
ener
gy fo
r the
pl
ant
- Ext
ensi
ve s
hadi
ng
roof
(whi
ch a
lso h
as
an in
tegr
ated
175
kW
PV
arra
y pr
ovid
ing
four
tim
esth
e bu
ildin
g’s
inte
rnal
ene
rgy
need
s
-Co n
verts
hea
t su
pply
of a
ll bu
ildin
gs fr
om
stea
m to
hot
wat
er
-Hea
t rec
over
y lo
opca
ptur
es 2
/3 o
f hea
t w
aste
from
cam
pus
cool
ing
syst
em fo
r ho
t wat
er
-Rad
iant
slab
is u
sed
with
exp
osed
chi
lled
beam
for h
eatin
g an
d co
olin
g
-LED
ligh
ts w
ith
occu
panc
y se
nsor
san
d da
ylig
ht
dim
min
g co
ntro
l
The
switc
h fro
m
cam
pus s
team
to h
ot
wat
er re
duce
s los
ses
thro
ugho
ut th
e sy
stem
, use
s the
was
te
heat
ent
rain
ed in
the
chill
ed w
ater
retu
rn
loop
to m
eet 9
3 pe
rcen
t of t
he c
ampu
s he
atin
g de
man
ds, a
nd
redu
ces t
he n
eed
for
cool
ing
tow
ers.
Th
e pr
ojec
t is
desi
gned
to c
onne
ct to
a
futu
re m
unic
ipal
sy
stem
that
will
pr
ovid
e no
n-po
tabl
e w
ater
for p
roce
ss
cool
ing
and
irrig
atio
n of
nat
ive
land
scap
ing—
the
larg
est w
ater
de
man
ds. T
he
land
scap
ing
utili
zes
nativ
e pl
ants
and
po
rous
gra
vel t
o as
sist
in re
char
ging
the
grou
nd w
ater
tabl
e, a
s w
ell a
s bio
swal
es to
co
llect
stor
mw
ater
ru
noff.
Drip
irr
igat
ion,
rath
er th
an
spra
y, w
ater
s the
pl
ants
. The
bui
ldin
g fe
atur
es lo
w-f
low
fix
ture
s. -N
o bl
ackw
ater
or
gray
wat
er re
use
-Pot
able
wat
er fo
r Irr
igat
ion
-Net
pos
itive
ene
rgy
-Gre
enho
use
gas e
miss
ions
re
duce
d by
68%
, fos
sil f
uel
use
redu
ced
by 6
5%, a
nd
wat
er u
se re
duce
d by
18%
- Pre
dict
ed c
onsu
med
EU
I: 25
kB
tu/s
q ft/
yr
- Pre
dict
ed N
et E
UI:
-75.
2 kB
tu/s
q ft/
yr
- Pre
dict
ed N
et c
arbo
n em
issio
ns:
-14.
4 lb
/sq
ft/yr
-Pr e
dict
ed p
erce
nt re
duct
ion
from
nat
iona
l ave
rage
EU
I for
bu
ildin
g ty
pe: 2
30 p
erce
nt
-Pre
dict
ed li
ghtin
g po
wer
de
nsity
: 0.4
4 W
/sq
ft
- Ant
icip
ated
num
ber o
f day
sth
e pr
ojec
t can
mai
ntai
n fu
nctio
n w
ithou
t util
ity
pow
er: 3
day
s (th
e pl
ant c
an
prov
ide
72 h
ours
of t
herm
al
utili
ties,
and
has t
hree
fuel
s fo
r hot
wat
er p
rodu
ctio
n fo
r m
axim
um re
silie
ncy)
-Bec
a use
of t
he m
ild c
limat
e,
dayl
ight
ing,
and
use
of n
atur
al
vent
ilatio
n, th
e ad
min
istra
tive
offic
e is
clai
med
pas
sive
ly
surv
ivab
le y
ear a
roun
d
1 Pe
rcen
tage
of f
loor
are
a or
per
cent
age
of o
ccup
ant w
ork
stat
ions
with
dire
ct v
iew
s of t
he o
utdo
ors (
PFV
O)
2 Per
cent
age
of fl
oor a
rea
or p
erce
ntag
e of
occ
upan
t wor
k st
atio
ns a
chie
ving
ade
quat
e lig
ht le
vels
with
out t
he u
se o
f arti
ficia
l lig
htin
g (P
WF/
O)
3 Per
cent
age
of fl
oor a
rea
or p
erce
ntag
e of
occ
upan
t wor
k st
atio
ns w
ithin
30
feet
of o
pera
ble
win
dow
s (PF
W30
)

463
Project
Yea
r of
co
mpl
etio
n
Proj
ect t
eam
L
ocat
ion
/Clim
ate
E
nvel
ope
Nat
ural
Hea
ting
N
atur
al C
oolin
g
Day
light
ing
N
atur
al
Ven
tilat
ion
A
ctiv
e sy
stem
s W
ater
M
ilest
ones
Bristol Community College John J. Sbrega Health and Science Building
July
201
6 -d
esig
n co
mpl
etio
n in
20
11
Are
a: 5
0,60
0 SF
Num
ber o
f oc
cupa
nts/
visi
tors
: 11,
111
Lan
dsca
pe A
rchi
tect
and
A
rchi
tect
: Sas
aki
ME
P: B
ard
Rao
+ A
than
as
Con
sulti
ng E
ngin
eers
St
ruct
ural
: RSE
Ass
ocia
tes
Fire
pro
tect
ion:
Fer
nand
ez
Ass
ocia
tes
Civ
il en
gine
er: N
itsch
En
gine
erin
g G
eoth
erm
al: H
aley
and
Ald
rich
Spec
ifica
tions
: Ste
ven
McH
ugh,
A
rchi
tect
C
ode:
Jens
en H
ughe
s C
onst
ruct
ion
man
agem
ent:
Bond
Bro
ther
s W
WW
.SA
SAK
I.CO
M
fcro
wel
l@sa
saki
.com
pr
inci
pal:
Fisk
e C
row
ell,
FAIA
, LE
ED A
P
Func
tion:
Edu
catio
nal
Rep
lace
men
t pro
ject
for a
sc
ienc
e an
d he
alth
lear
ning
ce
nter
Fall River, Massachusetts, Zone 6A
_ - S
ix so
lar t
herm
al
roof
-mou
nted
hot
w
ater
col
lect
ors (
65
MM
Btu/
Yr.
hot
wat
er)
-Use
of g
roun
d te
mpe
ratu
re in
GSH
P
- Se l
f-sha
ding
with
de
ep ro
of o
verh
angs
; sh
adin
g de
vice
s
- Day
light
/occ
upa
ncy
sens
ors
-Gla
zed
atriu
m
-Cle
rest
ory
on
the
east
side
-c
urta
in w
alls
sout
h an
d no
rth
-Gla
re is
co
ntro
lled
with
bo
th fr
itted
gla
ssan
d w
indo
w
treat
men
ts
P FV
O: 9
2%
PFW
/O:
70%
>300
lux
at
3pm
Mar
ch 2
1
Nat
ural
ve
ntila
tion
with
op
erab
le
win
dow
s, au
tom
atic
in th
e liv
ing
room
and
m
anua
l in
labs
PFW
30: 9
0%
-3.2
MW
sola
r ar
ray
over
a
park
ing
lot i
n ad
ditio
n to
the
site
arra
y, b
ut is
not
pa
rt of
the
proj
ect
- Ent
halp
y w
heel
he
at re
cove
ry
-Dec
oupl
ing
cool
ing/
heat
ing
from
ven
tilat
ion
-Fan
coi
l uni
ts a
re
used
for l
ocal
co
ntro
l
-Duc
tless
/filtr
atio
n fu
me
hood
s/ai
r-qu
ality
mon
itorin
g is
used
in
labo
rato
ries
-Gro
und
sour
ce/a
ir so
urce
hea
t pum
p
-DO
AS
for
vent
ilatio
n
-LED
-A 1
0,00
0-ga
llon
dete
ntio
n fa
cilit
y is
loca
ted
unde
rnea
th th
e la
wn
to o
ffset
the
limite
d st
orag
e ca
paci
ty o
f the
ba
sins
. See
di
agra
m
illus
tratin
g th
e flo
w o
f sto
rm
wat
er.
-The
land
scap
e pl
antin
gs a
re
nativ
e sp
ecie
s an
d do
not
rely
on
irrig
atio
n.
-Low
-flo
w
fixtu
res r
educ
e w
ater
usa
ge b
y 40
per
cent
.
-Wat
er is
not
re-
used
, but
the
bios
wal
es a
nd
infil
tratio
n ba
sins
rech
arge
the
aqui
fer
- Bla
ckw
ater
or
gray
wat
er is
not
re
used
-Rea
chin
g a
NZE
bu
ildin
g w
ithou
t ch
angi
ng th
e bu
dget
-Pre
dict
ed c
onsu
med
EU
I: 50
kBt
u/sq
ft/y
r
-Pre
dict
ed N
et E
UI:
0 kB
tu/s
q ft/
yr
-Pre
dict
ed N
et c
arbo
n em
issio
ns: 3
.45
lb/s
q ft/
yr
- Pre
dict
ed p
erce
nt
redu
ctio
n fro
m n
atio
nal
aver
age
EUI f
or b
uild
ing
type
: 100
per
cent
-Pre
dict
ed li
ghtin
g po
wer
de
nsity
: 0.5
8 W
/sq
ft
- 67%
redu
ctio
n in
ai
rflo
w
-33%
-67%
AC
H
redu
ctio
n -4
0 pe
rcen
t red
uctio
n in
LP
D
- Aw
arde
d by
M
assa
chus
etts
DO
ER th
e hi
ghes
t com
mer
cial
bu
ildin
g Pa
thw
ays t
o Ze
ro g
rant
-LEE
D S
ilver
- The
cla
imed
pas
sive
su
rviv
al is
yea
r aro
und

464
Project
Yea
r of
co
mpl
etio
n
Proj
ect t
eam
L
ocat
ion
/Clim
ate
E
nvel
ope
Nat
ural
Hea
ting
N
atur
al C
oolin
g
Day
light
ing
N
atur
al
Ven
tilat
ion
A
ctiv
e sy
stem
s M
ilest
ones
2015
-Des
ign
com
plet
ion
in
2013
Gro
ss
cond
ition
ed
floor
are
a:
10,5
18 S
F
Num
ber o
f oc
cupa
nts o
r vi
sito
rs: 2
5,00
0
Arc
hite
ct: S
mith
Gro
upJJ
R
WW
W.S
MIT
HG
RO
UPJ
JR.C
OM
E
ngin
eer
(ME
P): S
mith
Gro
upJJ
R
Eng
inee
r (c
ivil)
: WPL
Site
Des
ign
Eng
inee
r (s
truc
tura
l): A
+F
Engi
neer
ing
Gen
eral
con
trac
tor:
Hou
rigan
C
onst
ruct
ion
Lan
dsca
pe a
rchi
tect
: WPL
Site
D
esig
n O
wne
r's r
epre
sent
ativ
e: S
kans
ka
USA
L
BC
/LE
ED
man
agem
ent:
Jane
t H
arris
on A
rchi
tect
M
EP
com
mis
sion
ing:
Bro
oks +
W
right
B
uild
ing
encl
osur
e co
mm
issi
onin
g: T
he F
acad
e G
roup
F unc
tion:
Edu
catio
n, G
ener
al,
Offi
ce, a
nd P
ublic
Ass
embl
y.
Che
sape
ake
Bay
Foun
datio
n’s
(CB
F) H
ampt
on R
oads
offi
ce,
supp
ortin
g th
eir e
duca
tion,
ad
voca
cy a
nd re
stor
atio
n in
itiat
ive
Virginia Beach, Virginia/ 3A
-Ext
erio
ren
velo
pe (R
-31
wal
ls, R
-50
roof
, R-7
w
indo
ws)
si
gnifi
cant
ly
redu
ces h
eatin
g de
man
d.
-siz
ed w
indo
ws
(25%
WW
R) t
o pr
ovid
e op
timal
da
ylig
ht, v
iew
s, an
d ve
ntila
tion,
w
ithou
t ex
cess
ive
heat
ga
in
- Al l
mat
eria
lsus
ed in
side
the
cent
er c
ompl
y w
ith th
e LB
C
Red
List
-Dire
ct g
ain:
long
bar
cu
rves
slig
htly
to th
e ea
st, a
llow
ing
mor
ning
sun
to
preh
eat t
he in
terio
r -P
orch
alo
ng so
uth
faça
de s
hadi
ng th
e in
terio
r fro
m
unw
ante
d he
at g
ain
-Nor
th-fa
cing
cle
rest
ory
win
dow
s pro
vide
gla
re-
free
dayl
ight
- 97
perc
ent r
educ
tion
in
light
ing
ener
gy. A
whi
te,
acou
stic
al m
etal
dec
k ce
iling
and
hig
h, n
orth
cl
eres
tory
win
dow
s m
axim
ize
dayl
ight
ing
effe
ctiv
enes
s fro
m d
irect
day
light
-Blin
ds
PFV
O: 1
00%
PF
W/O
: 100
%>3
00 lu
x at
3p
m M
arch
21
-Lof
t-lik
ein
terio
rs to
pr
omot
e na
tura
l st
ack/
cros
s ve
ntila
tion
-bre
akin
g flo
or
plat
e w
ith a
do
gtro
t; a
dogt
rot
is an
ope
n ai
r pa
ss-th
roug
h th
at
crea
tes a
co
mfo
rtabl
e m
icro
-clim
ate
whi
le p
rom
otin
g ai
rflo
w to
redu
ce
horiz
onta
l st
ratif
icat
ion.
-The
prim
ary
circ
ulat
ion
corr
idor
alo
ng
the
sout
h ed
ge
buffe
rs
wor
ksta
tions
fro
m c
ool
bree
zes t
o ex
tend
th
e na
tura
l ve
ntila
tion
seas
on
- Ope
rabl
e w
indo
ws
P FW
30: 1
00%
-VR
F H
VA
Csy
stem
cou
pled
w
ith D
OA
S ve
ntila
tion,
util
izes
18 g
roun
d-so
urce
w
ells,
impr
ovin
g he
atin
g an
d co
olin
g ef
ficie
ncy
-45
KW
roof
m
ount
ed P
V o
n th
e so
uth-
faci
ng
roof
-Tw
o 10
kW
win
d tu
rbin
es
-Occ
upan
cy
sens
ors c
ontro
l lig
htin
g,
vent
ilatio
n, a
ndpl
ugs
-Ce i
ling
fans
/task
light
s
Livi
ng B
uild
ing
Cha
lleng
e LE
ED P
latin
um (2
009)
N
PE (p
rodu
ce 8
0% m
ore
ener
gy th
an c
onsu
med
yea
rly)
Zero
Was
te
-firs
t pro
ject
in th
e st
at e
to
gain
app
rova
l for
pot
able
use
of
rain
wat
er
-Pre
dict
ed c
onsu
med
EU
I: 15
.5 k
Btu/
sq ft
/yr
-Pre
dict
ed n
et E
UI:
-6.6
kB
tu/s
q ft/
yr
-Pre
dict
ed n
et c
arbo
n em
issio
ns: -
7.7
lb/s
q ft/
yr- P
redi
cted
per
cent
redu
ctio
n fro
m n
atio
nal a
vera
ge E
UI f
or
build
ing
type
: 100
per
cent
-Pre
dict
ed li
ghtin
g po
wer
de
nsity
: 0.6
9 W
/sq
ft
P OE
resu
lts:
-Act
ual c
onsu
med
EU
I: 14
.12
kBtu
/sq
ft/yr
-Act
ual n
et E
UI:
-11.
69
kBtu
/sq
ft/yr
-Act
ual n
et c
arbo
n em
issi
ons:
-1
2.6
lb/s
q ft/
yr
-Pas
sive
sur
viva
bilit
y cl
aim
ed: 5
day
s
Brock Environmental Center

465
Project Y
ear
of
com
plet
ion
Pr
ojec
t tea
m
Loc
atio
n /C
limat
e
Env
elop
e N
atur
al H
eatin
g
Nat
ural
Coo
ling
Day
light
ing
N
atur
al
Ven
tilat
ion
A
ctiv
e sy
stem
s W
ater
M
ilest
ones
Chatham University Eden Hall Campus
2015
-des
ign
com
plet
ion
in
2013
Gro
ss
cond
ition
ed
floor
are
a:
42,2
19 S
F
Gro
ss
unco
nditi
oned
flo
or a
rea:
3,
050S
F
Num
ber o
f oc
cupa
nts/
visi
tor
s: 1
50
WW
W.M
ITH
UN
.CO
M
ME
P: In
terfa
ce
Engi
neer
ing
Con
stru
cted
w
etla
nds a
nd w
ater
sy
stem
des
ign:
B
ioha
bita
ts
Civ
il: C
ivil
and
Envi
ronm
enta
l C
onsu
ltant
s (C
EC)
Stru
ctur
al: K
PFF
Engi
neer
s O
nsite
pro
ject
m
anag
emen
t: R
oths
child
Doy
no
Col
labo
rativ
e G
ener
al c
ontr
acto
r:
Sota
Con
stru
ctio
n C
omm
issi
onin
g ag
ent:
CJL
En
gine
erin
g Fo
od se
rvic
e: T
he
Mar
shal
l Ass
ocia
tes
Lig
htin
g de
sign
er:
WSP
| Pa
rson
s Br
inck
erho
ff
AV
/Aco
ustic
s: S
hen
Mils
on &
Wilk
e A
cces
sibi
lity:
Stu
dio
Paci
fica
Env
elop
e: S
imps
on
Gum
pertz
& H
eger
F unc
tion:
Edu
catio
n,
Res
taur
ant,
Dor
mito
ry, P
ublic
A
ssem
bly
Richland Township, Pennsylvania/ 5A
-Sup
erin
sula
ted
enve
lope
- P
PG c
ost-
effe
ctiv
e do
uble
gl
azed
pro
duct
s th
at o
ut-p
erfo
rm
tripl
e gl
azed
op
tions
- In n
ovat
ive
rain
scre
en
clad
ding
by
TAK
TL, a
loca
l bu
sine
ss th
at
deve
lope
d a
low
em
bodi
ed e
nerg
y m
etho
d
-Sol
ar h
ot w
ater
-Ear
th lo
op
-Sha
ding
with
ov
erha
ngs
PFV
O: 9
4%
PFW
/O: 3
0%>3
00
lux
at 3
pm M
arch
21
oper
able
win
dow
s
PFW
30: 7
7%
- Pho
tovo
ltaic
(PV
)ro
ofto
ps (s
uch
as 5
8 K
W W
elco
me
Shel
ter a
nd 3
8 K
W
for a
lab)
and
ca
nopi
es; g
eo-
exch
ange
-10
kW c
o-ge
nera
tion
plan
t in
the
dini
ng c
omm
ons
prod
uces
ele
ctric
ity
and
hot w
ater
usi
ng
natu
ral g
as w
ith b
io-
fuel
equ
ival
ency
-En e
rgy
loop
link
s bu
ildin
gs, e
nhan
cing
th
e ef
ficie
ncy
as lo
w
tem
pera
ture
geo
-ex
chan
ge w
ater
act
s as
a th
erm
al si
nk
and
dist
ribut
es
exce
ss h
eat t
o ot
her
build
ings
.
-Ele
ctric
indu
ctio
n co
okin
g, h
igh-
effic
ienc
y re
frige
ratio
n an
d a
root
cel
lar (
65%
re
duct
ion
in e
nerg
y us
e)
-Ra d
iant
hea
ting
and
cool
ing
syst
em
embe
dded
in th
e gy
psum
boa
rd
ceili
ng, q
uiet
ly
heat
ing
and
cool
ing
-DO
AS
-Use
of p
otab
lew
ater
is re
duce
d th
roug
h on
site
w
ater
trea
tmen
t an
d re
use
of
efflu
ent f
rom
all
build
ings
exc
ept
the
Orc
hard
Dor
ms
-The
toile
t flu
shin
g de
man
d is
prov
ided
by
recl
aim
ed w
ater
fro
m th
e ca
mpu
s sy
stem
-Per
cent
age
of
wat
er c
onsu
med
on
site
from
ra
inw
ater
cap
ture
: 39
%
-Per
cent
age
of
wat
er c
onsu
med
on
site
from
gr
eyw
ater
/bla
ckw
ate
r cap
ture
and
tre
atm
ent:
16%
Targ
etin
g Li
ving
B
uild
ing
Cha
lleng
e,
and
LEED
Pla
tinum
; G
rid c
onne
cted
, ta
rget
ing
net e
nerg
y po
sitiv
e ca
mpu
s
20 E
UI f
or b
uild
ing
load
s exc
lusi
ve o
f foo
d pr
ep a
nd a
quac
ultu
re
syst
ems
-Pre
dict
ed c
onsu
med
EU
I: 10
5.9
kBtu
/sq
ft/yr
-P
redi
cted
net
EU
I: 76
.23
kBtu
/sq
ft/yr
-Pre
dict
ed n
et c
arbo
n em
issio
ns: 7
27,5
25
lb/s
q ft/
yr
- Pre
dict
ed p
erce
nt
redu
ctio
n fro
m n
atio
nal
aver
age
EUI f
or
build
ing
type
: 70%
-Pre
dict
ed li
ghtin
g po
wer
den
sity
: 0.7
2 W
/sq
ft
P OE
resu
lts:
-Act
ual c
onsu
med
EU
I: 91
kBt
u/sq
ft/y
r
-Act
ual n
et E
UI:
62.2
3 kB
tu/s
q ft/
yr
-Act
ual n
et c
arbo
n em
issio
ns: 5
93,9
12
lb/s
q ft/
yr
-Pas
sive
sur
viva
bilit
y cl
aim
ed: 1
day

466
Project Y
ear
of
com
plet
ion
Pr
ojec
t tea
m
Loc
atio
n /C
limat
e
Env
elop
e N
atur
al H
eatin
g
Nat
ural
Coo
ling
D
aylig
htin
g
Nat
ural
V
entil
atio
n
Act
ive
syst
ems
Wat
er
Mile
ston
es
Discovery Elementary School
2016
-des
ign
com
plet
ion
in
2014
Gro
ss
cond
ition
ed
floor
are
a:
97,5
88 S
F
Num
ber o
f oc
cupa
nts/
visi
tors
: 715
Arc
hite
ct: V
MD
O
Arc
hite
cts
WW
W.V
MD
O.C
OM
Eng
inee
r (m
echa
nica
l, lig
htin
g, n
et-z
ero
ener
gy d
esig
n): C
MTA
C
onsu
lting
Eng
inee
rs
Eng
inee
r (p
ower
, pl
umbi
ng, f
ire
prot
ectio
n): 2
rw
Con
sulta
nts I
nc.
Eng
inee
r (s
truc
tura
l):
Fox
+ A
ssoc
iate
s E
ngin
eer
(civ
il):
Bow
man
Con
sulti
ng
Gro
up
Food
serv
ice
cons
ulta
nt: E
IS In
c.
Lan
dsca
pe a
rchi
tect
: O
culu
s T
raff
ic: T
oole
Des
ign
Gro
up
Cos
t est
imat
ing:
D
owne
y &
Sco
tt C
onst
ruct
ion
man
ager
: Hee
ry
P hili
p D
onav
an
(arc
hite
ct m
embe
r)
F unc
tion:
Edu
catio
n–K
-12
Scho
ol
Arlington, Virginia/4A
Air
tight
env
elop
e te
sted
at 0
.12
cfm
/ft2
38%
gla
zing
Supe
r ins
ulat
ed b
ut
over
-con
serv
ativ
e am
ount
s of
poly
styr
ene
roof
in
sula
tion
wer
e re
duce
d
Inte
rior C
MU
was
re
plac
ed w
ith h
igh-
impa
ct, h
igh
recy
cled
co
nten
t gyp
sum
wal
l bo
ard
The
exte
rior e
nvel
ope
was
a lo
ad-b
earin
g in
sula
ted
conc
rete
w
all s
yste
m (o
ne o
f th
e fir
st in
the
regi
on)-
allo
win
g fo
r a
sign
ifica
nt re
duct
ion
in th
e hi
gh le
vels
of
embo
died
ene
rgy
cont
aine
d in
stru
ctur
al
stee
l
Idea
l orie
ntat
ion
for
sola
r gen
erat
ion
Sola
r hot
wat
er
Hig
h th
erm
al m
ass
thro
ugh
ICF
cons
truct
ion
((Ins
ulat
ed C
oncr
ete
Form
s)
T her
mal
mas
s R
oof s
hape
PFV
O: 7
6.8%
PF
W/O
: 75%
>300
lu
x at
3pm
Mar
ch
21
62 S
olat
ubes
A te
rrac
ed
build
ing
sect
ion
that
bro
ught
ligh
t de
ep in
to th
e bu
ildin
g w
hile
m
axim
izin
g ro
of
top
Ope
rabl
e w
indo
ws
PFW
30: 7
2%
- Roo
f mou
nted
ph
otov
olta
ic (P
V)
pane
ls m
axim
um
500k
W (d
ue to
lo
cal u
tility
m
axim
um
perm
issi
on)
A la
b-qu
ality
se
nsor
con
stan
tly
mon
itors
CO
₂ le
vels
in e
very
re
gula
rly o
ccup
ied
spac
e an
d al
l br
eak-
out
inst
ruct
iona
l sp
aces
: a to
tal o
f 61
mon
itorin
g po
ints
. Whe
n an
y sp
ace
exce
eds 7
00
ppm
, an
incr
ease
d ra
te o
f fre
sh a
ir is
supp
lied.
All
elec
tric
kitc
hen
Geo
ther
mal
sour
ce
ener
gy
Rai
nwat
er
capt
ured
for
use
by th
e pr
ojec
t; 1%
o
f wat
er
cons
umed
on
site
com
es
from
ra
inw
ater
ca
ptur
ed
Gre
ywat
er o
r bl
ackw
ater
no
t cap
ture
d fo
r re-
use;
Pe
rcen
t of
rain
wat
er th
at
can
be
man
aged
on
site
from
m
axim
um
antic
ipat
ed
24-h
our,
2-ye
ar st
orm
ev
ent:
19.2
%
Firs
t net
zer
o en
ergy
sc
hool
in th
e M
id-
Atla
ntic
, the
larg
est i
n th
e U
S
-Pre
dict
ed c
onsu
med
EU
I: 21
.2 k
Btu/
sq ft
/yr
-Pre
dict
ed n
et E
UI:
-0.8
5 kB
tu/s
q ft/
yr
-Pre
dict
ed n
et c
arbo
n em
issio
ns: -
0.39
lb/s
q ft/
yr
- Pre
dict
ed p
erce
nt
redu
ctio
n fro
m n
atio
nal
aver
age
EUI f
or b
uild
ing
type
: 69%
-Pre
dict
ed li
ghtin
g po
wer
de
nsity
: 0.5
5 W
/sq
ft
P OE
resu
lts:
-Act
ual c
onsu
med
EU
I: 16
.21
kBtu
/sq
ft/yr
-Act
ual n
et E
UI:
-0.6
5 kB
tu/s
q ft/
yr
-Act
ual n
et c
arbo
n em
issio
ns: -
0.29
lb/s
q ft/
yr
- Act
ual p
erce
nt
redu
ctio
n fro
m n
atio
nal
aver
age
EUI f
or b
uild
ing
type
: 76%
-Pas
sive
sur
viva
bilit
y cl
aim
ed: u
nkno
wn
(sev
eral
day
s)

467
Project Y
ear
of
com
plet
ion
Pr
ojec
t tea
m
Loc
atio
n /C
limat
e
Env
elop
e N
atur
al H
eatin
g
Nat
ural
Coo
ling
D
aylig
htin
g
Nat
ural
V
entil
atio
n
Act
ive
syst
ems
Wat
er
Mile
ston
es
George Washington University , Milken Institute School of Public Health
2014
-des
ign
com
plet
ion
in
2012
Gro
ss
cond
ition
ed
floor
are
a:
145,
700
SF
Gro
ss
unco
nditi
oned
flo
or a
rea:
15
,400
SF
Num
ber o
f oc
cupa
nts/
visi
tors
: 147
7
Arc
hite
ct: P
ayet
te
WW
W.P
AY
ETTE
.CO
M
Civ
il en
gine
er: W
iles
Men
sch
Cor
pora
tion
ME
P/FP
eng
inee
r:
Affi
liate
d En
gine
ers,
Inc.
St
ruct
ural
eng
inee
r:
Tadj
er-C
ohen
-Ede
lson
Ass
ocia
tes
LE
ED
con
sulta
nt:
Pala
dino
and
Com
pany
L
ight
ing
desi
gner
: Ate
lier
Ten
Ele
vato
r co
nsul
tant
: Zip
f A
ssoc
iate
s, In
c.
Aco
ustic
al/A
udio
visu
al:
Shen
Mils
om W
ilke
Cod
e co
nsul
tant
: Rol
f Je
nsen
Ass
ocia
tes
Fire
pro
tect
ion
cons
ulta
nt: R
.W. S
ulliv
an
Engi
neer
ing
Func
tion:
Edu
catio
n—C
olle
ge/U
nive
rsity
cam
pus
leve
l
Washington, DC /4A
Trip
le g
lazi
ng
to m
inim
ize
heat
gai
n/lo
ss
An
exte
nsiv
e gr
een
roof
, with
pla
ntin
gs
adap
ted
to th
e he
at
and
hars
h ur
ban
envi
ronm
ent o
f DC
Whi
te P
VC
roof
to
min
imiz
e he
at is
land
ef
fect
PFV
O: 8
4%
P FW
/O:
64%
>300
lux
at
3pm
Mar
ch 2
1
S DA
=64%
S kyl
it at
rium
de
sign
brin
gs
dayl
ight
into
all
floor
s of t
he
build
ing
(20’
wid
e m
axim
um)
PFW
30: 0
%
- Hea
t rec
over
ych
iller
and
ene
rgy
whe
el
-Met
ers w
ere
inst
alle
d to
per
mit
ener
gy m
easu
rem
ent
and
verif
icat
ion
-Act
ive
chill
ed
beam
s whi
ch
deco
uple
coo
ling
from
ven
tilat
ion
(hyd
roni
c ch
illed
be
am re
quiri
ng le
ss
spac
e)
-Occ
upan
cy se
nsor
sto
con
trol l
ight
ing
and
vent
ilatio
ns
-Low
vel
ocity
un
derf
loor
di
spla
cem
ent a
ir in
se
at p
edes
tals
-DO
AS
for
vent
ilatio
n w
ith d
ual
whe
el e
xhau
st a
ir he
at re
cove
ry
-Occ
upan
t sen
sing
LE
D
Low
flow
pl
umbi
ng
fixtu
res
The
rain
wat
er
harv
est s
yste
m
cont
ribut
es to
a
41 p
erce
nt
redu
ctio
n in
bu
ildin
g fix
ture
w
ater
usa
ge.
The
use
of
nativ
e an
d ad
aptiv
e pl
ants
fo
r lan
dsca
ping
Rai
nwat
er
capt
ured
for u
se
by th
e pr
ojec
t; 15
%
of w
ater
co
nsum
ed
onsi
te c
omes
fro
m ra
inw
ater
ca
ptur
ed
Gre
ywat
er o
r bl
ackw
ater
is
not c
aptu
red
for
re-u
se
LEED
Pla
tinum
(v20
09)
Pred
icte
d co
nsum
ed E
UI:
84
kBtu
/sq
ft/yr
Pred
icte
d ne
t EU
I: 84
.1
kBtu
/sq
ft/yr
P red
icte
d ne
t car
bon
emiss
ions
: 28.
2 lb
/sq
ft/yr
P red
icte
d pe
rcen
t red
uctio
n fro
m n
atio
nal a
vera
ge E
UI
for b
uild
ing
type
: 64%
-Pre
dict
ed li
ghtin
g po
wer
de
nsity
: 0.8
4 W
/sq
ft
- 30%
redu
ctio
n in
ligh
ting
pow
er d
ensi
ty
P OE
resu
lts:
-Act
ual c
onsu
med
EU
I: 82
.3
kBtu
/sq
ft/yr
-Act
ual n
et E
UI:
82.3
kB
tu/s
q ft/
yr
-Act
ual n
et c
arbo
n em
issio
ns: 3
0.3
lb/s
q ft/
yr
- Act
ual p
erce
nt re
duct
ion
from
nat
iona
l ave
rage
EU
I fo
r bui
ldin
g ty
pe: 6
5%
P ass
ive
surv
ivab
ility
cl
aim
ed:1
day
Payb
ack
perio
d: P
V—
18
yrs;
hea
t rec
over
y ch
iller
—16
yea
rs; t
riple
gla
zing
—30
ye
ars

468
Project Y
ear
of
com
plet
ion
Pr
ojec
t tea
m
Loc
atio
n /C
limat
e E
nvel
ope
Nat
ural
Hea
ting
N
atur
al C
oolin
g
Day
light
ing
N
atur
al
Ven
tilat
ion
A
ctiv
e sy
stem
s W
ater
Manhattan Districts 1/2/5 Garage & Spring Street Salt Shed
2015
Des
ign
com
plet
ion
in
2012
Gro
ss
cond
ition
ed
floor
are
a:
302,
023S
F
Gro
ss
unco
nditi
oned
flo
or a
rea:
14
0,15
2 SF
Num
ber o
f oc
cupa
nts/
visi
tor
s: 2
38 F
TE
staf
f
Arc
hite
ct: D
attn
er A
rchi
tect
s W
WW
.DA
TTN
ER.C
OM
M
anha
ttan
Dis
tric
ts 1
/2/5
Gar
age
Gen
eral
con
trac
tor:
DeM
atte
is C
onst
ruct
ion
Com
pany
/Dar
con
Join
t V
entu
re
Eng
inee
r (s
truc
tura
l): T
he B
urns
Gro
up
Eng
inee
r (c
ivil
& M
EP)
: Gre
eley
and
H
anse
n C
omm
issi
onin
g: H
oriz
on E
ngin
eerin
g A
ssoc
iate
s E
ngin
eer
(geo
tech
nica
l): L
anga
n En
gine
erin
g C
urta
in w
all c
onsu
ltant
: Fro
nt In
c.
Lig
htin
g de
sign
er: D
omin
go G
onza
lez
Ass
ocia
tes,
Inc.
L
ands
cape
arc
hite
ct: A
bel B
ainn
son
But
z, L
LP
Ver
tical
tran
spor
tatio
n: V
an D
euse
n &
A
ssoc
iate
s (V
DA
) E
ngin
eer
(traf
fic):
Phili
p H
abib
&
Ass
ocia
tes
Arc
hite
ctur
al sp
ecifi
catio
ns: R
ober
t Sc
hwar
tz A
ssoc
iate
s C
onst
ruct
ion
man
ager
: Tur
ner
Sprin
g St
reet
Sal
t She
d G
ener
al c
ontr
acto
r: O
livei
ra C
ontra
ctin
g,
Inc.
E
ngin
eer
(str
uctu
ral):
The
Bur
ns G
roup
E
ngin
eer
(civ
il &
ME
P): G
reel
ey a
nd
Han
sen
Eng
inee
r (g
eote
chni
cal):
Lan
gan
Engi
neer
ing
Lig
htin
g de
sign
er: D
omin
go G
onza
lez
ssoc
iate
s, In
c.
Lan
dsca
pe a
rchi
tect
: Abe
l Bai
nnso
n B
utz,
LLP
A
rchi
tect
ural
con
cret
e co
nsul
tant
: R
egin
ald
Hou
gh F
AIA
/Ter
ra T
ech
Ass
ocia
tes I
nc.
Arc
hite
ctur
al sp
ecifi
catio
ns: R
ober
t Sc
hwar
tz A
ssoc
iate
s C
onst
ruct
ion
man
ager
: Tur
ner
Func
tion:
Offi
ce a
nd m
aint
enan
ce g
arag
e
New York, NY/4A
Dou
ble-
skin
fa
cade
that
redu
ces
sola
r gai
n w
hile
al
low
ing
dayl
ight
; co
mpr
ised
of
glaz
ed c
urta
in w
all
and
2,60
0 cu
stom
pe
rfora
ted-
alum
inum
sola
r sh
adin
g de
vice
s (f
ins)
Idea
l orie
ntat
ion
for
sola
r gen
erat
ion
A 1
.5-a
cre
gree
n ro
of p
rote
cts t
he
roof
mem
bran
e,
redu
ces h
eat-i
slan
d ef
fect
, enh
ance
s st
orm
wat
er
rete
ntio
n an
d th
erm
al
perfo
rman
ce. T
he
gree
n ro
of is
co
mpr
ised
of 1
3,25
0 pr
e-pl
ante
d tra
ys to
al
low
for a
qui
ck
inst
alla
tion
and
to
brin
g al
read
y es
tabl
ishe
d pl
ants
to
the
site
.
PFV
O: 9
3.5%
PF
W/O
: 0%
>300
lu
x at
3pm
Mar
ch
21
The
2,60
0 pe
rfora
ted
suns
hade
s red
uce
dire
ct su
nlig
ht o
n th
e gl
azin
g by
67
perc
ent,
limiti
ng
sola
r hea
t gai
n w
ithin
the
gara
ge
whi
le st
ill a
llow
ing
in a
n ab
unda
nce
of
natu
ral l
ight
At t
he so
uth-
faci
ng
pers
onne
l are
as, a
nd
at th
e re
pair
bays
on
the
wes
t sid
e, th
e fin
s are
ope
rabl
e an
d tra
ck th
e su
n’s
loca
tion
thro
ugho
ut
the
day
-Day
light
har
vest
ing
FW
30: 0
%
- 35.
8% re
duct
ion
calc
ulat
ed u
sing
the
ASH
RA
E 90
.1-2
004
met
hodo
logy
.
-Use
of m
unic
ipal
st
eam
for h
eatin
g -a
ndco
olin
g - a
con
dens
ate
heat
re
cove
ry sy
stem
-Mul
ti-le
vel l
ight
ing
fixtu
res
-use
of c
ontin
uous
air
mon
itorin
g an
d BM
S co
ntro
l of
vent
ilatio
n ra
tes
- Thr
ough
the
use
of
mun
icip
al st
eam
, no
fuel
s are
bur
ned
in th
e bu
ildin
g. T
he st
eam
is
used
to g
ener
ate
hot
wat
er to
tem
per t
he a
ir in
the
Gar
age,
hea
t the
pe
rson
nel s
pace
s, an
d pr
ovid
e do
mes
tic h
ot
wat
er. S
team
ab
sorp
tion
chill
ers
prov
ide
air-
cond
ition
ing
in th
e pe
rson
nel o
ffice
s and
lo
cker
room
s. A
275
kW
ext
ract
ing
turb
ine
gene
rato
r, po
wer
ed
thro
ugh
the
step
-dow
n pr
oces
s fro
m th
e hi
gh-
pres
sure
stea
m se
rvic
e to
the
wor
king
pre
ssur
est
eam
use
d in
the
build
ing,
furth
er
redu
ces g
rid lo
ads.
The
gree
n ro
of
parti
cipa
tes a
s a
build
ing
syst
em b
y pr
ovid
ing
a ha
bita
t and
fo
od fo
r mig
rato
ry
bird
s, ca
ptur
ing
100
perc
ent o
f rai
nwat
er
and
impr
ovin
g vi
ews
for n
eigh
borin
g bu
ildin
gs. G
reyw
ater
is
used
as a
sour
ce fo
r flu
shin
g re
stro
om
fixtu
res a
nd tr
uck
was
hing
.
Plan
ted
with
25
dist
inct
dr
ough
t-res
istan
t sp
ecie
s, th
e ro
of
requ
ires
no p
erm
anen
t irr
igat
ion.
The
pla
nt
varie
ty in
clud
es a
bio
-di
vers
e m
ix o
f sed
um,
sem
perv
ivum
, and
flo
wer
ing
pere
nnia
ls.
Perc
enta
ge o
f wat
er
cons
umed
ons
ite fr
om
rain
wat
er c
aptu
re:
64.2
%
Gre
ywat
er/b
lack
wat
er
capt
ured
for r
euse
100%
of r
ainw
ater
can
be
man
aged
on
site

469
Project Y
ear
of
com
plet
ion
Pr
ojec
t tea
m
Loc
atio
n /C
limat
e
Env
elop
e N
atur
al H
eatin
g
Nat
ural
Coo
ling
D
aylig
htin
g
Nat
ural
Ven
tilat
ion
Act
ive
syst
ems
Wat
er
Mile
ston
es
Green Mark Platinum-certified Ng Teng Fong General Hospital (NTFGH)
2015
-des
ign
com
plet
ion
in
2011
Gro
ss
cond
ition
ed
floor
are
a:
1,96
2,85
3 SF
Num
ber o
f oc
cupa
nts/
visi
tor
s: 1
100
Arc
hite
ct: H
OK
WW
W.H
OK
.CO
M
Arc
hite
cts/
Stru
ctur
al/
Civ
il: C
PG C
onsu
ltant
s Pt
e Lt
d D
esig
n C
onsu
ltant
an
d M
edic
al
Plan
ning
: HO
K
Des
ign
Con
sulta
nt:
Stud
io 5
05 M
elbo
urne
G
reen
Mar
k C
onsu
ltant
: ZEB
Te
chno
logy
Pte
Ltd
Si
ngap
ore
Mec
hani
cal a
nd
Ele
ctri
cal E
ngin
eer:
Pa
rson
s-Br
inke
rhof
f L
ands
cape
: Per
idia
n A
sia
Pte
Ltd
Inte
rior
Des
ign:
Ben
t Se
verin
and
Ass
ocia
tes
Pte
Ltd
F unc
tion:
Hea
lth C
are
(Clin
ic, H
ospi
tal
Inpa
tient
, Med
ical
O
ffice
; Out
patie
nt)
Gen
eral
Singapore/1A
Pre-
fabr
icat
ing
prec
ast
mod
ules
70%
of t
he fa
cilit
y is
pass
ivel
y co
oled
w
ith n
atur
al
vent
ilatio
n
- 100
% h
ot w
ater
de
man
d m
et b
y so
lar
ther
mal
Ther
mal
mas
s
Cro
ss v
entil
atio
n
Exte
rior s
hadi
ng
Den
se v
eget
atio
n co
verin
g lo
w ro
ofs
and
muc
h of
the
site
w
hich
form
hea
ling
gard
ens
Veg
etat
ion
also
gr
ows v
ertic
ally
up
the
build
ing,
bot
h in
pl
ante
r box
es a
nd
alon
g w
ires l
inki
ng
floor
s
Proj
ectin
g sl
abs a
nd
light
shel
ves s
hade
th
e hi
gh s
un a
ngle
s. C
usto
m e
xter
nal
shad
ing
devi
ces
incl
ude
slid
ing
suns
cree
ns a
nd li
ght
shel
ves.
The
shad
ing
desi
gn w
as
optim
ized
to p
rovi
de
at le
ast 6
0 pe
rcen
t sh
adin
g fo
r crit
ical
fa
cade
s and
40
perc
ent f
or o
ther
fa
cade
s.
PFV
O: 7
0%
PFW
30: 7
0%
PFW
/O: 5
0%>3
00 lu
x at
3pm
Mar
ch 2
1
DF
in a
ll w
ards
> 2%
Illum
inat
ion
is 85
0 Lu
x ne
ar th
e w
indo
ws
to 1
00 lu
x in
ci
rcul
atio
n sp
aces
A s a
w-to
oth
desi
gn
that
pro
vide
s eve
ry
patie
nt w
ith a
w
indo
w.
70%
of t
he fa
cilit
y is
natu
rally
ve
ntila
ted,
re
pres
entin
g 82
% o
f in
patie
nt b
eds
Ever
y pa
tient
with
an
adj
acen
t ope
rabl
e w
indo
w
NTF
GH
in
corp
orat
es p
arks
, gr
een
roof
s and
ve
rtica
l pla
ntin
gs
thro
ugho
ut th
e ca
mpu
s
-100
kWp
phot
ovol
taic
arra
y
-Dem
and-
cont
rolle
dve
ntila
tion
-Cei
ling
fans
-Flu
ores
cent
T5
and
LED
ligh
ting
with
da
ylig
ht a
nd
occu
panc
y se
nsor
s -B
MS
inco
rpor
ates
mon
itorin
g,
occu
panc
y le
vels,
an
d sl
eep
mod
es
-Th e
mec
hani
cal
syst
em u
ses e
ffici
ent
plan
t-sid
e an
d ai
r-sid
e eq
uipm
ent,
with
a
targ
et s
yste
m
effic
ienc
y of
<0.
625
kW/to
n
-Hea
t rec
over
y in
O
Rs:
heat
pum
ps
and
heat
exc
hang
ers
with
runa
roun
d co
ils
-Ch i
ller p
lant
m
easu
rem
ent a
nd
verif
icat
ion
syst
em
-Fo r
mec
hani
cally
co
oled
spac
es, d
ual
mod
e sw
itche
s au
tom
atic
ally
cut
off
air c
ondi
tioni
ng
whe
n w
indo
ws a
re
open
-Esc
alat
ors a
nd
elev
ator
s in
stan
dby
mod
e w
hen
occu
panc
y is
low
-The
use
of n
atur
al
vent
ilatio
n an
d pa
ssiv
e co
olin
g fo
r 70
% o
f the
bu
ildin
g si
gnifi
cant
ly
redu
ces w
ater
use
. Fo
r the
rem
aini
ng
cool
ing
need
s, th
e H
VA
C s
yste
m
uses
NEW
ater
, a
pilla
r of
Sing
apor
e’s w
ater
su
stai
nabi
lity
stra
tegy
. Thi
s m
unic
ipal
ly sc
aled
w
aste
wat
er
treat
men
t sys
tem
tre
ats r
ecla
imed
w
ater
to h
igh-
grad
e, p
otab
le
stan
dard
s. Be
caus
e of
its l
ow m
iner
al
cont
ent,
NEW
ater
is
mor
e ef
fect
ive
than
stan
dard
tap
wat
er in
the
HV
AC
sys
tem
and
ca
n be
use
d fo
r m
ore
cycl
es
-Lo w
flow
fixt
ure;
fu
ture
pos
sibi
lity
for t
oile
t flu
shin
g re
usin
g th
e w
ater
-N
o po
tabl
e w
ater
fo
r irr
igat
ion
NTF
GH
was
the
first
to u
se a
cro
ss
vent
ilatio
n sc
hem
e th
at a
llow
s for
hig
h ve
ntila
tion
rate
s at
ever
y pa
tient
bed
w
ithou
t cro
ss-
cont
amin
atio
n
-Pre
dict
ed
cons
umed
EU
I: 70
kB
tu/s
q ft/
yr
-Pre
dict
ed n
et E
UI:
69.8
kBt
u/sq
ft/y
r
-Pre
dict
ed n
et
carb
on e
miss
ions
: 19
.5 lb
/sq
ft/yr
- Pre
dict
ed p
erce
nt
redu
ctio
n fro
m
natio
nal a
vera
ge
EUI f
or b
uild
ing
type
: 38%
(70%
co
mpa
red
with
US
type
hos
pita
ls)
-Pre
dict
ed li
ghtin
g po
wer
den
sity
: 0.7
4 W
/sq
ft
-Pas
sive
su
rviv
abili
ty
clai
med
: 7 d
ays

470
Project Y
ear
of
com
plet
ion
Pr
ojec
t tea
m
Loc
atio
n /C
limat
e
Env
elop
e N
atur
al H
eatin
g
Nat
ural
Coo
ling
D
aylig
htin
g
Nat
ural
V
entil
atio
n
Act
ive
syst
ems
Wat
er
Mile
ston
es
R.W. Kern Center for Hampshire College campus
2016
-des
ign
com
plet
ion
in
2015
Gro
ss
cond
ition
ed
floor
are
a:
16,9
40 S
F
Gro
ss
unco
nditi
oned
flo
or a
rea:
87
0 SF
Num
ber o
f oc
cupa
nts/
visi
tors
: 36
Arc
hite
ct: B
rune
r/Cot
t &
Ass
ocia
tes
WW
W.B
RU
NER
CO
TT.C
OM
Adv
isor
(Liv
ing
Bui
ldin
g C
halle
nge)
: Col
dham
&
Har
tman
Arc
hite
cts
Con
stru
ctio
n m
anag
er:
Wrig
ht B
uild
ers
Con
sulta
nt (c
ode)
: Cut
ler
Con
sulti
ng
Con
sulta
nt (c
ost
estim
atin
g): A
.M. F
ogar
ty &
A
ssoc
iate
s Inc
.
Con
sulta
nt (e
nerg
y an
d sy
stem
s): S
outh
Mou
ntai
n C
ompa
ny
Con
sulta
nt (L
BC
mat
eria
l ve
tting
): In
tegr
ated
Eco
St
rate
gy
Con
sulta
nt (l
ight
ing
desi
gn):
Lew
is Li
ghtin
g D
esig
n, L
LC
Con
sulta
nt (s
peci
ficat
ions
): K
alin
Ass
ocia
tes
Eng
inee
r (e
lect
rica
l): R
.W.
Sulli
van
Eng
inee
r (f
ire
prot
ectio
n):
Ryb
ak E
ngin
eerin
g E
ngin
eer
(geo
tech
nica
l):
O’R
eilly
, Tal
bot &
Oku
n A
ssoc
iate
s E
ngin
eer
(mec
hani
cal,
plum
bing
, and
con
trol
s):
Koh
ler &
Lew
is En
gine
ers
Eng
inee
r (s
ite/c
ivil
and
perm
ittin
g): B
erks
hire
D
esig
n G
roup
E
ngin
eer
(str
uctu
ral):
Fol
ey
Buh
l Rob
erts
& A
ssoc
iate
s L
ands
cape
arc
hite
ct:
Ric
hard
Bur
ke A
ssoc
iate
s
Amherst, Massachusetts/5A
WW
R: 3
0%
An
air-
tight
en
velo
pe
Sim
ple,
ec
onom
ical
woo
d fra
min
g
Dou
ble-
stud
ca
vity
wal
l and
ro
of a
re fi
lled
with
cel
lulo
se to
ac
hiev
e as
sem
bly
valu
es o
f R-4
0 an
d R
-60,
re
spec
tivel
y
Cel
lulo
se
insu
latio
n w
as
sele
cted
for m
ost
parts
as a
low
-ca
rbon
, hig
h-pe
rform
ance
, no
n-to
xic,
and
re
cycl
able
m
ater
ial
Car
bon-
sequ
este
ring
woo
d as
the
maj
or st
ruct
ural
m
ater
ial
Ther
mal
effi
cien
cy
to h
elp
miti
gate
sw
ings
in
tem
pera
ture
and
hu
mid
ity ty
pica
l of
New
Eng
land
Pass
ive
sola
r or
ient
atio
n
Exte
rior s
hade
s;
roof
as a
shad
ing
devi
ce
Trip
le g
laze
d w
indo
ws
PFV
O: 1
00%
PF
W/O
: 10
0%>3
00 lu
x at
3pm
Mar
ch
21
-Tal
l ope
rabl
e w
indo
ws h
elp
achi
eve
a fu
lly
dayl
ight
bu
ildin
g w
ith a
w
indo
w to
wal
l ra
tio o
f 30
perc
ent
-Lig
ht lo
uver
sfo
r win
dow
s re
flect
ing
dayl
ight
and
da
ylig
ht
harv
estin
g co
ntro
l
-Ope
rabl
e w
indo
ws
-PFW
30:
100%
- Grid
tied
PV
syst
em
gene
rate
s abo
ut
17%
mor
e en
ergy
than
the
build
ing
uses
- Inv
erte
r-dr
iven
hea
t pu
mp
syst
em
prov
ides
he
atin
g an
d co
olin
g to
the
spac
es, s
epar
ate
from
the
heat
re
cove
ry
vent
ilatio
n sy
stem
.
- Tem
pera
ture
-in
depe
nden
t ve
ntila
tion
syst
ems e
nsur
ead
equa
te a
ir ci
rcul
atio
n
-LED
S
-Net
-zer
o w
ater
- The
bui
ldin
g em
ploy
s a
net-p
ositi
ve w
ater
sy
stem
, cap
turin
g,
treat
ing,
and
disp
osin
g of
al
l its
ow
n w
ater
on
site
. R
ainw
ater
is c
olle
cted
fro
m th
e ro
of a
nd st
ored
in
two
5,00
0 ga
llon
cist
erns
adj
acen
t to
the
build
ing.
Fro
m th
ese
it pa
sses
thro
ugh
carb
on
and
UV
filte
rs in
the
base
men
t, an
d is
read
y to
us
e as
pot
able
sup
ply
thro
ugho
ut th
e bu
ildin
g;
elim
inat
es d
amag
ing
stor
mw
ater
runo
ff fo
r a
10-y
ear s
torm
, cap
turin
g it
in ra
inga
rden
s whe
re it
is
re-a
bsor
bed
on si
te a
nd
rech
arge
s the
loca
l w
ater
shed
.
- Com
post
ing
toile
ts
elim
inat
ed c
reat
ion
of
blac
kwat
er a
nd re
duce
d ov
eral
l wat
er
cons
umpt
ion
to 1
00
gallo
ns p
er d
ay, a
bout
10
perc
ent o
f the
stan
dard
us
age
for b
uild
ings
of
this
type
.
-Gre
ywat
er fr
om s
inks
isfil
tere
d th
roug
h in
door
pl
ante
rs in
the
build
ing’
s ce
ntra
l com
mon
spac
e,
whe
re it
eva
potra
nspi
res,
and,
if n
eede
d, to
an
on-
site
cons
truct
ed w
etla
nd
of n
ativ
e pl
antin
gs.
Livi
ng B
uild
ing
Cer
tifie
d A
chie
ved
net z
ero
ener
gy a
nd w
ater
and
w
as b
uilt
with
out r
ed
list p
rodu
cts.
Beyo
nd
thes
e ac
hiev
emen
ts, a
s a
net-p
ositi
ve p
roje
ct,
the
Ker
n C
ente
r has
no
utili
ty b
ills.
-Pre
dict
ed c
onsu
med
EU
I: 23
kBt
u/sq
ft/y
r -P
redi
cted
net
EU
I: 0
kBtu
/sq
ft/yr
-Pre
dict
ed n
et c
arbo
n em
issio
ns: 0
-Pre
dict
ed li
ghtin
g po
wer
den
sity
: 0.5
2 W
/sq
ft
-Pas
sive
sur
viva
bilit
y cl
aim
ed: u
nkno
wn

471
Project Y
ear
of
com
plet
ion
Pr
ojec
t tea
m
Loc
atio
n /C
limat
e E
nvel
ope
Nat
ural
H
eatin
g
Nat
ural
C
oolin
g
Day
light
ing
N
atur
al V
entil
atio
n A
ctiv
e sy
stem
s W
ater
M
ilest
ones
NOAA Daniel K. Inouye Regional Center
2014
-des
ign
com
plet
ion
in
2010
Gro
ss
cond
ition
ed
floor
are
a:
350,
000
SF
Num
ber o
f oc
cupa
nts/
visi
tors
: 800
Arc
hite
ct: H
OK
Pr
inci
pal,
proj
ect m
anag
er,
proj
ect a
rchi
tect
: Fer
raro
Cho
i and
A
ssoc
iate
s Pr
ojec
t eng
inee
r, g
ener
al
cont
ract
or: W
alsh
Con
stru
ctio
n C
ivil
engi
neer
: Ken
nedy
Jenk
s C
onsu
ltant
s St
ruct
ural
eng
inee
r: S
OH
A
Engi
neer
s M
echa
nica
l eng
inee
r: W
SP F
lack
+
Kur
tz
Secu
rity
, aco
ustic
s: S
hen
Mils
om
Wilk
e Fi
re p
rote
ctio
n: S
.S. D
anna
way
A
ssoc
iate
s, In
c.
Sust
aina
bilit
y: B
uilt
Ecol
ogy
Com
mis
sion
ing:
Glu
mac
Eng
inee
rsL
ands
cape
arc
hite
ct: K
i Con
cept
s Fo
od se
rvic
e: G
eorg
e M
atsu
mot
o A
ssoc
iate
s V
ertic
al tr
ansp
orta
tion:
Sys
kaH
enne
ssy
Gro
up In
c.
His
tori
c pr
eser
vatio
n: M
ason
A
rchi
tect
s E
xhib
it sp
ace:
Dow
nstre
amG
raph
ic d
esig
n an
d co
py w
ritin
g:
Des
ign
Asy
lum
Inc.
Pha
se 3
C
ost e
stim
atin
g: D
avis
Lang
don
Cod
e co
nsul
ting:
Rol
f Jen
sen
&A
ssoc
iate
s E
nvir
onm
enta
l, ge
otec
hnic
al:
Kle
infe
lder
G
eote
chni
cal e
ngin
eer:
Geo
labs
Doo
r ha
rdw
are:
Doo
r Har
dwar
eC
onsu
ltant
s T
raff
ic c
onsu
ltant
: Wilb
ur S
mith
A
ssoc
iate
s A
ir q
ualit
y, w
ind:
Cer
mak
Pet
erka
Pete
rson
Inc.
Se
awat
er c
onsu
ltant
: Tom
Nan
ce
Res
ourc
e En
gine
erin
g Fu
nctio
n: O
ffice
—10
0,00
1 or
grea
ter,
Publ
ic A
ssem
bly—
Gen
eral
, Pu
blic
Ass
embl
y—Li
brar
y, P
ublic
Sa
fety
—G
ener
al, S
tora
ge—
gen
eral
,ot
her
Honolulu, Hawaii/1A
Hig
h pe
rform
ance
en
velo
pe
Pass
ive
dow
ndra
ft co
olin
g
Geo
-exc
hang
e PF
VO
: 4%
PF
W/O
: 45
%>3
00 lu
x at
3p
m M
arch
21
SDA
: 57%
Skyl
ight
s and
at
rium
s
Ligh
t wel
ls
Cra
fted
light
la
nter
ns th
at
capt
ure
and
refle
ct su
nlig
ht
dow
n in
to th
e sp
ace
with
out
artif
icia
l lig
htin
g.
Tran
sluc
ent
refle
ctor
s bel
ow
glow
like
ligh
t fix
ture
s, di
strib
utin
g su
nlig
ht a
nd
refle
ctin
g it
back
up
to th
e ce
iling
, whi
ch
beco
mes
a
lum
inai
re
Stac
k ve
ntila
tion:
C
ool v
entil
atio
n ai
r th
roug
h th
e pa
ssiv
e do
wnd
raft
syst
em is
su
pplie
d to
occ
upie
d sp
aces
via
a ra
ised
acce
ss fl
oor u
tiliz
ing
‘disp
lace
men
t’ pr
inci
ples
. Afte
r be
ing
supp
lied
at
low
leve
ls, th
e ai
r dr
aws h
eat f
rom
oc
cupa
nts,
equi
pmen
t, lig
hts,
sola
r and
, as i
ts
tem
pera
ture
rise
s, it
beco
mes
less
den
se
and
mor
e bu
oyan
t, ris
ing
up th
roug
h th
e bu
ildin
g vi
a in
terc
onne
cted
ligh
t w
ells
and
atria
be
fore
bei
ng
exha
uste
d to
at
mos
pher
e.
T he
build
ing
vent
ilate
s its
pub
lic
and
priv
ate/
offic
e sp
aces
usi
ng n
o m
echa
nica
l fan
s and
10
0 pe
rcen
t out
side
ai
r. Th
e ex
haus
t ve
ntila
tion
syst
em is
al
so 1
00 p
erce
nt
pass
ive.
P FW
30: 0
%
PV sy
stem
Sola
r the
rmal
Ge o
-exc
hang
e
Hea
t Rec
over
y Sy
stem
Act
ive
Chi
lled
Beam
s in
labs
Und
erflo
or a
ir di
strib
utio
n sy
stem
Aut
o mat
ed
mod
ulat
ing
dam
pers
on
the
roof
adj
ustin
g fo
r the
des
ired
win
d fo
r the
do
wnd
raft
syst
em
The
harv
este
d (n
on-p
otab
le)
wat
er su
pplie
s th
e to
ilet
flush
ing
requ
irem
ents
fo
r plu
mbi
ng
syst
ems.
A se
cond
st
rate
gy re
lies
on th
e ca
ptur
e an
d us
e of
the
grey
wat
er
was
te fr
om
elec
trica
l wat
er
cool
ers,
cond
ensa
te
from
the
roof
top
mec
hani
cal
equi
pmen
t, an
d th
e bu
ildin
g la
vato
ries a
nd
show
ers
fitte
d w
ith lo
w-f
low
fix
ture
s. Th
e gr
eyw
ater
su
pplie
s the
site
la
ndsc
ape
irrig
atio
n sy
stem
s and
pr
ovid
es 1
00
perc
ent o
f the
irr
igat
ion
dem
and,
m
inim
ized
by
the
use
of
nativ
e an
d ad
aptiv
e la
ndsc
apin
g.
LEED
Gol
d
The
ecol
ogy
of th
e Pa
cific
Is
land
s and
the
mis
sion
of
NO
AA
insp
ired
the
biom
imet
ic
desi
gn o
f int
egra
ted
syst
ems
for
air f
low
, day
light
ing
and
wat
er
dist
ribut
ion.
em
ulat
ing
the
mor
phol
ogy
of n
ativ
e H
awai
ian
trees
for p
assi
ve c
oolin
g,
vent
ilatio
n an
d lig
htin
g sy
stem
s.
Tree
s pro
tect
them
selv
es fr
om
hot t
empe
ratu
res b
y pu
lling
soil
moi
stur
e th
roug
h th
e va
scul
ar
stru
ctur
e in
to th
e le
aves
. M
oist
ure
rele
ased
as w
ater
vap
or
crea
tes a
coo
ling
effe
ct a
roun
d th
e ca
nopy
. Sim
ilarly
, a h
ydro
nic
syst
em p
ulls
wat
er fr
om b
elow
th
e se
a be
d in
to ro
of c
ools.
The
pr
evai
ling
sea
bree
zes p
ass o
ver
thes
e co
ol c
oils
and
enab
le
natu
ral v
entil
atio
n th
at d
rops
the
cool
ed, f
resh
air
supp
ly in
to
verti
cal “
ther
mal
chi
mne
ys”
(pas
sive
dow
ndra
ft) a
nd th
roug
h a
disp
lace
men
t sys
tem
of r
aise
d flo
ors.
-Pre
dict
ed c
onsu
med
EU
I: 72
kB
tu/s
q ft/
yr
-Pre
dict
ed n
et E
UI:
72 k
Btu/
sq
ft/yr
-Pre
dict
ed n
et c
arbo
n em
issi
ons:
6.
28 lb
/sq
ft/ y
r
-Pre
dict
ed p
erce
nt re
duct
ion
from
na
tiona
l ave
rage
EU
I: 58
%
-Pre
dict
ed li
ghtin
g po
wer
de
nsity
: 0.8
1 W
/sq
ft -P
assi
ve s
urvi
vabi
lity
clai
med
: 3da
ys

472
Table
F.2
. 201
0 A
IA C
OT
E T
op T
en A
war
d C
ase
Stud
ies
Project
Year of Completion
Proj
ect t
eam
Location /Climate
Env
elop
e N
atur
al H
eatin
g
Nat
ural
Coo
ling
Day
light
ing
N
atur
al V
entil
atio
n A
ctiv
e sy
stem
s W
ater
M
ilest
ones
355 11th Street
200
8
14,0
00
SF
Arc
hite
ct:
Aid
lin D
arlin
g D
esig
n
Josh
ua A
idlin
A
idlin
Dar
ling
Des
ign
http
://w
ww
.aid
linda
rling
desi
gn.c
om/
Con
trac
tor:
Dan
iel
Pelsi
nger
from
M
atar
ozzi
/Pel
sing
er B
uild
ers
Env
iron
men
tal b
uild
ing
cons
ulta
nt: W
illia
m
Wor
then
from
Sim
on a
nd
Ass
ocia
tes,
Gre
en B
uild
ing
Con
sulta
nts
Stru
ctur
al e
ngin
eer:
Bill
Ly
nch
from
Ber
kele
y St
ruct
ural
Des
ign
Mec
hani
cal a
nd
com
mis
sion
ing
engi
neer
: C
hike
zie
Nze
wi,
CB
Engi
neer
s C
ivil:
Bru
ce D
avis
from
Sa
ndis
Engi
neer
s L
ands
cape
arc
hite
ct:
Jeffr
ey M
iller
from
Mill
er
Com
pany
St
reet
scap
e D
esig
ner:
Jane
M
artin
from
Shi
ft D
esig
n St
udio
G
eote
chni
cal E
ngin
eer:
C
raig
Her
zog
from
Her
zog
Geo
tech
nica
l Con
sulti
ng
Engi
neer
s
Lig
htin
g de
sign
er: L
eslie
Si
egel
, LC
from
Ass
ocia
ted
Ligh
ting
Rep
rese
ntat
ives
, In
c.
Func
tion:
Mix
ed –
Use
, F
ood
Serv
ice
Res
taur
ant/C
afet
eria
O
ffice
San Francisco, CA/ 3C
Cus
tom
ized
C
NC
(com
pute
r nu
mer
ical
co
ntro
l) m
illin
g al
low
ed th
e cr
eatio
n of
a
seam
less
, bu
ildin
g-sc
ale
grad
ient
—fro
m
opaq
ue to
ove
r 50
% o
pen—
acro
ss th
e en
tire
faça
de
- A g
reen
roof
with
nat
ive
plan
ts
whi
ch in
sula
te th
ebu
ildin
g, a
nd
decr
ease
the
urba
n he
at-is
land
ef
fect
- Nat
ural
ve
ntila
tion
- Th e
per
fora
ted
oute
r ski
n m
itiga
tes s
olar
he
at g
ain
- Ove
r 90%
of a
ll sit
e su
rface
s (in
clud
ing
build
ing
roof
ar
eas)
are
eith
er
plan
ted
or h
igh-
albe
do, s
ervi
ng to
lo
wer
surfa
ce
tem
pera
ture
s and
th
us h
elpi
ng to
m
itiga
te th
e ur
ban
heat
-isla
nd e
ffect
PFV
O: 1
00%
Bui
ldin
g's n
ew
met
al sk
in
perfo
rate
d w
ith
field
s of s
mal
l ho
les t
hat a
llow
lig
ht to
pas
s th
roug
h ne
w
oper
able
w
indo
ws h
idde
n be
yond
, to
prov
ide
pass
ive
cool
ing
and
natu
ral
vent
ilatio
n fo
r w
arm
er p
erio
ds
-Bre
atha
ble
skin
: a
new
met
al sk
in is
pe
rfora
ted
with
fie
lds o
f sm
all h
oles
th
at a
llow
air
to p
ass
thro
ugh
new
op
erab
le w
indo
ws
hidd
en b
eyon
d fo
r cr
oss v
entil
atio
n;
perfo
rate
d, o
pera
ble
east
and
wes
t fac
ades
expl
oit t
hese
eas
t-w
est b
reez
es to
pr
ovid
e pa
ssiv
e cr
oss-
vent
ilatio
n
-Ope
rabl
e sk
ylig
hts
-30K
WPV
pro
duci
ng 3
8% o
f the
build
ing’
s ann
ual
elec
trici
ty
- In-
floor
radi
ant h
eatin
g to
mai
ntai
n co
mfo
rt on
co
oler
day
s (fo
r coo
ling
the
build
ing
in th
is m
ild
clim
ate
is de
pend
ent o
n na
tura
l ven
tilat
ion)
- Day
light
sens
ors
auto
mat
ical
ly a
djus
t the
ou
tput
of t
he m
ain
light
fix
ture
s to
take
full
adva
ntag
e of
ava
ilabl
e su
nlig
ht. L
ED ta
sk
light
ing
at e
ach
wor
ksta
tion
ensu
res
effic
ient
per
sona
l con
trol
of in
divi
dual
ligh
ting
cond
ition
s.
Perm
eabl
e su
rface
s on
over
85%
of t
he
avai
labl
e no
n-bu
ildin
g sit
e ar
ea, a
llow
ing
stor
mw
ater
to d
rain
di
rect
ly to
the
wat
er
tabl
e. N
atur
ally
sand
y so
il in
the
imm
edia
te
area
abs
orbs
wat
er
read
ily, d
iscou
ragi
ng
satu
ratio
n.
Xer
iscap
ing:
N
ativ
e/ad
apte
d pl
ant
spec
ies h
ave
been
us
ed th
roug
hout
the
site,
resu
lting
in a
la
ndsc
ape
that
will
not
re
quire
sup
plem
enta
l irr
igat
ion
afte
r an
initi
al o
ne-y
ear
esta
blis
hmen
t per
iod.
LEED
-NC
Gol
d (v
2.2,
20
09) a
dapt
ive
reus
e of
a
hist
oric
(and
pre
viou
sly
dere
lict)
turn
-of-
the-
cent
ury
indu
stria
l bu
ildin
g
Pre
dict
ed c
onsu
med
EU
I: 19
kBt
u/sf
/yr
Pred
icte
d N
et E
UI:
12
kBtu
/sq
ft/yr
Pred
icte
d lig
htin
g po
wer
de
nsity
: 9.6
-kW
(6.5
-kW
)

473
Project
Year of Completion
Proj
ect t
eam
Location /Climate
Env
elop
e N
atur
al H
eatin
g
Nat
ural
Coo
ling
D
aylig
htin
g
Nat
ural
V
entil
atio
n
Act
ive
syst
ems
Wat
er
Mile
ston
es
Michael J. Homer Science and Student Life Center
200
9
Gro
ss
Floo
r A
rea:
44
,109
SF
Arc
hite
ct:
Ledd
y M
aytu
m S
tacy
A
rchi
tect
s ht
tp://
ww
w.lm
sarc
h.co
m
Will
iam
Led
dy (m
ain
cont
act)
Con
trac
tor:
Eric
Lam
b fro
m
DPR
Con
stru
ctio
n St
ruct
ural
eng
inee
r: D
avid
M
ar fr
om T
ippi
ng M
ar
Lan
dsca
pe a
rchi
tect
: Mar
co
Espo
sito
SW
A G
roup
M
EP:
John
And
ary
from
St
ante
c
Civ
il en
gine
er: G
eorg
e Lu
k fro
m L
UK
Ass
ocia
tes
The
ater
/ A
V C
onsu
ltant
: A
dam
Sha
lleck
The
ater
/ A
V
Con
sulta
nt
Lig
htin
g de
sign
er: D
avid
M
alm
an fr
om A
rchi
tect
ural
Li
ghtin
g D
esig
n
Aco
ustic
al: C
harle
s Sal
ter
from
Cha
rles M
. Sal
ter
Ass
ocia
tes,
Inc.
Com
mis
sion
ing
agen
t: M
aia
Spee
r Gut
tman
n &
Bla
evoe
t
Food
Ser
vice
Con
sulta
nt:
Patri
ck S
tein
from
Pat
rick
Stei
n an
d A
ssoc
iate
s
Lab
orat
ory
Con
sulta
nt:
Gle
n Be
rry
from
Des
ign
for
Scie
nce
Func
tion:
Edu
catio
n-K
12
Atherton California/3C
Hig
h-pe
rform
ance
gl
azin
g
-Bui
ldin
g m
ass
- a g
reen
roof
/ liv
ing
roof
-Ene
rgy
Star
-rate
d co
ol
roof
ing
- hig
h-al
bedo
pav
emen
t-n
atur
al v
entil
atio
n fo
r co
olin
g fo
r the
100
%
area
s of t
he b
uild
ing
- Fix
ed su
nsha
des o
n th
eso
uth,
eas
t and
wes
t fa
cade
s
-Ope
rabl
e ex
tern
al
suns
hade
s are
pro
vide
d on
the
wes
t-fac
ing
- The
bui
ldin
g is
orga
nize
d on
an
east
-wes
t ax
is, w
ith th
e tw
o-st
ory
clas
sroo
m m
ass t
o th
e so
uth
and
the
audi
toriu
m,
Oak
Cou
rt an
d of
fices
or
gani
zed
agai
nst i
t to
the
north
; con
tinuu
m o
f in
door
/out
door
gat
herin
g sp
aces
on
the
first
floo
r, fro
m th
e su
nny
sout
hern
di
ning
pat
io to
the
shad
y no
rther
n O
ak C
ourt.
Ver
y co
mpa
ct fo
rm
conf
igur
atio
n to
min
imiz
e co
nditi
oned
are
a,
max
imiz
e pl
an, s
truct
ure
and
skin
effi
cien
cies
The
ne
t-to-
gros
s flo
or a
rea
ratio
is 8
2%
PFV
O: 9
8%
Inte
grat
ing
prop
er
orie
ntat
ion,
ligh
t sh
elve
s and
tu
bula
r sky
light
s, 10
0% o
f cl
assr
oom
s, of
fices
and
co
rrid
ors o
n th
e se
cond
floo
r em
ploy
da
ylig
htin
g.
Ove
rall,
55%
of
all b
uild
ings
sp
aces
use
da
ylig
ht a
s the
pr
imar
y lig
ht
sour
ce
Hig
h-ef
ficie
ncy
light
ing
is co
ntro
lled
by
timer
s, oc
cupa
ncy
sens
ors,
and
dayl
ight
dim
min
g sy
stem
s
The
build
ing
orie
nts t
o th
e pr
evai
ling
win
ds,
allo
win
g 10
0% o
f cl
assr
oom
s, of
fices
, and
the
dini
ng h
all—
and
50%
of a
ll co
mbi
ned
inte
rior
spac
es—
to b
e na
tura
lly
vent
ilate
d.
Nig
ht-ti
me
flush
ing
40-k
W P
V o
n th
eau
dito
rium
roof
pr
ovid
es 2
4% o
f the
site
ener
gy
Hig
h-ef
ficie
ncy
gas-
fired
boi
lers
serv
ing
in-f
loor
hyd
roni
c he
atin
g an
d ki
tche
n w
aste
hea
t bei
ng
reco
vere
d fo
r wat
er
and
spac
e he
atin
g
E ner
gy-e
ffici
ent
light
ing
is op
erat
ed b
y oc
cupa
ncy
sens
ors,
timer
s, an
d da
ylig
ht
dim
min
g sy
stem
s
Cei
ling
fans
(exc
ept i
n ki
tche
n an
d au
dito
rium
)
Ener
gy-e
ffici
ent
evap
orat
ive
cool
ing
units
for a
dditi
onal
co
olin
g in
cla
ssro
oms
and
offic
es in
ext
rem
e co
nditi
ons
-Aud
itoriu
m is
co
nditi
oned
by
a hy
brid
nat
ural
ve
ntila
tion/
un
derf
loor
di
spla
cem
ent
vent
ilatio
n H
VA
Csy
stem
-Ene
rgy
and
wat
er u
sem
onito
ring
syst
em
Pot
able
wat
er u
se is
redu
ced
by o
ver 5
0%
Non
-nat
ive,
wat
er-in
tens
ive
gras
s law
ns w
ere
sign
ifica
ntly
re
duce
d, w
hile
an
area
eq
uiva
lent
to 1
82%
of t
he
build
ing
foot
prin
t has
bee
n re
stor
ed u
sing
nat
ive,
dro
ught
-to
lera
nt p
lant
ings
Wat
erle
ss u
rinal
s, su
per-
low
flo
w d
ual-f
lush
toile
ts a
nd
othe
r wat
er-s
avin
g fix
ture
s re
duce
wat
er c
onsu
mpt
ion
by
51%
from
bas
elin
e fo
r non
-ki
tche
n us
es. T
he c
omm
erci
al
kitc
hen
utili
zes w
ater
-sav
ing
com
mer
cial
dis
hwas
hers
and
fa
ucet
s
Red
uced
law
n ar
eas,
drou
ght-
tole
rant
nat
ive
land
scap
ing
and
drip
irrig
atio
n sy
stem
s re
duce
land
scap
e w
ater
use
by
52.5
% fr
om b
asel
ine
I rrig
atio
n sy
stem
ac
com
mod
atin
g hy
droz
ones
an
d cl
imat
e ex
posu
re, a
nd b
y ut
ilizi
ng a
dvan
ced,
wea
ther
-ba
sed
irrig
atio
n co
ntro
llers
livin
g ro
of, p
ervi
ous p
avin
g an
d a
8,50
0 cu
. ft.
stor
m
drai
nage
rete
ntio
n ba
sin
com
bine
to re
duce
the
proj
ect’s
stor
mw
ater
flow
rate
by
91%
. Sto
rmw
ater
col
lect
ed
in th
e ba
sin
is re
duce
d an
d tre
ated
thro
ugh
infil
tratio
n in
to
the
soil,
surfa
ce e
vapo
ratio
n,
and
evap
otra
nspi
ratio
n fro
m
basi
n pl
antin
gs
LEED
Pla
tinum
(L
EED
200
7 fo
r Sc
hool
s v
2.0)
-Red
ucin
g si
te
ener
gy u
se b
y 69
% fr
om th
e na
tiona
l ave
rage
for s
choo
ls (C
BEC
S 20
03)
and
exce
edin
g th
e go
al se
t for
th
e 20
30
Cha
lleng
e.
-49%
less
en
ergy
per
A
SHR
AE
90.1
- Pre
dict
ed
cons
umed
EU
I: 34
kBt
u/sf
/yr
- Pre
dict
ed N
et
EUI:
30 k
Btu/
sq
ft/yr
Pred
icte
d lig
htin
g po
wer
de
nsity
: 0.8
w
/sq
ft

474
Project
Year of Completion
Proj
ect t
eam
Location /Climate
Env
elop
e N
atur
al H
eatin
g
Nat
ural
Coo
ling
D
aylig
htin
g
Nat
ural
V
entil
atio
n
Act
ive
syst
ems
Wat
er
Mile
ston
es
KAUST
200
9
Gro
ss F
loor
A
rea:
5,
340,
000
SF
Arc
hite
ct:
HO
K
Con
trac
tor:
Eric
Lam
b fro
m D
PR C
onst
ruct
ion
Stru
ctur
al e
ngin
eer:
Dav
id
Mar
from
Tip
ping
Mar
L
ands
cape
arc
hite
ct:
Mar
co E
spos
ito S
WA
Gro
up
ME
P: Jo
hn A
ndar
y fro
m
Stan
tec
Civ
il en
gine
er: G
eorg
e Lu
k fro
m L
UK
Ass
ocia
tes
The
ater
/ A
V C
onsu
ltant
: A
dam
Sha
lleck
The
ater
/ A
V C
onsu
ltant
Lig
htin
g de
sign
er: D
avid
M
alm
an fr
om A
rchi
tect
ural
Li
ghtin
g D
esig
n
Aco
ustic
al: C
harle
s Sal
ter
from
Cha
rles M
. Sal
ter
Ass
ocia
tes,
Inc.
Com
mis
sion
ing
agen
t: M
aia
Spee
r Gut
tman
n &
B
laev
oet
F ood
Ser
vice
Con
sulta
nt:
Patri
ck S
tein
from
Pat
rick
Stei
n an
d A
ssoc
iate
s
Lab
orat
ory
Con
sulta
nt:
Gle
n Be
rry
from
Des
ign
for
Scie
nce
F unc
tion:
Edu
catio
n –
Col
lege
/Uni
vers
ity (c
ampu
s-le
vel)
Thuwal, KSA/1A
Terra
-cot
ta,
ston
e, g
lass
an
d st
ainl
ess
stee
l wer
e de
velo
ped
in
a sh
ared
set o
f bu
ildin
g en
clos
ure
stra
tegi
es
appl
ied
to
mos
t spa
ces
Hig
hly
insu
late
d m
etal
roof
-Usi
ng c
ompa
ct fo
rms,
inte
grat
ed s
un sh
adin
g sc
reen
s, th
e pa
ssiv
e co
olin
g w
ith n
atur
al
vent
ilatio
n an
d us
ing
dayl
ight
ing
appl
ied
lear
ning
from
loca
l tra
ditio
nal p
assi
ve m
etho
dssu
ch a
s Sou
k, M
ashr
abiy
a,
Bedo
uin
tent
’s b
asic
ef
ficie
ncy
in s
helte
ring
from
the
sun
-Sol
ar th
erm
al fo
r the
labs
hot w
ater
-c
ourty
ard
with
pos
sibi
lity
to b
e co
vere
d
- Lig
ht-c
olor
ed p
avin
g m
ater
ials
- Sha
ding
and
orie
ntat
ion
desi
gn:
The
com
pact
, fin
ger-
shap
ed b
uild
ing
floor
pl
ates
allo
w fo
r nat
ural
da
ylig
htin
g fo
r all
perim
eter
spac
es a
nd
sele
cted
inte
rior s
pace
s. B
uild
ing
orie
ntat
ions
lim
it ha
rsh
east
ern
and
wes
tern
su
n ex
posu
re w
hile
taki
ng
adva
ntag
e of
pre
vaili
ng
Red
Sea
win
ds (N
-NE)
to
act a
s a c
oolin
g m
echa
nism
-Tw
o la
rge
sola
r tow
ers
(chi
mne
ys)
-One
mill
ion
SF o
f the
pede
stria
n sp
ine
is co
nditi
oned
thro
ugh
pass
ive
mea
ns
Ove
rall,
60%
of
all s
pace
s use
da
ylig
ht a
s the
pr
imar
y lig
ht
sour
ce
Two
larg
e so
lar
tow
ers
(chi
mne
ys)
Com
bine
d w
ith
the
prev
ailin
g w
ind
dire
ctio
n fro
m th
e R
EDSE
A
-Air
deliv
ery
mon
itorin
g to
rem
ove
harm
ful p
ollu
tant
s an
d ca
rbon
dio
xide
. -un
der-
floor
air
dist
ribut
ion
syst
em
- Dim
min
g ba
llast
s,oc
cupa
ncy
sens
ors
and
time
cloc
ks
- Chi
lled
beam
s
-hea
t rec
over
y w
heel
s
- Dis p
lace
men
t ve
ntila
tion
- Sm
art l
ight
ing
cont
rols
- Var
iabl
e fre
quen
cy
driv
es
-Low
-flo
w d
uct
desi
gn
T he
desi
gn e
mpl
oys
larg
e so
lar P
V a
rrays
, w
hich
with
sola
r th
erm
al, p
rovi
des
7.8%
of o
n-si
te
ener
gy
- A c
ompr
ehen
sive
bu
ildin
g au
tom
atio
n sy
stem
will
col
lect
en
ergy
flow
s fo
r PO
E la
ter
-Red
ucin
g th
ede
man
d fo
r the
ca
mpu
s bui
ldin
gs b
y 40
%
• Low
-flo
w la
vato
ry
fauc
ets w
ith
elec
troni
c op
erat
ors
pow
ered
from
room
lig
htin
g; •
Low
-flo
w
show
erhe
ads;
• Lo
w-f
low
sin
k fa
ucet
s with
el
ectro
nic
sens
ors
pow
ered
from
room
lig
htin
g; •
Lam
inar
flo
w fa
ucet
out
lets
(th
at m
inim
ize
wat
er
cons
umpt
ion)
; •
Wat
erle
ss u
rinal
s
-Irrig
atio
n pl
an
allo
cate
s wat
er
recl
amat
ion
load
s fro
m c
onde
nsat
e,
stor
m, g
ray,
and
bl
ack
wat
er to
sa
tisfy
a m
ajor
ity o
f th
e irr
igat
ion
requ
irem
ents
.
-Nat
ive
vege
tatio
n an
d ad
aptiv
e pl
antin
g
LEED
Pla
tinum
(L
EED
-NC
, v.2
.2,
2009
)
KA
UST
's ov
eral
l en
ergy
savi
ngs
is 27
.1%
bet
ter t
han
ASH
RA
E 90
.1-
2004
stan
dard
s
- Pre
dict
ed
cons
umed
EU
I: 80
kB
tu/s
f/yr
- Pre
dict
ed N
et
EUI:
74 k
Btu/
sq
ft/yr

475
Project
Year of Completion
Proj
ect t
eam
Location /Climate
Env
elop
e N
atur
al H
eatin
g
Nat
ural
Coo
ling
D
aylig
htin
g
Nat
ural
V
entil
atio
n
Act
ive
syst
ems
Wat
er
Mile
ston
es
Kroon Hall for the Yale School of Forestry and Environmental Studies
200
9
Gro
ss
Floo
r A
rea:
68
,800
SF
Arc
hite
ct: N
atha
niel
Moo
re
and
Mic
hael
Tay
lor f
rom
H
opki
ns A
rchi
tect
s (U
K,
Lond
on)
ME
P: C
raig
Win
ter f
rom
A
rup
Env
iron
men
tal b
uild
ing
cons
ulta
nt
Shan
ta T
ucke
r fro
m A
telie
r Ten
Civ
il en
gine
er: N
icol
e H
olm
es fr
om N
itsch
En
gine
erin
g
Lan
dsca
pe a
rchi
tect
: C
ricke
t Brie
n fro
m O
lin
Stud
io
Con
trac
tor:
Lyn
n Te
mpl
e fro
m T
urne
r Con
stru
ctio
n C
ompa
ny
F unc
tion:
Edu
catio
n –
Col
lege
/Uni
vers
ity
(cam
pus-
leve
l) Pu
blic
Ass
embl
y –
Libr
ary
New Haven, Connecticut/5A extreme variation of local climate conditions
Bui
ldin
g’s
oute
r she
ll be
com
es a
se
nsiti
ve sk
in
that
reac
ts
seas
onal
ly to
ch
angi
ng
atm
osph
eric
co
nditi
ons.
Nor
th a
nd so
uth
faça
des
feat
ure
deep
ly re
cess
ed
win
dow
s and
hi
ghly
insu
late
d st
one
vene
er
wal
ls
-Dire
ct so
lar g
ain:
bu
ildin
g is
orie
nted
al
ong
an e
ast-w
est
axis,
allo
win
g th
e so
uthe
rn fa
cade
to a
ct
as a
larg
e so
lar
colle
ctor
-e
mbe
ddin
g m
ost o
f th
e gr
ound
Flo
or in
th
e hi
llsid
e, a
idin
g in
th
erm
al m
anag
emen
t
-sol
ar h
ot w
ater
he
ater
s
- sig
nific
ant t
herm
al
mas
s (vi
sibl
e in
ex
pose
d co
ncre
te
soffi
ts a
nd st
air c
ores
)
The
build
ing’
s na
rrow
floo
rpla
te
prov
ides
nat
ural
lig
ht to
a la
rge
perc
enta
ge o
f spa
ces
and
allo
ws e
ffect
ive
cros
s-ve
ntila
tion
via
oper
able
win
dow
s an
d Si
lenc
eair
boxe
s ab
ove
door
s
-freq
uent
ly o
ccup
ied
area
s hav
e th
e m
ost
acce
ss to
day
light
w
hile
aux
iliar
y sp
aces
are
loca
ted
cent
rally
. Ind
icat
ors
tell
occu
pant
s ap
prop
riate
tim
es to
op
en w
indo
ws a
nd
whe
n ne
cess
ary
-A c
entra
l ope
n st
air
with
skyl
ight
s abo
ve-to
p ce
iling
hel
psw
ith d
aylig
ht
pene
tratio
n -T
he e
ast a
nd w
est
faça
des
have
tim
ber
louv
ers a
nd la
rge
over
hang
s tha
t sh
ade
curta
in w
alls
-O
vera
ll, 7
7% o
f all
build
ings
spac
es u
se
dayl
ight
as t
he
prim
ary
light
sour
ce
The
build
ing’
s na
rrow
floo
rpla
te
prov
ides
ef
fect
ive
cros
s-ve
ntila
tion
via
oper
able
w
indo
ws a
nd
Sile
nce
air b
oxes
ab
ove
door
s
T op
floor
’s h
igh
ceili
ng a
ids w
ith
air c
ircul
atio
n
The
ope
n ce
ntra
l st
air a
llow
s for
st
ack-
effe
ct
vent
ilatio
n be
twee
n le
vels
- 105
kW P
V p
anel
sar
e in
corp
orat
ed in
to
the
desi
gn a
nd n
ot
sim
ply
fixed
ont
o th
e fa
cade
s in
form
ing
for
exam
ple
the
pitc
h of
th
e la
rge,
arc
hing
ro
of a
nd it
s op
timiz
ed a
ngle
. In
tegr
ated
sola
r ar
ray
on th
e ro
of
prov
ides
25%
of t
he
build
ing’
s ene
rgy.
- I
nter
ior c
limat
e is
mai
ntai
ned
via
disp
lace
men
t ve
ntila
tion
and
indi
rect
eva
pora
tive
cool
ing,
Indi
rect
adi
abat
ic
cool
ing
and
heat
ex
chan
gers
reco
ver
75%
of e
nerg
y fro
m
exha
ust a
ir an
d fo
ur
grou
nd so
urce
hea
t pu
mps
to h
elp
regu
late
inte
rior
cond
ition
s
L igh
ting
occu
panc
y se
nsor
s, an
d m
ost
fixtu
res a
re
fluor
esce
nt o
r LED
-Bui
ldin
g en
ergy
us
e ca
n be
m
onito
red
by
occu
pant
s at a
ll tim
es v
ia tw
o to
uch-
scre
en m
onito
rs in
th
e lo
bby
-Pot
able
wat
er u
se is
redu
ced
by o
ver 7
5%
-Cou
rtyar
d’s f
ocal
poi
nt a
lso
serv
es a
s a st
orm
wat
er
treat
men
t bas
in
-With
a d
epth
of o
nly
2-3
ft av
aila
ble
on to
p of
the
unde
rgro
und
stru
ctur
e, a
so
il-ba
sed
stor
mw
ater
tre
atm
ent s
olut
ion
was
not
pr
actic
al; s
o an
inno
vativ
e w
ater
-bas
ed sy
stem
was
us
ed c
ompr
ised
of fl
oatin
g ra
fts w
ith n
ativ
e aq
uatic
pl
ants
spec
ially
sele
cted
to
rem
ove
pollu
tant
s car
ried
by
the
stor
mw
ater
that
recy
cles
th
roug
h it
-The
gre
en ro
of (c
ourty
ard)
us
es o
nly
harv
este
d ra
inw
ater
for l
ands
cape
irr
igat
ion
-La n
dsca
pe c
lean
st
orm
wat
er th
roug
h ph
ytor
emed
iatio
n. T
he fi
rst
inch
of s
torm
wat
er ru
noff
colle
cted
from
Kro
on H
all’s
ro
ofto
p an
d sit
e is
dive
rted
to th
is w
ater
bas
in. T
reat
ed
over
flow
is d
irect
ed to
a
subs
urfa
ce 2
0,00
0-ga
llon
cist
ern,
from
whi
ch it
is
cont
inua
lly re
cycl
ed th
roug
h th
e w
ater
feat
ure
by a
sm
all
pum
p. W
ater
har
vest
ed in
th
e ci
ster
n is
avai
labl
e fo
r re
use
in th
e bu
ildin
g fo
r to
ilet f
lush
ing
and
to ir
rigat
e po
rtion
s of t
he la
ndsc
ape.
-W
ater
less
urin
als,
dual
-flu
sh to
ilets
LEED
Pla
tinum
LE
ED-N
C,
v.2.
2, 2
010
A 1
00-y
ear
desi
gn li
fesp
an
build
ing
can
run
on n
early
60
% fe
wer
re
sour
ces t
han
its c
onve
ntio
nal
peer
s
- Pre
dict
ed
cons
umed
EU
I: 27
kBt
u/sf
/yr
- Pre
dict
ed N
et
EUI:
21
kBtu
/sq
ft/yr
P red
icte
d lig
htin
g po
wer
de
nsity
: 0.7
w
/sq
ft
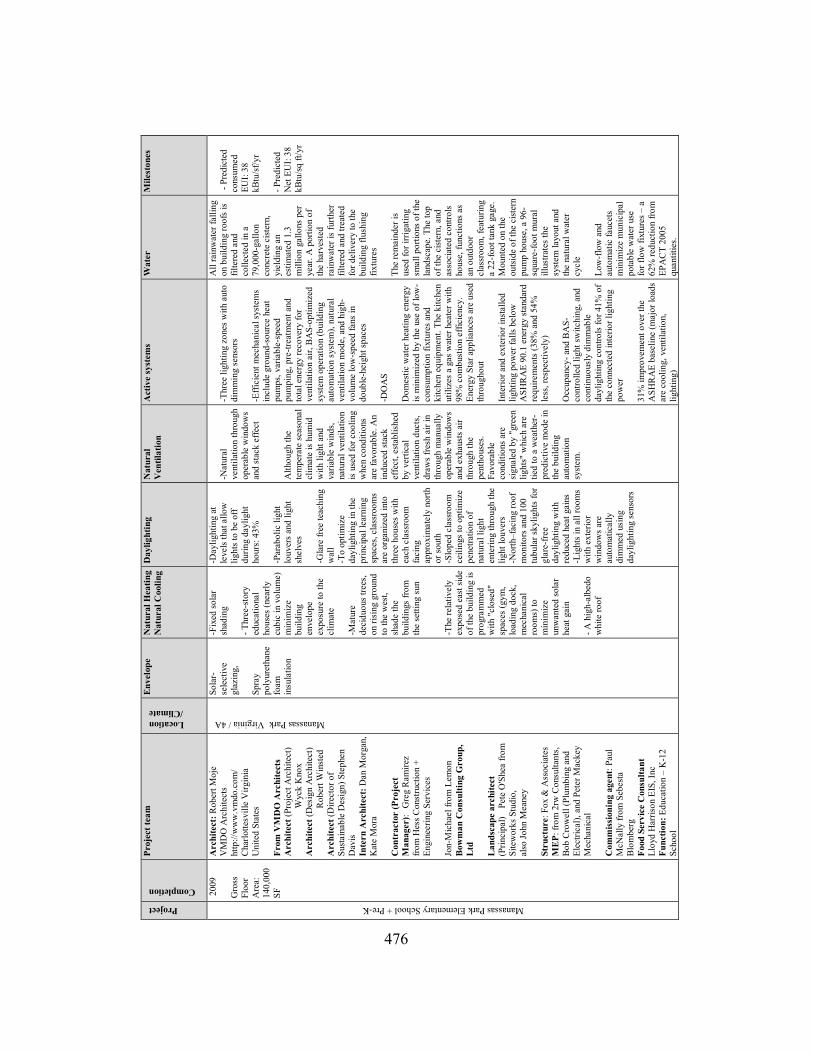
476
Project
Completion Pr
ojec
t tea
m
Location /Climate
Env
elop
e N
atur
al H
eatin
g
Nat
ural
Coo
ling
Day
light
ing
N
atur
al
Ven
tilat
ion
A
ctiv
e sy
stem
s W
ater
M
ilest
ones
Manassas Park Elementary School + Pre-K
200
9
Gro
ss
Floo
r A
rea:
14
0,00
0 SF
Arc
hite
ct: R
ober
t Moj
e V
MD
O A
rchi
tect
s ht
tp://
ww
w.v
mdo
.com
/ C
harlo
ttesv
ille
Virg
inia
U
nite
d St
ates
F rom
VM
DO
Arc
hite
cts
Arc
hite
ct (P
roje
ct A
rchi
tect
)W
yck
Kno
x
Arc
hite
ct (D
esig
n A
rchi
tect
)R
ober
t Win
sted
A
rchi
tect
(Dire
ctor
of
Sust
aina
ble
Des
ign)
Ste
phen
D
avis
In
tern
Arc
hite
ct: D
an M
orga
n,
Kat
e M
ora
Con
trac
tor
(Pro
ject
M
anag
er):
Gre
g R
amire
z fro
m H
ess C
onst
ruct
ion
+ En
gine
erin
g Se
rvic
es
Jon-
Mic
hael
from
Lem
on
Bow
man
Con
sulti
ng G
roup
, L
td
Lan
dsca
pe a
rchi
tect
(P
rinci
pal)
Pete
O'S
hea
from
Si
tew
orks
Stu
dio,
al
so Jo
hn M
eane
y
Stru
ctur
e: F
ox &
Ass
ocia
tes
ME
P: fr
om 2
rw C
onsu
ltant
s, Bo
b C
row
ell (
Plum
bing
and
El
ectri
cal),
and
Pet
er M
acke
y M
echa
nica
l
Com
mis
sion
ing
agen
t: Pa
ul
McN
ally
from
Seb
esta
B
lom
berg
Fo
od S
ervi
ce C
onsu
ltant
Ll
oyd
Har
rison
EIS
, Inc
Fu
nctio
n: E
duca
tion
– K
-12
Scho
ol
Manassas Park Virginia / 4A
Sola
r-se
lect
ive
glaz
ing,
Spra
y po
lyur
etha
ne
foam
in
sula
tion
-Fix
ed so
lar
shad
ing
- Thr
ee-s
tory
ed
ucat
iona
l ho
uses
(nea
rly
cubi
c in
vol
ume)
m
inim
ize
build
ing
enve
lope
ex
posu
re to
the
clim
ate
-Mat
ure
deci
duou
s tre
es,
on ri
sing
gro
und
to th
e w
est,
shad
e th
e bu
ildin
gs fr
om
the
setti
ng s
un
-The
rela
tivel
y ex
pose
d ea
st si
de
of th
e bu
ildin
g is
prog
ram
med
w
ith "c
lose
d"
spac
es (g
ym,
load
ing
dock
, m
echa
nica
l ro
oms)
to
min
imiz
e un
wan
ted
sola
r he
at g
ain
- A h
igh-
albe
do
whi
te ro
of
-Day
light
ing
at
leve
ls th
at a
llow
light
s to
be o
ff du
ring
dayl
ight
ho
urs:
43%
-Par
abol
ic li
ght
louv
ers a
nd li
ght
shel
ves
-Gla
re fr
ee te
achi
ng
wal
l -T
o op
timiz
e da
ylig
htin
g in
the
prin
cipa
l lea
rnin
g sp
aces
, cla
ssro
oms
are
orga
nize
d in
to
thre
e ho
uses
with
ea
ch c
lass
room
fa
cing
ap
prox
imat
ely
north
or
sout
h -S
lope
d cl
assr
oom
ce
iling
s to
optim
ize
pene
tratio
n of
na
tura
l lig
ht
ente
ring
thro
ugh
the
light
louv
ers
-Nor
th–f
acin
g ro
of
mon
itors
and
100
tu
bula
r sky
light
s fo
r gl
are-
free
dayl
ight
ing
with
re
duce
d he
at g
ains
-L
ight
s in
all r
oom
sw
ith e
xter
ior
win
dow
s are
au
tom
atic
ally
di
mm
ed u
sing
da
ylig
htin
g se
nsor
s
-Nat
ural
ve
ntila
tion
thro
ugh
oper
able
win
dow
s an
d st
ack
effe
ct
Alth
ough
the
tem
pera
te se
ason
al
clim
ate
is hu
mid
w
ith li
ght a
nd
varia
ble
win
ds,
natu
ral v
entil
atio
n is
used
for c
oolin
g w
hen
cond
ition
s ar
e fa
vora
ble.
An
indu
ced
stac
k ef
fect
, est
ablis
hed
by v
ertic
al
vent
ilatio
n du
cts,
draw
s fre
sh a
ir in
th
roug
h m
anua
lly
oper
able
win
dow
s an
d ex
haus
ts a
ir th
roug
h th
e pe
ntho
uses
. Fa
vora
ble
cond
ition
s are
si
gnal
ed b
y "g
reen
lig
hts"
whi
ch a
re
tied
to a
wea
ther
-pr
edic
tive
mod
e in
th
e bu
ildin
g au
tom
atio
n sy
stem
.
-Thr
ee li
ghtin
g zo
nes w
ith a
uto
dim
min
g se
nsor
s
-Effi
cien
t mec
hani
cal s
yste
ms
incl
ude
grou
nd-s
ourc
e he
at
pum
ps, v
aria
ble-
spee
d pu
mpi
ng, p
re-tr
eatm
ent a
nd
tota
l ene
rgy
reco
very
for
vent
ilatio
n ai
r, B
AS-
optim
ized
sy
stem
ope
ratio
n (b
uild
ing
auto
mat
ion
syst
em),
natu
ral
vent
ilatio
n m
ode,
and
hig
h-vo
lum
e lo
w-s
peed
fans
in
doub
le-h
eigh
t spa
ces
-DO
AS
Dom
estic
wat
er h
eatin
g en
ergy
is
min
imiz
ed b
y th
e us
e of
low
-co
nsum
ptio
n fix
ture
s and
ki
tche
n eq
uipm
ent.
The
kitc
hen
utili
zes a
gas
wat
er h
eate
r with
98
% c
ombu
stio
n ef
ficie
ncy.
En
ergy
Sta
r app
lianc
es a
re u
sed
thro
ugho
ut
I nte
rior a
nd e
xter
ior i
nsta
lled
light
ing
pow
er fa
lls b
elow
A
SHR
AE
90.1
ene
rgy
stan
dard
re
quire
men
ts (3
8% a
nd 5
4%
less
, res
pect
ivel
y)
Occ
upan
cy- a
nd B
AS-
cont
rolle
d lig
ht sw
itchi
ng, a
nd
cont
inuo
usly
dim
mab
le
dayl
ight
ing
cont
rols
for 4
1% o
f th
e co
nnec
ted
inte
rior l
ight
ing
pow
er
31%
impr
ovem
ent o
ver t
he
ASH
RA
E ba
selin
e (m
ajor
load
s ar
e co
olin
g, v
entil
atio
n,
light
ing)
All
rain
wat
er fa
lling
on
bui
ldin
g ro
ofs
is fil
tere
d an
d co
llect
ed in
a
79,0
00-g
allo
n co
ncre
te c
ister
n,
yiel
ding
an
estim
ated
1.3
m
illio
n ga
llons
per
ye
ar. A
por
tion
of
the
harv
este
d ra
inw
ater
is fu
rther
fil
tere
d an
d tre
ated
fo
r del
iver
y to
the
build
ing
flush
ing
fixtu
res
The
rem
aind
er is
us
ed fo
r irr
igat
ing
smal
l por
tions
of t
he
land
scap
e. T
he to
p of
the
cist
ern,
and
as
soci
ated
con
trols
hous
e, fu
nctio
ns a
s an
out
door
cl
assr
oom
, fea
turin
g a
22-fo
ot ta
nk g
age.
M
ount
ed o
n th
e ou
tsid
e of
the
cist
ern
pum
p ho
use,
a 9
6-sq
uare
-foot
mur
al
illus
trate
s the
sy
stem
layo
ut a
nd
the
natu
ral w
ater
cy
cle
Low
-flo
w a
nd
auto
mat
ic fa
ucet
s m
inim
ize
mun
icip
al
pota
ble
wat
er u
se
for f
low
fixt
ures
– a
62
% re
duct
ion
from
EP
AC
T 20
05
quan
titie
s.
- Pre
dict
edco
nsum
ed
EUI:
38
kBtu
/sf/y
r
- Pre
dict
ed
Net
EU
I: 38
kB
tu/s
q ft/
yr

477
Project
Completion Pr
ojec
t tea
m
Location /Climate
Env
elop
e N
atur
al H
eatin
g
Nat
ural
Coo
ling
D
aylig
htin
g
Nat
ural
V
entil
atio
n
Act
ive
syst
ems
Wat
er
Mile
ston
es
Manitoba Hydro Place
200
9
Gro
ss
Floo
r A
rea:
69
7,60
9 SF
Bru
ce K
uwab
ara
Kuw
abar
a Pa
yne
Mck
enna
B
lum
berg
Arc
hite
cts
http
://kp
mba
rchi
tect
s.com
/ A
rchi
tect
: Kuw
abar
a Pa
yne
McK
enna
Blu
mbe
rg A
rchi
tect
s;
Smith
Car
ter A
rchi
tect
s and
En
gine
ers;
Pra
irie
Arc
hite
cts
Ene
rgy
Con
sulta
nt: T
hom
as
Aue
r fro
m T
rans
sola
r En
ergi
etec
hnik
C
ontr
acto
r (P
roje
ct
Man
ager
): G
reg
Ram
irez
from
H
ess C
onst
ruct
ion
+ En
gine
erin
g Se
rvic
es
Stru
ctur
al e
ngin
eer:
Cro
sier K
ilgou
r & P
artn
ers
Ltd.
; H
alcr
ow Y
olle
s M
echa
nica
l and
ele
ctri
cal
engi
neer
: Ear
th T
ech
Can
ada
Lig
htin
g de
sign
er: P
ivot
al
Ligh
ting
Des
ign
Lan
dsca
pe a
rchi
tect
: H
ilder
man
Tho
mas
Fra
nk
Cra
m; P
hilli
ps F
arev
aag
Smal
lenb
erg
Fire
Pro
tect
ion
and
Bui
ldin
g C
ode
Eng
inee
ring
: Leb
er
Rub
es
Bui
ldin
g E
nvel
ope
cons
ulta
nt:
Broo
k V
an D
alen
& A
ssoc
iate
s V
ertic
al T
rans
port
atio
n co
nsul
tant
: Sob
erm
an
Engi
neer
ing
Aco
ustic
con
sulta
nt:
Aer
cous
tics E
ngin
eerin
g, L
td.
Ene
rgy
cons
ulta
nt: R
WD
I Q
uant
ity su
rvey
or: H
ansc
omb
Lim
ited
Wat
er a
rchi
tect
ure:
Dan
Eus
er
Wat
er A
rchi
tect
ure,
Inc
Fu
nctio
n: m
ixed
use
, offi
ce,
gene
ral p
ublic
ass
embl
y; th
e pr
imar
y en
ergy
util
ity in
the
prov
ince
of M
anito
ba
Winnipeg, Manitoba/ 7A
Dou
ble-
an
d tri
ple-
glaz
ed
curta
in
wal
l pan
els
-Geo
ther
mal
-M
assi
ng a
nd o
rient
atio
n - T
he c
oncr
ete
stru
ctur
e cr
eate
sth
erm
al m
ass t
o m
oder
ate
extre
me
tem
pera
ture
swin
gs.
Larg
e po
rtion
s of t
he st
ruct
ure
left
expo
sed
to in
crea
se th
e co
nduc
tivity
of t
he ra
dian
t co
ncre
te m
ass
-Tow
ers c
onve
rge
at th
e bu
ildin
g's n
orth
end
to m
inim
ize
north
-faci
ng s
urfa
ce a
rea.
To
max
imiz
e so
lar a
nd w
ind
expo
sure
, the
tow
ers s
play
ope
n to
the
sout
h, w
here
they
are
cla
d in
low
-iron
gla
zing
-Sou
th-fa
cing
, six
-sto
ry "
win
ter
gard
ens"
act
as l
ungs
, with
24-
met
er w
ater
falls
that
hu
mid
ify/d
ehum
idify
air
ente
ring
the
build
ing.
-g
reen
roof
on
the
podi
um ro
of:
extra
ther
mal
insu
latio
n
- Sun
shin
e an
d do
min
ant g
ustin
g so
uth
win
ds a
s fre
e en
ergi
es
-A ra
dian
t sla
b be
twee
n th
e do
uble
faca
des
mai
ntai
ns
min
imum
tem
pera
ture
s in
win
ter
and
heat
exc
hang
e w
ith th
e ge
othe
rmal
fiel
d in
sum
mer
. In
the
win
ter,
the
sola
r chi
mne
y dr
aws e
xhau
st a
ir do
wn
to h
eat
the
park
ade
and
preh
eat i
ncom
ing
cold
air
via
the
sout
h at
ria.
Dur
ing
war
mer
seas
ons,
the
sola
r ch
imne
y ex
haus
ts st
ale
air f
rom
th
e bu
ildin
g -C
apita
l A o
ptio
n of
the
15 te
sted
th
erm
al m
ass p
rovi
ded
max
imum
pa
ssiv
e so
lar g
ains
in w
inte
r and
na
tura
l ven
tilat
ion
in th
e sh
ould
er
and
sum
mer
seas
ons
Day
light
ing
at
leve
ls th
at a
llow
lig
hts t
o be
off
durin
g da
ylig
ht
hour
s: 8
5%
-Nar
row
, 11-
met
er-
wid
e flo
orpl
ates
en
sure
acc
ess t
o vi
ews a
nd n
atur
al
light
. Eas
t and
wes
t to
wer
faca
des a
re
doub
le-g
laze
d w
ith
mot
oriz
ed
win
dow
s on
the
exte
rior a
nd s
ingl
e-gl
azed
with
m
anua
lly o
pera
ble,
ho
pper
-sty
le
win
dow
s on
the
inte
rior.
Larg
e-fo
rmat
aut
omat
ed
louv
ers w
ithin
the
doub
le fa
çade
ope
n an
d cl
ose
thro
ugho
ut th
e da
y to
min
imiz
e so
lar
gain
and
gla
re.
Louv
er b
lade
s at
the
top
act a
s a
light
shel
f, bo
unci
ng
addi
tiona
l lig
ht
onto
the
whi
te
ceili
ng.
-Sou
th a
trium
with
rib
bon
wat
er
feat
ure
-Int
erio
r gal
lery
sp
ace
with
wes
t cl
eres
tory
gla
zing
115
m ta
ll so
lar
chim
ney
Larg
e-sc
ale
entra
nce
cano
pies
pr
otec
t aga
inst
pr
evai
ling
win
ds
and
prov
ide
shel
ter f
or
pede
stria
ns
100%
fres
h ai
r an
d m
axim
um
dayl
ight
: au
tom
ated
lo
uver
s and
w
indo
ws o
pen
and
clos
e in
re
actio
n to
ligh
t an
d te
mpe
ratu
re
chan
ges
Dur
ing
shou
lder
se
ason
s, w
indo
ws
open
and
sup
ply
air i
s dra
wn
in
pass
ivel
y by
the
sola
r chi
mne
y.
Low
-pre
ssur
e,
unde
r-flo
or
disp
lace
men
t air
deliv
ery
allo
ws
for i
ndiv
idua
l en
viro
nmen
tal
cont
rol
Man
ually
op
erab
le
win
dow
s pu
nctu
ate
the
exte
rior f
açad
e at
10
feet
on
cent
er
A m
assi
ve g
eoth
erm
al
syst
em w
ith 2
80
bore
hole
s, ea
ch 1
25 m
de
ep
31%
impr
ovem
ent o
ver
the
ASH
RA
E ba
selin
e (m
ajor
load
s are
coo
ling,
ve
ntila
tion,
ligh
ting)
Dire
ct/in
dire
ct T
5 H
O
fixtu
res a
re d
imm
able
, eq
uipp
ed w
ith d
ayl ig
htin
g an
d oc
cupa
ncy
sens
ors,
and
are
indi
vidu
ally
ad
just
able
from
the
cent
ral b
uild
ing
man
agem
ent s
yste
m
Slig
htly
low
er o
verh
ead
light
ing
leve
ls re
duce
po
tent
ial g
lare
, and
in
divi
dual
LED
task
lig
hts
T he
larg
e ge
othe
rmal
fie
ld, h
igh-
effic
ienc
y co
nden
sing
boi
lers
, and
ef
ficie
nt h
eatin
g an
d co
olin
g sy
stem
s ens
ure
that
sup
ply
and
exch
ange
is
utili
zed.
A
soph
istic
ated
bui
ldin
g m
anag
emen
t sys
tem
m
onito
rs in
tern
al a
nd
exte
rnal
env
ironm
ents
to
optim
ize
light
ing,
sola
r sh
adin
g, a
nd h
eatin
g an
d co
olin
g lo
ads.
The
met
erin
g lis
t inc
lude
s m
ain
utili
ty m
eter
s and
a
varie
ty o
f sub
-met
ers
for
light
ing,
plu
g lo
ads,
wat
er
heat
ing,
HV
AC
ene
rgy,
an
d te
nant
spac
es
Gre
en ro
ofs
cove
r the
po
dium
roof
w
ith n
ativ
e pl
ant s
peci
es,
irrig
ated
by
rain
fall
or,
durin
g dr
ough
t co
nditi
ons,
by
cond
ensa
te
colle
cted
from
th
e bu
ildin
g’s
mec
hani
cal
equi
pmen
t. Ex
cess
co
nden
sate
ge
nera
ted
by th
e bu
ildin
g’s
fan
coil
units
dur
ing
the
hot s
umm
er
mon
ths
is di
rect
ed to
larg
e ci
ster
ns lo
cate
d in
the
build
ing’
s pa
rkin
g ga
rage
. W
hen
cond
ition
s w
arra
nt, t
his
recl
aim
ed w
ater
is
pum
ped
back
up
to th
e gr
een
roof
and
re
dist
ribut
ed v
ia
an e
ffici
ent d
rip
irrig
atio
n sy
stem
Wat
erle
ss
urin
als a
nd lo
w-
flow
toile
ts a
nd
sink
s
-LEE
D G
old
-64.
9% e
nerg
y sa
ving
s by
harn
essi
ng m
axim
um
pass
ive
sola
r, w
ind,
an
d ge
othe
rmal
en
ergy
com
pare
d w
ith C
anad
a’s
Mod
el N
atio
nal
Ener
gy C
ode
for
Bui
ldin
gs (M
NEC
B)
-Tot
al E
UI:
28 k
Btu/
sf/y
r-N
et p
redi
cted
EU
I: 28
kBt
u/sf
/yr
-Lig
htin
g Po
wer
D
ensi
ty:
-0.9
0 w
atts
/sf
-Int
egra
ted
desi
gn
proc
ess
-To
refle
ct th
e bu
ildin
g’s
min
imal
ac
tive
mec
hani
cal
syst
ems a
nd
optim
ized
pas
sive
sy
stem
s, th
e op
erat
ions
team
in
clud
es a
n en
ergy
m
anag
emen
t en
gine
er a
nd a
bu
ildin
g co
ntro
ls sp
ecia
list.
With
ove
r 20
,000
con
trol p
oint
sin
tera
ctin
g w
ith a
w
eath
er st
atio
n lo
cate
d on
the
roof

478
Project
Completion Pr
ojec
t tea
m
Location /Climate
Env
elop
e N
atur
al H
eatin
g
Nat
ural
Coo
ling
D
aylig
htin
g
Nat
ural
Ven
tilat
ion
Act
ive
syst
ems
Wat
er
Mile
ston
es
The Omega Center for Sustainable Living (OCSL)
200
9
Gro
ss
Floo
r A
rea:
620
0 SF
Prim
ary
cont
act:
Laur
a Le
snie
wsk
i BN
IM A
rchi
tect
s ht
tp://
ww
w.b
nim
.com
/ A
rchi
tect
: Ste
ve
McD
owel
l, FA
IAfro
m
Berk
ebile
Nel
son
Imm
ensc
huh
McD
owel
l Arc
hite
cts;
Br
ad C
lark
form
BN
IM
Arc
hite
cts
ME
P (L
ight
ing)
: BG
R
Con
sulti
ng E
ngin
eers
Ene
rgy
Con
sulta
nt
(Lig
htin
g): B
NIM
A
rchi
tect
s
Civ
il: P
ierre
Bris
sette
fro
m C
haze
n C
ompa
nies
L
ands
cape
arc
hite
ct:
from
Ger
ould
Wilh
elm
C
onse
rvat
ion
Des
ign
Foru
m
Con
trac
tor:
Dav
id
Sem
ber f
rom
Dav
id
Sem
ber C
onst
ruct
ion
Com
mis
sion
ing
agen
t:
EME
Gro
up; J
ohn
Todd
Eco
logi
cal
Des
ign,
Inc.
; Nat
ural
Sy
stem
s In
tern
atio
nal
Stru
ctur
e: T
ippi
ng
Mar
Func
tion:
Edu
catio
n an
d w
ater
filtr
atio
n
Rhinebeck, New York/ 4A
The
insu
late
d th
erm
al m
ass
of th
e bu
ildin
g an
d th
e th
erm
al
mas
s of t
he
wat
er (5
5°F)
pa
ssin
g th
roug
h th
e tre
atm
ent
cycl
e ar
e in
stru
men
tal
in re
duci
ng
dem
ands
upo
n m
echa
nica
l sy
stem
s.
-Har
vest
sola
r ene
rgy
for p
assi
ve h
eatin
g an
d lig
htin
g, u
sing
the
entir
e m
ass f
or th
erm
al
com
fort
-com
pact
form
-w
ith a
n ea
st-w
est a
xis,
the
build
ing
is or
ient
ed
for o
ptim
al c
ontro
l of
dayl
ight
ing
and
sola
r he
at g
ain
- The
bui
ldin
g fo
rm a
nd
sect
ion
serv
e th
e pl
ants
fo
r was
tew
ater
tre
atm
ent i
n th
e Ec
o M
achi
ne. R
ecog
nizi
ng
that
the
plan
ts w
ould
re
ach
a lig
ht sa
tura
tion
poin
t at a
roun
d 30
,000
lu
x, th
e te
am fl
atte
n th
e am
ount
of l
ight
falli
ng
on th
e pl
ants
sur
face
s du
ring
the
sum
mer
m
onth
s to
this
leve
l in
orde
r to
min
imiz
e th
e he
at ta
ken
on b
y th
e sp
ace.
Con
vers
ely,
du
ring
cold
er m
onth
s, th
e am
ount
of l
ight
will
be
max
imiz
ed a
nd
war
m th
e sp
ace.
Sol
ar
track
ing
skyl
ight
s w
ould
do
this.
-R
oof m
ater
ials
incl
ude
a co
mbi
natio
n of
ve
geta
tion
and
recy
cled
m
etal
, whi
ch h
elp
to
cool
inte
rior s
pace
s, m
itiga
ting
the
"hea
t is
land
" effe
ct
-geo
ther
mal
-s
hadi
ng d
evic
es
Day
light
ing
at
leve
ls th
at a
llow
lig
hts t
o be
off
durin
g da
ylig
ht
hour
s: 9
8%
-Day
light
ing,
na
tura
l ve
ntila
tion,
and
vi
ews a
re
achi
eved
thro
ugh
a sy
stem
of
oper
able
, fix
ed,
and
sola
r-tra
ckin
g fe
nest
ratio
n
-Cl e
rest
ory
win
dow
s
-Nat
ural
ven
tilat
ion
thro
ugh
oper
able
w
indo
ws a
nd st
ack
effe
ct
- Cle
rest
ory
win
dow
s ven
tilat
e th
e lo
bby,
m
echa
nica
l roo
m,
and
rest
room
s. So
lar
radi
atio
n he
ats t
he
uppe
r vol
ume
of a
ir,
and
then
nat
ural
bu
oyan
cy in
duce
s st
ack
vent
ilatio
n,
whi
ch c
ause
s the
air
to p
ush
its w
ay o
ut
of th
e op
en w
indo
ws
and
pull
in fr
esh,
co
oler
air
from
lo
wer
win
dow
s in
th
ese
spac
es.
Ope
rabl
e w
indo
ws
inte
grat
ed in
to th
e so
uth
faça
de a
lso
allo
w fo
r nat
ural
ve
ntila
tion
to a
ssist
in
pus
hing
hot
air
out o
f the
bui
ldin
g by
cha
nnel
ing
prev
ailin
g br
eeze
s th
at h
ave
been
co
oled
whi
le
mov
ing
over
the
wet
land
s
PV sy
stem
pr
oduc
ing
mor
e th
an n
eede
d en
ergy
(sur
plus
el
ectri
city
is so
ld
to th
e lo
cal u
tility
. Th
e ex
cess
ene
rgy
is so
ld to
the
loca
l ut
ility
.) D
urin
g ev
enin
gs a
nd
certa
in w
inte
r pe
riods
ene
rgy
is pr
ovid
ed b
y th
e el
ectri
c ut
ility
. (N
P EU
I: -8
kBt
u/sq
ft/
yr)
-The
ent
ire
build
ing
and
wat
er
proc
ess u
se si
te-
harv
este
d re
new
able
ene
rgy
achi
evin
g a
net-
zero
ene
rgy
syst
em
F ans
: coo
ling
only
fo
r cla
sses
Ge o
ther
mal
wel
ls an
d he
at p
umps
78%
of B
uild
ing
is N
atur
ally
-Per
cent
redu
ctio
n of
regu
late
d po
tabl
e w
ater
: 10
0%
-he
Eco
Mac
hine
, bas
ed o
n th
e sa
me
natu
ral s
cien
ce a
s es
tuar
ies,
natu
re’s
ow
n w
ater
fil
tratio
n sy
stem
. It i
s co
mpr
ised
of a
serie
s of
hold
ing
tank
s, ea
ch c
onta
inin
g a
slig
htly
diff
eren
t eco
syst
em.
Plan
ts a
nd n
atur
al b
acte
ria
brea
k do
wn
was
te b
y-pr
oduc
ts o
ver a
1 to
3-d
ay
trave
l thr
ough
the
tank
s, pr
ogre
ssiv
ely
purif
ying
the
wat
er.
-The
sys
tem
use
s ear
th, p
lant
san
d su
nlig
ht.
-The
new
eng
inee
red
biol
ogic
al w
aste
wat
er
treat
men
t sys
tem
now
retu
rns
a hi
gher
qua
lity
of w
ater
bac
k to
the
earth
. Aer
ated
lago
ons
carr
y gr
ayw
ater
thro
ugh
the
recl
amat
ion
proc
ess.
At t
he
end,
the
wat
er m
ay b
e us
ed to
su
ppor
t the
nee
ds o
f the
bu
ildin
g.
-For
pot
able
wat
er u
ses,
wel
l w
ater
is st
ill d
raw
n fro
m th
e ea
rth. F
or to
ilet f
lush
ing,
ra
inw
ater
is c
olle
cted
from
the
build
ing’
s roo
f.
-Low
-flo
w p
lum
bing
fixt
ures
incl
udin
g w
ater
less
urin
als
-Bla
ckw
ater
and
gra
ywat
er
are
sent
to th
e w
aste
wat
er
treat
men
t lag
oons
and
co
nstru
cted
wet
land
s fo
r pu
rific
atio
n. B
y th
e en
d of
th
is cy
cle
that
use
s nat
ural
sy
stem
s, cl
eane
r wat
er is
re
intro
duce
d to
the
grou
ndw
ater
and
lake
LEED
Pla
tinum
ce
rtific
atio
n, a
nd th
e Li
ving
Bui
ldin
g C
halle
nge
Cer
tific
atio
n
Net
-zer
o en
ergy
- Pre
dict
ed c
onsu
med
EU
I: 13
kBt
u/sf
/yr
- Pre
dict
ed N
et E
UI:
-8
kBtu
/sq
ft/yr
-Hig
hly
sust
aina
ble
was
tew
ater
filtr
atio
n fa
cilit
y fo
r the
ir 19
5-ac
re c
ampu
s
-100
% o
f Ene
rgy
Supp
lied
by O
n-Si
te
Ren
ewab
le S
ourc
es
100%
of P
reci
pita
tion
Man
aged
On
Site
98%
of
Bui
ldin
g is
Day
lit
78%
of B
uild
ing
is N
atur
ally
Ven
tilat
ed
Net
Zer
o En
ergy
Net
Ze
ro W
ater
Net
Zer
o W
aste

479
Project
Completion Pr
ojec
t tea
m
Location /Climate
Env
elop
e N
atur
al H
eatin
g
Nat
ural
Coo
ling
D
aylig
htin
g
Nat
ural
V
entil
atio
n
Act
ive
syst
ems
Wat
er
Mile
ston
es
Twelve West
200
9
Gro
ss
Floo
r A
rea:
55
2000
SF
Prim
ary
Con
tact
: Pr
imar
y Su
bmis
sion
Con
tact
: ZG
F A
rchi
tect
s LL
P ht
tp://
ww
w.z
gf.c
om
Dev
elop
er:
Dev
elop
er D
ownt
own
Dev
elop
men
t Inc
Civ
il: D
avid
Eva
ns a
nd
Ass
ocia
tes
Mec
hani
cal e
ngin
eer:
G
lum
ac
Con
trac
tor:
Hof
fman
C
onst
ruct
ion
Stru
ctur
e: K
PFF
Con
sulti
ng
Engi
neer
s
Func
tion:
mix
ed u
se: F
ood
Serv
ice
Res
taur
ant/C
afet
eria
O
ffice
-Res
iden
tial
Mul
ti-Fa
mily
-Ret
ail S
tore
Portland Oregon/4C
Low
-E g
lass
w
ith 3
5% V
T (v
isib
le li
ght
trans
mis
sion
) an
d SR
74%
(of
asso
ciat
ed h
eat
refle
cted
)
Nig
ht-p
urge
(fan
as
siste
d): e
xpos
ed
conc
rete
bec
omes
co
ol d
urin
g ni
ght
time
and
will
mak
e th
e in
door
spac
e co
ol d
urin
g da
y tim
e
Roo
f gar
den
Sola
r the
rmal
pa
nels
heat
24%
of
hot w
ater
use
d in
th
e bu
ildin
g (p
ayba
ck o
f les
s th
an fo
ur y
ears
)
-Roo
f ter
race
s, hi
gh-a
lbed
o ro
ofin
g, a
nd 6
,000
sq
uare
feet
of r
oof
gard
ens w
ith
dive
rse
nativ
e pl
antin
gs. T
hese
in
tens
ive
roof
s re
duce
the
urba
n he
at is
land
effe
ct
Day
light
ing
at le
vels
that
allo
w li
ghts
to
be o
ff du
ring
dayl
ight
hou
rs:
55%
Vie
ws t
o th
e O
utdo
ors:
90
%
Day
light
ing
sens
ors
redu
ce li
ghtin
g en
ergy
by
60%
Met
allic
-coa
ted
rolle
r sha
des a
llow
oc
cupa
nts s
olar
co
ntro
l in
thei
r wor
k an
d liv
ing
area
s.
Expo
sed
conc
rete
ce
iling
s in
the
offic
e sp
aces
wer
e pa
inte
d w
hite
to im
prov
e da
ylig
ht p
enet
ratio
n bu
t mai
ntai
n m
ass
effe
cts
T he
orie
ntat
ion
of
livin
g an
d be
droo
m
spac
es a
long
the
floor
-to-c
eilin
g,
glas
s cur
tain
wal
l m
axim
izes
nat
ural
lig
htin
g.
Ope
rabl
e w
indo
ws a
s wel
l as
man
y ou
tdoo
r ba
lcon
ies a
nd
terra
ces,
acce
ssib
le
thro
ugho
ut th
e bu
ildin
g
Hig
h flo
or-to
-flo
or h
eigh
ts
furth
er fa
cilit
ate
dayl
ight
ing
and
incr
ease
ther
mal
co
mfo
rt by
al
low
ing
for
stra
tific
atio
n of
w
arm
er a
ir
Pass
ive
chill
ed b
eam
s
Four
win
d tu
rbin
es o
n th
e to
p pr
oduc
ing
10-
1200
0 K
W
elec
trici
ty/y
r to
run
elev
ator
s (lo
cate
d th
roug
h ex
tens
ive
win
d tu
nnel
sim
ulat
ions
)
Co2
mon
itorin
g
Rad
iant
hea
ting
and
cool
ing
Offi
ce a
rea
incl
udes
an
unde
rflo
or a
ir di
strib
utio
n (U
FAD
) sy
stem
that
del
iver
s air
dire
ctly
to th
e oc
cupi
ed
zone
nea
r the
floo
r with
in
divi
dual
con
trols
for
each
wor
k st
atio
n. T
his
syst
em, c
ombi
ned
with
th
e op
erab
le w
indo
ws
allo
ws f
or in
divi
dual
co
ntro
l of t
empe
ratu
re
and
airf
low
Hig
h-ef
ficie
ncy
mec
hani
cal e
quip
men
t, he
at re
cove
ry, f
an-
assis
ted
nigh
t flu
sh o
f th
erm
al m
ass f
or th
e of
fice
floor
s, ch
illed
be
ams a
nd h
ydro
nic
base
boar
d he
at in
the
offic
e flo
ors
Abo
ut 4
0%
redu
ctio
n in
pot
able
w
ater
use
- Low
-wat
er ro
of
plan
tings
Rai
n w
ater
reus
e fo
r of
fice
toile
t flu
shin
g (9
0%) a
nd to
irrig
ate
the
gree
n ro
of
(286
000
gallo
ns/y
r re
duct
ion
of c
ity
wat
er)
Exte
rior p
lant
ings
w
ere
chos
en fr
om
nativ
e sp
ecie
s to
use
min
imal
irrig
atio
n,
whi
ch re
sults
in a
n 84
% ir
rigat
ion
wat
er-u
se re
duct
ion
rela
tive
to
equi
vale
nt
land
scap
ing
need
s.
4 4%
wat
er u
se
redu
ctio
n th
roug
h ef
ficie
nt p
lum
bing
fix
ture
s
Col
lect
ing
cond
ensa
tion
of
1300
0 ga
llons
of
wat
er in
sum
mer
fro
m A
HU
s
Wat
er st
orag
e ta
nk
2300
0 ga
llons
from
ra
inw
ater
reus
e an
d co
nden
satio
n w
ater
Dou
ble
LEED
Pl
atin
um-c
ertif
ied
(bot
h LE
ED fo
r New
C
onst
ruct
ion
and
LEED
for
Com
mer
cial
Inte
riors
ra
ting
syst
ems,
LEED
-NC
, v.2
.2,
rate
d 20
10)
Ener
gy sa
ving
s of
45%
ove
r a b
asel
ine
code
bui
ldin
g
Tota
l pre
dict
ed E
UI:
27
kBt
u/sf
/yr
Net
pre
dict
ed E
UI:
26
kBt
u/sf
/yr
Ligh
ting
Pow
er
Den
sity
: 0.
50 w
atts
/sf

480
Project
Completion Pr
ojec
t tea
m
Location /Climate
Env
elop
e N
atur
al H
eatin
g
Nat
ural
Coo
ling
D
aylig
htin
g
Nat
ural
Ven
tilat
ion
Act
ive
syst
ems
Wat
er
Mile
ston
es
Special No. 9 House
200
9
Gro
ss
Floo
r A
rea:
152
0 SF
Prim
ary
Con
tact
: K
iera
nTim
berla
ke
http
://ki
eran
timbe
rlake
.co
m
Proj
ect A
rchi
tect
: Jo
hn W
illia
ms
John
C. W
illia
ms
Arc
hite
cts
http
://w
ww
.will
iam
sarc
hit
ects
.com
/
Mec
hani
cal e
ngin
eer:
M
echa
nica
l eng
inee
r Br
uce
E. B
rook
s &
Ass
ocia
tes;
Mos
es
Engi
neer
s, In
c C
ontr
acto
r: C
&G
C
onst
ruct
ion
Stru
ctur
e: C
ali &
LaP
lace
En
gine
ers,
LLC
; CV
M
Stru
ctur
al E
ngin
eers
Func
tion:
Res
iden
tial
New Orleans Louisiana/2A
Min
R30
ce
iling
in
sula
tion
Pipe
s in
sula
tions
Poly
prop
ylen
e m
esh
vine
tre
llis
-Lin
ear e
ast-w
est a
xis,
limiti
ng m
ost s
olar
ex
posu
re d
urin
g th
e su
mm
er a
nd sh
ould
er
seas
ons t
o th
e lo
ng
sout
h fa
cade
. The
sola
r he
at g
ains
that
wou
ld
norm
ally
resu
lt fro
m
such
a d
esig
n ar
e m
oder
ated
by
an
exte
nsiv
e tre
llis s
yste
m
alon
g th
e en
tiret
y of
the
sout
h fa
çade
with
futu
re
vege
tatio
n
-In
the
win
ter t
he tr
ellis
will
allo
w so
lar a
cces
s to
the
build
ing
enve
lope
, pro
vidi
ng a
he
atin
g be
nefit
.
Exce
ssiv
e gl
are
from
low
w
este
rn s
un is
m
oder
ated
th
roug
h oc
cupa
nt-
cont
rolle
d ex
tern
al
shad
ing
devi
ces
that
are
fully
co
mpl
iant
with
th
e hu
rric
ane
rate
d w
indo
ws
-To
faci
litat
e na
tura
l ve
ntila
tion,
the
hous
e in
clud
es
oper
able
tran
som
s ab
ove
the
win
dow
s an
d la
rge
oper
able
w
indo
ws i
nteg
rate
d in
to th
e so
uth,
eas
t, an
d w
est e
nvel
opes
. Th
ese
oper
able
en
velo
pe
com
pone
nts,
coup
led
with
ce
iling
-mou
nted
fa
ns a
nd 1
0-fo
ot
ceili
ngs,
allo
w fo
r si
gnifi
cant
pas
sive
cl
imat
ic a
dapt
atio
n
-Ope
rabl
e do
uble
hu
ng w
indo
ws;
op
erab
le a
wni
ng
win
dow
; ope
rabl
e ve
nt a
bove
inte
rior
door
Roo
f-m
ount
ed
phot
ovol
taic
ar
ray
at a
30-
degr
ee a
ngle
Cei
ling
fans
Hig
h-ef
ficie
ncy
HV
AC
sy
stem
100%
of s
ite-g
ener
ated
ru
noff
to b
e in
filtra
ted
onsi
te th
roug
h pe
rmea
ble
surf
acin
g. T
he p
arki
ng a
nd
driv
eway
are
as,
cons
titut
ing
17%
of t
he
site
surfa
ce, w
ere
cons
truct
ed o
f per
mea
ble
pavi
ng. A
ll ve
geta
ted
area
s, ac
coun
ting
for 8
0%
of th
e sit
e, a
re p
erm
eabl
e as
wel
l. Th
e re
mai
ning
3%
of
the
site
cons
istin
g of
im
perm
eabl
e su
rfac
es is
di
rect
ed to
war
d ot
her
perm
eabl
e su
rface
s fo
r in
filtra
tion.
In th
e ev
ent o
f ex
cess
ive
prec
ipita
tion,
the
runo
ff is
dire
cted
tow
ards
a
smal
l mod
ular
wet
land
fo
r bio
-filt
ratio
n pr
ior t
o en
terin
g th
e st
orm
sew
er
syst
em
- Cist
erns
loca
ted
unde
r th
e ho
use
are
capa
ble
of
reta
inin
g 62
% o
f the
pr
ecip
itatio
n re
aliz
ed fr
om
a no
rmal
rain
eve
nt, o
r 600
ga
llons
.
-Toi
let f
lush
ing:
Alth
ough
th
e re
gion
al c
ode
does
not
ye
t allo
w fo
r the
indo
or
use
of ra
inw
ater
, the
hou
seis
pre-
plum
bed
for c
ister
n w
ater
reus
e fo
r toi
let
flush
ing
in a
ntic
ipat
ion
of
futu
re c
ode
revi
sion
s
- Lo w
-flo
w fi
xtur
es fo
r all
lava
tory
sin
ks, s
how
ers,
and
toile
ts.
LEED
Pla
tinum
(LEE
D fo
r H
omes
v.1
, 200
9)
Tota
l pre
dict
ed E
UI:
27
kBt
u/sf
/yr
Net
pre
dict
ed E
UI:
19
kBt
u/sf
/yr
Mas
s pro
duct
ion
exam
ple
of
stor
m-r
esist
ant,
affo
rdab
le,
and
sust
aina
ble
hous
ing
optio
ns fo
r the
resi
dent
s of
New
Orle
ans'
Low
er N
inth
W
ard
disp
lace
d by
H
urric
ane
Kat
rina.
T wo
hous
ing
type
s: a
G
arde
n pr
otot
ype
that
in
clud
es a
roof
dec
k,
suns
cree
ns, a
nd m
esh
trelli
s;
and
a G
able
pro
toty
pe th
at
incl
udes
suns
cree
ns, s
latte
d tre
llis,
and
an a
rea
of re
fuge
.
HER
S (H
ome
Ener
gy
Rat
ing)
inde
x ra
ting
of 3
5,
mea
ning
the
hous
e co
nsum
es 6
5% le
ss e
nerg
y re
lativ
e to
a c
ompa
rabl
e ba
selin
e ho
me
in th
e sa
me
clim
ate
c arb
on n
eutra
lity
(a H
ERS
scor
e of
0) b
y su
rpas
sing
the
2030
Cha
lleng
e en
ergy
ta
rget
for 2
010—
a 60
%
redu
ctio
n in
ene
rgy
cons
umpt
ion
-Pre
fabr
icat
ion

481
Project
completion Pr
ojec
t tea
m
Location /Climate
Nat
ural
Hea
ting
N
atur
al C
oolin
g
Day
light
ing
N
atur
al V
entil
atio
n
Act
ive
syst
ems
Wat
er
Mile
ston
es
Watsonville Water Resource Center
200
9
Gro
ss
Floo
r A
rea:
16
000
SF
Prim
ary
cont
act:
Sa
m N
unes
W
RN
S St
udio
ht
tp://
ww
w.w
rnss
tudi
o.co
m
Proj
ect A
rchi
tect
: Lih
sing
K
uo fr
om W
RN
S St
udio
C
ivil:
Ric
hard
Iris
h En
gine
erin
g, In
c.
Lan
dsca
pe a
rchi
tect
: M
icha
el B
ellin
ger f
rom
Be
lling
er F
oste
r Ste
inm
etz
C
ontr
acto
r: G
arre
t Tom
ford
e fro
m D
evco
n C
onst
ruct
ion
L
ight
ing
Des
igne
r:
Dav
id M
aino
from
Inte
grat
ed
Des
ign
Ass
ocia
tes
Ele
ctri
cal e
ngin
eer
(Lig
htin
g de
sign
er) D
avid
Kan
eda
from
In
tegr
ated
Des
ign
Ass
ocia
tes
Stru
ctur
e: Ja
son
Cam
pbel
l fro
m JE
C S
truct
ural
C
onsu
lting
C
omm
issi
onin
g ag
ent:
Ric
k U
nvar
sky
Con
sulti
ng
Serv
ices
, Inc
. M
echa
nica
l & p
lum
bing
: R
umse
y En
gine
ers,
Inc.
Func
tion:
Lab
orat
ory;
wat
er
recy
cle
plan
t; of
fice;
ed
ucat
ion
spac
e.
Watsonville California/3C
- 290
feet
in le
ngth
,bu
ildin
g is
orie
nted
on
an
east
-wes
t axi
s,al
low
ing
for t
he
maj
ority
of t
he
build
ing'
s pro
gram
to
be
plac
ed a
long
th
e no
rth a
nd so
uth
faca
des.
- Sol
ar h
eat g
ain
is co
ntro
lled
thro
ugh
the
build
ing'
s eav
es
and
trees
pla
ced
alon
g th
e so
uthe
rn
edge
, and
ther
mal
m
ass i
s pro
vide
d by
a
polis
hed
conc
rete
ra
dian
t flo
or.
- The
site
pre
vaili
ng
coas
tal P
acifi
c w
inds
max
imiz
e co
mfo
rt in
the
outd
oor p
ublic
sp
aces
. Roo
ftop
vent
st
akes
alo
ng th
e bu
ildin
g's r
idge
line
allo
w th
ese
bree
zes
to d
raw
war
m o
ut o
f th
e in
terio
r nat
ural
ly
Day
light
ing
at le
vels
that
allo
w li
ghts
to b
e of
f dur
ing
dayl
ight
ho
urs:
60%
- Sky
light
s alo
ng th
e ce
ntra
l cor
ridor
was
h th
e w
hite
wal
ls w
ith
sunl
ight
- Priv
ate
offic
es a
re
equi
pped
with
gla
ss
sidel
ight
s and
ope
rabl
ecl
eres
tory
win
dow
s to
allo
w n
atur
al li
ght t
o ge
t thr
ough
the
build
ing'
s priv
ate
and
publ
ic sp
aces
-Aut
omat
ic d
aylig
ht
cont
rols
augm
ent
cont
rols
in in
divi
dual
of
fices
, allo
win
g us
ers
to m
anag
e th
eir o
wn
ambi
ent l
ight
leve
ls an
d ta
sk li
ghtin
g
- The
thin
ness
of t
hebu
ildin
gs (j
ust 4
3 fe
et
in w
idth
on
the
oper
atio
ns s
ide)
and
the
num
ber o
f stra
tegi
cally
pl
aced
ope
rabl
e w
indo
ws a
llow
nat
ural
br
eeze
s to
filte
r th
roug
hout
all
of th
e sp
aces
.
-Cro
ss a
nd st
ack
natu
ral
vent
ilatio
n
- Gla
ss si
delig
hts a
nd
oper
able
cle
rest
ory
win
dow
s to
allo
w th
e ai
r mov
e na
tura
lly
thro
ugh
the
build
ing'
spr
ivat
e an
d pu
blic
sp
aces
-b
uild
ing
chim
neys
-Roo
f-m
ount
ed so
lar p
anel
s
-For
day
light
har
vest
ing
occu
panc
y se
nsor
s are
in
clud
ed th
roug
hout
the
faci
lity
to m
inim
ize
ener
gy
use.
- In
occu
pied
spac
es, w
ater
flo
ws t
hrou
gh ra
dian
t tub
es
unde
rnea
th th
e flo
ors t
o pr
ovid
e he
atin
g an
d co
olin
g.
- The
ven
tilat
ion
and
heat
ing
/coo
ling
syst
ems
wer
e de
coup
led,
resu
lting
in
a sy
stem
that
is m
uch
less
en
ergy
inte
nsiv
e th
an a
st
anda
rd fo
rced
-air
syst
em.
- CO
2 se
nsor
s in
open
are
as
Perc
ent r
educ
tion
of
regu
late
d po
tabl
e w
ater
: 50%
To d
ispla
y w
ater
as a
se
ason
al re
sour
ce
conn
ecte
d to
the
loca
l ag
ricul
tura
l gro
win
g se
ason
, wat
er is
su
pplie
d to
a ti
led
wat
er fe
atur
e on
ly
whe
n re
cycl
ed w
ater
is
avai
labl
e to
the
site
. In
addi
tion,
rain
wat
er
flow
s fro
m e
aves
and
ra
in c
hain
s in
to sw
ales
, th
en is
car
ried
to
rete
ntio
n ba
sins
to b
e tre
ated
prio
r to
infil
tratin
g th
e gr
ound
wat
er sy
stem
. N
ativ
e an
d dr
ough
t-to
lera
nt p
lant
ings
, re
quiri
ng le
ss th
an 7
0%
of ty
pica
l wat
er u
sage
, ar
e w
ater
ed o
nly
whe
n re
cycl
ed w
ater
is
avai
labl
e.
T he
irrig
atio
n sy
stem
is
pred
omin
antly
an
effic
ient
, aut
omat
ical
ly
cont
rolle
d dr
ip s
yste
m
utili
zing
recy
cled
non
-po
tabl
e w
ater
LEED
Pla
tinum
200
9,
Net
Zer
o En
ergy
Ener
gy-e
ffici
ency
ta
rget
s exc
eed
ASH
RA
E 90
.1 b
y 76
%
- Pre
dict
ed c
onsu
med
EU
I: 45
kBt
u/sf
/yr
- Pre
dict
ed N
et E
UI:
45 k
Btu/
sq ft
/yr