RAVI-THESIS.pdf - OAKTrust - Texas A&M University
113
EXPERIMENTAL ASSESSMENT OF WATER BASED DRILLING FLUIDS IN HIGH PRESSURE AND HIGH TEMPERATURE CONDITIONS A Thesis by ASHWIN RAVI Submitted to the Office of Graduate Studies of Texas A&M University in partial fulfillment of the requirements for the degree of MASTER OF SCIENCE August 2011 Major Subject: Petroleum Engineering
-
Upload
khangminh22 -
Category
Documents
-
view
3 -
download
0
Transcript of RAVI-THESIS.pdf - OAKTrust - Texas A&M University

EXPERIMENTAL ASSESSMENT OF WATER BASED DRILLING
FLUIDS IN HIGH PRESSURE AND HIGH TEMPERATURE
CONDITIONS
A Thesis
by
ASHWIN RAVI
Submitted to the Office of Graduate Studies ofTexas A&M University
in partial fulfillment of the requirements for the degree of
MASTER OF SCIENCE
August 2011
Major Subject: Petroleum Engineering

Experimental Assessment of Water Based Drilling Fluids in High Pressure and High
Temperature Conditions
Copyright 2011 Ashwin Ravi

EXPERIMENTAL ASSESSMENT OF WATER BASED DRILLING
FLUIDS IN HIGH PRESSURE AND HIGH TEMPERATURE
CONDITIONS
A Thesis
by
ASHWIN RAVI
Submitted to the Office of Graduate Studies ofTexas A&M University
in partial fulfillment of the requirements for the degree of
MASTER OF SCIENCE
Approved by:
Co-Chairs of Committee, F.E.BeckJerome Schubert
Committee Members, Yufeng SunHead of Department, Stephen A. Holditch
August 2011
Major Subject: Petroleum Engineering

iii
ABSTRACT
Experimental Assessment of Water Based Drilling Fluids in High Pressure and High
Temperature Conditions. (August 2011)
Ashwin Ravi, B.E, College of Engineering,Guindy
Co–Chairs of Advisory Committee: Dr. F.E. BeckDr. Jerome Schubert
Proper selection of drilling fluids plays a major role in determining the efficient com-
pletion of any drilling operation. With the increasing number of ultra-deep offshore
wells being drilled and ever stringent environmental and safety regulations coming
into effect, it becomes necessary to examine and understand the behavior of water
based drilling fluids – which are cheaper and less polluting than their oil based coun-
terpart – under extreme temperature and pressure conditions.
In most of the existing literature, the testing procedure is simple – increase the
temperature of the fluid in steps and record rheological properties at each step. A
major drawback of this testing procedure is that it does not represent the continuous
temperature change that occurs in a drilling fluid as it is circulated through the
well bore. To have a better understanding of fluid behavior under such temperature
variation, a continuous test procedure was devised in which the temperature of the
drilling fluid was continuously increased to a pre-determined maximum value while
monitoring one rheological parameter. The results of such tests may then be used
to plan fluid treatment schedules. The experiments were conducted on a Chandler
7600 XHPHT viscometer and they seem to indicate specific temperature ranges above
which the properties of the drilling fluid deteriorate. Different fluid compositions and
drilling fluids in use in the field were tested and the results are discussed in detail.

iv
To my loving parents Krishnaswamy Ravi and Padmini
v
ACKNOWLEDGMENTS
An old sanskrit saying Maata Pita Guru Deivam (Mother, Father, Teacher and God)
lists the four most important people in a man’s life. I would like to begin by thank-
ing my wonderful teacher (guru), Dr. F.E. Beck, for his support during the entire
duration of this project. His experience in the field of drilling and drilling fluids was
invaluable to the successful completion of this thesis. I have cherished each and every
conversation I have had with him regarding this topic. He has been a treasure trove of
knowledge and his encouragement during the critical stages of experimentation gave
me tons of confidence. I am indebted to you, sir.
A huge shout of thanks to my committee members, Dr. Jerome Schubert and Dr.
Yuefeng Sun. I have learned a lot from them. Special thanks to Vivek Gupta for his
instruction on using the XHPHT viscometer.
My parents are the most important people in my life. I cannot express how much
their emotional support has meant to me during these two years. A mere ’thank you’
will never repay the debt of gratitude I owe them. I cannot list all my friends here,
but the least I can acknowledge their words of comfort during the emotionally testing
times I have faced.
vi
TABLE OF CONTENTS
CHAPTER Page
I INTRODUCTION TO HTHP DRILLING AND ITS CHALLENGES 1
1.1 Definition of a HTHP Well . . . . . . . . . . . . . . . . . . . . . 1
1.2 The Challenges of HTHP Drilling . . . . . . . . . . . . . . . . . 3
1.3 HTHP Hydraulics and Drilling Fluids . . . . . . . . . . . . . . . 6
1.4 HTHP Testing of Drilling Fluids – Why is it Indispensible? . . . 17
1.5 Types of Drilling Fluids . . . . . . . . . . . . . . . . . . . . . . 19
II LITERATURE SURVEY . . . . . . . . . . . . . . . . . . . . . . . . 23
2.1 Additives for Water Based Drilling Fluids . . . . . . . . . . . . 23
2.2 Existing Work on HTHP Properties of Water Based Muds . . . 35
2.3 Gelation of Bentonite Suspensions under Elevated Temperatures 43
III EXPERIMENTAL METHODS AND EQUIPMENT . . . . . . . . . 47
3.1 Principles of Non-Newtonian Rheology Measurement . . . . . . 47
3.2 The High Temperature - High Pressure Viscometer . . . . . . . 50
3.3 Sample Preparation . . . . . . . . . . . . . . . . . . . . . . . . . 59
IV RESULTS AND DISCUSSION . . . . . . . . . . . . . . . . . . . . . 60
4.1 The Continuous Test Schedule . . . . . . . . . . . . . . . . . . . 60
4.2 Experimental Results . . . . . . . . . . . . . . . . . . . . . . . . 66
4.3 The Bigger Picture . . . . . . . . . . . . . . . . . . . . . . . . . 86
V CONCLUSIONS AND RECOMMENDATIONS . . . . . . . . . . . 88
NOMENCLATURE . . . . . . . . . . . . . . . . . . . . . . . . . . . . . . . . 90
REFERENCES . . . . . . . . . . . . . . . . . . . . . . . . . . . . . . . . . . . 91
APPENDIX A . . . . . . . . . . . . . . . . . . . . . . . . . . . . . . . . . . . 97
APPENDIX B . . . . . . . . . . . . . . . . . . . . . . . . . . . . . . . . . . . 98
VITA . . . . . . . . . . . . . . . . . . . . . . . . . . . . . . . . . . . . . . . . 102

vii
LIST OF TABLES
TABLE Page
1.1 HTHP Well Classification . . . . . . . . . . . . . . . . . . . . . . . . 2
2.1 Common Additives for Water Based Muds . . . . . . . . . . . . . . . 24
2.2 Common Weighting Materials . . . . . . . . . . . . . . . . . . . . . . 31
4.1 Temperature and Pressure Step Data . . . . . . . . . . . . . . . . . . 67
4.2 Properties of TANNATHIN . . . . . . . . . . . . . . . . . . . . . . . 72
4.3 Composition Table for Weighted Fluids . . . . . . . . . . . . . . . . . 74
viii
LIST OF FIGURES
FIGURE Page
1.1 Graphical Classification of HTHP Wells . . . . . . . . . . . . . . . . 2
1.2 Safety Concerns in HTHP Drilling . . . . . . . . . . . . . . . . . . . 3
1.3 Typical Drilling Window for a HTHP Well . . . . . . . . . . . . . . . 5
1.4 Factors to Consider in a HTHP Project . . . . . . . . . . . . . . . . 5
1.5 Drilling Fluid Design Considerations . . . . . . . . . . . . . . . . . . 8
1.6 Typical HTHP Casing Design . . . . . . . . . . . . . . . . . . . . . . 9
1.7 Temperature Profiles in a Typical HTHP Well . . . . . . . . . . . . . 10
1.8 Effect of Pressure on the Density of Water Based Muds at 200F . . 11
1.9 Combined Effect of Pressure and Temperature on an SBM . . . . . 12
1.10 Effect of Temperature Variations on ESD . . . . . . . . . . . . . . . 13
1.11 Variation of Yield Point in a Well Bore . . . . . . . . . . . . . . . . 14
1.12 Impact of Varying Rheology on ECD . . . . . . . . . . . . . . . . . . 15
1.13 Variation in ECD With Time . . . . . . . . . . . . . . . . . . . . . . 16
1.14 Finite Difference Approach to Hydraulics Calculations . . . . . . . . 16
1.15 Sample Fluid Testing Matrix . . . . . . . . . . . . . . . . . . . . . . 17
1.16 Errors Due to Property Extrapolation . . . . . . . . . . . . . . . . . 18
1.17 Effect of Base Fluid on Log Quality . . . . . . . . . . . . . . . . . . . 20
1.18 Methane Gas Solubility in Base Fluids . . . . . . . . . . . . . . . . . 21
2.1 Structure of a Montmorillonite Clay Platelet . . . . . . . . . . . . . . 27
2.2 Hydration of Bentonite Clay . . . . . . . . . . . . . . . . . . . . . . . 28
ix
FIGURE Page
2.3 Hydrated Clay Sample . . . . . . . . . . . . . . . . . . . . . . . . . . 29
2.4 Structure of Xanthan . . . . . . . . . . . . . . . . . . . . . . . . . . . 30
2.5 Cross Section of a Filter Cake . . . . . . . . . . . . . . . . . . . . . . 33
2.6 Avenues for Lost Circulation . . . . . . . . . . . . . . . . . . . . . . 34
2.7 Equilibrium Rheogram Concept . . . . . . . . . . . . . . . . . . . . . 36
2.8 Effect of Pressure and Temperature on Rheology . . . . . . . . . . . 37
2.9 Bentonite Gelation at High Temperatures . . . . . . . . . . . . . . . 39
2.10 Effect of Hot Rolling on Bentonite Suspensions . . . . . . . . . . . . 40
2.11 WBM Viscosity as a Function of Depth . . . . . . . . . . . . . . . . 41
2.12 Cyclic Viscosity Variation of Bentonite Suspension . . . . . . . . . . 43
2.13 Types of Clay Association . . . . . . . . . . . . . . . . . . . . . . . . 45
2.14 Possible Flocculation Geometries . . . . . . . . . . . . . . . . . . . . 45
2.15 Action of Deflocculation Agents . . . . . . . . . . . . . . . . . . . . . 46
3.1 Schematic of Couette Geometry . . . . . . . . . . . . . . . . . . . . . 48
3.2 Bob and Cup Viscometer Geometry . . . . . . . . . . . . . . . . . . 49
3.3 The Chandler 7600 Viscometer . . . . . . . . . . . . . . . . . . . . . 51
3.4 Viscometer Cross Section . . . . . . . . . . . . . . . . . . . . . . . . 53
3.5 Schematic of Typical Test Schedule . . . . . . . . . . . . . . . . . . . 54
3.6 Pilot Test on Bentonite Suspension . . . . . . . . . . . . . . . . . . . 57
3.7 Dial Reading Variation During 1 Hour Shear Period . . . . . . . . . . 58
4.1 Comparison between Stepped and Continuous Testing . . . . . . . . 62
4.2 Schematic of Proposed Test Schedule . . . . . . . . . . . . . . . . . . 65

x
FIGURE Page
4.3 Overall Test Results for 2 PPB Xanthan Fluid . . . . . . . . . . . . . 69
4.4 Overall Test Results for 25 PPB Bentonite Solution . . . . . . . . . . 70
4.5 Overall Test Results for 25 PPB Bentonite with TANNATHIN . . . . 73
4.6 Comparison of Rheological Response of Two Bentonite Solutions . . 74
4.7 Overall Test Results for Fluid with 60 PPB Barite . . . . . . . . . . 76
4.8 Temp. vs Dial Reading Graph for 60 PPB Barite Solution . . . . . . 77
4.9 Effect of Solids Content on WBM Flocculation Temperature . . . . . 78
4.10 Repeatability Analysis for Sensitivity Tests . . . . . . . . . . . . . . 79
4.11 Effect of Lime Content on Flocculation Temperature . . . . . . . . . 80
4.12 High Temperature Test on Field Mud at 400F . . . . . . . . . . . . . 81
4.13 Hysterisis Effect for Field Mud . . . . . . . . . . . . . . . . . . . . . 82
4.14 High Temperature Test on Field Mud at 450F . . . . . . . . . . . . . 83
4.15 Completely Failed Fluid Sample . . . . . . . . . . . . . . . . . . . . . 84
4.16 Results of Cyclic Testing . . . . . . . . . . . . . . . . . . . . . . . . . 85
4.17 Application of Continuous Testing in the Overall Fluid Design Process 87
1
CHAPTER I
INTRODUCTION TO HTHP DRILLING AND ITS CHALLENGES
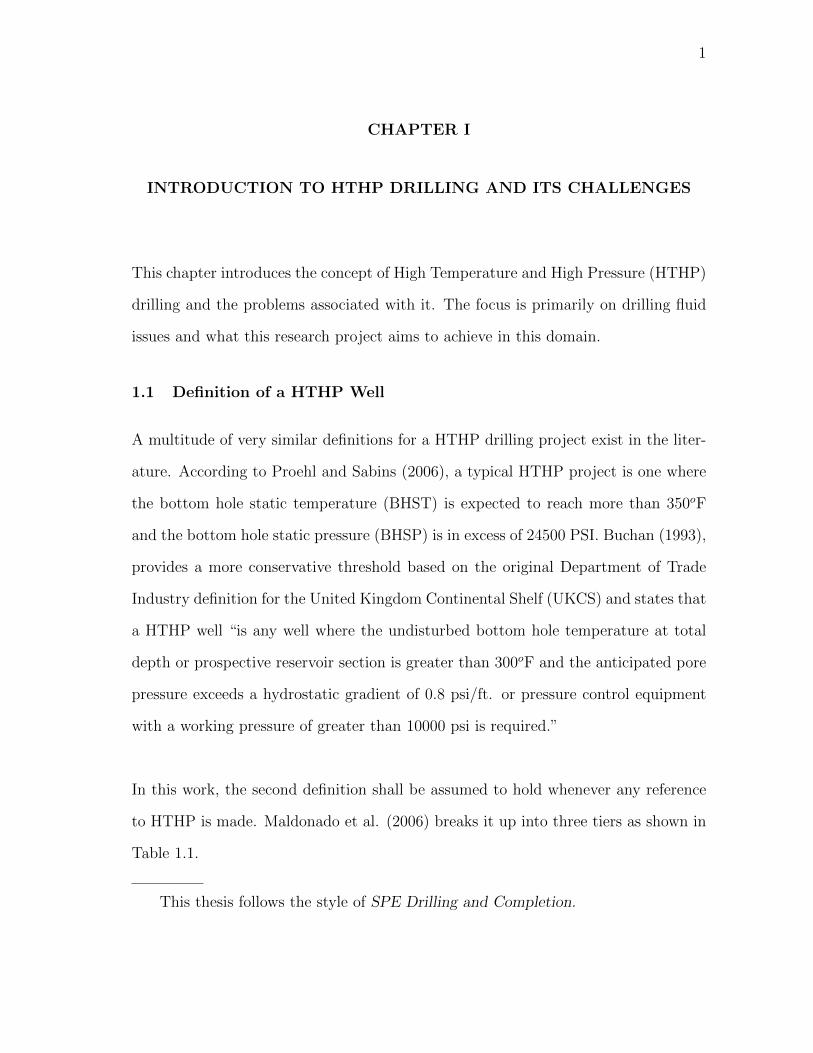
This chapter introduces the concept of High Temperature and High Pressure (HTHP)
drilling and the problems associated with it. The focus is primarily on drilling fluid
issues and what this research project aims to achieve in this domain.
1.1 Definition of a HTHP Well
A multitude of very similar definitions for a HTHP drilling project exist in the liter-
ature. According to Proehl and Sabins (2006), a typical HTHP project is one where
the bottom hole static temperature (BHST) is expected to reach more than 350oF
and the bottom hole static pressure (BHSP) is in excess of 24500 PSI. Buchan (1993),
provides a more conservative threshold based on the original Department of Trade
Industry definition for the United Kingdom Continental Shelf (UKCS) and states that
a HTHP well “is any well where the undisturbed bottom hole temperature at total
depth or prospective reservoir section is greater than 300oF and the anticipated pore
pressure exceeds a hydrostatic gradient of 0.8 psi/ft. or pressure control equipment
with a working pressure of greater than 10000 psi is required.”
In this work, the second definition shall be assumed to hold whenever any reference
to HTHP is made. Maldonado et al. (2006) breaks it up into three tiers as shown in
Table 1.1.
This thesis follows the style of SPE Drilling and Completion.
2
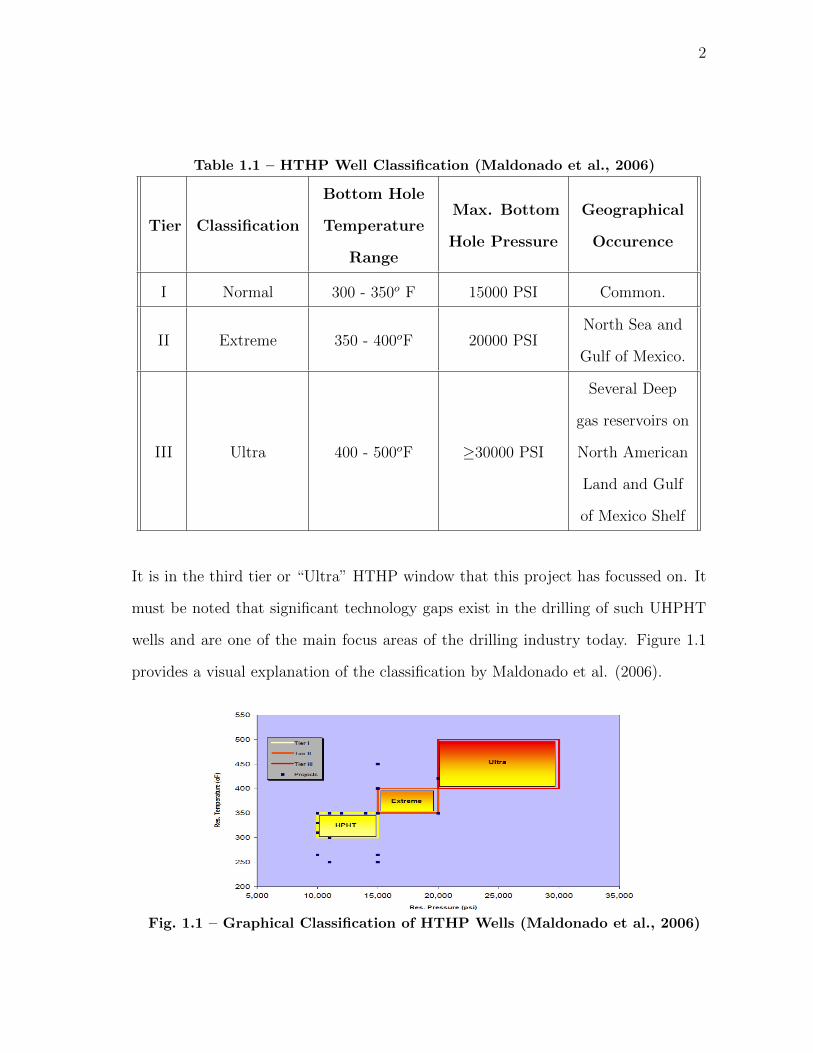
Table 1.1 – HTHP Well Classification (Maldonado et al., 2006)
Tier Classification
Bottom Hole
Temperature
Range
Max. Bottom
Hole Pressure
Geographical
Occurence
I Normal 300 - 350o F 15000 PSI Common.
II Extreme 350 - 400oF 20000 PSINorth Sea and
Gulf of Mexico.
III Ultra 400 - 500oF ≥30000 PSI
Several Deep
gas reservoirs on
North American
Land and Gulf
of Mexico Shelf
It is in the third tier or “Ultra” HTHP window that this project has focussed on. It
must be noted that significant technology gaps exist in the drilling of such UHPHT
wells and are one of the main focus areas of the drilling industry today. Figure 1.1
provides a visual explanation of the classification by Maldonado et al. (2006).
Fig. 1.1 – Graphical Classification of HTHP Wells (Maldonado et al., 2006)
3
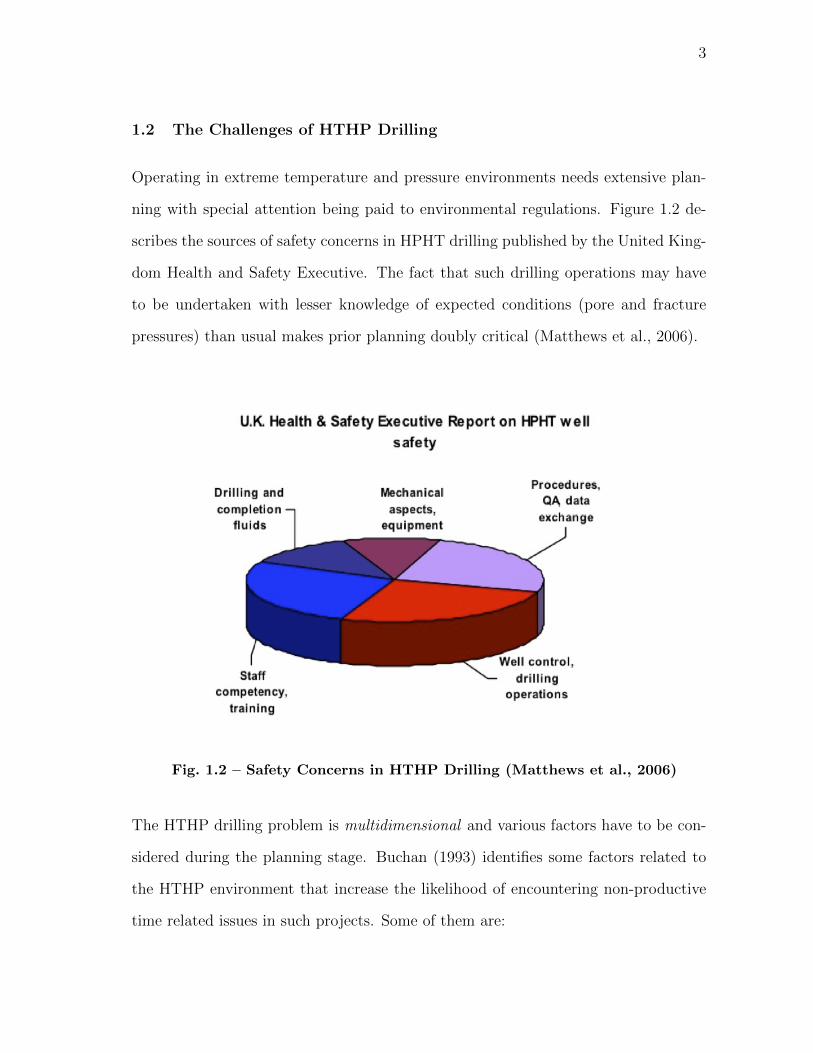
1.2 The Challenges of HTHP Drilling
Operating in extreme temperature and pressure environments needs extensive plan-
ning with special attention being paid to environmental regulations. Figure 1.2 de-
scribes the sources of safety concerns in HPHT drilling published by the United King-
dom Health and Safety Executive. The fact that such drilling operations may have
to be undertaken with lesser knowledge of expected conditions (pore and fracture
pressures) than usual makes prior planning doubly critical (Matthews et al., 2006).
Fig. 1.2 – Safety Concerns in HTHP Drilling (Matthews et al., 2006)
The HTHP drilling problem is multidimensional and various factors have to be con-
sidered during the planning stage. Buchan (1993) identifies some factors related to
the HTHP environment that increase the likelihood of encountering non-productive
time related issues in such projects. Some of them are:
4
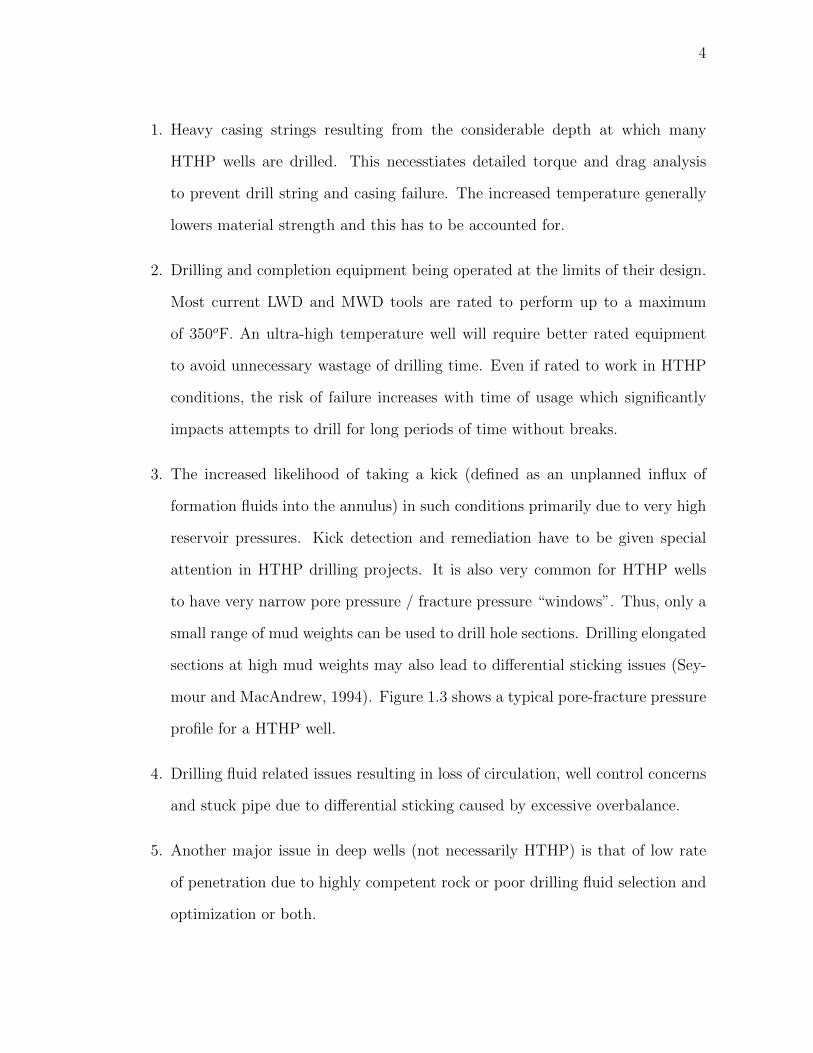
1. Heavy casing strings resulting from the considerable depth at which many
HTHP wells are drilled. This necesstiates detailed torque and drag analysis
to prevent drill string and casing failure. The increased temperature generally
lowers material strength and this has to be accounted for.
2. Drilling and completion equipment being operated at the limits of their design.
Most current LWD and MWD tools are rated to perform up to a maximum
of 350oF. An ultra-high temperature well will require better rated equipment
to avoid unnecessary wastage of drilling time. Even if rated to work in HTHP
conditions, the risk of failure increases with time of usage which significantly
impacts attempts to drill for long periods of time without breaks.
3. The increased likelihood of taking a kick (defined as an unplanned influx of
formation fluids into the annulus) in such conditions primarily due to very high
reservoir pressures. Kick detection and remediation have to be given special
attention in HTHP drilling projects. It is also very common for HTHP wells
to have very narrow pore pressure / fracture pressure “windows”. Thus, only a
small range of mud weights can be used to drill hole sections. Drilling elongated
sections at high mud weights may also lead to differential sticking issues (Sey-
mour and MacAndrew, 1994). Figure 1.3 shows a typical pore-fracture pressure
profile for a HTHP well.
4. Drilling fluid related issues resulting in loss of circulation, well control concerns
and stuck pipe due to differential sticking caused by excessive overbalance.
5. Another major issue in deep wells (not necessarily HTHP) is that of low rate
of penetration due to highly competent rock or poor drilling fluid selection and
optimization or both.
5
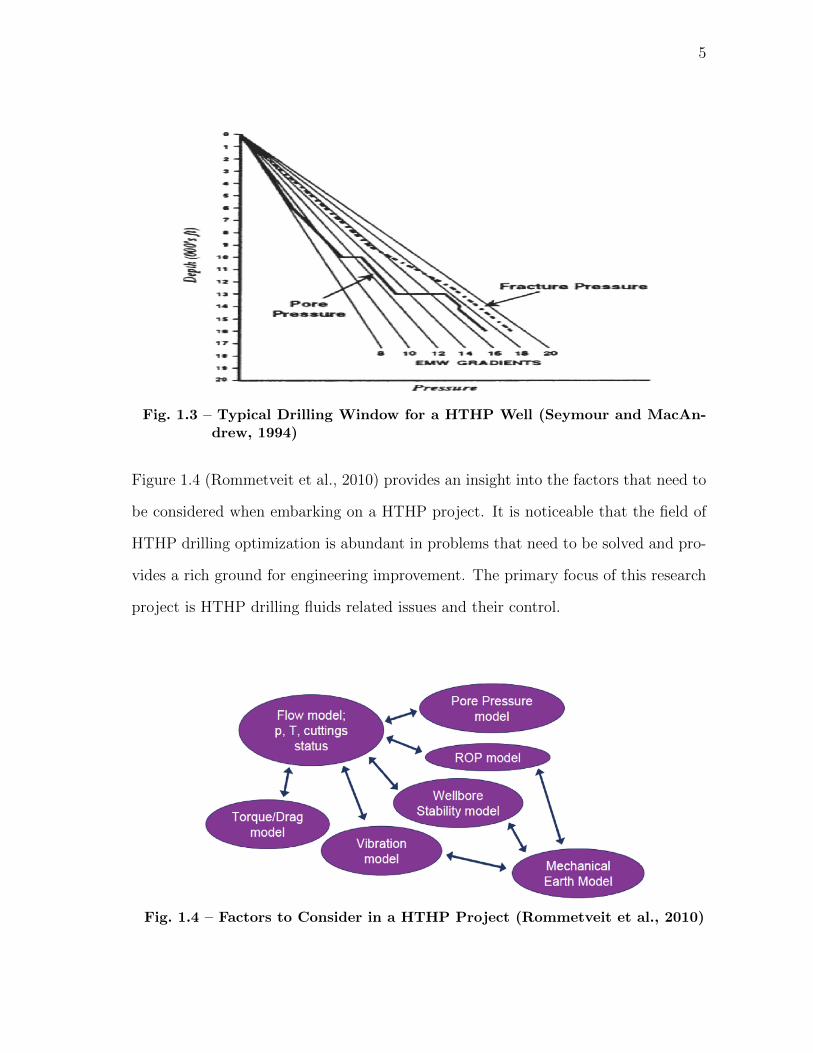
Fig. 1.3 – Typical Drilling Window for a HTHP Well (Seymour and MacAn-drew, 1994)
Figure 1.4 (Rommetveit et al., 2010) provides an insight into the factors that need to
be considered when embarking on a HTHP project. It is noticeable that the field of
HTHP drilling optimization is abundant in problems that need to be solved and pro-
vides a rich ground for engineering improvement. The primary focus of this research
project is HTHP drilling fluids related issues and their control.
Fig. 1.4 – Factors to Consider in a HTHP Project (Rommetveit et al., 2010)

6
1.3 HTHP Hydraulics and Drilling Fluids
The drilling fluid is one of the major components of any drilling operation. Its impor-
tance is amplified by the severity of losses that can result from its improper selection
and control. This is doubly true in HTHP operations where it is arguably the most
important factor in deciding whether a project is successfully and efficiently com-
pleted. A summary of the primary functions of a drilling fluid is given below (Caenn
and Chillingar, 1995) :
1. Transport of cuttings from the point of generation (the bit) to the surface and
lubricating the bit.
2. Ensuring that sufficient hydrostatic pressure is exerted in the annulus to prevent
an unwanted or uncontrolled influx of formation fluids.
3. Maintaining the stability of the well bore and preventing formation damage by
forming a filter cake.
4. Transmitting information from the MWD tool to the surface through mud pulse
telemetry.
Drilling fluids are designed to ensure that they perform these functions as efficiently
as possible throughout the period for which they are used. Periodic fluid testing
and treatment is carried to out to replace additives that may have been spent or
to enhance certain properties (such as mud weight, viscosity or fluid loss control)
as may be necessary to drill upcoming hole sections. Figure 1.5 (Bern et al., 2006)
shows a subsection of the factors that are considered during fluid design and the
“various interdependencies within the hydraulics and the rheology area”. Hydraulics
optimization is not a trivial task and needs to be viewed in a broader prospective
7
when it comes to HTHP wells. The following subsection discusses why this is so by
considering property variations in the wellbore with pressure and temperature.
1.3.1 Property Variations in the Well Bore
In order to perform the critical functions of pressure control and cuttings removal,
two properties of drilling fluids require special attention: density and viscosity (more
generally referred to as rheology or rheological behavior). Controlling these proper-
ties to meet hydraulics objectives is crucial in ensuring that the well is safely drilled
and completed with minimal lost time. However, it must be understood that the
properties of a drilling fluid vary with respect to time and position in the hydraulics
circuit. Temperatures and pressures change as a fluid is circulated in and out of
the wellbore. With these changes in conditions the rheology and the density of the
fluid undergoes (sometimes dramatic) change. In a HTHP well the magnitude of the
change in temperature and pressure as the fluid travels from the surface to the bit
can be of a very high order and it becomes important to understand how this change
can affect fluid properties.
The hydraulics planning and fluid design process is very dependent on establishing
how pressure and temperature conditions in the wellbore affect fluid rheology. Any
calculation that ignores these effects is bound to give erroneous results and course cor-
rection along with its associated costs may be required during later stages of drilling.
Any drilling fluid must be designed with the primary objective of maintaining its de-
sign properties through out the wellbore. The drilling fluid rheology not only decides
the ability of the fluid to carry cuttings but also the magnitude of the frictional pres-
sure drop that occurs as it is circulated through the system. This frictional pressure
drop, apart from determining the pump pressures required to maintain circulation

8
Fig. 1.5 – Drilling Fluid Design Considerations (Bern et al., 2006)

9
also determines the increase in pressure at the bottom of the well bore during cir-
culation (ECD) . In drilling operations involving narrow operating windows (pore
pressures and fracture pressures very close to each other, something commonly ex-
perienced in deep HTHP wells) prediction and control of ECD is a must to prevent
formation fracture and lost circulation which may result in well control and wellbore
stability issues. Figure 1.6 (Stiles and Trigg, 2007) shows the typical casing design
for an offshore HTHP well with a TVD of 15880 ft.
Fig. 1.6 – Typical HTHP Casing Design (Stiles and Trigg, 2007)
Figure 1.7 (Stiles and Trigg, 2007) shows the simulated and measured temperature
profiles in the 6 inch hole section for this particular well. It is clearly noticeable from

10
Figure 1.7 that the difference between the static mud temperatures and the circulat-
ing temperatures at any depth can be quite significant and at TVD this difference is
of the order of 100oF. The drilling fluid should be able to perform well in the entire
spectrum of temperatures that it experiences, including the low temperature regions
in the riser section. Balancing the needs for high temperature and low temperature
stability is a major challenge in HTHP fluids design and deployment. This balancing
is achieved through a thorough understanding of fluid properties and testing.
Fig. 1.7 – Temperature Profiles in a Typical HTHP Well (Stiles and Trigg,2007)
Figure 1.8 (Demirdal et al., 2007) shows the effect of pressure on the density of drilling
fluids at different temperatures. It is clear that the effects are far from negligible and
must be taken into account in simulation models for HPHT drilling. Among the dif-
ferent drilling fluid formulations presented it is noticeable that oil based muds show
more sensitivity to pressure changes than other mud formulations (Water Based Muds
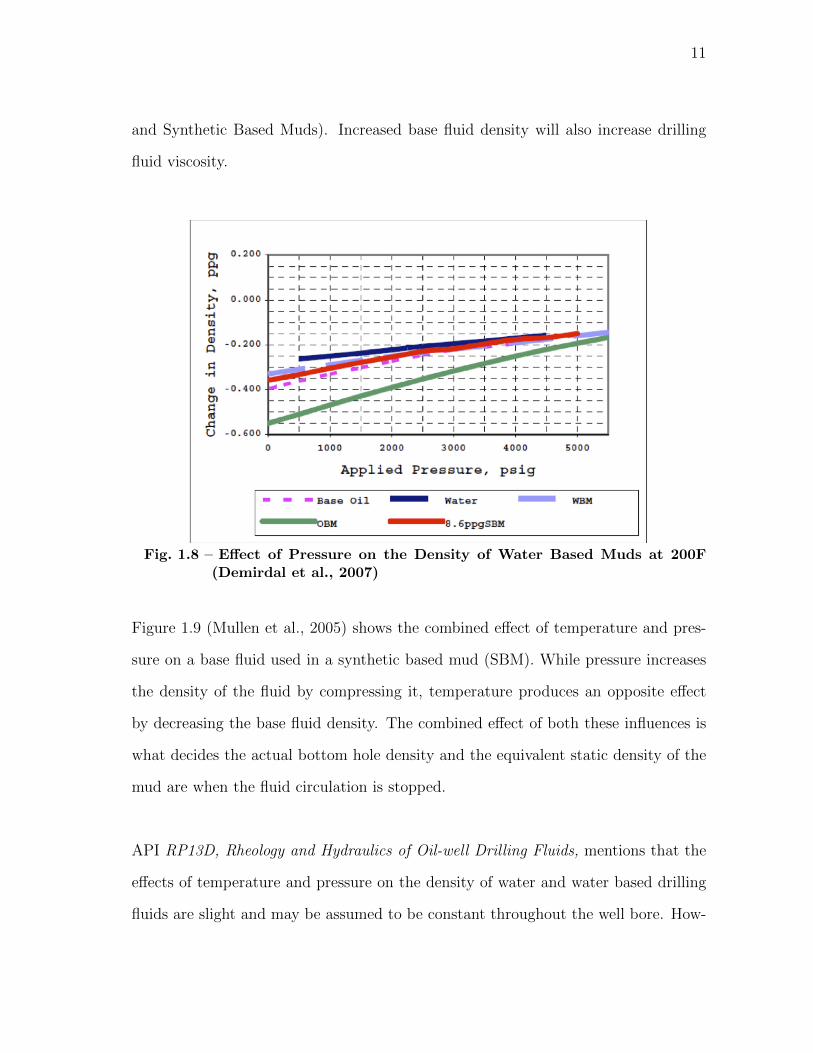
11
and Synthetic Based Muds). Increased base fluid density will also increase drilling
fluid viscosity.
Fig. 1.8 – Effect of Pressure on the Density of Water Based Muds at 200F(Demirdal et al., 2007)
Figure 1.9 (Mullen et al., 2005) shows the combined effect of temperature and pres-
sure on a base fluid used in a synthetic based mud (SBM). While pressure increases
the density of the fluid by compressing it, temperature produces an opposite effect
by decreasing the base fluid density. The combined effect of both these influences is
what decides the actual bottom hole density and the equivalent static density of the
mud are when the fluid circulation is stopped.
API RP13D, Rheology and Hydraulics of Oil-well Drilling Fluids, mentions that the
effects of temperature and pressure on the density of water and water based drilling
fluids are slight and may be assumed to be constant throughout the well bore. How-

12
Fig. 1.9 – Combined Effect of Pressure and Temperature on an SBM (Mullenet al., 2005)
ever, considering the extreme conditions in “Tier III” Ultra HPHT wells, this as-
sumption may not necessarily be valid.
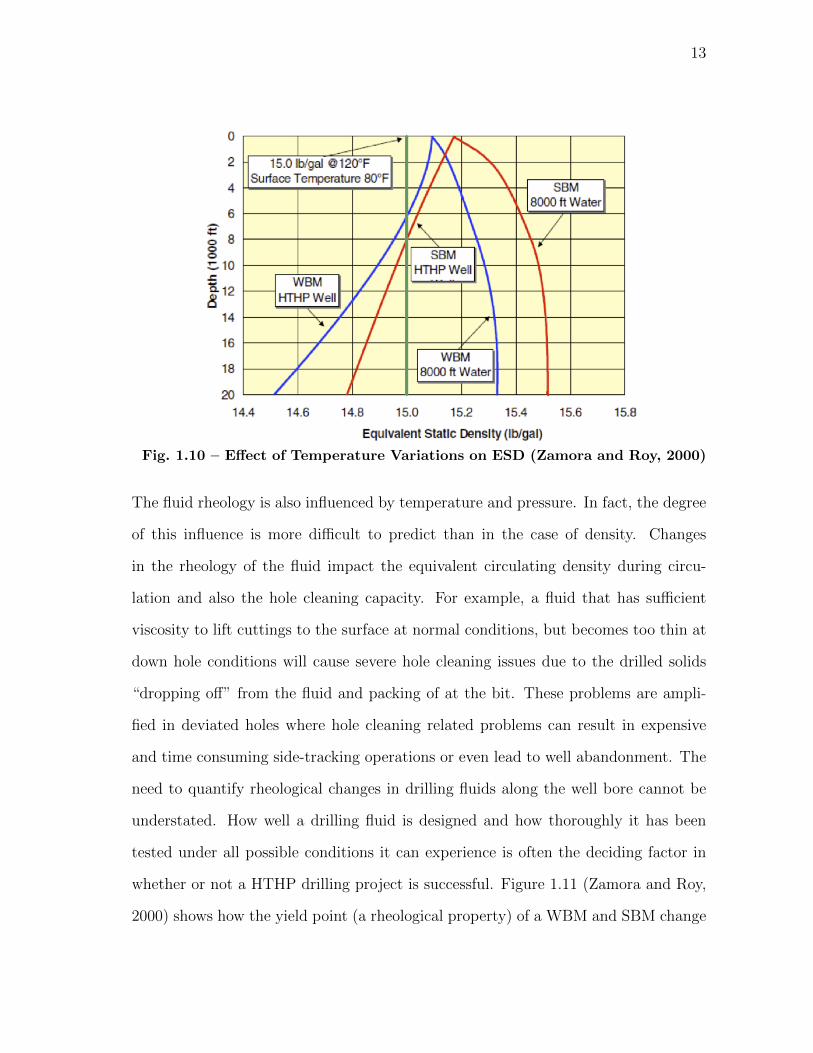
Figure 1.10 (Zamora and Roy, 2000) shows the impact of temperature on the calcu-
lated Equivalent static densities in a 20000 ft. well. As mentioned above, even though
the density variations in water based muds can be dismissed as being “slight”, the
combined temperature and pressure effects have the potential to throw calculations
significantly off the mark. The most common bottom hole pressure formula given by,
BHP (psi) = 0.052 × (TV D(ft)) × (MW (ppg)) (1.1)
is no longer an accurate representation of what is actually occurring and “mud weight
for all mud types must forever be linked to measurement temperature”.
13
Fig. 1.10 – Effect of Temperature Variations on ESD (Zamora and Roy, 2000)
The fluid rheology is also influenced by temperature and pressure. In fact, the degree
of this influence is more difficult to predict than in the case of density. Changes
in the rheology of the fluid impact the equivalent circulating density during circu-
lation and also the hole cleaning capacity. For example, a fluid that has sufficient
viscosity to lift cuttings to the surface at normal conditions, but becomes too thin at
down hole conditions will cause severe hole cleaning issues due to the drilled solids
“dropping off” from the fluid and packing of at the bit. These problems are ampli-
fied in deviated holes where hole cleaning related problems can result in expensive
and time consuming side-tracking operations or even lead to well abandonment. The
need to quantify rheological changes in drilling fluids along the well bore cannot be
understated. How well a drilling fluid is designed and how thoroughly it has been
tested under all possible conditions it can experience is often the deciding factor in
whether or not a HTHP drilling project is successful. Figure 1.11 (Zamora and Roy,
2000) shows how the yield point (a rheological property) of a WBM and SBM change

14
with simulated temperature in a simulated well. The degree of change in the case
of WBMs is quite radical and the fluid at the bottom of the hole may not bear any
rheological resemblance to what is seen at the surface. Quite obviously, the ramifica-
tions of such dramatic property variations on ECD calculations are huge. Figure 1.12
(Rommetveit and Bjørkevoll, 1997) shows how varying rheological properties impact
ECD calculations.
Fig. 1.11 – Variation of Yield Point in a Well Bore (Zamora and Roy, 2000)
It is worth noting from Figure 1.12 that a rheological model which assumes pressure-
temperature independence is likely to produce estimates of ECD very different and
often lower than those models which take property variations into account. Another
point worth noting is that the ECD profile in a well changes with time because the
temperature profile in the annulus is also changing from the geothermal profile at the
start of circulation to a more stable temperature regime after the transient period.

15
Fig. 1.12 – Impact of Varying Rheology on ECD (Rommetveit and Bjørkevoll,1997)
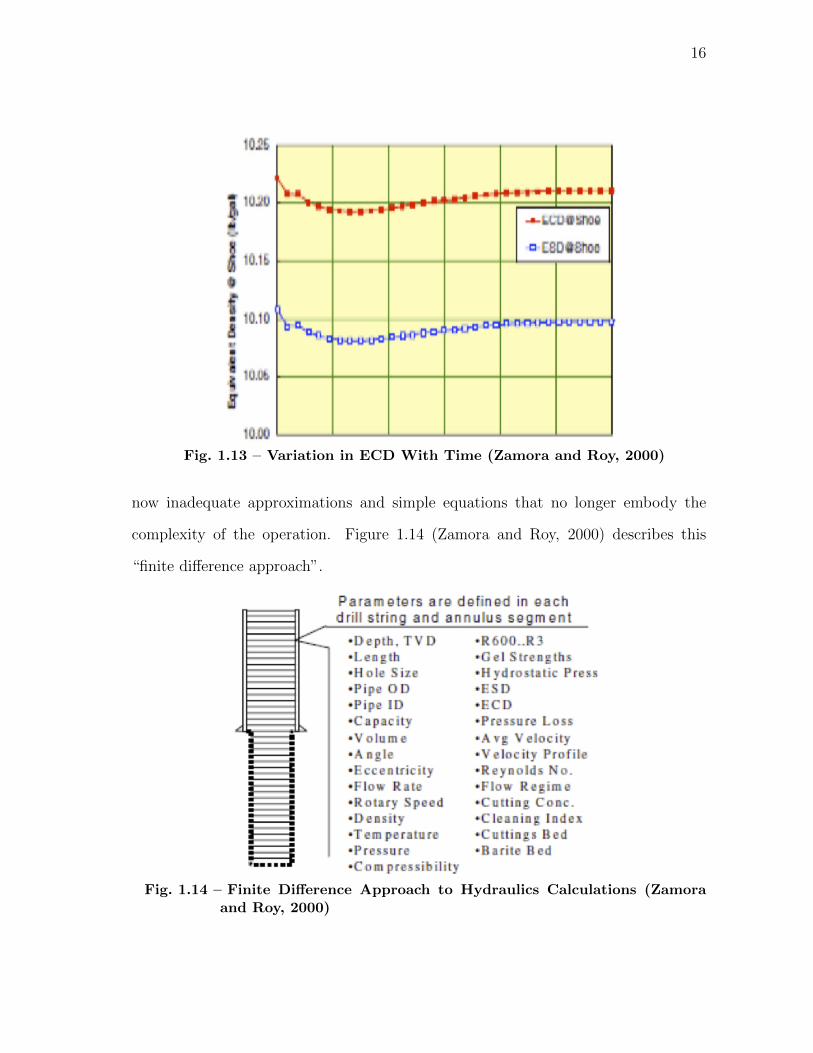
Figure 1.13 (Zamora and Roy, 2000) better illustrates how ECD and ESD change
with time in a wellbore.
Rommetveit and Bjørkevoll (1997) proposed a general formula for ECD calculations
that takes into account the changing conditions in the wellbore given by:
ECD =1
TV D
(∫ MD
0ρ(z) dz +
1
g
∫ MD
0
dpfdz
dz
)(1.2)
In conclusion, considering the numerous constraints and complications that HTHP
conditions impose on hydraulics planning, a radically new approach to this process
is in order. (Zamora and Roy, 2000) propose a finite difference approach, which
breaks up the well bore into discrete segments with fluid properties and other relevant
formation data being gathered in each segment. The calculations that ensue can
be easily handled by computers in use today. This is a big step forward from the
16
Fig. 1.13 – Variation in ECD With Time (Zamora and Roy, 2000)
now inadequate approximations and simple equations that no longer embody the
complexity of the operation. Figure 1.14 (Zamora and Roy, 2000) describes this
“finite difference approach”.
Fig. 1.14 – Finite Difference Approach to Hydraulics Calculations (Zamoraand Roy, 2000)
17
1.4 HTHP Testing of Drilling Fluids – Why is it Indispensible?
As discussed above, gathering accurate data on the downhole behavior of drilling
fluids cannot be overstated. Drilling simulators are only as good as the data they
are provided with and a good deal of effort must be put into the data acquisition
process. Drilling fluids are complicated in their composition and theoretical model-
ing of their rheological behavior under the range of conditions they are expected to
endure is not only infeasible but also likely to be plagued by inaccuracies. A more
pragmatic approach would be a comprehensive testing program that encompasses the
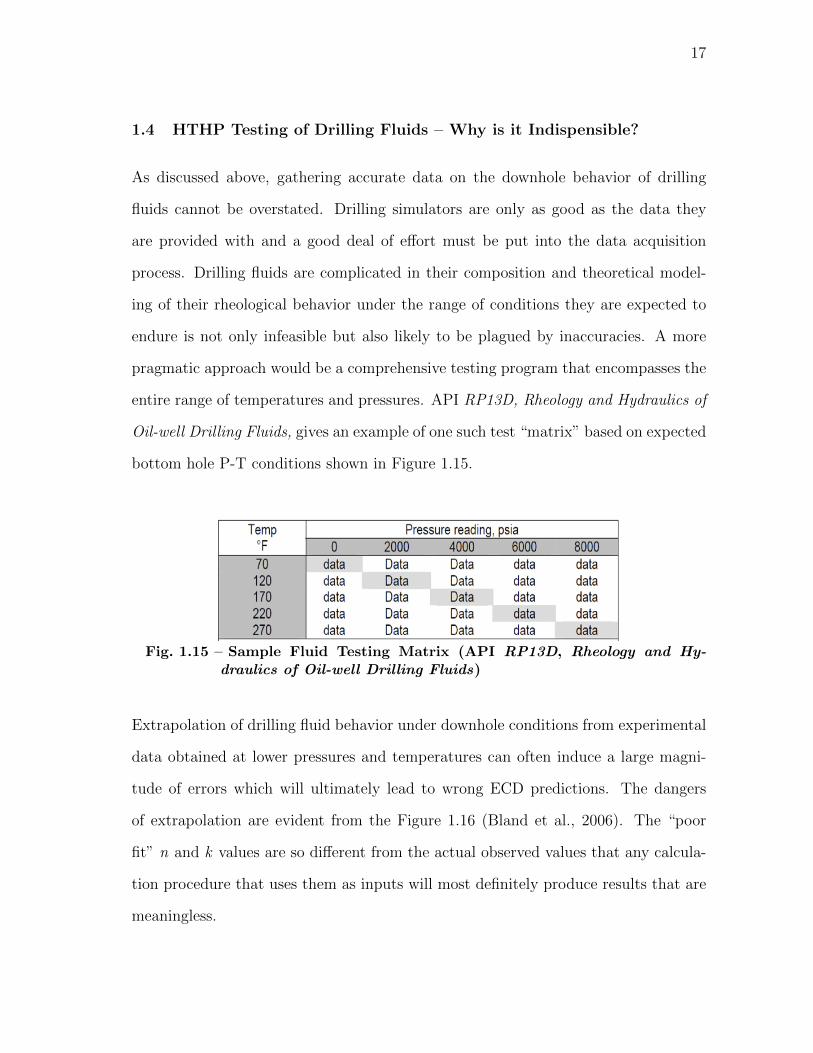
entire range of temperatures and pressures. API RP13D, Rheology and Hydraulics of
Oil-well Drilling Fluids, gives an example of one such test “matrix” based on expected
bottom hole P-T conditions shown in Figure 1.15.
Fig. 1.15 – Sample Fluid Testing Matrix (API RP13D, Rheology and Hy-draulics of Oil-well Drilling Fluids)
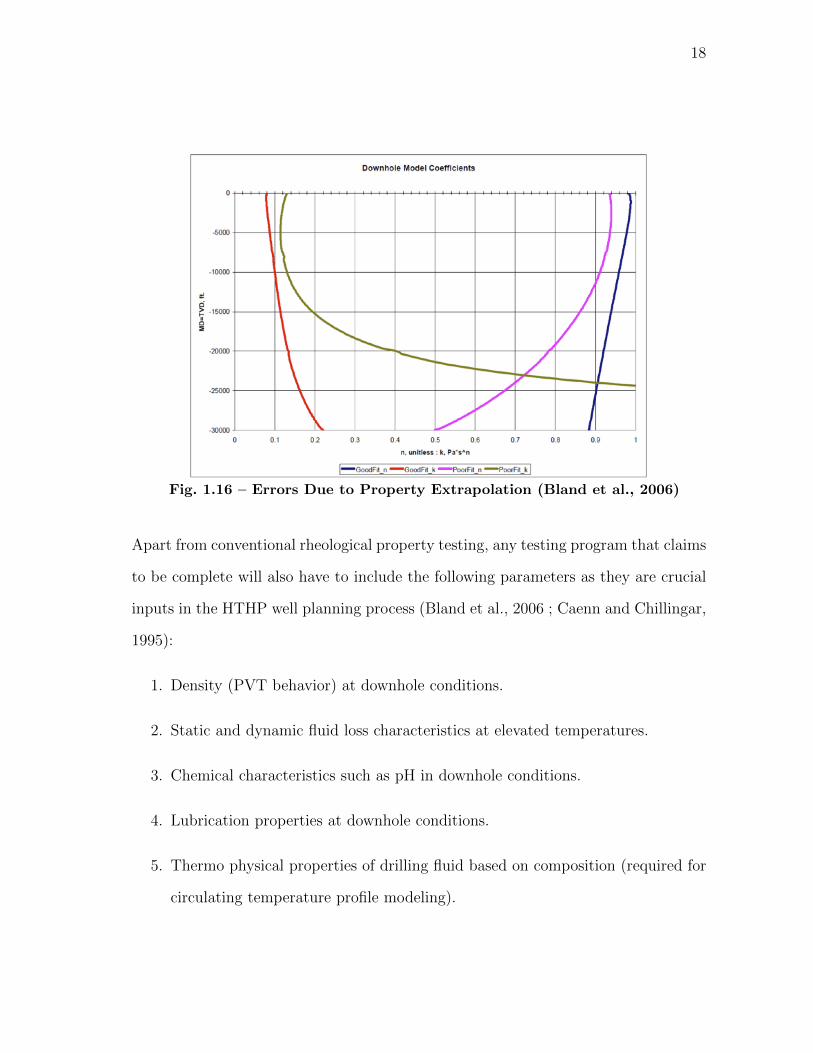
Extrapolation of drilling fluid behavior under downhole conditions from experimental
data obtained at lower pressures and temperatures can often induce a large magni-
tude of errors which will ultimately lead to wrong ECD predictions. The dangers
of extrapolation are evident from the Figure 1.16 (Bland et al., 2006). The “poor
fit” n and k values are so different from the actual observed values that any calcula-
tion procedure that uses them as inputs will most definitely produce results that are
meaningless.
18
Fig. 1.16 – Errors Due to Property Extrapolation (Bland et al., 2006)
Apart from conventional rheological property testing, any testing program that claims
to be complete will also have to include the following parameters as they are crucial
inputs in the HTHP well planning process (Bland et al., 2006 ; Caenn and Chillingar,
1995):
1. Density (PVT behavior) at downhole conditions.
2. Static and dynamic fluid loss characteristics at elevated temperatures.
3. Chemical characteristics such as pH in downhole conditions.
4. Lubrication properties at downhole conditions.
5. Thermo physical properties of drilling fluid based on composition (required for
circulating temperature profile modeling).
19
1.5 Types of Drilling Fluids
Drilling muds can be classified into three basic types depending upon what their
“base” fluid is. They are:
1. Water Based Muds (WBM): Water is the base fluid and clays and other
minerals are added to it to impart specific properties.
2. Oil Based Muds (OBM): Diesel oil or some other petroleum product is the
base fluid.
3. Synthetic Based Muds (SBM): Synthetic oil is the base fluid, typically used
in offshore wells.
Each of the above types of drilling fluids have their own advantages and disadvan-
tages related to cost , environmental impact and reliability in extreme conditions.
Synthetic based muds (SBMs) are much more expensive when compared to its water
based or oil based counterparts. Oil based muds (OBMs) are generally preferred to
water based alternatives in HPHT operations because of the fact that they provide
good drill string lubricity, are more stable in high temperature conditions and gener-
ally do not cause clay swelling in shales. Water based drilling fluids are also prone to
causing greater formation damage, hydration and disintegration of cuttings and well
bore stability issues due to pore pressure elevation (Bland et al., 2002). However, de-
spite these obvious advantages there are some drawbacks that are important and have
to be considered. Bland et al. (2002) state that “despite their broad applicability,
high performance and capacity for reuse, OBMs and SBMs also carry a higher unit
cost and are more susceptible to lost circulation problems”. Al-Saeedi et al. (2010)
suggest that a significant improvement in the quality of borehole logs can also be
achieved by using water based drilling fluids due to their smaller resistivity, thereby
20
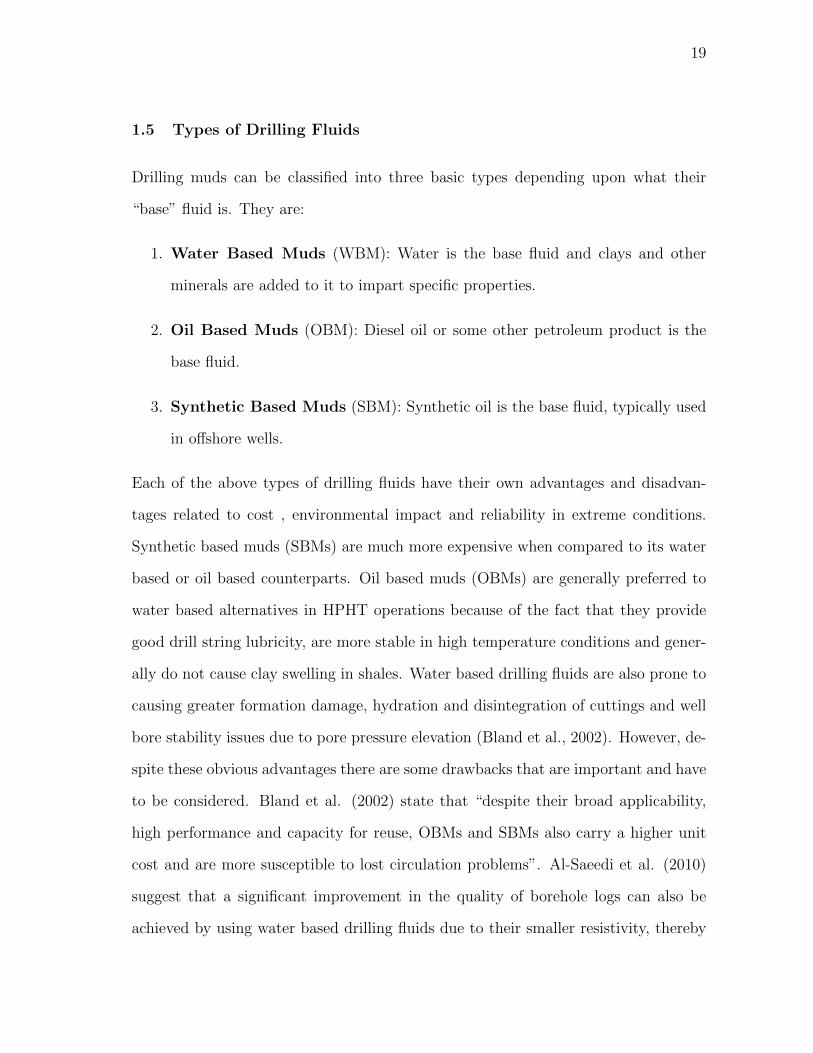
reducing the amount of interference in resistivity logs. Figure 1.17 (Al-Saeedi et al.,
2010) shows how a resistivity imaging tool provides much better resolution when used
in a well drilled with a properly designed water based mud.
Fig. 1.17 – Effect of Base Fuid on Log Quality. The Log Obtained Using aWater Based Mud is Shown on the Right (Al-Saeedi et al., 2010)
According to Buchan (1993), early effects of gas influx can prove to be quite difficult
to detect in oil based muds due to gas solubility. This could mean that the risk of an
undetected kick in wells using oil based muds is greater than those using water based
muds. Figure 1.18 (Bland et al., 2006) shows the solubility of methane gas in drilling
fluids at various pressures at a temperature of 100oF. Quite clearly, the solubility of
gas in water is negligible compared to oil based alternatives. As a result of this low
solubility, gas will exist as discrete bubbles in water based muds and migrate to the
surface, while in oil based muds it will remain in solution till the pressure of the oil
is below the bubble point pressure (Bland et al., 2006). Gas diffusion into OBMs can

21
also cause barite stripping leading to further well control issues. Oil based muds are
also generally more difficult to dispose especially in an offshore environment and a
significant amount of money can be spent in this process.
Fig. 1.18 – Methane Gas Solubility in Base Fluids (Bland et al., 2006)
The purpose of the above discussion was not to suggest that Water Based muds are
the only feasible alternative and they must replace all OBMs. That is definitely not
the case. But, along with the problem of gas solubility, OBMs are also becoming
increasingly subject to environmental regulation. For example, in certain regions of
Europe, environmental regulations explicitly prohibit the use of Oil based drilling
fluids and WBMs are used to drill HPHT wells (Tehrani et al., 2009). This has led
to an increased interest in water based muds. Keeping the above in mind this thesis
will focus exclusively on WBMs with the focus areas being:
1. Understanding the rheological behavior of WBMs in HPHT conditions.

22
2. Determination of temperature based operating thresholds of WBMs through
experimentation.
3. Providing general guidelines through experimental work on how these fluids
must be treated to ensure better performance and prevent instability that seems
to plague these fluids at extreme temperatures.
The objective of this section was to justify limiting the scope of investigation to only
water based drilling fluids in this thesis. It is believed that a thorough understanding
of how these muds fail at high temperature conditions will lead to their judicious
application in HTHP oilfields. Armed with a sufficient amount of data through ex-
periments, problems due to chemical instability can be more easily predicted and the
fluids modified or treated in a proactive manner. Knowing what to expect and when
to expect it is a powerful hydraulics planning tool.
Having described the problems associated with HTHP fluid design and testing and
the reason for the emphasis on water based drilling fluids. The next chapter will focus
on the existing research on the HTHP properties of water based muds through an
extensive literary survey.
23
CHAPTER II
LITERATURE SURVEY
Having given a fairly detailed overview of HPHT drilling issues, the present chapter
will focus solely on water based drilling fluids by reviewing some of the existing work
that has been presented in the literature. Firstly, the different types of additives for
WBMs and their respective functions will be discussed briefly. This will be followed
by a survey of experimental and theoretical work done by a few authors on the HPHT
behavior of WBMs and the final part of this chapter will focus on the issue of high
temperature thickening or “flocculation” of WBMs having clay based viscosifiers.
2.1 Additives for Water Based Drilling Fluids
Given the many functions that a drilling fluid has to perform, it is understandable
that its composition is also quite complex. Each additive has a specific function to
perform and the interaction between different fluid components makes studying the
high temperature behavior a challenging task. It should be noted that a detailed
discussion on additives in beyond the scope of this work and only a brief overview
will be presented here. The number of additives that are available and their diverse
functions make the process of listing and describing them very difficult and will thus
not be attempted. Table 2.1 shows some of the additives based on the function they
are expected to perform (Van Dyke, 2000).
Before considering the various additives and their functions, we must first look at the
three phases that make up a drilling fluid (Van Dyke, 2000). They are:

24
1. Continuous phase: This is the base fluid, which makes up the bulk of the
drilling fluid volume.
2. Non-reactive phase: They are chemically inert solids such as drilled solids,
weighting materials and some lost circulation materials.
3. Reactive phase: These are those additives and components that are capable of
chemically reacting with the base fluid and with each other. Typical examples
are clays, polymers, and deflocculants.etc.
Table 2.1 – Common Additives for Water Based Muds (Van Dyke, 2000)
Viscosifiers Bentonite, Attapulgite, Polymers
Swelling Inhibitors Salt, Encapsulating Agent, Lime, Gypsum
Viscosity ReducersLignosulfonate, Lignites , Tannates,
Phosphates
Emulsifiers Lignites, Lignosulfonate, Detergents
Fluid-loss
Additives
Starches, CMC, Synthetic Polymers,
Lignites, Lignosulfonate
Lost-circulation
materialsGranulars, Fibers, Flakes, Slurries
Weighting AgentsBarite, Hematite, Galena, Calcium
Carbonate, Dissolved Salts
Special Additives
Flocculants, Corrosion Controller,
Defoamer, pH Controller, Mud Lubricant,
Antodifferential sticking material

25
2.1.1 Additives for Viscosity
Drilling fluids need to have sufficient viscosity to lift cuttings to the surface at man-
ageable flow rates. Water by itself has insufficient rheological properties to be able
to transmit shear and perform hole cleaning satisfactorily. Thus, the viscosity of the
mud has to be increased by adding suitable viscosifying agents. An important point
to note is that high viscosity does not necessarily need to be conducive to the drilling
process. If the drilling fluid is too viscous, the swab and surge pressures during trip-
ping in and out may increase causing unplanned influxes (kicks) or lost circulation
respectively. Highly viscous fluids also cause increased ECD, which may exacerbate
lost circulation issues.
Clays are the most commonly used viscosifiers with water based drilling fluids. Clay
minerals are broadly classified as (Luckham and Rossi, 1999):
1. Illites (show no water absorption)
2. Chlorites
3. Smectites
4. Kaolinites (show no water absorption)
5. Attapulgites. (Rheological properties of suspensions in water are dependent on
mechanical interaction of the individual particles of clay)
The focus here will be on the family of clays known as “smectites” or to be more
specific, on a member of the smectite family known as Montmorillonite. Bentonite is
the most common clay based viscosifier used in the drilling industry. Chemically it
is known as Sodium Aluminosilicate (Montmorillonite) (Moore, 1986).
26
The colloidal chemistry of clays has been a subject of extensive scholarly investiga-
tion. A detailed description of the structure of clay molecules and their interaction
with water is bound be too complex and will not be attempted here. Instead, a few
salient features of the mineralogy of clay relevant to future discussions will be pre-
sented. The following discussion, though incomplete is sufficient keeping in view the
scope of this research.
The structural features of clay molecules can be summarized as follows (Luckham
and Rossi, 1999):
1. It has layered structure comprising silica and alumina sheets stacked on top of
each other.
2. Two dominant structural units are to be found in the atomic lattices the
tetrahedral unit consisting of silica tetrahedrons joined to form a hexagonal unit
and the octahedral unit consisting of two sheets of iron, magnesium or aluminum
atoms along with oxygens and hydroxyl groups forming an octahedron. This
structure is shown in Figure 2.1.
3. The octahedral and the tetrahedral sheet units are symmetric and similar in
size allowing them to share oxygen atoms. This combination of one octahedral
and two tetrahedral sheets is called a unit layer.
4. These unit layers are stacked parallel to each other in a structure known popu-
larly as the Hoffman structure.
5. The sheets comprising the Hoffman structure are individually stable as they
are held together by covalent bonds but their interaction with one another is
dominated by Van der Walls forces which are weak.
27
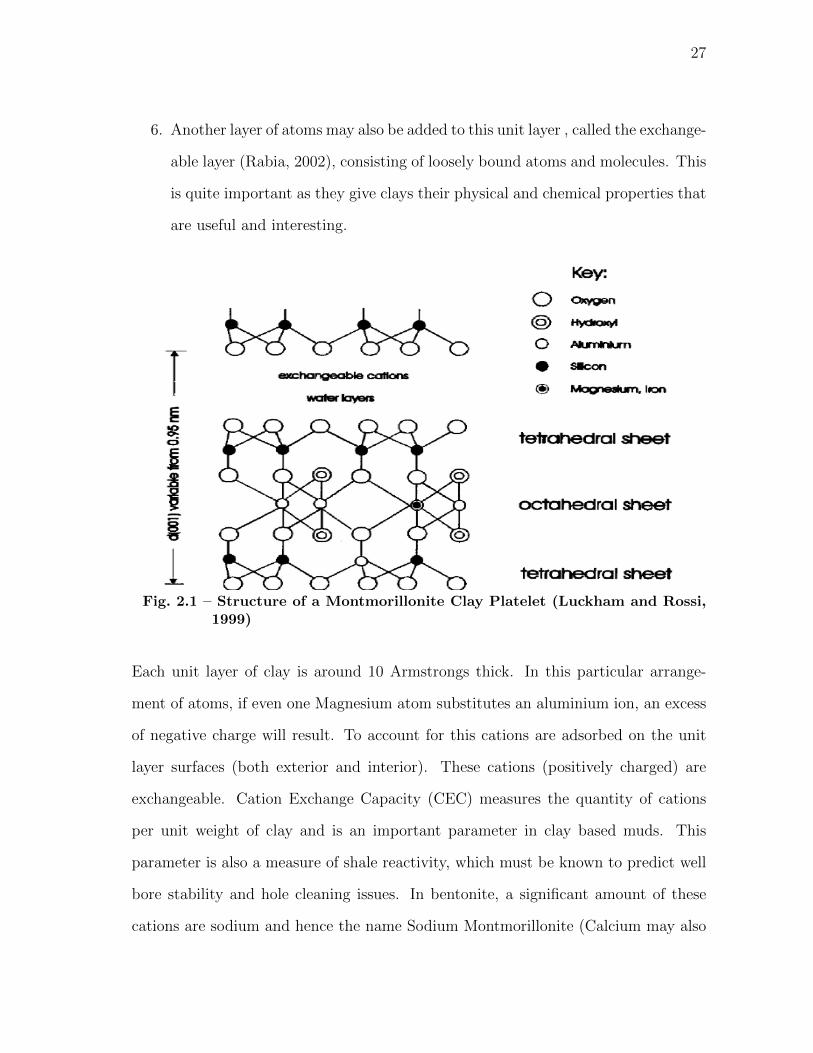
6. Another layer of atoms may also be added to this unit layer , called the exchange-
able layer (Rabia, 2002), consisting of loosely bound atoms and molecules. This
is quite important as they give clays their physical and chemical properties that
are useful and interesting.
Fig. 2.1 – Structure of a Montmorillonite Clay Platelet (Luckham and Rossi,1999)
Each unit layer of clay is around 10 Armstrongs thick. In this particular arrange-
ment of atoms, if even one Magnesium atom substitutes an aluminium ion, an excess
of negative charge will result. To account for this cations are adsorbed on the unit
layer surfaces (both exterior and interior). These cations (positively charged) are
exchangeable. Cation Exchange Capacity (CEC) measures the quantity of cations
per unit weight of clay and is an important parameter in clay based muds. This
parameter is also a measure of shale reactivity, which must be known to predict well
bore stability and hole cleaning issues. In bentonite, a significant amount of these
cations are sodium and hence the name Sodium Montmorillonite (Calcium may also
28
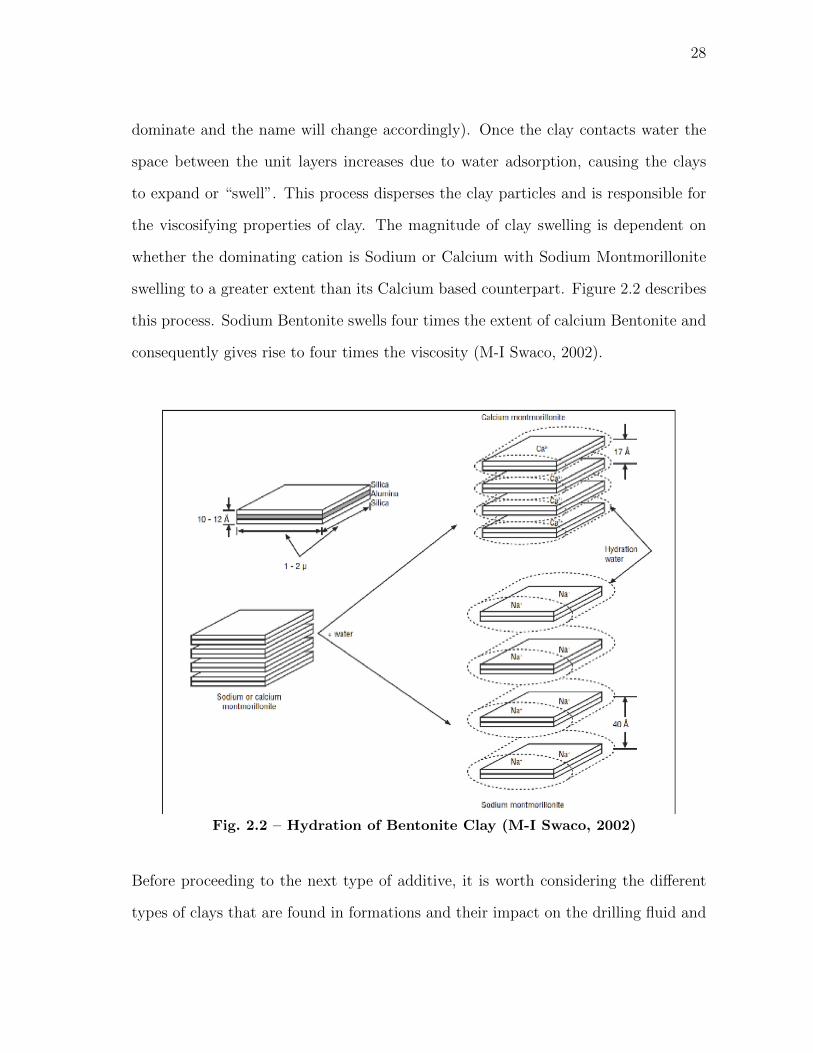
dominate and the name will change accordingly). Once the clay contacts water the
space between the unit layers increases due to water adsorption, causing the clays
to expand or “swell”. This process disperses the clay particles and is responsible for
the viscosifying properties of clay. The magnitude of clay swelling is dependent on
whether the dominating cation is Sodium or Calcium with Sodium Montmorillonite
swelling to a greater extent than its Calcium based counterpart. Figure 2.2 describes
this process. Sodium Bentonite swells four times the extent of calcium Bentonite and
consequently gives rise to four times the viscosity (M-I Swaco, 2002).
Fig. 2.2 – Hydration of Bentonite Clay (M-I Swaco, 2002)
Before proceeding to the next type of additive, it is worth considering the different
types of clays that are found in formations and their impact on the drilling fluid and

29
the drilling process as a whole. According to M-I Swaco (2002), formation shales
contain clays in the following order of abundance (decreasing):
1. Illite
2. Chlorite
3. Montmorillonite
4. Kaolinite
Since formation water is rich in Calcium, the Montmorillonite in shales is usually
Calcium Montmorillonite. The previously discussed phenomena of hydration and
swelling are also applicable to clays found in the formation. This causes severe bore
hole stability problems during drilling (shale “sloughing”) with water based drilling
fluids. However, with increasing depths the clay composition is increasingly skewed
towards illites which do not swell (but disperse). Shale stabilizers are added to water
based muds to prevent clay swelling and associated instability problems. Figure 2.3
shows a hydrated clay sample.
Fig. 2.3 – Hydrated Clay Sample (M-I Swaco, 2002)
30
Attapulgites are another family of clays that impart viscosity to water not through
hydration and swelling, but by interactions among their needle like structures. They
are typically useful in cases where salt water is the only available option as Bentonite
will not hydrate well when the water is saline.
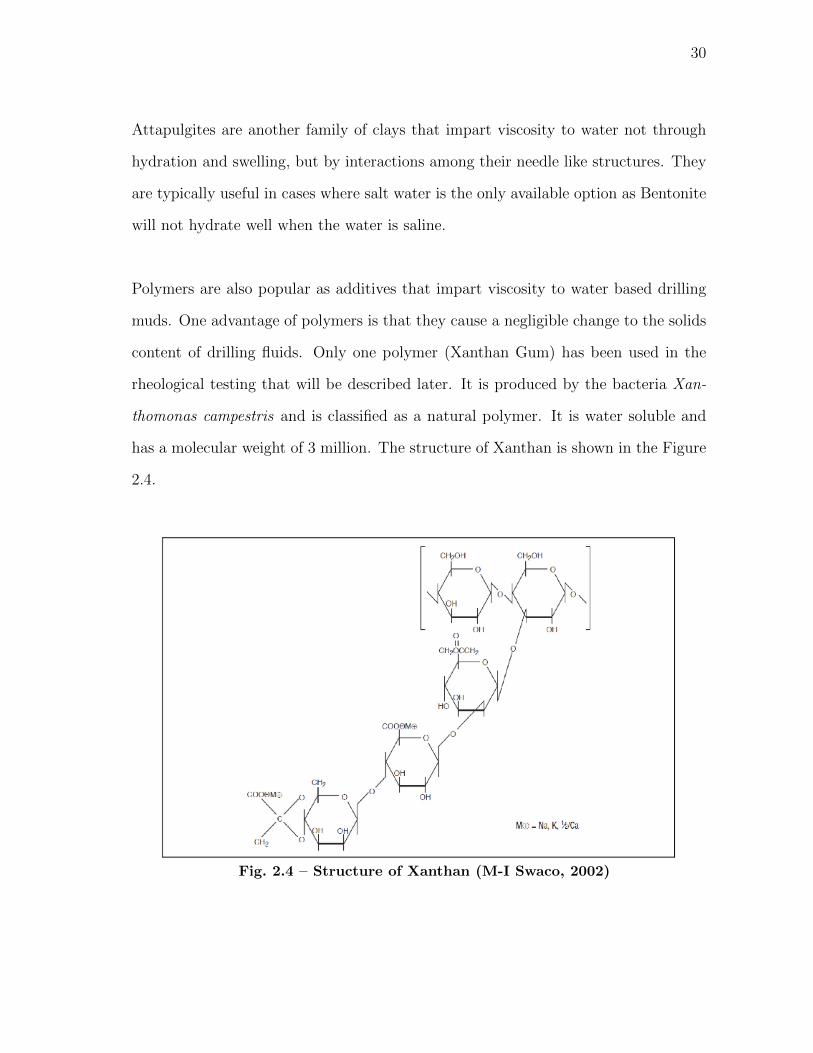
Polymers are also popular as additives that impart viscosity to water based drilling
muds. One advantage of polymers is that they cause a negligible change to the solids
content of drilling fluids. Only one polymer (Xanthan Gum) has been used in the
rheological testing that will be described later. It is produced by the bacteria Xan-
thomonas campestris and is classified as a natural polymer. It is water soluble and
has a molecular weight of 3 million. The structure of Xanthan is shown in the Figure
2.4.
Fig. 2.4 – Structure of Xanthan (M-I Swaco, 2002)

31
2.1.2 Weighting Materials
Drilling fluids must exert sufficient hydrostatic pressure on the formation to prevent
an influx of formation fluids. In order to perform pressure control effectively, the
drilling fluids need have sufficient density. The density of the drilling muds is con-
trolled by adding weighting materials to the base fluid. However, most weighting
agents are insoluble and non-reactive. On their own, they are incapable of remaining
suspended in the drilling fluid. Viscosity of the base fluid must be sufficient to ensure
that the weighting materials are suspended properly. Barite sag is said to occur when-
ever the drilling fluid loses weighting solids due to settling and is typically caused by
insufficient viscosity. Table 2.2 shows some of the common weighting agents and their
chemical composition. Barite (Barium Sulphate) was used as the weighting agent in
all the experiments performed as part of this research project.
Table 2.2 – Common Weighting Materials (Rabia, 2002)
MaterialPrincipal
ComponentSp. Gravity
Galena PbS 7.4-7.7
Haematite Fe2O3 4.9-5.3
Magnetite FeO4 5.0-5.2
Illmenite FeO.T iO2 4.5-5.1
Barite BaSO4 4.2-4.6
2.1.3 Filtration Control and Lost Circulation Material
Filtrate loss refers to the liquid phase of the drilling mud being lost to the permeable
formation due to the pressure differential that exists between the drilling fluid and
32
the formation fluid. Loss of drilling fluid to the permeable formation typically results
in a filter cake being formed on the borehole walls due to larger size particles in the
drilling fluid being unable to invade the pore spaces. Ideally, the filter cake must be
thin ( to prevent differential sticking problems associated with thick filter cakes) and
must posses low permeability to control further loss of drilling fluid (this prevents
formation damage). In highly permeable formations with large pore sizes it is pos-
sible that solids in the drilling mud of adequate size may also invade the formation.
In such cases, “bridging agents” are used to physically plug pore spaces near the
borehole wall and prevent further formation damage. Some common bridging agents
include Calcium Carbonate and ground Cellulose (M-I Swaco, 2002).
A wide range of particle sizes is preferable for good filtration control. Large parti-
cles form filter cakes of low permeability and smaller particles plug the gaps between
larger particles. Bentonite, which has a large surface area, has the potential to form
low permeability filter cakes. However, at high temperatures Bentonite suspensions
tend to flocculate causing an increase in filter cake permeability. Deflocculaants must
then be added to the drilling mud to achieve low filtration losses (M-I Swaco, 2002).
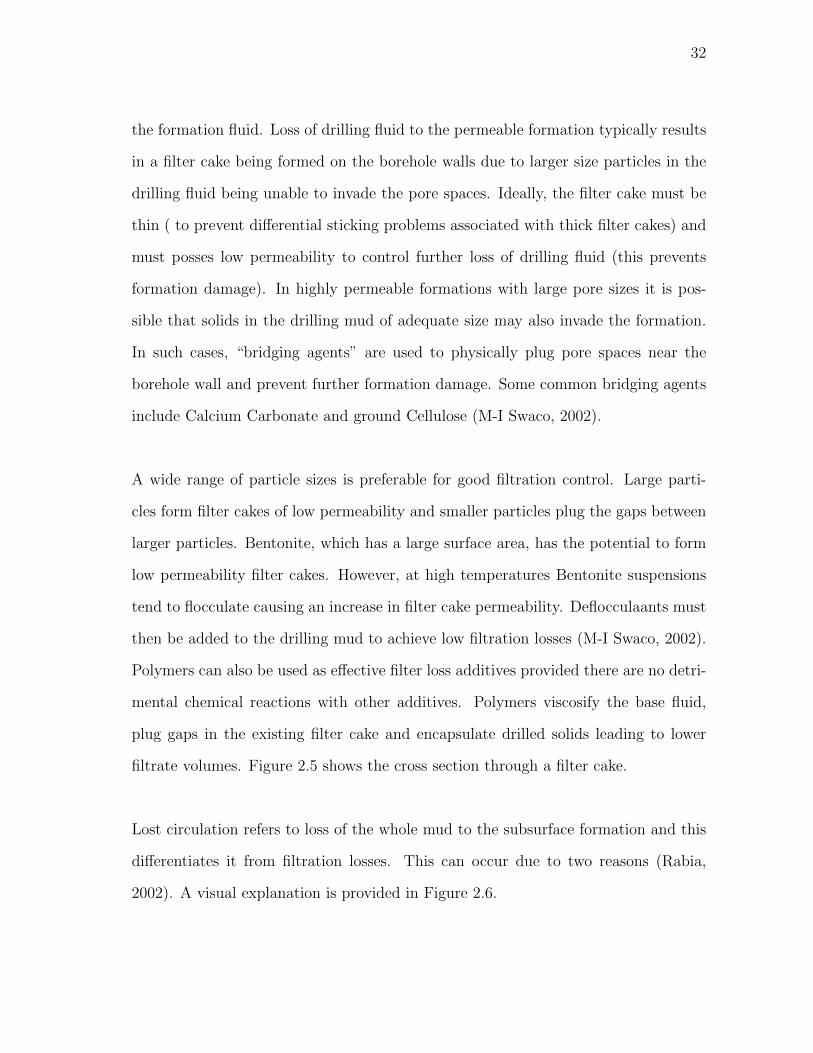
Polymers can also be used as effective filter loss additives provided there are no detri-
mental chemical reactions with other additives. Polymers viscosify the base fluid,
plug gaps in the existing filter cake and encapsulate drilled solids leading to lower
filtrate volumes. Figure 2.5 shows the cross section through a filter cake.
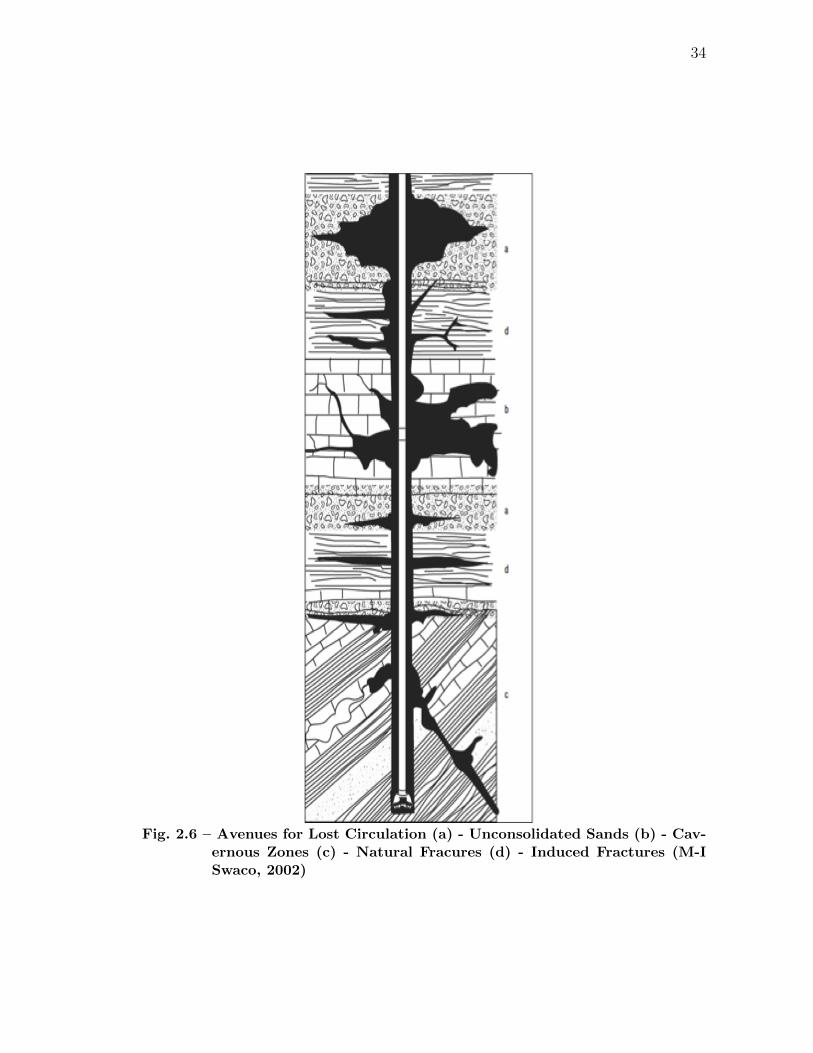
Lost circulation refers to loss of the whole mud to the subsurface formation and this
differentiates it from filtration losses. This can occur due to two reasons (Rabia,
2002). A visual explanation is provided in Figure 2.6.

33
Fig. 2.5 – Cross Section of a Filter Cake (M-I Swaco, 2002)
1. Natural Losses: This occurs due to natural fissures and fractures in the for-
mation caused by tectonic forces or due to large cavernous features in limestone
or dolomite formations. Large cavern-like features in formations can even lead
to total lost returns.
2. Induced Losses: They are caused by the mud pressures exceeding the forma-
tion fracture pressure leading to drilling fluid losses.
While some cases of lost returns cannot be dealt with due to the nature of the forma-
tion, there are a few ways of eliminating or reducing the magnitude of losses in other
cases (Rabia, 2002). They are:
1. Reducing the ECD by reducing flow rates, proper solids control, viscosity and
gel strength regulation.
2. Controlling surge pressures by reducing tripping speeds and rheological modifi-
cation of the drilling fluid. There is a possibility that a thick filter cake reduces
the annular clearance between the drill pipe and the formation leading to in-
creased surge pressures, so controlling filter cake thickness may also be a viable
option.
34
Fig. 2.6 – Avenues for Lost Circulation (a) - Unconsolidated Sands (b) - Cav-ernous Zones (c) - Natural Fracures (d) - Induced Fractures (M-ISwaco, 2002)
35
3. Setting casing at the appropriate depths using available fracture gradient infor-
mation.
4. Using lost circulation material (LCM) such as mica flakes, ground nut shells
or fibers to plug fissures and smaller fractures. Reinforcing plugs such as
Oil/Bentonite plugs or water/Bentonite plugs may also be pumped into prob-
lematic zones but this is usually a last resort.
2.2 Existing Work on HTHP Properties of Water Based Muds
Now that the different types of additives for WBMs and their functions have been
discussed, a review of the existing literature on high temperature testing of water
based muds (which is the central theme of this project) will be provided. This will
shed some light on the aim of the experiments that constitute the bulk of this research
project and also provide a brief summary of experimental techniques currently in use.
Alderman et al. (1988) discussed the complex rheology of water based muds stated
that, given the complex structure of these fluids resulting from the electrostatic inter-
action of clay particles, the fluid behavior is heavily determined by the shear history it
has been subjected to. This is ofcourse independent of the temperature and pressure
effects on rheology. The authors have sought to separate these two effects and pro-
vide a simple constitutive equation describing the change in rheological parameters
with pressure and temperature. Particular attention was paid to mud preparation
procedures to ensure that the clays were completely hydrated and dispersed before
the actual testing procedure. Experiments were conducted using a Haake D1000/300
concentric cylinder rheometer. The authors recognized that in order to decouple rhe-
ological responses occurring due to time dependent structural changes in the drilling
36
fluid (which occur even after an extensive and meticulous preparation sequence) the
testing procedure has to be modified to bring the fluid to what they refer to as an
isostructural condition. This is achieved by subjecting the fluid to a “standard shear
cycle history” to bring it to the equilibrium condition, thereby preventing thixotropic
(transient effects resulting from structural changes independent of temperature and
pressure) responses from fudging the actual data that needs to be measured. The
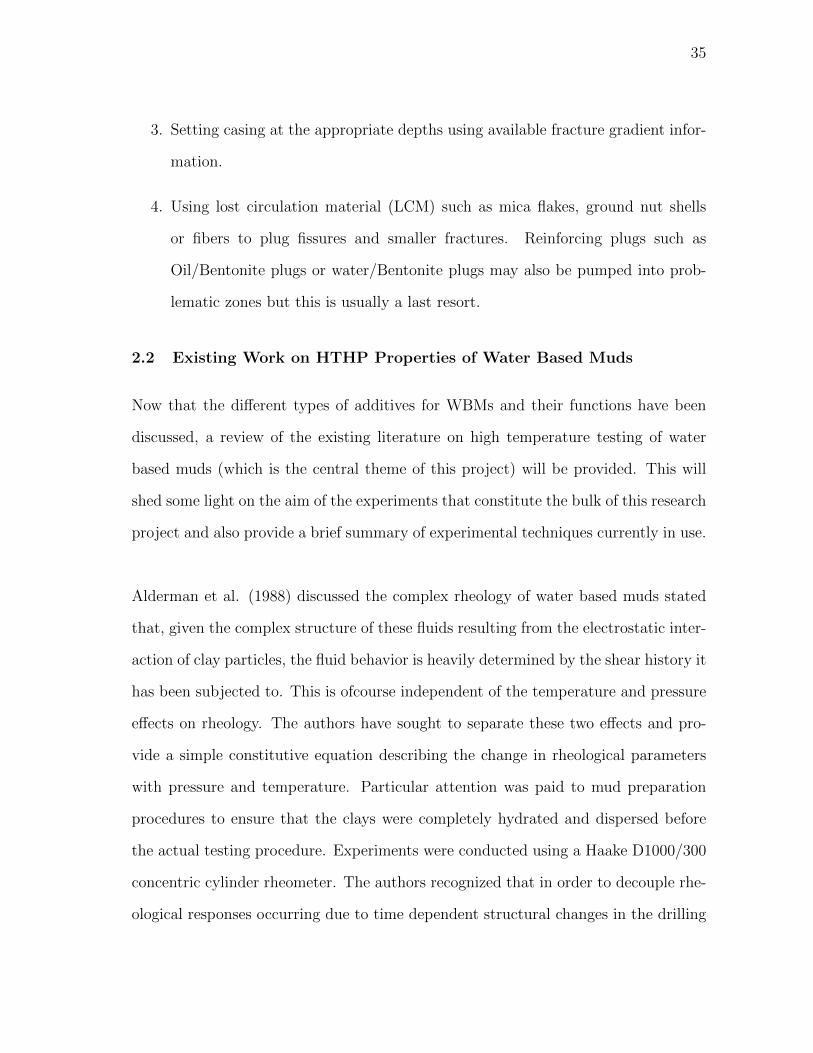
shear rates were ramped up and down repeatedly till the hysteresis effects are negli-
gible in between the shear rate cycles. A example equilibrium rheogram is shown in
Figure 2.7 for an unweighted Bentonite mud.
Fig. 2.7 – Equilibrium Rheogram Concept (Alderman et al. 1988)
Using the aforementioned procedure the authors tested several simple water based
systems at different pressures and temperatures and observed the following (Alderman
et al., 1988):
1. All fluids exhibit a yield stress followed by shear thinning behavior. The shear
thinning aspect of fluid behavior is explained by a structural breakdown of the
37
fluid at higher shear rates.
2. The yield stress of the fluid is highly insensitive to pressure, which suggests
that as far as fluid structure is concerned pressure does not produce any drastic
changes. It does compress the base fluid and this may be regarded as the
primary reason for rheological variation with pressure.
3. The yield stress becomes increasingly sensitive to temperature.
4. The equilibrium rheograms become less curved with increases in temperature.
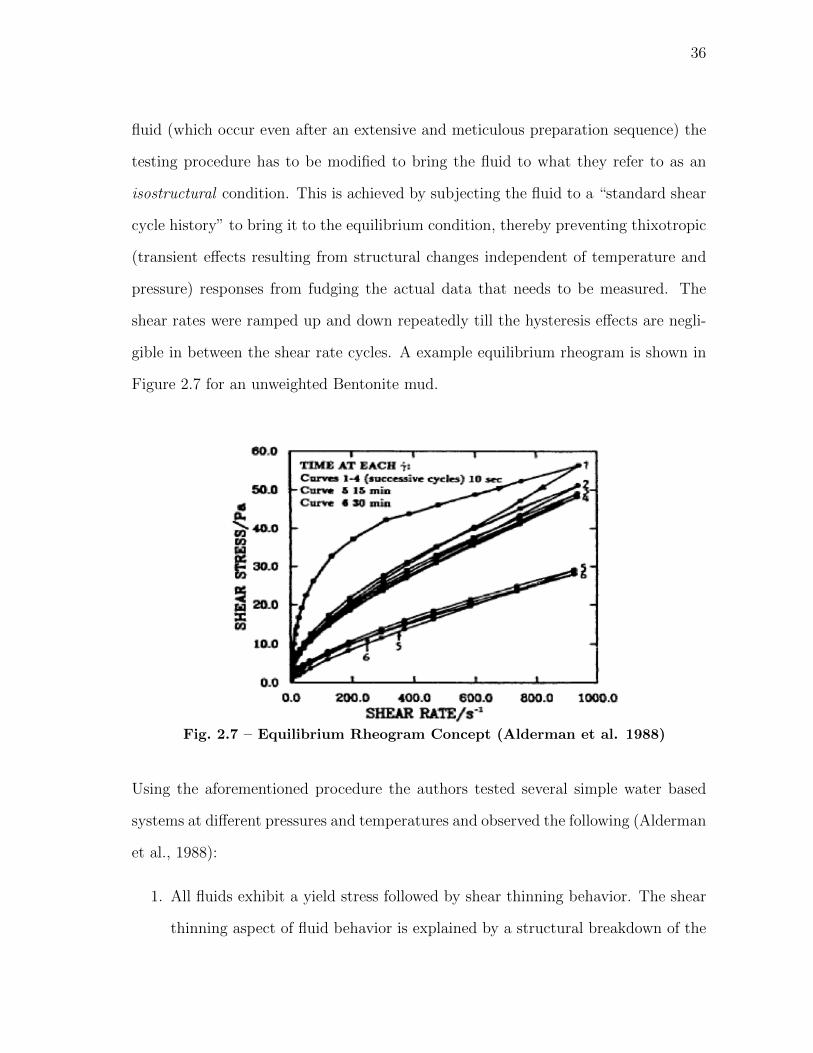
The Herschel - Bulkley model was found to fit the rheological data well (refer to
Appendix A for the formula describing the Herschel – Bulkley model ). An example
of the test results showing rheograms at various temperatures but constant pressure
is shown in Figure 2.8.
: >
Fig. 2.8 – Effect of Pressure and Temperature on Rheology (Alderman et al.,1988)
More importantly, the authors have attempted to describe the dramatic increase in

38
yield stress after a specified critical temperature in a mathematical formula given by,
τy = AL Exp[−EL
T
]if T < T ∗ (2.1)
τy = AH Exp[−EH
T
]if T ≥ T ∗ (2.2)
Carney, Guven and McGrew (1982) investigated the effect of polymer addition on
drilling fluids containing clay based viscosifiers. The observations they have made on
water-based muds containing Bentonite clay resonate with the central theme of the
project. Since their investigation concentrated on water-based drilling fluids used in
geothermal drilling operations, where the temperatures are quite extreme, it provides
a rare insight into WBM behavior in Ultra HPHT conditions. The authors observed
that conventional clay based systems undergo a viscosity hump after 350oF and the
gelation is so intense that the fluid is quickly rendered inoperative. This gelation was
seen not only in fluids containing impurities and significant solids content, but also
drilling fluids with no solids content except Bentonite clay. This is significant, because
there is an indication of a definite operating threshold for these fluid compositions.
Figure 2.9 shows the viscosity profiles of four fluids, each of a different composition.
Fluid A is a simple composition consisting of 20 PPB Wyoming Bentonite and 20
PPB southern Bentonite. Fluid D contains an additional 8 ppb of Spersene which is
a high temperature deflocculant. Interestingly, despite a lower base viscosity due to
addition of Spersene, the fluid does gel at higher temperatures but the gelation point
is just a little higher.
Carney, Guven and Panfill (1988a) have provided some useful recommendations re-
garding water based fluid design for high temperature applications. Some of the most
important are:

39
Fig. 2.9 – Bentonite Gelation at High Temperatures (Carney, Guven and Mc-Grew,1982)
• As far as possible use a primary viscosifier other than Bentonite- this is a direct
result of the poor high temperature stability of Bentonite. However, as seen
in the previous section, this decision may be disadvantageous in terms of cost
and to a limited extent fluid loss control as the natural sealing capacity of
Bentonite suspensions may have to be replaced with special fluid loss additives.
If Bentonite has to be used, keep the concentration to a minimum.
• Use polymer deflocculants to maintain high temperature rheology of water-
based systems.
• Any fluid system that is designed must be ecologically acceptable.
Carney, Guven and Panfill (1988b) have also performed a comparative rheological
investigation of various clays used in the drilling industry. An important conclusion
is the effect of hot rolling or autoclaving on the structure and subsequently the rheo-

40
logical behavior of Bentonite suspensions at higher temperatures. Hot Rolling in the
temperature range of 400oF to 600oF eliminated the viscosity enhancement that is
typically seen. The authors attributed this behavior due to dissolution of smectite
platelets in water during hot rolling at very high temperatures. Another important
conclusion is that flocculation ultimately reduces fluid loss properties due to increased
permeability of the filter cake. Figure 2.10 below shows the viscosity profile of a 6%
Bentonite solution that was autoclaved at different temperatures.
Fig. 2.10 – Effect of Hot Rolling on Bentonite Suspensions (Carney, Guvenand Panfill, 1988b)
Davison et al., (1999) described the hysteresis effect in yield stress values in water-
based flluids containing Bentonite. The fluid was heated to 195F(90C) and then
cooled down to 30oF(-1oC) which is representative of offshore drilling conditions where

41
subzero temperatures may be experienced in the riser section. The yield stress seemed
to increase during the heating cycle but does not reduce on the cooling cycle but con-
tinued to increase instead. This is a strong indicator of the fact that the mud had
flocculated at higher temperatures and “this state was maintained on the cooling
down cycle”.
Sinha (1970) conducted rheological measurements to quantify the effect of pressure
and temperature on various water based and oil based drilling fluid formulations.
The author devised an interesting methodology of displaying the results of his experi-
ments. The Figure 2.11 shows the equivalent viscosity of a 18.4 ppg water based mud
used in the field as a function of depth under a simulated geothermal gradient and
pressure gradient. A spike in viscosity is clearly noticeable after a certain depth that
corresponds to high temperature gelation of the fluid.
Fig. 2.11 – WBM Viscosity as a Function of Depth (Sinha, 1970)
42
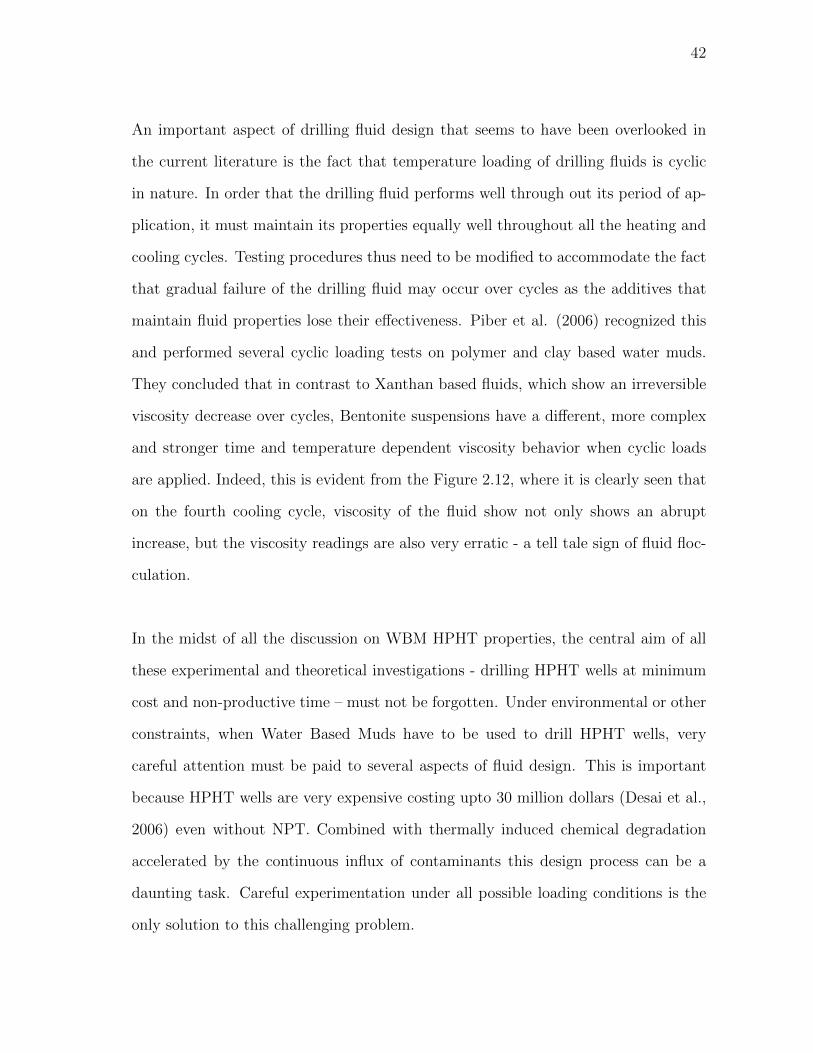
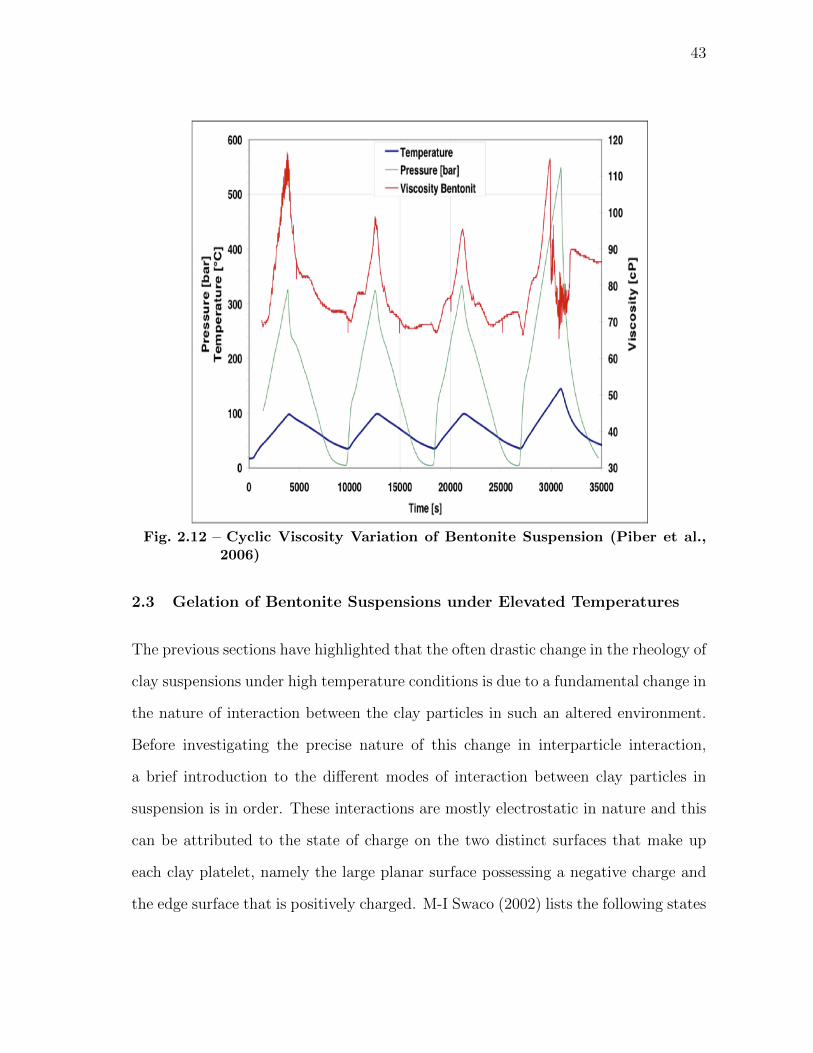
An important aspect of drilling fluid design that seems to have been overlooked in
the current literature is the fact that temperature loading of drilling fluids is cyclic
in nature. In order that the drilling fluid performs well through out its period of ap-
plication, it must maintain its properties equally well throughout all the heating and
cooling cycles. Testing procedures thus need to be modified to accommodate the fact
that gradual failure of the drilling fluid may occur over cycles as the additives that
maintain fluid properties lose their effectiveness. Piber et al. (2006) recognized this
and performed several cyclic loading tests on polymer and clay based water muds.
They concluded that in contrast to Xanthan based fluids, which show an irreversible
viscosity decrease over cycles, Bentonite suspensions have a different, more complex
and stronger time and temperature dependent viscosity behavior when cyclic loads
are applied. Indeed, this is evident from the Figure 2.12, where it is clearly seen that
on the fourth cooling cycle, viscosity of the fluid show not only shows an abrupt
increase, but the viscosity readings are also very erratic - a tell tale sign of fluid floc-
culation.
In the midst of all the discussion on WBM HPHT properties, the central aim of all
these experimental and theoretical investigations - drilling HPHT wells at minimum
cost and non-productive time – must not be forgotten. Under environmental or other
constraints, when Water Based Muds have to be used to drill HPHT wells, very
careful attention must be paid to several aspects of fluid design. This is important
because HPHT wells are very expensive costing upto 30 million dollars (Desai et al.,
2006) even without NPT. Combined with thermally induced chemical degradation
accelerated by the continuous influx of contaminants this design process can be a
daunting task. Careful experimentation under all possible loading conditions is the
only solution to this challenging problem.
43
Fig. 2.12 – Cyclic Viscosity Variation of Bentonite Suspension (Piber et al.,2006)
2.3 Gelation of Bentonite Suspensions under Elevated Temperatures
The previous sections have highlighted that the often drastic change in the rheology of
clay suspensions under high temperature conditions is due to a fundamental change in
the nature of interaction between the clay particles in such an altered environment.
Before investigating the precise nature of this change in interparticle interaction,
a brief introduction to the different modes of interaction between clay particles in
suspension is in order. These interactions are mostly electrostatic in nature and this
can be attributed to the state of charge on the two distinct surfaces that make up
each clay platelet, namely the large planar surface possessing a negative charge and
the edge surface that is positively charged. M-I Swaco (2002) lists the following states
44
of clay particle association:
• Aggregation refers to face-to-face particle linking (along the large planar sur-
faces). This leads to the formation of large packets of clay and reduces the
total number of particles in suspension. Intuitively, this leads to a decrease in
viscosity.
• Dispersion produces the opposite effect of aggregation. Clay platelets are
separated from one another, interspersed by the suspending medium (water in
our case). The net number of particles in suspension increases and so dues the
viscosity.
• Flocculation results from either edge-to-edge or edge to face association of
clay platelets in what is commonly referred to as a house of cards structure.
This causes an increase in viscosity due to the formation of interlinked flocs.
• Deflocculation is the reversal of the flocculation process leading to a reduction
in viscosity. The edge-to-edge association is weakened by the action of chem-
icals due to decrease in the electrochemical forces holding the house of cards
together. These four states of association are shown in Figure 2.13.
It is interesting to note that the edge-to-edge association model resulting in the struc-
tures shown above are not universally accepted. Luckham and Rossi (1999) suggest
that edge-to-edge association can form cross linked ribbons or there could also be
a band like structure as shown in the Figure 2.14 (Luckham and Rossi,1999). Re-
gardless of the nature of association, what matters from a fluid design standpoint
is that rheology is drastically modified in a manner that can be detrimental to the
drilling process. The increase in viscosity that occurs when the temperature of the

45
Fig. 2.13 – Types of Clay Association (M-I Swaco, 2002)
Bentonite suspensions is increased is due to a transition from the dispersed state to
the flocculated state. Increased temperatures seem to induce a change in the nature of
electrochemical interaction between the clay plates. Kelessides et.al, (2007) suggested
that the reasons behind this pattern of high temperature behavior are not entirely
known. Luckham and Rossi (1999) also determined that the origin of the flocculation
behavior is not entirely clear, but suggested that this may be due to modification of
the electrical double layer surrounding clay platelets by temperature.
Fig. 2.14 – Possible Flocculation Geometries (Luckham and Rossi, 1999)
46
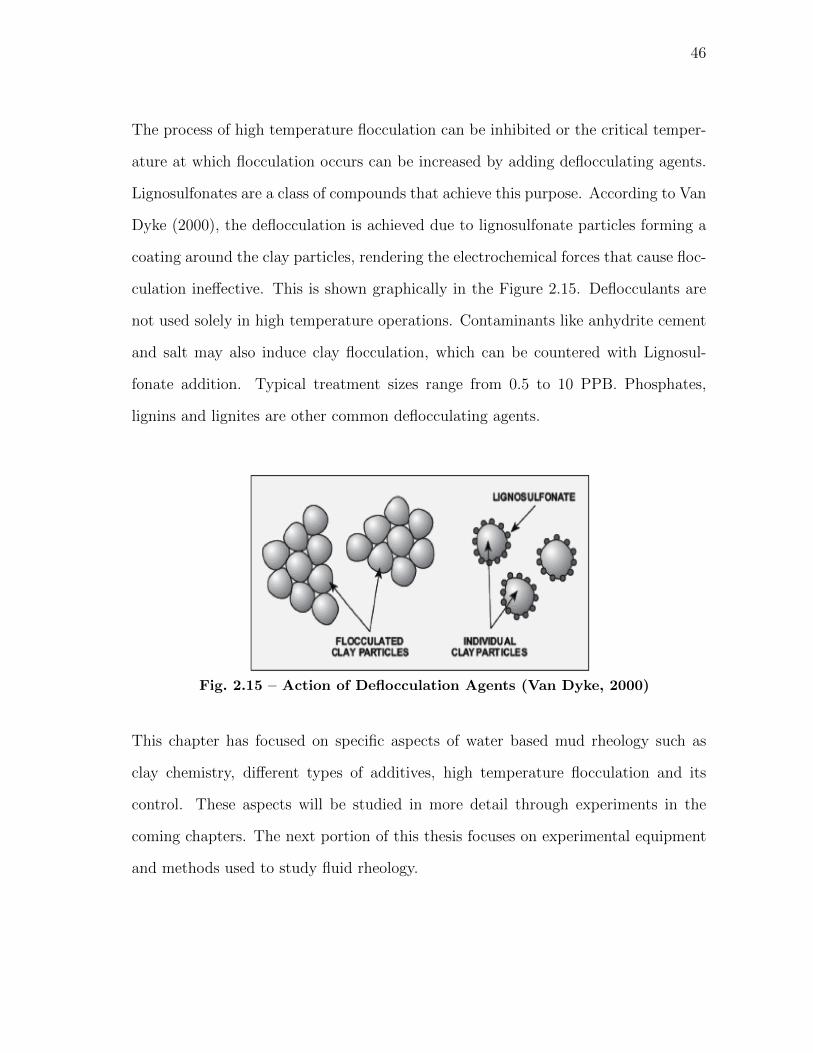
The process of high temperature flocculation can be inhibited or the critical temper-
ature at which flocculation occurs can be increased by adding deflocculating agents.
Lignosulfonates are a class of compounds that achieve this purpose. According to Van
Dyke (2000), the deflocculation is achieved due to lignosulfonate particles forming a
coating around the clay particles, rendering the electrochemical forces that cause floc-
culation ineffective. This is shown graphically in the Figure 2.15. Deflocculants are
not used solely in high temperature operations. Contaminants like anhydrite cement
and salt may also induce clay flocculation, which can be countered with Lignosul-
fonate addition. Typical treatment sizes range from 0.5 to 10 PPB. Phosphates,
lignins and lignites are other common deflocculating agents.
Fig. 2.15 – Action of Deflocculation Agents (Van Dyke, 2000)
This chapter has focused on specific aspects of water based mud rheology such as
clay chemistry, different types of additives, high temperature flocculation and its
control. These aspects will be studied in more detail through experiments in the
coming chapters. The next portion of this thesis focuses on experimental equipment
and methods used to study fluid rheology.
47
CHAPTER III
EXPERIMENTAL METHODS AND EQUIPMENT
This chapter describes the equipment used for testing the drilling fluids and its vari-
ous features. Only one viscometer was used in the testing of the drilling fluids – the
chandler 7600 XHPHT viscometer provided by Ametek Chandler Engineering. First,
a brief overview of non-newtonian rheology measurement techniques is provided, fol-
lowed by a detailed description of the equipment. The chapter concludes with a note
on the mud preparation procedures that were employed.
3.1 Principles of Non-Newtonian Rheology Measurement
The viscosity of non-newtonian fluids varies with the shear rates to which they are
subjected. Thus, non-newtonian rheological measurements are more complex than
the rheological mesurements involving simpler newtonian fluids. For a discussion on
fluid models, please refer to Appendix A. For now, it is sufficient to state that the
Herschel-Bulkley model (a three parameter model) was used to evaluate the drilling
fluids.
The concept behind fluid rheology measurement will not be discussed in too much
detail as sufficient explaination of the topic is available in the existing literature and
it is unnecessary to repeat it here. A brief overview will instead be provided. It must
be understood that since the non newtonian fluid can show variable viscosity under
different rhear rates (drilling fluids are mostly shear thinning), the fluid too is tested
under a sample of shear rates that it is most likely to experience. In all the experi-
48
ments that were performed in this project, the couette geometry viscometer was used.
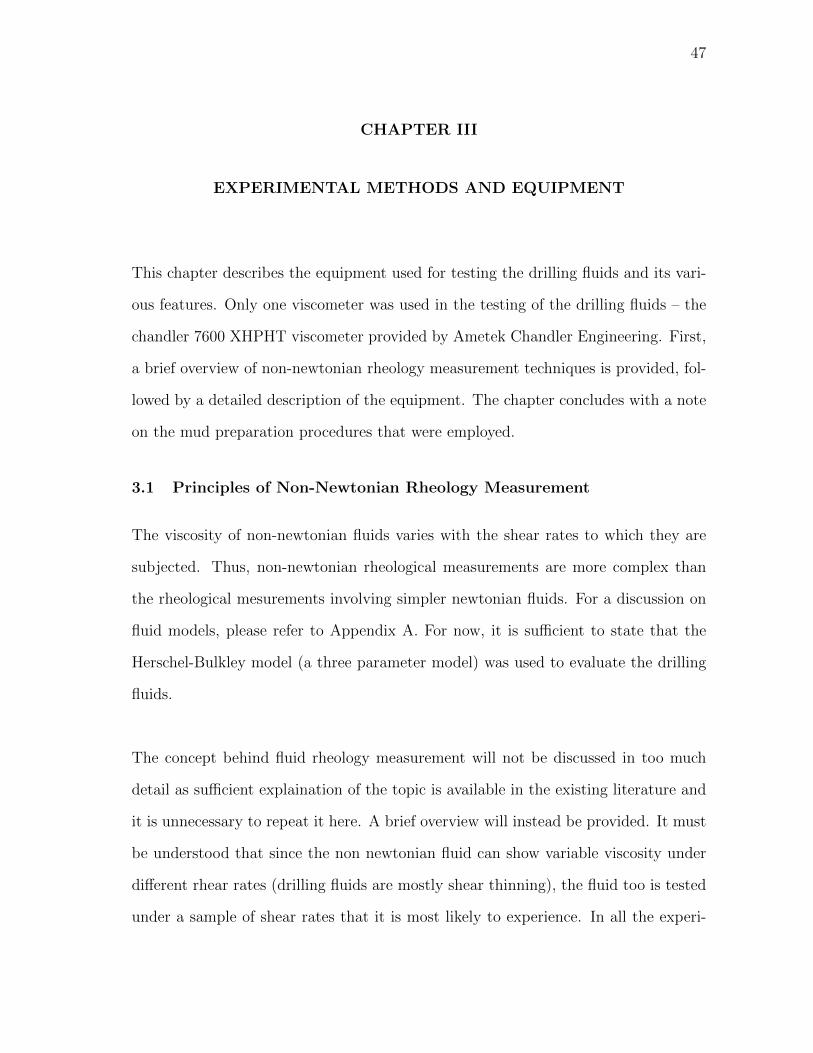
’Couette’ flow refers to the flow of a fluid in between two parallel surfaces. One of
these surfaces is typically moving, which causes the friction between the surface and
the layer of fluid immediately next to it to move , thereby shearing the entire fluid
that is present in the gap. This sheared fluid in turn exerts a force on the stationary
plate which can be measured and gives an estimate of the shear stress. The shear
rate of the fluid is directly related to the speed of motion of the moving plate. Figure
3.1 describes the processes occuring in a couette geometry.
Fig. 3.1 – Schematic of Couette Geometry (Ibeh, 2007)
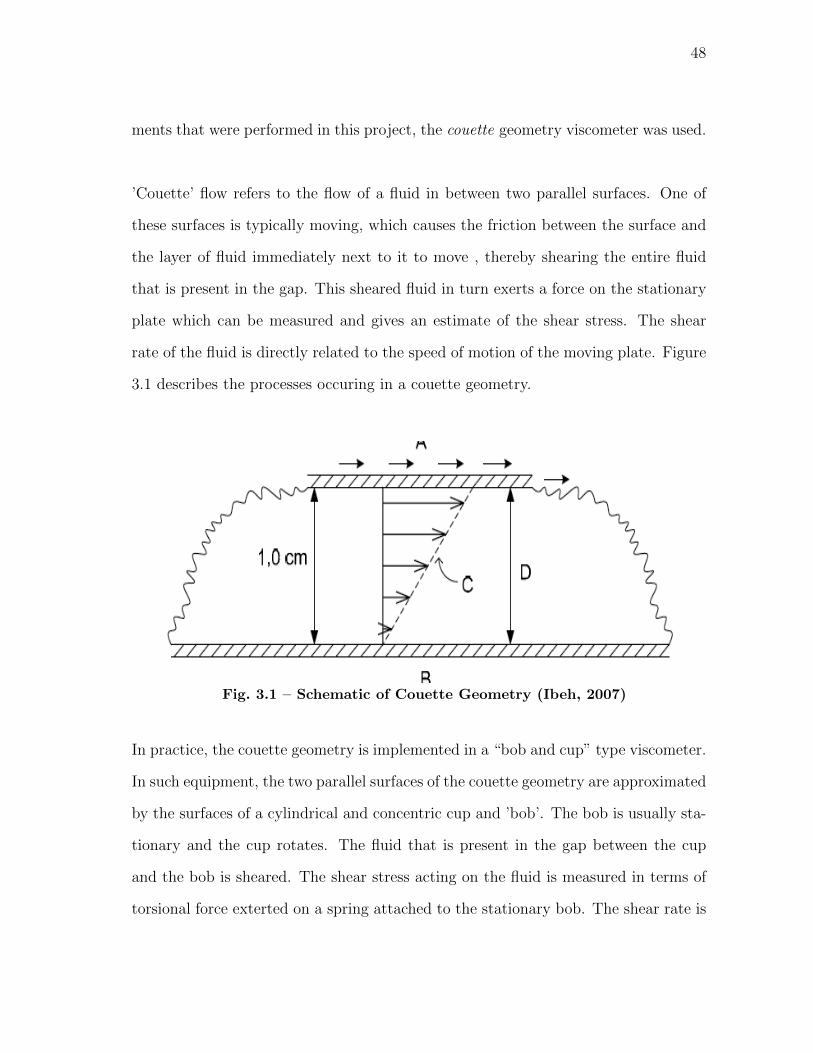
In practice, the couette geometry is implemented in a “bob and cup” type viscometer.
In such equipment, the two parallel surfaces of the couette geometry are approximated
by the surfaces of a cylindrical and concentric cup and ’bob’. The bob is usually sta-
tionary and the cup rotates. The fluid that is present in the gap between the cup
and the bob is sheared. The shear stress acting on the fluid is measured in terms of
torsional force exterted on a spring attached to the stationary bob. The shear rate is
49
a direct function of the geometry of the cup-bob system and the RPM at which the
rotor is moving. The shear stress is often read off a calibrated dial attached to the
torsion spring and hence the use of the term ’dial reading’ in the place of shear stress
is prominent. This term shall be used interchangably from here on in the thesis. A
schematic diamgram of the system is shown in the Figure 3.2.
Fig. 3.2 – Bob and Cup Viscometer Geometry (Ibeh, 2007)
In the drilling process, the flow loop of the drilling fluid can be segmented into groups
based on the shear rates that a drilling fluid experiences when flowing through them.
There are three shear rate ranges – low, medium and high. The low shear rate regions
are represented by viscosity measurements at 3 RPM and 6 RPM. The medium shear
rates are encapsulated by the 100 and 200 RPM rotor speeds and the high shear

50
rates by the 300 and 600 RPM speeds. An oilfield viscometer will thus have atleast
six preset speeds at which the rotor can be run so that the fluid properties can be
mesured at each representative shear rate. Any test involving this six speed sequence
(from lowest to highest) shall from here on be referred to as a ’baseline’ test sequence.
A FANN 35 viscometer with an attached thermocup was used to validate the room
temperature baseline tests from the XHPHT viscometer.
3.2 The High Temperature - High Pressure Viscometer
Since the drilling fluids in this project are being tested in the UHPHT range it is
not possible to use conventional viscometers whose range of operation (maxiumum
pressures and temperatures) is scarcely enough to meet the needs of ultra high temper-
ature testing. To overcome this obstacle a XHPHT viscometer provided by AMETEK
engineering – the CHANDLER 7600 – was used. This viscometer has the capability
to test fluids upto a maximum of 40000 PSIG and 600oF. The machine is almost fully
electronically controlled and uses the same principle of viscosity measurement as the
typical oil field viscometers (couette geometry flow). A photograph of the equipment
is shown in Figure 3.3.
The salient features of the equipment are:
• Viscometer meets the ISO 10414-1, 10414-2 and API RP13 requirements.
• Bench-top instrument.
• PC based data acquisition and control system.
• Automatic control of sample temperature and pressure using PID controllers.

51
Fig. 3.3 – The Chandler 7600 Viscometer
• High pressure (40,000 PSI/276 MPa), high temperature (600oF/316oC) sample
testing.
• Mixing of sample during test using mixing screw on outside diameter of rotor.
• Automatic control of instrument, including data collection, shear rate schedul-
ing, rheological model fits (n and K), display and calibration.
• Automatic 10 second and 10 minute gel strength measurements.
• Remote magnetic drive system, which eliminates interference with ferromag-
netic suspended solids.
• Sample wetted parts made from 300 series stainless steel and other corrosion
resistant high strength steel.
52
• Stepper motor and magnetic drive used to generate shear rates, providing high
accuracy and stability.
• High resolution measurement of torque (28800:1 encoder), jewel bearings.
• Safety systems designed into the instrument and software (over-pressure, overtem-
perature).
• Microsoft Excel compatible data output.
One of the main features of this equipment is that there is no mechanical linkage
between the servo motor that provides rotation and the rotor system. The linkage is
purely magnetic. This simple design enables the fluid to be subject to very high pres-
sures with minimal risk of leakage. Unlike conventional viscometers, the dial reading
measurement system is also magnetic in nature. The defelection of the bob due to
the shear stress is recorded electronically by a magnetic encoder which transmits the
data in real time to an acquisition system. The motor speed can be accurately con-
trolled and may be set to any required speed schedule. All the test parameters are
input electronically and the test is automatically controlled to stay within the desired
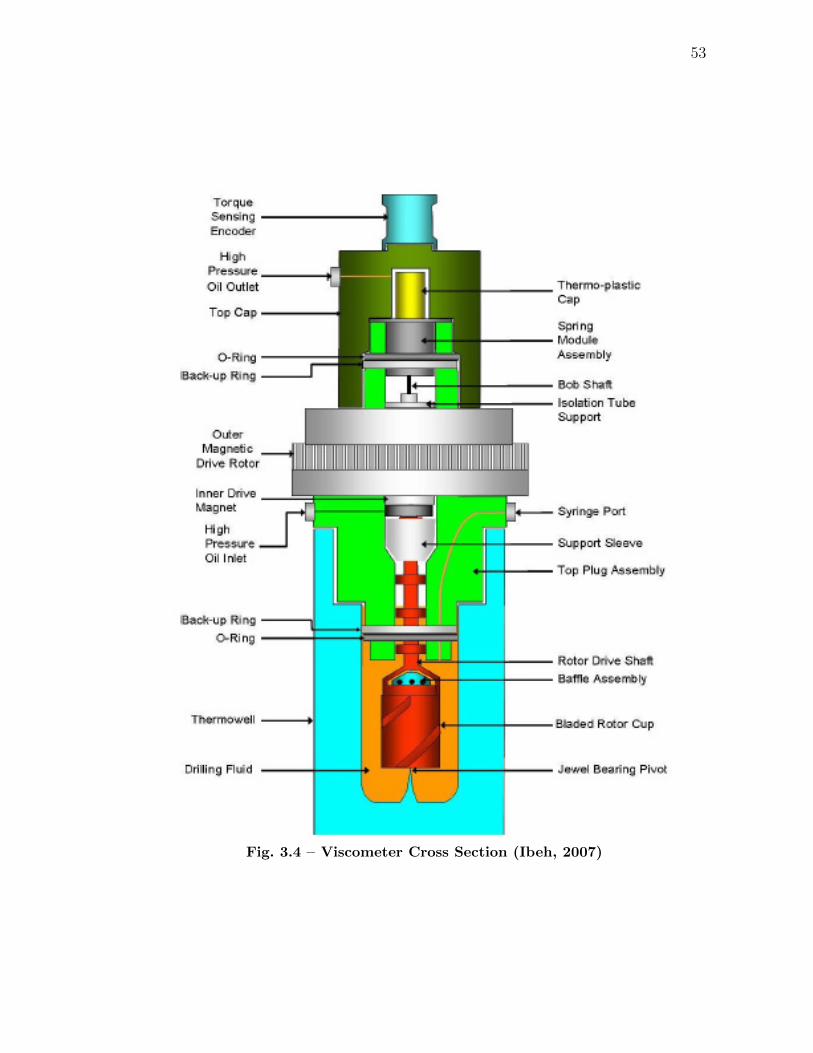
temperature and pressure range. Figure 3.4 shows a cross section of the test cell of
the viscometer.
Pressures and temperatures can also be controlled electronically in accordance with
a preset schedule. The pressure in the system is maintained using an air over water
pressurising system. Mineral oil is used as the hydraulic fluid. Though the mineral
oil does make contact with the tested fluid, it has been ensured that it does not affect
rheological measurements in any way. The temperature control is through a heater
53
Fig. 3.4 – Viscometer Cross Section (Ibeh, 2007)
54
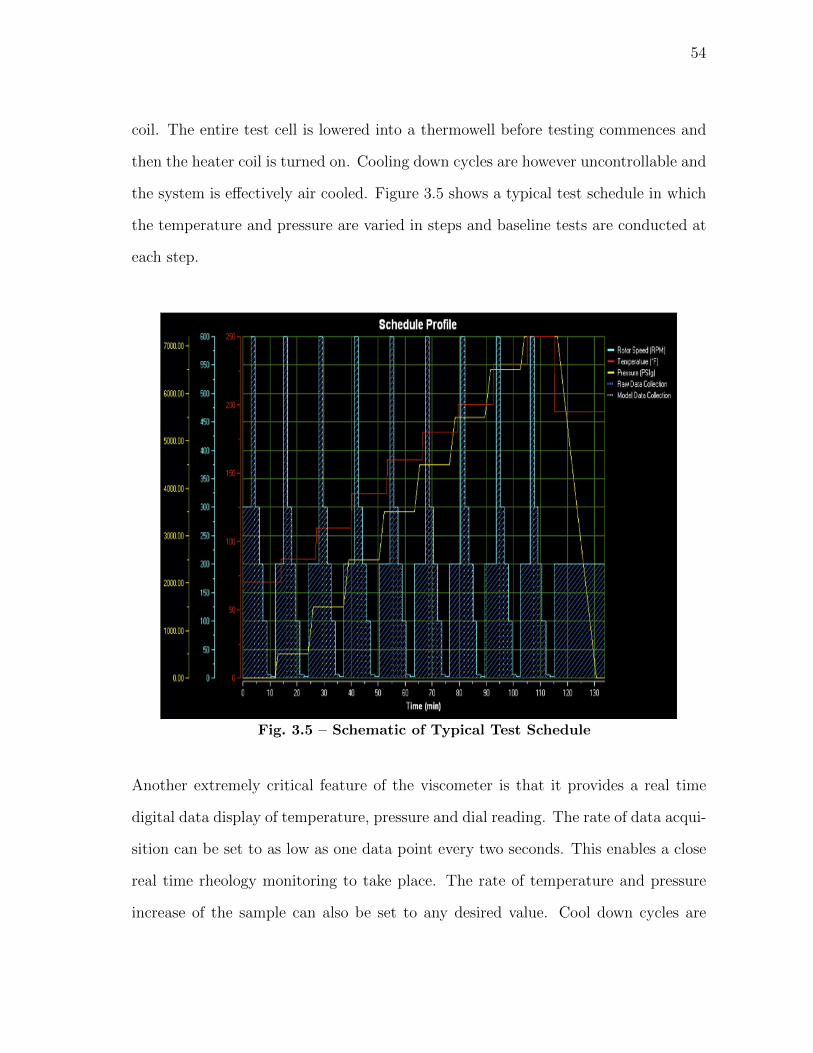
coil. The entire test cell is lowered into a thermowell before testing commences and
then the heater coil is turned on. Cooling down cycles are however uncontrollable and
the system is effectively air cooled. Figure 3.5 shows a typical test schedule in which
the temperature and pressure are varied in steps and baseline tests are conducted at
each step.
Fig. 3.5 – Schematic of Typical Test Schedule
Another extremely critical feature of the viscometer is that it provides a real time
digital data display of temperature, pressure and dial reading. The rate of data acqui-
sition can be set to as low as one data point every two seconds. This enables a close
real time rheology monitoring to take place. The rate of temperature and pressure
increase of the sample can also be set to any desired value. Cool down cycles are
55
typically less ’controllable’. Pressures can be ramped down at any desired rate, but
the sample will have to cool naturally.
Since the operation of the equipment is at extremely high temperatures and pres-
sures, several safety precautions have to be followed during operation. Care must
be taken not to exceed the operating limits of the equipment. Though almost all of
the processes are automated, there must be contninuous manual monitoring of the
equipment parameters to ensure that there is no anomalous activity. This becomes
doubly important in fluid flocculation tests, when a manual override has to be per-
formed in case the fluid becomes too thick and begins to damage the spring assembly.
Periodic calibraton of the equipment has to be carried out using a calibration fluid
( 200 CP silicone fluid). This is done to ensure that the equipment gives consistent
results devoid of long term drift.
The first experiment of the series was conducted to determine if there was any drift
in dial readings with time. Such a validation is necessary because in most of the tests
involving high sample temperatures and pressures it takes quite a while for the input
parameters (especially temperature) to stabilize and there may be a serious lack of
accuracy if the dial readings drift with time. It must be noted that the sample is
always being sheared by the rotor during the transient stages of the experiment. This
is necessary because of the thixotropic nature of the fluids being tested which means
that the dial readings may take some time to re-stabilize when the rotor is started
again.
In order to test the above mentioned drift characteristics of the viscometer, a pilot
test was conducted on a bentonite-water solution. The concentration of the sample

56
was set at 20 pounds of Bentonite per barrel of water. The bentonite clay was pre-
hydrated in water for 16 hours and then sheared in a high shear mixer for 30 minutes.
The sample was then tested in the Chandler 7600 viscometer at room temperature
and pressure. The following schedule was followed.
• Step 1: Shear at 300 RPM (510.60 1/s) for 5 minutes.
• Step 2: Conduct 4 baseline tests to get four sets of dial readings at 600, 300,
200, 100, 6 and 3 RPM.
• Step 3: Shear the sample at 300 RPM continuously for one hour.
• Step 4: Conduct four more baseline tests as described in step 2.
The results of the experiment are displayed in the Figure 3.6, which shows the dial
readings as a function of shearing time. The baseline tests (8 in total) can be seen
clearly, where there is an increase in dial readings with an increase in RPM of the
rotor. Each rotor speed has a dial reading associated with it, and as the RPM is
varied the dial reading curve shows as staircase profile that is evident in many of the
experimental graphs that follow. The rotor speed is maintained at a specific speed
for 90 or 180 seconds to allow for the dial readings to stabilize after which they are
recorded as model data. This will eliminate the influence of thixotropy that is usually
a feature of most drilling fluids. The 10 minute and 10 second gel strengths are also
recorded for the fluid. The fluid is sheared at 300 RPM (510 1/s) for 42 seconds before
the shear rate is reduced to zero for the gel strength tests. Separate commands are
available in the equipment software that automatically record gel strengths when the
rotor is restarted at 3 RPM.
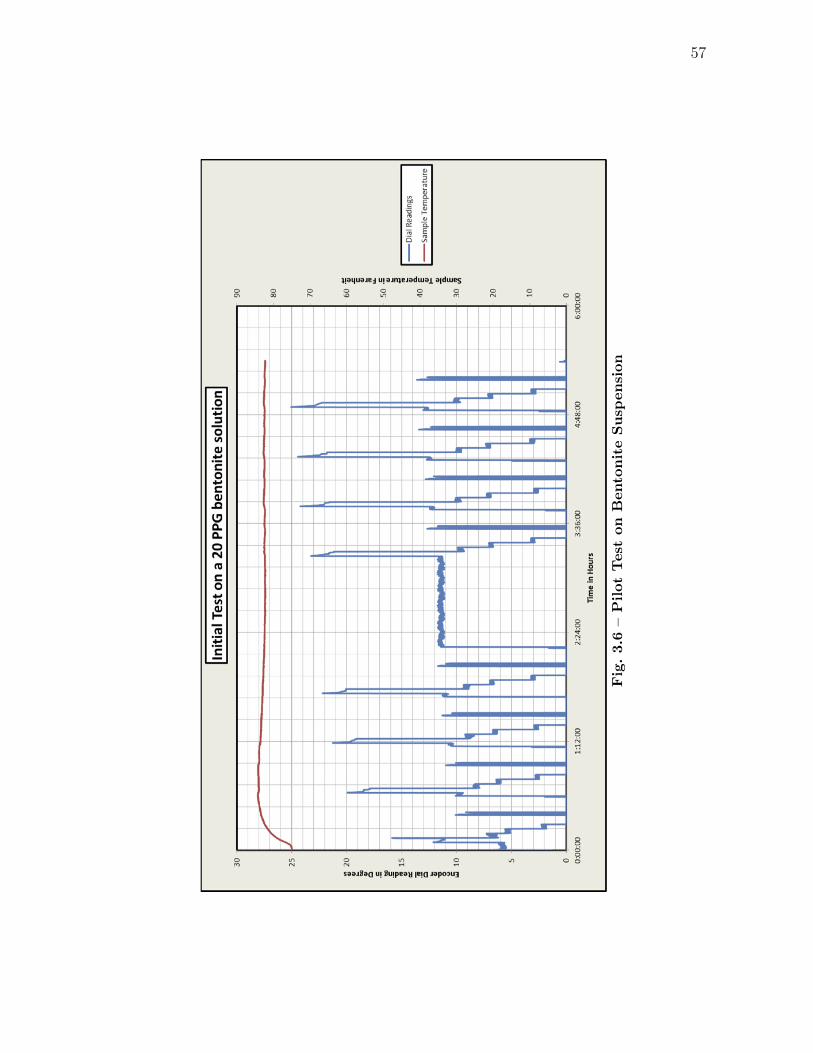
57
Fig
.3.6
–P
ilot
Test
on
Bento
nit
eS
usp
en
sion

58
As it can be seen, there is some rheological variation initially, but its magnitude re-
duces considerably as time wears on. During the one hour shear period too, there is
very little variation in dial readings observed (some oscillation about a mean value
exists, but its magnitude is within one degree) and there is almost no drift. After
the one hour shear period the baseline tests seem to show little variation compared
to those before. The variation is especially low at lower RPMs. Figure 3.7 shows the
dial readings during the one hour shear period. This confirms that the drift in the
equipment is negligible.
Fig. 3.7 – Dial Reading Variation During 1 Hour Shear Period

59
3.3 Sample Preparation
In order to ensure that the results are consistent over multiple experiments, a stan-
dard sample preparation procedure must be followed. The complex non-newtonian
nature of the fluids being tested implies that the shear history and the degree of
dispersion of clay particles in the suspension will have a major impact on the results
of the test. If the fluid samples are prepared in a haphazard manner, the variation in
test results must can be misinterpreted as arising from a change in fluid properties.
Therefore, in order to eliminate shear history effects a fluid preparation protocol was
followed.
The clay sample was first carefully weighed in an electronic weighing scale and then
added to the required quantity of water. This mixture was then sheared for about
five minutes in a high shear mixer. The clay was then allowed to prehydrate fully for
about 16 hours. This allowed the clay particles to be fully disperesed and ensured
that the clay had swollen to its maximum possible extent. The fluid was then sheared
for a period of 30 minutes in a high shear mixer to ensure that the properties were
uniformly distributed. Since all the samples were prepared in this manner their shear
history and level of dispersion going in to the experiment were the same, this would
mean that any difference in rheological response was due to the temperature and
pressure conditions imposed.
This chapter presented the basics of the experimental equipment used for testing and
the preparation rocedures selected for testing. A pilot test to determine viscometer
drift characteristics was also discussed. The next chapter will discuss special testing
schedule followed and the results obtained using this method.
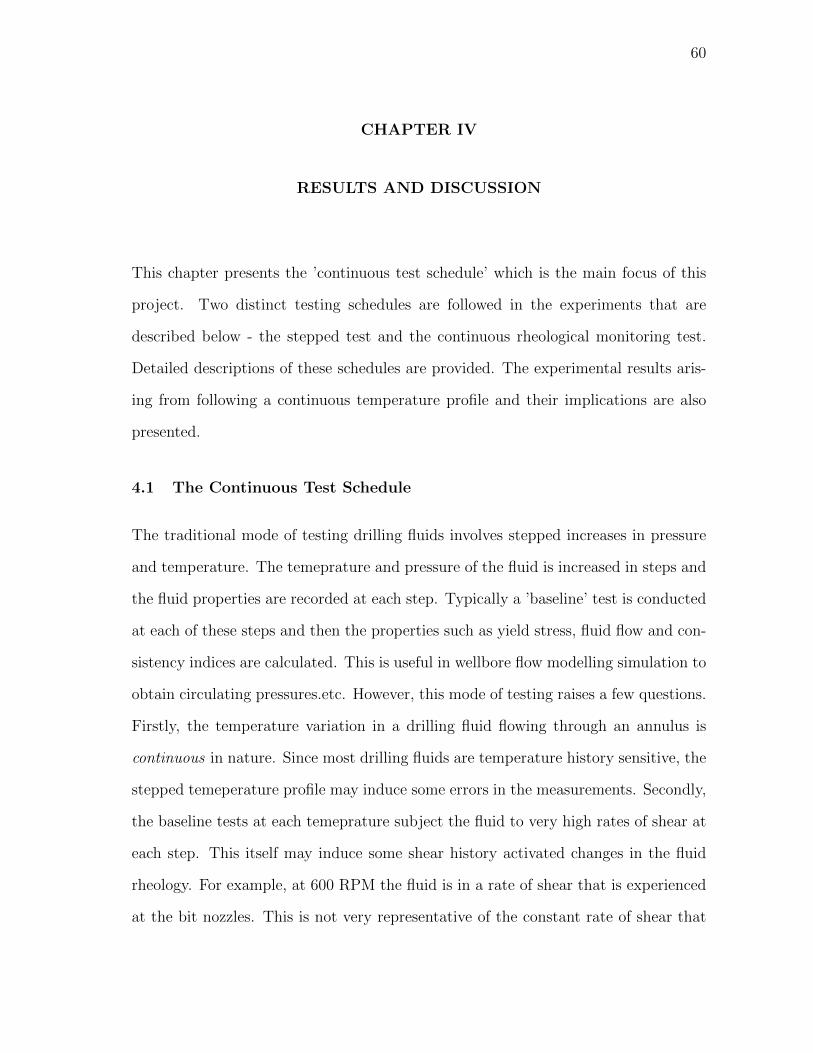
60
CHAPTER IV
RESULTS AND DISCUSSION
This chapter presents the ’continuous test schedule’ which is the main focus of this
project. Two distinct testing schedules are followed in the experiments that are
described below - the stepped test and the continuous rheological monitoring test.
Detailed descriptions of these schedules are provided. The experimental results aris-
ing from following a continuous temperature profile and their implications are also
presented.
4.1 The Continuous Test Schedule
The traditional mode of testing drilling fluids involves stepped increases in pressure
and temperature. The temeprature and pressure of the fluid is increased in steps and
the fluid properties are recorded at each step. Typically a ’baseline’ test is conducted
at each of these steps and then the properties such as yield stress, fluid flow and con-
sistency indices are calculated. This is useful in wellbore flow modelling simulation to
obtain circulating pressures.etc. However, this mode of testing raises a few questions.
Firstly, the temperature variation in a drilling fluid flowing through an annulus is
continuous in nature. Since most drilling fluids are temperature history sensitive, the
stepped temeperature profile may induce some errors in the measurements. Secondly,
the baseline tests at each temeprature subject the fluid to very high rates of shear at
each step. This itself may induce some shear history activated changes in the fluid
rheology. For example, at 600 RPM the fluid is in a rate of shear that is experienced
at the bit nozzles. This is not very representative of the constant rate of shear that

61
the fluid undergoes in the annulus. Therefore, a more representative mode of testing
is required.
It is difficult to simulate the exact flowing temperature profile of a drilling fluid in
experimental equipment, but very useful qualitative observations can be made by
continuously monitoring the variation of a single rheological parameter as the fluid
temperature changes according to a preset schedule. Such a real time observation of
rheological properties will bring to light possible hydraulics issues at higher temper-
atures, especially those due to high temperature gelation of fluids having clay based
viscosifiers. Such experiments may also enable the setting of operational limits or
failure points for drilling fluids and help in planning fluid treatment schedules based
on expected bottom hole temperatures. They can also provide useful insight into the
actual behavior of drilling fluids in hot wells. The high rate of data output from the
Chandler 7600 XHPHT viscometer makes this contnuous monitoring possible. By
manipulating the temperature increase rate, the temperature history can be made to
resemble the actual circulating profile of a drilling fluid in the flow loop. Figure 4.1
shows the difference between the stepped and continuous tests.
Based on the definition of a continuous test, a practical method of implementing the
procedure in the viscometer to make real time observations of fluid flocculation and
failure was formulated. One of the most important factors to take into account while
testing fluids to failure is ensuring that the dial readings are manually monitored in
real time to prevent damage to the equipment which may result from excessive thick-
ening of the fluid under high temperatures. A step by step outline of the developed
procedure is given below.
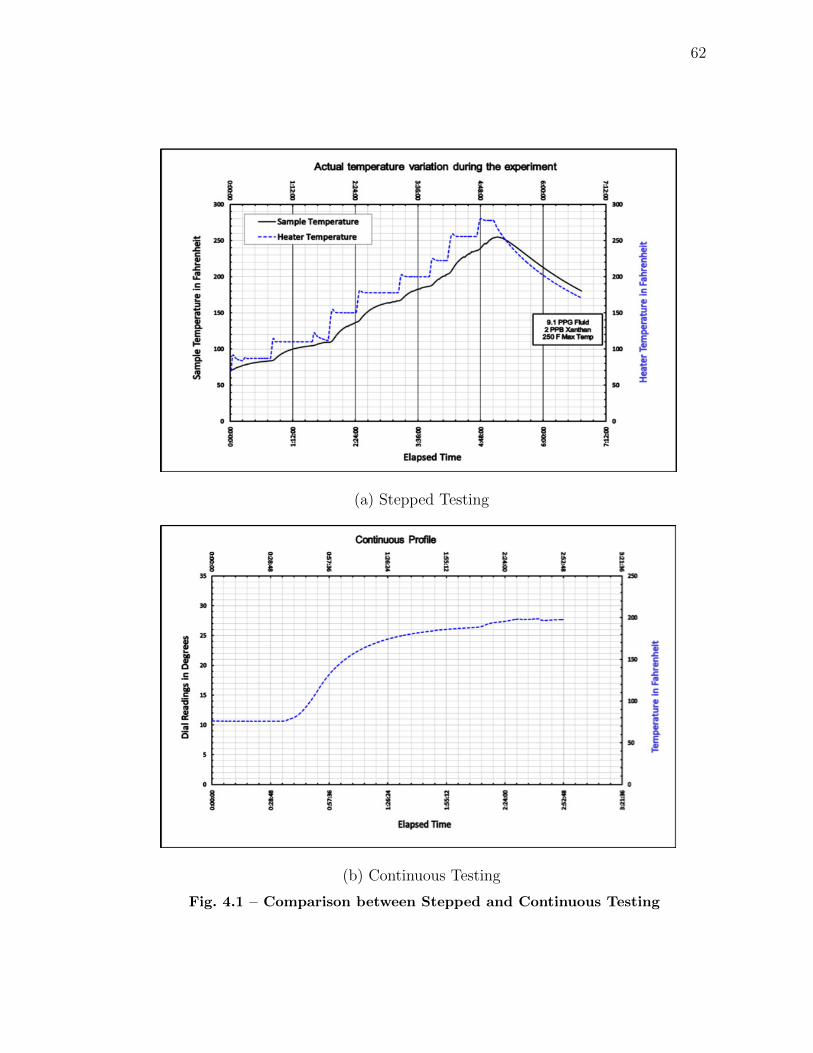
62
(a) Stepped Testing
(b) Continuous Testing
Fig. 4.1 – Comparison between Stepped and Continuous Testing
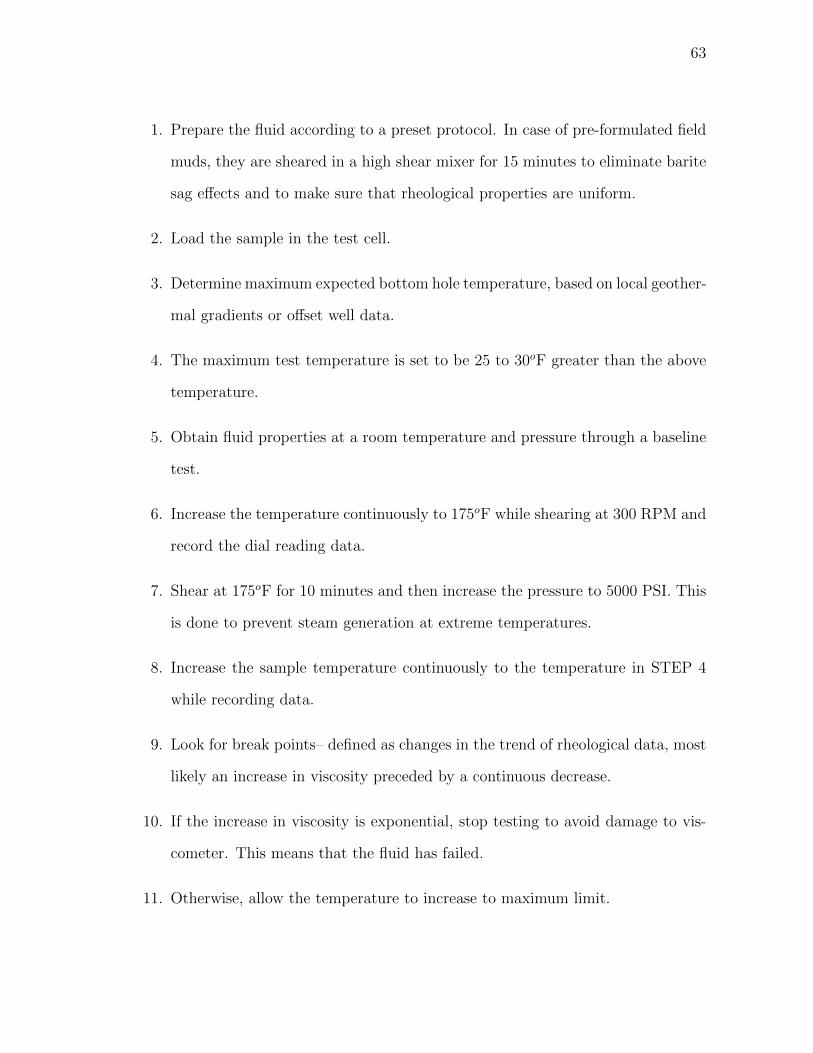
63
1. Prepare the fluid according to a preset protocol. In case of pre-formulated field
muds, they are sheared in a high shear mixer for 15 minutes to eliminate barite
sag effects and to make sure that rheological properties are uniform.
2. Load the sample in the test cell.
3. Determine maximum expected bottom hole temperature, based on local geother-
mal gradients or offset well data.
4. The maximum test temperature is set to be 25 to 30oF greater than the above
temperature.
5. Obtain fluid properties at a room temperature and pressure through a baseline
test.
6. Increase the temperature continuously to 175oF while shearing at 300 RPM and
record the dial reading data.
7. Shear at 175oF for 10 minutes and then increase the pressure to 5000 PSI. This
is done to prevent steam generation at extreme temperatures.
8. Increase the sample temperature continuously to the temperature in STEP 4
while recording data.
9. Look for break points– defined as changes in the trend of rheological data, most
likely an increase in viscosity preceded by a continuous decrease.
10. If the increase in viscosity is exponential, stop testing to avoid damage to vis-
cometer. This means that the fluid has failed.
11. Otherwise, allow the temperature to increase to maximum limit.

64
12. Begin cool down cycle while recording data.
13. Identify changes in fluid during heating and cooling.
14. If there is exponential or rapid change in viscosity during cooling, stop testing,
fluid has failed.
15. Otherwise, cool down to room temperature and obtain rheological properties
again. The procedure is graphically described in Figure 4.2.
The continuous test schedule should, if implemented correctly, be able to provide
valuable insights into changes in the properties of the drilling fluids that occur during
more realistic reproductions of actual temperature histories. It is true that with the
continuous availability of dial reading data during stepped testing, the fluid behavior
in between temperature steps can be recorded. But, this is definitely not representa-
tive of the actual temperature history of a drilling fluid. The step changes in shear
rates during the baseline tests at each step also compound the problem. Another
important point to be noted is that, a continuous test cannot give the rheological
parameters such as yield point. This requires that the fluid be tested at multiple
shear rates. This seems to be a definite disadvantage. However, by shearing the
fluid at approximately the same rate that is expected in the annulus a very definite
qualitative assessment of fluid behavior can be made. This seems a better approach
compared to interpolation of fluid properties between temperature steps which may
not yield a good estimate of the temperature at which detrimental rheological tran-
sition occurs. This concept will become clearer with the presentation of data from
actual experiments.

65
Fig
.4.2
–S
chem
ati
cof
Pro
pose
dT
est
Sch
ed
ule

66
The following sections discuss the data obtained from rheological experiments con-
ducted on a variety of mud frmulations. Only one stepped test is presented. The
rest of the experiments involve continuous temperature variation. While continuous
testing seems attractive on paper, only extensive experiments can definitively prove
that it is a useful tool in fluid design. This will be the objective of the section that
follows.
4.2 Experimental Results
An experiment was conducted on a 2 PPB solution of Xanthan gum in tap water
to demostrate the usefulness of the stepped test. This type of testing will not be
extensively discussed in the remainder of this thesis. The reader is requested to refer
to Ibeh (2007) for a more detailed appreciation of the data from such tests. The solu-
tion was prepared by mixing the requisite amount of Xanthan gum after weighing in
an electronic weighing scale with water and then shearing in a high shear mixer for
about 20 minutes to ensure that the rheological properties are uniform and stable.
It must be noted that water boils at 212oF at atmospheric pressure and it would
be impossible to measure rheological properties under such conditions. Thus, even
though rheology of water based systems may be only weakly dependent on pressure,
it becomes necessary to ensure that conditions of elevated pressure exist if high tem-
perature rheological investigations are to be made. The temperature and pressure
schedule of the experiment is shown in Table 4.1.
Due to issues with the pressure control system in the equipment, a precise control of
pressure was not possible but, as noted earlier, it is evident from literature and from
experimental data that the influence of pressure on rheology of water based muds
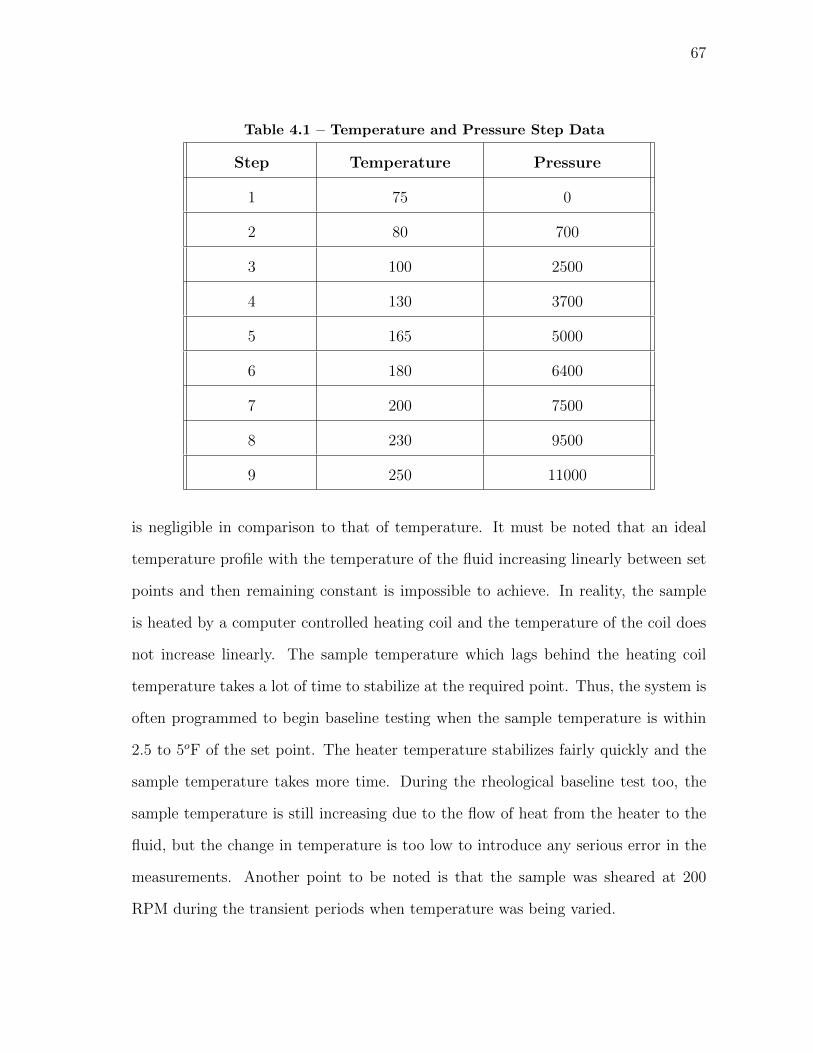
67
Table 4.1 – Temperature and Pressure Step Data
Step Temperature Pressure
1 75 0
2 80 700
3 100 2500
4 130 3700
5 165 5000
6 180 6400
7 200 7500
8 230 9500
9 250 11000
is negligible in comparison to that of temperature. It must be noted that an ideal
temperature profile with the temperature of the fluid increasing linearly between set
points and then remaining constant is impossible to achieve. In reality, the sample
is heated by a computer controlled heating coil and the temperature of the coil does
not increase linearly. The sample temperature which lags behind the heating coil
temperature takes a lot of time to stabilize at the required point. Thus, the system is
often programmed to begin baseline testing when the sample temperature is within
2.5 to 5oF of the set point. The heater temperature stabilizes fairly quickly and the
sample temperature takes more time. During the rheological baseline test too, the
sample temperature is still increasing due to the flow of heat from the heater to the
fluid, but the change in temperature is too low to introduce any serious error in the
measurements. Another point to be noted is that the sample was sheared at 200
RPM during the transient periods when temperature was being varied.
68
Figure 4.3 shows the results of the experiment graphically. As it can be seen from the
peaks of the dial reading curve, the fluid becomes thinner with temperature. One can
also notice that when pressure is increased, there is almost no response in the dial
reading curve, further reiterating the fact that pressures, especially below 20000 psig
do not drastically alter rheological data. The system was allowed to cool down below
the atmospheric boiling point of water before the pressure was manually released. The
duration of the entire test was approximately 6 hours and 45 minutes. Gel strengths
were not recorded during this test to reduce the overall testing time. An extremely
important point to note is that there is absolutely no viscosity recovery during the
cool down cycle after the stepped testing is complete. This gives us an indication of
rheological hystersis that occurs in drilling fluids with cyclic variation of temperature.
4.2.1 Continuous Rheological Monitoring on a 25 PPB Bentonite Solu-
tion
The first continuous rheological test was performed on 25 PPB solution of bentonite.
The objective of this test was to determine whether it is possible to determine with
a reasonable degree of precision an operational limit based on rheology for drilling
fluids. The fact that bentonite-water suspensions flocculate at high temperatures is a
fairly well recorded phenomenon. In stepped test, this will be observed as an increase
in dial readings at all shear rates after a critical temperature and an increase in the
yield point of the fluid. This test was scheduled as follows:
• Step 1: Shear the sample at 300 RPM for 5 minutes.
• Step 2: Conduct a Base line rheology check and collect model data.
• Step 3: Begin continuous test procedure.

69
Fig. 4.3 – Overall Test Results for 2 PPB Xanthan Fluid
Figure 4.4 shows the results of the experiment graphically. It is clearly seen that
after a certain temperature, the dial readings begin to increase and one can also
notice erratic behavior in that there are instantaneous jumps. This suggests that the
fluid sample has begun to flocculate. The test was stopped before the sample reached
200 F to avoid damaging the spring assembly. But, the general purpose of continuous
rheological monitoring was achieved and changes in fluid properties were observed as
they occurred.
It can be seen clearly that while the dial readings begin to increase at about
105oF, the transition is smooth till about 135oF when they start to become erratic.
This may be due to individual flocs being sheared in between the bob and the rotor,

70
Fig
.4.4
–O
vera
llT
est
Resu
lts
for
25
PP
BB
ento
nit
eS
olu
tion
71
causing the dial readings to jump. Thus, one can set an operational limit of about
135oF for this particular formulation. The compositon of this fluid sample is exceed-
ingly simple and is seldom seen is field use except when wells are being spudded.
But, the objective of the of the test was satisfied in that the usefulness of continuous
rheological monitoring was demonstrated. After the sample was allowed to cool down
and the equipment was dismantled, the evidence of flocculation was clearly visible
and the fluid sample could not be poured out of the test cell and had to be scooped
out instead. This test proved to a great extent the utility of continuous rheologi-
cal monitoring and confirmed that it could be implemented practically to produce
meaningful results.
4.2.2 Test on 25 PPB Bentonite Suspension with Commercial Additive
TANNATHIN
A similar experiment was performed on a 25 PPB suspension of Bentonite in water
with 5 PPB of a commercial deflocculant TANNATHIN added to it. According to the
product bulletin TANNATHIN “is a secondary deflocculant and is especially effective
in high temperature applications” and “it can be used in virtually any water based
fluid”. TANNATHIN also reduces the viscosity and the gel strengths of the mud.
Typical treatments range from 1 to 8 PPB. Its properties as per the product bulletin
are summarized in Table 4.2
The experimental schedule was the same as the one before with the maximum tem-
perature of investigation being 200oF. The results of the experiment are shown below
in Figure 4.5. In this particular experiment there is no sign of flocculation occurring
and unlike the previous case, there was no risk of damage to the spring assembly
due to continuous increase in dial readings. The 300 RPM dial readings remained
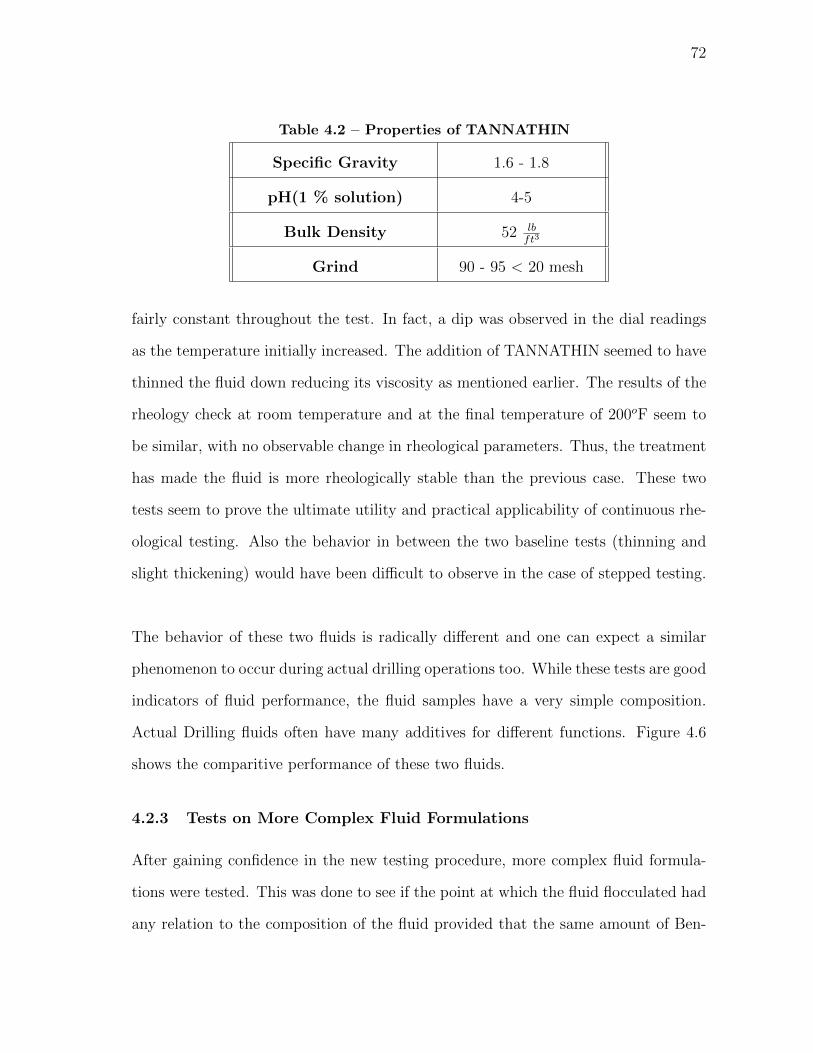
72
Table 4.2 – Properties of TANNATHIN
Specific Gravity 1.6 - 1.8
pH(1 % solution) 4-5
Bulk Density 52 lbft3
Grind 90 - 95 < 20 mesh
fairly constant throughout the test. In fact, a dip was observed in the dial readings
as the temperature initially increased. The addition of TANNATHIN seemed to have
thinned the fluid down reducing its viscosity as mentioned earlier. The results of the
rheology check at room temperature and at the final temperature of 200oF seem to
be similar, with no observable change in rheological parameters. Thus, the treatment
has made the fluid is more rheologically stable than the previous case. These two
tests seem to prove the ultimate utility and practical applicability of continuous rhe-
ological testing. Also the behavior in between the two baseline tests (thinning and
slight thickening) would have been difficult to observe in the case of stepped testing.
The behavior of these two fluids is radically different and one can expect a similar
phenomenon to occur during actual drilling operations too. While these tests are good
indicators of fluid performance, the fluid samples have a very simple composition.
Actual Drilling fluids often have many additives for different functions. Figure 4.6
shows the comparitive performance of these two fluids.
4.2.3 Tests on More Complex Fluid Formulations
After gaining confidence in the new testing procedure, more complex fluid formula-
tions were tested. This was done to see if the point at which the fluid flocculated had
any relation to the composition of the fluid provided that the same amount of Ben-
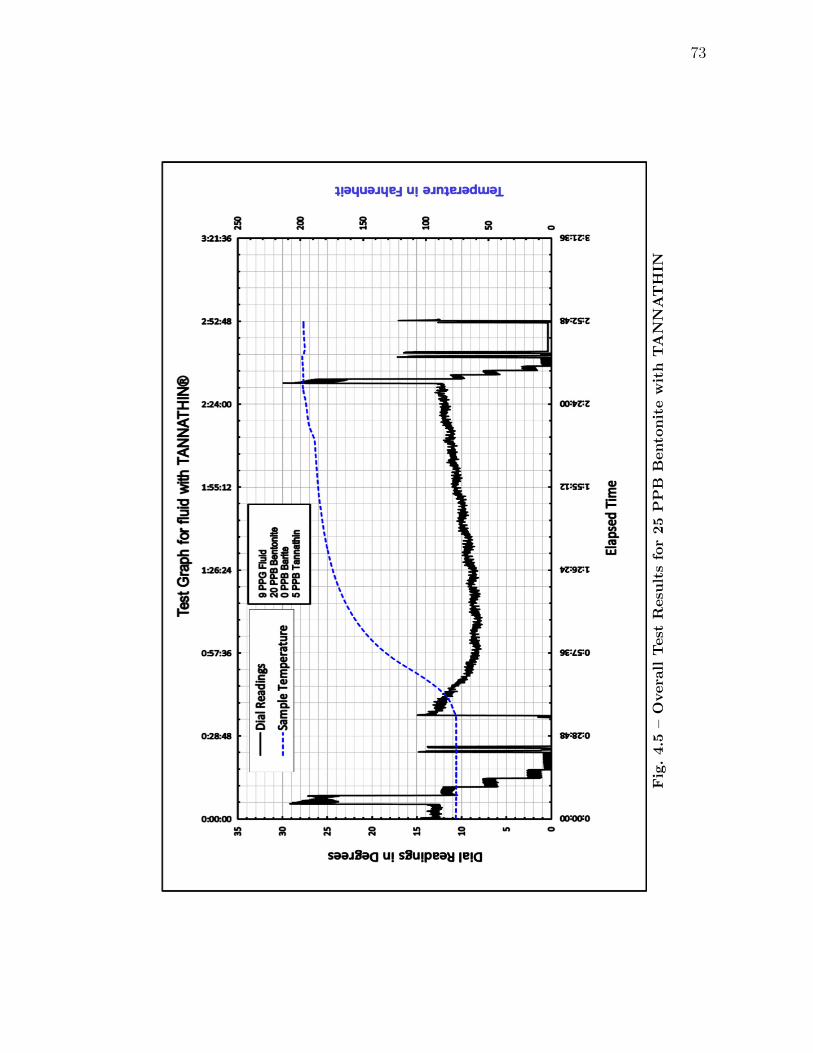
73
Fig
.4.5
–O
vera
llT
est
Resu
lts
for
25
PP
BB
ento
nit
ew
ith
TA
NN
AT
HIN

74
Fig. 4.6 – Comparison of Rheological Response of Two Bentonite Solutions
tonite and deflocculant were used. These tests were more extensive in that the testing
procedure also included a cooling cycle to see if there was any significant difference
in the rheological response during the heating and cooling cycles. All drilling fluids
were weighted with barite so that they could exert sufficient hydrostatic pressure on
the formation to prevent a fluid influx. The maximum temperature of the test was
also increased to reflect conditions that may be expereinced in UHPHT wells. The
general fluid compositon is given in Table 4.3.
Table 4.3 – Composition Table for Weighted Fluids
Component Concentrtion
Bentonite 25 PPB
Deflocculant 5 PPB
Barite Variable
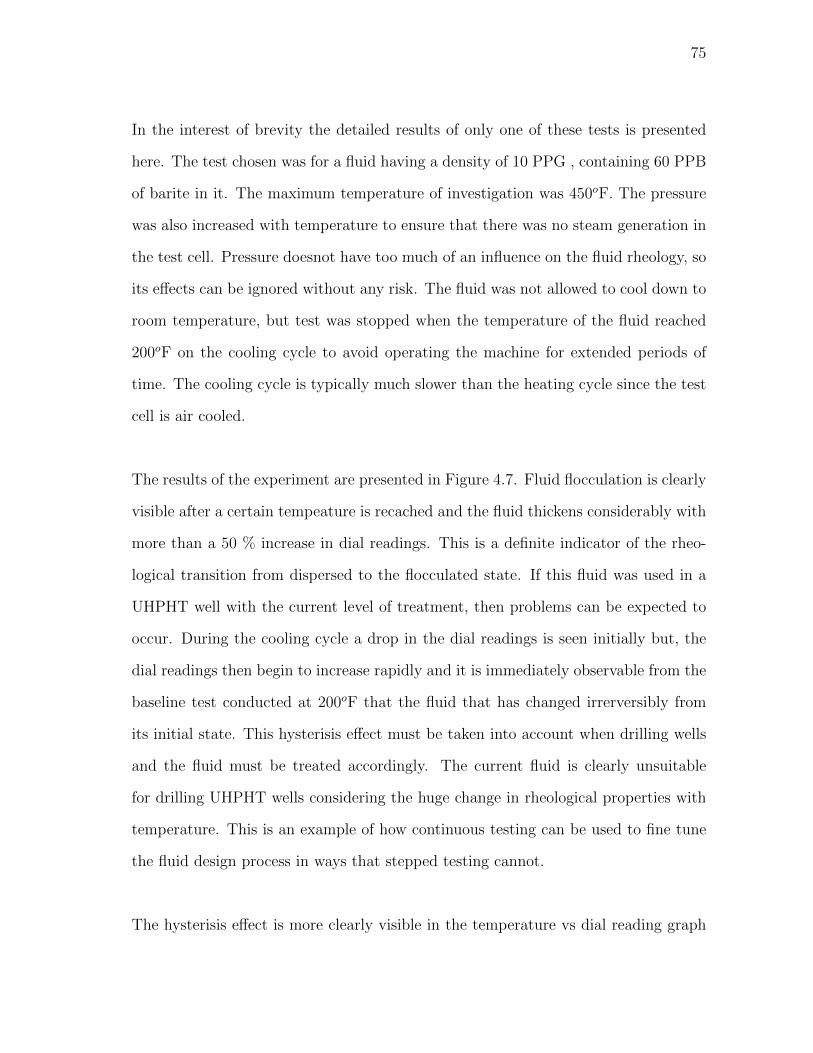
75
In the interest of brevity the detailed results of only one of these tests is presented
here. The test chosen was for a fluid having a density of 10 PPG , containing 60 PPB
of barite in it. The maximum temperature of investigation was 450oF. The pressure
was also increased with temperature to ensure that there was no steam generation in
the test cell. Pressure doesnot have too much of an influence on the fluid rheology, so
its effects can be ignored without any risk. The fluid was not allowed to cool down to
room temperature, but test was stopped when the temperature of the fluid reached
200oF on the cooling cycle to avoid operating the machine for extended periods of
time. The cooling cycle is typically much slower than the heating cycle since the test
cell is air cooled.
The results of the experiment are presented in Figure 4.7. Fluid flocculation is clearly
visible after a certain tempeature is recached and the fluid thickens considerably with
more than a 50 % increase in dial readings. This is a definite indicator of the rheo-
logical transition from dispersed to the flocculated state. If this fluid was used in a
UHPHT well with the current level of treatment, then problems can be expected to
occur. During the cooling cycle a drop in the dial readings is seen initially but, the
dial readings then begin to increase rapidly and it is immediately observable from the
baseline test conducted at 200oF that the fluid that has changed irrerversibly from
its initial state. This hysterisis effect must be taken into account when drilling wells
and the fluid must be treated accordingly. The current fluid is clearly unsuitable
for drilling UHPHT wells considering the huge change in rheological properties with
temperature. This is an example of how continuous testing can be used to fine tune
the fluid design process in ways that stepped testing cannot.
The hysterisis effect is more clearly visible in the temperature vs dial reading graph
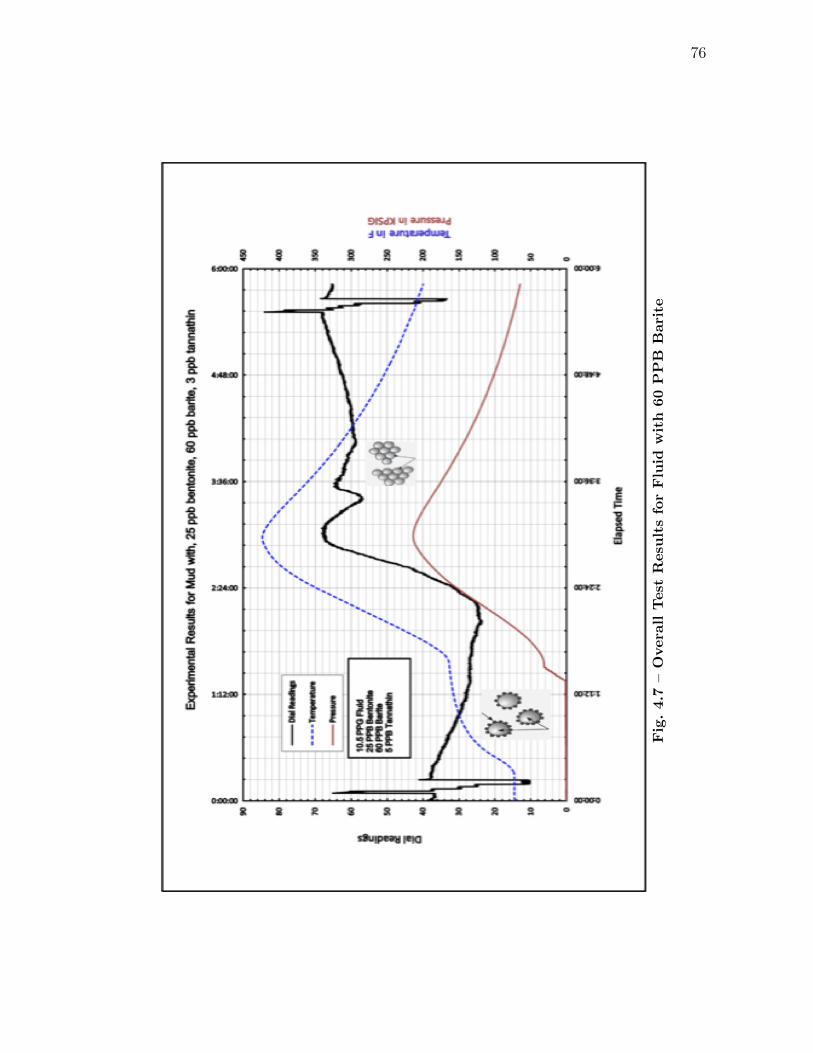
76
Fig
.4.7
–O
vera
llT
est
Resu
lts
for
Flu
idw
ith
60
PP
BB
ari
te
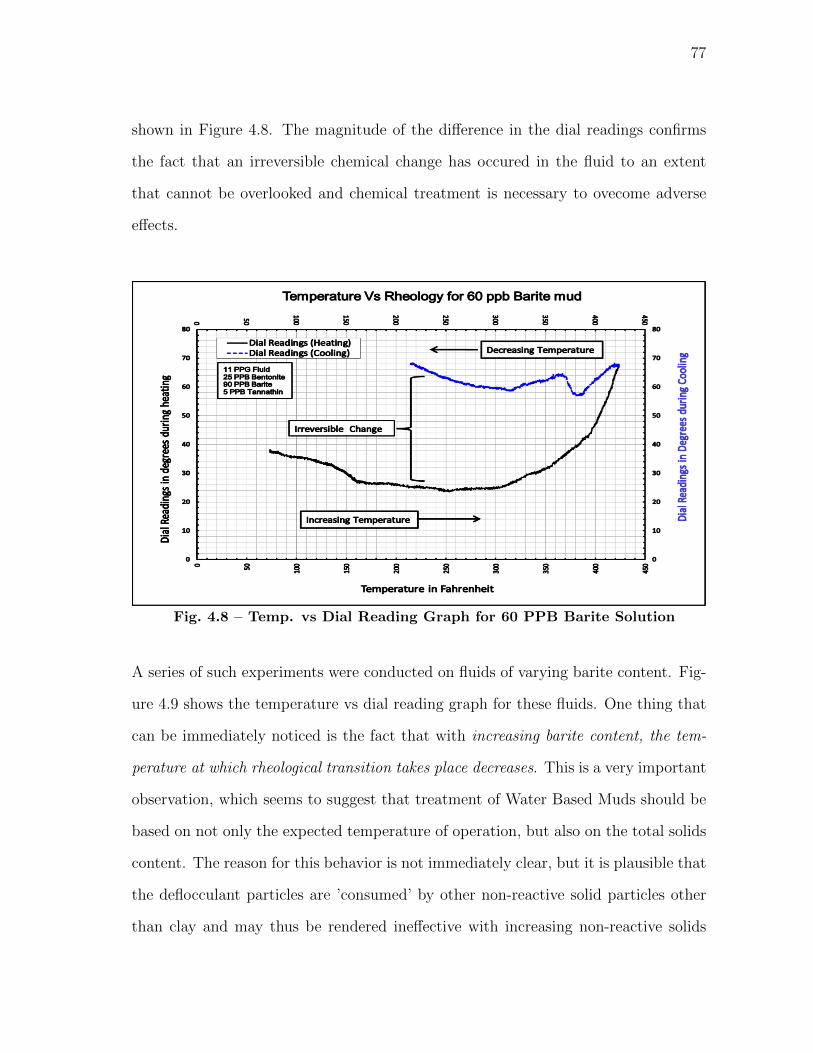
77
shown in Figure 4.8. The magnitude of the difference in the dial readings confirms
the fact that an irreversible chemical change has occured in the fluid to an extent
that cannot be overlooked and chemical treatment is necessary to ovecome adverse
effects.
Fig. 4.8 – Temp. vs Dial Reading Graph for 60 PPB Barite Solution
A series of such experiments were conducted on fluids of varying barite content. Fig-
ure 4.9 shows the temperature vs dial reading graph for these fluids. One thing that
can be immediately noticed is the fact that with increasing barite content, the tem-
perature at which rheological transition takes place decreases. This is a very important
observation, which seems to suggest that treatment of Water Based Muds should be
based on not only the expected temperature of operation, but also on the total solids
content. The reason for this behavior is not immediately clear, but it is plausible that
the deflocculant particles are ’consumed’ by other non-reactive solid particles other
than clay and may thus be rendered ineffective with increasing non-reactive solids

78
content. This is however only a conjecture unspported by detailed chemical analysis.
The important fact is that continuous rheological testing has enabled the detection
of this effect, which speaks volumes of its utility.
Fig. 4.9 – Effect of Solids Content on WBM Flocculation Temperature
These experiments were performed again on the same set of fluids to ensure that
the results were repeatable and consistent. The graph of the ’rheological transition’
temperature versus the barite content of the fluid is presented in Figure 4.10. It is
seen that the results of both sets of experiments are very similar and a definite trend
can be observed with respect to flocculation temperatures.
Another set of experiments was conducted on fluids containing Spersene - a commer-
cial fluid loss additive that doubles as a deflocculating agent. The lime content in
these fluids was varied to determine if there was any effect on the lime content on the
rheological transition temperature. As expected, there is a similar effect to that of
79
Fig. 4.10 – Repeatability Analysis for Sensitivity Tests
barite addition. An increase in lime concentration decreases the temperture at which
the ’viscosity hump’ is observed. Figure 4.11 shows this effect.
4.2.4 Tests on a Field Mud
After testing lab prepared fluid samples, a water based mud of density 18.4 ppg used
in drilling a deep onshore well of depth 17800 ft was tested using the same procedure.
This was done to determine if extremely complex fluid formulations would also show
the visible rheological transition that was observed in the simpler lab prepared sam-
ples. The properties of this fluid are listed in Appendix B.
After conducting a few pilot tests at lower temperatures to ensure that the mud was
in good condition , it was first subjected to a continuous rheological test with the
maximum temperarture being 400oF. Figure 4.12 shows the rheological response of
the fluid during the heating and cooling cycles. As it is seen from the graph, there

80
Fig. 4.11 – Effect of Lime Content on Flocculation Temperature
is a clear change in the rheology of the fluid at about 270oF with the dial readings
increasing rapidly after this point. This indicates that the clay-based viscosifiers in
the fluid have begun to flocculate and that the fluid is thickening. Such a direct
observation of rheological change would have been difficult to make when testing the
fluid in steps. During the cooling cycle, the fluid begins to lose viscosity initially, but
then thickens with further reduction in temperature. Eventually, the dial readings
in the cooling down cycle are higher than in the heating cycle, indicating permanent
rheological change. However, the magnitude of change doesnot seem to indicate any
immediate need to treat the fluid. This fluid can be used to drill further as it indeed
was (the maximum temperature in the well it was used to drill was 375oF).
A baseline test was conducted at the begining of the heating cycle and at the end of
the cooling cycle. The results of these tests show a definite change in the rheology

81
Fig. 4.12 – High Temperature Test on Field Mud at 400F
of the fluid especially at lower shear rates. Yet again, it must be emphasised that
the change is not drastic enough to demand immediate fluid treatment. Figure 4.13
shows the comparison of dial readings.
In order to validate the results of the previous experiment, another continuous rhe-
ological test was conducted, on the same fluid. This time however, the sample tem-
perature was increased to 450oF to see if there was any effect of further increase in
temperature on the fluid properties. The schedule was otherwise the same as that for
the previous test. Again, there is an increase in dial readings noticed at around 260oF,
as noted previously. However, in this case there is a significantly different behavior
during the cooling cycle, when the dial readings begin to increase at a tremendously
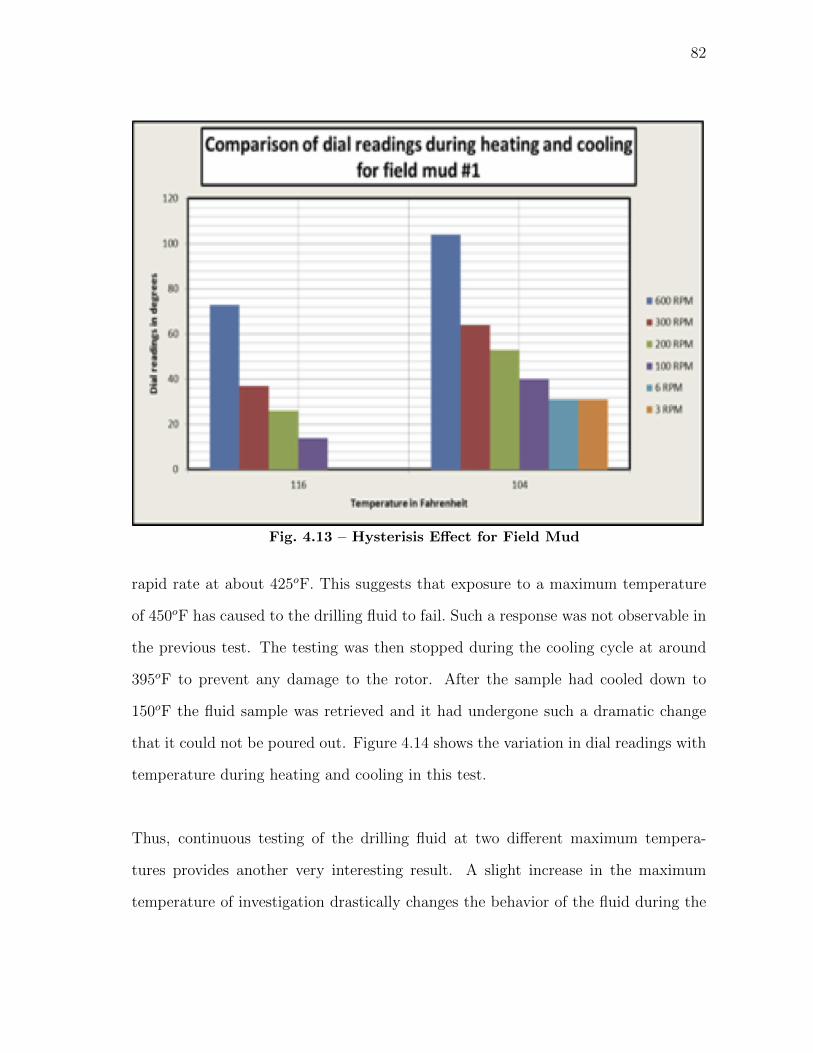
82
Fig. 4.13 – Hysterisis Effect for Field Mud
rapid rate at about 425oF. This suggests that exposure to a maximum temperature
of 450oF has caused to the drilling fluid to fail. Such a response was not observable in
the previous test. The testing was then stopped during the cooling cycle at around
395oF to prevent any damage to the rotor. After the sample had cooled down to
150oF the fluid sample was retrieved and it had undergone such a dramatic change
that it could not be poured out. Figure 4.14 shows the variation in dial readings with
temperature during heating and cooling in this test.
Thus, continuous testing of the drilling fluid at two different maximum tempera-
tures provides another very interesting result. A slight increase in the maximum
temperature of investigation drastically changes the behavior of the fluid during the
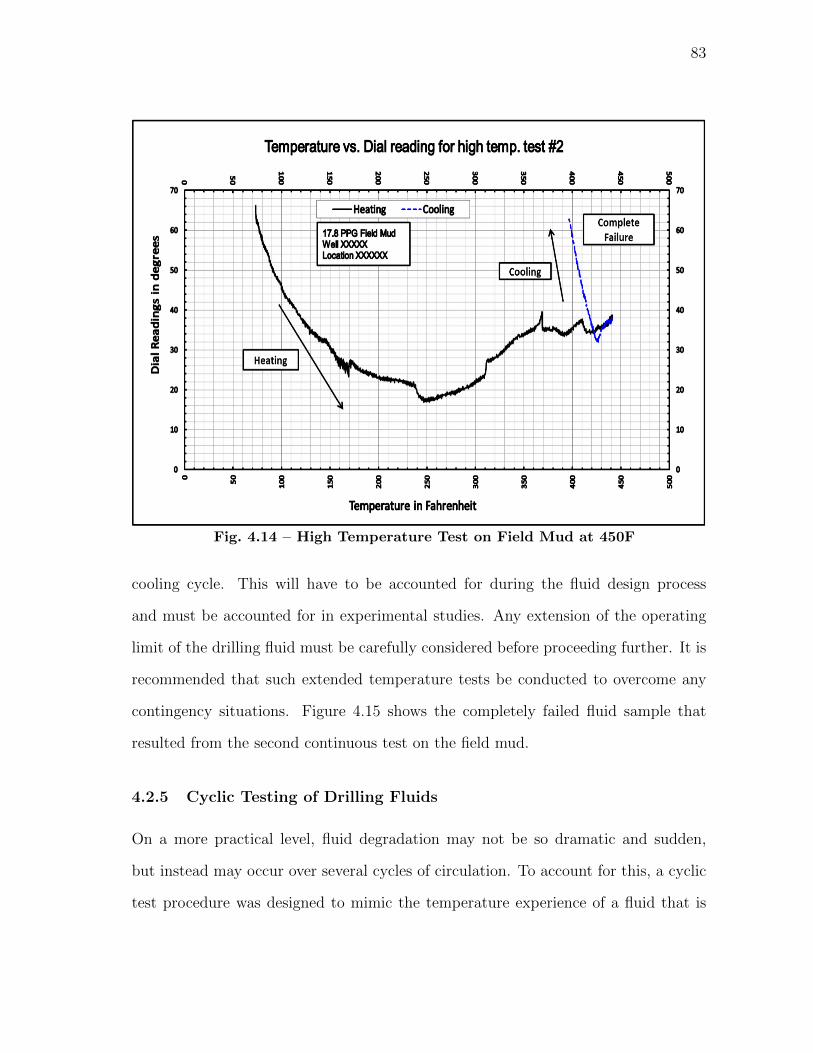
83
Fig. 4.14 – High Temperature Test on Field Mud at 450F
cooling cycle. This will have to be accounted for during the fluid design process
and must be accounted for in experimental studies. Any extension of the operating
limit of the drilling fluid must be carefully considered before proceeding further. It is
recommended that such extended temperature tests be conducted to overcome any
contingency situations. Figure 4.15 shows the completely failed fluid sample that
resulted from the second continuous test on the field mud.
4.2.5 Cyclic Testing of Drilling Fluids
On a more practical level, fluid degradation may not be so dramatic and sudden,
but instead may occur over several cycles of circulation. To account for this, a cyclic
test procedure was designed to mimic the temperature experience of a fluid that is

84
Fig. 4.15 – Completely Failed Fluid Sample
circulated in and out of a well bore. The results seem to indicate that fluid treatment
in UHPHT wells needs to be a continuous process. One such test is shown in Figure
4.16, indicating a less rapid but significant fluid degradation. The fluid had 90 PPB
of Barite and was loaded with 10 PPB of TANNATHIN to prevent early failure of
the fluid during the first cycle itself. This stage of the project is ongoing as we are
not yet confident that the equipment can tolerate such prolonged (greater than 24
hrs) exposure to extreme conditions.

85
Fig
.4.1
6–
Resu
lts
of
Cyclic
Test
ing
86
4.3 The Bigger Picture
The question that must be asked at the end is, where does the program of continuous
rheological testing fit into the larger picture of Water Based Mud Design? Given the
obvious advantages of this testing procedure it can definitely be performed along with
stepped testing with minimal cost and time. Considering the range of new data and
insight that it gives into fluid behavior at high temperatures, it may be a significant
addition to the fluid engineers repertoire. Figure 4.17 gives a graphical description
of how real time rheological monitoring fits into the processes that constiture fluid
design.
This chapter presented the rationale behind using the continuous procedure to test
drilling fluids. The procedure was then validated using a series of tests whether the
proposed testing schedule is worth the effort in terms of the usefulness of its output.
The results were found to be encouraging and merit more detailed investigation in
future projects.The following chapter briefly lists the conclusions of this research
projecty along with recommendations for future work.
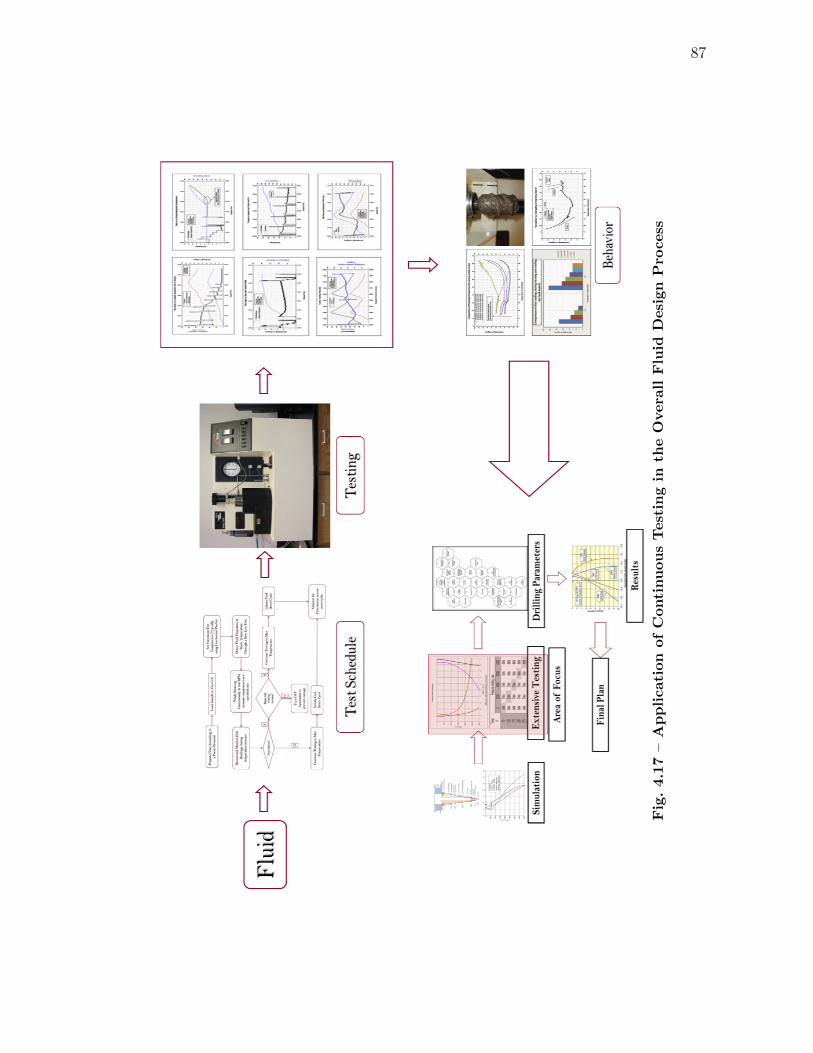
87
Fig
.4.1
7–
Ap
plicati
on
of
Conti
nu
ou
sT
est
ing
inth
eO
vera
llF
luid
Desi
gn
Pro
cess

88
CHAPTER V
CONCLUSIONS AND RECOMMENDATIONS
Based on the experimental test data that has been presented, the following conclusions
can be drawn:
• HPHT wells require a much more detailed fluid design process when Water
Based Muds are being used.
• The colloidal chemistry of clays has a significant influence on the behavior of
Water Based Muds at elevated Temperatures.
• Continuous rheological testing of Water Based Muds can reveal aspects of fluid
behavior that may not be immediately noticeable in stepped tests. Over 100
hours of continuous test data has been collected to backup this claim.
• In fluids containing clay based viscosifiers, the temperature of flocculation is
affected by the concentration of solids present in the fluid.
• Whether a drilling fluid fails in a high temperature well seems to be dependent
on the maximum temperature that the fluid experiences in its temperature
history.
• Cyclic testing of drilling fluids can indicate the gradual degradation of drilling
fluid peoperties with time and these results can be used to plan appropriate
fluid treatment schedules.
89
The current work has significant scope for improvement and extension in the future.
Some recommendations related to equipment redesign and future experimental testing
are presented below.
• The fluid tests can be extended to accomodate even more complex mud formu-
lations thereby quantifying the effect of each component on high temperature
behavior.
• Determination the effect of gas influx on water based drilling fluid rheology
through modification of the rheometer to include a high pressure gas injection
system.
• Modification of the Viscometer to include artificial cooling to incorporate longer
cyclic tests. The benfits of this will be significant as much more realistic cyclic
tests can be performed.
In conclusion it can be said that Water Based Fluid design for Ultra High Temperature
operations is not a trivial task. It is a complex optimization problem that has to take
into account several factors and influences. Extensive fluid testing with updated and
innovative testing schemes will aid tremendously in quantifying some of the unknowns
in this optimization problem. This will inturn enable faster, safer and deeper drilling
operations with Water Based Muds.
90
NOMENCLATURE
HTHP – High Temperature and High Pressure
BHST – Bottom Hole Static Temperature
BHSP – Bottom Hole Static Pressure
NPT – Non Productive Time
WBM – Water Based Mud
OBM – Oil Based Mud
RPM – Revolutions Per Minute
PPG – Pounds Per Gallon
PPB – Pounds Per Barrel
SBM – Synthetics Based Mud
SPE – Society of Petroleum Engineers
UKCS – United Kingdom Continental Shelf
API – American Petroleum Institute

91
REFERENCES
Al-Saeedi, M. J., Al-Khayyat, B., Al-Enezi, D., Aslan, A., Luzardo, J. and Carrera, C.
2010. Successful HPHT Application of Potassium Formate/Manganese Tetra-
Oxide Fluid Helps Improve Drilling Characteristics and Imaging Log Quality.
Paper SPE 132151 presented at the SPE Deep Gas Conference and Exhibition,
Manama, 24-26 January. doi:10.2118/132151-MS
Alderman, N.J., Gavignet, A., Guillot, D., Maitland, G.C., 1988. High-Temperature,
High Pressure Rheology of Water Based Muds. Paper SPE 18035 presented
at the SPE Annual Technology Conference and Exhibition, Houston, 2-5 Oc-
tober. doi:10.2118/18035-MS
Bern, P.A., Morton, E.K., Zamora, M., May, R., Moran, D., Hemphill, T., Robin-
son, L., Cooper, I., Shah, S. and Flores D.V. 2006. Modernization of the API
Recommended Practice on Rheology and Hydraulics: Creating Easy Access to
Integrated Wellbore Fluids Engineering. Paper SPE 98743 presented at the
ADC/SPE Drilling Conference, Miami, 2-5 October. doi:10.2118/98743-MS
Bland, R., Mullen, G., Gonzalez, Y., Harvey, F., and, Pless, F. 2006. HP/HT Drilling
Fluid Challenges. Paper SPE 103731 presented at the IADC/SPE Asia Pa-
cific Drilling Technology Conference and Exhibition, Bangkok, 2-5 October.
doi:10.2118/103731-MS
Bland, R.G, Waughman, R.R., Tomkins, P.G., Halliday, W.S., Pessier, R.C. and
92
Isbell, M.R . 2002. Water-Based Alternatives to Oil-Based Muds: Do They
Actually Exist?. Paper SPE 74542 presented at the IADC/SPE Drilling Con-
ference, Dallas, 26-28 February. doi:10.2118/74542-MS
Buchan, R. 1993. High-Pressure, High-Temeprature Drilling: Data Management and
Interpretation. Paper SPE/IADC 25764 presented at the SPE/IADC Drilling
Conference, Amsterdam, 23-25 February. doi:10.2118/25764-MS
Caenn, R., Chillingar, G.V. 1995. Drilling Fluids: State of the Art. Journal of Pet.
Sci. and Eng. 14 (3-4): 221-230.
Carney, L.L., Guven, N and McGrew, G.T. 1982. Investigation of High Temperature
Fluid Loss Control Agents in Geothermal Drilling Fluids. Paper SPE 10736
presented at the SPE California Regional Meeting, San Francisco, 24-26 Jan-
uary. doi:10.2118/10736-MS
Carney, L.L., Guven, N and Panfil, D.S., 1988a. Water-Base Mud System Having
Most of the Advantages of Any Oil-Base System Plus Ecological Advantages.
Paper SPE 17616 presented at the International Meeting on Petroleum Engi-
neering, Tianjin, 1-4 November. doi:10.2118/17616-MS
Carney, L.L., Guven, N and Panfil, D.S., 1988b. Comparative Rheology of Water-
Based Drilling Fluids With Various Clays. Paper SPE 17571 presented at
the International Meeting on Petroleum Engineering, Tianjin, 1-4 November.
doi:10.2118/17571-MS

93
Davison, J. M., Clary, S., Saasen, A., Allouche, M., Bodin, D. and Nguyen, V.A.
1999. Rheology of Various Drilling Fluid Systems Under Deepwater Drilling
Conditions and the Importance of Accurate Predictions of Downhole Fluid
Hydraulics. Paper SPE 56632 presented at the SPE Annual Technical Confer-
ence and Exhibition, Houston, 3-6 October. doi:10.2118/56632-MS
Demirdal, B., Miska, S., Takach, N., Cunha, J.C. 2007. Drilling Fluids Rheologi-
cal and Volumetric Characterization Under Downhole Conditions. paper SPE
108111 presented at the Latin American & Caribbean Petroleum Engineering
Conference, Buenos Aires, 5-18 April. doi:10.2118/108111-MS
Desai, H., Affes, S., Rahman, M. and Williams, G. 2006. Drilling Offshore HTHP
Wells in Environmentally Sensitive Area Using Water Based Mud. Paper SPE
104051 presented at the SPE/IADC Indian Drilling Technology Conference
and Exhibition, Mumbai, 6-18 October. doi:10.2118/104051-MS
Ibeh, C.S. 2007. Investigation on the Effects of Ultra-High Pressure and Temperature
on Rheological Properties of Oil-Based Drilling Fluids, Masters Thesis, Texas
A& M U., College Station, Texas.
Luckham, P.F. and Rossi, S. 1999. The Colloidal and Rheological Properties of Ben-
tonite Suspensions. Adv. Coll. Int. Sci. 82 (1-3): 43-92.
Maldonado, B., Arrazola, A., and Morton, B. 2006. Ultradeep HP/HT Completions:
Classification, Design Methodologies, and Technical Challenges. Paper SPE
17927 presented at the Offshore Technology Conference, Houston, 1-4 May.

94
doi:10.4043/17927-MS
Matthews, M., Standifird, W. and Ikeocha, C. 2006. Proactive prediction of geo-
pressures in ultra high temperature and high pressure environments. Paper
AADE-06-DF-HO-06 presented at the AADE Fluids Conference, Houston, 11-
12 April.
M-I Swaco, 2002. Drilling Fluids Engineering Manual, Houston, Texas : M I LLC.
Moore, P.L. 1986. Drilling Practices Manual, Tulsa, Oklahoma : PennWell Books.
Mullen, G.A., Tanche-Larsen, P., Clark, D.E. and Giles, A. 2005. The Pros and Cons
of Flat Rheology Drilling Fluids. Paper AADE-05-NTCE-28 presented at the
AADE Fluids Conference, Houston, 5-7 April.
Proehl, T. and Sabins, F. 2006. Drilling and Completion Gaps for HPHT Wells in
Deepwater. Final Report, Contract No. 1435-01-04 CT 37258, Mineral Man-
agement Service, Herndon, Virginia.
Piber, M., Prohaska, M., Hublik, G. and Thonhauser, G. 2006. Time-Dependent
Behavior of Drilling Fluids Under Cyclic Temperature and Pressure Loads.
Paper SPE 102127 presented at the SPE Annual Technical Conference and
Exhibition, San Antonio, 24-27 September. doi:10.2118/102127-MS
Rabia, H. 2002. Well Engineering and Construction. London: Entrac Consulting.

95
Rommetveit, R., Ødegard, S.I., Nordstrand, C., Bjørkevoll, K.S., Cerasi,P., Helset,
H.M., Fjeldheim, M., and Havardstein, S. 2010. Drilling a Challenging HPHT
Well Utilizing an Advanced ECD Management System with Decision Sup-
port and Real Time Simulations. Paper IADC/SPE 128648 presented at the
IADC/SPE Drilling Conference and Exhibition, New Orleans, 2-4 February.
doi:10.2118/128648-MS
Rommetveit, R. and Bjorkevoll, K.S. 1997. Temperature and Pressure Effects on
Drilling Fluid Rheology and ECD in Very Deep Wells. Paper SPE 39282 pre-
sented at the SPE/IADC Middle East Drilling Technology Conference, Man-
ama, 23-25 November. doi:10.2118/39282-MS
RP13D, Rheology and Hydraulics of Oil-well Drilling Fluids, 5th edition. 2006. Wash-
ington D.C.: API.
Seymour, K.P., MacAndrew,R. 1994. Design, Drilling, and Testing of a Deviated
HTHP Exploration Well in the North Sea. SPE Drill and Compl 9 (4): 244-
248. SPE-26874-PA. doi:10.2118/26874-PA
Sinha, B.K., 1970. A New Technique to Determine the Equivalent Viscosity of Drilling
Fluids Under High Temperatures and Pressures . SPE J. 10 (1): 33-40. SPE-
2384-PA. doi:10.2118/2384-PA
Stiles, D. and Trigg, M. 2007. Mathematical Temperature Simulators for Drilling
Deepwater HT/HP Wells: Comparisons, Applications, and Limitations. Pa-
per IADC/SPE 105437 presented at the IADC/SPE Drilling Conference and

96
Exhibition, Amsterdam, 20-22 February. doi:10.2118/105437-MS
Tehrani, A., Gerrard, D., Young, S. and Fernandez, J. 2009. Environmentally Friendly
Water Based Fluid for HT/HP Drilling. Paper SPE 121783 presented at the
SPE International Symposium on Oilfield Chemistry, The Woodlands, 20-22
April. doi:10.2118/121783-MS
Van Dyke, K. 2000. Drilling Fluids. Austin, Texas : Petroleum Extension Service.
Zamora, M. and Roy, S. 2000. The Top 10 Reasons to Rethink Hydraulics and Rhe-
ology. Paper SPE 62731 presented at the IADC/SPE Asia Pacific Drilling
Technology Conference, Kuala Lumpur, 11-13 September. doi:10.2118/62731-
MS

97
APPENDIX A
FLUID MODELS
The purpose of this section is to present a very brief introduction to the various com-
monly used non-newtonian fluid models in the drilling industry. Since non-newtonian
fluids donot have a shear stress that is directly proprtional to the shear rate of the
fluid, there exists a need to quantify the relationship between shear rate and shear
stress through specific equations known as fluid models. It must be noted that most
water based drilling fluids are shear thinning in nature. Their viscosity reduces with
shear rate. They also show time dependent rheological behavior known as thixotropy.
This is responsible for the increase in the viscosity of the fluid when it is at rest and
manifests itself as gel strength. Three of the most common fluid models along with
their governing relationships are presented below in Table A-1.
Table A-1Common fluid models
Model Name Governing Relation
Bingham Plastic τ = τy + µpγ
Power Law τ = Kγn
Herschel-Bulkley τ = τy +Kγn
Where, τ - Shear Stress
τy - Yield Stress
γ - Shear Rate
µp - Plastic Viscosity
K - Fluid Consistency Index
n - Fluid Flow index
98
APPENDIX B
DETAILED TEST RESULTS
The purpose of this appendix is to present in detail, some results of the tests that
were omitted from Chapter IV in order to maintain brevity or provide more detailed
graphs of tests that were not discussed in detail.
Figure B-1 describes the variation in dial readings as the temperature of the sample
is increased. It is clearly seen that the yield stress decreases with temperature, with
a large drop seen in between 130 and 165 oF. At 250 oF, the calculated yield stress
is only about 20 % of that at room temperature. The value of the parameter K also
drops to very low values at higher temperatures. Figure B-2 shows the H-B rheograms
at various temperatures drawn using the calculated parameters it is noticeable that as
the temperature increases, the rheograms become more and more linear, eventually
the value of the n parameter becomes 1 which essentially implies that the fluid now
behaves as a Bingham plastic. Figure B-3 shows the variation of dial readings with
temperature for the 25 PPB unweighted bentonite solution that was initially tested.
Figure B-4 shows the difference in the rheograms of the two fluid samples that were
subjected to the continuous test schedule. It is clearly noticeable that the fluid with
the deflocculant shows more or less newtonian behavior with lower viscosity. Table
B-1 shows the properties of the field mud that was used in continuous testing.

99
Figure B-1 Variation of Dial Readings in Xanthan Stepped Test
Figure B-2 Variation of Rheograms in Xanthan Stepped Test
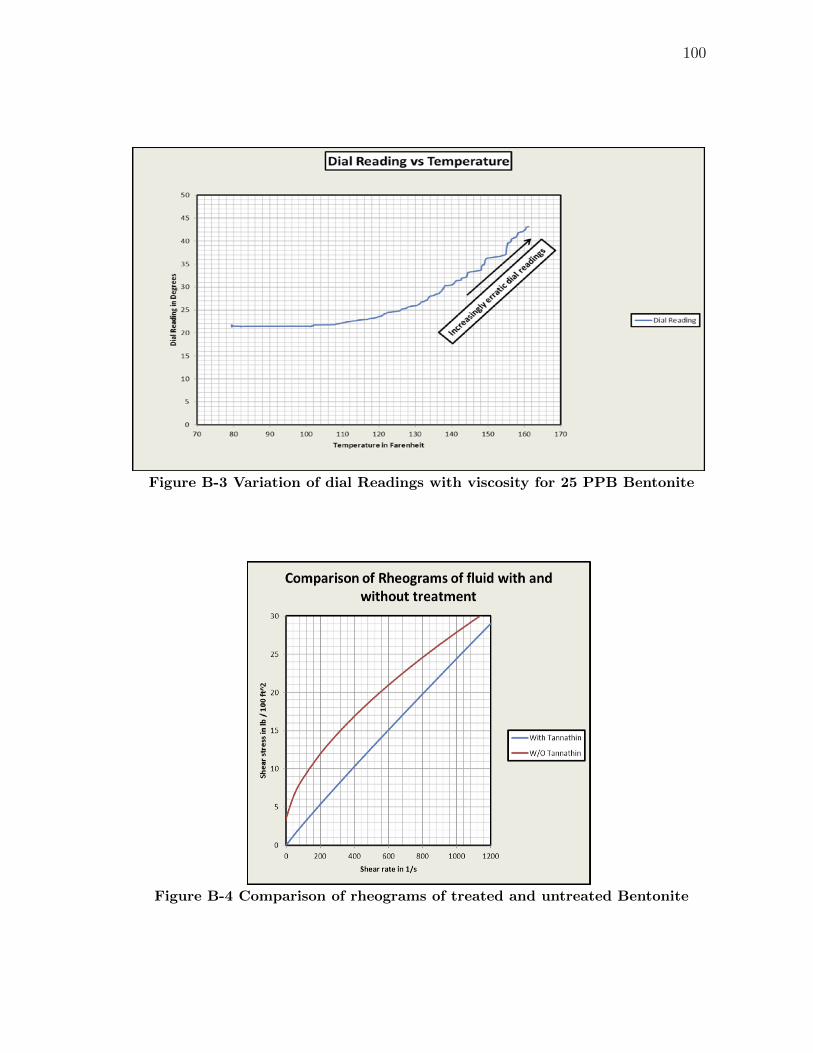
100
Figure B-3 Variation of dial Readings with viscosity for 25 PPB Bentonite
Figure B-4 Comparison of rheograms of treated and untreated Bentonite
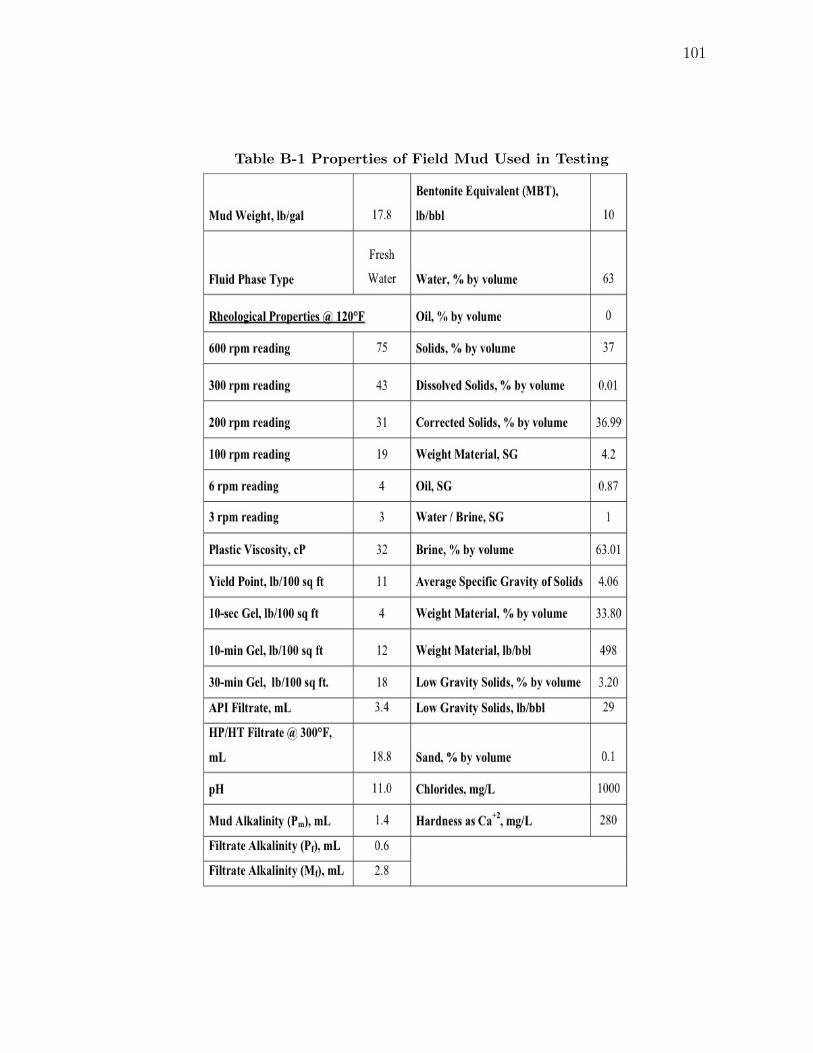
101
Table B-1 Properties of Field Mud Used in Testing

102
VITA
Ashwin Ravi was born in Chennai, India. After graduating from Prince Matriculation
Higher Senior Secondary School, Chennai, India he attended the College of Engineer-
ing, Guindy from August 2004 to May 2008. He majored in mechanical engineering
and received a Bachelor of Engineering in June 2008. He worked in Schlumberger
Technical Services - India as a Mechanical Engineer from August 2008 to August
2009. He attended Texas A& M University in College Station from August 2009 to
August 2011. He graduated with a Master of Science in petroleum engineering. He
may be reached at:
Office Address:
Harold Vance Department of Petroleum Engineering
Texas A& M University
3116 TAMU - 507 Richardson Building
College Station, TX 77843-3116
The typist for this thesis was Ashwin Ravi.