Investigating Multimedia Learning with Web Lectures
38
Investigating Multimedia Learning with Web Lectures Jason Day, Jim Foley, and Richard Catrambone Abstract Naturalistic research has shown that a web lecture intervention that includes multimedia lectures studied before class, short homework assignments, and in-class application activities can increase students’ grades and satisfaction. The multimedia lectures, called web lectures, are a combination of video, audio, and PowerPoint streamed over the web. This experimental study was motivated by a desire to understand the contribution of web lectures themselves to the web lecture intervention’s success. Educational multimedia design guidelines from Cognitive Load Theory (CLT) and the Cognitive Theory of Multimedia Learning (CTML) were used to evaluate and hypothesize about the learning efficacy of three information-equivalent—Video+Audio+PPT (web lecture), Audio+PPT, PPT+Transcript—and one information-nonequivalent—PPT-Only—educational presentation conditions. 60 randomly assigned participants studied the educational materials and completed a posttest and exit survey. Participants in the web lecture condition performed statistically significantly better on the posttest than all other conditions, and survey responses indicated that participants perceived the combination of modalities used by web lectures as more educationally effective than those used in the other conditions. This study verifies the educational contribution of web lectures to the web lecture intervention, web lectures’ educational effectiveness as standalone learning objects, and the value-added of video for educational multimedia. These results were not completely in line with our hypothesis based on CLT and CTML, suggesting these theories’ limited applicability for multimedia presentations with characteristics of those used in this study. Several possible factors that might account for the results inconsistent with CLT and CTML are identified, including the visibility of gesture in the video and the length and subject matter of the presentations.
-
Upload
khangminh22 -
Category
Documents
-
view
0 -
download
0
Transcript of Investigating Multimedia Learning with Web Lectures

Investigating Multimedia Learning with Web LecturesJason Day, Jim Foley, and Richard Catrambone
Abstract
Naturalistic research has shown that a web lecture intervention that includes multimedialectures studied before class, short homework assignments, and in-class applicationactivities can increase students’ grades and satisfaction. The multimedia lectures, calledweb lectures, are a combination of video, audio, and PowerPoint streamed over the web.This experimental study was motivated by a desire to understand the contribution of weblectures themselves to the web lecture intervention’s success. Educational multimediadesign guidelines from Cognitive Load Theory (CLT) and the Cognitive Theory ofMultimedia Learning (CTML) were used to evaluate and hypothesize about the learningefficacy of three information-equivalent—Video+Audio+PPT (web lecture), Audio+PPT,PPT+Transcript—and one information-nonequivalent—PPT-Only—educationalpresentation conditions. 60 randomly assigned participants studied the educationalmaterials and completed a posttest and exit survey. Participants in the web lecturecondition performed statistically significantly better on the posttest than all otherconditions, and survey responses indicated that participants perceived the combination ofmodalities used by web lectures as more educationally effective than those used in theother conditions. This study verifies the educational contribution of web lectures to theweb lecture intervention, web lectures’ educational effectiveness as standalone learningobjects, and the value-added of video for educational multimedia. These results were notcompletely in line with our hypothesis based on CLT and CTML, suggesting thesetheories’ limited applicability for multimedia presentations with characteristics of thoseused in this study. Several possible factors that might account for the results inconsistentwith CLT and CTML are identified, including the visibility of gesture in the video andthe length and subject matter of the presentations.

2
Introduction
We have been exploring the use of multimedia lecture presentations on the web (weblectures), consisting of video, audio, and PowerPoint (PPT) (Figure 1). Our goal is tomake the classroom a more active learning environment. In our web lecture intervention,web lectures and short lecture homeworks (LHWs) are pre-class supplements. Weblectures provide the information, concepts, and context of the traditional classroomlecture; they are studied by students before and outside of class. With the traditionallecture offloaded onto the web, in-class time is used for in-depth discussion and hands-onapplication of the web lecture content. LHWs provide motivation for students to study theweb lectures before class, and, more importantly, act as a pedagogical linking mechanismbetween web lectures and subsequent classroom activities.
In our classroom studies, we have found that students using our web lecture interventionachieve grades approximately 10% higher than students using a traditional in-classlecture format [1, 2], and students report strong positive attitudes about all aspects of theintervention [1-3]. These positive results led us to question what contribution, if any, theweb lectures themselves lend to the observed learning gains of the intervention as awhole, and how we might improve them. More specifically:
• Are web lectures any more or less effective than other similar multimediainstructional materials? Does the video add educational value? The audio? Orwould simple PPT slides be as effective as web lectures?
• What attributes of multimedia presentations like web lectures contribute to theireducational effectiveness?
Cognitive Load Theory (CLT) [4] and the Cognitive Theory of Multimedia Learning(CTML) [5] are two prominent theoretical frameworks that study the characteristics ofand provide design guidelines for educationally effective multimedia materials. Boththeories, albeit with somewhat different foci, explicate ways to manage humans’ limitedworking memory resources by leveraging our perceptual and cognitive capabilities.Improved learning occurs when multimedia instructional materials are designed to reducecognitive load on working memory and thus to increase available resources for othercognitive processes (e.g., active integration of verbal and pictorial mental models withlong term memory). For instance, CLT and CTML suggest that simultaneous presentationacross multiple modalities (e.g., auditory and visual) can improve learning, as comparedto presentation with one modality [6, 7]. However, the applicability of these theories tolengthy, lecture-style multimedia presentations is unknown. Zolna and Catrambone, forexample, have found results in contradiction to CLT and CTML design principles whenusing long presentations with audio narration [8].
This study experimentally investigates differences in learning efficacy of threeinformation-equivalent multimedia presentations. The independent variable was thecombination of modalities used by each presentation. The three information-equivalentconditions were: Video+Audio+PPT (VAP), Audio+PPT (AP), and PPT+Transcript(PT); a fourth information-nonequivalent condition, PPT-Only (PO), was included aswell. The VAP presentation was exactly the same as the web lectures used in previousnaturalistic studies. The dependant variable was performance on a posttest that assessed

3
participants’ retention and transfer of the subject matter presented. Subjective attitudinaldata were also collected using an exit survey.
As we will discuss in more detail below, of the information-equivalent conditions theVAP and AP conditions follow many, but not all, guidelines suggested by CLT andCTML; the PT condition does not adhere to as many of the guidelines (e.g., overloadingthe visual channel with PPT and transcription text), and is therefore likely to cause high,learning-detrimental cognitive load. Thus, we went into this study with the followinghypothesis: posttest performance for the VAP and AP conditions will be approximatelyequal, the PT condition performance will be worse than VAP and AP, and theinformation-nonequivalent PO condition will produce the worst performance of all fourconditions (VAP = AP > PT > PO).
However, other factors outside the scope of CLT and CTML might also facilitate orhinder learning efficacy. For instance, research by Goldin-Meadow and others suggestsgestures and other nonverbal communication—visible in web lectures’ video of thepresenter—enhance learning [9-12]. Also, Schnotz has suggested learners’ experiencewith electronic media, as well as affective and motivational factors must be consideredwith cognitive factors when considering contributions to effective learning withmultimedia [13]. Finally, differences in the characteristics between the multimediapresentations used in this study and those primarily used in CLT and CTML studies (e.g.,length [8]) might lead us to identify new conditions for effective application of thosetheories.
Thus, two primary research questions guided this study:
1. How does the combination of modalites used in web lectures affect educationallyeffectiveness, as compared to information-equivalent presentations using differentcombinations of modalities?
2. How appropriate are CLT and CTML as theoretical frameworks for predicting thelearning efficacy of multimedia presentations with characteristics different fromthose which the theories are primarily based? What other factors may beinfluencing educational effectiveness?
This paper begins by providing some background on web lecture multimediapresentations and a recently-conducted quasi-experiment that investigated their use inclassrooms. We then outline CLT and CTML, and provide a brief analysis of theirguidelines to web lectures (VAP) and the other conditions (AP, PT, and PO) used in thepresent experiment. A description of the experimental design is followed by presentationand discussion of the results. Finally, we close with a discussion of future work andconclusions.
Web Lectures Background
Web lectures are studio-recorded, condensed lectures. A typical web lecture is 15-25minutes in length, and covers about the same amount of material as 30-45 minutes ofclassroom lecture. Web lectures are purposefully kept at around 20 minutes in length tohelp maintain the attention of the viewer, but the condensed time in comparison to the

4
same classroom lecture comes about naturally because administrative announcements,instructor tangents, and student questions are not included.
Web lectures are authored using Microsoft Producer [14], a free plug-in for MicrosoftPowerPoint 2003. Microsoft Producer facilitates seamless integration of one video feed,two audio feeds, Microsoft PowerPoint slides, and static or live web pages. Any or all ofthese components are organized together with customizable presentation layouts, whichcan include a table of contents navigable in real time. For recording, we set up a smallstudio with a laptop, digital video camera, microphone, and appropriate lighting andbackground, at a total cost of less than US$3000. Recorded web lectures are published tothe web in both streaming and downloadable formats for easy viewing anytime,anywhere.
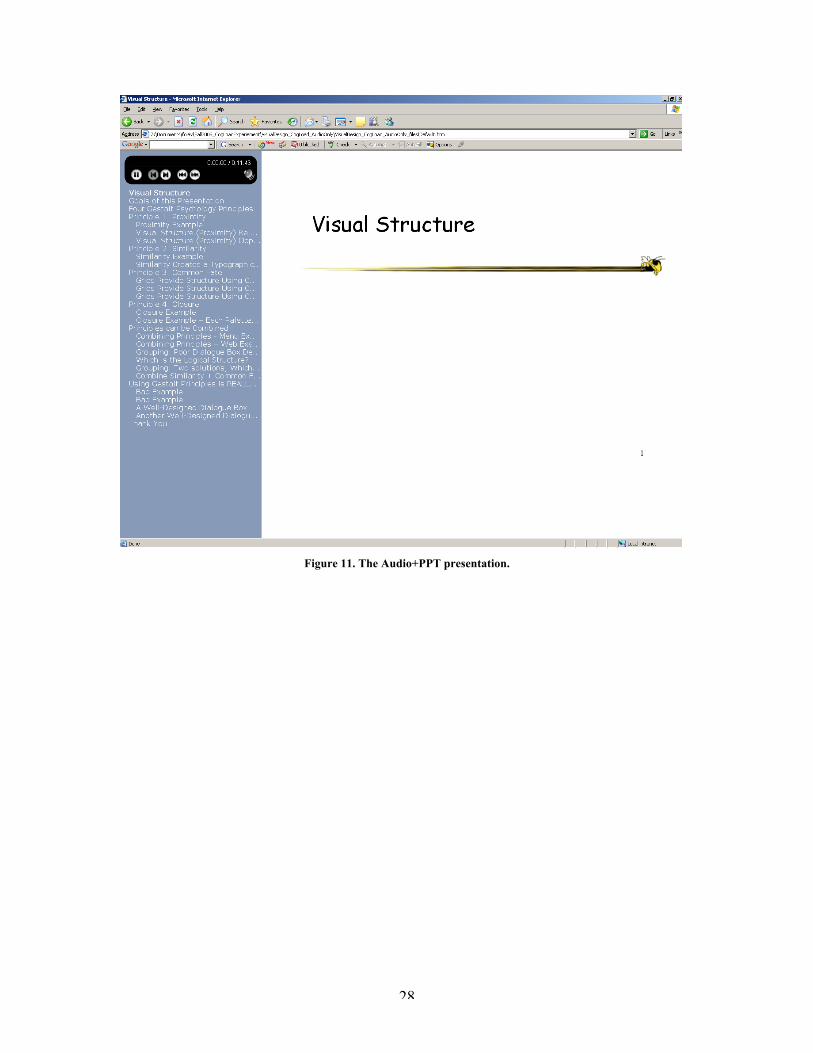
Figure 1. Web lecture playback in a web browser. This screen shot is from the web lecture used in the VAPcondition.
Figure 1 shows an example web lecture viewed in a Microsoft Internet Explorer browserwindow, which is in this case divided into three panes. The upper left pane is thestreamed video image, displayed by the Windows Media Player. The lower left pane isthe Table of Contents (ToC), a list of links that correspond to each slide in the lecture;each link also contains a synchronized anchor point in the video stream. Thus, viewerscan easily skip around in the web lecture simply by clicking on the ToC entries. The rightpane is the current PowerPoint slide. To help focus viewers’ attention, bullet points oneach slide change from light gray to black as they are discussed by the lecturer.

5
Quasi-experimental Investigation of the Web Lecture Intervention
Encouraging findings from multiple naturalistic pilot studies [3, 15] motivated a morecontrolled investigation that allowed us to evaluate the web lecture intervention not onlyin terms of students’ opinion, but also in terms of educational outcomes. A longitudinalquasi-experiment was conducted over the 15-week Spring 2005 semester with 46students in two sections of the same course: one section using web lectures and one usingtraditional lectures [1, 2]. Many control measures were in place to ensure internalvalidity, including: blind grading; same instructor, topics covered, lecture slides (used inclass or in the web lecture), assignments/exam, and required time on task (equating toseven fewer class meetings for the experimental group). Students in the web lecturesection scored higher grades on all assignments and exams, and their overall coursegrades were significantly higher (10%) than the traditional lecture section. Also, on foursurveys administered throughout the semester web lecture students reported increasinglystrong positive attitudes about all aspects of the intervention (e.g., web lectures, LHWs,in-class activities, the intervention as a whole, etc.). Moreover, web lecture students’superior objective course performance in terms of grades was reflected in subjective self-reports: when asked to rate how much they had learned from the course, web lecturestudents reported learning more than traditional lecture students. Thus, we continueclassroom evaluation of the web lecture intervention as improvements are made.
However, naturalistic classroom studies, while providing great insight into contextualizedand longitudinal application, preclude a certain amount of experimental control [16]. As aresult, many educational researchers employ both naturalistic and experimental methods(e.g., [17]).To complement our classroom studies, we have also begun a thread ofexperimental investigations (the first of which is presented here) intended to betterunderstand learning with web lectures independent of associated LHWs and classroomactivities. Based on their prominence in the fields of multimedia instructional design,Cognitive Load Theory and the Cognitive Theory of Multimedia Learning were chosenas theoretical frameworks for conducting our experimental investigations. Because somecharacteristics of web lectures are different from the multimedia materials used inbuilding these theories, this research also allows us to better understand conditions fortheir effective application.
Cognitive Load Theory and the Cognitive Theory of MultimediaLearning
Cognitive Load Theory (CLT) considers how the interaction between cognitivearchitecture and information structures can inform instructional design. Four basicassumptions are made about cognitive architecture in CLT [4, 18]:
1. We have a very limited working memory.
2. We have an effectively unlimited long-term memory.
3. Our primary learning mechanism is schema acquisition; schemas are cognitiveconstructs that allow us to categorize multiple elements of information into a singleelement with a specific function.
6
4. We can effectively bypass working memory limitations through automation ofschema use and other cognitive processes.
The information structures we interact with have different levels of elementalinteractivity that affect how difficult it will be for us to learn any given material; learninglow-elemental interactivity material will not depend on other elements, while learninghigh-elemental interactivity material requires understanding of multiple inter-dependantelements. Paas et al. use learning to use a photo-editing program as an example [19].Learning the effects of various function keys is an example of low elemental interactivity,because each element can be understood without reference to any other elements.Learning to edit a photo, on the other hand, is an example of high elemental interactivity;although the relevant elements can be learned independently (e.g., color tone, darkness,contrast), these elements interact and must be processed simultaneously to be understood.
CLT posits three different types of cognitive load on working memory: intrinsic,extraneous, and germane. Intrinsic cognitive load is directly proportional to elementalinteractivity, and therefore cannot be altered by instructional design for a given learningtask. Omitting interacting elements to form a simpler, different learning task (e.g. simple-to-complex approach) is perhaps one way to reduce this load. Extraneous cognitive loadrefers to unnecessary working memory demands imposed by the way material ispresented or the learning activities required (e.g., spatially or temporally separating textfrom illustrations forces learners to hold information in working memory to make senseof each). Finally, germane cognitive load is load incurred when learners are devotingworking memory to the beneficial process of schema acquisition and automation (e.g.,instructional techniques such as example variation and prompting imagination canfacilitate learners’ schema acquisition and automation). Both extraneous and germanecognitive load can be influenced by instructional design, but extraneous load interfereswith learning whereas germane load aids learning. These three cognitive loads areadditive; total cognitive load must be below working memory capacity to facilitatelearning. Thus, for a task with a given intrinsic load, the goal of the instructional designeris to reduce extraneous load to free up working memory available for germane load. Forinstance, studies by Mousavi et al. indicate that extraneous cognitive load can be reducedby designing instructional materials that make use of both auditory and visualpresentation modes [6].
The Cognitive Theory of Multimedia Learning [5] developed by Richard Mayerrecognizes the centrality of cognitive load on working memory for CLT, and goes on topropose how learners actively construct knowledge while studying multimedia materials.For CTML, multimedia materials consist of both words and pictures, and presentationscan be either book-based (e.g., text and diagrams) or computer-based (e.g., audionarration and animation). CTML research is concerned with determining the conditionsunder which multimedia materials are most likely to promote meaningful learning. Thetheory relies on the following assumptions:
1. The dual channel assumption: the human information-processing system consists ofan auditory/verbal channel and a visual/pictorial channel. This assumption is based ona combination of Baddeley’s [20] working memory model for auditory and visualprocessing (sensory modalities), and Pavio’s [21] dual code theory for verbal andpictorial knowledge processing (presentation mode).

7
2. The limited capacity assumption: each channel (auditory/verbal and visual/pictorial)has a limited capacity for cognitive processing.
3. The active processing assumption: a substantial amount of cognitive processing ineach channel is required for learning to occur, which includes attending to thematerial presented (select), organizing the material presented into a coherent structure(organize), and integrating the presented material with existing knowledge (integrate).
Mayer distinguishes among three types of cognitive load that are loosely equivalent tothose put forth by CLT: representational holding (intrinsic load), incidental processing(extraneous load), and essential processing (germane load). Mayer and Moreno haveoutlined nine ways to reduce cognitive load in multimedia learning [7]. For example,Mayer and Moreno suggest ‘off-loading’ when one channel is overloaded with essentialprocessing demands. If one channel is overloaded, some of the load in that channel canbe off-loaded onto the other channel for more efficient processing. An example of this inpractice—referred to as the ‘modality effect’—suggests students learn better when wordsare presented as audio narration with an animation as opposed to on-screen text with ananimation.
Web lectures (VAP condition) adhere to many of the design guidelines (‘effects’)suggested by Mayer and Moreno:
• Modality effect [7]: the presenter’s words are presented as audio narration, asopposed to on-screen text transcription—moving some essential processing fromthe visual to the auditory channel;
• Multimedia effect [5]: learners receive words and pictures (supporting diagramsin the PPT), as opposed to words alone—facilitating construction and connectionsbetween verbal and pictorial mental models;
• Segmentation effect [7]: content is presented in learner-controlled segments,paced by the learner instead of presented as a continuous unit—helping avoidworking memory overload by breaking material up logically (PPT divisions) andallowing individual control (playback controls and navigable ToC);
• Signaling effect [7]: PPT bullet animations and presenter gestures provide cuesfor how to process the material—reducing extraneous load;
• Temporal contiguity effect [7]: audio and visual elements are presentedsimultaneously rather than successively—minimizing need to hold representationsin memory;
• Personalization effect [22]: the presenter speaks in 1st and 2nd person conversationstyle, rather than 3rd person—helping learners relate material to personalexperiences, reduce processing effort needed to make sense of the material, andpromote mental interactions in active understanding.
Some aspects of web lecture design do not adhere to multimedia instructional guidelines.For instance, although PPT text is not a direct transcription of the presenter’s narration, itcould be argued that it is redundant information (redundancy effect [5]), which couldoverload the visual channel and reduce resources available to select/organize/integrateother relevant information. However, Mayer notes that the redundancy effect may not

8
apply to lecture-style presentations where notes or outlines (like those provided with PPTtext) could aid learner processing [5]. Also, it could be argued that the video of thepresenter—in addition to also possibly overloading the visual channel—does not addinstructional value, and in fact adds an extraneous material that competes with the PPTtext and diagrams for cognitive resources (split-attention [23] or coherence [5] effects). Instudies of animated pedagogical agents (which are similar to our video) in multimediamaterials, however, no evidence has been found for the split-attention effect caused bythe agent [24].
Based on similar comparisons of multimedia design to CLT and CTML suggestions, theAP condition is arguably as or more effective than the VAP condition; it adheres to allthe positive effects of VAP, without the possibility of negative split-attention / coherenceeffects. The PT condition, on the other hand, does not positively adhere to many of theguidelines, and suffers from obvious negative modality effects; the transcribed text andPPT text likely overload the visual channel.
This study is a step in determining whether CLT and CTML guidelines are applicable tomultimedia instructional material somewhat different from those used in the developmentof the theories. The multimedia materials used in CLT and CTML studies were primarilytextbook-like diagrams with audio or textual descriptions and short (less than 1 minute)presentations using animations with audio or textual descriptions; mathematics andcause-effect explanations (e.g., how lightning forms, how breaks work) were commonsubject matter. The multimedia presentations used in this study are much longer (almost12 minutes)—the application of these theories has been called into question for lengthymultimedia presentations by Zolna and Catrambone [8]. The VAP condition adds videoof the presenter, and although diagrams are used on the PPTs, no animations (other thanthe text highlighting) are used. Moreover, the subject matter used in this study was notmathematical or based on causal explanations, and a navigable ToC was present.
Method
In this section, we outline the research design for our experiment. Full text of thematerials used in the experimental procedure are included in the appendices where noted.
Experimental Conditions
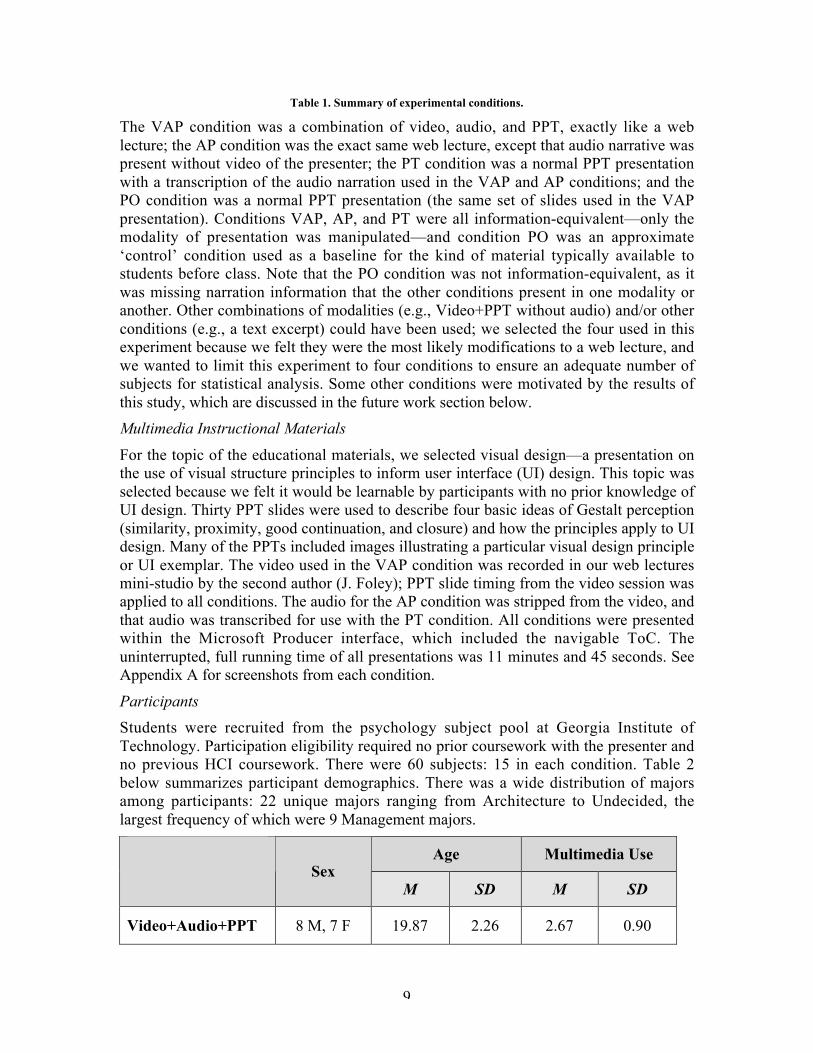
The modality distribution of the four experimental conditions is shown in Table 1 below.
Video Audio Text Transcript PPT
Video+Audio+PPT X X X
Audio+PPT X X
PPT+Transcription X X
PPT-Only X
9
Table 1. Summary of experimental conditions.
The VAP condition was a combination of video, audio, and PPT, exactly like a weblecture; the AP condition was the exact same web lecture, except that audio narrative waspresent without video of the presenter; the PT condition was a normal PPT presentationwith a transcription of the audio narration used in the VAP and AP conditions; and thePO condition was a normal PPT presentation (the same set of slides used in the VAPpresentation). Conditions VAP, AP, and PT were all information-equivalent—only themodality of presentation was manipulated—and condition PO was an approximate‘control’ condition used as a baseline for the kind of material typically available tostudents before class. Note that the PO condition was not information-equivalent, as itwas missing narration information that the other conditions present in one modality oranother. Other combinations of modalities (e.g., Video+PPT without audio) and/or otherconditions (e.g., a text excerpt) could have been used; we selected the four used in thisexperiment because we felt they were the most likely modifications to a web lecture, andwe wanted to limit this experiment to four conditions to ensure an adequate number ofsubjects for statistical analysis. Some other conditions were motivated by the results ofthis study, which are discussed in the future work section below.
Multimedia Instructional Materials
For the topic of the educational materials, we selected visual design—a presentation onthe use of visual structure principles to inform user interface (UI) design. This topic wasselected because we felt it would be learnable by participants with no prior knowledge ofUI design. Thirty PPT slides were used to describe four basic ideas of Gestalt perception(similarity, proximity, good continuation, and closure) and how the principles apply to UIdesign. Many of the PPTs included images illustrating a particular visual design principleor UI exemplar. The video used in the VAP condition was recorded in our web lecturesmini-studio by the second author (J. Foley); PPT slide timing from the video session wasapplied to all conditions. The audio for the AP condition was stripped from the video, andthat audio was transcribed for use with the PT condition. All conditions were presentedwithin the Microsoft Producer interface, which included the navigable ToC. Theuninterrupted, full running time of all presentations was 11 minutes and 45 seconds. SeeAppendix A for screenshots from each condition.
Participants
Students were recruited from the psychology subject pool at Georgia Institute ofTechnology. Participation eligibility required no prior coursework with the presenter andno previous HCI coursework. There were 60 subjects: 15 in each condition. Table 2below summarizes participant demographics. There was a wide distribution of majorsamong participants: 22 unique majors ranging from Architecture to Undecided, thelargest frequency of which were 9 Management majors.
Age Multimedia UseSex
M SD M SD
Video+Audio+PPT 8 M, 7 F 19.87 2.26 2.67 0.90

10
Audio+PPT 7 M, 8 F 19.87 2.36 2.67 1.49
PPT+Transcription 8 M, 7 F 19.80 1.47 2.86 1.06
PPT-Only 5 M, 10 F 20.33 2.09 2.73 0.96
All Conditions 28 M, 32 F 19.97 2.09 2.73 1.10
Table 2. Sex distribution, average age, and average self-reported educational multimedia use of participants.The “Multimedia Use” column represents average responses to a Likert scale question (1—None to 5—A Lot)
regarding prior use of multimedia instructional materials.
Experimental Protocol
The experiment was conducted in the Georgia Institute of Technology GVU Centerusability lab. The participant area is equipped with two new PCs with 17 in. flat-panelmonitors. Upon arriving at the usability lab, each participant was randomly assigned to anexperimental condition and went through the following protocol:
1. Scripted introduction and tutorial on how to view the educational material
2. Entrance survey
3. Up to 20 minutes to study material for the randomly assigned condition
4. Up to 20 minutes to complete a posttest on the materials
5. Exit survey
Scripts and Tutorials
To assure that each participant received that exact same information, a script was createdfor each condition. The scripts for each condition differed only when addressing theparticulars of the educational materials determined by the condition. The scriptssummarized the purpose and procedure of the study, and provided a condition-specifictutorial for the controls and use of the multimedia presentation. To ensure participantswere not exposed to presentation content before the session actually began, paperscreenshots that displayed only the title slide were used for the tutorials.
Entrance Survey
The purpose of the entrance survey was to collect demographic data, redundant screeningfor incoming HCI experience or coursework with the presenter, and to query participants’incoming experience with and attitudes about multimedia instruction [Appendix B].
Exposure to Educational Materials
Participants’ maximum time with the educational materials was limited to 20minutes—about 12 minutes for a full viewing and about 8 minutes to review. At anytimeduring the session, a participant could notify the experimenter that they were finishedreviewing the materials and ready to take the posttest. If a participant had not done sowithin 20 minutes, the experimenter would close the participant’s presentation andadminister the posttest. The amount of time each participant spent studying the materialswas recorded, which allowed us to evaluate each condition in terms of learning efficiency
11
in addition to learning efficacy. Thus, even if no difference in posttest scores was evidentacross the conditions, we had data useful for determining if one or more conditionsrequired significantly less time to match the posttest performance of the others.
Testing Instrument
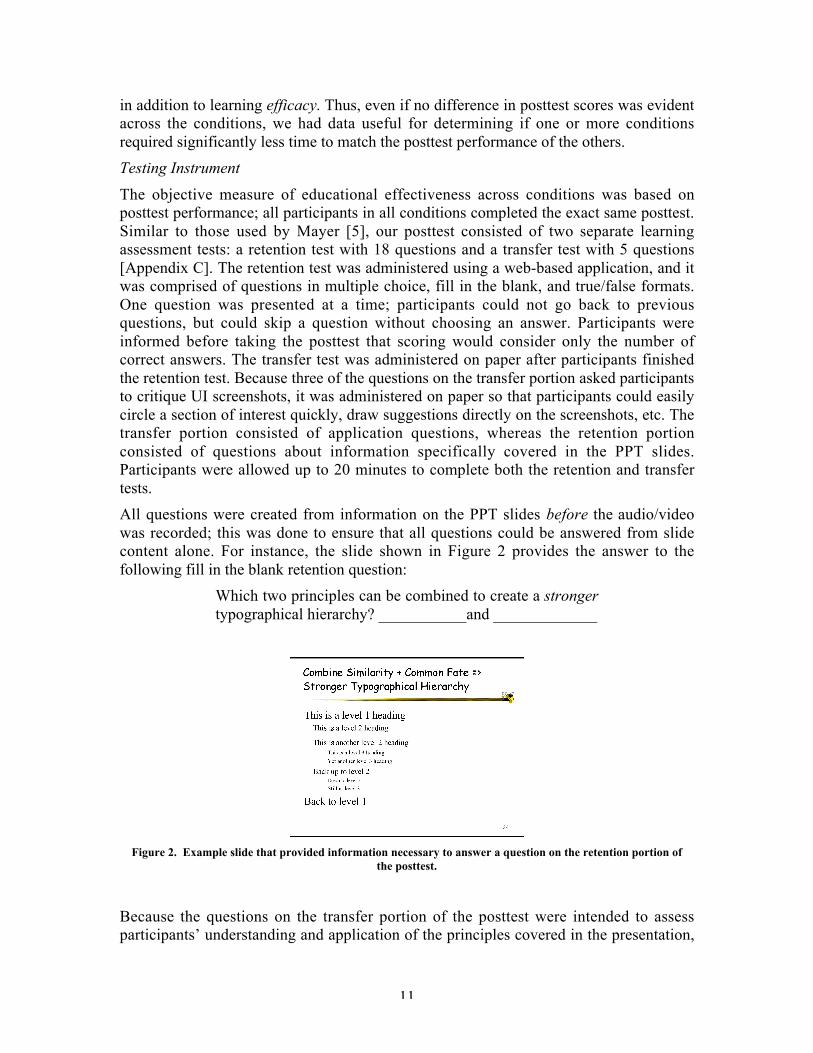
The objective measure of educational effectiveness across conditions was based onposttest performance; all participants in all conditions completed the exact same posttest.Similar to those used by Mayer [5], our posttest consisted of two separate learningassessment tests: a retention test with 18 questions and a transfer test with 5 questions[Appendix C]. The retention test was administered using a web-based application, and itwas comprised of questions in multiple choice, fill in the blank, and true/false formats.One question was presented at a time; participants could not go back to previousquestions, but could skip a question without choosing an answer. Participants wereinformed before taking the posttest that scoring would consider only the number ofcorrect answers. The transfer test was administered on paper after participants finishedthe retention test. Because three of the questions on the transfer portion asked participantsto critique UI screenshots, it was administered on paper so that participants could easilycircle a section of interest quickly, draw suggestions directly on the screenshots, etc. Thetransfer portion consisted of application questions, whereas the retention portionconsisted of questions about information specifically covered in the PPT slides.Participants were allowed up to 20 minutes to complete both the retention and transfertests.
All questions were created from information on the PPT slides before the audio/videowas recorded; this was done to ensure that all questions could be answered from slidecontent alone. For instance, the slide shown in Figure 2 provides the answer to thefollowing fill in the blank retention question:
Which two principles can be combined to create a strongertypographical hierarchy? ___________and _____________
Figure 2. Example slide that provided information necessary to answer a question on the retention portion ofthe posttest.
Because the questions on the transfer portion of the posttest were intended to assessparticipants’ understanding and application of the principles covered in the presentation,

12
the information needed to answer the transfer questions was not explicitly included in theslides as it was for the retention questions. However, relevant examples of applying theprinciples were included in the PPT slides that should have adequately preparedparticipants to answer the transfer questions. Consider, for example, the slide shown inFigure 3, and the following transfer question:
Figure 3. Example slide that provided a UI critique that could be similarly applied to answer a question on thetransfer portion of the posttest.
In terms of visual structure, would you consider the UIscreenshot below (Figure 4) good, bad, or a little of both?Use the four principles of visual structure discussed in thepresentation to justify your answer.
Figure 4. UI screenshot provided for critique on the transfer portion of the posttest.

13
For purposes of scoring, each question on the transfer test was broken down into thesmallest objective parts possible, to come up with a standard, objective scoring scheme.For example, consider the following transfer question:
Sketch a simple representative example (not used in thePowerPoint presentation) of one of the four principlesdiscussed in the presentation. Identify the principle andexplain your example.
This question above was worth 3 points, scored as follows: 1 point for a representativesketch not used in the PPT, 1 point for correctly labeling the principle, and 1 point for acorrect and adequate explanation of example given.
The first two authors independently developed a set of acceptable answers before theexperiment was conducted, and revised them based on the range of responses after theexperiment. The two sets were reconciled to come up with the final set of acceptableanswers. Two coders then scored the same six tests independently using the objectivescoring scheme and set of acceptable answers. To assuring inter-rater reliability,consistency across scorers was compared, and the process was repeated twice, at whichtime scoring differences were less 5%. Also, to control for bias during scoring, all testswere scored condition-blind.
Exit Survey
The exit survey [Appendix D] collected subjective participant attitudes about themultimedia instructional materials and self-reports of compatibility of the presentationmethod used with their study practices.
Results
This section discusses our analysis of posttest performance and survey responses, as wellas implications of these results. Unless noted otherwise, statistical significance wasdetermined using two-tailed independent groups t-tests assuming equal variances, with afamilywise alpha of .05.
Review and Test Taking Time
Participants were allowed up to 20 minutes to review the educational material (recall thatthe running time for all conditions was 11 minutes 45 seconds), and up to 20 minutes tocomplete entire posttest (retention and transfer portions). The average amount of timetaken for review and posttest completion is displayed in Table 3 below.

14
ReviewTime
RetentionTime
TransferTime
OverallPosttest Time
M SD M SD M SD M SD
Video+Audio+PPT 16.40 4.05 4.07 1.58 13.73 2.52 17.73 1.98
Audio+PPT 16.33 3.15 4.07 2.02 13.67 3.20 17.73 2.84
PPT+Transcription 15.40 3.52 3.73 1.53 12.07 3.20 15.80 3.34
PPT-Only 14.27 3.65 3.87 1.30 12.67 4.27 16.33 4.10
Table 3. Average times (in minutes) and standard deviations for review and posttest completion.
On average, participants in the VAP and AP conditions used slightly more time for bothreview and test taking than those in the PT and PO conditions, but the differences werenot statistically significant.
Posttest Performance
Scores by condition for the retention and transfer tests (and the combined overall posttestscore) are in Table 4 below. The retention and transfer tests were both scored out of 20points; the overall test score is simply the sum of the retention and transfer tests (40points).
Retention Test Transfer Test Overall Posttest
M SD M SD M SD
Video+Audio+PPT 18.2 1.26 17.17 2.34 35.37 2.89
Audio+PPT 17.07 1.83 14.67 2.84 31.73 3.08
PPT+Transcription 16.33 2.26 14.63 3.30 30.97 4.73
PPT-Only 14.53 3.46 13.30 3.94 27.83 6.33
Table 4. Performance averages and standard deviations on test instruments.
Both retention and transfer test scores were the highest for participants in theVideo+Audio+PPT condition, followed by those in the Audio+PPT condition, thePPT+Transcript condition, and participants in the PPT-Only condition scored the lowest.Overall posttest performance is visually represented in Figure 5 below.

15
88.42
79.33 77.41
69.58
0
10
20
30
40
50
60
70
80
90
100
VAP AP PT PO
Condition
Ave
rag
e S
core
(%
)
Figure 5. Average overall test score (%) by condition.
A one-way fixed effects ANOVA revealed a significant difference among the groups’mean overall posttest scores, F(3, 36)=3.91, p<.05, MSE=9.99. Post-hoc comparisonsindicated VAP participants’ overall posttest scores were statistically significantly higherthan participants in the other three conditions. Also, AP participants’ overall posttestperformance was higher than the PO condition, but was marginally insignificant. Table 5below shows the resulting p-values for all pair-wise comparisons.
Video+Audio+PPT
Audio+PPT PPT+Transcript PPT-Only
Video+Audio+PPT 0.0024* 0.0053* 0.0004*
Audio+PPT 0.6035 0.0442
PPT+Transcription 0.1366
PPT-Only
Table 5. P-values for pair-wise condition comparisons on overall test performance. An asterisk (*) indicatesstatistical significance after Bonferroni correction.
Exit Survey – Likert Scale Questions
All 60 participants responded to all Likert scale questions on the exit survey. Table 6provides an overview of responses to selected questions.

16
Q1: GeneralLearning
Effectiveness
Q2: PosttestPreparationEffectiveness
Q3:Comprehension
Q4:Likelihood
of Use
M SD M SD M SD M SD
Video+Audio+PPT 4.27 0.46 4.47 0.64 4.47 0.83 4.67 0.49
Audio+PPT 3.87 0.83 4.2 0.56 3.87 0.74 4.00 0.76
PPT+Transcription 3.27 0.59 3.67 0.90 3.60 0.74 3.40 0.91
PPT-Only 3.33 0.72 3.40 0.99 3.47 0.99 3.60 0.63
Table 6. Average responses to exit survey questions by condition. Q1) In terms of your general learning, howwould you rate the effectiveness of the educational materials you were provided? Scale 1—Very Ineffective to5—Very Effective. Q2) In terms of preparing you for the posttest, how would you rate the effectiveness of theeducational materials you were provided? Scale 1—Very Ineffective to 5—Very Effective. Q3) Consider thepresentation mode of the educational materials separately from the content. How does the mode of delivery
affect your comprehension of the content? Scale 1—Greatly Decreases Comprehension to 5—Greatly IncreasesComprehension. Q4) How likely is it that you would choose to use the kind of educational materials you were
provided? Scale 1—Very Unlikely to 5—Very Likely.
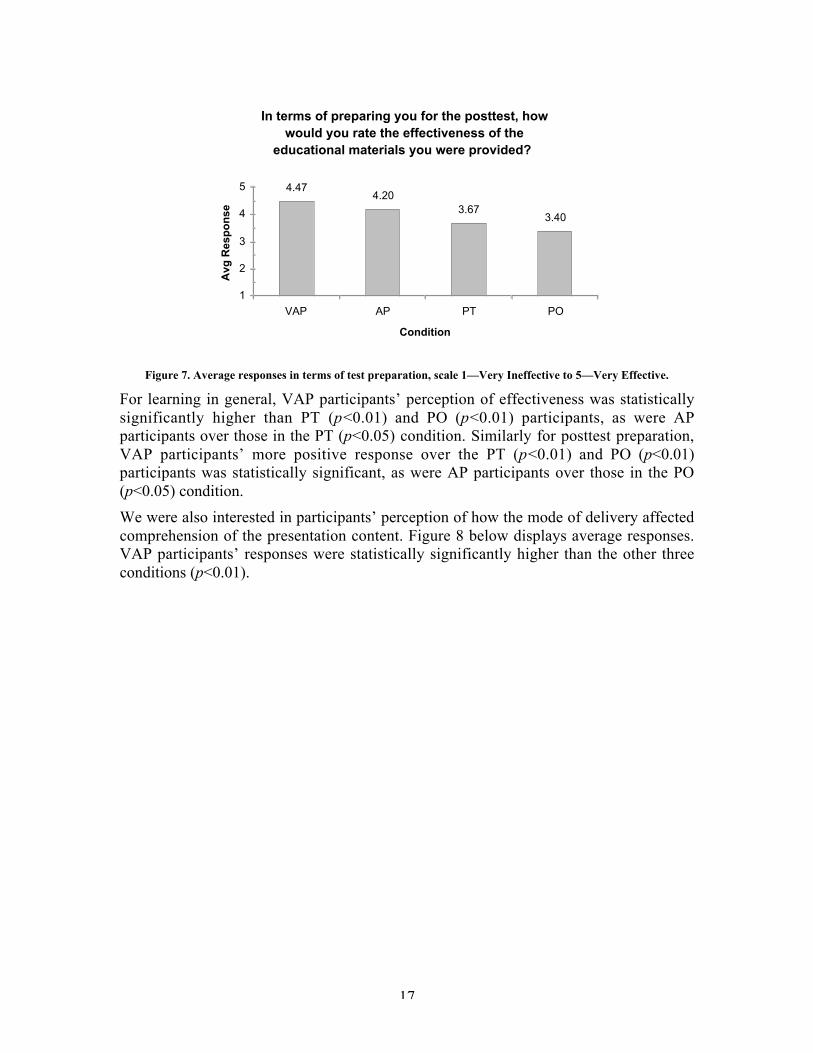
We were interested in participants’ perception of the effectiveness the educationalmaterial provided, both in terms of learning in general and in terms of preparing them forthe posttest taken as part of the experiment. Figures 6 and 7 below show averageresponses to two questions addressing learning from each of these perspectives.
In terms of your general learning, how would you rate the effectiveness of the educational materials
you were provided?
4.273.87
3.27 3.33
1
2
3
4
5
VAP AP PT PO
Condition
Avg
Res
po
nse
Figure 6. Average responses in terms of education in general, scale 1—Very Ineffective to 5—Very Effective.
17
In terms of preparing you for the posttest, how would you rate the effectiveness of the
educational materials you were provided?
4.474.20
3.673.40
1
2
3
4
5
VAP AP PT PO
Condition
Avg
Res
po
nse
Figure 7. Average responses in terms of test preparation, scale 1—Very Ineffective to 5—Very Effective.
For learning in general, VAP participants’ perception of effectiveness was statisticallysignificantly higher than PT (p<0.01) and PO (p<0.01) participants, as were APparticipants over those in the PT (p<0.05) condition. Similarly for posttest preparation,VAP participants’ more positive response over the PT (p<0.01) and PO (p<0.01)participants was statistically significant, as were AP participants over those in the PO(p<0.05) condition.
We were also interested in participants’ perception of how the mode of delivery affectedcomprehension of the presentation content. Figure 8 below displays average responses.VAP participants’ responses were statistically significantly higher than the other threeconditions (p<0.01).

18
Consider the presentation of the educational materials seperately from the content. How does
the mode of delivery affect your comprehension of the content?
4.67
3.40 3.604.00
1
2
3
4
5
VAP AP PT PO
Condition
Avg
Res
po
nse
Figure 8. Average responses to comprehension question, scale 1—Greatly Decreases Comprehension to5—Greatly Increases Comprehension.
Figure 9 shows how likely participants would be to choose to use the kind of multimediainstructional material they used during the experiment. Again, VAP participants’responses were statistically significantly higher than the other three conditions (p<0.05),indicating a strong subjective preference for multimedia materials that include video asopposed to only audio, only transcription text, or the PPT slide alone.
How likely is it that you would choose to use the kind of educational material you were provided?
4.47
3.873.60 3.47
1
2
3
4
5
VAP AP PT PO
Condition
Avg
Res
po
nse
Figure 9. Average responses to likelihood of use question, scale 1—Very Unlikely to 5—Very Likely.
Exit Survey – Open-Ended Questions
The exit survey had eight open-ended questions: participants answered 98%. Allresponses were aggregated by question and condition, and then coded. For selectedquestions, we summarize relevant trends the coding revealed, and provide representativeresponses. Numbers in parentheses after a statement indicate the frequency of responsesthat fell into that coding category.

19
• What did you like best about the mode of delivery (the presentation alone, consideredindependently of the content) of the educational material?
Across all conditions, a common response was the presence of the ToC for contextand review (8) and the helpfulness of the animated slides (4). Participants in the VAPand AP conditions highly praised the ability to use the audio/video controls forreview (7) and keeping the presentation at a pace suitable for their learning styles (5).Some participants in the AP condition particularly like the addition of audio to thePPT (4), and the presence of an actual human voice was noted as well (2). Finally,participants in the VAP condition expressed appreciation specifically for the video ofthe presenter (5), for the addition of audio/video in general (8), and for the similaritiesto being in a live lecture (3). Representative quotes from participants in the VAPcondition are:
o “I like how the presenter could be viewed. It was very nice to not just listen toa presentation that you watched, but that you actually had a person to lookat—like in an actual lecture.”
o “The idea of a video and PPT [is] really good. It is like going to class, but atyour own pace and better because you can go back to things you missed.”
o “I liked being able to watch the speaker talk because if I was having troublefocusing on what he was saying, I could look at him to refocus.”
• What did you like least about the mode of delivery (the presentation alone, consideredindependently of the content) of the educational material?
The most common response across all conditions related to the speed of thepresentation (15). Participants noted that the standalone pace of the presentationadvanced a little too quickly. We attribute this to our effort to make the presentationas short as possible. Other responses across all conditions included stating thatnothing was wrong with the presentation (13) and the volume was too loud (4). Forthe PT condition, participants found reading all of the transcribed text and the PPTtext to be difficult (5): “The transcribed text at the bottom, it was too hard to payattention to that and the slide.” This comment could be explained by the split-attention effect [23] or a combination of modality and spatial contiguity effects [7].One participant in the VAP condition stated that the video was not necessary, that theaudio alone would have been enough.
• Please describe any ideas you have about what would make the educational materialmore effective.
Many responses to this question were suggestions for kinds/number of examples andthe order of material in the presentation. These responses point out a small flaw in theway we asked the question; we were more interested in ideas to improve the mode ofdelivery rather than the content, which was not clear in the question. Some of thesuggestions were relevant, however. For instance, VAP and AP participantssuggested adding some interactive functionality (6) such as integrated quizzes orstudent note taking areas. Also, across all conditions except the VAP condition,participants suggested specifically adding video (7) or adding audio/video (7).Representative quotes are:

20
o “I would have learned even more if there had been a window on [the] panelwhere I could have taken my own notes.”
o “More visual stimuli (videos, animations) would bore the viewer less, butotherwise it was good.”
o “Video or sound. More color. A person giving the real world examples wouldbe helpful.”
• What is your goal(s) when you engage in normal pre-class preparation? Do you thinkthe mode of information presentation you just experienced would support you inachieving that goal(s)?
Across all conditions almost all participants indicated their pre-class preparation goalsinvolve familiarizing themselves with the material so they can understand the lecturebetter or comprehending a topic in order to complete a home work assignment orquiz. VAP participants reported strong support from the mode of presentation:
o “To become somewhat familiar with the topic. Of course this would supportthat, it is like having someone explain it to me in person.”
o “Pre-class preparation is to give a basic understanding of the material prior toclass. I think this mode of information would greatly support achieving thatgoal. I would understand the material better.”
o “The goal of pre-class preparation is to comprehend the topic about to belectured on better than hearing it for the first time in class. The video is veryhelpful toward that goal.”
• Please provide any other feedback you might have here.
This question was not considered one of the eight open-ended questions, but therewere a few interesting comments from the VAP participants:
o “I think it would make my study time less, because I would have auditory andvisual reinforcement at the same time rather than at separate times.”
o “I enjoyed learning this material. And I hope that you can convince someprofessors to use this presentation mode to teach us.”
o “I would be pleased to see this used in the classroom.”
Discussion
The VAP condition outperformed the other three conditions. Participants who studiedmaterials using a combination of video, audio, and PPT scored statistically significantlyhigher than all other conditions on both the retention and transfer portions of the posttest.Analysis confirms that posttest performance was not affected by self-reported multimediaexposure, sex, age, major, time spent reviewing material, or time spent completing theposttest. At least for HCI-related subject matter, this objective measure of learning ranksVideo+Audio+PPT educational materials such as web lectures the most learningeffective, followed by materials with Audio+PPT, PPT+Transcript materials, and finallymaterials using PPT-Only. These data do not suggest an effect on learning efficiency forany of the conditions.
21
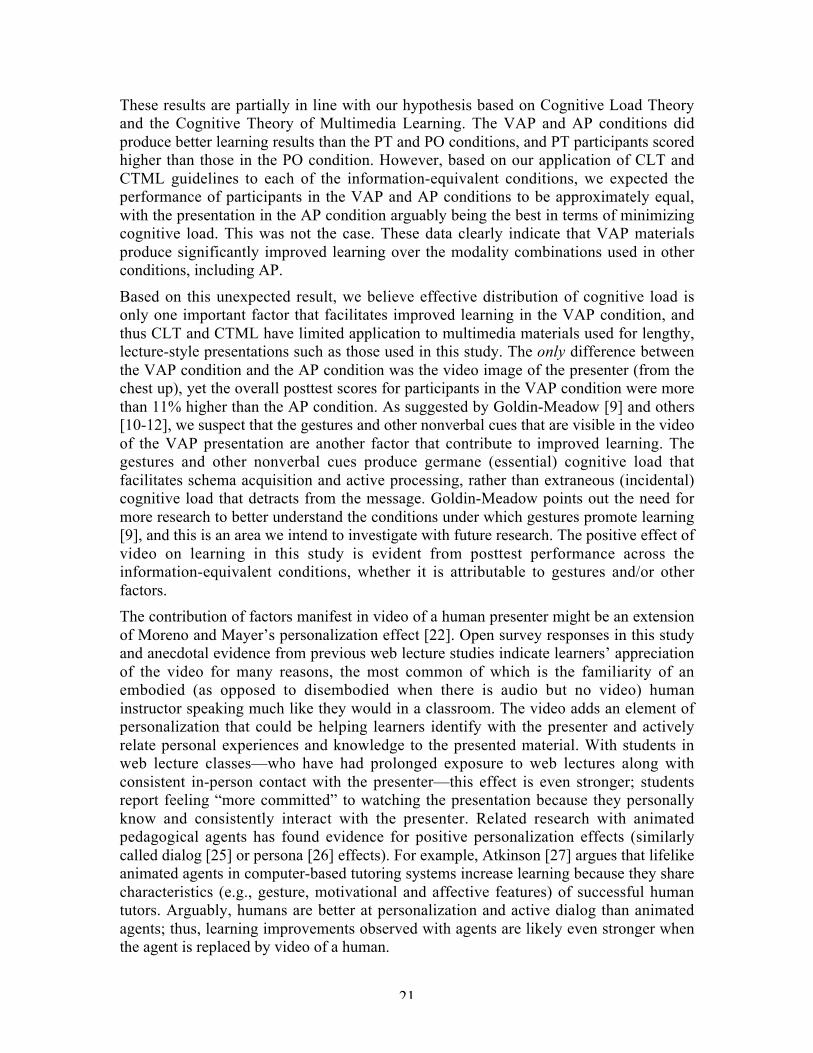
These results are partially in line with our hypothesis based on Cognitive Load Theoryand the Cognitive Theory of Multimedia Learning. The VAP and AP conditions didproduce better learning results than the PT and PO conditions, and PT participants scoredhigher than those in the PO condition. However, based on our application of CLT andCTML guidelines to each of the information-equivalent conditions, we expected theperformance of participants in the VAP and AP conditions to be approximately equal,with the presentation in the AP condition arguably being the best in terms of minimizingcognitive load. This was not the case. These data clearly indicate that VAP materialsproduce significantly improved learning over the modality combinations used in otherconditions, including AP.
Based on this unexpected result, we believe effective distribution of cognitive load isonly one important factor that facilitates improved learning in the VAP condition, andthus CLT and CTML have limited application to multimedia materials used for lengthy,lecture-style presentations such as those used in this study. The only difference betweenthe VAP condition and the AP condition was the video image of the presenter (from thechest up), yet the overall posttest scores for participants in the VAP condition were morethan 11% higher than the AP condition. As suggested by Goldin-Meadow [9] and others[10-12], we suspect that the gestures and other nonverbal cues that are visible in the videoof the VAP presentation are another factor that contribute to improved learning. Thegestures and other nonverbal cues produce germane (essential) cognitive load thatfacilitates schema acquisition and active processing, rather than extraneous (incidental)cognitive load that detracts from the message. Goldin-Meadow points out the need formore research to better understand the conditions under which gestures promote learning[9], and this is an area we intend to investigate with future research. The positive effect ofvideo on learning in this study is evident from posttest performance across theinformation-equivalent conditions, whether it is attributable to gestures and/or otherfactors.
The contribution of factors manifest in video of a human presenter might be an extensionof Moreno and Mayer’s personalization effect [22]. Open survey responses in this studyand anecdotal evidence from previous web lecture studies indicate learners’ appreciationof the video for many reasons, the most common of which is the familiarity of anembodied (as opposed to disembodied when there is audio but no video) humaninstructor speaking much like they would in a classroom. The video adds an element ofpersonalization that could be helping learners identify with the presenter and activelyrelate personal experiences and knowledge to the presented material. With students inweb lecture classes—who have had prolonged exposure to web lectures along withconsistent in-person contact with the presenter—this effect is even stronger; studentsreport feeling “more committed” to watching the presentation because they personallyknow and consistently interact with the presenter. Related research with animatedpedagogical agents has found evidence for positive personalization effects (similarlycalled dialog [25] or persona [26] effects). For example, Atkinson [27] argues that lifelikeanimated agents in computer-based tutoring systems increase learning because they sharecharacteristics (e.g., gesture, motivational and affective features) of successful humantutors. Arguably, humans are better at personalization and active dialog than animatedagents; thus, learning improvements observed with agents are likely even stronger whenthe agent is replaced by video of a human.

22
Of the information-equivalent conditions (VAP, AP, and PT), PT is the poorest atdistributing information across multiple processing channels using different modalities;all of the verbal information presented in the VAP and AP conditions was transcribed andforced into the visual channel in the form of additional on-screen text. Thus, it is notsurprising that the PT condition is the least learning effective of the information-equivalent conditions, as CLT and CTML would predict.
The difference in test scores between the AP and PT conditions was surprising, however.Although participants in the AP condition did score higher than those in the PT conditionon both retention and transfer tests, the improvement was only marginal. Based on themodality distributions, we hypothesized the same rank order of learning effectiveness ourresults produced; however, we expected to see a larger performance difference betweenthe AP and PT conditions. This unexpected deviation from what CLT and CTML wouldsuggest might be due to the presentation length (cf. [8]), the lecture-based nature of thepresentations, the broader subject matter, and/or the presence of a navigable ToC thateffectively outlined the presentation content. Again, this result suggests the limitedapplicability of CLT and CTML guidelines for the types of multimedia presentationsused in this study.
It is interesting that the PPT-Only condition performed so poorly in comparison to theother conditions. Although the condition lacked the additional narrative informationavailable in the other three conditions, the test instruments were designed frominformation only on the PPT slides—exposure to the narration was not necessary toanswer any of the questions. This condition is not discussed in terms of cognitive loadbecause it was not information-equivalent, but the result is important for instructionaldesign, as PPT is a very common form of educational material.
In addition to performing significantly better on the objective learning measure, VAPparticipants also self-reported subjective perceptions of learning and comprehension thatwere higher than the other three conditions. Moreover, when asked how likely theywould be to use the educational material provided, VAP participants reported higherlikelihood of use than the other three conditions. Interestingly, for most of the Likertsurvey questions there was a clear distinction between the VAP / AP conditions and thePT / PO conditions. Though posttest results did not show a significant improvement ofAP over the two latter conditions as expected, survey results indicated a larger increase inperceived learning and comprehension.
As briefly mentioned above, open-ended survey responses suggest the value-added ofvideo. Many participants in the VAP condition expressed strong positive opinions infavor of the video feed, citing its ability to aid focus, make the presentation feel more likea classroom lecture, and add to the feeling of engagement with the material. Schnotzsuggested that affective and motivational factors such as these must also be consideredwhen assessing learning gains from multimedia instructional materials [13]. Also, manyparticipants who were not in the VAP condition suggested adding video as a way toimprove the presentation.
Future Work
There are many ways for us to expand and improve upon the experiment presented here.For instance, some limitations of this study that could be addressed in future studies
23
include more rigorous pretests of incoming knowledge, spatial ability, and workingmemory capacity. Mayer’s individual differences principle suggests that design effectsare stronger for low-knowledge, low-spatial learners, and CLT in particular recognizesthe importance of working memory capacity; these factors can be measured upfront andtreated as covariates to control for individual differences.
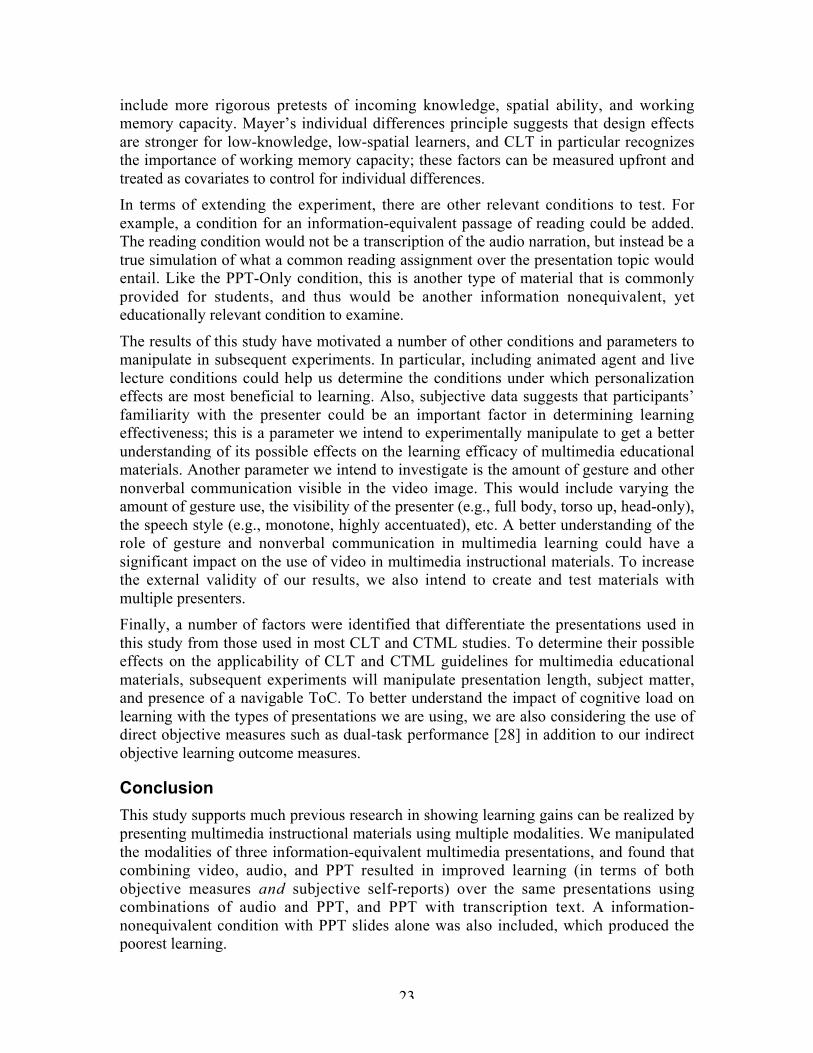
In terms of extending the experiment, there are other relevant conditions to test. Forexample, a condition for an information-equivalent passage of reading could be added.The reading condition would not be a transcription of the audio narration, but instead be atrue simulation of what a common reading assignment over the presentation topic wouldentail. Like the PPT-Only condition, this is another type of material that is commonlyprovided for students, and thus would be another information nonequivalent, yeteducationally relevant condition to examine.
The results of this study have motivated a number of other conditions and parameters tomanipulate in subsequent experiments. In particular, including animated agent and livelecture conditions could help us determine the conditions under which personalizationeffects are most beneficial to learning. Also, subjective data suggests that participants’familiarity with the presenter could be an important factor in determining learningeffectiveness; this is a parameter we intend to experimentally manipulate to get a betterunderstanding of its possible effects on the learning efficacy of multimedia educationalmaterials. Another parameter we intend to investigate is the amount of gesture and othernonverbal communication visible in the video image. This would include varying theamount of gesture use, the visibility of the presenter (e.g., full body, torso up, head-only),the speech style (e.g., monotone, highly accentuated), etc. A better understanding of therole of gesture and nonverbal communication in multimedia learning could have asignificant impact on the use of video in multimedia instructional materials. To increasethe external validity of our results, we also intend to create and test materials withmultiple presenters.
Finally, a number of factors were identified that differentiate the presentations used inthis study from those used in most CLT and CTML studies. To determine their possibleeffects on the applicability of CLT and CTML guidelines for multimedia educationalmaterials, subsequent experiments will manipulate presentation length, subject matter,and presence of a navigable ToC. To better understand the impact of cognitive load onlearning with the types of presentations we are using, we are also considering the use ofdirect objective measures such as dual-task performance [28] in addition to our indirectobjective learning outcome measures.
Conclusion
This study supports much previous research in showing learning gains can be realized bypresenting multimedia instructional materials using multiple modalities. We manipulatedthe modalities of three information-equivalent multimedia presentations, and found thatcombining video, audio, and PPT resulted in improved learning (in terms of bothobjective measures and subjective self-reports) over the same presentations usingcombinations of audio and PPT, and PPT with transcription text. A information-nonequivalent condition with PPT slides alone was also included, which produced thepoorest learning.

24
Our motivation for conducting this study grew out of an empirically-validatededucational intervention using web lectures. Because Video+Audio+PPT presentationsare exactly the same as web lectures used in the intervention, the results of this studyprovide support for the contribution of web lectures to the learning gains observed at theintervention level. When evaluating the web lectures intervention in the classroom, theeffect of web lectures could not be teased out from other aspects of the intervention, suchas increased participation in in-class application activities. Although we acknowledge theinherently decontextualized use of web lectures in the lab setting, we believe this studyjustifies the use of web lectures as opposed to other similar pre-class educationalmaterials. Moreover, it provides evidence for the educational effectiveness of weblectures as standalone learning objects.
The significantly better learning of participants studying Video+Audio+PPTpresentations cannot be wholly attributed to multimedia design consistent with CLT andCTML guidelines. Otherwise, Audio+PPT participants should have performed the same(or better) than Video+Audio+PPT participants. We identified some other factors presentin the video that may have contributed to the observed learning gains, such as thevisibility of gestures of and other nonverbal communication, and affective andmotivational factors (e.g., personal identification with a human presenter), but more workis needed to determine the extent of these factors’ effect on learning with videomultimedia materials. As a start, this study provides experimental evidence andsubjective support for the value-added of video in educational presentations, whichsuggest multimedia instructional designers should integrate video of a human presenterwhen possible. Note that the presenter video used in this study was studio-recorded fromthe torso up; we believe this type of shot produces a more one-on-one, engagingexperience than less personalized video, such as recorded classroom lectures.
Our investigation was framed by CLT and CTML, but our results were not completely inline with our interpretation of what those theories would predict. Learning measures forthe Audio+PPT and PPT+Transcript conditions were much closer than an analysis ofcognitive load for each would suggest. Longer, lecture-style characteristics of thepresentations, the presence of a navigable ToC, and different subject matter have beenidentified as possible causes of these unexpected results. Some of the effects of high orlow cognitive load may not be as powerful when exposure to the material is longer thanthe conditions under which those effects were recognized in developing CLT and CTML.Our results suggest that CLT and CTML have limited application to multimedia materialssuch the ones used in this experiment. More studies are needed to determine theconditions under which CLT and CTML guidelines can be effectively applied.
References
[1] J. A. Day and J. D. Foley, "Evaluating a Web Lectures Intervention in a Human-Computer Interaction Course," IEEE Transactions on Education, pp. In Press,2006.
[2] J. A. Day and J. D. Foley, "Evaluating Web Lectures: A Case Study from HCI,"presented at CHI '06, 2006.

25
[3] J. A. Day, J. D. Foley, R. Groeneweg, and C. Van der Mast, "Enhancing theClassroom Learning Experience with Web Lectures," presented at InternationalConference of Computers in Education, Singapore, 2005.
[4] P. Chandler and J. Sweller, "Cognitive Load Theory and the Format ofInstruction," Cognition and Instruction, vol. 8, pp. 293-332, 1991.
[5] R. E. Mayer, Multimedia Learning. New York: Cambridge University Press,2001.
[6] S. Y. Mousavi, R. Low, and J. Sweller, "Reducing Cognitive Load by MixingAuditory and Visual Presentation Modes," Journal of Educational Psychology,vol. 87, pp. 319-334, 1995.
[7] R. E. Mayer and R. Moreno, "Nine Ways to Reduce Cognitive Load inMultimedia Learning," Educational Psychologist, vol. 38, pp. 42-52, 2003.
[8] J. S. Zolna and R. Catrambone, "Learning from Multimedia: Cognitive ModalityEffects," Journal of Human Factors, vol. In Submission, 2005.
[9] S. Goldin-Meadow, "Gesture's Role in the Learning Process," Theory IntoPractice, vol. 43, pp. 314-321, 2004.
[10] R. B. Church, S. Ayman-Nolley, and S. Mahootian, "The Role of Gesture inBilingual Education: Does Gesture Enhance Learning?" International Journal ofBilingual Education and Bilingualism, vol. 7, pp. 303-319, 2004.
[11] L. Valenzeno, M. W. Alibali, and R. Klatzky, "Teacher's Gesture FacilitateStudents' Learning: A Lesson in Symmetry," Contemporary EducationalPsychology, vol. 28, pp. 187-204, 2003.
[12] M. Perry, D. Berch, and J. Singleton, "Constructing Shared Understanding: TheRole of Nonverbal Input in Learning Contexts," Journal of Contemporary LegalIssues, vol. 6, pp. 213-235, 1995.
[13] W. Schnotz, "Towards an Integrated View of Learning from Text and VisualDisplays," Educational Psychology Review, vol. 14, pp. 101-120, 2002.
[14] http://www.microsoft.com/office/powerpoint/-producer/prodinfo/default.mspx.
[15] J. A. Day, J. Foley, R. Groeneweg, and C. Van der Mast, "Enhancing theClassroom Learning Experience with Web Lectures," Georgia Tech GVUTechnical Report 04-18, 2004.
[16] A. L. Brown, "Design Experiments: Theoretical and Methodological Challengesin Creating Complex Interventions in Classroom Settings," The Journal ofLearning Sciences, vol. 2, pp. 141-178, 1992.
[17] S. Barab and K. Squire, "Design-Based Research: Putting a Stake in the Ground,"The Journal of the Learning Sciences, vol. 13, pp. 1-14, 2004.
[18] J. Sweller, J. J. G. van Merrienboer, and F. Paas, "Cognitive Architecture andInstructional Design," Educational Psychology Review, vol. 10, pp. 251-296,1998.

26
[19] F. Paas, A. Renkl, and J. Sweller, "Cognitive Load Theory and InstructionalDesign: Recent Developments," Educational Psychologist, vol. 38, pp. 1-4, 2003.
[20] A. Baddeley, Human Memory. Boston: Allyn & Bacon, 1998.
[21] A. Paivio, Mental Representations: A Dual Coding Approach. Oxford, England:Oxford University Press, 1986.
[22] R. Moreno and R. E. Mayer, "Engaging Students in Active Learning: The Casefor Personalized Multimedia Messages," Journal of Educational Psychology, vol.92, pp. 724-733, 2000.
[23] S. Kalyuga, P. Chandler, and J. Sweller, "Managing Split-Attention andRedundancy in Multimedia," Applied Cognitive Psychology, vol. 13, pp. 351-371,1999.
[24] S. D. Craig, B. Gholson, and D. M. Driscoll, "Animated Pedagogical Agents inMultimedia Educational Environments: Effects of Agent Properties, PictureFeatures, and Redundancy," Journal of Educational Psychology, vol. 94, pp. 428-434, 2002.
[25] R. Moreno, R. E. Mayer, and J. C. Lester, "Life-Like Pedagogical Agents inConstructivist Multimedia Environments: Cognitive Consequences of theirInteraction," presented at ED-MEDIA 2000, Charlottesville, NC, 2000.
[26] J. C. Lester, S. A. Convers, B. A. Stone, S. E. Kahler, and S. T. Barlow,"Animated Pedagogical Agents and Problem-Solving Effectiveness: A Large-scale Empirical Evaluation," presented at Eighth World Conference on ArtificialIntelligence in Education, Washington, D. C., 1997.
[27] R. K. Atkinson, "Optimizing Learning From Examples Using AnimatedPedagogical Agents," Journal of Educational Psychology, vol. 94, pp. 416-427,2002.
[28] R. Brunken, J. L. Plass, and D. Leutner, "Direct Measurement of Cognitive Loadin Multimedia Learning," Educational Psychologist, vol. 38, pp. 53-61, 2003.

27
Appendix A: Screenshots used in tutorial for each condition.
Figure 10. The Video+Audio+PPT (web lecture) presentation.
28
Figure 11. The Audio+PPT presentation.

29
Figure 12. The PPT+Transcript presentation.

30
Figure 13. The PPT-Only presentation.

31
Appendix B: Entrance Survey
Entrance Survey
Study Title: Investigating the Effects of Variously Moded Educational Materials onLearning
Please answer the following questions about your background experience. If at any pointyou have a question, please ask the study administrator.
Demographic Data
1. What is your age? _______
2. What is your gender? Male / Female
3. What year are you?
Freshman Sophomore Junior Senior Other:_____________
4. What is your major? _____________________
5. Have you taken or are you taking any Human-Computer Interaction (HCI) orrelated courses (e.g. CS/PSYC4750, CS/PSYC6750, etc.) ?
Yes No
6. Have you taken or are you taking a course with Prof. Jim Foley?
Yes No
7. How much exposure / interaction / use of multimedia educational materials haveyou experienced?
8. Please list and briefly describe all multimedia educational materials you have hadexperience with:
1
None
2
Not VeryMuch
3
Some
4
Quite a Bit
5
A Lot

32
Appendix C: Testing Instrument, both Retention and Transfer portions.
Retention Questions:
1. The principles presented were from what branch of psychology?
2. “Our eyes/brain logically group together visual elements that are close to oneanother.” This is the definition for which of the following:
3. “Our eyes/brain logically group together visual elements that are alike to oneanother.” This is the definition for which of the following:
4. “Our eyes/brain associate elements that are aligned alike to one another.” This isthe definition for which of the following:
5. “Our eyes/brain logically group together visual elements that approximate awhole shape, to for that whole shape.” This is the definition for which of thefollowing:
6. Which Gestalt principle causes you to group the “h” at the end of the first word inthis sentence with the first word as opposed to seeing it as part of the secondword?
Closure Continuation Proximity Extension Similarity
Cognitive Gestalt Educational Developmental Organizational
Common
Fate
Proximity Situatedness Similarity Closure
Situatedness Similarity CommonFate
Proximity Congruency
CommonFate
Congruency Proximity Closure Similarity
Extension Similarity CommonFate
Proximity Closure

33
7. Indentation can provide structure representative of which principle? ___________
8. How many principles of visual structure were presented? _________
9. Grids can provide structure representative of which principle? ____________
10. Use visual structure to ___________________________________________.
11. Which two principles can be combined to create a stronger typographicalhierarchy? _____________ and ________________
12. T / F . If combined, Gestalt principles always compliment one another.
13. T / F . Visual design principles are good to use for dialog boxes, but not for webpage design.
14. T / F . Items close together appear to have a relationship.
15. T / F . Gestalt principles cannot be combined.
16. T / F . Grids avoid disconcerting irregularities.
17. The mantra for visual design for user interface design is, “Use visual structure toreinforce logical structure.”
18. T / F. The Closure principle provides guidelines for logical placement of “Close”and “Exit” buttons in dialog boxes.
Transfer Questions:
1. Sketch a simple representative example (not used in the PowerPoint presentation)of one of the four principles discussed in the presentation. Identify the principleand explain your example.
2. Sketch a simple representative example (not used in the PowerPoint presentation)of one of the three remaining principles discussed in the presentation. Identify theprinciple and explain your example.

34
3. In terms of visual structure, would you consider the UI screenshot below good,bad, or a little of both? Use the four principles of visual structure discussed in thepresentation to justify your answer.
4. In terms of visual structure, would you consider the UI screenshot below good,bad, or a little of both? Use the four principles of visual structure to justify youranswer.

35
5. In terms of visual structure, would you consider the UI screenshot below good,bad, or a little of both? Use the four principles of visual structure to justify youranswer.

36
Appendix D: Exit Survey
Exit Survey
Study Title: Investigating the Effects of Variously Moded Educational Materials onLearning
Please answer the following questions about your experiences while participating in thisstudy. If at any point you have a question, please ask the study administrator.
1. In terms of your general learning, how would you rate the effectiveness of theeducational materials you were provided?
2. In terms of preparing you for the test, how would you rate the effectiveness of theeducational materials you were provided?
3. How likely is it that you would choose to use the kind of educational material youwere provided?
4. What did you like best about the mode of delivery (the presentation alone, consideredindependently of the content) of the educational material?
5. What did you like least about the mode of delivery (the presentation alone, consideredindependently of the content) of the educational material?
6. Please describe any ideas you have about what would make the educational materialmore effective:
7. How much does your opinion of the effectiveness of the educational material youwere provided depend on the mode of delivery?
1
VeryIneffective
2
Ineffective
3
Neutral
4
Effective
5
Very Effective
1
VeryIneffective
2
Ineffective
3
Neutral
4
Effective
5
Very Effective
1
VeryUnlikely
2
Unlikely
3
Neutral
4
Likely
5
Very Likely

37
8. Think about the mode of delivery of the educational material independently of thecontent again. How does the mode of delivery affect your comprehension of thecontent?
9. Consider the following course format: students are assigned educational material suchas you were provided to study before coming to class, so less class time is needed forlecture and students come into class with some basic knowledge. Freed up class timeis used to engage students with real-world application activities, discussion, and otheractive learning.
a. In terms of educational effectiveness, how would you rate this course format incomparison to the traditional in-class lecture format?
b. In terms of overall course enjoyment, how would you rate this course format incomparison to the traditional in-class lecture format?
10. How would you rate your general attitude towards the effectiveness of educationaltechnology?
1
Much Worse
2
Worse
3
About theSame
4
Better
5
Much Better
1
Not at All
2
Not VeryMuch
3
Some
4
Quite a Bit
5
A Lot
1
GreatlyDecreases
Comprehension
2
DecreasesComprehension
3
No Affect onComprehension
4
IncreasesComprehension
5
Greatly IncreasesComprehension
1
Much Worse
2
Worse
3
About theSame
4
Better
5
Much Better
1
VeryNegative
2
Negative
3
Neutral
4
Positive
5
Very Positive
38
11. How would you characterize your learning style?
Audio Learner Visual Learner Audio and Visual Learner Other:__________
12. Please list your normal study activities and/or pre-class preparation.
13. Think about any study habits you have that involve direct interaction with the studymaterials (highlighting text, skipping around in a PPT, taking notes on the material,etc.) Would the direct interaction mechanisms (technological affordances such asclickable table of contents, pause capability, etc.) offered by the mode of informationpresentation you just experienced support your normal study activities and/or pre-class preparation? Why or why not?
14. Think about any study habits you have that do not involve direct interaction with thestudy materials (note taking on separate paper, thinking aloud, etc.). Would the modeof information presentation you just experienced support these kinds of study habits?Please explain.
15. Would the mode of information presentation you just experienced allow you to learnand think about material in the same way your normal study activities do? Pleaseexplain.
16. What is your goal(s) when you engage in normal pre-class preparation? Do you thinkthe mode of information presentation you just experienced would support you inachieving that goal(s)
17. Please provide any other feedback you might have here.