Introductory Macreoecnomic Chapter - 1 - Govt Mizo HSS
16
(XI Economics Part B (text book page 85 to 97) Chapter - 5 Presentation of Data (Textual & Tabular) Sir. VL Felfamkima (Felby-a) M.Com (SLET), M.Phil, B.Ed Lecturer, Deptt. of Economics
-
Upload
khangminh22 -
Category
Documents
-
view
5 -
download
0
Transcript of Introductory Macreoecnomic Chapter - 1 - Govt Mizo HSS

(XI Economics Part B(text book page 85 to 97)
Chapter - 5Presentation of Data(Textual & Tabular)
Sir. VL Felfamkima (Felby-a)M.Com (SLET), M.Phil, B.Ed
Lecturer, Deptt. of Economics

1. Textual Presentation
In Textual presentation, data are a part of the text of studyor a part of the description of the subject matter of study.Such a presentation is called descriptive presentation ofdata.
This data is the most common form of data presentationwhen the quantity of data is not very large.
Textual presentation of data is most suitable when thequantum data is not very large.
Example: In 2008 – 09, total production of foods grains was 2,344 lakhtonnes of which production of rice, wheat and other crops was 992,807 and 545 lakh tonnes, respectively. Percentage share of rice, wheatand other crops in the total production of food grains was 42.32, 34.43and 23.25 respectively.

2. Tabular Presentation
In the words of Neiswanger, “A statistical table is asystematic organization of data in columns and rows.
Components of a Table:-
• Table Numbers
• Title
• Head Note
• Stubs
• Caption
• Body or Field
• Footnotes
• Source

Let us be Practical: Table 1: Production of Food Grains in India
in 2008-09(Total in Lakh Tonnes, and Percentage)
Footnote: In ‘others’, all remaining food grains are included
Source: Economic Survey, 2010-11
Let us construct a table,showing its variouscomponents, given thefollowing information:In 2008 – 09, total productionof foods grains was 2,344lakh tonnes of whichproduction of rice, wheat andother crops was 992, 807 and545 lakh tonnes, respectively.Percentage share of rice,wheat and other crops in thetotal production of foodgrains was 42.32, 34.43 and23.25 respectively.
Food Grain Production
Total Quantity Percentage of Total Food Grain Production
1. Rice
2. Wheat
3. Others
992
807
545
42.32
34.43
23.25
Total 2,344 100.00

Guidelines for the construction of a Table or Features of a Good table (see text book page 89 & 90)
Kinds of TableThere are three basis of classifying tables:-
1. Purpose of a table
2. Originality of a table
3. Construction of a table
1. According to Purpose of a table:-
a) General Purpose Table: It is that table which is of general use. It does not serve any specific purpose.
b) Special Purpose Table: It is that table which is prepared with some specific purpose in mind.
2. According to Originality of a table:-
a) Original Table: It is that table in which data are presented in the same form andmanner in which they are collected.
b) Derived Table: It is that table in which data are not presented in the same formand manner in which these are collected. Instead the data are first converted intoratios or percentage and then presented.

3. According to Construction of a table
1. Simple or One way Table: It shows only one characteristic of the data. It shows numberof students in a college:
2. Complex Table : It shows more than one characteristic of the data.
(a) Double or Two-way Table: Table According to Class and Sex.
Class No. of Students
XII BAII BAIII BA
2001008060
Total 440
Class No. of Students Total
Boys Girls
XII BAII BAIII BA
160406050
40602010
2001008060
Total 310 130 440

(b) Treble Table: It shows three characteristics of the data. Table According to Class, Sex and Habitation.
Class Boys Girls Total
Rural Urban Total Rural Urban Total Rural Urban Total
XII BAII BAIII BA
50101510
110304540
160406050
101555
3045155
40602010
60252015
140756045
2001008060
Total 85 225 310 35 95 130 120 320 440

(c) Manifold table: It shows more than three characteristics of the data. Table According to Class, Sex, Habitant and Marital Status.
Class Boys Girls Total
Rural Urban Rural Urban
Married Unmarried Married Unmarried Married Unmarried Married Unmarried
XII BAII BAIII BA
5555
5515105
10151520
90353020
2423
8432
5452
2518103
2001008060
Total 20 85 60 175 11 17 16 56 440
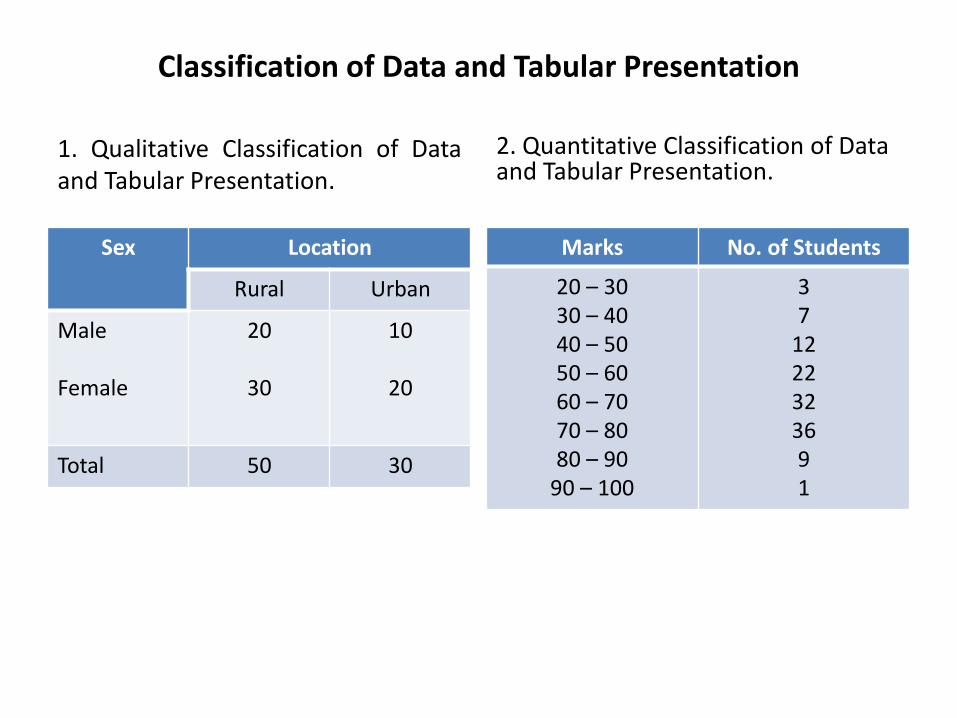
Classification of Data and Tabular Presentation
1. Qualitative Classification of Dataand Tabular Presentation.
Sex Location
Rural Urban
Male
Female
20
30
10
20
Total 50 30
2. Quantitative Classification of Data and Tabular Presentation.
Marks No. of Students
20 – 3030 – 4040 – 5050 – 6060 – 7070 – 80 80 – 90
90 – 100
37
1222323691

Classification of Data and Tabular Presentation
3. Temporal Classification - Times becomes the classifying variables
Year Sales (Units)
20062007200820092010
50,00070,00090,000
1,00,0002,00,000
4. Spatial Classification – Place orLocation becomes the classifyingvariables
Indian Students in No. of Students
USAUK
JapanRussia
Australia
50,00015,0005,0002,0007,000

Merits of Tabular Presentation
1. Simple and Brief Presentation
2. Facilitates Comparison
3. Easy Analysis
4. Highlights Characteristics of Data
5. Economical

Illustration 1. Page 96
Prepare a blank table to show the percentage of rural and urban population in India in 1981, 1991, 2001, 2011.
Table No. 01. Percentage Distribution of Urban and Rural Population in India
Census Year Percentage of Population Total
1981199120012011

Illustration 2. Page 96.
Point out the mistakes in the following table and rearrange it in the form of a good table.
Literate
Less than 20
20 -30
30 – 40 40 and above
Male
Female
Solution:1. There is no table no. and no title of the table.2. The table is without any head note3. Caption and sub-entries have not been properly noted.4. Total of the rows and columns has not been indicated.
Table 2. Distribution of Population (According to Age, Sex and Literate)(in lakhs)
Age Literate Illiterate
Male Female Total Male Female Total
20 or Less
20 - 30
30 - 40
40 & above
Total

Assignments(Theory)
Short Answer Type:1. What is meant by presentation of data?2. What is complex Table?3. What is two-way table?4. What is manifold table?5. What are the kinds of table?
Long Answer Type:1. Explain the merits of a Tabular Presentation.2. Write the components of a Table.3. Describe the general guidelines for the construction of as table or Characteristics.
(Essential Practical)
Text Book Page 85 – 98)Questions No: 1, 2, 3 and 4
DATE OF ASSIGNMENT : 11.08.2021DATE OF SUBMISSION : 16.8.2021

Things to remember
1. Students are informed to read text book (page 85 to98) as much as possible for self learning.
2. Students are informed to make respective notes fromthe given assignments in their note book or PDF orWord file for ready submission.
3. Internal marks/Internal assessment will be madebased on their respective notes/assignments.
4. If any query, kindly feel free to contact any timethrough phone/ internet/WhatsApp group/email.

Thank You