
Introduction to Web Mapping
368
Michael Dorman Introduction to Web Mapping
-
Upload
khangminh22 -
Category
Documents
-
view
3 -
download
0
Transcript of Introduction to Web Mapping

Michael Dorman
Introduction to Web Mapping

To my daughter Ariel,
who inspires me to explore new things
Contents
List of Tables vii
List of Figures ix
Preface xiii0.1 What is web mapping? . . . . . . . . . . . . . . . . . . . . . . . . . . . . . xiii0.2 What is JavaScript? . . . . . . . . . . . . . . . . . . . . . . . . . . . . . . . xv0.3 Why use JavaScript for web mapping? . . . . . . . . . . . . . . . . . . . . . xv0.4 Learning objectives . . . . . . . . . . . . . . . . . . . . . . . . . . . . . . . xvi0.5 Software . . . . . . . . . . . . . . . . . . . . . . . . . . . . . . . . . . . . . xvi0.6 Background knowledge . . . . . . . . . . . . . . . . . . . . . . . . . . . . . xviii0.7 Online version . . . . . . . . . . . . . . . . . . . . . . . . . . . . . . . . . . xix0.8 Acknowledgments . . . . . . . . . . . . . . . . . . . . . . . . . . . . . . . . xix
I Introduction to Web Technologies 1
1 HTML 31.1 Introduction . . . . . . . . . . . . . . . . . . . . . . . . . . . . . . . . . . . 31.2 How do people access the web? . . . . . . . . . . . . . . . . . . . . . . . . . 41.3 Web pages . . . . . . . . . . . . . . . . . . . . . . . . . . . . . . . . . . . . 51.4 Text editors . . . . . . . . . . . . . . . . . . . . . . . . . . . . . . . . . . . 71.5 What is HTML? . . . . . . . . . . . . . . . . . . . . . . . . . . . . . . . . . 81.6 Common HTML elements . . . . . . . . . . . . . . . . . . . . . . . . . . . . 111.7 id, class, and style attributes . . . . . . . . . . . . . . . . . . . . . . . . 281.8 Code layout . . . . . . . . . . . . . . . . . . . . . . . . . . . . . . . . . . . 301.9 Inspecting elements . . . . . . . . . . . . . . . . . . . . . . . . . . . . . . . 311.10 Exercise . . . . . . . . . . . . . . . . . . . . . . . . . . . . . . . . . . . . . . 32
2 CSS 332.1 Introduction . . . . . . . . . . . . . . . . . . . . . . . . . . . . . . . . . . . 332.2 What is CSS? . . . . . . . . . . . . . . . . . . . . . . . . . . . . . . . . . . 332.3 CSS rules . . . . . . . . . . . . . . . . . . . . . . . . . . . . . . . . . . . . . 332.4 CSS selectors . . . . . . . . . . . . . . . . . . . . . . . . . . . . . . . . . . . 342.5 CSS conflicts . . . . . . . . . . . . . . . . . . . . . . . . . . . . . . . . . . . 372.6 CSS inheritance . . . . . . . . . . . . . . . . . . . . . . . . . . . . . . . . . 382.7 Linking CSS to HTML . . . . . . . . . . . . . . . . . . . . . . . . . . . . . 392.8 CSS properties . . . . . . . . . . . . . . . . . . . . . . . . . . . . . . . . . . 412.9 Hurricane scale example . . . . . . . . . . . . . . . . . . . . . . . . . . . . . 512.10 Map description example . . . . . . . . . . . . . . . . . . . . . . . . . . . . 542.11 Exercise . . . . . . . . . . . . . . . . . . . . . . . . . . . . . . . . . . . . . . 58
3 JavaScript Basics 593.1 Introduction . . . . . . . . . . . . . . . . . . . . . . . . . . . . . . . . . . . 59
iii
iv Contents
3.2 What is JavaScript? . . . . . . . . . . . . . . . . . . . . . . . . . . . . . . . 593.3 Client-side vs. server-side . . . . . . . . . . . . . . . . . . . . . . . . . . . . 603.4 The JavaScript console . . . . . . . . . . . . . . . . . . . . . . . . . . . . . 603.5 Assignment . . . . . . . . . . . . . . . . . . . . . . . . . . . . . . . . . . . . 623.6 Data types . . . . . . . . . . . . . . . . . . . . . . . . . . . . . . . . . . . . 633.7 Functions . . . . . . . . . . . . . . . . . . . . . . . . . . . . . . . . . . . . . 713.8 Methods . . . . . . . . . . . . . . . . . . . . . . . . . . . . . . . . . . . . . 723.9 Scope . . . . . . . . . . . . . . . . . . . . . . . . . . . . . . . . . . . . . . . 743.10 Flow control . . . . . . . . . . . . . . . . . . . . . . . . . . . . . . . . . . . 753.11 JavaScript Object Notation (JSON) . . . . . . . . . . . . . . . . . . . . . . 813.12 Exercise . . . . . . . . . . . . . . . . . . . . . . . . . . . . . . . . . . . . . . 84
4 JavaScript Interactivity 874.1 Introduction . . . . . . . . . . . . . . . . . . . . . . . . . . . . . . . . . . . 874.2 The Document Object Model (DOM) . . . . . . . . . . . . . . . . . . . . . 874.3 Accessing and modifying elements . . . . . . . . . . . . . . . . . . . . . . . 894.4 Event listeners . . . . . . . . . . . . . . . . . . . . . . . . . . . . . . . . . . 914.5 Hello example . . . . . . . . . . . . . . . . . . . . . . . . . . . . . . . . . . 934.6 Poles example . . . . . . . . . . . . . . . . . . . . . . . . . . . . . . . . . . 964.7 Operating on multiple selections . . . . . . . . . . . . . . . . . . . . . . . . 974.8 Getting and setting input values . . . . . . . . . . . . . . . . . . . . . . . . 1004.9 Multiple event listeners . . . . . . . . . . . . . . . . . . . . . . . . . . . . . 1014.10 The event object . . . . . . . . . . . . . . . . . . . . . . . . . . . . . . . . . 1024.11 Modifying page based on data . . . . . . . . . . . . . . . . . . . . . . . . . 1054.12 Calculator example . . . . . . . . . . . . . . . . . . . . . . . . . . . . . . . 1094.13 Exercise . . . . . . . . . . . . . . . . . . . . . . . . . . . . . . . . . . . . . . 111
5 Web Servers 1135.1 Introduction . . . . . . . . . . . . . . . . . . . . . . . . . . . . . . . . . . . 1135.2 Web servers . . . . . . . . . . . . . . . . . . . . . . . . . . . . . . . . . . . 1145.3 Communicating through HTTP . . . . . . . . . . . . . . . . . . . . . . . . 1155.4 Static vs. dynamic servers . . . . . . . . . . . . . . . . . . . . . . . . . . . . 1165.5 URLs and file structure . . . . . . . . . . . . . . . . . . . . . . . . . . . . . 1205.6 Running a static server . . . . . . . . . . . . . . . . . . . . . . . . . . . . . 123
II Web Mapping with Leaflet 135
6 Leaflet 1376.1 Introduction . . . . . . . . . . . . . . . . . . . . . . . . . . . . . . . . . . . 1376.2 What is a web map? . . . . . . . . . . . . . . . . . . . . . . . . . . . . . . . 1376.3 What is Leaflet? . . . . . . . . . . . . . . . . . . . . . . . . . . . . . . . . . 1386.4 Alternatives to Leaflet . . . . . . . . . . . . . . . . . . . . . . . . . . . . . . 1386.5 Creating a basic web map . . . . . . . . . . . . . . . . . . . . . . . . . . . . 1406.6 Adding vector layers . . . . . . . . . . . . . . . . . . . . . . . . . . . . . . . 1546.7 Adding popups . . . . . . . . . . . . . . . . . . . . . . . . . . . . . . . . . . 1596.8 Adding a description . . . . . . . . . . . . . . . . . . . . . . . . . . . . . . 1606.9 Introducing map events . . . . . . . . . . . . . . . . . . . . . . . . . . . . . 1636.10 Exercise . . . . . . . . . . . . . . . . . . . . . . . . . . . . . . . . . . . . . . 167
7 GeoJSON 1697.1 Introduction . . . . . . . . . . . . . . . . . . . . . . . . . . . . . . . . . . . 1697.2 What is GeoJSON? . . . . . . . . . . . . . . . . . . . . . . . . . . . . . . . 169
Contents v
7.3 GeoJSON structure . . . . . . . . . . . . . . . . . . . . . . . . . . . . . . . 1707.4 Editing GeoJSON . . . . . . . . . . . . . . . . . . . . . . . . . . . . . . . . 1787.5 Adding GeoJSON to Leaflet map . . . . . . . . . . . . . . . . . . . . . . . 1817.6 GeoJSON viewer example . . . . . . . . . . . . . . . . . . . . . . . . . . . . 1847.7 Ajax and the fetch API . . . . . . . . . . . . . . . . . . . . . . . . . . . . 1887.8 Loading GeoJSON files . . . . . . . . . . . . . . . . . . . . . . . . . . . . . 1927.9 Exercise . . . . . . . . . . . . . . . . . . . . . . . . . . . . . . . . . . . . . . 196
8 Symbology and Interactivity 1978.1 Introduction . . . . . . . . . . . . . . . . . . . . . . . . . . . . . . . . . . . 1978.2 L.geoJSON options . . . . . . . . . . . . . . . . . . . . . . . . . . . . . . . . 1978.3 Constant style . . . . . . . . . . . . . . . . . . . . . . . . . . . . . . . . . . 1988.4 Varying style . . . . . . . . . . . . . . . . . . . . . . . . . . . . . . . . . . . 1998.5 Constructing popups from data . . . . . . . . . . . . . . . . . . . . . . . . 2078.6 Adding a legend . . . . . . . . . . . . . . . . . . . . . . . . . . . . . . . . . 2108.7 Dynamic style . . . . . . . . . . . . . . . . . . . . . . . . . . . . . . . . . . 2138.8 Exercise . . . . . . . . . . . . . . . . . . . . . . . . . . . . . . . . . . . . . . 220
III Databases 223
9 Databases 2259.1 Introduction . . . . . . . . . . . . . . . . . . . . . . . . . . . . . . . . . . . 2259.2 What is CARTO? . . . . . . . . . . . . . . . . . . . . . . . . . . . . . . . . 2269.3 Databases . . . . . . . . . . . . . . . . . . . . . . . . . . . . . . . . . . . . 2279.4 Spatial databases . . . . . . . . . . . . . . . . . . . . . . . . . . . . . . . . 2279.5 What is PostGIS? . . . . . . . . . . . . . . . . . . . . . . . . . . . . . . . . 2299.6 What is SQL? . . . . . . . . . . . . . . . . . . . . . . . . . . . . . . . . . . 2299.7 The CARTO SQL API . . . . . . . . . . . . . . . . . . . . . . . . . . . . . 2339.8 CARTO and Leaflet . . . . . . . . . . . . . . . . . . . . . . . . . . . . . . . 2409.9 Exercise . . . . . . . . . . . . . . . . . . . . . . . . . . . . . . . . . . . . . . 242
10 Non-spatial Queries 24510.1 Introduction . . . . . . . . . . . . . . . . . . . . . . . . . . . . . . . . . . . 24510.2 Subsetting with SQL . . . . . . . . . . . . . . . . . . . . . . . . . . . . . . 24510.3 Creating a dropdown menu . . . . . . . . . . . . . . . . . . . . . . . . . . . 24810.4 Populating dropdown options . . . . . . . . . . . . . . . . . . . . . . . . . . 25110.5 Updating the map . . . . . . . . . . . . . . . . . . . . . . . . . . . . . . . . 25710.6 Refactoring the code . . . . . . . . . . . . . . . . . . . . . . . . . . . . . . . 26010.7 Exercise . . . . . . . . . . . . . . . . . . . . . . . . . . . . . . . . . . . . . . 264
11 Spatial Queries 26711.1 Introduction . . . . . . . . . . . . . . . . . . . . . . . . . . . . . . . . . . . 26711.2 Adding markers on click . . . . . . . . . . . . . . . . . . . . . . . . . . . . . 26711.3 Spatial PostGIS operators . . . . . . . . . . . . . . . . . . . . . . . . . . . 27311.4 Adding nearest points to map . . . . . . . . . . . . . . . . . . . . . . . . . 27711.5 Drawing line connectors . . . . . . . . . . . . . . . . . . . . . . . . . . . . . 28011.6 Exercise . . . . . . . . . . . . . . . . . . . . . . . . . . . . . . . . . . . . . . 283
IV Advanced Topics 285
12 Client-side Geoprocessing 28712.1 Introduction . . . . . . . . . . . . . . . . . . . . . . . . . . . . . . . . . . . 287
vi Contents
12.2 Geoprocessing with Turf.js . . . . . . . . . . . . . . . . . . . . . . . . . . . 28812.3 Great Circle line . . . . . . . . . . . . . . . . . . . . . . . . . . . . . . . . . 28912.4 Continuously updated TIN . . . . . . . . . . . . . . . . . . . . . . . . . . . 29112.5 Clustering . . . . . . . . . . . . . . . . . . . . . . . . . . . . . . . . . . . . 29912.6 Heatmaps with Leaflet.heat . . . . . . . . . . . . . . . . . . . . . . . . . . . 30712.7 Exercise . . . . . . . . . . . . . . . . . . . . . . . . . . . . . . . . . . . . . . 308
13 Collaborative Mapping 31113.1 Introduction . . . . . . . . . . . . . . . . . . . . . . . . . . . . . . . . . . . 31113.2 Crowdsourcing . . . . . . . . . . . . . . . . . . . . . . . . . . . . . . . . . . 31113.3 The drawing control . . . . . . . . . . . . . . . . . . . . . . . . . . . . . . . 31313.4 Working with drawn items . . . . . . . . . . . . . . . . . . . . . . . . . . . 31613.5 Submission form . . . . . . . . . . . . . . . . . . . . . . . . . . . . . . . . . 31913.6 Sending features to the database . . . . . . . . . . . . . . . . . . . . . . . . 32413.7 Exercise . . . . . . . . . . . . . . . . . . . . . . . . . . . . . . . . . . . . . . 334
V Appendices 335
Appendix 337
A Associated Files 337
B List of Examples 341
C List of Exercise Solutions 343
Bibliography 345
Index 347
List of Tables
0.1 Examples of web maps for different purposes . . . . . . . . . . . . . . . . . xiii0.2 JavaScript library versions used in the book . . . . . . . . . . . . . . . . . . xviii
1.1 Popular web browsers . . . . . . . . . . . . . . . . . . . . . . . . . . . . . . 41.2 HTML element structure . . . . . . . . . . . . . . . . . . . . . . . . . . . . 81.3 HTML element attribute structure . . . . . . . . . . . . . . . . . . . . . . . 91.4 Common HTML elements . . . . . . . . . . . . . . . . . . . . . . . . . . . . 111.5 HTML input elements . . . . . . . . . . . . . . . . . . . . . . . . . . . . . . 25
2.1 CSS rule structure . . . . . . . . . . . . . . . . . . . . . . . . . . . . . . . . 342.2 CSS selectors targeting specific elements . . . . . . . . . . . . . . . . . . . . 352.3 CSS selector combinations . . . . . . . . . . . . . . . . . . . . . . . . . . . . 352.4 Common CSS properties . . . . . . . . . . . . . . . . . . . . . . . . . . . . . 412.5 Methods for specifying color in CSS . . . . . . . . . . . . . . . . . . . . . . 42
3.1 JavaScript data types . . . . . . . . . . . . . . . . . . . . . . . . . . . . . . 643.2 JavaScript comparison operators . . . . . . . . . . . . . . . . . . . . . . . . 66
4.1 Commonly used browser event types . . . . . . . . . . . . . . . . . . . . . . 92
6.1 Popular web-mapping libraries . . . . . . . . . . . . . . . . . . . . . . . . . 1386.2 Commonly used Leaflet layer types . . . . . . . . . . . . . . . . . . . . . . . 158
7.1 GeoJSON geometry types . . . . . . . . . . . . . . . . . . . . . . . . . . . . 1717.2 GeoJSON single-part geometries . . . . . . . . . . . . . . . . . . . . . . . . 1737.3 GeoJSON multi-part geometries . . . . . . . . . . . . . . . . . . . . . . . . . 1747.4 GeoJSON geometry collection . . . . . . . . . . . . . . . . . . . . . . . . . . 1757.5 GeoJSON feature . . . . . . . . . . . . . . . . . . . . . . . . . . . . . . . . . 1767.6 GeoJSON feature collection . . . . . . . . . . . . . . . . . . . . . . . . . . . 177
12.1 Turf.js functions used in Chapter 12 . . . . . . . . . . . . . . . . . . . . . . 288
B.1 List of examples . . . . . . . . . . . . . . . . . . . . . . . . . . . . . . . . . 341
C.1 List of exercise solutions . . . . . . . . . . . . . . . . . . . . . . . . . . . . . 343
vii

List of Figures
1 Earth weather on https://earth.nullschool.net . . . . . . . . . . . . . xiv2 Programming language popularity . . . . . . . . . . . . . . . . . . . . . . . xv3 Technologies timeline . . . . . . . . . . . . . . . . . . . . . . . . . . . . . . . xvii
1.1 Screenshot of example-01-01.html . . . . . . . . . . . . . . . . . . . . . . . 51.2 HTML document source code . . . . . . . . . . . . . . . . . . . . . . . . . . 61.3 HTML document and its source code . . . . . . . . . . . . . . . . . . . . . . 71.4 Block vs. inline HTML elements . . . . . . . . . . . . . . . . . . . . . . . . 111.5 Screenshot of example-01-02.html . . . . . . . . . . . . . . . . . . . . . . . 181.6 Screenshot of example-01-03.html . . . . . . . . . . . . . . . . . . . . . . . 201.7 Screenshot of example-01-04.html . . . . . . . . . . . . . . . . . . . . . . . 221.8 Screenshot of example-01-05.html . . . . . . . . . . . . . . . . . . . . . . . 231.9 Screenshot of example-01-06.html . . . . . . . . . . . . . . . . . . . . . . . 261.10 Using the Inspect Element tool in Chrome . . . . . . . . . . . . . . . . . . . 31
2.1 HTML elements considered as boxes . . . . . . . . . . . . . . . . . . . . . . 342.2 Screenshot of example-02-01.html . . . . . . . . . . . . . . . . . . . . . . . 382.3 Screenshot of example-02-02.html . . . . . . . . . . . . . . . . . . . . . . . 442.4 Screenshot of example-02-03.html . . . . . . . . . . . . . . . . . . . . . . . 452.5 Margin, border, and padding around an HTML element . . . . . . . . . . . 462.6 Screenshot of example-02-04.html . . . . . . . . . . . . . . . . . . . . . . . 482.7 Screenshot of example-02-05.html . . . . . . . . . . . . . . . . . . . . . . . 512.8 Screenshot of example-02-06.html . . . . . . . . . . . . . . . . . . . . . . . 522.9 Screenshot of example-02-07.html . . . . . . . . . . . . . . . . . . . . . . . 542.10 Screenshot of example-02-08.html . . . . . . . . . . . . . . . . . . . . . . . 552.11 Screenshot of example-02-09.html . . . . . . . . . . . . . . . . . . . . . . . 572.12 Screenshot of example-02-10.html . . . . . . . . . . . . . . . . . . . . . . . 572.13 Screenshot of example-02-11.html . . . . . . . . . . . . . . . . . . . . . . . 58
3.1 The JavaScript console in Chrome . . . . . . . . . . . . . . . . . . . . . . . 613.2 A JavaScript object . . . . . . . . . . . . . . . . . . . . . . . . . . . . . . . 68
4.1 The Document Object Model (DOM) . . . . . . . . . . . . . . . . . . . . . 884.2 Screenshot of example-04-01.html . . . . . . . . . . . . . . . . . . . . . . . 954.3 Screenshot of example-04-02.html . . . . . . . . . . . . . . . . . . . . . . . 974.4 Screenshot of example-04-03.html . . . . . . . . . . . . . . . . . . . . . . . 984.5 Screenshot of example-04-04.html . . . . . . . . . . . . . . . . . . . . . . . 1024.6 Screenshot of example-04-05.html . . . . . . . . . . . . . . . . . . . . . . . 1044.7 Screenshot of example-04-06.html . . . . . . . . . . . . . . . . . . . . . . . 1094.8 Screenshot of example-04-07.html . . . . . . . . . . . . . . . . . . . . . . . 1114.9 Screenshot of solution-04.html . . . . . . . . . . . . . . . . . . . . . . . . 112
5.1 Client-server communication through HTTP . . . . . . . . . . . . . . . . . . 114
ix
x List of Figures
5.2 Static server architecture . . . . . . . . . . . . . . . . . . . . . . . . . . . . 1175.3 Dynamic server architecture . . . . . . . . . . . . . . . . . . . . . . . . . . . 1185.4 Running Python’s simple HTTP server . . . . . . . . . . . . . . . . . . . . . 1255.5 Determining the IP address using ipconfig . . . . . . . . . . . . . . . . . . 1275.6 Creating a new repository on GitHub . . . . . . . . . . . . . . . . . . . . . 1305.7 The Create repository button . . . . . . . . . . . . . . . . . . . . . . . . . . 1305.8 Newly created repository, with README.md file . . . . . . . . . . . . . . . . . 1315.9 Setting the main branch as GitHub Pages source . . . . . . . . . . . . . . . 1315.10 File upload screen . . . . . . . . . . . . . . . . . . . . . . . . . . . . . . . . 1325.11 The Commit changes button . . . . . . . . . . . . . . . . . . . . . . . . . . 1325.12 The repository with uploaded files . . . . . . . . . . . . . . . . . . . . . . . 133
6.1 Map projections: EPSG:4326 vs. EPSG:3857 . . . . . . . . . . . . . . . . . . 1466.2 Tiles for zoom levels 0, 1 and 2 . . . . . . . . . . . . . . . . . . . . . . . . . 1476.3 Individual raster tile . . . . . . . . . . . . . . . . . . . . . . . . . . . . . . . 1486.4 Screenshot of example-06-01.html . . . . . . . . . . . . . . . . . . . . . . . 1496.5 Screenshot of example-06-02.html . . . . . . . . . . . . . . . . . . . . . . . 1526.6 Network traffic when loading tiles . . . . . . . . . . . . . . . . . . . . . . . . 1526.7 Interactive preview of tile layer providers . . . . . . . . . . . . . . . . . . . 1536.8 Screenshot of example-06-03.html . . . . . . . . . . . . . . . . . . . . . . . 1556.9 Screenshot of example-06-04.html . . . . . . . . . . . . . . . . . . . . . . . 1576.10 Screenshot of example-06-05.html . . . . . . . . . . . . . . . . . . . . . . . 1586.11 Screenshot of example-06-06.html . . . . . . . . . . . . . . . . . . . . . . . 1606.12 Map description . . . . . . . . . . . . . . . . . . . . . . . . . . . . . . . . . 1616.13 Screenshot of example-06-07.html . . . . . . . . . . . . . . . . . . . . . . . 1636.14 A popup displaying clicked location coordinates . . . . . . . . . . . . . . . . 1656.15 Screenshot of example-06-08.html . . . . . . . . . . . . . . . . . . . . . . . 1666.16 Screenshot of solution-06.html . . . . . . . . . . . . . . . . . . . . . . . . 167
7.1 Simple Feature geometry types . . . . . . . . . . . . . . . . . . . . . . . . . 1727.2 The geojson.io web application . . . . . . . . . . . . . . . . . . . . . . . . 1787.3 The mapshaper.org web application . . . . . . . . . . . . . . . . . . . . . . 1807.4 Screenshot of example-07-01.html . . . . . . . . . . . . . . . . . . . . . . . 1837.5 Screenshot of example-07-02.html . . . . . . . . . . . . . . . . . . . . . . . 1877.6 Traditional model vs. Ajax . . . . . . . . . . . . . . . . . . . . . . . . . . . 1897.7 How Ajax works . . . . . . . . . . . . . . . . . . . . . . . . . . . . . . . . . 1907.8 Auto-complete in Google search . . . . . . . . . . . . . . . . . . . . . . . . . 1907.9 Screenshot of example-07-03.html . . . . . . . . . . . . . . . . . . . . . . . 1947.10 Screenshot of example-07-04.html . . . . . . . . . . . . . . . . . . . . . . . 1957.11 Cross-Origin Resource Sharing (CORS) error . . . . . . . . . . . . . . . . . 1957.12 Screenshot of solution-07.html . . . . . . . . . . . . . . . . . . . . . . . . 196
8.1 Screenshot of example-08-01.html . . . . . . . . . . . . . . . . . . . . . . . 1998.2 Screenshot of example-08-02.html . . . . . . . . . . . . . . . . . . . . . . . 2018.3 Setting symbology in QGIS . . . . . . . . . . . . . . . . . . . . . . . . . . . 2038.4 ColorBrewer scales . . . . . . . . . . . . . . . . . . . . . . . . . . . . . . . . 2048.5 Screenshot of example-08-03.html . . . . . . . . . . . . . . . . . . . . . . . 2078.6 Screenshot of example-08-04.html . . . . . . . . . . . . . . . . . . . . . . . 2098.7 Screenshot of example-08-05.html . . . . . . . . . . . . . . . . . . . . . . . 2128.8 Screenshot of example-08-06.html . . . . . . . . . . . . . . . . . . . . . . . 2158.9 Screenshot of example-08-07.html . . . . . . . . . . . . . . . . . . . . . . . 218
List of Figures xi
8.10 Screenshot of example-08-08.html . . . . . . . . . . . . . . . . . . . . . . . 2218.11 Screenshot of solution-08.html . . . . . . . . . . . . . . . . . . . . . . . . 222
9.1 Relational database example . . . . . . . . . . . . . . . . . . . . . . . . . . 2289.2 The plants table on the CARTO web interface . . . . . . . . . . . . . . . . 2359.3 GeoJSON from CARTO displayed in QGIS . . . . . . . . . . . . . . . . . . 2379.4 CSV from CARTO displayed in LibreOffice Calc . . . . . . . . . . . . . . . 2389.5 Datasets screen on CARTO . . . . . . . . . . . . . . . . . . . . . . . . . . . 2399.6 The file upload screen in the CARTO web interface . . . . . . . . . . . . . . 2399.7 Screenshot of example-09-01.html . . . . . . . . . . . . . . . . . . . . . . . 2429.8 Screenshot of solution-09.html . . . . . . . . . . . . . . . . . . . . . . . . 243
10.1 Iris mariae, a rare Iris species found in Israel . . . . . . . . . . . . . . . . . 24710.2 Screenshot of example-10-01.html . . . . . . . . . . . . . . . . . . . . . . . 24810.3 Screenshot of example-10-02.html . . . . . . . . . . . . . . . . . . . . . . . 25110.4 Screenshot of example-10-03.html . . . . . . . . . . . . . . . . . . . . . . . 25610.5 Species names printed with console.log . . . . . . . . . . . . . . . . . . . 25710.6 Screenshot of example-10-04.html . . . . . . . . . . . . . . . . . . . . . . . 26110.7 Screenshot of example-10-05.html . . . . . . . . . . . . . . . . . . . . . . . 26410.8 Screenshot of solution-10.html . . . . . . . . . . . . . . . . . . . . . . . . 265
11.1 Screenshot of example-11-01.html . . . . . . . . . . . . . . . . . . . . . . . 26811.2 Default and custom Leaflet markers . . . . . . . . . . . . . . . . . . . . . . 26911.3 Inspecting Leaflet icon <img> element . . . . . . . . . . . . . . . . . . . . . 27011.4 PNG image properties . . . . . . . . . . . . . . . . . . . . . . . . . . . . . . 27111.5 Icon anchor point . . . . . . . . . . . . . . . . . . . . . . . . . . . . . . . . . 27211.6 Screenshot of example-11-02.html . . . . . . . . . . . . . . . . . . . . . . . 27211.7 Screenshot of example-11-03.html . . . . . . . . . . . . . . . . . . . . . . . 28011.8 Screenshot of example-11-04.html . . . . . . . . . . . . . . . . . . . . . . . 28311.9 Screenshot of solution-11.html . . . . . . . . . . . . . . . . . . . . . . . . 284
12.1 Screenshot of example-12-01.html . . . . . . . . . . . . . . . . . . . . . . . 29312.2 Screenshot of example-12-02.html . . . . . . . . . . . . . . . . . . . . . . . 29412.3 Draggable marker in the Google Maps . . . . . . . . . . . . . . . . . . . . . 29512.4 Screenshot of example-12-03.html . . . . . . . . . . . . . . . . . . . . . . . 29612.5 Screenshot of example-12-04.html . . . . . . . . . . . . . . . . . . . . . . . 29912.6 Screenshot of example-12-05.html . . . . . . . . . . . . . . . . . . . . . . . 30312.7 Screenshot of example-12-06.html . . . . . . . . . . . . . . . . . . . . . . . 30412.8 Screenshot of example-12-07.html . . . . . . . . . . . . . . . . . . . . . . . 30612.9 Screenshot of example-12-08.html . . . . . . . . . . . . . . . . . . . . . . . 30912.10Screenshot of solution-12.html . . . . . . . . . . . . . . . . . . . . . . . . 309
13.1 The iD editor for OpenStreetMap . . . . . . . . . . . . . . . . . . . . . . . . 31213.2 The Leaflet.draw control . . . . . . . . . . . . . . . . . . . . . . . . . . . . . 31413.3 Screenshot of example-13-01.html . . . . . . . . . . . . . . . . . . . . . . . 31513.4 Screenshot of example-13-02.html . . . . . . . . . . . . . . . . . . . . . . . 31713.5 Screenshot of example-13-03.html . . . . . . . . . . . . . . . . . . . . . . . 31913.6 A form inside a Leaflet popup . . . . . . . . . . . . . . . . . . . . . . . . . . 32013.7 Screenshot of example-13-04.html . . . . . . . . . . . . . . . . . . . . . . . 32413.8 Creating an empty table on CARTO . . . . . . . . . . . . . . . . . . . . . . 32513.9 Granting INSERT permission on CARTO . . . . . . . . . . . . . . . . . . . . 32813.10Screenshot of example-13-05.html . . . . . . . . . . . . . . . . . . . . . . . 333

Preface
0.1 What is web mapping?A web map1 is an interactive display of geographic information, in the form of a web page,that you can use to tell stories and answer questions. In the past, most digital geographicinformation was confined to specialized software on desktop PCs and could not be easilyshared. With the advent of web mapping, geographical information can be shared, visualized,and edited in the browser. The most important advantage to this is accessibility: a web map,just like any website, can be reached by anyone from any device that has an internet browserand an internet connection.
Web maps are interactive. The term interactive implies that the viewer can interact withthe map. This can mean selecting different map data layers or features to view, zoominginto a particular part of the map that you are interested in, inspecting feature properties,editing existing content, or submitting new content, and so on.
Web maps are also said to be powered by the web, rather than just digital maps on theweb. This means that the map is usually not self-contained; in other words, it depends onthe internet. At least some of the content displayed on a web maps is usually loaded fromother locations on the web, such as a tile server (Section 6.5.10.2).
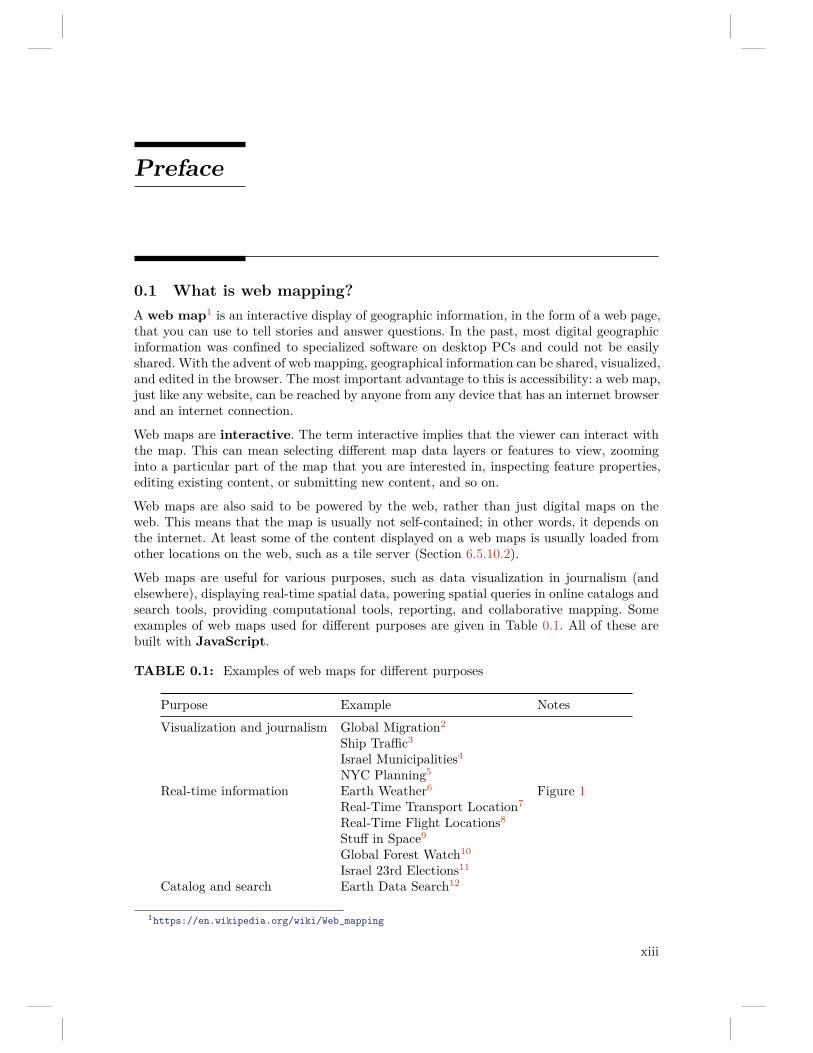
Web maps are useful for various purposes, such as data visualization in journalism (andelsewhere), displaying real-time spatial data, powering spatial queries in online catalogs andsearch tools, providing computational tools, reporting, and collaborative mapping. Someexamples of web maps used for different purposes are given in Table 0.1. All of these arebuilt with JavaScript.
TABLE 0.1: Examples of web maps for different purposes
Purpose Example NotesVisualization and journalism Global Migration2
Ship Traffic3
Israel Municipalities4
NYC Planning5
Real-time information Earth Weather6 Figure 1Real-Time Transport Location7
Real-Time Flight Locations8
Stuff in Space9
Global Forest Watch10
Israel 23rd Elections11
Catalog and search Earth Data Search12
1https://en.wikipedia.org/wiki/Web_mapping
xiii
xiv Preface
Purpose Example NotesComputational tools Google Maps13
SunCalc14
geojson.io15 see Section 7.4.1mapshaper16 see Section 7.4.2Route Planner17
Reporting and collaboration OpenStreetMap18 see Section 13.2Falling Fruit19
FIGURE 1: Real-time earth weather visualization on https://earth.nullschool.net
2http://metrocosm.com/global-migration-map.html3https://www.shipmap.org/4http://mindthemap.info/mtm/5https://zola.planning.nyc.gov/6https://earth.nullschool.net/7https://traze.app/8https://www.flightradar24.com/9http://stuffin.space/
10https://www.globalforestwatch.org/11https://elections.kaplanopensource.co.il/12https://search.earthdata.nasa.gov/13https://www.google.com/maps14http://suncalc.net/15http://geojson.io/16http://mapshaper.org/17https://www.outdooractive.com/en/routeplanner/18http://www.openstreetmap.org19https://fallingfruit.org/
What is JavaScript? xv
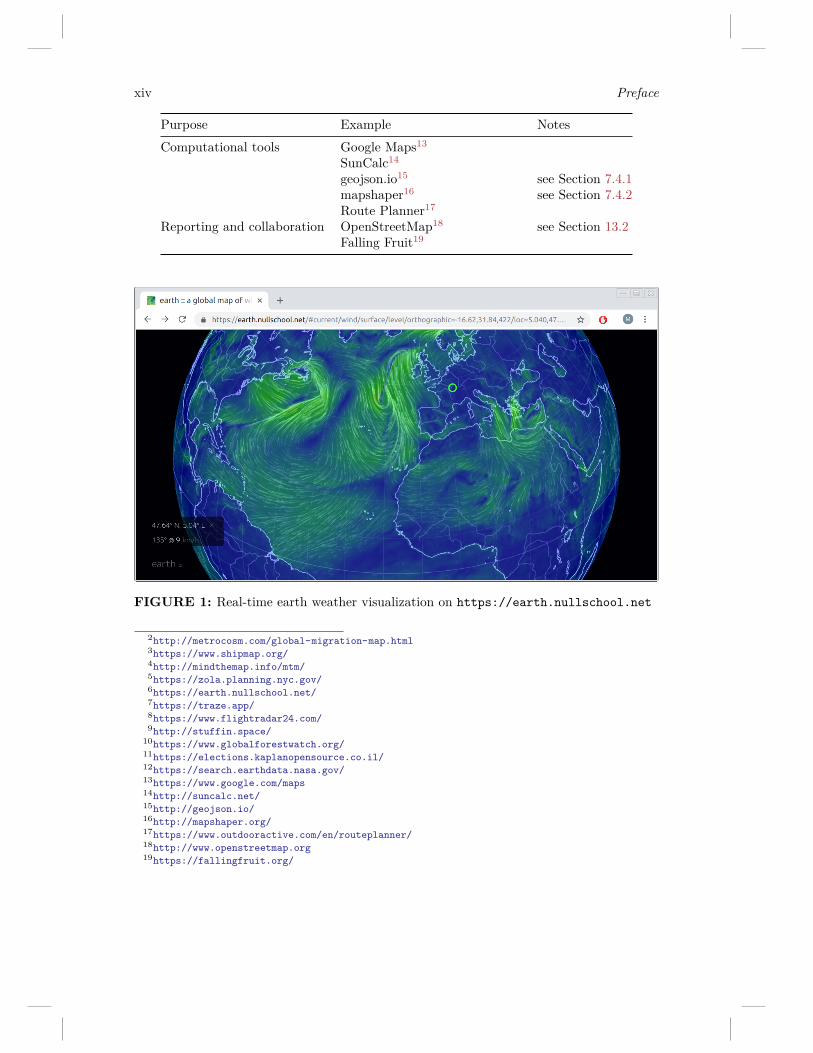
0.2 What is JavaScript?JavaScript is a programming language, primarily used to control interactive behavior inweb pages. Alongside HTML and CSS, JavaScript is one of the three core technologies ofthe web. JavaScript is the only programming language that can run in the web browser,and it is used by ~95 percent of websites. The importance of the internet thus makesJavaScript one of the most popular programming20 languages (Figure 2).
55.3% 54.2%51.6%
45.2%
35.9%
31.5% 30.7%27.3%
24.3%
20.1%
0%
20%
40%
60%
JavaScript HTML CSS SQL Java Bash/Shell Python C# PHP C++
Wor
ked
with
the
lang
uage
(%
)
FIGURE 2: Programming language popularity, based on the StackOverflow survey for2018
JavaScript and web development are huge topics. In this book, we are going to learnJavaScript from the specific point of view of web mapping.
0.3 Why use JavaScript for web mapping?The availability of code-free, graphical interfaces for making sophisticated web maps remainsan ongoing goal for the web-mapping community. Several platforms now provide straight-forward interactive interfaces for building and publishing web maps and web-mapping ap-plications, such as:
• CARTO Builder21
20Based on the StackOverflow survey for 2018 (https://stackoverflow.blog/2018/05/30/public-data-release-of-stack-overflows-2018-developer-survey/).
21https://carto.com/builder/
xvi Preface
• Mapbox’s Studio22
• ESRI’s Configurable Apps23
• qgis2web Plugin for QGIS24
A more customizable, programmatic approach for building web maps is available throughscripting languages such as R and Python. Both languages have libraries that give theability to build web maps, using few lines of code and incorporating data from the userenvironment:
• leaflet25 and mapview26 (R packages)• folium27 (Python library)
All of the above eventually build HTML, CSS, and JavaScript code, with varying degreesof flexibility and customization.
Nevertheless, proficiency in the fundamental web technologies HTML, CSS, and JavaScripteventually allows web cartographers to control all low-level properties of the web map theyare building. That way, the user experience of web maps can be enhanced and customizedbeyond what is provided by either of the above “indirect,” or high-level, approaches. Forexample, the Leaflet web mapping JavaScript library has a wide range of plugins and exten-sions28, mostly unavailable in external tools and libraries unless using it directly, throughJavaScript coding (Sections 13.3 and 12.6).
0.4 Learning objectivesBy the end of this book, you will be able to:
• Build and publish basic websites and web maps• Use JavaScript to add interactive behavior in your maps• Connect you web map to a database to display large amounts of data• Include client-side geoprocessing functionality in your web map• Gain an understanding on how the web works, and a starting point for learning more
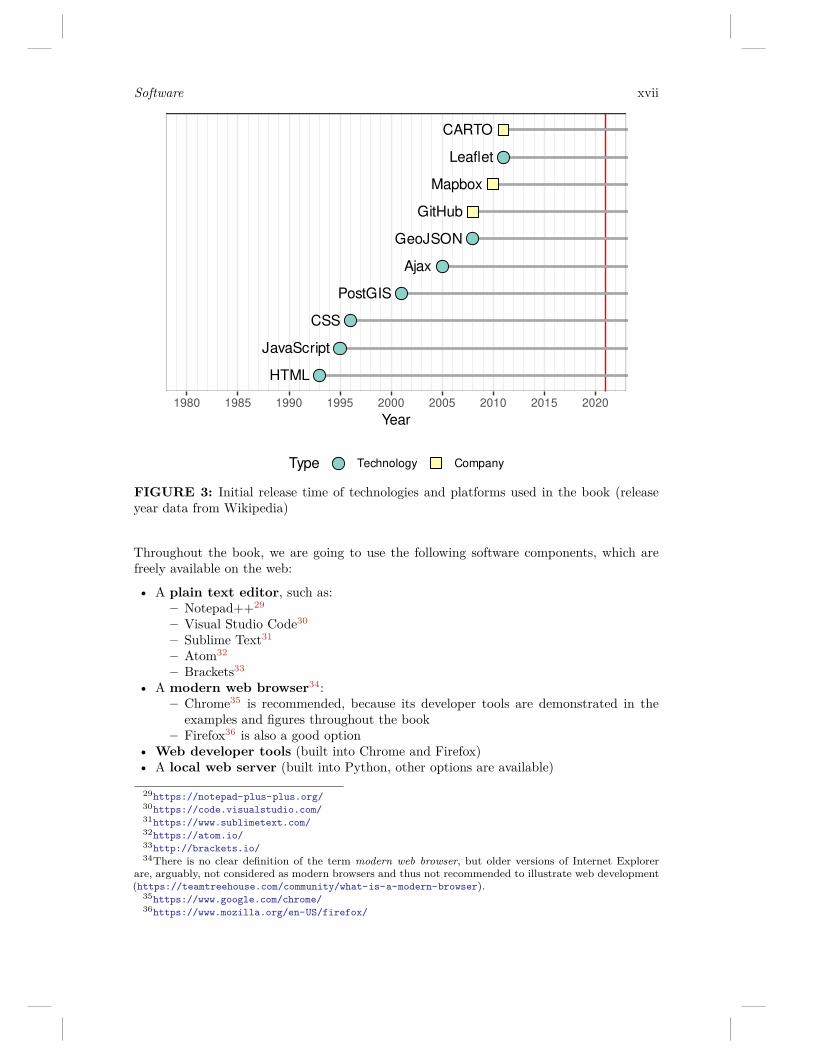
0.5 SoftwareThe field of web mapping, much like web development as a whole, is rapidly changing. Thebook thus intends to emphasize established technologies, libraries, and principles which areunlikely to go away soon. These include HTML, CSS, JavaScript, Leaflet, GeoJSON, Ajax,and PostGIS (Figure 3).
22https://www.mapbox.com/mapbox-studio/23http://www.esri.com/software/configurable-apps24https://github.com/tomchadwin/qgis2web25https://rstudio.github.io/leaflet/26https://r-spatial.github.io/mapview/27http://python-visualization.github.io/folium/28https://leafletjs.com/plugins.html
Software xvii
HTML
JavaScript
CSS
PostGIS
Ajax
GeoJSON
GitHub
Leaflet
Mapbox
CARTO
1980 1985 1990 1995 2000 2005 2010 2015 2020
Year
Type Technology Company
FIGURE 3: Initial release time of technologies and platforms used in the book (releaseyear data from Wikipedia)
Throughout the book, we are going to use the following software components, which arefreely available on the web:
• A plain text editor, such as:– Notepad++29
– Visual Studio Code30
– Sublime Text31
– Atom32
– Brackets33
• A modern web browser34:– Chrome35 is recommended, because its developer tools are demonstrated in the
examples and figures throughout the book– Firefox36 is also a good option
• Web developer tools (built into Chrome and Firefox)• A local web server (built into Python, other options are available)
29https://notepad-plus-plus.org/30https://code.visualstudio.com/31https://www.sublimetext.com/32https://atom.io/33http://brackets.io/34There is no clear definition of the term modern web browser, but older versions of Internet Explorer
are, arguably, not considered as modern browsers and thus not recommended to illustrate web development(https://teamtreehouse.com/community/what-is-a-modern-browser).
35https://www.google.com/chrome/36https://www.mozilla.org/en-US/firefox/
xviii Preface
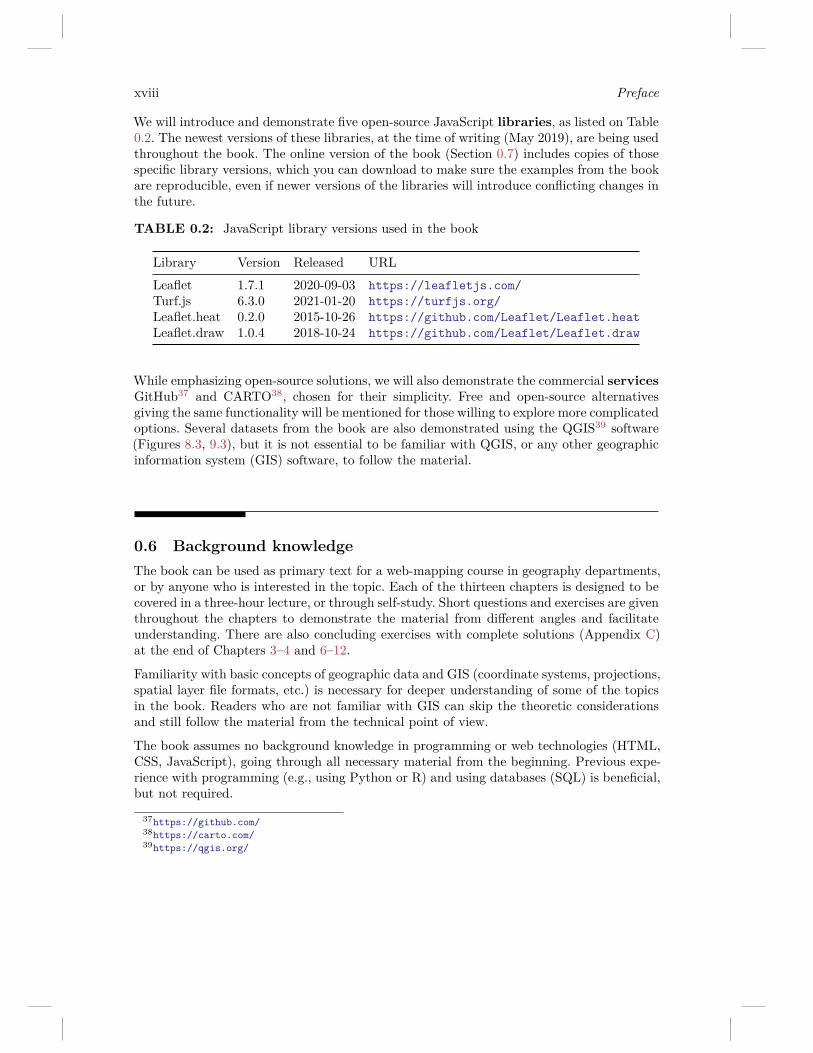
We will introduce and demonstrate five open-source JavaScript libraries, as listed on Table0.2. The newest versions of these libraries, at the time of writing (May 2019), are being usedthroughout the book. The online version of the book (Section 0.7) includes copies of thosespecific library versions, which you can download to make sure the examples from the bookare reproducible, even if newer versions of the libraries will introduce conflicting changes inthe future.
TABLE 0.2: JavaScript library versions used in the book
Library Version Released URLLeaflet 1.7.1 2020-09-03 https://leafletjs.com/Turf.js 6.3.0 2021-01-20 https://turfjs.org/Leaflet.heat 0.2.0 2015-10-26 https://github.com/Leaflet/Leaflet.heatLeaflet.draw 1.0.4 2018-10-24 https://github.com/Leaflet/Leaflet.draw
While emphasizing open-source solutions, we will also demonstrate the commercial servicesGitHub37 and CARTO38, chosen for their simplicity. Free and open-source alternativesgiving the same functionality will be mentioned for those willing to explore more complicatedoptions. Several datasets from the book are also demonstrated using the QGIS39 software(Figures 8.3, 9.3), but it is not essential to be familiar with QGIS, or any other geographicinformation system (GIS) software, to follow the material.
0.6 Background knowledgeThe book can be used as primary text for a web-mapping course in geography departments,or by anyone who is interested in the topic. Each of the thirteen chapters is designed to becovered in a three-hour lecture, or through self-study. Short questions and exercises are giventhroughout the chapters to demonstrate the material from different angles and facilitateunderstanding. There are also concluding exercises with complete solutions (Appendix C)at the end of Chapters 3–4 and 6–12.
Familiarity with basic concepts of geographic data and GIS (coordinate systems, projections,spatial layer file formats, etc.) is necessary for deeper understanding of some of the topicsin the book. Readers who are not familiar with GIS can skip the theoretic considerationsand still follow the material from the technical point of view.
The book assumes no background knowledge in programming or web technologies (HTML,CSS, JavaScript), going through all necessary material from the beginning. Previous expe-rience with programming (e.g., using Python or R) and using databases (SQL) is beneficial,but not required.
37https://github.com/38https://carto.com/39https://qgis.org/
Online version xix
0.7 Online versionThe online version of this book is freely available, with agreement from the publisher, atthe following addresses:
• http://geobgu.xyz/web-mapping/• https://web-mapping.surge.sh/
In addition to the content of the printed version, the online version includes live versionsand downloadable code for all ninety-plus complete examples (Appendix B) and exercisesolutions (Appendix C), as well as an additional appendix with instructions for setting upan SQL API (see Section 9.2.2).
0.8 AcknowledgmentsI thank the creators and contributors of the open-source tools used in this book, namelyLeaflet, Turf.js, Leaflet.heat, and Leaflet.draw (Table 0.2). Vladimir Agafonkin, the creatorof the Leaflet web-mapping library, deserves special mention here. Leaflet took open-sourceweb mapping to a new level: for me to write this book, and for readers to enter the fieldof web mapping, would have been much more difficult without Leaflet. I am also gratefulto Yihui Xie, whose bookdown (Xie, 2018, 2016) R package (R Core Team, 2018) greatlyfacilitated the technical process of writing the book.
Figure 6.1 was prepared using R packages sf (Pebesma, 2018) and rworldmap (South, 2011).Figure 7.1 and the images inside Tables 7.2–7.6 were also prepared using package sf. Figure8.4 was prepared using R package RColorBrewer (Neuwirth, 2014). Figures 8.3 and 9.3were prepared using QGIS (QGIS Development Team, 2018). The sample database shownin Figure 9.1 was prepared using data from R package nycflights13 (Wickham, 2018).Figures 6.2 and 6.3 display images of OpenStreetMap tiles (© OpenStreetMap contributors).
I would like to thank Rob Calver and Lara Spieker from CRC Press for working with meand supporting this project, starting from a talk with Rob at a conference in Brussels insummer 2017, going through project initiation, the professional review process, and up tofinalizing the manuscript and bringing it to press. I also thank Annie Sophia, Vaishali Singhand Jyotsna Jangra for the professional proofreading and production of the book. ShashiKumar and John Kimmel from CRC are acknowledged for their assistance in technicalissues.
This book is based on the materials of the course Introduction to JavaScript for Web Map-ping, given by the Department of Geography, Ben-Gurion University of the Negev, in Spring2018 and 2019. I am grateful to Prof. Tal Svoray and Prof. Itai Kloog from the departmentfor their guidance and encouragement during the development of course materials, and tothe students for valuable feedback. I thank Shai Sussman and three anonymous reviewersfor comments that greatly helped improve the manuscript.
Several figures in the book include icons from external sources: “computer,” “web page,”

xx Preface
and “car” icons by Freepik40, “folder” and “database” icons by Smashicons41, “gears” iconby Good Ware42, from https://www.flaticon.com/, licensed by CC 3.0 BY43.
40http://www.freepik.com41https://www.flaticon.com/authors/smashicons42https://www.flaticon.com/authors/good-ware43http://creativecommons.org/licenses/by/3.0/

Part I
Introduction to WebTechnologies

1HTML
1.1 IntroductionIn this chapter, we introduce the most basic and fundamental component of web technolo-gies: HTML. As we will see, HTML is a data format used to encode the contents andstructure of web pages. HTML is usually stored in plain text files with the .html file exten-sion. Every time one accesses a web page, using a web browser, the respective HTML filefor that web page is transferred and decoded into the visual image that we see on screen.Simple web pages, such as the ones we build in this chapter, are composed of nothing butHTML code contained in a single .html file.
Starting from this chapter and onward, we are going to present computer code examples.Some examples are short, separate pieces of code used to illustrate an idea or concept. Otherexamples include the complete source code of a web page, which you can open and displayin the browser, as well as modify and experiment with. The way that each of the completecode examples will appear when opened with the browser is shown in a separate figure, suchas in Figure 1.1. As mentioned in Section 0.7, the online version of this book contains liveversions of all ninety-plus complete examples (Appendices B–C), as well as a downloadablefolder with all code files to experiment with the examples on your own computer (AppendixA).
Learning programming requires a lot of practice, so it is highly recommended to open theexamples on your computer as you go along through the book. Better yet, you can modifythe code of each example and observe the way that the displayed result changes, to makesure you understand what is the purpose of each code component. For instance, the firstexample (Figure 1.1) displays a simple web page with one heading and one paragraph—youcan try to modify its source code (see Section 1.4 to learn how) to change the contents ofthe heading and/or paragraph, to add a second paragraph below the first one, and so on.
Chapter 2 in Introduction to Data Technologies (Murrell, 2009) gives a gentle and gradualintroduction to HTML as well as the practice of writing computer code1. It is a highlyrecommended complementary reading to the present chapter, especially for readers who arenew to computer programming.
1The book has a freely available PDF version here: https://www.stat.auckland.ac.nz/~paul/ItDT/.
3
4 1 HTML
1.2 How do people access the web?1.2.1 Web browsersPeople access the web using software known as a web browser2. Popular examples of webbrowsers are listed in Table 1.1.
TABLE 1.1: Popular web browsers
Browser URLChrome https://www.google.com/chrome/Firefox https://www.mozilla.org/en-US/firefox/Edge https://www.microsoft.com/en-us/windows/microsoft-edgeInternet Explorer https://www.microsoft.com/en-us/download/internet-
explorer.aspxSafari https://www.apple.com/lae/safari/
In order to view a web page, users might:
• Type a URL (Section 5.5.1) into the address bar of the browser• Follow a link from another site• Use a bookmark
1.2.2 Web serversWhen you ask your browser for a web page, typing a URL3 such as https://www.google.com in the address bar, the request is sent across the internet to a special computerknown as a web server which hosts the website. Web servers are special computers thatare constantly connected to the internet, and are optimized to send web pages out to peoplewho request them. Your computer, the client, receives the file and renders the web pageyou ultimately see on screen. We will discuss web servers and server-client communicationin Chapter 5.
When you are looking at a website, it is most likely that your browser will be receivingHTML and CSS documents from the web server that hosts the site. The web browserinterprets the HTML and CSS code to create the page that you see. We will learn aboutHTML in Chapter 1 (this chapter) and about CSS in Chapter 2.
Most web pages also send JavaScript code to your browser to make the page interactive.The browser runs the JavaScript code, on page load and/or later on while the user inter-acts with the web page. The JavaScript code can modify the content of the page. We willintroduce JavaScript in Chapters 3–4.
2https://en.wikipedia.org/wiki/Web_browser3https://en.wikipedia.org/wiki/URL
1.3 Web pages 5
1.3 Web pagesAt the most basic level, a web page is a plain text document containing HTML code.This book comes with several examples of complete web pages. The examples are listed inAppendices B–C. They can be viewed and/or downloaded from the online version of thisbook (Section 0.7).
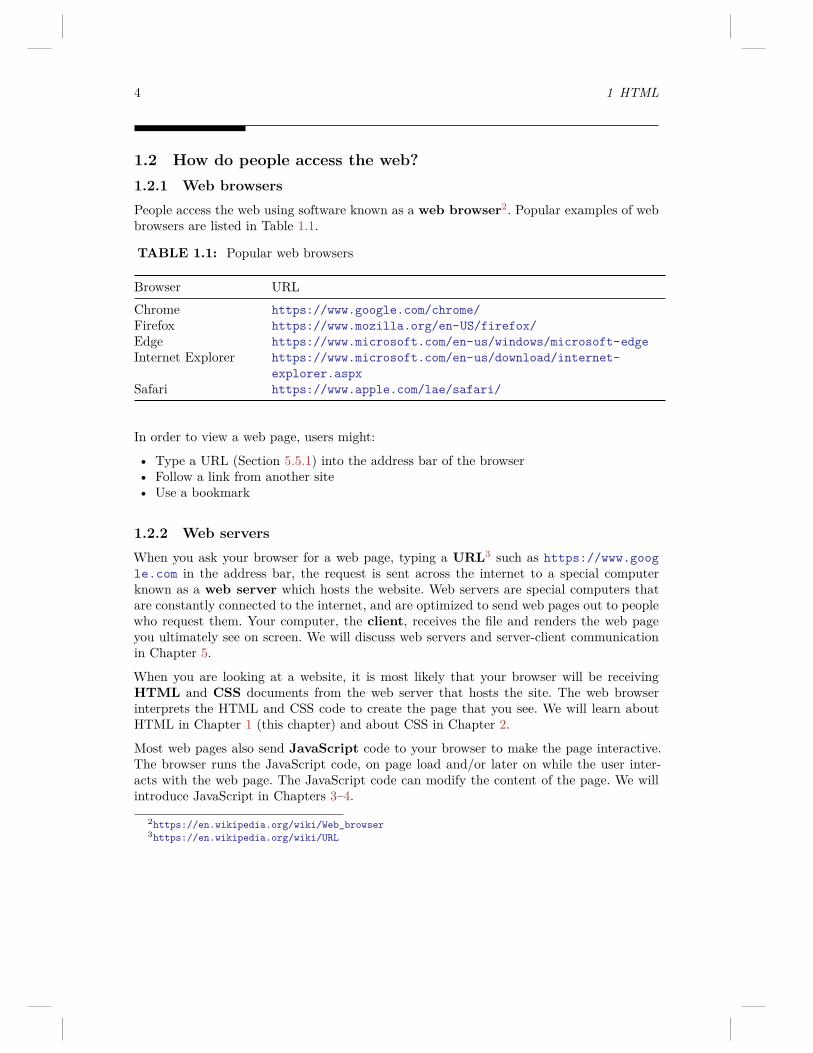
The first example, example-01-01.html, is a minimal HTML document. When openingthis file in the browser, a minimal web page is displayed (Figure 1.1).
FIGURE 1.1: Screenshot of example-01-01.html
Here is the source code you should see when opening the file example-01-01.html in aplain text editor (Figure 1.2), or in the source code tab in the browser (Figure 1.3):
<!DOCTYPE html><html>
<head><title>A minimal web page</title>
</head><body>
<h1>This is the main heading</h1><p>This is a paragraph.</p>
</body></html>
• Download the book materials from the online version (Section 0.7).
6 1 HTML
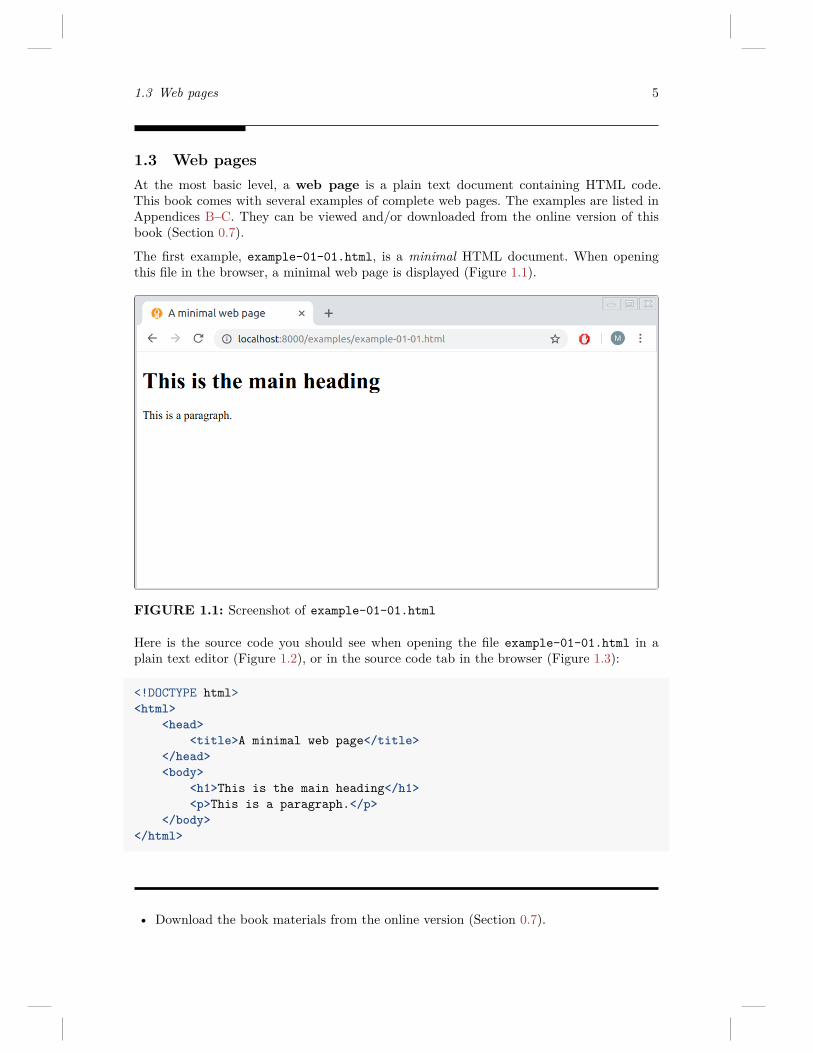
FIGURE 1.2: HTML document source code viewed in a text editor (Notepad++)
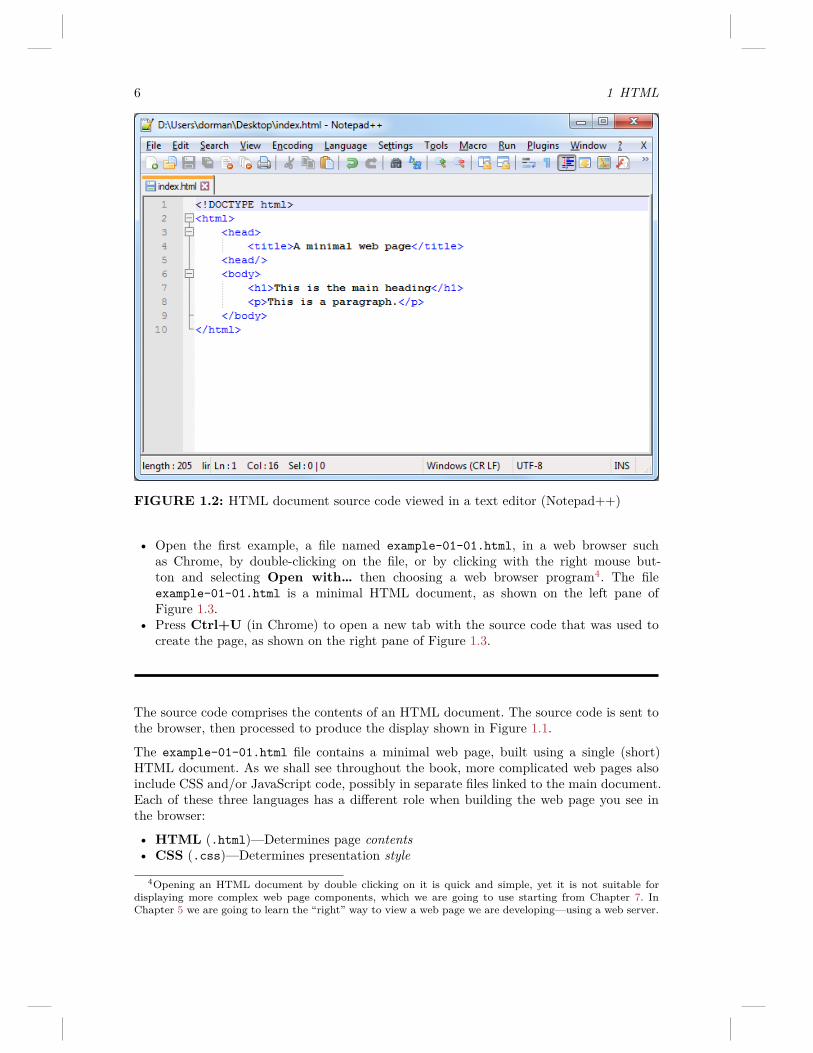
• Open the first example, a file named example-01-01.html, in a web browser suchas Chrome, by double-clicking on the file, or by clicking with the right mouse but-ton and selecting Open with… then choosing a web browser program4. The fileexample-01-01.html is a minimal HTML document, as shown on the left pane ofFigure 1.3.
• Press Ctrl+U (in Chrome) to open a new tab with the source code that was used tocreate the page, as shown on the right pane of Figure 1.3.
The source code comprises the contents of an HTML document. The source code is sent tothe browser, then processed to produce the display shown in Figure 1.1.
The example-01-01.html file contains a minimal web page, built using a single (short)HTML document. As we shall see throughout the book, more complicated web pages alsoinclude CSS and/or JavaScript code, possibly in separate files linked to the main document.Each of these three languages has a different role when building the web page you see inthe browser:
• HTML (.html)—Determines page contents• CSS (.css)—Determines presentation style
4Opening an HTML document by double clicking on it is quick and simple, yet it is not suitable fordisplaying more complex web page components, which we are going to use starting from Chapter 7. InChapter 5 we are going to learn the “right” way to view a web page we are developing—using a web server.
1.4 Text editors 7
FIGURE 1.3: HTML document (left) and its source code (right)
• JavaScript (.js)—Determines interactive behavior
1.4 Text editorsHTML, CSS, and JavaScript code, like any other computer code, is plain text5 storedin text files. To edit them, you need to use a plain text editor. The simplest option isNotepad++6. There are also more advanced editors, such as Visual Studio Code7 orSublime Text8. The more advanced editors contain additional features for easier textediting, such as shortcuts, highlighted syntax, marked matching brackets, etc. You can useany plain text editor you prefer9.
• Open a plain text editor, such as Notepad++.• Copy the HTML code section given above (Section 1.3) and paste it into a blank text
document (Figure 1.2).• Click Save As… and save the document to a file named index.html. If you are using
Notepad++, make sure you choose Save as type… and select the Hyper Text MarkupLanguage (HTML) file format.
• Go to the location where you saved the file on your computer and double click on thefile.
• The browser should now open and display the minimal web page!• Go back to the text editor, locate the text This is a paragraph., replace it with any
other text of your choice and save the document.• Refresh the browser—you should see the new text displayed on the web page!
5https://en.wikipedia.org/wiki/Plain_text6https://notepad-plus-plus.org/7https://code.visualstudio.com/8https://www.sublimetext.com/9See Section 0.5 for a list of recommended plain text editors.
8 1 HTML
1.5 What is HTML?1.5.1 OverviewHypertext Markup Language (HTML)10 is the language that describes the contentsand structure of web pages. Most web pages today are composed of more than just HTML,but simple web pages—such as example-01-01.html and the other examples we create inthis chapter—can be made with HTML alone.
HTML code consists of HTML elements11. An HTML element may contain text and/orother elements. This makes HTML code hierarchical. An HTML element consists of a starttag, followed by the element content, followed by an end tag. A start tag is of the form<elementName> and an end tag is of the form </elementName>. Both the start and the endtags contain the element name (elementName).
The following example shows a <title> element; the start tag is <title>, the end tag is</title>, and the contents is the text Web Mapping:
<title>Web Mapping</title>
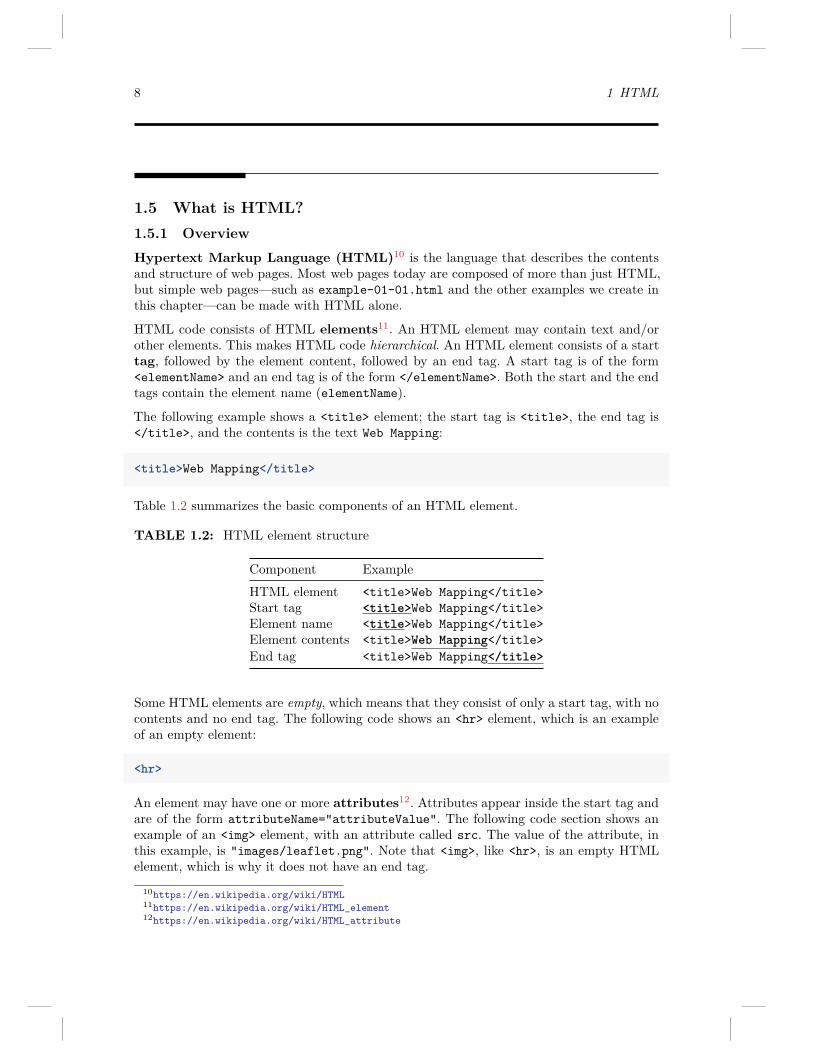
Table 1.2 summarizes the basic components of an HTML element.
TABLE 1.2: HTML element structure
Component ExampleHTML element <title>Web Mapping</title>Start tag <title>Web Mapping</title>Element name <title>Web Mapping</title>Element contents <title>Web Mapping</title>End tag <title>Web Mapping</title>
Some HTML elements are empty, which means that they consist of only a start tag, with nocontents and no end tag. The following code shows an <hr> element, which is an exampleof an empty element:
<hr>
An element may have one or more attributes12. Attributes appear inside the start tag andare of the form attributeName="attributeValue". The following code section shows anexample of an <img> element, with an attribute called src. The value of the attribute, inthis example, is "images/leaflet.png". Note that <img>, like <hr>, is an empty HTMLelement, which is why it does not have an end tag.
10https://en.wikipedia.org/wiki/HTML11https://en.wikipedia.org/wiki/HTML_element12https://en.wikipedia.org/wiki/HTML_attribute
1.5 What is HTML? 9
<img src="images/leaflet.png">
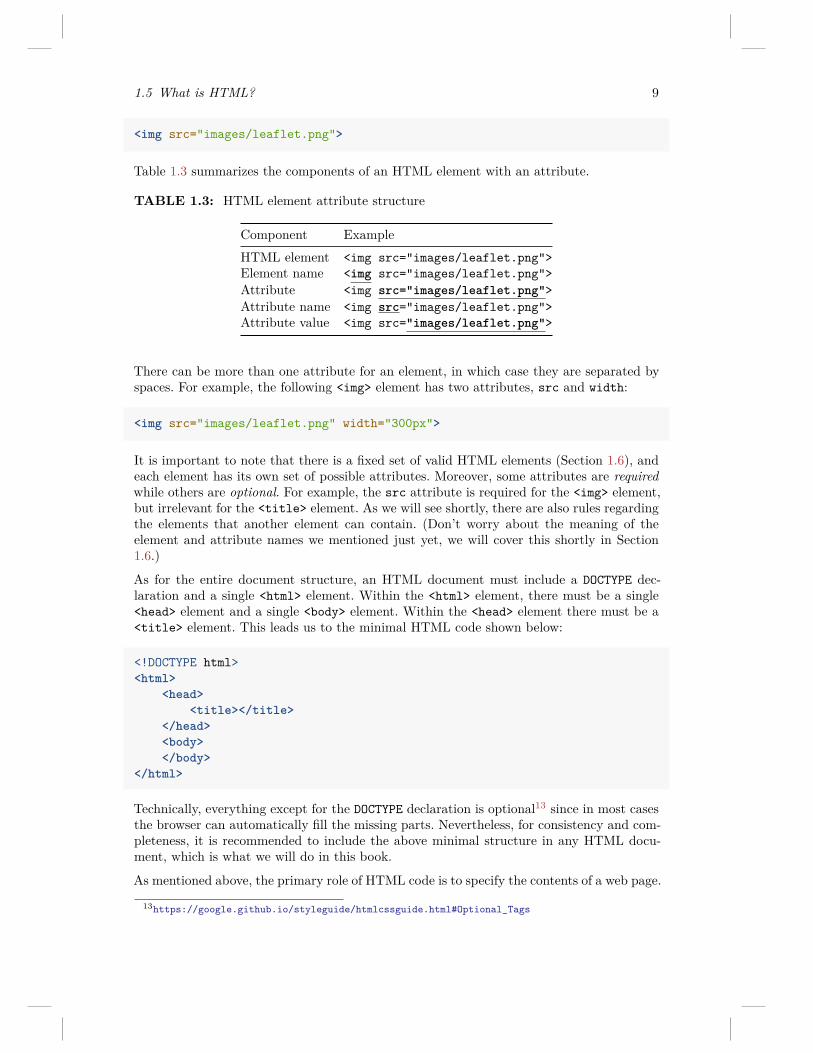
Table 1.3 summarizes the components of an HTML element with an attribute.
TABLE 1.3: HTML element attribute structure
Component ExampleHTML element <img src="images/leaflet.png">Element name <img src="images/leaflet.png">Attribute <img src="images/leaflet.png">Attribute name <img src="images/leaflet.png">Attribute value <img src="images/leaflet.png">
There can be more than one attribute for an element, in which case they are separated byspaces. For example, the following <img> element has two attributes, src and width:
<img src="images/leaflet.png" width="300px">
It is important to note that there is a fixed set of valid HTML elements (Section 1.6), andeach element has its own set of possible attributes. Moreover, some attributes are requiredwhile others are optional. For example, the src attribute is required for the <img> element,but irrelevant for the <title> element. As we will see shortly, there are also rules regardingthe elements that another element can contain. (Don’t worry about the meaning of theelement and attribute names we mentioned just yet, we will cover this shortly in Section1.6.)
As for the entire document structure, an HTML document must include a DOCTYPE dec-laration and a single <html> element. Within the <html> element, there must be a single<head> element and a single <body> element. Within the <head> element there must be a<title> element. This leads us to the minimal HTML code shown below:
<!DOCTYPE html><html>
<head><title></title>
</head><body></body>
</html>
Technically, everything except for the DOCTYPE declaration is optional13 since in most casesthe browser can automatically fill the missing parts. Nevertheless, for consistency and com-pleteness, it is recommended to include the above minimal structure in any HTML docu-ment, which is what we will do in this book.
As mentioned above, the primary role of HTML code is to specify the contents of a web page.
13https://google.github.io/styleguide/htmlcssguide.html#Optional_Tags
10 1 HTML
The type of elements being used and their ordering determine the structure of informationthat is being displayed in the browser.
1.5.2 HTML commentsIt is good practice to keep comments in our code, so that we can remember our intentionslater on, and so that other people reading our code can understand what we did more easily.In HTML, comments are written as follows:
<!-- This is a comment -->
Anything between the start <!-- and end -->, including HTML tags, is completely ignoredby the computer. It is only there to pass messages to a human reader of the code.
1.5.3 Block vs. inlineWhile learning about the various HTML elements (Section 1.6), it is important to keep inmind that HTML elements are divided into two general types of behaviors14:
• Block-level elements• Inline elements
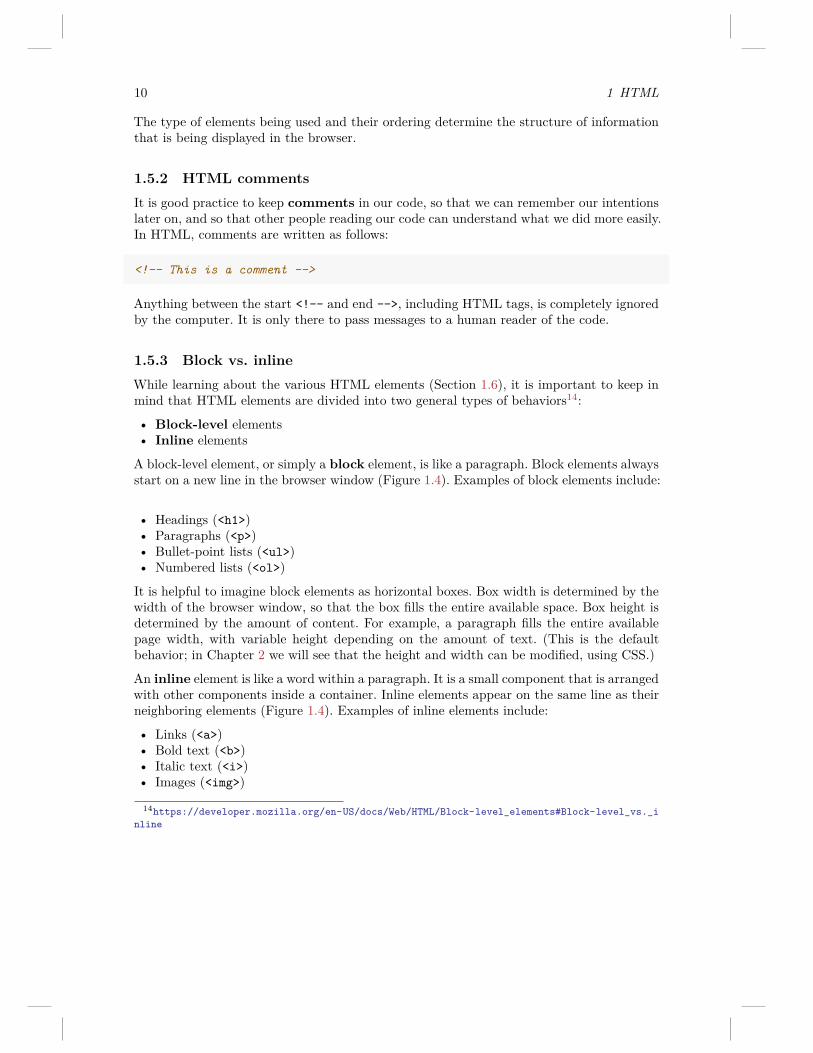
A block-level element, or simply a block element, is like a paragraph. Block elements alwaysstart on a new line in the browser window (Figure 1.4). Examples of block elements include:
• Headings (<h1>)• Paragraphs (<p>)• Bullet-point lists (<ul>)• Numbered lists (<ol>)
It is helpful to imagine block elements as horizontal boxes. Box width is determined by thewidth of the browser window, so that the box fills the entire available space. Box height isdetermined by the amount of content. For example, a paragraph fills the entire availablepage width, with variable height depending on the amount of text. (This is the defaultbehavior; in Chapter 2 we will see that the height and width can be modified, using CSS.)
An inline element is like a word within a paragraph. It is a small component that is arrangedwith other components inside a container. Inline elements appear on the same line as theirneighboring elements (Figure 1.4). Examples of inline elements include:
• Links (<a>)• Bold text (<b>)• Italic text (<i>)• Images (<img>)
14https://developer.mozilla.org/en-US/docs/Web/HTML/Block-level_elements#Block-level_vs._inline
1.6 Common HTML elements 11
<h1>
Block Elements Inline Elements
<p>
<p>
<p> <a>..... ...
<b> ............
<i> ...........</p>.................
FIGURE 1.4: Block vs. inline HTML elements
1.6 Common HTML elements1.6.1 HTML element typesThis section briefly describes the important behavior, attributes, and rules for each of thecommon HTML elements. We will use most of these elements throughout the book, so itis important to be familiar with them from the start. You don’t need to remember how touse each element—you can always come back to this section later on. Keep in mind thatthe HTML elements we are going to cover in this chapter are just the most common ones.HTML defines a lot of other element types that we will not use in the book15.
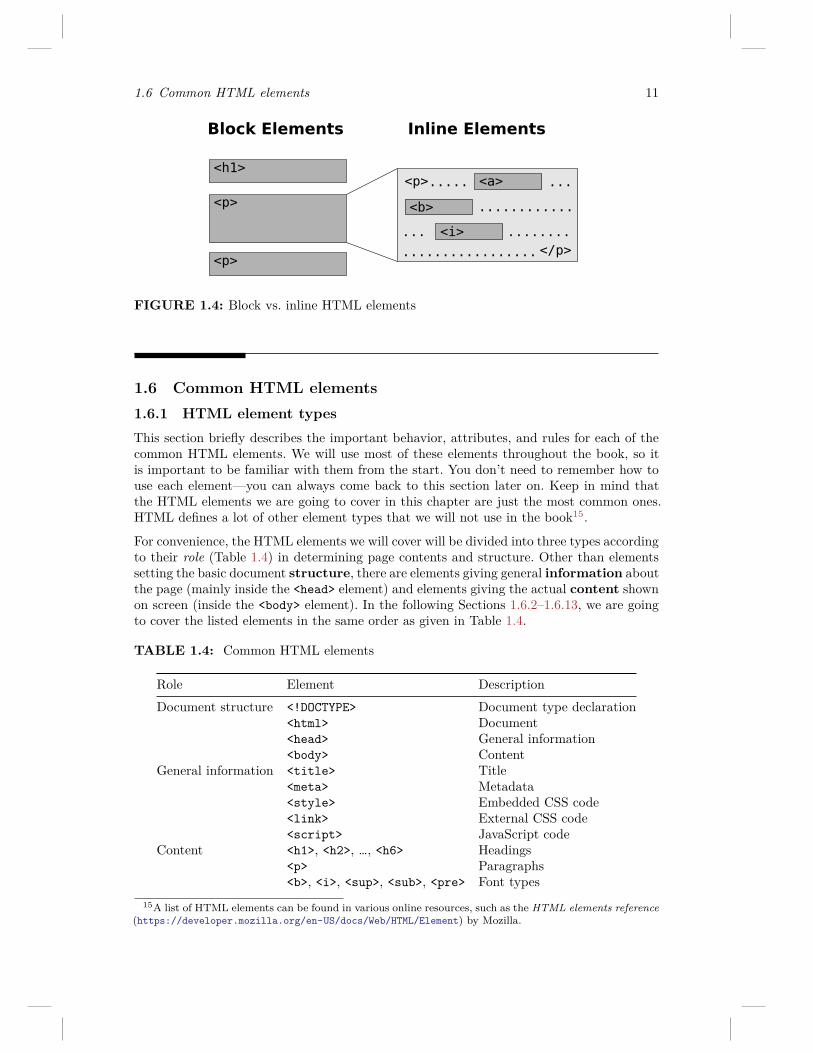
For convenience, the HTML elements we will cover will be divided into three types accordingto their role (Table 1.4) in determining page contents and structure. Other than elementssetting the basic document structure, there are elements giving general information aboutthe page (mainly inside the <head> element) and elements giving the actual content shownon screen (inside the <body> element). In the following Sections 1.6.2–1.6.13, we are goingto cover the listed elements in the same order as given in Table 1.4.
TABLE 1.4: Common HTML elements
Role Element DescriptionDocument structure <!DOCTYPE> Document type declaration
<html> Document<head> General information<body> Content
General information <title> Title<meta> Metadata<style> Embedded CSS code<link> External CSS code<script> JavaScript code
Content <h1>, <h2>, …, <h6> Headings<p> Paragraphs<b>, <i>, <sup>, <sub>, <pre> Font types
15A list of HTML elements can be found in various online resources, such as the HTML elements reference(https://developer.mozilla.org/en-US/docs/Web/HTML/Element) by Mozilla.
12 1 HTML
Role Element Description<br>, <hr> Spacing<ul>, <ol>, <li> Lists<a> Links<img> Images<table>, <th>, <tr>, <td> Tables<div>, <span> Grouping<input>, <select>, <option> User input
1.6.2 Structure1.6.2.1 Overview
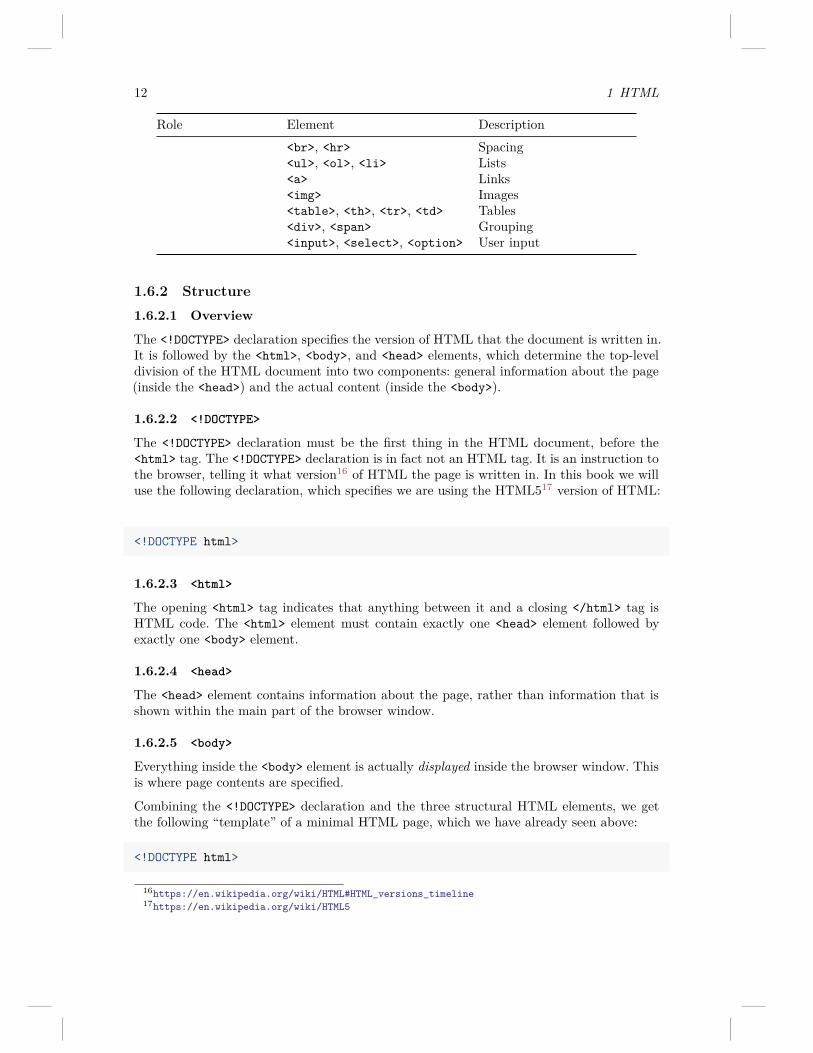
The <!DOCTYPE> declaration specifies the version of HTML that the document is written in.It is followed by the <html>, <body>, and <head> elements, which determine the top-leveldivision of the HTML document into two components: general information about the page(inside the <head>) and the actual content (inside the <body>).
1.6.2.2 <!DOCTYPE>
The <!DOCTYPE> declaration must be the first thing in the HTML document, before the<html> tag. The <!DOCTYPE> declaration is in fact not an HTML tag. It is an instruction tothe browser, telling it what version16 of HTML the page is written in. In this book we willuse the following declaration, which specifies we are using the HTML517 version of HTML:
<!DOCTYPE html>
1.6.2.3 <html>
The opening <html> tag indicates that anything between it and a closing </html> tag isHTML code. The <html> element must contain exactly one <head> element followed byexactly one <body> element.
1.6.2.4 <head>
The <head> element contains information about the page, rather than information that isshown within the main part of the browser window.
1.6.2.5 <body>
Everything inside the <body> element is actually displayed inside the browser window. Thisis where page contents are specified.
Combining the <!DOCTYPE> declaration and the three structural HTML elements, we getthe following “template” of a minimal HTML page, which we have already seen above:
<!DOCTYPE html>
16https://en.wikipedia.org/wiki/HTML#HTML_versions_timeline17https://en.wikipedia.org/wiki/HTML5
1.6 Common HTML elements 13
<html><head>
<!-- General information goes here --></head><body>
<!-- Page content goes here --></body>
</html>
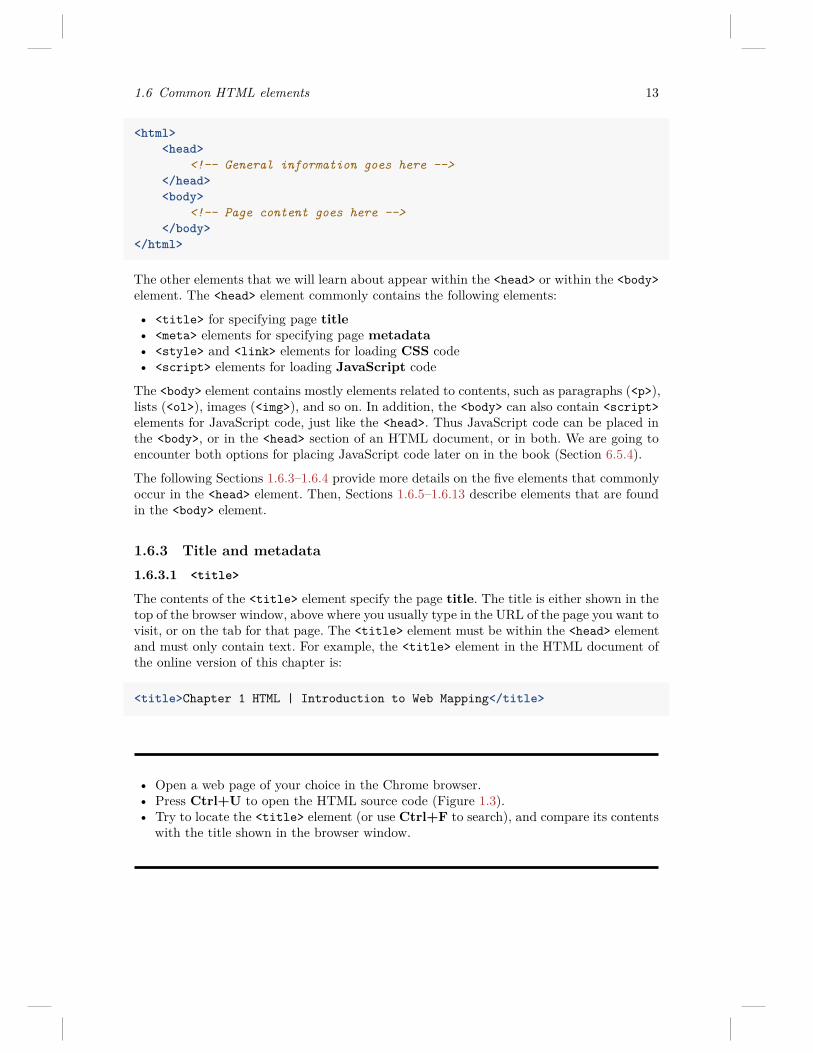
The other elements that we will learn about appear within the <head> or within the <body>element. The <head> element commonly contains the following elements:
• <title> for specifying page title• <meta> elements for specifying page metadata• <style> and <link> elements for loading CSS code• <script> elements for loading JavaScript code
The <body> element contains mostly elements related to contents, such as paragraphs (<p>),lists (<ol>), images (<img>), and so on. In addition, the <body> can also contain <script>elements for JavaScript code, just like the <head>. Thus JavaScript code can be placed inthe <body>, or in the <head> section of an HTML document, or in both. We are going toencounter both options for placing JavaScript code later on in the book (Section 6.5.4).
The following Sections 1.6.3–1.6.4 provide more details on the five elements that commonlyoccur in the <head> element. Then, Sections 1.6.5–1.6.13 describe elements that are foundin the <body> element.
1.6.3 Title and metadata1.6.3.1 <title>
The contents of the <title> element specify the page title. The title is either shown in thetop of the browser window, above where you usually type in the URL of the page you want tovisit, or on the tab for that page. The <title> element must be within the <head> elementand must only contain text. For example, the <title> element in the HTML document ofthe online version of this chapter is:
<title>Chapter 1 HTML | Introduction to Web Mapping</title>
• Open a web page of your choice in the Chrome browser.• Press Ctrl+U to open the HTML source code (Figure 1.3).• Try to locate the <title> element (or use Ctrl+F to search), and compare its contents
with the title shown in the browser window.
14 1 HTML
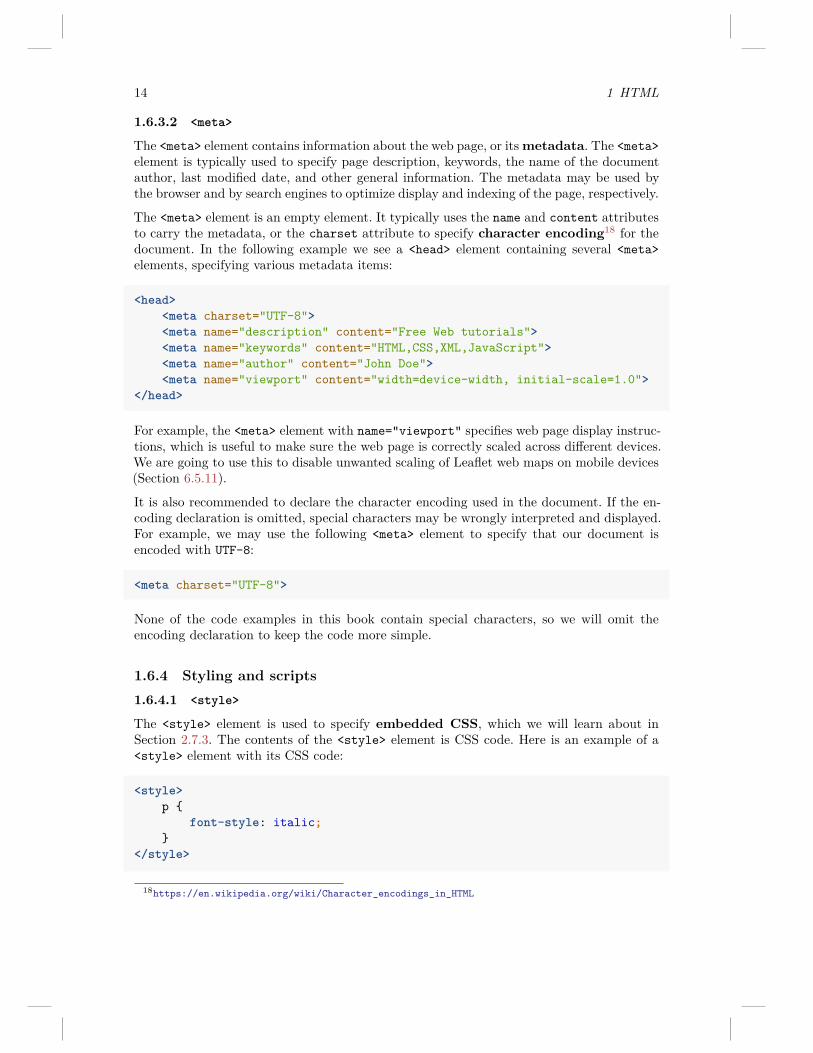
1.6.3.2 <meta>
The <meta> element contains information about the web page, or its metadata. The <meta>element is typically used to specify page description, keywords, the name of the documentauthor, last modified date, and other general information. The metadata may be used bythe browser and by search engines to optimize display and indexing of the page, respectively.
The <meta> element is an empty element. It typically uses the name and content attributesto carry the metadata, or the charset attribute to specify character encoding18 for thedocument. In the following example we see a <head> element containing several <meta>elements, specifying various metadata items:
<head><meta charset="UTF-8"><meta name="description" content="Free Web tutorials"><meta name="keywords" content="HTML,CSS,XML,JavaScript"><meta name="author" content="John Doe"><meta name="viewport" content="width=device-width, initial-scale=1.0">
</head>
For example, the <meta> element with name="viewport" specifies web page display instruc-tions, which is useful to make sure the web page is correctly scaled across different devices.We are going to use this to disable unwanted scaling of Leaflet web maps on mobile devices(Section 6.5.11).
It is also recommended to declare the character encoding used in the document. If the en-coding declaration is omitted, special characters may be wrongly interpreted and displayed.For example, we may use the following <meta> element to specify that our document isencoded with UTF-8:
<meta charset="UTF-8">
None of the code examples in this book contain special characters, so we will omit theencoding declaration to keep the code more simple.
1.6.4 Styling and scripts1.6.4.1 <style>
The <style> element is used to specify embedded CSS, which we will learn about inSection 2.7.3. The contents of the <style> element is CSS code. Here is an example of a<style> element with its CSS code:
<style>p {
font-style: italic;}
</style>
18https://en.wikipedia.org/wiki/Character_encodings_in_HTML
1.6 Common HTML elements 15
1.6.4.2 <link>
The <link> element refers to external CSS, which we will learn about in Section 2.7.4.The <link> element is an empty element that must reside inside the <head> element. Itsimportant attributes are:
• rel—Should have the value "stylesheet"• href—Specifies the location of a file containing CSS code
An example of a <link> element is shown below:
<link rel="stylesheet" href="style.css">
1.6.4.3 <script>
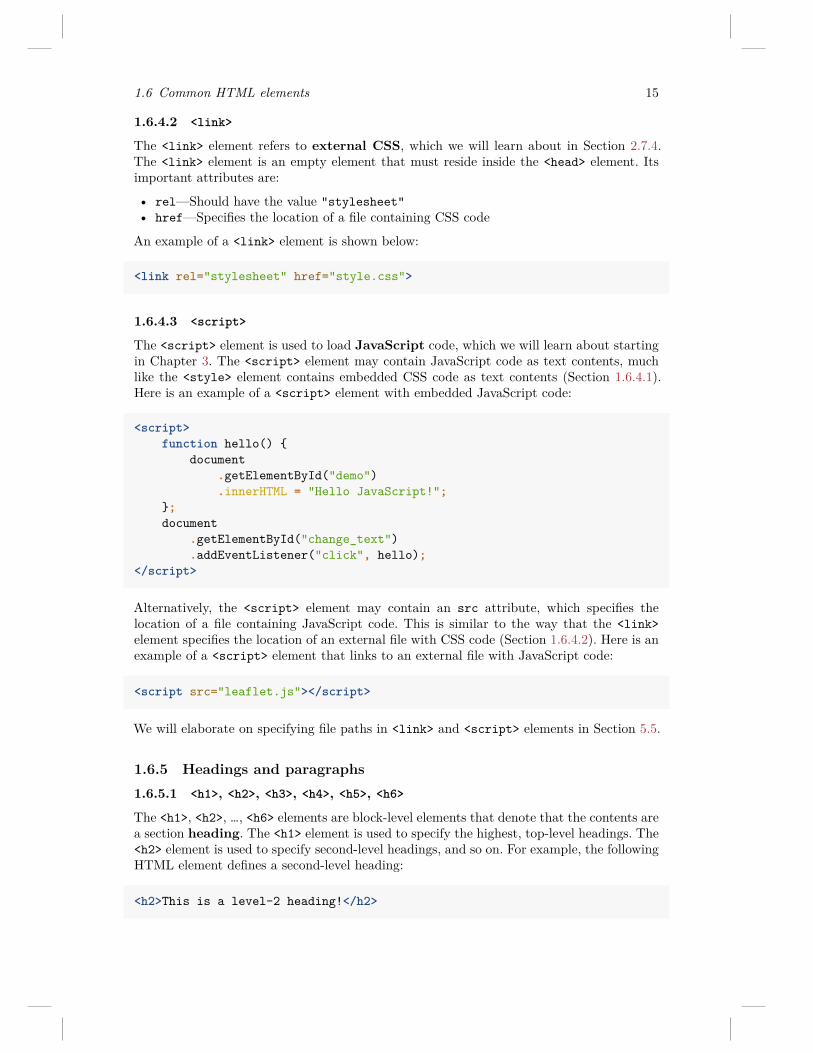
The <script> element is used to load JavaScript code, which we will learn about startingin Chapter 3. The <script> element may contain JavaScript code as text contents, muchlike the <style> element contains embedded CSS code as text contents (Section 1.6.4.1).Here is an example of a <script> element with embedded JavaScript code:
<script>function hello() {
document.getElementById("demo").innerHTML = "Hello JavaScript!";
};document
.getElementById("change_text")
.addEventListener("click", hello);</script>
Alternatively, the <script> element may contain an src attribute, which specifies thelocation of a file containing JavaScript code. This is similar to the way that the <link>element specifies the location of an external file with CSS code (Section 1.6.4.2). Here is anexample of a <script> element that links to an external file with JavaScript code:
<script src="leaflet.js"></script>
We will elaborate on specifying file paths in <link> and <script> elements in Section 5.5.
1.6.5 Headings and paragraphs1.6.5.1 <h1>, <h2>, <h3>, <h4>, <h5>, <h6>
The <h1>, <h2>, …, <h6> elements are block-level elements that denote that the contents area section heading. The <h1> element is used to specify the highest, top-level headings. The<h2> element is used to specify second-level headings, and so on. For example, the followingHTML element defines a second-level heading:
<h2>This is a level-2 heading!</h2>
16 1 HTML
1.6.5.2 <p>
The <p> element is a block-level element defining a paragraph. Note that the browserautomatically decides where to break lines inside the paragraph, according to the containingelement width (see Section 1.6.7 below). For example, the following code defines a paragraph:
<p>This is a paragraph!</p>
• Open the web page of the online version of this book, or any other web page that haslots of text.
• Resize browser window width.• You should see the paragraph length changing, as the text is being split to multiple lines
in different ways, depending on page width.
1.6.6 Font formatting1.6.6.1 Overview
Some characteristics of font formatting can be modified using HTML elements, such as <b>for bold font (Section 1.6.6.2), <i> for italics (Section 1.6.6.3), <sup> for superscript (Section1.6.6.4), <sub> for subscript (Section 1.6.6.5), and <pre> for preformatted text (Section1.6.6.6). These characteristics, and other ones such as text color, can also be specified usingCSS, which we learn later on (Sections 2.8.2–2.8.3).
1.6.6.2 <b>
Text within the <b> element appears bold. For example, the following HTML code:
This text <b>is bold</b>.
renders the “is bold” part in bold font.
1.6.6.3 <i>
Text within the <i> element appears italic. For example, the following HTML code:
This text <i>is italic</i>.
renders the “is italic” part in italic font.
1.6.6.4 <sup>
Text within the <sup> element appear superscript. For example, the following HTML code:
1.6 Common HTML elements 17
E=MC<sup>2</sup>
appears in the browser as:
E=MC2
1.6.6.5 <sub>
Text within the <sub> element appear subscript. For example, the following HTML code:
The concentration of CO<sub>2</sub> is increasing.
appears in the browser as:
The concentration of CO2 is increasing.
1.6.6.6 <pre>
The <pre> element—preformatted text—is a block-level element that displays any textcontents exactly as it appears in the source code. This is contrary to the usual behavior,where the browser ignores line breaks and repeated spaces (Section 1.6.7). The <pre> ele-ment is useful for displaying computer code or computer output. For example, consider thefollowing <pre> element:
<pre>Text in a pre elementis displayed in a fixed-widthfont, and it preservesboth spaces andline breaks</pre>
The text is displayed in the browser as is, with the given spaces and line breaks:
Text in a pre elementis displayed in a fixed-widthfont, and it preservesboth spaces andline breaks
Note that the <pre> element contents are displayed in a fixed-width font by default, whichis convenient for computer code but may not be suitable for ordinary text.
• Try pasting the above text inside a <p> element, rather than a <pre> element, to observethe way that line breaks and multiple spaces are ignored when the text is displayed inthe browser.
18 1 HTML
1.6.7 Spacing1.6.7.1 Whitespace collapsing
When the browser comes across two or more spaces next to each other, it only displays onespace. Similarly, if it comes across a line break, it treats it as a single space too. This is knownas whitespace collapsing. Consider the following HTML code of example-01-02.html:
<!DOCTYPE html><html>
<head><title>White space collapsing</title>
</head><body>
<p>The Moon's distance to Earth is 384,402 km</p><p>The Moon's distance to Earth is 384,402 km</p><p>The Moon's distance to Earth
is 384,402 km</p></body>
</html>
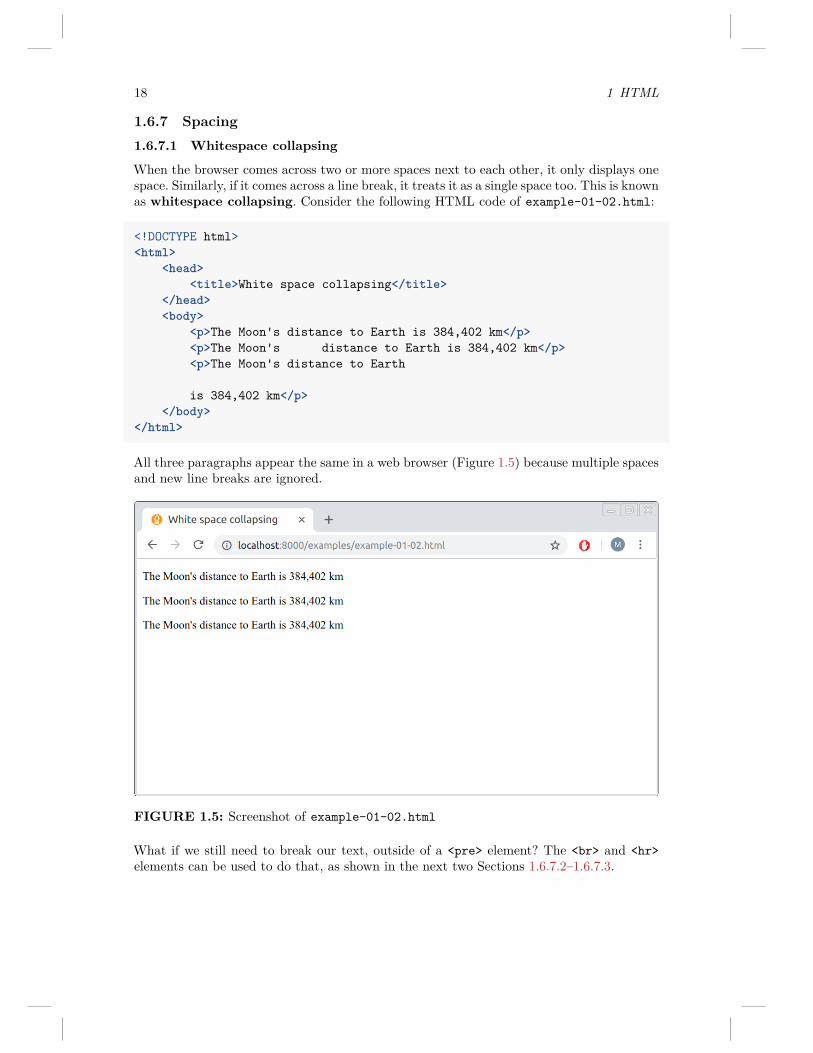
All three paragraphs appear the same in a web browser (Figure 1.5) because multiple spacesand new line breaks are ignored.
FIGURE 1.5: Screenshot of example-01-02.html
What if we still need to break our text, outside of a <pre> element? The <br> and <hr>elements can be used to do that, as shown in the next two Sections 1.6.7.2–1.6.7.3.
1.6 Common HTML elements 19
1.6.7.2 <br>
The <br> element is an empty element that forces a new line or line break. For example,the following <br> element will split the sentence in two lines:
This is a new<br>line.
The first line will contain the “This is a new” part, while the second line will contain the“line” part. The <br> element should be used sparingly; in most cases, text should be brokeninto lines by the browser to fit the available space.
1.6.7.3 <hr>
The <hr> element is an empty element that produces a horizontal rule (line). For example:
<hr>
A horizontal line will appear in the browser at the location where the <hr> element appears.
1.6.8 Lists1.6.8.1 <ul>, <ol>, and <li>
An unordered list (i.e., a bullet-point list) can be created with the <ul> element. The<ul> element contains internal <li> elements, representing the individual list items. Forexample, the following HTML code creates an unordered list with three items:
<ul><li>Coffee</li><li>Tea</li><li>Milk</li>
</ul>
An ordered list (numbered list) list can be created exactly the same way, just replacingthe <ul> element with the <ol> element. For example, the following HTML code createsan ordered list with the same three items:
<ol><li>Coffee</li><li>Tea</li><li>Milk</li>
</ol>
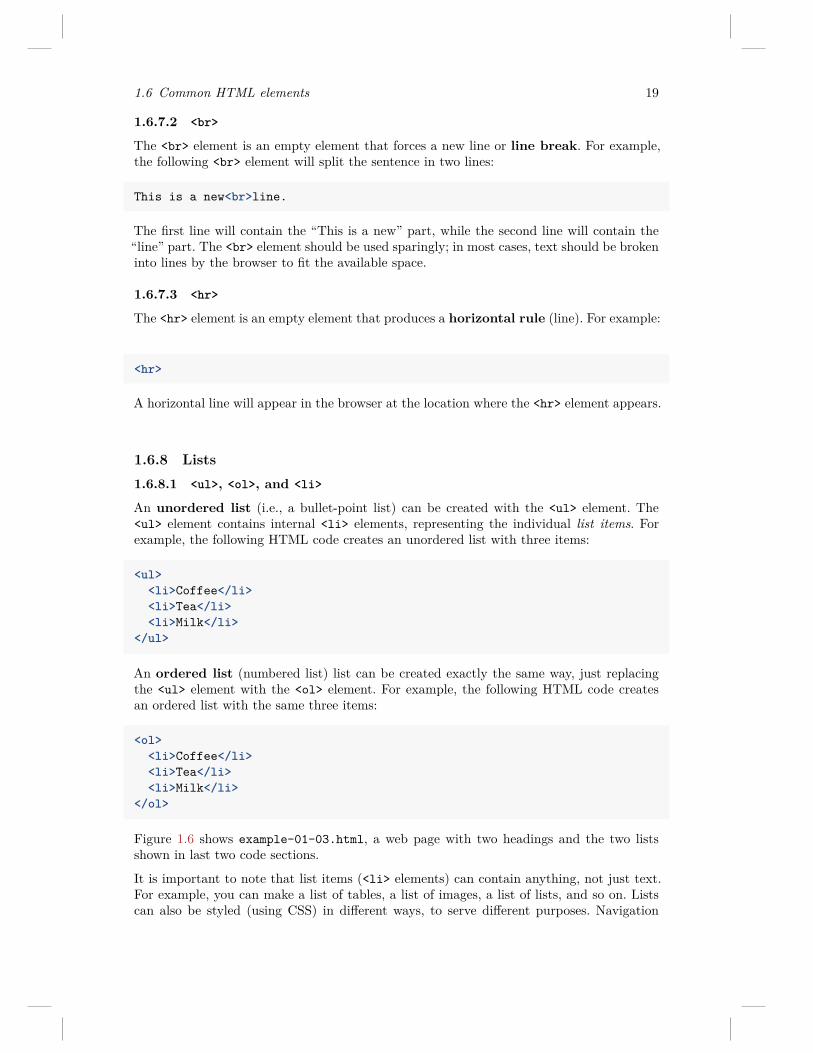
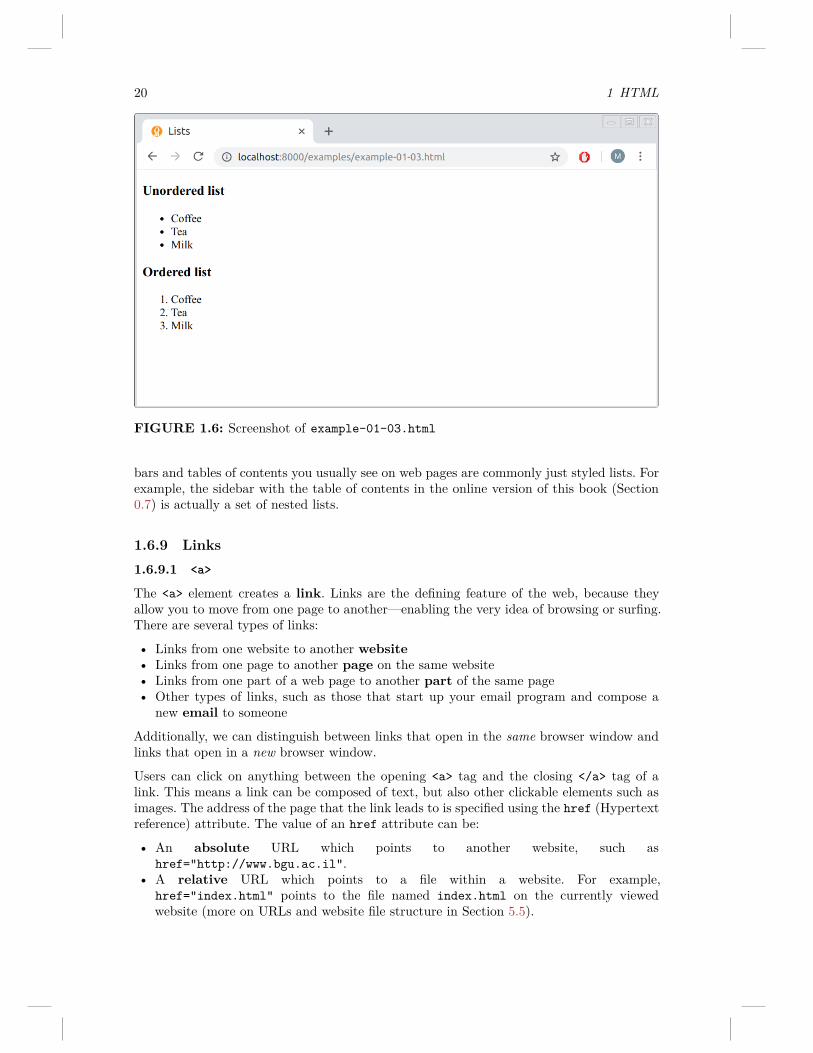
Figure 1.6 shows example-01-03.html, a web page with two headings and the two listsshown in last two code sections.
It is important to note that list items (<li> elements) can contain anything, not just text.For example, you can make a list of tables, a list of images, a list of lists, and so on. Listscan also be styled (using CSS) in different ways, to serve different purposes. Navigation
20 1 HTML
FIGURE 1.6: Screenshot of example-01-03.html
bars and tables of contents you usually see on web pages are commonly just styled lists. Forexample, the sidebar with the table of contents in the online version of this book (Section0.7) is actually a set of nested lists.
1.6.9 Links1.6.9.1 <a>
The <a> element creates a link. Links are the defining feature of the web, because theyallow you to move from one page to another—enabling the very idea of browsing or surfing.There are several types of links:
• Links from one website to another website• Links from one page to another page on the same website• Links from one part of a web page to another part of the same page• Other types of links, such as those that start up your email program and compose a
new email to someone
Additionally, we can distinguish between links that open in the same browser window andlinks that open in a new browser window.
Users can click on anything between the opening <a> tag and the closing </a> tag of alink. This means a link can be composed of text, but also other clickable elements such asimages. The address of the page that the link leads to is specified using the href (Hypertextreference) attribute. The value of an href attribute can be:
• An absolute URL which points to another website, such ashref="http://www.bgu.ac.il".
• A relative URL which points to a file within a website. For example,href="index.html" points to the file named index.html on the currently viewedwebsite (more on URLs and website file structure in Section 5.5).
1.6 Common HTML elements 21
• A link to an element with a specified id (see Section 1.7.2 below) within the current webpage, in which case the browser will scroll to that location. For example, href="#top"points to the element that has id value of "top".
• A combination of a URL and location within the page. For example,href="index.html#top" points to the element that has id value of "top" within thefile named index.html.
By default, the link is opened in the same browser window. If you want a link to open in anew window, you can add the target="_blank" attribute in the opening <a> tag.
For example, the following HTML code displays the word “BGU” as a link—usually in blueand underlined font. Clicking on the word “BGU” navigates to http://www.bgu.ac.il ina new browser window.
<a href="http://www.bgu.ac.il" target="_blank">BGU</a>
• Edit the HTML file of either one of the examples shown so far (example-01.html,example-02.html or example-03.html) by inserting the above <a> element into theHTML <body>.
• Refresh the page.• You should now see a functional link to the http://www.bgu.ac.il page.
1.6.10 Images1.6.10.1 <img>
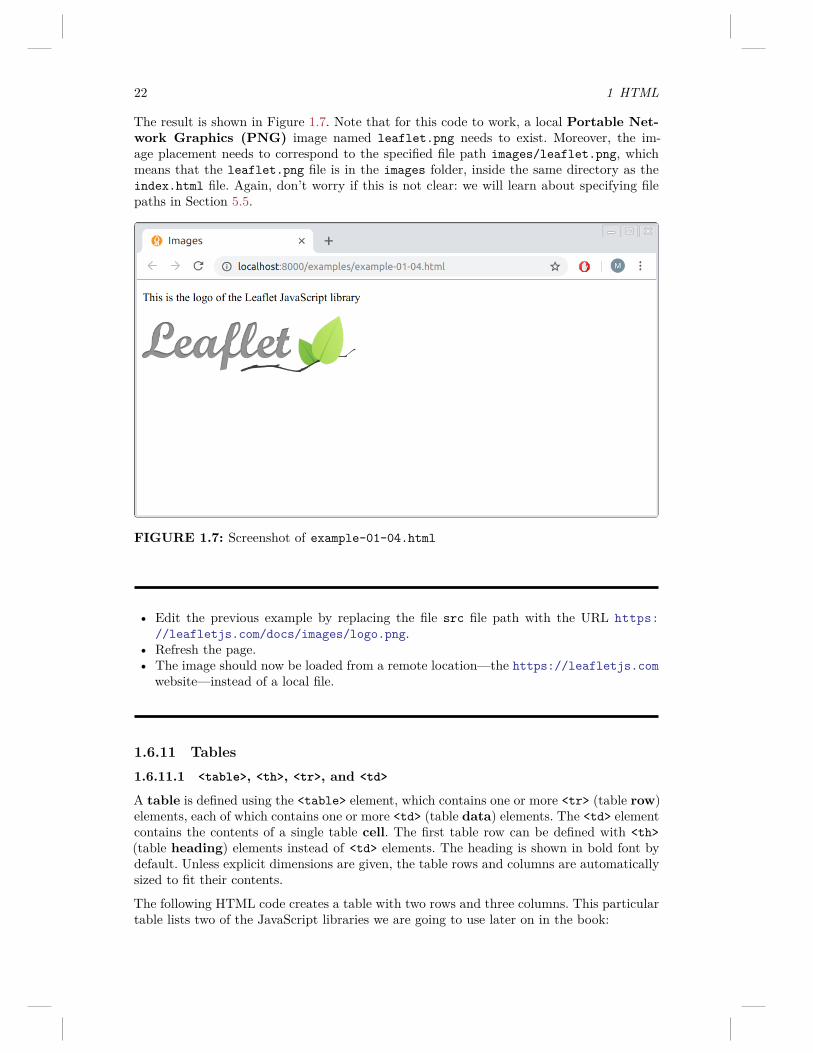
The <img> element adds an image to the web page. This is an empty, inline element, whichmeans that images are treated like words in a sentence. The most important attribute ofthe <img> element is src, which specifies the file path of the image. The src may be a pathto a local file (more on that in Section 5.5) or a URL, i.e., an image located anywhere onthe web. We can also set image height and/or width using the height and width attributes,respectively.
For example, the following HTML document (example-01-04.html) contains one text para-graph and one image:
<!DOCTYPE html><html>
<head><title>Images</title>
</head><body>
<p>This is the logo of the Leaflet JavaScript library</p><img src="images/leaflet.png" width="300px">
</body></html>
22 1 HTML
The result is shown in Figure 1.7. Note that for this code to work, a local Portable Net-work Graphics (PNG) image named leaflet.png needs to exist. Moreover, the im-age placement needs to correspond to the specified file path images/leaflet.png, whichmeans that the leaflet.png file is in the images folder, inside the same directory as theindex.html file. Again, don’t worry if this is not clear: we will learn about specifying filepaths in Section 5.5.
FIGURE 1.7: Screenshot of example-01-04.html
• Edit the previous example by replacing the file src file path with the URL https://leafletjs.com/docs/images/logo.png.
• Refresh the page.• The image should now be loaded from a remote location—the https://leafletjs.com
website—instead of a local file.
1.6.11 Tables1.6.11.1 <table>, <th>, <tr>, and <td>
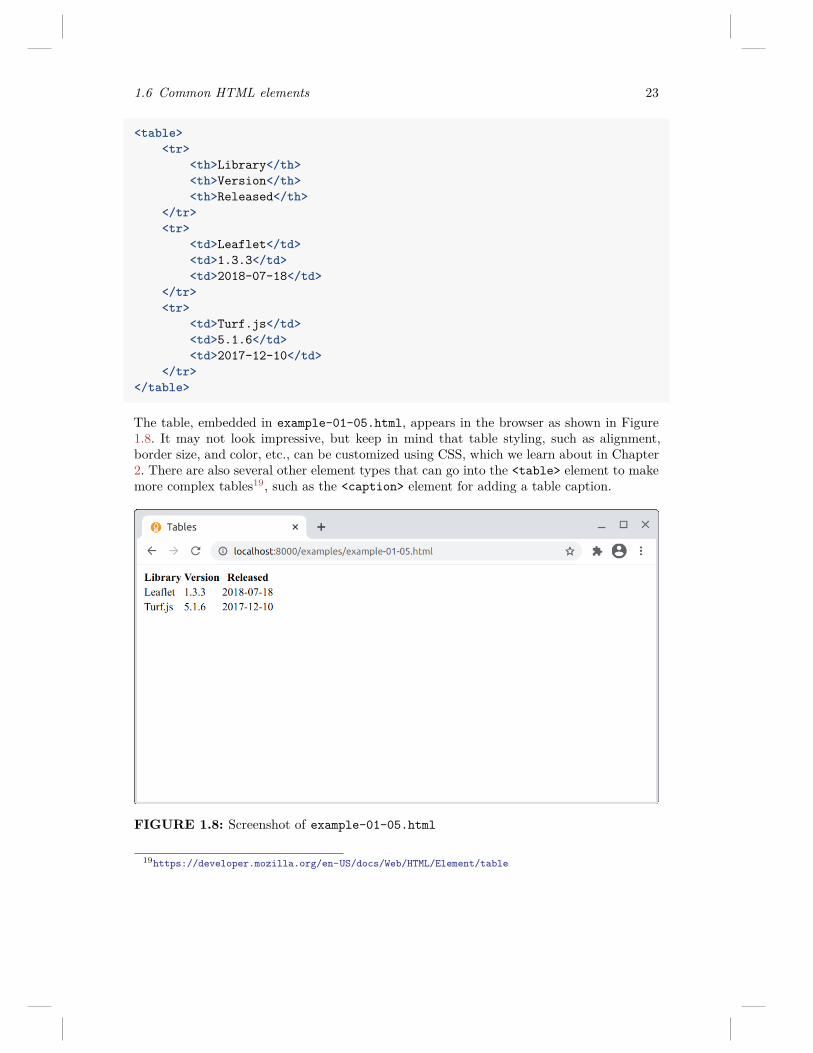
A table is defined using the <table> element, which contains one or more <tr> (table row)elements, each of which contains one or more <td> (table data) elements. The <td> elementcontains the contents of a single table cell. The first table row can be defined with <th>(table heading) elements instead of <td> elements. The heading is shown in bold font bydefault. Unless explicit dimensions are given, the table rows and columns are automaticallysized to fit their contents.
The following HTML code creates a table with two rows and three columns. This particulartable lists two of the JavaScript libraries we are going to use later on in the book:
1.6 Common HTML elements 23
<table><tr>
<th>Library</th><th>Version</th><th>Released</th>
</tr><tr>
<td>Leaflet</td><td>1.3.3</td><td>2018-07-18</td>
</tr><tr>
<td>Turf.js</td><td>5.1.6</td><td>2017-12-10</td>
</tr></table>
The table, embedded in example-01-05.html, appears in the browser as shown in Figure1.8. It may not look impressive, but keep in mind that table styling, such as alignment,border size, and color, etc., can be customized using CSS, which we learn about in Chapter2. There are also several other element types that can go into the <table> element to makemore complex tables19, such as the <caption> element for adding a table caption.
FIGURE 1.8: Screenshot of example-01-05.html
19https://developer.mozilla.org/en-US/docs/Web/HTML/Element/table
24 1 HTML
1.6.12 Grouping1.6.12.1 Overview
The next HTML elements we discuss are <div> (Section 1.6.12.2) and <span> (Section1.6.12.3). These are generic block-level and inline elements, respectively, which are used togroup other elements and content, usually to associate each group with CSS styling rules(Chapter 2), or (mostly for <div>) with JavaScript code (Chapter 4).
1.6.12.2 <div>
The <div> element allows you to group a set of elements together in one block-level box. Forexample, you might create a <div> element to contain all of the elements for the header ofyour site (the logo and the navigation bar), or you might create a <div> element to containcomments from visitors.
In a browser, the contents of the <div> element will start on a new line, but other than thisit will make no difference to the presentation of the page. Using an id or class attribute onthe <div> element (Section 1.7 below), however, we can distinguish the <div> with specificappearance and behavior. For example, we can create styling rules (with CSS) to indicatehow much space the <div> element should occupy on the screen (Section 2.8.4.2), whereit should be placed (Section 2.8.4.6), change the appearance of all the elements containedwithin it, and so on.
Another use case of the <div> element is to create an empty container, or placeholder,to be populated with content on page load using JavaScript. We will use this techniquethroughout Chapters 6–13, when creating web maps with the Leaflet JavaScript library(Section 6.5.8).
1.6.12.3 <span>
The <span> element acts like an inline equivalent of the <div> element. It is used to do oneof the following:
• Contain a section of text where there is no other suitable element to differentiate it fromits surrounding text
• Contain a number of inline elements
Again, the most common reason why people use <span> elements is so that they can controlthe appearance of the content of these elements, using CSS.
1.6.13 Input elements1.6.13.1 Overview
HTML supports several types of input elements. Input elements are used to collect informa-tion from the user and thus make the web page interactive. Buttons, check boxes, sliders, andtext inputs are all examples of input elements. The search box on https://www.google.comis perhaps the most well-known example of a text-input element.
Input elements can be added with the <input> tag. The <input> element has severalimportant attributes:
• type—The type of input• name—The identifier that is sent to the server when you submit a form—a collection
of related input elements (see below)
1.6 Common HTML elements 25
• value—The initial value in text and numeric inputs, or the text appearing on a button
Text area inputs are a special case, defined with the <textarea> element rather than withthe <input> element (Section 1.6.13.5). Dropdown menu input is another special case, de-fined with the <select> and <option> elements (Section 1.6.13.8).
Input elements are commonly grouped inside a form, using the <form> element. This hasseveral advantages20 for handling multiple inputs as a single unit. Through most of thebook we will use simple, individual inputs—therefore to simplify the material we will avoidenclosing the inputs in a <form>. We will then come back to an example with a <form>element in Section 13.5.
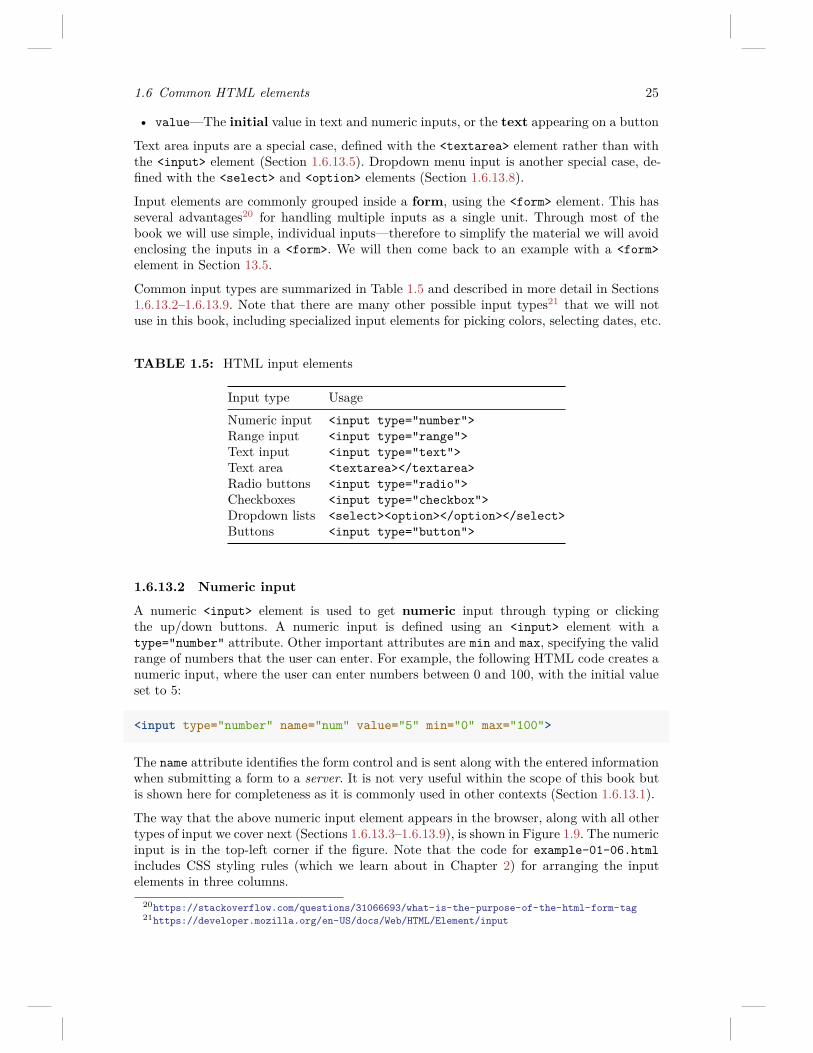
Common input types are summarized in Table 1.5 and described in more detail in Sections1.6.13.2–1.6.13.9. Note that there are many other possible input types21 that we will notuse in this book, including specialized input elements for picking colors, selecting dates, etc.
TABLE 1.5: HTML input elements
Input type UsageNumeric input <input type="number">Range input <input type="range">Text input <input type="text">Text area <textarea></textarea>Radio buttons <input type="radio">Checkboxes <input type="checkbox">Dropdown lists <select><option></option></select>Buttons <input type="button">
1.6.13.2 Numeric input
A numeric <input> element is used to get numeric input through typing or clickingthe up/down buttons. A numeric input is defined using an <input> element with atype="number" attribute. Other important attributes are min and max, specifying the validrange of numbers that the user can enter. For example, the following HTML code creates anumeric input, where the user can enter numbers between 0 and 100, with the initial valueset to 5:
<input type="number" name="num" value="5" min="0" max="100">
The name attribute identifies the form control and is sent along with the entered informationwhen submitting a form to a server. It is not very useful within the scope of this book butis shown here for completeness as it is commonly used in other contexts (Section 1.6.13.1).
The way that the above numeric input element appears in the browser, along with all othertypes of input we cover next (Sections 1.6.13.3–1.6.13.9), is shown in Figure 1.9. The numericinput is in the top-left corner if the figure. Note that the code for example-01-06.htmlincludes CSS styling rules (which we learn about in Chapter 2) for arranging the inputelements in three columns.
20https://stackoverflow.com/questions/31066693/what-is-the-purpose-of-the-html-form-tag21https://developer.mozilla.org/en-US/docs/Web/HTML/Element/input
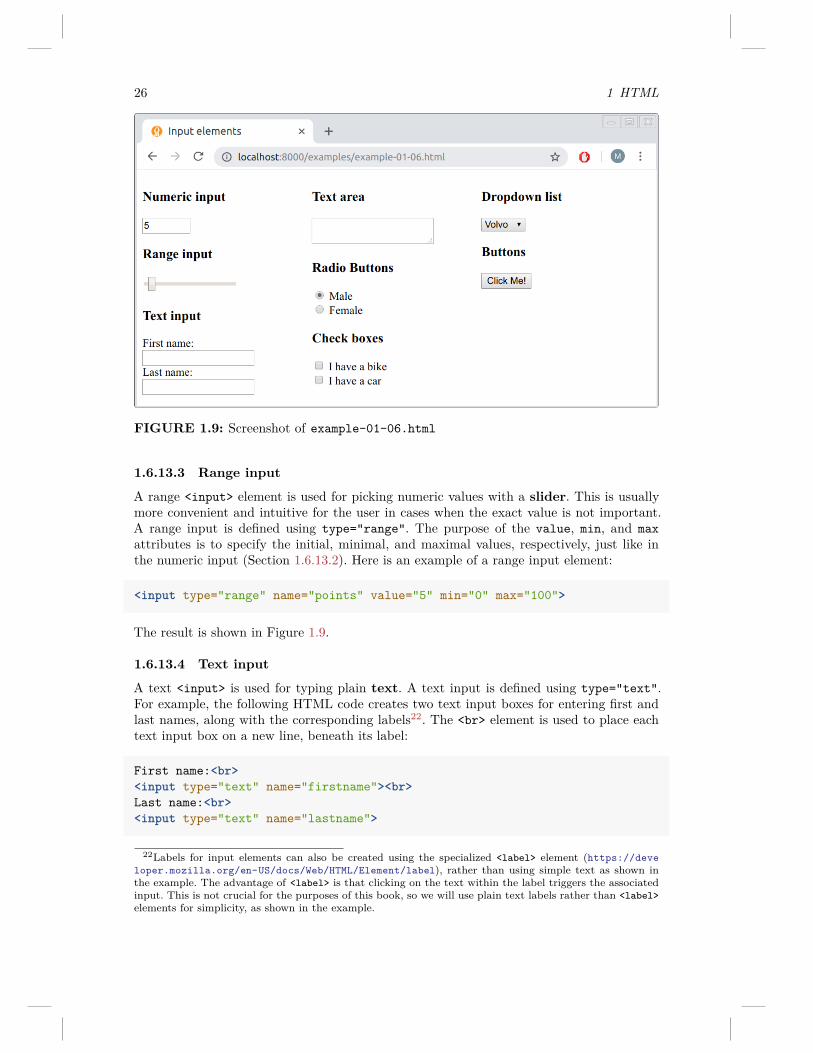
26 1 HTML
FIGURE 1.9: Screenshot of example-01-06.html
1.6.13.3 Range input
A range <input> element is used for picking numeric values with a slider. This is usuallymore convenient and intuitive for the user in cases when the exact value is not important.A range input is defined using type="range". The purpose of the value, min, and maxattributes is to specify the initial, minimal, and maximal values, respectively, just like inthe numeric input (Section 1.6.13.2). Here is an example of a range input element:
<input type="range" name="points" value="5" min="0" max="100">
The result is shown in Figure 1.9.
1.6.13.4 Text input
A text <input> is used for typing plain text. A text input is defined using type="text".For example, the following HTML code creates two text input boxes for entering first andlast names, along with the corresponding labels22. The <br> element is used to place eachtext input box on a new line, beneath its label:
First name:<br><input type="text" name="firstname"><br>Last name:<br><input type="text" name="lastname">
22Labels for input elements can also be created using the specialized <label> element (https://developer.mozilla.org/en-US/docs/Web/HTML/Element/label), rather than using simple text as shown inthe example. The advantage of <label> is that clicking on the text within the label triggers the associatedinput. This is not crucial for the purposes of this book, so we will use plain text labels rather than <label>elements for simplicity, as shown in the example.
1.6 Common HTML elements 27
The result is shown in Figure 1.9.
1.6.13.5 Text area
A text area input is used for typing plain text, just like text input, but intended for multi-line rather than single-line text input (e.g., Figure 7.5). A text input is defined using the<textarea> element, as shown in the following example:
<textarea name="mytext"></textarea>
The result is shown in Figure 1.9.
1.6.13.6 Radio buttons
Radio buttons are used to select one of several options. Each radio button is defined with aseparate <input> element using type="radio". The user can select only one option of theradio buttons sharing the same value for the name attribute. The checked attribute can beused to define which button is selected on page load. Note that the checked attribute has novalue. For example, the following HTML code creates two radio buttons, with correspondinglabels:
<input type="radio" name="gender" value="male" checked> Male<br><input type="radio" name="gender" value="female"> Female<br>
The result is shown in Figure 1.9. The “Male” option is initially checked because of thechecked attribute.
1.6.13.7 Checkboxes
Checkboxes are used to select one or more (or none) of several options. Each checkbox is de-fined with a separate <input> element using type="checkbox". For example, the followingHTML code creates two checkboxes, with labels:
<input type="checkbox" name="vehicle1" value="Bike"> I have a bike<br><input type="checkbox" name="vehicle2" value="Car"> I have a car<br>
The result is shown in Figure 1.9.
1.6.13.8 Dropdown menus
Dropdown lists, or dropdown menus, are used to select one option from a list. The list isinitially hidden from view, expanding only when clicked. The list is also scrollable, thereforethe number of items is potentially longer than can fit on screen. This makes dropdown listssuitable for situations when we have a long list of options the user needs to choose from,and we do not want to “waste” page space displaying all possible options at all times (e.g.,Figure 10.4).
The dropdown menu is initiated using the <select> element. Inside the <select> element,each option is defined with a separate <option> element. For example:
28 1 HTML
<select name="cars"><option value="volvo">Volvo</option><option value="suzuki">Suzuki</option><option value="fiat">Fiat</option><option value="audi">Audi</option>
</select>
The result is shown in Figure 1.9.
Note that in radio buttons (Section 1.6.13.6), checkboxes (Section 1.6.13.7) and dropdownmenus (Section 1.6.13.8), the value attribute identifies the currently selected option whensending the data to the server. The value does not necessarily have to be identical to thetext contents we see on screen when interacting with the input element in the browser. Forexample, in the above HTML code the first <option> has value="volvo", which is used toidentify the option when sending data to a server, while the text shown on screen is actually"Volvo" (with capital V).
1.6.13.9 Buttons
A button is used to trigger actions on the page. A button can be created using the <input>element with the type="button" attribute. The value attribute is used to set the text labelthat appears on the button. For example, the following HTML code creates a button withthe text “Click me!” on top:
<input type="button" value="Click Me!">
The result is shown in Figure 1.9.
On their own, the input elements are not very useful. For example, interacting with thevarious input elements in example-01-06.html (Figure 1.9) has no effect whatsoever. Tomake the input elements useful, we need to capture the input element values and write codethat does something with those values. In Section 4.12 we will learn how the current valuesof input elements can be captured and used to modify page appearance and/or contents,using JavaScript.
1.7 id, class, and style attributes1.7.1 OverviewSo far we have mostly encountered specific attributes for different HTML elements. Forexample, the src attribute is specific to <img> (and several other) elements and the hrefattribute is specific to <a> (and several other) elements. All HTML elements also sharethree important non-specific attributes, which can appear in any element:
• id—Unique identifier• class—Non-unique identifier• style—Inline CSS
1.7 id, class, and style attributes 29
The following Sections 1.7.2–1.7.4 cover the purpose and usage of these three non-specificattributes.
1.7.2 idThe id attribute is used to uniquely identify an HTML element from other elements onthe page. Its value should start with a letter or an underscore, not a number or any othercharacter. It is important that no two elements on the same page have the same value fortheir id attributes—otherwise the value is no longer unique.
For example, the following page has three <p> elements with id attributes. Note that thevalues of the id attribute—"intro", "middle", and "summary"—are different from eachother and thus unique for each element.
<!DOCTYPE html><html>
<head><title>A Minimal HTML Document</title>
</head><body>
<p id="intro">The 1st paragraph is an overview.</p><p id="middle">The 2nd paragraph gives more details.</p><p id="summary">The 3rd paragraph is a summary.</p>
</body></html>
As we will see when discussing CSS (Chapter 2), giving an element a unique id allows us tostyle it differently than any other instance of the same element on the page. For example,we may want to assign one paragraph within the page a different color than all of the otherparagraphs. When we go on to learn about JavaScript and interactive behavior (Chapter 4),we will also use id attributes to allow our scripts to uniquely affect the interactive behaviorof particular elements on the page.
1.7.3 classEvery HTML element can also carry a class attribute. Sometimes, rather than uniquelyidentify one element within a document using an id, we will want to identify a group ofelements as being different from all other elements on the page. For example, we may havesome paragraphs of text that contain information that is more important than others andwant to distinguish these elements, or differentiate between links that point to other pageson your own site and links that point to external sites.
To mark multiple elements as belonging to one group we can use the class attribute. Thevalue of the class attribute identifies the group those elements belong to. For example, inthe following HTML document, the first and third <p> elements share the class attributevalue of "important".
<!DOCTYPE html><html>
<head>
30 1 HTML
<title>A Minimal HTML Document</title></head><body>
<p class="important">The 1st paragraph is an overview.</p><p>The 2nd paragraph gives more details.</p><p class="important">The 3rd paragraph is a summary.</p>
</body></html>
Just like an id, the class attribute is commonly used for styling, or interacting with, agroup of elements on the page.
1.7.4 styleAll elements may also have a style attribute, which allows inline CSS rules to be specifiedwithin the element’s start tag. We will talk about inline CSS in Section 2.7.2.
1.8 Code layoutWhen writing code, it is useful to keep a uniform code layout. For example, we can usetabs to distinguish content that is inside another element, thus highlighting the hierarchicalstructure of code.
The following two HTML documents are the same as far as the computer is concerned,i.e., they are displayed exactly the same way in the browser. However, the second HTMLdocument is much more readable to humans thanks to the facts that:
• Each element starts on a new line.• Internal elements are indented with tabs.
<!DOCTYPE html><html><head><title>A Minimal HTML Document</title></head><body><p>The content goes here!</p></body></html>
<!DOCTYPE html><html>
<head><title>A Minimal HTML Document</title>
</head><body>
<p>The content goes here!</p></body>
</html>
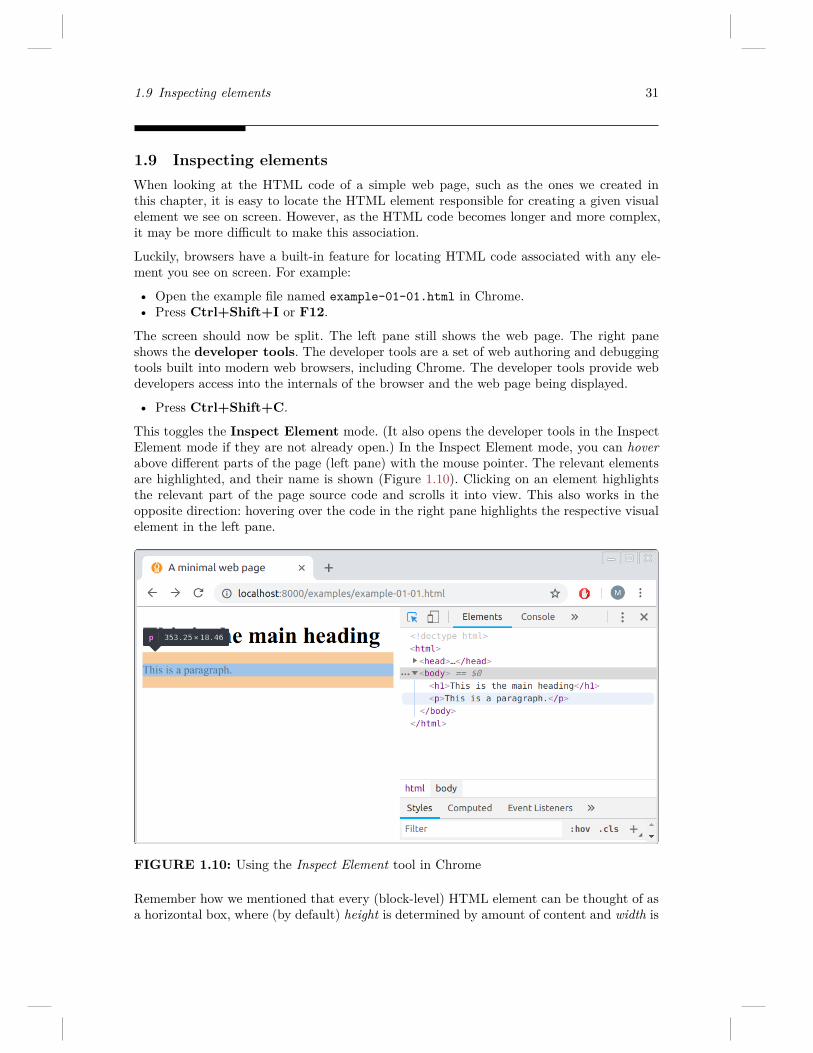
1.9 Inspecting elements 31
1.9 Inspecting elementsWhen looking at the HTML code of a simple web page, such as the ones we created inthis chapter, it is easy to locate the HTML element responsible for creating a given visualelement we see on screen. However, as the HTML code becomes longer and more complex,it may be more difficult to make this association.
Luckily, browsers have a built-in feature for locating HTML code associated with any ele-ment you see on screen. For example:
• Open the example file named example-01-01.html in Chrome.• Press Ctrl+Shift+I or F12.
The screen should now be split. The left pane still shows the web page. The right paneshows the developer tools. The developer tools are a set of web authoring and debuggingtools built into modern web browsers, including Chrome. The developer tools provide webdevelopers access into the internals of the browser and the web page being displayed.
• Press Ctrl+Shift+C.
This toggles the Inspect Element mode. (It also opens the developer tools in the InspectElement mode if they are not already open.) In the Inspect Element mode, you can hoverabove different parts of the page (left pane) with the mouse pointer. The relevant elementsare highlighted, and their name is shown (Figure 1.10). Clicking on an element highlightsthe relevant part of the page source code and scrolls it into view. This also works in theopposite direction: hovering over the code in the right pane highlights the respective visualelement in the left pane.
FIGURE 1.10: Using the Inspect Element tool in Chrome
Remember how we mentioned that every (block-level) HTML element can be thought of asa horizontal box, where (by default) height is determined by amount of content and width is
32 1 HTML
set to maximum of browser width (Section 1.5.3)? This becomes evident when the InspectElement tool highlights those boxes (Figure 1.10).
1.10 Exercise• Edit the minimal HTML document example-01-01.html to experiment with the HTML
element types we learned in this Chapter:– Modify the title of the page and the first-level heading.– Delete the existing paragraph and add a new paragraph with two to three sentences
about a subject you are interested in.– Use the appropriate tags to format some of the words in italic or bold font.– Use the <a> tag to add a link to another web page.– Add a list with two levels, i.e., a list where each list item is also a list.– Add images which are loaded from another location on the internet, such as from
Flickr23.
23https://www.flickr.com/

2CSS
2.1 IntroductionIn Chapter 1, we introduced HTML—the data format for specifying the contents and struc-ture of web pages. Using HTML alone, however, the web pages you create will share thesame default single-column arrangement, default colors, default fonts, etc. You will almostnever encounter “real” websites with the outdated appearance like the examples shown inChapter 1. The main thing that differentiates modern-looking, customized web pages fromsimple ones is CSS—the data format for specifying style and appearance of web pages.
2.2 What is CSS?Cascading Style Sheets (CSS)1 is a language for specifying the style and appearance ofweb pages. For example, CSS is used to specify:
• Fonts• Colors• Arrangement of elements on the page
The key to understanding how CSS works is to imagine that there is an invisible box aroundevery HTML element (Figure 2.1). CSS allows us to create rules that control the way thateach individual box, and the contents of that box, is presented. CSS is run when it is linkedto HTML code, while that HTML code is processed and visually presented by the browser.
2.3 CSS rulesCSS works by associating styling rules with HTML elements. The CSS rules govern howthe contents of specified elements should be displayed. A CSS rule contains two parts:
• A selector• One or more declarations
The selector specifies which HTML elements the rule applies to. The declarations indicatehow the elements referred to by the selector should be styled. Each declaration is split intotwo parts: a property name and a property value. Here is an example of a CSS rule:
1https://en.wikipedia.org/wiki/Cascading_Style_Sheets
33
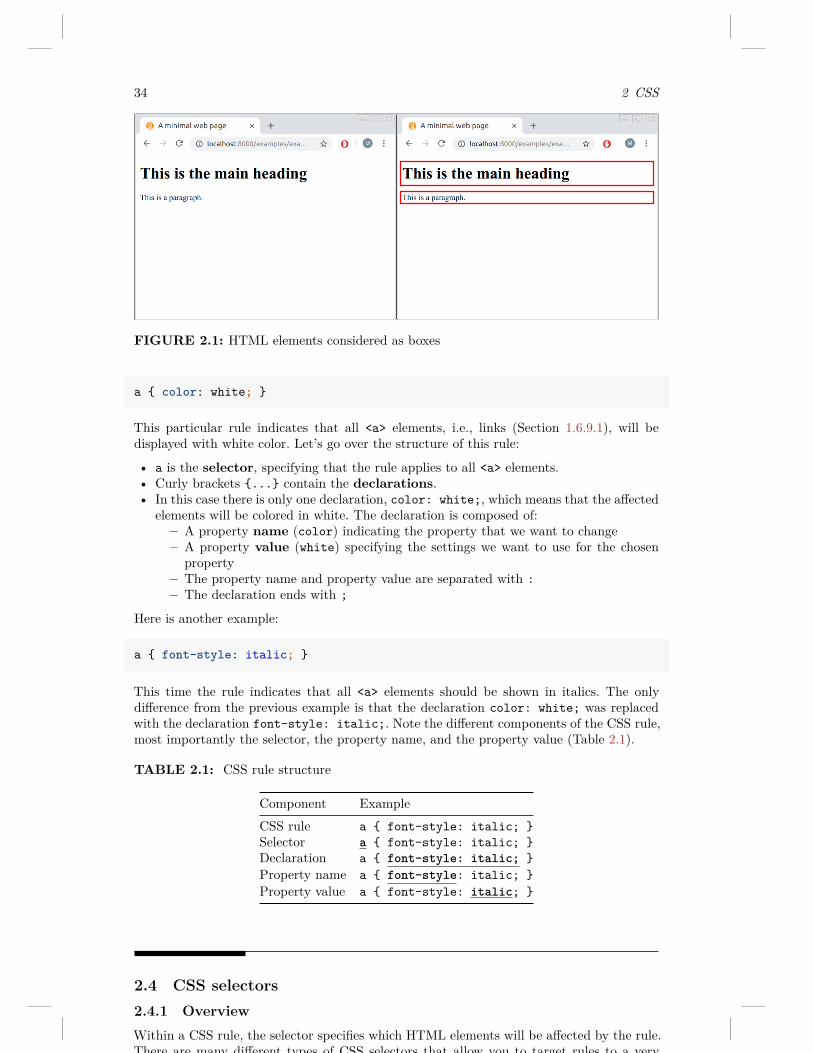
34 2 CSS
FIGURE 2.1: HTML elements considered as boxes
a { color: white; }
This particular rule indicates that all <a> elements, i.e., links (Section 1.6.9.1), will bedisplayed with white color. Let’s go over the structure of this rule:
• a is the selector, specifying that the rule applies to all <a> elements.• Curly brackets {...} contain the declarations.• In this case there is only one declaration, color: white;, which means that the affected
elements will be colored in white. The declaration is composed of:– A property name (color) indicating the property that we want to change– A property value (white) specifying the settings we want to use for the chosen
property– The property name and property value are separated with :– The declaration ends with ;
Here is another example:
a { font-style: italic; }
This time the rule indicates that all <a> elements should be shown in italics. The onlydifference from the previous example is that the declaration color: white; was replacedwith the declaration font-style: italic;. Note the different components of the CSS rule,most importantly the selector, the property name, and the property value (Table 2.1).
TABLE 2.1: CSS rule structure
Component ExampleCSS rule a { font-style: italic; }Selector a { font-style: italic; }Declaration a { font-style: italic; }Property name a { font-style: italic; }Property value a { font-style: italic; }
2.4 CSS selectors2.4.1 OverviewWithin a CSS rule, the selector specifies which HTML elements will be affected by the rule.There are many different types of CSS selectors that allow you to target rules to a veryspecific selection of elements in an HTML document. Some CSS selectors are used to targetspecific HTML elements (Table 2.2), while other selectors specify selector combinations(Table 2.3).
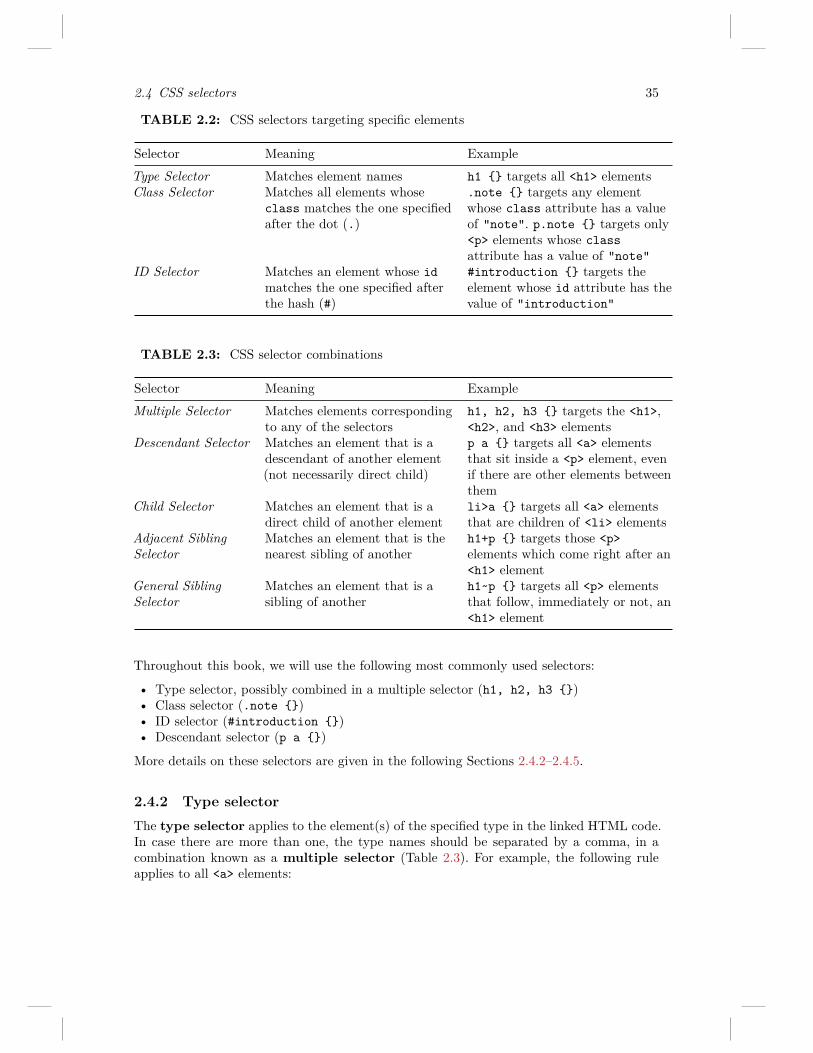
2.4 CSS selectors 35
TABLE 2.2: CSS selectors targeting specific elements
Selector Meaning ExampleType Selector Matches element names h1 {} targets all <h1> elementsClass Selector Matches all elements whose
class matches the one specifiedafter the dot (.)
.note {} targets any elementwhose class attribute has a valueof "note". p.note {} targets only<p> elements whose classattribute has a value of "note"
ID Selector Matches an element whose idmatches the one specified afterthe hash (#)
#introduction {} targets theelement whose id attribute has thevalue of "introduction"
TABLE 2.3: CSS selector combinations
Selector Meaning ExampleMultiple Selector Matches elements corresponding
to any of the selectorsh1, h2, h3 {} targets the <h1>,<h2>, and <h3> elements
Descendant Selector Matches an element that is adescendant of another element(not necessarily direct child)
p a {} targets all <a> elementsthat sit inside a <p> element, evenif there are other elements betweenthem
Child Selector Matches an element that is adirect child of another element
li>a {} targets all <a> elementsthat are children of <li> elements
Adjacent SiblingSelector
Matches an element that is thenearest sibling of another
h1+p {} targets those <p>elements which come right after an<h1> element
General SiblingSelector
Matches an element that is asibling of another
h1~p {} targets all <p> elementsthat follow, immediately or not, an<h1> element
Throughout this book, we will use the following most commonly used selectors:
• Type selector, possibly combined in a multiple selector (h1, h2, h3 {})• Class selector (.note {})• ID selector (#introduction {})• Descendant selector (p a {})
More details on these selectors are given in the following Sections 2.4.2–2.4.5.
2.4.2 Type selectorThe type selector applies to the element(s) of the specified type in the linked HTML code.In case there are more than one, the type names should be separated by a comma, in acombination known as a multiple selector (Table 2.3). For example, the following ruleapplies to all <a> elements:
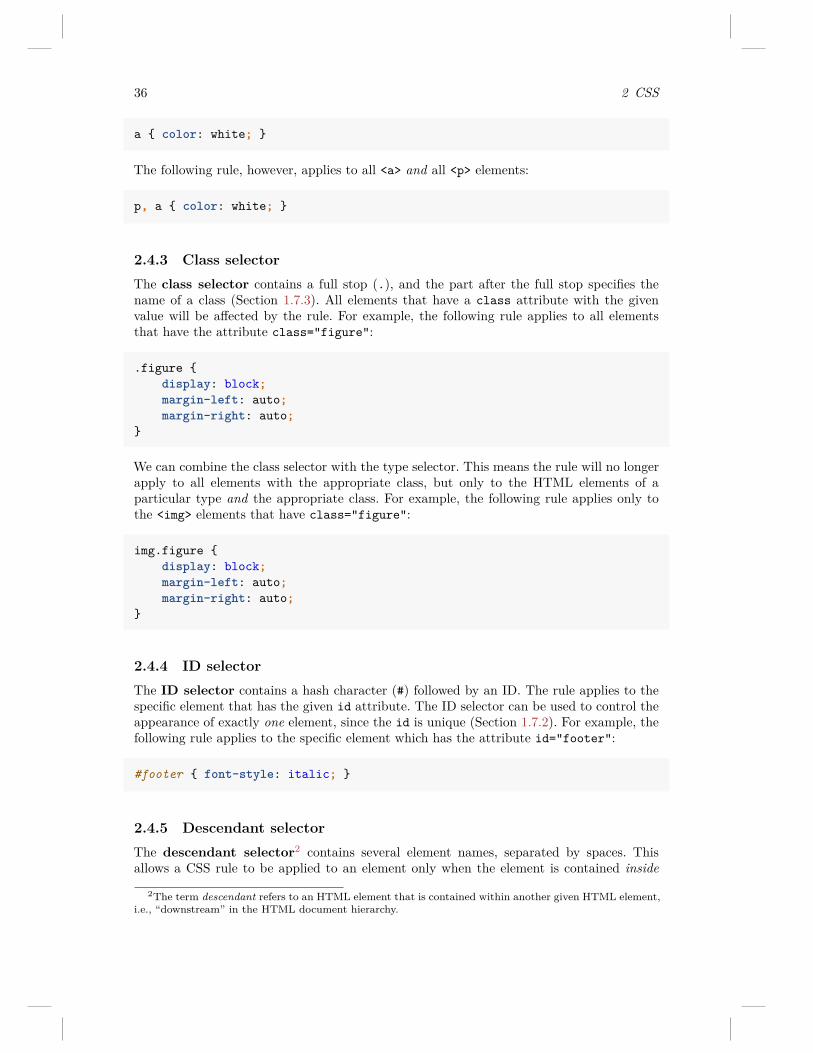
36 2 CSS
a { color: white; }
The following rule, however, applies to all <a> and all <p> elements:
p, a { color: white; }
2.4.3 Class selectorThe class selector contains a full stop (.), and the part after the full stop specifies thename of a class (Section 1.7.3). All elements that have a class attribute with the givenvalue will be affected by the rule. For example, the following rule applies to all elementsthat have the attribute class="figure":
.figure {display: block;margin-left: auto;margin-right: auto;
}
We can combine the class selector with the type selector. This means the rule will no longerapply to all elements with the appropriate class, but only to the HTML elements of aparticular type and the appropriate class. For example, the following rule applies only tothe <img> elements that have class="figure":
img.figure {display: block;margin-left: auto;margin-right: auto;
}
2.4.4 ID selectorThe ID selector contains a hash character (#) followed by an ID. The rule applies to thespecific element that has the given id attribute. The ID selector can be used to control theappearance of exactly one element, since the id is unique (Section 1.7.2). For example, thefollowing rule applies to the specific element which has the attribute id="footer":
#footer { font-style: italic; }
2.4.5 Descendant selectorThe descendant selector2 contains several element names, separated by spaces. Thisallows a CSS rule to be applied to an element only when the element is contained inside
2The term descendant refers to an HTML element that is contained within another given HTML element,i.e., “downstream” in the HTML document hierarchy.
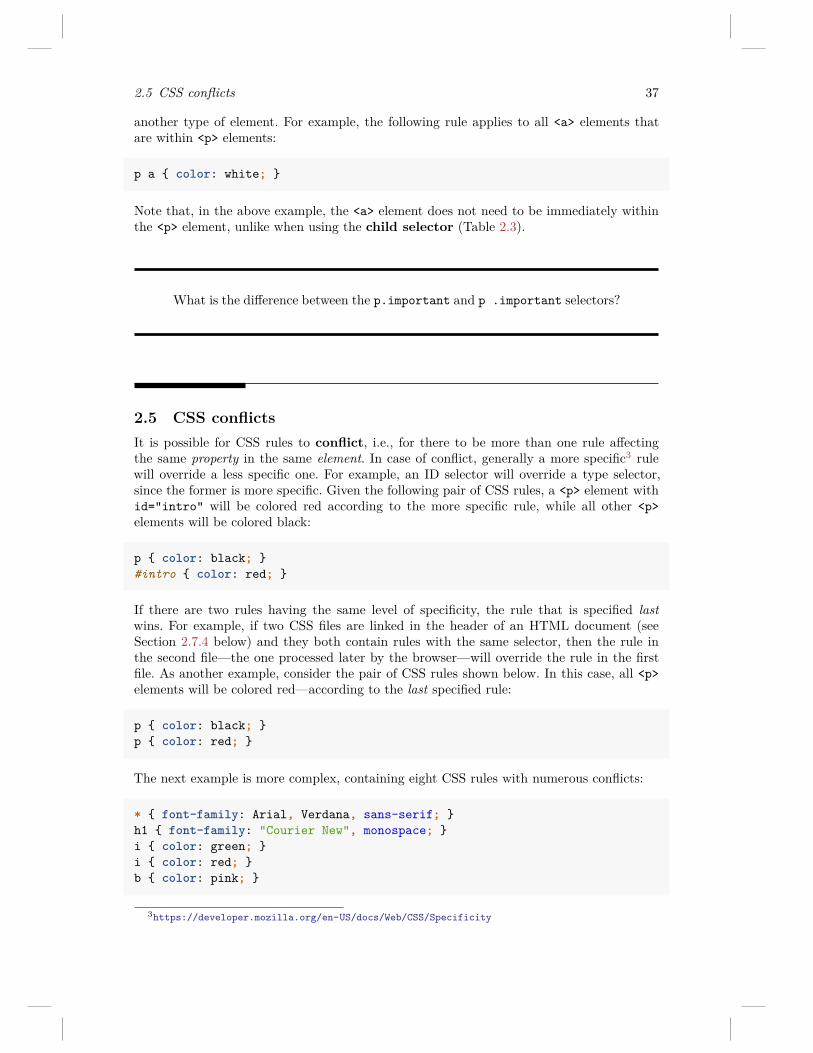
2.5 CSS conflicts 37
another type of element. For example, the following rule applies to all <a> elements thatare within <p> elements:
p a { color: white; }
Note that, in the above example, the <a> element does not need to be immediately withinthe <p> element, unlike when using the child selector (Table 2.3).
What is the difference between the p.important and p .important selectors?
2.5 CSS conflictsIt is possible for CSS rules to conflict, i.e., for there to be more than one rule affectingthe same property in the same element. In case of conflict, generally a more specific3 rulewill override a less specific one. For example, an ID selector will override a type selector,since the former is more specific. Given the following pair of CSS rules, a <p> element withid="intro" will be colored red according to the more specific rule, while all other <p>elements will be colored black:
p { color: black; }#intro { color: red; }
If there are two rules having the same level of specificity, the rule that is specified lastwins. For example, if two CSS files are linked in the header of an HTML document (seeSection 2.7.4 below) and they both contain rules with the same selector, then the rule inthe second file—the one processed later by the browser—will override the rule in the firstfile. As another example, consider the pair of CSS rules shown below. In this case, all <p>elements will be colored red—according to the last specified rule:
p { color: black; }p { color: red; }
The next example is more complex, containing eight CSS rules with numerous conflicts:
* { font-family: Arial, Verdana, sans-serif; }h1 { font-family: "Courier New", monospace; }i { color: green; }i { color: red; }b { color: pink; }
3https://developer.mozilla.org/en-US/docs/Web/CSS/Specificity
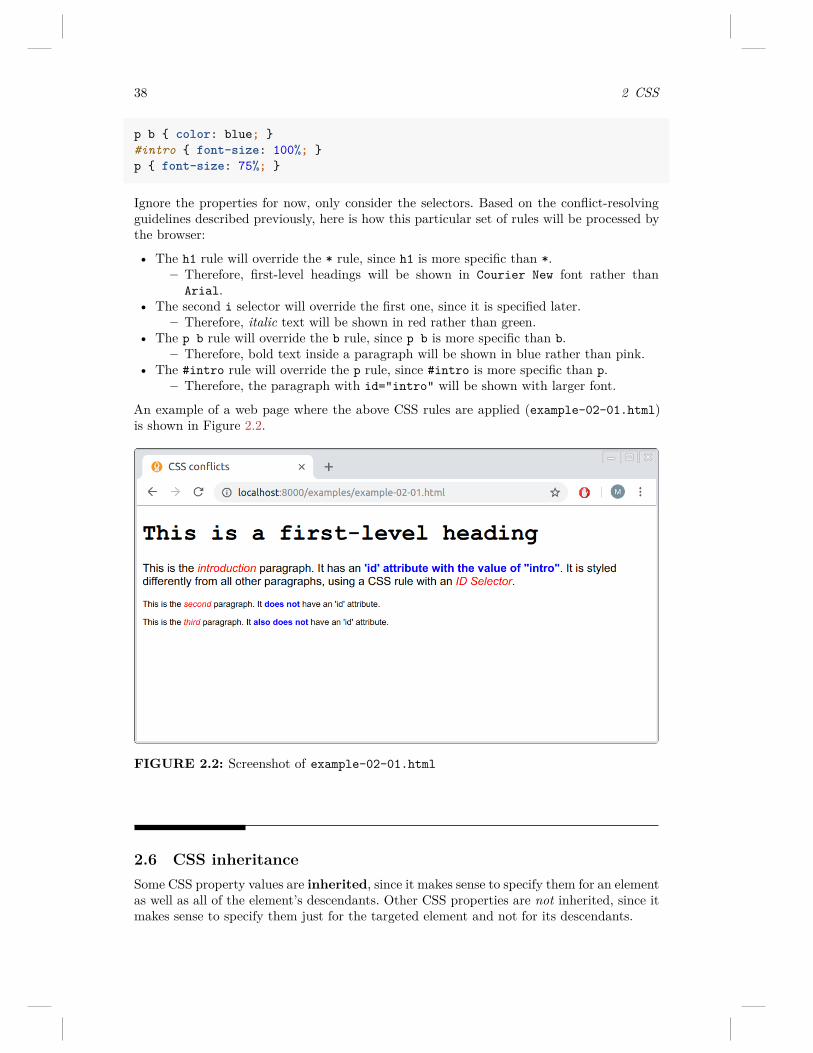
38 2 CSS
p b { color: blue; }#intro { font-size: 100%; }p { font-size: 75%; }
Ignore the properties for now, only consider the selectors. Based on the conflict-resolvingguidelines described previously, here is how this particular set of rules will be processed bythe browser:
• The h1 rule will override the * rule, since h1 is more specific than *.– Therefore, first-level headings will be shown in Courier New font rather than
Arial.• The second i selector will override the first one, since it is specified later.
– Therefore, italic text will be shown in red rather than green.• The p b rule will override the b rule, since p b is more specific than b.
– Therefore, bold text inside a paragraph will be shown in blue rather than pink.• The #intro rule will override the p rule, since #intro is more specific than p.
– Therefore, the paragraph with id="intro" will be shown with larger font.
An example of a web page where the above CSS rules are applied (example-02-01.html)is shown in Figure 2.2.
FIGURE 2.2: Screenshot of example-02-01.html
2.6 CSS inheritanceSome CSS property values are inherited, since it makes sense to specify them for an elementas well as all of the element’s descendants. Other CSS properties are not inherited, since itmakes sense to specify them just for the targeted element and not for its descendants.
2.7 Linking CSS to HTML 39
For example, it makes sense for font-family and color to be inherited, as that makes iteasy to set a document-wide base font and base color by setting the font-family and coloron the <body> element. That way, all of the heading, paragraphs, and all other elements inthe document—which are all descendants of the <body> element—are uniformly displayedin the same font and color. When necessary, you can override the fonts and/or colors onindividual elements where needed, relying on the fact that a specific rule overrides a generalone (Section 2.5). It would be really annoying to have to set the base font separately onevery element.
Contrariwise, it makes no sense for margin, padding, and border to be inherited. TheseCSS properties control the placement and border style of HTML elements (Section 2.8.4).Imagine the styling mess that would occur if you set these properties on a container elementand had them inherited by every single internal element! Nevertheless, in rare situationsforcing inheritance is necessary. Forcing a property to inherit values from their “parent”element can be done by using the keyword inherit as the respective property value (seeSection 2.9 for an example)4.
2.7 Linking CSS to HTML2.7.1 Methods for linking CSSHow can we actually link our CSS code to an HTML document, to affect its presentationin the browser? There are three methods in which CSS code can be linked to an HTMLdocument:
• Inline CSS (Section 2.7.2)• Embedded CSS (Section 2.7.3)• External CSS (Section 2.7.4)
The following Sections 2.7.2–2.7.4 shortly explain each of these methods.
2.7.2 Inline CSSThe simplest approach to associate CSS code with HTML elements is to include the CSScode within the style attribute of an HTML element. As mentioned in Section 1.7.4, styleis one of three general attributes that can appear in every type of HTML element (alongwith id and class). The value of the style attribute contains CSS declarations applyingto that element. This method is called inline CSS. For example, a paragraph that has thefollowing start tag will be displayed with italic font, thanks to the inline CSS rule. Here,CSS is used to control the appearance of text within this paragraph only.
<p style="font-style:italic;">
Note that, with inline CSS, the code consists of just declaration(s), with no selectors. Selec-tors are not needed, since inline CSS by definition only applies to a specific HTML elementwhere the style attribute appears.
4A more detailed description of CSS conflict resolution and inheritance can be found in the Cascade andInheritance article (https://developer.mozilla.org/en-US/docs/Learn/CSS/Introduction_to_CSS/Cascade_and_inheritance) by Mozilla.
40 2 CSS
Using inline CSS is generally not recommended, and should be used sparingly, because it:
• Mixes CSS code with HTML code, making both of them harder to maintain• Requires repeating CSS code in all elements where the same style needs to be applied
We will see one example where inline CSS comes in handy later on (Section 8.6).
2.7.3 Embedded CSSIt is also possible to include CSS code within a <style> element within the <head> elementof HTML code (Section 1.6.4.1). This approach is called embedded CSS. For example,here are the first few lines of an HTML document that uses embedded CSS:
<!DOCTYPE html><html>
<head><style>
p { font-style: italic; }</style>
...
In this example, the appearance of text within all paragraphs in the document is controlledwith a single CSS rule. Embedded CSS is a better approach than inline CSS, because withembedded CSS the rules do not need to be attached to each individual HTML element.However, embedded CSS is still not ideal, because:
• the separation between HTML and CSS is not complete—although all CSS code is inone place, it is still embedded in the HTML document; and
• consequently, any reuse of the CSS code with other HTML code requires making multiplecopies of the same CSS code in the <head> of each page.
2.7.4 External CSSThe third approach, called external CSS, is writing CSS code in a separate .css file andreferring to that CSS file from the HTML code. The CSS file is referred to using a <link>element within the <head> element (Section 1.6.4.2). For example, here are the first fewlines of an HTML document that uses external CSS:
<!DOCTYPE html><html>
<head><link rel="stylesheet" href="style.css">
...
The above <link> element refers to a file with CSS code, in this case a file named style.css.The contents of the style.css file is plain CSS code, such as:
p { font-style: italic; }
The external CSS approach is the recommended way of using CSS, since it makes HTMLand CSS code completely separate, and thus the CSS code is easier to maintain. Additionally,
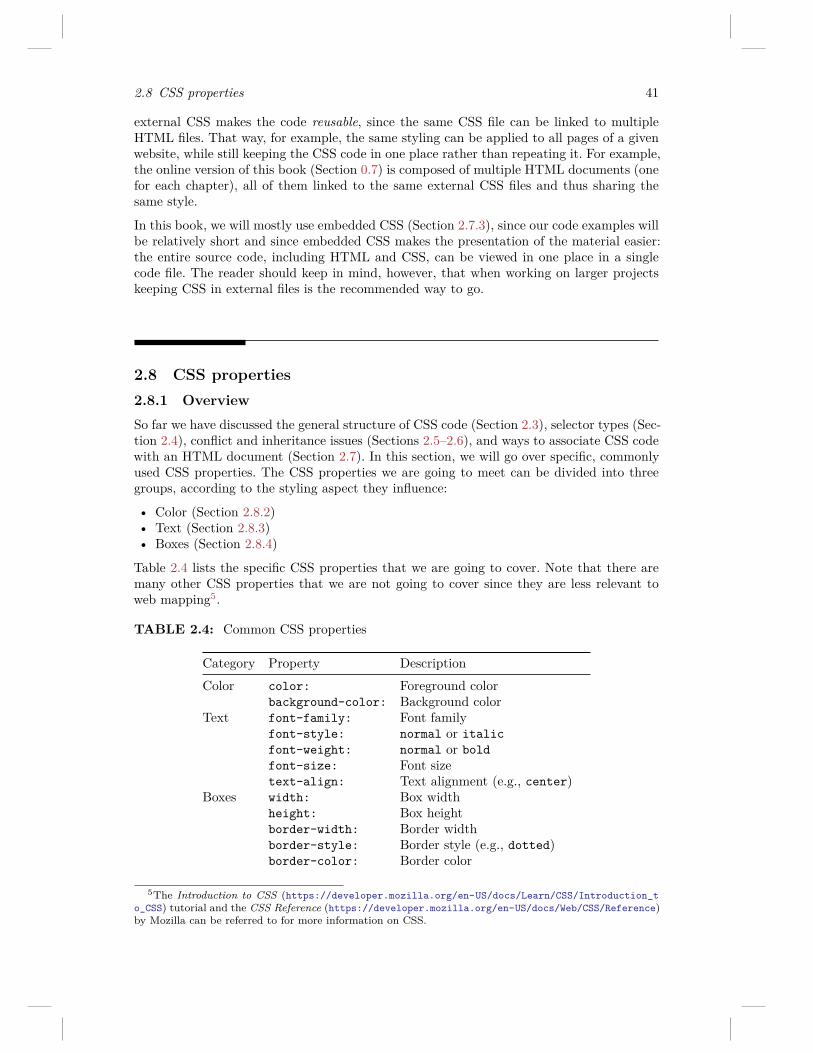
2.8 CSS properties 41
external CSS makes the code reusable, since the same CSS file can be linked to multipleHTML files. That way, for example, the same styling can be applied to all pages of a givenwebsite, while still keeping the CSS code in one place rather than repeating it. For example,the online version of this book (Section 0.7) is composed of multiple HTML documents (onefor each chapter), all of them linked to the same external CSS files and thus sharing thesame style.
In this book, we will mostly use embedded CSS (Section 2.7.3), since our code examples willbe relatively short and since embedded CSS makes the presentation of the material easier:the entire source code, including HTML and CSS, can be viewed in one place in a singlecode file. The reader should keep in mind, however, that when working on larger projectskeeping CSS in external files is the recommended way to go.
2.8 CSS properties2.8.1 OverviewSo far we have discussed the general structure of CSS code (Section 2.3), selector types (Sec-tion 2.4), conflict and inheritance issues (Sections 2.5–2.6), and ways to associate CSS codewith an HTML document (Section 2.7). In this section, we will go over specific, commonlyused CSS properties. The CSS properties we are going to meet can be divided into threegroups, according to the styling aspect they influence:
• Color (Section 2.8.2)• Text (Section 2.8.3)• Boxes (Section 2.8.4)
Table 2.4 lists the specific CSS properties that we are going to cover. Note that there aremany other CSS properties that we are not going to cover since they are less relevant toweb mapping5.
TABLE 2.4: Common CSS properties
Category Property DescriptionColor color: Foreground color
background-color: Background colorText font-family: Font family
font-style: normal or italicfont-weight: normal or boldfont-size: Font sizetext-align: Text alignment (e.g., center)
Boxes width: Box widthheight: Box heightborder-width: Border widthborder-style: Border style (e.g., dotted)border-color: Border color
5The Introduction to CSS (https://developer.mozilla.org/en-US/docs/Learn/CSS/Introduction_to_CSS) tutorial and the CSS Reference (https://developer.mozilla.org/en-US/docs/Web/CSS/Reference)by Mozilla can be referred to for more information on CSS.
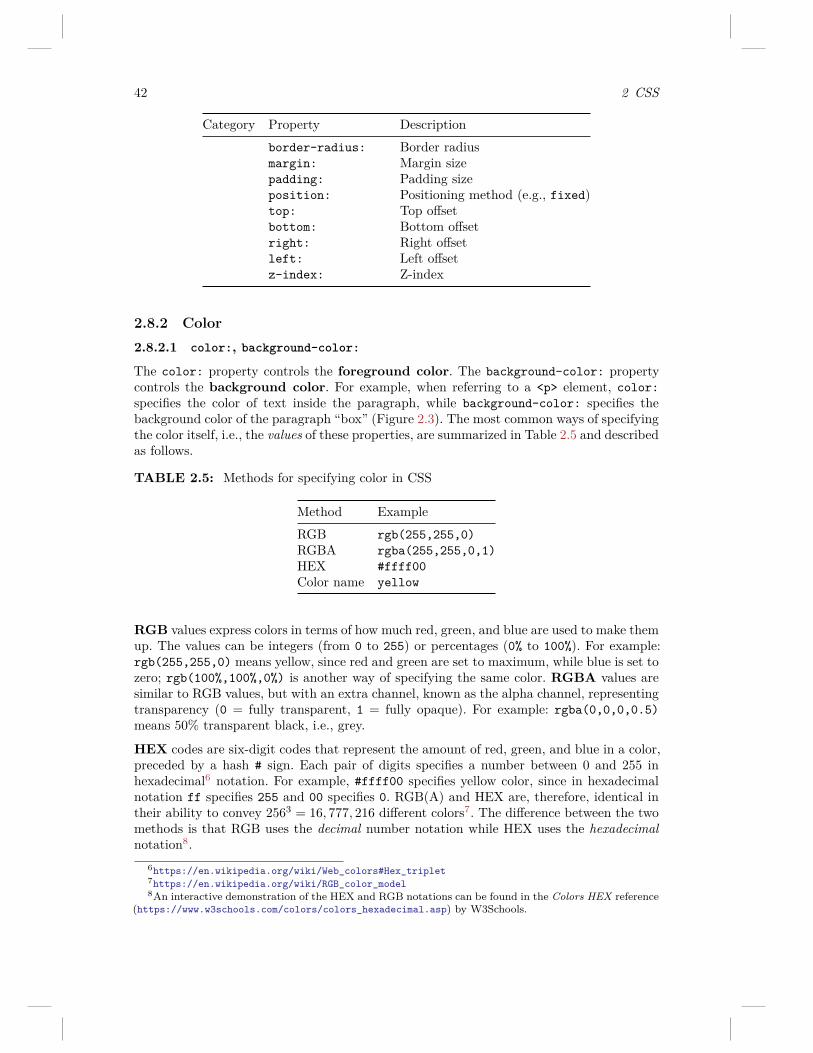
42 2 CSS
Category Property Descriptionborder-radius: Border radiusmargin: Margin sizepadding: Padding sizeposition: Positioning method (e.g., fixed)top: Top offsetbottom: Bottom offsetright: Right offsetleft: Left offsetz-index: Z-index
2.8.2 Color2.8.2.1 color:, background-color:
The color: property controls the foreground color. The background-color: propertycontrols the background color. For example, when referring to a <p> element, color:specifies the color of text inside the paragraph, while background-color: specifies thebackground color of the paragraph “box” (Figure 2.3). The most common ways of specifyingthe color itself, i.e., the values of these properties, are summarized in Table 2.5 and describedas follows.
TABLE 2.5: Methods for specifying color in CSS
Method ExampleRGB rgb(255,255,0)RGBA rgba(255,255,0,1)HEX #ffff00Color name yellow
RGB values express colors in terms of how much red, green, and blue are used to make themup. The values can be integers (from 0 to 255) or percentages (0% to 100%). For example:rgb(255,255,0) means yellow, since red and green are set to maximum, while blue is set tozero; rgb(100%,100%,0%) is another way of specifying the same color. RGBA values aresimilar to RGB values, but with an extra channel, known as the alpha channel, representingtransparency (0 = fully transparent, 1 = fully opaque). For example: rgba(0,0,0,0.5)means 50% transparent black, i.e., grey.
HEX codes are six-digit codes that represent the amount of red, green, and blue in a color,preceded by a hash # sign. Each pair of digits specifies a number between 0 and 255 inhexadecimal6 notation. For example, #ffff00 specifies yellow color, since in hexadecimalnotation ff specifies 255 and 00 specifies 0. RGB(A) and HEX are, therefore, identical intheir ability to convey 2563 = 16, 777, 216 different colors7. The difference between the twomethods is that RGB uses the decimal number notation while HEX uses the hexadecimalnotation8.
6https://en.wikipedia.org/wiki/Web_colors#Hex_triplet7https://en.wikipedia.org/wiki/RGB_color_model8An interactive demonstration of the HEX and RGB notations can be found in the Colors HEX reference
(https://www.w3schools.com/colors/colors_hexadecimal.asp) by W3Schools.
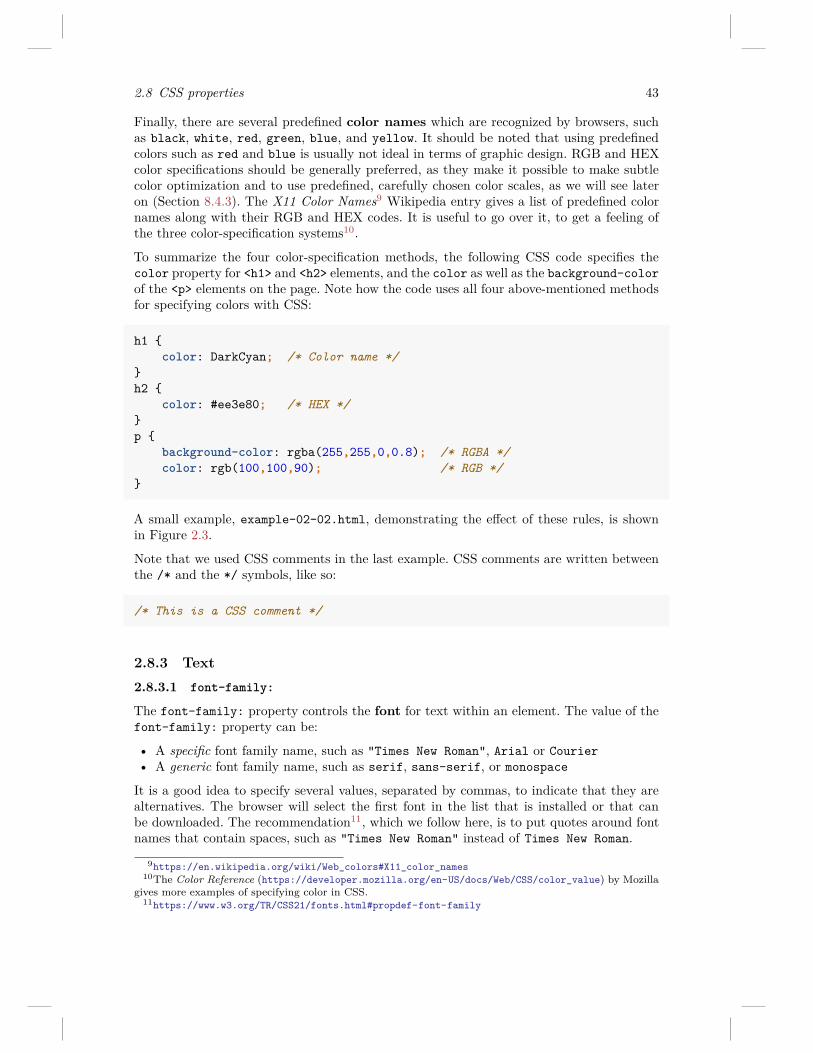
2.8 CSS properties 43
Finally, there are several predefined color names which are recognized by browsers, suchas black, white, red, green, blue, and yellow. It should be noted that using predefinedcolors such as red and blue is usually not ideal in terms of graphic design. RGB and HEXcolor specifications should be generally preferred, as they make it possible to make subtlecolor optimization and to use predefined, carefully chosen color scales, as we will see lateron (Section 8.4.3). The X11 Color Names9 Wikipedia entry gives a list of predefined colornames along with their RGB and HEX codes. It is useful to go over it, to get a feeling ofthe three color-specification systems10.
To summarize the four color-specification methods, the following CSS code specifies thecolor property for <h1> and <h2> elements, and the color as well as the background-colorof the <p> elements on the page. Note how the code uses all four above-mentioned methodsfor specifying colors with CSS:
h1 {color: DarkCyan; /* Color name */
}h2 {
color: #ee3e80; /* HEX */}p {
background-color: rgba(255,255,0,0.8); /* RGBA */color: rgb(100,100,90); /* RGB */
}
A small example, example-02-02.html, demonstrating the effect of these rules, is shownin Figure 2.3.
Note that we used CSS comments in the last example. CSS comments are written betweenthe /* and the */ symbols, like so:
/* This is a CSS comment */
2.8.3 Text2.8.3.1 font-family:
The font-family: property controls the font for text within an element. The value of thefont-family: property can be:
• A specific font family name, such as "Times New Roman", Arial or Courier• A generic font family name, such as serif, sans-serif, or monospace
It is a good idea to specify several values, separated by commas, to indicate that they arealternatives. The browser will select the first font in the list that is installed or that canbe downloaded. The recommendation11, which we follow here, is to put quotes around fontnames that contain spaces, such as "Times New Roman" instead of Times New Roman.
9https://en.wikipedia.org/wiki/Web_colors#X11_color_names10The Color Reference (https://developer.mozilla.org/en-US/docs/Web/CSS/color_value) by Mozilla
gives more examples of specifying color in CSS.11https://www.w3.org/TR/CSS21/fonts.html#propdef-font-family
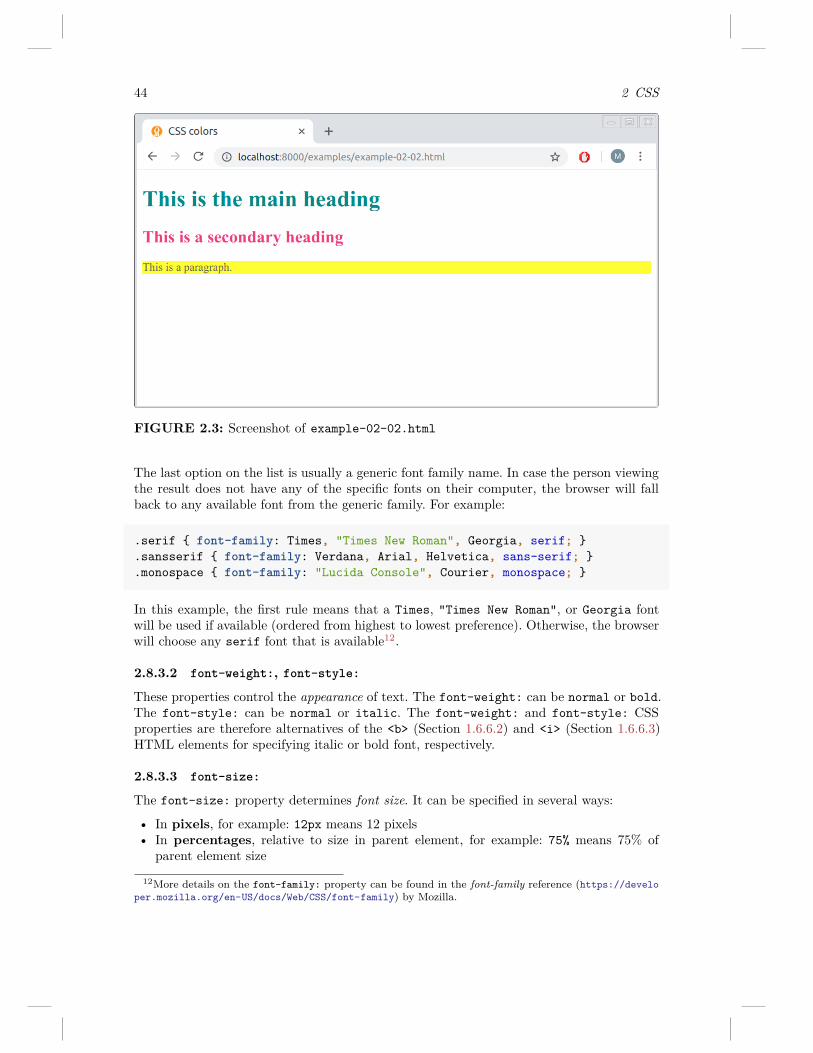
44 2 CSS
FIGURE 2.3: Screenshot of example-02-02.html
The last option on the list is usually a generic font family name. In case the person viewingthe result does not have any of the specific fonts on their computer, the browser will fallback to any available font from the generic family. For example:
.serif { font-family: Times, "Times New Roman", Georgia, serif; }
.sansserif { font-family: Verdana, Arial, Helvetica, sans-serif; }
.monospace { font-family: "Lucida Console", Courier, monospace; }
In this example, the first rule means that a Times, "Times New Roman", or Georgia fontwill be used if available (ordered from highest to lowest preference). Otherwise, the browserwill choose any serif font that is available12.
2.8.3.2 font-weight:, font-style:
These properties control the appearance of text. The font-weight: can be normal or bold.The font-style: can be normal or italic. The font-weight: and font-style: CSSproperties are therefore alternatives of the <b> (Section 1.6.6.2) and <i> (Section 1.6.6.3)HTML elements for specifying italic or bold font, respectively.
2.8.3.3 font-size:
The font-size: property determines font size. It can be specified in several ways:
• In pixels, for example: 12px means 12 pixels• In percentages, relative to size in parent element, for example: 75% means 75% of
parent element size
12More details on the font-family: property can be found in the font-family reference (https://developer.mozilla.org/en-US/docs/Web/CSS/font-family) by Mozilla.
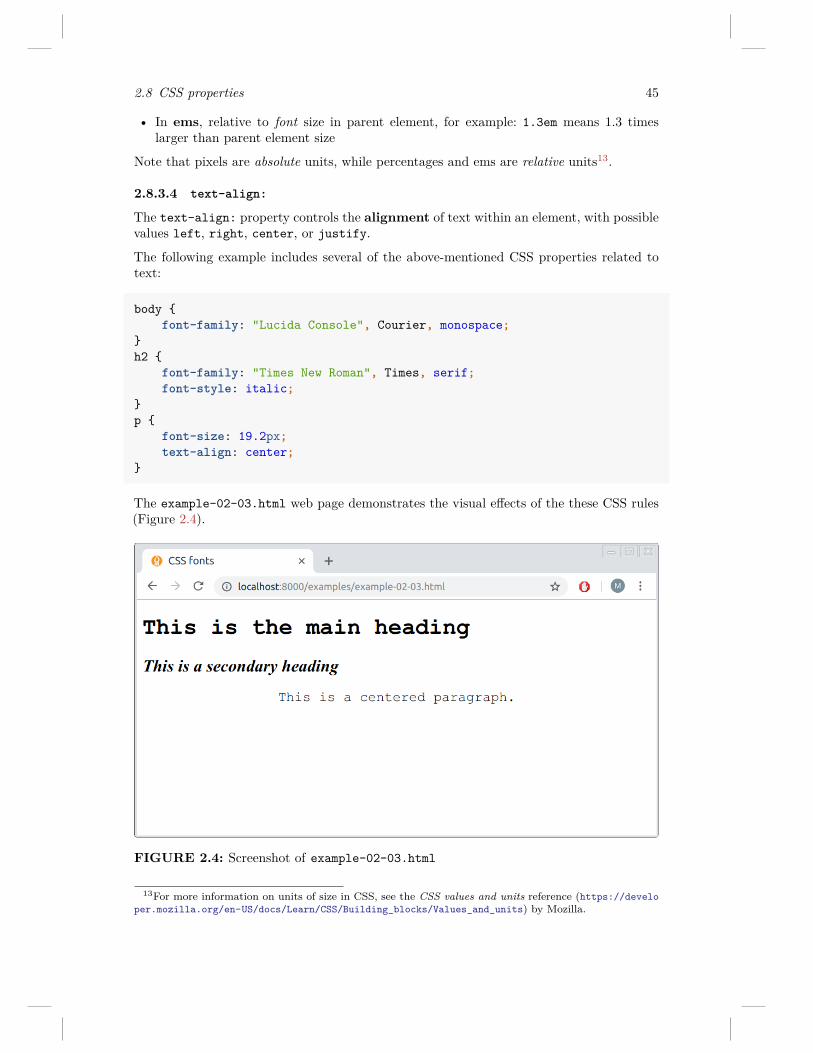
2.8 CSS properties 45
• In ems, relative to font size in parent element, for example: 1.3em means 1.3 timeslarger than parent element size
Note that pixels are absolute units, while percentages and ems are relative units13.
2.8.3.4 text-align:
The text-align: property controls the alignment of text within an element, with possiblevalues left, right, center, or justify.
The following example includes several of the above-mentioned CSS properties related totext:
body {font-family: "Lucida Console", Courier, monospace;
}h2 {
font-family: "Times New Roman", Times, serif;font-style: italic;
}p {
font-size: 19.2px;text-align: center;
}
The example-02-03.html web page demonstrates the visual effects of the these CSS rules(Figure 2.4).
FIGURE 2.4: Screenshot of example-02-03.html
13For more information on units of size in CSS, see the CSS values and units reference (https://developer.mozilla.org/en-US/docs/Learn/CSS/Building_blocks/Values_and_units) by Mozilla.
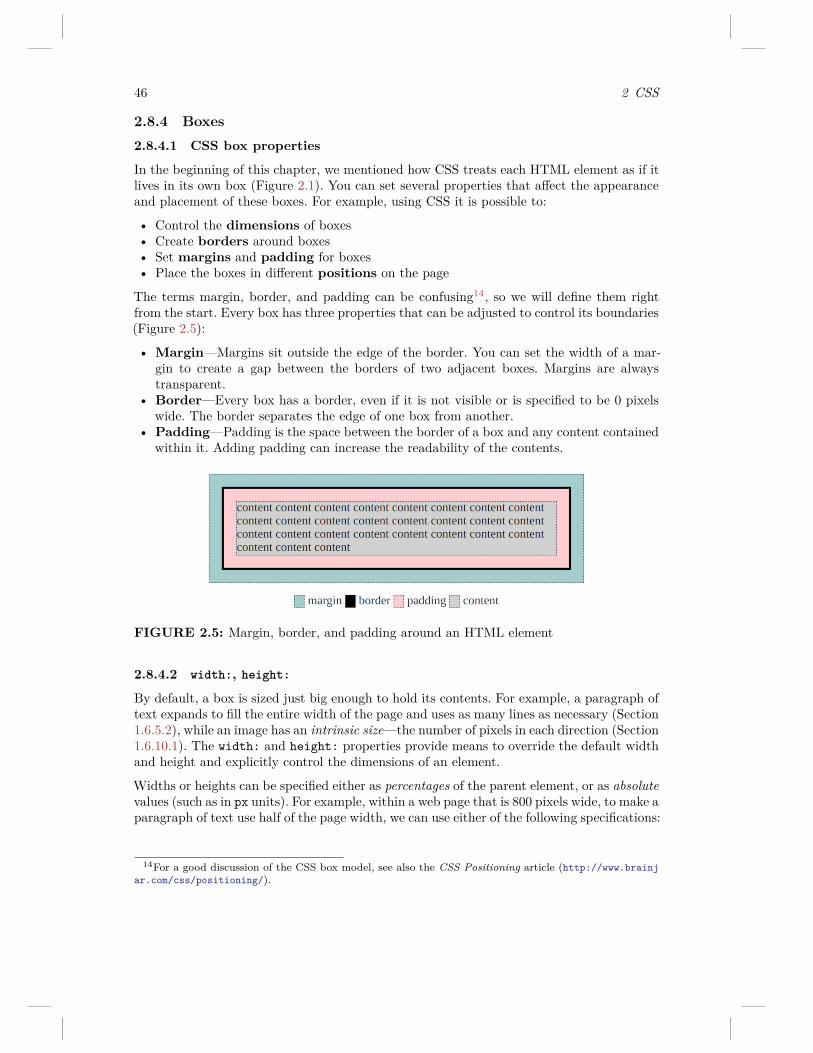
46 2 CSS
2.8.4 Boxes2.8.4.1 CSS box properties
In the beginning of this chapter, we mentioned how CSS treats each HTML element as if itlives in its own box (Figure 2.1). You can set several properties that affect the appearanceand placement of these boxes. For example, using CSS it is possible to:
• Control the dimensions of boxes• Create borders around boxes• Set margins and padding for boxes• Place the boxes in different positions on the page
The terms margin, border, and padding can be confusing14, so we will define them rightfrom the start. Every box has three properties that can be adjusted to control its boundaries(Figure 2.5):
• Margin—Margins sit outside the edge of the border. You can set the width of a mar-gin to create a gap between the borders of two adjacent boxes. Margins are alwaystransparent.
• Border—Every box has a border, even if it is not visible or is specified to be 0 pixelswide. The border separates the edge of one box from another.
• Padding—Padding is the space between the border of a box and any content containedwithin it. Adding padding can increase the readability of the contents.
FIGURE 2.5: Margin, border, and padding around an HTML element
2.8.4.2 width:, height:
By default, a box is sized just big enough to hold its contents. For example, a paragraph oftext expands to fill the entire width of the page and uses as many lines as necessary (Section1.6.5.2), while an image has an intrinsic size—the number of pixels in each direction (Section1.6.10.1). The width: and height: properties provide means to override the default widthand height and explicitly control the dimensions of an element.
Widths or heights can be specified either as percentages of the parent element, or as absolutevalues (such as in px units). For example, within a web page that is 800 pixels wide, to make aparagraph of text use half of the page width, we can use either of the following specifications:
14For a good discussion of the CSS box model, see also the CSS Positioning article (http://www.brainjar.com/css/positioning/).
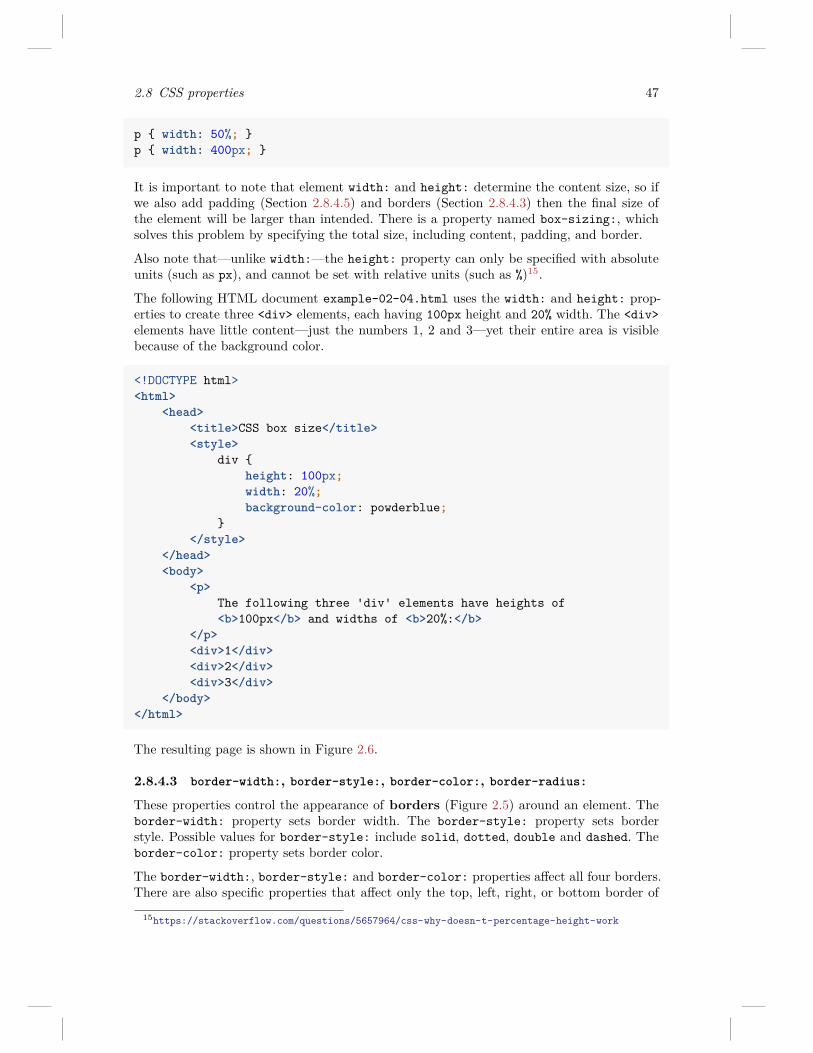
2.8 CSS properties 47
p { width: 50%; }p { width: 400px; }
It is important to note that element width: and height: determine the content size, so ifwe also add padding (Section 2.8.4.5) and borders (Section 2.8.4.3) then the final size ofthe element will be larger than intended. There is a property named box-sizing:, whichsolves this problem by specifying the total size, including content, padding, and border.
Also note that—unlike width:—the height: property can only be specified with absoluteunits (such as px), and cannot be set with relative units (such as %)15.
The following HTML document example-02-04.html uses the width: and height: prop-erties to create three <div> elements, each having 100px height and 20% width. The <div>elements have little content—just the numbers 1, 2 and 3—yet their entire area is visiblebecause of the background color.
<!DOCTYPE html><html>
<head><title>CSS box size</title><style>
div {height: 100px;width: 20%;background-color: powderblue;
}</style>
</head><body>
<p>The following three 'div' elements have heights of<b>100px</b> and widths of <b>20%:</b>
</p><div>1</div><div>2</div><div>3</div>
</body></html>
The resulting page is shown in Figure 2.6.
2.8.4.3 border-width:, border-style:, border-color:, border-radius:
These properties control the appearance of borders (Figure 2.5) around an element. Theborder-width: property sets border width. The border-style: property sets borderstyle. Possible values for border-style: include solid, dotted, double and dashed. Theborder-color: property sets border color.
The border-width:, border-style: and border-color: properties affect all four borders.There are also specific properties that affect only the top, left, right, or bottom border of
15https://stackoverflow.com/questions/5657964/css-why-doesn-t-percentage-height-work
48 2 CSS
FIGURE 2.6: Screenshot of example-02-04.html
an element. These can be used by adding -top-, -left-, -right-, or -bottom- in theproperty name, respectively. For example, the following CSS rule can be used to producehorizontal lines at the top of all paragraphs on a web page:
p {border-top-width: 1px;border-top-style: solid;
}
The border-radius: property can be used to make the border corners appear rounded (seeSection 2.10.2 for an example).
2.8.4.4 margin:
The margin: property controls the margin—how much space is allocated around the out-side of the element (Figure 2.5), that is, between the given element and its neighboringelements. The size of margins can be expressed using various units of length, same as in thewidth: and height: properties (Section 2.8.4.2).
The margin: property affects all four margins. Just like with borders (Section 2.8.4.3),there are also properties for controlling individual margins: margin-top:, margin-bottom:,margin-right:, and margin-left:.
2.8.4.5 padding:
The padding: property controls box padding—how much space is allocated between theborder of the element and its contents (Figure 2.5). Values are specified the same way asfor margins. Similarly, there are specific properties (padding-top:, etc.), for controlling thepadding on each side of the element.
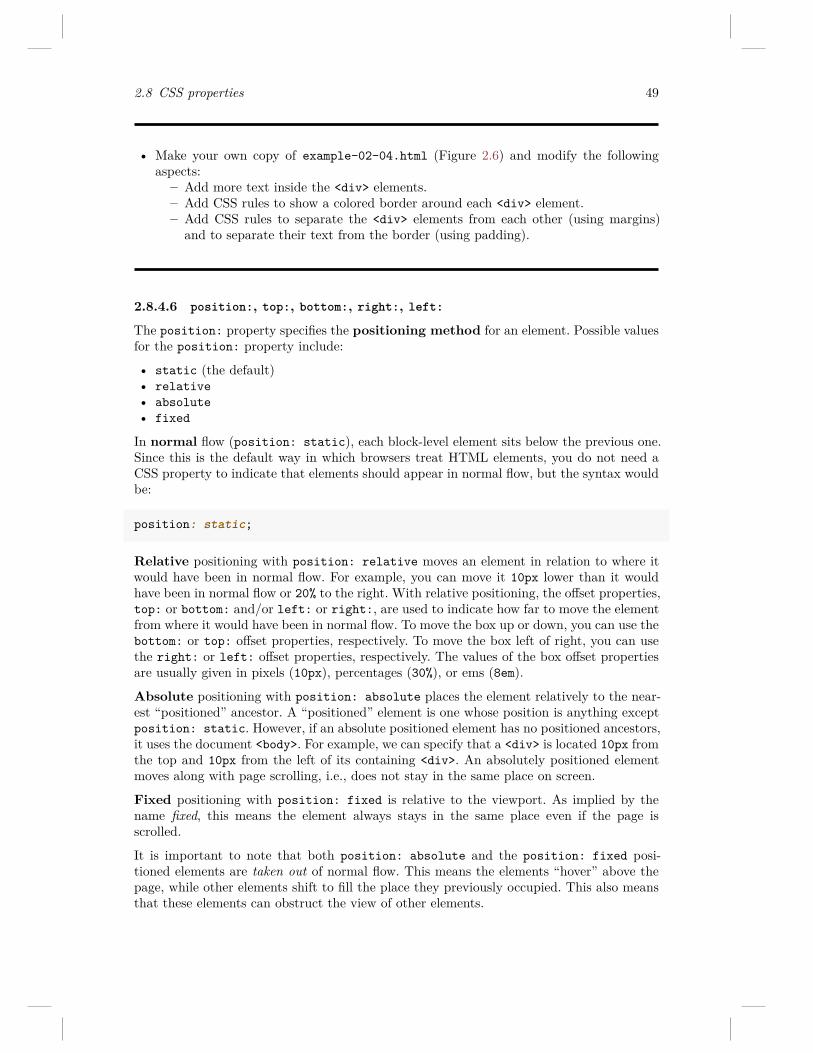
2.8 CSS properties 49
• Make your own copy of example-02-04.html (Figure 2.6) and modify the followingaspects:
– Add more text inside the <div> elements.– Add CSS rules to show a colored border around each <div> element.– Add CSS rules to separate the <div> elements from each other (using margins)
and to separate their text from the border (using padding).
2.8.4.6 position:, top:, bottom:, right:, left:
The position: property specifies the positioning method for an element. Possible valuesfor the position: property include:
• static (the default)• relative• absolute• fixed
In normal flow (position: static), each block-level element sits below the previous one.Since this is the default way in which browsers treat HTML elements, you do not need aCSS property to indicate that elements should appear in normal flow, but the syntax wouldbe:
position: static;
Relative positioning with position: relative moves an element in relation to where itwould have been in normal flow. For example, you can move it 10px lower than it wouldhave been in normal flow or 20% to the right. With relative positioning, the offset properties,top: or bottom: and/or left: or right:, are used to indicate how far to move the elementfrom where it would have been in normal flow. To move the box up or down, you can use thebottom: or top: offset properties, respectively. To move the box left of right, you can usethe right: or left: offset properties, respectively. The values of the box offset propertiesare usually given in pixels (10px), percentages (30%), or ems (8em).
Absolute positioning with position: absolute places the element relatively to the near-est “positioned” ancestor. A “positioned” element is one whose position is anything exceptposition: static. However, if an absolute positioned element has no positioned ancestors,it uses the document <body>. For example, we can specify that a <div> is located 10px fromthe top and 10px from the left of its containing <div>. An absolutely positioned elementmoves along with page scrolling, i.e., does not stay in the same place on screen.
Fixed positioning with position: fixed is relative to the viewport. As implied by thename fixed, this means the element always stays in the same place even if the page isscrolled.
It is important to note that both position: absolute and the position: fixed posi-tioned elements are taken out of normal flow. This means the elements “hover” above thepage, while other elements shift to fill the place they previously occupied. This also meansthat these elements can obstruct the view of other elements.
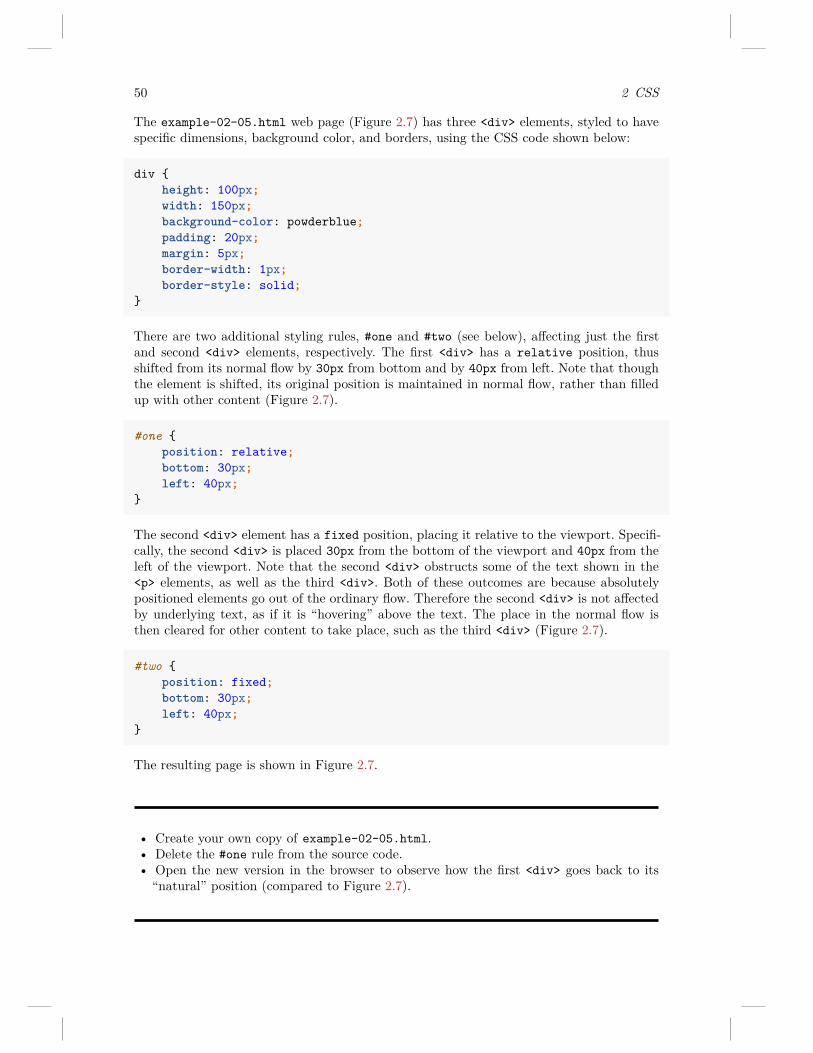
50 2 CSS
The example-02-05.html web page (Figure 2.7) has three <div> elements, styled to havespecific dimensions, background color, and borders, using the CSS code shown below:
div {height: 100px;width: 150px;background-color: powderblue;padding: 20px;margin: 5px;border-width: 1px;border-style: solid;
}
There are two additional styling rules, #one and #two (see below), affecting just the firstand second <div> elements, respectively. The first <div> has a relative position, thusshifted from its normal flow by 30px from bottom and by 40px from left. Note that thoughthe element is shifted, its original position is maintained in normal flow, rather than filledup with other content (Figure 2.7).
#one {position: relative;bottom: 30px;left: 40px;
}
The second <div> element has a fixed position, placing it relative to the viewport. Specifi-cally, the second <div> is placed 30px from the bottom of the viewport and 40px from theleft of the viewport. Note that the second <div> obstructs some of the text shown in the<p> elements, as well as the third <div>. Both of these outcomes are because absolutelypositioned elements go out of the ordinary flow. Therefore the second <div> is not affectedby underlying text, as if it is “hovering” above the text. The place in the normal flow isthen cleared for other content to take place, such as the third <div> (Figure 2.7).
#two {position: fixed;bottom: 30px;left: 40px;
}
The resulting page is shown in Figure 2.7.
• Create your own copy of example-02-05.html.• Delete the #one rule from the source code.• Open the new version in the browser to observe how the first <div> goes back to its
“natural” position (compared to Figure 2.7).
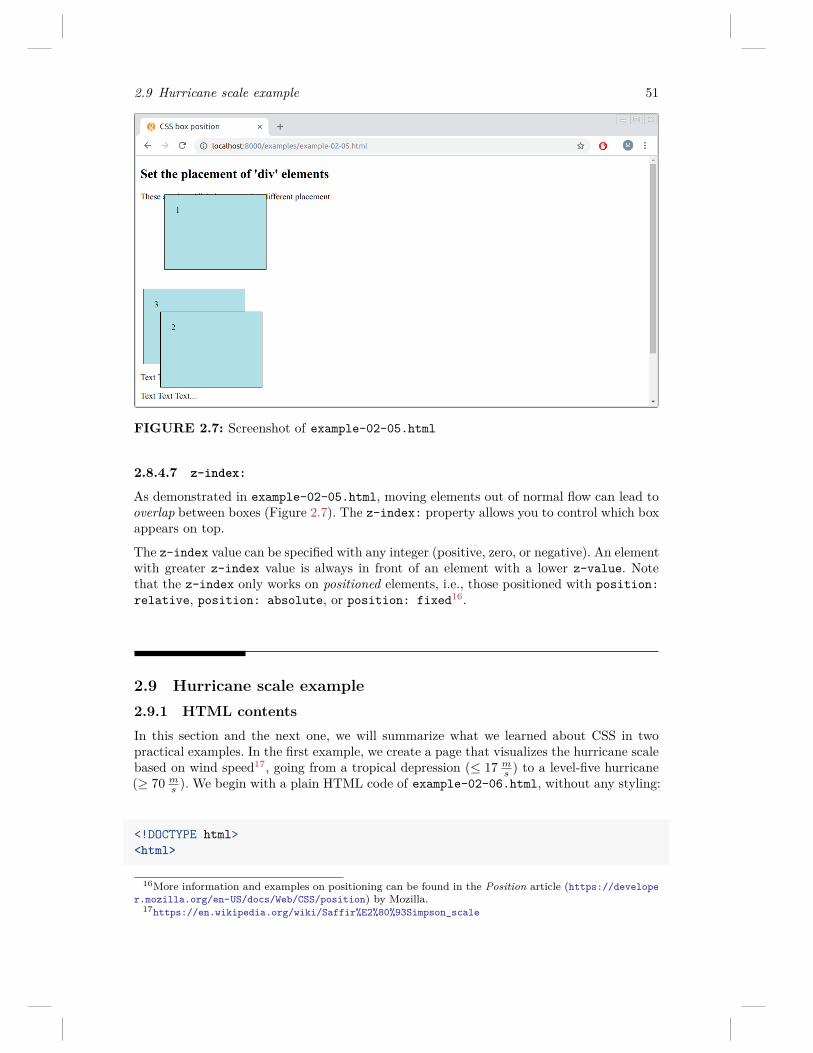
2.9 Hurricane scale example 51
FIGURE 2.7: Screenshot of example-02-05.html
2.8.4.7 z-index:
As demonstrated in example-02-05.html, moving elements out of normal flow can lead tooverlap between boxes (Figure 2.7). The z-index: property allows you to control which boxappears on top.
The z-index value can be specified with any integer (positive, zero, or negative). An elementwith greater z-index value is always in front of an element with a lower z-value. Notethat the z-index only works on positioned elements, i.e., those positioned with position:relative, position: absolute, or position: fixed16.
2.9 Hurricane scale example2.9.1 HTML contentsIn this section and the next one, we will summarize what we learned about CSS in twopractical examples. In the first example, we create a page that visualizes the hurricane scalebased on wind speed17, going from a tropical depression (≤ 17 𝑚
𝑠 ) to a level-five hurricane(≥ 70 𝑚
𝑠 ). We begin with a plain HTML code of example-02-06.html, without any styling:
<!DOCTYPE html><html>
16More information and examples on positioning can be found in the Position article (https://developer.mozilla.org/en-US/docs/Web/CSS/position) by Mozilla.
17https://en.wikipedia.org/wiki/Saffir%E2%80%93Simpson_scale
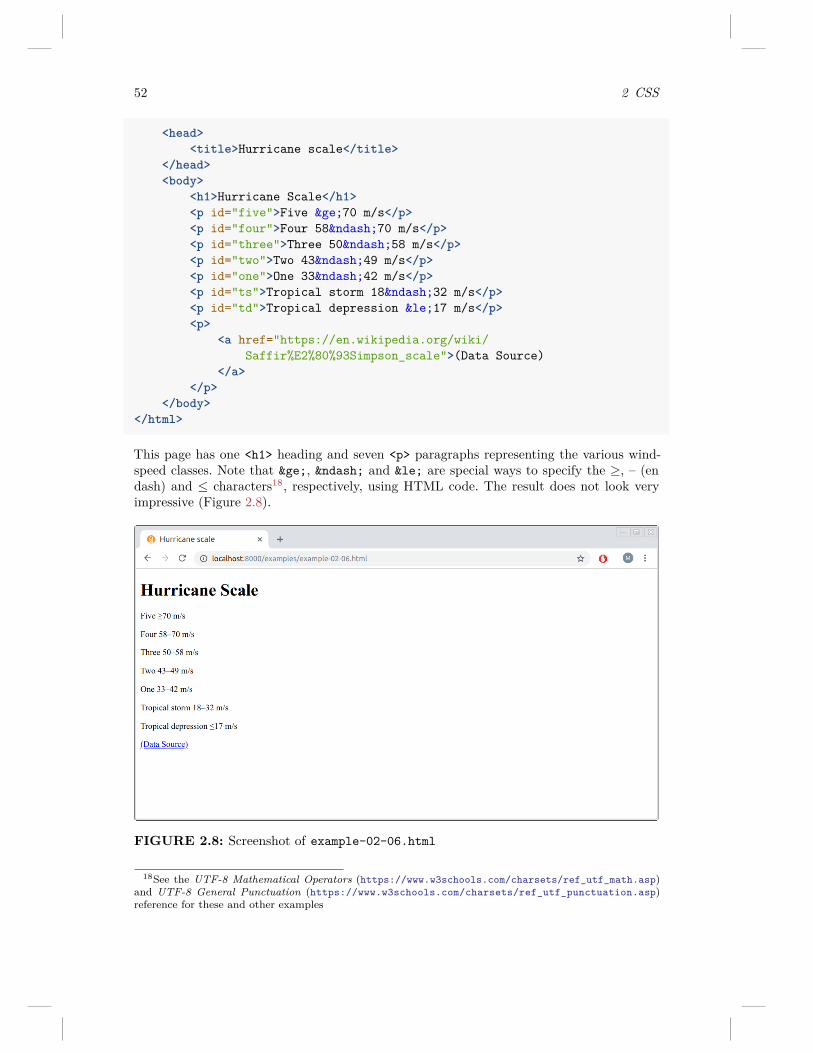
52 2 CSS
<head><title>Hurricane scale</title>
</head><body>
<h1>Hurricane Scale</h1><p id="five">Five ≥70 m/s</p><p id="four">Four 58–70 m/s</p><p id="three">Three 50–58 m/s</p><p id="two">Two 43–49 m/s</p><p id="one">One 33–42 m/s</p><p id="ts">Tropical storm 18–32 m/s</p><p id="td">Tropical depression ≤17 m/s</p><p>
<a href="https://en.wikipedia.org/wiki/Saffir%E2%80%93Simpson_scale">(Data Source)
</a></p>
</body></html>
This page has one <h1> heading and seven <p> paragraphs representing the various wind-speed classes. Note that ≥, – and ≤ are special ways to specify the ≥, – (endash) and ≤ characters18, respectively, using HTML code. The result does not look veryimpressive (Figure 2.8).
FIGURE 2.8: Screenshot of example-02-06.html
18See the UTF-8 Mathematical Operators (https://www.w3schools.com/charsets/ref_utf_math.asp)and UTF-8 General Punctuation (https://www.w3schools.com/charsets/ref_utf_punctuation.asp)reference for these and other examples
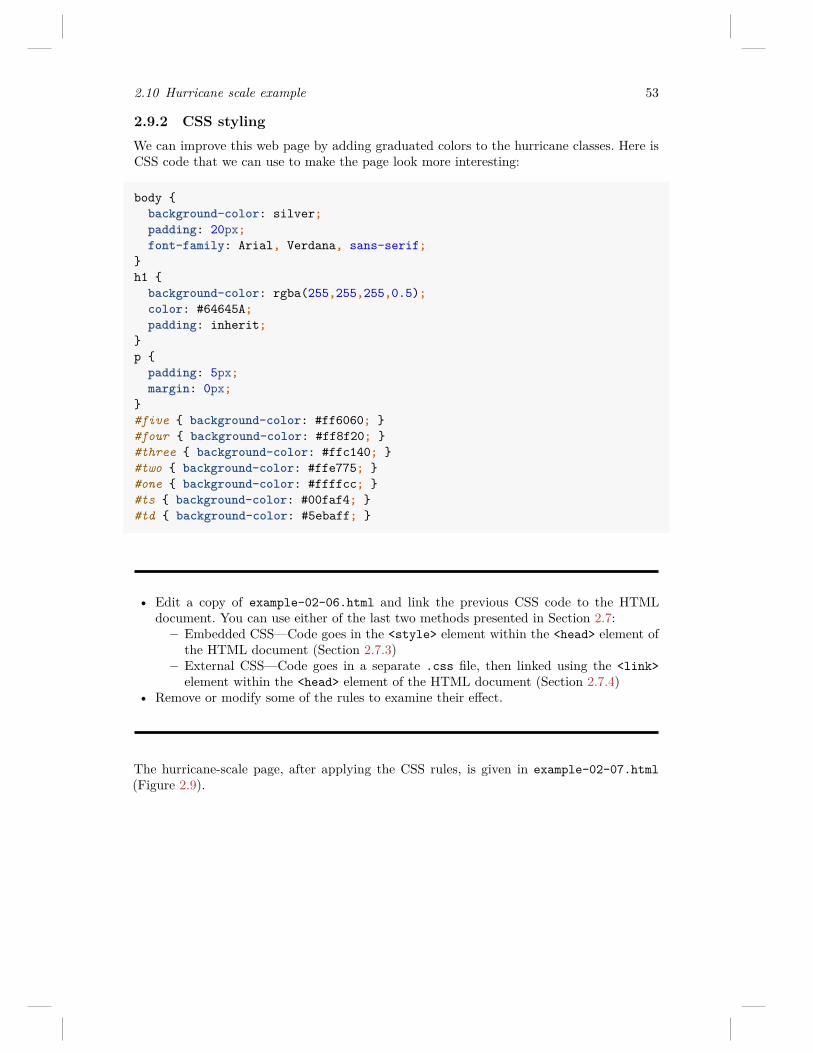
2.10 Hurricane scale example 53
2.9.2 CSS stylingWe can improve this web page by adding graduated colors to the hurricane classes. Here isCSS code that we can use to make the page look more interesting:
body {background-color: silver;padding: 20px;font-family: Arial, Verdana, sans-serif;
}h1 {background-color: rgba(255,255,255,0.5);color: #64645A;padding: inherit;
}p {padding: 5px;margin: 0px;
}#five { background-color: #ff6060; }#four { background-color: #ff8f20; }#three { background-color: #ffc140; }#two { background-color: #ffe775; }#one { background-color: #ffffcc; }#ts { background-color: #00faf4; }#td { background-color: #5ebaff; }
• Edit a copy of example-02-06.html and link the previous CSS code to the HTMLdocument. You can use either of the last two methods presented in Section 2.7:
– Embedded CSS—Code goes in the <style> element within the <head> element ofthe HTML document (Section 2.7.3)
– External CSS—Code goes in a separate .css file, then linked using the <link>element within the <head> element of the HTML document (Section 2.7.4)
• Remove or modify some of the rules to examine their effect.
The hurricane-scale page, after applying the CSS rules, is given in example-02-07.html(Figure 2.9).
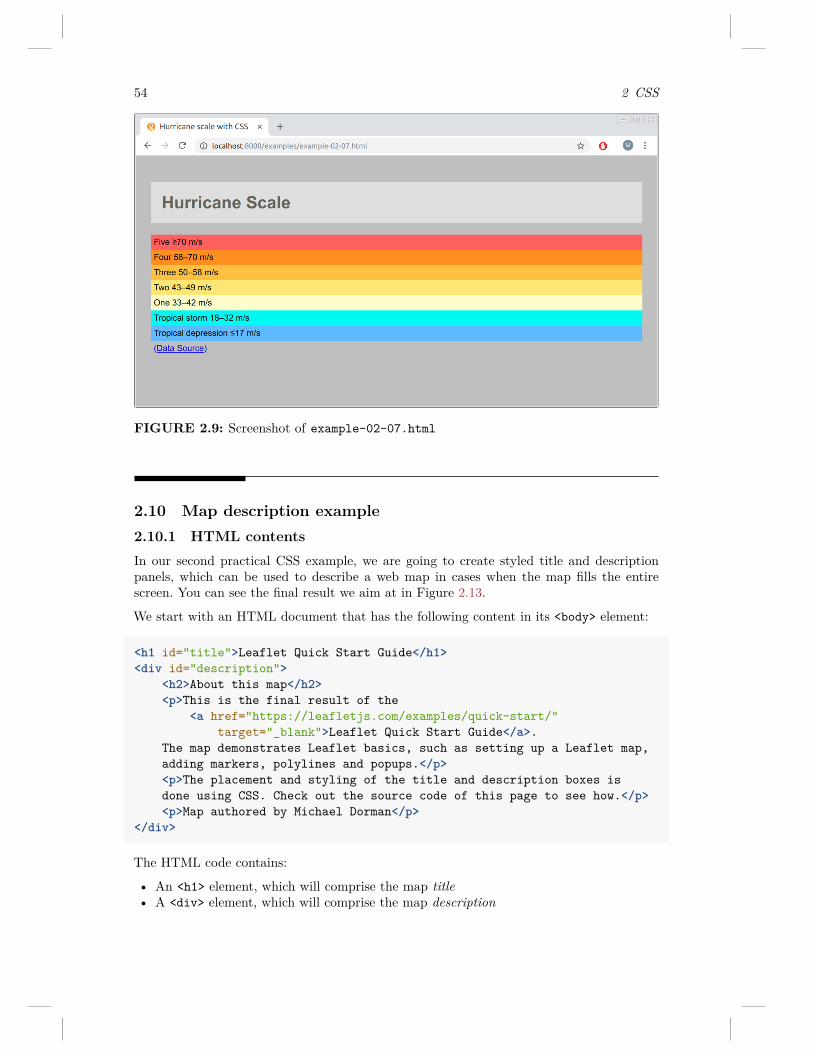
54 2 CSS
FIGURE 2.9: Screenshot of example-02-07.html
2.10 Map description example2.10.1 HTML contentsIn our second practical CSS example, we are going to create styled title and descriptionpanels, which can be used to describe a web map in cases when the map fills the entirescreen. You can see the final result we aim at in Figure 2.13.
We start with an HTML document that has the following content in its <body> element:
<h1 id="title">Leaflet Quick Start Guide</h1><div id="description">
<h2>About this map</h2><p>This is the final result of the
<a href="https://leafletjs.com/examples/quick-start/"target="_blank">Leaflet Quick Start Guide</a>.
The map demonstrates Leaflet basics, such as setting up a Leaflet map,adding markers, polylines and popups.</p><p>The placement and styling of the title and description boxes isdone using CSS. Check out the source code of this page to see how.</p><p>Map authored by Michael Dorman</p>
</div>
The HTML code contains:
• An <h1> element, which will comprise the map title• A <div> element, which will comprise the map description
2.10 Map description example 55
The map title in the <h1> element is just text, saying Leaflet Quick Start Guide. Themap description in the <div> element is composed of a smaller title (<h2>) and threeparagraphs (<p>). Using the <div> element we bind the entire description into a group(Section 1.6.12.2) with a specific ID, id="description". The ID will be used to set thedescription style with CSS. Similarly, the <h1> element is marked with id="title".
The way our HTML page appears—before any CSS styling is applied—is shown in Figure2.10. This is quite different from the final result (Figure 2.13), but hang on. We will getthere using CSS styling.
FIGURE 2.10: Screenshot of example-02-08.html
2.10.2 CSS styling: box positionMoving on to styling. Assuming our web map is going to fill the entire screen, we would like toposition the title and description in boxes “above” the map. As discussed in Section 2.8.4.6,this means we need the boxes to exit normal flow, using position: absolute or position:fixed. To achieve the modified positioning, as well as specify other aesthetic properties ofthe boxes (discussed below), we add the following CSS rules in example-02-09.html:
#title {position: fixed;top: 10px;left: 55px;margin-top: 0;padding: 10px 15px;background-color: rgba(255, 255, 255, 0.5);border: 1px solid grey;border-radius: 3px;
}#description {
56 2 CSS
position: fixed;bottom: 20px;left: 10px;width: 280px;padding: 0px 15px;background-color: rgba(255, 255, 255, 0.7);border: 1px solid grey;border-radius: 3px;
}
In the above CSS code, we are using several concepts:
• The position: fixed property along with top: and left: or bottom: and left:, toput the title and description into a specific position on the page
• The margin-top:, to “disable” the default margin around <h1> elements, so the thebox isn’t pushed further down than set with top:
• The padding: property, to make sure there is enough space around the text• The border: and border-radius:, to make the box border visible and having rounded
corners• The background-color: property to make the background color semi-transparent white
There are also two CSS shortcuts, which we have not met up until now. CSS has many typesof shortcuts of this sort, and we will encounter several other ones in later chapters:
• Using border: 1px solid grey; as a shortcut for border-width: 1px,border-style: solid and border-color: grey all in one declaration
• Using padding: 10px 15px; as a shortcut for padding-top: 10px, padding-bottom:10px, padding-right: 15px and padding-left: 15px in one declaration
The result after applying the above CSS rules is shown in Figure 2.11. As you can see, thetitle and map description are now in separate bordered boxes, positioned in the specifiedlocations inside the viewport.
2.10.3 CSS styling: final touchesThere are more CSS properties that can be modified to make the boxes even nicer. Forexample, we can use specific fonts (free ones, loaded from a Google server) and change thelink style when hovering with the mouse. We are not going to learn about these properties,but you are welcome to explore them in example-02-10.html, which gives the slightlymodified result shown in Figure 2.12.
2.10.4 Adding map in the backgroundFinally, we are missing the web map itself which the title and description refer to. The finalversion example-02-11.html adds a web map in the background. If you inspect its sourcecode, you will see that one of the things that has been added in the code is the following<script> element (Section 1.6.4.3) in the end of the <body>:
<script src="map.js"></script>
This <script> element loads a JavaScript code from a separate file named map.js. Another
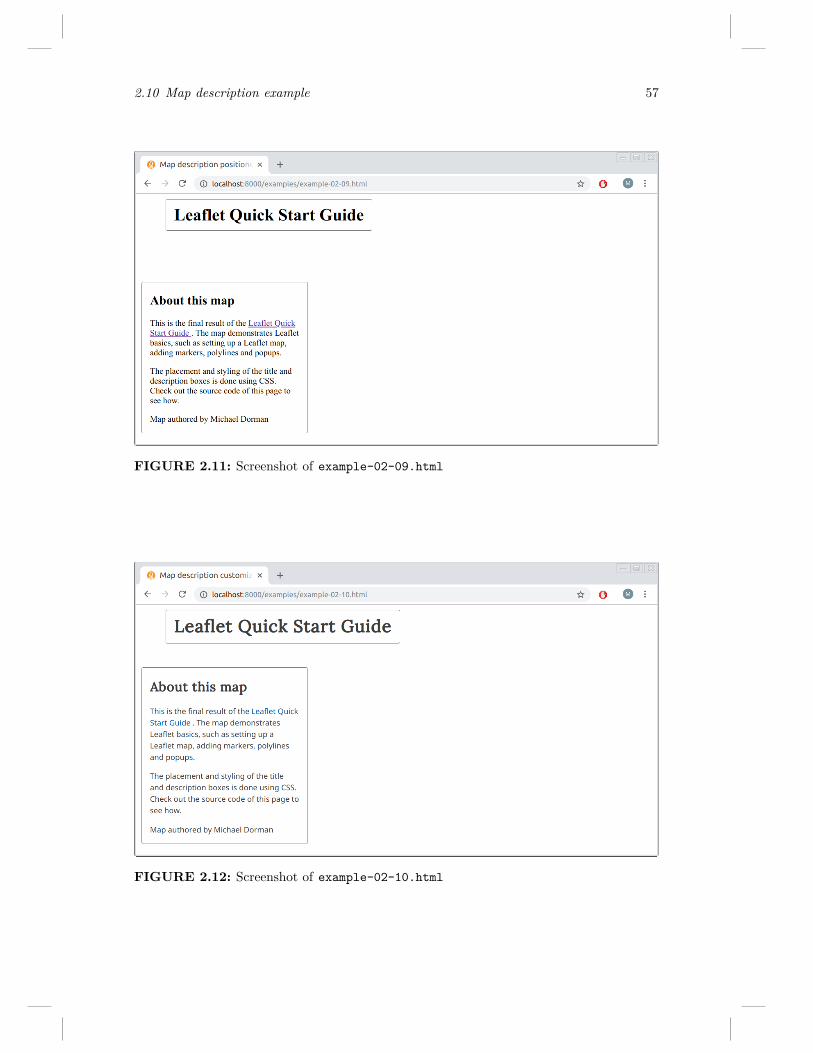
2.10 Map description example 57
FIGURE 2.11: Screenshot of example-02-09.html
FIGURE 2.12: Screenshot of example-02-10.html
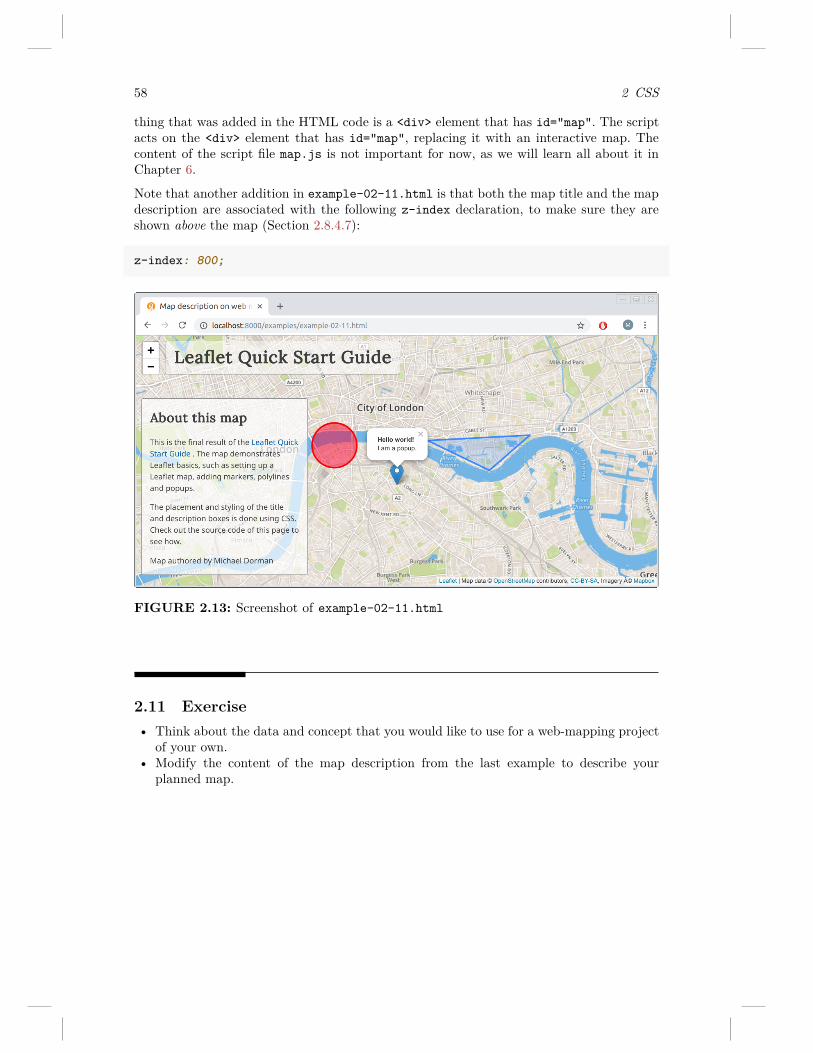
58 2 CSS
thing that was added in the HTML code is a <div> element that has id="map". The scriptacts on the <div> element that has id="map", replacing it with an interactive map. Thecontent of the script file map.js is not important for now, as we will learn all about it inChapter 6.
Note that another addition in example-02-11.html is that both the map title and the mapdescription are associated with the following z-index declaration, to make sure they areshown above the map (Section 2.8.4.7):
z-index: 800;
FIGURE 2.13: Screenshot of example-02-11.html
2.11 Exercise• Think about the data and concept that you would like to use for a web-mapping project
of your own.• Modify the content of the map description from the last example to describe your
planned map.
3JavaScript Basics
3.1 IntroductionSo far we learned how to define the contents and style of web pages, with HTML (Chapter1) and CSS (Chapter 2), respectively. We now move to the third major web technology,JavaScript. Being a programming language, JavaScript is fundamentally different fromHTML and CSS, which are essentially data formats. Using HTML and CSS we can instructthe browser to display the given contents, with particular styling. Using a programminglanguage, such as JavaScript, we can give the browser (or other computing environments) amuch wider variety of instructions. For example, we can instruct the computer to performmathematical calculations, to show or hide contents in response to user input, to periodicallyload up-to-date contents from an external source, and so on.
JavaScript is the most important of the technologies presented in this book, and we willuse it extensively throughout the later chapters to build interactive web maps. Chapter 3(this chapter) introduces the basic principles of the JavaScript language and the practicalway of experimenting with it, using the JavaScript console built into web browsers (Figure3.1). All of the examples we will see in this chapter work “in isolation”, not affecting webpage content and style. Therefore, while reading this chapter, the reader can temporarilyput aside what we learned in Chapters 1–2. Then, in Chapter 4, we will go back to HTMLand CSS and see how to associate our JavaScript code with the web page contents, and howto modify that contents in response to user input. Finally, in Chapters 6–13, we will applythese techniques in the context of web mapping, using JavaScript to create customized webmaps and to control their behavior.
3.2 What is JavaScript?JavaScript1 is a programming language, mostly used to define the interactive behaviorof web pages. JavaScript allows you to make web pages more interactive by accessing andmodifying the contents and styling in a web page while it is being viewed in the browser.JavaScript, along with HTML and CSS, forms the foundation of modern web browsers andthe internet.
JavaScript is considered, unofficially, to be the most popular programming language inthe world (Figure 2). Numerous open-source mapping and data visualization libraries arewritten in JavaScript, including Leaflet, which we use in this book, OpenLayers, D3, andmany others. Many commercial services of web mapping also provide a JavaScript API for
1https://en.wikipedia.org/wiki/JavaScript
59
60 3 JavaScript Basics
building web maps with their tools, such as Google Maps JavaScript API, MapboxGL JS and ArcGIS API for JavaScript (more on that in Section 6.4).
3.3 Client-side vs. server-sideWhen talking about programming for the web, one of the major concepts is the distinctionbetween server-side and client-side.
• The server is the location on the web that serves your website to the rest of the world.• The client is the computer that is accessing that website, requesting information from
the server.
In server-side programming, we are writing scripts that run on the server. In client-sideprogramming, we are writing scripts that run on the client, that is—in the browser. Thisbook focuses on client-side programming, though we will say a few words on server-sideprogramming in Chapter 5. JavaScript can be used in both server-side2 and client-sideprogramming, but is primarily a client-side language, working in the browser on the clientcomputer.
As we will see later on, there are two fundamental ways for using JavaScript on the client-side:
• Executing scripts when the web page is being loaded, such as scripts that instruct thebrowser to download data from an external location and display them on the page
• Executing scripts in response to user input or interaction with the page, such as per-forming a calculation and showing the result when the user clicks on a button
When JavaScript code is executed in a web page, it can do many different types of things,such as modifying the contents of the page, changing the appearance of content, sendinginformation to a server, or getting information from the server.
3.4 The JavaScript consoleWhen loading a web page which is associated with one or more scripts, the JavaScript codeis automatically interpreted and executed by the browser. We can also manually interactwith the browser’s interpreter or engine3 using the JavaScript console, also known as thecommand line, which is built into all modern web browsers. The console is basically away to type code into a computer and get the computer’s answer back. This is useful forexperimenting with JavaScript code, such as quickly testing short JavaScript code snippets.It is exactly what we are going to do in this chapter.
• Open a web browser.2Node.js (https://nodejs.org/en/) is a prominent example of a server-side environment for executing
JavaScript code.3https://en.wikipedia.org/wiki/JavaScript_engine
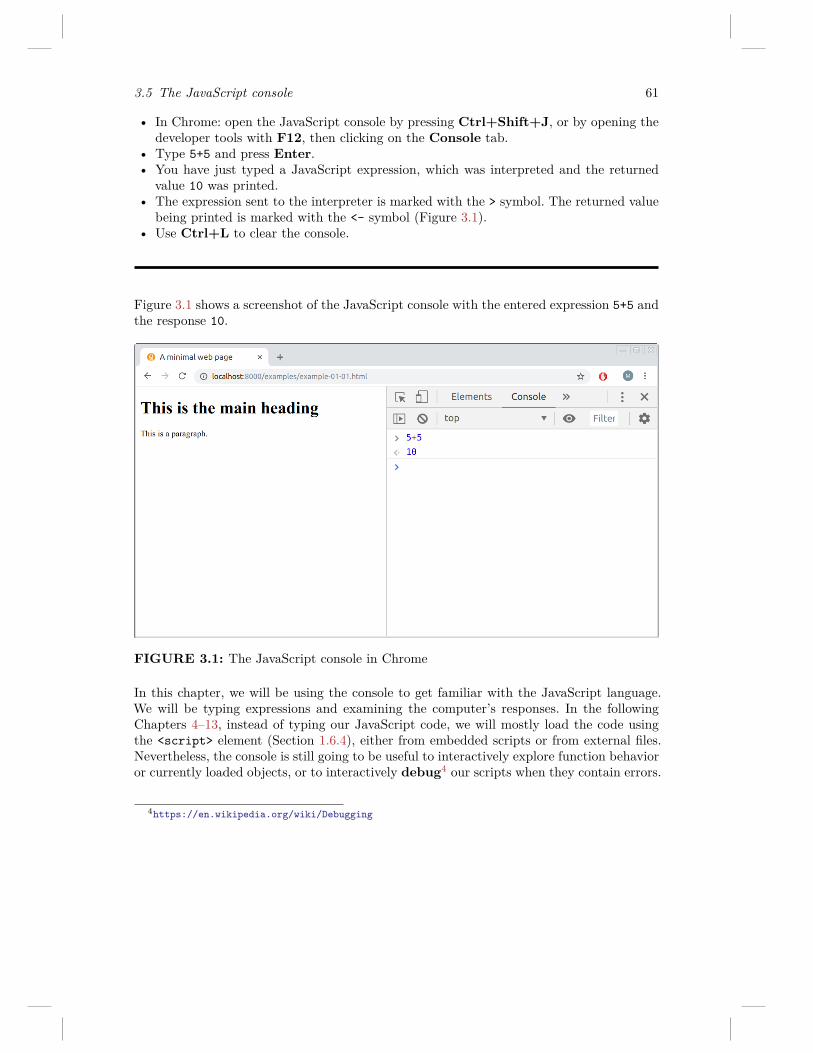
3.5 The JavaScript console 61
• In Chrome: open the JavaScript console by pressing Ctrl+Shift+J, or by opening thedeveloper tools with F12, then clicking on the Console tab.
• Type 5+5 and press Enter.• You have just typed a JavaScript expression, which was interpreted and the returned
value 10 was printed.• The expression sent to the interpreter is marked with the > symbol. The returned value
being printed is marked with the <- symbol (Figure 3.1).• Use Ctrl+L to clear the console.
Figure 3.1 shows a screenshot of the JavaScript console with the entered expression 5+5 andthe response 10.
FIGURE 3.1: The JavaScript console in Chrome
In this chapter, we will be using the console to get familiar with the JavaScript language.We will be typing expressions and examining the computer’s responses. In the followingChapters 4–13, instead of typing our JavaScript code, we will mostly load the code usingthe <script> element (Section 1.6.4), either from embedded scripts or from external files.Nevertheless, the console is still going to be useful to interactively explore function behavioror currently loaded objects, or to interactively debug4 our scripts when they contain errors.
4https://en.wikipedia.org/wiki/Debugging
62 3 JavaScript Basics
3.5 AssignmentAssignment to variables is one of the most important concepts in programming, since itlets us keep previously calculated results in memory for further processing. Variables arecontainers that hold data values, simple or complex, that can be referred to later in yourcode.
There are several ways to define variables in JavaScript, using the following keywords:
• var• let• const
The traditional way has been using the keyword var. The newer method—using the keywordlet—is more similar to the “usual” behavior in other programming languages. For example,variables defined with let have block-scope, are inaccessible before the declaration, andcannot be re-defined. For these reasons, in this book we are going to use let. You shouldbe aware of var as well, because it is still commonly used and you are going to see it oftenin other scripts, programming forums, etc.
The third keyword, const, is similar to let but used to define constant variables, whichcannot be modified later on in our code. We are going to use let throughout the book to keepthings simple. Keep in mind that using const instead let is recommended for variables thatare kept constant throughout the program, to increase code clarity and minimize potentialmistakes.
To define a variable, the let keyword is followed by the variable name. For example, thefollowing two expressions define the variables x and y:
let x;let y;
Note that each JavaScript expression should end with ;. Ending statements with semicolonis not strictly required, since statement ending can also be automatically determined by thebrowser, but it is highly recommended to use ; in order to reduce ambiguity.
Values can be assigned to variables using the assignment operator =. Assignment can bemade along with variable definition:
let x = 5;let y = 6;
or later on, in separate expressions, after the variables have already been defined:
x = 5;y = 6;
Either way, we have now defined two variables x and y. The values contained in these twovariables are 5 and 6, respectively. In your JavaScript console, to see a current value of avariable, type its name and hit Enter. The current value will be returned and printed:
3.6 Data types 63
x; // Returns 5
The above code uses a JavaScript comment. We already learned how to write HTMLcomments (Section 1.5.2) and CSS comments (Section 2.8.2.1) in previous chapters. InJavaScript:
• Single line comments start with //• Single or multi-line comments start with /* and end with */ (like in CSS)
Note that you cannot re-define an existing variable defined with let, but you can assigna new value into an existing variable. For example, the following pair of expressions raisesan error5:
let x = 5;let x = 6; // Uncaught SyntaxError: Identifier 'x' has already been declared
while the following is perfectly fine:
let x = 5;x = 6;
There are several short-hand assignment operators, in addition to the basic assignmentoperator =. For example, another commonly used assignment operator is the additionassignment operator +=, which adds a value to a variable. The following expression usesthe addition assignment operator +=:
x += 10;
This is basically a shortcut for the following assignment6:
x = x + 10;
3.6 Data types3.6.1 OverviewIn the examples in Section 3.5 we defined variables holding numeric data, such as thenumbers 5 and 6. JavaScript variables can also hold other data types. JavaScript datatypes are divided into two groups: primitive data types and objects.
5At the time of writing, the console inside the developer tools in Chrome does allow redefining variablesdefined with let, which makes code testing easier (https://stackoverflow.com/questions/62911715/redeclaration-with-var-works-but-not-with-let-in-chrome-snippets#answer-62912023). Elsewhere—e.g., in scripts executed on page load—variables defined with let cannot be redefined.
6More information on +=, and other assignment operators, can be found in the Assignment Operatorsreference (https://developer.mozilla.org/en-US/docs/Web/JavaScript/Reference/Operators/Assignment_Operators) by Mozilla.
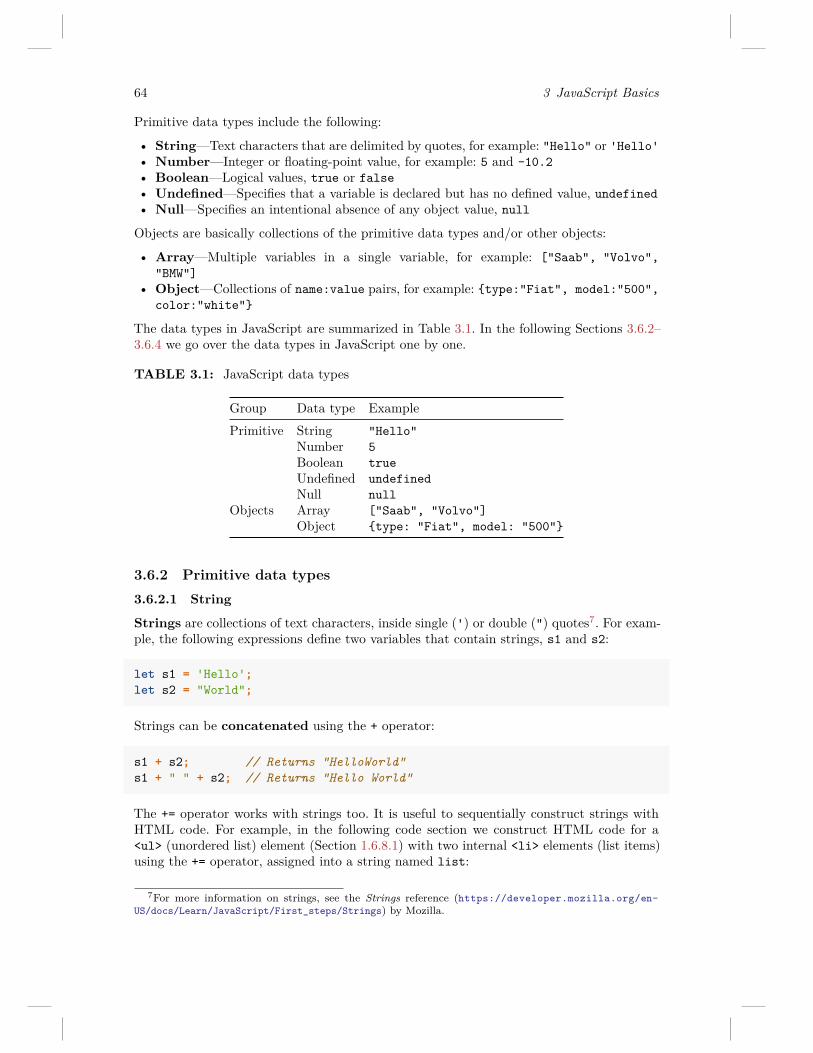
64 3 JavaScript Basics
Primitive data types include the following:
• String—Text characters that are delimited by quotes, for example: "Hello" or 'Hello'• Number—Integer or floating-point value, for example: 5 and -10.2• Boolean—Logical values, true or false• Undefined—Specifies that a variable is declared but has no defined value, undefined• Null—Specifies an intentional absence of any object value, null
Objects are basically collections of the primitive data types and/or other objects:
• Array—Multiple variables in a single variable, for example: ["Saab", "Volvo","BMW"]
• Object—Collections of name:value pairs, for example: {type:"Fiat", model:"500",color:"white"}
The data types in JavaScript are summarized in Table 3.1. In the following Sections 3.6.2–3.6.4 we go over the data types in JavaScript one by one.
TABLE 3.1: JavaScript data types
Group Data type ExamplePrimitive String "Hello"
Number 5Boolean trueUndefined undefinedNull null
Objects Array ["Saab", "Volvo"]Object {type: "Fiat", model: "500"}
3.6.2 Primitive data types3.6.2.1 String
Strings are collections of text characters, inside single (') or double (") quotes7. For exam-ple, the following expressions define two variables that contain strings, s1 and s2:
let s1 = 'Hello';let s2 = "World";
Strings can be concatenated using the + operator:
s1 + s2; // Returns "HelloWorld"s1 + " " + s2; // Returns "Hello World"
The += operator works with strings too. It is useful to sequentially construct strings withHTML code. For example, in the following code section we construct HTML code for a<ul> (unordered list) element (Section 1.6.8.1) with two internal <li> elements (list items)using the += operator, assigned into a string named list:
7For more information on strings, see the Strings reference (https://developer.mozilla.org/en-US/docs/Learn/JavaScript/First_steps/Strings) by Mozilla.
3.6 Data types 65
let list = "";list += "<ul>";list += "<li>Apples</li>";list += "<li>Oranges</li>";list += "</ul>";
We are going to revisit this technique later on, when constructing HTML code using loops(Section 3.10.3).
3.6.2.2 Number
Numbers can be integers or decimals. The usual arithmetic operators, +, -, *, and /,can be used with numeric variables:
let x = 5, y = 6, z;z = x + y; // Returns 11
In this example, we defined two variables x and y and assigned their values (5 and 6). Wealso defined a third variable z without assigning a value. Note how we defined x, y, and z inthe same expression, separated by commas—this saves typing the let keyword three times.In the last expression we calculated x+y and assigned the result of that calculation into z.
JavaScript also has increment ++ and decrement -- operators. The increment operator++ adds one to the current number. The decrement operator -- subtracts one from thecurrent number. For example:
let x = 5;x++; // Same as: x=x+1; the value of x is now 6x--; // Same as: x=x-1; the value of x is now 5
When running the last two expressions, you will see 5 and 6 (not 6 and 5) printed in theconsole, respectively. This is because the increment ++ and decrement -- expressions returnthe current value, before modifying it8.
3.6.2.3 Boolean
Boolean (logical) values are either true or false. For example:
let found = true;let lost = false;
In practice, boolean values are usually created as the result of comparison operators. Forexample:
9 >= 10; // Returns false11 > 10; // Returns true
8For more information on numbers, see the Numbers and Operators reference (https://developer.mozilla.org/en-US/docs/Learn/JavaScript/First_steps/Math) by Mozilla.
66 3 JavaScript Basics
JavaScript comparison operators are summarized in Table 3.2.
TABLE 3.2: JavaScript comparison operators
Operator Meaning== Equal to=== Equal value and equal type!= Not equal!== Not equal value or not equal type> Greater than< Less than>= Greater than or equal to<= Less than or equal to
You may have noticed there are two versions of the equality (==, ===) and inequality (!=,!==) comparison operators (Table 3.2). The difference between them is that the former ones(==, !=) consider just the value, while the latter ones (===, !==) consider both value andtype. What do the terms equal value and equal type mean? Consider the following example,where 5 and "5" have equal value (5) but unequal type (number vs. string). Comparingthese two values gives different results when using the == and === operators. This is because== considers just the value, while === is more strict and considers both value and type:
"5" == 5; // Returns true"5" === 5; // Returns false
Since the conversion rules of the == and != operators are complicated and unmemorable,it is not advised to use them. Instead, the === and !== operators, with their expected andstrict behaviors, are recommended (Crockford, 2008).
Boolean values can be combined with logical operators:
• &&—AND operator, true only if both values are true• ||—OR operator, true if at least one of the values is true9
• !—NOT operator, true if value is false
For example:
let x = 6;let y = 3;x < 10 && y > 1; // Returns truex == 5 || y == 5; // Returns false!(x == 5 || y == 5); // Returns true
Boolean values are commonly used for flow control, which we learn about later on (Section3.10).
9Note the distinction between && and &, and between || and |. The latter, & and |, are known as bitwiseoperators and are not intended for combining comparison expressions.
3.6 Data types 67
3.6.2.4 Undefined
Undefined (undefined) means that a variable has been declared but has not been assignedwith a value yet. For example:
let x;x; // Returns undefined
3.6.2.5 Null
Null (null) is another special data type, representing lack of a value. For example:
let x = null;
3.6.3 Objects3.6.3.1 Array
JavaScript arrays are used to store an ordered set of values in a single variable. An arraycan be created by putting zero or more values inside a pair of square brackets ([ and ]),separating the values with commas (,). For example:
let a = []; // Empty arraylet b = [1, 3, 5]; // Array with three elements
Array items can be accessed using the brackets ([) along with a numeric index. Note thatindex position in JavaScript starts at 0. For example:
b[0]; // Returns 1b[1]; // Returns 3b[2]; // Returns 5
An array can be composed of different types of values, though this is rarely useful:
let c = ["hello", 10, undefined];
An array element can also be an array, or an object (Section 3.6.3.2 below). For example,an array of arrays can be thought of as a multi-dimensional array:
let d = [[1, 2, 3], [4, 5, 6], [7, 8, 9]];
To access an element inside a multi-dimensional array we can combine several array accessoperations:
d[2][1]; // Returns 8
In the last expression, we used d[2] to access the element in position 2 of d, which is [7,8, 9]. This is actually the third element of d, since, as you remember, JavaScript index
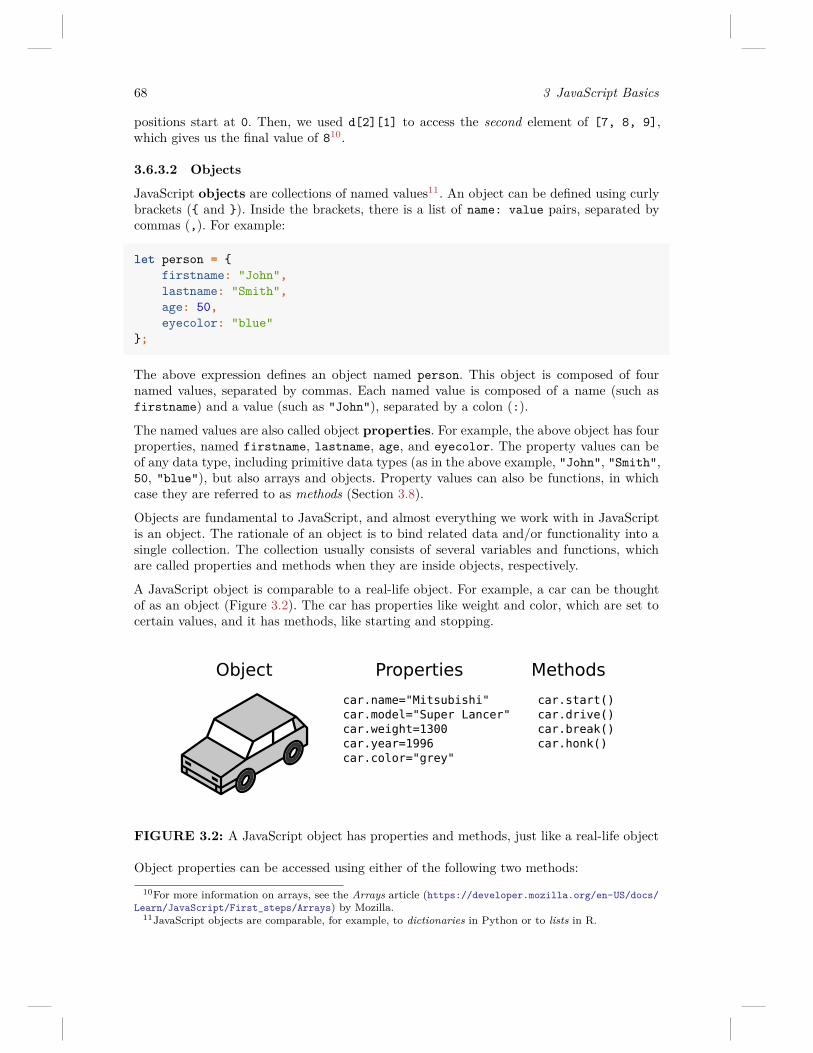
68 3 JavaScript Basics
positions start at 0. Then, we used d[2][1] to access the second element of [7, 8, 9],which gives us the final value of 810.
3.6.3.2 Objects
JavaScript objects are collections of named values11. An object can be defined using curlybrackets ({ and }). Inside the brackets, there is a list of name: value pairs, separated bycommas (,). For example:
let person = {firstname: "John",lastname: "Smith",age: 50,eyecolor: "blue"
};
The above expression defines an object named person. This object is composed of fournamed values, separated by commas. Each named value is composed of a name (such asfirstname) and a value (such as "John"), separated by a colon (:).
The named values are also called object properties. For example, the above object has fourproperties, named firstname, lastname, age, and eyecolor. The property values can beof any data type, including primitive data types (as in the above example, "John", "Smith",50, "blue"), but also arrays and objects. Property values can also be functions, in whichcase they are referred to as methods (Section 3.8).
Objects are fundamental to JavaScript, and almost everything we work with in JavaScriptis an object. The rationale of an object is to bind related data and/or functionality into asingle collection. The collection usually consists of several variables and functions, whichare called properties and methods when they are inside objects, respectively.
A JavaScript object is comparable to a real-life object. For example, a car can be thoughtof as an object (Figure 3.2). The car has properties like weight and color, which are set tocertain values, and it has methods, like starting and stopping.
FIGURE 3.2: A JavaScript object has properties and methods, just like a real-life object
Object properties can be accessed using either of the following two methods:10For more information on arrays, see the Arrays article (https://developer.mozilla.org/en-US/docs/
Learn/JavaScript/First_steps/Arrays) by Mozilla.11JavaScript objects are comparable, for example, to dictionaries in Python or to lists in R.
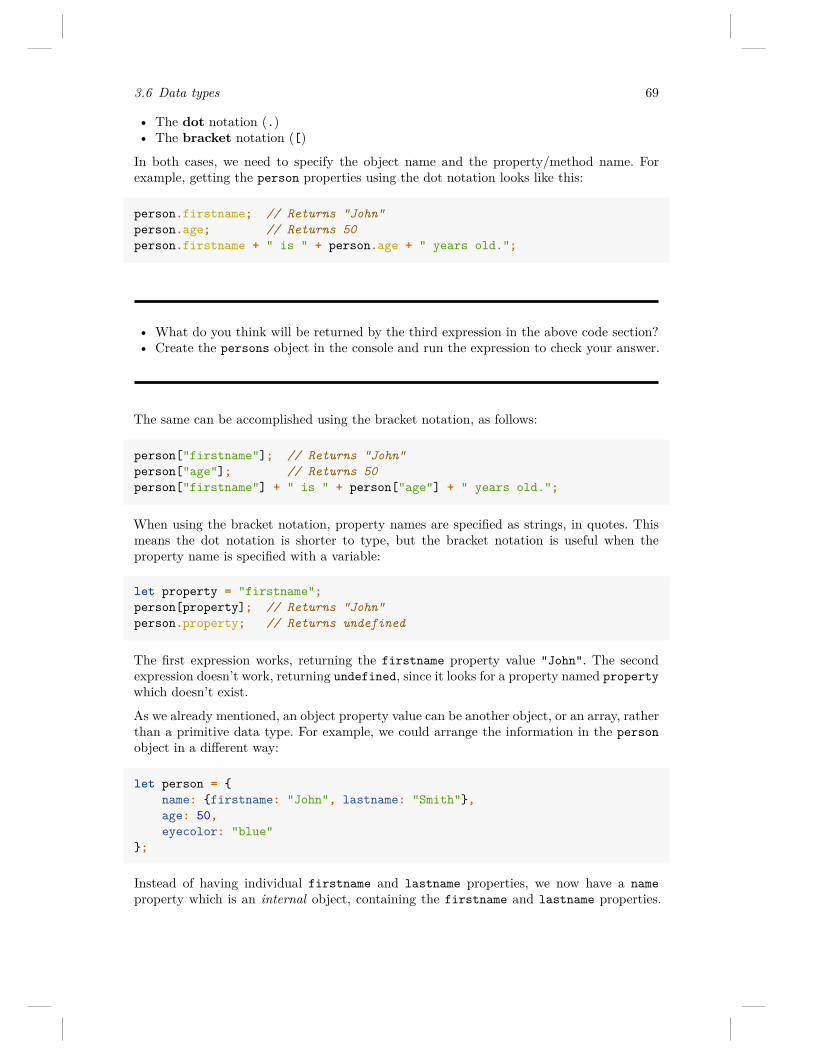
3.6 Data types 69
• The dot notation (.)• The bracket notation ([)
In both cases, we need to specify the object name and the property/method name. Forexample, getting the person properties using the dot notation looks like this:
person.firstname; // Returns "John"person.age; // Returns 50person.firstname + " is " + person.age + " years old.";
• What do you think will be returned by the third expression in the above code section?• Create the persons object in the console and run the expression to check your answer.
The same can be accomplished using the bracket notation, as follows:
person["firstname"]; // Returns "John"person["age"]; // Returns 50person["firstname"] + " is " + person["age"] + " years old.";
When using the bracket notation, property names are specified as strings, in quotes. Thismeans the dot notation is shorter to type, but the bracket notation is useful when theproperty name is specified with a variable:
let property = "firstname";person[property]; // Returns "John"person.property; // Returns undefined
The first expression works, returning the firstname property value "John". The secondexpression doesn’t work, returning undefined, since it looks for a property named propertywhich doesn’t exist.
As we already mentioned, an object property value can be another object, or an array, ratherthan a primitive data type. For example, we could arrange the information in the personobject in a different way:
let person = {name: {firstname: "John", lastname: "Smith"},age: 50,eyecolor: "blue"
};
Instead of having individual firstname and lastname properties, we now have a nameproperty which is an internal object, containing the firstname and lastname properties.
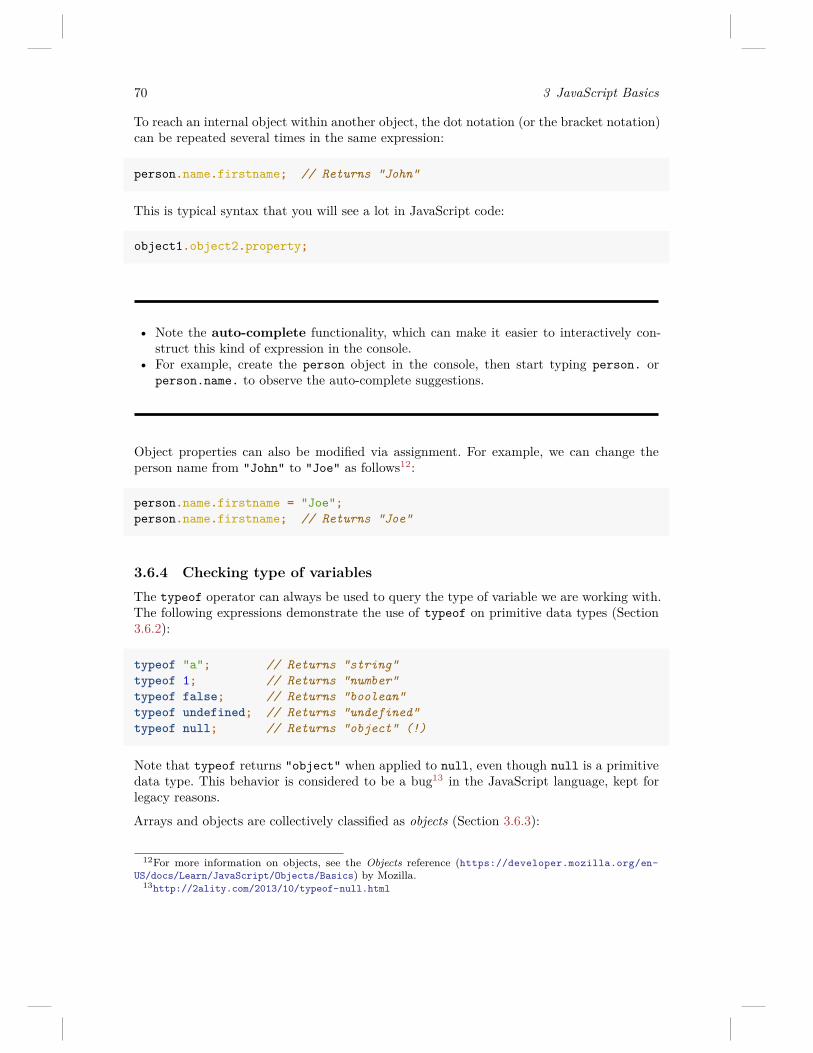
70 3 JavaScript Basics
To reach an internal object within another object, the dot notation (or the bracket notation)can be repeated several times in the same expression:
person.name.firstname; // Returns "John"
This is typical syntax that you will see a lot in JavaScript code:
object1.object2.property;
• Note the auto-complete functionality, which can make it easier to interactively con-struct this kind of expression in the console.
• For example, create the person object in the console, then start typing person. orperson.name. to observe the auto-complete suggestions.
Object properties can also be modified via assignment. For example, we can change theperson name from "John" to "Joe" as follows12:
person.name.firstname = "Joe";person.name.firstname; // Returns "Joe"
3.6.4 Checking type of variablesThe typeof operator can always be used to query the type of variable we are working with.The following expressions demonstrate the use of typeof on primitive data types (Section3.6.2):
typeof "a"; // Returns "string"typeof 1; // Returns "number"typeof false; // Returns "boolean"typeof undefined; // Returns "undefined"typeof null; // Returns "object" (!)
Note that typeof returns "object" when applied to null, even though null is a primitivedata type. This behavior is considered to be a bug13 in the JavaScript language, kept forlegacy reasons.
Arrays and objects are collectively classified as objects (Section 3.6.3):
12For more information on objects, see the Objects reference (https://developer.mozilla.org/en-US/docs/Learn/JavaScript/Objects/Basics) by Mozilla.
13http://2ality.com/2013/10/typeof-null.html
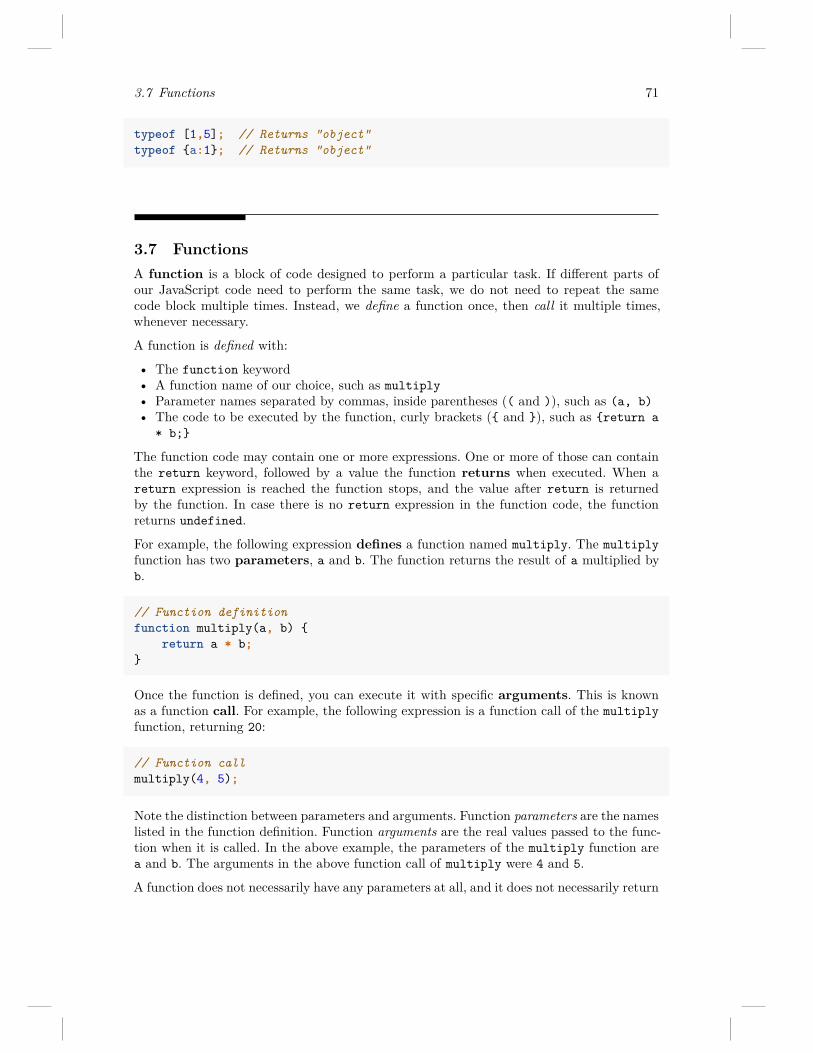
3.7 Functions 71
typeof [1,5]; // Returns "object"typeof {a:1}; // Returns "object"
3.7 FunctionsA function is a block of code designed to perform a particular task. If different parts ofour JavaScript code need to perform the same task, we do not need to repeat the samecode block multiple times. Instead, we define a function once, then call it multiple times,whenever necessary.
A function is defined with:
• The function keyword• A function name of our choice, such as multiply• Parameter names separated by commas, inside parentheses (( and )), such as (a, b)• The code to be executed by the function, curly brackets ({ and }), such as {return a
* b;}
The function code may contain one or more expressions. One or more of those can containthe return keyword, followed by a value the function returns when executed. When areturn expression is reached the function stops, and the value after return is returnedby the function. In case there is no return expression in the function code, the functionreturns undefined.
For example, the following expression defines a function named multiply. The multiplyfunction has two parameters, a and b. The function returns the result of a multiplied byb.
// Function definitionfunction multiply(a, b) {
return a * b;}
Once the function is defined, you can execute it with specific arguments. This is knownas a function call. For example, the following expression is a function call of the multiplyfunction, returning 20:
// Function callmultiply(4, 5);
Note the distinction between parameters and arguments. Function parameters are the nameslisted in the function definition. Function arguments are the real values passed to the func-tion when it is called. In the above example, the parameters of the multiply function area and b. The arguments in the above function call of multiply were 4 and 5.
A function does not necessarily have any parameters at all, and it does not necessarily return
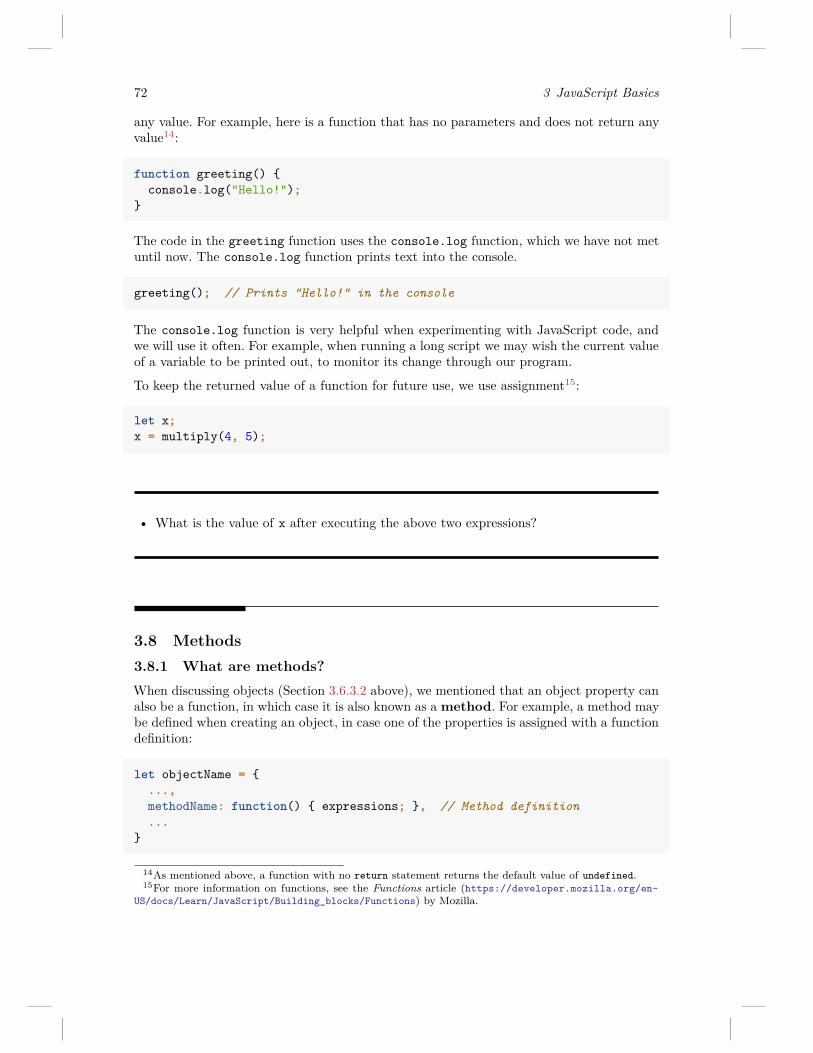
72 3 JavaScript Basics
any value. For example, here is a function that has no parameters and does not return anyvalue14:
function greeting() {console.log("Hello!");
}
The code in the greeting function uses the console.log function, which we have not metuntil now. The console.log function prints text into the console.
greeting(); // Prints "Hello!" in the console
The console.log function is very helpful when experimenting with JavaScript code, andwe will use it often. For example, when running a long script we may wish the current valueof a variable to be printed out, to monitor its change through our program.
To keep the returned value of a function for future use, we use assignment15:
let x;x = multiply(4, 5);
• What is the value of x after executing the above two expressions?
3.8 Methods3.8.1 What are methods?When discussing objects (Section 3.6.3.2 above), we mentioned that an object property canalso be a function, in which case it is also known as a method. For example, a method maybe defined when creating an object, in case one of the properties is assigned with a functiondefinition:
let objectName = {...,methodName: function() { expressions; }, // Method definition...
}
14As mentioned above, a function with no return statement returns the default value of undefined.15For more information on functions, see the Functions article (https://developer.mozilla.org/en-
US/docs/Learn/JavaScript/Building_blocks/Functions) by Mozilla.
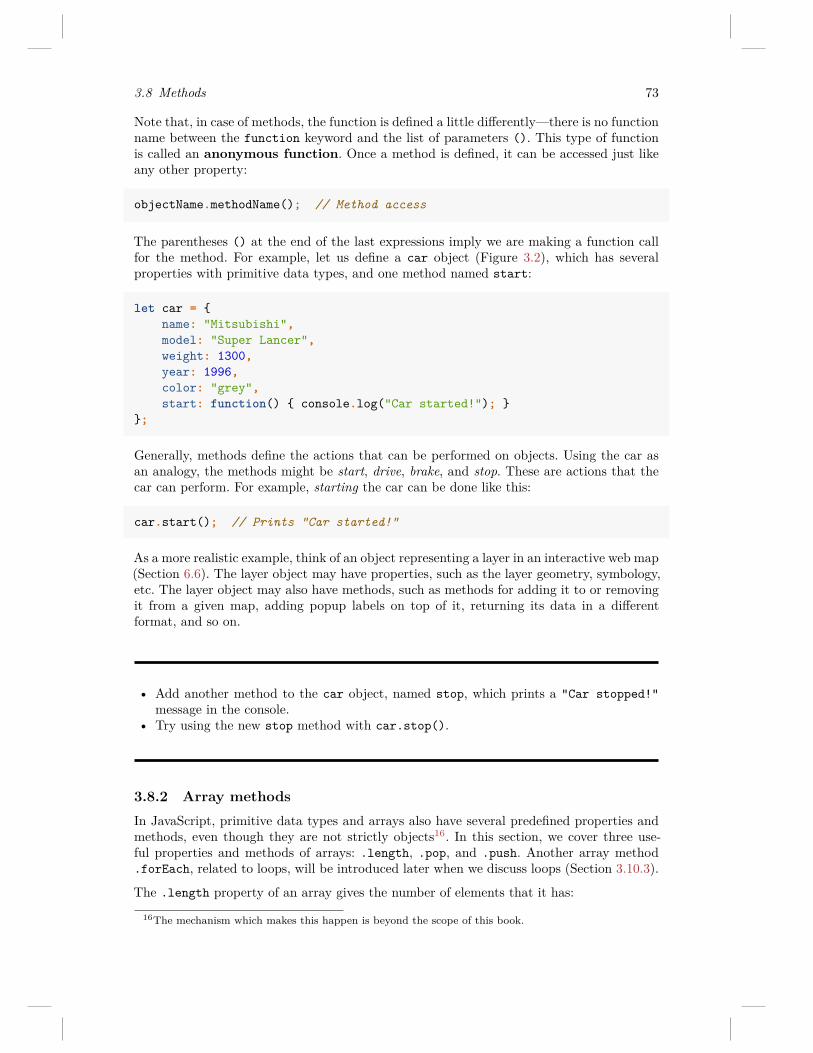
3.8 Methods 73
Note that, in case of methods, the function is defined a little differently—there is no functionname between the function keyword and the list of parameters (). This type of functionis called an anonymous function. Once a method is defined, it can be accessed just likeany other property:
objectName.methodName(); // Method access
The parentheses () at the end of the last expressions imply we are making a function callfor the method. For example, let us define a car object (Figure 3.2), which has severalproperties with primitive data types, and one method named start:
let car = {name: "Mitsubishi",model: "Super Lancer",weight: 1300,year: 1996,color: "grey",start: function() { console.log("Car started!"); }
};
Generally, methods define the actions that can be performed on objects. Using the car asan analogy, the methods might be start, drive, brake, and stop. These are actions that thecar can perform. For example, starting the car can be done like this:
car.start(); // Prints "Car started!"
As a more realistic example, think of an object representing a layer in an interactive web map(Section 6.6). The layer object may have properties, such as the layer geometry, symbology,etc. The layer object may also have methods, such as methods for adding it to or removingit from a given map, adding popup labels on top of it, returning its data in a differentformat, and so on.
• Add another method to the car object, named stop, which prints a "Car stopped!"message in the console.
• Try using the new stop method with car.stop().
3.8.2 Array methodsIn JavaScript, primitive data types and arrays also have several predefined properties andmethods, even though they are not strictly objects16. In this section, we cover three use-ful properties and methods of arrays: .length, .pop, and .push. Another array method.forEach, related to loops, will be introduced later when we discuss loops (Section 3.10.3).
The .length property of an array gives the number of elements that it has:16The mechanism which makes this happen is beyond the scope of this book.
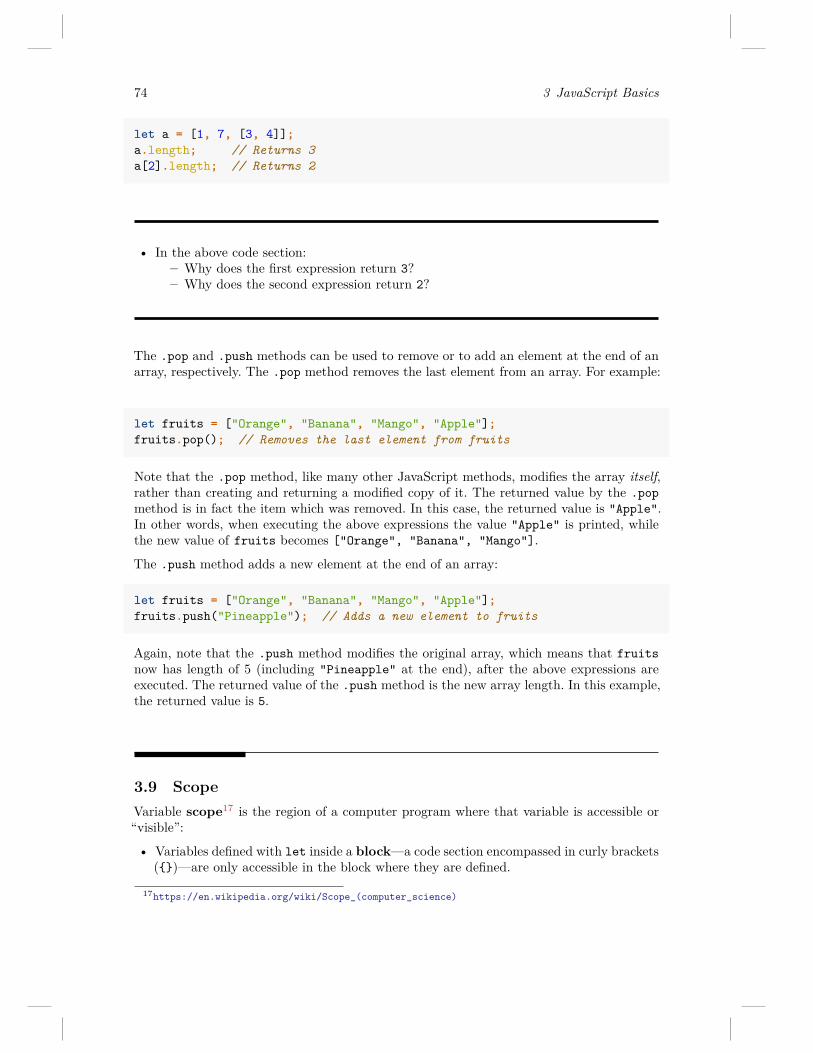
74 3 JavaScript Basics
let a = [1, 7, [3, 4]];a.length; // Returns 3a[2].length; // Returns 2
• In the above code section:– Why does the first expression return 3?– Why does the second expression return 2?
The .pop and .push methods can be used to remove or to add an element at the end of anarray, respectively. The .pop method removes the last element from an array. For example:
let fruits = ["Orange", "Banana", "Mango", "Apple"];fruits.pop(); // Removes the last element from fruits
Note that the .pop method, like many other JavaScript methods, modifies the array itself,rather than creating and returning a modified copy of it. The returned value by the .popmethod is in fact the item which was removed. In this case, the returned value is "Apple".In other words, when executing the above expressions the value "Apple" is printed, whilethe new value of fruits becomes ["Orange", "Banana", "Mango"].
The .push method adds a new element at the end of an array:
let fruits = ["Orange", "Banana", "Mango", "Apple"];fruits.push("Pineapple"); // Adds a new element to fruits
Again, note that the .push method modifies the original array, which means that fruitsnow has length of 5 (including "Pineapple" at the end), after the above expressions areexecuted. The returned value of the .push method is the new array length. In this example,the returned value is 5.
3.9 ScopeVariable scope17 is the region of a computer program where that variable is accessible or“visible”:
• Variables defined with let inside a block—a code section encompassed in curly brackets({})—are only accessible in the block where they are defined.
17https://en.wikipedia.org/wiki/Scope_(computer_science)
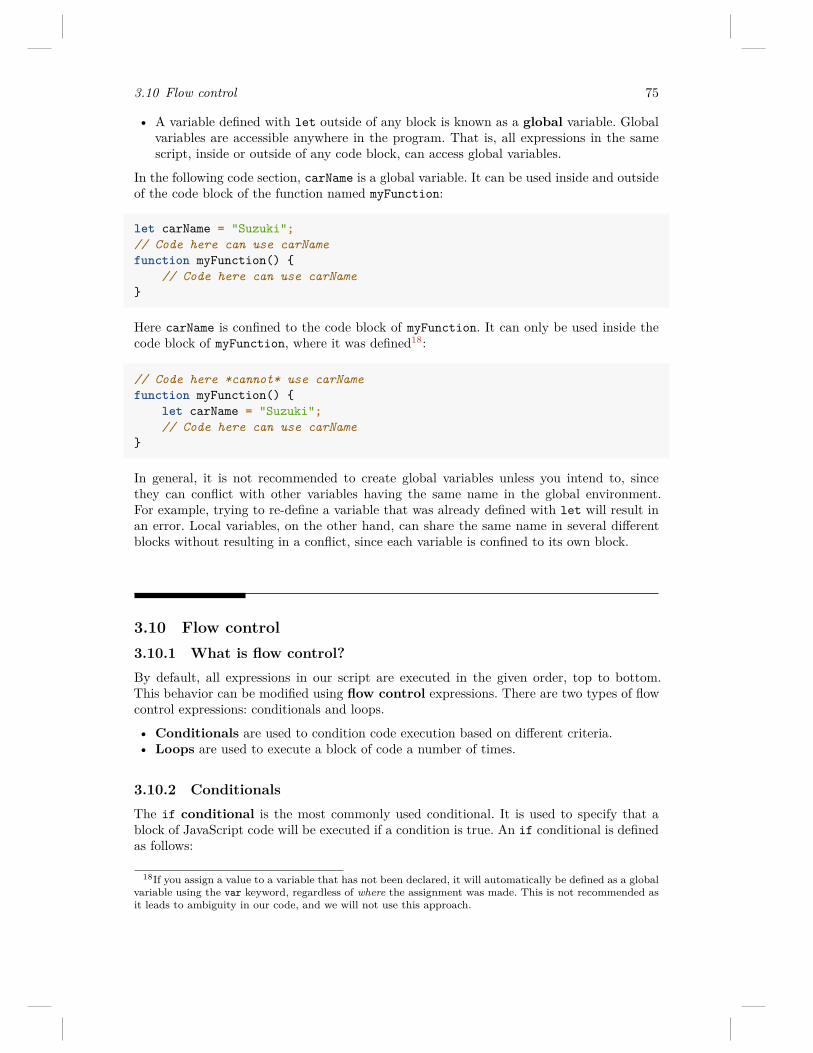
3.10 Flow control 75
• A variable defined with let outside of any block is known as a global variable. Globalvariables are accessible anywhere in the program. That is, all expressions in the samescript, inside or outside of any code block, can access global variables.
In the following code section, carName is a global variable. It can be used inside and outsideof the code block of the function named myFunction:
let carName = "Suzuki";// Code here can use carNamefunction myFunction() {
// Code here can use carName}
Here carName is confined to the code block of myFunction. It can only be used inside thecode block of myFunction, where it was defined18:
// Code here *cannot* use carNamefunction myFunction() {
let carName = "Suzuki";// Code here can use carName
}
In general, it is not recommended to create global variables unless you intend to, sincethey can conflict with other variables having the same name in the global environment.For example, trying to re-define a variable that was already defined with let will result inan error. Local variables, on the other hand, can share the same name in several differentblocks without resulting in a conflict, since each variable is confined to its own block.
3.10 Flow control3.10.1 What is flow control?By default, all expressions in our script are executed in the given order, top to bottom.This behavior can be modified using flow control expressions. There are two types of flowcontrol expressions: conditionals and loops.
• Conditionals are used to condition code execution based on different criteria.• Loops are used to execute a block of code a number of times.
3.10.2 ConditionalsThe if conditional is the most commonly used conditional. It is used to specify that ablock of JavaScript code will be executed if a condition is true. An if conditional is definedas follows:
18If you assign a value to a variable that has not been declared, it will automatically be defined as a globalvariable using the var keyword, regardless of where the assignment was made. This is not recommended asit leads to ambiguity in our code, and we will not use this approach.
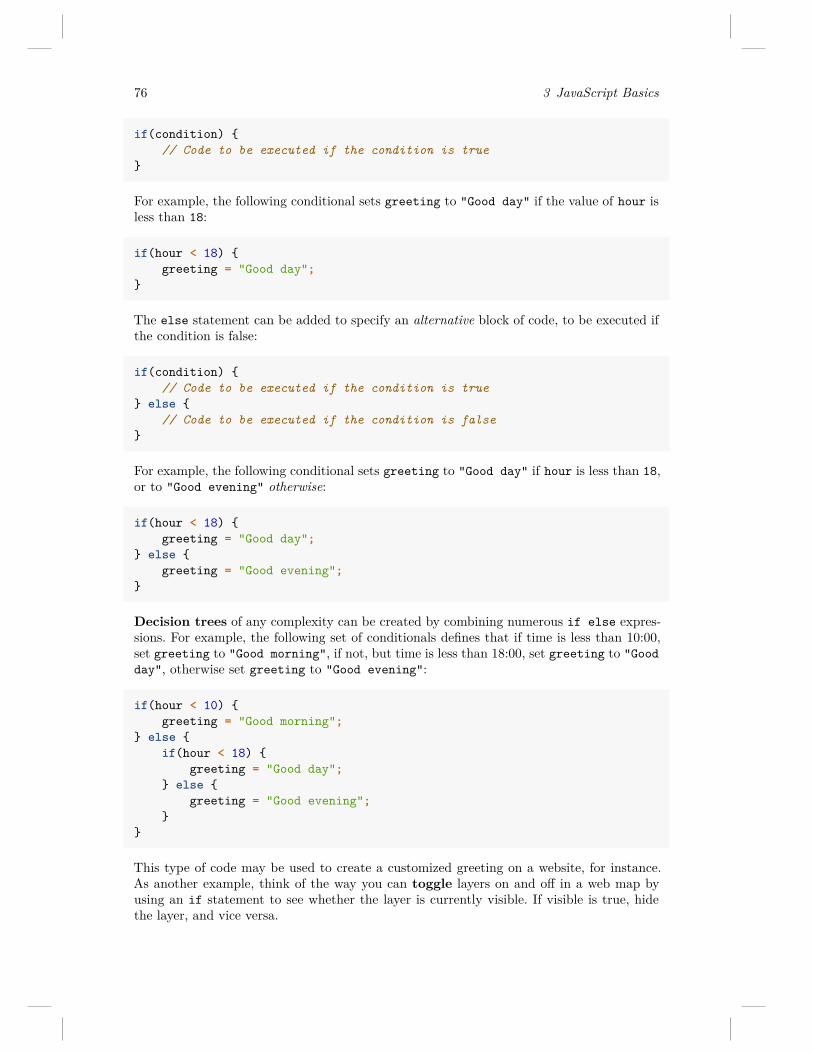
76 3 JavaScript Basics
if(condition) {// Code to be executed if the condition is true
}
For example, the following conditional sets greeting to "Good day" if the value of hour isless than 18:
if(hour < 18) {greeting = "Good day";
}
The else statement can be added to specify an alternative block of code, to be executed ifthe condition is false:
if(condition) {// Code to be executed if the condition is true
} else {// Code to be executed if the condition is false
}
For example, the following conditional sets greeting to "Good day" if hour is less than 18,or to "Good evening" otherwise:
if(hour < 18) {greeting = "Good day";
} else {greeting = "Good evening";
}
Decision trees of any complexity can be created by combining numerous if else expres-sions. For example, the following set of conditionals defines that if time is less than 10:00,set greeting to "Good morning", if not, but time is less than 18:00, set greeting to "Goodday", otherwise set greeting to "Good evening":
if(hour < 10) {greeting = "Good morning";
} else {if(hour < 18) {
greeting = "Good day";} else {
greeting = "Good evening";}
}
This type of code may be used to create a customized greeting on a website, for instance.As another example, think of the way you can toggle layers on and off in a web map byusing an if statement to see whether the layer is currently visible. If visible is true, hidethe layer, and vice versa.
3.10 Flow control 77
Conditionals can also be used in map symbology, as we will see later on (Section 8.4).Consider the following example of a function that determines color based on an attribute.The function uses conditionals to return a color based on the “party” attribute: "red" forRepublican, "blue" for Democrat, and "grey" for anything else:
function states_color(p) {if(p === "Republican") return "red";if(p === "Democrat") return "blue";return "grey";
}
Note that in the above example, the brackets ({}) around conditional code blocks are omit-ted to make the code shorter, which is legal when code blocks consist of a single expression.Also note that the code does not use else. Instead it relies on the fact that when return isencountered the function terminates. That way, when p is equal to either "Republican" or"Democrat" the funtion returns "red" or "blue", respectively, and terminates. Otherwise,the last expression is executed, and the function return the “default” value "grey"19.
• Define the states_color function, by copying the above code and pasting it in theconsole.
• Try running the states_color function three times, each time with a different argument,to see how you can get all three possible returned values: "red", "blue", or "grey".
3.10.3 Loops3.10.3.1 Standard for loop syntax
Loops are used to execute a piece of code a number of times. JavaScript supports severaltypes of loops. The most useful kind of loop within the scope of this book is the for loop.
The standard for loop has the following syntax:
for(statement 1; statement 2; statement 3) {// Code block to be executed
}
where:
• Statement 1 is executed once, before the loop starts.• Statement 2 defines the condition to keep running the loop.• Statement 3 is executed in each “round,” after the code block is executed.
In practice, statement 1 usually initializes a counter variable, such as let i=0. Statement 2
19For more information on conditionals, see the Making decisions in your code—conditionals article(https://developer.mozilla.org/en-US/docs/Learn/JavaScript/Building_blocks/conditionals) byMozilla.
78 3 JavaScript Basics
contains a condition referring to i, such as i<5. Statement 3 increments i (Section 3.6.2.2),such as i++. For example:
let text = "";for(let i = 0; i < 5; i++) {
text += "The number is " + i + "<br>";}
Let’s try to locate the for loop components in the above example:
• Statement 1 sets a variable before the loop starts (let i=0).• Statement 2 defines the condition for the loop to keep running (i<5 must be true, i.e.,
i must be less than five).• Statement 3 increases the value of i (i++) each time the code block in the loop has
been executed, using the increment operator ++ (Section 3.6.2.2).
As a result, the code block is executed five times, with i values of 0, 1, 2, 3, and 4. A loopis thus an alternative to repetitive code. For example, the above for loop is an alternativeto the following code section, which gives exactly the same result without using a loop:
let text = "";text += "The number is " + 0 + "<br>";text += "The number is " + 1 + "<br>";text += "The number is " + 2 + "<br>";text += "The number is " + 3 + "<br>";text += "The number is " + 4 + "<br>";
• Execute the for loop from the above code section, then print the value of the textvariable to see the effect of the loop.
Here is another example of a for loop. In this example, the code will be executed 1000times, since i gets the values of 0, 1, 2, etc., up to 999.
for(let i = 0; i < 1000; i++) {// Code here will run 1000 times
}
3.10.3.2 Iterative for loop syntax
In addition to the standard for loop syntax shown above, there is a special syntax toiterate over elements of arrays or objects. In this iterative syntax, instead of having threestatements, we define the loop with just one statement:
3.10 Flow control 79
for(let i in object) {// Code block to be executed
}
where i is a variable name (of our choice) and object is the object which we iterate over.In each iteration, i is set to another object element name. In case object is an array, igets the array index values: "0", "1", "2", and so on. In case object is an object, i getsthe property names. For example:
let obj = {a: 12, b: 13, c: 14};for(let i in obj) {
console.log(i + " " + obj[i]);}
This loop runs three times, once for each property of the object obj. Each time, the i variablegets the next property name of obj. Inside the code block, the current property name (i)and property value (obj[i]) are being printed, so that the following output appears in theconsole:
a 12b 13c 14
For the next for loop example, we define an object named directory:
let directory = {musicians: [
{firstname: "Chuck", lastname: "Berry"},{firstname: "Ray", lastname: "Charles"},{firstname: "Buddy", lastname: "Holly"}
]};
The directory object has just one property, named musicians, which is an array. Eachelement in the directory.musicians array is an object, with firstname and lastnameproperties. Using a for loop we can go over the musicians array, printing the full name ofeach musician20:
for(let i in directory.musicians) {let musician = directory.musicians[i];console.log(musician.firstname + " " + musician.lastname);
}
This time, since directory.musicians is an array, i gets the array indices "0",
20Note that it is possible to redefine a local variable inside the code block of a for loop, since a newseparate variable is created in each “round” of the loop (https://stackoverflow.com/questions/34952429/javascript-variable-declaration-within-loop).
80 3 JavaScript Basics
"1", and "2". These indices are used to select the current item in the array, withdirectory.musicians[i]. As a result, all of the musician names printed in the console21:
Chuck BerryRay CharlesBuddy Holly
3.10.3.3 The .forEach array method
The .forEach array method (Section 3.8.2) can be used as a cleaner and shorter alternativeto for loops (Section 3.10.3.2) in case we wish to go over the array and apply a functionon each element.
The .forEach method accepts a function that will be applied on each element.The func-tion passed to forEach, also takes one argument: the contents of the array element. Theparameter name of the internal function is for us to choose, though the name element is acommon convention. We could choose any different name. The important point is that theparameter refers to the element contents which we can do something with in the functionbody. Here is a small example of the .forEach array method:
let a = [52, 97, 104, 20];a.forEach(function(element) {
console.log(element);});
In the first expression, we define an array named a. In the second expression, we are applyingan (anonymous) function on each element of a, using .forEach. The function takes oneargument, element. The function code includes just a console.log function call to printelement. As a result, all elements of a are printed in the console:
529710420
As another example, the following code is the forEach version of the last code examplefrom Section 3.10.3.2 for printing musician names:
directory.musicians.forEach(function(element) {console.log(element.firstname + " " + element.lastname);
});
Here is another example with the same data. In this case, we “extract” the musician namesinto a new array named musicians, instead of just printing them into the console. First,musicians is initialized as an empty array. Then, in each iteration, the current musicianname is appended to the musicians array using the .push method (Section 3.8.2):
21For more information on loops, see the Looping code article (https://developer.mozilla.org/en-US/docs/Learn/JavaScript/Building_blocks/Looping_code) by Mozilla.
3.11 JavaScript Object Notation (JSON) 81
let musicians = [];directory.musicians.forEach(function(element) {
musicians.push(element.firstname + " " + element.lastname);});
• Run the above code in the console, after difining the directory object.• Examine the contents of the resulting musicians array.
Note how the code using .forEach is shorter and avoids the need to declare a counter i,compared to for loops (Section 3.10.3.2). Most loops we are going to use in this book willbe iterations over arrays, in which case we are going to use .forEach for its simplicity. Inother cases, we will resort to for.
3.11 JavaScript Object Notation (JSON)3.11.1 JSONJavaScript Object Notation (JSON)22 (Bassett, 2015) is a data format closely relatedto JavaScript objects. It is a plain text format, which means that a JSON instance ispractically a character string, which can be saved in a plain text file (usually with the.json file extension), in a database, or in computer memory23.
JSON and JavaScript objects are very similar and easily interchangeable. For that reason,JSON is the most commonly used format for exchanging data between the server and theclient in web applications. The principal difference between JSON and JavaScript objectsis as follows:
• A JavaScript object (Section 3.6.3.2) is a data type in the JavaScript environment. AJavaScript object does not make sense outside of the JavaScript environment.
• A JSON instance is a plain text string, formatted in a certain way according to theJSON standard24. A JSON string is thus not limited to the JavaScript environment. Itcan exist in another programming language, or simply stored inside a plain text file ora database.
For example, we already saw (Section 3.6.3.2) that a JavaScript object can be created usingcurly brackets ({}), in an expression such as the following one:
22https://en.wikipedia.org/wiki/JSON23Other well-known plain text data formats are, for instance, Comma-Separated Values (CSV) (https:
//en.wikipedia.org/wiki/Comma-separated_values) and Extensible Markup Language (XML) (https://en.wikipedia.org/wiki/XML).
24https://json.org/
82 3 JavaScript Basics
let obj = {a: 1, b: 2};
The corresponding JSON string can be defined, and stored in a variable, as follows:
let json = '{"a": 1, "b": 2}';
A notable difference between how the above two variables are defined is that in a JSONstring the property names must be enclosed in quotes: "a" and "b" (it’s possible to encloseproperty names in quotes when defining an object too, but it’s not mandatory). The JSONstandard requires double quotes (") around property names, therefore we need to enclosethe entire string with single quotes (').
To make a JSON string useful within the JavaScript environment, the JSON string canbe parsed to produce an object. The parsing process, JSON→object, is done with theJSON.parse function. The JSON.parse function is used to convert a JSON string (e.g.,coming from a server) to a JavaScript object:
JSON.parse(json); // Returns an object
The opposite conversion, object→JSON, is done with JSON.stringify:
JSON.stringify(obj); // Returns a JSON string
The JSON.stringify function is commonly used when sending an object from theJavaScript environment to a server. Since, like we said, JavaScript objects cannot existoutside of the JavaScript environment, we need to convert the object to a string withJSON.stringify before the data are sent elsewhere. For example, we are going to useJSON.stringify in Chapter 13 when sending spatial layers to permanent storage in adatabase (Section 13.6).
Finally, keep in mind that JSON is limited in that it cannot store undefined values orfunctions. JSON can store all of the other JavaScript data types (Section 3.6.1)25, namely:
• Strings• Numbers• Booleans• null• Arrays• Objects
3.11.2 GeoJSONGeoJSON26 is a spatial vector layer format based on JSON. Since GeoJSON is a specialcase of JSON, it can be processed in the JavaScript environment using the same methodsas any other JSON string, such as JSON.parse and JSON.stringify (Section 3.11.1). For
25For more details on the difference between a JavaScript object and a JSON string, check out theStackOverflow question on this matter (https://stackoverflow.com/questions/6489783/whats-the-difference-between-javascript-object-and-json-object).
26https://en.wikipedia.org/wiki/GeoJSON
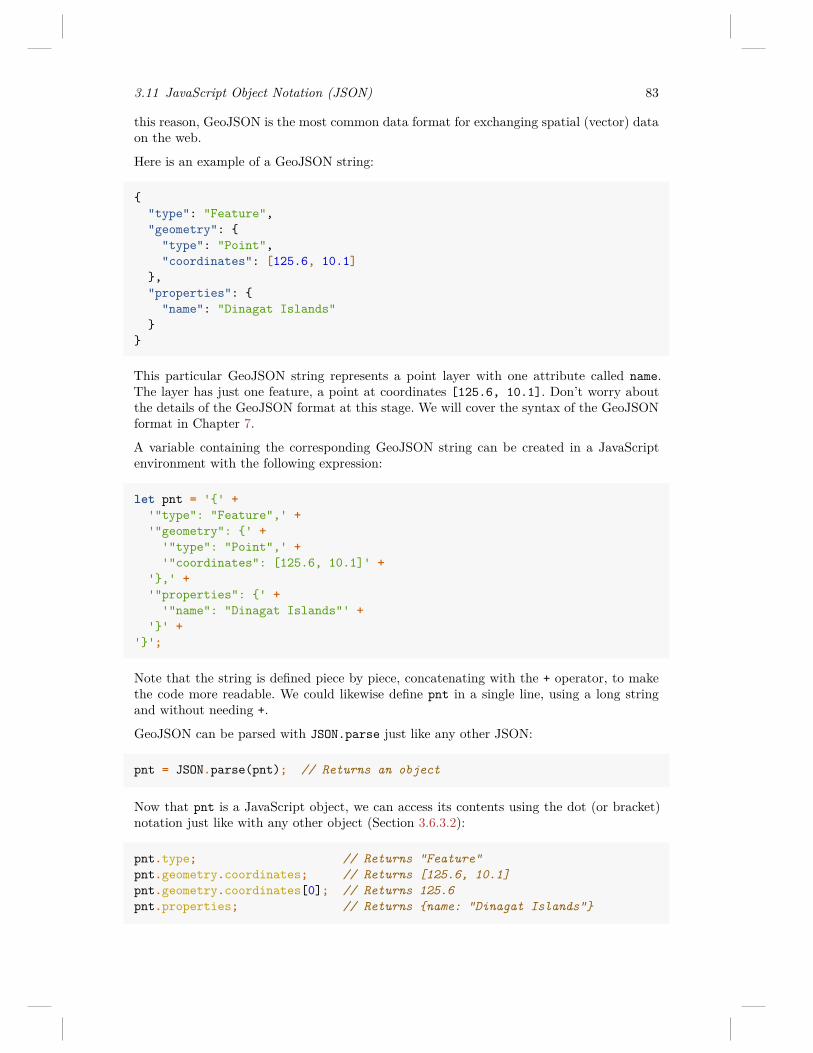
3.11 JavaScript Object Notation (JSON) 83
this reason, GeoJSON is the most common data format for exchanging spatial (vector) dataon the web.
Here is an example of a GeoJSON string:
{"type": "Feature","geometry": {
"type": "Point","coordinates": [125.6, 10.1]
},"properties": {
"name": "Dinagat Islands"}
}
This particular GeoJSON string represents a point layer with one attribute called name.The layer has just one feature, a point at coordinates [125.6, 10.1]. Don’t worry aboutthe details of the GeoJSON format at this stage. We will cover the syntax of the GeoJSONformat in Chapter 7.
A variable containing the corresponding GeoJSON string can be created in a JavaScriptenvironment with the following expression:
let pnt = '{' +'"type": "Feature",' +'"geometry": {' +
'"type": "Point",' +'"coordinates": [125.6, 10.1]' +
'},' +'"properties": {' +
'"name": "Dinagat Islands"' +'}' +
'}';
Note that the string is defined piece by piece, concatenating with the + operator, to makethe code more readable. We could likewise define pnt in a single line, using a long stringand without needing +.
GeoJSON can be parsed with JSON.parse just like any other JSON:
pnt = JSON.parse(pnt); // Returns an object
Now that pnt is a JavaScript object, we can access its contents using the dot (or bracket)notation just like with any other object (Section 3.6.3.2):
pnt.type; // Returns "Feature"pnt.geometry.coordinates; // Returns [125.6, 10.1]pnt.geometry.coordinates[0]; // Returns 125.6pnt.properties; // Returns {name: "Dinagat Islands"}
84 3 JavaScript Basics
Going back to a GeoJSON string is done with JSON.stringify:
JSON.stringify(pnt); // Returns a string
The above expression gives the following result27:
{"type":"Feature","geometry":{"type":"Point","coordinates":[...]}
Note that JSON.stringify takes further arguments to control the formatting of the result-ing string. For example, JSON.stringify(pnt, null, 4) will create the following indented,multi-line string—much like the one we began with. This is much easier to read than thedefault one-line result shown above:
{"type": "Feature","geometry": {
"type": "Point","coordinates": [
125.6,10.1
]},"properties": {
"name": "Dinagat Islands"}
}
3.12 Exercise• Write JavaScript code, as follows.• The code starts with defining two arrays:
– The first array A represents a single two-dimensional coordinate, such as: [100,200].
– The second array B contains several coordinates, as internal arrays of length 2, suchas: [[0, 3], [0, 4], [1, 5], [2, 5]].
• Then, the code creates a new array, where the individual coordinate A is at-tached to each of the coordinates in B, so that we get an array of coor-dinate pairs, such as: [[[100, 200], [0, 3]], [[100, 200], [0, 4]], [[100,200], [1, 5]], [[100, 200], [2, 5]]]28.
• Hint: create an empty array result, then run a loop that goes over the second arrayB, each time “pushing” (Section 3.8.2) the A element plus the current B element intoresult.
27The last part of the string is omitted and replaced with [...] to fit on the page.28The resulting array can be useful for drawing line segments between a single point A and a second set
of points B (Figure 11.8).

3.12 Exercise 85
• Solution to this exercise, and most of the other excercises in the book, can be found inSection C.

4JavaScript Interactivity
4.1 IntroductionIn Chapters 1–2, we mentioned that JavaScript is primarily used to control the interactivebehavior of web pages. However, in Chapter 3 we introduced the JavaScript language “inisolation”: none of the JavaScript expressions we executed in the console had any effect onthe contents of the web page where they were run. Indeed, how can we link JavaScript codewith page contents, to interactively modify the web page? This is precisely the subject ofthe current chapter—employing JavaScript to query and modify web page content. As wewill see, the mechanism which makes the link possible is the Document Object Model(DOM).
4.2 The Document Object Model (DOM)When a web browser loads an HTML document, it displays (renders) the contents of thatdocument on the screen, possibly styled according to CSS styling rules. But that’s not allthe web browser does with the tags, attributes, and text contents of the HTML document.The browser also creates and memorizes a “model” of that page’s HTML (Figure 4.1). Inother words, the browser remembers the HTML tags, their attributes, and the order inwhich they appear in the file. This representation of the page is called the DocumentObject Model (DOM)1.
The DOM is sometimes referred to as an Application Programming Interface (API)2
for accessing HTML documents with JavaScript. An API is a general term for methods ofcommunication between software components. The DOM can be considered an API, sinceit bridges between JavaScript code and page contents displayed in the browser. The DOMbasically provides the information and tools necessary to navigate through, or make changesor additions, to the HTML on the page. The DOM itself isn’t actually JavaScript—it’s astandard from the World Wide Web Consortium (W3C)3 that most browser manufacturershave adopted and added to their browsers.
1https://en.wikipedia.org/wiki/Document_Object_Model2https://en.wikipedia.org/wiki/Application_programming_interface3https://www.w3.org/DOM/
87
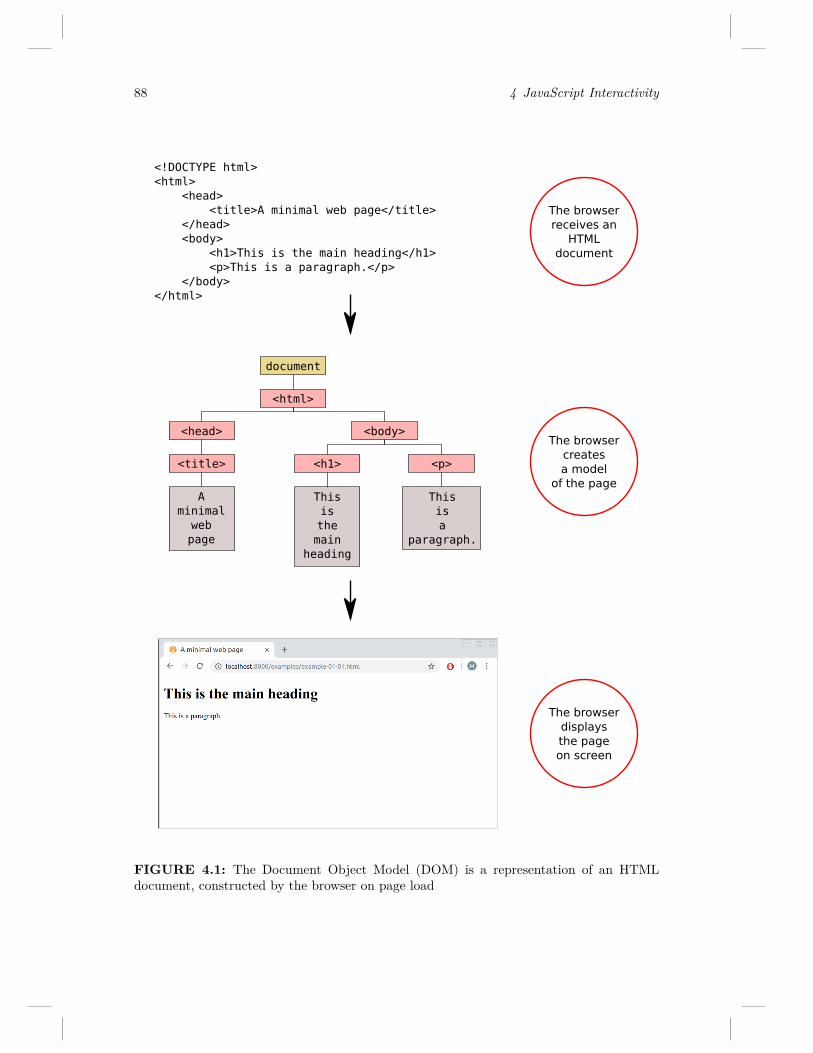
88 4 JavaScript Interactivity
<!DOCTYPE html><html> <head> <title>A minimal web page</title> </head> <body> <h1>This is the main heading</h1> <p>This is a paragraph.</p> </body></html>
The browserreceives an
HTMLdocument
The browsercreates a model
of the page
The browserdisplaysthe pageon screen
document
<html>
A minimal web page
This is the main
heading
This is a
paragraph.
<head> <body>
<h1><title> <p>
FIGURE 4.1: The Document Object Model (DOM) is a representation of an HTMLdocument, constructed by the browser on page load
4.3 Accessing and modifying elements 89
4.3 Accessing and modifying elements4.3.1 OverviewAll of the properties and methods of the DOM, available for manipulating web pages, areorganized into objects which are accessible through JavaScript code. Two of the most im-portant objects are:
• The window object, which represents the browser window, i.e., the global environment• The document object, which represents the document itself4
Using the properties and methods of the window and document objects, we are able to accessdocument element contents or their display settings, and also dynamically adjust them. Forexample, the document object has a property named title, referring to the text within the<title> element—the page title (Section 1.6.3.1). We can access document.title, to get astring with page title, or modify page title, by assigning a new string to document.title.
• Open the browser and browse to any web page you like.• Open the JavaScript console (Section 3.4) and try typing document.title and
window.location.href.• Check the type of returned values, using the typeof operator (Section 3.6.4).• Try assigning a new string into document.title. The new title should appear on top
of the browser window!• Go to any page (other than h t t p s : / / w w w . g o o g l e . c om) and type
window.location.href="https://www.google.com" into the console. What doyou think will happen?
4.3.2 Accessing elementsThe document.title property was just an example, referring to the specific <title> ele-ment. We need a more general method if we want to be able to locate, and modify, anyelement in our document. The document object indeed contains several methods for findingelements in the DOM. These methods are called DOM selectors, or DOM queries. Thefollowing expressions are examples of DOM selectors:
document.getElementById("firstParagraph");document.getElementsByClassName("important");document.getElementsByTagName("p");
These three expressions employ methods of the document object:
• The first selector uses the .getElementById method to select an individual elementwith a specific ID, id="firstParagraph".
4The document object, like all other global objects, is in fact a property of the window object. That is,document is a shortcut for window.document.
90 4 JavaScript Interactivity
• The second selector uses the .getElementsByClassName method to select all elementswith a specific class, class="important".
• The third selector uses the .getElementsByTagName method to select all elements witha specific type, <p> (i.e., all paragraphs)5.
Note that the first method returns an individual element reference. The second and thirdmethods, however, returns an array-like collection of multiple references, even if there isjust one element with the particular class or type (more on that in Section 4.7.2). We aregoing to see just one example of working with a collection of DOM references in Section4.7.2. Selecting one element at a time, using .getElementById, is going to be sufficient forall of the examples in this chapter and throughout most of the book.
• Open the console in example-02-01.html (Figure 2.2), and type the following expres-sions:
– document.getElementById("intro");– document.getElementsByTagName("p");
• Which element(s) does each of the resulting references represent?
4.3.3 Getting element propertiesThe result of a DOM query (Section 4.3.2) is a reference to an element, or to a collectionof elements, in the DOM. That reference can be used to query or to modify (Section 4.3.4)the contents or behavior of the element(s). For example, the innerHTML property of a DOMelement refers to the HTML code of that element. The following expression returns theHTML contents of the element that has id="firstParagraph":
document.getElementById("firstParagraph").innerHTML;
• Open the console in example-02-01.html (Figure 2.2), and type the expressiondocument.getElementById("intro").innerHTML;.
– What does the returned data represent?– What is the type of the returned data? Check using the typeof operator (Section
3.6.4).
4.3.4 Modifying elementsElement references can also be used to modify the contents and the behavior (Section 4.4) ofthe respecive elements. For example, assignment of a string into the .innerHTML property
5Note the letter s in .getElementsByClassName and in .getElementsByTagName (elements = plural), asopposed to .getElementById (element = singular).
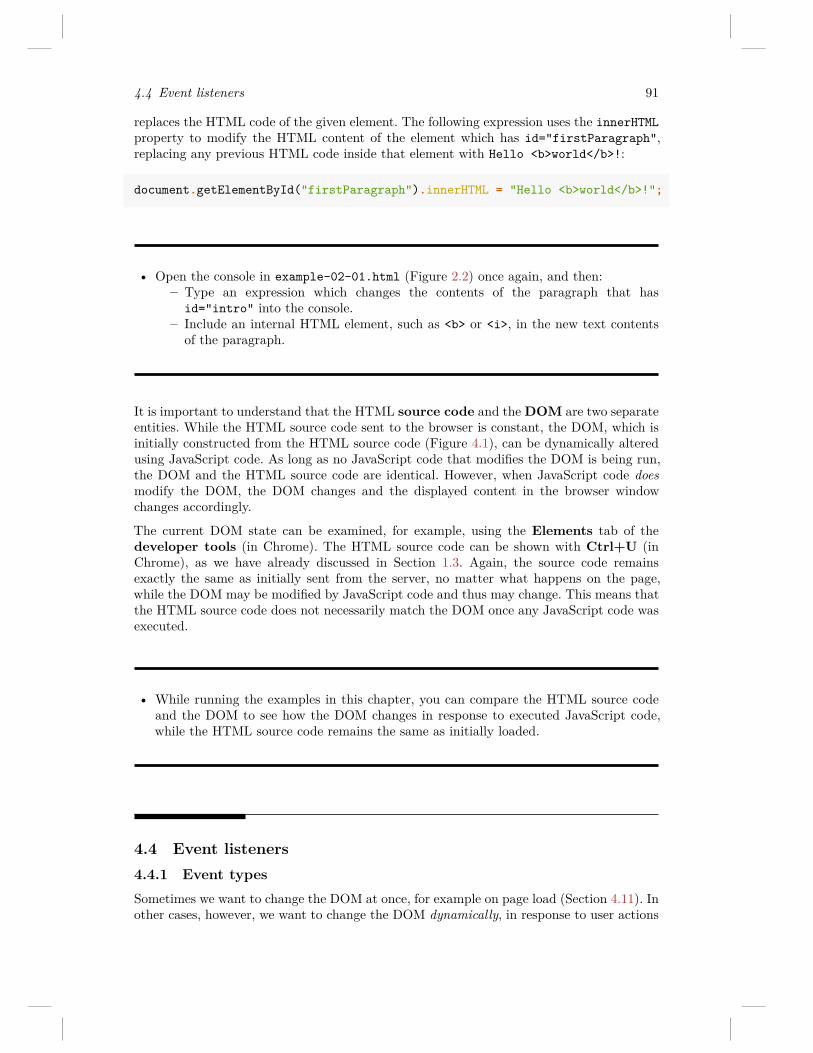
4.4 Event listeners 91
replaces the HTML code of the given element. The following expression uses the innerHTMLproperty to modify the HTML content of the element which has id="firstParagraph",replacing any previous HTML code inside that element with Hello <b>world</b>!:
document.getElementById("firstParagraph").innerHTML = "Hello <b>world</b>!";
• Open the console in example-02-01.html (Figure 2.2) once again, and then:– Type an expression which changes the contents of the paragraph that has
id="intro" into the console.– Include an internal HTML element, such as <b> or <i>, in the new text contents
of the paragraph.
It is important to understand that the HTML source code and the DOM are two separateentities. While the HTML source code sent to the browser is constant, the DOM, which isinitially constructed from the HTML source code (Figure 4.1), can be dynamically alteredusing JavaScript code. As long as no JavaScript code that modifies the DOM is being run,the DOM and the HTML source code are identical. However, when JavaScript code doesmodify the DOM, the DOM changes and the displayed content in the browser windowchanges accordingly.
The current DOM state can be examined, for example, using the Elements tab of thedeveloper tools (in Chrome). The HTML source code can be shown with Ctrl+U (inChrome), as we have already discussed in Section 1.3. Again, the source code remainsexactly the same as initially sent from the server, no matter what happens on the page,while the DOM may be modified by JavaScript code and thus may change. This means thatthe HTML source code does not necessarily match the DOM once any JavaScript code wasexecuted.
• While running the examples in this chapter, you can compare the HTML source codeand the DOM to see how the DOM changes in response to executed JavaScript code,while the HTML source code remains the same as initially loaded.
4.4 Event listeners4.4.1 Event typesSometimes we want to change the DOM at once, for example on page load (Section 4.11). Inother cases, however, we want to change the DOM dynamically, in response to user actions
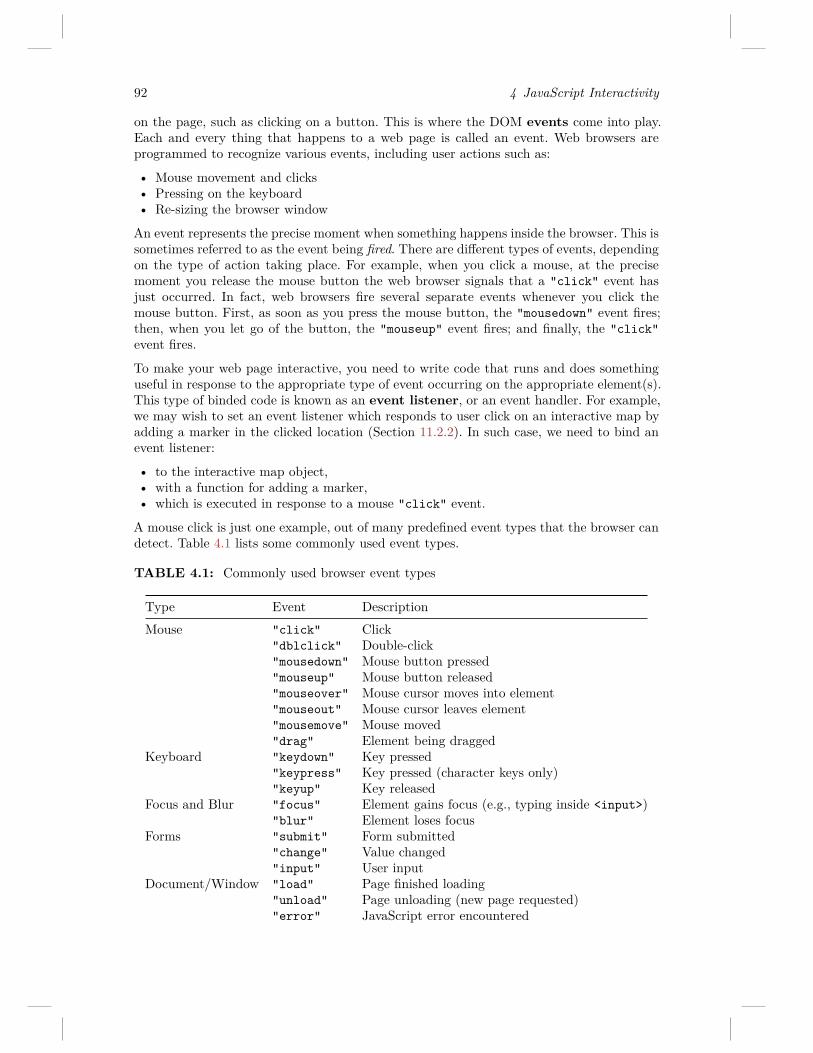
92 4 JavaScript Interactivity
on the page, such as clicking on a button. This is where the DOM events come into play.Each and every thing that happens to a web page is called an event. Web browsers areprogrammed to recognize various events, including user actions such as:
• Mouse movement and clicks• Pressing on the keyboard• Re-sizing the browser window
An event represents the precise moment when something happens inside the browser. This issometimes referred to as the event being fired. There are different types of events, dependingon the type of action taking place. For example, when you click a mouse, at the precisemoment you release the mouse button the web browser signals that a "click" event hasjust occurred. In fact, web browsers fire several separate events whenever you click themouse button. First, as soon as you press the mouse button, the "mousedown" event fires;then, when you let go of the button, the "mouseup" event fires; and finally, the "click"event fires.
To make your web page interactive, you need to write code that runs and does somethinguseful in response to the appropriate type of event occurring on the appropriate element(s).This type of binded code is known as an event listener, or an event handler. For example,we may wish to set an event listener which responds to user click on an interactive map byadding a marker in the clicked location (Section 11.2.2). In such case, we need to bind anevent listener:
• to the interactive map object,• with a function for adding a marker,• which is executed in response to a mouse "click" event.
A mouse click is just one example, out of many predefined event types that the browser candetect. Table 4.1 lists some commonly used event types.
TABLE 4.1: Commonly used browser event types
Type Event DescriptionMouse "click" Click
"dblclick" Double-click"mousedown" Mouse button pressed"mouseup" Mouse button released"mouseover" Mouse cursor moves into element"mouseout" Mouse cursor leaves element"mousemove" Mouse moved"drag" Element being dragged
Keyboard "keydown" Key pressed"keypress" Key pressed (character keys only)"keyup" Key released
Focus and Blur "focus" Element gains focus (e.g., typing inside <input>)"blur" Element loses focus
Forms "submit" Form submitted"change" Value changed"input" User input
Document/Window "load" Page finished loading"unload" Page unloading (new page requested)"error" JavaScript error encountered
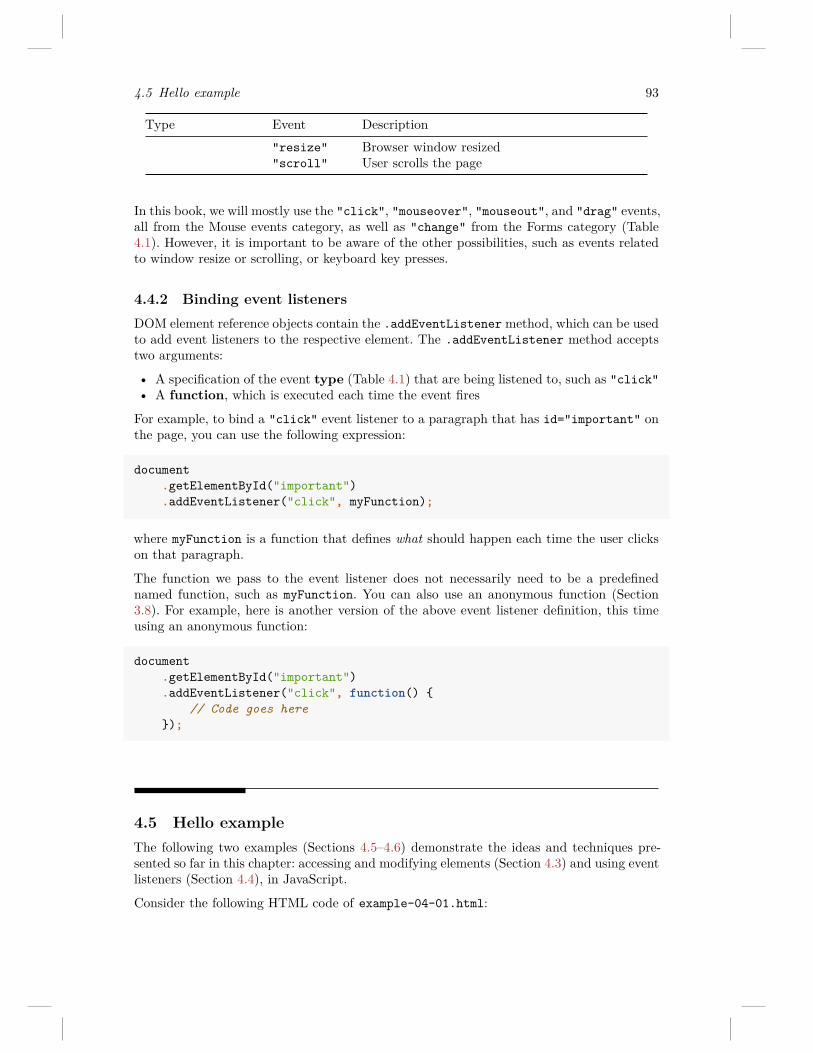
4.5 Hello example 93
Type Event Description"resize" Browser window resized"scroll" User scrolls the page
In this book, we will mostly use the "click", "mouseover", "mouseout", and "drag" events,all from the Mouse events category, as well as "change" from the Forms category (Table4.1). However, it is important to be aware of the other possibilities, such as events relatedto window resize or scrolling, or keyboard key presses.
4.4.2 Binding event listenersDOM element reference objects contain the .addEventListener method, which can be usedto add event listeners to the respective element. The .addEventListener method acceptstwo arguments:
• A specification of the event type (Table 4.1) that are being listened to, such as "click"• A function, which is executed each time the event fires
For example, to bind a "click" event listener to a paragraph that has id="important" onthe page, you can use the following expression:
document.getElementById("important").addEventListener("click", myFunction);
where myFunction is a function that defines what should happen each time the user clickson that paragraph.
The function we pass to the event listener does not necessarily need to be a predefinednamed function, such as myFunction. You can also use an anonymous function (Section3.8). For example, here is another version of the above event listener definition, this timeusing an anonymous function:
document.getElementById("important").addEventListener("click", function() {
// Code goes here});
4.5 Hello exampleThe following two examples (Sections 4.5–4.6) demonstrate the ideas and techniques pre-sented so far in this chapter: accessing and modifying elements (Section 4.3) and using eventlisteners (Section 4.4), in JavaScript.
Consider the following HTML code of example-04-01.html:
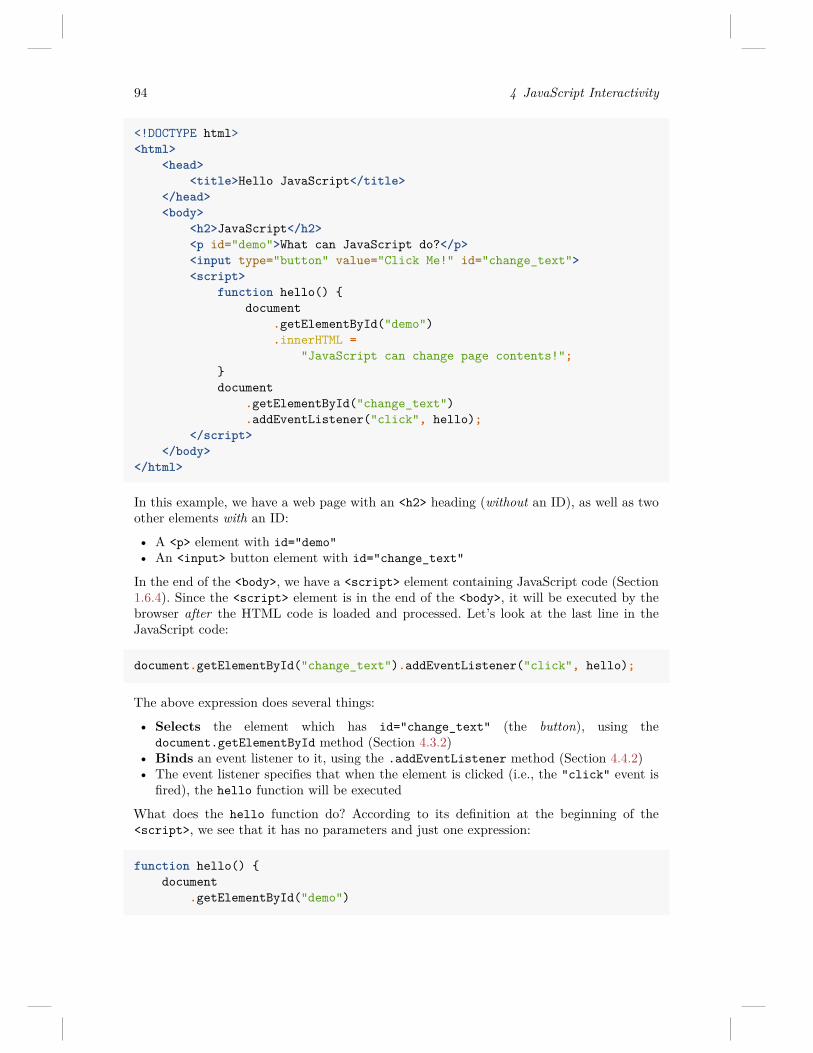
94 4 JavaScript Interactivity
<!DOCTYPE html><html>
<head><title>Hello JavaScript</title>
</head><body>
<h2>JavaScript</h2><p id="demo">What can JavaScript do?</p><input type="button" value="Click Me!" id="change_text"><script>
function hello() {document
.getElementById("demo")
.innerHTML ="JavaScript can change page contents!";
}document
.getElementById("change_text")
.addEventListener("click", hello);</script>
</body></html>
In this example, we have a web page with an <h2> heading (without an ID), as well as twoother elements with an ID:
• A <p> element with id="demo"• An <input> button element with id="change_text"
In the end of the <body>, we have a <script> element containing JavaScript code (Section1.6.4). Since the <script> element is in the end of the <body>, it will be executed by thebrowser after the HTML code is loaded and processed. Let’s look at the last line in theJavaScript code:
document.getElementById("change_text").addEventListener("click", hello);
The above expression does several things:
• Selects the element which has id="change_text" (the button), using thedocument.getElementById method (Section 4.3.2)
• Binds an event listener to it, using the .addEventListener method (Section 4.4.2)• The event listener specifies that when the element is clicked (i.e., the "click" event is
fired), the hello function will be executed
What does the hello function do? According to its definition at the beginning of the<script>, we see that it has no parameters and just one expression:
function hello() {document
.getElementById("demo")
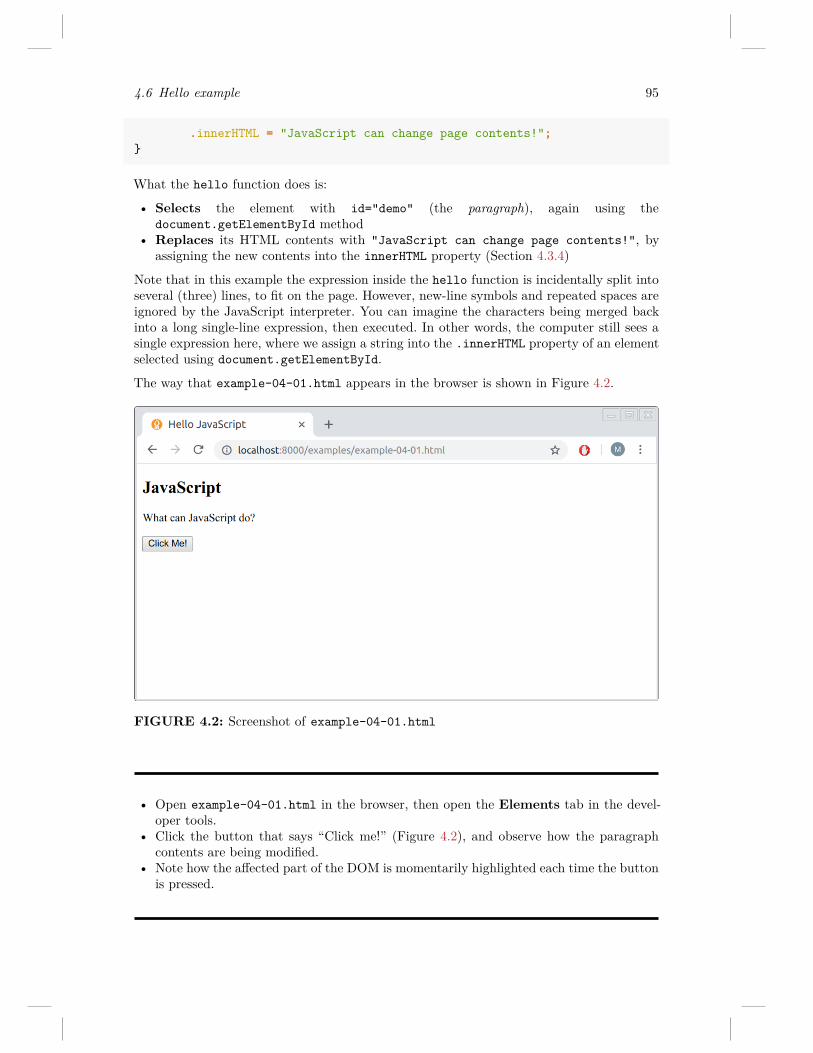
4.6 Hello example 95
.innerHTML = "JavaScript can change page contents!";}
What the hello function does is:
• Selects the element with id="demo" (the paragraph), again using thedocument.getElementById method
• Replaces its HTML contents with "JavaScript can change page contents!", byassigning the new contents into the innerHTML property (Section 4.3.4)
Note that in this example the expression inside the hello function is incidentally split intoseveral (three) lines, to fit on the page. However, new-line symbols and repeated spaces areignored by the JavaScript interpreter. You can imagine the characters being merged backinto a long single-line expression, then executed. In other words, the computer still sees asingle expression here, where we assign a string into the .innerHTML property of an elementselected using document.getElementById.
The way that example-04-01.html appears in the browser is shown in Figure 4.2.
FIGURE 4.2: Screenshot of example-04-01.html
• Open example-04-01.html in the browser, then open the Elements tab in the devel-oper tools.
• Click the button that says “Click me!” (Figure 4.2), and observe how the paragraphcontents are being modified.
• Note how the affected part of the DOM is momentarily highlighted each time the buttonis pressed.
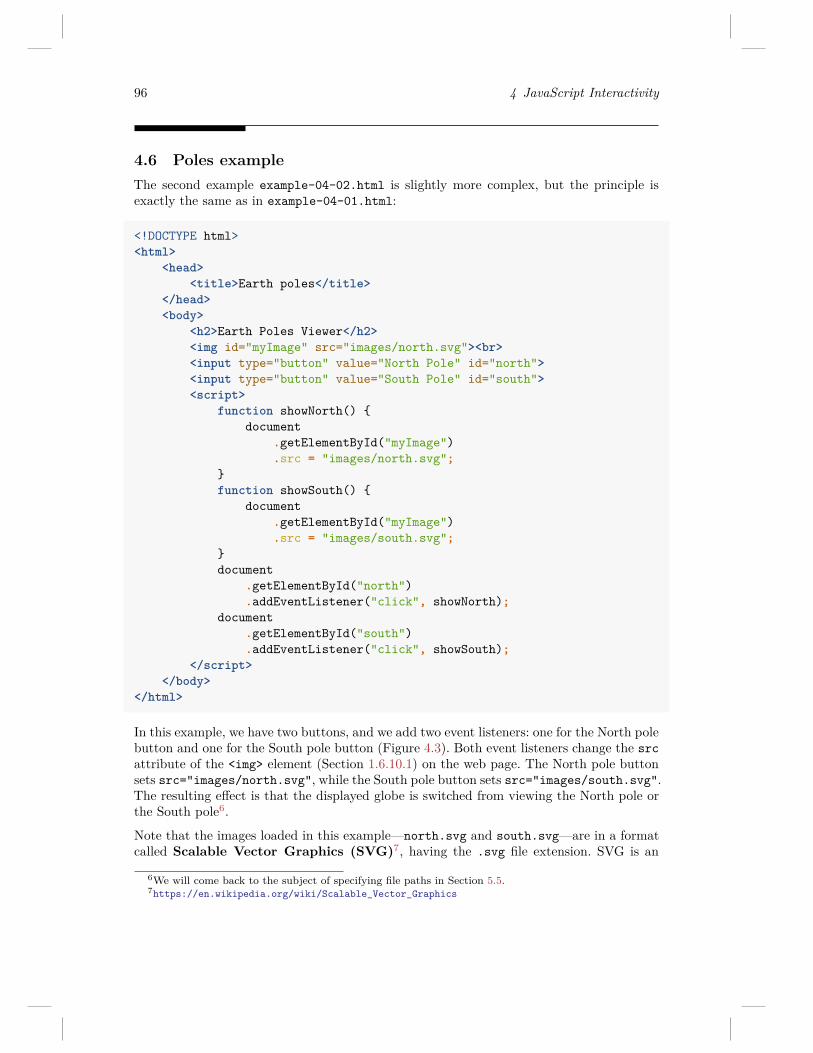
96 4 JavaScript Interactivity
4.6 Poles exampleThe second example example-04-02.html is slightly more complex, but the principle isexactly the same as in example-04-01.html:
<!DOCTYPE html><html>
<head><title>Earth poles</title>
</head><body>
<h2>Earth Poles Viewer</h2><img id="myImage" src="images/north.svg"><br><input type="button" value="North Pole" id="north"><input type="button" value="South Pole" id="south"><script>
function showNorth() {document
.getElementById("myImage")
.src = "images/north.svg";}function showSouth() {
document.getElementById("myImage").src = "images/south.svg";
}document
.getElementById("north")
.addEventListener("click", showNorth);document
.getElementById("south")
.addEventListener("click", showSouth);</script>
</body></html>
In this example, we have two buttons, and we add two event listeners: one for the North polebutton and one for the South pole button (Figure 4.3). Both event listeners change the srcattribute of the <img> element (Section 1.6.10.1) on the web page. The North pole buttonsets src="images/north.svg", while the South pole button sets src="images/south.svg".The resulting effect is that the displayed globe is switched from viewing the North pole orthe South pole6.
Note that the images loaded in this example—north.svg and south.svg—are in a formatcalled Scalable Vector Graphics (SVG)7, having the .svg file extension. SVG is an
6We will come back to the subject of specifying file paths in Section 5.5.7https://en.wikipedia.org/wiki/Scalable_Vector_Graphics
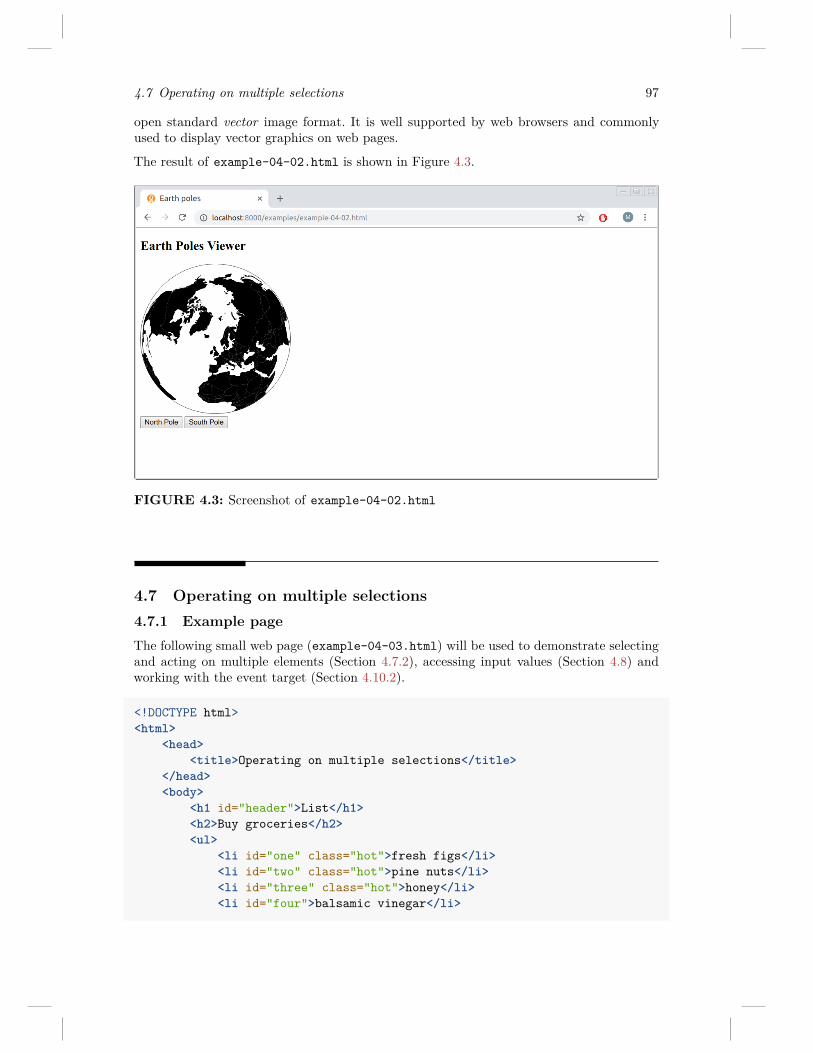
4.7 Operating on multiple selections 97
open standard vector image format. It is well supported by web browsers and commonlyused to display vector graphics on web pages.
The result of example-04-02.html is shown in Figure 4.3.
FIGURE 4.3: Screenshot of example-04-02.html
4.7 Operating on multiple selections4.7.1 Example pageThe following small web page (example-04-03.html) will be used to demonstrate selectingand acting on multiple elements (Section 4.7.2), accessing input values (Section 4.8) andworking with the event target (Section 4.10.2).
<!DOCTYPE html><html>
<head><title>Operating on multiple selections</title>
</head><body>
<h1 id="header">List</h1><h2>Buy groceries</h2><ul>
<li id="one" class="hot">fresh figs</li><li id="two" class="hot">pine nuts</li><li id="three" class="hot">honey</li><li id="four">balsamic vinegar</li>
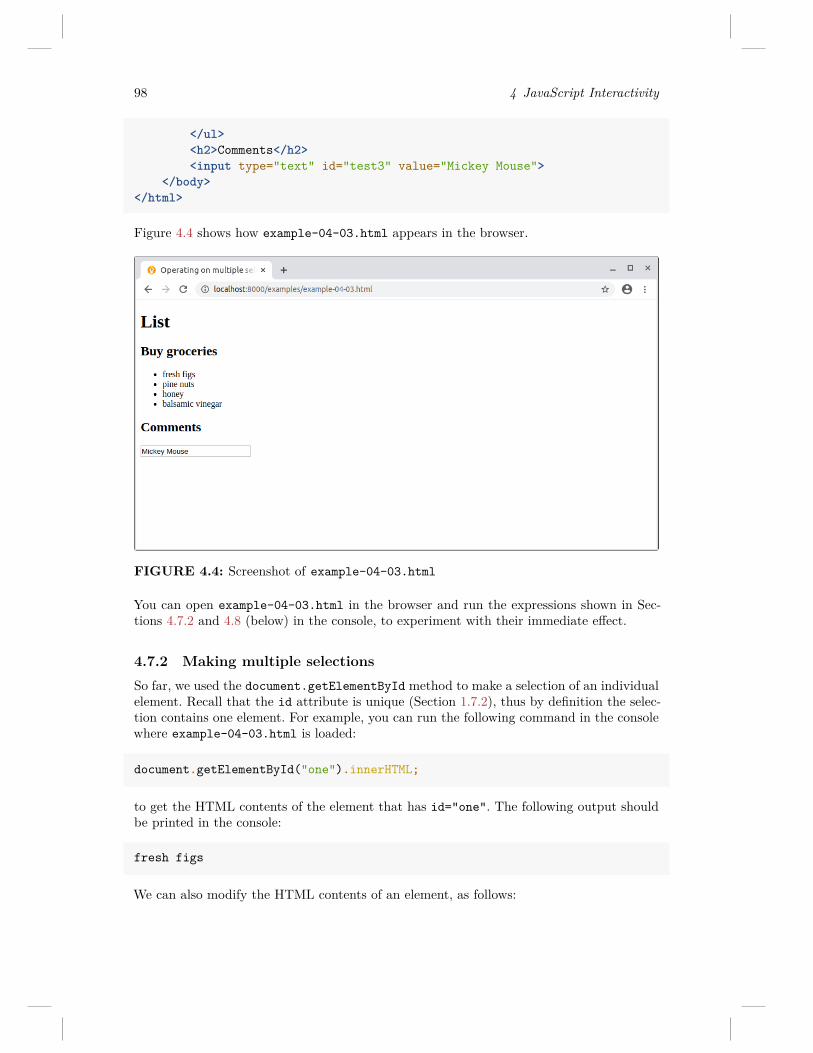
98 4 JavaScript Interactivity
</ul><h2>Comments</h2><input type="text" id="test3" value="Mickey Mouse">
</body></html>
Figure 4.4 shows how example-04-03.html appears in the browser.
FIGURE 4.4: Screenshot of example-04-03.html
You can open example-04-03.html in the browser and run the expressions shown in Sec-tions 4.7.2 and 4.8 (below) in the console, to experiment with their immediate effect.
4.7.2 Making multiple selectionsSo far, we used the document.getElementById method to make a selection of an individualelement. Recall that the id attribute is unique (Section 1.7.2), thus by definition the selec-tion contains one element. For example, you can run the following command in the consolewhere example-04-03.html is loaded:
document.getElementById("one").innerHTML;
to get the HTML contents of the element that has id="one". The following output shouldbe printed in the console:
fresh figs
We can also modify the HTML contents of an element, as follows:
4.7 Operating on multiple selections 99
document.getElementById("one").innerHTML = "<i>Not very fresh</i> figs";
• Open example-04-03.html and run the above expression for changing the contents ofthe first <li> element in the console.
• Compare the HTML source code (Ctrl+U) and the DOM (Elements tab in the de-veloper tools).
• Which one reflects the above change and why? (Hint: see Section 4.3.4.)
The document object contains other methods for making DOM selections, potentially re-turning more than one element. For example:
• getElementsByClassName—Get all elements sharing the specified class• getElementsByTagName—Get all elements of the specified HTML type8
For example, the following expression uses the getElementsByTagName method to get areference to all <li> elements in the document:
let nodes = document.getElementsByTagName("li");
The returned object is a collection9 of references to HTML elements in the DOM. Thecollection is an array-like object. For example, we can check its length (Section 3.8.2):
nodes.length; // Returns 4
or select an individual element from the collection using an index (Section 3.6.3.1):
nodes[0].innerHTML; // Returns "fresh figs"
How can we do something with all of the elements in the collection? For example, how canwe print the HTML contents of all of the <li> elements? Unfortunately, the collection doesnot have a .forEach method (Section 3.10.3.3). Therefore, to iterate over the collection weneed to use the standard for loop syntax (Section 3.10.3.1):
for(let i = 0; i < nodes.length; i++) {console.log(nodes[i].innerHTML);
}
8Other commonly used selectors include querySelectorAll, which gets all elements matching the givenCSS selector, and querySelector, which gets the just the first element matching the given CSS selector.
9https://developer.mozilla.org/en-US/docs/Web/API/HTMLCollection
100 4 JavaScript Interactivity
Try to modify the code of the for loop to append an exclamation mark (“!”)at the end of each list item, so that “fresh figs” becomes “fresh figs!”, etc.
Using loops, we can therefore work with multiple selections, one element at a time. Inthis book, we will rarely need to use multiple selection JavaScript techniques, since wewill mostly be working with individual selections (using getElementById). However, work-ing with multiple selections is often necessary so it is important to be familiar with thispossibility.
4.8 Getting and setting input valuesThe .value property of a reference to an input element—such as <input> or <select>(Section 1.6.13)—can be used to get or set its current value. This is conceptually similarto the way that the .innerHTML property is used to get or set HTML contents (Sections4.3.2–4.3.4) and the .src property is used to get or set the .src attribute (Section 4.6).
For example, the web page we are experimenting with (example-04-03.html) contains thefollowing <input> element (Figure 4.4):
<input type="text" id="test3" value="Mickey Mouse">
The following expression gets the current value of that element, which is equal to "MickeyMouse" unless the user interacted with the text area and typed something else:
document.getElementById("test3").value; // Returns "Mickey Mouse"
If you manually modify the contents of the text input area, and run the above expressionagain, you will see the new, currently entered text. The DOM, on the other hand, will stillshow the original value="Mickey Mouse" attribute.
You may already have guessed that assigning a new value to the .value property modifiesthe current input value. The following expression sets the input value to "Donald Duck",replacing the previous value of "Mickey Mouse", or whatever else that was typed into thetext area, with the new value "Donald Duck":
document.getElementById("test3").value = "Donald Duck";
Note that the .value property refers to the real-time value, including user changes such ascurrently entered text in a text box. These changes are not reflected in the value attribute,which retains the initial value set on page load. Compare the value attribute of the modified<input> (through the DOM inspector in the developer tools) with the .value propertystring to see this for yourself.
We will get back to another practical example using .value and <input> elements in Section4.12.
4.9 Multiple event listeners 101
• Create a small web page with:– A slider input, i.e., <input type="range"> (Section 1.6.13.3)– A paragraph
• The paragraph should display the up-to-date value of the slider, whether the initialvalue or a new value selected by the user.
• Hints:– Bind an event listener to the slider, with function that updates paragraph contents
with the current value of the slider.– Use the .value property to obtain the current value of the slider.– Set the event listener to respond to the "input" event type (Section 4.4), so that
the function is executed every time the slider is scrolled (i.e., gets any user input).
4.9 Multiple event listenersIt is often convenient to add multiple event listeners to the same element selection, in order totrigger different responses for different events. In our next example (example-04-04.html),two event listeners10 are binded to the id="p1" paragraph. The first event listener respondsto the "mouseover" event (mouse cursor entering the element), printing "You enteredp1!" in the console. The second event listener responds to the "mouseout" event (mousecursor leaving the element), printing "You left p1!" in the console.
let el = document.getElementById("p1");el.addEventListener("mouseover", function() {
console.log("You entered p1!");});el.addEventListener("mouseout", function() {
console.log("You left p1!");});
As a result, the phrases the "You entered p1!" or "You left p1!" are interchangeablyprinted in the console whenever the user moves the mouse into the paragraph or outof the paragraph. The small web page implementing the above pair of event listeners(example-04-04.html) is shown in Figure 4.5.
• Open example-04-04.html in the browser, and open the JavaScript console.• Move the mouse cursor over the paragraph and check out the messages being printed in
the console (Figure 4.5).• Try modifying the source code of this example so that the messages are displayed on the
10It is possible to bind two (or more) event listeners to the same selection in the same expression, thanksto the fact that the .on method returns the original selection.
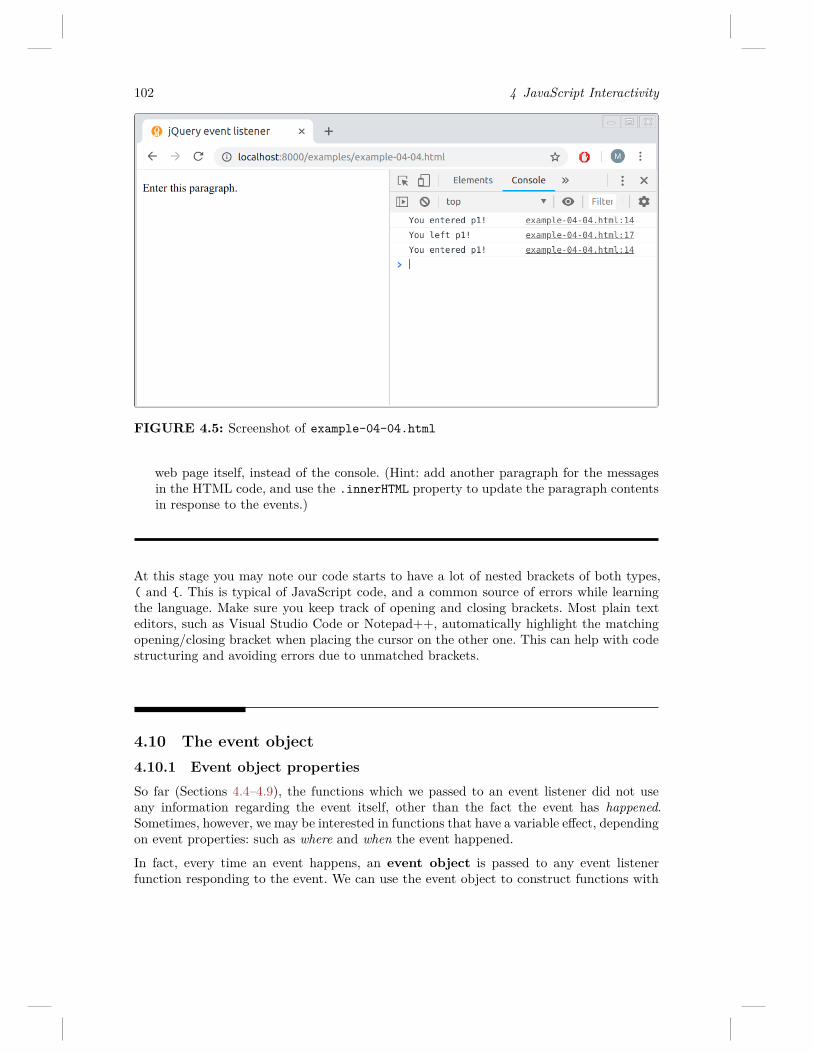
102 4 JavaScript Interactivity
FIGURE 4.5: Screenshot of example-04-04.html
web page itself, instead of the console. (Hint: add another paragraph for the messagesin the HTML code, and use the .innerHTML property to update the paragraph contentsin response to the events.)
At this stage you may note our code starts to have a lot of nested brackets of both types,( and {. This is typical of JavaScript code, and a common source of errors while learningthe language. Make sure you keep track of opening and closing brackets. Most plain texteditors, such as Visual Studio Code or Notepad++, automatically highlight the matchingopening/closing bracket when placing the cursor on the other one. This can help with codestructuring and avoiding errors due to unmatched brackets.
4.10 The event object4.10.1 Event object propertiesSo far (Sections 4.4–4.9), the functions which we passed to an event listener did not useany information regarding the event itself, other than the fact the event has happened.Sometimes, however, we may be interested in functions that have a variable effect, dependingon event properties: such as where and when the event happened.
In fact, every time an event happens, an event object is passed to any event listenerfunction responding to the event. We can use the event object to construct functions with
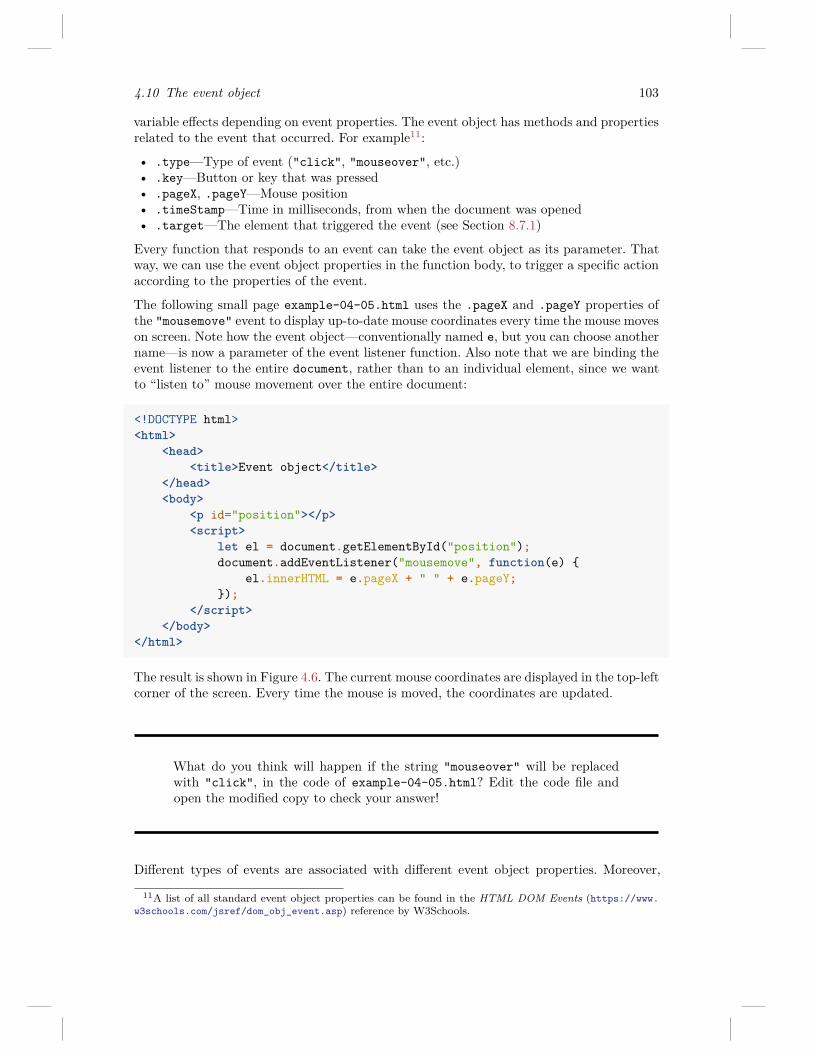
4.10 The event object 103
variable effects depending on event properties. The event object has methods and propertiesrelated to the event that occurred. For example11:
• .type—Type of event ("click", "mouseover", etc.)• .key—Button or key that was pressed• .pageX, .pageY—Mouse position• .timeStamp—Time in milliseconds, from when the document was opened• .target—The element that triggered the event (see Section 8.7.1)
Every function that responds to an event can take the event object as its parameter. Thatway, we can use the event object properties in the function body, to trigger a specific actionaccording to the properties of the event.
The following small page example-04-05.html uses the .pageX and .pageY properties ofthe "mousemove" event to display up-to-date mouse coordinates every time the mouse moveson screen. Note how the event object—conventionally named e, but you can choose anothername—is now a parameter of the event listener function. Also note that we are binding theevent listener to the entire document, rather than to an individual element, since we wantto “listen to” mouse movement over the entire document:
<!DOCTYPE html><html>
<head><title>Event object</title>
</head><body>
<p id="position"></p><script>
let el = document.getElementById("position");document.addEventListener("mousemove", function(e) {
el.innerHTML = e.pageX + " " + e.pageY;});
</script></body>
</html>
The result is shown in Figure 4.6. The current mouse coordinates are displayed in the top-leftcorner of the screen. Every time the mouse is moved, the coordinates are updated.
What do you think will happen if the string "mouseover" will be replacedwith "click", in the code of example-04-05.html? Edit the code file andopen the modified copy to check your answer!
Different types of events are associated with different event object properties. Moreover,
11A list of all standard event object properties can be found in the HTML DOM Events (https://www.w3schools.com/jsref/dom_obj_event.asp) reference by W3Schools.
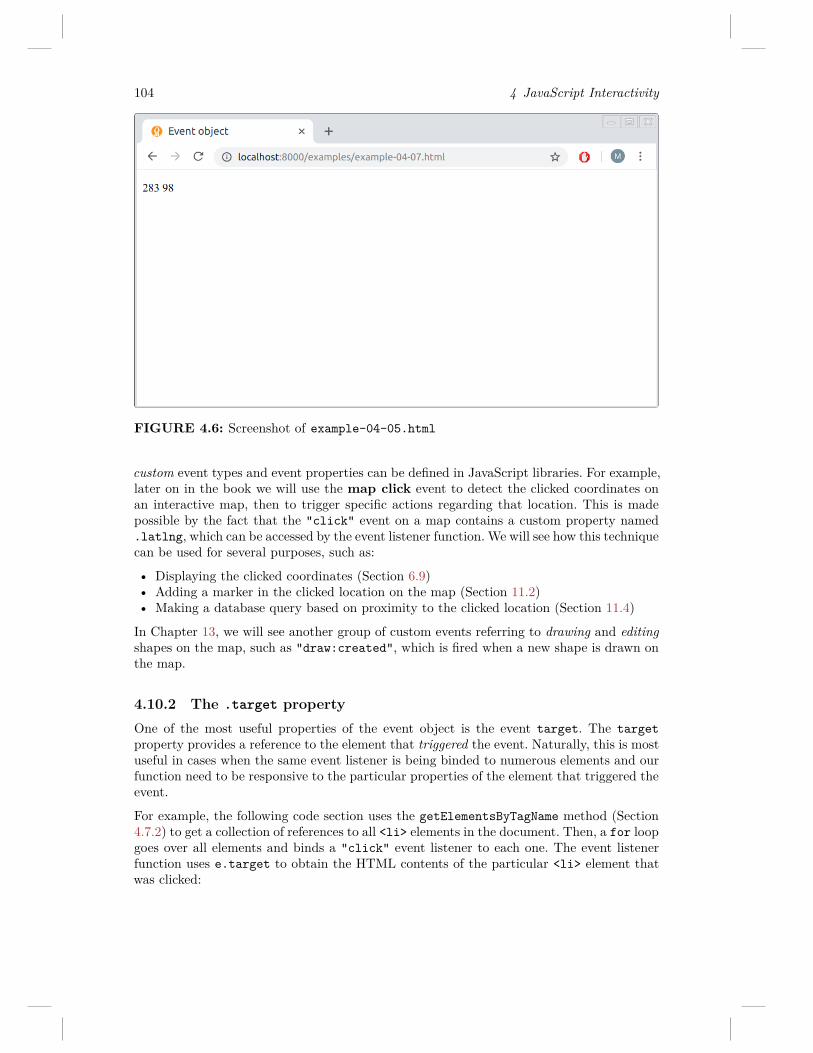
104 4 JavaScript Interactivity
FIGURE 4.6: Screenshot of example-04-05.html
custom event types and event properties can be defined in JavaScript libraries. For example,later on in the book we will use the map click event to detect the clicked coordinates onan interactive map, then to trigger specific actions regarding that location. This is madepossible by the fact that the "click" event on a map contains a custom property named.latlng, which can be accessed by the event listener function. We will see how this techniquecan be used for several purposes, such as:
• Displaying the clicked coordinates (Section 6.9)• Adding a marker in the clicked location on the map (Section 11.2)• Making a database query based on proximity to the clicked location (Section 11.4)
In Chapter 13, we will see another group of custom events referring to drawing and editingshapes on the map, such as "draw:created", which is fired when a new shape is drawn onthe map.
4.10.2 The .target propertyOne of the most useful properties of the event object is the event target. The targetproperty provides a reference to the element that triggered the event. Naturally, this is mostuseful in cases when the same event listener is being binded to numerous elements and ourfunction need to be responsive to the particular properties of the element that triggered theevent.
For example, the following code section uses the getElementsByTagName method (Section4.7.2) to get a collection of references to all <li> elements in the document. Then, a for loopgoes over all elements and binds a "click" event listener to each one. The event listenerfunction uses e.target to obtain the HTML contents of the particular <li> element thatwas clicked:
4.11 Modifying page based on data 105
let nodes = document.getElementsByTagName("li");for(let i = 0; i < nodes.length; i++) {nodes[i].addEventListener("click", function(e) {console.log(e.target.innerHTML);
});}
We are going to use a similar technique later on, for example to influence the style or displaythe properties of a particular polygon that is being hovered with the mouse in a web map(Figure 8.9).
4.11 Modifying page based on dataOne of the most important use cases of JavaScript is dynamically generating page contentsbased on data. The data we wish to display on the page can come from various sources,such as an object in the JavaScript environment, a file, or a database. JavaScript code canbe used to process the data into HTML elements, which can then be added to the DOM(Section 4.7) and consequently displayed in the browser. Modifying page contents basedon data is also a use case where iteration (Sections 3.10.3.2–3.10.3.3) turns out to be veryuseful.
Our next example is a simple and small web page, containing just two paragraphs and oneunordered list (Figure 4.7). We already know how to write the necessary HTML code forsuch a web page (Chapter 1). The novel part in example-04-06.html is that we are goingto generate some of the HTML code based on data and using JavaScript, rather than havethe entire HTML contents predefined.
Let’s assume we need to dynamically create a list of items on our page, and we have anarray with the contents that should go into each list item. We will use the .forEach arraymethod (Section 3.10.3.3) for iterating over the array and preparing the HTML contentsthat goes into the <ul> element on the page. For example, suppose we have the followingarray named data, including the Latin names of eight Oncocyclus Iris species12 found inIsrael:
let data = ["Iris atrofusca","Iris atropurpurea","Iris bismarckiana","Iris haynei","Iris hermona","Iris lortetii","Iris mariae","Iris petrana"
];
In the HTML code, we may initially have an empty <ul> placeholder:
12https://en.wikipedia.org/wiki/Iris_subg._Iris#Oncocyclus
106 4 JavaScript Interactivity
<ul id="species"></ul>
which we would like to fill with the <li> HTML elements (Section 1.6.8.1) based on theabove array of species names13, as follows:
<ul id="species"><li><i>Iris atrofusca</i></li><li><i>Iris atropurpurea</i></li><li><i>Iris bismarckiana</i></li><li><i>Iris haynei</i></li><li><i>Iris hermona</i></li><li><i>Iris lortetii</i></li><li><i>Iris mariae</i></li><li><i>Iris petrana</i></li>
</ul>
Why not embed the above HTML code directly into the HTML document, instead of con-structing it with JavaScript? Two reasons why the former may not always be a good idea:
• The contents can be much longer, e.g., tens or hundreds of elements, which means itis less convenient to type the HTML by hand. We could use tools such as Pandoc14
to programmatically convert text plus markup to HTML, thus reducing the need tomanually type all of the HTML tags, but then it is probably more flexible to do thesame with JavaScript anyway.
• We may want to build page content based on real-time data, loaded each time the useraccesses the website, and/or make it responsive to user input. For example, a list ofheadlines in a news website can be based on a real-time news stories database and/orcustomized according to user preferences.
To build the above HTML code programmatically, based on the data array, we can useiteration, such as a for loop (Section 3.10.3.1–3.10.3.2) or the .forEach array method(Section 3.10.3.3). In the following example, we will use .forEach.
First, recall that .forEach accepts a function that can do something with the currentelement the array, subsequently applied on all elements. For example, here is how we cansequentially print all array elements in the console:
data.forEach(function(element) {console.log(element);
});
As a result, the following output is printed in the console:
Iris atrofuscaIris atropurpureaIris bismarckianaIris haynei
13Note that we are also using the <i> element (Section 1.6.6.3) to display species in italics.14https://pandoc.org/
4.11 Modifying page based on data 107
Iris hermonaIris lortetiiIris mariaeIris petrana
Now that we know how to iterate over our array data, we just need to modify the functionthat is being applied. Instead of just printing the array contents in the console, we want thefunction to create eight new <li> elements in the DOM. Additionally, we need to create theempty <ul> placeholder element in our document (using HTML) that the <li> elementswill be appended to, as shown above.
To create an empty <ul> element, we can add the following HTML code inside the <body>:
<ul id="species"></ul>
Note that we are using an ID to identify the particular <ul> element, in this caseid="species". This is very important since we need to identify the particular elementwhich our JavaScript code will operate on!
Next, to add the a new <li> element inside the <ul> element, we can:
• Start with an empty string• Append new HTML code with an <li> element per each element in data, using the
.forEach iteration, to the string• Assign the string, now containing eigth <li> elements, to the .innerHTML property of
the <ul> element
Here is how we accomplish those steps. The first part, creating the empty string namedhtml is as follows:
let html = "";
Second, the .forEach iteration “pastes” the element contents (species name) with the startand end HTML tags, appending it to the html string:
data.forEach(function(element) {html += "<li><i>" + element + "</i></li>";
});
Finally, the complete string is assigned to the .innerHTML property of the <ul> element:
document.getElementById("species").innerHTML = html;
The complete code for dynamic construction of the list looks like this:
let html = "";data.forEach(function(element) {
html += "<li><i>" + element + "</i></li>";
108 4 JavaScript Interactivity
});document.getElementById("species").innerHTML = html;
And here is the complete code of the small web page example-04-06.html, implementingthe dynamic creation of an unordered list using JavaScript:
<!DOCTYPE html><html>
<head><title>Populating list</title>
</head><body>
<p>List of rare <i>Iris</i> species in Israel:</p><ul id="species"></ul><p>It was created dynamically using JavaScript.</p><script>
let data = ["Iris atrofusca","Iris atropurpurea","Iris bismarckiana","Iris haynei","Iris hermona","Iris lortetii","Iris mariae","Iris petrana"
];let html = "";data.forEach(function(element) {
html += "<li><i>" + element + "</i></li>";});document.getElementById("species").innerHTML = html;
</script></body>
</html>
The result is shown in Figure 4.7.
Again, in this small example the advantage of generating the list with JavaScript, ratherthan writing the HTML code by hand, may not be evident. However, this technique is verypowerful in more realistic settings, such as when our data is much larger and/or needs tobe constantly updated. For example, later on we will use this technique to dynamicallygenerate a dropdown list with dozens of plant species names, according to real-time datacoming from a database (Section 10.4.4).
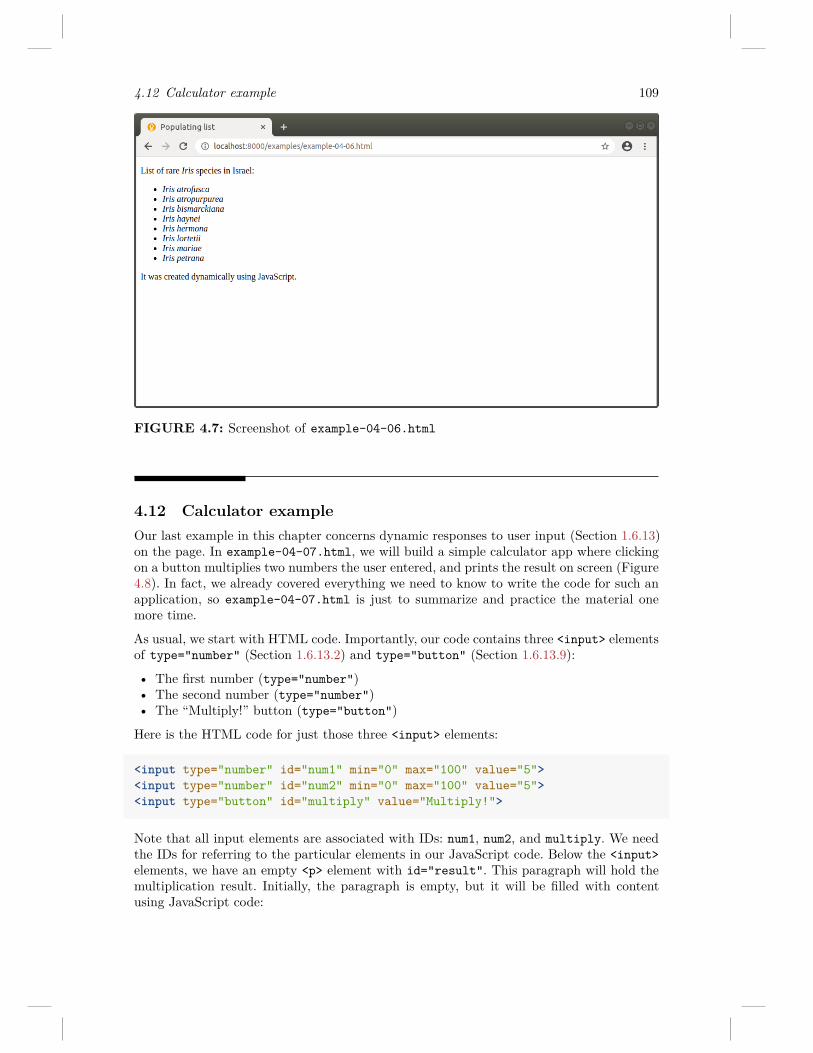
4.12 Calculator example 109
FIGURE 4.7: Screenshot of example-04-06.html
4.12 Calculator exampleOur last example in this chapter concerns dynamic responses to user input (Section 1.6.13)on the page. In example-04-07.html, we will build a simple calculator app where clickingon a button multiplies two numbers the user entered, and prints the result on screen (Figure4.8). In fact, we already covered everything we need to know to write the code for such anapplication, so example-04-07.html is just to summarize and practice the material onemore time.
As usual, we start with HTML code. Importantly, our code contains three <input> elementsof type="number" (Section 1.6.13.2) and type="button" (Section 1.6.13.9):
• The first number (type="number")• The second number (type="number")• The “Multiply!” button (type="button")
Here is the HTML code for just those three <input> elements:
<input type="number" id="num1" min="0" max="100" value="5"><input type="number" id="num2" min="0" max="100" value="5"><input type="button" id="multiply" value="Multiply!">
Note that all input elements are associated with IDs: num1, num2, and multiply. We needthe IDs for referring to the particular elements in our JavaScript code. Below the <input>elements, we have an empty <p> element with id="result". This paragraph will hold themultiplication result. Initially, the paragraph is empty, but it will be filled with contentusing JavaScript code:
110 4 JavaScript Interactivity
<p id="result"></p>
The only scenario where the contents of the page change is when the user clicks on the “Mul-tiply!” button. Therefore, our <script> is mainly composed of an event listener, respondingto "click" events on the id="multiply" button:
document.getElementById("multiply").addEventListener("click", function() {...});
The function being passed to the event listener modifies the text contents of the <p> element(result). The inserted text is the multiplication result of the .value properties of bothinput numbers (num1 and num2). For convenience, we may want to keep the three elementreferences ("num1", "num2", and "result") in predefined variables num1, num2, and result:
let num1 = document.getElementById("num1");let num2 = document.getElementById("num2");let result = document.getElementById("result");document.getElementById("multiply").addEventListener("click", function() {
result.innerHTML = "The result is: " + num1.value * num2.value;});
It is important to note that all input values are returned as text strings, even when we aretalking about numeric <input> elements. You can see this by opening example-04-07.htmland typing document.getElementById("num1").value in the console. However, when us-ing the multiplication operator * strings are automatically converted to numbers, which iswhy multiplication still works15. Here is the complete code of our arithmetic web application,given in example-04-07.html:
<!DOCTYPE html><html>
<head><title>Working with user input</title>
</head><body>
<p>First number<input type="number" id="num1" min="0" max="100" value="5">
</p><p>Second number
<input type="number" id="num2" min="0" max="100" value="5"></p><input type="button" id="multiply" value="Multiply!"><p id="result"></p><script>
let num1 = document.getElementById("num1");let num2 = document.getElementById("num2");let result = document.getElementById("result");document.getElementById("multiply").addEventListener("click", function() {
15Try typing "5" * "5" in the console to see this behavior in action.
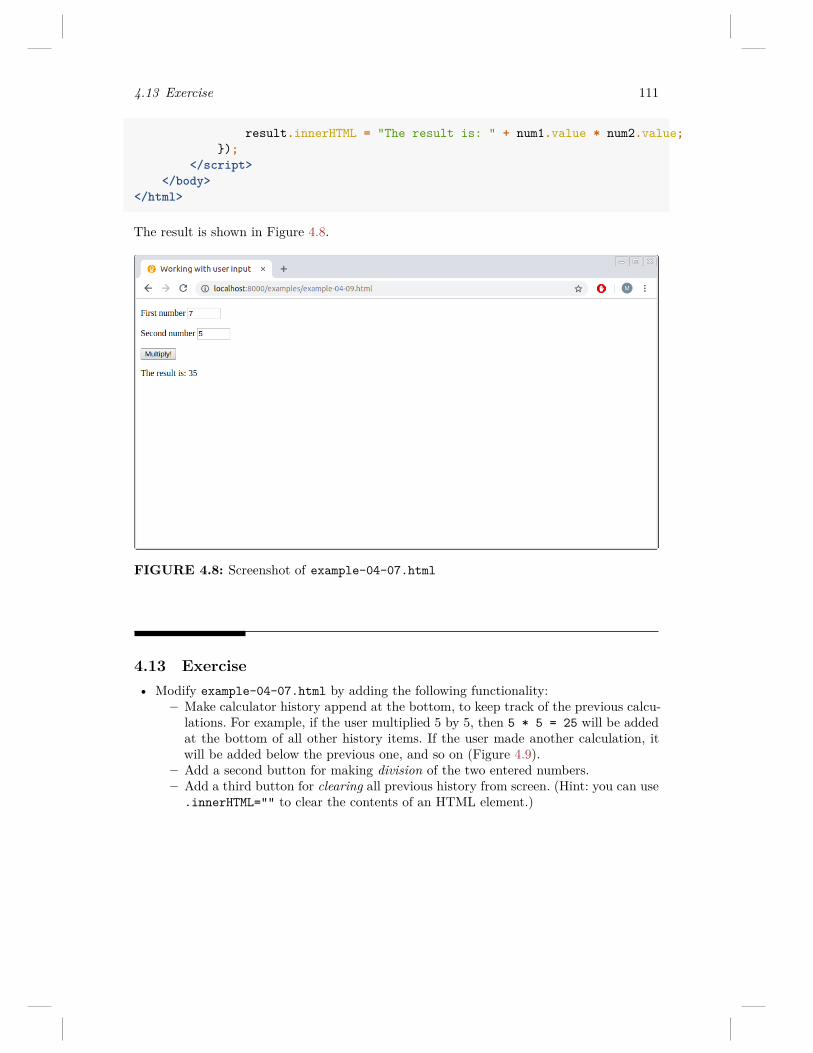
4.13 Exercise 111
result.innerHTML = "The result is: " + num1.value * num2.value;});
</script></body>
</html>
The result is shown in Figure 4.8.
FIGURE 4.8: Screenshot of example-04-07.html
4.13 Exercise• Modify example-04-07.html by adding the following functionality:
– Make calculator history append at the bottom, to keep track of the previous calcu-lations. For example, if the user multiplied 5 by 5, then 5 * 5 = 25 will be addedat the bottom of all other history items. If the user made another calculation, itwill be added below the previous one, and so on (Figure 4.9).
– Add a second button for making division of the two entered numbers.– Add a third button for clearing all previous history from screen. (Hint: you can use
.innerHTML="" to clear the contents of an HTML element.)
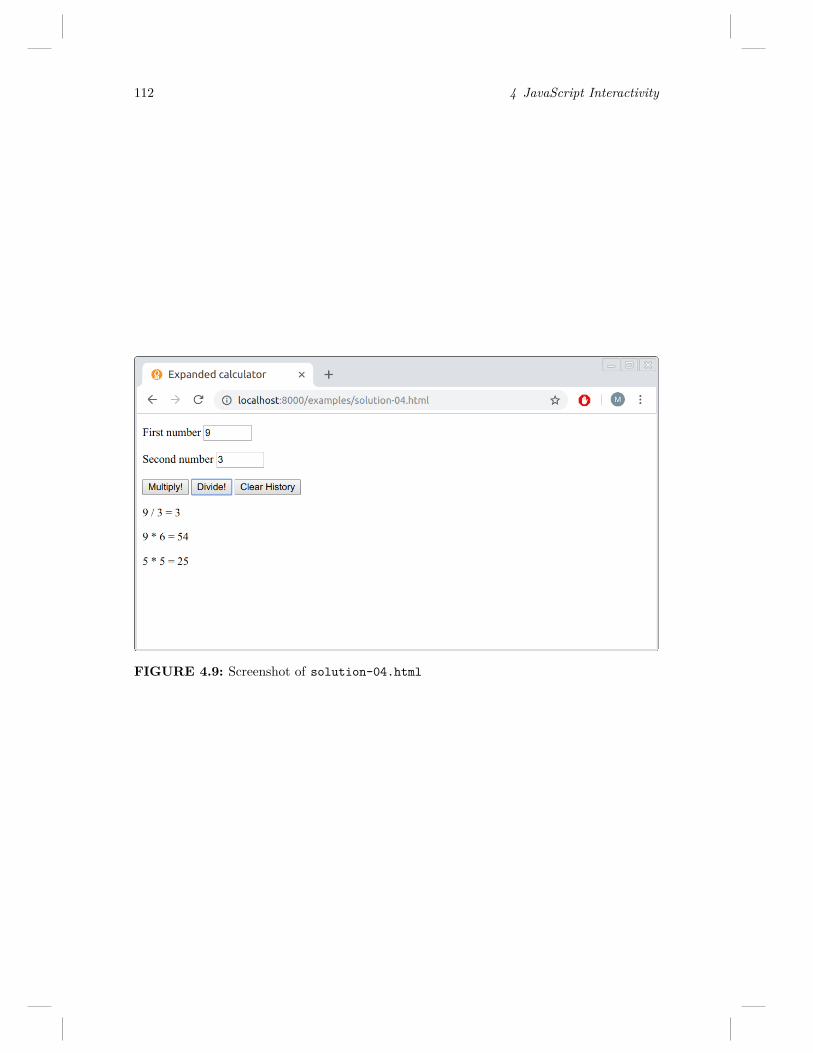
112 4 JavaScript Interactivity
FIGURE 4.9: Screenshot of solution-04.html
5Web Servers
5.1 IntroductionSo far we have primarily dealt with the code—HTML (Chapter 1), CSS (Chapter 2), andJavaScript (Chapter 3–4)—required for building a website. We have not yet considered,however, the infrastructure required for hosting a website on a server, and the nature ofcommunication between that server and the client, the web browser.
As mentioned in Chapter 1, at the most basic level a web page is an HTML document whichis located at a node on the internet. This node is called a server1, as it serves the file tothe world wide web, allowing your computer, the client2, to access it. When you open aweb browser, such as Chrome, and enter a URL, such as https://www.google.com/, intothe address bar, the web browser navigates to the node you have specified and requests thisdocument, which it reads, interprets, and displays on our screen. The browser also appliesCSS styling rules (Chapter 2) and runs JavaScript code (Chapter 4), in case those are linkedto the document.
This means that to host a website you need to take care of two things:
• You need to have the right kinds of documents and code files.• You need to have a location on the internet (hardware) where you can place these
documents and code files, as well as an appropriate environment (software) to servethem.
We already discussed what kind of documents and code files we can use to build a website.Specifically, we learned about:
• HTML, in Chapter 1• CSS, in Chapter 2• JavaScript, in Chapters 3–4
We have also seen how our customized HTML documents, along with any associated files,such as CSS and JavaScript, can be created using a plain text editor, such as Notepad++,then opened and viewed in the browser. The natural question that arises is what do weneed to do to make the next step and turn our page into a “real” website, one that can beaccessed and viewed by other people rather than just us.
In this chapter we focus on exactly that, the second part of the picture: having a locationwhere our documents are placed, and software to publish or serve them over the network,so that they are accessible to other people.
1https://en.wikipedia.org/wiki/Web_server2https://en.wikipedia.org/wiki/Client_(computing)
113
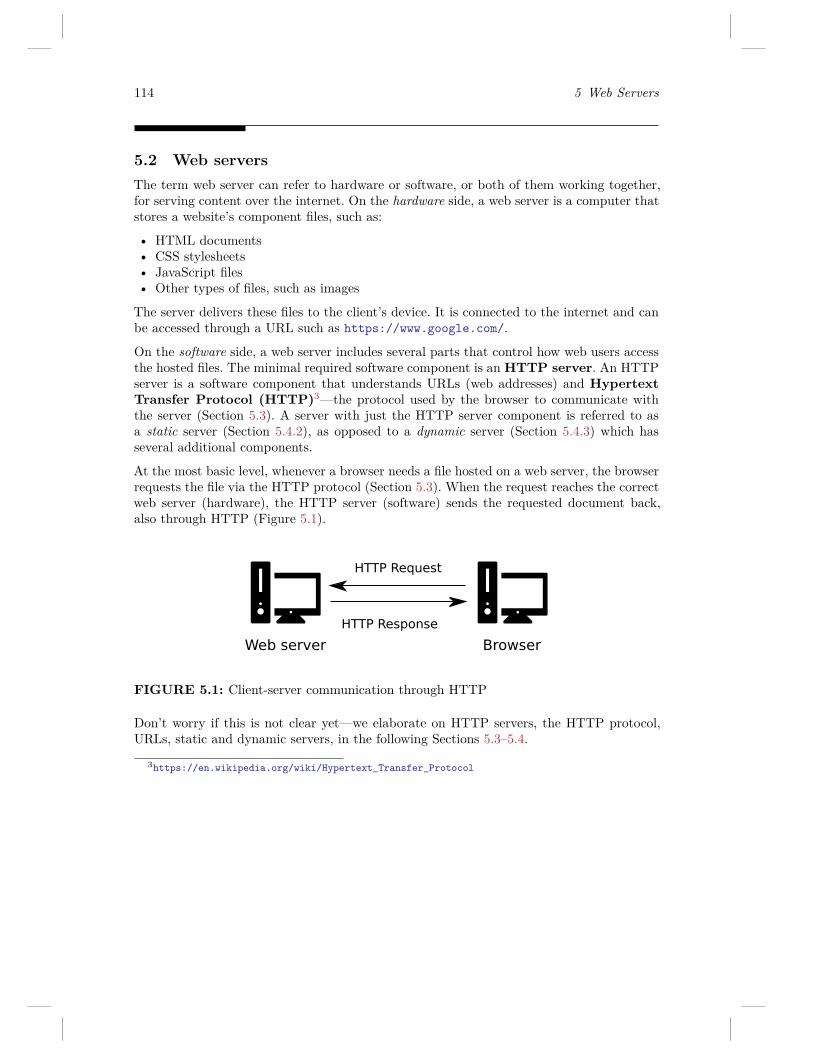
114 5 Web Servers
5.2 Web serversThe term web server can refer to hardware or software, or both of them working together,for serving content over the internet. On the hardware side, a web server is a computer thatstores a website’s component files, such as:
• HTML documents• CSS stylesheets• JavaScript files• Other types of files, such as images
The server delivers these files to the client’s device. It is connected to the internet and canbe accessed through a URL such as https://www.google.com/.
On the software side, a web server includes several parts that control how web users accessthe hosted files. The minimal required software component is an HTTP server. An HTTPserver is a software component that understands URLs (web addresses) and HypertextTransfer Protocol (HTTP)3—the protocol used by the browser to communicate withthe server (Section 5.3). A server with just the HTTP server component is referred to asa static server (Section 5.4.2), as opposed to a dynamic server (Section 5.4.3) which hasseveral additional components.
At the most basic level, whenever a browser needs a file hosted on a web server, the browserrequests the file via the HTTP protocol (Section 5.3). When the request reaches the correctweb server (hardware), the HTTP server (software) sends the requested document back,also through HTTP (Figure 5.1).
BrowserWeb server
HTTP Request
HTTP Response
FIGURE 5.1: Client-server communication through HTTP
Don’t worry if this is not clear yet—we elaborate on HTTP servers, the HTTP protocol,URLs, static and dynamic servers, in the following Sections 5.3–5.4.
3https://en.wikipedia.org/wiki/Hypertext_Transfer_Protocol
5.3 Communicating through HTTP 115
5.3 Communicating through HTTP5.3.1 Web protocols and HTTPHTTP is a protocol specifying the way that communication between the client and theserver takes place. As its name—Hypertext Transfer Protocol—implies, HTTP is mainlyused to transfer hypertext (i.e., HTML documents) between two computers.
HTTP is not the only protocol in use for communication on the web. For example, FTP4
and WebSocket5 are examples of other web communication protocols. However, HTTP isthe most basic and most commonly used protocol. Almost everything we do online, includingeverything we do in this book, is accomplished through HTTP communication. The securedversion of HTTP, known as HTTPS6, is becoming a very common alternative to HTTP andthus should be mentioned. However, HTTPS just adds a layer of security through encryptedcommunication and is not fundamentally different from HTTP.
In the context of the web, a protocol is a set of rules for communication between twocomputers. HTTP, specifically, is a textual and stateless protocol:
• Textual means that all commands are plain-text, therefore human-readable.• Stateless means that neither the server nor the client remember previous communica-
tions. For example, an HTTP server, relying on HTTP alone, cannot remember if youare “logged-in” with a password, or in what step you are in a purchase transaction.
Furthermore, only clients can make HTTP requests, and then only to servers. Servers canonly respond to a client’s HTTP request. When requesting a file via HTTP, clients mustprovide the file’s URL. The web server must answer every HTTP request, at least with anerror message. For example, in case the requested file is not found the server may returnthe “404 Not Found”7 error message. The 404 error is so common that many servers areconfigured to send a customized 404 error page.
• Try navigating to https://google.com/abcde.html, or any other non-existing docu-ment on https://google.com/.
• What you see is Google’s customized 404 error page.
5.3.2 HTTP methods5.3.2.1 Overview
The HTTP protocol defines several methods, or verbs, to indicate the desired action onthe requested resource on the server. The two most commonly used HTTP methods, for arequest-response between client and server, are GET and POST:
4https://en.wikipedia.org/wiki/File_Transfer_Protocol5https://en.wikipedia.org/wiki/WebSocket6https://en.wikipedia.org/wiki/HTTPS7https://en.wikipedia.org/wiki/HTTP_404
116 5 Web Servers
• GET—Used to request data from the server (Section 5.3.2.2)• POST—Used to submit data to be processed on the server (Section 5.3.2.3)
There are a few other methods8, such as PUT and DELETE, which are used much more rarelyand we will not go into.
5.3.2.2 The GET method
The GET method is used to request data. It is by far the most commonly used method inour usual interaction with the web. For example, typing a URL in the address bar of thebrowser in fact instructs the browser to send a GET request to the respective server. A staticserver (Section 5.4.2) is sufficient for processing GET requests in case the requested file isphysically present on the server. The response is usually an HTML document, which isthen displayed in the browser, but it can also be other types of content, such as GeoJSON(Section 3.11.2).
In addition to manual typing in the browser address bar, GET requests can also be sentprogrammatically, by running code. In this book, we will frequently send GET requests usingJavaScript code. For example, in the following chapters we will learn about a method forloading GeoJSON content from local files (Section 7.8.1), or from remote locations on theweb (Sections 7.8.2 and 9.7), using GET requests.
5.3.2.3 The POST method
The POST method is used when the client sends data to be processed on the server. It ismore rarely used compared to GET, and somewhat more complicated. For example, there isno way to send a POST request by simply typing a URL in the browser address tab, unlikewith GET. Instead, making a POST request to a web server can only be made through code,such as JavaScript code. Also, a dynamic server (Section 5.4.3) is required to process POSTrequests, where server-side scripts determine what to do with the received data. Plainlyspeaking, POST requests are preferred over GET requests when we need to send substantialamounts of data to the server.
In this book, we will encounter just one example of using POST requests, in Chapter 13. Inthat chapter, we will build a crowdsourcing web application where the user draws layers ona web map. These layers are subsequently sent for permanent storage in a database. Sendingthe drawn layer to the server (Section 13.6) will be accomplished using POST requests.
5.4 Static vs. dynamic servers5.4.1 OverviewWeb servers can be divided in two general categories:
• Static web servers• Dynamic web servers
What we discussed so far, and what we use in this book9, refers to static servers. Dynamic
8https://en.wikipedia.org/wiki/Hypertext_Transfer_Protocol#Request_methods9We will use a dynamic server established in advance by a company called CARTO in Section 9.2.
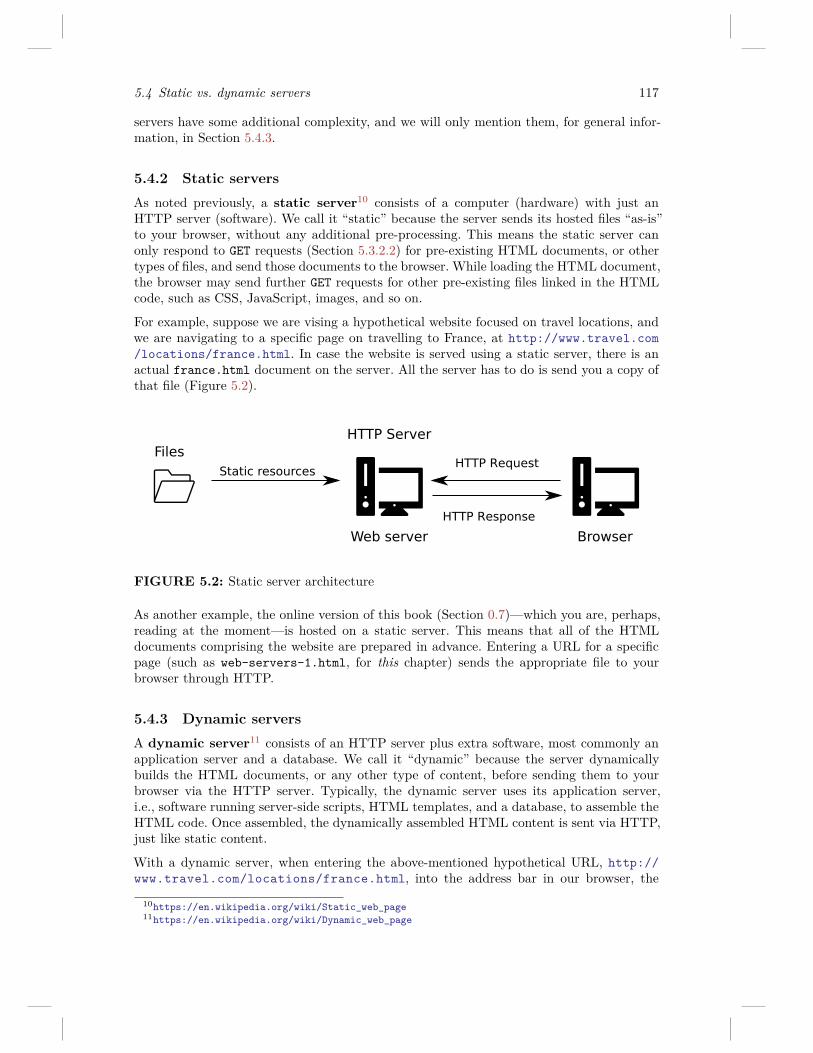
5.4 Static vs. dynamic servers 117
servers have some additional complexity, and we will only mention them, for general infor-mation, in Section 5.4.3.
5.4.2 Static serversAs noted previously, a static server10 consists of a computer (hardware) with just anHTTP server (software). We call it “static” because the server sends its hosted files “as-is”to your browser, without any additional pre-processing. This means the static server canonly respond to GET requests (Section 5.3.2.2) for pre-existing HTML documents, or othertypes of files, and send those documents to the browser. While loading the HTML document,the browser may send further GET requests for other pre-existing files linked in the HTMLcode, such as CSS, JavaScript, images, and so on.
For example, suppose we are vising a hypothetical website focused on travel locations, andwe are navigating to a specific page on travelling to France, at http://www.travel.com/locations/france.html. In case the website is served using a static server, there is anactual france.html document on the server. All the server has to do is send you a copy ofthat file (Figure 5.2).
BrowserWeb server
HTTP Request
HTTP Response
HTTP ServerFiles
Static resources
FIGURE 5.2: Static server architecture
As another example, the online version of this book (Section 0.7)—which you are, perhaps,reading at the moment—is hosted on a static server. This means that all of the HTMLdocuments comprising the website are prepared in advance. Entering a URL for a specificpage (such as web-servers-1.html, for this chapter) sends the appropriate file to yourbrowser through HTTP.
5.4.3 Dynamic serversA dynamic server11 consists of an HTTP server plus extra software, most commonly anapplication server and a database. We call it “dynamic” because the server dynamicallybuilds the HTML documents, or any other type of content, before sending them to yourbrowser via the HTTP server. Typically, the dynamic server uses its application server,i.e., software running server-side scripts, HTML templates, and a database, to assemble theHTML code. Once assembled, the dynamically assembled HTML content is sent via HTTP,just like static content.
With a dynamic server, when entering the above-mentioned hypothetical URL, http://www.travel.com/locations/france.html, into the address bar in our browser, the
10https://en.wikipedia.org/wiki/Static_web_page11https://en.wikipedia.org/wiki/Dynamic_web_page
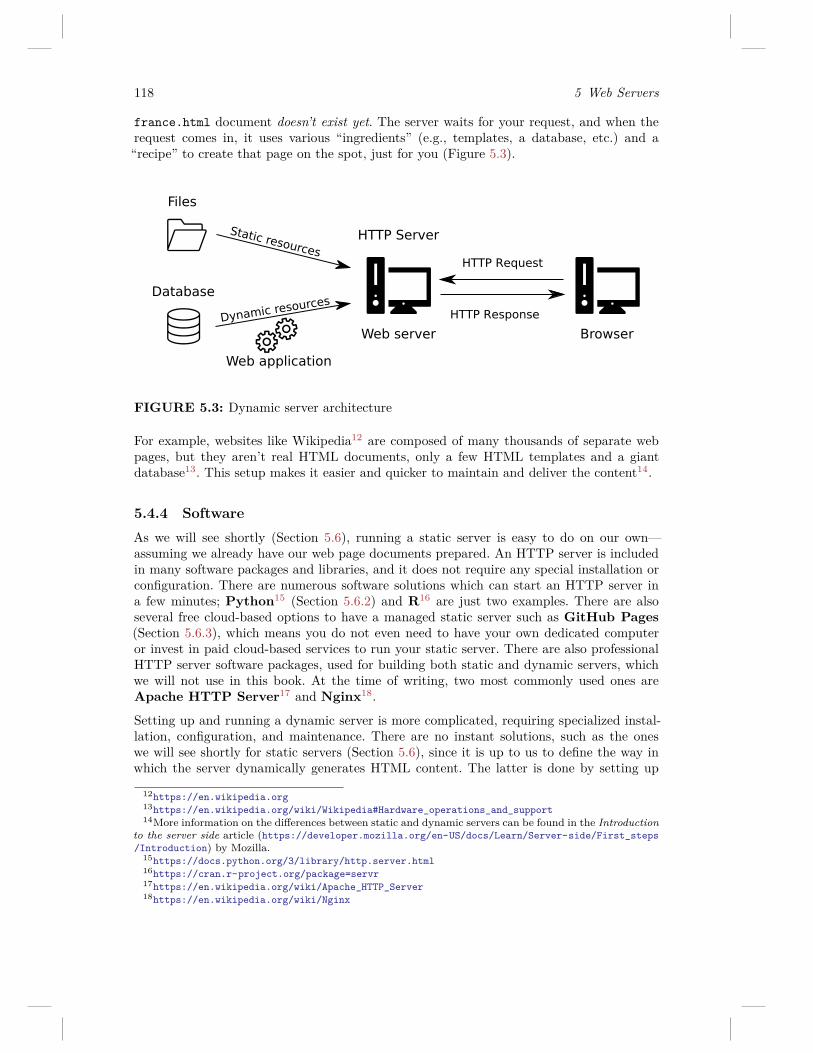
118 5 Web Servers
france.html document doesn’t exist yet. The server waits for your request, and when therequest comes in, it uses various “ingredients” (e.g., templates, a database, etc.) and a“recipe” to create that page on the spot, just for you (Figure 5.3).
BrowserWeb server
HTTP Request
HTTP Response
HTTP Server
Files
Static resources
Database
Dynamic resources
Web application
FIGURE 5.3: Dynamic server architecture
For example, websites like Wikipedia12 are composed of many thousands of separate webpages, but they aren’t real HTML documents, only a few HTML templates and a giantdatabase13. This setup makes it easier and quicker to maintain and deliver the content14.
5.4.4 SoftwareAs we will see shortly (Section 5.6), running a static server is easy to do on our own—assuming we already have our web page documents prepared. An HTTP server is includedin many software packages and libraries, and it does not require any special installation orconfiguration. There are numerous software solutions which can start an HTTP server ina few minutes; Python15 (Section 5.6.2) and R16 are just two examples. There are alsoseveral free cloud-based options to have a managed static server such as GitHub Pages(Section 5.6.3), which means you do not even need to have your own dedicated computeror invest in paid cloud-based services to run your static server. There are also professionalHTTP server software packages, used for building both static and dynamic servers, whichwe will not use in this book. At the time of writing, two most commonly used ones areApache HTTP Server17 and Nginx18.
Setting up and running a dynamic server is more complicated, requiring specialized instal-lation, configuration, and maintenance. There are no instant solutions, such as the oneswe will see shortly for static servers (Section 5.6), since it is up to us to define the way inwhich the server dynamically generates HTML content. The latter is done by setting up
12https://en.wikipedia.org13https://en.wikipedia.org/wiki/Wikipedia#Hardware_operations_and_support14More information on the differences between static and dynamic servers can be found in the Introduction
to the server side article (https://developer.mozilla.org/en-US/docs/Learn/Server-side/First_steps/Introduction) by Mozilla.
15https://docs.python.org/3/library/http.server.html16https://cran.r-project.org/package=servr17https://en.wikipedia.org/wiki/Apache_HTTP_Server18https://en.wikipedia.org/wiki/Nginx
5.4 Static vs. dynamic servers 119
an application server and writing custom server-side scripts19. With a dynamic server,in addition to the HTTP server software, you need to write server-side scripts which runon the server, as opposed to client-side JavaScript scripts that run on the client (Chapter4). Server-side scripts are responsible for tasks such as generating customized HTML con-tent, authentication, managing user sessions, etc. There are several programming languages(and frameworks) that are commonly used for writing server-side scripts, such as PHP20,Python (Django)21, Ruby (on Rails)22, and JavaScript (Node.js)23.
5.4.5 Practical considerationsThere are advantages and disadvantages to both the static and the dynamic server ap-proaches. Static sites (i.e., sites served with a static server) are simple, fast, and cheap, butthey are harder to maintain (if they are complex) and impersonal. Dynamic sites providemore flexibility and are easier to modify, but also slower, more expensive, and technicallymore difficult to build and handle.
In this book, we will only build static sites hosted using a static web server. A static servercannot use a database or template to send personalized HTML content, just pre-compiledHTML documents. Nevertheless, as we will see throughout the book, a static server isnot limited to showing fixed, non-interactive content. For example, the HTML content ofthe web page can be modified in response to user actions through client-side scripts (inJavaScript), without needing a server, using the methods we learned in Chapter 4. Later on,we will also see that static pages can dynamically “grab” information from other locationson the web, again using client-side JavaScript, including from existing dynamic servers anddatabases (Section 9.7). That way, we can integrate dynamic content even though we donot operate our own dynamic server. Still, there are things that can only be accomplishedwith a dynamic server.
The most notable example where a dynamic server is an obvious (and only) solution isauthentication. For example, suppose we want to create a password-protected website.In our website, we can add a form with an input element (Section 1.6.13) where the userenters a password, and only if the password is valid—the content will be shown. This requiresauthentication—some way to evaluate the validity of the entered password. Now, supposewe have a database of valid passwords for the various authorized website users. Where canwe place that database, and how can our page access it? If we place it directly on the client,e.g., as an array (Section 3.6.3.1) in our JavaScript code, the contents will be exposed toanyone looking at the source code of our page. Remember that whenever a JavaScript scriptis linked to our HTML document, the user can access and view the code. Even if we placethe password database on a different location, such as a separate static server, we still needto hard-code the instructions for accessing that other location in our JavaScript code, sothat the web page can access it. Again, anyone who reads those instructions can access thedatabase the same way the browser does. The solution is to send the user-entered passwordfor validation using a server-side script. If the password is valid, the server can return an“OK” message and/or any content that the specific user is allowed to see. That way, thepassword database is not accessible, since the server is not allowed to send it—only to acceptan entered password and compare it to those in the database.
19https://en.wikipedia.org/wiki/Server-side_scripting20https://en.wikipedia.org/wiki/PHP21https://en.wikipedia.org/wiki/Django_(web_framework)22https://en.wikipedia.org/wiki/Ruby_on_Rails23https://en.wikipedia.org/wiki/Node.js
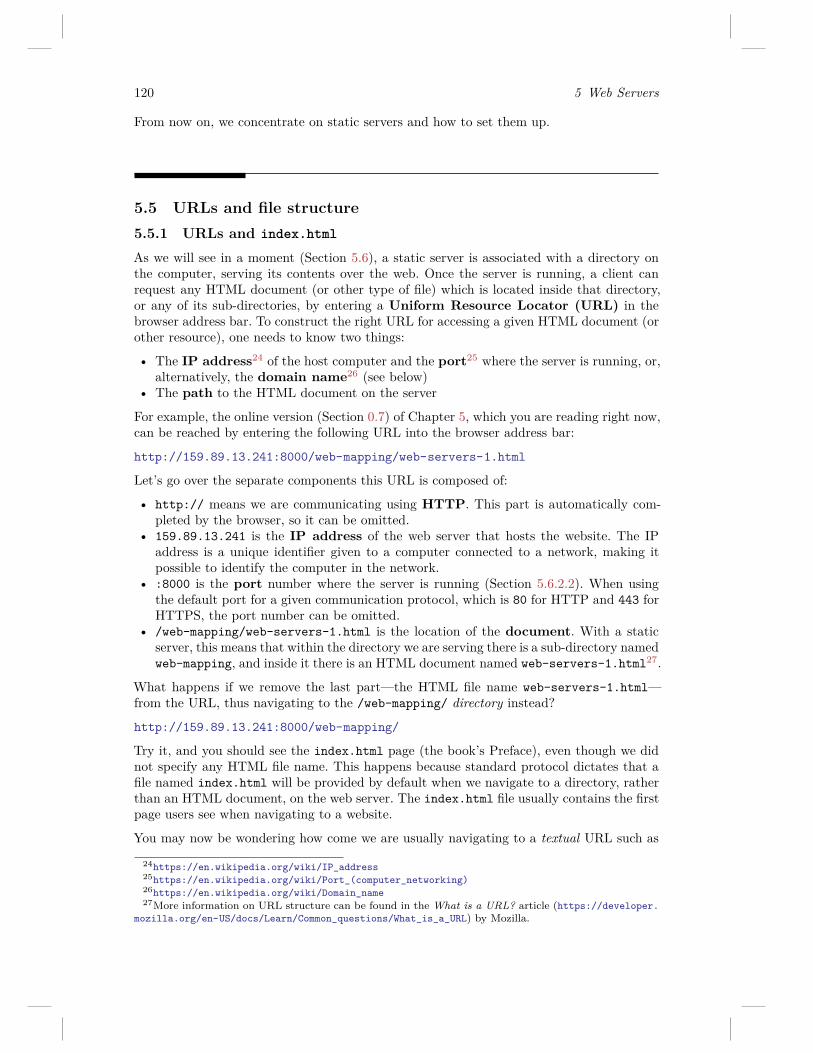
120 5 Web Servers
From now on, we concentrate on static servers and how to set them up.
5.5 URLs and file structure5.5.1 URLs and index.htmlAs we will see in a moment (Section 5.6), a static server is associated with a directory onthe computer, serving its contents over the web. Once the server is running, a client canrequest any HTML document (or other type of file) which is located inside that directory,or any of its sub-directories, by entering a Uniform Resource Locator (URL) in thebrowser address bar. To construct the right URL for accessing a given HTML document (orother resource), one needs to know two things:
• The IP address24 of the host computer and the port25 where the server is running, or,alternatively, the domain name26 (see below)
• The path to the HTML document on the server
For example, the online version (Section 0.7) of Chapter 5, which you are reading right now,can be reached by entering the following URL into the browser address bar:
http://159.89.13.241:8000/web-mapping/web-servers-1.html
Let’s go over the separate components this URL is composed of:
• http:// means we are communicating using HTTP. This part is automatically com-pleted by the browser, so it can be omitted.
• 159.89.13.241 is the IP address of the web server that hosts the website. The IPaddress is a unique identifier given to a computer connected to a network, making itpossible to identify the computer in the network.
• :8000 is the port number where the server is running (Section 5.6.2.2). When usingthe default port for a given communication protocol, which is 80 for HTTP and 443 forHTTPS, the port number can be omitted.
• /web-mapping/web-servers-1.html is the location of the document. With a staticserver, this means that within the directory we are serving there is a sub-directory namedweb-mapping, and inside it there is an HTML document named web-servers-1.html27.
What happens if we remove the last part—the HTML file name web-servers-1.html—from the URL, thus navigating to the /web-mapping/ directory instead?
http://159.89.13.241:8000/web-mapping/
Try it, and you should see the index.html page (the book’s Preface), even though we didnot specify any HTML file name. This happens because standard protocol dictates that afile named index.html will be provided by default when we navigate to a directory, ratherthan an HTML document, on the web server. The index.html file usually contains the firstpage users see when navigating to a website.
You may now be wondering how come we are usually navigating to a textual URL such as
24https://en.wikipedia.org/wiki/IP_address25https://en.wikipedia.org/wiki/Port_(computer_networking)26https://en.wikipedia.org/wiki/Domain_name27More information on URL structure can be found in the What is a URL? article (https://developer.
mozilla.org/en-US/docs/Learn/Common_questions/What_is_a_URL) by Mozilla.
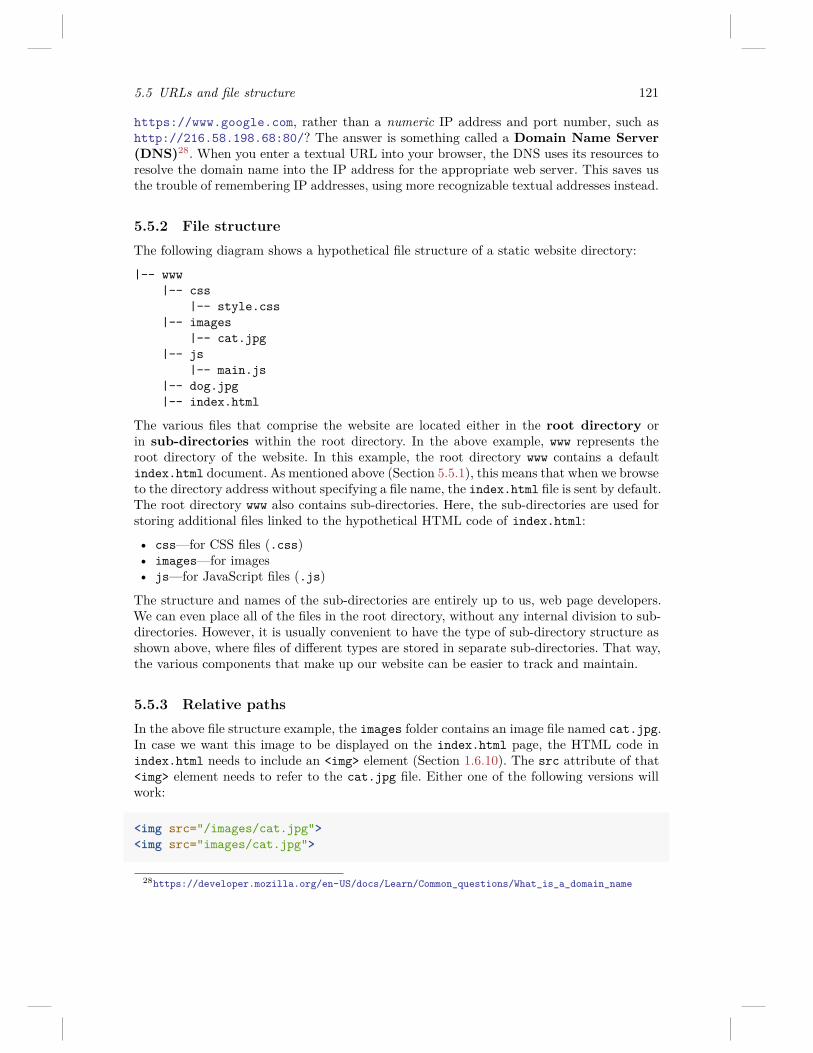
5.5 URLs and file structure 121
https://www.google.com, rather than a numeric IP address and port number, such ashttp://216.58.198.68:80/? The answer is something called a Domain Name Server(DNS)28. When you enter a textual URL into your browser, the DNS uses its resources toresolve the domain name into the IP address for the appropriate web server. This saves usthe trouble of remembering IP addresses, using more recognizable textual addresses instead.
5.5.2 File structureThe following diagram shows a hypothetical file structure of a static website directory:
|-- www|-- css
|-- style.css|-- images
|-- cat.jpg|-- js
|-- main.js|-- dog.jpg|-- index.html
The various files that comprise the website are located either in the root directory orin sub-directories within the root directory. In the above example, www represents theroot directory of the website. In this example, the root directory www contains a defaultindex.html document. As mentioned above (Section 5.5.1), this means that when we browseto the directory address without specifying a file name, the index.html file is sent by default.The root directory www also contains sub-directories. Here, the sub-directories are used forstoring additional files linked to the hypothetical HTML code of index.html:
• css—for CSS files (.css)• images—for images• js—for JavaScript files (.js)
The structure and names of the sub-directories are entirely up to us, web page developers.We can even place all of the files in the root directory, without any internal division to sub-directories. However, it is usually convenient to have the type of sub-directory structure asshown above, where files of different types are stored in separate sub-directories. That way,the various components that make up our website can be easier to track and maintain.
5.5.3 Relative pathsIn the above file structure example, the images folder contains an image file named cat.jpg.In case we want this image to be displayed on the index.html page, the HTML code inindex.html needs to include an <img> element (Section 1.6.10). The src attribute of that<img> element needs to refer to the cat.jpg file. Either one of the following versions willwork:
<img src="/images/cat.jpg"><img src="images/cat.jpg">
28https://developer.mozilla.org/en-US/docs/Learn/Common_questions/What_is_a_domain_name
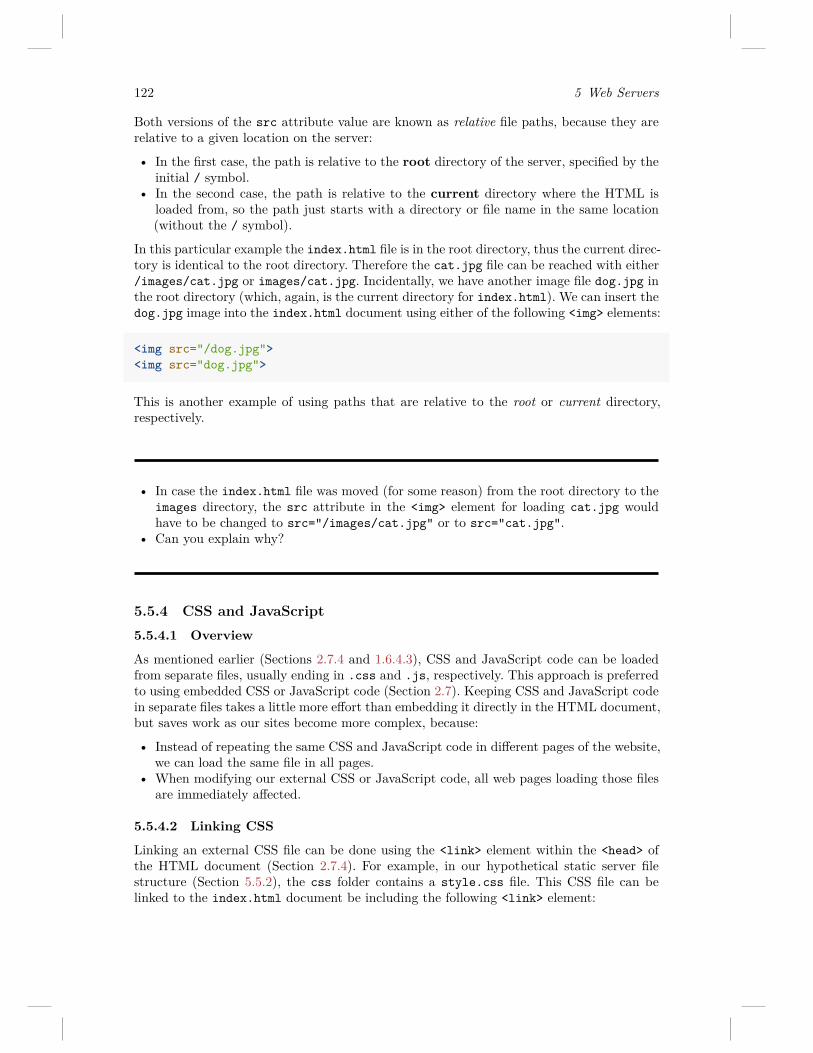
122 5 Web Servers
Both versions of the src attribute value are known as relative file paths, because they arerelative to a given location on the server:
• In the first case, the path is relative to the root directory of the server, specified by theinitial / symbol.
• In the second case, the path is relative to the current directory where the HTML isloaded from, so the path just starts with a directory or file name in the same location(without the / symbol).
In this particular example the index.html file is in the root directory, thus the current direc-tory is identical to the root directory. Therefore the cat.jpg file can be reached with either/images/cat.jpg or images/cat.jpg. Incidentally, we have another image file dog.jpg inthe root directory (which, again, is the current directory for index.html). We can insert thedog.jpg image into the index.html document using either of the following <img> elements:
<img src="/dog.jpg"><img src="dog.jpg">
This is another example of using paths that are relative to the root or current directory,respectively.
• In case the index.html file was moved (for some reason) from the root directory to theimages directory, the src attribute in the <img> element for loading cat.jpg wouldhave to be changed to src="/images/cat.jpg" or to src="cat.jpg".
• Can you explain why?
5.5.4 CSS and JavaScript5.5.4.1 Overview
As mentioned earlier (Sections 2.7.4 and 1.6.4.3), CSS and JavaScript code can be loadedfrom separate files, usually ending in .css and .js, respectively. This approach is preferredto using embedded CSS or JavaScript code (Section 2.7). Keeping CSS and JavaScript codein separate files takes a little more effort than embedding it directly in the HTML document,but saves work as our sites become more complex, because:
• Instead of repeating the same CSS and JavaScript code in different pages of the website,we can load the same file in all pages.
• When modifying our external CSS or JavaScript code, all web pages loading those filesare immediately affected.
5.5.4.2 Linking CSS
Linking an external CSS file can be done using the <link> element within the <head> ofthe HTML document (Section 2.7.4). For example, in our hypothetical static server filestructure (Section 5.5.2), the css folder contains a style.css file. This CSS file can belinked to the index.html document be including the following <link> element:
5.6 Running a static server 123
<link rel="stylesheet" href="/css/style.css">
Note that, in this case, it makes sense to use a relative path which is relative to the rootdirectory, since a website usually has a single set of CSS and JavaScript files. That way,exactly the same <link> element can be embedded in all HTML documents, regardless ofwhere those HTML documents are placed.
5.5.4.3 Linking JavaScript
Linking a JavaScript code file can be done by adding a file path in the src attribute of a<script> element (Section 6.5.5). The <script> element can then be placed in the <head>or the <body> of the HTML document. For example, our hypothetical file structure has afolder named js with a JavaScript file named main.js. That script can be loaded in theindex.html document by including the following <script> element:
<script src="/js/main.js"></script>
Again, a relative path, relative to the root directory, is being used.
5.6 Running a static server5.6.1 OverviewSo far we have discussed several background topics related to running a static server:
• Communication through HTTP (Section 5.3)• Difference between static and dynamic servers (Section 5.4)• Components of a URL and the file structure on the server (Section 5.5)
What is left to be done is actually running a server, to see how it all works in practice. In thenext two sections we will experiment with running a static web server using two differentmethods:
• A local server, using your own computer and Python (Section 5.6.2)• A remote server, using the GitHub Pages platform (Section 5.6.3)
5.6.2 Local with Python5.6.2.1 Setup instructions
We begin with the local option for running a static server. The exercise will demonstrate theHTTP server built into Python, which only requires you have Python installed. If you areworking in a computer classroom, there is a good chance that Python is already installed.In any case, you can check if Python is installed by opening the Command Prompt(open the Start menu, then type cmd) and typing python. If you see a message with thePython version number, then Python is installed and you have just entered its commandline, marked by the >>> symbol. You can exit the Python command line by typing exit()and pressing Enter. In case you see an error message, such as the following one, then Pythonis not installed:
124 5 Web Servers
'python' is not recognized as an internal or external command,operable program or batch file.
Python installation instructions are beyond the scope of the book, but there is a plenty ofinformation on installing Python that you can find online.
5.6.2.2 Running the server
To run Python’s HTTP Server, follow these steps:
• Open the Start menu and type cmd to enter the Command Prompt.• Navigate to the directory (Section 5.5.2) that you want to serve (e.g., where your
index.html file is), using cd (change directory) followed by directory name. For ex-ample, if your directory is in drive D:\, inside a directory named Data and then asub-directory named server, you need to type cd D:\Data\server to navigate to thatdirectory.
• Type the expression python -m SimpleHTTPServer (if you are using Python 2) orpython -m http.server (if you are using Python 3). To check which version of Pythonyou have, type python -V in the Command Prompt.
If all goes well, you should see a message such as the following (Figure 5.4), meaning thatthe server is running:
Serving HTTP on 0.0.0.0 port 8000 ...
As evident from the above message, the default port (Section 5.5.1) where the Python serveris running is 8000. In case you want to use a different port, such as 8080, you can specifythe port number as an additional parameter:
python -m SimpleHTTPServer 8080 # Python 2python -m http.server 8080 # Python 3
To stop the server, press Ctrl+C.
5.6.2.3 Testing served page
Once the server is running, you can access the served web page(s) by navigating to thefollowing address in a web browser, assuming there is an index.html file in the root of theserved directory:
http://localhost:8000/
In case you want to load an HTML document other than index.html, or if the documentis located in one of the sub-directories of the server, you can specify the path to the HTMLfile you wish to load. For example:
http://localhost:8000/locations/france.html
If you initiated the server on a different port, replace the 8000 part with the port numberyou chose:
http://localhost:8080/locations/france.html
The word localhost means you are accessing this computer29. In other words, the serverand the client are the same computer. This kind of setting may seem strange, but in fact
29https://en.wikipedia.org/wiki/Localhost
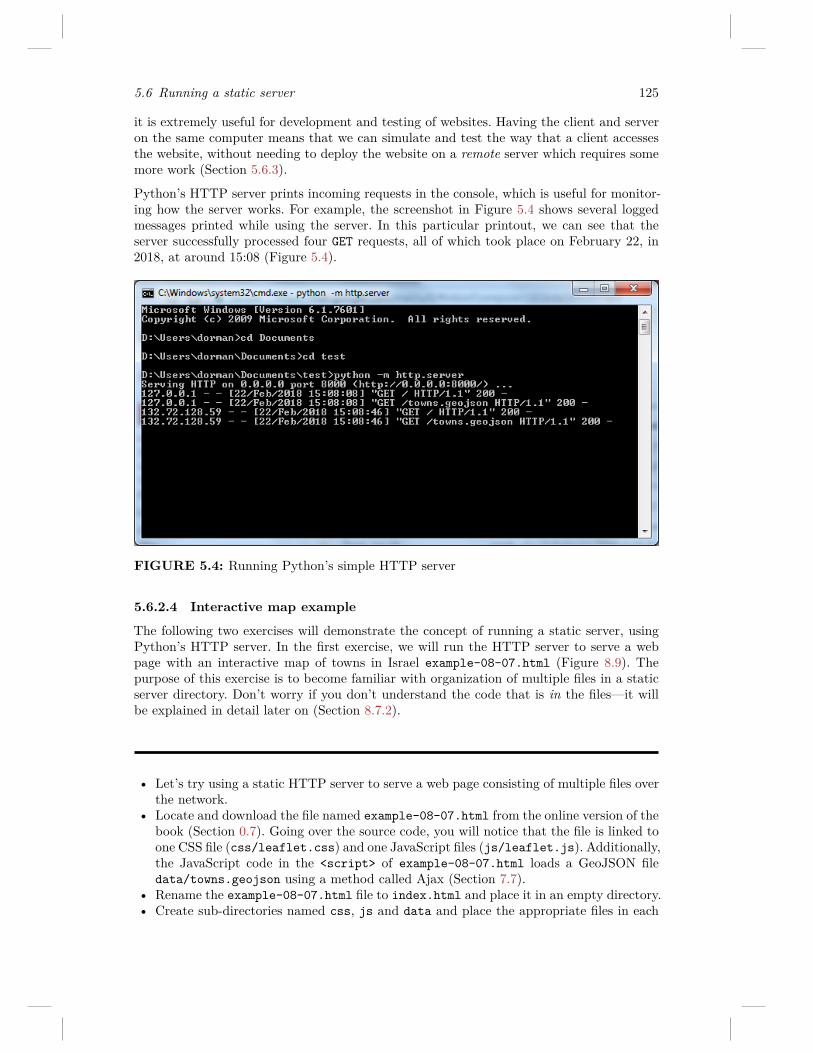
5.6 Running a static server 125
it is extremely useful for development and testing of websites. Having the client and serveron the same computer means that we can simulate and test the way that a client accessesthe website, without needing to deploy the website on a remote server which requires somemore work (Section 5.6.3).
Python’s HTTP server prints incoming requests in the console, which is useful for monitor-ing how the server works. For example, the screenshot in Figure 5.4 shows several loggedmessages printed while using the server. In this particular printout, we can see that theserver successfully processed four GET requests, all of which took place on February 22, in2018, at around 15:08 (Figure 5.4).
FIGURE 5.4: Running Python’s simple HTTP server
5.6.2.4 Interactive map example
The following two exercises will demonstrate the concept of running a static server, usingPython’s HTTP server. In the first exercise, we will run the HTTP server to serve a webpage with an interactive map of towns in Israel example-08-07.html (Figure 8.9). Thepurpose of this exercise is to become familiar with organization of multiple files in a staticserver directory. Don’t worry if you don’t understand the code that is in the files—it willbe explained in detail later on (Section 8.7.2).
• Let’s try using a static HTTP server to serve a web page consisting of multiple files overthe network.
• Locate and download the file named example-08-07.html from the online version of thebook (Section 0.7). Going over the source code, you will notice that the file is linked toone CSS file (css/leaflet.css) and one JavaScript files (js/leaflet.js). Additionally,the JavaScript code in the <script> of example-08-07.html loads a GeoJSON filedata/towns.geojson using a method called Ajax (Section 7.7).
• Rename the example-08-07.html file to index.html and place it in an empty directory.• Create sub-directories named css, js and data and place the appropriate files in each
126 5 Web Servers
directory—leaflet.css in the css directory, leaflet.js in the js directory, andtowns.geojson in the data directory.
• Start a local server from within the directory where the index.html file is placed, andopen the page in the browser by navigating to http://localhost:8000/.
• You should see a map of town borders, with highlighted names on mouse hover (Figure8.9).
• Now try opening the index.html file by double-clicking on it; the towns layer may nowbe absent, because loading GeoJSON content from a file using the Ajax (Section 7.7)method is blocked by some browsers (such as Chrome), unless running a server (Section7.8.1). This demonstrates the necessity of going through the trouble of running a localserver, for correctly emulating the way that web content is being served during websitedevelopment.
5.6.2.5 Access from a different computer
In the second exercise, we will try to navigate to a web page served from a different com-puter. Note that this exercise will not work under certain network settings, due to differentcomplications that require some more effort to overcome. For example:
• If you are connected to the internet through a private network, e.g., behind a routerat your home, then the IP address of your computer (shown with ipconfig; see below)refers to an internal address of the private network, so other computers will not be ableto reach your page simply by typing that IP address in the browser.
• If there is a firewall preventing other computers from reaching yours, then they willnot be able to navigate to the page that you are serving.
The above considerations are handled by network administrators30 and are beyond thescope of this book.
• While the page from the previous exercise is up and running, let’s try to access it froma different computer over the network. This exercise should be done in pairs.
• Start up the static server with the interactive map from the previous example.• Identify the IP address of your computer. To do that, click on the Start button, type
cmd in the text box to open a second command line prompt (the first one should stillrun your server so you cannot type additional commands there!), then type ipconfigin the command line. Locate your IP address in the printed output (Figure 5.5). Theaddress should be listed next to the line where it says IPv4 Address. For example, inthe output shown in Figure 5.5 the IP address is 132.72.129.98.
• Tell the person next to you what your IP address is, and which port your server is runningon. For example, if your IP address was 132.72.129.98 and the port number is 8000then the address you should pass to the person next to you is http://132.72.129.98:8000/.
• The other person should type the address in his/her browser. If all worked well, yourwebsite will be displayed. Check your server’s log—you should see the GET request(s)and the IP of the other computer that connected to your website!
30https://en.wikipedia.org/wiki/Network_administrator
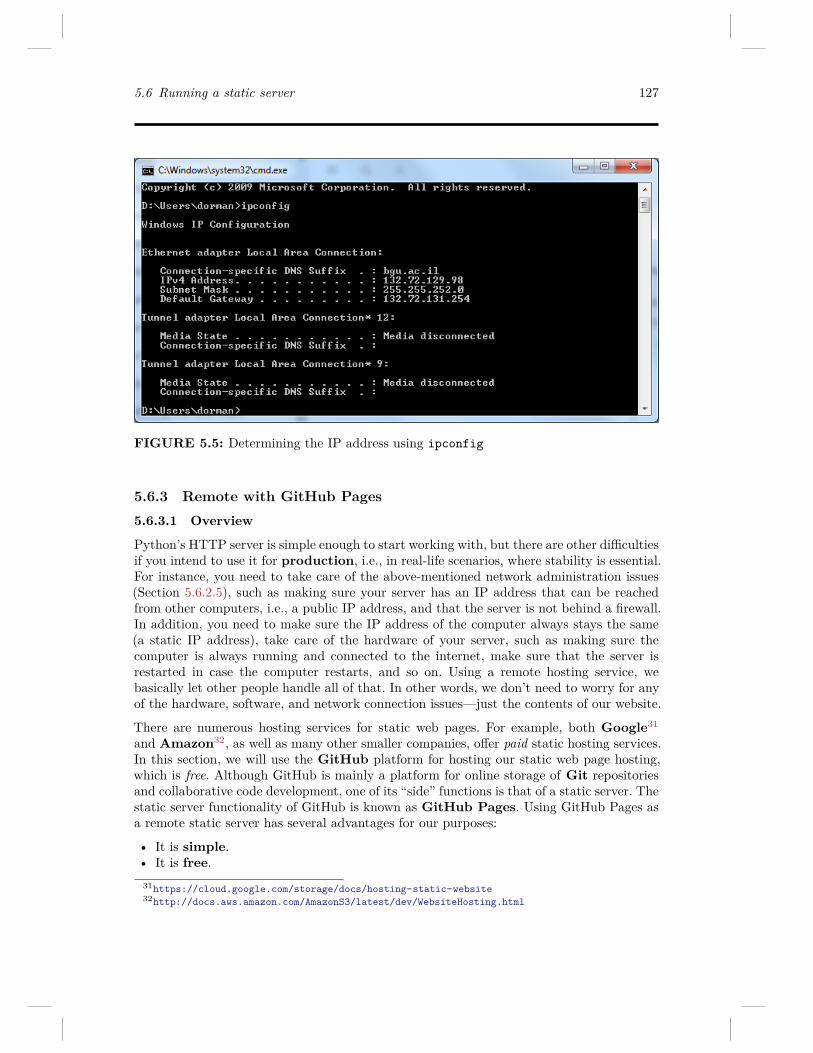
5.6 Running a static server 127
FIGURE 5.5: Determining the IP address using ipconfig
5.6.3 Remote with GitHub Pages5.6.3.1 Overview
Python’s HTTP server is simple enough to start working with, but there are other difficultiesif you intend to use it for production, i.e., in real-life scenarios, where stability is essential.For instance, you need to take care of the above-mentioned network administration issues(Section 5.6.2.5), such as making sure your server has an IP address that can be reachedfrom other computers, i.e., a public IP address, and that the server is not behind a firewall.In addition, you need to make sure the IP address of the computer always stays the same(a static IP address), take care of the hardware of your server, such as making sure thecomputer is always running and connected to the internet, make sure that the server isrestarted in case the computer restarts, and so on. Using a remote hosting service, webasically let other people handle all of that. In other words, we don’t need to worry for anyof the hardware, software, and network connection issues—just the contents of our website.
There are numerous hosting services for static web pages. For example, both Google31
and Amazon32, as well as many other smaller companies, offer paid static hosting services.In this section, we will use the GitHub platform for hosting our static web page hosting,which is free. Although GitHub is mainly a platform for online storage of Git repositoriesand collaborative code development, one of its “side” functions is that of a static server. Thestatic server functionality of GitHub is known as GitHub Pages. Using GitHub Pages asa remote static server has several advantages for our purposes:
• It is simple.• It is free.31https://cloud.google.com/storage/docs/hosting-static-website32http://docs.aws.amazon.com/AmazonS3/latest/dev/WebsiteHosting.html
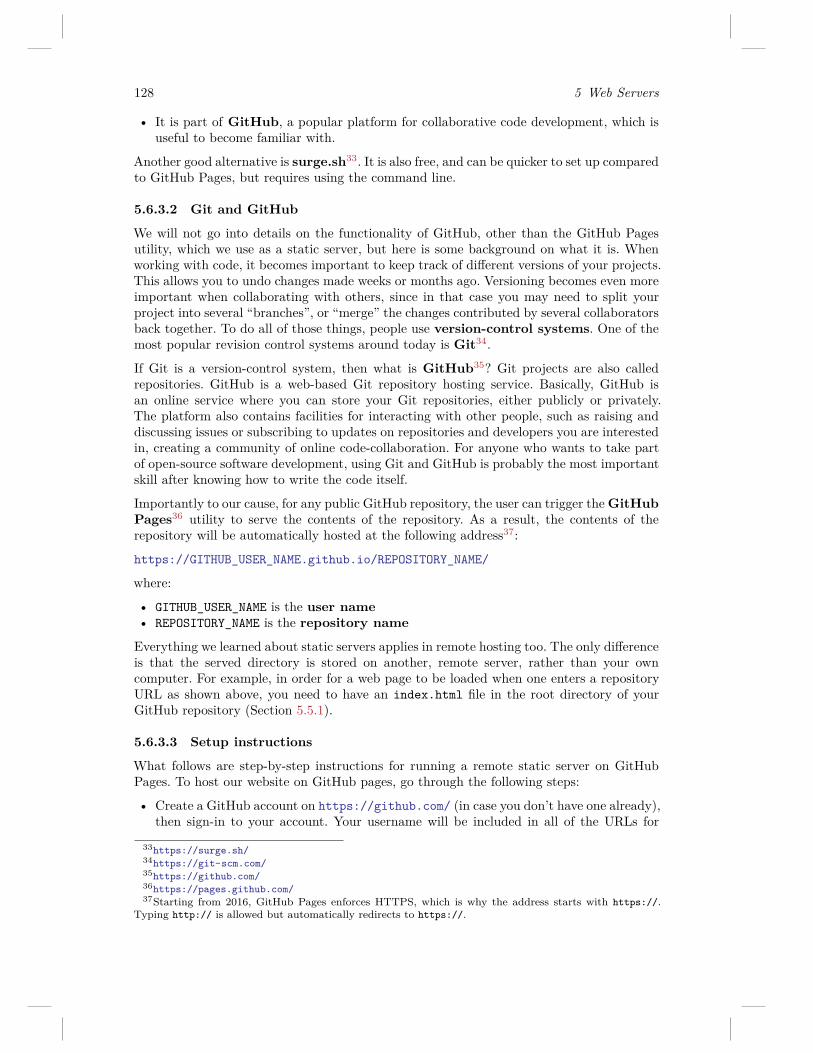
128 5 Web Servers
• It is part of GitHub, a popular platform for collaborative code development, which isuseful to become familiar with.
Another good alternative is surge.sh33. It is also free, and can be quicker to set up comparedto GitHub Pages, but requires using the command line.
5.6.3.2 Git and GitHub
We will not go into details on the functionality of GitHub, other than the GitHub Pagesutility, which we use as a static server, but here is some background on what it is. Whenworking with code, it becomes important to keep track of different versions of your projects.This allows you to undo changes made weeks or months ago. Versioning becomes even moreimportant when collaborating with others, since in that case you may need to split yourproject into several “branches”, or “merge” the changes contributed by several collaboratorsback together. To do all of those things, people use version-control systems. One of themost popular revision control systems around today is Git34.
If Git is a version-control system, then what is GitHub35? Git projects are also calledrepositories. GitHub is a web-based Git repository hosting service. Basically, GitHub isan online service where you can store your Git repositories, either publicly or privately.The platform also contains facilities for interacting with other people, such as raising anddiscussing issues or subscribing to updates on repositories and developers you are interestedin, creating a community of online code-collaboration. For anyone who wants to take partof open-source software development, using Git and GitHub is probably the most importantskill after knowing how to write the code itself.
Importantly to our cause, for any public GitHub repository, the user can trigger the GitHubPages36 utility to serve the contents of the repository. As a result, the contents of therepository will be automatically hosted at the following address37:
https://GITHUB_USER_NAME.github.io/REPOSITORY_NAME/
where:
• GITHUB_USER_NAME is the user name• REPOSITORY_NAME is the repository name
Everything we learned about static servers applies in remote hosting too. The only differenceis that the served directory is stored on another, remote server, rather than your owncomputer. For example, in order for a web page to be loaded when one enters a repositoryURL as shown above, you need to have an index.html file in the root directory of yourGitHub repository (Section 5.5.1).
5.6.3.3 Setup instructions
What follows are step-by-step instructions for running a remote static server on GitHubPages. To host our website on GitHub pages, go through the following steps:
• Create a GitHub account on https://github.com/ (in case you don’t have one already),then sign-in to your account. Your username will be included in all of the URLs for
33https://surge.sh/34https://git-scm.com/35https://github.com/36https://pages.github.com/37Starting from 2016, GitHub Pages enforces HTTPS, which is why the address starts with https://.
Typing http:// is allowed but automatically redirects to https://.
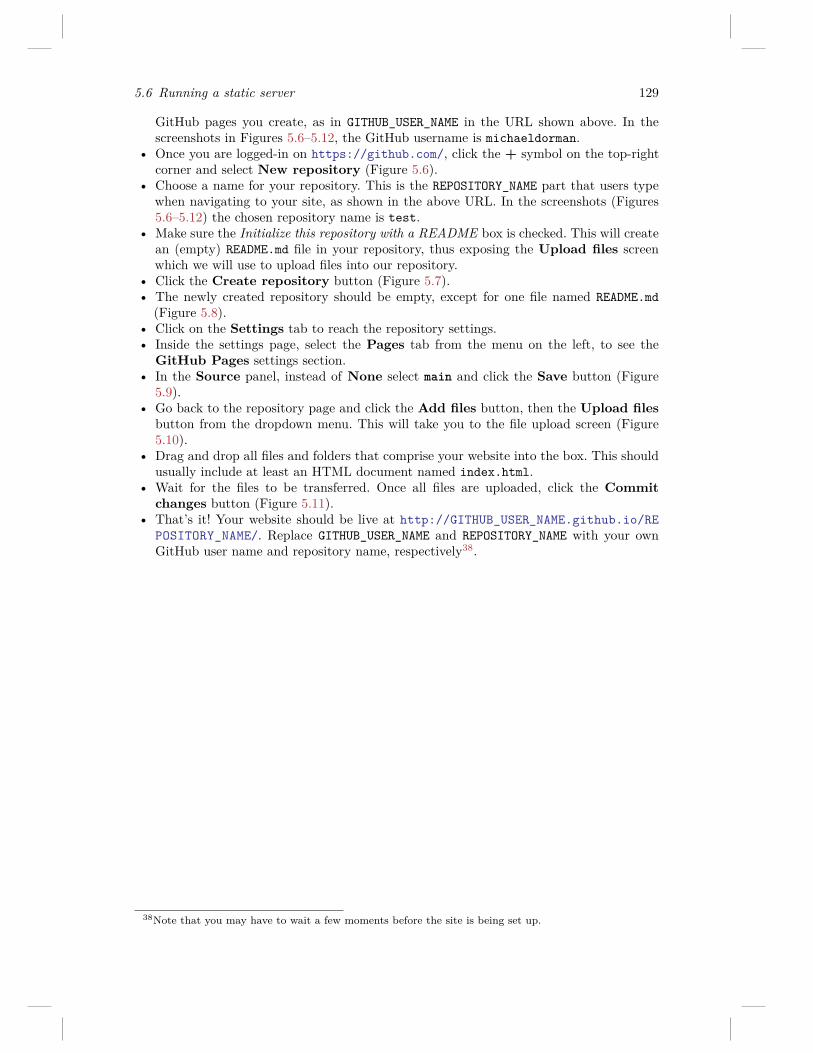
5.6 Running a static server 129
GitHub pages you create, as in GITHUB_USER_NAME in the URL shown above. In thescreenshots in Figures 5.6–5.12, the GitHub username is michaeldorman.
• Once you are logged-in on https://github.com/, click the + symbol on the top-rightcorner and select New repository (Figure 5.6).
• Choose a name for your repository. This is the REPOSITORY_NAME part that users typewhen navigating to your site, as shown in the above URL. In the screenshots (Figures5.6–5.12) the chosen repository name is test.
• Make sure the Initialize this repository with a README box is checked. This will createan (empty) README.md file in your repository, thus exposing the Upload files screenwhich we will use to upload files into our repository.
• Click the Create repository button (Figure 5.7).• The newly created repository should be empty, except for one file named README.md
(Figure 5.8).• Click on the Settings tab to reach the repository settings.• Inside the settings page, select the Pages tab from the menu on the left, to see the
GitHub Pages settings section.• In the Source panel, instead of None select main and click the Save button (Figure
5.9).• Go back to the repository page and click the Add files button, then the Upload files
button from the dropdown menu. This will take you to the file upload screen (Figure5.10).
• Drag and drop all files and folders that comprise your website into the box. This shouldusually include at least an HTML document named index.html.
• Wait for the files to be transferred. Once all files are uploaded, click the Commitchanges button (Figure 5.11).
• That’s it! Your website should be live at http://GITHUB_USER_NAME.github.io/REPOSITORY_NAME/. Replace GITHUB_USER_NAME and REPOSITORY_NAME with your ownGitHub user name and repository name, respectively38.
38Note that you may have to wait a few moments before the site is being set up.
130 5 Web Servers
FIGURE 5.6: Creating a new repository on GitHub
FIGURE 5.7: The Create repository button
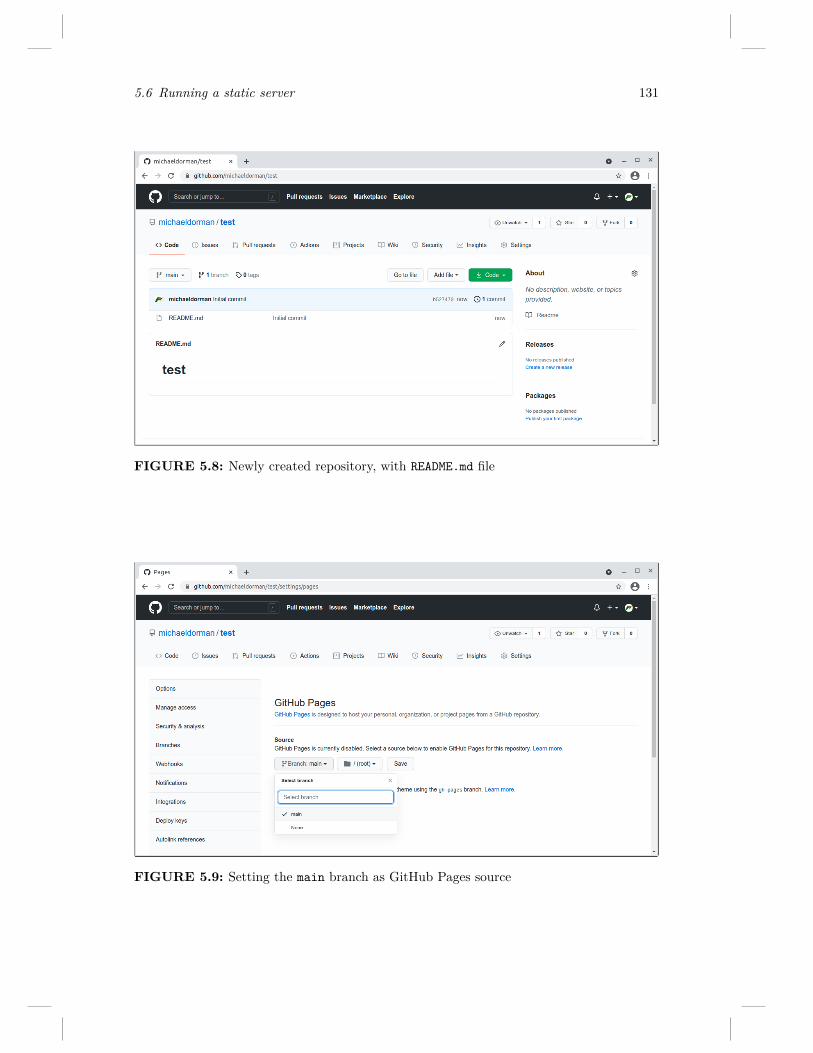
5.6 Running a static server 131
FIGURE 5.8: Newly created repository, with README.md file
FIGURE 5.9: Setting the main branch as GitHub Pages source
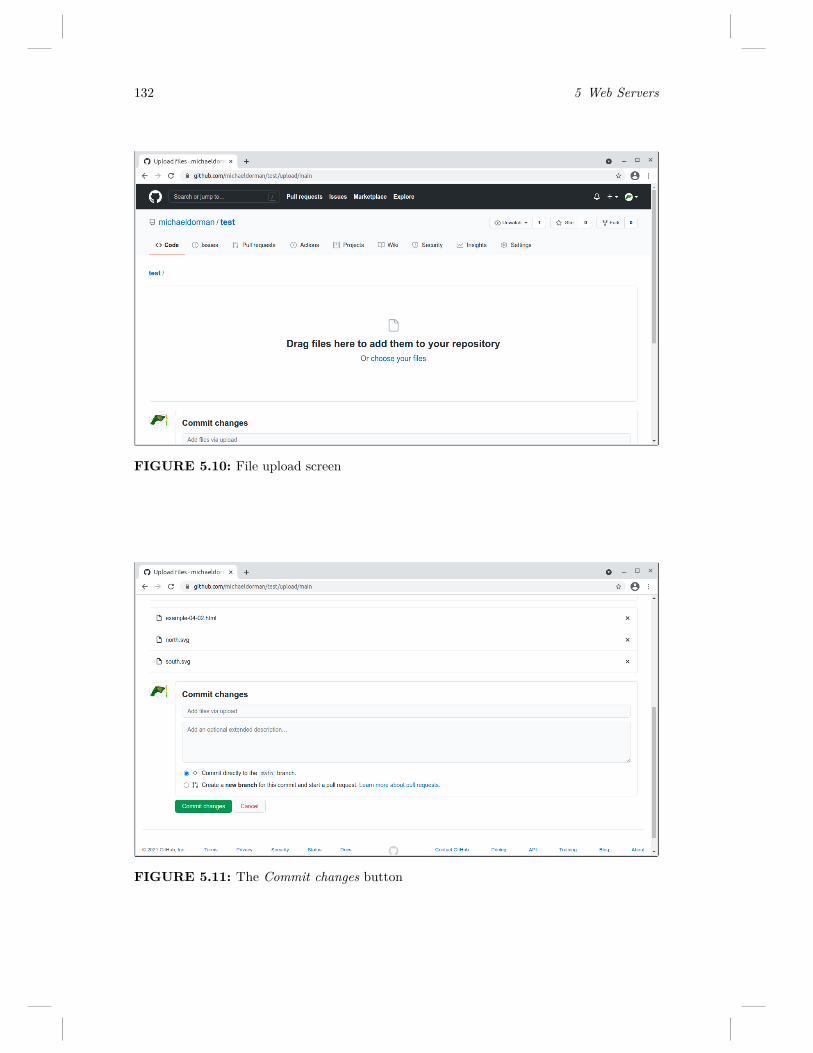
132 5 Web Servers
FIGURE 5.10: File upload screen
FIGURE 5.11: The Commit changes button
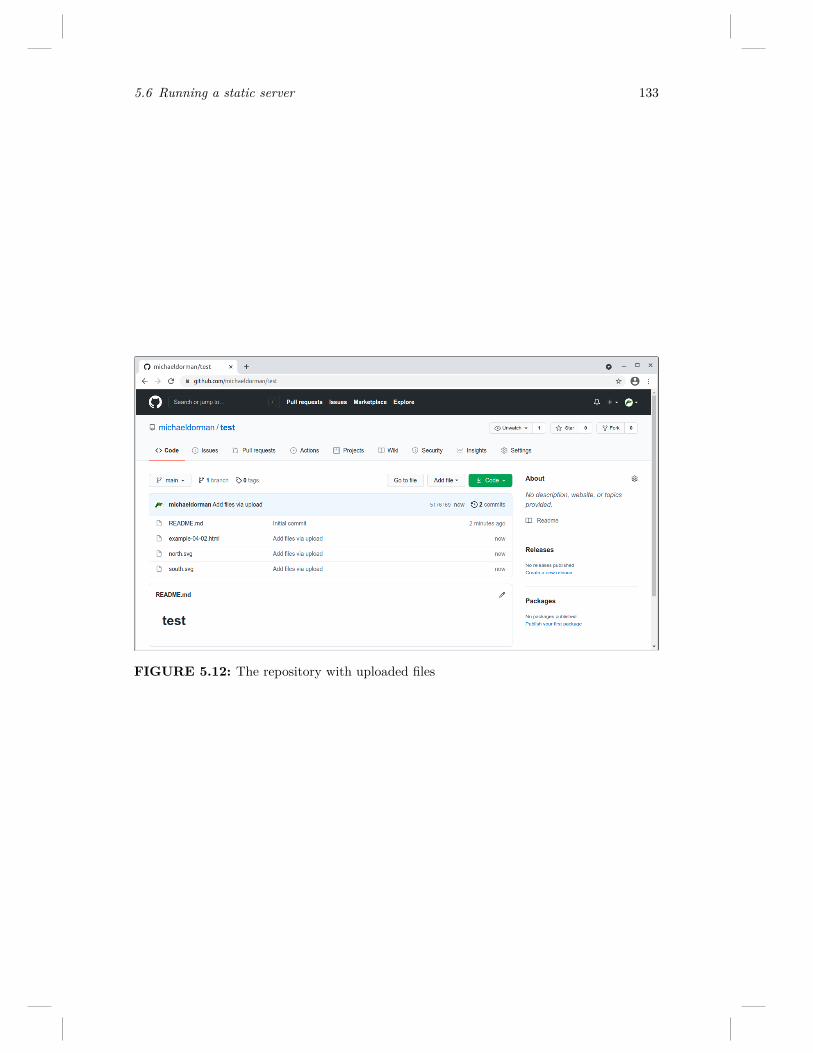
5.6 Running a static server 133
FIGURE 5.12: The repository with uploaded files


Part II
Web Mapping with Leaflet

6Leaflet
6.1 IntroductionNow that we have covered the basics of web technologies, we are moving on to the maintopic of this book: web mapping. This chapter and the next two (Chapters 6–8) introduceLeaflet, a JavaScript library used to create interactive web maps. Using Leaflet, you cancreate a simple map using just two or three JavaScript expressions, or you can build acomplex map using hundreds of lines of code.
In this chapter, we will learn how to initialize a Leaflet web map on our web page, and howto add several types of layers on the map: tile layers (Section 6.5.11) and simple shapes suchas point markers (Section 6.6.2), lines (Section 6.6.3), and polygons (Section 6.6.4). We willalso learn to add interactive popups for our layers (Section 6.7) and a panel with a textualdescription of our map (Section 6.8). Finally, we will introduce map events—browser eventsassociated with the web map (Section 6.9).
In the next two Chapters 7–8, we will learn some more advanced Leaflet functionality. InChapter 7, we will learn to add complex shapes coming from external GeoJSON files. Then,in Chapter 8, we will learn how to define symbology and interactive behavior in our webmap.
6.2 What is a web map?We already introduced the concept of web mapping in Section 0.1. We mentioned that theterm “web map” usually implies a map that is not simply on the web, but rather one that ispowered by the web. It is usually interactive, and not always self-contained, meaning that it“pulls” content from other locations, such as tile layer servers (Section 6.5.12) or databaseAPIs (Section 9.7)1.
Similarly to spatial information displayed in GIS software2, web maps are usually composedof one or more layers. Web map layers can be generally classified into two categories:
• Background layers, or basemaps, comprising collections of gridded images or vectortiles, which are usually general-purpose and not prepared specifically for our map
• Foreground layers, or overlays, which are usually vector layers (points, lines, and poly-gons), commonly prepared and/or fine-tuned for the specific map web where they areshown
1A good introduction to web mapping can be found in the Web Maps 101 (http://maptimeboston.github.io/web-maps-101/#0) presentation by Maptime Boston (https://maptimeboston.github.io/resources).
2https://en.wikipedia.org/wiki/Geographic_information_system
137
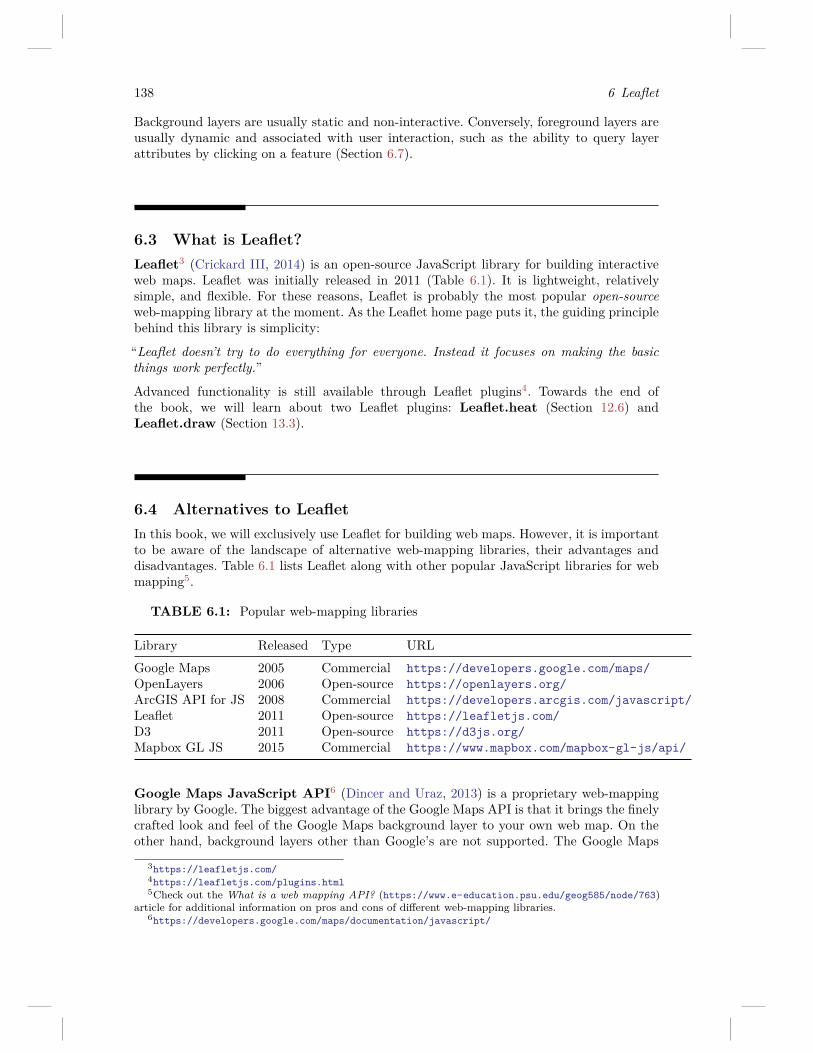
138 6 Leaflet
Background layers are usually static and non-interactive. Conversely, foreground layers areusually dynamic and associated with user interaction, such as the ability to query layerattributes by clicking on a feature (Section 6.7).
6.3 What is Leaflet?Leaflet3 (Crickard III, 2014) is an open-source JavaScript library for building interactiveweb maps. Leaflet was initially released in 2011 (Table 6.1). It is lightweight, relativelysimple, and flexible. For these reasons, Leaflet is probably the most popular open-sourceweb-mapping library at the moment. As the Leaflet home page puts it, the guiding principlebehind this library is simplicity:
“Leaflet doesn’t try to do everything for everyone. Instead it focuses on making the basicthings work perfectly.”
Advanced functionality is still available through Leaflet plugins4. Towards the end ofthe book, we will learn about two Leaflet plugins: Leaflet.heat (Section 12.6) andLeaflet.draw (Section 13.3).
6.4 Alternatives to LeafletIn this book, we will exclusively use Leaflet for building web maps. However, it is importantto be aware of the landscape of alternative web-mapping libraries, their advantages anddisadvantages. Table 6.1 lists Leaflet along with other popular JavaScript libraries for webmapping5.
TABLE 6.1: Popular web-mapping libraries
Library Released Type URLGoogle Maps 2005 Commercial https://developers.google.com/maps/OpenLayers 2006 Open-source https://openlayers.org/ArcGIS API for JS 2008 Commercial https://developers.arcgis.com/javascript/Leaflet 2011 Open-source https://leafletjs.com/D3 2011 Open-source https://d3js.org/Mapbox GL JS 2015 Commercial https://www.mapbox.com/mapbox-gl-js/api/
Google Maps JavaScript API6 (Dincer and Uraz, 2013) is a proprietary web-mappinglibrary by Google. The biggest advantage of the Google Maps API is that it brings the finelycrafted look and feel of the Google Maps background layer to your own web map. On theother hand, background layers other than Google’s are not supported. The Google Maps
3https://leafletjs.com/4https://leafletjs.com/plugins.html5Check out the What is a web mapping API? (https://www.e-education.psu.edu/geog585/node/763)
article for additional information on pros and cons of different web-mapping libraries.6https://developers.google.com/maps/documentation/javascript/
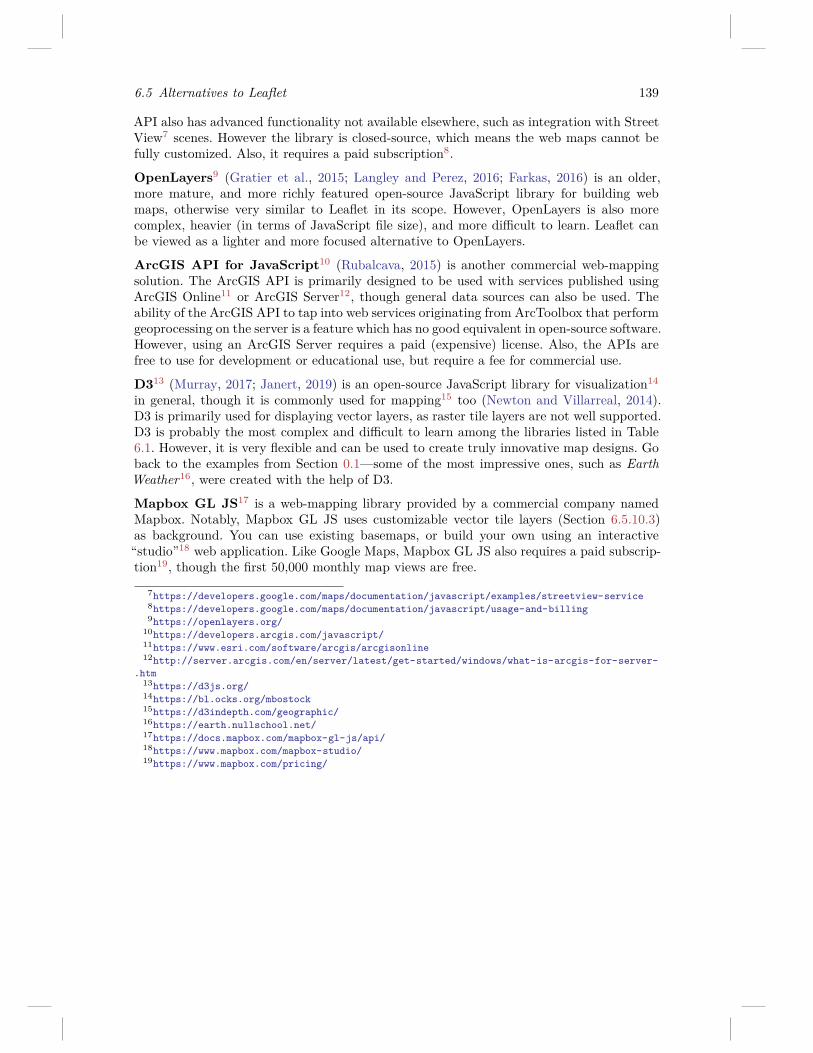
6.5 Alternatives to Leaflet 139
API also has advanced functionality not available elsewhere, such as integration with StreetView7 scenes. However the library is closed-source, which means the web maps cannot befully customized. Also, it requires a paid subscription8.
OpenLayers9 (Gratier et al., 2015; Langley and Perez, 2016; Farkas, 2016) is an older,more mature, and more richly featured open-source JavaScript library for building webmaps, otherwise very similar to Leaflet in its scope. However, OpenLayers is also morecomplex, heavier (in terms of JavaScript file size), and more difficult to learn. Leaflet canbe viewed as a lighter and more focused alternative to OpenLayers.
ArcGIS API for JavaScript10 (Rubalcava, 2015) is another commercial web-mappingsolution. The ArcGIS API is primarily designed to be used with services published usingArcGIS Online11 or ArcGIS Server12, though general data sources can also be used. Theability of the ArcGIS API to tap into web services originating from ArcToolbox that performgeoprocessing on the server is a feature which has no good equivalent in open-source software.However, using an ArcGIS Server requires a paid (expensive) license. Also, the APIs arefree to use for development or educational use, but require a fee for commercial use.
D313 (Murray, 2017; Janert, 2019) is an open-source JavaScript library for visualization14
in general, though it is commonly used for mapping15 too (Newton and Villarreal, 2014).D3 is primarily used for displaying vector layers, as raster tile layers are not well supported.D3 is probably the most complex and difficult to learn among the libraries listed in Table6.1. However, it is very flexible and can be used to create truly innovative map designs. Goback to the examples from Section 0.1—some of the most impressive ones, such as EarthWeather16, were created with the help of D3.
Mapbox GL JS17 is a web-mapping library provided by a commercial company namedMapbox. Notably, Mapbox GL JS uses customizable vector tile layers (Section 6.5.10.3)as background. You can use existing basemaps, or build your own using an interactive“studio”18 web application. Like Google Maps, Mapbox GL JS also requires a paid subscrip-tion19, though the first 50,000 monthly map views are free.
7https://developers.google.com/maps/documentation/javascript/examples/streetview-service8https://developers.google.com/maps/documentation/javascript/usage-and-billing9https://openlayers.org/
10https://developers.arcgis.com/javascript/11https://www.esri.com/software/arcgis/arcgisonline12http://server.arcgis.com/en/server/latest/get-started/windows/what-is-arcgis-for-server-
.htm13https://d3js.org/14https://bl.ocks.org/mbostock15https://d3indepth.com/geographic/16https://earth.nullschool.net/17https://docs.mapbox.com/mapbox-gl-js/api/18https://www.mapbox.com/mapbox-studio/19https://www.mapbox.com/pricing/
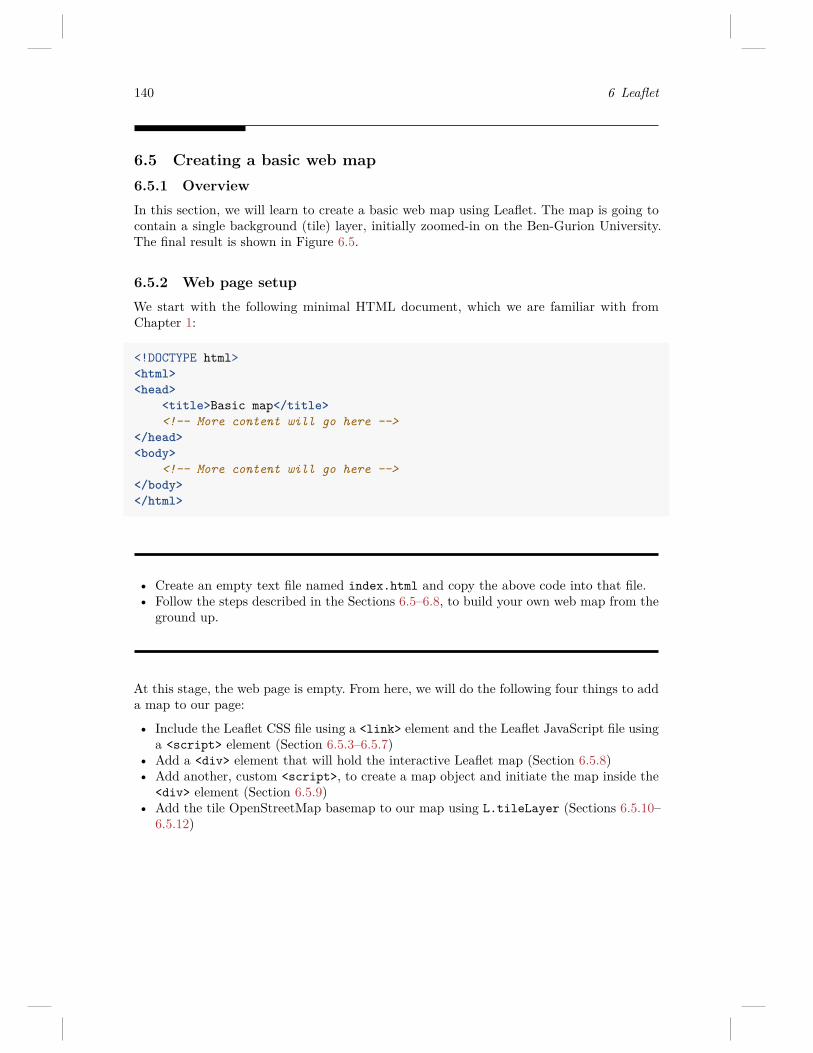
140 6 Leaflet
6.5 Creating a basic web map6.5.1 OverviewIn this section, we will learn to create a basic web map using Leaflet. The map is going tocontain a single background (tile) layer, initially zoomed-in on the Ben-Gurion University.The final result is shown in Figure 6.5.
6.5.2 Web page setupWe start with the following minimal HTML document, which we are familiar with fromChapter 1:
<!DOCTYPE html><html><head>
<title>Basic map</title><!-- More content will go here -->
</head><body>
<!-- More content will go here --></body></html>
• Create an empty text file named index.html and copy the above code into that file.• Follow the steps described in the Sections 6.5–6.8, to build your own web map from the
ground up.
At this stage, the web page is empty. From here, we will do the following four things to adda map to our page:
• Include the Leaflet CSS file using a <link> element and the Leaflet JavaScript file usinga <script> element (Section 6.5.3–6.5.7)
• Add a <div> element that will hold the interactive Leaflet map (Section 6.5.8)• Add another, custom <script>, to create a map object and initiate the map inside the
<div> element (Section 6.5.9)• Add the tile OpenStreetMap basemap to our map using L.tileLayer (Sections 6.5.10–
6.5.12)
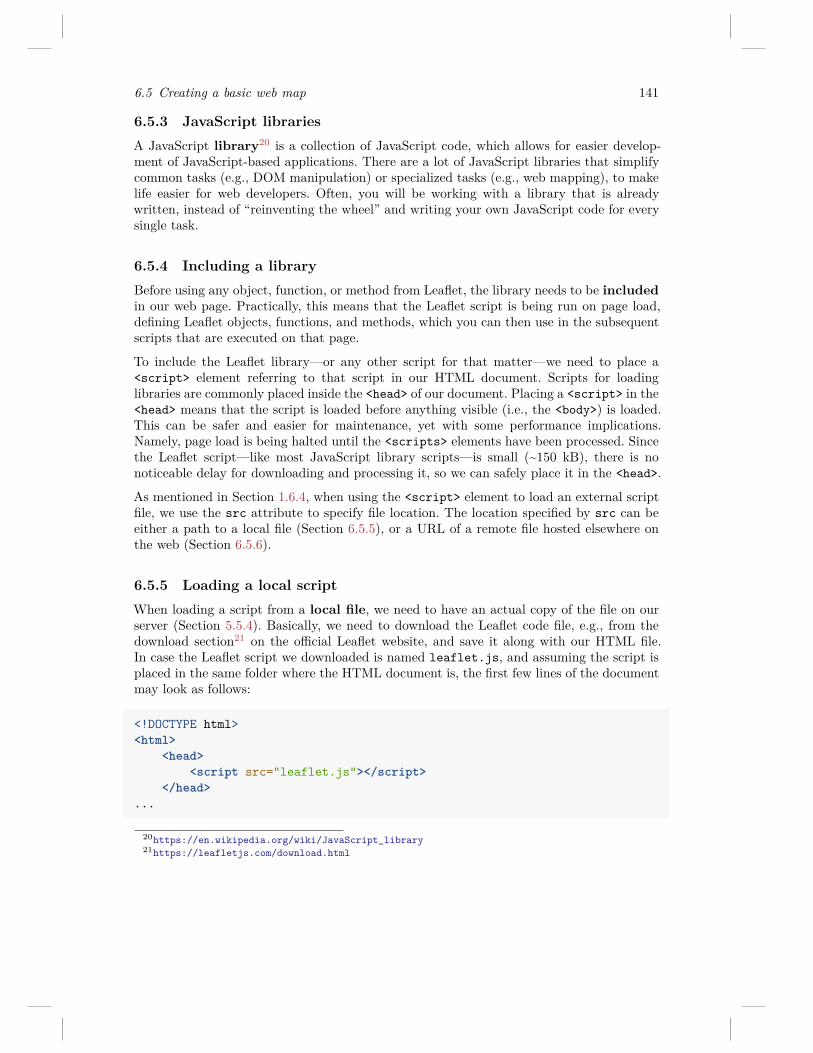
6.5 Creating a basic web map 141
6.5.3 JavaScript librariesA JavaScript library20 is a collection of JavaScript code, which allows for easier develop-ment of JavaScript-based applications. There are a lot of JavaScript libraries that simplifycommon tasks (e.g., DOM manipulation) or specialized tasks (e.g., web mapping), to makelife easier for web developers. Often, you will be working with a library that is alreadywritten, instead of “reinventing the wheel” and writing your own JavaScript code for everysingle task.
6.5.4 Including a libraryBefore using any object, function, or method from Leaflet, the library needs to be includedin our web page. Practically, this means that the Leaflet script is being run on page load,defining Leaflet objects, functions, and methods, which you can then use in the subsequentscripts that are executed on that page.
To include the Leaflet library—or any other script for that matter—we need to place a<script> element referring to that script in our HTML document. Scripts for loadinglibraries are commonly placed inside the <head> of our document. Placing a <script> in the<head> means that the script is loaded before anything visible (i.e., the <body>) is loaded.This can be safer and easier for maintenance, yet with some performance implications.Namely, page load is being halted until the <scripts> elements have been processed. Sincethe Leaflet script—like most JavaScript library scripts—is small (~150 kB), there is nonoticeable delay for downloading and processing it, so we can safely place it in the <head>.
As mentioned in Section 1.6.4, when using the <script> element to load an external scriptfile, we use the src attribute to specify file location. The location specified by src can beeither a path to a local file (Section 6.5.5), or a URL of a remote file hosted elsewhere onthe web (Section 6.5.6).
6.5.5 Loading a local scriptWhen loading a script from a local file, we need to have an actual copy of the file on ourserver (Section 5.5.4). Basically, we need to download the Leaflet code file, e.g., from thedownload section21 on the official Leaflet website, and save it along with our HTML file.In case the Leaflet script we downloaded is named leaflet.js, and assuming the script isplaced in the same folder where the HTML document is, the first few lines of the documentmay look as follows:
<!DOCTYPE html><html>
<head><script src="leaflet.js"></script>
</head>...
20https://en.wikipedia.org/wiki/JavaScript_library21https://leafletjs.com/download.html
142 6 Leaflet
6.5.6 Loading a remote scriptWhen loading a script from a remote file, hosted on the web in some location other thanour own computer, we need to provide the file URL. A reliable option is to use a ContentDelivery Network (CDN)22, such as UNPKG23. A CDN is a series of servers designedto serve static files very quickly. In case we are loading the Leaflet library from UNPKG,the first few lines of the document may look as follows:
<!DOCTYPE html><html>
<head><script src="https://unpkg.com/[...]/leaflet.js"></script>
</head>...
The src attribute value is truncated with [...] to save space. Here is the complete URLthat needs to go into the src attribute value:
https://unpkg.com/[email protected]/dist/leaflet.js
• Browse to the above URL to view the Leaflet library contents. You can also downloadthe file by clicking Save as… to view it in a text editor instead of the browser.
• You will note that the code is formatted in a strange way, as if the entire content is ina single line, with very few space and new line characters. This makes it hard for us toread the code. Can you guess what is the reason for this type of formatting?
6.5.7 Including Leaflet CSS and JavaScriptWe need to include the Leaflet library on our web page before we can start using it. Asmentioned above (Sections 6.5.5–6.5.6), there are two options for doing this. We can eitherdownload the library files from the Leaflet website and load those local files, or we can usea hosted version of the files from a CDN. In the examples, we use the local copy option.
Many JavaScript libraries, such as the Turf.js library we will learn about later on (Section12.2), consist of just one .js file. The Leaflet library is slightly more complex: it consists oftwo files, a JavaScript file and a CSS file, plus several image files. The image files are usedby the Leaflet script, for example to display markers on the map (Section 11.2.2).
The Leaflet JavaScript and CSS files are included just like any other JavaScript and CSSfiles. To include the Leaflet CSS file, we add a <link> element (Section 2.7.4) referringto the file within the <head> section (after the <title>). We will use a local copy namedleaflet.css placed inside a sub-directory called css:
<link rel="stylesheet" href="css/leaflet.css">
22https://en.wikipedia.org/wiki/Content_delivery_network23https://unpkg.com/
6.5 Creating a basic web map 143
Remember that the path to the local file needs to correspond to the website directorystructure (Section 5.5.2). For example, in the above <link> element, we are using a relativepath: css/leaflet.css. This means that the leaflet.css file is located in a sub-directorynamed css, inside the directory where the HTML document is. For loading the file from aCDN (Section 6.5.6), we could replace the css/leaflet.css part with the following URL:
https://unpkg.com/[email protected]/dist/leaflet.css
After24 including the Leaflet CSS file, we need to add a <script> element referring to theLeaflet JavaScript file. We are going to load a local copy named leaflet.js placed inside asub-directory named js. This means we need to put the following <script> element insidethe <head>:
<script src="js/leaflet.js"></script>
The path js/leaflet.js refers to a file named leaflet.js inside a sub-directory namedjs. For loading the Leaflet JavaScript file from a CDN, replace js/leaflet.js with thefollowing URL which was already shown above (Section 6.5.6):
https://unpkg.com/[email protected]/dist/leaflet.js
Either way, after adding the above <link> and <script> elements, the Leaflet CSS andJavaScript files will be loaded and processed by the browser, which means we can use itsfunctions and methods in other scripts on that page. Note that the local files provided inthe online supplement, as well as the above remote URLs, refer to a specific version ofLeaflet—namely Leaflet version 1.7.1—which is the newest version at the time of writing(Table 0.2). In case we need to load a newer or older version, the local copies or URLs canbe modified accordingly.
When working with a local copy of the Leaflet library, in addition to the JavaScript andCSS files we also need to create an images directory within the directory where our CSSfile is (e.g., css), and place several PNG image files25 there, such as marker-icon.png andmarker-shadow.png. These files are necessary for displaying markers and other images ontop of our map (Section 6.6.2). More information on how Leaflet actually uses those PNGimages will be given in Section 11.2.2.
6.5.8 Adding map <div>Our next step is to add a <div> element, inside the <body>. The <div> will be used to holdthe interactive map. As we learned in Section 1.6.12, a <div> is a generic grouping element.It is used to collect elements into the same block group so that it can be referred to in CSSor JavaScript code. The <div> intended for our map is initially empty, but needs to havean ID. We will use JavaScript to “fill” this element with the interactive web map, later on:
<div id="map"></div>
In case we want the web map to cover the entire screen (e.g., Figure 6.5), which is what wewill usually do in this book, we also need the following CSS rules:
24Not before!25See Appendix A for complete list of files and directory structure; see online version (Section 0.7) for
downloading the complete set of files for the Leaflet library.
144 6 Leaflet
body {padding: 0;margin: 0;
}html, body, #map {
height: 100%;width: 100%;
}
This CSS code can be added in the <style> element in the <head>. Recall that this methodof adding CSS is known as embedded CSS (Section 2.7.3).
6.5.9 Creating a map objectNow that the Leaflet library is loaded, and the <div> element which will be used to containit is defined and styled, we can move on to actually adding the map, using JavaScript.The Leaflet library defines a global object named L, which holds all of the Leaflet libraryfunctions and methods. Using the L.map method, our first step is to create a map object.When creating a map object there are two important arguments supplied to L.map:
• The ID of the <div> element where the map goes in• Additional map options, passed as an object
In our case, since the <div> intended for our map has id="map" (Section 6.5.8), we caninitiate the map with the following expression, which goes inside a <script> element at theend of the <body>:
L.map("map");
As for additional map options26, there are several ones that we can set. The options arepassed together, as a single object, where property name refers to the option and theproperty value refers to the value which we want to set. The most essential options ofL.map are those specifying the initially viewed map extent. One way to specify the initialextent is using the center and zoom option, passing the coordinates where the map isinitially panned to and its initial zoom level, respectively. For example, to focus on theBen-Gurion University we can indicate the [31.262218, 34.801472] location and set thezoom level to 17. The L.map expression now takes the following form:
L.map("map", {center: [31.262218, 34.801472], zoom: 17});
Note that the center option is specified in geographic coordinates (longitude and lati-tude) using an array of the form [lat, lon] rather than [lon, lat], that is, in the [Y, X]rather than the [X, Y] order. This may seem unintuitive to GIS users, but the [lat, lon]ordering is actually very common in many applications that are not specifically targeted togeographers, including Leaflet and other web-mapping libraries such as the Google MapsAPI27. When working with Leaflet, you need to be constantly aware of the convention to
26You can always to refer to the documentation (https://leafletjs.com/reference-1.7.1.html) forthe complete list of options for L.map, or any other Leaflet function.
27https://developers.google.com/maps/documentation/javascript/adding-a-google-map
6.5 Creating a basic web map 145
use [lat, lon] coordinates, to avoid errors such as displaying the wrong area (also seeSection 7.3.2.1).
One more thing to keep in mind regarding coordinates is that most web mapping libraries,including Leaflet, usually work with geographic coordinates (longitude, latitude) only as faras the user is concerned. This means that all placement settings (such as map center), as wellas layer coordinates (Section 6.6), are passed to Leaflet functions as geographic coordinates(latitude, longitude), i.e., the WGS8428 (EPSG:4326) coordinate reference system29. Themap itself, however, is displayed using coordinates in a different system, called the Webmercator30 projection (EPSG:3857) (Figure 6.1). For example, the following [lon, lat]coordinates (EPSG:4326) for central London:
[-0.09, 51.51]
will be internally converted to the following [X, Y] coordinates in Web mercator(EPSG:3857) before being displayed on screen:
[-10018.75, 6712008]
The user never has to deal with the Web mercator system, since it is only used internally,before drawing the final display on screen. However, it is important to be aware that itexists. As for the zoom, you may wonder what does the 17 zoom level mean. This will beexplained when discussing tile layers (Section 6.5.10).
The L.map function returns a map object, which has useful methods and can be passed tomethods of other objects (such as .addTo, see below). Therefore, we usually want to savethat object in a variable, such as the one named map in the following expression, so thatwe can refer to it when running those methods later on in our script. Combining all of theabove considerations, we should now have the following JavaScript code in the <script>element in our web page:
let map = L.map("map", {center: [31.262218, 34.801472], zoom: 17});
If you open the map at this stage, you should see that it has no content, just grey backgroundwith the “+” and “-” (zoom-in and zoom-out) buttons, which are part of the standard mapinterface. Our next step is to add a background layer (Section 6.2) on the map.
6.5.10 What are tile layers?6.5.10.1 Overview
Tile layers are a fundamental technology behind web maps. They comprise the backgroundlayer in most web maps, thus helping the viewer to locate the foreground layers in geo-graphical space. The word tile in tile layers comes from the fact that the layer is split intoindividual rectangular tiles. Tile layers come in two forms, which we are going to cover next:raster tiles (Section 6.5.10.2) and vector tiles (Section 6.5.10.3).
28https://en.wikipedia.org/wiki/World_Geodetic_System29https://en.wikipedia.org/wiki/Spatial_reference_system30https://en.wikipedia.org/wiki/Web_Mercator_projection
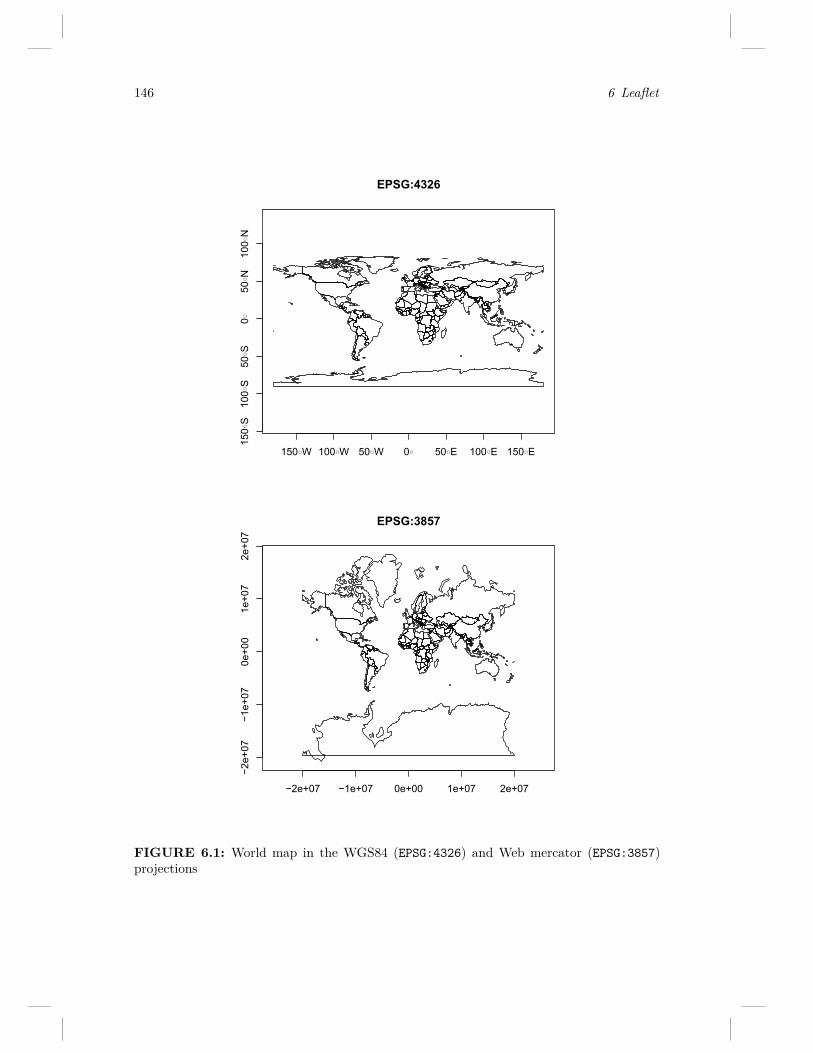
146 6 Leaflet
150°W 100°W 50°W 0° 50°E 100°E 150°E
150°S
100°S
50°S
0°50
°N100°N
EPSG:4326
−2e+07 −1e+07 0e+00 1e+07 2e+07
−2e+07
−1e+07
0e+00
1e+07
2e+07
EPSG:3857
FIGURE 6.1: World map in the WGS84 (EPSG:4326) and Web mercator (EPSG:3857)projections
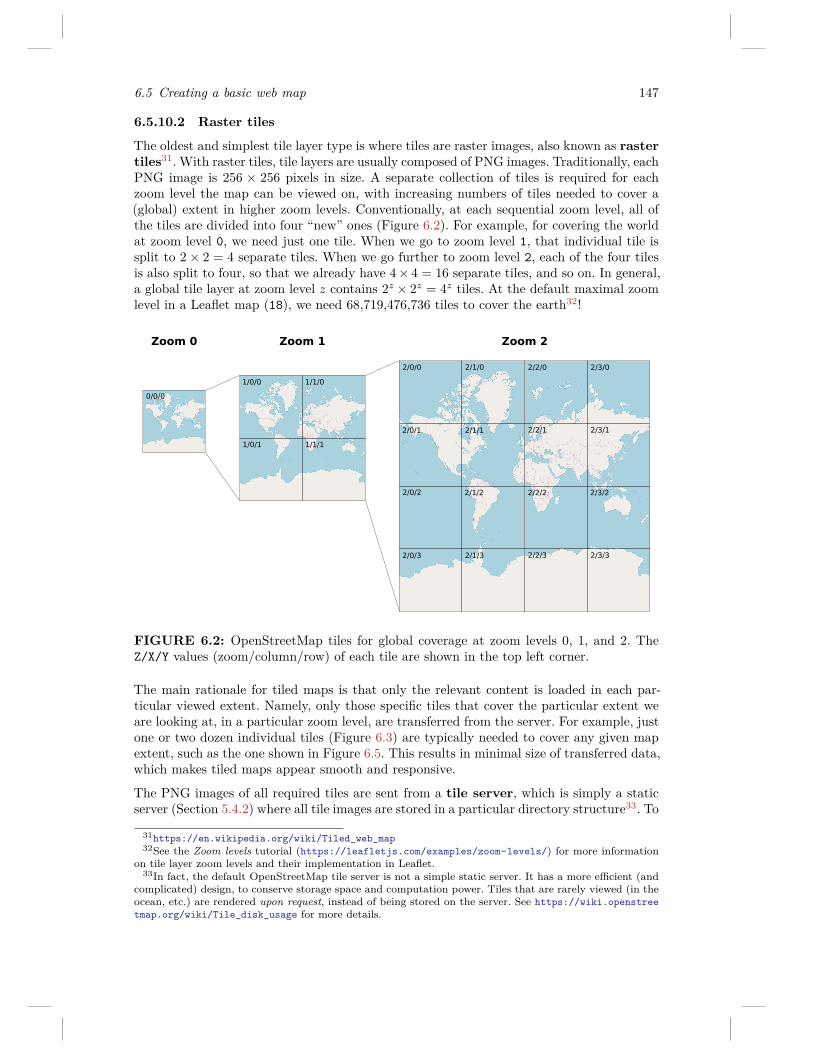
6.5 Creating a basic web map 147
6.5.10.2 Raster tiles
The oldest and simplest tile layer type is where tiles are raster images, also known as rastertiles31. With raster tiles, tile layers are usually composed of PNG images. Traditionally, eachPNG image is 256 × 256 pixels in size. A separate collection of tiles is required for eachzoom level the map can be viewed on, with increasing numbers of tiles needed to cover a(global) extent in higher zoom levels. Conventionally, at each sequential zoom level, all ofthe tiles are divided into four “new” ones (Figure 6.2). For example, for covering the worldat zoom level 0, we need just one tile. When we go to zoom level 1, that individual tile issplit to 2 × 2 = 4 separate tiles. When we go further to zoom level 2, each of the four tilesis also split to four, so that we already have 4 × 4 = 16 separate tiles, and so on. In general,a global tile layer at zoom level 𝑧 contains 2𝑧 × 2𝑧 = 4𝑧 tiles. At the default maximal zoomlevel in a Leaflet map (18), we need 68,719,476,736 tiles to cover the earth32!
0/0/0
1/0/0 1/1/0
1/0/1 1/1/1
2/0/0
2/0/1
2/0/2
2/0/3
2/1/0
2/1/1
2/1/2
2/1/3
2/2/0
2/2/1
2/2/2
2/2/3
2/3/0
2/3/1
2/3/2
2/3/3
Zoom 0 Zoom 1 Zoom 2
FIGURE 6.2: OpenStreetMap tiles for global coverage at zoom levels 0, 1, and 2. TheZ/X/Y values (zoom/column/row) of each tile are shown in the top left corner.
The main rationale for tiled maps is that only the relevant content is loaded in each par-ticular viewed extent. Namely, only those specific tiles that cover the particular extent weare looking at, in a particular zoom level, are transferred from the server. For example, justone or two dozen individual tiles (Figure 6.3) are typically needed to cover any given mapextent, such as the one shown in Figure 6.5. This results in minimal size of transferred data,which makes tiled maps appear smooth and responsive.
The PNG images of all required tiles are sent from a tile server, which is simply a staticserver (Section 5.4.2) where all tile images are stored in a particular directory structure33. To
31https://en.wikipedia.org/wiki/Tiled_web_map32See the Zoom levels tutorial (https://leafletjs.com/examples/zoom-levels/) for more information
on tile layer zoom levels and their implementation in Leaflet.33In fact, the default OpenStreetMap tile server is not a simple static server. It has a more efficient (and
complicated) design, to conserve storage space and computation power. Tiles that are rarely viewed (in theocean, etc.) are rendered upon request, instead of being stored on the server. See https://wiki.openstreetmap.org/wiki/Tile_disk_usage for more details.
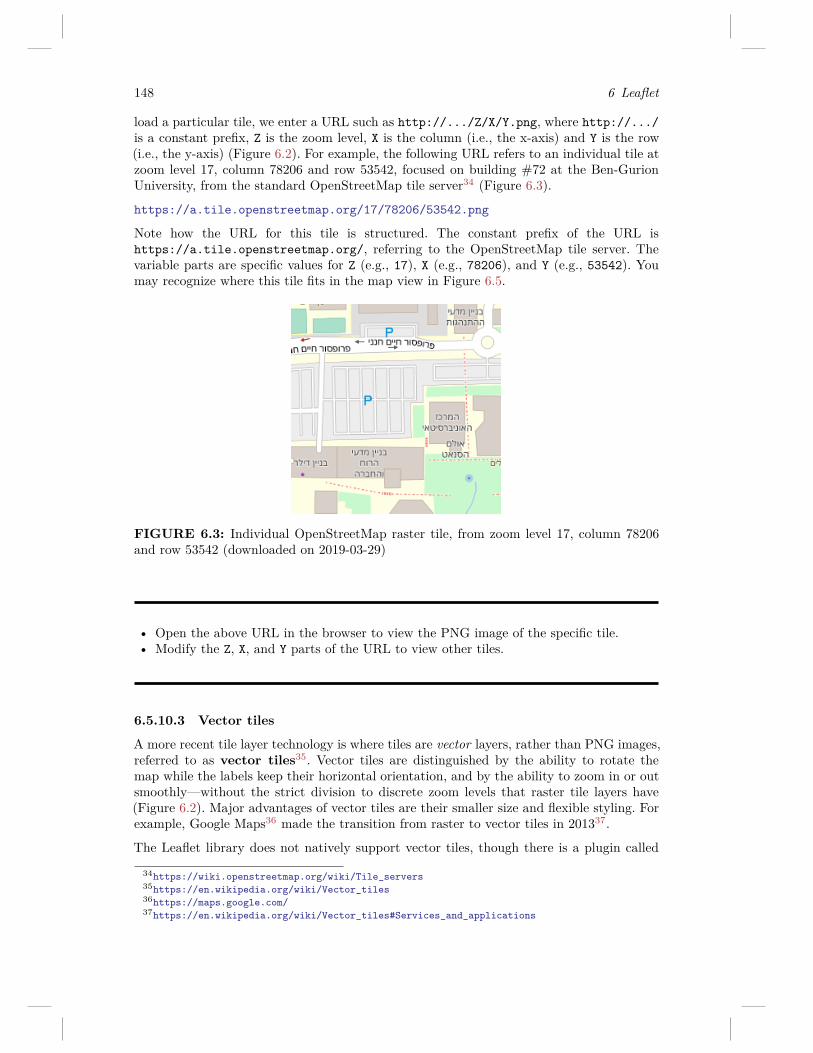
148 6 Leaflet
load a particular tile, we enter a URL such as http://.../Z/X/Y.png, where http://.../is a constant prefix, Z is the zoom level, X is the column (i.e., the x-axis) and Y is the row(i.e., the y-axis) (Figure 6.2). For example, the following URL refers to an individual tile atzoom level 17, column 78206 and row 53542, focused on building #72 at the Ben-GurionUniversity, from the standard OpenStreetMap tile server34 (Figure 6.3).
https://a.tile.openstreetmap.org/17/78206/53542.png
Note how the URL for this tile is structured. The constant prefix of the URL ishttps://a.tile.openstreetmap.org/, referring to the OpenStreetMap tile server. Thevariable parts are specific values for Z (e.g., 17), X (e.g., 78206), and Y (e.g., 53542). Youmay recognize where this tile fits in the map view in Figure 6.5.
FIGURE 6.3: Individual OpenStreetMap raster tile, from zoom level 17, column 78206and row 53542 (downloaded on 2019-03-29)
• Open the above URL in the browser to view the PNG image of the specific tile.• Modify the Z, X, and Y parts of the URL to view other tiles.
6.5.10.3 Vector tiles
A more recent tile layer technology is where tiles are vector layers, rather than PNG images,referred to as vector tiles35. Vector tiles are distinguished by the ability to rotate themap while the labels keep their horizontal orientation, and by the ability to zoom in or outsmoothly—without the strict division to discrete zoom levels that raster tile layers have(Figure 6.2). Major advantages of vector tiles are their smaller size and flexible styling. Forexample, Google Maps36 made the transition from raster to vector tiles in 201337.
The Leaflet library does not natively support vector tiles, though there is a plugin called
34https://wiki.openstreetmap.org/wiki/Tile_servers35https://en.wikipedia.org/wiki/Vector_tiles36https://maps.google.com/37https://en.wikipedia.org/wiki/Vector_tiles#Services_and_applications
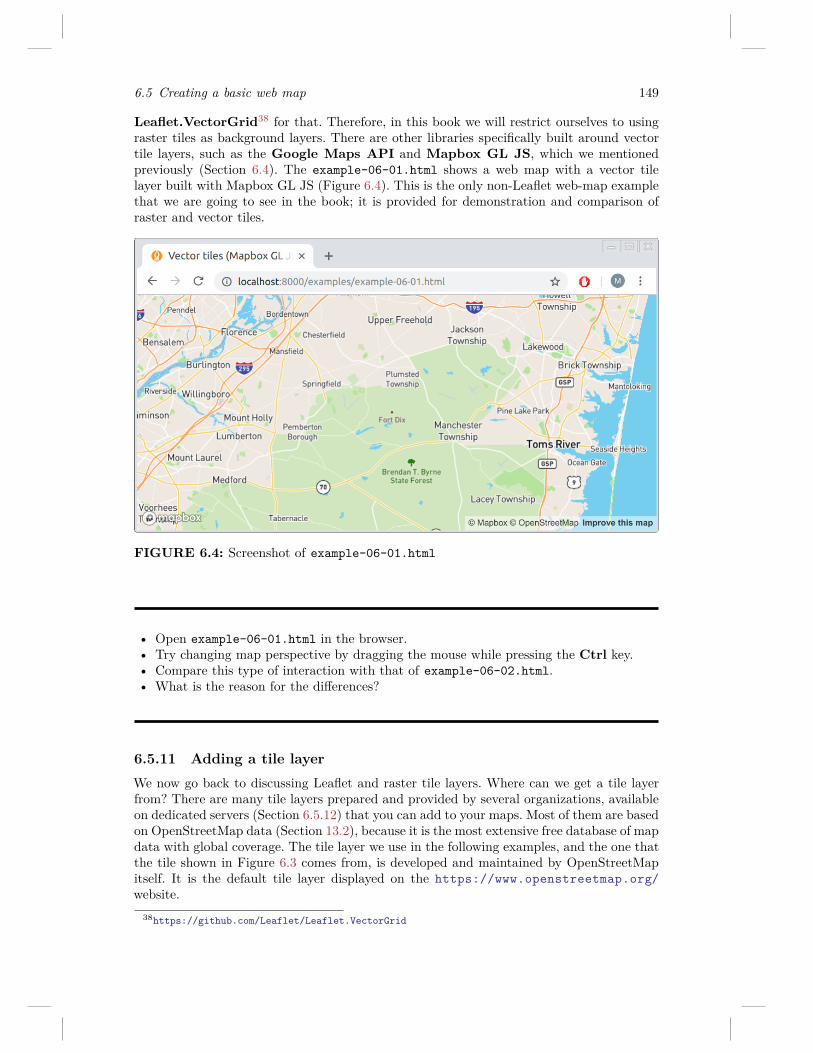
6.5 Creating a basic web map 149
Leaflet.VectorGrid38 for that. Therefore, in this book we will restrict ourselves to usingraster tiles as background layers. There are other libraries specifically built around vectortile layers, such as the Google Maps API and Mapbox GL JS, which we mentionedpreviously (Section 6.4). The example-06-01.html shows a web map with a vector tilelayer built with Mapbox GL JS (Figure 6.4). This is the only non-Leaflet web-map examplethat we are going to see in the book; it is provided for demonstration and comparison ofraster and vector tiles.
FIGURE 6.4: Screenshot of example-06-01.html
• Open example-06-01.html in the browser.• Try changing map perspective by dragging the mouse while pressing the Ctrl key.• Compare this type of interaction with that of example-06-02.html.• What is the reason for the differences?
6.5.11 Adding a tile layerWe now go back to discussing Leaflet and raster tile layers. Where can we get a tile layerfrom? There are many tile layers prepared and provided by several organizations, availableon dedicated servers (Section 6.5.12) that you can add to your maps. Most of them are basedon OpenStreetMap data (Section 13.2), because it is the most extensive free database of mapdata with global coverage. The tile layer we use in the following examples, and the one thatthe tile shown in Figure 6.3 comes from, is developed and maintained by OpenStreetMapitself. It is the default tile layer displayed on the https://www.openstreetmap.org/website.
38https://github.com/Leaflet/Leaflet.VectorGrid
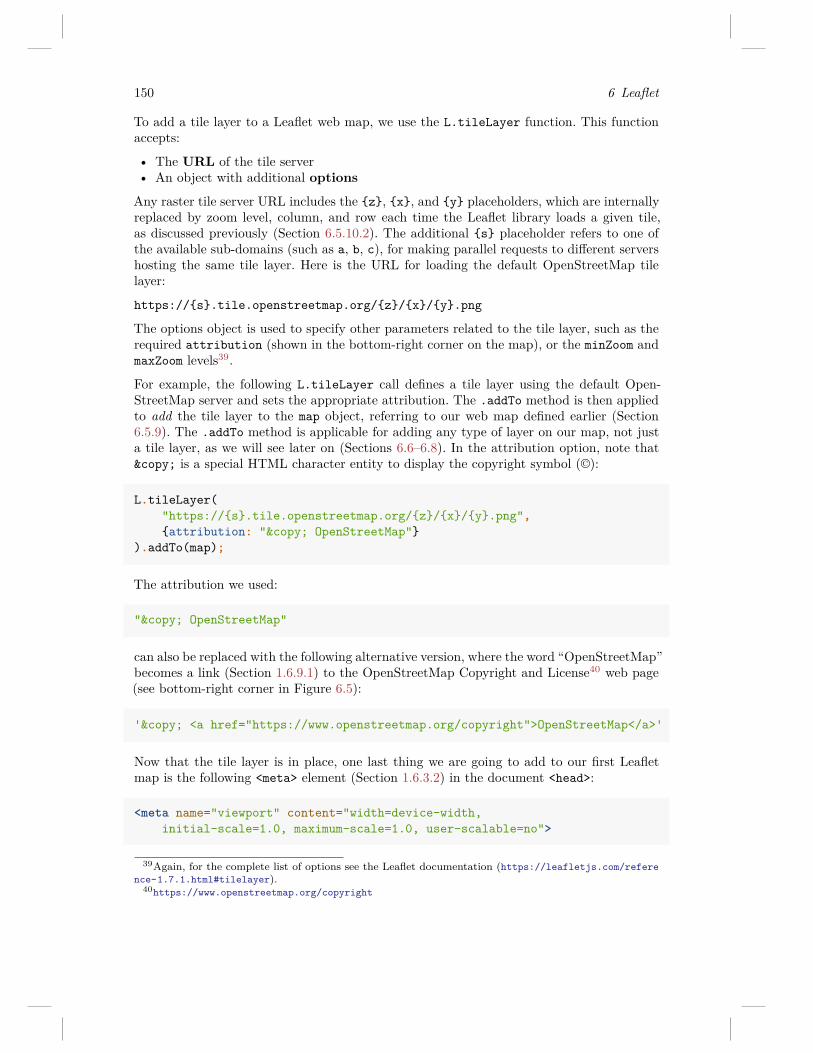
150 6 Leaflet
To add a tile layer to a Leaflet web map, we use the L.tileLayer function. This functionaccepts:
• The URL of the tile server• An object with additional options
Any raster tile server URL includes the {z}, {x}, and {y} placeholders, which are internallyreplaced by zoom level, column, and row each time the Leaflet library loads a given tile,as discussed previously (Section 6.5.10.2). The additional {s} placeholder refers to one ofthe available sub-domains (such as a, b, c), for making parallel requests to different servershosting the same tile layer. Here is the URL for loading the default OpenStreetMap tilelayer:
https://{s}.tile.openstreetmap.org/{z}/{x}/{y}.png
The options object is used to specify other parameters related to the tile layer, such as therequired attribution (shown in the bottom-right corner on the map), or the minZoom andmaxZoom levels39.
For example, the following L.tileLayer call defines a tile layer using the default Open-StreetMap server and sets the appropriate attribution. The .addTo method is then appliedto add the tile layer to the map object, referring to our web map defined earlier (Section6.5.9). The .addTo method is applicable for adding any type of layer on our map, not justa tile layer, as we will see later on (Sections 6.6–6.8). In the attribution option, note that© is a special HTML character entity to display the copyright symbol (©):
L.tileLayer("https://{s}.tile.openstreetmap.org/{z}/{x}/{y}.png",{attribution: "© OpenStreetMap"}
).addTo(map);
The attribution we used:
"© OpenStreetMap"
can also be replaced with the following alternative version, where the word “OpenStreetMap”becomes a link (Section 1.6.9.1) to the OpenStreetMap Copyright and License40 web page(see bottom-right corner in Figure 6.5):
'© <a href="https://www.openstreetmap.org/copyright">OpenStreetMap</a>'
Now that the tile layer is in place, one last thing we are going to add to our first Leafletmap is the following <meta> element (Section 1.6.3.2) in the document <head>:
<meta name="viewport" content="width=device-width,initial-scale=1.0, maximum-scale=1.0, user-scalable=no">
39Again, for the complete list of options see the Leaflet documentation (https://leafletjs.com/reference-1.7.1.html#tilelayer).
40https://www.openstreetmap.org/copyright
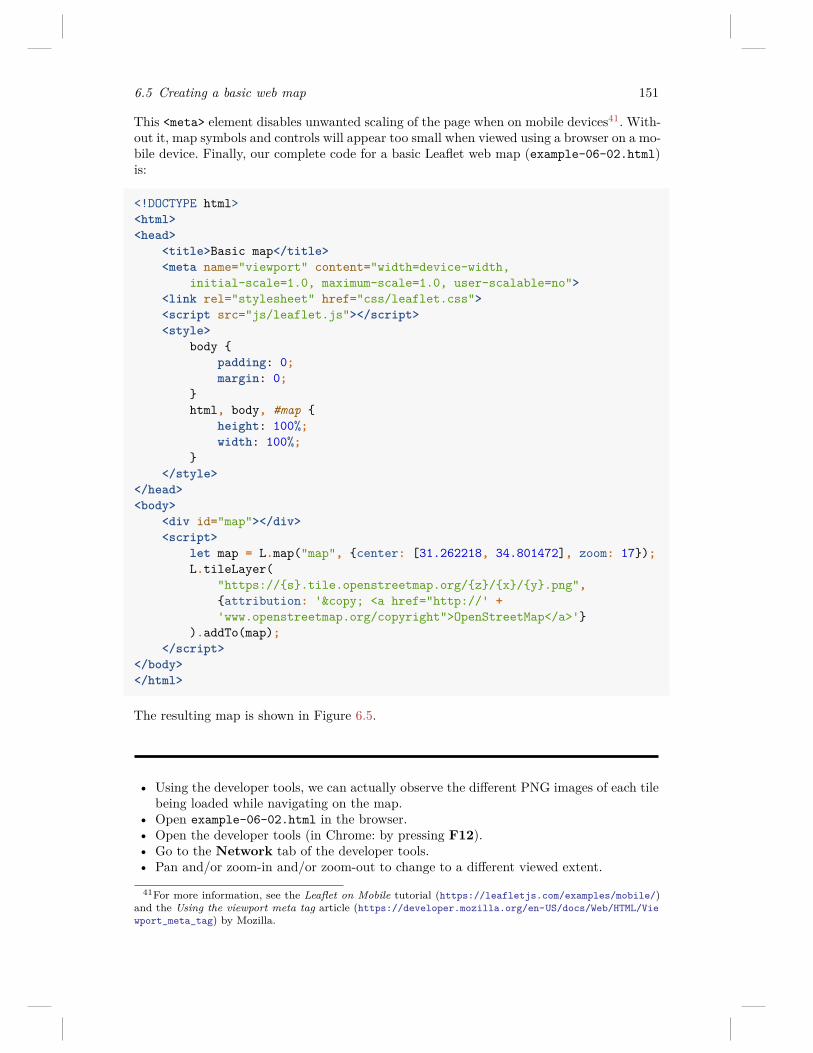
6.5 Creating a basic web map 151
This <meta> element disables unwanted scaling of the page when on mobile devices41. With-out it, map symbols and controls will appear too small when viewed using a browser on a mo-bile device. Finally, our complete code for a basic Leaflet web map (example-06-02.html)is:
<!DOCTYPE html><html><head>
<title>Basic map</title><meta name="viewport" content="width=device-width,
initial-scale=1.0, maximum-scale=1.0, user-scalable=no"><link rel="stylesheet" href="css/leaflet.css"><script src="js/leaflet.js"></script><style>
body {padding: 0;margin: 0;
}html, body, #map {
height: 100%;width: 100%;
}</style>
</head><body>
<div id="map"></div><script>
let map = L.map("map", {center: [31.262218, 34.801472], zoom: 17});L.tileLayer(
"https://{s}.tile.openstreetmap.org/{z}/{x}/{y}.png",{attribution: '© <a href="http://' +'www.openstreetmap.org/copyright">OpenStreetMap</a>'}
).addTo(map);</script>
</body></html>
The resulting map is shown in Figure 6.5.
• Using the developer tools, we can actually observe the different PNG images of each tilebeing loaded while navigating on the map.
• Open example-06-02.html in the browser.• Open the developer tools (in Chrome: by pressing F12).• Go to the Network tab of the developer tools.• Pan and/or zoom-in and/or zoom-out to change to a different viewed extent.
41For more information, see the Leaflet on Mobile tutorial (https://leafletjs.com/examples/mobile/)and the Using the viewport meta tag article (https://developer.mozilla.org/en-US/docs/Web/HTML/Viewport_meta_tag) by Mozilla.
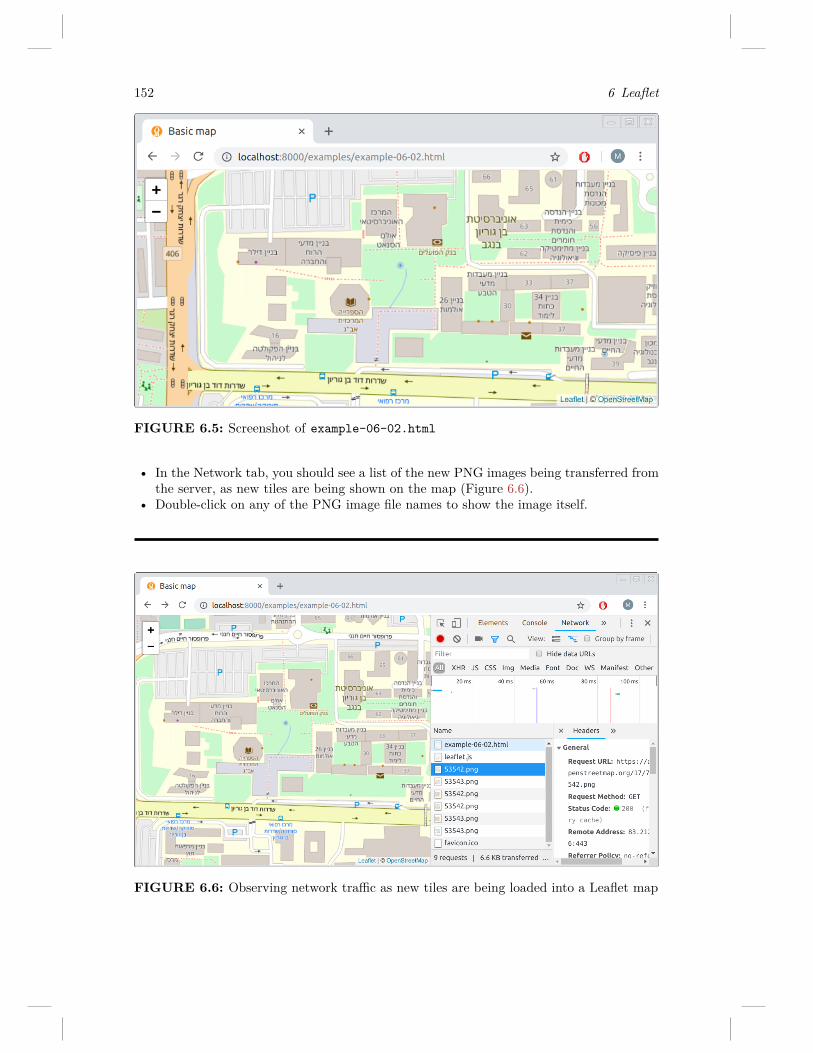
152 6 Leaflet
FIGURE 6.5: Screenshot of example-06-02.html
• In the Network tab, you should see a list of the new PNG images being transferred fromthe server, as new tiles are being shown on the map (Figure 6.6).
• Double-click on any of the PNG image file names to show the image itself.
FIGURE 6.6: Observing network traffic as new tiles are being loaded into a Leaflet map
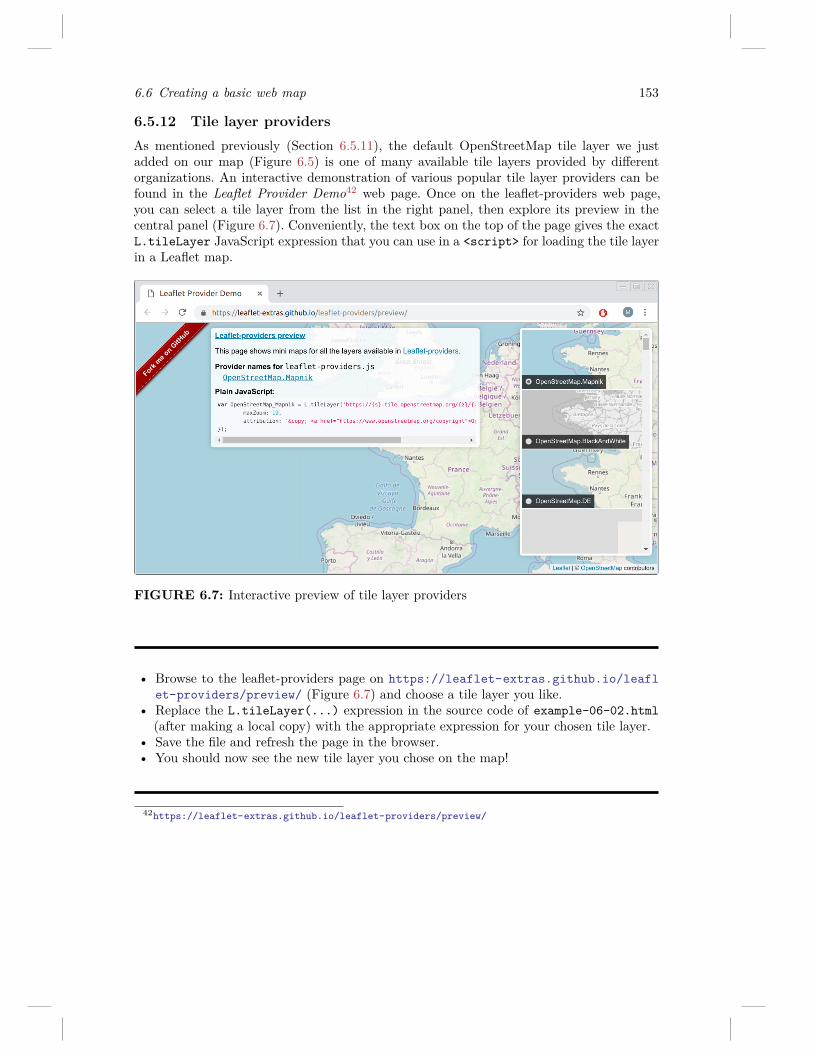
6.6 Creating a basic web map 153
6.5.12 Tile layer providersAs mentioned previously (Section 6.5.11), the default OpenStreetMap tile layer we justadded on our map (Figure 6.5) is one of many available tile layers provided by differentorganizations. An interactive demonstration of various popular tile layer providers can befound in the Leaflet Provider Demo42 web page. Once on the leaflet-providers web page,you can select a tile layer from the list in the right panel, then explore its preview in thecentral panel (Figure 6.7). Conveniently, the text box on the top of the page gives the exactL.tileLayer JavaScript expression that you can use in a <script> for loading the tile layerin a Leaflet map.
FIGURE 6.7: Interactive preview of tile layer providers
• Browse to the leaflet-providers page on https://leaflet-extras.github.io/leaflet-providers/preview/ (Figure 6.7) and choose a tile layer you like.
• Replace the L.tileLayer(...) expression in the source code of example-06-02.html(after making a local copy) with the appropriate expression for your chosen tile layer.
• Save the file and refresh the page in the browser.• You should now see the new tile layer you chose on the map!
42https://leaflet-extras.github.io/leaflet-providers/preview/
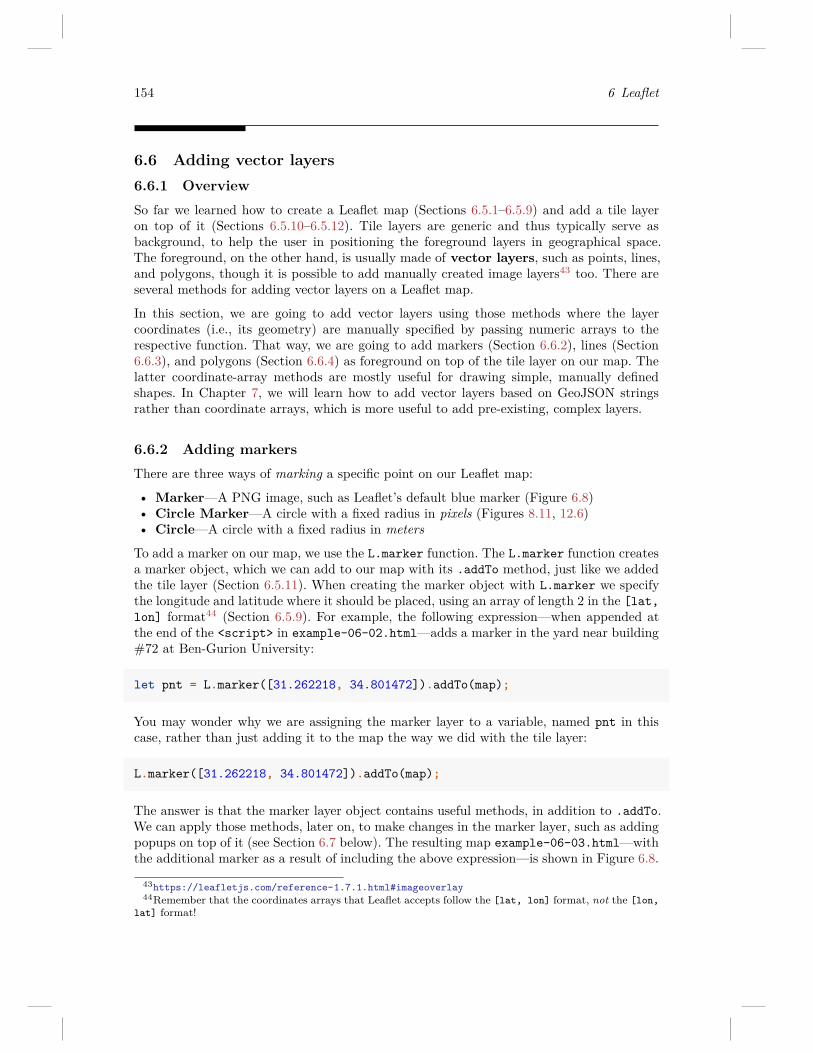
154 6 Leaflet
6.6 Adding vector layers6.6.1 OverviewSo far we learned how to create a Leaflet map (Sections 6.5.1–6.5.9) and add a tile layeron top of it (Sections 6.5.10–6.5.12). Tile layers are generic and thus typically serve asbackground, to help the user in positioning the foreground layers in geographical space.The foreground, on the other hand, is usually made of vector layers, such as points, lines,and polygons, though it is possible to add manually created image layers43 too. There areseveral methods for adding vector layers on a Leaflet map.
In this section, we are going to add vector layers using those methods where the layercoordinates (i.e., its geometry) are manually specified by passing numeric arrays to therespective function. That way, we are going to add markers (Section 6.6.2), lines (Section6.6.3), and polygons (Section 6.6.4) as foreground on top of the tile layer on our map. Thelatter coordinate-array methods are mostly useful for drawing simple, manually definedshapes. In Chapter 7, we will learn how to add vector layers based on GeoJSON stringsrather than coordinate arrays, which is more useful to add pre-existing, complex layers.
6.6.2 Adding markersThere are three ways of marking a specific point on our Leaflet map:
• Marker—A PNG image, such as Leaflet’s default blue marker (Figure 6.8)• Circle Marker—A circle with a fixed radius in pixels (Figures 8.11, 12.6)• Circle—A circle with a fixed radius in meters
To add a marker on our map, we use the L.marker function. The L.marker function createsa marker object, which we can add to our map with its .addTo method, just like we addedthe tile layer (Section 6.5.11). When creating the marker object with L.marker we specifythe longitude and latitude where it should be placed, using an array of length 2 in the [lat,lon] format44 (Section 6.5.9). For example, the following expression—when appended atthe end of the <script> in example-06-02.html—adds a marker in the yard near building#72 at Ben-Gurion University:
let pnt = L.marker([31.262218, 34.801472]).addTo(map);
You may wonder why we are assigning the marker layer to a variable, named pnt in thiscase, rather than just adding it to the map the way we did with the tile layer:
L.marker([31.262218, 34.801472]).addTo(map);
The answer is that the marker layer object contains useful methods, in addition to .addTo.We can apply those methods, later on, to make changes in the marker layer, such as addingpopups on top of it (see Section 6.7 below). The resulting map example-06-03.html—withthe additional marker as a result of including the above expression—is shown in Figure 6.8.
43https://leafletjs.com/reference-1.7.1.html#imageoverlay44Remember that the coordinates arrays that Leaflet accepts follow the [lat, lon] format, not the [lon,
lat] format!
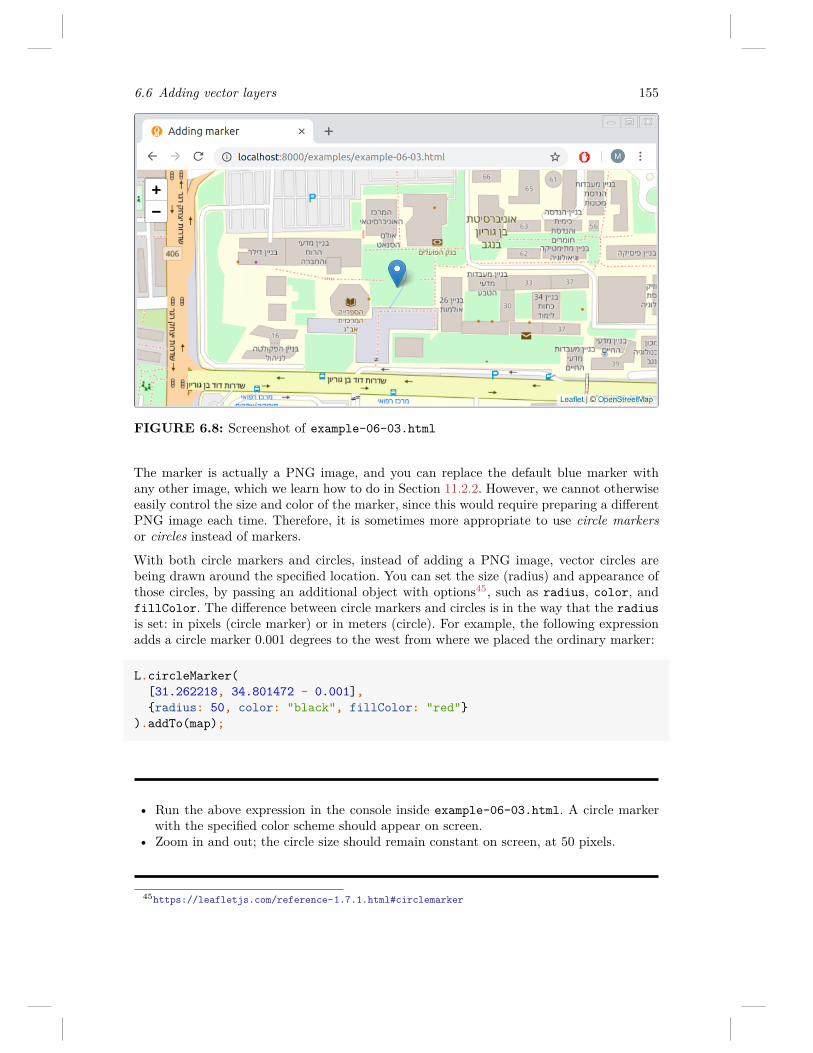
6.6 Adding vector layers 155
FIGURE 6.8: Screenshot of example-06-03.html
The marker is actually a PNG image, and you can replace the default blue marker withany other image, which we learn how to do in Section 11.2.2. However, we cannot otherwiseeasily control the size and color of the marker, since this would require preparing a differentPNG image each time. Therefore, it is sometimes more appropriate to use circle markersor circles instead of markers.
With both circle markers and circles, instead of adding a PNG image, vector circles arebeing drawn around the specified location. You can set the size (radius) and appearance ofthose circles, by passing an additional object with options45, such as radius, color, andfillColor. The difference between circle markers and circles is in the way that the radiusis set: in pixels (circle marker) or in meters (circle). For example, the following expressionadds a circle marker 0.001 degrees to the west from where we placed the ordinary marker:
L.circleMarker([31.262218, 34.801472 - 0.001],{radius: 50, color: "black", fillColor: "red"}
).addTo(map);
• Run the above expression in the console inside example-06-03.html. A circle markerwith the specified color scheme should appear on screen.
• Zoom in and out; the circle size should remain constant on screen, at 50 pixels.
45https://leafletjs.com/reference-1.7.1.html#circlemarker
156 6 Leaflet
Remember that in circle markers, created with L.circleMarker, the radius property isgiven in pixels (e.g., 50), which means the circle marker maintains constant size on screen,irrespective of zoom level. In circles, created using L.circle, the radius is set in meters,which means the circle size maintains constant spatial extent, expanding or shrinking as wezoom in or out.
6.6.3 Adding linesTo add a line on our map, we use the L.polyline function. Since a line is composed ofseveral points, we specify the series of point coordinates the line goes through as an arrayof coordinate arrays. The internal arrays, i.e., the point coordinates, are specified just likemarker coordinates, in the [lat, lon] format. In the following example, we are constructinga line that has just two points, but there could be many more points when making a morecomplex line. The line is drawn in the order given by the array, from the first point to thelast one.
We can specify the appearance of the line, much like with the circle marker (Section 6.6.2),by setting various options such as line color and weight (i.e., width, in pixels). In case weare not passing any options, a default light blue 3px line will be drawn. In the followingexample, we override the default color and weight options, setting them to "red" and 10,respectively:
let line = L.polyline([[31.262705, 34.800514], [31.262053, 34.800782]],{color: "red", weight: 10}
).addTo(map);
Note that the list of relevant options differs between different layer types, so once more youare referred to the documentation46 to check which properties may be modified for eachparticular layer type. For example, the radius option which we used for a circle marker isirrelevant for lines.
The resulting map example-06-04.html, now with both a marker and a line, is shown inFigure 6.9.
It is also possible to draw a multi-part line (Table 7.3) with L.polyline, by passing anarray of separate line segments: an array of arrays of arrays. We will not elaborate on thisoption here, because this type of more complex multi-part shapes are usually loaded fromexisting GeoJSON layers (Chapter 7).
6.6.4 Adding polygonsAdding a polygon is very similar to adding a line, only that we use the L.polygon functioninstead of L.polyline. Like L.polyline, the L.polygon function also accepts an array ofpoint coordinates the polygon consists of. Again, the polygon is drawn in the given order,from first node to last. Note that the array is not expected to have the last point repeatingthe first one, to “close” the shape (unlike in the GeoJSON format; see Section 7.3.2.2).
Like with circle markers, it is useful to define the border color and fill color of polygons, whichcan be done using the color and fillColor properties of the options object, respectively.
46https://leafletjs.com/reference-1.7.1.html#polyline
6.6 Adding vector layers 157
FIGURE 6.9: Screenshot of example-06-04.html
For example, the following expression adds a polygon that has four nodes, with red border,yellow fill, and 4px border width:
let pol = L.polygon([[31.263127, 34.803668],[31.262503, 34.803089],[31.261733, 34.803561],[31.262448, 34.804752]
],{color: "red", fillColor: "yellow", weight: 4}
).addTo(map);
The resulting map example-06-05.html, now with a marker, a line, and a polygon, is shownin Figure 6.10. Similarly to what we mentioned concerning lines (Section 6.6.3), it is alsopossible to use L.polygon to add more complex polygons such as multi-part polygons orpolygons with holes (Table 7.3). As mentioned previously, we will use the GeoJSON formatfor adding such complex shapes (Chapter 7).
6.6.5 Other layer typesSo far we mentioned about half of the commonly used types of layers in Leaflet47, as listedin the first six lines of Table 6.2. We haven’t mentioned the rectangle layer, but this ispractically a specific case of a polygon layer (Section 6.6.4) so there is not much to say
47The complete list of Leaflet layer types is given in the Leaflet documentation (https://leafletjs.com/reference-1.7.1.html).
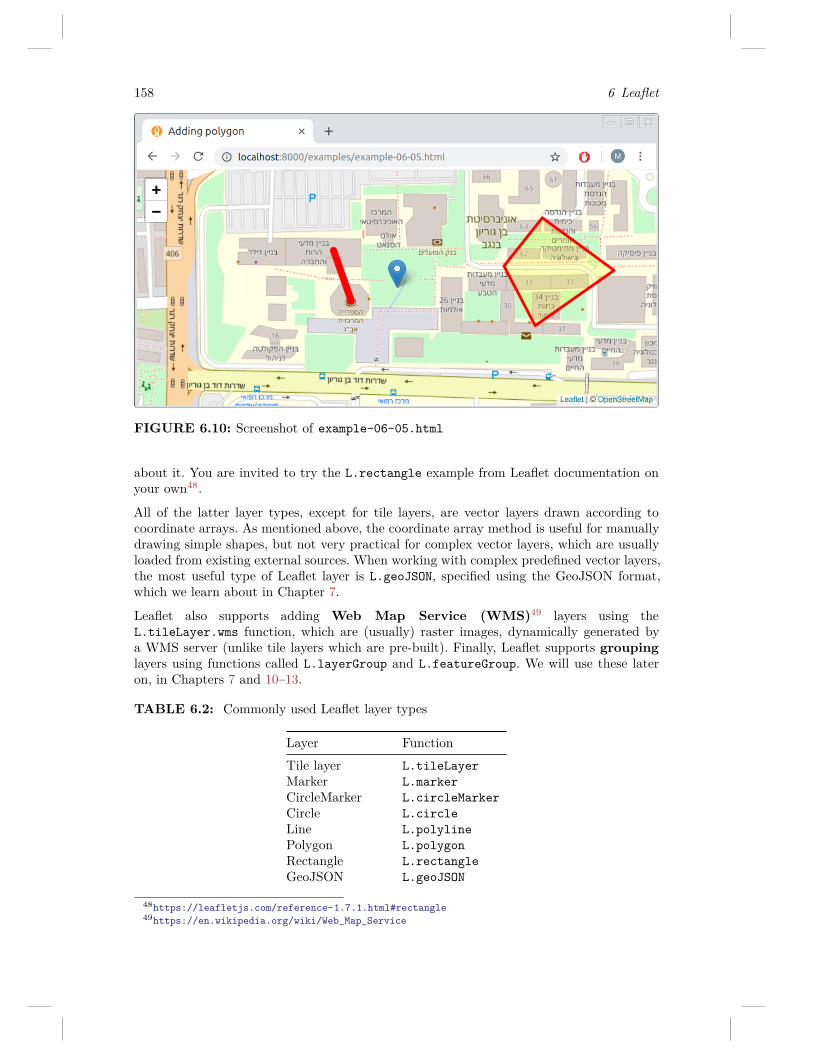
158 6 Leaflet
FIGURE 6.10: Screenshot of example-06-05.html
about it. You are invited to try the L.rectangle example from Leaflet documentation onyour own48.
All of the latter layer types, except for tile layers, are vector layers drawn according tocoordinate arrays. As mentioned above, the coordinate array method is useful for manuallydrawing simple shapes, but not very practical for complex vector layers, which are usuallyloaded from existing external sources. When working with complex predefined vector layers,the most useful type of Leaflet layer is L.geoJSON, specified using the GeoJSON format,which we learn about in Chapter 7.
Leaflet also supports adding Web Map Service (WMS)49 layers using theL.tileLayer.wms function, which are (usually) raster images, dynamically generated bya WMS server (unlike tile layers which are pre-built). Finally, Leaflet supports groupinglayers using functions called L.layerGroup and L.featureGroup. We will use these lateron, in Chapters 7 and 10–13.
TABLE 6.2: Commonly used Leaflet layer types
Layer FunctionTile layer L.tileLayerMarker L.markerCircleMarker L.circleMarkerCircle L.circleLine L.polylinePolygon L.polygonRectangle L.rectangleGeoJSON L.geoJSON
48https://leafletjs.com/reference-1.7.1.html#rectangle49https://en.wikipedia.org/wiki/Web_Map_Service
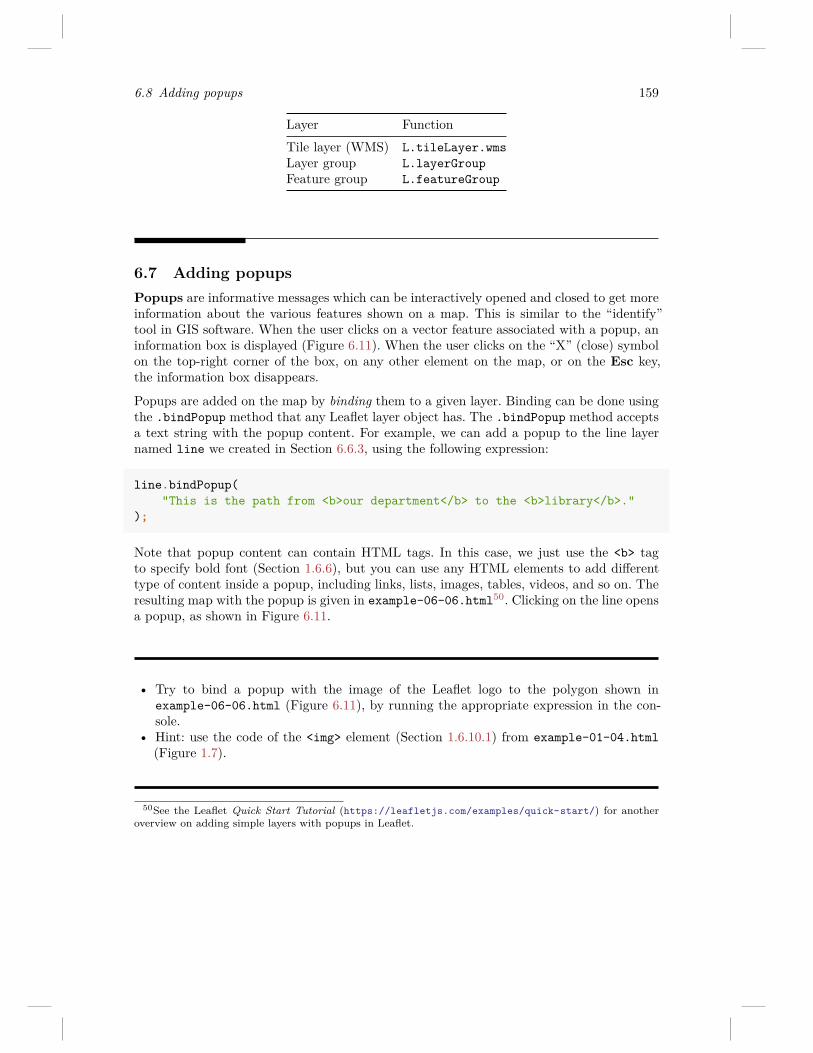
6.8 Adding popups 159
Layer FunctionTile layer (WMS) L.tileLayer.wmsLayer group L.layerGroupFeature group L.featureGroup
6.7 Adding popupsPopups are informative messages which can be interactively opened and closed to get moreinformation about the various features shown on a map. This is similar to the “identify”tool in GIS software. When the user clicks on a vector feature associated with a popup, aninformation box is displayed (Figure 6.11). When the user clicks on the “X” (close) symbolon the top-right corner of the box, on any other element on the map, or on the Esc key,the information box disappears.
Popups are added on the map by binding them to a given layer. Binding can be done usingthe .bindPopup method that any Leaflet layer object has. The .bindPopup method acceptsa text string with the popup content. For example, we can add a popup to the line layernamed line we created in Section 6.6.3, using the following expression:
line.bindPopup("This is the path from <b>our department</b> to the <b>library</b>."
);
Note that popup content can contain HTML tags. In this case, we just use the <b> tagto specify bold font (Section 1.6.6), but you can use any HTML elements to add differenttype of content inside a popup, including links, lists, images, tables, videos, and so on. Theresulting map with the popup is given in example-06-06.html50. Clicking on the line opensa popup, as shown in Figure 6.11.
• Try to bind a popup with the image of the Leaflet logo to the polygon shown inexample-06-06.html (Figure 6.11), by running the appropriate expression in the con-sole.
• Hint: use the code of the <img> element (Section 1.6.10.1) from example-01-04.html(Figure 1.7).
50See the Leaflet Quick Start Tutorial (https://leafletjs.com/examples/quick-start/) for anotheroverview on adding simple layers with popups in Leaflet.
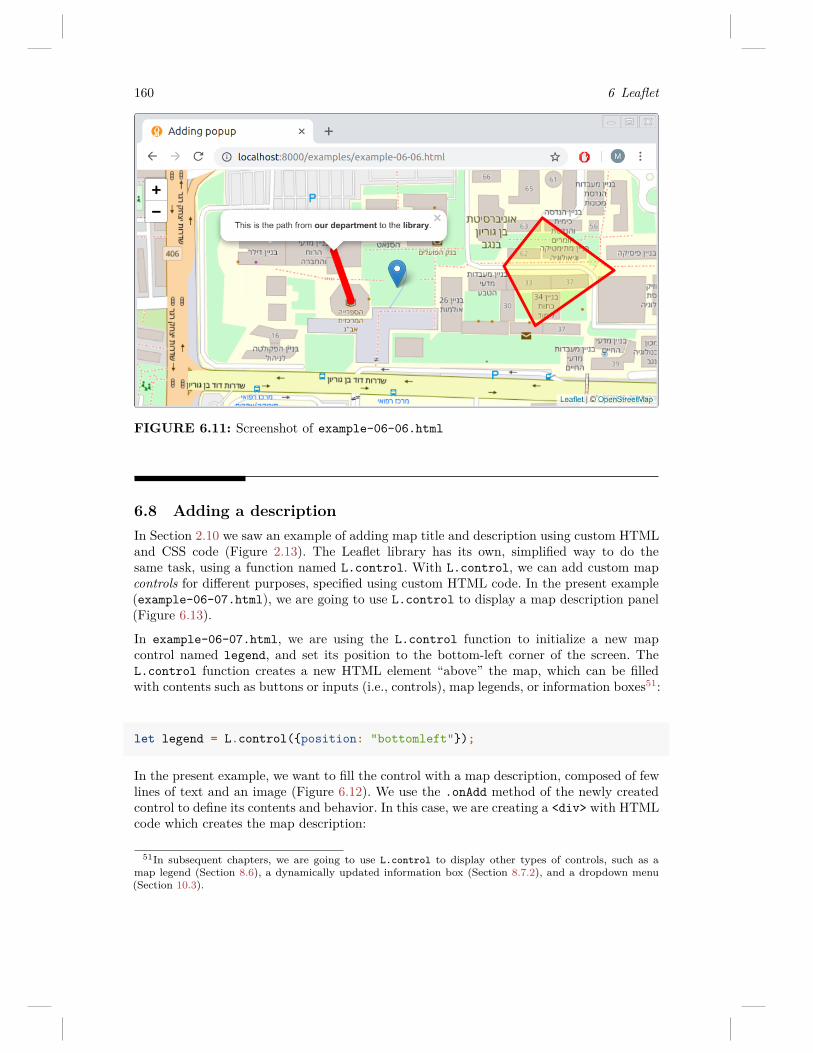
160 6 Leaflet
FIGURE 6.11: Screenshot of example-06-06.html
6.8 Adding a descriptionIn Section 2.10 we saw an example of adding map title and description using custom HTMLand CSS code (Figure 2.13). The Leaflet library has its own, simplified way to do thesame task, using a function named L.control. With L.control, we can add custom mapcontrols for different purposes, specified using custom HTML code. In the present example(example-06-07.html), we are going to use L.control to display a map description panel(Figure 6.13).
In example-06-07.html, we are using the L.control function to initialize a new mapcontrol named legend, and set its position to the bottom-left corner of the screen. TheL.control function creates a new HTML element “above” the map, which can be filledwith contents such as buttons or inputs (i.e., controls), map legends, or information boxes51:
let legend = L.control({position: "bottomleft"});
In the present example, we want to fill the control with a map description, composed of fewlines of text and an image (Figure 6.12). We use the .onAdd method of the newly createdcontrol to define its contents and behavior. In this case, we are creating a <div> with HTMLcode which creates the map description:
51In subsequent chapters, we are going to use L.control to display other types of controls, such as amap legend (Section 8.6), a dynamically updated information box (Section 8.7.2), and a dropdown menu(Section 10.3).
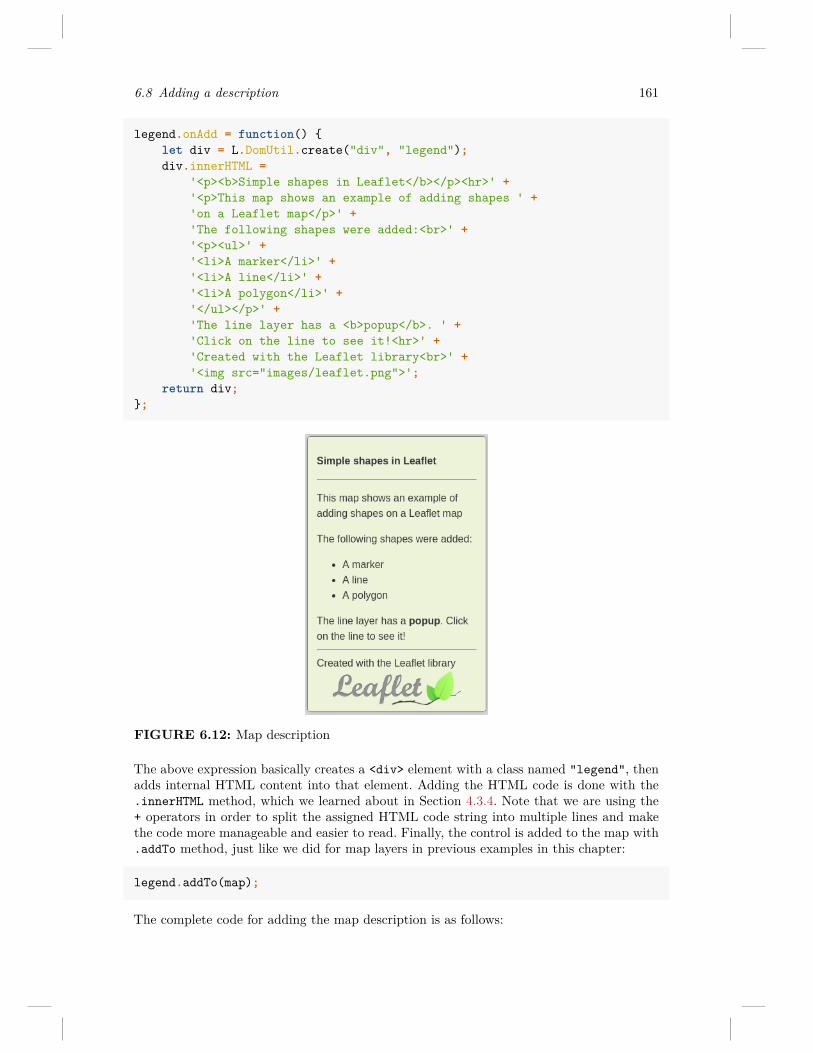
6.8 Adding a description 161
legend.onAdd = function() {let div = L.DomUtil.create("div", "legend");div.innerHTML =
'<p><b>Simple shapes in Leaflet</b></p><hr>' +'<p>This map shows an example of adding shapes ' +'on a Leaflet map</p>' +'The following shapes were added:<br>' +'<p><ul>' +'<li>A marker</li>' +'<li>A line</li>' +'<li>A polygon</li>' +'</ul></p>' +'The line layer has a <b>popup</b>. ' +'Click on the line to see it!<hr>' +'Created with the Leaflet library<br>' +'<img src="images/leaflet.png">';
return div;};
FIGURE 6.12: Map description
The above expression basically creates a <div> element with a class named "legend", thenadds internal HTML content into that element. Adding the HTML code is done with the.innerHTML method, which we learned about in Section 4.3.4. Note that we are using the+ operators in order to split the assigned HTML code string into multiple lines and makethe code more manageable and easier to read. Finally, the control is added to the map with.addTo method, just like we did for map layers in previous examples in this chapter:
legend.addTo(map);
The complete code for adding the map description is as follows:
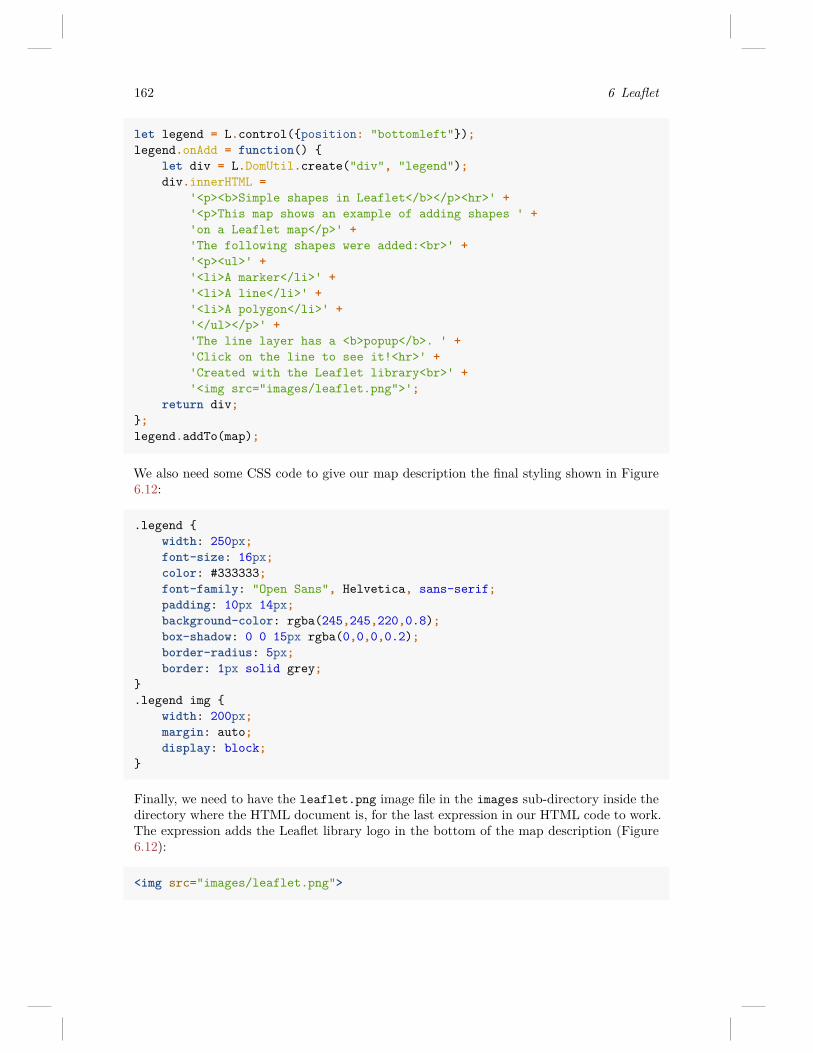
162 6 Leaflet
let legend = L.control({position: "bottomleft"});legend.onAdd = function() {
let div = L.DomUtil.create("div", "legend");div.innerHTML =
'<p><b>Simple shapes in Leaflet</b></p><hr>' +'<p>This map shows an example of adding shapes ' +'on a Leaflet map</p>' +'The following shapes were added:<br>' +'<p><ul>' +'<li>A marker</li>' +'<li>A line</li>' +'<li>A polygon</li>' +'</ul></p>' +'The line layer has a <b>popup</b>. ' +'Click on the line to see it!<hr>' +'Created with the Leaflet library<br>' +'<img src="images/leaflet.png">';
return div;};legend.addTo(map);
We also need some CSS code to give our map description the final styling shown in Figure6.12:
.legend {width: 250px;font-size: 16px;color: #333333;font-family: "Open Sans", Helvetica, sans-serif;padding: 10px 14px;background-color: rgba(245,245,220,0.8);box-shadow: 0 0 15px rgba(0,0,0,0.2);border-radius: 5px;border: 1px solid grey;
}.legend img {
width: 200px;margin: auto;display: block;
}
Finally, we need to have the leaflet.png image file in the images sub-directory inside thedirectory where the HTML document is, for the last expression in our HTML code to work.The expression adds the Leaflet library logo in the bottom of the map description (Figure6.12):
<img src="images/leaflet.png">
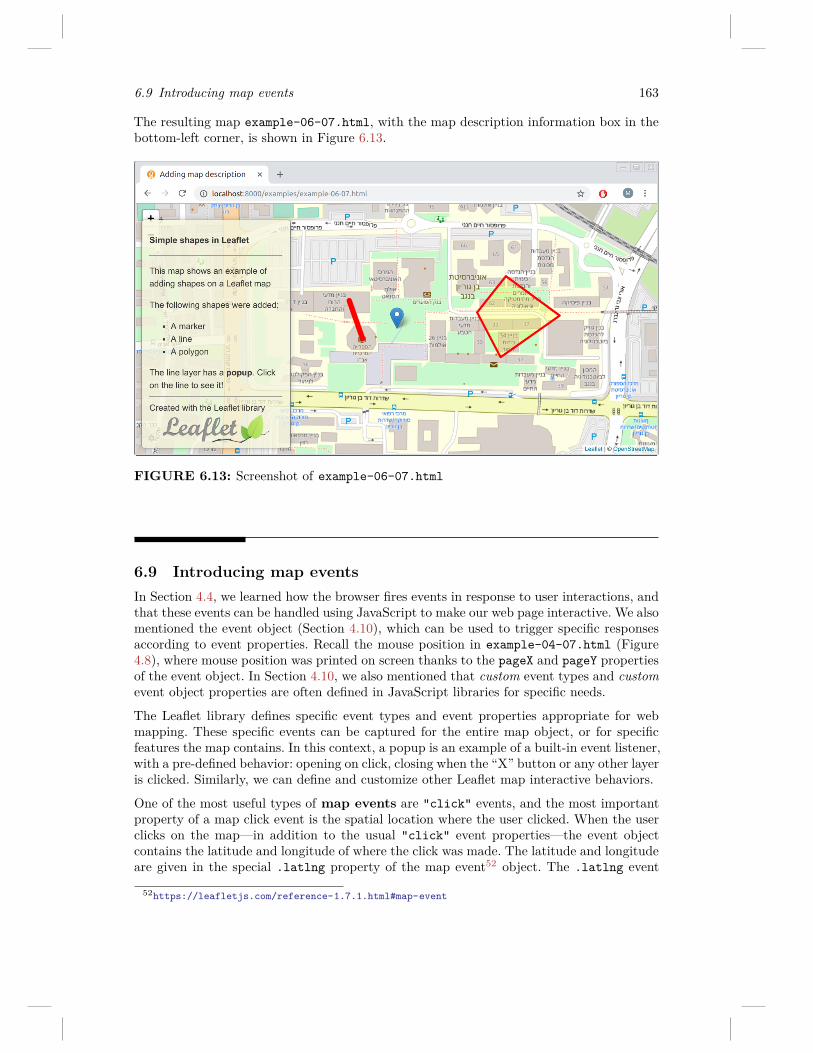
6.9 Introducing map events 163
The resulting map example-06-07.html, with the map description information box in thebottom-left corner, is shown in Figure 6.13.
FIGURE 6.13: Screenshot of example-06-07.html
6.9 Introducing map eventsIn Section 4.4, we learned how the browser fires events in response to user interactions, andthat these events can be handled using JavaScript to make our web page interactive. We alsomentioned the event object (Section 4.10), which can be used to trigger specific responsesaccording to event properties. Recall the mouse position in example-04-07.html (Figure4.8), where mouse position was printed on screen thanks to the pageX and pageY propertiesof the event object. In Section 4.10, we also mentioned that custom event types and customevent object properties are often defined in JavaScript libraries for specific needs.
The Leaflet library defines specific event types and event properties appropriate for webmapping. These specific events can be captured for the entire map object, or for specificfeatures the map contains. In this context, a popup is an example of a built-in event listener,with a pre-defined behavior: opening on click, closing when the “X” button or any other layeris clicked. Similarly, we can define and customize other Leaflet map interactive behaviors.
One of the most useful types of map events are "click" events, and the most importantproperty of a map click event is the spatial location where the user clicked. When the userclicks on the map—in addition to the usual "click" event properties—the event objectcontains the latitude and longitude of where the click was made. The latitude and longitudeare given in the special .latlng property of the map event52 object. The .latlng event
52https://leafletjs.com/reference-1.7.1.html#map-event
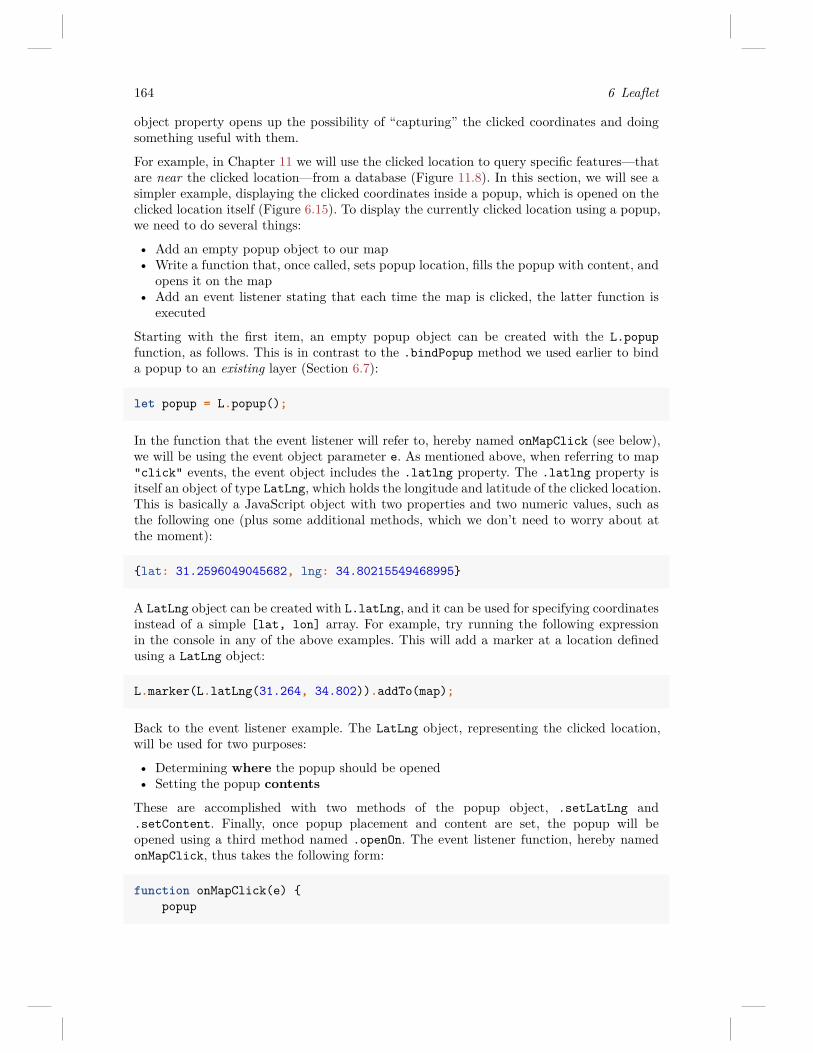
164 6 Leaflet
object property opens up the possibility of “capturing” the clicked coordinates and doingsomething useful with them.
For example, in Chapter 11 we will use the clicked location to query specific features—thatare near the clicked location—from a database (Figure 11.8). In this section, we will see asimpler example, displaying the clicked coordinates inside a popup, which is opened on theclicked location itself (Figure 6.15). To display the currently clicked location using a popup,we need to do several things:
• Add an empty popup object to our map• Write a function that, once called, sets popup location, fills the popup with content, and
opens it on the map• Add an event listener stating that each time the map is clicked, the latter function is
executed
Starting with the first item, an empty popup object can be created with the L.popupfunction, as follows. This is in contrast to the .bindPopup method we used earlier to binda popup to an existing layer (Section 6.7):
let popup = L.popup();
In the function that the event listener will refer to, hereby named onMapClick (see below),we will be using the event object parameter e. As mentioned above, when referring to map"click" events, the event object includes the .latlng property. The .latlng property isitself an object of type LatLng, which holds the longitude and latitude of the clicked location.This is basically a JavaScript object with two properties and two numeric values, such asthe following one (plus some additional methods, which we don’t need to worry about atthe moment):
{lat: 31.2596049045682, lng: 34.80215549468995}
A LatLng object can be created with L.latLng, and it can be used for specifying coordinatesinstead of a simple [lat, lon] array. For example, try running the following expressionin the console in any of the above examples. This will add a marker at a location definedusing a LatLng object:
L.marker(L.latLng(31.264, 34.802)).addTo(map);
Back to the event listener example. The LatLng object, representing the clicked location,will be used for two purposes:
• Determining where the popup should be opened• Setting the popup contents
These are accomplished with two methods of the popup object, .setLatLng and.setContent. Finally, once popup placement and content are set, the popup will beopened using a third method named .openOn. The event listener function, hereby namedonMapClick, thus takes the following form:
function onMapClick(e) {popup
6.9 Introducing map events 165
.setLatLng(e.latlng)
.setContent("You clicked the map at -<br>" +"<b>lon:</b> " + e.latlng.lng + "<br>" +"<b>lat:</b> " + e.latlng.lat
).openOn(map);
}
To better understand what this function does, try running the following code in the consolein one of the Leaflet examples from this chapter:
let myLocation = L.latLng(31.264, 34.802);L.popup()
.setLatLng(myLocation)
.setContent("You clicked the map at -<br>" +"<b>lon:</b> " + myLocation.lng + "<br>" +"<b>lat:</b> " + myLocation.lat
).openOn(map);
This is basically the same code as the body of the onMapClick function, only that insteadof e.latlng we used a specific LatLng instance, named myLocation. As a result of runningthis code section, you should see a popup with the content shown in Figure 6.14, opened atthe location specified by L.latLng(31.264, 34.802).
FIGURE 6.14: A popup displaying clicked location coordinates
Finally, we add an event listener (Section 4.4) specifying that the onMapClick functionshould be executed on map click. Note that in this case the element responding to the eventis the entire map, so that any click inside the map triggers the onMapClick function53:
map.addEventListener("click", onMapClick);
The complete code we need to add to a basic Leaflet map, so that clicked coordinates aredisplayed in a popup, is shown on the following page:
53The .on method—which you may encounter in the Leaflet tutorials and other code examples—is identicalto the .addEventListener method. Either one can be used to bind event listeners in Leaflet. In this book,we will be using .addEventListener for uniformity with the plain JavaScript syntax (Section 4.4).
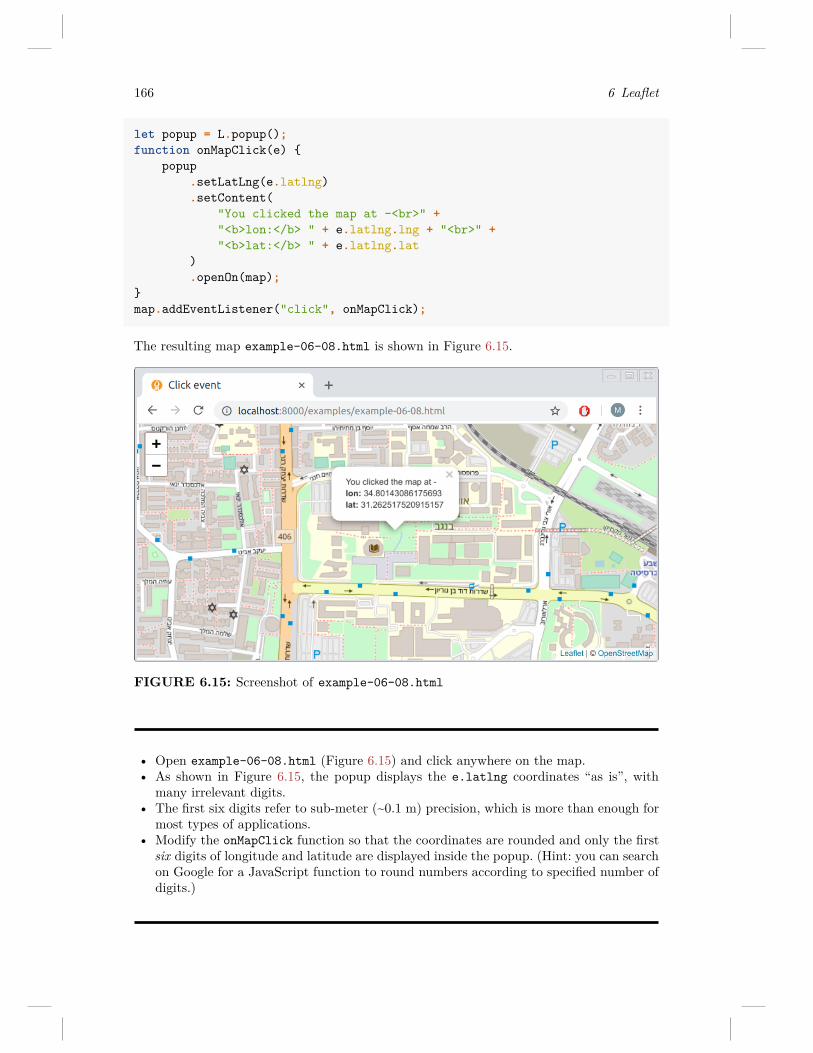
166 6 Leaflet
let popup = L.popup();function onMapClick(e) {
popup.setLatLng(e.latlng).setContent(
"You clicked the map at -<br>" +"<b>lon:</b> " + e.latlng.lng + "<br>" +"<b>lat:</b> " + e.latlng.lat
).openOn(map);
}map.addEventListener("click", onMapClick);
The resulting map example-06-08.html is shown in Figure 6.15.
FIGURE 6.15: Screenshot of example-06-08.html
• Open example-06-08.html (Figure 6.15) and click anywhere on the map.• As shown in Figure 6.15, the popup displays the e.latlng coordinates “as is”, with
many irrelevant digits.• The first six digits refer to sub-meter (~0.1 m) precision, which is more than enough for
most types of applications.• Modify the onMapClick function so that the coordinates are rounded and only the first
six digits of longitude and latitude are displayed inside the popup. (Hint: you can searchon Google for a JavaScript function to round numbers according to specified number ofdigits.)
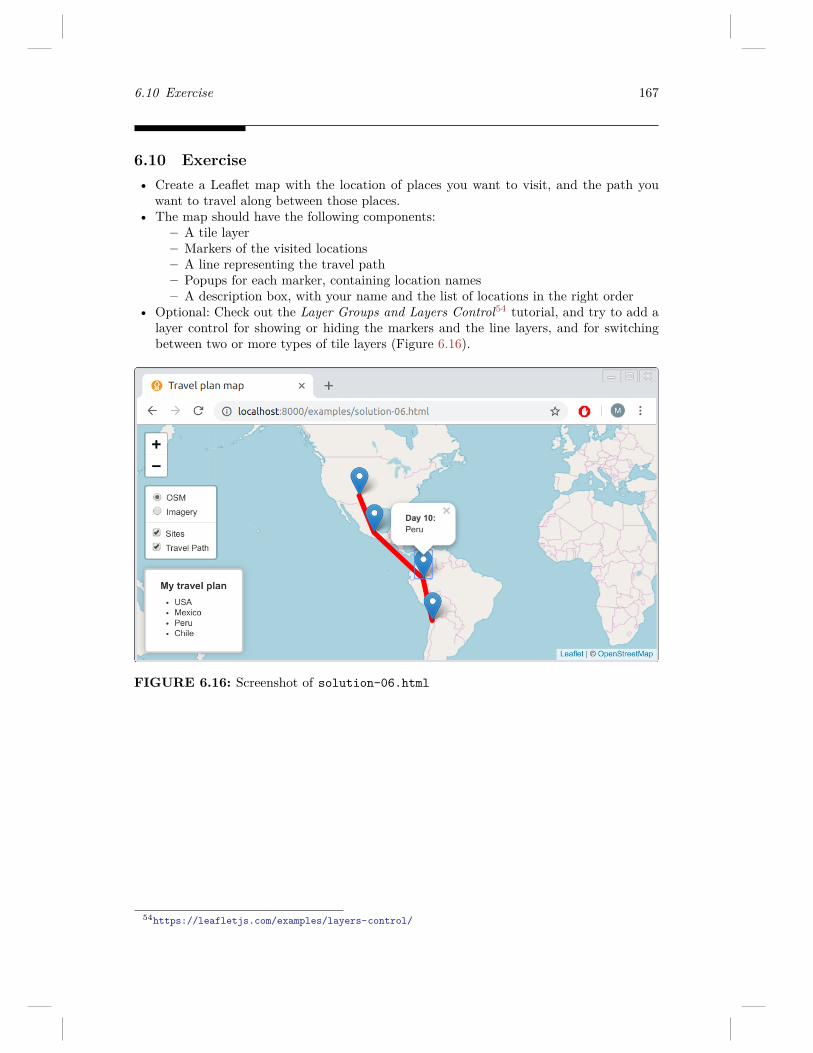
6.10 Exercise 167
6.10 Exercise• Create a Leaflet map with the location of places you want to visit, and the path you
want to travel along between those places.• The map should have the following components:
– A tile layer– Markers of the visited locations– A line representing the travel path– Popups for each marker, containing location names– A description box, with your name and the list of locations in the right order
• Optional: Check out the Layer Groups and Layers Control54 tutorial, and try to add alayer control for showing or hiding the markers and the line layers, and for switchingbetween two or more types of tile layers (Figure 6.16).
FIGURE 6.16: Screenshot of solution-06.html
54https://leafletjs.com/examples/layers-control/

7GeoJSON
7.1 IntroductionIn this chapter, we are going to learn about GeoJSON—a plain text format for vectorlayers. On the one hand, GeoJSON is a special case of JSON, which makes it fully compatibleand easy to process with web technologies such as JavaScript. On the other hand, it is afully-featured vector layer format, capable of representing complex vector layers and theirnon-spatial attributes. GeoJSON is, therefore, widely-used in web mapping and deserves itsown chapter.
We are going to start with the definition of GeoJSON (Section 7.2) and an overview of itssyntax and usage for representing various types of geometries (Sections 7.3–7.4). Then, wewill discuss ways in which GeoJSON can be loaded and displayed on a Leaflet map (Sections7.5–7.8).
7.2 What is GeoJSON?GeoJSON is an plain-text format designed for representing vector geometries, with or with-out non-spatial attributes, based on the JavaScript Object Notation, JSON (Section 3.11.1).We briefly introduced the GeoJSON format in Section 3.11.2. This chapter is devoted tomore in-depth treatment of the format and its use in web maps.
GeoJSON has become a very popular data format in many GIS technologies and servicesrelated to web mapping. It is actually the standard format for passing spatial vector layerdata between the client and the server in web applications. As mentioned in Section 3.11.2,the main reason for its popularity is the fact that GeoJSON is a special case of JSON,which means that it can be easily parsed and processed with JavaScript. As a result, Geo-JSON is the best (sometimes even the only) supported format by JavaScript web-mappinglibraries and platforms, including those we learn about in this book: Leaflet (Chapters6–8), CARTO (Chapters 9–11), and Turf.js (Chapter 12).
Other advantages of GeoJSON are that it is simple and human-readable, being a plain-textformat. A disadvantage of GeoJSON is that its file size can get relatively large compared toother spatial vector layer formats, such as the Shapefile1 or GeoPackage2 formats. How-ever, there are ways to reduce GeoJSON file size by simplifying its geometry and removingunnecessary attributes (Section 7.4.2).
1https://en.wikipedia.org/wiki/Shapefile2https://en.wikipedia.org/wiki/GeoPackage
169
170 7 GeoJSON
In this chapter, we learn about how the GeoJSON format is structured (Section 7.3), howwe can to create GeoJSON instances and edit them (Section 7.4), and how we can addGeoJSON layers on a Leaflet map (Sections 7.5–7.8). Keep in mind that, for simplicity,we will use the term GeoJSON interchangeably referring to both the original GeoJSONstring, as well as the parsed object derived from that string in a JavaScript environment.Mapping library documentation often also uses the term GeoJSON for both cases. However,strictly speaking, the term GeoJSON refers just to text string instances, not to the derivedJavaScript objects (see Section 3.11).
7.3 GeoJSON structure7.3.1 OverviewIn this section, we go over the structure of different types of GeoJSON strings you mayencounter when working with this format. If you are new to JSON and GeoJSON, it mayseem difficult to grasp the exact syntax of the GeoJSON format right from the start. Don’tworry—we will come back to more examples later on in this chapter, as well as in thesubsequent chapters. Moreover, rest assured one is almost never required to type GeoJSONstrings by hand. Instead, web-map developers generally use pre-existing GeoJSON, exportedfrom layers in other formats using GIS software, or coming from external web resources anddatabases. As we will see in the Section 7.4, you can create and edit GeoJSON even withoutGIS software, using web interfaces such as the one called geojson.io. Nevertheless, it isimportant to be familiar with the general structure of GeoJSON to recognize what type oflayer you have at hand, and how to extract meaningful information from it.
GeoJSON is a format for representing Simple Feature3 geometries, possibly along withtheir non-spatial attributes. The Simple Features standard defines 20+ types of geome-try types, and the Well-Known Text (WKT)4 format for representing them5. GeoJ-SON supports just the seven most commonly used Simple Feature geometry types (Figure7.1). Having non-spatial attributes is not required for valid GeoJSON, so the seven geome-tries alone are encountered when representing geometric shapes only, with no attributes.In case non-spatial attributes are present, their combination with a geometry forms a"Feature". Finally, a collection of more than one feature forms a "FeatureCollection".The "FeatureCollection" GeoJSON type most closely corresponds to the meaning of a“layer”, which you may be familiar with from GIS software (e.g., a Shapefile). The hierarchyof GeoJSON types thus includes nine types, which can be grouped into three “levels” ofcomplexity:
• Geometry—One of seven Simple Feature geometry types, such as "MultiPolygon" (Ta-ble 7.1, Figure 7.1)
• "Feature"—A feature, i.e., a geometry along with its non-spatial attributes• "FeatureCollection"—A collection of features
The seven geometry types that GeoJSON supports are listed in Table 7.1.
3https://en.wikipedia.org/wiki/Simple_Features4https://en.wikipedia.org/wiki/Well-known_text5We will come back to WKT in Section 9.6.3, when discussing spatial databases.
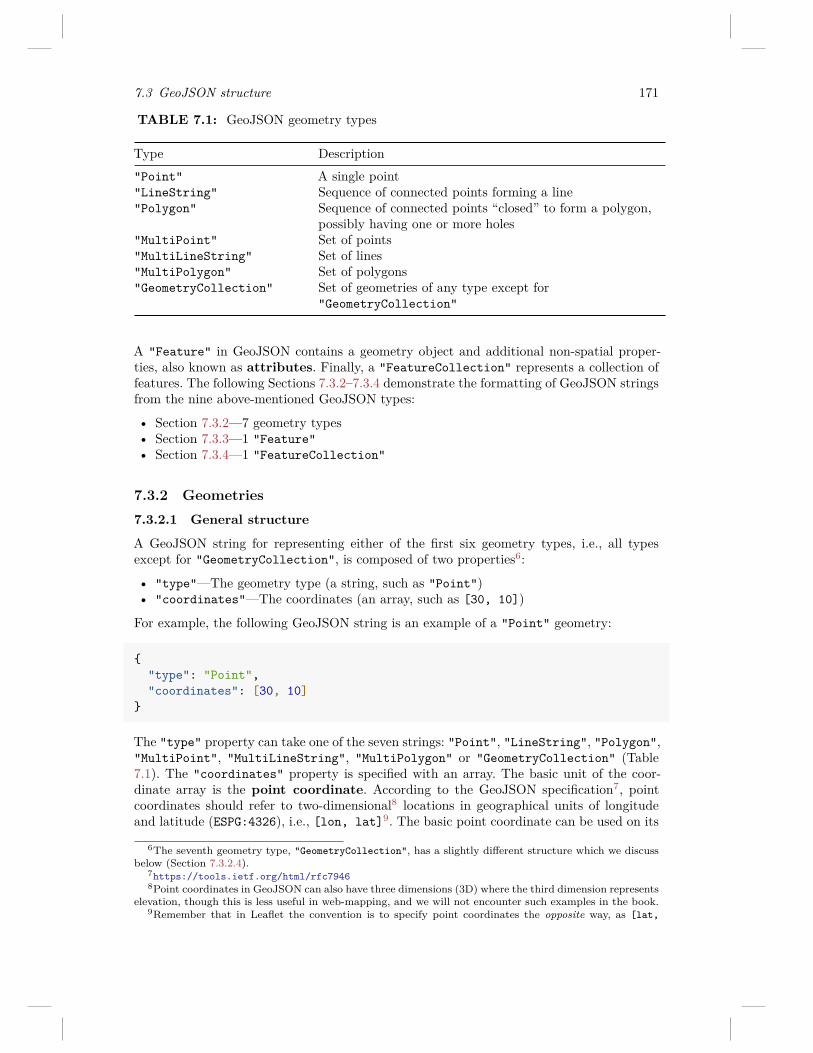
7.3 GeoJSON structure 171
TABLE 7.1: GeoJSON geometry types
Type Description"Point" A single point"LineString" Sequence of connected points forming a line"Polygon" Sequence of connected points “closed” to form a polygon,
possibly having one or more holes"MultiPoint" Set of points"MultiLineString" Set of lines"MultiPolygon" Set of polygons"GeometryCollection" Set of geometries of any type except for
"GeometryCollection"
A "Feature" in GeoJSON contains a geometry object and additional non-spatial proper-ties, also known as attributes. Finally, a "FeatureCollection" represents a collection offeatures. The following Sections 7.3.2–7.3.4 demonstrate the formatting of GeoJSON stringsfrom the nine above-mentioned GeoJSON types:
• Section 7.3.2—7 geometry types• Section 7.3.3—1 "Feature"• Section 7.3.4—1 "FeatureCollection"
7.3.2 Geometries7.3.2.1 General structure
A GeoJSON string for representing either of the first six geometry types, i.e., all typesexcept for "GeometryCollection", is composed of two properties6:
• "type"—The geometry type (a string, such as "Point")• "coordinates"—The coordinates (an array, such as [30, 10])
For example, the following GeoJSON string is an example of a "Point" geometry:
{"type": "Point","coordinates": [30, 10]
}
The "type" property can take one of the seven strings: "Point", "LineString", "Polygon","MultiPoint", "MultiLineString", "MultiPolygon" or "GeometryCollection" (Table7.1). The "coordinates" property is specified with an array. The basic unit of the coor-dinate array is the point coordinate. According to the GeoJSON specification7, pointcoordinates should refer to two-dimensional8 locations in geographical units of longitudeand latitude (ESPG:4326), i.e., [lon, lat]9. The basic point coordinate can be used on its
6The seventh geometry type, "GeometryCollection", has a slightly different structure which we discussbelow (Section 7.3.2.4).
7https://tools.ietf.org/html/rfc79468Point coordinates in GeoJSON can also have three dimensions (3D) where the third dimension represents
elevation, though this is less useful in web-mapping, and we will not encounter such examples in the book.9Remember that in Leaflet the convention is to specify point coordinates the opposite way, as [lat,
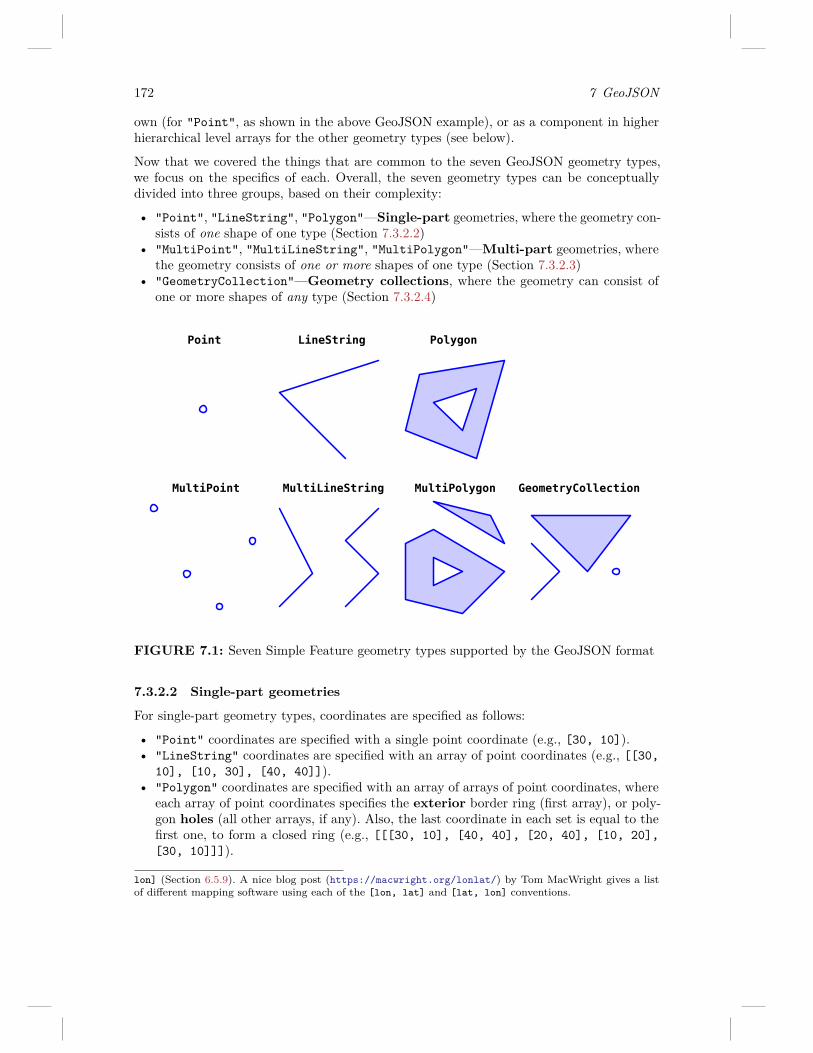
172 7 GeoJSON
own (for "Point", as shown in the above GeoJSON example), or as a component in higherhierarchical level arrays for the other geometry types (see below).
Now that we covered the things that are common to the seven GeoJSON geometry types,we focus on the specifics of each. Overall, the seven geometry types can be conceptuallydivided into three groups, based on their complexity:
• "Point", "LineString", "Polygon"—Single-part geometries, where the geometry con-sists of one shape of one type (Section 7.3.2.2)
• "MultiPoint", "MultiLineString", "MultiPolygon"—Multi-part geometries, wherethe geometry consists of one or more shapes of one type (Section 7.3.2.3)
• "GeometryCollection"—Geometry collections, where the geometry can consist ofone or more shapes of any type (Section 7.3.2.4)
Point LineString Polygon
MultiPoint MultiLineString MultiPolygon GeometryCollection
FIGURE 7.1: Seven Simple Feature geometry types supported by the GeoJSON format
7.3.2.2 Single-part geometries
For single-part geometry types, coordinates are specified as follows:
• "Point" coordinates are specified with a single point coordinate (e.g., [30, 10]).• "LineString" coordinates are specified with an array of point coordinates (e.g., [[30,
10], [10, 30], [40, 40]]).• "Polygon" coordinates are specified with an array of arrays of point coordinates, where
each array of point coordinates specifies the exterior border ring (first array), or poly-gon holes (all other arrays, if any). Also, the last coordinate in each set is equal to thefirst one, to form a closed ring (e.g., [[[30, 10], [40, 40], [20, 40], [10, 20],[30, 10]]]).
lon] (Section 6.5.9). A nice blog post (https://macwright.org/lonlat/) by Tom MacWright gives a listof different mapping software using each of the [lon, lat] and [lat, lon] conventions.
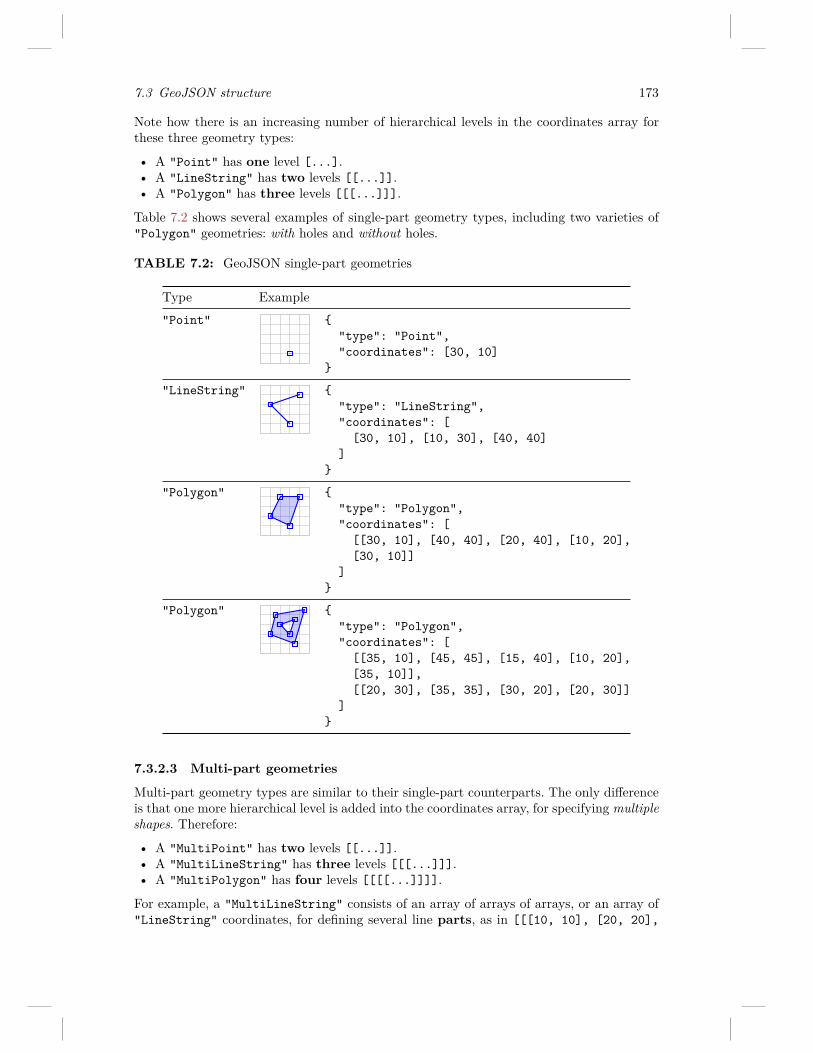
7.3 GeoJSON structure 173
Note how there is an increasing number of hierarchical levels in the coordinates array forthese three geometry types:
• A "Point" has one level [...].• A "LineString" has two levels [[...]].• A "Polygon" has three levels [[[...]]].
Table 7.2 shows several examples of single-part geometry types, including two varieties of"Polygon" geometries: with holes and without holes.
TABLE 7.2: GeoJSON single-part geometries
Type Example"Point" {
"type": "Point","coordinates": [30, 10]
}
"LineString" {"type": "LineString","coordinates": [[30, 10], [10, 30], [40, 40]
]}
"Polygon" {"type": "Polygon","coordinates": [[[30, 10], [40, 40], [20, 40], [10, 20],[30, 10]]
]}
"Polygon" {"type": "Polygon","coordinates": [[[35, 10], [45, 45], [15, 40], [10, 20],[35, 10]],[[20, 30], [35, 35], [30, 20], [20, 30]]
]}
7.3.2.3 Multi-part geometries
Multi-part geometry types are similar to their single-part counterparts. The only differenceis that one more hierarchical level is added into the coordinates array, for specifying multipleshapes. Therefore:
• A "MultiPoint" has two levels [[...]].• A "MultiLineString" has three levels [[[...]]].• A "MultiPolygon" has four levels [[[[...]]]].
For example, a "MultiLineString" consists of an array of arrays of arrays, or an array of"LineString" coordinates, for defining several line parts, as in [[[10, 10], [20, 20],
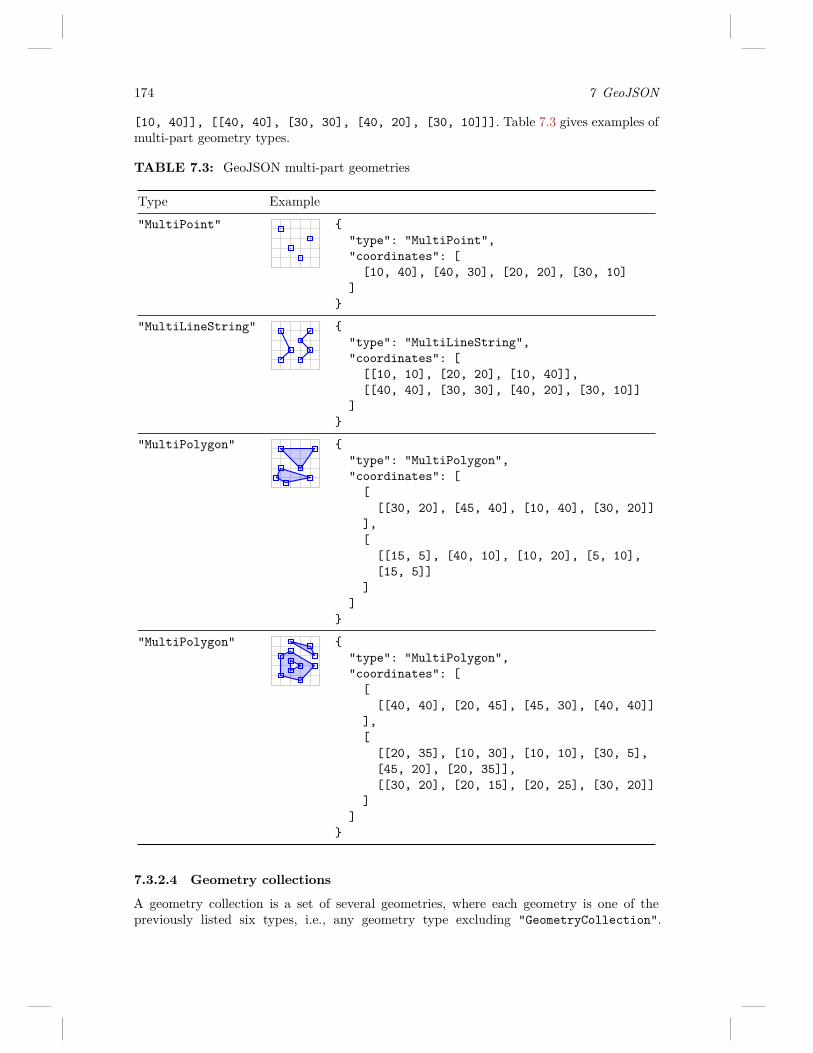
174 7 GeoJSON
[10, 40]], [[40, 40], [30, 30], [40, 20], [30, 10]]]. Table 7.3 gives examples ofmulti-part geometry types.
TABLE 7.3: GeoJSON multi-part geometries
Type Example"MultiPoint" {
"type": "MultiPoint","coordinates": [[10, 40], [40, 30], [20, 20], [30, 10]
]}
"MultiLineString" {"type": "MultiLineString","coordinates": [[[10, 10], [20, 20], [10, 40]],[[40, 40], [30, 30], [40, 20], [30, 10]]
]}
"MultiPolygon" {"type": "MultiPolygon","coordinates": [[[[30, 20], [45, 40], [10, 40], [30, 20]]
],[[[15, 5], [40, 10], [10, 20], [5, 10],[15, 5]]
]]
}
"MultiPolygon" {"type": "MultiPolygon","coordinates": [[[[40, 40], [20, 45], [45, 30], [40, 40]]
],[[[20, 35], [10, 30], [10, 10], [30, 5],[45, 20], [20, 35]],[[30, 20], [20, 15], [20, 25], [30, 20]]
]]
}
7.3.2.4 Geometry collections
A geometry collection is a set of several geometries, where each geometry is one of thepreviously listed six types, i.e., any geometry type excluding "GeometryCollection".
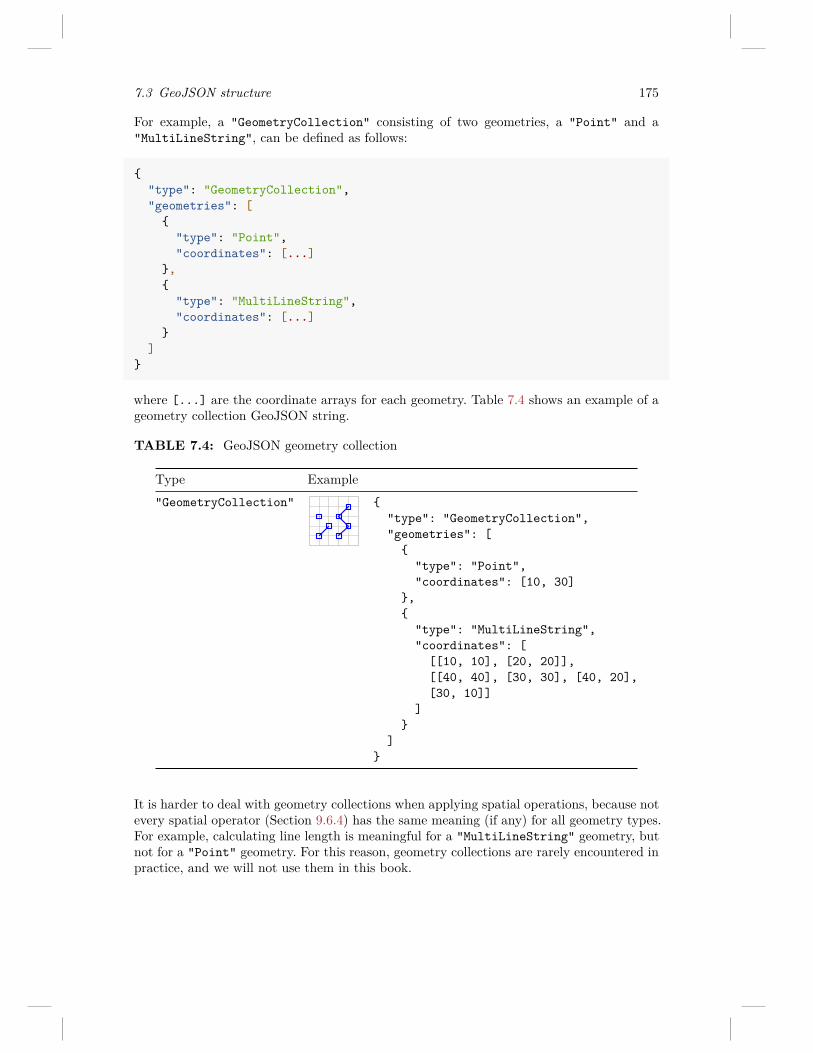
7.3 GeoJSON structure 175
For example, a "GeometryCollection" consisting of two geometries, a "Point" and a"MultiLineString", can be defined as follows:
{"type": "GeometryCollection","geometries": [
{"type": "Point","coordinates": [...]
},{
"type": "MultiLineString","coordinates": [...]
}]
}
where [...] are the coordinate arrays for each geometry. Table 7.4 shows an example of ageometry collection GeoJSON string.
TABLE 7.4: GeoJSON geometry collection
Type Example"GeometryCollection" {
"type": "GeometryCollection","geometries": [{"type": "Point","coordinates": [10, 30]
},{"type": "MultiLineString","coordinates": [[[10, 10], [20, 20]],[[40, 40], [30, 30], [40, 20],[30, 10]]
]}
]}
It is harder to deal with geometry collections when applying spatial operations, because notevery spatial operator (Section 9.6.4) has the same meaning (if any) for all geometry types.For example, calculating line length is meaningful for a "MultiLineString" geometry, butnot for a "Point" geometry. For this reason, geometry collections are rarely encountered inpractice, and we will not use them in this book.
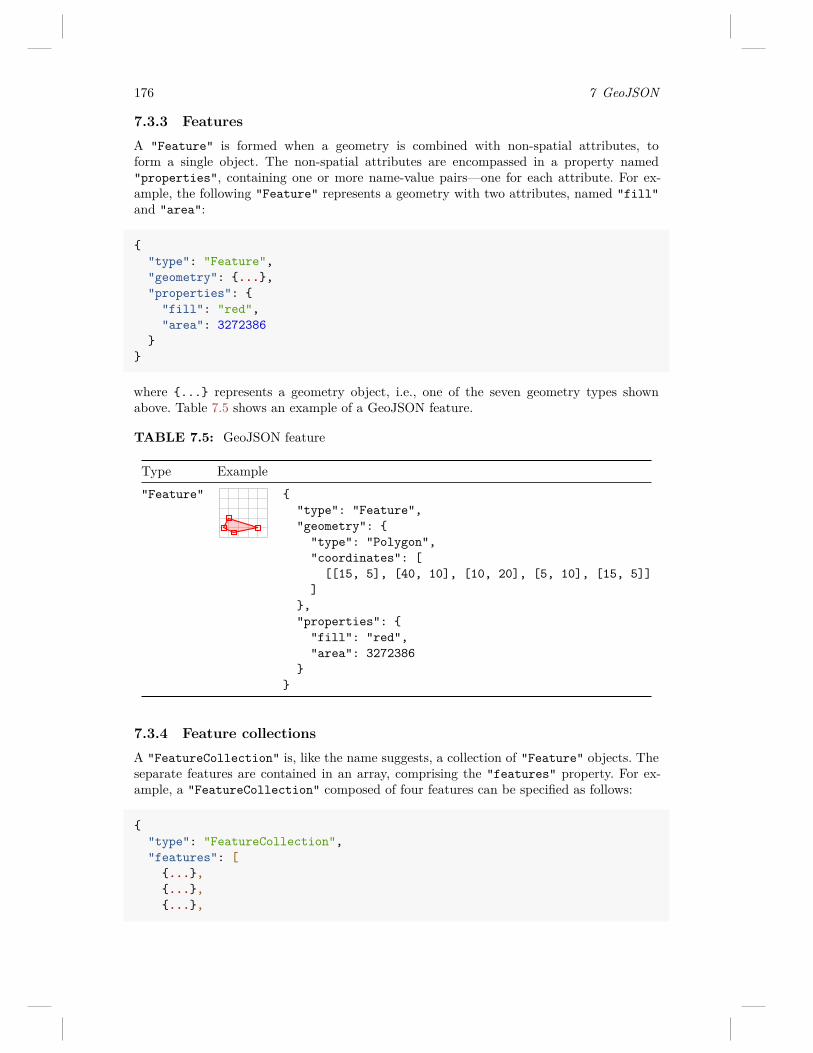
176 7 GeoJSON
7.3.3 FeaturesA "Feature" is formed when a geometry is combined with non-spatial attributes, toform a single object. The non-spatial attributes are encompassed in a property named"properties", containing one or more name-value pairs—one for each attribute. For ex-ample, the following "Feature" represents a geometry with two attributes, named "fill"and "area":
{"type": "Feature","geometry": {...},"properties": {
"fill": "red","area": 3272386
}}
where {...} represents a geometry object, i.e., one of the seven geometry types shownabove. Table 7.5 shows an example of a GeoJSON feature.
TABLE 7.5: GeoJSON feature
Type Example"Feature" {
"type": "Feature","geometry": {"type": "Polygon","coordinates": [[[15, 5], [40, 10], [10, 20], [5, 10], [15, 5]]
]},"properties": {"fill": "red","area": 3272386
}}
7.3.4 Feature collectionsA "FeatureCollection" is, like the name suggests, a collection of "Feature" objects. Theseparate features are contained in an array, comprising the "features" property. For ex-ample, a "FeatureCollection" composed of four features can be specified as follows:
{"type": "FeatureCollection","features": [
{...},{...},{...},
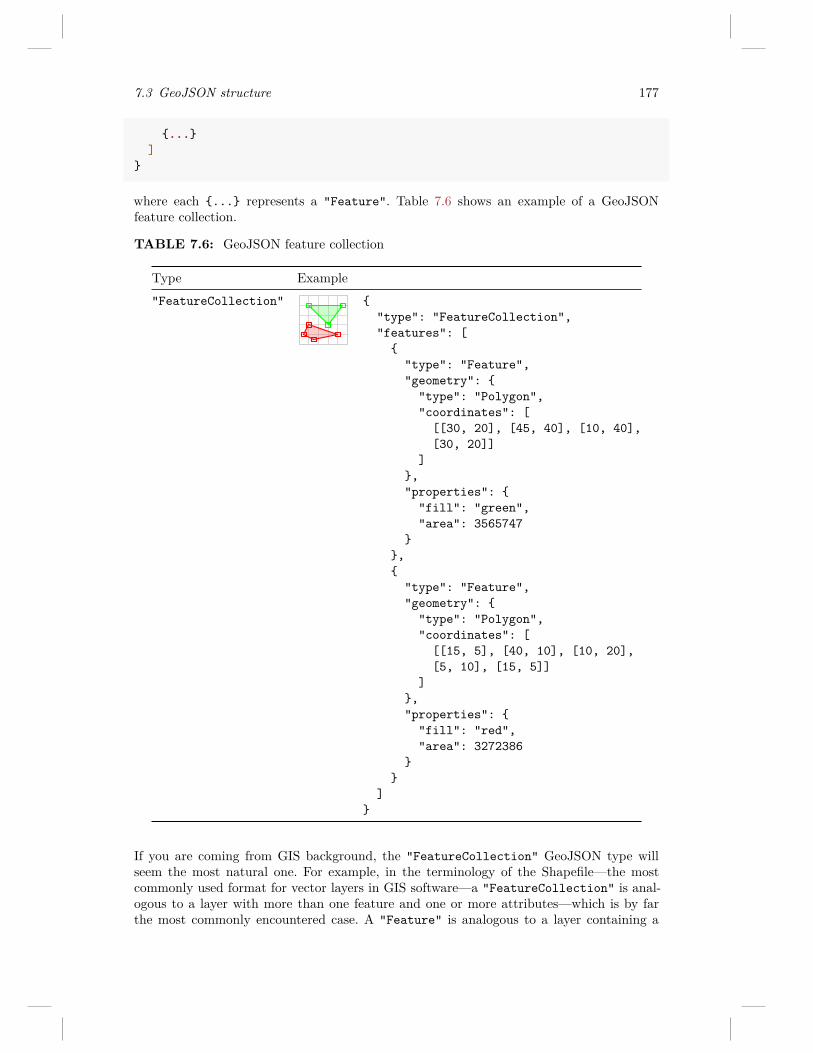
7.3 GeoJSON structure 177
{...}]
}
where each {...} represents a "Feature". Table 7.6 shows an example of a GeoJSONfeature collection.
TABLE 7.6: GeoJSON feature collection
Type Example"FeatureCollection" {
"type": "FeatureCollection","features": [{"type": "Feature","geometry": {"type": "Polygon","coordinates": [[[30, 20], [45, 40], [10, 40],[30, 20]]
]},"properties": {"fill": "green","area": 3565747
}},{"type": "Feature","geometry": {"type": "Polygon","coordinates": [[[15, 5], [40, 10], [10, 20],[5, 10], [15, 5]]
]},"properties": {"fill": "red","area": 3272386
}}
]}
If you are coming from GIS background, the "FeatureCollection" GeoJSON type willseem the most natural one. For example, in the terminology of the Shapefile—the mostcommonly used format for vector layers in GIS software—a "FeatureCollection" is anal-ogous to a layer with more than one feature and one or more attributes—which is by farthe most commonly encountered case. A "Feature" is analogous to a layer containing a
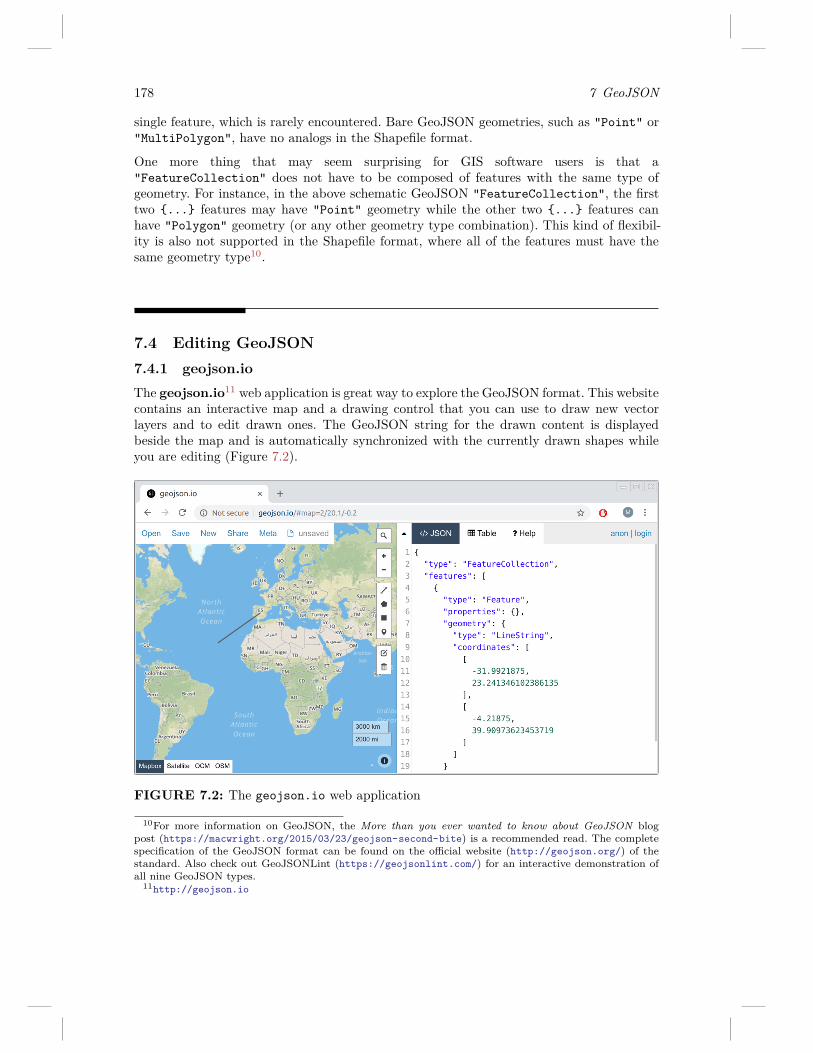
178 7 GeoJSON
single feature, which is rarely encountered. Bare GeoJSON geometries, such as "Point" or"MultiPolygon", have no analogs in the Shapefile format.
One more thing that may seem surprising for GIS software users is that a"FeatureCollection" does not have to be composed of features with the same type ofgeometry. For instance, in the above schematic GeoJSON "FeatureCollection", the firsttwo {...} features may have "Point" geometry while the other two {...} features canhave "Polygon" geometry (or any other geometry type combination). This kind of flexibil-ity is also not supported in the Shapefile format, where all of the features must have thesame geometry type10.
7.4 Editing GeoJSON7.4.1 geojson.ioThe geojson.io11 web application is great way to explore the GeoJSON format. This websitecontains an interactive map and a drawing control that you can use to draw new vectorlayers and to edit drawn ones. The GeoJSON string for the drawn content is displayedbeside the map and is automatically synchronized with the currently drawn shapes whileyou are editing (Figure 7.2).
FIGURE 7.2: The geojson.io web application
10For more information on GeoJSON, the More than you ever wanted to know about GeoJSON blogpost (https://macwright.org/2015/03/23/geojson-second-bite) is a recommended read. The completespecification of the GeoJSON format can be found on the official website (http://geojson.org/) of thestandard. Also check out GeoJSONLint (https://geojsonlint.com/) for an interactive demonstration ofall nine GeoJSON types.
11http://geojson.io
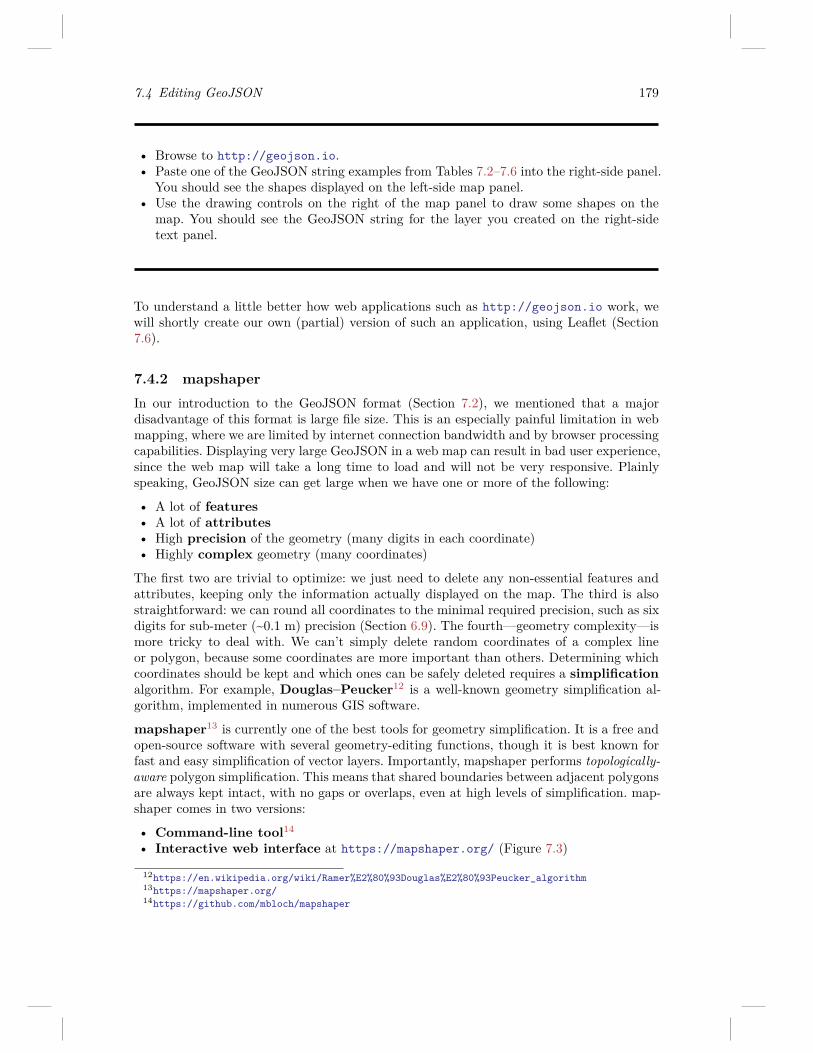
7.4 Editing GeoJSON 179
• Browse to http://geojson.io.• Paste one of the GeoJSON string examples from Tables 7.2–7.6 into the right-side panel.
You should see the shapes displayed on the left-side map panel.• Use the drawing controls on the right of the map panel to draw some shapes on the
map. You should see the GeoJSON string for the layer you created on the right-sidetext panel.
To understand a little better how web applications such as http://geojson.io work, wewill shortly create our own (partial) version of such an application, using Leaflet (Section7.6).
7.4.2 mapshaperIn our introduction to the GeoJSON format (Section 7.2), we mentioned that a majordisadvantage of this format is large file size. This is an especially painful limitation in webmapping, where we are limited by internet connection bandwidth and by browser processingcapabilities. Displaying very large GeoJSON in a web map can result in bad user experience,since the web map will take a long time to load and will not be very responsive. Plainlyspeaking, GeoJSON size can get large when we have one or more of the following:
• A lot of features• A lot of attributes• High precision of the geometry (many digits in each coordinate)• Highly complex geometry (many coordinates)
The first two are trivial to optimize: we just need to delete any non-essential features andattributes, keeping only the information actually displayed on the map. The third is alsostraightforward: we can round all coordinates to the minimal required precision, such as sixdigits for sub-meter (~0.1 m) precision (Section 6.9). The fourth—geometry complexity—ismore tricky to deal with. We can’t simply delete random coordinates of a complex lineor polygon, because some coordinates are more important than others. Determining whichcoordinates should be kept and which ones can be safely deleted requires a simplificationalgorithm. For example, Douglas–Peucker12 is a well-known geometry simplification al-gorithm, implemented in numerous GIS software.
mapshaper13 is currently one of the best tools for geometry simplification. It is a free andopen-source software with several geometry-editing functions, though it is best known forfast and easy simplification of vector layers. Importantly, mapshaper performs topologically-aware polygon simplification. This means that shared boundaries between adjacent polygonsare always kept intact, with no gaps or overlaps, even at high levels of simplification. map-shaper comes in two versions:
• Command-line tool14
• Interactive web interface at https://mapshaper.org/ (Figure 7.3)
12https://en.wikipedia.org/wiki/Ramer%E2%80%93Douglas%E2%80%93Peucker_algorithm13https://mapshaper.org/14https://github.com/mbloch/mapshaper
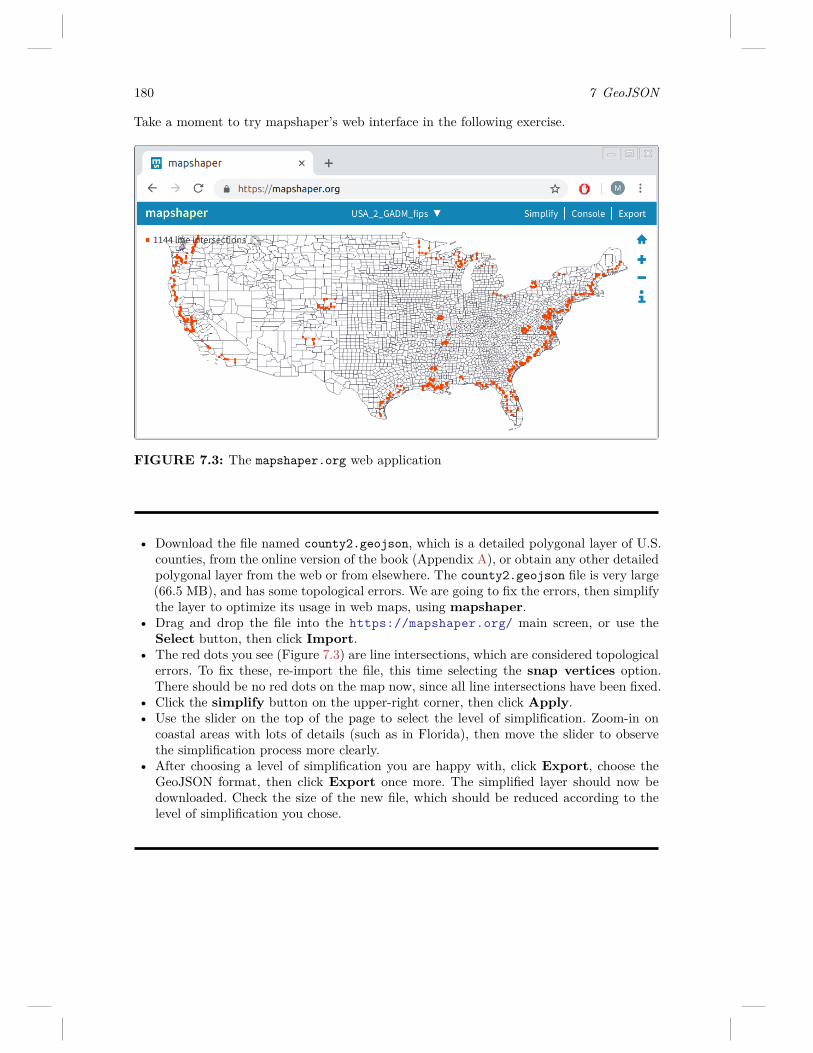
180 7 GeoJSON
Take a moment to try mapshaper’s web interface in the following exercise.
FIGURE 7.3: The mapshaper.org web application
• Download the file named county2.geojson, which is a detailed polygonal layer of U.S.counties, from the online version of the book (Appendix A), or obtain any other detailedpolygonal layer from the web or from elsewhere. The county2.geojson file is very large(66.5 MB), and has some topological errors. We are going to fix the errors, then simplifythe layer to optimize its usage in web maps, using mapshaper.
• Drag and drop the file into the https://mapshaper.org/ main screen, or use theSelect button, then click Import.
• The red dots you see (Figure 7.3) are line intersections, which are considered topologicalerrors. To fix these, re-import the file, this time selecting the snap vertices option.There should be no red dots on the map now, since all line intersections have been fixed.
• Click the simplify button on the upper-right corner, then click Apply.• Use the slider on the top of the page to select the level of simplification. Zoom-in on
coastal areas with lots of details (such as in Florida), then move the slider to observethe simplification process more clearly.
• After choosing a level of simplification you are happy with, click Export, choose theGeoJSON format, then click Export once more. The simplified layer should now bedownloaded. Check the size of the new file, which should be reduced according to thelevel of simplification you chose.
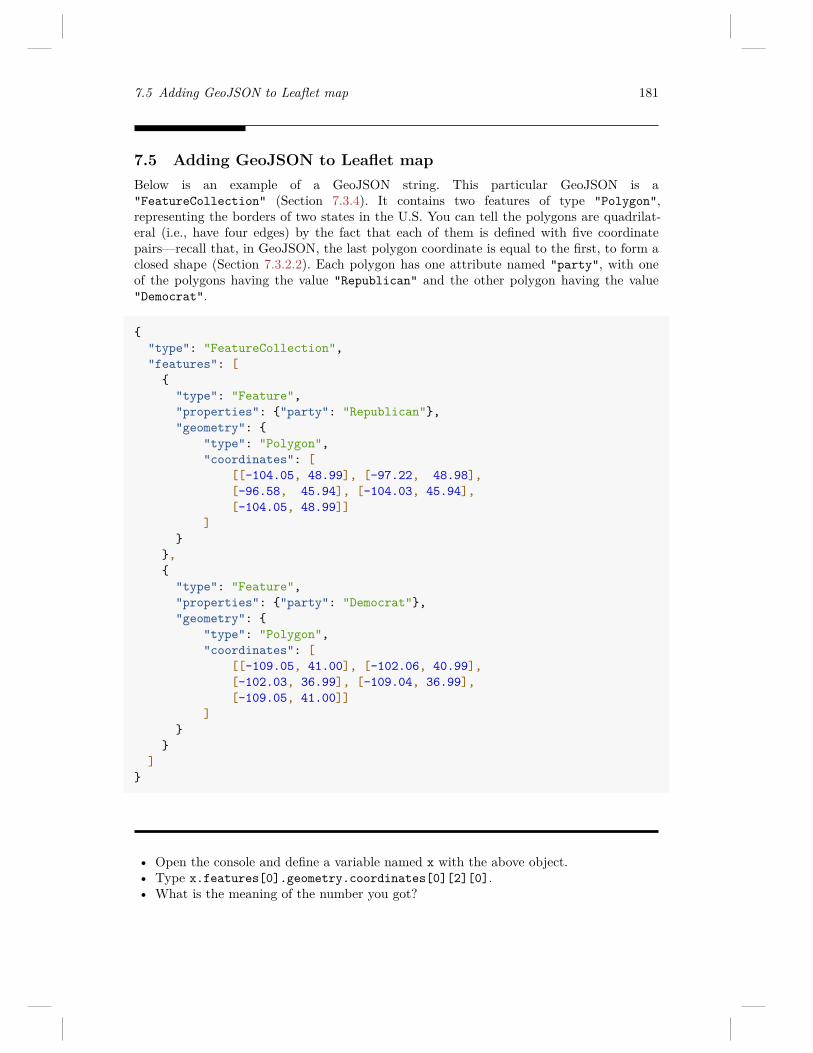
7.5 Adding GeoJSON to Leaflet map 181
7.5 Adding GeoJSON to Leaflet mapBelow is an example of a GeoJSON string. This particular GeoJSON is a"FeatureCollection" (Section 7.3.4). It contains two features of type "Polygon",representing the borders of two states in the U.S. You can tell the polygons are quadrilat-eral (i.e., have four edges) by the fact that each of them is defined with five coordinatepairs—recall that, in GeoJSON, the last polygon coordinate is equal to the first, to form aclosed shape (Section 7.3.2.2). Each polygon has one attribute named "party", with oneof the polygons having the value "Republican" and the other polygon having the value"Democrat".
{"type": "FeatureCollection","features": [
{"type": "Feature","properties": {"party": "Republican"},"geometry": {
"type": "Polygon","coordinates": [
[[-104.05, 48.99], [-97.22, 48.98],[-96.58, 45.94], [-104.03, 45.94],[-104.05, 48.99]]
]}
},{
"type": "Feature","properties": {"party": "Democrat"},"geometry": {
"type": "Polygon","coordinates": [
[[-109.05, 41.00], [-102.06, 40.99],[-102.03, 36.99], [-109.04, 36.99],[-109.05, 41.00]]
]}
}]
}
• Open the console and define a variable named x with the above object.• Type x.features[0].geometry.coordinates[0][2][0].• What is the meaning of the number you got?
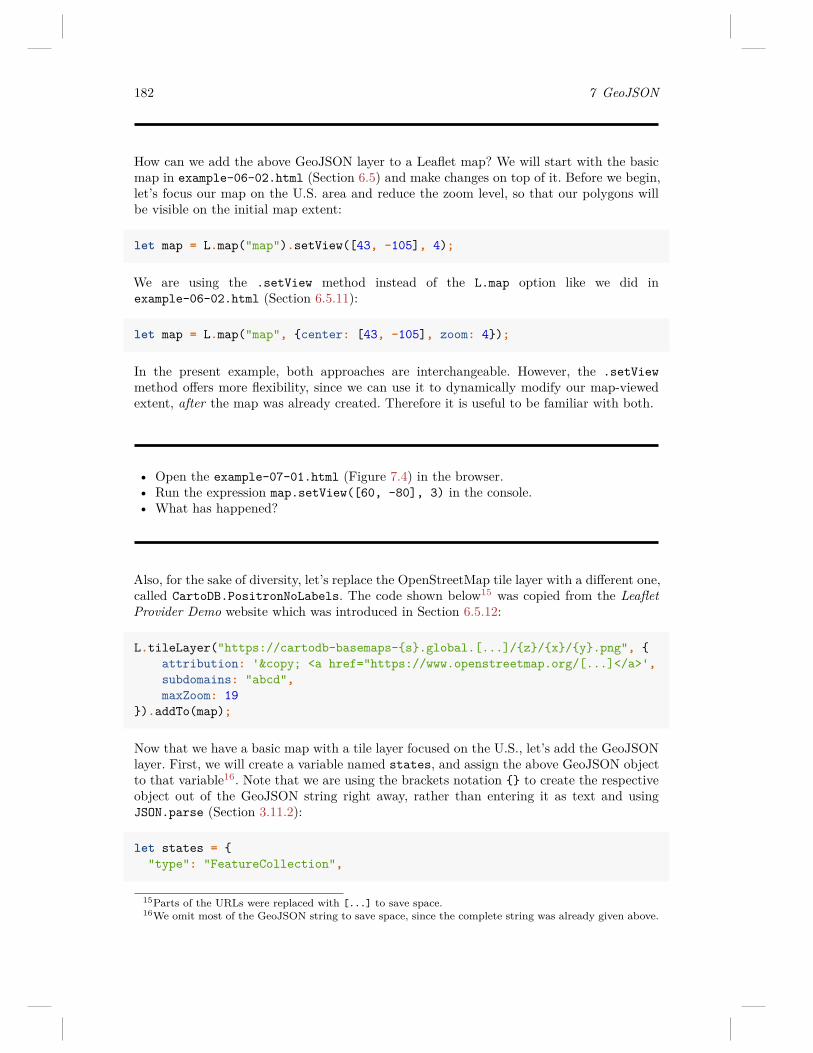
182 7 GeoJSON
How can we add the above GeoJSON layer to a Leaflet map? We will start with the basicmap in example-06-02.html (Section 6.5) and make changes on top of it. Before we begin,let’s focus our map on the U.S. area and reduce the zoom level, so that our polygons willbe visible on the initial map extent:
let map = L.map("map").setView([43, -105], 4);
We are using the .setView method instead of the L.map option like we did inexample-06-02.html (Section 6.5.11):
let map = L.map("map", {center: [43, -105], zoom: 4});
In the present example, both approaches are interchangeable. However, the .setViewmethod offers more flexibility, since we can use it to dynamically modify our map-viewedextent, after the map was already created. Therefore it is useful to be familiar with both.
• Open the example-07-01.html (Figure 7.4) in the browser.• Run the expression map.setView([60, -80], 3) in the console.• What has happened?
Also, for the sake of diversity, let’s replace the OpenStreetMap tile layer with a different one,called CartoDB.PositronNoLabels. The code shown below15 was copied from the LeafletProvider Demo website which was introduced in Section 6.5.12:
L.tileLayer("https://cartodb-basemaps-{s}.global.[...]/{z}/{x}/{y}.png", {attribution: '© <a href="https://www.openstreetmap.org/[...]</a>',subdomains: "abcd",maxZoom: 19
}).addTo(map);
Now that we have a basic map with a tile layer focused on the U.S., let’s add the GeoJSONlayer. First, we will create a variable named states, and assign the above GeoJSON objectto that variable16. Note that we are using the brackets notation {} to create the respectiveobject out of the GeoJSON string right away, rather than entering it as text and usingJSON.parse (Section 3.11.2):
let states = {"type": "FeatureCollection",
15Parts of the URLs were replaced with [...] to save space.16We omit most of the GeoJSON string to save space, since the complete string was already given above.
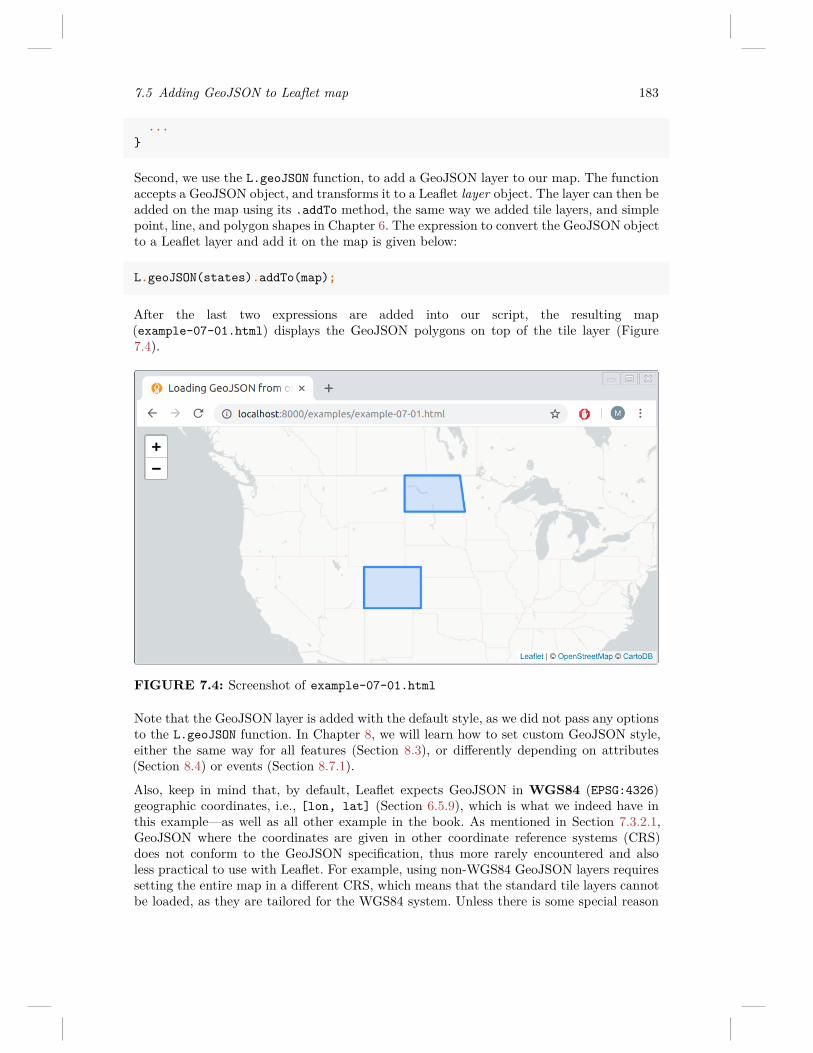
7.5 Adding GeoJSON to Leaflet map 183
...}
Second, we use the L.geoJSON function, to add a GeoJSON layer to our map. The functionaccepts a GeoJSON object, and transforms it to a Leaflet layer object. The layer can then beadded on the map using its .addTo method, the same way we added tile layers, and simplepoint, line, and polygon shapes in Chapter 6. The expression to convert the GeoJSON objectto a Leaflet layer and add it on the map is given below:
L.geoJSON(states).addTo(map);
After the last two expressions are added into our script, the resulting map(example-07-01.html) displays the GeoJSON polygons on top of the tile layer (Figure7.4).
FIGURE 7.4: Screenshot of example-07-01.html
Note that the GeoJSON layer is added with the default style, as we did not pass any optionsto the L.geoJSON function. In Chapter 8, we will learn how to set custom GeoJSON style,either the same way for all features (Section 8.3), or differently depending on attributes(Section 8.4) or events (Section 8.7.1).
Also, keep in mind that, by default, Leaflet expects GeoJSON in WGS84 (EPSG:4326)geographic coordinates, i.e., [lon, lat] (Section 6.5.9), which is what we indeed have inthis example—as well as all other example in the book. As mentioned in Section 7.3.2.1,GeoJSON where the coordinates are given in other coordinate reference systems (CRS)does not conform to the GeoJSON specification, thus more rarely encountered and alsoless practical to use with Leaflet. For example, using non-WGS84 GeoJSON layers requiressetting the entire map in a different CRS, which means that the standard tile layers cannotbe loaded, as they are tailored for the WGS84 system. Unless there is some special reason
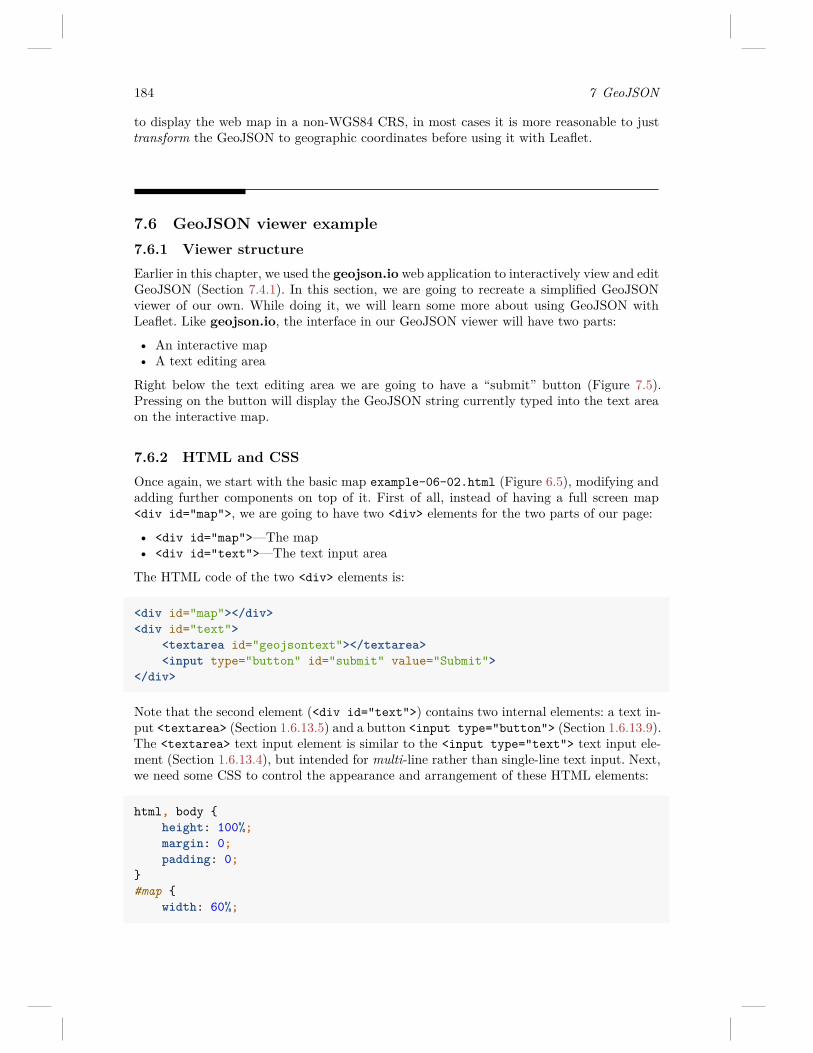
184 7 GeoJSON
to display the web map in a non-WGS84 CRS, in most cases it is more reasonable to justtransform the GeoJSON to geographic coordinates before using it with Leaflet.
7.6 GeoJSON viewer example7.6.1 Viewer structureEarlier in this chapter, we used the geojson.io web application to interactively view and editGeoJSON (Section 7.4.1). In this section, we are going to recreate a simplified GeoJSONviewer of our own. While doing it, we will learn some more about using GeoJSON withLeaflet. Like geojson.io, the interface in our GeoJSON viewer will have two parts:
• An interactive map• A text editing area
Right below the text editing area we are going to have a “submit” button (Figure 7.5).Pressing on the button will display the GeoJSON string currently typed into the text areaon the interactive map.
7.6.2 HTML and CSSOnce again, we start with the basic map example-06-02.html (Figure 6.5), modifying andadding further components on top of it. First of all, instead of having a full screen map<div id="map">, we are going to have two <div> elements for the two parts of our page:
• <div id="map">—The map• <div id="text">—The text input area
The HTML code of the two <div> elements is:
<div id="map"></div><div id="text">
<textarea id="geojsontext"></textarea><input type="button" id="submit" value="Submit">
</div>
Note that the second element (<div id="text">) contains two internal elements: a text in-put <textarea> (Section 1.6.13.5) and a button <input type="button"> (Section 1.6.13.9).The <textarea> text input element is similar to the <input type="text"> text input ele-ment (Section 1.6.13.4), but intended for multi-line rather than single-line text input. Next,we need some CSS to control the appearance and arrangement of these HTML elements:
html, body {height: 100%;margin: 0;padding: 0;
}#map {
width: 60%;
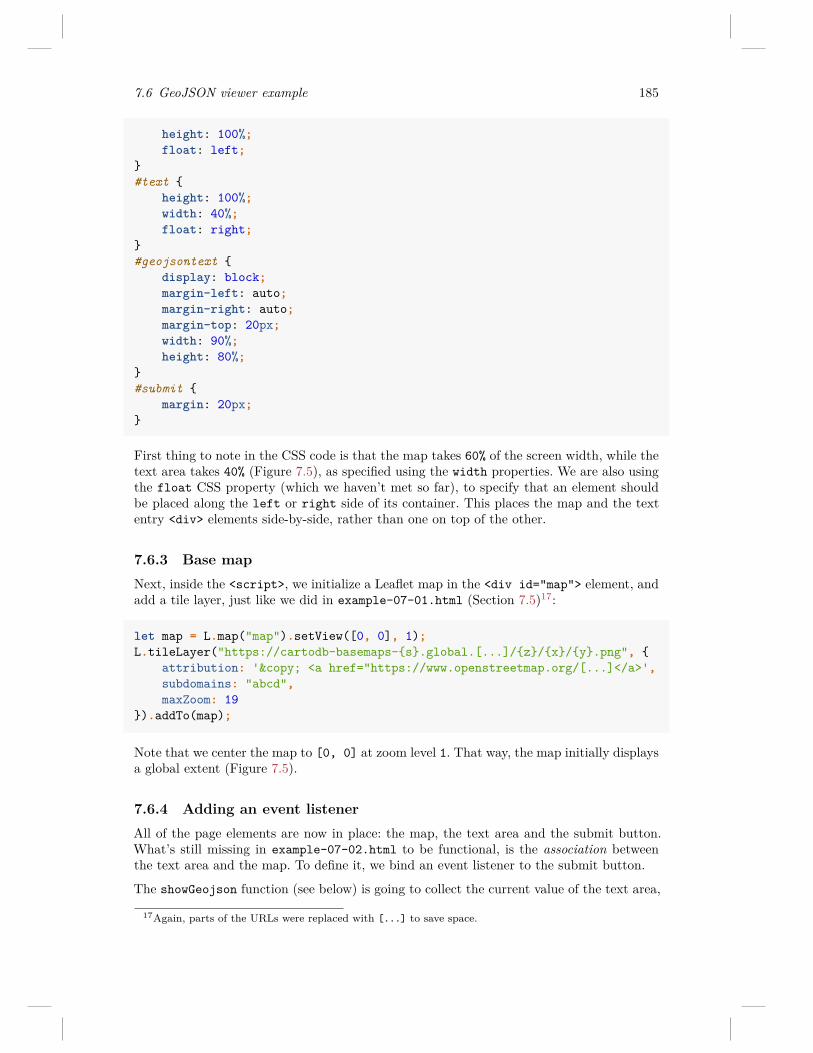
7.6 GeoJSON viewer example 185
height: 100%;float: left;
}#text {
height: 100%;width: 40%;float: right;
}#geojsontext {
display: block;margin-left: auto;margin-right: auto;margin-top: 20px;width: 90%;height: 80%;
}#submit {
margin: 20px;}
First thing to note in the CSS code is that the map takes 60% of the screen width, while thetext area takes 40% (Figure 7.5), as specified using the width properties. We are also usingthe float CSS property (which we haven’t met so far), to specify that an element shouldbe placed along the left or right side of its container. This places the map and the textentry <div> elements side-by-side, rather than one on top of the other.
7.6.3 Base mapNext, inside the <script>, we initialize a Leaflet map in the <div id="map"> element, andadd a tile layer, just like we did in example-07-01.html (Section 7.5)17:
let map = L.map("map").setView([0, 0], 1);L.tileLayer("https://cartodb-basemaps-{s}.global.[...]/{z}/{x}/{y}.png", {
attribution: '© <a href="https://www.openstreetmap.org/[...]</a>',subdomains: "abcd",maxZoom: 19
}).addTo(map);
Note that we center the map to [0, 0] at zoom level 1. That way, the map initially displaysa global extent (Figure 7.5).
7.6.4 Adding an event listenerAll of the page elements are now in place: the map, the text area and the submit button.What’s still missing in example-07-02.html to be functional, is the association betweenthe text area and the map. To define it, we bind an event listener to the submit button.
The showGeojson function (see below) is going to collect the current value of the text area,
17Again, parts of the URLs were replaced with [...] to save space.
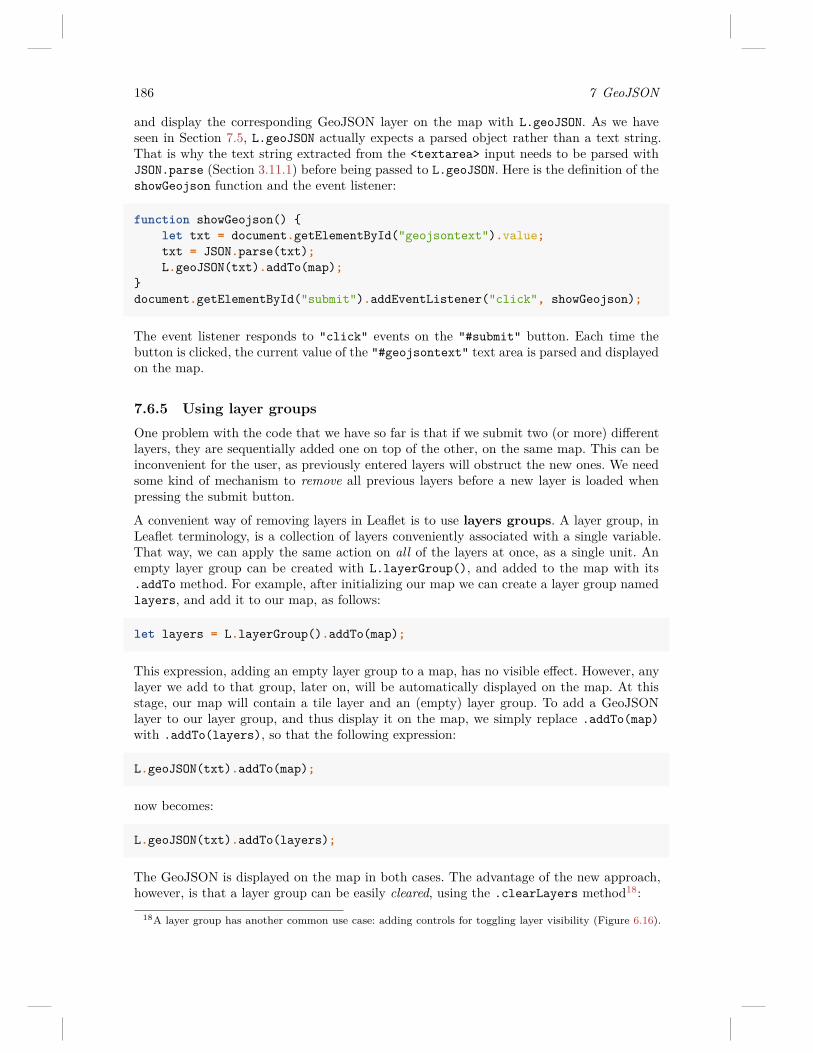
186 7 GeoJSON
and display the corresponding GeoJSON layer on the map with L.geoJSON. As we haveseen in Section 7.5, L.geoJSON actually expects a parsed object rather than a text string.That is why the text string extracted from the <textarea> input needs to be parsed withJSON.parse (Section 3.11.1) before being passed to L.geoJSON. Here is the definition of theshowGeojson function and the event listener:
function showGeojson() {let txt = document.getElementById("geojsontext").value;txt = JSON.parse(txt);L.geoJSON(txt).addTo(map);
}document.getElementById("submit").addEventListener("click", showGeojson);
The event listener responds to "click" events on the "#submit" button. Each time thebutton is clicked, the current value of the "#geojsontext" text area is parsed and displayedon the map.
7.6.5 Using layer groupsOne problem with the code that we have so far is that if we submit two (or more) differentlayers, they are sequentially added one on top of the other, on the same map. This can beinconvenient for the user, as previously entered layers will obstruct the new ones. We needsome kind of mechanism to remove all previous layers before a new layer is loaded whenpressing the submit button.
A convenient way of removing layers in Leaflet is to use layers groups. A layer group, inLeaflet terminology, is a collection of layers conveniently associated with a single variable.That way, we can apply the same action on all of the layers at once, as a single unit. Anempty layer group can be created with L.layerGroup(), and added to the map with its.addTo method. For example, after initializing our map we can create a layer group namedlayers, and add it to our map, as follows:
let layers = L.layerGroup().addTo(map);
This expression, adding an empty layer group to a map, has no visible effect. However, anylayer we add to that group, later on, will be automatically displayed on the map. At thisstage, our map will contain a tile layer and an (empty) layer group. To add a GeoJSONlayer to our layer group, and thus display it on the map, we simply replace .addTo(map)with .addTo(layers), so that the following expression:
L.geoJSON(txt).addTo(map);
now becomes:
L.geoJSON(txt).addTo(layers);
The GeoJSON is displayed on the map in both cases. The advantage of the new approach,however, is that a layer group can be easily cleared, using the .clearLayers method18:
18A layer group has another common use case: adding controls for toggling layer visibility (Figure 6.16).
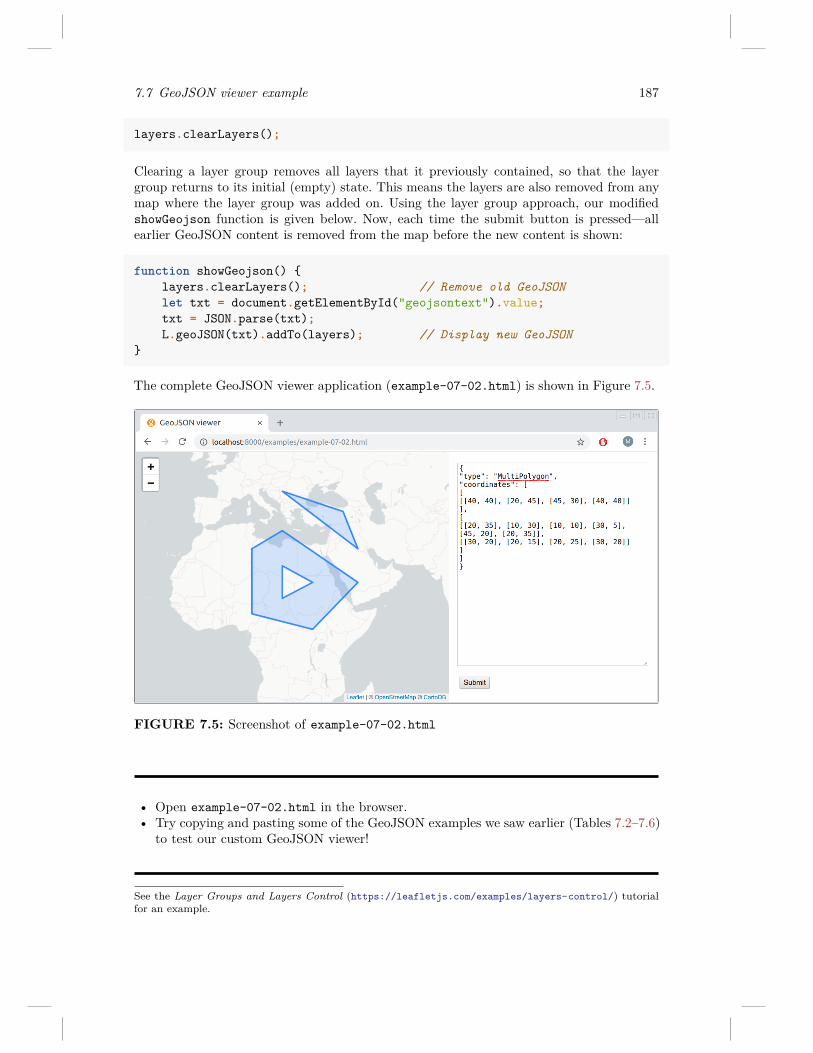
7.7 GeoJSON viewer example 187
layers.clearLayers();
Clearing a layer group removes all layers that it previously contained, so that the layergroup returns to its initial (empty) state. This means the layers are also removed from anymap where the layer group was added on. Using the layer group approach, our modifiedshowGeojson function is given below. Now, each time the submit button is pressed—allearlier GeoJSON content is removed from the map before the new content is shown:
function showGeojson() {layers.clearLayers(); // Remove old GeoJSONlet txt = document.getElementById("geojsontext").value;txt = JSON.parse(txt);L.geoJSON(txt).addTo(layers); // Display new GeoJSON
}
The complete GeoJSON viewer application (example-07-02.html) is shown in Figure 7.5.
FIGURE 7.5: Screenshot of example-07-02.html
• Open example-07-02.html in the browser.• Try copying and pasting some of the GeoJSON examples we saw earlier (Tables 7.2–7.6)
to test our custom GeoJSON viewer!
See the Layer Groups and Layers Control (https://leafletjs.com/examples/layers-control/) tutorialfor an example.
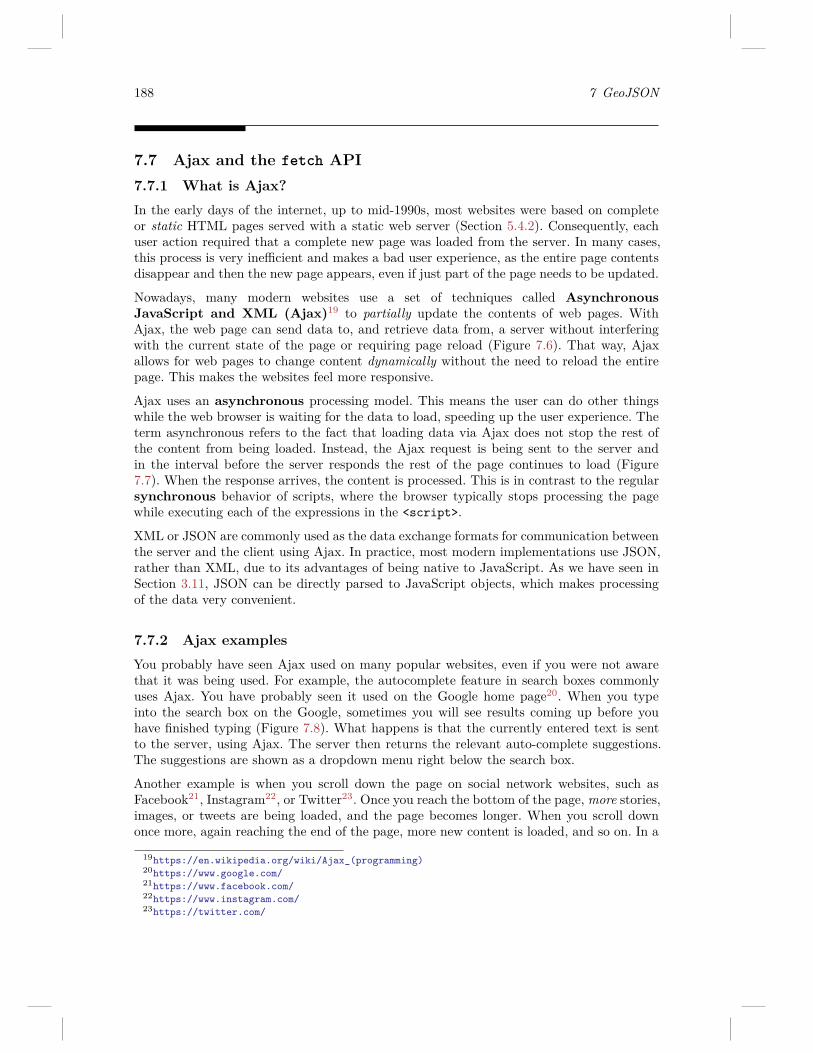
188 7 GeoJSON
7.7 Ajax and the fetch API7.7.1 What is Ajax?In the early days of the internet, up to mid-1990s, most websites were based on completeor static HTML pages served with a static web server (Section 5.4.2). Consequently, eachuser action required that a complete new page was loaded from the server. In many cases,this process is very inefficient and makes a bad user experience, as the entire page contentsdisappear and then the new page appears, even if just part of the page needs to be updated.
Nowadays, many modern websites use a set of techniques called AsynchronousJavaScript and XML (Ajax)19 to partially update the contents of web pages. WithAjax, the web page can send data to, and retrieve data from, a server without interferingwith the current state of the page or requiring page reload (Figure 7.6). That way, Ajaxallows for web pages to change content dynamically without the need to reload the entirepage. This makes the websites feel more responsive.
Ajax uses an asynchronous processing model. This means the user can do other thingswhile the web browser is waiting for the data to load, speeding up the user experience. Theterm asynchronous refers to the fact that loading data via Ajax does not stop the rest ofthe content from being loaded. Instead, the Ajax request is being sent to the server andin the interval before the server responds the rest of the page continues to load (Figure7.7). When the response arrives, the content is processed. This is in contrast to the regularsynchronous behavior of scripts, where the browser typically stops processing the pagewhile executing each of the expressions in the <script>.
XML or JSON are commonly used as the data exchange formats for communication betweenthe server and the client using Ajax. In practice, most modern implementations use JSON,rather than XML, due to its advantages of being native to JavaScript. As we have seen inSection 3.11, JSON can be directly parsed to JavaScript objects, which makes processingof the data very convenient.
7.7.2 Ajax examplesYou probably have seen Ajax used on many popular websites, even if you were not awarethat it was being used. For example, the autocomplete feature in search boxes commonlyuses Ajax. You have probably seen it used on the Google home page20. When you typeinto the search box on the Google, sometimes you will see results coming up before youhave finished typing (Figure 7.8). What happens is that the currently entered text is sentto the server, using Ajax. The server then returns the relevant auto-complete suggestions.The suggestions are shown as a dropdown menu right below the search box.
Another example is when you scroll down the page on social network websites, such asFacebook21, Instagram22, or Twitter23. Once you reach the bottom of the page, more stories,images, or tweets are being loaded, and the page becomes longer. When you scroll downonce more, again reaching the end of the page, more new content is loaded, and so on. In a
19https://en.wikipedia.org/wiki/Ajax_(programming)20https://www.google.com/21https://www.facebook.com/22https://www.instagram.com/23https://twitter.com/
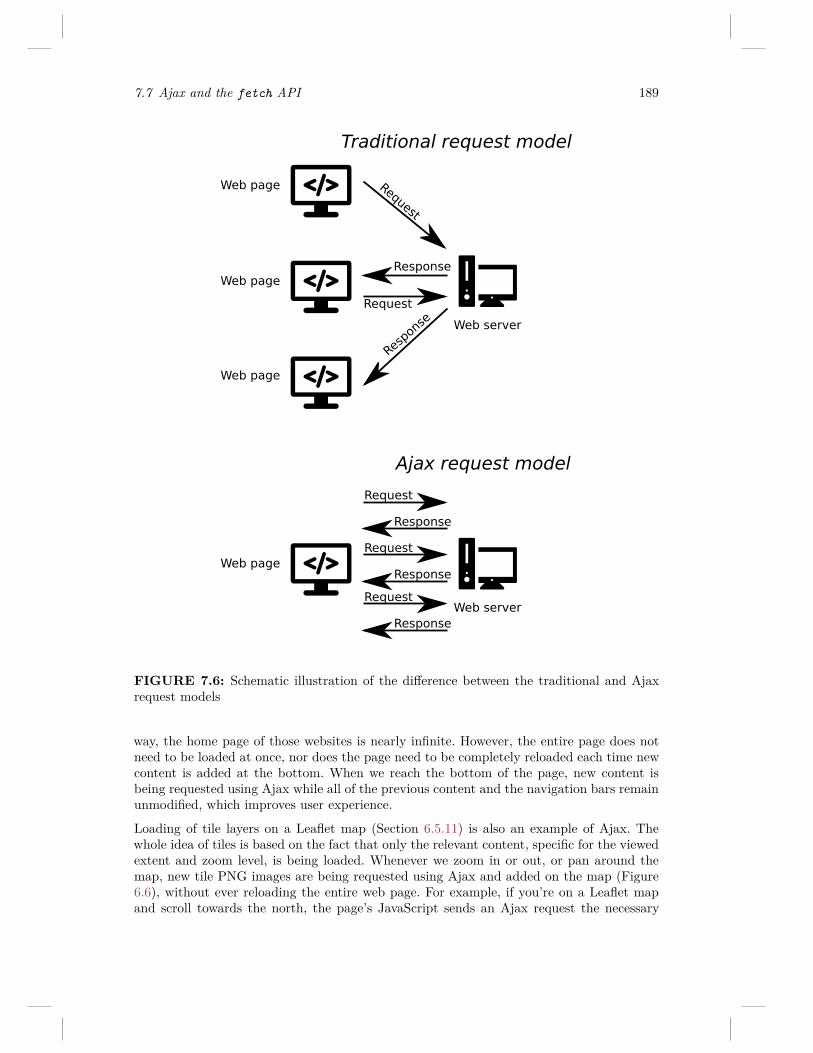
7.7 Ajax and the fetch API 189
Web server
Request
Response
Respon
seRequest
Traditional request model
Ajax request model
Web server
Response
Request
Response
Request
Response
Request
Web page
Web page
Web page
Web page
FIGURE 7.6: Schematic illustration of the difference between the traditional and Ajaxrequest models
way, the home page of those websites is nearly infinite. However, the entire page does notneed to be loaded at once, nor does the page need to be completely reloaded each time newcontent is added at the bottom. When we reach the bottom of the page, new content isbeing requested using Ajax while all of the previous content and the navigation bars remainunmodified, which improves user experience.
Loading of tile layers on a Leaflet map (Section 6.5.11) is also an example of Ajax. Thewhole idea of tiles is based on the fact that only the relevant content, specific for the viewedextent and zoom level, is being loaded. Whenever we zoom in or out, or pan around themap, new tile PNG images are being requested using Ajax and added on the map (Figure6.6), without ever reloading the entire web page. For example, if you’re on a Leaflet mapand scroll towards the north, the page’s JavaScript sends an Ajax request the necessary
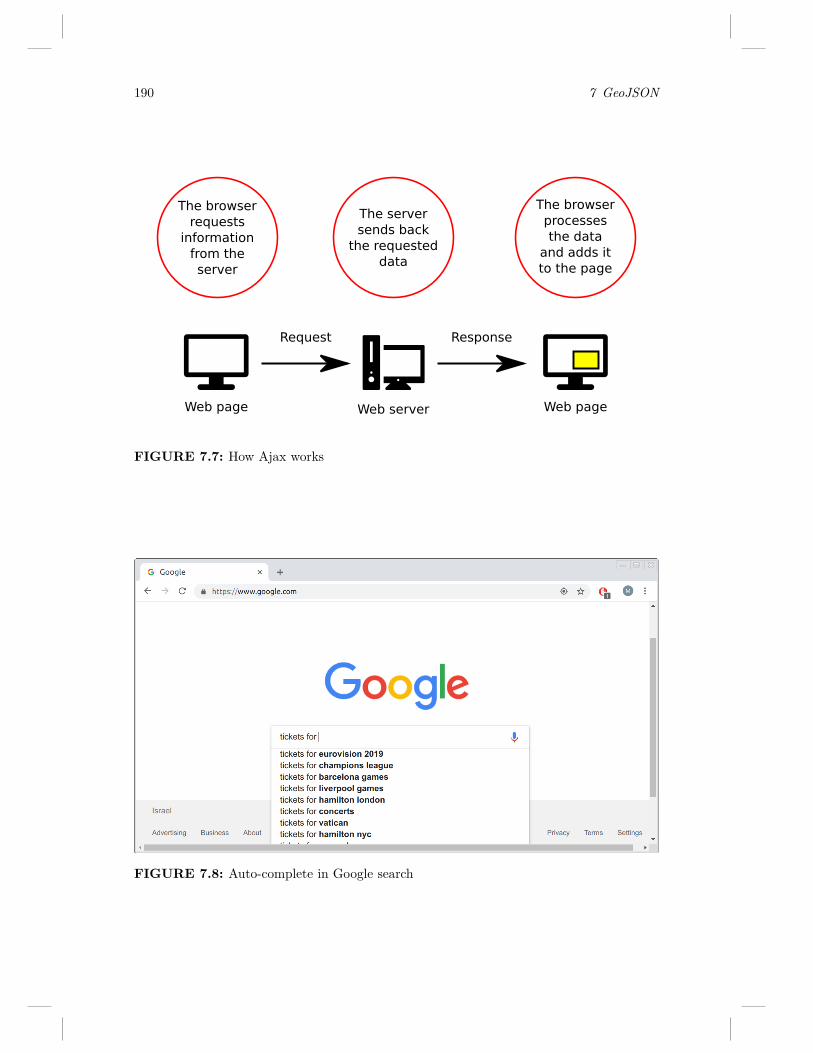
190 7 GeoJSON
Web server
Request
Web page Web page
Response
The browserrequests
informationfrom the server
The server sends back
the requested data
The browser processes the data
and adds it to the page
FIGURE 7.7: How Ajax works
FIGURE 7.8: Auto-complete in Google search
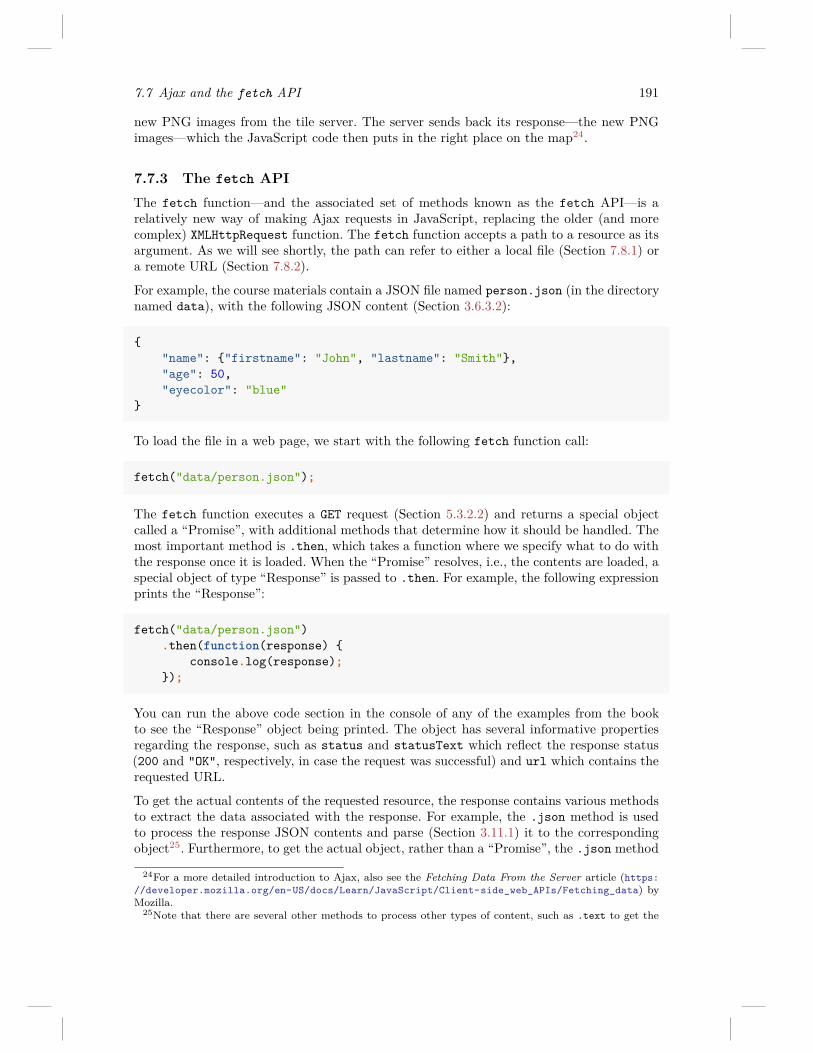
7.7 Ajax and the fetch API 191
new PNG images from the tile server. The server sends back its response—the new PNGimages—which the JavaScript code then puts in the right place on the map24.
7.7.3 The fetch APIThe fetch function—and the associated set of methods known as the fetch API—is arelatively new way of making Ajax requests in JavaScript, replacing the older (and morecomplex) XMLHttpRequest function. The fetch function accepts a path to a resource as itsargument. As we will see shortly, the path can refer to either a local file (Section 7.8.1) ora remote URL (Section 7.8.2).
For example, the course materials contain a JSON file named person.json (in the directorynamed data), with the following JSON content (Section 3.6.3.2):
{"name": {"firstname": "John", "lastname": "Smith"},"age": 50,"eyecolor": "blue"
}
To load the file in a web page, we start with the following fetch function call:
fetch("data/person.json");
The fetch function executes a GET request (Section 5.3.2.2) and returns a special objectcalled a “Promise”, with additional methods that determine how it should be handled. Themost important method is .then, which takes a function where we specify what to do withthe response once it is loaded. When the “Promise” resolves, i.e., the contents are loaded, aspecial object of type “Response” is passed to .then. For example, the following expressionprints the “Response”:
fetch("data/person.json").then(function(response) {
console.log(response);});
You can run the above code section in the console of any of the examples from the bookto see the “Response” object being printed. The object has several informative propertiesregarding the response, such as status and statusText which reflect the response status(200 and "OK", respectively, in case the request was successful) and url which contains therequested URL.
To get the actual contents of the requested resource, the response contains various methodsto extract the data associated with the response. For example, the .json method is usedto process the response JSON contents and parse (Section 3.11.1) it to the correspondingobject25. Furthermore, to get the actual object, rather than a “Promise”, the .json method
24For a more detailed introduction to Ajax, also see the Fetching Data From the Server article (https://developer.mozilla.org/en-US/docs/Learn/JavaScript/Client-side_web_APIs/Fetching_data) byMozilla.
25Note that there are several other methods to process other types of content, such as .text to get the
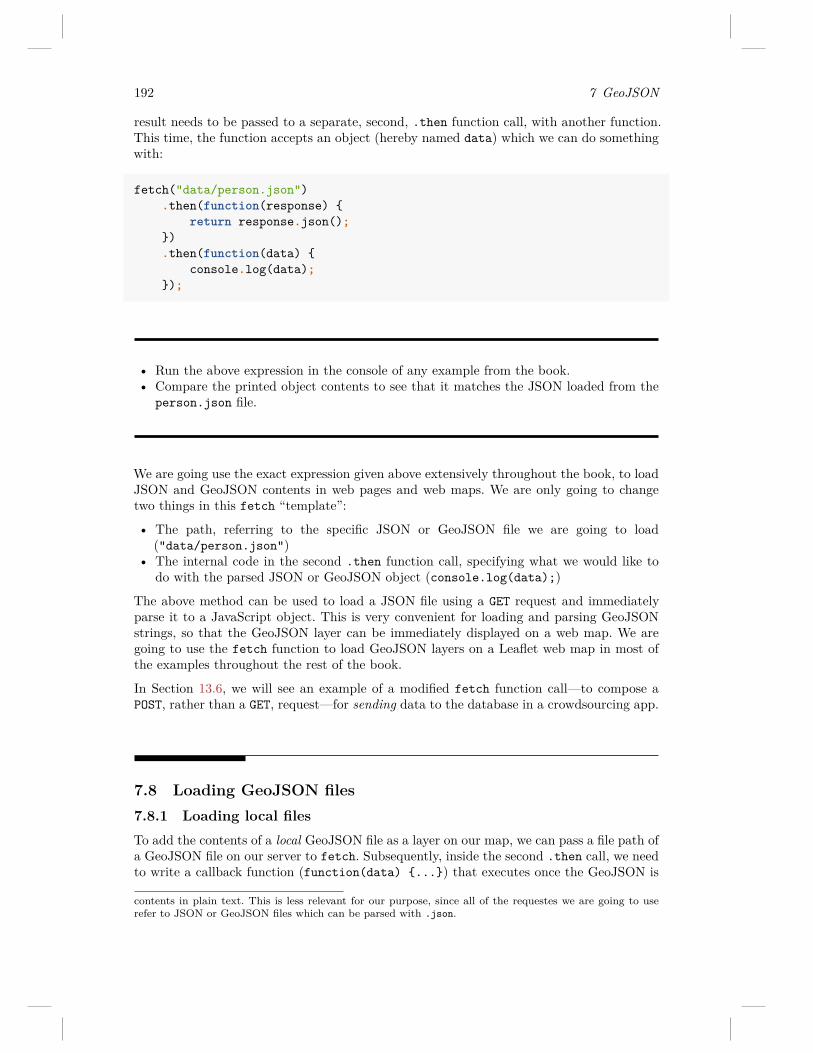
192 7 GeoJSON
result needs to be passed to a separate, second, .then function call, with another function.This time, the function accepts an object (hereby named data) which we can do somethingwith:
fetch("data/person.json").then(function(response) {
return response.json();}).then(function(data) {
console.log(data);});
• Run the above expression in the console of any example from the book.• Compare the printed object contents to see that it matches the JSON loaded from the
person.json file.
We are going use the exact expression given above extensively throughout the book, to loadJSON and GeoJSON contents in web pages and web maps. We are only going to changetwo things in this fetch “template”:
• The path, referring to the specific JSON or GeoJSON file we are going to load("data/person.json")
• The internal code in the second .then function call, specifying what we would like todo with the parsed JSON or GeoJSON object (console.log(data);)
The above method can be used to load a JSON file using a GET request and immediatelyparse it to a JavaScript object. This is very convenient for loading and parsing GeoJSONstrings, so that the GeoJSON layer can be immediately displayed on a web map. We aregoing to use the fetch function to load GeoJSON layers on a Leaflet web map in most ofthe examples throughout the rest of the book.
In Section 13.6, we will see an example of a modified fetch function call—to compose aPOST, rather than a GET, request—for sending data to the database in a crowdsourcing app.
7.8 Loading GeoJSON files7.8.1 Loading local filesTo add the contents of a local GeoJSON file as a layer on our map, we can pass a file path ofa GeoJSON file on our server to fetch. Subsequently, inside the second .then call, we needto write a callback function (function(data) {...}) that executes once the GeoJSON is
contents in plain text. This is less relevant for our purpose, since all of the requestes we are going to userefer to JSON or GeoJSON files which can be parsed with .json.
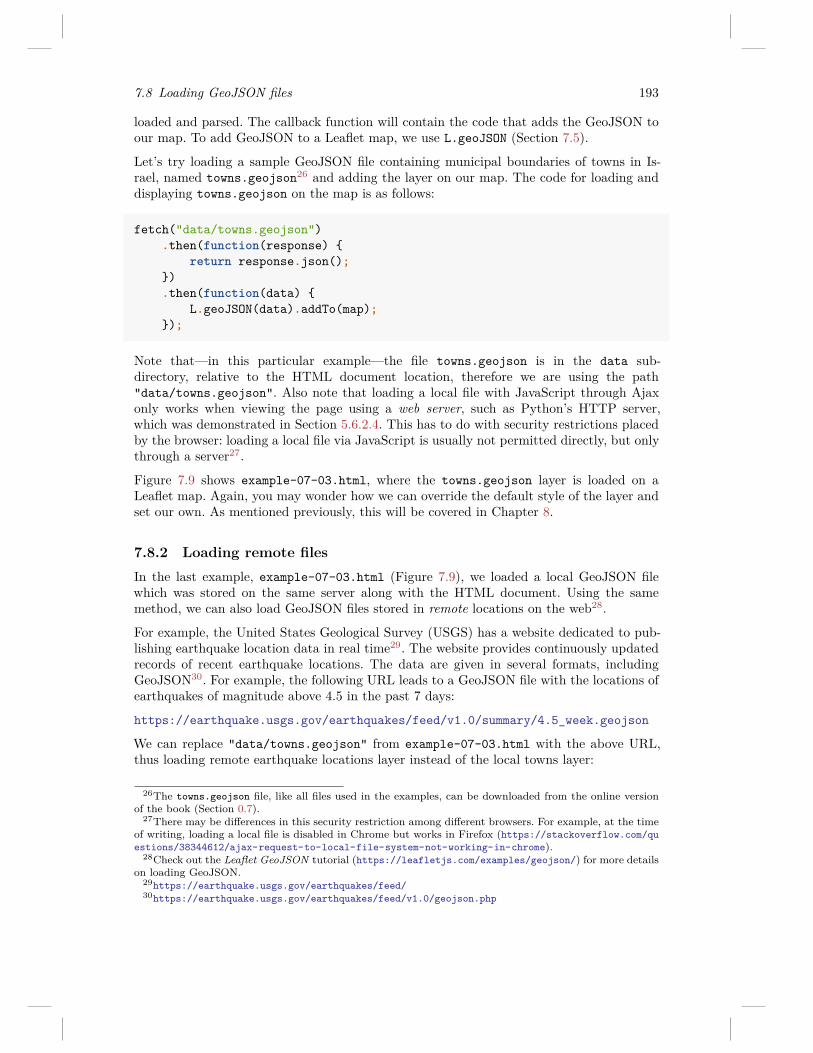
7.8 Loading GeoJSON files 193
loaded and parsed. The callback function will contain the code that adds the GeoJSON toour map. To add GeoJSON to a Leaflet map, we use L.geoJSON (Section 7.5).
Let’s try loading a sample GeoJSON file containing municipal boundaries of towns in Is-rael, named towns.geojson26 and adding the layer on our map. The code for loading anddisplaying towns.geojson on the map is as follows:
fetch("data/towns.geojson").then(function(response) {
return response.json();}).then(function(data) {
L.geoJSON(data).addTo(map);});
Note that—in this particular example—the file towns.geojson is in the data sub-directory, relative to the HTML document location, therefore we are using the path"data/towns.geojson". Also note that loading a local file with JavaScript through Ajaxonly works when viewing the page using a web server, such as Python’s HTTP server,which was demonstrated in Section 5.6.2.4. This has to do with security restrictions placedby the browser: loading a local file via JavaScript is usually not permitted directly, but onlythrough a server27.
Figure 7.9 shows example-07-03.html, where the towns.geojson layer is loaded on aLeaflet map. Again, you may wonder how we can override the default style of the layer andset our own. As mentioned previously, this will be covered in Chapter 8.
7.8.2 Loading remote filesIn the last example, example-07-03.html (Figure 7.9), we loaded a local GeoJSON filewhich was stored on the same server along with the HTML document. Using the samemethod, we can also load GeoJSON files stored in remote locations on the web28.
For example, the United States Geological Survey (USGS) has a website dedicated to pub-lishing earthquake location data in real time29. The website provides continuously updatedrecords of recent earthquake locations. The data are given in several formats, includingGeoJSON30. For example, the following URL leads to a GeoJSON file with the locations ofearthquakes of magnitude above 4.5 in the past 7 days:
https://earthquake.usgs.gov/earthquakes/feed/v1.0/summary/4.5_week.geojson
We can replace "data/towns.geojson" from example-07-03.html with the above URL,thus loading remote earthquake locations layer instead of the local towns layer:
26The towns.geojson file, like all files used in the examples, can be downloaded from the online versionof the book (Section 0.7).
27There may be differences in this security restriction among different browsers. For example, at the timeof writing, loading a local file is disabled in Chrome but works in Firefox (https://stackoverflow.com/questions/38344612/ajax-request-to-local-file-system-not-working-in-chrome).
28Check out the Leaflet GeoJSON tutorial (https://leafletjs.com/examples/geojson/) for more detailson loading GeoJSON.
29https://earthquake.usgs.gov/earthquakes/feed/30https://earthquake.usgs.gov/earthquakes/feed/v1.0/geojson.php
https://stackoverflow.com/questions/38344612/ajax-request-to-local-file-system-not-working-in-chrome
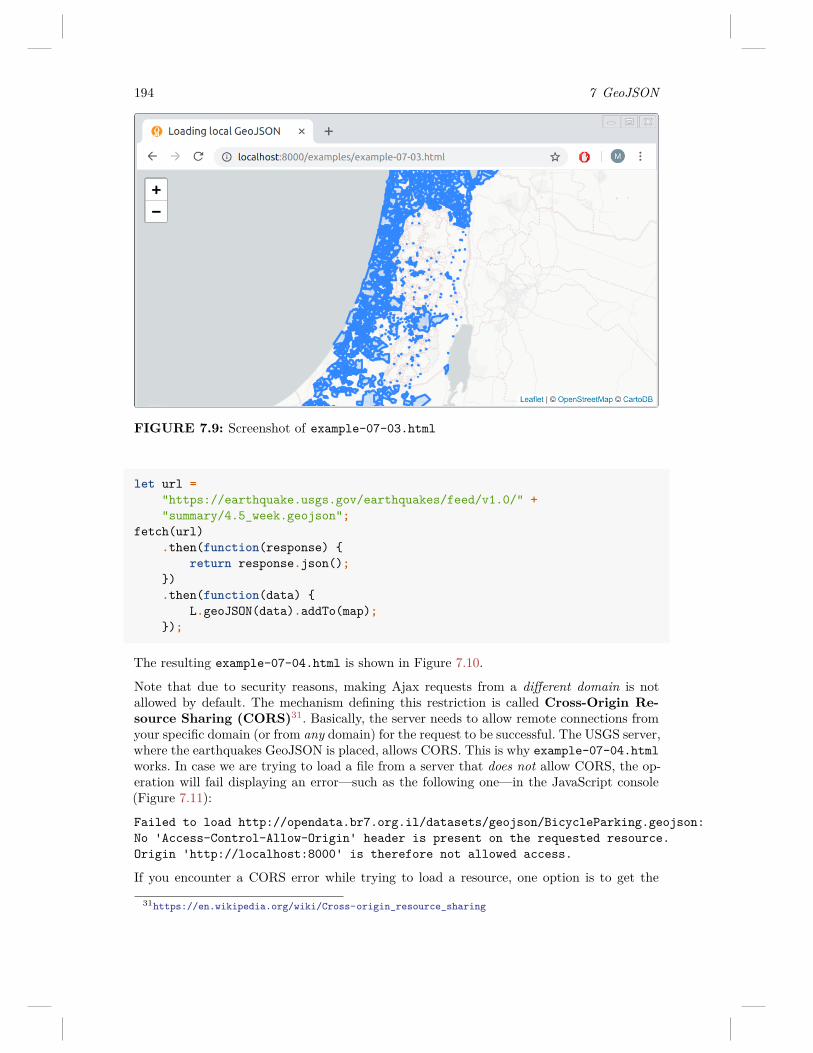
194 7 GeoJSON
FIGURE 7.9: Screenshot of example-07-03.html
let url ="https://earthquake.usgs.gov/earthquakes/feed/v1.0/" +"summary/4.5_week.geojson";
fetch(url).then(function(response) {
return response.json();}).then(function(data) {
L.geoJSON(data).addTo(map);});
The resulting example-07-04.html is shown in Figure 7.10.
Note that due to security reasons, making Ajax requests from a different domain is notallowed by default. The mechanism defining this restriction is called Cross-Origin Re-source Sharing (CORS)31. Basically, the server needs to allow remote connections fromyour specific domain (or from any domain) for the request to be successful. The USGS server,where the earthquakes GeoJSON is placed, allows CORS. This is why example-07-04.htmlworks. In case we are trying to load a file from a server that does not allow CORS, the op-eration will fail displaying an error—such as the following one—in the JavaScript console(Figure 7.11):
Failed to load http://opendata.br7.org.il/datasets/geojson/BicycleParking.geojson:No 'Access-Control-Allow-Origin' header is present on the requested resource.Origin 'http://localhost:8000' is therefore not allowed access.
If you encounter a CORS error while trying to load a resource, one option is to get the
31https://en.wikipedia.org/wiki/Cross-origin_resource_sharing
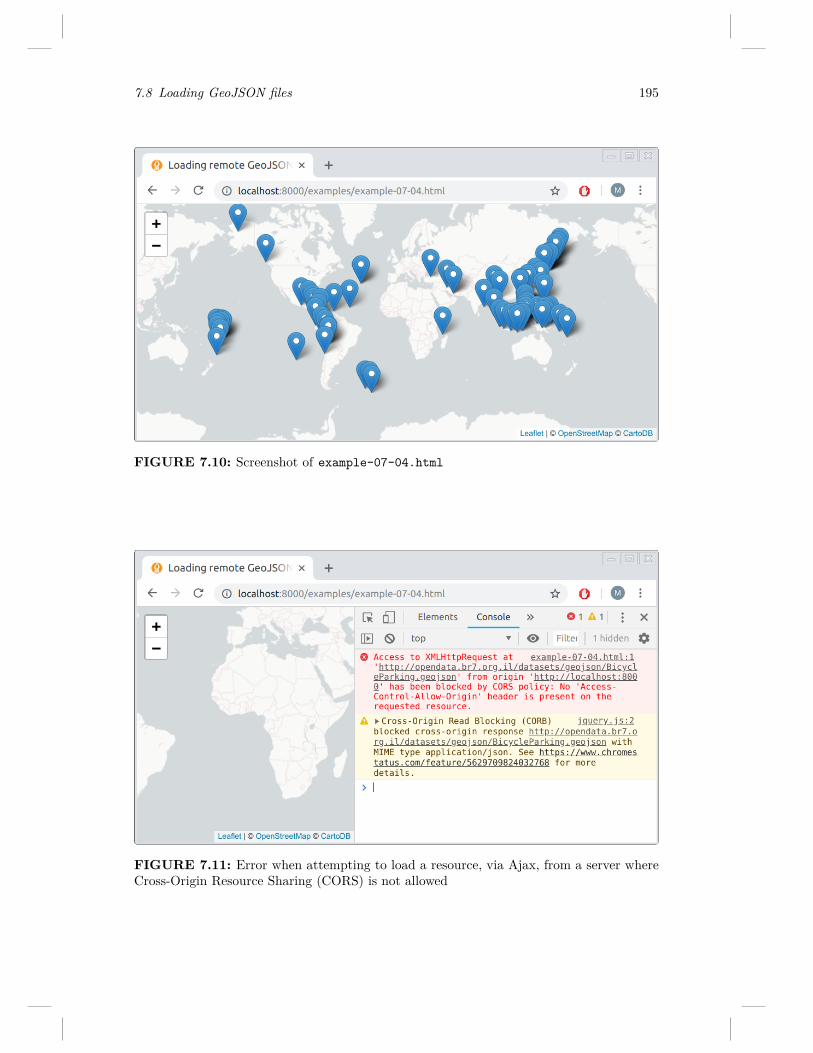
7.8 Loading GeoJSON files 195
FIGURE 7.10: Screenshot of example-07-04.html
FIGURE 7.11: Error when attempting to load a resource, via Ajax, from a server whereCross-Origin Resource Sharing (CORS) is not allowed
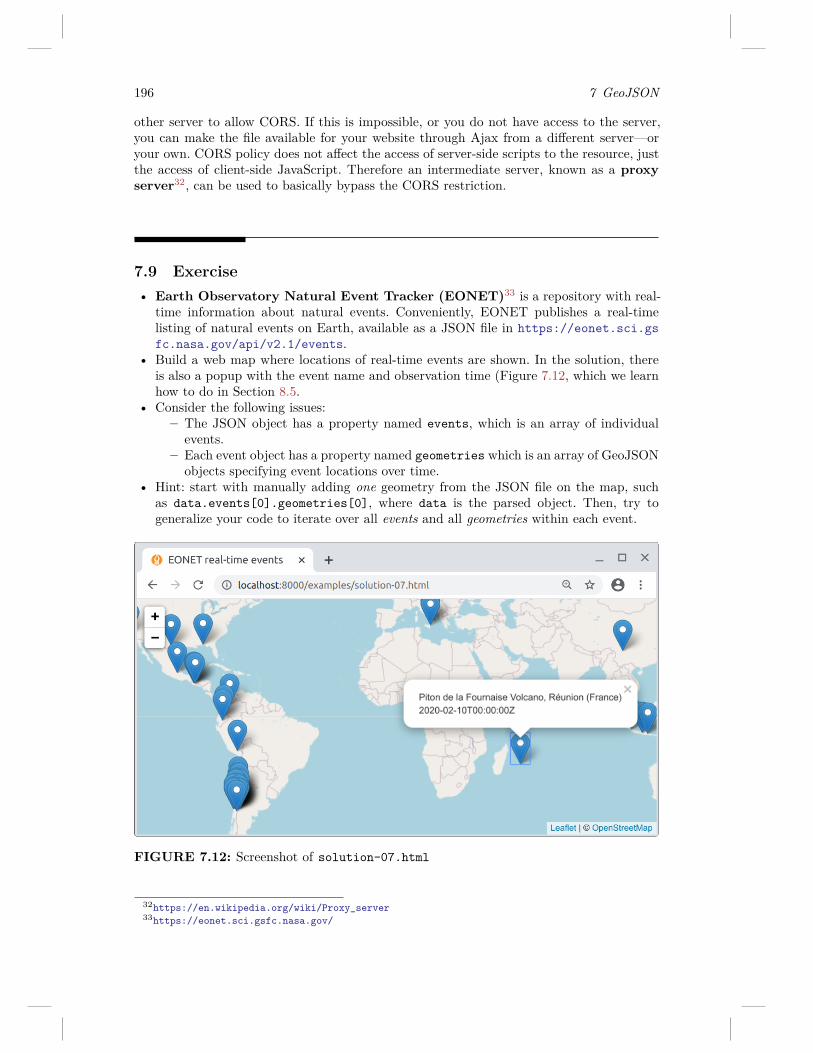
196 7 GeoJSON
other server to allow CORS. If this is impossible, or you do not have access to the server,you can make the file available for your website through Ajax from a different server—oryour own. CORS policy does not affect the access of server-side scripts to the resource, justthe access of client-side JavaScript. Therefore an intermediate server, known as a proxyserver32, can be used to basically bypass the CORS restriction.
7.9 Exercise• Earth Observatory Natural Event Tracker (EONET)33 is a repository with real-
time information about natural events. Conveniently, EONET publishes a real-timelisting of natural events on Earth, available as a JSON file in https://eonet.sci.gsfc.nasa.gov/api/v2.1/events.
• Build a web map where locations of real-time events are shown. In the solution, thereis also a popup with the event name and observation time (Figure 7.12, which we learnhow to do in Section 8.5.
• Consider the following issues:– The JSON object has a property named events, which is an array of individual
events.– Each event object has a property named geometries which is an array of GeoJSON
objects specifying event locations over time.• Hint: start with manually adding one geometry from the JSON file on the map, such
as data.events[0].geometries[0], where data is the parsed object. Then, try togeneralize your code to iterate over all events and all geometries within each event.
FIGURE 7.12: Screenshot of solution-07.html
32https://en.wikipedia.org/wiki/Proxy_server33https://eonet.sci.gsfc.nasa.gov/
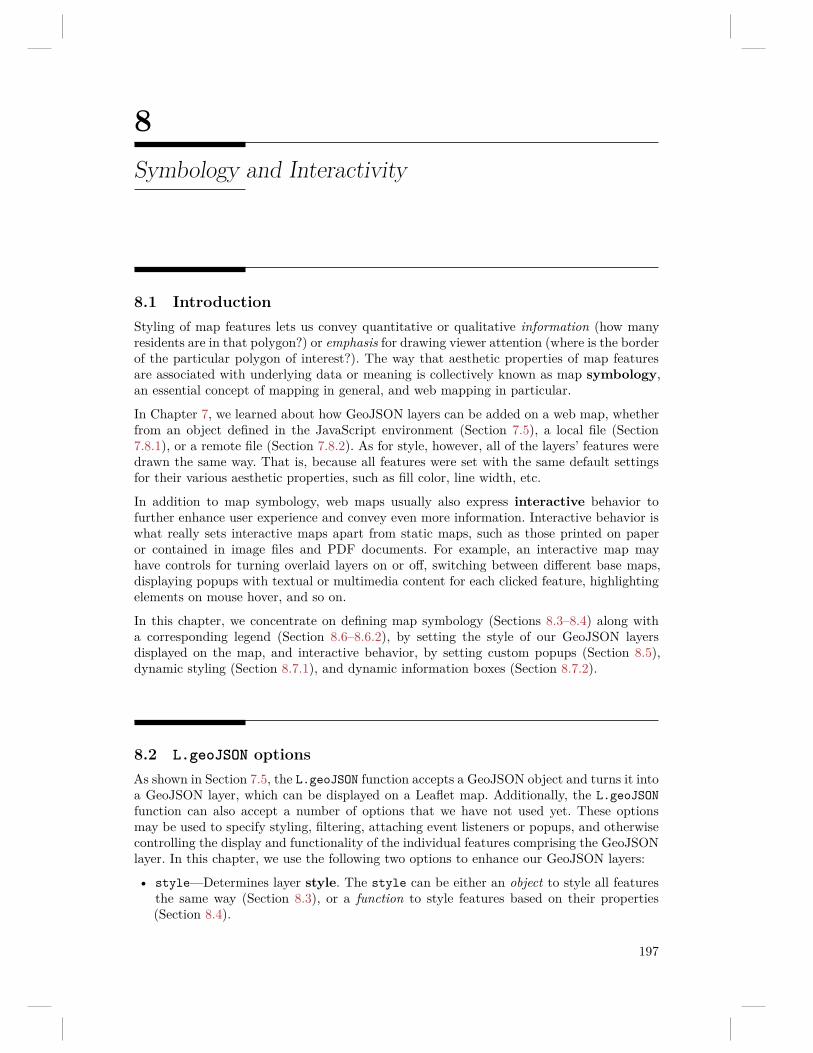
8Symbology and Interactivity
8.1 IntroductionStyling of map features lets us convey quantitative or qualitative information (how manyresidents are in that polygon?) or emphasis for drawing viewer attention (where is the borderof the particular polygon of interest?). The way that aesthetic properties of map featuresare associated with underlying data or meaning is collectively known as map symbology,an essential concept of mapping in general, and web mapping in particular.
In Chapter 7, we learned about how GeoJSON layers can be added on a web map, whetherfrom an object defined in the JavaScript environment (Section 7.5), a local file (Section7.8.1), or a remote file (Section 7.8.2). As for style, however, all of the layers’ features weredrawn the same way. That is, because all features were set with the same default settingsfor their various aesthetic properties, such as fill color, line width, etc.
In addition to map symbology, web maps usually also express interactive behavior tofurther enhance user experience and convey even more information. Interactive behavior iswhat really sets interactive maps apart from static maps, such as those printed on paperor contained in image files and PDF documents. For example, an interactive map mayhave controls for turning overlaid layers on or off, switching between different base maps,displaying popups with textual or multimedia content for each clicked feature, highlightingelements on mouse hover, and so on.
In this chapter, we concentrate on defining map symbology (Sections 8.3–8.4) along witha corresponding legend (Section 8.6–8.6.2), by setting the style of our GeoJSON layersdisplayed on the map, and interactive behavior, by setting custom popups (Section 8.5),dynamic styling (Section 8.7.1), and dynamic information boxes (Section 8.7.2).
8.2 L.geoJSON optionsAs shown in Section 7.5, the L.geoJSON function accepts a GeoJSON object and turns it intoa GeoJSON layer, which can be displayed on a Leaflet map. Additionally, the L.geoJSONfunction can also accept a number of options that we have not used yet. These optionsmay be used to specify styling, filtering, attaching event listeners or popups, and otherwisecontrolling the display and functionality of the individual features comprising the GeoJSONlayer. In this chapter, we use the following two options to enhance our GeoJSON layers:
• style—Determines layer style. The style can be either an object to style all featuresthe same way (Section 8.3), or a function to style features based on their properties(Section 8.4).
197
198 8 Symbology and Interactivity
• onEachFeature—A function that gets called on each feature before adding it to theGeoJSON layer. The onEachFeature function can be used to add specific popups (Sec-tion 8.5) or event listeners (Section 8.7.1) to each feature.
When using both options, the L.geoJSON function call may look like this:
L.geoJSON(geojson, {style: ..., onEachFeature: ...}).addTo(map);
where:
• geojson is the GeoJSON object; and• {style: ..., onEachFeature: ...} is the options object, in this case including both
style and onEachFeature options.
The ... parts in the above expression are to be replaced with an object or a function (seebelow), depending on how we want to define the appearance and behavior of the GeoJSONlayer.
In addition to style and onEachFeature, in Chapter 12 we will use a third option ofL.geoJSON called pointToLayer (Sections 12.4.5 and 12.5.2). The pointToLayer optiondetermines the way that GeoJSON point geometries are translated to visual layers. Forexample the pointToLayer option can be used to determine whether a GeoJSON "Point"feature should be displayed using a marker (Figure 7.10; the default), a circle marker (Fig-ures 12.6–12.8), or a circle.
8.3 Constant styleThe simplest way to style our GeoJSON layer is to set constant aesthetic properties for allof the features it contains. Just like in styling of line (Sections 6.6.3) and polygon (Section6.6.4) layers, we only need to set those specific properties where we would like to overridethe default appearance. For example, let’s start with example-07-01.html from Section7.5. In that example, we used the following expression to add the GeoJSON object namedstates to our map:
L.geoJSON(states).addTo(map);
This sets the default Leaflet style for all polygons—blue border and semi-transparent blue fill(Figure 7.4). To override some of the default settings, the above expression can be replacedwith the following one:
L.geoJSON(states, {style: {
color: "red",weight: 5,fillColor: "yellow",fillOpacity: 0.2
}}).addTo(map);
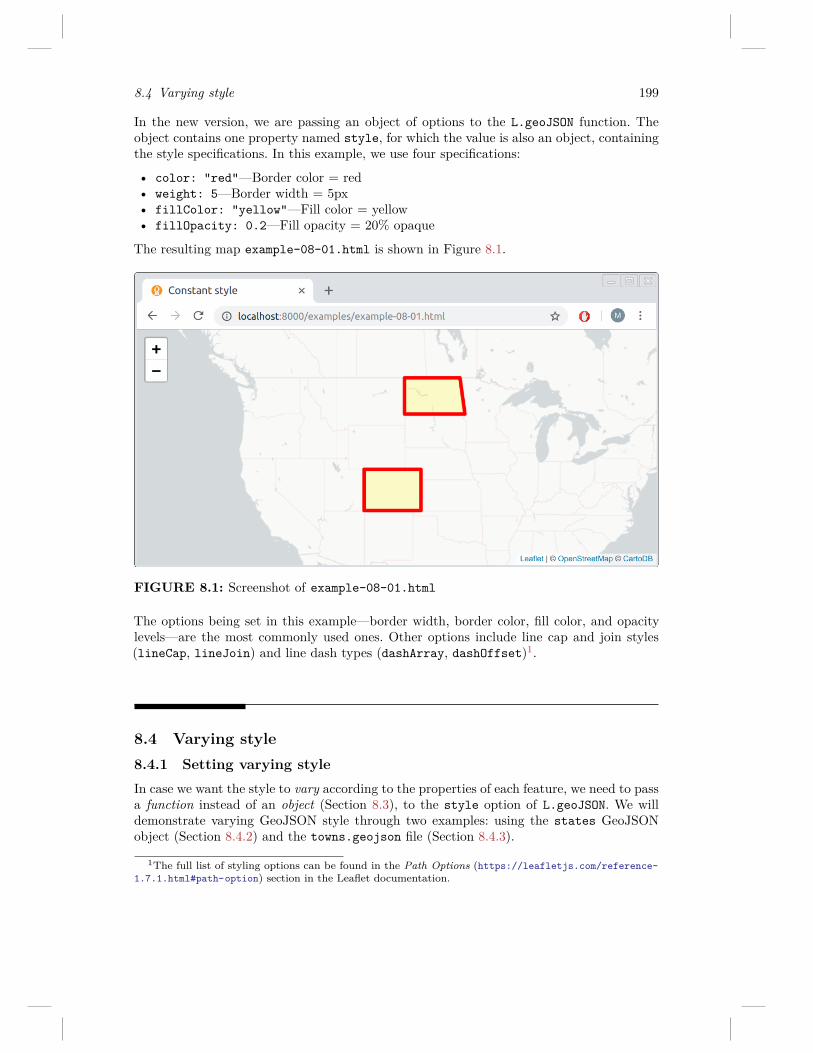
8.4 Varying style 199
In the new version, we are passing an object of options to the L.geoJSON function. Theobject contains one property named style, for which the value is also an object, containingthe style specifications. In this example, we use four specifications:
• color: "red"—Border color = red• weight: 5—Border width = 5px• fillColor: "yellow"—Fill color = yellow• fillOpacity: 0.2—Fill opacity = 20% opaque
The resulting map example-08-01.html is shown in Figure 8.1.
FIGURE 8.1: Screenshot of example-08-01.html
The options being set in this example—border width, border color, fill color, and opacitylevels—are the most commonly used ones. Other options include line cap and join styles(lineCap, lineJoin) and line dash types (dashArray, dashOffset)1.
8.4 Varying style8.4.1 Setting varying styleIn case we want the style to vary according to the properties of each feature, we need to passa function instead of an object (Section 8.3), to the style option of L.geoJSON. We willdemonstrate varying GeoJSON style through two examples: using the states GeoJSONobject (Section 8.4.2) and the towns.geojson file (Section 8.4.3).
1The full list of styling options can be found in the Path Options (https://leafletjs.com/reference-1.7.1.html#path-option) section in the Leaflet documentation.
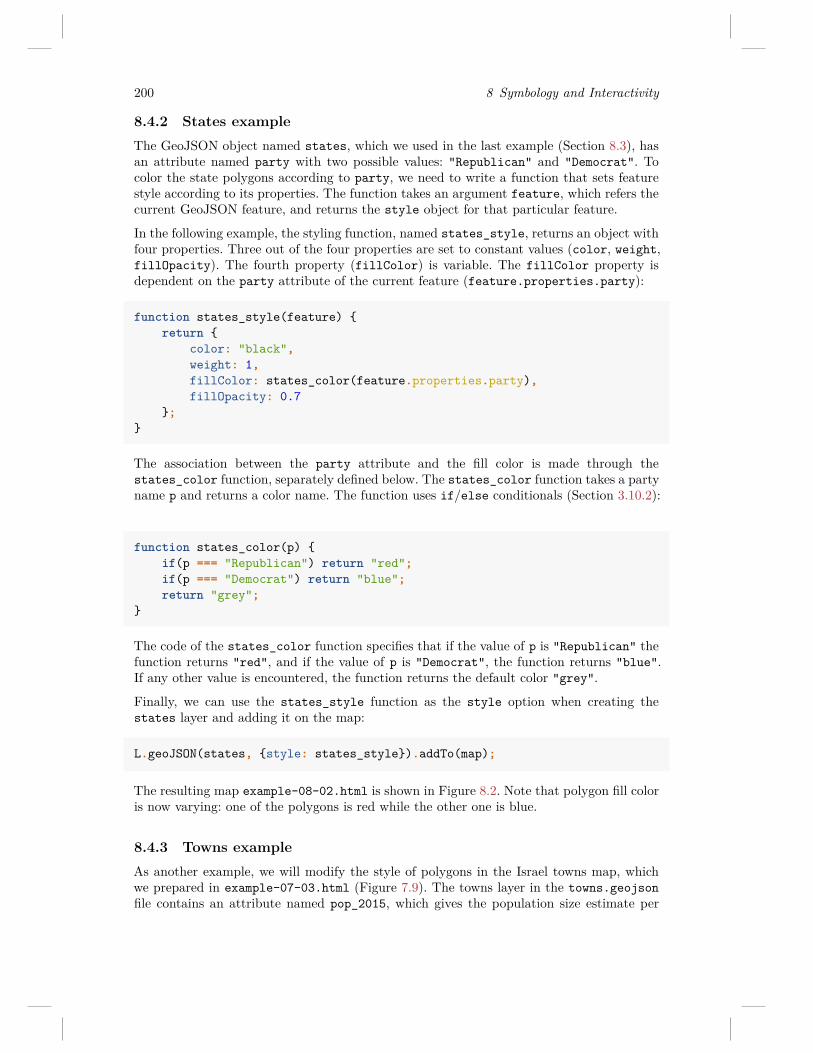
200 8 Symbology and Interactivity
8.4.2 States exampleThe GeoJSON object named states, which we used in the last example (Section 8.3), hasan attribute named party with two possible values: "Republican" and "Democrat". Tocolor the state polygons according to party, we need to write a function that sets featurestyle according to its properties. The function takes an argument feature, which refers thecurrent GeoJSON feature, and returns the style object for that particular feature.
In the following example, the styling function, named states_style, returns an object withfour properties. Three out of the four properties are set to constant values (color, weight,fillOpacity). The fourth property (fillColor) is variable. The fillColor property isdependent on the party attribute of the current feature (feature.properties.party):
function states_style(feature) {return {
color: "black",weight: 1,fillColor: states_color(feature.properties.party),fillOpacity: 0.7
};}
The association between the party attribute and the fill color is made through thestates_color function, separately defined below. The states_color function takes a partyname p and returns a color name. The function uses if/else conditionals (Section 3.10.2):
function states_color(p) {if(p === "Republican") return "red";if(p === "Democrat") return "blue";return "grey";
}
The code of the states_color function specifies that if the value of p is "Republican" thefunction returns "red", and if the value of p is "Democrat", the function returns "blue".If any other value is encountered, the function returns the default color "grey".
Finally, we can use the states_style function as the style option when creating thestates layer and adding it on the map:
L.geoJSON(states, {style: states_style}).addTo(map);
The resulting map example-08-02.html is shown in Figure 8.2. Note that polygon fill coloris now varying: one of the polygons is red while the other one is blue.
8.4.3 Towns exampleAs another example, we will modify the style of polygons in the Israel towns map, whichwe prepared in example-07-03.html (Figure 7.9). The towns layer in the towns.geojsonfile contains an attribute named pop_2015, which gives the population size estimate per
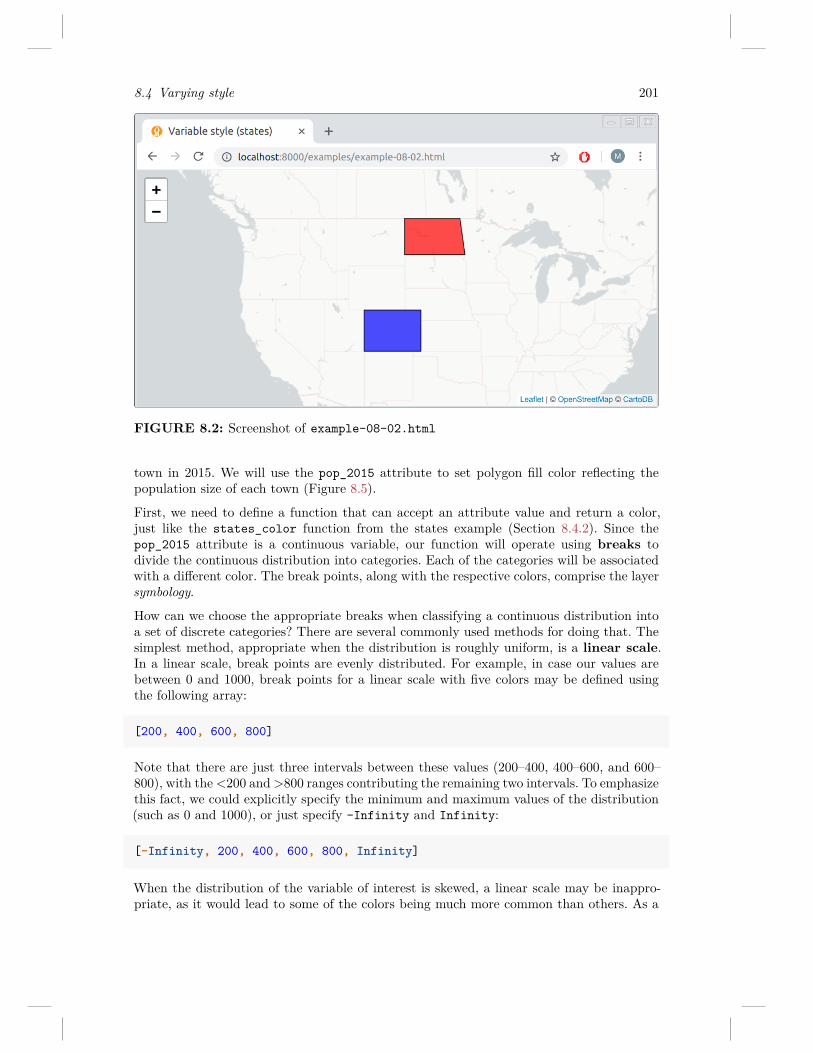
8.4 Varying style 201
FIGURE 8.2: Screenshot of example-08-02.html
town in 2015. We will use the pop_2015 attribute to set polygon fill color reflecting thepopulation size of each town (Figure 8.5).
First, we need to define a function that can accept an attribute value and return a color,just like the states_color function from the states example (Section 8.4.2). Since thepop_2015 attribute is a continuous variable, our function will operate using breaks todivide the continuous distribution into categories. Each of the categories will be associatedwith a different color. The break points, along with the respective colors, comprise the layersymbology.
How can we choose the appropriate breaks when classifying a continuous distribution intoa set of discrete categories? There are several commonly used methods for doing that. Thesimplest method, appropriate when the distribution is roughly uniform, is a linear scale.In a linear scale, break points are evenly distributed. For example, in case our values arebetween 0 and 1000, break points for a linear scale with five colors may be defined usingthe following array:
[200, 400, 600, 800]
Note that there are just three intervals between these values (200–400, 400–600, and 600–800), with the <200 and >800 ranges contributing the remaining two intervals. To emphasizethis fact, we could explicitly specify the minimum and maximum values of the distribution(such as 0 and 1000), or just specify -Infinity and Infinity:
[-Infinity, 200, 400, 600, 800, Infinity]
When the distribution of the variable of interest is skewed, a linear scale may be inappro-priate, as it would lead to some of the colors being much more common than others. As a
202 8 Symbology and Interactivity
result, the map may have little color diversity and appear uniformly colored. One solutionis to use a logarithmic scale, such as:
[1, 10, 100, 1000]
The logarithmic scale gives increasingly detailed emphasis on one side of the distribution—the smaller values—by inducing increasingly wider categories. For example, the first category(1–10) is much narrower than the last category (100–1000).
A more flexible way of dealing with non-uniform distributions, which we are going to demon-strate in the present example, is using quantiles2. Quantiles are break points that distributeour set of observations into groups with equal counts of cases. For example, using quantileswe may divide our distribution into four equal groups, each containing a quarter of all val-ues (0%–25%–50%–75%–100%)3. There are advantages and disadvantages4 to using quantilebreaks in mapping. The major advantage is that all colors are equally represented, whichmakes it easy to detect ordinal spatial patterns in our data. The downside is that categoryranges can be widely different, in a non-systematic manner, which means that different color“steps” on the map are not consistently related to quantitative differences.
How can we calculate the quantile breaks for a given variable? There are many ways tocalculate the break points in various software and programming languages, including inJavaScript5. One example of an external software to calculate quantiles is QGIS (QGISDevelopment Team, 2018). Once the layer of interest (such as towns.geojson) is loadedin QGIS, we need to set its symbology choosing the Quantile (Equal Count) for Mode,as shown in Figure 8.3. We also need to choose how many quantiles we want. For example,choosing 5 means that our values are divided into 5 equally sized groups, each containing 20%of the observations (i.e., 0%–20%–40%–60%–80%–100%). The breaks will be automaticallycalculated and displayed (Figure 8.3).
The four break points to split the pop_2015 variable into five quantiles are given in thefollowing array (Figure 8.3):
[399, 642, 933.2, 2089.8]
Once we figured out the break points, we can write a color-selection function, such asthe one hereby named towns_color. The function accepts a value d (population size) anddetermines the appropriate color for that value. Since we have five different categories, thefunction uses a hierarchical set of four conditionals, as follows:
function towns_color(d) {if(d > 2089.8) return "...";if(d > 933.2) return "...";if(d > 642) return "...";if(d > 399) return "...";return "...";
}
2https://en.wikipedia.org/wiki/Quantile3This specific case is called quartiles (https://en.wikipedia.org/wiki/Quartile).4http://wiki.gis.com/wiki/index.php/Quantile5https://simplestatistics.org/docs/#quantile
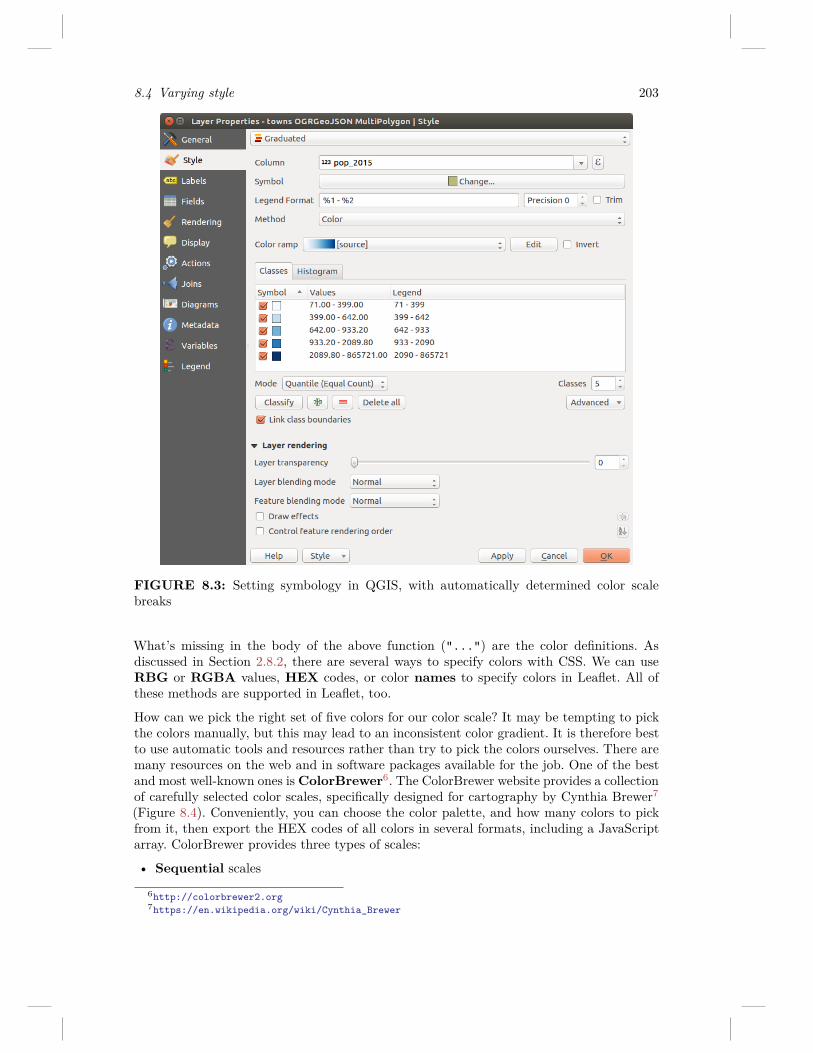
8.4 Varying style 203
FIGURE 8.3: Setting symbology in QGIS, with automatically determined color scalebreaks
What’s missing in the body of the above function ("...") are the color definitions. Asdiscussed in Section 2.8.2, there are several ways to specify colors with CSS. We can useRBG or RGBA values, HEX codes, or color names to specify colors in Leaflet. All ofthese methods are supported in Leaflet, too.
How can we pick the right set of five colors for our color scale? It may be tempting to pickthe colors manually, but this may lead to an inconsistent color gradient. It is therefore bestto use automatic tools and resources rather than try to pick the colors ourselves. There aremany resources on the web and in software packages available for the job. One of the bestand most well-known ones is ColorBrewer6. The ColorBrewer website provides a collectionof carefully selected color scales, specifically designed for cartography by Cynthia Brewer7
(Figure 8.4). Conveniently, you can choose the color palette, and how many colors to pickfrom it, then export the HEX codes of all colors in several formats, including a JavaScriptarray. ColorBrewer provides three types of scales:
• Sequential scales
6http://colorbrewer2.org7https://en.wikipedia.org/wiki/Cynthia_Brewer
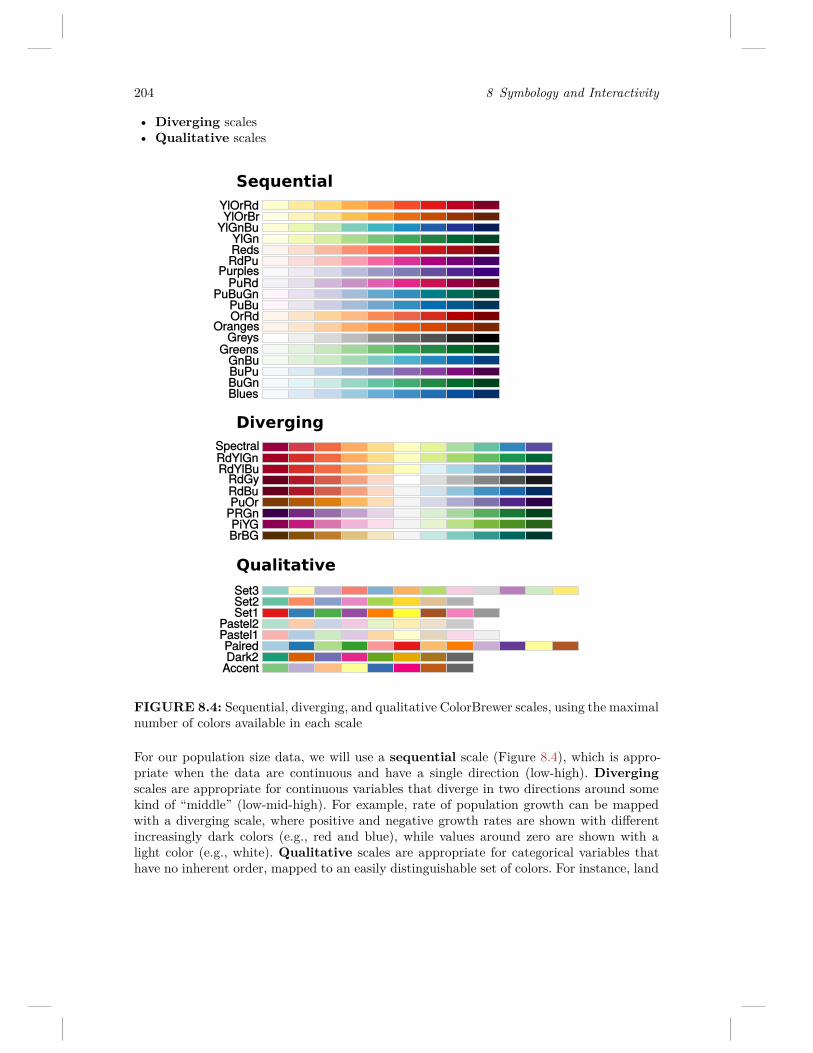
204 8 Symbology and Interactivity
• Diverging scales• Qualitative scales
Qualitative
Diverging
Sequential
FIGURE 8.4: Sequential, diverging, and qualitative ColorBrewer scales, using the maximalnumber of colors available in each scale
For our population size data, we will use a sequential scale (Figure 8.4), which is appro-priate when the data are continuous and have a single direction (low-high). Divergingscales are appropriate for continuous variables that diverge in two directions around somekind of “middle” (low-mid-high). For example, rate of population growth can be mappedwith a diverging scale, where positive and negative growth rates are shown with differentincreasingly dark colors (e.g., red and blue), while values around zero are shown with alight color (e.g., white). Qualitative scales are appropriate for categorical variables thathave no inherent order, mapped to an easily distinguishable set of colors. For instance, land
8.4 Varying style 205
cover categories (e.g., built area, forests, water bodies, etc.) can be mapped to a qualitativescale8.
To export a JavaScript array of HEX color codes from ColorBrewer:
• Go to http://colorbrewer2.org.• Select the Number of data classes (e.g., 5).• Pick the Nature of your data, i.e., the scale type (e.g., “sequential”).• Select the scale in the Pick a color scheme menu (e.g., “OrRd” for an Orange-Red
scale).• Click Export and copy the contents of the text box named JavaScript.
For example, choosing five colors from the sequential color scheme called “OrRd” (Orange-Red), the ColorBrewer website gives us the following set of HEX color codes:
["#fef0d9", "#fdcc8a", "#fc8d59", "#e34a33", "#b30000"]
This is an expression for creating a JavaScript array, which we can copy and paste directlyinto our JavaScript code. The ColorBrewer website also contains a JavaScript code filenamed colorbrewer.js9, with the complete set of color palette definitions as JavaScriptarrays. If you use many different scales in a particular web map, it may be a good idea toinclude the file in your web page and then refer to the various color scale arrays by namein your JavaScript code.
Now that we have the five color codes, let’s insert them into the towns_color functiondefinition. The function accepts a population size d, and returns the corresponding colorcode:
function towns_color(d) {if(d > 2089.8) return "#b30000";if(d > 933.2) return "#e34a33";if(d > 642) return "#fc8d59";if(d > 399) return "#fdcc8a";return "#fef0d9";
}
One disadvantage of the above towns_color function definition is that it uses a rigid set ofif/else conditionals, which will be inconvenient to modify in case we decide to change thenumber of break points and colors. A more general version of the function could operateon an array of break points and a corresponding array of colors. Then, instead of if/elseconditionals the function could use a for loop (Section 3.10.3.1). The loop goes over thebreaks array, detects between which pair of breaks our value is situated, and returns theappropriate color. Here is an alternative version of the towns_color function, using a forloop instead of if/else conditionals:
let breaks = [-Infinity, 399, 642, 933.2, 2089.8, Infinity];let colors = ["#fef0d9", "#fdcc8a", "#fc8d59", "#e34a33", "#b30000"];
8In a qualitative scale, it makes sense to choose intuitively interpretable colors whenever possible, e.g.,built area = grey, water body = blue, forest = green, etc.
9http://colorbrewer2.org/export/colorbrewer.js
206 8 Symbology and Interactivity
function towns_color(d) {for(let i = 0; i < breaks.length; i++) {
if(d > breaks[i] && d <= breaks[i+1]) {return colors[i];
}}
}
With this version, it is easier to replace the color scale whenever necessary. All we need todo is modify the breaks and colors arrays.
Like in the states example (example-08-02.html), our next step is to wrap the towns_colorfunction into another function, hereby named towns_style, which is responsible for settingall of the styling options where we override the defaults:
function towns_style(feature) {return {
fillColor: towns_color(feature.properties.pop_2015),weight: 0.5,opacity: 1,color: "black",fillOpacity: 0.7
};}
This time, we have four constant properties (weight, opacity, color, and fillOpacity)and one variable property (fillColor). Finally, we need to pass the towns_style functionto the GeoJSON style option when loading the towns layer (Section 7.8.1) and adding iton the map:
fetch("data/towns.geojson").then(function(response) {
return response.json();}).then(function(data) {
L.geoJSON(data, {style: towns_style}).addTo(map);});
The resulting map example-08-03.html is shown in Figure 8.5. The towns polygons arenow filled with one of the five colors from the Orange-Red ColorBrewer scale, according tothe town popupation size, as defined in the towns_color function.
There is a lot of theory and considerations behind choosing the type of symbology andcolor scale for a map, which we barely scratched the surface of. While we mainly focusedon the technical process of defining and applying a color scale in a web map, the reader isreferred to textbooks on cartography (Dent et al., 2008) and data visualization (Tufte, 2001;Wilke, 2019) for more information on the theoretical considerations of choosing a color scalefor particular types of data and display purposes. For example, visualizing raw counts perpolygon—when polygons are not of the same size—is considered misleading, since it drawsthe attention to larger polygons and minimizes the significance of smaller polygons with
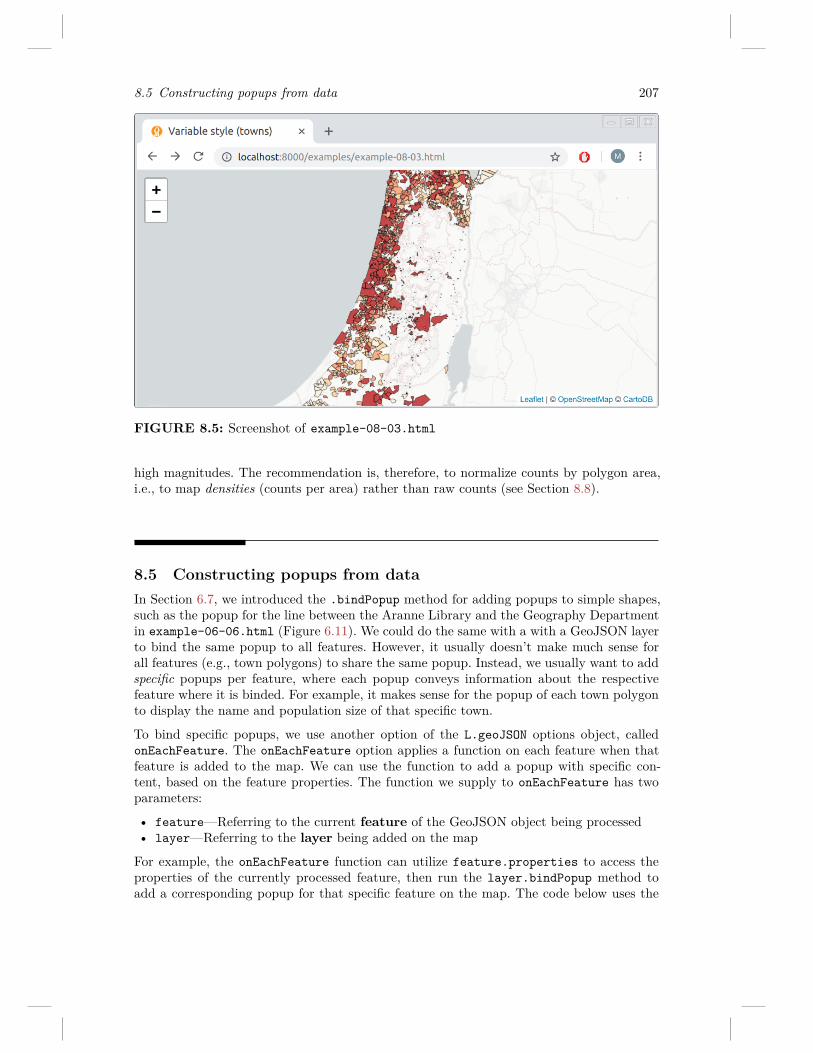
8.5 Constructing popups from data 207
FIGURE 8.5: Screenshot of example-08-03.html
high magnitudes. The recommendation is, therefore, to normalize counts by polygon area,i.e., to map densities (counts per area) rather than raw counts (see Section 8.8).
8.5 Constructing popups from dataIn Section 6.7, we introduced the .bindPopup method for adding popups to simple shapes,such as the popup for the line between the Aranne Library and the Geography Departmentin example-06-06.html (Figure 6.11). We could do the same with a with a GeoJSON layerto bind the same popup to all features. However, it usually doesn’t make much sense forall features (e.g., town polygons) to share the same popup. Instead, we usually want to addspecific popups per feature, where each popup conveys information about the respectivefeature where it is binded. For example, it makes sense for the popup of each town polygonto display the name and population size of that specific town.
To bind specific popups, we use another option of the L.geoJSON options object, calledonEachFeature. The onEachFeature option applies a function on each feature when thatfeature is added to the map. We can use the function to add a popup with specific con-tent, based on the feature properties. The function we supply to onEachFeature has twoparameters:
• feature—Referring to the current feature of the GeoJSON object being processed• layer—Referring to the layer being added on the map
For example, the onEachFeature function can utilize feature.properties to access theproperties of the currently processed feature, then run the layer.bindPopup method toadd a corresponding popup for that specific feature on the map. The code below uses the
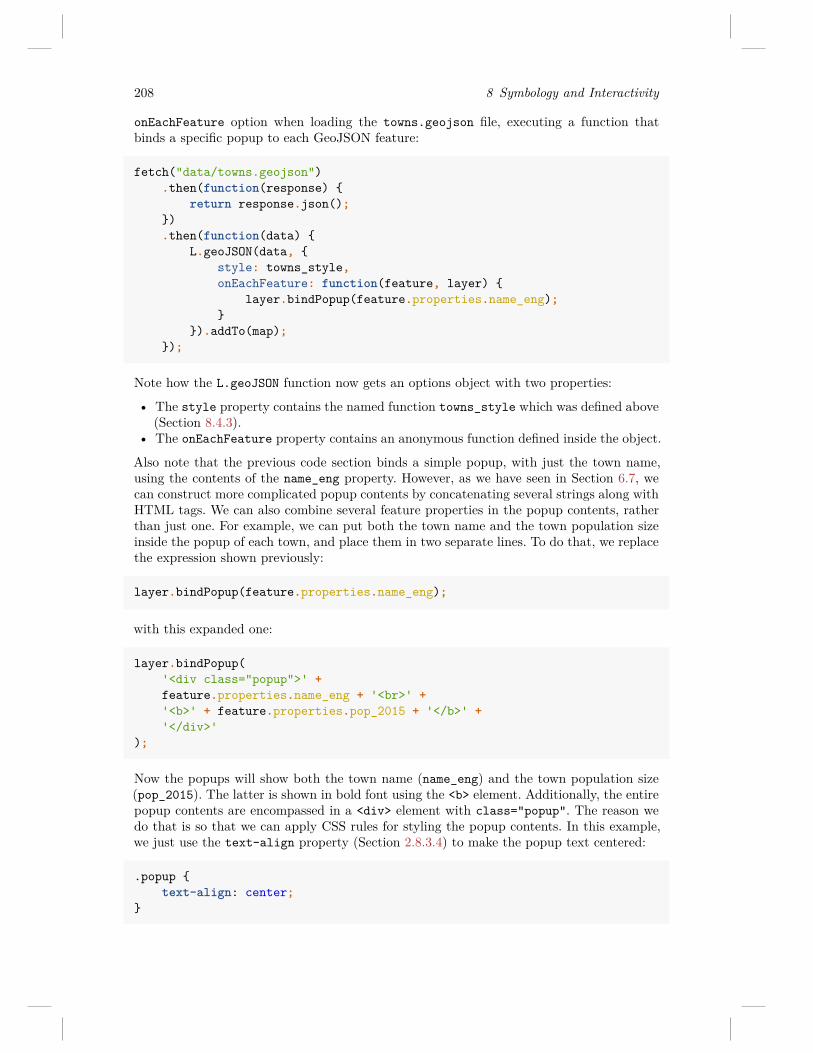
208 8 Symbology and Interactivity
onEachFeature option when loading the towns.geojson file, executing a function thatbinds a specific popup to each GeoJSON feature:
fetch("data/towns.geojson").then(function(response) {
return response.json();}).then(function(data) {
L.geoJSON(data, {style: towns_style,onEachFeature: function(feature, layer) {
layer.bindPopup(feature.properties.name_eng);}
}).addTo(map);});
Note how the L.geoJSON function now gets an options object with two properties:
• The style property contains the named function towns_style which was defined above(Section 8.4.3).
• The onEachFeature property contains an anonymous function defined inside the object.
Also note that the previous code section binds a simple popup, with just the town name,using the contents of the name_eng property. However, as we have seen in Section 6.7, wecan construct more complicated popup contents by concatenating several strings along withHTML tags. We can also combine several feature properties in the popup contents, ratherthan just one. For example, we can put both the town name and the town population sizeinside the popup of each town, and place them in two separate lines. To do that, we replacethe expression shown previously:
layer.bindPopup(feature.properties.name_eng);
with this expanded one:
layer.bindPopup('<div class="popup">' +feature.properties.name_eng + '<br>' +'<b>' + feature.properties.pop_2015 + '</b>' +'</div>'
);
Now the popups will show both the town name (name_eng) and the town population size(pop_2015). The latter is shown in bold font using the <b> element. Additionally, the entirepopup contents are encompassed in a <div> element with class="popup". The reason wedo that is so that we can apply CSS rules for styling the popup contents. In this example,we just use the text-align property (Section 2.8.3.4) to make the popup text centered:
.popup {text-align: center;
}
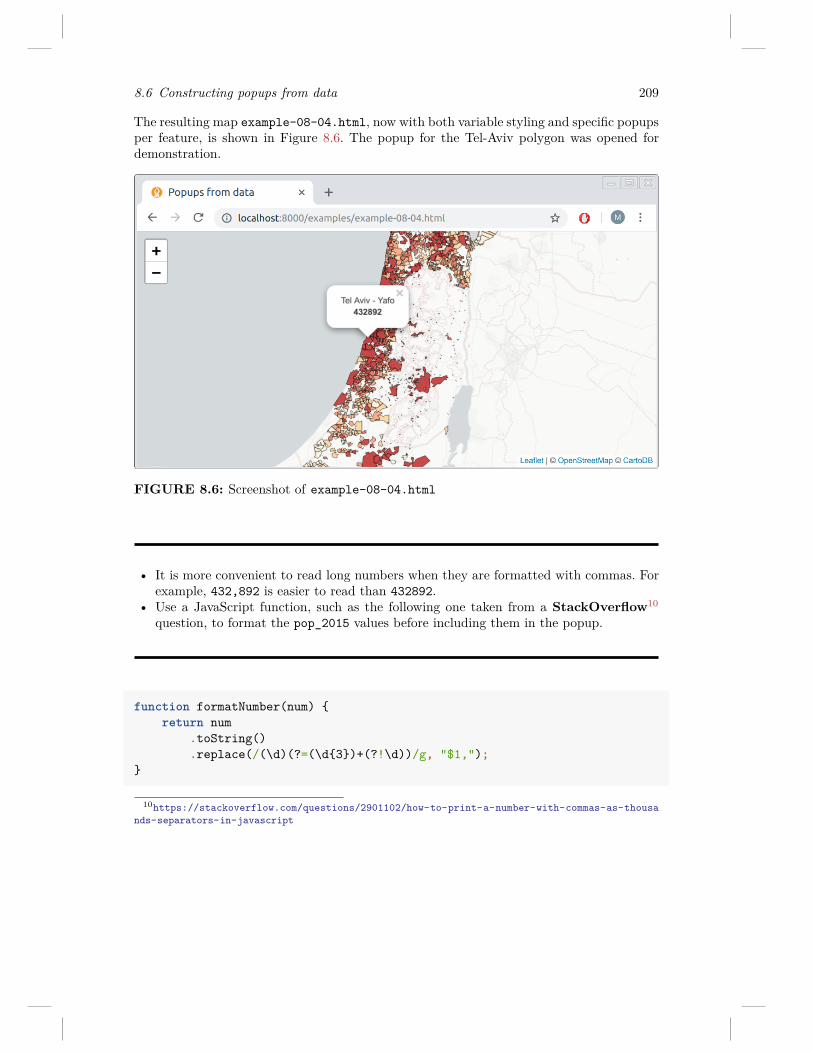
8.6 Constructing popups from data 209
The resulting map example-08-04.html, now with both variable styling and specific popupsper feature, is shown in Figure 8.6. The popup for the Tel-Aviv polygon was opened fordemonstration.
FIGURE 8.6: Screenshot of example-08-04.html
• It is more convenient to read long numbers when they are formatted with commas. Forexample, 432,892 is easier to read than 432892.
• Use a JavaScript function, such as the following one taken from a StackOverflow10
question, to format the pop_2015 values before including them in the popup.
function formatNumber(num) {return num
.toString()
.replace(/(\d)(?=(\d{3})+(?!\d))/g, "$1,");}
10https://stackoverflow.com/questions/2901102/how-to-print-a-number-with-commas-as-thousands-separators-in-javascript
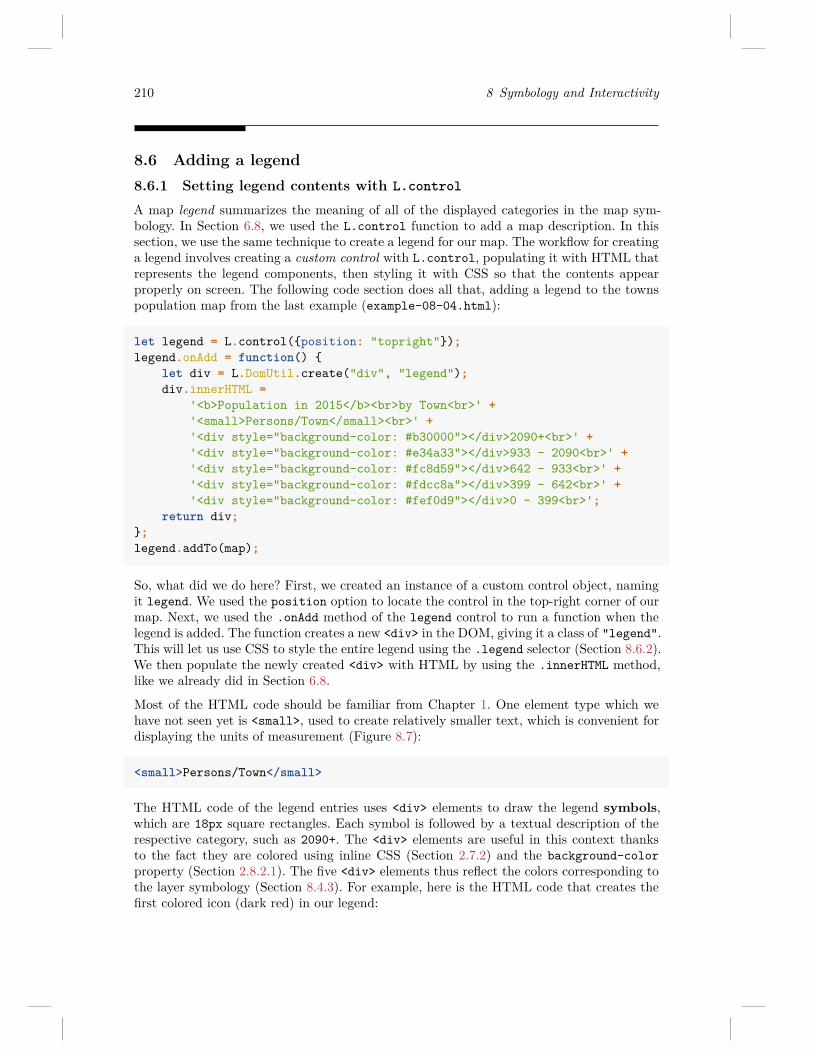
210 8 Symbology and Interactivity
8.6 Adding a legend8.6.1 Setting legend contents with L.controlA map legend summarizes the meaning of all of the displayed categories in the map sym-bology. In Section 6.8, we used the L.control function to add a map description. In thissection, we use the same technique to create a legend for our map. The workflow for creatinga legend involves creating a custom control with L.control, populating it with HTML thatrepresents the legend components, then styling it with CSS so that the contents appearproperly on screen. The following code section does all that, adding a legend to the townspopulation map from the last example (example-08-04.html):
let legend = L.control({position: "topright"});legend.onAdd = function() {
let div = L.DomUtil.create("div", "legend");div.innerHTML =
'<b>Population in 2015</b><br>by Town<br>' +'<small>Persons/Town</small><br>' +'<div style="background-color: #b30000"></div>2090+<br>' +'<div style="background-color: #e34a33"></div>933 - 2090<br>' +'<div style="background-color: #fc8d59"></div>642 - 933<br>' +'<div style="background-color: #fdcc8a"></div>399 - 642<br>' +'<div style="background-color: #fef0d9"></div>0 - 399<br>';
return div;};legend.addTo(map);
So, what did we do here? First, we created an instance of a custom control object, namingit legend. We used the position option to locate the control in the top-right corner of ourmap. Next, we used the .onAdd method of the legend control to run a function when thelegend is added. The function creates a new <div> in the DOM, giving it a class of "legend".This will let us use CSS to style the entire legend using the .legend selector (Section 8.6.2).We then populate the newly created <div> with HTML by using the .innerHTML method,like we already did in Section 6.8.
Most of the HTML code should be familiar from Chapter 1. One element type which wehave not seen yet is <small>, used to create relatively smaller text, which is convenient fordisplaying the units of measurement (Figure 8.7):
<small>Persons/Town</small>
The HTML code of the legend entries uses <div> elements to draw the legend symbols,which are 18px square rectangles. Each symbol is followed by a textual description of therespective category, such as 2090+. The <div> elements are useful in this context thanksto the fact they are colored using inline CSS (Section 2.7.2) and the background-colorproperty (Section 2.8.2.1). The five <div> elements thus reflect the colors corresponding tothe layer symbology (Section 8.4.3). For example, here is the HTML code that creates thefirst colored icon (dark red) in our legend:
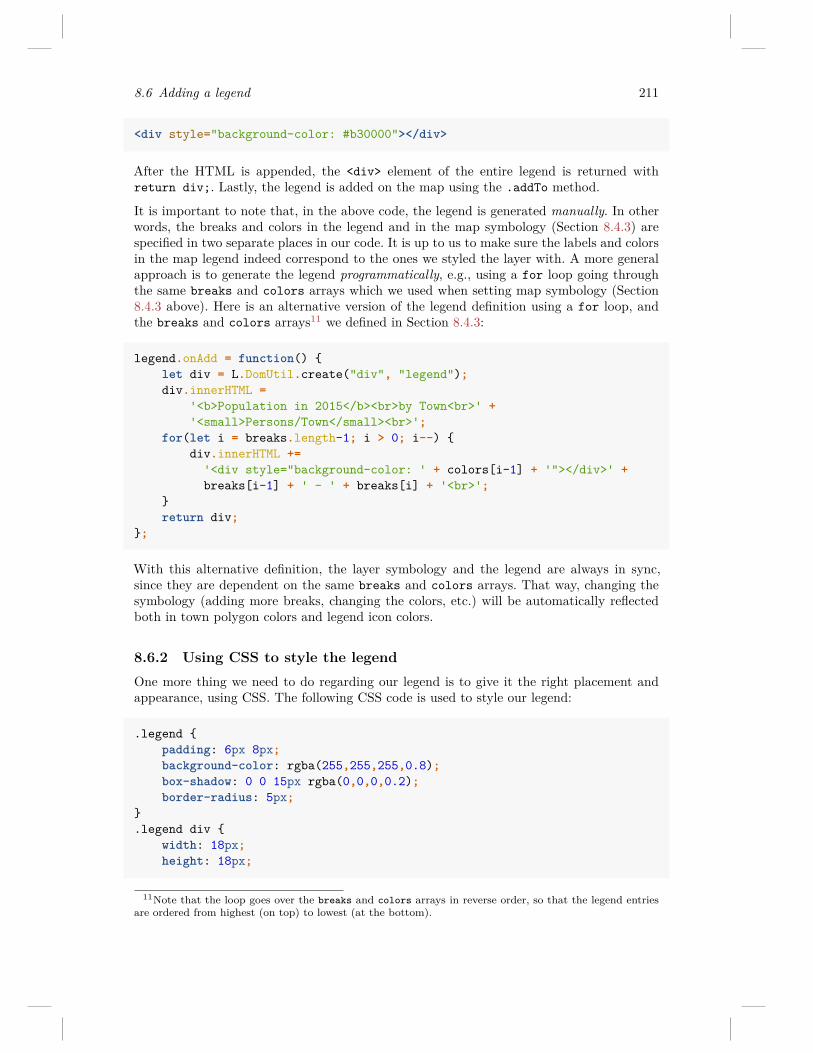
8.6 Adding a legend 211
<div style="background-color: #b30000"></div>
After the HTML is appended, the <div> element of the entire legend is returned withreturn div;. Lastly, the legend is added on the map using the .addTo method.
It is important to note that, in the above code, the legend is generated manually. In otherwords, the breaks and colors in the legend and in the map symbology (Section 8.4.3) arespecified in two separate places in our code. It is up to us to make sure the labels and colorsin the map legend indeed correspond to the ones we styled the layer with. A more generalapproach is to generate the legend programmatically, e.g., using a for loop going throughthe same breaks and colors arrays which we used when setting map symbology (Section8.4.3 above). Here is an alternative version of the legend definition using a for loop, andthe breaks and colors arrays11 we defined in Section 8.4.3:
legend.onAdd = function() {let div = L.DomUtil.create("div", "legend");div.innerHTML =
'<b>Population in 2015</b><br>by Town<br>' +'<small>Persons/Town</small><br>';
for(let i = breaks.length-1; i > 0; i--) {div.innerHTML +='<div style="background-color: ' + colors[i-1] + '"></div>' +breaks[i-1] + ' - ' + breaks[i] + '<br>';
}return div;
};
With this alternative definition, the layer symbology and the legend are always in sync,since they are dependent on the same breaks and colors arrays. That way, changing thesymbology (adding more breaks, changing the colors, etc.) will be automatically reflectedboth in town polygon colors and legend icon colors.
8.6.2 Using CSS to style the legendOne more thing we need to do regarding our legend is to give it the right placement andappearance, using CSS. The following CSS code is used to style our legend:
.legend {padding: 6px 8px;background-color: rgba(255,255,255,0.8);box-shadow: 0 0 15px rgba(0,0,0,0.2);border-radius: 5px;
}.legend div {
width: 18px;height: 18px;
11Note that the loop goes over the breaks and colors arrays in reverse order, so that the legend entriesare ordered from highest (on top) to lowest (at the bottom).
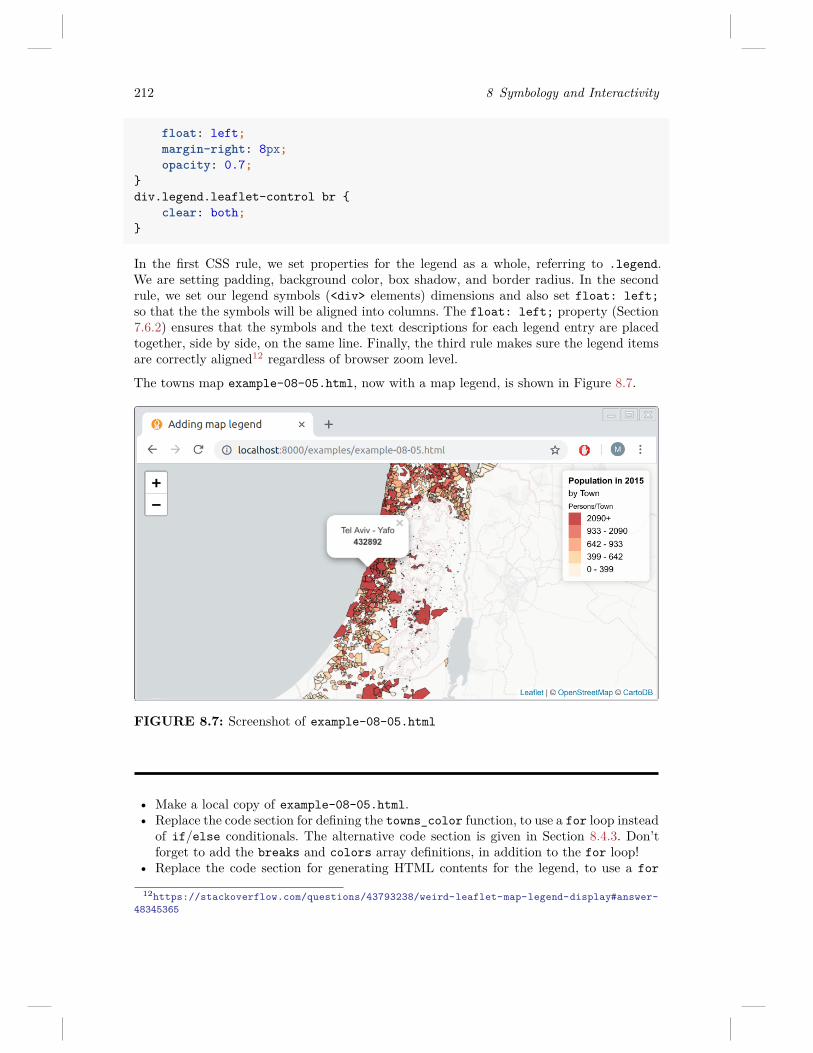
212 8 Symbology and Interactivity
float: left;margin-right: 8px;opacity: 0.7;
}div.legend.leaflet-control br {
clear: both;}
In the first CSS rule, we set properties for the legend as a whole, referring to .legend.We are setting padding, background color, box shadow, and border radius. In the secondrule, we set our legend symbols (<div> elements) dimensions and also set float: left;so that the the symbols will be aligned into columns. The float: left; property (Section7.6.2) ensures that the symbols and the text descriptions for each legend entry are placedtogether, side by side, on the same line. Finally, the third rule makes sure the legend itemsare correctly aligned12 regardless of browser zoom level.
The towns map example-08-05.html, now with a map legend, is shown in Figure 8.7.
FIGURE 8.7: Screenshot of example-08-05.html
• Make a local copy of example-08-05.html.• Replace the code section for defining the towns_color function, to use a for loop instead
of if/else conditionals. The alternative code section is given in Section 8.4.3. Don’tforget to add the breaks and colors array definitions, in addition to the for loop!
• Replace the code section for generating HTML contents for the legend, to use a for
12https://stackoverflow.com/questions/43793238/weird-leaflet-map-legend-display#answer-48345365
8.7 Dynamic style 213
loop instead of the fixed HTML string. The alternative code section is given in Section8.6.
• You should see few small differences between the labels of each color category in thelegends of example-08-05.html (Figure 8.7) and your modified version. Can you figureout which parts of the code are responsible for those differences?
8.7 Dynamic style8.7.1 Styling in response to eventsIn the previous examples, we learned how to set a constant style, which is the same forall GeoJSON features (Section 8.3), and a variable style, which is dependent on featureproperties, such as political party (Section 8.4.2) or population size (Section 8.4.3). In bothcases, however, the style was determined on page load and remained the same, regardless ofsubsequent user interaction with the map. In this section, we will see how styling can alsobe made dynamic. This means the style can change while the user interacts with the page.For example, a specific feature can be highlighted when the user places the mouse cursorabove it (Figure 8.8). Dynamic styling can greatly enhance user experience and is one ofthe distinctive features of interactive web maps.
To achieve dynamic styling, we need to add event listeners to modify layer style in responseto particular events. In the next example, we will add event listeners for changing anyfeature hovered with the mouse to “highlighted” style. Our event listeners are going to haveto respond to "mouseover" and "mouseout" events (Section 4.4), and change the respectivefeature style to “highlighted” or “normal” state, respectively.
Specific event listeners per feature can be binded when loading the GeoJSON layer usingthe onEachFeature option, similarly to the way we used it to bind specific popups (Section8.5). Inside the onEachFeature function, we can use the .addEventListener method oflayer to add the event listeners. Our code for loading the GeoJSON layer then takes thefollowing form, where highlightFeature and resetHighlight, as their name suggests, arefunctions for highlighting and resetting feature style:
fetch("data/towns.geojson").then(function(response) {
return response.json();}).then(function(data) {
geojson = L.geoJSON(data, {style: towns_style,onEachFeature: function(feature, layer) {
layer.addEventListener("mouseover", highlightFeature);layer.addEventListener("mouseout", resetHighlight);
}}).addTo(map);
});
214 8 Symbology and Interactivity
The above code means that whenever we enter or leave a GeoJSON feature with the mouse,the highlightFeature or resetHighlight function will be executed, respectively. Thesefunctions (defined below) will be responsible for changing the feature style to “highlighted”or “normal”, respectively.
One more thing introduced in this code section is that the reference to the GeoJSON layeris assigned to a variable, hereby named geojson. This will be useful shortly, when we willuse the reference to the GeoJSON layer to execute its methods. Since we are assigning avalue to the geojson variable, we should define it with an expression such as the followingone, at the beginning of our script:
let geojson;
How can we make sure we highlight the specific feature which triggered the event, i.e., theone we enter with the mouse, rather than any other feature? This brings us back to theevent object, introduced in Section 4.10 and further discussed in Section 6.9. For example,in Section 6.9 we used the event object property named .latlng to obtain and displaythe clicked map coordinates within a popup (Section 6.15). In the present case, we use.target event object property (Section 4.10.2) to get the reference to the page elementwhich triggered the event, i.e., a reference to the hovered feature.
To understand what exactly the .target property contains when referring to a GeoJSONlayer, we can manually create a reference to an individual feature in our GeoJSON layergeojson using the following expression, where 100 is the ID of a specific feature:
geojson._layers[100];
The ID values are arbitrary numbers, automatically generated by Leaflet. When neces-sary, however, we can always set our own IDs when the layer is created, again using theonEachFeature option (Section 8.7.3). The reference to a specific GeoJSON feature, suchas geojson._layers[100], contains numerous useful methods. Importantly, it has the fol-lowing two methods that are useful for dynamic styling:
• .setStyle—Changes the style of the respective feature• .bringToFront—Moves the feature to the front, in terms of display order
In addition, the entire GeoJSON layer object (such as geojson, in our example) has amethod named .resetStyle. The .resetStyle method accepts a feature reference andresets the feature style back to the original GeoJSON style. Using these three meth-ods, together with the .target property of the event object, our highlightFeature andresetHighlight functions can be defined as follows:
function highlightFeature(e) {e.target.setStyle({weight: 5, color: "yellow", fillOpacity: 0.5});e.target.bringToFront();
}
function resetHighlight(e) {geojson.resetStyle(e.target);
}
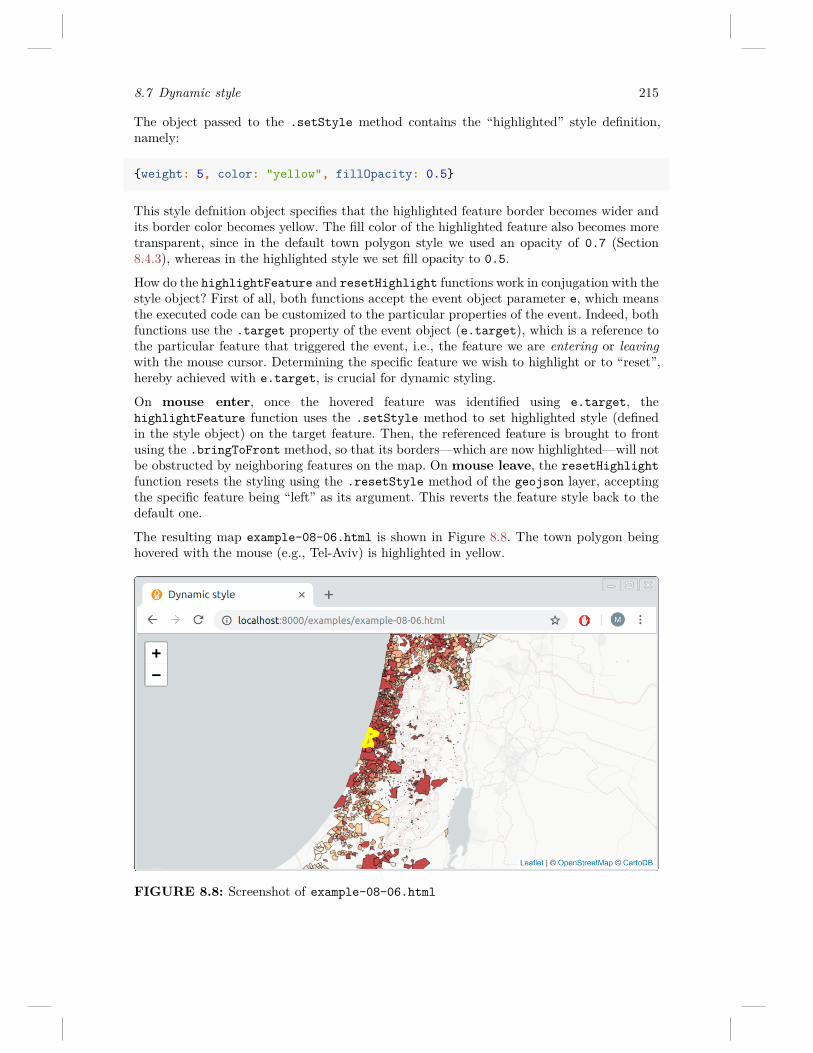
8.7 Dynamic style 215
The object passed to the .setStyle method contains the “highlighted” style definition,namely:
{weight: 5, color: "yellow", fillOpacity: 0.5}
This style defnition object specifies that the highlighted feature border becomes wider andits border color becomes yellow. The fill color of the highlighted feature also becomes moretransparent, since in the default town polygon style we used an opacity of 0.7 (Section8.4.3), whereas in the highlighted style we set fill opacity to 0.5.
How do the highlightFeature and resetHighlight functions work in conjugation with thestyle object? First of all, both functions accept the event object parameter e, which meansthe executed code can be customized to the particular properties of the event. Indeed, bothfunctions use the .target property of the event object (e.target), which is a reference tothe particular feature that triggered the event, i.e., the feature we are entering or leavingwith the mouse cursor. Determining the specific feature we wish to highlight or to “reset”,hereby achieved with e.target, is crucial for dynamic styling.
On mouse enter, once the hovered feature was identified using e.target, thehighlightFeature function uses the .setStyle method to set highlighted style (definedin the style object) on the target feature. Then, the referenced feature is brought to frontusing the .bringToFront method, so that its borders—which are now highlighted—will notbe obstructed by neighboring features on the map. On mouse leave, the resetHighlightfunction resets the styling using the .resetStyle method of the geojson layer, acceptingthe specific feature being “left” as its argument. This reverts the feature style back to thedefault one.
The resulting map example-08-06.html is shown in Figure 8.8. The town polygon beinghovered with the mouse (e.g., Tel-Aviv) is highlighted in yellow.
FIGURE 8.8: Screenshot of example-08-06.html
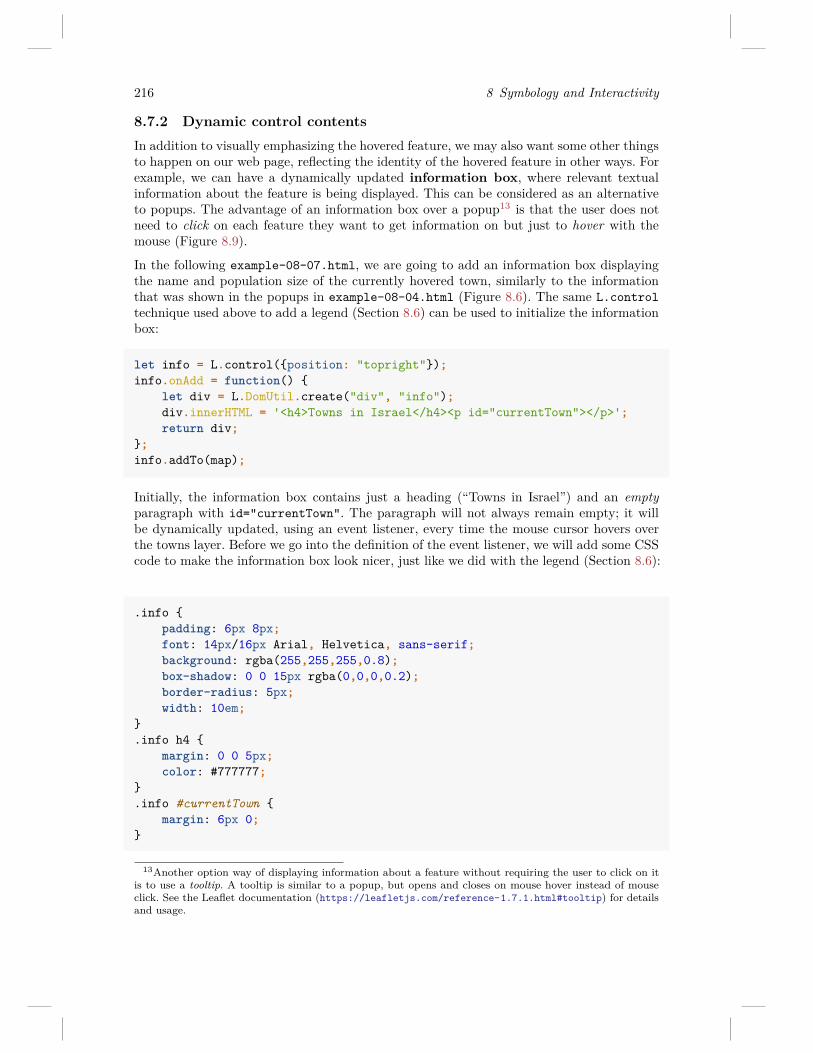
216 8 Symbology and Interactivity
8.7.2 Dynamic control contentsIn addition to visually emphasizing the hovered feature, we may also want some other thingsto happen on our web page, reflecting the identity of the hovered feature in other ways. Forexample, we can have a dynamically updated information box, where relevant textualinformation about the feature is being displayed. This can be considered as an alternativeto popups. The advantage of an information box over a popup13 is that the user does notneed to click on each feature they want to get information on but just to hover with themouse (Figure 8.9).
In the following example-08-07.html, we are going to add an information box displayingthe name and population size of the currently hovered town, similarly to the informationthat was shown in the popups in example-08-04.html (Figure 8.6). The same L.controltechnique used above to add a legend (Section 8.6) can be used to initialize the informationbox:
let info = L.control({position: "topright"});info.onAdd = function() {
let div = L.DomUtil.create("div", "info");div.innerHTML = '<h4>Towns in Israel</h4><p id="currentTown"></p>';return div;
};info.addTo(map);
Initially, the information box contains just a heading (“Towns in Israel”) and an emptyparagraph with id="currentTown". The paragraph will not always remain empty; it willbe dynamically updated, using an event listener, every time the mouse cursor hovers overthe towns layer. Before we go into the definition of the event listener, we will add some CSScode to make the information box look nicer, just like we did with the legend (Section 8.6):
.info {padding: 6px 8px;font: 14px/16px Arial, Helvetica, sans-serif;background: rgba(255,255,255,0.8);box-shadow: 0 0 15px rgba(0,0,0,0.2);border-radius: 5px;width: 10em;
}.info h4 {
margin: 0 0 5px;color: #777777;
}.info #currentTown {
margin: 6px 0;}
13Another option way of displaying information about a feature without requiring the user to click on itis to use a tooltip. A tooltip is similar to a popup, but opens and closes on mouse hover instead of mouseclick. See the Leaflet documentation (https://leafletjs.com/reference-1.7.1.html#tooltip) for detailsand usage.
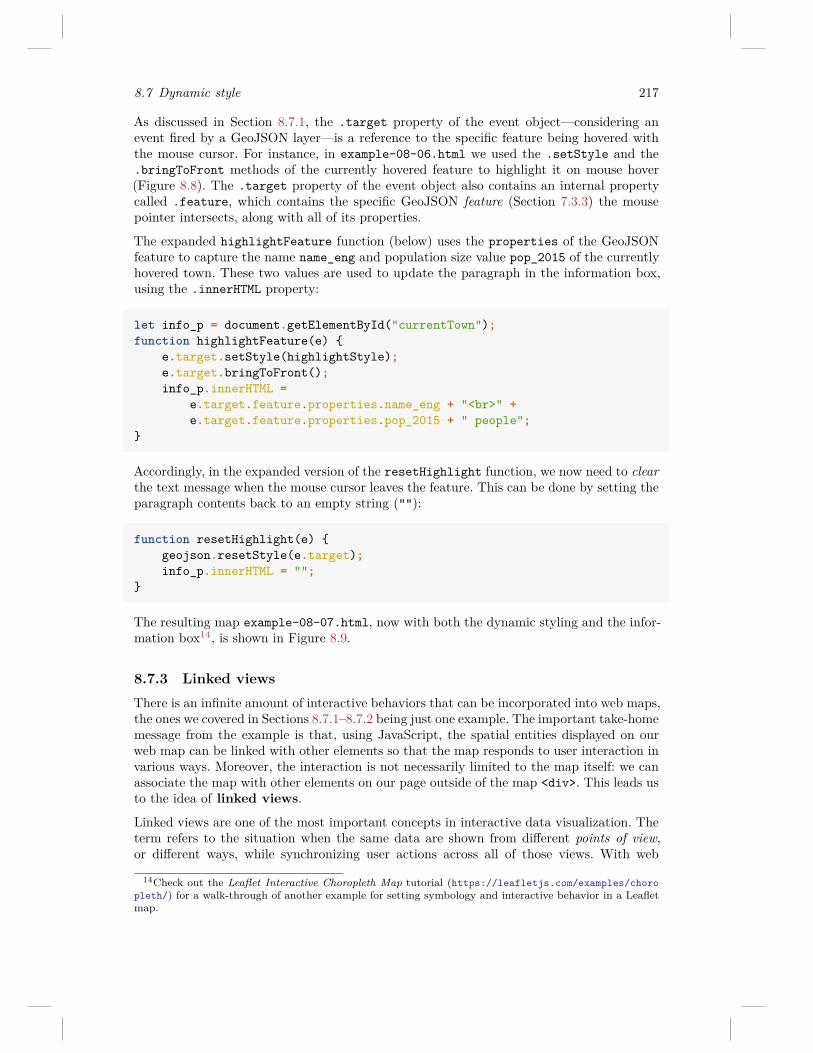
8.7 Dynamic style 217
As discussed in Section 8.7.1, the .target property of the event object—considering anevent fired by a GeoJSON layer—is a reference to the specific feature being hovered withthe mouse cursor. For instance, in example-08-06.html we used the .setStyle and the.bringToFront methods of the currently hovered feature to highlight it on mouse hover(Figure 8.8). The .target property of the event object also contains an internal propertycalled .feature, which contains the specific GeoJSON feature (Section 7.3.3) the mousepointer intersects, along with all of its properties.
The expanded highlightFeature function (below) uses the properties of the GeoJSONfeature to capture the name name_eng and population size value pop_2015 of the currentlyhovered town. These two values are used to update the paragraph in the information box,using the .innerHTML property:
let info_p = document.getElementById("currentTown");function highlightFeature(e) {
e.target.setStyle(highlightStyle);e.target.bringToFront();info_p.innerHTML =
e.target.feature.properties.name_eng + "<br>" +e.target.feature.properties.pop_2015 + " people";
}
Accordingly, in the expanded version of the resetHighlight function, we now need to clearthe text message when the mouse cursor leaves the feature. This can be done by setting theparagraph contents back to an empty string (""):
function resetHighlight(e) {geojson.resetStyle(e.target);info_p.innerHTML = "";
}
The resulting map example-08-07.html, now with both the dynamic styling and the infor-mation box14, is shown in Figure 8.9.
8.7.3 Linked viewsThere is an infinite amount of interactive behaviors that can be incorporated into web maps,the ones we covered in Sections 8.7.1–8.7.2 being just one example. The important take-homemessage from the example is that, using JavaScript, the spatial entities displayed on ourweb map can be linked with other elements so that the map responds to user interaction invarious ways. Moreover, the interaction is not necessarily limited to the map itself: we canassociate the map with other elements on our page outside of the map <div>. This leads usto the idea of linked views.
Linked views are one of the most important concepts in interactive data visualization. Theterm refers to the situation when the same data are shown from different points of view,or different ways, while synchronizing user actions across all of those views. With web
14Check out the Leaflet Interactive Choropleth Map tutorial (https://leafletjs.com/examples/choropleth/) for a walk-through of another example for setting symbology and interactive behavior in a Leafletmap.
218 8 Symbology and Interactivity
FIGURE 8.9: Screenshot of example-08-07.html
mapping, this usually means that in addition to a web map, our page contains one or moreother panels, displaying information about the same spatial features in different ways: tables,graphs, lists, and so on. User selection on the map is reflected on the other panels, such asfiltering the tables, highlighting data points on graphs, etc., and the other way around.
The following example-08-08.html (Figure 8.10) implements a link between a web mapand a list. Whenever a polygon of a given town is hovered on the map, the polygon itselfas well as the corresponding entry in the towns list are highlighted. Similarly, whenever atown name is hovered on the list, the list item itself as well as the corresponding polygonare highlighted. This is mostly accomplished with methods we already covered in previousChapters 4–7, except for several techniques15. The key to the association between the listand the GeoJSON layer is that both the list items and the GeoJSON features are assignedwith matching IDs when loading the GeoJSON layer:
function onEachFeature(feature, layer) {let town = feature.properties.town;let name_eng = feature.properties.name_eng;html += '<li id="' + town + '">' + name_eng + '</li>';layer._leaflet_id = town;layer.addEventListener("mouseover", function(e) {
let hovered_feature = e.target;hovered_feature.setStyle(highlightStyle);hovered_feature.bringToFront();let el = document.getElementById(hovered_feature._leaflet_id);
15This example is slightly more complex than other examples in the book, and we do not cover its code inas much detail as elsewhere in the book. It is provided mainly to demonstrate the idea of linked views andthe principles of implementing it. Readers who are interested in using this approach in their work shouldcarefully go over the code of example-08-08.html after reading this section.
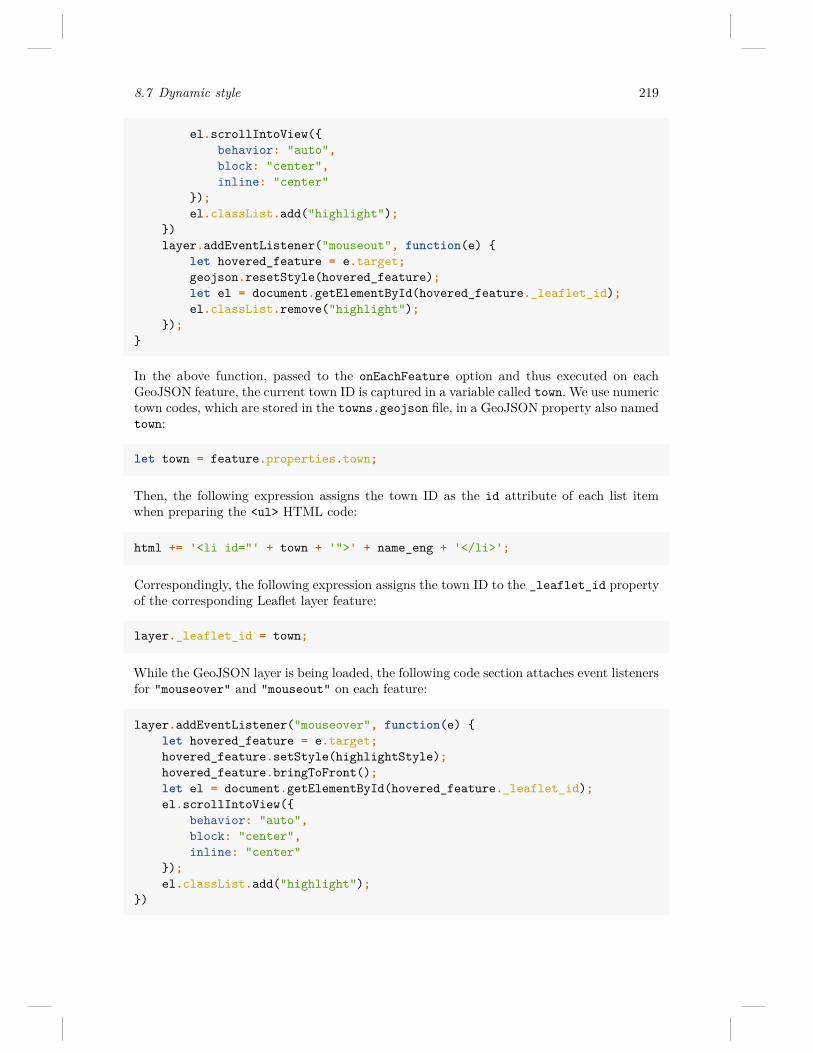
8.7 Dynamic style 219
el.scrollIntoView({behavior: "auto",block: "center",inline: "center"
});el.classList.add("highlight");
})layer.addEventListener("mouseout", function(e) {
let hovered_feature = e.target;geojson.resetStyle(hovered_feature);let el = document.getElementById(hovered_feature._leaflet_id);el.classList.remove("highlight");
});}
In the above function, passed to the onEachFeature option and thus executed on eachGeoJSON feature, the current town ID is captured in a variable called town. We use numerictown codes, which are stored in the towns.geojson file, in a GeoJSON property also namedtown:
let town = feature.properties.town;
Then, the following expression assigns the town ID as the id attribute of each list itemwhen preparing the <ul> HTML code:
html += '<li id="' + town + '">' + name_eng + '</li>';
Correspondingly, the following expression assigns the town ID to the _leaflet_id propertyof the corresponding Leaflet layer feature:
layer._leaflet_id = town;
While the GeoJSON layer is being loaded, the following code section attaches event listenersfor "mouseover" and "mouseout" on each feature:
layer.addEventListener("mouseover", function(e) {let hovered_feature = e.target;hovered_feature.setStyle(highlightStyle);hovered_feature.bringToFront();let el = document.getElementById(hovered_feature._leaflet_id);el.scrollIntoView({
behavior: "auto",block: "center",inline: "center"
});el.classList.add("highlight");
})
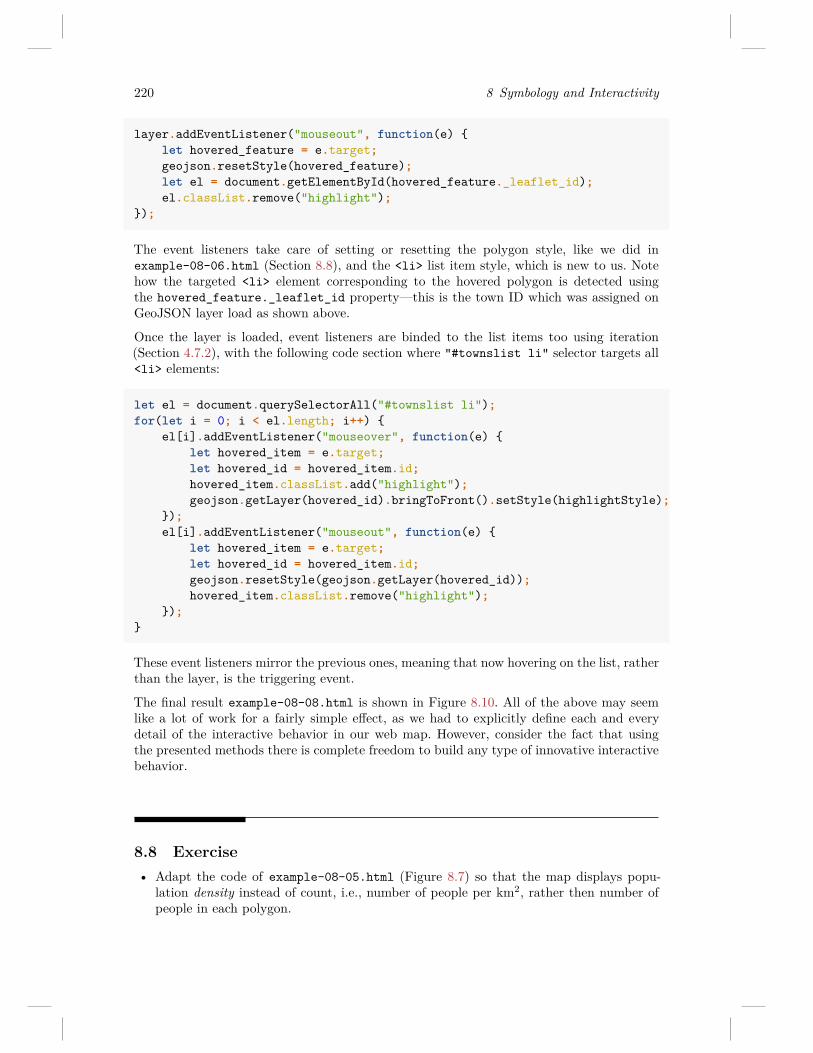
220 8 Symbology and Interactivity
layer.addEventListener("mouseout", function(e) {let hovered_feature = e.target;geojson.resetStyle(hovered_feature);let el = document.getElementById(hovered_feature._leaflet_id);el.classList.remove("highlight");
});
The event listeners take care of setting or resetting the polygon style, like we did inexample-08-06.html (Section 8.8), and the <li> list item style, which is new to us. Notehow the targeted <li> element corresponding to the hovered polygon is detected usingthe hovered_feature._leaflet_id property—this is the town ID which was assigned onGeoJSON layer load as shown above.
Once the layer is loaded, event listeners are binded to the list items too using iteration(Section 4.7.2), with the following code section where "#townslist li" selector targets all<li> elements:
let el = document.querySelectorAll("#townslist li");for(let i = 0; i < el.length; i++) {
el[i].addEventListener("mouseover", function(e) {let hovered_item = e.target;let hovered_id = hovered_item.id;hovered_item.classList.add("highlight");geojson.getLayer(hovered_id).bringToFront().setStyle(highlightStyle);
});el[i].addEventListener("mouseout", function(e) {
let hovered_item = e.target;let hovered_id = hovered_item.id;geojson.resetStyle(geojson.getLayer(hovered_id));hovered_item.classList.remove("highlight");
});}
These event listeners mirror the previous ones, meaning that now hovering on the list, ratherthan the layer, is the triggering event.
The final result example-08-08.html is shown in Figure 8.10. All of the above may seemlike a lot of work for a fairly simple effect, as we had to explicitly define each and everydetail of the interactive behavior in our web map. However, consider the fact that usingthe presented methods there is complete freedom to build any type of innovative interactivebehavior.
8.8 Exercise• Adapt the code of example-08-05.html (Figure 8.7) so that the map displays popu-
lation density instead of count, i.e., number of people per km2, rather then number ofpeople in each polygon.
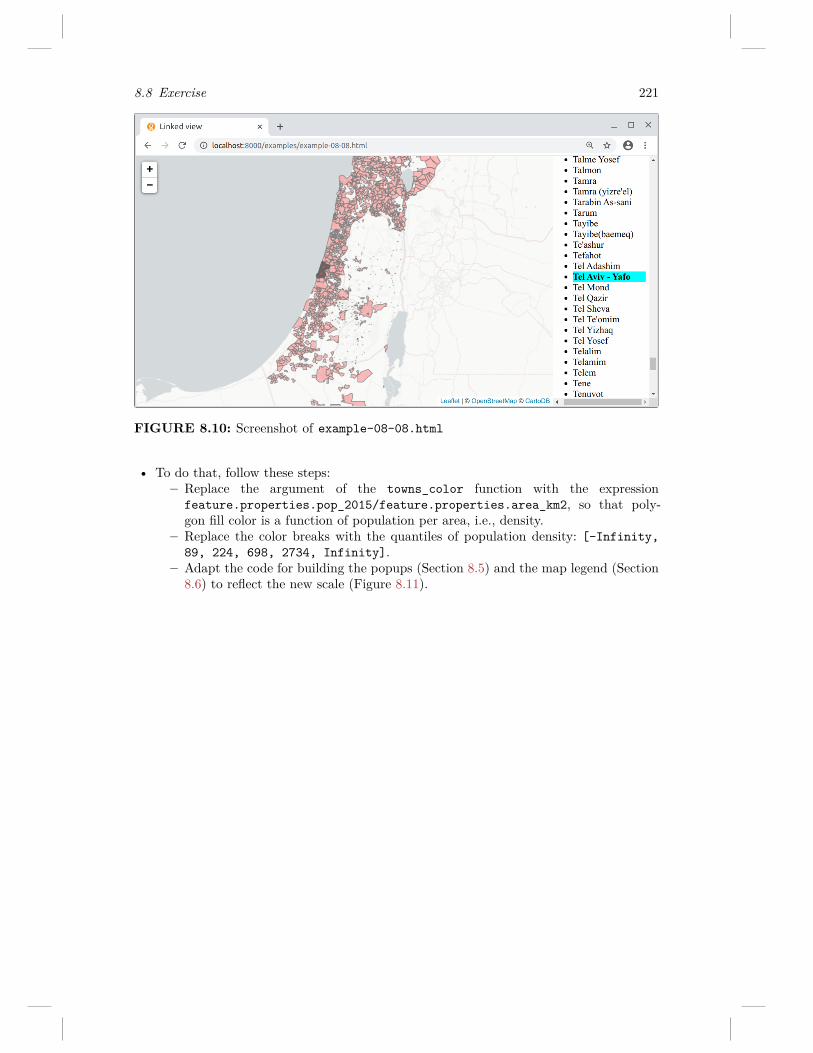
8.8 Exercise 221
FIGURE 8.10: Screenshot of example-08-08.html
• To do that, follow these steps:– Replace the argument of the towns_color function with the expression
feature.properties.pop_2015/feature.properties.area_km2, so that poly-gon fill color is a function of population per area, i.e., density.
– Replace the color breaks with the quantiles of population density: [-Infinity,89, 224, 698, 2734, Infinity].
– Adapt the code for building the popups (Section 8.5) and the map legend (Section8.6) to reflect the new scale (Figure 8.11).
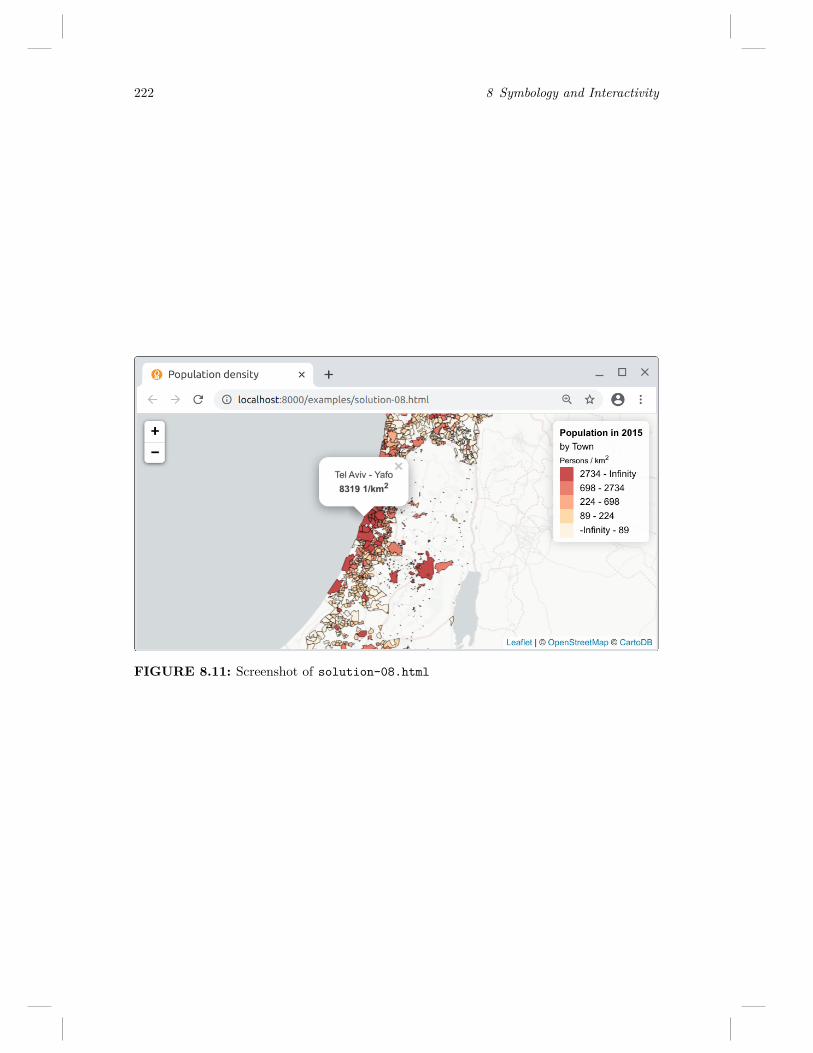
222 8 Symbology and Interactivity
FIGURE 8.11: Screenshot of solution-08.html

Part III
Databases

9Databases
9.1 IntroductionIn Chapters 7–8, the foreground layers we displayed on Leaflet web maps came from GeoJ-SON files stored on the server. This is a viable approach when our data are relatively smalland not constantly updated. When this is not the case, however, using GeoJSON files canbecome limiting.
For example, loading layers from GeoJSON files becomes prohibitive when files get too large,because the entire file needs to be transferred through the network, even if we only want todisplay some of the content, for example by subsetting the layer in the JavaScript code afterit has been received. It is obviously unreasonable to have the user wait until tens or hundredsof megabytes are being received, in the meanwhile seeing an empty map. Processing verylarge amounts of data can also make the browser unresponsive. A natural solution is to usea database. Unlike a file, a database can be queried to request just the minimal requiredportion of information each time, thus making sure that we are transferring and processingmanageable amounts of data.
Another limitation of using GeoJSON files becomes apparent when the data are constantlyupdated and/or used for different purposes rather than just being displayed on a particularweb map. For example, we may wish to build a web map displaying real-time municipalevents, which means the data are constantly updated or edited (e.g., by the municipalitystaff) and/or used in various contexts (e.g., examined in GIS software by other profession-als). Again, a natural solution is to use a database, shared between numerous concurrentconnections for viewing and editing the data, through many types of different interfaces.Our web map, making use of one such concurrent connection, will therefore be synchronizedwith the database so that the displayed information is always up-to-date.
This chapter (Chapter 9) and the next two (Chapters 10–11) introduce the idea of loadingdata from a spatial database to display them on an interactive map, while dynamicallyfiltering the data to transfer just the portion that we need. That way, we are freed fromthe limitation regarding the amount of data “behind” the web map. In other words, thedatabase that stands behind our web map can be very large in size, yet the web map willstay responsive, thanks to the fact that we load subsets of the data each time, based onwhat the user chooses to see. In this chapter (Chapter 9), we introduce the concepts andtechnologies that enable a Leaflet map to load data from a spatial database. In the next twochapters, we go through examples of using non-spatial (Chapter 10) and spatial (Chapter11) database queries for loading subsets of data from a database.
It should be mentioned that Web Map Services (WMS) (Section 6.6.5) comprise analternative solution for displaying large, up-to-date amounts of data on a web map, howeverthis solution is beyond the scope of this book. In short, with a WMS we are using a GISdatabase to build on-demand raster tiles. The server generates custom tiles based on the
225
226 9 Databases
parameters it is given, so that the user has control of the displayed content, such as choosingwhich layers to display. This is unlike pre-compiled tile datasets, such as those introduced inSection 6.5.10 and used as base layers in the examples in Chapters 6–8, since pre-compiledtiles are fixed and cannot be dynamically modified based on user input.
There are valid use cases for both the database and WMS approaches. Basically, thedatabase approach works better when loading vector layers that the user interacts with,which is made possible by the fact that the server can send raw data (such as GeoJSON),and we can control the way that data are displayed on the client, using JavaScript code. TheWMS approach works better when our data are very complex and have elaborate symbology.In such cases, it makes sense to have a dedicated map server with specialized software tobuild raster images with the displayed content, and send them to the client to be displayedas-is1.
9.2 What is CARTO?9.2.1 The CARTO platformA problem that immediately arises regarding retrieval of spatial data from a database onto aweb map is that client-side scripts cannot directly connect to a database. A dynamic server,which we mentioned in Section 5.4.3, is the solution to this problem. On the dynamic server,server-side scripts, which indeed can connect to the database, are used to query the databaseand send the data back to the client. In fact, the need to send information from a databaseto the browser is one of the main motives for setting up a dynamic server.
In this book, we focus on client-side solutions, so we will not be dealing with setting up ourown dynamic server coupled with a database. Instead, we will use a cloud-based service bya company called CARTO2. The CARTO platform provides several cloud computing GISand web-mapping services. One of the most notable services, and the one we are going touse in this book, is the SQL API (Section 9.7). CARTO allows you to upload your owndata into a managed spatial database, while CARTO’s SQL API allows you to interact withthat database. In other words, CARTO takes care of setting up and maintaining a spatialdatabase, as well as setting up server-side components to make that database reachablethrough HTTP.
In this chapter, we will introduce the CARTO platform and the technologies it is basedon: databases (Section 9.3) and spatial databases (Section 9.4), PostGIS (Section 9.5), SQL(Section 9.6), and the SQL API (Section 9.7). Towards the end of the chapter, we will seehow CARTO can be used for querying and displaying data from a database on a Leafletmap (Section 9.8). In the next two chapters, we will dig a little deeper into different typesof queries and their utilization in web mapping. In Chapter 10, we will see an example ofnon-spatial, attribute-based filtering of data, based on user input from a dropdown menu.In Chapter 11, we will see an example of using spatial queries to retrieve data based onproximity to a clicked location.
1There is an official tutorial on using WMS with Leaflet (https://leafletjs.com/examples/wms/wms.html), where you can see a practical example.
2https://carto.com/
9.4 Databases 227
9.2.2 Alternatives to CARTOCARTO is a commercial service that comes at a price3, though at the time of writing thereis a free plan for trying CARTO for 12 months. It is worth mentioning that the CARTOplatform is open-source4. In principle, it can be installed on any computer to replicatealmost5 the entire functionality of CARTO for free. The installation and maintenance arequite complicated though.
A minimal alternative to CARTO, comprising a simple dynamic server, a database, and anSQL API can be set up (relatively) more easily. The online version of the book (Section 0.7)includes an additional supplement with instructions for one way to do that, using Node.jsand PostgreSQL/PostGIS. This is beyond the scope of the main text of the book, butit is important to be aware that no matter how convenient CARTO is, if some day we needto cut costs and manage our own server for the tasks covered in the following chapters—itcan be done. Accordingly, all examples where a CARTO database is used are also given inalternative versions, using the custom SQL API setup instead of CARTO. The latter aremarked with -s, as in example-09-01.html and example-09-01-s.html (Appendix B).
9.3 DatabasesThe term database6 describes an organized collection of data. A database stores data,but also facilitates indexing, searching, and querying the data, as well as modifying andadding new data. The most established and commonly used databases follow the relationalmodel7, where the records are organized in tables, and the tables are usually associatedwith one another via common columns.
For example, Figure 9.1 shows a small hypothetical database with two tables namedairports and flights. The airports table gives the name and location (lon, lat) ofseven different airports. The flights table lists the departure time (year, month, day,dep_time), the origin (origin), and the destination (dest) of five different flights thattook place between the airports listed in the airports table on a particular day. Impor-tantly, the airports and flights tables are related through the airport code column faain the airports table matching the origin and dest columns in the flights table.
Relational database queries, including both “ordinary” (Section 9.6.2) and spatial (Sections9.6.3–9.6.4) queries, are expressed in a language called SQL (Section 9.6).
9.4 Spatial databasesA spatial database8 is a database that is optimized to store and query data that representsobjects defined in a geometric space. Regarding the storage part, plainly speaking, the tables
3https://carto.com/pricing/4https://github.com/CartoDB/cartodb5https://gis.stackexchange.com/questions/269822/cartodb-opensource-vs-paid-one6https://en.wikipedia.org/wiki/Database7https://en.wikipedia.org/wiki/Relational_database8https://en.wikipedia.org/wiki/Spatial_database
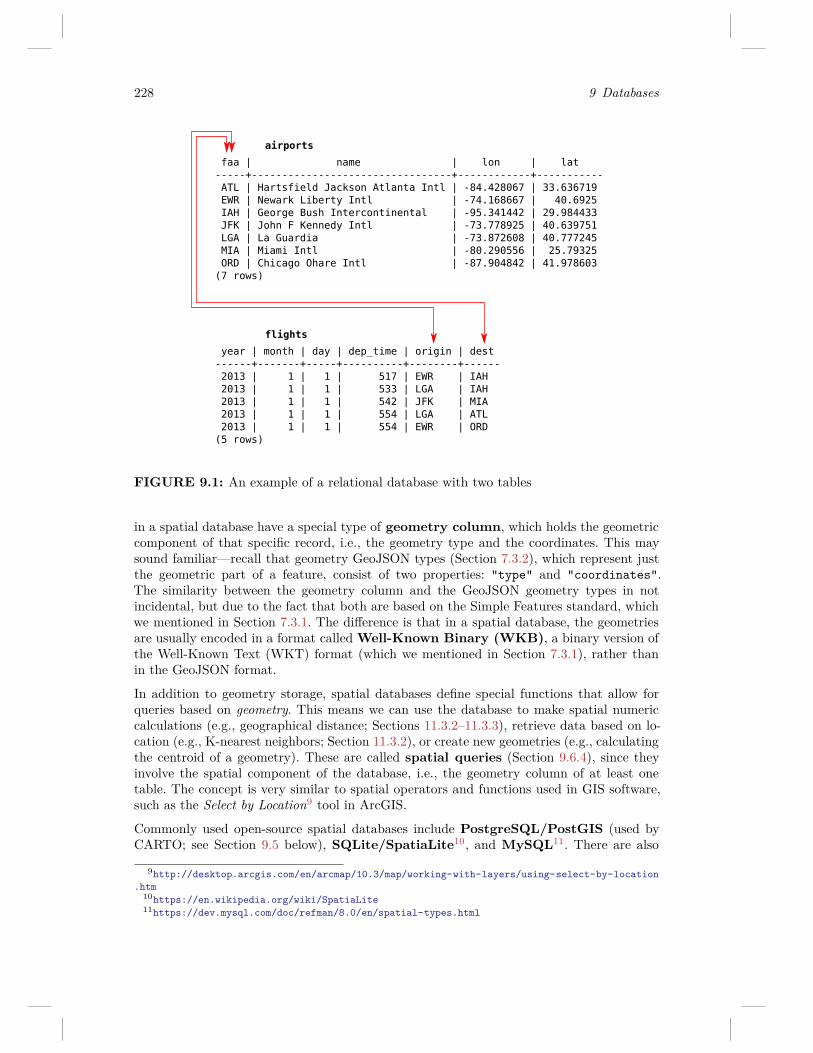
228 9 Databases
faa | name | lon | lat -----+---------------------------------+------------+----------- ATL | Hartsfield Jackson Atlanta Intl | -84.428067 | 33.636719 EWR | Newark Liberty Intl | -74.168667 | 40.6925 IAH | George Bush Intercontinental | -95.341442 | 29.984433 JFK | John F Kennedy Intl | -73.778925 | 40.639751 LGA | La Guardia | -73.872608 | 40.777245 MIA | Miami Intl | -80.290556 | 25.79325 ORD | Chicago Ohare Intl | -87.904842 | 41.978603(7 rows)
year | month | day | dep_time | origin | dest ------+-------+-----+----------+--------+------ 2013 | 1 | 1 | 517 | EWR | IAH 2013 | 1 | 1 | 533 | LGA | IAH 2013 | 1 | 1 | 542 | JFK | MIA 2013 | 1 | 1 | 554 | LGA | ATL 2013 | 1 | 1 | 554 | EWR | ORD(5 rows)
flights
airports
FIGURE 9.1: An example of a relational database with two tables
in a spatial database have a special type of geometry column, which holds the geometriccomponent of that specific record, i.e., the geometry type and the coordinates. This maysound familiar—recall that geometry GeoJSON types (Section 7.3.2), which represent justthe geometric part of a feature, consist of two properties: "type" and "coordinates".The similarity between the geometry column and the GeoJSON geometry types in notincidental, but due to the fact that both are based on the Simple Features standard, whichwe mentioned in Section 7.3.1. The difference is that in a spatial database, the geometriesare usually encoded in a format called Well-Known Binary (WKB), a binary version ofthe Well-Known Text (WKT) format (which we mentioned in Section 7.3.1), rather thanin the GeoJSON format.
In addition to geometry storage, spatial databases define special functions that allow forqueries based on geometry. This means we can use the database to make spatial numericcalculations (e.g., geographical distance; Sections 11.3.2–11.3.3), retrieve data based on lo-cation (e.g., K-nearest neighbors; Section 11.3.2), or create new geometries (e.g., calculatingthe centroid of a geometry). These are called spatial queries (Section 9.6.4), since theyinvolve the spatial component of the database, i.e., the geometry column of at least onetable. The concept is very similar to spatial operators and functions used in GIS software,such as the Select by Location9 tool in ArcGIS.
Commonly used open-source spatial databases include PostgreSQL/PostGIS (used byCARTO; see Section 9.5 below), SQLite/SpatiaLite10, and MySQL11. There are also
9http://desktop.arcgis.com/en/arcmap/10.3/map/working-with-layers/using-select-by-location.htm
10https://en.wikipedia.org/wiki/SpatiaLite11https://dev.mysql.com/doc/refman/8.0/en/spatial-types.html
9.6 What is PostGIS? 229
proprietary databases that support spatial data, such as Oracle Spatial12 and MicrosoftSQL server13.
9.5 What is PostGIS?PostGIS14 is a popular extension for the PostgreSQL15 database, making the Post-greSQL/PostGIS combination a spatial database (Obe and Hsu, 2020). In other words,a PostgreSQL database with the PostGIS extension enabled allows for storage of spa-tial data and execution of spatial SQL queries (Section 9.6.4). At the moment, the Post-greSQL/PostGIS combination16 makes the most powerful open-source spatial databaseavailable.
Since both PostgreSQL and PostGIS are free and open-source, you can install PostGIS onyour computer and set up your own database. However, running a database requires someadvanced setup and maintenance, which is outside the scope of this book17. As mentionedpreviously, the CARTO platform provides a cloud-based PostGIS database as a service,which we are going to use in this book.
9.6 What is SQL?9.6.1 OverviewSQL18 is a language for writing statements to query or to modify tables stored in a relationaldatabase, whether spatial or non-spatial. Using SQL, you can perform many types of tasks:filtering, joining, inserting new data, updating existing data, etc. SQL statements can beexecuted in many types of database interfaces, from command lines interfaces, throughdatabase administrator consoles in GIS software, and to APIs that connect to the databasethrough HTTP—such as the CARTO SQL API, which we are going to use (Section 9.7).You may already be familiar with SQL syntax from GIS software, such as ArcGIS19 andQGIS20, where SQL can be used to select features from a spatial layer.
Using CARTO, we will experiment with writing SQL queries to extract data from a cloud-based database (Section 9.7) and to display these data on Leaflet map (Section 9.8). Thatway, we will become familiar with the whole idea of querying spatial databases, from theweb-mapping perspective. Hopefully, this introduction will be of use if, later on, you decideto go deeper into the subject and set up a spatial database on your own (Section 9.2.2).
12https://en.wikipedia.org/wiki/Oracle_Spatial_and_Graph13https://docs.microsoft.com/en-us/sql/relational-databases/spatial/spatial-data-sql-server14https://en.wikipedia.org/wiki/PostGIS15https://en.wikipedia.org/wiki/PostgreSQL16PostgreSQL with the PostGIS extension will be referred to as PostGIS from now on, for simplicity.17The online supplement includes instructions for installing PostGIS, as part of the custom SQL API
setup (Section 9.2.2).18https://en.wikipedia.org/wiki/SQL19http://pro.arcgis.com/en/pro-app/help/mapping/navigation/sql-reference-for-elements-used-
in-query-expressions.htm20https://docs.qgis.org/2.8/en/docs/user_manual/working_with_vector/query_builder.html
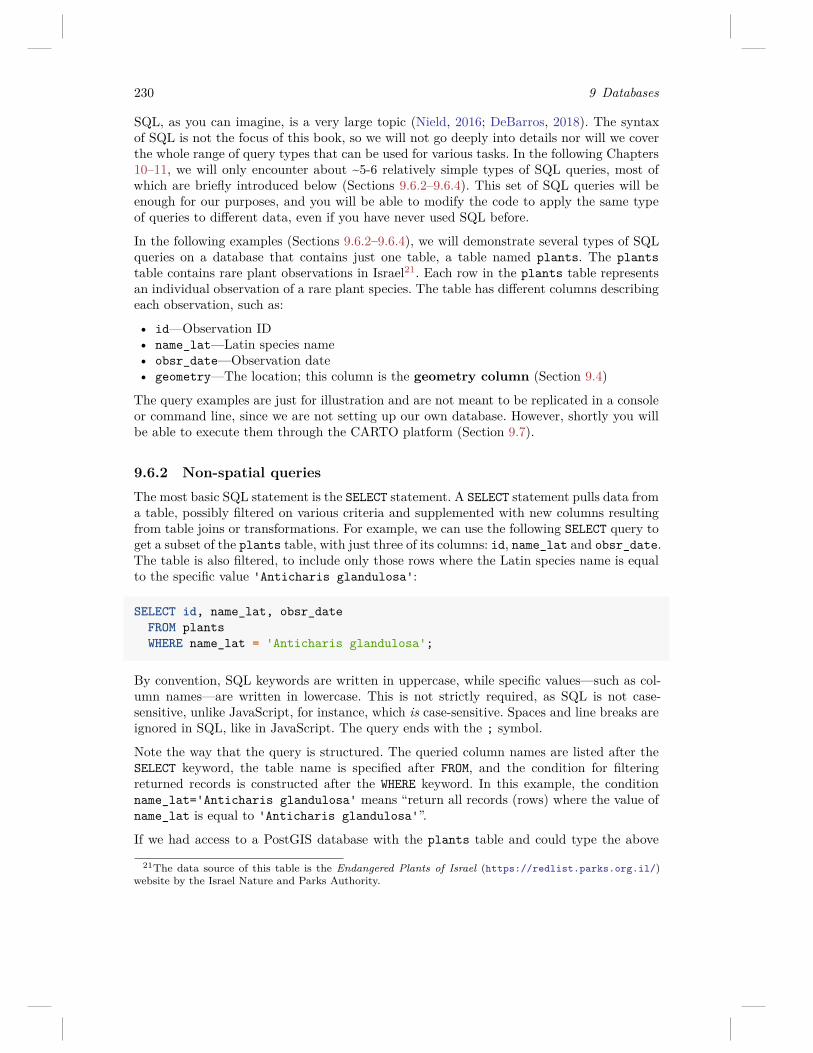
230 9 Databases
SQL, as you can imagine, is a very large topic (Nield, 2016; DeBarros, 2018). The syntaxof SQL is not the focus of this book, so we will not go deeply into details nor will we coverthe whole range of query types that can be used for various tasks. In the following Chapters10–11, we will only encounter about ~5-6 relatively simple types of SQL queries, most ofwhich are briefly introduced below (Sections 9.6.2–9.6.4). This set of SQL queries will beenough for our purposes, and you will be able to modify the code to apply the same typeof queries to different data, even if you have never used SQL before.
In the following examples (Sections 9.6.2–9.6.4), we will demonstrate several types of SQLqueries on a database that contains just one table, a table named plants. The plantstable contains rare plant observations in Israel21. Each row in the plants table representsan individual observation of a rare plant species. The table has different columns describingeach observation, such as:
• id—Observation ID• name_lat—Latin species name• obsr_date—Observation date• geometry—The location; this column is the geometry column (Section 9.4)
The query examples are just for illustration and are not meant to be replicated in a consoleor command line, since we are not setting up our own database. However, shortly you willbe able to execute them through the CARTO platform (Section 9.7).
9.6.2 Non-spatial queriesThe most basic SQL statement is the SELECT statement. A SELECT statement pulls data froma table, possibly filtered on various criteria and supplemented with new columns resultingfrom table joins or transformations. For example, we can use the following SELECT query toget a subset of the plants table, with just three of its columns: id, name_lat and obsr_date.The table is also filtered, to include only those rows where the Latin species name is equalto the specific value 'Anticharis glandulosa':
SELECT id, name_lat, obsr_dateFROM plantsWHERE name_lat = 'Anticharis glandulosa';
By convention, SQL keywords are written in uppercase, while specific values—such as col-umn names—are written in lowercase. This is not strictly required, as SQL is not case-sensitive, unlike JavaScript, for instance, which is case-sensitive. Spaces and line breaks areignored in SQL, like in JavaScript. The query ends with the ; symbol.
Note the way that the query is structured. The queried column names are listed after theSELECT keyword, the table name is specified after FROM, and the condition for filteringreturned records is constructed after the WHERE keyword. In this example, the conditionname_lat='Anticharis glandulosa' means “return all records (rows) where the value ofname_lat is equal to 'Anticharis glandulosa'”.
If we had access to a PostGIS database with the plants table and could type the above
21The data source of this table is the Endangered Plants of Israel (https://redlist.parks.org.il/)website by the Israel Nature and Parks Authority.
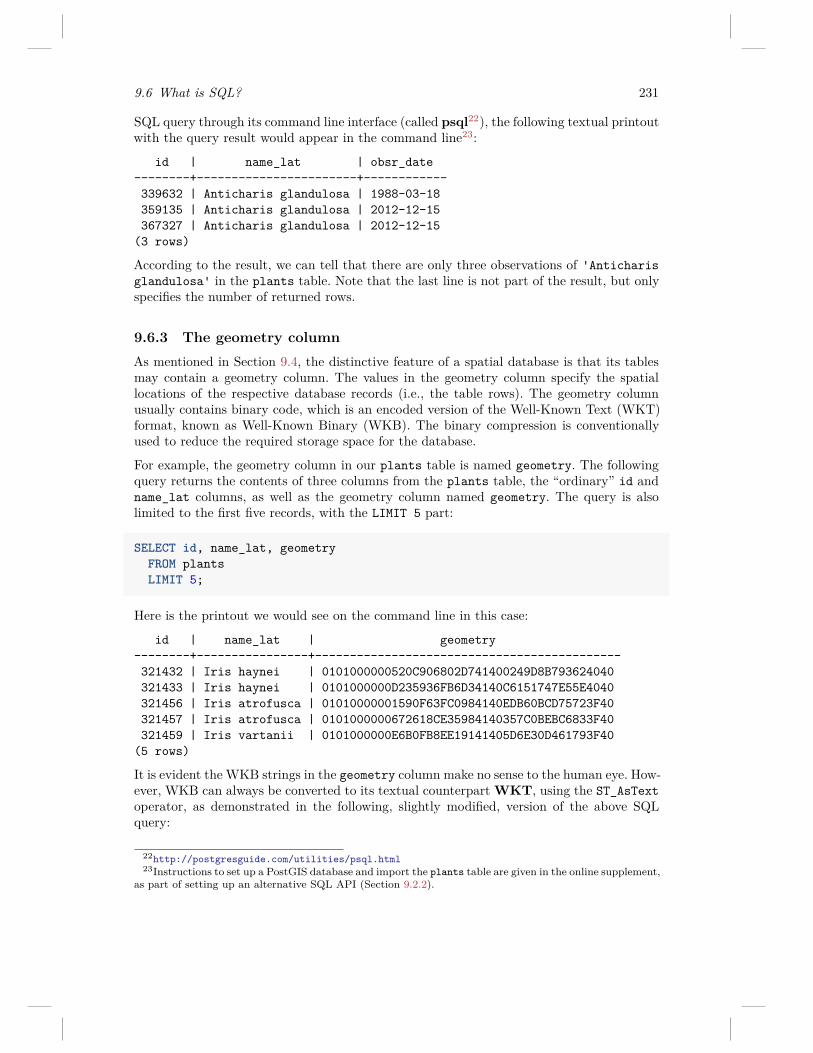
9.6 What is SQL? 231
SQL query through its command line interface (called psql22), the following textual printoutwith the query result would appear in the command line23:
id | name_lat | obsr_date--------+-----------------------+------------339632 | Anticharis glandulosa | 1988-03-18359135 | Anticharis glandulosa | 2012-12-15367327 | Anticharis glandulosa | 2012-12-15(3 rows)
According to the result, we can tell that there are only three observations of 'Anticharisglandulosa' in the plants table. Note that the last line is not part of the result, but onlyspecifies the number of returned rows.
9.6.3 The geometry columnAs mentioned in Section 9.4, the distinctive feature of a spatial database is that its tablesmay contain a geometry column. The values in the geometry column specify the spatiallocations of the respective database records (i.e., the table rows). The geometry columnusually contains binary code, which is an encoded version of the Well-Known Text (WKT)format, known as Well-Known Binary (WKB). The binary compression is conventionallyused to reduce the required storage space for the database.
For example, the geometry column in our plants table is named geometry. The followingquery returns the contents of three columns from the plants table, the “ordinary” id andname_lat columns, as well as the geometry column named geometry. The query is alsolimited to the first five records, with the LIMIT 5 part:
SELECT id, name_lat, geometryFROM plantsLIMIT 5;
Here is the printout we would see on the command line in this case:
id | name_lat | geometry--------+----------------+--------------------------------------------321432 | Iris haynei | 0101000000520C906802D741400249D8B793624040321433 | Iris haynei | 0101000000D235936FB6D34140C6151747E55E4040321456 | Iris atrofusca | 01010000001590F63FC0984140EDB60BCD75723F40321457 | Iris atrofusca | 0101000000672618CE35984140357C0BEBC6833F40321459 | Iris vartanii | 0101000000E6B0FB8EE19141405D6E30D461793F40(5 rows)
It is evident the WKB strings in the geometry column make no sense to the human eye. How-ever, WKB can always be converted to its textual counterpart WKT, using the ST_AsTextoperator, as demonstrated in the following, slightly modified, version of the above SQLquery:
22http://postgresguide.com/utilities/psql.html23Instructions to set up a PostGIS database and import the plants table are given in the online supplement,
as part of setting up an alternative SQL API (Section 9.2.2).
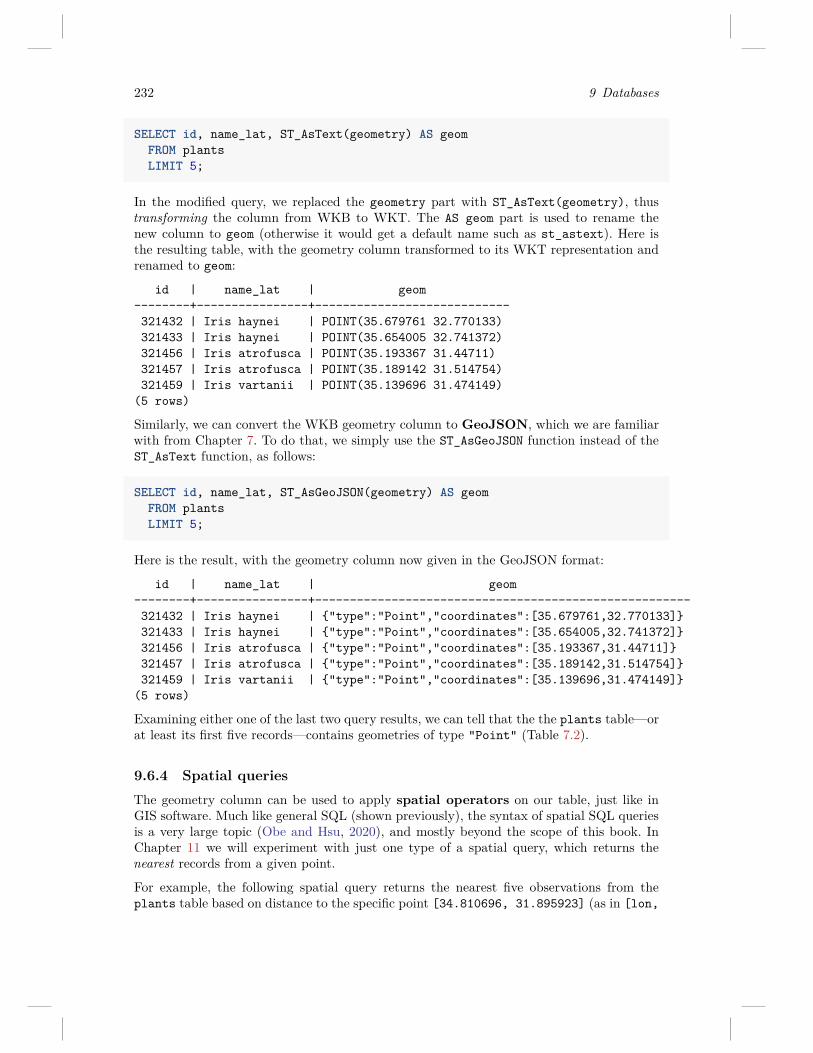
232 9 Databases
SELECT id, name_lat, ST_AsText(geometry) AS geomFROM plantsLIMIT 5;
In the modified query, we replaced the geometry part with ST_AsText(geometry), thustransforming the column from WKB to WKT. The AS geom part is used to rename thenew column to geom (otherwise it would get a default name such as st_astext). Here isthe resulting table, with the geometry column transformed to its WKT representation andrenamed to geom:
id | name_lat | geom--------+----------------+----------------------------321432 | Iris haynei | POINT(35.679761 32.770133)321433 | Iris haynei | POINT(35.654005 32.741372)321456 | Iris atrofusca | POINT(35.193367 31.44711)321457 | Iris atrofusca | POINT(35.189142 31.514754)321459 | Iris vartanii | POINT(35.139696 31.474149)(5 rows)
Similarly, we can convert the WKB geometry column to GeoJSON, which we are familiarwith from Chapter 7. To do that, we simply use the ST_AsGeoJSON function instead of theST_AsText function, as follows:
SELECT id, name_lat, ST_AsGeoJSON(geometry) AS geomFROM plantsLIMIT 5;
Here is the result, with the geometry column now given in the GeoJSON format:
id | name_lat | geom--------+----------------+------------------------------------------------------321432 | Iris haynei | {"type":"Point","coordinates":[35.679761,32.770133]}321433 | Iris haynei | {"type":"Point","coordinates":[35.654005,32.741372]}321456 | Iris atrofusca | {"type":"Point","coordinates":[35.193367,31.44711]}321457 | Iris atrofusca | {"type":"Point","coordinates":[35.189142,31.514754]}321459 | Iris vartanii | {"type":"Point","coordinates":[35.139696,31.474149]}(5 rows)
Examining either one of the last two query results, we can tell that the the plants table—orat least its first five records—contains geometries of type "Point" (Table 7.2).
9.6.4 Spatial queriesThe geometry column can be used to apply spatial operators on our table, just like inGIS software. Much like general SQL (shown previously), the syntax of spatial SQL queriesis a very large topic (Obe and Hsu, 2020), and mostly beyond the scope of this book. InChapter 11 we will experiment with just one type of a spatial query, which returns thenearest records from a given point.
For example, the following spatial query returns the nearest five observations from theplants table based on distance to the specific point [34.810696, 31.895923] (as in [lon,
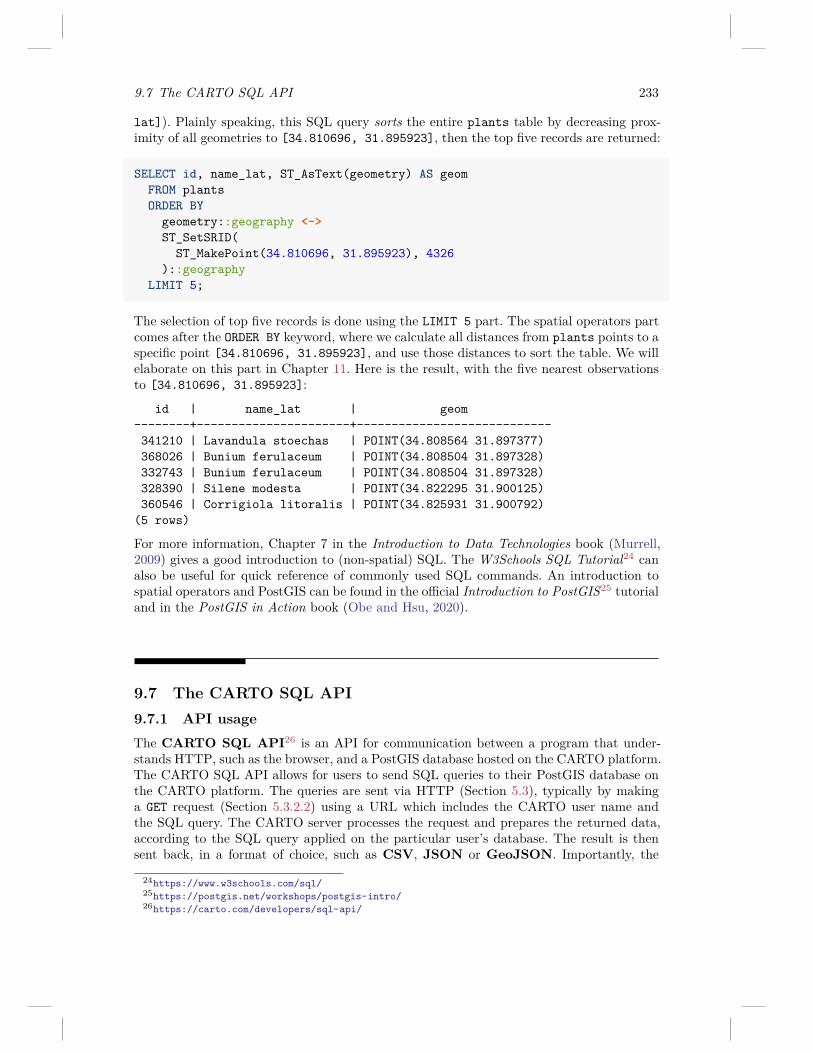
9.7 The CARTO SQL API 233
lat]). Plainly speaking, this SQL query sorts the entire plants table by decreasing prox-imity of all geometries to [34.810696, 31.895923], then the top five records are returned:
SELECT id, name_lat, ST_AsText(geometry) AS geomFROM plantsORDER BY
geometry::geography <->ST_SetSRID(
ST_MakePoint(34.810696, 31.895923), 4326)::geography
LIMIT 5;
The selection of top five records is done using the LIMIT 5 part. The spatial operators partcomes after the ORDER BY keyword, where we calculate all distances from plants points to aspecific point [34.810696, 31.895923], and use those distances to sort the table. We willelaborate on this part in Chapter 11. Here is the result, with the five nearest observationsto [34.810696, 31.895923]:
id | name_lat | geom--------+----------------------+----------------------------341210 | Lavandula stoechas | POINT(34.808564 31.897377)368026 | Bunium ferulaceum | POINT(34.808504 31.897328)332743 | Bunium ferulaceum | POINT(34.808504 31.897328)328390 | Silene modesta | POINT(34.822295 31.900125)360546 | Corrigiola litoralis | POINT(34.825931 31.900792)(5 rows)
For more information, Chapter 7 in the Introduction to Data Technologies book (Murrell,2009) gives a good introduction to (non-spatial) SQL. The W3Schools SQL Tutorial24 canalso be useful for quick reference of commonly used SQL commands. An introduction tospatial operators and PostGIS can be found in the official Introduction to PostGIS25 tutorialand in the PostGIS in Action book (Obe and Hsu, 2020).
9.7 The CARTO SQL API9.7.1 API usageThe CARTO SQL API26 is an API for communication between a program that under-stands HTTP, such as the browser, and a PostGIS database hosted on the CARTO platform.The CARTO SQL API allows for users to send SQL queries to their PostGIS database onthe CARTO platform. The queries are sent via HTTP (Section 5.3), typically by makinga GET request (Section 5.3.2.2) using a URL which includes the CARTO user name andthe SQL query. The CARTO server processes the request and prepares the returned data,according to the SQL query applied on the particular user’s database. The result is thensent back, in a format of choice, such as CSV, JSON or GeoJSON. Importantly, the
24https://www.w3schools.com/sql/25https://postgis.net/workshops/postgis-intro/26https://carto.com/developers/sql-api/
234 9 Databases
fact that the requests are made through HTTP means that we can send requests to thedatabase, and get the responses, from client-side JavaScript code using Ajax (Section 7.7).
It is important to note that some types of queries other than SELECT, namely queriesthat modify our data, such as INSERT, require an API key as an additional parameter inour request. The API key serves as a password for making sensitive queries. Without thisrestriction, anyone who knows our username could make changes to our database, or evendelete its entire contents. We will not be using this type of sensitive queries up until Section13.6.1, where a method to hide the API key from the client and still be able to write to thedatabase will be introduced.
The basic URL structure for sending a GET request to the CARTO SQL API looks like this:
https://CARTO_USERNAME.carto.com/api/v2/sql?format=FORMAT&q=SQL_STATEMENT
where:
• CARTO_USERNAME should be replaced with your CARTO user name• FORMAT should be replaced with the required format• SQL_STATEMENT should be replaced with the SQL query
Note that this is a special URL structure, which contains a query string27. A query stringis used to send parameters to the server as part of the URL. The query string comes at theend of the URL, after the ? symbol, with the parameters separated by & symbols. In thiscase, the query string contains two parameters, format and q.
For example, here is a specific query:
https://michaeldorman.carto.com/api/v2/sql?format=GeoJSON&q=SELECT id, name_lat, the_geom FROM plants LIMIT 2
where:
• CARTO_USERNAME was replaced with michaeldorman• FORMAT was replaced with GeoJSON• SQL_STATEMENT was replaced with SELECT id, name_lat, the_geom FROM plants
LIMIT 2
Possible values for the format parameter include JSON, GeoJSON, and CSV. The defaultreturned format is JSON, so to get your result returned in JSON you can omit the formatparameter to get a slightly simplified URL:
https://michaeldorman.carto.com/api/v2/sql?q=SELECT id, name_lat, the_geom FROM plants LIMIT 2
To get your results in a format other than JSON, such as GeoJSON or CSV, you need toexplicitly specify the format, as in format=GeoJSON or format=CSV. Other possible formatsinclude GPKG, SHP, SVG, KML, and SpatiaLite28.
9.7.2 Query exampleThe plants table used in the above SQL examples (Section 9.6) was already uploaded to aCARTO account named michaeldorman. We will query the database associated with thisaccount to experiment with the CARTO SQL API.
27https://en.wikipedia.org/wiki/Query_string28For the full list, refer to the CARTO SQL API documentation (https://carto.com/developers/sql-
api/reference/).
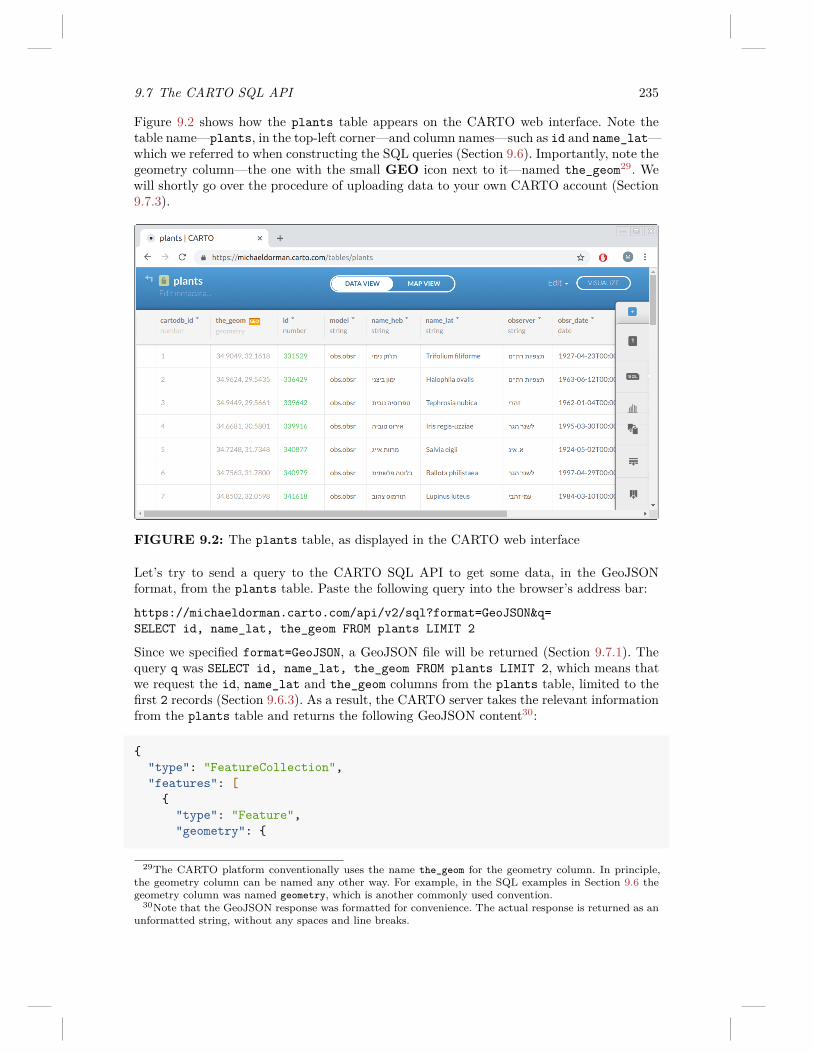
9.7 The CARTO SQL API 235
Figure 9.2 shows how the plants table appears on the CARTO web interface. Note thetable name—plants, in the top-left corner—and column names—such as id and name_lat—which we referred to when constructing the SQL queries (Section 9.6). Importantly, note thegeometry column—the one with the small GEO icon next to it—named the_geom29. Wewill shortly go over the procedure of uploading data to your own CARTO account (Section9.7.3).
FIGURE 9.2: The plants table, as displayed in the CARTO web interface
Let’s try to send a query to the CARTO SQL API to get some data, in the GeoJSONformat, from the plants table. Paste the following query into the browser’s address bar:
https://michaeldorman.carto.com/api/v2/sql?format=GeoJSON&q=SELECT id, name_lat, the_geom FROM plants LIMIT 2
Since we specified format=GeoJSON, a GeoJSON file will be returned (Section 9.7.1). Thequery q was SELECT id, name_lat, the_geom FROM plants LIMIT 2, which means thatwe request the id, name_lat and the_geom columns from the plants table, limited to thefirst 2 records (Section 9.6.3). As a result, the CARTO server takes the relevant informationfrom the plants table and returns the following GeoJSON content30:
{"type": "FeatureCollection","features": [
{"type": "Feature","geometry": {
29The CARTO platform conventionally uses the name the_geom for the geometry column. In principle,the geometry column can be named any other way. For example, in the SQL examples in Section 9.6 thegeometry column was named geometry, which is another commonly used convention.
30Note that the GeoJSON response was formatted for convenience. The actual response is returned as anunformatted string, without any spaces and line breaks.
236 9 Databases
"type": "Point","coordinates": [35.032018, 32.800539]
},"properties": {"id": 345305,"name_lat": "Elymus elongatus"
}},{
"type": "Feature","geometry": {"type": "Point","coordinates": [35.564703, 33.047197]
},"properties": {"id": 346805,"name_lat": "Galium chaetopodum"
}}
]}
This is a GeoJSON string of type "FeatureCollection" (Section 7.3.4). It contains twofeatures with "Point" geometries, each having two non-spatial attributes: id and name_lat.
Remember that the geometry column the_geom needs to appear in the query whenever weexport the result in a spatial format, such as format=GeoJSON. Otherwise, the server cannotgenerate the geometric part of the layer and we get an error. For example, omitting thethe_geom column from the above query:
https://michaeldorman.carto.com/api/v2/sql?format=GeoJSON&q=SELECT id, name_lat FROM plants LIMIT 2
returns the following error message instead of the requested GeoJSON:
{"error":["column \"the_geom\" does not exist"]}
By the way, while pasting these URL examples into the browser, you may have noticed howthe browser automatically encodes31 the URL into a format that can be transmitted overthe Internet. This is something that happens automatically, and we do not need to worryabout. For example, as part of URL encoding, spaces are converted to %20, so that the URLwe typed above:
https://michaeldorman.carto.com/api/v2/sql?format=GeoJSON&q=SELECT id, name_lat, the_geom FROM plants LIMIT 2
becomes:
https://michaeldorman.carto.com/api/v2/sql?format=GeoJSON&q=SELECT%20id,%20name_lat,%20the_geom%20FROM%20plants%20LIMIT%202
31https://en.wikipedia.org/wiki/Percent-encoding
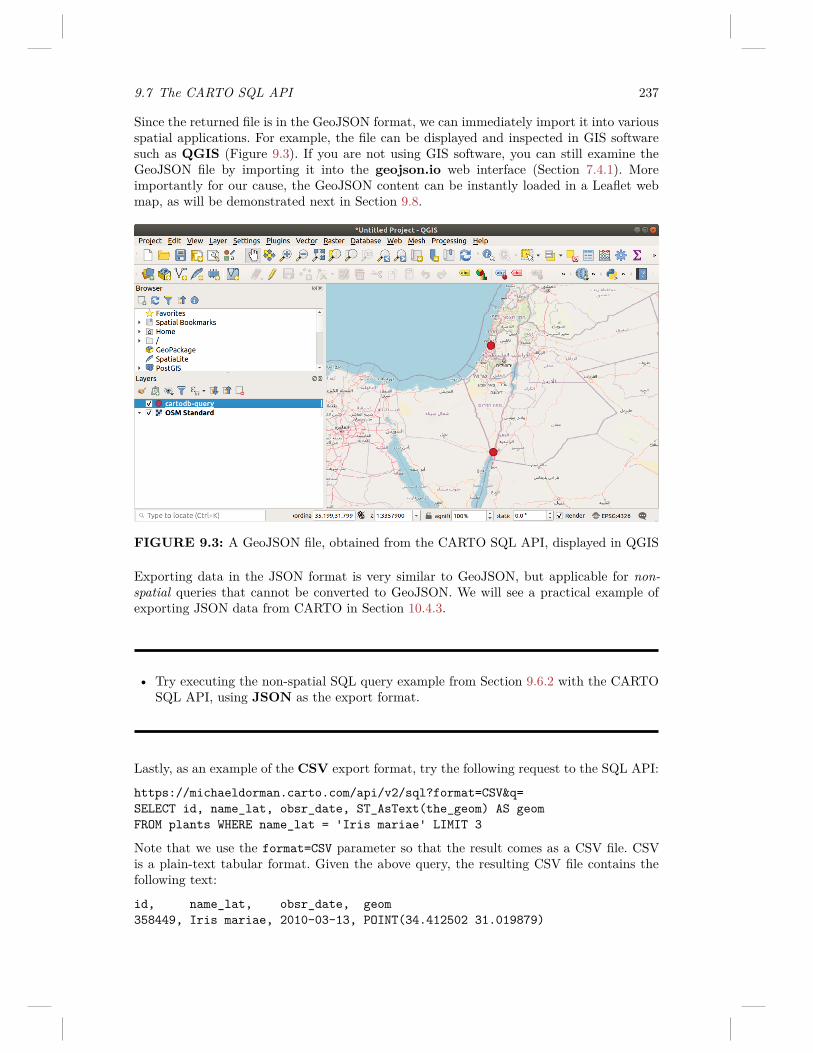
9.7 The CARTO SQL API 237
Since the returned file is in the GeoJSON format, we can immediately import it into variousspatial applications. For example, the file can be displayed and inspected in GIS softwaresuch as QGIS (Figure 9.3). If you are not using GIS software, you can still examine theGeoJSON file by importing it into the geojson.io web interface (Section 7.4.1). Moreimportantly for our cause, the GeoJSON content can be instantly loaded in a Leaflet webmap, as will be demonstrated next in Section 9.8.
FIGURE 9.3: A GeoJSON file, obtained from the CARTO SQL API, displayed in QGIS
Exporting data in the JSON format is very similar to GeoJSON, but applicable for non-spatial queries that cannot be converted to GeoJSON. We will see a practical example ofexporting JSON data from CARTO in Section 10.4.3.
• Try executing the non-spatial SQL query example from Section 9.6.2 with the CARTOSQL API, using JSON as the export format.
Lastly, as an example of the CSV export format, try the following request to the SQL API:
https://michaeldorman.carto.com/api/v2/sql?format=CSV&q=SELECT id, name_lat, obsr_date, ST_AsText(the_geom) AS geomFROM plants WHERE name_lat = 'Iris mariae' LIMIT 3
Note that we use the format=CSV parameter so that the result comes as a CSV file. CSVis a plain-text tabular format. Given the above query, the resulting CSV file contains thefollowing text:
id, name_lat, obsr_date, geom358449, Iris mariae, 2010-03-13, POINT(34.412502 31.019879)
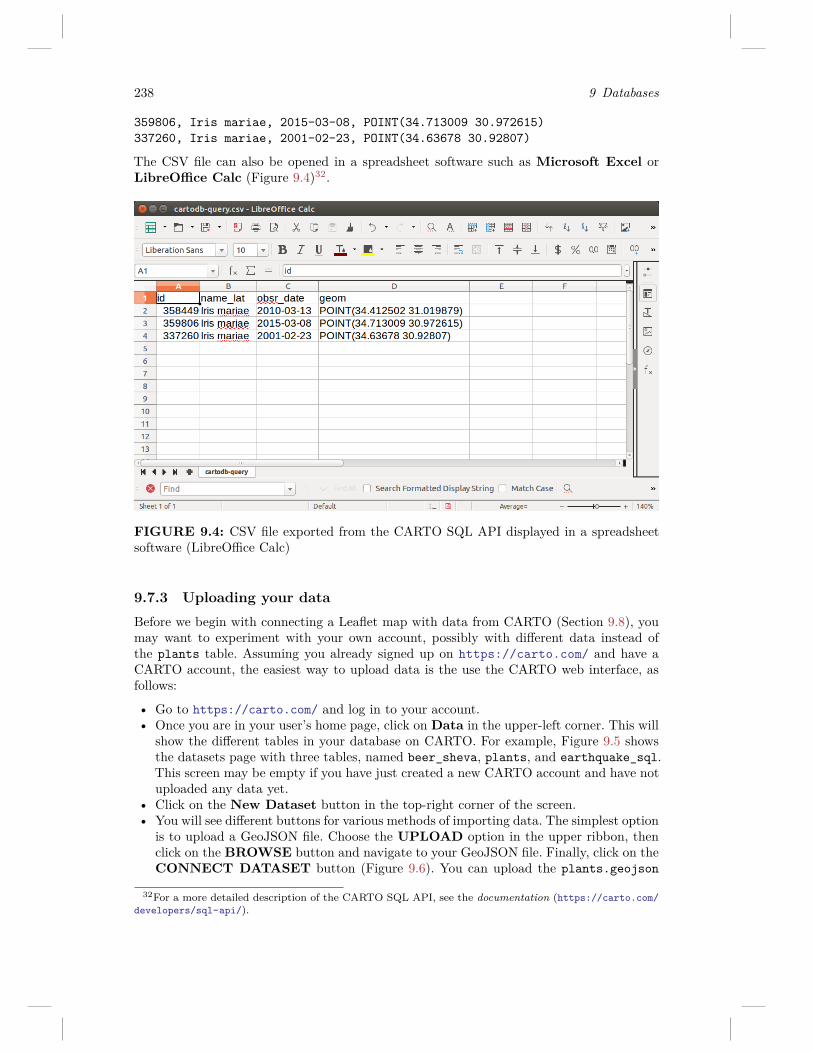
238 9 Databases
359806, Iris mariae, 2015-03-08, POINT(34.713009 30.972615)337260, Iris mariae, 2001-02-23, POINT(34.63678 30.92807)
The CSV file can also be opened in a spreadsheet software such as Microsoft Excel orLibreOffice Calc (Figure 9.4)32.
FIGURE 9.4: CSV file exported from the CARTO SQL API displayed in a spreadsheetsoftware (LibreOffice Calc)
9.7.3 Uploading your dataBefore we begin with connecting a Leaflet map with data from CARTO (Section 9.8), youmay want to experiment with your own account, possibly with different data instead ofthe plants table. Assuming you already signed up on https://carto.com/ and have aCARTO account, the easiest way to upload data is the use the CARTO web interface, asfollows:
• Go to https://carto.com/ and log in to your account.• Once you are in your user’s home page, click on Data in the upper-left corner. This will
show the different tables in your database on CARTO. For example, Figure 9.5 showsthe datasets page with three tables, named beer_sheva, plants, and earthquake_sql.This screen may be empty if you have just created a new CARTO account and have notuploaded any data yet.
• Click on the New Dataset button in the top-right corner of the screen.• You will see different buttons for various methods of importing data. The simplest option
is to upload a GeoJSON file. Choose the UPLOAD option in the upper ribbon, thenclick on the BROWSE button and navigate to your GeoJSON file. Finally, click on theCONNECT DATASET button (Figure 9.6). You can upload the plants.geojson
32For a more detailed description of the CARTO SQL API, see the documentation (https://carto.com/developers/sql-api/).
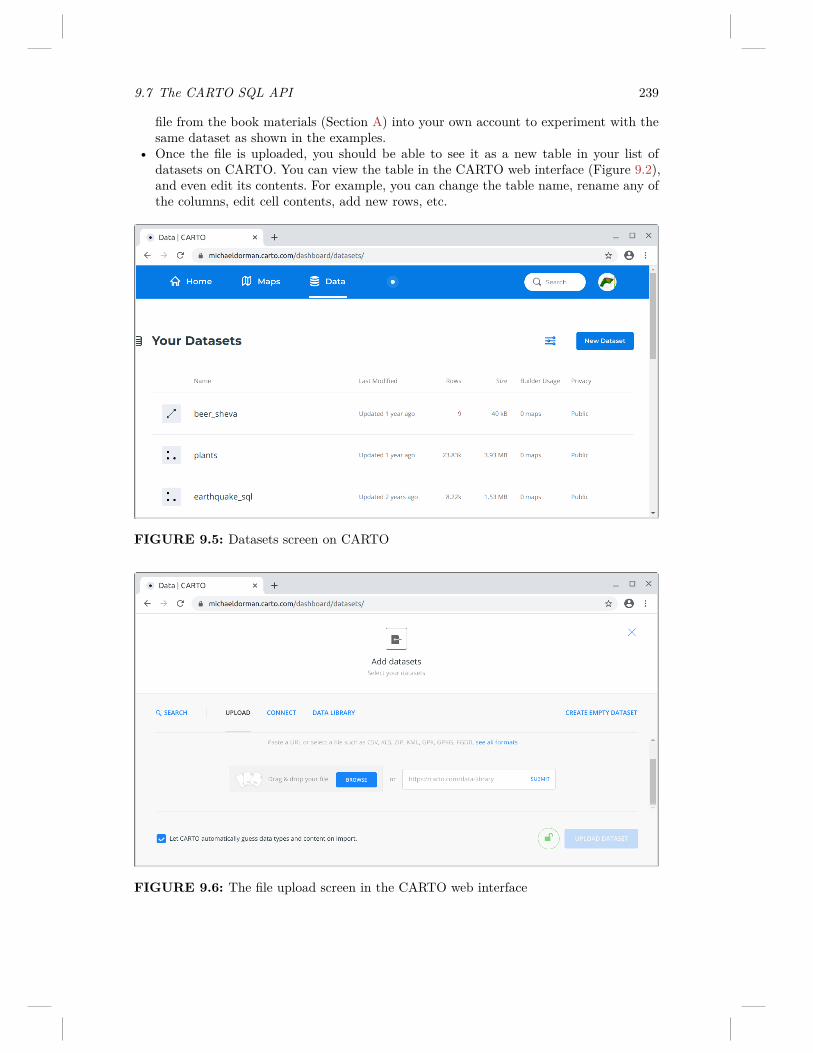
9.7 The CARTO SQL API 239
file from the book materials (Section A) into your own account to experiment with thesame dataset as shown in the examples.
• Once the file is uploaded, you should be able to see it as a new table in your list ofdatasets on CARTO. You can view the table in the CARTO web interface (Figure 9.2),and even edit its contents. For example, you can change the table name, rename any ofthe columns, edit cell contents, add new rows, etc.
FIGURE 9.5: Datasets screen on CARTO
FIGURE 9.6: The file upload screen in the CARTO web interface
240 9 Databases
• Upload any GeoJSON file other than plants.gejson to CARTO, then try to adapt theabove SQL API queries to your own username, table name, and column names.
• Test the new queries by pasting the respective URLs into the browser address bar andexamining the returned results.
9.8 CARTO and LeafletWe have just learned how to use the CARTO SQL API to send SQL queries to a CARTOdatabase (Section 9.7). Importantly, since we are working with a spatial database, one ofthe formats in which we can choose to get the returned results is GeoJSON (Section 9.7.2).In this section, we will load a CARTO query result in a web page and display it on a Leafletmap. The method we are going to use for loading the query result is the fetch function,which we introduced in Section 7.8 and used in many of the examples in Chapters 7–8 whenloading GeoJSON layers from files.
Our starting point is the basic map example-06-02.html from Section 6.5.11, with a mod-ified initial map extent, as follows, so that the plants observations will be visible on pageload:
let map = L.map("map").setView([32, 35], 8);
Now, in order to load data from CARTO on the Leaflet map, we need to go through thefollowing steps:
• Construct the URL to query the CARTO SQL API• Get the data from CARTO and add it on the map
As the first step, we will construct the query URL. For convenience, the URL will be split intwo parts: the fixed base URL prefix and the varying SQL query suffix. Combining bothparts gives the complete URL, which we will use to retrieve data from the CARTO database.The fixed base URL, specific to a particular CARTO user, can be kept in a separate variablehereby named url. That way, we do not need to repeat it in each and every query we makein our script:
let url = "https://michaeldorman.carto.com/api/v2/sql?format=GeoJSON&q=";
Note that to make the code even more manageable you can split the base URL into twoparts too, keeping the user name in a separate variable. That way, if we need to switch toa different CARTO account it is more clear which part of the code needs to be modified:
let carto_user = "michaeldorman";let url = "https://" + carto_user + ".carto.com/api/v2/sql?format=GeoJSON&q=";
Either way, our next step is to define the varying SQL query part, used to retrieve data
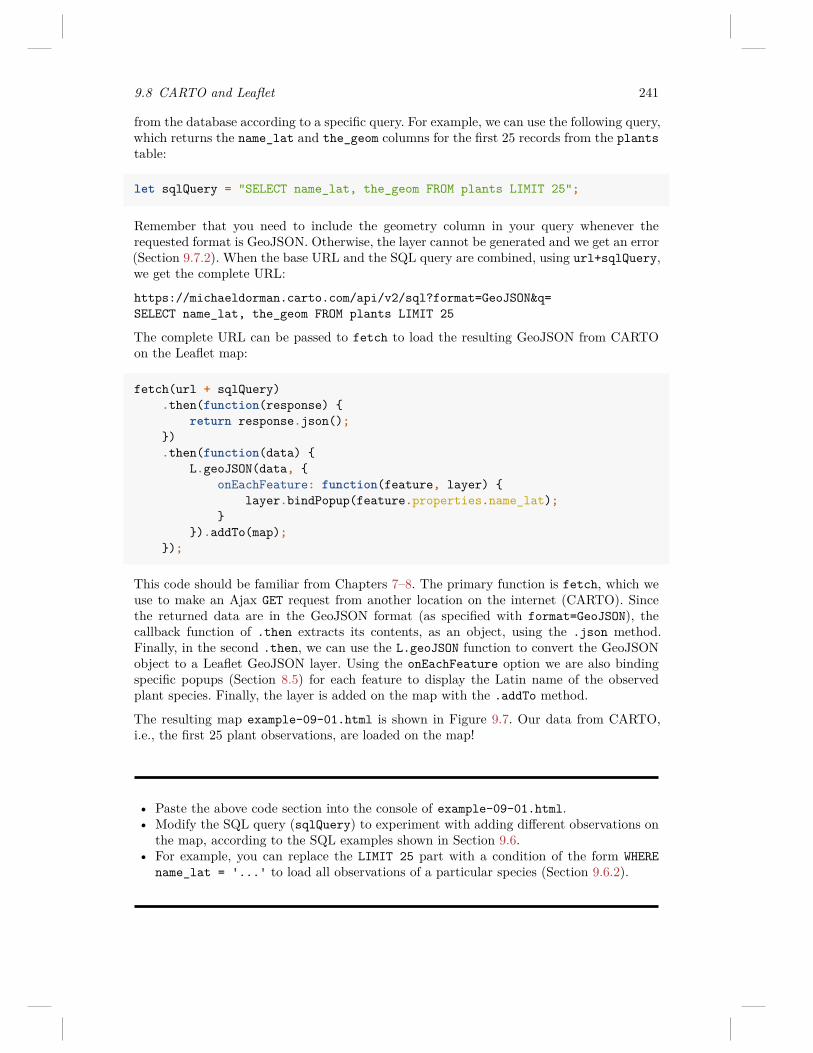
9.8 CARTO and Leaflet 241
from the database according to a specific query. For example, we can use the following query,which returns the name_lat and the_geom columns for the first 25 records from the plantstable:
let sqlQuery = "SELECT name_lat, the_geom FROM plants LIMIT 25";
Remember that you need to include the geometry column in your query whenever therequested format is GeoJSON. Otherwise, the layer cannot be generated and we get an error(Section 9.7.2). When the base URL and the SQL query are combined, using url+sqlQuery,we get the complete URL:
https://michaeldorman.carto.com/api/v2/sql?format=GeoJSON&q=SELECT name_lat, the_geom FROM plants LIMIT 25
The complete URL can be passed to fetch to load the resulting GeoJSON from CARTOon the Leaflet map:
fetch(url + sqlQuery).then(function(response) {
return response.json();}).then(function(data) {
L.geoJSON(data, {onEachFeature: function(feature, layer) {
layer.bindPopup(feature.properties.name_lat);}
}).addTo(map);});
This code should be familiar from Chapters 7–8. The primary function is fetch, which weuse to make an Ajax GET request from another location on the internet (CARTO). Sincethe returned data are in the GeoJSON format (as specified with format=GeoJSON), thecallback function of .then extracts its contents, as an object, using the .json method.Finally, in the second .then, we can use the L.geoJSON function to convert the GeoJSONobject to a Leaflet GeoJSON layer. Using the onEachFeature option we are also bindingspecific popups (Section 8.5) for each feature to display the Latin name of the observedplant species. Finally, the layer is added on the map with the .addTo method.
The resulting map example-09-01.html is shown in Figure 9.7. Our data from CARTO,i.e., the first 25 plant observations, are loaded on the map!
• Paste the above code section into the console of example-09-01.html.• Modify the SQL query (sqlQuery) to experiment with adding different observations on
the map, according to the SQL examples shown in Section 9.6.• For example, you can replace the LIMIT 25 part with a condition of the form WHERE
name_lat = '...' to load all observations of a particular species (Section 9.6.2).
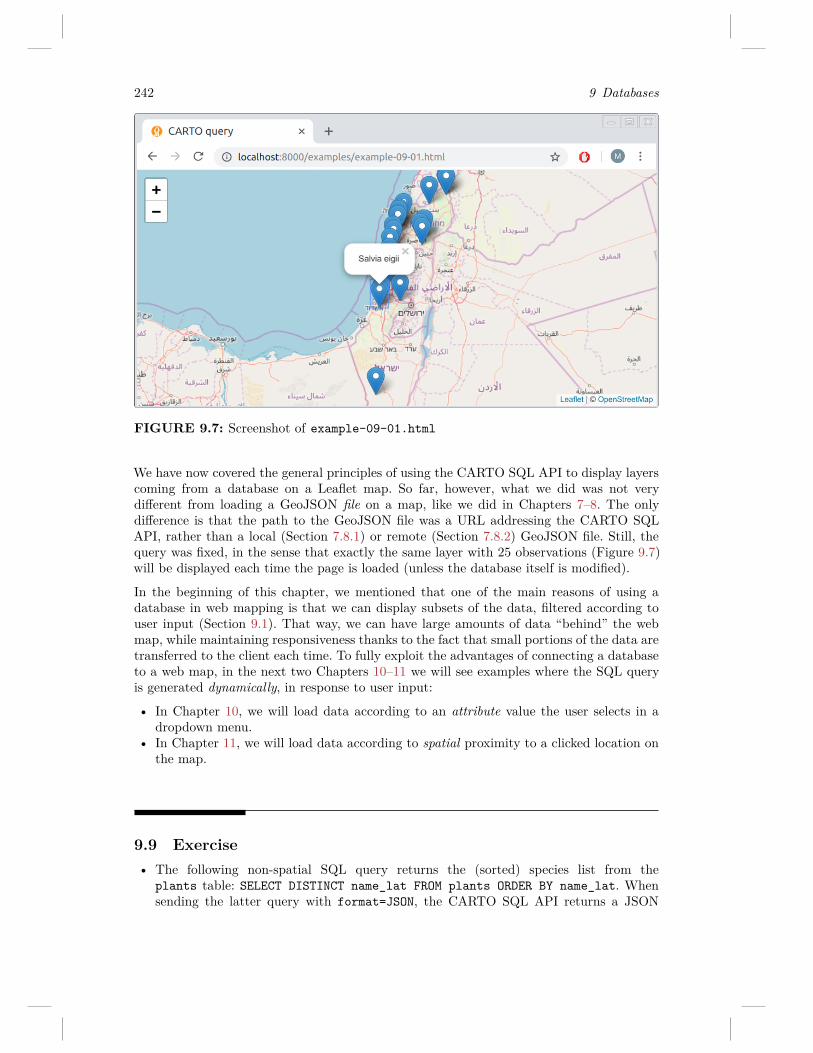
242 9 Databases
FIGURE 9.7: Screenshot of example-09-01.html
We have now covered the general principles of using the CARTO SQL API to display layerscoming from a database on a Leaflet map. So far, however, what we did was not verydifferent from loading a GeoJSON file on a map, like we did in Chapters 7–8. The onlydifference is that the path to the GeoJSON file was a URL addressing the CARTO SQLAPI, rather than a local (Section 7.8.1) or remote (Section 7.8.2) GeoJSON file. Still, thequery was fixed, in the sense that exactly the same layer with 25 observations (Figure 9.7)will be displayed each time the page is loaded (unless the database itself is modified).
In the beginning of this chapter, we mentioned that one of the main reasons of using adatabase in web mapping is that we can display subsets of the data, filtered according touser input (Section 9.1). That way, we can have large amounts of data “behind” the webmap, while maintaining responsiveness thanks to the fact that small portions of the data aretransferred to the client each time. To fully exploit the advantages of connecting a databaseto a web map, in the next two Chapters 10–11 we will see examples where the SQL queryis generated dynamically, in response to user input:
• In Chapter 10, we will load data according to an attribute value the user selects in adropdown menu.
• In Chapter 11, we will load data according to spatial proximity to a clicked location onthe map.
9.9 Exercise• The following non-spatial SQL query returns the (sorted) species list from the
plants table: SELECT DISTINCT name_lat FROM plants ORDER BY name_lat. Whensending the latter query with format=JSON, the CARTO SQL API returns a JSON
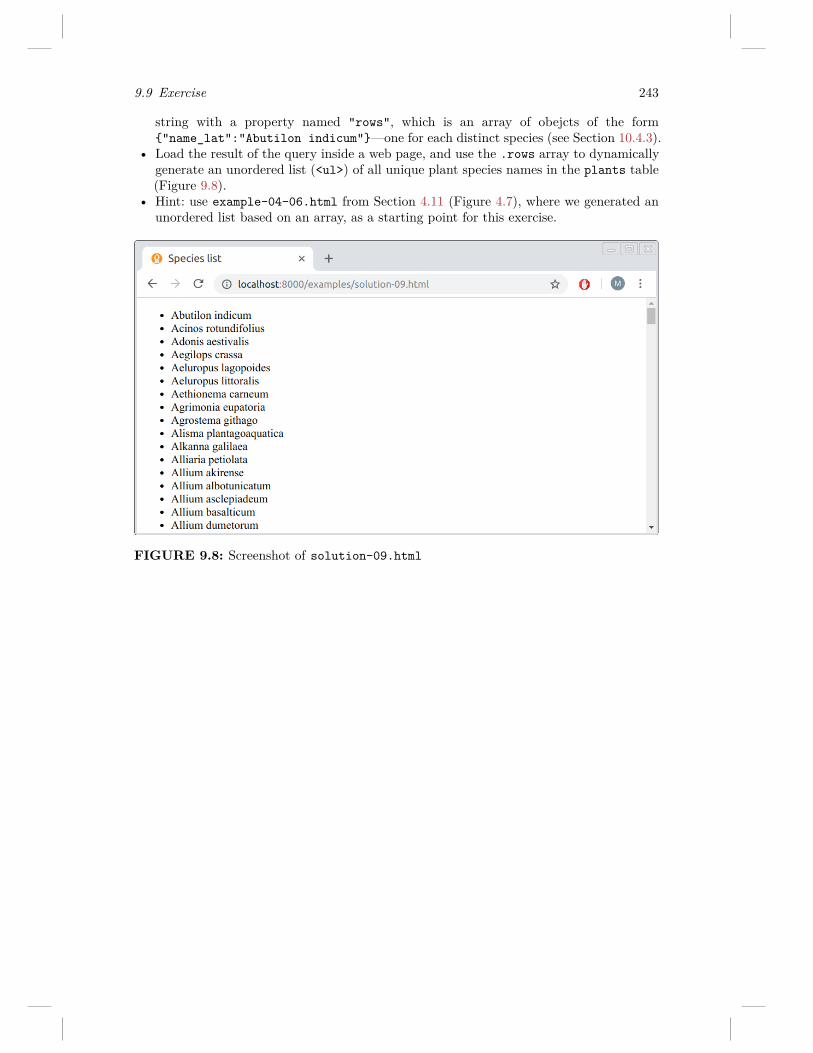
9.9 Exercise 243
string with a property named "rows", which is an array of obejcts of the form{"name_lat":"Abutilon indicum"}—one for each distinct species (see Section 10.4.3).
• Load the result of the query inside a web page, and use the .rows array to dynamicallygenerate an unordered list (<ul>) of all unique plant species names in the plants table(Figure 9.8).
• Hint: use example-04-06.html from Section 4.11 (Figure 4.7), where we generated anunordered list based on an array, as a starting point for this exercise.
FIGURE 9.8: Screenshot of solution-09.html

10Non-spatial Queries
10.1 IntroductionIn Chapter 9, we introduced the CARTO SQL API, and used it to display the result ofa database query on a Leaflet map (Figure 9.7). The query we used was constant: thesame observations—namely the first 25 records in the plants table—were always loaded.In this chapter, we are going to extend example-09-01.html by adding a user interface,where one can choose which subset of the data gets loaded and displayed on the map.Specifically, we will use an input element, where the user selects a plant species, which wewill use to dynamically generate an SQL query for filtering the plants table and gettingthe observations for that particular species only. That way, the user is able to load allobservations of any given plant species, one at a time.
We will accomplish the above by going through several steps:
• Using SQL filtering based on column values (Section 10.2.1)• Loading a subset of records from a database onto a Leaflet map (Section 10.2.2)• Adding a <select> input for choosing a species (Section 10.3)• Collecting all unique species names, also using SQL (Section 10.4.3)• Automatically adding all unique species names as <option> elements inside <select>
(Section 10.4.4)• Associating the list with the map, so that changing the species choice will load new
observations on the map (Sections 10.5–10.6)
The final result we aim at is shown in Figure 10.7.
10.2 Subsetting with SQL10.2.1 Filtering based on attributesIn Chapter 9, we used the following SQL query to load the first 25 records from the plantstable on a Leaflet map (Figure 9.7).
SELECT name_lat, the_geomFROM plantsLIMIT 25;
As mentioned in Section 9.6.2, using SQL we can also filter the returned data, using theWHERE keyword combined with one or more criteria. For example, the name_lat column
245
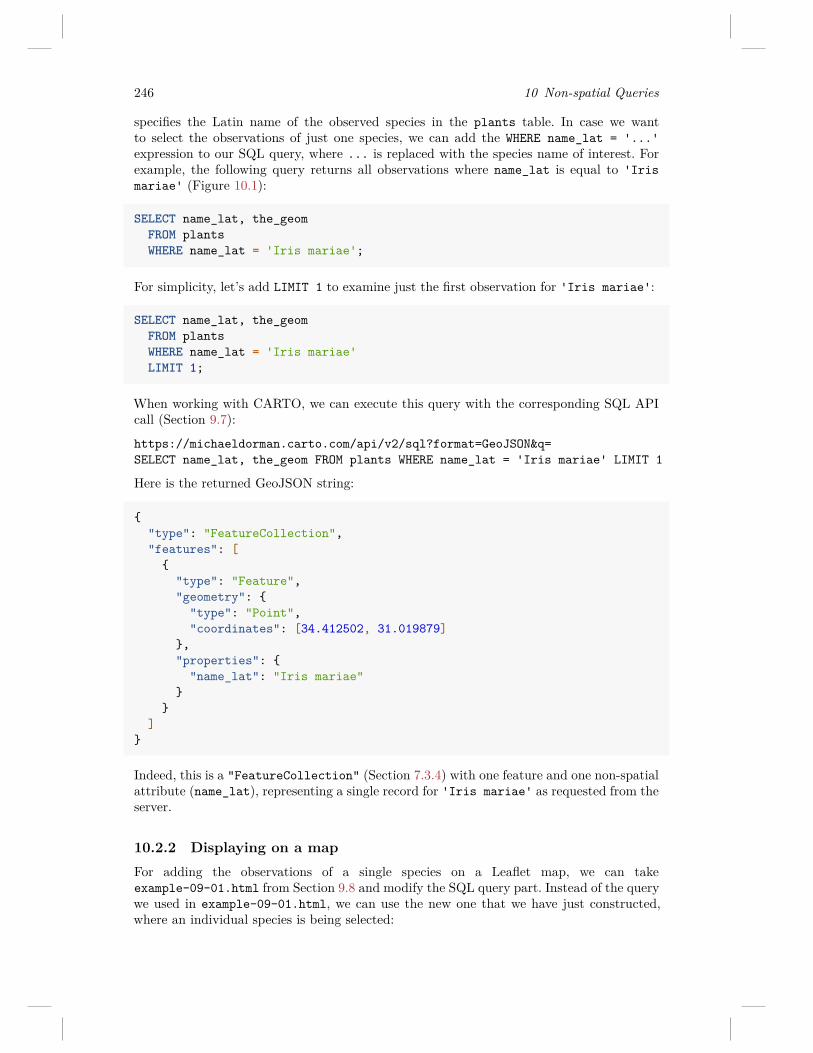
246 10 Non-spatial Queries
specifies the Latin name of the observed species in the plants table. In case we wantto select the observations of just one species, we can add the WHERE name_lat = '...'expression to our SQL query, where ... is replaced with the species name of interest. Forexample, the following query returns all observations where name_lat is equal to 'Irismariae' (Figure 10.1):
SELECT name_lat, the_geomFROM plantsWHERE name_lat = 'Iris mariae';
For simplicity, let’s add LIMIT 1 to examine just the first observation for 'Iris mariae':
SELECT name_lat, the_geomFROM plantsWHERE name_lat = 'Iris mariae'LIMIT 1;
When working with CARTO, we can execute this query with the corresponding SQL APIcall (Section 9.7):
https://michaeldorman.carto.com/api/v2/sql?format=GeoJSON&q=SELECT name_lat, the_geom FROM plants WHERE name_lat = 'Iris mariae' LIMIT 1
Here is the returned GeoJSON string:
{"type": "FeatureCollection","features": [
{"type": "Feature","geometry": {"type": "Point","coordinates": [34.412502, 31.019879]
},"properties": {"name_lat": "Iris mariae"
}}
]}
Indeed, this is a "FeatureCollection" (Section 7.3.4) with one feature and one non-spatialattribute (name_lat), representing a single record for 'Iris mariae' as requested from theserver.
10.2.2 Displaying on a mapFor adding the observations of a single species on a Leaflet map, we can takeexample-09-01.html from Section 9.8 and modify the SQL query part. Instead of the querywe used in example-09-01.html, we can use the new one that we have just constructed,where an individual species is being selected:
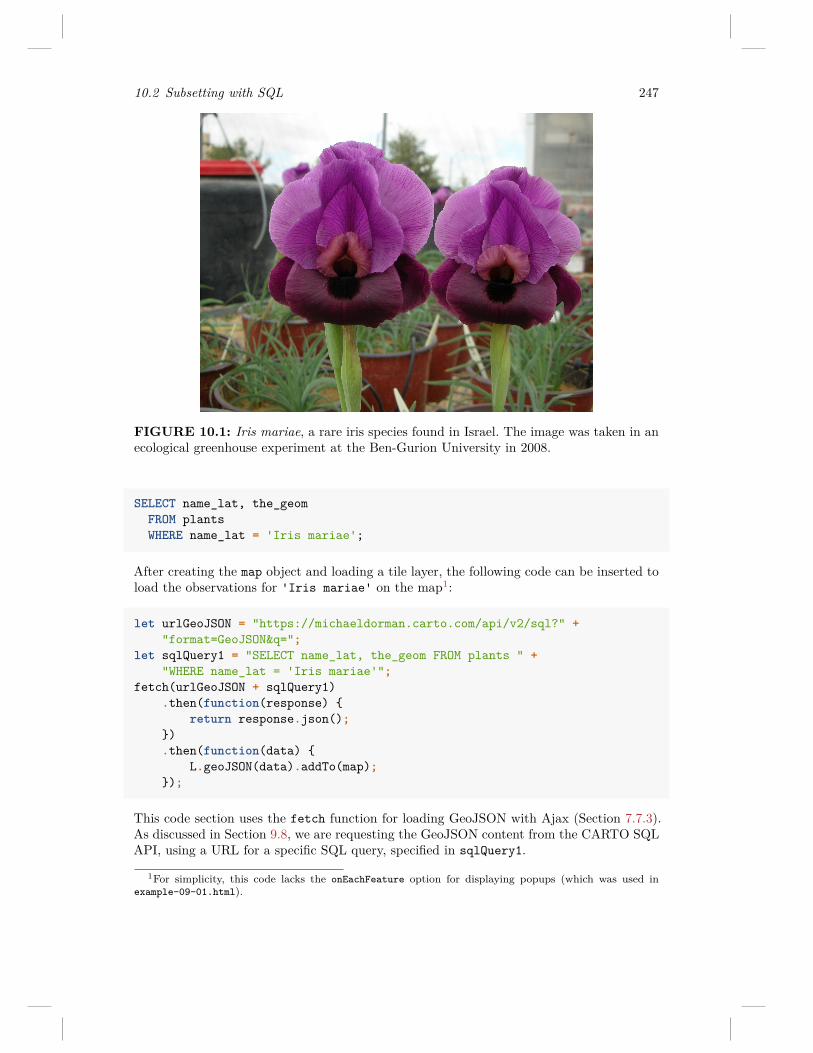
10.2 Subsetting with SQL 247
FIGURE 10.1: Iris mariae, a rare iris species found in Israel. The image was taken in anecological greenhouse experiment at the Ben-Gurion University in 2008.
SELECT name_lat, the_geomFROM plantsWHERE name_lat = 'Iris mariae';
After creating the map object and loading a tile layer, the following code can be inserted toload the observations for 'Iris mariae' on the map1:
let urlGeoJSON = "https://michaeldorman.carto.com/api/v2/sql?" +"format=GeoJSON&q=";
let sqlQuery1 = "SELECT name_lat, the_geom FROM plants " +"WHERE name_lat = 'Iris mariae'";
fetch(urlGeoJSON + sqlQuery1).then(function(response) {
return response.json();}).then(function(data) {
L.geoJSON(data).addTo(map);});
This code section uses the fetch function for loading GeoJSON with Ajax (Section 7.7.3).As discussed in Section 9.8, we are requesting the GeoJSON content from the CARTO SQLAPI, using a URL for a specific SQL query, specified in sqlQuery1.
1For simplicity, this code lacks the onEachFeature option for displaying popups (which was used inexample-09-01.html).
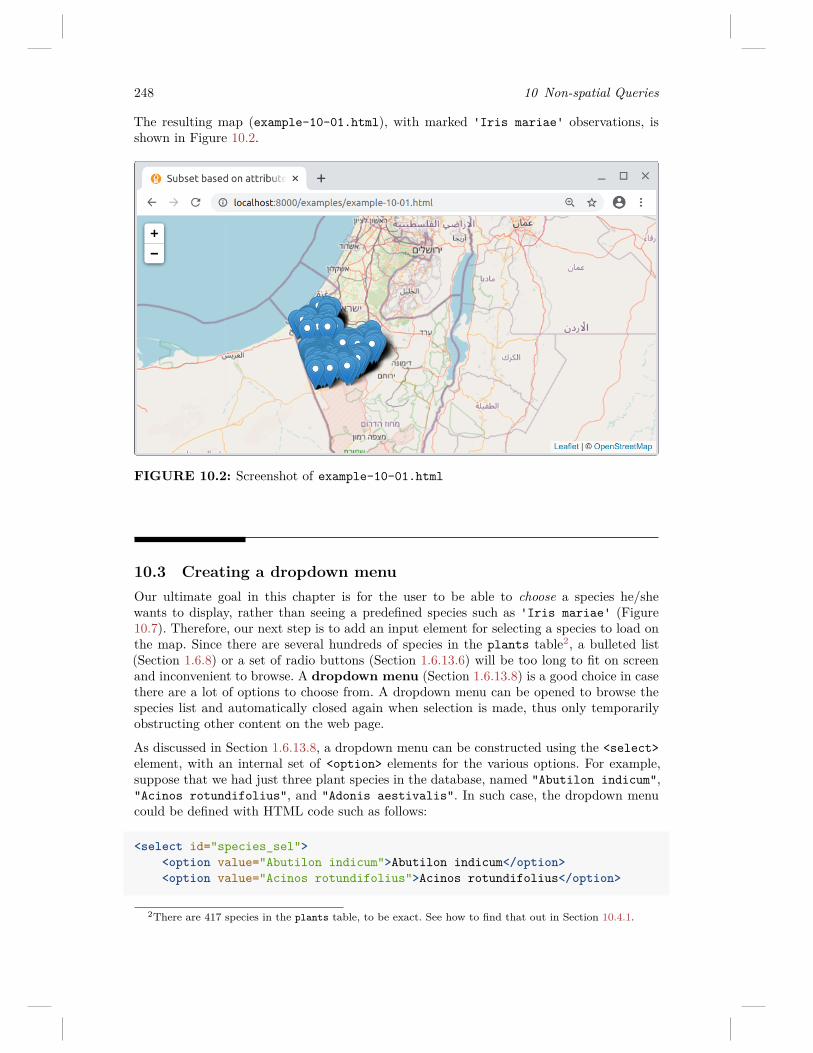
248 10 Non-spatial Queries
The resulting map (example-10-01.html), with marked 'Iris mariae' observations, isshown in Figure 10.2.
FIGURE 10.2: Screenshot of example-10-01.html
10.3 Creating a dropdown menuOur ultimate goal in this chapter is for the user to be able to choose a species he/shewants to display, rather than seeing a predefined species such as 'Iris mariae' (Figure10.7). Therefore, our next step is to add an input element for selecting a species to load onthe map. Since there are several hundreds of species in the plants table2, a bulleted list(Section 1.6.8) or a set of radio buttons (Section 1.6.13.6) will be too long to fit on screenand inconvenient to browse. A dropdown menu (Section 1.6.13.8) is a good choice in casethere are a lot of options to choose from. A dropdown menu can be opened to browse thespecies list and automatically closed again when selection is made, thus only temporarilyobstructing other content on the web page.
As discussed in Section 1.6.13.8, a dropdown menu can be constructed using the <select>element, with an internal set of <option> elements for the various options. For example,suppose that we had just three plant species in the database, named "Abutilon indicum","Acinos rotundifolius", and "Adonis aestivalis". In such case, the dropdown menucould be defined with HTML code such as follows:
<select id="species_sel"><option value="Abutilon indicum">Abutilon indicum</option><option value="Acinos rotundifolius">Acinos rotundifolius</option>
2There are 417 species in the plants table, to be exact. See how to find that out in Section 10.4.1.
10.3 Creating a dropdown menu 249
<option value="Adonis aestivalis">Adonis aestivalis</option></select>
Each <option> element has a value attribute, as well as text contents. Recall from Section1.6.13 that the value attribute specifies the ID sent to the server, or queried with the.value property (Section 4.8), while the text contents between the opening and closingtags (<option>...</option>) is actually displayed on screen. In this particular example,the value attribute and the text content are identical, but this does not necessarily have tobe so (Section 1.6.13). In fact, when the value attribute is missing, the element contentsare treated as the values3. Therefore, when text contents and value are identical, the valuecan be omitted, as in <option>Abutilon indicum</option>. The <select> element canthus be defined with more concise code, as follows:
<select id="species_sel"><option>Abutilon indicum</option><option>Acinos rotundifolius</option><option>Adonis aestivalis</option>
</select>
To incorporate a dropdown menu—such as the one coded above—into our Leaflet map, weuse the L.control function, which we already know how to use from Sections 6.8, 8.6, and8.7.2. The following code can be added to our <script> to build the dropdown menu:
let dropdown = L.control({position: "topleft"});dropdown.onAdd = function() {
let div = L.DomUtil.create("div", "dropdown");div.innerHTML =
'<select id="species_sel">' +'<option>Abutilon indicum</option>' +'<option>Acinos rotundifolius</option>' +'<option>Adonis aestivalis</option>' +
'</select>';return div;
};dropdown.addTo(map);
Like in previous examples of L.control, the above code is actually composed of threeexpressions:
• Defining a map control object, named dropdown, using L.control.• Setting the contents of the control, assigning custom HTML code into the .innterHTML
property. Note that the control itself is set as a <div> element with class "dropdown",and the <select> element inside the <div> is set with an ID attribute of"species_sel".
• Adding the dropdown control to our map.
Next, we probably want to improve the default styling of the dropdown menu, by addingsome CSS rules applied to #species_sel, which refers to the <select> input element. For
3https://developer.mozilla.org/en-US/docs/Web/HTML/Element/option
250 10 Non-spatial Queries
example, we can make the font slightly larger and add shadow effects around the input box.To do that, we add the following CSS code inside the <style> element within the <head>:
#species_sel {padding: 6px 8px;font: 14px/16px Arial, Helvetica, sans-serif;background-color: rgba(255,255,255,0.8);box-shadow: 0 0 15px rgba(0,0,0,0.2);border-radius: 5px;
}
Here is a short explanation of what each of the above styling rules does. You can go backto Chapter 2 for more information on each of these properties.
• padding—The padding clears an area around the contents (and inside the border) ofan element. When two values are given, the first one (6px) refers to padding-top andpadding-bottom and the second one (8px) refers to padding-right and padding-left(Section 2.8.4).
• font—Specifies the font properties. When two sizes are given, the first one (14px) refersto font-size, and the second one (16px) refers to line-height (the total height of textplus the distance to the next line). The font specification first gives specific fonts (Arial,Helvetica), then a general font family (sans-serif) to fall back on if those fonts arenot installed on the system (Section 2.8.3).
• background-color—The box background color is given in the RGBA format: intensityof red, green, blue, and transparency (alpha). In this case, we have white at 80% opacity(rgba(255,255,255,0.8)) (Section 2.8.2).
• box-shadow—Adds a shadow around the element’s box. The sizes refer to horizontaloffset (0) and vertical offset (0), where zero means the shadow is symmetrical aroundall sides of the box. Blur distance (15 px) determines how far the shadow extends.Color specification comes next, in this case the shadow color is black at 20% opacity(rgba(0,0,0,0.2)).
• border-radius—Adds rounded corners to an element, the size (5px) sets the radius(Section 2.8.4.3).
The reason we do not need any styling rules for the entire control <div> (using theclass selector .dropdown), just for the internal <select> element (using the ID selector#species_sel), is that the control contains nothing but the dropdown menu. The exerciseat the end of this chapter (Section 10.7) will require creating a more complex control, withtwo dropdown menus. In that case, styling the entire control <div> is necessary too—for ex-ample, setting its external border style and the style of text labels for the separate dropdownmenus (Figure 10.8).
• Open example-10-02.html.• Uncheck each of the dropdown menu CSS styling rules in the developer tools, or delete
them from the source code, to see their effect on dropdown menu appearance.
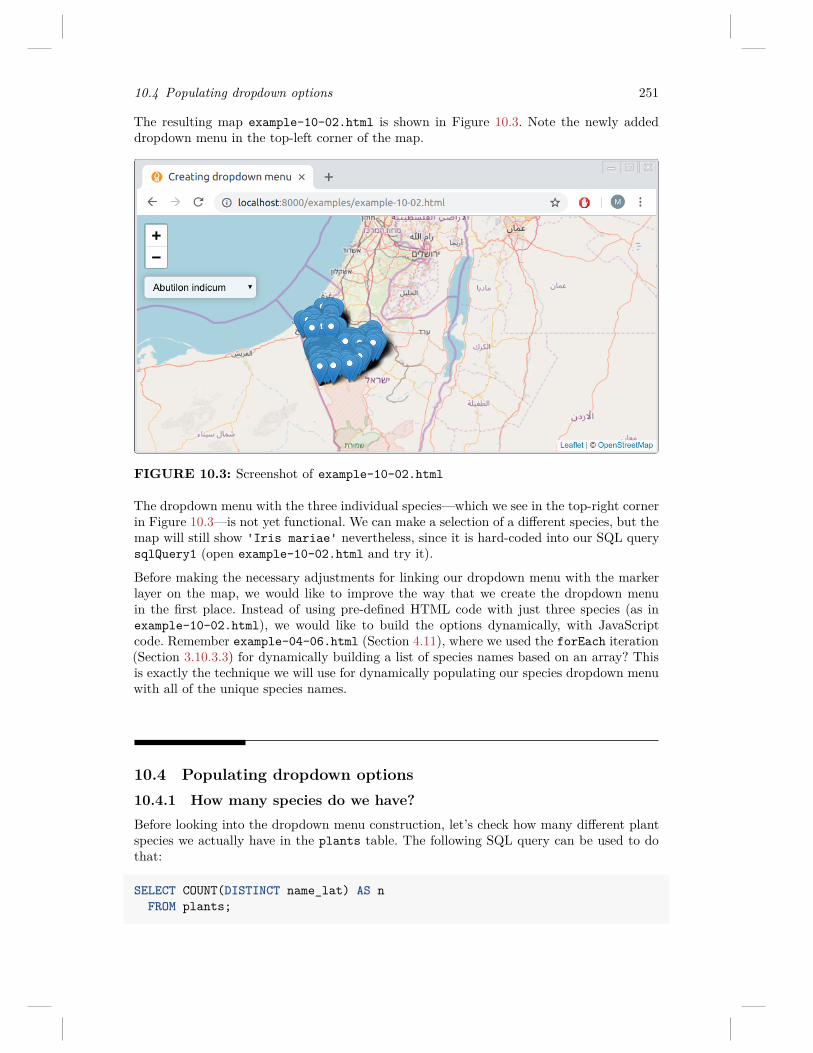
10.4 Populating dropdown options 251
The resulting map example-10-02.html is shown in Figure 10.3. Note the newly addeddropdown menu in the top-left corner of the map.
FIGURE 10.3: Screenshot of example-10-02.html
The dropdown menu with the three individual species—which we see in the top-right cornerin Figure 10.3—is not yet functional. We can make a selection of a different species, but themap will still show 'Iris mariae' nevertheless, since it is hard-coded into our SQL querysqlQuery1 (open example-10-02.html and try it).
Before making the necessary adjustments for linking our dropdown menu with the markerlayer on the map, we would like to improve the way that we create the dropdown menuin the first place. Instead of using pre-defined HTML code with just three species (as inexample-10-02.html), we would like to build the options dynamically, with JavaScriptcode. Remember example-04-06.html (Section 4.11), where we used the forEach iteration(Section 3.10.3.3) for dynamically building a list of species names based on an array? Thisis exactly the technique we will use for dynamically populating our species dropdown menuwith all of the unique species names.
10.4 Populating dropdown options10.4.1 How many species do we have?Before looking into the dropdown menu construction, let’s check how many different plantspecies we actually have in the plants table. The following SQL query can be used to dothat:
SELECT COUNT(DISTINCT name_lat) AS nFROM plants;
252 10 Non-spatial Queries
We are using the COUNT function along with the DISTINCT keyword to get the number ofunique values in the name_lat column, putting the result into a new column named n. Theresult is a small table with one column (n) and one row, as follows:
n-----417(1 row)
We can get this result with the CARTO SQL API too, as follows:
https://michaeldorman.carto.com/api/v2/sql?q=SELECT COUNT(DISTINCT name_lat) AS n FROM plants
Here is the response:
{"rows": [
{"n": 417}],"time": 0.04,"fields": {
"n": {"type": "number"
}},"total_rows": 1
}
Omitting the format parameter implies the default format=JSON, thus our result is a JSONobject (Section 9.7.2). In JSON results coming from the CARTO SQL API, the "rows"property has the actual tabular content. The other properties in the JSON object aremetadata, with information regarding processing time ("time"), the column data types("fields"), and the total number of rows ("total_rows")4.
The "rows" property is structured as an array, with array elements representing table rows.Each element is an object, representing all of the column values for that table row. In thiscase, there is just one row and one column, which is why the array has just one element,and that element is an object with just one property:
[{"n": 417}]
The response tells us that there are 417 species in the plants table, which we would liketo include as dropdown menu options. Manually writing the <option> elements code foreach and every one of the species is obviously not a good idea (Section 4.11). Automatingthe construction of HTML code with 417 <option> element will be more convenient. Whatis more important, however, is the fact that our dynamically generated dropdown menuwill be based on the exact species present in the database, in real-time. In other words,with the dynamic approach we no longer need to worry about updating the HTML code
4Remember that, as mentioned in Section 9.7.2, applying a non-spatial query (such as the unique speciescount) combined with the format=GeoJSON option will result in an error, because in order to produce aGeoJSON response the query must include the geometry column.
10.4 Populating dropdown options 253
in case the database changes, since the HTML code is dynamically constructed based onthe database itself and therefore always up-to-date. Remember that unlike a local file, theCARTO database, just like any other database, may be accessed and modified by differentusers on different platforms (Section 9.1). For example, a database with a list of rare andprotected species may be periodically updated by the GIS department of the Nature andParks authority, adding new observations, removing species that are no longer consideredrare, and so on. If our web page connects to the database to dynamically generate itscontents on page load, we do not need to worry about changing the code to reflect databasemodifications; the up-to-date version will be automatically loaded each time5.
• Removing the DISTINCT keyword from the above query gives the overall number ofvalues in the name_lat column, that is, the total number of records in the table.
• Execute the query through the CARTO SQL API to find out how many individual plantobservations are there in the plants table6 (also see Section 12.6).
10.4.2 Dropdown menu placeholderWe now begin with populating the dropdown options. As a first step, it is convenient tocreate an empty placeholder, like we did in the species list example from Section 4.11. Thatway, the placement of the contents on our page is easier to manage. To create the emptyplaceholder, instead of the HTML code for a <select> element with three pre-defined<option> elements (Section 10.3), we place the following HTML code which creates anempty <select> element, with no internal <option> elements at all:
let dropdown = L.control({position: "topright"});dropdown.onAdd = function() {
let div = L.DomUtil.create("div", "dropdown");div.innerHTML = '<select id="species_sel"></select>';return div;
};dropdown.addTo(map);
Just like in example-10-02.html (Section 10.3), we hereby set an ID "species_sel" forthe <select> element. We already used the ID for styling the dropdown menu with CSS(Section 10.3). Now, in example-10-03.html (Section 10.4.4), we will also use the ID inour <script> to dynamically populate the dropdown <option> elements. To do that, weneed to:
• Get the list of all unique species in the database (Section 10.4.3)• Iterate over the species, adding an <option> element inside the <select> for each one
of them (Section 10.4.4)
5Note that the particular CARTO database used in this example is for demonstration, not directly relatedto the Nature and Parks authority, or any other users, and thus remains unchanged, but the principle stillholds.
6The answer is 23,827.
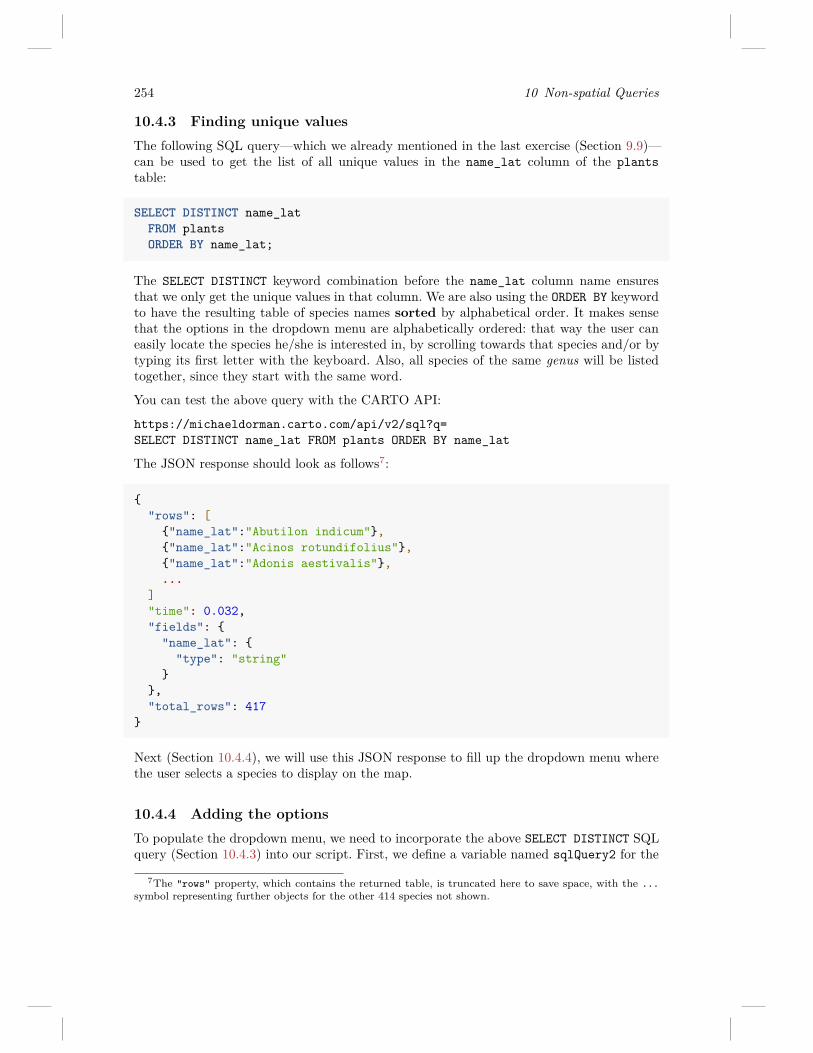
254 10 Non-spatial Queries
10.4.3 Finding unique valuesThe following SQL query—which we already mentioned in the last exercise (Section 9.9)—can be used to get the list of all unique values in the name_lat column of the plantstable:
SELECT DISTINCT name_latFROM plantsORDER BY name_lat;
The SELECT DISTINCT keyword combination before the name_lat column name ensuresthat we only get the unique values in that column. We are also using the ORDER BY keywordto have the resulting table of species names sorted by alphabetical order. It makes sensethat the options in the dropdown menu are alphabetically ordered: that way the user caneasily locate the species he/she is interested in, by scrolling towards that species and/or bytyping its first letter with the keyboard. Also, all species of the same genus will be listedtogether, since they start with the same word.
You can test the above query with the CARTO API:
https://michaeldorman.carto.com/api/v2/sql?q=SELECT DISTINCT name_lat FROM plants ORDER BY name_lat
The JSON response should look as follows7:
{"rows": [
{"name_lat":"Abutilon indicum"},{"name_lat":"Acinos rotundifolius"},{"name_lat":"Adonis aestivalis"},...
]"time": 0.032,"fields": {
"name_lat": {"type": "string"
}},"total_rows": 417
}
Next (Section 10.4.4), we will use this JSON response to fill up the dropdown menu wherethe user selects a species to display on the map.
10.4.4 Adding the optionsTo populate the dropdown menu, we need to incorporate the above SELECT DISTINCT SQLquery (Section 10.4.3) into our script. First, we define a variable named sqlQuery2 for the
7The "rows" property, which contains the returned table, is truncated here to save space, with the ...symbol representing further objects for the other 414 species not shown.
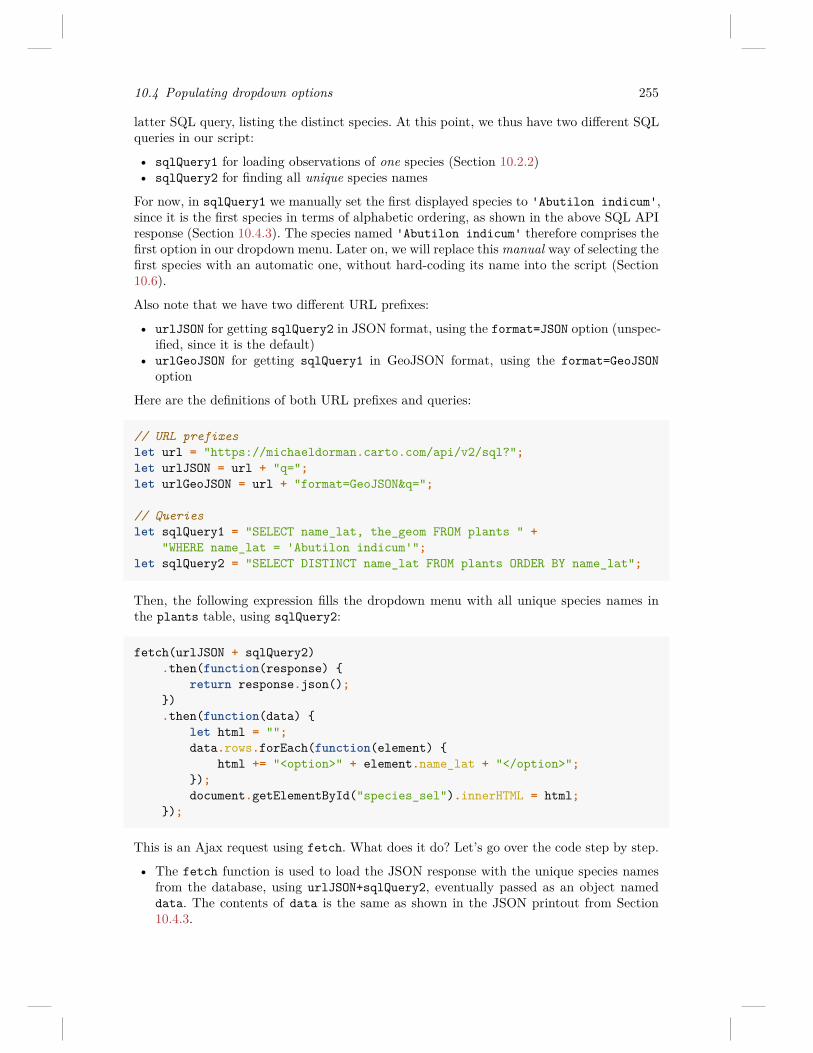
10.4 Populating dropdown options 255
latter SQL query, listing the distinct species. At this point, we thus have two different SQLqueries in our script:
• sqlQuery1 for loading observations of one species (Section 10.2.2)• sqlQuery2 for finding all unique species names
For now, in sqlQuery1 we manually set the first displayed species to 'Abutilon indicum',since it is the first species in terms of alphabetic ordering, as shown in the above SQL APIresponse (Section 10.4.3). The species named 'Abutilon indicum' therefore comprises thefirst option in our dropdown menu. Later on, we will replace this manual way of selecting thefirst species with an automatic one, without hard-coding its name into the script (Section10.6).
Also note that we have two different URL prefixes:
• urlJSON for getting sqlQuery2 in JSON format, using the format=JSON option (unspec-ified, since it is the default)
• urlGeoJSON for getting sqlQuery1 in GeoJSON format, using the format=GeoJSONoption
Here are the definitions of both URL prefixes and queries:
// URL prefixeslet url = "https://michaeldorman.carto.com/api/v2/sql?";let urlJSON = url + "q=";let urlGeoJSON = url + "format=GeoJSON&q=";
// Querieslet sqlQuery1 = "SELECT name_lat, the_geom FROM plants " +
"WHERE name_lat = 'Abutilon indicum'";let sqlQuery2 = "SELECT DISTINCT name_lat FROM plants ORDER BY name_lat";
Then, the following expression fills the dropdown menu with all unique species names inthe plants table, using sqlQuery2:
fetch(urlJSON + sqlQuery2).then(function(response) {
return response.json();}).then(function(data) {
let html = "";data.rows.forEach(function(element) {
html += "<option>" + element.name_lat + "</option>";});document.getElementById("species_sel").innerHTML = html;
});
This is an Ajax request using fetch. What does it do? Let’s go over the code step by step.
• The fetch function is used to load the JSON response with the unique species namesfrom the database, using urlJSON+sqlQuery2, eventually passed as an object nameddata. The contents of data is the same as shown in the JSON printout from Section10.4.3.
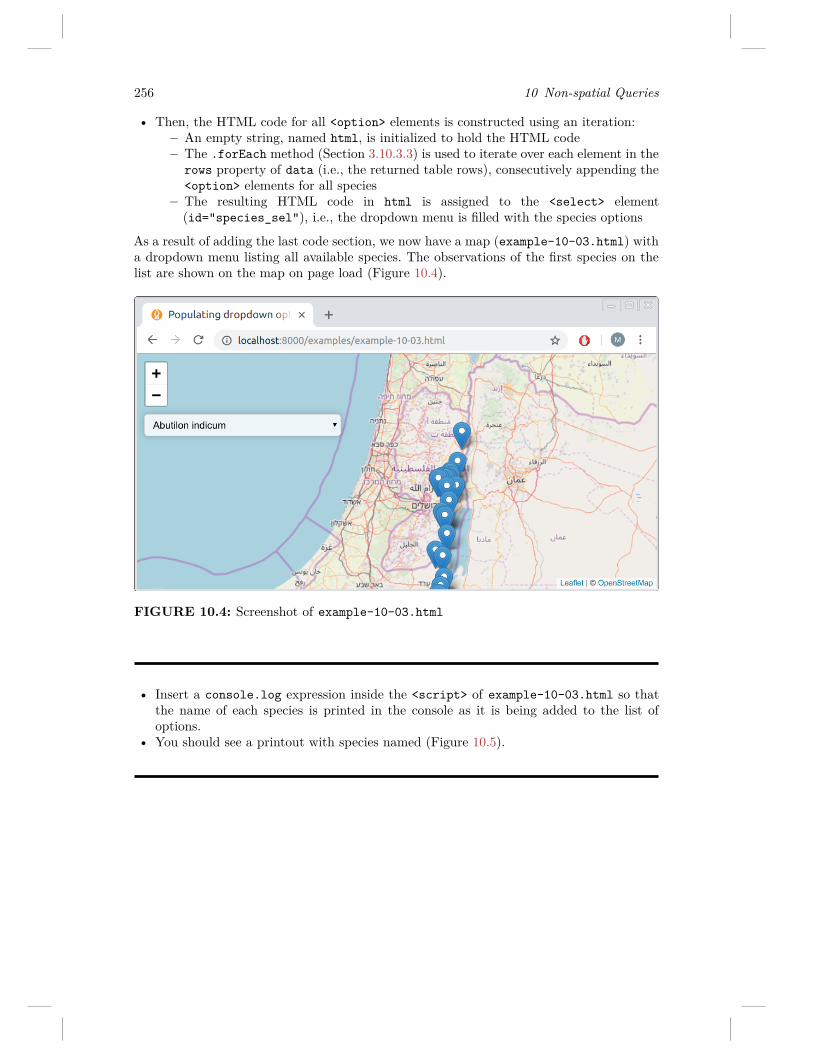
256 10 Non-spatial Queries
• Then, the HTML code for all <option> elements is constructed using an iteration:– An empty string, named html, is initialized to hold the HTML code– The .forEach method (Section 3.10.3.3) is used to iterate over each element in the
rows property of data (i.e., the returned table rows), consecutively appending the<option> elements for all species
– The resulting HTML code in html is assigned to the <select> element(id="species_sel"), i.e., the dropdown menu is filled with the species options
As a result of adding the last code section, we now have a map (example-10-03.html) witha dropdown menu listing all available species. The observations of the first species on thelist are shown on the map on page load (Figure 10.4).
FIGURE 10.4: Screenshot of example-10-03.html
• Insert a console.log expression inside the <script> of example-10-03.html so thatthe name of each species is printed in the console as it is being added to the list ofoptions.
• You should see a printout with species named (Figure 10.5).
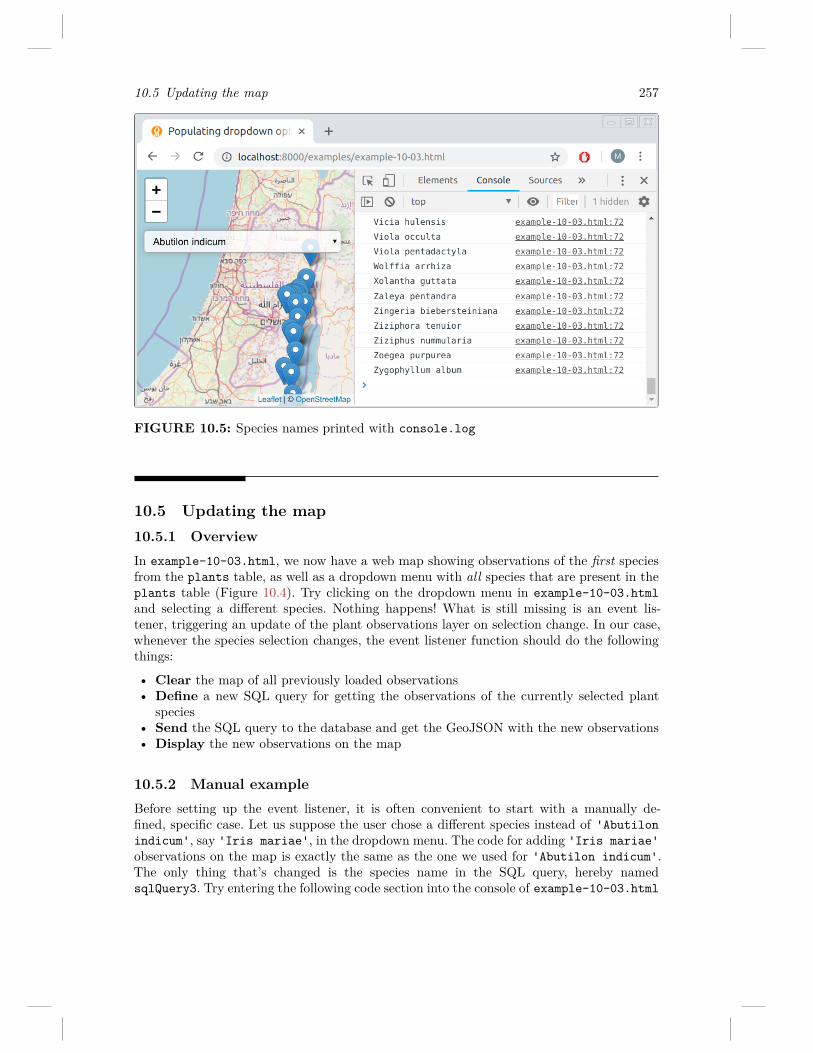
10.5 Updating the map 257
FIGURE 10.5: Species names printed with console.log
10.5 Updating the map10.5.1 OverviewIn example-10-03.html, we now have a web map showing observations of the first speciesfrom the plants table, as well as a dropdown menu with all species that are present in theplants table (Figure 10.4). Try clicking on the dropdown menu in example-10-03.htmland selecting a different species. Nothing happens! What is still missing is an event lis-tener, triggering an update of the plant observations layer on selection change. In our case,whenever the species selection changes, the event listener function should do the followingthings:
• Clear the map of all previously loaded observations• Define a new SQL query for getting the observations of the currently selected plant
species• Send the SQL query to the database and get the GeoJSON with the new observations• Display the new observations on the map
10.5.2 Manual exampleBefore setting up the event listener, it is often convenient to start with a manually de-fined, specific case. Let us suppose the user chose a different species instead of 'Abutilonindicum', say 'Iris mariae', in the dropdown menu. The code for adding 'Iris mariae'observations on the map is exactly the same as the one we used for 'Abutilon indicum'.The only thing that’s changed is the species name in the SQL query, hereby namedsqlQuery3. Try entering the following code section into the console of example-10-03.html
258 10 Non-spatial Queries
(Figure 10.4). This should load new observations, for 'Iris mariae', on top of the existingones for 'Abutilon indicum':
let valueSelected = "Iris mariae";let sqlQuery3 = "SELECT name_lat, the_geom FROM plants " +
"WHERE name_lat = '" + valueSelected + "'";fetch(urlGeoJSON + sqlQuery3)
.then(function(response) {return response.json();
}).then(function(data) {
L.geoJSON(data).addTo(map);});
• Change the value of valueSelected in the above code section to a different speciesname, such as "Iris atropurpurea", then execute the modified code section in theconsole of example-10-03.html.
• You should see observations of the species you chose added on the map.
10.5.3 Automatic updatingIn the last code section, we manually added new observations of another species from thedatabase. What we now need is to associate this code section with dropdown menu changes.In other words, we want the selection of a new species in the menu to trigger the automaticremoval of the old observations and loading the new ones. This is where the event listenercomes into play.
The first thing we do is define a layerGroup named plantsLayer and add it on the map:
let plantsLayer = L.layerGroup().addTo(map);
The named layer group can be referenced later on, to clear it or add layers into it. This willmake it easier for us to clear any previously loaded species and add markers for the currentlyselected one. Recall the GeoJSON viewer in example-07-02.html (Section 7.6), where weused a layer group for clearing old GeoJSON layers whenever a new one is submitted fromthe text area input.
Accordingly, we replace the .addTo(map) part with .addTo(plantsLayer) when loadingthe initial species on the map. So, the following expression from example-10-03.html:
fetch(urlGeoJSON + sqlQuery1).then(function(response) {
return response.json();}).then(function(data) {
10.5 Updating the map 259
L.geoJSON(data).addTo(map);});
is replaced with this one in example-10-04.html:
fetch(urlGeoJSON + sqlQuery1).then(function(response) {
return response.json();}).then(function(data) {
L.geoJSON(data).addTo(plantsLayer);});
The second thing we do is “wrap” the manual example from the previous section, which weused to load "Iris mariae" observations, so that:
• The code for loading observations on the map is contained inside an event listenerfunction, responding to changes in the dropdown menu (id="species_sel"). The ap-propriate event type in this case is "change" (Section 4.4), which means that any changein the input element triggers the event listener.
• The species to load from the database is determined based on the currently selected valuein the dropdown menu, using document.getElementById("species_sel").value,rather than hard coded as "Iris mariae".
• The old observations are cleared before adding new ones, using .clearLayers().
The following code section does all of those things:
document.getElementById("species_sel").addEventListener("change", function() {
let valueSelected = document.getElementById("species_sel").value;let sqlQuery3 =
"SELECT name_lat, the_geom FROM plants WHERE name_lat = '" +valueSelected + "'";
fetch(urlGeoJSON + sqlQuery3).then(function(response) {
return response.json();}).then(function(data) {
plantsLayer.clearLayers();L.geoJSON(data).addTo(plantsLayer);
});});
Let’s go over the code, step by step. In the outermost part of the expression, an eventlistener is being binded to a DOM selection:
document.getElementById("species_sel")
260 10 Non-spatial Queries
.addEventListener("change", function() {...
});
More specifically, an anonymous function is being set to execute every time the input element"#species_sel" changes. Let’s now review the body of that anonymous function. Firstthing, the function defines a local variable named valueSelected:
let valueSelected = document.getElementById("species_sel").value;
The value of valueSelected is the name of the currently selected species in the dropdownmenu. The current value is obtained through the .value property (Section 4.8). This isconceptually similar to the calculator example example-04-07.html (Figure 4.8), wherewe used the .value property to get the currently entered numbers, for displaying theirmultiplication product (Section 4.12).
Then, valueSelected is being used to construct a new SQL query string sqlQuery3. Thisquery will be used to request the observations of the newly selected species from thedatabase:
let sqlQuery3 = "SELECT name_lat, the_geom FROM plants " +"WHERE name_lat = '" + valueSelected + "'";
Finally, the new GeoJSON content is being requested with urlGeoJSON+sqlQuery3 usingthe fetch. Once the request finishes, the returned GeoJSON object is added on the mapusing L.geoJSON and .addTo(plantsLayer), but not before the old observations are clearedwith plantsLayer.clearLayers():
fetch(urlGeoJSON + sqlQuery3).then(function(response) {
return response.json();}).then(function(data) {
plantsLayer.clearLayers();L.geoJSON(data).addTo(plantsLayer);
});
The resulting map (example-10-04.html) is shown in Figure 10.6. Thanks to the eventlistener, the dropdown menu is now functional, and the map is responsive to the currentspecies selection.
10.6 Refactoring the codeGoing over the complete code of example-10-04.html (Section 10.5.3), you may notice oneimportant drawback: there are two code sections doing practically the same thing. Namely,
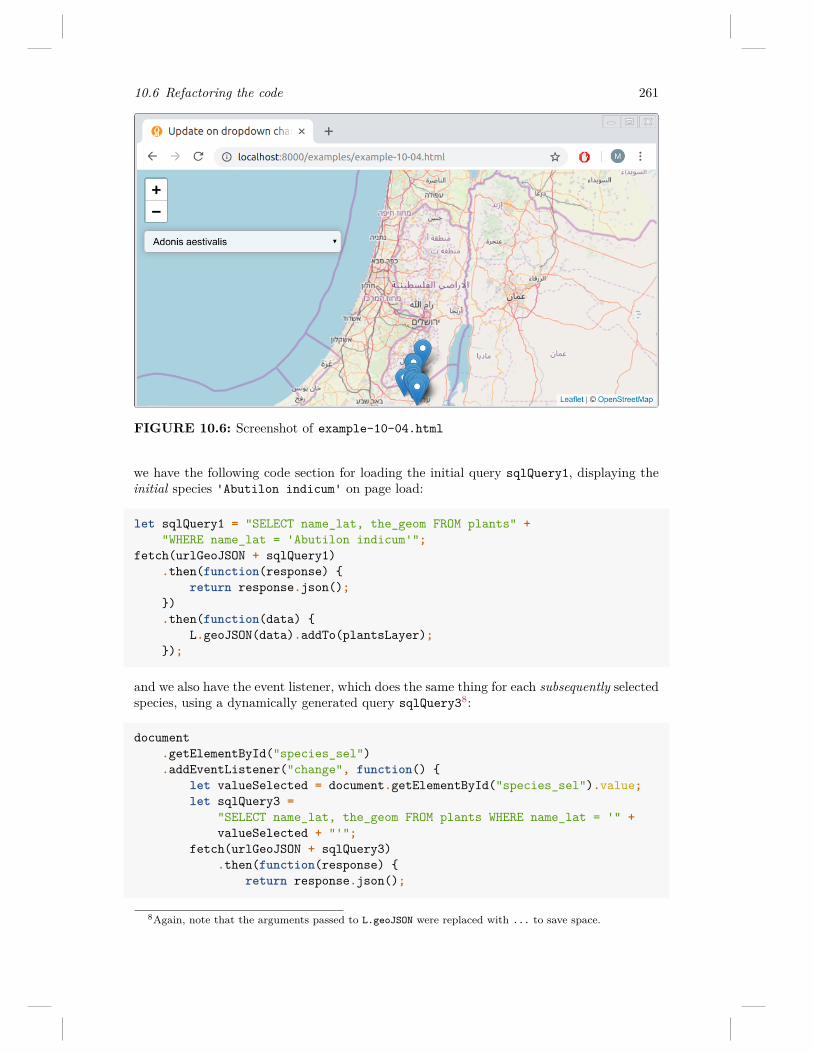
10.6 Refactoring the code 261
FIGURE 10.6: Screenshot of example-10-04.html
we have the following code section for loading the initial query sqlQuery1, displaying theinitial species 'Abutilon indicum' on page load:
let sqlQuery1 = "SELECT name_lat, the_geom FROM plants" +"WHERE name_lat = 'Abutilon indicum'";
fetch(urlGeoJSON + sqlQuery1).then(function(response) {
return response.json();}).then(function(data) {
L.geoJSON(data).addTo(plantsLayer);});
and we also have the event listener, which does the same thing for each subsequently selectedspecies, using a dynamically generated query sqlQuery38:
document.getElementById("species_sel").addEventListener("change", function() {
let valueSelected = document.getElementById("species_sel").value;let sqlQuery3 =
"SELECT name_lat, the_geom FROM plants WHERE name_lat = '" +valueSelected + "'";
fetch(urlGeoJSON + sqlQuery3).then(function(response) {
return response.json();
8Again, note that the arguments passed to L.geoJSON were replaced with ... to save space.
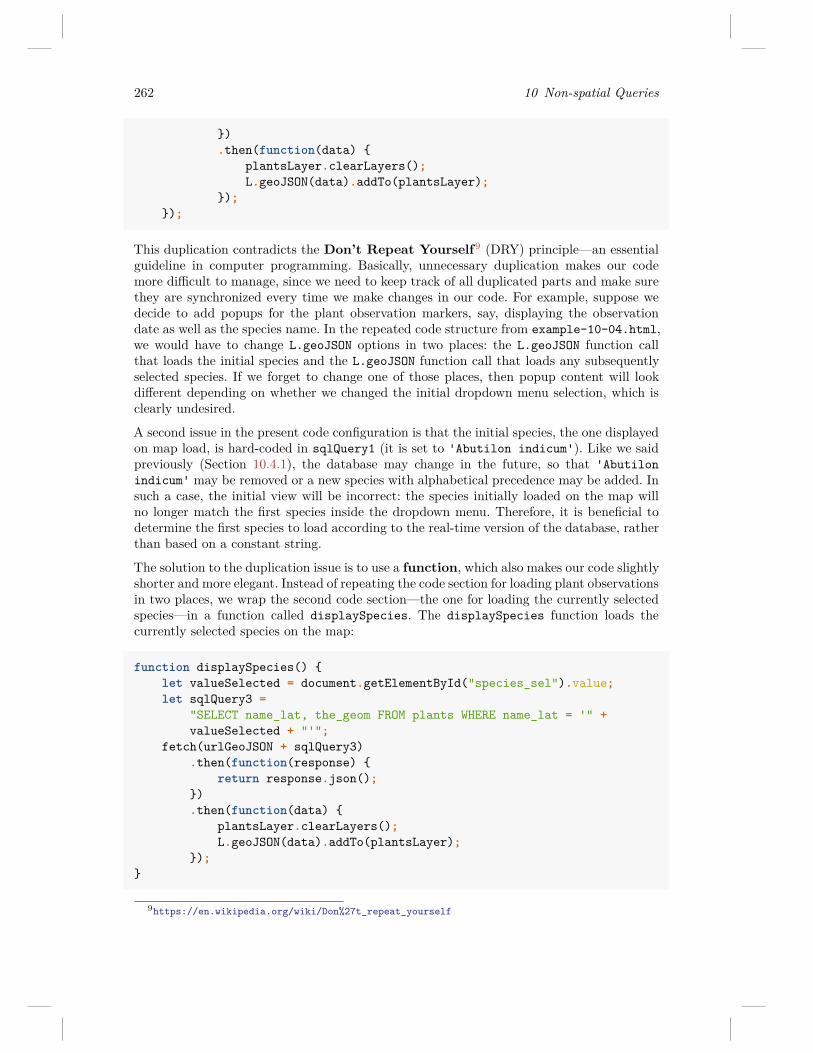
262 10 Non-spatial Queries
}).then(function(data) {
plantsLayer.clearLayers();L.geoJSON(data).addTo(plantsLayer);
});});
This duplication contradicts the Don’t Repeat Yourself9 (DRY) principle—an essentialguideline in computer programming. Basically, unnecessary duplication makes our codemore difficult to manage, since we need to keep track of all duplicated parts and make surethey are synchronized every time we make changes in our code. For example, suppose wedecide to add popups for the plant observation markers, say, displaying the observationdate as well as the species name. In the repeated code structure from example-10-04.html,we would have to change L.geoJSON options in two places: the L.geoJSON function callthat loads the initial species and the L.geoJSON function call that loads any subsequentlyselected species. If we forget to change one of those places, then popup content will lookdifferent depending on whether we changed the initial dropdown menu selection, which isclearly undesired.
A second issue in the present code configuration is that the initial species, the one displayedon map load, is hard-coded in sqlQuery1 (it is set to 'Abutilon indicum'). Like we saidpreviously (Section 10.4.1), the database may change in the future, so that 'Abutilonindicum' may be removed or a new species with alphabetical precedence may be added. Insuch a case, the initial view will be incorrect: the species initially loaded on the map willno longer match the first species inside the dropdown menu. Therefore, it is beneficial todetermine the first species to load according to the real-time version of the database, ratherthan based on a constant string.
The solution to the duplication issue is to use a function, which also makes our code slightlyshorter and more elegant. Instead of repeating the code section for loading plant observationsin two places, we wrap the second code section—the one for loading the currently selectedspecies—in a function called displaySpecies. The displaySpecies function loads thecurrently selected species on the map:
function displaySpecies() {let valueSelected = document.getElementById("species_sel").value;let sqlQuery3 =
"SELECT name_lat, the_geom FROM plants WHERE name_lat = '" +valueSelected + "'";
fetch(urlGeoJSON + sqlQuery3).then(function(response) {
return response.json();}).then(function(data) {
plantsLayer.clearLayers();L.geoJSON(data).addTo(plantsLayer);
});}
9https://en.wikipedia.org/wiki/Don%27t_repeat_yourself
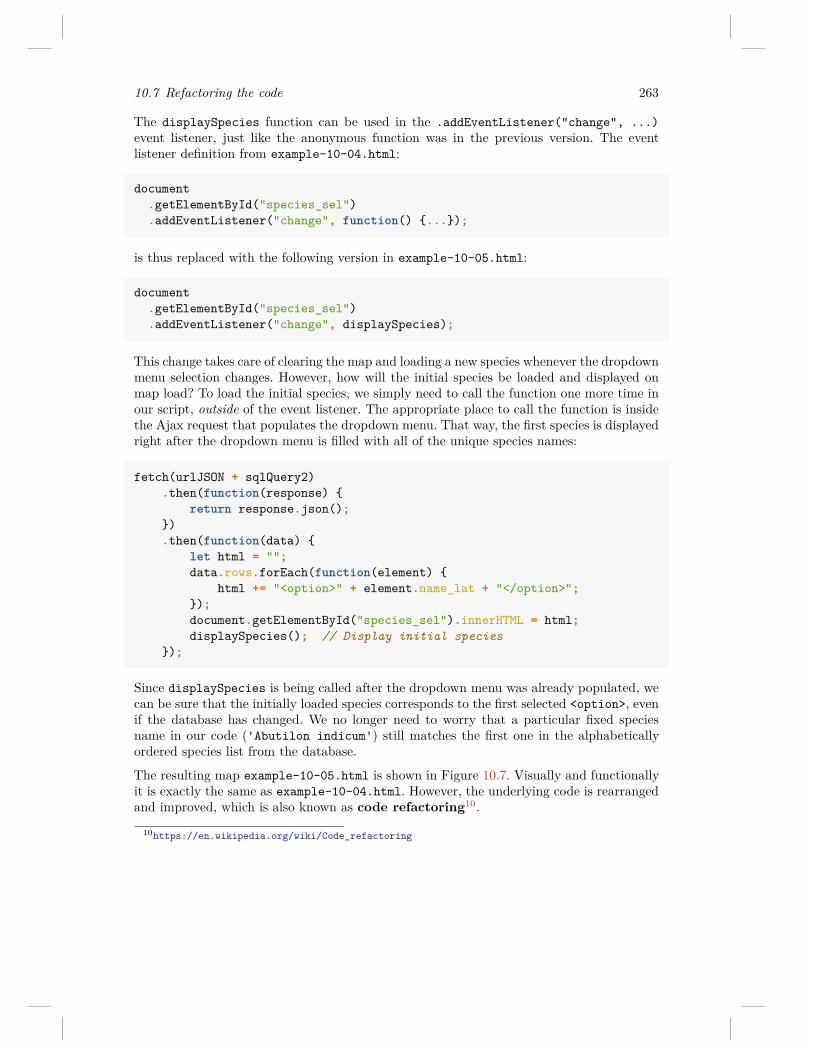
10.7 Refactoring the code 263
The displaySpecies function can be used in the .addEventListener("change", ...)event listener, just like the anonymous function was in the previous version. The eventlistener definition from example-10-04.html:
document.getElementById("species_sel").addEventListener("change", function() {...});
is thus replaced with the following version in example-10-05.html:
document.getElementById("species_sel").addEventListener("change", displaySpecies);
This change takes care of clearing the map and loading a new species whenever the dropdownmenu selection changes. However, how will the initial species be loaded and displayed onmap load? To load the initial species, we simply need to call the function one more time inour script, outside of the event listener. The appropriate place to call the function is insidethe Ajax request that populates the dropdown menu. That way, the first species is displayedright after the dropdown menu is filled with all of the unique species names:
fetch(urlJSON + sqlQuery2).then(function(response) {
return response.json();}).then(function(data) {
let html = "";data.rows.forEach(function(element) {
html += "<option>" + element.name_lat + "</option>";});document.getElementById("species_sel").innerHTML = html;displaySpecies(); // Display initial species
});
Since displaySpecies is being called after the dropdown menu was already populated, wecan be sure that the initially loaded species corresponds to the first selected <option>, evenif the database has changed. We no longer need to worry that a particular fixed speciesname in our code ('Abutilon indicum') still matches the first one in the alphabeticallyordered species list from the database.
The resulting map example-10-05.html is shown in Figure 10.7. Visually and functionallyit is exactly the same as example-10-04.html. However, the underlying code is rearrangedand improved, which is also known as code refactoring10.
10https://en.wikipedia.org/wiki/Code_refactoring
264 10 Non-spatial Queries
FIGURE 10.7: Screenshot of example-10-05.html
10.7 Exercise
• Extend example-10-05.html into a web map with two dropdown menus—one for choos-ing the genus and another one for choosing the species (Figure 10.8).
• When the user selects a genus, the second dropdown should automatically update tolist the species in that genus. The user then selects a species to show it on the map. Ifthe user made no selection yet, the first species in each genus should be automaticallydisplayed on the map.
• This is a challenging exercise, so here is a hint on how to start. Run the code sectionshown below in the console of example-10-05.html. This code constructs an objectnamed species, whose properties are genus names and values are arrays with all speciesin that genus. Use the species object to populate the dropdown menus.
let url = "https://michaeldorman.carto.com/api/v2/sql?";let urlJSON = url + "q=";let sqlQuery = "SELECT DISTINCT name_lat FROM plants ORDER BY name_lat";let species = {};fetch(urlJSON + sqlQuery)
.then(function(response) {return response.json();
10.7 Exercise 265
}).then(function(data) {
data.rows.forEach(function(element) {let tmp = element.name_lat;let tmp_split = tmp.split(" ");if(species[tmp_split[0]] === undefined) {
species[tmp_split[0]] = [tmp];} else {
species[tmp_split[0]].push(tmp);}
});});
FIGURE 10.8: Screenshot of solution-10.html

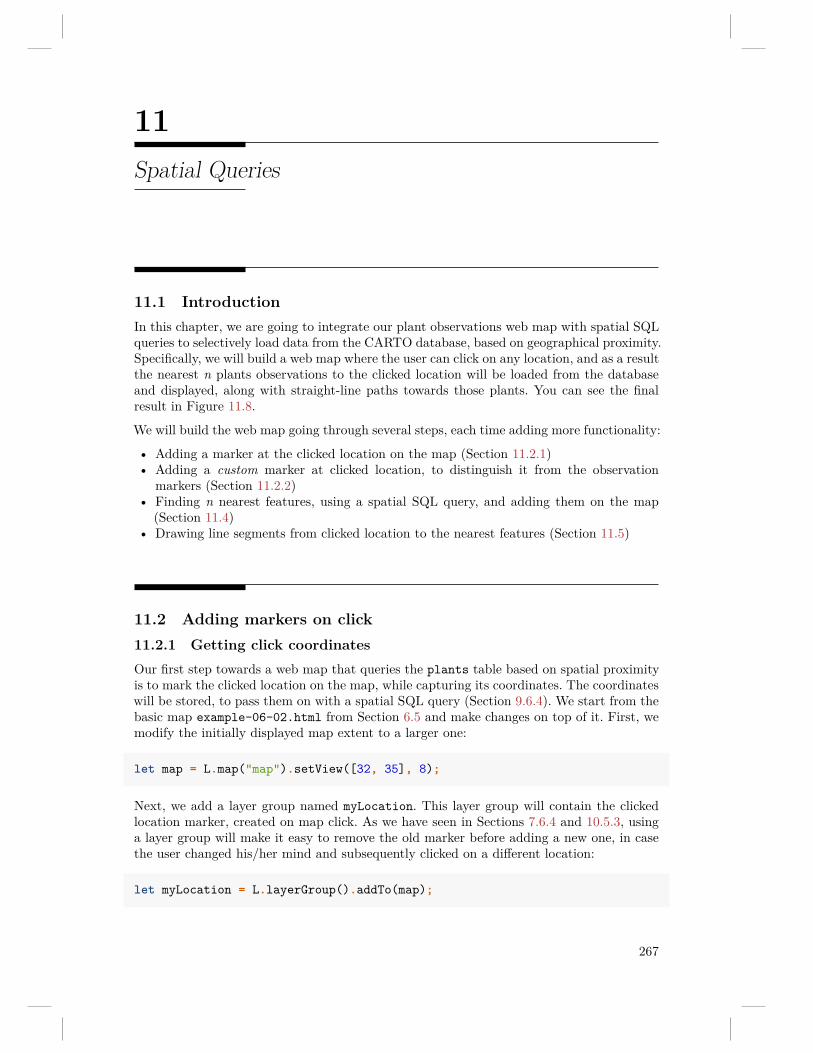
11Spatial Queries
11.1 IntroductionIn this chapter, we are going to integrate our plant observations web map with spatial SQLqueries to selectively load data from the CARTO database, based on geographical proximity.Specifically, we will build a web map where the user can click on any location, and as a resultthe nearest n plants observations to the clicked location will be loaded from the databaseand displayed, along with straight-line paths towards those plants. You can see the finalresult in Figure 11.8.
We will build the web map going through several steps, each time adding more functionality:
• Adding a marker at the clicked location on the map (Section 11.2.1)• Adding a custom marker at clicked location, to distinguish it from the observation
markers (Section 11.2.2)• Finding n nearest features, using a spatial SQL query, and adding them on the map
(Section 11.4)• Drawing line segments from clicked location to the nearest features (Section 11.5)
11.2 Adding markers on click11.2.1 Getting click coordinatesOur first step towards a web map that queries the plants table based on spatial proximityis to mark the clicked location on the map, while capturing its coordinates. The coordinateswill be stored, to pass them on with a spatial SQL query (Section 9.6.4). We start from thebasic map example-06-02.html from Section 6.5 and make changes on top of it. First, wemodify the initially displayed map extent to a larger one:
let map = L.map("map").setView([32, 35], 8);
Next, we add a layer group named myLocation. This layer group will contain the clickedlocation marker, created on map click. As we have seen in Sections 7.6.4 and 10.5.3, usinga layer group will make it easy to remove the old marker before adding a new one, in casethe user changed his/her mind and subsequently clicked on a different location:
let myLocation = L.layerGroup().addTo(map);
267
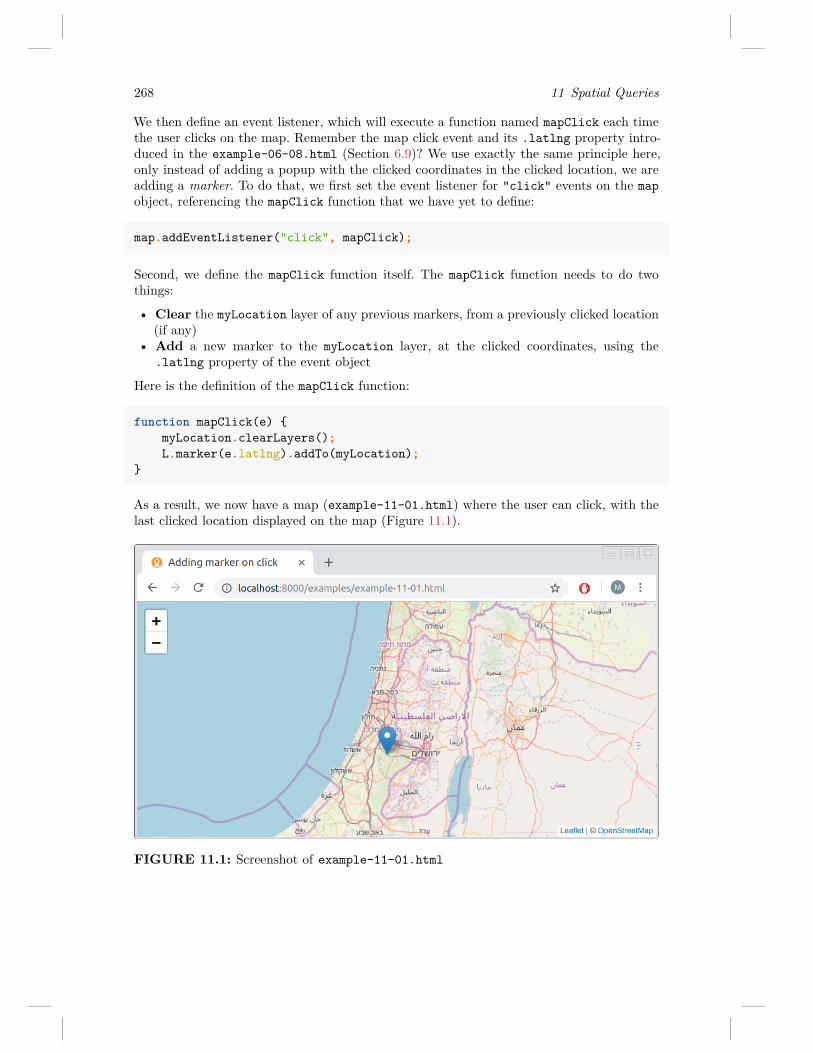
268 11 Spatial Queries
We then define an event listener, which will execute a function named mapClick each timethe user clicks on the map. Remember the map click event and its .latlng property intro-duced in the example-06-08.html (Section 6.9)? We use exactly the same principle here,only instead of adding a popup with the clicked coordinates in the clicked location, we areadding a marker. To do that, we first set the event listener for "click" events on the mapobject, referencing the mapClick function that we have yet to define:
map.addEventListener("click", mapClick);
Second, we define the mapClick function itself. The mapClick function needs to do twothings:
• Clear the myLocation layer of any previous markers, from a previously clicked location(if any)
• Add a new marker to the myLocation layer, at the clicked coordinates, using the.latlng property of the event object
Here is the definition of the mapClick function:
function mapClick(e) {myLocation.clearLayers();L.marker(e.latlng).addTo(myLocation);
}
As a result, we now have a map (example-11-01.html) where the user can click, with thelast clicked location displayed on the map (Figure 11.1).
FIGURE 11.1: Screenshot of example-11-01.html
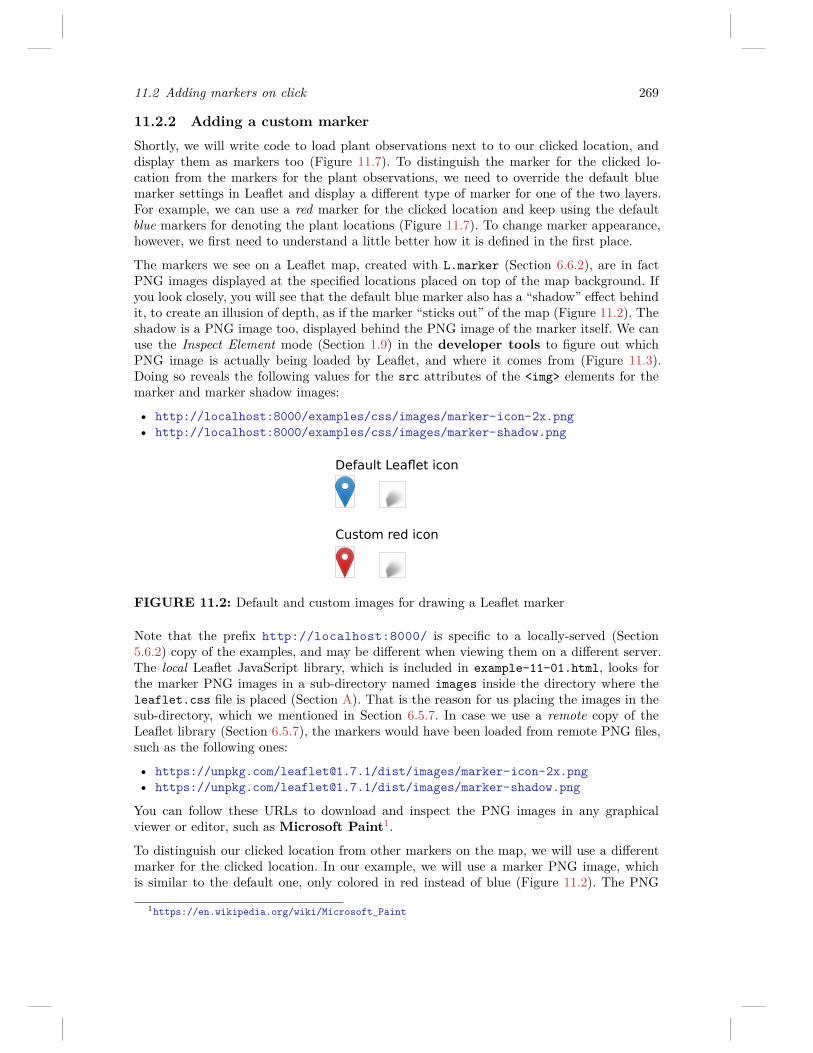
11.2 Adding markers on click 269
11.2.2 Adding a custom markerShortly, we will write code to load plant observations next to to our clicked location, anddisplay them as markers too (Figure 11.7). To distinguish the marker for the clicked lo-cation from the markers for the plant observations, we need to override the default bluemarker settings in Leaflet and display a different type of marker for one of the two layers.For example, we can use a red marker for the clicked location and keep using the defaultblue markers for denoting the plant locations (Figure 11.7). To change marker appearance,however, we first need to understand a little better how it is defined in the first place.
The markers we see on a Leaflet map, created with L.marker (Section 6.6.2), are in factPNG images displayed at the specified locations placed on top of the map background. Ifyou look closely, you will see that the default blue marker also has a “shadow” effect behindit, to create an illusion of depth, as if the marker “sticks out” of the map (Figure 11.2). Theshadow is a PNG image too, displayed behind the PNG image of the marker itself. We canuse the Inspect Element mode (Section 1.9) in the developer tools to figure out whichPNG image is actually being loaded by Leaflet, and where it comes from (Figure 11.3).Doing so reveals the following values for the src attributes of the <img> elements for themarker and marker shadow images:
• http://localhost:8000/examples/css/images/marker-icon-2x.png• http://localhost:8000/examples/css/images/marker-shadow.png
Default Leaflet icon
Custom red icon
FIGURE 11.2: Default and custom images for drawing a Leaflet marker
Note that the prefix http://localhost:8000/ is specific to a locally-served (Section5.6.2) copy of the examples, and may be different when viewing them on a different server.The local Leaflet JavaScript library, which is included in example-11-01.html, looks forthe marker PNG images in a sub-directory named images inside the directory where theleaflet.css file is placed (Section A). That is the reason for us placing the images in thesub-directory, which we mentioned in Section 6.5.7. In case we use a remote copy of theLeaflet library (Section 6.5.7), the markers would have been loaded from remote PNG files,such as the following ones:
• https://unpkg.com/[email protected]/dist/images/marker-icon-2x.png• https://unpkg.com/[email protected]/dist/images/marker-shadow.png
You can follow these URLs to download and inspect the PNG images in any graphicalviewer or editor, such as Microsoft Paint1.
To distinguish our clicked location from other markers on the map, we will use a differentmarker for the clicked location. In our example, we will use a marker PNG image, whichis similar to the default one, only colored in red instead of blue (Figure 11.2). The PNG
1https://en.wikipedia.org/wiki/Microsoft_Paint
270 11 Spatial Queries
FIGURE 11.3: Inspecting Leaflet icon <img> element
images for the red icon and its shadow are also included in the online book materials, inthe images sub-directory (Appendix A):
• images/redIcon.png• images/marker-shadow.png
To set a custom Leaflet marker, based on the PNG images redIcon.png andmarker-shadow.png, you need to place these files on your server. For example, the filescan be placed in a folder named images within the root directory of the web page (seeSection 5.5.2), as given in the online materials. A custom marker using these PNG images,assuming they are in the images folder, is then defined with the L.icon function as follows:
let redIcon = L.icon({iconUrl: "images/redIcon.png",shadowUrl: "images/marker-shadow.png",iconAnchor: [13, 41]
});
The L.icon function requires a path to the PNG images for the icon (iconUrl), and,optionally, a path to the PNG image for the shadow (shadowUrl). The other importantparameter is iconAnchor, which sets the anchor point, i.e., the exact icon image pixelwhich corresponds to the point coordinates where the marker is initiated. The custom iconobject is assigned to a variable, hereby named redIcon, which we can later use to drawcustom markers on the map with L.marker.
What is the meaning of iconAnchor, and why did we use the value of [13, 41]? TheiconAnchor parameter specifies which pixel of the marker PNG image will be placed onthe [lon, lat] point where the marker is initialized. To determine the right anchor pointcoordinates, we need to figure out the size (in pixels) of our particular marker, and the imageregion where we would like the anchor to be placed. The image size can be determined by
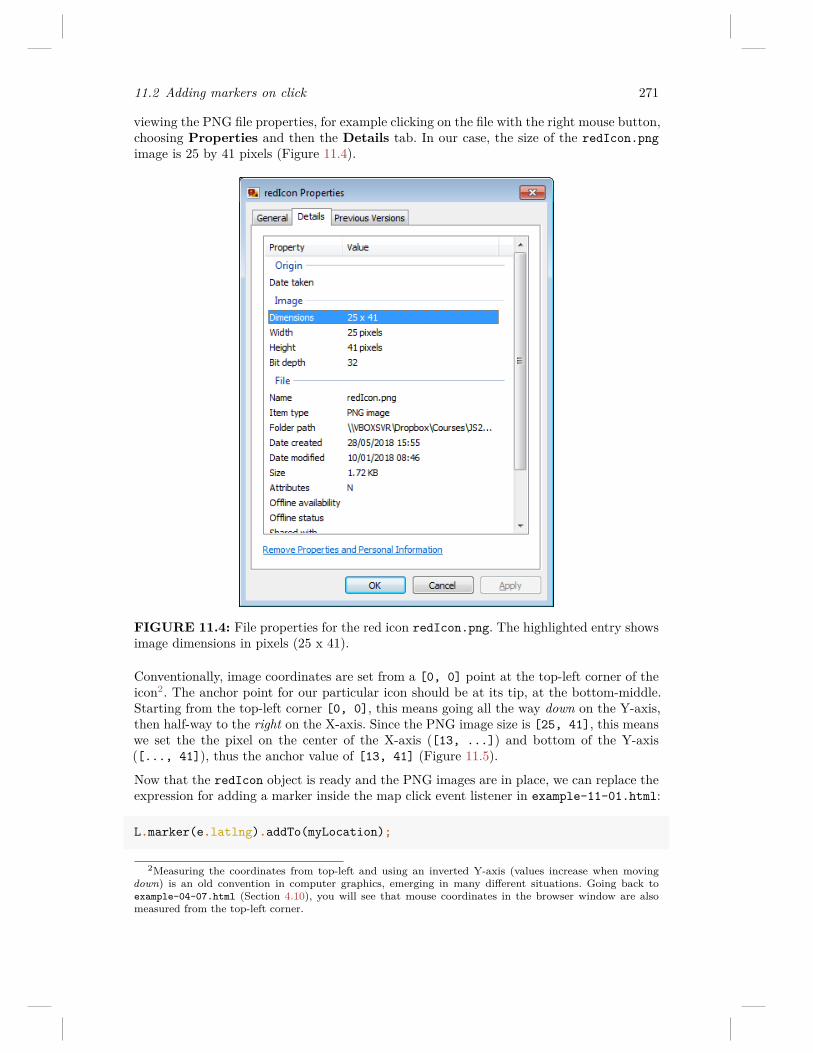
11.2 Adding markers on click 271
viewing the PNG file properties, for example clicking on the file with the right mouse button,choosing Properties and then the Details tab. In our case, the size of the redIcon.pngimage is 25 by 41 pixels (Figure 11.4).
FIGURE 11.4: File properties for the red icon redIcon.png. The highlighted entry showsimage dimensions in pixels (25 x 41).
Conventionally, image coordinates are set from a [0, 0] point at the top-left corner of theicon2. The anchor point for our particular icon should be at its tip, at the bottom-middle.Starting from the top-left corner [0, 0], this means going all the way down on the Y-axis,then half-way to the right on the X-axis. Since the PNG image size is [25, 41], this meanswe set the the pixel on the center of the X-axis ([13, ...]) and bottom of the Y-axis([..., 41]), thus the anchor value of [13, 41] (Figure 11.5).
Now that the redIcon object is ready and the PNG images are in place, we can replace theexpression for adding a marker inside the map click event listener in example-11-01.html:
L.marker(e.latlng).addTo(myLocation);
2Measuring the coordinates from top-left and using an inverted Y-axis (values increase when movingdown) is an old convention in computer graphics, emerging in many different situations. Going back toexample-04-07.html (Section 4.10), you will see that mouse coordinates in the browser window are alsomeasured from the top-left corner.
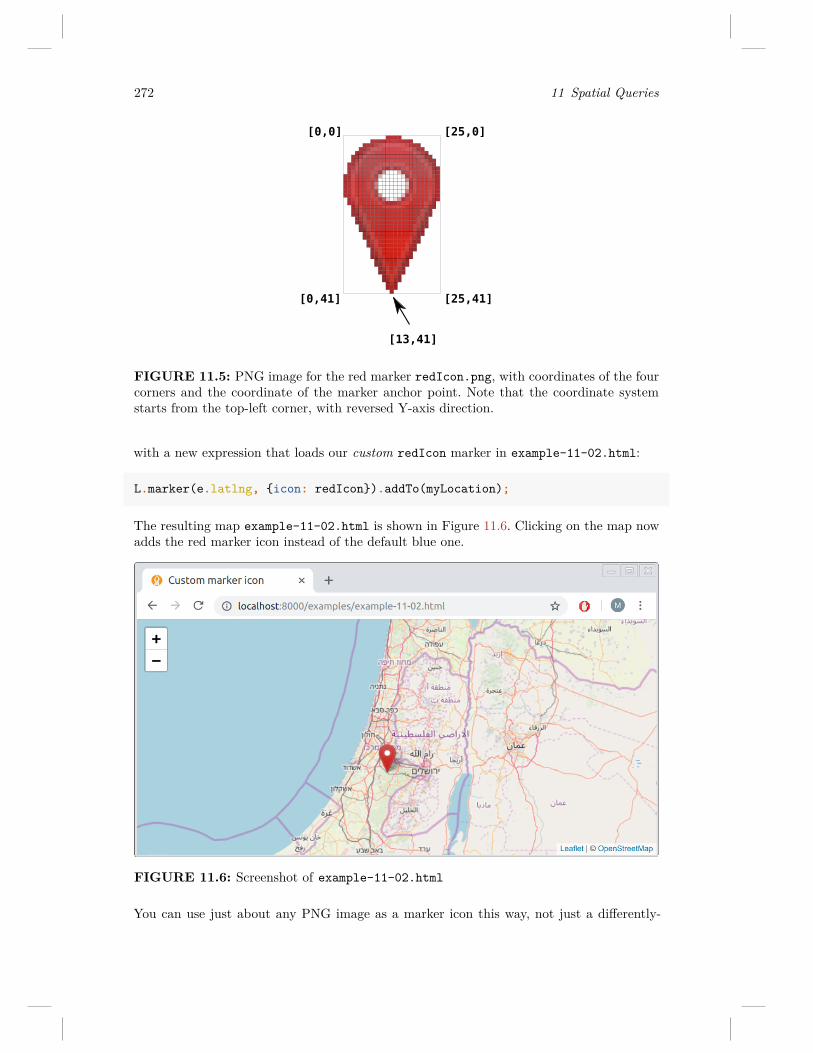
272 11 Spatial Queries
[0,0]
[0,41]
[25,0]
[25,41]
[13,41]
FIGURE 11.5: PNG image for the red marker redIcon.png, with coordinates of the fourcorners and the coordinate of the marker anchor point. Note that the coordinate systemstarts from the top-left corner, with reversed Y-axis direction.
with a new expression that loads our custom redIcon marker in example-11-02.html:
L.marker(e.latlng, {icon: redIcon}).addTo(myLocation);
The resulting map example-11-02.html is shown in Figure 11.6. Clicking on the map nowadds the red marker icon instead of the default blue one.
FIGURE 11.6: Screenshot of example-11-02.html
You can use just about any PNG image as a marker icon this way, not just a differently-
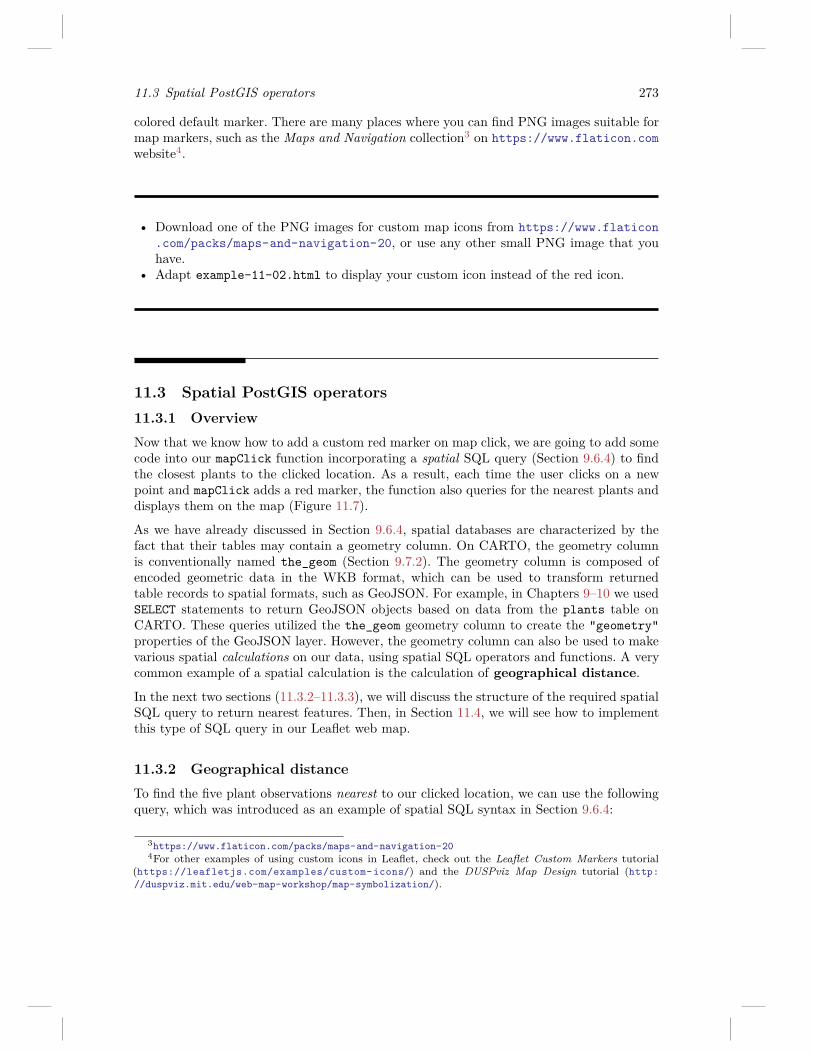
11.3 Spatial PostGIS operators 273
colored default marker. There are many places where you can find PNG images suitable formap markers, such as the Maps and Navigation collection3 on https://www.flaticon.comwebsite4.
• Download one of the PNG images for custom map icons from https://www.flaticon.com/packs/maps-and-navigation-20, or use any other small PNG image that youhave.
• Adapt example-11-02.html to display your custom icon instead of the red icon.
11.3 Spatial PostGIS operators11.3.1 OverviewNow that we know how to add a custom red marker on map click, we are going to add somecode into our mapClick function incorporating a spatial SQL query (Section 9.6.4) to findthe closest plants to the clicked location. As a result, each time the user clicks on a newpoint and mapClick adds a red marker, the function also queries for the nearest plants anddisplays them on the map (Figure 11.7).
As we have already discussed in Section 9.6.4, spatial databases are characterized by thefact that their tables may contain a geometry column. On CARTO, the geometry columnis conventionally named the_geom (Section 9.7.2). The geometry column is composed ofencoded geometric data in the WKB format, which can be used to transform returnedtable records to spatial formats, such as GeoJSON. For example, in Chapters 9–10 we usedSELECT statements to return GeoJSON objects based on data from the plants table onCARTO. These queries utilized the the_geom geometry column to create the "geometry"properties of the GeoJSON layer. However, the geometry column can also be used to makevarious spatial calculations on our data, using spatial SQL operators and functions. A verycommon example of a spatial calculation is the calculation of geographical distance.
In the next two sections (11.3.2–11.3.3), we will discuss the structure of the required spatialSQL query to return nearest features. Then, in Section 11.4, we will see how to implementthis type of SQL query in our Leaflet web map.
11.3.2 Geographical distanceTo find the five plant observations nearest to our clicked location, we can use the followingquery, which was introduced as an example of spatial SQL syntax in Section 9.6.4:
3https://www.flaticon.com/packs/maps-and-navigation-204For other examples of using custom icons in Leaflet, check out the Leaflet Custom Markers tutorial
(https://leafletjs.com/examples/custom-icons/) and the DUSPviz Map Design tutorial (http://duspviz.mit.edu/web-map-workshop/map-symbolization/).
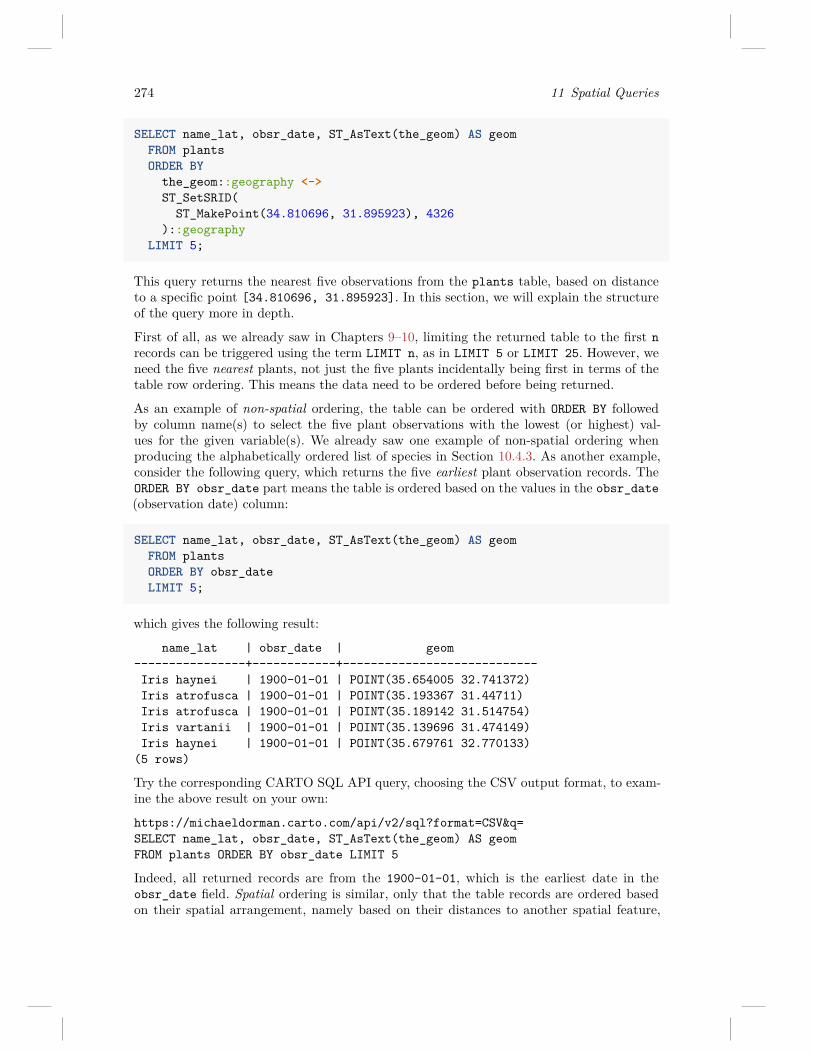
274 11 Spatial Queries
SELECT name_lat, obsr_date, ST_AsText(the_geom) AS geomFROM plantsORDER BY
the_geom::geography <->ST_SetSRID(
ST_MakePoint(34.810696, 31.895923), 4326)::geography
LIMIT 5;
This query returns the nearest five observations from the plants table, based on distanceto a specific point [34.810696, 31.895923]. In this section, we will explain the structureof the query more in depth.
First of all, as we already saw in Chapters 9–10, limiting the returned table to the first nrecords can be triggered using the term LIMIT n, as in LIMIT 5 or LIMIT 25. However, weneed the five nearest plants, not just the five plants incidentally being first in terms of thetable row ordering. This means the data need to be ordered before being returned.
As an example of non-spatial ordering, the table can be ordered with ORDER BY followedby column name(s) to select the five plant observations with the lowest (or highest) val-ues for the given variable(s). We already saw one example of non-spatial ordering whenproducing the alphabetically ordered list of species in Section 10.4.3. As another example,consider the following query, which returns the five earliest plant observation records. TheORDER BY obsr_date part means the table is ordered based on the values in the obsr_date(observation date) column:
SELECT name_lat, obsr_date, ST_AsText(the_geom) AS geomFROM plantsORDER BY obsr_dateLIMIT 5;
which gives the following result:
name_lat | obsr_date | geom----------------+------------+----------------------------Iris haynei | 1900-01-01 | POINT(35.654005 32.741372)Iris atrofusca | 1900-01-01 | POINT(35.193367 31.44711)Iris atrofusca | 1900-01-01 | POINT(35.189142 31.514754)Iris vartanii | 1900-01-01 | POINT(35.139696 31.474149)Iris haynei | 1900-01-01 | POINT(35.679761 32.770133)(5 rows)
Try the corresponding CARTO SQL API query, choosing the CSV output format, to exam-ine the above result on your own:
https://michaeldorman.carto.com/api/v2/sql?format=CSV&q=SELECT name_lat, obsr_date, ST_AsText(the_geom) AS geomFROM plants ORDER BY obsr_date LIMIT 5
Indeed, all returned records are from the 1900-01-01, which is the earliest date in theobsr_date field. Spatial ordering is similar, only that the table records are ordered basedon their spatial arrangement, namely based on their distances to another spatial feature,
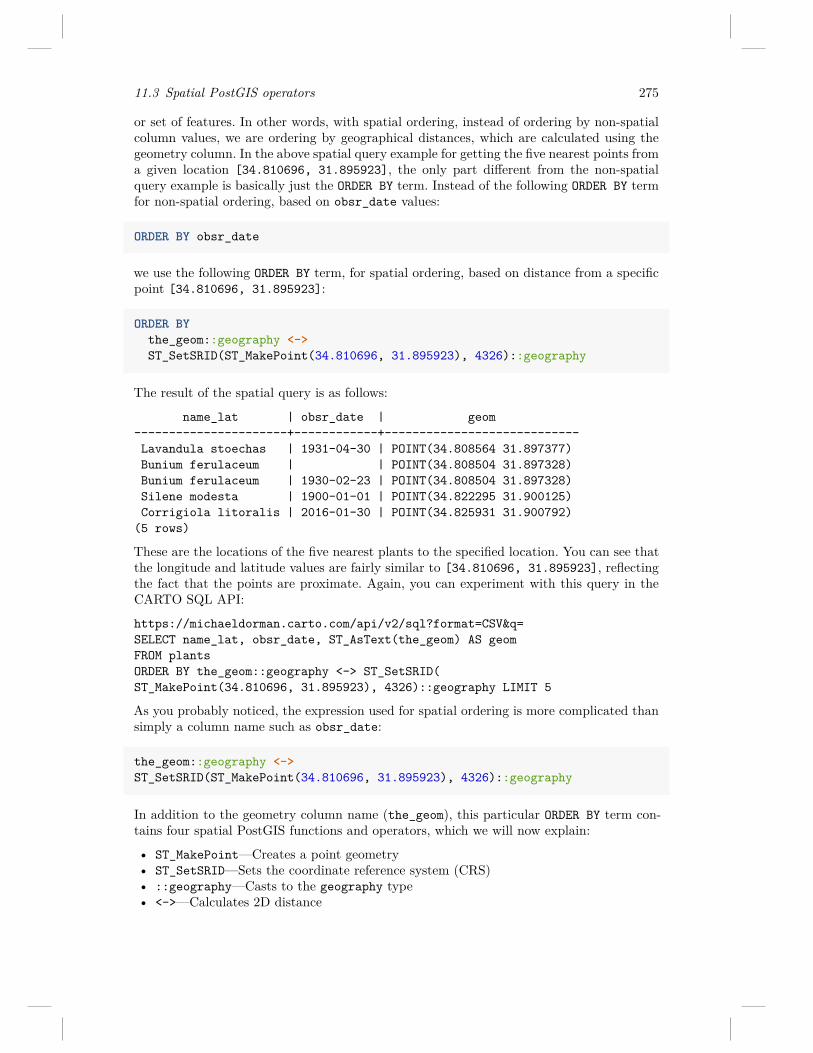
11.3 Spatial PostGIS operators 275
or set of features. In other words, with spatial ordering, instead of ordering by non-spatialcolumn values, we are ordering by geographical distances, which are calculated using thegeometry column. In the above spatial query example for getting the five nearest points froma given location [34.810696, 31.895923], the only part different from the non-spatialquery example is basically just the ORDER BY term. Instead of the following ORDER BY termfor non-spatial ordering, based on obsr_date values:
ORDER BY obsr_date
we use the following ORDER BY term, for spatial ordering, based on distance from a specificpoint [34.810696, 31.895923]:
ORDER BYthe_geom::geography <->ST_SetSRID(ST_MakePoint(34.810696, 31.895923), 4326)::geography
The result of the spatial query is as follows:
name_lat | obsr_date | geom----------------------+------------+----------------------------Lavandula stoechas | 1931-04-30 | POINT(34.808564 31.897377)Bunium ferulaceum | | POINT(34.808504 31.897328)Bunium ferulaceum | 1930-02-23 | POINT(34.808504 31.897328)Silene modesta | 1900-01-01 | POINT(34.822295 31.900125)Corrigiola litoralis | 2016-01-30 | POINT(34.825931 31.900792)(5 rows)
These are the locations of the five nearest plants to the specified location. You can see thatthe longitude and latitude values are fairly similar to [34.810696, 31.895923], reflectingthe fact that the points are proximate. Again, you can experiment with this query in theCARTO SQL API:
https://michaeldorman.carto.com/api/v2/sql?format=CSV&q=SELECT name_lat, obsr_date, ST_AsText(the_geom) AS geomFROM plantsORDER BY the_geom::geography <-> ST_SetSRID(ST_MakePoint(34.810696, 31.895923), 4326)::geography LIMIT 5
As you probably noticed, the expression used for spatial ordering is more complicated thansimply a column name such as obsr_date:
the_geom::geography <->ST_SetSRID(ST_MakePoint(34.810696, 31.895923), 4326)::geography
In addition to the geometry column name (the_geom), this particular ORDER BY term con-tains four spatial PostGIS functions and operators, which we will now explain:
• ST_MakePoint—Creates a point geometry• ST_SetSRID—Sets the coordinate reference system (CRS)• ::geography—Casts to the geography type• <->—Calculates 2D distance
276 11 Spatial Queries
A two-dimensional point geometry is constructed using the ST_MakePoint function, giventwo coordinates x and y, in this case 34.810696 and 31.895923, respectively. Thus,the expression ST_MakePoint(34.810696, 31.895923) defines a single geometry of type"Point", which we can use in spatial calculations. The ST_SetSRID function then sets thecoordinate reference system (CRS) for the geometry. The 4326 argument is the EPSG codeof the WGS84 geographical projection (i.e., lon/lat) (Figure 6.1).
The ::geography part casts5 the geometry to a special type called geography, thus deter-mining that what follows is a calculation with spherical geometry, which is the appropri-ate way to do distance-based calculations with lon/lat data. With ::geography, distancecalculations give the spherical Great Circle6 distance, in meters (Figure 12.10). Omittingthe ::geography part is equivalent to using the default ::geometry type, implying thatwhat follows is a planar geometry calculation. Planar geometry calculations are only ap-propriate for projected data, which we do not use in this book. Using ::geometry whencalculating distances on lon/lat data gives straight-line euclidean distances, in degree units,which is almost always inappropriate.
The <-> operator returns the 2D distance7 between two sets of geometries. Since we set::geography, the result represents spherical Great Circle distance in meters. In the presentexample, we are calculating the distances between the_geom, which is the geometry columnof the plants table, and an individual point. The result is a series of distances in meters,corresponding to all features of the plants table.
Finally, the series of distances is passed to the ORDER BY keyword, thus rearranging the tablebased on the calculated distances, from the smallest to largest, i.e., from nearest observationto furthest. The LIMIT 5 part then takes the top five records, which are the five nearestones to [34.810696, 31.895923].
11.3.3 Sphere vs. spheroidAs another demonstration of the four spatial PostGIS functions discussed in Section 11.3.2(above), consider the following small query. This query calculates the distance between twopoints [0, 0] and [0, 1] in geographic coordinates (lon/lat), i.e., the length of one degreeof longitude along the equator:
SELECT(ST_SetSRID(ST_MakePoint(0, 0), 4326)::geography <->ST_SetSRID(ST_MakePoint(1, 0), 4326)::geography) / 1000
AS dist_km;
According to the result, the distance is 111.195 km:
dist_km------------------111.195079734632(1 row)
In this query, we are manually constructing two points in lon/lat, [0, 0] and [1, 0], usingST_MakePoint, ST_SetSRID and ::geography. The 2D distance operator <-> is the applied
5http://postgis.net/workshops/postgis-intro/geography.html6https://en.wikipedia.org/wiki/Great_circle7https://postgis.net/docs/geometry_distance_knn.html
11.4 Adding nearest points to map 277
on the points to calculate the Great Circle distance between them, in meters. Dividing theresult by 1000 transforms the distance from meter to kilometer units8.
The true distance between [0, 0] and [1, 0], however, is 111.320 km9 and not 111.195.What is the reason for the discrepancy? The reason is that the <-> operator, though usingspherical geometry, relies on a sphere model of the earth, rather than the more accuratespheroid model. In PostGIS, the more accurate but somewhat slower distance calculationbased on a spheroid can be obtained with ST_Distance instead of <->, as in:
SELECT ST_distance(ST_SetSRID(ST_MakePoint(0, 0), 4326)::geography,ST_SetSRID(ST_MakePoint(1, 0), 4326)::geography) / 1000
AS dist_km;
This gives the more accurate result of 111.319 km:
dist_km-----------------111.31949079327(1 row)
Though ST_distance gives the more accurate estimate, the calculation takes longer. Forexample, finding the 5 nearest neighbors from the plants table took 0.17 seconds using the<-> operator, compared to 0.37 seconds with ST_Distance, on an average laptop computer.This is a more than twice longer calculation time. Although, in this particular example,exactly the same five plants are returned in both cases, theoretically the ordering may dif-fer among the two methods in some cases, due to small differences in distance estimatesbetween the sphere and spheroid models. In practice, the trade-off between speed and accu-racy should always be considered when choosing the right distance-based calculation giventhe application requirements, dataset resolution and dataset size. With small amounts ofdata and/or high accuracy requirements ST_Distance should be preferred; otherwise theaccuracy given by <-> may be sufficient.
• What do you think will happen if we omit the ::geography keyword from both placeswhere it appears in the above query?
• Check your answer using the CARTO SQL API.
11.4 Adding nearest points to mapWe are now ready to take the SQL spatial query from Section 11.3.2 and incorporate itinto the mapClick function, so that the nearest 25 plants are displayed along with the red
8Note that this query does not use data from any table, because it calculates distance between two pointscreated as part of the query itself.
9https://en.wikipedia.org/wiki/Longitude#Length_of_a_degree_of_longitude
278 11 Spatial Queries
marker. The key here is that we are going to make the spatial query dynamic, each timereplacing the proximity search according to the location clicked by the user on the webmap. Unlike in Section 11.3.2, where the longitude and latitude were hard-coded into theSQL query ([34.810696, 31.895923]), we are going to generate the SQL query by pastinguser-clicked coordinates into the SQL query “template”. Specifically, we will use longitudeand latitude returned from our map click event, e.latlng (Section 11.2.1).
We proceed, modifying example-11-02.html. First, we add two more variable definitions:a layer group for the nearest plant markers (plantLocations), and the URL prefix forquerying the CARTO SQL API (url). Along with the the layer group for the clicked loca-tion (myLocation), which we already defined in the previous example (Section 11.2.1), thevariable definition part in our <script> is now composed of the following three expressions:
let myLocation = L.layerGroup().addTo(map);let plantLocations = L.layerGroup().addTo(map);let url = "https://michaeldorman.carto.com/api/v2/sql?format=GeoJSON&q=";
The remaining code changes are all inside our mapClick function. In its new version, thefunction will not only display the clicked location, but also the locations of 25 nearestobservations of rare plants. Recall that the previous version of the mapClick function inexample-11-02.html (Section 11.2.1) merely cleared the old marker and added a new oneaccording to the e.latlng object:
function mapClick(e) {myLocation.clearLayers();L.marker(e.latlng, {icon: redIcon}).addTo(myLocation);
}
In the new version of the function, we add four new expressions. First, we define a new localvariable clickCoords capturing the contents of e.latlng (Section 6.9) for that particularevent. This is just a convenience, for typing clickCoords instead of e.latlng in the variousplaces where we will use the clicked coordinates in the new function code body:
let clickCoords = e.latlng;
Second, we make sure that the nearest plant observations are cleared between consecu-tive clicks, just like the red marker is. The following expression takes care of clearing anypreviously loaded plantLocations contents:
plantLocations.clearLayers();
In the third expression, we dynamically compose the SQL query to get 25 nearest recordsfrom the plants table, considering the clicked location. We basically replace the hard-codedlon/lat coordinates from the specific SQL query discussed in Section 11.3.2 with the lngand lat properties of the clickCoords object. The result, named sqlQueryClosest, isthe specific SQL query string needed to obtain the 25 nearest plant observations from ourcurrently clicked location. This is conceptually similar to the way that we dynamicallyconstructed an SQL query to select the observations of a particular species (Section 10.5.3):
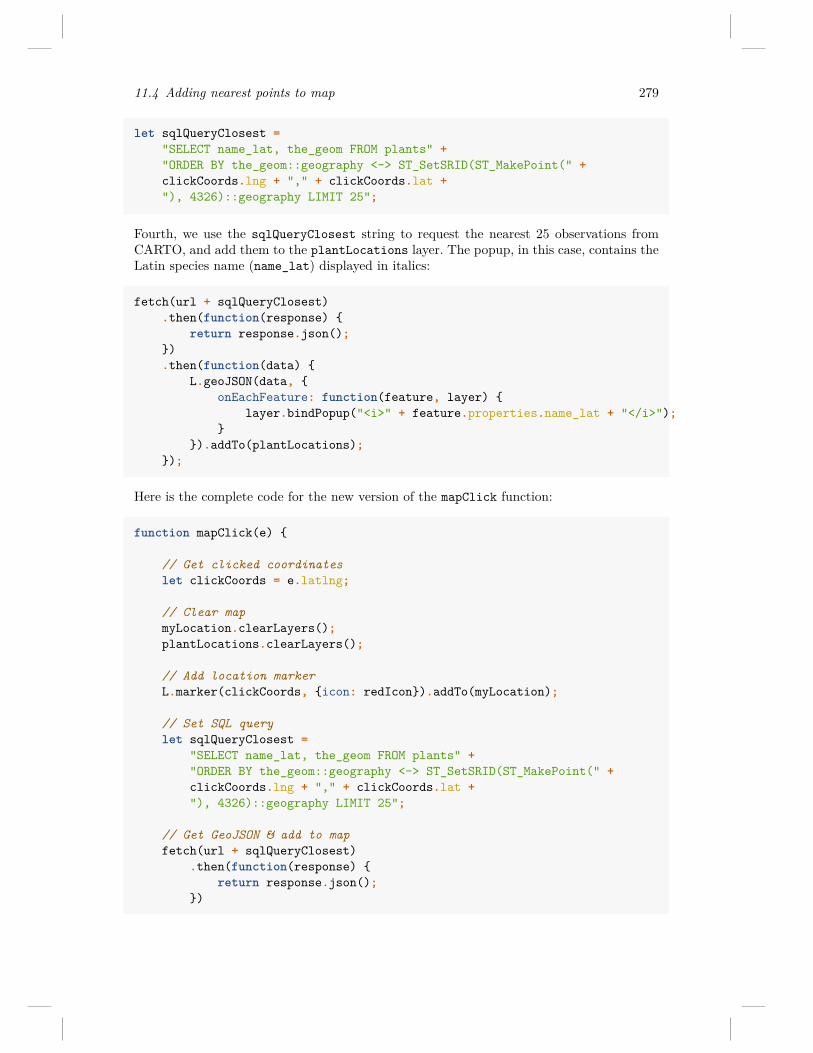
11.4 Adding nearest points to map 279
let sqlQueryClosest ="SELECT name_lat, the_geom FROM plants" +"ORDER BY the_geom::geography <-> ST_SetSRID(ST_MakePoint(" +clickCoords.lng + "," + clickCoords.lat +"), 4326)::geography LIMIT 25";
Fourth, we use the sqlQueryClosest string to request the nearest 25 observations fromCARTO, and add them to the plantLocations layer. The popup, in this case, contains theLatin species name (name_lat) displayed in italics:
fetch(url + sqlQueryClosest).then(function(response) {
return response.json();}).then(function(data) {
L.geoJSON(data, {onEachFeature: function(feature, layer) {
layer.bindPopup("<i>" + feature.properties.name_lat + "</i>");}
}).addTo(plantLocations);});
Here is the complete code for the new version of the mapClick function:
function mapClick(e) {
// Get clicked coordinateslet clickCoords = e.latlng;
// Clear mapmyLocation.clearLayers();plantLocations.clearLayers();
// Add location markerL.marker(clickCoords, {icon: redIcon}).addTo(myLocation);
// Set SQL querylet sqlQueryClosest =
"SELECT name_lat, the_geom FROM plants" +"ORDER BY the_geom::geography <-> ST_SetSRID(ST_MakePoint(" +clickCoords.lng + "," + clickCoords.lat +"), 4326)::geography LIMIT 25";
// Get GeoJSON & add to mapfetch(url + sqlQueryClosest)
.then(function(response) {return response.json();
})
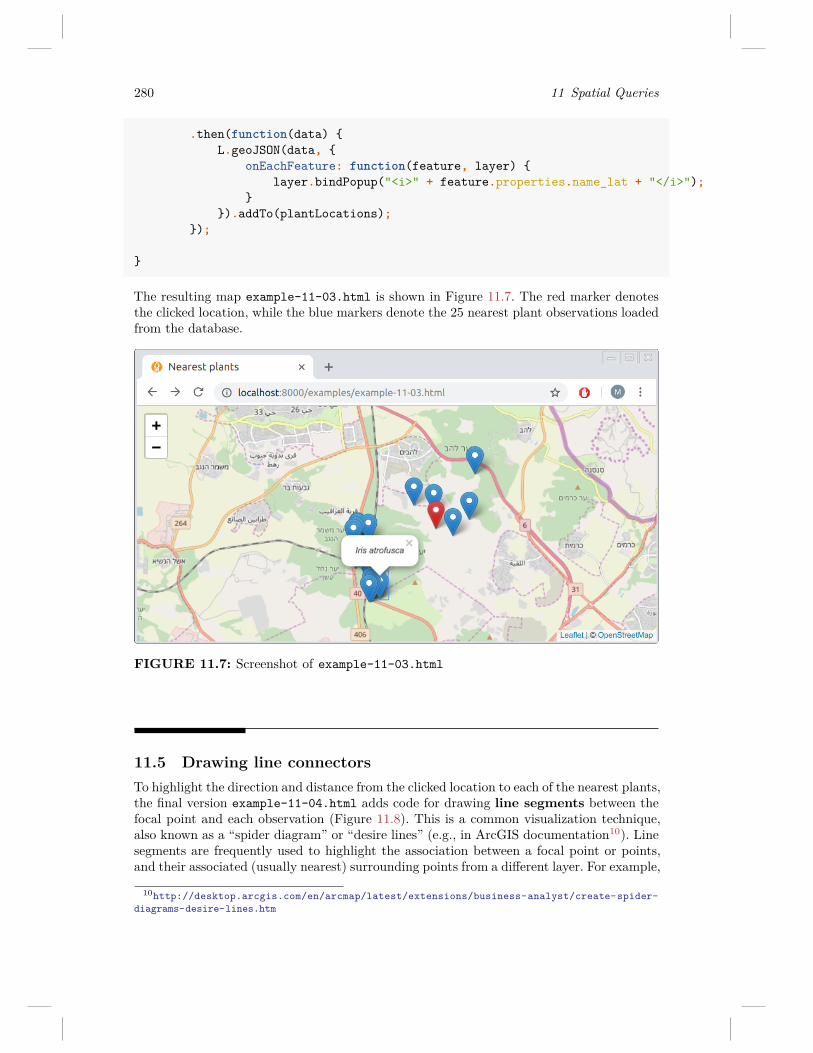
280 11 Spatial Queries
.then(function(data) {L.geoJSON(data, {
onEachFeature: function(feature, layer) {layer.bindPopup("<i>" + feature.properties.name_lat + "</i>");
}}).addTo(plantLocations);
});
}
The resulting map example-11-03.html is shown in Figure 11.7. The red marker denotesthe clicked location, while the blue markers denote the 25 nearest plant observations loadedfrom the database.
FIGURE 11.7: Screenshot of example-11-03.html
11.5 Drawing line connectorsTo highlight the direction and distance from the clicked location to each of the nearest plants,the final version example-11-04.html adds code for drawing line segments between thefocal point and each observation (Figure 11.8). This is a common visualization technique,also known as a “spider diagram” or “desire lines” (e.g., in ArcGIS documentation10). Linesegments are frequently used to highlight the association between a focal point or points,and their associated (usually nearest) surrounding points from a different layer. For example,
10http://desktop.arcgis.com/en/arcmap/latest/extensions/business-analyst/create-spider-diagrams-desire-lines.htm
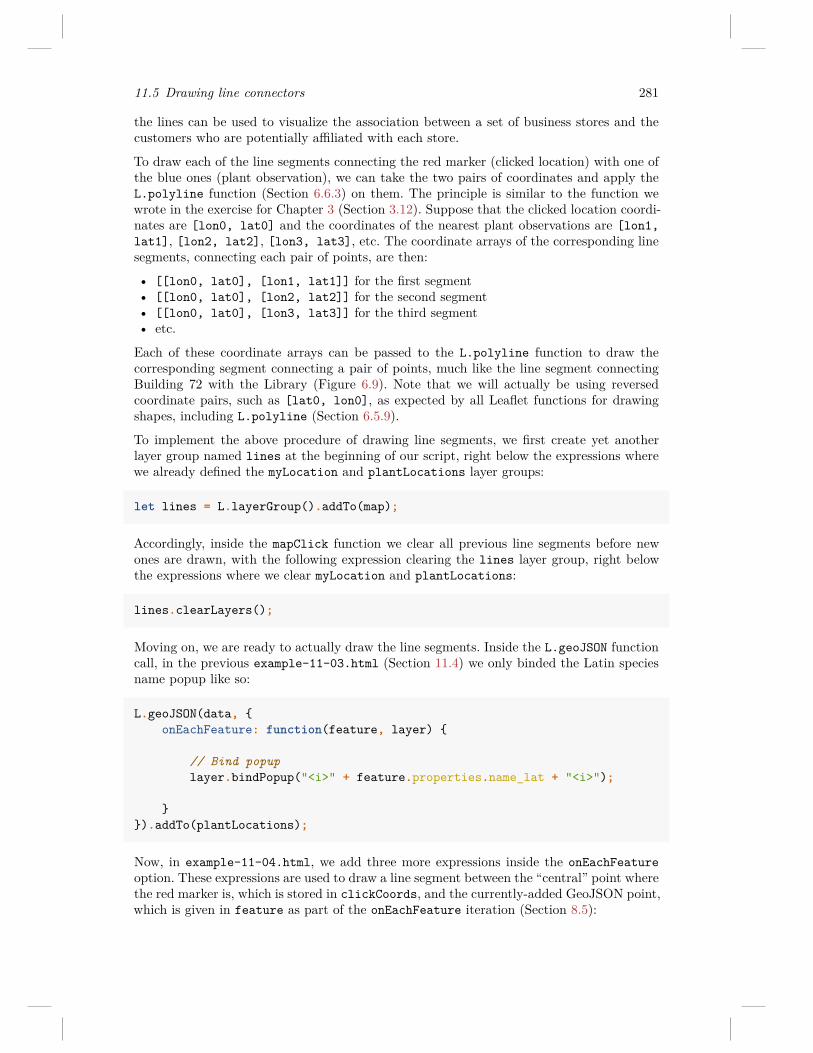
11.5 Drawing line connectors 281
the lines can be used to visualize the association between a set of business stores and thecustomers who are potentially affiliated with each store.
To draw each of the line segments connecting the red marker (clicked location) with one ofthe blue ones (plant observation), we can take the two pairs of coordinates and apply theL.polyline function (Section 6.6.3) on them. The principle is similar to the function wewrote in the exercise for Chapter 3 (Section 3.12). Suppose that the clicked location coordi-nates are [lon0, lat0] and the coordinates of the nearest plant observations are [lon1,lat1], [lon2, lat2], [lon3, lat3], etc. The coordinate arrays of the corresponding linesegments, connecting each pair of points, are then:
• [[lon0, lat0], [lon1, lat1]] for the first segment• [[lon0, lat0], [lon2, lat2]] for the second segment• [[lon0, lat0], [lon3, lat3]] for the third segment• etc.
Each of these coordinate arrays can be passed to the L.polyline function to draw thecorresponding segment connecting a pair of points, much like the line segment connectingBuilding 72 with the Library (Figure 6.9). Note that we will actually be using reversedcoordinate pairs, such as [lat0, lon0], as expected by all Leaflet functions for drawingshapes, including L.polyline (Section 6.5.9).
To implement the above procedure of drawing line segments, we first create yet anotherlayer group named lines at the beginning of our script, right below the expressions wherewe already defined the myLocation and plantLocations layer groups:
let lines = L.layerGroup().addTo(map);
Accordingly, inside the mapClick function we clear all previous line segments before newones are drawn, with the following expression clearing the lines layer group, right belowthe expressions where we clear myLocation and plantLocations:
lines.clearLayers();
Moving on, we are ready to actually draw the line segments. Inside the L.geoJSON functioncall, in the previous example-11-03.html (Section 11.4) we only binded the Latin speciesname popup like so:
L.geoJSON(data, {onEachFeature: function(feature, layer) {
// Bind popuplayer.bindPopup("<i>" + feature.properties.name_lat + "<i>");
}}).addTo(plantLocations);
Now, in example-11-04.html, we add three more expressions inside the onEachFeatureoption. These expressions are used to draw a line segment between the “central” point wherethe red marker is, which is stored in clickCoords, and the currently-added GeoJSON point,which is given in feature as part of the onEachFeature iteration (Section 8.5):
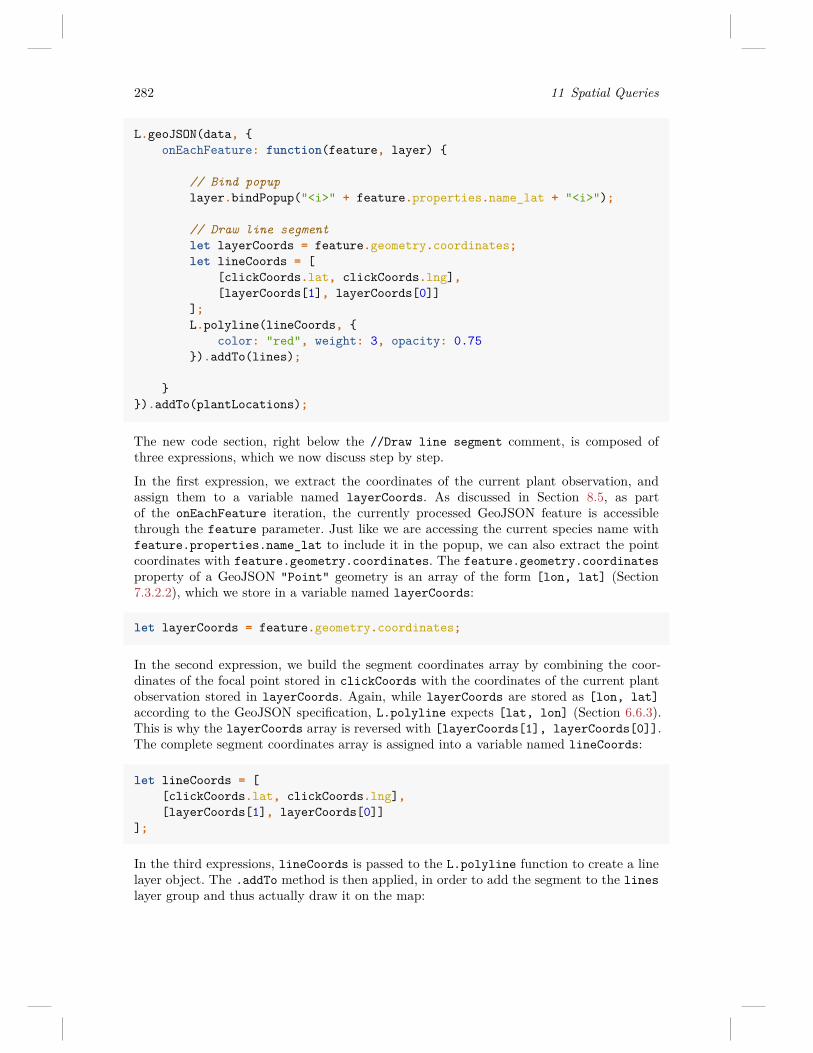
282 11 Spatial Queries
L.geoJSON(data, {onEachFeature: function(feature, layer) {
// Bind popuplayer.bindPopup("<i>" + feature.properties.name_lat + "<i>");
// Draw line segmentlet layerCoords = feature.geometry.coordinates;let lineCoords = [
[clickCoords.lat, clickCoords.lng],[layerCoords[1], layerCoords[0]]
];L.polyline(lineCoords, {
color: "red", weight: 3, opacity: 0.75}).addTo(lines);
}}).addTo(plantLocations);
The new code section, right below the //Draw line segment comment, is composed ofthree expressions, which we now discuss step by step.
In the first expression, we extract the coordinates of the current plant observation, andassign them to a variable named layerCoords. As discussed in Section 8.5, as partof the onEachFeature iteration, the currently processed GeoJSON feature is accessiblethrough the feature parameter. Just like we are accessing the current species name withfeature.properties.name_lat to include it in the popup, we can also extract the pointcoordinates with feature.geometry.coordinates. The feature.geometry.coordinatesproperty of a GeoJSON "Point" geometry is an array of the form [lon, lat] (Section7.3.2.2), which we store in a variable named layerCoords:
let layerCoords = feature.geometry.coordinates;
In the second expression, we build the segment coordinates array by combining the coor-dinates of the focal point stored in clickCoords with the coordinates of the current plantobservation stored in layerCoords. Again, while layerCoords are stored as [lon, lat]according to the GeoJSON specification, L.polyline expects [lat, lon] (Section 6.6.3).This is why the layerCoords array is reversed with [layerCoords[1], layerCoords[0]].The complete segment coordinates array is assigned into a variable named lineCoords:
let lineCoords = [[clickCoords.lat, clickCoords.lng],[layerCoords[1], layerCoords[0]]
];
In the third expressions, lineCoords is passed to the L.polyline function to create a linelayer object. The .addTo method is then applied, in order to add the segment to the lineslayer group and thus actually draw it on the map:
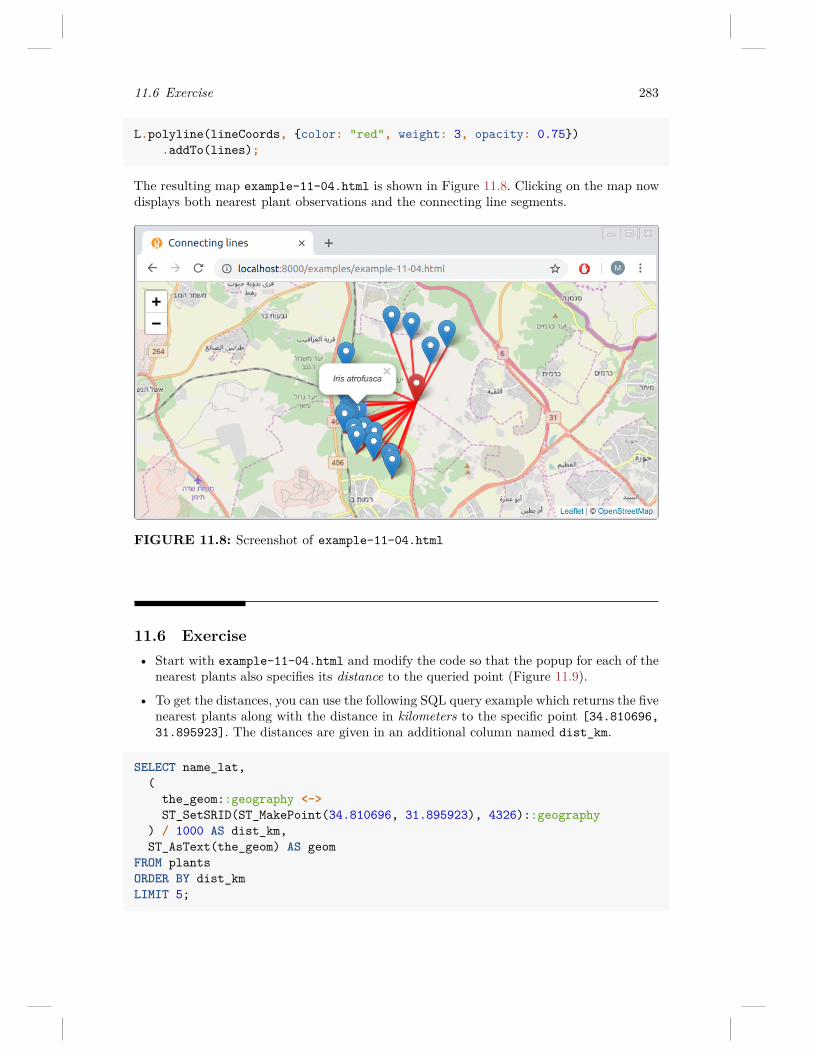
11.6 Exercise 283
L.polyline(lineCoords, {color: "red", weight: 3, opacity: 0.75}).addTo(lines);
The resulting map example-11-04.html is shown in Figure 11.8. Clicking on the map nowdisplays both nearest plant observations and the connecting line segments.
FIGURE 11.8: Screenshot of example-11-04.html
11.6 Exercise• Start with example-11-04.html and modify the code so that the popup for each of the
nearest plants also specifies its distance to the queried point (Figure 11.9).
• To get the distances, you can use the following SQL query example which returns the fivenearest plants along with the distance in kilometers to the specific point [34.810696,31.895923]. The distances are given in an additional column named dist_km.
SELECT name_lat,(the_geom::geography <->ST_SetSRID(ST_MakePoint(34.810696, 31.895923), 4326)::geography
) / 1000 AS dist_km,ST_AsText(the_geom) AS geom
FROM plantsORDER BY dist_kmLIMIT 5;
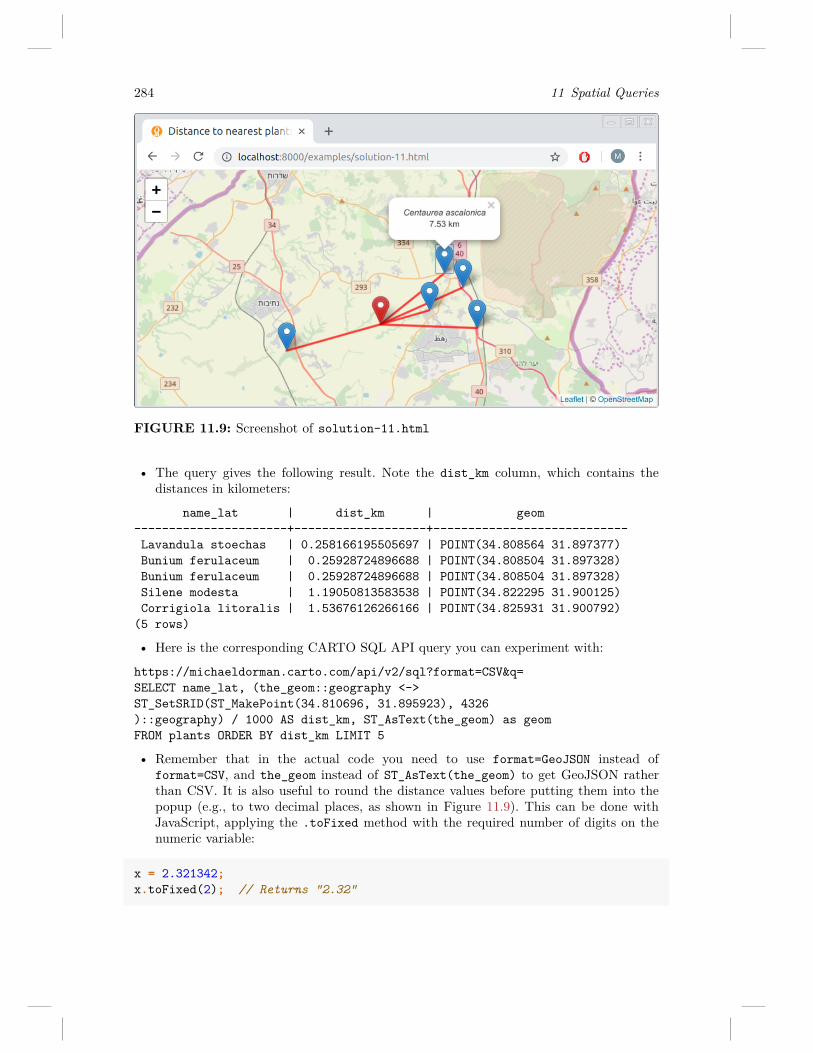
284 11 Spatial Queries
FIGURE 11.9: Screenshot of solution-11.html
• The query gives the following result. Note the dist_km column, which contains thedistances in kilometers:
name_lat | dist_km | geom----------------------+-------------------+----------------------------Lavandula stoechas | 0.258166195505697 | POINT(34.808564 31.897377)Bunium ferulaceum | 0.25928724896688 | POINT(34.808504 31.897328)Bunium ferulaceum | 0.25928724896688 | POINT(34.808504 31.897328)Silene modesta | 1.19050813583538 | POINT(34.822295 31.900125)Corrigiola litoralis | 1.53676126266166 | POINT(34.825931 31.900792)(5 rows)
• Here is the corresponding CARTO SQL API query you can experiment with:
https://michaeldorman.carto.com/api/v2/sql?format=CSV&q=SELECT name_lat, (the_geom::geography <->ST_SetSRID(ST_MakePoint(34.810696, 31.895923), 4326)::geography) / 1000 AS dist_km, ST_AsText(the_geom) as geomFROM plants ORDER BY dist_km LIMIT 5
• Remember that in the actual code you need to use format=GeoJSON instead offormat=CSV, and the_geom instead of ST_AsText(the_geom) to get GeoJSON ratherthan CSV. It is also useful to round the distance values before putting them into thepopup (e.g., to two decimal places, as shown in Figure 11.9). This can be done withJavaScript, applying the .toFixed method with the required number of digits on thenumeric variable:
x = 2.321342;x.toFixed(2); // Returns "2.32"

Part IV
Advanced Topics

12Client-side Geoprocessing
12.1 IntroductionIn Chapter 11, we used spatial SQL queries to load a subset of features from a PostGISdatabase on a web map. In other words, we performed a geoprocessing operation—findingthe n-nearest points—using SQL. Notably, the operation was performed on the server (theCARTO platform), and the result was returned to us via HTTP. Sometimes, it is moreconvenient to perform geoprocessing operations on the client, rather than on the server,for various reasons.
One reason to prefer client-side geoprocessing is that we may need the web page to beinstantaneously responsive, such as a web map that is continuously updated in responseto user input (Figure 12.5). This is very difficult to achieve when communicating with aserver: even if the internet connection is very fast, there is usually going to be a noticeablelag due the time interval between sending the request and receiving the response. Anotherreason may be the relative simplicity and flexibility of using various algorithms and methodsthrough JavaScript libraries, compared to the cost of setting up and managing a server withthe same functionality.
The main disadvantage of client-side geoprocessing is that we are limited by the hardwareconstraints of the client. While the hardware of the server is (potentially) very powerful,and in any case it is under our control, the different clients that connect to our web pagemay have widely varying hardware. To make our website responsive, we should thereforelimit client-side geoprocessing to relatively light-weight operations. Another constraint inclient-side geoprocessing is that we are limited to JavaScript libraries and cannot rely onany other software or programming language (such as a PostGIS database).
In this chapter we will see several examples of client-side geoprocessing:
• Calculating Great Circle lines (Section 12.3)• Drawing a continuously-updated TIN (Section 12.4)• Detecting spatial clusters (Section 12.5)• Drawing heatmaps (Section 12.6)
All of these will be done in the browser, using JavaScript code, without requiring a dedicatedserver. In the examples, we will use two different JavaScript libraries:
• Turf.js (Sections 12.2–12.5)—A general-purpose geoprocessing library, with a compre-hensive set of functions for various geoprocessing tasks
• Leaflet.heat (Section 12.6)—A single-purpose plugin for Leaflet, dedicated to generat-ing point-density heatmaps
287
288 12 Client-side Geoprocessing
12.2 Geoprocessing with Turf.js12.2.1 OverviewTurf.js1 is a JavaScript library for client-side geoprocessing. It includes a comprehensiveset of functions, covering a wide range of geoprocessing tasks. The Turf.js library also hasexcellent documentation2, including a small visual example for each of its functions.
As we will see shortly, the basic data type that Turf.js works with is GeoJSON. This is veryconvenient, because it means that any geoprocessing product can be immediately loaded ona Leaflet map with the L.geoJSON function, which we have been using in Chapters 7–11. Asfor the other way around, we will also see that any existing Leaflet layer can be convertedback to GeoJSON using the .toGeoJSON method, so that it can passed to a Turf.js functionfor processing. Therefore, when working with Turf.js we typically have to go back and forthbetween Leaflet layer objects, which the Leaflet library understands, and GeoJSON objects,which the Turf.js library understands (Section 12.4.5).
In this chapter, we will use seven different functions from the Turf.js library (Table 12.1).There are dozens of other functions which we will not use; you are invited to browse throughthe documentation to explore what kind of other tasks can be done with Turf.js.
TABLE 12.1: Turf.js functions used in Chapter 12
Function Descriptionturf.point Convert point coordinates to GeoJSON of type "Point"turf.greatCircle Calculate a Great Circle lineturf.randomPoint Calculate random pointsturf.tin Calculate a Triangulated Irregular Network (TIN)turf.clusterEach Apply function on each subset of GeoJSON featuresturf.convex Calculate a Convex Hull polygonturf.clustersDbscan Detect clusters using the DBSCAN method
12.2.2 Including the Turf.js libraryTo use Turf.js in our web page, we first need to include it, using a <script> element. Asalways, the JavaScript file can be included from a local copy, or from a CDN (Section 6.5.6)such as the following one:
https://npmcdn.com/@turf/turf/turf.min.js
We will use a local copy stored in the js folder on our server. Therefore, we add the following<script> element inside the <head>:
<script src="js/turf.js"></script>
You can download the Turf.js file from the URL specified at the beginning of this section,
1http://turfjs.org/2http://turfjs.org/docs/
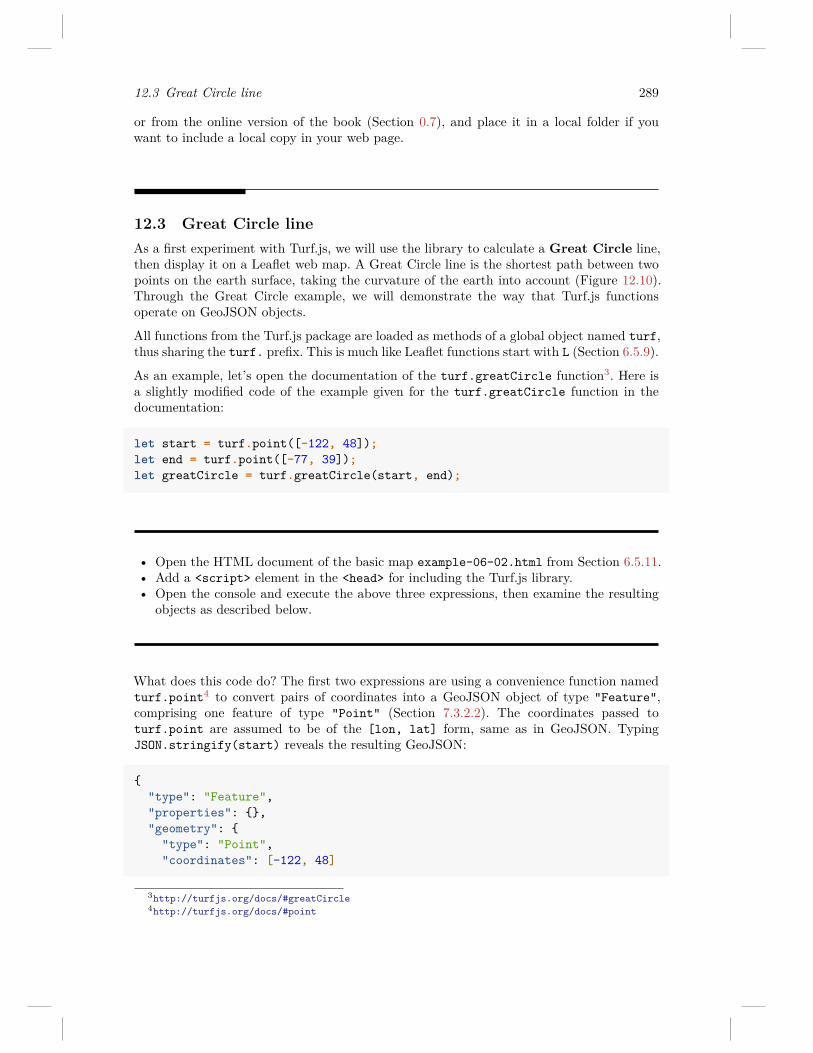
12.3 Great Circle line 289
or from the online version of the book (Section 0.7), and place it in a local folder if youwant to include a local copy in your web page.
12.3 Great Circle lineAs a first experiment with Turf.js, we will use the library to calculate a Great Circle line,then display it on a Leaflet web map. A Great Circle line is the shortest path between twopoints on the earth surface, taking the curvature of the earth into account (Figure 12.10).Through the Great Circle example, we will demonstrate the way that Turf.js functionsoperate on GeoJSON objects.
All functions from the Turf.js package are loaded as methods of a global object named turf,thus sharing the turf. prefix. This is much like Leaflet functions start with L (Section 6.5.9).
As an example, let’s open the documentation of the turf.greatCircle function3. Here isa slightly modified code of the example given for the turf.greatCircle function in thedocumentation:
let start = turf.point([-122, 48]);let end = turf.point([-77, 39]);let greatCircle = turf.greatCircle(start, end);
• Open the HTML document of the basic map example-06-02.html from Section 6.5.11.• Add a <script> element in the <head> for including the Turf.js library.• Open the console and execute the above three expressions, then examine the resulting
objects as described below.
What does this code do? The first two expressions are using a convenience function namedturf.point4 to convert pairs of coordinates into a GeoJSON object of type "Feature",comprising one feature of type "Point" (Section 7.3.2.2). The coordinates passed toturf.point are assumed to be of the [lon, lat] form, same as in GeoJSON. TypingJSON.stringify(start) reveals the resulting GeoJSON:
{"type": "Feature","properties": {},"geometry": {
"type": "Point","coordinates": [-122, 48]
3http://turfjs.org/docs/#greatCircle4http://turfjs.org/docs/#point
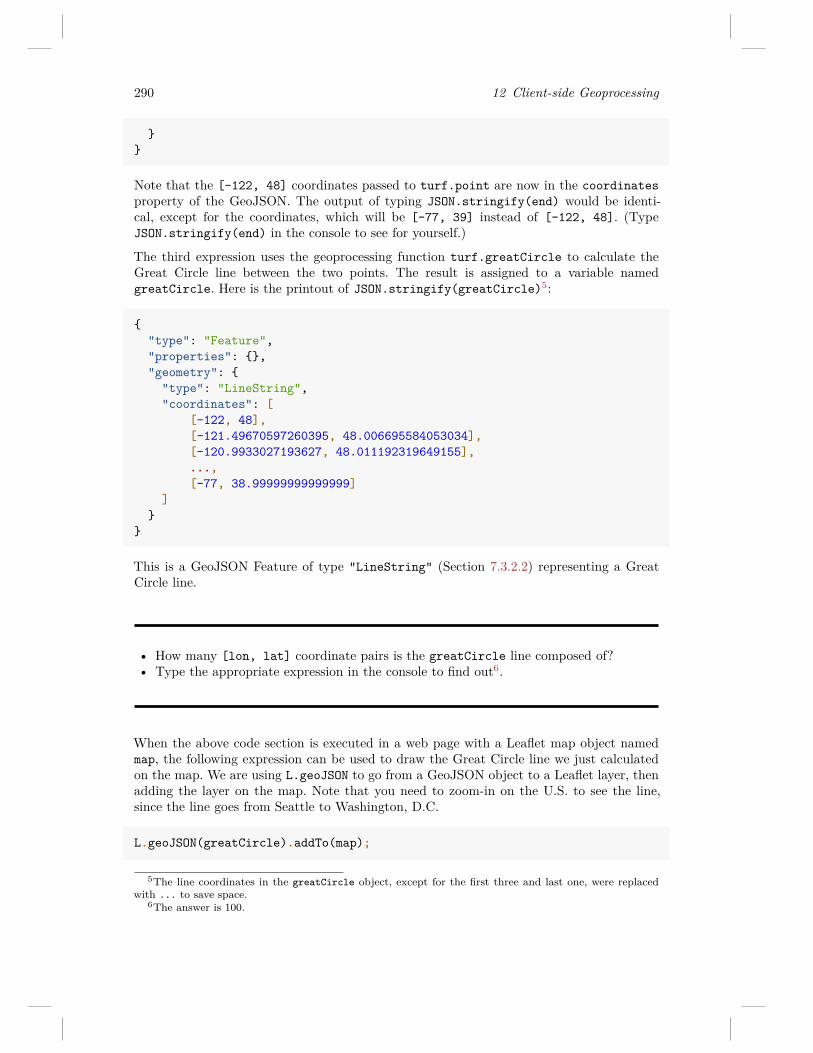
290 12 Client-side Geoprocessing
}}
Note that the [-122, 48] coordinates passed to turf.point are now in the coordinatesproperty of the GeoJSON. The output of typing JSON.stringify(end) would be identi-cal, except for the coordinates, which will be [-77, 39] instead of [-122, 48]. (TypeJSON.stringify(end) in the console to see for yourself.)
The third expression uses the geoprocessing function turf.greatCircle to calculate theGreat Circle line between the two points. The result is assigned to a variable namedgreatCircle. Here is the printout of JSON.stringify(greatCircle)5:
{"type": "Feature","properties": {},"geometry": {
"type": "LineString","coordinates": [
[-122, 48],[-121.49670597260395, 48.006695584053034],[-120.9933027193627, 48.011192319649155],...,[-77, 38.99999999999999]
]}
}
This is a GeoJSON Feature of type "LineString" (Section 7.3.2.2) representing a GreatCircle line.
• How many [lon, lat] coordinate pairs is the greatCircle line composed of?• Type the appropriate expression in the console to find out6.
When the above code section is executed in a web page with a Leaflet map object namedmap, the following expression can be used to draw the Great Circle line we just calculatedon the map. We are using L.geoJSON to go from a GeoJSON object to a Leaflet layer, thenadding the layer on the map. Note that you need to zoom-in on the U.S. to see the line,since the line goes from Seattle to Washington, D.C.
L.geoJSON(greatCircle).addTo(map);
5The line coordinates in the greatCircle object, except for the first three and last one, were replacedwith ... to save space.
6The answer is 100.
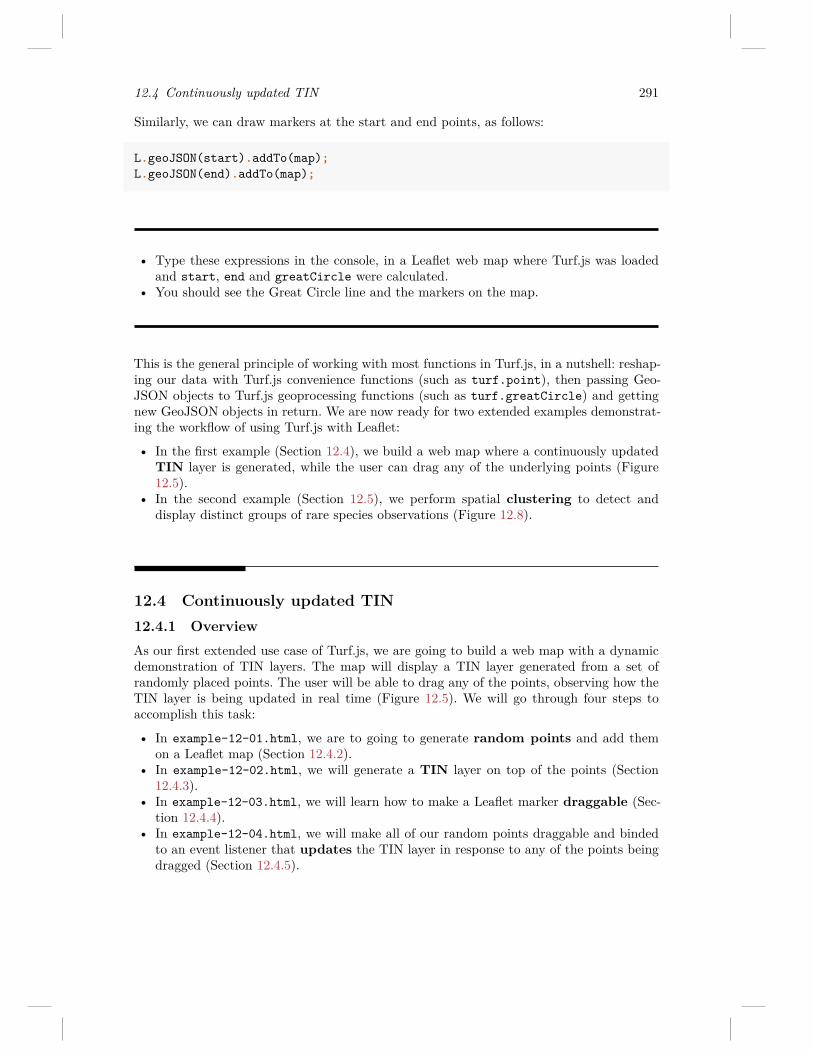
12.4 Continuously updated TIN 291
Similarly, we can draw markers at the start and end points, as follows:
L.geoJSON(start).addTo(map);L.geoJSON(end).addTo(map);
• Type these expressions in the console, in a Leaflet web map where Turf.js was loadedand start, end and greatCircle were calculated.
• You should see the Great Circle line and the markers on the map.
This is the general principle of working with most functions in Turf.js, in a nutshell: reshap-ing our data with Turf.js convenience functions (such as turf.point), then passing Geo-JSON objects to Turf.js geoprocessing functions (such as turf.greatCircle) and gettingnew GeoJSON objects in return. We are now ready for two extended examples demonstrat-ing the workflow of using Turf.js with Leaflet:
• In the first example (Section 12.4), we build a web map where a continuously updatedTIN layer is generated, while the user can drag any of the underlying points (Figure12.5).
• In the second example (Section 12.5), we perform spatial clustering to detect anddisplay distinct groups of rare species observations (Figure 12.8).
12.4 Continuously updated TIN12.4.1 OverviewAs our first extended use case of Turf.js, we are going to build a web map with a dynamicdemonstration of TIN layers. The map will display a TIN layer generated from a set ofrandomly placed points. The user will be able to drag any of the points, observing how theTIN layer is being updated in real time (Figure 12.5). We will go through four steps toaccomplish this task:
• In example-12-01.html, we are to going to generate random points and add themon a Leaflet map (Section 12.4.2).
• In example-12-02.html, we will generate a TIN layer on top of the points (Section12.4.3).
• In example-12-03.html, we will learn how to make a Leaflet marker draggable (Sec-tion 12.4.4).
• In example-12-04.html, we will make all of our random points draggable and bindedto an event listener that updates the TIN layer in response to any of the points beingdragged (Section 12.4.5).
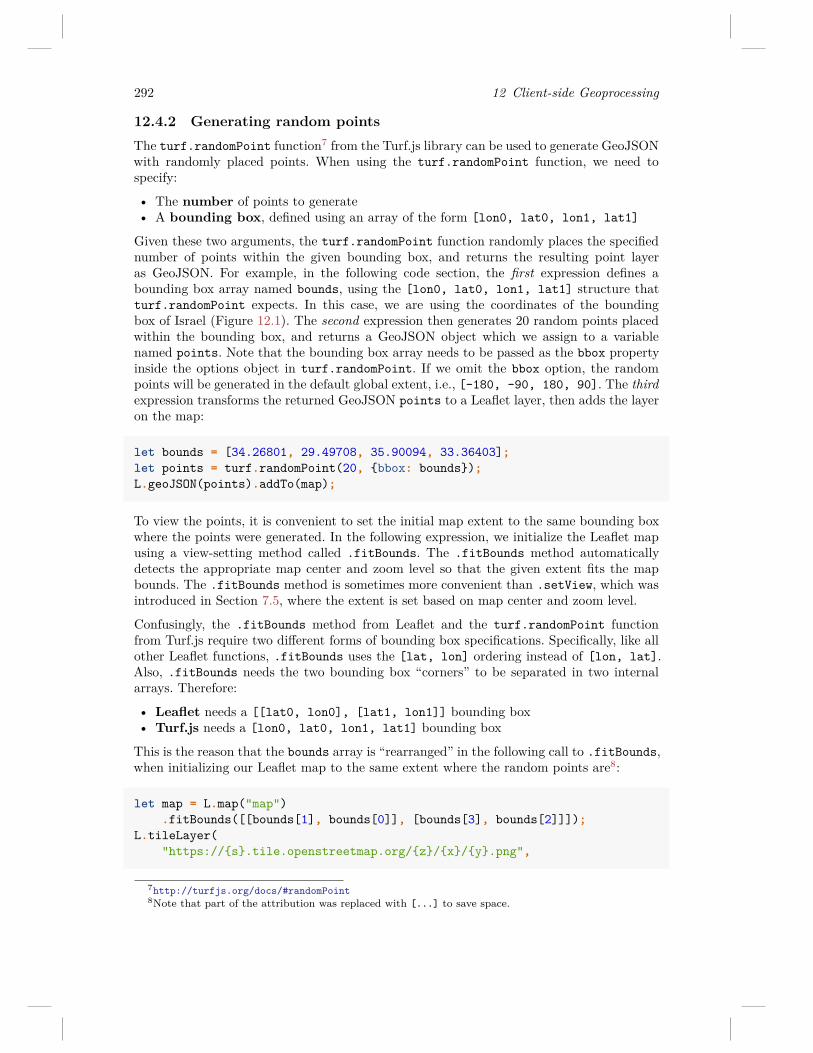
292 12 Client-side Geoprocessing
12.4.2 Generating random pointsThe turf.randomPoint function7 from the Turf.js library can be used to generate GeoJSONwith randomly placed points. When using the turf.randomPoint function, we need tospecify:
• The number of points to generate• A bounding box, defined using an array of the form [lon0, lat0, lon1, lat1]
Given these two arguments, the turf.randomPoint function randomly places the specifiednumber of points within the given bounding box, and returns the resulting point layeras GeoJSON. For example, in the following code section, the first expression defines abounding box array named bounds, using the [lon0, lat0, lon1, lat1] structure thatturf.randomPoint expects. In this case, we are using the coordinates of the boundingbox of Israel (Figure 12.1). The second expression then generates 20 random points placedwithin the bounding box, and returns a GeoJSON object which we assign to a variablenamed points. Note that the bounding box array needs to be passed as the bbox propertyinside the options object in turf.randomPoint. If we omit the bbox option, the randompoints will be generated in the default global extent, i.e., [-180, -90, 180, 90]. The thirdexpression transforms the returned GeoJSON points to a Leaflet layer, then adds the layeron the map:
let bounds = [34.26801, 29.49708, 35.90094, 33.36403];let points = turf.randomPoint(20, {bbox: bounds});L.geoJSON(points).addTo(map);
To view the points, it is convenient to set the initial map extent to the same bounding boxwhere the points were generated. In the following expression, we initialize the Leaflet mapusing a view-setting method called .fitBounds. The .fitBounds method automaticallydetects the appropriate map center and zoom level so that the given extent fits the mapbounds. The .fitBounds method is sometimes more convenient than .setView, which wasintroduced in Section 7.5, where the extent is set based on map center and zoom level.
Confusingly, the .fitBounds method from Leaflet and the turf.randomPoint functionfrom Turf.js require two different forms of bounding box specifications. Specifically, like allother Leaflet functions, .fitBounds uses the [lat, lon] ordering instead of [lon, lat].Also, .fitBounds needs the two bounding box “corners” to be separated in two internalarrays. Therefore:
• Leaflet needs a [[lat0, lon0], [lat1, lon1]] bounding box• Turf.js needs a [lon0, lat0, lon1, lat1] bounding box
This is the reason that the bounds array is “rearranged” in the following call to .fitBounds,when initializing our Leaflet map to the same extent where the random points are8:
let map = L.map("map").fitBounds([[bounds[1], bounds[0]], [bounds[3], bounds[2]]]);
L.tileLayer("https://{s}.tile.openstreetmap.org/{z}/{x}/{y}.png",
7http://turfjs.org/docs/#randomPoint8Note that part of the attribution was replaced with [...] to save space.
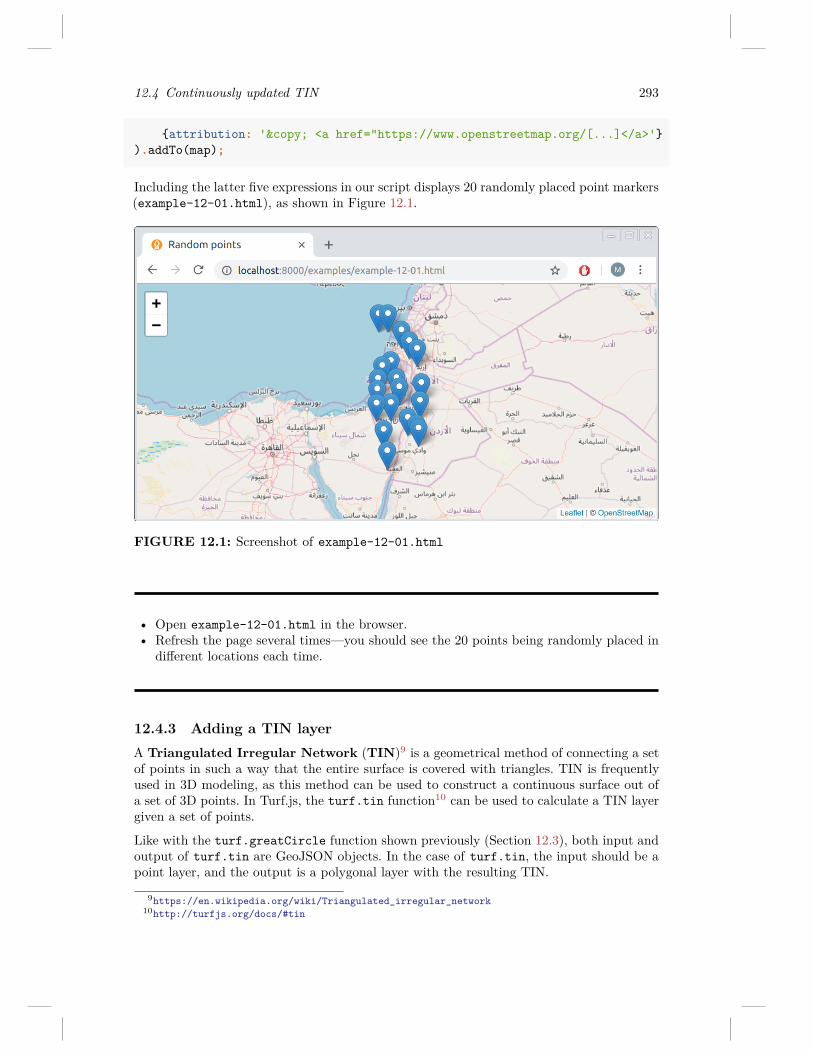
12.4 Continuously updated TIN 293
{attribution: '© <a href="https://www.openstreetmap.org/[...]</a>'}).addTo(map);
Including the latter five expressions in our script displays 20 randomly placed point markers(example-12-01.html), as shown in Figure 12.1.
FIGURE 12.1: Screenshot of example-12-01.html
• Open example-12-01.html in the browser.• Refresh the page several times—you should see the 20 points being randomly placed in
different locations each time.
12.4.3 Adding a TIN layerA Triangulated Irregular Network (TIN)9 is a geometrical method of connecting a setof points in such a way that the entire surface is covered with triangles. TIN is frequentlyused in 3D modeling, as this method can be used to construct a continuous surface out ofa set of 3D points. In Turf.js, the turf.tin function10 can be used to calculate a TIN layergiven a set of points.
Like with the turf.greatCircle function shown previously (Section 12.3), both input andoutput of turf.tin are GeoJSON objects. In the case of turf.tin, the input should be apoint layer, and the output is a polygonal layer with the resulting TIN.
9https://en.wikipedia.org/wiki/Triangulated_irregular_network10http://turfjs.org/docs/#tin
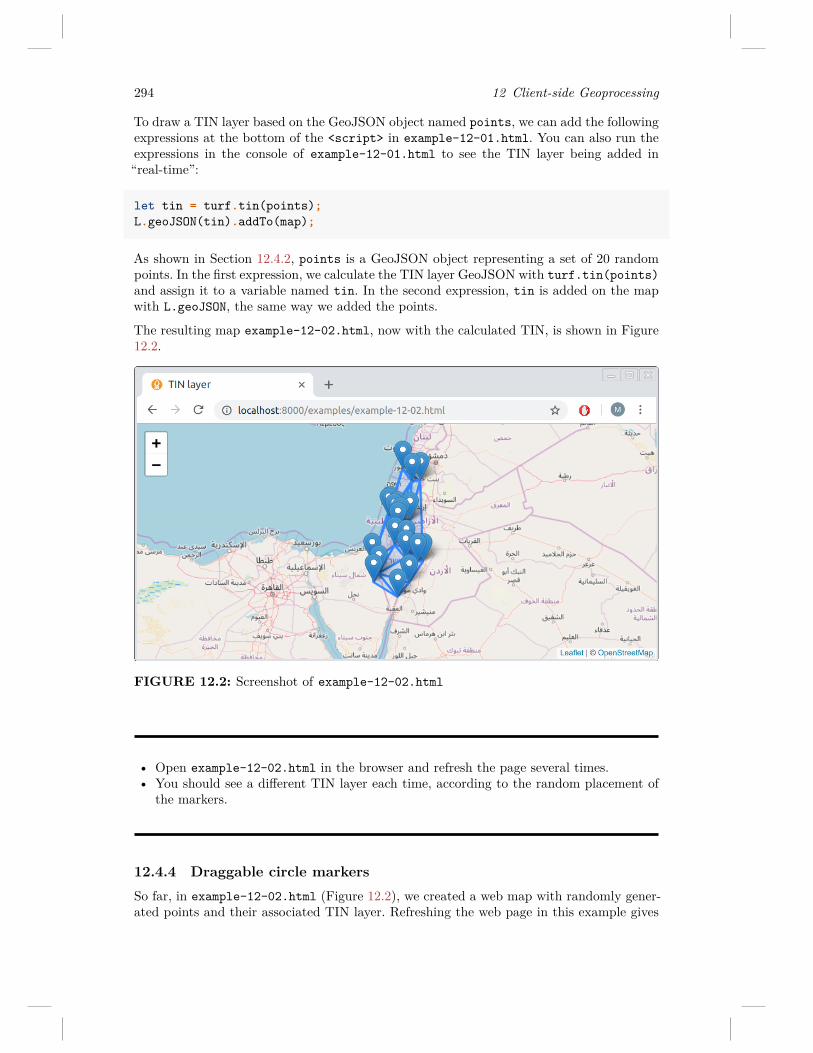
294 12 Client-side Geoprocessing
To draw a TIN layer based on the GeoJSON object named points, we can add the followingexpressions at the bottom of the <script> in example-12-01.html. You can also run theexpressions in the console of example-12-01.html to see the TIN layer being added in“real-time”:
let tin = turf.tin(points);L.geoJSON(tin).addTo(map);
As shown in Section 12.4.2, points is a GeoJSON object representing a set of 20 randompoints. In the first expression, we calculate the TIN layer GeoJSON with turf.tin(points)and assign it to a variable named tin. In the second expression, tin is added on the mapwith L.geoJSON, the same way we added the points.
The resulting map example-12-02.html, now with the calculated TIN, is shown in Figure12.2.
FIGURE 12.2: Screenshot of example-12-02.html
• Open example-12-02.html in the browser and refresh the page several times.• You should see a different TIN layer each time, according to the random placement of
the markers.
12.4.4 Draggable circle markersSo far, in example-12-02.html (Figure 12.2), we created a web map with randomly gener-ated points and their associated TIN layer. Refreshing the web page in this example gives
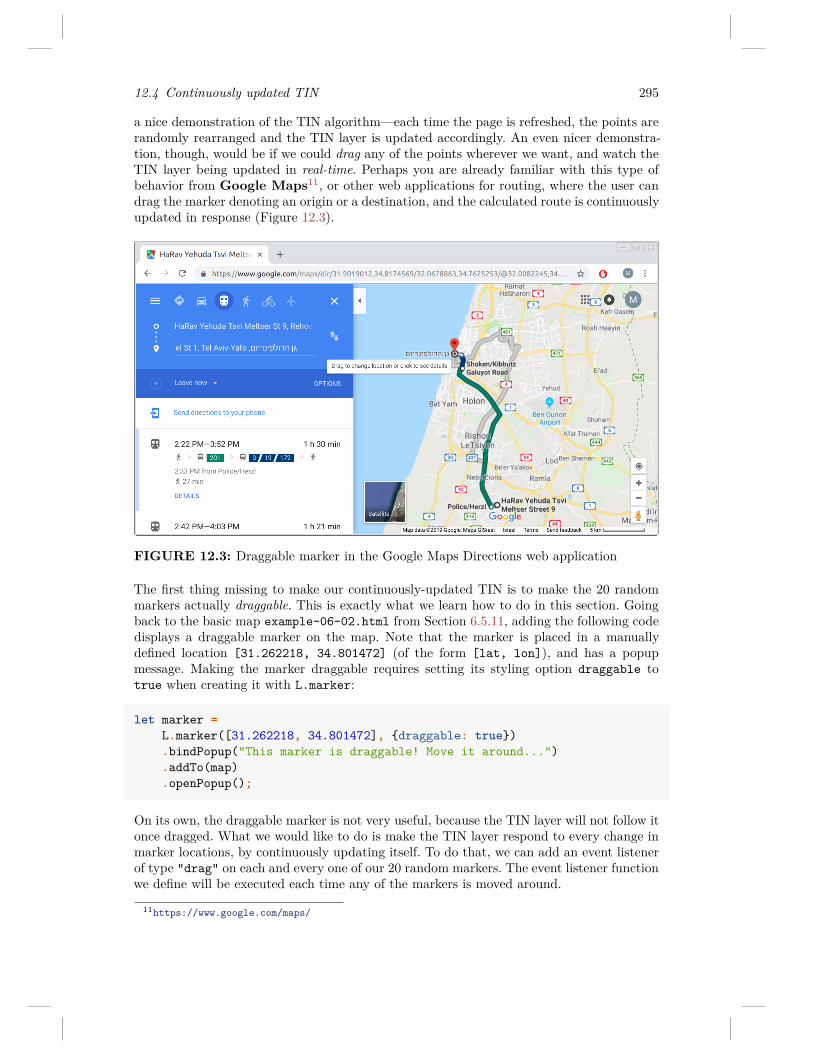
12.4 Continuously updated TIN 295
a nice demonstration of the TIN algorithm—each time the page is refreshed, the points arerandomly rearranged and the TIN layer is updated accordingly. An even nicer demonstra-tion, though, would be if we could drag any of the points wherever we want, and watch theTIN layer being updated in real-time. Perhaps you are already familiar with this type ofbehavior from Google Maps11, or other web applications for routing, where the user candrag the marker denoting an origin or a destination, and the calculated route is continuouslyupdated in response (Figure 12.3).
FIGURE 12.3: Draggable marker in the Google Maps Directions web application
The first thing missing to make our continuously-updated TIN is to make the 20 randommarkers actually draggable. This is exactly what we learn how to do in this section. Goingback to the basic map example-06-02.html from Section 6.5.11, adding the following codedisplays a draggable marker on the map. Note that the marker is placed in a manuallydefined location [31.262218, 34.801472] (of the form [lat, lon]), and has a popupmessage. Making the marker draggable requires setting its styling option draggable totrue when creating it with L.marker:
let marker =L.marker([31.262218, 34.801472], {draggable: true}).bindPopup("This marker is draggable! Move it around...").addTo(map).openPopup();
On its own, the draggable marker is not very useful, because the TIN layer will not follow itonce dragged. What we would like to do is make the TIN layer respond to every change inmarker locations, by continuously updating itself. To do that, we can add an event listenerof type "drag" on each and every one of our 20 random markers. The event listener functionwe define will be executed each time any of the markers is moved around.
11https://www.google.com/maps/
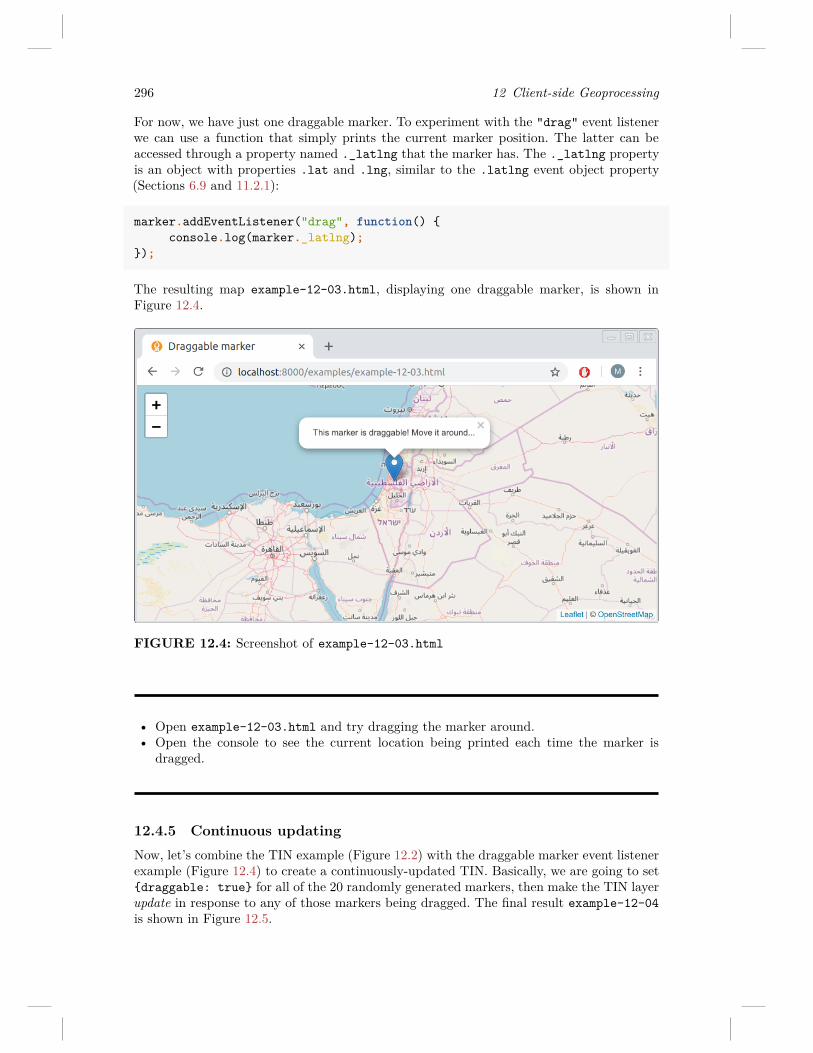
296 12 Client-side Geoprocessing
For now, we have just one draggable marker. To experiment with the "drag" event listenerwe can use a function that simply prints the current marker position. The latter can beaccessed through a property named ._latlng that the marker has. The ._latlng propertyis an object with properties .lat and .lng, similar to the .latlng event object property(Sections 6.9 and 11.2.1):
marker.addEventListener("drag", function() {console.log(marker._latlng);
});
The resulting map example-12-03.html, displaying one draggable marker, is shown inFigure 12.4.
FIGURE 12.4: Screenshot of example-12-03.html
• Open example-12-03.html and try dragging the marker around.• Open the console to see the current location being printed each time the marker is
dragged.
12.4.5 Continuous updatingNow, let’s combine the TIN example (Figure 12.2) with the draggable marker event listenerexample (Figure 12.4) to create a continuously-updated TIN. Basically, we are going to set{draggable: true} for all of the 20 randomly generated markers, then make the TIN layerupdate in response to any of those markers being dragged. The final result example-12-04is shown in Figure 12.5.
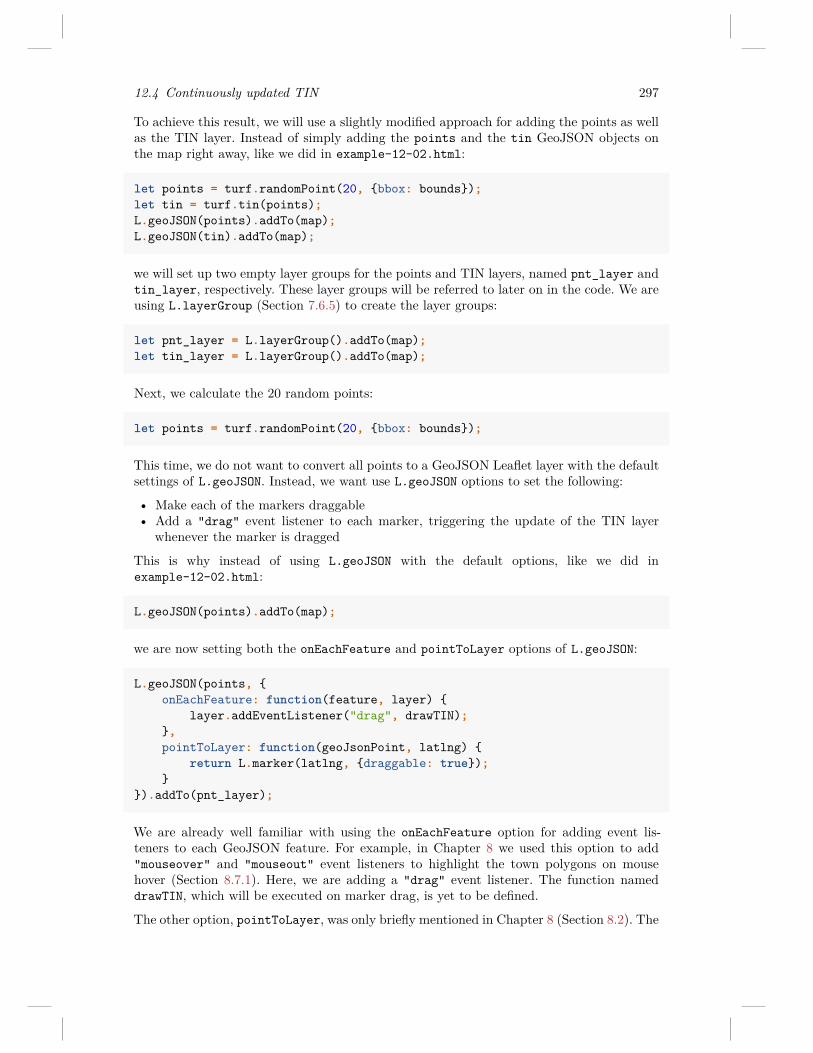
12.4 Continuously updated TIN 297
To achieve this result, we will use a slightly modified approach for adding the points as wellas the TIN layer. Instead of simply adding the points and the tin GeoJSON objects onthe map right away, like we did in example-12-02.html:
let points = turf.randomPoint(20, {bbox: bounds});let tin = turf.tin(points);L.geoJSON(points).addTo(map);L.geoJSON(tin).addTo(map);
we will set up two empty layer groups for the points and TIN layers, named pnt_layer andtin_layer, respectively. These layer groups will be referred to later on in the code. We areusing L.layerGroup (Section 7.6.5) to create the layer groups:
let pnt_layer = L.layerGroup().addTo(map);let tin_layer = L.layerGroup().addTo(map);
Next, we calculate the 20 random points:
let points = turf.randomPoint(20, {bbox: bounds});
This time, we do not want to convert all points to a GeoJSON Leaflet layer with the defaultsettings of L.geoJSON. Instead, we want use L.geoJSON options to set the following:
• Make each of the markers draggable• Add a "drag" event listener to each marker, triggering the update of the TIN layer
whenever the marker is dragged
This is why instead of using L.geoJSON with the default options, like we did inexample-12-02.html:
L.geoJSON(points).addTo(map);
we are now setting both the onEachFeature and pointToLayer options of L.geoJSON:
L.geoJSON(points, {onEachFeature: function(feature, layer) {
layer.addEventListener("drag", drawTIN);},pointToLayer: function(geoJsonPoint, latlng) {
return L.marker(latlng, {draggable: true});}
}).addTo(pnt_layer);
We are already well familiar with using the onEachFeature option for adding event lis-teners to each GeoJSON feature. For example, in Chapter 8 we used this option to add"mouseover" and "mouseout" event listeners to highlight the town polygons on mousehover (Section 8.7.1). Here, we are adding a "drag" event listener. The function nameddrawTIN, which will be executed on marker drag, is yet to be defined.
The other option, pointToLayer, was only briefly mentioned in Chapter 8 (Section 8.2). The
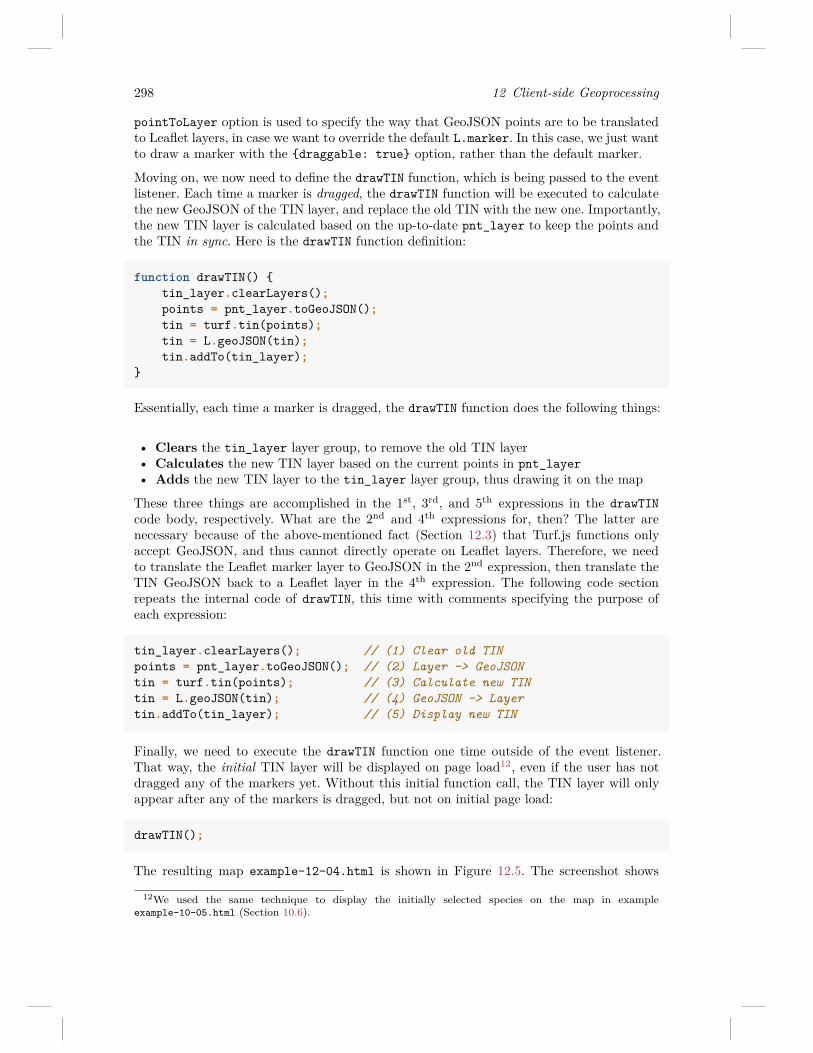
298 12 Client-side Geoprocessing
pointToLayer option is used to specify the way that GeoJSON points are to be translatedto Leaflet layers, in case we want to override the default L.marker. In this case, we just wantto draw a marker with the {draggable: true} option, rather than the default marker.
Moving on, we now need to define the drawTIN function, which is being passed to the eventlistener. Each time a marker is dragged, the drawTIN function will be executed to calculatethe new GeoJSON of the TIN layer, and replace the old TIN with the new one. Importantly,the new TIN layer is calculated based on the up-to-date pnt_layer to keep the points andthe TIN in sync. Here is the drawTIN function definition:
function drawTIN() {tin_layer.clearLayers();points = pnt_layer.toGeoJSON();tin = turf.tin(points);tin = L.geoJSON(tin);tin.addTo(tin_layer);
}
Essentially, each time a marker is dragged, the drawTIN function does the following things:
• Clears the tin_layer layer group, to remove the old TIN layer• Calculates the new TIN layer based on the current points in pnt_layer• Adds the new TIN layer to the tin_layer layer group, thus drawing it on the map
These three things are accomplished in the 1st, 3rd, and 5th expressions in the drawTINcode body, respectively. What are the 2nd and 4th expressions for, then? The latter arenecessary because of the above-mentioned fact (Section 12.3) that Turf.js functions onlyaccept GeoJSON, and thus cannot directly operate on Leaflet layers. Therefore, we needto translate the Leaflet marker layer to GeoJSON in the 2nd expression, then translate theTIN GeoJSON back to a Leaflet layer in the 4th expression. The following code sectionrepeats the internal code of drawTIN, this time with comments specifying the purpose ofeach expression:
tin_layer.clearLayers(); // (1) Clear old TINpoints = pnt_layer.toGeoJSON(); // (2) Layer -> GeoJSONtin = turf.tin(points); // (3) Calculate new TINtin = L.geoJSON(tin); // (4) GeoJSON -> Layertin.addTo(tin_layer); // (5) Display new TIN
Finally, we need to execute the drawTIN function one time outside of the event listener.That way, the initial TIN layer will be displayed on page load12, even if the user has notdragged any of the markers yet. Without this initial function call, the TIN layer will onlyappear after any of the markers is dragged, but not on initial page load:
drawTIN();
The resulting map example-12-04.html is shown in Figure 12.5. The screenshot shows
12We used the same technique to display the initially selected species on the map in exampleexample-10-05.html (Section 10.6).
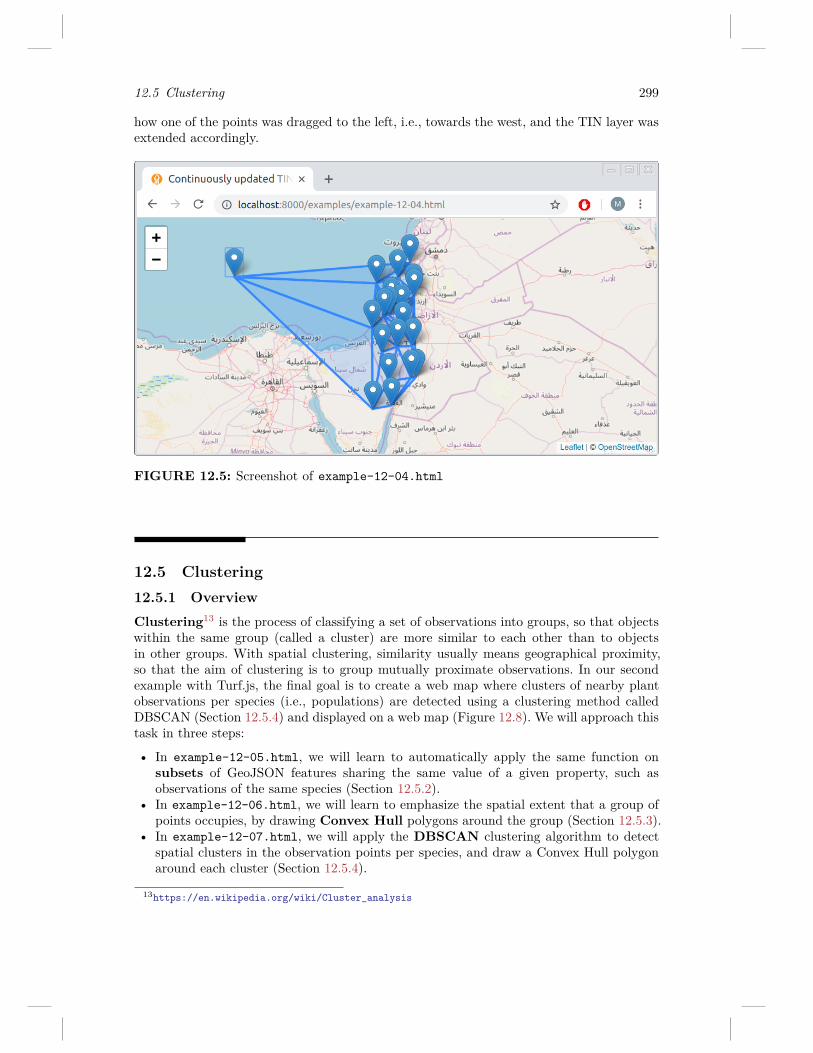
12.5 Clustering 299
how one of the points was dragged to the left, i.e., towards the west, and the TIN layer wasextended accordingly.
FIGURE 12.5: Screenshot of example-12-04.html
12.5 Clustering12.5.1 OverviewClustering13 is the process of classifying a set of observations into groups, so that objectswithin the same group (called a cluster) are more similar to each other than to objectsin other groups. With spatial clustering, similarity usually means geographical proximity,so that the aim of clustering is to group mutually proximate observations. In our secondexample with Turf.js, the final goal is to create a web map where clusters of nearby plantobservations per species (i.e., populations) are detected using a clustering method calledDBSCAN (Section 12.5.4) and displayed on a web map (Figure 12.8). We will approach thistask in three steps:
• In example-12-05.html, we will learn to automatically apply the same function onsubsets of GeoJSON features sharing the same value of a given property, such asobservations of the same species (Section 12.5.2).
• In example-12-06.html, we will learn to emphasize the spatial extent that a group ofpoints occupies, by drawing Convex Hull polygons around the group (Section 12.5.3).
• In example-12-07.html, we will apply the DBSCAN clustering algorithm to detectspatial clusters in the observation points per species, and draw a Convex Hull polygonaround each cluster (Section 12.5.4).
13https://en.wikipedia.org/wiki/Cluster_analysis
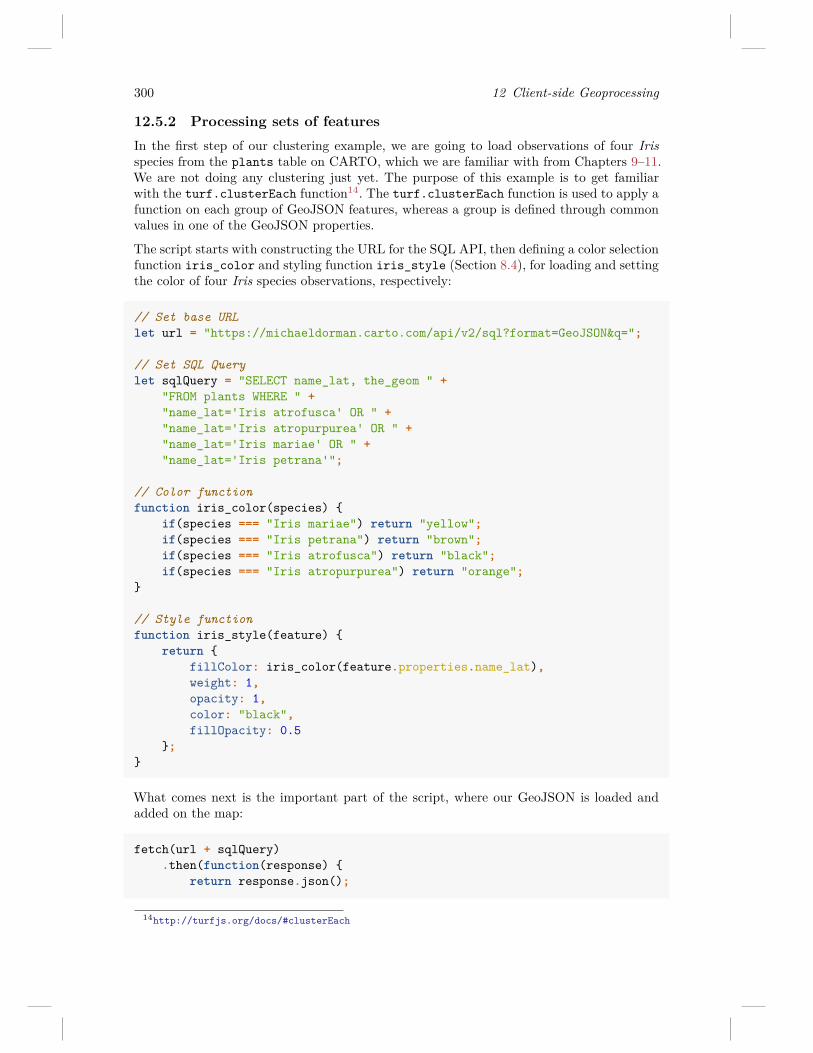
300 12 Client-side Geoprocessing
12.5.2 Processing sets of featuresIn the first step of our clustering example, we are going to load observations of four Irisspecies from the plants table on CARTO, which we are familiar with from Chapters 9–11.We are not doing any clustering just yet. The purpose of this example is to get familiarwith the turf.clusterEach function14. The turf.clusterEach function is used to apply afunction on each group of GeoJSON features, whereas a group is defined through commonvalues in one of the GeoJSON properties.
The script starts with constructing the URL for the SQL API, then defining a color selectionfunction iris_color and styling function iris_style (Section 8.4), for loading and settingthe color of four Iris species observations, respectively:
// Set base URLlet url = "https://michaeldorman.carto.com/api/v2/sql?format=GeoJSON&q=";
// Set SQL Querylet sqlQuery = "SELECT name_lat, the_geom " +
"FROM plants WHERE " +"name_lat='Iris atrofusca' OR " +"name_lat='Iris atropurpurea' OR " +"name_lat='Iris mariae' OR " +"name_lat='Iris petrana'";
// Color functionfunction iris_color(species) {
if(species === "Iris mariae") return "yellow";if(species === "Iris petrana") return "brown";if(species === "Iris atrofusca") return "black";if(species === "Iris atropurpurea") return "orange";
}
// Style functionfunction iris_style(feature) {
return {fillColor: iris_color(feature.properties.name_lat),weight: 1,opacity: 1,color: "black",fillOpacity: 0.5
};}
What comes next is the important part of the script, where our GeoJSON is loaded andadded on the map:
fetch(url + sqlQuery).then(function(response) {
return response.json();
14http://turfjs.org/docs/#clusterEach
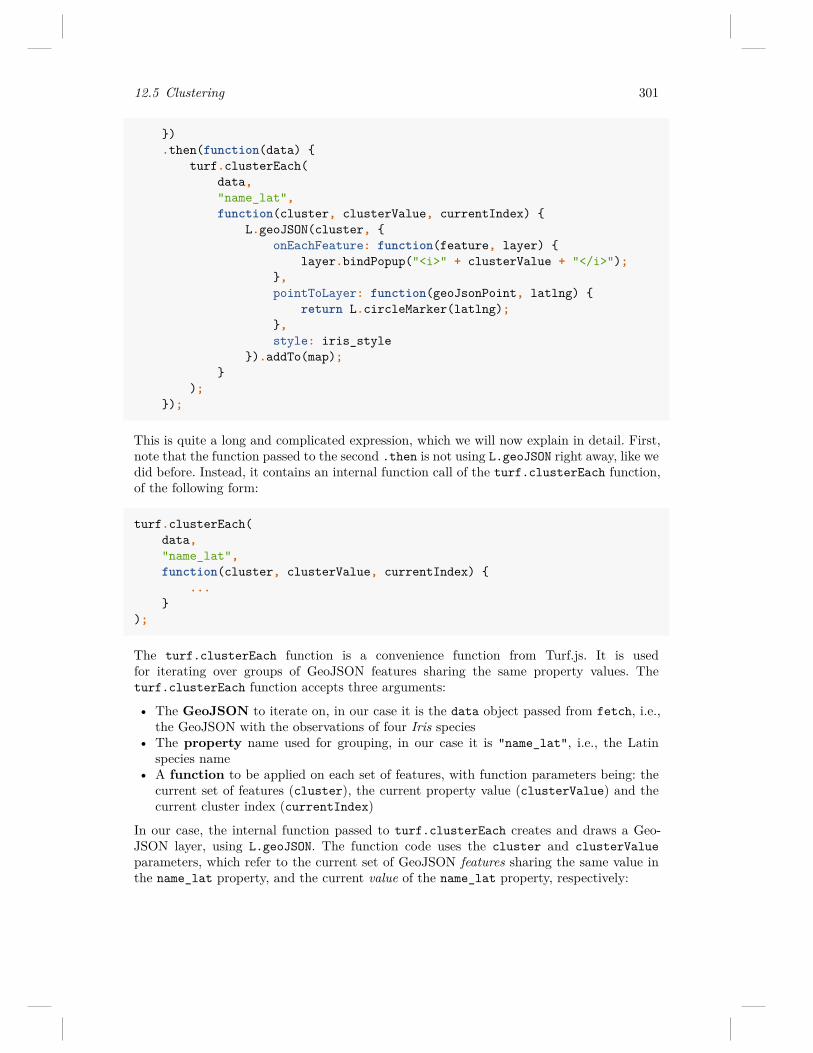
12.5 Clustering 301
}).then(function(data) {
turf.clusterEach(data,"name_lat",function(cluster, clusterValue, currentIndex) {
L.geoJSON(cluster, {onEachFeature: function(feature, layer) {
layer.bindPopup("<i>" + clusterValue + "</i>");},pointToLayer: function(geoJsonPoint, latlng) {
return L.circleMarker(latlng);},style: iris_style
}).addTo(map);}
);});
This is quite a long and complicated expression, which we will now explain in detail. First,note that the function passed to the second .then is not using L.geoJSON right away, like wedid before. Instead, it contains an internal function call of the turf.clusterEach function,of the following form:
turf.clusterEach(data,"name_lat",function(cluster, clusterValue, currentIndex) {
...}
);
The turf.clusterEach function is a convenience function from Turf.js. It is usedfor iterating over groups of GeoJSON features sharing the same property values. Theturf.clusterEach function accepts three arguments:
• The GeoJSON to iterate on, in our case it is the data object passed from fetch, i.e.,the GeoJSON with the observations of four Iris species
• The property name used for grouping, in our case it is "name_lat", i.e., the Latinspecies name
• A function to be applied on each set of features, with function parameters being: thecurrent set of features (cluster), the current property value (clusterValue) and thecurrent cluster index (currentIndex)
In our case, the internal function passed to turf.clusterEach creates and draws a Geo-JSON layer, using L.geoJSON. The function code uses the cluster and clusterValueparameters, which refer to the current set of GeoJSON features sharing the same value inthe name_lat property, and the current value of the name_lat property, respectively:
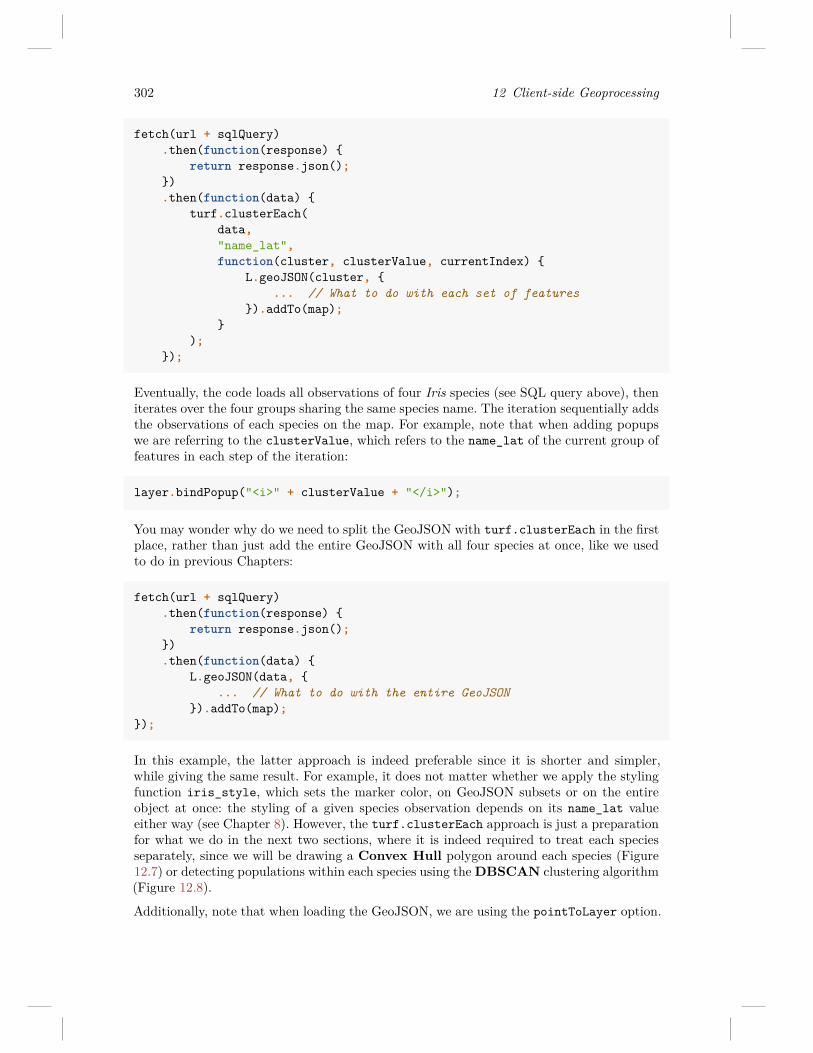
302 12 Client-side Geoprocessing
fetch(url + sqlQuery).then(function(response) {
return response.json();}).then(function(data) {
turf.clusterEach(data,"name_lat",function(cluster, clusterValue, currentIndex) {
L.geoJSON(cluster, {... // What to do with each set of features
}).addTo(map);}
);});
Eventually, the code loads all observations of four Iris species (see SQL query above), theniterates over the four groups sharing the same species name. The iteration sequentially addsthe observations of each species on the map. For example, note that when adding popupswe are referring to the clusterValue, which refers to the name_lat of the current group offeatures in each step of the iteration:
layer.bindPopup("<i>" + clusterValue + "</i>");
You may wonder why do we need to split the GeoJSON with turf.clusterEach in the firstplace, rather than just add the entire GeoJSON with all four species at once, like we usedto do in previous Chapters:
fetch(url + sqlQuery).then(function(response) {
return response.json();}).then(function(data) {
L.geoJSON(data, {... // What to do with the entire GeoJSON
}).addTo(map);});
In this example, the latter approach is indeed preferable since it is shorter and simpler,while giving the same result. For example, it does not matter whether we apply the stylingfunction iris_style, which sets the marker color, on GeoJSON subsets or on the entireobject at once: the styling of a given species observation depends on its name_lat valueeither way (see Chapter 8). However, the turf.clusterEach approach is just a preparationfor what we do in the next two sections, where it is indeed required to treat each speciesseparately, since we will be drawing a Convex Hull polygon around each species (Figure12.7) or detecting populations within each species using the DBSCAN clustering algorithm(Figure 12.8).
Additionally, note that when loading the GeoJSON, we are using the pointToLayer option.
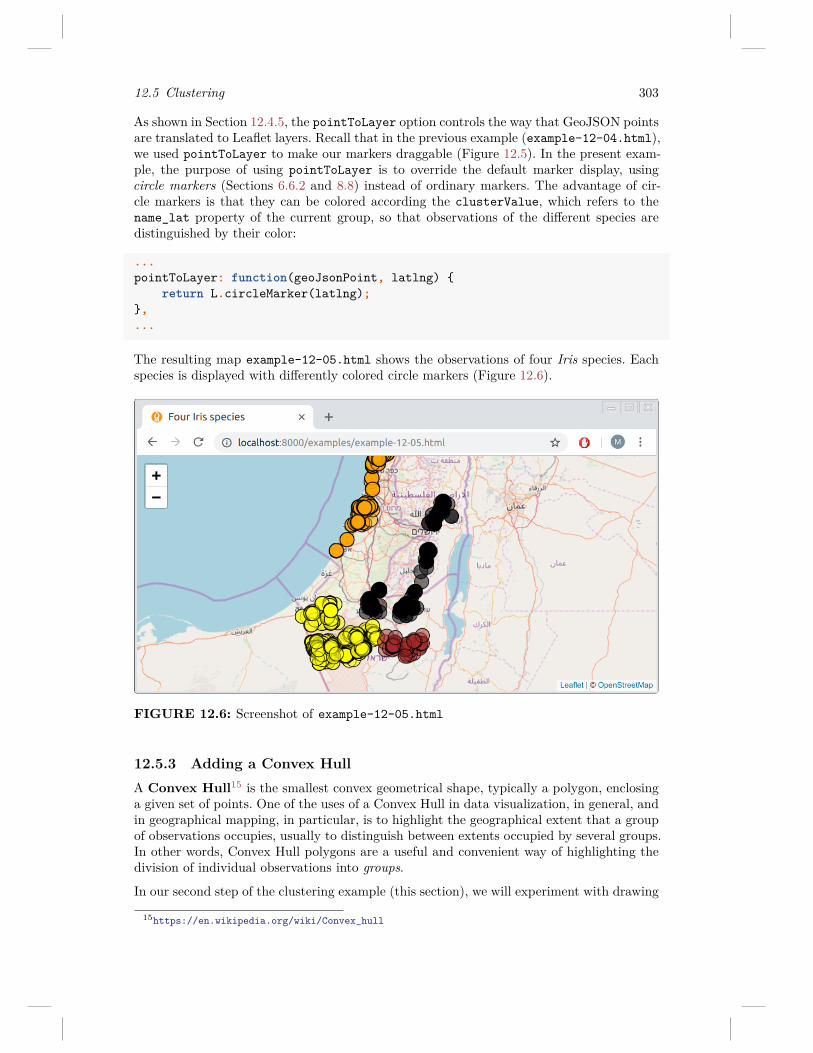
12.5 Clustering 303
As shown in Section 12.4.5, the pointToLayer option controls the way that GeoJSON pointsare translated to Leaflet layers. Recall that in the previous example (example-12-04.html),we used pointToLayer to make our markers draggable (Figure 12.5). In the present exam-ple, the purpose of using pointToLayer is to override the default marker display, usingcircle markers (Sections 6.6.2 and 8.8) instead of ordinary markers. The advantage of cir-cle markers is that they can be colored according the clusterValue, which refers to thename_lat property of the current group, so that observations of the different species aredistinguished by their color:
...pointToLayer: function(geoJsonPoint, latlng) {
return L.circleMarker(latlng);},...
The resulting map example-12-05.html shows the observations of four Iris species. Eachspecies is displayed with differently colored circle markers (Figure 12.6).
FIGURE 12.6: Screenshot of example-12-05.html
12.5.3 Adding a Convex HullA Convex Hull15 is the smallest convex geometrical shape, typically a polygon, enclosinga given set of points. One of the uses of a Convex Hull in data visualization, in general, andin geographical mapping, in particular, is to highlight the geographical extent that a groupof observations occupies, usually to distinguish between extents occupied by several groups.In other words, Convex Hull polygons are a useful and convenient way of highlighting thedivision of individual observations into groups.
In our second step of the clustering example (this section), we will experiment with drawing
15https://en.wikipedia.org/wiki/Convex_hull
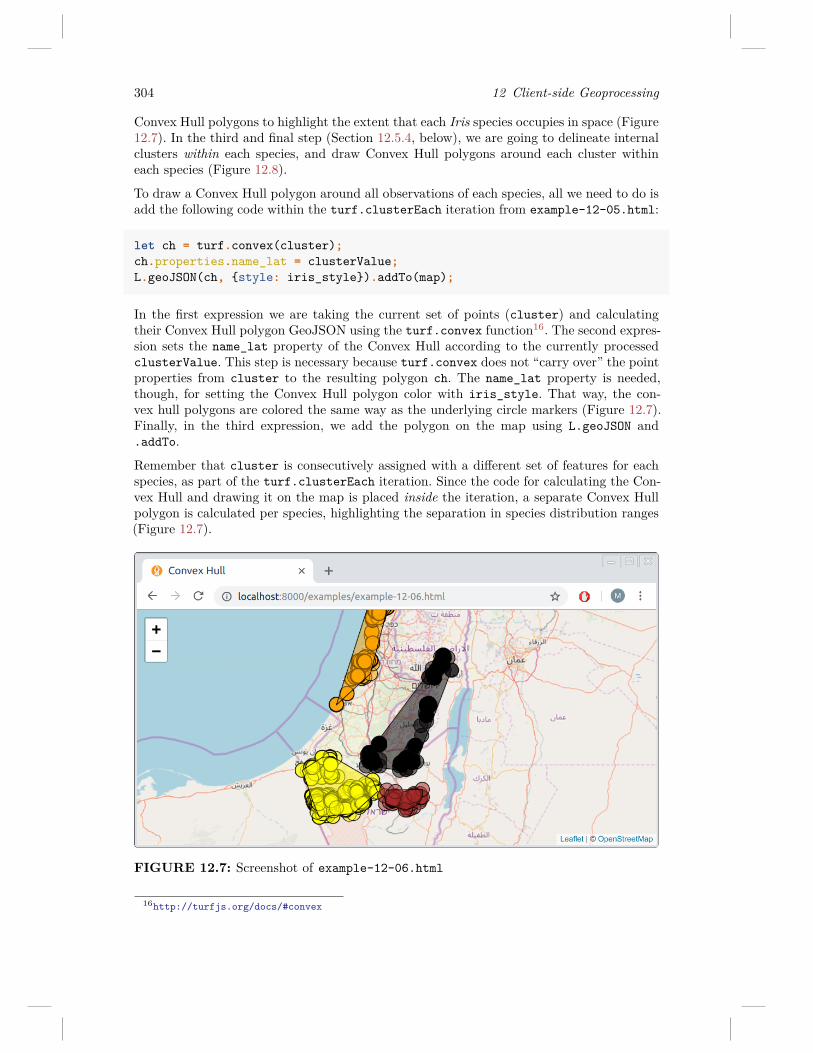
304 12 Client-side Geoprocessing
Convex Hull polygons to highlight the extent that each Iris species occupies in space (Figure12.7). In the third and final step (Section 12.5.4, below), we are going to delineate internalclusters within each species, and draw Convex Hull polygons around each cluster withineach species (Figure 12.8).
To draw a Convex Hull polygon around all observations of each species, all we need to do isadd the following code within the turf.clusterEach iteration from example-12-05.html:
let ch = turf.convex(cluster);ch.properties.name_lat = clusterValue;L.geoJSON(ch, {style: iris_style}).addTo(map);
In the first expression we are taking the current set of points (cluster) and calculatingtheir Convex Hull polygon GeoJSON using the turf.convex function16. The second expres-sion sets the name_lat property of the Convex Hull according to the currently processedclusterValue. This step is necessary because turf.convex does not “carry over” the pointproperties from cluster to the resulting polygon ch. The name_lat property is needed,though, for setting the Convex Hull polygon color with iris_style. That way, the con-vex hull polygons are colored the same way as the underlying circle markers (Figure 12.7).Finally, in the third expression, we add the polygon on the map using L.geoJSON and.addTo.
Remember that cluster is consecutively assigned with a different set of features for eachspecies, as part of the turf.clusterEach iteration. Since the code for calculating the Con-vex Hull and drawing it on the map is placed inside the iteration, a separate Convex Hullpolygon is calculated per species, highlighting the separation in species distribution ranges(Figure 12.7).
FIGURE 12.7: Screenshot of example-12-06.html
16http://turfjs.org/docs/#convex
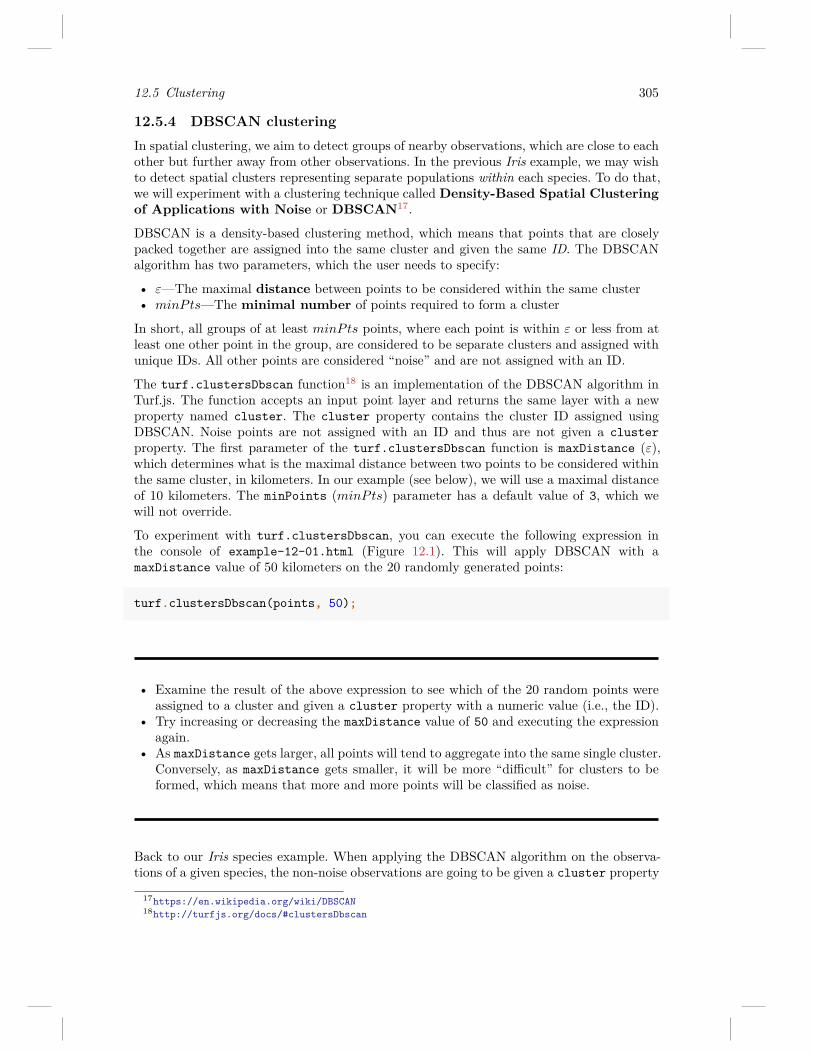
12.5 Clustering 305
12.5.4 DBSCAN clusteringIn spatial clustering, we aim to detect groups of nearby observations, which are close to eachother but further away from other observations. In the previous Iris example, we may wishto detect spatial clusters representing separate populations within each species. To do that,we will experiment with a clustering technique called Density-Based Spatial Clusteringof Applications with Noise or DBSCAN17.
DBSCAN is a density-based clustering method, which means that points that are closelypacked together are assigned into the same cluster and given the same ID. The DBSCANalgorithm has two parameters, which the user needs to specify:
• 𝜀—The maximal distance between points to be considered within the same cluster• 𝑚𝑖𝑛𝑃𝑡𝑠—The minimal number of points required to form a cluster
In short, all groups of at least 𝑚𝑖𝑛𝑃𝑡𝑠 points, where each point is within 𝜀 or less from atleast one other point in the group, are considered to be separate clusters and assigned withunique IDs. All other points are considered “noise” and are not assigned with an ID.
The turf.clustersDbscan function18 is an implementation of the DBSCAN algorithm inTurf.js. The function accepts an input point layer and returns the same layer with a newproperty named cluster. The cluster property contains the cluster ID assigned usingDBSCAN. Noise points are not assigned with an ID and thus are not given a clusterproperty. The first parameter of the turf.clustersDbscan function is maxDistance (𝜀),which determines what is the maximal distance between two points to be considered withinthe same cluster, in kilometers. In our example (see below), we will use a maximal distanceof 10 kilometers. The minPoints (𝑚𝑖𝑛𝑃𝑡𝑠) parameter has a default value of 3, which wewill not override.
To experiment with turf.clustersDbscan, you can execute the following expression inthe console of example-12-01.html (Figure 12.1). This will apply DBSCAN with amaxDistance value of 50 kilometers on the 20 randomly generated points:
turf.clustersDbscan(points, 50);
• Examine the result of the above expression to see which of the 20 random points wereassigned to a cluster and given a cluster property with a numeric value (i.e., the ID).
• Try increasing or decreasing the maxDistance value of 50 and executing the expressionagain.
• As maxDistance gets larger, all points will tend to aggregate into the same single cluster.Conversely, as maxDistance gets smaller, it will be more “difficult” for clusters to beformed, which means that more and more points will be classified as noise.
Back to our Iris species example. When applying the DBSCAN algorithm on the observa-tions of a given species, the non-noise observations are going to be given a cluster property
17https://en.wikipedia.org/wiki/DBSCAN18http://turfjs.org/docs/#clustersDbscan
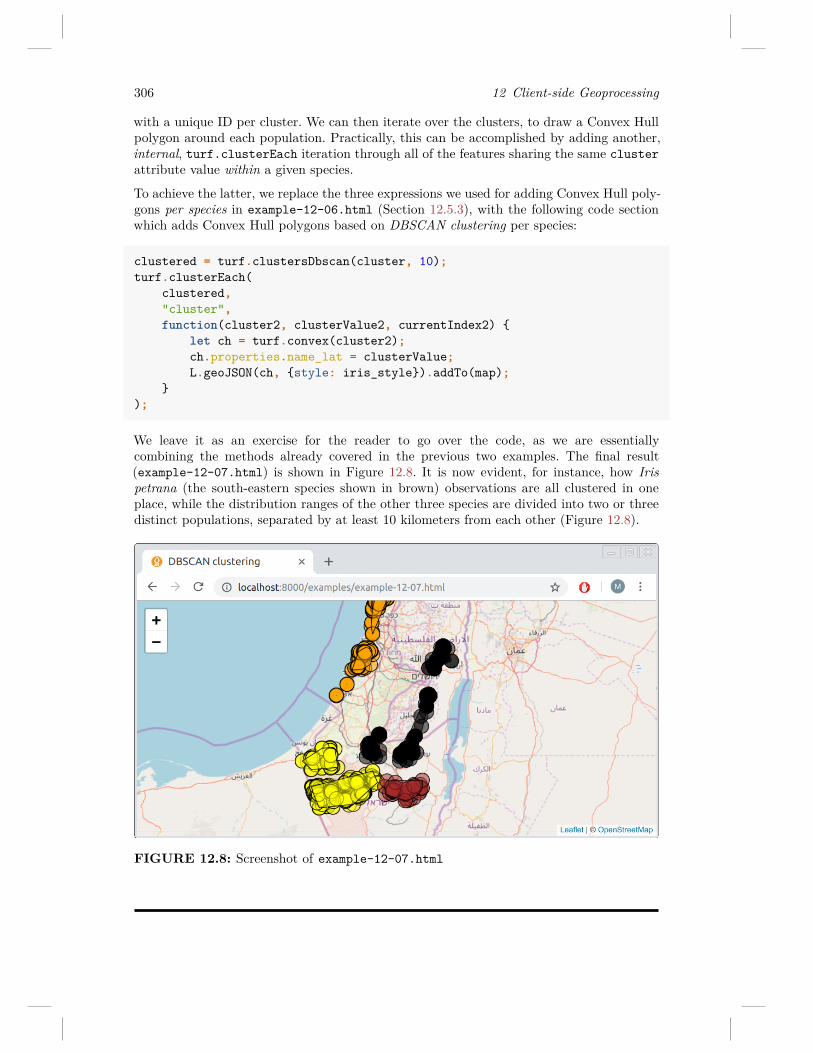
306 12 Client-side Geoprocessing
with a unique ID per cluster. We can then iterate over the clusters, to draw a Convex Hullpolygon around each population. Practically, this can be accomplished by adding another,internal, turf.clusterEach iteration through all of the features sharing the same clusterattribute value within a given species.
To achieve the latter, we replace the three expressions we used for adding Convex Hull poly-gons per species in example-12-06.html (Section 12.5.3), with the following code sectionwhich adds Convex Hull polygons based on DBSCAN clustering per species:
clustered = turf.clustersDbscan(cluster, 10);turf.clusterEach(
clustered,"cluster",function(cluster2, clusterValue2, currentIndex2) {
let ch = turf.convex(cluster2);ch.properties.name_lat = clusterValue;L.geoJSON(ch, {style: iris_style}).addTo(map);
});
We leave it as an exercise for the reader to go over the code, as we are essentiallycombining the methods already covered in the previous two examples. The final result(example-12-07.html) is shown in Figure 12.8. It is now evident, for instance, how Irispetrana (the south-eastern species shown in brown) observations are all clustered in oneplace, while the distribution ranges of the other three species are divided into two or threedistinct populations, separated by at least 10 kilometers from each other (Figure 12.8).
FIGURE 12.8: Screenshot of example-12-07.html
12.6 Heatmaps with Leaflet.heat 307
• Expand example-12-07.html, adding popups for the Convex Hull polygons to displaythe species name and the cluster ID when clicked.
• Modify the maximal distance parameter in turf.clustersDbscan (currently set to 10)and check out how the clustering result changes. What is the reason for the console errorwhen maxDistance is very small? How can we address the problem?
12.6 Heatmaps with Leaflet.heatTurf.js is one of the most comprehensive client-side geoprocessing JavaScript libraries, butit is not the only one. The Leaflet.heat19 library, for example, is a geoprocessing pluginfor the Leaflet library. The term “plugin”, in this context, means that Leaflet.heat is anextension of the Leaflet library and thus cannot be used without Leaflet, unlike Turf.js,which is an independent library that can be used with Leaflet or with any other library,or even on its own. Also, unlike Turf.js, which is a general-purpose geoprocessing library,Leaflet.heat does just one thing—drawing a heatmap to display the density of point data.The Leaflet.heat plugin is one of many created to extend the core functionality of Leaflet20.
Drawing individual points can be visually overwhelming, slow, and hard to comprehendwhen there are too many of them. Heatmaps are a convenient alternative way of conveyingthe distribution of large amounts of point data. A heatmap is basically a way to summarizeand display point density, instead of showing each and every individual point. Technicallyspeaking, a heatmap uses two-dimensional Kernel Density Estimation (KDE)21 tocalculate a smooth surface representing point density.
The following example (example-12-08.html) draws a heatmap of all rare plant observa-tions from the plants table on CARTO. Overall, there are 23,827 points in the plantstable (Section 10.4.1). Drawing markers, or even the simpler circle markers, for such a largeamount of points is usually not a good idea. First, it may cause the browser to becomeunresponsive due to computational intensity. Second, it is usually difficult to pick the rightstyling (size, opacity, etc.) for each point so that dense locations are clearly distinguished onthe various map zoom levels the user may choose. This is where the density-based heatmapsbecome very useful. Particularly, the Leaflet.heat library automatically re-calculates theheatmap for each zoom level, allowing the user to conveniently explore point density onboth large and small scales.
To use the Leaflet.heat library we first need to load it. Again, we will use a local copy:
<script src="js/leaflet.heat.js"></script>
which can be downloaded, or directly referenced, using the following URL:
https://leaflet.github.io/Leaflet.heat/dist/leaflet-heat.js
19https://github.com/Leaflet/Leaflet.heat20In Chapter 13, we are going to work with another Leaflet plugin, called Leaflet.draw. See the Leaflet
Plugins section in the Leaflet documentation (https://leafletjs.com/plugins.html) for the complete listof Leaflet plugins.
21https://en.wikipedia.org/wiki/Kernel_density_estimation
308 12 Client-side Geoprocessing
Next, when loading the plant observations GeoJSON we need to convert it to an array of[lat, lon, intensity] arrays, which is the data structure that the Leaflet.heat libraryexpects. The intensity value can be used to give different weights to each point:
[[lat, lon, intensity],[lat, lon, intensity],[lat, lon, intensity],...
]
There are many possible ways to go from a GeoJSON of type "FeatureCollection", com-posed of "Point" features, to the array structure shown above. The code section belowshows one way to do it, using the .forEach array iteration method (Section 3.10.3.3). The.forEach iteration goes over the features of a GeoJSON object named data, such as theresult of a CARTO SQL API request obtained with fetch. For each of the features, thelatitude and longitude are extracted into an array of the form [lat, lon], along with theconstant intensity value of 0.5 which gives all points equal weights when calculating density.When the iteration ends, we have an array named locations, containing 23,827 triplets ofthe form [lat, lon, intensity].
let locations = [];data.features.forEach(function(element) {
let coords = element.geometry.coordinates;let location = [coords[1], coords[0], 0.5];locations.push(location);
});
Once the locations array is ready, we can run the L.heatLayer function on the array tocreate the heatmap layer, then add it on our map. The additional parameters define theradius of each point on the map (i.e., the smoothing kernel width) and the minimal heatmapopacity:
L.heatLayer(locations, {radius: 20, minOpacity: 0.5}).addTo(map);
The resulting map example-12-08.html, with the heatmap, is shown in Figure 12.9.
12.7 Exercise• Create a web map with two markers and a Great Circle line between them, where the
Great Circle line is continuously updated whenever the markers are dragged (Figure12.10).
• Use example-12-04.html (Figure 12.5) for guidance on how to make the Great Circleline continuously updated.
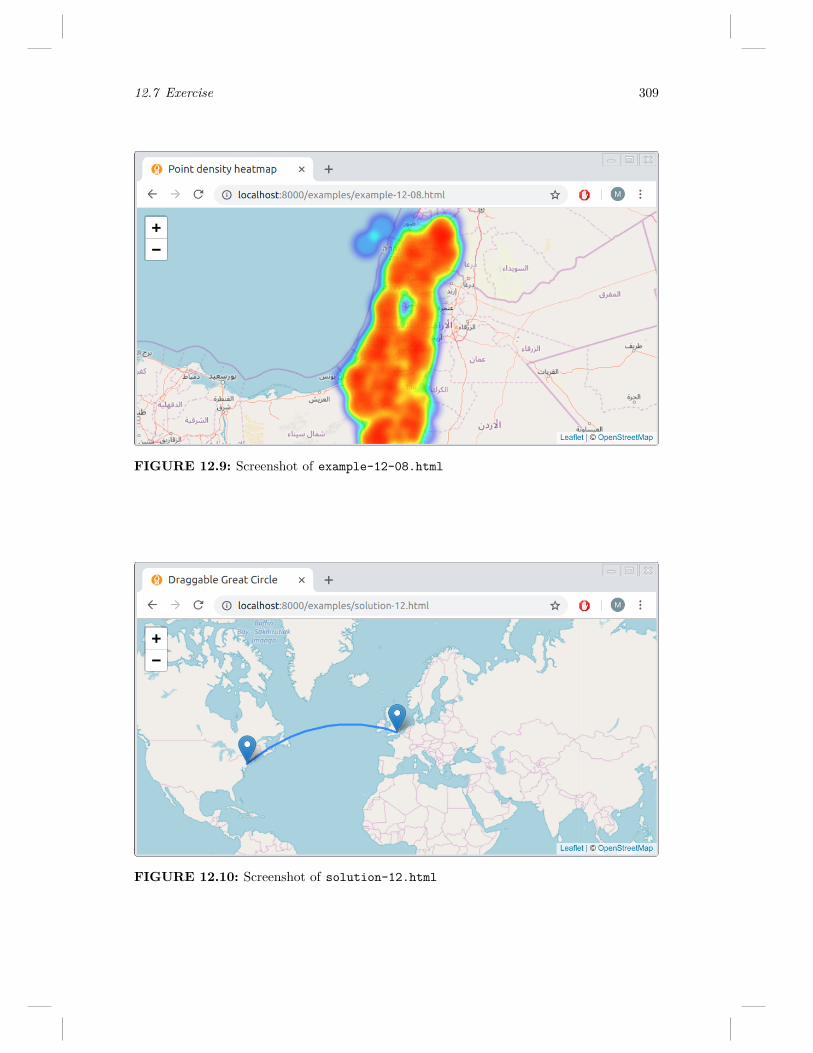
12.7 Exercise 309
FIGURE 12.9: Screenshot of example-12-08.html
FIGURE 12.10: Screenshot of solution-12.html

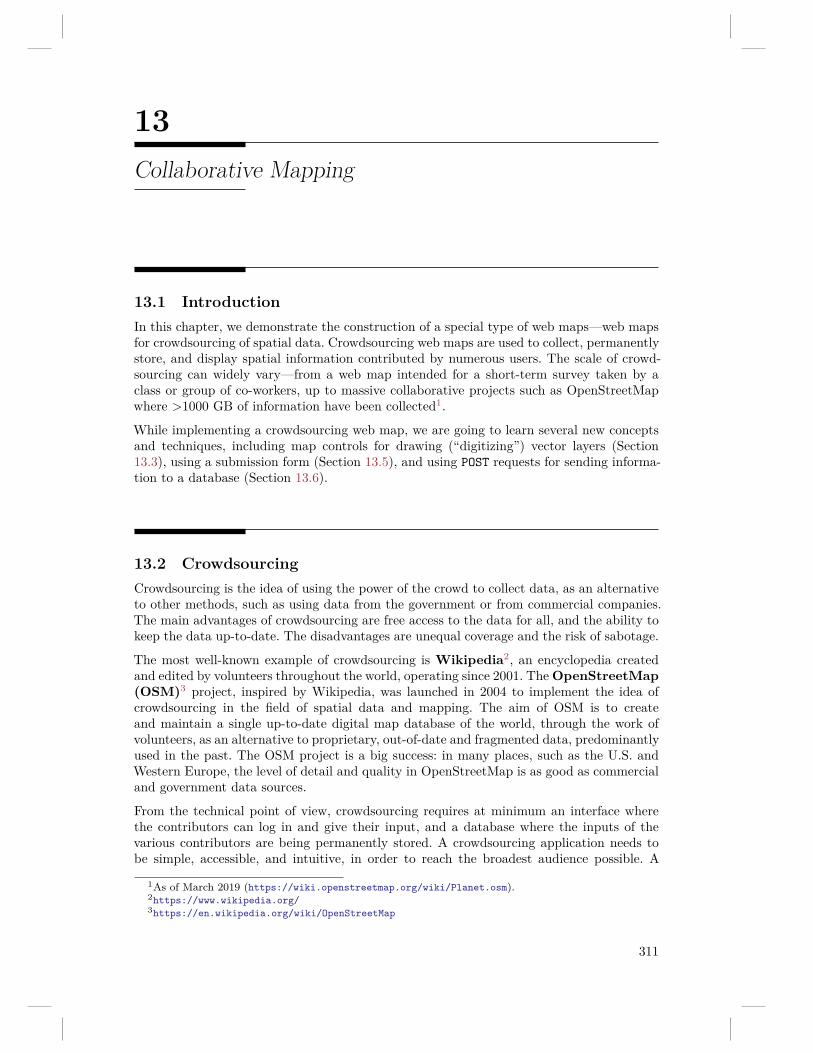
13Collaborative Mapping
13.1 IntroductionIn this chapter, we demonstrate the construction of a special type of web maps—web mapsfor crowdsourcing of spatial data. Crowdsourcing web maps are used to collect, permanentlystore, and display spatial information contributed by numerous users. The scale of crowd-sourcing can widely vary—from a web map intended for a short-term survey taken by aclass or group of co-workers, up to massive collaborative projects such as OpenStreetMapwhere >1000 GB of information have been collected1.
While implementing a crowdsourcing web map, we are going to learn several new conceptsand techniques, including map controls for drawing (“digitizing”) vector layers (Section13.3), using a submission form (Section 13.5), and using POST requests for sending informa-tion to a database (Section 13.6).
13.2 CrowdsourcingCrowdsourcing is the idea of using the power of the crowd to collect data, as an alternativeto other methods, such as using data from the government or from commercial companies.The main advantages of crowdsourcing are free access to the data for all, and the ability tokeep the data up-to-date. The disadvantages are unequal coverage and the risk of sabotage.
The most well-known example of crowdsourcing is Wikipedia2, an encyclopedia createdand edited by volunteers throughout the world, operating since 2001. The OpenStreetMap(OSM)3 project, inspired by Wikipedia, was launched in 2004 to implement the idea ofcrowdsourcing in the field of spatial data and mapping. The aim of OSM is to createand maintain a single up-to-date digital map database of the world, through the work ofvolunteers, as an alternative to proprietary, out-of-date and fragmented data, predominantlyused in the past. The OSM project is a big success: in many places, such as the U.S. andWestern Europe, the level of detail and quality in OpenStreetMap is as good as commercialand government data sources.
From the technical point of view, crowdsourcing requires at minimum an interface wherethe contributors can log in and give their input, and a database where the inputs of thevarious contributors are being permanently stored. A crowdsourcing application needs tobe simple, accessible, and intuitive, in order to reach the broadest audience possible. A
1As of March 2019 (https://wiki.openstreetmap.org/wiki/Planet.osm).2https://www.wikipedia.org/3https://en.wikipedia.org/wiki/OpenStreetMap
311
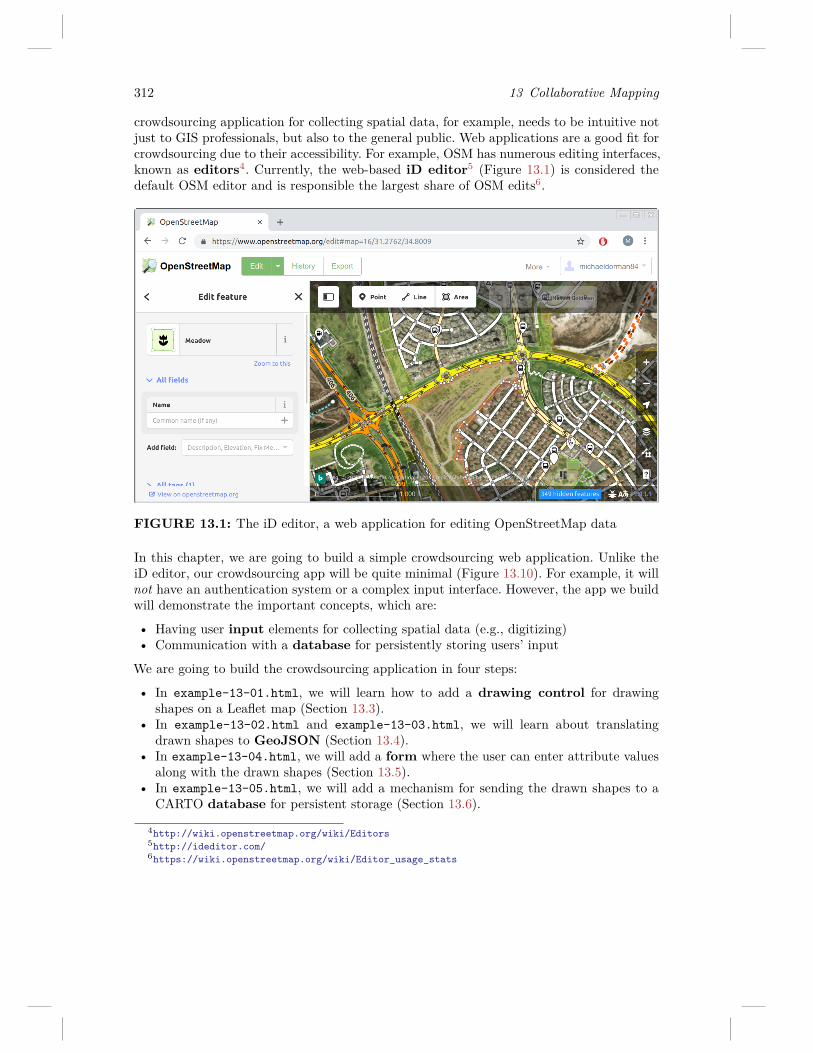
312 13 Collaborative Mapping
crowdsourcing application for collecting spatial data, for example, needs to be intuitive notjust to GIS professionals, but also to the general public. Web applications are a good fit forcrowdsourcing due to their accessibility. For example, OSM has numerous editing interfaces,known as editors4. Currently, the web-based iD editor5 (Figure 13.1) is considered thedefault OSM editor and is responsible the largest share of OSM edits6.
FIGURE 13.1: The iD editor, a web application for editing OpenStreetMap data
In this chapter, we are going to build a simple crowdsourcing web application. Unlike theiD editor, our crowdsourcing app will be quite minimal (Figure 13.10). For example, it willnot have an authentication system or a complex input interface. However, the app we buildwill demonstrate the important concepts, which are:
• Having user input elements for collecting spatial data (e.g., digitizing)• Communication with a database for persistently storing users’ input
We are going to build the crowdsourcing application in four steps:
• In example-13-01.html, we will learn how to add a drawing control for drawingshapes on a Leaflet map (Section 13.3).
• In example-13-02.html and example-13-03.html, we will learn about translatingdrawn shapes to GeoJSON (Section 13.4).
• In example-13-04.html, we will add a form where the user can enter attribute valuesalong with the drawn shapes (Section 13.5).
• In example-13-05.html, we will add a mechanism for sending the drawn shapes to aCARTO database for persistent storage (Section 13.6).
4http://wiki.openstreetmap.org/wiki/Editors5http://ideditor.com/6https://wiki.openstreetmap.org/wiki/Editor_usage_stats
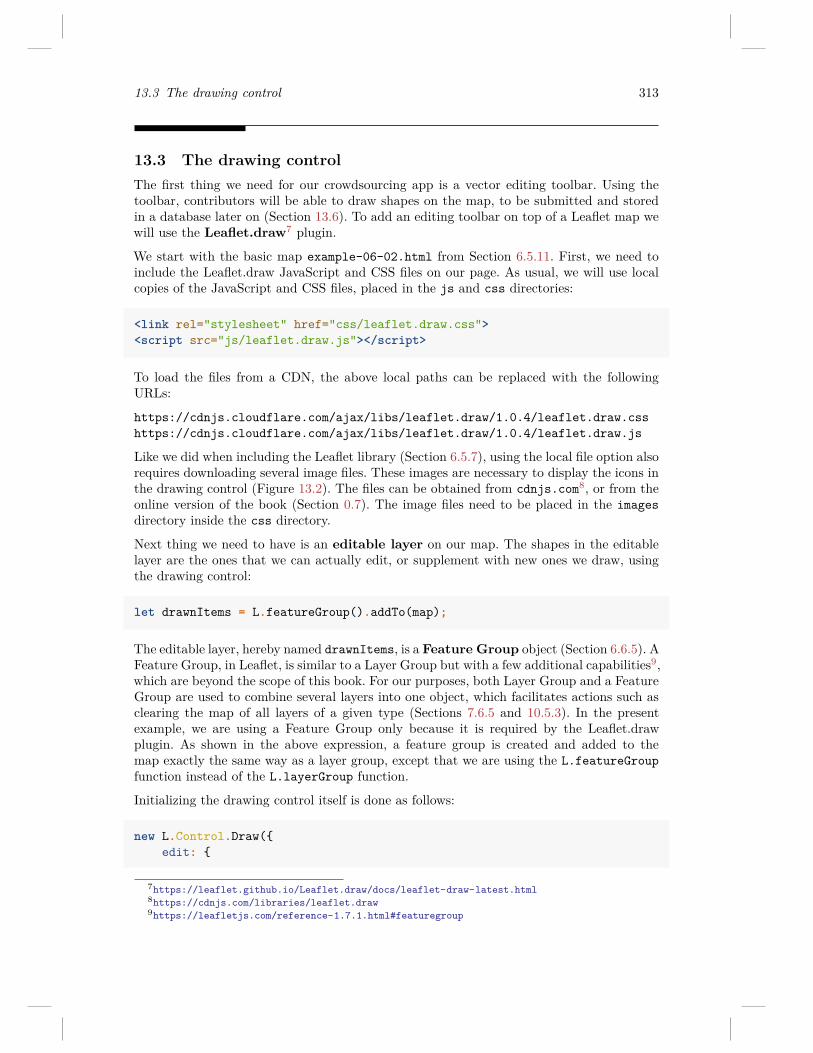
13.3 The drawing control 313
13.3 The drawing controlThe first thing we need for our crowdsourcing app is a vector editing toolbar. Using thetoolbar, contributors will be able to draw shapes on the map, to be submitted and storedin a database later on (Section 13.6). To add an editing toolbar on top of a Leaflet map wewill use the Leaflet.draw7 plugin.
We start with the basic map example-06-02.html from Section 6.5.11. First, we need toinclude the Leaflet.draw JavaScript and CSS files on our page. As usual, we will use localcopies of the JavaScript and CSS files, placed in the js and css directories:
<link rel="stylesheet" href="css/leaflet.draw.css"><script src="js/leaflet.draw.js"></script>
To load the files from a CDN, the above local paths can be replaced with the followingURLs:
https://cdnjs.cloudflare.com/ajax/libs/leaflet.draw/1.0.4/leaflet.draw.csshttps://cdnjs.cloudflare.com/ajax/libs/leaflet.draw/1.0.4/leaflet.draw.js
Like we did when including the Leaflet library (Section 6.5.7), using the local file option alsorequires downloading several image files. These images are necessary to display the icons inthe drawing control (Figure 13.2). The files can be obtained from cdnjs.com8, or from theonline version of the book (Section 0.7). The image files need to be placed in the imagesdirectory inside the css directory.
Next thing we need to have is an editable layer on our map. The shapes in the editablelayer are the ones that we can actually edit, or supplement with new ones we draw, usingthe drawing control:
let drawnItems = L.featureGroup().addTo(map);
The editable layer, hereby named drawnItems, is a Feature Group object (Section 6.6.5). AFeature Group, in Leaflet, is similar to a Layer Group but with a few additional capabilities9,which are beyond the scope of this book. For our purposes, both Layer Group and a FeatureGroup are used to combine several layers into one object, which facilitates actions such asclearing the map of all layers of a given type (Sections 7.6.5 and 10.5.3). In the presentexample, we are using a Feature Group only because it is required by the Leaflet.drawplugin. As shown in the above expression, a feature group is created and added to themap exactly the same way as a layer group, except that we are using the L.featureGroupfunction instead of the L.layerGroup function.
Initializing the drawing control itself is done as follows:
new L.Control.Draw({edit: {
7https://leaflet.github.io/Leaflet.draw/docs/leaflet-draw-latest.html8https://cdnjs.com/libraries/leaflet.draw9https://leafletjs.com/reference-1.7.1.html#featuregroup
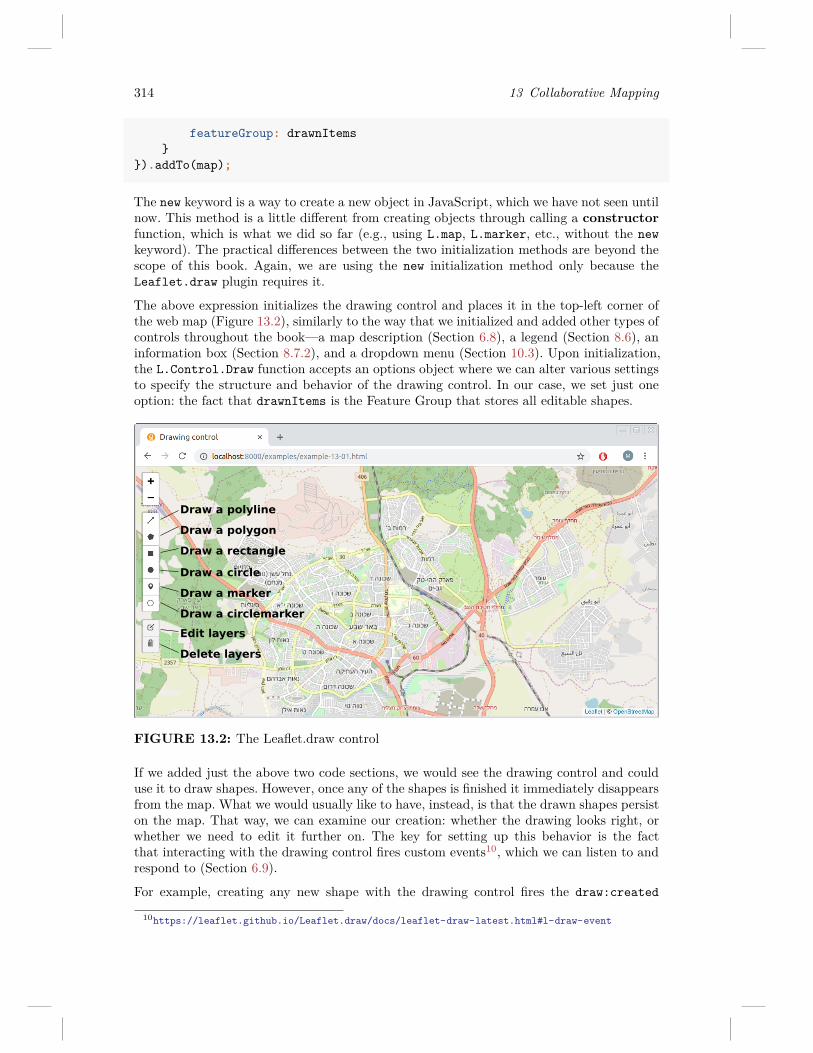
314 13 Collaborative Mapping
featureGroup: drawnItems}
}).addTo(map);
The new keyword is a way to create a new object in JavaScript, which we have not seen untilnow. This method is a little different from creating objects through calling a constructorfunction, which is what we did so far (e.g., using L.map, L.marker, etc., without the newkeyword). The practical differences between the two initialization methods are beyond thescope of this book. Again, we are using the new initialization method only because theLeaflet.draw plugin requires it.
The above expression initializes the drawing control and places it in the top-left corner ofthe web map (Figure 13.2), similarly to the way that we initialized and added other types ofcontrols throughout the book—a map description (Section 6.8), a legend (Section 8.6), aninformation box (Section 8.7.2), and a dropdown menu (Section 10.3). Upon initialization,the L.Control.Draw function accepts an options object where we can alter various settingsto specify the structure and behavior of the drawing control. In our case, we set just oneoption: the fact that drawnItems is the Feature Group that stores all editable shapes.
Draw a polyline
Draw a polygon
Draw a rectangle
Draw a circle
Draw a marker
Draw a circlemarker
Edit layers
Delete layers
FIGURE 13.2: The Leaflet.draw control
If we added just the above two code sections, we would see the drawing control and coulduse it to draw shapes. However, once any of the shapes is finished it immediately disappearsfrom the map. What we would usually like to have, instead, is that the drawn shapes persiston the map. That way, we can examine our creation: whether the drawing looks right, orwhether we need to edit it further on. The key for setting up this behavior is the factthat interacting with the drawing control fires custom events10, which we can listen to andrespond to (Section 6.9).
For example, creating any new shape with the drawing control fires the draw:created
10https://leaflet.github.io/Leaflet.draw/docs/leaflet-draw-latest.html#l-draw-event
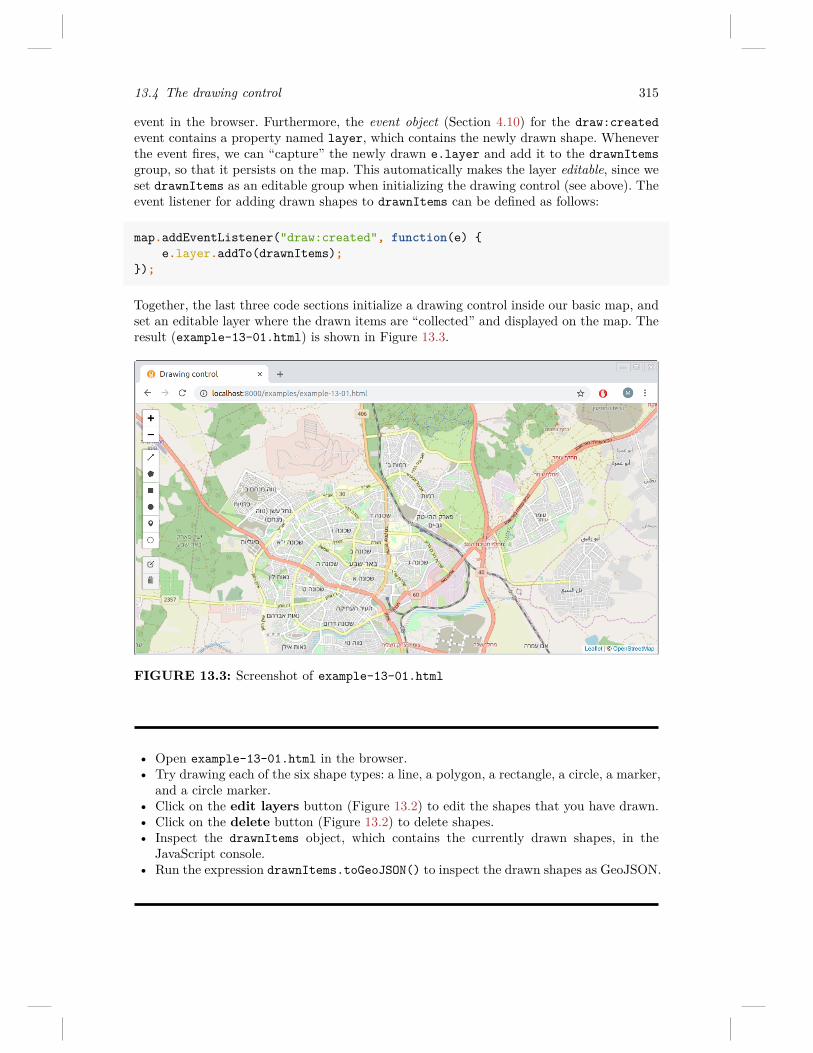
13.4 The drawing control 315
event in the browser. Furthermore, the event object (Section 4.10) for the draw:createdevent contains a property named layer, which contains the newly drawn shape. Wheneverthe event fires, we can “capture” the newly drawn e.layer and add it to the drawnItemsgroup, so that it persists on the map. This automatically makes the layer editable, since weset drawnItems as an editable group when initializing the drawing control (see above). Theevent listener for adding drawn shapes to drawnItems can be defined as follows:
map.addEventListener("draw:created", function(e) {e.layer.addTo(drawnItems);
});
Together, the last three code sections initialize a drawing control inside our basic map, andset an editable layer where the drawn items are “collected” and displayed on the map. Theresult (example-13-01.html) is shown in Figure 13.3.
FIGURE 13.3: Screenshot of example-13-01.html
• Open example-13-01.html in the browser.• Try drawing each of the six shape types: a line, a polygon, a rectangle, a circle, a marker,
and a circle marker.• Click on the edit layers button (Figure 13.2) to edit the shapes that you have drawn.• Click on the delete button (Figure 13.2) to delete shapes.• Inspect the drawnItems object, which contains the currently drawn shapes, in the
JavaScript console.• Run the expression drawnItems.toGeoJSON() to inspect the drawn shapes as GeoJSON.
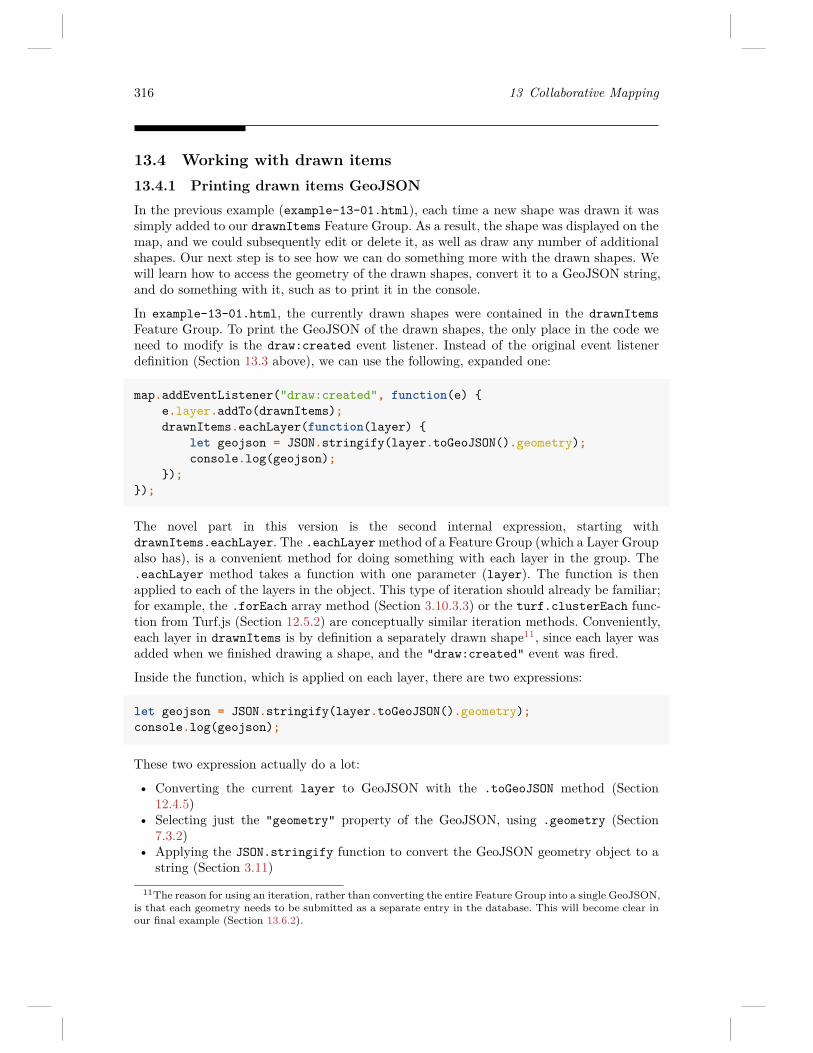
316 13 Collaborative Mapping
13.4 Working with drawn items13.4.1 Printing drawn items GeoJSONIn the previous example (example-13-01.html), each time a new shape was drawn it wassimply added to our drawnItems Feature Group. As a result, the shape was displayed on themap, and we could subsequently edit or delete it, as well as draw any number of additionalshapes. Our next step is to see how we can do something more with the drawn shapes. Wewill learn how to access the geometry of the drawn shapes, convert it to a GeoJSON string,and do something with it, such as to print it in the console.
In example-13-01.html, the currently drawn shapes were contained in the drawnItemsFeature Group. To print the GeoJSON of the drawn shapes, the only place in the code weneed to modify is the draw:created event listener. Instead of the original event listenerdefinition (Section 13.3 above), we can use the following, expanded one:
map.addEventListener("draw:created", function(e) {e.layer.addTo(drawnItems);drawnItems.eachLayer(function(layer) {
let geojson = JSON.stringify(layer.toGeoJSON().geometry);console.log(geojson);
});});
The novel part in this version is the second internal expression, starting withdrawnItems.eachLayer. The .eachLayer method of a Feature Group (which a Layer Groupalso has), is a convenient method for doing something with each layer in the group. The.eachLayer method takes a function with one parameter (layer). The function is thenapplied to each of the layers in the object. This type of iteration should already be familiar;for example, the .forEach array method (Section 3.10.3.3) or the turf.clusterEach func-tion from Turf.js (Section 12.5.2) are conceptually similar iteration methods. Conveniently,each layer in drawnItems is by definition a separately drawn shape11, since each layer wasadded when we finished drawing a shape, and the "draw:created" event was fired.
Inside the function, which is applied on each layer, there are two expressions:
let geojson = JSON.stringify(layer.toGeoJSON().geometry);console.log(geojson);
These two expression actually do a lot:
• Converting the current layer to GeoJSON with the .toGeoJSON method (Section12.4.5)
• Selecting just the "geometry" property of the GeoJSON, using .geometry (Section7.3.2)
• Applying the JSON.stringify function to convert the GeoJSON geometry object to astring (Section 3.11)
11The reason for using an iteration, rather than converting the entire Feature Group into a single GeoJSON,is that each geometry needs to be submitted as a separate entry in the database. This will become clear inour final example (Section 13.6.2).
13.4 Working with drawn items 317
• Printing the string with console.log
The resulting map (example-13-02.html) is shown in Figure 13.4. The screenshot showsthe GeoJSON string printed in the console after one shape (a rectangle) has been drawn onthe map.
FIGURE 13.4: Screenshot of example-13-02.html
• Open example-13-02.html in the browser.• Draw several shapes and inspect the output printed in the console.
13.4.2 Expanded GeoJSON viewerAs another example of doing something with the drawn shapes, we can now expand theGeoJSON viewer example-07-02.html (Figure 7.5) from Section 7.6. In that example, wehad a text area where the user could type GeoJSON strings. When clicking “submit”, thetyped GeoJSON string was turned into a Leaflet layer and displayed on the map. Now thatwe know how to work with the drawing control, we can implement the other direction too:letting the user draw new shapes on the map and making the GeoJSON strings of thosedrawn shapes appear in the text area (Figure 13.5).
To make things simple, we will decide the user can only draw one geometry at a time, andcannot edit or delete it after creation. To do that, we define the drawing control a littledifferently, with editing disabled:
new L.Control.Draw({
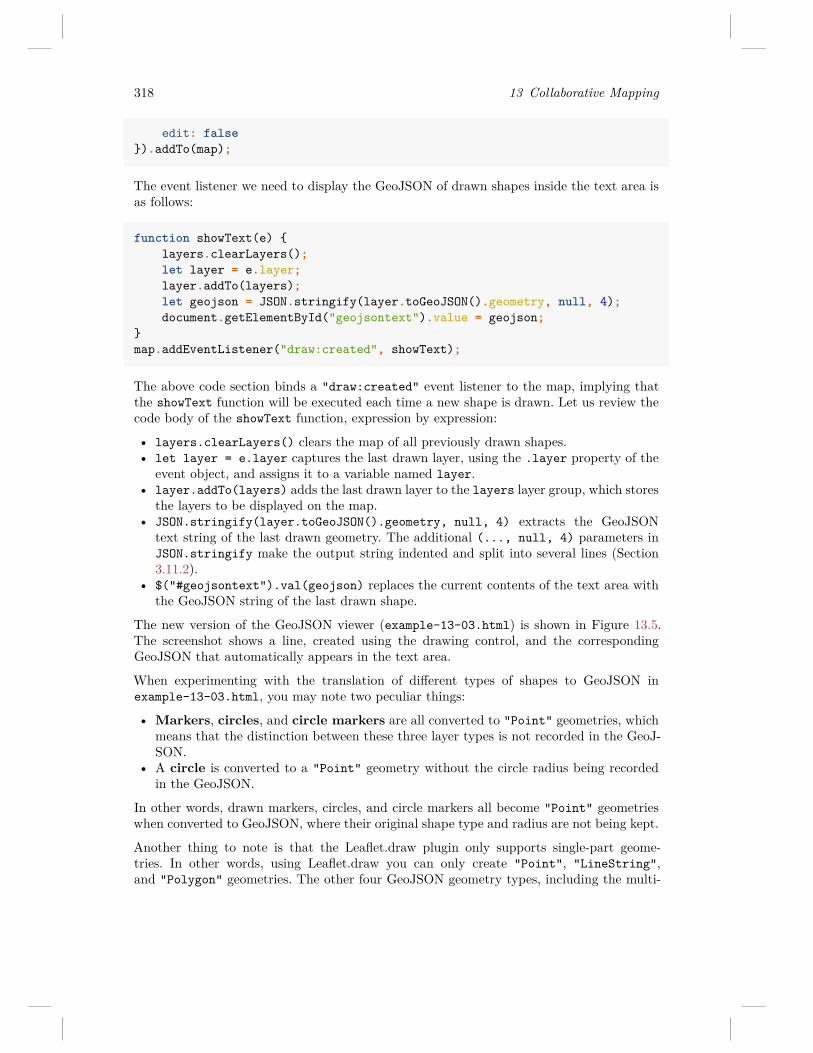
318 13 Collaborative Mapping
edit: false}).addTo(map);
The event listener we need to display the GeoJSON of drawn shapes inside the text area isas follows:
function showText(e) {layers.clearLayers();let layer = e.layer;layer.addTo(layers);let geojson = JSON.stringify(layer.toGeoJSON().geometry, null, 4);document.getElementById("geojsontext").value = geojson;
}map.addEventListener("draw:created", showText);
The above code section binds a "draw:created" event listener to the map, implying thatthe showText function will be executed each time a new shape is drawn. Let us review thecode body of the showText function, expression by expression:
• layers.clearLayers() clears the map of all previously drawn shapes.• let layer = e.layer captures the last drawn layer, using the .layer property of the
event object, and assigns it to a variable named layer.• layer.addTo(layers) adds the last drawn layer to the layers layer group, which stores
the layers to be displayed on the map.• JSON.stringify(layer.toGeoJSON().geometry, null, 4) extracts the GeoJSON
text string of the last drawn geometry. The additional (..., null, 4) parameters inJSON.stringify make the output string indented and split into several lines (Section3.11.2).
• $("#geojsontext").val(geojson) replaces the current contents of the text area withthe GeoJSON string of the last drawn shape.
The new version of the GeoJSON viewer (example-13-03.html) is shown in Figure 13.5.The screenshot shows a line, created using the drawing control, and the correspondingGeoJSON that automatically appears in the text area.
When experimenting with the translation of different types of shapes to GeoJSON inexample-13-03.html, you may note two peculiar things:
• Markers, circles, and circle markers are all converted to "Point" geometries, whichmeans that the distinction between these three layer types is not recorded in the GeoJ-SON.
• A circle is converted to a "Point" geometry without the circle radius being recordedin the GeoJSON.
In other words, drawn markers, circles, and circle markers all become "Point" geometrieswhen converted to GeoJSON, where their original shape type and radius are not being kept.
Another thing to note is that the Leaflet.draw plugin only supports single-part geome-tries. In other words, using Leaflet.draw you can only create "Point", "LineString",and "Polygon" geometries. The other four GeoJSON geometry types, including the multi-
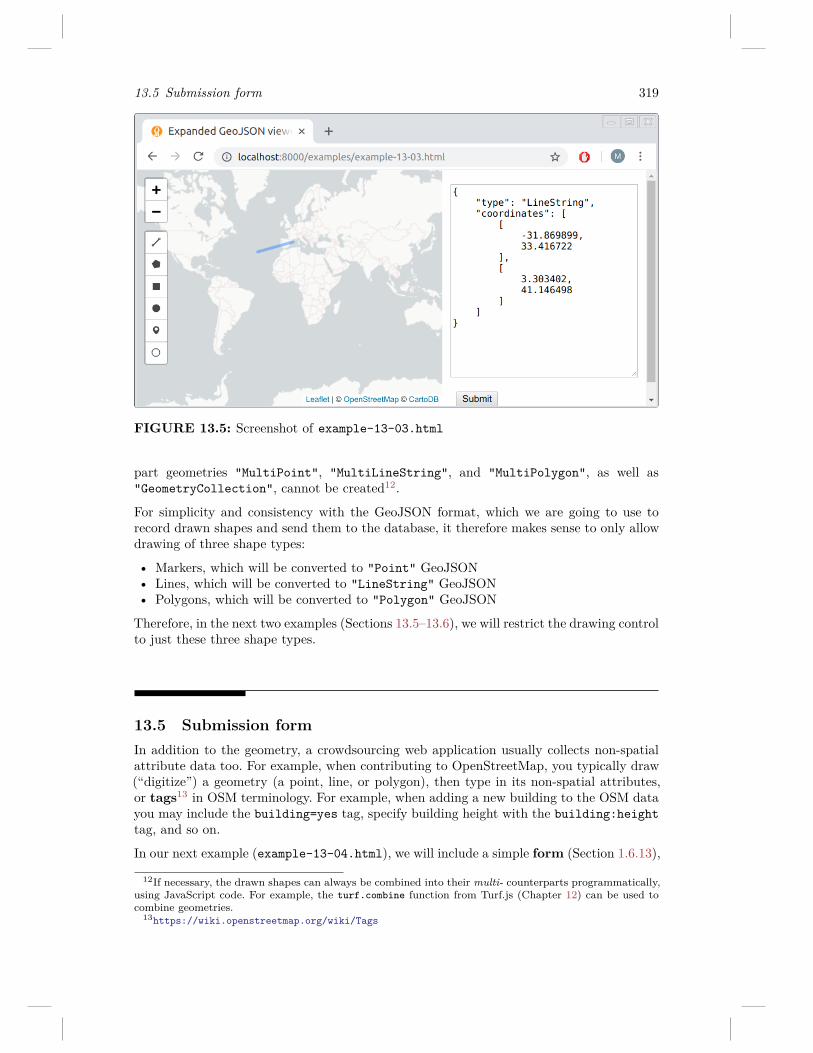
13.5 Submission form 319
FIGURE 13.5: Screenshot of example-13-03.html
part geometries "MultiPoint", "MultiLineString", and "MultiPolygon", as well as"GeometryCollection", cannot be created12.
For simplicity and consistency with the GeoJSON format, which we are going to use torecord drawn shapes and send them to the database, it therefore makes sense to only allowdrawing of three shape types:
• Markers, which will be converted to "Point" GeoJSON• Lines, which will be converted to "LineString" GeoJSON• Polygons, which will be converted to "Polygon" GeoJSON
Therefore, in the next two examples (Sections 13.5–13.6), we will restrict the drawing controlto just these three shape types.
13.5 Submission formIn addition to the geometry, a crowdsourcing web application usually collects non-spatialattribute data too. For example, when contributing to OpenStreetMap, you typically draw(“digitize”) a geometry (a point, line, or polygon), then type in its non-spatial attributes,or tags13 in OSM terminology. For example, when adding a new building to the OSM datayou may include the building=yes tag, specify building height with the building:heighttag, and so on.
In our next example (example-13-04.html), we will include a simple form (Section 1.6.13),
12If necessary, the drawn shapes can always be combined into their multi- counterparts programmatically,using JavaScript code. For example, the turf.combine function from Turf.js (Chapter 12) can be used tocombine geometries.
13https://wiki.openstreetmap.org/wiki/Tags
320 13 Collaborative Mapping
where the user enters a description and the contributor’s name. The description and nameentered by the user are going to be sent to the database as non-spatial attributes, togetherwith the GeoJSON representing the drawn geometry.
Like in the previous examples, the first thing we need is a drawing control definition. Thistime we will disable the buttons for adding circles, circle markers and rectangles. We keepthe buttons for adding markers, lines, and polygons, which can be translated to "Point","LineString", and "Polygon" GeoJSON geometries, respectively, without loss of informa-tion (Section 13.4.2):
new L.Control.Draw({draw : {
polygon : true,polyline : true,rectangle : false, // Rectangles disabledcircle : false, // Circles disabledcirclemarker : false, // Circle markers disabledmarker: true
},edit : {
featureGroup: drawnItems}
}).addTo(map);
Our submission form will reside in a popup, conveniently appearing on top of the drawnshape once it is finished. The form contents will be defined with the following HTML code:
<form>Description:<br><input type="text" id="input_desc"><br>Name:<br><input type="text" id="input_name"><br><input type="button" value="Submit" id="submit">
</form>
You can see what the form looks like in Figure 13.6.
FIGURE 13.6: A form for collecting non-spatial attributes inside a Leaflet popup
Based on the above HTML code for creating the form, we can write a function calledcreateFormPopup that binds and opens a popup with an editable form on the drawnItemsfeature group:
13.5 Submission form 321
function createFormPopup() {let popupContent =
'<form>' +'Description:<br><input type="text" id="input_desc"><br>' +'Name:<br><input type="text" id="input_name"><br>' +'<input type="button" value="Submit" id="submit">' +'</form>';
drawnItems.bindPopup(popupContent).openPopup();}
The createFormPopup function will be executed each time the user finishes to drawa shape, so that he/she can also enter the name and description and submit every-thing to the database. Accordingly, we have to modify the "draw:created" event lis-tener, so that when done editing, the “submit” popup will open. Basically, we replacethe drawnItems.eachLayer iteration inside the "draw:created" event listener defined inexample-13-02.html, with a createFormPopup function call. That way, instead of printingthe drawn shape GeoJSON in the console, an editable popup will open:
map.addEventListener("draw:created", function(e) {e.layer.addTo(drawnItems);createFormPopup();
});
The event listener for clicking the “submit” button triggers the setData function. This isthe part where we determine what to do with the drawn layer. Here is the definition of thesetData function:
function setData(e) {
if(e.target && e.target.id == "submit") {
// Get user name and descriptionlet enteredUsername = document.getElementById("input_name").value;let enteredDescription = document.getElementById("input_desc").value;
// Print user name and descriptionconsole.log(enteredUsername);console.log(enteredDescription);
// Get and print GeoJSON for each drawn layerdrawnItems.eachLayer(function(layer) {
let drawing = JSON.stringify(layer.toGeoJSON().geometry);console.log(drawing);
});
// Clear drawn items layerdrawnItems.closePopup();drawnItems.clearLayers();
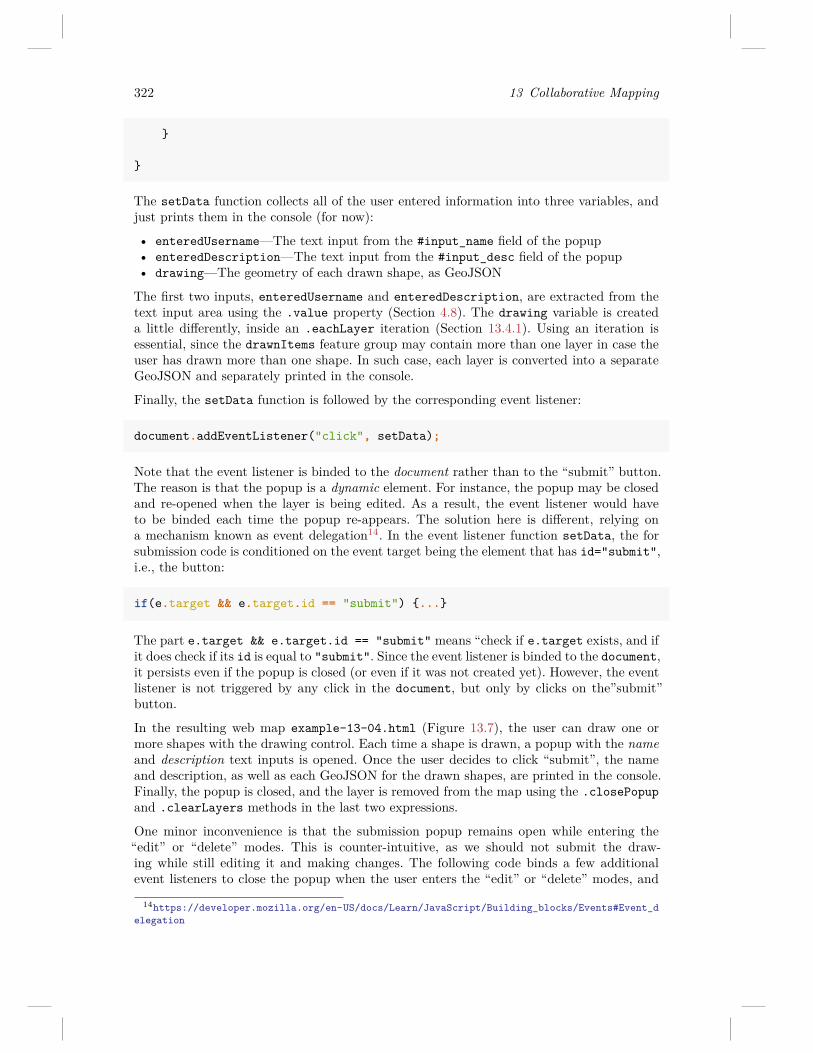
322 13 Collaborative Mapping
}
}
The setData function collects all of the user entered information into three variables, andjust prints them in the console (for now):
• enteredUsername—The text input from the #input_name field of the popup• enteredDescription—The text input from the #input_desc field of the popup• drawing—The geometry of each drawn shape, as GeoJSON
The first two inputs, enteredUsername and enteredDescription, are extracted from thetext input area using the .value property (Section 4.8). The drawing variable is createda little differently, inside an .eachLayer iteration (Section 13.4.1). Using an iteration isessential, since the drawnItems feature group may contain more than one layer in case theuser has drawn more than one shape. In such case, each layer is converted into a separateGeoJSON and separately printed in the console.
Finally, the setData function is followed by the corresponding event listener:
document.addEventListener("click", setData);
Note that the event listener is binded to the document rather than to the “submit” button.The reason is that the popup is a dynamic element. For instance, the popup may be closedand re-opened when the layer is being edited. As a result, the event listener would haveto be binded each time the popup re-appears. The solution here is different, relying ona mechanism known as event delegation14. In the event listener function setData, the forsubmission code is conditioned on the event target being the element that has id="submit",i.e., the button:
if(e.target && e.target.id == "submit") {...}
The part e.target && e.target.id == "submit" means “check if e.target exists, and ifit does check if its id is equal to "submit". Since the event listener is binded to the document,it persists even if the popup is closed (or even if it was not created yet). However, the eventlistener is not triggered by any click in the document, but only by clicks on the”submit”button.
In the resulting web map example-13-04.html (Figure 13.7), the user can draw one ormore shapes with the drawing control. Each time a shape is drawn, a popup with the nameand description text inputs is opened. Once the user decides to click “submit”, the nameand description, as well as each GeoJSON for the drawn shapes, are printed in the console.Finally, the popup is closed, and the layer is removed from the map using the .closePopupand .clearLayers methods in the last two expressions.
One minor inconvenience is that the submission popup remains open while entering the“edit” or “delete” modes. This is counter-intuitive, as we should not submit the draw-ing while still editing it and making changes. The following code binds a few additionalevent listeners to close the popup when the user enters the “edit” or “delete” modes, and
14https://developer.mozilla.org/en-US/docs/Learn/JavaScript/Building_blocks/Events#Event_delegation
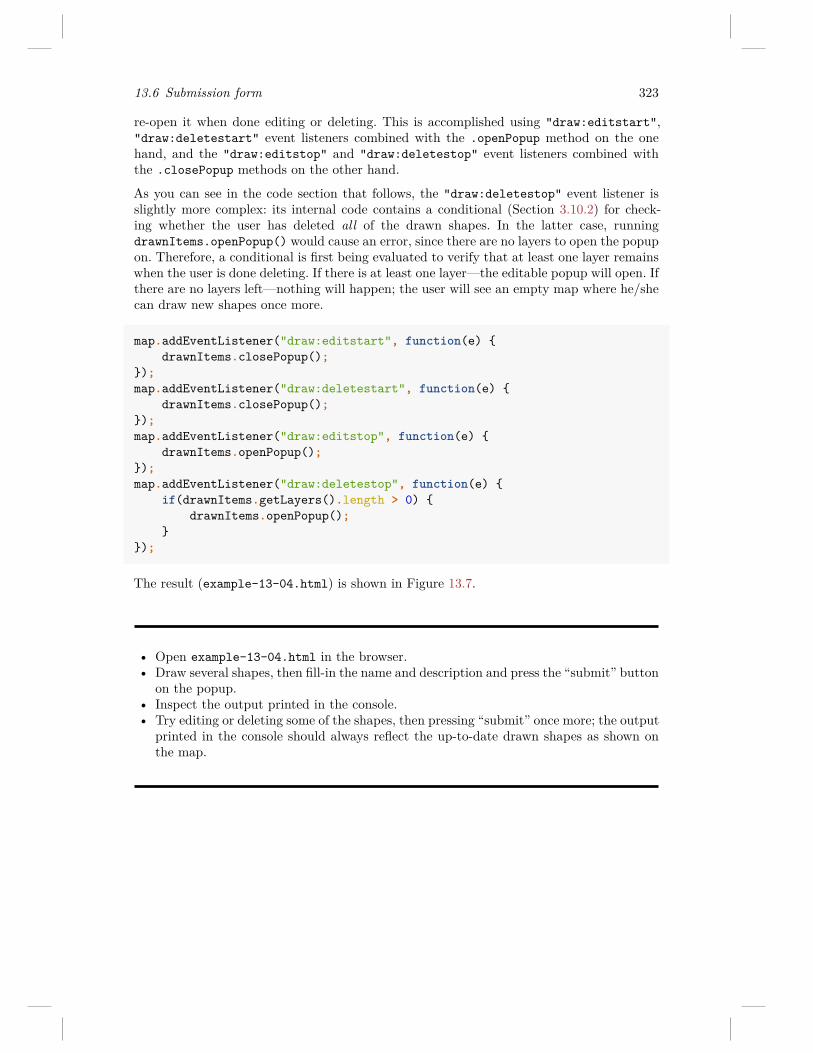
13.6 Submission form 323
re-open it when done editing or deleting. This is accomplished using "draw:editstart","draw:deletestart" event listeners combined with the .openPopup method on the onehand, and the "draw:editstop" and "draw:deletestop" event listeners combined withthe .closePopup methods on the other hand.
As you can see in the code section that follows, the "draw:deletestop" event listener isslightly more complex: its internal code contains a conditional (Section 3.10.2) for check-ing whether the user has deleted all of the drawn shapes. In the latter case, runningdrawnItems.openPopup() would cause an error, since there are no layers to open the popupon. Therefore, a conditional is first being evaluated to verify that at least one layer remainswhen the user is done deleting. If there is at least one layer—the editable popup will open. Ifthere are no layers left—nothing will happen; the user will see an empty map where he/shecan draw new shapes once more.
map.addEventListener("draw:editstart", function(e) {drawnItems.closePopup();
});map.addEventListener("draw:deletestart", function(e) {
drawnItems.closePopup();});map.addEventListener("draw:editstop", function(e) {
drawnItems.openPopup();});map.addEventListener("draw:deletestop", function(e) {
if(drawnItems.getLayers().length > 0) {drawnItems.openPopup();
}});
The result (example-13-04.html) is shown in Figure 13.7.
• Open example-13-04.html in the browser.• Draw several shapes, then fill-in the name and description and press the “submit” button
on the popup.• Inspect the output printed in the console.• Try editing or deleting some of the shapes, then pressing “submit” once more; the output
printed in the console should always reflect the up-to-date drawn shapes as shown onthe map.
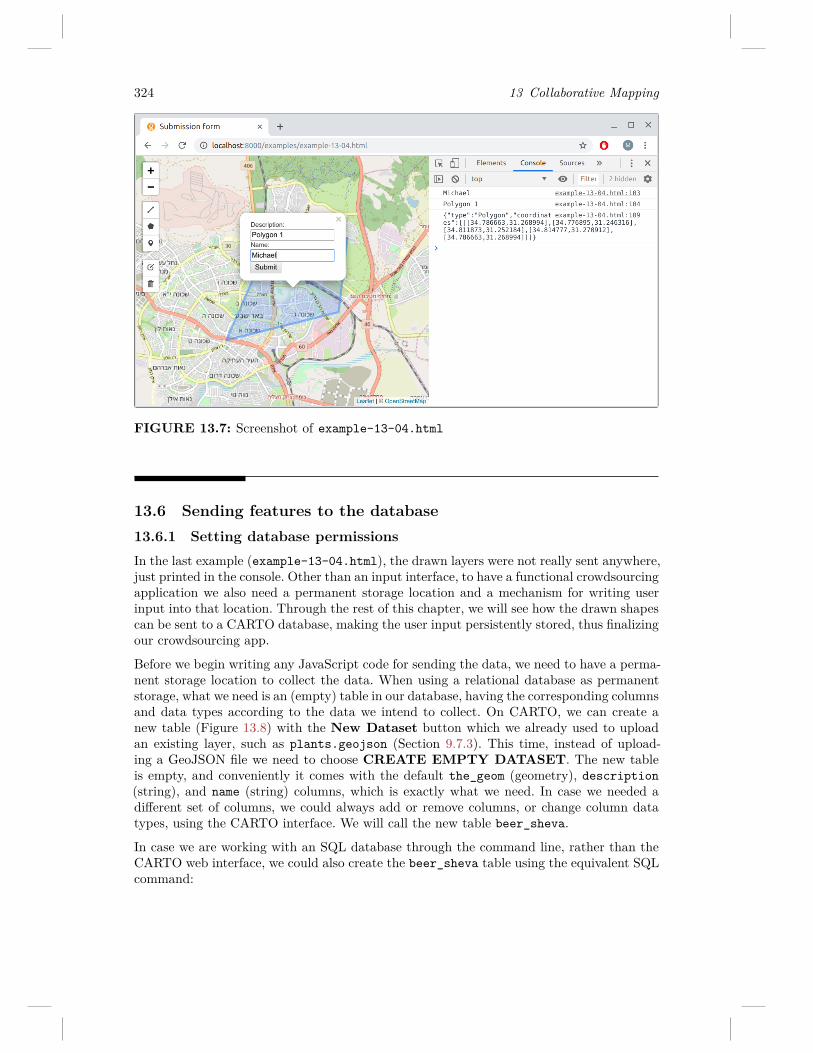
324 13 Collaborative Mapping
FIGURE 13.7: Screenshot of example-13-04.html
13.6 Sending features to the database13.6.1 Setting database permissionsIn the last example (example-13-04.html), the drawn layers were not really sent anywhere,just printed in the console. Other than an input interface, to have a functional crowdsourcingapplication we also need a permanent storage location and a mechanism for writing userinput into that location. Through the rest of this chapter, we will see how the drawn shapescan be sent to a CARTO database, making the user input persistently stored, thus finalizingour crowdsourcing app.
Before we begin writing any JavaScript code for sending the data, we need to have a perma-nent storage location to collect the data. When using a relational database as permanentstorage, what we need is an (empty) table in our database, having the corresponding columnsand data types according to the data we intend to collect. On CARTO, we can create anew table (Figure 13.8) with the New Dataset button which we already used to uploadan existing layer, such as plants.geojson (Section 9.7.3). This time, instead of upload-ing a GeoJSON file we need to choose CREATE EMPTY DATASET. The new tableis empty, and conveniently it comes with the default the_geom (geometry), description(string), and name (string) columns, which is exactly what we need. In case we needed adifferent set of columns, we could always add or remove columns, or change column datatypes, using the CARTO interface. We will call the new table beer_sheva.
In case we are working with an SQL database through the command line, rather than theCARTO web interface, we could also create the beer_sheva table using the equivalent SQLcommand:
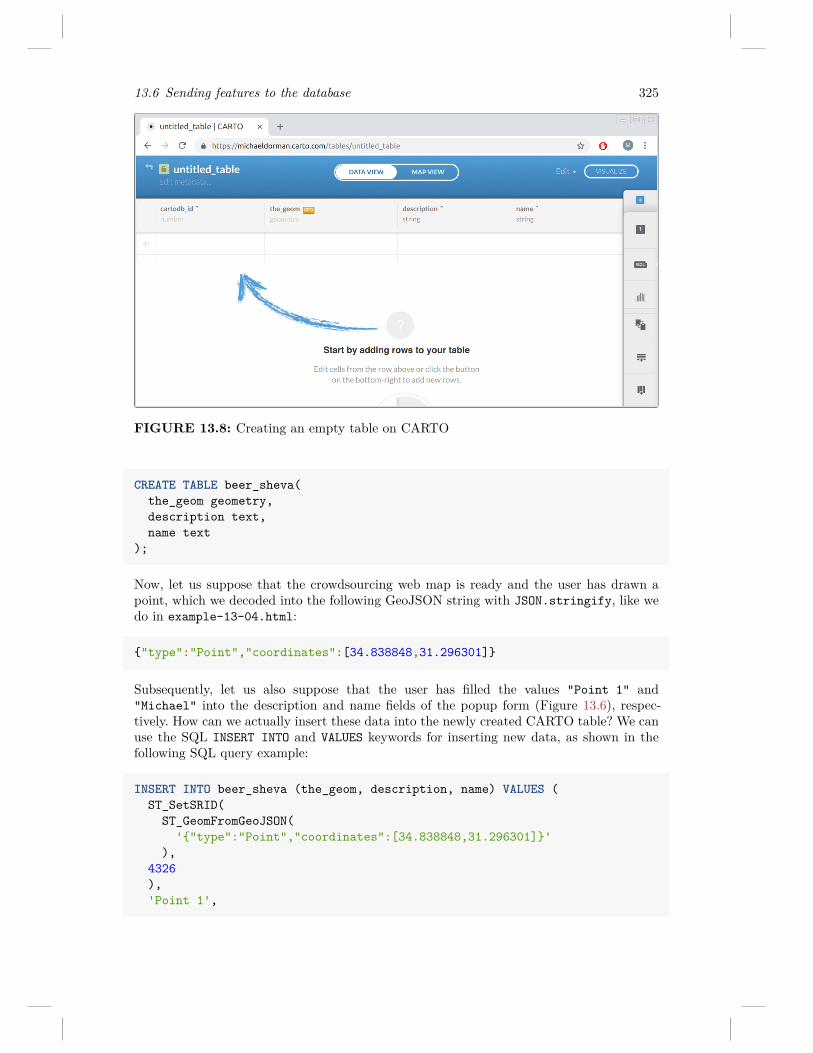
13.6 Sending features to the database 325
FIGURE 13.8: Creating an empty table on CARTO
CREATE TABLE beer_sheva(the_geom geometry,description text,name text
);
Now, let us suppose that the crowdsourcing web map is ready and the user has drawn apoint, which we decoded into the following GeoJSON string with JSON.stringify, like wedo in example-13-04.html:
{"type":"Point","coordinates":[34.838848,31.296301]}
Subsequently, let us also suppose that the user has filled the values "Point 1" and"Michael" into the description and name fields of the popup form (Figure 13.6), respec-tively. How can we actually insert these data into the newly created CARTO table? We canuse the SQL INSERT INTO and VALUES keywords for inserting new data, as shown in thefollowing SQL query example:
INSERT INTO beer_sheva (the_geom, description, name) VALUES (ST_SetSRID(ST_GeomFromGeoJSON(
'{"type":"Point","coordinates":[34.838848,31.296301]}'),
4326),'Point 1',
326 13 Collaborative Mapping
'Michael');
The query looks quite long and complex, but note the high-level structure used to specifythe column names and values to insert:
INSERT INTO beer_sheva(..., ..., ...) VALUES (..., ..., ...);
The first three ... symbols are replaced with the column names where the values go into.The last three ... symbols are replaced with the values themselves. Note that the order ofcolumn names needs to match the order of values, so that the right value will be insertedinto the right column. In the present example, the ordering of the first triplet (the columnnames the_geom, description, and name) matches the order of the second triplet after theVALUES keyword (the geometry, 'Point 1', and 'Michael').
To create the geometry value which goes into the the_geom column, the query makes use ofthe ST_GeomFromGeoJSON function to convert from GeoJSON into WKB. This is exactly theopposite of decoding the geometry column into GeoJSON text with ST_AsGeoJSON (Section9.6.3). The ST_SetSRID function specifies that our GeoJSON coordinates are in lon/lat,i.e., in the WGS84 coordinate reference system which we work with throughout the book(Section 11.3), specified with the EPSG code 4326.
The corresponding CARTO SQL API query is given below:
https://michaeldorman.carto.com/api/v2/sql?q=INSERT INTO beer_sheva (the_geom, description, name)VALUES (ST_SetSRID(ST_GeomFromGeoJSON('{"type":"Point","coordinates":[34.838848,31.296301]}'),4326),'Point 1','Michael')
Alas, the above API call will not work on a newly created table. Instead, an error messagesuch as the following one will be returned:
{"error":["permission denied for relation beer_sheva"]}
This error message, as the phrase "permission denied" suggests, concerns the issue ofdatabase permissions, which we have not really considered yet. Any database, in fact, isassociated with one or more database users, with each user having his/her own passwordand associated with a set of privileges, i.e., rules for what the user can and cannot do inthe database. For example, an administrator may have the maximal set of privileges,meaning that he/she can do anything in the database: reading and writing into tables,creating new tables, deleting existing tables, adding or removing other users, granting orrevoking privileges to other users, and so on. On the other hand, a read-only user may havelimited “read-only” privileges, so that they can only consume content from the databasebut cannot make any changes in the tables, or in their own or other users’ privileges.
The way we accessed our CARTO database with the CARTO SQL API, in fact, implieda database connection with the default user named publicuser, which is automaticallycreated by CARTO when setting up our account. The publicuser user has read permissionson all tables in our database, which is why we could execute any of the SQL queries startingwith SELECT throughout Chapters 9–12. The publicuser, however, by default does not havewrite permissions. This is why the above INSERT query failed with a "permission denied"error.
13.6 Sending features to the database 327
In addition to publicuser, CARTO defines an API Key15 user, who has all possibleprivileges on the tables in the database: read, write, update, create, delete, and so on. Touse the CARTO SQL API with the “API Key” user, we need to supply an additionalapi_key parameter in our query, as in:
https://michaeldorman.carto.com/api/v2/sql?q=INSERT INTO beer_sheva (the_geom, description, name)VALUES (ST_SetSRID(ST_GeomFromGeoJSON('{"type":"Point","coordinates":[34.838848,31.296301]}'),4326),'Point 1','Michael')&api_key=fb85************************************
The api_key is a long string, which acts like a password. You can get the API Key fromyour account settings panel in the CARTO web interface.
So, there are actually two possible solutions to the "permission denied" problem whentrying to insert a new record into the beer_sheva table:
• We can connect to the database with the API Key user, who has maximal privilegesand therefore can execute INSERT queries on the beer_sheva table.
• We can grant the publicuser user a new privilege, for executing INSERT queries ontable beer_sheva.
The first option may seem the most convenient, since the only thing we need to do is locateour API Key string in the CARTO interface and attach it in the SQL API query URL, asshown above. However, there is a serious security issue we need to consider when using thisapproach. If we include the API Key in our JavaScript code, in principle anyone looking intothe source code of our page will be able to copy the API Key, and use it to make any kindof SQL query on our account, having maximal privileges. For example, if anyone wanted to,he/she could even permanently delete any table in our account using DROP TABLE command.Exposing the API Key in client-side scripts is therefore a serious security risk. The API Keyis really intended only for server-side scripts, whose source code cannot be accessed by theweb page users. For instance, the server-side script may accept requests with a passwordthe user entered; if the password is valid the server can make a query to the CARTO SQLAPI and send back the result, otherwise the query will be rejected. This approach requiressetting up a dynamic server (Section 5.4.3), which means that, to use it securely, the APIKey solution is not so simple after all. In this book, we concentrate on client-side solutions,so we will not elaborate further on the API Key approach.
For a simple crowdsourcing app, intended for a trusted audience, the second option ofgranting INSERT privileges to publicuser is a simple and effective solution. In a way, thismakes our database exposed: anyone who enters our web page will be able to insert newrecords into the beer_sheva table. On the other hand, the worst-case scenario is just thatour table will be filled with many unnecessary records. The only privilege we will grantis INSERT, which means that publicuser cannot delete any previously entered records ormodify the table in any other way. Moreover, when the URL for our page is shared with atrusted audience, such as among students taking a survey in a class, the chances of someonetaking the trouble of finding our page and intentionally sabotaging our database by fillingit with a large amount of fake records is very small. Thus, in small-scale use cases, the effortof making a dynamic server with an authentication system may be superfluous, since thesimple solution presented below is sufficient.
15https://carto.com/developers/sql-api/guides/authentication/
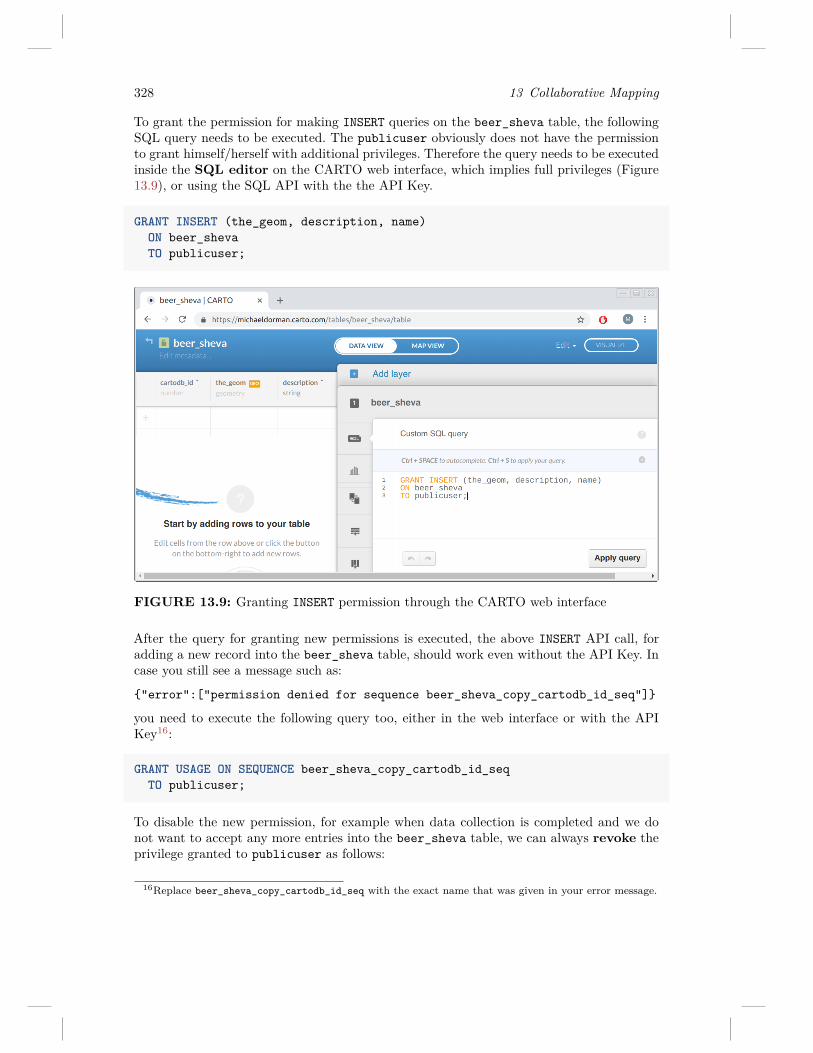
328 13 Collaborative Mapping
To grant the permission for making INSERT queries on the beer_sheva table, the followingSQL query needs to be executed. The publicuser obviously does not have the permissionto grant himself/herself with additional privileges. Therefore the query needs to be executedinside the SQL editor on the CARTO web interface, which implies full privileges (Figure13.9), or using the SQL API with the the API Key.
GRANT INSERT (the_geom, description, name)ON beer_shevaTO publicuser;
FIGURE 13.9: Granting INSERT permission through the CARTO web interface
After the query for granting new permissions is executed, the above INSERT API call, foradding a new record into the beer_sheva table, should work even without the API Key. Incase you still see a message such as:
{"error":["permission denied for sequence beer_sheva_copy_cartodb_id_seq"]}
you need to execute the following query too, either in the web interface or with the APIKey16:
GRANT USAGE ON SEQUENCE beer_sheva_copy_cartodb_id_seqTO publicuser;
To disable the new permission, for example when data collection is completed and we donot want to accept any more entries into the beer_sheva table, we can always revoke theprivilege granted to publicuser as follows:
16Replace beer_sheva_copy_cartodb_id_seq with the exact name that was given in your error message.
13.6 Sending features to the database 329
REVOKE INSERT ON TABLE beer_shevaFROM publicuser;
After the beer_sheva table is created and the INSERT permissions are taken care of, thedatabase is ready and waiting to receive the crowdsourced data. Now, let us move on todefining the web-map script for processing and sending the user-edited data to the database.
13.6.2 Adding the drawing controlLike in the previous examples, first thing we need in our script is to have a drawing controldefinition. We use the same definition from example-13-04.html (Section 13.5), with circles,circle markers, and rectangles disabled17:
new L.Control.Draw({...}).addTo(map);
Next, in case we would like the map to display the previous shapes drawn by other users,we can set up a layer group named cartoData to contain them:
let cartoData = L.layerGroup().addTo(map);
Accordingly, we need to load the items already contained in the beer_sheva table fromprevious editing sessions, using the following code section:
let url = "https://michaeldorman.carto.com/api/v2/sql";let urlGeoJSON = url + "?format=GeoJSON&q=";let sqlQuery = "SELECT the_geom, description, name FROM beer_sheva";function addPopup(feature, layer) {
layer.bindPopup(feature.properties.description +"<br>Submitted by " + feature.properties.name
);}fetch(urlGeoJSON + sqlQuery)
.then(function(response) {return response.json();
}).then(function(data) {
L.geoJSON(data, {onEachFeature: addPopup}).addTo(cartoData);});
Note that the popup for each of the loaded features displays the name and the descriptionproperties, which were entered in previous sessions when submitting drawn shapes and savedin the beer_sheva table.
Other than loading previously stored shapes using the above code, the major change com-
17The L.Control.Draw options were replaced with ... to save space, see Section 13.5 for the completecode.
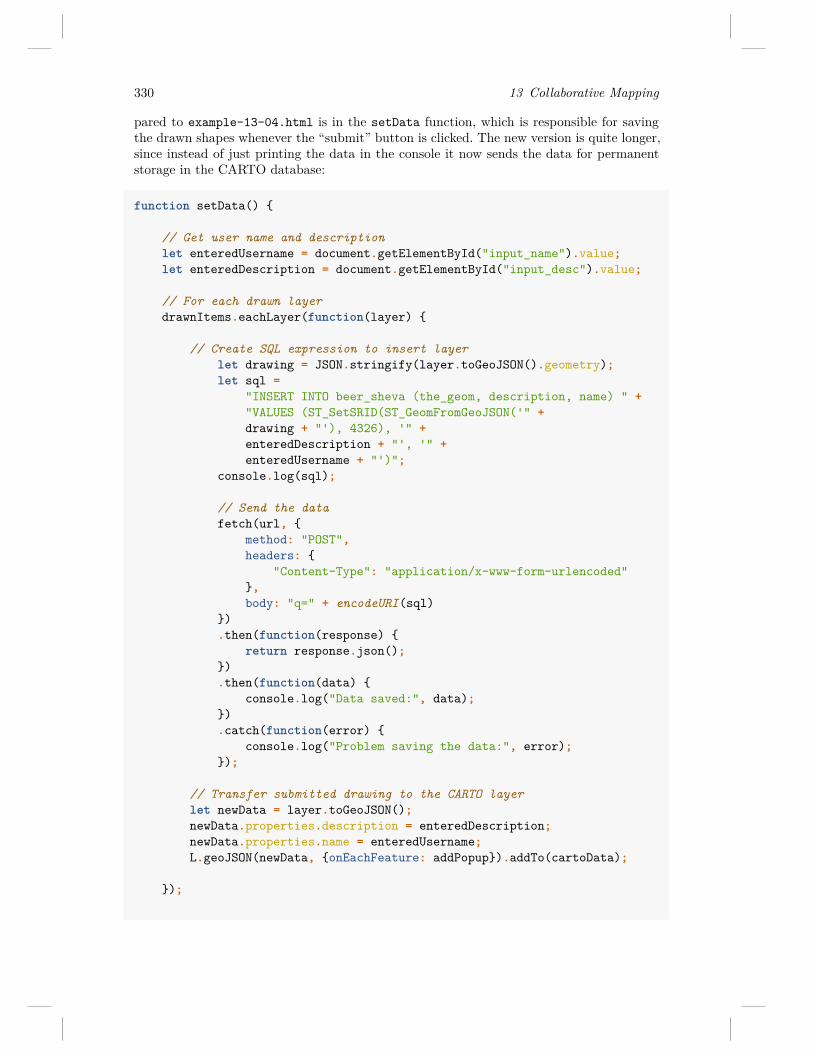
330 13 Collaborative Mapping
pared to example-13-04.html is in the setData function, which is responsible for savingthe drawn shapes whenever the “submit” button is clicked. The new version is quite longer,since instead of just printing the data in the console it now sends the data for permanentstorage in the CARTO database:
function setData() {
// Get user name and descriptionlet enteredUsername = document.getElementById("input_name").value;let enteredDescription = document.getElementById("input_desc").value;
// For each drawn layerdrawnItems.eachLayer(function(layer) {
// Create SQL expression to insert layerlet drawing = JSON.stringify(layer.toGeoJSON().geometry);let sql =
"INSERT INTO beer_sheva (the_geom, description, name) " +"VALUES (ST_SetSRID(ST_GeomFromGeoJSON('" +drawing + "'), 4326), '" +enteredDescription + "', '" +enteredUsername + "')";
console.log(sql);
// Send the datafetch(url, {
method: "POST",headers: {
"Content-Type": "application/x-www-form-urlencoded"},body: "q=" + encodeURI(sql)
}).then(function(response) {
return response.json();}).then(function(data) {
console.log("Data saved:", data);}).catch(function(error) {
console.log("Problem saving the data:", error);});
// Transfer submitted drawing to the CARTO layerlet newData = layer.toGeoJSON();newData.properties.description = enteredDescription;newData.properties.name = enteredUsername;L.geoJSON(newData, {onEachFeature: addPopup}).addTo(cartoData);
});
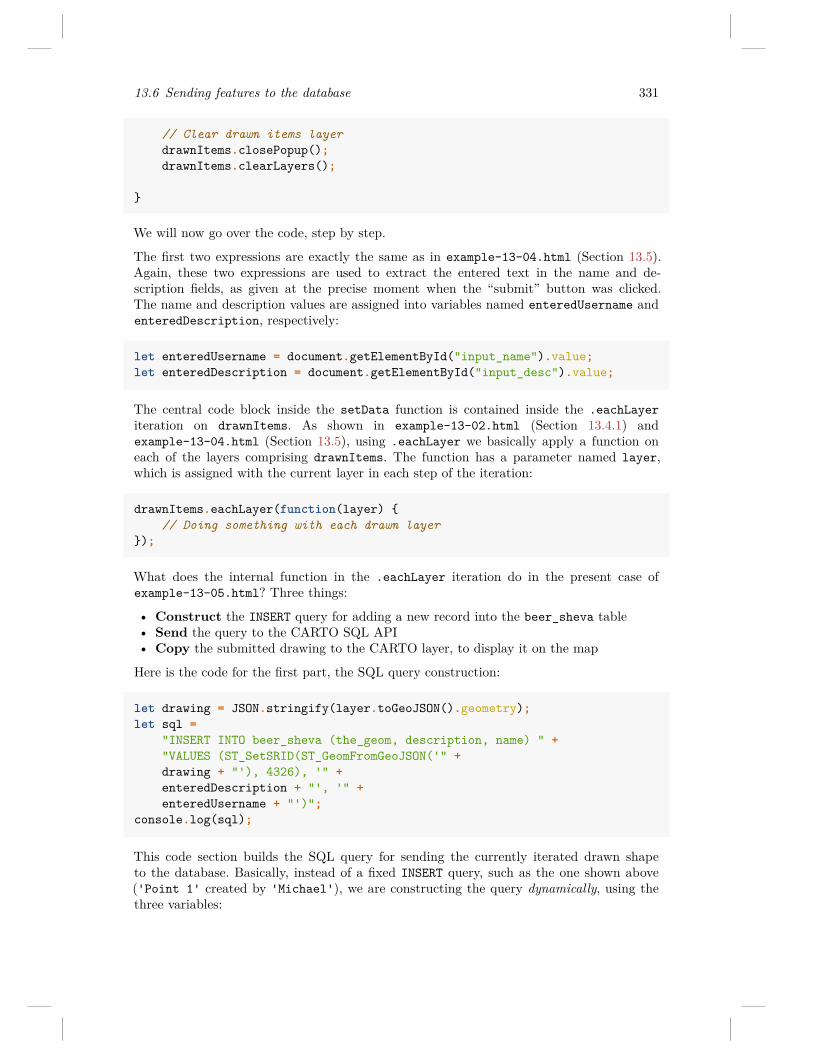
13.6 Sending features to the database 331
// Clear drawn items layerdrawnItems.closePopup();drawnItems.clearLayers();
}
We will now go over the code, step by step.
The first two expressions are exactly the same as in example-13-04.html (Section 13.5).Again, these two expressions are used to extract the entered text in the name and de-scription fields, as given at the precise moment when the “submit” button was clicked.The name and description values are assigned into variables named enteredUsername andenteredDescription, respectively:
let enteredUsername = document.getElementById("input_name").value;let enteredDescription = document.getElementById("input_desc").value;
The central code block inside the setData function is contained inside the .eachLayeriteration on drawnItems. As shown in example-13-02.html (Section 13.4.1) andexample-13-04.html (Section 13.5), using .eachLayer we basically apply a function oneach of the layers comprising drawnItems. The function has a parameter named layer,which is assigned with the current layer in each step of the iteration:
drawnItems.eachLayer(function(layer) {// Doing something with each drawn layer
});
What does the internal function in the .eachLayer iteration do in the present case ofexample-13-05.html? Three things:
• Construct the INSERT query for adding a new record into the beer_sheva table• Send the query to the CARTO SQL API• Copy the submitted drawing to the CARTO layer, to display it on the map
Here is the code for the first part, the SQL query construction:
let drawing = JSON.stringify(layer.toGeoJSON().geometry);let sql =
"INSERT INTO beer_sheva (the_geom, description, name) " +"VALUES (ST_SetSRID(ST_GeomFromGeoJSON('" +drawing + "'), 4326), '" +enteredDescription + "', '" +enteredUsername + "')";
console.log(sql);
This code section builds the SQL query for sending the currently iterated drawn shapeto the database. Basically, instead of a fixed INSERT query, such as the one shown above('Point 1' created by 'Michael'), we are constructing the query dynamically, using thethree variables:
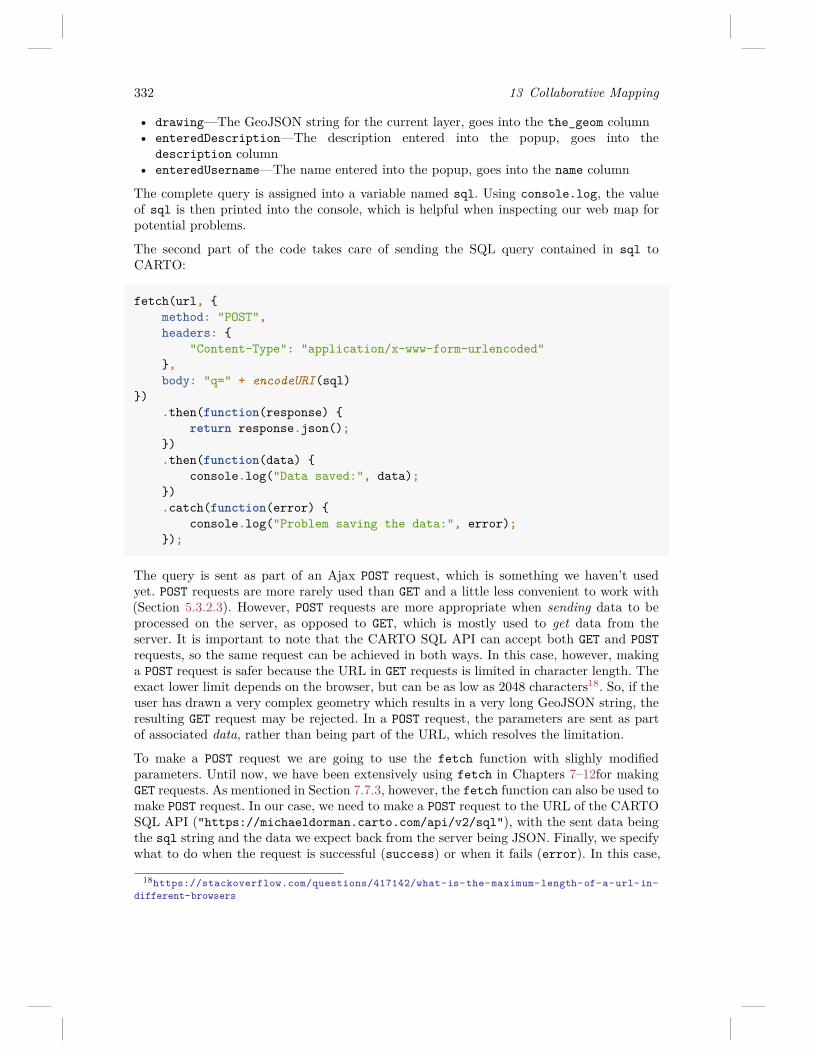
332 13 Collaborative Mapping
• drawing—The GeoJSON string for the current layer, goes into the the_geom column• enteredDescription—The description entered into the popup, goes into the
description column• enteredUsername—The name entered into the popup, goes into the name column
The complete query is assigned into a variable named sql. Using console.log, the valueof sql is then printed into the console, which is helpful when inspecting our web map forpotential problems.
The second part of the code takes care of sending the SQL query contained in sql toCARTO:
fetch(url, {method: "POST",headers: {
"Content-Type": "application/x-www-form-urlencoded"},body: "q=" + encodeURI(sql)
}).then(function(response) {
return response.json();}).then(function(data) {
console.log("Data saved:", data);}).catch(function(error) {
console.log("Problem saving the data:", error);});
The query is sent as part of an Ajax POST request, which is something we haven’t usedyet. POST requests are more rarely used than GET and a little less convenient to work with(Section 5.3.2.3). However, POST requests are more appropriate when sending data to beprocessed on the server, as opposed to GET, which is mostly used to get data from theserver. It is important to note that the CARTO SQL API can accept both GET and POSTrequests, so the same request can be achieved in both ways. In this case, however, makinga POST request is safer because the URL in GET requests is limited in character length. Theexact lower limit depends on the browser, but can be as low as 2048 characters18. So, if theuser has drawn a very complex geometry which results in a very long GeoJSON string, theresulting GET request may be rejected. In a POST request, the parameters are sent as partof associated data, rather than being part of the URL, which resolves the limitation.
To make a POST request we are going to use the fetch function with slighly modifiedparameters. Until now, we have been extensively using fetch in Chapters 7–12for makingGET requests. As mentioned in Section 7.7.3, however, the fetch function can also be used tomake POST request. In our case, we need to make a POST request to the URL of the CARTOSQL API ("https://michaeldorman.carto.com/api/v2/sql"), with the sent data beingthe sql string and the data we expect back from the server being JSON. Finally, we specifywhat to do when the request is successful (success) or when it fails (error). In this case,
18https://stackoverflow.com/questions/417142/what-is-the-maximum-length-of-a-url-in-different-browsers
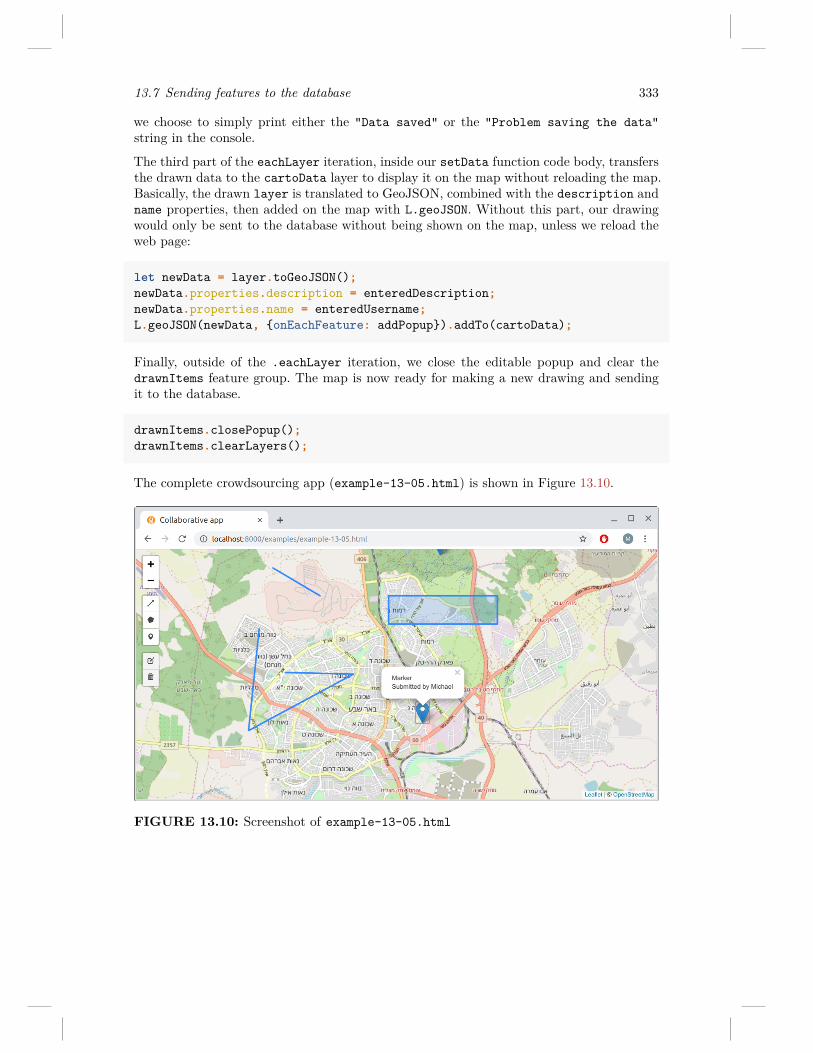
13.7 Sending features to the database 333
we choose to simply print either the "Data saved" or the "Problem saving the data"string in the console.
The third part of the eachLayer iteration, inside our setData function code body, transfersthe drawn data to the cartoData layer to display it on the map without reloading the map.Basically, the drawn layer is translated to GeoJSON, combined with the description andname properties, then added on the map with L.geoJSON. Without this part, our drawingwould only be sent to the database without being shown on the map, unless we reload theweb page:
let newData = layer.toGeoJSON();newData.properties.description = enteredDescription;newData.properties.name = enteredUsername;L.geoJSON(newData, {onEachFeature: addPopup}).addTo(cartoData);
Finally, outside of the .eachLayer iteration, we close the editable popup and clear thedrawnItems feature group. The map is now ready for making a new drawing and sendingit to the database.
drawnItems.closePopup();drawnItems.clearLayers();
The complete crowdsourcing app (example-13-05.html) is shown in Figure 13.10.
FIGURE 13.10: Screenshot of example-13-05.html

334 13 Collaborative Mapping
13.7 Exercise• Use the previous guidelines and example-13-05.html to create your own crowdsourcing
app:– Create a new table for the responses on CARTO.– Run the appropriate SQL query for granting INSERT privileges on your table (Sec-
tion 13.6.1).– Modify the code in example-13-05.html (Section 13.6.2) to include your CARTO
username and table name.
Part V
Appendices

AAssociated Files
The following tree specifies the structure of the folder that contains the book examples,solutions, and associated files needed to run the examples, such as local copies of the requiredJavaScript libraries. Appendices B and C give the complete lists of the example and solutionfiles, respectively.
The entire folder is available as a ZIP file in the online version of the book (Section 0.7).
|-- css| |-- images| | |-- layers-2x.png| | |-- layers.png| | |-- marker-icon-2x.png| | |-- marker-icon.png| | |-- marker-shadow.png| | |-- spritesheet-2x.png| | |-- spritesheet.png| | |-- spritesheet.svg| |-- leaflet.css| |-- leaflet.draw.css|-- data| |-- county2.geojson| |-- events.json| |-- person.json| |-- plants.geojson| |-- towns.geojson|-- images| |-- leaflet.png| |-- marker-shadow.png| |-- north.svg| |-- redIcon.png| |-- south.svg|-- js| |-- leaflet.draw.js| |-- leaflet.heat.js| |-- leaflet.js| |-- turf.js|-- example-01-01.html|-- example-01-02.html|-- example-01-03.html|-- example-01-04.html|-- example-01-05.html|-- example-01-06.html
337
338 A Associated Files
|-- example-02-01.html|-- example-02-02.html|-- example-02-03.html|-- example-02-04.html|-- example-02-05.html|-- example-02-06.html|-- example-02-07.html|-- example-02-08.html|-- example-02-09.html|-- example-02-10.html|-- example-02-11.html|-- example-04-01.html|-- example-04-02.html|-- example-04-03.html|-- example-04-04.html|-- example-04-05.html|-- example-04-06.html|-- example-04-07.html|-- example-06-01.html|-- example-06-02.html|-- example-06-03.html|-- example-06-04.html|-- example-06-05.html|-- example-06-06.html|-- example-06-07.html|-- example-06-08.html|-- example-07-01.html|-- example-07-02.html|-- example-07-03.html|-- example-07-04.html|-- example-08-01.html|-- example-08-02.html|-- example-08-03.html|-- example-08-04.html|-- example-08-05.html|-- example-08-06.html|-- example-08-07.html|-- example-08-08.html|-- example-09-01.html|-- example-09-01-s.html|-- example-10-01.html|-- example-10-01-s.html|-- example-10-02.html|-- example-10-02-s.html|-- example-10-03.html|-- example-10-03-s.html|-- example-10-04.html|-- example-10-04-s.html|-- example-10-05.html|-- example-10-05-s.html|-- example-11-01.html
A.0 339
|-- example-11-02.html|-- example-11-03.html|-- example-11-03-s.html|-- example-11-04.html|-- example-11-04-s.html|-- example-12-01.html|-- example-12-02.html|-- example-12-03.html|-- example-12-04.html|-- example-12-05.html|-- example-12-05-s.html|-- example-12-06.html|-- example-12-06-s.html|-- example-12-07.html|-- example-12-07-s.html|-- example-12-08.html|-- example-12-08-s.html|-- example-13-01.html|-- example-13-02.html|-- example-13-03.html|-- example-13-04.html|-- example-13-05.html|-- example-13-05-s.html|-- map.js|-- solution-03.html|-- solution-04.html|-- solution-06.html|-- solution-07.html|-- solution-08.html|-- solution-09.html|-- solution-09-s.html|-- solution-10.html|-- solution-10-s.html|-- solution-11.html|-- solution-11-s.html|-- solution-12.html
5 directories, 117 files

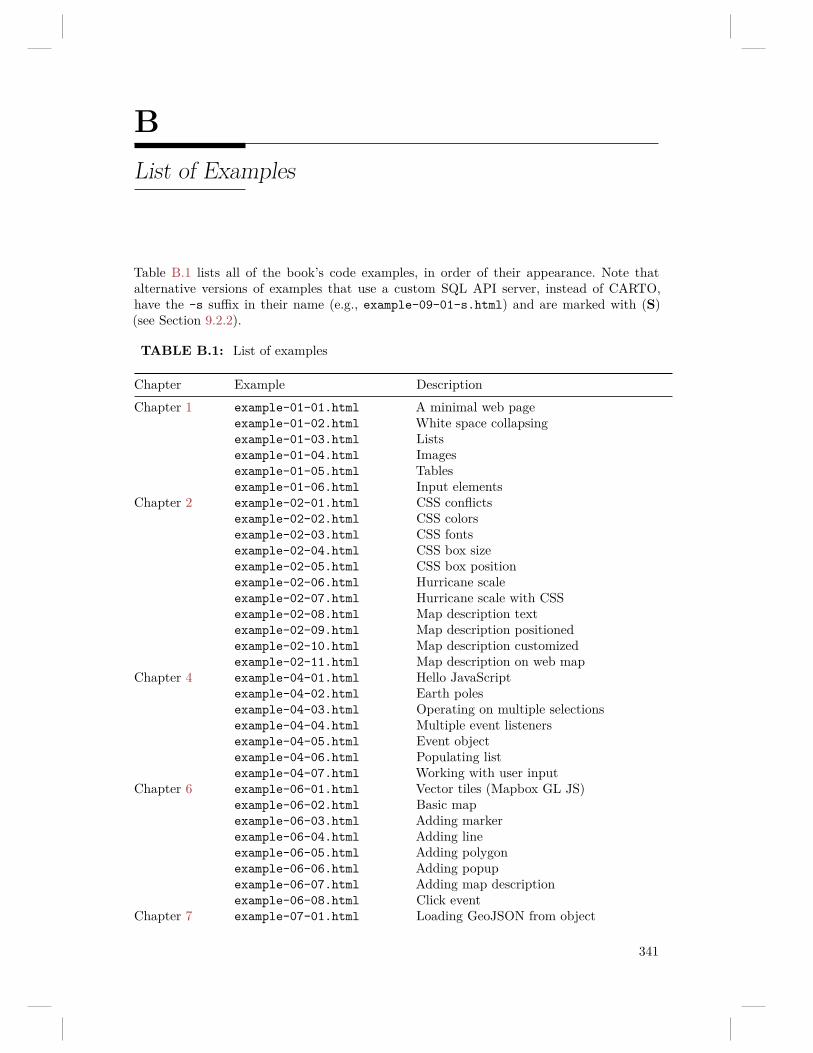
BList of Examples
Table B.1 lists all of the book’s code examples, in order of their appearance. Note thatalternative versions of examples that use a custom SQL API server, instead of CARTO,have the -s suffix in their name (e.g., example-09-01-s.html) and are marked with (S)(see Section 9.2.2).
TABLE B.1: List of examples
Chapter Example DescriptionChapter 1 example-01-01.html A minimal web page
example-01-02.html White space collapsingexample-01-03.html Listsexample-01-04.html Imagesexample-01-05.html Tablesexample-01-06.html Input elements
Chapter 2 example-02-01.html CSS conflictsexample-02-02.html CSS colorsexample-02-03.html CSS fontsexample-02-04.html CSS box sizeexample-02-05.html CSS box positionexample-02-06.html Hurricane scaleexample-02-07.html Hurricane scale with CSSexample-02-08.html Map description textexample-02-09.html Map description positionedexample-02-10.html Map description customizedexample-02-11.html Map description on web map
Chapter 4 example-04-01.html Hello JavaScriptexample-04-02.html Earth polesexample-04-03.html Operating on multiple selectionsexample-04-04.html Multiple event listenersexample-04-05.html Event objectexample-04-06.html Populating listexample-04-07.html Working with user input
Chapter 6 example-06-01.html Vector tiles (Mapbox GL JS)example-06-02.html Basic mapexample-06-03.html Adding markerexample-06-04.html Adding lineexample-06-05.html Adding polygonexample-06-06.html Adding popupexample-06-07.html Adding map descriptionexample-06-08.html Click event
Chapter 7 example-07-01.html Loading GeoJSON from object
341
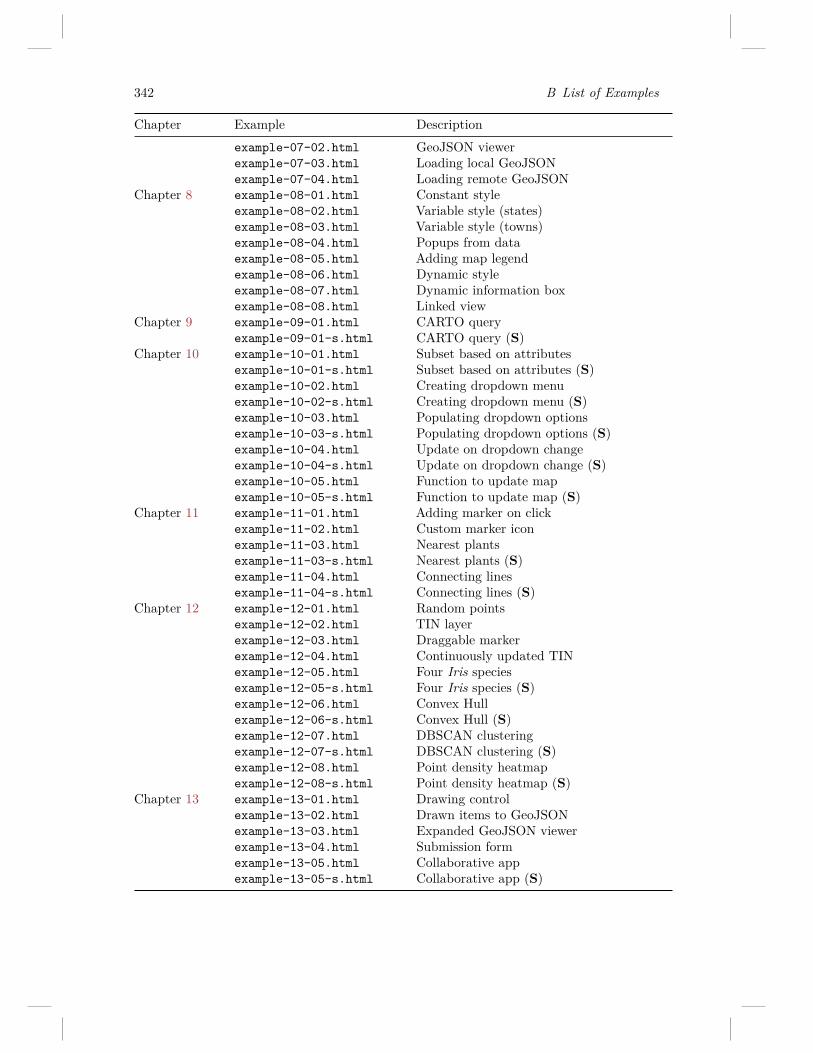
342 B List of Examples
Chapter Example Descriptionexample-07-02.html GeoJSON viewerexample-07-03.html Loading local GeoJSONexample-07-04.html Loading remote GeoJSON
Chapter 8 example-08-01.html Constant styleexample-08-02.html Variable style (states)example-08-03.html Variable style (towns)example-08-04.html Popups from dataexample-08-05.html Adding map legendexample-08-06.html Dynamic styleexample-08-07.html Dynamic information boxexample-08-08.html Linked view
Chapter 9 example-09-01.html CARTO queryexample-09-01-s.html CARTO query (S)
Chapter 10 example-10-01.html Subset based on attributesexample-10-01-s.html Subset based on attributes (S)example-10-02.html Creating dropdown menuexample-10-02-s.html Creating dropdown menu (S)example-10-03.html Populating dropdown optionsexample-10-03-s.html Populating dropdown options (S)example-10-04.html Update on dropdown changeexample-10-04-s.html Update on dropdown change (S)example-10-05.html Function to update mapexample-10-05-s.html Function to update map (S)
Chapter 11 example-11-01.html Adding marker on clickexample-11-02.html Custom marker iconexample-11-03.html Nearest plantsexample-11-03-s.html Nearest plants (S)example-11-04.html Connecting linesexample-11-04-s.html Connecting lines (S)
Chapter 12 example-12-01.html Random pointsexample-12-02.html TIN layerexample-12-03.html Draggable markerexample-12-04.html Continuously updated TINexample-12-05.html Four Iris speciesexample-12-05-s.html Four Iris species (S)example-12-06.html Convex Hullexample-12-06-s.html Convex Hull (S)example-12-07.html DBSCAN clusteringexample-12-07-s.html DBSCAN clustering (S)example-12-08.html Point density heatmapexample-12-08-s.html Point density heatmap (S)
Chapter 13 example-13-01.html Drawing controlexample-13-02.html Drawn items to GeoJSONexample-13-03.html Expanded GeoJSON viewerexample-13-04.html Submission formexample-13-05.html Collaborative appexample-13-05-s.html Collaborative app (S)
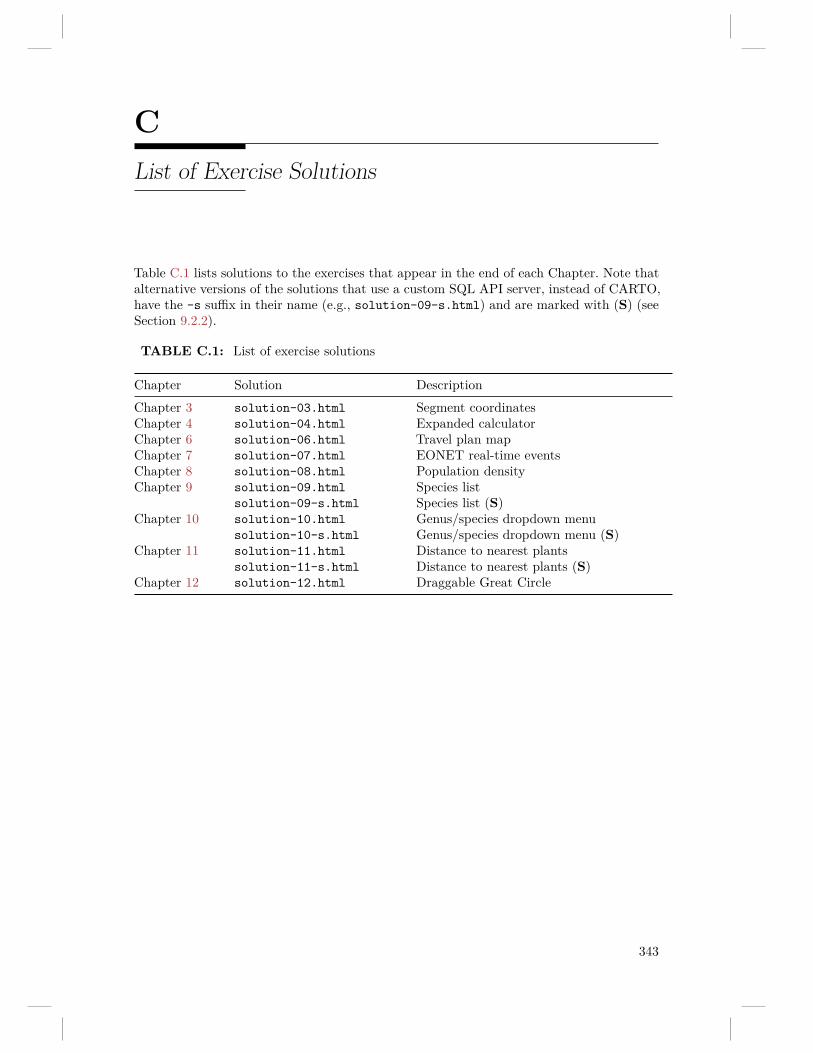
CList of Exercise Solutions
Table C.1 lists solutions to the exercises that appear in the end of each Chapter. Note thatalternative versions of the solutions that use a custom SQL API server, instead of CARTO,have the -s suffix in their name (e.g., solution-09-s.html) and are marked with (S) (seeSection 9.2.2).
TABLE C.1: List of exercise solutions
Chapter Solution DescriptionChapter 3 solution-03.html Segment coordinatesChapter 4 solution-04.html Expanded calculatorChapter 6 solution-06.html Travel plan mapChapter 7 solution-07.html EONET real-time eventsChapter 8 solution-08.html Population densityChapter 9 solution-09.html Species list
solution-09-s.html Species list (S)Chapter 10 solution-10.html Genus/species dropdown menu
solution-10-s.html Genus/species dropdown menu (S)Chapter 11 solution-11.html Distance to nearest plants
solution-11-s.html Distance to nearest plants (S)Chapter 12 solution-12.html Draggable Great Circle
343

Bibliography
Bassett, L. (2015). Introduction to JavaScript Object Notation: a to-the-point guide to JSON.O’Reilly Media, Inc., Sebastopol, CA, USA.
Crickard III, P. (2014). Leaflet.js Essentials. Packt Publishing Ltd., Birmingham, UK.
Crockford, D. (2008). JavaScript: The Good Parts. O’Reilly Media, Inc., Sebastopol, CA,USA.
DeBarros, A. (2018). Practical SQL: A Beginner’s Guide to Storytelling with Data. NoStarch Press, San Francisco, CA, USA.
Dent, B. D., Torguson, J. S., and Hodler, T. W. (2008). Cartography: Thematic map design.WCB/McGraw-Hill Boston, New York, NY, USA, 6th edition.
Dincer, A. and Uraz, B. (2013). Google Maps JavaScript API Cookbook. Packt PublishingLtd., Birmingham, UK.
Farkas, G. (2016). Mastering OpenLayers 3. Packt Publishing Ltd., Birmingham, UK.
Gratier, T., Spencer, P., and Hazzard, E. (2015). OpenLayers 3: Beginner’s Guide. PacktPublishing Ltd.
Janert, P. K. (2019). D3 for the Impatient: Interactive Graphics for Programmers andScientists. O’Reilly Media, Inc., Sebastopol, CA, USA.
Langley, P. J. and Perez, A. S. (2016). OpenLayers 3.x Cookbook. Packt Publishing Ltd.,Birmingham, UK, 2nd edition.
Murray, S. (2017). Interactive Data Visualization for the Web: An Introduction to Designingwith D3. O’Reilly Media, Inc., Sebastopol, CA, USA.
Murrell, P. (2009). Introduction to Data Technologies. Chapman and Hall/CRC, BocaRaton, FL, USA.
Neuwirth, E. (2014). RColorBrewer: ColorBrewer Palettes. R package version 1.1-2.
Newton, T. and Villarreal, O. (2014). Learning D3.js Mapping. Packt Publishing Ltd.,Birmingham, UK.
Nield, T. (2016). Getting Started with SQL: A Hands-On Approach for Beginners. O’ReillyMedia, Inc., Sebastopol, CA, USA.
Obe, R. and Hsu, L. (2020). PostGIS in Action. Manning Publications Co., Shelter Island,NY, USA., 3rd edition.
Pebesma, E. (2018). Simple Features for R: Standardized Support for Spatial Vector Data.The R Journal, 10(1):439–446.
QGIS Development Team (2018). QGIS Geographic Information System. Open SourceGeospatial Foundation.
345
346 C Bibliography
R Core Team (2018). R: A Language and Environment for Statistical Computing. RFoundation for Statistical Computing, Vienna, Austria.
Rubalcava, R. (2015). ArcGIS Web Development. Manning Publications Co., Shelter Island,NY, USA.
South, A. (2011). rworldmap: A New R package for Mapping Global Data. The R Journal,3(1):35–43.
Tufte, E. (2001). The quantitative display of information. Graphics Press, Cheshire, CT,USA, 2nd edition.
Wickham, H. (2018). nycflights13: Flights that Departed NYC in 2013. R package version1.0.0.
Wilke, C. O. (2019). Fundamentals of Data Visualization: A Primer on Making Informativeand Compelling Figures. O’Reilly Media, Inc., Sebastopol, CA, USA.
Xie, Y. (2016). bookdown: Authoring Books and Technical Documents with R Markdown.Chapman and Hall/CRC, Boca Raton, FL, USA.
Xie, Y. (2018). bookdown: Authoring Books and Technical Documents with R Markdown. Rpackage version 0.9.
Index
Anonymous function, 73, 91, 204, 255, 258Application Programming Interface (API),
85, 230–234ArcGIS, 224, 225Asynchronous JavaScript and XML (Ajax),
184–186
CARTO (platform), 222, 223, 230–238,247–249, 320–324
Cascading Style Sheets (CSS), 23, 24, 30,33–58, 120, 158, 180, 204, 206, 207,212, 245
Comma-Separated Values (CSV), 233, 234,280
Content Delivery Network (CDN), 137Convex Hull, 299, 300Cross-Origin Resource Sharing (CORS),
190–192
Density-Based Spatial Clustering ofApplications with Noise(DBSCAN), 301, 302
Document Object Model (DOM), 85–87, 89,93
Domain Name Server (DNS), 119Douglas–Peucker algorithm, 175
Event listener/handler, 90, 91, 99, 100Event object, 100–102Extensible Markup Language (XML), 184
fetch API, 187–192
GeoJSON, 83, 84, 123, 165–183, 224, 228,242, 286, 288, 320
geojson.io (web application), 174, 175, 180,233
GeoPackage (format), 165Git, 126GitHub (platform), 126–130Great Circle, 272, 285, 304
Heatmap, 303HTTP Secure (HTTPS), 113
Hypertext Markup Language (HTML),8–32, 316
Hypertext Transfer Protocol (HTTP), 113,114, 229
Iteration, 77–80, 103–106, 251, 252, 304, 312
JavaScript, 59–84JavaScript Object Notation (JSON), 81–84,
184, 248, 250
Kernel Density Estimation (KDE), 303
Leaflet (JavaScript Library), 134–136,138–162, 182, 183, 193–216
Leaflet.draw (Leaflet plugin), 309–319, 325,327–329
Leaflet.heat (Leaflet plugin), 303, 304
mapshaper (software), 175, 176
OpenStreetMap, 143–146, 307, 308
Portable Network Graphics (PNG), 22, 139,141, 148, 185, 265, 268
PostGIS, 225, 229, 269–273, 279, 280Python (language), xii, 116, 121, 122
QGIS, xiv, 198, 225, 233Quantiles, 198Query string, 230
R (language), xii, 116Raster tiles, 143, 221
Scalable Vector Graphics (SVG), 94Shapefile (format), 165, 173Simple Features, 166, 224Spatial database, 223SQL, 225–229, 241, 242, 247–249, 269–273,
320–324
Triangulated Irregular Network (TIN), 289Turf.js (JavaScript Library), 284–302
347

348 Index
Uniform Resource Locator (URL), 4, 114,118, 119, 143, 145, 230, 232
Vector tiles, 144, 145
Web Map Services (WMS), 154, 221Web mercator, 140–142Well-Known Binary (WKB), 227, 228Well-Known Text (WKT), 166, 227, 228WGS84 (coordinate reference system), 140,
179, 272, 322