Intraclass correlation among measures related to cigarette use by adolescents
12
Addictive Behaviors, Vol. 22, No. 1, pp. t-12. lYY7 Pergamon Copyright 0 19% Elsevier Science Ltd Printed in the USA. All rights reserved 0306-4603/97 $17.00 + .M SSDI 030&4603(95)00099-2 INTRACLASS CORRELATION AMONG MEASURES RELATED TO TOBACCO USE BY ADOLESCENTS: ESTIMATES, CORRELATES, AND APPLICATIONS IN INTERVENTION STUDIES DAVID M. MURRAY and BRIAN J. SHORT Department of Epidemiology, University of Minnesota Abstract-Tobacco intervention studies that employ a community trial design require ad- justment to the usual analytic methods to account for the allocation of intact social groups to study conditions and the positive intraclass correlation (p) that is inevitable in such a design. In the absence of valid estimates of the relevant p. investigators seeking to establish an appro- priate sample size could only guess about the magnitude of the problem. We recently pub- lished estimates of p for common measures of adolescent tobacco use. but those estimates were unadjusted for potential covariates and so represented an upper limit on the magnitude of p. This report demonstrates how estimates of intraclass correlation may be substantially rc- duced through regression adjustment for easily measured covariates. Results show that both the p and the residual variance can be reduced, by an average of 20 and 11%. respectively. of- fering greater efficiency for investigators who plan future studies and who are able to measure those covariates in their studies, Future work should seek both to replicate this work and to extend it: for example, to cohort designs where the improvements might be even greater. Copyright 0 19% Elsevier Science Ltd INTRODUCTION Most adolescent tobacco-use-prevention studies employ designs in which classrooms. schools, school districts. or sometimes entire communities are assigned to treatment conditions while observations are made on individual students (U.S. Department of Health and Human Services, 1994). As such. they belong to a class of studies often called community trials. One of the common features of such community trials is their collection of data at levels that are subsidiary to the level at which the treatments are allocated. Studies with different units of assignment and observation exist in many disciplines and pose a number of design and analysis problems not present when individuals are randomized directly to conditions (Donner, Birkett, & Buck. 1981; Feldman & McKinlay. 1994; Hopkins. 1982: Kish. 1965; Koepsell et al., 1991: Bryk & Raudenbush, 1992: Skinner. Holt. & Smith. 1989; Zucker, 1990). The major problem is that the treatment effect must be assessed against the between-group variance. Unfortunately, that variance is usually larger when based on intact social groups than if based on randomly consti- tuted groups. In addition, the precision available to estimate the between-group vari- ance is usually less than that for the within-group variance. These factors often com- bine to reduce power so that it is almost impossible to detect important treatment effects in an otherwise well-designed and properly executed study. Let “ij, i = 1 . . . WZ, j = 1 . . . n, represent observations from n individuals nested within each of m groups. Let a2 represent the within-group variance: the Xij can be con- This research was supported by a grant from the National Cancer Institute (ROl CA.54893-01). The authors thank Kate Denevan for technical assistance with the final version of the manuscript. Requests for reprints should be sent to David M. Murray. University of Minnesota, School of Public Health. Ste. 300. 1300 S. Second St., Minneapolis. MN 55454-1015
-
Upload
washington -
Category
Documents
-
view
1 -
download
0
Transcript of Intraclass correlation among measures related to cigarette use by adolescents

Addictive Behaviors, Vol. 22, No. 1, pp. t-12. lYY7
Pergamon Copyright 0 19% Elsevier Science Ltd Printed in the USA. All rights reserved
0306-4603/97 $17.00 + .M
SSDI 030&4603(95)00099-2
INTRACLASS CORRELATION AMONG MEASURES RELATED TO TOBACCO USE BY ADOLESCENTS: ESTIMATES, CORRELATES,
AND APPLICATIONS IN INTERVENTION STUDIES
DAVID M. MURRAY and BRIAN J. SHORT Department of Epidemiology, University of Minnesota
Abstract-Tobacco intervention studies that employ a community trial design require ad- justment to the usual analytic methods to account for the allocation of intact social groups to study conditions and the positive intraclass correlation (p) that is inevitable in such a design. In the absence of valid estimates of the relevant p. investigators seeking to establish an appro- priate sample size could only guess about the magnitude of the problem. We recently pub- lished estimates of p for common measures of adolescent tobacco use. but those estimates were unadjusted for potential covariates and so represented an upper limit on the magnitude of p. This report demonstrates how estimates of intraclass correlation may be substantially rc- duced through regression adjustment for easily measured covariates. Results show that both the p and the residual variance can be reduced, by an average of 20 and 11%. respectively. of- fering greater efficiency for investigators who plan future studies and who are able to measure those covariates in their studies, Future work should seek both to replicate this work and to extend it: for example, to cohort designs where the improvements might be even greater.
Copyright 0 19% Elsevier Science Ltd
INTRODUCTION
Most adolescent tobacco-use-prevention studies employ designs in which classrooms. schools, school districts. or sometimes entire communities are assigned to treatment conditions while observations are made on individual students (U.S. Department of Health and Human Services, 1994). As such. they belong to a class of studies often called community trials.
One of the common features of such community trials is their collection of data at levels that are subsidiary to the level at which the treatments are allocated. Studies with different units of assignment and observation exist in many disciplines and pose a number of design and analysis problems not present when individuals are randomized directly to conditions (Donner, Birkett, & Buck. 1981; Feldman & McKinlay. 1994; Hopkins. 1982: Kish. 1965; Koepsell et al., 1991: Bryk & Raudenbush, 1992: Skinner. Holt. & Smith. 1989; Zucker, 1990). The major problem is that the treatment effect must be assessed against the between-group variance. Unfortunately, that variance is usually larger when based on intact social groups than if based on randomly consti- tuted groups. In addition, the precision available to estimate the between-group vari- ance is usually less than that for the within-group variance. These factors often com- bine to reduce power so that it is almost impossible to detect important treatment effects in an otherwise well-designed and properly executed study.
Let “ij, i = 1 . . . WZ, j = 1 . . . n, represent observations from n individuals nested within each of m groups. Let a2 represent the within-group variance: the Xij can be con-
This research was supported by a grant from the National Cancer Institute (ROl CA.54893-01). The authors thank Kate Denevan for technical assistance with the final version of the manuscript. Requests for reprints should be sent to David M. Murray. University of Minnesota, School of Public
Health. Ste. 300. 1300 S. Second St., Minneapolis. MN 55454-1015
2 D. M. MURRAY and B. SHORT
tinuous or discrete and their distribution need not be specified. When group member- ship is established by random assignment, it is reasonable to assume that the xij are in- dependent, so that the variance of the mean is simply a*/n. Because the members of an intact social group are likely to be similar to one another, the xij will show positive intra- class correlation (corr(Xj, Xi’) = p) and the variance of the mean is (u*/n)*(l + (n - 1) p)) (Kish, 1965). The factor (1 +(n - 1) p)) defines the extra variation resulting from the intraclass correlation between members of the same group; it has been called both the design effect (Kish, 1965) and the variance inflation factor (Donner et al., 1981). Note that the inflation factor is 1 when p = 0, so that the variance of the mean is u*/n. When p > 0, the inflation factor increases both with increasing intraclass correlation and with increasing group size. Even for small p, the inflation factor is large when n is large. The practical consequence in community trials is that this extra variation can substantially reduce power. In addition, the precision to estimate p is tied directly to the often lim- ited number of groups included in the study, further reducing power.
Given the current state of affairs, the best advice is to plan a large enough study to allow for the extra variation inherent in the community trial and then to take advan- tage of other design and analysis strategies to limit its impact (Murray et al., 1994). To do so, investigators need good estimates of the magnitude of the extra variation to be expected in their nested designs. Of particular importance are estimates of p for the outcomes of interest, which together with the number of observations per intact group, n, determine the magnitude of the extra variation in the nested design. Two re- cent reports presented estimates of p for common measures of adolescent tobacco use (Murray et al., 1994; Murray & Hannan, 1990) and described their use in planning new studies. The purpose of this report was to show how these estimates might be reduced during the analysis so that their otherwise deleterious effects on power may be diminished.
METHODS
Tobacco policy options for prevention The data presented here were collected as part of the baseline survey for the To-
bacco Policy Organization and Prevention (TPOP) project. TPOP is a randomized community trial to evaluate the effects of a community organizing effort to change the physical, social, and policy environments of communities in order to reduce adolescent tobacco use and subsequent problems associated with tobacco use.
Late in 1992, TPOP staff identified all Minnesota school districts that had at least 90 students enrolled in each of grades 8-10, were not participating in any other Division of Epidemiology studies, and were outside the Minnesota ASSIST target area. Eligi- ble districts were listed in order of decreasing proportion of students who lived within the boundaries of the community that was the focal point for the district, and school districts were contacted for invitation to the study in descending order. Twenty-two school districts were contacted to recruit the 14 districts needed for the study. Districts that declined to participate did so because they had recently participated in another health-related survey project. The 14 communities represented by those districts ranged in size from 3,200 to 14,000 residents, and all were at least 90 miles from the Twin Cities metropolitan area. None of the communities had considered any local policies regarding youth access to tobacco in the previous 5 years, and all school districts rep- resenting those cities had adopted tobacco-free policies for students, staff, and visitors before the study began.
Intraclass correlation of adolescent tobacco measures
Survey design The two major components of the TPOP baseline data collection schedule were sur-
veys of students in eighth, ninth, and tenth grades and purchase attempts at tobacco outlets. Gender and ethnic groups were included in the surveys proportional to their representation in the populations. This paper reports data from the survey of students at school.
School surveys were conducted in the spring of 1993 in the public schools of the par- ticipating communities. Because of the small size of those communities, there was only one school per grade in each locality. Passive informed-consent was obtained from the parent(s) of each child prior to the survey interview. Surveys were conducted during regular class sessions and confidentiality was assured. Surveys were administered by two-person teams of survey interviewers specially trained for this project. Expired-air tests for carbon monoxide were used as an incentive to encourage accurate self-reports of tobacco use (Murray & Perry, 1987; Murray, Perry, O’Connell, & Schmid, 1987).
Variables of interest and their measures Questionnaire items for the school survey included detailed information on tobacco
and smokeless tobacco use, peer and family use of tobacco, and related measures. De- pendent variables included in the analyses reported here are six measures frequently used as outcomes in tobacco-use prevention studies. These measures were daily use of cigarettes, weekly use of cigarettes, the number cigarettes smoked per week, use of cigarettes in the past month, daily use of smokeless tobacco, and weekly use of smoke- less tobacco. The first three measures were created based on an index of cigarette smoking scaled to reflect the number of cigarettes smoked weekly (Pechacek et al., 1984). This index was cut at seven and one cigarette per week, respectively, to create the dichotomous measures of daily and weekly smoking; the index was used as a con- tinuous measure for the number of cigarettes smoked weekly. The measures of past month smoking and the two smokeless tobacco-use measures were constructed from single items asking about any use of tobacco in the past month and any use of smoke- less tobacco in the past 24 h and in the previous week.
Independent variables included school, gender, age (in years), whether either of the respondent’s parents had an education beyond high school, whether the respondent was living with one or both parents, whether someone 21 or older was home between the end of school and dinner time. and the respondent’s weekly discretionary income. Other independent variables related to family-member tobacco use. These included cigarette use by the respondent’s father, mother, and siblings. and smokeless tobacco use by the respondent’s father and siblings.
Analysis methods Analyses were conducted in a series of mixed-model regressions using SAS PROC
MIXED, a mixed-model regression program especially suited to the analysis of data from complex survey designs (Murray & Wolfinger, 1994; SAS Institute Inc., 1992). For each tobacco-use measure, three sets of analyses were conducted. In Model 7, school was included as the only independent variable and was defined as a random ef- fect in the regression analysis; Model 1 provided an estimate of the crude p for each dependent variable. In Model 2, age and gender were added as fixed effects, since age and gender adjustments are often used to standardize survey data; Model 2 provided age- and gender-standardized estimates of p for each dependent variable. Model 3 ad-
4 D. M. MURRAY and B. SHORT
justed for age, gender, and additional person-level covariates specific to each of the six dependent variables. All such person-level covariates were added to Model 2 to create an initial version of Model 3. Individual covariates were then removed through back- ward stepwise elimination, deleting the item with the lowest F-test at each iteration until all remaining covariates were significant at p < .05; age and gender were retained through each iteration. The three grade levels were analyzed separately, and all analy- ses of the smokeless tobacco measures were restricted to male respondents as smoke- less tobacco use is largely a male phenomenon (U.S. Department of Health and Hu- man Services, 1994).
SAS PROC MIXED provides an estimate of the variance for each random effect in- cluded in the analysis. As a result, each set of analyses provided variance estimates for school and for residual error. These estimates were used to compute p as the propor- tion of the total variance associated with the school component (Snedecor & Cochran, 1989). The 95% confidence bounds for p were computed based on the upper and lower critical values for the F-distribution given the degrees of freedom available to estimate the two variance components (Snedecor & Cochran, 1989). Variance estimates from Models 2 and 3 were compared to those from Model 1 to compute the percent change obtained from the adjustments applied in Models 2 and 3.
RESULTS
A total of 2,091 eighth graders, 1,995 ninth graders, and 1,880 tenth graders were surveyed, representing 91.2% of the students enrolled in the schools at the time of the survey; approximately 1% refused participation and the remainder were absent on the day of the survey. The sample was 49.3% female and 5.1% identified themselves as members of an ethnic or racial minority. Fully 70.4% reported that they lived in the community where the school was located.
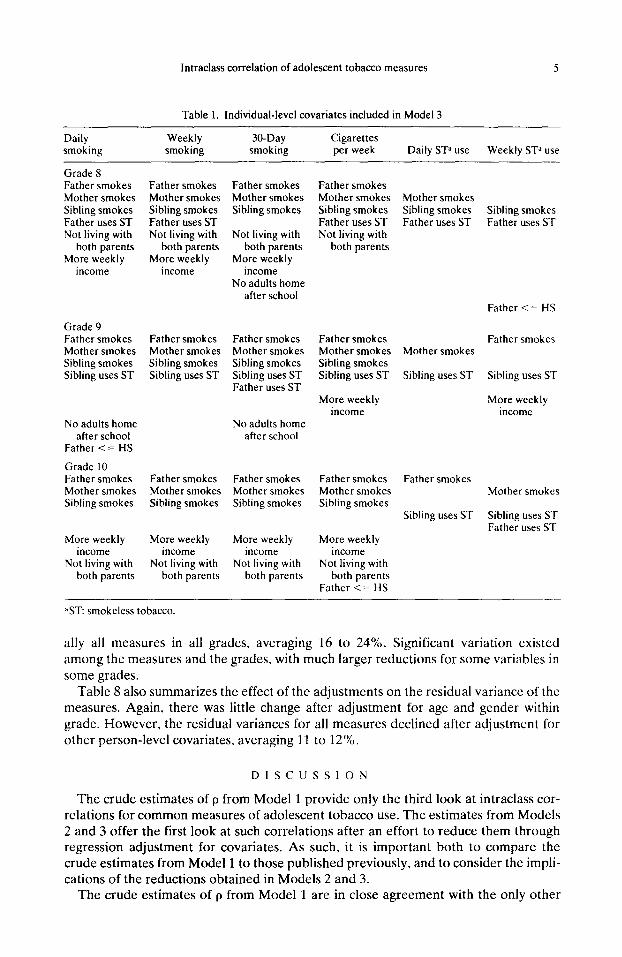
Table 1 summarizes the person-level covariates employed to develop Model 3 for each dependent variable; for each covariate, the indicated level was associated with more tobacco use. Not surprisingly, there was considerable overlap among the covari- ates across dependent variables and grade levels, and the results were largely consis- tent with previous studies (U.S. Department of Health and Human Services, 1994).
Tables 2 through 7 present parameter estimates for the three grade levels for each dependent variable examined for this paper, including the point estimates (proportions, or means), the intraclass correlation coefficients and their 95% confidence bounds, and the residual variances; values are reported for each of the three models. The point es- timates varied from measure to measure, but the most common outcomes were similar to values reported elsewhere for this age group (Johnston, O’Malley, & Bachman, 1994). The crude p based on Model 1 were generally small, with slightly higher values for tenth graders and slightly lower values for eighth graders; these estimates are also similar to those reported elsewhere (Murray et al., 1994; Murray & Hannan, 1990). The adjusted p based on Models 2 and 3 provided the first look at the extent to which intraclass correlations for common measures of adolescent smoking can be reduced through adjustment for individual-level covariates.
Table 8 summarizes the effect on those p of adjustments for age and gender (Model 2) and for the other person-level covariates (Model 3). Adjustment for age and gender had little effect, although modest reductions were seen for several measures among tenth graders, particularly those related to smokeless tobacco use. After adjustment for the other significant person-level covariates, the estimates of p declined for virtu-
lntraclass correlation of adolescent tobacco measures 5
Table 1. Individual-level covariates included in Model 3
Daily smoking
Weekly smoking
30-Day smoking
Cigarettes per week Daily SP use Weekly ST” use
Grade 8 Father smokes Mother smokes Sibling smokes Father uses ST Not living with
both parents More weekly
income
Father smokes Mother smokes Sibling smokes Father uses ST Not living with
both parents More weekly
income
Grade 9 Father smokes Father smokes Mother smokes Mother smokes Sibling smokes Sibling smokes Sibling uses ST Sibling uses ST
No adults home after school
Father <= HS
Grade 10 Father smokes Father smokes Mother smokes Mother smokes Sibling smokes Sibling smokes
More weekly More weekly income income
Not living with Not living with both parents both parents
,‘ST: smokeless tobacco.
Father smokes Mother smokes Sibling smokes
Not living with both parents
More weekly income
No adults home after school
Father smokes Mother smokes Sibling smokes Sibling uses ST Father uses ST
No adults home after school
Father smokes Father smokes Mother smokes Mother smokes Sibling smokes Sibling smokes
More weekly income
Not living with both parents
Father smokes Mother smokes Sibling smokes Father uses ST Not living with
both parents
Father smokes Mother smokes Sibling smokes Sibling uses ST
More weekly income
More weekly income
Not living with both parents
Father <= HS
Mother smokes Sibling smokes Sibling smokes Father uses ST Father uses ST
Father <= HS
Father smokes Mother smokes
Sibling uses ST Sibling uses ST
More weekly income
Father smokes Mother smokes
Sibling uses ST Sibling uses ST Father uses ST
ally all measures in all grades, averaging 16 to 24%. Significant variation existed among the measures and the grades, with much larger reductions for some variables in some grades.
Table 8 also summarizes the effect of the adjustments on the residual variance of the measures. Again. there was little change after adjustment for age and gender within grade. However, the residual variances for all measures declined after adjustment for other person-level covariates, averaging 11 to 12%.
DISCUSSION
The crude estimates of p from Model 1 provide only the third look at intraclass cor- relations for common measures of adolescent tobacco use. The estimates from Models 2 and 3 offer the first look at such correlations after an effort to reduce them through regression adjustment for covariates. As such, it is important both to compare the crude estimates from Model 1 to those published previously. and to consider the impli- cations of the reductions obtained in Models 2 and 3.
The crude estimates of p from Model 1 are in close agreement with the only other
6 D. M. MURRAY and B. SHORT
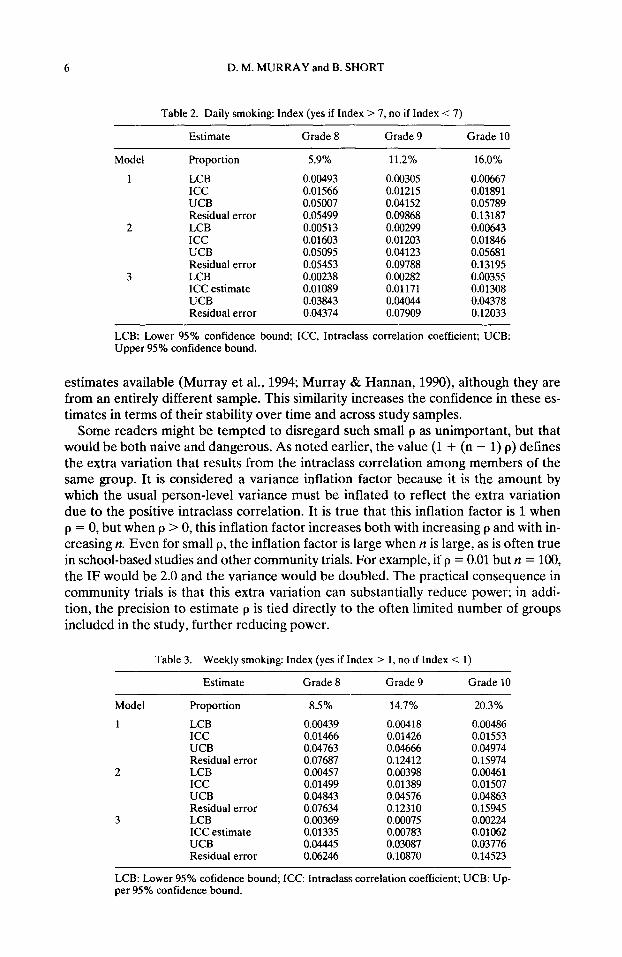
Table 2. Daily smoking: Index (yes if Index > 7, no if Index < 7)
Estimate Grade 8 Grade 9 Grade 10
Model
1
2
3
Proportion
LCB ICC UCB Residual error LCB ICC UCB Residual error LCB ICC estimate UCB Residual error
5.9% 11.2% 16.0%
0.00493 0.00305 0.00667 0.01566 0.01215 0.01891 0.05007 0.04152 0.05789 0.05499 0.09868 0.13187 0.00513 0.00299 0.00643 0.01603 0.01203 0.01846 0.05095 0.04123 0.05681 0.05453 0.09788 0.13195 0.00238 0.00282 0.00355 0.01089 0.01171 0.01308 0.03843 0.04044 0.04378 0.04374 0.07909 0.12033
LCB: Lower 95% confidence bound; ICC, Intraclass correlation coefficient; UCB: Upper 95% confidence bound.
estimates available (Murray et al., 1994; Murray & Hannan, 1990), although they are from an entirely different sample. This similarity increases the confidence in these es- timates in terms of their stability over time and across study samples.
Some readers might be tempted to disregard such small p as unimportant, but that would be both naive and dangerous. As noted earlier, the value (1 + (n - 1) p) defines the extra variation that results from the intraclass correlation among members of the same group. It is considered a variance inflation factor because it is the amount by which the usual person-level variance must be inflated to reflect the extra variation due to the positive intraclass correlation. It is true that this inflation factor is 1 when p = 0, but when p > 0, this inflation factor increases both with increasing p and with in- creasing II. Even for small p, the inflation factor is large when n is large, as is often true in school-based studies and other community trials. For example, if p = 0.01 but n = 100, the IF would be 2.0 and the variance would be doubled. The practical consequence in community trials is that this extra variation can substantially reduce power; in addi- tion, the precision to estimate p is tied directly to the often limited number of groups included in the study, further reducing power.
Table 3. Weekly smoking: Index (yes if Index > 1, no if Index < 1)
Estimate Grade 8 Grade 9 Grade 10
Model Proportion 8.5% 14.7% 20.3%
1 LCB 0.00439 0.00418 0.00486 ICC 0.01466 0.01426 0.01553 UCB 0.04763 0.04666 0.04974 Residual error 0.07687 0.12412 0.15974
2 LCB 0.00457 0.00398 0.00461 ICC 0.01499 0.01389 0.01507 UCB 0.04843 0.04576 0.04863 Residual error 0.07634 0.12310 0.15945
3 LCB 0.00369 0.00075 0.00224 ICC estimate 0.01335 0.00783 0.01062 UCB 0.04445 0.03087 0.03776 Residual error 0.06246 0.10870 0.14523
LCB: Lower 95% cofidence bound; ICC: Intraclass correlation coefficient; UCB: Up- per 95% confidence bound.
lntraclass correlation of adolescent tobacco measures
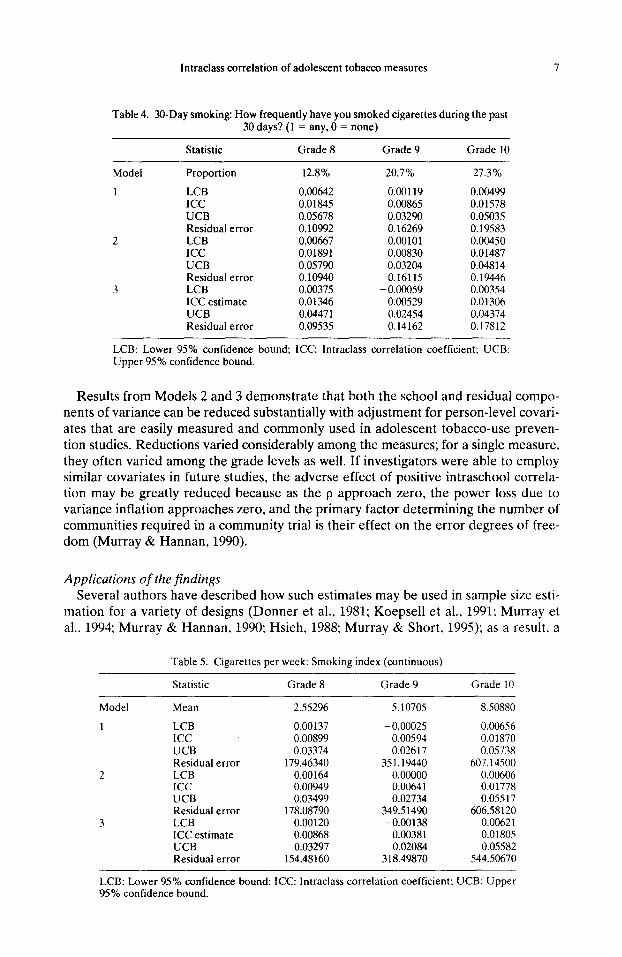
Table 4. 30-Day smoking: How frequently have you smoked cigarettes during the past 30 days? (1 = any, 0 = none)
Statistic Grade 8 Grade 9 Grade 10
Model Proportion
1 LCB ICC UCB Residual error
2 LCB ICC UCB Residual error
3 LCB ICC estimate UCB Residual error
12.8% 20.7% 27.3%
0.00642 0.00119 0.00499 0.01845 0.00865 0.01578 0.05678 0.03290 0.05035 0.10992 0.16269 0.19583 0.00667 0.00101 0.00450 0.01891 0.00830 0.01487 0.05790 0.03204 0.04814 0.10940 0.16115 0.19446 0.00375 -0.OGO59 0.00354 0.01346 0.00529 0.01306 0.04471 0.02454 0.04374 0.09535 0.14162 0.17812
LCB: Lower 95% confidence bound: ICC: lntraclass correlation coefficient; UCB: Upper 95% confidence bound.
Results from Models 2 and 3 demonstrate that both the school and residual compo- nents of variance can be reduced substantially with adjustment for person-level covari- ates that are easily measured and commonly used in adolescent tobacco-use preven- tion studies. Reductions varied considerably among the measures; for a single measure. they often varied among the grade levels as well. If investigators were able to employ similar covariates in future studies, the adverse effect of positive intraschool correla- tion may be greatly reduced because as the p approach zero, the power loss due to variance inflation approaches zero, and the primary factor determining the number of communities required in a community trial is their effect on the error degrees of free- dom (Murray & Hannan, 1990).
Applications of the findings Several authors have described how such estimates may be used in sample size esti-
mation for a variety of designs (Donner et al., 1981; Koepsell et al., 1991: Murray et al.. 1994; Murray & Hannan, 1990; Hsieh, 1988; Murray & Short, 1995); as a result, a
Model
1
2
3
Table 5. Cigarettes per week: Smoking index (continuous)
Statistic Grade 8 Grade 9 Grade IO
Mean 2.55296 5.10705 8.50880
LCB 0.00137 -0.00025 0.00656 ICC 0.00899 0.00594 0.01870 UCB 0.03374 0.02617 0.05738 Residual error 179.46340 351.19440 607.14500 LCB 0.00164 0.00000 0.00606 ICC 0.00949 0.00641 0.01778 UCB 0.03499 0.02734 0.05517 Residual error 178.08790 349.51490 606.58120 LCB 0.00120 -0.00138 0.00621 ICC estimate 0.00868 0.00381 0.01805 UCB 0.03297 0.02084 0.05582 Residual error 154.48160 318.49870 544.50670
LCB: Lower 95% confidence bound: ICC: lntraclass correlation coefficient: UCB: Upper 95% confidence bound.
D. M. MURRAY and B. SHORT
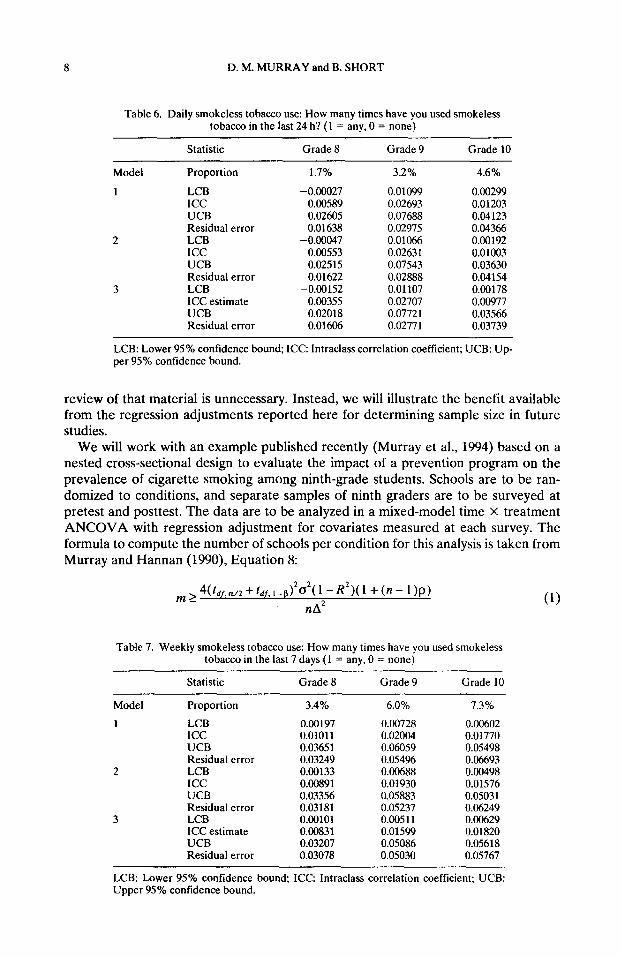
Table 6. Daily smokeless tobacco use: How many times have you used smokeless tobacco in the last 24 h? (1 = any, 0 = none)
Statistic Grade 8 Grade 9 Grade 10
Model Proportion
1 LCB ICC UCB Residual error
2 LCB ICC UCB Residual error
3 LCB ICC estimate UCB Residual error
1.7% 3.2% 4.6%
-0.00027 0.01099 0.00299 0.00589 0.02693 0.01203 0.02605 0.07688 0.04123 0.01638 0.02975 0.04366
-0.00047 0.01066 0.00192 0.00553 0.02631 0.01003 0.02515 0.07543 0.03630 0.01622 0.02888 0.04154
-0.00152 0.01107 0.00178 0.00355 0.02707 0.00977 0.02018 0.07721 0.03566 0.01606 0.02771 0.03739
LCB: Lower 95% confidence bound; ICC: Intraclass correlation coefficient; UCB: Up- per 95% confidence bound.
review of that material is unnecessary. Instead, we will illustrate the benefit available from the regression adjustments reported here for determining sample size in future studies.
We will work with an example published recently (Murray et al., 1994) based on a nested cross-sectional design to evaluate the impact of a prevention program on the prevalence of cigarette smoking among ninth-grade students. Schools are to be ran- domized to conditions, and separate samples of ninth graders are to be surveyed at pretest and posttest. The data are to be analyzed in a mixed-model time X treatment ANCOVA with regression adjustment for covariates measured at each survey. The formula to compute the number of schools per condition for this analysis is taken from Murray and Hannan (1990) Equation 8:
m14(f~,,“,2+f~,,‘-~)202(l -R’)(l +(n- 1)~) nA2
Table 7. Weekly smokeless tobacco use: How many times have you used smokeless tobacco in the last 7 days (1 = any, 0 = none)
Model
1
2
3
Statistic Grade 8 Grade 9 Grade 10
Proportion 3.4% 6.0% 7.3%
LCB 0.00197 0.00728 0.00602 ICC 0.01011 0.02004 0.01770 UCB 0.03651 0.06059 0.05498 Residual error 0.03249 0.054% 0.06693 LCB 0.00133 0.00688 0.00498 ICC 0.00891 0.01930 0.01576 UCB 0.03356 0.05883 0.05031 Residual error 0.03181 0.05237 0.06249 LCB 0.00101 0.00511 0.00629 ICC estimate 0.00831 0.01599 0.01820 UCB 0.03207 0.05086 0.05618 Residual error 0.03078 0.05030 0.05767
(1)
LCB: Lower 95% confidence bound; ICC: Intraclass correlation coefficient; UCB: Upper 95% confidence bound.
lntraclass correlation of adolescent tobacco measures 9
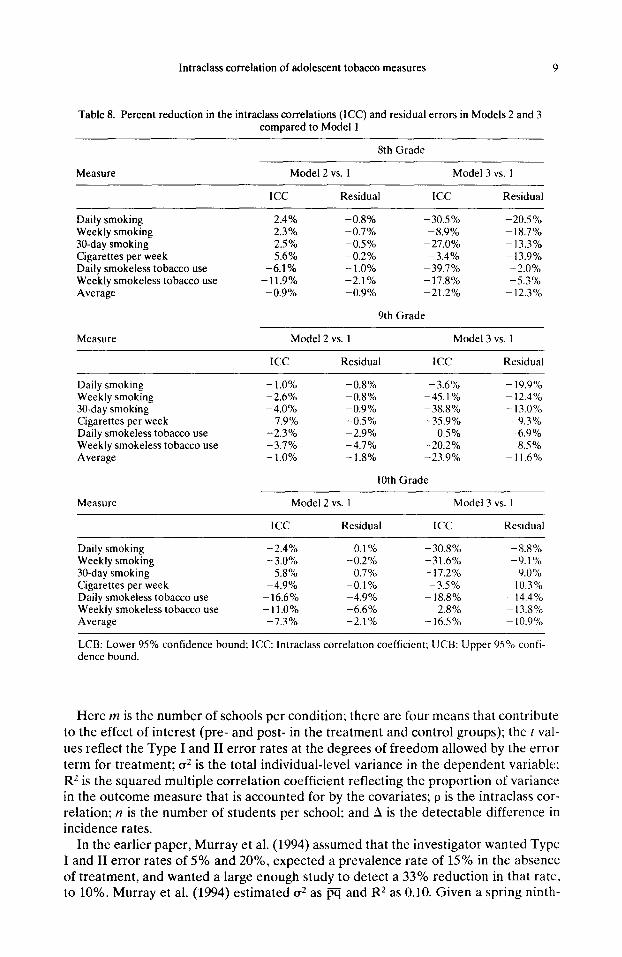
Table 8. Percent reduction in the intraclass correlations (ICC) and residual errors in Models 2 and 3 compared to Model 1
8th Grade
Measure Model 2 vs. 1 Model 3 vs. I
ICC Residual ICC Residual
Daily smoking Weekly smoking 30-day smoking Cigarettes per week Daily smokeless tobacco use Weekly smokeless tobacco use Average
2.4% 2.3% 2.5% 5.6%
-6.1% -11.9% -0.9%
-0.8% -30.5% -20.5% -0.7% -8.9% - 18.7% -0.5% -27.0% -13.3% -0.2% -3.4% -13.9% -1.0% -39.7% -2.0% -2.1% -17.8% -5.3% -0.9% -21.2% -12.3%
9th Grade
Measure Model 2 vs. I Model 3 vs. 1
ICC Residual ICC Residual
Daily smoking Weekly smoking 30-day smoking Cigarettes per week Daily smokeless tobacco use Weekly smokeless tobacco use Average
-1.0% -2.6% -4.0%
7.9% -2.3% -3.7% - 1.0%
-0.8% -3.6% -0.8% -45.1% -0.9% -38.8% -0.5% -35.9% -2.9% 0.5% -4.7% -20.2% -1.8% -23.9%
10th Grade
- 19.9% - 12.4% - 13.0% -9.3% -6.9% -8.5%
-11.6%
Measure Model 2 vs. 1 Model 3 vs. 1
ICC Residual ICC Residual
Daily smoking Weekly smoking 30-day smoking Cigarettes per week Daily smokeless tobacco use Weekly smokeless tobacco use Average
-2.4% 0.1% - 30.8% -8.8% -3.0% -0.2% -31.6% -9.1% -5.8% -0.7% - 17.2% -9.0% -4.9% -0.1% -3.5% ~ 10.3%
-16.6% -4.9% - 18.8% - 14.4% -11.0% -6.6% 2.8% - 13.5% -7.3% -2.1% - 16.5% - 10.9%
LCB: Lower 95% confidence bound; ICC: Intraclass correlation coefficient; UCB: Upper 95% confi- dence bound.
Here m is the number of schools per condition; there are four means that contribute to the effect of interest (pre- and post- in the treatment and control groups): the I val- ues reflect the Type I and II error rates at the degrees of freedom allowed by the error term for treatment; a2 is the total individual-level variance in the dependent variable: RZ is the squared multiple correlation coefficient reflecting the proportion of variance in the outcome measure that is accounted for by the covariates; p is the intraclass cor- relation: IZ is the number of students per school; and A is the detectable difference in incidence rates.
In the earlier paper, Murray et al. (1994) assumed that the investigator wanted Type I and II error rates of 5% and 20%, expected a prevalence rate of 15% in the absence of treatment, and wanted a large enough study to detect a 33% reduction in that rate, to 10%. Murray et al. (1994) estimated a2 as m and R2 as 0.10. Given a spring ninth-
10 D. M. MURRAY and B. SHORT
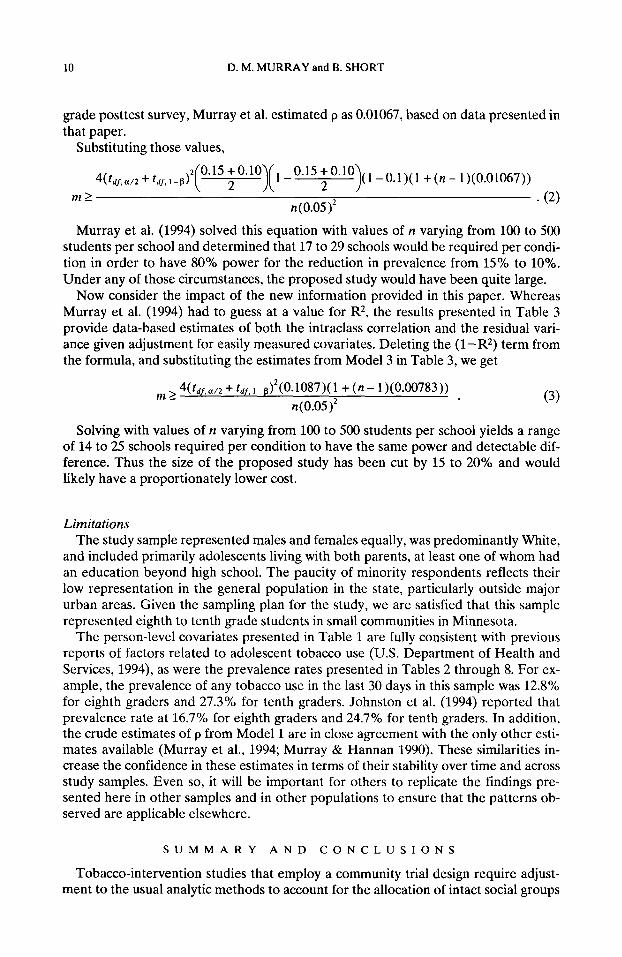
grade posttest survey, Murray et al. estimated p as 0.01067, based on data presented in that paper.
Substituting those values,
4(f, a/~
m2
+~~~,,_s)z(0*15;o~10)(1-o~15;o~10)(1-0.1)(1 +(n-1)(0.01067)) . (2)
n(0.0zQ2
Murray et al. (1994) solved this equation with values of it varying from 100 to 500 students per school and determined that 17 to 29 schools would be required per condi- tion in order to have 80% power for the reduction in prevalence from 15% to 10%. Under any of those circumstances, the proposed study would have been quite large.
Now consider the impact of the new information provided in this paper. Whereas Murray et al. (1994) had to guess at a value for R2, the results presented in Table 3 provide data-based estimates of both the intraclass correlation and the residual vari- ance given adjustment for easily measured covariates. Deleting the (1-R2) term from the formula, and substituting the estimates from Model 3 in Table 3, we get
m 2 4(fdf,a,2 + fdr,,_s)*(0.1087)( 1 + (n- 1)(0.00783))
n(0.05)2 (3)
Solving with values of n varying from 100 to 500 students per school yields a range of 14 to 25 schools required per condition to have the same power and detectable dif- ference. Thus the size of the proposed study has been cut by 15 to 20% and would likely have a proportionately lower cost.
Limitations The study sample represented males and females equally, was predominantly White,
and included primarily adolescents living with both parents, at least one of whom had an education beyond high school. The paucity of minority respondents reflects their low representation in the general population in the state, particularly outside major urban areas. Given the sampling plan for the study, we are satisfied that this sample represented eighth to tenth grade students in small communities in Minnesota.
The person-level covariates presented in Table 1 are fully consistent with previous reports of factors related to adolescent tobacco use (U.S. Department of Health and Services, 1994) as were the prevalence rates presented in Tables 2 through 8. For ex- ample, the prevalence of any tobacco use in the last 30 days in this sample was 12.8% for eighth graders and 27.3% for tenth graders. Johnston et al. (1994) reported that prevalence rate at 16.7% for eighth graders and 24.7% for tenth graders. In addition, the crude estimates of p from Model 1 are in close agreement with the only other esti- mates available (Murray et al., 1994; Murray & Hannan 1990). These similarities in- crease the confidence in these estimates in terms of their stability over time and across study samples. Even so, it will be important for others to replicate the findings pre- sented here in other samples and in other populations to ensure that the patterns ob- served are applicable elsewhere.
SUMMARY AND CONCLUSIONS
Tobacco-intervention studies that employ a community trial design require adjust- ment to the usual analytic methods to account for the allocation of intact social groups
Intraclass correlation of adolescent tobacco measures 11
to study conditions and the positive intraclass correlation (p) that is inevitable in such a design. In the absence of valid estimates of the relevant p, investigators seeking to establish an appropriate sample size could only guess about the magnitude of the problem. Estimates of p for common measures of adolescent tobacco use were pub- lished recently (Murray et al., 1994; Murray & Hannan, 1990), but those estimates were unadjusted for potential covariates and so represented an upper limit on the magnitude of p.
The purpose of this paper was to demonstrate how such estimates might be substan- tially reduced through regression adjustment for easily measured covariates. The re- sults demonstrate that both the intraclass correlations and the residual variances can be reduced, sometimes substantially. Such reductions can offer greater efficiency for investigators who are planning future studies and who are able to measure those covar- iates in their studies. Future work should seek both to replicate this work and to ex- tend it-to cohort designs, for example, where the improvements are likely to be greater.
REFERENCES
Bryk, A. S., & Raudenbush, S. W. (1992). Hierarchical linear models: Applications and data analysis methods, Newbury Park, CA: Sage.
Donner, A., Birkett, N., & Buck, C. (1981). Randomization by cluster. American Journal of Epidemiology, 114.906914.
Feldman, H. A., & McKinlay, S. M. (1994). Cohort versus cross-sectional design in large field trials: Preci- sion, sample size, and unifying model. Statistical Medicine, 13.61-78.
Goldstein, H. (1987). Multilevel models in educational and social research. New York: Oxford University Press.
Hopkins K. D. (1982). The unit of analysis: Group means versus individual observations American Educa- tion Research Journal, 19,5-18.
Hsieh, F. Y. (1988). Sample size formulae for intervention studies with the cluster as unit of randomization. Sfatistics in Medicine, 8,1195-1201.
Johnston, L. D., O’Malley, I? M., & Bachman, J. G.. (1995) National survey results on drug use from the Mon- itoring the Future study, 1975-1994. Vol. I Secondary Schooi Srudents. (NIH Publication No. 964026). Rockville (MD): National Institute on Drug Abuse.
Kish, L. (1965). Survey sampling, New York: Wiley. Koepsell,T. D., Martin, D. C., Diehr, P H., Psaty, B. M., Wagner, E. H.. Perrin, E. B., & Cheadle, A. (1991).
Data analysis and sample size issues in evaluations of community-based health promotion and disease prevention programs: A mixed-model analysis of variance approach. Journal of Clinical Epidemiologv. 44(7),701-713.
Murray, D. M., & Hannan, P. J. (1990). Planning for the appopriate analysis in school-based drug-use pre- vention studies Journal of Consulting and Clinical Psychology, 58(4), 458-468.
Murray. D. M., & Perry, C. L. (1987). The measurement of substance use among adolescents: When is the “bogus pipeline” method needed? Addictive Behaviors, 12,225-233.
Murray, D. M., Perry, C. L., O’Connell, C., & Schmid, L. (1987). Seventh-grade cigarette, alcohol. and mari- juana use: Distribution in a north central U.S. metropolitan population. international Journal of the Addictions, 22(4), 357-376.
Murray, D. M.. Rooney, B. L., Hannan, P J., Peterson, A. V., Ary, D. V.. Biglan, A., Botvin, G. J., Evans, R. I., Flay, B. R., Futterman, R., Getz, J. Cr., Marek, P M., Orlandi, M., Pentz, M. A., Perry, C. L.. & Schinke, S. P (1994). lntraclass correlation among common measures of adolescent smoking: Estimates. correlates, and applications in smoking prevention studies. Amerrcan Journal of Epidemiology. 140, 1038-1050.
Murray, D. M., & Short, B. (1995). Intraclass correlation among measures related to alcohol use by young adults: Estimates, correlates and applications in intervention studies. Journal of Studies on Alcohol, 56, 681-694.
Murray, D. M., & Wolfinger, R. D. (1994). Analysis Issues in the evaluation of community trials: Progress toward solutions in SAS/STAT MIXED. Journal of Communit.v Psychology. CSAP Special Issue, 140- 154.
Pechacek.T. F., Murray, D. M., Luepker, R. V., Mittlemark, M. B.. Johnson. C. A., & Schultz. J. M. (1984). Measurement of adolescent smoking behavior: Rationale and methods. Journal of Behavioral Medi- cine, 7( l), 123-140.
SAS Institute Inc. (1992). SAS Technical Report P-229, SASSTA T SoftrrJare: Changes and enhancemenrs. Release 6.07 (pp. 287-368). Gary, NC: SAS Institute.

12 D. M. MURRAY and B. SHORT
Skinner, C. _I., Holt, D., & Smith,T. M. F. (1989). Analysis of complex surveys. New York: Wiley. Snedecor, G. W., & Cochran, W. M. (1989). Statistical methods (8th ed.). Ames, IA: Iowa State University
Press U.S. Department of Health and Human Services. (1994). Preventing tobacco use among young people: A
report of the Surgeon General. Public Health Service, Centers for Disease Control and Prevention, National Center for Chronic Disease Prevention and Health Promotion, Office on Smoking and Health. DHHS Pub1 No. N-017-001-00491-0.
Zucker, D. (1990). An analysis of variance pitfall: The fixed effects analysis in a nested design. Educationnl and Psychological Measurement, SO, 731-738.