Intra-specific variation in resting metabolic rate in MF1 mice is not associated with membrane lipid...
10
This article was published in an Elsevier journal. The attached copy is furnished to the author for non-commercial research and education use, including for instruction at the author’s institution, sharing with colleagues and providing to institution administration. Other uses, including reproduction and distribution, or selling or licensing copies, or posting to personal, institutional or third party websites are prohibited. In most cases authors are permitted to post their version of the article (e.g. in Word or Tex form) to their personal website or institutional repository. Authors requiring further information regarding Elsevier’s archiving and manuscript policies are encouraged to visit: http://www.elsevier.com/copyright
Transcript of Intra-specific variation in resting metabolic rate in MF1 mice is not associated with membrane lipid...
This article was published in an Elsevier journal. The attached copyis furnished to the author for non-commercial research and
education use, including for instruction at the author’s institution,sharing with colleagues and providing to institution administration.
Other uses, including reproduction and distribution, or selling orlicensing copies, or posting to personal, institutional or third party
websites are prohibited.
In most cases authors are permitted to post their version of thearticle (e.g. in Word or Tex form) to their personal website orinstitutional repository. Authors requiring further information
regarding Elsevier’s archiving and manuscript policies areencouraged to visit:
http://www.elsevier.com/copyright
Author's personal copy
Intra-specific variation in resting metabolic rate in MF1 mice is not
associated with membrane lipid desaturation in the liver
C. Haggerty a,b, N. Hoggard a, D.S. Brown a, J.C. Clapham c, J.R. Speakman a,b,*a Aberdeen Centre for Energy Regulation and Obesity (ACERO), School of Biological Sciences, University of Aberdeen, Aberdeen, Scotland AB21 9SB, UK
b ACERO, School of Biological Sciences, University of Aberdeen, Aberdeen, Scotland AB24 2TZ, UKc Astrazeneca, Molndal, Sweden
Received 4 October 2006; received in revised form 16 October 2007; accepted 5 November 2007
Available online 17 November 2007
Abstract
The ‘membrane pacemaker’ hypothesis provides a putative mechanistic linkage between variations in energy metabolism, rates of ageing and
lifespan across different species. Within species we have found positive associations between longevity and metabolism, which contrast the inter-
specific trends. It is of interest to know therefore how levels of lipid desaturation in membranes are linked to variation in metabolism between
individuals within species. We explored this problem by extracting membrane fatty acids from the livers of mice that varied in their metabolic rate,
in a strain (MF1) where we have previously demonstrated a positive association between metabolism and lifespan. We measured resting metabolic
rate (RMR) in 60 mice, each measured on three occasions, and measured their body compositions using dual energy X-ray absorptiometry (DXA).
We selected 28 individuals that exhibited a wide variation in their mean resting metabolic rates (RMR) and extracted membrane lipids from the
livers of these mice post mortem and analysed them for the patterns of contribution of different fatty acids. We then sought associations between the
levels of membrane desaturation and the individual variability in RMR, using the proportional contributions of each fatty acid as predictors in a
stepwise regression or by re-describing the variation in fatty acyl lipids using a PCA analysis and then seeking associations between scores on the
derived components and RMR. We used whole animal RMRs and also RMR with the effects of body composition (fat free mass) removed. The
level of individual variation in RMR was consistent with our previous observations. There was a significant positive association ( p = 0.019)
between the proportion of palmitic acid (16:0) in the membranes and RMR, which was strengthened ( p = 0.014) when we adjusted RMR for
differences in fat free mass. The proportion of palmitic acid (16:0) explained 20.9% of the individual variation in residual RMR. There was no
association between RMR or mass adjusted RMR and the proportional representation of any other fatty acid, including 22:6 (DHA) predicted by
the membrane pacemaker hypothesis to be of particular significance. High levels of saturated fatty acids in the membranes of mice with high rates
of metabolism may contribute to their greater longevity, but the mechanism tying together increased membrane saturation with elevated RMR
remains unclear.
# 2007 Elsevier Ireland Ltd. All rights reserved.
Keywords: Membrane pacemaker; RMR; Lifespan; Ageing; Metabolism
1. Introduction
The idea that ageing should be linked in some manner to the
rate of energy utilisation is intuitively attractive and has been
under investigation for almost the past 100 years, since the
seminal observations of Rubner (1908) that the product of
resting energy expenditure and maximal lifespan in a sample of
five mammal species was invariant. This invariance implies that
energy metabolism and lifespan are negatively associated—
mammal species with high rates of metabolism live short lives.
Increases in the database over the past 100 years have served
only to reinforce the original idea in mammals (Calder, 1984;
Peters, 1983) and in birds (Prinzinger, 2005). However, recent
analyses have cast doubt on the veracity of the relationships
(Speakman et al., 2002). If the effect of body mass on both
lifespan and RMR is removed then the relationships between
them is substantially weakened (Speakman, 2005a). Moreover,
if daily rather than resting energy demands are used, then the
product of energy expenditure and maximal lifespan is no
longer constant, but indicates those animals with higher rates of
www.elsevier.com/locate/mechagedev
Available online at www.sciencedirect.com
Mechanisms of Ageing and Development 129 (2008) 129–137
* Corresponding author at: Aberdeen Centre for Energy Regulation and
Obesity (ACERO), Rowett Research Institute, Bucksburn, Aberdeen, Scotland
AB21 9SB, UK. Tel.: +44 1224 272879; fax: +44 1224 272396.
E-mail address: [email protected] (J.R. Speakman).
0047-6374/$ – see front matter # 2007 Elsevier Ireland Ltd. All rights reserved.
doi:10.1016/j.mad.2007.11.001
Author's personal copy
metabolism have tissues that burn through more energy during
their lives than animals with lower rates of metabolism:
opposite the direction of the presumed association (Speakman,
2005a). This relationship is similar to interclass observations of
endotherms, which suggest that birds—which have higher rates
of metabolism than mammals (Bennett and Harvey, 1987;
McKechnie and Wolf, 2004; Reynolds and Lee, 1996) live
longer (Barja, 1998; Carey and Judge, 2000; Holmes and
Austad, 1995a,b; Holmes et al., 2001; Lindstedt and Calder,
1976; Ricklefs and Scheuerlein, 2001), and interordinal
comparisons suggesting marsupials combine shorter lives with
slower metabolic rates (Austad and Fischer, 1991).
In contrast to the plethora of inter-specific, and interclass,
comparisons, studies of links between energy metabolism and
lifespan at the level of the individual have been only rarely
performed. In a cohort of MF1 mice, however, we have
previously shown that those individuals with higher rates of
metabolism lived longer lives (Speakman et al., 2004a). This
relationship was true if the energy expenditure was expressed per
whole animal, per gram of tissue, or if the effects of mass were
removed statistically by analysis of covariance (ANCOVA). This
phenomenon may be more widely significant since in humans,
centenarians have higher rates of metabolism than anticipated
(Rizzo et al., 2004), and it is consistent with the observations that
species and classes with high rates of metabolism utilise more
energy per gram of tissue during their lifetimes (Speakman,
2005a). A positive association between lifespan and metabolic
rate has also been observed in yeast (Lin et al., 2002),
photoperiodic mutant hamsters (Oklejewicz and Daan, 2002;
Oklejewicz et al., 1997) and dogs (Speakman et al., 2003).
The mechanism underpinning this linkage remains uncer-
tain. We have shown that mice with the top 25% of RMRs had
higher levels of mitochondrial proton leak and higher activation
of uncoupling protein 3 (UCP-3) and the adenine nucleotide
translocase (ANT) in their mitochondria compared to mice with
the bottom 25% of RMRs (Speakman et al., 2004a). These
patterns are consistent with the hypothesis that production of
radical oxygen species by mitochondria should be sensitive to
the level of mitochondrial uncoupling (Brand, 2000; Brookes,
2005; Castiella et al., 2001; Nicholls and Ferguson, 2002;
Speakman, 2004). The link of UCP expression to lifespan has
been confirmed recently by transgenic overexpression of UCP2
in the brains of Drosophila (Fridell et al., 2005).
One factor that may confound these observations however is
the level of membrane lipid desaturation. It has been suggested
that membrane lipid desaturation is a key factor driving the
level of membrane proton leakage (Brookes et al., 1998;
Hulbert et al., 2002b; Porter et al., 1996). Experimentally
increasing DHA content of the liver in mice elevates proton
leak (Stillwell et al., 1997). In addition membrane lipids may
radically affect the behaviour of protein complexes embedded
in the membranes, notably the activity of the Na-K ATPase
(Else and Wu, 1999; Turner et al., 2003, 2005; Wu et al., 2001,
2004) and also components of the cytochrome system (Hulbert
et al., 2006). These twin effects of membrane fatty acyl
desaturation on key proteins and proton leakage may drive
variation in resting metabolic rate between species (Hulbert
et al., 1991, 2002b) and has been called the ‘membrane
pacemaker’ hypothesis for variation in resting metabolism
(Hulbert and Else, 1999, 2000, 2005; Hulbert, 2007). The same
hypothesis provides a potential link between metabolism and
ageing phenomena (Hulbert, 2003, 2005; Pamplona et al.,
2000) because membrane fatty acyl chain desaturation is also
correlated with the propensity for oxidative damage and with
lifespan (Pamplona et al., 2002; Portero-Otin et al., 2001). This
association may occur because fatty acids differ in their
susceptibility to oxidative damage: single-bonded carbons
located between the doubled-bonded carbons in fatty acyl
chains are most susceptible to damage by radical oxygen
species (ROS) (Halliwell and Gutteridge, 1999). However, the
linkage implied by this association is the opposite to that we
empirically observed in the MF1 mice.
The correlations between membrane desaturation and both
metabolism and lifespan have been developed by making inter-
specific comparisons that largely ignore covariances of both
traits with body size and the potentially confounding effects of
phylogeny (see Promislow (1993) and Speakman (2005b) for
discussions of these problems). Analyses removing these
artefacts suggest the associations between membrane desatura-
tion and metabolism may be less robust than previously
considered (Valencak and Ruf, 2007). In the current paper we
aimed to explore the association between individual variability
in membrane desaturation and RMR in the MF1 strain of mouse
to examine if the useful insights generated by this hypothesis
across species are replicated within species.
2. Experimental procedures
2.1. Animals
Mice were maintained in accordance with the UK Home Office Animals
(Scientific procedures) Act 1986. Male MF1 outbred mice (Mus musculus) were
purchased from Harlan UK Ltd. The mice were 9–11 weeks old during the
present study (n = 60). During the measurements mice were housed individually
in cages (48 cm � 15 cm � 13 cm) with enrichment provided (red plastic
housing, wood shavings and paper bedding) in a temperature-controlled
environment with a 12-h light/dark cycle with lights on at 7 a.m., with ad
libitum access to chow (pelleted rat and mouse breeder and grower diet, Special
Diet Services, BP Nutrition, UK) and water.
2.2. Dual-energy X-ray absorptiometry
Body composition was assessed using a dual energy X-ray absorptiomtery
(DXA) machine (Lunar PIXImus mouse densitometer, GE Medical Systems,
UK). Mice were placed under isofluorane inhalational anaesthetic during X-ray
scanning, the duration of which was approximately 3.25 min. The head region
was excluded from analysis following the manufacturer’s recommendations and
was in any case obscured by the mask used to administer the anaesthetic. We
used an individual calibration for this particular machine as recommended by
Johnston et al. (2005). Fat-free mass values were derived from fat percentages
produced by the PIXImus.
2.3. Resting metabolic rate
Resting metabolic rate (RMR) was measured as in Selman et al. (2001)
using sampling criteria as outlined in Hayes et al. (1992). Briefly, RMR was
quantified as the rate of oxygen consumption at thermoneutral temperature for
mice (30 8C) during the light-phase using an open-flow respirometry system.
C. Haggerty et al. / Mechanisms of Ageing and Development 129 (2008) 129–137130
Author's personal copy
Oxygen consumption was measured using a paramagnetic oxygen analyser and
infra-red CO2 analyser (Xentra, 1400, Servomex, UK). A standard flow rate
(600–800 ml/min) was pumped (Charles Austen Pumps, UK) through the
system and regulated by a mass flow controller (Dwyer flow controller). Each
mouse spent approximately 3 h being measured, during which they were
unrestricted in a cylindrical Plexiglass chamber (9 cm diameter by 35 cm in
length). This was repeated two more times on separate days to obtain triplicate
RMRs to calculate an average RMR estimate (units in VO2 ml min�1) and also
VCO2. Respiratory quotient (RQ) was determined from the ratio of the rates of
oxygen consumption and carbon dioxide production.
2.4. Dissection
Following completion of the third RMR measurement, mice were sacrificed
by carbon dioxide inhalation. Tissues were promptly removed into cryotubes
and frozen in liquid nitrogen, blood was also additionally collected via cardiac
puncture. Tissues collected included liver, heart, brain, brown adipose tissue,
white adipose tissue, and skeletal muscle (gastrocnemius and soleus). Once
dissection was completed the tissues were removed from liquid nitrogen and
stored at �80 8C. Care was taken to keep the bench-top and tools sterile by
cleaning with 70% ethanol between each dissection.
2.5. Membrane fatty acid composition
All solvents and chemicals used in the extraction and preparation of fatty
acid methyl esters (FAMEs) were all obtained from VWR, Poole, Dorset. Fatty
acids were extracted and converted to methyl esters using procedures based on
methods described by Hulbert et al. (2002b). Samples of liver (approximately
200 mg) were homogenised (Ultra Turrax, IKA Werke; GmbH & Co KG; D-
179219; Staufen; Germany) for 1min with 4mls of chloroform/methanol (2:1, v/
v) The homogeniser was rinsed with a further 2� 1 ml of chloroform/methanol
(2:1, v/v). All solvents used throughout the sample preparation process con-
tained 0.01% butylated hydroxytoluene (BHT) as an antioxidant. The homo-
genate was rotated for a least 3–4 h to ensure maximum extraction of lipids in a
tube roller (Denley Instruments, Billinghurst, West Sussex). The mixture was
shaken for 15–20 s following the addition of 1.5 ml of 2 M HCl before
centrifugation at 1000 rpm for 10 min. The upper layer was removed by
aspiration and discarded. A small quantity of sodium hydrosulphite was added
to the chloroform (remaining lower phase), shaken and then filtered into a clean
tube. Chloroform was evaporated off under Nitrogen then 5 ml hexane was
added to the dry tube. This was transferred to a silica Sep-Pak cartridge (Waters,
Elsrtee, England) and triglycerides eluted with 3� 5 ml ethyl acetate and
phospholipids eluted using 6� 2.5 ml methanol.
Extracted fatty acids were converted to fatty acid methyl esters (FAME) by
direct trans-esterification (Lepage and Roy, 1986). Briefly 2 ml of methanol:-
toluene (4:1, v/v) was added. To this 200 ml of acetyl chloride was added very
slowly whilst vortexing. The mixture was then heated at 100 8C for 1 h on a
heating block. This was followed by rapid cooling in cold water and the slow
addition of 5 ml of potassium carbonate (6% solution). After vortexing the
mixture was centrifuged for 10 min at 300 rpm at 4 8C to separate out the upper
toluene phase which was removed and stored at �20 8C until GC analysis.
FAME were separated and quantitated using a gas chromatograph (Model
6890, Agilent Technologies UK Ltd., Stockport, UK) equipped with a flame-
ionization detector, auto-injection port and a 50-m fused silica capillary column
(0.25 mm i.d.) coated with 0.2 mm film of cyanopropyl polysiloxane (CP-SIL 88;
Varian Analytical Instruments, Walton-on-Thames, Surrey, UK). Total FAME
profile in a 1 ml sample at a split ratio of 15:1 was determined using a temperature
gradient programme (initial temperature 80 8C for 1 min; increased at a rate of
25 8C/min to 160 8C which was held for 3 min; increased at a rate of 1 8C/min to
190 8C; increased at a rate of 10 8C/min to 230 8C held for 30 min) and helium as
the carrier gas operated at constant pressure (14 psi) and flow rate of 0.6 ml/min.
Injector and detector temperatures were maintained at 250 and 270 8C, respec-
tively. Peaks were routinely identified by comparison of retention times with
authentic FAME standards The calibration standard used was a 37 component mix
of fatty acid methyl esters, supplied by Supelco, Poole, Dorset.
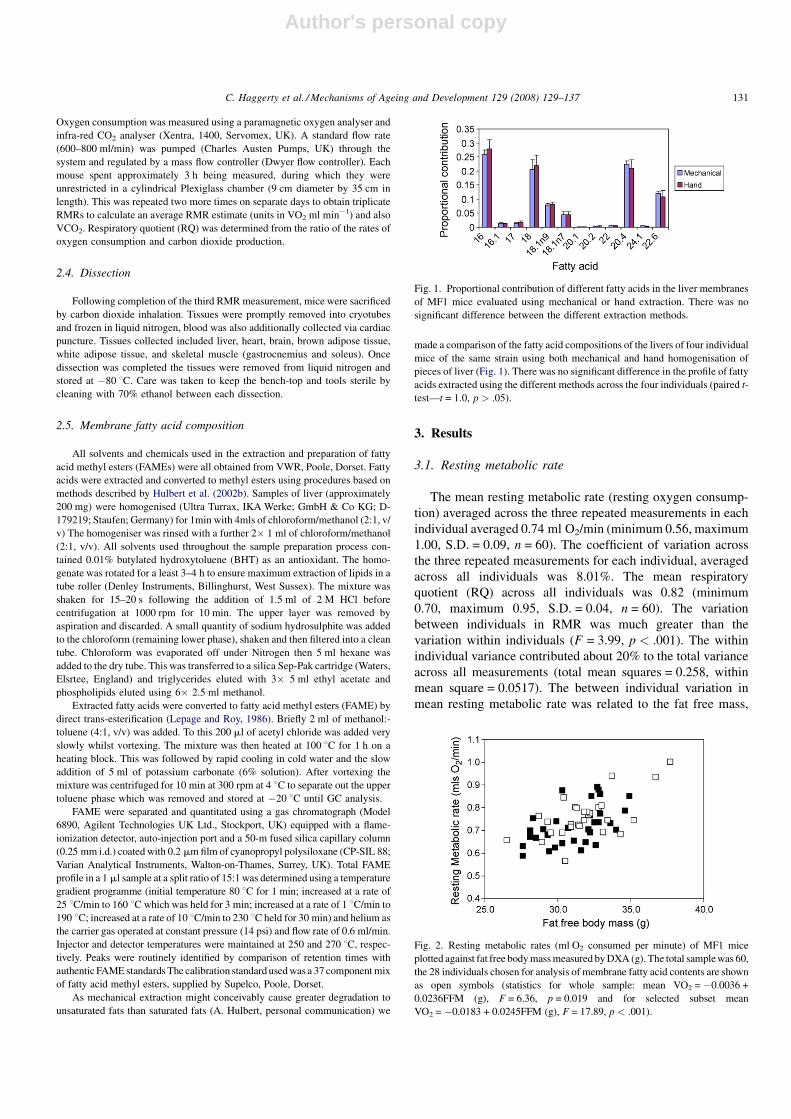
As mechanical extraction might conceivably cause greater degradation to
unsaturated fats than saturated fats (A. Hulbert, personal communication) we
made a comparison of the fatty acid compositions of the livers of four individual
mice of the same strain using both mechanical and hand homogenisation of
pieces of liver (Fig. 1). There was no significant difference in the profile of fatty
acids extracted using the different methods across the four individuals (paired t-
test—t = 1.0, p > .05).
3. Results
3.1. Resting metabolic rate
The mean resting metabolic rate (resting oxygen consump-
tion) averaged across the three repeated measurements in each
individual averaged 0.74 ml O2/min (minimum 0.56, maximum
1.00, S.D. = 0.09, n = 60). The coefficient of variation across
the three repeated measurements for each individual, averaged
across all individuals was 8.01%. The mean respiratory
quotient (RQ) across all individuals was 0.82 (minimum
0.70, maximum 0.95, S.D. = 0.04, n = 60). The variation
between individuals in RMR was much greater than the
variation within individuals (F = 3.99, p < .001). The within
individual variance contributed about 20% to the total variance
across all measurements (total mean squares = 0.258, within
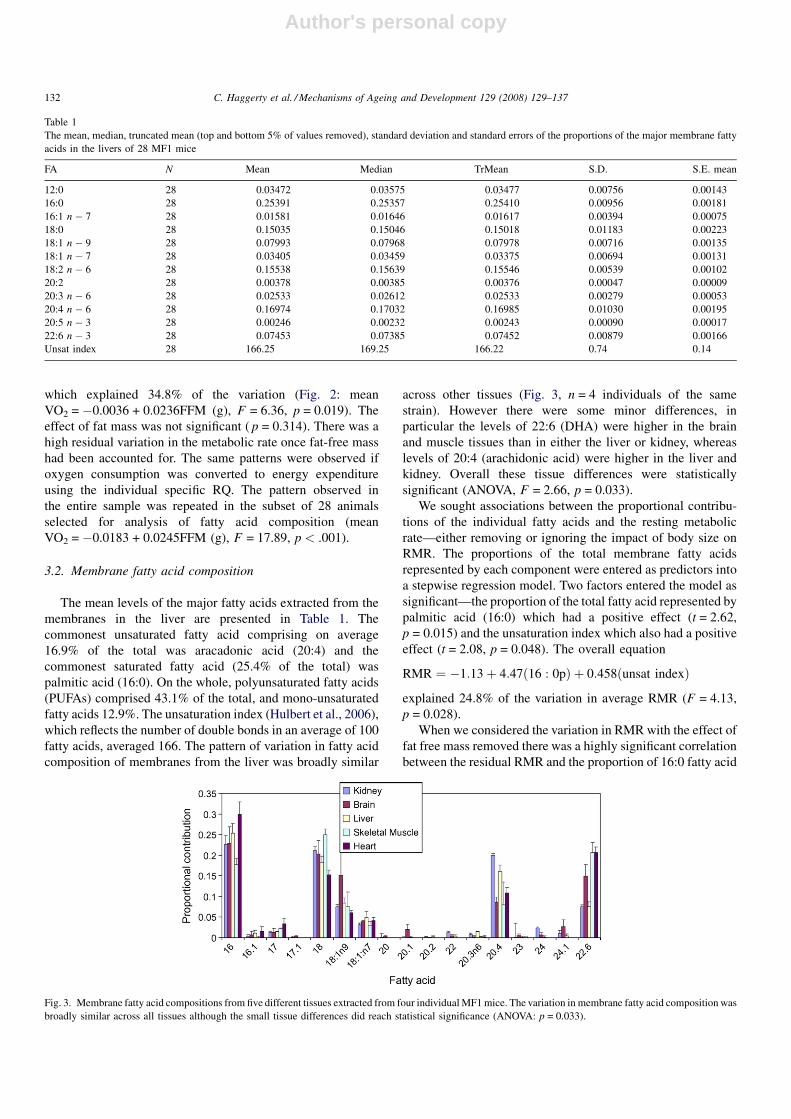
mean square = 0.0517). The between individual variation in
mean resting metabolic rate was related to the fat free mass,
Fig. 1. Proportional contribution of different fatty acids in the liver membranes
of MF1 mice evaluated using mechanical or hand extraction. There was no
significant difference between the different extraction methods.
Fig. 2. Resting metabolic rates (ml O2 consumed per minute) of MF1 mice
plotted against fat free body mass measured by DXA (g). The total sample was 60,
the 28 individuals chosen for analysis of membrane fatty acid contents are shown
as open symbols (statistics for whole sample: mean VO2 = �0.0036 +
0.0236FFM (g), F = 6.36, p = 0.019 and for selected subset mean
VO2 = �0.0183 + 0.0245FFM (g), F = 17.89, p < .001).
C. Haggerty et al. / Mechanisms of Ageing and Development 129 (2008) 129–137 131
Author's personal copy
which explained 34.8% of the variation (Fig. 2: mean
VO2 = �0.0036 + 0.0236FFM (g), F = 6.36, p = 0.019). The
effect of fat mass was not significant ( p = 0.314). There was a
high residual variation in the metabolic rate once fat-free mass
had been accounted for. The same patterns were observed if
oxygen consumption was converted to energy expenditure
using the individual specific RQ. The pattern observed in
the entire sample was repeated in the subset of 28 animals
selected for analysis of fatty acid composition (mean
VO2 = �0.0183 + 0.0245FFM (g), F = 17.89, p < .001).
3.2. Membrane fatty acid composition
The mean levels of the major fatty acids extracted from the
membranes in the liver are presented in Table 1. The
commonest unsaturated fatty acid comprising on average
16.9% of the total was aracadonic acid (20:4) and the
commonest saturated fatty acid (25.4% of the total) was
palmitic acid (16:0). On the whole, polyunsaturated fatty acids
(PUFAs) comprised 43.1% of the total, and mono-unsaturated
fatty acids 12.9%. The unsaturation index (Hulbert et al., 2006),
which reflects the number of double bonds in an average of 100
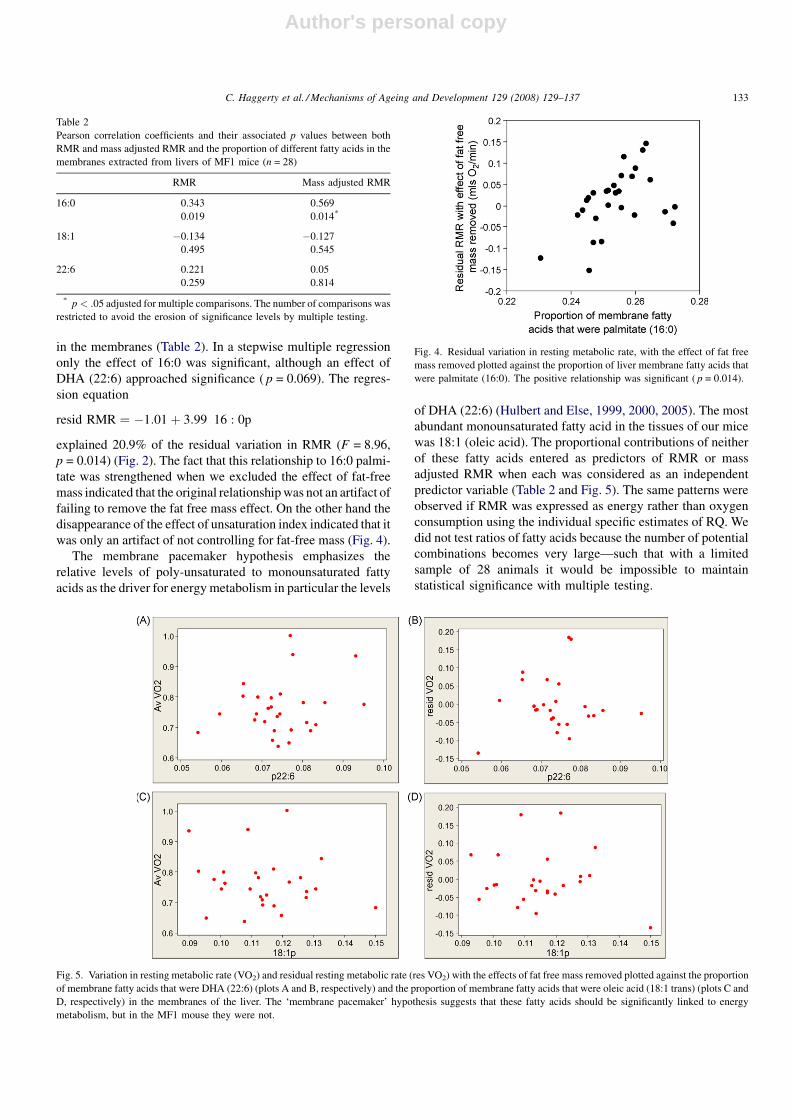
fatty acids, averaged 166. The pattern of variation in fatty acid
composition of membranes from the liver was broadly similar
across other tissues (Fig. 3, n = 4 individuals of the same
strain). However there were some minor differences, in
particular the levels of 22:6 (DHA) were higher in the brain
and muscle tissues than in either the liver or kidney, whereas
levels of 20:4 (arachidonic acid) were higher in the liver and
kidney. Overall these tissue differences were statistically
significant (ANOVA, F = 2.66, p = 0.033).
We sought associations between the proportional contribu-
tions of the individual fatty acids and the resting metabolic
rate—either removing or ignoring the impact of body size on
RMR. The proportions of the total membrane fatty acids
represented by each component were entered as predictors into
a stepwise regression model. Two factors entered the model as
significant—the proportion of the total fatty acid represented by
palmitic acid (16:0) which had a positive effect (t = 2.62,
p = 0.015) and the unsaturation index which also had a positive
effect (t = 2.08, p = 0.048). The overall equation
RMR ¼ �1:13þ 4:47ð16 : 0pÞ þ 0:458ðunsat indexÞ
explained 24.8% of the variation in average RMR (F = 4.13,
p = 0.028).
When we considered the variation in RMR with the effect of
fat free mass removed there was a highly significant correlation
between the residual RMR and the proportion of 16:0 fatty acid
Table 1
The mean, median, truncated mean (top and bottom 5% of values removed), standard deviation and standard errors of the proportions of the major membrane fatty
acids in the livers of 28 MF1 mice
FA N Mean Median TrMean S.D. S.E. mean
12:0 28 0.03472 0.03575 0.03477 0.00756 0.00143
16:0 28 0.25391 0.25357 0.25410 0.00956 0.00181
16:1 n � 7 28 0.01581 0.01646 0.01617 0.00394 0.00075
18:0 28 0.15035 0.15046 0.15018 0.01183 0.00223
18:1 n � 9 28 0.07993 0.07968 0.07978 0.00716 0.00135
18:1 n � 7 28 0.03405 0.03459 0.03375 0.00694 0.00131
18:2 n � 6 28 0.15538 0.15639 0.15546 0.00539 0.00102
20:2 28 0.00378 0.00385 0.00376 0.00047 0.00009
20:3 n � 6 28 0.02533 0.02612 0.02533 0.00279 0.00053
20:4 n � 6 28 0.16974 0.17032 0.16985 0.01030 0.00195
20:5 n � 3 28 0.00246 0.00232 0.00243 0.00090 0.00017
22:6 n � 3 28 0.07453 0.07385 0.07452 0.00879 0.00166
Unsat index 28 166.25 169.25 166.22 0.74 0.14
Fig. 3. Membrane fatty acid compositions from five different tissues extracted from four individual MF1 mice. The variation in membrane fatty acid composition was
broadly similar across all tissues although the small tissue differences did reach statistical significance (ANOVA: p = 0.033).
C. Haggerty et al. / Mechanisms of Ageing and Development 129 (2008) 129–137132
Author's personal copy
in the membranes (Table 2). In a stepwise multiple regression
only the effect of 16:0 was significant, although an effect of
DHA (22:6) approached significance ( p = 0.069). The regres-
sion equation
resid RMR ¼ �1:01þ 3:99 16 : 0p
explained 20.9% of the residual variation in RMR (F = 8.96,
p = 0.014) (Fig. 2). The fact that this relationship to 16:0 palmi-
tate was strengthened when we excluded the effect of fat-free
mass indicated that the original relationship was not an artifact of
failing to remove the fat free mass effect. On the other hand the
disappearance of the effect of unsaturation index indicated that it
was only an artifact of not controlling for fat-free mass (Fig. 4).
The membrane pacemaker hypothesis emphasizes the
relative levels of poly-unsaturated to monounsaturated fatty
acids as the driver for energy metabolism in particular the levels
of DHA (22:6) (Hulbert and Else, 1999, 2000, 2005). The most
abundant monounsaturated fatty acid in the tissues of our mice
was 18:1 (oleic acid). The proportional contributions of neither
of these fatty acids entered as predictors of RMR or mass
adjusted RMR when each was considered as an independent
predictor variable (Table 2 and Fig. 5). The same patterns were
observed if RMR was expressed as energy rather than oxygen
consumption using the individual specific estimates of RQ. We
did not test ratios of fatty acids because the number of potential
combinations becomes very large—such that with a limited
sample of 28 animals it would be impossible to maintain
statistical significance with multiple testing.
Table 2
Pearson correlation coefficients and their associated p values between both
RMR and mass adjusted RMR and the proportion of different fatty acids in the
membranes extracted from livers of MF1 mice (n = 28)
RMR Mass adjusted RMR
16:0 0.343 0.569
0.019 0.014*
18:1 �0.134 �0.127
0.495 0.545
22:6 0.221 0.05
0.259 0.814
* p < .05 adjusted for multiple comparisons. The number of comparisons was
restricted to avoid the erosion of significance levels by multiple testing.
Fig. 4. Residual variation in resting metabolic rate, with the effect of fat free
mass removed plotted against the proportion of liver membrane fatty acids that
were palmitate (16:0). The positive relationship was significant ( p = 0.014).
Fig. 5. Variation in resting metabolic rate (VO2) and residual resting metabolic rate (res VO2) with the effects of fat free mass removed plotted against the proportion
of membrane fatty acids that were DHA (22:6) (plots A and B, respectively) and the proportion of membrane fatty acids that were oleic acid (18:1 trans) (plots C and
D, respectively) in the membranes of the liver. The ‘membrane pacemaker’ hypothesis suggests that these fatty acids should be significantly linked to energy
metabolism, but in the MF1 mouse they were not.
C. Haggerty et al. / Mechanisms of Ageing and Development 129 (2008) 129–137 133
Author's personal copy
The levels of different fatty acids were significantly
correlated with each other across the individuals. A matrix
of correlations is shown in Table 3. An effect of one fatty acid
like palmitic acid (16:0) detailed above might arise therefore
because of a complex interaction of effects dependent on the
inter-correlations of the different fatty acids. To capture this
pattern of variability, the pattern of variation was re-described
using principal components analysis (PCA). This was
performed in two ways. First, using the raw fatty acid data
(area under peak), and second, using the data on proportions of
each fatty acid in the total. Using the raw data the first five
principal components (PCs) from this analysis contained 89%
of the original variation (Table 4B). Scores on these PCs were
used as predictors of RMR and fat-free mass adjusted RMR.
None of the scores on any PC was significantly related to either
RMR or fat-free mass adjusted RMR. Using the proportions,
the first five PCs captured 85.3% of the variation (Table 4A) but
again none of the scores on these five PCs were significantly
related to the RMR or fat-free mass adjusted RMR. These data
suggest the association between RMR and levels of palmitic
acid were not due to complex interactions between it and other
fatty acids in the membranes. Expressing RMR as energy rather
than oxygen consumption did not affect the absence of
significant relationships.
An alternative approach to assessing the role of fatty acid
composition on RMR is to pool different classes of fatty acid
together (such as the %saturates, %monounsaturates, %poly-
unsaturates, %n � 3 polyunsaturates and %n � 6 polyunsatu-
rates) and seek a relationship between representation of these
broader composite classes with RMR. This is not as strong an
analysis as that performed using principal component analysis
(above) because there still remains some interdependence
between the derived traits which is eliminated in the PCA.
Nevertheless when we used these pooled classes there was no
significant relationship between fat-free mass adjusted RMR
and any of the composite classes (%saturates: F = 0.02,
p = 0.903, %monounsaturates, F = 0.14, p = 0.714, %polyun-
saturates, F = 0.23, p = 0.639, %n � 3 polyunsaturates,
F = 0.06, p = 0.814, %n � 6 polyunsaturates, F = 0.25,
p = 0.620). In a stepwise multiple regression none of the
composite traits entered as significant predictors.
Table 3
Correlation matrix between the different proportional contributions of fatty acids extracted from membranes from the livers of MF1 mice
12p 16p 16:1p 18p 18:1(9) 18:1(11) 18:2p 20:2p 20:3p 20:4p 20:5p 22:6p
16p �0.320
16:1p �0.095 �0.090
18p 0.234 0.081 �0.259
18:1(9) �0.127 �0.115 0.520 �0.396
18:1(7) �0.011 �0.355 0.354 �0.540 0.808
18:2p �0.194 0.266 �0.011 �0.207 �0.080 �0.272
20:2p 0.148 �0.009 �0.275 �0.310 0.147 0.356 0.240
20:3p �0.299 �0.228 0.497 �0.685 0.635 0.716 �0.094 0.166
20:4p �0.312 �0.280 �0.489 �0.133 �0.438 �0.274 0.013 �0.086 �0.169
20:5p �0.072 �0.265 0.493 �0.472 0.249 0.334 0.108 0.016 0.683 �0.277
22:6p �0.094 �0.242 �0.237 �0.204 �0.592 �0.279 �0.182 �0.132 �0.019 0.452 0.236
Unsat in �0.324 �0.381 �0.223 �0.463 �0.388 �0.094 �0.011 �0.042 0.190 0.749 0.249 0.852
Table 4
Eigenvectors for the first five principal components relative to the original
scores in a PCA analysis to redescribe the variation in membrane fatty acids
(A) Raw data
Eigenvalue 7.7010 1.7376 0.8548 0.7091 0.4199
Proportion 0.642 0.145 0.071 0.059 0.035
Cumulative 0.642 0.787 0.858 0.917 0.952
Variable
PC1 PC2 PC3 PC4 PC5
12:0 �0.043 �0.497 �0.764 0.028 �0.333
16:0 �0.339 �0.141 0.202 �0.080 �0.073
16:1 �0.228 0.395 �0.133 �0.504 �0.483
18:0 �0.286 �0.329 0.253 �0.285 �0.115
18:1 (9) �0.333 0.165 0.120 0.146 �0.319
18:1 (7) �0.261 0.352 �0.066 0.527 �0.054
18:2 �0.346 �0.137 0.084 �0.069 �0.071
20:2 �0.293 �0.148 �0.096 0.513 �0.006
20:3 �0.338 0.202 �0.074 0.066 0.057
20:4 �0.331 �0.218 0.145 �0.022 0.126
20:5 �0.222 0.380 �0.477 �0.236 0.447
22:6 �0.303 �0.209 �0.063 �0.172 0.55
(B) Proportions data
Eigenvalue 3.8923 2.0679 1.6690 1.4777 1.1320
Proportion 0.324 0.172 0.139 0.123 0.094
Cumulative 0.324 0.497 0.636 0.759 0.853
Variable
PC1 PC2 PC3 PC4 PC5
12:0 �0.065 �0.209 0.503 �0.261 �0.482
16:0 �0.119 �0.296 �0.524 0.137 0.044
16:1 0.335 �0.135 0.034 0.466 �0.124
18:0 �0.330 �0.342 0.253 0.160 0.044
18:1 (9) 0.428 �0.234 0.002 �0.062 0.288
18:1 (7) 0.436 �0.010 0.164 �0.257 0.230
18:2p �0.022 �0.037 �0.581 �0.101 �0.404
20:2p 0.114 �0.012 �0.158 �0.703 �0.204
20:3p 0.452 0.201 �0.050 0.049 0.062
20:4p �0.211 0.492 �0.064 �0.139 0.369
20:5p 0.327 0.244 �0.003 0.241 �0.478
22:6p �0.135 0.579 0.107 0.128 �0.197
(A) Using the raw fatty acid compositions; (B) using the proportional con-
tribution of each fatty acid.
C. Haggerty et al. / Mechanisms of Ageing and Development 129 (2008) 129–137134
Author's personal copy
4. Discussion
The pattern of variation in RMR was consistent with our
previous observations in this strain (Speakman et al., 2004a)
and also with the patterns of variation in RMR in other small
mammal species (Jackson et al., 2001; Labocha et al., 2004)
and humans (Johnstone et al., 2005; Weyer et al., 2000). As
with the present study, a significant portion of the individual
variation in RMR in these previous studies can be accounted for
by differences in fat free-mass (FFM), but there was still a large
residual variability between individuals once the effects of FFM
were removed. The nature of this variation is enigmatic
(Speakman et al., 2004b). Although some studies have linked
intra-specific variation in RMR of mice to differences in the
size of the liver (e.g. Selman et al., 2001) we have performed
several studies now for MF1 mice where we have sought
associations between the variation in RMR and detailed aspects
of body composition (Johnson et al., 2001; Speakman and
Johnson, 2000; Krol et al., 2003) and in none of these cases was
variability in the sizes of particular organs an explanation of the
residual variance in energy metabolism. In humans several
studies have indicated links with hormone levels, e.g. thyroxine
(Johnstone et al., 2005) and genetic factors (Astrup et al., 1999),
but these generally explain only small components of the
variation once overall body composition has been accounted
for. In some cases the links to hormones, such as leptin levels,
disappear entirely when differences due to body composition
are removed (Johnstone et al., 2005). The within individual
variation reported here at a coefficient of variation of 8% was
almost identical to the repeatability reported previously
(Speakman and Krol, 2005) for RMR measurements on voles
(Microtus agrestis). Given our previous observations that
variation in organ size was not an important factor influencing
residual variation in RMR in this strain of mouse we have
assumed that the mass specific rate of metabolism in the livers
of mice with high metabolic rates was greater than that in the
livers of mice with low metabolic rates and these differences
were reflected in the observed variation in whole animal
metabolic rates of these animals.
The pattern of variation in membrane fatty acids was
consistent with the patterns previously observed in mice and
rats, with the most abundant saturates being palmitic (16:0) and
stearic (18:0) acids and the most abundant PUFAs being
linoleic (18:2) and arachidonic (20:4) acids (Hulbert et al.,
2006). The overall level of PUFAs at 44% was similar to the
level reported previously for liver tissue from mice of 51%
(Couture and Hulbert, 1995) and that reported generally for
mammals, which vary between 39 and 70% (Valencak et al.,
2004). The desaturation index reported here was however lower
than has been previously reported in other strains of mice. The
cause of this difference is uncertain but it is unlikely to be a
consequence of differential degradation of unsaturated fatty
acids during extraction resulting from our use of a mechanical
extractor rather than performing the homogenisations by hand
(Fig. 1). Presumably the difference is a strain effect. If so
significant strain differences in unsaturation index may provide
a valuable resource for further testing the membrane pacemaker
hypothesis and links between membrane saturation and ageing
phenomena at the intra-specific level. Valencak et al. (2004)
explored the covariation in levels of membrane fatty acids in
muscle tissues of the brown hare (Lepus europeaus) using a
PCA analysis similar to that performed here. The patterns
observed in mice did not match the patterns detected in the
hares. In particular in mice there were no consistent loadings on
any PC that grouped together either the saturated or mono-
unsaturated fatty acids (Table 4). Clearly covariation in the
patterns of membrane fatty acids must reflect individual
patterns of the activities of desaturase enzymes that interact
with dietary intakes of fatty acids in complex species specific
and probably tissue specific ways—hence the absence of a close
correspondence between the patterns in the livers of mice and
muscles of hares is not surprising.
Previous studies of the role of membrane lipid desaturation
on RMR and on lifespan have been made at the level of inter-
specific comparisons or interclass comparisons (Hulbert, 2003,
2005; Hulbert and Else, 1999, 2000, 2005; Pamplona et al.,
2000). The present study is the first to attempt to tie together the
patterns of inter-individual variations in RMR within a species
to the same patterns of variation in membrane lipid
desaturation. Despite the fact that RMR was highly variable
between individuals, and there was also variation in lipid
desaturation in the liver between individuals, there was no
indication that these patterns were correlated. Most notably
there was no association between RMR (or mass adjusted
RMR) and either the proportion of DHA (22:6) or oleic acid
(18:1) in the liver membranes (Table 2 and Fig. 5). DHA level
has been previously identified as key component of the
membrane pacemaker hypothesis (Hulbert and Else, 1999,
2000, 2005). Our analysis was performed using both whole
body RMR and fat-free mass adjusted RMR as well as using
raw lipid contributions, scores along a PC analysis and
proportional representation of different functional groupings of
fatty acids with the same results. This analysis indicates that, at
least as far as liver membranes are concerned, at the level of the
individual within a species, the membrane pacemaker
hypothesis does not explain the variance in RMR (or residual
RMR). We chose liver for these analyses because it is a large
organ with a high metabolic rate that has been speculated to
contribute a high proportion to the total RMR. It remains to be
established whether the absence of a correlation between
desaturation of membranes in the liver and energy metabolism
shown here is repeated in other tissues. However, we did show a
broad correlation between the membrane fatty acid composi-
tion of the liver and the membrane fatty acid compositions of
other tissues suggesting that the liver may be generally
representative of the membrane fatty acid composition
throughout the body as has been assumed in other studies.
The absence of an effect of desaturated lipids in these data
may occur because the extent of variation that is evident within
a given species is very small when compared with the enormous
differences between species across the class Mammalia
(Couture and Hulbert, 1995; Hulbert and Else, 1999, 2000,
2005), or the differences between representatives of different
major vertebrate classes (Hulbert et al., 2006). Hence the
C. Haggerty et al. / Mechanisms of Ageing and Development 129 (2008) 129–137 135
Author's personal copy
membrane pacemaker theory may explain these much broader
patterns of variation, but at the level of the individual within a
species other factors become much more important. However,
as noted in the introduction, the membrane pacemaker idea has
been developed largely ignoring confounding influences of
body size and phylogeny on relatively small data sets. The
problems with such analyses have been previously highlighted
(Promislow, 1993; Speakman, 2005b). A more detailed and
sophisticated analysis of 42 mammalian species taking account
of these factors did not support the hypothesis of a link between
membrane desaturation and basal metabolism (Valencak and
Ruf, 2007) suggesting that even at the inter-specific level the
importance of membrane desaturation on metabolism may have
been over-emphasised.
Finally, one of the factors that may be linked to RMR
suggested by the current study was the proportion of fatty acyl
chains in the membrane that are 16:0 palmitate (Fig. 3). The
reasons for this association are unclear and the trend is opposite
that suggested by the membrane pacemaker hypothesis.
However, the association between variation in 16:0 and RMR
was strong and large (Fig. 2). A difference in the proportion of
16:0 palmitate from 0.23 to 0.27 was correlated with a difference
in residual RMR from around �0.12 to +0.12 ml/min. At the
mean RMR of 0.76 O2 ml/min this difference is equivalent to a
difference of 35% between the individuals with low and high
levels of palmitate. This was about the same difference between
the upper and lower 25 centiles of metabolism of mice that
differed in their lifespans by 36% (Speakman et al., 2004a). The
higher levels of the saturated fatty acid in the membranes of the
mice with high metabolic rates would be consistent with these
mice being protected from oxidative stress because saturated fats
are less prone to oxidation—which predominantly affects PUFAs
(Pamplona et al., 2002). Birds, which live longer than mammals
of equivalent body mass, and have higher metabolic rates, also
have higher levels of membrane saturation (Brand et al., 2003;
Hulbert et al., 2002a; Portero-Otin et al., 2001). The mechanism
linking greater saturation to elevated RMR however is currently
unclear.
Acknowledgements
We are grateful to Tony Hulbert for supplying the
methodology for membrane fatty acid extraction and for his
comments on an earlier version of the manuscript and to Mrs.
Christine Horrocks for her help in the FAME analysis. The
study was funded by a BBSRC studentship and the Scottish
Executive Rural Affairs Department.
References
Astrup, A., Toubro, S., Dalgaard, L.T., Urhammer, S.A., Sorensen, T.I.A.,
Pedersen, O., 1999. Impact of the v/v 55 polymorphism of the uncoupling
protein 2 gene on 24-h energy expenditure and substrate oxidation. Int J.
Obesity 23, 1030–1034.
Austad, S.N., Fischer, K.E., 1991. Mammalian aging, metabolism, and ecol-
ogy—evidence from the bats and marsupials. J. Gerontol. 46, B47–B53.
Barja, G., 1998. Mitochondrial free radical production and aging in mammals
and birds. Towards Prolong. Healthy Life Span 854, 224–238.
Bennett, A.F., Harvey, P.H., 1987. Active and resting metabolic rate in birds:
allometry, phylogeny and ecology. J. Zool. Lond. 213, 327–363.
Brand, M.D., 2000. Uncoupling to survive? The role of mitochondrial ineffi-
ciency in ageing. Exp. Gerontol. 35, 811–820.
Brand, M.D., Turner, N., Ocloo, A., Else, P.L., Hulbert, A.J., 2003. Proton
conductance and fatty acyl composition of liver mitochondria correlates
with body mass in birds. Biochem. J. 376, 741–748.
Brookes, P.S., 2005. Mitochondrial H+ leak and ROS generation: an odd couple.
Free Radical Biol. Med. 38, 12–23.
Brookes, P.S., Buckingham, J.A., Tenreiro, A.M., Hulbert, A.J., Brand, M.D.,
1998. The proton permeability of the inner membrane of liver mitochondria
from ectothermic and endothermic vertebrates and from obese rats: correla-
tions with standard metabolic rate and phospholipid fatty acid composition.
Comp. Biochem. Phys. B 119, 325–334.
Calder, W.A., 1984. Size, Function, and Life History. Harvard University Press,
Cambridge.
Carey, J.R., Judge, D.S., 2000. Longevity Records: Life Spans of Mammals,
Birds, Amphibians, Reptiles, and Fish. Odense University Press, Odense.
Castiella, L., Rigoulet, M., Penicaud, L., 2001. Mitochondrial ROS metabolism:
modulation by uncoupling proteins. IUBMB Life 52, 181–188.
Couture, P., Hulbert, A.J., 1995. Membrane fatty acid composition of tissues is
related to body mass of mammals. J. Membr. Biol. 148, 27–39.
Else, P.L., Wu, B.J., 1999. Do membranes contribute to the high sodium pump
molecular activity of mammals. J. Comp. Physiol. B 169, 296–302.
Fridell, Y.W.C., Sanchez-Blanco, A., Silvia, B.A., Helfand, S.L., 2005. Targeted
expression of the human uncoupling protein 2 (hUCP2) to adult neurons
extends life span in the fly. Cell Metab. 1, 145–152.
Halliwell, B., Gutteridge, J.M.C., 1999. Free Radicals in Biology and Medicine,
3rd ed. Oxford University Press, Oxford.
Hayes, J.P., Speakman, J.R., Racey, P.A., 1992. Sampling bias in respirometry.
Physiol. Zool. 65, 604–619.
Holmes, D.J., Austad, S.N., 1995a. Birds as animal-models for the comparative
biology of aging—a prospectus. J. Gerontol. A 50, B59–B66.
Holmes, D.J., Austad, S.N., 1995b. The evolution of avian senescence pat-
terns—implications for understanding primary aging processes. Am. Zool.
35, 307–317.
Holmes, D.J., Fluckiger, R., Austad, S.N., 2001. Comparative biology of aging
in birds: an update. Exp. Gerontol. 36, 869–883.
Hulbert, A.J., 2003. Life, death and membrane bilayers. J. Exp. Biol. 206, 2303–
2311.
Hulbert, A.J., 2005. On the importance of fatty acid composition of membranes
for aging. J. Theor. Biol. 234, 277–288.
Hulbert, A.J., 2007. Membrane fatty acids as pacemakers of animal metabolism.
Lipids [EPub ahead of print April 2007].
Hulbert, A.J., Else, P.L., 1999. Membranes as possible pacemakers of meta-
bolism. J. Theor. Biol. 199, 257–274.
Hulbert, A.J., Else, P.L., 2000. Mechanisms underlying the cost of living in
animals. Ann. Rev. Physiol. 62, 207–235.
Hulbert, A.J., Else, P.L., 2005. Membranes and the setting of energy demand. J.
Exp. Biol. 208, 1593–1599.
Hulbert, A.J., Faulks, S., Buttemer, W.A., Else, P.L., 2002a. Acyl composition
of muscle membranes varies with body size in birds. J. Exp. Biol. 205,
3561–3569.
Hulbert, A.J., Mantaj, W., Janssens, P.A., 1991. Development of mammalian
endothermic metabolism: quantitative changes in tissue mitochondria. Am.
J. Physiol. 261, R561–R568.
Hulbert, A.J., Rana, T., Couture, P., 2002b. The acyl composition of mammalian
phospholipids: an allometric analysis. Comp. Biochem. Physiol. 132B,
515–527.
Hulbert, A.J., Turner, N., Hinde, J., Else, P., Guderley, H., 2006. How might you
compare mitochondria from different tissues and different species? J.
Comp. Physiol. 176, 93–105.
Jackson, D.M., Trayhurn, P., Speakman, J.R., 2001. Associations between
energetics and over-winter survival in the short-tailed field vole Microtus
agrestis. J. Anim. Ecol. 70, 633–640.
Johnson, M.S., Thomson, S.C., Speakman, J.R., 2001. Limits to sustained energy
intake. II. Inter-relationships between resting metabolic rate, life-history
traits and morphology in Mus musculus. J. Exp. Biol. 204, 1937–1946.
C. Haggerty et al. / Mechanisms of Ageing and Development 129 (2008) 129–137136
Author's personal copy
Johnstone, A.M., Murison, S.D., Duncan, J.S., Rance, K.A., Speakman, J.R.,
2005. Factors influencing variation in basal metabolic rate include fat-free
mass, fat mass, age, and circulating thyroxine but not sex, circulating leptin,
or triiodothyronine. Am. J. Clin. Nutr. 82, 941–948.
Johnston, S.L., Peacock, W.L., Bell, L.M., Lonchampt, M., Speakman, J.R.,
2005. PIXImus DXA with different software need individual calibration to
accurately predict fat mass. Obesity Res. 13, 1558–1565.
Krol, E., Johnson, M.S., Speakman, J.R., 2003. Limits to sustained energy
intake. VIII. Resting metabolic rate and organ morphology of laboratory
mice lactating at thermoneutrality. J. Exp. Biol. 206, 4283–4291.
Labocha, M.K., Sadowska, E.T., Baliga, K., Semer, A.K., Koteja, P., 2004.
Individual variation and repeatability of basal metabolism in the bank vole,
Clethrionomys glareolus. Proc. Roy. Soc. B 271, 367–372.
Lepage, G., Roy, G.C., 1986. Direct transesterification of all classes of lipid in a
one step reaction. J. Lipid Res. 27, 114–120.
Lin, S.J., Kaeberlein, M., Andalis, A.A., Sturtz, L.A., Defossez, P.A., Culotta,
V.C., Fink, G.R., Guarente, L., 2002. Calorie restriction extends Sacchar-
omyces cerevisiae lifespan by increasing respiration. Nature 418, 344–348.
Lindstedt, S.L., Calder, W.A., 1976. Body size and longevity in birds. Condor
78, 91–94.
McKechnie, A.E., Wolf, B.O., 2004. The allometry of avian basal metabolic
rate: good predictions need good data. Physiol. Biochem. Zool. 77, 502–
521.
Nicholls, D.G., Ferguson, S.J., 2002. Bioenergetics. Academic Press, London.
Oklejewicz, M., Daan, S., 2002. Enhanced longevity in tau mutant Syrian
hamsters, Mesocricetus auratus. J. Biol. Rhythms 17, 210–216.
Oklejewicz, M., Hut, R.A., Daan, S., Loudon, A.S., Stirland, A.J., 1997.
Metabolic rate changesproportionally to circadian frequency in tau mutant
Syrian hamsters. J. Biol. Rhythms 12, 413–422.
Pamplona, R., Barja, G., Portero-Otin, M., 2002. Membrane fatty acid unsa-
turation, protection against oxidative stress, and maximum life span—a
homeoviscous-longevity adaptation? Ann. N.Y. Acad. Sci. 959, 475–490.
Pamplona, R., Portero-Otin, M., Riba, D., Requena, J.R., Thorpe, S.R., Lopez-
Torres, M., Barja, G., 2000. Low fatty acid unsaturation: a mechanism for
lowered lipoperoxidative modification of tissue proteins in mammalian
species with long life spans. J. Gerontol. A 55, B286–B291.
Peters, R.H., 1983. The Ecological Implications of Body Size. Cambridge
University Press, Cambridge.
Porter, R.K., Hulbert, A.J., Brand, M.D., 1996. Allometry of mitochondrial
proton leak: influence of membrane surface area and fatty acid composition.
Am. J. Physiol. 271, R1550–R1560.
Portero-Otin, M., Bellmunt, M.J., Ruiz, M.C., Barja, G., Pamplona, R., 2001.
Correlation of fatty acid unsaturation of the major liver mitochondrial
phospholipid classes in mammals to their maximum life span potential.
Lipids 36, 491–498.
Prinzinger, R., 2005. Programmed ageing: the theory of maximal metabolic
scope. How does the biological clock tick? EMBO Rep. 6, S14–S19.
Promislow, D.E., 1993. On size and survival: progress and pitfalls in the
allometry of life span. J Gerontol. 48, B115–B123.
Reynolds, P.S., Lee III, R.M., 1996. Phylogenetic analysis of avian energetics:
passerines and nonpasserines do not differ. Am Nat. 147, 735–759.
Ricklefs, R.E., Scheuerlein, A., 2001. Comparison of aging-related mortality
among birds and mammals. Exp. Gerontol. 36, 845–857.
Rizzo, M.R., Mari, D., Barberi, M., Ragno, R., Grella, R., Provenzano, R., Villa,
I., Esposito, K., Giugliano, D., Paolisso, G., 2004. Resting metabolic rate and
respiratory quotient in human longevity. J. Clin. Endo. Metab. 90, 409–413.
Rubner, M., 1908. Das Problem det Lebensdaur und seiner beziehunger zum
Wachstum und Ernarnhung. Oldenberg, Munich.
Selman, C., Lumsden, S., Bunger, L., Hill, W.G., Speakman, J.R., 2001. Resting
metabolic rate and morphology in mice (Mus musculus) selected for high
and low food intake. J. Exp. Biol. 204, 777–784.
Speakman, J.R., 2004. Oxidative phosphorylation, mitochondrial proton
cycling, free-radical production and aging. In: Mattson, M.P. (Ed.), Energy
Metabolism and Lifespan Determination. Advances in Cell Ageing and
Gerontology, vol. 14. Elsevier, Amsterdam, pp. 35–69.
Speakman, J.R., 2005a. Body size, energy metabolism and lifespan. J. Exp.
Biol. 208, 1717–1730.
Speakman, J.R., 2005b. Correlations between physiology and lifespan—two
widely ignored problems with comparative studies. Aging Cell 4, 167–175.
Speakman, J.R., Johnson, M.S., 2000. Relationships between resting meta-
bolic rate and morphology in lactating mice: what tissues are the major
contributors to resting metabolism? In: Heldmaier, G., Klingenspor, M.
(Eds.), Living in the Cold, vol. III. Springer, Berlin.
Speakman, J.R., Krol, B., 2005. Comparison of different approaches for the
calculation of energy expenditure using doubly labeled water in a small
mammal. Physiol. Biochem. Zool. 78, 650–667.
Speakman, J.R., Selman, C., McLaren, J.S., Harper, J.E., 2002. Living fast,
dying when? The links between energetics and ageing. J. Nutr. 132, 1583S–
1597S.
Speakman, J.R., Talbot, D.A., Selman, C., Snart, S., McLaren, J.S., Redman, P.,
Krol, E., Jackson, D.M., Johnson, M.S., Brand, M.D., 2004a. Uncoupled
and surviving: individual mice with high metabolism have greater mito-
chondrial uncoupling and live longer. Aging Cell 3, 87–95.
Speakman, J.R., Krol, E., Johnston, M.S., 2004b. The functional significance of
individual variations in BMR. Physiol. Biochem. Zool. 77, 900–915.
Speakman, J.R., van Acker, A., Harper, E.J., 2003. Age-related changes in the
metabolism and body composition of three dog breeds and their relationship
to life expectancy. Aging Cell 2, 265–275.
Stillwell, W., Jenski, L.J., Crump, T., Ehringer, W., 1997. Effect ofdocosahex-
aenoic acid on mouse mitochondrial membrane properties. Lipids 32, 497–
506.
Turner, N., Else, P.L., Hulbert, A.J., 2003. Docosahexaenoic acid content of
membranes determines molecular activity of the sodium pump: implications
for diseases states and metabolism. Naturwissenschaften 90, 521–523.
Turner, N., Haga, K.L., Hulbert, A.J., Else, P.L., 2005. Relationship between
body size, sodium pump molecular activity, and membrane lipid composi-
tion in the kidney of mammals and birds. Am. J. Physiol. 288, 301–310.
Valencak, T.G., Arnold, W., Tataruch, F., Ruf, T., 2004. High content of
polyunsaturated fatty acids in muscle phospholipids of a fast runner, the
European brown hare (Lepus europaeus). J. Comp. Physiol. B 173, 695–
702.
Valencak, T.G., Ruf, T., 2007. N-3 polyunsaturated fatty acids impair lifespan
but have no role for metabolism. Aging Cell 6, 15–25.
Weyer, C., Walford, R.L., Harper, I.T., Milner, M., MacCallum, T., Tataranni,
P.A., Ravussin, E., 2000. Energy metabolism after 2 y of energy restriction:
the Biosphere 2 experiment. Am. J. Clin. Nutr. 72, 946–953.
Wu, B.J., Else, P.L., Storlien, L.H., Hulbert, A.J., 2001. Molecular activity of
Na+, K+-ATPase from different sources is related to the packing of
membrane lipids. J. Exp. Biol. 204, 4271–4280.
Wu, B.J., Hulbert, A.J., Storlien, L.H., Else, P.L., 2004. Membrane lipids and
sodium pumps of cattle and crocodiles: an experimental test of the mem-
brane pacemaker theory of metabolism. Am. J. Physiol. 287, R633–R641.
C. Haggerty et al. / Mechanisms of Ageing and Development 129 (2008) 129–137 137


![Peripherally administered [Nle4, D-Phe7]-MSH increases resting metabolic rate, while peripheral AgRP has no effect, in wild type C57BL/6 and ob/ob mice.](https://static.fdokumen.com/doc/165x107/631268023ed465f0570a36fc/peripherally-administered-nle4-d-phe7-msh-increases-resting-metabolic-rate-while.jpg)