
Intra-population differences of apolipoproteins in the aqueous ...
10
RESEARCH Open Access Intra-population differences of apolipoproteins in the aqueous humor Parth A. Patel 1 , Tae Jin Lee 1 , Sai Karthik Kodeboyina 1,2 , Garrett Jones 1 , Kathryn Bollinger 3 , Lane Ulrich 3 , David Bogorad 3 , Amy Estes 3 , Wenbo Zhi 1 , Shruti Sharma 1,3 and Ashok Sharma 1,3,4* Abstract Background: Evidence suggests that proteins related to lipid metabolism, such as apolipoproteins, play an important role in the maintenance of normal vision. While several members of the apolipoprotein family are abundant in human aqueous humor (AH), their study remains difficult due to the AH’s small volume, low protein concentration, and the invasive nature of sample collection. In this study, we report the use of Liquid Chromatography Tandem Mass Spectrometry (LC-MS/MS) to discover associations between AH apolipoproteins and race, gender, and ocular structure in patients with and without primary open angle glaucoma (POAG). Methods: AH samples were collected from 231 patients undergoing phacoemulsification or glaucoma incisional surgery at the Medical College of Georgia, Augusta University and subsequently analyzed via LC-MS/MS. The number of peptide spectrum matches (PSMs) for each protein was used as a semi-quantitative measure of relative protein levels. Parameters related to ocular structure were determined using Optical Coherence Tomography (OCT) and Heidelberg Retinal Tomography (HRT). These data sets were probed for relationships between apolipoprotein levels and POAG, demographics (gender and race), and ocular structure. Results: A total of ten apolipoproteins were detected in the 231 collected AH samples, with six detected in 100% of the samples, one detected in almost 57% of the samples and three detected in less than 10% of the samples. The levels of APOA1, APOC3, and APOD were higher among POAG subjects. Stratification by gender and race revealed demographic-specific variations. The levels of five apolipoproteins (APOA1, APOA2, APOA4, APOC3, and APOD) were higher in female POAG patients, whereas no apolipoprotein levels were altered in male POAG patients. The levels of APOA1, APOA2, APOA4, and APOD were increased in glaucomatous African American patients, whereas APOE and APOH levels were decreased in glaucomatous Caucasian patients. We also found distinct associations between apolipoprotein levels and OCT and HRT parameters in patients with and without POAG. Conclusions: The intra-population variation in apolipoprotein levels highlights the heterogeneity of glaucoma as a disease, suggesting the importance of personalized treatments. Gender and race-specific alterations may be associated with higher risks of POAG in females and members of the African American population. © The Author(s). 2021 Open Access This article is licensed under a Creative Commons Attribution 4.0 International License, which permits use, sharing, adaptation, distribution and reproduction in any medium or format, as long as you give appropriate credit to the original author(s) and the source, provide a link to the Creative Commons licence, and indicate if changes were made. The images or other third party material in this article are included in the article's Creative Commons licence, unless indicated otherwise in a credit line to the material. If material is not included in the article's Creative Commons licence and your intended use is not permitted by statutory regulation or exceeds the permitted use, you will need to obtain permission directly from the copyright holder. To view a copy of this licence, visit http://creativecommons.org/licenses/by/4.0/. The Creative Commons Public Domain Dedication waiver (http://creativecommons.org/publicdomain/zero/1.0/) applies to the data made available in this article, unless otherwise stated in a credit line to the data. * Correspondence: [email protected] 1 Center for Biotechnology and Genomic Medicine, Medical College of Georgia, Augusta University, 1120 15th Street, CA4094, Augusta, GA 30912, USA 3 Department of Ophthalmology, Medical College of Georgia, Augusta University, Augusta, GA 30912, USA Full list of author information is available at the end of the article Patel et al. Lipids in Health and Disease (2021) 20:128 https://doi.org/10.1186/s12944-021-01555-0
-
Upload
khangminh22 -
Category
Documents
-
view
0 -
download
0
Transcript of Intra-population differences of apolipoproteins in the aqueous ...
RESEARCH Open Access
Intra-population differences ofapolipoproteins in the aqueous humorParth A. Patel1, Tae Jin Lee1, Sai Karthik Kodeboyina1,2, Garrett Jones1, Kathryn Bollinger3, Lane Ulrich3,David Bogorad3, Amy Estes3, Wenbo Zhi1, Shruti Sharma1,3 and Ashok Sharma1,3,4*
Abstract
Background: Evidence suggests that proteins related to lipid metabolism, such as apolipoproteins, play animportant role in the maintenance of normal vision. While several members of the apolipoprotein family areabundant in human aqueous humor (AH), their study remains difficult due to the AH’s small volume, low proteinconcentration, and the invasive nature of sample collection. In this study, we report the use of LiquidChromatography Tandem Mass Spectrometry (LC-MS/MS) to discover associations between AH apolipoproteins andrace, gender, and ocular structure in patients with and without primary open angle glaucoma (POAG).
Methods: AH samples were collected from 231 patients undergoing phacoemulsification or glaucoma incisionalsurgery at the Medical College of Georgia, Augusta University and subsequently analyzed via LC-MS/MS. Thenumber of peptide spectrum matches (PSMs) for each protein was used as a semi-quantitative measure of relativeprotein levels. Parameters related to ocular structure were determined using Optical Coherence Tomography (OCT)and Heidelberg Retinal Tomography (HRT). These data sets were probed for relationships between apolipoproteinlevels and POAG, demographics (gender and race), and ocular structure.
Results: A total of ten apolipoproteins were detected in the 231 collected AH samples, with six detected in 100%of the samples, one detected in almost 57% of the samples and three detected in less than 10% of the samples.The levels of APOA1, APOC3, and APOD were higher among POAG subjects. Stratification by gender and racerevealed demographic-specific variations. The levels of five apolipoproteins (APOA1, APOA2, APOA4, APOC3, andAPOD) were higher in female POAG patients, whereas no apolipoprotein levels were altered in male POAG patients.The levels of APOA1, APOA2, APOA4, and APOD were increased in glaucomatous African American patients,whereas APOE and APOH levels were decreased in glaucomatous Caucasian patients. We also found distinctassociations between apolipoprotein levels and OCT and HRT parameters in patients with and without POAG.
Conclusions: The intra-population variation in apolipoprotein levels highlights the heterogeneity of glaucoma as adisease, suggesting the importance of personalized treatments. Gender and race-specific alterations may beassociated with higher risks of POAG in females and members of the African American population.
© The Author(s). 2021 Open Access This article is licensed under a Creative Commons Attribution 4.0 International License,which permits use, sharing, adaptation, distribution and reproduction in any medium or format, as long as you giveappropriate credit to the original author(s) and the source, provide a link to the Creative Commons licence, and indicate ifchanges were made. The images or other third party material in this article are included in the article's Creative Commonslicence, unless indicated otherwise in a credit line to the material. If material is not included in the article's Creative Commonslicence and your intended use is not permitted by statutory regulation or exceeds the permitted use, you will need to obtainpermission directly from the copyright holder. To view a copy of this licence, visit http://creativecommons.org/licenses/by/4.0/.The Creative Commons Public Domain Dedication waiver (http://creativecommons.org/publicdomain/zero/1.0/) applies to thedata made available in this article, unless otherwise stated in a credit line to the data.
* Correspondence: [email protected] for Biotechnology and Genomic Medicine, Medical College ofGeorgia, Augusta University, 1120 15th Street, CA4094, Augusta, GA 30912,USA3Department of Ophthalmology, Medical College of Georgia, AugustaUniversity, Augusta, GA 30912, USAFull list of author information is available at the end of the article
Patel et al. Lipids in Health and Disease (2021) 20:128 https://doi.org/10.1186/s12944-021-01555-0

IntroductionAqueous humor (AH) is the clear fluid located withinthe anterior and posterior chambers of the eye. The keyfunctions of AH include maintenance of refraction, ocu-lar shape, intraocular pressure, oxygen management, nu-trient delivery, and metabolic waste removal [1]. Tofurther establish an understanding of these homeostaticprocesses, research efforts have sought to delineate theAH proteome [1–4]. Apolipoproteins have been identi-fied as a prominent category in this proteome.Apolipoproteins carry out many intraocular functions.
By binding to lipids, they enable transport of those lipidsthrough various hydrophilic biological domains. Whenacting as enzymatic cofactors, they are involved in themetabolism of lipoproteins [5, 6]. Through structuraland functional complexity, these entities are classifiedinto numerous classes and subclasses, each with aunique role in the complex biological milieu of the hu-man body.Several studies have examined the relationship between
apolipoproteins and ocular conditions including glau-coma, cataracts, pseudo-exfoliation syndrome, and age-related macular degeneration [7–12]. APOA1, APOC3,and APOE have been shown to be elevated in the AH ofPOAG patients as compared to patients with cataracts[10, 12]. Previous studies have also reported substantialgender-specific differences in plasma apolipoprotein con-centrations [13, 14]. However, prior research exploringgender and race variations in the AH proteome has beenlimited by relatively small sample sizes [15].In the present study, we quantified differences in levels
of apolipoproteins in 231 subjects based on disease state(POAG vs. non-glaucomatous cataract), gender, race,and ocular structure, as assessed by Heidelberg RetinalTomography (HRT) and optical coherence tomography(OCT). We found gender and race-specific associationsbetween AH apolipoproteins and POAG. Furthermore,the correlations of apolipoproteins with ocular structurewere distinct among the POAG and cataract subgroups.
Materials and methodsSubjectsAH samples were obtained from 231 subjects undergo-ing ocular surgery at the Medical College of Georgia,Augusta University. Samples were collected by aspiration
of AH from the anterior chamber after the initial clearcorneal incision was made during cataract and glaucomasurgeries. This collection does not involve any additionalocular procedures or any alteration in the amount ormethod of AH removal. The AH samples were placed insealed sterile tubes, then frozen at − 80 °C until process-ing. The Institutional Review Board of Augusta Univer-sity has approved the study (IRB #611480) and written,informed consents were obtained from all study partici-pants. In total, 158 AH samples from cataract surgerypatients and 73 AH samples from POAG patients werecollected. No significant differences in race, gender, orIOP levels were observed between these groups(Table 1).
LC-MS/MS analysisAH samples (60 μL) were successively lyophilized andreconstituted in 30 μL of 8M urea in 50mM Tris-HCl(pH 8). Cysteine residues were reduced with 20mM di-thiothreitol, alkylated with 55mM iodoacetemide,followed by the addition of 240 μL of 50 mM ammoniumbicarbonate buffer to decrease the urea concentration toless than 1 mM. Protein concentration was measuredusing a Bradford assay kit (Pierce, Rockford, IL), accord-ing to the manufacturer’s instructions. Finally, proteindigestion was performed by the addition of a 1:20 ratio(w/w) of trypsin and maintained overnight at 37 C°.The digested AH samples were cleaned on a C18 spin
plate (Nest Group, Southborough, MA, USA), separatedvia an Ultimate 3000 nano-UPLC system (Thermo Sci-entific), and analyzed with an Orbitrap Fusion Tribridmass spectrometer (Thermo Scientific). The reconsti-tuted peptide mixture (6 μL) was trapped and washed ona Pepmap100 C18 trap (5 μm, 0.3 × 5mm) for 10 min ata rate of 20 μL/min using 2% acetonitrile in water with0.1% formic acid. The peptides were then separated on aPepman100 RSLC C18 column (2.0 μm, 75 μm× 150mm) using a gradient of 2 to 40% acetonitrile with 0.1%formic acid over 120 min (flow rate: 300 nL/min; columntemperature: 40 C). Eluted peptides were analyzed viadata-dependent acquisition in positive mode using thefollowing settings: Orbitrap MS analyzer for precursorscan at 120,000 FWHM from 300 to 1500m/z; Ion-trapMS analyzer for MS/MS scans in top speed mode (2-scycle time) with dynamic exclusion settings (repeat
Table 1 Demographic information of subjects
Demographic Characteristic Cataract(n = 158)
POAG(n = 73)
p-value
Age (years, mean ± SD) 67.65 ± 8.91 68.79 ± 10.79 0.43a
Gender (F/M) 100/58 43/30 0.62b
Race (African Americans/Caucasians) 95/63 44/29 1b
atwo-sample t-testbchi-square test
Patel et al. Lipids in Health and Disease (2021) 20:128 Page 2 of 10

count: 1; repeat duration: 15 s; exclusion duration: 30 s).The fragmentation method was collision-induced dissoci-ation (CID) with a normalized collision energy of 30%.
Protein identification and quantificationFor the purposes of protein identification and quantifica-tion, raw MS data were processed via the Proteome Dis-coverer (v1.4; Thermo Scientific) and searched using theSequestHT algorithm against the Uniprot-SwissProt hu-man database with 20,385 entries. Search parameterswere set as follows: 10 ppm precursor and 0.6 Da prod-uct ion tolerances; static carbidomethylation (+ 57.021Da) for cysteine; dynamic oxidation (+ 15.995 Da) formethionine; dynamic phosphorylation (+ 79.966 Da) forserine, threonine, and tyrosine. The Percolator peptide-spectrum matching validator located within the Prote-ome Discoverer software was used to validate PSMs.Proteins unable to be differentiated by MS/MS analysisalone because of similar peptide composition weregrouped using the principles of parsimony. The reportconsisting of identities and spectrum counts (number ofPSMs) for each protein was then exported to serve as asemi-quantitative measure of relative protein levels de-tected in each AH sample.
OCT and HRT measurementsRetinal nerve fiber layer (RNFL) thickness was calculatedusing SPECTRALIS Tracking Laser Tomography (Hei-delberg Engineering, Franklin, MA, USA). Via this sys-tem, a 24-line high resolution radial scan of the opticnerve head centered on the Bruch’s membrane opening(BMO) was acquired. The neuroretinal rim was subse-quently defined as the region between the BMO and thenearest point on the internal limiting membrane basedon this image. RNFL thickness was determined utilizingthree circular scans centered on the optic nerve head de-lineated by the BMO. These findings were then com-pared to a reference database of healthy eyes adjustedfor BMO size and age and presented in the Garway-Heath sector format, facilitating structural and func-tional correlations. Additionally, the ganglion cell layer(GCL) and the macula were comprehensively evaluatedby the multi-layer segmentation software, the results ofwhich were illustrated using a GCL thickness map.Imaging of the optic nerve head was also performed
using the Heidelberg Retinal Tomograph (HeidelbergEngineering, Franklin, MA, USA). A set of 3D images ofthe optic nerve and surrounding retina at various depthswere collected and collated to create a 3D representationof the whole optic nerve. From this, a set of stereometricparameters (e.g., cup-to-disc area ratio, cup shape meas-ure, and rim volume) were calculated. The cup-to-discarea ratio evaluates the extent of cupping relative to thearea of the optic disc. In patients with uncontrolled
glaucoma, the cup-to-disc area increases over time. Thecup shape measure numerically encapsulates the config-uration of the cup, incorporating an assessment of boththe steepness of cup walls and variation in depth. In pa-tients without evidence of glaucomatous damage, thismetric is generally negative. Conversely, for glaucomat-ous eyes, this value is typically less negative or positive[16]. Finally, rim area assesses the neuroretinal rim,which forms the demarcation between the cup and disc.Among patients with glaucoma, this metric is typicallylower, reflecting degradation or loss of the nerve fibersthat compose the neuroretinal rim.
Statistical analysesAll statistical analyses were performed using the R pro-ject for Statistical Computing (version 3.6.3). The two-tailed t-test and chi-square tests were utilized to com-pare the clinical characteristics of POAG and cataractpatients. Prior to data analysis, PSM values derived fromLC-MS/MS analysis were quantile normalized and theproportion of samples in which each protein was detectedwas determined. The negative binomial regression modelwas fitted to assess the disease-specific differences in apo-lipoproteins levels. Correlations between apolipoproteinsand clinical parameters (e.g., OCT and HRT measures)were assessed through Spearman’s correlation coefficients.The threshold for significance was set at p < 0.05.
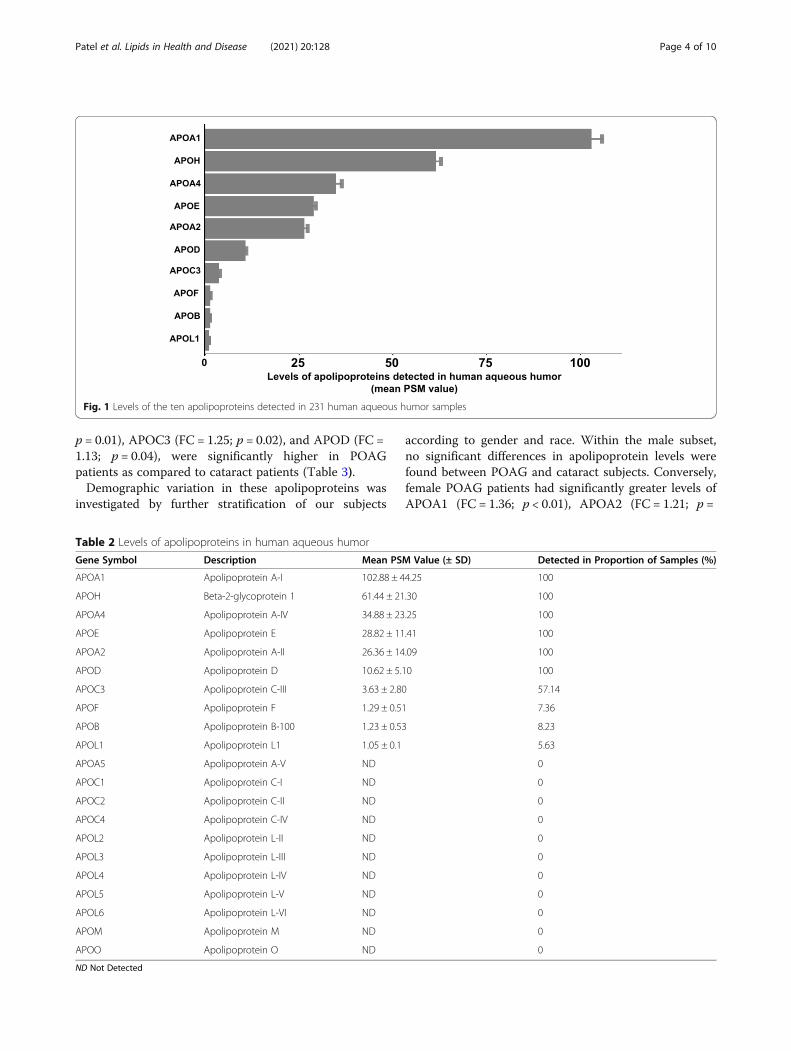
ResultsApolipoprotein levels in human aqueous humorA total of 21 apolipoproteins are known to be a part ofthe human proteome [17], 10 of which we identified inthe 231 AH samples analyzed (Fig. 1). The mean PSMvalues of all apolipoproteins and the proportion of sam-ples in which they were detected are listed in Table 2.Three of the 10 apolipoproteins were detected in fewerthan 10% of samples and were therefore excluded fromfurther statistical analyses. Six of the other seven apoli-poproteins were detected in 100% of samples, while theseventh was detected in 57% of our samples. Theseseven most abundant apolipoproteins were APOA1(mean PSM ± SD, 102.88 ± 44.25), APOH (61.44 ± 21.30),APOA4 (34.88 ± 23.25), APOE (28.82 ± 11.41), APOA2(26.36 ± 14.09), APOD (10.62 ± 5.10), and APOC3(3.63 ± 2.80).
POAG-specific alterations in human aqueous humorapolipoproteinsStatistical analyses were performed to determine thePOAG-specific alterations in aqueous humor apolipo-proteins using all 231 samples (Fig. 2). Fold change (FC)values represent the change in protein levels in thePOAG group (n = 158) compared to the cataract group(n = 73). The levels of three proteins, APOA1 (FC = 1.17;
Patel et al. Lipids in Health and Disease (2021) 20:128 Page 3 of 10
p = 0.01), APOC3 (FC = 1.25; p = 0.02), and APOD (FC =1.13; p = 0.04), were significantly higher in POAGpatients as compared to cataract patients (Table 3).Demographic variation in these apolipoproteins was
investigated by further stratification of our subjects
according to gender and race. Within the male subset,no significant differences in apolipoprotein levels werefound between POAG and cataract subjects. Conversely,female POAG patients had significantly greater levels ofAPOA1 (FC = 1.36; p < 0.01), APOA2 (FC = 1.21; p =
Fig. 1 Levels of the ten apolipoproteins detected in 231 human aqueous humor samples
Table 2 Levels of apolipoproteins in human aqueous humor
Gene Symbol Description Mean PSM Value (± SD) Detected in Proportion of Samples (%)
APOA1 Apolipoprotein A-I 102.88 ± 44.25 100
APOH Beta-2-glycoprotein 1 61.44 ± 21.30 100
APOA4 Apolipoprotein A-IV 34.88 ± 23.25 100
APOE Apolipoprotein E 28.82 ± 11.41 100
APOA2 Apolipoprotein A-II 26.36 ± 14.09 100
APOD Apolipoprotein D 10.62 ± 5.10 100
APOC3 Apolipoprotein C-III 3.63 ± 2.80 57.14
APOF Apolipoprotein F 1.29 ± 0.51 7.36
APOB Apolipoprotein B-100 1.23 ± 0.53 8.23
APOL1 Apolipoprotein L1 1.05 ± 0.1 5.63
APOA5 Apolipoprotein A-V ND 0
APOC1 Apolipoprotein C-I ND 0
APOC2 Apolipoprotein C-II ND 0
APOC4 Apolipoprotein C-IV ND 0
APOL2 Apolipoprotein L-II ND 0
APOL3 Apolipoprotein L-III ND 0
APOL4 Apolipoprotein L-IV ND 0
APOL5 Apolipoprotein L-V ND 0
APOL6 Apolipoprotein L-VI ND 0
APOM Apolipoprotein M ND 0
APOO Apolipoprotein O ND 0
ND Not Detected
Patel et al. Lipids in Health and Disease (2021) 20:128 Page 4 of 10

0.03), APOA4 (FC = 1.30; p = 0.04), APOC3 (FC = 1.38;p = 0.01), and APOD (FC = 1.20; p = 0.04) compared tocataract patients (Fig. 3).When parsed along the lines of race, two apolipopro-
tein levels were found to be lower in the CaucasianPOAG subset: APOE (FC = 0.82; p = 0.02) and APOH(FC = 0.76; p = 0.01). In the African American POAGsubset, significant upregulation of four apolipoproteinswas noted: APOA1 (FC = 1.34; p < 0.01), APOA2 (FC =1.25; p = 0.02), APOA4 (FC = 1.37; p = 0.01), and APOD(FC = 1.19; p = 0.04) (Fig. 4).
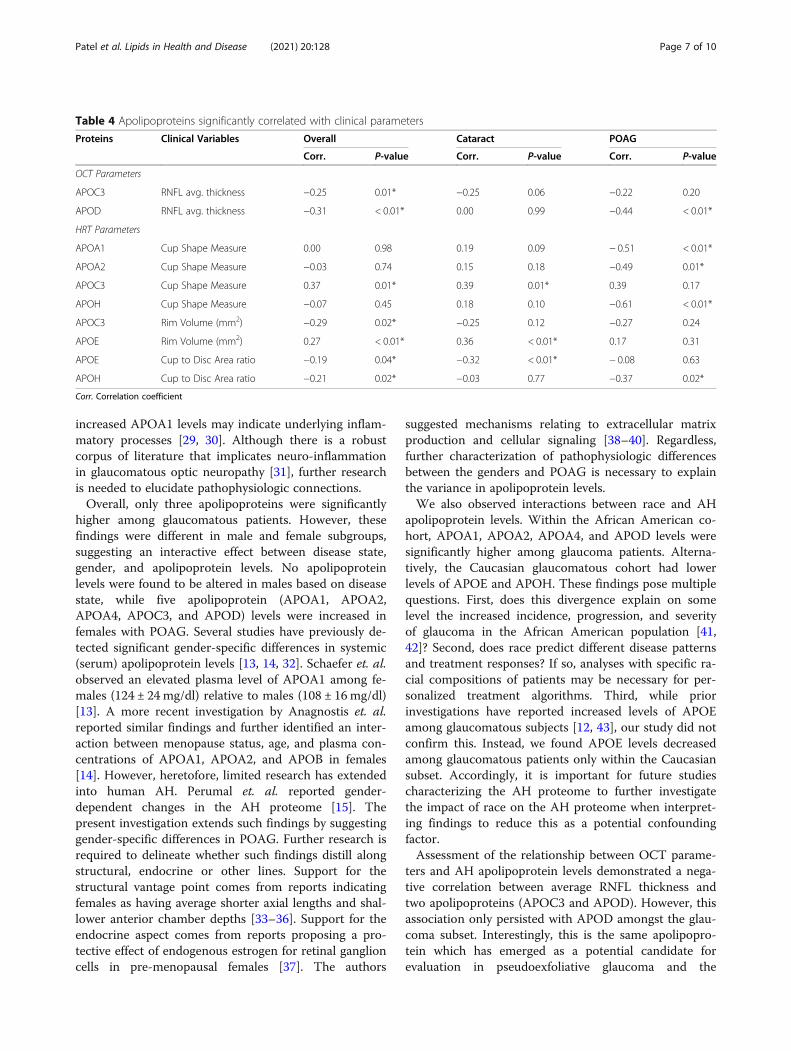
Correlation of human aqueous humor apolipoproteinswith RNFL thicknessTwo of the seven apolipoproteins were significantly cor-related with RNFL thickness across the 231 subjects:APOC3 (ρ = − 0.25; p = 0.01) and APOD (ρ = − 0.31; p <0.01. When these subjects were stratified by diseasestate, only the association between APOD levels andRNFL thickness remained significant in the POAG sub-set (ρ = − 0.44; p < 0.01).
Correlation of human aqueous humor apolipoproteinswith HRT parametersThe association of the seven apolipoproteins with HRTparameters are recorded in Table 4. APOC3 levels werepositively correlated with cup shape measure (ρ = 0.37;p = 0.01), which persisted in the cataract subset (ρ = 0.39;p = 0.01). Contrastingly, amongst the POAG subgroup,levels of APOA1 (ρ = − 0.51; p < 0.01), APOA2 (ρ = −0.49; p < 0.01), and APOH (ρ = − 0.61; p < 0.01) had anegative correlation with cup shape measure.The cup-to-disc ratio was negatively associated with
APOE (ρ = − 0.32; p < 0.01) and APOH (ρ = − 0.21; p =0.02) in the overall sample set. This negative correlationpersisted for APOE in the cataract subset (ρ = − 0.32;p < 0.01) and APOH in the POAG subset (ρ = − 0.37;p = 0.02).Rim volume was negatively associated with APOC3
level (ρ = − 0.29; p = 0.02), but positively associated withAPOE (ρ = 0.27; p < 0.01). Stratification by POAG andcataract status only retained the positive correlation be-tween APOE and rim volume in the cataract subset (ρ =0.36; p < 0.01).
Fig. 2 Levels of three apolipoproteins were significantly increased in subjects with primary open angle glaucoma (POAG) compared to subjectswith cataracts alone, the controls (C). The boxplots depict the distribution of protein levels in each group. Peptide spectrum match (PSM) valueswere used as semi-quantitative measurement of protein levels. The raw PSM values were log2 transformed to achieve a normal distribution
Table 3 Race and sex specific changes in the levels of apolipoproteins in POAG subjectsAPOA1 APOA2 APOA4 APOC3 APOD APOE APOH
(Mean PSM ± SD) (Mean PSM ± SD) (Mean PSM ± SD) (Mean PSM ± SD) (Mean PSM ± SD) (Mean PSM ± SD) (Mean PSM ± SD)
Overall Cataract 97.29 ± 39.78 25.44 ± 12.16 33.94 ± 23.69 3.3 ± 2.79 10.09 ± 4.74 29.15 ± 10.79 62.39 ± 21.26
POAG 114.97 ± 50.87* 28.34 ± 17.49 36.91 ± 22.31 4.21 ± 2.77* 11.75 ± 5.67* 28.08 ± 12.68 59.4 ± 21.4
Male Cataract 111.95 ± 39.55 29.03 ± 14.01 42.26 ± 23.82 3.79 ± 2.78 10.14 ± 3.96 28.32 ± 9.69 67.47 ± 21.46
POAG 107.84 ± 44.59 26.64 ± 11.7 38.47 ± 20.76 3.96 ± 2.49 10.9 ± 5.11 26.69 ± 10.23 58.3 ± 23.67
Female Cataract 88.79 ± 37.56 23.36 ± 10.46 29.11 ± 22.34 2.97 ± 2.77 10.07 ± 5.16 29.64 ± 11.4 59.44 ± 20.68
POAG 119.94 ± 54.78* 29.52 ± 20.65* 35.82 ± 23.5* 4.35 ± 2.96* 12.34 ± 6.01* 29.05 ± 14.18 60.16 ± 19.93
Caucasian Cataract 113.2 ± 36.86 30.57 ± 11.98 42.15 ± 23.49 3.01 ± 2.3 10.16 ± 4.74 30.75 ± 11.32 71.39 ± 20.65
POAG 112.58 ± 43.7 27.75 ± 11.8 39.24 ± 25.54 3.92 ± 2.15 10.63 ± 4.79 25.03 ± 9.09* 56.8 ± 24.06*
AfricanAmerican
Cataract 86.74 ± 38.27 22.04 ± 11.08 28.49 ± 22.32 3.44 ± 3.01 10.05 ± 4.77 28.09 ± 10.35 56.42 ± 19.58
POAG 116.54 ± 55.52* 28.72 ± 20.52* 35.37 ± 20.06* 4.36 ± 3.08 12.49 ± 6.12* 30.1 ± 14.32 61.11 ± 19.56
Patel et al. Lipids in Health and Disease (2021) 20:128 Page 5 of 10

DiscussionExamination of variations in the AH proteome betweendisease states as well as between demographic groupsmay prove helpful in understanding the elusive mecha-nism(s) of glaucomatous optic neuropathy. Apolipopro-teins have been previously established as markers formultiple systemic [18–20] and neurodegenerative dis-eases [21–25], and it has been more recently observedthat their levels in AH are altered in the presence ofocular conditions [8, 10]. As such, we aimed to probeour large data set for differences in AH apolipoproteinlevels between glaucomatous and cataract patients andquantify intra-population variation. In both of theseareas, we discovered interactive effects that suggestdisease-specific alterations in apolipoprotein levels varybetween demographic groups.We detected 10 apolipoproteins in our AH samples.
After excluding the three low-incidence apolipoproteins
(APOB, APOF, APOL1), the remaining seven (APOA1,APOA2, APOA4, APOC3, APOD, APOE, and APOH)were abundant in the AH proteome. The detection ofAPOA1, APOA2, APOA4, APOD, APOE, and APOH isconsistent with the findings of other studies [3, 12, 26].When considering all 231 subjects, APOA1, APOC3,
and APOD were significantly higher among patientswith POAG. This agrees with previous investigationswherein elevated levels of both APOA1 and APOC3were detected among individuals with glaucoma [12, 27].APOA1 levels, in particular, have demonstrated potentialvalue for the detection of primary chronic angle-closureglaucoma as the component of a proposed diagnosticprotein panel [28]. Leveraging such a finding to thera-peutic effect remains difficult as mechanistic linkages tothe optic neuropathy remain to be discovered. Investiga-tions of other ocular conditions (e.g., diabetic retino-pathy, age-related maculopathy) have posited that
Fig. 3 Levels of five apolipoproteins were significantly increased in female subjects with primary open angle glaucoma (G) compared to subjectswith cataracts alone, the controls (C). No significant alterations in apolipoproteins were detected in male subjects. The boxplots depict thedistribution of protein levels in each group
Fig. 4 Levels of four apolipoproteins were significantly increased in African American subjects with primary open angle glaucoma (G) comparedto subjects with cataracts alone, the controls (C). Levels of two apolipoproteins were significantly decreased in Caucasian subjects with primaryopen angle glaucoma compared to subjects with cataracts alone. The boxplots depict the distribution of protein levels in each group
Patel et al. Lipids in Health and Disease (2021) 20:128 Page 6 of 10
increased APOA1 levels may indicate underlying inflam-matory processes [29, 30]. Although there is a robustcorpus of literature that implicates neuro-inflammationin glaucomatous optic neuropathy [31], further researchis needed to elucidate pathophysiologic connections.Overall, only three apolipoproteins were significantly
higher among glaucomatous patients. However, thesefindings were different in male and female subgroups,suggesting an interactive effect between disease state,gender, and apolipoprotein levels. No apolipoproteinlevels were found to be altered in males based on diseasestate, while five apolipoprotein (APOA1, APOA2,APOA4, APOC3, and APOD) levels were increased infemales with POAG. Several studies have previously de-tected significant gender-specific differences in systemic(serum) apolipoprotein levels [13, 14, 32]. Schaefer et. al.observed an elevated plasma level of APOA1 among fe-males (124 ± 24mg/dl) relative to males (108 ± 16mg/dl)[13]. A more recent investigation by Anagnostis et. al.reported similar findings and further identified an inter-action between menopause status, age, and plasma con-centrations of APOA1, APOA2, and APOB in females[14]. However, heretofore, limited research has extendedinto human AH. Perumal et. al. reported gender-dependent changes in the AH proteome [15]. Thepresent investigation extends such findings by suggestinggender-specific differences in POAG. Further research isrequired to delineate whether such findings distill alongstructural, endocrine or other lines. Support for thestructural vantage point comes from reports indicatingfemales as having average shorter axial lengths and shal-lower anterior chamber depths [33–36]. Support for theendocrine aspect comes from reports proposing a pro-tective effect of endogenous estrogen for retinal ganglioncells in pre-menopausal females [37]. The authors
suggested mechanisms relating to extracellular matrixproduction and cellular signaling [38–40]. Regardless,further characterization of pathophysiologic differencesbetween the genders and POAG is necessary to explainthe variance in apolipoprotein levels.We also observed interactions between race and AH
apolipoprotein levels. Within the African American co-hort, APOA1, APOA2, APOA4, and APOD levels weresignificantly higher among glaucoma patients. Alterna-tively, the Caucasian glaucomatous cohort had lowerlevels of APOE and APOH. These findings pose multiplequestions. First, does this divergence explain on somelevel the increased incidence, progression, and severityof glaucoma in the African American population [41,42]? Second, does race predict different disease patternsand treatment responses? If so, analyses with specific ra-cial compositions of patients may be necessary for per-sonalized treatment algorithms. Third, while priorinvestigations have reported increased levels of APOEamong glaucomatous subjects [12, 43], our study did notconfirm this. Instead, we found APOE levels decreasedamong glaucomatous patients only within the Caucasiansubset. Accordingly, it is important for future studiescharacterizing the AH proteome to further investigatethe impact of race on the AH proteome when interpret-ing findings to reduce this as a potential confoundingfactor.Assessment of the relationship between OCT parame-
ters and AH apolipoprotein levels demonstrated a nega-tive correlation between average RNFL thickness andtwo apolipoproteins (APOC3 and APOD). However, thisassociation only persisted with APOD amongst the glau-coma subset. Interestingly, this is the same apolipopro-tein which has emerged as a potential candidate forevaluation in pseudoexfoliative glaucoma and the
Table 4 Apolipoproteins significantly correlated with clinical parameters
Proteins Clinical Variables Overall Cataract POAG
Corr. P-value Corr. P-value Corr. P-value
OCT Parameters
APOC3 RNFL avg. thickness −0.25 0.01* −0.25 0.06 −0.22 0.20
APOD RNFL avg. thickness −0.31 < 0.01* 0.00 0.99 −0.44 < 0.01*
HRT Parameters
APOA1 Cup Shape Measure 0.00 0.98 0.19 0.09 − 0.51 < 0.01*
APOA2 Cup Shape Measure −0.03 0.74 0.15 0.18 −0.49 0.01*
APOC3 Cup Shape Measure 0.37 0.01* 0.39 0.01* 0.39 0.17
APOH Cup Shape Measure −0.07 0.45 0.18 0.10 −0.61 < 0.01*
APOC3 Rim Volume (mm2) −0.29 0.02* −0.25 0.12 −0.27 0.24
APOE Rim Volume (mm2) 0.27 < 0.01* 0.36 < 0.01* 0.17 0.31
APOE Cup to Disc Area ratio −0.19 0.04* −0.32 < 0.01* − 0.08 0.63
APOH Cup to Disc Area ratio −0.21 0.02* −0.03 0.77 −0.37 0.02*
Corr. Correlation coefficient
Patel et al. Lipids in Health and Disease (2021) 20:128 Page 7 of 10

neurodegenerative conditions of multiple sclerosis andAlzheimer’s disease [44–48]. Among glaucomatous pa-tients, APOD has previously been demonstrated to cor-relate with functional visual field parameters includingPattern Standard Deviation (PSD), Visual Field Index(VFI), Mean Deviation (MD), and Glaucoma HemifieldTest (GHT) [49]. Lipids and cholesterol are conservedfollowing neurodegenerative processes [50, 51], andtherefore elevated APOD levels may reflect increased re-cycling of these substances during regeneration. This, inturn, may promote neuritogenesis and synaptogenesis inthese patients [52]. Taken together, these results suggestthat higher levels of APOD may facilitate increased re-generation in patients with glaucomatous damage.Previously, APOC3 has been implicated in certain ocu-
lar conditions. Increased APOC3 levels have been ob-served in patients with branch retinal vein occlusionwith macular edema. It is proposed as interrelating withinflammatory processes [53]. Other studies have alsoelucidated a linkage between POAG and APOC3 [10, 27,54]. In these studies, APOC3 levels were also upregu-lated. Although APOH was associated with HRT para-meters in POAG patients, there remains a limitedunderstanding of its role within the neurodegenerativecondition. Despite its implication in other ocular dis-eases such as proliferative diabetic retinopathy [55, 56],further characterization of the role of apolipoproteins inthe process of glaucoma has yet to be conducted.Despite an abundance of literature grossly analyzing
differences in the AH between patients with and withoutPOAG [3, 10, 12, 27], to our knowledge, studies evaluat-ing the influence of demographics are limited. Inaddition, studies analyzing gender and race-specific dif-ferences in the AH proteome did not examine differentdisease states [2, 15]. Therefore, our study extendsknowledge to identify how the interaction betweendemographic characteristics and POAG affects apolipo-protein levels in human AH.Our study possesses multiple strengths, including a
large sample set and utilization of one of the latest LC-MS/MS technologiesy for identification of proteins fromsmall volume samples [57, 58]. One of the limitations ofthis study is lack of quantification of the lipid content inhuman AH. Other investigations have reported that theAH lipid profiles of patients with POAG are distinctfrom controls. Those studies have suggested the differen-tial regulation of lipids such as 12,13-DiHOME andplatelet activating factor, among others, is implicated ininflammatory processes [59, 60]. Because lipids may bean essential component of the oxidative stress-relatedpathogenesis of POAG, further studies into the relation-ship between AH lipid content and apolipoprotein levelsare required. Another limitation is our utilization ofcataract patients as the control group. While these
individuals have been traditionally employed in studiesinvolving the AH [10–12, 27], cataract formation isassociated with alterations in multiple proteins, includ-ing β-crystallin and keratin proteins [26, 54]. Accuratequantification of differences associated with diseasestates such as POAG would require the collection ofcontrol samples from healthy adults, an ethically unfeas-ible task.
ConclusionsIn the present study, through utilization of a large sam-ple set, we identified six apolipoproteins detected in allAH samples and one apolipoprotein detected in 57% ofsamples. Analysis of the relationships between theseproteins and disease state, patient demographics, andclinical parameters of glaucomatous damage demon-strated multiple interactive effects. These differentialassociations emphasize the necessity of consideringdemographic factors including race and gender whenanalyzing a heterogeneous population. The elucidationof whether apolipoprotein alterations represent causa-tive, degenerative, and/or reparative processes is import-ant and warrants further study. Leveraging such resultsto treat glaucoma, detect its presence, or assess adequacyof treatment would be a boon to human vision.
Supplementary InformationThe online version contains supplementary material available at https://doi.org/10.1186/s12944-021-01555-0.
Additional file 1.
AcknowledgementsNot applicable.
Authors’ contributionsConceptualization, P.A.P, S.K.K., S.S. and A.S.; Data curation, S.K.K. and G.J.;Formal analysis, S.K.K. and T.J.L.; Funding acquisition, A.S.; Methodology, S.K.K.and W.Z.; Project administration, A.S.; Resources, K.B., L.U., D.B., A.E., S.S. andA.S.; Software, T.J.L., A.S., and G.J.; Supervision, A.S.; Visualization, T.J.L.;Writing—original draft, P.A.P.; Writing—review & editing, L.U., S.S., A.S., andG.J. All authors have read and agreed to the published version of themanuscript.
FundingThis work was funded by an NIH/NEI grant (R01-EY029728) awarded toAshok Sharma.
Availability of data and materialsThe datasets used in the current study are available as Supplemental Table-1.
Declarations
Ethics approval and consent to participateThe Institutional Review Board at Augusta University approved the study (IRB#611480) and written informed consents were obtained from all studyparticipants.
Consent for publicationNot applicable.
Patel et al. Lipids in Health and Disease (2021) 20:128 Page 8 of 10
Competing interestsThe authors declare no conflict of interest.
Author details1Center for Biotechnology and Genomic Medicine, Medical College ofGeorgia, Augusta University, 1120 15th Street, CA4094, Augusta, GA 30912,USA. 2Mass General Brigham, 215 First Street, Cambridge, MA 02142, USA.3Department of Ophthalmology, Medical College of Georgia, AugustaUniversity, Augusta, GA 30912, USA. 4Department of Population HealthSciences, Medical College of Georgia, Augusta University, Augusta, GA 30912,USA.
Received: 21 July 2021 Accepted: 13 September 2021
References1. Grus FH, Joachim SC, Pfeiffer N. Proteomics in ocular fluids. Proteomics Clin
Appl. 2007;1:876–88.2. Kodeboyina SK, Lee TJ, Churchwell L, Ulrich L, Bollinger K, Bogorad D, et al.
The constitutive proteome of human aqueous humor and race specificalterations. Proteomes. 2020;8.
3. Chowdhury UR, Madden BJ, Charlesworth MC, Fautsch MP. Proteome analysisof human aqueous humor. Invest Ophthalmol Vis Sci. 2010;51:4921–31.
4. Murthy KR, Rajagopalan P, Pinto SM, Advani J, Murthy PR, Goel R, et al.Proteomics of human aqueous humor. OMICS. 2015;19:283–93.
5. Dominiczak MH, Caslake MJ. Apolipoproteins: metabolic role and clinicalbiochemistry applications. Ann Clin Biochem. 2011;48:498–515.
6. Ramasamy I. Recent advances in physiological lipoprotein metabolism. ClinChem Lab Med. 2014;52:1695–727.
7. Sacca SC, Centofanti M, Izzotti A. New proteins as vascular biomarkers inprimary open angle glaucomatous aqueous humor. Invest Ophthalmol VisSci. 2012;53:4242–53.
8. Kliuchnikova AA, Samokhina NI, Ilina IY, Karpov DS, Pyatnitskiy MA,Kuznetsova KG, et al. Human aqueous humor proteome in cataract,glaucoma, and pseudoexfoliation syndrome. Proteomics. 2016;16:1938–46.
9. Bouhenni RA, Al Shahwan S, Morales J, Wakim BT, Chomyk AM, Alkuraya FS,et al. Identification of differentially expressed proteins in the aqueoushumor of primary congenital glaucoma. Exp Eye Res. 2011;92:67–75.
10. Sharma S, Bollinger KE, Kodeboyina SK, Zhi W, Patton J, Bai S, et al.Proteomic alterations in aqueous humor from patients with primary openangle Glaucoma. Invest Ophthalmol Vis Sci. 2018;59:2635–43.
11. Baek JH, Lim D, Park KH, Chae JB, Jang H, Lee J, et al. Quantitativeproteomic analysis of aqueous humor from patients with drusen andreticular pseudodrusen in age-related macular degeneration. BMCOphthalmol. 2018;18:289.
12. Inoue T, Kawaji T, Tanihara H. Elevated levels of multiple biomarkers ofAlzheimer's disease in the aqueous humor of eyes with open-angleGlaucoma. Invest Ophthalmol Vis Sci. 2013;54:5353–8.
13. Schaefer EJ, Zech LA, Jenkins LL, Bronzert TJ, Rubalcaba EA, LindgrenFT, et al. Human apolipoprotein A-I and A-II metabolism. J Lipid Res.1982;23:850–62.
14. Anagnostis P, Stevenson JC, Crook D, Johnston DG, Godsland IF. Effects ofgender, age and menopausal status on serum apolipoproteinconcentrations. Clin Endocrinol. 2016;85:733–40.
15. Perumal N, Manicam C, Steinicke M, Funke S, Pfeiffer N, Grus FH.Characterization of the human aqueous humour proteome: a comparisonof the genders. PLoS One. 2017;12:e0172481.
16. Salgarello T, Colotto A, Falsini B, Buzzonetti L, Cesari L, Iarossi G, et al.Correlation of pattern Electroretinogram with optic disc cup shape in ocularhypertension. Invest Ophthalmol Vis Sci. 1999;40:1989–97.
17. Apolipoproteins | HUGO Gene Nomenclature Committee [https://www.genenames.org/data/genegroup/#!/group/405].
18. Mao Y, Xu Y, Lu L. The nonlinear association between apolipoprotein Bto apolipoprotein A1 ratio and type 2 diabetes. Medicine (Baltimore).2017;96:e5834.
19. Contois JH, McConnell JP, Sethi AA, Csako G, Devaraj S, Hoefner DM, et al.Vascular diseases division working group on best P: apolipoprotein B andcardiovascular disease risk: position statement from the AACC Lipoproteinsand vascular diseases division working group on best practices. Clin Chem.2009;55:407–19.
20. Mendivil CO, Rimm EB, Furtado J, Chiuve SE, Sacks FM. Low-densitylipoproteins containing apolipoprotein C-III and the risk of coronary heartdisease. Circulation. 2011;124:2065–72.
21. Kim J, Basak JM, Holtzman DM. The role of apolipoprotein E in Alzheimer'sdisease. Neuron. 2009;63:287–303.
22. Giau VV, Bagyinszky E, An SS, Kim SY. Role of apolipoprotein E inneurodegenerative diseases. Neuropsychiatr Dis Treat. 2015;11:1723–37.
23. Najm R, Jones EA, Huang Y. Apolipoprotein E4, inhibitory networkdysfunction, and Alzheimer’s disease. Mol Neurodegener. 2019;14:24.
24. Williams T, Borchelt DR, Chakrabarty P. Therapeutic approachestargeting apolipoprotein E function in Alzheimer’s disease. MolNeurodegener. 2020;15:8.
25. Maiti TK, Konar S, Bir S, Kalakoti P, Bollam P, Nanda A. Role of apolipoproteinE polymorphism as a prognostic marker in traumatic brain injury andneurodegenerative disease: a critical review. Neurosurg Focus. 2015;39:E3.
26. Xiang M, Zhang X, Li Q, Wang H, Zhang Z, Han Z, et al. Identification ofproteins in the aqueous humor associated with cataract development usingiTRAQ methodology. Mol Med Rep. 2017;15:3111–20.
27. Kaeslin MA, Killer HE, Fuhrer CA, Zeleny N, Huber AR, Neutzner A. Changesto the aqueous humor proteome during Glaucoma. PLoS One. 2016;11:e0165314.
28. Liu X, Liu X, Wang Y, Sun H, Guo Z, Tang X, et al. Proteome characterizationof glaucoma aqueous humour. Mol Cell Proteomics. 2021;100117.
29. Buch H, Vinding T, La Cour M, Jensen GB, Prause JU, Nielsen NV. Risk factorsfor age-related maculopathy in a 14-year follow-up study: the CopenhagenCity eye study. Acta Ophthalmol Scand. 2005;83:409–18.
30. Kawai S, Nakajima T, Hokari S, Komoda T, Kawai K. Apolipoprotein A-Iconcentration in tears in diabetic retinopathy. Ann Clin Biochem. 2002;39:56–61.
31. Quaranta L, Bruttini C, Micheletti E, Konstas AGP, Michelessi M, Oddone F,et al. Glaucoma and neuroinflammation: An overview. Surv Ophthalmol.2021;66:693–713.
32. Sun Z, Larson IA, Ordovas JM, Barnard JR, Schaefer EJ. Effects of age, gender,and lifestyle factors on plasma apolipoprotein A-IV concentrations.Atherosclerosis. 2000;151:381–8.
33. Foster PJ, Broadway DC, Hayat S, Luben R, Dalzell N, Bingham S, et al.Refractive error, axial length and anterior chamber depth of the eye inBritish adults: the EPIC-Norfolk eye study. Br J Ophthalmol. 2010;94:827–30.
34. Hashemi H, Khabazkhoob M, Miraftab M, Emamian MH, Shariati M,Abdolahinia T, et al. The distribution of axial length, anterior chamberdepth, lens thickness, and vitreous chamber depth in an adult populationof Shahroud, Iran. BMC Ophthalmol. 2012;12:50.
35. Chen H, Lin H, Lin Z, Chen J, Chen W. Distribution of axial length, anteriorchamber depth, and corneal curvature in an aged population in SouthChina. BMC Ophthalmol. 2016;16:47.
36. Zhang N, Wang J, Li Y, Jiang B. Prevalence of primary open angle glaucomain the last 20 years: a meta-analysis and systematic review. Sci Rep. 2021;11:13762.
37. Tehrani S. Gender difference in the pathophysiology and treatment ofGlaucoma. Curr Eye Res. 2015;40:191–200.
38. Prokai-Tatrai K, Xin H, Nguyen V, Szarka S, Blazics B, Prokai L, et al. 17β-estradiol eye drops protect the retinal ganglion cell layer and preservevisual function in an in vivo model of glaucoma. Mol Pharm. 2013;10:3253–61.
39. Zhou X, Li F, Ge J, Sarkisian SR Jr, Tomita H, Zaharia A, et al. Retinal ganglioncell protection by 17-beta-estradiol in a mouse model of inheritedglaucoma. Dev Neurobiol. 2007;67:603–16.
40. Zalewski A, Cecchini EL, Deroo BJ. Expression of extracellular matrixcomponents is disrupted in the immature and adult estrogen receptor β-null mouse ovary. PLoS One. 2012;7:e29937.
41. Friedman DS, Wolfs RC, O'Colmain BJ, Klein BE, Taylor HR, West S, et al.Prevalence of open-angle glaucoma among adults in the United States.Arch Ophthalmol. 2004;122:532–8.
42. Broman AT, Quigley HA, West SK, Katz J, Munoz B, Bandeen-Roche K, et al.Estimating the rate of progressive visual field damage in those with open-angle glaucoma, from cross-sectional data. Invest Ophthalmol Vis Sci. 2008;49:66–76.
43. Szaflik JP, Nowak A, Rozpędek W, Siwak M, Szymanek K, Szaflik M, et al.Association of apolipoprotein E with a risk of primary open-angle glaucoma.Acta Ophthalmol. 2017;95.
Patel et al. Lipids in Health and Disease (2021) 20:128 Page 9 of 10
44. Reindl M, Knipping G, Wicher I, Dilitz E, Egg R, Deisenhammer F, et al.Increased intrathecal production of apolipoprotein D in multiple sclerosis. JNeuroimmunol. 2001;119:327–32.
45. Terrisse L, Poirier J, Bertrand P, Merched A, Visvikis S, Siest G, et al. Increasedlevels of apolipoprotein D in cerebrospinal fluid and hippocampus ofAlzheimer's patients. J Neurochem. 1998;71:1643–50.
46. Zenkel M, Pöschl E, von der Mark K, Hofmann-Rummelt C, Naumann GO,Kruse FE, et al. Differential gene expression in pseudoexfoliation syndrome.Invest Ophthalmol Vis Sci. 2005;46:3742–52.
47. Thomas EA, Copolov DL, Sutcliffe JG. From pharmacotherapy topathophysiology: emerging mechanisms of apolipoprotein D in psychiatricdisorders. Curr Mol Med. 2003;3:408–18.
48. Sutcliffe JG, Thomas EA. The neurobiology of apolipoproteins in psychiatricdisorders. Mol Neurobiol. 2002;26:369–88.
49. Kodeboyina SK, Lee TJ, Bollinger K, Ulrich L, Bogorad D, Estes A, et al.Aqueous humor proteomic alterations associated with visual field indexparameters in Glaucoma patients: a pilot study. J Clin Med. 2021;10:1180.
50. Goodrum JF, Earnhardt T, Goines N, Bouldin TW. Fate of myelin lipidsduring degeneration and regeneration of peripheral nerve: anautoradiographic study. J Neurosci. 1994;14:357–67.
51. Goodrum JF, Weaver JE, Goines ND, Bouldin TW. Fatty acids fromdegenerating myelin lipids are conserved and reutilized for myelin synthesisduring regeneration in peripheral nerve. J Neurochem. 1995;65:1752–9.
52. Rickhag M, Deierborg T, Patel S, Ruscher K, Wieloch T. Apolipoprotein D iselevated in oligodendrocytes in the peri-infarct region after experimentalstroke: influence of enriched environment. J Cereb Blood Flow Metab. 2008;28:551–62.
53. Cehofski LJ, Kojima K, Terao N, Kitazawa K, Thineshkumar S, Grauslund J,et al. Aqueous fibronectin correlates with severity of macular edema andvisual acuity in patients with branch retinal vein occlusion: a proteomestudy. Invest Ophthalmol Vis Sci. 2020;61:6–6.
54. Ji Y, Rong X, Ye H, Zhang K, Lu Y. Proteomic analysis of aqueous humorproteins associated with cataract development. Clin Biochem. 2015;48:1304–9.
55. Ouchi M, West K, Crabb JW, Kinoshita S, Kamei M. Proteomic analysis ofvitreous from diabetic macular edema. Exp Eye Res. 2005;81:176–82.
56. Simó R, Higuera M, García-Ramírez M, Canals F, García-Arumí J, HernándezC. Elevation of apolipoprotein A-I and apolipoprotein H levels in thevitreous fluid and overexpression in the retina of diabetic patients. ArchOphthalmol. 2008;126:1076–81.
57. Baldwin MA. Protein identification by mass spectrometry: issues to beconsidered. Mol Cell Proteomics. 2004;3:1–9.
58. Di Girolamo F, Lante I, Muraca M, Putignani L. The role of massspectrometry in the "Omics" era. Curr Org Chem. 2013;17:2891–905.
59. Azbukina NV, Chistyakov DV, Goriainov SV, Kotelin VI, Fedoseeva EV, PetrovSY, et al. Targeted Lipidomic analysis of aqueous humor reveals signalinglipid-mediated pathways in primary open-angle Glaucoma. Biology (Basel).2021;10.
60. Cabrerizo J, Urcola JA, Vecino E. Changes in the Lipidomic profile ofaqueous humor in open-angle Glaucoma. J Glaucoma. 2017;26:349–55.
Publisher’s NoteSpringer Nature remains neutral with regard to jurisdictional claims inpublished maps and institutional affiliations.
Patel et al. Lipids in Health and Disease (2021) 20:128 Page 10 of 10