Into the crucible. Methodological approaches to reconstructing crucible metallurgy, from New Kingdom...
684
Into the Crucible Methodological approaches to reconstructing crucible metallurgy, from New Kingdom Egypt to Late Roman Thrace Frederik W. A. Rademakers Thesis submitted to University College London for the degree of D OCTOR OF P HILOSOPHY (P H D) UCL Institute of Archaeology 31-34 Gordon Square London, WC1H 0PY, United Kingdom February 2015
-
Upload
britishmuseum -
Category
Documents
-
view
1 -
download
0
Transcript of Into the crucible. Methodological approaches to reconstructing crucible metallurgy, from New Kingdom...

Into the Crucible
Methodological approaches to reconstructing crucible metallurgy,from New Kingdom Egypt to Late Roman Thrace
Frederik W. A. Rademakers
Thesis submitted to
University College London
for the degree of
DOCTOR OF PHILOSOPHY (PHD)
UCL Institute of Archaeology
31-34 Gordon Square
London, WC1H 0PY, United Kingdom
February 2015


Frederik Rademakers Declaration of Authorship 3
I, Frederik Rademakers, confirm that the work presented in this thesis is my own. Where
information has been derived from other sources, I confirm that this has been indicated
in the thesis.
Date:
Signed:

4 Frederik Rademakers

Abstract
The subject of this PhD thesis is the study of ancient metallurgical crucible assemblages,
with a particular focus on the methodological framework for such studies. This is ap-
proached through three case studies from the eastern Mediterranean: Qantir – Pi-Ramesse
(Ramesside Egypt, 13th century BC), Gordion (Late Phrygian/Achaemenid Anatolia, 6th-
4th century BC) and Nicopolis/Philippopolis/Serdica/Stara Zagora (Roman Thrace, 2nd -
5th century AD).
For each of these three case studies, the metallurgical activities are reconstructed and
contextualised. This involves determining the technical processes, material use and or-
ganisation of metal production both on the site and regional scale. No relation exists be-
tween these sites and each case study stands on its own: results from the technological re-
construction are interpreted within their particular archaeological and regional/historical
context, to which they offer novel contributions.
The main research material consists of crucible remains, and to a lesser extent metal re-
mains, which are investigated using optical microscopy and SEM(-EDS) to establish the
technological processes and material use. The applicability of handheld XRF for such re-
constructions is evaluated as well. Finally, lead isotope analysis (using MC-ICP-MS) of
metal remains (scrap, spills, ingots, objects and prills extracted from crucible slag) and
crucible ceramic and slag is performed.
The overarching goal of this research is to evaluate methodological approaches to the
study of crucibles and crucible assemblages by comparing the results for these three ex-
amples, not in terms of technology, but by evaluating the influence of varying crucible ty-
pology, preservation, abundance, contextual information, and sample availability, as well
as the use of various analytical techniques. These considerations are then combined to
formulate more general recommendations for the sampling, examination and interpreta-
tion of ancient crucible assemblages.
5

6 Frederik Rademakers

Table of Contents
Table of Contents 7
List of Figures 13
List of Tables 29
Acknowledgements 33
Part IIntroduction
1 Background, aims and layout of the thesis 41
1.1 Three case studies . . . . . . . . . . . . . . . . . . . . . . . . . . . . . . . . 42
1.2 Archaeometallurgical methodology . . . . . . . . . . . . . . . . . . . . . . 45
1.3 Research questions . . . . . . . . . . . . . . . . . . . . . . . . . . . . . . . . 47
1.4 Thesis layout and terminology . . . . . . . . . . . . . . . . . . . . . . . . . 49
2 Theoretical framework 53
2.1 Technology in archaeology . . . . . . . . . . . . . . . . . . . . . . . . . . . 54
2.2 Crucible metallurgy in a metallurgical chaîne opératoire . . . . . . . . . . 57
Part IIAnalytical Methodology
3 Methodology for the analysis of crucible remains 63
3.1 Macroscopic investigation . . . . . . . . . . . . . . . . . . . . . . . . . . . . 63
3.2 Reflected light microscopy . . . . . . . . . . . . . . . . . . . . . . . . . . . . 64
3.3 Scanning electron microscopy - energy dispersive spectrometry . . . . . 69
7

8 Table of Contents Frederik Rademakers
3.4 Lead isotope analysis . . . . . . . . . . . . . . . . . . . . . . . . . . . . . . . 78
3.5 Handheld X-ray fluorescence spectrometry . . . . . . . . . . . . . . . . . 82
Part IIIQantir – Pi-Ramesse
4 Archaeological background 89
4.1 Introduction . . . . . . . . . . . . . . . . . . . . . . . . . . . . . . . . . . . . 89
4.2 High-temperature processes in Pi-Ramesse . . . . . . . . . . . . . . . . . 91
4.3 Site QI . . . . . . . . . . . . . . . . . . . . . . . . . . . . . . . . . . . . . . . . 94
4.4 The nature of metallurgical workshop contexts . . . . . . . . . . . . . . . 95
4.5 The organisation of Egyptian metallurgy . . . . . . . . . . . . . . . . . . . 99
4.6 Specific questions . . . . . . . . . . . . . . . . . . . . . . . . . . . . . . . . . 104
5 Analytical results 105
5.1 General crucible characteristics . . . . . . . . . . . . . . . . . . . . . . . . 105
5.2 Detailed description of crucible slag . . . . . . . . . . . . . . . . . . . . . . 110
5.3 Handheld XRF results . . . . . . . . . . . . . . . . . . . . . . . . . . . . . . 137
5.4 Technical interpretation . . . . . . . . . . . . . . . . . . . . . . . . . . . . . 166
5.5 Lead isotope analysis . . . . . . . . . . . . . . . . . . . . . . . . . . . . . . . 192
6 Discussion 231
6.1 Bronze production technology . . . . . . . . . . . . . . . . . . . . . . . . . 231
6.2 Sources of metal . . . . . . . . . . . . . . . . . . . . . . . . . . . . . . . . . . 236
6.3 Contextualising bronze production in Pi-Ramesse . . . . . . . . . . . . . 246
Part IVGordion
7 Archaeological background 255
7.1 Introduction . . . . . . . . . . . . . . . . . . . . . . . . . . . . . . . . . . . . 255
7.2 Metallurgy in Gordion . . . . . . . . . . . . . . . . . . . . . . . . . . . . . . 256

Frederik Rademakers Table of Contents 9
8 Analytical results 263
8.1 General crucible characteristics . . . . . . . . . . . . . . . . . . . . . . . . 263
8.2 Detailed description of crucible slag . . . . . . . . . . . . . . . . . . . . . . 270
8.3 Technical interpretation . . . . . . . . . . . . . . . . . . . . . . . . . . . . . 298
8.4 Metals . . . . . . . . . . . . . . . . . . . . . . . . . . . . . . . . . . . . . . . . 314
8.5 Moulds . . . . . . . . . . . . . . . . . . . . . . . . . . . . . . . . . . . . . . . 316
9 Discussion 321
Part VRoman Thrace
10 Archaeological background 329
10.1 Roman Thrace . . . . . . . . . . . . . . . . . . . . . . . . . . . . . . . . . . . 329
10.2 Assemblage-specific backgrounds . . . . . . . . . . . . . . . . . . . . . . . 332
11 Analytical results 343
11.1 Detailed description of crucible ceramic and slag . . . . . . . . . . . . . . 343
11.2 Technical interpretation . . . . . . . . . . . . . . . . . . . . . . . . . . . . . 388
11.3 Overview . . . . . . . . . . . . . . . . . . . . . . . . . . . . . . . . . . . . . . 401
12 Discussion 409
Part VIDiscussion
13 Methodological issues for crucible metallurgy studies 419
13.1 Within-crucible variability . . . . . . . . . . . . . . . . . . . . . . . . . . . . 420
13.2 Assemblage-wide variability . . . . . . . . . . . . . . . . . . . . . . . . . . . 427
13.3 Methodological implications . . . . . . . . . . . . . . . . . . . . . . . . . . 432
13.4 Technical interpretative issues . . . . . . . . . . . . . . . . . . . . . . . . . 443
14 Site-specific contextualisation: synthesis 453

10 Table of Contents Frederik Rademakers
Part VIIConclusion
15 Conclusions and avenues of future research 463
Bibliography 469
Methodology Appendices
Appendix A SEM-EDS analysis of CRM 533
A.1 Basalt . . . . . . . . . . . . . . . . . . . . . . . . . . . . . . . . . . . . . . . . 534
A.2 Clay and ceramic . . . . . . . . . . . . . . . . . . . . . . . . . . . . . . . . . 535
A.3 Metal . . . . . . . . . . . . . . . . . . . . . . . . . . . . . . . . . . . . . . . . 536
A.4 Glass . . . . . . . . . . . . . . . . . . . . . . . . . . . . . . . . . . . . . . . . 540
A.5 Summary . . . . . . . . . . . . . . . . . . . . . . . . . . . . . . . . . . . . . . 542
Pi-Ramesse Appendices
Appendix B Sample details 545
Appendix C Bulk Compositions 547
Appendix D Oxide phases in crucible slag 557
D.1 Fe-bearing oxides . . . . . . . . . . . . . . . . . . . . . . . . . . . . . . . . . 557
D.2 Ca-bearing oxides . . . . . . . . . . . . . . . . . . . . . . . . . . . . . . . . . 562
D.3 Cu-bearing oxides . . . . . . . . . . . . . . . . . . . . . . . . . . . . . . . . . 566
D.4 Sn-bearing oxides . . . . . . . . . . . . . . . . . . . . . . . . . . . . . . . . . 571
D.5 Co-bearing oxides . . . . . . . . . . . . . . . . . . . . . . . . . . . . . . . . . 575
D.6 Zircon . . . . . . . . . . . . . . . . . . . . . . . . . . . . . . . . . . . . . . . . 577
Appendix E Composition of metallic prills 581
Appendix F Lead isotope data 585

Frederik Rademakers Table of Contents 11
Appendix G Volume Calculations 595
G.1 Crucible dimensions . . . . . . . . . . . . . . . . . . . . . . . . . . . . . . . 595
G.2 Approximating cobalt content in copper charge . . . . . . . . . . . . . . . 597
Gordion Appendices
Appendix H Notes on Late Phrygian foundry 601
Appendix I Sample list and overview of excavated contexts 605
Appendix J Bulk Compositions 609
Appendix K Oxide phases in crucible slag 619
K.1 Fe-bearing oxides . . . . . . . . . . . . . . . . . . . . . . . . . . . . . . . . . 619
K.2 Ca-bearing oxides . . . . . . . . . . . . . . . . . . . . . . . . . . . . . . . . . 625
K.3 Cu-bearing oxides . . . . . . . . . . . . . . . . . . . . . . . . . . . . . . . . . 630
K.4 Sn-bearing oxides . . . . . . . . . . . . . . . . . . . . . . . . . . . . . . . . . 635
K.5 Pb-bearing oxides . . . . . . . . . . . . . . . . . . . . . . . . . . . . . . . . . 639
Appendix L Composition of metallic prills 643
Appendix M Metals analysis 647
M.1 Analysis of metal spills and objects . . . . . . . . . . . . . . . . . . . . . . . 647
M.2 MASCA Report . . . . . . . . . . . . . . . . . . . . . . . . . . . . . . . . . . . 660
Appendix N Moulds 661
Roman Thrace Appendices
Appendix O Bulk Compositions 669
O.1 Nicopolis bulk compositions . . . . . . . . . . . . . . . . . . . . . . . . . . 669
O.2 Philippopolis bulk compositions . . . . . . . . . . . . . . . . . . . . . . . . 673
O.3 Serdica bulk compositions . . . . . . . . . . . . . . . . . . . . . . . . . . . . 676
O.4 Stara Zagora bulk compositions . . . . . . . . . . . . . . . . . . . . . . . . 679

12 Table of Contents Frederik Rademakers
Appendix P Composition of metallic prills 681
P.1 Nicopolis metallic prills . . . . . . . . . . . . . . . . . . . . . . . . . . . . . 681
P.2 Philippopolis metallic prills . . . . . . . . . . . . . . . . . . . . . . . . . . . 682
P.3 Serdica metallic prills . . . . . . . . . . . . . . . . . . . . . . . . . . . . . . . 683
P.4 Stara Zagora metallic prills . . . . . . . . . . . . . . . . . . . . . . . . . . . 684

List of Figures
Chapter 1 41
1.1 Map showing the location of the sites from which the three assemblages,
studied in this thesis, were excavated: Qantir – Pi-Ramesse, Gordion and
Roman Thrace (Google Earth 7.1.2, 2013) . . . . . . . . . . . . . . . . . . 43
1.2 Crucible terminology overview . . . . . . . . . . . . . . . . . . . . . . . . 50
Chapter 2 53
2.1 Stages in the production process of metals (from Miller, 2007, Figure
4.11, p. 146) . . . . . . . . . . . . . . . . . . . . . . . . . . . . . . . . . . . . 58
2.2 Metallurgical chaîne opératoire or ‘Cycle of copper production and work-
ing’ (from Ottaway, 2001, Figure 1, p. 88) . . . . . . . . . . . . . . . . . . . 59
Chapter 3 63
3.1 Schematic representation of reflected light microscopy (from Klein and
Dutrow, 2007, Figure 13.27, p. 305) . . . . . . . . . . . . . . . . . . . . . . 66
3.2 Diagram of scanning electron microscope (from www.purdue.edu) . . . 70
3.3 Schematic representation of electron beam and sample interaction in an
electron microscope (from Watt, 1997, Figure 2.4, p. 34) . . . . . . . . . . 71
3.4 An example of the applied SEM-EDS methodology . . . . . . . . . . . . . 74
Chapter 4 89
4.1 Location of Pi-Ramesse (Google Earth 7.1.2, 2013) . . . . . . . . . . . . . 90
4.2 Excavated areas of Pi-Ramesse, showing (blue) ancient Nile (from Pusch
and Rehren, 2007, Map 05, p. 53) . . . . . . . . . . . . . . . . . . . . . . . 91
13

14 List of Figures Frederik Rademakers
4.3 Map showing excavation areas QI, QIV and QV; LH and MH refer to ex-
cavations by Labib Habachi and Mahmoud Hamza respectively (from
Pusch and Rehren, 2007, Map 01, p. 20). The industrial area is indicated
in red, the multifunctional workshops in green, and the QIV workshop
in blue . . . . . . . . . . . . . . . . . . . . . . . . . . . . . . . . . . . . . . . 96
4.4 Map of industrial area within QI (red square in Figure 4.3)), stratum B/3,
showing melting batteries (I-VI) and cross-furnaces (A-D); multifunc-
tional workshops south of wall are not shown (from Pusch, 1990) . . . . 97
4.5 Detail of melting batteries . . . . . . . . . . . . . . . . . . . . . . . . . . . 98
4.6 Operation of the B/3 melting batteries (from Pusch, 1994, Figure 1, p. 153) 99
4.7 Map of area QI, stratum B/2; multifunctional workshops in areas c-f (green)
are separated by a double wall from the open courtyard (B/3 ‘industrial
area’ - red) in ax-b (from Prell, 2011, Figure 05, p. 23) . . . . . . . . . . . . 100
4.8 Wall decoration in Rekhmire Tomb (Theban Tomb 100), showing im-
port of ingots on the right and crucible metallurgy (possibly similar to
Pi-Ramesse) on the left (from Pusch, 1990, Figure 9, p. 94) . . . . . . . . 102
4.9 Map showing Qantir – Pi-Ramesse and possible sources of metal for an-
cient Egypt. Circled: ‘Egyptian’ mining, dot: Ayn-Soukhna, arrows: pos-
sible ingot/raw metal import (modified from Wilkinson, 1994) . . . . . . 103
Chapter 5 105
5.1 Reconstructed Pi-Ramesse crucible (left: top view; right: side view) (from
Pusch, 1990, Figure 7, p. 89) . . . . . . . . . . . . . . . . . . . . . . . . . . 106
5.2 A few macroscopic observations . . . . . . . . . . . . . . . . . . . . . . . . 107
5.3 Finger imprints on crucible exterior surface . . . . . . . . . . . . . . . . . 109
5.4 Examples of quartz fraction in crucible ceramic . . . . . . . . . . . . . . 111
5.5 Ternary plots for ceramic (red) and slag (blue) composition (phase dia-
grams from Muan, 1957 (top) and Hall and Insley, 1933 (bottom)) . . . . 113
5.6 Ternary plots of slag composition, distinguishing between rim (green),
body (orange) and body-near-rim (blue) samples . . . . . . . . . . . . . 115
5.7 Crucible fragment showing reddish slag near rim and darker slag towards
lower body (fragment 88_1374,0001) . . . . . . . . . . . . . . . . . . . . . 116

Frederik Rademakers List of Figures 15
5.8 Absolute Al2O3 content (in wt%) in ceramic and slag (after removal of
base metals) . . . . . . . . . . . . . . . . . . . . . . . . . . . . . . . . . . . 116
5.9 Change in the ratio SiO2/Al2O3 between ceramic and slag (two outliers not
shown) . . . . . . . . . . . . . . . . . . . . . . . . . . . . . . . . . . . . . . . 117
5.10 Change in the ratio C aO/Al2O3 between ceramic and slag . . . . . . . . . . 120
5.11 Change in the ratio C aO/Al2O3 vs M gO/Al2O3, P2O5/Al2O3, K2O/Al2O3, N a2O/Al2O3
and SiO2/Al2O3, between ceramic and slag . . . . . . . . . . . . . . . . . . . 121
5.12 Change in the ratio T iO2/Al2O3 between ceramic and slag . . . . . . . . . . 122
5.13 Change in the ratio FeO/Al2O3 between ceramic and slag . . . . . . . . . . 123
5.14 Change in the ratio FeO/Al2O3 between ceramic and slag: bi-modal distri-
bution . . . . . . . . . . . . . . . . . . . . . . . . . . . . . . . . . . . . . . . 124
5.15 Change in the ratio C aO/Al2O3 vs FeO/Al2O3, with and without four high
FeO-increase outliers, between ceramic and slag . . . . . . . . . . . . . . 124
5.16 Bulk CuO content (in wt%) in slag . . . . . . . . . . . . . . . . . . . . . . . 125
5.17 Bulk SnO2 content (in wt%) in slag . . . . . . . . . . . . . . . . . . . . . . 125
5.18 Bulk CuO vs SnO2 content (in wt%) in slag . . . . . . . . . . . . . . . . . . 126
5.19 Bulk CuO and SnO2 content vs ∆C aO/Al2O3 between ceramic and slag . . 127
5.20 Cu-Sn phase diagram, casting conditions (modified from Scott, 1991; all
phase compositional boundaries approximate) . . . . . . . . . . . . . . . 131
5.21 High-tin prills . . . . . . . . . . . . . . . . . . . . . . . . . . . . . . . . . . . 131
5.22 Prill with finely dispersed, undissolved Pb-droplets (and magnetite burnt
out of prill), sample 87_0762 . . . . . . . . . . . . . . . . . . . . . . . . . . 132
5.23 Co-rich prills in sample 97_0690,02 . . . . . . . . . . . . . . . . . . . . . . 132
5.24 Cu2S-prill on the far left and bronze prill (undissolved Pb-droplets) in
the centre, fayalitic slag zone of sample 94_0560 (long chains, dark grey:
fayalite; medium grey: magnetite) . . . . . . . . . . . . . . . . . . . . . . . 133
5.25 Two iron-rich prills in sample 86_0749c (three phases described on p. 130) 133
5.26 Gold-rich prill in sample 86_0749c . . . . . . . . . . . . . . . . . . . . . . 134
5.27 Charcoal . . . . . . . . . . . . . . . . . . . . . . . . . . . . . . . . . . . . . . 136
5.28 pXRF: Titanium . . . . . . . . . . . . . . . . . . . . . . . . . . . . . . . . . . 141

16 List of Figures Frederik Rademakers
5.29 pXRF: Iron . . . . . . . . . . . . . . . . . . . . . . . . . . . . . . . . . . . . . 143
5.30 pXRF: Fe/Ti ratio ceramic and slag . . . . . . . . . . . . . . . . . . . . . . 144
5.31 pXRF: Fe vs Ti, ceramic (red) and slag (blue) . . . . . . . . . . . . . . . . . 145
5.32 pXRF: Fe/Ti ratio in slag (narrow bins) . . . . . . . . . . . . . . . . . . . . 145
5.33 pXRF: Calcium . . . . . . . . . . . . . . . . . . . . . . . . . . . . . . . . . . 147
5.34 pXRF: Ca/Ti . . . . . . . . . . . . . . . . . . . . . . . . . . . . . . . . . . . . 148
5.35 pXRF: Strontium . . . . . . . . . . . . . . . . . . . . . . . . . . . . . . . . . 150
5.36 pXRF: Sr/Ti . . . . . . . . . . . . . . . . . . . . . . . . . . . . . . . . . . . . 151
5.37 pXRF: Strontium vs calcium . . . . . . . . . . . . . . . . . . . . . . . . . . 152
5.38 pXRF: Copper . . . . . . . . . . . . . . . . . . . . . . . . . . . . . . . . . . . 154
5.39 pXRF: Tin . . . . . . . . . . . . . . . . . . . . . . . . . . . . . . . . . . . . . 156
5.40 pXRF: Copper vs tin . . . . . . . . . . . . . . . . . . . . . . . . . . . . . . . 157
5.41 pXRF: Cobalt . . . . . . . . . . . . . . . . . . . . . . . . . . . . . . . . . . . 159
5.42 Influence of cobalt on secondary iron peak . . . . . . . . . . . . . . . . . 160
5.43 pXRF: Lead . . . . . . . . . . . . . . . . . . . . . . . . . . . . . . . . . . . . 163
5.44 pXRF: Arsenic . . . . . . . . . . . . . . . . . . . . . . . . . . . . . . . . . . . 164
5.45 pXRF: Secondary Pb and As peaks . . . . . . . . . . . . . . . . . . . . . . . 165
5.46 pXRF: Primary vs secondary Pb and As peaks for ceramic (red) and slag
(blue) . . . . . . . . . . . . . . . . . . . . . . . . . . . . . . . . . . . . . . . 165
5.47 Exceptionally thick crucible fragments (top: 1984_1171,0001, bottom:
1987_1530a,0013-0014) . . . . . . . . . . . . . . . . . . . . . . . . . . . . . 169
5.48 Exceptionally shallow crucible fragments, 1992_0645b,0001-2 (left: sec-
tion through wall, right: section through bottom) . . . . . . . . . . . . . 170
5.49 Crucible (1984_1264d) showing signs of repair and re-use. Top: section
showing boundary between original rim and repair layer (red arrow) and
a prill on top of original rim, beneath repair layer (blue arrow). Bottom:
view of interior surface and section . . . . . . . . . . . . . . . . . . . . . . 171
5.50 Cu-Sn phase diagram (casting conditions), showing typical Egyptian cop-
per/bronze composition (A), high-tin prills of intermediate composition
(B) and a source of fresh tin (C) (modified from Scott, 1991; all phase
compositional boundaries approximate) . . . . . . . . . . . . . . . . . . . 174

Frederik Rademakers List of Figures 17
5.51 Clear example of tin oxidising out of a large prill (sample 97_0631E,04).
Large clusters of tin oxide surround the prill, which is depleted of tin.
More tin oxide occurs within the prill (shown section is close to prill sur-
face). Cuprite formation, seen around the prill surface, occurs only after
all tin has oxidized from the bronze (right: O.M. image) . . . . . . . . . . 176
5.52 Copper-oxide crystals in a pore, with SnO2 surrounding it, seemingly
concentric - a completely burnt-out bronze prill? (sample 87_0884,01-
56c) . . . . . . . . . . . . . . . . . . . . . . . . . . . . . . . . . . . . . . . . . 176
5.53 Residual cassiterite mineral grains in crucible slag. Bottom right exam-
ple: left side partly re-crystallized . . . . . . . . . . . . . . . . . . . . . . . 178
5.54 Iron-rich copper prills (98-99 wt% Cu with 1-2 wt% Fe), sample 83_1149b 180
5.55 Iron-rich copper prills (left image, ±0-2 wt% Fe) and bronze prills (right
image, ±3-6 wt% Sn and 1-3 wt% Fe) (light grey) from which iron and
tin oxidised preferentially into the crucible slag, forming magnetite (mid
grey crystals) and tin oxide (bright angular crystals). The magnetite is
iron oxide incorporating ±1-8 wt% Sn, 1-2 wt% Al and 2-3 wt% Mg . . . 180
5.56 Cobalt spinel in crucible slag. Bottom micrograph shows a large spinel
aggregate, probably oxidized out of cobalt/iron-rich copper prills (bright).
The spinel has ±77 wt% FeO and 12 wt% CoO, as well as ±5-6 wt% Al2O3,
2-3 wt% TiO2 and 1 wt% SiO2, MgO and SnO2. The bronze prill contains
±5 wt% Sn, 2 wt% Fe and 0.5 wt% Co . . . . . . . . . . . . . . . . . . . . . 183
5.57 Sharp boundary between two slag layers in sample 94_560 . . . . . . . . 189
5.58 Fayalite-rich (left) and magnetite-rich (right) area in second slag zone of
sample 94_560 . . . . . . . . . . . . . . . . . . . . . . . . . . . . . . . . . . 189
5.59 Top image: copper oxhide ingot (from Kassianidou, 2009) showing large
slag inclusions in section (from Hauptmann et al., 2002, not to scale).
Bottom image: schematic representation of second slag layer formation:
slag-rich ingot as part of crucible charge (left) - slag inclusions (black)
rising to float on liquid bronze surface (central) - slag layer sticks to cru-
cible wall during casting (right) . . . . . . . . . . . . . . . . . . . . . . . . 190
5.60 LI compositions for all analysed copper (alloys) . . . . . . . . . . . . . . 194
5.61 LI compositions for all analysed copper (alloys), showing high- and low-
lead samples . . . . . . . . . . . . . . . . . . . . . . . . . . . . . . . . . . . 195

18 List of Figures Frederik Rademakers
5.62 Comparison of Pi-Ramesse copper to Cyprus ores and Uluburun ingot
cores LI compositions . . . . . . . . . . . . . . . . . . . . . . . . . . . . . . 196
5.63 Comparison of Pi-Ramesse copper to Feinan and Timna LI compositions 198
5.64 Comparison of Pi-Ramesse copper to Amarna copper and El Rakham
Egyptian Blue LI compositions (left: all data, right: close-up) . . . . . . . 199
5.65 Comparison of Pi-Ramesse and Amarna copper and El Rakham Egyptian
Blue to Lavrion copper ore LI compositions (left: all data, right: close-up) 200
5.66 Comparison of Pi-Ramesse copper to Sinai and Eastern Desert copper
ore, slag and metal LI compositions (left: all data, right: close-up) . . . . 202
5.67 Histogram showing tin content for metal samples . . . . . . . . . . . . . 205
5.68 Histogram showing lead content for metal samples . . . . . . . . . . . . 206
5.69 Histogram showing iron content for metal samples . . . . . . . . . . . . 207
5.70 Histogram showing cobalt content for metal samples . . . . . . . . . . . 208
5.71 Iron vs cobalt content for metal samples . . . . . . . . . . . . . . . . . . . 208
5.72 Interim overview of LI compositional groups . . . . . . . . . . . . . . . . 210
5.73 Overview of LI compositions by context . . . . . . . . . . . . . . . . . . . 212
5.74 Overview of LI compositions, highlighting QI-c/4.5 samples (left) and
most iron-rich samples (right) . . . . . . . . . . . . . . . . . . . . . . . . . 213
5.75 Comparison of Pi-Ramesse metal LI compositions to Omani ores and
copper . . . . . . . . . . . . . . . . . . . . . . . . . . . . . . . . . . . . . . . 214
5.76 Final overview of LI compositions of Pi-Ramesse copper and bronze . . 216
5.77 LI data for crucibles and copper/bronze from Pi-Ramesse . . . . . . . . 218
5.78 Example of ceramic, slag and prill of a single crucible . . . . . . . . . . . 221
5.79 Crucible ceramic and slag - ‘domestic’ group; individual pairs of ceramic
and slag are linked by lines . . . . . . . . . . . . . . . . . . . . . . . . . . . 222
5.80 Crucible ceramic and slag - Timna group; individual pairs of ceramic and
slag are linked by lines . . . . . . . . . . . . . . . . . . . . . . . . . . . . . . 223
5.81 Crucible ceramic and slag - mixed group; individual pairs of ceramic and
slag are linked by lines . . . . . . . . . . . . . . . . . . . . . . . . . . . . . . 226
5.82 Crucible ceramic and slag - overview by context . . . . . . . . . . . . . . 227

Frederik Rademakers List of Figures 19
Chapter 6 231
6.1 Scrap bronze found in the production area at Pi-Ramesse. FZN: 1997/1288,
site: QIV-h/28, stratum Bd . . . . . . . . . . . . . . . . . . . . . . . . . . . 234
Chapter 7 255
7.1 Map showing location of Gordion (from Mellink, 1956, p. 370) . . . . . . 257
7.2 Aerial overview of the site and its surroundings, showing the citadel mound,
tumuli (dots) and Yassıhüyük village (from Rose and Darbyshire, 2012,
Figure 0.1, p. xiv) . . . . . . . . . . . . . . . . . . . . . . . . . . . . . . . . . 258
7.3 Overview of excavated areas within the Citadel Mound (from Voigt, 2012,
Figure 1, p. 236) . . . . . . . . . . . . . . . . . . . . . . . . . . . . . . . . . 259
7.4 Top: Gordion, Middle Phrygian citadel: foundry area indicated in red,
OP1 and OP2 (crucible excavation areas) in green (after Voigt and Young,
1999, Figure 8, p. 201). Bottom: Reconstructed location of ‘foundry’
within the Gordion citadel (from Fields, 2011, Figures 8 and 17) . . . . . 261
Chapter 8 263
8.1 Largest crucible fragment . . . . . . . . . . . . . . . . . . . . . . . . . . . . 264
8.2 Crucible drawings . . . . . . . . . . . . . . . . . . . . . . . . . . . . . . . . 265
8.3 Indications for organic temper in crucibles: fibrous impressions on ex-
terior surface and elongated porosity in cross-section . . . . . . . . . . . 265
8.4 Corrosion products on interior crucible surfaces . . . . . . . . . . . . . . 266
8.5 Typical structural changes through crucible profile . . . . . . . . . . . . 268
8.6 Coarse inclusions in the ceramic fabric . . . . . . . . . . . . . . . . . . . . 271
8.7 Ternary plots for ceramic (red+orange) and slag (blue+turquoise) com-
position . . . . . . . . . . . . . . . . . . . . . . . . . . . . . . . . . . . . . . 273
8.8 Ternary plots of slag composition, distinguishing between body (blue),
rim (grey) and body-near-rim (pink) samples . . . . . . . . . . . . . . . . 274
8.9 Absolute change in Al2O3 content (in wt%) between ceramic and slag
(after removal of metals) . . . . . . . . . . . . . . . . . . . . . . . . . . . . 275
8.10 Change in the ratio SiO2/Al2O3 between ceramic and slag . . . . . . . . . . 276

20 List of Figures Frederik Rademakers
8.11 Change in the ratio C aO/Al2O3 between ceramic and slag . . . . . . . . . . 279
8.12 Change in the ratio C aO/Al2O3 vs M gO/Al2O3, P2O5/Al2O3, K2O/Al2O3, N a2O/Al2O3
and SiO2/Al2O3, between ceramic and slag . . . . . . . . . . . . . . . . . . . 280
8.13 Change in the ratio T iO2/Al2O3 between ceramic and slag . . . . . . . . . . 281
8.14 Change in the ratio FeO/Al2O3 between ceramic and slag . . . . . . . . . . 282
8.15 Change in the ratio C aO/Al2O3 vs FeO/Al2O3 between ceramic and slag . . . 283
8.16 Bulk CuO content (in wt%) in slag . . . . . . . . . . . . . . . . . . . . . . . 283
8.17 Bulk SnO2 content (in wt%) in slag . . . . . . . . . . . . . . . . . . . . . . 284
8.18 Bulk CuO vs SnO2 content (in wt%) in slag . . . . . . . . . . . . . . . . . . 284
8.19 Bulk PbO content (in wt%) in slag . . . . . . . . . . . . . . . . . . . . . . . 285
8.20 Bulk CuO vs PbO content (in wt%) in slag . . . . . . . . . . . . . . . . . . 285
8.21 Bulk CuO, SnO2 and PbO content vs ∆C aO/Al2O3 between ceramic and slag 286
8.22 Bulk metal content (in wt%) in body (1), body-rim (2) and rim (3) frag-
ments (boxplot1) . . . . . . . . . . . . . . . . . . . . . . . . . . . . . . . . . 287
8.23 Pure copper prills . . . . . . . . . . . . . . . . . . . . . . . . . . . . . . . . 291
8.24 Low-tin bronze prills (bright) . . . . . . . . . . . . . . . . . . . . . . . . . 292
8.25 High-tin (leaded) bronze prills (bright) . . . . . . . . . . . . . . . . . . . . 292
8.26 CuCl prills . . . . . . . . . . . . . . . . . . . . . . . . . . . . . . . . . . . . . 293
8.27 Silver(-rich) prills . . . . . . . . . . . . . . . . . . . . . . . . . . . . . . . . 293
8.28 Aberrant crucible fragments . . . . . . . . . . . . . . . . . . . . . . . . . . 296
8.29 Ceramic fabric Gordion-23707 and -28236 . . . . . . . . . . . . . . . . . . 296
8.30 Slag with pyroxene (medium-dark grey, angular), plagioclase (dark grey,
on bottom left and right), tin oxide (white, angular), and prills (copper
with A: 0.6 wt% Fe and 2.8 wt% Sb, B: 1.5 wt% As, 1.5 wt% Sn, 3.4 wt% Sb
and 31 wt% Pb, C: 0.7 wt% Sb), Gordion-26891 . . . . . . . . . . . . . . . 303
8.31 Lead-rich glassy phase in area with burnt SnO2 . . . . . . . . . . . . . . . 306
8.32 Multi-sampling of crucible fragments (top: Gordion-27609, middle: Gordion-
27613, bottom left: Gordion-23045, bottom right: Gordion-25394) . . . 310
8.33 Variation in crucible slag for rim (A), intermediate (B) and lower body (C)
samples in Gordion 25394 . . . . . . . . . . . . . . . . . . . . . . . . . . . 312

Frederik Rademakers List of Figures 21
8.34 Slag layering in Gordion-22673-A . . . . . . . . . . . . . . . . . . . . . . . 314
8.35 Gordion-22611: ring-like fragment . . . . . . . . . . . . . . . . . . . . . . 315
8.36 Gordion-22611: large cast fragment . . . . . . . . . . . . . . . . . . . . . . 315
8.37 Two examples of mould fragments (see Figure N.6 as well) . . . . . . . . 317
8.38 Raw handheld XRF spectrum for Gordion mould (exterior surface in red,
interior surface in green) . . . . . . . . . . . . . . . . . . . . . . . . . . . . 318
8.39 Raw handheld XRF spectrum for Gordion crucible (exterior surface in
red, interior surface in green) . . . . . . . . . . . . . . . . . . . . . . . . . 319
Chapter 10 329
10.1 Map of Roman Thrace, showing four sites from which assemblages are
examined (adapted from Haynes, 2011, p. 6) . . . . . . . . . . . . . . . . 330
10.2 Crucible fragments from Nicopolis, context N660 . . . . . . . . . . . . . 333
10.3 Remaining crucible fragments from Nicopolis . . . . . . . . . . . . . . . 333
10.4 Crucibles (P1-P5) from second century workshop, Philippopolis . . . . . 334
10.5 Left: crucible P8 (left) with an unsampled gold-processing crucible (cen-
tre) and ingot mould (right) from second-third century Roman forum
context, Philippopolis. Right: drawing of P8 . . . . . . . . . . . . . . . . . 335
10.6 Preliminary drawing of crucible P7, Philippopolis . . . . . . . . . . . . . 335
10.7 Crucible fragments (P9) from second century smithy, Philippopolis . . . 336
10.8 Crucible fragments S1-S2 from late Roman Serdica. Left: S1, right: S2 . 338
10.9 Crucible fragments S3-S4, Serdica . . . . . . . . . . . . . . . . . . . . . . . 339
10.10 Crucible fragment S5 drawing, Serdica . . . . . . . . . . . . . . . . . . . . 339
10.11 Crucible fragments S6 (left) and S7 (middle, right) from Roman or late
Roman (?) Serdica . . . . . . . . . . . . . . . . . . . . . . . . . . . . . . . . 340
10.12 Crucible fragments S8-S11 from Roman or late Roman (?) Serdica . . . . 341
10.13 Crucible drawing (StZ1) from late Roman Stara Zagora . . . . . . . . . . 341
Chapter 11 343
11.1 Terminology used for various copper alloys (from Bayley, 1998, Figure 1,
p.8) . . . . . . . . . . . . . . . . . . . . . . . . . . . . . . . . . . . . . . . . . 344

22 List of Figures Frederik Rademakers
11.2 Nicopolis ceramic groups . . . . . . . . . . . . . . . . . . . . . . . . . . . . 345
11.3 Nicopolis bulk compositions of ceramic and slag . . . . . . . . . . . . . . 346
11.4 N2 ceramic fabric. Left: exterior zone, right: interior zone . . . . . . . . 346
11.5 N2 slag (N2a: top left, N2b: top right), and prills embedded in N2b (bright,
bottom) with spinel (light grey) . . . . . . . . . . . . . . . . . . . . . . . . 347
11.6 N4 (top) and N5 (bottom) vitrified exterior layer (left) and fused ceramic
(right) . . . . . . . . . . . . . . . . . . . . . . . . . . . . . . . . . . . . . . . 349
11.7 Bloated interior of N4 (top left), N5 ‘slag lump’ (top right) and N5 slag
and dross layer (bottom left and right) . . . . . . . . . . . . . . . . . . . . 350
11.8 Top: N1 (left) and N3 (right) ceramic. Bottom: N6 ceramic (left) and
interior ceramic layer (right) . . . . . . . . . . . . . . . . . . . . . . . . . . 352
11.9 N1 slag layer with malayaite (light grey) and spinel-like oxides (medium-
light grey) . . . . . . . . . . . . . . . . . . . . . . . . . . . . . . . . . . . . . 352
11.10 N3 slag layer with high-tin prills (bright) and Fe-Sn-Zn oxides (light grey) 353
11.11 N6 slag layer (top) and SnO2 with elevated lead content (bottom, light
grey angular phases) . . . . . . . . . . . . . . . . . . . . . . . . . . . . . . . 353
11.12 Philippopolis ceramic groups . . . . . . . . . . . . . . . . . . . . . . . . . 355
11.13 Philippopolis bulk compositions of ceramic and slag . . . . . . . . . . . 356
11.14 Sample P1: (vitrified) ceramic (top) and leaded brass prills (bottom) . . 356
11.15 Examples of dross from sample P2 (top left), P3 (top right), P4 (bottom
left) and P5 (bottom right) . . . . . . . . . . . . . . . . . . . . . . . . . . . 357
11.16 Dross details in samples P2-P5 . . . . . . . . . . . . . . . . . . . . . . . . . 358
11.17 Overview of fragment P6. Top: bloated and vitrified external surface, 2nd
row: fused crucible fabric, 3r d row: interior slag layer, bottom: interior
slag: corroded prills (left) and tiny metallic prills (right) . . . . . . . . . . 360
11.18 Fragment P7 ‘ceramic’ (left) and dross (right) . . . . . . . . . . . . . . . . 361
11.19 Fragment P8 exterior surface (top left), ceramic (top right), slag (bottom
left) and dross (bottom right) . . . . . . . . . . . . . . . . . . . . . . . . . 361
11.20 Fragment P9 . . . . . . . . . . . . . . . . . . . . . . . . . . . . . . . . . . . 362
11.21 Sample P9a: primary slag layer in between two bloated ceramic layers
(composite SEM image) . . . . . . . . . . . . . . . . . . . . . . . . . . . . . 363

Frederik Rademakers List of Figures 23
11.22 Sample P9a: possible residual cassiterite . . . . . . . . . . . . . . . . . . . 364
11.23 Sample P9a: thin secondary slag layer (left) with high-temperature tin
oxide crystals (right) . . . . . . . . . . . . . . . . . . . . . . . . . . . . . . . 364
11.24 Sample P9b: primary (left) and secondary (right) ceramic layers . . . . . 364
11.25 Sample P9b: primary slag layer (left) with leaded bronze prills (right) . . 365
11.26 Sample P9b: secondary slag layer (left) with small prills (right) . . . . . . 365
11.27 Serdica ceramic groups . . . . . . . . . . . . . . . . . . . . . . . . . . . . . 367
11.28 Serdica bulk compositions of ceramic and slag . . . . . . . . . . . . . . . 368
11.29 S1 ceramic A (top) and B (bottom) . . . . . . . . . . . . . . . . . . . . . . 368
11.30 S1 slag (top), silver (bottom left) and silver sulphide (bottom right) . . . 369
11.31 S2 silver sulphide (bright) with various iron-silver sulphides (light grey)
and iron-copper-silver sulphides (medium grey) . . . . . . . . . . . . . . 370
11.32 S3 ceramic (top) and bloated ceramic (bottom) with zircon (bright) . . . 371
11.33 S4 ceramic. Graphite temper clearly visible under reflected light micro-
scope (right: bright, yellow; O.M. image) . . . . . . . . . . . . . . . . . . . 372
11.34 S4 interior slag (top) with (multi-phase) prills and limited dross (bottom) 372
11.35 S4 exterior glaze (top) with prills (bottom), some gold-bearing (bottom
prill, bottom right) . . . . . . . . . . . . . . . . . . . . . . . . . . . . . . . . 373
11.36 S5 ceramic (top) with graphite temper clearly visible under reflected light
microscope (top right: bright, yellow; O.M. image) and rutile (elongate,
light grey) and silver chloride (bright) (bottom) . . . . . . . . . . . . . . . 374
11.37 S5 interior slag (top) with lead- and lime-rich aluminosilicates (bottom
left, black) and some gold-bearing silver prills (bottom right, with adja-
cent cubic silver chloride crystals) . . . . . . . . . . . . . . . . . . . . . . . 375
11.38 S5 bloated exterior . . . . . . . . . . . . . . . . . . . . . . . . . . . . . . . . 375
11.39 S6 (vitrified) ceramic . . . . . . . . . . . . . . . . . . . . . . . . . . . . . . 376
11.40 S6 dross with copper(-tin) oxides (bright) . . . . . . . . . . . . . . . . . . 376
11.41 S7 ceramic (top) and prills on exterior surface (bottom) . . . . . . . . . . 377
11.42 S7 slag (top) with copper-tin and copper-lead oxides (bright), and tiny
metallic prills (bottom) . . . . . . . . . . . . . . . . . . . . . . . . . . . . . 378

24 List of Figures Frederik Rademakers
11.43 S8 slag (top) with (bottom) Pb-K-rich aluminosilicates (dark, elongate)
and iron-tin-lead silicates (light grey, angular) . . . . . . . . . . . . . . . 379
11.44 S9 ceramic (top) with gunmetal prills (middle left) and iron-rich prills
(middle right) within fused ceramic and ‘slag’ (bottom) . . . . . . . . . . 381
11.45 S10 ceramic (left) and glazed surface (right) with iron-copper prill (bot-
tom) . . . . . . . . . . . . . . . . . . . . . . . . . . . . . . . . . . . . . . . . 382
11.46 S11 ceramic (left) and bloated interior (right) with copper oxides (bright)
and iron-copper-tin prills (bottom) . . . . . . . . . . . . . . . . . . . . . . 383
11.47 Stara Zagora sample zoning (left: view onto interior surface A) . . . . . . 384
11.48 StZ1, part A ceramic . . . . . . . . . . . . . . . . . . . . . . . . . . . . . . . 384
11.49 Stara Zagora bulk compositions of ceramic and slag . . . . . . . . . . . . 385
11.50 StZ1, part A interior slag (top) and embedded prills (bottom) . . . . . . . 385
11.51 StZ1, part A central vitrification (top) and embedded prills (bottom) . . 386
11.52 StZ1, part B porous glaze (top), embedded prills (bottom left) and cor-
roded prill on crucible rim (bottom right) . . . . . . . . . . . . . . . . . . 387
11.53 Ternary diagram showing all analysed ceramics from Roman Thrace . . 401
Chapter 13 419
13.1 Schematic representation of heterogeneous crucible conditions at a par-
ticular point in time, with hotter (A) and cooler (B) regions and more ox-
idising (C) and reducing (D) conditions . . . . . . . . . . . . . . . . . . . 420
13.2 Pi-Ramesse crucible fragment 88_1374,0001, showing macroscopic dif-
ferentiation between rim (top) and lower body (bottom) . . . . . . . . . 422
13.3 Small Pi-Ramesse rim fragment (left), from which two samples (83_1149b
- 1 and 2) were cut and mounted (middle). Prills in both samples are
shown on the right . . . . . . . . . . . . . . . . . . . . . . . . . . . . . . . . 423
13.4 Gordion crucible fragment from which three samples were taken (left),
with representative images of the three areas (right) . . . . . . . . . . . . 424
13.5 Boxplot of bulk copper, tin and lead oxide content in 49 Pi-Ramesse (top
- 9 rim, 6 body-rim and 34 body samples) and 46 Gordion crucible sam-
ples (bottom - 16 rim, 6 body-rim and 24 body samples) . . . . . . . . . 426

Frederik Rademakers List of Figures 25
13.6 Histogram showing relative change in bulk iron content between ceramic
and slag measured by SEM-EDS (left, in %) and ratio of iron to titanium
in crucible slag measured by pXRF (right), for the Pi-Ramesse assemblage 434
13.7 Histogram showing copper (top) and tin (bottom) enrichments in rim
(left) and body fragments (right), measured by pXRF for the Pi-Ramesse
assemblage . . . . . . . . . . . . . . . . . . . . . . . . . . . . . . . . . . . . 435
13.8 Ternary diagrams and histograms for Pi-Ramesse sample compositions,
based on randomly chosen single measurements for each sample . . . . 439
13.9 Tin oxide clusters (Pi-Ramesse) . . . . . . . . . . . . . . . . . . . . . . . . 445
13.10 Cuprite (light grey) clusters with surrounding delafossite (medium grey)
and tin oxide (white). Delafossite can further be noted in between cuprite,
Pi-Ramesse sample 87_0762 (2) . . . . . . . . . . . . . . . . . . . . . . . . 447
13.11 Massive magnetite cluster and small cobalt spinel cluster (medium grey),
both without associated macro-prills, though tiny prills may be noted
(bright specks), Pi-Ramesse samples 87_0634c,04 and 87_0762,0Nv (2) . 448
Appendix D 557
D.1 Fayalite in sample 94_560 (top) and sample 94_0775,01 (bottom) . . . . 559
D.2 Magnetite . . . . . . . . . . . . . . . . . . . . . . . . . . . . . . . . . . . . . 560
D.3 ‘Delafossite’ . . . . . . . . . . . . . . . . . . . . . . . . . . . . . . . . . . . . 561
D.4 Ilmenite . . . . . . . . . . . . . . . . . . . . . . . . . . . . . . . . . . . . . . 561
D.5 Ternary diagrams showing samples with Fe-bearing phases . . . . . . . 562
D.6 Ternary diagrams showing samples with Ca-bearing phases . . . . . . . 563
D.7 Diopside-hedenbergite . . . . . . . . . . . . . . . . . . . . . . . . . . . . . 564
D.8 Plagioclase . . . . . . . . . . . . . . . . . . . . . . . . . . . . . . . . . . . . 565
D.9 Plagioclase crystals (dark grey) occurring together with diopside-hedenbergite
(light grey) . . . . . . . . . . . . . . . . . . . . . . . . . . . . . . . . . . . . . 565
D.10 Copper-oxides . . . . . . . . . . . . . . . . . . . . . . . . . . . . . . . . . . 567
D.11 Cuprite in pores in the crucible slag, samples 87_0884,01-56b, 87_0884,01-
56c and 94_0560 . . . . . . . . . . . . . . . . . . . . . . . . . . . . . . . . . 568
D.12 Corroded bronze prill, sample 86_0471b,01 (top: O.M. image, 200X, w.o.i.
±1mm - left: PPL, right: XPL) . . . . . . . . . . . . . . . . . . . . . . . . . . 569

26 List of Figures Frederik Rademakers
D.13 Cu-silicate ‘bubbles’ in pores in the crucible slag of sample 87_0726,68-
78b . . . . . . . . . . . . . . . . . . . . . . . . . . . . . . . . . . . . . . . . . 570
D.14 Ternary diagrams showing samples enriched in CuO (+5 and +10 wt%
CuO) . . . . . . . . . . . . . . . . . . . . . . . . . . . . . . . . . . . . . . . . 570
D.15 SnO2 phases . . . . . . . . . . . . . . . . . . . . . . . . . . . . . . . . . . . 572
D.16 SnO2 with distinct different morphology . . . . . . . . . . . . . . . . . . . 573
D.17 ‘Malayaite’ (light grey) with SnO2 (white) . . . . . . . . . . . . . . . . . . . 573
D.18 Ternary diagrams showing samples enriched in SnO2 (+5 and +10 wt%
SnO2) . . . . . . . . . . . . . . . . . . . . . . . . . . . . . . . . . . . . . . . 574
D.19 Ternary diagrams showing samples with Sn-bearing oxides . . . . . . . . 574
D.20 Co-rich phases . . . . . . . . . . . . . . . . . . . . . . . . . . . . . . . . . . 576
D.21 Co-spinel oxidising into crucible slag from Fe- and Co-rich copper prills,
sample 87_0791,01-88 . . . . . . . . . . . . . . . . . . . . . . . . . . . . . . 576
D.22 Ternary diagrams showing samples with Co-bearing phases . . . . . . . 577
D.23 Zircon . . . . . . . . . . . . . . . . . . . . . . . . . . . . . . . . . . . . . . . 578
D.24 Zircon (bright, left) in ceramic fabric, sample 87_0762 (1) . . . . . . . . . 578
D.25 Ternary diagrams showing samples with zircon in crucible slag . . . . . 579
Appendix F 585
F.1 NAA data: As vs Au content and Sn vs Au content . . . . . . . . . . . . . . 591
F.2 NAA data: Au vs Ag content and As vs Ag content . . . . . . . . . . . . . . 591
F.3 XRF and NAA data: As vs Ni content . . . . . . . . . . . . . . . . . . . . . 591
F.4 XRF and NAA data: As vs Sb content . . . . . . . . . . . . . . . . . . . . . 591
F.5 XRF and NAA data: Co vs As content . . . . . . . . . . . . . . . . . . . . . 592
F.6 XRF and NAA data: Co vs Ni content . . . . . . . . . . . . . . . . . . . . . 592
F.7 XRF and NAA data: Fe vs Zn content . . . . . . . . . . . . . . . . . . . . . 592
F.8 XRF and NAA data: Ni vs Sb content . . . . . . . . . . . . . . . . . . . . . 592
F.9 XRF data: Pb vs Sb content and Pb vs Sn content . . . . . . . . . . . . . . 593
F.10 XRF data: Pb vs As content and Pb vs Ni content . . . . . . . . . . . . . . 593

Frederik Rademakers List of Figures 27
Appendix H 601
H.1 View of foundry wall from south-east . . . . . . . . . . . . . . . . . . . . . 603
H.2 Architect’s plan of foundry area . . . . . . . . . . . . . . . . . . . . . . . . 604
Appendix K 619
K.1 Olivine (light grey chains) in Gordion-22958 . . . . . . . . . . . . . . . . . 621
K.2 Olivine-like oxides (bright, angular-shaped, ‘dotted’) . . . . . . . . . . . 621
K.3 Spinel . . . . . . . . . . . . . . . . . . . . . . . . . . . . . . . . . . . . . . . 622
K.4 ‘High-silica spinel’ (bright, angular-shaped, ‘dotted’), Gordion-27635 (1) 623
K.5 Chrome-rich spinel (bright) . . . . . . . . . . . . . . . . . . . . . . . . . . 623
K.6 Titanium-rich spinel (bright) . . . . . . . . . . . . . . . . . . . . . . . . . . 624
K.7 Plagioclase (dark grey) . . . . . . . . . . . . . . . . . . . . . . . . . . . . . 627
K.8 Pyroxene . . . . . . . . . . . . . . . . . . . . . . . . . . . . . . . . . . . . . 628
K.9 High-Ca augite (medium grey) . . . . . . . . . . . . . . . . . . . . . . . . . 628
K.10 Anhydrite (dark grey) in between Cu2ClO2-Cu2ClO3 (light grey) in Gordion-
28877 . . . . . . . . . . . . . . . . . . . . . . . . . . . . . . . . . . . . . . . . 629
K.11 Ca-Mg-peroxide (dark grey) in charcoal inclusion in Gordion-23797 . . 629
K.12 Cuprite . . . . . . . . . . . . . . . . . . . . . . . . . . . . . . . . . . . . . . 631
K.13 Cu2ClO2-Cu2ClO3 . . . . . . . . . . . . . . . . . . . . . . . . . . . . . . . . 632
K.14 Cu2ClO2-Cu2ClO3 in Gordion-28932 (2) . . . . . . . . . . . . . . . . . . . 633
K.15 Cu3Pb2Cl3O2 (white) in dross layer of Gordion-22673 (tin oxide is light
grey) . . . . . . . . . . . . . . . . . . . . . . . . . . . . . . . . . . . . . . . . 633
K.16 Delafossite (white) . . . . . . . . . . . . . . . . . . . . . . . . . . . . . . . . 634
K.17 Variable Cu-Sn oxides in Gordion-22626 and -22673-A . . . . . . . . . . 634
K.18 SnO2 (bright, angular) . . . . . . . . . . . . . . . . . . . . . . . . . . . . . . 636
K.19 Examples of (somewhat) cassiterite-like SnO2 (bright) . . . . . . . . . . . 637
K.20 Malayaite . . . . . . . . . . . . . . . . . . . . . . . . . . . . . . . . . . . . . 638
K.21 Lead oxides in Gordion-22763-B . . . . . . . . . . . . . . . . . . . . . . . . 640
K.22 Lead sulphate in Gordion-23128 . . . . . . . . . . . . . . . . . . . . . . . . 640
K.23 PbK2S2O7 in Gordion-27640 . . . . . . . . . . . . . . . . . . . . . . . . . . 641

28 List of Figures Frederik Rademakers
Appendix M 647
M.1 Gordion-25545 . . . . . . . . . . . . . . . . . . . . . . . . . . . . . . . . . . 650
M.2 Gordion-22611: ring . . . . . . . . . . . . . . . . . . . . . . . . . . . . . . . 652
M.3 Gordion-22611: large fragment . . . . . . . . . . . . . . . . . . . . . . . . 654
M.4 Gordion-22611: large fragment . . . . . . . . . . . . . . . . . . . . . . . . 655
M.5 Gordion-22611: medium fragment . . . . . . . . . . . . . . . . . . . . . . 657
M.6 Gordion-22611: small fragment . . . . . . . . . . . . . . . . . . . . . . . . 659
Appendix N 661
N.1 Two mould fragments with angular shapes . . . . . . . . . . . . . . . . . 662
N.2 Possible sprue, through which metal would have been poured into the
mould . . . . . . . . . . . . . . . . . . . . . . . . . . . . . . . . . . . . . . . 663
N.3 Layered mould fragment, possibly indicating use of existing ceramic with
additional clay layer . . . . . . . . . . . . . . . . . . . . . . . . . . . . . . . 663
N.4 Three mould fragments for elongated shapes, possibly rods . . . . . . . 664
N.5 Example of ring-shaped moulds . . . . . . . . . . . . . . . . . . . . . . . . 665
N.6 Example of ring-shaped moulds (see Figure 8.37) . . . . . . . . . . . . . . 666
Appendix O 669
O.1 Change in the ratio C aO/Al2O3 vs M gO/Al2O3, P2O5/Al2O3, K2O/Al2O3, N a2O/Al2O3
and SiO2/Al2O3, between ceramic and slag (fragments N4 and N5) . . . . 672

List of Tables
Chapter 4 89
4.1 Suggested correlation of strata and related dates at sites QI, QIV and QV
(translated from Pusch and Rehren, 2007, Table 19, p. 130) . . . . . . . . . 92
Chapter 5 105
5.1 Summary of pXRF results: titanium . . . . . . . . . . . . . . . . . . . . . . 140
5.2 Summary of pXRF results: iron . . . . . . . . . . . . . . . . . . . . . . . . . 142
5.3 Summary of pXRF results: iron/titanium . . . . . . . . . . . . . . . . . . . 144
5.4 Summary of pXRF results: calcium . . . . . . . . . . . . . . . . . . . . . . . 146
5.5 Summary of pXRF results: Ca/Ti . . . . . . . . . . . . . . . . . . . . . . . . 147
5.6 Summary of pXRF results: strontium . . . . . . . . . . . . . . . . . . . . . 149
5.7 Summary of pXRF results: Sr/Ti . . . . . . . . . . . . . . . . . . . . . . . . 150
5.8 Summary of pXRF results: copper . . . . . . . . . . . . . . . . . . . . . . . 153
5.9 Summary of pXRF results: tin . . . . . . . . . . . . . . . . . . . . . . . . . . 155
5.10 Summary of pXRF results: cobalt . . . . . . . . . . . . . . . . . . . . . . . . 158
5.11 Summary of pXRF results: lead . . . . . . . . . . . . . . . . . . . . . . . . . 162
5.12 Summary of pXRF results: arsenic . . . . . . . . . . . . . . . . . . . . . . . 162
5.13 Summary of mounted samples . . . . . . . . . . . . . . . . . . . . . . . . . 173
5.14 Bulk composition of normal slag layer, fayalite-dominated slag zone and
magnetite-dominated slag zone in sample 94_0560 (in wt%, normalised
to 100%) . . . . . . . . . . . . . . . . . . . . . . . . . . . . . . . . . . . . . . 186
5.15 Alumina ratios for normal slag layer, fayalite-dominated slag zone and
magnetite-dominated slag zone in sample 94_0560 . . . . . . . . . . . . . 187
29

30 List of Tables Frederik Rademakers
Chapter 7 255
7.1 Stratigraphic sequence for Gordion (from Rose and Darbyshire, 2012, Ta-
ble 0.1, p. 2) . . . . . . . . . . . . . . . . . . . . . . . . . . . . . . . . . . . . 257
Chapter 8 263
8.1 Bulk composition of coarse inclusions in the ceramic fabric (in wt%, nor-
malised to 100%) . . . . . . . . . . . . . . . . . . . . . . . . . . . . . . . . . 269
8.2 Average ceramic bulk composition for three aberrant samples (Gordion-
23707 and Gordion-28236) and rest of the assemblage (in wt%, normalised
to 100%) . . . . . . . . . . . . . . . . . . . . . . . . . . . . . . . . . . . . . . 297
8.3 Average bulk composition of ceramic, slag and dross (in wt%, normalised
to 100%) . . . . . . . . . . . . . . . . . . . . . . . . . . . . . . . . . . . . . . 297
8.4 Distribution of fragments and samples for different contexts . . . . . . . 301
8.5 Bulk composition of slag (in wt%, normalised to 100%) for four samples
in different locations . . . . . . . . . . . . . . . . . . . . . . . . . . . . . . . 309
8.6 Relative changes (%) between ceramic and slag for four samples in differ-
ent locations . . . . . . . . . . . . . . . . . . . . . . . . . . . . . . . . . . . . 309
8.7 Composition (in wt%, normalised to 100%) of three zones in Gordion-
22673-A crucible slag . . . . . . . . . . . . . . . . . . . . . . . . . . . . . . . 313
Chapter 11 343
11.1 Bulk composition (in wt%, normalised to 100%) of crucibles N4 and N5
(full data in Appendix O.1) . . . . . . . . . . . . . . . . . . . . . . . . . . . . 391
11.2 Bulk composition (in wt%, normalised to 100%) of crucible S4 (full data
in Appendix O.3) . . . . . . . . . . . . . . . . . . . . . . . . . . . . . . . . . 396
Chapter 13 419
13.1 Bulk slag metal content for Gordion-25394 (in wt% (following normalisa-
tion to 100%), other oxides omitted) . . . . . . . . . . . . . . . . . . . . . . 424
13.2 Average coefficient of variation (in %) of all measured oxides for each as-
semblage . . . . . . . . . . . . . . . . . . . . . . . . . . . . . . . . . . . . . . 436

Frederik Rademakers List of Tables 31
13.3 Average composition (in wt%, normalised to 100%) for ceramic (top four
rows) and slag (bottom four rows) for Pi-Ramesse crucibles, based on ran-
dom single area measurements for each sample, compared to standard
approach (5 area measurements) . . . . . . . . . . . . . . . . . . . . . . . . 440
Appendix A 533
A.1 BHVO-2: Basalt, Hawaiian Volcanic Observatory. Not measured: 0.27 wt%
P2O5, 0.17 wt% MnO and trace elements (F, V, Cr, Cu, Zn, Sr, Zr, Ba) . . . . . . . 534
A.2 BCR-2: Basalt, Columbia River, Oregon. Not measured: 0.35 wt% P2O5, 0.20
wt% MnO and trace elements (F, V, Cr, Cu, Zn, Sr, Zr, Mo, Ba) . . . . . . . . . . . 534
A.3 Clay DC60105 (China National Analysis Centre). Not measured: 0.11 wt%
P2O5, 0.03 wt% SO3, 0.09 wt% MnO and 0.01 wt% Cl . . . . . . . . . . . . . . . 535
A.4 NIST 76a: Burnt Refractory. Not measured: 0.07 wt% Na2O, 0.12 wt% P2O5,
0.22 wt% CaO, 0.02 wt% Li and 0.03 wt% Sr . . . . . . . . . . . . . . . . . . . . 536
A.5 CURM 42.23-2: Admiralty Brass. Not measured: 0.13 wt% P, 0.05 wt% S, 0.17
wt% Ni, 0.17 wt% As, 0.36 wt% Sb, 0.01 wt% Al, 0.02 wt% Si, 0.02 wt% Mn and 0.03
wt% Bi . . . . . . . . . . . . . . . . . . . . . . . . . . . . . . . . . . . . . . . . 538
A.6 CURM 50.01-4: Leaded Bronze. Not measured: 0.02 wt% Al, 0.01 wt% Si, 0.02
wt% Mn and 0.03 wt% Bi . . . . . . . . . . . . . . . . . . . . . . . . . . . . . . 538
A.7 CURM 50.04-4: Leaded Bronze. Not measured: 0.03 wt% P, 0.10 wt% Fe, 0.66
wt% Zn, 0.01 wt% Al, 0.01 wt% Si, 0.03 wt% Mn and 0.10 wt% Bi . . . . . . . . . 539
A.8 CURM 71.32.4: Leaded Gunmetal. Not measured: 0.02 wt% P, 0.08 wt% S, 0.26
wt% Sb, 0.12 wt% Al, 0.02 wt% Si, 0.05 wt% Mn, 0.05 wt% Bi, 0.05 wt% Cr and 0.03
wt% Ag . . . . . . . . . . . . . . . . . . . . . . . . . . . . . . . . . . . . . . . 539
A.9 NIST 1412: Multi-Component Glass. Not measured: 0.03 wt% FeO, 4.50 wt%
Li2O and 4.53 wt% B2O3 . . . . . . . . . . . . . . . . . . . . . . . . . . . . . . 541
A.10 Corning B: Soda-Lime-Silica Glass. *(Cl in wt%) Not measured: 0.04 wt%
V2O5, 0.05 wt% CoO, 0.10 wt% NiO, 0.19 wt% ZnO, 0.02 wt% SrO, 0.04 wt% SnO2,
0.46 wt% Sb2O5, 0.12 wt% BaO and 0.61 wt% PbO . . . . . . . . . . . . . . . . 541
A.11 Corning D: Potash Glass. *(Cl in wt%) Not measured: 0.10 wt% ZnO, 0.10 wt%
SnO2, 0.97 wt% Sb2O3, 0.51 wt% BaO, 0.48 wt% PbO, 0.02 wt% CoO, 0.06 wt%
NiO and 0.06 wt% SrO . . . . . . . . . . . . . . . . . . . . . . . . . . . . . . . 541

32 List of Tables Frederik Rademakers
Appendix F 585
F.1 Copper (alloy) samples with context and lead isotope ratios . . . . . . . . 586
F.2 XRF data for CEZ copper (alloy) samples . . . . . . . . . . . . . . . . . . . 587
F.3 NAA data for CEZ copper (alloy) samples . . . . . . . . . . . . . . . . . . . 588
F.4 XRF data for ISO copper (alloy) samples . . . . . . . . . . . . . . . . . . . . 589
F.5 Crucible samples with context and lead isotope ratios . . . . . . . . . . . 590
Appendix G 595
G.1 Crucible dimensions (after Pusch, 1994, Table 4, p. 152) . . . . . . . . . . 595
G.2 Crucible capacity (after Pusch, 1994, Table 5, p. 160) . . . . . . . . . . . . 596
Appendix I 605
I.1 Overview of samples and their respective excavation contexts . . . . . . . 606
Appendix K 619
K.1 Composition of glassy slag background (11 measurements) in Gordion
crucibles, compared to average ceramic composition (Appendix J) . . . . 626
Appendix M 647
M.1 Compositional analysis Gordion-25545 (in wt%) . . . . . . . . . . . . . . . 651
M.2 Compositional analysis Gordion-22611: ring (in wt%) . . . . . . . . . . . 653
M.3 Compositional analysis Gordion-22611: large fragment (in wt%) . . . . . 656
M.4 Compositional analysis Gordion-22611: medium fragment (in wt%) . . . 658
M.5 Compositional analysis Gordion-22611: small fragment (in wt%) . . . . . 659
M.6 Contextual data for analysed samples . . . . . . . . . . . . . . . . . . . . . 660
M.7 Results of PIXE analysis and microscopic investigation . . . . . . . . . . . 660

Acknowledgements
There are many people I would like to thank for making this PhD possible and turning it
into the fantastic experience it has been for me.
I’ll start with my supervisor, Thilo Rehren, who recognised my commitment and potential,
and took me on as a student despite my less traditional background. Your guidance and
mentorship has taught me not only about archaeological science, but scientific endeavour
in general, and I hope to have become a better scholar for it. Our collaboration has been a
privilege and a pleasure for me, and I hope it will continue beyond this PhD.
I’m very happy to have had Richard Bussmann appointed to me as my second supervisor.
Though the more technical perspective of my research may have differed from your field
of expertise, your interest in my project and broader reflections on its significance have
greatly improved my education, and I am very grateful for your critical engagement.
Next, I would like to thank the European FP7 Marie Curie Initial Training Network, NAR-
NIA, for providing me with the generous funding to undertake this research.
My work at the Institute would not have gone as smoothly as it has, had it not been for
the help and companionship of all the people there. In particular, I want to thank all the
“basement people” (past, present, and honorary): Siran Liu, P Venunan, Mainardo Gau-
denzi Asinelli, Kristina Franke, Anastasya Cholakova, Loïc Boscher, Maninder Singh Gill,
Matt Phelps, David Larreina Garcia, Rahil Alipour, Agnese Benzonelli, Vana Orfanou, Car-
men Ting, Silvia Amicone, Ruth Fillery-Travis, Carlotta Gardner, Miljana Radivojevic, Tere
Plaza Calogne, Fernanda Kalazich, Edwinus Lyaya, Marianne Hem Eriksen, Géraldine Del-
ley and Lou Iles-Bamforth. A special mention must be made here for my 2011 starting co-
hort in archaeometallurgy, who’ve accompanied me through this PhD almost every day:
Siran, P, and Mainardo. Thank you so much for all the coffee, beers, dinners, trips, good
times and enriching talks.
Next are my fellow 322b people, who’ve turned those long days at the office into a pleasant
memory: Tessa Dickinson, Anke Marsh, Alice Hunt, Enrico Crema, Valentina Bernardi, Adi
33

34 Acknowledgements Frederik Rademakers
Keinan-Schoonbaert, Alessio Palmisano, Eugenio Bortolini, Stuart Eve, Sophia Laparidou,
Ying Zhang, Jennifer Tung, Eva Jobbova, Mariana Nabais, Stacy Hackner, Liz Farebrother,
Joe Roe and Rob Kaleta. The graduate reps, for getting me out my shell and involved with
IoA life: Hania Sosnowka, Oli Lown, Matilda Duncker, Tina Paphitis and Carl Walsh, and
finally the MSc students I’ve met over the past years, particularly the ‘13-‘14 bunch: Car-
lotta Farci, Lina María, Daniela Reggio, Ben Turkel, Erika Smith and Umberto Veronesi.
I have learned so much from all of you and, more importantly, had so much fun over these
past few years. I’m fortunate to count you among my friends and look forward to being
your colleague in the future!
I further want to thank the support staff at the Institute, in particular Stuart Laidlaw in
the photography lab, Kevin Reeves in the SEM lab, Patrick Quinn and Harriet White in the
sample preparation lab, Peter Schauer for IT support, Sandra Bond for various facilities, as
well as Fiona McLean, Lisa Daniel and Thom Rynsaard on the ground floor. Your support
has made my work here very easy! Special thanks are due to Harriet for introducing me to
wall climbing this last year, which has had very beneficial effects on both my physical and
mental health while writing up this thesis.
Finally, I would like to thank the academic staff at the Institute, in particular Ian Freestone,
Marcos Martinón-Torres, John Merkel, Daniela Rosenow and Mike Charlton, and Myrto
Georgakopoulou at UCL-Qatar, for their valuable support and insightful discussions.
The Garden Kiosk on Gordon Square and its staff are kindly acknowledged for providing
daily caffeine and a good reason to walk in the park.
I must thank the London Surf Club and its members for contributing to my spiritual and
physical balance over the years, through regular cold water therapy. It has been wonderful
meeting so many different people from across the globe and sharing the British waves.
Next, I want to thank the “Narnians”: Noemi Müller, Christina Makarona, Roberta Mente-
sana, Will Gilstrap, Artemi Chaviara, Andrea Ceglia, Andreas Charalambous, Lente Van
Brempt, Demetrios Ioannides, Olivier Bonnerot, Lydia Avlonitou, Francesca Licenziati,
Marta Tenconi, Elisavet Charalambous, Ioannis Christodoulakis, Evangelos Tsakalos, Ellery
Frahm, and Sia and Mainardo. Being part of such a great project as NARNIA has been fan-
tastic, and the various workshops throughout Europe have greatly enhanced my PhD ex-
perience. The true value of this project, however, lies in the people I met along the way. I’m
very glad to know all of you, and to have learned so much from the different projects you
are involved in. The many fun evenings across the world, at workshops and conferences,
have been a privilege. I’m particularly grateful to Will and Artemi for helping me find my
feet in Athens, when I was still so new to this strange world of archaeological scientists.

Frederik Rademakers Acknowledgements 35
I further want to thank all the senior academic staff on the NARNIA project, who have
taken their time to teach me about their various expertises at workshops and conferences,
and for the pleasant times we shared: Lina Kassianidou, Peter Day, Vassilis Kilikoglou,
Eleni Aloupi, Anno Hein, Roger Doonan, Karin Nys, Marcos, and all the others involved. A
special thanks is reserved for Maria Dikomitou, who kept the project (and all those Narni-
ans) on the rails and provided kind help at all times.
And finally, I’d like to thank Patrick Degryse for making me aware of NARNIA and encour-
aging me to apply, which has been crucial to beginning this adventure.
Several people have helped me with the acquisition and study of the three assemblages
presented in this thesis, in each case facilitated by Thilo’s support.
For the Pi-Ramesse crucibles, I am immensely indebted to Edgar Pusch, who excavated
these crucibles all those years ago (and to Thilo, for not finding the time to analyse them
before I arrived). Both in correspondence and during my time in Qantir and Doha in 2013,
Edgar has provided me with more council and help than I could have wished for. Your
hospitality, patience and gentility have turned the study of a daunting crucible mountain
into a truly enjoyable experience. Thanks also to the spring 2013 excavation team for your
help and good company, and to Ernst Pernicka for his feedback on my interpretation of
the lead isotope data for the Pi-Ramesse metals.
The Gordion crucibles were kindly offered by Mary Voigt, who introduced me to the site
and its archaeology. Your friendly welcome in Philadelphia, and the hospitality shown by
you and Naomi Miller, have made this research trip yet another pleasant episode within
this PhD. I would further like to thank Alison Fields for her help in gathering all the evi-
dence related to the foundry at Gordion.
For the final assemblage, I have had great support from the excavator (and fellow Narnian)
Sia Cholakova. Your knowledge and friendly help have not only made the examination of
these little fragments more intelligible, but a pleasure to undertake.
Next, I want to thank my friends in Belgium. For not forgetting me while I’ve been on this
island. For being there whenever I made it across. In particular, I’d like to thank Laurens
Cerulus (for his help and the fun times during that first year in London), Sam Klein, Joris
Wauters, Elise Goossens, Dieter Vander Velpen, Vincent Boeckx, Koen Hoornaert, Marijs
Vrancken, Wouter Carmeliet, Patricia Goijens, Tim Mellaerts, Eline Jalon, Eline Van Eldere,
Andries Brys, Chloé Vander Velpen, Hans Rymenams, Tinneke Vanwinkel, Annerose Alle-
mon, Ide Smets, Ilse Peeters and Eline Mordijck.
Finally, I would like to thank my family. There are not that many of us, but your support
has surely been the greatest.

36 Acknowledgements Frederik Rademakers
My parents, Mama and Papa, have prepared me for independent life for as long as I can
remember. Our many travels together and your guidance on the way towards responsibil-
ity and self-reliance have given me not only the ability, but indeed the eagerness to leave
the comforts of the familiar and explore the world beyond. Your encouragement, love and
support has brought me where I am today, and I am very happy to be here.
My sister, Emilie, has equally played a very important role. I may not have been around
that much lately, but I feel we have grown much closer nonetheless. Our talks and times
together have strengthened me over these past few years. I’m very fortunate to be your
sibling and to count you among my dearest friends.
My grandparents: Bomma, Bompa, Oma and Opa. You have all been among my most
important inspirations. It is such a great privilege to know you as parents, teachers and,
most of all, good friends. Your open-mindedness and inquisitive spirits have made it so
incredibly easy for me to sail off into the world. Losing three of you during the final year
of my PhD has been difficult, particularly as I could not be with you as much as I would
have liked. However, your unconditional support and love over all these years has allowed
me to surpass the pain of your loss, and appreciate the role you have played in making me
who I am today. This thesis is therefore dedicated to the four of you.
Finally, I want to thank Poety, Ef, Sarah, Tobia and Giuseppe. I love each one of you and
am grateful for all the support you have given me these past years, each in your own way.
For several years now, my small family has grown a little and I therefore want to include
Ann, Luc, Mirose, Dies and Sara and thank them for their support and friendship through-
out this PhD and beyond.
This brings me to the final acknowledgement. Of course I haven’t forgotten you. I just
saved you for last. Like my favourite sweet from a richly filled box I can call my life. Thank
you for understanding me. For knowing what I want, when I’m not really sure. For men-
tally evaporating this bit of water between us, and coming across with me. For generously
taking care of me, my roots and my dreams.
You are my source of energy, inspiration and happiness.

Frederik Rademakers Acknowledgements 37
Voor Bomma, Bompa, Oma en Opa
Watterson, 1992

38 Frederik Rademakers

Part I
Introduction
He bowed at the dark, straightened, tossed his hat over his shoulder, and, car-
rying the muleta in his left hand and the sword in his right, walked out toward
the bull.
Hemingway, 1927
39

40 Frederik Rademakers

CHAPTER 1
Background, aims and layout of the thesis
Metals have played an important role for humans ever since their discovery, evolving from
decorative personal objects and precious gifts to indispensable tools, shaping the world
as we know it today. Their changing use across cultures and time therefore reflects human
activity, innovation, creativity and value, from a societal to an individual level, making it
an essential aspect of archaeological inquiry.
Archaeometallurgy focuses on the complete range of activities associated with the pro-
duction, working and consumption of ancient metals. It has grown from the purely tech-
nical description of metals and production waste to the study of technological transfer
and innovation, pre-modern economies, aspects of materiality, as well as the social con-
textualisation of technology (Killick and Fenn, 2012; Rehren and Pernicka, 2008). This has
attracted scholars with highly variable backgrounds, ranging from archaeology, anthro-
pology and history to geology, physics, chemistry and engineering, inevitably leading to
different emphases being placed on the central aim within the discipline: understanding
how and why people in the past made, viewed and consumed metals the way they did.
Ideally, an integrated, holistic approach to archaeometallurgy should emerge, acknowl-
edging the various aspects related to it. However, like so many other sub-disciplines of
archaeology that have appeared over the last few decades (e.g., palaeobotany, archaeo-
zoology, geoarchaeology), this one is still very much evolving. Both its theoretical and
analytical approaches will continue to change in light of new discoveries through archae-
ological case studies, as well as experimental work and the integration of new theoretical
concepts. Though steady development is an essential characteristic of any science, a for-
malised archaeometallurgical methodology still appears to be a while away.
41

42 Part I: Introduction. Chapter 1 Frederik Rademakers
This PhD thesis deals with crucibles employed for ancient metallurgical activities. Cru-
cibles hold a high informative potential with regards to ancient human activity. They rep-
resent an integrative technology, drawing on both ceramic and metallurgical traditions.
Furthermore, they bridge the gap between primary metal production and metal process-
ing, and may inform and draw connections between these existing fields of research. They
can provide way-points for metal trade routes, thus refining our understanding of a metal’s
journey from mine to deposited object, and the changes it undergoes along the way. Re-
constructing crucible metallurgy within various workshop contexts further holds the po-
tential to examine issues of technological (ex)change across different socio-cultural set-
tings, regions and time, and offers a proxy for metal processing and consumption that
have become archaeologically invisible.
This thesis contributes to the development of archaeometallurgy on two levels. Firstly,
three case studies of metallurgical crucible activity from different east Mediterranean re-
gions are presented, for which the study of metallurgical technology is currently limited.
In doing so, a fundamental reference is established for future investigations of metallurgy
in these particular areas and periods, and equally for studies of crucible technology in gen-
eral. In their own right, these case studies provide technical reconstructions of a specific
metallurgical activity, and a socio-cultural contextualisation of technology to the highest
achievable degree for each particular historical region.
Secondly, an essential contribution to the methodology of crucible research is made. This
encompasses primarily the more analytical aspects, such as sampling, analysis and data
interpretation. However, more overarching issues related to the informative value of cru-
cible research regarding reconstructions of not only technology, but its contextualisation
on different scales (from a single crucible to an assemblage, workshop, site and eventually
regional scale) are discussed as well. Given the current lack of explicit guidelines for cru-
cible analysis and interpretation, this methodological perspective adds a timely contribu-
tion to a more formalised research methodology by providing some generalised practical
recommendations for crucible analysis.
Section 1.1
Three case studies
This thesis is centred around the study of three crucible assemblages. Initially, each of
these assemblages is studied in isolation. Through their analysis, a detailed reconstruc-
tion of metallurgical techniques and materials is offered. From this essentially technical

Frederik Rademakers Part I: Introduction. Chapter 1 43
Figure 1.1: Map showing the location of the sites from which the three assemblages,
studied in this thesis, were excavated: Qantir – Pi-Ramesse, Gordion and Roman Thrace
(Google Earth 7.1.2, 2013)
foundation, the metallurgical activity reflected in the crucible remains is then considered
in more detail within its particular archaeological context. This encompasses the interpre-
tation of this metallurgical activity within a chaîne opératoire approach, both on the scale
of an individual’s use of a crucible, and the overarching scale of the broader organisation
of metal production (see Chapter 2).
The three case studies cover assemblages from several sites in the eastern Mediterranean
region, shown in Figure 1.1. The first case study is Qantir – Pi-Ramesse, the New Kingdom
Egyptian capital, with metallurgical remains from the 13th century BC royal workshops.
This thesis presents the first full analytical study of metallurgical crucibles from ancient
Egypt. The second case study is Late Phrygian (c. 540-330 BC) Gordion (Turkey), where
crucibles from various dump contexts within the ancient citadel are examined. Again, no
comparable studies exist for this area and period. The third and final case study involves
crucibles from various rescue excavations in Thrace (modern Bulgaria), covering several
Roman sites from the 2nd - 5th century AD (mainly 2nd century). Though some com-
parable studies exist for the western Roman Empire, examples from the eastern Roman
provinces are few.
For each case study, the crucibles relate mainly to copper-based, secondary metallurgi-
cal activity (e.g., refining, recycling, alloying and casting). Their analysis therefore pro-
vides a basis for a framework of metallurgical studies for each of their particular historical-

44 Part I: Introduction. Chapter 1 Frederik Rademakers
cultural settings, but equally contributes to secondary copper metallurgy studies in gen-
eral. Surprisingly little research on secondary metallurgical activity currently exists, and
the production of bronze, for example, is still poorly understood despite its apparently
simple nature (Pigott et al., 2003; Rovira, 2007).
All crucibles receive the same basic treatment, consisting of macroscopic description of
the fragments and microscopic examination through the use of mounted samples for op-
tical microscopy and scanning electron microscopy, as described in Chapter 3. The main
case study, however, is Pi-Ramesse, where the most abundant and best-preserved mate-
rial is available. While visiting Qantir (Egypt), the author has analysed the entire crucible
assemblage by handheld XRF, which has not been possible for the Gordion and Roman
assemblages as only a limited selection of those crucibles was available for study in Lon-
don. In addition to this, lead isotope analysis has been conducted for the Pi-Ramesse
crucibles and metal remains. Due to the high cost of lead isotope studies, this could only
be performed for one assemblage. Furthermore, the expected utility of lead isotope anal-
ysis was highest for this assemblage: the existing framework for lead isotope studies in
archaeology is strongly focused on the Late Bronze Age, and the analysis of bronze (at Pi-
Ramesse), rather than leaded bronze (at Gordion) or various metals (Thrace), is expected
to reveal patterns that may be interpreted less ambiguously. Therefore, the Pi-Ramesse
chapter can be considered as a case study for which all the stops are pulled out, while
Gordion and Roman Thrace represent a more common scale of analysis.
Going beyond their individual contributions to archaeology as case studies, the study of
these assemblages is instrumental for exploring methodological issues for crucible re-
search. This is achieved by assessing the effects of sampling on both the crucible and
assemblage scale, as well as by evaluating the way by which crucible samples can then
be analysed and interpreted. The archaeological contexts, as well as the crucible remains
themselves, vary significantly among these three case studies, which further motivated
their selection for this research. For Pi-Ramesse, there is an excellent conservation of the
abundant remains, coming from a well-preserved workshop context, with high temporal
resolution. The Gordion assemblage consists of fairly abundant, well-preserved material,
but derives mainly from dump contexts, with less constrained dating and only inferred
connections to production installations. Finally, the Roman material is far more limited,
from various rescue excavation contexts, and covers a broad time period. Here sampling
constraints allowed only small or tiny crucible fragments to be obtained. The compari-
son of these case studies therefore provides the opportunity to evaluate the influence of
different crucible types and archaeological contexts on methodology.

Frederik Rademakers Part I: Introduction. Chapter 1 45
Section 1.2
Archaeometallurgical methodology
There has been a slow but steady growth of interest in the study of ancient metallurgy over
the past decades. Publications on various metallurgical waste products span the whole of
Europe (e.g., from Scandinavia (Ling et al., 2013) and England (Rohl and Needham, 1998)
through France (König and Serneels, 2013), Germany (Brauns et al., 2013) and the Alps
(Doonan, 1999a) to Italy (Jung et al., 2011), and from Portugal (Valério et al., 2010) and
Spain (Rovira, 2007) to Bulgaria (Gale et al., 2003), Greece (Hein and Kilikoglou, 2011; Man-
gou and Ioannou, 2000) and beyond), the Near East (e.g., Allan, 1979; Davey and Edwards,
2007; Eliyahu-Behar et al., 2012; Klein and Hauptmann, 1999; Levy et al., 2012; Knapp,
2011; Nezafati et al., 2011; Rothenberg, 1990 and Thornton and Rehren, 2009), Latin Amer-
ica (e.g., Guerra, 2004; Martinón-Torres et al., 2007; Scott and Seeley, 1983 and Zori et al.,
2013), North America (e.g., Cooper et al., 2008 and Wayman et al., 1985), Asia (e.g., Li et al.,
2011; Murillo-Barroso et al., 2010 and Pigott, 2011, 2012) and Africa (e.g., Chirikure et al.,
2010 and Iles and Martinón-Torres, 2009).
The field of archaeometallurgy, however, is still very much under development. This is
evident from the range of approaches exemplified within the literature mentioned above.
As recently noted by Rehren (2014), a few more decades of research are probably required
before a formalised approach, in the shape of a textbook, can be generated. Though a
few very important introductory publications already exist (e.g., Bachmann, 1982b; Bay-
ley et al., 2001, 2008 and Craddock, 1995), their lack of explicit guidelines for sampling,
analysis and interpretation make them insufficient as practical tools for the archaeomet-
allurgist. More case studies are needed, not only to develop a diachronic overview of met-
allurgical technology for various regions in the world, but equally to discover and agree
on the best analytical procedures by which to study metallurgical production waste. Cur-
rently, most researchers already apply the same range of analytical techniques to inves-
tigate metal artefacts and their production waste. However, the methodological design
by which these analytical techniques are employed usually does not follow any standard
approach. It is mostly dictated by sample characteristics (availability, amounts, size etc.),
regional and personal preference for particular analytical techniques, financial budgets
and, of course, the research questions at hand. Unfortunately, the methodology section in
publications is all too often limited to listing the applied techniques (methods), without
actually stating the way in which they are used (methodology), or why they were selected.
Most analysts have the same goals: to describe and characterise the structure, (micro-)

46 Part I: Introduction. Chapter 1 Frederik Rademakers
texture and chemical composition of metallurgical production waste, with the aim of re-
constructing starting products, process parameters (e.g., temperature, redox-conditions)
and the final (metal) product. There are, however, several ways to do this. While it is
beyond the scope of this thesis to run through all branches of archaeometallurgy, the dif-
ferent ways by which crucibles can be analysed, and the effect this has on their interpre-
tation, is discussed in depth. In doing so, this thesis advocates greater transparency in the
research methodology for crucible studies, not only to enhance justification and compara-
bility of published data, but to open the way for collective methodological improvements.
In comparison to other aspects of archaeometallurgy, crucible research is particularly in
need of such a discussion. The study of iron smelting waste, for example, already has more
developed analytical methodologies (e.g., Fluzin et al., 2000) and entire conferences and
books dedicated to it (Cech and Rehren, 2014; Humphris and Rehren, 2013). Similarly, the
primary smelting of copper has received far more attention (e.g., Anguilano et al., 2009; Ar-
tioli et al., 2009; Bachmann, 1980, 1982a; Bamberger, 1985; Bassiakos and Catapotis, 2006;
Bourgarit, 2007; Burger et al., 2010; Chiarantini et al., 2009; Doonan, 1994; Doonan et al.,
1996; Erb-Satullo et al., 2014; Georgakopoulou et al., 2011; Hauptmann, 2007; Hauptmann
et al., 1988, 2003; Kassianidou, 2013; Knapp et al., 2001; Krismer et al., 2013; Levy et al.,
2002; Maldonado and Rehren, 2009; Manasse et al., 2001; Nocete et al., 2008; Pryce et al.,
2007, 2011, 2010; Rostoker et al., 1989; Rovira, 2002; Ryndina et al., 1999; Schreiner et al.,
2003; Severin et al., 2011; Zwicker and Goudarzloo, 1979 and Zwicker et al., 1977, 1980,
1981), and benefits from the comparability to modern extractive metallurgy, for which
many textbooks exist (e.g., Beeley, 2001; Davenport et al., 2002 and Rosenqvist, 1974).
The study of finished objects similarly benefits from modern metallography, and has been
summarised for archaeological metals by Scott (1991, 2012, 2013). Though some more in-
terest for crucibles existed in the earlier days of archaeometallurgy (e.g., Coghlan, 1975;
Tylecote, 1982a; Zwicker, 1982 and Zwicker et al., 1985), this has waned over the previ-
ous decades. It has, however, picked up again over the past few years (e.g., Angelini et al.,
2009; Davey and Edwards, 2007; Eniosova and Rehren, 2012; Evely et al., 2012; König and
Serneels, 2013; Lehner et al., 2009; Martinón-Torres et al., 2008; Masioli et al., 2006; Rehren
and Papachristou, 2003; Sahlén, 2013 and Thornton and Rehren, 2009), making this inves-
tigation all the more timely.
Important work for crucibles has already been undertaken in the past: Bayley and Rehren
(2007) and Rehren (2003) provide essential introductions to the classification of crucibles,
mainly from a typological perspective, but the practical framework for their analysis is be-
yond the scope of these and most other publications. Recent work by Martinón-Torres
and Rehren (2014) offers an excellent overview of the range of metallurgical processes for

Frederik Rademakers Part I: Introduction. Chapter 1 47
which crucibles are employed, and how some of these may be recognised macroscopically,
microscopically and chemically. However, this text may only serve as a rough guide to cru-
cible analysis, as a result of its broader focus on the study of technical ceramics in general.
More detailed issues concerning sampling and analytical methodology (listed in section
1.3), which provide detailed practical guidelines for crucible analysis, were left for future
discussion. Beyond some specific problems (e.g., Dungworth, 2000a), a general discus-
sion of methodological approaches to crucible metallurgy is currently missing from the
literature.
Through the comparison of the three case studies presented in this thesis, and drawing on
existing literature, the influence of different crucible types, sampling strategies, analytical
methods and archaeological contexts on the results of crucible research is evaluated. This
raises several questions, relevant to the praxis of crucible research, which are elaborated
in section 1.3.
Section 1.3
Research questions
The research aims of this thesis can be subdivided into two categories, related to the three
case studies as such, and archaeometallurgical methodology more generally. Some of the
terminology mentioned here is further explained in section 1.4.
For the three case studies, a range of questions are considered:
• How where the crucibles created? What materials were used, what was their design
and how where they prepared for use?
• What metallurgical process is reflected in the crucible remains? More specifically,
this involves establishing:
– The raw materials employed in the process
– The techniques used (e.g., simple metal melting, refining or alloying)
– The process parameters characterising the process (e.g., temperature and redox-
conditions)
• How do the crucibles relate to other metallurgical waste products, such as tuyères
and moulds, and can these be used to create a more detailed reconstruction of the
production sequence (chaîne opératoire) reflected in their archaeological context?

48 Part I: Introduction. Chapter 1 Frederik Rademakers
• Can the crucible technology be related to other (high-temperature) technologies at-
tested on the site?
• How is this metallurgical activity more widely situated in the organisation of metal
production for its particular socio-cultural setting?
Beyond this, more specific questions arise for each particular assemblage, which are for-
mulated and addressed within their respective case studies.
In terms of broader methodological issues, many more questions arise, as already men-
tioned in the previous section:
• What are the effects of taking a sample of a certain size and from a particular crucible
area in terms of its representativeness of that crucible?
• How can confidence be gained in having sufficiently large sample numbers to ad-
equately represent the metallurgical activity reflected in an entire crucible assem-
blage?
• What is the effect of crucible abundance, preservation, typology and refractoriness
on their potential for answering the questions formulated for the case studies above?
• Which techniques are most suitable in answering these questions, given limitations
imposed by not only the crucible remains, but time, financial budget, export regula-
tions and curatorial considerations as well?
• Under such limitations, how well can one expect to be able to answer those ques-
tions, and when does the cost of doing so outweigh the expected knowledge ac-
quired?
• When confronted with a very limited, fragmented assemblage such as the Roman
one (which is arguably the most common occurrence in archaeological projects),
what may be expected from its study?
• Can some general recommendations for sampling, analysis and interpretation be
defined?
• How do these methodological considerations influence the broader expectations
that can be laid out for crucible studies? What is the expected informative value
of crucible analysis with regards to ancient human behaviour?
A comparative approach is adopted to address these questions, drawing on the rich dataset
presented within the three case studies and integrating the existing literature.
Frederik Rademakers Part I: Introduction. Chapter 1 49
Section 1.4
Thesis layout and terminology
Following this introductory chapter, the analytical methodology applied for the analysis of
crucibles throughout this research is detailed in Part II. Next, the three case studies are pre-
sented: Qantir – Pi-Ramesse (Part III), Gordion (Part IV), and Roman Thrace (Part V). Each
of these case studies is similarly structured: after an introduction to the sites and the rele-
vant historical and cultural background, the results of the crucible analysis are presented.
This entails macroscopic and microscopic descriptions, chemical characterisation (bulk
and micro-textural) of ceramic and slag, and the technical interpretation of these results.
This interpretation aims to provide a purely technical reconstruction of the crucible pro-
cesses, while broader contextualisation of these results is provided in the discussion at the
end of each case study. There is some variability in the dimensions of these three case
studies, reflecting the size of the assemblages and the range of analytical techniques ap-
plied to their study.
Finally, a broader discussion, transcending the individual case studies and focusing on
broader methodological issues, is held in Part VI. This is further subdivided into a chapter
on analytical methodology (Chapter 13) and a chapter on the contextualisation of crucible
metallurgy (Chapter 14).
Concluding remarks are presented in Part VII.
The full analytical results are presented in the appendices, organised by case study, where
a list of samples1, bulk compositional data for ceramic and slag, as well as metallic prill
compositions are compiled, along with other reference data.
Finally, a list of technical terminology used throughout this thesis is presented here. These
terms are further elucidated through the overview of metallurgical processes in section
2.2.
• Crucibles: Free standing, movable ceramic vessels that are used for high-temperature
metallurgical operations (Rehren, 2003). Crucibles may be used for both (primary)
smelting and secondary metallurgical operations. An example, modelled after the
Pi-Ramesse crucibles, is shown in Figure 1.2, with further associated terminology
discussed below.
• (Primary) smelting: The metallurgical extraction process whereby metal is produced
from an ore.1Samples are labelled by excavation number and the date of sampling for this PhD.

50 Part I: Introduction. Chapter 1 Frederik Rademakers
Figure 1.2: Crucible terminology overview
• Secondary metallurgy: High-temperature working of (raw) metal, such as refining,
recycling and alloying (molten state) or hammering and annealing (solid-state).
• Slag: Generic term for metallurgical waste, typically referring to a “once molten
silicate or silicate mixture, sometimes including oxides, phosphates, borates, sul-
phides, carbides, pure metals etc.” (Bachmann, 1982b: 1). In the context of non-
ferrous metallurgy, a distinction can be made between smelting slag, which is the
waste product of primary smelting operations and therefore typically (though not
exclusively) formed in furnaces (e.g., furnace slag, tap slag), and crucible slag, which
is formed inside crucibles (see below) and usually associated with secondary metal-
lurgy. Many process-specific slag types may be formed during particular metallurgi-
cal operations, which are not discussed in detail here (for an overview, see Craddock,
1995).
• Crucible slag: Slag that has developed at the interface of the crucible and its charge,
through the combination of vitrified ceramic and various contributions from the
crucible charge, such as fuel ash and metal oxides.
When exposed to increasing temperatures, the crucible ceramic typically fuses and
vitrifies to a certain extent. Depending on the heating mode, such vitrification may

Frederik Rademakers Part I: Introduction. Chapter 1 51
occur in different areas. For internally heated crucibles, the interior surface of the
crucible usually bloats and vitrifies to a certain depth into its ceramic body, away
from the interior surface. It is, however, closer to this interior surface that actual
crucible slag is formed, through the interaction between charge constituents and
the vitrified ceramic. Though the vitrified crucible ceramic forms a continuum with
the crucible slag, this slag is distinguished and defined by its various metallurgical
waste products. As indicated in Figure 1.2, when ‘deeper slag areas’ are mentioned
within this thesis, this refers to slag areas relatively further away from the crucible’s
interior surface. For externally heated crucibles, a thin vitrified layer may form on
the exterior crucible surface (glaze), which is not considered ‘slag’, as it is not formed
through interaction with the crucible charge.
• Dross: Crucible dross consists of various metal oxides that are not captured in the
crucible slag and float on top of the crucible charge during the metallurgical process
(see Figure 1.2). Such dross layers are sometimes referred to as crucible slag in the
literature (e.g., Craddock, 2013 and Tylecote, 1986). In this thesis, however, the term
crucible slag refers strictly to the slagged ceramic attached to the crucible interior, as
defined above. Dross is a more generic term for what is sometimes called ‘refining
slag’ in the literature (e.g., Craddock and Meeks, 1987; Karageorghis and Kassian-
idou, 1999; Merkel, 1990 and Pernicka, 1999).
When the metal content is cast from the crucible, such dross layers may be removed
manually beforehand, or left to settle within the crucible. It is thus sometimes de-
posited on top of the crucible slag, to which it may fuse and form a continuous layer.
As illustrated for each assemblage, however, these dross layers may be distinguished
from the crucible slag through microscopic and chemical analysis.
• Tuyère: A hollow pipe or tube through which air is blown into a furnace or crucible.
• Bellow: A device used to create a strong air blast, which is then directed through the
tuyère into the furnace or crucible.
• Mould: Hollow container into which metal is cast into a particular shape.
• Refractory: In general, this term refers to materials that remain mechanically and
chemically stable during high-temperature processes. In reference to archaeological
materials, ‘refractories’ are commonly ceramics. Given the wide variety of ceramic
types, as well as the different temperature and chemical requirements posed by var-
ious metallurgical processes, refractoriness should be considered a relative term in

52 Part I: Introduction. Chapter 1 Frederik Rademakers
archaeological context (Freestone, 1989; Freestone and Tite, 1986; Martinón-Torres
and Rehren, 2014; Tite et al., 1985).
• Bronze: Bronze in this thesis refers strictly to alloys of copper and tin. Different
grades of bronze may be distinguished, with low- to intermediate-tin (±0-12 wt%
Sn), intermediate- to high-tin (±12-20 wt% Sn) and high-tin (over ±20-25 wt% Sn)
bronze. Clearly, these present rough ranges, rather than distinct categories.
Leaded bronze refers to an alloy of copper, tin and lead, while leaded copper refers to
an alloy of copper and lead.

CHAPTER 2
Theoretical framework
Archaeometallurgy is, first and foremost, an archaeological discipline (Rehren, 2000). As
such, it shares the fundamental aim of archaeology, which is the study of human be-
haviour through the remains of material culture (Renfrew and Bahn, 2012: 12) in their par-
ticular context. This implies that certain fundamental theoretical concepts from archae-
ology apply to archaeometallurgical studies, though more specific concepts are equally
needed. While this thesis leans strongly towards the analytical side of archaeometallurgy,
focusing in particular on analytical methodology, theoretical considerations still play an
important role. Not only is any scientific, laboratory observation inherently biased by the-
oretical preconceptions and expectations to some degree (Brewer and Lambert, 2001), but
the archaeological interpretation of this generated data requires at least a minimal disclo-
sure of the author’s theoretical background. However, this is indeed kept to a minimum, as
theoretical concepts applied in this thesis are primarily instrumental. This thesis does not
intend to contribute significantly to interpretative theoretical frameworks, though some
ideas concerning workshop interpretation are discussed further in the overall discussion
(Part VI). This chapter therefore sets out the background against which research on ancient
technology is undertaken, with particular focus on metallurgy. A more general discussion
of archaeological theory (Johnson, 2010) and its fundamental concepts (Lyman, 2012) is
omitted as it is not a focal point of this thesis, and such broad discussions would therefore
be tedious and out of place here.
53

54 Part I: Introduction. Chapter 2 Frederik Rademakers
Section 2.1
Technology in archaeology
The study of technology has always been an integral part of archaeology, as most artefacts
retrieved from the archaeological record were produced by humans in some way or an-
other. Understanding how ancient people made things and manipulated the world around
them has therefore become a core archaeological inquiry.
Rather than focusing only on the technical aspects of a certain technology, archaeologists
are interested in the context within which technologies were developed and used. To do
so, contextual evidence is combined with the material evidence to elucidate its meaning.
A well known example is the variation in production contexts for pottery, proposed by
Peacock (1982), which is mainly based on aspects such as standardisation (Roux, 2003),
complexity and specialisation. Making use of parallels in contemporary pottery practice,
Peacock took an ethnographic approach to understanding archaeological remains. The
study of technology in archaeology in general has widely benefited from anthropological
work, which provides theoretical frameworks for the discipline. It is beyond the scope
of this thesis to discuss this in great detail, but some fundamental concepts used in this
research are briefly presented here, while more specific ideas related to metallurgy are dis-
cussed in section 2.2.
Some basic concepts are defined here to avoid ambiguity of their use within this thesis,
largely following terminology proposed by Miller (2007). ‘Production’ refers to the pro-
cesses, including both materials and techniques, involved in fabrication or creation of a
certain material object, and the ‘organisation of production’ is the way in which these pro-
duction processes are organised socially. ‘Technology’ is a broader term, encompassing
both production and consumption, including the interaction between people and objects
over this whole range of processes.
The reconstruction of production is the starting point for each case study presented in this
thesis, and is covered in the technical interpretation of the analytical results. This aspect
of technology is the most commonly investigated in archaeological research, and often
relies on comparisons to modern production techniques. Here, researchers look at firing
temperatures for ceramics, blowing techniques for glass, alloy compositions of metals, etc.
While this is sometimes the end point, rather than just the starting point, of technological
investigations, this thesis aims to include wider discussions of technology that go beyond
mere descriptions of production processes.
As a first step, the organisation of production is considered. Four general parameters have

Frederik Rademakers Part I: Introduction. Chapter 2 55
been suggested by Costin (1991) to describe the organisation of production. The first one
is ‘context’, which represents the nature of control over production and distribution. A
distinction can be made here between an attached production context, where produc-
tion and consumption are largely elite-controlled, and independent production context,
where independent specialists produce for a more general market. As ‘context’ refers more
generally to archaeological context, the term ‘production context’ is used here. Within this
thesis, Pi-Ramesse may be classified as an elite-controlled production context, while in-
sufficient information is available to allocate confidently the other assemblages to a par-
ticular production context. Probably, they can be interpreted as more independent.
A second parameter is ‘concentration’, which reflects the relative regional concentration of
production facilities. This parameter is particularly important when considering transport
and trade issues, but cannot readily be assessed for these case studies: each represents the
first regional example of (crucible) metallurgy.
‘Scale’ is the third parameter, which comprises both the size and make-up of production
units. A simple correlation of, for example, workshop size to elite control is not neces-
sarily valid, and can only be appreciated in light of other parameters, such as the ease by
which a certain technical process can be conducted at various scales. Scale, then, does
not equate size, but is rather concerned with the coordinated use of a production area of
a certain size. The issue of production scale is considered in the final discussion of this
thesis (Chapter 14).
Finally, ‘intensity’ represents the degree to which producers are active on a part- to full-
time basis. Costin (1991) argues, for example, that there is a greater tendency for attached
specialists to work full-time in non-industrial economies for a variety of reasons, such as
the elite control over highly desirable special goods. For the case studies considered here,
it is difficult to substantiate any debate on the nature of production intensity on the basis
of available evidence, though some remarks on the issue are made.
Overall, it is hard to assess the parameters listed here, and throughout this thesis only ten-
tative suggestions can be made. While it is through the recognition of variation in these
parameters within different environmental, social, cultural, economic and political con-
texts that the organisation of production may be understood, the isolated nature of the
evidence presented here makes such discussions problematic. Furthermore, an under-
standing of the consumption-side of the market is essential to explain production. As
mentioned in section 1.1, and detailed further for each case study, little comparative data
is available to push the interpretation of production to the level of its organisation. Though
some more evidence is available for New Kingdom Egypt (see section 4.5), almost nothing
is known for Achaemenid Phrygia. Roman Thrace, in contrast, may draw on comparisons

56 Part I: Introduction. Chapter 2 Frederik Rademakers
to the broader Roman world, but the material and contextual limitations of this assem-
blage hinder such efforts. Therefore, discussions of the organisation of production in this
thesis are mostly provisional, and aimed at illuminating where future studies may further
our understanding of these issues.
The study of technology as a whole goes further than what has been discussed so far. Tech-
nology more broadly encompasses all human activity behind production and its organi-
sation. This idea is perhaps best understood here through the concept of ‘technological
choice’ (Lemonnier, 1993). It refers to the selection of particular techniques and materials
to achieve a certain goal, from the wider range of choices available to a person. Such
choices are not considered in light of simply technical terms, as it is abundantly clear
that influences from social, cultural, economic and ideological spheres can shape these
choices, despite being ‘non-technical’. Through the consideration of the many possible
choices that were (consciously or unconsciously) forsaken in favour of the choice wit-
nessed in archaeological remains, a wider view of technology, as embedded in a socio-
cultural context, becomes apparent.
The question of technological choice may be asked for each step of the production pro-
cess, where the final objects represents a series of choices of techniques and materials,
resulting in a particular outcome (Sillar and Tite, 2000). Such a sequence of steps was
first described by Leroi-Gourhan (1964, 1965) in the context of Paleolithic stone technol-
ogy (see further Audouze, 2002), who introduced the term chaîne opératoire. This is not
limited to the listing of different production steps, but rather incorporates environmental
factors, as well as economic, social and political organisation and the belief systems as
fundamental factors influencing each of these steps.
The five most important areas for technological choice were defined by Sillar and Tite
(2000) as the raw materials, tools, energy sources, techniques and the sequence (chaîne
opératoire) in which they are applied. Sillar and Tite emphasise the need for researchers
to consider the full scope of alternative techniques from which technological choices can
be made, evaluating the influences from functional, environmental and cultural factors
and the consequences, both immediate and longer-term, of these choices. The extent to
which particular factors, such as environmental or cultural influences affect technological
choice differ for each case study, but ‘universals’ such as chemical properties of materials
and particular social contexts in which these materials were manipulated should be con-
sidered as embedded in technological choice.
Throughout this thesis, these opportunities for technological choice are considered, and
an attempt is made to understand the broader factors underlying each production step,
embedded within a wider technical and social practice. While material science offers the
Frederik Rademakers Part I: Introduction. Chapter 2 57
baseline against which these choices are evaluated, socio-cultural factors are kept in mind
throughout the analysis of the remains as these do not simply begin where purely techni-
cal, physical reasoning ends, but are deeply entwined (see Dobres, 2010, Doonan, 1999a
and Lemonnier and Pfaffenberger, 1989). However, broader discussions of social and rit-
ual meaning of technological activity (Pfaffenberger, 1988) as part of a ‘sociotechnical sys-
tem concept’ (Pfaffenberger, 1992) are beyond what is intended here. Where needed, such
issues are mentioned in the text, but they are not central to this research. Similarly, ques-
tions of materiality (e.g., Jones, 2004 and Martinón-Torres and Rehren, 2009) and techno-
logical style (e.g., Childs, 1991) are beyond the scope of this project.
This thesis is primarily concerned with the more technical interpretation of crucibles.
While the entwined nature of technology in a much broader socio-cultural context must
be kept in mind during such interpretations, the results presented throughout this thesis
aim to show that current understanding of ‘baseline material science’ is often insufficient
to address such questions for now. The study of ancient crucible metallurgy is still very
much in its infancy, and requires thorough discussion of its analytical methodologies and
many more case studies, before it becomes possible to make sense of these broader issues.
Nonetheless, they should be kept in mind in the course of this ground-laying work, which
is why some space has been allocated to the issue in this introduction. The contextual
interpretation of crucible metallurgy within this thesis, then, aims to explore technologi-
cal choices to the extent that the crucible and contextual evidence allow, without opening
broader discussions for which the comparative evidence is currently lacking.
Section 2.2
Crucible metallurgy in a metallurgical chaîne opératoire
An overview of metallurgical production processes is given by Miller (2007) and shown in
Figure 2.1 (a similar diagram is presented by Hauptmann (2014), Fig. 5.1, p. 92).
The main steps in the production of copper objects are:
1. Mining/collecting copper ores
2. Ore sorting, beneficiation and roasting, furnace and crucible manufacture, and other
preliminary processes
3. Smelting: primary production of copper from its ore

58 Part I: Introduction. Chapter 2 Frederik Rademakers
Figure 2.1: Stages in the production process of metals (from Miller, 2007, Figure 4.11, p.
146)

Frederik Rademakers Part I: Introduction. Chapter 2 59
Figure 2.2: Metallurgical chaîne opératoire or ‘Cycle of copper production and working’
(from Ottaway, 2001, Figure 1, p. 88)
4. Secondary metallurgy: further high-temperature processes such as refining, recy-
cling and alloying (molten state) or hammering and annealing (solid-state)
5. Creation of final objects by casting or other shaping methods
Figure 2.2 schematically shows the chaîne opératoire of copper production, as proposed
by Ottaway (2001). The focus of a chaîne opératoire approach is wider and does not stop
at artefact fabrication, but encompasses its use and ultimate destruction, which yields a
‘life cycle’. It further incorporates social structure and historical context along each step,
though Figure 2.2 only emphasises this for the finished artefacts. Much more detail could
be added to the different steps shown here, but producing a state-of-the-art overview for
each different step is beyond the scope of this research.
The value of the chaîne opératoire concept lies in its ability to integrate a wide variety of
activities related to a particular technology, witnessed in archaeological contexts. It is a
bottom-up approach, allowing archaeologists to refine or expand the chaîne opératoire
as new data appears. As such, it is not so much an explanatory tool for understanding
scientific results (like those produced in this thesis), but rather a framework that can be
corroborated and improved by archaeologists studying ancient technology. In this way,
others may familiarise themselves with the wide scope of technological choices ancient

60 Part I: Introduction. Chapter 2 Frederik Rademakers
people made and look at their particular case studies from a broader perspective.
In this thesis, the main focus lies on the secondary production processes, located in the
bottom-right corner of Figure 2.2. Though crucibles are sometimes associated with pri-
mary smelting processes, they are most commonly (and in all the assemblages presented
here) used for secondary metallurgy. They represent a transitional stage between raw
metal and finished objects, and may be informative of both. For example, particular con-
taminants that are left behind in the crucible slag relate it to the melting of a particular
raw copper that may no longer be present on site. Similarly, the prills embedded in it can
infer the alloy composition of the finished object that is usually not found in archaeologi-
cal association to the crucibles.
The crucibles themselves are ceramic vessels, which solicits comparisons to general ce-
ramic technology. This may help in discovering overlaps between different technologies
in technical, organisational and socio-cultural aspects. Such cross-craft comparisons are
made, for example, in Pi-Ramesse to other contemporary high-temperature technologies
like glass production.
The context in which these activities take place further informs the organisation of pro-
duction. For example, the primary production of metal is commonly undertaken close
to the mining areas, whereas secondary production is often encountered in urban envi-
ronments, closer to the consumers. However, very few assemblages have hitherto been
studied in detail, making such distinctions tentative at best, and in need of further testing.
The existing bias for excavation of particular archaeological contexts, such as funerary
and palatial environments in favour of rural settlements, further hinders such broad in-
terpretations. While assemblages should be evaluated within their particular context, it is
therefore important to keep in mind that a comparative approach is needed to evaluate
the influence of contextual factors on a particular technology. As emphasised throughout
this thesis, the absence of comparative data for all of the discussed assemblages imposes
strong limitations on their contextualisation. Their presentation and discussion is there-
fore aimed at giving an overview of the existing knowledge of technology, and offer sug-
gestions for future research in support of establishing a more complete chaîne opératoire.

Part II
Analytical Methodology
Get your facts first, and then you can distort them as much as you please.
Mark Twain in Kipling, 1899
61

62 Frederik Rademakers

CHAPTER 3
Methodology for the analysis of crucible remains
This chapter presents an overview of the methodology applied for analysing each assem-
blage. Sample selection and documentation is a first aspect of this methodology, but is
covered for each case study separately. The next important step is macroscopic investiga-
tion, briefly discussed in section 3.1, followed by optical microscopy, detailed in section
3.2. The use of scanning electron microscopy (with energy dispersive spectrometry) is de-
scribed in section 3.3, while lead isotope analysis is treated in section 3.4. Finally, section
3.5 discusses the application of handheld X-ray fluorescence spectrometry.
Section 3.1
Macroscopic investigation
Macroscopic investigation entails the analysis of an object’s properties by eye. The recog-
nition of an object as related to metallurgical activity often takes place already in the field,
based on a number of observations related to its physical appearance. Bachmann (1982b)
provides a reference for recognising metallurgical production waste and distinguishing it
from other material such as rocks, ceramics and vitrified matter. This initial interpretation
of the material allows it to be grouped in different categories for further study. Bachmann
states that this initial stage of macroscopic sample description does not only serve as a
prelude to further microscopic analysis, but may often render elaborate laboratory work
unnecessary. Though this may sometimes be true, this research shows that elaborate lab-
oratory work can often provide further details which allow a deeper understanding of cru-
63

64 Part II: Analytical Methodology. Chapter 3 Frederik Rademakers
cible technology. Nonetheless, crucible typology is often strongly reflective of its function,
and macroscopically visible aspects of the crucible ceramic and slag can reveal much of
the process.
For archaeometallurgists working on material excavated by others in the past, the ideal
scenario is to receive an assemblage that has already been separated from non-metallurgical
debris, without essential material having been left out. For each assemblage presented in
this thesis, provisional identification of the metallurgical material by the excavators has
yielded well-defined groups of crucible remains. An assessment of the representativeness
of these crucibles for the ancient metallurgical activity they reflect, is made in the final
discussion (Part VI). The macroscopic appearance differs significantly between these as-
semblages and is discussed separately for each case study.
Section 3.2
Reflected light microscopy
For the analysis of archaeological ceramics, thin section petrography is the technique of
preference (e.g., Peterson, 2009 and Quinn, 2009), using transmitted light microscopy and
drawing on the principles of mineralogy (e.g., MacKenzie and Guilford, 1980). Fabric de-
scriptions are then commonly used to establish ceramic production technology and to
provenance different wares (e.g., Arnold et al., 1993; Day et al., 1999; Hein et al., 2008; Ki-
likoglou et al., 1995; Müller et al., 2010 and Tite et al., 2001). This has been applied to the
study of metallurgical ceramics to better understand the selection of raw materials used
in their production (e.g., Hein et al., 2007 and Katona et al., 2007) and to evaluate their
thermal and mechanical properties.
The study of metals using a reflected light microscope is a well established technique,
commonly known as metallography, often applied to ancient metals (e.g., Chen et al.,
2009; Scott, 1991 and Yahalom-Mack et al., 2014). In geology, reflected light microscopy
is used for the study of opaque materials, such as ores (e.g., Ineson, 1989).
Metallurgical slag is often similar to ores in its composition and opacity, which makes mi-
croscopic study in mounted section (using reflected light) rather than thin section (using
transmitted light) more sensible. However, the minerals and structures recognised in ore
microscopy are not directly comparable to archaeometallurgical materials, which are not
formed by natural processes. This means that the formation history is often very different
and phases can be formed which naturally occur in different configurations or not at all.

Frederik Rademakers Part II: Analytical Methodology. Chapter 3 65
Keeping this in mind, the microscopic study of metallurgical remains such as slag and
technical ceramics can be very informative in understanding their formation history. Recog-
nising different phases and structural features helps in achieving this understanding. The
best (and only) systematic example of how to study these materials using reflected light
microscopy is given by Bachmann (1982b). No real systematic methodology has been
developed for studying (crucible) slag (see section 1.2); most publications are case stud-
ies in which a variety of approaches are used (e.g., Bassiakos and Catapotis, 2006; Geor-
gakopoulou et al., 2011; Stos and Gale, 2006; Thompson, 2006; Thornton and Rehren, 2009
and Zwicker et al., 1981). This partially reflects the fact that methodological choices are
strongly driven by specific research questions: it is often not very useful to recognise and
quantify every single phase present in a sample. Rather, specific process markers and spe-
cial features should be looked for, depending on the hypothesis one wants to test. This
hypothesis is often already formed during macroscopic investigation, but can obviously
change during further analysis. The overview by Martinón-Torres and Rehren (2014) of
important process markers commonly encountered during crucible analysis, which are
not reiterated here, is a good starting point for guiding crucible analysis. A more gener-
alised analytical methodology, however, offering practical guidelines for consistent anal-
ysis, is currently still lacking. Such practical guidelines would consist of, e.g., how to best
select a crucible sample, how many areas should be analysed, and which micro-phases
are diagnostic of particular process parameters. Though some of this knowledge is of-
ten implicitly assumed, this thesis aims to highlight the need for more discussion of these
practical matters and their effect on successful crucible analysis.
The study of metallurgical crucibles then is on the boundary between ceramic and slag
analysis. For this project, a metallurgy-oriented approach is followed where the crucible
contents rather than the ceramics themselves are the main object of interest. This means
that, though adequate attention is given to the ceramic technology, the crucible slag re-
ceives the main focus. Therefore, crucible sections are mounted in resin for reflected light
microscopic analysis of the opaque crucible slag (and ceramic) and subsequent chemical
analysis using SEM-EDS (see section 3.3). Though the use of polished thin sections would
allow both the use of transmitted light microscopy and chemical analysis using SEM-EDS
(e.g., König and Serneels, 2013; Rehren, 1999, 2009 and Tite et al., 1985), sample prepara-
tion for this approach is more time-consuming and does not present sufficient advantages
for this research. The study of mounted sections is a common approach in crucible met-
allurgy reconstruction (e.g., Martinón-Torres et al., 2008; Renzi et al., 2009 and Thornton
and Rehren, 2009).

66 Part II: Analytical Methodology. Chapter 3 Frederik Rademakers
Figure 3.1: Schematic representation of reflected light microscopy (from Klein and
Dutrow, 2007, Figure 13.27, p. 305)
3.2.1 The microscope
A Leica DM4500 P LED polarisation microscope, equipped with a Leica DFC 290 HD cam-
era, has been used for microscopic analysis and image acquisition, using Leica Application
Suite PC software.
Figure 3.1 shows the basic mechanism of a reflected light microscope: light (coming from
the right) is first polarised (‘polarizer’) and then reflected down by the beam splitter (‘glass
plate reflector’) onto the sample. The sample reflects this light, which then passes ver-
tically upwards through the beam splitter to the ocular and/or camera. The ‘analyzer’
(which is oriented at a 90° angle from the ‘polarizer’) can be placed in the path between
sample and ocular to polarise the light reflected from the sample. Viewing the sample with
or without the use of this second polariser is respectively called cross- and plane-polarised
reflected light microscopy.
This configuration allows analysts to make use of diagnostic optical properties of differ-
ent materials, such as colour, reflectivity and bireflectance1 (Klein and Dutrow, 2007). The
main optical property used to distinguish between minerals is colour, typically a shade of
grey or yellow. Isotropic crystal structures do not alter the state of polarisation of the light
1Bireflectance is a similar behaviour to pleochroism seen in transmitted-light microscopy of non-opaque
minerals.

Frederik Rademakers Part II: Analytical Methodology. Chapter 3 67
reflected from their surface2 and therefore appear dark when viewed using crossed po-
larised light. Many nonisometric (i.e., non-cubic) minerals, however, show bireflectance
and therefore change brightness or colour when rotated under plane-polarised light. Un-
der cross-polarised light, these minerals exhibit extinction. These optical properties can
be used to distinguish between different minerals present in the crucible samples.
3.2.2 Goals and objectives
The first objective of microscopic analysis is to get an overview of the crucible structure
and texture. Observation at a low magnification (25-50X) is usually sufficient to get a good
idea of the sample’s different parts, such as ceramic fabric, slag and corrosion or dross
layers, and structural relations between them.
After establishing this overview, a second objective is to study the different parts at a higher
magnification and to investigate their mineralogical make-up.
Finally, specific phases, prills and other features can be identified under high magnifica-
tion.
For each of these steps, both plane- and cross-polarised light is used and the sample stage
is moved around to utilise the various phases’ optical properties for identification.
Photomicrographs are taken using a digital camera. This documentation is a goal in itself,
but is equally important as a reference while investigating the sample using SEM. Micro-
graphs shown throughout this thesis are mostly SEM-BSE images (see below). Optical
microscopy images are denoted as ‘O.M. image’.
3.2.3 Sample preparation
The samples are cut3 in such a way as to fit the 32 mm resin moulds. The location of
where a sample is cut determines what is visible during microscopy. A section through
the crucible wall, showing the changes from outside to inside, has been aimed at every-
where. The selection of a particular section of a crucible (fragment) is based on previous
macroscopic investigation and greatly influences the information that can be gained from
it. While it seems natural to go for ‘juicy’ areas –containing thicker, more developed slag–
no guidelines exist for sample selection. Assessing the influence of taking samples from
2Isotropic minerals show neither bireflectance nor extinction positions.3Samples are cut using a wet saw which is cleaned using de-ionised water after each sample, to avoid
contamination.

68 Part II: Analytical Methodology. Chapter 3 Frederik Rademakers
particular areas within a crucible is one of the objectives of this research, further discussed
in Chapter 13. Apart from considerations of ‘information yield’, a crucible’s preference to
fracture in certain areas and presenting itself as such in the archaeological record, after
possible post-depositional effects, introduces inevitable restrictions. Furthermore, the re-
searcher’s personal habits and inclinations during sampling introduce an inherent bias,
which are minimised by working in a consistent manner. Preservation of the artefact usu-
ally needs to be taken into account as well, by minimising disfigurement during sampling.
Finally, the exclusion of large metal prills in a section is attempted, as these prills are can-
didates for lead isotope analysis (see section 3.4).
Once the samples have been cut, they are placed face-down into a clean resin mould. A
label, containing sample ID, a brief description, researcher name and the date, is added to
the mould, which is subsequently filled with epoxy resin. This is prepared as a 4:1 mixture
of epoxy and resin hardener. Due to the often high porosity of crucible samples, it is nec-
essary to place the moulds in a vacuum for a short period, to draw the air out of the pores
and fill them with resin4. The samples are left to harden under a fume extraction vent for
24 hours at room temperature.
The hardened samples are then removed from the moulds and ground to create two flat
parallel surfaces. Next, the surface exposing the sample is ground using abrasive paper,
starting from a rough grit size (P120) and progressing to a finer grade (P320-P600-P1200-
P2500-P4000)5. The sample is cleaned using running water between each paper grade,
while a quick microscopic investigation shows whether the marks of the previous grade
have been removed and the next grade can be started. After the P4000 grit, the sample is
cleaned in acetone in an ultrasonic bath and dried. Finally, two polishing steps are per-
formed, using cloths with consecutively 1 µm and 1/4 µm diamond paste (either by hand
or on an automated polisher6). After each of these two steps, the samples are cleaned in
the ultrasonic bath and dried. The finished samples are then stored in a dry environment
to avoid hydration/oxidation at the sample surface.
Each finished sample is scanned using an ordinary office scanner. This image (see Figure
3.4b) is stored for future reference, while a print-out is used as a guide and note-taking
paper when investigating the sample under the microscope and SEM.
4Large pores in the polished surface of the sample can lead to charge build-up during SEM-analysis,
which suppresses the electron beam and disturbs analysis.5The two last steps of grinding can be facilitated by the use of a Buehler MetaServ 3000 Variable Speed
Grinder-Polisher with Vector LC Power head.6Struers LaboPol-5 with Struers LaboForce-3.

Frederik Rademakers Part II: Analytical Methodology. Chapter 3 69
3.2.4 Methodology
The samples are placed under the microscope for investigation by eye, while a camera at-
tached to the microscope allows image acquisition and monitoring on a computer. The
structure is first investigated at low magnification (50X). Further details of the different
crystal phases are acquired at higher magnification (up to 500X), using both plane-polarised
(PPL) and cross-polarised light (XPL). In this study, the main focus is given to the crucible
slag, while only a basic description and abnormal features are recorded for the ceramic
fabric (after a ‘typical’ ceramic description has been obtained). Throughout the analysis,
photomicrographs are taken and mapped on the printout, for documentation purposes
and as an aid during examination by SEM.
Sadly, references for phase identification are scarce. Bachmann (1982b) noted over thirty
years ago that a general description of mineral content in ancient slags had not been com-
piled yet. Only through the collation of information from occasional papers dealing with
particular sites and assemblages can such a list be generated. As the field of archaeomet-
allurgy develops, such a list should be continuously expanded and updated. While Bach-
mann’s publication was intended to serve as a first tentative guide, no concerted effort
has taken place since 1982 to compile a list of phases encountered in ancient metallurgi-
cal (crucible) slag, and the investigator has to rely on his own resources and the case study
oriented examples in the literature for their identification.
Section 3.3
Scanning electron microscopy - energy dispersive spectrome-
try
This section covers the principles of scanning electron microscopy, with energy disper-
sive spectrometry, and its specific application in the analysis of crucibles throughout this
research.
3.3.1 The scanning electron microscope
An electron microscope uses an electron beam to illuminate the sample. This electron
beam is focused onto the sample using a series of electromagnetic lenses, which control
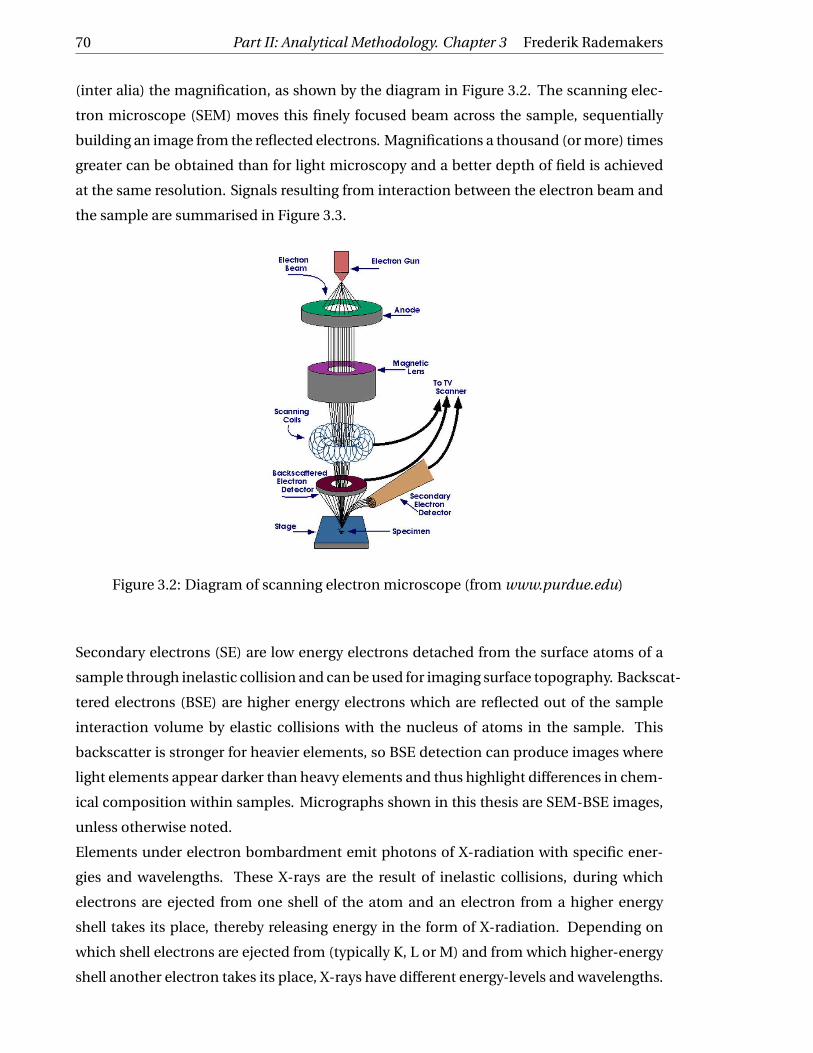
70 Part II: Analytical Methodology. Chapter 3 Frederik Rademakers
(inter alia) the magnification, as shown by the diagram in Figure 3.2. The scanning elec-
tron microscope (SEM) moves this finely focused beam across the sample, sequentially
building an image from the reflected electrons. Magnifications a thousand (or more) times
greater can be obtained than for light microscopy and a better depth of field is achieved
at the same resolution. Signals resulting from interaction between the electron beam and
the sample are summarised in Figure 3.3.
Figure 3.2: Diagram of scanning electron microscope (from www.purdue.edu)
Secondary electrons (SE) are low energy electrons detached from the surface atoms of a
sample through inelastic collision and can be used for imaging surface topography. Backscat-
tered electrons (BSE) are higher energy electrons which are reflected out of the sample
interaction volume by elastic collisions with the nucleus of atoms in the sample. This
backscatter is stronger for heavier elements, so BSE detection can produce images where
light elements appear darker than heavy elements and thus highlight differences in chem-
ical composition within samples. Micrographs shown in this thesis are SEM-BSE images,
unless otherwise noted.
Elements under electron bombardment emit photons of X-radiation with specific ener-
gies and wavelengths. These X-rays are the result of inelastic collisions, during which
electrons are ejected from one shell of the atom and an electron from a higher energy
shell takes its place, thereby releasing energy in the form of X-radiation. Depending on
which shell electrons are ejected from (typically K, L or M) and from which higher-energy
shell another electron takes its place, X-rays have different energy-levels and wavelengths.

Frederik Rademakers Part II: Analytical Methodology. Chapter 3 71
Therefore, each atom species produces a characteristic X-ray emission spectrum reflect-
ing the likelihood of these different possible electron-jumps. It is possible to measure this
X-radiation spectrum using either the energy-levels of these X-rays or their wavelengths,
which is called energy (EDS) or wavelength dispersive spectrometry (WDS) respectively.
These X-rays are representative of the surface atoms, as fluorescent photons cannot es-
cape the sample from depths exceeding±10 micron, even though the electron beam might
penetrate deeper into the sample (Pollard et al., 2007; Watt, 1997).
Besides this characteristic X-ray spectrum, Bremsstrahlung (a continuum background ra-
diation) is emitted. The more discrete characteristic lines are superimposed onto this
background radiation spectrum, the range of which is related to the maximum beam en-
ergy, rather than the atoms being excited.
Auger electrons and cathodoluminescence7 are not discussed here.
Figure 3.3: Schematic representation of electron beam and sample interaction in an elec-
tron microscope (from Watt, 1997, Figure 2.4, p. 34)
The main differences between EDS and WDS for chemical analysis are the range of ele-
ments that can be measured8 and the higher quantitative precision that can be achieved
by WDS9. The main disadvantage to WDS is the need for moving detectors with low (se-
quential) collection efficiency, resulting in a much slower method.
7For a recent application of CL in ceramic analysis, see Hunt (2013).8EDS can detect elements from sodium (Z=11) upwards, while WDS can detect lighter elements from
boron (Z=5) upwards.9WDS is able to better resolve peaks (problems caused by proximity of characteristic X-rays emitted by
different elements) than EDS and has lower detection limits (due to higher peak/background ratios).

72 Part II: Analytical Methodology. Chapter 3 Frederik Rademakers
EDS is considered more suited to the purposes of this research, as it is faster, more appro-
priate for the analysis of many large areas and discrete phases, and has sufficiently low
detection limits to answer the questions at hand.
A JEOL 8600 Superprobe equipped with an Oxford Instruments EDS attachment is used
with INCA software for data-processing.
Obviously, the above discussion is a strongly simplified and necessarily brief overview
of SEM(-EDS) principles. For more detailed information on the workings and operation
of scanning electron microscopes, the reader is referred to, e.g., Chescoe and Goodhew
(1990); Goldstein et al. (2007) and Watt (1997).
3.3.2 Goals and objectives
In the first instance, SEM can be used for further microscopic investigation of the crucible
structure and different crystal phases, similarly to optical microscopy (see section 3.2.2).
Though this can be done at a much higher magnification than achievable by optical mi-
croscopy, SEM is much more time-consuming for this type of analysis and only produces
greyscale images, which are indicative of elemental composition but do not allow the use
of optical properties for mineral identification. For this reason, it is complementary to
optical microscopy and cannot replace it (Photos and Salter, 1986).
The SEM is equipped with an EDS-system, which allows for chemical analysis of different
phases at high spatial resolution. This feature is used to identify the chemical composition
of phases and features that have been identified during microscopic analysis.
Finally, the chemical analysis of larger areas (‘bulk analysis’) within the sample is under-
taken to look at chemical changes within each sample between the ceramic part and the
slag part.
No analysis of fresh fracture surfaces to estimate firing temperatures (Hein et al., 2007; Tite
et al., 1982) is performed.
3.3.3 Sample preparation
The mounted section prepared for optical microscopy can be used for SEM(-EDS). The
only additionally required preparation step is to apply a carbon coating to the sample.
This makes the surface conductive, which is necessary to avoid charge build-up on the
sample surface. The carbon layer has a default thickness of approximately 15 nm.

Frederik Rademakers Part II: Analytical Methodology. Chapter 3 73
The coated samples are placed in a holder and secured using carbon tape. This tape holds
the samples in place and acts as a conduct for current between the sample face and the
holder. The holder is then put into a vacuum lock before being introduced into the actual
SEM chamber. This allows the JEOL 8600 Superprobe to maintain a permanent vacuum,
contributing to the stability of the electron beam. The sample stage can be operated either
by introducing the desired coordinates into a computer or by using a joystick.
3.3.4 Methodology
A PC equipped with INCA10 software is attached to the JEOL 8600 Superprobe, which is
used for data-acquisition during analysis. An accelerating voltage of 20 kV is used, with a
working distance of 10 mm and a live time of 50 seconds. At the start of each session, a
cobalt standard (loaded in the holder) is analysed for quantitative optimisation.
After optimisation, the actual sample analysis begins. As each archaeological sample is
slightly different, the exact procedure differs for each case. However, a general methodol-
ogy for analysing crucible sections has been followed and is detailed here. A visual exam-
ple is shown in Figure 3.4.
• For the steps described here, a 100X magnification is used.
• The chemical composition of the entire area visible in the frame (±1 mm2) is mea-
sured11. Quartz grains and any other inclusions are included in these frames and
not avoided, as their omission would bias any comparison in bulk chemical com-
position between different crucible parts. On average, five bulk measurements are
taken for each part of the crucible. These are usually the ceramic and slag part, but
the composition of other areas areas noted during microscopy (e.g., corrosion lay-
ers) is sometimes measured too12.
10INCA Microanalysis Suite - Issue 16. Oxford Instruments INCA 4.06.11INCA can automatically measure the bulk composition for the viewed area, but the author was initially
unaware of this function. For this reason, the frame of analysis was selected manually during examination of
the Pi-Ramesse material. This resulted in the analysis of areas of 75-80% of the field of view, the maximum
frame size for which INCA software allows manual analysis. For the remaining two assemblages, the full
frame was analysed.12At the start of this study, bulk compositions of the bloated transition zone between ceramic and slag
were measured. These are interesting for showing intermediate changes, but are omitted here as they do not
contribute much in the interpretation stage: the real information (relevant to questions asked here) lies in
the comparison of ceramic to slag composition.

74 Part II: Analytical Methodology. Chapter 3 Frederik Rademakers
(a) Crucible sample (b) Mounted crucible sample
(c) Areas of chemical analysis
(d) Example of differences between ceramic and slag
Figure 3.4: An example of the applied SEM-EDS methodology

Frederik Rademakers Part II: Analytical Methodology. Chapter 3 75
• For each frame of analysis, a number of set elements13 are measured for their abun-
dance. For each measurement, the spectrum is checked to see if any other elements
are present, in which case they are incorporated into the analysis. Sometimes, the
INCA software suggests the presence of elements that are absent or, inversely, ne-
glects to suggest elements that are actually present. It is up to the operator to inspect
spectra and decide whether or not to include a certain element in the analysis. Some
further discussion on the use of a set list is given in section 3.3.6.
• The element abundances are then processed by stoichiometry, combining them
with oxygen. This means that the actual measured oxygen is ignored and oxygen
is added to the other measured elements according to their stoichiometry (e.g., Ca
as CaO and Si as SiO2). The oxidation state for each element is fixed by the INCA
software (e.g., FeO and not Fe2O3), without regard for the actual oxidation state that
each element is in14. This should be kept in mind during further analysis of the re-
sults.
• The bulk chemical compositions for each part (ceramic and slag) are calculated by
averaging the measurements15 and calculating a standard deviation16 for each ele-
ment (as oxide).
• Alumina is rarely a significant part of the crucible charge, and by looking at the
changing ratios of oxides to Al2O3, the relative enrichment of these oxides in the
slag (with respect to the ceramic) can be judged. This normalisation removes pos-
sible distorting effects from the inclusion of quartz grains and base metal(oxide)s
(Cu, Sn and Pb), which vary greatly throughout crucibles and can distort absolute
changes of other oxides between ceramic and slag. The (relative) change in ratio (in
%) is calculated for each oxide as ∆oxi de/Al2O3 =oxi desl ag/Al2O3sl ag−oxi decer ami c/Al2O3cer ami c
oxi decer ami c/Al2O3cer ami c.
The procedure outlined here is comparable to that used by Freestone and Tite (1986), who
13Set list of elements (as oxides) checked: Na2O, MgO, Al2O3, SiO2, P2O5, K2O, CaO, TiO2, MnO, FeO, CuO,
As2O3 and SnO214To get a better idea of the oxidation state of elements in a particular phase, the analysis of this phase
is processed using the ‘all elements’ rather than ‘elements by stoichiometry’ option in INCA. However, the
measurement of oxygen (Z=8) by EDS is not very precise and treated accordingly.15The average here is an unweighed mean of the results, calculated as x =
∑x
n , where x is one value out of
the n values for a particular element and n is the number of values, corresponding to the number of frames
analysed (typically five).16To calculate the standard deviation, the function ‘STDEV.S’ in Microsoft Excel is used, which uses the
following formula: σ=√∑
(x−x)2
(n−1) , where x is one value out of the n values, x is the mean of the n values (i.e.,
the average) and n is the number of values, corresponding to the number of frames analysed.

76 Part II: Analytical Methodology. Chapter 3 Frederik Rademakers
similarly use a set list of elements, though no distinction is made here between ‘bulk’
and ‘matrix’ (omitting coarse grains) analysis. Here, five bulk measurements are averaged
rather than only one to three. Other publications of metallurgical crucible analysis typ-
ically do not provide such detailed information on their analytical procedure, impeding
any comparison. While SEM-EDS analysis does not offer the highest attainable accuracy
and precision for bulk analysis, for which other methods (such as XRF, NAA) are often pre-
ferred, it is quite appropriate here. It avoids the often problematic physical separation of
crucible ceramic and slag samples, and reduces the amount of sample needed as essential
micro-textural information is obtained from the same mounted section. As discussed in
more detail in section 13.3, it offers an adequate measurement of bulk composition for
crucible studies.
The methodology described so far only concerns bulk chemical change occurring within
the different parts in a sample. It is often very informative, however, to use the SEM-EDS
to investigate different phases in the sample at a very high magnification to allow better
understanding of their structure and chemical composition. This does not follow a set
method, but rather is driven by the previous study by optical microscopy and what is dis-
covered during the analysis described above. A good example is the study of metal prills:
the composition of a single prill and (if present) the different phases within a prill can be
measured, taking into account all elements (i.e., not processing oxygen by stoichiome-
try). Another example is the investigation of different oxide phases crystallised from the
slag. This clarifies the distribution of the different elements measured during bulk analy-
sis. Structural features like the presence of charcoal remains can equally be investigated.
This stage cannot follow a set method, but rather is dictated by each sample’s particular
features and the specific research questions.
3.3.5 Note on detection limits
A number of certified reference materials (CRM’s) have been analysed by SEM-EDS. These
reference materials are selected to approximate as closely as possible the materials under
study (i.e., ceramic, crucible slag and metal) and assess the accuracy and precision of the
machine in measuring their composition. The results of this analysis are presented and
discussed in full detail in Appendix A and only briefly summarised here.
The detection limit (i.e., the minimal concentration17 for which an element or oxide can
be accurately measured) for SEM-EDS analysis using the JEOL 8600 Superprobe is approx-
imately 0.5 wt%, with the exception of a few elements/oxides which have detection limits
17Actually mass fractions are used here, expressed in wt%.

Frederik Rademakers Part II: Analytical Methodology. Chapter 3 77
of ±1 wt%.
The measurement precision is generally high (coefficient of variation below 10%), though
sometimes lower for elements/oxides present at low levels and for light elements/oxides.
The accuracy is similarly good, typically showing a relative error of less than 10% when
compared to certified reference values.
The presence of lead in metal can be problematic due to polishing effects, leading to poor
precision and accuracy (consistent underestimation of ±30%) in its measurement and a
lowered accuracy of the measurement of other alloy constituents, such as tin. In glass
(and ceramic, not measured), PbO has a detection limit of ±1 wt%, due to lead’s high-
energy characteristic spectrum (Lα1=10.551 keV and Lβ1=12.619 keV).
No standards were available to assess precision and accuracy for measurements of silver,
cobalt and bismuth, which are encountered in some crucibles. It is assumed that similar
values apply for these elements.
For the measurement of SnO2, it should be noted that standard SEM-EDS calibration pro-
vides wrong results: approximately SnO3-Sn3O7. This problem is most likely due to an
overlap between M-lines for tin and oxygen, and similarly affects the measurement of
other tin-bearing oxides. A cassiterite-based standard has been developed to confirm the
composition of such oxides.
3.3.6 Using a set list of elements in SEM-EDS
As mentioned above, a set list of elements is measured for each analysed area. Any other
elements that show up are added into the analysis where appropriate.
The use of a set list has as a consequence that sometimes elements are measured that are
not present. The software, however, still provides a result, often differing from zero and
sometimes negative concentrations are reported, which obviously is not realistic. This
results from the INCA software procedure to account for all elements checked by the user.
By performing multiple measurements for the same part of a sample (see section 3.3.4),
the results can be averaged to get a better idea of the composition of this part. In doing so,
a better estimate is achieved for elements that are not present, as any random variation
introduced by the software is damped. For this reason, negative results are not initially ze-
roed by default, but rather taken along in the calculations, to get a more realistic estimate
(with standard error) of the elements (not) present.
A side note should be made here: when processing elements by stoichiometry, the INCA
software invariably sets Cl-oxide to zero. The reason for this is unknown, but it is an in-

78 Part II: Analytical Methodology. Chapter 3 Frederik Rademakers
herent and recurring problem. There appears to be a constant chlorine background of
0.1-0.2 wt% (measured as ‘all elements’) which can be attributed to epoxy resin (noted by
Freestone and Tite, 1986). The omission of chlorine in the bulk chemical measurements
is therefore not an issue as long as this background level is not exceeded. Where this is the
case, a note is made.
Section 3.4
Lead isotope analysis
As mentioned in the introduction, lead isotope analysis is only performed for the Pi-Ramesse
assemblage. This section briefly discusses the principles behind the technique, its appli-
cation in archaeological science and specific use within this project.
3.4.1 The technique
Lead has four stable isotopes: 204Pb, 206Pb, 207Pb and 208Pb. The last three are the end
members of radioactive decay series (uranium and thorium series), though each one equally
occurs as primordial isotope. This means that, when the earth was formed, the ratios of204Pb to primordial 206Pb, 207Pb and 208Pb within the earth’s mantle were fixed. However,
fresh 206Pb, 207Pb and 208Pb has continued to form over time through radioactive decay,
while 204Pb has remained constant at its primordial level. This has caused the ratio of204Pb to 206Pb, 207Pb and 208Pb in the earth’s mantle to change through time accordingly
(Stacey and Kramers, 1975; Vollmer, 1977).
When an ore body mineralises at a certain point in geological time, its lead content has an
isotopic composition that reflects the lead isotope ratios as present in the earth’s mantle at
that time. While lead’s isotopic composition within the mantle continues to change there-
after, it is ‘frozen’ in the mineralised ore body (Pernicka, 2014). As such, the ore body’s lead
isotope composition can be used as a time indicator for its formation in geological history.
This is of course a crude simplification of reality, where lead isotope ratios within the
earth’s mantle present a far more complex issue (Cumming and Richards, 1975; Elliott
et al., 1999; Kramers and Tolstikhin, 1997) and the further geological history of ore de-
posits, involving for example hydrothermal and metamorphic processes, as well as the
presence of U and/or Th, can alter lead isotope compositions after primary ore formation.
Usually, then, an ore deposit encompasses a range of lead isotope compositions through-
out its expanse, reflecting its formation history.

Frederik Rademakers Part II: Analytical Methodology. Chapter 3 79
The technique used in archaeology is based on the premise that when copper ore forma-
tions are deposited, varying amounts of lead are chemically incorporated into the ore. This
appears to be the case for most copper ore bodies encountered on earth. When smelting
these ores, some of this lead partitions into the copper metal, without any noticeable frac-
tionation18 (Budd et al., 1995a,c; Cui and Wu, 2011; Stos-Gale and Gale, 2009). Therefore,
the isotopic composition of lead present in raw copper metal relates to the formation his-
tory of the copper ore from which it was smelted. When the lead isotope composition of
archaeologically retrieved copper is determined, it can be compared to that of known ore
bodies which have been exploited in ancient times, as discussed further in section 3.4.2.
A variety of techniques exist by which these isotopes can be measured, the most popular
of which have been TIMS19 and currently MC-ICP-MS20 (see, e.g., Becker, 2002; Clayton
et al., 2002; Niederschlag et al., 2003 and Pollard et al., 2007). Both methods provide high
accuracy (±0.1% or better) and precision which is needed for metal provenancing, while
the accuracy of ICP-QMS21 is too low and LA-ICP-MS22 does not agree well with other
methods when analysing low-lead (<100 ppm) samples (Stos-Gale and Gale, 2009).
3.4.2 Goals and objectives
The initial application of lead isotope analysis to archaeology has been to relate lead (Brill
and Wampler, 1967) and copper (Gale and Stos-Gale, 1982) artefacts to the ore sources
from which they were smelted. Following a period of great enthusiasm in the 1970’s and
80’s, particularly for its application to the study of Mediterranean Bronze Age metal trade
(e.g., Gale, 1991; Muhly, 1977 and Stos-Gale et al., 1997), methodological issues were raised
and heavily discussed during the 90’s. The literature generated by this debate is obscured
by its scale and spread over a wide range of journals, rendering any overview here neces-
sarily incomplete. The main (though not only) contributors to the debate are Budd et al.
(1993, 1995b); Gale and Stos-Gale (1995); Hall (1995); Knapp (2000); Leese (1992); Muhly
(1995); Pernicka (1995); Reedy and Reedy (1992); Rohl and Needham (1998); Sayre et al.
(1992) and Tite (1996). A first major issue (mentioned in section 3.4.1) is the definition
of lead isotope fields for ore bodies. Not only are sample numbers often insufficient to
fully characterise internal variability of the isotope compositions within an ore body, but
18Isotope fractionation: change in isotope content between an original mixture (the ore) and the fractions
that are separated from it (metal and slag).19TIMS: Thermal Ionisation Mass Spectrometry.20MC-ICP-MS: Multiple Collector - Inductively Coupled Plasma - Mass Spectrometry.21ICP-QMS: Inductively Coupled Plasma - Quadrupole Mass Spectrometry.22LA-ICP-MS: Laser Ablation - Inductively Coupled Plasma - Mass Spectrometry.

80 Part II: Analytical Methodology. Chapter 3 Frederik Rademakers
strong overlap can exist between different deposits (e.g., Timna and Feinan (Hauptmann,
2007)). A second point of contention is the possible distorting effect of mixing and recy-
cling of copper objects: when two (or more) copper objects are mixed, their lead isotope
composition becomes an intermediate product of their respective lead isotope compo-
sitions, depending on both their absolute lead contents and difference between isotope
compositions. Especially for later historical periods, when more metal was (presumably)
in circulation, mixing probably becomes a significant problem to the application of lead
isotope studies as defined above.
The lead contribution from tin used for bronze alloying is often disregarded, but this is
probably23 a safe omission given the low natural lead content in cassiterite, the main tin
ore (Begemann et al., 1999; Galili et al., 2013). When lead is added to produce leaded
bronze, its isotope composition completely overshadows the much smaller contribution
from lead in the copper.
Following some very fierce and sometimes personal discussions, the controversy has some-
what subsided into the background, without any real consensus having been achieved and
applications often remaining controversial (see, e.g., Bray and Pollard, 2012; Gale, 2009
and Pollard, 2009, 2011). Nevertheless, careful use of the method continues steadily and
the ‘exclusion method’, whereby potential ore sources are rejected based on their isotopic
composition, appears a generally accepted application. While straightforward assignment
of a copper object to a particular ore source should be avoided, the use of trace element
chemistry can provide some further confidence in narrowing down the possible candi-
dates24 (Cooper et al., 2008; Ling et al., 2013, 2014; Pernicka, 1999; Rehren and Pernicka,
2008).
Finally, the way by which the actual isotope data should be analysed is still under discus-
sion. For example, the traditional display of data using bivariate plots and point-by point
comparison, using Euclidian distance, for the assignment of metals to ore sources, ad-
vocated by Stos-Gale and Gale (2010) and used by many others (see Stos-Gale and Gale,
2009), were recently contested by Albarède et al. (2012).
The primary aim of lead isotope analysis within this project, then, is not strictly to define
potential ore sources for copper used in Pi-Ramesse. Rather, the identification of variation
within copper sources used in the bronze workshops is a first aim in itself (see Chapter
23Convincing experimental evidence to confirm this assumption is, however, lacking.24Stos-Gale and Gale (2009) note that most of this is a matter of semantics: following the exclusion of many
sources based on comparison of their lead isotope compositions, trace element chemistry and historical
information, only one potential source usually remains. One can then fairly say that given the present state
of knowledge a copper object was smelted from that particular ore source.

Frederik Rademakers Part II: Analytical Methodology. Chapter 3 81
1 and section 4.6). To this end, the lead isotope composition of prills embedded in the
crucible slag, as well as metal artefacts from the workshop context, is analysed by MC-
ICP-MS. These results are then compared to conclusions obtained from chemical analysis
of the crucible slag, which provides further information on the use of particular copper
sources through its bulk composition and that of metal prills embedded in it.
In addition to this, the lead isotope composition of actual crucible slag (without visible
or ‘extractable’ prills) of selected crucibles is analysed and compared to the lead isotope
composition of the crucible ceramic. This is a methodological exercise (similar to Lehner
et al., 2009) to determine the contribution of lead from the metal charge to the crucible
slag and appraise the possible application of this method to reconstruct the lead isotope
composition of the metal charge when no actual metal prills are present.
3.4.3 Sample selection and analytical methodology
The application of this method is limited to samples from Pi-Ramesse, where material and
context are most suitable.
Three datasets are selected for lead isotope analysis. Firstly, small pieces of metal artefacts
from the workshop contexts are analysed. All of these are additionally analysed by XRF25
and some by NAA26 to obtain their chemical composition. Secondly, metal prills are ex-
tracted from the crucible slag for lead isotope analysis. Finally, samples of both crucible
ceramic and slag are analysed for their isotopic composition.
The selection of samples is dictated by the results from microscopy and SEM-EDS, as well
as the spatial distribution of finds within the site. The aim is to select samples representa-
tive of different production contexts and from crucibles that indicate differing technology
and material use (see section 5.5).
These samples are sent off to an external laboratory for MC-ICP-MS analysis following the
protocol detailed by Niederschlag et al. (2003), which is not discussed further here. More
general discussion on the use of lead isotope data for crucible analysis within this thesis
is not concerned with the analytical procedure of obtaining these lead isotope data, but
rather their interpretation towards understanding crucible metallurgy. This is in contrast
to the other methods described in this chapter, for which both the practical aspects of data
acquisition and their interpretation are discussed.
25XRF: X-Ray Fluorescence. This is performed by the same external lab performing the lead isotope anal-
ysis.26NAA: Neutron Activation Analysis. Again by the same external lab performing the lead isotope analysis.

82 Part II: Analytical Methodology. Chapter 3 Frederik Rademakers
Section 3.5
Handheld X-ray fluorescence spectrometry
Handheld or portable X-ray fluorescence (pXRF) analysis is performed for the Pi-Ramesse
assemblage, with the aims of testing the applicability of this technique for fast chemical
characterisation of a complete crucible assemblage. The same procedure could not be
repeated for the other two assemblages, as only a limited selection of those crucibles was
available for study. This section briefly discusses the principles behind the technique, its
application in archaeological science and specific use within this project.
3.5.1 X-ray fluorescence
The principles behind X-ray fluorescence are very similar to those explained for SEM-EDS
(section 3.3.1). Rather than using an electron beam, the sample is exposed to X-rays27 of a
particular energy and wavelength. These primary X-rays hit the sample’s atoms, creating
inner shell vacancies (K-, L-, M-shells) to which electrons from outer shells fall back, pro-
ducing secondary X-rays. These characteristic (secondary) X-rays can then be measured
using energy- or wavelength-dispersive methods. Typical escape depths of a few micron
(light elements) to several hundred microns (heavier elements) for fluorescent photons
make this a surface-analysis technique (Pollard et al., 2007).
Apart from the generation of secondary X-rays, the primary X-rays equally give rise to
scattering (elastic, Rayleigh and inelastic, Compton scattering) and absorption processes,
as well as Auger electron emission and the occurrence of sum and escape peaks in the
spectrum. Scattered X-rays28 produce peaks in the measured spectrum related to the
primary X-ray source, rather than the sample under analysis, and need to be treated ac-
cordingly when converting spectra into quantitative compositional data for the sample.
Bremsstrahlung occurs due to deceleration of electrons hitting the anode of the X-ray tube
and, more importantly, due to primary X-rays decelerating within the matrix of the sample
itself which produces non-characteristic secondary xrays, together creating background
‘noise’ in the spectrum (Shackley, 2011).
Matrix effects, caused by the absorption of X-rays and the generation of secondary fluo-
rescence29 are typically corrected for by either internal machine calibrations or software
27X-rays are generated using either an X-ray tube, a radioactive source or synchrotron radiation.28Scattered X-rays do not occur for SEM-EDS, as there are no incident X-rays.29When high-energy characteristic (secondary) X-rays of one element interact with another (lighter) el-
ement before escaping from the sample, this second element may be excited and generate characteristic

Frederik Rademakers Part II: Analytical Methodology. Chapter 3 83
packages used for analysis of the raw data.
pXRF provides a portable alternative to the commonly laboratory-based application of
XRF-analysis. The production of such compact devices necessarily results in analytical
compromises relative to laboratory-based XRF-machines. These are overly complex to
address in any detail here, but important to mention as they have sparked substantial de-
bate in the archaeological literature. However, it is not so much the limitations of the
analytical device itself that fuel the controversy,30 but the way in which it can be used.
The user-friendly nature of pXRF could lead to overconfidence (or overindulgence?) in
its application and the seemingly simple output31 belies very complex sample-beam in-
teraction, measurement and calibration. Keeping all technical limitations of this surface-
analysis technique in mind, however, the thoughtful use of pXRF in archaeology opens
new methodological horizons, such as geochemical surveying (Derham et al., 2013; Dung-
worth et al., 2013), (in situ) stratigraphy characterisation (Davis et al., 2012; Gauss et al.,
2013), rapid obsidian-sourcing in the field (Frahm et al., 2014) or the non-invasive anal-
ysis of architectural glass (Dungworth, 2012a) and other objects that cannot be removed
from sites or museums (Charalambous et al., 2014). Frahm and Doonan (2013) present
an overview of the application of pXRF in archaeology, while a good example of ongoing
controversy is given by Frahm (2013a,b) and Speakman and Shackley (2013).
3.5.2 Goals and objectives
For this research project, pXRF is not used as a tool for quantitative chemical analysis.
Rather, it is applied as a fast, on-site technique to qualitatively assess the presence and
approximate abundance of certain elements in the (surface of) crucible slag.
Low acquisition times allow the analysis of an entire assemblage, which for practical rea-
sons is not possible for microscopic and SEM-EDS analysis. Furthermore, multiple mea-
surements at different areas within the same crucible fragment (further apart than the area
covered by a polished sample) can be taken and compared.
The aim here is to look for broad (qualitative) trends obtained from the analysis of the
entire Pi-Ramesse assemblage. This can then be related to results of the more detailed
X-rays. This results in an apparent absorption effect for the heavier element and a false enhancement for
the lighter element (Shugar, 2009).30Every analytical method has limitations, and any data generated using those methods is subject to in-
terpretation within those limits.31Many pXRF devices, originally conceived for quickly sorting through scrap or roughly assessing ore grade
in a mining face, show only the calculated abundance of (selected) elements, with little opportunity (or
encouragement) to manually inspect the actual spectra.

84 Part II: Analytical Methodology. Chapter 3 Frederik Rademakers
chemical analysis of polished samples. From this comparison, a discussion is held on
the application of pXRF to the analysis of metallurgical crucible assemblages, which has
hitherto not been addressed in the literature (though examples of the analysis of ceramics
(Aimers et al., 2012; Behrendt et al., 2012; Forster et al., 2011; Hunt and Speakman, 2014;
Papadopoulou et al., 2006) and primary production slag (Ben-Yosef and Levy, 2014; Eekel-
ers et al., 2014) already exist).
3.5.3 Sample preparation and methodology
±60% of the Pi-Ramesse assemblage (rather than the intended full assemblage, see section
5.3.1) is analysed in Qantir, Egypt, using an Innov-X Systems handheld XRF32. 3 measure-
ments per sample are performed, with the following basic settings:
• Single Beam, suppress LE (MC=3, nS=2)
• Test time = 15s
• 40 kV
Though the device provides both spectral and elemental data output, only spectral data
has been used in this analysis33. Spectral data output covers the 40 kV spectrum using
2048 intervals (i.e., 19.53V each). For each interval, or ‘channel’, the output presents the
averaged intensity (in counts/second) at the centre of that interval. Results (section 5.3.2)
are given as ‘intensity’, which corresponds to counts/second for a particular energy-level.
Each different chemical element, when present and excited by the incident beam, pro-
duces X-rays with particular energy-levels (in keV):
• Ca: Kα1 = 3.692 & Kβ1 = 4.013
• Ti: Kα1 = 4.512 & Kβ1 = 4.932
• Fe: Kα1 = 6.405 & Kβ1 = 7.058
• Co: Kα1 = 6.931 & Kβ1 = 7.649
• Cu: Kα1 = 8.046 & Kβ1 = 8.905
32Delta Family XRF Handheld Analysers. Type: Premium. Model: DP 4000. Serial no.: 51024033This spectral data represents the actual raw data generated by the instrument, while elemental data is
the result of spectral interpretation using internal machine standards.

Frederik Rademakers Part II: Analytical Methodology. Chapter 3 85
• Pb: Lα1 = 10.551 & Lβ1 = 12.619
• As: Kα1 = 10.544 & Kβ1 = 11.727
• Sr: Kα1 = 14.165 & Kβ1 = 15.836
• Sn: Kα1 = 25.271 & Kβ1 = 28.491
The intensity of the measured signal at these specific energy levels is calculated by inter-
polating between the two closest surrounding interval centres.
Analysis is performed directly on the clean surface of the crucible and no sample prepara-
tion is needed. Further details on sampling are discussed in section 5.3.1.

86 Frederik Rademakers

Part III
Qantir – Pi-Ramesse
Polish comes from the cities; wisdom from the desert.
Herbert, 1965
87

88 Frederik Rademakers

CHAPTER 4
Archaeological background
This chapter provides a background of both the archaeological context in Pi-Ramesse
which included the bronze production remains and the wider historical and archaeologi-
cal background against which these activities should be situated.
Section 4.1 presents a brief introduction to the site and its excavation. Section 4.2 offers an
overview of the different production processes evidenced at Pi-Ramesse, while section 4.3
zooms in on the metallurgical context. Section 4.4 discusses the nature of such metallur-
gical workshop contexts. In section 4.5, the broad-scale organisation of ancient Egyptian
metallurgy is discussed, setting out the interpretative framework for this case study and its
particular research questions, outlined in section 4.6.
Section 4.1
Introduction
Ancient Pi-Ramesse is located largely underneath modern Qantir, in the eastern Nile Delta
of Egypt (Figure 4.1). It lay on the (now silted up) Pelusiac branch of the Nile and was estab-
lished as the capital under Pharaoh Ramses II (although there appears to have been con-
tinued habitation around Pi-Ramesse from the late Twelfth Dynasty onwards, initially cen-
tred around Avaris, and from the late Eighteenth Dynasty at Qantir (Bietak and Forstner-
Müller, 2011). Under his reign, the city flourished as a Late Bronze Age trade centre, from
where Ramses expanded his influence as one of the select rulers engaged in diplomatic
exchange in the eastern Mediterranean (Van De Mieroop, 2007). During this period, Egypt
89

90 Part III: Pi-Ramesse. Chapter 4 Frederik Rademakers
Figure 4.1: Location of Pi-Ramesse (Google Earth 7.1.2, 2013)
was at its largest territorial extent in history and actively involved in a complex and chang-
ing economic system (e.g., Bevan, 2010 and Sherratt, 1998, 2003) with associated politics
and warfare in the Near East (e.g. the Battle of Qadesh), exposing it to an expanding cul-
tural diversity. This highlights the importance of Pi-Ramesse as a strategic location, which
served as the military basis for the pharaoh’s chariot garrison. It is beyond the scope of
this research to fully discuss the history and politics of Ramesside Egypt, but the interna-
tional nature of Pi-Ramesse needs pointing out, as does its scale as an urban development
project under Ramses the Great.
Pierre Montet discovered many of Pi-Ramesse’s monuments at Tanis in the 1930s and the
first excavations at Qantir took place already in 1929 (Hamza, 1930). However, it was only
in the 1960s that its true location was discovered by Dr. Manfred Bietak, who mapped
all branches of the ancient Nile Delta and firmly linked Qantir to Pi-Ramesse. Since the
1970s, the area has been investigated by the Austrian Archaeological Institute at Cairo,
under direction of Dr. Bietak (Bietak, 1981). From 1980 onwards, this team has focused on
the remains of ancient Avaris (modern Tell el-Dab’a), while Qantir was excavated by the
Roemer-Pelizaeus Museum in Germany, led by Dr. Edgar B. Pusch (see Pusch, 1991 (early
years), 1993 and Pusch and Herold, 1999).
A number of areas have since been excavated, the main ones labelled QI-QVII (Figure
4.2). Pi-Ramesse occupied islands in the Nile, which was vital to its harbour existence
(Hodgkinson, 2007). An overview of the stratigraphy and dating is given in Table 4.1.
Clearly, only a tiny fraction of the original city has been excavated, though all but the cen-
tral area (believed to have held the pharaoh’s palace, now underneath Qantir) has been
mapped using magnetic and resistivity surveys (Abdallatif et al., 2003; Forstner-Müller,

Frederik Rademakers Part III: Pi-Ramesse. Chapter 4 91
Figure 4.2: Excavated areas of Pi-Ramesse, showing (blue) ancient Nile (from Pusch and
Rehren, 2007, Map 05, p. 53)
2009; Forstner-Müller et al., 2009; Forstner-Müller and Müller, 2007; Pusch, 1998/99, 1999b;
Pusch et al., 1999). An artist’s reconstruction of the city is given by Bietak (1996), Figure 2,
p. 4.
Section 4.2
High-temperature processes in Pi-Ramesse
A number of high-temperature production processes, all of them centred around the use
of copper, were carried out at Pi-Ramesse. All of these took place in the area surrounding
sites QI, QIV and QV, which should probably be seen as one large high-temperature pro-
duction centre. The degree to which these different processes depended on each other or
interaction existed is unclear at this point. However, it seems likely that some resources,
like copper, and knowledge would have been shared here, given their spatial and strati-
graphic proximity.
The high-temperature process which has been most extensively studied so far (Rehren,
1997b; Rehren and Pusch, 1997, 1999, 2005; Rehren et al., 1998, 2001), is the production

92 Part III: Pi-Ramesse. Chapter 4 Frederik Rademakers
QI QIV QV
Building
levelFunction
Building
levelFunction
Building
levelFunction Dating
- - Aa’ Channel - -Persian
period
A/1 Disturbed Aa Squatter - -
Post 3r d
Inter-
mediate
Period
A/2 Cemetery Ab Cemetery - -1st millen-
nium BC
Ac Burial - Disturbed?22nd /21st
Dynasty
B/1Demolition of
previous layerBa Living area B/0
Fillings/pits/
disturbed
21st /20th
Dynasty
B/2a
Training
court/ Multi-
func. work-
shops
Bb Horse stable B/1“Foreign Of-
fice”
20th/19th
Dynasty
B/2b
Training
court/ Multi-
func. work-
shops
BcPrecursor to
stableB/2
Precursor
to “Foreign
Office”
19th Dy-
nasty
B/3a
Industrial
bronze instal-
lations (N-S
orientation)/
Multifunc.
workshops
Bc/d Glass industry B/3 Glass industry
B/3b
Industrial
bronze instal-
lations (W-E
orientation)/
Multifunc.
workshops
Bd/e Workshop
C? (contami-
nated sand)Be/f
Residential
buildings- -
19th/18th
Dynasty
D/1Settlement
area/pitsBf/g
Settlement
area/pits- -
18th Dy-
nasty
Table 4.1: Suggested correlation of strata and related dates at sites QI, QIV and QV (trans-
lated from Pusch and Rehren, 2007, Table 19, p. 130)

Frederik Rademakers Part III: Pi-Ramesse. Chapter 4 93
of glass, definitely published by Pusch and Rehren (2007). Production concerns almost
exclusively copper-red glass, with some rare examples of Co-blue glass. Activities were
mainly confined to area QIV and QV, though some remains occur at QI. The Hamza ex-
cavations (location shown in Figure 4.3) revealed additional production remains, though
lacking contextual data, as well as a complete red glass ingot (now at the Museum of Egyp-
tian Antiquities, Cairo).
Substantive evidence for the production of faience was first unearthed by Hamza (1930).
An overview of faience moulds (mostly for small objects) from Pi-Ramesse is given by Her-
rmann (1957), including a catalogue with drawings and some pictures. The production of
architectural elements is discussed by Hayes (1937). More recent excavations furnished
additional production remains, hitherto unpublished.
Excavation area QIV provided evidence for the production of Egyptian Blue, though this
has not been thoroughly studied yet. Further material from Hamza (1930) again lacks
contextual data.
Finally, there is evidence for the production of bronze (Prell, 2011; Pusch, 1990, 1994, 2000;
Rehren and Pusch, 2012). The evidence for this production derives mainly from area QI
(and QIV, to a lesser extent), which therefore receives more attention in the following sec-
tion.
A note can be made here on the distinction between primary production (glass and Egyp-
tian Blue) and secondary production (bronze) at Pi-Ramesse. Glass ingots for export were
produced at Pi-Ramesse, while secondary glass workshops (where final objects were made,
like at Malkata and Lisht (Mass et al., 2002)) are absent or hitherto undiscovered. Bronze,
on the other hand, was being recycled and alloyed (see section 5.4) to fabricate objects.
Faience is a one-step product where this distinction is not really possible, though the thou-
sands of moulds point to a large-scale production of usable objects.
Finally, Rehren et al. (2001) point out that, with copper abundant and central to technolog-
ical activity in Pi-Ramesse, specialisation there appears to be governed by the virtuosity by
which the material was worked under different conditions and in different compositions,
rather than its availability. Of interest to this research is to appreciate that virtuosity in its
application to bronze production, within a setting of cross-craft interaction.

94 Part III: Pi-Ramesse. Chapter 4 Frederik Rademakers
Section 4.3
Site QI
Site QI is indicated in Figures 4.2 and 4.3. It is located to the south of modern Qantir, and
presumably to the south of Ramses II’s palace. As outlined in Table 4.1, there are two main
phases (B/3 and B/2) of interest to the study of bronze production activity.
Phase B/3 contains industrial-scale facilities related to bronze-casting, shown in Figure
4.4, adjacent to small-scale workshops to the south (separated by a wall). The large instal-
lations encompass multiple melting batteries (with changing orientation: strata B/3a-b)
and cross-furnaces, as well as many smaller finds related to metallurgical activity, such
as tuyères, pot bellows, bronze objects, a piece of copper ingot, scrap metal, moulds for
casting and cold working, and, importantly, hundreds to thousands of crucible fragments
(Pusch, 1990). A detail of the melting batteries as found in situ is shown in Figure 4.5, while
Figure 4.6 shows their reconstructed operation involving crucibles for melting bronze.
Crucibles were placed inside the melting batteries, covered in charcoal and air was blown
into them from above by tuyères powered by pot bellows. A detailed discussion of how
these batteries were used is given by Pusch (1994) and further discussed in section 6.3.
The function of the cross-furnaces is still not well understood (similar structures occur in
Kerma (Bonnet, 1986, 2004)). In the smaller workshops, a number of different materials,
including wood, bone, stone and metal, were being worked in a ‘souk’-like environment
and indications for ephemeral metallurgical activity are present.
Contemporary to these activities in QI, glass production was taking place at site QIV. As
indicated earlier, however, some metallurgical activity took place at QIV (separate metal
workshop context) and, conversely, some glass production remains were discovered at QI.
As mentioned by Rehren et al. (1998), soundings have shown that the metallurgical activ-
ities must have extended over an area1 of at least 10000 m2, implying even more melting
batteries in the surrounding area.
Phase B/2 records the closing down of the large scale metallurgical complex and the es-
tablishment of a chariot training court in its place, shown in Figure 4.7. This is mirrored
by the termination of glass production at site QIV and the construction of horse stables
there (Figure 4.3, right), with a capacity for holding hundreds of horses. At site QI, the
multifunctional workshops remain in place though, and their expansion may point to an
increased importance. A recent overview of these workshops, focusing mostly on stone
and cold metal working, is given by Prell (2011).
1This probably covered the area bounded by areas QI-QIV and LH/MH (red dashed line in Figure 4.3).

Frederik Rademakers Part III: Pi-Ramesse. Chapter 4 95
These two phases seem indicative of a changing focus in activities. During the earliest
phase, these were probably mostly concerned with the urban development of the new
capital, such as the production of architectural features (e.g., faience decoration, bronze
doors, statues, etc.), while phase B/2 seems focused on the establishment and mainte-
nance of a chariot army that was stationed at Pi-Ramesse.
A detailed overview, including comparisons to Egyptological sources, of the installations
is offered by Pusch (1990, 1994). Rehren et al. (1998) give an abbreviated overview.
Section 4.4
The nature of metallurgical workshop contexts
At this point, it is important to elaborate on the nature of the archaeological contexts at
site QI and QIV.
To do so, it is necessary to establish what could reasonably be considered primary, sec-
ondary or tertiary archaeological contexts in a metallurgical workshop setting. The nature
of such environments, with crucibles being very mobile items, makes the attribution of
crucibles to particular contexts quite problematic.
Intuitively, a crucible found within a melting battery or furnace would appear to be in
primary position. However, taking into consideration the role crucibles play in the chaîne
opératoire for bronze production, this is not necessarily so. The crucibles would have been
lifted from the melting battery after melting the metal inside and taken to another loca-
tion for casting (possibly the cross furnaces). After casting, it seems unlikely that crucibles
were reused (see section 6.3), so they would have been discarded. Whether an allocated
depository for used crucibles existed is unclear, but is a distinct possibility, given the highly
organised nature of the industrial area. In archaeological terms, such a deposit would be
labelled a dump, which is usually not considered primary. From a chaîne opératoire point
of view, however, it could be considered as such. In some locations, heaps of crucibles
were recovered from pits which represent such dump contexts. During the second phase
of production (B/2), the industrial area was shut down and levelled for the establishment
of a training courtyard. At this point, any large piles of dumped crucibles would have prob-
ably been removed or at least moved. Possibly, these crucibles were spread out and mixed
in the levelling layer. The majority of crucibles from the QI industrial area were, in fact,
retrieved from stratum B/2. However, it is most likely that they were actually used in the
preceding phase B/3 and migrated vertically in the archaeological stratigraphy, rather than
having been used in the B/2 multifunctional workshops and moving horizontally across a

96 Part III: Pi-Ramesse. Chapter 4 Frederik Rademakers
Figure 4.3: Map showing excavation areas QI, QIV and QV; LH and MH refer to excavations
by Labib Habachi and Mahmoud Hamza respectively (from Pusch and Rehren, 2007, Map
01, p. 20). The industrial area is indicated in red, the multifunctional workshops in green,
and the QIV workshop in blue

Frederik Rademakers Part III: Pi-Ramesse. Chapter 4 97
Figure 4.4: Map of industrial area within QI (red square in Figure 4.3)), stratum B/3, show-
ing melting batteries (I-VI) and cross-furnaces (A-D); multifunctional workshops south of
wall are not shown (from Pusch, 1990)

98 Part III: Pi-Ramesse. Chapter 4 Frederik Rademakers
(a) Detail from Figure 4.4
(b) Section of melting batteries with tuyères in situ (from Pusch, 1990, Table IV)
Figure 4.5: Detail of melting batteries

Frederik Rademakers Part III: Pi-Ramesse. Chapter 4 99
Figure 4.6: Operation of the B/3 melting batteries (from Pusch, 1994, Figure 1, p. 153)
double wall and alleyway to the industrial-area-turned-training-courtyard.
Nonetheless, in discussions of crucible distributions within Chapter 6, this uncertainty
in relating crucibles to either the QI-B/3 industrial workshops or later QI-B/2 multifunc-
tional workshops must be kept in mind. Furthermore, glass finds in QI might have moved
there from QIV, without necessarily indicating glass production activity in QI, implying
some crucibles may have moved between those areas as well. The metallurgical crucibles
from QIV, however, are clearly associated to a ‘smithy’ (non-ferrous) there.
Full disclosure of contextual distributions of all excavated crucibles, including informa-
tion on the exact deposit types (e.g., workshop floor, pit, levelling debris), will be included
in the forthcoming Pi-Ramesse metallurgy volume (FoRa series, cfr. Pusch and Rehren,
2007). A summary for sampled crucibles is presented in Appendix B.
Section 4.5
The organisation of Egyptian metallurgy
Given Egyptian archaeology’s dominant focus on architecture, inscriptions and artefacts,
archaeometallurgy has hitherto received comparatively little attention (Killick, 2009). Though
a pioneering work, Garland and Bannister’s (1927) overview is largely outdated and fo-

100 Part III: Pi-Ramesse. Chapter 4 Frederik Rademakers
Figure 4.7: Map of area QI, stratum B/2; multifunctional workshops in areas c-f (green)
are separated by a double wall from the open courtyard (B/3 ‘industrial area’ - red) in ax-b
(from Prell, 2011, Figure 05, p. 23)

Frederik Rademakers Part III: Pi-Ramesse. Chapter 4 101
cuses mainly on metal artefacts. Scheel’s (1989) summary of archaeological evidence re-
mains concise, reflecting the scarcity of production waste studies in Egyptian archaeology.
Lacking other overviews, a framework for studying (the organisation of) ancient Egyptian
metallurgy is absent. A brief review of related studies is given here.
Much scholarly attention has been given to Egyptian presence in Timna (e.g., Bachmann,
1980; Ben-Yosef, 2012 and Rothenberg, 1988, 1990, 2003), and the debate on this subject
is ongoing (e.g., Avner, 2013). An Egyptian presence in the region, influencing the mining
and smelting of copper ore, can be inferred, though the extent of control remains unclear.
The actual smelting was probably carried out by local people.
Garson (1977), Said (1990), and Abouzeid and Khalid (2011) present possible Egyptian
metal ores from a geological perspective, while Beit-Arieh (1985), Chartier-Raymond et al.
(1994), Stos-Gale et al. (1995), Hikade (1998, 2006, 2007), and Ogden (2000) discuss copper
deposits exploited in ancient Egypt and particularly Sinai. Abd El-Rahman et al. (2013),
Castel et al. (1996, 2008), Klemm and Klemm (2013), Rothenberg et al. (1998), Shaw (1994,
1998) and Shaw and Durucan (2008) discuss ancient mining and smelting of Eastern Desert
copper, tin and gold. At the Middle Kingdom site of Ayn-Soukhna (Abd el Raziq et al.,
2011; Tallet, 2012), copper ore, probably from Sinai (Tallet et al., 2011), arrived by ship, was
smelted at the harbour and then transported further into Egypt.
Additional metal was traded into Egypt: a Late Bronze Age trade network of copper and
tin ingots, seemingly coming from all over the known world (e.g., Budd et al., 1995b; Gale,
2011; Kassianidou, 2003b; Knapp, 2000; Lo Schiavo, 2012; Muhly, 2003; Pulak, 1997; Sher-
ratt, 2000; Stos, 2009 and Yahalom-Mack et al., 2014), existed in which Egypt participated,
as evidenced by tomb representations (e.g., Tomb of Rekhmire (Davies, 1935a), see Figure
4.8) and the find of a Cypriot oxhide ingot fragment at Pi-Ramesse (Gale, 1999). These
different sources are summarized in Figure 4.9.
All the foregoing is concerned with procurement of raw metal, while its further trade and
use within Egypt has received little attention. Though metal objects have attracted some
interest (e.g., Cowell, 1986; Farag, 1981; James, 1972; Kallfass and Hörz, 1989; Pelleg et al.,
1979; Philip, 2007 and Scheel, 1985, 1986, 1987), research into the intermediate segment
of the chaîne opératoire (secondary production processes) is lagging behind (noteworthy
exceptions are Davey (1985), Eccleston and Kemp (2008), Pusch (1990, 1994), and Scheel
(1988)). However, this gap in current knowledge merits filling, as it holds information on
technological and material knowledge of ancient people in a variety of socio-cultural con-
texts. The study of bronze production at Pi-Ramesse aims to address this.
Rehren and Pusch (2012) have proposed a framework for understanding the consumption

102 Part III: Pi-Ramesse. Chapter 4 Frederik Rademakers
Figure 4.8: Wall decoration in Rekhmire Tomb (Theban Tomb 100), showing import of
ingots on the right and crucible metallurgy (possibly similar to Pi-Ramesse) on the left
(from Pusch, 1990, Figure 9, p. 94)
of copper in New Kingdom Egypt. They suggest a hierarchical system with three compo-
nents:
1. Scrap copper: Metal accessible to most of the population through recycling, small-
scale smelting and trickle-down from state-controlled metal.
2. Mainstream copper: State-controlled metal, produced through regular expeditions
and projects, under a tightly controlled administration. Operations such as those at
Timna should be seen in this context.
3. Special project copper: Exceptional projects requiring large amounts of copper on
short notice, impossible to provide by regular expeditions, for political strategies
(bribing?) or massive projects, such as the construction of a new capital at Pi-Ramesse.
The stratigraphic and contextual variation at Pi-Ramesse allows to test whether a distinc-
tion in technology and material use, which can be expected for this system, is discernible
on site, though the resolution at which this variation can be discussed is moot (see section
4.4). As proposed by Rehren and Pusch (2012), scrap, mainstream and special project cop-
per could all be expected in the production contexts at Pi-Ramesse. This provides some
specific research questions for Pi-Ramesse, outlined in section 4.6.
Broadly speaking then, the study of bronze production at Pi-Ramesse aims to contribute
in two main ways: on the one hand, it can clarify the organisation of metallurgical activity
in ancient Egypt by considering the wide perspective elaborated here, while on the other
hand it can inform on the much smaller workshop scale on the (organisation of) bronze-
related activities within the Ramesside capital.

Frederik Rademakers Part III: Pi-Ramesse. Chapter 4 103
Figure 4.9: Map showing Qantir – Pi-Ramesse and possible sources of metal for ancient
Egypt. Circled: ‘Egyptian’ mining, dot: Ayn-Soukhna, arrows: possible ingot/raw metal
import (modified from Wilkinson, 1994)

104 Part III: Pi-Ramesse. Chapter 4 Frederik Rademakers
Section 4.6
Specific questions
Some more detailed questions, flowing from the main research questions, are spelled out
here. The aim of these questions is to maximise the use of contextual information to un-
derstand bronze metallurgy at Pi-Ramesse, elucidating this less studied segment of Egyp-
tian metallurgical activity: the final productive stages and ‘consumer-side’ of metal trade.
• What techniques were used for bronze production?
• Is metal from multiple sources coming into Pi-Ramesse?
• How important is recycling?
• Do different production contexts (‘industrial’ vs. ‘souk’) show the use of different
technologies and/or metal sources?
• Is production technology object specific? Is there, for example, differentiation be-
tween production technology for architectural materials (e.g., cast doors, sculptures
etc.) and that used for producing military equipment?
• Who had access to particular materials and technologies?
• What are the relations to the glass, faience and Egyptian blue workshops? Are the
material supplies and trade networks (for glass, see Jackson, 2005 and Rehren and
Pusch, 2005) related2? Are there any technical relations (e.g., temperature ranges,
fuel use, technical ceramics etc.) between the different production systems?
• How does metallurgical technology in Pi-Ramesse compare to other Egyptian met-
allurgical activity? How does it compare to contemporary bronze production else-
where in the region?
To conclude, it is emphasised that through these specific questions, the research offers
alternatives to an iconographic tradition of crafts-analysis in Egyptology, refining the un-
derstanding of metallurgical activity spatially within its context, as well as its social organi-
sation. It thereby fits into a broader diachronic research of metallurgical practice in Egypt,
which lags behind with respect to other eastern Mediterranean countries.
2This is focused on the specific materials produced in the Pi-Ramesse workshops. Broader discussions
on the interconnected nature of various goods produced and traded throughout the eastern Mediterranean,
as presented by Bevan (2010), are limited here.

CHAPTER 5
Analytical results
The excavations at Pi-Ramesse have yielded a total of 1042 collected crucible fragments:
814 in QI industrial area, 126 in QI workshop area and 97 in QIV area (and one in area
QII, four in area QV). ±60% of these have been analysed by pXRF in Qantir, while forty-
nine fragments were sampled1 for further analysis using optical microscopy and SEM-
EDS. A complete sample list, including contextual information, is presented in Appendix
B. Section 5.1 gives an overview of the general crucible characteristics, while section 5.2
goes into more detail on the micro-structure and chemistry of the crucible slag, based on
the microscopy and SEM-EDS data. Section 5.3 describes the results of the large-scale
pXRF-study. These first sections are all meant to be purely descriptive, while section 5.4
offers a technical interpretation of all results combined. In section 5.5, the results of lead
isotope analysis are presented separately. All analytical results are then integrated and
further discussed in Chapter 6.
Section 5.1
General crucible characteristics
Rather than going into a detailed description of each crucible fragment that has been in-
vestigated, this section summarises the general characteristics of most samples. This is
1Sampling occurred prior to the start of this PhD project and samples were therefore not selected by the
author. An attempt was made at that time to cover as well as possible the macroscopically visible variation
within the assemblage. This is further discussed in section 5.4.3.
105

106 Part III: Pi-Ramesse. Chapter 5 Frederik Rademakers
Figure 5.1: Reconstructed Pi-Ramesse crucible (left: top view; right: side view) (from
Pusch, 1990, Figure 7, p. 89)
then used as a baseline against which samples can be compared, focusing on difference
from the norm than rather describing each sample individually. Though no complete ex-
amples have been recovered, Figure 5.1 shows an outline of a reconstructed crucible. Typ-
ical dimensions are given by Pusch (1994) (see Appendix G.1): wall thickness ranges from
1-3 cm and volumes average around 350-400 ml (equivalent to 3-3.5 kg bronze).
5.1.1 Macroscopic investigation
The distinct industrial-like setting of melting batteries and cross-furnaces in which the
crucibles were found at Pi-Ramesse, in association with tuyères, pot bellows, a piece of
copper ingot, scrap bronze, moulds and bronze objects, immediately allowed them to be
identified as part of a high-temperature bronze production facility. Macroscopic exami-
nation of the crucible fragments, for which some images are shown in Figure 5.2, reveals
important information. For example, green corrosion products (Figure 5.2a) at the surface
of the ceramic are indicative of the presence of copper/bronze.
Other striking features of the crucibles are their consistently thick walls, tempered with
organic material (indicated by the high porosity and typical pore shapes). A comparison
to contemporary ceramics from the site indicates the use of local Nile Silt as the basic raw
material2.
2Clay type Nilton I.C, as described by Aston et al. (2007: 518-519): “While this material is represented by
two sub-groups at Tell el-Dab’a, IC01 and IC02, in Qantir only subgroup IC01 is present. Both correspond
with ‘VS Nile C’. The I.C.01 material is characterized by an obvious and rich temper with significant coarse
straw and chaff which are visible both in the fracture and on the surface. Also clearly visible are mica, quartz
and sand grains, of variable quantities, that constitute the matrix. In its technical use as crucibles for bronze
casting and the associated wind tubes for firing the furnaces, this material is sometimes exposed to extreme
temperatures which leads to corresponding changes in its appearance.”

Frederik Rademakers Part III: Pi-Ramesse. Chapter 5 107
(a) Corroded prill stuck in slagged inner crucible
surface (close-up)
(b) Largest recovered whole crucible frag-
ment (Figure 5.1)
(c) Inside view of a fragment, showing
slagged interior (left) and cross-section
(right)
(d) Examples of crucible wall cross sections, with
ceramic (A), bloated (B) and slag zone (C)
Figure 5.2: A few macroscopic observations

108 Part III: Pi-Ramesse. Chapter 5 Frederik Rademakers
The gradient through the crucible wall - from a typically red fired ceramic on the outside to
a dark grey slag on the inside - indicates a difference in temperature and redox-conditions
outside and within the crucibles. This type of profile (Figure 5.2d) is indicative of the cru-
cibles being heated from the inside. The slagged layer on most of the inner crucible sur-
faces, often trapping metallic prills, indicates exposure to high temperature.
Though no complete vessels remain, almost all fragments conform to a single type of cru-
cible of standardised size (shown in Figure 5.1). This suggests a routine production, pos-
sibly (but not necessarily) involving the use of moulds. Finger imprints on some crucibles
(see Figure 5.3) indicate that they were shaped and/or finished by hand, rather than using
a wheel. The crucibles were then pre-fired, which can be inferred from the consistently
red-fired outside of all fragments. Without pre-firing, the heating from above by tuyères
would likely have resulted in a much more irregular firing of the ceramic during the (prob-
ably brief) metallurgical operation. Furthermore, pre-firing is a way of testing the crucible
before use, which makes sense when producing large amounts of standard crucibles from
fairly basic raw materials. Finally, using un-fired crucibles would probably mean signifi-
cant loss of energy and time: metal remains solid while the ceramic is being fired, delay-
ing the intended melting/alloying. The unexplained delay (up to 20 minutes) in reaching
melting temperatures (1100-1200°C) when using unfired crucibles, noted by Davey and
Edwards (2007), can most probably be attributed to a ‘ceramic firing stage’ at about 800°C
(Th. Rehren, pers. comm.).
The tuyères are made of the same fabric as the crucibles, and their cross-sections are
rounded to octagonal (exterior surface) with a circular opening through which the air
flowed (see Pusch, 1990, Abb. 5, p. 87). They were most likely pre-fired at lower temper-
atures or for a shorter duration than the crucibles. The ends of the tuyères were exposed
to high temperatures (see Figure 4.6) and their very ends are often vitrified and some-
times contaminated with copper and tin. All tuyère fragments are broken off at ±20-30
cm from this ‘hot end’, with the fragment connecting to the bellows consistently missing.
This probably indicates that these tuyères were pushed aside and broken at the end of the
operation: the fracture occurred at the point were the tuyères were not exposed to heat
and remained low-fired. The ‘cold ends’ of these tuyères probably crumbled and disin-
tegrated, leading to their archaeological absence. This discussion is further expanded in
section 6.3.

Frederik Rademakers Part III: Pi-Ramesse. Chapter 5 109
Figure 5.3: Finger imprints on crucible exterior surface
5.1.2 Microscopic investigation
Looking at the samples under magnification allows some further general characteristics
to be discerned.
1. Typically, three main parts are present in each section through a crucible wall:
(a) On the outside, a fired ceramic part.
(b) In the centre, a very porous part which marks the disintegration of the ceramic
and the transition into a slagged part.
(c) A slag part, consisting of vitrified ceramic and various charge components,
such as metal prills.
2. The ceramic part is rich in silica. Almost invariably, there is a fine, angular quartz
fraction which is part of the matrix and appears to occur naturally in the Nile Silt. In
most samples, a coarser, sub-angular to (sub-)rounded quartz fraction is found, for
which it is not clear whether it is natural or added as (sand) temper. Though a few
samples argue in favour of tempering, many cases are dubious (see section 5.1.3).
3. The ceramic is porous due to the burning out of organic temper. This is evidenced
by the characteristic shape of the voids (macroscopically visible) and the presence of
phytoliths (microscopic siliceous plant secretions characteristic to each plant species
and thus useful for their identification). No thorough analysis has been performed
on these phytoliths, but they appear to indicate the use of rice husks or another
grassy species, corroborating suggested use of straw or chaff (Aston et al., 2007).

110 Part III: Pi-Ramesse. Chapter 5 Frederik Rademakers
4. The ceramic part gradually becomes more porous towards the inside of the crucible
wall, up to the point where it loses all its structurally bound water, disintegrates and
bloats. Firing experiments performed with local Nile Silt indicate that this bloating
takes place at temperatures of 1200°C upwards (Merkel and Rehren, 2007).
5. The inside of the crucible shows the continuation of this bloating into a (partly) vitri-
fied zone, resulting from the further disintegration of the ceramic, and its interaction
with the crucible charge to form crucible slag. Temperatures here did not necessar-
ily exceed 1200°C; the occurrence of the bloated zone simply indicates how deep this
temperature penetrated into the crucible wall.
6. 90% of all samples contain metallic prills. The size of metallic phases varies from tiny
prills to quite large particles, and their abundance fluctuates between and within
samples.
5.1.3 Sand tempering?
Generally, the crucible ceramic contains a fine, angular quartz fraction (natural compo-
nent of Nile Silt) and a coarser, sub-angular to (sub-)rounded quartz fraction. In some
cases, the abundance of this coarser fraction is too low to convincingly argue for this frac-
tion being added as temper. The Nile silt may naturally have a bi-modal distribution, with
a low abundance of this coarser quartz, or perhaps this variability existed in the available
clay sources, from which a coarser mixture was selected for this fabric (see similar dis-
cussion for Amarna fabrics by Bourriau and Nicholson (1992)). While there are samples
which might argue in favour of tempering (with quartz sand), in many cases both could
be argued. Figure 5.4 shows some examples. Often, the ceramic is fused due to high-
temperature exposure, making assessment of the quartz fraction distribution more diffi-
cult. Moreover, mounted sections are inferior to thin sections for addressing this question.
Section 5.2
Detailed description of crucible slag
The structural characteristics of the crucibles are quite consistent and do not allow for any
meaningful distinction of groups. In this section, the chemical data obtained by SEM-EDS
is used to look for broad trends in the bulk compositions of ceramic and slag. A descrip-
tion is given of all phases (oxides in section 5.2.3, metals in 5.2.4) that occur in minor or

Frederik Rademakers Part III: Pi-Ramesse. Chapter 5 111
(a) ‘Natural distribution’, sample 84_1189b,0 (b) ‘Natural distribution’, sample 86_0792b,04
(c) ‘Natural distribution’? Sample 86_0471b,01 (d) ‘Quartz temper’, sample 82_0223b,01
(e) ‘Quartz temper’, sample 87_0773,04 (f) ‘Quartz temper’, sample 92_0606
Figure 5.4: Examples of quartz fraction in crucible ceramic

112 Part III: Pi-Ramesse. Chapter 5 Frederik Rademakers
major amounts in the crucible slag. This section aims to be purely descriptive, with inter-
pretation and discussion reserved to section 5.4 and Chapter 13 respectively.
5.2.1 Some broad trends
Full results of the chemical analysis of crucible ceramic and slag are given in Appendix
C. To process the large amounts of chemical data, the most abundant elements (adding
up to ±91 wt% of ceramic and ±82 wt% of slag bulk composition) have been plotted in
ternary diagrams to discern any broad patterns: SiO2, Al2O3, FeO and CaO. Another way
to simplify the data would be to calculate basicity and viscosity, as proposed by Bachmann
(1980), though this method is aimed at liquid primary production slag (more specifically
iron smelting slag) and not applicable here.
Figure 5.5 shows ternary plots of SiO2 - Al2O3 - FeO and SiO2 - Al2O3 - CaO for crucible
ceramic and slag composition (in each case ignoring all other elements). The ceramic
composition is quite uniform, except for some variability in silica content. This is either
due to the natural variability in silica content of the Nile Silt or the (debatable) addition of
sand temper. As discussed in Chapter 3, an effort has been made to minimise bias through
inclusion/exclusion of large quartz grains in the area of analysis (a problem noted by Free-
stone and Tite (1986)). Therefore, this silica variability may be considered meaningful.
It should be stressed that melting temperatures shown for these compositions were not
necessarily reached, as the crucible slag rarely became fully liquid: undissolved, frac-
tured quartz grains are present in nearly all crucible slag. Moreover, true compositions are
more complex than these ternary diagrams suggest, resulting in significantly lower melt-
ing temperatures (Hauptmann, 2007). Finally, redox-conditions during the metallurgical
crucible process did not necessarily correspond to those at which these diagrams were
constructed.
Another trend that can be noticed is that some of the slag compositions are not distinct
from the ceramic composition, in terms of SiO2 - Al2O3 - FeO. All slag, however, is at least
somewhat enriched in CaO. Some slag compositions differ significantly, being enriched
both in FeO and CaO. The overall impression from Figure 5.5 is that the slag compositions
do not show any real grouping, but rather form a single group with a broad compositional
spread. The impression that all variability witnessed in this crucible assemblage could be
explained by the variability of a single process (i.e., a single process producing a variable
waste product), rather than it being a reflection of multiple processes, is addressed in more
detail in section 5.4.

Frederik Rademakers Part III: Pi-Ramesse. Chapter 5 113
Figure 5.5: Ternary plots for ceramic (red) and slag (blue) composition (phase diagrams
from Muan, 1957 (top) and Hall and Insley, 1933 (bottom))

114 Part III: Pi-Ramesse. Chapter 5 Frederik Rademakers
Finally, the distinction between rim and body crucible fragments should be pointed out.
Figure 5.6 again shows the slag compositions, distinguishing between rim and body sam-
ples (and body samples taken near rims). Body fragments tend to be more enriched in CaO
and only body fragments are significantly enriched in FeO. Slag on rim fragments better
resembles ceramic composition. Figure 5.7 shows a crucible fragment with visibly differ-
ent slag types near the rim (reddish) and lower on the body (darker black/green). Both
qualify as ‘crucible slag’, but the ‘rim slag’ is mainly ceramic fluxed by lime (with limited
copper enrichment), while the ‘body slag’ (3 cm away) is enriched in iron, copper, tin and
cobalt (measured by pXRF). The line demarcating the two slag types probably represents
the level of liquid metal in the crucible during operation. This contrast introduces some
important methodological issues, which are further discussed in Chapter 13.
5.2.2 Bulk analysis
‘Bulk analysis’, as defined in section 3.3.4, is conducted for all samples. The full compo-
sitional data for all crucibles is given in Appendix C and broken down into the ratios of
oxides to alumina and changes of these ratios between ceramic and slag (ignoring base
metal content3). The absolute Al2O3 content is slightly lower in slag than ceramic for most
samples, as shown in Figure 5.8. This simply reflects dilution due to slag enrichment in
other elements. The first part of this section is based on the changes in ratios of oxides
to Al2O3. Base metal-oxide content is presented as wt% in slag (as ceramic base metal
content is below detection limits, this metal content is equivalent to ‘change in metal con-
tent’).
Distributions have been tested for normality using the Shapiro-Wilk normality test. Corre-
lation coefficients for two variables have been calculated using Pearson Product Moment
Correlation4; R- and p-values are given in the text below.
• The change in SiO2/Al2O3 between slag and ceramic (Figure 5.9) has a normal distri-
bution (excluding two outliers) around a very minor increase.
• All samples show enrichment of CaO. The majority of samples show moderate en-
richment and there is a decrease in incidence for higher enrichments (Figure 5.10).
3Base metals removed: copper, tin and lead. Arsenic is equally removed from calculations, while iron is
not.4The pair(s) of variables with positive correlation coefficients (R) and p-values below 0.050 tend to increase
together. For the pairs with negative correlation coefficients and p-values below 0.050, one variable tends to
decrease while the other increases. For pairs with p-values greater than 0.050, there is no significant relation-
ship between the two variables. (SigmaPlot Version 12)

Frederik Rademakers Part III: Pi-Ramesse. Chapter 5 115
Figure 5.6: Ternary plots of slag composition, distinguishing between rim (green), body
(orange) and body-near-rim (blue) samples

116 Part III: Pi-Ramesse. Chapter 5 Frederik Rademakers
Figure 5.7: Crucible fragment showing reddish slag near rim and darker slag towards lower
body (fragment 88_1374,0001)
Figure 5.8: Absolute Al2O3 content (in wt%) in ceramic and slag (after removal of base
metals)

Frederik Rademakers Part III: Pi-Ramesse. Chapter 5 117
Figure 5.9: Change in the ratio SiO2/Al2O3 between ceramic and slag (two outliers not
shown)
The scatter plot shows the samples sorted by increasing enrichment, which appears
to follow a step-wise increasing trend. Though some of this might be explained
by insufficient sampling, it probably points to a bi-modal distribution (below and
above±400% change). Within these two, there are two further steps: ±0-200% change,
±200-400% change, ±400-600% change and ±600-1100% change. The main two
groups are probably explained to some extent by the distinction between body and
rim fragments. A second effect (which might explain the further division within
each group) could then be the degree to which the ceramic was fluxed by CaO and
slagged. This degree of slagging (indicated by higher lime enrichment), appears to
be related to increased iron, copper and tin enrichment, as discussed further below
and in more detail in section 5.4.9.
Figure 5.11 shows the increase in CaO plotted against MgO, P2O5, K2O, Na2O and
SiO2. There is a good correlation between the increase in CaO and MgO (R = 0.802,
p = 4.401 × 10⁻¹²) and P2O5 (R = 0.833, p = 1.089 × 10⁻¹³). The correlation be-
tween CaO and Na2O is weaker (R = 0.525, p = 0.109×10⁻³) and between CaO, K2O
(R = 0.0859, p = 0.557) and SiO2 (R = 0.0965, p = 0.509), no significant correlation
exists. These observations, most likely related to fuel ash contributions to the cru-
cible slag, are discussed in section 5.2.5.
• The change in T iO2/Al2O3-ratio, shown in Figure 5.12, has a normal distribution (ex-

118 Part III: Pi-Ramesse. Chapter 5 Frederik Rademakers
cluding one outlier) around a very minor increase.
• The change in FeO/Al2O3-ratio, shown in Figure 5.13, has no normal distribution. The
scatter plot shows the samples sorted by increasing enrichment. This trend shows
an FeO enrichment with normal distribution around a low value, with an extended
tail of higher enrichment. The low enrichment (normally distributed) occurs in both
body and rim fragments. The tail of samples with higher enrichment (right of arrow)
encompasses mainly body fragments.
The data in Figure 5.13 probably presents two populations: one (±31/49 samples, 63%
of population) normally distributed around a very low iron enrichment, and one
group (±18/49 samples, 37% of population, starting at the bump indicated by the red
arrow) more clearly enriched in iron (no normal distribution). The same histogram
is shown with smaller bin size in Figure 5.14, visualising these two populations. Fig-
ure 5.15 shows that there is only moderate correlation (R = 0.556, p = 0.34× 10⁻⁴)
between CaO- and FeO-increase (the highest CaO enrichment occurs at moderate
FeO-increase and vice-versa), indicating separate sources for these enrichments.
However, they do tend to increase together.
• MnO content is very low (at detection limit), does not show any significant changes,
and may be considered absent.
• As2O3 content is very low (at detection limit), does not show any significant changes,
and may be considered absent.
• CuO content increases to varying degrees. 90% of all samples contain metallic prills,
explaining the CuO increase in nearly all samples. However, due to the irregular
occurrence of prills throughout the slag, their measurement is quite variable: it is
sensitive to prills being present in the analysed frame. Figure 5.16 shows the distri-
bution of CuO enrichment: the bulk of all samples has enrichment up to 6 wt%, with
a few outliers showing higher enrichment.
• SnO2 content increases to varying degrees. Due to the heterogeneous occurrence of
SnO2 aggregates (see Appendix D.4), their measurement is quite variable: it is sensi-
tive to bronze prills and tin oxide clusters being present in the analysed frame. Fig-
ure 5.17 shows the distribution of SnO2 enrichment: the bulk of all samples has en-
richment up to 10 wt%, with a few outliers showing higher enrichment. Figure 5.18
shows a scatter plot of CuO vs SnO2 enrichment, showing some correlation between
both (R = 0.711, p = 0.104×10⁻⁷). The plot shows that there is actually one group of
samples enriched in copper only (pure copper prills) and one group in which CuO

Frederik Rademakers Part III: Pi-Ramesse. Chapter 5 119
and SnO2 increase together. In this second group, there is a higher average enrich-
ment in SnO2 than CuO (±2/1), which does not match the ratio in bronze (usually
±1/20− 1/8). Figure 5.19 shows there is a general trend for higher CuO and SnO2 with
higher ∆C aO/Al2O3(R = 0.495, p = 0.297×10⁻³ and R = 0.657,p = 0.296×10⁻⁶).
• There is an increase in bulk CoO content (0.3-2.1 wt%) for six samples (and occur-
rence of Co-rich phases in an additional three samples, see Appendix D.5).
• There is a modest increase in bulk PbO content (up to 1.4 wt%) for seven samples.
It should be mentioned that with a beam voltage of 20 kV, Pb present in low quantities
are not sufficiently excited to be picked up by SEM-EDS and remains below detection lim-
its (±1 wt%, see section 3.3.5), though pXRF-analysis, using a 40 kV-beam, could pick up
lower concentrations (see section 5.3.2). The same problem exists for Sr.

120 Part III: Pi-Ramesse. Chapter 5 Frederik Rademakers
Figure 5.10: Change in the ratio C aO/Al2O3 between ceramic and slag

Frederik Rademakers Part III: Pi-Ramesse. Chapter 5 121
Figure 5.11: Change in the ratio C aO/Al2O3 vs M gO/Al2O3, P2O5/Al2O3, K2O/Al2O3, N a2O/Al2O3 and
SiO2/Al2O3, between ceramic and slag

122 Part III: Pi-Ramesse. Chapter 5 Frederik Rademakers
Figure 5.12: Change in the ratio T iO2/Al2O3 between ceramic and slag

Frederik Rademakers Part III: Pi-Ramesse. Chapter 5 123
Figure 5.13: Change in the ratio FeO/Al2O3 between ceramic and slag

124 Part III: Pi-Ramesse. Chapter 5 Frederik Rademakers
Figure 5.14: Change in the ratio FeO/Al2O3 between ceramic and slag: bi-modal distribution
Figure 5.15: Change in the ratio C aO/Al2O3 vs FeO/Al2O3, with and without four high FeO-
increase outliers, between ceramic and slag

Frederik Rademakers Part III: Pi-Ramesse. Chapter 5 125
Figure 5.16: Bulk CuO content (in wt%) in slag
Figure 5.17: Bulk SnO2 content (in wt%) in slag

126 Part III: Pi-Ramesse. Chapter 5 Frederik Rademakers
Figure 5.18: Bulk CuO vs SnO2 content (in wt%) in slag

Frederik Rademakers Part III: Pi-Ramesse. Chapter 5 127
Figure 5.19: Bulk CuO and SnO2 content vs ∆C aO/Al2O3 between ceramic and slag

128 Part III: Pi-Ramesse. Chapter 5 Frederik Rademakers
5.2.3 Oxide phases in crucible slag
A full list of oxides occurring in the crucible slag has been established, including details
such as composition, shape, frequency of occurrence etc. Their varying occurrence is
interpreted in section 5.4. The main oxides that occur are Fe-bearing, Ca-bearing, Cu-
bearing, Sn-bearing and Co-bearing phases.
The recognition of these various phases is very time-consuming and their omission here
to some extent misrepresents this crucible research. However, the majority of them do
not offer diagnostic evidence for the technical reconstruction of metallurgical processes.
Therefore, only more diagnostic phases are highlighted throughout this chapter, while the
others are confined to Appendix D, to allow more space for relevant interpretation and
discussion.
Terminology for the different oxides in the crucible slag is adapted from mineralogy (e.g.,
Klein and Dutrow, 2007). However, it should be emphasised that this terminology is used
on the basis of compositional correspondence or similarity to natural minerals. Most slag
crystals are formed during the high-temperature process, and are therefore essentially dif-
ferent from naturally occurring minerals. The importance of this distinction is especially
crucial for the case of tin oxide and cassiterite, as argued in section 5.4.5.

Frederik Rademakers Part III: Pi-Ramesse. Chapter 5 129
5.2.4 Metallic prills
All prills are spherical (unless otherwise noted), indicative of a liquid state during the
crucible process. Under the optical microscope, all copper-based prills have a yellowish
colour, which varies with the Sn content (high-tin prills are lighter, more faded). Common
alloy elements are Sn, Fe, Co, Ni, As and Pb. In a few samples, Cu2S occurs. Here, a list
is given of the main types of prills. A complete overview of all measured metallic prills
is given in Appendix E. Often, prills are too small to measure by SEM-EDS, and noted as
‘micro-prills’.
1. Copper/bronze: The main type of metallic phase found in the crucible slag is cop-
per/bronze. A range of compositions is encountered, going from pure Cu to high-tin
bronze, and less frequently other Cu-alloys. Figure 5.20 shows the phase diagram for
Cu-Sn alloys.
(a) Pure copper, sometimes with cuprite (Cu2O) edge (e.g., Figure D.10a).
(b) Low- to intermediate-tin bronze (0-12 wt% Sn). These prills are dominated by
α-phase bronze (e.g., top left in Figure D.15d). Typical bronze artefacts from
Pi-Ramesse (and most of contemporary Egypt5) have ±5-10 wt% Sn (Herold,
1998; Pusch and Rehren, 2007; Rehren et al., 1998), and belong to this category.
(c) High-tin bronze (over 20-25 wt% Sn). These prills are essential to the discus-
sion of intentional alloying in section 5.4.4. Examples are shown in Figures
D.1c, D.2a, 5.21 and 5.23. Prills consist of either δ-phase (±33 wt% Sn) den-
drites in an α+δ interdendritic (±25 wt% Sn) or a combination of δ-phase, ε-
phase (±40 wt% Sn) and η-phase (±61 wt% Sn). δ-phase, ε-phase and η-phase
are stable under normal casting conditions, while α+δ does not form a stable
solution (see Figure 5.20).
(d) Bronze prills with variable composition, and minuscule dispersed Pb droplets
(Pb is largely insoluble in copper) which do not show up in the bulk compo-
sition of the prill (below detection limit). An example is shown in Figures 5.22
and 5.24.
(e) Cu or bronze prills enriched in other elements (Fe, As, Co, Ni and Pb). One
example of Co-rich prills is shown in Figure 5.23. For its composition and more
examples, see Appendix E.
(f) Non-metallic prills:
5Occasionally higher levels occur, though rarely over 16 wt% (Ogden, 2000).

130 Part III: Pi-Ramesse. Chapter 5 Frederik Rademakers
i. Chalcocite (Cu2S) prills have been noted in six samples. One example is
shown in Figure 5.24.
ii. Cuprite (Cu2O). In many samples, prills entirely composed of cuprite oc-
cur (sometimes, prills of Cu4Cl2O5). These are either indicative of (locally)
very oxidising operating conditions or post-depositional alteration. Exam-
ples are shown in Appendix D.3.
These prills are sometimes composed of multiple phases (as indicated in Appendix
E).
2. Iron: There are no pure Fe-prills occurring in any of the samples, though Fe-rich
prills do occur. The example with highest Fe content occurs in sample 86_0749c.
The two prills shown in Figure 5.25 have the following composition:
Cu Fe As Sn Ni S
Phase 1 7.3 89.4 2.8 - 0.5 -
Phase 2 91.3 6.7 1.0 1.0 - -
Sulphidic edge (3) 67.8 8.1 - - - 24.1
(in wt%)
3. Gold: A single occurrence in sample 86_0749c: a prill with composition: 70 at% Au +
30 at% Cu, shown in Figure 5.26 (see section 5.4.11).
As shown in Figure D.12, dendritic structure in bronze prills is emphasised by differential
corrosion. When a liquid bronze solidifies, the solid metal grows along a dendritic pattern.
The first solidifying metal tends to be rather poor in tin, thereby increasing the tin content
in the liquid phase. As solidification continues, the metal deposited towards the outside of
the dendrites becomes richer in tin and thus harder. This is discussed more fully by Scott
(1991). In a corrosive environment, the softer dendrite cores, low in tin, are removed first,
resulting in a structure as shown in Figure D.12.

Frederik Rademakers Part III: Pi-Ramesse. Chapter 5 131
Figure 5.20: Cu-Sn phase diagram, casting conditions (modified from Scott, 1991; all phase
compositional boundaries approximate)
(a) Sample 87_0762,0Nv (1) (b) Sample 94_0775,01
Figure 5.21: High-tin prills

132 Part III: Pi-Ramesse. Chapter 5 Frederik Rademakers
Figure 5.22: Prill with finely dispersed, undissolved Pb-droplets (and magnetite burnt out
of prill), sample 87_0762
(a) Two phased (high-tin) prill (b) Three-phased prill
Figure 5.23: Co-rich prills in sample 97_0690,02

Frederik Rademakers Part III: Pi-Ramesse. Chapter 5 133
Figure 5.24: Cu2S-prill on the far left and bronze prill (undissolved Pb-droplets) in the
centre, fayalitic slag zone of sample 94_0560 (long chains, dark grey: fayalite; medium
grey: magnetite)
Figure 5.25: Two iron-rich prills in sample 86_0749c (three phases described on p. 130)

134 Part III: Pi-Ramesse. Chapter 5 Frederik Rademakers
Figure 5.26: Gold-rich prill in sample 86_0749c
5.2.5 Charcoal and fuel ash
In situ production remains show that air was blown into the crucibles by tuyères from
above, into a charcoal cover. This charcoal functioned both as fuel, producing heat to melt
the charge, and as a reducing agent (Horne, 1982; Rehren, 1997a). A number of charcoal
fragments from Pi-Ramesse have been analysed by M. Fischer (unpublished). Fragments
from within the QI batteries are mainly acacia, and some fig sycamore6. Charcoal spread
throughout the production levels is predominantly acacia, though some further species
are represented. Charcoal remains are found embedded in the crucible slag in a number
of samples, as shown in Figure 5.27. The pores of the charcoal in each of these examples
shown are filled with Cu-(Fe-)silicate and light enrichment in CaO can be measured in
some cases. During burning, this charcoal formed a fuel ash, which is typically enriched
in lime (CaO), alkali (e.g., MgO and K2O) and P2O5 (Evans and Tylecote, 1967; Misra et al.,
1993; Rovira, 2007; Tylecote, 1982b; Wood, 2009). This fuel ash acts as a flux for the ce-
ramic, lowering its melting temperature and promoting slag formation, and enriching the
slag in these elements. Figure 5.11 shows the change (between ceramic and slag) in the
6Charred fruit pits have been found within the batteries and larger area. These are most likely not in-
tended as fuel, but might reflect workmen eating fruit and subsequently spitting pits into the fire.

Frederik Rademakers Part III: Pi-Ramesse. Chapter 5 135
ratios of CaO, MgO, P2O5, K2O, Na2O and SiO2 to Al2O3 (correlation coefficients given in
section 5.2.2).
Lime, potash and magnesia are the main constituents of fuel ash (Misra et al., 1993, Table
4, p. 111) and should therefore be expected to show good correlation. This holds true for
MgO, but not for K2O. The reason for this is the dissociation of K2Ca(CO3)2 and simultane-
ous volatilisation of K2O formed after dissociation at about 9000C (Misra et al., 1993). As
crucible temperatures reach around 12000C, potash is volatilised and does not contribute
significantly to the fuel ash.
Phosphorus is a minor fuel ash component but, like magnesia, its abundance in fuel ash
remains constant at higher temperatures and therefore is represented proportionally to
lime in the crucible slag.
Silica and soda are usually only present in minor amounts, which could fit the minor in-
crease seen here. Furthermore, SiO2 is so abundantly (and variably) present in the ce-
ramic, that any contributions can be expected to be small relative to background presence.
Soda, however, does show some larger increases in a few samples.

136 Part III: Pi-Ramesse. Chapter 5 Frederik Rademakers
(a) Sample 83_0597l,01 (b) Sample 87_0726,68-78b
(c) Sample 97_0632D,01 (d) Sample 94_0239,01
Figure 5.27: Charcoal

Frederik Rademakers Part III: Pi-Ramesse. Chapter 5 137
Section 5.3
Handheld XRF results
During the 2013 spring study season (May-June), the author took a handheld XRF-device
(pXRF) to Qantir, Egypt, to study the full crucible assemblage in the excavation house. All
crucible fragments were taken out of their find bags, visually inspected and described.
Then, three measurements on the slag surface were taken with the pXRF. The goal of this
study has been to acquire (qualitative) compositional data for the entire crucible assem-
blage. Given restrictions on sample export and the impracticality of studying 1042 sam-
ples by SEM-EDS, pXRF is the most appropriate method to chemically investigate a full
assemblage within a reasonable time-frame7, in a non-invasive manner. The main disad-
vantages to this method are that it provides surface analysis only, and does not produce
quantitative data. Therefore, it can never provide the detailed information presented in
section 5.2. However, under many circumstances, such detailed analysis is not possible
due to sampling, budget, time, and other restrictions. It is therefore a useful exercise to
compare the results from section 5.2 to those obtained by pXRF.
Apart from this methodological exercise, the analysis of the full crucible assemblage has
another use. If the broad trends, such as iron and cobalt enrichment, can be similarly
observed using pXRF, an analysis of the full assemblage could provide a more accurate
view of the distribution of these particular trends within the different contexts on site.
Section 5.3.1 offers a brief overview of the methodological approach, while in section 5.3.2,
the results for the entire assemblage are presented and broad trends are discussed. Details
on sample preparation and analytical protocol are presented in section 3.5.3.
5.3.1 Approach
The goal at Qantir has been to analyse the slag on all crucible fragments. However, five find
bags encountered by the end of the campaign contained such large numbers (>100-200),
that a representative selection8 had to be made.
The slagged surface of 615 crucible fragments was analysed, corresponding to 1834 mea-
surements, out of a total of 1042 crucible fragments. The results for each crucible (three
7The description of all 1042 fragments, including three pXRF measurements per fragment, was performed
in six days (including delays caused by daily power failures and machine overheating).8Representative selection: the total number of rim, body and spout fragments in each bag was counted
and a proportional selection of samples from that bag was analysed.

138 Part III: Pi-Ramesse. Chapter 5 Frederik Rademakers
measurements9) were then averaged. For the five large bags which were ‘sub-sampled’,
the results were proportionally multiplied to achieve the same number of measurements
as there were fragments in the bags. This way, the results below represent a full sample of
the assemblage (1042 fragments). Within this assemblage, 637 body fragments are present,
394 rim fragments and 11 spout fragments.
150 measurements of the ceramic fabric were made, which was expected to have fairly
consistent chemical composition (see section 5.2), with exception of SiO2 content, which
is not measured by pXRF.
XRF typically does not allow reliable measurement of elements with atomic numbers lower
than 11 (sodium) (Shackley, 2011). The three main chemical constituents of ceramic and
slag, SiO2, Al2O3 and CaO, are too light to be measured using a 40 kV beam intensity. To
measure these elements, a method using two beams should be used (one 40 kV beam for
heavy elements and a lower energy beam for lighter elements). As this doubles or triples
measurement time, and metal content is the main interest for this research, this has been
omitted. While the SEM-EDS provides fairly quantitative data on the chemical composi-
tion of ceramic and slag, pXRF clearly does not. Rather, the aim here is to focus on metal
content.
The qualitative analysis of a full dataset, as proposed here, is intended to test groupings
in composition that appeared in the analysis of forty-nine samples analysed by SEM-EDS,
without requiring full quantitative data. The results are not translated into concentrations
(wt%), as quantitative results cannot be expected here (Shugar, 2013). Comparison of peak
intensities for different elements as a proxy for concentrations is dangerous for several
reasons, such as element-dependent intensity, peak overlap etc. Therefore, each element
is considered in isolation, taking into account overlap issues where relevant (see section
3.5).
For each element, intensities (in counts/second) are presented in tables (average, stan-
dard deviation, minimum, maximum, median, 25- and 75%-percentile) as well as his-
tograms10 for ceramic and slag. The slag data is additionally subdivided into body and
rim fragments.
9Three measurements were taken on average; variation exists due to occasional failed measurements and
tiny samples which received only one/two measurements10For each element, the range of measured peak intensities was divided into 30 bins. For each of these
bins, the number of samples with a peak intensity within that bin’s range are shown. The range of the X-axis
(intensity) shown in the figures in section 5.3.2, is kept constant for ceramic and slag. When the actual range
for, e.g., ceramic is smaller than that occurring for slag, this results in narrower bins for ceramic. A note is
made when more than 30 bins are used, which results in narrower bins.

Frederik Rademakers Part III: Pi-Ramesse. Chapter 5 139
The results for each separate fragment are not considered in isolation. Given the hetero-
geneity of crucible slag (see section 5.4.9), this approach is not useful. Rather, the strength
of using pXRF lies in the analysis of large sample numbers, as argued in more depth in
Chapter 13.

140 Part III: Pi-Ramesse. Chapter 5 Frederik Rademakers
5.3.2 pXRF results
5.3.2.1 Titanium
The pXRF-results for titanium are given in Table 5.1 and shown in Figure 5.28.
Ceramic Slag Slag - body Slag - rim
Average 123 85 83 89
Std. dev. 21 21 21 21
Min 40 28 28 41
Max 197 162 162 152
Median 122 83 79 88
25% 114 70 68 72
75% 133 99 96 103
Table 5.1: Summary of pXRF results: titanium
Titanium content in the ceramic is higher than that in the slag; the content for body and
rim fragments is similar. The full SEM-EDS data (Appendix C) equally show an average
decrease of titanium content from ceramic (1.5 wt%) to slag (1.2 wt%), which points to a
dilution effect as titanium is usually not a significant component of the crucible charge.
When looking at the change in T iO2/Al2O3 (see section section 5.2.2), a very small increase
can be noted. This means that the dilution effect for titanium is slightly lower than for
aluminium.

Frederik Rademakers Part III: Pi-Ramesse. Chapter 5 141
(a) Ceramic (b) Slag
(c) Slag: body fragments (d) Slag: rim fragments
Figure 5.28: pXRF: Titanium

142 Part III: Pi-Ramesse. Chapter 5 Frederik Rademakers
5.3.2.2 Iron
The pXRF-results for iron are given in Table 5.2 and shown in Figure 5.29.
Ceramic Slag Slag - body Slag - rim
Average 5610 4689 4712 4653
Std. dev. 826 1444 1591 1178
Min 1990 1541 1541 1988
Max 7507 15705 15705 7937
Median 5600 4523 4553 4505
25% 5248 3793 3834 3769
75% 6016 5424 5434 5411
Table 5.2: Summary of pXRF results: iron
The iron content in the ceramic has a fairly normal distribution around an average of 5610
counts/s. This is higher than the average for slag (4689 counts/s), which however has a
tail of high values. This lowered iron content in the slag is again a dilution effect, similar
to that seen for titanium. To properly assess the change in iron content, the ratio FeO/Al2O3
(see section 5.2.2) should be evaluated. However, aluminium is not measured by pXRF. As
an alternative, titanium, which undergoes a dilution effect similar to aluminium, can be
used: the trends obtained for FeO/Al2O3 in section 5.2.2 have been identically reproduced
by looking at the ratio FeO/T iO2 for the SEM-EDS data (results omitted).
Table 5.3 and Figure 5.30 show the ratios of peak intensities measured for iron and tita-
nium. From these results, the same trend seen in the SEM-EDS data emerges: there is an
increase of iron relative to titanium in the slag compared to the ceramic. However, the in-
crease is not a general trend for all crucible slag: there are two populations present in the
crucible slag.
The ceramic shows a neatly, normally distributed Fe/Ti-ratio, with an average of 46 counts/s
and a maximum of 56 counts/s. For the slag, ±2/3 of the population (711/1042 fragments,
68%) have a value falling within the normal ceramic range (i.e., no significant iron enrich-
ment). The other fragments (331/1042, 32%), however, have increased Fe/Ti-ratios. This
observation corresponds very well with that made for the SEM-EDS data and verifies the
trend seen there.
Figure 5.31 shows a scatter of Fe- vs Ti-intensity for both ceramic and slag, which illus-
trates the same trend: ceramic (red) has a normally distributed ratio of Fe to Ti, and ±2/3
of the slag (blue) falls along that line, while ±1/3 of the slag shows elevated Fe/Ti.
As Table 5.3 and Figure 5.32 show, iron enrichment occurs both in body and rim fragments,

Frederik Rademakers Part III: Pi-Ramesse. Chapter 5 143
but stronger enrichment tends to occur in body fragments. This again verifies trends seen
in the SEM-EDS data.
(a) Ceramic (b) Slag
(c) Slag: body fragments (d) Slag: rim fragments
Figure 5.29: pXRF: Iron

144 Part III: Pi-Ramesse. Chapter 5 Frederik Rademakers
Ceramic Slag Slag - body Slag - rim
Average 46 56 59 53
Std. dev. 4 15 18 9
Min 36 26 26 33
Max 56 195 195 103
Median 46 52 53 51
25% 43 47 47 47
75% 48 60 64 56
Table 5.3: Summary of pXRF results: iron/titanium
(a) Ceramic
(b) Slag (narrow bins)
Figure 5.30: pXRF: Fe/Ti ratio ceramic and slag

Frederik Rademakers Part III: Pi-Ramesse. Chapter 5 145
Figure 5.31: pXRF: Fe vs Ti, ceramic (red) and slag (blue)
(a) Slag: body fragments
(b) Slag: rim fragments
Figure 5.32: pXRF: Fe/Ti ratio in slag (narrow bins)

146 Part III: Pi-Ramesse. Chapter 5 Frederik Rademakers
5.3.2.3 Calcium
The pXRF-results for calcium are given in Table 5.4 and shown in Figure 5.33.
Ceramic Slag Slag - body Slag - rim
Average 173 303 304 301
Std. dev. 191 104 112 91
Min 87 67 67 117
Max 1597 806 806 771
Median 133 301 304 294
25% 117 228 224 235
75% 159 371 381 355
Table 5.4: Summary of pXRF results: calcium
Despite requiring a lower intensity beam to achieve more reliable results, the 40 kV beam
generates some response in the calcium energy range which is worth examining (bearing
in mind that this is less dependable than results for heavier elements). With the excep-
tion of three outliers (not visible in histogram), calcium content in ceramic is fairly low
when compared to that in slag, corresponding to an average calcium enrichment of cru-
cible slag.
Again, the ratio of calcium to titanium can be calculated to remove dilution effects. The re-
sults are shown in Table 5.5 and Figure 5.34, and show the relative increase of the crucible
slag in lime more strongly. The effect is slightly higher in body fragments when compared
to rim fragments.
This agrees well with SEM-EDS results, and reflects the increase in lime due to fuel ash
contributions to the crucible slag.

Frederik Rademakers Part III: Pi-Ramesse. Chapter 5 147
(a) Ceramic (b) Slag
(c) Slag: body fragments (d) Slag: rim fragments
Figure 5.33: pXRF: Calcium
Ceramic Slag Slag - body Slag - rim
Average 1.2 3.7 3.9 3.6
Std. dev. 0.6 1.5 1.6 1.3
Min 0.7 0.8 0.8 1.2
Max 6.5 14.5 14.3 14.5
Median 1.1 3.6 3.7 3.5
25% 0.9 2.7 2.8 2.7
75% 1.3 4.4 4.6 4.1
Table 5.5: Summary of pXRF results: Ca/Ti

148 Part III: Pi-Ramesse. Chapter 5 Frederik Rademakers
(a) Ceramic (b) Slag
(c) Slag: body fragments (d) Slag: rim fragments
Figure 5.34: pXRF: Ca/Ti

Frederik Rademakers Part III: Pi-Ramesse. Chapter 5 149
5.3.2.4 Strontium
The pXRF-results for strontium are given in Table 5.6 and shown in Figure 5.35.
Ceramic Slag Slag - body Slag - rim
Average 215 297 291 307
Std. dev. 53 105 110 96
Min 128 52 52 107
Max 417 651 651 622
Median 210 281 276 302
25% 179 225 208 237
75% 242 368 368 362
Table 5.6: Summary of pXRF results: strontium
Strontium content in the ceramic is lower than that in slag, both for body and rim frag-
ments (slightly higher). Due to its high Kα1 characteristic energy, strontium is not mea-
sured by SEM-EDS at 20 kV accelerating voltage, so results cannot be compared.
Again, the ratio of strontium to titanium is calculated to remove dilution effects. This bet-
ter reveals the relative increase of the crucible slag in strontium (Table 5.7 and Figure 5.36).
The effect is slightly higher in body fragments compared to rim fragments.
As Figure 5.37 shows, strontium- and calcium-increase in the crucible slag correlate well,
indicating a similar origin: fuel ash (Freestone et al., 2003; Pierce et al., 1998; Wedepohl
and Simon, 2010; Wedepohl et al., 2011).

150 Part III: Pi-Ramesse. Chapter 5 Frederik Rademakers
(a) Ceramic (b) Slag
(c) Slag: body fragments (d) Slag: rim fragments
Figure 5.35: pXRF: Strontium
Ceramic Slag Slag - body Slag - rim
Average 1.8 3.6 3.7 3.6
Std. dev. 1.0 1.3 1.4 1.3
Min. 1.0 1.0 1.0 1.2
Max. 9.4 8.6 8.6 8.2
Median 1.7 3.6 3.7 3.4
25% 1.4 2.5 2.5 2.6
75% 2.0 4.4 4.5 4.3
Table 5.7: Summary of pXRF results: Sr/Ti
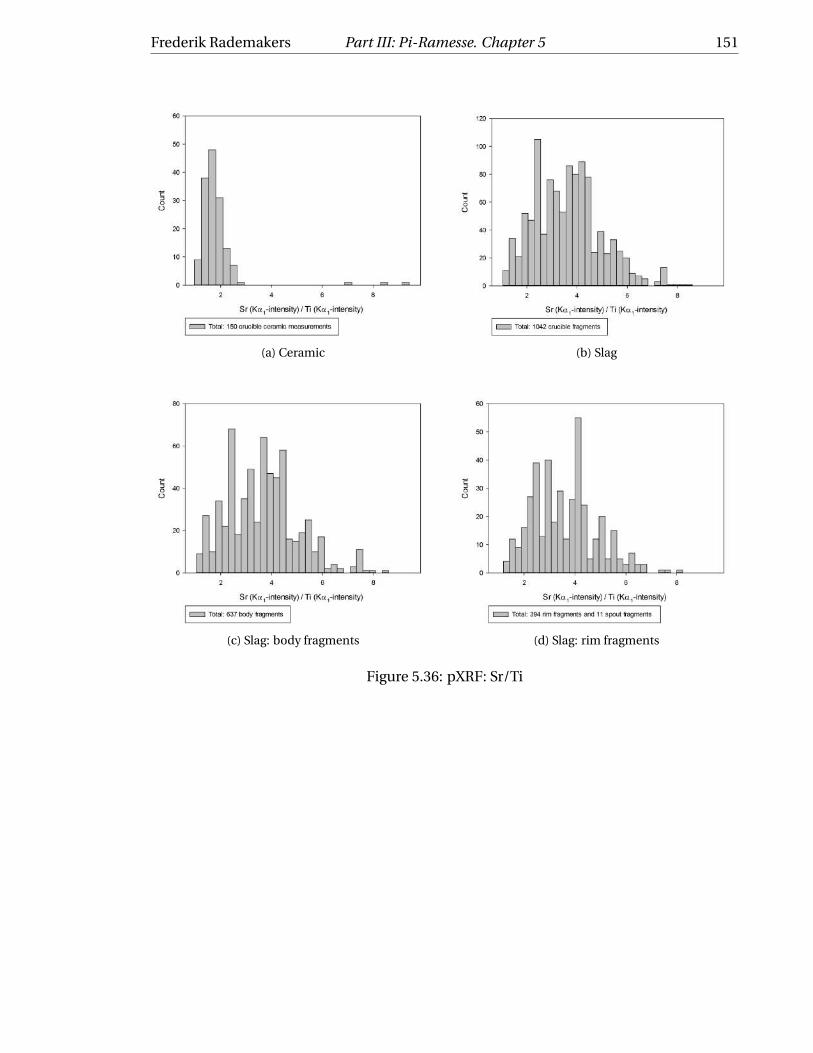
Frederik Rademakers Part III: Pi-Ramesse. Chapter 5 151
(a) Ceramic (b) Slag
(c) Slag: body fragments (d) Slag: rim fragments
Figure 5.36: pXRF: Sr/Ti

152 Part III: Pi-Ramesse. Chapter 5 Frederik Rademakers
(a) Slag
(b) Slag: body fragments (c) Slag: rim fragments
Figure 5.37: pXRF: Strontium vs calcium

Frederik Rademakers Part III: Pi-Ramesse. Chapter 5 153
5.3.2.5 Copper
The pXRF-results for copper are given in Table 5.8 and shown in Figure 5.38.
Ceramic Slag Slag - body Slag - rim
Average 149 2207 2711 1414
Std. dev. 108 3022 3438 1971
Min 22 20 20 25
Max 656 27272 27272 13187
Median 135 1109 1487 626
25% 68 458 473 400
75% 191 2942 3720 1701
Table 5.8: Summary of pXRF results: copper
The copper measured in the ceramic is low, but present. Close inspection of the spectra
shows that there is a very small peak for 8.046 keV, which cannot be attributed solely to the
spectrum background. As copper is not expected to be naturally present in Nile Silt (Allen
et al., 1989; Bourriau et al., 2006; Redmount and Morgenstein, 1996), this peak can prob-
ably be explained as a surface contamination from the sample bag, within which copper
corrosion products are often visible as green dust.
Copper content in the crucible slag varies greatly. This is due to both the varying abun-
dance of copper between different crucibles (trapping effect) and within crucibles (sam-
pling effect). The trend seen here corresponds well to that seen in section 5.2.2. There is
a markedly higher enrichment in copper noticeable for body fragments compared to rim
fragments.

154 Part III: Pi-Ramesse. Chapter 5 Frederik Rademakers
(a) Ceramic (b) Slag
(c) Slag: body fragments (d) Slag: rim fragments
Figure 5.38: pXRF: Copper

Frederik Rademakers Part III: Pi-Ramesse. Chapter 5 155
5.3.2.6 Tin
The pXRF-results for tin are given in Table 5.9 and shown in Figure 5.39.
Ceramic Slag Slag - body Slag - rim
Average 219 1280 1561 838
Std. dev. 33 1382 1578 828
Min 161 110 110 137
Max 315 7630 7630 5223
Median 215 676 930 538
25% 192 255 295 248
75% 239 1859 2492 1028
Table 5.9: Summary of pXRF results: tin
The tin measured in the ceramic is low, and closer inspection of the XRF-spectra shows
that the background has an average value of ±200 counts/s in the 25 kV range. This means
tin is practically absent in the spectrum, which is in agreement with Allen et al. (1989);
Bourriau et al. (2006); Hancock et al. (1986); Redmount and Morgenstein (1996) and im-
plies that tin contamination from the sample bag is not as important as copper contami-
nation.
The amount of tin present in crucible slag varies greatly. This is due to both the varying
abundance of tin between different crucibles (trapping effect) and within crucibles (sam-
pling effect). The trend seen here corresponds well to that seen in section 5.2.2. There is
a markedly higher enrichment in tin noticeable for body fragments compared to rim frag-
ments.
As Figure 5.40 shows, most crucibles show limited copper and tin enrichment. For higher
enrichments, there is little correlation between copper and tin: some crucibles are more
enriched in copper, others more in tin and others yet in both. A similar trend is seen in
Figure 5.18.

156 Part III: Pi-Ramesse. Chapter 5 Frederik Rademakers
(a) Ceramic (b) Slag
(c) Slag: body fragments (d) Slag: rim fragments
Figure 5.39: pXRF: Tin

Frederik Rademakers Part III: Pi-Ramesse. Chapter 5 157
(a) Slag
(b) Slag: body fragments (c) Slag: rim fragments
Figure 5.40: pXRF: Copper vs tin

158 Part III: Pi-Ramesse. Chapter 5 Frederik Rademakers
5.3.2.7 Cobalt
The pXRF-results for cobalt are given in Table 5.10 and shown in Figure 5.41.
Ceramic Slag Slag - body Slag - rim
Average 57 117 143 77
Std. dev. 12 162 193 78
Min 17 19 19 22
Max 89 2748 2748 906
Median 58 65 74 58
25% 51 48 51 46
75% 65 115 148 76
Table 5.10: Summary of pXRF results: cobalt
Cobalt is measured in very low values in the ceramic. Though Allen et al. (1989); Bour-
riau et al. (2006) report trace levels of Co naturally present in Nile Silt (±10-30 ppm), these
are probably below the detection limit here as the Kα1 line for cobalt (6.931 keV) is largely
overshadowed by the Kβ1 line of iron (7.058 keV). This influence of cobalt on the iron Kβ1-
peak is illustrated in Figure 5.42. It appears that, when no significant cobalt is present, the
Kα1/Kβ1-ratio lies between 8 and 11. When significant cobalt is present, this ratio drops be-
low 8. Using this rough cut-off value, 11.6% of the population (121/1042 fragments) shows
elevated cobalt content in the slag.
This result compares fairly well to the SEM-EDS data (section 5.2.2), where (bulk) cobalt
enrichment was measured in approximately 12.2% (6/49) of the samples.
As mentioned in Appendix D.5, cobalt actually occurs in nine samples (±18% of popula-
tion), while only causing a noticeable increase of bulk CoO content in six. There is, then,
a ‘nugget-effect’11 to detecting cobalt in crucible slag, as well as an attenuation effect ef-
fectively ‘hiding’ deeper-lying cobalt from detection by this surface-analysis. By looking
at the non-averaged pXRF-measurements and counting single cobalt occurrences rather
than bulk/averaged contents, an average of 13.8-17% of the fragments can be said to con-
tain cobalt.
11This ‘nugget”-effect is similarly important to the measurement of copper and tin in a sample, impeding
direct comparison between pXRF and SEM-EDS results for a single crucible fragment, as further discussed
in Chapter 13.

Frederik Rademakers Part III: Pi-Ramesse. Chapter 5 159
(a) Ceramic (b) Slag
(c) Slag: body fragments (d) Slag: rim fragments
Figure 5.41: pXRF: Cobalt

160 Part III: Pi-Ramesse. Chapter 5 Frederik Rademakers
(a) Slag
(b) Slag: body fragments (c) Slag: rim fragments
Figure 5.42: Influence of cobalt on secondary iron peak

Frederik Rademakers Part III: Pi-Ramesse. Chapter 5 161
5.3.2.8 Lead and arsenic
The pXRF-results for lead are given in Table 5.11 and shown in Figure 5.43; for arsenic they
are given in Table 5.12 and shown in Figure 5.44.
Given the very close proximity of the Pb-Lα1 (10.551 keV) and As-Kα1 (10.544 keV) lines,
the presence of these two elements is difficult to disentangle. Evaluation of the secondary,
lower-intensity lines (Pb-Lβ1 (12.619 keV) and As-Kβ1 (11.727 keV)) is necessary to inter-
pret the actual presence of these elements. The problem here, though, is that while the
Pb-Lβ1-line has a similar characteristic intensity to the Pb-Lα1-line, the As-Kβ1-line has
a much lower intensity (10% relative to As-Kα1), resulting in lower sensitivity and more
difficult quantification.
As Figure 5.45 shows, there are relative increases in both the Pb-Lβ1 and As-Kβ1 in the
slag compared to the ceramic. The absolute increases are far more dramatic for lead and
remain limited (not exceeding 70 counts/s) for arsenic. Furthermore, Figure 5.46 shows
clearly that increases in Pb-Lα1 are more tightly correlated to an increase in Pb-Lβ1 than
the increases between As-Kα1 and As-Kβ1. This suggests that the high counts/s measured
at around 10.54-10.55 keV should be mainly attributed to lead. A minor presence of ar-
senic, however, cannot be excluded based on this data.
Lead content is not reported in the NAA results of Allen et al. (1989) and Bourriau et al.
(2006). Based on the pXRF data shown here, it appears that there is lead naturally present
in Nile Silt (trace levels).
For a number of fragments, an increased lead content is measured in the slag (though de-
termining a cut-off value is difficult here). This was not revealed by SEM-EDS, which has
fairly high detection limits for lead content when using an excitation voltage of 20 kV. It
should be kept in mind here that even trace levels of lead in the metal charge can lead to
elevated lead contents in the slag when measured by XRF (Dungworth, 2000a; Kearns et al.,
2010). Though some lead might have been present in the crucible charge of a number of
crucibles (some prills analysed by SEM-EDS show undissolved lead), its limited contribu-
tion to the crucible slag suggest that it was probably present as a (copper) contaminant
rather than being added as a separate alloying ingredient to produce leaded bronze. This
is confirmed by object analysis presented in section 5.5. From these pXRF results, some
lead presence can be suggested for ±15% of all crucibles, represented by the high-lead
(>400-500 counts/second) tail in Figure 5.43. This matches the SEM-EDS results (section
5.2.2), where ±15% of all samples exhibited increased bulk lead content in the crucible
slag.
Small amounts of arsenic have been noted in a few prills by SEM-EDS, but not in the bulk

162 Part III: Pi-Ramesse. Chapter 5 Frederik Rademakers
Ceramic Slag Slag - body Slag - rim
Average 16 179 157 212
Std. dev. 12 270 142 393
Min 3 3 3 7
Max 86 2549 1091 2549
Median 13 115 115 118
25% 9 56 61 51
75% 18 202 204 194
Table 5.11: Summary of pXRF results: lead
Ceramic Slag Slag - body Slag - rim
Average 15 166 146 197
Std. dev. 11 250 13 364
Min 3 5 5 6
Max 75 2359 1008 2359
Median 13 107 107 108
25% 9 52 57 46
75% 18 188 192 184
Table 5.12: Summary of pXRF results: arsenic
analysis. Here too, it seems most likely that arsenic was introduced as a copper contami-
nant, rather than being deliberately added as an alloying ingredient.

Frederik Rademakers Part III: Pi-Ramesse. Chapter 5 163
(a) Ceramic (b) Slag
(c) Slag: body fragments (d) Slag: rim fragments
Figure 5.43: pXRF: Lead

164 Part III: Pi-Ramesse. Chapter 5 Frederik Rademakers
(a) Ceramic (b) Slag
(c) Slag: body fragments (d) Slag: rim fragments
Figure 5.44: pXRF: Arsenic

Frederik Rademakers Part III: Pi-Ramesse. Chapter 5 165
(a) Ceramic (b) Slag
(c) Ceramic (d) Slag
Figure 5.45: pXRF: Secondary Pb and As peaks
(a) Lead (b) Arsenic
Figure 5.46: pXRF: Primary vs secondary Pb and As peaks for ceramic (red) and slag (blue)

166 Part III: Pi-Ramesse. Chapter 5 Frederik Rademakers
Section 5.4
Technical interpretation
5.4.1 Interpreting general crucible characteristics
General crucible characteristics, summarised in section 5.1, are further interpreted here.
Crucible wall thickness varies from 1 (rim) to 3 cm (lower body). Typically, three main
parts are present in each section through a crucible wall: a fired ceramic part, a bloated
transition zone and a slag part in which no ceramic structure remains. This structure is
caused by internal heating of the crucible and occurs in all samples, though the extent of
each zone varies between samples.
The ceramic zone is present in most samples, though sometimes the sample has lost all ce-
ramic structure due to heating or, alternatively, the ceramic part has broken off along the
bloated transition zone (acting as a perforated plane of weakness along which fractures
can propagate easily). The thick, porous12 ceramic acts as a thermal insulator (Hein and
Kilikoglou, 2007; Hein et al., 2007, 2013), allowing heat to be maintained inside the cru-
cible. At the same time, its thickness and structure give the crucible mechanical strength:
the temper-induced porosity impedes fracture propagation, while the quartz (which re-
mains largely inert during the metallurgical process) reduces shrinkage, provides further
strength and slows down disintegration at high temperatures (Freestone and Tite, 1986;
Kilikoglou et al., 1995, 1998).
The bloated transition zone is present in each analysed sample. The depth to which the
slag zone penetrates the crucible wall varies, most likely due to changing operating condi-
tions and duration, causing irregular slag zone thickness even within a crucible. In a few
samples, barely any slag is present, which can reflect a lack of slag forming in some (areas
of) crucibles or the slag breaking off from the crucible wall along the bloated zone.
Crucible edge fragments are often vitrified but, as they were most likely not in contact
with the actual metal crucible charge, this ‘slag’ is mainly composed of ceramic and fuel
ash contributions, and limited contamination from the charge. This contrasts with body
fragments, where slag is composed of contributions from the ceramic, fuel ash and metal
charge (and its contaminants). Clearly, rim fragments’ slag reveals mainly fuel ash contri-
butions, while body fragments are needed to reconstruct the metal charge.
12Porosity from burnt-out organic material and thermal expansion of silica

Frederik Rademakers Part III: Pi-Ramesse. Chapter 5 167
It should be emphasised here already that temperature and redox-conditions within cru-
cibles often appear to be very heterogeneous. This can be highly problematic when only
small crucible samples are available for study, as is the case here, because one fragment
does not necessarily represent operating conditions throughout the crucible. This issue is
less important when studying, for example, modern graphite crucibles or medieval mul-
lite crucibles (Martinón-Torres et al., 2006, 2008), which maintain more constant reduc-
ing conditions and barely participate in slag formation. In crucibles like those from Pi-
Ramesse, however, operating conditions are far less homogeneous and the crucible inter-
acts heavily with the charge. Therefore, the study of an assemblage of macroscopically
similar crucible fragments (as is the case here) can yield variable results which should be
interpreted as variations of the same process where possible. Some results, however, are
not clearly related to variation of a single process and point to variations in technology
and material use, as discussed further in the sections below.
Nearly all samples show evidence of metal being charged into the crucibles, with variable
slag enrichment in copper and tin. It is therefore safe to say that these crucibles were
primarily used to process bronze. Whether remelting, alloying or variations thereof were
taking place, is discussed further below.
5.4.2 Aberrant crucible fragments
Before continuing the interpretation of the general assemblage, it should be noted that six
fragments do not fit the general description given in section 5.4.1:
• Three fragments (1984_1171,0001 and 1987_1530a,0013-0014) are significantly thicker,
larger and heavier than average, as shown in Figure 5.47. Though these fragments
could represent the extreme end of the normal variation in crucible size, they are
most likely outliers. Extrapolating from the fragments, these crucibles would have
been very large (� ≈ ±30−40 cm) and probably impossible to move when charged
with metal. They may have been made for a particular purpose, though it is unclear
which. The fragments are from the industrial area: fragment 1984_1171,0001 has
unknown context, while fragments 1987_1530a,0013-0014 were found inside melt-
ing battery II (phase B/3a). These pieces show limited or no slagging, though a few
copper prills are present on the interior surfaces.
• Two fragments (1992_0645b,0001-2), shown in Figure 5.48, seem to belong to a more
shallow crucible type. Again, these could represent the extreme end of the normal

168 Part III: Pi-Ramesse. Chapter 5 Frederik Rademakers
variation in crucible size, but are most likely outliers. Other fragments exhibiting
a bent profile exist, but can reasonably be interpreted as variations of the ‘normal’
shape shown in Figure 5.1. These two fragments, however, exhibit a full profile, in-
cluding a rim and an almost flat bottom, and therefore could represent a different
crucible type. They belong to area QIV-i/28. Both fragments are slagged, but do not
show deviant composition (measured by pXRF). Fragment 1992_0645b,0002 could
be cobalt enriched.
• One fragment (1984_1264d) exhibits clear signs of repair and re-use. As Figure 5.49
shows, the original crucible had a typical profile, with a copper prill adhering to the
rim (blue arrow). After its first use, a new layer of clay was applied over the rim (red
arrow indicates boundary visible on exterior crucible surface, just below the origi-
nal rim), extending the profile by 1-2 cm. The extent to which clay was applied to
the interior surface of the crucible is unclear. The crucible was then re-used, cre-
ating a new slag layer and interior bloated zone. At the rim, this bloated zone does
not completely overwrite the original profile and the two layers can be identified
macroscopically. On the lower end of the fragment though, the two slag layers ap-
pear more fused. As the interior view shows, a clean fracture is needed to reveal
this repair/re-use. No microscopic analysis of this fragment was performed, so it
remains unknown whether the crucible slag from the first operation can be distin-
guished from that of the second operation.
The first five fragments discussed here represent either the extreme ends of the ‘crucible
shape spectrum’ in the assemblage, or distinct crucible types. Either way, they constitute
a marginal part of the assemblage and should not be attributed overly high importance.
The fragment demonstrating a practice of re-use, however, bears further contemplation.
Clearly, signs of re-use are easy to miss, unless a fresh cut of the fragment is made. Even
so, not all sections should be expected to show macroscopic signs of re-use, particularly
those from body fragments. Therefore, re-use could easily go undetected.
Then again, the fact that no other examples of repair were found in the entire assemblage
argues for a limited importance of this practice. Nonetheless, the possible ramifications
should be taken into consideration when formulating a final interpretation of the assem-
blage, and are noted upon in section 6.1.5.

Frederik Rademakers Part III: Pi-Ramesse. Chapter 5 169
Figure 5.47: Exceptionally thick crucible fragments (top: 1984_1171,0001, bottom:
1987_1530a,0013-0014)
5.4.3 Rim vs. body fragments, crucible distributions and sample selec-
tion
A distinction needs to be made between rim and body fragments. Rim fragments are de-
fined as fragments which include a rim in their section. These are mainly fragments with
limited crucible wall remaining below that rim, but include more complete profiles. Body
fragments have no rim attached and a curvature corresponding to a lower part of the cru-
cible profile.
The complete assemblage (1042 fragments) is divided into:
QI (north) Industrial area (QI-Ia): 814 crucible fragments (78.1% of population)
516 Body fragments 63.4%
294 Rim fragments 36.1%
4 Spout fragments 0.5%

170 Part III: Pi-Ramesse. Chapter 5 Frederik Rademakers
Figure 5.48: Exceptionally shallow crucible fragments, 1992_0645b,0001-2 (left: section
through wall, right: section through bottom)

Frederik Rademakers Part III: Pi-Ramesse. Chapter 5 171
Figure 5.49: Crucible (1984_1264d) showing signs of repair and re-use. Top: section show-
ing boundary between original rim and repair layer (red arrow) and a prill on top of origi-
nal rim, beneath repair layer (blue arrow). Bottom: view of interior surface and section

172 Part III: Pi-Ramesse. Chapter 5 Frederik Rademakers
QI (south) Workshop area (QI-Wa): 126 crucible fragments (12.1% of population)
61 Body fragments 48.4%
59 Rim fragments 46.8%
6 Spout fragments 4.8%
QIV Workshop area (QIV-Wa): 97 crucible fragments (9.3% of population)
57 Body fragments 58.8%
39 Rim fragments 40.2%
1 Spout fragment 1%
One rim fragment was found in area QIII and four fragments in area QV-b/9: three body
fragments and one rim fragment.
Overall, body fragments make up 61.13%, rim fragments 37.81% and spout fragments
1.06% of the assemblage. The assemblage from QI-Wa deviates most strongly from this
pattern, containing more rim fragments.
Table 5.13 summarises the distribution of the mounted samples across different areas and
body vs. rim (see Appendix B). This selection deviates from the actual distributions: QI-Ia
is under-represented, while QI-Wa and especially QIV-Wa are over-represented. The over-
all selection of body and rim fragments approximates the actual distribution, but within
each area, the sample selection again deviates from the true pattern: body fragments are
over-represented for QI-Ia and QIV-Wa, and under-represented for QI-Wa.
The selection of samples for detailed analysis was made prior to the start of this project,
before detailed consideration of area and body-rim distributions, and is therefore a given
for this study. However, it has some important implications for the interpretation of an-
alytical results, as body and rim fragments have different characteristics and informative
value (see section 5.2.1 and Chapter 13): relatively less information on the metal charge
for crucibles from QI-Wa is available. Furthermore, overall trends are skewed due to the
contextual distribution of selected samples. The effects of including both body and rim
fragments is considered in the interpretation of tin, iron and cobalt in crucible slag (sec-
tions 5.4.5, 5.4.6 and 5.4.7). Finally, the results are contrasted for each area in section 6.3.
5.4.4 Alloying evidence
The abundant presence of copper and bronze prills in nearly all of the crucible fragments
firmly places them in a context of bronze working. Some high-tin prills (defined as those

Frederik Rademakers Part III: Pi-Ramesse. Chapter 5 173
49 samples mounted for microscopy and SEM-EDS
# Samples # Body fragments # Rim + close to rim fragments
QI Industrial area 23 (47%) 20 (87%) 1 + 2 (13%)
QI Workshop area 11 (22%) 3 (27%) 5 + 3 (73%)
QIV Workshop area 15 (31%) 11 (73%) 2 + 2 (27%)
Total 49 (100%) 34 (69%) 8 + 7 (31%)
Table 5.13: Summary of mounted samples
with dominant δ-, ε- and/or η-phase, see section 5.2.4) give direct evidence for the alloy-
ing of copper (or recycled bronze) with fresh tin (or cassiterite) (Crew and Rehren, 2002;
Rehren, 2001; Rehren and Pusch, 2012).
Re-melting of existing bronze can only result in prills with a tin content equal to or below
that of the original bronze, as tin oxidises preferentially to copper, thereby lowering the tin
content in trapped prills (Dungworth, 2000a; Kearns et al., 2010). When alloying copper
(or recycled bronze) with a fresh source of tin, however, any composition intermediate be-
tween pure copper and tin could occur. Prills of such intermediate composition, as shown
in the phase diagram in Figure 5.50, can therefore be taken as very strong evidence for the
use of a tin-rich material and indicate an active alloying process.
As the goal of alloying copper and tin in Pi-Ramesse would have been to form a manage-
able low- to intermediate-tin bronze (see section 5.2.4), such high-tin prills should be seen
as an intermediate product of the alloying process and their trapping in the crucible slag
incidental. Thus, there are two issues with this type of evidence: its absence cannot be
interpreted as counter-evidence of active alloying (as these prills are only present when
full reaction did not occur in the sampled crucible area) nor does its presence provide any
information on the source of tin used in the alloying process.
Fragments in which low tin bronze prills, pure copper prills or no metallic prills occur, can
therefore belong to a crucible that was used for re-melting or recycling bronze, but may
equally have been used for active alloying.
5.4.5 Sources of tin
Active bronze alloying requires a source of tin to add to either pure copper or recycled
bronze to control the final alloy. The two most common sources are tin metal and mineral
cassiterite (the most common tin ore, SnO2).
Though the presence of high-tin prills indicates the use of a fresh tin source, it does not

174 Part III: Pi-Ramesse. Chapter 5 Frederik Rademakers
Figure 5.50: Cu-Sn phase diagram (casting conditions), showing typical Egyptian cop-
per/bronze composition (A), high-tin prills of intermediate composition (B) and a source
of fresh tin (C) (modified from Scott, 1991; all phase compositional boundaries approxi-
mate)

Frederik Rademakers Part III: Pi-Ramesse. Chapter 5 175
provide information on the nature of this tin. Here, it is argued that tin oxide crystals
present in the crucible slag can, under some circumstances, provide further information
on this tin source.
Tin oxide (SnO2) is abundantly present in the crucible slag and in itself indicative of bronze-
related activity. The varied shapes and forms in which this tin oxide occurs, however,
have received relatively little attention in the archaeometallurgical literature, though some
exceptions exist (Dungworth, 2000b; Eliyahu-Behar et al., 2012; Figueiredo et al., 2010b;
Murillo-Barroso et al., 2010; Rovira et al., 2009; Schwab, 2011).
On the one hand, there are crystals which have shapes that clearly point to high-temperature
formation, which are discussed in section 5.4.5.1. On the other hand, there are clusters of
tin oxide which differ significantly from those crystallized at high temperature. It is argued
in section 5.4.5.2 that these are residual cassiterite grains.
5.4.5.1 Burning out of SnO2
As has been noted before, oxidising conditions can cause bronze to lose some of its tin
content as it oxidises more readily than copper (Ellingham, 1944) and is thus ‘burnt out’
of the bronze. As explained in Appendix G, a limited loss of tin from the bronze charge can
lead to significantly elevated tin content in the crucible slag. This occurs abundantly in Pi-
Ramesse crucibles, as is shown for example in Figure 5.51, where crystals have formed all
around the prill surface. Another example of burning out of bronze is shown in Figure 5.52.
The orientation of the SnO2 crystals (in a circle around the pore) indicates that these were
burnt out from a prill (positioned at the location where now a pore is present). Further
oxidation could have caused the copper to form the cuprite crystals in the pore (though
cuprite formation might be post-depositional).
The tin oxide crystals formed in this way exhibit the shapes shown in Figure D.15, and
occur in at least twenty-two of the analysed crucibles. Often, the core of such crystals con-
tains copper or bronze, indicating that they formed by preferential oxidation of tin from a
liquid melt (Cooke and Nielsen, 1978; Dungworth, 2000b; Hofmann and Klein, 1966; Klein
and Hauptmann, 1999). Tin burning out of bronze in this way is indicative of locally oxi-
dizing conditions in certain areas of the crucible. Tin oxide is then frequently found in a
region rich in metallic copper rather than bronze. These crystals can form under locally
oxidizing conditions in the context of any process involving bronze melting13. Tin could
preferentially oxidise out of bronze that was either recycled (Rovira and Montero-Ruiz,
13Examples of similar crystals forming in Egyptian Blue are shown by Jaksch et al. (1983), Figure 8, p. 533,
and with malayaite by El Goresy et al. (1996), Figure 3.a-c, p.327-329

176 Part III: Pi-Ramesse. Chapter 5 Frederik Rademakers
Figure 5.51: Clear example of tin oxidising out of a large prill (sample 97_0631E,04). Large
clusters of tin oxide surround the prill, which is depleted of tin. More tin oxide occurs
within the prill (shown section is close to prill surface). Cuprite formation, seen around
the prill surface, occurs only after all tin has oxidized from the bronze (right: O.M. image)
Figure 5.52: Copper-oxide crystals in a pore, with SnO2 surrounding it, seemingly concen-
tric - a completely burnt-out bronze prill? (sample 87_0884,01-56c)

Frederik Rademakers Part III: Pi-Ramesse. Chapter 5 177
2003) or freshly alloyed in the crucible. Alternatively, pure tin metal could oxidise directly.
Finally, tin oxide could form directly from the re-crystallization of mineral cassiterite (e.g.,
Figure 5.53 (bottom right), Yener et al., 2003, Figure 12.10, p. 189 and Murillo-Barroso et al.,
2010, Figure 14, p. 1170). Therefore, such high-temperature crystals provide no diagnostic
information towards the source of tin for alloying.
5.4.5.2 Evidence for cassiterite?
Four examples, shown in Figure 5.53, occur in areas of crucible slag where reaction prob-
ably did not reach completion (e.g., deeper area of viscous slag or slag trapped in a crack).
These clusters have the outline of mineral grains (composition: pure SnO2): presum-
ably, these were partly dissolved by the crucible slag and, when the reaction stopped,
re-deposited in their macroscopic mineral shape (similar to residual ore fragments in pri-
mary production slag or partially reacted ilmenite shown in Figure D.4b). The adjacent
metal prills are often bronze (though this is not always the case), indicating the formation
of bronze rather than its oxidation. As Figure 5.53 shows, high-temperature SnO2 crystals
sometimes occur right next to re-deposited mineral grains (top right). This illustrates the
highly heterogeneous conditions within a single crucible. Based mainly on their excep-
tional structural appearance, these partly dissolved grains are taken to be residual cassi-
terite, the most common tin ore. Such residual cassiterite has been identified in at least
five crucibles.
5.4.5.3 Summary of tin sources for alloying
The few examples of possible residual cassiterite grains are insufficient to exclude the use
of metallic tin at Pi-Ramesse. Firstly, there is no diagnostic evidence to be expected in
the crucible slag for the use of metallic tin, so its absence does not argue against the use
of metallic tin. Secondly, no tin ingots have been found at Pi-Ramesse, but this is to be
expected for such a precious metal, as discussed further in section 6.1.2. Therefore, both
cassiterite and metallic tin are likely to have been used for alloying at Pi-Ramesse.
Given that high-tin prills and residual cassiterite are intermediate products of an alloying
process, it is impossible to estimate and compare the prevalence of each within separate
contexts or the site as a whole.

178 Part III: Pi-Ramesse. Chapter 5 Frederik Rademakers
Figure 5.53: Residual cassiterite mineral grains in crucible slag. Bottom right example: left
side partly re-crystallized
5.4.6 Iron enriched crucible slag
In approximately 1/3 of the crucible fragments, the crucible slag shows bulk chemical en-
richment in iron compared to the ceramic. This trend is observed for both the 49 samples
analysed by SEM-EDS and the larger sample analysed by pXRF. However, it should be kept
in mind that this does not necessarily mean that 1/3 of all crucibles was enriched in iron,
as counting both rim and body fragments skews the results: rim fragments are less likely
to be enriched in iron, thereby lowering the overall incidence of iron enrichment. Out of
49 analysed fragments, ±18 are significantly enriched in iron (see section 5.2.1). Only one
of these is a rim fragment and it shows lesser (though significant) enrichment. As 34 out
of 49 analysed fragments are body fragments, it is likely that in reality about 50% of the
crucibles are enriched in iron.
It should be noted that, out of this 50%, a fraction is enriched in both iron and cobalt. This
is the case for ± 25-30% of the iron enriched fragments, or ±15% of the entire population
(see section 5.4.7). This means that the fragments enriched in iron only, make up approx-
imately 35% of the entire population.
A rough comparison between contexts, based on both SEM-EDS and pXRF data, indicates
iron contamination to be approximately twice as prevalent in phase B/2 as it is in phase
B/3. Cobalt enrichment, however, occurs more often in phase B/3 (industrial area) and

Frederik Rademakers Part III: Pi-Ramesse. Chapter 5 179
the B/2 multifunctional workshops than in QIV.
This iron increase is unlikely to derive from the fuel ash or an intentional iron addition.
Instead, it probably originates from the use of a copper source enriched in iron, for exam-
ple unrefined raw copper (Craddock, 2000; Craddock and Meeks, 1987) or copper ingots
containing metallic iron (Rothenberg, 1990) or slag inclusions (Hauptmann et al., 2002).
Cassiterite used for cementation could be another source of iron (Murillo-Barroso et al.,
2010), as could metallic tin enriched in iron-tin inter-metallic phases (‘hard head’) formed
during tin smelting (Chirikure et al., 2010; Crew and Rehren, 2002; Miller and Hall, 2008;
Tylecote et al., 1989), but these are unlikely to be responsible for the high enrichment seen
here as tin would have been added in comparatively low quantities. Moreover, there is
evidence for iron-rich copper prills in the crucible slag (Figure 5.54), as well as iron ox-
idising out of copper and bronze prills and forming magnetite in the slag, as shown in
Figure 5.55. Where locally oxidizing conditions prevail in the crucible, iron will preferen-
tially oxidise out of metallic copper and bronze (or metallic tin) before any copper oxide
is formed (Craddock and Meeks, 1987; Ellingham, 1944; Hauptmann et al., 2002; Merkel,
1990), thereby effectively refining the copper. In this way, a copper used for melting or
alloying which contained a few percent iron could produce strong iron enrichments in the
crucible slag (similar to tin and cobalt enrichment, see Appendix G).
Though this appears to be the most likely scenario, others are possible. When iron-rich
cassiterite is reduced in a cementation process, iron would inevitably be reduced with the
tin, as their reducing conditions are very similar (Miller and Hall, 2008), and thus produce
iron-rich bronze. Similarly, iron-rich bronze could be formed from alloying iron-rich tin
metal with copper. Iron could then oxidise out of this iron-rich bronze in a more oxidis-
ing region of the crucible, as shown in the right-hand image in Figure 5.55. Here, iron in
bronze could derive from either the copper or tin. This creates some ambiguity concern-
ing the origin of iron in these prills. As the overview in Appendix E shows, most iron-rich
prills have significant tin content. Though the left-hand image of Figure 5.55 shows iron-
rich copper rather than bronze prills, the surrounding tin oxide crystals and tin-rich mag-
netite suggest that these prills were iron-rich bronze from which all the tin and most of the
iron has oxidised.
This ambiguity concerning the source of iron largely disappears when considering that the
iron-tin ratio in the iron-rich bronze prills greatly exceeds the levels which could reason-
ably be attributed to iron-rich tin or cassiterite. This suggests that the copper was iron-rich
to begin with. More clarity exists for the samples discussed in section 5.4.7, where copper
prills are enriched in iron, cobalt and sometimes nickel, with iron and cobalt oxidising

180 Part III: Pi-Ramesse. Chapter 5 Frederik Rademakers
Figure 5.54: Iron-rich copper prills (98-99 wt% Cu with 1-2 wt% Fe), sample 83_1149b
Figure 5.55: Iron-rich copper prills (left image, ±0-2 wt% Fe) and bronze prills (right image,
±3-6 wt% Sn and 1-3 wt% Fe) (light grey) from which iron and tin oxidised preferentially
into the crucible slag, forming magnetite (mid grey crystals) and tin oxide (bright angular
crystals). The magnetite is iron oxide incorporating ±1-8 wt% Sn, 1-2 wt% Al and 2-3 wt%
Mg
into the slag from these prills.
5.4.7 Cobalt enriched crucible slag
In ±12% of the fragments, there is a significant increase (2-3 wt% of bulk composition)
of CoO content in the slag, together with iron enrichment. This reflects cobalt contam-
ination in ±15-18% of all crucibles (taking into account body/rim distributions and the
occurrence of Co-bearing prills), revealed in both SEM-EDS and pXRF data. As described
in Appendix D.5, this CoO is mostly found in a spinel-like, Fe-Al-oxide phase, and metallic
cobalt only rarely occurs within copper prills.

Frederik Rademakers Part III: Pi-Ramesse. Chapter 5 181
This cobalt does not occur in the ceramic, so it must have been introduced into the cru-
cible with the charge: either through the copper, tin or fuel ash (or an unknown charge
constituent). Fuel ash has no significant cobalt content and is an unlikely source. Proba-
bly, metallic cobalt was introduced with the copper (as a contaminant) and oxidised into
the slag: similarly to iron and tin, cobalt oxidises preferentially to copper (Ellingham, 1944)
and is burned out into the slag in oxidising crucible environments14. A possible explana-
tion is the use of raw copper which was enriched in cobalt and iron. Cobalt does not occur
as a native metal and is (in modern times) produced as a by-product of nickel and copper
mining. It occurs for example in hydrothermal vein deposits as carrollite (CuCo2S4), and
could therefore have ended up in copper smelted from such ores, as a natural alloy. Using
such an alloy at Pi-Ramesse would probably not have happened intentionally, given that
there seems to be no conscious use of cobalt at the site15 and low amounts (a few wt%) of
cobalt in raw copper would not change its observable characteristics.
Another possibility is that the Co was already present as CoO in the copper. This could be
due to it being part of the slag formed from smelting a Co-rich copper ore. If the copper
from such a smelt was not properly separated from its slag, and this copper, with slag-
inclusions, was melted in the crucibles, the CoO-rich slag could integrate with the crucible
slag, as conditions do not appear to have been sufficiently reducing in the crucibles to
warrant the formation of metallic cobalt.
However, the first explanation is most likely: the cobalt spinel appears to form by oxida-
tion from cobalt- and iron-rich copper prills, similarly to iron (Figure 5.55). Figure 5.56
shows an example of the cobalt-rich spinel aggregates, and the process of oxidation from
a prill into the the slag. In some cases, these prills are further enriched in nickel. Nickel,
however, does not occur as an oxide in the crucible slag: cobalt is more easily oxidised into
the slag than nickel (Hauptmann, 2007). Depending on the relative importance of nickel
compared to cobalt as a contaminant in the copper, nickel could be expected in low con-
centrations in some of the bronze objects from Pi-Ramesse, which is indeed the case (see
section 5.5.1). This combination of iron, cobalt and nickel is indicative of the geological
origin of the ore from which the raw copper, used in these crucibles, was smelted under
14Merkel’s 1990 refining experiments indicate that cobalt (at ppm level) burns off together with iron first,
while tin (at ppm level) is retained in the copper.15It is, however, interesting to note here that the glass-production industry at Pi-Ramesse was focused
almost exclusively on Cu-coloured glass, while only three examples of Co-coloured glass occur (Pusch and
Rehren, 2007), and one CoCu-coloured glass (Smirniou and Rehren, 2013). Importantly, cobalt-blue glass
from New Kingdom Egypt was coloured using alum from the Western Oases of Egypt (Kaczmarczyk, 1986;
Shortland et al., 2006), for example in Amarna (Smirniou and Rehren, 2011; Tite and Shortland, 2003), rather
than using scrap bronze, as has been suggested for the copper-red glas from Pi-Ramesse.

182 Part III: Pi-Ramesse. Chapter 5 Frederik Rademakers
strongly reducing conditions.
There is no evidence to suggest that tin could be a source of cobalt here. The CoO enriched
samples have ‘average’ SnO2 enrichment (no correlation to CoO enrichment) and the ratio
∆CoO/∆SnO2 is 0.3-0.5(-1), which means the slag enrichment in tin is typically two or three
times greater than that in cobalt. Given that the Gibbs-free energy of formation16 for CoO
(s) (at 25 ºC), is 4G0f = −214.22 kJ/mol and for SnO2 (s) (at 25 ºC), 4G0
f = −519.6 kJ/mol
(for SnO (s) (at 25 ºC), 4G0f =−256.9 kJ/mol), tin oxidises more readily than cobalt (Elling-
ham, 1944). In the hypothetical situation where cobalt came into the crucible charge with
tin (metallic or mineral), the ratio of cobalt to tin would have to be very high (±1/1 ) to
achieve the slag enrichments seen here. As typical Co-levels in tin minerals are in the
ppm-range (Northover and Gillis, 1999), such a cobalt-tin alloy or mineral is unlikely to
have existed and been used at Pi-Ramesse.
5.4.8 Lead (and arsenic) in crucible slag
Neither lead nor arsenic are important components of the crucible slag. Low levels of
lead are measured as a bulk chemical component by SEM-EDS for seven out of forty-nine
samples (though near detection limits for two or three of these), and in a similar portion of
the larger sample when using pXRF: ±15% (taking into account body/rim distributions).
It is rarely measured in metallic prills (two samples), though it can sometimes be seen as
insoluble droplets. For the two cases were it is measured in appreciable levels in prills,
it occurs together with arsenic and iron, and in one case with a sulphidic edge, within
fayalitic slag.
Arsenic does not appear as a bulk component using SEM-EDS measurements and its pres-
ence cannot reliably be measured using pXRF. Low amounts of arsenic are measured in
prills for seventeen out of forty-nine samples, accompanied by the presence of iron and
cobalt in eight samples (and nickel in three).
Given the low levels at which both lead and arsenic occur, it seems unlikely that either
were added intentionally to form a lead- or arsenic-rich copper alloy. Probably, both lead
and arsenic were introduced into the crucibles with copper. This could point to the use of
recycled arsenical copper or leaded bronze (though this is unlikely, given lead’s association
to iron and sulphide here and because leaded bronze was very uncommon in Egypt at this
point in time). Another, more likely explanation is that these were contaminants of raw
copper. Lead could be associated to raw copper smelted from ores like those at Feinan,
16Gibbs-free energy values from Oxtoby et al., 2003, Appendix D

Frederik Rademakers Part III: Pi-Ramesse. Chapter 5 183
Figure 5.56: Cobalt spinel in crucible slag. Bottom micrograph shows a large spinel aggre-
gate, probably oxidized out of cobalt/iron-rich copper prills (bright). The spinel has ±77
wt% FeO and 12 wt% CoO, as well as ±5-6 wt% Al2O3, 2-3 wt% TiO2 and 1 wt% SiO2, MgO
and SnO2. The bronze prill contains ±5 wt% Sn, 2 wt% Fe and 0.5 wt% Co

184 Part III: Pi-Ramesse. Chapter 5 Frederik Rademakers
which often incorporates copper sulphides and lead (e.g., EBA III Khirbet Hamra Ifdan
ingot, see Hauptmann, 2007, Figure 7.16, p. 242), though no arsenic. Co-Ni-As-Fe ores ap-
pear in the rooting zones of massive sulphide deposits, for example in Limassol (Cyprus)
where these were mined in Hellenistic-Roman times (Constantinou, 1980; Hauptmann,
2007). The use of copper smelted from such ores could explain the presence of prills with
(some of) these elements in the crucible slag. For example, copper ingots smelted from
ores in Oman are typically enriched in arsenic, cobalt and nickel (Begemann et al., 2010),
though not iron.
An issue with the identification of arsenic in crucible slag is its tendency to volatilise, es-
pecially under oxidising conditions. According to Pigott et al. (2003), the addition of tin
or cassiterite to a crucible charged with Co-Ni-As-rich copper, would further increase the
volatilisation of arsenic. Clearly, this complicates the evaluation of the importance of ar-
senic as a copper contaminant through the study of crucible slag.
5.4.9 Variation in crucible slag
Within the full crucible assemblage, there exists variability in the crucible slag composi-
tion, mineralogy and metal content. This variability is caused by several different interact-
ing factors:
• Variability in the composition of the crucible charge. An example of this is the
enrichment in iron and/or cobalt. Slag containing iron-rich phases usually shows
bulk enrichment in iron-oxide (Figure D.5).
• Variability in the cooling speed of the crucible slag. As Figure D.6 shows, Ca-bearing
phases occur in crucible slag with both low and high bulk lime enrichment. These
phases are most likely formed at low cooling speed, while quick cooling results in
more glassy slag. This effect appears less important for iron-rich phases, which
precipitate whenever the slag bulk content is enriched in iron, due to iron over-
saturation of the glassy matrix at these operating temperatures.
• Variability in redox-conditions. It appears that within a crucible, both reducing and
more oxidising regions exist. This is exemplified by the occurrence of high-tin prills,
created by alloying under relatively reducing conditions, as well as tin oxide crystals,
formed by the oxidation of bronze, within a single crucible.
• Variability in temperature. This variability is most likely directly linked to variabil-
ity in redox-conditions, and controlled through air supply (Hauptmann, 2007). Sud-

Frederik Rademakers Part III: Pi-Ramesse. Chapter 5 185
den variations in temperature can lead to slag solidification which traps liquid metal
prills during the alloying process.
• Variability of the process through time. The oxidising regions, mentioned above,
could exist in the crucible during the melting or alloying stage, but could equally
reflect a more oxidising phase of the process, for example casting. The variability of
the crucible process through time is thus reflected in the crucible slag.
• Degree of slagging. It appears that some crucibles (or areas of crucibles) are more
slagged than others. This is probably due to differences in temperature and fluxing
of the ceramic by fuel ash. The relative change in lime between ceramic and slag
is indicative of the degree of fluxing and slagging of the crucible. This slagging has
important implications:
– More slagged crucibles tend to trap more metal prills, thereby elevating the
bulk metal content.
– Higher metal content due to prill trapping increases the likelihood of metal
contaminants (e.g., iron17 and cobalt) being elevated in the bulk content (though
oxidising conditions are important here).
• Location within a crucible. The strong difference between body and rim fragments
is caused by a combination of the above factors. The most important factor appears
to be the contact with the metal charge, which does not occur close to the rim, as
shown in Figure 5.7. This then again leads to variations in redox-conditions and
slagging.
To summarise, it appears that the variability seen within this crucible assemblage is largely
explained by two principal effects. The first effect is variability within the crucible due to
changing oxygen supply, temperature, material presence and cooling rates. This causes
the crucibles to slag to varying degrees, trap more or less metal prills and contaminants
and exhibit more glassy or crystallised slag. The second effect is the variability in crucible
charge, which introduces different materials, such as iron and cobalt or residual cassi-
terite. This second effect is of the highest interest from an archaeological perspective, but
its visibility is impeded by the first effect.
17This probably explains the small (but existing) correlation between CaO- and FeO-increase (see Figure
5.15).

186 Part III: Pi-Ramesse. Chapter 5 Frederik Rademakers
Na2O MgO Al2O3 SiO2 P2O5 K2O CaO TiO2 MnO FeO CuO As2O3 SnO2 PbO
Normal slag 1.6 2.0 12 68 0.4 1.7 3.0 1.4 0.2 7.9 1.3 0 0.1 0.1
Fayalitic slag 1.7 1.5 5 30 1.5 1.1 8.2 0.5 0.5 38.9 5.8 0.2 4.9 0.5
Magnetite slag 1.4 1.6 4 23 1.3 0.8 9.0 0.3 0.2 31.6 10.7 0.3 15.4 1.1
Table 5.14: Bulk composition of normal slag layer, fayalite-dominated slag zone and
magnetite-dominated slag zone in sample 94_0560 (in wt%, normalised to 100%)
5.4.10 Fayalitic slag in sample 94_560
For this particular crucible, two distinct slag areas are noted:
• A zone of slagged ceramic with increased amounts of fractured quartz but otherwise
‘normal’ crucible slag (relatively ‘deeper’).
• A second zone, partly infiltrating the first area, composed of highly crystallised slag
with high metal content (towards interior surface).
A somewhat sharp, in places angular, boundary exists between these two zones, as shown
in Figure 5.57. This second zone has a much higher FeO content than the typical crucible
slag (outlier in Figure 5.5). It can be further sub-divided into two areas (shown in Figure
5.58):
• Area dominated by fayalitic slag (composition: (Fe,Mg)2SiO4, with Mg/Fe ≈ 1/8) oc-
curring mainly towards the border with the first zone, often with Fe3O4 (magnetite)
interspersed.
• Further towards the inner surface of the crucible, magnetite dominates and less fay-
alite is present.
The bulk composition of the three slag areas is given in Table 5.14, and alumina ratios
in Table 5.15. This shows the chemical similarity between the fayalite- and magnetite-
dominated areas, and large difference between these and the normal slag zone. The two
areas within the second zone are most likely explained by more oxidising conditions at the
inner surface, producing magnetite.
Another remarkable feature of this second zone is the presence of iron-rich prills with a
sulphidic edge, sometimes enriched in As and Pb (see Figure 5.24 and Appendix E).
The most likely explanation for these observations is that the interior zone represents nor-
mal crucible slag as observed in other crucibles, while the second zone represents a layer

Frederik Rademakers Part III: Pi-Ramesse. Chapter 5 187
N a2OAl2O3
M gOAl2O3
SiO2Al2O3
P2O5Al2O3
K2OAl2O3
C aOAl2O3
T iO2Al2O3
MnOAl2O3
FeOAl2O3
Normal slag 0.1 0.2 5.9 0 0.1 0.3 0.1 0 0.7
Fayalitic slag 0.4 0.3 6.1 0.3 0.2 1.7 0.1 0.1 8.1
Magnetite slag 0.4 0.4 6.3 0.3 0.2 2.5 0.1 0.1 8.7
Table 5.15: Alumina ratios for normal slag layer, fayalite-dominated slag zone and
magnetite-dominated slag zone in sample 94_0560
formed on top of this after the formation of the first zone. The sharp boundary between
the two zones argues in favour of this, rather than a segregation into two zones of one
molten material. However, the two layers are fused, suggesting that the second layer came
into contact with the first one while both were still hot and viscous.
The composition of the second layer is very different from that of all other crucible slag. It
lies on a trough in the ternary diagram, indicating low melting temperatures, fairly close to
the ‘optimum 1’ for iron bloomery smelting (as defined by Rehren et al., 2007), and is sim-
ilar to the composition of primary copper production slag (e.g., Maldonado and Rehren,
2009, Figure 8, p. 2003).
A likely explanation here is that a dross-like layer formed on top of the charge during melt-
ing. During casting, this layer stayed behind in the crucible and settled against the crucible
wall, forming a second layer. As both the ‘normal’ crucible slag and the second layer were
still very hot at this point, they fused and cooled down together.
The origin of this second layer is most likely a slag inclusion inside the copper that was
charged into the crucible. This slag inclusion would be a remnant of the primary smelting
process, poorly separated from the raw copper. Such poor separation has been attested for
multiple ingots by Hauptmann et al. (2002); Tylecote and Bachmann (1990) and Zwicker
et al. (1980). Upon remelting in the crucible, this slag would float to the surface of the
liquid batch. During casting, it would then settle on the crucible wall. This process is pre-
sented schematically in Figure 5.59.
It is important to note that this fayalitic slag was not necessarily liquid inside the crucible,
as its melting temperature (derived from the phase diagram shown in Figure 5.5) is ±1150-
1200◦C and exceeds the melting temperature of copper and bronze. Therefore, the fayalite
and magnetite crystals could either be newly formed or residual from the original smelting
process. The presence of iron-rich sulphidic prills18 inside this ‘primary slag’, which did
18The iron and lead content in the prills points to reducing conditions (during primary smelting). The
sulphide indicates that the copper was probably smelted from a sulphidic ore, though this is not necessarily
the case (Balmuth and Tylecote, 1976).

188 Part III: Pi-Ramesse. Chapter 5 Frederik Rademakers
not migrate from it into the metal batch, suggests that this slag may not have completely
liquefied. Furthermore, the large fayalite crystals indicate a slow, homogeneous cooling,
which does not correspond well to formation within an alloying/casting scenario. The
magnetite crystals could have formed on top of the dross layer during the alloying/casting
due to the more oxidising conditions at the surface of the batch, leading to a higher con-
centration of magnetite towards the exterior of the layer. However, a significant fraction of
the magnetite could equally be residual.
Another possibility would be that the second layer was newly formed during the alloying
process as an interaction between the (slagging) ceramic and the metal batch. This would
imply a very high amount of iron migrating from the metal batch into the ceramic, in a
way very different from what is seen in other crucibles (see section 5.4.6). It is unclear,
however, how this would be possible, especially considering the (probably) short duration
of the melting/alloying process.
Though giving a conclusive explanation for this fragment remains difficult, it appears that
the second slag layer was formed through the introduction of a high amount of iron in
the metal batch. This suggests the use of an ‘iron-contaminated’ copper source, probably
with slag inclusions in the copper.
5.4.11 Sample 86_0749c: another peculiar case?
Macroscopically, this sample does not appear very different from other samples. No red
ceramic zone is present (probably broken off), only a grey-black fired ceramic remains and
the slag zone penetrates deep into it, but this occurs frequently. There are, however, some
unusual features to this sample:
• A gold prill with composition 70-30 at% Au-Cu (Figure 5.26).
• Two iron-rich prills with bulk composition 87 wt% Fe, 10 wt% Cu and 1.5 wt% As,
trace Ni and Sn. These prills contain two phases and a sulphidic edge (see Figure
5.25):
Cu Fe As Sn Ni S
Phase 1 7.3 89.4 2.8 - 0.5 -
Phase 2 91.3 6.7 1.0 1.0 - -
Sulphidic edge (3) 67.8 8.1 - - - 24.1
(in wt%)

Frederik Rademakers Part III: Pi-Ramesse. Chapter 5 189
Figure 5.57: Sharp boundary between two slag layers in sample 94_560
Figure 5.58: Fayalite-rich (left) and magnetite-rich (right) area in second slag zone of sam-
ple 94_560

190 Part III: Pi-Ramesse. Chapter 5 Frederik Rademakers
Figure 5.59: Top image: copper oxhide ingot (from Kassianidou, 2009) showing large
slag inclusions in section (from Hauptmann et al., 2002, not to scale). Bottom image:
schematic representation of second slag layer formation: slag-rich ingot as part of cru-
cible charge (left) - slag inclusions (black) rising to float on liquid bronze surface (central)
- slag layer sticks to crucible wall during casting (right)

Frederik Rademakers Part III: Pi-Ramesse. Chapter 5 191
• A copper prill with 1.5 wt% As (not unique, other samples contain prills with higher
As content, see Appendix 5.2.4).
• Copper occurs mostly as an oxide.
• Sample 86_0749c has low CuO (0.76±0.71 wt%) and SnO2 (0.41±0.12 wt%) bulk con-
tent in the slag.
Disregarding the gold-rich prill, all of the features listed here are not unique and occur
in other fragments within the assemblage. This particular sample could be interpreted
as vitrified (fuel ash contaminated), probably from close to the crucible rim, with limited
metal enrichment. The presence of two sulphidic prills is unusual, but not unique, and
could point to the use of an impure copper source (see sections 5.4.6 and 5.4.10).
The occurrence of a gold-rich prill (though only a single one was found), is unique within
the assemblage. If this is interpreted within the general setting of bronze production, it
probably points to the recycling of a formerly gilded copper or bronze. Interesting to note
here, is that Pusch and Rehren (2007) discovered microscopic gold prills in some glass
fragments, which they tentatively relate to white quartz (basic glass constituent) being
sourced from gold mining regions in the Eastern Desert or Nubia.
Viewed in isolation, the lack of significant copper and tin enrichment could point to this
crucible being used for a non-bronze related process, e.g. remelting a gilded copper. How-
ever, the general characteristics of this crucible allow it to easily fit into the variability seen
within the rest of the assemblage. Taking note of the occurrence of a single gold-rich prill,
this crucible should probably be included as part of the ‘normal’ assemblage.

192 Part III: Pi-Ramesse. Chapter 5 Frederik Rademakers
Section 5.5
Lead isotope analysis
Before starting an overall discussion of bronze metallurgy at Pi-Ramesse (Chapter 6), the
results from lead isotope analysis are presented.
The lead isotope (LI) ratios have been analysed for two main material types: metal remains
(26 copper alloys: some artefacts, some spills, drops etc.) and crucibles (both ceramic and
slag parts of 12 crucibles and 1 further slag part). The sample information and raw data
from these analyses are presented in Appendix F. These two datasets are discussed in sec-
tions 5.5.1 and 5.5.2, before attempting to reconcile all data in an overarching interpreta-
tion.
Some of this data (9 metal samples) was produced by the Oxford Isotrace Laboratory in
1996 within the Pi-Ramesse project, but has not been published or interpreted further
since its mentioning by Gale (1999). The majority of the lead isotope data has been pro-
duced within the framework of this PhD by the Curt-Engelhorn-Centre Archaeometry Lab-
oratory for Material Analysis (crucibles and metal spills). A selection of copper alloy ma-
terials has been made to get a representative spread across contexts and time, within the
limited range of metal samples available in London, taking into account considerations
of sample size and corrosion. The crucible samples were taken from the same crucible
fragments previously sampled for analysis in mounted section. As such, an attempt has
been made to reflect the different groups discussed earlier: ‘clean’, iron contaminated,
iron-cobalt contaminated and (mildly) lead contaminated crucibles.
The sample numbers, both metal and crucible, are largely dictated by sample availability
and budget considerations. As such, they are far from an ideal sample in statistical terms,
but offer a qualitative assessment of the lead isotope compositional variability within the
Pi-Ramesse bronzes.
5.5.1 Copper and bronze
The results for the LI analysis of all copper (alloys) are shown in Figure 5.60, distinguishing
between the Isotrace and CEZ data. These samples and their contextual data are presented
in Table F.1.
Most samples are (corroded) unidentified metal fragments, a few objects and two metal

Frederik Rademakers Part III: Pi-Ramesse. Chapter 5 193
prills extracted from crucibles. Lab-XRF analysis was performed for all samples19, and
NAA for seven of the samples (results summarised in Tables F.2, F.3 and F.4). Lead contents
generally vary between <0.01 wt% to 1.1 wt% (average: ±0.5 wt%), with the exception of
four samples that have higher lead content (three with ±2 wt%, one with ±5 wt%).
The lead isotope data is presented as ratios of 204Pb, which provides a better means to
distinguish between various lead sources and assess potential mixing more easily20 (El-
lam, 2010). The data shows a fairly wide spread, pointing to copper from various sources
being used. No radiogenic lead appears to be present in any of the samples. Some sam-
ples, indicated in Figure 5.61, have very low lead contents, while others have unusually
high lead contents. Rather than discussing the complete dataset straight away, the follow-
ing sections address some particular patterns emerging from the data, before an overall
interpretation is offered.
5.5.1.1 Apliki, Cyprus
The oxhide ingot fragment (1987_0803,0004) has previously been identified as coinciding
with the LI range characteristic of Apliki ores by Gale (1999). Figure 5.62 shows a com-
parison between the LI composition of the copper (alloy) samples from Pi-Ramesse and
Cypriot copper ores (Limassol, Solea and Apliki, data from Gale et al., 1997), and copper
ingots from the Uluburun wreck (ingot core data from Gale, 2005).
The oxhide ingot fragment indeed falls within the Apliki LI range (when considering both
iron and copper ores), and matches the similarly identified Uluburun wreck ingots (as well
as Apliki-consistent ingots identified by Yahalom-Mack et al. (2014)). Furthermore, sam-
ples 97_0390,02- and 87_0897a,01-45 (2) lie very close to the oxhide ingot and match the
Apliki field as well. These are both metal prills, which were embedded in crucible slag
and extracted for analysis. Unfortunately, no chemical compositional data is available for
these two samples.
This result is particularly interesting, as it is the first evidence of a Late Bronze Age oxhide
ingot (fragment) being molten down in a crucible.
Some close resemblance can be seen for two samples (1986_0720 and 1992_0905,0002)
with the Limassol copper ores. However, exploitation of this copper source during the
19With the exception of 2 prills that were analysed together with the crucibles, for which no compositional
data is available.20It should be noted, however, that the same conclusions were reached during exploratory analysis of
the data using the more common ratios found in archaeological literature (207Pb/206Pb vs 208Pb/206Pb and208Pb/204Pb). The ratios of 204Pb, however, provide even better distinction between groups. 207Pb/204Pb and206Pb/204Pb are easily calculated from the other ratios presented in Appendix F.

194 Part III: Pi-Ramesse. Chapter 5 Frederik Rademakers
Figure 5.60: LI compositions for all analysed copper (alloys)

Frederik Rademakers Part III: Pi-Ramesse. Chapter 5 195
Figure 5.61: LI compositions for all analysed copper (alloys), showing high- and low-lead
samples

196 Part III: Pi-Ramesse. Chapter 5 Frederik Rademakers
Figure 5.62: Comparison of Pi-Ramesse copper to Cyprus ores and Uluburun ingot cores
LI compositions
Late Bronze Age is not well understood (Kassianidou, 2013) and is mainly confined to Hel-
lenistic and Roman times (Constantinou, 1980; Hauptmann, 2007; Stos-Gale et al., 1997).
As discussed below, these samples more likely have a different provenance.
5.5.1.2 Moderately lead-rich samples - Timna/Feinan
Figure 5.63 shows a comparison of the LI composition of the Pi-Ramesse metal samples
with Feinan (data from Hauptmann et al., 1992) and Timna (data from Gale et al., 1990)
copper ores. The three samples with ±2 wt% lead content all fall within the isotopic range
characteristic for both Feinan (DLS ores) and Timna, which are geologically very similar.
Their moderate lead content is in line with an interpretation as copper smelted from ei-
ther Feinan (DLS) or Timna ore, though lead contents for Timna tend to be lower (Haupt-
mann, 2007). The moderate iron content in these three samples does not contradict their

Frederik Rademakers Part III: Pi-Ramesse. Chapter 5 197
interpretation as raw copper (ingots). It must be noted that major mining activity for both
Feinan (Ben-Yosef et al., 2010; Levy et al., 2012) and Timna (Ben-Yosef et al., 2012) should
be situated in the Iron Age, rather than Late Bronze Age. Given strong indications for cul-
tural contact between Egypt and Timna during the Late Bronze Age (Rothenberg, 1987,
1988, 1990), and its geographical vicinity, it is more likely that these three samples repre-
sent Timna copper. Further correspondence to Timna copper can be found in comparison
to ingots discussed by Yahalom-Mack et al. (2014). Feinan, however, cannot strictly be ex-
cluded.
The proximity of the ‘tail’ of the Feinan data (high 208−207−206Pb/204Pb, representing MBS
ores) to the largest cluster of Pi-Ramesse copper (see section 5.5.1.3) most likely holds lit-
tle value.
Interestingly, these three samples all belong to the QIV context. Sample 1987_0512,0002
lies fairly close to them and could equally match Timna (or Feinan) but is not characterised
by increased lead content (only 0.3 wt%).
5.5.1.3 Largest cluster
The largest cluster of data (around ±38.8-39 208Pb/204Pb, ±15.67-15.70 207Pb/204Pb and
±18.7-18.9 206Pb/204Pb) shows strong likeness to one of the few available metal LI data-
sets available for Egypt: the bronzes from Amarna (Stos-Gale et al., 1995), chronologically
separated from Pi-Ramesse by only ±50 years. These are plotted alongside the Pi-Ramesse
metal in Figure 5.64, together with contemporary Egyptian Blue samples from the Rames-
side fortress at El Rakham (Shortland, 2006). Clearly, these three groups show very close
resemblance in their LI composition.
At the time of publication, Stos-Gale et al. (1995) concluded that one of the Amarna sam-
ples might reflect Timna ores, while some overlapped with the Lavrion copper ores from
Greece (Gale et al., 2009), and the majority could not be assigned to any known ore source.
More recently, a comparison was made to the Taurus 1A ores in Anatolia (Yener et al.,
1991), which appeared to coincide with the ‘unknown’ end of the Amarna data (Philip
et al., 2003). However, these are lead ores, and therefore not useful for comparison here.
The Pi-Ramesse, Amarna and El Rakham LI results are shown together with the Lavrion
copper ore LI data (from Oxalid21) in Figure 5.65. This image shows that, though a few
copper samples match the Lavrion copper ores, the majority does not coincide. In fact,
the Lavrion copper ore lies on a different axis from this ‘Egyptian group’ (Lavrion sitting
21Oxalid: Oxford Archaeological Lead Isotope Database (http://oxalid.arch.ox.ac.uk/). LI data drawn from
several publications is brought together there. Most of the Lavrion copper ore data is, however, unpublished.

198 Part III: Pi-Ramesse. Chapter 5 Frederik Rademakers
Figure 5.63: Comparison of Pi-Ramesse copper to Feinan and Timna LI compositions

Frederik Rademakers Part III: Pi-Ramesse. Chapter 5 199
Figure 5.64: Comparison of Pi-Ramesse copper to Amarna copper and El Rakham Egyp-
tian Blue LI compositions (left: all data, right: close-up)

200 Part III: Pi-Ramesse. Chapter 5 Frederik Rademakers
Figure 5.65: Comparison of Pi-Ramesse and Amarna copper and El Rakham Egyptian Blue
to Lavrion copper ore LI compositions (left: all data, right: close-up)
below it in terms of 208Pb/204Pb), and the proximity to some of the copper samples here is
most likely incidental.
This group does not correspond to any of the other ‘well-known Late Bronze Age copper
suppliers22’ (Stos, 2009), but appears to be a local, Egyptian metal group (not necessarily
equating Egyptian ore sources). The contemporary material from Amarna and El Rakham
offers particularly good support for such a statement.
Apart from Amarna, Maadi (Abdel-Motelib et al., 2012) and Tell el-Farkha (Rehren and Per-
nicka, 2014), discussed below, the only known published LI analysis of Egyptian metals is
by Fleming (1982), who examined Late Period Egyptian bronzes (8th-5th century BC) from
Sanam abu Dom and Kawa (Upper Nile region) and Memphis (Lower Nile). It is important
to note here that these are mainly leaded bronzes, such that their isotopic composition is
dominated by that of the lead metal added to the alloy. Therefore, their comparison here
is not very instructive.
Other materials have been analysed by Brill et al. (1974), El Goresy et al. (1998), Fleming
22Comparisons have been made to Cypriot, Arabah, Anatolian, Omani, Sardinian and Cretan ores

Frederik Rademakers Part III: Pi-Ramesse. Chapter 5 201
(1982) and Shortland (2006), including lead and silver objects, a few ores, kohl (majority of
samples), glass, faience, Egyptian Blue and green frit. With the exception of Egyptian Blue,
the LI composition of these materials mostly reflects their important lead content. The
kohl (eye-paint produced from galena), for example, matches quite well to Egyptian lead
ore bodies (Shortland, 2006) and indicates domestic production. This group of materials,
however, offers no useful comparison for the Pi-Ramesse copper.
The Egyptian Blue samples from El Rakham, a coastal fortress-town from the reign of Ram-
ses II at the western border of Egypt, offer more fruitful discussion. These appear to coin-
cide quite well with the Pi-Ramesse and Amarna copper, which could indicate the use of
similar copper for their production. In this context, the suggestion by Rehren et al. (2001)
that Egyptian blue cakes were produced at Pi-Ramesse, and probably traded throughout
Egypt, is particularly remarkable, and may shed further light on the interconnections ex-
isting between the different high-temperature technologies at Pi-Ramesse. Though Short-
land (2006) concludes that the copper used to produce these pigments must have come
from outside of Egypt, this must be revisited here in light of more recent investigations.
Abdel-Motelib et al. (2012) offer an overview of mining and smelting in the Eastern Desert
of Egypt and in Sinai. It is important to note that all mineralisations there are very pure:
very low concentrations of arsenic, nickel, cobalt, bismuth, lead, silver and gold occur,
and should similarly be expected in any metal smelted from these ores. Though the ma-
jority of explored sites show evidence for Chalcolithic, Early and Middle Bronze Age ex-
ploitation, there is evidence for significant Late Bronze Age copper production as well.
Specifically at Bir Nasib I, Abdel-Motelib et al. (2012) estimate that over 5000 ton of copper
may have been produced during the New Kingdom, with ore probably coming from Wadi
Umm Rinna, making it a major production area. It is therefore worth comparing LI data for
these ore sources to copper from Pi-Ramesse, as was recently done by Rehren and Pernicka
(2014) for metals from Tell el-Farkha. As discussed there, some of the Tell el-Farkha metal
indicates radiogenic lead, which is most readily explained by a Sinai provenance, while
other samples have higher 207Pb/206Pb, which could equally point to Sinai, but are hard to
distinguish from Feinan. In conjunction with the radiogenic lead samples, however, Sinai
appears to be the most likely ore source for the majority of metals in Tell el-Farkha.
No radiogenic lead is attested for Pi-Ramesse (or Amarna), but a comparison to Sinai and
Eastern Desert copper (ores) can still be made, and is shown in Figure 5.66. It is impor-
tant to bear in mind, however, that 204Pb-measurement was fairly imprecise for the Abdel-
Motelib et al. assemblage (E. Pernicka, pers. comm., November 2014).
Again, there is no overlap with the large cluster from Pi-Ramesse (and Amarna) for any of
the ore samples, though they fall within the broader LI range. The closest match is seen

202 Part III: Pi-Ramesse. Chapter 5 Frederik Rademakers
Figure 5.66: Comparison of Pi-Ramesse copper to Sinai and Eastern Desert copper ore,
slag and metal LI compositions (left: all data, right: close-up)
for a copper ore fragment found in Maadi, most likely brought in from Sinai (Maadi H31 II
5/4), dating to the Naqadian period (4th millennium BC). A copper fragment from Sheikh
Muhsen overlaps with one of the moderately high-lead samples. Given the pure nature
of these ores, Timna/Feinan is a more suitable candidate here. In general, the Sinai and
Eastern Desert ores appear to sit both above and below the large Pi-Ramesse cluster in ‘LI
space’. It must be emphasised that this data reflects a very large range of deposits and ex-
ploitation evidence spanning several millennia. The most relevant site for this study, Bir
Nasib I, is represented by only two (slag) samples, both of which have low to very low lead
content.
The (admittedly limited) current evidence indicates that early Egyptians relied at least to
some degree on local copper production from the Eastern Desert and Sinai in their pro-
vision of copper. Mining evidence further shows that there is continuity in production
from this region at least up until Middle Kingdom times. Even during the New Kingdom,
there was large scale production of copper from Bir Nasib I, South Sinai (Abdel-Motelib
et al., 2012; Rothenberg, 1987; Yahalom-Mack et al., 2014), as well as the exploitation of

Frederik Rademakers Part III: Pi-Ramesse. Chapter 5 203
gold sources in the Eastern Desert (Klemm and Klemm, 2013). Altogether, there is fairly
compelling evidence to suggest that ‘domestic copper’, coming from the Eastern Desert
and/or Sinai, would have been in circulation in Egypt throughout its pharaonic history
(see section 4.5). This copper, already attested early on in Maadi and Tell el-Farkha, would
have probably been regularly replenished with freshly mined ‘domestic copper’, as well
as (perhaps more occasional) copper from abroad. Here, the most likely candidates for
long-time contribution are Timna (and Feinan), while sources from further away (Cyprus,
Greece, Anatolia, etc.) are expectedly minor contributors, at least up until the Late Bronze
Age.
For Pi-Ramesse (and Amarna), it would be highly likely that at least some of this ‘Egyptian
domestic copper’ (the mainstream and scrap copper in circulation, as defined by Rehren
and Pusch (2012)), was used. This could be both freshly mined copper and recycled cir-
culating copper or bronze. In fact, there are good indications for the practice of recycling
within the Pi-Ramesse workshops (see section 6.1). The presence of ‘domestic copper’
should therefore be reflected in the lead isotope field presented here.
It can therefore be suggested that this large LI cluster is in fact this ‘domestic copper’, rep-
resenting both freshly smelted copper from various Sinai and Eastern Desert (extending
into Nubia) copper ores, as well as recycled metal from these sources. Though no perfect
match currently exists with the available data for these ores, this may be the most likely
explanation for the clustering of the Pi-Ramesse, Amarna and El Rakham material. It is
hoped that this hypothesis can be further tested in the future with more extensive data
from various Sinai and Eastern Desert copper ores.
The notion of recycling should be expanded a bit further here. If circulating copper was in-
deed recycled and mixed within Egypt, with regular replenishment from its ‘domestic ore
sources’ (Sinai and Eastern Desert), some clustering of LI composition would be expected,
though a spread towards the end members of this mixing scenario would be maintained if
regular replenishment took place. However, recycling does not necessarily imply mixing.
For the interpretation of such a scenario, more LI data is required from both Egyptian
metal and ‘domestic ores’ to produce a diachronic picture for Egypt. This 19th Dynasty
‘snapshot’ cannot elucidate this any further. It can be noted, however, that the Sinai and
Eastern Desert show such a large LI compositional range, that, even though no exact over-
lap with the Pi-Ramesse metal exists for the current ore samples, copper ores probably
exist which match the ‘domestic metal group’ seen here, and are yet to be analysed. Alter-
natively, a selection of ores (surrounding the ‘domestic group’) may have been mixed to
arrive at this ‘domestic group’ composition, but it is currently impossible to validate this.
It is important to point out that this provisional interpretation differs from the (much

204 Part III: Pi-Ramesse. Chapter 5 Frederik Rademakers
debated) koine proposed for the eastern Mediterranean trade as a whole by Budd et al.
(1995b). The scale envisaged here is much smaller, and concerns a far more closed system,
with metal input limited to internal sources (Eastern Desert and Sinai, perhaps Timna),
with only the occasional influx of foreign metal23 (compare to suggestions by Pinarelli
(2004) for local Sardinian copper). This metal would have circulated internally in the Egyp-
tian economy, where it could have been regularly recycled. This is suggested, for example,
by the tight control over metal tools seen at Deir el-Medina (Eccleston and Kemp, 2008),
and indications for the recycling of metal tools in the workshops (QI and QIV - B/2) at Pi-
Ramesse (Prell, 2011). The general attitude of ancient Egyptians (especially the pharaonic
state itself) towards (precious) resources seems to have been quite frugal, favouring a sys-
tem of recycling.
5.5.1.4 Further information from chemical compositional data
Before continuing the discussion on LI composition for the remaining samples, some
notes on chemical compositions are made.
Tin content averages at±10-11% (see Figure 5.67). However, four samples (1984_1162,0001,
1985_0205,0001-0003, 1986_0909, and 1987_0803,0004) consist of unalloyed copper. In-
terestingly, these samples all have low (below detection limits) lead content as well, which
does not occur for the alloyed samples. In terms of LI composition, they mainly plot in-
termediate to the clusters identified so far (see Figure 5.61). The two crucible prills which
match the Apliki oxhide ingot are expected to have similarly low lead content, but this
has not been measured. This coincidence of low lead and tin content is remarkable, as it
concerns 15-20% of the samples.
Another interesting observation related to the unalloyed samples is that they have low gold
contents as well. For samples 1984_1162,0001 and 1985_0205,0001-0003, gold content is
<10 ppm, while the average gold content in the bronze samples is >100 ppm (no NAA data
available for other two unalloyed samples). This could point to the presence of >100 ppm
gold in most copper used at Pi-Ramesse, with the exception of these few instances. How-
ever, it is more likely that the tin used for alloying at Pi-Ramesse contained traces of gold,
which is thus present in all bronzes. This would not be contrary to the proposed use of
alluvial cassiterite from the Eastern Desert in a cementation process for bronze produc-
tion (section 5.4.5). A similar argument was made for gold content noted in the Amarna
23Shaw (1998) notes that the quantities of copper acquired through Egyptian mining are cited by the an-
cient Egyptians in thousands [sic], while only small amounts came in through (military) expeditions abroad.

Frederik Rademakers Part III: Pi-Ramesse. Chapter 5 205
Figure 5.67: Histogram showing tin content for metal samples
bronzes by Stos-Gale et al. (1995) (referring to alluvial tin and gold deposits of Abu Dab-
bab).
0.2% gold was measured in one bronze object (1982_0219b,0002), described as possibly
gilded. Such objects might have been indiscriminately remelted in the Pi-Ramesse cru-
cibles, as indicated by copper-gold prills in crucible 86_0749c (section 5.4.11). The rarity
of gold in both the bronze crucibles and objects suggests that it was not intentionally or
actively processed in the bronze workshops at Pi-Ramesse (though it was probably worked
elsewhere in the capital, see Pusch, 1999a). The LI composition for this sample sits below
the ‘domestic group’.
The lead content for all samples is summarised in Figure 5.68. With the exception of four
samples with strongly elevated lead content (±5% and ±2%), all bronze samples have lead
contents of±0.5%. The four unalloyed copper samples have lead contents below detection
limits. The lead content in the bronzes most likely indicates the presence of lead as an
unintentional contaminant of copper, rather than its intentional alloying (in which case
one would expect a normal distribution around a value exceeding 1%). Though values up
to ±1% occur in four samples, this seems to be the normal range for limited remnant lead
in copper (most likely from the smelting process (Pernicka et al., 1990), though possibly
from repeated recycling of (moderately) leaded copper).
High iron content (7.5% by NAA, 4.4% by XRF) is noted in sample 1985_0205,0001-0003,
with moderately high iron content noted in another three or four. In at least two of these,

206 Part III: Pi-Ramesse. Chapter 5 Frederik Rademakers
Figure 5.68: Histogram showing lead content for metal samples
there is significant cobalt enrichment as well. Moderate to low iron content (low<0.5%,
0.5%<moderate<1%) can be noted in most other samples (iron is below detection limits
for the nine Isotrace samples).
This iron (and cobalt) content derives from a combination of several factors, including the
ore composition, primary smelting process (redox-conditions etc.) and refining/recycling
processes. The importance of these factors can vary for different samples, as they may
have gone through different technological trajectories through time, and their absolute
contents can therefore not be directly compared. Figures 5.69 and 5.70 show the iron and
cobalt content in all analysed samples. This shows a similar pattern to that seen for lead,
indicative of its presence as a contaminant in the copper (ore), diluted throughout met-
allurgical operations. This matches very well the results from crucible slag analysis con-
cerning iron and cobalt (sections 5.4.6 and 5.4.7). As Figure 5.71 shows, iron and cobalt
content do not fully correlate. Crucible analysis indicates that some iron-rich copper was
used, which did not contain significant cobalt, while some copper had significant cobalt
content, invariably accompanied by iron. This is mirrored by seven samples in Figure 5.71
with cobalt below detection limit, and eight samples with 0.01-0.06% Co. Cobalt content,
when present, appears to have some correlation to iron content. Due to variable losses
during smelting, remelting/recycling, alloying etc., a weak correlation is all that can be ex-
pected here.
The variable presence of cobalt (with iron) points to the use of copper smelted from cobalt-
bearing ores. This provides further information on the geology of the copper ore sources

Frederik Rademakers Part III: Pi-Ramesse. Chapter 5 207
Figure 5.69: Histogram showing iron content for metal samples
for these samples, which could be useful in conjunction with the LI data. The absence
of cobalt in other samples, however, could be due to losses during previous metallurgical
operations, or indicative of the use of different ores.
Further plots of arsenic, nickel, cobalt, antimony, iron, lead, tin, zinc, silver and gold con-
tent are shown in Appendix F. Arsenic (average 0.5%), nickel (average 0.03%), antimony
(average 0.042%), tin and gold (average 83 ppm) show fairly good correlation between
each other, with correlation coefficients between arsenic and gold, antimony, and tin of
0.93, 0.72, and 0.64, respectively, and between gold and tin and antimony of 0.67. Gold
and silver correlate quite well, with the exception of one sample. Cobalt and zinc are not
very well correlated to any other element, with the exception of iron (correlation coef-
ficients 0.73 and 0.86 respectively), which in turn does not correlate well to any of the
above mentioned elements. Lead does not exhibit a linear correlation to any of these ele-
ments, though some correlation may exist between lead and arsenic, nickel and antimony
at lower levels of lead.
The distributions of these elements (not plotted) suggest that arsenic, zinc and antimony
are predominantly present as contaminants (i.e., patterns similar to iron and lead), while
this is less clear for the other elements. It must be emphasised that this data represents
mainly corroded metal and that the sensitivity of different elements to process-related
changes (oxidation, volatilisation, siderophile/lithophile/chalcophile separation, etc.) in
the course of their technological trajectory can obscure their initial relations from the ore.
Furthermore, the number of samples analysed by NAA is very limited, and any conclu-

208 Part III: Pi-Ramesse. Chapter 5 Frederik Rademakers
Figure 5.70: Histogram showing cobalt content for metal samples
Figure 5.71: Iron vs cobalt content for metal samples

Frederik Rademakers Part III: Pi-Ramesse. Chapter 5 209
sions drawn here are therefore tentative at best.
Overall, most of these elements (arsenic, nickel, cobalt, antimony, iron, lead, zinc, silver
and gold) are present at contaminant levels. Given that there appear to be several sources
of metal introduced into these crucibles, the chemical relationships between elements
may differ for these different sources.
5.5.1.5 Remaining samples and contextual distributions
With this information in mind, the remaining LI samples are considered. Figure 5.72
shows the samples tentatively assigned to particular groups so far: Apliki copper (ingot
and two crucible prills), three moderately leaded samples of Timna copper (and one with
lower lead content, close in composition), and a large group of ‘domestic copper’. The
high-lead (5%) and high-iron (7.5%) samples are both separate in terms of LI composi-
tion, while the remaining six samples are intermediate with respect to the three tentatively
identified groups.
The high lead content in sample 1984_1381 may indicate intentional alloying to produce
a leaded bronze (only 5% Sn) or the use of copper smelted from a lead-rich ore. Its iden-
tification as a ‘round rod’, provides no further clue as to why a leaded bronze would have
been selected here. The lack of indications for intentional leaded bronze alloying in the
Pi-Ramesse crucibles, coupled with the scarcity of leaded bronze use in Egypt as a whole
for this period, suggests that its use as an intentional alloy is in fact doubtful. This leaves
two plausible explanations for this sample:
1. It was produced as an intentionally leaded bronze elsewhere, and subsequently reused
in Pi-Ramesse. At 5% lead, the lead content from the copper would provide only a
limited contribution to the final LI composition of the leaded bronze. Therefore, this
final composition is mostly reflective of the lead ore, rather than the copper ore.
2. Following primary smelting, the copper had an exceptionally high lead content.
High lead contents have, for example, been noted for Feinan ingots (Hauptmann
et al., 1992, Table 6, p. 22). No further chemical data to support this interpretation
as raw copper (e.g., increased iron) is available for this sample.
Whether this particular object was brought into Pi-Ramesse from abroad ready-made, or
fabricated in the Ramesside workshops using foreign (lead-rich) metal remains unknown.
It appears most likely, however, that the higher lead content is not intentional. No good
ore match can be suggested for this sample at present.

210 Part III: Pi-Ramesse. Chapter 5 Frederik Rademakers
Figure 5.72: Interim overview of LI compositional groups

Frederik Rademakers Part III: Pi-Ramesse. Chapter 5 211
One sample (1985_0205,0001-0003) shows a particularly high iron content (7.5% by NAA,
4.4% by XRF), as well as fairly high cobalt content (620 ppm by NAA, 0.06% by XRF) and
is an outlier for Pi-Ramesse in the LI field. It is not alloyed with tin and has a very low
lead content. It has extremely low silver and gold content (7 ppm and 2 ppm by NAA
respectively), as well as above average zinc content (263 ppm by NAA).
When copper with such a high iron content is melted in a crucible, it is more than likely
that a significant and notable dross layer will form on top of the crucible charge (Merkel,
1990) and significant iron enrichment builds up in the crucible slag. This dross would
have preferably been removed before adding any tin to the charge, perhaps through more
than one refining operation.
At this point, it is worth including the contextual distribution of these samples in the dis-
cussion. In Figure 5.73, a distinction is made between the QI industrial workshops (phase
B/3) and later finds from that area (phase B/2), the QI multifunctional workshops (phase
B/2) and the QIV workshop. Possible stratigraphical mixing, discussed in section 4.4, has
to be kept in mind though. Figure 5.74 highlights the most highly sampled excavation
square (QI-c/4.5) and the five most iron-rich samples. These plots reveal some interesting
patterns.
The QI industrial workshops appear to have mainly used ‘domestic copper’, while Apliki
copper occurs in the same area only in phase B/2 and in QIV (contemporary). Timna cop-
per appears exclusively in the QIV workshop. Perhaps most interestingly, the majority of
remaining samples (with both intermediate and extreme LI compositions) belong to the
QI multifunctional workshops, where some ‘domestic copper’ equally occurs. The five
most iron-rich samples all belong to phase B/2, in particular the multifunctional work-
shops. This may not be a coincidence, and indicate more ‘dirty copper’ being used in
this context, while the ‘clean’ Apliki and Timna copper was reserved to other workshops
(though equally during phase B/2). Similarly, all samples with increased cobalt content
belong to phase B/2 (multifunctional workshops and QIV workshop). Finally, the gilded
bronze fragment belongs to the B/2 multifunctional workshops as well.
Of particular interest are the six QI-c/4.5 samples, which range from the ‘dirtiest’ (most
iron-rich) copper to the ‘domestic group’. It is noteworthy that three out of the four unal-
loyed samples belong to this group. Could this group of samples be indicative of refining
activity in this particular workshop in area c/4.5, whereby successive remelting took place
before the copper was considered clean enough to alloy? Could some of the more familiar
domestic copper have been added to it, thus pulling the LI composition to this interme-
diate area? Or do these samples all represent different copper sources? Some could be
identified as Limassol copper (see above), while the most iron rich might fall in the range

212 Part III: Pi-Ramesse. Chapter 5 Frederik Rademakers
Figure 5.73: Overview of LI compositions by context

Frederik Rademakers Part III: Pi-Ramesse. Chapter 5 213
Figure 5.74: Overview of LI compositions, highlighting QI-c/4.5 samples (left) and most
iron-rich samples (right)
of Timna copper. A final interesting comparison may be made to Omani copper ores and
metals from Middle to Late Bronze Age Wadi Suq (data from Begemann et al., 2010). As
Figure 5.75 shows, these ore and metal samples (full range not shown) overlap to a reason-
able degree with the ‘QI-c/4.5’ samples and some of the ‘domestic copper’. Interestingly,
this copper source has increased cobalt and nickel content, and ‘dirty’ export ingots pro-
duced from it could provide a match for these intermediate samples. It is difficult to push
this interpretation any further here, but an interpretation as Omani copper may be a better
explanation for these samples than any other available at this point.
5.5.1.6 Summary
Though overlap of Sinai and Eastern Desert ores exists with nearly the entire range of met-
als attested at Pi-Ramesse, this does not weaken the identification of certain materials as
deriving from different sources. The integration of chemical (e.g., lead and iron content)
and typological (e.g., oxhide ingot) information allows the distinction of at least three, and

214 Part III: Pi-Ramesse. Chapter 5 Frederik Rademakers
Figure 5.75: Comparison of Pi-Ramesse metal LI compositions to Omani ores and copper

Frederik Rademakers Part III: Pi-Ramesse. Chapter 5 215
most likely four, different metal sources within the Pi-Ramesse workshops, as shown in
the final overview of Figure 5.76.
A ‘domestic group’, probably representing copper smelted from Sinai and Eastern Desert
ores, forms the largest cluster, and represents copper used in QI, predominantly (though
not exclusively) in the industrial workshop area. Secondly, the use of Cypriot oxhide ingot
copper has been identified in both the QI and QIV area (phase B/2). Thirdly, the use of
lead-rich copper, most likely from Timna, has been identified in area QIV.
One sample from QI may equally represent Timna copper, but its lower lead content and
different dating (B/3 rather than B/2) suggests that it does not belong to the same ‘batch’
as the Timna copper attested in QIV. An Omani provenance may be suggested here, as an
excellent match exists with a Wadi Suq bronze spearhead.
One sample from the QIV workshop is situated intermediately between the Apliki and do-
mestic cluster. This could suggest the mixing of copper from these two sources in a cru-
cible, resulting in an intermediate LI composition.
Finally, a varied group of samples from the multifunctional workshops remains. This con-
sists of a very iron-rich copper, a leaded and a gilded bronze and two alloyed and two un-
alloyed samples with LI compositions intermediate to all other groups. This could suggest
Omani copper being used in these workshops, or, alternatively, may indicate the refining
and mixing of the raw, iron-rich copper (which may be Timna or Omani copper) with ‘do-
mestic copper’. If the three samples closest to the ‘domestic group’ (gilded bronze and
copper/bronze from QI-c/4.5) may be included in that group (which seems reasonable),
then the two remaining intermediate (QI-c/4.5) samples may indeed be interpreted as the
result of mixing copper from different groups. This would not at all be surprising, given
the clear archaeological evidence for metal recycling in these workshops.
It is, however, possible that these intermediate samples represent (unmixed) Sinai or East-
ern Desert copper, or, more likely given the presence of cobalt, nickel and arsenic, Omani
copper. If so, Figure 5.75 suggests that some of the ‘domestic copper’ may in fact be Omani
copper as well.
Finally, some initial connections to the crucible slag analysis may be drawn here. The oc-
currence of limited lead enrichment of the crucible slag in ±15% of the assemblage may
reflect the use of moderately leaded Timna copper. The use of ‘clean copper’ in approxi-
mately 50% of the assemblage may correspond to the ‘domestic group’ defined here. If this
copper was indeed smelted from Sinai or Eastern Desert ores, few contaminants are to be
expected indeed (Abdel-Motelib et al., 2012). The more cobalt enriched crucibles, finally,
could be related to the use of Omani copper. Such distinction is not tenable, however,

216 Part III: Pi-Ramesse. Chapter 5 Frederik Rademakers
Figure 5.76: Final overview of LI compositions of Pi-Ramesse copper and bronze

Frederik Rademakers Part III: Pi-Ramesse. Chapter 5 217
based on the limited chemical data available, and certain samples identified as Timna
and ‘domestic’ copper equally exhibit increased cobalt content (while cobalt is absent in
others). The connection to iron contaminated crucible slag is discussed in section 6.2.
Further correspondence to crucible slag analysis may be found in the association of gold
with tin. This further validates the tentatively identified use of alluvial cassiterite in a
bronze cementation process.
5.5.2 Crucibles
5.5.2.1 Introduction
Figure 5.77 shows the LI compositions for ceramic and slag of the Pi-Ramesse crucibles
(full data in Table F.5). These cover a very similar range to the metal samples, but the
nature of the data is quite different here.
The ceramic part of the crucible, made of Nile silt, has a certain lead content24 with strongly
varying isotopic composition. This spread is assumed to be natural for the Egyptian Nile
silt and reflective of the Nile basin geology, which draws on various upstream floodplains
(see, e.g., Adamson et al., 1980; Foucault and Stanley, 1989; Garzanti et al., 2006; Krom
et al., 2002 and Stanley et al., 1988) and therefore represents a broad geological time-scale.
Publications on LI compositions for these sediments, however, do not exist.
In each crucible a slag layer is formed, which has a certain lead content too. This lead con-
tent is a mixture of lead from the molten ceramic and lead added into the slag from the
molten charge. Therefore, the isotopic composition of lead in the crucible slag is a mixture
of the isotopic composition of lead in the ceramic and copper/bronze charge respectively.
In principle, these should both contribute to the slag proportionally to their absolute lead
content. It can therefore be argued that, a line, drawn in the three dimensional space
formed by the LI ratios going through the LI composition of the crucible ceramic and slag,
should run through the LI composition of copper/bronze that was molten inside that cru-
cible. The LI composition of the crucible slag would lie on this line intermediate to that
of the ceramic and the metal. The distance between ceramic and slag and between slag
and metal, would be determined by the relative contributions of both to the lead content
in the slag.
24Lead content was not determined by NAA or labXRF and not detectable by SEM-EDS. pXRF analysis (see
section 5.3) gives <75 ppm for the ceramic and an average of ±1600 ppm for the slag. These numbers should
be treated with great caution, and provide a broad indication only: lead content in the slag is roughly 20
times higher than in the ceramic.

218 Part III: Pi-Ramesse. Chapter 5 Frederik Rademakers
Figure 5.77: LI data for crucibles and copper/bronze from Pi-Ramesse

Frederik Rademakers Part III: Pi-Ramesse. Chapter 5 219
Some initial caveats:
• LI compositions for the Nile silt appear to vary; therefore, they might be variable
within a single crucible, which complicates the principle outlined above.
• The relative contributions of lead to the slag by ceramic and metal are not just de-
termined by absolute lead contents, but additionally influenced by the degree of
slagging of the ceramic, contact with the metal batch etc. An example of high lead
contributions from the ceramic to the slag (where the slag LI composition is domi-
nated by that of the ceramic) is most likely seen in the Göltepe crucibles of Lehner
et al. (2009), in the only known similar measurements of crucible lead isotope com-
positions.
• Other sources might contribute to the lead content in the crucible slag. Fuel ash de-
riving from charcoal made of trees grown in lead-rich soil could be an example. Such
effects have hitherto not been studied, but are most likely marginal with respect to
the two main contributors: ceramic and metal.
Theoretically, then, the results for these crucibles could be used to tentatively identify ar-
eas in the LI compositional space where metals molten in those crucibles are isotopically
defined. Obviously, the stronger the contribution of the ceramic is, the more difficult it is
to propose such an identification. The further away the slag LI composition is from the
ceramic LI composition, the higher the confidence can be that it better reflects the metal
LI composition. Nevertheless, any interpretations made from this kind of data should be
considered tentative.
5.5.2.2 First example - Apliki
Figure 5.78 shows the only example of a crucible for which both ceramic and slag as well as
a prill (manually extracted from its crucible slag) were analysed. This particular prill falls
within the ‘Apliki group’, discussed in section 5.5.1.1. Interestingly, the slag LI composition
is closer to that of the ceramic than to the metal prill. Though this can probably be mainly
attributed to the typically low lead content of Apliki copper (Kassianidou, 2009), the rela-
tive contributions of copper and slag are further controlled by the crucible metallurgical
process25. It should further be noted that the line connecting these three points in space
is only approximately straight. This could be the result of other components contributing
25This crucible sample (97_0690,02-) shows no iron contamination and limited slagging.

220 Part III: Pi-Ramesse. Chapter 5 Frederik Rademakers
to the slag LI composition or, perhaps more likely, the inhomogeneity in LI composition
of the crucible ceramic. This example serves as a guide to interpreting the other samples,
where these factors cannot always be assessed. As no prills are available for the other anal-
ysed crucibles, these have been studied by drawing a line between the ceramic and slag LI
compositions. This appears to create a meaningful separation of three groups.
5.5.2.3 ‘Domestic group’-related crucibles
A first group of crucibles is shown in Figure 5.79. These all seem to have contained metal
similar to the ‘domestic group’ defined in section 5.5.1. Such an interpretation seems es-
pecially appropriate for the sample with the highest 206Pb/204Pb (87_0634c,04), for which
the crucible slag plots squarely in the middle of the ‘domestic cluster’. Here, the slag LI
composition is probably dominated by the copper contribution.
Copper from crucible 87_0897a,01-45 (2), with lower 208−207−206Pb/204Pb, might similarly
belong to this group. While more limited lead contribution from the copper may have
led to the slag’s intermediate position, it could equally point to the use of ‘intermediate
(QI-c/4.5-type) copper’. Interestingly, the SEM-EDS analysis of this particular crucible re-
vealed significant iron and cobalt slag contamination, as well as the presence of Fe, Co, Ni,
As and S in embedded prills. This is in contrast to the first crucible sample of this group,
for which only iron enrichment is noted (possibly in line with Eastern Desert/Sinai ores),
and may suggest the use of Omani copper (possible contributor to the ‘domestic group’)
for this second crucible.
Finally, the third crucible (83_1149b) shows a very large distance between the ceramic and
slag LI composition, indicative of a dominant lead contribution from the crucible charge.
As a rim fragment, this crucible shows limited slag bulk enrichment, but several prills with
very significant iron, cobalt and nickel content occur. Therefore, the copper melted in this
crucible may be very similar to that noted in the second sample: Omani copper.
5.5.2.4 Timna-related crucibles
Five crucibles, shown in Figure 5.80, seem to have contained metal similar in LI composi-
tion to the Timna copper.
Some variability exists within this first group. Firstly, it can be noticed that there is a fairly
large shift in LI composition between ceramic and slag for two crucibles, a medium shift
for another two and a much smaller shift for one. While this may point to variable lead
enrichment of the crucible slag for each sample, it may equally be explained by the inci-

Frederik Rademakers Part III: Pi-Ramesse. Chapter 5 221
Figure 5.78: Example of ceramic, slag and prill of a single crucible

222 Part III: Pi-Ramesse. Chapter 5 Frederik Rademakers
Figure 5.79: Crucible ceramic and slag - ‘domestic’ group; individual pairs of ceramic and
slag are linked by lines

Frederik Rademakers Part III: Pi-Ramesse. Chapter 5 223
Figure 5.80: Crucible ceramic and slag - Timna group; individual pairs of ceramic and slag
are linked by lines

224 Part III: Pi-Ramesse. Chapter 5 Frederik Rademakers
dental proximity of ceramic and metal LI compositions in some samples. All slags show
decreased 206Pb/204Pb, indicative of a general ‘pull’ towards the Timna LI composition
area.
One crucible slag plots clearly within the LI range seen in the three (tentatively identi-
fied) Timna samples, almost overlapping with one of the metal samples. This crucible
(87_0762,0Nv) exhibited no bulk slag iron enrichment, but increased lead content, which
further validates its association to this moderately leaded Timna copper.
The other two samples (97_0631E,01 and 97_0631E,04) with slag compositions very close
to this first crucible slag both similarly exhibit minor lead bulk enrichments (and moderate
iron enrichment in 97_0631E,04). For 97_0631E,04 there is barely any difference between
ceramic and slag LI composition, which may be due to strong ceramic contribution or its
incidental proximity. This illustrates the difficulty of this approach where no information
from actual prills embedded in the crucible slag is available.
The crucible slag LI composition of a fourth sample (83_0597l,01) almost perfectly over-
laps with the metal sample previously identified as ‘Timna/Oman’. It exhibits minor bulk
lead enrichment and no significant iron content.
The remaining sample (87_0942g,03) shows the largest jump in LI composition between
ceramic and slag. No bulk lead enrichment of the crucible slag has been noted, while more
significant iron and arsenic content was noted in embedded prills. Its slag LI composition
does not plot squarely in the ‘Timna range’, but may have been influenced by it, explain-
ing the large distance between ceramic and slag (in contrast to the Apliki example above).
Alternatively, another ‘intermediate’ (Omani?) copper may have been charged in this cru-
cible.
An interesting note can be made here: as mentioned earlier, the three lead-rich ‘Timna
copper samples’ all come from area QIV. Crucible analysis confirms the use of this ‘Timna
copper’ inside two crucibles found in QIV, but equally in a QI crucible dating to phase
B/2. Therefore, the use of ‘Timna copper’ cannot be exclusively linked to the QIV work-
shop, though it may have been particularly important there, but evidence for its use is
most strongly attested for phase B/2. The two remaining samples may be related either to
Timna or Oman. Regardless, the lower lead content in both crucibles and metal samples
indicates that this represents a batch of copper distinct from the other ‘Timna copper’.
5.5.2.5 Intermediate group
The final group is shown in Figure 5.81. These three crucibles (83_0542b,01, 87_0762 and
98_0387,03) do not appear to be associated with any of the three above-mentioned groups,

Frederik Rademakers Part III: Pi-Ramesse. Chapter 5 225
but their slag LI compositions seem rather to fall in the intermediate copper LI range at-
tested for the multifunctional workshop copper. They represent all workshop areas, but
only phase B/2. The two samples with higher 208−206Pb/204Pb belong to area QI, while the
sample with lower 208−206Pb/204Pb belongs to area QIV.
As mentioned earlier, the lack of data on the absolute lead content for ceramic and slag
makes it very difficult to assess where (along the line from ceramic through slag) the LI
composition representative of the crucible charge could be. This issue is particularly prob-
lematic for sample 87_0726,68-78b, for which no ceramic LI composition was measured.
Its slag LI composition is similar to the other four discussed here. A tentative attribution
to ‘intermediate copper’, possibly representing Omani copper, may be made here.
5.5.2.6 Conclusion
In conclusion, the analysis of crucibles can provide some further insight into the copper
sources charged into them. However, when no data is available on the lead content of
ceramic and slag, and no prills are available for analysis, this method is difficult to ap-
ply. Furthermore, the variability of the lead isotope composition of the clay, as well as the
crucible process variability introduce possible problems for interpretation. These should
be further clarified (through controlled experiments) before this method of analysis can
be performed with great confidence. Nonetheless, the above examples could serve as an
interesting starting point, and tie in quite well with the analysis of metals at Pi-Ramesse.
5.5.3 Overview of lead isotope analysis results
An overview of the analysed crucibles by context is presented in Figure 5.82. This offers
contextual refinement to the use of different copper sources attested in the metal sam-
ples (Figure 5.73). It can be argued that copper from four different sources was used at
Pi-Ramesse: Apliki, Timna, Sinai/Eastern Desert and Oman copper. However, these are
only tentative identifications, and in particular Sinai/Eastern Desert and Oman are provi-
sional: overlap exists between these sources, and some tentatively identified samples may
belong to either of them, or represent (several) other sources altogether. The ‘intermedi-
ate samples’ could represent the mixing of copper, further complicating this provisional
evaluation. This overview presents the best possible interpretation of the lead isotope
data, taking into account the results from crucible analysis and the (limited) information
available on ore sources.
It is worth mentioning here that about 30 to 50 different samples from a particular ore

226 Part III: Pi-Ramesse. Chapter 5 Frederik Rademakers
Figure 5.81: Crucible ceramic and slag - mixed group; individual pairs of ceramic and slag
are linked by lines

Frederik Rademakers Part III: Pi-Ramesse. Chapter 5 227
Figure 5.82: Crucible ceramic and slag - overview by context

228 Part III: Pi-Ramesse. Chapter 5 Frederik Rademakers
deposit should ideally be analysed to establish its characteristic lead isotope field (Stos-
Gale and Gale, 2009, see further Baxter, 1999; Baxter and Gale, 1998). Such sample sizes
are rarely achieved, and this issue affects the discussion held here: many of the ore fields to
which the Pi-Ramesse data is compared are under-sampled, while the Pi-Ramesse sample
itself is equally limited. When considering the Sinai and Eastern Desert data, for example,
far more data is clearly needed to achieve an understanding of several millennia of mining
and metal smelting in this vast area, though Abdel-Motelib et al.’s 2012 publication is an
important milestone along that way.
Differences between the various workshops at Pi-Ramesse appear to exist, nonetheless.
‘Domestic copper’ was predominantly used in area QI, during both phases and in both
areas. ‘Timna copper’ was used during phase B/2 only, and predominantly (though not
exclusively) in area QIV. It is possible though, that another batch of Timna copper, with
lower lead content, was used in the (B/3) industrial QI workshops, but this sample may
equally represent ‘intermediate’ or ‘Omani’ copper. This ‘intermediate’ or ‘Omani’ cop-
per appears primarily in the QI multifunctional workshops, though its use may be as-
sumed for all workshops. In general, however, the greatest variability in copper seems
to have been gathered in the multifunctional workshops, where refining of ‘dirty’ (iron-
and iron/cobalt-rich) copper took place alongside the recycling of existing bronzes (e.g.,
gilded and leaded bronze). This ties in with the finds of scrap copper and bronze during
phase B/2, in both QI and QIV, and the identification of ‘intermediate copper’ in crucibles
from both. Finally, the Apliki ingot copper appears during phase B/2, rather than B/3, in
both area QI and QIV.
It is remarkable that Apliki copper has only been noted in its ingot form and as two prills
trapped in crucible slag, but not in any objects. In fact, it has not been noted in any objects
throughout the Late Bronze Age Mediterranean at all (with the exception of Cypriot arte-
facts: Gale and Stos-Gale, 2012), resulting in speculation that it was in fact never molten
down, but (broken) ingots were used as currency or prestige objects. Its discovery in two
crucibles is therefore a major one. However, its discovery embedded in the crucible slag
begs a further question. Do these prills represent Apliki copper only because they did not
interact further with the crucible charge? It may be that the low lead content in Apliki cop-
per is overshadowed by the lead content of any tin added during alloying, even if that lead
content is only minor, and Apliki copper therefore becomes invisible to archaeological sci-
entists. When mixed with other copper, such a scenario seems especially likely. This may
indeed explain the apparent dearth of Apliki copper in Late Bronze Age bronzes, despite
its widespread trade (Gale, 2011). A similar argument for Apliki copper’s disappearance in
the crucible was made by Muhly (2003, 2009), though his suggested importance of ‘Lavrion

Frederik Rademakers Part III: Pi-Ramesse. Chapter 5 229
lead contamination’ appears unnecessary.
For the sample intermediate to Apliki and ‘domestic’ copper (Figure 5.76), it could be sug-
gested that its LI composition is the result of mixing ‘domestic copper’ and Apliki copper.
However, the resulting lead content in the bronze is only 0.02%, which would indicate a
very minor contribution from the ‘domestic copper’, which typically has lead contents of
±0.5%. Alternatively, it may be suggested that adding 11% tin (with unknown lead content
and isotopic composition) to Apliki copper was sufficient to pull it away from the Apliki
LI range. Lead contents for Eastern Desert tin have never been measured, but typical lead
contents for contemporary tin ingots are in the 10-100 ppm range (Galili et al., 2013). Ex-
ceptions exist, however, with 600-1200 ppm Pb measured in some ingots (Begemann et al.,
1999; Molofsky et al., 2014). Their addition to a virtually lead-free (Apliki) copper, would
introduce lead in the 0.01% range (for±10 wt% tin), which is sufficient to shift the resulting
bronze LI composition away from that of Apliki copper. Several alternative interpretations
may be suggested here, but without further data from both ancient materials (metals and
ores) and, more importantly, experimental work on bronze alloying and recycling effects
on resulting LI compositions, these difficult interpretations remain educated guesswork.

230 Part III: Pi-Ramesse. Chapter 5 Frederik Rademakers

CHAPTER 6
Discussion
The analytical results, presented and interpreted in Chapter 5, are further discussed both
from the perspective of a broader organisation of metallurgy in Late Bronze Age Egypt,
and as a more contextual interpretation of metallurgical activities at Pi-Ramesse.
Section 6.1
Bronze production technology
There are four fundamental ways by which bronze can be produced: the alloying of two
fresh metals (copper and tin), cementation (alloying copper metal with tin ore), co-smelting
(smelting copper and tin ore together to directly form bronze) and recycling bronze (pos-
sibly adding a copper/tin source). Differentiating between these processes through the
study of ancient production remains has received relatively little attention in archaeomet-
allurgical studies (Pigott et al., 2003; Rovira, 2007). However, it could provide valuable in-
sights into technological choices and inform on technical ability, material availability and
cultural preference of ancient metallurgists. In this section, the evidence at Pi-Ramesse in
relation to each of these options is evaluated.
Before doing so, however, it is important to emphasize the complex nature of evidence
derived from crucible analysis. It needs to be underscored that each sample covers only a
flat, 2-3 cm section of a crucible, which in fact is a much larger, three-dimensional object.
As conditions within a single open crucible are not in equilibrium and can vary rapidly
231

232 Part III: Pi-Ramesse. Chapter 6 Frederik Rademakers
and over very short distances in terms of temperature, oxygen supply and material pres-
ence, it can hardly be expected that a single sample is representative of an entire crucible
process. Even if conditions were homogeneous within a crucible, it can be expected that,
contrary to primary production slag, crucible slag often presents different stages of the
metallurgical process, thereby complicating its evaluation. Conversely, this theoretically
allows the study of these different stages within each crucible. When studying an entire
crucible assemblage, it is therefore important to realize that variability witnessed between
samples should in the first instance be understood as different manifestations of a single
process, before more complicated scenarios are considered. This principle is elaborated
further in Chapter 13.
The three key parameters indicating the relevant process are the nature of metal prills
trapped in the slag, the presence and shape of metal oxide crystals, and the slag composi-
tion compared to the composition of the crucible fabric.
6.1.1 Active alloying vs. recycling
The presence of high-tin prills (defined as those with dominantδ-, ε- orη-phase) in several
Pi-Ramesse crucibles gives evidence for an active alloying process as opposed to recycling
by remelting existing bronze without the addition of fresh tin (ore). However, these prills
are intermediate products and can therefore not be expected to be found in each sample
from a crucible used for active alloying: their absence does not rule out active alloying.
Another problem associated with these high-tin prills is that they do not provide any in-
formation on the nature of the tin source used for alloying. Here, the evidence provided
by the morphology of tin oxide crystals in the crucible slag comes in.
6.1.2 Fresh metals or cementation?
It is a long-standing debate whether during the Late Bronze Age tin metal or mineral cas-
siterite was the tin source of choice for bronze production. The presence of tin-rich prills
is inconclusive, since cassiterite has to be reduced to tin metal to facilitate alloying, and
at this stage can form these prills in the same way as metallic tin added to copper. Thus,
other indicators need to be found.
First it should be repeated that tin oxide crystals can be expected to form under locally ox-
idizing conditions in the context of any process involving bronze melting. Pure tin metal
could oxidize (alloying of two metals), tin could preferentially oxidize out of bronze (re-
cycled bronze or bronze produced by any method and then re-oxidized) or cassiterite

Frederik Rademakers Part III: Pi-Ramesse. Chapter 6 233
could directly re-crystallize to form new tin oxide crystals. Such high-temperature crys-
tals provide no diagnostic information, though they are sometimes (questionably (Rehren,
2003)) taken as an indication for co-smelting or cementation using mineral cassiterite
(e.g., Frisch and Thiele, 1985 and Valério et al., 2013).
However, some Pi-Ramesse crucibles appear to contain residual cassiterite. This has been
tentatively identified by its distinct structural appearance compared to newly-formed tin
oxide crystals. Though more laboratory experiments are needed to verify this identifi-
cation, comparison to geological cassiterite seems to confirm this assumption. Similar
shapes have likewise been identified by Merideth (1998) in crucibles from Iberia, a region
where cassiterite cementation has been reported repeatedly (e.g., Rovira, 2007 and Valério
et al., 2013).
The limited NAA data available for Pi-Ramesse copper and bronze indicates that tin was
associated with gold, further corroborating the tentative identification of alluvial cassi-
terite as a tin source for alloying.
As discussed in section 5.4.5, the limited examples of tentatively identified residual cassi-
terite are inadequate for excluding the possible use of metallic tin at Pi-Ramesse. Metallic
tin does not provide diagnostic evidence in the crucible slag and its possible use can there-
fore not be argued against. Given the precious nature of tin as a metal, likely acquired by
long-distance trade (see section 6.2.3), it is not surprising that no ingots were found in
Pi-Ramesse. The use of oxhide ingot copper in Pi-Ramesse corroborates the framework
outlined earlier (Rehren and Pusch, 2012), suggesting Pi-Ramesse would have had access
to the Late Bronze Age metal ingot trade and therefore to tin ingots. Tin ingot finds are
exceptional though, and archaeological absence should be expected in a highly controlled
workshop environment where important materials would have been under strict control.
Therefore, the use of tin metal for alloying is not altogether unlikely, though proper evi-
dence cannot be presented.
6.1.3 Co-smelting
Co-smelting, that is the smelting of mixed copper and tin ore, does not seem likely to have
taken place in Pi-Ramesse. Though there are indications for the use of cassiterite, no rem-
nant copper ore was found in the crucible slag. Furthermore, no slag resembling primary
copper smelting slag was discerned (with the exception of sample 94_560, explained in
section 5.4.10). The use of highly purified copper ore (e.g., malachite) is possible but un-
likely as there is no evidence for ore (or its beneficiation) on site. As discussed in section
4.5, copper smelting during the Late Bronze Age typically took place at or close to copper

234 Part III: Pi-Ramesse. Chapter 6 Frederik Rademakers
mines, rather than in urban centres. Typically, the smelting was performed in furnaces
by this time, rather than crucibles. No evidence suggests that metallurgical practice at
Pi-Ramesse deviated from this pattern.
6.1.4 Recycling
The evidence for recycling is even more difficult to obtain based on slag analysis. Very little
(iron) contamination is to be expected, but the same holds true when alloying pure/refined
metal. No high-tin prills would be formed but, as mentioned earlier, the absence of evi-
dence cannot be used as the evidence for absence. In the case of Pi-Ramesse, however,
scrap bronze present in the production area strongly suggests the practice of recycling. An
example of such scrap material is shown in Figure 6.1. Hauptmann (2007) and Levy et al.
(2002) use similar evidence (clustered metal prills, lumps and tools, with negative crucible
base impressions) to argue for recycling and (re-)melting at Khirbat Hamra Ifdan (Jordan)
and Shahdad (Iran).
Figure 6.1: Scrap bronze found in the production area at Pi-Ramesse. FZN: 1997/1288,
site: QIV-h/28, stratum Bd
6.1.5 Summary
The analytical results presented here demonstrate that active alloying took place at Pi-
Ramesse, and there are indications that mineral cassiterite could have been used for bronze
production by cementation. As mentioned before though, the production waste freezes a
single moment of a process that is variable in time. As such, a sample cannot be taken as

Frederik Rademakers Part III: Pi-Ramesse. Chapter 6 235
representative for a heterogeneous crucible and should not be expected to reveal the vari-
ability that exists within a production technology. Samples lacking any residual cassiterite
could therefore reflect the full reaction of cassiterite in a cementation process, or the use
of an alternative technique. As the use of tin metal for alloying is not expected to produce
diagnostic crucible slag, its prevalence in the various Pi-Ramesse workshops cannot be
contrasted to that of cassiterite. Though the relative paucity (as attested by lead isotope
data) of ingot copper relative to ‘domestic copper’ may similarly suggest that ingot tin was
used to a lesser extent than ‘domestic cassiterite’ (discussed further below), this argument
is insufficient to exclude the use of metallic tin for alloying.
In summary, it seems appropriate to suggest that fresh bronze alloying was accomplished
at Pi-Ramesse through both the mixing of fresh metals and the cementation method. In
addition to this, existing bronze was recycled, whereby both metallic tin or cassiterite may
sometimes have been added to control the final alloy.
It can be noted that some copper may not have been alloyed with tin: while the crucibles
within which no tin was detected most likely represent the ‘clean end’ (limited slag forma-
tion, reducing conditions) of the bronze alloying crucible spectrum, the possibility of pure
copper melting cannot be excluded. If practised, it appears to have been of only minor
importance at Pi-Ramesse: apart from casting waste and raw materials, all analysed ob-
jects in Pi-Ramesse are bronzes. Variability in tin content from five to twenty-one percent
represents process variability to some degree, but most likely alloy composition was var-
ied to suit the final object. While 5-10 wt% represented the ‘normal range’, special objects,
such as a chariot wheel-hub (Table F.4), may have been deliberately made using a higher
tin content, to achieve a more golden or silvery colour (Fang and McDonnell, 2011).
The possibility of crucible reuse, which appears not to have been widely practised in Pi-
Ramesse (see section 6.3), does not affect this overall interpretation of technology. It is,
e.g., possible that a crucible used for recycling was subsequently reused for active alloy-
ing, rendering the first recycling activity ‘archaeologically invisible’ when high-tin prills
are discovered. Similarly, it may mix up signals of varying copper sources, discussed in
section 6.2. However, the crucible remains are so variable anyway, that the variations in
process may be expected to appear nonetheless if enough samples are investigated, and
therefore assemblage-wide interpretations remain unchanged. The prevalence of each
technique throughout the assemblage might be skewed if crucible reuse is involved, but
assessments of this are approximate anyway. Broader issues related to reuse are explored
in more depth in section 13.4.

236 Part III: Pi-Ramesse. Chapter 6 Frederik Rademakers
Section 6.2
Sources of metal
6.2.1 Copper sources: the crucible evidence
The large scale of copper consumption at Pi-Ramesse and its distance from suitable ore
deposits raises the question of where the copper came from. Several pieces of evidence
indicate that multiple copper sources were used. In the first instance, the evidence derived
from the crucible slag analysis is discussed, without considering the lead isotope results
(section 6.2.2).
The crucible slag analysis indicates that, in approximately half of the crucibles, ‘clean
metal’ (no iron contamination) was used. This implies the use of clean copper ingots
(i.e., raw copper with few (natural) contaminants or previously refined) and/or recycling
of fairly pure copper/bronze already in circulation.
Secondly, an iron-rich copper source can be inferred from the crucible slag analysis, which
accounts for roughly 35% of the assemblage. This suggests the use of a raw copper, en-
riched in iron, such as:
• Unrefined copper from the primary smelting of sulphidic ores, e.g.,
– Cypriot oxhide ingots (Knapp et al., 2001; Stos-Gale, 2011)
– ‘Dirty’ Uluburun ingots (Hauptmann et al., 2002) (see section 5.4.10)
Both of these examples often incorporate copper-sulphide inclusions.
• Raw copper smelted from oxidic ores (e.g., Timna and Faynan ingots) (Eliyahu-Behar
et al., 2012; Hauptmann, 2007; Rothenberg, 1990; Tylecote et al., 1977)
In each case, the iron content reflects both ore composition and smelting conditions.
Though tin and/or cassiterite could equally be responsible for iron contaminations, these
high enrichments should be attributed to the copper source (see section 5.4.6).
The piece of oxhide ingot (Apliki copper) found in the production area could very well
fall into either ‘clean’ or iron-rich copper sources discussed above. However, it does not
necessarily constitute either of these groups and may represent a separate source.
Finally, a cobalt/nickel-rich copper source has been identified. This quite clearly points to
a source different from Cyprus, as cobalt, nickel, arsenic and lead only occur in traces in

Frederik Rademakers Part III: Pi-Ramesse. Chapter 6 237
Cypriot ores exploited during this period in time (Constantinou, 1980; Hauptmann, 2007)
and cobalt is generally absent from Late Bronze Age Mediterranean oxhide ingots1, which
are (presumably) predominantly Cypriot from 1400 BC onwards (Stos-Gale and Gale, 2009;
Gale, 2011)2. Interesting to note is that cobalt occurs in ingots of Omani copper (Bege-
mann et al., 2010; Goy et al., 2013; Weeks, 2003), though not always accompanied by sig-
nificant iron content (Craddock et al., 2003). Oman is known to have provided copper for
Mesopotamia in earlier times (end of fourth to third millenium BC) and large-scale pro-
duction of copper began again during the late second millenium BC (Begemann et al.,
2010), so its copper may well have reached Egypt at some point in time. Dayton (2003)
suggests that copper ore from Kilembe (Uganda), rich in cobalt, could have been mined
during the Middle Kingdom, together with the attested exploitation of kohl there. Inter-
estingly, gold mining took place there as well, which raises the possibility of cassiterite
exploitation (see section 6.2.3).
The ‘Land of Punt’, the location of which has been much debated in Egyptology (e.g., Fat-
tovich, 2012; Manzo, 2012 and Meeks, 2003), should be mentioned here too. Its impor-
tance as an international trade partner for Egypt is attested from the Old Kingdom through
to the Late Period, with strongest indications for trade during the Middle Kingdom period.
Most likely, its core should be situated on the Arabian Peninsula towards or in Yemen, with
trade posts along the Red Sea coast on both Arabian and African sides. The ‘Mine of Punt’
(Bia-Punt), a hinterland possibly encompassing parts of Sudan and Eritrea, is believed to
have been the source of metals (particularly gold), ebony and other exotic materials im-
ported to Egypt. Regardless of the exact position of Punt, it appears that the Egyptians
were trading with people in the Red Sea basin who had access to raw materials from both
the Eastern Desert of Sudan, the Eritrean-Sudanese lowlands and the Arabian Peninsula.
This region is therefore another candidate metal supplier for the ancient Egyptian market,
and may have provided access to Omani copper.
Though some of these options appear enticing, they are all speculative at this point. Fur-
thermore, the cobalt and iron enrichment of this copper most likely points to a raw source
of copper, but recycled material cannot be entirely excluded.
A further complication should be considered: the cobalt- and iron-rich source could be
the same. Within the crucibles, it is possible that the slag is enriched in iron in one area,
1Though some more cobalt-(and iron-)rich Cretan (up to 0.8 wt% Co, Mangou and Ioannou, 2000, Table
3, p. 213) and Nuragic (up to 0.25 wt% Co, Begemann et al., 2001) ingots exist. The highest level in Cypriot
ingots (an oxhide ingot fragment from Mathiatis, Kassianidou, 2009, Table 9, p. 54) is 0.2 wt% Co.2This issue of a Cypriot ‘monopoly’ in Late Bronze Age oxhide ingots has been hotly debated during the
1990’s, without reaching any real consensus (see for example Sayre et al., 1992 and comments, Budd et al.,
1995b and comments, and Pollard, 2009 and comments).

238 Part III: Pi-Ramesse. Chapter 6 Frederik Rademakers
while it is enriched in both cobalt and iron in other areas. Sample 87_0897a,01-45 (1), for
example, contains a prill with 1.1 wt% Co and its slag is enriched in bulk FeO content but
exhibits no cobalt enrichment. Similar prills occur in sample 87_0897a,01-45 (2) (from the
same find context), but additional cobalt-rich spinel is present in the crucible slag and a
bulk enrichment in cobalt of ±1.5 wt% exists.
Though it can be said that it is likely that the iron-rich and cobalt/iron-rich fragments rep-
resent two different copper sources, some degree of overlap probably exists between the
manifestation of these two sources in the crucible slag.
It is relevant to push this idea further still. If the iron- and cobalt/iron-rich fragments
indeed represent varying crucible slag enrichment when using the same (iron/cobalt-
rich) copper source, it could be argued that the ‘clean crucible fragments’ (without iron
or cobalt slag enrichment) equally represent the use of this same copper. Under reduc-
ing circumstances, where limited copper burning takes place, the iron/cobalt-rich copper
may not leave behind any trace of its contaminants, and thus such crucible fragments
could represent the ‘clean end of the spectrum’. The common attestation of oxidising con-
ditions in many of these ‘clean crucible fragments’ (e.g., tin and copper oxides), and the
recurring pattern of clean, iron-rich and cobalt/iron-rich copper from SEM-EDS, pXRF
and NAA analysis, however, argues against such an interpretation.
A discussion of the importance of these three or four (or more) sources is necessarily qual-
itative. However, the good correspondence between the pXRF data and results from de-
tailed SEM-EDS analysis provides some confidence in the measured distributions.
It appears that ‘clean copper’ accounts for approximately 50% of the copper used. This
could represent a single or multiple raw sources, as well as recycled material.
Iron enriched copper makes up approximately 35% of the population, while cobalt/iron
enriched copper covers the remaining 15%. These distributions are reconsidered in the
next section, taking into account the results derived from lead isotope analysis.
6.2.2 Copper sources: connecting the lead isotope evidence
The results of lead isotope analysis can complement those obtained by crucible slag analy-
sis to shed further light on the sources of metal used in the Pi-Ramesse bronze workshops.
So far, this technique has rarely been applied for metals from ancient Egypt and Nubia
(Killick, 2009), and these results may open the way to resolving ancient copper use for
these areas.
Similarly to the crucible slag analysis, lead isotope data has tentatively identified three or
four sources of copper used at Pi-Ramesse. Most securely identified are the use of oxhide

Frederik Rademakers Part III: Pi-Ramesse. Chapter 6 239
ingot copper from Cyprus and Timna copper. These appear to account for only a minor
fraction of copper use, however, and are confined to phase B/2. The dominant group of
copper was used everywhere, but predominantly in the industrial workshops (QI-B/3). It
has been tentatively identified as a ‘domestic copper’, probably representing copper ores
from Sinai and the Eastern Desert. Finally, a group of ‘intermediate samples’, with more
strongly varying LI compositions, has been noted. It occurs primarily in the multifunc-
tional workshops, and may represent copper from Oman, but further includes recycled
and possibly mixed copper. Tentatively identified Oman copper may partially constitute
the ‘domestic group’.
It is difficult to propose a straightforward parallel between these groups and those defined
by crucible slag analysis. One reason for this is the far more limited sample obtained for
lead isotope analysis. Another is the fundamental difference between lead isotope and
chemical groupings, as they are not altered by metallurgical processes in the same way.
Nonetheless, a few correspondences may be noted.
The increased lead content for crucible slag in ±15% of the crucible population (as anal-
ysed by SEM-EDS), found across all different excavation areas, but all from phase B/2,
may be related to the high lead content of ‘Timna copper’ in ±12.5% of the population (as
analysed by LIA) and the single lead-rich (5% Pb) sample (±4% of population). In the cru-
cible slag analysis, this lead content is never associated with any bulk cobalt enrichment,
though two of the Timna copper samples identified by lead isotope analysis have notable
cobalt content (±200 ppm).
For the Apliki copper (ingot and prills), no chemical data is available, making it impossible
to relate to the crucible slag analysis. Its importance is equally difficult to assess based on
lead isotope analysis, as it may be obscured there as a result of its low lead content (see
section 5.5.3).
The ‘domestic copper’ group may largely represent copper from Sinai and the Eastern
Desert. As such, it would be expected to have relatively low levels (<1 wt%) of contami-
nants such as arsenic, nickel, cobalt etc. (Abdel-Motelib et al., 2012), and may largely co-
incide with the ‘clean metal’ defined in section 6.2.1. Too little chemical data is available to
investigate this further, but some of the ‘domestic copper’ contains up to 600 ppm cobalt,
while other samples (with almost identical LI composition) bear no detectable cobalt.
Though it is very well possible that this may reflect the existence of hitherto undiscov-
ered Sinai/Eastern Desert copper ores with a certain cobalt/nickel content, it may be ar-
gued that this ‘domestic group’ reflects the use of copper from a limited number of sources
through time within Egypt, resulting in a mixed chemical composition, but fairly homo-
geneous LI composition. Such use would involve raw metal, as well as the recycling and

240 Part III: Pi-Ramesse. Chapter 6 Frederik Rademakers
mixing of circulating metal (see section 5.5.1.3). A potential contributor to such a system
could then be Omani copper. Raw Omani copper may be reflected in the most iron- and
cobalt-rich sample identified, at the edge of the LI spectrum, as well as the ‘intermediate
LI group’. Omani copper may equally comprise some of the ‘domestic group’, or be mixed
into it, thus creating a LI overlap. Its prevalence is very difficult to assess, but appears
more limited than the Sinai/Eastern Desert copper. Overall, this discussion is quite tenu-
ous given the analytical uncertainties and the limited samples.
Finally, it must be emphasised that, contrary to the lead isotope data, much of the crucible
slag analysis data reflects mainly process, rather than provenance. This is especially true
for iron enrichments, which are mainly the result of primary smelting conditions (control-
ling iron content in raw copper) and crucible conditions (controlling iron content in cru-
cible slag). Obviously, the nature of the ore and previous refining operations do play a role
in this as well. Still, it is difficult to correlate iron content to any of the provenance groups
defined by lead isotope analysis. Nonetheless, these technological groupings are very rel-
evant to the discussion of copper sources. They can reveal the existence of ‘batches’ of
unrefined (and thus iron-rich) copper, for example, the characteristics of which probably
often held more meaning to the ancient craftspeople than the distinction between partic-
ular ore sources. Given the nature of the crucible evidence, it is very difficult to trace such
batches to particular contexts, but a very rough approximation can be gained from the
pXRF data: iron-rich copper is roughly twice as prevalent in the B/2 crucibles (all work-
shops) compared to the B/3 crucibles. This reflects the more common use of ‘clean cop-
per’ in the industrial area, while more raw copper is used in the later, smaller workshops.
When iron enrichment occurs for the B/3 crucibles, it is more often connected to cobalt
enrichment than elsewhere.
6.2.3 Tin sources
It is generally assumed that during the Late Bronze Age an international trade in tin in-
gots existed, in which Egypt would have participated (Dayton, 1971, 2003; Muhly, 1979;
Penhallurick, 1986; Nezafati et al., 2011), as mentioned in section 4.5. Although there is
no conclusive evidence for this in the production context of Pi-Ramesse, the discussion
of production technology (section 6.1) concludes that both tin metal and cassiterite could
have been added to either fresh copper or recycled copper/bronze.
Tin metal would most likely have been imported to Pi-Ramesse in ingot form through in-
ternational trade. Such ingots often moved together with copper ingots, as exemplified
by the Uluburun, Cape Galedonya and Hishuley Carmel shipwrecks (Bass, 1967; Charles,

Frederik Rademakers Part III: Pi-Ramesse. Chapter 6 241
1979; Galili et al., 1986, 2013; Pulak, 2000), and confirmed by other studies (e.g., Kassian-
idou, 2003b). It is therefore plausible that such tin ingots arrived in Pi-Ramesse, possibly
together with (Cypriot) copper oxhide ingots.
The origin of tin for these Late Bronze Age ingots is one of the longest-standing unre-
solved debates in the study of ancient metallurgy. Geological tin sources exist throughout
the world and appear to be concentrated in ‘tin belts’ (de Jesus, 1979). However, archae-
ological evidence for tin mining is largely absent. This is probably a result of the nature
of tin deposits: primary deposits within granites were in all likelihood too hard to mine in
ancient times, while secondary deposits (alluvial or placer concentrations of cassiterite,
transported after weathering of the primary granite rock) require no invasive mining tech-
niques and leave few visible traces. This is further exacerbated by the limited slag, and
thus archaeological visibility, formed during tin smelting of such alluvial cassiterite. Some
archaeological evidence exists in Cornwall and Iberia, but the role of these deposits in sup-
plying the eastern Mediterranean is highly controversial (Eaton and McKerrel, 1976; Galili
et al., 2013; Haustein et al., 2010; Tylecote, 1979). Similarly, Erzgebirge (Bartelheim et al.,
1998; Taylor, 1983), Aegean (Skarpelis, 2003) and Serbian tin (Durman, 1997) are unlikely
to have been imported at Pi-Ramesse.
Another possible source of tin (again controversial: Hall and Steadman, 1991; Pernicka
et al., 1992; Sharp and Mittwede, 1994) is located in the Taurus Mountain range in south
central Turkey. Evidence for tin mining at Kestel mine and tin smelting at Göltepe (Adri-
aens, 1996; Yener, 2000, 2009; Yener and Vandiver, 1993; Yener et al., 1989, 2003), however,
is mainly confined to the Early Bronze Age, and it does not seem to be a likely source of tin
during the Late Bronze Age.
Ancient written accounts, discussed by Muhly (1979, 1985, 1999), offer further informa-
tion. These tend to argue for a tin source in the east, perhaps Afghanistan, Uzbekistan,
Kyrgyzstan or Tajikistan (ancient mining activity has been identified there: see Alimov
et al., 1999; Boroffka et al., 2002; Cierny and Weisgerber, 2003; Parzinger and Boroffka,
2003), that could have reached the Mediterranean along various routes, possibly related
to the trade in lapis lazuli. Muhly (1979) considers such a long-distance trade to be not
only a possibility but a necessity. Work by Nezafati et al. (2006, 2009, 2011) suggests that
mining activities at Deh Hosein (Iran) may have produced large amounts of tin during the
early second to first millenium BC, which could imply an important supply role not only
for ancient Iran and Mesopotamia (Helwing, 2009), but the wider Mediterranean world.
Perhaps even sources such as the Bauchi region in Nigeria (Taylor, 1982) should be con-
sidered for Egypt, even though exploitation evidence is absent there (Dayton, 2003) and
the lack of interest in tin (and gold and lead) in central and southern Africa prior to their

242 Part III: Pi-Ramesse. Chapter 6 Frederik Rademakers
contact with the Muslim world (Herbert, 1984; Killick, 2009) could perhaps argue against
this option.
The role of Cyprus in the trade of tin (and obviously copper) is often cited and does not
seem unlikely, based on ingots discussed by Muhly (1985) and finds such as the Uluburun
shipwreck (Pulak, 1997; Pulak and Bass, 1997; Hauptmann et al., 2002; Yalçin et al., 2005).
A good overview of the evidence related to ancient tin production and trade is given by
Pigott (2011, 2012).
As mentioned earlier, the possibility to use either tin or cassiterite for alloying is of prime
importance. While tin might make more sense as a trade commodity (higher value-to-
weight), cassiterite appears to offer the technical advantage of higher tin-recovery when
co-smelted directly with copper3 (Charles, 1979). From a less technical point of view, it is
a very different approach to alloying: in one case, copper is alloyed with another metal,
while in the other case, a rock is used. This implies a different technological concept and
understanding of material. Therefore, it is of high interest to elucidate the identification
of tin oxide in crucible slag by experimental archaeometallurgy, to distinguish between
non-diagnostic oxidation products and residual cassiterite.
The evidence presented here strongly indicates that cassiterite was indeed used for ce-
mentation at Pi-Ramesse. This cassiterite is likely to have had a more local origin than
tin ingots discussed above. As Ogden (2000) equally notes that some, but not all tin was
probably imported into Egypt, the possible use of cassiterite from Egyptian sources (see
Dayton, 1971; Lucas, 1962; Muhly, 1985; Nibbi, 1976; Rothe and Rapp, 1995; Rothe et al.,
1996; Rothenberg et al., 1998; Sabet et al., 1976 and Wertime, 1979) gains particular im-
portance in this context. Inscriptions in Egypt’s (south) Eastern Desert indicate that tin
mining took place there during the Old and Middle Kingdom (see, e.g., Rothe and Miller,
1999; Rothe et al., 2008), secondary to gold mining activity. Although the co-occurrence
of gold and cassiterite is rare (Penhallurick, 1986), it is possible (and not unlikely, given
its obvious density (Killick, 2009)) that the Egyptian search for gold led to the discovery
of cassiterite in alluvial deposits, for example at El Mueilha (Wertime, 1979). There are,
however, no inscriptions related to tin mining dating to New Kingdom times. Though
this has been interpreted to indicate a decline in exploitation of these tin sources, at least
through state-organised expeditions, there is no plausible evidence to exclude the possi-
bility that local (nomadic) people continued to (occasionally) exploit these sources and
3In the reaction SnO2 +C −→ Sn +CO2, the activity of Sn can be lowered by dissolving it into copper,
assisting the reaction in the rightward direction. At the same time, the temperature at which reduction of
cassiterite to tin takes place is lowered. Alloying copper with cassiterite would therefore lead to a higher
overall recovery of tin.

Frederik Rademakers Part III: Pi-Ramesse. Chapter 6 243
that cassiterite made its way onto the Egyptian market in small quantities. The contin-
ued exploitation of alluvial gold deposits may indeed be reflected in second Intermedi-
ate Period gold-work (Troalen et al., 2014). Abdel-Motelib et al. (2012) furthermore sug-
gest much earlier ore/metal trade between the Naqadians and bedouins, and Rehren and
Pusch (2012) equally indicate the importance of nomadic people’s participation in the cir-
culation of scrap metal throughout Egypt’s history. The results from Pi-Ramesse should
therefore renew interest for Egypt’s potential domestic cassiterite/tin production and as
such form an exciting contribution to the long-standing debate of tin supply in the Late
Bronze Age. While a long-distance trade may have dominated the overall market system
for tin during the Late Bronze Age, local use of domestic tin deposits (where available) may
have been equally important, despite being less tangible in archaeological and historical
evidence.
As far as provenance is concerned, the case of tin is even more difficult than that of copper.
Lead content in tin is much lower than in copper, which dominates the lead isotope com-
position of bronzes, allowing their use for copper provenancing (Begemann et al., 1999;
Galili et al., 2013). The use of trace elements, described by Rapp (1979), Rapp et al. (1999)
and Grant (1999), becomes problematic once alloying has occurred. The use of tin iso-
topes (Begemann et al., 1999; Budd et al., 1995a; Clayton et al., 2002; Yi et al., 1999) is
equally fraught with difficulty4, but the further development of this technique holds some
promise, as shown by Haustein et al. (2010) (method developed for cassiterite, not bronze),
Nickel et al. (2012), Nowell et al. (2002) and Yamazaki et al. (2014). Gillis et al. (2003) mea-
sured tin isotopes of Wadi Mueilha cassiterite, which differed strongly from European and
Central Asian tin. Their sample numbers are, however, very low and only increasing refer-
ence data will show whether or not this method is viable. As with lead isotope studies, in-
creasing characterisation of ore sources will probably reveal more overlaps between them
in terms of tin isotope composition.
As a final note, it should be pointed out that some of the tin did not necessarily end up in
the Pi-Ramesse crucibles as a pure metal or as cassiterite, given that recycling of existing
bronzes was part of the technological activity there.
4Tin has 10 natural isotopes. Contrary to lead isotope analysis though, which provides 3 independent
variables, tin isotope analysis only yields one independent variable (Begemann et al., 1999) and limited
isotope fractionation (Gale, 1997; Northover and Gillis, 1999). Overlap between sources is therefore much
more likely. Tin mixing, for example during ingot production, presents further possible issues.

244 Part III: Pi-Ramesse. Chapter 6 Frederik Rademakers
6.2.4 Summary of metal use
The use of metal from a variety of sources has been identified in the Pi-Ramesse bronze
workshops, which can be related to the broader framework introduced in section 4.5. The
importance of ‘special project copper’ (Rehren and Pusch, 2012), as may be represented
by Uluburun-type cargoes, appears minimal in Pi-Ramesse. Admittedly, the limited ev-
idence for Apliki copper may in part be attributed to its weak lead isotope signal (low
lead content). Nonetheless, it has been noted, but only in the phase B/2 workshops. This
argues against large-scale use of such copper for the industrial-scale project, though it
must be emphasised that this argument in absentio is not conclusive. It appears, however,
that another group of metal dominates the supply for the industrial workshop. This has
been tentatively identified as ‘domestic copper’, similarly occurring in Amarna metal and
Ramesside Egyptian Blue objects, and cannot be equated to known ore sources. However,
it may be argued that this group represents a domestic copper trade, representative for the
‘scrap copper’ and (to some extent) ‘mainstream bronze’ identified by Rehren and Pusch
(2012), without necessarily equating this to a particular ore source. Most likely, it mainly
reflects nearby ore sources that may be considered ‘domestic’ to ancient Egypt, such as
Sinai and the Eastern Desert (for which massive Late Bronze Age exploitation is attested
at Bir Nasib), and to a lesser extent imported copper from ‘regular partners’, such as the
Land of Punt, or expeditions to Timna. It is important to emphasise that this may imply
both the use of ‘fresh domestic copper’ and the remelting of ‘circulating domestic copper’
in Pi-Ramesse. Timna copper, probably furnished through state-organised mining expe-
ditions, is again primarily attested for phase B/2, rather than the industrial workshops.
Finally, the multifunctional workshops, for which some ‘domestic copper’ is attested, are
dominated by copper with a more mixed lead isotope composition. This may indicate
the mixing of above mentioned sources, or the use of more varied ore sources, probably
including Omani copper. Overall, the industrial workshops are dominated by clean, do-
mestic copper, the multifunctional workshops by mixed and ‘dirtier’ copper, and the QIV
workshop by Timna and Apliki (and possibly mixed) copper.
The use of metallic tin, arriving at the Pi-Ramesse workshops as (parts of) trade ingots of
unknown provenance cannot be excluded. It appears, however, that mineral cassiterite
was used to some extent for the production of bronze by cementation. The nature of the
evidence does not allow the attribution of this technique to a particular workshop context.
It shows, however, that it was in use at Pi-Ramesse, which in turn suggests the use of a
domestic cassiterite source. Domestic should be understood here in the same way as for
the suggested ‘domestic copper’: cassiterite from the Eastern Desert, acquired through

Frederik Rademakers Part III: Pi-Ramesse. Chapter 6 245
both state-controlled mining expeditions and more informal trade and bartering. Some
tin was further acquired through the remelting of existing bronze, most likely representing
‘domestic bronze’.
Overall, this paints an interesting picture of ancient Egyptian metal provisioning systems.
Rather than being heavily reliant on external sources, it suggests a strong self-reliance for
the execution of large-scale projects, further supported by metal acquisition through in-
ternational trade. The scope of this last category is difficult to quantify, but it seems likely
that the domestic copper and bronze market in Egypt at this time constituted a large stock
of metal, from which the state could draw in times of need. This only partially agrees
with the hypothesis of Hikade (1998), who surmised that Ramses II may have increased
independence of copper imports through increased domestic production. Rather, it leans
more towards Warburton’s (2010) suggestion that the state did not fully control copper
production, but a freer market system existed which was sufficiently extensive to (quickly)
supply the bulk of metal needed for the industrial workshops at Pi-Ramesse.
It is important to nuance the term ‘sources’, as discussed in the preceding sections. Lead
isotope data is used to infer relations between copper metal and copper ore sources, and
has been discussed as such. However, such relations were probably not always known to
ancient people. As archaeologists, it is almost impossible to reconstruct how quickly cop-
per travelled from mining districts to workshops, where it was stored along the way, how
many times it was traded before it was molten down, etc. Pollard et al. (2014) have argued
for the importance of ‘time’ in discussions of provenance. For example, was copper mined
during the Middle Kingdom still available during the New Kingdom? If so, was any of it
left as raw copper, or had it all been made into objects? How long did it take for copper to
travel from Cyprus to Pi-Ramesse and how recently would that copper have been mined
and smelted? The practice of recycling copper and bronze is very likely to have played
a significant role throughout the Late Bronze Age (Gale, 2001; Knapp, 2000). It is there-
fore particularly significant to consider the ‘domestic copper’ as a palimpsest-type cop-
per source, representing a dynamic pool, continuously replenished by both freshly mined
and recycled ‘old’ copper, as presented in section 5.5.1.3. Probably, the ‘intermediate’ or
Omani copper should equally be regarded as such, though its history from mine to Egyp-
tian workshop may have been different, e.g., through the kingdoms of Punt and Sheba
(Galili et al., 2013). While its original source may have been foreign to the Egyptians (e.g.,
trade with the Land of Punt), it may have been part of the domestic copper trade by the
time it arrived in Pi-Ramesse. When cast into an object, it would not have been iden-
tifiable in the way a raw ingot may be (through inscriptions or shape). The presence of
scrap objects in the workshops illustrates the importance of this dual concept of source:

246 Part III: Pi-Ramesse. Chapter 6 Frederik Rademakers
both the ‘ultimate source’ (reflecting an ore) and ‘direct source’ (reflecting where the work-
shops acquired its copper) are relevant to these discussions. The Timna and Apliki copper
is more likely to represent ‘fresh metal’, arriving at Pi-Ramesse without a prior history of
metallurgical use. Interestingly, this is the first evidence for oxhide ingot fragments effec-
tively being molten down, rather than deposited as such (see, e.g., Lo Schiavo et al., 2013
and Muhly, 2009). High iron contents and possible slag inclusions further argue for the
existence of such raw copper in the workshops. However, the speed by which it travelled
hence from the mines remains difficult to estimate, and it should be emphasised that such
Timna (and possibly Sinai) copper were equally traded as scrap, together with ‘fresh’ Apliki
ingots, as evidenced by the Kefar Samir shipwreck (Yahalom-Mack et al., 2014), suggesting
their presence in more ‘informal’ copper markets. Such trickling down of ingot copper
into the scrap market over time should not be surprising (Rehren and Pusch, 2012).
Overall, it can be suggested that copper supply in Pi-Ramesse was largely supported through
sources familiar to the ancient Egyptians: copper from Sinai, the Eastern Desert, Timna
and the Land of Punt (Oman) represents the state’s mining campaigns and trade with
its close neighbours, and is probably representative of copper commonly available at the
Ramesside Egyptian capital.
Section 6.3
Contextualising bronze production in Pi-Ramesse
As a final part of this discussion, all the preceding information is brought together to
attempt a detailed reconstruction of the chaîne opératoire of bronze production, at Pi-
Ramesse, expanding the work of Pusch (1990, 1994).
The onset of bronze production is situated in context QI-B/3, and appears to be a large-
scale, state-controlled operation. Before actual bronze casting, a number of practical
preparations were made: channel digging and construction with mud bricks, building of
cross-furnaces, moulding and pre-firing (possibly in the cross-furnaces) of crucibles and
tuyères, acquisition of charcoal, metal and cassiterite, construction of pot bellows, prepa-
ration of casting moulds etc. Considerations such as tuyère length and orientation, to
avoid exposure of the bellow operators (Dungworth, 2013), and other ‘health and safety’
decisions related to large-scale operations may have been made at this point as well. The
preparation of these large melting batteries must have required extensive planning and
many hours of manual labour, before the actual bronze alloying could take place.
The preparation of crucibles and tuyères followed the same ceramic recipe, but the tuyères

Frederik Rademakers Part III: Pi-Ramesse. Chapter 6 247
did not go through the same pre-firing process as the crucibles. This suggests the involve-
ment of the ancient ‘metallurgists’ in their production (as in Amarna, see Eccleston and
Kemp, 2008), as a first technological choice for the metallurgical process was made there.
The definition of ‘metallurgist’ is broad here: it simply refers to the people with the re-
quired skills and knowledge for bronze production, who may very well be involved with
other high-temperature processes as well. While the Nile clay may not have been very re-
fractory, it was well know to the craftspeople and customised to its particular function by
tempering and ceramic design. This is exemplified in the use of the same clay for glass
production crucibles, with a different design and heating mode (Rehren and Pusch, 1997).
The choice not to pre-fire the tuyères to the same extent (thus saving fuel) is another ex-
ample of how well material properties were understood for particular purposes.
When preparations were finished, several melting batteries may have been taken into
operation at the same time to produce large quantities of bronze, though it is very well
possible that single batteries may have been used individually as well. Nonetheless, the
contemporary existence of several identical batteries next to each other suggests that si-
multaneous use did take place. Their changing orientation further suggests that multiple
large-scale events took place, and infers a relation between these melting batteries and the
similarly oriented cross-furnaces, which were possibly used for heating large moulds.
At the start of the process, the crucibles were set into the channels of the melting batter-
ies. It is most likely that copper or bronze was placed inside the crucible, together with
tin or cassiterite, and subsequently covered in charcoal, though some initial preheating
with charcoal inside the crucible may have preceded this. Once covered, the tuyères were
put in place, and the complete charcoal bed was quickly brought to combustion using a
highly concentrated airflow directed at the crucible interior. It is possible that some of the
charge was added to the crucible at this later point, as Charles (1980) and Merideth (1998)
suggested for cassiterite, though this appears unlikely as the tuyère positions would have
hindered easy access to the crucibles, once installed. The use of several (up to four) tuyères
at once guaranteed quick attainment of necessary melting temperatures, probably result-
ing in a molten bronze batch of 3-3.5 kg in less than fifteen minutes (see experiments by
Davey and Edwards (2007)). Other than speed, minimising fuel consumption may have
been a consideration here. In this process, the ends of the tuyères were thoroughly fired
and sometimes vitrified. Once the bronze in all the crucibles was molten, the tuyères
were quickly pushed aside to lift the crucibles from their bed, perhaps leaving some char-
coal on top of the crucibles until just before casting. This would have broken most of
the tuyères at the transition of their fired and low-fired part, as reflected in the recurring
fracture patterns of the tuyère remains. No ‘cold ends’ of the tuyères were preserved ar-

248 Part III: Pi-Ramesse. Chapter 6 Frederik Rademakers
chaeologically, as these low-fired ends disintegrated more easily. Iconographic evidence
indicates that strong sticks were used to carry the crucibles to the casting pits, which have
been found scattered throughout the workshop (Pusch, 1991), or the large cross-furnaces,
to pour the liquid metal into moulds. As shown through experiments by Schneider and
Zimmer (1984) and Zwicker (1984), the exterior crucible surface temperatures would have
been low enough to allow such handling (Rehren, 1996a). This heat concentration within
the crucibles, due to their isolating properties and the concentrated heating set-up, fur-
ther explains the limited burning of the mud bricks in the melting channels. A concerted
effort must have been made to bring all crucibles to the large casting moulds (at the cross-
furnaces) with as little time as possible in between, to attain an almost continuous pour.
For the casting of smaller objects, this would not have been necessary. Casting moulds
were probably made of unfired clay and disintegrated afterwards, leaving no archaeolog-
ical remains. The only known clay moulds from Egypt were recently recovered in a Late
Period tomb context in Qubbet el-Hawa (Fitzenreiter et al., 2014). Further bronze work-
ing, attested in the multifunctional workshops for chariot production, is discussed by Prell
(2011).
Following this casting, it is worth asking what happened to the crucibles. The exposure to
high temperature, fluxing by fuel ash and interaction with the bronze produced a thick, ir-
regular slag layer on their interior surfaces. It appears that very few crucibles were reused,
though a single example of a repaired and reused crucible occurs in phase B/2. However,
given the delicate planning and organisation of the B/3 operations, and the low cost of
crucible production, it appears highly unlikely that the risk of crucible failure through re-
peated use would have been acceptable. Furthermore, the singular evidence for reuse in
an assemblage of over one thousand fragments makes it difficult to believe this would have
been a widespread practice. Most likely then, these crucibles were discarded after use.
Strikingly, not a single intact crucible was found in Pi-Ramesse. Considering that these
vessels were quite solid and thick-walled, there must be a reason for their consistent dis-
integration. Without exception, the crucible fracturing occurred after solidification of the
crucible slag, and thus not immediately after casting. This again argues against their fail-
ure during use, and thus makes it unlikely that they were repeatedly reused until the point
of failure. Rather, the crucibles must have been broken when they were dumped or rede-
posited (incautiously) during later activities.
The duration over which these industrial installations were in use deserves further discus-
sion. Stratigraphically, phase B/3 is constrained to approximately twenty years in time,
which is a great archaeological resolution when looking at events taking place over three
thousand years ago. However, it appears unlikely that these industrial activities lasted

Frederik Rademakers Part III: Pi-Ramesse. Chapter 6 249
twenty years. Considering the organisation needed to run such concerted castings, the
large amounts of metal consumed and the (relatively) limited number of massive bronzes
probably needed, a much shorter lifespan may be suggested for these workshops. Indeed,
the changing orientations (B/3b to B/3a) may reflect two large casting events, each of
which may have taken place in the course of days, or perhaps a week or two at most. It
seems most appropriate to view the gathering of resources and people with the necessary
knowledge into a large-scale operation like this as an ‘event’, rather than a standing op-
eration, running for months or even years. Such an event, involving, for example, several
batteries with twenty or forty crucibles each (Pusch, 1994), could have been performed a
few times in the course of a single day, consuming over a hundred crucibles. It is therefore
possible that the entire crucible assemblage, which is the biggest Late Bronze Age example
hitherto recovered, was produced in the course of a week or two.
Of course, not all crucibles at Pi-Ramesse were recovered during excavation, and several
other workshops are known to have existed in the wider vicinity of QI, but this does not
change the argument: the majority of all remains were most likely produced in a series of
fairly short-lived events.
In contrast, the ‘multifunctional workshops’ were presumably in use for longer, but pro-
duced far lower quantities of metal and crucibles. Metal production there was probably
more an ad hoc operation, making it far more difficult to reconstruct in time. The dynam-
ics of such workshops, with more ephemeral hearths, regular cleaning, outside dump-
ing of waste and smaller scale casting are very different from the melting batteries, and
a detailed reconstruction like that made for the industrial area is impossible. However,
it appears that the general procedure was the same, with the exclusion of purpose-built
structures, resulting in undistinguishable crucible evidence. In such a context, it is easier
to imagine occasional crucible reuse.
Metal supply has been exhaustively discussed in section 6.2, but the foregoing remarks
on workshop lifespan elicit some further thought. If the industrial workshops are indeed
short-lived, it is not surprising to see less variation in metal sources there. It may not be
surprising to see mainly ‘domestic copper’ in this context when a carefully orchestrated
casting event was planned. While the timely delivery of such copper to Pi-Ramesse could
probably be foreseen, either through organised mining expeditions or procurement of
copper on the domestic market, oversea shipments were probably less reliable. Having
a large workforce and specialised craftsmen on hold while awaiting delivery of raw re-
sources may have been an expensive situation that the pharaonic institution wished to
avoid.
The variability in copper sources detected within the multifunctional workshops can prob-

250 Part III: Pi-Ramesse. Chapter 6 Frederik Rademakers
ably be attributed to the different supply chain to which these had access, but part of it
may reflect different sources of metal arriving in Pi-Ramesse over time. Not only domestic
copper, but other shipments of copper from, e.g., Cyprus, Timna and the land of Punt may
have trickled into the local market and ended up in these workshops.
Of course, such discussions are difficult to substantiate, given the limited evidence avail-
able at this point. A much larger sample is needed for statistical evaluation of such vari-
ability across workshops and time, and these ideas must remain hypothetical.
Concerning the question who was active in these workshops, this research cannot offer
many new insights. While the organisation of production in Pi-Ramesse, both for the in-
dustrial phase (state control) and the later workshops (state and/or private control), seems
to differ clearly from domestic organisation in Amarna (Eccleston and Kemp, 2008), the
identity of the metallurgist cannot be found inside the crucibles.
Comparisons to Amarna, Thebes (Pusch, 1994), Kerma (Bonnet, 1986) and Buhen (El Ga-
yar and Jones, 1989a,b) are out of place here, as they cannot go beyond speculation as
to the actual technology practised at these sites, or are too far separated in time to draw
meaningful connections.
In the industrial workshops, it seems that a large group of people were employed for a
short period in the execution of a major project. Apart from the overseers and, presumably,
unskilled (or less skilled) manual labour, perhaps similarly employed in other projects
such as mining expeditions, specialists of high-temperature processes were involved in
the planning as well as execution of bronze production. These specialists may have been
migrant, perhaps even international craftspeople, but could just as well have been lo-
cal. Such considerations are beyond the scope of this research. However, it is likely that
these people were well treated given their high skill, as suggested by Sapir-Hen and Ben-
Yosef (2014), and may have enjoyed a higher degree of independence than suggested by
Scheel (1989), despite their contractual engagements with the state. Indeed, following this
large project, some may have remained active in the later multifunctional workshops on
a (somewhat) more independent basis, which may explain the continuity in technology
seen there. Whatever the case may be, it is difficult to elucidate such issues further with-
out comparative data from different social contexts in ancient Egypt to contrast the very
unique situation at Pi-Ramesse.
Finally, there must have been interaction between the different material workshops at
Pi-Ramesse. Bronze filings were used for the production of Egyptian Blue (Jaksch et al.,
1983) and the colouring of glass (Mass et al., 2002), as deduced from glass analysis in Pi-
Ramesse (Pusch and Rehren, 2007). New lead isotope evidence presented in this thesis
further established a link with Egyptian Blue production. Further research on the Egyp-

Frederik Rademakers Part III: Pi-Ramesse. Chapter 6 251
tian Blue production waste excavated at Pi-Ramesse may consolidate this connection to
bronze production, and clarify the possible export of Egyptian Blue from Pi-Ramesse, per-
haps drawing another parallel to glass production. While glass and Egyptian Blue were
probably produced largely for export, as ingots and cakes, bronze and faience were pre-
sumably used at Pi-Ramesse for architectural purposes, as well as in objects. Contrary to
faience, however, bronze could be recycled. This probably happened to many, if not most,
Pi-Ramesse bronze objects. It is for example imaginable that large architectural bronzes
were molten down by the time the Ramesside architecture was moved to Tanis (or earlier),
and the bronze weaponry of Ramses II’s army dispersed throughout Egypt and the Lev-
ant, despite the state’s best efforts to control it. For these reasons, a diachronic approach
is needed to fully understand the results presented here. While the crucible evidence is
often ambiguous through its inherent variability, the Pi-Ramesse case study is simply the
first of its kind, and many of the questions posed here require comparative data from Egypt
and its neighbours. It is hoped that these questions can inspire future research into met-
allurgical activity in ancient Egypt.

252 Frederik Rademakers

Part IV
Gordion
I trust, that with your dispositions, even the acquisition of science is a pleasing
employment. I can assure you, that the possession of it is what (next to an honest
heart) will above all things render you dear to your friends, and give you fame
and promotion in your own country. When your mind shall be well improved
with science, nothing will be necessary to place you in the highest points of view,
but to pursue the interests of your country, the interests of your friends, and your
own interests also, with the purest integrity, the most chaste honor. ... If ever
you find yourself environed with difficulties and perplexing circumstances, out
of which you are at a loss how to extricate yourself, do what is right, and be
assured that that will extricate you the best out of the worst situations. Though
you cannot see, when you take one step, what will be the next, yet follow truth,
justice, and plain dealing, and never fear their leading you out of the labyrinth,
in the easiest manner possible. The knot which you thought a Gordian one, will
untie itself before you.
Jefferson, 1785
253

254 Frederik Rademakers

CHAPTER 7
Archaeological background
Section 7.1
Introduction
Gordion is located on the ancient Sangarios river (modern Sakarya) in central Anatolia,
near the modern town of Yassıhüyük, ±70-80 km southwest of Ankara, as shown in Figure
7.1. Its stratigraphic sequence was recently revised by Rose and Darbyshire (2012) (Table
7.1).
Gordion was the capital of the Phrygian kingdom, which reached its largest extent during
the Early Phrygian period. It then bordered Lydia in the west and Assyria and Urartu in
the east, and Gordion developed and expanded its monumental architecture. Following
a destruction of the city1, further construction and fortification of the citadel took place
during the Middle Phrygian period, possibly under the influence of king Midas (whose
touch, according to legend, could turn anything into gold) and his predecessor Gordios,
who posthumously occupied the largest tumulus in the area (Tumulus MM). The citadel
and surrounding tumuli are shown in Figure 7.2.
Phrygian independence ended when they were subjected to Persian rule by Cyrus the
Great around 540 BC (probably following a period of Lydian control). Under Achaemenid
government, Phrygia became a satrapy with Daskyleion as its capital. Gordion remained
an important economic centre on the Royal Road (restored by Darius) and prospered: con-
1This destruction level was previously attributed to the Kimmerians (e.g., Sams, 1979 and Young, 1958),
which is no longer tenable (Rose and Darbyshire, 2012).
255

256 Part IV: Gordion. Chapter 7 Frederik Rademakers
tinuity in both size and monumentality can be seen between Middle and Late Phrygian
Gordion. Though no longer a royal seat of power, Gordion retained much of its prestige,
while escaping excessive cultural influence from the Persian rulers, as is attested more
strongly in Lydia. By the late Achaemenid period, however, Gordion appears to have lost
some of its glory, despite maintaining its commercial character and size.
In 333 BC, Gordion was visited by Alexander the Great, who (according to legend) cut the
Gordian knot, a symbol of Gordion’s strategic importance for trade and military east-west
movement. The ensuing Hellenistic (and Roman) periods attested at Gordion indicate
continued habitation, though the city never again achieved its former grandeur.
A brief historical overview of Gordion is given by Darbyshire and Pizzorno (2009).
Gordion was first discovered by A. Körte in 1893, who subsequently excavated there in
1900. Large scale excavations were undertaken by the University of Pennsylvania Museum,
under the direction of R. S. Young, between 1950 and 1973. Following a period of post-
excavation research led by K. DeVries, excavations (headed by M. M. Voigt) started anew
in 1988-2006, under the directorship of K. Sams. The excavated areas of the citadel are
shown in Figure 7.3. Kealhofer (2005) offers an overview of recent work at Gordion, while
the Gordion project website2 provides a historical overview as well as regularly updated
news.
Though other Phrygian archaeological sites exist, such as Yazılıkaya (‘Midas-City’, Eskise-
hir Province) and Dorylaeum (near modern Eskisehir city), Gordion is the type-site for
Phrygian culture, with the greatest wealth of archaeological evidence for this civilisation
throughout its history.
Section 7.2
Metallurgy in Gordion
Metallurgical remains at Gordion were first encountered by Young during excavations in
1953. He noted a ‘foundry’ in the Late Phrygian level, but fairly little attention was given to
this feature and the associated metallurgical products (although Young (1958: 228) men-
tions that “ample evidence for a local bronzeworking industry operating as early as the
middle of the seventh century” exists in the form of “deposits of bronze slag, and partic-
ularly fragments of coarse clay crucibles from which molten bronze has been poured”). An
overview of all excavation notes related to this foundry was compiled by A. Fields and
2Gordion Project website: http://sites.museum.upenn.edu/gordion/

Frederik Rademakers Part IV: Gordion. Chapter 7 257
Figure 7.1: Map showing location of Gordion (from Mellink, 1956, p. 370)
YHSS Phase Period Name Approximate Dates
0 Modern 1920s
1 Medieval 10th-15th centuries AD
3 Roman 1st-4th centuries AD
3A Later Hellenistic 260?-100 BC
3B Early Hellenistic 330-?260 BC
4 Late Phrygian 540s-333 BC
5 Middle Phrygian after 800-540s BC
6A-B Early Phrygian 900-800 BC
7A-B Early Iron Age ?1100-900 BC
9-8 Late Bronze Age 1600-?1100 BC
Table 7.1: Stratigraphic sequence for Gordion (from Rose and Darbyshire, 2012, Table 0.1,
p. 2)

258 Part IV: Gordion. Chapter 7 Frederik Rademakers
Figure 7.2: Aerial overview of the site and its surroundings, showing the citadel mound,
tumuli (dots) and Yassıhüyük village (from Rose and Darbyshire, 2012, Figure 0.1, p. xiv)

Frederik Rademakers Part IV: Gordion. Chapter 7 259
Figure 7.3: Overview of excavated areas within the Citadel Mound (from Voigt, 2012, Figure
1, p. 236)

260 Part IV: Gordion. Chapter 7 Frederik Rademakers
is presented in Appendix H. Though no furnace remains could be identified, it appears
that these ‘foundry buildings’ were associated with metallurgical activity comprising both
bronze melting/alloying and possibly iron metallurgy, as indicated by crucible fragments,
arrowheads, bronze and iron garments and ‘iron slag clunkers’. The dating of this foundry
is not straightforward, but it appears to have seen only a relatively short period of use dur-
ing the Late Phrygian period (late 5th to early 4th century BC) and was out of use before
the Hellenistic period. None of the crucibles discussed in this chapter were directly asso-
ciated with this foundry, as the crucibles from this context were not preserved.
The location of the ‘foundry’ is over the Middle Phrygian ‘Painted House’ and ‘Building C’
on the Eastern Mound of the citadel, reconstructed by A. Fields as shown in Figure 7.4.
The metallurgical crucible assemblage under study in this chapter was unearthed in the
more recent campaigns led by M. M. Voigt. They stem from various contexts in between
several houses on the citadel, located in OP 1, 2 and 7 (see Figure 7.3). Only crucibles from
Late Phrygian contexts are discussed here, which make up the majority of the assemblage
(though crucibles from (mixed) Hellenistic contexts appear (macroscopically) to be part
of the same assemblage).
None of the crucibles were excavated in an obvious metallurgical context associated with
tuyères, bellows, furnaces or other structural features. Many of the contexts are pits that
were dug and used as trash deposits for metallurgical debris as well as other (domestic)
trash (pottery, bones, latrine waste etc.), while other find contexts are robber trenches,
ash lenses, and few surfaces. More detailed descriptions of these contexts, spanning the
entire Late Phrygian period, are given in Appendix I.
In addition to the crucibles, some bronze objects, spills and casting moulds have been
identified within the same contexts (discussed in sections 8.4 and 8.5), as well as indica-
tions for iron metallurgy (not discussed in this thesis).
These deposits were strewn in between buildings in OP 1, 2 and 7, approximately 60 meters
from the location of the presumed foundry. It is therefore possible that some crucibles are
related to that foundry, and were discarded in the wider area. However, the amount of ar-
chitecture separating crucible deposits and foundry, and the pre-dating of several crucible
deposits to the foundry, indicates that other metallurgical workshops must have existed,
most likely spread over a larger area.

Frederik Rademakers Part IV: Gordion. Chapter 7 261
Figure 7.4: Top: Gordion, Middle Phrygian citadel: foundry area indicated in red, OP1 and
OP2 (crucible excavation areas) in green (after Voigt and Young, 1999, Figure 8, p. 201).
Bottom: Reconstructed location of ‘foundry’ within the Gordion citadel (from Fields, 2011,
Figures 8 and 17)

262 Part IV: Gordion. Chapter 7 Frederik Rademakers

CHAPTER 8
Analytical results
Section 8.1
General crucible characteristics
The general characteristics of most crucible samples are summarised here, offering an
overview of the crucibles’ design, ceramic fabric and the main zones occurring within
each crucible. This serves as the basis for further examination of the crucible slag (sec-
tion 8.2) and the interpretation of the metallurgical processes underlying its formation
(section 8.3).
8.1.1 Macroscopic investigation
No complete crucible has been found in Gordion. The largest fragment, shown in Figure
8.1, indicates a crucible height of ±10 cm (±2 cm wall thickness, internal height ±8 cm)
and a diameter of perhaps ±15-18 cm. The shape is unknown and is most probably circu-
lar to elliptical. No spout fragments have been encountered.
Most other fragments are smaller, usually around 5 cm in size. Wall thickness averages
around 1.5-2 cm, sometimes tapering to 1 cm at the crucible rim. These fragments do not
provide much information on the complete shape of the crucibles. They all conform to
the shape deduced from the largest fragment, but might equally be fragments of smaller
or larger crucibles. However, the average size appears to be roughly the same or slightly
263

264 Part IV: Gordion. Chapter 8 Frederik Rademakers
Figure 8.1: Largest crucible fragment
larger than the Pi-Ramesse crucibles: �≈ 10−15 cm, volume ≈ 270−700 ml. Reconstruc-
tion drawings are shown in Figure 8.2.
There are some macroscopic indications for the use of organic temper (see Figure 8.3),
such as straw or chaff, though not in every fragment. Macroscopic indications are not as
clear as for Pi-Ramesse and microscopically, the pores exhibit less characteristic shapes.
All crucibles were heated from the inside, as can be deduced from their wall profile: from
fired ceramic on the outside, to bloated, slagged ceramic on the inside. The regularity by
which the crucibles’ external surface is fired, suggests pre-firing before use, similar to the
Pi-Ramesse crucibles (section 5.1.1).
The internally slagged surface is typically dark grey to black in colour, and often contains
green corrosion products, indicative of copper-related metallurgy. In fact, the amount
of corrosion is markedly higher than that seen in the Pi-Ramesse crucibles, as shown in
Figure 8.4.
It is difficult to say whether these crucibles were hand-shaped or wheel-turned. Though
finger-imprints have not been noticed, the irregular rims, variable wall thickness and un-
even exterior wall surface indicate that these crucibles were manually shaped.

Frederik Rademakers Part IV: Gordion. Chapter 8 265
Figure 8.2: Crucible drawings
Figure 8.3: Indications for organic temper in crucibles: fibrous impressions on exterior
surface and elongated porosity in cross-section

266 Part IV: Gordion. Chapter 8 Frederik Rademakers
Figure 8.4: Corrosion products on interior crucible surfaces
8.1.2 Microscopic investigation
Microscopic investigation reveals some further general characteristics, listed here.
1. Typically, three main parts are present in each section through a crucible wall:
(a) On the outside, a fired ceramic part.
(b) In the centre, towards the interior surface, a porous, bloated part which marks
the disintegration of the ceramic and the transition into a slagged part.
(c) A slag part, consisting of vitrified ceramic (no original ceramic structure re-
maining) and varying quantities of charge contributions, such as fuel ash and
metal oxides.
2. The ceramic part is made up of a fine clay fraction, with abundant small to medium
angular quartz fragments and variable (from few to abundant) medium to (very)
large coarse inclusions, further described in section 8.1.3.
3. The ceramic has a similar to slightly lower porosity than the Pi-Ramesse crucibles.
Pore shapes are sometimes characteristic of burnt-out organic temper, though not

Frederik Rademakers Part IV: Gordion. Chapter 8 267
always. No phytoliths are encountered. In addition to porosity induced by organic
temper, many pores appear due to expansion and shrinkage of the clay minerals and
rock fragments (see section 8.1.3) upon firing.
4. The ceramic part gradually becomes more porous towards the inside of the crucible
wall, up to the point where it loses all its structurally bound water, disintegrates and
bloats, similar to the situation seen in the Pi-Ramesse crucibles.
5. The inside of the crucible shows the continuation of this bloated zone, which is a
(partly) vitrified zone resulting from the further disintegration of the ceramic. Closer
towards the crucible interior, this vitrified ceramic interacts with the crucible charge
to form crucible slag. Important to note here is that this slag zone is not always well
developed, resulting in a very thin or absent slag layer in 28% of all crucible samples.
6. In 30% of the crucible samples, an additional ‘layer’ exists, consisting primarily of
copper and bronze corrosion products. The limited contribution of vitrified ceramic
distinguishes this layer from the crucible slag, and ‘dross’ is a more appropriate term
for it. This dross layer is difficult to see macroscopically, but can be noted as green
areas embedded in the more glassy slag zone, sometimes with fibrous or powdery
corrosion on the surface.
7. Metallic prills were noted in 74% of all samples.
Examples of the three to four main parts typically present in each crucible profile are
shown in Figure 8.5.
8.1.3 Crucible ceramic fabric
In all samples (with three exceptions, see section 8.2.6), the ceramic fabric contains coarse
inclusions. Some examples are shown in Figure 8.6. These inclusions typically consist of
three main mineral1 phases (colours refer to SEM images):
• Pyroxene: A light grey phase, with approximate composition of 70% diopside (MgCaSi2O6)
- 30 % hedenbergite (FeCaSi2O6). These two minerals form a complete solid solution
series at elevated temperatures. Typically, 0.4-0.5 at% Na and 0.8-1.0 at% Ti, i.e., mi-
nor augite ((Ca,Na)(Mg,Fe,Al)(Si,Al)2O6), is present (solid solution).
1Compositional, mineralogical and occurrence information from Klein and Dutrow (2007).

268 Part IV: Gordion. Chapter 8 Frederik Rademakers
(a) Profiles through crucible walls
(b) Ceramic fabric (c) Bloated ceramic
(d) Slag (e) Dross
Figure 8.5: Typical structural changes through crucible profile

Frederik Rademakers Part IV: Gordion. Chapter 8 269
Na2O MgO Al2O3 SiO2 P2O5 K2O CaO TiO2 FeO
Average 4.5 3.7 20 52 0.7 1.2 10.2 1.8 6.9
St. dev. (12 measurements) 0.9 1.5 2 1 0.1 0.4 2.3 0.5 1.4
Table 8.1: Bulk composition of coarse inclusions in the ceramic fabric (in wt%, normalised
to 100%)
• Plagioclase: A medium grey phase, with approximate labradorite composition, or
60% anorthite (CaAl2Si2O8) - 40 % albite (NaAlSi3O8). Typically, 0.2 up to 0.6 at%
potassium and 0.2 at% Fe are present. Some zoning can be seen in the bottom right
example of Figure 8.6, with a lighter shade of grey in the central area of the plagio-
clase, darkening towards the edges.
• Spinel: A bright, almost white phase, with approximate composition of 65% ul-
vöspinel (Fe2TiO4) - 35% magnetite (Fe3O4). These two minerals form a solid so-
lution at temperatures above 600°C.
Pyroxene and plagioclase make up the bulk of the inclusions, as more elongated crystals,
while spinel is present in smaller quantities, with a characteristic isometric shape. Diop-
side and hedenbergite occur in metamorphic rocks, but are equally formed during igneous
crystallisation. In gabbros and basalts, labradorite is the common feldspar. Ulvöspinel-
magnetite is sometimes associated with metamorphic rocks, but often crystallises from
mafic (basalt-gabbro) magmas. Therefore, these inclusions are most likely mafic (basalt-
gabbro) rock fragments. These fragments could have been deliberately added to the clay
as temper, or be present as residual fragments if the clay was weathered from this basalt-
gabbro rock. The bulk composition of these coarse inclusions is given in Table 8.1. Based
on chemical composition and following the system proposed by Le Bas et al. (1986), these
rock fragments can be identified as (sodic) basaltic trachyandesite.
The bulk composition of the ceramic as a whole (see Appendix J, discussed in section
8.2.2) is very similar to this, but has slightly lower Na2O and Al2O3 content and slightly
higher FeO content. Smaller inclusions in the ceramic fabric include spinel (ulvöspinel-
magnetite) and pyroxenes (diopside-hedenbergite, augite and ferrosilite2-magnetite), which
are probably fragments from the coarse rock inclusions discussed above.
All of this agrees with the hypothesis that a clay weathered from a mafic mother rock, with
some remaining rock inclusions, was used for fabricating these crucibles, without the de-
liberate addition of rock fragments. The presence of these rock fragments, however, might
2Ferrosilite is the iron-rich end-member of the orthopyroxene series, with an approximate FeSiO3 com-
position.

270 Part IV: Gordion. Chapter 8 Frederik Rademakers
have been the reason why this particular clay was (deliberately) selected for its purpose.
This is discussed further in section 8.3.1.
Though no detailed mineralogical fabric description for (Late Phrygian) ceramics from
Gordion exists (discussions by Grave et al. (2005, 2009); Henrickson (1994, 2005) and Hen-
rickson and Blackman (1996) mention ‘coarse inclusions’, but not the nature of these in-
clusions3), the discussion of regional physical geography by Marsh (2000, 2005) sheds fur-
ther light on the clay sources available for ceramic production. Two main soil types oc-
cur around Gordion, which reflect the major rock types upon which they developed: silty
marl produced more calcareous, silty and pale clays, while basalt intrusions yielded less
calcareous, red basalt-derived soils. These abundant basalt-derived soils from the eastern
region surrounding Gordion, which would have been used for agricultural purposes, were
most likely the source of sediment used to produce the metallurgical crucibles under in-
vestigation. Thin-section ceramic petrography could provide more conclusive evidence
for this hypothesis.
Section 8.2
Detailed description of crucible slag
The structural characteristics of the forty-six analysed crucible samples (listed in Appendix
I) are quite consistent and do not allow for any meaningful distinction of groups (excep-
tions are discussed in section 8.2.6). Here, the chemical data obtained by SEM-EDS is used
to look for broad trends in the bulk compositions of ceramic and slag (dross layers are dis-
cussed separately in section 8.2.7). A description is given of all phases (oxides in section
8.2.3, metals in 8.2.4) that occur in minor or major amounts in the crucible slag. This sec-
tion aims to be purely descriptive, with interpretation and discussion reserved to section
8.3 and Chapter 13.
8.2.1 Some broad trends
Full results of the chemical analysis of crucible ceramic and slag are given in Appendix
J. The most abundant elements (SiO2, Al2O3, FeO and CaO, adding up to ±89 wt% of ce-
ramic and ±80 wt% of slag bulk composition) have been plotted in ternary diagrams to
3Furthermore, no full chemical compositional data is available - only trace element data and results of
Principal Component Analysis are shown.

Frederik Rademakers Part IV: Gordion. Chapter 8 271
Figure 8.6: Coarse inclusions in the ceramic fabric

272 Part IV: Gordion. Chapter 8 Frederik Rademakers
discern any broad patterns: Figure 8.7 shows these crucible ceramic and slag composi-
tions, in each case ignoring all other elements. The ceramic composition (red) is very
uniform, showing tight compositional clustering. As discussed in Chapter 3, an effort has
been made to minimise bias through inclusion/exclusion of large inclusions in the area of
analysis. The presence of coarse inclusions (discussed in section 8.1.3) therefore does not
appear to cause variation in bulk composition in the way quartz does in the Pi-Ramesse
crucibles (see section 5.2.2). This strengthens the hypothesis that the coarse ceramic in-
clusions are naturally present as residual mother rock in the clay used for making these
crucibles.
The slag compositions (blue) almost completely overlap with the ceramic composition,
both in SiO2 - Al2O3 - FeO and SiO2 - Al2O3 - CaO. Only a few samples show minor enrich-
ment in FeO, while there is a general (small) enrichment in CaO. None of this is compara-
ble to the extent of enrichment seen in the Pi-Ramesse crucibles.
Three crucible samples are clearly different from the rest of the assemblage. They are
macroscopically identifiable due to their shape and the lighter colour of the ceramic fab-
ric, which has a strongly different composition (orange) (excluded from average compo-
sition in Appendix J). Their slag composition (turquoise) shows a similar relation to the
corresponding ceramic composition as for the other crucibles, and is included in section
8.2.2. These three samples are discussed in section 8.2.6.
The frequent presence of undissolved, fractured quartz grains in the crucible slag shows
that it usually did not fully liquefy. Moreover, the actual chemical composition is more
complex than these ternary diagrams suggest (Hauptmann, 2007). Therefore, the melt-
ing temperatures of 1400-1600°C, indicated by the ternary diagrams, were probably not
reached. Additionally, redox-conditions during the metallurgical process did not neces-
sarily correspond to those for which these diagrams were constructed.
Finally, Figure 8.8 shows the same slag compositions (ceramic compositions are omitted),
distinguishing between crucible rim and body samples (and body samples near rims).
Contrary to the Pi-Ramesse case (see Figure 5.6), there is no clear distinction between rim
and body samples in terms of their bulk chemical composition. This is examined in more
detail in section 8.3.2.
8.2.2 Bulk analysis
‘Bulk analysis’, as defined in section 3.3.4, is conducted for all samples. The full compo-
sitional data for all crucibles is given in Appendix J and broken down into the ratios of

Frederik Rademakers Part IV: Gordion. Chapter 8 273
Figure 8.7: Ternary plots for ceramic (red+orange) and slag (blue+turquoise) composition

274 Part IV: Gordion. Chapter 8 Frederik Rademakers
Figure 8.8: Ternary plots of slag composition, distinguishing between body (blue), rim
(grey) and body-near-rim (pink) samples

Frederik Rademakers Part IV: Gordion. Chapter 8 275
Figure 8.9: Absolute change in Al2O3 content (in wt%) between ceramic and slag (after
removal of metals)
oxides to alumina and changes of these ratios between ceramic and slag (ignoring base
metal content). Similar to the Pi-Ramesse crucibles, the absolute Al2O3 content is slightly
lower in slag than ceramic, as shown in Figure 8.9, which simply reflects dilution due to
slag enrichment in other elements.
First, the changes in ratios of oxides to Al2O3 are discussed to identify changes between
crucible ceramic and slag. Next, base metal oxide content is presented as wt% in slag (as
ceramic base metal content is below detection limits, this metal content is equivalent to
‘change in metal content’). Distributions have again been tested for normality using the
Shapiro-Wilk normality test and correlation coefficients for two variables have been cal-
culated using Pearson Product Moment Correlation, as explained in section 5.2.2.
• Figure 8.10 shows that the change in SiO2/Al2O3 between slag and ceramic has a nor-
mal distribution around a minor decrease. This reflects dilution of silica similar to
that of alumina.
• ±90% of all samples show some enrichment in CaO. As the histogram in Figure 8.11
shows, the majority of samples show low enrichment and there is a decrease in in-
cidence for higher enrichments. Compared to the Pi-Ramesse crucibles, the relative
lime enrichment here is very low. The scatter plot shows the samples sorted by in-

276 Part IV: Gordion. Chapter 8 Frederik Rademakers
Figure 8.10: Change in the ratio SiO2/Al2O3 between ceramic and slag
creasing enrichment, which again appears to follow a step-wise increasing trend.
Though some of this might be explained by insufficient sampling, it probably points
to a bi-modal distribution (below and above ±40% relative change) reflecting higher
enrichments for body fragment slag. Compared to Pi-Ramesse, where there is a
±400% relative change, enrichments here are much lower (nearly ten times).
Figure 8.12 shows the relative increase in CaO plotted against MgO, P2O5, K2O, Na2O
and SiO2. There is a good correlation between the relative increase in CaO and
P2O5 (R = 0.757, p = 1.15 × 10⁻⁹) and K2O (R = 0.856, p = 3.576 × 10⁻¹⁴), and a
weaker correlation between CaO and MgO (R = 0.453, p = 1.58× 10⁻³ ) and SiO2
(R = 0.436, p = 0.244× 10⁻³). Between CaO and Na2O, no significant correlation
exists (R = −0.0704, p = 0.642). These observations, most likely related to fuel ash
contributions to the crucible slag, are discussed in section 8.2.5.
• The change in T iO2/Al2O3-ratio, shown in Figure 8.13, has a normal distribution around
a minor average increase.
• The change in FeO/Al2O3-ratio, shown in Figure 8.14, has no normal distribution. The
scatter plot shows the samples sorted by increasing enrichment. This trend shows
an iron enrichment with normal distribution around a low value, with an extended
tail of higher enrichment. The low enrichment (normally distributed) occurs in both

Frederik Rademakers Part IV: Gordion. Chapter 8 277
body and rim fragments. The tail of eight samples with higher enrichment encom-
passes mainly body fragments (seven out of eight).
The data in Figure 8.14 probably presents two populations: one (±38/46 samples,
83% of population) normally distributed around a very low iron enrichment (mean:
1.6%, std. dev.: 11.4%), and one group (±8/46 samples, 17% of population) more
clearly enriched in iron. Though this appears similar to iron enrichment seen in the
Pi-Ramesse crucibles, it should be noted that the absolute enrichment is very low
by comparison. Like the lime enrichment, iron enrichment seen here is ten times
smaller than that witnessed in the Pi-Ramesse crucibles.
Figure 8.15 shows that there is no significant correlation (R = 0.155, p = 0.304) be-
tween CaO- and FeO-increase (the highest FeO enrichment does not coincide with
high CaO enrichment and vice-versa). Exclusion of the eight samples with higher
iron enrichment does not improve this.
• MnO content is very low (at detection limit), does not show any significant changes,
and may be considered absent.
• As2O3 content is very low (at detection limit), does not show any significant changes,
and may be considered absent.
• CuO content increases to varying degrees. All but one of the crucibles contain either
copper-based metal prills or oxides, explaining the CuO-increase in nearly all sam-
ples. However, due to the irregular occurrence of prills throughout the slag, their
measurement is quite variable: it is sensitive to prills being present in the analysed
frame. Figure 8.16 shows the distribution of CuO enrichment: most crucibles have
enrichments below 10 wt%, while some have enrichments up to 24 wt%.
• SnO2 content increases to varying degrees. Its measurement is quite variable: it is
sensitive to bronze prills and tin oxide clusters, which occur heterogeneously through-
out the crucible slag, being present in the analysed frame. Figure 8.17 shows the dis-
tribution of SnO2 enrichment: half of the samples show enrichments up to 3 wt%,
while the other half show enrichments up to 19 wt%. Figure 8.18 shows a scatter plot
of CuO vs SnO2 enrichment, indicating some correlation between both (R = 0.564,
p = 0.44×10⁻⁴). The highest CuO enrichment occurs at moderately high SnO2 en-
richment, while the highest SnO2 enrichment occurs at moderate CuO enrichment.
• PbO content increases to varying degrees. In ±2/3 of all crucibles, no significant lead
enrichment is measured. In the remainder of the crucibles, enrichments between
0 and 5 wt% are measured, as shown in Figure 8.19. Figure 8.20 shows a scatter

278 Part IV: Gordion. Chapter 8 Frederik Rademakers
plot of CuO vs PbO enrichment, indicating low (but significant) correlation between
both (R = 0.434, p = 0.261×10⁻³). This is due to the better correlation (R = 0.761,
p = 0.167×10⁻⁵) between CuO and PbO when PbO is actually present.
• Figure 8.21 shows there is no significant relation between the increase in CuO or PbO
with higher ∆C aO/Al2O3 (R = 0.121, p = 0.421 and R = 0.0782,p = 0.606) and a very low
correlation between the increase in SnO2 and ∆C aO/Al2O3 (R = 0.326, p = 0.0272).
• Figure 8.22 shows the CuO, SnO2 and PbO content for body and rim fragments.
Though there is no full separation (variable metal content occurs in all fragment
types), there is a trend for higher metal content in body rather than rim fragments.
It should be mentioned that with a beam voltage of 20 kV, Pb present in low quantities is
not sufficiently excited to be picked up by SEM-EDS4 and remains below detection lim-
its. Contrary to the Pi-Ramesse case, a number of Gordion crucibles show lead contents
exceeding this detection limit, indicating more significant lead contamination of the cru-
cible slag.
As mentioned in section 3.3.6, Cl oxide is not reported by INCA. Sections 8.2.3 and 8.2.4
show that chlorine occurs in some phases within the crucible slag, but especially the dross
layer, which means it should be expected as a bulk component there.
Finally, a note should be made on the presence of SO2. In some slag area analyses, INCA
suggests the measurement of sulphur. However, there is a strong overlap between sulphur
and lead peaks. In the presence of lead, the measurement of SO2 is false and usually does
not account for more than 0.2-0.5 wt% (effectively below the detection limit). Therefore, it
is omitted from the bulk measurements presented in Appendix J.
Significant SO2, however, occurs in two crucibles. In Gordion-23707, SO2 is measured at
±1 wt% of the bulk composition of both ceramic and slag, but not in any particular phase.
It seems, therefore, that this presents an overall contamination of the sample. In Gordion-
28932 (2), sulphur is not measured in the ceramic, but only in the slag, where it is con-
centrated in a corrosion layer on the interior slag surface (see Figure K.14c). This is rare,
but not entirely uncommon (limited copper sulphide corrosion products occurs in three
other samples) and most likely represents post-depositional corrosion (not correlated to
the presence of sulphidic prills in the crucible slag).
4For lead, Lα1=10.551 keV & Lβ1=12.619 keV

Frederik Rademakers Part IV: Gordion. Chapter 8 279
Figure 8.11: Change in the ratio C aO/Al2O3 between ceramic and slag

280 Part IV: Gordion. Chapter 8 Frederik Rademakers
Figure 8.12: Change in the ratio C aO/Al2O3 vs M gO/Al2O3, P2O5/Al2O3, K2O/Al2O3, N a2O/Al2O3 and
SiO2/Al2O3, between ceramic and slag

Frederik Rademakers Part IV: Gordion. Chapter 8 281
Figure 8.13: Change in the ratio T iO2/Al2O3 between ceramic and slag

282 Part IV: Gordion. Chapter 8 Frederik Rademakers
Figure 8.14: Change in the ratio FeO/Al2O3 between ceramic and slag

Frederik Rademakers Part IV: Gordion. Chapter 8 283
Figure 8.15: Change in the ratio C aO/Al2O3 vs FeO/Al2O3 between ceramic and slag
Figure 8.16: Bulk CuO content (in wt%) in slag

284 Part IV: Gordion. Chapter 8 Frederik Rademakers
Figure 8.17: Bulk SnO2 content (in wt%) in slag
Figure 8.18: Bulk CuO vs SnO2 content (in wt%) in slag

Frederik Rademakers Part IV: Gordion. Chapter 8 285
Figure 8.19: Bulk PbO content (in wt%) in slag
Figure 8.20: Bulk CuO vs PbO content (in wt%) in slag

286 Part IV: Gordion. Chapter 8 Frederik Rademakers
Figure 8.21: Bulk CuO, SnO2 and PbO content vs ∆C aO/Al2O3 between ceramic and slag

Frederik Rademakers Part IV: Gordion. Chapter 8 287
Figure 8.22: Bulk metal content (in wt%) in body (1), body-rim (2) and rim (3) fragments
(boxplot5)
5Sigmaplot Version 12: Boxplots graph data as a box representing statistical values. The boundary of the
box closest to zero indicates the 25th percentile, a line within the box marks the median, and the boundary of
the box farthest from zero indicates the 75th percentile. Whiskers (error bars) above and below the box indicate
the 90th and 10th percentiles. Individual points are outliers.

288 Part IV: Gordion. Chapter 8 Frederik Rademakers
8.2.3 Oxide phases in crucible slag
A full list of oxides occurring in the crucible slag has been established, including details
such as composition, shape, frequency of occurrence etc. Their varying occurrence is
interpreted in section 8.3. The predominant types of oxides are Fe-bearing, Ca-bearing,
Cu-bearing, Sn-bearing and Pb-bearing phases, with Ag-rich phases occurring in only two
crucibles. Similar to the Pi-Ramesse case study, this overview is given in Appendix K, while
diagnostic phases are discussed in more detail throughout the interpretation and discus-
sion below.

Frederik Rademakers Part IV: Gordion. Chapter 8 289
8.2.4 Metallic prills
Metallic prills (typically spherical, indicating liquidity during the crucible process) have
been recorded in 74% of the crucibles. The majority of these prills are copper-based (rang-
ing from pure copper to (leaded) bronze, incorporating variable amounts of Fe), though
some exceptions occur. A complete overview of all measured metallic prills is given in
Appendix L, with a summary presented here.
1. Copper and (leaded) bronze:
(a) Pure copper prills occur in a few crucibles, typically surrounded by various ox-
ides (see Figure 8.23).
(b) (Leaded) tin bronze. Tin content in (leaded) bronze prills varies from 0 to
51.6 wt%, with good representation of low- to intermediate-tin (±0-12 wt%
Sn), intermediate- to high-tin (±12-20 wt% Sn) and high-tin (over ±20-25 wt%
Sn) bronze. Lead content is generally quite low, varying from 0 to 3.5 wt% (of-
ten ±1.5 wt%) without any correlation to tin content. An exception occurs in
Gordion-26891: a prill with 31 wt% Pb. Some examples of low- to intermediate-
tin (leaded) bronzes are shown in Figure 8.24 and Figures K.3e, K.8d, K.18a,
K.20c and K.20d.
(c) High-tin (leaded) bronze prills have been measured more frequently for Gor-
dion than for Pi-Ramesse crucibles. Prills with >25 wt% Sn occur in 26% of cru-
cibles, with half of them having tin contents >40 wt%. The highest prill tin con-
tent (51.5 wt%) occurs in Gordion-23797, with 2.7 wt% Co (no cobalt is mea-
sured in any of the other crucibles). It is important to point out here that high-
tin prills occur both in reducing and oxidising (accompanied by Cu/Sn/Fe/Pb
oxides) crucible slag and dross environments. Some examples are shown in
Figures 8.25 and K.3f.
The various Cn-Sn oxides and silicates mentioned in Appendix K.3 offer highly
distorted reflections of these bronze prills.
(d) Iron content in the (leaded) bronze prills typically varies from zero to 10 wt%.
An exception occurs in Gordion-22626, where some small prills contain 37.4
wt% Fe and an elevated zinc content (no zinc is noted in other crucibles).
(e) Non-metallic prills: copper chloride (CuCl or cuprous chloride) prills occur in
some crucibles (Figure 8.26), often in the corrosion/dross layer. In Gordion-
23329, a Cu2S and Pb-Cu-Cl oxide inclusion where noted. Similar Pb-Cu-Cl
oxide inclusions are noted in Gordion-26891.

290 Part IV: Gordion. Chapter 8 Frederik Rademakers
2. Iron: A tiny prill of almost pure iron occurs in Gordion-27638, with 90.5 wt% Fe, 7.5
wt% Cu and 2 wt% As.
3. Silver: Found in one crucible: Gordion-22529. Almost pure silver prills have been
measured (slightly corroded: 4-7.5 wt% Cl), and some copper prills contain 6-10 wt%
Ag. In the same crucible, 1.4 at% Ag is noted in Cu-Pb-Cl oxides (oxidised/corroded
prills). The crucible slag for Gordion-22529 has a 0.35 wt% bulk increase in Ag2O,
omitted in Appendix J. In Gordion-23329, 3.38 at% Ag occurs in a corroded prill as
well, but was not measured in metallic prills. Examples are shown in Figure 8.27.
Nickel is noted in low (< 1 wt%) quantities in (high-tin) bronze prills in two crucibles
(Gordion-25568 and -27734 (1)), where 0.5-1.2 at% Ni is present in some of the Cu-Sn ox-
ides and silicates too.
Antimony (0.5-3.5 wt%) occurs in bronze prills in two crucibles (Gordion-22529 and -
26891), both associated with elevated PbO content in the bulk crucible slag and in some
cases significant lead content in the prills as well.

Frederik Rademakers Part IV: Gordion. Chapter 8 291
(a) Pure (with < 1 wt% Fe) copper (bright), Gordion-
28932 (2)
(b) Pure copper (light grey) with various surround-
ing oxides, Gordion-23128
(c) Pure copper (bright) with Cu-Cl oxide corrosion
(light grey), Gordion-28236
(d) Close-up showing minor copper oxide (light
grey) in between pure copper (bright), Gordion-
28236
Figure 8.23: Pure copper prills

292 Part IV: Gordion. Chapter 8 Frederik Rademakers
(a) Low-tin, iron-rich (2.9-3.5 wt% Sn, 1.1-1.4 wt%
Fe, 1.1-1.6 wt% As) bronze prills, Gordion-28932 (1)
(b) Low-tin leaded bronze prills, abundant tin oxide,
Gordion-27640
Figure 8.24: Low-tin bronze prills (bright)
(a) High-tin (leaded) bronze prill (limited Fe) with
oxidised prills and olivine, Gordion-22958
(b) High-tin bronze prills (limited Fe) with spinel
and malayaite (both light grey), Gordion-27734 (1)
Figure 8.25: High-tin (leaded) bronze prills (bright)

Frederik Rademakers Part IV: Gordion. Chapter 8 293
(a) CuCl and Cu2ClO2-Cu2ClO3, Gordion-27609-S (b) CuCl with Cu2ClO2-Cu2ClO3 and malayaite,
Gordion-23707
Figure 8.26: CuCl prills
(a) Silver prill (with Cl), Gordion-22529 (b) Silver-rich copper and Cu-Pb-Cl oxides,
Gordion-22529
(c) Silver-rich corrosion (of leaded tin-bronze),
Gordion-23329
Figure 8.27: Silver(-rich) prills

294 Part IV: Gordion. Chapter 8 Frederik Rademakers
8.2.5 Charcoal and fuel ash
Contrary to Pi-Ramesse, the Gordion excavations have not yielded any evidence for tuyères
or furnace installations in which the crucibles were used. Their heating profile, however,
indicates that they were heated from the inside, presumably under a charcoal cover. Evi-
dence in the form of charcoal inclusions in the crucible slag is much scarcer here than for
Pi-Ramesse, though an example occurs in Gordion-23797 (Figure K.11), associated with
increased lime and magnesia content.
Further evidence can be obtained from the comparison of crucible ceramic and slag, with
specific attention to lime, alkali and P2O5 content, shown in Figure 8.12. As explained in
section 5.2.5, increases in these elements are indicative of a fuel ash contribution to the
crucible slag formation. For the Gordion crucible slag, there is a good correlation between
increases in lime and magnesia, phosphorus oxide, potash and silica, but not between
lime and soda.
The average relative increase in potash (±40% K2OAl2O3
) is similar to that in lime (±30% C aOAl2O3
),
whereas in the Pi-Ramesse crucibles, the average relative increase in lime is over seven
times greater than that in potash (±330% and ±40% respectively). Furthermore, the ce-
ramic silica content is significantly lower in the Gordion crucibles, which could explain
the more pronounced silica fuel ash contribution (though still low compared to magnesia,
phosphorus oxide and potash enrichment). While these differences are noteworthy, their
cause cannot easily be deduced: charcoal and fuel composition can be highly variable,
even within the same species of tree used, depending on which part of the tree (trunk,
branch or twigs) is used and what time of year of the wood is cut. Additionally, blowing
conditions during firing can influence the varying enrichments of different fuel ash com-
ponents. This difference can therefore not be easily explained, but makes little difference
in terms of the technological interpretation presented here.
From Table K.1, it appears that lime and particularly magnesia are mostly concentrated in
the glassy slag matrix, though the content strongly varies. The variation on the potash and
phosphorus oxide measurement is too great to confidently suggest the same for these two
components, though they are most likely equally concentrated in the glassy matrix.
These findings suggest an important fuel ash contribution to slag formation in the Gordion
crucibles, supporting an interpretation that open crucibles were heated under a charcoal
cover, very similar to the situation attested in Pi-Ramesse.

Frederik Rademakers Part IV: Gordion. Chapter 8 295
8.2.6 Aberrant crucible fragments
Three samples have a ceramic fabric different from the other crucibles, as shown in Figure
8.28. Their bulk composition is different from that of the rest of the assemblage, as shown
in Table 8.2.
Two samples were taken from the group of small fragments (Gordion-23707, possibly rep-
resenting one crucible). These are comprised of a thin (<5 mm) ceramic layer and a glassy
slag layer with green corrosion products (<10 mm). The ceramic has a light grey colour
with small (<1 mm) red and white inclusions.
One sample was taken from Gordion-28236, which has a grey (centre) to red (exterior)
colour (pointing to oxidising conditions outside of the crucible, and more reducing condi-
tions at its interior) and limited inclusions. This fragment shows cracks along its exterior
surface, extending deep into the profile. Its fabric feels more brittle than the other cru-
cibles (as does the Gordion-23707 fabric).
These crucible fragments therefore immediately stand out due to their softer fabric and
the lack of large rock inclusions.
Microscopic and chemical analysis further verifies their aberrant nature. Gordion-23707
is rich in medium-large (sub-)angular quartz fragments (Figure 8.29a), reflected in an in-
creased bulk silica content, as well as a lowered magnesium, aluminium, titanium and
iron oxide content. Additionally, higher potash and lime can be noted.
Gordion-28236 has no large inclusions (though many small-medium sub-rounded to sub-
angular quartz fragments) and is more porous than other crucibles, as indicated in Figure
8.29b. This crucible has ‘normal’ silica content, but is characterised by highly elevated
lime content (almost 20 wt%) and somewhat elevated potash content. Conversely, it has
lower magnesium, aluminium, titanium and iron oxide content.
In summary, both Gordion-23707 and Gordion-28236 show elevated soda, silica, potash
and lime, and lower iron oxide (relative to alumina), compared to other crucibles.
Referring back to the available clay sources for ceramic production (see section 8.1.3),
Gordion-28236 was probably made using the more calcareous, marl-derived clay. Gordion-
23707 might have been made using the same clay, with the addition of quartz temper.
Comparison to fabric descriptions of contemporary domestic ceramics would be interest-
ing to further understand the ceramic recipe used in preparing these aberrant crucibles.
As far as their metallurgical use is concerned, these crucibles do not show aberrant be-
haviour. The changes in bulk content between ceramic and slag do not vary significantly
from the ‘normal range’ seen in other crucibles (see section 8.2.2), and ‘normal’ metallic

296 Part IV: Gordion. Chapter 8 Frederik Rademakers
(a) Small fragments, Gordion-23707 (b) Large fragment, Gordion-28236
Figure 8.28: Aberrant crucible fragments
(a) Ceramic fabric, Gordion-23707 (b) Ceramic fabric, Gordion-28236
Figure 8.29: Ceramic fabric Gordion-23707 and -28236
prills are encountered in the crucible slag (see Appendix L). One notable difference is the
exceptionally high CuO content in the two Gordion-23707 samples (17.3 and 24 wt%).
8.2.7 Dross
A dross layer (comprising various oxides) sometimes forms and floats on top of the cru-
cible charge during the metallurgical process which, during casting, can be deposited on
top of the interior crucible slag. Such a layer therefore does not necessarily cover the entire
crucible interior surface, but a rather small area (typically towards the crucible bottom),
and could be missed during sampling. Dross layer formation is comparable to that of the
‘second slag layer’ in Pi-Ramesse crucible 94_560, shown in Figure 5.59, though no pri-
mary slag inclusions are requisite: the dross layer is made up mainly of oxidised metal.

Frederik Rademakers Part IV: Gordion. Chapter 8 297
Na2O MgO Al2O3 SiO2 P2O5 K2O CaO TiO2 MnO FeO
Gordion 23707 2.7 3.0 13 60 0.3 3.6 11.8 0.6 0.1 4.0
Gordion 28236 3.6 2.8 13 49 0.3 3.8 19.8 1.0 0 5.7
Other crucibles 3.0 3.8 18 51 0.5 1.9 10.4 1.6 0.1 9.2
Table 8.2: Average ceramic bulk composition for three aberrant samples (Gordion-23707
and Gordion-28236) and rest of the assemblage (in wt%, normalised to 100%)
Na2O MgO Al2O3 SiO2 P2O5 K2O CaO TiO2 MnO FeO CuO As2O3 SnO2 PbO
Ceramic 3.0 3.8 18 51 0.5 1.9 10.4 1.6 0.1 9.2 0.1 0.2 0.4 0
Slag 2.8 3.6 16 44 0.5 2.2 11.3 1.5 0.1 8.6 4.8 0.2 4.1 0-2.2
Dross 0.5 1.1 5 14 0.3 0.5 3.7 0.3 0 7.3 35.0 0.1 27.7 4.0
Table 8.3: Average bulk composition of ceramic, slag and dross (in wt%, normalised to
100%)
Dross layers have been noted for 30% of the examined crucible fragments, though almost
exclusively on body fragments (out of this 30%, 28% are body fragments). Therefore, out
of all the body fragment samples, 50-60% exhibit these dross layers6. It is therefore likely
(though not necessary) that nearly all crucibles formed such a dross layer, which is rep-
resented in only half of the examined body samples as a result of its limited extent and
random sampling.
A comparison between the average crucible ceramic, slag and dross7 composition is given
in Table 8.3.
Clearly, this dross is distinct from the crucible slag: it is dominated by copper, tin and lead
oxide. The slag contribution is low, as indicated by the limited alumina and silica content.
Calculating the ratios of oxides to alumina (omitted here), shows that Na2O, MgO, SiO2,
P2O5, K2O, CaO and TiO2 ratios are more or less the same as those in the slag. These oxides
therefore represent the crucible slag contribution to dross formation. FeO/Al2O3, however,
is three times higher for the dross than the slag (1.55 instead of 0.56). This indicates that
additional iron is burnt out of the crucible charge into the dross layer, together with cop-
per, tin and lead. In total, the dross is therefore typically made up of ±1/3 crucible slag and
±2/3 oxidised metal.
6As body fragments make up ±52% of the assemblage (see section 8.3.2), and ±28/52% contain dross,
±54% of the body fragments contain dross, while it has only been noted on ±4% of the rim fragments.)7The dross layer was measured separately for five crucibles; averages here represent five times five mea-
surements.

298 Part IV: Gordion. Chapter 8 Frederik Rademakers
Section 8.3
Technical interpretation
8.3.1 Interpreting general crucible characteristics
A further interpretation of crucible characteristics (see section 8.1) is given here.
The choice of a mafic rock-derived clay, as discussed in section 8.1.3, has some important
consequences for the crucibles’ behaviour. While crucible slag is routinely developed in
most Pi-Ramesse crucibles, this is not the case in many Gordion crucibles. Typically, the
thickness of the slag layer is far more modest, with a more limited bloated zone and less
true vitrification. In many crucibles, (large parts of) the interior surfaces are merely burnt,
without slag formation occurring (e.g., variable slagging on fragment in Figure 8.1). The
variability in slag within a single crucible, assessed by taking multiple samples in a single
crucible, is discussed further in section 8.3.8.
Several factors influence the development of crucible slag, one of the most important be-
ing the ceramic fabric. More refractory ceramics tend to react less with the crucible charge
and remain both chemically and mechanically stable. The chemical composition of the
Gordion crucibles is close to that of mafic rocks (basalt-trachyandesite), which have rel-
atively high melting temperatures (Bowen, 1915) that equal or exceed temperatures typi-
cally attained during copper or bronze melting. This means that, compared to Pi-Ramesse
crucibles that completely bloat at 1200°C, the Gordion crucibles were operating just below
or at their thermal stability, and therefore did not disintegrate as extensively.
This lack of crucible slagging limits the possibility of interaction between the crucible and
its charge. While the crucible charge could interact with slag in Pi-Ramesse, resulting in
increased fuel ash, iron, copper, tin, and sometimes cobalt content, this exchange is lim-
ited in the Gordion crucibles. Rather, a dross layer formed in many (if not all) Gordion
crucibles, in which significantly more iron, copper, tin and lead oxides are gathered than
can be noted in the actual crucible slag. Therefore, sufficient attention should be given to
these dross layers to fully appreciate the metallurgical process.
An unfortunate consequence of such dross formation, however, appears to be its increased
sensitivity to corrosion. While crucible slag is a glassy product, effectively protecting trapped
metallic phases, dross is dominated by metal (oxides), with only limited glassy phase present,
and therefore corrodes more readily. Though metallic content is sometimes noted in this
dross layer during microscopic inspection (including high-tin prills), it has mostly been
corroded post-depositionally. This results in the prevalent green corrosion products shown

Frederik Rademakers Part IV: Gordion. Chapter 8 299
in Figure 8.4. The high metal oxide content greatly hinders the identification of metallic
phases in the dross layer during SEM(-EDS) analysis, due to their similar greyscale tone.
Contrary to Pi-Ramesse crucibles, none of the Gordion crucibles is bloated or slagged
throughout the full wall profile. Crucible wall thickness in Gordion is similar to or slightly
lower than in Pi-Ramesse, which is another indication that (presuming similar temper-
ature gradients) the Gordion crucibles have better refractory performance. This perfor-
mance can be partly attributed to their bulk chemistry, but is further influenced by the
presence of voids induced by (perhaps limited) burnt organic temper and around coarse
rock fragments. Furthermore, these coarse fragments add mechanical stability to the cru-
cibles. Though further geological information is required, it appears that these rock frag-
ments are residual to the clay, rather than intentionally added. Comparison to other ce-
ramics could indicate the extent to which this fragment-rich clay was selected specifically
(rather than fragment-poor clay) for the purpose of crucible making, or simply was the
only clay at hand.
During the metallurgical process, these rock fragments remain fairly stable throughout the
bloated zone and in less developed slag layers, as shown in Figure K.7. However, in fully
developed slag, the rock fragments are dissolved and plagioclase8 appears to re-crystallise
into finer, more elongated shapes, often resulting in a plagioclase-dominated slag with
glassy background.
The charcoal and fuel ash evidence indicates that the crucibles were left open, and heated
from above with a tuyère (possibly more than one) blowing into the crucible under a char-
coal cover. The exact set-up at Gordion is unknown, however. The number of tuyères,
the angle at which they blew air into the crucibles, the type of bellows and the shape of
the furnace cannot be reconstructed. Most likely, a bowl-type furnace (see Timberlake,
1994) or simple depression in the ground was used, where the crucibles may have sat on
a bed of sand or perhaps (non-burning) charcoal if the bowl was clay-lined. Alternatively,
more permanent structures may have been present in the so-called ‘foundry’. The cru-
cible evidence itself does not offer any further evidence, apart from the fact that the heat
was concentrated at the crucibles’ interior, while their exterior surface was exposed to far
lower temperatures.
The presence of copper and tin (oxides) in nearly all crucibles is indicative of their use
for the processing of bronze (and perhaps pure copper in some). The relatively frequent
occurrence of lead further points to the processing of leaded bronze, at least in some of the
8Klein and Dutrow (2007), Fig. 11.6, p. 253, indicates a melting temperature of (labradorite) plagioclase
of ±1300°C.

300 Part IV: Gordion. Chapter 8 Frederik Rademakers
crucibles. Whether these crucibles were used for remelting or alloying, is further discussed
in the following sections.
8.3.2 Rim vs. body fragments, crucible distributions and sample selec-
tion
Again, a distinction can be made between rim and body fragments (defined in section
5.4.3). The entire Late Phrygian assemblage is composed of 36 (60%) rim and 24 (40%)
body fragments: a total of 60 crucible fragments. Compared to Pi-Ramesse, rim fragments
are more strongly represented in the Gordion assemblage. However, many of the rim frag-
ments here contain large portions of the crucible profile.
46 samples have been analysed from the Gordion crucibles, out of which 16 (±35%) are
rim fragments, 24 (±52%) are body fragments and 6 (±13%) are body fragments from near
rims. As many of the ‘rim fragments’ contain large portions of the full crucible profile, it
was possible to take body-near-rim as well as body samples from ‘rim fragments’. For a
few crucibles, rim and body samples were taken from the same fragment.
Based on the experience with the Pi-Ramesse crucibles, a stronger representation of body
fragments has been selected, while further assessing variability within single crucibles, as
discussed in section 8.3.8.
An attempt has been made to achieve a sample distribution that is representative of the
actual distribution of crucible fragments for the various contexts. An overview of the se-
lected samples for each context is given in Table 8.4. Individual samples and their respec-
tive contexts are presented in Appendix I.
8.3.3 Alloying evidence
As explained in section 5.4.4, high-tin prills (over ±20-25 wt% Sn) give direct evidence for
the active alloying of copper (or recycled bronze) with fresh tin (or cassiterite). This rea-
soning is based on the premise that no circulating bronzes at that time had such high tin
contents, and these high-tin prills can therefore not represent recycling. An overview of
contemporary, regional bronzes and newly analysed bronze spills from Gordion (section
8.4) indicates that typical bronzes did not have tin contents exceeding ±15 wt%, making
this a reasonable assumption. The best explanation for high-tin prills, then, is that they
result from the addition of a high-tin, and most likely pure tin, additive to the crucible.
As outlined in section 8.2.4, bronze prills with >25 wt% Sn are found in about a quarter

Frederik Rademakers Part IV: Gordion. Chapter 8 301
# fragments Rim Body # samples Rim Body Body-rim Phase Operation Locus Lot Context type
5 4 1 3 1 2 0 2 12 17 Balk trimming
2 2 1 1 0 2 33 141 Mixed in excavation
1 1 1 1 0 2 51 149 Pit
3 2 1 1 1 0 2 66 157 Trash
1 1 3 1 1 1 400 2 19 57 Mixed in excavation
5 4 1 2 2 400 2 6 123 Mixed in excavation
2 1 1 1 1 400 7 32 123 ?
3 1 2 1 1 400 2 19 154 Mixed in excavation
3 2 1 2 2 410 2 11 16 Trash on surface
1 1 1 1 410.04 1 65 130 Pit
1 1 1 1 420 1 75 149 Ash lense
6 4 2 4 1 3 420 1 82 162 Exterior surface
4 2 2 2 2 420 2 73 177 Lensed trash
2 1 1 2 2 420.01 1 51 129 Pit
1 1 1 1 430 1 18 61 Pits mixed in excavation
2 1 1 2 1 1 430.07 1 18 63 Pit
1 1 1 1 430.08 1 19 64 Pit
3 2 1 2 1 1 435 2 6 118 Exterior surfaces
2 1 1 1 1 440.01 1 34 111 Floor deposit
3 3 1 1 440.03 1 32 96 Pit
1 1 1 1 460 1 98 228 Robber trench
2 1 1 2 1 1 460 1 98 237 Robber trench
1 1 2 1 1 470 1 25 76 Exterior surface
1 1 2 1 1 470.02 1 26 80 Pit
2 2 3 3 620 1 100 213 Pit
2 1 1 3 2 1 1 82 188 ?
60 36 24 46 16 24 6
Table 8.4: Distribution of fragments and samples for different contexts
of all crucibles, while one eighth of all crucibles have prills with tin content exceeding 40
wt%. Therefore, there is abundant evidence to suggest that active tin alloying was taking
place at Gordion.
Interestingly, the detection frequency of high-tin prills is much higher than in Pi-Ramesse.
This could be incidental, but might point to the higher importance of active alloying at
Gordion and lower prevalence of recycling. As discussed earlier, however, this kind of ar-
gument in absentia is difficult to substantiate.
Contrary to the Pi-Ramesse crucibles, lead occurs in metallic prills in ten of the Gordion
crucibles (and more often in surrounding corrosion products). Therefore, the possibil-
ity of active lead alloying should be considered. Following an argument similar to that
for tin alloying, it could be expected that prills with lead levels greatly exceeding those of
common leaded bronzes are indicative of an active alloying process. High-lead prills (>30
wt% Pb), containing antimony (and arsenic), have only been encountered in one crucible
(Gordion-26891), which contained several copper-lead oxides and chlorides. Interestingly,
these prills show only low tin contents.
It should be kept in mind that lead content is somewhat underestimated by SEM-EDS
analysis, especially for metal prills (see section 3.3.5). Nevertheless, the limited occur-
rence of high or even slightly elevated lead contents in bronze prills, as well as the more
limited bulk slag content (bulk PbO/SnO2 ≈ 0−0.5), seems to indicate that lead was probably

302 Part IV: Gordion. Chapter 8 Frederik Rademakers
not added separately to the crucible charge and came in with another charge constituent.
The high-lead prills in Gordion-26891 are surrounded by tin oxide and characterised by
low tin content, as shown in Figure 8.30. The shape of the tin oxide suggests that it has
been burnt out from the bronze. Indeed, tin is expected to oxidise more readily than lead
(Ellingham, 1944), which mostly remains in the metal prill until all tin is burnt off. The oxi-
dising context in this particular (tiny!) area of the crucible does not point to active alloying.
However, given the heterogeneity seen within single crucibles (see section 8.3.8), it is very
well possible that this crucible was used for alloying. Several scenarios are plausible:
• Lead was added to bronze, forming an intermediate high-lead bronze prill, which
subsequently partially oxidised in the area shown in Figure 8.30.
• Tin was added to leaded copper, forming a (high-)lead bronze prill which then par-
tially oxidised.
• Tin and lead were added to copper, forming a (high-)lead bronze prill which then
partially oxidised.
• Leaded bronze was remelted in this crucible, with oxidising conditions leading to
some loss of tin.
Whatever the true scenario may be, either a pure source of lead or lead enriched copper
or bronze was added to the crucible. Given the evidence from other crucibles, it seems
most likely that a leaded copper was added to this particular crucible. However, the lead
content witnessed in this prill is not necessarily representative of the lead content of this
added leaded copper.
Finally, it should be noted that this is the only crucible where significant Sb has been noted
repeatedly in metal prills (with the exception of the crucible associated with silver, see
section 8.3.7). This antimony presence could be related to the lead source.
Taking into account both the evidence from crucible analysis and metal analysis (section
8.4), it can be reasonably assumed that pure tin bronze as well as leaded tin bronze was
produced in Gordion. Most likely, lead was not introduced separately into the crucible,
but as leaded copper. At levels of ±1-5 wt%, this would have produced a noticeable effect
on the bronze’s properties, arguing for an intentional selection of lead-rich copper. At low
levels (below ±1 wt%), the presence of lead is probably unintentional.

Frederik Rademakers Part IV: Gordion. Chapter 8 303
Figure 8.30: Slag with pyroxene (medium-dark grey, angular), plagioclase (dark grey, on
bottom left and right), tin oxide (white, angular), and prills (copper with A: 0.6 wt% Fe
and 2.8 wt% Sb, B: 1.5 wt% As, 1.5 wt% Sn, 3.4 wt% Sb and 31 wt% Pb, C: 0.7 wt% Sb),
Gordion-26891
8.3.4 Sources of tin
There is ample evidence, present in the crucible slag in the form of high-tin prills, to indi-
cate the practice of active alloying at Gordion. These prills do not provide any conclusive
evidence as to the used source of tin, which could either be tin metal or ore (cassiterite), to
be used in a metal mixing or cementation process respectively (excluding the possibility
of co-smelting).
Though tin could have been introduced into crucibles as a component of recycled bronze
(scrap), this explanation only suffices for crucibles where no high-tin prills are encoun-
tered. When high-tin prills are present, a fresh source of tin is implied (see section 5.4.4).
As in the Pi-Ramesse crucibles, high-temperature SnO2 crystals are very common in both
the crucible slag and dross in Gordion, which do not provide any information on the na-
ture of the alloying process, but could indeed even form during simple recycling and (re-
)melting operations (Rademakers and Rehren, 2013).
Therefore, the only possible evidence that can be used to distinguish between alloying
pure metals and the cementation process can be found in remnant cassiterite grains, em-
bedded in the crucible slag.
As discussed in Appendix K.4, the evidence for cassiterite use is far from compelling in the

304 Part IV: Gordion. Chapter 8 Frederik Rademakers
Gordion crucibles. The only (somewhat) convincing examples occur in Gordion-25394,
shown in Figure K.19a. Here, the few possible cassiterite clusters are located in the deeper
crucible slag, while the overlying dross layer is dominated by newly formed tin oxide crys-
tals. All other clusters witnessed in the crucible slag are either too tiny to confidently build
a case for cementation, or are clusters of high-temperature SnO2 crystals. Though it is pos-
sible that clusters of such crystals (e.g., Figures K.18f and K.19d) represent re-crystallised
mineral cassiterite grains, their common association with iron and more importantly cop-
per oxides is indicative of a different process. Such clusters are more likely to be the result
of complete oxidation/burning of a bronze prill at that particular location, whereby all tin
is converted into SnO2 crystals, iron is burnt into spinel (often incorporating some tin)
and finally copper is turned into cuprite. This is discussed in some more detail in Chapter
13.
In conclusion, then, it appears that there is very little direct evidence for the use of cassi-
terite in a cementation process. However, the absence of residual mineral grains, which
are intermediate products, cannot convincingly argue against cassiterite cementation here.
Furthermore, the use of more refractory crucibles which form a less developed slag, could
work against the trapping of such grains. The consequential development of a dross layer
(see section 8.2.7), which floats at the top of the crucible charge, might be a further reason
prohibiting the preservation of mineral grains: the dross layers are dominated by high-
temperature oxide products, due to their exposure to more oxidising conditions (CuO and
SnO2 make up 2/3 of the bulk content). Such an environment is in stark contrast to the
‘desired’ setting for preservation of residual mineral grains (reducing areas, cut off from
further participation in the alloying process).
Presented with this evidence, the nature of the tin source added in the alloying process
must remain unknown: either tin metal or ore could have been added to the crucibles.
8.3.5 Iron enriched crucible slag
As discussed in section 8.2.2, 83% of the examined samples show only minor iron enrich-
ment (+1.6% ∆FeO/Al2O3), which does not represent any significant change. The crucible
slag in 17% of the samples (most of which are body fragments), however, is further en-
riched in iron (+30-80% ∆FeO/Al2O3). This includes the two ‘pure slag’ samples (Gordion-
23045-S and -27609-S), taken from (exceptionally) thick crucible slag (see section 8.3.8).
Though this enrichment is only minor in absolute terms (especially compared to that seen
in Pi-Ramesse crucible slag), it differs significantly from the normal population and there-
fore merits some further attention.

Frederik Rademakers Part IV: Gordion. Chapter 8 305
Spinel is found in 33% of all samples, which include seven out of eight significantly en-
riched samples (and the most highly enriched samples from the ‘normal population’).
Though a real correlation cannot be determined, bulk iron enrichment appears to coin-
cide with the appearance of iron-rich oxide phases. These are typically associated with
iron-rich (±0.5-4 wt% Fe) copper/bronze prills, as shown in Figure K.3, implying copper
as the source from which iron is introduced into the crucible slag. This is fully in line
with observations made for the Pi-Ramesse crucibles, despite the difference in absolute
enrichments.
The different nature of the Gordion crucibles is probably again important in explaining
this result. The limited slagging of these crucibles provides little opportunity for iron to be
exchanged between the charge and the crucible. The dross layer, however, which forms
on top of the charge, is three times more enriched in iron (section 8.2.7). Therefore, any
iron burnt out of the crucible charge is expected to be reflected in the crucible slag to a
lesser extent. Nonetheless, even when considering the iron enriched dross layer, the iron
content of the copper used at Gordion was probably not as significant as that used in a
third of the Pi-Ramesse crucibles.
The possibility of some iron being introduced with the tin source (with cassiterite or as
‘hard head’ with tin, see section 5.4.6) can not be entirely excluded.
Though it is probably reasonable to assume similar redox-conditions for the Gordion and
Pi-Ramesse crucibles when comparing the two, this assumption does not necessarily hold.
The conditions in Gordion might have been more reducing, preventing excessive oxida-
tion of iron. However, the similarity in CuO and SnO2 enrichment (around 4-5 wt%) seen
in both assemblages as well as the general resemblance between the crucibles suggests
that their operation was quite comparable.
8.3.6 Lead enriched crucible slag
In ±2/3 of examined crucible fragments, no lead enrichment is measured in the crucible
slag. In the other third, bulk PbO enrichments up to 5 wt% are noted (mainly body frag-
ments). Leaded bronze prills have been noted in 26% of the samples, of which all but two
show bulk PbO enrichments. Therefore, leaded bronze prills are not noted in all samples
exhibiting bulk PbO enrichment, and vice-versa, but this most likely represents a sampling
artefact, introduced by crucible heterogeneity. For bulk enriched samples, PbO is usually a
component of the glassy slag phase. Some lead oxides, chloride-oxides and silicates, often
incorporating copper are encountered too. The general impression from the various lead

306 Part IV: Gordion. Chapter 8 Frederik Rademakers
Figure 8.31: Lead-rich glassy phase in area with burnt SnO2
occurrences in the crucible slag is either its association to copper in a particular oxide, or
its dissolution into the glassy slag phase otherwise. Very few pure lead oxides or high-lead
phases exist.
Including the observations made in section 8.3.3, the lead appears to be introduced into
the crucible slag with the copper. Though lead is usually found dispersed in the copper
as metallic droplets, lead sulphate is sometimes encountered (Figure K.22) in association
with copper. In dross layers, lead often participates in the formation of various corrosion
products.
Contrary to tin, which forms stable SnO2 crystals upon oxidation from bronze, lead does
not seem to produce any characteristic crystals and discreetly disappears into the glassy
phase, hindering its identification as a bronze oxidation product. This is illustrated in
Figures 8.30 and 8.31, where SnO2 crystals occur in an area with localised lead-rich glass
phase (±19 wt% PbO), indicating a similar source for lead enrichment.
Though the slag analysis by itself does not rule out the possibility that pure lead was added
to the crucible, which then subsequently reacted with the crucible slag to form a leaded
glass phase, the consideration of all evidence points in the direction of lead being a com-
ponent of the copper introduced into the crucibles.
As noted in Appendix A, SEM-EDS analysis probably underestimates the actual lead con-
tent in the crucible slag. Additionally, the more refractory character of the Gordion cru-
cibles could impede the inclusion of lead into the crucible slag (though the similar copper

Frederik Rademakers Part IV: Gordion. Chapter 8 307
and tin enrichments argue against this, as mentioned in section 8.3.5). The general im-
pression that lead was a component in approximately half of the population (half of the
body fragments), matches the observations made for Gordion metals (section 8.4): leaded
bronze was one out of several alloys produced in Gordion.
8.3.7 Silver
Silver prills have been encountered in one crucible (Gordion-22529), and minor silver has
been found in one corroded prill from another crucible (Gordion-23329).
In Gordion-22529, both pure silver prills and silver-copper prills occur. The pure prills are
found in the more glassy crucible slag, while the mixed prills occur in the drossy layer,
sometimes associated with lead as well. The limited amounts of chloride associated with
the silver prills are most likely due to post-depositional corrosion. The bulk Ag2O content
in the slag and dross is ±0.3 and ±0.5-0.8 wt%, respectively. The bulk PbO content in the
crucible slag and dross is very high (±5 wt%). Antimony is noted in some of the copper
prills in this crucible as well.
This crucible is difficult to interpret, as several scenarios might have produced this out-
come:
• It could have first been used for silver melting, which produced the more or less pure
silver prills in the crucible slag, without formation of a dross layer. This would have
required lower temperatures than those used for melting/alloying bronze. Despite
the high lead content, it is unlikely that the crucible was used for a cupellation pro-
cess9, as the lead oxide content (litharge) is too low, the crucible itself does not have
good cupel characteristics and it does not have an abnormal appearance compared
to the rest of the assemblage. Following silver melting, the crucible could then have
been used for bronze melting/alloying, whereby some of the silver was taken up by
the copper/bronze prills.
• Similarly, the crucible could have been used for bronze melting/alloying first and sil-
ver melting later. This appears unlikely, as copper/bronze residue would obviously
contaminate the silver, and the silver is embedded deeper in the crucible slag than
the copper/bronze.
9In cupellation processes, a precious metal (e.g., silver) is molten with excess lead, which under oxidis-
ing conditions forms lead oxide (litharge). This litharge incorporates the base metals contaminating the
precious metal, thereby purifying it (Bayley, 1996; Bayley et al., 2008).

308 Part IV: Gordion. Chapter 8 Frederik Rademakers
• A silver-rich or -coated copper/bronze might have been remolten in this crucible,
resulting in silver-rich copper/bronze prills and pure silver prills (copper oxidises
preferentially to silver).
Though the presence of silver appears remarkable, the actual amount of silver is quite
low and most likely points in the direction of a copper contaminant. The occurrence of
silver in both the crucible slag and dross furthermore indicates that it was part of a single
operation involving bronze. Similarly, the high lead content in both the crucible slag and
dross is most likely due to the remelting/alloying of leaded bronze, which fits with the
interpretation of the assemblage as a whole, rather than any operation particularly related
to silver.
A similar interpretation is most appropriate for the low silver content noted in a corroded
prill in Gordion-23329.
It is nonetheless interesting to note that silver-bearing copper was used in one or two cru-
cibles. This probably points to a recycling operation, perhaps of a silver-gilded object
(similar to the possible remelting of a gold-gilded object in Pi-Ramesse, section 5.4.11)
or silver-bearing coinage. It is difficult to ascertain from this evidence whether the silver
content would have actually been noticed by the ancient metallurgists in Gordion.
8.3.8 Variation in crucible slag
The crucible assemblage shows variation in terms of slag composition, mineralogy and
metal content, which is due to several interacting factors (Rademakers and Rehren, 2014).
These are the same as those outlined in section 5.4.9: variability in the crucible charge
composition, the cooling speed of the slag, the redox-conditions and temperature. These
again vary through time during the process and depend on the location within a crucible,
which can result in varying degrees of slagging throughout a single crucible and between
different crucibles.
As the analysis of the Pi-Ramesse crucibles indicated that variation within a single cru-
cible was most likely an important underlying cause for variability seen within a crucible
assemblage, multiple samples were taken from four of the Gordion crucibles. The sample
selection for these crucibles is shown in Figure 8.32. For three fragments, both a rim and
lower body sample were taken. These are Gordion-23045 (the largest fragment in the as-
semblage), Gordion-27609 and Gordion-27613. For the fourth fragment, Gordion-25394,
three samples were taken along the crucible profile. A comparison between the slag bulk

Frederik Rademakers Part IV: Gordion. Chapter 8 309
Na2O MgO Al2O3 SiO2 P2O5 K2O CaO TiO2 MnO FeO CuO As2O3 SnO2 PbO
Gordion-23045: Rim 3.1 4.3 17 50 0.4 2.1 11.6 2.0 0.2 8.4 0.1 0.1 0.4
Gordion-23045: Body 2.6 4.9 16 47 0.3 1.8 14.4 1.7 0.1 8.7 0.9 0.2 1.2
Gordion-27609: Rim 2.3 4.4 15 47 0.6 4.3 15.6 1.5 0.1 7.8 0.2 0.1 0.5
Gordion-27609: Thick slag 2.0 4.1 13 40 1.0 2.8 14.0 1.2 0.2 8.9 5.4 0.2 6.7
Gordion-27613: Rim 3.1 3.8 17 49 0.5 2.2 11.6 2.0 0.1 9.9 0.1 0.3 0.3
Gordion-27613: Body 4.1 3.3 18 48 0.6 2.5 10.8 1.6 0.1 8.3 0.2 0.2 1.3 0.8
Gordion-25394: Rim 2.6 4.7 16 47 0.4 2.7 12.7 1.8 0.2 9.5 0.8 0.1 0.8
Gordion-25394: Body (near rim) 2.6 3.9 17 45 0.4 2.7 11.6 1.5 0.2 10.2 2.1 0.3 2.6
Gordion-25394: Lower body 1.8 3.4 11 31 0.5 1.8 9.4 0.9 0 8.7 8.5 0.2 19 4.4
Table 8.5: Bulk composition of slag (in wt%, normalised to 100%) for four samples in dif-
ferent locations
∆N a2OAl2O3
∆M gO
Al2O3∆
SiO2Al2O3
∆P2O5Al2O3
∆K2O
Al2O3∆ C aO
Al2O3∆
T iO2Al2O3
∆ MnOAl2O3
∆ FeOAl2O3
Gordion-23045: Rim 13 12 -1 17 19 -1 29 60 6
Gordion-23045: Body -12 38 -2 -40 7 30 9 -20 -3
Gordion-27609: Rim 0 40 11 15 170 61 22 177 12
Gordion-27609: Thick slag -11 45 4 145 80 71 6 77 34
Gordion-27613: Rim 5 9 0 -11 21 10 35 4 18
Gordion-27613: Body 27 -5 -2 27 43 14 5 223 4
Gordion-25394: Rim 17 11 1 -24 34 24 45 92 10
Gordion-25394: Body (near rim) 1 6 -2 -16 43 17 7 57 20
Gordion-25394: Lower body 10 45 7 90 39 40 1 90 74
Table 8.6: Relative changes (%) between ceramic and slag for four samples in different
locations
contents for these samples is given in Table 8.5, while the relative change between ceramic
and slag is shown in Table 8.6.
Some differences between samples from a single crucible stand out: in all cases, the cop-
per, tin and lead content (when present) is elevated in body fragments compared to rim
fragments. Relative iron enrichment (which is very modest here, compared to the Pi-
Ramesse crucibles), when significantly present (>30% ∆FeO/Al2O3) as in Gordion-27609 and
Gordion-25394, is more outspoken in the body fragments. Differences in fuel ash compo-
nents are more difficult to discern.
The thickest slag development for these four crucibles is seen in Gordion-27609 and Gordion-
25394, whereas Gordion-27613 and Gordion-23045 show more equal and limited slagging.
The lower areas of Gordion-27609 and Gordion-25394 are thicker due to the combined
presence of crucible slag and dross, which is further reflected in the more significant cop-
per, tin and iron enrichments.
Some more information can be gathered from examining the variability in micro-structure
and phases for these samples. For Gordion-25394, several differences in the crucible slag
can be noted for the rim, intermediate and lower body samples, shown in Figure 8.33. The
rim sample exhibits limited slagging, and most of the interior is simply bloated and vitri-
fied ceramic. A few tiny prills occur further away from the rim (towards the lower body),

310 Part IV: Gordion. Chapter 8 Frederik Rademakers
Figure 8.32: Multi-sampling of crucible fragments (top: Gordion-27609, middle: Gordion-
27613, bottom left: Gordion-23045, bottom right: Gordion-25394)

Frederik Rademakers Part IV: Gordion. Chapter 8 311
which are iron- and arsenic-rich bronze (see Appendix L), and the total metal content is
low. In the second (intermediate) sample, the slag is more developed (though not every-
where) and more metal prills are present. These are mainly pure copper prills with minor
iron content, while the slag contains large amounts of tin oxide, malayaite and copper
(chloride) oxides. Finally, the third sample represents the thick crucible slag and dross at
the bottom of the fragment, where the ceramic was broken off. Here, the deeper slag layer
is similar to the intermediate sample (with iron-rich bronze prills), while the surface layer
is more dross-like and dominated by various metal oxides. The base metal content in the
second sample is higher than that of the rim fragment, but lower than that measured in
the bottom fragment (Table 8.5). However, this is reflective of the high metal oxide content
in the dross, rather than the elevated presence of metallic prills. In fact, the large amounts
of metal oxides greatly impede the detection of metallic prills in dross during SEM-EDS
analysis. Fuel ash contributions and iron contamination of the crucible slag are lower for
the rim and intermediate sample than for the bottom sample.
This shows that rim samples generally capture fewer charge constituents than lower body
samples, while variable redox-conditions modify the type of evidence found in these body
fragments (e.g., variable metal content, different oxide phases etc.).
The location at which a crucible fragment is sampled therefore strongly influences the in-
formative nature of analytical results. A notable feature of the Gordion crucibles in this
context is the formation of dross. This typically accumulates at the lower end of the cru-
cible (after casting), which further changes the explanatory value of lower body samples.
This issue is revisited in Chapter 13.
On the whole, most crucibles are slagged to a similar extent with fairly limited variation in
slag thickness between them, and the lime contributions are far more modest than those
seen in Pi-Ramesse. As a result, there is no obvious correlation between more enriched
(in iron, copper, tin or lead) crucibles and the degree of slagging here. Nevertheless, some
vitrification is a prerequisite to the entrapment of prills and other charge components.
A final note on corrosion products should be made here as well. As mentioned in sec-
tion 8.3.1, the presence of a dross layer appears to be at least partially responsible for the
high amounts of corrosion products on the crucible interior surface (see Figure 8.4): the
lack of a protective glassy slag phase increases its sensitivity to corrosion. However, post-
depositional conditions have played an important role as well and the metal remains are
equally corroded (see section 8.4). The abundance of chloride-dominated corrosion prod-
ucts is indicative of a different post-depositional environment to that of Qantir. The burial
below the water table in Qantir restricted oxygen supply, thereby protecting the bronzes

312 Part IV: Gordion. Chapter 8 Frederik Rademakers
Figure 8.33: Variation in crucible slag for rim (A), intermediate (B) and lower body (C)
samples in Gordion 25394

Frederik Rademakers Part IV: Gordion. Chapter 8 313
Na2O MgO Al2O3 SiO2 K2O CaO TiO2 FeO CuO SnO2
Deeper slag 3.8 3.6 18 50 3.2 10.5 2.1 9.7
Thin layer 2.0 3.8 17 50 10.7 9.7 1.6 5.0
Outer slag 2.6 5.2 12 37 4.5 24.0 1.2 7.4 4.0 1.7
Table 8.7: Composition (in wt%, normalised to 100%) of three zones in Gordion-22673-A
crucible slag
from corrosion. In Gordion, however, the more variable seasons expose the remains to
dry and wet conditions. In salt-bearing soils, this typically leads to ‘bronze disease’. Some
corrosion may have occurred post-excavation (Mödlinger and Piccardo, 2013). Detailed
analysis of corrosion processes belongs to the field of conservation science (see, e.g., Fab-
rizi, 1988; Figueiredo et al., 2010a; Ingo et al., 2006; McNeil and Little, 1992 and Scott, 1985)
and is beyond the scope of this project.
8.3.9 Potassium in Gordion-22673
A type of ‘slag layering’ occurs in two samples: Gordion-22673-A and B (from two different
crucible fragments, which may or may not have belonged to the same crucible, but do not
fit together). This layering is shown in Figure 8.34, with the composition of these three
areas (for Gordion-22763-A; it is similar for Gordion-22763-B) given in Table 8.7. On the
left, the deeper-lying slag (mostly vitrified ceramic) can be seen, dominated by plagioclase.
On the right, the slag is dominated by pyroxene (with a drossy layer at the interior crucible
surface). In between the plagioclase and pyroxene slag areas, a more porous area can be
noted (‘thin layer’ in Table 8.7).
What is particular about this intermediate layer is its high potash content. This layering
effect, however, does not persist from the top to the lower end of the mounted crucible
section, and is probably a localised phenomenon, due to a small area of the ceramic being
particularly enriched in potash (either a natural clay effect or due to segregation upon
heating). Its isolated occurrence does not argue for any technological significance.

314 Part IV: Gordion. Chapter 8 Frederik Rademakers
Figure 8.34: Slag layering in Gordion-22673-A
Section 8.4
Metals
A very brief overview of metals analyses conducted for Gordion metal artefacts is given in
this section. The full results of the analysis of five metal samples by the author are given in
Appendix M.1. These consist of three metal spills, and two cast metal objects, all of which
are corroded to some degree. The cast objects were leaded tin bronzes, with approximately
6-7 wt% Sn and 1-2 wt% Pb. Two of the spills have similar compositions, while the third
one was probably a pure tin bronze with 10-11 wt% Sn.
The exact assessment of these compositions is impeded by the significant corrosion present
on most samples, which consists of various copper-tin-lead oxides and chloride(-oxide)s.
One of the cast fragments (Figure 8.35) has a ring-like shape, with a rectangular corner,
which roughly matches the size and shape of some of the (tentatively identified) moulds
from Gordion (see section 8.5). The other large cast fragment (Figure 8.36) has a less dis-
tinct shape, and is characterised by copious amounts of high-temperature SnO2 crystals
(see Figures M.3 and M.4). These indicate highly oxidising conditions, probably during
casting.
Some previous analyses of copper-base material from Gordion were undertaken by Pigott
et al. (1991). These comprise microscopic description of (etched) metal samples and the

Frederik Rademakers Part IV: Gordion. Chapter 8 315
Figure 8.35: Gordion-22611: ring-like fragment
Figure 8.36: Gordion-22611: large cast fragment

316 Part IV: Gordion. Chapter 8 Frederik Rademakers
results of their analysis by PIXE10 analysis, which are reproduced in Appendix M.2.
There are three main alloys present: low-tin bronze (3.5-6.7 wt% Sn), normal (interme-
diate) tin bronze (10-15 wt% Sn) and leaded tin bronze (10-16 wt% Sn, 0.7-1.7 wt% Pb).
The minimal lead content for considering a sample to be either leaded bronze or ‘nor-
mal’ bronze is quite arbitrary here, especially since all these analyses were performed on
corroded samples. Nevertheless, there appear to be samples with negligible as well as sig-
nificant lead contents, with some samples falling in between. Tin contents, on the other
hand, appear to indicate a meaningful differentiation between low- and high-tin bronze.
In sample YH 29997, a tin content of 20 wt% is noted. Though this is possible, the heavy
corrosion and elevated presence of SnO2 inclusions probably causes an over-estimation
of the actual tin content. In some samples, Pigott et al. (1991) have identified SnO2 laths,
which they relate to the intentional alloying of copper with cassiterite mineral in a crucible
cementation process. The quality of images supporting this interim report, however, are
insufficient to properly assess this suggestion. Given that these crystals are described as
laths, and the two samples are spills or casts, it appears most likely that these SnO2 crys-
tals point to oxidising casting conditions where tin was burnt out of the bronze (see, e.g.,
Dungworth, 2013), rather than a cementation process. This interpretation is furthermore
supported by crucible slag analysis (section 8.3) and the author’s analysis of other metal
spills (Appendix M.1).
The overall impression from these analyses is that two alloy types were being produced
and cast in Gordion: pure tin bronzes and leaded tin bronzes. The pure tin bronzes,
which sometimes have minor lead content, can be further subdivided in low- and high-
tin bronzes. The (fairly) good separation between these different alloys indicates that they
were probably intentionally selected for specific purposes and perhaps subjected to dif-
ferent processes (casting, with or without cold working or annealing). Furthermore, it is
possible that alloy preference changed through time. However, the sample size presented
here is far too small to assess these questions and relate alloy selection to intended object
use with any true confidence.
Section 8.5
Moulds
Within the crucible find bags, some ceramic fragments are not actual crucibles, but rather
appear to be mould fragments. Though full analysis and discussion of moulds for bronze
10PIXE: Particle Induced X-ray Emission.

Frederik Rademakers Part IV: Gordion. Chapter 8 317
Figure 8.37: Two examples of mould fragments (see Figure N.6 as well)
casting is beyond the scope of this PhD project, a brief overview is presented here. Two
examples are shown in Figure 8.37, while the complete set of moulds is illustrated in Ap-
pendix N.
The fabric for these moulds is similar to that of the Gordion crucibles, based on visual
inspection (no further microscopic analysis has been undertaken). The interior surface
of the moulds, however, appears to be more fine-grained and smooth. The temperature
profile throughout the moulds indicates that they were probably pre-fired (similar to the
crucibles, see section 8.1.1), and subsequently exposed to higher temperatures under re-
ducing conditions on the interior, resulting in a grey surface typical for clay moulds (Bayley
et al., 2001, p. 16-17, Figures 24 and 26). This exposure is most likely due to the contact
of the interior surface with liquid metal, as it was poured into the mould and left to cool
there. Contrary to the crucibles, however, no significant slag or dross formation can be
noted, and the ceramic did not lose its structure. Though liquid metal would have entered

318 Part IV: Gordion. Chapter 8 Frederik Rademakers
Figure 8.38: Raw handheld XRF spectrum for Gordion mould (exterior surface in red, in-
terior surface in green)
the moulds at approximately the same temperatures as those within the hot crucibles,
these temperatures were not sustained in the moulds. The internal temperature would
have quickly decreased when the metal was left to cool, in contrast to the prolonged inter-
nal heating of the crucibles, explaining the difference in slag formation.
Their similarity in ceramic fabric and firing conditions may suggest that these moulds
were made and pre-fired together with the crucibles.
The varied shapes (see Appendix N) are indicative of a variety of objects being cast in Gor-
dion, ranging from small ring-like shapes (Figure 8.35) to elongated, rod-like (?) shapes
and perhaps vessels (Figure N.3). Figure N.3 furthermore indicates that in some cases an
existing ceramic vessel or shape may have been used as a mould, with the application of a
coarser clay (similar to crucible fabric) on the exterior.
Analysis of the exterior and interior surface by handheld XRF indicated a significant in-
crease in lead on the interior surface, as well as a minor increase in copper (Figure 8.38).
Crucibles, on the other hand, showed increased tin content on their interior surfaces, in
addition to more significant copper increases (Figure 8.39).
This is in line with the expectations for mould surface enrichments, as discussed by Kearns
et al. (2010): for (leaded) bronzes, lead is very strongly enriched, while only minor copper
and very minor tin enrichments can be detected. This skewed enrichment does not allow
further evaluation of the relation between alloy selection and object typology.

Frederik Rademakers Part IV: Gordion. Chapter 8 319
Figure 8.39: Raw handheld XRF spectrum for Gordion crucible (exterior surface in red,
interior surface in green)
Note on handheld XRF analysis
The pXRF analysis of these moulds took place in the University of Pennsylvania Museum
of Archaeology and Anthropology as a means of sorting through the assemblage for sam-
ple selection. This data was obtained using their recently acquired handheld XRF device
(Bruker Tracer III SD, S/N: T3S165q, yellow filter11, 45 seconds live-time), which had not
been calibrated for quantitative analysis. Raw spectra were visually inspected to look at
presence/absence of elements, in order to assess variability in the assemblage.
No structured assemblage-wide analysis was undertaken for this assemblage.
11‘Yellow Filter’: “These settings allow all the x rays from 12 kV to 40kV to reach the sample thus efficiently
exciting the elements noted above (Ti to Ag K lines and the W to Bi L lines). There is little or no sensitivity to
elements below Ca with these settings”. (Bruker Tracer III SD Manual)

320 Part IV: Gordion. Chapter 8 Frederik Rademakers

CHAPTER 9
Discussion
This discussion aims to provide a broader perspective to the Gordion crucibles. Not only
do they offer the first example of Phrygian crucible technology, but equally an original in-
sight into the types of metal produced within the citadel. This is compared here to the
limited available data for (roughly) contemporary metal production, trade and consump-
tion in the region, and used to indicate where further research is needed.
The production of crucibles at Gordion seems to have been a local affair. Similarly to Pi-
Ramesse, the metallurgists selected the most appropriate, easily available clay and made
minor adjustments (e.g., addition of organic temper) to improve its refractoriness. The
crucibles were shaped by hand, suggesting a fast, ad hoc production (probably by the met-
allurgists themselves, rather than specialised potters). That is not to say that the crucibles
were a flimsy product: their characteristics were perfectly suited to their intended techno-
logical purpose.
Based on the analysis of metals and crucibles from Gordion, it appears that during the
Achaemenid/Late Phrygian period, both tin bronzes and leaded tin bronzes were being
produced. This was done using either recycled or raw copper, some of which probably had
a significant lead content (naturally from the smelting process or intentionally added),
together with a fresh source of tin. It is difficult to assess whether tin was added in its
metallic form or as cassiterite, due to the nature of slag formation in the Gordion crucibles.
Overall, very few indications for a cementation process exist within these crucibles. The
extent to which metallic tin would have been available through trade in this region in the
Achaemenid Period is not well documented either, however, leaving this issue unresolved
for now.
321

322 Part IV: Gordion. Chapter 9 Frederik Rademakers
Lead isotope studies have not been performed for either the metals or crucibles from Gor-
dion. For the bronzes and crucibles with elevated lead contents, the lead isotope signa-
tures would be dominated by the lead that was probably added to the bronze, rather than
naturally present in the copper. Though such results could be interesting, the rough strati-
graphical resolution available for the Gordion crucibles would render an examination of
variable metal sourcing within the workshop through time (as attempted for Pi-Ramesse,
section 5.5) almost impossible. It is therefore harder to justify the (financial and time) cost
associated with such analysis for the Gordion material.
Contrary to the Pi-Ramesse crucibles, the compositional analysis of crucible slag from
Gordion does not provide many clues as to the sources of copper used to produce (leaded)
bronze there. Most of the copper appear to have been fairly ‘clean’, pointing to refined
(raw or recycled) copper, while more iron-rich copper was introduced into a small por-
tion (±17%) of the crucibles. This iron content appears to have been comparatively lower
than that reflected in the Pi-Ramesse crucibles, which should mainly be attributed to a less
contaminated copper source (though higher crucibles refractoriness plays a role here too).
The presence of lead in ±1/3 of the crucibles most likely indicates the specific selection of
a lead-rich copper source to produce leaded bronze. Recycling of existing (leaded) bronze
appears to have been important, though the use of fresh materials, particularly tin (ore),
is attested as well. The provenance of this tin cannot be identified based on the results
presented here. Tin ore may have been available within the Sakarya basin, in the Phrygian
hinterland, as indicated in Gale et al. (1985), Figure 2, p. 150, but no further information
on the ancient exploitation of this deposit is available.
In summary, a mixture of different technological choices is reflected in the crucible as-
semblage. Their contextual distribution, however, does not allow any analysis to be made
on whether this variable technology reflects a change in time, space or intended purpose
of the produced alloy. The variability seen here might well attest the ad hoc nature of the
workshops, where small batches of metal could have been produced with the material re-
sources at hand (often recycled scrap) to produce fairly small objects. It is at present not
possible to provide any further insights into the practical organisation of the metallurgical
workshops at Gordion.
Apart from the production of leaded bronze, the presence of various iron slags indicates
that iron was both being smelted (primary production) and smithed (secondary process)
in Gordion in the same workshop context. Though further analysis and discussion of iron
metallurgy at Gordion is beyond the scope of this research, it can be noted that in Gordion,
there probably was no clear separation between bronze and iron metallurgists. Though it
is hard to unequivocally prove that these were the same people, the contextual proximity

Frederik Rademakers Part IV: Gordion. Chapter 9 323
indicates that they were well aware of each other’s craft.
Young (1963: 357) described the Phrygians as “bronze-workers of the first order, familiar
with all the techniques of casting, solid or hollow, of hammering bronze vessels by sinking
or by raising, and of decorating them repoussé or by chasing”, which Bilgi (2004) attributes
to a deep-rooted cultural tradition. Young similarly identified the forms of bronze vessels
and fibulae found at Gordion as local Phrygian productions and takes their ready use and
adaptation abroad (e.g., in Western Turkey (Lafli and Buora, 2012), the Aegean (Craddock,
1976) and Lydia) as a proxy for the dissemination of Phrygian ideas and influence.
This flow of goods and ideas along the Royal Road during the 8th and 7th century BC
(Birmingham, 1961) may have dwindled prior to the Achaemenid (Late Phrygian) period,
but was restored by Darius, confirming Gordion in its role as a trade hub.
The available compositional data for Phrygian(-style) objects, however, is too limited to as-
sess the extent to which metal objects, cast in Phrygia, were transported and used abroad.
The quintessential (archaeologically attested) Phrygian metal object is the fibula, which
is found in many contemporary contexts of cultures in contact with Phrygia. Muscarella
(1967) discusses the variety in Phrygian fibulae from Gordion, as well as their prevalence in
foreign sites. More fibulae, as well as bronze belts, are presented by Vassileva (2012). The
characteristic fibula typology marks them as domestic products, with production most
likely situated in Gordion, though no moulds have been found. Examination of the fibulae
indicates that they were most likely cast in ‘one-use’ on some and ‘multiple-use’ moulds on
other occasions. It appears that both open and closed moulds were used. The brief results
presented in section 8.5 are the first attestation of moulds in Gordion, some of which may
have been related to the casting of fibulae. The alloys employed in the making of these
various fibulae are not specified by Muscarella or Vassileva beyond the generic ‘bronze’
description. Some were later analysed by the Oxford Research Laboratory for Archaeology
and the History of Art for Arthur Steinburg, and mentiond by Craddock (1978): the 8th-7th
century Phrygian fibulae from Gordion were made of brass, with ±10% zinc and little tin
or lead. This is confirmed by later XRF analysis of other Gordion fibulae and equally true
for other Phrygian and East Greek material (though three ‘Phrygian fibulae’ from north-
ern Greece are made of tin bronze (Craddock, 1976)). This result is quite surprising, as
no indications for brass-working, -casting or -processing are found in the metallurgical
assemblage presented in this chapter. It could point to a changing preference in copper
alloys through time, perhaps related to Achaemenid influence, but equally to the existence
of other metallurgical workshop contexts in Gordion (and other Phrygian sites) that have
hitherto not been discovered. Clearly, further excavation and analysis of metallurgical pro-
duction waste is needed to shed more light on this issue.

324 Part IV: Gordion. Chapter 9 Frederik Rademakers
Analysis of eight Phrygian metal objects from 8th-7th century BC Ankara by Atasoy and
Buluç (1982) shows the use of tin (±10%) bronzes, some of which were hammered and
annealed. They go on to suggest that metal workshops outside Gordion were probably in
existence as well, producing Phrygian-style bronzes.
Overall, the results from metal and crucible analysis presented in this chapter are the first
evidence of leaded bronze production in Gordion and Phrygia. The use of this alloy at this
time in history, however, is not unusual and similarly attested, for example, in Bogazköy
during the Iron Age (Lehner, 2012). The absence of references to (Late) Phrygian leaded
bronze in the literature mainly reflects the scarcity of analyses hitherto performed.
There exist a fair amount of publications on Anatolian metals, mostly concerned with
the composition (chemical and lead isotopes) of geological deposits and metal artefacts.
These studies cover a huge chronological scale, ranging from the Chalcolithic to Islamic
times, and are typically focused on the provenance of metals. Some examples (though by
no means an exhaustive list) are: Gale et al., 1985; Lehner and Prikhodko, 2010; Lehner
et al., 2009; Moorey and Schweizer, 1974; Pernicka et al., 1984; Sayre et al., 1992; Seeliger
et al., 1985; Wagner et al., 1985, 1989, 2003 and Yener et al., 1991. These concentrate mainly
on copper-related artefacts and mines (evidence for (Early Bronze Age) tin mining in Ana-
tolia has previously been mentioned in section 6.2.3).
The analysis of Phrygian artefacts in particular is mentioned by Hirao et al. (1995), who
note that most (copper) metals (from Kaman-Kalehöyük) appear to agree with minerals
from the Ala and Bolkar Mountains (Taurus). Sayre et al. (2001) equally indicate a local
origin for most (copper) metals employed within Phrygia/Anatolia, which is not surpris-
ing given the abundance of metalliferous deposits in the region. It is possible that tin was
similarly acquired from within Anatolia. However, these broad observations cannot be
tested for Gordion specifically without further analyses (e.g., lead and tin isotopes, as well
as trace element analysis).
There are no published studies of Phrygian crucible metallurgy known to the author. Bossert
(2000), for example, discusses Phrygian ceramics in Bogazköy, but mentions no crucibles.
de Jesus (1980) presents some drawings of (3rd millennium BC) Trojan crucibles, tuyères
and moulds, and a few from Arslantepe and Alishar, which reveal little stylistic resem-
blance to the Gordion material and were not scientifically analysed. Early Bronze Age
examples of internally heated crucibles from Nevalı Çori, used for primary smelting, are
shown by Hauptmann et al. (1993). The analysis of Phrygian crucibles presented here is
the first of its kind, and will serve as a reference for future studies of Phrygian metallurgy.
As a consequence, there are no comparisons to be made between the Gordion crucibles
and other Phrygian assemblages.

Frederik Rademakers Part IV: Gordion. Chapter 9 325
Contemporary crucible metallurgy in Anatolia or Achaemenid Persia is equally poorly rep-
resented in the literature. This makes it very difficult to hold a meaningful discussion of
technological (ex)changes in the region, both diachronic and between different cultures.
Finally, the crucibles themselves point to a local tradition or at least adaptation of cru-
cible manufacture. This is commonly the case for Bronze and Iron Age crucibles, with the
exception of very specialised (and chronologically much later) technical ceramics with
particular fabrics, such as those used in the production of crucible steel (e.g., Rehren and
Papachristou, 2003) or the widely distributed medieval Hessian wares (Martinón-Torres
and Rehren, 2009). Typically, crucibles are as indigenous as the local cooking ware, and
their typological comparison to examples from distant contexts (in time and space) holds
little value. More interesting results can be obtained from the comparison of their met-
allurgical application and the information about technological choices that are hidden in
their fragmented remains. At this point, such comparisons cannot be made.

326 Frederik Rademakers

Part V
Roman Thrace
Felix, qui potuit rerum cognoscere causas
Goscinny and Uderzo, 1997, after Vergilius
327

328 Frederik Rademakers

CHAPTER 10
Archaeological background
In the final case study presented for this thesis, four assemblages from different sites in
Roman Thrace are discussed. Though there is much to be said about the history and ar-
chaeology of the eastern Roman provinces, including Thrace, such a discussion would fill
several PhD theses. Therefore, a more succinct introduction is given here, focusing on
aspects relevant to the interpretation of the crucible remains.
Section 10.1
Roman Thrace
The assemblages discussed in this chapter were excavated at four different sites in modern-
day Bulgaria, shown in Figure 10.1. This region was known as Thrace in pre-Roman times
and the sites were included in the Roman province of Thracia, though provincial bound-
aries were re-drawn over time. Serdica became part of Dacia Mediterranea under Dio-
cletian (late third century AD) and Nicopolis ad Istrum was incorporated into Moesia Se-
cunda.
As in most provinces, gradual Romanisation took place following the conquest of these
regions, with strong Roman influence visible in the urban development of the sites un-
der discussion (Ivanov and von Bülow, 2008). Local traditions of agriculture and exploita-
tion of other resources (e.g., mining: Dušanic, 2004) were adapted by the conquerors, but
new industries were equally introduced (see, e.g., Vagalinski, 2011), resulting in an eco-
nomic and cultural ‘revival’ during the second and early third centuries AD (Ivanov, 1983).
329

330 Part V: Roman Thrace. Chapter 10 Frederik Rademakers
Figure 10.1: Map of Roman Thrace, showing four sites from which assemblages are exam-
ined (adapted from Haynes, 2011, p. 6)
Frederik Rademakers Part V: Roman Thrace. Chapter 10 331
Though no legions were stationed in Thracia, the province was well known as a supplier
of military troops to the Empire (Haynes, 2011), particularly from the Serdica and Philip-
popolis regions (Boyanov, 2013).
It is far beyond the scope of this thesis to discuss all the developments that took place in
Thracia under Roman rule, and only very basic introduction to each site and known met-
allurgical activity there is given here. Further details of the particular contexts pertaining
to the assemblages under study are given in section 10.2.
Nicopolis ad Istrum (near modern-day Nikyup village) was founded under Trajan (around
110 AD), in memory of his victory over the Dacians (Poulter, 1983, 2002, 2007a; Slokoska,
2002). The town is located at the confluence of the Rositsa and Yantra rivers and built fol-
lowing the classical orthogonal system. Excavations by a British team at Nicopolis (unre-
lated to crucibles discussed in this chapter) have yielded significant amounts of lead and
copper-alloy scrap, mostly concentrated in particular areas close to the late Roman city
walls and presumably intended for recycling (Poulter, 2007b), as well as significant evi-
dence for ferrous metallurgy and minor evidence for copper-related metallurgy1 (Salter,
2007). Nicopolis had its own mint under the Severan dynasty (Ivanov and von Bülow,
2008), though some coins were struck before (Minkova, 2002).
Philippopolis (after Philip II of Macedonia, modern-day Plovdiv) was already an important
centre in existence before Roman occupation (Ivanov, 1983), and continued to grow fol-
lowing its incorporation into the province Thracia, eventually becoming its capital (named
Trimontium) in the early third century AD, with a very intensive mint earlier, under Domi-
tianus until Elagabalus (Ivanov and von Bülow, 2008).
Serdica (modern-day Sofia) was another important settlement long before the arrival of
the Romans (Ivanov, 1983; Staddon and Mollov, 2000) and expanded as a municipium
from the end of the first century AD onwards, with its own mint under Marcus Aure-
lius until Gallienus (Ivanov and von Bülow, 2008). It finally became the capital of Dacia
Mediterranea under Diocletian’s reforms, with renewed minting taking place in 303-308
AD (Hendy, 1972).
Stara Zagora (modern-day name) was founded at the start of the second century AD and
named Augusta Traiana, after its founder Emperor Marcus Ulpius Traianus. It was one
of the largest cities of Roman Thrace, second only to Philippopolis, and had its own mint
from the mid-second to mid-third century AD (Ivanov and von Bülow, 2008).
1Two (?) crucible fragments were recovered in areas K 4508 and P 5021, made of a thin white fabric with
the application of a less refractory external clay layer, vitrified during use.

332 Part V: Roman Thrace. Chapter 10 Frederik Rademakers
Section 10.2
Assemblage-specific backgrounds
Most of the information presented in this section is based on notes by A. Cholakova, who
excavated many of the crucibles discussed here, and Th. Rehren, who accompanied her
for sampling these crucibles at several museums in Bulgaria. I am greatly indebted to both
for the documentation and preliminary interpretation of this material.
Samples N1, N2, N3, N4 (as well as P9 and S7) come from fragments published by Cholakova
(2006). Fragments N5-N6, P6, and StZ1 derive from recent rescue excavations, hitherto un-
published. Excavation reports for fragments P1-P5 (1976), P7-P8 (1987) and S1-S11 (1953-
1958) offer no contextual information beyond their rough dating outlined below.
10.2.1 Nicopolis ad Istrum
All the Nicopolis samples belong to the Regional Museum of History, Veliko Tarnovo, and
derive from two different locations within the site, comprising three particular contexts:
N660 and 0012 are different layers of a single area (Cholakova, 2006) and context 604 (un-
published) is located in an unknown area.
The first context (N660, trench excavated in 2000/2001) is dated to the early second cen-
tury AD and contained fragments N1-N3. It is a dump deposit2 comprising pottery, glass
and other small parts, of which a considerable amount are metalworking remains and
production waste. These remains cannot be linked to any in situ production installations.
The crucibles from this context are shown in Figure 10.2. N1 is an internally heated, large
hemispherical crucible, shaped by hand (finger traces on exterior), with 2-3 cm thick walls.
N3 is an externally heated crucible fragment. N2 is something quite different, and has
been tentatively described as a type of ‘collar’, probably belonging to a larger metallurgical
structure, with slag adhering to its internal surface.
Clay moulds were found in this context, suggesting the casting of small rings, as well
as many pieces of copper-base metal scrap. Finally, the presence of over 25 kg of iron
(s)melting slag (both primary tap slag and smithing slag) indicates associated ferrous met-
allurgy.
The second group was excavated between 1996-2002 and consists of three different cru-
cible fragments (N4-N6), shown in Figure 10.3. N4 is a base fragment of a crucible from
2Specifically between pillars V and VI of the civil basilica, shown by Cholakova, 2006, Figure 1.

Frederik Rademakers Part V: Roman Thrace. Chapter 10 333
Figure 10.2: Crucible fragments from Nicopolis, context N660
Figure 10.3: Remaining crucible fragments from Nicopolis

334 Part V: Roman Thrace. Chapter 10 Frederik Rademakers
Figure 10.4: Crucibles (P1-P5) from second century workshop, Philippopolis
context 0012 (basilica, no exact location or date). N5 is a base fragment from a third-fourth
century AD context (604). Both N4 and N5 appear to be wheel turned domestic pottery,
re-used as crucibles. N6 is an unstratified rim fragment from the same area (604).
10.2.2 Philippopolis
All the Philippopolis samples belong to the Regional Museum of Archaeology, Plovdiv, and
derive from four separate contexts.
Samples P1-P53 were taken from an assemblage of eight crucibles (Figure 10.4), dated to
the second century AD. They were excavated in 1976, and belong to a Roman workshop in
Philippopolis, together with copper (alloy) ingots and scrap. All crucibles were handmade
with non-refractory, soft clay fabrics and heated on the outside, which resulted in reddish
exterior vitrification with charcoal impressions. The insides were all dry with some prills
adhering but little dross and no slag present. All samples consist of small dross flakes and
fragments, taken from the crucible interior, without crucible ceramic.
Sample P64 was taken from a crucible base fragment (no image available) dated to the
Late Roman period (fourth-sixth century AD?), excavated in 2005 in a non-workshop, res-
idential context. It is an externally heated, pear-shaped crucible base with heavy external
vitrification, charcoal impressions and a reddish glaze. It has a dark fabric with 12-15 mm
thick walls, and appears to be wheel-turned.
3Museum inventory numbers: P1 = II 403, P2 = II 404, P3 = II 405, P4 = II 409 and P5 = II 410.4Museum inventory number: P6 = NSF 637.

Frederik Rademakers Part V: Roman Thrace. Chapter 10 335
Figure 10.5: Left: crucible P8 (left) with an unsampled gold-processing crucible (centre)
and ingot mould (right) from second-third century Roman forum context, Philippopolis.
Right: drawing of P8
Figure 10.6: Preliminary drawing of crucible P7, Philippopolis
Samples P7-85 derive from a second-third century AD context, excavated in 1987, where
three crucibles and an ingot mould (?) were found. Two of these crucibles, including P8,
are shown in Figure 10.5. From the small, triangular crucible (P8), a wall section was taken.
This showed hardly any vitrification (in or out) and has tentatively been linked to silver
processing. Dumped in the Roman forum of Philippopolis, there is again no directly re-
lated workshop context. Crucible P7 (Figure 10.6) was externally heated and the copper
dross on its interior has been sampled.
Finally, sample P96 was taken from a group of crucible fragments (Figure 10.7) found in
a smithy context (excavated in 2004), dated to the second century AD. In this workshop,
5Museum inventory numbers: P7 = II 1039 and P8 = II 22506Corresponding museum inventory number: P9 = NSF 638

336 Part V: Roman Thrace. Chapter 10 Frederik Rademakers
Figure 10.7: Crucible fragments (P9) from second century smithy, Philippopolis
remains of iron-working (slag, hammerscale) and other metal finds were found together
with this crucible. It is handmade, heated from above and two layers are macroscopically
visible, indicating reuse. It has been suggested that this workshop produced small iron
implements with copper alloy parts (e.g., keys or brooches). The crucible remains consist
of rim fragments only.
10.2.3 Serdica
All the Serdica samples belong to the Historical Museum of Sofia (ME ‘Old Sofia’), and de-
rive from four (tentatively identified) contexts excavated in the 1950’s. Excavation reports
offer no further information on the nature of these deposits.
Samples S1 and S27 were taken from two crucible fragments belonging to a single late
Roman (?) context excavated in 1958 (Figure 10.8). Both S1 and S2 are re-used pottery
7Museum inventory numbers: S1 = MHS A-1380, S2 = MHS A-1379

Frederik Rademakers Part V: Roman Thrace. Chapter 10 337
(either domestic or storage (amphorae?) fragments), wheel-turned and very thick-walled,
with flat bottoms. Though their morphologies are quite different, their stable flat bases,
thick walls and size were probably the criterion for their selection. A secondary layer of
clay has been applied to the external surface of both crucibles. Due to external heating of
the crucibles, this clay has turned black and fully vitrified, while protecting the crucibles’
interiors from disintegration.
S1 has a whitish main body and dark outer layer. A sample was taken from the internal
black dross/corrosion. The second crucible has a similar white, micaceous body and black
internal ‘skin’. The interior is very ‘dry’, with only a few black prills visible in grooves near
the bottom, from which a sample was taken (i.e., no ceramic, slag or dross). Both crucibles
were tentatively identified as silver-related.
Samples S3 and S48 were both excavated from the same large area in 1953, but are not
necessarily contextually associated and from unclear stratigraphy.
S3 is a hemisphere-like small vessel, hand-made and thin-walled, with a spout (Figure
10.9). It was intentionally produced as a crucible, and heated from outside. Small cracks
in the walls occur. The sample is a rim fragment of this crucible, which has a very fine grey
clay fabric with small quartz grains and some fine-medium feldspar. The outer surface is
vitrified and the spout contains traces of gold. Gold sparks on the inside appear to indicate
a ‘watermark’ of half the interior height. An olive green glassy slag occurs at the bottom
only, with gold prills within, eating into the porous crucible body.
S4 is a sample from a bottom fragment of another purpose-made crucible which has a flat,
thick bottom, but is conical inside. With its graphite-dominated fabric, it resembles early
modern (17th century?) triangular crucibles. It has ±1 mm exterior vitrification and a very
thin interior slag layer (red to blue, green whitish ?). The exterior slag/lining could indicate
its fixing on a pedestal during use, but is too heavily burnt for confident interpretation. It
probably had a spout.
Sample S59 was excavated in 1955 and derives from a tentatively identified late (?) context
(and might be related to S4, despite deriving from a different location). It was taken from
another flat, thick-bottomed crucible, with a rounded inside (Figure 10.10). It has vitrified
‘hotspots’ on its exterior, but is otherwise ‘dry’. Inside, a thin red slag coat is present, which
is somewhat thicker upwards. The sample was taken from an exceptionally thick slag area.
Finally, fragments S6-S1110 look very similar to each other and are therefore assumed to
form a single production debris assemblage of Roman/late Roman date. Though all come
8Museum inventory numbers: S3 = MHS A-668 and S4 = MHS A-4909Museum inventory number: S5 = MHS A-1034
10S6 = MHS A-676, S7 = MHS A-675, S8-11 = MHS A-677

338 Part V: Roman Thrace. Chapter 10 Frederik Rademakers
Figure 10.8: Crucible fragments S1-S2 from late Roman Serdica. Left: S1, right: S2

Frederik Rademakers Part V: Roman Thrace. Chapter 10 339
Figure 10.9: Crucible fragments S3-S4, Serdica
Figure 10.10: Crucible fragment S5 drawing, Serdica

340 Part V: Roman Thrace. Chapter 10 Frederik Rademakers
Figure 10.11: Crucible fragments S6 (left) and S7 (middle, right) from Roman or late Roman
(?) Serdica
from the same 1953 excavations, the excavated area is too big to assume any relationship
between the fragments based on location. Their inferred relation is based on macroscopic
similarity, and their consecutive numbering. S6-S11 probably represent at least three or
four vessels, possibly more, which all appear fairly large compared to the crucibles from
the other sites presented here. All are hand-made, with round bases and cylindrical bodies
(?), whitish very hard (refractory) clay, and no evidence for additional layers. For S7, it ap-
pears that the vessel had a relatively wide spout for pouring metal. Comparison to general
types of local and regional Roman/late Roman pottery indicates an intentional selection
of particular clay, not the most commonly used by the local potters.
S6 was taken from a base fragment, for which a thick, irregular, reddish to greenish dross
layer is present on the inside with some copper metal trapped inside (Figure 10.11). The
outside is ash-glazed, with some copper contamination, but no separate layer is present.
S7 (Figure 10.11) is taken from a similar crucible with outside vitrification/corrosion and
some drips at the bottom. The inside slag has been sampled, and some dross (less than
for S6) is present. ‘A-677’ consists of five different fragments, shown in Figure 10.12. S8 is
a rim fragment, S9-S10 are two base fragments and S11 is a big body fragment. The rim
fragment indicates an internal diameter of 8-9 cm. The slag is olive-green and glassy in-
side, reddish on the outside. Small, flaky samples were taken for S8-S10, while a crucible
wall section was available for S11. It is impossible to reconstruct S8-S11 as a single vessel.

Frederik Rademakers Part V: Roman Thrace. Chapter 10 341
Figure 10.12: Crucible fragments S8-S11 from Roman or late Roman (?) Serdica
10.2.4 Stara Zagora
Only one sample from Stara Zagora (Augusta Traiana) was available for study. It belongs
to the Regional Museum of History in Stara Zagora.
The sample was taken from a rim fragment of a crucible shown in Figure 10.13, which was
excavated in 2006, and belongs to a late Roman (fourth-sixth century AD) context. It has
some small green drops of metal in the rim, inner surface and fractures. The walls are
lined (repaired?) with as secondary layer of clay, very thick on the rim and even present on
(some of?) the interior.
Figure 10.13: Crucible drawing (StZ1) from late Roman Stara Zagora

342 Part V: Roman Thrace. Chapter 10 Frederik Rademakers

CHAPTER 11
Analytical results
Section 11.1
Detailed description of crucible ceramic and slag
Contrary to Pi-Ramesse and Gordion (Parts III and IV), this case study does not cover a
(macroscopically) homogeneous assemblage. Rather, material from several sites is pre-
sented, with visible variability existing within each assemblage. For this reason, each site
is discussed separately, with an overview given in section 11.3.
The layout of the following chapters differs further from the previous two, due to the more
fragmented nature of the crucible remains. Where Pi-Ramesse and Gordion offered many
large fragments for sampling, only a few pieces and flakes from diverse crucibles were
available here, all of which were mounted for analysis. Therefore, it does not make sense to
discuss general crucible characteristics for each site as for the other case studies. Rather,
each sample must be discussed separately. However, the degree of detail described for
each sample is limited, as within-crucible variability (Chapter 13) cannot be assessed on
the basis of single samples, and the discussion of every occurring slag phase (sections 5.2.3
and 8.2.3) is less informative here.
Bulk compositions for ceramic and slag are presented in Appendix O, while the composi-
tions of metallic prills embedded in crucible slag are given in Appendix P. The terminology
used for various copper alloys throughout this chapter is shown schematically in Figure
11.1.
An important difference between these Roman and previously presented assemblages must
343

344 Part V: Roman Thrace. Chapter 11 Frederik Rademakers
Figure 11.1: Terminology used for various copper alloys (from Bayley, 1998, Figure 1, p.8)
be noted. As slag layers are often quite thin in these crucibles, smaller frame sizes had
sometimes to be used to measure their bulk compositions. Therefore, the comparison
between ceramic (still measured at 100X) and slag (usually measured at 100X, but 200X
where needed) is not always based on the same sample size.
11.1.1 Nicopolis ad Istrum
Three crucible groups (fragments N2, N4-N5 and N1-N3-N6) can be distinguished within
the Nicopolis assemblage, based on their ceramic composition and fabric, as shown in
Figure 11.2, and are discussed separately below. Figure 11.3 shows the bulk composition
of crucible slag, relative to ceramic, for each crucible.
11.1.1.1 Fragment N2
The ceramic fabric of this fragment can be subdivided into an exterior and interior zone
(Figure 11.4). For both zones, the ceramic consists of small, angular to sub-rounded quartz
grains in a fine grey clay matrix, with elongated pores indicative of burnt out organic tem-
per. In the exterior zone, a more brownish fine clay (without quartz fragments) is interwo-
ven with the grey matrix. This is particularly so for sample N2a, for which the exterior zone
composition does not overlap other N2 compositions (Figure 11.3): it has elevated lime
and slightly elevated iron content. Furthermore, the exterior zone exhibits some cracks
originating from the exterior surface, most likely formed during the metallurgical process.
The interior ceramic zone has somewhat higher porosity.

Frederik Rademakers Part V: Roman Thrace. Chapter 11 345
(a) Mounted sections
(b) Ternary diagrams showing compositional groups
Figure 11.2: Nicopolis ceramic groups

346 Part V: Roman Thrace. Chapter 11 Frederik Rademakers
Figure 11.3: Nicopolis bulk compositions of ceramic and slag
Figure 11.4: N2 ceramic fabric. Left: exterior zone, right: interior zone
The interior slag is not very well developed for sample N2a (Figure 11.5), and no metallic
prills occur within the layer. For sample N2b, however, a more glassy slag layer has devel-
oped, within which many copper prills occur, all with 1-4 wt% iron and up to ±1 wt% tin or
lead, associated with spinel crystals. No significant bulk slag enrichment in metal content
can be noted (though minor copper content (0.5 wt% CuO) occurs in both ceramic and
slag) and no other significant relative enrichments occur.
11.1.1.2 Fragments N4 and N5
These crucibles are quite thin-walled, made of highly refractory clay (white to light grey).
The clay has fully fused, with fractured quartz being the only remaining original mineral

Frederik Rademakers Part V: Roman Thrace. Chapter 11 347
Figure 11.5: N2 slag (N2a: top left, N2b: top right), and prills embedded in N2b (bright,
bottom) with spinel (light grey)

348 Part V: Roman Thrace. Chapter 11 Frederik Rademakers
(Figure 11.6). N4 remains more porous than N5, which has vitrified almost completely.
Both crucibles have a very thin, porous and glassy, reddish exterior layer.
In N4 no internal slag layer has developed, and the interior consists of bloated ceramic
with (more) cracked quartz. In N5, a glassy slag layer has developed, as well as a corro-
sion/dross layer. Finally, a ‘slag lump’ of N5 was analysed, which consists of fused ceramic
with some cracks filled in by glassy slag. These slag zones are illustrated in Figure 11.7.
Both bloated interior (N4) or slag (N5) and exterior vitrified layers show similar relative
enrichments in iron (∆FeO/Al2O3 ≈ 200%). There is a strong increase in lime for both in-
terior and exterior layers, with more outspoken enrichment on the exterior (Figure 11.3).
Lime and magnesia, potash and phosphorus oxide (Figure O.1) seem to increase propor-
tionally1, suggesting a single enrichment source (fuel ash). Strong soda enrichment exists
as well. Lime and iron oxide do not share this proportional relationship.
The bloated interior of N4 does not show significant bulk enrichment in metal content,
while a bulk increase in copper, zinc and lead oxide occurs for the interior slag layer in N5
(in the ‘slag lump’, only minor CuO-enrichment can be noted). Similarly, no metal prills
were found embedded in N4, while a few iron-rich leaded bronze prills were found in N5
(and almost pure copper prills in the ‘slag lump’). No zinc has been detected in the metal
prills. Copper, zinc and lead are present as various (chlorine) oxides in N5, mainly in the
corrosion/dross layer (Figure 11.7, bottom right).
11.1.1.3 Fragments N1, N3 and N6
These fragments have a wall thickness of 2-3 cm. N1 has a fine clay matrix, with very
abundant, small to medium, sub-rounded quartz grains. N3 has a similarly high quartz
content, but its matrix is mostly fused and bloated, with no real ceramic remaining (Figure
11.8). While N6 has a similar bulk composition, its fabric is quite different: it consists of
quartz (often fractured closer to the exterior crucible surface) within a glassy phase, with
no other clay minerals remaining. Interestingly, on top of the interior slag surface of N6,
another ceramic layer is present, which is almost identical to the N1 ceramic in fabric and
composition. The porosity in all crucibles is indicative of limited organic temper.
The interior zone of N1 consists of fully recrystallised slag, as shown in Figure 11.9. It ex-
hibits extreme relative enrichment in iron (∆FeO/Al2O3 ≈ 850%) and lime content (∆C aO/Al2O3 ≈4000%), causing the big shift seen in Figure 11.3. There is a similarly strong relative en-
richment in soda, potash, phosphorus oxide and magnesia. The slag shows further bulk
1Sample is too small for statistical evaluation of this statement.

Frederik Rademakers Part V: Roman Thrace. Chapter 11 349
Figure 11.6: N4 (top) and N5 (bottom) vitrified exterior layer (left) and fused ceramic
(right)

350 Part V: Roman Thrace. Chapter 11 Frederik Rademakers
Figure 11.7: Bloated interior of N4 (top left), N5 ‘slag lump’ (top right) and N5 slag and
dross layer (bottom left and right)

Frederik Rademakers Part V: Roman Thrace. Chapter 11 351
enrichment in copper, zinc, tin and lead oxide, which is present in the form of malayaite
(Ca(Sn,Fe)(SiO4) with iron substituting for tin), Pb in various states of oxidation (with mi-
nor iron substitution) and other Cu-Pb-Zn-Sn-Fe-oxides, some of which appear to have
spinel-like structure (Fe3O4, with various elements substituting for iron). No metallic prills
have been detected.
The slag layer of N3 is not as thickly developed, but consists of a thin glassy layer, in which
several metal prills are embedded (Figure 11.10). It shows moderate iron enrichment and
is enriched in fuel ash components (lime, soda, phosphorus oxide and magnesia). Strong
bulk slag enrichment in copper, tin and zinc oxide can be noted (not in lead oxide). Several
high-tin prills occur, typically averaging 30-40 wt% tin (with one prill containing 64 wt%
Sn), sometimes accompanied by 1-2 wt% Pb. No zinc is found in the metallic state, but
it occurs together with tin and iron in spinel-like crystals (approximately FeSnZn1−2O7-
FeSnZn2−3O10). Lead is only found in the metallic state.
Finally, the slag layer of N6 (Figure 11.11) does not show any significant changes in bulk
composition relative to the ceramic, with the exception of strongly elevated tin and lead
content and modestly elevated copper content. This occurs mainly as low-tin (3-4 wt%
tin) prills, a high-tin bronze prill (35 wt% tin) and various copper-lead oxides and tin-lead
oxides (SnO2 with up to 5 wt% Pb).

352 Part V: Roman Thrace. Chapter 11 Frederik Rademakers
Figure 11.8: Top: N1 (left) and N3 (right) ceramic. Bottom: N6 ceramic (left) and interior
ceramic layer (right)
Figure 11.9: N1 slag layer with malayaite (light grey) and spinel-like oxides (medium-light
grey)

Frederik Rademakers Part V: Roman Thrace. Chapter 11 353
Figure 11.10: N3 slag layer with high-tin prills (bright) and Fe-Sn-Zn oxides (light grey)
Figure 11.11: N6 slag layer (top) and SnO2 with elevated lead content (bottom, light grey
angular phases)

354 Part V: Roman Thrace. Chapter 11 Frederik Rademakers
11.1.2 Philippopolis
Based on the ceramic composition and fabric, three groups of crucibles can be distin-
guished within the Philippopolis assemblage, as shown in Figure 11.12. The ‘dark blue
group’ (P2-P5) has no preserved ceramic fabric, and is therefore not shown on Figure
11.12b. This grouping is therefore not as convincing as for Nicopolis: the ‘red group’ con-
sists of two samples taken from the same crucible, while the ‘olive group’ (stroke outline)
is not tightly defined and exhibits macroscopic variation. Hence, the discussion below is
organised by context (see section 10.2.2). Ternary diagrams for ceramic and slag compo-
sitions are shown in Figure 11.13.
11.1.2.1 Fragments P1-P5
Sample P1 (Figure 11.14) consists of ceramic to vitrified ceramic (it is impossible to mea-
sure ceramic and slag separately). Its bulk composition is the closest approximation avail-
able to ‘ceramic composition’ for this group of crucibles (P1-P5). Prills sampled for P1 are
pure copper (with lead and zinc oxides) and leaded brass (±6 wt% lead and 4-8 wt% zinc).
For P2-P5, only dross is available for analysis, as reflected in the low bulk alumina and
silica content (Appendix O.2.1). Relative to P1, samples P2-P5 show relative increases in
lime and phosphorus oxide content and P2-P4 in iron oxide as well. Some examples of this
dross are shown in Figures 11.15 and 11.16.
Sample P2 contains many Cu-Sn-Zn-Pb oxides, of highly variable composition (typically
±(Cu,Sn,Zn,Pb)2O3). Various low- to high-tin prills occur (Figure 11.16a), with variable
lead (up to 4 wt%) and rare antimony (1 wt%).
Sample P3 comprises many corroded prills, with only limited dross available for analysis
(2 areas for bulk analysis). Within the dross, one leaded bronze prill (medium/high-tin)
with minor antimony occurs.
Sample P4 again contains many (partially) corroded prills with minor dross adhering (Fig-
ure 11.16b), though some metallic high-tin (34-36 wt% Sn) prills exist as well. One of these
incorporates 0.9 wt% Co, and a bulk dross content of 0.4 wt% CoO can be noted (at detec-
tion limit).
Sample P5 has a more developed slag component (higher lime content), within which
black angular slag crystals (±Ca2Si2ZnO7−8) and light grey angular crystals (±SnZn2O6)
occur (Figure 11.16c). It further contains pure copper prills with cuprite dendrites and
undissolved lead droplets (Figure 11.16d).

Frederik Rademakers Part V: Roman Thrace. Chapter 11 355
(a) Mounted sections
(b) Ternary diagrams showing compositional groups
Figure 11.12: Philippopolis ceramic groups

356 Part V: Roman Thrace. Chapter 11 Frederik Rademakers
Figure 11.13: Philippopolis bulk compositions of ceramic and slag
Figure 11.14: Sample P1: (vitrified) ceramic (top) and leaded brass prills (bottom)

Frederik Rademakers Part V: Roman Thrace. Chapter 11 357
Figure 11.15: Examples of dross from sample P2 (top left), P3 (top right), P4 (bottom left)
and P5 (bottom right)

358 Part V: Roman Thrace. Chapter 11 Frederik Rademakers
(a) Small prills in P2 (b) Corroded prills in P4
(c) Tin- and zinc-bearing crystals in P5 (d) Prill with dendritic cuprite and undissolved lead,
P5
Figure 11.16: Dross details in samples P2-P5

Frederik Rademakers Part V: Roman Thrace. Chapter 11 359
11.1.2.2 Fragment P6
The crucible fabric is almost entirely fused, with only some fractured quartz remaining of
the original ceramic. An almost pure iron prill was noted within the ‘ceramic’ area.
The crucible exterior is bloated and fully vitrified in places, and contains almost pure iron
prills with 2-4 wt% copper.
The crucible interior is less vitrified than the exterior surface, contains residual fractured
quartz, and exhibits various copper oxides, sometimes incorporating lead, which are mostly
corroded prills. Very few, tiny metallic slag prills (copper with low tin and high iron con-
tent) remain. The various areas are illustrated in Figure 11.17.
11.1.2.3 Fragments P7-P8
Sample P7 (Figure 11.18) consists of dross fragments (though one small ‘ceramic’ fragment
has been analysed). These are composed of various copper oxides (mainly cuprite) and
Cu-Sn-Zn-Pb oxides of highly variable composition, with very low ‘slag’ content (alumina,
silica or lime). Within all this corrosion, some metal phase remains, which is all brass (2-8
wt% Zn), surrounded by the Cu-Sn-Zn-Pb oxides.
Sample P8 (Figure 11.19) is a crucible wall cross-section, for which the ceramic, slag, exte-
rior and dross areas have been analysed. The ceramic consists of a fine matrix with small
to medium, angular quartz and some elongated porosity, indicative of organic temper.
The exterior surface is slightly bloated, but not vitrified.
The interior slag contains many silver chloride (no true AgCl; mostly limited chlorine)
prills and some silver sulphides (Ag2S), occasionally including minor (<2 wt%) copper or
iron, but no metallic silver. Some dross is present as well, with increased calcium, sulphur,
silver, tin and lead oxide content and low alumina and silica.
11.1.2.4 Fragment P9
Samples P9a and P9b were taken from the same fragment, shown in Figure 11.20. Two
layers of ceramic and slag can be seen superimposed on each other: the primary (interior)
sequence and a secondary use sequence.
P9a comprises the top of the rim. Though some remnant primary ceramic and slag re-
mains, the sample contains mainly secondary slag (no ceramic).
The primary slag layer sits in between the primary and secondary bloated ceramic, as
shown in Figure 11.21, and is separate from the secondary slag layer with which it fuses

360 Part V: Roman Thrace. Chapter 11 Frederik Rademakers
Figure 11.17: Overview of fragment P6. Top: bloated and vitrified external surface, 2nd
row: fused crucible fabric, 3r d row: interior slag layer, bottom: interior slag: corroded
prills (left) and tiny metallic prills (right)

Frederik Rademakers Part V: Roman Thrace. Chapter 11 361
Figure 11.18: Fragment P7 ‘ceramic’ (left) and dross (right)
Figure 11.19: Fragment P8 exterior surface (top left), ceramic (top right), slag (bottom left)
and dross (bottom right)

362 Part V: Roman Thrace. Chapter 11 Frederik Rademakers
Figure 11.20: Fragment P9
only at the top of the crucible rim. It contains mainly pure copper prills and some bronze,
with up to 15 wt% Sn. Interesting tin oxide structures occur, some of which might be iden-
tified as residual cassiterite (Figure 11.22).
Some tiny prills occur in the thin secondary (surface) slag layer, which are all pure copper
(with <1 wt% Fe), and some high-temperature tin oxide crystals are present (Figure 11.23).
P9b better exhibits the two ceramic-slag layers. The ceramic is similar in both layers (and
chemically identical, within analytical error), consisting of small to large (sometimes frac-
tured) quartz grains in a porous fine matrix, which is more fused in the secondary layer
(Figure 11.24).
The primary (interior) slag (Figure 11.25) contains many leaded bronze prills (1.5-3.5 wt%
lead and 11-24 wt% tin, some iron) and some spinel, with up to 10 wt% Zn and 10 wt% Sn.
Comparison of the primary slag layer in the two samples shows relatively higher-tin prills
occurring lower on the rim.
The secondary (surface) slag layer (Figure 11.26) is again not as well developed: it is thin
and contains less and smaller prills. However, many high-temperature tin oxides and var-
ious Fe-Cu-Sn-Zn-Pb oxides (±(Fe,Cu,Sn,Zn,Pb)2O3) occur.

Frederik Rademakers Part V: Roman Thrace. Chapter 11 363
Figure 11.21: Sample P9a: primary slag layer in between two bloated ceramic layers (com-
posite SEM image)

364 Part V: Roman Thrace. Chapter 11 Frederik Rademakers
Figure 11.22: Sample P9a: possible residual cassiterite
Figure 11.23: Sample P9a: thin secondary slag layer (left) with high-temperature tin oxide
crystals (right)
Figure 11.24: Sample P9b: primary (left) and secondary (right) ceramic layers

Frederik Rademakers Part V: Roman Thrace. Chapter 11 365
Figure 11.25: Sample P9b: primary slag layer (left) with leaded bronze prills (right)
Figure 11.26: Sample P9b: secondary slag layer (left) with small prills (right)

366 Part V: Roman Thrace. Chapter 11 Frederik Rademakers
11.1.3 Serdica
Based on the ceramic composition and fabric, four groups of crucibles can be distin-
guished within the Nicopolis assemblage, as shown in Figure 11.2. The ‘dark blue group’
(S2 and S8) has no preserved ceramic fabric, and is therefore not shown on Figure 11.12b.
This grouping does not follow the contextual segregation of samples (section 10.2.3), which
is followed below. The ceramic grouping is noteworthy, however, and is addressed in sec-
tion 11.2.3. Ternary diagrams for ceramic and slag compositions are shown in Figure 11.28.
11.1.3.1 Fragments S1-S2
Despite not being intentionally sampled (see section 10.2.3), fragments of two different ce-
ramic fabrics (Figure 11.29) occur in sample S1: ceramic A has elongate feldspar/feldspathoid2
matrix with small-medium angular quartz grains, ilmenite, zircon, monazite ((Ce, La, Nd)PO4)
and (FeS)2SO2. Ceramic B has no elongate feldspar/feldspathoid minerals (though some
small grains may occur) and is dominated by small angular quartz grains.
The slag fragments (Figure 11.30) are porous and contain no metallic prills, but many sil-
ver sulphides3. Their bulk composition shows a modest relative increase in fuel ash and
iron oxide. One silver prill with 2.5 wt% copper and a few silver prills with minor cadmium
were embedded as well (not within slag).
Sample S2 consists of metal sulphides only: no ceramic, slag or dross was sampled. The
sulphides (Figure 11.31) are the same as those described for S2: some pure silver sulphide
(Ag2S), but mainly iron-silver sulphides with variable substitution of silver by copper (up
to 31 wt% Cu).
11.1.3.2 Fragments S3-S4
The crucible fabric in S3 (Figure 11.32) is fully fused but remains fairly porous, with no
ceramic remaining except the medium, angular, fractured quartz grains and some zircon.
The interior surface is bloated, but no true slag has developed. No metallic prills or signif-
icant enrichments of any kind (except a relative increase in soda) can be noted.
The crucible fabric in S4 (Figure 11.33) is mainly composed of graphite, interspersed with
vitrified ceramic which makes up the bulk composition (SEM-EDS cannot distinguish be-
2Feldspar/felspatoid in S1: ±(K,Fe,Mg)(Si,Al)3O5 and ±(Na,K,P)Si6Al5O20 (not a correct formula; compo-
sition (in at%) is: 59.5 O, 0.9 Na, 0.5 Mg, 15 Al, 19 Si, 2.2 P, 2.0 K, 0.3 Ca, 0.1 Ti 0.5 Fe.)3Silver sulphides in S1: AgFeS2, (Cu,Ag,Fe)S2 with Cu/Ag/Fe ≈ 15/1/9, ±Ag4Fe4(SO3)3 and
±(Cu,Ag)Fe2(SO)2 with Cu/Ag ≈ 1/4 - 1/1

Frederik Rademakers Part V: Roman Thrace. Chapter 11 367
(a) Mounted sections
(b) Ternary diagrams showing compositional groups (‘blue group’ has no preserved ceramic)
Figure 11.27: Serdica ceramic groups

368 Part V: Roman Thrace. Chapter 11 Frederik Rademakers
Figure 11.28: Serdica bulk compositions of ceramic and slag
Figure 11.29: S1 ceramic A (top) and B (bottom)

Frederik Rademakers Part V: Roman Thrace. Chapter 11 369
Figure 11.30: S1 slag (top), silver (bottom left) and silver sulphide (bottom right)

370 Part V: Roman Thrace. Chapter 11 Frederik Rademakers
Figure 11.31: S2 silver sulphide (bright) with various iron-silver sulphides (light grey) and
iron-copper-silver sulphides (medium grey)

Frederik Rademakers Part V: Roman Thrace. Chapter 11 371
Figure 11.32: S3 ceramic (top) and bloated ceramic (bottom) with zircon (bright)
tween graphite carbon and applied carbon coating).
A thin but fully vitrified slag layer has developed on the crucible interior, which shows
strong relative enrichment in fuel ash components and iron oxide (∆FeO/Al2O3 ≈ 1200%).
Many prills are embedded in the interior slag (Figure 11.34), all of which are copper with
varying amounts of arsenic and silver (up to 20 and 13 wt%, respectively). The slag itself,
however, is not only enriched in copper, arsenic and silver, but furthermore in zinc and
lead (which do not occur in the metallic state). Small areas of dross/corrosion have been
noted as well (mainly composed of copper-arsenic-lead oxide).
The exterior surface is extremely enriched in fuel ash components (∆C aO/Al2O3 ≈ 5800%)
as well as iron oxide (∆FeO/Al2O3 ≈ 3100%), and shows modestly increased copper, zinc,
arsenic, silver, and lead oxide content. This exterior glaze (Figure 11.35) exhibits various
lime- and potash-rich oxide and silicate phases and metal (mainly copper) oxides. Metallic
prills on the exterior have similar compositions to the interior slag prills, with the excep-
tion of a few gold-bearing (5 wt%) copper-arsenic-silver prills.

372 Part V: Roman Thrace. Chapter 11 Frederik Rademakers
Figure 11.33: S4 ceramic. Graphite temper clearly visible under reflected light microscope
(right: bright, yellow; O.M. image)
Figure 11.34: S4 interior slag (top) with (multi-phase) prills and limited dross (bottom)

Frederik Rademakers Part V: Roman Thrace. Chapter 11 373
Figure 11.35: S4 exterior glaze (top) with prills (bottom), some gold-bearing (bottom prill,
bottom right)

374 Part V: Roman Thrace. Chapter 11 Frederik Rademakers
Figure 11.36: S5 ceramic (top) with graphite temper clearly visible under reflected light
microscope (top right: bright, yellow; O.M. image) and rutile (elongate, light grey) and
silver chloride (bright) (bottom)
11.1.3.3 Fragments S5
The ceramic (Figure 11.36) is highly fused, with limited porosity and graphite temper (though
not extensive as in S4), rutile and some silver chloride (intrusion through cracks?).
The interior slag is very peculiar, with minor relative fuel ash and iron oxide enrichment,
but very strong enrichment in copper, silver, lead, and, strikingly, bismuth oxide (>20
wt%). This gives the slag an unusual appearance, shown in Figure 11.37, with Bi2O3 mak-
ing up approximately 20-40 wt% of the background matrix. The black crystals are lead-
and lime-rich aluminosilicates. Many metallic prills occur, all of which contain >90 wt%
silver with varying copper (up to 1 wt%) and/or gold (up to 8 wt%) content, and occa-
sionally minor chlorine (up to 8 wt% Cl, no true AgCl). Bismuth was not detected in the
metallic state.
The exterior crucible surface (Figure 11.38) is bloated but not slagged, and shows only mi-
nor enrichment in fuel ash components.

Frederik Rademakers Part V: Roman Thrace. Chapter 11 375
Figure 11.37: S5 interior slag (top) with lead- and lime-rich aluminosilicates (bottom left,
black) and some gold-bearing silver prills (bottom right, with adjacent cubic silver chlo-
ride crystals)
Figure 11.38: S5 bloated exterior

376 Part V: Roman Thrace. Chapter 11 Frederik Rademakers
Figure 11.39: S6 (vitrified) ceramic
Figure 11.40: S6 dross with copper(-tin) oxides (bright)
11.1.3.4 Fragments S6-S11
Sample S6 has no pure ceramic fragments available, but rather ‘(vitrified) ceramic’ frag-
ments (similar to P1, section 11.1.2.1), shown in Figure 11.39. It is generally dominated by
quartz with vitrified areas in between, within which various copper-tin-lead oxides occur.
The drossy fragments (Figure 11.40) still contain many quartz fragments, but are relatively
enriched in fuel ash components and iron oxide, and full of copper and copper-tin ox-
ides. These drossy fragments cannot be considered fully separate from the (vitrified) ce-
ramic fragments, but are simply closer to the far end of the continuous ‘ceramic-slag-dross
spectrum’. The distinction here was deemed appropriate, based on the clearly visible dif-
ferences (Figures 11.39 and 11.40). A few metallic prills have been detected, which are
high-tin bronzes (33-35 wt% Sn) with arsenic, antimony, (nickel) and lead.
The fabric of S7 (Figure 11.41) is fused/vitrified throughout, with only fractured quartz
and some zircon remaining of the ceramic. Close to the exterior surface, some further
vitrification occurs and a few metallic prills can be noted, which are all nickel-bearing

Frederik Rademakers Part V: Roman Thrace. Chapter 11 377
Figure 11.41: S7 ceramic (top) and prills on exterior surface (bottom)
bronzes or gunmetals (±2 wt% Ni, 9-13 wt% Sn and 0-1.5 wt% Zn).
On the crucible interior, a very thin and not well developed slag layer occurs (Figure 11.42),
within which copper-tin and copper-lead oxides occur, as well as a few tiny bronze prills
with minor iron, arsenic and nickel content. The interior is quite strongly enriched in fuel
ash components (∆C aO/Al2O3 ≈ 2700%), but not in iron. The exterior shows lower, though
fairly significant fuel ash component enrichment (∆C aO/Al2O3 ≈ 800%).
S8 consists of slag fragments only, shown in Figure 11.43. These are made up of a lead-rich
glassy matrix with minor zinc content and remnant quartz (fractured and with smooth
contours) and zircon. Various lead- and potassium-rich aluminosilicates, as well as iron-
tin-lead-silicates have crystallised from the slag. No metallic prills could be detected.
S9 (Figure 11.44) consists mainly of ceramic, similar to S6, but without the abundant glassy
phase. It is dominated by quartz grains, fused together by vitrified ceramic ‘bridges’. A
glassy phase occurs in one area, and has been measured separately as ‘slag’. Within the
fused ceramic ‘bridges’, tiny prills can be found, which are mainly composed of medium/high-
tin gunmetal (17-32 wt% tin) with minor to high (9.5 wt%) iron content, up to 5 wt% zinc
and in one occasion 0.8 wt% silver. A pure high-tin bronze prill (35 wt% Sn) occurs as well.

378 Part V: Roman Thrace. Chapter 11 Frederik Rademakers
Figure 11.42: S7 slag (top) with copper-tin and copper-lead oxides (bright), and tiny metal-
lic prills (bottom)

Frederik Rademakers Part V: Roman Thrace. Chapter 11 379
Figure 11.43: S8 slag (top) with (bottom) Pb-K-rich aluminosilicates (dark, elongate) and
iron-tin-lead silicates (light grey, angular)

380 Part V: Roman Thrace. Chapter 11 Frederik Rademakers
Finally, some high-iron prills should be noted (93-95 wt% iron, 5-7 wt% copper).
S10 (Figure 11.45) consists of fused ceramic with small to large, fractured quartz grains and
a ‘glazed surface’ (probably crucible exterior) of more closely fused ceramic with similar
quartz grains. Only one prill (94 wt% iron, 6 wt% copper) was noted on the glazed surface,
which is relatively enriched in zinc oxide.
The fabric of S11 (Figure 11.46) is fully fused with medium to large, fractured quartz frag-
ments, zircon and monazite ((Ce, La)PO4, with 2 wt% Ag) remaining. Its interior surface is
not really slagged but slightly bloated, incorporating cuprite and copper-tin-lead oxides,
as well as tiny prills (±95 wt% iron, 1-2 wt% copper and 0.5-3.5 wt% tin). The interior is
strongly enriched in lime and iron, and particularly in soda (∆N a2O/Al2O3 ≈ 2600%).
11.1.4 Stara Zagora
Only one sample (StZ1) has been analysed from Stara Zagora. Two distinct parts are visi-
ble in cross-section, as indicated on Figure 11.47. Part A is the crucible interior, while part
B is an external layer, extending over the rim of part A, but not onto the interior surface.
However, slag A and B have fused at the transition on the rim, blurring this distinction.
At the centre of part A, a limited amount of remnant ceramic fabric occurs, which is al-
most entirely fused, but contains some remnant fractured quartz grains (Figure 11.48).
The chemical difference between these two parts is illustrated in Figure 11.49.
Towards the crucible interior, further bloating and vitrification occurs. Several prills are
embedded within this interior slag layer (Figure 11.50), varying in composition between
bronze, leaded bronze, leaded copper, brass and gunmetal, sometimes incorporating up
to 1.3 wt% iron. Notably, a prill of 93 wt% lead and 7 wt% copper occurs as well. Relative
to the remnant ceramic, this interior slag layer is enriched in fuel ash components.
The area of part A closest to part B (‘part A - central’) is equally characterised by vitrifi-
cation with residual quartz (Figure 11.51), which is similarly enriched in fuel ash compo-
nents. Several prills can be noted, ranging mostly from pure copper to leaded copper, with
rare low tin or iron content.
Part B (Figure 11.52) consists of vitrified ceramic, more porous (bloated) than part A. There
is no distinct boundary between part A (central) and part B, which have fully fused. Part B
contains very few (pure copper) prills, which are concentrated on the exterior surface. It
is difficult to say if part B is enriched in any particular oxides, as its reference composition
is unknown. The difference in silica and alumina relative to part A, as well as high soda,
magnesia and potash content, suggests the use of a different clay from part A, and enrich-

Frederik Rademakers Part V: Roman Thrace. Chapter 11 381
Figure 11.44: S9 ceramic (top) with gunmetal prills (middle left) and iron-rich prills (mid-
dle right) within fused ceramic and ‘slag’ (bottom)

382 Part V: Roman Thrace. Chapter 11 Frederik Rademakers
Figure 11.45: S10 ceramic (left) and glazed surface (right) with iron-copper prill (bottom)

Frederik Rademakers Part V: Roman Thrace. Chapter 11 383
Figure 11.46: S11 ceramic (left) and bloated interior (right) with copper oxides (bright) and
iron-copper-tin prills (bottom)

384 Part V: Roman Thrace. Chapter 11 Frederik Rademakers
Figure 11.47: Stara Zagora sample zoning (left: view onto interior surface A)
Figure 11.48: StZ1, part A ceramic
ment with fuel ash. Iron oxide enrichment is difficult to assess. At the top of part B (top of
the crucible rim) sits a partially corroded prill.

Frederik Rademakers Part V: Roman Thrace. Chapter 11 385
Figure 11.49: Stara Zagora bulk compositions of ceramic and slag
Figure 11.50: StZ1, part A interior slag (top) and embedded prills (bottom)

386 Part V: Roman Thrace. Chapter 11 Frederik Rademakers
Figure 11.51: StZ1, part A central vitrification (top) and embedded prills (bottom)

Frederik Rademakers Part V: Roman Thrace. Chapter 11 387
Figure 11.52: StZ1, part B porous glaze (top), embedded prills (bottom left) and corroded
prill on crucible rim (bottom right)

388 Part V: Roman Thrace. Chapter 11 Frederik Rademakers
Section 11.2
Technical interpretation
The evidence presented by the fragmented remains in this chapter is almost invariably
ambiguous. An effort is made in this section to spell out all relevant possible interpre-
tations for each crucible, but in some cases omission are made and only the most likely
scenarios are discussed.
Furthermore, the basic assumption is made that all crucibles reflect a single use, or at least
use for a single purpose. Only where such interpretations do not fit the evidence are multi-
use scenarios elaborated. The interpretative issues of possible reuse are further elaborated
in Chapter 13.
11.2.1 Nicopolis ad Istrum
Fragment N2 stands out from the rest of the assemblage on the basis of typology and ce-
ramic fabric. It is not a true crucible, but its relation to metallurgical activity is indicated
by the presence of prills in sample N2b. Exposure to high temperatures for a significant
time is suggested by the development of a slag layer there, and the inclusion of several
prills indicates direct contact with a liquid metal charge while at high temperature. This
contact could have been continuous or momentary. The presence of less slagged areas
(N2a) on the ‘collar’, indicates variable conditions, whereby certain areas were exposed to
lower temperatures and did not come into contact with liquid metal.
Variability in ceramic composition has been noted, with slightly less refractory clay to-
wards the exterior surface in N2a, but not N2b. While this may point to the application of
an outer clay layer, it may equally reflect ceramic heterogeneity.
The open shape and size of the ‘collar’ suggest that it was a stationary feature of the met-
allurgical installation. Its diameter of approximately 25 centimetre makes it too wide to
act as a casting sprue, and it would be relatively small for a smelting furnace rim. It was
perhaps sitting on top of a hearth or crucible employed for copper-based metallurgy, but
its exact function is difficult to reconstruct.
Fragments N1 and N3 derive from the same context, and have a similar ceramic fabric,
though N3 is more bloated than N1. N6, an unstratified find from a different area (same
as N4-N5), has a similar ceramic bulk composition, but very different fabric. All fragments
have a similar wall thickness, but the heating profiles are different. While N1 has been in-
ternally heated, and has a red-fired exterior surface (reflecting oxidising conditions), both

Frederik Rademakers Part V: Roman Thrace. Chapter 11 389
N3 and N6 were externally heated, resulting in bloating (N3) and vitrification (N6) of the
grey-fired exterior surface.
Slag analysis of these crucibles further corroborates their different modes of use. Sample
N1 shows extreme enrichments in iron, fuel ash and metal oxides (and lowered alumina
and silica contents), in line with enrichments encountered in dross layers. The absence of
metallic prills suggests that the sampled area of the crucible reflects highly oxidising con-
ditions, resulting in the burning of its metal content: most likely an iron-contaminated
leaded bronze or gunmetal. The high contribution of fuel ash further indicates that the
crucible was covered with charcoal for heating. This again illustrates crucible heterogene-
ity: despite charcoal cover, highly oxidising conditions can prevail for a certain amount of
time in a certain crucible area, resulting in (localised) burning of metal.
Crucible N3 has developed only a thin slag layer, within which leaded bronze prills are
found, indicating active bronze alloying: up to ±65 wt% tin occurs in these prills. Follow-
ing similar arguments held for the Gordion crucibles (see section 8.3.3), the source of lead
cannot be reconstructed here: it could have entered the charge either as a pure metal, a
leaded copper, a tin-lead alloy or, more unlikely, as a lead ore. Zinc could have been in-
volved in this process as well, as suggested by its high oxide content in the slag. However,
it does not occur in any of the prills. Probably, it was present as a contaminant in the
(leaded) copper that was being alloyed with tin in this crucible, and burnt off into the cru-
cible slag. If (leaded) brass was alloyed with tin to produce leaded gunmetal, higher zinc
contents should be expected in the embedded prills. Tin could have been added either as
a mineral or metal.
N1 and N3 could be different reflections of the same process (leaded bronze alloying) car-
ried out in different crucible types and under different heating modes, resulting in very
different production evidence.
The slag layer of N6 does not show strong contamination, with the exception of bronze
prills and various lead-bearing oxides. This strong bulk enrichment in tin and lead sug-
gests the processing of a leaded bronze, whereby the many copper-lead and tin-lead ox-
ides represent oxidising crucible conditions, but the single high-tin (unleaded) bronze
prill (35 wt% tin) reflects an area with more reducing conditions. Though this single prill
may not appear entirely convincing evidence for the identification of active alloying, it sits
well above the average tin content for contemporary bronzes (±10 wt% in tin bronzes, 5
wt% in leaded bronzes, 20 wt% for mirror/bell bronzes (Riederer, 2002b)). The absence of
zinc distinguishes this crucible from N1 and N3.
As a final note, the secondary clay layer on top of the slag layer of N6 should be discussed.
It has the exact (within analytical error) same composition and fabric as the N1 ceramic.

390 Part V: Roman Thrace. Chapter 11 Frederik Rademakers
Though this layer could indicate the preparation of this crucible for secondary use, no
metallurgical indicators can be found on its surface, and it was probably never reused.
Crucibles N4 and N5 have both been identified as wheel-turned, re-used domestic pottery.
Their ceramic fabrics are more or less identical chemically, with only minor differences in
structure and colour due to firing. Both have a thin external vitrified layer, which seems
to be the result of ceramic fluxing by fuel ash. This suggests an external heating mode for
both crucibles. However, this fuel ash contribution is seen quite strongly in the interior
slag as well, which may indicate that the crucibles were left open and perhaps sitting in a
charcoal bed, with fuel ash allowed to fall into the crucibles.
Interestingly, the relative increase in iron is equally seen for both the internal slag and
external vitrified layer, and does not correlate to the fuel ash increases (see Table 11.1).
Taking into account the visible differentiation between the central ceramic areas in N4
and N5 (grey, white), and their external vitrified and internal slag layers (reddish to black),
this could suggest the application of a thin (secondary) clay layer (different to the original
ceramic) to both internal and external surfaces of these crucibles. This (secondary) clay
layer appears to be less refractory than the original ceramic, resulting in more outspoken
bloating and vitrification. This has produced a vitrified layer on the exterior crucible sur-
face, and a slag layer on its interior surface, through interaction with the crucible charge.
Both the external vitrified layer and the internal slag layer are completely fused with the
original, central ceramic, erasing any boundaries visible under the microscope or SEM4.
An increased lime content in the applied (secondary) clay layer may further explain the
increased lime content on both interior and exterior surfaces, relative to the original cen-
tral ceramic. The relatively higher lime enrichment on the exterior surface can then be
attributed to fuel ash, as a result of external heating (with only limited fuel ash entering
the crucible). Though the application of such a clay layer to the crucible exterior is not
uncommon (e.g., König and Serneels, 2013 and Thornton and Rehren, 2009), its applica-
tion to the interior is surprising, as it results in a more outspoken interior slag layer than
would be the case without this added clay. Furthermore, this increases the likelihood of
interaction and trapped prills inside the slag, which could be seen as undesirable.
N4 does not offer any indication of metal contamination, making it impossible to recon-
struct its charge. This suggests that the applied clay layer was in fact sufficiently refractory
for the process. N5 contains (iron-rich) leaded bronze prills, and the dross layer contains
copper, zinc and lead oxides, but no tin. Its exterior vitrified layer5 is weakly enriched in
4Using cross-polarised microscopy, however, a difference in colour can still be seen between the central
ceramic area and the external vitrified and internal slag layers respectively.5Though some copper, zinc and lead oxide is present within this exterior vitrified layer, it does not qualify

Frederik Rademakers Part V: Roman Thrace. Chapter 11 391
Na2O MgO Al2O3 SiO2 P2O5 K2O CaO TiO2 FeO CuO ZnO PbO
N4 ceramic 0.7 0.9 22 69 0.2 2.0 1.7 1.0 2.5 0.1
Std. dev. (5 ms) 0.1 0.1 2 2 0.4 0.1 1.2 0.3 0.1 0.1
N4 internal slag 3.4 1.0 9 78 0.2 2.3 2.6 0.6 3.1 0.1
Std. dev. (5 ms) 0.7 0.1 1 1 0.1 0.2 0.8 0.1 0.2 0.1
N4 external layer 1.8 1.6 8 70 1.5 5.2 8.3 0.4 2.8 0
Std. dev. (5 ms) 0.3 0.6 1 5 0.7 1.0 4.5 0.1 0.2 0.1
N5 ceramic 0.9 0.9 24 65 0.1 3.0 1.9 0.8 2.5 0.3 0 0
Std. dev. (5 ms) 0.2 0.3 3 2 0.1 1.0 1.2 0.1 0.2 0.4 0.2 0.1
N5 internal slag 2.5 0.9 14 64 0.3 1.9 6.9 0.6 4.9 2.1 0.9 1.0
Std. dev. (5 ms) 0.1 0.1 2 6 0.1 0.4 0.6 0.2 2.3 1.6 1.2 1.8
N5 external layer 1.7 1.5 14 59 0.9 6.4 9.3 0.8 3.6 2.5 0.2 0.2
Std. dev. (5 ms) 0.3 0.5 2 3 0.6 1.0 3.0 0.3 0.5 1.4 0.3 0.1
Table 11.1: Bulk composition (in wt%, normalised to 100%) of crucibles N4 and N5 (full
data in Appendix O.1)
zinc and lead oxide, but more strongly in copper. This points to the melting of leaded
bronze in fairly oxidising conditions (with high lead contamination of the interior slag),
with zinc again present as a possible contaminant (similar to N3).
Though no good stratigraphical connection exists for N4 and N5, the apparent application
of a relatively iron- and lime-rich clay layer connects these two crucibles from a techno-
logical perspective.
Overall, the crucibles from Nicopolis appear to have mainly been used for active alloying
of leaded bronze. This was done in a variety of crucibles and under variable heating con-
ditions, resulting in very different metallurgical waste products.
It is interesting to note that no zinc has been encountered in the metallic state within any
of these crucibles, but often occurred in an oxidised state on either the crucible interior
and/or exterior. This indicates that zinc was not actively added to the crucible charge,
but was often present as a contaminant, most likely of (recycled) copper. Due to its easy
volatilisation and oxidation relative to other alloy components, even minute levels of zinc
in the molten metal can give rise to high enrichments in crucibles (and moulds), as noted
by Dungworth (2000a) and Kearns et al. (2010). It appears that zinc is a common cop-
per contaminant for Roman copper/bronze, and this issue is further elaborated in section
11.3.
The frequent enrichment of exterior crucible surfaces in metal oxides (copper, tin, lead
and zinc) most likely reflects contamination during the casting phase, through spillage
and vaporisation.
A discussion of technological variability (e.g., application of an extra clay layer in N4 and
N5, but not N3 and N6) across contexts and time for this site cannot reasonably be devel-
as ‘slag’. Rather, a fuel ash glaze was formed, which was then contaminated by spilled metal, dross or fumes,
most likely during casting.
392 Part V: Roman Thrace. Chapter 11 Frederik Rademakers
oped on the basis of these few samples.
11.2.2 Philippopolis
Samples P1-P5 were all taken from a group of macroscopically identical crucibles, deriv-
ing from a single context. No proper ceramic fabric was available for study of these cru-
cibles. Relative to the P1 (vitrified) ceramic (which was taken as the best representative
for ceramic composition for the crucible group), the P2-P5 dross shows increased fuel ash
content. All four samples show bulk increases in copper, zinc, tin and lead oxide content,
averaging to 70 wt% of the dross. The relative proportions of these metal oxides vary, how-
ever, with P2 and P3 being most similar, while P4 is most strongly enriched in copper oxide
(and metal oxides overall) and P5 is most strongly enriched in zinc oxide.
The likeness between P2 and P3 extends to their prill content, with both showing indi-
cations for alloying in the form of high-tin prills, which incorporate lead and sometimes
minor antimony. P4 equally exhibits fairly high-tin prills and lead, but no antimony. The
presence of minor cobalt may further distinguish P4 from the other crucibles, though it is
only present at the EDS detection limit. P5, finally, contains only pure copper prills.
It is again remarkable to find no zinc in the metallic phase in any of these crucibles, while
all show bulk enrichment in zinc oxide. It appears therefore, that zinc is volatilised/oxidised
from the metal in all of these crucibles, similarly to the Nicopolis crucibles.
Overall, it is possible to suggest an overarching interpretation for crucibles P2-P5, whereby
active alloying of leaded bronze can be suggested, using a copper (or tin) source with some
iron contamination. Zinc was probably present only as a contaminant in the used copper,
and not as an element that was added to the alloy. Lead could have been introduced sepa-
rately or as part of an existing (copper) alloy. Minor antimony entered the charge, probably
together with lead or copper. Tin was added either as a mineral or metal.
A problem with this interpretation is introduced, however, by P1: here, several prills (from
the crucible interior) were sampled, which are leaded gunmetal. This suggests that leaded
gunmetal, rather than bronze was being produced in these crucibles. The absence of such
prills in samples from P2-P5 may be a sampling issue or the result of extreme oxidation in
the sampled areas for those crucibles. If an overarching interpretation is to be made, P1-
P5 can all be understood as the result of leaded gunmetal production. The importance of
a single sample for reaching this conclusion is striking, and is further discussed in section
11.3.
P6 is another externally heated crucible, showing limited fuel ash enrichments and slag
formation. The metal oxides point to the processing of leaded bronze. Both interior and

Frederik Rademakers Part V: Roman Thrace. Chapter 11 393
exterior slag are relatively impoverished in iron, which is unusual. Furthermore, pure iron
prills occur within the ceramic fabric, and similarly on the exterior surface (with minor
copper content). This could point to very reducing heating conditions, whereby iron from
the clay is locally reduced to its metallic state. The interaction of such iron with bronze
prills on the crucible interior may be a better explanation for their very high iron content
(26.5 wt%), rather than the iron being present as a copper contaminant. This last possibil-
ity cannot be excluded, however.
The crucible dross (relatively enriched in fuel ash) from P7 again points to the processing
of leaded brass or gunmetal. Here, brass prills remain present, while lead and tin have ox-
idised, as well as some copper and zinc. As zinc is more prone to volatilisation/oxidation
than lead and tin (Dungworth, 2000a), its remaining presence in metal prills after the re-
moval of lead and tin strongly indicates that zinc is a major alloy component here. Under
highly oxidising conditions, it can be expected that some copper, tin and lead will oxidise
before all zinc is oxidised (despite thermodynamics predicting all zinc will burn off first).
When zinc-bearing prills (without tin or lead) survive such conditions, it suggests a major
presence of that element and only minor tin and lead content. Furthermore, it is worth
noting that the bulk lead and tin oxide content in the P7 dross is much lower than that in
P2-P5 dross, while its bulk zinc (and copper) oxide content is much higher. This further
corroborates the different nature of P7 with respect to P1-P5. P7 is therefore best inter-
preted as a crucible used for leaded brass melting/alloying.
P8 derives from the same context, but is a different crucible type, used for a different pur-
pose: it is clearly related to the processing of silver. Its interior shows significant fuel ash
enrichment, while its exterior does not. The minor dross enrichment in copper and tin
and strong enrichment in lead and silver, together with the limited macroscopic evidence
for heating, could point to recycling activity: a small amount of debased silver may have
been briefly exposed to a concentrated heat source, together with some charcoal, to burn
off base metals, which resulted in the loss of minor silver as well. This would constitute the
‘assaying’ of scrap silver before its reuse, rather than the assaying of silver ore (Bayley and
Eckstein, 1997). However, it is equally possible that a small amount of debased silver was
simply remelted in this crucible for casting into a new small object, with some base metals
being oxidised in the process. The presence of silver chlorides suggests (incomplete) post-
depositional corrosion (see Graedel (1992); McNeil and Little (1992) and Rice et al. (1981)
and ‘patina’ mentioned by Rehren et al. (1996)) of silver prills embedded in the crucible
dross.
Crucible P9 is the largest crucible from Philippopolis, and internally heated for the melt-
ing of leaded bronze. The tin contents within the metallic prills are too low to assert active

394 Part V: Roman Thrace. Chapter 11 Frederik Rademakers
alloying. However, some tin oxide agglomerations could be tentatively identified as resid-
ual cassiterite grains, suggesting a cementation process (and thus active alloying). Again,
iron and zinc have been burnt off into the crucible slag, and are probably present as cop-
per contaminants. In some areas, copper and lead are oxidised as well. The comparable
levels of zinc and tin oxide in the crucible slag, but retention of only tin in metallic prills,
is indicative of tin being an actual alloy component, while zinc is merely present as a con-
taminant.
This crucible has clearly been used twice, with a layer of clay (same clay as original cru-
cible) being applied on top of the slag layer from the first use. While the first use can be
tentatively linked to cementation of cassiterite with (leaded) copper, the second layer does
not exhibit technological markers to suggest the same. It appears to be more enriched in
zinc (though not that strongly), but more importantly, far less enriched in tin and lead.
Furthermore, fuel ash enrichments are much higher for the first layer than for the second.
This can all be explained by the more limited development of the second slag layer, which
therefore trapped fewer charge fragments and contaminants. Most likely, the process con-
ducted during secondary use of this crucible was the same as during the first use: bronze
melting/alloying.
Overall, the entire Philoppopolis assemblage consists of externally heated crucibles, with
the exception of P8 and P9. The production of (leaded) bronze, leaded brass and leaded
gunmetal is attested, as well as small-scale silver melting. Again, zinc plays a difficult role
when interpreting these crucibles. For both leaded brass and gunmetal production here,
zinc was most likely introduced as a copper contaminant or alloy component, and cop-
per/brass was mixed with lead and/or tin. As such, the ‘active alloying’ here refers to the
addition of lead and/or tin, rather than zinc.
Similar to the Nicopolis case, no meaningful discussion of technological variability through
time at this site can be made, given the limited evidence at hand and the rough dating
available. It is notable, however, that the later (in a very rough sense) crucibles (P6, P7-P8)
appear to be made of more refractory clay than the earlier, second century crucibles.
11.2.3 Serdica
Similar pottery appears to have been selected for reuse as crucibles for S1 and S2. These
were probably employed for the same metallurgical purpose. As ceramic fragments were
only sampled (accidentally) for S1, these must be taken as representative for both crucible
fabrics. The reused domestic vessels were made of ‘ceramic A’, employing a fairly refrac-
tory, micaceous clay, while ‘ceramic B’ derives from a more sandy clay. It is difficult to say

Frederik Rademakers Part V: Roman Thrace. Chapter 11 395
if ‘ceramic B’ represents the external clay layer, which was not sampled and in fact com-
pletely bloated, or is simply dirt (‘a layer of wet clay’ was noted in Sofia).
These crucibles were clearly used for silver related metallurgy. Though little metallic silver
remains, the few prills, many sulphides and overall dross enrichment reveal the presence
of iron, copper and minor cadmium. This abundance of sulphides and their shapes, sug-
gest severe sulphide corrosion of silver that was once present in these crucibles. Though
the identification of some iron, copper and cadmium as probable contaminants of that
silver is possible, it is difficult to further reconstruct the metallurgical process for which
these crucibles were used.
Whether entire vessels (amphorae?) or just the bottom fragments (possibly closed on top)
were reused as crucibles, cannot be reconstructed from examination of these dross frag-
ments.
The rim sample of crucible S3 is not very illuminating: it simply shows that the rim was
somewhat bloated and mildly enriched in fuel ash. No further interpretation beyond that
made by macroscopic examination can be made here: the crucible was probably used for
the melting or refining of gold. No compositional data for this gold (alloy) can be presented
here.
Though copper is the main metal present in crucible S4, it is accompanied by iron, zinc,
arsenic, silver and lead. It appears that silver and arsenic are the main alloy elements,
with fairly high levels occurring in the metallic state, while zinc and lead are burnt off into
the slag and most likely represent contaminants. The fuel ash enrichment is very strong
in the crucible interior slag, and even more so in the exterior glaze (see Table 11.2). This
indicates exposure to high temperatures mainly on the outside, but on the inside as well,
probably through covering the entire, open crucible with charcoal. Alternatively, it could
be indicative of reuse of this crucible, switching between internal and external heating.
It is remarkable that no iron oxide crystals were noted in either the external glaze or inter-
nal slag, despite their enormous bulk enrichment in iron oxide. This could suggest that,
rather than iron entering the slag as a copper contaminant, this enrichment is in fact the
result of a (very) thin, iron-rich clay lining being applied to the crucible’s surface (inside
and outside), which subsequently formed a glaze on the external crucible surface, and a
slag layer on its interior. If that is indeed the case, the change in fuel ash components may
have to be partially attributed to the different bulk chemistry of the applied clay layer, sim-
ilar to the suggested interpretation of N4-N5. The far greater iron and fuel ash enrichment
of the exterior surface suggests that most of that clay would have been applied to the cru-
cible exterior, where the crucible was heated.
The lesser enrichment of the crucible exterior in copper, zinc, arsenic, silver and lead is
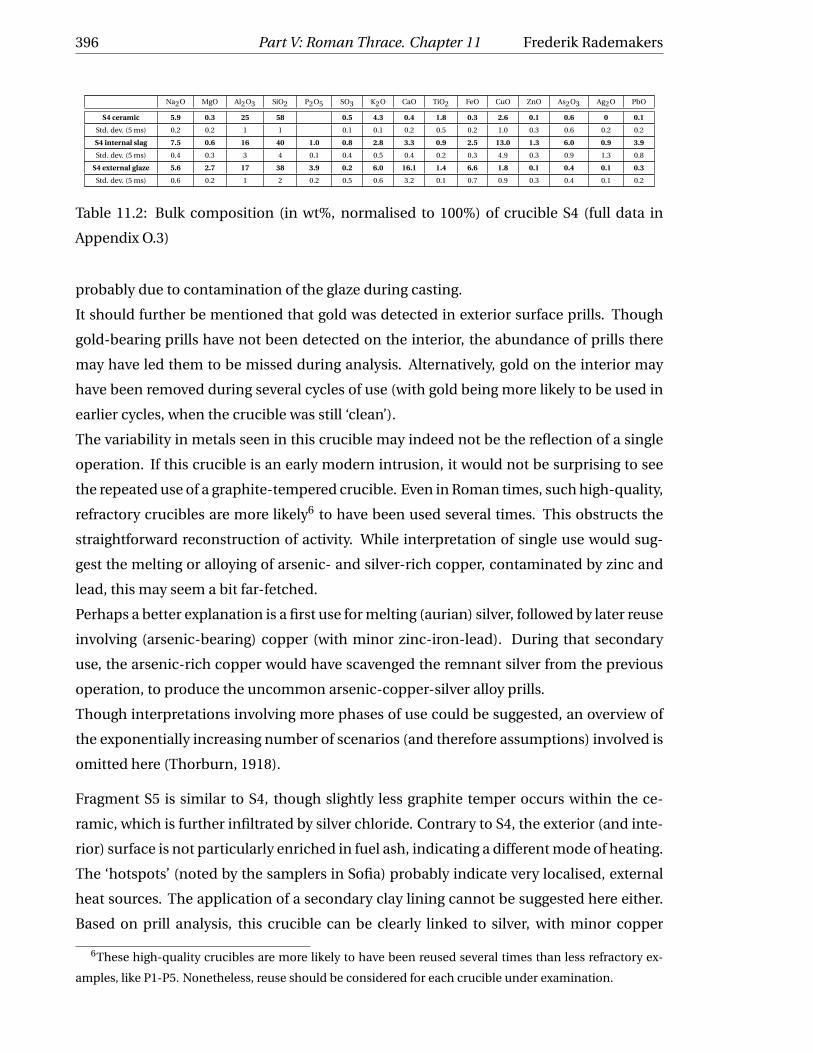
396 Part V: Roman Thrace. Chapter 11 Frederik Rademakers
Na2O MgO Al2O3 SiO2 P2O5 SO3 K2O CaO TiO2 FeO CuO ZnO As2O3 Ag2O PbO
S4 ceramic 5.9 0.3 25 58 0.5 4.3 0.4 1.8 0.3 2.6 0.1 0.6 0 0.1
Std. dev. (5 ms) 0.2 0.2 1 1 0.1 0.1 0.2 0.5 0.2 1.0 0.3 0.6 0.2 0.2
S4 internal slag 7.5 0.6 16 40 1.0 0.8 2.8 3.3 0.9 2.5 13.0 1.3 6.0 0.9 3.9
Std. dev. (5 ms) 0.4 0.3 3 4 0.1 0.4 0.5 0.4 0.2 0.3 4.9 0.3 0.9 1.3 0.8
S4 external glaze 5.6 2.7 17 38 3.9 0.2 6.0 16.1 1.4 6.6 1.8 0.1 0.4 0.1 0.3
Std. dev. (5 ms) 0.6 0.2 1 2 0.2 0.5 0.6 3.2 0.1 0.7 0.9 0.3 0.4 0.1 0.2
Table 11.2: Bulk composition (in wt%, normalised to 100%) of crucible S4 (full data in
Appendix O.3)
probably due to contamination of the glaze during casting.
It should further be mentioned that gold was detected in exterior surface prills. Though
gold-bearing prills have not been detected on the interior, the abundance of prills there
may have led them to be missed during analysis. Alternatively, gold on the interior may
have been removed during several cycles of use (with gold being more likely to be used in
earlier cycles, when the crucible was still ‘clean’).
The variability in metals seen in this crucible may indeed not be the reflection of a single
operation. If this crucible is an early modern intrusion, it would not be surprising to see
the repeated use of a graphite-tempered crucible. Even in Roman times, such high-quality,
refractory crucibles are more likely6 to have been used several times. This obstructs the
straightforward reconstruction of activity. While interpretation of single use would sug-
gest the melting or alloying of arsenic- and silver-rich copper, contaminated by zinc and
lead, this may seem a bit far-fetched.
Perhaps a better explanation is a first use for melting (aurian) silver, followed by later reuse
involving (arsenic-bearing) copper (with minor zinc-iron-lead). During that secondary
use, the arsenic-rich copper would have scavenged the remnant silver from the previous
operation, to produce the uncommon arsenic-copper-silver alloy prills.
Though interpretations involving more phases of use could be suggested, an overview of
the exponentially increasing number of scenarios (and therefore assumptions) involved is
omitted here (Thorburn, 1918).
Fragment S5 is similar to S4, though slightly less graphite temper occurs within the ce-
ramic, which is further infiltrated by silver chloride. Contrary to S4, the exterior (and inte-
rior) surface is not particularly enriched in fuel ash, indicating a different mode of heating.
The ‘hotspots’ (noted by the samplers in Sofia) probably indicate very localised, external
heat sources. The application of a secondary clay lining cannot be suggested here either.
Based on prill analysis, this crucible can be clearly linked to silver, with minor copper
6These high-quality crucibles are more likely to have been reused several times than less refractory ex-
amples, like P1-P5. Nonetheless, reuse should be considered for each crucible under examination.

Frederik Rademakers Part V: Roman Thrace. Chapter 11 397
involved and, notably, significant gold content. This could suggest the processing of an
electrum-like alloy or ‘aurian silver’. However, enrichments of the interior slag could sug-
gest different scenarios. While the presence of copper, silver, and even some lead would
not be surprising (Thompson, 2003), the highly elevated bismuth content is unusual.
The presence of bismuth in aurian silver is explained by Craddock (1995) as a result of
smelting silver from jarosite ores (Amorós et al., 1981). This was practised by the Romans
in Rio Tinto (Spain) and resulted in raw silver (after cupellation) with significant gold, cop-
per and bismuth content (Craddock, 1995, Fig. 6.7, p. 220). The melting of such raw silver
in a crucible under (mildly) oxidising conditions would result in the formation of a dross
from the preferred oxidation of bismuth, prior to copper, silver or gold (Ellingham, 1944).
It is important to bear in mind that strong slag enrichment in Bi2O3 does not necessarily
represent high bismuth content in the metal charge. As the relative volumes of slag and
melt are unknown, it is difficult to say whether raw silver, rather than silver with minor
bismuth content (e.g., common denarius coins (Butcher and Ponting, 2005)) were melted
in this crucible. As noted earlier, the slag that was sampled for S5 was exceptionally thick,
sitting relatively close to the crucible rim. This corroborates its identification as burnt-
off contaminants floating on top of the charge, but it remains hard to assess the relative
amount of bismuth in the original melt. The presence of lead could indicate its intentional
addition with the purpose of silver refining (removal of copper/bismuth), but the use of a
graphite crucible and relatively low level of lead argues against cupellation for S5. Lead
is therefore probably only present as a contaminant from the earlier smelting and cupel-
lation processes. It should be noted that silver may have been intentionally mixed with
gold in particular contexts, as shown for example by Rehren et al. (1996), but the com-
bined presence of bismuth, copper and gold suggests that ore geology is responsible for
the observations here.
Before continuing the interpretation of crucibles S6-S11, it should be noted that the ce-
ramic compositions of S3-S5 are quite close to those of S1-S2. This could suggest the use
of a similar clay, though graphite-tempered in the case of S4 and S5. Even if there might
be a large temporal discrepancy between these crucibles, the repeated use of a local clay
from the Serdica area for different crucible types might be reflected here.
Though some similarities exist between S4 and S5 (graphite temper, presence of aurian sil-
ver), there are notable differences as well (abundance of graphite, application of secondary
clay layer, presence/absence of bismuth in silver), which make it difficult to consolidate
the tentatively suggested relation between these two crucibles, excavated from different
contexts.
Fragments S6-S11 form a single context, with the crucible clay compositions coinciding

398 Part V: Roman Thrace. Chapter 11 Frederik Rademakers
(red group, Figure 11.27), and the ceramic of S6 and S9 having a slightly different but com-
parable composition. This crucible fabric is strongly dominated by fused quartz grains.
S6 appears to have been used for active bronze alloying (fairly high-tin prills), with lead
and antimony being important further alloy components. The more humble arsenic and
nickel (and minor iron) contents probably represent copper contaminants, originating
from the copper ore. Lead and antimony could have entered the charge as separately
added alloy components, or as previous alloy components of copper. Tin was most likely
added in its pure form (metal or cassiterite). Minor fuel ash contributions in the dross cor-
roborate external heating, as derived by visual examination, but suggest an open crucible.
S7 was probably equally used without a lid, more thoroughly covered in fuel, using a sim-
ilar iron/arsenic/nickel-rich copper for bronze making. No high-tin prills are present in
this crucible to suggest active alloying, however. The similarity to S6, with the exception
of lead and antimony in this crucible could suggest that those two metals were added to-
gether in S6, possibly as a single alloying component. Furthermore, the analysis of the
exterior surface of S7 reveals the presence of zinc (and increased nickel) in prills.
The analysis of sample S8 did not reveal anything conclusive. The high lead content of the
slag, with minor zinc and some tin does not contradict its initial interpretation as part of
the same operation as S6-S11.
Fragment S9 is more revealing and clearly shows more reducing conditions within that
crucible, attested by the reduction of iron. As a result, gunmetal, sometimes with high
iron content is preserved in this fragment, while zinc and iron are lost in the prills of other
fragments (with the rare exception in S7). The high tin content of the prills again argues
for its active addition to the crucible charge.
It appears that for S10, fragments of the interior surface were either not sampled or poorly
mounted, and there is again not much to say. The reddish exterior surface is enriched in
zinc. The high iron content in the only prill again argues for reducing conditions.
S11 is similarly indicative of reducing conditions, with inconclusive indications for bronze
processing.
It is possible to suggest an overall interpretation for S6-S11 at this point. S6 appears to
have been used for the production of leaded bronze. Antimony in S6 was most likely in-
troduced together with lead, perhaps mixed up as a single metal (either intentionally or
accidentally). For the other crucibles, the addition of lead/antimony to the bronze is not
attested. However, the use of a similar copper source, enriched in iron-arsenic-nickel (and
possibly zinc) may be seen throughout this group of crucibles, though its reflection in the
samples varies. The most reducing conditions are attested in sample S9, where elevated
zinc content is accompanied by high iron and tin content, suggesting the active addition

Frederik Rademakers Part V: Roman Thrace. Chapter 11 399
of tin.
It therefore appears that, while leaded bronze was produced in S6, S7-S11 were used for
the production of plain bronze. The same source of copper was probably used in all cru-
cibles, though S9 may have had exceptionally high iron and zinc content, indicative of a
different raw copper, or possibly the production of gunmetal in that crucible.
Though fragments S8-S11 may not constitute a single crucible, their interpretation as part
of a single, larger operation seems most appropriate, rather than suggesting a plethora of
possible interpretations for each individual fragment.
Overall, the Serdica crucibles can be subdivided into those used for precious metals (S1-
S5) and those for base metal alloys (S6-S11). Domestic pottery was reused for some silver-
related process in S1 and S2, while a purpose-made crucible (S3) was most likely involved
with gold processing. The graphite-tempered crucibles (S4-S5) present more complicated
cases of (aurian) silver processing, with the possible addition of an additional clay layer
and multiple phases of use in S4 making interpretation particularly difficult. A different
crucible type, mostly made up of quartz sand, was used for the alloying of (leaded) bronze
and possibly gunmetal, in a separate context (S6-S11). Similarly to Philippopolis, zinc was
probably not added actively to these alloys.
11.2.4 Stara Zagora
The zoning of this crucible suggest two distinct episodes of use. First, the crucible was
used without external layer B, and some prills were deposited on its exterior as well as in-
terior surface. For its second (or perhaps ‘nth ’) use, an additional layer was applied to its
external surface (covering the exterior prills deposited during previous use). If this layer
was applied further over the rim and onto the interior surface, this is no longer visible due
to fusing of those layers.
Reconstructing the alloys melted or produced within this crucible is complicated by the
issue of double use, whereby the interior crucible slag represents the mixed result of two
operations. No structural indications (e.g., two slag layers) exist to differentiate between
features of the two operations. The embedded prills suggest the melting of leaded bronze.
This could, however, be an alloy resulting from the mixture of metals introduced into the
crucible during distinct operations. The presence of an almost pure lead prill suggests the
introduction of lead as a pure metal for active alloying.
Prills on the exterior of part A are all leaded copper (with minor tin or iron), and its vit-
rified surface is more strongly enriched in zinc than the interior. This is evidence for the
presence of copper, tin, zinc and lead in the crucible during its first phase of use.

400 Part V: Roman Thrace. Chapter 11 Frederik Rademakers
For its second use, the exterior surface (part B) only reveals pure copper prills, and its slag
is not particularly enriched in zinc.
It is notable that tin is more or less absent on both exterior surfaces, though present in low
quantities in part A.
The most abundantly occurring prills on the crucible interior are bronze and leaded bronze.
Zinc occurs only in prills with fairly low tin content or more outspoken iron content, sug-
gesting that zinc, like iron, is therefore again present as a copper contaminant and not as
an intended component of the final alloy. The first phase of use, then, could have been the
active alloying of copper/bronze with lead to produced leaded bronze, while the second
phase consisted of copper or bronze melting, with no indications for active alloying or the
presence of lead.
It must be stressed that some aspects of this argument rely on the absence of evidence.

Frederik Rademakers Part V: Roman Thrace. Chapter 11 401
Section 11.3
Overview
One common characteristic of all crucibles investigated in this chapter is their composi-
tional homogeneity: within each crucible, the ceramic fabric shows little variation. How-
ever, differences in ceramic fabric exist between the various crucibles. An overview of all
crucible ceramic compositions (showing alumina, silica and ‘flux components’, cfr. Free-
stone and Tite, 1986) is shown in Figure 11.53.
Figure 11.53: Ternary diagram showing all analysed ceramics from Roman Thrace
The most silica-rich crucibles (N1, N3, N6, S7, S10 and S11) were all used for the melting
and alloying of leaded and plain bronze. The compositional clustering of these crucibles,
as well as the similar type of metallurgy for which they were employed, does not coincide
with a single crucible typology, however. Within this group, both external and internal
heating modes are attested, which is reflected in the different crucible designs.
The improvised crucibles N4 and N5 (reused pottery with additional clay layer) have simi-
larly low flux components (0-10%), but relatively higher alumina content. Their slag com-
positions, however, are largely dominated by the application of an additional clay layer,
which is similar in composition to N1, N3 and N6. They can again be related to the melt-
ing of leaded bronze.
The majority of examined crucibles is richer in flux components (10-20%). A first group
here are the Serdica crucibles used for precious metal melting (S1-S5). S1 and S2 were

402 Part V: Roman Thrace. Chapter 11 Frederik Rademakers
used for silver-related metallurgy and are not purpose-made crucibles. However, it ap-
pears the functionality of these particular domestic vessels was known to the metallurgist
who reused them, following application of a protective clay layer. Their compositions are
indeed very close to those of the purpose-made crucibles S3 (gold metallurgy) and S4-
S5 (graphite-tempered crucibles, employed for silver-related metallurgy). All are charac-
terised by relatively high alumina content. S9, in contrast, has lower alumina content, and
was used for melting leaded bronze/gunmetal.
P9 is compositionally very similar to S9, and equally used for the production of leaded
bronze, possibly through a cementation process. In this case, however, a very different
crucible design was employed for internal heating. Interestingly, crucible P9 has been re-
lined with the same clay and reused for bronze melting a second time.
P1-P5 and P6-P8 are compositionally closer to the precious metal crucibles from Serdica.
The first group of crucibles was used for the production of leaded gunmetal (or bronze)
and, with their fairly high flux content and rough design, became quite malleable and lost
some of their shape in the process.
P7 is closest in composition to this group, and similarly looks a bit bent after its use for
leaded brass melting/alloying. It should be noted that this limited (apparent) loss of struc-
tural integrity of crucibles P1-P5 and P7 probably did not affect their functionality.
P8, which is relatively closer to S1-S5 in terms of ceramic composition, was used for silver
processing, and therefore probably exposed to relatively lower temperatures over a shorter
period than crucibles P1-P7, allowing it to fully retain its structure.
P6, applied in the processing of leaded bronze, has the lowest bulk flux components in this
crucible group.
Finally, the Stara Zagora crucible, used for active leaded bronze alloying and reused for
bronze melting, must be situated in this broad compositional cluster as well.
The crucible with the largest flux component (20-30%) is N2. This is, however, not really
a crucible, but should simply be labelled a ‘technical ceramic’, involved in copper-based
metallurgy. This corresponds to the observations made by Freestone and Tite (1986), that
furnace materials tend to be slightly less refractory than those employed in the manufac-
ture of crucibles.
It should be noted here that for many crucibles, some difficulty existed in performing a
good comparison of ceramic and slag compositions. This was due to the frequent lack of
either ‘pure’ ceramic or slag areas available in the sample (e.g., no ceramic for group P1-
P5). Therefore, calculations of variable enrichment in certain components has not always
been possible, or not as accurate as those presented for the Pi-Ramesse and Gordion case
studies. Furthermore, the information on crucible shapes strongly varies as well. While

Frederik Rademakers Part V: Roman Thrace. Chapter 11 403
some crucibles have remained complete (e.g., P1-P5), most (e.g., S8-S11) are very frag-
mented and usually only one piece is available for a particular crucible type (provided
such types exist), making it very difficult to reconstruct their shapes. Their overall inter-
pretation is therefore further impeded, as crucible shapes and the use of lids vary strongly
in Roman times (as opposed to the typical open Bronze Age vessels for bronze melting and
alloying) and provide essential clues to identifying their metallurgical purpose.
The very fragmented nature of these assemblages therefore present a strong limitation on
their overall interpretation. In fact, as can be seen from the lengthy interpretations in sec-
tion 11.2, the limited evidence provides less opportunities to build strong interpretations
through the comparison of multiple samples and much ambiguity remains.
Despite its small size, the assemblage reveals some significant aspects in the context of
this thesis, nonetheless. While the above mentioned limitations are further discussed in
Chapter 13, some further general interpretative remarks can be made here.
More than half of the investigated crucibles show bulk enrichment in zinc oxide, which
corresponds to ±65% of all crucibles used for copper based metallurgy. However, it ap-
pears that in most cases, zinc is present merely as a contaminant, rather than an actually
intended alloy component. This distinction is sometimes difficult to make, though. The
main factors to distinguish actual brass-making from zinc-contaminated copper or brass
melting, are the presence/absence of zinc-bearing metallic prills, the absence/presence
of other contaminants, such as iron7, in those prills and the indications for a reducing at-
mosphere through the use of a (perforated) lid, which provides the necessary pressure for
zinc vapour to enter the copper. Bayley (1984) remarks that relative bulk enrichments of
zinc8 are up to an order of magnitude higher in brass cementation crucibles than in melt-
ing crucibles, but such distinctions seem difficult to maintain given variable process con-
ditions. Some examples of (lidded) Roman brass-making crucibles are shown in Rehren
and Martinón-Torres, 2008, Figure 9.1, p. 171. In general, Roman brass-making appears
to have followed a cementation process, though very rare finds of metallic zinc, which
could have been used for pure metal alloying, are known as well (Craddock, 1998; Rehren,
1996b).
In a cementation brass-making process, copper is expected to remain solid while zinc
is vaporised inside the crucible. As such, liquid prills could be considered evidence for
brass-melting rather than -making. However, it is possible that the same crucibles used
for cementation were subsequently used for melting. Such a practice would further elim-
7In such cases, however, ‘dirty copper’ might have been alloyed with zinc, creating a similar outcome.8Measured relative to iron by Bayley, which may be problematic as iron could be present as a copper
contaminant.

404 Part V: Roman Thrace. Chapter 11 Frederik Rademakers
inate another possible technological marker: the degree of crucible slagging. Where brass-
making requires relatively low, very controlled temperatures (Rehren and Martinón-Torres,
2008), resulting in limited crucible slagging (e.g., in Roman Xanten (Rehren, 1999), where
crucibles are heated indirectly), the subsequent heating to increased temperatures for
brass melting and casting in the same crucible, as seen in Roman Britain (Bayley, 1998),
could result in crucible slagging anyway (Craddock and Eckstein, 2003). Obviously, the re-
fractoriness of the ceramics employed in brass-making or -melting influences their slag-
ging in the process and limits the generality of these remarks. Finally, the presence of
residual calamine, the zinc ore (in fact smithsonite, ZnCO3) employed in brass cementa-
tion, could be a technological marker for the process. However, similar to residual cassi-
terite in bronze cementation crucibles (see sections 5.4.5 and 8.3.4), this has hitherto not
been implemented in any published studies.
Overall, it appears that none of the crucibles presented here were used for an active alloy-
ing of zinc (ore) with copper.
The following distinction that must be made, then, is between brass melting and the melt-
ing of a copper (alloy) with limited zinc contamination. Making such a distinction is par-
ticularly difficult due to the over-representation of zinc as a contaminant in crucibles and
moulds, relative to its importance as an actual charge component (Dungworth, 2000a;
Kearns et al., 2010). In general, very high zinc oxide content should be expected in slag/dross
of crucibles where zinc is present as an alloy component, while more moderate zinc oxide
content can be expected when zinc is present on a contaminant level. However, the vari-
ability in crucible conditions makes such a distinction untenable. Important zinc content
(>4 wt%, see Craddock, 1978) in metallic prills more strongly argues for its presence as a
significant alloy component.
For example, crucibles P2-P5 all show strong enrichments of zinc oxide in their dross, to-
gether with copper, tin and lead oxide. In a strictly theoretical sense, the presence of metal
oxides other than zinc oxide, suggests that all zinc has burnt from the metal charge (high
to low Gibbs-free energy: Zn-Sn-Pb-Cu, and high to low volatility: Zn-Pb-Sn-Cu), but this
assumes ideal conditions. The absence of zinc in any of the metallic prills may confirm
the hypothesis that zinc is only present as a copper contaminant in these crucibles.
However, taking into account crucible P1, which should represent the same process, the
occurrence of leaded brass/gunmetal prills, suggests that zinc may have been present at
more significant levels. The choice of dross samples for P2-P5 could therefore have pro-
hibited the reconstruction of the crucible charge. Furthermore, it is possible that the sam-
pling of an oxidising crucible fragment (rather than dross) could have resulted in a similar
representation: copper/bronze prills from which all zinc has oxidised into the crucible

Frederik Rademakers Part V: Roman Thrace. Chapter 11 405
slag. This illustrates the (uncontrollable) effect of sample selection on crucible interpre-
tation that is introduced by crucible heterogeneity: one sample (P1) can strongly alter the
overall interpretation of a group of crucibles (P1-P5), and a single sample will often miss
important information (‘nugget effect’). For the identification of processes involving zinc,
this effect seems to be especially problematic.
It is of course possible that P1 represents a different process from P2-P5, i.e., leaded gun-
metal making on the one hand and (contaminated) leaded bronze making on the other
hand, but this does not alter the above-mentioned problems faced during analysis. Here,
it is best to suggest a single process interpretation that fits the data, rather than multiple
possible processes.
P7 appears to represent the dross from a crucible in which leaded brass was melted. It
shows very high zinc content, burnt off under oxidising conditions, but significant zinc
content remains in the prills. In contrast, all tin and lead are burnt off, despite the re-
maining zinc content. Therefore, it can be concluded that zinc is a more important alloy
component here. In the case of P1-P5, the presence of more important tin and lead can
be said to ‘push zinc out’ of the metallic state. However, it must be emphasised again that
different operating conditions, changing in time and location within the crucibles, could
have altered the outcome of what may have been the same processes.
Finally, it can be noted that N6, used for leaded bronze alloying, does not show any zinc
contamination. Though arguments in absentio are dangerous, the presence of various
metal oxides and the lack of zinc oxide in crucible slag/dross is fairly compelling to sug-
gest zinc absence in the charge.
A final, more general note on zinc oxide contamination of crucible slag should be made
here, which equally applies to other metal oxides (see Appendix G). The actual amounts of
zinc oxide in crucible slag or dross, converted to metal zinc, are usually very small relative
to the metal charge in the crucible. Slag enrichments of several wt% usually translate to
losses in the order or 0.1 wt% or less from the metal charge. Therefore, the zinc contents of
preserved metallic prills provide a more reliable tool in assessing the relative importance
of zinc in the charge.
The identification of the processes to which the precious metals were subjected is again
difficult, based on the limited evidence available. The silver is often strongly corroded by
either chlorine or sulphur, each indicative of particular environmental parameters, which
are not really of interest for this discussion. Though chlorine and sulphur are known to
have been used for the parting of silver and gold (Rehren, 2013), the shapes of the vari-
ous silver chlorides and sulphides seen in the crucibles discussed here correspond best to
corroded silver, rather than those seen in parting vessels (Meeks et al., 1996). The occur-

406 Part V: Roman Thrace. Chapter 11 Frederik Rademakers
rence of copper-rich aurian silver, with bismuth and lead-rich slag (S5) therefore probably
points to remelting of raw (aurian) silver, rather than attempted gold/silver parting.
Silver, aurian silver and gold were melted in crucibles in Serdica and Philippopolis, though
the purpose of these operations cannot be specified much further based on the analyses
presented here. The identification of contaminants such as bismuth and lead does reveal
some more detail regarding the origin of the silver processed in S5, tentatively linking it to
poly-metallic ores. For S3, however, no information is gained beyond that available before
analysis.
A note can be made here on the occurrence of almost pure iron prills in several crucibles
(P6, S9-S11). These prills point to highly reducing conditions, provoking the reduction
of iron oxide from the ceramic to the metallic state. The presence of minor copper in
these prills, may suggest that tiny copper prills could act as nuclei for such reduction.
It should be further noted that, though such iron prills indeed point to locally reducing
conditions, those conditions did not necessarily prevail throughout the crucible. In Pi-
Ramesse (sample 86_0749c) and Gordion (samples 22626 and 27638), for example, iron
prills have been noted in the context of an open crucible process.
Finally, some comments are required on the practice of crucible reuse and its implications
for the interpretations made in this chapter. Direct indications for reuse have been found
on all sites, with the exception of Nicopolis. In Philippolis, P9 shows the unmistakable ap-
plication of a secondary clay layer (identical to primary ceramic fabric) for its second use.
In Serdica, S4 does not show any clear structural features revealing reuse, which is in that
case suggested by the nature of the metal prills. In Stara Zagora, the crucible was clearly
repaired or reinforced for its second use.
It should be remarked here that ‘second use’ in the above implies a minimum number of
uses, suggested by prills or the application secondary clay layers. However, it is possible
that these crucibles were used several times before and/or after a secondary clay layer was
applied, without leaving any diagnostic evidence. Here, the same reasoning is applied as
that applied for all other crucibles: a ‘single use perspective’ is adopted for interpretation
wherever possible.
Overall, it appears that repair and reuse of crucibles is not uncommon in this assemblage.
Though not directly attested in Nicopolis, the interior ceramic layer in N6 may be an in-
dication of ‘prepared reuse’ that was never executed. The positive identification of reuse
in several crucibles may provide confidence in the interpretation of other crucibles as sin-
gle use vessels, but this is no guarantee. Though a single use interpretation is preferable
wherever possible, it is easy to imagine that certain crucibles were used for the same pur-
pose several times, resulting in a slag and dross representative of that purpose. For highly

Frederik Rademakers Part V: Roman Thrace. Chapter 11 407
refractory crucibles, it is even easier to envisage the ‘overwriting’ of evidence through fre-
quent reuse, as little crucible slag is formed and dross is easily removed. In those cases,
the slag/dross most likely reveals the most recent metallurgical process executed in those
crucibles. All in all, the most likely candidates for such ‘invisible reuse’ in this assemblage
are N4, P8 and S1-S3.
A final aspect of reuse in this assemblage is the adaptation of existing (domestic) pottery
for metallurgical purposes, seen in N4-N5 and S1-S2. Such reuse is not expected to influ-
ence the interpretation of the actual metallurgical process.

408 Part V: Roman Thrace. Chapter 11 Frederik Rademakers

CHAPTER 12
Discussion
From the foregoing discussion, it appears that zinc is quite common as a contaminant in
Roman copper based alloys. Though it is beyond the scope of this project to discuss the
various alloys produced in Roman times and their application, a few points can be made
based on the crucible analysis presented here. Some general overviews of the use of stan-
dardised Roman alloys is given by Dungworth (1997), Hook and Craddock (1996), Riederer
(2002a,b) and Unglik (1991). Roman brass in particular is discussed by Craddock (1978).
Brass was adopted as a popular alloy at the early stages of the empire, in particular for the
production of military equipment, but additionally for other purposes such as coinage. In
Roman Britain, for example, it appears within a decade following conquest, though mainly
in an imperial military setting (Bayley, 1998). Similarly, it was introduced in other newly
conquered Roman provinces and reflects a ‘typically Roman’ metallurgical practice. In
Palestine, for example, local inhabitants seem to have preferred their traditional bronze al-
loys over the imported Roman technology (Ponting, 2002). In North-Africa, it appears that
the imported copper and brass may have been locally manipulated and perhaps mixed
with local metals (in some cases mined by the Romans themselves (Skaggs et al., 2012)) as
it was incorporated into the trans-Saharan metal trade (Fenn et al., 2009).
At any rate, brass production seems to have been largely under imperial control, and
the decline in zinc content of copper alloys during the later Roman empire (Rehren and
Martinón-Torres, 2008), particularly in brass coinage (where this decline was first noted by
Caley (1964)), was most likely a deliberate choice. Brass coins were diluted by the addition
of leaded bronze, which parallels the dilution of the silver denarius coinage (Dungworth,
1996). A similar transition from brass to leaded bronze is noted in military equipment by
409

410 Part V: Roman Thrace. Chapter 12 Frederik Rademakers
Dungworth and Starley (2009). Bayley (1998) further mentions the deliberate or acciden-
tal mixing of brass and bronze scrap as indicated by the inversely proportional relation
between tin and zinc in many copper alloys. This was equally observed by (Craddock,
1978), who further noted the lack of tin-zinc correlation for levels of zinc below 4%, which
suggests zinc’s unintentional presence as scrap at that level.
The contribution that can be made to this picture through the analysis of the crucibles
presented in this chapter is perhaps limited, though it shows that Roman metallurgical
practice reached Thracia, and can aid future comparisons with imperial centres. It corrob-
orates that zinc was pervasively present in Roman copper alloys, either as a deliberate alloy
component or as a contaminant. Zinc’s occurrence as a contaminant here may probably
be explained by the repeated recycling of brass, rather than reflecting the ore from which
copper was smelted. Though it is often difficult to reconstruct the exact alloys that were
being produced in these crucibles, many give the impression that various copper scrap
may have been recycled and mixed together to form (leaded) brass, bronze or gunmetal.
In P9, for example, (leaded) bronze was produced using a zinc-contaminated copper, as
in N1 and N3, while leaded bronze was alloyed in N6 using a zinc-free copper.
Within these Thracian workshops, brass then appears to have been available mainly as
scrap, as the use of a fresh zinc source is not attested. However, this does not exclude
the availability of zinc, which may have been used in hitherto unexamined crucibles. Fu-
ture case studies may reveal patterns of zinc availability in the Roman provinces, and the
degree to which various workshops were reliant on recycling brass. Whether recycling in
the crucibles under discussion reflects a conscious choice by the metallurgists to achieve
particular mechanical, visual or other properties is impossible to guess. Different metals
(pure and alloys) were most likely available, though probably at different costs, allowing
them to select the appropriate material for particular purposes. A comparison of these
single samples from different contexts and periods does not allow further discussion on
this subject.
A few moulds discovered at Nicopolis (Cholakova, 2006), which indicate the production
of small rings, are the only objects which may be tentatively related to the metallurgical
chaîne opératoire to which these crucibles belong. Contrary to the artefact analysis per-
formed by Ponting (2002) for Roman Palestine, these crucibles themselves offer little in-
sight into the social implementation of Roman metallurgy in Thrace. The particular social
contexts in which these crucibles were used is unknown, and they can therefore not be
used to compare technological choices made in different settings here. Though some in-
formation can be gained from the analysis of metal finds from the region, their relation to
these particular crucibles cannot be established. No information is available for the fur-

Frederik Rademakers Part V: Roman Thrace. Chapter 12 411
ther working of the metal produced at the contexts under discussion, as no furnaces, tools
for cold/hot working, metal objects etc. were available for study. The actual object pro-
duction techniques beyond the crucible stage, like casting and annealing (Unglik, 1991),
can therefore not be discussed here.
It is, however, possible to make some tentative suggestions on the types of object that
might have been produced from the various crucibles presented here. In Nicopolis, the
larger crucibles are related to (leaded) bronze alloying, and the smaller crucibles to melt-
ing/alloying. The use of leaded bronze was preferred to plain bronze for casting (Riederer,
2002a), and the volumes seen here conform to small object casting, like small rings, though
somewhat larger objects may have been cast as well. Lead may equally have been alloyed
with bronze for the purpose of adding weight at a lower price (Unglik, 1991).
In Philippopolis, both (leaded) bronze/brass/gunmetal and silver were processed. P1-
P5 are fairly small crucibles, offering better control of interior conditions, which is im-
portant for brass/gunmetal melting and production. This small scale is compensated by
their numbers, indicating that perhaps several crucibles were heated at once to produce
more significant amounts of leaded brass/gunmetal (through the addition of tin to ex-
isting leaded copper/brass). There are no indications (spouts or rim traces) to suggest
that liquid metal was poured from these crucibles. The produced metal may have been
remelted in a different crucible for casting (either as small batches or by combining metal
from several crucibles) or worked as such. P6 and P7 are of a similar size, but used for the
melting/alloying of leaded bronze and brass respectively. P9 is quite different, as it ap-
pears to have been used for a cassiterite cementation process to produce (leaded) bronze,
and is quite a bit larger. It is interesting to note here the difference in size and shape be-
tween P6 and P9, both used for leaded bronze metallurgy. This could be indicative of many
things, such as simple melting of limited metal (P6) or active alloying of more significant
amounts (P9) or perhaps objects of different sizes being intended for casting. The singular
occurrence of these crucibles renders such discussions very difficult, if not futile. In fact,
if gunmetal prills happened to be missed in this particular sample of P6, its comparison to
P9 becomes even more tenuous. P8 stands out as the only crucible used for silver process-
ing, and its spout suggests it may have been used to cast small silver objects.
In Serdica, a particular group of crucibles was used for the alloying of leaded bronze, pos-
sibly gunmetal (S6-S11). Though their size is difficult to estimate exactly, they appear to be
fairly large and, as a group, suggest the production of more substantial amounts of metal.
Of course, it is difficult to establish whether all crucibles were used contemporaneously.
The other crucibles, used for precious metal melting, are fairly small. S1-S2 were prob-
ably used for simple remelting of silver, and S3 for the remelting of gold. While S3 has a

412 Part V: Roman Thrace. Chapter 12 Frederik Rademakers
spout and was clearly used for subsequent casting, this is difficult to establish for S1-S2,
which probably did not have a spout as they were not purpose-made crucibles. S4-S5 may
have been used for refining of (raw) aurian silver, and subsequent casting. Their similarity
to post-medieval crucibles (compare Figure 11.33 and Martinón-Torres and Rehren, 2009,
Figure 6, p. 61) suggests they could be late intrusions.
The Stara Zagora crucible was most likely used for the alloying and casting of a relatively
modest amount of leaded bronze.
It should be noted that both base metals and precious metals were probably being recy-
cled, melted, alloyed and cast in all of the sites under discussion, without this necessarily
being represented in the limited sample investigated here. Furthermore, this would have
taken place alongside ferrous metallurgy, as noted by Salter (2007) in Nicopolis. These
samples therefore do not allow any further comparison of the different sites in terms of
variety and importance of different metallurgical operations, as they are simply not rep-
resentative at that scale. Furthermore, any link between crucible typology and alloy type
cannot be securely established on the basis of these samples. Though preferences for cer-
tain crucibles for particular purposes probably existed, it is evident that a range of shapes,
sizes and ceramics were used, sometimes in a rather ad hoc way, as exemplified by the
reused domestic pottery. This reveals a flexibility of the Roman metallurgist, reflected
in the crucible remains, which may be partially related to the scale at which they were
working. These small, urban workshops would probably have produced a large variety
of objects, composed of different metals and alloys, and drew from a range of vessels for
particular purposes. However, the most specialised vessels appear to have been reserved
for precious metals (e.g., P8 and S4-S5). Nonetheless, the overall high quality of ceram-
ics available in Roman times allowed them to use less specialised vessels, provided with a
protective clay layer, if that ceramic was of the right quality. The clustering of clay com-
positions across crucible typology indicates the recognition of such quality by the ancient
craftspeople.
An exhaustive comparison of this assemblage to different crucibles found across the en-
tire Roman Empire would therefore be exciting, but such a gargantuan task is beyond the
scope of this thesis. Many such crucibles have been published in various site reports, as
well as more crucible-oriented studies (e.g., Bachmann, 1976; Bayley, 1984, 1987; Dung-
worth, 2001a,b; Dungworth and Bowstead Stallybrass, 2000; Dungworth and Starley, 2009;
Horsley, 1997; König and Serneels, 2013; Nicholas, 2003; Rehren, 1999), with a strong bias
towards the western Roman provinces. For the majority of these crucibles, analysis was re-
stricted to pXRF. The potential for pXRF, in particular when limited fragments are available
for study, as is the case for the assemblages discussed in this chapter, is further discussed

Frederik Rademakers Part V: Roman Thrace. Chapter 12 413
in Chapter 13.
One particular comparison can be made here to Roman crucibles discussed by König and
Serneels (2013), who noted the presence of an ‘engobe’ on most of the crucibles. This ap-
pears to be a thin layer of clay on the interior of the crucible, made up of the same material
as the exterior protective layer applied to the crucible. Though a strong visual identifica-
tion of such a layer could not be made for any of the crucibles discussed in this chapter,
some similarity may exist to the added clay layer tentatively identified in crucibles N4-N5
and on S4. In both cases, however, an iron-rich clay appears to have been applied, while
König and Serneels (2013) note particularly high lime contents, which may be (partially)
attributed to fuel ash contributions, as well as the selection of a particular clay. As men-
tioned before, the application of this iron-rich clay to the crucible interior is quite peculiar,
as it does not seem to offer any discernible technical advantage. Perhaps surface uneven-
ness or small cracks in the reused pottery warranted this application, and was intended
to avoid any losses (e.g., silver chloride in fragment S5, but not S4). At any rate, it appears
that these layers served their purpose and did not result in failure of the crucible process.
The sources of metal available to Roman metallurgists were probably quite varied. Clearly,
a well-established Roman trade system for ingots existed, which covered many different
metal types (Beagrie, 1985; Hughes, 1980; Kingsley and Raveh, 1994; Klein et al., 2007;
Pagès et al., 2011; Parker, 1974; Parker and Price, 1981; Pinarelli et al., 1995; Skaggs et al.,
2012; Tisseyre et al., 2008; Trincherini et al., 2009). In this context, it is perhaps interesting
to mention the existence of mixed metal ingots. Pewter (tin/lead) ingots with deliberately
varied compositions were most probably intended for the easy production of specific al-
loys (Hughes, 1980). The suggested use of a mixed lead/antimony additive to the S6 cru-
cible may tentatively be related to this practice, but such ingots are yet to be identified in
the archaeological record.
Though ingots probably reached Thracia, both precious metals and base metals occurred
and were mined in the province as well (Davies, 1935b, 1936; Dušanic, 2004). The evidence
for primary iron production in Nicopolis (Salter, 2007), probably points to the smelting of
local rather than imported iron ore, and allows the possibility that other local metal ores
were being smelted as well. Evidence for such primary metal production has hitherto not
been published.
This introduces the question of where the raw (or at least bismuth-contaminated) silver,
identified in crucible S5, may have come from. Though some complex silver ore occur-
rences are known in Thrace (Davies, 1935b), the evidence for raw silver extraction from
jarosite ores in Spain, mentioned in section 11.2.3, is perhaps more compelling. This sug-
gests the export of raw silver from the region, which would still require further refining

414 Part V: Roman Thrace. Chapter 12 Frederik Rademakers
before its actual use. However, such refining may have taken place in a single process im-
mediately preceding the casting of the desired object, with any dross/slag remaining in
the crucible. As such, it would not be surprising to find some remaining bismuth and per-
haps minor lead, but especially copper and gold in the resulting silver artefact. Through
repeated recycling and remelting, the bismuth, lead and copper content is expected to de-
crease significantly, though not disappear completely (e.g., denarius coins (Butcher and
Ponting, 2005)).
Despite Spain being a likely candidate for this silver, the evidence from relatively nearby
Sardis should be mentioned here as well. Bismuth and copper are noted there by Meeks
(2000) in silver mixed with gold, and furthermore in silver coins (Cowell and Hyne, 2000).
However, this much pre-dates the Roman period, during which Sardis was part of the
province Lydia rather than Thracia. Another interesting case is a silver coin with high gold
content, as well as elemental copper and bismuth inclusions, discussed by Giovannelli
et al. (2005) who interpret it as unrefined silver smelted from a poly-metallic ore, possibly
jarosite. Though from a (6th century BC) Greek, rather than late Roman, context, this type
of metal is probably quite close to what should be envisaged as the charge for crucible S5.
Overall, it is interesting to point out the identification of jarosite ores being used for denar-
ius minting under Augustus and Tiberius (Butcher and Ponting, 2005), followed by an ap-
parent switch to oxidised ores (lower bismuth), dry ores and galena (which do not produce
the same gold/bismuth enrichment, though sometimes one of both occurs) later on1. This
in turn opens the issue of minting, which has been mentioned already during the intro-
duction to this chapter. Even though the minting of coinage took place at each of the cities
discussed in this chapter, the particular contexts under investigation are not clearly linked
to any mint. Furthermore, none of the crucibles provide convincing evidence that such a
relation should be presumed. Though any of the crucibles could be related to minting (of
either bronze, brass or precious metal coinage), each may have equally been used for dif-
ferent purposes. Without further contextual information and related finds such as moulds
or blanks, a relation to minting will remain tentative at best.
Nonetheless, some general remarks on coinage in Thracia can be made here. An overview
of coin hoards in Bulgaria is given by Paunov and Prokopov (2002), who note that coins
were first circulated in Thracia-Moesia just after the start of the first century BC, with
denarii being particularly introduced for military and strategic reasons, rather than com-
merce. More general discussion on Roman coinage can be found in, e.g., Bland (2013);
Butcher and Ponting (1995, 2005); Carradice and Cowell (1987); Carter (1978); Crawford
(1977); Hendy (1972); Klein and von Kaenel (2000); Klein et al. (2004) and Reece (1985),
1This could be suggestive of an early dating for crucible S5, though the evidence is very conjectural.

Frederik Rademakers Part V: Roman Thrace. Chapter 12 415
and is quite beyond the scope of this thesis. In this context, Butcher and Ponting (2005)
note that lead isotope analysis of silver mostly reflects the lead used in the silver refining
process, rather than the original silver ore. Any attempts at relating silver objects to their
ores through lead isotope analysis (Baron et al., 2011), is therefore particularly difficult.
The widespread use of lead in brass and bronze, compounded by the regular recycling
and debasement of coins, renders the use of lead isotopes for provenance studies in a Ro-
man context very complicated, and mostly relevant for the study of lead sources (e.g., Bode
et al., 2009; Boni et al., 2000; Durali-Müller et al., 2007; Kuleff et al., 2006; Pinarelli et al.,
1995; Skaggs et al., 2012), though attempts have been made for copper using a combined
analytical approach (e.g., Klein et al., 2007). Ponting et al. (2003) suggest that, rather than
reconstructing ore sources, particular mints or workshops may be reflected in the lead iso-
topes, though further analysis is needed to determine the applicability of this hypothesis.
Where only limited sampling for crucibles is possible, technological reconstruction is more
likely (though definitely not guaranteed) to succeed than metal provenancing. Nonethe-
less, the identification of particular chemical/mineralogical markers (like bismuth in the
case of silver) can provide some clues here.
Bronze vessels from Roman Thrace are discussed by Nenova-Merdjanova (1997, 2002a,b,
2011), who furthermore suggests that approximately half of all these were imported from
abroad (mainly Italy, Egypt and Syria), while the rest was produced in Thrace. These im-
ports were apparently mainly luxury products, intended for consumption by the local no-
bility, while the local production furnished vessels for the less wealthy, and was not organ-
ised on an industrial scale. Similarly, it appears that functional workshops for the repair
of military items were set up ad hoc, for example in military camps, while mass produc-
tion took place in centralised fabricae. Of interest here, perhaps, is the location chosen for
these smaller scale workshops, both private and military. As noted by Dungworth and Star-
ley (2009), workshops in military encampments (in that case fairly sizeable) are typically
located close to the ramparts. This is paralleled in Xanten, where the private workshops
are found in the craft quarter, close to the walls (insula 39, Rehren and Kraus, 1999), as well
as Nicopolis ad Istrum. Poulter (2007b) suggests this may be related to the better control
of fire hazards.
The crucibles discussed in this chapter can most likely be situated in such a context of
small, urban workshops, geared towards producing and repairing a variety of rather small
objects for local consumption and following a more adaptive, ad hoc approach than what
could be expected in the more industrialised fabricae.
In conclusion, it must be noted that the fragmented nature of these crucibles is largely
responsible for spawning a rather exasperating (and perhaps tedious) interpretation and

416 Part V: Roman Thrace. Chapter 12 Frederik Rademakers
discussion. Where many samples were available to study the metallurgical process exe-
cuted in a homogeneous group of crucibles in the two preceding case studies, this assem-
blage is made up almost completely of unique crucibles. In the few cases were several
similar crucibles were available (e.g., P1-P5 and S6-S11), the combined information de-
duced from these fragments typically allowed more meaningful discussions than possible
on the basis of single samples. The issues introduced by limited samples are further ag-
gravated by the complexity and variety of Roman metallurgy, where mixing and recycling
of old and new metal appears not to have been uncommon. Restricted contextual infor-
mation further limits the scope for broader discussion of these results. These issues are
further examined in a broader methodological discussion in Chapter 13.
Nonetheless, the reconstructions offered in this chapter present some of the most de-
tailed elaborations of metallurgical practice in eastern Roman provincial cities currently
available. As such, their examination stands as an important basis of comparison for fu-
ture metallurgical studies in the region. Despite interpretative difficulties discussed here,
these crucibles shed light on the alloys worked within these urban workshops, and raise
questions on provincial metal production (organisation) that may be addressed by future
research.

Part VI
Discussion
At work here is that powerful WYSIATI2 rule. You cannot help dealing with the
limited information you have as if it were all there is to know. You build the best
possible story from the information available to you, and if it is a good story,
you believe it. Paradoxically, it is easier to construct a coherent story when you
know little, when there are fewer pieces to fit into the puzzle. Our comforting
conviction that the world makes sense rests on a secure foundation: our almost
unlimited ability to ignore our ignorance.
Kahneman, 2012
2WYSIATI: What you see is all there is.
417

418 Frederik Rademakers

CHAPTER 13
Methodological issues for crucible metallurgy
studies
The outcome of ancient crucible studies depends on many factors, some of which are
within the researcher’s control, while others are not. Crucible slag variability, first noted
in this thesis for the Pi-Ramesse assemblage (section 5.4.9) is discussed in more detail
here, distinguishing between the variability witnessed within crucibles (section 13.1) and
throughout crucible assemblages (section 13.2). These two forms of variability have hith-
erto not been discussed in the literature, but are shown to impact greatly on the interpre-
tation of analytical data. In fact, with the exception of work by Humphris et al. (2009) on
iron smelting slag, the methodological implications of variability in ancient production
remains for archaeometallurgical studies has barely received any attention.
In section 13.3, the methodological options to cope with such variability are discussed,
and an agenda for ‘best practice’ in crucible studies is outlined. Bayley et al. (2001), Bay-
ley and Rehren (2007), Martinón-Torres and Rehren (2014), Rehren (2003) and Tite et al.
(1985) provide a general framework for the analysis of ancient metallurgical crucibles. This
chapter offers a more detailed discussion of sampling, analysis and interpretation issues.
419

420 Part VI: Discussion. Chapter 13 Frederik Rademakers
Section 13.1
Within-crucible variability
Previous studies have not considered the variability that may exist within crucible assem-
blages. As this section demonstrates, the first type of variability that can be identified
within crucible assemblages is the variation that occurs within crucibles themselves. The
analysis of a single crucible sample does not necessarily capture this variability, and some
of the differences seen between samples from different crucibles can often be attributed
to variability of the same process. The main factors influencing this within-crucible vari-
ability and its characteristics are discussed in this section.
Several process parameters may vary strongly during metallurgical crucible processes.
The most important are redox-conditions, temperature and the distribution of charge
constituents. The first two are strongly related to changing oxygen supply within the cru-
cible, which in turn is controlled by tuyère placement, continuity in bellowing action and
charcoal cover. This oxygen supply is a dynamic factor, producing hotter and cooler re-
gions within a crucible, and more oxidising or reducing conditions in different areas, as
shown in Figure 13.1. These zones may change rapidly through time, and as crucibles go
through several stages in their use, such as pre-firing, charging, melting/smelting, casting,
cooling and reuse.
Figure 13.1: Schematic representation of heterogeneous crucible conditions at a particular
point in time, with hotter (A) and cooler (B) regions and more oxidising (C) and reducing
(D) conditions

Frederik Rademakers Part VI: Discussion. Chapter 13 421
Most information on the metallurgical process is contained in the crucible slag forming
through the melting of the inner surface of the crucible. The degree of this melting is a
function of the composition and refractoriness of the ceramic, which is usually constant
across the crucible fabric. Despite this compositional homogeneity of the ceramic, vit-
rification and slag formation may vary strongly within crucibles. This changing rate of
ceramic disintegration stems mainly from variability in process parameters throughout
the crucible. The degree to which the ceramic vitrifies and melts in turn influences the
amounts of charge constituents that can be encapsulated, such as charcoal/fuel ash, ore
fragments, metal prills and metal oxides, which transform vitrified ceramic into crucible
slag. None of these charge constituents are necessarily present in every particular area of
the crucible, even though they may occur in one area.
In oxidising areas of the crucible, some of the metal in the charge can oxidise. In the case
of copper, contaminants such as iron, cobalt, nickel and arsenic or alloying elements such
as tin, lead and zinc are burnt off before the copper itself oxidises (Ellingham, 1944; Dung-
worth, 2000a; Kearns et al., 2010). If this happens in an area with a sufficiently developed
liquid slag layer, the metal oxides can be incorporated into that slag layer and provide
highly distorted information on the nature of the original metal melted in a crucible. Un-
der more reducing conditions, metal prills can be trapped nearly unaltered in the slag,
reflecting the original metal composition more adequately. The relative proportions of
molten ceramic, fuel ash, metal oxides and metal inclusions in the crucible slag can vary
highly from one part of the crucible to the next, and over very short distances. When no
slag is formed, some of these metal oxides typically gather on top of the molten charge as a
dross layer. Similarly, slag inclusions (silicate-based waste) will typically float on top of the
charge and mix with any dross (oxide-based waste) formed, as illustrated in section 5.4.10.
At the casting stage, the dross layer may be removed by the metallurgist, or deposited on
the crucible interior.
Some examples from the three case studies discussed in this thesis can be used to illustrate
this variable slag formation. A crucible fragment from Pi-Ramesse, shown in Figure 13.2
(and earlier in Figure 5.7), is slagged along its entire profile. The slag layer is fairly regular
and thin closer to the rim (top) and its reddish surface is quite flat. Lower down, however,
the slag thickness increases and is more variable, and the dark grey slag exhibits a more
irregular surface with visibly corroded copper-based prills. Analysis by pXRF shows that
closer to the rim, the slag is mainly enriched with lime (with limited copper enrichment),
while the slag in the body part of the sherd (measured only 3 cm away) is enriched in iron,
copper, tin and cobalt. Though this particular sherd could not be sampled in Egypt, the
rim and lower body areas are represented by similar samples analysed by SEM-EDS, such
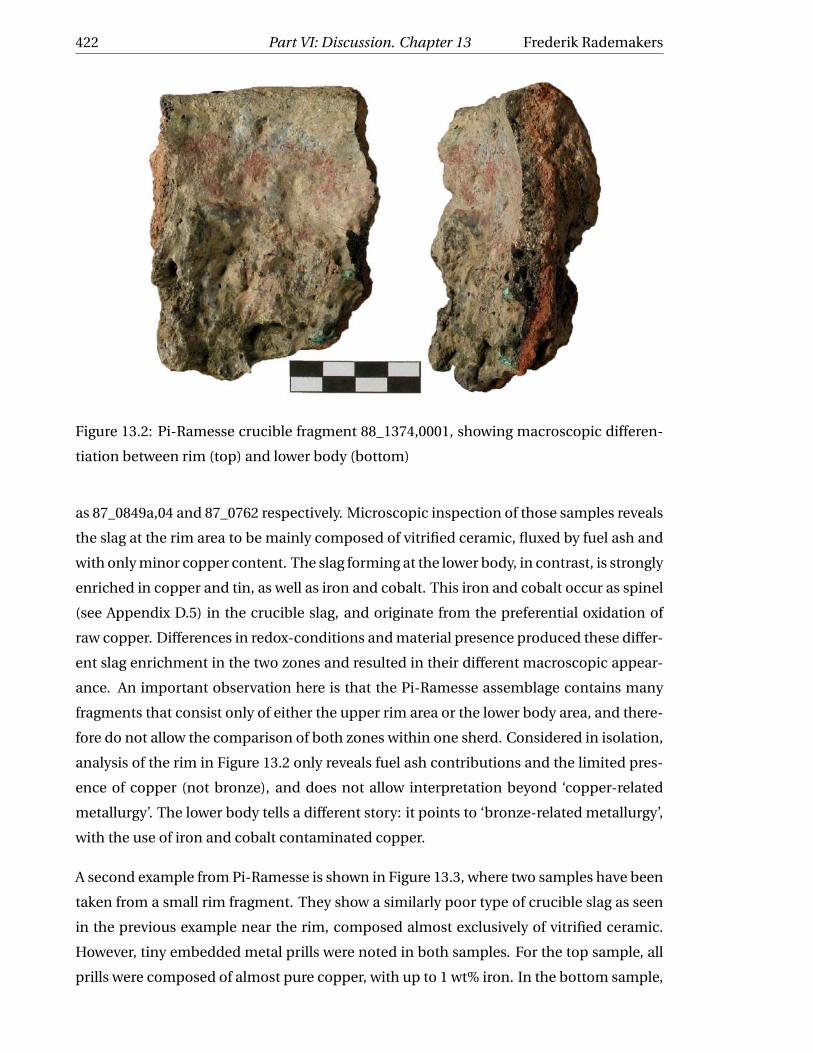
422 Part VI: Discussion. Chapter 13 Frederik Rademakers
Figure 13.2: Pi-Ramesse crucible fragment 88_1374,0001, showing macroscopic differen-
tiation between rim (top) and lower body (bottom)
as 87_0849a,04 and 87_0762 respectively. Microscopic inspection of those samples reveals
the slag at the rim area to be mainly composed of vitrified ceramic, fluxed by fuel ash and
with only minor copper content. The slag forming at the lower body, in contrast, is strongly
enriched in copper and tin, as well as iron and cobalt. This iron and cobalt occur as spinel
(see Appendix D.5) in the crucible slag, and originate from the preferential oxidation of
raw copper. Differences in redox-conditions and material presence produced these differ-
ent slag enrichment in the two zones and resulted in their different macroscopic appear-
ance. An important observation here is that the Pi-Ramesse assemblage contains many
fragments that consist only of either the upper rim area or the lower body area, and there-
fore do not allow the comparison of both zones within one sherd. Considered in isolation,
analysis of the rim in Figure 13.2 only reveals fuel ash contributions and the limited pres-
ence of copper (not bronze), and does not allow interpretation beyond ‘copper-related
metallurgy’. The lower body tells a different story: it points to ‘bronze-related metallurgy’,
with the use of iron and cobalt contaminated copper.
A second example from Pi-Ramesse is shown in Figure 13.3, where two samples have been
taken from a small rim fragment. They show a similarly poor type of crucible slag as seen
in the previous example near the rim, composed almost exclusively of vitrified ceramic.
However, tiny embedded metal prills were noted in both samples. For the top sample, all
prills were composed of almost pure copper, with up to 1 wt% iron. In the bottom sample,

Frederik Rademakers Part VI: Discussion. Chapter 13 423
Figure 13.3: Small Pi-Ramesse rim fragment (left), from which two samples (83_1149b - 1
and 2) were cut and mounted (middle). Prills in both samples are shown on the right
all prills had a radically different composition, averaging around ±30 wt% copper, 40 wt%
nickel, 15 wt% cobalt and 15 wt% iron. Despite being taken only two centimetres apart,
these samples present varying evidence of what must have been the same process and,
viewed in isolation, would again lead to divergent interpretations.
Upon noting this variability in the Pi-Ramesse assemblage, the analysis of several sam-
ples from single fragments of the Gordion crucibles was undertaken, as detailed in section
8.3.8. The variability seen in Gordion-25394 is summarised in Figure 13.4. The rim sam-
ple (A) exhibits limited slagging, and most of the interior is simply vitrified ceramic. A
few tiny prills occur further away from the rim (towards the lower body), which are iron-
and arsenic-rich bronze, but the bulk slag metal content is low (Table 13.1). In the inter-
mediate sample (B), the slag is more developed (though not everywhere) and more metal
prills are present. These are mainly pure copper prills with minor iron content, while the
slag contains large amounts of tin oxide, malayaite and copper (chloride) oxides. Finally,
the lower body sample (C) presents the thick crucible slag at the bottom of the fragment.
Here, two layers exist: the deeper slag layer is similar to sample B (with iron-rich bronze
prills), while a dross layer is deposited on its surface, which is dominated by various metal
oxides (including lead oxide). The bulk slag metal content in sample B is higher than that
of sample A, but lower than that measured in sample C (Table 13.1), which is reflective of

424 Part VI: Discussion. Chapter 13 Frederik Rademakers
Figure 13.4: Gordion crucible fragment from which three samples were taken (left), with
representative images of the three areas (right)
CuO SnO2 PbO
Sample A 0.8 0.8 0
Sample B 2.1 2.6 0
Sample C 8.5 19.0 4.4
Table 13.1: Bulk slag metal content for Gordion-25394 (in wt% (following normalisation to
100%), other oxides omitted)
the high metal oxide content in the dross, rather than the elevated presence of metallic
prills. Though these dross layers can be helpful in identifying alloy types melted in a cru-
cible, metallic prills rather than metal oxides are required to assess better the actual alloy
composition. Fuel ash contributions and iron contamination of the crucible slag are lower
for samples A and B than for sample C.
It should be emphasised, however, that such variability is not seen in every crucible, as ex-
emplified by Gordion-23045 and Gordion-27613 (see section 8.3.8). Overall, it appears that
high variability is to be expected though, especially when the crucible interior is slagged
throughout. As discussed above, this degree of slagging is related to oxygen supply, tem-
perature and charge distribution, as well as the refractoriness of the crucible. Even when
no variability is macroscopically apparent, it should be assumed a priori.

Frederik Rademakers Part VI: Discussion. Chapter 13 425
For the crucible assemblage from Roman Thrace, it has not been possible to evaluate
within-crucible variability. Due to sampling limitations, only single fragments were avail-
able for study, which often consisted of no more than a few dross scrapings. Furthermore,
the crucibles showed far greater variety in terms of both their ceramic fabric and their met-
allurgical use. Finally, complementary data from the analysis of interior surfaces by pXRF
was not available. It is obvious that such conditions present problems in evaluating the
representativeness of a single sample for a particular crucible process. When only dross
samples are available, metal prills are usually absent, making it difficult to reconstruct
the original alloy. However, this matter may often not be resolved by increased sampling:
some crucibles are simply very ‘dry’, meaning little or no crucible slag has developed. This
situation often occurs in more refractory (and thus often historically later) crucibles, par-
ticularly when process temperatures were not extremely high. For such processes, the
evidence is scarce by default. Though some dross may develop, this is not always the case
and when it does, it is not always preserved in the crucible.
Nonetheless, if the Philippopolis crucibles P1-P5, which all have a similar crucible fabric
and design, can be taken as representative for a single process, their within-process vari-
ability can be discussed through comparison of the five samples. As mentioned in section
11.3, it appears that the involvement of zinc in an oxidising metallurgical process hinders
straightforward interpretation. Its over-representation in crucible slag makes it difficult
to reconstruct its actual importance in the charge. Zinc’s volatility further impedes the
preservation of zinc-rich prills, which limits the likelihood of their detection during anal-
ysis, particularly in dross layers. The hit-or-miss nature of such evidence is further dis-
cussed in section 13.3, and appears particularly important for more refractory crucibles,
where limited slag develops and therefore fewer technological markers are trapped.
At this point, some examples of more refractory crucibles may be discussed, drawing from
examples beyond the crucibles presented in this thesis. Steel production crucibles are
typically made of a highly refractory ceramic which interacts very little with the charge.
Examples from Uzbekistan are shown by Martinón-Torres and Rehren (2014) in Figure 6.7,
p. 115, Rehren and Papachristou (2003) in Figure 2, p. 398, and Bayley and Rehren (2007)
in Figure 10, p. 52. In such processes, a steel ingot forms at the bottom of the crucible,
with a layer of slag floating on top of it. After use, the crucible is broken to remove the steel
ingot, resulting in many fragments of fairly ‘clean’ ceramic, as well as a larger fragment to
which the slag layer is attached. The analysis of such ‘crucible slag’ is more akin to primary
smelting slag analysis than crucible slag analysis discussed in this thesis, as the ceramic
does not partake in its formation. The crucibles themselves tend to maintain very ‘dry’
interior surfaces, while the exterior surface typically develops a vitrified layer through ex-

426 Part VI: Discussion. Chapter 13 Frederik Rademakers
Figure 13.5: Boxplot of bulk copper, tin and lead oxide content in 49 Pi-Ramesse (top - 9
rim, 6 body-rim and 34 body samples) and 46 Gordion crucible samples (bottom - 16 rim,
6 body-rim and 24 body samples)
ternal heating.
Another example of refractory ceramics can be found in medieval Austrian scorifiers, which
are shallow ceramic dishes used for various oxidising metallurgical reactions. Examples
are shown by Martinón-Torres and Rehren (2014) in Figure 6.11, p. 117 and Mongiatti
(2010) in Figure 5.6, p. 116, where the regulus of metal settling at the bottom of the cru-
cible can be seen, leaving a negative imprint on the slag after its removal. This crucible
slag is in fact mainly dross, as limited reaction usually takes place with the actual ceramic.
For such crucibles, some of the crucible slag/dross has been removed by mechanically
breaking out the settled metal, resulting in a skewed representation of the original process
in the archaeological remains.
A similar example of refractory crucibles from 19th century London, showing a regulus
and limited vitrification in particular areas is discussed by Dungworth (2010, 2012b).
Returning to the Pi-Ramesse and Gordion assemblages, some more general observations
concerning body and rim fragments can be made. When comparing the copper, tin and
lead content in all analysed rim and body samples (where ‘body-rim’ means body samples
taken near the crucible rim, as opposed to lower body samples), a trend becomes evident:
body fragments are generally more highly enriched in metal (oxides) than rim fragments,
as illustrated in Figure 13.5. However, this trend is by no means a strict rule, and high
variability exists. The highest lead oxide content within Gordion crucibles, for example, is
measured in a rim fragment.

Frederik Rademakers Part VI: Discussion. Chapter 13 427
These observations confirm that slag of rim fragments often consists of vitrified ceramic,
fluxed by fuel ash, and is generally less informative than lower body slag, which was in con-
tact with the crucible charge1. For these body fragments, the variable temperature, redox-
conditions and distribution of charge components modify the type of evidence available
(e.g., metal content, different oxide phases). When sampling a crucible fragment, the cho-
sen location will therefore strongly influence the informative nature of analytical results,
and complete disclosure of the crucible process is rarely obtained from a single sample.
Post-depositional effects such as differential corrosion and fracturing can further bias the
representativeness of a fragment for understanding ancient metallurgical processes.
Section 13.2
Assemblage-wide variability
Two main types of variability can be expected within crucible assemblages. The first is due
to the variability inherent to the crucible process, as discussed in section 13.1. The second
type is introduced by the variable technological choices ancient craftspeople made, which
are sometimes reflected in the crucible slag. This involves the variation in techniques, as
well as variation in raw materials used in the metallurgical process. Here archaeologists
can address questions such as: did ancient metallurgists stick to one ‘recipe’ or draw from
several technological options? Were raw materials from several sources used? Is there
any variation in these choices through time or various production contexts? Obviously,
such questions have higher archaeological significance than the detailed understanding
of process variability, described above, which probably played a minor role for the ancient
metallurgist.
The example of plain bronze production is used to discuss the concept of assemblage-
wide variability. The main techniques of choice are:
1. Alloying of two fresh metals (copper and tin)
2. Cementation (copper metal with tin ore)
3. Co-smelting (copper and tin ore)
4. Recycling (possibly involving addition of fresh metal (or tin ore))
1It is interesting to contrast this with typological studies of ceramics in general, where rim fragments are
typically considered more diagnostic than body fragments.

428 Part VI: Discussion. Chapter 13 Frederik Rademakers
Their differentiation in actual archaeological finds has received relatively little attention in
archaeometallurgical studies (however see Pigott et al., 2003; Rovira, 2007), but has been
discussed in greater detail for Pi-Ramesse (Rademakers et al., in press) and Gordion in
Chapters 6 and 9. In addition to choices of technique, variability due to the use of dif-
ferent raw materials can be expected as well. Here, the identification of materials from
different sources (geologically, economically, culturally) does not necessarily represent a
deliberate choice by the metallurgist. Finally, though variability in techniques and mate-
rials can occur across an assemblage, this is obviously not always necessarily the case.
The main problem for identification of technological variation lies in the nature of the
available evidence. This can be illustrated by the typical process indicators as preserved
in crucible slag that allow identifying different bronze production techniques. Active al-
loying, as opposed to the mere recycling of existing bronze, can lead to the production of
high-tin prills with δ-, ε- and/or η-phase bronze. Though these prills allow exclusion of
‘technique 4’ from the list above (i.e., recycling), they offer no distinction between ‘tech-
niques 1-3’. During cementation and co-smelting (‘techniques 2-3’), however, it is possible
for mineral grains from the ore to be trapped in the crucible slag and excluded from fur-
ther participation in the metallurgical process. As such, residual mineral grains can allow
the differentiation of ‘techniques 2-3’ from ‘1 and 4’.
The problem here is that these phases are not the intended end products of the metal-
lurgical operation: high-tin prills and residual ore are the result of processes not reaching
completion (in a particular crucible area). Under ‘ideal conditions’, these process indica-
tors are not preserved in crucible slag at the end of the operation, and they cannot always
be expected to be found in a crucible sample taken for analysis. Furthermore, many slag
phases are ambiguous and inconclusive towards identifying technological choices. Low-
tin prills, for example, could indicate the production of a low-tin bronze, but equally result
from the recycling (and partial burning) of medium-tin bronze. Similarly, acicular, high-
temperature tin oxide crystals can be formed in a crucible following any production tech-
nique (Dungworth, 2000b and Rademakers and Farci, in preparation). This is discussed
further in section 13.4.
Recognising variability in the use of raw material is equally difficult. For the case of (raw)
copper added to a crucible, a general distinction can be made between ‘clean’ and ‘con-
taminated’ copper. ‘Contaminated copper’ is typically raw copper which has not been
refined after the primary smelting stage. Depending on the type of ore that was smelted,
contaminated copper can contain elements such as iron, cobalt, nickel, arsenic, tin or lead
that were reduced during smelting and incorporated in the copper. Alternatively, raw cop-
per could be contaminated by remnant primary smelting slag, when poor separation was

Frederik Rademakers Part VI: Discussion. Chapter 13 429
achieved during the smelting process (Hauptmann et al., 2002) or when slag was inten-
tionally added to copper ingots, in an attempt at cheating when trading the copper. Most
contaminants oxidise preferentially to copper and will burn off into the crucible slag first.
Enrichment of the crucible slag in these oxides, therefore, can be used as an indicator for
the use of different raw materials across a crucible assemblage. Furthermore, it offers the
possibility to broadly relate crucibles to final artefact chemistry.
However, while a distinction can sometimes be made between ‘clean’ and ‘contaminated’
raw materials used in different crucibles, it is important to remember that contaminants
are only oxidised into the crucible slag under oxidising conditions. These environments
are not necessarily present in every crucible (area) and, as a result, the relevant metal ox-
ides are not present in each sample taken from a crucible.
Therefore, the absence of certain process indicators, technical or material, is often not suf-
ficient to exclude certain technological choices from the interpretation of an assemblage.
Due to the inherent process variability witnessed within each crucible, the absence of ev-
idence can usually not be taken as the evidence for absence. Only when the researcher
has investigated sufficiently large sample numbers can more confidence in an overall in-
terpretation be achieved. Defining ‘sufficiently large sample numbers’, however, is not an
easy task. This depends both on the process-inherent (i.e., within-crucible) variability,
and the a priori unknown variability in technology and material use present within the
assemblage. As discussed further in section 13.3, visual inspection of the assemblage and
the application of pXRF can provide some measure of this variability and inform sampling
strategies. Overall, conservativeness with regards to generalising interpretations is most
appropriate. The quote from Kahneman (2012) at the start of this discussion (page 417)
mirrors this idea that there is often more (to crucibles) than what we see (in our samples),
and we must actively acknowledge our unavoidable ignorance of certain facts when mak-
ing broad interpretations.
The effect of within-crucible variability on the assessment of assemblage-wide variability
is illustrated by looking at the changes in bulk chemistry between crucible ceramic and
slag for the Pi-Ramesse crucibles (Figure 5.5). As discussed in section 5.2.2, all samples
show enrichment in lime (and other fuel ash components), but this enrichment ranges
from low to high. As all crucibles were presumably placed under a similar charcoal cover
during operation, this range of enrichment reflects the within-crucible variability of fuel
ash contribution. However, the possibility of aberrant practice, employing exceptionally
little or large charcoal cover, cannot be teased out from such a pattern. Only when such
aberrant practice occurs frequently (at which point it is no longer aberrant), would a shift
in distribution of fuel ash enrichments become visible (e.g., bi-modal distribution). As

430 Part VI: Discussion. Chapter 13 Frederik Rademakers
such, the heterogeneous nature of the crucible process tends to hide aberrant or rare oc-
currences of technological variability within the assemblage.
In two thirds of the Pi-Ramesse crucible fragments, no slag enrichment in iron can be
noted, whereas one third exhibits varying degrees of iron enrichment. This enrichment
is most likely due to the use of ‘contaminated (raw) copper’, and the spread from low to
high enrichment is a result of within-crucible variability as well as variable iron content in
the raw copper. Therefore, some of the crucibles without notable iron enrichment could
similarly have contained ‘contaminated copper’, for which iron was not oxidised into the
crucible slag in the sampled part of the crucible.
Figure 5.6 shows the same ternary diagrams, distinguishing between rim and body cru-
cible fragments. Corroborating the remarks made in section 13.1, some differences can
be noted between rim and lower body fragments. Higher lime slag enrichments typically
occur for body fragments, though some rim fragments show moderate to high enrich-
ments, too. This reflects a fairly equal distribution of fuel ash throughout the crucibles,
though somewhat higher uptake in the more slagged lower body fragments, reflected in a
bi-modal distribution of lime enrichment (see Figure 5.10).
Slag enrichment in iron, on the contrary, occurs almost exclusively for body fragments
and is low for the rim fragments where it occurs. This reflects one of the primary factors
for within-crucible variation: the spatial distribution of charge constituents. Closer to the
crucible rim, less or no copper is available to exchange contaminants with the crucible
slag. An important consequence of this (perhaps elementary) observation is that the de-
duced importance of ‘contaminated’ raw copper use is skewed for the full assemblage, and
should be based only on the analysis of body fragments. For Pi-Ramesse, this means that
in reality about half of the crucibles show iron enrichments, indicative of the use of ‘con-
taminated’ copper (out of which ±15% are additionally contaminated with cobalt/nickel,
indicating a different raw material).
In contrast to the Pi-Ramesse crucibles, strong variability in bulk composition is not wit-
nessed in the Gordion crucibles, as illustrated in Figure 8.7. One the one hand, this reflects
the more refractory nature of these crucibles, which do not interact as strongly with the
charge. On the other hand, it appears that the metal charge is fairly ‘clean’, compared to
that in Pi-Ramesse. Though this result may appear less exciting than the bulk composi-
tional variability seen in Pi-Ramesse, it is equally interesting in its own right. As mentioned
above, variability in material use is not to be expected in every assemblage and its absence
equally informative for broader archaeological interpretation.
Assessment of the complete range of analytical results, however, shows that technological
variability did exist within the Gordion assemblage: it appears that both plain and leaded

Frederik Rademakers Part VI: Discussion. Chapter 13 431
bronze were being alloyed. The more refractory nature of the crucibles limited slag forma-
tion, which in turn limited the trapping of technological markers. Therefore, the impor-
tance of cassiterite for alloying through cementation is more difficult to ascertain for this
case. As discussed in section 13.1, within-crucible variability does exist for the Gordion
crucibles, and is reflected most strongly in the prill compositions.
For the Thracian crucibles, it is not possible to discuss assemblage-wide variability in
terms of metallurgical technology: very few crucibles were used for the same purpose,
only limited samples were available and these derived from a variety of contexts (rang-
ing greatly in both time and space). Rather than opening an assemblage-wide discussion,
each fragment necessitates an isolated case study, which is difficult to relate technologi-
cally to fragments used for other processes. Within-crucible variability could not be as-
sessed either, and as only single crucibles were usually present to reconstruct a particu-
lar process, variability in technology and material use for that particular process is not
attested. Though a discussion of variability in ceramic technology is possible (see sec-
tion 11.3), it must be emphasised that this does not reflect variability within a particular
context, and therefore differs significantly from discussions of Pi-Ramesse and Gordion.
Finally, it should be remembered that the more refractory nature of these Roman cru-
cibles limits the range of evidence available for analysis in general, and increased sampling
would not necessarily provide further information on assemblage-wide variability.
As a final note, it should be mentioned that variability in the crucible ceramic throughout
an assemblage should be examined as well. For the Pi-Ramesse assemblage, this vari-
ability appears to be limited to the natural variability present in Nile silt, and possibly
the influence of limited sand temper. In Gordion, the natural clay variability appears to
be smaller, but a few crucibles are made from a different fabric altogether. In the Thra-
cian assemblage, few crucibles are made from the same fabric. This is a further source of
variability that should always be considered in crucible studies, and necessitates the re-
construction of bulk slag enrichments to be assessed through comparison to the ceramic
composition of the same crucible. When no crucible ceramic is attached to a slag sam-
ple, its interpretative value is therefore always limited: even though technological markers
may still be preserved, bulk enrichments cannot be discerned confidently.
Though it is expected (and therefore not discussed in section 13.1) that the ceramic fabric
is fairly homogeneous within a crucible both in terms of texture and composition, this may
not always be the case. If variability in chemical composition indeed exists throughout the
ceramic, this introduces a further possible source of error when comparing ceramic and
slag composition for a crucible: the contribution of particular elements to the crucible slag
may be under- or overestimated in a single sample. Such effects appear to be limited in

432 Part VI: Discussion. Chapter 13 Frederik Rademakers
terms of bulk chemistry, but it should be noted that variability in lead isotope composition
throughout a crucible ceramic (and slag) may be more problematic, and poses significant
issues when interpreting lead isotope composition shifts between ceramic and slag.
Section 13.3
Methodological implications
Sections 13.1 and 13.2 have identified several issues, fundamental to understanding vari-
ability within crucible assemblages. The importance of within-crucible variability, super-
imposed on assemblage-wide variability, has hitherto not been discussed in the literature.
Furthermore, their influence on methodological choices, such as sampling and analytical
strategies, has not been evaluated. This is investigated further in this section.
The degree to which these issues affect crucible slag formation strongly varies, of course.
One of the critical factors influencing the degree of slag formation is crucible refractori-
ness. Poorly refractory crucibles typically form thick slag layers as their fabric disinte-
grates at high temperatures. This enables the mechanical trapping of charge fragments
(e.g., charcoal, ore and metal fragments) and the incorporation of contaminants into the
slag through chemical interaction. In more refractory crucibles, this melting of the ce-
ramic fabric is less pronounced, as for example in the Gordion and Thracia crucibles. An
important result of limited slag formation is the absence of an exchange medium for the
crucible charge into which contaminants can be burnt off. When iron-rich copper is used,
for example, this iron will oxidise and, in the absence of a crucible slag phase, collect as
a dross layer on top of the crucible charge together with other metal oxides. Upon cast-
ing, such dross layers are either manually removed, or are deposited as a thin layer on top
of a limited area of the crucible slag, which is typically enriched in metal oxides several
times more strongly than normal crucible slag. It should be noted that these dross lay-
ers, due to the absence of a protecting glassy slag phase, are typically more susceptible
to post-depositional corrosion or mechanical loss than regular crucible slag. This further
illustrates the impact of crucible refractoriness on the evidence available to the archaeo-
logical scientist.
In this section, the implications of these unavoidable issues on sampling and analysis
strategies are discussed further.
As a first point, the sampling strategy for analysis by optical microscopy and SEM-EDS
analysis, which has formed the core of this thesis, can be discussed. This sampling should

Frederik Rademakers Part VI: Discussion. Chapter 13 433
follow a thorough visual inspection of the entire assemblage to assess variable slag for-
mation. Ideally, a large number of samples should be taken to assess variability within
crucibles and discover variation within the assemblage with confidence. As mentioned
earlier, it is difficult to define a general guideline for sample numbers, and every case study
requires specific consideration. The use of pXRF in defining minimum sample numbers is
discussed further below.
In reality, however, sampling is constrained by limitations in time or budget, export regu-
lations and curatorial considerations, rather than the concerns expressed above. For such
cases, the foregoing discussion has shown that selecting lower body fragments for anal-
ysis will generally prove to be more informative than rim fragments when reconstructing
technology and material use, and thicker, more developed slag is more likely to capture
process indicators. This corresponds to what most researchers have probably been doing
intuitively for decades: go for the ‘juicy’-looking slag. The results presented in this the-
sis, however, finally provide a more scientific basis to follow those instincts. Nonetheless,
it is important to stress that no strict regularity exists and ‘juicy’ samples might not be as
informative as they look. Furthermore, a strong ‘nugget effect’ exists for technological pro-
cess indicators: one may capture a particularly informative inclusion in a sample, or miss
it by a hair. Finally, it is possible that a single fragment does capture a large amount of
the process-inherent variability. Here, thermodynamically incompatible conditions can
sometimes be seen occurring in close proximity, highlighting the absence of equilibrium
conditions in most crucibles (e.g., Müller et al., 2004), and the importance of kinetics in
slag formation. Similar to the firing of ceramics (see Heimann, 1989), the crucible process
must be understood as one of micro- or local equilibria, with the entire system (ceramic
and charge) never being in complete equilibrium.
Thus, while previous studies may have often discovered essential process indicators through
the analysis of promising samples, their representativeness is difficult to establish when
no measure of process variability is offered. Of course, this does not render their contri-
bution useless, but the results presented here encourage their critical appraisal.
The use of pXRF, which is becoming increasingly available to archaeologists everywhere,
may offer further assistance for an adequately adapted sampling strategy. A few examples
from the extensively sampled Pi-Ramesse assemblage illustrate this point. In Figure 13.6,
left, the relative change in bulk iron content between crucible ceramic and slag is shown,
as measured by SEM-EDS analysis of 49 samples (see Figure 5.14). The largest group of
samples (about 2/3, in blue) shows a normal distribution around zero, indicating no iron
contamination. The second group (about one third, in purple) shows increased iron con-
tent relative to alumina, indicative of the use of an iron-contaminated copper source. Alu-

434 Part VI: Discussion. Chapter 13 Frederik Rademakers
Figure 13.6: Histogram showing relative change in bulk iron content between ceramic and
slag measured by SEM-EDS (left, in %) and ratio of iron to titanium in crucible slag mea-
sured by pXRF (right), for the Pi-Ramesse assemblage
minium peak intensities are not readily measured by pXRF; hence, a similar ratio (using
the iron and titanium Kα1-intensities measured in crucible slag) has been used for in-the-
field analysis, as shown in Figure 13.6, right, based on the analysis of the large Pi-Ramesse
sample by pXRF. The same pattern emerges, indicating a large group of ‘clean slag’ and a
smaller group of iron-contaminated slag. Though less clearly defined for the pXRF data, it
is much more easily obtained and provides the same assemblage-wide pattern.
Within-crucible variation can equally be investigated using pXRF, as shown by example in
Figure 13.7, where the copper and tin content for rim and body fragments is compared.
Though increased content in both metals can be noted for both fragment types, the inci-
dence of greater enrichments is significantly higher for body fragments, in similar propor-
tions as noted by SEM-EDS analysis of mounted samples.
These examples show the potential for pXRF in fast qualitative analysis of entire assem-
blages to pick up overall trends, though its efficacy should be further tested for other as-
semblages. This has not been possible for the Gordion and Thracia assemblages, as they
could not be accessed for such analysis.
As an analytical method in its own right, pXRF has some limitations. It does not provide
the same high-resolution data acquired through micro-analysis of mounted sections, and
hence cannot possibly furnish the same detailed technological reconstruction. Nonethe-
less, it is commonly applied for the analysis of crucibles, for example by English Heritage
(e.g., Bayley, 1987; Blakelock, 2005; Doonan, 1999b,c; Dungworth, 2001a; Dungworth and
Bayley, 1999; Dungworth and Bowstead Stallybrass, 2000; Dungworth and Starley, 2009;
Horsley, 1997; Nicholas, 2003; Phelps et al., 2011 and Robbins and Bayley, 1996). While

Frederik Rademakers Part VI: Discussion. Chapter 13 435
Figure 13.7: Histogram showing copper (top) and tin (bottom) enrichments in rim (left)
and body fragments (right), measured by pXRF for the Pi-Ramesse assemblage
this only provides a rough estimation of the alloy molten inside the crucibles, such results
can still support meaningful discussion, as long as these limitations are duly recognised
(Dungworth, 2000a). As such, the successful use of pXRF for the analysis of crucibles is
simply a matter of querying the obtained data appropriately.
Finally, it should be pointed out that pXRF analysis of crucible fragments does not always
correspond on a one-to-one basis with SEM-EDS analysis of the same fragment. Here
the ‘nugget effect’ as an extreme example of the heterogeneity of individual crucible frag-
ments can produce different results depending on the relatively small area analysed by the
pXRF beam. For this reason, pXRF analysis yields better results as a qualitative screening
method applied to entire assemblages, while for individual samples, SEM-EDS analysis
provides more reliable data.
It is, however, important to discuss the limitations of analysis by SEM-EDS as well. Though
the analysis of mounted samples by optical microscopy and SEM allows a finely detailed
understanding of a crucible’s micro-structure and the distribution of different phases within

436 Part VI: Discussion. Chapter 13 Frederik Rademakers
Na
2 OM
gOA
l2 O3
SiO2
P2 O
5SO
2K
2 OC
aOT
iO2
Mn
OFeO
Cu
OZ
nO
As2 O
3A
g2 O
SnO
2P
bO
Co
OB
i2 O3
Pi-R
amesse
Ceram
ic17.2
15.011.0
5.441.6
15.617.2
18.480.0
11.4
Slag24.3
19.516.2
11.134.7
24.330.7
24.284.4
23.270.6
108.061.7
54.972.5
Go
rdio
nC
eramic
10.911.0
4.42.2
38.912.0
7.817.7
161.312.7
Slag15.2
16.414.5
10.939.4
78.018.0
16.242.4
105.818.9
76.7136.1
104.168.3
59.5
Nico
po
lisC
eramic
26.618.4
10.83.2
67.213.0
31.227.5
8.5
Slag31.1
15.514.1
8.139.0
22.217.1
29.824.8
74.078.5
60.296.7
Ph
ilipp
op
olis
Ceram
ic/slag27.5
27.934.1
20.479.3
38.745.6
44.340.2
72.163.8
66.285.7
65.3
Serdica
Ceram
ic39.4
23.78.8
3.683.3
48.310.1
28.630.5
21.6
Slag37.6
32.519.3
15.723.6
108.926.2
39.632.8
35.192.0
82.957.5
104.448.6
37.849.8
StaraZ
agora
All
17.221.8
16.95.9
53.212.6
42.530.0
13.156.2
65.8
Average
24.720.2
15.08.7
50.078.4
19.327.7
29.8107.9
20.973.6
72.7100.5
91.564.9
62.972.5
49.8
Table
13.2:Average
coeffi
ciento
fvariation
(in%
)o
fallmeasu
redoxid
esfo
reach
assemb
lage

Frederik Rademakers Part VI: Discussion. Chapter 13 437
crucible slag, the areas that can be analysed are small relative to the volumes analysed by
XRF or NAA, for example. However, SEM-EDS offers far better control over exactly which
crucible zone is analysed, compared to crushed and homogenised samples, for which the
mechanical separation of ceramic and slag is often difficult to achieve. This trade-off en-
tails increased sensitivity to chemical heterogeneity for measurements of bulk composi-
tion by SEM-EDS. It should be clear from the above that such heterogeneity can certainly
be an issue for crucible studies. From the data presented in Appendices C, J and O, the co-
efficient of variation for each oxide measured2 for each sample can be calculated (omitted
here). The average coefficient of variation for each oxide, as measured for each assem-
blage3, is presented in Table 13.2. These values give a relative measure of the precision
by which these oxides are measured within a particular sample. This value reflects two
effects: the analytical precision of the machine (see section 3.3.5) and the heterogeneity
of those oxides in samples of each analysed assemblage. While the measurements of ox-
ides in certified reference materials typically deliver a coefficient of variation of 5-10%,
much higher variability is measured in the actual samples: 10-30% for the main elements,
and even higher for copper oxide and the other alloy constituent oxides. This mostly re-
flects heterogeneity within the crucible samples, which is not present in the homogenised
CRM’s. Table 13.2 shows that this variability is more problematic for the crucible slag than
the crucible ceramic, and for oxides present in low (at detection limit) quantities like phos-
phorus, sulphur and manganese oxide. The increased variability measured for copper and
its alloy components is due to the highly variable inclusion of prills and corroded metal in
the analysed areas.
To limit analytical sensitivity to heterogeneity, five area measurements were taken for each
sample and averaged for the ceramic and slag zones respectively. Figure 13.8 shows the re-
sults for the Pi-Ramesse assemblage when only one area measurement (randomly selected
from the five existing measurements) is used for each sample. The average compositions
for such an analysis are presented in Table 13.3. Clearly, the same general trends appear
(not reiterated here), despite the severe reduction in area analysed per sample. This is not
surprising, however, and reflects the same conclusion reached through the discussion of
pXRF results: a rough analysis performed on sufficiently high sample numbers will reveal
the broad trends that exist within an assemblage. However, comparison to the full data
highlights an important difference: there is a great drop in the precision of these results.
While little difference is apparent for the ceramic part (which is quite homogeneous), it is
2The coefficient of variation on these measurements is calculated as σ/x and expressed in %.3The coefficient of variation, calculated for different oxides for each sample, is averaged across each as-
semblage.

438 Part VI: Discussion. Chapter 13 Frederik Rademakers
strongly pronounced for the slag part. There, the standard deviation is doubled and some-
times tripled due to the decrease in analysed area. Though the average compositions are
not greatly affected, some differences can be noted for calcium, iron, copper and tin oxide.
This is not surprising, as these elements are most sensitive to local variation throughout
the crucible slag. In summary, the trade-off between analytical speed and precision, which
is obvious when comparing pXRF and SEM-EDS analysis, is similarly present when con-
sidering the analytical procedure used for a specific technique. Under time constraints,
one may prefer to analyse fewer areas for bulk composition using SEM-EDS, at a signifi-
cant loss of precision and to a lesser extent accuracy, in order to dedicate more time to the
identification of particular phases in the crucible slag.
However, such focus on specific phases is perhaps not always warranted. When few cru-
cibles are available for analysis, as for the Thracian crucibles, it makes less sense to com-
pile a complete list of phases as has been done for the Pi-Ramesse and Gordion assem-
blages. While such a list is useful to understand variability of a process as expressed in a
wide range of samples, such an endeavour is unlikely to succeed when only one sample
of a unique crucible is available. Therefore, it seems more appropriate to perform a more
precise bulk measurement of the crucible areas (i.e., more measurements) and to look at
the various slag phases more qualitatively, while dedicating more focus on technological
markers. Though it is often difficult to predict what those markers will be prior to analysis,
many have been discussed for various metallurgical processes in the course of this thesis
and may serve as examples. In general, metallic prills, residual ore fragments and bulk
enrichments of slag relative to ceramic provide the key parameters in reconstructing met-
allurgical technology. When the data processing for a particular sample generates an in-
terpretative hypothesis for which particular technological markers are missing, it is more
useful to revisit that sample with this particular hypothesis in mind, rather than analysing
all phases during the first examination as a default procedure.
The focus on bulk measurements is especially useful when investigating additional lay-
ers of the crucible ceramic, as discussed for the Thracian crucibles N4-N5 and S4. The
analytical approach employed throughout this thesis allows an easy and reliable recogni-
tion of such added layers, and enables distinction between outer layers that are fuel ash
glazes (i.e., the vitrified crucible ceramic, fluxed by fuel ash) and intentionally added, less
refractory clay layers (that may have vitrified, possibly with fuel ash contributions). While
similar bulk compositional SEM-EDS data for layered crucibles is presented by Thornton
and Rehren (2009: Table 1, p. 2704), they omit analytical details of their measurement
(i.e., frame size, number of analyses, variation within layers). König and Serneels (2013:
Table 2, p. 161) present similar data from XRF-WDS analysis of powder discs from various

Frederik Rademakers Part VI: Discussion. Chapter 13 439
Figure 13.8: Ternary diagrams and histograms for Pi-Ramesse sample compositions, based
on randomly chosen single measurements for each sample
crucible layers, but omit details of analyses per crucible fragment and variation within
fragments. Though both offer very useful comparative data, future analyses may benefit
from such added analytical detail to better represent crucible variability and its possible
interpretative limitations.
Further drawbacks of SEM-EDS analysis are the relatively high detection limits for most
elements, and the ensuing inability to measure trace elements. Such elements can be
valuable for the comparison of trace elements typically measured in the analysis of metal
artefacts (often performed by XRF, EPMA, (I)NAA or ICP-techniques, e.g., Butcher and
Ponting, 2005; Chen et al., 2009; Guerra et al., 1999; Hancock et al., 1994; Kassianidou,
2003a; Lutz and Pernicka, 1996; Northover and Saghieh, 2002; Rehren and Temme, 1994
and Thornton et al., 2002, though sometimes by SEM-EDS, e.g., Kaufman, 2013; Lehner,
2012; Martinón-Torres et al., 2012 and Park and Gordon, 2007, and increasingly by pXRF

440 Part VI: Discussion. Chapter 13 Frederik Rademakers
Na2O MgO Al2O3 SiO2 P2O5 K2O CaO TiO2 MnO FeO CuO As2O3 SnO2
Average (1 area) 2.1 2.2 13 66 0.6 1.9 3.2 1.5 0.1 8.4 0.3 0.2 0.1
St.dev. (1 area) 0.6 0.4 2 5 0.4 0.5 0.6 0.4 0.1 1.7 0.9 0.2 0.3
Average (5 areas) 2.0 2.2 13 66 0.6 1.9 3.2 1.5 0.1 8.3 0.6 0.2 0.2
St.dev. (5 areas) 0.3 0.3 1 4 0.3 0.3 0.6 0.3 0.1 1.0 0.5 0.2 0.3
Average (1 area) 2.7 2.5 10 55 0.9 2.0 8.0 1.2 0.1 9.4 3.9 0.2 3.4
St.dev. (1 area) 1.8 0.8 3 14 0.5 0.9 4.6 0.5 0.1 6.3 6.1 0.2 6.0
Average (5 areas) 2.8 2.5 10 54 1.1 1.9 9.0 1.2 0.1 8.9 4.3 0.2 4.4
St.dev. (5 areas) 0.6 0.5 2 6 0.3 0.4 2.6 0.3 0.1 2.2 2.3 0.2 2.4
Table 13.3: Average composition (in wt%, normalised to 100%) for ceramic (top four rows)
and slag (bottom four rows) for Pi-Ramesse crucibles, based on random single area mea-
surements for each sample, compared to standard approach (5 area measurements)
as well, e.g., Charalambous et al., 2014; Gouda et al., 2012 and Montero-Ruiz et al., 2003),
to those encountered in the crucible slag, to relate better these two material categories.
However, it must be stressed that the heterogeneity of crucible slag is expected to impede
such efforts regardless of the analytical technique used: the variable enrichment of cru-
cible slag in copper contaminants will rarely reflect the complete trace element pattern of
that copper as measured in an artefact.
This warrants the repetition of an issue that has been noted in earlier chapters: the lev-
els of crucible slag enrichment in a particular charge constituent necessarily represent
the loss of a certain amount of that constituent from the crucible charge (see Appendix G).
When calculated this way, even ‘strong slag enrichments’ typically do not amount to severe
losses of those particular constituents from the charge, given the much smaller volume of
crucible slag present, relative to the metal within the crucible. Therefore, it remains diffi-
cult to assess the actual abundance of these particular constituents in the crucible charge
based on their enrichment in the crucible slag: this is a highly unstable, non-equilibrium
exchange process, for which the chemical equations are unknown, the starting products
are unknown, the end products are only partially known, and therefore the activity levels
for the unknown equation cannot be assessed. Taking the example of Pi-Ramesse, this
could mean that the cobalt and iron enriched crucible slags reflect the use of either a cop-
per source with very minor cobalt, of which a lot has burnt off into the crucible slag, or
a copper source with more important cobalt content, of which only a minor amount was
oxidised4. Such considerations reduce the confidence one can obtain in linking certain
crucibles to particular metal artefacts: a presence/absence comparison of particular com-
ponents is most useful here, and can best be used to exclude possible crucible-artefact
4The presence of contaminants in prills plays an important role in evaluating their abundance in the
original charge. Prills are, however, not always available for analysis in the crucible sample.

Frederik Rademakers Part VI: Discussion. Chapter 13 441
associations rather than proving them.
Following this discussion of the advantages and drawbacks of the main techniques used
in the analysis of metallurgical crucibles, it is instructive to return to the issue of sampling.
It has been argued above that, when no restrictions of time, money, regulations or con-
servation apply, a selection of thickly slagged crucible fragments for analysis in mounted
section is preferable. However, such restrictions usually exist. Though the availability of
research time on a scanning electron microscope for archaeological purposes may seem
self-evident at certain institutions (in casu, the UCL Institute of Archaeology), budget lim-
itations and the need for inter-departmental or inter-university collaborations to access
such equipment at many other archaeological research units may prevent extensive use
of this technique as presented in this thesis. Furthermore, restrictions on sample export
often exclude crucible samples from leaving the excavation site for laboratory analysis in
the first place. When (limited) invasive sampling is allowed on site, some further infor-
mation on micro-structure could be obtained using a portable microscopy set-up (Goren,
2014).
Even when export of samples is possible, however, invasive sampling should not neces-
sarily be the default approach. This choice should be guided by the nature of the cru-
cibles, the freedom the archaeologist has in taking a sample and the particular research
questions he or she has in mind. For this issue, it is particularly instructive to consider
the Thracian crucibles. In many cases, the crucibles were quite ‘dry’, and limited crucible
slag was available to aid in the reconstruction of metallurgical technology. In particular
when a sample is taken from a very ‘dry’ area of the crucible (which happened equally
for some Pi-Ramesse and Gordion crucibles), its interpretative value is limited. Though
the study of ceramic technology may be approached through such samples, they should
not be made when this is no research aim. If it is, the use of thin sections rather than
mounted sections would be preferable. In some cases, restrictions on which area of a
crucible could be sampled were applicable. When a crucible is complete, for example, cu-
rators tend to be less inclined to allow invasive sampling. When only limited scrapings
of crucible slag or dross are available for sampling, it should be contemplated whether or
not to take those samples. It has been shown that, particularly when considered in isola-
tion, such samples have only limited informative value: metal prills are rarely preserved
and, when present, are often severely oxidised and no comparison between slag and ce-
ramic composition can be made. Under such conditions, technological reconstruction is
much impeded, and the analysis by pXRF may often provide similar data. It is appropriate
to consider not sampling under such conditions, in particular when limited SEM-time is
available, which could be dedicated to the analysis of more promising samples. This is-

442 Part VI: Discussion. Chapter 13 Frederik Rademakers
sue is further exacerbated when only a single crucible of a particular type or function is
retrieved from an archaeological context. A single sample from that crucible is unlikely
to reveal the within-crucible variability inherent to its ancient use and the ‘nugget effect’
limits the validity of any reconstruction based on a single sample, in particular when cer-
tain technological markers are noted as ‘absent’. If present, however, such markers can of
course only be found through detailed analysis in mounted section. Only when such con-
siderations are fully acknowledged in the interpretation of such a single sample, can it be
useful. In many cases, however, this will mean that the interpretation cannot be extended
beyond that typically obtained through pXRF analysis, in a much faster and cheaper way.
In fact, the pXRF analysis of many points on the crucible interior may reveal more of the
within-crucible variability than analysis of the mounted sample. In conclusion then, it
seems only appropriate to analyse a single mounted sample of a unique crucible when a
sufficiently ‘juicy’ sample can be taken, and ideally its analysis should be complemented
by pXRF analysis of the crucible interior and exterior. When the crucible is more or less
‘dry’, not sampling may often be the best strategy.
A discussion of the application of lead isotope analysis for crucible studies must be brief
at this point. With exception of the single Göltepe crucible analysed by Lehner et al. (2009),
no comparable studies have hitherto been undertaken. The Göltepe example shows widely
ranging lead isotope compositions, which are most likely reflective of varying lead isotope
composition of the crucible ceramic itself, rather than the metal charged in it, and en-
vironmental contamination (mobile lead ions from lead artefacts in the excavation area)
may equally be an issue. This has been similarly witnessed for the Pi-Ramesse crucibles,
and an investigation of lead content and its isotopic variability in clays is needed in this
context. Furthermore, experimental archaeometallurgical studies to elucidate the relative
contributions of crucible charge, ceramic and possibly other contributors such as fuel ash
are required to interpret such data.
The issue of how lead isotope ratios are influenced during bronze recycling and mixing has
been much debated but never resolved. Similar to the analysis of lead isotope measure-
ments for crucibles, these issues could be much better understood through the execution
of a range of controlled laboratory experiments.
However, the analysis of lead isotopes within crucible slag can clearly not be equated to
that of metals. Their interpretation is far more complex, and it seems that convincing ar-
guments can only be made on the basis of metallic prills embedded in crucible slag at this
point. Nonetheless, if this type of analysis is further developed, with the aid of experimen-
tal work, it holds the promise of further elucidating certain archaeological questions. In
conjunction with trace element chemistry, it may offer a stronger basis to link crucibles to

Frederik Rademakers Part VI: Discussion. Chapter 13 443
the final artefacts that were cast from them, thus increasing the detail by which we under-
stand metallurgical activities.
Finally, it should be noted that this thesis has focused entirely on secondary metallurgi-
cal crucible processes, with little mention of primary crucible metallurgy. The selection
of crucibles from urban context generally implies, from the Late Bronze Age onwards,
mainly secondary metallurgical activity. By that time, most primary metal production
took place in furnaces (Bayley and Rehren, 2007; Craddock, 1995), reflecting increased
production scales and the easier transport of metal produced and cast into ingots (e.g.,
Ben-Yosef, 2012; Hauptmann et al., 2002; Kassianidou, 2013 and Roman, 1990) at or close
to the mines. Particularly in urban environments (from which all assemblages in this the-
sis derive), then, primary smelting is quite rare. When it does occur, it is usually performed
in furnaces rather than crucibles.
However, it should be pointed out that the methodological discussion on the analysis of
crucibles presented in this thesis is expected to be equally valid for smelting crucibles.
The methodology outlined for the analysis of mounted sections should yield satisfactory
results in the identification of primary smelting. It can be expected that the crucible slag
will in such cases be more strongly enriched in gangue constituents, such as iron, alumina
and silica, and possible flux components, apart from containing residual ore fragments
and freshly produced metal prills. As such, it more strongly resembles primary production
slag as described in the more extensive literature concerning that subject (see section 1.2)
compared to literature available for crucible slag. It is beyond the scope of this discussion
to list all the possible markers that could exist for primary smelting (there are probably
as many as there are different ores and smelting techniques), but it should be highlighted
that the considerations of within-crucible and assemblage-wide variability, presented in
sections 13.1 and 13.2, are directly applicable to the study of primary smelting crucibles.
Section 13.4
Technical interpretative issues
One of the issues that has been reiterated several times throughout this thesis is the iden-
tification of tin oxide in crucible slag. While the final word has not been spoken on this
matter, experiments are under way (Rademakers and Farci, in preparation), which so far
support the hypothesis put forth in this thesis: elongated, acicular, columnar tin oxide
crystals are all products of high-temperature recrystallisation, with highly variable shapes
(see section 5.4.5) representing different degrees and conditions of crystallisation. They

444 Part VI: Discussion. Chapter 13 Frederik Rademakers
provide no diagnostic evidence for any type of bronze-related metallurgy (‘techniques 1-
4’, section 13.2) and it is therefore advisable to label them as ‘tin oxide’ rather than ‘cassi-
terite’, as this last term leads to confusion in discussions of bronze technology.
This is evident from the literature, where it is often difficult to ascertain whether authors
consider the tin oxide they encounter in crucible slag to be residual cassiterite or newly
crystallised tin oxide (or simply do not care to differentiate between them), despite earlier
efforts by Benvenuti et al. (2003); Cooke and Nielsen (1978); Dungworth (2000b); Hofmann
and Klein (1966) and Klein and Hauptmann (1999) to address this issue. Some examples
of natural cassiterite grains, which could be helpful for identifying residual cassiterite in
crucible slag, are shown by Dill (2007); Dill et al. (2008); Earl and Özbal (1996); Pirrie et al.
(2002); Nezafati et al. (2009); Salvarredy-Aranguren et al. (2008) and Yener et al. (1989).
Though residual cassiterite in archaeological samples has been identified convincingly
by Adriaens (1996); Merideth (1998); Murillo-Barroso et al. (2010) and Rovira (2011-2012),
these publications5 do not emphasise the particular attributes that distinguish these resid-
ual grains from high-temperature tin oxide crystals. The occurrence of tin oxide crystals
is widely noted throughout the archaeometallurgical literature, however. An exhaustive
(though probably incomplete) list of publications includes Adriaens (1996); Chirikure et al.
(2010); Cooke and Nielsen (1978); Crew and Rehren (2002); Denbow and Miller (2007);
Dungworth (2000b, 2001b); Eliyahu-Behar et al. (2009, 2012); Figueiredo et al. (2010b);
Frisch and Thiele (1985); Heimann et al. (2010); Hofmann and Klein (1966); Klein and
Hauptmann (1999); Lackinger et al. (2013); Meeks (1990); Miller (2003); Miller and Hall
(2008); Murillo-Barroso et al. (2010); Renzi et al. (2009); Rodriguez Diaz et al. (2001); Rovira
(2007, 2011-2012); Rovira et al. (2009); Schwab (2011); Valério et al. (2013); Wayman et al.
(1988); Yener et al. (2003); Yener and Vandiver (1993); Zhou et al. (2009) and Zwicker et al.
(1985). It is beyond the scope of this chapter to discuss each of these occurrences and
their interpretations, but in many of these publications, the interpretation of tin oxide as
a technological marker remains quite unclear.
It is interesting to note that similar crystals are found to occur in Egyptian Blue (El Goresy
et al., 1996; Jaksch et al., 1983) and tin glazes (Bajnóczi et al., 2014; Mason and Tite, 1997).
Though it is often unclear what the source of tin is in these processes, some of the crys-
tals (Bajnóczi et al., 2014, Figure 4b, p. 6), appear to be residual cassiterite (surrounded by
high-temperature crystals). The others, however, are very similar to those most commonly
noted in crucible slag, supporting their interpretation as high-temperature crystallisation
of tin oxide in a glassy matrix. It is hoped that the identification of residual cassiterite in
the Pi-Ramesse crucibles (Rademakers et al., in press), as part of this PhD research, in con-
5Yener and Earl (1994), Figure 8, p. 174 may provide another example, but the images are unclear.

Frederik Rademakers Part VI: Discussion. Chapter 13 445
(a) ‘Typical’ tin oxide (white) clusters with cuprite (light grey) and malayaite (medium grey), sample
87_0762 (left) and 87_0762,0Nv (1) (right)
(b) Cluster of tin oxide (white) and malayaite (medium grey), with delafossite (medium grey) (left) and
cluster of tin oxide, malayaite and cuprite (light grey) surrounding a partially oxidised copper prill (right),
sample 87_0762,0Nv (1)
Figure 13.9: Tin oxide clusters (Pi-Ramesse)
junction with forthcoming experimental studies (Rademakers and Farci, in preparation)
will extinguish any remaining confusion surrounding these crystals from the literature.
It is at this point interesting to talk about clusters of various oxides, using tin oxide as a
starting point. Such clusters have been noted in Appendix D.4, and are illustrated in Fig-
ures D.15b (Pi-Ramesse) and K.18e-K.18f (Gordion). For convenience, a few examples are
shown here in Figure 13.9. Being entirely made up of high-temperature tin oxide crystals
and commonly associated with other oxides (typically of iron and copper) and (low tin)
bronze prills, such clusters are quite distinct from those tentatively identified as residual
cassiterite. As suggested in section 8.3.4, these clusters should probably be interpreted as
the result of localised bronze burning: under oxidising conditions, a bronze prill burns off
some of its tin content (as seen in Figure 5.51), which forms a dense cluster of oxides in

446 Part VI: Discussion. Chapter 13 Frederik Rademakers
that area. Unlike the rare situation shown in Figure 5.51, the liquid metal often migrates
to another location within the crucible (slag) following this burning, while the tin oxide
cluster remains immobile. A few metallic prills typically accompany these clusters, how-
ever, and in many cases some cuprite and spinel is associated with them. As such, they are
fairly easily distinguished from (tentatively identified) residual cassiterite.
Similarly, clusters of iron oxide are often found, as shown in Figures D.2 (Pi-Ramesse) and
K.3e (Gordion). These are typically associated with (iron-rich) copper prills, indicative of
their formation through localised burning. A comparable clustering of cobalt-rich spinel
is shown in Figure D.21, right (Pi-Ramesse).
Some cuprite clusters from a Pi-Ramesse crucible are shown in Figure 13.10, with sur-
rounding delafossite and tin oxide. It may be suggested that such clusters are indicative
of complete burning of a copper/bronze prill, and therefore strongly oxidising conditions
(unlike post-depositional cuprite formation, e.g., Figure D.12). The same phenomenon
therefore seems to give rise to these various oxide clusters: oxidation first burns off the
various copper contaminants, in order of reactivity, followed by the ultimate oxidation of
copper itself. The final oxide cluster composition then depends on the copper contami-
nants present in the metal and the duration of the oxidation event.
To emphasise the localised nature of such phenomena, it should be noted that residual
cassiterite was equally noted (see Figure D.16a) in a deeper-lying slag area of the same
sample (87_0762 (2)) shown in Figure 13.10. Similarly, examples of residual cassiterite
have tentatively been identified in Pi-Ramesse sample 87_0762,0Nv (1) (bottom of Figure
5.53) in fairly ‘reducing’ slag areas, while severely oxidising conditions are attested else-
where (see Figure 13.9). Considering that these samples are only ±3 cm in diameter, the
concentrated nature of this variability becomes even more apparent.
The distinction between newly formed oxide clusters and residual minerals is not always
clear, however. The occurrence of a massive magnetite cluster (see Figures D.2c and 13.11,
left) with only a few tiny associated prills might represent a ‘well-drained’ area of extreme
iron burning, but the lack of other oxides within the cluster and its size may argue for
an interpretation as residual magnetite, which was introduced into the crucible as such.
A comparable occurrence in copper smelting slag is shown by Erb-Satullo et al. (2014),
Figure 6, p. 152. Similarly, a (small) cobalt spinel cluster shown in Figure 13.11, right, is
difficult to interpret. Though it appears similar to other cobalt spinel clusters, no macro-
prills could be noted nearby, indicating it should probably be interpreted as a residual
spinel fragment, perhaps introduced as a contaminant from primary smelting. Contrary
to the residual cassiterite fragments, which are sometimes similar in shape, these (cobalt)
spinels invariably incorporate ±1 wt% copper in their bulk composition, strengthening

Frederik Rademakers Part VI: Discussion. Chapter 13 447
Figure 13.10: Cuprite (light grey) clusters with surrounding delafossite (medium grey) and
tin oxide (white). Delafossite can further be noted in between cuprite, Pi-Ramesse sample
87_0762 (2)
their interpretation as copper-related neo-forms. Finally, a residual cassiterite fragment
which subsequently re-crystallises completely may not be distinguishable from the clus-
ters discussed above. An example of such a situation may be attested in Murillo-Barroso
et al., 2010, Figure 14, p. 1170, and partial reaction could possibly be identified in Figure
5.53, bottom right. Experimental work, by which such shapes are produced under con-
trolled conditions, is needed to further this discussion.
In summary, some clusters pose interpretative difficulties, such as the ambiguous clusters
shown in Figure 13.11, but it seems that the majority of oxide clusters encountered during
analysis should be interpreted as the products of localised burning.
Next, some remarks on metallic prills should be made. The above discussion has illus-
trated how prills may be informative technological markers. They supply a better repre-
sentation of the original metal charge of a crucible than the variable oxidation products
reflected in bulk slag and dross compositions, and sometimes prills can provide a strong
argument for a particular production process (e.g., high-tin prills argue for active alloy-

448 Part VI: Discussion. Chapter 13 Frederik Rademakers
Figure 13.11: Massive magnetite cluster and small cobalt spinel cluster (medium grey),
both without associated macro-prills, though tiny prills may be noted (bright specks), Pi-
Ramesse samples 87_0634c,04 and 87_0762,0Nv (2)
ing). Nonetheless, their use has limitations as well. Where high contents of a particular
element (e.g., tin) in a prill offer a good basis for technological discussion, low contents
do not. This reflects the same problem witnessed on a higher scale for crucible analysis in
general: the absence of evidence (in crucible slag or prills) does not equate the evidence
for absence. Strength comes in numbers here, though such numbers are difficult to define
for metal prills. A few dozen prills occurring close together are expected to have simi-
lar compositions, and their numbers do not count for much. Only through the analysis
of many prills from various areas within a crucible and throughout many crucibles, can
some confidence be gained in the absence of certain alloy components or contaminants.
It is important here to consider the various locations on which prills are encountered: sit-
ting deeper within the crucible slag, on its interior surface, the crucible rim or even its ex-
terior surface. These environments present significantly different temperature and redox-
conditions during the metallurgical process, and different sensitivity to post-depositional
corrosion. Prills preserved deeper in the crucible slag are less likely to be affected by post-
depositional corrosion, but their early trapping during the crucible process could have
prevented their reaction with alloy products added later. Therefore, prills closer to the
crucible interior surface may be more reliable for reconstructing the crucible charge. Prills
on the exterior surface have typically been more exposed to oxidising conditions (Dung-
worth, 2001b), resulting in increased loss of alloy components. Though the issue of cor-
rosion plays an important role, particularly for prills embedded in dross layers, this tends
to be limited for prills embedded in the crucible slag, making them the most reliable for
charge reconstruction. Nevertheless, changing crucible process conditions necessitate a
conservative approach when interpreting prills.

Frederik Rademakers Part VI: Discussion. Chapter 13 449
These observations further emphasise the problematic nature of analysing highly refrac-
tory crucibles: as little slag is usually developed, the adhering prills are less likely to be
fully representative of the original crucible charge and should be used with more cau-
tion. In this context, it is interesting to note the higher frequency by which high-tin prills
were observed in the Gordion crucibles, compared to the Pi-Ramesse crucibles, despite
the more limited slagging in the Gordion crucibles. Though this could very well be a sam-
pling bias (‘nugget effect’), it may equally indicate the higher importance of active alloy-
ing in the Gordion assemblage, with more frequent recycling attested in the Pi-Ramesse
assemblage. Similarly, the higher abundance of residual cassiterite (though still relatively
low) in the Pi-Ramesse crucibles, compared to the Gordion crucibles, may indicate that
cementation was more important in Pi-Ramesse. However, the more limited slag forma-
tion would have inhibited cassiterite trapping for the Gordion crucibles, and furthermore,
its occurrence and recognition in a sample is really hit-or-miss. As a counter-example, the
occurrence of cassiterite in Thracian crucible P9, without the presence of high-tin prills,
serves as a reminder that these technological process indicators are intermediate products
and their preservation is highly variable: while residual cassiterite points to active alloy-
ing, supporting evidence in the form of high-tin prills cannot always be expected within
the same sample (or even crucible). Nonetheless, taking into consideration the evidence
presented for the Thracian crucibles, it appears that more refractory crucibles generally
offer a lower abundance of technological markers.
Finally, the issue of reuse is revisited. As with the attestation of any technique in a cru-
cible, specific indicators are expected to exist for reuse, and their frequent identification
throughout an assemblage can be taken as a measure of its importance. The indications
for reuse in the three assemblages discussed in this thesis vary. For Pi-Ramesse, only one
fragment shows macroscopic evidence of reuse (see section 5.4.2), while no microscopic
indications for reuse were identified. The Gordion assemblage shows no indications for
crucible reuse at all. For the Thracian assemblage, reuse is more common and attested at
each site (see section 11.3).
The primary macroscopic indicator for reuse is the application of a second clay layer on
the crucible interior and/or exterior6. This appears particularly true for less refractory cru-
cibles, which may be in need of repair after a first use, while more refractory crucibles (e.g.,
Thracian crucible S4) do not show any macroscopic evidence. Such repair attempts were
most likely undertaken to avoid failure during a crucible’s second use. The more outspo-
ken slag development in less refractory crucibles, like the Pi-Ramesse ones or Thracian
6This does not refer to the application of a (less refractory) clay layer to existing pottery before use (e.g.,
N4-N5 and S1-S2), which implies ‘pottery reuse’ rather than ‘metallurgical reuse’.

450 Part VI: Discussion. Chapter 13 Frederik Rademakers
crucible P9, may itself not have concerned ancient metallurgists too much, as their rel-
atively small volume could not present significant contamination to the second charge.
Such contemplations are difficult to assess on the basis of fragmented crucible remains.
An important observation, however, is that the interior slag produced during secondary
use can fuse entirely with the primary crucible slag, though mainly on the lower crucible
body. At the crucible rim, a double profile (ceramic-slag-ceramic-slag) is more likely to
be preserved. This means that the macroscopic identification of reuse for body fragments
could be quite problematic. In particular when no secondary clay layer is applied, macro-
scopic evidence is most likely absent. The question, then, is whether any microscopic
evidence can be found for reuse. While it seems reasonable to suggest that the execution
of two different metallurgical processes will produce a final crucible slag which cannot
be reconciled with a single use interpretation (e.g., Thracian crucible S4), the reuse of a
crucible for the same purpose may remain quite invisible when no secondary clay layer is
applied. When a secondary clay layer is applied, its preservation is more likely closer to the
crucible rim. The only known examples of crucible reuse in the literature show two layers
of slag separated by a clay layer (Evely et al., 2012) or, more dramatically, eight slag layers
separated by clay (Mecking and Walter, 2004). When no secondary clay is applied, crucible
slag from the first use may simply remelt and charge constituents from the secondary use
could then join those of the first use in that slag. The degree to which slag constituents
of the first use would mix with those introduced during secondary use is probably lim-
ited: most oxides crystallised into a glassy matrix are very stable (e.g., tin oxide: Charles,
1979) and therefore unlikely to react with newly introduced contaminants. As such, any
embedded prills most likely reflect a particular operation, rather than the mixed reflec-
tion of several uses. This idea does not hold, however, for more refractory crucibles, where
prills are not protected by a vitrified slag, and can more freely interact with different cru-
cible charges during consecutive operations. Similarly, crucible dross is more sensitive to
homogenisation when a crucible is reused, and as such it is more difficult to filter several
processes out from it.
As a general rule for crucible interpretation, then, each crucible slag that can be reasonably
explained as representing single crucible use, should be interpreted as such. Only when
observations cannot be reconciled as reflecting a single process, should reuse scenarios
be elaborated. However, it should be noted that such single use may, in reality, represent
multiple uses of that crucible for a single process (e.g., bronze melting). To determine
the likelihood of reuse, several factors can be taken into consideration. At Pi-Ramesse,
for example, the low cost of production for crucibles, relative to the potentially high cost
of crucible failure and associated failure of a large bronze casting, makes crucible reuse

Frederik Rademakers Part VI: Discussion. Chapter 13 451
unlikely as a common practice. The single observed occurrence there is most likely just
that: an exception. It would, however, be interesting to have experimental data on the ef-
fects of reuse on less refractory crucibles (e.g., after how many uses do crucibles fracture,
does slag development become excessive etc.), to better assess its reflection in archaeo-
logical remains. For later, more refractory crucibles, the same general rule applies, though
the likelihood of reuse is increased. As always, the contextual evidence accompanying the
crucibles (when available) can provide further confidence in their interpretation.

452 Part VI: Discussion. Chapter 13 Frederik Rademakers

CHAPTER 14
Site-specific contextualisation: synthesis
The most extensive crucible assemblage and contextual information has been available
for study from Pi-Ramesse. For this reason, the largest analytical focus has been given to
this assemblage within this PhD project, applying the full range of available methods. As a
result, a richer dataset is available to reconstruct the metallurgical activities in the Rames-
side capital compared not only to the other two case studies, but any case study hitherto
published. The question, then, is what valuable information such an extensive analytical
study has yielded and may continue to provide for future studies.
Analysis of the Pi-Ramesse assemblage, featuring a combination of optical microscopy,
SEM-EDS, pXRF, (lab-based) XRF, NAA and MC-ICP-MS analysis, has provided the recon-
struction of bronze production technology, and illuminated the material sources associ-
ated with it. For the first time, the complexity of variable techniques being applied within a
single workshop has been elucidated, revealing not only the technical flexibility of the an-
cient Egyptian craftspeople, but furthermore highlighting the need for increased attention
to such variability from archaeological scientists. Never before has any reconstruction of
secondary Egyptian metallurgical activity been produced in such detail, and it will serve as
a baseline for future crucible studies in ancient Egypt. Furthermore, the identification of
potential sources from which these Ramesside workshops obtained their metal, through
an integrated approach combining all listed analytical techniques, is the most significant
(and only) contribution towards understanding New Kingdom copper provisioning within
Egypt to be published since Stos-Gale et al.’s 1995 work. In addition to this, the tentative
identification of cassiterite within the crucibles not only adds to the technological nar-
rative for the Pi-Ramesse workshops, but widens the perspective on Late Bronze Age tin
453

454 Part VI: Discussion. Chapter 14 Frederik Rademakers
provisioning for the eastern Mediterranean polities, suggesting the significant reliance on
domestic resources which are less represented in historical sources.
Further contextualisation of these results is particularly difficult, given the lack of compa-
rable studies on (large) crucible assemblages available for Egypt. In fact, no such publi-
cations on ancient bronze production exist at all. Discussions on the evolution of bronze
production technology within ancient Egypt are therefore excluded. Obviously, such di-
achronic discussions are necessary to better understand how the workshops in Pi-Ramesse
are representative as an expression of ancient Egyptian metallurgy. While the suggestion
that some Hittite chariot maintenance probably took place in Pi-Ramesse (Van De Mieroop,
2007) cannot be dismissed, it is quite certain that the workshop activities discussed here
are the work of Egyptian craftspeople. It must be stressed, however, that Pi-Ramesse is
an extraordinary site. Ramses II is the first pharaoh to initiate building projects on such
a large scale (Desroches-Noblecourt, 2007; Kitchen, 1982; Menu, 1999), but even so, the
production of such large amounts of bronze presumably did not happen on a regular ba-
sis. Bronze production and working on a day-to-day basis almost certainly took place in
very different contexts throughout ancient Egypt. The smaller workshops in Pi-Ramesse
(QI-B/2 and QIV) are unlikely to be representative of such activity, and the broader focus
of past excavations in Egypt on palatial, religious and funerary context may have strongly
skewed the available record for archaeometallurgical studies towards ‘unusual settings’. To
come to terms with broad questions like ‘How did the ancient Egyptians produce bronze?’,
or ‘Where did the ancient Egyptians get their metal from?’, many more case studies of pro-
duction waste from various contexts are necessary (Rehren and Pusch, 2012). The recent
work at Ayn Soukhna (Abd el Raziq et al., 2011) is a good example, but while it is clear that
most urban environments in ancient Egypt are in some way state controlled (see, e.g., Up-
hill, 2001), evidence from expeditions like those at Ayn Soukhna probably similarly reflect
some state involvement. Our currently limited knowledge of the social standing and mo-
bility of high-temperature craftspeople within ancient Egypt obscures our understanding
of the contexts in which they worked. At this point, we probably only see them operat-
ing in state-commissioned larger projects (see, e.g., Stevens and Eccleston, 2007), while
smaller scale activities, perhaps more reflective of their daily activities, are not reflected in
our current archaeological record. The excavation of village environments, for example,
may shed light on their activities in more informal settings. Through the integration of
results from such varied contexts, a more nuanced understanding of metal provisioning
and bronze production throughout Egypt’s long history may be established.
For now, the Pi-Ramesse case study stands as a first example of how, despite methodologi-
cal limitations, detailed crucible analysis may reveal differentiated production technology

Frederik Rademakers Part VI: Discussion. Chapter 14 455
and material use on a workshops scale. Some ambiguity will always remain, given the
variability that cannot be assessed for each individual crucible. Similarly, the ambiguity
concerning copper sources would not necessarily disappear through increased sampling,
though it is likely to improve the interpretation of lead isotope results. Nonetheless, this
research has shown the technological continuity existing between different workshops at
Pi-Ramesse, and offered important insights into variable metal supply between them and
through time. It further hints at new cross-craft relations with Egyptian Blue, and will
hopefully stimulate further investigations of ancient Egyptian mining and metallurgy, of
which the current state of research does not reflect its social and economic importance
throughout Egypt’s long history.
Although a similar number of mounted sections has been studied, the Gordion assem-
blage itself is far smaller than the Pi-Ramesse one. Compared to Pi-Ramesse, the Gordion
crucible remains exhibited lower variability, reflective of their more refractory nature and
(probably) the use of ‘cleaner’ starting materials. This hinders the easy evaluation of pro-
duction technology: though it has been possible to identify active alloying, a discrimina-
tion between cassiterite cementation and pure metal alloying could not be securely made.
It has, however, been possible to distinguish between the production of plain and leaded
bronze, which has hitherto not been recognised in any other published crucible assem-
blage in such detail.
Again, no material evidence from Phrygia is available to make a meaningful comparison to
this assemblage, and parallels can neither be found in (contemporary) Anatolia and Per-
sia. Therefore, it remains difficult to assess this metallurgical technology in a diachronic
perspective at this point. Given that Gordion was under Achaemenid rule during the Late
Phrygian period, it is even unclear whether this metallurgical activity reflects Phrygian or
Achaemenid technology. At any rate, the crucibles appear to have been made using local
ceramic recipes.
The Gordion casting moulds are similarly made of local clay, and represent the first ex-
ample of such moulds for Phrygia. Late Bronze and Iron Age casting moulds are quite
rarely found in the eastern Mediterranean, and this particular assemblage was preserved
as a result of their firing before use. Their preservation, coupled to a small assemblage of
metal casting waste, has allowed for a more complete reconstruction of the chaîne opéra-
toire of (leaded) bronze artefact production. Indeed, the identification of both leaded and
unleaded bronze in the metal spills validates and strengthens the interpretation of this dis-
tinction within the Gordion crucibles. This illustrates the importance of studying the en-
tire range of material evidence associated with metallurgical activity to better understand
the processes, but equally for building confidence in these newly developed interpretative

456 Part VI: Discussion. Chapter 14 Frederik Rademakers
frameworks for crucible analysis.
Considering the ore sources from which the Gordion metallurgists may have obtained
their metal, little evidence has been made available through this research. In retrospect, it
would have been interesting to have some lead isotope data for Gordion, as almost none
is available for Phrygia, or even (Achaemenid) Persia for that matter. Budget considera-
tions, the acquisition of this crucible assemblage at a later point in the PhD, and the more
ambiguous evaluation of lead isotope data for leaded bronze has led to its exclusion from
this research, in favour of the Pi-Ramesse assemblage. Nonetheless, information on lead
sources during the Iron Age, when leaded bronze becomes far more prevalent throughout
the Mediterranean, would be of interest for future research.
A truly contextual understanding of the use of these crucibles will equally remain impos-
sible for now. This, however, is a result of the limited contextual information available for
these crucibles, rather than the analytical methodology followed. The discovery of these
crucibles in difficult and varied contexts, coupled to the absence of comparable mate-
rial from other sites, limits the possibilities for linking this activity to a particular socio-
economic setting. Each deposit may represent a group of crucibles from a single produc-
tion event, all related to a single workshop; perhaps the so-called ‘foundry’. More likely,
several workshops are represented here (through time). Each context may represent a
longer period of activity from a particular workshop, while other (contemporary) work-
shops used different dump locations, presumably closer by their work area. Then again,
multiple workshops may have shared dump locations, and many other scenarios may be
suggested. Such hypotheses are not testable in the absence of associated workshop en-
vironments, and archaeological dating cannot confidently separate the different dump
contexts in time. The interesting issues concerned with organisation of production, fre-
quency of activity, scale, and variability in time, are therefore beyond the scope of crucible
analysis performed on assemblages from contexts without well-constrained chronology
and associated workshops.
These issues similarly affect the assemblage from Roman Thrace, where no associated
metal working installations were discovered during excavation of the crucibles. Further-
more, the dating of these crucibles is often problematic, and they tend to be isolated finds.
As such, their interpretation as representative of a particular workshop, or even period, is
beyond the realms of possibility.
Notwithstanding their currently unsettled contextual interpretation, the analysis of these
crucibles again serves several purposes. For example, the identification of their particu-
lar metallurgical purpose can be related to their ceramic fabric and typology. The current
lack of comparable material should not deter researchers from undertaking such studies:

Frederik Rademakers Part VI: Discussion. Chapter 14 457
the identical exercise is performed for other material categories, such as glass and ceram-
ics, where compositional data equally add another dimension to typological studies. The
present-day absence of a framework for comparison is hopefully of a transient nature, and
the crucibles presented here may one day provide context for another assemblage from
the eastern Roman provinces, or have their dating refined through analogy with many
similar, well-dated crucibles. Their current isolation may appear discouraging, but confi-
dence in continued crucible research within the eastern Mediterranean offers some con-
solation. Obviously, the time consuming nature of detailed crucible research may impede
immediate progress, but the use of pXRF for fast, qualitative analysis may help in accel-
erating the establishment of a (somewhat rough) framework for crucible typologies and
their associated metallurgical processes. Given the industrial nature of the Roman econ-
omy, it may be reasonably expected that general trends in crucible use will appear across
wider geographical areas once enough data is assembled, similar to those seen in other
ceramic categories. Detailed analysis of thin sections (crucible fabric) and mounted sec-
tion (metallurgical technology) remains necessary, however, for such a framework to be
able to answer more refined questions concerning technological traditions, adaptations
and innovations in the Roman provinces through time.
Furthermore, the analysis of these crucibles has identified a range of metals being pro-
cessed in these different sites. Though it is commonly assumed that a large range of metals
were indeed routinely worked in Roman settlements, evidence for this is lacking in the lit-
erature, particularly for the eastern Roman provinces. Therefore, the evidence presented
here is a first step towards identifying patterns of metal production at different provincial
centres. It should be emphasised that many workshops probably existed within a sin-
gle settlement, and within-site comparisons are a necessary component to such research.
Obviously, it would be preferable to select more contextualised material for this purpose,
whenever available.
Finally, the analysis of this assemblage has highlighted some methodological difficulties
inherently associated with the study of refractory crucibles. Though this does not directly
provide information on their particular context, it aids in shaping reasonable expectations
on the nature of evidence that can be obtained from such analysis in the future.
In general then, successful, contextualised reconstructions of technology rely on both a
considerate analysis of the crucible remains and the availability of detailed contextual in-
formation. The various issues related to crucible sampling, analysis and technical inter-
pretation have been thoroughly discussed in Chapter 13. Here, it is important to contem-
plate what is actually reflected in a crucible. Beyond the identification of technology and
material use, both in terms of ceramic and metallurgical technology, what do these cru-

458 Part VI: Discussion. Chapter 14 Frederik Rademakers
cibles represent? What do they tell us about their users? Are these craftspeople full-time
metallurgists? Is it possible to identify the manufacturers of early crucibles as potters or
the metallurgists themselves? Are crucibles representative of occasional or daily activities?
Over what period of time were they used? Do they reflect a tradition of metalworking, or
were they ad hoc adaptations? If they are the latter, where and when did the necessary
technological insights for their successful manufacture and use develop?
Such questions can clearly not be resolved by considering the results of crucible analysis in
isolation. They require the integration of all available information, ranging from the par-
ticular context from which they were excavated, to the wider site, region and, eventually,
all comparable contexts across the world. A collaborative effort from all archaeologists
involved with the site is required to obtain an integrated understanding of the crucible as-
semblage within its context, and its relationship to other material evidence. Though it is
the task of archaeometallurgists to familiarise themselves with the site’s material culture
and stratigraphy, it is obviously unrealistic for archaeometallurgists to become an author-
ity on every site from which production waste is investigated. It is therefore vital to col-
laborate closely with excavation directors and other project members, in order to obtain
the best results. In particular cases, such as Egypt, visual and written evidence may pro-
vide further insights into the social (who?) and cultural (why?) aspects of technology (e.g.,
Stevens and Eccleston, 2007). In addition, a diachronic, region-wide perspective is needed
to address questions of technological development, spread and adaptation. The develop-
ment of a frame of reference, through the study and, particularly, publication of many
more crucible assemblages across the world is urgently needed before such diachronic is-
sues can be tackled.
Furthermore, the integration of theoretical, anthropological and experimental archaeol-
ogy frameworks of interpretation is necessary to consider many of these problems. Such a
background is needed to shape reasonable expectations on what may be inferred from the
material evidence in relation to the general questions raised at the start of this paragraph.
Mirroring the technical interpretation of crucible remains, practical guidelines for con-
textual interpretation of crucible assemblages have not yet been established. An attempt
has been made in this thesis to discuss issues such as the number of crucibles one would
expect to be associated to a single, large-scale event such as the industrial workshops in
Pi-Ramesse, and where on site these may be deposited. Similarly, it should be considered
what evidence can be expected from the excavation of a single (smaller scale) workshop
which operated for a longer period in time. Obviously, the crucibles related to a decade of
daily activity would not have been stored inside such a workshop (unless they were con-
tinuously recycled, perhaps as grog temper), but were more likely dumped elsewhere on

Frederik Rademakers Part VI: Discussion. Chapter 14 459
site, and are therefore too disconnected archaeologically to securely relate them to their
production area. Crucibles preserved within the workshop, on the other hand, are prob-
ably representative of only the most recent activity. The majority of activities performed
in a particular workshop are therefore often not preserved within it, and this should be
kept in mind when interpreting the evidence from it. The availability of both workshop
environments and well-dated dump contexts related to them, revealing a diachronic per-
spective on activities, may rarely be expected from archaeological excavation, in particular
when no specific focus on metallurgical activity is given. The successful study of crucible
assemblages therefore begins during excavation, where an increased awareness for this
material category is key.
Although reconstructions of metallurgical activity should aim to include as much detail as
possible on the actions performed during its course, this should not be stretched beyond
the available data (contextual and material). For example, the reconstruction of crucibles
as vessels for ritually reinforcing social and political world views (Swenson and Warner,
2012) seems to border on what is permissible, especially on the basis of limited metallur-
gical evidence. The scale of activity represented in crucibles should be taken at face value,
and the interpretation of a single crucible, though interesting from a technological per-
spective (see, e.g., Thornton and Rehren, 2009) and in continuously building a reference
framework, cannot be taken as representative for a metallurgical tradition when found in
isolation. Given that the methodology for technological reconstruction of crucible metal-
lurgy is still under development, it seems inadvisable to start running before we are steady
on our feet. As has been argued throughout this thesis, a much larger sample is needed
to confidently asses technological choices, which may or may not be related to changing
context, and disentangle them from process-inherent variability.
While technological information can (usually) be obtained from their study, their nature
as mobile items, typically discarded after use, renders the contextual attribution of cru-
cibles difficult and often impossible. Therefore, the hopes of providing a truly detailed
understanding of what crucibles represent, beyond vessels for metallurgical operation,
should be tempered by the detail of their archaeological context, and await further empir-
ical development of methodological and interpretative frameworks. This establishment of
reference frameworks is necessary, but it is not the only justification for continued crucible
research. The technological information obtained from their study, through the establish-
ment of wider narratives of technological choice, metallurgical development and trade,
will eventually lead to a detailed understanding of metallurgical practice on a workshop
level. As always, however, for successful reconstructions, good context is everything.

460 Frederik Rademakers

Part VII
Conclusion
Oh let the sun beat down upon my face,
stars to fill my dream
I am a traveler of both time and space,
to be where I have been
To sit with elders of the gentle race,
this world has seldom seen
They talk of days for which they sit and wait,
when all will be revealed
Plant et al., 1975
461

462 Frederik Rademakers

CHAPTER 15
Conclusions and avenues of future research
This thesis set out to explore the contextualised reconstruction of crucible metallurgy for
several eastern Mediterranean sites, and to offer a discussion of methodological issues
related to the study of ancient metallurgical crucible assemblages.
For each of these case studies, the first step towards reconstructing metallurgical tech-
nology has consisted of a technical description of the crucible remains. This has started
from the ceramic fabric of each crucible, which, together with its design, is key to under-
standing its performance for a particular metallurgical operation. Following this, a more
detailed investigation of crucible slag has been undertaken for each sample, as the main
source of evidence for reconstructing the raw materials, techniques and process param-
eters that characterised the metallurgical process. Finally, these results have been inter-
preted within their particular context to further elucidate their place within the chaîne
opératoire of bronze production for each particular workshop environment and wider re-
gional setting.
At Pi-Ramesse, several techniques were employed to produce bronze (fresh metals, ce-
mentation and recycling), while making use of raw materials from various origins. The
surprisingly high proportion of domestic materials such as copper and cassiterite, in ad-
dition to imported materials, suggests a well-developed tradition of indigenous bronze
production. The shared use of these materials between high-temperature industries, as
suggested earlier for glass, may now be tentatively extended to Egyptian Blue production.
Bronze production does not vary distinctly from context to context within Pi-Ramesse:
the use of similar techniques may reflect widespread tradition or the activity of the same
craftspeople within different workshops. In terms of material use, however, it seems that
463

464 Part VII: Conclusion. Chapter 15 Frederik Rademakers
the industrial workshops relied, at least in part, on different copper sources for their pro-
visioning. This could relate to differential access to material sources within different pro-
duction contexts, but may equally reflect other factors such as changing availability of
particular materials through time.
These results offer the first detailed insight into Egyptian bronze production on a work-
shop level, illuminating the different steps from workshop preparation to object casting,
as well as the broader technology within ancient Egypt, and may serve as a baseline for fur-
ther research into the subject. Here, the examination of many more crucible assemblages
will be key to creating a more refined and differentiated understanding of bronze technol-
ogy in a variety of social settings, while continued exploration of primary metal mining
and smelting, as well as the analysis of final objects are necessary to provide the relevant
context within which those results should be interpreted. The core of the Pi-Ramesse as-
semblage most likely represents an unusual event, lasting only a few weeks, while every-
day bronze production, across thousands of years of pharaonic Egyptian history, remains
to be explored.
For Gordion, far less variability has been witnessed inside the crucibles. They reflect the
production of both bronze and leaded bronze, which entail the same technique but differ-
ent starting products: copper with tin/cassiterite and leaded copper with tin/cassiterite.
This distinction is further supported by the analysis of casting spills. Though further vari-
ability may have existed in the used copper sources, all appear to have been relatively pure,
making such distinctions invisible for slag analysis without the measurement of lead iso-
tope ratios. An added feature to this assemblage are the moulds, which offer insight into
another step of secondary metallurgy. The recovery of these crucibles from various con-
texts makes it very difficult to address questions of workshop practice, and their isolation
on a regional scale prevents comparisons to contemporary activity. As such, they must
stand as a first example of Phrygian and/or Achaemenid metal production technology
which may be further illuminated through continued study of not only crucible assem-
blages, but primary smelting as well as consumption contexts.
For Roman Thrace, a much larger range of different crucible fabrics and designs, related to
different metallurgical processes, has been discovered. Though too many to list here, each
of these crucibles offers a contribution towards understanding provincial Roman metal-
lurgical practice. For example, a variety of crucibles has been employed in the produc-
tion of (leaded) bronze across different sites. Whether this reflects changing technologies
through time, or different solutions to the same problem under different environmental or
social settings cannot be evaluated at this point. The main factor inhibiting such discus-
sions is the problematic contextual information accompanying these crucibles. However,

Frederik Rademakers Part VII: Conclusion. Chapter 15 465
this effect is further exaggerated by the limited comparative material currently available,
presenting these crucibles to be more isolated than they actually are. As for the previ-
ous two case studies, the continued examination of Roman crucible assemblages from the
wider region will much improve their explanatory value. In fact, while their presentation
within this thesis may have left more questions unanswered than the other assemblages,
the far greater abundance of Roman site excavations (within which metallurgical activity
may be expected) holds the promise of developing an interpretative framework for Ro-
man (crucible) metallurgy in a much shorter time. As everywhere, well contextualised
crucible evidence will be essential to lending more gravity to its research beyond the met-
allurgical techniques, towards an integrated understanding of metallurgy across different
socio-cultural contexts.
Apart from site-specific contributions, technological markers for particular crucible pro-
cesses have been elaborated. For example, the identification of residual cassiterite to iden-
tify cementation, and the often ambiguous interpretation of its absence, have not been
thoroughly explored before. Furthermore, identification of the use of multiple raw copper
sources within a single assemblage, through both slag analysis and lead isotope studies,
has not been achieved previously. Finally, highlighting the problematic nature of certain
crucible slag phases with regards to process identification, such as tin and zinc oxide, of-
fers important contributions towards future crucible studies.
In relation to methodology more generally, three main issues have emerged from the re-
sults of these case studies. Firstly, strongly variable slag formation is possible within a
single crucible: crucible slag is a palimpsest, reflecting the changing conditions through
space and time inside a crucible. This can result in different slag types in various zones
of the crucible, with typically strong discrepancy between rim and lower body areas. Such
variability has been commonly ignored in previous studies, making it difficult to assess
inherent bias and the broader validity of published results.
Secondly, different technological choices made by the ancient craftspeople can exist within
the assemblage as a whole. These differences, for example in production techniques, raw
materials and crucible design, may in turn reflect underlying socio-cultural factors and
more practical issues of material availability and technical knowledge. Not all techniques
and raw materials provide diagnostic evidence, however, and some of the technological
variation may be hidden by process-inherent variation that is superimposed on it. There-
fore, these choices can not always be extricated from the crucible remains, though the
methodology laid out in this thesis, summarised below, offers a sound approach to recog-
nising them whenever possible. Evidently, such technological variations do not necessar-
ily exist within every assemblage.

466 Part VII: Conclusion. Chapter 15 Frederik Rademakers
Thirdly, multiple technological pathways must always be considered when assessing cru-
cible remains. On the one hand, a single process can produce a range of crucible slag types
due to varying crucible conditions. On the other hand, a range of processes can result in
very similar crucible slag types.
These issues affect crucibles to varying degrees, depending on the refractoriness of the
crucible and the metallurgical process for which it was employed. However, they present
the essential background against which studies should be undertaken, and their consid-
eration advances some more general guidelines for the study of ancient crucible assem-
blages.
First, a macroscopic investigation of the entire assemblage should be undertaken, focus-
ing on the variability in crucible fabric and design, as well as the degree of external vit-
rification and internal slagging, to develop an understanding of technological variability
within the assemblage.
Whenever possible, at least one sample should be taken from each macroscopically iden-
tifiable group within a particular archaeological context, but preferably two or three as a
starting point to detect variability within each group. For larger assemblages, where such
groups are represented by hundreds or thousands of sherds, rather than a (few) dozen,
sample numbers should increase proportionally. When sampling opportunities are lim-
ited, the use of pXRF may offer a grip on chemical variability: the analysis of several areas
within a single crucible can illuminate within-crucible variability, while population-wide
trends may be picked up through analysis of the entire assemblage. Subject to sampling
limitations, it is usually more appropriate to sample a lower body fragment for which a
fairly substantial slag layer has developed, rather than rim fragments. If this is not possi-
ble, it must be considered whether rim samples or dross scrapings offer sufficient promise
towards answering the research questions to justify the costs of detailed analysis.
While the issue of representativeness is difficult to scale in absolute terms, the use of pXRF
and more detailed analysis of multiple samples typically allows the researcher to build a
measure of confidence in assessing variability, both on a crucible and assemblage-wide
scale. Though it seems that a complete understanding of process variability is beyond the
powers of current research methods, any recognition of it improves the authority of sug-
gested interpretations. When this cannot be established, the identification of particular
process markers will always improve process interpretation, though limitations in broader
validity of such interpretations must be recognised.
A cross section of a lower body fragment should be mounted in resin for reconstructions
of metallurgical techniques and raw material use. The key parameters for such recon-
structions on which to focus during analysis are metallic prills and residual ore fragments

Frederik Rademakers Part VII: Conclusion. Chapter 15 467
embedded in the crucible slag, and bulk chemical enrichments of slag relative to ceramic.
For the interpretation of results, it is advisable to attempt reconciliation of all observations
as reflections of a single process wherever possible. This applies both to the interpretation
of a single sherd, as well as to that of all samples taken across an assemblage. Only when
process-inherent variability cannot account for observed variations should differentiation
in techniques and raw materials be considered.
In general, a conservative attitude towards broader interpretations is advisable. It is nec-
essary to consider for each assemblage the degree to which process variability may hide
evidence for particular techniques, and where particular processes may not leave any di-
agnostic evidence. Greater sample numbers offer greater confidence for assemblage-wide
interpretations, but only the continued examination (and publication) of many crucible
assemblages will empirically strengthen interpretation cogency.
Of course, many methodological issues remain to be resolved. Experimental work is vi-
tal in this regard, for example to verify the validity of tentatively identified technologi-
cal markers, such as residual cassiterite, or to elucidate the various lead contributions to
crucible slag (and metal) during bronze production. This will increase confidence in the
identification of different techniques and raw materials within crucible assemblages. Fur-
thermore, it is crucial to expand the debate on what is reflected exactly in these crucibles.
With assemblages varying from isolated sherds to thousands of fragments, it is essential to
question continuously the informative value of detailed analysis for a particular context.
The greatest strength in examining material culture lies in its comparison to similar mate-
rials within different contexts. The case studies presented in this thesis create a foundation
for refined methodology and interpretation, which future work across the ancient world
can build on. An increased potency of reconstructed technological choices, as well as the
broader methodology for their study, will follow from such continued study of crucible
assemblages.
Crucibles stand at the cross-roads of metallurgy and ceramic technology, of raw materials
trade and the market of consumable objects, and of massive as well as individual produc-
tion scales. From there, they can play an informative role for each of these contingent
spheres of human activity. Their transformational and integrative nature, both from a
technological perspective and a more socio-cultural point of view, make crucibles worthy
of far more attention than they currently receive.
I hope this thesis may therefore inspire others to jump the many hurdles presented by pro-
cess variability and to have shown how a considerate methodology for journeys into the
crucible may reveal the choices made by ancient craftspeople and their societies.

468 Frederik Rademakers

Bibliography
Abd El-Rahman, Y., Surour, A. A., El Manawi, A. H. W., Rifai, M., Abdel Motelib, A., Ali, W. K.,
and El Dougdoug, A. M. (2013): Ancient mining and smelting activities in the Wadi Abu
Gerida area, central Eastern Desert, Egypt: preliminary results, Archaeometry, 55, 1067–
1087.
Abd el Raziq, M., Castel, G., Tallet, P., and Fluzin, P. (2011): Ayn Soukhna II: les Ateliers
Métallurgiques du Moyen Empire, Cairo: Institut français d’archéologie orientale.
Abdallatif, T. F., Mousa, S. E., and Elbassiony, A. (2003): Geophysical investigation for map-
ping the archaeological features at Qantir, Sharqyia, Egypt, Archaeological Prospection,
10, 27–42.
Abdel-Motelib, A., Bode, M., Hartmann, R., Hartung, U., Hauptmann, A., and Pfeiffer, K.
(2012): Archaeometallurgical expeditions to the Sinai Peninsula and the Eastern Desert
of Egypt (2006, 2008), Metalla (Bochum), 19, 3–59.
Abouzeid, A.-Z. M. and Khalid, A.-A. M. (2011): Mineral industry in Egypt - Part I: metallic
mineral commodities, Natural Resources, 2, 35–53.
Adamson, D. A., Gasse, F., Street, F. A., and Williams, M. A. J. (1980): Late Quaternary history
of the Nile, Nature, 288, 50–55.
Adriaens, A. (1996): Elemental composition and microstructure of Early Bronze Age and
Medieval tin slags, Mikrochimica Acta, 124, 89–98.
Aimers, J. J., Farthing, D. J., and Shugar, A. N. (2012): Handheld XRF analysis of Maya ce-
ramics: a pilot study presenting issues related to quantification and calibration, in A. N.
Shugar and J. L. Mass, eds., Handheld XRF for Art and Archaeology, Studies in Archaeo-
logical Sciences 3, Leuven University Press, pp. 423–448.
469

470 Bibliography Frederik Rademakers
Albarède, F., Desaulty, A.-M., and Blichert-Toft, J. (2012): A geological perspective on the
use of Pb isotopes in archaeometry, Archaeometry, 54, 853–867.
Alimov, K., Boroffka, N., Burjakov, Ju., Cierny, J., Lutz, J., Parzinger, H., Pernicka, E.,
Ruzanov, V., Shirinov, T., and Weisgerber, G. (1999): Research at Karnab, Uzbekistan.
Preliminary notes from the 1997 campaign, History of Material Culture of Uzbekistan,
30, 80–87.
Allan, J. W. (1979): Persian Metal Technology, 700-1300 AD, London: Ithaca Press for the
Faculty of Oriental Studies and the Ashmolean Museum, University of Oxford.
Allen, R. O., Hamroush, H., and Hoffman, M. A. (1989): Archaeological implications of dif-
ferences in the composition of Nile sediments, in R. O. Allen, ed., Archaeological Chem-
istry IV, Washington: American Chemical Society, pp. 33–56.
Amorós, J. L., Lunar, R., and Tavira, P. (1981): Jarosite: a silver bearing mineral of the gossan
of Rio Tinto (Huelva) and la Union (Cartagena, Spain), Mineralium Deposita, 16, 205–
213.
Angelini, I., Masiero, E., Bianchi, P., and Molin, G. (2009): Crucibles, wastes, and metals
from the Terramara settlement of Beneceto (PR, Italy): report of preliminary archaeo-
metric investigation, in Archaeometallurgy in Europe 2007. Selected Papers of the 2nd
International Conference 17.-21. June 2007 in Aquileia, Milan: Associazione Italiana di
Metallurgia, pp. 177–190.
Anguilano, L., Oberrauch, H., Hauser, H., Rehren, Th., and Artiolo, G. (2009): Copper
smelting at Fennhals-Kurtatsch, in J.-F. Moreau, R. Auger, J. Chabot, and A. Herzog,
eds., Proceedings of the 36th International Symposium on Archaeometry, Quebec City,
Canada, 2-6 May, 2006, CELAT, Université du Laval, pp. 375–382.
Arnold, D., Bourriau, J. D., and Nordström, H.-Å., eds. (1993): An Introduction to Ancient
Egyptian Pottery, Mainz: Verlag Philip Von Zabern.
Artioli, G., Angelini, I., Burger, E., Bourgarit, D., and Colpani, F. (2009): Petrographic and
chemical investigations of the earliest copper smelting slags in Italy: towards a recon-
struction of the beginning of copper metallurgy, in Archaeometallurgy in Europe 2007.
Selected Papers of the 2nd International Conference 17.-21. June 2007 in Aquileia [CD-
ROM], Milan: Associazione Italiana di Metallurgia.
Aston, D. A., Mommsen, H., Mountjoy, P., Pusch, E. B., and Rehren, Th. (2007): Die in-
und ausländischen Werkstoffe der Grabung Qantir in Wort und Bild, in E. B. Pusch and

Frederik Rademakers Bibliography 471
M. Bietak, eds., Die Keramik des Grabungsplatzes Q I - Teil 2: Schaber, Scherben und
Marken., Forschungen in der Ramses-Stadt Band 5, Hildesheim: Gerstenberg Verlag,
pp. 509–554.
Atasoy, E. and Buluç, S. (1982): Metallurgical and archaeological examination of Phrygian
objects, Anatolian Studies, 32, 157–160.
Audouze, F. (2002): Leroi-Gourhan, a philosopher of technique and evolution, Journal of
Archaeological Research, 10, 277–306.
Avner, U. (2013): Egyptian Timna - reconsidered, Paper presented at the Timna Park Inter-
national Conference in memory of Professor Beno Rothenberg. Mining for Copper: Envi-
ronment, Culture and Copper in Antiquity. 22-25 April 2013, Timna, Israel.
Bachmann, H.-G. (1976): Crucibles from a Roman settlement in Germany, Journal of the
Historical Metallurgy Society, 10, 34–35.
Bachmann, H.-G. (1980): Early copper smelting techniques in Sinai and Negev as deduced
from slag investigations, in P. T. Craddock, ed., Scientific Studies in Early Mining and
Extractive Metallurgy, Occasional Paper 20, London: British Museum, pp. 103–134.
Bachmann, H.-G. (1982a): Copper smelting slags from Cyprus: review and classification
of analytical data, in J. D. Muhly, R. Maddin, and V. Karageorghis, eds., Early Metallurgy
in Cyprus, 4000-500B.C., Nicosia: Pierides Foundation, pp. 143–152.
Bachmann, H.-G. (1982b): The Identification of Slags from Archaeological Sites, London:
Institute of Archaeology.
Bajnóczi, B., Nagy, G., Tóth, M., Ringer, I., and Ridovics, A. (2014): Archaeometric char-
acterization of 17th-century tin-glazed Anabaptist (Hutterite) faience artefacts from
North-East-Hungary, Journal of Archaeological Science, 45, 1–14.
Balmuth, M. S. and Tylecote, R. F. (1976): Ancient copper and bronze in Sardinia: excava-
tion and analysis, Journal of Field Archaeology, 3, 195–201.
Bamberger, M. (1985): The working conditions of the ancient copper smelting process, in
P. T. Craddock and M. J. Hughes, eds., Furnaces and Smelting Technology in Antiquity,
Occasional Paper 48, London: British Museum, pp. 151–157.
Baron, S., Tamas, C. G., Cauuet, B., and Munoz, M. (2011): Lead isotope analyses of gold-
silver ores from Rosia Montana (Romania): a first step of metal provenance study of

472 Bibliography Frederik Rademakers
Roman mining activity in Alburnus Maior (Roman Dacia), Journal of Archaeological Sci-
ence, 38, 1090–1100.
Bartelheim, M., Niederschlag, E., and Rehren, Th. (1998): Research into prehistoric metal-
lurgy in the Bohemian/Saxon Erzgebirge, in B. Hänsel, ed., Mensch und Umwelt in der
Bronzezeit Europas. Man and Environment in European Bronze Age, Kiel: Oetker-Voges
Verlag, pp. 225–229.
Bass, G. F. (1967): Cape Gelidonya: a Bronze Age shipwreck, Transactions of the American
Philosophical Society, 57, 1–177.
Bassiakos, Y. and Catapotis, M. (2006): Reconstruction of the copper smelting process
based on the analysis of ore and slag samples, in P. P. Betancourt, ed., The Chrysokamino
Metallurgy Workshop and Its Territory, Hesperia Supplements 36, The American School
of Classical Studies at Athens, pp. 329–353.
Baxter, M. J. (1999): On the multivariate normality of data arising from lead isotope fields,
Journal of Archaeological Science, 26, 117–124.
Baxter, M. J. and Gale, N. H. (1998): Testing for multivariate normality via univariate tests:
a case study using lead isotope ratio data, Journal of Applied Statistics, 25, 671–683.
Bayley, J. (1984): Roman brass-making in Britain, Journal of the Historical Metallurgy So-
ciety, 18, 42–43.
Bayley, J. (1987): Final Report on the Brooch Analyses and Crucibles from Prestatyn,
Clwyd, Ancient Monuments Laboratory Report 28/87, Historic Buildings and Monu-
ments Commission.
Bayley, J. (1996): Innovation in later medieval urban metalworking, Historical Metallurgy,
30, 67–71.
Bayley, J. (1998): The production of brass in antiquity with particular reference to Roman
Britain, in P. T. Craddock, ed., 2000 Years of Zinc and Brass, Occasional Paper 50, London:
British Museum, pp. 7–26.
Bayley, J., Crossley, D., and Ponting, M. (2008): Metals and Metalworking - A Research
Framework for Archaeometallurgy, The Historical Metallurgy Society.
Bayley, J., Dungworth, D., and Paynter, S. (2001): Centre for Archaeology Guidelines: Ar-
chaeometallurgy, Swindon: English Heritage Publications.

Frederik Rademakers Bibliography 473
Bayley, J. and Eckstein, K. (1997): Silver refining - production, recycling, assaying, in A. Sin-
clair, E. Slater, and J. Gowlett, eds., Archaeological Sciences 1995. Proceedings of a Con-
ference on the Application of Scientific Techniques to the Study of Archaeology, Liverpool,
July 1995, Oxbow Monograph 64, Oxford: Oxbow Books, pp. 107–111.
Bayley, J. and Rehren, Th. (2007): Towards a functional and typological classification of
crucibles, in S. La Niece, D. Hook, and P. T. Craddock, eds., Metals and Mines. Studies in
Archaeometallurgy, London: Archetype Books, pp. 46–55.
Beagrie, N. (1985): Some early tin ingots, ores and slags from Western Europe, Historical
Metallurgy, 19, 162–168.
Becker, J. S. (2002): State-of-the-art and progress in precise and accurate isotope ratio
measurements by ICP-MS and LA-ICP-MS, Journal of Analytical Atomic Spectrometry,
17, 1172–1185.
Beeley, P. R. (2001): Foundry Technology, Oxford: Butterworth-Heinemann.
Begemann, F., Hauptmann, A., Schmitt-Strecker, S., and Weisgerber, G. (2010): Lead iso-
tope and chemical signature of copper from Oman and its occurrence in Mesopotamia
and sites on the Arabian Gulf coast, Arabian Archaeology and Epigraphy, 21, 135–169.
Begemann, F., Kallas, K., Schmitt-Strecker, S., and Pernicka, E. (1999): Tracing ancient tin
via isotope analyses, in A. Hauptmann, E. Pernicka, Th. Rehren, and Ü. Yalçin, eds., The
Beginnings of Metallurgy, Bochum: Deutsches Bergbau-Museum, pp. 277–284.
Begemann, F., Schmitt-Strecker, S., Pernicka, E., and Lo Schiavo, F. (2001): Chemical com-
position and lead isotopy of copper and bronze from Nuragic Sardinia, European Jour-
nal of Archaeology, 4, 43–85.
Behrendt, S., Mielke, D. P., and Mecking, O. (2012): Die Portable Röntgenfluoreszenzanal-
yse (P-RFA) in der Keramikforschung: Grundlagen und Potenzial, Restaurierung und
Archäologie, 5, 93–110.
Beit-Arieh, I. (1985): Serabit el-Khadim: new metallurgical and chronological aspects, Lev-
ant, 17, 89–116.
Ben-Yosef, E. (2012): A unique casting mould from the new excavations at Timna Site 30
(Israel): evidence of western influence?, in V. Kassianidou and G. Papasavvas, eds., East-
ern Mediterranean Metallurgy and Metalwork in the Second Millennium BC - A Con-
ference in Honour of James D. Muhly, Nicosia, 10th-11th October 2009, Oxford: Oxbow
Books, pp. 188–196.

474 Bibliography Frederik Rademakers
Ben-Yosef, E. and Levy, T. E. (2014): Tracking technological change in high resolution: an
XRF study of Iron Age copper smelting in the Southern Levant, Poster presented at the
40th International Symposium on Archaeometry, 19-23 May 2014, Los Angeles, USA.
Ben-Yosef, E., Levy, T. E., Higham, T., Najjar, M., and Tauxe, L. (2010): The beginning of Iron
Age copper production in the southern Levant: new evidence from Khirbat al-Jariya,
Faynan, Jordan, Antiquity, 84, 724–746.
Ben-Yosef, E., Shaar, R., Tauxe, L., and Ron, H. (2012): A new chronological framework
for Iron Age copper production at Timna (Israel), Bulletin of the American Schools of
Oriental Research, 367, 31–71.
Benvenuti, M., Chiarantini, L., Norfini, L., Casini, A., Guideri, S., and Tanelli, G. (2003):
The “Etruscan tin”: a preliminary contribution from researches at Monte Valerio and
Baratti-Populonia (southern Tuscany, Italy), in A. Giumlia-Mair and F. Lo Schiavo, eds.,
The Problem of Early Tin. Acts of the XIVth UISPP Congress, BAR International Series
1199, Oxford: Archaeopress, pp. 55–65.
Bevan, A. (2010): Making and marking relationships: Bronze Age brandings and Mediter-
ranean commodities, in A. Bevan and D. Wengrow, eds., Cultures of Commodity Brand-
ing, Walnut Creek, US: Left Coast Press, pp. 35–86.
Bietak, M. (1981): Avaris and Piramesse. Archaeological Exploration in the Eastern Nile
Delta, Oxford: University Press.
Bietak, M. (1996): Avaris, the Capital of the Hyksos. Recent Excavations at Tell el-Dab’a,
London: British Museum Press.
Bietak, M. and Forstner-Müller, I. (2011): The topography of New Kingdom Avaris and Per-
Ramesses, in M. Collier and S. Snape, eds., Ramesside Studies in Honour of K.A. Kitchen,
Bolton: Rutherford, pp. 23–50.
Bilgi, Ö., ed. (2004): Anatolia, Cradle of Castings, Istanbul: Döktas.
Birmingham, J. M. (1961): The overland route across Anatolia in the eighth and seventh
centuries B.C., Anatolian Studies, 11, 185–195.
Blakelock, E. (2005): Qualitative Analysis of the Crucibles from Bloodmoor Hill, Carlton
Colville, Suffolk, Centre for Archaeology Report 22/2005, English Heritage.
Bland, R. (2013): What happened to gold coinage in the 3rd c. A.D.?, Journal of Roman
Archaeology, 26, 263–280.

Frederik Rademakers Bibliography 475
Bode, M., Hauptmann, A., and Mezger, K. (2009): Tracing Roman lead sources using lead
isotope analyses in conjunction with archaeological and epigraphic evidence - a case
study from Augustan/Tiberian Germania, Archaeological and Anthropological Sciences,
1, 177–194.
Boni, M., Di Maio, G., Frei, R., and Villa, I. M. (2000): Lead isotopic evidence for a mixed
provenance for Roman water pipes from Pompeii, Archaeometry, 42, 201–208.
Bonnet, C. (1986): Un atelier de bronziers à Kerma, in M. Krause, ed., Nubische Stu-
dien. Tagungsakten der 5. Internationalen Konferenz der International Society for Nu-
bian Studies, Heidelberg, 22.-25. September 1982, Mainz: Verlag Philip Von Zabern, pp.
19–22.
Bonnet, C. (2004): Le Temple Principal de la Ville de Kerma et son Quartier Religieux, Paris:
Editions Errance.
Boroffka, N., Cierny, J., Lutz, J., Parzinger, H., Pernicka, E., and Weisgerber, G. (2002):
Bronze Age tin from Central Asia: preliminary notes, in K. Boyle, C. Renfrew, and
M. Levine, eds., Ancient Interactions: East and West in Eurasia, McDonald Institute
Monographs, Cambridge: McDonald Institute for Archaeological Research, pp. 135–159.
Bossert, E.-M. (2000): Die Keramik phrygischer Zeit von Bogazköy: Funde aus den
Grabungskampagnen 1906, 1907, 1911, 1912, 1931-1939 und 1952-1960, Mainz: Philip
von Zabern.
Bourgarit, D. (2007): Chalcolithic copper smelting, in S. La Niece, D. Hook, and P. T. Crad-
dock, eds., Metals and Mines. Studies in Archaeometallurgy, London: Archetype Books,
pp. 3–14.
Bourriau, J. D., Bellido, A., Bryan, N., and Robinson, V. (2006): Egyptian pottery fabrics:
a comparison between NAA groupings and the “Vienna System”, in E. Czerny, I. Hein,
H. Hunger, D. Melman, and A. Schwab, eds., Timelines. Studies in Honour of Manfred
Bietak, Volume III, Leuven: Peeters Publishers & Department of Oriental Studies, pp.
261–292.
Bourriau, J. D. and Nicholson, P. T. (1992): Marl clay pottery fabrics of the New Kingdom
from Memphis, Saqqara and Amarna, The Journal of Egyptian Archaeology, 78, 29–91.
Bourriau, J. D., Smith, L. M. V., and Nicholson, P. T. (2000): New Kingdom Pottery Fabrics:
Nile Clay and Mixed Nile/Marl Clay Fabrics from Memphis and Amarna, Fourteenth Oc-
casional Publication, London: The Egypt Exploration Society.

476 Bibliography Frederik Rademakers
Bowen, N. L. (1915): The later stages of the evolution of the igneous rocks, The Journal of
Geology, 23, 1–91.
Boyanov, I. (2013): Veterans and society in Roman Serdica, Ancient West and East, 12, 237–
249.
Brauns, M., Schwab, R., Gassmann, G., Wieland, G., and Pernicka, E. (2013): Provenance of
Iron Age iron in southern Germany: a new approach, Journal of Archaeological Science,
40, 841–849.
Bray, P. J. and Pollard, A. M. (2012): A new interpretative approach to the chemistry of
copper-alloy objects: source, recycling and technology, Antiquity, 86, 853–867.
Brewer, W. F. and Lambert, B. L. (2001): The theory-ladenness of observation and the
theory-ladenness of the rest of the scientific process, Philosophy of Science, 68, 176–186.
Brill, R. H., Barnes, I. L., and Adams, B. (1974): Lead isotopes in some ancient Egyptian
objects, in A. Bishay, ed., Recent Advances in Science and Technology of Materials, Band
3 (= The Proceedings of the Second Cairo Solid State Conference Held in Cairo, Egypt,
April 21-26, 1973), New York: Plenum, pp. 9–27.
Brill, R. H. and Wampler, J. M. (1967): Isotope studies of ancient lead, American Journal of
Archaeology, 71, 63–77.
Budd, P., Gale, D., Pollard, A. M., Thomas, R. G., and Williams, P. A. (1993): Evaluating lead
isotope data: further observations, Archaeometry, 35, 241–263.
Budd, P., Haggerty, R., Pollard, A. M., Scaife, B., and Thomas, R. G. (1995a): New heavy
isotope studies in archaeology, Israel Journal of Chemistry, 35, 125–130.
Budd, P., Pollard, A. M., Scaife, B., and Thomas, R. G. (1995b): Oxhide ingots, recycling and
the Mediterranean metals trade, Journal of Mediterranean Archaeology, 8, 1–32.
Budd, P., Pollard, A. M., Scaife, B., and Thomas, R. G. (1995c): The possible fractionation of
lead isotopes in ancient metallurgical processes, Archaeometry, 37, 143–150.
Burger, E., Bourgarit, D., Wattiaux, A., and Fialin, M. (2010): The reconstruction of the first
copper-smelting processes in Europe during the 4th and the 3rd millennium BC: where
does the oxygen come from?, Applied Physics A. Materials Science and Processing, 100,
713–724.

Frederik Rademakers Bibliography 477
Butcher, K. and Ponting, M. (1995): Rome and the east. Production of Roman provincial
silver coinage for Caesarea in Cappadocia under Vespasian, AD 69-79, Oxford Journal of
Archaeology, 14, 63–77.
Butcher, K. and Ponting, M. (2005): The Roman denarius under the Julio-Claudian emper-
ors: mints, metallurgy and technology, Oxford Journal of Archaeology, 24, 163–197.
Caley, E. R. (1964): Orichalcum and Related Ancient Alloys. Origin, Composition, and Man-
ufacture, with Special Reference to the Coinage of the Roman Empire, New York: Ameri-
can Numismatic Society.
Carradice, I. and Cowell, M. (1987): The minting of Roman imperial bronze coins for cir-
culation in the east: Vespasian to Trajan, The Numismatic Chronicle, 147, 26–50.
Carter, G. F. (1978): Precision in the X-ray fluorescence analysis of sixty-one Augustan
quadrantes, Journal of Archaeological Science, 5, 293–300.
Castel, G., Mathieu, B., Pouit, G., El Hawari, M., Shaaban, G., Hellal, H., Abdallah, T., and
Ossama, A. (1996): Wadi Dara copper mines, in F. A. Esmael, ed., Proceedings of the First
International Conference on Ancient Egyptian Mining and Metallurgy and Conservation
of Metallic Artifacts, Cairo: Ministry of Culture, Supreme Council of Antiquities, pp. 15–
31.
Castel, G., Tallet, P., and Fluzin, P. (2008): La métallurgie du cuivre au temps des pharaons,
Archéologia, 460, 62–71.
Cech, B. and Rehren, Th., eds. (2014): Early Iron in Europe, Monographies Instrumentum
50, Montagnac: Editions Monique Mergoil.
Charalambous, A., Kassianidou, V., and Papasavvas, G. (2014): A compositional study of
Cypriot bronzes dating to the Early Iron Age using portable X-ray fluorescence spec-
trometry (pXRF), Journal of Archaeological Science, 46, 205–216.
Charles, J. A. (1979): The development of the usage of tin and tin-bronze: some problems,
in A. D. Franklin, J. S. Olin, and T. A. Wertime, eds., The Search for Ancient Tin: a Semi-
nar Organized by Theodore A. Wertime and held at the Smithsonian Institution and the
National Bureau of Standards, Washington, D.C., March 14-15, 1977, Washington, D.C.:
Smithsonian Institution Press, pp. 25–32.
Charles, J. A. (1980): The coming of copper and copper-base alloys and iron, in T. A. Wer-
time and J. D. Muhly, eds., The Coming of Age of Iron, New Haven: Yale University Press,
pp. 151–181.

478 Bibliography Frederik Rademakers
Chartier-Raymond, M., Gratien, B., Traunecker, C., and Vinçon, J.-M. (1994): Les site
miniers pharaoniques du Sud-Sinai. Quelques notes et observations de terrain, Cahiers
de Recherches de l’Institut de Papyrologie et d’Egyptologie de Lille, 16, 31–77.
Chen, K., Rehren, Th., Mei, J., and Zhao, C. (2009): Special alloys from remote frontiers of
the Shang Kingdom: scientific study of the Hanzhong bronzes from southwest Shaanxi,
China, Journal of Archaeological Science, 36, 2108–2118.
Chescoe, D. and Goodhew, P. J. (1990): The Operation of Transmission and Scanning Elec-
tron Microscopes, Oxford: Oxford University Press.
Chiarantini, L., Benvenuti, M., Costagliola, P., Fedi, M. E., Guideri, S., and Romualdi, A.
(2009): Copper production at Baratti (Populonia, southern Tuscany) in the early Etr-
uscan period (9th-8th centuries BC), Journal of Archaeological Science, 36, 1626–1636.
Childs, S. T. (1991): Style, technology, and iron smelting furnaces in Bantu-speaking Africa,
Journal of Anthropological Archaeology, 10, 332–359.
Chirikure, S., Heimann, R. B., and Killick, D. (2010): The technology of tin smelting in the
Rooiberg Valley, Limpopo Province, South Africa, ca. 1650-1850 CE, Journal of Archaeo-
logical Science, 37, 1656–1669.
Cholakova, A. (2006): Metalworking in the earliest site period of Nicopolis ad Istrum, Bul-
letin of the National Institute of Archaeology, 39, 163–184.
Cierny, J. and Weisgerber, G. (2003): Bronze Age tin mines in Central Asia, in A. Giumlia-
Mair and F. Lo Schiavo, eds., The Problem of Early Tin. Acts of the XIVth UISPP Congress,
BAR International Series 1199, Oxford: Archaeopress, pp. 23–31.
Clayton, R., Andersson, P., Gale, N. H., Gillis, C., and Whitehouse, M. J. (2002): Precise de-
termination of the isotopic composition of Sn using MC-ICP-MS, Journal of Analytical
Atomic Spectrometry, 17, 1248–1256.
Coghlan, H. H. (1975): Notes on the Prehistoric Metallurgy of Copper and Bronze in the Old
World (Second Edition), Oxford: University Press.
Constantinou, G. (1980): Metallogenesis associated with the Troodos ophiolite, in
A. Panayiotou, ed., Ophiolites. Proceedings of the International Ophiolite Symposium,
Cyprus, 1979, Nicosia: Cyprus Geological Survey Department, pp. 663–674.

Frederik Rademakers Bibliography 479
Cooke, S. R. B. and Nielsen, B. V. (1978): Slags and other metallurgical products, in G. Jr.
Rapp and S. E. Aschenbrenner, eds., Excavations at Nichoria in Southwest Greece. Vol.1:
Site, Environs and Techniques, Minneapolis: University of Minnesota Press, pp. 182–224.
Cooper, H. K., Duke, M. J. M., Simonetti, A., and Chen, G. (2008): Trace element and Pb
isotope provenance analyses of native copper in northwestern North America: results of
a recent pilot study using INAA, ICP-MS, and LA-MC-ICP-MS, Journal of Archaeological
Science, 35, 1732–1747.
Costin, C. L. (1991): Craft specialization: issues in defining, documenting, and explaining
the organization of production, Archaeological Method and Theory, 3, 1–56.
Cowell, M. R. (1986): The composition of Egyptian copper-based metalwork, in R. A.
David, ed., Science in Egyptology, Manchester: Manchester University Press, pp. 463–
468.
Cowell, M. R. and Hyne, K. (2000): Scientific examination of the Lydian precious metal
coinages, in A. Ramage and P. T. Craddock, eds., King Croesus’ Gold. Excavations at
Sardis and the History of Gold Refining, London: British Museum Press, pp. 169–174.
Craddock, P. T. (1976): The composition of the copper alloys used by the Greek, Etruscan
and Roman civilizations. 1: The Greeks before the Archaic Period, Journal of Archaeo-
logical Science, 3, 93–113.
Craddock, P. T. (1978): The composition of the copper alloys used by the Greek, Etruscan
and Roman civilizations. 3: The origins and early use of brass, Journal of Archaeological
Science, 5, 1–16.
Craddock, P. T. (1995): Early Metal Mining and Production, Cambridge: Edinburgh Uni-
versity Press.
Craddock, P. T. (1998): Zinc in classical antiquity, in P. T. Craddock, ed., 2000 Years of Zinc
and Brass, Occasional Paper 50, London: British Museum, pp. 1–6.
Craddock, P. T. (2000): From hearth to furnace: evidences for the earliest metal smelting
technologies in the eastern Mediterranean, Paléorient, 26, 151–165.
Craddock, P. T. (2013): Refractories: ceramics with a purpose, The Old Potter’s Almanack,
18, 9–20.

480 Bibliography Frederik Rademakers
Craddock, P. T. and Eckstein, K. (2003): Production of brass in Antiquity by direct reduc-
tion, in P. T. Craddock and J. Lang, eds., Mining and Metal Production. Through the Ages,
London: British Museum Press, pp. 216–230.
Craddock, P. T., La Niece, S., and Hook, D. R. (2003): Evidences for the production, trading
and refining of copper in the Gulf of Oman during the third millennium BC, in T. Stöll-
ner, G. Körlin, G. Steffens, and J. Cierny, eds., Man and Mining (Mensch und Bergbau),
Der Anschnitt, Beiheft 16, Bochum: Deutsches Bergbau-Museum, pp. 103–112.
Craddock, P. T. and Meeks, N. D. (1987): Iron in ancient copper, Archaeometry, 29, 187–204.
Crawford, M. H. (1977): Republican denarii in Romania: the suppression of piracy and the
slave-trade, The Journal of Roman Studies, 67, 117–124.
Crew, P. and Rehren, Th. (2002): High-temperature workshop residues from Tara - iron,
bronze and glass, Discovery Programme Report, 6, 83–103.
Cui, J. and Wu, X. (2011): An experimental investigation on lead isotopic fractionation
during metallurgical processes, Archaeometry, 53, 205–214.
Cumming, G. L. and Richards, J. R. (1975): Ore lead isotope ratios in a continuously chang-
ing earth, Earth and Planetary Science Letters, 28, 155–171.
Darbyshire, G. and Pizzorno, G. H. (2009): Gordion in history, Expedition, 51, 11–22.
Davenport, W. G., King, M., Schlesinger, M. E., and Biswas, A. K. (2002): Extractive Metal-
lurgy of Copper (4th Edition), Oxford: Pergamon.
Davey, C. J. (1985): Crucibles in the Petrie Collection and hieroglyphic ideograms for
metal, Journal of Egyptian Archaeology, 71, 142–148.
Davey, C. J. and Edwards, W. I. (2007): Crucibles from the Bronze Age of Egypt and
Mesopotamia, Proceedings of the Royal Society of Victoria, 120, 146–154.
Davies, N. de G. (1935a): Paintings from the Tomb of Rekh-mi-Re at Thebes, New York:
Plantin Press.
Davies, O. (1935b): Roman Mines in Europe, Oxford: Clarendon Press.
Davies, O. (1936): Prehistoric copper mines near Burgas, Man, 36, 92–93.
Davis, L. G., Macfarlan, S. J., and Henrickson, C. N. (2012): A PXRF-based chemostratigra-
phy and provenience system for the Cooper’s Ferry site, Idaho, Journal of Archaeological
Science, 39, 663–671.

Frederik Rademakers Bibliography 481
Day, P. M., Kiriatzi, E., Tsolakidou, A., and Kilikoglou, V. (1999): Group therapy in Crete:
a comparison between analyses by NAA and thin section petrography of Early Minoan
pottery, Journal of Archaeological Science, 26, 1025–1036.
Dayton, J. E. (1971): The problem of tin in the ancient world, World Archaeology, 3, 49–70.
Dayton, J. E. (2003): The problem of tin in the ancient world (part 2), in A. Giumlia-Mair
and F. Lo Schiavo, eds., The Problem of Early Tin. Acts of the XIVth UISPP Congress, BAR
International Series 1199, Oxford: Archaeopress, pp. 165–170.
de Jesus, P. S. (1979): Considerations on the occurrence and exploitation of tin sources in
the ancient Near East, in A. D. Franklin, J. S. Olin, and T. A. Wertime, eds., The Search for
Ancient Tin: a Seminar organized by Theodore A. Wertime and held at the Smithsonian
Institution and the National Bureau of Standards, Washington, D.C., March 14-15, 1977,
Washington, D.C.: Smithsonian Institution Press, pp. 33–38.
de Jesus, P. S. (1980): The Development of Prehistoric Mining and Metallurgy in Anatolia.
Part I, BAR International Series 74, Oxford: British Archaeological Reports.
Denbow, J. and Miller, D. (2007): Metal working at Bosutswe, Botswana, Journal of African
Archaeology, 5, 271–313.
Derham, B., Doonan, R. C. P., Lolos, Y., Sarris, A., and Jones, R. (2013): Integrating geo-
chemical survey, ethnography and organic residue analysis to identify and understand
areas of foodstuff processing, in S. Voutsaki and S. M. Valamoti, eds., Diet, Economy
and Society in the Ancient Greek World. Towards a Better Integration of Archaeology and
Science. Proceedings of the International Conference held at the Netherlands Institute at
Athens on 22-24 March 2010, Leuven/Paris/Walpole, MA: Peeters, pp. 47–54.
Desroches-Noblecourt, C. (2007): Ramses II: An Illustrated Biography, Paris: Flammarion.
Dill, H. G. (2007): Grain morphology of heavy minerals from marine and continental
placer deposits, with special reference to Fe-Ti oxides, Sedimentary Geology, 198, 1–27.
Dill, H. G., Techmer, A., Weber, B., and Füßl, M. (2008): Mineralogical and chemical dis-
tribution patterns of placers and ferricretes in Quaternary sediments in SE Germany:
the impact of nature and man on the unroofing of pegmatites, Journal of Geochemical
Exploration, 96, 1–24.
Dobres, M.-A. (2010): Archaeologies of technology, Cambridge Journal of Economics, 34,
103–114.

482 Bibliography Frederik Rademakers
Doonan, R. C. P. (1994): Sweat, fire and brimstone: pre-treatment of copper ore and the
effects on smelting techniques, Historical Metallurgy, 28, 84–97.
Doonan, R. C. P. (1999a): Copper production in the eastern Alps during the Bronze Age:
technological change and the unintended consequences of social reorganisation, in
S. M. M. Young, A. M. Pollard, P. Budd, and R. A. Ixer, eds., Metals in Antiquity, BAR
S792, Oxford: Archaeopress, pp. 72–77.
Doonan, R. C. P. (1999b): Metallurgical Debris from Eynsham Abbey, Oxfordshire, Ancient
Monuments Laboratory Report 70/1999, English Heritage.
Doonan, R. C. P. (1999c): The Mould Fragments and Slag from Huntsman’s Quarry, Kemer-
ton, Ancient Monuments Laboratory Report 71/1999, English Heritage.
Doonan, R. C. P., Klemm, S., Ottaway, B. S., Sperl, G., and Weinek, H. (1996): The east
Alpine Bronze Age copper smelting process: evidence from the Ramsau Valley, Eisen-
erz, Austria, in S. Demirci, A. M. Özer, and G. D. Summers, eds., Archaeometry 94. The
Proceedings of the 29th International Symposium on Archaeometry. Ankara, 9-14 May
1994, Ankara: TÜBITAK.
Dungworth, D. (1996): Caley’s ‘zinc decline’ reconsidered, The Numismatic Chronicle, 156,
228–234.
Dungworth, D. (1997): Roman copper alloys: analysis of artefacts from Northern Britain,
Journal of Archaeological Science, 24, 901–910.
Dungworth, D. (2000a): A note on the analysis of crucibles and moulds, Historical Metal-
lurgy, 34, 83–86.
Dungworth, D. (2000b): Serendipity in the foundry? Tin oxide inclusions in copper and
copper alloys as an indicator of production process, Bulletin of the Metals Museum, 32,
1–5.
Dungworth, D. (2001a): Metal Working Debris from Elms Farm, Heybridge, Essex, Centre
for Archaeology Report 69/2001, English Heritage.
Dungworth, D. (2001b): Metal Working Evidence from Housesteads Roman Fort, Northum-
berland, Centre for Archaeology Report 109/2001, English Heritage.
Dungworth, D. (2010): Wild Court Rookery, City of London. Scientific Examination of Early
19th-century Crucibles, Research Department Report Series 58-2010, English Heritage.

Frederik Rademakers Bibliography 483
Dungworth, D. (2012a): Historic window glass. The use of chemical analysis to date man-
ufacture, Journal of Architectural Conservation, 18, 7–25.
Dungworth, D. (2012b): Scientific examination of the crucible fragments from Cesspit 1,
Appendix to Jeffries, N. and Watson, B. From Saxon Lundenwic to Victorian Rookery:
excavations at the City Lit, Keeley Street, London WC2, Transactions of the London and
Middlesex Archaeological Society, 65, 85–87.
Dungworth, D. (2013): Experimental archaeometallurgy: hypothesis testing, happy acci-
dents and theatrical performances, in D. Dungworth and R. C. P. Doonan, eds., Acciden-
tal and Experimental Archaeometallurgy, HMS Occasional Publication 7, The Historical
Metallurgy Society, pp. 11–16.
Dungworth, D. and Bayley, J. (1999): Crucibles, moulds and tuyeres from Mucking, Essex,
Ancient Monuments Laboratory Report 72, English Heritage.
Dungworth, D. and Bowstead Stallybrass, H. S. (2000): Metal Working Evidence from No 1
Poultry, London, Ancient Monuments Laboratory Report 54/2000, English Heritage.
Dungworth, D., Comeau, B., and Lowerre, A. (2013): St. Algar’s Farm, Selwood, Somerset.
Geochemical Survey, Research Department Report Series 28-2013, English Heritage.
Dungworth, D. and Starley, D. (2009): The metalworking debris, in A. Rushworth, ed.,
Housesteads Roman Fort - The Grandest Station, Swindon: English Heritage, pp. 579–
588.
Durali-Müller, S., Brey, G. P., Wigg-Wolf, D., and Lahaye, Y. (2007): Roman lead mining in
Germany: its origin and development through time deduced from lead isotope prove-
nance studies, Journal of Archaeological Science, 34, 1555–1567.
Durman, A. (1997): Tin in southeastern Europe?, Opuscula Archaeologica, 21, 7–14.
Dušanic, S. (2004): Roman mining in Illyricum: historical aspects, in G. Urso, ed.,
Dall’ Adriatico al Danubio. L’Illyrico nell’étà Greca é Romana. Atti del Convegno Inter-
nazionale Cividale del Friuli, 25-27 Settembre 2003, Pisa, pp. 247–270.
Earl, B. and Özbal, H. (1996): Early Bronze Age tin processing at Kestel/Göltepe, Anatolia,
Archaeometry, 38, 289–303.
Eaton, E. R. and McKerrel, H. (1976): Near Eastern alloying and some textual evidence for
the early use of arsenical copper, World Archaeology, 8, 169–191.

484 Bibliography Frederik Rademakers
Eccleston, M. A. J. and Kemp, B. J. (2008): Metalworking and crucibles, in B. J. Kemp and
A. K. Stevens, eds., Busy Lives at Amarna: Excavations at Grid 12 in the Main City, Lon-
don: Egypt Exploration Society.
Eekelers, K., Scott, R., Degryse, P., and Muchez, P. (2014): Comparison between quanti-
tative (ICP-OES) and qualitative (pXRF) data of iron slag from Sagalassos (SW-Turkey),
Poster presented at the 40th International Symposium on Archaeometry, 19-23 May 2014,
Los Angeles, USA.
El Gayar, E.-S. and Jones, M. P. (1989a): Old Kingdom copper smelting artifacts from Buhen
in Upper Egypt, Historical Metallurgy, 23, 16–24.
El Gayar, E.-S. and Jones, M. P. (1989b): A possible source of copper ore fragments found
at the Old Kingdom town of Buhen, The Journal of Egyptian Archaeology, 75, 31–40.
El Goresy, A., Schiegl, S., and Weiner, K. L. (1996): A chronological scheme for the tech-
nological evolution of copper in ancient Egypt, in F. A. Esmael, ed., Proceedings of the
First International Conference on Ancient Egyptian Mining and Metallurgy and Conser-
vation of Metallic Artifacts, Cairo: Ministry of Culture, Supreme Council of Antiquities,
pp. 215–234.
El Goresy, A., Tera, F., Schlick-Nolte, B., and Pernicka, E. (1998): Chemistry and lead iso-
topic compositions of glass from a Ramesside workshop at Lisht and Egyptian lead ores:
a test for a genetic link and for the source of glass, in C. J. Eyre, ed., Proceedings of the
Seventh International Congress of Egyptologists. Cambridge, 3-9 September 1995, Orien-
talia Lovaniensia Analecta 82, Leuven: Peeters, pp. 471–481.
Eliyahu-Behar, A., Regev, L., Shilstein, S., Weiner, S., Shalev, Y., Sharon, I., and Berg, J.
(2009): Identifying a Roman casting pit at Tel Dor, Israel: integrating field and laboratory
research, Journal of Field Archaeology, 34, 135–151.
Eliyahu-Behar, A., Yahalom-Mack, N., Shilstein, S., Zukerman, A., Shafer-Elliott, C., Maeir,
A. M., Boaretto, E., Finkelstein, I., and Weiner, S. (2012): Iron and bronze production in
Iron Age IIA Philistia: new evidence from Tell es-Safi/Gath, Israel, Journal of Archaeo-
logical Science, 39, 255–267.
Ellam, R. M. (2010): The graphical presentation of lead isotope data for environmental
source apportionment, Science of the Total Environment, 408, 3490–3492.
Ellingham, H. J. T. (1944): Reducibility of oxides and sulphides in metallurgical processes,
Journal of the Society of Chemical Industry, 5, 125–133.

Frederik Rademakers Bibliography 485
Elliott, T., Zindler, A., and Bourdon, B. (1999): Exploring the kappa conundrum: the role
of recycling in the lead isotope evolution of the mantle, Earth and Planetary Science
Letters, 169, 129–145.
Eniosova, N. and Rehren, Th. (2012): Metal melting crucibles from medieval Novgorod, in
M. Brisbane, N. Makarov, and E. Nosov, eds., The Archaeology of Medieval Novgorod in
Context. Studies in Centre/Periphery Relations, Oxford: Oxbow Books, pp. 210–223.
Erb-Satullo, N. L., Gilmour, B. J. J., and Khakhutaishvili, N. (2014): Late Bronze and Early
Iron Age copper smelting technologies in the South Caucasus: the view from ancient
Colchis c. 1500-600 BC, Journal of Archaeological Science, 49, 147–159.
Evans, R. T. and Tylecote, R. F. (1967): Some vitrified products, Bulletin of the Historical
Metallurgy Group, 1, 22–23.
Evely, D., Hein, A., and Nodarou, E. (2012): Crucibles from Palaikastro, East Crete: insights
into metallurgical technology in the Aegean Late Bronze Age, Journal of Archaeological
Science, 39, 1821–1836.
Fabrizi, M. (1988): Copper corrosion products: analysis and interpretation, in E. A. Slater
and J. O. Tate, eds., Science and Archaeology. Proceedings of a Conference on the Applica-
tion of Scientific Techniques to Archaeology, Glasgow, September 1987, BAR British Series
196, Oxford: BAR, pp. 295–303.
Fang, J.-L. and McDonnell, G. (2011): The colour of copper alloys, Historical Metallurgy,
45, 52–61.
Farag, M. (1981): Metallurgy in ancient Egypt - some aspects of techniques and materials,
Metals Museum Bulletin, 6, 15–30.
Fattovich, R. (2012): Egypt’s trade with Punt: new discoveries on the Red Sea coast, British
Museum Studies in Ancient Egypt and Sudan, 18, 1–59.
Fenn, T. R., Killick, D. J., Chesley, J., Magnavita, S., and Ruiz, J. (2009): Contacts between
West Africa and Roman North Africa: archaeometallurgical results from Kissi, north-
eastern Burkina Faso, in S. Magnavita, L. Kote, and P. Breunig, eds., Crossroads/Carrefour
Sahel: Cultural and Technological Developments in First Millennium BC/AD West Africa,
Journal of African Archaeology Monograph Series 2, Frankfurt: Africa Magna Verlag, pp.
119–146.

486 Bibliography Frederik Rademakers
Fields, A. (2011): The Late Phrygian Citadel at Gordion, Turkey: a Preliminary Study, Mas-
ter’s thesis, University of Cincinnati, Department of Classics, Cincinnati, OH.
Figueiredo, E., Silva, R. J. C., Braz Fernandes, F. M., and Araújo, M. F. (2010a): Some long
term corrosion patterns in archaeological metal artefacts, Materials Science Forum, 636-
637, 1030–1035.
Figueiredo, E., Silva, R. J. C., Senna-Martinez, J. C., Araújo, M. F., Braz Fernandes, F. M.,
and Inêz Vaz, J. L. (2010b): Smelting and recycling evidences from the Late Bronze Age
habitat site of Baiões (Viseu, Portugal), Journal of Archaeological Science, 37, 1623–1634.
Fitzenreiter, M., Loeben, C. E., Raue, D., and Wallenstein, U., eds. (2014): Gegossene Götter.
Metallhandwerk und Massenproduktion im alten Ägypten, Rahden/Westfalen: Verlag
Marie Leidorf GmbH.
Fleming, S. J. (1982): Lead isotope analyses of Late Period Egyptian bronzes, MASCA Jour-
nal, 2, 65–69.
Fluzin, P., Ploquin, A., and Serneels, V. (2000): Archéométrie des déchets de production
sidérurgique. Moyens et méthodes d’identification des différents éléments de la chaîne
opératoire directe, Gallia, 57, 101–121.
Forster, N., Grave, P., Vickery, N., and Kealhofer, L. (2011): Non-destructive analysis using
PXRF: methodology and application to archaeological ceramics, X-Ray Spectrometry,
40, 389–398.
Forstner-Müller, I. (2009): Providing a map of Avaris, Egyptian Archaeology, 34, 10–13.
Forstner-Müller, I., Herbich, T., Schweitzer, C., and Weissl, M. (2009): Preliminary report
on the geophysical survey at Tell el-Dab’a/Qantir in spring 2008, Ägypten und Levante,
18, 87–106.
Forstner-Müller, I. and Müller, W. (2007): Neueste Ergebnisse des Magnetometersurveys
während der Frühjahrskampagne 2006 in Tell el-Dab’a/Qantir, Ägypten und Levante, 16,
79–87.
Foucault, A. and Stanley, D. J. (1989): Late Quaternary paleoclimatic oscillations in East
Africa recorded by heavy minerals in the Nile delta, Nature, 339, 44–46.
Frahm, E. (2013a): Is obsidian sourcing about geochemistry or archaeology? A reply to
Speakman and Shackley, Journal of Archaeological Science, 40, 1444–1448.
Frederik Rademakers Bibliography 487
Frahm, E. (2013b): Validity of "off-the-shelf" handheld portable XRF for sourcing Near
Eastern obsidian chip debris, Journal of Archaeological Science, 40, 1080–1092.
Frahm, E. and Doonan, R. C. P. (2013): The technological versus methodological revolution
of portable XRF in archaeology, Journal of Archaeological Science, 40, 1425–1434.
Frahm, E., Schmidt, B. A., Gasparyan, B., Yeritsyan, B., Karapetian, S., Meliksetian, K., and
Adler, D. S. (2014): Ten seconds in the field: rapid Armenian obsidian sourcing with
portable XRF to inform excavations and surveys, Journal of Archaeological Science, 41,
333–348.
Freestone, I. C. (1989): Refractory materials and their procurement, in A. Hauptmann,
E. Pernicka, and G. Wagner, eds., Old World Archaeometallurgy. Der Anschnitt, Beiheft 7,
Bochum: Deutsches Bergbau-Museum, pp. 155–162.
Freestone, I. C., Leslie, K. A., Thirlwall, M., and Goren-Rosen, Y. (2003): Strontium isotopes
in the investigation of early glass production: Byzantine and Early Islamic glass from the
Near East, Archaeometry, 45, 19–32.
Freestone, I. C. and Tite, M. S. (1986): Refractories in the ancient and preindustrial world,
in W. D. Kingery and E. Lense, eds., High-technology Ceramics: Past, Present, and Future.
The Nature of Innovation and Change in Ceramic Technology, Westerville, OH: American
Ceramic Society, pp. 35–63.
Frisch, B. and Thiele, W.-R. (1985): Die vorgeschichtliche Bronze- und Eisenmetallurgie
von Kamid el-Loz, in B. Frisch, G. Mansfeld, and W.-R. Thiele, eds., Kamid el-Loz 6. Die
Werkstätten der spätbronzezeitlichen Paläste, Saarbrücker Beiträge zur Altertumskunde,
Band 33, Bonn: Habelt, pp. 151–164.
Gale, N. H. (1991): Bronze Age Trade in the Mediterranean: Papers presented at the Confer-
ence held at Rewley House, Oxford, in December 1989, Jonsered: Åstrom.
Gale, N. H. (1997): The isotopic composition of tin in some ancient metals and the recy-
cling problem in metal provenancing, Archaeometry, 39, 71–82.
Gale, N. H. (1999): Lead isotope characterization of the ore deposits of Cyprus and Sardinia
and its application to the discovery of the sources of copper for Late Bronze Age oxhide
ingots, in S. M. M. Young, A. M. Pollard, P. Budd, and R. A. Ixer, eds., Metals in Antiquity,
BAR S792, Oxford: Archaeopress, pp. 110–121.

488 Bibliography Frederik Rademakers
Gale, N. H. (2001): Archaeology, science-based archaeology and the Mediterranean Bronze
Age metals trade: a contribution to the debate, European Journal of Archaeology, 4, 113–
130.
Gale, N. H. (2005): Die Kupferbarren von Uluburun. Teil 2: Bleiisotopenanalysen von
Bohrkernen aus den Barren, in Ü. Yalçin, C. Pulak, and R. Slotta, eds., Das Schiff von
Uluburun. Welthandel vor 3000 Jahren, Bochum: Deutsches Bergbau-Museum, pp.
141–148.
Gale, N. H. (2009): A response to the paper of A. M. Pollard: What a long strange trip it’s
been: lead isotopes and archaeology, in A. J. Shortland, I. C. Freestone, and Th. Rehren,
eds., From Mine to Microscope. Advances in the Study of Ancient Technology, Oxford:
Oxbow Books, pp. 191–196.
Gale, N. H. (2011): Copper oxhide ingots and lead isotope provenancing, in P. P. Betan-
court and S. C. Ferrence, eds., Metallurgy: Understanding How, Learning Why. Studies
in Honor of James D. Muhly, Philadelphia, PA: INSTAP Academic Press, pp. 213–220.
Gale, N. H., Bachmann, H.-G., Rothenberg, B., Stos-Gale, Z. A., and Tylecote, R. F. (1990):
The adventitious production of iron in the smelting of copper, in B. Rothenberg, ed.,
The Ancient Metallurgy of Copper: Archaeology-Experiment-Theory. (Researches in the
Arabah 1959-84; v. 2), London: The Institute for Archaeo-Metallurgical Studies, pp. 182–
191.
Gale, N. H., Kayafa, M., and Stos-Gale, Z. A. (2009): Further evidence for Bronze Age pro-
duction of copper from ores in the Lavrion district, Attica, Greece, in Archaeometallurgy
in Europe 2007. Selected Papers of the 2nd International Conference 17.-21. June 2007 in
Aquileia, Milan: Associazione Italiana di Metallurgia, pp. 158–176.
Gale, N. H. and Stos-Gale, Z. A. (1982): Bronze Age copper sources in the Mediterranean:
a new approach, Science, 216, 11–19.
Gale, N. H. and Stos-Gale, Z. A. (1995): Comments on ‘Oxhide ingots, recycling, and the
Mediterranean metals trade’, Journal of Mediterranean Archaeology, 8, 33–41.
Gale, N. H. and Stos-Gale, Z. A. (2012): The role of the Apliki mine region in the post c. 1400
BC copper production and trade networks in Cyprus and the wider Mediterranean, in
V. Kassianidou and G. Papasavvas, eds., Eastern Mediterranean Metallurgy and Metal-
work in the Second Millennium BC - A Conference in Honour of James D. Muhly, Nicosia,
10th-11th October 2009, Oxford: Oxbow Books, pp. 70–82.

Frederik Rademakers Bibliography 489
Gale, N. H., Stos-Gale, Z. A., and Gilmore, G. R. (1985): Alloy types and copper sources of
Anatolian copper alloy artifacts, Anatolian Studies, 35, 143–173.
Gale, N. H., Stos-Gale, Z. A., Maliotis, G., and Annetts, N. (1997): Lead isotope data from the
Isotrace Laboratory, Oxford: Archaeometry data base 4, ores from Cyprus, Archaeome-
try, 39, 237–246.
Gale, N. H., Stos-Gale, Z. A., Raduncheva, A., Panayotov, I., Ivanov, I., Lilov, P., and Todorov,
T. (2003): Early metallurgy in Bulgaria, in P. T. Craddock and J. Lang, eds., Mining and
Metal Production. Through the Ages, London: British Museum Press, pp. 122–174.
Galili, E., Gale, N. H., and Rosen, B. (2013): A Late Bronze Age shipwreck with a metal
cargo from Hishuley Carmel, Israel, The International Journal of Nautical Archaeology,
42, 2–23.
Galili, E., Shmueli, N., and Artzy, M. (1986): Bronze Age ship’s cargo of copper and tin, The
International Journal of Nautical Archaeology, 15, 25–37.
Garland, H. and Bannister, C. O. (1927): Ancient Egyptian Metallurgy, London: Charles
Griffin & Co.
Garson, M. S. (1977): Younger granites of Egypt and associated mineralization, Transac-
tions of the Institution of Mining and Metallurgy, 86, 161.
Garzanti, E., Andò, S., Vezzoli, G., Abdel Megid, A. A., and El Kammar, A. (2006): Petrology
of Nile River sands (Ethiopia and Sudan): sediment budgets and erosion patterns, Earth
and Planetary Science Letters, 252, 327–341.
Gauss, R. K., Bátora, J., Nowaczinski, E., Rassmann, K., and Schukraft, G. (2013): The Early
Bronze Age settlement of Fidvár, Vráble (Slovakia): reconstructing prehistoric settle-
ment patterns using portable XRF, Journal of Archaeological Science, 40, 2942–2960.
Georgakopoulou, M., Bassiakos, Y., and Philaniotou, O. (2011): Seriphos surfaces: a study
of copper slag heaps and copper sources in the context of Early Bronze Age Aegean
metal production, Archaeometry, 53, 123–145.
Gillis, C., Clayton, R., Pernicka, E., and Gale, N. H. (2003): Tin in the Aegean Bronze Age, in
R. Laffineur and K. Foster, eds., Metron. Measuring the Aegean Bronze Age. Proceedings of
the 9th International Aegean Conference, New Haven, Yale University, 18-21 April 2002,
Aegaeum 24, Liege/Austin, pp. 103–110.

490 Bibliography Frederik Rademakers
Giovannelli, G., Natali, S., Bozzini, B., Siciliano, A., Sarcinelli, G., and Vitale, R. (2005): Mi-
crostructural characterization of early western Greek incuse coins, Archaeometry, 47,
817–833.
Goldstein, J. I., Newbury, D. E., Joy, D. C., Lyman, C. E., Echlin, P., Lifshin, E., Sawyer, L.,
and Michael, J. R. (2007): Scanning Electron Microscopy and X-Ray Microanalysis, New
York and London: Kluwer Academic/ Plenum Publishers.
Goren, Y. (2014): The operation of a portable petrographic thin-section laboratory for field
studies, New York Microscopical Society Newsletter, September, 1–17.
Goscinny, R. and Uderzo, A. (1997): Asterix in Corsica, Paris: Hachette.
Gouda, V. K., Youssef, G. I., and Abdel Ghany, N. A. (2012): Characterization of Egyptian
bronze archaeological artifacts, Surface and Interface Analysis, 44, 1338–1345.
Goy, J., Le Carlier de Veslud, C., and Degli Esposti, M. (2013): Archaeometallurgical re-
search in the northern Hajjar Mountains (Oman Peninsula) during the Iron Age (1200-
300 BCE), Poster presented at the Timna Park International Conference in memory of
Professor Beno Rothenberg. Mining for Copper: Environment, Culture and Copper in An-
tiquity. 22-25 April 2013, Timna, Israel.
Graedel, T. E. (1992): Corrosion mechanisms for silver exposed to the atmosphere, Journal
of the Electrochemical Society, 139, 1963–1970.
Grant, M. R. (1999): The sourcing of southern African tin artefacts, Journal of Archaeologi-
cal Science, 26, 1111–1117.
Grave, P., Kealhofer, L., and Marsh, B. (2005): Ceramic compositional analysis and the
Phrygian sanctuary at Dümrek, in L. Kealhofer, ed., The Archaeology of Midas and the
Phrygians: Recent Work at Gordion, Philadelphia, PA: University of Pennsylvania Mu-
seum of Archaeology and Anthropology, pp. 149–160.
Grave, P., Kealhofer, L., Marsh, B., Sams, K., Voigt, M., and DeVries, K. (2009): Ceramic
production and provenience at Gordion, Central Anatolia, Journal of Archaeological Sci-
ence, 36, 2162–2176.
Guerra, M. F. (2004): The circulation of South American precious metals in Brazil at the
end of the 17th century, Journal of Archaeological Science, 31, 1225–1236.

Frederik Rademakers Bibliography 491
Guerra, M. F., Sarthre, C.-O., Gondonneau, A., and Barrandon, J.-N. (1999): Precious metals
and provenance enquiries using LA-ICP-MS, Journal of Archaeological Science, 26, 1101–
1110.
Hall, F. P. and Insley, H. (1933): A compilation of phase-rule diagrams of interest to the
ceramist and silicate technologist, Journal of the American Ceramic Society, 16, 463–567.
Hall, M. C. (1995): Comments on ‘Oxhide ingots, recycling, and the Mediterranean metals
trade’, Journal of Mediterranean Archaeology, 8, 42–44.
Hall, M. C. and Steadman, S. R. (1991): Tin and Anatolia - another look, Journal of Mediter-
ranean Archaeology, 4, 217–234.
Hamza, M. (1930): Excavations of the Department of Antiquities at Qantir (Faqus District),
Annales du Service des Antiquités, 30, 31–68.
Hancock, R. G. V., Millet, N. B., and Mills, A. J. (1986): A rapid INAA method to characterize
Egyptian ceramics, Journal of Archaeological Science, 13, 107–117.
Hancock, R. G. V., Pavlish, L. A., Farquhar, R. M., Julig, P. J., and Fox, W. A. (1994): Chemical
seriation of northeastern North American archaeological sites using copper artifacts,
in D. Scott and P. Meyers, eds., Archaeometry of Pre-Columbian Sites and Artifacts. Pro-
ceedings of a Symposium organized by the UCLA Institute of Archaeology and the Getty
Conservation Institute, Los Angeles, California, March 23-27, 1992, Los Angeles, CA: The
Getty Conservation Institute, pp. 255–265.
Hauptmann, A. (2007): The Archaeometallurgy of Copper - Evidence from Faynan, Jordan,
Springer.
Hauptmann, A. (2014): The investigation of archaeometallurgical slag, in B. W. Roberts
and C. P. Thornton, eds., Archaeometallurgy in Global Perspective, Springer, pp. 91–105.
Hauptmann, A., Begemann, F., Heitkemper, E., Pernicka, E., and Schmitt-Strecker, S.
(1992): Early copper produced at Feinan, Wadi Araba, Jordan: the composition of ores
and copper, Archeomaterials, 6, 1–33.
Hauptmann, A., Lutz, J., Pernicka, E., and Yalçin, Ü. (1993): Zur Technologie der Früh-
esten Kupferverhüttung im Östlichen Mittelmeerraum, in M. Frangipane, H. Haupt-
mann, M. Liverani, P. Matthiae, and M. Mellink, eds., Between the Rivers and Over the
Mountains. Archaeologica Anatolica et Mesopotamica. Alba Palmieri Dedicata, Rome:
Dipartimento di Scienze Storiche Archeologiche e Antropologiche dell’Antichità. Uni-
versità di Roma La Sapienza, pp. 541–572.

492 Bibliography Frederik Rademakers
Hauptmann, A., Maddin, R., and Prange, M. (2002): On the structure and composition of
copper and tin ingots excavated from the shipwreck of Uluburun, Bulletin of the Ameri-
can Schools of Oriental Research, 328, 1–30.
Hauptmann, A., Rehren, Th., and Schmitt-Strecker, S. (2003): Early Bronze Age copper
metallurgy at Shahr-i Sokhta (Iran), reconsidered, in T. Stöllner, G. Körlin, G. Steffens,
and J. Cierny, eds., Man and Mining (Mensch und Bergbau), Der Anschnitt, Beiheft 16,
Bochum: Deutsches Bergbau-Museum, pp. 197–213.
Hauptmann, A., Weisgerber, G., and Bachmann, H.-G. (1988): Early copper metallurgy in
Oman, in R. Maddin, ed., The Beginning of the Use of Metals and Alloys, Cambridge, MA:
MIT Press.
Haustein, M., Gillis, C., and Pernicka, E. (2010): Tin isotopy - a new method for solving old
questions, Archaeometry, 52, 816–832.
Hayes, W. C. (1937): Glazed Tiles from a Palace of Ramesses II at Kantir, New York: The
Metropolitan Museum of Art.
Haynes, I. P. (2011): Early Roman Thrace, in I. P. Haynes, ed., Early Roman Thrace. New
Evidence from Bulgaria, JRA Supplementary Series 82, Portsmouth, Rhode Island, pp.
6–14.
Heimann, R. B. (1989): Assessing the technology of ancient pottery: the use of ceramic
phase diagrams, Archeomaterials, 3, 123–148.
Heimann, R. B., Chirikure, S., and Killick, D. (2010): Mineralogical study of precolonial
(1650-1850 CE) tin smelting slags from Rooiberg, Limpopo Province, South Africa, Eu-
ropean Journal of Mineralogy, 22, 751–761.
Hein, A., Karatasios, I., Müller, N. S., and Kilikoglou, V. (2013): Heat transfer properties of
pyrotechnical ceramics used in ancient metallurgy, Thermochimica Acta, 573, 87–94.
Hein, A. and Kilikoglou, V. (2007): Modeling of thermal behavior of ancient metallurgical
ceramics, Journal of the American Ceramic Society, 90, 878–884.
Hein, A. and Kilikoglou, V. (2011): Technological aspects of Bronze Age metallurgical ce-
ramics in the eastern Mediterranean, in P. P. Betancourt and S. C. Ferrence, eds., Metal-
lurgy: Understanding How, Learning Why. Studies in Honor of James D. Muhly, Philadel-
phia, PA: INSTAP Academic Press, pp. 181–187.

Frederik Rademakers Bibliography 493
Hein, A., Kilikoglou, V., and Kassianidou, V. (2007): Chemical and mineralogical examina-
tion of metallurgical ceramics from a Late Bronze Age copper smelting site in Cyprus,
Journal of Archaeological Science, 34, 141–154.
Hein, A., Müller, N. S., Day, P. M., and Kilikoglou, V. (2008): Thermal conductivity of ar-
chaeological ceramics: the effect of inclusions, porosity and firing temperature, Ther-
mochimica Acta, 480, 35–42.
Helwing, B. (2009): Rethinking the tin mountains: patterns of usage and circulation of
tin in greater Iran from the 4th to the 1st millennium BC, Turkiye Bilimler Akademisi
Arkeoloji Dergisi (TUBA-AR). Turkish Academy of Sciences Journal of Archaeology, 12,
209–221.
Hemingway, E. (1927): The Undefeated, in Men Without Women, New York: Charles Scrib-
ner’s Sons.
Hendy, M. (1972): Mint and fiscal administration under Diocletian, his colleagues, and his
successiors, A. D. 305-24, The Journal of Roman Studies, 62, 75–82.
Henrickson, R. C. (1994): Continuity and discontinuity in the ceramic tradition at Gordion
during the Iron Age, in D. French and A. Çilingiroglu, eds., Anatolian Iron Ages 3. The
Proceedings of the Third Anatolian Iron Ages Colloquium Held at Van, 6-12 August 1990,
British Institute of Archaeology at Ankara, Monograph 16, London: British Institute of
Archaeology at Ankara, pp. 95–129.
Henrickson, R. C. (2005): The local potter’s craft at Phrygian Gordion, in L. Kealhofer, ed.,
The Archaeology of Midas and the Phrygians: Recent Work at Gordion, Philadelphia, PA:
University of Pennsylvania Museum of Archaeology and Anthropology, pp. 124–135.
Henrickson, R. C. and Blackman, M. J. (1996): Large-scale production of pottery at Gor-
dion: a comparison of the Late Bronze and Early Phrygian industries, Paléorient, 22,
67–87.
Herbert, E. W. (1984): Red Gold of Africa: Copper in Precolonial History and Culture, Madi-
son: University of Wisconsin Press.
Herbert, F. (1965): Dune, New York: Chilton Books.
Herold, A. (1998): Gegossen - Geschmiedet - Tordiert. Zur Herstellung van bronzenen
Trensen in der Ramses-Stadt Piramesse/Ägypten, Metalla (Bochum), 5, 3–21.

494 Bibliography Frederik Rademakers
Herrmann, C. (1957): Formen für Ägyptische Fayencen aus Qantir: Katalog der Sammlung
des Franciscan Biblical Museum, Jerusalem und zweier Privatsammlungen, Fribourg:
Academic Press.
Hikade, T. (1998): Economic aspects of the New Kingdom: the expeditions to the copper
mines of the Sinai, Bulletin of the Australian Centre for Egyptology, 9, 43–52.
Hikade, T. (2006): Expeditions to the Wadi Hammamat during the New Kingdom, The Jour-
nal of Egyptian Archaeology, 92, 153–168.
Hikade, T. (2007): Crossing the frontier into the desert: Egyptian expeditions to the Sinai
Peninsula, Ancient West and East, 6, 1–22.
Hirao, Y., Enomoto, J., and Tachikawa, H. (1995): Lead isotope ratios of copper, zinc and
lead minerals in Turkey in relation to the provenance study of artefacts, in H. I. H. Prince
Takahito Mikasa, ed., Essays on Ancient Anatolia and its surrounding civilisations, Wies-
baden: Harrassowitz Verlag, pp. 89–114.
Hodgkinson, A. K. (2007): The final phase of Per-Ramesses: the history of the city in light
of its natural environment, in M. Cannata, ed., Current Research in Egyptology 2006:
Proceedings of the Seventh Annual Symposium, Which Took Place at the University of
Oxford, April 2006, Oxford: Oxbow, pp. 99–115.
Hofmann, W. and Klein, M. (1966): Beitrag zur Kenntnis des Dreistoffsystems Kupfer-Zinn-
Sauerstoff, Zeitschrift für Metallkunde, 83, 421–441.
Hook, D. R. and Craddock, P. T. (1996): Appendix. The scientific analysis of the copper-alloy
lamps: aspects of classical alloying practices, in D. M. Bailey, ed., Catalogue of Lamps in
the British Museum, London: British Museum Press, pp. 144–163.
Horne, L. (1982): Fuel for the metal worker - the role of charcoal and charcoal production
in ancient metallurgy, Expedition, 25, 6–13.
Horsley, T. (1997): Roman and Medieval Crucible Sherds from London, Ancient Monu-
ments Laboratory Report 8/97, English Heritage.
Hughes, M. J. (1980): The analysis of Roman tin and pewter ingots, in W. A. Oddy, ed.,
Aspects of early metallurgy, Occasional Paper 17, London: British Museum, pp. 41–50.
Humphris, J., Martinón-Torres, M., Rehren, Th., and Reid, A. (2009): Variability in single
smelting episodes - a pilot study using iron slag from Uganda, Journal of Archaeological
Science, 36, 359–369.

Frederik Rademakers Bibliography 495
Humphris, J. and Rehren, Th., eds. (2013): The World of Iron, London: Archetype Publica-
tions.
Hunt, A. (2013): Development of quartz cathodoluminescence for the geological grouping
of archaeological ceramics: firing effects and data analysis, Journal of Archaeological
Science, 40, 2902–2912.
Hunt, A. and Speakman, R. J. (2014): Protocol for the analysis of archaeological ceramics
and sediments by pXRF, Poster presented at the 79th Annual Meeting of the Society for
American Archaeology, April 23-27 2014, Austin, Texas.
Iles, L. and Martinón-Torres, M. (2009): Pastoralist iron production on the Laikipia
Plateau, Kenya: wider implications for archaeometallurgical studies, Journal of Archae-
ological Science, 36, 2314–2326.
Ineson, P. R. (1989): Introduction to Practical Ore Microscopy, Harlow: Longman Scientific
and Technical.
Ingo, G. M., De Caro, T., Riccucci, C., Angelini, E., Grassini, S., Balbi, S., Bernardini, P.,
Salvi, D., Bousselmi, I., Çilingiroglu, A., Gener, M., Gouda, V. K., al Jarrah, O., Khosroff, S.,
Mahdjoub, Z., al Saad, Z., el Saddik, W., and Vassiliou, P. (2006): Large scale investigation
of chemical composition, structure and corrosion mechanism of bronze archeological
artefacts from Mediterranean basin, Applied Physics A, 83, 513–520.
Ivanov, R. T. and von Bülow, G. (2008): Thracia: eine römische Provinz auf der Balkan-
halbinsel, Zaberns Bildbände zur Archäologie. Sonderbände der Antiken Welt. Orbis
provinciarum, Mainz: Verlag Philip von Zabern.
Ivanov, T. (1983): The Roman cities of Moesia and Thrace (modern Bulgaria), in A. G. Poul-
ter, ed., Ancient Bulgaria. Papers presented to the International Symposium on the An-
cient History and Archaeology of Bulgaria, University of Nottingham, 1981, Nottingham:
Department of Classical and Archaeological Studies, pp. 129–154.
Jackson, C. M. (2005): Glassmaking in Bronze-Age Egypt, Science, 308, 1750–1752.
Jaksch, H., Seipel, W., Weiner, K. L., and El Goresy, A. (1983): Egyptian blue - cuprorivaite:
a window to ancient Egyptian technology, Naturwissenschaften, 70, 525–535.
James, T. G. H. (1972): Gold technology in ancient Egypt. Mastery of metal working meth-
ods, Gold Bulletin, 5, 38–42.
Jefferson, T. (1785): Letter to Peter Carr. August 19, 1785.

496 Bibliography Frederik Rademakers
Johnson, M. (2010): Archaeological Theory: An Introduction (2nd Edition), Wiley-
Blackwell.
Jones, A. (2004): Archaeometry and materiality: materials-based analysis in theory and
practice, Archaeometry, 46, 327–338.
Jung, R., Mehofer, M., and Pernicka, E. (2011): Metal exchange in Italy from the Middle to
the Final Bronze Age (14th-11th century BCE), in P. P. Betancourt and S. C. Ferrence, eds.,
Metallurgy: Understanding How, Learning Why. Studies in Honor of James D. Muhly,
Philadelphia, PA: INSTAP Academic Press, pp. 231–248.
Kaczmarczyk, A. (1986): The source of cobalt in ancient Egyptian pigments, in J. S. Olin
and M. J. Blackman, eds., Proceedings of the 24th International Archaeometry Sympo-
sium, Washington, D.C.: Smithsonian Institution Press, pp. 369–376.
Kahneman, D. (2012): Thinking, Fast and Slow, London: Penguin.
Kallfass, M. and Hörz, G. (1989): Metallographic investigations on archaeological tin
bronzes of Late Egyptian and Bronze Period, Practical Metallography, 26, 105–121.
Karageorghis, V. and Kassianidou, V. (1999): Metalworking and recycling in Late Bronze
Age Cyprus - the evidence from Kition, Oxford Journal of Archaeology, 18, 171–188.
Kassianidou, V. (2003a): Archaeometallurgical procedures, in M. Given and A. B. Knapp,
eds., The Sydney Cyprus Survey Project. Social Approaches to Regional Archaeological
Survey, Monumenta Archaeologica 21, Los Angeles, CA: UCLA Cotsen Institute of Ar-
chaeology, pp. 44–48.
Kassianidou, V. (2003b): The trade of tin and the island of copper, in A. Giumlia-Mair and
F. Lo Schiavo, eds., The Problem of Early Tin. Acts of the XIVth UISPP Congress, BAR
International Series 1199, Oxford: Archaeopress, pp. 109–119.
Kassianidou, V. (2009): Oxhide ingots in Cyprus, in F. Lo Schiavo, J. D. Muhly, R. Maddin,
and A. Giumlia-Mair, eds., Oxhide Ingots in the Central Mediterranean, A. G. Leventis
Foundation and CNR Instituto di Studi sulle Civiltà dell’Egeo e del Vicino Oriente, pp.
41–81.
Kassianidou, V. (2013): The production and trade of Cypriot copper in the Late Bronze Age.
An analysis of the evidence, Pasiphae, 7, 133–146.
Katona, I., Bourgarit, D., Thomas, N., and Bouquillon, A. (2007): From furnace to casting
moulds: an exceptional 14th century copper-metallurgy workshop studied in the light

Frederik Rademakers Bibliography 497
of refractory ceramic materials, in S. Y. Waksman, ed., Archaeometric and Archaeological
Approaches to Ceramics: Papers Presented at EMAC ’05, 8th European Meeting on Ancient
Ceramics, Lyon 2005, BAR International Series 1691, Oxford: Archaeopress, pp. 161–167.
Kaufman, B. (2013): Copper alloys from the ‘Enot Shuni cemetery and the origins of bronze
metallurgy in the EB IV - MB II Levant, Archaeometry, 55, 663–690.
Kealhofer, L., ed. (2005): The Archaeology of Midas and the Phrygians: Recent Work at Gor-
dion, Philadelphia, PA: University of Pennsylvania Museum of Archaeology and Anthro-
pology.
Kearns, T., Martinón-Torres, M., and Rehren, Th. (2010): Metal to mould: alloy identifica-
tion in experimental casting moulds using XRF, Historical Metallurgy, 44, 48–58.
Kilikoglou, V., Vekinis, G., and Maniatis, Y. (1995): Toughening of ceramic earthenwares
by quartz inclusions: an ancient art revisited, Acta Metallurgica et Materialia, 43, 2959–
2965.
Kilikoglou, V., Vekinis, G., Maniatis, Y., and Day, P. M. (1998): Mechanical performance of
quartz-tempered ceramics: part I, strength and toughness, Archaeometry, 40, 261–279.
Killick, D. (2009): Cairo to Cape: the spread of metallurgy through eastern and southern
Africa, Journal of World Prehistory, 22, 399–414.
Killick, D. and Fenn, T. (2012): Archaeometallurgy: the study of preindustrial mining and
metallurgy, Annual Review of Anthropology, 41, 559–575.
Kingsley, S. A. and Raveh, K. (1994): Stamped lead ingots from the coast of Israel, The
International Journal of Nautical Archaeology, 23, 119–128.
Kipling, R. (1899): From Sea to Sea: Letters of Travel, New York: Doubleday and McClure.
Kitchen, K. A. (1982): Pharaoh Triumphant: the Life and Times of Ramesses II King of Egypt,
Warminster: Aris & Phillips.
Klein, C. and Dutrow, B. (2007): Manual of Mineral Science (23rd edition), Wiley.
Klein, S. and Hauptmann, A. (1999): Iron Age leaded tin bronzes from Khirbet edh-Dharih,
Jordan, Journal of Archaeological Science, 26, 1075–1082.
Klein, S., Lahaye, Y., Brey, G. P., and Von Kaenel, H.-M. (2004): The early Roman Impe-
rial Aes coinage II: tracing the copper sources by analysis of lead and copper isotopes -
copper coins of Augustus and Tiberius, Archaeometry, 46, 469–480.

498 Bibliography Frederik Rademakers
Klein, S., Rico, C., Lahaye, Y., von Kaenel, H. M., Domergue, C., and Brey, G. P. (2007): Cop-
per ingots form the western Mediterranean Sea: chemical characterisation and prove-
nance studies through lead- and copper isotope analyses, Journal of Roman Archaeol-
ogy, 20, 202–221.
Klein, S. and von Kaenel, H.-M. (2000): The early Roman Imperial aes coinage: metal anal-
ysis and numismatic studies. Part 1, Schweizerische Numismatische Rundschau, 79, 53–
106.
Klemm, R. and Klemm, D. (2013): Gold and Gold Mining in Ancient Egypt and Nubia.
Geoarchaeology of the Ancient Gold Mining Sites in the Egyptian and Sudanese Eastern
Deserts, Berlin: Springer.
Knapp, A. B. (2000): Archaeology, science-based archaeology and the Mediterranean
Bronze Age metals trade, European Journal of Archaeology, 3, 31–56.
Knapp, A. B. (2011): Cyprus, copper, and Alashiya, in P. P. Betancourt and S. C. Fer-
rence, eds., Metallurgy: Understanding How, Learning Why. Studies in Honor of James
D. Muhly, Philadelphia, PA: INSTAP Academic Press, pp. 249–254.
Knapp, A. B., Kassianidou, V., and Donnelly, M. (2001): Copper smelting in Late Bronze Age
Cyprus: the excavations at Politiko Phorades, Near Eastern Archaeology, 64, 204–210.
König, D. and Serneels, V. (2013): Roman double-layered crucibles from Autun/France: a
petrological and geochemical approach, Journal of Archaeological Science, 40, 156–165.
Kramers, J. D. and Tolstikhin, I. N. (1997): Two terrestrial lead isotope paradoxes, forward
transport modelling, core formation and the history of the continental crust, Chemical
Geology, 139, 75–110.
Krismer, M., Töchterle, U., Goldenberg, G., Tropper, P., and Vavtar, F. (2013): Mineralogical
and petrological investigations of Early Bronze Age copper-smelting remains from the
Kiechlberg (Tyrol, Austria), Archaeometry, 55, 923–945.
Krom, M. D., Stanley, D. J., Cliff, R. A., and Woodward, J. C. (2002): Nile River sediment
fluctuations over the past 7000 yr and their key role in sapropel development, Geology,
30, 71–74.
Kuleff, I., Iliev, I., Pernicka, E., and Gergova, D. (2006): Chemical and lead isotope compo-
sitions of lead artefacts from ancient Thracia (Bulgaria), Journal of Cultural Heritage, 7,
244–256.

Frederik Rademakers Bibliography 499
Lackinger, A., Comendador, B., Figueiredo, E., Araújo, M. F., Silva, R., and Rovira, S.
(2013): Copper plus tin plus people. Public co-smelting experimentation in northwest-
ern Iberia, Poster presented at the 7th Experimental Archaeology Conference, Cardiff (UK)
Amgueddfa Cymru - St Fagans National History Museum (WLS), January 2013.
Lafli, E. and Buora, M. (2012): Fibulae in the Museum of Ödemis (Western Turkey), Orien-
tal Archive, 80, 1–18.
Le Bas, M. J., Le Maitre, R. W., Streckeisen, A., and Zanettin, B. (1986): A chemical classifi-
cation of volcanic rocks based on the total alkali-silica diagram, Journal of Petrology, 27,
745–750.
Leese, M. N. (1992): Evaluating lead isotope data: comments on E. V. Sayre, K. A. Yener, E.
C. Joel and I. L. Barnes, ‘Statistical evaluation of the presently accumulated lead isotope
data from Anatolia and surrounding regions’, Archaeometry, 34 (1) (1992), 73-105, and
reply. Comments... II, Archaeometry, 34, 318–322.
Lehner, J. W. (2012): A preliminary report on the microstructure and microanalysis of
metal from Bogazköy, Archaologischer Anzeiger, 2011, 57–64.
Lehner, J. W. and Prikhodko, S. (2010): Microstructure and microanalysis of metal artifacts
from Kerkenes Dag, Central Turkey, ca. 600 BC, Microscopy and Microanalysis, 16, 1244–
1245.
Lehner, J. W., Yener, K. A., and Burton, J. (2009): Lead isotope analysis and chemical char-
acterization of metallic residues of an Early Bronze Age crucible from Göltepe using
ICP-MS, Turkiye Bilimler Akademisi Arkeoloji Dergisi (TUBA-AR). Turkish Academy of
Sciences Journal of Archaeology, 12, 165–174.
Lemonnier, P. (1993): Introduction, in P. Lemonnier, ed., Technological Choices: Transfor-
mations in Material Cultures Since the Neolithic, London: Routledge, pp. 1–35.
Lemonnier, P. and Pfaffenberger, B. (1989): Towards an anthropology of technology, Man,
24 (New Series), 526–527.
Leroi-Gourhan, A. (1964): La Geste et la Parole I - Technique et Langage, Paris: Albin
Michel.
Leroi-Gourhan, A. (1965): La Geste et la Parole II - La Mémoire et les Rythmes, Paris: Albin
Michel.

500 Bibliography Frederik Rademakers
Levy, T. E., Adams, R. B., Hauptmann, A., Prange, M., Schmitt-Strecker, S., and Najjar, M.
(2002): Early Bronze Age metallurgy: a newly discovered copper manufactory in south-
ern Jordan, Antiquity, 76, 425–437.
Levy, T. E., Ben-Yosef, E., and Najjar, M. (2012): New perspectives on Iron Age copper pro-
duction and society in the Faynan Region, Jordan, in V. Kassianidou and G. Papasavvas,
eds., Eastern Mediterranean Metallurgy and Metalwork in the Second Millennium BC
- A Conference in Honour of James D. Muhly, Nicosia, 10th-11th October 2009, Oxford:
Oxbow Books, pp. 197–214.
Li, X. J., Martinón-Torres, M., Meeks, N. D., Xia, Y., and Zhao, K. (2011): Inscriptions, filing,
grinding and polishing marks on the bronze weapons frin the Qin Terracotta Army in
China, Journal of Archaeological Science, 38, 492–501.
Ling, J., Hjärthner-Holdar, E., Grandin, L., Billström, K., and Persson, P.-O. (2013): Moving
metals or indigenous mining? Provenancing Scandinavian Bronze Age artefacts by lead
isotopes and trace elements, Journal of Archaeological Science, 40, 291–304.
Ling, J., Stos-Gale, Z. A., Grandin, L., Billström, K., Hjärthner-Holdar, E., and Persson, P.-
O. (2014): Moving metals II: provenancing Scandinavian Bronze Age artefacts by lead
isotope and elemental analyses, Journal of Archaeological Science, 41, 106–132.
Lo Schiavo, F. (2012): Cyprus and Sardinia, beyond the oxhide ingots, in V. Kassianidou
and G. Papasavvas, eds., Eastern Mediterranean Metallurgy and Metalwork in the Second
Millennium BC - A Conference in Honour of James D. Muhly, Nicosia, 10th-11th October
2009, Oxford: Oxbow Books, pp. 142–150.
Lo Schiavo, F., Sorge, E., Cucuzza, N., Gale, N. H., and Stos-Gale, Z. A. (2013): An oxhide
ingot fragment from Piazzale dei Sacelli, Ayia Triada (Crete) to the National Archaeolog-
ical Museum, Florence, in G. Graziadio, R. Guglielmino, V. Lenuzza, and S. Vitale, eds.,
Studies in Mediterranean Archaeology for Mario Benzi, BAR International Series 2460,
Oxford: Archaeopress, pp. 49–60.
Lucas, A. (1962): Ancient Egyptian Materials and Industries, London: Edward Arnold.
Lutz, J. and Pernicka, E. (1996): Energy dispersive X-ray fluorescence analysis of ancient
copper alloys: empirical values for precision and accuracy, Archaeometry, 38, 313–323.
Lyman, R. L. (2012): A historical sketch on the concepts of archaeological association, con-
text, and provenience, Journal of Archaeological Method and Theory, 19, 207–240.

Frederik Rademakers Bibliography 501
MacKenzie, W. S. and Guilford, C. (1980): Atlas of Rock Forming Minerals in Thin Section,
London: Longman.
Maldonado, B. and Rehren, Th. (2009): Early copper smelting at Itziparátzico, Mexico,
Journal of Archaeological Science, 36, 1998–2006.
Manasse, A., Mellini, M., and Viti, C. (2001): The copper slags of the Capattoli Valley,
Campiglia Marittima, Italy, European Journal of Mineralogy, 13, 949–960.
Mangou, H. and Ioannou, P. V. (2000): Studies of the Late Bronze Age copper-based ingots
found in Greece, The Annual of the British School at Athens, 95, 207–217.
Manzo, A. (2012): From the sea to the deserts and back: new research in eastern Sudan,
British Museum Studies in Ancient Egypt and Sudan, 18, 75–106.
Marsh, B. (2000): Geomorphology of the Gordion Regional Survey, Unpublished report
dated September 12, 2000, Gordion archive, Philadelphia, PA: University of Pennsyl-
vania Museum of Archaeology and Anthropology.
Marsh, B. (2005): Physical geography, land use, and human impact at Gordion, in L. Keal-
hofer, ed., The Archaeology of Midas and the Phrygians: Recent Work at Gordion,
Philadelphia, PA: University of Pennsylvania Museum of Archaeology and Anthropol-
ogy, pp. 161–171.
Martinón-Torres, M., Freestone, I. C., Hunt, A., and Rehren, Th. (2008): Mass-produced
mullite crucibles in medieval Europe: manufacture and material properties, Journal of
the American Ceramic Society, 91, 2071–2074.
Martinón-Torres, M. and Rehren, Th. (2009): Post-medieval crucible production and dis-
tribution: a study of materials and materialities, Archaeometry, 51, 49–74.
Martinón-Torres, M. and Rehren, Th. (2014): Technical ceramics, in B. W. Roberts and C. P.
Thornton, eds., Archaeometallurgy in Global Perspective, Springer, pp. 107–131.
Martinón-Torres, M., Rehren, Th., and Freestone, I. C. (2006): Mullite and the mystery of
Hessian wares, Nature, 444, 437–438.
Martinón-Torres, M., Rojas, R. V., Cooper, J., and Rehren, Th. (2007): Metals, microanalysis
and meaning: a study of metal objects excavated from the indigenous cemetery of El
Chorro de Maíta, Cuba, Journal of Archaeological Science, 34, 194–204.

502 Bibliography Frederik Rademakers
Martinón-Torres, M., Valcárcel Rojas, R., Sáenz Samper, J., and Guerra, M. F. (2012): Metal-
lic encounters in Cuba: the technology, exchange and meaning of metals before and
after Columbus, Journal of Anthropological Archaeology, 31, 439–454.
Masioli, E., Vidale, M., Artioli, D., Bianchetti, P., Guida, G., Sidoti, G., Di Pilato, S., and
Salvatori, S. (2006): Copper-melting crucibles from the surface of Altyn-Depe, Turk-
menistan (ca 2500-2000 BC), Paléorient, 32, 157–174.
Mason, R. B. and Tite, M. S. (1997): The beginnings of tin-opacification of pottery glazes,
Archaeometry, 39, 41–58.
Mass, J. L., Wypyski, M. T., and Stone, R. E. (2002): Malkata and Lisht glassmaking tech-
nologies: towards a specific link between second millennium BC metallurgists and
glassmakers, Archaeometry, 44, 67–82.
McNeil, M. B. and Little, B. J. (1992): Corrosion mechanisms for copper and silver objects
in near-surface environments, Journal of the American Institute for Conservation, 31,
355–366.
Mödlinger, M. and Piccardo, P. (2013): Corrosion on prehistoric Cu-Sn-alloys: the influ-
ence of artificial environment and storage, Applied Physics A: Materials Science & Pro-
cessing, 113, 1069–1080.
Mecking, O. and Walter, D. (2004): Gussformen und Tiegel aus zwei Siedlungen der Urnen-
felderzeit im nördlichen Thüringen, Alt-Thüringen, 37, 53–67.
Meeks, D. (2003): Locating Punt, in D. O’Connor and S. Quirke, eds., Mysterious Lands,
London: UCL Press, pp. 53–80.
Meeks, N. D. (1990): The examination of a sample from a copper ingot found off Plymouth,
Devon, The International Journal of Nautical Archaeology, 19, 153–156.
Meeks, N. D. (2000): Scanning electron microscopy of the refractory remains and the gold,
in A. Ramage and P. T. Craddock, eds., King Croesus’ Gold. Excavations at Sardis and the
History of Gold Refining, London: British Museum Press, pp. 99–156.
Meeks, N. D., Craddock, P. T., Hook, D. R., Middleton, A. P., Geçkinli, A., and Ramage, A.
(1996): The scientific study of the refractory remains and gold particles from the Lydian
gold refinery at Sardis, in A. Demirci, S. Özer and G. Summers, eds., Archaeometry 94.
The Proceedings of the 29th International Symposium on Archaeometry, Ankara 9-14,
May 1994, Ankara: Tübitak, pp. 461–482.

Frederik Rademakers Bibliography 503
Mellink, M. J. (1956): Archaeology in Asia Minor, American Journal of Archaeology, 60, 369–
384.
Menu, B. (1999): Ramesses the Great: Warrior and Builder, London: Thames & Hudson.
Merideth, C. (1998): An Archaeometallurgical Survey for Ancient Tin Mines and Smelting
Sites in Spain and Portugal, BAR International Series B714, Oxford: Archaeopress.
Merkel, J. F. (1990): Experimental reconstruction of Bronze Age copper smelting based on
archaeological evidence from Timna, in B. Rothenberg, ed., The Ancient Metallurgy of
Copper: Archaeology-Experiment-Theory. (Researches in the Arabah 1959-84; v. 2), Lon-
don: The Institute for Archaeo-Metallurgical Studies, pp. 78–122.
Merkel, S. and Rehren, Th. (2007): Parting layers, ash trays, and Ramesside glass-making:
an experimental study, in E. B. Pusch and Th. Rehren, eds., Hochtemperatur-Technologie
in der Ramses-Stadt - Rubinglas für den Pharao, Forschungen in der Ramses-Stadt Band
6, Hildesheim: Gerstenberg Verlag, pp. 201–221.
Miller, D. (2003): Archaeological bronze processing in Botswana, in Proceedings of the Mi-
croscopy Society of Southern Africa 33, Microscopy Society of Southern Africa, p. 18.
Miller, D. and Hall, S. (2008): Rooiberg revisited - the analysis of tin and copper smelting
debris, Historical Metallurgy, 42, 23–38.
Miller, H. M.-L. (2007): Archaeological Approaches to Technology, Amsterdan; London: El-
sevier/Academic Press.
Minkova, M. (2002): Some remarks on the circulation and the coinage of Nicopolis ad
Istrum in light of specimens from the Historical Museum in Stara Zagora, in L. Slokoska,
R. T. Ivanov, and V. Dinchev, eds., The Roman and Late Roman City. The International
Conference, Veliko Turnovo, 26-30 July 2000, Sofia: Prof. Marin Drinov Academic Pub-
lishing House, pp. 128–132.
Misra, M. K., Ragland, K. W., and Baker, A. J. (1993): Wood ash composition as a function
of furnace temperature, Biomass and Bioenergy, 4, 103–116.
Müller, N. S., Kilikoglou, V., Day, P. M., and Vekinis, G. (2010): The influence of temper
shape on the mechanical properties of archaeological ceramics, Journal of the European
Ceramic Society, 30, 2457–2465.
Müller, R., Rehren, Th., and Rovira, S. (2004): Almizaraque and the early copper metallurgy
of southeast Spain: new data, Madrider Mitteilungen, 45, 33–56.

504 Bibliography Frederik Rademakers
Molofsky, L. J., Killick, D., Ducea, M. N., Macovei, M., Chesley, J. T., Ruiz, J., Thibodeau, A.,
and Popescu, G. C. (2014): A novel approach to lead isotope provenance studies of tin
and bronze: applications to South African, Botswanan and Romanian artifacts, Journal
of Archaeological Science, 50, 440–450.
Mongiatti, A. (2010): Assaying and Smelting Noble Metals in Sixteenth-century Austria: a
Comparative Analytical Study, Ph.D. thesis, University College London.
Montero-Ruiz, I., Rovira, S., Delibes, G., Fernández-Manzano, J., Fernández-Posse, M. D.,
Herrán, J. I., Martín, C., and Maicas, R. (2003): High leaded bronze in the Late Bronze
Age metallurgy of the Iberian Peninsula, in Archaeometallurgy in Europe. International
Conference 24.-26. September 2003 Milan, Italy. Proceedings Vol. 1, Milan: Associazione
Italiana di Metallurgia, pp. 39–46.
Moorey, P. R. S. and Schweizer, F. (1974): Copper and copper alloys in ancient Turkey: some
new analyses, Archaeometry, 16, 112–115.
Muan, A. (1957): Phase equilibria at liquidus temperatures in the system iron oxide-Al2O3-
SiO2 in air atmosphere, Journal of the American Ceramic Society, 40, 121–133.
Muhly, J. D. (1977): The copper ox-hide ingots and the Bronze Age metal trade, Iraq, 39,
73–82.
Muhly, J. D. (1979): New evidence for sources of and trade in Bronze Age tin, in A. D.
Franklin, J. S. Olin, and T. A. Wertime, eds., The Search for Ancient Tin: a Seminar orga-
nized by Theodore A. Wertime and held at the Smithsonian Institution and the National
Bureau of Standards, Washington, D.C., March 14-15, 1977, Washington, D.C.: Smithso-
nian Institution Press, pp. 43–48.
Muhly, J. D. (1985): Sources of tin and the beginnings of bronze metallurgy, American Jour-
nal of Archaeology, 89, 275–291.
Muhly, J. D. (1995): Lead isotope analysis and the archaeologist, Journal of Mediterranean
Archaeology, 8, 54–58.
Muhly, J. D. (1999): Copper and bronze in Cyprus and the eastern Mediterranean, in V. C.
Pigott, ed., The Archaeometallurgy of the Asian Old World, Philadelphia, PA: University
of Pennsylvania Museum of Archaeology and Anthropology, pp. 15–25.
Muhly, J. D. (2003): Trade in metals in the Late Bronze Age and the Iron Age, in N. Chr.
Stampolidis and V. Karageorggis, eds., Sea Routes... Interconnections in the Mediter-
ranean 16th - 6th c. BC. Proceedings of the International Symposium held at Rethymnon,

Frederik Rademakers Bibliography 505
Crete, September 29th - October 2nd, 2002, Athens: The University of Crete and the A.G.
Leventis Foundation, pp. 141–150.
Muhly, J. D. (2009): Oxhide ingots in the Aegean and Egypt, in F. Lo Schiavo, J. D. Muhly,
R. Maddin, and A. Giumlia-Mair, eds., Oxhide Ingots in the Central Mediterranean,
Rome: A.G. Leventis Foundation. CNR - Instituto di Studi sulle Civiltà dell’Egeo e del
Vicino Oriente, pp. 17–39.
Murillo-Barroso, M., Pryce, T. O., Bellina, B., and Martinón-Torres, M. (2010): Khao Sam
Kaeo - an archaeometallurgical crossroads for trans-asiatic technological traditions,
Journal of Archaeological Science, 37, 1761–1772.
Muscarella, O. W. (1967): Phrygian Fibulae from Gordion, Colt Archaeological Institute,
London and Beccles: William Clowes and Sons, Limited.
Nenova-Merdjanova, R. (1997): Roman precious bronze vessels from Moesia and Thracia,
Archaeologia Bulgarica, 1, 30–37.
Nenova-Merdjanova, R. (2002a): Bronze production of Pautalia, in L. Slokoska, R. T. Ivanov,
and V. Dinchev, eds., The Roman and Late Roman City. The International Conference,
Veliko Turnovo, 26-30 July 2000, Sofia: Prof. Marin Drinov Academic Publishing House,
pp. 378–382.
Nenova-Merdjanova, R. (2002b): Tradition and inventiveness. On the local production of
bronze vessels in the Roman province Thracia, in A. Giumlia-Mair, ed., I Bronzi Antichi:
Produzione e tecnologia. Atti del XV Congresso Internazionale sui Bronzi Antichi, orga-
nizzato dall’ Università di Udine, sede di Gorizia, Grado-Aquileia, 22-26 maggio 2001,
Monographies Instrumentum 21, Montagnac: Editions Monique Mergoil, pp. 591–599.
Nenova-Merdjanova, R. (2011): Production and consumption of bronzework in Roman
Thrace, in I. P. Haynes, ed., Early Roman Thrace. New Evidence from Bulgaria, JRA Sup-
plementary Series 82, Portsmouth, Rhode Island, pp. 115–134.
Nezafati, N., Pernicka, E., and Momenzadeh, M. (2006): Ancient tin: old question and a
new answer, Antiquity Project Gallery, 80.
Nezafati, N., Pernicka, E., and Momenzadeh, M. (2009): Introduction of the Deh Hosein
ancient tin-copper mine, western Iran: evidence from geology, archaeology, geochem-
istry and lead isotope data, Turkiye Bilimler Akademisi Arkeoloji Dergisi (TUBA-AR).
Turkish Academy of Sciences Journal of Archaeology, 12, 223–236.

506 Bibliography Frederik Rademakers
Nezafati, N., Pernicka, E., and Momenzadeh, M. (2011): Early tin-copper ore from Iran,
a possible clue for the enigma of Bronze Age tin, in Ü. Yalçin, ed., Anatolian Metal V,
Bochum: Deutsches Bergbau-Museum, pp. 211–230.
Nibbi, A. (1976): Tin from the Eastern Desert, Göttinger Miszellen, 19, 49–50.
Nicholas, M. (2003): Roman Crucibles, Hearth Lining and Alag from Usk, Monmouthshire,
South Wales, Centre for Archaeology Report 35/2003, English Heritage.
Nickel, D., Haustein, M., Lampke, T., and Pernicka, E. (2012): Identification of forgeries by
measuring tin isotopes in corroded bronze objects, Archaeometry, 54, 167–174.
Niederschlag, E., Pernicka, E., Seifert, Th., and Bartelheim, M. (2003): The determination
of lead isotope ratios by multiple collector ICP-MS: a case study of Early Bronze Age
artefacts and their possible relation with ore deposits of the Erzgebirge, Archaeometry,
45, 61–100.
Nocete, F., Queipo, G., Sáez, R., Nieto, J. M., Inácio, N., Bayona, M. R., Peramo, A., Vargas,
J. M., Cruz-Auñón, R., Gil-Ibarguchi, J. I., and Santos, J. F. (2008): The smelting quarter
of Valencina de la Concepción (Seville, Spain): the specialised copper industry in a po-
litical centre of the Guadalquivir Valley during the third millennium BC (2750-2500 BC),
Journal of Archaeological Science, 35, 717–732.
Northover, J. P. and Gillis, C. (1999): Questions in the analysis of ancient tin, in S. M. M.
Young, A. M. Pollard, P. Budd, and R. A. Ixer, eds., Metals in Antiquity, BAR S792, Oxford:
Archaeopress, pp. 78–85.
Northover, J. P. and Saghieh, M. B. (2002): Copper alloy metalwork from the 5th-th cen-
tury levels in Beirut, Lebanon, in A. Giumlia-Mair, ed., I Bronzi Antichi: Produzione
e tecnologia. Atti del XV Congresso Internazionale sui Bronzi Antichi, organizzato dall’
Università di Udine, sede di Gorizia, Grado-Aquileia, 22-26 maggio 2001, Monographies
Instrumentum 21, Montagnac: Editions Monique Mergoil, pp. 630–633.
Nowell, G., Clayton, R., Gale, N. H., and Stos-Gale, Z. A. (2002): Sources of tin - is isotopic
evidence likely to help?, in E. Bartelheim, M. Pernicka and R. Krause, eds., Anfänge der
Metallurgie in der Alten Welt / The Beginnings of Metallurgy in the Old World, Forschun-
gen zur Archäometrie und Altertumswissenschaft 1, Rahden/Westfalen: Verlag Marie
Leidorf GmbH, pp. 291–302.
Ogden, J. (2000): Metals, in P. T. Nicholson and I. Shaw, eds., Ancient Egyptian Materials
and Technology, Cambridge: Cambridge University Press, pp. 148–176.

Frederik Rademakers Bibliography 507
Ottaway, B. S. (2001): Innovation, production and specialization in early prehistoric cop-
per metallurgy, European Journal of Archaeology 2001 4: 87, 4, 87–112.
Oxtoby, D. W., Freeman, W. A., and Block, T. F. (2003): Chemistry: Science of Change, Thom-
son - Brooks/Cole.
Pagès, G., Dillmann, P., Fluzin, P., and Long, L. (2011): A study of the Roman iron bars of
Saintes-Maries-de-la-Mer (Bouches-du-Rhône, France). A proposal for a comprehen-
sive metallographic approach, Journal of Archaeological Science, 38, 1234–1252.
Papadopoulou, D. N., Zachariadis, G. A., Anthemidis, A. N., Tsirliganis, N. C., and Stratis,
J. A. (2006): Development and optimisation of a portable micro-XRF method for in situ
multi-element analysis of ancient ceramics, Talanta, 68, 1692–1699.
Park, J.-S. and Gordon, R. B. (2007): Traditions and transitions in Korean bronze technol-
ogy, Journal of Archaeological Science, 34, 1991–2002.
Parker, A. J. (1974): Lead ingots from a Roman ship at Ses Salines, Majorca, The Interna-
tional Journal of Nautical Archaeology, 3, 147–150.
Parker, A. J. and Price, J. (1981): Spanish exports of the Claudian Period: the significance
of the Port Vendres II wreck reconsidered, The International Journal of Nautical Archae-
ology, 10, 221–228.
Parzinger, H. and Boroffka, N., eds. (2003): Das Zinn der Bronzezeit in Mittelasien I:
Die siedlungsarchäologischen Forschungen im Umfeld der Zinnlagerstätten, Archäolo-
gie in Iran und Turan, Band 5. Deutsches Archäologisches Institut, Eurasien-Abteilung,
Aussenstelle Teheran, Mainz: Verlag Philipp von Zabern.
Paunov, E. I. and Prokopov, I. S. (2002): An Inventory of Roman Republican Coin Hoards
and Coins from Bulgaria, Glaux. Collana di Studi e Ricerche di Numismatica 15, Milan:
Edizioni Ennerre S.r.l.
Peacock, D. P. S. (1982): Pottery in the Roman world: an Ethnoarchaeological Approach,
London: Longman.
Pelleg, J., Baram, J., and Oren, E. (1979): An investigation of bronze artifacts from the North
Sinai coast and the Nile Delta region, Metallography, 12, 313–324.
Penhallurick, R. D. (1986): Tin in Antiquity: Its Mining and Trade Throughout the Ancient
World with Particular Reference to Cornwall, London: Institute of Metals.

508 Bibliography Frederik Rademakers
Pernicka, E. (1995): Crisis or catharsis in lead isotope analysis?, Journal of Mediterranean
Archaeology, 8, 59–64.
Pernicka, E. (1999): Trace element fingerprinting of ancient copper: a guide to technology
or provenance?, in S. M. M. Young, A. M. Pollard, P. Budd, and R. A. Ixer, eds., Metals in
Antiquity, BAR S792, Oxford: Archaeopress, pp. 163–171.
Pernicka, E. (2014): Provenance determination of archaeological metal objects, in B. W.
Roberts and C. P. Thornton, eds., Archaeometallurgy in Global Perspective, Springer, pp.
239–268.
Pernicka, E., Begemann, F., Schmitt-Strecker, S., and Grimanis, A. P. (1990): On the com-
position and provenance of metal artefacts from Poliochni on Lemnos, Oxford Journal
of Archaeology, 9, 263–298.
Pernicka, E., Seeliger, T. C., Wagner, G. A., Begemann, F., Schmitt-Strecker, S., Eibner,
C., Öztunali, Ö., and Baranyi, I. (1984): Archäometallurgische Untersuchungen in
Nordwest-anatolien, Jahrbuch des Römisch-Germanischen Zentralmuseums Mainz, 31,
533–599.
Pernicka, E., Wagner, G. A., Muhly, J. D., and Öztunali, Ö. (1992): Comment on the discus-
sion of ancient tin sources in Anatolia, Journal of Mediterranean Archaeology, 5, 91–98.
Peterson, S. E. (2009): Thin-section Petrography of Ceramic Materials, Philadelphia, PA:
INSTAP Academic Press.
Pfaffenberger, B. (1988): Fetishised objects and humanised nature: towards an anthropol-
ogy of technology, Man, 23 (New Series), 236–252.
Pfaffenberger, B. (1992): Social anthropology of technology, Annual Review of Anthropol-
ogy, 21, 491–516.
Phelps, M., Paynter, S., and Dungworth, D. (2011): Downside Mill, Cobham, Surrey. Anal-
ysis of the Metalworking Remains, Research Department Report Series 43-2011, English
Heritage.
Philip, G. (2007): Tell El-Dab’a XV, Metalwork and Metalworking Evidence of the Late Mid-
dle Kingdom and The Second Intermediate Period, Wien: Verlag der Osterreichischen
Akademie der Wissenschaften.

Frederik Rademakers Bibliography 509
Philip, G., Clogg, P. W., and Dungworth, D. (2003): Copper metallurgy in the Jordan val-
ley from the third to the first millennia BC: chemical, metallographic and lead isotope
analyses of artefacts from Pella, Levant, 35, 71–100.
Photos, E. and Salter, C. J. (1986): A reappraisal of phase characterization in slags, in J. S.
Olin and M. J. Blackman, eds., Proceedings of the 24th International Archaeometry Sym-
posium, Washington, D.C.: Smithsonian Institution Press, pp. 259–265.
Pierce, C., Adams, K. R., and Stewart, J. D. (1998): Determining the fuel constituents of
ancient hearth ash via ICP-AES analysis, Journal of Archaeological Science, 25, 493–503.
Pigott, V. C. (2011): Sources of tin and the tin trade in Southwest Asia: recent research
and its relevance to current understanding, in P. P. Betancourt and S. C. Ferrence, eds.,
Metallurgy: Understanding How, Learning Why. Studies in Honor of James D. Muhly,
Philadelphia, PA: INSTAP Academic Press, pp. 273–291.
Pigott, V. C. (2012): On ancient tin and tin-bronze in the Asian Old World: further com-
ments, in V. Kassianidou and G. Papasavvas, eds., Eastern Mediterranean Metallurgy and
Metalwork in the Second Millennium BC - A Conference in Honour of James D. Muhly,
Nicosia, 10th-11th October 2009, Oxford: Oxbow Books, pp. 222–236.
Pigott, V. C., Fleming, S. J., and Darby, C. (1991): Preliminary Research on Copper-Base
Material at Gordion: Metallographic and Compositional Analyses, MASCA Archaeomet-
allurgy Interim Report, University of Pennsylvania Museum of Archaeology and Anthro-
pology.
Pigott, V. C., Rogers, H. C., and Nash, S. K. (2003): Archaeometallurgical investigations at
Malyan: the evidence for tin-bronze in the Kaftari Phase, in N. F. Miller and K. Abdi, eds.,
Yeki Bud, Yeki Nabud: Essays on the Archaeology of Iran in Honor of William M. Sumner,
Los Angeles: Cotsen Institute of Archaeology at UCLA, in association with the American
Institute of Iranian Studies and the University of Pennsylvania Museum of Archaeology
and Anthropology, pp. 161–176.
Pinarelli, L. (2004): Lead isotope characterisation of copper ingots from Sardinia (Italy):
inferences on their origins, Bulletin of the Geological Society of Greece, 36, 1173–1180.
Pinarelli, L., Salvi, D., and Ferrera, G. (1995): The source of ancient Roman lead, as deduced
from lead isotopes: the ingots from the Mal di Ventre wreck (western Sardinia, Italy),
Science and Technology for Cultural Heritage, 4, 79–86.

510 Bibliography Frederik Rademakers
Pirrie, D., Power, M. R., Wheeler, P. D., Cundy, A., Bridges, C., and Davey, G. (2002): Geo-
chemical signature of historical mining: Fowey Estuary, Cornwall, UK, Journal of Geo-
chemical Exploration, 76, 31–43.
Plant, R., Page, J., Bonham, J., and Jones, J. P. (1975): Kashmir, in Physical Graffiti, London:
Swan Song.
Pollard, A. M. (2009): What a long, strange trip it’s been: lead isotopes and archaeology, in
A. J. Shortland, I. C. Freestone, and Th. Rehren, eds., From Mine to Microscope. Advances
in the Study of Ancient Technology, Oxford: Oxbow Books, pp. 181–189.
Pollard, A. M. (2011): Isotopes and impact: a cautionary tale, Antiquity, 85, 631–638.
Pollard, A. M., Batt, C. M, Stern, B., and Young, S. M. M. (2007): Analytical Chemistry in
Archaeology, Cambridge: Cambridge University Press.
Pollard, A. M., Bray, P. J., and Gosden, C. (2014): Is there something missing in scientific
provenance studies of prehistoric artefacts?, Antiquity, 88, 625–631.
Ponting, M. (2002): Keeping up with the Romans? Romanisation and copper alloys in First
Revolt Palestine, Institute of Archaeo-Metallurgical Studies, 22, 3–6.
Ponting, M., Evans, J. A., and Pashley, V. (2003): Fingerprinting of Roman mints using laser-
ablation MC-ICP-MS lead isotope analysis, Archaeometry, 45, 591–597.
Poulter, A. G. (1983): Town and country in Moesia Inferior, in A. G. Poulter, ed., Ancient
Bulgaria. Papers presented to the International Symposium on the Ancient History and
Archaeology of Bulgaria, University of Nottingham, 1981, Nottingham: Department of
Classical and Archaeological Studies, pp. 74–118.
Poulter, A. G. (2002): From city to fortress and from town to country: 15 years of Anglo-
Bulgarian collaboration, in L. Slokoska, R. T. Ivanov, and V. Dinchev, eds., The Roman
and Late Roman City. The International Conference, Veliko Turnovo, 26-30 July 2000,
Sofia: Prof. Marin Drinov Academic Publishing House, pp. 14–29.
Poulter, A. G. (2007a): Introduction, in A. G. Poulter, ed., Nicopolis ad Istrum. A Late Roman
and Early Byzantine City. The Finds and the Biological Remains, Oxford: Oxbow Books,
pp. 1–14.
Poulter, A. G. (2007b): The metalwork, in A. G. Poulter, ed., Nicopolis ad Istrum. A Late
Roman and Early Byzantine City. The Finds and the Biological Remains, Oxford: Oxbow
Books, pp. 15–64.

Frederik Rademakers Bibliography 511
Prell, S. (2011): Einblicke in die Werkstätten der Residenz - Die Stein- und Metallwerkzeuge
des Grabungsplatzes Q I, Forschungen in der Ramses-Stadt Band 8, Hildesheim: Ger-
stenberg Verlag.
Pryce, T. O., Bassiakos, Y., Catapotis, M., and Doonan, R. C. P. (2007): ‘De Caerimo-
niae’ technological choices in copper-smelting furnace design at Early Bronze Age
Chrysokamino, Crete, Archaeometry, 49, 543–557.
Pryce, T. O., Brauns, M., Chang, N., Pernicka, E., Pollard, A. M., Ramsey, C., Rehren, Th.,
Souksavatdy, V., and Sayavongkhamdy, T. (2011): Isotopic and technological variation in
prehistoric Southeast Asian primary copper production, Journal of Archaeological Sci-
ence, 38, 3309–3322.
Pryce, T. O., Pigott, V. C., Martinón-Torres, M., and Rehren, Th. (2010): Prehistoric copper
production and technological reproduction in the Khao Wong Prachan Valley of Central
Thailand, Archaeological and Anthropological Sciences, 2, 237–264.
Pulak, C. (1997): The Uluburun shipwreck, in S. Swiny, R. L. Hohlfelder, and H. W. Swiny,
eds., Res Maritimae: Cyprus and the Eastern Mediterranean from Prehistory to Late An-
tiquity: Proceedings of the Second International Symposium “Cities on the Sea”, Nicosia,
Cyprus, October 18-22, 1994, Scholars Press, pp. 233–262.
Pulak, C. (2000): The copper and tin ingots from the Late Bronze Age shipwreck at Ulubu-
run, in Ü. Yalçin, ed., Anatolian Metal I. Der Anschnitt, Beiheft 13, Bochum: Deutsches
Bergbau-Museum, pp. 137–157.
Pulak, C. and Bass, G. F. (1997): Uluburun, in E. Meyers, ed., The Oxford Encyclopedia of
Archaeology in the Near East, New York and Oxford: Oxford University Press, pp. 266–
268.
Pusch, E. B. (1990): Metallverarbeitende Werkstätten der frühen Ramessidenzeit in Qantir-
Piramesse/Nord - Ein Zwischenbericht, Ägypten und Levante, 1, 75–113.
Pusch, E. B. (1991): Recent work at northern Piramesse - results of excavations by the
Pelizaeus-Museum, Hildesheim, at Qantir, in E. Bleiberg and R. Freed, eds., Fragments
of a Shattered Visage: The Proceedings of the International Symposium of Ramesses the
Great, Memphis: Memphis State University, pp. 199–220.
Pusch, E. B. (1993): Pi-Ramesse-geliebt-von-Amun, Hauptquartier Deiner Streitwagen.
Ägypter und Hethiter in der Delta-Residenz der Ramessiden, in A. Eggebrecht, ed.,

512 Bibliography Frederik Rademakers
Pelizaeus-Museum Hildesheim. Die Ägyptische Sammlung, Mainz: Verlag Philip von
Zabern, pp. 126–143.
Pusch, E. B. (1994): Divergierende Verfahren der Metallverarbeitung in Theben und Qan-
tir? Bemerkungen zur Konstruktion und Technik, Ägypten und Levante, 4, 145–170.
Pusch, E. B. (1998/99): Auf dem Wege zu einem Stadtplan der Ramses-Stadt. Ergebnisse
der Hildesheimer Grabung Qantir aus dem Herbst 1998, Hildesheimer Jahrbuch, 70/71,
473–478.
Pusch, E. B. (1999a): Goldschmiedewerkstatt oder vergoldeter Fußboden?, Ägypten und
Levante, 9, 121–133.
Pusch, E. B. (1999b): Towards a map of Piramesse, Egyptian Archaeology, 14, 13–15.
Pusch, E. B. (2000): Doors - statues - musical instruments? Large scale bronze production
and casting at the delta residence of the Ramessides, Egypt, in R. Eichmann, E. Hick-
mann, and I. Laufs, eds., Musikarchäologie früher Metallzeiten; Vorträge des 1. Sym-
posiums der International Study Group on Music Archaeology im Kloster Michaelstein,
18.-24. März 1998, Studien zur Musikarchäologie 2; Orient-Archäologie 7, Leidorf, pp.
219–232.
Pusch, E. B., Becker, H., and Fassbinder, J. (1999): Wohnen und Leben: oder: weitere
Schnitte zum einem Stadtplan der Ramses-Stadt, Ägypten und Levante, 9, 155–170.
Pusch, E. B. and Herold, A. (1999): Qantir/Pi-Ramesses, in K. Bard, ed., Encyclopedia of the
Archaeology of Ancient Egypt, London: Routledge, pp. 647–649.
Pusch, E. B. and Rehren, Th. (2007): Hochtemperatur-Technologie in der Ramses-Stadt -
Rubinglas für den Pharao, Forschungen in der Ramses-Stadt Band 6, Hildesheim: Ger-
stenberg Verlag.
Quinn, P. S., ed. (2009): Interpreting Silent Artefacts: Petrographic Approaches to Archaeo-
logical Ceramics, Oxford: Archaeopress.
Rademakers, F. W. and Rehren, Th. (2013): Tin oxide in crucible slag. From slag crystals
to technological choices in bronze production, Poster presented at the Historical Metal-
lurgy Society 50th Anniversary Conference, 14-16 June 2013, London, UK.
Rademakers, F. W. and Rehren, Th. (2014): Heterogeneity in the crucible. Some method-
ological issues for reconstructing ancient crucible metallurgy, Poster presented at the
40th International Symposium on Archaeometry, 19-23 May 2014, Los Angeles, USA.

Frederik Rademakers Bibliography 513
Rademakers, F. W., Rehren, Th., and Pusch, E. B. (in press): Bronze production in Pi-
Ramesse: alloying technology and material use, in E. Ben-Yosef and Y. Goren, eds., Min-
ing for Copper: Essays in Honor of Professor Beno Rothenberg, Tel Aviv: Institute of Ar-
chaeology of Tel Aviv.
Rapp, G. Jr. (1979): Trace elements as a guide to the geographical source of tin ore: smelt-
ing experiments, in A. D. Franklin, J. S. Olin, and T. A. Wertime, eds., The Search for
Ancient Tin: a Seminar organized by Theodore A. Wertime and held at the Smithsonian
Institution and the National Bureau of Standards, Washington, D.C., March 14-15, 1977,
Washington, D.C.: Smithsonian Institution Press, pp. 59–63.
Rapp, G. Jr., Russel, R., and Zhichun, J. (1999): Using neutron activation analysis to source
ancient tin (cassiterite), in S. M. Young, A. M. Pollard, P. Budd, and R. A. Ixer, eds., Metals
in Antiquity, BAR S792, Oxford: Archaeopress, pp. 153–162.
Redmount, C. A. and Morgenstein, M. E. (1996): Major and trace element analysis of mod-
ern Egyptian pottery, Journal of Archaeological Science, 23, 741–762.
Reece, R. (1985): The chemical analysis of Roman coins: past and future, in P. Phillips,
ed., The Archaeologist and the Laboratory, London: Council for British Archaeology, pp.
60–62.
Reedy, T. J. and Reedy, C. L. (1992): Evaluating lead isotope data: comments on E. V. Sayre,
K. A. Yener, E. C. Joel and I. L. Barnes, ‘Statistical evaluation of the presently accumulated
lead isotope data from Anatolia and surrounding regions’, Archaeometry, 34 (1) (1992),
73-105, and reply. Comments... IV, Archaeometry, 34, 327–329.
Rehren, Th. (1996a): High temperature industries in the Late Bronze Age capital
Piramesse-(Qantir): I - bronze and blass production and processing, in F. A. Esmael,
ed., Proceedings of the First International Conference on Ancient Egyptian Mining and
Metallurgy and Conservation of Metallic Artifacts, Cairo: Ministry of Culture, Supreme
Council of Antiquities, pp. 101–119.
Rehren, Th. (1996b): A Roman zinc tablet from Bern, Switzerland: reconstruction of the
manufacture, in A. Demirci, S. Özer and G. Summers, eds., Archaeometry 94. The Pro-
ceedings of the 29th International Symposium on Archaeometry, Ankara 9-14, May 1994,
Ankara: Tübitak, pp. 35–45.
Rehren, Th. (1997a): Die Rolle des Kohlenstoffs in der prähistorischen Metallurgie, Stahl
und Eisen, 117, 87–92.

514 Bibliography Frederik Rademakers
Rehren, Th. (1997b): Ramesside glass-colouring crucibles, Archaeometry, 39, 355–368.
Rehren, Th. (1999): Small size, large scale: Roman brass production in Germania Inferior,
Journal of Archaeological Science, 26, 1083–1087.
Rehren, Th. (2000): Archaeometallurgy - an island?, Antiquity, 74, 964–967.
Rehren, Th. (2001): Aspects of the production of cobalt-blue glass in Egypt, Archaeometry,
43, 483–489.
Rehren, Th. (2003): Crucibles as reaction vessels in ancient metallurgy, in P. T. Craddock
and J. Lang, eds., Mining and Metal Production. Through the Ages, London: British Mu-
seum Press, pp. 207–215.
Rehren, Th. (2009): From mine to microbe - the Neolithic copper melting crucibles from
Switzerland, in A. J. Shortland, I. C. Freestone, and Th. Rehren, eds., From Mine to Micro-
scope. Advances in the Study of Ancient Technology, Oxford: Oxbow Books, pp. 155–162.
Rehren, Th. (2013): Metallurgy, Greece and Rome, in R. S. Bagnall, K. Brodersen, C. B.
Champion, A. Erskine, and S. R. Huebner, eds., The Encyclopedia of Ancient History,
Blackwell Publishing.
Rehren, Th. (2014): One minute interview, The Crucible. Historical Metallurgy Society
News, 87, 10–11.
Rehren, Th., Charlton, M., Chirikure, S., Humphris, J., Ige, A., and Veldhuijzen, H. (2007):
Decisions set in slag - the human factor in African iron smelting, in S. La Niece, D. Hook,
and P. T. Craddock, eds., Metals and Mines. Studies in Archaeometallurgy, London:
Archetype Books, pp. 211–218.
Rehren, Th., Hess, K., and Philip, G. (1996): Auriferous silver in western Asia: ore or alloy?,
Historical Metallurgy, 30, 1–10.
Rehren, Th. and Kraus, K. (1999): Cupel and crucible: the refining of debased silver in the
Colonia Ulpia Traiana, Xanten, Journal of Roman Archaeology, 12, 263–272.
Rehren, Th. and Martinón-Torres, M. (2008): Naturam ars imitata: European brassmaking
between craft and science, in M. Martinón-Torres and Th. Rehren, eds., Archaeology,
History and Science. Integrating Approaches to Ancient Materials, Walnut Creek, CA: Left
Coast Press, pp. 167–188.

Frederik Rademakers Bibliography 515
Rehren, Th. and Papachristou, O. (2003): Similar like white and black: a comparison of
steel-making crucibles from Central Asia and the Indian subcontinent, in T. Stöllner,
G. Körlin, G. Steffens, and J. Cierny, eds., Man and Mining (Mensch und Bergbau), Der
Anschnitt, Beiheft 16, Bochum: Deutsches Bergbau-Museum, pp. 393–404.
Rehren, Th. and Pernicka, E. (2008): Coins, artefacts and isotopes - archaeometallurgy and
archaeometry, Archaeometry, 50, 232–248.
Rehren, Th. and Pernicka, E. (2014): First data on the nature and origin of the metalwork
from Tell el-Farkha, in A. Maczynska, ed., The Nile Delta as a Centre of Cultural Interac-
tions between Upper Egypt and the Southern Levant in the 4th Millennium BC, Studies
in African Archaeology 13, Poznan, pp. 237–252.
Rehren, Th. and Pusch, E. B. (1997): New Kingdom glass-melting crucibles from Qantir-
Piramesses, Journal of Egyptian Archaeology, 83, 127–141.
Rehren, Th. and Pusch, E. B. (1999): Glass and glass making at Qantir-Piramesses and
beyond, Ägypten und Levante, 9, 171–179.
Rehren, Th. and Pusch, E. B. (2005): Late Bronze Age glass production at Qantir-
Piramesses, Egypt, Science, 308, 1756–1758.
Rehren, Th. and Pusch, E. B. (2012): Alloying and resource management in New King-
dom Egypt: the bronze industry at Qantir - Pi-Ramesse and its relationship to Egyptian
copper sources, in V. Kassianidou and G. Papasavvas, eds., Eastern Mediterranean Met-
allurgy and Metalwork in the Second Millennium BC - A Conference in Honour of James
D. Muhly, Nicosia, 10th-11th October 2009, Oxford: Oxbow Books, pp. 215–221.
Rehren, Th., Pusch, E. B., and Herold, A. (1998): Glass coloring works within a copper-
centered industrial complex in Late Bronze Age Egypt, in P. McCray and W. D. Kingery,
eds., The Prehistory and History of Glassmaking Technology (Ceramics and Civilization
Vol. 8), The American Ceramic Society, pp. 227–250.
Rehren, Th., Pusch, E. B., and Herold, A. (2001): Qantir-Piramesses and the organisation
of the Egyptian glass industry, in A. J. Shortland, ed., The Social Context of Technological
Change. Egypt and the Near East, 1650-1550 BC, Oxford: Oxbow Books, pp. 223–238.
Rehren, Th. and Temme, M. (1994): Pre-Columbian gold processing at Putushio, south
Ecuador: the archaeometallurgical evidence, in D. Scott and P. Meyers, eds., Archaeom-
etry of Pre-Columbian Sites and Artifacts. Proceedings of a Symposium organized by the

516 Bibliography Frederik Rademakers
UCLA Institute of Archaeology and the Getty Conservation Institute, Los Angeles, Califor-
nia, March 23-27, 1992, Los Angeles, CA: The Getty Conservation Institute, pp. 267–284.
Renfrew, C. and Bahn, P. (2012): Archaeology: Theories, Methods and Practice (6th Edition),
New York: Thames & Hudson.
Renzi, M., Hauptmann, A., and Rovira, S. (2009): Phoenician metallurgical production at
SE-Spain, in Archaeometallurgy in Europe 2007. Selected Papers of the 2nd International
Conference 17.-21. June 2007 in Aquileia [CD-ROM], Milan: Associazione Italiana di Met-
allurgia.
Rice, D. W., Peterson, P., Rigby, E. B., Phipps, P. B. P., Cappell, R. J., and Tremoureux, R.
(1981): Atmospheric corrosion of copper and silver, Journal of the Electrochemical Soci-
ety, 128, 275–284.
Riederer, J. (2002a): Die Metallanalyse der römischen Statuetten des Römisch-
Germanischen Museums in Köln, in A. Giumlia-Mair, ed., I Bronzi Antichi: Produzione
e tecnologia. Atti del XV Congresso Internazionale sui Bronzi Antichi, organizzato dall’
Università di Udine, sede di Gorizia, Grado-Aquileia, 22-26 maggio 2001, Monographies
Instrumentum 21, Montagnac: Editions Monique Mergoil, pp. 292–300.
Riederer, J. (2002b): The use of standardised copper alloys in Roman metal technology,
in A. Giumlia-Mair, ed., I Bronzi Antichi: Produzione e tecnologia. Atti del XV Congresso
Internazionale sui Bronzi Antichi, organizzato dall’ Università di Udine, sede di Gorizia,
Grado-Aquileia, 22-26 maggio 2001, Monographies Instrumentum 21, Montagnac: Edi-
tions Monique Mergoil, pp. 284–291.
Robbins, K. and Bayley, J. (1996): Coin Pellet Mould and Crucible Fragments from Old
Sleaford, Lincolnshire, Ancient Monuments Laboratory Report 69/1996, English Her-
itage.
Rodriguez, E. C. and Hastorf, C. A. (2013): Calculating ceramic vessel volume: an assess-
ment of methods, Antiquity, 87, 1182–1190.
Rodriguez Diaz, A., Pavon Soldevila, I., Merideth, C., and Tresserras, J. J. I. (2001): El Cerro
de San Cristobal, Logrosan, Extremadura, Spain. The Archaeometallurgical Excavation
of a Late Bronze Age Tin-Mining and Metalworking Site. First Excavation Season 1998,
BAR international series 922, Oxford: Archaeopress.
Rohl, B. and Needham, S. (1998): The Circulation of Metal in the British Bronze Age: the
Application of Lead Isotope Analysis, Occasional Paper 102, London: British Museum.

Frederik Rademakers Bibliography 517
Roman, I. (1990): Copper ingots, in B. Rothenberg, ed., The Ancient Metallurgy of Copper:
Archaeology-Experiment-Theory. (Researches in the Arabah 1959-84; v. 2), London: The
Institute for Archaeo-Metallurgical Studies, pp. 176–181.
Rose, C. B. and Darbyshire, G., eds. (2012): The New Chronology of Iron Age Gordion,
Philadelphia, PA: University of Pennsylvania Museum of Archaeology and Anthropol-
ogy.
Rosenqvist, T. (1974): Principles of Extractive Metallurgy, New York: MacGraw-Hill.
Rostoker, W., Pigott, V. C., and Dvorak, J. R. (1989): Direct reduction to copper metal by
oxide-sulfide mineral interaction, Archeomaterials, 3, 69–87.
Rothe, R. and Rapp, G. Jr. (1995): Trace-element analyses of Egyptian Eastern Desert tin
and its importance to Egyptian archaeology, in A. A. A. Hussein, M. Miele, and S. Riad,
eds., Proceedings of the Egyptian-Italian Seminar on the Geosciences and Archaeology in
the Mediterranean Countries, Special Publication 70, Cairo: Geological Survey of Egypt,
pp. 229–244.
Rothe, R. D. and Miller, W. K. (1999): More inscriptions from the southern Eastern Desert,
Journal of the American Research Center in Egypt, 36, 87–101.
Rothe, R. D., Miller, W. K., and Rapp, G. R. (2008): Pharaonic Inscriptions from the Southern
Eastern Desert of Egypt, Winona Lake, IN: Eisenbrauns.
Rothe, R. D., Rapp, G. Jr., and Miller, W. K. (1996): New hieroglyphic evidence for pharaonic
activity in the Eastern Desert of Egypt, Journal of the American Research Center in Egypt,
33, 77–104.
Rothenberg, B. (1987): Pharaonic copper mines in South Sinai, Institute of Archaeo-
Metallurgical Studies, 10-11, 1–7.
Rothenberg, B. (1988): The Egyptian Mining Temple at Timna, London: The Institute for
Archaeo-Metallurgical Studies.
Rothenberg, B., ed. (1990): The Ancient Metallurgy of Copper: Archaeology-Experiment-
Theory. (Researches in the Arabah 1959-84; v. 2), London: The Institute for Archaeo-
Metallurgical Studies.
Rothenberg, B. (2003): Egyptian chariots, Midianites from Hijaz/Midian (Northwest
Arabia) and Amalekites from the Negev in the Timna Mines, Institute of Archaeo-
Metallurgical Studies, 23, 9–14.

518 Bibliography Frederik Rademakers
Rothenberg, B., Shaw, C. T., Hassan, F. A., and Hussein, A. A. A. (1998): Reconnaissance
survey of ancient mining and metallurgy in the Mersa Alam region Eastern Desert of
Egypt, Institute of Archaeo-Metallurgical Studies, 20, 4–9.
Roux, V. (2003): Ceramic standardization and intensity of production: quantifying degrees
of specialization, American Antiquity, 68, 768–782.
Rovira, S. (2002): Early slags and smelting by-products of copper metallurgy in Spain, in
E. Bartelheim, M. Pernicka and R. Krause, eds., Anfänge der Metallurgie in der Alten Welt
/ The Beginnings of Metallurgy in the Old World, Forschungen zur Archäometrie und
Altertumswissenschaft 1, Rahden/Westfalen: Verlag Marie Leidorf GmbH, pp. 83–98.
Rovira, S. (2007): La producción de bronces en la prehistoria, in J. Molera, J. Farjas,
P. Roura, and T. Pradell, eds., Avances En Arqueometría. Actas Del VI Congreso Ibérico
De Arqueometría 2005, Girona: Universidad de Girona, pp. 21–35.
Rovira, S. (2011-2012): Arqueometalurgia experimental en el departamento de Prehis-
toria y Arqueología de la U.A.M., Cuadernos de Prehistoria y Arqueología Universidad
Autónoma de Madrid, 37-38, 105–120.
Rovira, S. and Montero-Ruiz, I. (2003): Natural tin-bronze alloy in Iberian Peninsula met-
allurgy: potentiality and reality, in A. Giumlia-Mair and F. Lo Schiavo, eds., The Problem
of Early Tin. Acts of the XIVth UISPP Congress, BAR International Series 1199, Oxford:
Archaeopress, pp. 15–22.
Rovira, S., Montero-Ruiz, I., and Renzi, M. (2009): Experimental co-smelting to copper-tin
alloys, in T. L. Kienlin and B. W. Roberts, eds., Metals and Societies. Studies in Honour
of Barbara S. Ottaway, Universitätsforschungen zur prähistorischen Archäologie, Band
169, Bonn: Habelt, pp. 407–414.
Ryndina, N., Indenbaum, G., and Kolosova, V. (1999): Copper production from polymetal-
lic sulphide ores in the northeastern Balkan Eneolithic culture, Journal of Archaeological
Science, 26, 1059–1068.
Sabet, A. H., Tsogoev, V. B., Shibanin, S. P., El-Kadi, M.B., and Awad, S. (1976): The placer
tin-deposits of Igla, Abu Dabbab and Nuweibi, Annals of the Geological Survey of Egypt,
4, 169–180.
Sahlén, D. (2013): Selected with care? - the technology of crucibles in late prehistoric Scot-
land. A petrographic and chemical assessment, Journal of Archaeological Science, 40,
4207–4221.

Frederik Rademakers Bibliography 519
Said, R. (1990): The Geology of Egypt, Elsevier.
Salter, C. (2007): The metallurgical debris, in A. G. Poulter, ed., Nicopolis ad Istrum. A Late
Roman and Early Byzantine City. The Finds and the Biological Remains, Oxford: Oxbow
Books, pp. 298–305.
Salvarredy-Aranguren, M. M., Probst, A., Roulet, M., and Isaure, M.-P. (2008): Contamina-
tion of surface waters by mining wastes in the Milluni Valley (Cordillera Real, Bolivia):
mineralogical and hydrological influences, Applied Geochemistry, 23, 1299–1324.
Sams, G. K. (1979): Imports at Gordion. Lydian and Persian periods, Expedition, 21, 6–17.
Sapir-Hen, L. and Ben-Yosef, E. (2014): The socioeconomic status of Iron Age metalwork-
ers: animal economy in the ‘Slaves’ Hill’, Timna, Israel, Antiquity, 88, 775–790.
Sayre, E. V., Joel, E. C., Blackman, M. J., Yener, K. A., and Özbal, H. (2001): Stable lead iso-
tope studies of Black Sea Anatolian ore sources and related Bronze Age and Phrygian
artefacts from nearby archaeological sites. Appendix: new Central Taurus ore data, Ar-
chaeometry, 43, 77–115.
Sayre, E. V., Yener, K. A., and Joel, E. C. (1992): Statistical evaluation of the presently ac-
cumulated lead isotope data from Anatolia and surrounding regions, Archaeometry, 34,
73–105.
Scheel, B. (1985): Studien zum Metallhandwerk in Alten Ägypten I. Handlungen und Beis-
chriften in den Bildprogrammen der Gräber des Alten Reiches, Studien zur Altägyptis-
chen Kultur, 12, 117–177.
Scheel, B. (1986): Studien zum Metallhandwerk in Alten Ägypten II. Handlungen und Beis-
chriften in den Bildprogrammen der Gräber des Mittleren Reiches, Studien zur Altägyp-
tischen Kultur, 13, 181–205.
Scheel, B. (1987): Studien zum Metallhandwerk in Alten Ägypten III. Handlungen und
Beischriften in den Bildprogrammen der Gräber des Neuen Reiches und der Spätzeit,
Studien zur Altägyptischen Kultur, 14, 247–264.
Scheel, B. (1988): Fundobjecte eines Ptolemäerzeitlichen Metallverarbeitungsstätte in
Theben und Verlgeichsfunde anderer Vorderorientalischer Ausgrabungsplätze, Studien
zur Altägyptischen Kultur, 15, 243–254.
Scheel, B. (1989): Egyptian Metalworking and Tools, Shire.

520 Bibliography Frederik Rademakers
Schneider, G. and Zimmer, G. (1984): Technische Keramik aus antiken Bronzegußwerk-
stätten in Olympia und Athen, Berliner Beiträge zur Archäometrie, 9, 17–60.
Schreiner, M., Heimann, R. B., and Pernicka, E. (2003): Mineralogical and geochemical in-
vestigations into prehistoric smelting slags from Tepe Sialk, Central Iran, in Archaeomet-
allurgy in Europe. International Conference 24.-26. September 2003 Milan, Italy. Proceed-
ings Vol. 1, Milan: Associazione Italiana di Metallurgia, pp. 487–496.
Schwab, R. (2011): Kupferlegierungen und Kupferverarbeitung im Oppidum auf dem
Martberg, Berichte zur Archäologie an Mittelrhein und Mosel, 17, 267–285.
Scott, D. A. (1985): Periodic corrosion phenomena in bronze antiquities, Studies in Con-
servation, 30, 49–57.
Scott, D. A. (1991): Metallography and Microstructure of Ancient and Historic Metals, The
J. Paul Getty Trust.
Scott, D. A. (2012): Gold and Platinum Metallurgy of Ancient Colombia and Ecuador, An-
cient Metals: Microstructure and Metallurgy, Volume II, Conservation Science Press.
Scott, D. A. (2013): Iron and Steel, Ancient Metals: Microstructure and Metallurgy, Volume
IV, Conservation Science Press.
Scott, D. A. and Seeley, N. J. (1983): The examination of a pre-hispanic gold chisel from
Columbia, Journal of Archaeological Science, 10, 153–163.
Seeliger, T. C., Pernicka, E., Wagner, G. A., Begemann, F., Schmitt-Strecker, S., Eibner, C.,
Öztunali, Ö., and Baranyi, I. (1985): Archaeometallurgische Untersuchungen in Nord-
und Ostanatolien, Jahrbuch des Römisch-Germanischen Zentralmuseums Mainz, 32,
597–659.
Severin, T., Rehren, Th., and Schleicher, H. (2011): Early metal smelting in Aksum,
Ethiopia: copper or iron?, European Journal of Mineralogy, 23, 981–992.
Shackley, M. S. (2011): An introduction to X-Ray Fluorescence (XRF) analysis in archae-
ology, in M. S. Shackley, ed., X-Ray Fluorescence Spectrometry (XRF) in Geoarchaeology,
Springer Science, pp. 7–44.
Sharp, W. E. and Mittwede, S. K. (1994): Was Kestel really the source of tin for ancient
bronze?, Geoarchaeology: An International Journal, 9, 155–158.

Frederik Rademakers Bibliography 521
Shaw, C. T. and Durucan, S. (2008): A study of mining methods and ventilation during the
Egyptian period at the mines of Timna, in Ü. Yalçin, H. Özbal, and A. G. Pasamehme-
toglu, eds., Ancient Mining in Turkey and the Eastern Mediterranean, Ankara: Atilim
University, pp. 435–464.
Shaw, I. (1994): Pharaonic quarrying and mining: settlement and procurement in Egypt’s
marginal regions, Antiquity, 68, 108–119.
Shaw, I. (1998): Exploiting the desert frontier. The logistics and politics of ancient Egyp-
tian mining expeditions, in A. B. Knapp, V. C. Pigott, and E. W. Herbert, eds., Social Ap-
proaches to an Industrial Past, London and New York: Routledge, pp. 242–258.
Sherratt, S. (1998): Sea peoples and the economic structure of the late second millennium
in the eastern Mediterranean, in T. K. Dothan, S. Gitin, A. Mazar, and E. Stern, eds.,
Mediterranean Peoples in Transition: Thirteenth to Early Tenth Centuries BCE : in Honor
of Professor Trude Dothan, Israel Exploration Society, pp. 292–313.
Sherratt, S. (2000): Circulation of metals and the end of the Bronze Age in the eastern
Mediterranean, in C. F. E. Pare, ed., Metals Make the World Go Round. The Supply and
Circulation of Metals in Bronze Age Europe, Oxford: Oxbow Books, pp. 82–95.
Sherratt, S. (2003): The Mediterranean economy: “globalization” at the end of the sec-
ond millennium BCE, in W. G. Dever and S. Gitin, eds., Symbiosis, Symbolism, and the
Power of the Past. Canaan, Ancient Israel, and Their Neighbors from the Late Bronze Age
through Roman Palaestina. Proceedings of the Centennial Symposium, W.F. Albright In-
stitute of Archaeological Research and American Schools of Oriental Research, Jerusalem,
May 29-31, 2000, Winona Lake, IN: Eisenbrauns, pp. 37–62.
Shortland, A. J. (2006): Application of lead isotope analysis to a wide range of Late Bronze
Age Egyptian materials, Archaeometry, 48, 657–669.
Shortland, A. J., Tite, M. S., and Ewart, I. (2006): Ancient exploitation and use of cobalt
alums from the Western Oases of Egypt, Archaeometry, 45, 153–168.
Shugar, A. (2009): Peaking your interest: an introductory explanation of how to interpret
XRF data, WAAC Newsletter, 31, 8–10.
Shugar, A. N. (2013): Portable X-ray fluorescence and archaeology: limitations of the in-
strument and suggested methods to achieve desired results, in R. A. Armitage and J. H.
Burton, eds., Archaeological Chemistry VIII, Washington, DC: American Chemical Soci-
ety, pp. 173–193.

522 Bibliography Frederik Rademakers
Sillar, B. and Tite, M. S. (2000): The challenge of ‘technological choices’ for materials sci-
ence approaches in archaeology, Archaeometry, 42, 2–20.
Skaggs, S., Norman, N., Garrison, E., Coleman, D., and Bouhlel, S. (2012): Local mining or
lead importation in the Roman province of Africa Proconsularis? Lead isotope analysis
of curse tablets from Roman Carthage, Tunisia, Journal of Archaeological Science, 39,
970–983.
Skarpelis, N. (2003): Potential tin sources in the Aegean, in A. Giumlia-Mair and F. Lo Schi-
avo, eds., The Problem of Early Tin. Acts of the XIVth UISPP Congress, BAR International
Series 1199, Oxford: Archaeopress, pp. 159–164.
Slokoska, L. (2002): A century of archaeological excavations in Nicopolis ad Istrum, in
L. Slokoska, R. T. Ivanov, and V. Dinchev, eds., The Roman and Late Roman City. The
International Conference, Veliko Turnovo, 26-30 July 2000, Sofia: Prof. Marin Drinov Aca-
demic Publishing House, pp. 9–13.
Smirniou, M. and Rehren, Th. (2011): Direct evidence of primary glass production in Late
Bronze Age Amarna, Egypt, Archaeometry, 53, 58–80.
Smirniou, M. and Rehren, Th. (2013): Shades of blue - cobalt-copper coloured blue
glass from New Kingdom Egypt and the Mycenaean world: a matter of production or
colourant source?, Journal of Archaeological Science, 40, 4731–4743.
Speakman, R. J. and Shackley, M. S. (2013): Silo science and portable XRF in archaeology:
a response to Frahm, Journal of Archaeological Science, 40, 1435–1443.
Stacey, J. S. and Kramers, J. D. (1975): Approximation of terrestrial lead isotope evolution
by a two-stage model, Earth and Planetary Science Letters, 26, 207–221.
Staddon, C. and Mollov, B. (2000): City profile: Sofia, Bulgaria, Cities, 17, 379–387.
Stanley, D. J., Sheng, H., and Pan, Y. (1988): Heavy minerals and provenance of Late Qua-
ternary sands, eastern Nile delta, Journal of African Earth Sciences, 7, 735–741.
Stevens, A. and Eccleston, M. A. J. (2007): Craft production and technology, in T. Wilkinson,
ed., The Egyptian World, London: Routledge, pp. 146–159.
Stos, Z. A. (2009): Across the wine dark seas... sailor tinkers and royal cargoes in the Late
Bronze Age eastern Mediterranean, in A. J. Shortland, I. C. Freestone, and Th. Rehren,
eds., From Mine to Microscope. Advances in the Study of Ancient Technology, Oxford:
Oxbow Books, pp. 163–180.

Frederik Rademakers Bibliography 523
Stos, Z. A. and Gale, N. H. (2006): Lead isotope and chemical analyses of slags from
Chrysokamino, in P. P. Betancourt, ed., The Chrysokamino Metallurgy Workshop and Its
Territory, Hesperia Supplements 36, The American School of Classical Studies at Athens,
pp. 229–319.
Stos-Gale, Z. A. (2011): “Biscuits with ears”: a search for the origin of the earliest oxhide in-
gots, in P. P. Betancourt and S. C. Ferrence, eds., Metallurgy: Understanding How, Learn-
ing Why. Studies in Honor of James D. Muhly, Philadelphia, PA: INSTAP Academic Press,
pp. 221–229.
Stos-Gale, Z. A. and Gale, N. H. (2009): Metal provenancing using isotopes and the Ox-
ford archaeological lead isotope database (OXALID), Archaeological and Anthropologi-
cal Sciences, 1, 195–213.
Stos-Gale, Z. A. and Gale, N. H. (2010): Bronze Age metal artefacts found on Cyprus - metal
from Anatolia and the western Mediterranean, Trabajos de Prehistoria, 67, 389–403.
Stos-Gale, Z. A., Gale, N. H., and Houghton, J. (1995): The origins of Egyptian copper:
lead-isotope analysis of metals from el-Amarna, in V. W. Davies and L. Schofield, eds.,
Egypt, the Aegean and the Levant: Interconnections in the Second Millennium BC, Lon-
don: British Museum Press, pp. 127–135.
Stos-Gale, Z. A., Maliotis, G., Gale, N.H., and Annetts, N. (1997): Lead isotope characteris-
tics of the Cyprus copper ore deposits applied to provenance studies of copper oxhide
ingots, Archaeometry, 39, 83–123.
Swenson, E. R. and Warner, J. P. (2012): Crucibles of power: forging copper and forging
subjects at the Moche ceremonial center of Huaca Colorada, Peru, Journal of Anthropo-
logical Archaeology, 31, 314–333.
Tallet, P. (2012): Ayn Sukhna and Wadi el-Jarf: two newly discovered pharaonic harbours
on the Suez Gulf, British Museum Studies in Ancient Egypt and Sudan, 18, 147–168.
Tallet, P., Castel, G., and Fluzin, P. (2011): Metallurgical sites of south Sinai (Egypt) in the
pharaonic era: new discoveries, Paléorient, 37, 79–89.
Taylor, J. W. (1982): A Nigerian tin trade in antiquity?, Oxford Journal of Archaeology, 1,
317–324.
Taylor, J. W. (1983): Erzgebirge tin: a closer look, Oxford Journal of Archaeology, 2, 295–298.

524 Bibliography Frederik Rademakers
Thompson, C. M. (2003): Sealed silver in Iron Age Cisjordan and the ‘invention’ of coinage,
Oxford Journal of Archaeology, 22, 67–107.
Thompson, C. M. (2006): Slag analysis by wavelength dispersive spectrometry, in P. P. Be-
tancourt, ed., The Chrysokamino Metallurgy Workshop and Its Territory, Hesperia Sup-
plements 36, The American School of Classical Studies at Athens, pp. 325–328.
Thorburn, W. M. (1918): The myth of Occam’s Razor, Mind, 27, 345–353.
Thornton, C. P., Lamberg-Karlovsky, C. C., Liezers, M., and Young, S. M. M. (2002): On pins
and needles: tracing the evolution of copper-base alloying at Tepe Yahya, Iran, via ICP-
MS analysis of common-place items, Journal of Archaeological Science, 29, 1451–1460.
Thornton, C. P. and Rehren, Th. (2009): A truly refractory crucible from fourth millennium
Tepe Hissar, northeast Iran, Journal of Archaeological Science, 36, 2700–2712.
Timberlake, S. (1994): An experimental tin smelt at Flag Fen, Historical Metallurgy, 28,
121–128.
Tisseyre, P., Tusa, S., Cairns, W. R. L., Selvaggio Battacin, F., Barbante, C., Ciriminna, R.,
and Pagliaro, M. (2008): The lead ingots of Capo Passero: Roman global Mediterranean
trade, Oxford Journal of Archaeology, 27, 315–323.
Tite, M. S. (1996): In defence of lead isotope analysis, Antiquity, 70, 959–962.
Tite, M. S., Freestone, I. C., Meeks, N. D., and Bimson, M. (1982): The use of scanning
electron microscopy in the technological analysis of ancient ceramics, in J. S. Olin and
A. D. Franklin, eds., Archaeological Ceramics, Washington, D.C.: Smithsonian Institution
Press, pp. 109–120.
Tite, M. S., Freestone, I. C., Meeks, N. D., and Craddock, P. T. (1985): The examination of
refractory ceramics from metal-production and metalworking sites, in P. Phillips, ed.,
The Archaeologist and the Laboratory, London: Council for British Archaeology, pp. 50–
55.
Tite, M. S., Kilikoglou, V., and Vekinis, G. (2001): Strength, toughness and thermal shock re-
sistance of ancient ceramics and their influence on technological choice, Archaeometry,
43, 301–324.
Tite, M. S. and Shortland, A. J. (2003): Production technology for copper- and cobalt-blue
vitreous materials from the New Kingdom site of Amarna - a reappraisal, Archaeometry,
45, 285–312.

Frederik Rademakers Bibliography 525
Trincherini, P. R., Domergue, C., Manteca, I., Nesta, A., and Quarati, P. (2009): The identi-
fication of lead ingots from the Roman mines of Cartagena (Murcia, Spain): the role of
lead isotope analysis, Journal of Roman Archaeology, 22, 123–145.
Troalen, L. G., Tate, J., and Guerra, M. F. (2014): Goldwork in ancient Egypt: workshop
practices at Qurneh in the 2nd Intermediate Period, Journal of Archaeological Science,
50, 219–226.
Tylecote, R. F. (1979): Early tin ingots and tinstone from Western Europe and the Mediter-
ranean, in A. D. Franklin, J. S. Olin, and T. A. Wertime, eds., The Search for Ancient Tin: a
Seminar organized by Theodore A. Wertime and held at the Smithsonian Institution and
the National Bureau of Standards, Washington, D.C., March 14-15, 1977, Washington,
D.C.: Smithsonian Institution Press, pp. 49–52.
Tylecote, R. F. (1982a): The Late Bronze Age: copper and bronze metallurgy at Enkomi and
Kition, in J. D. Muhly, R. Maddin, and V. Karageorghis, eds., Early Metallurgy in Cyprus,
4000-500 BC, Nicosia: Pierides Foundation, pp. 81–103.
Tylecote, R. F. (1982b): Metallurgical crucibles and crucible slags, in J. S. Olin and A. D.
Franklin, eds., Archaeological Ceramics, Washington, D.C.: Smithsonian Institution
Press, pp. 231–243.
Tylecote, R. F. (1986): The Prehistory of Metallurgy in the British Isles. 2nd edition., London:
The Institute of Metals.
Tylecote, R. F. and Bachmann, H.-G. (1990): Metallographic notes on some ingots from the
Arabah and Sinai, in B. Rothenberg, ed., The Ancient Metallurgy of Copper: Archaeology-
Experiment-Theory. (Researches in the Arabah 1959-84; v. 2), London: The Institute for
Archaeo-Metallurgical Studies, pp. 74–77.
Tylecote, R. F., Ghaznavi, H. A., and Boydell, P. J. (1977): Partitioning of trace elements
between the ores, fluxes, slags and metal during the smelting of copper, Journal of Ar-
chaeological Science, 4, 305–333.
Tylecote, R. F., Photos, E., and Earl, B. (1989): The composition of tin slags from the South-
West of England, World Archaeology, 20, 434–445.
Unglik, H. (1991): Structure, composition, and technology of Late Roman copper alloy
artifacts from the Canadian excavations at Carthage, Archeomaterials, 5, 91–110.
Uphill, E. P. (2001): Egyptian Towns and Cities, Shire.

526 Bibliography Frederik Rademakers
Vagalinski, L. F. (2011): Light industry in Roman Thrace: the case of lime production, in
I. P. Haynes, ed., Early Roman Thrace. New Evidence from Bulgaria, JRA Supplementary
Series 82, Portsmouth, Rhode Island, pp. 41–58.
Valério, P., Monge Soares, A. M., Silva, R. J. C., Araújo, M. F., Rebelo, P., Neto, N., Santos, R.,
and Fontes, T. (2013): Bronze production in southwestern Iberian Peninsula: the Late
Bronze Age metallurgical workshop from Entre Águas 5 (Portugal), Journal of Archaeo-
logical Science, 40, 439–451.
Valério, P., Silva, R. J. C., Araújo, M. F., Monge Soares, A. M., and Braz Fernandes, F. M.
(2010): Microstructural signatures of bronze archaeological artifacts from the south-
western Iberian Peninsula, Materials Science Forum, 636-637, 597–604.
Van De Mieroop, M. (2007): The Eastern Mediterranean in the Age of Ramesses II, Oxford:
Blackwell Publishing.
Vassileva, M. (2012): Early bronze fibulae and belts from the Gordion citadel mound, in
C. B. Rose, ed., The Archaeology of Phrygian Gordion, Royal City of Midas, Philadelphia,
PA: University of Pennsylvania Museum of Archaeology and Anthropology, pp. 111–126.
VDEh, Verein Deutscher Eisenhüttenleute, ed. (1995): Slag Atlas. 2nd Edition, Düsseldorf:
Verlag Stahleisen.
Vergilius, P. (2009): Georgics, Oxford: Oxford University Press.
Voigt, M. M. (2012): Human and animal sacrifice at Galatian Gordion: the uses of ritual
in a multiethnic community, in A. Porter and G. Schwartz, eds., Sacred Killing: the Ar-
chaeology of Sacrifice in the Ancient Near East, Winona Lake, Indiana: Eisenbrauns, pp.
235–288.
Voigt, M. M. and Young, T. C. Jr. (1999): From Phrygian capital to Achaemenid entrepot:
Middle and Late Phrygian Gordion, Iranica Antiqua, 34, 191–241.
Vollmer, R. (1977): Terrestrial lead isotope evolution and formation time of the Earth’s core,
Nature, 270, 144–147.
Wagner, G. A., Begemann, F., Eibner, C., Lutz, J., Öztunali, Ö., Pernicka, E., and Schmitt-
Strecker, S. (1989): Archäometallurgischer Untersuchungen an Rohstoffquellen des
frühen Kupfers Ostanatoliens, Jahrbuch des Römisch-Germanischen Zentralmuseums
Mainz, 36, 637–686.

Frederik Rademakers Bibliography 527
Wagner, G. A., Pernicka, E., Seeliger, T. C., Öztunali, Ö., Baranyi, I., Begemann, F., and
Schmitt-Strecker, S. (1985): Geologische Untersuchungen zur Fruhen Metallurgie in
NW-Anatolien, Bulletin of the Mineral and Exploration Institute of Turkey, 100-101, 45–
81.
Wagner, G. A., Wagner, I., Öztunali, Ö., Schmitt-Strecker, S., and Begemann, F. (2003):
Archäometallurgischer Bericht über Feldforschung in Anatolien und bleiisotopische
Studien an Erzen und Schlacken, in T. Stöllner, G. Körlin, G. Steffens, and J. Cierny, eds.,
Man and Mining (Mensch und Bergbau), Der Anschnitt, Beiheft 16, Bochum: Deutsches
Bergbau-Museum, pp. 475–494.
Warburton, D. A. (2010): The Egyptian economy: sources, models and history, in
A. Hudecz and M. Petrik, eds., Commerce and Economy in Ancient Egypt. Proceedings
of the Third International Congress for Young Egyptologists 25-27 September 2009, Bu-
dapest, BAR S2131, Oxford: Archaeopress, pp. 71–79.
Watt, I. M. (1997): The Principles and Practice of Electron Microscopy, Cambridge: Cam-
bridge University Press.
Watterson, B. (1992): Calvin and Hobbes, Universal Press Syndicate.
Wayman, M. L., Gualtieri, M., and Konzuk, R. A. (1988): Bronze metallurgy at Roccaglo-
riosa, in R. M. Farquhar, R. G. V. Hancock, and L. A. Pavlish, eds., Proceedings of the 26th
International Archaeometry Symposium, Toronto, Toronto: The Archaeometry Labora-
tory, pp. 128–132.
Wayman, M. L., Smith, R. R., Hickey, C. G., and Duke, M. J. M. (1985): The analysis of
copper artifacts of the Copper Inuit, Journal of Archaeological Science, 12, 367–375.
Wedepohl, K. H. and Simon, K. (2010): The chemical composition of medieval wood ash
glass from Central Europe, Chemie der Erde, 70, 89–97.
Wedepohl, K. H., Simon, K., and Kronz, A. (2011): Data on 61 chemical elements for the
characterization of three major glass compositions in late antiquity and the Middle
Ages, Archaeometry, 53, 81–102.
Weeks, L. (2003): Early Metallurgy of the Persian Gulf, American School of Prehistoric Re-
search Monograph Series 2, Boston/Leiden: Brill Academic Publishers, Inc.
Wertime, T. A. (1979): The search for ancient tin: the geographic and historic boundaries,
in A. D. Franklin, J. S. Olin, and T. A. Wertime, eds., The Search for Ancient Tin: a Semi-
nar organized by Theodore A. Wertime and held at the Smithsonian Institution and the

528 Bibliography Frederik Rademakers
National Bureau of Standards, Washington, D.C., March 14-15, 1977, Washington, D.C.:
Smithsonian Institution Press, pp. 1–6.
Wilkinson, R. H. (1994): Symbol and Magic in Egyptian Art, London: Thames and Hudson.
Wood, N. (2009): Some implications of the use of wood ash in Chinese stoneware glazes, in
A. J. Shortland, I. C. Freestone, and Th. Rehren, eds., From Mine to Microscope. Advances
in the Study of Ancient Technology, Oxford: Oxbow Books, pp. 51–60.
Yahalom-Mack, N., Galili, E., Segal, I., Eliyahu-Behar, A., Boaretto, E., Shilstein, S., and
Finkelstein, I. (2014): New insights into Levantine copper trade: analysis of ingots from
the Bronze and Iron Ages in Israel, Journal of Archaeological Science, 45, 159–177.
Yalçin, Ü., Pulak, C., and Slotta, R., eds. (2005): Das Schiff von Uluburun. Welthandel vor
3000 Jahren, Bochum: Deutsches Bergbau-Museum.
Yamazaki, E., Nakai, S., Sahoo, Y., Yokoyama, T., Mifune, H., Saito, T., Chen, J., Takagi, N.,
Hokanishi, N., and Yasuda, A. (2014): Feasibility studies of Sn isotope composition for
provenancing ancient bronzes, Journal of Archaeological Science, 52, 458–467.
Yener, K. A. (2000): The Domestication of Metals: The Rise of Complex Metal Industries in
Anatolia, Leiden: Brill.
Yener, K. A. (2009): Strategic industries and tin in the ancient Near East: Anatolia updated,
Turkiye Bilimler Akademisi Arkeoloji Dergisi (TUBA-AR). Turkish Academy of Sciences
Journal of Archaeology, 12, 143–154.
Yener, K. A., Adriaens, A., Earl, B., and Özbal, H. (2003): Analysis of metalliferous residues,
crucible fragments, experimental smelts, and ores from Kestel tin mine and the tin pro-
cessing site of Göltepe, Turkey, in P. T. Craddock and J. Lang, eds., Mining and Metal
Production. Through the Ages, London: British Museum Press, pp. 181–197.
Yener, K. A. and Earl, B. (1994): Replication experiments of tin using crucibles, Göltepe
1992, Arkeometri Sonuçlari Toplantisi, 9, 163–176.
Yener, K. A., Sayre, E. V., Joel, E. C., Özbal, H., Barnes, I. L., and Brill, R. H. (1991): Stable
lead isotope studies of Central Taurus ore sources and related artifacts from eastern
Mediterranean Chalcolithic and Bronze Age sites, Journal of Archaeological Science, 18,
541–577.
Yener, K. A. and Vandiver, P. B. (1993): Tin processing at Göltepe, an Early Bronze Age site
in Anatolia, American Journal of Archaeology, 97, 207–238.

Frederik Rademakers Bibliography 529
Yener, K. A., Özbal, H., Kaptan, E., Pehlivan, A. N., and Goodway, M. (1989): Kestel: an Early
Bronze Age source of tin ore in the Taurus Mountains, Turkey, Science, 224, 200–203.
Yi, W., Budd, P., McGill, R. A. R., Young, S. M. M., Halliday, A. N., Haggerty, R., Scaife, B.,
and Pollard, A. M. (1999): Tin isotope studies of experimental and prehistoric bronzes,
in A. Hauptmann, E. Pernicka, Th. Rehren, and Ü. Yalçin, eds., The Beginnings of Metal-
lurgy, Bochum: Deutsches Bergbau-Museum, pp. 285–290.
Young, R. S. (1958): Bronzes from Gordion’s Royal Tomb, Archaeology, 11, 227–231.
Young, R. S. (1963): Gordion on the Royal Road, Proceedings of the American Philosophical
Society, 107, 348–364.
Zhou, W., Chen, J., Lei, X., Xu, T., Chong, J., and Wang, Z. (2009): Three Western Zhou
bronze foundry sites in the Zhouyuan area, Shaanxi province, China, in J. Mei and Th.
Rehren, eds., Metallurgy and Civilisation. Eurasia and Beyond, London: Archetype Pub-
lications, pp. 62–72.
Zori, C., Tropper, P., and Scott, D. (2013): Copper production in late prehispanic northern
Chile, Journal of Archaeological Science, 40, 1165–1175.
Zwicker, U. (1982): Bronze Age metallurgy at Ambelikou-Aletri and arsenical copper in a
crucible from Episcopi-Phaneromeni, in J. D. Muhly, R. Maddin, and V. Karageorghis,
eds., Early Metallurgy in Cyprus, 4000-500 BC, Nicosia: Pierides Foundation, pp. 63–68.
Zwicker, U. (1984): Metallographische und analytische Untersuchungen an Proben aus
den Grabungen der Bronzegießerei in der Phidias-Werkstatt von Olympia und Versuche
zum Schmelzen von Bronze in flachen Tiegeln, Berliner Beiträge zur Archeometrie, 9,
61–94.
Zwicker, U., Constantinou, G., Buchholz, H. G., and Karageorghis, V. (1981): Investigation
on ore, flux and crucible slag from prehistoric copper smelting at Ambelikou, Cyprus,
Revue d’Archéométrie. Bulletin de Liaison du Groupe des Méthodes Physiques et Chim-
iques de l’Archéologie Rennes. Actes du XX Symposium International d’Archéométrie,
Paris 26-29 mars 1980, 3, 331–340.
Zwicker, U. and Goudarzloo, F. (1979): Investigation on the distribution of metallic ele-
ments in copper slag, copper matte and copper and comparison with samples from
prehistoric smelting places, in Proceedings of the 18th International Symposium on Ar-
chaeometry and Archaeological Prospection, Bonn, 14-17 March 1978, Archaeo-Physika
Band 10, Köln: Rheinland-Verlag GmbH, pp. 360–375.

530 Bibliography Frederik Rademakers
Zwicker, U., Greiner, H., Hoffman, K.-H., and Reithinger, M. (1985): Smelting, refining and
alloying of copper and copper alloys in crucible furnaces during prehistoric up to Ro-
man times, in P. T. Craddock and M. J. Hughes, eds., Furnaces and Smelting Technology
in Antiquity, Occasional Paper 48, London: British Museum, pp. 103–115.
Zwicker, U., Grembler, E., and Rollig, H. (1977): Investigations of copper-slags from Cyprus
(second report), Report of the Department of Antiquities Cyprus, 310–316.
Zwicker, U., Virdis, P., and Ceruti, M. L. (1980): Investigations on copper ore, prehistoric
copper slag and copper ingots from Sardinia, in P. T. Craddock, ed., Scientific Studies in
Early Mining and Extractive Metallurgy, Occasional Paper 20, London: British Museum,
pp. 135–163.

Methodology Appendices
531

532 Frederik Rademakers

APPENDIX A
SEM-EDS analysis of CRM
A number of certified reference materials have been analysed by SEM-EDS (area analysis
at 800X, all other machine settings as discussed in section 3.3.4) to assess accuracy and
precision. Two basalts, a clay and a burnt refractory have been tested as comparative ma-
terials for the crucibles’ ceramic fabric. Metal CRM’s have been analysed to compare to
metallic phases in the crucible slag. Glass standards have been tested as a comparative
material for the crucible slag.
533

534 Appendix A Frederik Rademakers
Section A.1
Basalt
The results for the analysis of two basalt reference materials (fused to glasses, mounted in
resin, ground and polished) are presented in Tables A.1 and A.2. Both basalts are provided
by the United States Geological Survey.
For both reference materials, the measurement precision is very good (coefficient of vari-
ation below 10% for all oxides, below 5% for most), as is the accuracy (relative error below
10% for all oxides, below 5% for most).
Low levels of phosphorus and manganese oxide are not measured.
Oxide compositions in wt%Na2O MgO Al2O3 SiO2 K2O CaO TiO2 FeO Total
Measurement 1 2.17 7.03 13.11 50.06 0.54 11.51 2.64 11.15 98.21
Measurement 2 2.34 7.19 12.71 49.63 0.52 11.79 2.90 11.38 98.46
Measurement 3 2.35 7.37 13.01 50.52 0.57 11.51 2.90 10.95 99.16
Measurement 4 2.26 7.33 12.83 50.02 0.54 11.52 2.93 11.41 98.84
Measurement 5 2.73 7.28 13.06 51.07 0.48 11.78 2.73 11.17 100.31
Measurement 6 2.41 7.78 13.09 51.09 0.53 11.42 2.81 11.18 100.30
Average normalised data 2.41 7.11 13.10 50.94 0.54 11.72 2.85 11.34 100
Standard deviation 0.17 0.20 0.15 0.23 0.03 0.19 0.12 0.22 0
Coefficient of variation (%) 7.25 2.80 1.18 0.46 5.86 1.64 4.20 1.96 0
Reference values 2.22 7.23 13.50 49.90 0.52 11.40 2.73 11.07 98.57
Normalised reference values 2.25 7.33 13.70 50.62 0.53 11.57 2.77 11.23 100
Absolute error -0.16 0.23 0.60 -0.31 -0.01 -0.16 -0.08 -0.11
Relative error (%) -6.89 3.10 4.35 -0.62 -1.65 -1.38 -2.96 -0.96
Table A.1: BHVO-2: Basalt, Hawaiian Volcanic Observatory. Not measured: 0.27 wt% P2O5,
0.17 wt% MnO and trace elements (F, V, Cr, Cu, Zn, Sr, Zr, Ba)
Oxide compositions in wt%Na2O MgO Al2O3 SiO2 K2O CaO TiO2 FeO Total
Measurement 1 3.28 3.66 12.91 55.27 1.79 7.30 2.32 12.54 99.07
Measurement 2 3.25 3.85 13.04 55.50 1.87 7.13 2.32 12.61 99.56
Measurement 3 3.21 3.43 12.84 54.67 1.89 7.30 2.50 12.54 98.37
Measurement 4 3.14 3.69 12.72 55.16 1.71 7.32 2.24 12.43 98.41
Measurement 5 3.32 3.81 13.02 55.06 1.77 7.33 2.20 12.75 99.28
Measurement 6 3.56 3.77 12.72 55.75 1.70 7.15 2.43 12.15 99.24
Average normalised data 3.33 3.59 13.02 55.88 1.81 7.34 2.37 12.65 100
Standard deviation 0.14 0.13 0.11 0.28 0.08 0.12 0.12 0.21 0
Coefficient of variation (%) 4.20 3.72 0.86 0.49 4.30 1.59 4.98 1.64 0
Reference values 3.16 3.59 13.50 54.10 1.79 7.12 2.26 12.42 97.94
Normalised reference values 3.23 3.67 13.78 55.24 1.83 7.27 2.31 12.68 100
Absolute error -0.11 0.08 0.76 -0.64 0.02 -0.07 -0.06 0.02
Relative error (%) -3.36 2.14 5.53 -1.16 0.93 -1.03 -2.49 0.19
Table A.2: BCR-2: Basalt, Columbia River, Oregon. Not measured: 0.35 wt% P2O5, 0.20 wt%
MnO and trace elements (F, V, Cr, Cu, Zn, Sr, Zr, Mo, Ba)

Frederik Rademakers Appendix A 535
Section A.2
Clay and ceramic
The results for the analysis of one clay and one burnt refractory reference material (pressed
powder discs, no resin, not polished) are presented in Tables A.3 and A.4 respectively. The
clay is provided by the China National Analysis Centre, while the burnt refractory is pro-
vided by the National Institute of Standards and Technology.
For both, the measurement precision is quite good (coefficient of variation below 10%),
with the exception of TiO2 (below 15%) in the clay and MgO in the burnt refractory. The
accuracy, however, is quite problematic. For the clay, measurement of MgO, Al2O3, K2O,
CaO, TiO2 and FeO differ more than 10% from the reference values. For the burnt refrac-
tory, results are better, though measurement of FeO differs strongly from the reference
values.
Low levels of sodium, phosphorus, sulphur, calcium and manganese oxide, and chlorine,
lithium and strontium are not measured.
These poor results are quite surprising (in light of the good results for all other reference
materials) and probably reflect the use of powder samples for analysis (which results in low
totals: ±82.6% and ±86.3% respectively). For the clay, there appears to be a dilution effect:
lowered silica (6 wt%) could give rise to enrichment in most other oxides. For both cases,
however, there appears to be a significant overestimation of iron content.
Oxide compositions in wt%Na2O MgO Al2O3 SiO2 K2O CaO TiO2 FeO Total
Measurement 1 1.53 2.15 13.77 53.66 2.62 3.19 0.71 5.18 82.82
Measurement 2 1.62 2.09 13.24 53.29 2.65 3.36 0.70 4.92 81.87
Measurement 3 1.38 2.37 13.53 53.34 2.73 3.55 0.67 5.32 82.90
Measurement 4 1.54 2.12 13.17 53.09 2.58 3.29 0.47 5.17 81.43
Measurement 5 1.64 2.16 14.15 54.21 2.62 3.16 0.60 4.59 83.12
Measurement 6 1.52 2.13 13.59 53.38 2.68 3.58 0.62 4.82 82.34
Measurement 7 1.46 2.23 13.97 53.68 2.74 3.49 0.70 5.37 83.64
Average of normalised data 1.85 2.64 16.51 64.81 3.22 4.08 0.77 6.12 100
Standard deviation 0.11 0.10 0.31 0.41 0.06 0.21 0.10 0.34 0
Coefficient of variation (%) 6.11 3.90 1.86 0.63 1.87 5.04 13.32 5.56 0
Reference values 1.81 1.84 13.28 66.64 2.50 3.23 0.66 4.17 94.13
Normalised reference values 1.92 1.95 14.11 70.80 2.66 3.43 0.70 4.43 100
Absolute error 0.07 -0.68 -2.40 5.99 -0.57 -0.65 -0.07 -1.69
Relative error (%) 3.86 -34.91 -17.01 8.46 -21.40 -19.03 -10.23 -38.08
Table A.3: Clay DC60105 (China National Analysis Centre). Not measured: 0.11 wt% P2O5,
0.03 wt% SO3, 0.09 wt% MnO and 0.01 wt% Cl
Oxide compositions in wt%MgO Al2O3 SiO2 K2O TiO2 FeO Total
Measurement 1 0.44 32.08 47.32 1.26 1.92 1.85 84.88
Measurement 2 0.29 32.23 47.96 1.30 2.18 1.78 85.73

536 Appendix A Frederik Rademakers
Oxide compositions in wt%MgO Al2O3 SiO2 K2O TiO2 FeO Total
Measurement 3 0.50 33.08 49.18 1.22 2.06 1.66 87.70
Measurement 4 0.38 32.96 49.08 1.11 1.74 1.55 86.82
Measurement 5 0.41 33.05 48.71 1.29 2.00 1.42 86.89
Measurement 6 0.50 32.91 47.69 1.20 1.76 1.65 85.71
Average of normalised data 0.49 37.92 56.00 1.43 2.25 1.92 100
Standard deviation 0.09 0.28 0.31 0.09 0.20 0.19 0
Coefficient of variation (%) 19.17 0.75 0.55 6.07 8.66 10.06 0
Reference values 0.52 38.70 54.90 1.33 2.03 1.44 98.92
Normalised reference values 0.53 39.12 55.50 1.34 2.05 1.46 100
Absolute error 0.04 1.20 -0.50 -0.08 -0.20 -0.46
Relative error (%) 7.42 3.08 -0.91 -5.99 -9.80 -31.69
Table A.4: NIST 76a: Burnt Refractory. Not measured: 0.07 wt% Na2O, 0.12 wt% P2O5, 0.22 wt%
CaO, 0.02 wt% Li and 0.03 wt% Sr
Section A.3
Metal
Four metal CRM’s (mounted in resin, ground and polished) have been analysed. As no
pure tin-bronze reference materials were available, a group of (leaded) bronzes and brass
was used. This matches some of the prills measured in the Gordion and Roman sam-
ples, but not those of Pi-Ramesse (mostly unleaded bronze). No cobalt-bearing copper
alloys, similar to prills encountered in some Pi-Ramesse crucibles, and no silver-rich al-
loys, matching the composition of some Gordion prills, were available either. The results
for the analysis of the four metal reference materials are presented in Tables A.5, A.6, A.7
and A.8. All samples are provided by the Bureau of Analysed Samples.
The measurements of CURM 42.23-2 (brass) show fairly good precision (coefficient of vari-
ation below 10% for all major elements, though high for iron and lead, present at low lev-
els) and good accuracy (relative error below 5% for all elements, except for lead, present at
low levels). This indicates that low levels of lead (in brass) are difficult to measure and low
levels of iron (in brass) are measured, but not precisely.
Low levels of phosphorus, sulphur, nickel, arsenic, antimony, aluminium, silicon, man-
ganese and bismuth are not measured.
The (15!) measurements of CURM 50.01-4 (leaded bronze) show good precision (coef-
ficient of variation below 10%) for copper, tin and nickel, but poor precision for zinc and
lead (present at significant levels), iron, arsenic and antimony (present at lower levels) and
phosphorus and sulphur (light elements, present at low levels). The accuracy is slightly
better, with copper, iron, nickel and zinc at acceptable levels, while tin, antimony, lead,
arsenic, phosphorus and sulphur show poor accuracy.

Frederik Rademakers Appendix A 537
Looking at these 15 measurements in more detail, it becomes clear that lead is the main
problem influencing these measurements: the lead, which forms an undissolved phase in
the bronze, has a tendency to be pulled out of the sample surface during polishing, lower-
ing the overall lead content of the sample. This gives rise to a low precision in the measure-
ments (as some areas of analysis contain lead phases while lead has been removed in oth-
ers) and an average underestimation (±30%) of the lead content. Tin, the other main alloy
component, is measured more precisely, but consistently overestimated (±13%, which is
not entirely unacceptable).
Low levels of aluminium, silicon, manganese and bismuth are not measured.
The measurements of CURM 50.04-4 (leaded bronze) show good precision (coefficient of
variation below 10%) for copper and tin, but poor precision for lead (the other main alloy
constituent), arsenic and antimony (present at low levels), nickel (present at significant
levels, precision is not entirely unacceptable (coefficient of variation below 15%)) and sul-
phur (light element, present at low levels). The accuracy is equally poor, with copper (and
arsenic) showing relative errors below 10%, while lead is again underestimated by ±30%,
tin is overestimated by ±12%, antimony and nickel are ±15% off and sulphur is far off.
These results correspond to those seen for CURM 50.01-4: the lowering effect of polishing
on lead content and the overestimation of tin content.
Low levels of phosphorus, iron, zinc, aluminium, silicon, manganese and bismuth are not
measured.
The measurements of CURM 71.32.4 (leaded gunmetal) show good precision for copper,
zinc and tin (coefficient of variation below 5-10%), but poor precision for lead (similar
to the previous cases), nickel (though below 15%, not entirely unacceptable), iron and
arsenic (present at low levels). Accuracy is slightly better here, with relative errors below
10% for copper, nickel, zinc and tin, below 15% for iron and arsenic and the (by now)
typical underestimation of ±30% for lead.
Low levels of phosphorus, sulphur, antimony, aluminium, silicon, manganese, bismuth,
chromium and silver are not measured.
In conclusion, it appears that lead has a strong influence on the measurement of bronzes
and brasses. Lead is not measured precisely and it is consistently underestimated. Fur-
thermore, it appears to impact the measurement of tin: though it is measured precisely,
the accuracy of its measurement seems to be lowered by the presence of lead (though not
to entirely unacceptable levels). A comparison of results for CURM 42.23-2 and 71.32.4
(low lead) to CURM 50.01-4 and 50.04-4 (high lead) supports this idea.
Iron and nickel can be measured fairly accurately at levels down to ±0.5 wt%, though not

538 Appendix A Frederik Rademakers
always with great precision. Arsenic can similarly be measured at levels down to ±0.5 wt%,
though with more problematic precision. For zinc and antimony, levels below ±0.6-0.7
wt% are not detected, while higher levels were detected with poor to fair precision. Light
elements like sulphur and phosphorus present more difficulty when present at low levels.
All in all, it appears that a detection limit of ±0.5 wt% seems to apply for most elements
present in copper. The accuracy of the measurement is quite good, though care must be
taken when significant amounts of lead are present.
Elemental compositions in wt%Fe Cu Zn Sn Pb Total
Measurement 1 0.25 73.96 21.97 1.56 0.01 97.75
Measurement 2 0.39 74.00 22.07 1.67 0.29 98.43
Measurement 3 0.24 74.65 21.35 1.39 0.33 97.97
Measurement 4 0.47 74.24 21.37 1.56 0.41 98.05
Measurement 5 0.35 73.79 21.18 1.83 0.13 97.28
Measurement 6 0.37 73.69 21.68 1.72 0.72 98.17
Measurement 7 0.27 73.73 21.27 1.86 0.59 97.71
Measurement 8 0.40 74.31 20.83 1.46 0.13 97.12
Measurement 9 0.26 73.98 22.21 1.90 0.56 98.91
Measurement 10 0.36 74.50 21.25 1.80 0.61 98.51
Measurement 11 0.33 73.71 21.03 1.59 1.19 97.85
Measurement 12 0.32 73.93 21.08 1.63 0.74 97.71
Average normalised data 0.34 75.59 21.89 1.70 0.48 100
Standard deviation 0.07 0.48 0.38 0.16 0.34 0
Coefficient of variation (%) 21.06 0.63 1.73 9.64 69.98 0
Reference values 0.35 74.36 22.13 1.63 0.58 99.99
Normalised reference values 0.35 74.37 22.13 1.63 0.58 100
Absolute error 0.01 -1.22 0.24 -0.07 0.09
Relative error (%) 3.96 -1.64 1.10 -4.18 16.10
Table A.5: CURM 42.23-2: Admiralty Brass. Not measured: 0.13 wt% P, 0.05 wt% S, 0.17 wt% Ni,
0.17 wt% As, 0.36 wt% Sb, 0.01 wt% Al, 0.02 wt% Si, 0.02 wt% Mn and 0.03 wt% Bi
Elemental compositions in wt%P S Fe Ni Cu Zn As Sn Sb Pb Total
Measurement 1 0.16 0.17 0.25 2.24 78.67 1.38 0.24 10.59 0.76 6.53 100.99
Measurement 2 0.28 0.22 0.19 2.47 77.77 1.19 0.39 11.29 0.37 6.66 100.84
Measurement 3 0.13 0.14 0.37 2.60 78.53 1.00 0.11 11.37 0.49 6.61 101.35
Measurement 4 0.14 0.18 0.18 2.51 79.37 0.95 0.34 10.70 0.55 6.96 101.88
Measurement 5 0.31 0.20 0.33 2.81 76.89 1.02 0.35 11.06 0.91 8.33 102.22
Measurement 6 0.17 0.11 0.23 2.63 77.46 1.04 0.14 11.50 0.33 6.85 100.47
Measurement 7 0.23 0.33 0.27 2.14 80.00 1.21 0.38 10.98 0.81 5.06 101.41
Measurement 8 0.21 0.36 0.02 2.22 77.54 1.50 0.31 10.97 0.35 6.09 99.58
Measurement 9 0.17 0.10 0.14 2.73 77.85 1.23 0.72 11.24 0.70 5.86 100.74
Measurement 10 0.16 0.21 0.41 2.54 78.05 1.00 0.19 11.19 0.55 6.48 100.78
Measurement 11 -0.01 0.11 0.21 2.47 83.23 1.48 0.42 9.36 0.01 2.51 99.80
Measurement 12 0.01 0.15 0.23 2.21 75.18 1.47 0.10 10.72 0.40 10.65 101.12
Measurement 13 0.09 0.12 0.05 2.34 73.03 1.35 0.45 10.74 0.16 12.37 100.70
Measurement 14 0.10 0.04 0.18 2.34 70.11 1.52 0.37 9.90 0.36 17.01 101.92
Measurement 15 0.09 1.36 0.25 2.24 70.05 2.00 0.10 10.91 0.75 13.17 100.92
Average normalised data 0.15 0.25 0.22 2.41 76.18 1.28 0.31 10.73 0.49 7.99 100
Standard deviation 0.09 0.32 0.10 0.20 3.71 0.28 0.17 0.56 0.25 3.63 0
Coefficient of variation (%) 58.91 125.31 47.46 8.33 4.87 22.03 54.64 5.21 50.25 45.49 0
Reference values 0.11 0.11 0.24 2.24 74.08 1.17 0.22 9.45 0.59 11.74 100.04
Normalised reference values 0.11 0.11 0.24 2.24 74.05 1.17 0.22 9.45 0.59 11.74 100
Absolute error -0.04 -0.14 0.02 -0.17 -2.10 -0.11 -0.09 -1.28 0.10 3.75
Relative error (%) -31.56 -123.01 9.47 -7.50 -2.83 -9.23 -39.09 -13.54 16.27 31.96
Table A.6: CURM 50.01-4: Leaded Bronze. Not measured: 0.02 wt% Al, 0.01 wt% Si, 0.02 wt%
Mn and 0.03 wt% Bi

Frederik Rademakers Appendix A 539
Elemental compositions in wt%S Ni Cu As Sn Sb Pb Total
Measurement 1 0.41 1.41 78.25 0.09 13.26 0.48 6.03 99.93
Measurement 2 0.31 1.43 77.89 0.29 12.96 0.17 6.70 99.75
Measurement 3 0.26 1.28 79.29 -0.04 12.88 0.59 5.38 99.64
Measurement 4 0.35 1.33 77.43 -0.06 13.36 0.88 6.82 100.11
Measurement 5 0.08 1.07 78.35 0.16 12.57 0.15 6.18 98.54
Measurement 6 -0.07 1.24 80.12 0.23 12.17 0.59 5.67 99.95
Measurement 7 0.37 1.49 78.14 0.02 11.76 0.61 7.68 100.08
Measurement 8 0.31 1.06 78.65 -0.10 12.78 0.19 5.58 98.45
Measurement 9 0.32 1.33 76.36 0.09 13.02 0.36 7.55 99.02
Measurement 10 0.26 1.03 77.7 0.05 12.78 0.31 6.49 98.61
Measurement 11 0.32 1.34 81.13 0.04 11.90 0.41 4.28 99.43
Measurement 12 0.29 1.07 76.03 0.01 11.44 0.38 11.12 100.33
Average normalised data 0.27 1.26 78.68 0.07 12.64 0.43 6.65 100
Standard deviation 0.13 0.16 1.57 0.12 0.64 0.22 1.68 0
Coefficient of variation (%) 49.95 12.59 1.99 178.85 5.10 50.36 25.30 0
Reference values 0.14 1.10 76.11 0.06 11.30 0.50 9.94 100.10
Normalised reference values 0.14 1.10 76.04 0.06 11.29 0.50 9.93 100
Absolute error -0.13 -0.16 -2.65 -0.01 -1.35 0.07 3.28
Relative error (%) -91.25 -14.73 -3.48 -9.83 -11.96 14.25 33.01
Table A.7: CURM 50.04-4: Leaded Bronze. Not measured: 0.03 wt% P, 0.10 wt% Fe, 0.66 wt% Zn,
0.01 wt% Al, 0.01 wt% Si, 0.03 wt% Mn and 0.10 wt% Bi
Elemental compositions in wt%Fe Ni Cu Zn As Sn Pb Total
Measurement 1 0.33 0.66 80.19 6.19 0.18 6.57 3.67 97.81
Measurement 2 0.55 0.82 80.88 6.43 0.04 6.96 3.20 98.89
Measurement 3 0.44 0.70 82.34 6.77 0.14 7.16 3.06 100.60
Measurement 4 0.45 0.68 82.85 7.01 0.13 7.03 1.66 99.81
Measurement 5 0.41 0.67 81.10 6.78 0.16 7.06 3.06 99.24
Measurement 6 0.36 0.85 78.68 5.81 0.22 6.86 6.01 98.79
Measurement 7 0.13 0.74 80.99 6.18 0.49 7.64 3.09 99.26
Measurement 8 0.37 0.68 81.48 6.40 0.11 7.12 3.13 99.30
Measurement 9 0.34 0.87 81.92 6.82 0.33 6.41 2.03 98.74
Measurement 10 0.53 0.70 82.47 6.68 0.18 7.08 2.05 99.69
Measurement 11 0.38 0.87 81.58 6.44 0.51 6.66 2.30 98.74
Measurement 12 0.39 0.94 80.93 5.98 0.14 7.07 3.46 98.90
Average normalised data 0.39 0.77 81.98 6.51 0.22 7.03 3.09 100
Standard deviation 0.11 0.10 0.89 0.35 0.15 0.30 1.14 0
Coefficient of variation (%) 27.37 13.27 1.09 5.36 66.47 4.23 36.89 0
Reference values 0.35 0.70 80.48 6.52 0.25 6.46 4.43 99.87
Normalised reference values 0.35 0.70 80.59 6.53 0.25 6.47 4.44 100
Absolute error -0.04 -0.07 -1.40 0.02 0.03 -0.56 1.35
Relative error (%) -12.23 -9.86 -1.73 0.26 11.12 -8.68 30.34
Table A.8: CURM 71.32.4: Leaded Gunmetal. Not measured: 0.02 wt% P, 0.08 wt% S, 0.26 wt%
Sb, 0.12 wt% Al, 0.02 wt% Si, 0.05 wt% Mn, 0.05 wt% Bi, 0.05 wt% Cr and 0.03 wt% Ag

540 Appendix A Frederik Rademakers
Section A.4
Glass
Three glass reference materials were analysed (mounted in resin, ground and polished).
The results of these measurements are given in Tables A.9, A.10 and A.11. The first sam-
ple was provided by the National Institute of Standards and Technology, while the other
two were provided by the Corning Museum of Glass. No bismuth-bearing glasses, as a
comparative for crucible S5 (section 11.1.3.3), were available for analysis.
The measurements for all three samples show very good precision (coefficient of variation
below 10% for most oxides) and accuracy (relative error below 10% for most oxides), with
some exceptions detailed below.
For the NIST 1412 glass, the only exception is Na2O, which shows slightly lower accuracy
(still below 15% relative error).
Low levels of FeO are not measured. Reported high levels (4.5 wt%) of extremely light
oxides Li2O and B2O3 are not measured.
For the Corning B glass, the measurement of MnO, FeO and Cl (all present at relatively
low levels) and MgO and SO3 (light oxides, present at relatively low levels) shows lowered
precision. The accuracy, however, is quite good. Only low levels of SO3 and FeO are not
measured accurately (relative error of ±20%), while Al2O3 and CuO show relative errors
below 15%, which are not entirely unacceptable. 0.9 wt% TiO2 is measured quite poorly,
both in terms of precision and accuracy.
Low levels of V2O5, CoO, NiO, ZnO, SrO, SnO2, Sb2O5, BaO and PbO are not measured.
For the Corning D glass, the measurement of Na2O shows slightly lower precision (still
below 15% coefficient of variation). The measurement of SO3 (light element), TiO2, MnO,
FeO, CuO and Cl (all present at relatively low levels) shows poor precision. Accuracy is
poor for Na2O, SO3, TiO2 and Cl.
Low levels of ZnO, SnO2, Sb2O3, BaO, PbO, CoO, NiO and SrO were not measured.
In conclusion, the measurements of these glass samples show very good precision and
accuracy for all oxides present at levels down to 0.5 wt%, sometimes lower. TiO2, Sb2O3
and PbO form an exception and appear to have a higher detection limit (±0.7-1 wt%).
Measurements of light oxides, such as SO3 and Na2O, have lowered precision.
Oxide compositions in wt%Na2O MgO Al2O3 SiO2 K2O CaO ZnO SrO CdO BaO PbO Total
Measurement 1 5.36 4.63 6.93 41.69 3.55 4.51 4.44 3.63 4.67 4.55 4.60 89.35
Measurement 2 5.37 4.29 7.22 43.03 4.03 4.47 4.30 4.47 4.43 4.70 4.45 90.76

Frederik Rademakers Appendix A 541
Oxide compositions in wt%Na2O MgO Al2O3 SiO2 K2O CaO ZnO SrO CdO BaO PbO Total
Measurement 3 5.08 4.59 7.36 42.83 3.80 4.87 5.15 4.47 4.75 4.63 4.85 92.39
Measurement 4 5.58 4.37 7.28 43.09 4.14 4.56 4.63 3.95 4.56 4.76 4.74 91.66
Measurement 5 5.44 4.60 7.11 41.74 4.53 4.56 4.38 4.54 4.28 4.92 4.44 90.52
Measurement 6 5.41 4.58 7.29 43.36 3.98 4.52 4.69 4.34 4.24 4.76 4.50 91.65
Measurement 7 4.95 4.48 6.84 42.99 4.00 4.71 4.22 4.65 4.57 5.00 4.41 90.83
Measurement 8 4.96 4.68 7.39 42.91 4.48 4.56 4.51 4.17 4.56 5.01 4.69 91.93
Measurement 9 5.39 4.66 7.31 42.78 4.16 4.56 4.34 4.57 4.81 4.91 4.65 92.15
Average normalised data 5.79 4.98 7.88 46.81 4.46 5.03 4.95 4.72 4.98 5.26 5.03 100
Standard deviation 0.27 0.15 0.15 0.47 0.33 0.12 0.28 0.35 0.21 0.17 0.14 0
Coefficient of variation (%) 4.61 2.99 1.95 1.01 7.28 2.43 5.74 7.46 4.19 3.29 2.83 0
Reference values 4.69 4.69 7.52 42.38 4.14 4.53 4.48 4.55 4.38 4.67 4.40 90.46
Normalised reference values 5.18 5.18 8.31 46.85 4.58 5.01 4.95 5.03 4.84 5.16 4.86 100
Absolute error -0.60 0.21 0.43 0.04 0.11 -0.02 0 0.31 -0.14 -0.10 -0.17
Relative error (%) -11.63 3.99 5.17 0.08 2.48 -0.47 0.05 6.12 -2.81 -1.93 -3.43
Table A.9: NIST 1412: Multi-Component Glass. Not measured: 0.03 wt% FeO, 4.50 wt% Li2O
and 4.53 wt% B2O3
Oxide compositions in wt%Na2O MgO Al2O3 SiO2 P2O5 SO3 K2O CaO TiO2 MnO FeO CuO *Cl Total
Measurement 1 17.16 1.06 3.84 62.30 0.95 0.64 1.04 9.01 0.10 0.13 0.48 3.06 0.26 99.74
Measurement 2 17.47 0.70 4.05 62.34 0.98 0.88 0.99 8.74 0.01 0.45 0.22 3.04 0.14 99.86
Measurement 3 16.81 0.97 3.72 63.02 0.85 0.58 1.20 8.86 0.01 0.43 0.19 3.10 0.27 99.73
Measurement 4 16.78 0.99 3.89 63.11 0.78 0.58 1.08 8.94 0.15 0.21 0.39 2.95 0.16 99.84
Measurement 5 17.08 1.13 4.04 62.75 0.87 0.39 1.06 8.57 0.07 0.32 0.32 3.23 0.16 99.83
Measurement 6 17.35 0.90 4.04 62.76 0.81 0.66 0.97 8.95 0.06 0.12 0.35 2.77 0.26 99.74
Measurement 7 17.20 1.02 3.68 62.65 0.75 0.71 1.18 8.93 0.10 0.18 0.36 3.03 0.22 99.78
Measurement 8 17.21 0.94 3.84 62.66 0.93 0.71 1.09 9.10 0.06 0.14 0.52 2.57 0.22 99.78
Average of normalised data 17.13 0.96 3.89 62.70 0.87 0.64 1.08 8.89 0.07 0.25 0.35 2.97 0.21 100.01
Standard deviation 0.24 0.13 0.15 0.29 0.08 0.14 0.08 0.17 0.05 0.14 0.11 0.21 0.05 0.01
Coefficient of variation (%) 1.40 13.26 3.73 0.46 9.42 21.73 7.60 1.86 67.78 54.37 32.29 6.96 24.46 0.01
Reference values 17.00 1.03 4.36 61.55 0.82 0.54 1.00 8.56 0.89 0.25 0.31 2.66 0.20 100.59
Normalised reference values 16.90 1.02 4.33 61.19 0.82 0.54 0.99 8.51 0.88 0.25 0.30 2.64 100
Absolute error -0.23 0.06 0.45 -1.50 -0.05 -0.11 -0.08 -0.38 0.82 0 -0.05 -0.32 -0.01
Relative error (%) -0.01 0.06 0.10 -0.02 -0.06 -0.20 -0.08 -0.04 0.92 0 -0.17 -0.12 -5.62
Table A.10: Corning B: Soda-Lime-Silica Glass. *(Cl in wt%) Not measured: 0.04 wt% V2O5,
0.05 wt% CoO, 0.10 wt% NiO, 0.19 wt% ZnO, 0.02 wt% SrO, 0.04 wt% SnO2, 0.46 wt% Sb2O5, 0.12
wt% BaO and 0.61 wt% PbO
Oxide compositions in wt%Na2O MgO Al2O3 SiO2 P2O5 SO3 K2O CaO TiO2 MnO FeO CuO *Cl Total
Measurement 1 1.55 3.85 4.83 54.75 4.23 0.27 11.55 15.23 0.51 0.52 0.28 0.46 0.20 98.04
Measurement 2 1.38 3.92 4.66 55.93 4.18 0.20 11.27 14.57 0.58 0.63 0.47 0.52 0.18 98.32
Measurement 3 1.71 3.84 4.78 53.85 4.11 0.31 11.27 14.94 0.64 0.48 0.53 0.40 0.16 96.87
Measurement 4 1.47 3.96 4.71 54.96 4.12 0.53 11.71 14.89 0.35 0.36 0.46 0.47 0.18 98.00
Measurement 5 1.34 3.84 4.86 54.83 3.93 0.40 11.34 14.86 0.44 0.41 0.49 0.22 0.11 96.97
Measurement 6 1.37 3.93 4.69 54.85 4.01 0.23 11.38 14.63 0.59 0.50 0.40 0.32 0.17 96.91
Measurement 7 1.22 4.01 4.59 55.28 3.74 0.38 11.32 14.82 0.60 0.61 0.57 0.38 0.21 97.52
Measurement 8 1.08 3.81 4.44 54.91 3.98 0.28 11.50 14.77 0.56 0.74 0.51 0.22 0.12 96.81
Average normalised data 1.43 3.99 4.81 56.27 4.14 0.34 11.70 15.21 0.55 0.55 0.48 0.38 0.17 99.83
Standard deviation 0.20 0.06 0.14 0.47 0.15 0.11 0.16 0.22 0.10 0.13 0.09 0.11 0.04 0.04
Coefficient of variation (%) 13.72 1.60 2.92 0.84 3.70 32.22 1.35 1.43 18.10 23.00 19.13 30.08 21.31 0.04
Reference values 1.20 3.94 5.30 55.24 3.93 0.30 11.30 14.80 0.38 0.55 0.48 0.38 0.40 100.10
Normalised reference values 1.20 3.94 5.29 55.18 3.93 0.30 11.29 14.79 0.38 0.55 0.48 0.38 100
Absolute error -0.23 -0.05 0.48 -1.09 -0.21 -0.04 -0.41 -0.42 -0.17 0 0 0 -0.17
Relative error (%) -18.97 -1.37 9.11 -1.97 -5.39 -12.20 -3.65 -2.86 -44.22 0.81 0.94 -0.43 -41.56
Table A.11: Corning D: Potash Glass. *(Cl in wt%) Not measured: 0.10 wt% ZnO, 0.10 wt% SnO2,
0.97 wt% Sb2O3, 0.51 wt% BaO, 0.48 wt% PbO, 0.02 wt% CoO, 0.06 wt% NiO and 0.06 wt% SrO

542 Appendix A Frederik Rademakers
Section A.5
Summary
In summary, the detection limit (i.e., the minimal concentration1 for which an element
or oxide can be accurately measured) for SEM-EDS analysis, using the JEOL 8600 Super-
probe, equipped with an Oxford Instruments EDS attachment, appears to be ±0.5 wt%,
with the exception of a few elements/oxides which have detection limits of ±1 wt%.
The measurement precision is generally high (coefficient of variation below 10%), though
sometimes lower for elements/oxides present at low levels and for light elements/oxides.
The accuracy is similarly good, typically showing a relative error of less than 10% when
compared to certified reference values.
The presence of lead in metal can be problematic due to polishing effects, leading to poor
precision and accuracy (consistent underestimation of ±30%) in its measurement and a
lowered accuracy of the measurement of other alloy constituents, such as tin.
1Actually mass fractions, expressed in wt%, are used here rather than concentrations (measure relative to
volume).

Pi-Ramesse Appendices
543

544 Frederik Rademakers

APPENDIX B
Sample details
The table below presents contextual details for the forty-nine samples analysed by optical
microscopy and SEM-EDS. “PQ” refers to Planquadrate, which is the excavation square
(see, e.g., Figure 4.7). “Strat” refers to building levels from Table 4.1, while “Context”
refers to the primary, secondary, tertiary and unclear (?) excavation context, as assessed
by the excavator. Having evaluated the stratigraphical allocation of each individual find,
Dr. Pusch is fairly confident of the building levels in column “Strat”. Given the particu-
larly high incidence of tertiary find contexts for the industrial area, and bearing in mind
considerations presented in section 4.4, many (if not all) of the B/2 fragments from the
industrial area likely belong to the industrial phase B/3.
Area Sample PQ Strat Context Sample type
QI multifunctional workshops 82_0223b,01 - 10.1.12 QI-d/3 B/1-B/2 Tert Rim
QI multifunctional workshops 82_298b,01 - 21.3.2012 QI-d/3 B/2a Tert? Rim
QI multifunctional workshops 83_0542b,01 - 21.3.2012 QI-e/1 B/2a Sec Rim
QI multifunctional workshops 83_0597l,01 - 21.3.2012 QI-e/1 B/1-B/2 Tert Body
QI multifunctional workshops 83_1149b - 12.11.2012 (1) QI-d/02.03 B/3 ? Rim
QI multifunctional workshops 83_1149b - 12.11.2012 (2) QI-d/02.03 B/3 ? Body-rim, below (1)
QI multifunctional workshops 84_0030c,01 - 10.1.2012 QI-e/02.03 B/3 ? Body-rim
QI multifunctional workshops 84_0106c - 12.11.2012 QI-d/4.5 B/3 Sec Body
QI industrial area 84_0749, - 10.1.12 QI-a/3 B/3 Tert Body-rim
QI industrial area 84_1189b,0 - 12.11.2012 QI-b/3 B/1 Tert Body-rim
QI multifunctional workshops 84_1232, - 12.11.2012 QI-f/02.03 B/3 ? Body-rim
QI multifunctional workshops 86_0208b - 12.11.2012 QI-b/10 B/3b ? Rim
QI industrial area 86_0471b,01 - 19.1.2006 QI-ax/3 B/2a ? Body
QI industrial area 86_0749c - 19.1.2006 QI-ax/4.5 B/3 ? Body
QI multifunctional workshops 86_0792b,04 - 12.11.2012 QI-d/4.5 B/3 Sec/tert Body
QI industrial area 87_0423b - 19.1.2006 QI-ax/3-4.5 B/3 ? Body
QI industrial area 87_0634c,04 - 12.11.2012 QI-b/5 B/3b Sec Body
545

546 Appendix B Frederik Rademakers
Area Sample PQ Strat Context Sample type
QI industrial area 87_0725c,1-20 - 12.11.2012 QI-a/3.4 B/2a ? Body
QI industrial area 87_0726,68-78b - 19.1.2006 QI-a/3.4 B/2a Sec Body
QI industrial area 87_0726c,2-60a - 19.1.2006 QI-a/3.4 B/2a Sec Body
QI industrial area 87_0762, - 21.3.2012 QI-a/3 B/2a Tert Body
QI industrial area 87_0762, - 22.3.2013 (1) QI-a/3 B/2a Tert Body
QI industrial area 87_0762, - 22.3.2013 (2) QI-a/3 B/2a Tert Body
QI industrial area 87_0762,0Nv - 21.2.2012 QI-a/3 B/2a Tert Body
QI industrial area 87_0762,0Nv - 22.3.2013 (1) QI-a/3 B/2a Tert Body
QI industrial area 87_0762,0Nv - 22.3.2013 (2) QI-a/3 B/2a Tert Body
QI industrial area 87_0773,04 - 12.11.2012 QI-a/3 B/3 Tert Rim
QI industrial area 87_0791,01-88 - 12.11.2012 QI-a/3.4 B/2a Tert Body
QI industrial area 87_0849a,04 - 21.3.2012 QI-a/3 B/3 Tert Body
QI industrial area 87_0884,01-56b - 19.1.2006 QI-a/3 B/2a Tert Body
QI industrial area 87_0884,01-56c - 19.1.2006 QI-a/3 B/2a Tert Body
QI industrial area 87_0897a,01-45 - 12.11.2012 (1) QI-a/3 B/2a Tert Body
QI industrial area 87_0897a,01-45 - 12.11.2012 (2) QI-a/3 B/2a Tert Body
QI industrial area 87_0942g,03 - 12.11.2012 QI-a/3 B/3 Tert Body
QIV workshop 92_0606 - 12.11.2012 QIV-i/27 ? ? Body
QIV workshop 92_0645b - 21.3.2012 QIV-i/28 Ba Sec/tert Body
QIV workshop 94_0239,01 - 21.3.2012 QIV-j.k/28.29 Bb Tert Body
QIV workshop 94_0560 - 10.01.12 QIV-j.l/27.28 Ba/b? Prim? Body
QIV workshop 94_0775,01 - 12.11.2012 QIV-j.k/28 Ba? Tert Body
QIV workshop 94_842 - 21.2.2012 QIV-h.i/31.32 Ba Sec/tert Body-rim
QIV workshop 97_0631E,01 - 12.11.2012 QIV-S-Schn Bc Prim Body-rim
QIV workshop 97_0631E,04 - 12.11.2012 QIV-S-Schn Bc Prim Body
QIV workshop 97_0632D,01 - 10.1.12 QIV-S-Schn Bc Prim Body
QIV workshop 97_0675,02 - 12.11.2012 QIV-g/28 Bc/Bd? Prim/sec Rim
QIV workshop 97_0690,02 - 21.2.2012 QIV-S-Schn Bc/2 ? Body
QIV workshop 97_0690,02- - 21.2.2012 QIV-S-Schn Bc/2 ? Body
QIV workshop 97_1176 - 12.11.2012 QIV-h/28 Bc? ? Body
QIV workshop 98_0387,03 - 21.3.2012 QIV-j/28 Bb? Tert Body
QIV workshop 98_1325 - 12.11.2012 QIV-h/28 Bd/Be? Prim/sec Rim

APPENDIX C
Bulk Compositions
In this appendix, the bulk composition of both the crucible ceramic and the crucible slag
are given in the first two tables. The final three tables show the ratios of elements to Al2O3,
for ceramic, slag and the change between them respectively.
Average ceramic composition. All results in wt%, normalised to 100%.Sample Na2O MgO Al2O3 SiO2 P2O5 K2O CaO TiO2 MnO FeO CuO As2O3 SnO2
82_0223b,01 - 10.1.12 3.7 1.8 12 67 0.6 1.7 3.2 1.4 0.1 7.0 0.2 0.2 0.3
Std. dev. (5 ms) 0.9 0.3 2 5 0.1 0.4 0.7 0.4 0.1 1.0 0.2 0.3 0.4
Min. 2.5 1.4 11 62 0.4 1.3 2.4 1.0 0 5.7 0 0 0
Max. 5.1 2.1 15 74 0.7 2.1 4.1 1.9 0.2 8.1 0.5 0.7 0.7
82_298b,01 - 21.3.2012 2.1 2.2 13 67 0.6 1.6 3.4 1.3 0.1 7.9 0 0.1 0.3
Std. dev. (5 ms) 0.2 0.2 1 1 0.8 0.1 0.5 0.2 0.1 0.4 0.1 0.2 0.1
Min. 1.7 2.0 11 65 0.1 1.5 2.8 1.1 0 7.4 0 0 0.2
Max. 2.4 2.4 15 69 2.1 1.8 4.2 1.6 0.2 8.4 0.2 0.4 0.5
83_0542b,01 - 21.3.2012 2.3 2.5 12 67 0.8 1.7 4.0 1.6 0.1 7.6 0.1 0.2 0.1
Std. dev. (4 ms) 0.4 0.3 1 3 0.3 0.2 0.7 0.1 0 0.5 0.1 0.4 0.2
Min. 1.9 2.3 11 64 0.5 1.5 2.9 1.4 0 7.1 0 0 0
Max. 2.8 2.8 14 71 1.1 1.9 4.4 1.7 0.1 8.3 0.3 0.5 0.3
83_0597b,01 - 21.3.2012 2.2 2.7 16 60 0.3 1.5 3.8 1.9 0.2 10.7 0 0.4 0.2
Std. dev. (4 ms) 0.2 0.1 0 1 0.2 0 0.5 0.3 0.1 0.4 0.2 0.2 0.2
Min. 1.9 2.5 16 59 0 1.5 3.4 1.6 0.2 10.4 0 0.1 0
Max. 2.3 2.9 17 61 0.6 1.6 4.4 2.2 0.3 11.3 0.1 0.6 0.4
83_1149b - 12.11.2012 (1) 2.0 2.3 13 67 0.5 1.6 3.1 1.4 0 8.4 0 0.3 0.2
Std. dev. (4 ms) 0.1 0.4 2 6 0.1 0.3 0.7 0.2 0.1 1.2 0.1 0.2 0.5
Min. 1.9 1.8 10 63 0.3 1.3 2.1 1.2 0 6.6 0 0 0
Max. 2.1 2.7 15 75 0.6 2.0 3.5 1.5 0.1 9.3 0.1 0.4 0.9
83_1149b - 12.11.2012 (2) 3.5 2.6 14 63 0.4 1.6 3.4 1.7 0.2 9.1 0 0.1 0
Std. dev. (4 ms) 0.2 0 0 1 0.1 0.1 0.5 0.2 0.1 0.5 0.2 0.2 0.2
Min. 3.3 2.5 13 62 0.3 1.4 2.8 1.4 0 8.4 0 0 0
Max. 3.8 2.6 15 64 0.6 1.7 4.1 1.9 0.3 9.7 0.3 0.4 0.2
84_0030c,01 - 10.1.2012 1.9 2.7 12 64 0.7 2.1 4.3 2.0 0.1 9.0 0.1 0 0.5
Std. dev. (3 ms) 0.3 0.9 1 3 0.1 0.2 1.1 0.7 0 0.9 0.2 0.2 0.2
Min. 1.6 1.9 12 61 0.6 2.0 3.6 1.2 0.1 7.9 0 0 0.2
Max. 2.1 3.7 13 67 0.7 2.3 5.5 2.5 0.1 9.6 0.3 0.3 0.7
84_0106c - 12.11.2012 1.6 2.0 14 68 0.5 1.6 2.7 1.4 0.1 8.4 0.1 0.2 0
Std. dev. (4 ms) 0.3 0.5 2 5 0 0.4 0.4 0.2 0.1 0.9 0.1 0.3 0.3
Min. 1.3 1.5 11 62 0.5 1.2 2.2 1.1 0 7.7 0 0 0
Max. 1.9 2.7 17 72 0.6 2.1 3.2 1.5 0.2 9.8 0.3 0.5 0.3
84_0749, - 10.01.12 2.5 2.7 16 62 0.4 1.7 2.9 1.6 0.1 9.6 0.1 0.2 0.4
Std. dev. (9 ms) 0 0.2 1 1 0.1 0.1 0.2 0 0.1 0.2 0.3 0.1 0.1
547

548 Appendix C Frederik Rademakers
Average ceramic composition. All results in wt%, normalised to 100%.Sample Na2O MgO Al2O3 SiO2 P2O5 K2O CaO TiO2 MnO FeO CuO As2O3 SnO2
Min. 1.7 1.7 12 61 0.2 1.3 2.8 1.6 0 8.0 0 0 0
Max. 5.1 2.9 16 66 0.6 2.3 4.4 2.0 0.9 10.0 0.5 0.4 0.5
84_1189b,0 - 12.11.2012 1.9 2.6 13 66 0.6 1.7 3.7 1.5 0.2 8.1 0 0.1 0.5
Std. dev. (5 ms) 0.2 0.3 1 1 0.2 0.2 0.2 0.1 0.1 0.6 0.2 0.1 0.4
Min. 1.6 2.3 12 64 0.4 1.5 3.4 1.4 0.2 7.2 0 0 0
Max. 2.1 3.1 14 67 0.8 2.2 4.0 1.6 0.3 8.9 0.2 0.3 1.0
84_1232, - 12.11.2012 1.3 1.8 11 72 0.4 1.4 2.9 1.2 0.3 7.5 0 0.3 0.1
Std. dev. (4 ms) 0.3 0.2 2 3 0.2 0.1 0.5 0.1 0.2 0.7 0.2 0.2 0.2
Min. 1.0 1.6 10 67 0.2 1.2 2.4 1.1 0.1 7.0 0 0 0
Max. 1.8 2.0 14 75 0.6 1.5 3.4 1.3 0.5 8.6 0.3 0.5 0.3
86_0208b - 12.11.2012 1.7 1.9 10 72 0.3 1.8 3.0 1.3 0.1 6.8 0 0.1 0.1
Std. dev. (4 ms) 0.2 0.4 2 4 0.1 0.3 0.5 0.2 0.1 0.9 0.1 0.3 0.1
Min. 1.5 1.5 8 70 0.3 1.5 2.2 1.1 0 5.6 0 0 0
Max. 2.1 2.4 12 78 0.5 2.3 3.3 1.5 0.2 7.4 0.1 0.4 0.2
86_0471b,01 - 19.1.2006 1.5 2.0 13 68 0.6 1.9 2.5 1.4 0.1 8.8 0 0.1 0.1
Std. dev. (5 ms) 0.2 0.3 1 2 0.1 0.4 0.1 0.2 0.1 1.2 0.1 0.1 0.4
Min. 1.3 1.6 12 64 0.4 1.6 2.4 1.2 0 7.7 0 0 0
Max. 1.8 2.4 15 70 0.7 2.5 2.7 1.8 0.3 10.8 0.1 0.3 0.5
86_0749c - 19.1.2006 1.9 2.0 13 65 1.1 1.9 3.1 1.4 0.1 9.3 0 0.4 0.1
Std. dev. (4 ms) 0.3 0.5 2 8 1.1 0.4 1.2 0.2 0.2 1.9 0.2 0.2 0.3
Min. 1.6 1.4 11 56 0.4 1.3 2.2 1.2 0 7.1 0 0.1 0
Max. 2.2 2.5 16 74 2.7 2.3 4.7 1.6 0.5 11.0 0.3 0.6 0.4
86_0792b,04 - 12.11.2012 2.3 2.5 15 64 0.2 1.7 3.3 1.6 0.1 9.1 0.2 0.3 0.3
Std. dev. (5 ms) 0.3 0.4 1 1 0.2 0.2 0.1 0.2 0.1 0.4 0.2 0.1 0.3
Min. 2.0 2.1 14 62 0 1.5 3.2 1.4 0 8.7 0 0.1 0.1
Max. 2.6 3 16 65 0.4 2.0 3.4 1.9 0.2 9.7 0.4 0.5 0.8
87_0423b - 19.1.2006 2.8 0.8 7 83 0.3 1.1 1.8 0.7 0.1 3.0 0.1 0 0
Std. dev. (4 ms) 0.5 0.2 1 1 0.3 0.3 0.5 0.2 0.1 0.5 0.2 0.2 0.1
Min. 2.1 0.5 6 82 0 0.7 1.3 0.5 0 2.5 0 0 0
Max. 3.1 0.9 7 84 0.7 1.3 2.3 0.9 0.1 3.6 0.3 0.1 0.2
87_0634c,04 - 12.11.2012 1.7 2.0 14 66 0.7 1.8 3.2 1.5 0.1 8.3 0.2 0.3 0.2
Std. dev. (4 ms) 0.4 0.1 1 3 0 0.2 0.3 0.1 0 0.7 0.2 0.2 0.2
Min. 1.2 1.9 13 62 0.7 1.7 2.9 1.3 0 7.9 0 0.1 0
Max. 2.2 2.2 16 68 0.7 2.1 3.6 1.6 0.1 9.4 0.4 0.6 0.5
87_0725c,1-20 - 12.11.2012 2.2 1.9 13 68 0.8 2.3 3.0 1.3 0.2 7.6 0.1 0.1 0
Std. dev. (5 ms) 0.4 0.4 2 5 0.2 0.4 0.6 0.3 0.1 1.1 0.1 0.2 0.4
Min. 1.8 1.3 10 62 0.5 1.8 2.3 0.8 0.1 6.5 0 0 0
Max. 2.7 2.5 16 74 1.1 2.7 3.9 1.7 0.3 9.3 0.3 0.4 0.5
87_0726,68-78b - 19.1.2006 1.5 2.1 11 57 0.3 1.3 3.0 2.2 0.1 8.5 13.1 0.1 0.3
Std. dev. (5 ms) 0.4 0.3 2 4 0.3 0.4 0.4 0.9 0.1 2.2 9.5 0.1 0.3
Min. 1.0 1.6 8 53 0 0.8 2.3 0.9 0 5.1 2.5 0 0
Max. 1.9 2.5 14 62 0.7 1.7 3.3 3.1 0.3 11.1 25.3 0.1 0.6
87_0726c,2-60a - 19.1.2006 2.0 2.5 14 64 0.6 1.5 3.9 1.6 0.2 9.1 0 0.1 0.1
Std. dev. (3 ms) 0.3 0.3 1 1 0.2 0.1 0.2 0.2 0 0.5 0.1 0.3 0.1
Min. 1.7 2.2 13 63 0.4 1.4 3.8 1.3 0.1 8.6 0 0 0
Max. 2.3 2.7 15 65 0.9 1.7 4.1 1.8 0.2 9.6 0.1 0.4 0.2
87_0762, - 21.3.2012 1.7 2.3 14 65 0.4 1.7 3.0 1.5 0.3 9.5 0.5 0 0.3
Std. dev. (5 ms) 0.2 0.3 1 2 0.3 0.4 0.5 0.1 0.1 0.9 0.3 0.3 0.4
Min. 1.5 1.9 12 63 0.1 1.4 2.3 1.3 0.1 8.3 0.2 0 0
Max. 2.0 2.6 14 69 0.7 2.3 3.5 1.6 0.4 10.6 0.8 0.2 0.8
87_0762, - 22.3.2013 (1) 2.1 2.0 12 67 1.8 2.3 4.1 1.3 0.1 7.0 0 0.2 0.2
Std. dev. (5 ms) 0.4 0.4 1 5 0.9 0.4 1.3 0.3 0.2 0.8 0.2 0.1 0.3
Min. 1.6 1.4 11 59 1.2 1.8 3.1 1.0 0 6.2 0 0 0
Max. 2.7 2.3 14 71 3.3 2.7 6.3 1.8 0.3 8.0 0.4 0.3 0.7
87_0762, - 22.3.2013 (2) 1.5 2.1 14 66 0.5 1.6 3.4 1.8 0.1 8.7 0.1 0.3 0.3
Std. dev. (5 ms) 0.2 0.2 1 2 0.4 0.1 0.5 0.3 0.1 0.7 0.2 0.1 0.4
Min. 1.2 1.9 12 63 0.3 1.5 2.7 1.4 0 7.8 0 0.2 0
Max. 1.7 2.4 15 68 1.3 1.7 3.9 2.2 0.2 9.7 0.4 0.5 0.9
87_0762,0Nv - 21.2.2012 2.2 2.3 12 68 0.9 2.1 3.3 1.4 0.1 7.6 0 0.1 0.1
Std. dev. (5 ms) 0.1 0.4 1 3 0.1 0.3 0.5 0.4 0.1 0.8 0.1 0.3 0.2
Min. 2.0 2.0 11 64 0.8 1.8 2.5 1.0 0 6.5 0 0 0
Max. 2.4 2.8 13 71 1.1 2.5 3.9 1.9 0.2 8.5 0 0.5 0.3
87_0762,0Nv - 22.3.2013 (1) 2.3 2.2 13 64 0.6 2.4 3.0 1.8 0.2 9.3 0.3 0 0.3
Std. dev. (5 ms) 0.5 0.3 2 3 0.2 0.5 0.3 0.8 0.1 0.5 0.2 0.2 0.1
Min. 1.9 1.8 12 60 0.4 2.0 2.6 1.1 0 8.6 0.1 0 0.1
Max. 3.0 2.7 16 68 0.9 3.3 3.5 2.7 0.3 9.9 0.5 0.3 0.4
87_0762,0Nv - 22.3.2013 (2) 1.5 2.0 12 68 0.4 1.6 2.8 1.4 0.2 9.7 0 0.2 0.3
Std. dev. (5 ms) 0.3 0.3 2 5 0.2 0.4 0.3 0.3 0.1 1.6 0.2 0.2 0.4
Min. 1.3 1.4 10 61 0.2 1.1 2.4 1.1 0.1 7.4 0 0 0

Frederik Rademakers Appendix C 549
Average ceramic composition. All results in wt%, normalised to 100%.Sample Na2O MgO Al2O3 SiO2 P2O5 K2O CaO TiO2 MnO FeO CuO As2O3 SnO2
Max. 2.0 2.2 15 74 0.7 2.3 3.2 1.9 0.3 11.6 0.4 0.3 0.7
87_0773,04 - 12.11.2012 1.4 2.2 12 70 0.3 1.4 2.7 1.4 0.2 7.9 0.1 0.1 0.2
Std. dev. (4 ms) 0.2 0.4 1 4 0.1 0.4 0.3 0.2 0.1 0.8 0.1 0.2 0.4
Min. 1.2 1.9 11 65 0.3 1.0 2.3 1.1 0.2 7.1 0 0 0
Max. 1.6 2.7 14 73 0.4 2.0 3.0 1.6 0.3 8.9 0.2 0.3 0.7
87_0791,01-88 - 12.11.2012 1.8 2.2 14 64 0.6 1.9 3.4 1.7 0.1 9.6 0.1 0.2 0.2
Std. dev. (5 ms) 0.3 0.3 2 4 0.1 0.2 0.4 0.2 0.1 1.1 0.1 0.2 0.3
Min. 1.3 1.8 11 59 0.4 1.6 2.8 1.4 0 7.9 0 0 0
Max. 2.0 2.6 16 70 0.8 2.1 4.0 1.9 0.2 10.9 0.3 0.4 0.6
87_0849a,04 - 21.3.2012 1.8 2.7 15 62 0.3 1.5 4.2 2.1 0.2 10.2 0.1 0.2 0.1
Std. dev. (5 ms) 0.2 0.2 1 3 0.1 0.1 0.8 0.3 0.1 0.8 0.1 0.1 0.2
Min. 1.6 2.5 14 57 0.1 1.4 3.3 1.8 0.1 9.2 0.1 0 0
Max. 2.0 3.0 17 65 0.5 1.7 5.1 2.5 0.3 11.3 0.2 0.4 0.3
87_0884,01-56b - 19.1.2006 2.6 2.5 14 55 0.5 2.3 4.6 1.6 0.1 11.1 3.9 0.4 1.0
Std. dev. (6 ms) 0.7 0.2 2 5 0.1 0.3 2.0 0.2 0.1 1.0 3.3 0.2 1.5
Min. 1.3 2.4 12 49 0.4 2.0 3.1 1.3 0 10.2 1.2 0.1 0.2
Max. 3.2 3.8 16 59 0.6 3.2 8.1 1.9 0.3 14.8 8.3 0.7 3.7
87_0884,01-56c - 19.1.2006 1.9 3.3 15 50 0.5 2.6 3.3 1.8 0.2 14.7 5.6 0.1 0.7
Std. dev. (3 ms) 0.3 1.0 2 10 0 0.6 0.4 0.3 0.1 4.9 4.6 0.2 0.5
Min. 1.6 2.7 13 42 0.4 1.9 2.9 1.5 0.2 10.4 0.2 0 0.2
Max. 2.2 4.5 16 61 0.5 3.1 3.6 2.0 0.3 20.0 8.3 0.3 1.2
87_0897a,01-45 - 12.11.2012 (1) 2.6 2.5 13 66 0.6 1.8 3.7 1.4 0.1 7.6 0.2 0.1 0.4
Std. dev. (4 ms) 0.7 0.3 2 5 0.1 0.6 0.2 0.2 0.1 1.0 0.1 0.3 0.3
Min. 1.9 2.2 10 61 0.4 1.3 3.4 1.3 0 6.6 0.1 0 0
Max. 3.4 2.8 15 72 0.7 2.4 3.9 1.7 0.3 8.9 0.2 0.4 0.7
87_0897a,01-45 - 12.11.2012 (2) 2.6 2.5 13 66 0.6 1.8 3.7 1.4 0.1 7.6 0.2 0.1 0.4
Std. dev. (4 ms) 0.7 0.3 2 5 0.1 0.6 0.2 0.2 0.1 1.0 0.1 0.3 0.3
Min. 1.9 2.2 10 61 0.4 1.3 3.4 1.3 0 6.6 0.1 0 0
Max. 3.4 2.8 15 72 0.7 2.4 3.9 1.7 0.3 8.9 0.2 0.4 0.7
87_0942g,03 - 12.11.2012 1.5 2.3 13 68 0.4 1.4 3.1 1.7 0.1 8.1 0.3 0.1 0.2
Std. dev. (5 ms) 0.3 0.2 1 3 0.2 0.1 0.2 0.5 0.1 0.8 0.1 0.1 0.1
Min. 1.1 2.0 11 65 0.1 1.2 2.7 1.2 0 7.2 0.1 0 0.1
Max. 1.9 2.5 14 72 0.6 1.4 3.3 2.4 0.2 8.8 0.4 0.2 0.4
92_0606 - 12.11.2012 1.7 1.2 9 76 0.8 2.1 2.7 0.8 0 4.9 0 0.1 0.1
Std. dev. (4 ms) 0.4 0.2 1 3 0.1 0.3 0.4 0.2 0.1 0.8 0.2 0.2 0.3
Min. 1.2 0.9 8 72 0.6 1.8 2.3 0.5 0 3.8 0 0 0
Max. 2.0 1.4 11 80 0.9 2.5 3.1 0.9 0.2 5.8 0.3 0.3 0.5
92_0645b - 21.3.2012 2.4 2.1 14 65 1.2 2.6 3.1 1.3 0.1 7.8 0.1 0.1 0.4
Std. dev. (4 ms) 0.4 0.3 1 3 0.3 0.2 0.4 0.3 0.1 1.0 0.1 0.2 0.4
Min. 2.1 1.8 12 62 0.9 2.5 2.7 0.9 0.1 6.9 0 0 0
Max. 2.9 2.4 15 68 1.7 2.9 3.5 1.6 0.2 8.8 0.3 0.2 0.8
94_0239,01 - 21.3.2012 2.2 1.9 13 67 0.8 2.4 2.8 1.2 0.2 7.9 0.1 0.1 0.3
Std. dev. (4 ms) 0.6 0.4 2 6 0.3 0.4 0.5 0.3 0 1.3 0.1 0.1 0.3
Min. 1.4 1.3 10 62 0.4 1.9 2.3 0.8 0.1 6.3 0 0 0
Max. 2.7 2.3 15 75 1.0 2.8 3.4 1.4 0.2 9.2 0.2 0.3 0.6
94_0560 - 10.1.12 1.6 2.0 12 69 0.4 1.7 3.3 1.3 0.2 8.0 0 0.3 0.2
Std. dev. (4 ms) 0 0.4 2 4 0.2 0.2 0.8 0.2 0 1.1 0.3 0.1 0.2
Min. 1.5 1.4 10 64 0.2 1.5 2.4 1.2 0.1 6.5 0 0.1 0
Max. 1.6 2.4 15 74 0.6 1.9 4.2 1.6 0.2 8.9 0.2 0.4 0.3
94_0775,01 - 12.11.2012 1.7 2.6 16 63 0.4 1.6 4.1 1.6 0.1 9.2 0 0.1 0.2
Std. dev. (5 ms) 0.2 0.3 0 1 0.2 0.2 0.3 0.2 0.1 0.6 0.2 0.5 0.3
Min. 1.4 2.3 15 62 0.1 1.4 3.7 1.4 0 8.3 0 0 0
Max. 1.9 3.0 16 64 0.7 1.8 4.3 1.8 0.3 9.9 0.2 0.6 0.5
94_842 - 21.2.2012 1.6 1.2 9 79 0.5 1.3 1.9 0.9 0 4.7 0 0.2 0.2
Std. dev. (4 ms) 0.4 0.3 1 3 0.4 0.2 0.5 0.3 0.1 0.6 0.1 0.1 0.3
Min. 1.3 0.9 7 76 0.1 0.9 1.4 0.8 0 4.0 0 0.1 0
Max. 2.3 1.5 9 83 1.1 1.4 2.6 1.4 0.2 5.5 0.2 0.3 0.5
97_0631E,01 - 12.11.2012 1.9 1.7 12 70 0.5 2.3 2.7 1.1 0.1 7.1 0.2 0.1 0
Std. dev. (5 ms) 0.5 0.4 2 5 0.2 0.6 0.6 0.2 0.1 0.8 0.2 0.2 0.3
Min. 1.1 1.3 9 65 0.2 1.5 2.1 0.9 0 5.9 0 0 0
Max. 2.4 2.3 14 78 0.7 3.2 3.4 1.3 0.3 8.0 0.5 0.3 0.1
97_0631E,04 - 12.11.2012 1.8 1.5 10 74 0.6 2.1 2.3 0.8 0.1 6.0 0.2 0.1 0.3
Std. dev. (5 ms) 0.4 0.2 1 2 0.1 0.4 0.2 0.2 0.2 0.8 0.2 0.2 0.3
Min. 1.2 1.3 9 71 0.5 1.7 2.1 0.5 0 4.8 0 0 0
Max. 2.3 1.7 12 76 0.8 2.7 2.6 1.0 0.3 7.0 0.4 0.3 0.5
97_0632D,01 - 10.1.12 1.8 2.3 15 63 1.2 2.0 3.4 1.4 0.1 9.0 0.4 0.1 0
Std. dev. (5 ms) 0.4 0.2 1 3 1.6 0.3 1.6 0.2 0.2 0.5 0.2 0.3 0.4
Min. 1.3 2.1 14 58 0.4 1.7 2.7 1.2 0 8.7 0.3 0 0
Max. 2.4 2.5 17 66 4.0 2.4 6.3 1.8 0.3 9.8 0.8 0.3 0.4

550 Appendix C Frederik Rademakers
Average ceramic composition. All results in wt%, normalised to 100%.Sample Na2O MgO Al2O3 SiO2 P2O5 K2O CaO TiO2 MnO FeO CuO As2O3 SnO2
97_0675,02 - 12.11.2012 1.6 1.9 12 70 1.0 2.1 3.0 1.2 0.1 7.1 0.1 0.2 0.1
Std. dev. (5 ms) 0.4 0.2 2 4 0.2 0.3 0.2 0.3 0.1 0.9 0.2 0.2 0.3
Min. 1.2 1.7 10 65 0.8 1.7 2.8 0.7 0 6.3 0 0 0
Max. 2.0 2.2 15 74 1.3 2.5 3.2 1.4 0.2 8.4 0.4 0.4 0.5
97_0690,02 - 21.2.2012 2.2 1.7 12 67 1.0 2.2 3.8 1.3 0.1 7.6 0.1 0.4 0
Std. dev. (4 ms) 0.6 0.2 2 7 0.4 0.5 2.5 0.4 0.1 1.5 0.2 0.1 0.3
Min. 1.3 1.5 9 60 0.4 1.6 1.9 0.9 0 5.5 0 0.2 0
Max. 2.6 2.1 13 77 1.4 2.8 7.5 1.6 0.2 8.7 0.2 0.5 0.3
97_0690,02- - 21.2.2012 2.2 2.1 13 66 1.1 3.1 2.8 1.2 0.2 7.9 0.3 0.3 0
Std. dev. (4 ms) 0.3 0.3 1 3 0.3 0.3 0.7 0.3 0.1 0.7 0.4 0.3 0.4
Min. 1.8 1.8 12 62 0.8 2.6 2.0 0.9 0.1 7.1 0 0 0
Max. 2.5 2.4 15 69 1.4 3.4 3.5 1.5 0.3 8.6 0.9 0.6 0.2
97_1176 - 12.11.2012 1.9 2.2 15 64 0.5 2.0 2.9 1.7 0.2 9.4 0.1 0.2 0.2
Std. dev. (5 ms) 0.4 0.2 1 3 0.2 0.2 0.4 0.1 0.1 0.7 0.1 0.2 0.1
Min. 1.4 1.9 13 62 0.2 1.7 2.3 1.5 0.1 8.6 0 0 0
Max. 2.5 2.5 16 68 0.7 2.2 3.2 1.8 0.3 10.3 0.3 0.4 0.3
98_0387,03 - 21.3.2012 2.2 2.4 14 64 0.6 1.9 3.4 1.6 0.2 8.6 0 0.4 0.3
Std. dev. (5 ms) 0.4 0.2 1 3 0.3 0.2 0.3 0.2 0.1 0.7 0.1 0.2 0.3
Min. 1.8 2.2 13 62 0.3 1.6 3.1 1.5 0.1 7.5 0 0.1 0
Max. 2.8 2.7 15 68 1.0 2.2 3.8 1.9 0.3 9.4 0.2 0.7 0.7
98_1325 - 12.11.2012 1.1 2.0 14 67 0.3 1.6 2.9 1.5 0 9.6 0 0.4 0
Std. dev. (3 ms) 0.2 0.5 2 4 0 0.1 0.5 0.3 0.1 1.3 0.2 0.4 0.3
Min. 1.0 1.7 12 62 0.3 1.5 2.4 1.3 0 8.4 0 0 0
Max. 1.4 2.6 16 71 0.4 1.7 3.5 1.9 0.1 10.9 0.1 0.8 0.2
Average Ceramic Composition 2.0 2.2 13 66 0.6 1.9 3.2 1.5 0.1 8.3 0.6 0.2 0.2

Frederik Rademakers Appendix C 551
Average slag composition. All results in wt%, normalised to 100%.Sample Na2O MgO Al2O3 SiO2 P2O5 K2O CaO TiO2 MnO FeO CuO As2O3 SnO2 PbO CoO
82_0223b,01 - 10.1.12 2.9 1.3 4 77 0.5 1.0 6.0 1.0 0 3.5 1.4 0.2 0.9 0.2
Std. dev. (5 ms) 0.9 0.3 2 5 0.1 0.4 0.7 0.4 0.1 1.0 0.2 0.3 0.4 0
Min. 1.9 0.7 3 66 0.2 0.5 3.3 0.4 0 2.0 0.4 0 0.2 0
Max. 4.2 2.1 7 84 0.9 1.3 11.3 2.2 0.2 5.7 3.6 0.5 1.6 1.2
82_298b,01 - 21.3.2012 9.0 2.4 11 57 0.9 1.3 9.4 1.4 0.2 6.4 0.2 0.1 0.6
Std. dev. (5 ms) 0.9 0.3 1 4 0.2 0.2 3.1 0.1 0.1 1.3 0.1 0.1 0.4
Min. 7.8 2.0 10 51 0.7 1.1 5.6 1.2 0.1 5.1 0 0 0.1
Max. 10.1 2.7 12 62 1.2 1.5 12.5 1.5 0.3 8.5 0.3 0.3 1.1
83_0542b,01 - 21.3.2012 3.2 2.7 12 62 0.7 2.4 5.8 1.6 0.1 7.9 0.4 0.3 1.2
Std. dev. (4 ms) 0.5 0.3 1 1 0.2 0.4 0.9 0.5 0.1 0.8 0.3 0.3 1.4
Min. 2.8 2.3 10 60 0.5 1.8 5.2 1.2 0.1 7.0 0.2 0 0.3
Max. 3.9 3.0 13 63 0.9 2.7 7.2 2.3 0.2 8.8 0.8 0.6 3.3
83_0597b,01 - 21.3.2012 2.7 3.2 8 47 1.9 2.4 15 0.9 0.2 8.5 2.7 0.2 6.7 0.7
Std. dev. (4 ms) 1.3 0.2 1 3 0.3 0.3 1.6 0.2 0.1 0.9 1.3 0.3 1.9 0.3
Min. 1.6 3.1 7 42 1.6 2.0 12.9 0.7 0.1 7.9 1.5 0 4.8 0.5
Max. 4.0 3.4 10 50 2.2 2.7 16.7 1.2 0.3 9.9 4.2 0.5 8.6 1.1
83_1149b - 12.11.2012 (1) 2.1 3.2 12 55 1.0 2.2 11.0 1.5 0.1 8.7 2.8 0.1 0.3
Std. dev. (4 ms) 0.2 0.8 1 6 0.6 0.3 6.1 0.3 0.1 1.3 3.0 0.2 0.2
Min. 1.9 2.3 11 49 0.4 1.9 3.9 1.2 0 7.0 0.6 0 0.1
Max. 2.3 4.1 13 61 1.6 2.5 16.8 1.9 0.3 10.1 7.3 0.2 0.6
83_1149b - 12.11.2012 (2) 2.0 2.6 14 61 0.5 1.8 5.4 1.9 0.2 10.4 0.4 0.4 0.2
Std. dev. (4 ms) 0.3 0.2 1 3 0.2 0.3 1.0 0.2 0.1 1.9 0.2 0.2 0.2
Min. 1.7 2.3 13 57 0.3 1.6 4.3 1.6 0.1 8.7 0.2 0.3 0.1
Max. 2.3 2.9 15 64 0.7 2.2 6.7 2.2 0.3 13.1 0.6 0.6 0.5
84_0030c,01 - 10.1.2012 1.3 2.2 9 56 0.7 1.7 6.6 1.3 0.1 7.1 4.4 0.1 8.8
Std. dev. (3 ms) 0.3 0.4 2 11 0.1 0.3 0.9 0.4 0.1 2.2 1.7 0.1 12.7
Min. 1.0 1.9 7 45 0.5 1.4 5.5 0.8 0 5.8 2.5 0 1.5
Max. 1.6 2.7 12 66 0.8 2.0 7.2 1.5 0.1 9.7 5.8 0.3 23.5
84_0106c - 12.11.2012 1.6 3.0 16 53 1.1 1.9 3.5 1.5 0.2 15.4 2.0 0.2 0.4
Std. dev. (4 ms) 0.7 0.8 2 10 0.7 0.5 0.9 0.4 0.1 10.8 1.4 0.2 0.2
Min. 0.8 2.2 13 38 0.4 1.4 2.1 1.1 0 6.6 0.5 0 0.1
Max. 2.1 4.1 18 61 1.9 2.4 4.1 2.1 0.2 31.1 3.8 0.3 0.6
84_0749, - 10.1.12 4.1 2.6 14 61 0.4 2.2 4.6 1.8 0.1 9.0 0.2 0.2 0.3
Std. dev. (9 ms) 1.1 0.3 1 3 0.2 0.3 0.9 0.3 0.1 0.9 0.1 0.3 0.3
Min. 2.5 2.1 12 58 0.2 1.7 3.4 1.5 0 7.7 0 0 0
Max. 6.3 3.1 15 65 0.8 2.8 6.1 2.3 0.3 9.8 0.4 0.7 0.7
84_1189b,0 - 12.11.2012 2.2 2.5 12 65 0.4 2.0 5.3 1.8 0.2 7.8 0.2 0.1 0.4
Std. dev. (5 ms) 0.2 0.5 1 4 0.3 0.3 1.3 0.2 0.1 0.6 0.2 0.1 0.5
Min. 1.9 2.0 11 61 0.2 1.6 3.9 1.5 0.1 7.1 0 0 0
Max. 2.4 3.0 13 69 0.8 2.3 6.8 2.1 0.2 8.5 0.4 0.3 1.1
84_1232, - 12.11.2012 2.7 2.0 9 66 0.9 2.6 6.4 1.2 0.1 6.3 0.4 0.2 2.3
Std. dev. (4 ms) 0.6 0.3 1 4 0.4 0.3 2.9 0.3 0.1 1.5 0.3 0.1 2.3
Min. 2.0 1.5 8 62 0.4 2.3 2.6 0.9 0 5.0 0.1 0.1 0.6
Max. 3.5 2.3 9 72 1.3 2.8 8.7 1.5 0.1 7.7 0.8 0.3 5.7
86_0208b - 12.11.2012 2.4 2.4 11 60 1.8 2.9 10.9 1.3 0.1 7.0 0.2 0.1 0.5
Std. dev. (4 ms) 0.3 0.7 1 12 1.7 0.3 8.5 0.3 0.1 1.5 0.3 0.1 0.2
Min. 2.1 1.5 9 48 0.3 2.4 3.5 1.0 0 5.1 0 0 0.1
Max. 2.8 3.2 12 73 3.9 3.2 20 1.6 0.1 8.3 0.6 0.3 0.6
86_0471b,01 - 19.1.2006 2.1 2.0 10 69 0.7 2.5 6.0 1.3 0.2 4.9 0.9 0.3 0.4
Std. dev. (5 ms) 0.3 0.2 1 2 0.2 0.2 1.8 0.2 0.1 0.5 1.5 0.2 0.3
Min. 1.8 1.8 9 66 0.5 2.2 4.5 1.1 0 4.5 0 0 0.1
Max. 2.7 2.3 13 71 0.9 2.8 9.1 1.6 0.3 5.6 3.7 0.4 0.9
86_0749c - 19.1.2006 1.7 2.6 12 60 1.1 2.4 11.4 1.4 0.1 6.6 0.8 0.1 0.4
Std. dev. (4 ms) 0.4 0.9 2 8 0.4 0.5 6.6 0.2 0.1 1.2 0.7 0.2 0.1
Min. 1.4 1.7 9 53 0.7 1.7 5.7 1.1 0 4.9 0.3 0 0.3
Max. 2.3 3.7 14 70 1.5 2.8 18.3 1.7 0.2 7.5 1.8 0.4 0.6
86_0792b,04 - 12.11.2012 2.1 2.9 13 58 0.5 2.6 5.3 1.7 0.2 9.1 4.1 0.3 0.5
Std. dev. (5 ms) 0.1 0.2 1 3 0.2 1.0 1.5 0.2 0.1 1.5 1.6 0.2 0.2
Min. 2.0 2.5 12 54 0.3 1.8 3.8 1.5 0.1 7.6 2.6 0 0.2
Max. 2.3 3.1 14 63 0.8 4.3 6.9 2.1 0.3 11.2 6.5 0.4 0.9
87_0423b - 19.1.2006 8.7 2.8 8 65 0.3 1.5 4.0 1.0 0 4.8 3.7 0.1 0.2
Std. dev. (4 ms) 2.2 1.2 1 2 0.2 0.3 0.7 0.2 0.1 1.1 3.1 0.1 0
Min. 5.9 1.8 7 63 0 1.1 3.0 0.8 0 4.0 0.7 0 0
Max. 11.1 4.5 8 67 0.5 1.8 4.8 1.2 0.2 6.5 8.0 0.3 0.5
87_0634c,04 - 12.11.2012 1.6 2.0 7 38 1.1 1.8 10.0 0.7 0.1 11.7 6.0 0.2 19.9
Std. dev. (4 ms) 0.5 0.7 1 4 0.2 0.3 3.0 0.2 0.1 5.0 1.4 0.2 3.7
Min. 1.2 1.4 6 32 0.9 1.4 8.3 0.5 0 5.8 4.0 0 16.8
Max. 2.3 2.8 9 42 1.3 2.1 14.5 0.9 0.1 17.1 7.2 0.3 24.5
87_0725c,1-20 - 12.11.2012 3.0 3.3 12 47 2.3 1.6 15.3 1.4 0.3 12.7 0.2 0.2 0.6

552 Appendix C Frederik Rademakers
Average slag composition. All results in wt%, normalised to 100%.Sample Na2O MgO Al2O3 SiO2 P2O5 K2O CaO TiO2 MnO FeO CuO As2O3 SnO2 PbO CoO
Std. dev. (5 ms) 0.5 0.7 2 3 0.6 0.6 4.8 0.5 0.1 4.9 0.2 0.2 0.2
Min. 2.6 2.4 10 45 1.7 1.1 10.9 0.7 0.2 9.8 0 0 0.4
Max. 3.6 3.9 13 51 3.1 2.4 19.6 1.8 0.5 20.0 0.5 0.4 0.8
87_0726,68-78b - 19.1.2006 1.2 2.4 4 26 0.9 1.2 9.0 0.5 0.1 14.3 21.6 0.5 18.0
Std. dev. (5 ms) 0.6 0.7 1 4 0.3 0.4 2.8 0.1 0.1 4.2 4.8 0.3 6.1
Min. 0.2 1.4 3 22 0.4 0.5 4.7 0.3 0 7.0 16.8 0.2 11.8
Max. 1.8 3.0 5 33 1.2 1.6 12.2 0.6 0.2 17.9 27.9 1.0 25.9
87_0726c,2-60a - 19.1.2006 6.1 3.0 9 46 1.3 1.6 16.6 1.1 0.1 7.3 2.8 0.3 4.6
Std. dev. (3 ms) 1.0 0.5 2 9 0.2 0.7 4.4 0.3 0.1 1.4 4.4 0.2 4.2
Min. 5.0 2.5 7 36 1.1 1.1 11.5 0.7 0 5.8 0.2 0.1 1.4
Max. 7.0 3.5 11 55 1.5 2.3 19.4 1.3 0.2 8.1 7.9 0.4 9.4
87_0762, - 21.3.2012 5.0 3.1 9 46 1.5 1.9 13.1 1.0 0.1 11.8 2.1 0.1 3.7 1.7
Std. dev. (5 ms) 1.4 0.4 1 7 0.3 0.3 2.5 0.1 0.1 4.8 1.0 0.1 4.0 2.0
Min. 3.1 2.8 7 39 1.1 1.6 10.5 0.9 0 8.8 1.0 0 0.7 0.6
Max. 6.5 3.7 11 53 1.9 2.4 16.9 1.2 0.2 20.3 3.5 0.3 10.2 5.2
87_0762, - 22.3.2013 (1) 2.3 1.7 10 68 0.4 2.0 7.3 1.3 0.1 5.8 1.1 0 0
Std. dev. (5 ms) 0.5 0.4 2 6 0.1 0.6 3.3 0.2 0.1 1.0 0.9 0.1 0.2
Min. 1.6 1.3 7 62 0.3 1.2 4.5 1.0 0 4.5 0.3 0 0
Max. 3.0 2.3 12 75 0.6 2.7 12.1 1.7 0.2 7.0 2.4 0.2 0.2
87_0762, - 22.3.2013 (2) 4.7 2.7 7 32 1.2 1.3 11.2 0.6 0.2 6.0 15.8 0.4 16.4 1.4
Std. dev. (5 ms) 0.6 0.3 1 4 0.2 0.3 2.8 0.2 0.1 1.3 7.4 0.2 7.1 0.4
Min. 4.1 2.5 6 26 0.9 0.9 8.5 0.3 0 4.8 5.6 0.1 11.6 1.0
Max. 5.3 3.3 8 37 1.5 1.7 15.9 0.9 0.3 8.2 24.6 0.6 28.8 2.0
87_0762,0Nv - 21.2.2012 3.8 2.9 11 57 1.3 2.6 8.3 1.3 0.1 7.0 3.8 0.2 0.7
Std. dev. (5 ms) 1.2 0.7 2 11 0.3 0.5 4.4 0.3 0.1 1.4 8.0 0.2 0.6
Min. 2.6 2.0 9 42 1.0 1.9 4.2 0.8 0 5.3 0 0 0.2
Max. 5.5 3.9 13 69 1.7 3.1 14.1 1.7 0.3 8.6 18.1 0.4 1.4
87_0762,0Nv - 22.3.2013 (1) 4.3 2.7 8 49 1.3 2.0 9.8 0.9 0.2 6.2 5.2 0.2 9.5 0.7
Std. dev. (5 ms) 0.9 0.6 2 14 0.7 0.7 5.5 0.2 0.2 0.6 5.9 0.3 6.6 0.5
Min. 3.1 2.2 5 27 0.8 1.0 5.5 0.6 0 5.3 1.3 0 2.0 0.17
Max. 5.4 3.4 10 66 2.5 2.7 18.9 1.1 0.3 7.0 15.5 0.5 16.3 1.51
87_0762,0Nv - 22.3.2013 (2) 2.3 2.3 10 58 1.0 2.9 7.9 1.4 0.2 8.6 3.2 0 3.0
Std. dev. (5 ms) 0.4 0.4 2 13 0.4 0.6 5.0 0.7 0.1 3.4 3.5 0.3 4.4
Min. 1.8 1.9 6 34 0.5 1.7 3.3 0.7 0 4.8 0.3 0 0.5
Max. 2.8 2.8 12 70 1.5 3.3 16.3 2.2 0.3 13.3 9.8 0.5 11.5
87_0773,04 - 12.11.2012 1.8 2.2 13 67 0.4 1.9 4.0 1.5 0.2 8.1 0.2 0.1 0.1
Std. dev. (4 ms) 0.6 0.5 3 6 0.1 0.5 0.9 0.4 0.2 1.8 0.2 0.1 0.2
Min. 1.0 1.6 8 61 0.3 1.3 3.3 1.0 0.1 5.9 0 0 0
Max. 2.2 2.7 15 74 0.7 2.4 5.2 1.9 0.4 10.1 0.4 0.2 0.4
87_0791,01-88 - 12.11.2012 1.5 3.1 10 48 1.2 2.8 12.8 1.2 0.1 12.9 1.7 0.3 3.6 1.4
Std. dev. (5 ms) 0.1 0.3 1 4 0.1 0.2 0.8 0.1 0.1 2.6 0.3 0.2 1.7 0.6
Min. 1.3 2.7 9 43 1.1 2.6 11.5 1.0 0 9.8 1.3 0.1 1.7 0.6
Max. 1.6 3.5 11 54 1.3 3.1 13.8 1.3 0.3 16.3 2.1 0.5 6.3 2.0
87_0849a,04 - 21.3.2012 1.4 3.6 13 53 0.7 1.9 13.7 1.9 0.1 8.8 0.7 0.1 0.5
Std. dev. (5 ms) 0.2 0.3 1 2 0 0.1 1.2 0.1 0.1 0.9 0.2 0.1 0.1
Min. 1.2 3.2 13 50 0.6 1.7 12.2 1.8 0 7.6 0.4 0 0.4
Max. 1.6 3.9 15 56 0.8 2.0 15.4 2.0 0.2 9.7 0.9 0.2 0.7
87_0884,01-56b - 19.1.2006 1.9 3.1 8 34 1.5 1.2 15.5 0.8 0.1 13.3 10.9 0.5 6.8 2.1
Std. dev. (6 ms) 1.1 1.1 2 5 0.9 0.8 1.7 0.2 0.2 3.8 6.8 0.5 6.0 1.5
Min. 0.3 2.0 5 27 0.5 0.4 14.0 0.5 0 7.8 4.1 0 1.5 0.8
Max. 3.3 5.1 10 40 3.1 2.3 17.8 1.2 0.5 19.4 20.4 1.1 17.9 4.4
87_0884,01-56c - 19.1.2006 2.0 3.5 8 36 1.5 1.3 19.5 0.8 0.1 12.5 5.1 0 9.2 1.4
Std. dev. (3 ms) 0.5 0.2 1 1 0.5 0.7 2.6 0.1 0.1 1.1 2.2 0.1 5.3 0.1
Min. 1.6 3.3 7 34 1.1 0.4 16.6 0.7 0.1 11.4 2.9 0 3.3 1.2
Max. 2.5 3.7 8 36 2.1 1.7 21.6 0.9 0.2 13.7 7.2 0.2 13.5 1.5
87_0897a,01-45 - 12.11.2012 (1) 5.0 2.5 10 53 1.0 2.0 9.4 1.7 0.1 12.9 0.9 0.1 1.2
Std. dev. (4 ms) 0.1 0.2 2 6 0.3 0.4 3.9 1.2 0.2 3.1 0.4 0.1 1.0
Min. 4.9 2.3 8 47 0.6 1.5 4.2 1.0 0 9.1 0.5 0 0
Max. 5.2 2.8 13 58 1.4 2.5 13.5 3.5 0.3 15.5 1.4 0.2 2.2
87_0897a,01-45 - 12.11.2012 (2) 2.0 3.5 9 37 1.1 0.8 16.8 1.0 0.1 8.9 10.2 0.2 8.2 1.6
Std. dev. (3 ms) 0.9 0.2 0 2 0.1 0.4 2.1 0 0.1 0.8 0.2 0.2 4.0 1.0
Min. 1.1 3.3 9 35 1.0 0.5 14.4 0.9 0 8.0 10.0 0 5.8 0.6
Max. 2.7 3.7 9 38 1.3 1.2 18.3 1.0 0.2 9.5 10.5 0.4 12.9 2.4
87_0942g,03 - 12.11.2012 1.7 2.5 12 64 0.6 1.9 5.8 1.6 0.2 8.4 1.0 0.1 0.3
Std. dev. (5 ms) 0.2 0.5 1 6 0.1 0.2 2.0 0.3 0.1 2.0 1.8 0.3 0.1
Min. 1.3 1.9 10 57 0.4 1.7 3.6 1.4 0.1 6.3 0.1 0 0.1
Max. 1.9 3.1 13 72 0.7 2.1 8.3 2.2 0.4 11.2 4.2 0.6 0.4
92_0606 - 12.11.2012 1.9 1.4 8 73 0.8 2.7 2.5 1.0 0.1 4.4 3.3 0.1 0 0.3
Std. dev. (4 ms) 0.6 0.3 2 7 0.3 1.1 1.0 0.1 0.1 0.8 4.2 0.2 0.2 0.4

Frederik Rademakers Appendix C 553
Average slag composition. All results in wt%, normalised to 100%.Sample Na2O MgO Al2O3 SiO2 P2O5 K2O CaO TiO2 MnO FeO CuO As2O3 SnO2 PbO CoO
Min. 1.4 1.0 6 64 0.5 1.9 1.7 0.8 0 3.5 0.3 0 0 0
Max. 2.8 1.6 11 80 1.1 4.2 3.8 1.1 0.2 5.4 9.3 0.4 0.1 0.9
92_0645b - 21.3.2012 1.9 2.4 11 60 2.1 3.9 8.3 1.1 0.1 6.2 1.6 0.2 1.0
Std. dev. (4 ms) 0.2 0.5 2 7 0.4 0.7 2.5 0.1 0 1.1 0.4 0.1 0.6
Min. 1.8 1.6 9 53 1.5 3.2 4.7 0.9 0 4.7 1.2 0.1 0.3
Max. 2.2 2.8 13 69 2.5 4.8 10.1 1.3 0.1 7.1 2.1 0.4 1.7
94_0239,01 - 21.3.2012 6.7 2.3 5 31 2.6 0.9 9.7 0.5 0.2 20.7 6.3 0.2 13.9
Std. dev. (4 ms) 2.3 0.4 1 3 0.7 0.2 1.2 0.1 0.1 5.1 3.0 0.2 4.8
Min. 4.4 1.9 4 28 1.7 0.7 8.6 0.4 0.1 13.3 3.5 0 7.0
Max. 9.5 2.6 7 35 3.1 1.1 11.1 0.6 0.2 24.8 9.4 0.3 18.1
94_0560 - 10.1.12 - 1st layer 1.6 2.0 12 68 0.4 1.7 3.0 1.4 0.2 7.9 1.3 0 0.1 0.1
Std. dev. (4 ms) 0 0.4 2 4 0.2 0.2 0.8 0.2 0 1.1 0.3 0.1 0.2 0.2
Min. 1.0 2.0 9 66 0.3 1.5 2.5 1.2 0.1 6.4 0.3 0 0 0.1
Max. 1.9 2.2 13 73 0.5 1.9 3.5 1.5 0.3 8.9 3.5 0.1 0.2 0.2
94_0560 - 10.1.12 - 2nd layer 1.6 1.6 5 27 1.4 1.0 8.6 0.4 0.4 35.3 8.3 0.3 10.2 0.8
Std. dev. (4 ms) 0.3 0.2 1 3.0 0.2 0.2 1.2 0.1 0.2 5.9 1.7 0.3 6.3 0.3
Min. 1.0 1.1 4 21 1.1 0.6 7.2 0.3 0.1 24.9 3.4 0 0.4 0.2
Max. 1.9 2.1 6 32 1.7 1.2 10.0 0.6 0.7 43.2 11.7 0.5 22.1 1.5
94_0775,01 - 12.11.2012 3.1 2.6 12 53 0.7 1.8 8.5 1.6 0.1 12.1 1.3 0.2 2.4
Std. dev. (5 ms) 1.2 0.5 2 6 0.3 0.3 3.4 0.4 0.1 4.0 1.4 0.2 1.1
Min. 1.9 1.8 10 48 0.2 1.5 4.2 1.3 0 6.0 0.3 0 0.6
Max. 4.8 3.1 16 63 1.0 2.2 12.9 2.3 0.2 16.5 3.4 0.4 3.3
94_842 - 21.2.2012 1.4 2.1 8 62 0.9 2.0 7.5 1.1 0.2 5.7 7.4 0.2 0.7
Std. dev. (4 ms) 0.2 0.5 1 7 0.4 0.4 1.9 0.1 0.1 1.4 1.9 0.3 0.2
Min. 1.1 1.4 7 56 0.5 1.6 4.7 1.0 0.1 4.0 5.8 0 0.5
Max. 1.6 2.6 10 73 1.3 2.5 9.2 1.2 0.3 7.1 9.8 0.6 0.9
97_0631E,01 - 12.11.2012 2.1 2.2 9 47 0.9 2.2 7.2 0.8 0.1 4.5 12.3 0.2 11.1 0.4
Std. dev. (5 ms) 0.4 0.6 4 18 0.2 0.7 3.7 0.3 0.1 1.6 8.5 0.1 12.1 0.5
Min. 1.7 1.8 5 25 0.5 1.4 4.4 0.4 0 3.0 2.5 0.1 0.4 0
Max. 2.5 3.2 15 65 1.1 3.2 12.9 1.1 0.2 6.6 20.1 0.3 25.4 1.0
97_0631E,04 - 12.11.2012 5.9 1.9 4 29 1.2 0.7 8.8 0.4 0 4.6 10.6 0.1 32.1 0.9
Std. dev. (5 ms) 1.5 0.5 1 4 0.1 0.1 2.2 0.2 0.1 1.2 4.3 0.1 6.5 0.6
Min. 3.8 1.2 3 23 1.0 0.6 6.0 0.3 0 3.3 6.8 0 21.4 0.3
Max. 8.0 2.5 4 35 1.3 0.9 10.8 0.8 0.1 6.0 15.8 0.3 38.1 1.72
97_0632D,01 - 10.1.12 0.7 1.2 7 61 0.4 0.8 1.8 0.4 0.2 3.4 21.6 0 1.3
Std. dev. (5 ms) 0.5 0.4 2 6 0.5 0.4 0.4 0.2 0.2 1.0 7.3 0.2 0.2
Min. 0.1 0.5 5 54 0 0.5 1.4 0.3 0 2.4 0.7 0 1.1
Max. 3.1 1.9 9 68 1.2 3.5 8.1 0.8 0.4 7.0 29.7 0.2 3.7
97_0675,02 - 12.11.2012 1.4 1.8 10 68 0.7 1.8 2.7 1.3 0.2 5.9 5.4 0.1 0.4
Std. dev. (5 ms) 0.9 0.6 3 6 0.2 1.2 1.0 0.5 0.1 2.6 6.7 0.1 0.4
Min. 0.6 1.0 6 61 0.4 0.6 1.8 0.5 0.1 3.0 0 0 0
Max. 2.6 2.4 14 75 1.0 3.4 4.5 2.1 0.4 9.3 16.0 0.3 1.0
97_0690,02 - 21.2.2012 1.8 1.8 9 68 1.2 2.5 4.7 1.1 0.1 6.6 1.0 0.2 1.3
Std. dev. (4 ms) 0.7 0.9 3 10 0.4 0.6 2.0 0.4 0.1 2.0 0.2 0.2 0.6
Min. 1.2 1.0 6 55 0.8 1.9 2.2 0.7 0 4.0 0.8 0 0.6
Max. 2.7 3.0 13 79 1.7 3.2 7.2 1.6 0.3 8.9 1.2 0.4 2.1
97_0690,02- - 21.2.2012 2.4 2.1 11 62 1.1 2.8 4.8 1.4 0.1 6.3 5.5 0.3 0.2
Std. dev. (4 ms) 0.3 0.4 1 3 0.4 0.4 2.8 1.2 0.1 1.7 3.9 0.1 0.3
Min. 2.0 1.6 10 59 0.7 2.4 2.7 0.7 0 4.4 1.2 0.2 0
Max. 2.7 2.6 13 67 1.7 3.4 9.6 3.4 0.2 9.1 10.6 0.4 0.5
97_1176 - 12.11.2012 1.5 3.0 13 60 0.5 1.6 7.9 1.8 0.1 9.3 0.8 0.1 1.1
Std. dev. (5 ms) 0.2 0.4 2 5 0.3 0.3 2.7 0.3 0.1 1.7 0.7 0.2 0.5
Min. 1.4 2.4 10 53 0.2 1.2 4.4 1.5 0 6.9 0.2 0 0.5
Max. 1.7 3.4 15 66 0.9 2.0 11.3 2.2 0.3 11.5 1.8 0.4 1.7
98_0387,03 - 21.3.2012 2.2 3.3 13 56 1.1 2.6 11.0 1.6 0.1 8.3 1.0 0.1 0.3
Std. dev. (5 ms) 0.5 0.5 1 7 0.6 0.2 6.2 0.1 0.1 0.4 0.5 0.2 0.3
Min. 1.7 2.8 11 47 0.4 2.4 4.4 1.4 0 7.9 0.6 0 0
Max. 2.8 3.9 14 63 1.8 2.9 18.3 1.7 0.2 8.9 1.9 0.4 0.8
98_1325 - 12.11.2012 0.7 4.1 10 41 2.5 0.9 22.6 1.4 0.3 8.8 5.2 0.7 1.6
Std. dev. (1 ms) 0 0 0 0 0 0 0 0 0 0 0 0 0
Min. 0.7 4.1 10 41 2.5 0.9 22.6 1.4 0.3 8.8 5.2 0.7 1.6
Max. 0.7 4.1 10 41 2.5 0.9 22.6 1.4 0.3 8.8 5.2 0.7 1.6
Average Slag Composition 2.8 2.5 10 54 1.1 1.9 9 1.2 0.1 8.9 4.3 0.2 4.4 / /

554 Appendix C Frederik Rademakers
Ceramic. Ratio of oxides to Al2O3, metals removed.Sample
N a2OAl2O3
M gOAl2O3
SiO2Al2O3
P2O5Al2O3
K2OAl2O3
C aOAl2O3
T iO2Al2O3
MnOAl2O3
FeOAl2O3
82_0223b,01 - 10.1.12 0.31 0.15 5.58 0.05 0.14 0.27 0.12 0.01 0.58
82_298b,01 - 21.3.2012 0.16 0.17 5.15 0.05 0.12 0.26 0.10 0.01 0.61
83_0542b,01 - 21.3.2012 0.19 0.21 5.58 0.07 0.14 0.33 0.13 0.01 0.63
83_0597b,01 - 21.3.2012 0.14 0.17 3.75 0.02 0.09 0.24 0.12 0.01 0.67
83_1149b - 12.11.2012 (1) 0.15 0.18 5.15 0.04 0.12 0.24 0.11 0 0.65
83_1149b - 12.11.2012 (2) 0.25 0.19 4.50 0.03 0.11 0.24 0.12 0.01 0.65
84_0030c,01 - 10.1.2012 0.16 0.23 5.33 0.06 0.18 0.36 0.17 0.01 0.75
84_0106c - 12.11.2012 0.11 0.14 4.86 0.04 0.11 0.19 0.10 0.01 0.60
84_0749, - 10.1.12 0.16 0.17 3.88 0.03 0.11 0.18 0.10 0.01 0.60
84_1189b,0 - 12.11.2012 0.15 0.20 5.08 0.05 0.13 0.28 0.12 0.02 0.62
84_1232, - 12.11.2012 0.12 0.16 6.55 0.04 0.13 0.26 0.11 0.03 0.68
86_0208b - 12.11.2012 0.17 0.19 7.20 0.03 0.18 0.30 0.13 0.01 0.68
86_0471b,01 - 19.1.2006 0.12 0.15 5.23 0.05 0.15 0.19 0.11 0.01 0.68
86_0749c - 19.1.2006 0.15 0.15 5.00 0.08 0.15 0.24 0.11 0.01 0.72
86_0792b,04 - 12.11.2012 0.15 0.17 4.27 0.01 0.11 0.22 0.11 0.01 0.61
87_0423b - 19.1.2006 0.40 0.11 11.86 0.04 0.16 0.26 0.10 0.01 0.43
87_0634c,04 - 12.11.2012 0.12 0.14 4.71 0.05 0.13 0.23 0.11 0.01 0.59
87_0725c,1-20 - 12.11.2012 0.17 0.15 5.23 0.06 0.18 0.23 0.10 0.02 0.58
87_0726,68-78b - 19.1.2006 0.14 0.19 5.18 0.03 0.12 0.27 0.20 0.01 0.77
87_0726c,2-60a - 19.1.2006 0.14 0.18 4.57 0.04 0.11 0.28 0.11 0.01 0.65
87_0762, - 21.3.2012 0.12 0.16 4.64 0.03 0.12 0.21 0.11 0.02 0.68
87_0762, - 22.3.2013 (1) 0.18 0.17 5.58 0.15 0.19 0.34 0.11 0.01 0.58
87_0762, - 22.3.2013 (2) 0.11 0.15 4.71 0.04 0.11 0.24 0.13 0.01 0.62
87_0762,0Nv - 21.2.2012 0.18 0.19 5.67 0.08 0.18 0.28 0.12 0.01 0.63
87_0762,0Nv - 22.3.2013 (1) 0.18 0.17 4.92 0.05 0.18 0.23 0.14 0.02 0.72
87_0762,0Nv - 22.3.2013 (2) 0.13 0.17 5.67 0.03 0.13 0.23 0.12 0.02 0.81
87_0773,04 - 12.11.2012 0.12 0.18 5.83 0.03 0.12 0.23 0.12 0.02 0.66
87_0791,01-88 - 12.11.2012 0.13 0.16 4.57 0.04 0.14 0.24 0.12 0.01 0.69
87_0849a,04 - 21.3.2012 0.12 0.18 4.13 0.02 0.10 0.28 0.14 0.01 0.68
87_0884,01-56b - 19.1.2006 0.19 0.18 3.93 0.04 0.16 0.33 0.11 0.01 0.79
87_0884,01-56c - 19.1.2006 0.13 0.22 3.33 0.03 0.17 0.22 0.12 0.01 0.98
87_0897a,01-45 - 12.11.2012 (1) 0.20 0.19 5.08 0.05 0.14 0.28 0.11 0.01 0.58
87_0897a,01-45 - 12.11.2012 (2) 0.20 0.19 5.08 0.05 0.14 0.28 0.11 0.01 0.58
87_0942g,03 - 12.11.2012 0.12 0.18 5.23 0.03 0.11 0.24 0.13 0.01 0.62
92_0606 - 12.11.2012 0.19 0.13 8.44 0.09 0.23 0.30 0.09 0 0.54
92_0645b - 21.3.2012 0.17 0.15 4.64 0.09 0.19 0.22 0.09 0.01 0.56
94_0239,01 - 21.3.2012 0.17 0.15 5.15 0.06 0.18 0.22 0.09 0.02 0.61
94_0560 - 10.1.12 0.13 0.17 5.75 0.03 0.14 0.28 0.11 0.02 0.67
94_0775,01 - 12.11.2012 0.11 0.16 3.94 0.03 0.10 0.26 0.10 0.01 0.58
94_842 - 21.2.2012 0.18 0.13 8.78 0.06 0.14 0.21 0.10 0 0.52
97_0631E,01 - 12.11.2012 0.16 0.14 5.83 0.04 0.19 0.23 0.09 0.01 0.59
97_0631E,04 - 12.11.2012 0.18 0.15 7.40 0.06 0.21 0.23 0.08 0.01 0.60
97_0632D,01 - 10.1.12 0.12 0.15 4.20 0.08 0.13 0.23 0.09 0.01 0.60
97_0675,02 - 12.11.2012 0.13 0.16 5.83 0.08 0.18 0.25 0.10 0.01 0.59
97_0690,02 - 21.2.2012 0.18 0.14 5.58 0.08 0.18 0.32 0.11 0.01 0.63
97_0690,02- - 21.2.2012 0.17 0.16 5.08 0.08 0.24 0.22 0.09 0.02 0.61
97_1176 - 12.11.2012 0.13 0.15 4.27 0.03 0.13 0.19 0.11 0.01 0.63
98_0387,03 - 21.3.2012 0.16 0.17 4.57 0.04 0.14 0.24 0.11 0.01 0.61
98_1325 - 12.11.2012 0.08 0.14 4.79 0.02 0.11 0.21 0.11 0 0.69
Average 0.16 0.17 5.33 0.05 0.15 0.25 0.11 0.01 0.64

Frederik Rademakers Appendix C 555
Slag. Ratio of oxides to Al2O3, metals removed.Sample
N a2OAl2O3
M gOAl2O3
SiO2Al2O3
P2O5Al2O3
K2OAl2O3
C aOAl2O3
T iO2Al2O3
MnOAl2O3
FeOAl2O3
82_0223b,01 - 10.1.12 0.75 0.33 19.75 0.13 0.25 1.55 0.25 0 0.90
82_298b,01 - 21.3.2012 0.83 0.22 5.27 0.08 0.12 0.86 0.13 0.02 0.59
83_0542b,01 - 21.3.2012 0.28 0.23 5.25 0.06 0.20 0.49 0.13 0.01 0.67
83_0597b,01 - 21.3.2012 0.33 0.40 5.78 0.23 0.30 1.86 0.11 0.02 1.06
83_1149b - 12.11.2012 (1) 0.18 0.28 4.75 0.08 0.19 0.95 0.13 0.01 0.75
83_1149b - 12.11.2012 (2) 0.14 0.19 4.36 0.04 0.13 0.39 0.14 0.01 0.74
84_0030c,01 - 10.1.2012 0.15 0.26 6.50 0.08 0.20 0.77 0.15 0.01 0.83
84_0106c - 12.11.2012 0.10 0.19 3.44 0.07 0.13 0.23 0.09 0.01 0.99
84_0749, - 10.1.12 0.29 0.19 4.36 0.03 0.16 0.33 0.13 0.01 0.64
84_1189b,0 - 12.11.2012 0.18 0.21 5.50 0.03 0.17 0.44 0.15 0.02 0.66
84_1232, - 12.11.2012 0.31 0.23 7.56 0.10 0.30 0.73 0.13 0.01 0.72
86_0208b - 12.11.2012 0.22 0.22 5.45 0.16 0.26 0.99 0.12 0.01 0.64
86_0471b,01 - 19.1.2006 0.21 0.20 7.00 0.07 0.25 0.61 0.13 0.02 0.50
86_0749c - 19.1.2006 0.14 0.22 5.00 0.09 0.20 0.96 0.12 0.01 0.55
86_0792b,04 - 12.11.2012 0.16 0.21 4.36 0.04 0.19 0.40 0.13 0.01 0.68
87_0423b - 19.1.2006 1.14 0.36 8.50 0.04 0.20 0.53 0.13 0 0.63
87_0634c,04 - 12.11.2012 0.24 0.30 5.67 0.17 0.27 1.50 0.10 0.01 1.76
87_0725c,1-20 - 12.11.2012 0.25 0.28 4.00 0.19 0.13 1.29 0.12 0.03 1.07
87_0726,68-78b - 19.1.2006 0.29 0.57 6.29 0.21 0.29 2.16 0.11 0.03 3.43
87_0726c,2-60a - 19.1.2006 0.66 0.33 5.00 0.14 0.17 1.80 0.12 0.01 0.79
87_0762, - 21.3.2012 0.54 0.34 5.00 0.16 0.21 1.42 0.11 0.01 1.28
87_0762, - 22.3.2013 (1) 0.23 0.17 6.90 0.04 0.20 0.74 0.13 0.01 0.59
87_0762, - 22.3.2013 (2) 0.70 0.40 4.80 0.18 0.19 1.67 0.09 0.03 0.90
87_0762,0Nv - 21.2.2012 0.33 0.25 5.00 0.12 0.23 0.73 0.12 0.01 0.61
87_0762,0Nv - 22.3.2013 (1) 0.57 0.36 6.44 0.17 0.27 1.29 0.12 0.02 0.81
87_0762,0Nv - 22.3.2013 (2) 0.22 0.22 5.55 0.10 0.28 0.76 0.14 0.02 0.83
87_0773,04 - 12.11.2012 0.14 0.17 5.15 0.03 0.15 0.31 0.12 0.02 0.62
87_0791,01-88 - 12.11.2012 0.15 0.30 4.64 0.12 0.27 1.25 0.12 0.01 1.25
87_0849a,04 - 21.3.2012 0.11 0.28 4.15 0.05 0.15 1.08 0.15 0.01 0.69
87_0884,01-56b - 19.1.2006 0.24 0.39 4.30 0.19 0.15 1.95 0.10 0.01 1.68
87_0884,01-56c - 19.1.2006 0.26 0.46 4.67 0.20 0.17 2.54 0.10 0.01 1.63
87_0897a,01-45 - 12.11.2012 (1) 0.51 0.26 5.40 0.10 0.20 0.96 0.17 0.01 1.32
87_0897a,01-45 - 12.11.2012 (2) 0.23 0.40 4.18 0.13 0.09 1.90 0.11 0.01 1.01
87_0942g,03 - 12.11.2012 0.14 0.21 5.42 0.05 0.16 0.49 0.13 0.02 0.71
92_0606 - 12.11.2012 0.25 0.19 9.50 0.10 0.35 0.33 0.13 0.01 0.58
92_0645b - 21.3.2012 0.18 0.23 5.64 0.20 0.36 0.78 0.10 0.01 0.58
94_0239,01 - 21.3.2012 1.40 0.48 6.50 0.55 0.18 2.03 0.10 0.05 4.33
94_0560 - 10.1.12 - 1st layer 0.14 0.18 5.87 0.04 0.15 0.26 0.12 0.02 0.68
94_0560 - 10.1.12 - 2nd layer 0.37 0.38 6.20 0.33 0.23 2.09 0.09 0.08 8.40
94_0775,01 - 12.11.2012 0.25 0.21 4.23 0.05 0.15 0.68 0.13 0.01 0.98
94_842 - 21.2.2012 0.17 0.26 7.56 0.11 0.24 0.92 0.13 0.02 0.70
97_0631E,01 - 12.11.2012 0.23 0.24 5.17 0.10 0.24 0.79 0.09 0.01 0.49
97_0631E,04 - 12.11.2012 1.49 0.49 7.29 0.30 0.17 2.23 0.10 0 1.16
97_0632D,01 - 10.1.12 0.10 0.18 8.78 0.06 0.11 0.26 0.06 0.03 0.49
97_0675,02 - 12.11.2012 0.14 0.17 6.55 0.06 0.17 0.26 0.13 0.02 0.57
97_0690,02 - 21.2.2012 0.21 0.21 7.78 0.13 0.29 0.54 0.12 0.01 0.76
97_0690,02- - 21.2.2012 0.22 0.18 5.50 0.10 0.25 0.43 0.13 0.01 0.56
97_1176 - 12.11.2012 0.12 0.23 4.69 0.04 0.12 0.62 0.14 0.01 0.72
98_0387,03 - 21.3.2012 0.17 0.25 4.31 0.08 0.20 0.85 0.12 0.01 0.65
98_1325 - 12.11.2012 0.07 0.40 4.00 0.25 0.09 2.23 0.14 0.03 0.86
Average 0.34 0.28 5.90 0.13 0.20 1.06 0.12 0.01 1.10

556 Appendix C Frederik Rademakers
Change (in %) in ratio of oxides to Al2O3 between ceramic and slag,metals removed.
SampleN a2OAl2O3
M gOAl2O3
SiO2Al2O3
P2O5Al2O3
K2OAl2O3
C aOAl2O3
T iO2Al2O3
MnOAl2O3
FeOAl2O3
82_0223b,01 - 10.1.12 142 120 254 160 79 474 108 -100 55
82_298b,01 - 21.3.2012 419 29 2 60 0 231 30 100 -3
83_0542b,01 - 21.3.2012 47 10 -6 -14 43 48 0 0 6
83_0597b,01 - 21.3.2012 136 135 54 1050 233 675 -8 100 58
83_1149b - 12.11.2012 (1) 20 56 -8 100 58 296 18 ∞ 15
83_1149b - 12.11.2012 (2) -44 0 -3 33 18 63 17 0 14
84_0030c,01 - 10.1.2012 -6 13 22 33 11 114 -12 0 11
84_0106c - 12.11.2012 -9 36 -29 75 18 21 -10 0 65
84_0749, - 10.1.12 81 12 12 0 45 83 30 0 7
84_1189b,0 - 12.11.2012 20 5 8 -40 31 57 25 0 6
84_1232, - 12.11.2012 158 44 15 150 131 181 18 -67 6
86_0208b - 12.11.2012 29 16 -241 433 44 230 -8 0 -6
86_0471b,01 - 19.1.2006 75 33 34 40 67 221 18 100 -26
86_0749c - 19.1.2006 -7 47 0 13 33 300 9 0 -24
86_0792b,04 - 12.11.2012 7 24 2 300 73 82 18 0 11
87_0423b - 19.1.2006 185 227 -28 0 25 104 30 -100 47
87_0634c,04 - 12.11.2012 100 114 20 240 108 552 -9 0 198
87_0725c,1-20 - 12.11.2012 47 87 -24 217 -28 461 20 50 84
87_0726,68-78b - 19.1.2006 107 200 21 600 142 700 -45 200 345
87_0726c,2-60a - 19.1.2006 371 83 9 250 55 543 9 0 22
87_0762, - 21.3.2012 350 113 8 433 75 576 0 -50 88
87_0762, - 22.3.2013 (1) 28 0 24 -73 5 118 18 0 2
87_0762, - 22.3.2013 (2) 536 167 2 350 73 596 -31 200 45
87_0762,0Nv - 21.2.2012 83 32 -12 50 28 161 0 0 -3
87_0762,0Nv - 22.3.2013 (1) 217 112 31 240 50 461 -14 0 13
87_0762,0Nv - 22.3.2013 (2) 69 29 -2 233 115 230 17 0 2
87_0773,04 - 12.11.2012 17 -6 -12 0 25 35 0 0 -6
87_0791,01-88 - 12.11.2012 15 88 2 200 93 421 0 0 81
87_0849a,04 - 21.3.2012 -8 56 0 150 50 286 7 0 1
87_0884,01-56b - 19.1.2006 26 117 9 375 -6 491 -9 0 113
87_0884,01-56c - 19.1.2006 100 109 40 567 0 1055 -17 0 66
87_0897a,01-45 - 12.11.2012 (1) 155 37 6 100 43 243 55 0 128
87_0897a,01-45 - 12.11.2012 (2) 15 111 -18 160 -36 579 0 0 74
87_0942g,03 - 12.11.2012 17 17 4 67 45 104 0 100 15
92_0606 - 12.11.2012 32 46 13 11 52 10 44 ∞ 7
92_0645b - 21.3.2012 6 53 22 122 89 255 11 0 4
94_0239,01 - 21.3.2012 724 220 26 817 0 823 11 150 610
94_0560 - 10.1.12 - 1st layer 7 9 3 16 4 -3 8 40 3
94_0560 - 10.1.12 - 2nd layer 184 127 8 860 56 676 -19 460 1171
94_0775,01 - 12.11.2012 127 31 7 67 50 162 30 0 69
94_842 - 21.2.2012 -6 100 -14 83 71 338 30 ∞ 35
97_0631E,01 - 12.11.2012 44 71 -11 150 26 243 0 0 -17
97_0631E,04 - 12.11.2012 728 227 -1 400 -19 870 25 -100 93
97_0632D,01 - 10.1.12 -17 20 109 -25 -15 13 -33 200 -18
97_0675,02 - 12.11.2012 8 6 12 -25 -6 4 30 100 -3
97_0690,02 - 21.2.2012 17 50 39 63 61 69 9 0 21
97_0690,02- - 21.2.2012 29 13 8 25 4 95 44 -50 -8
97_1176 - 12.11.2012 -8 53 10 33 -8 226 27 0 14
98_0387,03 - 21.3.2012 6 47 -6 100 43 254 9 0 7
98_1325 - 12.11.2012 -13 186 -16 1150 -18 962 27 ∞ 25
Average change 112 73 13 215 44 328 11 19 70

APPENDIX D
Oxide phases in crucible slag
A full list of oxides occurring in the crucible slag has been established, including details
such as composition, shape, frequency of occurrence etc. Their varying occurrence is
interpreted in section 5.4. The main oxides that occur are Fe-bearing, Ca-bearing, Cu-
bearing, Sn-bearing and Co-bearing phases.
Terminology for the different oxides in the crucible slag is adapted from mineralogy (e.g.,
Klein and Dutrow, 2007). However, it should be emphasised that this terminology is used
on the basis of compositional correspondence or similarity to natural minerals. Most slag
crystals are formed during the high-temperature process, and are therefore essentially dif-
ferent from naturally occurring minerals. The importance of this distinction is especially
crucial for the case of tin oxide and cassiterite, as argued in section 5.4.5.
Section D.1
Fe-bearing oxides
Most of the oxides in the crucible slag contain some FeO and it is an important component
of the glassy slag phase. Here, the Fe-based oxides are examined.
1. Olivine: This phase (olivine group: fayalite (Fe2SiO4) - forsterite (Mg2SiO4)) occurs
in only two of the analysed samples (94_0560 and 94_0775,01). The morphology is
different in each case. In sample 94_0560 (Figure D.1, top), the composition of these
crystals is approximately fayalitic: (Fe,Mg)2SiO4, with M g/Fe ≈ 1/8. They are often in-
terspersed with spinel, as shown in Figure D.1b. In sample 94_0775,01, the olivine
557

558 Appendix D Frederik Rademakers
phase occurs more as dendrites interspersed between diopside-hedenbergite, as
shown in Figure D.1c. In some cases spinels are present, as shown in Figure D.1d. In
sample 94_0775,01, the composition is intermediate between fayalite and forsterite:
(Fe,Mg)2SiO4, with M g/Fe ≈ 1.
2. Spinel: By definition XY2O4, with the minerals MgAl2O4 (spinel) and Fe3O4 (mag-
netite) as typical examples. Magnetite occurs in noteworthy amounts in eight sam-
ples (+ seven samples in which a Co-rich magnetite phase occurs, see section D.5).
Examples of magnetite are shown in Figure D.2. It usually occurs agglomerated in
certain areas of the sample, often in association with other oxides (SnO2, malayaite,
delafossite). Its composition is typically 33-42 at% Fe, 57 at% O and variable amounts
of Al (often around 4 at%), Mg (often around 2 at%), and lower Ti, Si, Ca and Sn
(though up to 8 wt% Sn in one sample). This is close to magnetite composition, with
some Fe2+ being replaced by Mg2+ and Ca2+ and Fe3+ by Al3+, Si4+, Sn4+ and Ti4+.
3. Delafossite: The nominal composition (CuFeO2) does not occur. Crystals of approxi-
mate delafossite composition occur in six samples, though only significantly in two,
shown in Figure D.3. In the first example, laths of Cu2Fe(Mg,Si,Ca,Al,Ti,Sn)O4 (de-
lafossite with about half of the Fe replaced) occur; in the second example, the laths
are approximately Cu(Fe,Mg,Sn)O2 (with M g/Fe ≈ Sn/Fe ≈ 1/10).
4. Diopside-hedenbergite: see section D.2.
5. Ilmenite: Ilmenite (FeTiO3) is present in the ceramic fabric of all samples. It often oc-
curs in the slag, though not abundantly, and usually concentrated near the bloated
transition zone rather than the truly slagged area, as shown in Figure D.4a. An ex-
ample of ilmenite occurring more dispersed in the slag is shown in Figure D.4b.
Figure D.5 shows ternary diagrams indicating which samples contain Fe-bearing oxides.
Generally, these are the samples with a more iron enriched slag.

Frederik Rademakers Appendix D 559
(a) Fayalite (b) Lath-shaped fayalite with (lighter) spinel
(c) Fayalite-forsterite dendrites (light grey) in be-
tween diopside-hedenbergite (dark grey) with high-
tin prill (white)
(d) Fayalite-forsterite dendrites (light grey) in
between diopside-hedenbergite (dark grey) with
(lighter) spinel
Figure D.1: Fayalite in sample 94_560 (top) and sample 94_0775,01 (bottom)

560 Appendix D Frederik Rademakers
(a) Magnetite in sample 87_0726,68- 78b, surround-
ing a high-tin bronze prill
(b) Magnetite in sample 94_0560, next to a (cor-
roded) bronze prill (top left)
(c) Magnetite agglomeration in sample 87_0634c,04
with interspersed Fe-rich copper metal droplets
(bright grey) and surrounding SnO2 (white)
(d) Chain of magnetite with high-tin (+Pb) prills in
sample 94_0239,01
Figure D.2: Magnetite

Frederik Rademakers Appendix D 561
(a) ‘Delafossite’ laths in sample 87_0726,68- 78b (b) ‘Delafossite’ laths (light grey) in between SnO2
(white) and malayite (light grey, slightly darker) in
sample 87_0762,0Nv (1)
Figure D.3: ‘Delafossite’
(a) Ilmenite (light grey) occurring in the bloated
transition zone, sample 87_0762,0Nv
(b) Ilmenite (light grey) occurring more dispersed in
the slag area, sample 84_1232
Figure D.4: Ilmenite

562 Appendix D Frederik Rademakers
Figure D.5: Ternary diagrams showing samples with Fe-bearing phases
Section D.2
Ca-bearing oxides
CaO is present in most of the crucible slag. It occurs in both the glassy phase and a few
crystallised oxides, discussed below.
1. Diopside-hedenbergite: Diopside has a nominal MgCaSi2O6 composition and forms
a complete solid solution with hedenbergite, FeCaSi2O6. Occurrences here usually
have intermediate compositions (variable Mg and Fe), with some Al substituting for
Si (forming (Mg,Fe)Ca(Si,Al)2O6). In some cases, Ca2+ is partially replaced (up to
50%) by Mg2+/Fe2+. Fe2+ and Mg2+ are sometimes replaced by a few wt% Na2+.
Examples are shown in Figure D.7. In some samples, a few crystals or clusters of
crystals are formed in an isolated area of the slag (e.g., Figures D.7a-D.7b). In other
samples, the entire matrix is dominated by these crystals (e.g., Figures D.7c-D.7d).
Figure D.7e shows an example of Co-bearing (±1 wt%) diopside-hedenbergite. Fig-
ure D.7f shows a matrix in which the diopside-hedenbergite crystals seem to have
merged. Note that these oxides often show zoning, indicating changing composi-
tion during crystal growth.
2. Plagioclase: A number of samples have crystals of approximate plagioclase (labradorite-
bytownite) composition. This is equivalent to±70% anorthite (CaAl2SiO8) and±30%
albite (NaAlSi3O8). Some examples are shown in Figure D.8. As Figure D.9 shows,

Frederik Rademakers Appendix D 563
Figure D.6: Ternary diagrams showing samples with Ca-bearing phases
this plagioclase often occurs in association with diopside-hedenbergite (but less fre-
quently).
3. Malayaite: see section D.4.
Figure D.6 shows ternary diagrams indicating which samples contain Ca-bearing oxides.
These occur both for samples with high and lower lime enrichment.

564 Appendix D Frederik Rademakers
(a) Diopside-hedenbergite cluster in sample
83_1149b (1)
(b) Diopside-hedenbergite cluster in sample
84_1232
(c) Diopside-hedenbergite (medium-grey) matrix in
sample 87_0884,01-56b (with Co-rich spinel, light
grey)
(d) Diopside-hedenbergite (medium-grey) matrix
in sample 87_0762, (with Co-rich spinel, light grey)
(e) Co-bearing diopside-hedenbergite matrix in
sample 87_0897a,01-45 (2)
(f) Diopside-hedenbergite matrix in sample
87_0884,01-56c
Figure D.7: Diopside-hedenbergite

Frederik Rademakers Appendix D 565
(a) Plagioclase crystals in sample 86_0749c (b) Plagioclase crystals in sample 87_0849a,04
(c) Plagioclase crystals in sample 87_0897a,01-45 (1) (d) Plagioclase crystals in sample 94_0775,01
Figure D.8: Plagioclase
(a) Sample 87_0725c,1-20 (b) Sample 98_0387,03
Figure D.9: Plagioclase crystals (dark grey) occurring together with diopside-hedenbergite
(light grey)

566 Appendix D Frederik Rademakers
Section D.3
Cu-bearing oxides
Most of the copper in the crucibles occurs in metallic prills (see section 5.2.4). Besides
that, it occurs in a number of oxide phases.
1. Delafossite: See section D.1.
2. Cuprite: Surrounding metallic prills, an oxidised layer is often formed, which is usu-
ally a mixture of mostly Cu2O with some CuO and sometimes Cu2ClO2−3. These
oxide layers appear to form mostly around pure Cu prills, indicating other elements
(Fe, Sn, As, Co), when present, burn out before the copper oxidises, as shown in
Figure D.10a. In some cases though, a few wt% Sn/As remains (e.g., Figures D.10b-
D.10c), while in others entire prills are oxidised into cuprite (e.g., Figure D.10d). Fig-
ure D.10e shows how pores and cracks are sometimes filled with cuprite (most likely
formed post-depositionally). In pores, cuprite can form (geode-like) cubic crystals
as shown in Figure D.11. Probably, these pore structures are related to gas bubbles
in the crucible slag. Figure D.12 shows a bronze prill, in which preferential corro-
sion of part of the alloy has taken place (see section 5.2.4). The alteration products
(greenish in PPL, reddish in XPL) are typically Cu-oxide with variable stoichiometry
and widely ranging Sn content, and a lower Si, Cl, Fe and As content.
3. Cu-silicates: Sample 87_0726,68- 78b has Cu-silicate ‘bubbles’ occurring in pores,
with an approximate composition of Cu3Si4O9 (and low Ca, Mg & Al), shown in Fig-
ure D.13. These images show that these are actually (corrosion-related) hydrated
phases which disintegrate in the SEM-chamber’s vacuum. Another occurrence of
Cu-silicate, with a (very) approximate composition of Cu4SiO4 (with low Fe & Ca),
takes a ‘sun-like’ shape (spherical core with dendritic growth away from the centre)
and is dispersed between SnO2 laths (see Figure D.15a).
Figure D.14 shows ternary diagrams indicating which samples are enriched in bulk CuO
content.

Frederik Rademakers Appendix D 567
(a) Two examples of pure Cu prills with cuprite edge, surrounded by SnO2, in sample 87_0726c,2-60a (left:
O.M. image, 200X, w.o.i. ±1mm)
(b) Cuprite surrounding prill with a few wt% Sn and
As remaining, sample 87_0897a,01-45 (2)
(c) Cuprite surrounding prill with a few wt% Sn and
As remaining, sample 87_0884,01-56c
(d) Fully oxidised prill surrounded by SnO2, sample
87_0726c,2-60a (O.M. image, 100X, w.o.i. ±2mm)
(e) Fully oxidised prill with cuprite ‘leaking’ into
slag, sample 87_0884,01-56c
Figure D.10: Copper-oxides

568 Appendix D Frederik Rademakers
Figure D.11: Cuprite in pores in the crucible slag, samples 87_0884,01-56b, 87_0884,01-56c
and 94_0560
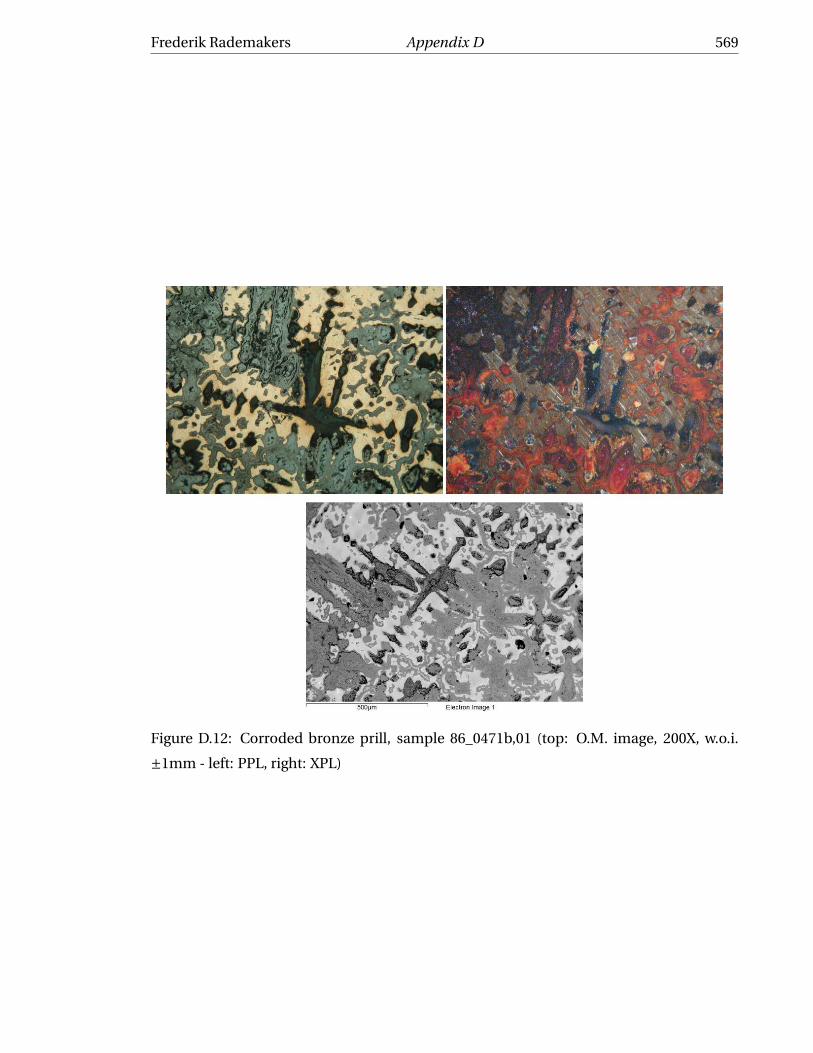
Frederik Rademakers Appendix D 569
Figure D.12: Corroded bronze prill, sample 86_0471b,01 (top: O.M. image, 200X, w.o.i.
±1mm - left: PPL, right: XPL)

570 Appendix D Frederik Rademakers
Figure D.13: Cu-silicate ‘bubbles’ in pores in the crucible slag of sample 87_0726,68- 78b
Figure D.14: Ternary diagrams showing samples enriched in CuO (+5 and +10 wt% CuO)

Frederik Rademakers Appendix D 571
Section D.4
Sn-bearing oxides
When present, tin occurs either in the metallic phase as bronze constituent (no pure tin
metal) or in two different oxides in the slag.
1. Tin oxide: The first one, shown in Figure D.15, has a composition of SnO2 (compo-
sitionally identical to mineral cassiterite). Very often, these oxides occur in clusters
spread throughout the crucible slag, often in association with Cu-phases, and are
absent in other areas (e.g., Figure D.15b). There exists large variability in the shapes
of these oxides, illustrated in Figures D.15a-D.15f. The cores of the SnO2 crystals are
often filled with copper, as shown in close-up in Figure D.15f. All of these obser-
vations are important with respect to the interpretation of these crystals as newly
formed, secondary tin oxide (see section 5.4.5).
There are a few occurrences of SnO2 which differ strongly from the examples shown
in Figure D.15, and could be residual mineral cassiterite (see section 5.4.5). Some
examples are given in Figure D.16.
2. Malayaite: The second Sn-bearing phase, shown in Figure D.17, has a composition
which approximately matches malayaite (CaSnO(SiO4)), and is probably formed by
interaction of SnO2 with the lime-rich slag. These phases are typically subhedral to
anhedral, grey, and slightly less bright than magnetite, and often have a pure SnO2
core.
Figure D.18 shows ternary diagrams indicating which samples are enriched in bulk SnO2
content. Figure D.19 shows a ternary diagram indicating which samples contain Sn-bearing
oxides. As SnO2 tends to occur abundantly when it does occur, the SnO2-rich (bulk con-
tent) samples mainly correspond to those with Sn-bearing phases.

572 Appendix D Frederik Rademakers
(a) SnO2 (light grey), copper-silicates in back-
ground, sample 87_0726,68-78b
(b) SnO2 (white), typical aggregation, sample
87_0762
(c) Variable shape of SnO2 (white), sample
87_0634c,04
(d) Variable shape of SnO2 (light grey), sample
87_0634c,04
(e) Variable shape of SnO2 (light grey), sample
87_0634c,04
(f) Copper (medium grey) in core of SnO2 (light
grey), sample 84_0030c,01
Figure D.15: SnO2 phases

Frederik Rademakers Appendix D 573
(a) Sample 87_0762 (2) (b) Sample 97_0631E,01
Figure D.16: SnO2 with distinct different morphology
(a) Sample 83_0597b,01 (b) Sample 84_1232
Figure D.17: ‘Malayaite’ (light grey) with SnO2 (white)

574 Appendix D Frederik Rademakers
Figure D.18: Ternary diagrams showing samples enriched in SnO2 (+5 and +10 wt% SnO2)
Figure D.19: Ternary diagrams showing samples with Sn-bearing oxides

Frederik Rademakers Appendix D 575
Section D.5
Co-bearing oxides
Six samples show noticeable amounts (0.3-2.1 wt% of bulk composition) of CoO in the slag
phase. Upon closer examination, this cobalt appears to consistently be present in a phase
with somewhat variable composition from approximately Fe6Co2AlO11 to Fe5Co(Si,Al)O9.
This phase appears similar to spinel, where Co replaces some of the Fe (or Al?) (Co com-
monly has oxidation states 2+ or 3+). The formula could then be (Fe,Co)(Fe,Al)2O4, with
typically up to 6 wt% Co. As shown in Figure D.20a, it can have a typical spinel-like shape,
but it equally appears in dendritic and skeletal structures, as shown in Figures D.20b-
D.20c, against a background of diopside-hedenbergite. It occurs in the six samples en-
riched in Co, and in one which does not show bulk increase in CoO content.
Co is present in copper prills (up to 24 wt%) in nine samples (the total number of samples
showing presence of cobalt in any form). As Figures D.20c and D.21 show, it appears that
the Co-spinel is formed by the oxidation of Fe- and Co-rich copper prills.
It is important to note here that some of the Co-spinel has low Ni contents. A number of
Co-rich copper prills has significant Ni content (up to 46 wt%, see section 5.2.4).
Figure D.22 shows ternary diagrams indicating which samples contain Co-bearing oxides.
In five out of six, the cobalt enrichment is paired with an iron enrichment of the crucible
slag. The sixth sample (92_0606) shows the lowest CoO enrichment (0.3 wt%) and limited
iron enrichment.

576 Appendix D Frederik Rademakers
(a) Sample 87_0762, similar to spinel structure. (b) Sample 87_0884,01-56b, with dendritic struc-
ture. Diopside-hedenbergite in matrix.
(c) Sample 87_0884,01-56b, with skeletal structure.
Diopside-hedenbergite in matrix.
Figure D.20: Co-rich phases
Figure D.21: Co-spinel oxidising into crucible slag from Fe- and Co-rich copper prills, sam-
ple 87_0791,01-88

Frederik Rademakers Appendix D 577
Figure D.22: Ternary diagrams showing samples with Co-bearing phases
Section D.6
Zircon
There are ten samples in which zircon (ZrSiO4) has been detected in the crucible slag
(though it could easily have been missed in others). In all cases, zircon occurs as a sin-
gle, isolated crystal. Some examples are shown in Figure D.23 (Figure D.23c: possibly
metamict1 structure). There is one recorded example of zircon occurring within the ce-
ramic fabric, as shown in Figure D.24. Zircon commonly occurs as an accessory mineral
in igneous rocks, particulary in granite, granodiorite, syenite, monzonite and nepheline
syenite. It is often an accessory mineral in sediments, due to its chemical stability (Klein
and Dutrow, 2007), and is not uncommon in Nile clay fabrics (Bourriau et al., 2000). Most
likely this zircon derives from the ceramic (i.e., the Nile Silt), where it is sometimes noted,
though it might have come into the crucible slag as an accessory mineral with cassiterite
(which often derives from igneous host rocks) as well.
Figure D.25 shows ternary diagrams indicating which samples contain zircon in the slag
area.
1Metamictisation: natural degradation of a mineral’s crystal structure into amorphous structure. Ura-
nium and thorium can cause metamictisation of zircon due to radiation (Klein and Dutrow, 2007).

578 Appendix D Frederik Rademakers
(a) Sample 83_1149b (2) (b) Sample 84_1232
(c) Sample 86_0749c (d) Sample 87_0762,0Nv
Figure D.23: Zircon
Figure D.24: Zircon (bright, left) in ceramic fabric, sample 87_0762 (1)

Frederik Rademakers Appendix D 579
Figure D.25: Ternary diagrams showing samples with zircon in crucible slag

580 Appendix D Frederik Rademakers

APPENDIX E
Composition of metallic prills
Oxidised prills are omitted. Where an abundance of 1+ is noted, this refers to one mea-
sured prill, but probably more of similar composition present in the crucible slag. Micro
refers to tiny prills dispersed throughout the crucible slag, which are too small to measure.
Composition of metallic prills in crucible slag (in wt%)Sample Abundance Cu Sn Fe As Co Ni Pb S
82_0223b,01 - 10.1.12 1+ 100
82_298b,01 - 21.3.2012 Micro
83_0542b,01 - 21.3.2012 Micro
83_0597b,01 - 21.3.2012 1+ 91.9 7.3 0.8
83_1149b - 12.11.2012 (1)
4 98.5-99 1-1.5
1 91.1 1.4 6.1 1.4
Micro
83_1149b - 12.11.2012 (2)7 30-65 0-2 5-20 6-24 26-46
Micro
84_0030c,01 - 10.1.2012 Multi 100
84_0106c - 12.11.2012 /
84_0749, - 10.1.12
Multi 95-100 0-5
2 96-96.8 3.2-4
1 95.1-95.4 4.6-4.9
84_1189b,0 - 12.11.2012 Micro
84_1232, - 12.11.2012 1+ 99 1
86_0208b - 12.11.2012 Micro
86_0471b,01 - 19.1.20061+ 89 11
Micro
86_0749c - 19.1.2006
1+ 98.5 1.5
1 (3 phase) 10 tr 87 1.5 tr
−→ phases:
7.3 89 2.8 0.5
93.3 1 7 1
68.4 8.3 24.5
Micro
Gold (30 at% Cu and 70 at% Au)
86_0792b,04 - 12.11.2012Multi 100
Multi 97.25-99.5 0-2 0.5-0.8
87_0423b - 19.1.2006
1+ 98.4 1.6
Micro
Cu2S x x
Fe1−2S2O x x
87_0634c,04 - 12.11.2012
Multi 95-100 0-5
Multi 96-98 2-4
1 92.7 4.3 0.6 1.6 0.8
581

582 Appendix E Frederik Rademakers
Composition of metallic prills in crucible slag (in wt%)Sample Abundance Cu Sn Fe As Co Ni Pb S
87_0725c,1-20 - 12.11.2012 /
87_0726,68-78b - 19.1.2006
1 82.1 15.2 1.5 1.2
1 81.5 17.5 1
1 81.8 16.4 0.8 1
,→ 16.4 Sn: small areas of 25-28 Sn in 15-15.8 Sn matrix
1 75.9 22.1 2
Micro
87_0726c,2-60a - 19.1.2006
Multi 100
Multi 96-97 3-4
1 97.8 2.2
1 100 x
87_0762, - 21.3.2012Multi 95 1.5-2.4 1.8 0.8-1.1
Multi 90-91 9-10 x
87_0762, - 22.3.2013 (1) /
87_0762, - 22.3.2013 (2)
Multi 100
Multi 92-95 5-8
1+ 98.8 1.2
Micro
87_0762,0Nv - 21.2.2012Cu2S x x
Micro
87_0762,0Nv - 22.3.2013 (1)
Multi 100
Multi 98-100 0-2
1+ 86.3 11.3 2.4
2 71-72 28-29
,→ 28-29 Sn: δ-phase in α+δ interdendritic
87_0762,0Nv - 22.3.2013 (2)Multi 99 1
1+ 98 2
87_0773,04 - 12.11.2012 /
87_0791,01-88 - 12.11.20121 96 2.4-2.5 1.5-1.6
Multi 84.3-95.5 3-7 1-6 0-1.7 0.5-1
87_0849a,04 - 21.3.2012 Micro
87_0884,01-56b - 19.1.2006
Multi 100 (?)
Multi 84-94 6.3-16 0-2.3
Multi 95.8 1.5 2 0.6-0.7
87_0884,01-56c - 19.1.2006Multi 100
1+ 95.3 1.2 3.5
87_0897a,01-45 - 12.11.2012 (1)
1 69 13.1 2.7 17.2
1 81.6 14.4 4.3
1 68.3 22.1 4.1 4.4 1.1
1 80.2 15.2 4.6
1 76.1 3.1 20.8
1 62.8 33.1 1.7 0.9 0.6 0.9
87_0897a,01-45 - 12.11.2012 (2) Multi 85-96 1.5-3.1 1.7-7.5 0.5-1.1 0-0.6 0-2.8
87_0942g,03 - 12.11.2012 Multi 94-97 1.4-1.7 1.5-4.4
92_0606 - 12.11.2012Multi 98.6-99 1-1.4
Multi 96-98 1.1-1.9 1-1.9
92_0645b - 21.3.20121+ 96 2.5 1.5
Micro
94_0239,01 - 21.3.2012
1 69.9 23.6 1.8 1.2 3.5
1 70.7 26.7 1.6 1
1 68 30 2
1 65.3 31.7 3
1 83.6 13.4 3
1 91.9 6.2 1.9
1 94.1 3.2 2.7
94_0560 - 10.1.12 (Fayalite)
Multi Cu2S x 1.8-3.6 x
1+ 91.6 5.1 0.9 1.1 1.3
,→ Prill has Cu2S edge (2.5 Fe)
1+ 9.5 0.6 1 0.4
94_0560 - 10.1.12 (Magnetite)
3+ 80-87 10.6-15.7 1.6-4.3 0.5-1
1+ 90 6.5 1 1.8 0.7
,→ Prill has Cu2S edge (2 Fe)
94_0775,01 - 12.11.2012
1 58.7 39.8 1.5
1 38.4 59.6 2
1 54.8 43.1 2.1
1: tiny, 2 phase35.2 60 2.2 2.6
57 41 2
Micro
94_842 - 21.2.2012
Multi 100 (some with Cu2O edges)
1+ 98.5 1.5
Micro

Frederik Rademakers Appendix E 583
Composition of metallic prills in crucible slag (in wt%)Sample Abundance Cu Sn Fe As Co Ni Pb S
97_0631E,01 - 12.11.2012Multi 100 (some with Cu2O edges)
Multi 97.9 1.5 0.6
97_0631E,04 - 12.11.2012
Multi 100 (Sn burning out, cuprite formation only after)
Multi Bronze
1 66 34
97_0632D,01 - 10.1.12
1 (2 phase) 80 20
−→ phases:67.1 32.9
83.7 15.4 0.9
Multi Unmeasured (multi-phase) prills
Micro
97_0675,02 - 12.11.2012 /
97_0690,02 - 21.2.2012
Multi 60 39 1
1 (2 phase) 51 48 0.3 0.6
−→ phases:60 40
40 60
1: tiny, 3 phase 17.3 7.6 28 2.3 44.3
−→ phases:
10 4 32 3 51
83 17
71 29
Micro
97_0690,02- - 21.2.2012 Micro
97_1176 - 12.11.2012
Multi Unmeasured (multi-phase) prills
Multi (2 phase)12 25 63
85.3 8 1.4 1 4.3
Multi 69-71 26.7-29.5 1.1-1.2 1-1.2
Micro
98_0387,03 - 21.3.2012Multi 100 (some with Cu2O edges)
Micro
98_1325 - 12.11.2012 /

584 Appendix E Frederik Rademakers

APPENDIX F
Lead isotope data
Lead isotope analysis has been performed at the Curt-Engelhorn-Centre (CEZ) and Oxford
Isotrace (ISO) laboratories. Raw data of lead isotope analysis performed on metal samples
(CEZ and ISO), as well as chemical analysis of these metal samples (XRF and NAA by CEZ,
XRF only by ISO) are presented in the tables below. This is followed by lead isotope data
for crucible samples (CEZ), without chemical data. Finally, some additional plots showing
correlations between various copper constituents are offered.
585

586 Appendix F Frederik Rademakers
Samp
leL
abP
QStrat
Type
208P
b/ 206
Pb
mean
208P
b/ 206
Pb
2σ
207P
b/ 206
Pb
mean
207P
b/ 206
Pb
2σ
208P
b/ 204
Pb
mean
208P
b/ 204
Pb
2σ
87_0897a,01-45(2)
CE
ZQ
I-a/3B
/2aP
rill2.07130
0.00020.83982
0.0000438.4500
0.004
97_0390,02-C
EZ
QIV
-S-Schn
Bc/2
Prill
2.072700.0001
0.841120.00005
38.39300.01
1985_0027c-
Mep
96/004C
EZ
QI-b
/5B
/3aFragm
ent
2.059800.0001
0.830380.00001
38.90100.001
1984_1162,0001-
MeP
96/056C
EZ
QI-c/4.5
B/3b
?Fragm
entw
ithm
etalcore
2.085900.0001
0.849580.00002
38.36400.001
1984_1162,0002-
MeP
96/057C
EZ
QI-c/4.5
B/3b
?Fragm
entw
ithm
etalcore
2.059500.0001
0.830340.00001
38.90700.002
1985_0152-
MeP
96/064C
EZ
QI-c/3
B/2b
Powd
er,corro
sion
2.059800.0001
0.830600.00001
38.88900.001
1983_0196-
MeP
96/055C
EZ
QI-c/4.5
B/2a
Powd
er,corro
sion
2.065000.0001
0.833680.00001
38.84900.001
1985_0205,0001-0003-
MeP
96/063C
EZ
QI-c/4.5
B/2b
Fragmen
twith
metalco
re2.08500
0.00010.85250
0.0000138.0770
0.001
1984_1498b-
MeP
96/003C
EZ
QI-c/3
B/2b
Powd
er,corro
sion
2.058200.0001
0.829280.00001
38.91600.001
1988_1211-
MeP
96/058C
EZ
QIV
-d/28
?Pow
der,co
rrosio
n2.11080
0.00010.86583
0.0000138.1560
0.001
1992_0240-
MeP
96/060C
EZ
QIV
-i.j/26?
Fragmen
twith
metalco
re2.11740
0.00010.86877
0.0000138.0860
0.001
1985_0046c-
MeP
08/055C
EZ
QI-b
/5B
/3aFragm
ent,co
rrosio
n2.05760
0.00010.82938
0.0000138.8940
0.001
1987_0507,0002-
MeP
08/082C
EZ
QI-b
/5B
/3bFragm
ent,co
rrosio
n2.06030
0.00010.83066
0.0000138.9020
0.002
1987_1633-
MeP
08/098C
EZ
QI-b.c/3
B/3a
Fragmen
t,corro
sion
2.056500.0003
0.829900.00001
38.84400.007
1987_1670,0008-
MeP
08/099C
EZ
QI-b
/3B
/2bFragm
ent,co
rrosio
n2.05960
0.00010.82997
0.0000138.9260
0.001
1992_0905,0002-
MeP
08/117C
EZ
QIV
-j/27?
Fragmen
t,corro
sion
2.062000.0001
0.832390.00001
38.75300.001
1997_0575,0005-
MeP
08/143C
EZ
QIV
-S-Schn
?Fragm
ent,co
rrosio
n2.11720
0.00010.87013
0.0000138.0770
0.001
1984_1411ISO
QI-d
/3B
/2aC
asting
deb
ris2.06083
n.a
0.83121n
.a38.9064
n.a
1982_0219b,0002-
MeP
85/03ISO
QI-d
/3B
/2aG
ilded
?2.07498
n.a
0.83934n
.a38.7793
n.a
1986_0280a-
MeP
87/01ISO
QI-b
/9B
/2bW
heelh
ub
2.05835n
.a0.82864
n.a
38.9975n
.a
1984_1381-
MeP
87/14ISO
QI-f/02.03
B/2
Ro
un
dro
d2.07461
n.a
0.84035n
.a38.8678
n.a
1986_0720-
MeP
87/19ISO
QI-c/4.5
B/3
Dagger
2.08087n
.a0.84375
n.a
38.6209n
.a
1987_0140-
MeP
87/25ISO
QI-ax/4.5
B/3b
Ro
d2.06052
n.a
0.83052n
.a38.9376
n.a
1986_0909-
MeP
87/30ISO
QI-c/4.5
B/3
Castin
gw
aste2.06822
n.a
0.83583n
.a38.8031
n.a
1987_0512,0002-
MeP
87/39ISO
QI-b
/5B
/3bSp
earhead
2.10477n
.a0.86185
n.a
38.2441n
.a
1987_0803,0004-
MeP
87/45ISO
QI-a/3
B/2a
Oxh
ide
ingo
tfragmen
t2.07394
n.a
0.84124n
.a38.4239
n.a
Table
F.1:Co
pp
er(alloy)
samp
lesw
ithco
ntextan
dlead
isoto
pe
ratios

Frederik Rademakers Appendix F 587
Sam
ple
PQ
Stra
tTy
pe
Cu
Mn
FeC
oN
iZ
nA
sSe
Ag
SnSb
TeP
bB
i
%%
%%
%%
%%
%%
%%
%%
1985
_002
7c-M
ep96
/004
QI-
b/5
B/3
aFr
agm
ent
85<
0.01
0.12
0.01
0.04
<0.
10.
780.
020.
021
13.7
0.06
70.
015
0.54
<0.
01
1984
_116
2,00
01-M
eP96
/056
QI-
c/4.
5B
/3b
?Fr
agm
entw
ith
met
alco
re10
0<
0.01
0.21
<0.
01<
0.01
<0.
10.
010.
040.
021
<0.
005
<0.
005
0.02
3<
0.01
0.02
1984
_116
2,00
02-M
eP96
/057
QI-
c/4.
5B
/3b
?Fr
agm
entw
ith
met
alco
re87
<0.
010.
34<
0.01
0.04
<0.
10.
53<
0.01
0.02
211
.50.
034
<0.
005
0.57
<0.
01
1985
_015
2-M
eP96
/064
QI-
c/3
B/2
bPo
wd
er,c
orr
osi
on
88<
0.01
0.95
0.03
0.02
<0.
10.
27<
0.01
0.01
110
.30.
019
<0.
005
0.32
<0.
01
1983
_019
6-M
eP96
/055
QI-
c/4.
5B
/2a
Pow
der
,co
rro
sio
n83
<0.
011.
080.
020.
03<
0.1
0.85
0.01
0.10
113
.60.
115
0.00
80.
85<
0.01
1985
_020
5,00
01-0
003
-MeP
96/0
63Q
I-c/
4.5
B/2
bFr
agm
entw
ith
met
alco
re95
<0.
014.
40.
06<
0.01
<0.
10.
100.
01<
0.00
2<
0.00
50.
005
0.00
7<
0.01
<0.
01
1984
_149
8b-M
eP96
/003
QI-
c/3
B/2
bPo
wd
er,c
orr
osi
on
850.
013.
10.
020.
02<
0.1
0.56
<0.
010.
013
11.1
0.04
60.
005
0.08
<0.
01
1988
_121
1-M
eP96
/058
QIV
-d/2
8?
Pow
der
,co
rro
sio
n84
<0.
010.
430.
030.
04<
0.1
0.59
<0.
010.
014
12.5
0.07
0<
0.00
51.
93<
0.01
1992
_024
0-M
eP96
/060
QIV
-i.j/
26?
Frag
men
twit
hm
etal
core
82<
0.01
0.25
0.02
0.03
<0.
10.
22<
0.01
0.01
216
.00.
019
<0.
005
1.70
<0.
01
1985
_004
6c-M
eP08
/055
QI-
b/5
B/3
aFr
agm
entw
ith
met
alco
re93
<0.
010.
340.
010.
02<
0.1
0.47
<0.
010.
003
5.2
0.01
7<
0.00
50.
48<
0.01
1987
_050
7,00
02-M
eP08
/082
QI-
b/5
B/3
bFr
agm
ent,
corr
osi
on
920.
010.
65<
0.01
0.02
<0.
10.
53<
0.01
0.00
66.
50.
030
0.00
80.
46<
0.01
1987
_163
3-M
eP08
/098
QI-
b.c/
3B
/3a
Frag
men
t,co
rro
sio
n90
<0.
010.
35<
0.01
0.03
<0.
10.
77<
0.01
0.00
57.
60.
043
0.00
60.
78<
0.01
1987
_167
0,00
08-M
eP08
/099
QI-
b/3
B/2
bFr
agm
ent,
corr
osi
on
90<
0.01
0.84
<0.
010.
03<
0.1
0.58
<0.
010.
006
7.2
0.05
40.
006
1.10
0.01
1992
_090
5,00
02-M
eP08
/117
QIV
-j/2
7?
Frag
men
t,co
rro
sio
n88
<0.
010.
55<
0.01
0.02
<0.
10.
31<
0.01
0.00
310
.80.
021
0.01
00.
02<
0.01
1997
_057
5,00
05-M
eP08
/143
QIV
-S-S
chn
?Fr
agm
ent,
corr
osi
on
87<
0.01
0.13
<0.
010.
02<
0.1
0.42
<0.
010.
016
9.8
0.05
10.
011
2.04
<0.
01
Tab
leF.
2:X
RF
dat
afo
rC
EZ
cop
per
(allo
y)sa
mp
les

588 Appendix F Frederik Rademakers
Samp
leP
QStrat
Type
Cu
σFe
σC
oσ
Ni
σZ
nσ
As
σ
%%
pp
mp
pm
pp
mp
pm
1985_0027c-M
ep96/004
QI-b
/5B
/3aFragm
ent
73.22.3
0.1126
1035
2888
3217
63102
1984_1162,0001-M
eP96/056
QI-c/4.5
B/3b
?Fragm
entw
ithm
etalcore
98.32.3
0.0445
5.77.6
5437
3518
1512
1984_1162,0002-M
eP96/057
QI-c/4.5
B/3b
?Fragm
entw
ithm
etalcore
75.92.3
0.2426
1065
35011
11210
40202
1985_0152-M
eP96/064
QI-c/3
B/2b
Powd
er,corro
sion
59.12.3
1.2821
6305
24711
6112
14842
1985_0205,0001-0003-M
eP96/063
QI-c/4.5
B/2b
Fragmen
twith
metalco
re83.1
2.37.50
21620
5340
21263
8944
2
1988_1211-M
eP96/058
QIV
-d/28
?Pow
der,co
rrosio
n64.3
2.30.18
24211
5280
718
232830
2
1992_0240-M
eP96/060
QIV
-i.j/26?
Fragmen
twith
metalco
re69.5
2.30.17
25169
5266
8130
51749
2
Samp
leP
QStrat
Type
Seσ
Ag
σSn
σSb
σTe
σA
uσ
pp
mp
pm
%p
pm
pp
mp
pm
1985_0027c-M
ep96/004
QI-b
/5B
/3aFragm
ent
82.42.9
2231
13.11.7
3921.4
83.09.5
1982
1984_1162,0001-M
eP96/056
QI-c/4.5
B/3b
?Fragm
entw
ithm
etalcore
4182
2991
<0,0264
3.4319
58.7
3
1984_1162,0002-M
eP96/057
QI-c/4.5
B/3b
?Fragm
entw
ithm
etalcore
48.85.2
1832
10.31.7
3061.4
56.020.2
1722.4
1985_0152-M
eP96/064
QI-c/3
B/2b
Powd
er,corro
sion
37.63.6
961.6
11.11.7
1841.4
30.019.3
87.62
1985_0205,0001-0003-M
eP96/063
QI-c/4.5
B/2b
Fragmen
twith
metalco
re96.6
2.97.0
12.6<0,013
21.51.9
62.017.6
2.04.0
1988_1211-M
eP96/058
QIV
-d/28
?Pow
der,co
rrosio
n36.5
3.2124
18.4
1.7553
1.446.0
11.180.3
2.4
1992_0240-M
eP96/060
QIV
-i.j/26?
Fragmen
twith
metalco
re8.8
10.4104
113.6
1.7137
1.4<
1635.6
2.4
Table
F.3:NA
Ad
atafo
rC
EZ
cop
per
(alloy)sam
ples

Frederik Rademakers Appendix F 589
Sam
ple
PQ
Stra
tTy
pe
Cu
FeSn
Pb
As
Ag
Au
%%
%%
%%
%
84_1
411
QI-
d/3
B/2
aC
asti
ng
deb
ris
92.0
0<0
.17.
00.
40<0
.2<0
.1<0
.2
1982
_021
9b,0
002
-M
eP85
/03
QI-
d/3
B/2
aG
ilded
?94
.00
<0.1
6.0
0.80
<0.2
<0.1
0.2
1986
_028
0a-
MeP
87/0
1Q
I-b
/9B
/2b
Wh
eelh
ub
79.0
0<0
.121
.00.
200.
2<0
.1<0
.2
1984
_138
1-
MeP
87/1
4Q
I-f/
02.0
3B
/2R
ou
nd
rod
89.0
0<0
.15.
05.
00<0
.2<0
.1<0
.2
1986
_072
0-
MeP
87/1
9Q
I-c/
4.5
B/3
Dag
ger
89.0
0<0
.110
.00.
20<0
.2<0
.1<0
.2
1987
_014
0-
MeP
87/2
5Q
I-ax
/4.5
B/3
bR
od
88.0
0<0
.112
.00.
30<0
.2<0
.1<0
.2
1986
_090
9-
MeP
87/3
0Q
I-c/
4.5
B/3
Cas
tin
gw
aste
99.0
0<0
.1<0
.2<0
.1<0
.2<0
.1<0
.2
1987
_051
2,00
02-
MeP
87/3
9Q
I-b
/5B
/3b
Spea
rhea
d84
.00
<0.1
15.0
0.30
<0.2
<0.1
<0.2
1987
_080
3,00
04-
MeP
87/4
5Q
I-a/
3B
/2a
Oxh
ide
ingo
tfra
gmen
t99
.00
<0.1
<0.2
<0.1
0.2
<0.1
<0.2
Tab
leF.
4:X
RF
dat
afo
rIS
Oco
pp
er(a
lloy)
sam
ple
s

590 Appendix F Frederik Rademakers
Samp
leP
QStrat
Type
208Pb
/ 206Pb
mean
208Pb
/ 206Pb
2σ
207Pb
/ 206Pb
mean
207Pb
/ 206Pb
2σ
208Pb
/ 204Pb
mean
208Pb
/ 204Pb
2σ
83_0597l,01Q
I-e/1B
/1-B/2
Ceram
ic0.85869
0.000092.0991
0.000238.212
0.008
Slag0.86223
0.000032.1061
0.000138.255
0.006
87_0897a,01-45(2)
QI-a/3
B/2a
Ceram
ic0.83540
0.000032.0663
0.000138.708
0.004
Slag0.83347
0.000032.0640
0.000138.811
0.010
87_0762Q
I-a/3B
/2aC
eramic
0.843140.00002
2.07730.0002
38.5340.005
Slag0.84444
0.000022.0802
0.000138.609
0.007
87_0762,0Nv
QI-a/3
B/2a
Ceram
ic0.85214
0.000032.0888
0.000138.342
0.010
Slag0.86675
0.000012.1121
0.000138.149
0.005
83_0542b,01Q
I-e/1B
/2aC
eramic
0.838480.00004
2.07180.0002
38.6910.009
Slag0.84077
0.000052.0760
0.000238.695
0.004
87_0942g,03Q
I-a/3B
/3C
eramic
0.840510.00005
2.07280.0003
38.6100.005
Slag0.85859
0.000012.1002
0.000138.249
0.001
83_1149bQ
I-d/02.03
B/3
Ceram
ic0.85551
0.000022.0939
0.000138.291
0.007
Slag0.83785
0.000012.0747
0.000138.799
0.009
87_0634c,04Q
I-b/5
B/3b
Ceram
ic0.83106
0.000022.0550
0.000238.735
0.006
Slag0.83015
0.000052.0590
0.000238.907
0.010
98_0387,03Q
IV-j/28
Bb
?C
eramic
0.848790.00001
2.08440.0001
38.4180.003
Slag0.85282
0.000022.0904
0.000138.290
0.008
97_0631E,01
QIV
-S-Schn
Bc
Ceram
ic0.85893
0.000082.1005
0.000138.273
0.010
Slag0.86296
0.000032.1068
0.000338.213
0.006
97_0631E,04
QIV
-S-Schn
Bc
Ceram
ic0.86343
0.000032.1070
0.000138.185
0.008
Slag0.86430
0.000032.1086
0.000138.195
0.005
97_0690,02-Q
IV-S-Sch
nB
c/2C
eramic
0.861570.00004
2.10400.0002
38.2150.004
Slag0.85835
0.000012.0991
0.000138.223
0.002
87_0726,68-78bQ
I-a/3.4B
/2aSlag
0.849610.00003
2.08700.0001
38.4010.007
Table
F.5:Cru
cible
samp
lesw
ithco
ntextan
dlead
isoto
pe
ratios

Frederik Rademakers Appendix F 591
Figure F.1: NAA data: As vs Au content and Sn vs Au content
Figure F.2: NAA data: Au vs Ag content and As vs Ag content
Figure F.3: XRF and NAA data: As vs Ni content
Figure F.4: XRF and NAA data: As vs Sb content

592 Appendix F Frederik Rademakers
Figure F.5: XRF and NAA data: Co vs As content
Figure F.6: XRF and NAA data: Co vs Ni content
Figure F.7: XRF and NAA data: Fe vs Zn content
Figure F.8: XRF and NAA data: Ni vs Sb content

Frederik Rademakers Appendix F 593
Figure F.9: XRF data: Pb vs Sb content and Pb vs Sn content
Figure F.10: XRF data: Pb vs As content and Pb vs Ni content

594 Appendix F Frederik Rademakers

APPENDIX G
Volume Calculations
Section G.1
Crucible dimensions
The crucible dimensions are given in Table G.1:
Exterior
Length ±19.8 cm
Width ±13.5 cm
Height ±10.4 cm
Bottom diameter missing
Interior
Length ±18.3 cm
Width ±10.5 cm
Heigth ±7.0 cm
Spout-width missing
Wall thicknesses
Rim ±1.5 cm
Bottom ±3.5 cm
Table G.1: Crucible dimensions (after Pusch, 1994, Table 4, p. 152)
Assuming that the crucible is approximately half an ellipsoid1, the inner crucible volume
can be calculated as
1An elliptical model better approximates the irregular ceramic geometry than a circular model (see Ro-
driguez and Hastorf, 2013).
595

596 Appendix G Frederik Rademakers
Vi nner = 4
3πabc/2
with a, b and c the dimensions (two diameters and height) of the ellipsoid.
For the inner volume, this calculation adds up to Vi nner = 352cm3 or 352 ml.
This is quite similar to what is published by Pusch (1994), shown in Table G.2:
Volume
Bottom/rim ±380 ccm
Bottom/spout ±250 ccm
Bottom/spout-0.5cm ±204 ccm
Bottom/spout-1 cm ±158 ccm
Copper weight
Bottom/rim ±3404.8 g
Bottom/spout ±2240.0 g
Bottom/spout-0.5cm ±1827.8 g
Bottom/spout-1 cm ±1415.7 g
Table G.2: Crucible capacity (after Pusch, 1994, Table 5, p. 160)
In his calculations (unpublished), Pusch approached the crucibles as a combination of a
hemisphere and half of a cone:
Vhemi spher e =4
3πr 3/2 = 4
3π4.83/2 = 232cm3
and
Vsemi cone =πr 2 h
3/2 =π3.62 8
3/2 = 16cm3
This sums up to V = 250cm3. A remaining ‘unused’ volume of 158cm3 was then calcu-
lated. Added together, this makes ±380cm3.
Both calculation methods presented here are approximations. For the sake of conve-
nience, the ellipsoid shape is used for further calculations. As these calculations are aimed
at providing a relative assessment of slag volume (and content) to inner crucible volume,
the absolute size is less important here.

Frederik Rademakers Appendix G 597
Section G.2
Approximating cobalt content in copper charge
Based on the cobalt content in the crucible slag, the cobalt content in the copper charge
can be approximated, as developed here.
The slag volume (as part of the crucible) can be calculated by assuming a certain thickness
of slag layer ‘t’ (equal thickness over entire crucible wall assumed as approximation):
Vsl ag = 4
3π/2((a + t )(b + t )(c + t )−abc)
The slag mass, therefore, is:
msl ag = ρsl ag Vsl ag = ρsl ag (2
3π((a + t )(b + t )(c + t )−abc)
The mass of cobalt oxide in the slag is a fraction of this:
mCo−oxi de = (w t%CoO)msl ag = (w t%CoO)ρsl ag (2
3π((a + t )(b + t )(c + t )−abc)
The mass of copper charged into the crucible is2:
mcopper = (w t%Cu − i n −br onze)mbr onze = (w t%Cu − i n −br onze)Vi nnerρbr onze
= (w t%Cu − i n −br onze)(2
3πabc)ρbr onze
Assuming that the cobalt oxide in the slag derives from the mass of copper charged into
the crucible, and no cobalt remains in this copper charge, the original content of cobalt
oxide in copper can be approximated as:
CoO − contentor i g i nal =mCo−oxi de
mcopper
CoO − contentor i g i nal =(w t%CoO)ρsl ag ( 2
3π((a + t )(b + t )(c + t )−abc))
(w t%Cu − i n −br onze)( 23πabc)ρbr onze
Assuming:
2The density of bronze depends on the tin content (wt%Sn-in-bronze and wt%Cu-in-bronze). As
ρcopper = 8.96 g/cm3 and ρt i n = 7.298 g/cm3, the density of bronze is usually around 8.5 to 8.9 g/cm3. For a
10 wt% tin-bronze, ρbr onze = 8.7641 g/cm3.

598 Appendix G Frederik Rademakers
• CoO content in slag is 3 wt%
• Cu in bronze content is 90 wt% (i.e., a 10 wt% tin-bronze)
• ρbr onze = 8.76 g/cm3
• ρsl ag = 3 g/cm3 (unknown, but should be similar value; see VDEh, 1995)
• a, b and c are (half of) the interior measures from Table G.1.
• t is 0.5 cm
Then the cobalt oxide content originally present in the copper charge is 0.0037 or 0.37
wt%. If this cobalt is present as a metal phase, it would make up 0.29 wt% of the copper
charge3.
Though a number of assumptions and approximations (e.g., crucible shape, slag density
and slag layer thickness) are made for this calculation, the result gives an idea of the or-
der of magnitude of the cobalt content in the copper charge: less than 0.5 wt% Co in the
copper charge can produce about 3 wt% CoO in the crucible slag. Obviously, the cobalt
content in the copper could be higher without leading to stronger enrichment, as long as
it was not completely oxidised out. This is a realistic scenario.
A similar conclusion can be made for the slag enrichment in FeO, SnO2, ZnO and PbO: as
the volume of the crucible charge greatly exceeds that of the crucible slag, enrichments of
a few wt% (bulk composition) of the slag, do not necessarily represent high metal losses
from the charge.
3Atomic mass of Co: 58.9332 amu. Atomic mass of O: 15.9994 amu. Wt% Co in CoO: 58.933258.9332+15.9994 = 78.65
wt%

Gordion Appendices
599

600 Frederik Rademakers

APPENDIX H
Notes on Late Phrygian foundry
All the available information on the Late Phrygian foundry, excavated by Young in 1953,
was collected by Alison Fields. Her unpublished report is reproduced in full below.
Trench NCT-A3
• Gordion Notebook 39, p. 113-135
• Gordion Notebook 38, p. 125 (possible north extension)
• Gordion Notebook 53, p. 59 (final reference; removal of the west wall of the foundry 2
seasons later on June 12-13, 1955, before excavation of Painted House)
In Notebook 39:
Floor 6 = Floor of foundry
Layer 6/Fill over Floor 6 = Foundry destruction fill
The so-called foundry comprised of two or three rooms on a N-S axis. The southernmost
room and the room north of that (which was either the northernmost room or the central
room) were excavated in 1953 in Trench NCT-A3; a different excavator digging a dike (NCT-
A2-3 dike) just north of these rooms identified a line of three regularly cut stones claiming
that it might represent a third room of the foundry to the north (NB 38, p. 125).
The foundry was situated just over the line of the west wall of Building C and thus directly
over the Painted House. (The floor of the foundry was ca. 30 cm above the destruction
fill of the PH.) The walls of the foundry were constructed of reused stones from Building C
that had been turned on end in order to maximize the surface of the stones, creating a sort
601

602 Appendix H Frederik Rademakers
of orthostate course (see photographs; Figure H.1). Rubble was added in the construction
above and between these larger stones. The walls were preserved only to a height of about 60
cm. so it is possible that the remaining superstructure was composed of mudbrick. The west
wall was the best preserved; only one block was preserved of the south wall; the east wall
was mostly robbed out; the northernmost wall is not mentioned (unless you count the three
stones from NB 38, p. 125 as the northernmost extent). The interior crosswall is referred to
as ‘Wall F’ and was given measurements: 465 cm long, 110 cm wide).
Two features are mentioned in the notebooks: one is a stone-lined pit abutting the inter-
nal crosswall (‘Wall F’) and the west wall. The pit was “filled with pure black burnt sandy
substance and pieces of slag iron clunkers, etc...” The second (possible) feature might be
represented by a line a stones running E-W and abutting the east wall in the southernmost
room. Both of these features can be seen in the sketch in Notebook 39, p. 122 and on the
architect’s plan I attached to the email (Figure H.2). On the architect’s plan, the foundry is
the structure at the top of the scan. The two rooms mentioned above are easily identifiable;
the possible northernmost extension is represented by the small line of three stones to the
north (that is, ‘notebook north’ - or northeast on the architect’s plan).
The building has been identified as a foundry based on the contents of the fill overlying the
floor of the building (‘Floor 6’) and the contents of the pit mentioned above. The excavator
notes that it was “covered with burning and slag, pieces of crucibles, arrowheads, bronze,
and iron garments” (NB 39, p. 121). Several pits were cut into the floor (locations shown on
architect’s plan), c. 50 cm in diameter and 40-50 cm deep; all were “filled with some sort
of burnt earth, slag, etc, as covered the floor.” The northern (or central) room might have
had two phases, because the excavator notes that under the floor was a fill c. 10-15 cm thick
of heavily burnt earth and ash and a second floor which might be reused from Building C
(similar yellow color, NB 39, p. 133).
The dating is not as clear-cut as we would like. I have gone through all of the context pot-
tery I was able to identify in the fill above the floor of the foundry and the fill between the
foundry and the Painted House, and I have come to the conclusion that the foundry must
have been built at some point at the end of the 5th or early 4th century B.C.E. and was put
out of use before the Hellenistic period, perhaps in the first half of the 4th century... so it had
a relatively short life. There are no sherds from the fill over the floor dating to the 3rd century,
so the argument is one in absentia. In NCT-A3 Bag 1B, which contained fill directly over the
floor, there was an Attic bolsal (c. 400), a 5th century Attic askos, and some Achaemenid
bowls; bag 1A contained an Attic salt cellar and an oinochoe from the 5th century. Unfor-
tunately the fill between the Painted House and the foundry is inconclusive, as no imported

Frederik Rademakers Appendix H 603
Figure H.1: View of foundry wall from south-east
pottery has been found here and the local Late Phrygian wares cannot be stylistically dated
with any precision. The late Keith DeVries made a note on the context card that the fill is
no later than the early 4th century, so it seems that the construction and life span of the
foundry was some time around the turn of the 5th-4th centuries, being put out of use before
the Hellenistic period, sometime in the mid-4th.
Different descriptions of fill/small finds:
p. 116: Immediately over it:
grey bowl (polish)
4 3-flanged arrowheads (2917 B521)
1 1-flanged arrowhead
triangular strip of bronze 11 cm long
glass frag (blue and white) 2919 G158
p. 120: Fill over floor 6
buff and greyware bowls
black glazed bowl base & rim frag, dated by GRE to 400
smaller bag of fill between floor 4 & 6 - greyware cooking pot ware, Lydion base, buff bowls
with orange stripes

604 Appendix H Frederik Rademakers
Figure H.2: Architect’s plan of foundry area

APPENDIX I
Sample list and overview of excavated contexts
The contexts from which crucibles were excavated are summarised in Table I.1. The dif-
ferent ‘operations’ are shown in Figure 7.3. Within this, ‘phases’ denote the time period
(Late Phrygian) and different ‘loci’ and ‘lots’ have been defined during excavation to iden-
tify different layers and material assemblages. This list offers more detailed information
for the various (dump) contexts:
A: Deep round, bell-shaped pit in northeast quadrant of trench. Partially cut away by
test Loc 61, cuts pit Loc 68. Lot cleared bottom of pit. Hunks of burned dung(?), very
loose fill.
B: Removal of wall locus 20. At bottom of foundation trench. Went through bottom,
crucible from this new (Late Phrygian) deposit (cf NB II:46), in which several pit tops
were visible.
C: Surface along north balk, beneath Loc 77 lot 155; within ‘Landfill’. Light grayish-
brown silt, compacted but much trash, charcoal, pebbles. Traces of phytoliths. ‘No-
table’ amount of sand, especially to east.
D: Complex of pits associated with lion sculpture; this lot from beneath stones, cut
away horizontal strata which are probably matrix–surfaces associated with Wall Lo-
cus 76/1989 17.
E: Ash lense at top of Loc 77, L Phrygian land fill. Along north balk, c. 1 m in diameter.
Full of charcoal bits, may have had clay edge on one side (indicated by section).
605

606 Appendix I Frederik Rademakers
Sample Phase Operation Locus Lot Context type Context description
Gordion 21299 - 15.10.2013 410.04 1 65 130 Pit A
Gordion 22529 - 13.9.2013 400 2 33 141 Mixed in excavation B
Gordion 22626 - 15.10.2013 420 1 82 162 Exterior surface C
Gordion 22673 - 15.1.2014 420 1 82 162 Exterior surface C
Gordion 22673-A - 15.10.2013 420 1 82 162 Exterior surface C
Gordion 22673-B - 15.10.2013 420 1 82 162 Exterior surface C
Gordion 22829 - 15.10.2013 0 2 51 149 Pit D
Gordion 22958 - 9.4.2013 420 1 75 149 Ash lense E
Gordion 22999 - 13.9.2013 420 1 100 213 Pit F
Gordion 23045-A - 15.10.2013 1 82 188 ? ?
Gordion 23045-B - 15.10.2013 1 82 188 ? ?
Gordion 23045-S - 15.10.2013 1 82 188 ? ?
Gordion 23128 - 13.9.2013 0 2 66 157 Trash G
Gordion 23329 - 9.4.2013 420 2 73 177 Lensed trash H
Gordion 23329 - 15.1.2014 420 2 73 177 Lensed trash H
Gordion 23523 - 15.10.2013 460 1 98 237 Robber trench I
Gordion 23707 - 9.4.2013 430.04 1 100 214 Pit F
Gordion 23707 - 15.1.2014 430.04 1 100 214 Pit F
Gordion 23778 - 13.9.2013 460 1 98 237 Robber trench I
Gordion 23797 - 9.4.2013 460 1 98 228 Robber trench J
Gordion 25368 - 13.9.2013 0 2 12 17 Balk trimming K
Gordion 25394 - 9.4.2013 400 2 19 57 Mixed in excavation L
Gordion 25394_A - 13.9.2013 400 2 19 57 Mixed in excavation L
Gordion 25394_B - 13.9.2013 400 2 19 57 Mixed in excavation L
Gordion 25568 - 9.4.2013 410 2 11 16 Trash on surface M
Gordion 25568 - 15.1.2014 410 2 11 16 Trash on surface M
Gordion 25569-A - 15.10.2013 0 2 12 17 Balk trimming K
Gordion 25569-B - 15.10.2013 0 2 12 17 Balk trimming K
Gordion 26891 - 9.4.2013 435 2 6 118 Exterior surfaces N
Gordion 27609 - 15.10.2013 470 1 25 76 Exterior surface O
Gordion 27609-S - 15.10.2013 470 1 25 76 Exterior surface O
Gordion 27613-A - 13.9.2013 470.02 1 26 80 Pit P
Gordion 27613-B - 13.9.2013 470.02 1 26 80 Pit P
Gordion 27629 - 15.10.2013 435 2 6 118 Exterior surfaces N
Gordion 27634 - 12.11.2013 430.08 1 19 64 Pit Q
Gordion 27635 (1) - 12.11.2013 430.07 1 18 63 Pit R
Gordion 27635 (2) - 12.11.2013 430.07 1 18 63 Pit R
Gordion 27636 - 9.4.2013 430 1 18 61 Pits mixed in excavation S
Gordion 27638 - 12.11.2013 400 2 6 123 Mixed in excavation T
Gordion 27640 - 12.11.2013 400 2 6 123 Mixed in excavation T
Gordion 27734 (1) - 12.11.2013 400 2 19 154 Mixed in excavation U
Gordion 28218 - 12.11.2013 440.03 1 32 96 Pit V
Gordion 28236 - 9.04.2013 440.01 1 34 111 Floor deposit W
Gordion 28877 - 9.04.2013 400 7 32 123 ? X
Gordion 28932 (1) - 12.11.2013 420.01 1 51 129 Pit Y
Gordion 28932 (2) - 12.11.2013 420.01 1 51 129 Pit Y
Table I.1: Overview of samples and their respective excavation contexts

Frederik Rademakers Appendix I 607
F: Pit, completed in 1989 as Op 1 Loc 7; initially dug in 1988 as part of Loc 99. Could
be a double pit, but different fill. Lot 213 contained ashy bones, loose silt, charcoal,
some pebbles. Lumps of mud brick as well as sherds and bones noted. Cuts into
robber trench for Building I.
G: ‘Landfill’ to northwest of foundation trench locus 20/33, south of lion pit complex.
Can’t be linked to any section, but cut by pit Locus 65. CK sherds for date.
H: Stripping landfill, southeast quadrant. May include pit tops, but close in date to
matrix.
I: Large amorphous trashy area within ‘patio’. Large quantity of sherds found in this
lot which exposed an oval paved area. Change of texture in area, could have been
pit or just variation within dump. Area beneath uppermost clay surfaces, cut away
more such surfaces preserved in southeast corner of trench. May be associated with
pyrotechnic feature in this area.
J: Dark brown soil, white flecked, next to east balk, just north of patio. Continued in
1989 revealing a pit, Loc 11.2 lot 34 which turned into Loc 12 lot 35. Whole area
churned up, this lot probably from pit cut into early robber trench for EW wall of
Building I.
K: Trimming east balk, western face. Most of deposit is trash immediately beneath AV.
L: Material on surface associated with cut stone block wall locus 17; between wall and
south balk; pit in corner shows up in section. Soft with large pieces of pottery and
bone.
M: Trench to east of Wall 17. Dry ashy soil resting on hard yellow surface associated
with cut stone wall 17. Metallurgical debris on this yellow surface, [Locus 16].
N: Soft brown soil running along south balk, up against cut stone wall fragment [Locus
17] in southwestern corner of trench. Abundant evidence of metal working includ-
ing crucible(s), slag, bellows piece or tuyère.
O: Isolated block of material in northern part of operation, left after clearance of pits.
Top at same height as remains of cellar wall [Op 1 loc 11]. Brown chunky, presumably
‘landfill’ above clay?
P: Small oval pit cut in western part of trench to north of Building I:2 extended E-W
wall with cobble fill, capped by yellow clay. Pit is dark brown, filled with charcoal.

608 Appendix I Frederik Rademakers
Q: Large pit near north balk, northeast quadrant. Cut in turn by pit Locus 21. Earlier
than 21. At northern end of trench. Soft brown-gray trashy matrix, little charcoal.
Discovered at level of cellar top, should be similar in date to Latrine Pit Locus 47.
R: Eastern and deeper pit of 2?(initially mixed in lot 61). Bottoms out on hard clay,
‘dance-floor’. Cut from surface of units excavated as Locus 20.1. Capped by 1988
Locus 82, landfill. Along north balk. Lot is from clayey deposit.
S: Two inter-cut pits at northern end of trench, extending into balk. Soft brown matrix,
little charcoal or lime. Beneath 1988 Locus 81, above dancefloor surface. Cut from
top of Locus 20.1. Lot is from top of pit, soft and ashy.
T: Trash above robbed out wall of Cellar, approximately at level of Wall locus 17. Ar-
rowhead and crucible. Mixture of robber pit, latrine pit, and cellar trash.
U: Surface associated with cut stone wall, locus 17, to south of wall; pit in southwest
corner not separately cleared, could also go beneath surface associated with wall
locus 17 (435).
V: Pit cut along southern edge of ‘patio’. Should have been sealed by upper clay surfaces
exposed in 1988. Cut into ‘tile fall’ layer [locus 34] lying on second paving [locus 71]
in this area.
W: Deposit with tile and burning immediately above lower stone paving in ‘patio’ area,
last well-preserved surface in this area, floor drained by tile drain in ‘courtyard’ of
Building I.
X: Notes contradictory. Could be Late Phrygian or foundation levelling mud for north
wall Op 2 structure Op 2/7 balk. RCH says Late Phrygian based on pottery.
Y: Large quantities of industrial waste in lower levels of pit, domestic trash above. Same
context as 1988 Op 1 Loc 91 [capped by 88 Locus 71]. Cuts pit locus 2.1 1989 [1988
locus 93]. MSR considers pit contemporary with 1989 pits excavated at Loci 23, 30,
7.

APPENDIX J
Bulk Compositions
In this appendix, the bulk composition of both the crucible ceramic and the crucible slag
are given in the first two tables. The final three tables show the ratios of elements to Al2O3,
for ceramic, slag and the change between them respectively.
Average ceramic composition. All results in wt%, normalised to 100%.Sample Na2O MgO Al2O3 SiO2 P2O5 K2O CaO TiO2 MnO FeO CuO As2O3 SnO2 PbO
Gordion 21299 - 15.10.2013 3.2 3.5 18 50 0.6 1.8 10.7 1.7 0 10.7 0.1 0.2 0.1 0
Std. dev. (5 ms) 0.1 0.1 0 1 0.1 0.2 0.3 0.1 0.1 0.3 0.1 0.3 0.2 0.3
Min. 3.1 3.4 17 48 0.4 1.6 10.3 1.6 0 10.4 0 0 0 0
Max. 3.4 3.6 18 50 0.7 2.1 11.1 1.9 0.1 11.1 0.2 0.7 0.4 0.4
Gordion 22529 - 13.9.2013 2.8 3.6 17 50 0.6 2.1 9.2 1.5 0.2 12.4 0 0.1 0.4 0.2
Std. dev. (5 ms) 0.2 0.3 1 4 0.2 0.3 1.3 0.3 0.2 6.3 0.2 0.3 0.2 0.1
Min. 2.6 3.1 16 43 0.3 1.6 7.2 1.2 0 8.9 0 0 0.1 0.1
Max. 3.2 3.9 18 52 0.9 2.4 10.7 2.0 0.4 23.6 0.2 0.7 0.6 0.3
Gordion 22626 - 15.10.2013 3.4 3.5 18 52 0.4 1.8 9.1 2.0 0.2 9.0 0 0.1 0.3
Std. dev. (5 ms) 0.5 0.5 1 0 0.1 0.3 0.6 0.6 0.1 1.2 0.1 0.2 0.4
Min. 2.7 2.7 17 51 0.2 1.5 8.3 1.2 0.1 7.4 0 0 0
Max. 3.9 3.9 20 52 0.6 2.2 9.8 2.6 0.3 10.4 0.2 0.4 0.8
Gordion 22673 - 15.1.2014 3.3 3.3 19 52 0.6 1.6 9.2 1.7 0.1 8.6 0.1 0.2 0.4 0.2
Std. dev. (5 ms) 0.2 0.4 1 1 0.1 0.1 0.6 0.4 0.1 0.7 0.2 0.2 0.3 0.2
Min. 3.1 2.8 18 51 0.4 1.4 8.2 1.2 0 7.9 0 0 0.1 0
Max. 3.7 3.9 20 53 0.7 1.8 10.0 2.1 0.3 9.5 0.5 0.4 0.8 0.4
Gordion 22673-A - 15.10.2013 3.0 3.4 19 51 0.6 2.0 10.4 1.6 0.3 8.6 0.1 0.1 0.4
Std. dev. (5 ms) 0.4 0.5 1 1 0.3 0.3 0.8 0.5 0.1 1.4 0.1 0.3 0.5
Min. 2.6 2.8 18 50 0.2 1.7 9.3 0.8 0.1 6.8 0 0 0
Max. 3.5 3.9 21 52 1.0 2.4 11.1 2.1 0.4 10.5 0.1 0.5 1.0
Gordion 22673-B - 15.10.2013 3.2 3.3 18 52 0.6 1.8 8.6 1.8 0.1 9.1 0 0.1 0.4 0.2
Std. dev. (5 ms) 0.3 0.4 1 2 0.2 0.2 0.6 0.4 0.2 1.0 0.1 0.1 0.3 0.3
Min. 3.0 2.9 17 50 0.3 1.6 7.8 1.5 0 8.0 0 0 0 0
Max. 3.7 3.8 19 56 0.8 2.1 9.5 2.3 0.4 10.3 0 0.2 0.8 0.6
Gordion 22829 - 15.10.2013 2.8 3.6 18 52 0.5 2.0 9.8 1.5 0.2 8.8 0 0.2 0.6
Std. dev. (5 ms) 0.3 0.2 1 2 0.1 0.2 0.5 0.2 0.2 0.7 0.1 0.4 0.4
Min. 2.5 3.3 17 50 0.4 1.7 9.2 1.3 0 8.0 0 0 0.1
Max. 3.1 4.0 18 56 0.7 2.2 10.3 1.6 0.3 9.9 0.2 0.9 1.1
Gordion 22958 - 9.04.2013 2.8 4.1 18 49 0.5 1.5 13.5 1.5 0.2 8.2 0.1 0.3 0.3
Std. dev. (5 ms) 0.5 0.4 1 2 0.2 0.2 1.8 0.2 0.1 0.9 0.2 0.2 0.3
Min. 2.3 3.6 17 46 0.2 1.3 12.2 1.4 0.1 7.2 0 0.1 0
Max. 3.4 4.5 19 51 0.6 1.8 16.3 1.7 0.4 9.1 0.3 0.6 0.7
Gordion 22999 - 13.9.2013 3.1 3.5 18 51 0.5 1.8 10.1 2.0 0.2 8.8 0 0.3 0.3 0.2
Std. dev. (5 ms) 0.3 0.2 1 1 0.2 0.1 0.6 0.5 0.1 1.5 0.3 0.4 0.4 0.2
609

610 Appendix J Frederik Rademakers
Average ceramic composition. All results in wt%, normalised to 100%.Sample Na2O MgO Al2O3 SiO2 P2O5 K2O CaO TiO2 MnO FeO CuO As2O3 SnO2 PbO
Min. 2.7 3.3 17 50 0.3 1.6 9.1 1.5 0 7.6 0 0 0 0
Max. 3.6 3.8 19 53 0.9 2.0 10.7 2.8 0.3 11.2 0.2 0.7 0.7 0.3
Gordion 23045-A - 15.10.2013 2.8 3.9 18 51 0.4 1.8 12.0 1.6 0.1 8.1 0 0 0.3
Std. dev. (5 ms) 0.2 0.3 0 0 0.1 0.4 0.8 0.2 0.1 0.5 0.1 0.2 0.4
Min. 2.7 3.3 16 49 0.2 1.8 10.2 1.6 0 7.1 0 0 0
Max. 3.6 4.8 18 51 0.7 2.6 12.5 2.3 0.4 9.3 0.2 0.5 0.8
Gordion 23045-B - 15.10.2013 3.0 3.7 17 50 0.6 1.8 11.6 1.6 0.2 9.4 0 0.3 0.3
Std. dev. (5 ms) 0.5 0.5 0 1 0.2 0.2 1.0 0.2 0.1 1.5 0.2 0.1 0.3
Min. 2.7 2.8 17 49 0.4 1.5 10.5 1.5 0.1 7.9 0 0.1 0
Max. 3.9 4.2 18 51 0.8 2.0 13.1 1.9 0.3 11.8 0.2 0.4 0.6
Gordion 23045-S - 15.10.2013
(0 ms)
Gordion 23128 - 13.9.2013
(0 ms)
Gordion 23329 - 9.4.2013 3.3 3.4 18 51 0.5 1.9 8.8 1.7 0.2 9.7 0.1 0.4 0.4 0.1
Std. dev. (5 ms) 0.3 0.5 1 1 0.1 0.2 0.6 0.1 0.1 1.1 0.1 0.2 0.3 0.1
Min. 2.9 2.6 17 51 0.4 1.7 7.9 1.6 0.1 8.8 0 0.2 0.2 0
Max. 3.6 4.0 20 52 0.7 2.3 9.5 1.9 0.3 11.5 0.3 0.7 0.9 0.2
Gordion 23329 - 15.1.2014 3.0 3.7 18 51 0.6 2.1 9.6 1.5 0.1 10.0 0.1 0 0.3 0.1
Std. dev. (5 ms) 0.3 0.2 1 2 0.2 0.2 0.5 0.2 0.1 1.8 0.1 0.3 0.2 0.2
Min. 2.7 3.5 17 49 0.4 1.7 9.0 1.3 0 8.2 0 0 0 0
Max. 3.3 3.9 19 53 0.8 2.2 10.2 1.8 0.2 12.9 0.3 0.3 0.4 0.4
Gordion 23523 - 15.10.2013 3.1 3.8 18 51 0.4 2.0 9.7 1.5 0.1 9.8 0 0.3 0.3
Std. dev. (5 ms) 0.2 0.2 1 1 0.2 0.3 0.8 0.2 0.1 0.7 0.1 0.2 0.4
Min. 2.8 3.5 17 50 0.2 1.7 9.1 1.3 0 8.6 0 0.1 0
Max. 3.4 4.2 19 52 0.6 2.4 11.0 1.6 0.2 10.4 0 0.5 1.0
Gordion 23707 - 9.4.2013 2.7 3.1 13 59 0.3 3.8 11.9 0.6 0.1 4.2 0.1 0.1 0.6
Std. dev. (5 ms) 0.4 0.6 1 3 0.3 0.4 2.3 0.1 0.1 0.9 0.2 0.3 0.2
Min. 2.4 2.1 12 57 0 3.3 8.1 0.3 0 3.2 0 0 0.3
Max. 3.2 3.8 14 65 0.7 4.4 14.1 0.7 0.3 5.5 0.3 0.4 0.8
Gordion 23707 - 15.1.2014 2.7 2.9 12 62 0.2 3.5 11.7 0.6 0.1 3.9 0 0.1 0.4
Std. dev. (5 ms) 0.3 0.6 1 2 0 0.7 1.7 0.3 0.1 0.3 0.2 0.3 0.2
Min. 2.4 2.3 12 59 0.2 2.5 9.5 0.4 0 3.5 0 0 0.1
Max. 3.2 3.7 14 64 0.3 4.2 13.8 1.0 0.3 4.3 0.2 0.5 0.6
Gordion 23778 - 13.9.2013 3.0 3.7 17 51 0.6 2.1 9.2 1.5 0.1 9.9 0.1 0.2 0.5 0.3
Std. dev. (5 ms) 0.2 0.3 1 2 0.3 0.1 0.4 0.2 0.1 2.0 0.2 0.3 0.1 0.2
Min. 2.8 3.3 16 49 0.3 2.0 9.0 1.3 0 8.8 0 0 0.3 0.1
Max. 3.2 4.0 18 54 1.1 2.2 10.0 1.7 0.3 13.5 0.5 0.7 0.7 0.4
Gordion 23797 - 9.4.2013 3.0 3.8 17 51 0.8 1.9 10.7 1.3 0 9.8 0.1 0.3 0.3 0.2
Std. dev. (5 ms) 0.3 0.7 1 2 0.2 0.4 1.7 0.2 0.1 4.0 0.2 0.4 0.3 0.2
Min. 2.6 2.7 16 47 0.5 1.5 8.4 1.0 0 7.2 0 0 0 0
Max. 3.4 4.6 19 52 1.0 2.6 13.0 1.7 0.2 16.8 0.3 0.9 0.6 0.4
Gordion 25368 - 13.9.2013 2.6 4.0 18 49 0.4 2.1 10.8 1.3 0.2 10.8 0.1 0.2 0.4 0.1
Std. dev. (5 ms) 0.4 0.1 1 2 0.1 0.2 0.6 0.3 0.1 3.4 0.1 0.1 0.1 0.1
Min. 2.2 3.9 16 46 0.4 1.9 9.8 0.9 0 9.0 0 0.2 0.2 0
Max. 3.0 4.1 18 50 0.6 2.3 11.3 1.6 0.4 16.8 0.2 0.3 0.5 0.3
Gordion 25394 - 9.4.2013 2.8 4.1 18 49 0.4 2.2 11.6 1.6 0 8.6 0.1 0.1 0.5 0.2
Std. dev. (5 ms) 0.4 0.5 1 1 0.2 0.2 0.6 0.1 0.1 1.3 0.1 0.3 0.2 0.1
Min. 2.3 3.3 17 49 0.3 2.0 11.0 1.5 0 6.7 0 0 0.2 0.1
Max. 3.2 4.5 20 50 0.7 2.6 12.4 1.7 0.2 10.3 0.3 0.5 0.8 0.3
Gordion 25394_A - 13.9.2013 2.4 4.6 17 50 0.6 2.1 10.9 1.4 0.1 9.3 0 0.2 0.6
Std. dev. (5 ms) 0.2 0.3 0 1 0.3 0.3 0.8 0.4 0.1 0.6 0.3 0.3 0.2
Min. 2.0 4.3 17 50 0.3 1.7 10.1 1.0 0 8.7 0 0 0.3
Max. 2.7 4.9 18 51 1.0 2.5 12.2 2.0 0.2 10.1 0.5 0.7 0.8
Gordion 25394_B - 13.9.2013 2.8 4.0 18 50 0.6 2.0 10.8 1.5 0.1 9.2 0 0.4 0.4
Std. dev. (5 ms) 0.3 0.3 1 1 0.3 0.3 0.7 0.2 0.1 1.0 0.1 0.3 0.2
Min. 2.3 3.6 17 49 0.1 1.6 10.0 1.3 0 8.1 0 0 0.1
Max. 3.1 4.4 19 51 0.9 2.6 11.7 1.8 0.2 10.4 0.1 0.7 0.6
Gordion 25568 - 9.4.2013 3.4 3.8 19 51 0.3 1.4 10.5 1.5 0.1 8.6 0 0.2 0.4 0.3
Std. dev. (5 ms) 0.6 0.4 1 1 0.2 0.2 0.5 0.1 0.1 0.9 0.1 0.3 0.2 0.1
Min. 2.7 3.1 18 50 0 1.1 9.8 1.4 0.1 7.1 0 0 0.2 0.1
Max. 4.1 4.2 21 51 0.6 1.7 11.3 1.6 0.2 9.3 0.2 0.6 0.7 0.4
Gordion 25568 - 15.1.2014 2.8 4.2 18 51 0.4 1.4 11.4 1.5 0.1 8.7 0.1 0.4 0.1
Std. dev. (5 ms) 0.3 0.5 0 1 0.2 0.2 0.5 0.3 0 0.5 0.3 0.3 0.3
Min. 2.6 3.7 17 50 0.2 1.2 11.0 1.2 0.1 8.0 0 0 0
Max. 3.2 4.9 18 52 0.6 1.6 11.9 1.9 0.2 9.2 0.6 0.8 0.4
Gordion 25569-A - 15.10.2013 2.8 4.2 18 50 0.4 1.4 11.9 1.6 0.1 9.4 0.1 0.3 0.3 0.1
Std. dev. (5 ms) 0.4 0.4 1 1 0.1 0.1 0.7 0.3 0.1 1.2 0.1 0.1 0.4 0.1
Min. 2.2 3.8 17 48 0.2 1.2 11.2 1.3 0 7.5 0 0.2 0 0

Frederik Rademakers Appendix J 611
Average ceramic composition. All results in wt%, normalised to 100%.Sample Na2O MgO Al2O3 SiO2 P2O5 K2O CaO TiO2 MnO FeO CuO As2O3 SnO2 PbO
Max. 3.2 4.7 19 51 0.6 1.5 12.8 1.9 0.2 10.7 0.2 0.5 0.9 0.2
Gordion 25569-B - 15.10.2013 2.7 4.2 18 50 0.4 1.8 11.3 1.7 0.1 9.1 0 0.1 0.2
Std. dev. (5 ms) 0.4 0.3 1 1 0.1 0.1 0.7 0.2 0.1 0.4 0.1 0.2 0.3
Min. 2.3 3.9 17 50 0.2 1.6 10.2 1.3 0 8.4 0 0 0
Max. 3.3 4.7 19 51 0.6 2.0 12.1 1.9 0.2 9.4 0.1 0.4 0.5
Gordion 26891 - 9.4.2013 3.2 3.5 18 52 0.5 1.7 8.8 1.8 0.1 9.8 0.2 0.1 0.4 0.2
Std. dev. (5 ms) 0.3 0.3 1 1 0.2 0.2 0.4 0.3 0.1 0.6 0.2 0.2 0.4 0.2
Min. 2.8 3.3 17 51 0.2 1.5 8.3 1.5 0 9.3 0 0 0 0
Max. 3.7 4.0 19 54 0.7 2.0 9.4 2.2 0.3 10.5 0.4 0.3 1.1 0.5
Gordion 27609 - 15.10.2013 2.8 3.8 18 51 0.6 1.9 11.6 1.4 0.1 8.3 0.1 0.2 0.2
Std. dev. (5 ms) 0.3 0.3 0 1 0.2 0.1 0.6 0.2 0.1 0.4 0.1 0.3 0.2
Min. 2.6 3.3 18 50 0.3 1.8 11.1 1.2 0 7.9 0 0 0
Max. 3.2 4.1 19 51 0.9 2.1 12.7 1.6 0.1 9.0 0.3 0.6 0.4
Gordion 27609-S - 15.10.2013
(0 ms)
Gordion 27613_A 13.9.2013 3.1 3.6 18 51 0.6 1.9 11.0 1.5 0.1 8.7 0 0.4 0.3
Std. dev. (5 ms) 0.6 0.2 1 1 0.2 0.1 1.3 0.4 0.2 0.8 0.2 0.3 0.3
Min. 2.5 3.4 17 50 0.4 1.8 9.4 1.2 0 7.8 0 0 0
Max. 4.0 3.8 19 52 0.9 2.0 12.9 2.1 0.2 9.7 0.2 0.8 0.7
Gordion 27613_B - 13.9.2013 3.3 3.6 18 51 0.5 1.8 9.9 1.6 0 8.3 0 0.4 0.4 0.2
Std. dev. (5 ms) 0.2 0.4 0 1 0.1 0.3 0.7 0.2 0.1 0.9 0.2 0.3 0.4 0.1
Min. 3.1 3.3 18 51 0.4 1.6 8.8 1.4 0 7.3 0 0 0 0.1
Max. 3.5 4.2 19 53 0.7 2.4 10.7 1.9 0.1 9.5 0.2 0.7 1 0.3
Gordion 27629 - 15.10.2013 3.4 3.5 18 50 1.0 1.9 10.8 1.6 0.1 9.3 0 0.2 0.3
Std. dev. (5 ms) 0.4 0.5 1 1 0.6 0.2 0.8 0.2 0.2 0.4 0.1 0.4 0.2
Min. 2.8 2.9 17 49 0.5 1.6 9.9 1.3 0 8.8 0 0 0.1
Max. 3.8 4.0 19 51 1.9 2.1 12.0 1.9 0.4 9.8 0 0.9 0.4
Gordion 27634 - 12.11.2013 2.5 4.9 17 51 0.5 2.4 11.9 1.5 0.1 7.7 0 0.2 0.6
Std. dev. (5 ms) 0.4 1.1 1 1 0.2 0.5 1.2 0.1 0.2 0.5 0.3 0.1 0.1
Min. 1.8 4.1 16 49 0.4 1.9 10.6 1.4 0 7.1 0 0 0.4
Max. 3.0 6.7 19 52 0.8 3.2 13.7 1.6 0.3 8.2 0.1 0.4 0.7
Gordion 27635 (1) - 12.11.2013 3.4 3.8 18 51 0.5 2.1 10.3 1.8 0.1 9.0 0.2 0.2 0.1
Std. dev. (5 ms) 0.3 0.4 0 1 0.3 0.2 0.3 0.4 0.2 0.5 0.2 0.3 0.4
Min. 3.0 3.5 18 49 0.2 1.9 9.9 1.3 0 8.3 0 0 0
Max. 3.7 4.2 19 52 0.8 2.3 10.8 2.5 0.3 9.6 0.3 0.5 0.6
Gordion 27635 (2) - 12.11.2013 3.3 3.4 19 50 0.7 1.5 10.1 1.4 0.2 9.6 0.4 0.2 0.3 0
Std. dev. (5 ms) 0.5 0.5 1 1 0.3 0.2 0.7 0.3 0.1 1.3 0.7 0.2 0.3 0.1
Min. 2.7 2.8 17 49 0.4 1.3 9.2 1.0 0.1 8.2 0 0 0 0
Max. 3.9 4.1 19 52 1.2 1.8 11.0 1.8 0.3 11.1 1.6 0.5 0.6 0
Gordion 27636 - 9.4.2013 3.1 3.7 18 51 0.6 2.0 9.7 1.6 0.1 9.1 0.1 0.2 0.4
Std. dev. (5 ms) 0.3 0.4 1 1 0.2 0.2 0.2 0.2 0.1 0.6 0.2 0.3 0.4
Min. 2.7 3.0 18 51 0.2 1.8 9.5 1.4 0 8.3 0 0 0
Max. 3.5 4.2 20 52 0.9 2.3 10.1 2.0 0.2 9.7 0.3 0.5 0.9
Gordion 27638 - 12.11.2013 3.3 3.7 18 51 0.6 2.3 9.9 1.7 0.1 8.7 0.1 0.2 0.2
Std. dev. (5 ms) 0.2 0.3 0 0 0.1 0.1 0.8 0.3 0.1 0.5 0.1 0 0.3
Min. 3.0 3.4 18 50 0.4 2.2 9.2 1.5 0.1 7.9 0 0.2 0
Max. 3.5 4.3 19 51 0.7 2.4 10.9 2.1 0.2 9.2 0.2 0.3 0.5
Gordion 27640 - 12.11.2013 2.9 3.7 18 50 0.5 2.1 10.1 1.7 0.2 10.2 0.2 0.2 0.6 0.2
Std. dev. (5 ms) 0.3 0.4 0 0 0.1 0.2 0.7 0.2 0.1 0.7 0.1 0.4 0.1 0.3
Min. 2.4 3.1 17 49 0.5 1.9 9.0 1.5 0.1 9.3 0 0 0.5 0
Max. 3.2 4.0 18 50 0.7 2.3 11.0 2.1 0.3 10.9 0.4 0.6 0.7 0.5
Gordion 27734 (1) - 12.11.2013 3.2 3.7 18 52 0.4 1.9 9.2 2.1 0.1 9.8 0 0.2 0.2
Std. dev. (5 ms) 0.2 0.5 1 2 0.2 0.3 0.5 1.2 0.1 1.3 0.2 0.1 0.3
Min. 3.0 2.9 17 49 0.3 1.7 8.7 1.3 0 8.4 0 0.1 0
Max. 3.4 4.2 19 54 0.6 2.3 10.0 4.1 0.2 11.0 0.2 0.3 0.6
Gordion 28218 - 12.11.2013 3.0 3.5 18 52 0.4 1.8 9.2 1.6 0.1 9.6 0.1 0.3 0.3
Std. dev. (5 ms) 0.4 0.4 1 2 0.1 0.1 0.7 0.2 0.1 1.4 0.1 0.1 0.1
Min. 2.6 3.1 18 50 0.2 1.6 8.5 1.4 0 8.1 0 0.2 0.1
Max. 3.5 4.0 19 54 0.6 1.9 10.4 1.8 0.2 11.3 0.2 0.4 0.5
Gordion 28236 - 9.4.2013 3.6 2.8 13 49 0.3 3.8 19.8 1.0 0 5.7 0 0.2 0.4
Std. dev. (5 ms) 0.7 0.3 1 2 0.2 0.2 3.4 0.1 0.1 1.3 0.3 0.2 0.2
Min. 2.5 2.5 11 46 0 3.6 15.6 0.8 0 4.1 0 0 0.2
Max. 4.2 3.1 14 51 0.5 4.1 25.0 1.1 0.2 7.3 0.2 0.5 0.7
Gordion 28877 - 9.4.2013 3.7 3.3 19 52 0.6 1.7 9.1 1.6 0 8.8 0.1 0.2 0.3
Std. dev. (5 ms) 0.2 0.6 1 0 0.1 0.2 0.3 0.3 0.1 1.0 0.2 0.2 0.3
Min. 3.4 2.8 18 51 0.4 1.5 8.7 1.1 0 8.0 0 0 0
Max. 4.0 4.1 20 52 0.7 2.0 9.5 1.9 0.2 10.0 0.5 0.5 0.8
Gordion 28932 (1) - 12.11.2013 3.2 3.8 18 50 0.7 2.5 10.9 1.4 0.1 9.2 0 0.2 0.4
Std. dev. (5 ms) 0.4 0.7 1 1 0.2 0.4 2.1 0.1 0.1 1.1 0.1 0.4 0.2

612 Appendix J Frederik Rademakers
Average ceramic composition. All results in wt%, normalised to 100%.Sample Na2O MgO Al2O3 SiO2 P2O5 K2O CaO TiO2 MnO FeO CuO As2O3 SnO2 PbO
Min. 2.6 2.8 17 49 0.5 2.1 7.5 1.2 0 8.3 0 0 0.1
Max. 3.7 4.4 18 51 1.0 3.0 12.6 1.6 0.2 11.1 0.2 0.9 0.7
Gordion 28932 (2) - 12.11.2013 3.1 4.3 17 49 0.6 2.6 11.2 1.6 0.1 8.9 0.1 0.1 0.6
Std. dev. (5 ms) 0.3 0.5 1 0 0.1 0.3 0.8 0.3 0.1 0.7 0.1 0.2 0.1
Min. 2.8 3.8 16 49 0.4 2.3 9.9 1.4 0 8.0 0.1 0 0.5
Max. 3.6 5.0 19 50 0.8 2.9 12.2 2.1 0.2 9.8 0.2 0.4 0.7
Average Ceramic Composition 3.0 3.8 18 51 0.5 1.9 10.4 1.6 0.1 9.2 0.1 0.2 0.4

Frederik Rademakers Appendix J 613
Average slag composition. All results in wt%, normalised to 100%.Sample Na2O MgO Al2O3 SiO2 P2O5 K2O CaO TiO2 MnO FeO CuO As2O3 SnO2 PbO
Gordion 21299 - 15.10.2013 3.2 3.6 16 45 0.4 2.6 12.2 1.4 0 8.3 5.3 0.2 0.9 0.7
Std. dev. (5 ms) 0.8 0.8 2 4 0.2 0.3 2.3 0.1 0.1 0.7 5.8 0.3 0.4 0.6
Min. 2.4 2.6 14 40 0.2 2.3 9.9 1.3 0 7.1 0.1 0 0.5 0.3
Max. 4.3 4.6 20 49 0.7 3.1 15.5 1.6 0.2 8.8 13.0 0.7 1.4 1.7
Gordion 22529 - 13.9.2013 1.9 2.6 12 34 0.5 2.1 10.5 1.0 0.1 7.3 13.0 0.3 9.9 5.0
Std. dev. (5 ms) 0.4 0.4 3 7 0.1 0.5 1.1 0.3 0.1 1.0 5.0 0.2 5.6 1.7
Min. 1.5 2.3 9 24 0.4 1.7 8.9 0.6 0 5.6 5.2 0 1.7 2.8
Max. 2.5 3.1 16 44 0.5 2.9 11.5 1.4 0.2 8.4 18.0 0.5 17.2 7.4
Gordion 22626 - 15.10.2013 3.0 3.5 16 49 0.6 2.0 12.0 1.7 0.1 10.2 1.0 0.1 0.8
Std. dev. (5 ms) 0.3 0.4 1 5 0.5 0.1 2.6 0.3 0.1 1.1 1.5 0.2 0.6
Min. 2.5 3.1 14 41 0.3 1.9 9.9 1.4 0 8.8 0.1 0 0.2
Max. 3.3 4.1 18 55 1.4 2.2 16.4 2.0 0.2 11.7 3.6 0.5 1.8
Gordion 22673 - 15.1.2014 3.4 2.4 18 44 0.3 1.4 8.3 1.6 0 8.0 6.8 0.3 1.4 3.8
Std. dev. (5 ms) 0.4 0.4 2 4 0.1 0.4 0.8 0.2 0.1 0.8 3.1 0.2 2.2 3.4
Min. 2.8 2.0 15 38 0.2 1.0 7.1 1.2 0 7.1 3.6 0 0.2 1.3
Max. 3.9 2.8 20 48 0.5 2.1 9.0 1.7 0.2 9.3 11.0 0.6 5.2 9.8
Second layer 1.1 1.7 7 19 0.3 0.6 5.3 0.6 0 8.6 21.0 0.2 29.8 5.3
Std. dev. (5 ms) 0.4 0.2 2 3 0.2 0.1 3.6 0 0.2 2.8 3.5 0.2 6.2 2.3
Min. 0.8 1.5 5 16 0 0.4 2.7 0.6 0 6.2 15.3 0 22.9 3.8
Max. 1.8 1.9 10 24 0.5 0.8 11.5 0.7 0.1 13.0 23.9 0.4 35.7 9.3
Gordion 22673-A - 15.10.2013 3.1 3.5 17 47 0.5 3.4 11.5 1.8 0.1 9.3 1.1 0.1 0.9
Std. dev. (5 ms) 0.4 0.2 1 3 0.1 1.7 1.5 0.2 0.1 1.0 1.3 0.1 0.5
Min. 2.7 3.3 16 45 0.4 2.1 10.2 1.7 0 8.1 0.1 0 0.3
Max. 3.8 3.7 19 50 0.6 5.5 13.2 2.0 0.3 10.4 2.8 0.3 1.4
Gordion 22673-B - 15.10.2013 3.1 3.8 15 44 0.7 2.4 12.3 1.3 0.1 7.5 5.6 0.1 2.3 2.3
Std. dev. (5 ms) 0.8 1.2 4 6 0.4 0.6 2.9 0.6 0.1 1.5 6.3 0.2 2.2 1.6
Min. 1.6 2.7 8 36 0.4 1.8 8.9 0.5 0.1 5.9 0 0 0.4 0.1
Max. 3.6 5.8 18 51 1.3 2.9 16.1 1.9 0.2 9.6 14.5 0.5 5.8 4.5
Gordion 22829 - 15.10.2013 3.2 3.4 17 46 0.5 3.7 15.6 1.6 0.1 8.0 0.2 0.3 0.8
Std. dev. (5 ms) 0.6 0.5 1 3 0.2 0.8 3.2 0.2 0.1 0.8 0.2 0.1 0.5
Min. 2.3 2.8 14 43 0.4 2.9 11.2 1.4 0 7.3 0 0.2 0.4
Max. 3.9 4.1 19 50 0.9 4.8 20.0 1.8 0.3 9.2 0.6 0.5 1.5
Gordion 22958 - 9.4.2013 2.4 4.4 16 45 0.3 1.4 12.9 1.7 0.1 10.7 2.5 0.1 2.1
Std. dev. (5 ms) 0.3 0.5 1 4 0.2 0.1 0.8 0.3 0.1 1.0 4.1 0.2 2.3
Min. 2.0 3.7 14 38 0.1 1.3 11.6 1.2 0 9.5 0.5 0 0.7
Max. 2.9 5.0 17 48 0.6 1.5 13.7 2.0 0.3 12.0 9.8 0.3 6.2
Gordion 22999 - 13.9.2013 2.6 2.5 14 37 0.3 1.7 7.8 1.3 0 7.3 9.6 0.2 13 2.5
Std. dev. (5 ms) 0.2 0.4 1 4 0.2 0.3 1.4 0.3 0.1 1.1 6.3 0.3 10.6 0.4
Min. 2.3 2.1 12 32 0.1 1.3 6.2 1.0 0 5.8 1.0 0 4.5 1.9
Max. 2.9 3.0 15 42 0.5 2.2 9.7 1.8 0.2 8.5 17.5 0.6 31.0 3.0
Gordion 23045-A - 15.10.2013 3.1 4.3 17 50 0.4 2.1 11.6 2.0 0.2 8.4 0.1 0.1 0.4
Std. dev. (5 ms) 0.4 0.6 1 1 0.2 0.3 0.9 0.2 0.1 0.9 0.1 0.3 0.5
Min. 2.7 3.3 16 49 0.2 1.8 10.2 1.6 0 7.1 0 0 0
Max. 3.6 4.8 18 51 0.7 2.6 12.5 2.3 0.4 9.3 0.2 0.5 0.8
Gordion 23045-B - 15.10.2013 2.6 4.9 16 47 0.3 1.8 14.4 1.7 0.1 8.7 0.9 0.2 1.2
Std. dev. (5 ms) 0.3 0.6 1 2 0.2 0.2 2.5 0.2 0.1 0.9 0.7 0.1 0.4
Min. 2.2 4.3 14 43 0.1 1.6 12.9 1.5 0 7.5 0.2 0 0.7
Max. 3.0 5.8 18 49 0.6 2.1 18.7 2.0 0.2 9.6 2.1 0.4 1.7
Gordion 23045-S - 15.10.2013 2.4 3.3 13 36 0.4 1.9 8.3 1.2 0.1 9.8 8.9 0.1 11.1 4.2
Std. dev. (5 ms) 0.6 0.2 3 8 0.1 0.4 1.7 0.2 0.1 2.2 6.0 0.3 7.2 3.5
Min. 1.8 3.1 9 26 0.3 1.3 6.3 0.9 0 7.8 2.8 0 1.0 0.8
Max. 3.1 3.6 17 48 0.5 2.4 10.9 1.5 0.2 13.5 15.8 0.7 18.8 9.6
Gordion 23128 - 13.9.2013 2.3 4.5 15 43 0.2 1.3 10.4 1.5 0.2 7.4 8.5 0.1 3.7 1.6
Std. dev. (5 ms) 0.5 1.1 2 9 0.1 0.3 3 0.3 0.1 2.0 12.0 0.2 4.6 2.3
Min. 1.8 2.8 11 29 0.1 0.7 5.7 1.0 0.1 4.2 0.3 0 0.1 0
Max. 3.0 5.8 18 50 0.4 1.5 13.1 1.8 0.2 9.4 29.2 0.4 9.0 5.4
Gordion 23329 - 9.4.2013 2.6 2.7 16 43 0.5 1.7 7.4 1.4 0.1 7.3 14.9 0.3 0.6 1.3
Std. dev. (5 ms) 0.1 0.5 0 1 0.3 0.2 0.4 0.2 0.1 1.5 3.9 0.2 0.2 0.3
Min. 2.4 2.2 16 42 0.2 1.4 7.0 1.2 0.1 5.8 9.8 0.1 0.3 1.1
Max. 2.8 3.4 17 45 0.9 1.9 8.1 1.6 0.3 9.5 18.2 0.5 0.8 1.8
Second layer 1.6 2.0 10 26 0.4 1.1 6.0 0.7 0 7.9 14.5 0.2 25.8 3.9
Std. dev. (5 ms) 0.3 0.4 1 3 0.2 0.2 1.1 0.2 0.1 2.6 4.5 0.2 3.2 0.9
Min. 1.3 1.6 8 22 0.2 0.9 5.0 0.5 0 4.9 10.2 0 21.4 2.9
Max. 2.0 2.5 12 29 0.7 1.4 7.7 0.9 0.1 11.6 21.3 0.4 28.9 4.9
Gordion 23329 - 15.1.2014 3.2 3.6 17 46 0.5 2.1 10.4 1.7 0.2 9.1 3.7 0.3 2.1 0.8
Std. dev. (5 ms) 0.5 0.8 2 4 0.2 0.2 1.4 0.4 0.2 1.8 3.7 0.2 3.2 0.6
Min. 2.6 2.9 14 39 0.4 1.9 9.2 1.3 0 7.2 0 0.1 0.4 0.1
Max. 3.9 5.0 19 50 0.8 2.3 12.8 2.3 0.5 11.8 9.8 0.7 7.8 1.6
Gordion 23523 - 15.10.2013 3.3 3.4 18 50 0.7 1.9 11.0 1.9 0.1 9.2 0.5 0.2 0.6

614 Appendix J Frederik Rademakers
Average slag composition. All results in wt%, normalised to 100%.Sample Na2O MgO Al2O3 SiO2 P2O5 K2O CaO TiO2 MnO FeO CuO As2O3 SnO2 PbO
Std. dev. (5 ms) 0.4 0.7 1 1 0.3 0.2 1.2 0.1 0.1 0.5 0.6 0.2 0.4
Min. 2.9 2.5 16 49 0.4 1.6 9.6 1.8 0 8.6 0 0.1 0.2
Max. 3.8 4.4 19 51 1.1 2.1 12.8 2.0 0.2 9.9 1.3 0.4 1.1
Gordion 23707 - 9.4.2013 1.9 2.2 11 47 0.2 3.2 8.1 0.4 0 3.2 17.3 0.3 4.4
Std. dev. (5 ms) 0.3 0.5 1 8 0.1 0.8 1.5 0.1 0.1 0.4 7.4 0.1 5.1
Min. 1.6 1.6 10 37 0.1 2.2 6.2 0.2 0 2.7 9.3 0.1 0.4
Max. 2.2 2.8 13 57 0.3 3.9 10.3 0.5 0.2 3.7 28.8 0.5 11.0
Gordion 23707 - 15.1.2014 1.5 2.5 9 40 0.4 2.8 9.3 0.3 0 4.7 24.0 0.3 5.7
Std. dev. (5 ms) 0.4 0.4 2 7 0.1 0.5 2.5 0.2 0.1 2.2 11.3 0.3 4.1
Min. 0.9 2.1 7 33 0.2 2.2 6.8 0.1 0 2.8 8.8 0 2.9
Max. 1.9 3.0 11 50 0.5 3.5 12.7 0.5 0.1 8.3 35.5 0.5 12.7
Gordion 23778 - 13.9.2013 3.5 3.4 18 49 0.5 2.1 10.2 1.6 0 9.2 0.6 0.1 0.9 1.2
Std. dev. (5 ms) 0.5 0.2 2 2 0.2 0.3 0.4 0.3 0.1 1.5 0.5 0.2 0.3 0.9
Min. 3.1 3.2 16 47 0.3 1.6 9.7 1.2 0 7.3 0 0 0.5 0.2
Max. 4.1 3.8 20 51 0.8 2.3 10.7 1.9 0.2 10.8 1.2 0.3 1.2 2.5
Gordion 23797 - 9.4.2013 2.0 2.8 11 31 0.5 2.3 8.7 1.1 0 6.5 12.2 0.1 18.7 2.4
Std. dev. (5 ms) 0.8 0.4 3 8 0.1 0.9 2.1 0.4 0.1 1.6 9.4 0.3 12.6 0.5
Min. 1.0 2.3 7 19 0.4 1.4 5.6 0.7 0 4.1 1.9 0 2.6 1.7
Max. 3.1 3.3 15 41 0.6 3.4 11.5 1.7 0.2 8.7 26.9 0.6 30.9 2.9
Gordion 25368 - 13.9.2013 1.8 3.4 11 32 0.6 1.9 9.2 1.0 0 8.1 10.7 0.2 17.7 2.5
Std. dev. (5 ms) 0.4 0.3 2 4 0.2 0.1 0.7 0.1 0.1 1.5 4.0 0.1 4.7 0.6
Min. 1.3 3.1 9 28 0.4 1.7 8.3 0.9 0 7.0 6.2 0 12.6 2.0
Max. 2.2 3.7 14 38 0.9 2.0 9.7 1.1 0.1 10.8 15.4 0.4 25.0 3.4
Gordion 25394 - 9.4.2013 1.8 3.4 11 31 0.5 1.8 9.4 0.9 0 8.7 8.5 0.2 19.0 4.4
Std. dev. (5 ms) 0.4 0.3 2 4 0 0.3 0.7 0.3 0.1 0.7 2.7 0.2 4.2 1.0
Min. 1.3 3.2 9 27 0.4 1.4 8.9 0.7 0 7.5 6.8 0 14.1 3.0
Max. 2.1 3.8 13 35 0.5 2.0 10.7 1.2 0.2 9.5 13.2 0.5 23.5 5.6
Gordion 25394_A - 13.9.2013 2.6 4.7 16 47 0.4 2.7 12.7 1.8 0.2 9.5 0.8 0.1 0.8
Std. dev. (5 ms) 0.3 0.5 1 2 0.1 0.5 2.0 0.2 0.1 1.5 1.3 0.2 0.5
Min. 2.3 4.4 16 44 0.3 1.9 9.3 1.5 0.1 8.5 0 0 0.4
Max. 2.9 5.6 18 50 0.6 3.3 14.2 2.1 0.2 12.1 3.0 0.3 1.7
Gordion 25394_B - 13.9.2013 2.6 3.9 17 45 0.4 2.7 11.6 1.5 0.2 10.2 2.1 0.3 2.6
Std. dev. (5 ms) 0.4 0.5 1 2 0.2 0.3 0.7 0.3 0.1 1.3 1.9 0.3 2.2
Min. 2.2 3.5 15 44 0.2 2.3 10.9 1.1 0.1 8.2 0.1 0 0.4
Max. 3.1 4.8 18 49 0.7 3.1 12.7 1.9 0.2 11.8 5.0 0.8 5.7
Gordion 25568 - 9.4.2013 1.7 3.6 12 33 0.8 3.1 16.4 1.0 0.2 6.4 12.9 0.1 7.9 1.4
Std. dev. (5 ms) 0.4 0.5 2 5 0.4 0.5 3.3 0.2 0.1 1.8 6.8 0.2 2.5 1.2
Min. 1.2 3.2 9 28 0.5 2.8 12.3 0.8 0.1 5.0 4.1 0 3.6 0.4
Max. 2.3 4.4 14 40 1.5 4.0 21.5 1.4 0.4 9.4 19.6 0.3 9.7 3.2
Gordion 25568 - 15.1.2014 2.8 3.8 16 43 0.3 1.7 11.0 1.4 0.2 9.6 6.6 0.3 3.6
Std. dev. (5 ms) 0.5 0.3 2 7 0.1 0.4 1.3 0.3 0.1 2.3 6.4 0.2 3.5
Min. 1.9 3.4 12 32 0.2 1.2 9.1 1.2 0.1 8.3 0.3 0.1 0.3
Max. 3.2 4.3 19 50 0.4 2.2 12.5 1.8 0.2 13.7 17.1 0.5 7.7
Gordion 25569-A - 15.10.2013 2.7 4.9 16 46 0.4 1.4 11.5 1.6 0.2 9.0 4.4 0.2 0.9 0.7
Std. dev. (5 ms) 0.3 0.7 1 3 0.2 0.3 0.5 0.4 0.1 1.6 4.2 0.2 0.9 0.6
Min. 2.2 3.9 15 42 0.2 1.0 11.2 1.1 0 7.3 0.2 0 0 0.2
Max. 3.0 5.7 18 49 0.6 1.7 12.3 2.2 0.3 10.9 8.9 0.6 2.0 1.7
Gordion 25569-B - 15.10.2013 2.8 4.4 18 49 0.4 2.2 11.9 1.9 0.1 8.8 0.3 0.2 0.4
Std. dev. (5 ms) 0.3 1.0 1 0 0.1 0.2 0.7 0.3 0.1 0.6 0.2 0.3 0.4
Min. 2.4 3.1 17 49 0.3 1.9 10.8 1.4 0 8.1 0.1 0 0
Max. 3.2 5.6 20 50 0.5 2.5 12.5 2.2 0.1 9.8 0.5 0.6 0.8
Gordion 26891 - 9.4.2013 3.4 2.5 17 46 0.4 1.7 9.0 1.6 0.1 8.8 4.0 0.1 4.1 1.5
Std. dev. (5 ms) 0.5 0.4 2 6 0.1 0.3 1.2 0.3 0.1 0.9 4.1 0.3 5.1 1.6
Min. 2.6 1.9 14 37 0.2 1.3 7.1 1.2 0 7.9 0.1 0 0.2 0.2
Max. 4.0 2.9 19 51 0.6 2.0 10.3 2.0 0.2 9.9 9.9 0.5 12.5 3.7
Gordion 27609 - 15.10.2013 2.3 4.4 15 47 0.6 4.3 15.6 1.5 0.1 7.8 0.2 0.1 0.5
Std. dev. (5 ms) 0.2 0.7 1 1 0.1 0.7 1.9 0.2 0.1 0.6 0.1 0.4 0.2
Min. 2.0 3.7 14 46 0.4 3.3 14.1 1.2 0 7.0 0.1 0 0.4
Max. 2.6 5.5 16 49 0.7 5.1 18.4 1.8 0.2 8.5 0.4 0.6 0.9
Gordion 27609-S - 15.10.2013 2.0 4.1 13 40 1.0 2.8 14.0 1.2 0.2 8.9 5.4 0.2 6.7
Std. dev. (5 ms) 0.5 0.4 2 4 0.9 0.2 2.1 0.2 0.1 1.7 4.5 0.2 2.9
Min. 1.4 3.6 11 35 0.4 2.5 11.6 1.0 0.1 7.4 2.9 0 3.0
Max. 2.7 4.5 16 43 2.5 3.0 16.5 1.6 0.2 11.4 13.5 0.4 10.7
Gordion 27613_A 13.9.2013 3.1 3.8 17 49 0.5 2.2 11.6 2.0 0.1 9.9 0.1 0.3 0.3
Std. dev. (5 ms) 0.3 0.6 1 1 0.2 0.4 1.2 0.1 0.1 1.1 0.2 0.3 0.2
Min. 2.9 3.3 16 48 0.3 1.7 10.3 1.9 0 8.2 0 0 0.2
Max. 3.5 4.8 18 49 0.8 2.9 13.6 2.2 0.2 11.1 0.3 0.7 0.7
Gordion 27613_B - 13.9.2013 4.1 3.3 18 48 0.6 2.5 10.8 1.6 0.1 8.3 0.2 0.2 1.3 0.8
Std. dev. (5 ms) 0.2 0.3 1 2 0.2 0.2 1.0 0.3 0 1.3 0.1 0.2 0.8 0.9

Frederik Rademakers Appendix J 615
Average slag composition. All results in wt%, normalised to 100%.Sample Na2O MgO Al2O3 SiO2 P2O5 K2O CaO TiO2 MnO FeO CuO As2O3 SnO2 PbO
Min. 3.9 2.9 17 47 0.5 2.2 9.3 1.2 0.1 7.1 0.1 0 0.7 0.2
Max. 4.5 3.7 18 50 0.8 2.8 11.8 2.1 0.2 10.5 0.3 0.6 2.6 2.2
Gordion 27629 - 15.10.2013 3.4 3.8 18 49 0.5 2.0 11.4 1.7 0.1 9.6 0 0.2 0.5
Std. dev. (5 ms) 0.5 1.0 1 1 0.3 0.2 0.9 0.3 0.1 0.8 0.2 0.2 0.3
Min. 2.9 2.1 17 47 0.1 1.8 10.2 1.4 0 8.4 0 0 0.1
Max. 4.2 4.9 20 50 1.0 2.1 12.7 2.0 0.2 10.5 0.2 0.5 0.8
Gordion 27634 - 12.11.2013 2.7 4.8 17 49 0.3 2.1 13.0 1.8 0.2 8.0 0 0.1 0.6
Std. dev. (5 ms) 0.2 0.4 0 1 0.1 0.4 0.7 0.1 0.1 0.3 0.1 0.2 0.4
Min. 2.5 4.3 17 49 0.2 1.8 11.9 1.7 0.1 7.7 0 0 0.1
Max. 2.9 5.4 18 50 0.4 2.6 13.8 1.9 0.3 8.5 0.2 0.3 1.2
Gordion 27635 (1) - 12.11.2013 3.1 3.8 17 49 0.5 2.5 10.7 2.0 0.1 9.6 0.1 0.6 0.4
Std. dev. (5 ms) 0.3 0.5 1 0 0.2 0.4 0.6 0.2 0.1 1.3 0.2 0.4 0.3
Min. 2.8 3.3 16 49 0.3 1.8 10.1 1.7 0 7.5 0 0.3 0
Max. 3.5 4.4 19 50 0.6 2.8 11.5 2.2 0.2 10.6 0.4 1.2 0.7
Gordion 27635 (2) - 12.11.2013 2.9 4.0 18 47 0.2 1.4 12.1 1.7 0.1 8.0 2.9 0.3 1.4 0.2
Std. dev. (5 ms) 0.3 0.8 1 3 0.1 0.3 1.6 0.4 0.1 0.6 3.4 0.1 2.2 0.5
Min. 2.6 2.8 17 42 0.1 1.0 9.4 1.4 0 7.2 0.5 0.1 0 0
Max. 3.3 4.8 19 49 0.3 1.8 13.3 2.2 0.3 8.7 8.7 0.5 5.3 0.9
Second layer 0.5 1.4 4 14 0.3 0.4 4.5 0.3 0 14.3 24.5 0.2 32.1 3.2
Std. dev. (3 ms) 0.6 0.8 2 5 0.2 0.3 2.3 0.2 0 7.5 7.1 0.1 5.4 0.9
Min. 0 0.7 2 10 0.1 0.1 2.1 0.1 0 6.8 19.9 0 26.3 2.3
Max. 0.9 2.4 7 19 0.4 0.6 6.8 0.4 0 21.8 32.7 0.3 36.9 4.2
Gordion 27636 - 9.4.2013 3.1 3.3 17 47 0.4 1.8 10.4 1.7 0 11.7 2.6 0.2 1.3
Std. dev. (5 ms) 0.6 0.2 1 2 0.1 0.2 0.6 0.1 0.1 1.9 2.0 0.1 0.8
Min. 2.2 3.1 15 44 0.3 1.6 9.3 1.6 0 8.8 0.7 0.1 0.3
Max. 3.7 3.7 18 48 0.5 1.9 11.0 1.8 0.2 13.6 5.4 0.3 2.4
Gordion 27638 - 12.11.2013 3.1 3.6 18 49 0.6 2.8 11.6 1.7 0.1 8.7 0.1 0.3 0.4
Std. dev. (5 ms) 0.3 0.2 1 1 0.1 0.3 1.1 0.1 0.2 0.8 0.3 0.4 0.1
Min. 2.6 3.4 17 48 0.5 2.4 10.6 1.6 0 7.6 0 0 0.3
Max. 3.5 3.8 19 51 0.7 3.2 13.4 1.8 0.3 9.5 0.5 0.6 0.5
Gordion 27640 - 12.11.2013 2.3 2.9 12 33 0.4 1.7 9.9 1.1 0.1 5.7 14.7 0.2 11.6 4.1
Std. dev. (5 ms) 0.8 0.6 5 13 0.2 0.4 1.4 0.5 0.1 2.4 9.0 0.3 11.9 1.7
Min. 1.5 2.1 6 17 0.3 1.2 8.6 0.4 0 2.6 7.3 0 2.0 1.9
Max. 3.3 3.5 17 45 0.7 2.0 11.9 1.5 0.2 7.8 28.2 0.5 25.6 5.9
Second layer 0 0.2 1 4 0.3 0.3 0.6 0 0 0.6 73.0 0.2 16.2 4.0
Std. dev. (5 ms) 0.9 0.2 1 2 0.1 0.1 0.3 0.1 0.2 0.6 15.2 0.4 10.7 0.3
Min. 0 0 0 1 0.2 0.2 0.3 0 0 0 54.2 0 6.8 3.6
Max. 0.5 0.4 2 8 0.4 0.4 0.9 0.2 0.1 1.5 87.2 0.6 28.7 4.2
Gordion 27734 (1) - 12.11.2013 2.1 3.1 12 33 1.0 3.8 14.0 0.9 0.1 7.2 9.4 0.1 13.8
Std. dev. (5 ms) 0.7 0.4 2 6 0.5 0.8 1.9 0.3 0.1 0.8 6.0 0.1 6.7
Min. 1.3 2.7 9 24 0.3 2.7 12.0 0.5 0 6.5 3.3 0 5.7
Max. 2.9 3.6 15 41 1.6 4.6 16.9 1.4 0.2 8.2 16.4 0.3 22.9
Gordion 28218 - 12.11.2013 2.7 3.1 14 38 1.0 2.2 10.9 1.1 0.1 13.2 5.4 0.1 7.7
Std. dev. (5 ms) 0.5 0.1 2 5 0.3 0.3 1.9 0.3 0.1 3.0 3.0 0.1 5.3
Min. 2.0 2.9 12 33 0.8 1.9 9.2 0.8 0 9.7 0.6 0 2.8
Max. 3.3 3.2 17 43 1.4 2.5 13.8 1.5 0.2 17.9 8.7 0.2 16.6
Gordion 28236 - 9.4.2013 2.6 4.9 12 43 0.3 2.9 18.4 1.0 0.1 5.7 7.6 0.3 1.6
Std. dev. (5 ms) 0.3 0.1 2 5 0.1 0.5 3.0 0.3 0.1 1.7 9.4 0.1 1.6
Min. 2.4 4.7 10 35 0.1 2.1 15.8 0.7 0 3.4 0 0.3 0
Max. 3.1 5.1 14 48 0.5 3.4 22.6 1.5 0.3 8.2 22.4 0.5 3.8
Gordion 28877 - 9.4.2013 3.7 2.8 18 48 0.4 1.6 9.5 1.4 0.1 7.6 6.2 0.2 0.6
Std. dev. (5 ms) 0.3 0.4 1 2 0.1 0.2 1.1 0.3 0.1 1.2 3.8 0.1 0.4
Min. 3.3 2.3 18 45 0.2 1.3 8.3 1.1 0 6.2 2.5 0 0.3
Max. 4.2 3.1 19 50 0.5 1.9 11.2 1.8 0.2 9.4 11.2 0.3 1.3
Gordion 28932 (1) - 12.11.2013 3.0 4.1 17 48 0.5 2.2 12.2 1.6 0.1 8.6 1.2 0.1 0.5
Std. dev. (5 ms) 0.4 1.0 2 2 0.1 0.3 1.8 0.2 0 0.6 1.5 0.2 0.3
Min. 2.3 3.1 15 45 0.3 1.7 10.4 1.4 0.1 7.9 0 0 0.1
Max. 3.4 5.7 20 50 0.7 2.5 15.1 1.9 0.2 9.2 3.1 0.2 0.8
Gordion 28932 (2) - 12.11.2013 2.3 4.1 14 42 0.6 2.6 11.4 1.2 0.1 6.9 12.3 0.4 2.6
Std. dev. (5 ms) 0.3 0.2 2 3 0.1 0.3 1.2 0.3 0.1 0.8 4.5 0.2 1.7
Min. 2.0 4.0 12 37 0.4 2.3 9.9 0.8 0 5.6 7.7 0.2 1.6
Max. 2.7 4.4 15 44 0.8 2.9 12.9 1.6 0.2 7.7 18.0 0.6 5.7
Average Slag Composition 2.8 3.6 16 44 0.5 2.2 11.3 1.5 0.1 8.6 4.8 0.2 4.1

616 Appendix J Frederik Rademakers
Ceramic. Ratio of oxides to Al2O3, metals removed.Sample
N a2OAl2O3
M gOAl2O3
SiO2Al2O3
P2O5Al2O3
K2OAl2O3
C aOAl2O3
T iO2Al2O3
MnOAl2O3
FeOAl2O3
Gordion 21299 - 15.10.2013 0.18 0.20 2.78 0.03 0.10 0.60 0.10 0 0.60
Gordion 22529 - 13.9.2013 0.16 0.21 2.89 0.03 0.12 0.54 0.09 0.01 0.72
Gordion 22626 - 15.10.2013 0.18 0.19 2.79 0.02 0.10 0.49 0.11 0.01 0.49
Gordion 22673 - 15.1.2014 0.17 0.18 2.74 0.03 0.08 0.49 0.09 0 0.46
Gordion 22673-A - 15.10.2013 0.16 0.18 2.69 0.03 0.11 0.55 0.08 0.01 0.46
Gordion 22673-B - 15.10.2013 0.17 0.18 2.86 0.03 0.10 0.47 0.10 0.01 0.50
Gordion 22829 - 15.10.2013 0.16 0.21 2.96 0.03 0.11 0.56 0.08 0.01 0.50
Gordion 22958 - 9.4.2013 0.16 0.23 2.73 0.03 0.09 0.75 0.08 0.01 0.46
Gordion 22999 - 13.9.2013 0.17 0.19 2.81 0.03 0.10 0.56 0.11 0.01 0.48
Gordion 23045-A - 15.10.2013 0.16 0.22 2.88 0.02 0.10 0.68 0.09 0.01 0.45
Gordion 23045-B - 15.10.2013 0.18 0.21 2.91 0.03 0.10 0.67 0.09 0.01 0.54
Gordion 23045-S - 15.10.2013
Gordion 23128 - 13.9.2013
Gordion 23329 - 9.4.2013 0.18 0.18 2.76 0.03 0.10 0.48 0.09 0.01 0.53
Gordion 23329 - 15.1.2014 0.17 0.20 2.83 0.03 0.11 0.53 0.08 0.01 0.55
Gordion 23523 - 15.10.2013 0.17 0.21 2.84 0.02 0.11 0.54 0.08 0.01 0.54
Gordion 23707 - 9.4.2013 0.21 0.23 4.46 0.02 0.28 0.89 0.04 0.01 0.31
Gordion 23707 - 15.1.2014 0.22 0.23 4.95 0.02 0.28 0.94 0.05 0.01 0.31
Gordion 23778 - 13.9.2013 0.17 0.21 2.96 0.03 0.12 0.53 0.09 0.01 0.57
Gordion 23797 - 9.4.2013 0.17 0.22 2.93 0.04 0.11 0.62 0.08 0 0.57
Gordion 25368 - 13.9.2013 0.15 0.23 2.78 0.03 0.12 0.61 0.07 0.01 0.61
Gordion 25394 - 9.4.2013 0.15 0.22 2.70 0.02 0.12 0.64 0.09 0 0.47
Gordion 25394_A - 13.9.2013 0.14 0.26 2.89 0.04 0.12 0.63 0.08 0.01 0.53
Gordion 25394_B - 13.9.2013 0.15 0.22 2.80 0.03 0.11 0.60 0.08 0.01 0.51
Gordion 25568 - 9.4.2013 0.18 0.20 2.65 0.02 0.07 0.55 0.08 0.01 0.45
Gordion 25568 - 15.1.2014 0.15 0.24 2.82 0.02 0.08 0.63 0.08 0.01 0.49
Gordion 25569-A - 15.10.2013 0.16 0.24 2.80 0.02 0.08 0.67 0.09 0.01 0.53
Gordion 25569-B - 15.10.2013 0.15 0.23 2.79 0.02 0.10 0.63 0.09 0 0.50
Gordion 26891 - 9.4.2013 0.18 0.19 2.91 0.03 0.10 0.49 0.10 0.01 0.55
Gordion 27609 - 15.10.2013 0.15 0.21 2.76 0.03 0.10 0.63 0.08 0 0.45
Gordion 27609-S - 15.10.2013
Gordion 27613_A 13.9.2013 0.17 0.20 2.82 0.03 0.11 0.61 0.09 0.01 0.49
Gordion 27613_B - 13.9.2013 0.18 0.20 2.79 0.03 0.10 0.54 0.09 0 0.45
Gordion 27629 - 15.10.2013 0.19 0.19 2.73 0.05 0.10 0.59 0.09 0 0.51
Gordion 27634 - 12.11.2013 0.15 0.29 2.96 0.03 0.14 0.70 0.09 0.01 0.45
Gordion 27635 (1) - 12.11.2013 0.19 0.21 2.80 0.03 0.11 0.57 0.10 0.01 0.50
Gordion 27635 (2) - 12.11.2013 0.18 0.18 2.69 0.04 0.08 0.54 0.08 0.01 0.51
Gordion 27636 - 9.4.2013 0.17 0.20 2.78 0.03 0.11 0.53 0.09 0.01 0.49
Gordion 27638 - 12.11.2013 0.18 0.21 2.80 0.03 0.13 0.55 0.09 0.01 0.48
Gordion 27640 - 12.11.2013 0.16 0.21 2.83 0.03 0.12 0.58 0.10 0.01 0.58
Gordion 27734 (1) - 12.11.2013 0.18 0.21 2.92 0.03 0.11 0.52 0.12 0.01 0.55
Gordion 28218 - 12.11.2013 0.16 0.19 2.79 0.02 0.10 0.50 0.09 0 0.52
Gordion 28236 - 9.4.2013 0.27 0.22 3.77 0.02 0.29 1.51 0.07 0 0.43
Gordion 28877 - 9.4.2013 0.20 0.18 2.71 0.03 0.09 0.48 0.08 0 0.46
Gordion 28932 (1) - 12.11.2013 0.18 0.22 2.87 0.04 0.14 0.62 0.08 0.01 0.53
Gordion 28932 (2) - 12.11.2013 0.18 0.25 2.85 0.04 0.15 0.64 0.09 0 0.51
Average 0.17 0.21 2.82 0.03 0.11 0.58 0.09 0.01 0.51

Frederik Rademakers Appendix J 617
Slag. Ratio of oxides to Al2O3, metals removed.Sample
N a2OAl2O3
M gOAl2O3
SiO2Al2O3
P2O5Al2O3
K2OAl2O3
C aOAl2O3
T iO2Al2O3
MnOAl2O3
FeOAl2O3
Gordion 21299 - 15.10.2013 0.20 0.22 2.71 0.03 0.16 0.74 0.09 0 0.50
Gordion 22529 - 13.9.2013 0.15 0.21 2.76 0.04 0.16 0.86 0.08 0.01 0.60
Gordion 22626 - 15.10.2013 0.18 0.22 2.97 0.04 0.12 0.73 0.11 0.01 0.63
Gordion 22673 - 15.1.2014 0.19 0.13 2.43 0.02 0.08 0.46 0.09 0 0.44
Gordion 22673-A - 15.10.2013 0.18 0.20 2.73 0.03 0.20 0.66 0.11 0.01 0.53
Gordion 22673-B - 15.10.2013 0.20 0.25 2.90 0.05 0.16 0.82 0.09 0.01 0.50
Gordion 22829 - 15.10.2013 0.19 0.20 2.77 0.03 0.22 0.94 0.10 0.01 0.48
Gordion 22958 - 9.4.2013 0.15 0.27 2.78 0.02 0.09 0.80 0.10 0.01 0.66
Gordion 22999 - 13.9.2013 0.18 0.17 2.55 0.02 0.12 0.54 0.09 0 0.51
Gordion 23045-A - 15.10.2013 0.18 0.25 2.86 0.02 0.12 0.67 0.11 0.01 0.48
Gordion 23045-B - 15.10.2013 0.16 0.30 2.84 0.02 0.11 0.87 0.10 0.01 0.53
Gordion 23045-S - 15.10.2013 0.18 0.25 2.77 0.03 0.15 0.65 0.09 0.01 0.77
Gordion 23128 - 13.9.2013 0.15 0.30 2.86 0.02 0.08 0.69 0.10 0.01 0.49
Gordion 23329 - 9.4.2013 0.16 0.16 2.67 0.03 0.10 0.46 0.09 0.01 0.45
Gordion 23329 - 15.1.2014 0.19 0.21 2.71 0.03 0.12 0.62 0.10 0.01 0.54
Gordion 23523 - 15.10.2013 0.18 0.19 2.77 0.04 0.11 0.61 0.11 0 0.51
Gordion 23707 - 9.4.2013 0.17 0.20 4.26 0.02 0.29 0.72 0.04 0 0.29
Gordion 23707 - 15.1.2014 0.17 0.28 4.40 0.04 0.31 1.04 0.03 0 0.52
Gordion 23778 - 13.9.2013 0.20 0.19 2.73 0.03 0.11 0.57 0.09 0 0.52
Gordion 23797 - 9.4.2013 0.17 0.25 2.80 0.04 0.21 0.78 0.10 0 0.57
Gordion 25368 - 13.9.2013 0.16 0.29 2.76 0.05 0.16 0.80 0.08 0 0.71
Gordion 25394 - 9.4.2013 0.17 0.32 2.90 0.04 0.17 0.89 0.09 0 0.82
Gordion 25394_A - 13.9.2013 0.16 0.29 2.92 0.03 0.16 0.78 0.11 0.01 0.59
Gordion 25394_B - 13.9.2013 0.16 0.24 2.74 0.03 0.16 0.70 0.09 0.01 0.62
Gordion 25568 - 9.4.2013 0.15 0.31 2.86 0.07 0.27 1.42 0.09 0.02 0.55
Gordion 25568 - 15.1.2014 0.17 0.24 2.64 0.02 0.11 0.68 0.09 0.01 0.60
Gordion 25569-A - 15.10.2013 0.16 0.30 2.83 0.02 0.09 0.71 0.10 0.01 0.55
Gordion 25569-B - 15.10.2013 0.16 0.25 2.77 0.02 0.13 0.67 0.10 0 0.50
Gordion 26891 - 9.4.2013 0.20 0.14 2.68 0.02 0.10 0.53 0.09 0.01 0.51
Gordion 27609 - 15.10.2013 0.15 0.29 3.08 0.04 0.28 1.02 0.10 0.01 0.51
Gordion 27609-S - 15.10.2013 0.15 0.31 3.03 0.07 0.21 1.05 0.09 0.01 0.67
Gordion 27613_A 13.9.2013 0.18 0.22 2.82 0.03 0.13 0.67 0.12 0.01 0.57
Gordion 27613_B - 13.9.2013 0.23 0.19 2.73 0.04 0.14 0.61 0.09 0.01 0.47
Gordion 27629 - 15.10.2013 0.18 0.21 2.67 0.02 0.11 0.62 0.09 0.01 0.52
Gordion 27634 - 12.11.2013 0.16 0.28 2.89 0.02 0.12 0.76 0.11 0.01 0.47
Gordion 27635 (1) - 12.11.2013 0.18 0.22 2.87 0.03 0.14 0.62 0.11 0 0.55
Gordion 27635 (2) - 12.11.2013 0.16 0.22 2.63 0.01 0.08 0.68 0.10 0.01 0.45
Gordion 27636 - 9.4.2013 0.18 0.20 2.78 0.02 0.11 0.62 0.10 0 0.7
Gordion 27638 - 12.11.2013 0.17 0.20 2.79 0.03 0.16 0.65 0.09 0.01 0.49
Gordion 27640 - 12.11.2013 0.19 0.24 2.73 0.04 0.14 0.82 0.09 0.01 0.47
Gordion 27734 (1) - 12.11.2013 0.18 0.27 2.86 0.08 0.33 1.22 0.08 0.01 0.63
Gordion 28218 - 12.11.2013 0.19 0.22 2.68 0.07 0.15 0.77 0.08 0.01 0.93
Gordion 28236 - 9.4.2013 0.22 0.42 3.69 0.03 0.25 1.58 0.08 0.01 0.49
Gordion 28877 - 9.4.2013 0.20 0.15 2.58 0.02 0.09 0.52 0.08 0 0.41
Gordion 28932 (1) - 12.11.2013 0.17 0.24 2.79 0.03 0.13 0.70 0.09 0.01 0.50
Gordion 28932 (2) - 12.11.2013 0.16 0.29 2.94 0.04 0.18 0.81 0.09 0.01 0.49
Average 0.18 0.24 2.78 0.03 0.15 0.74 0.09 0.01 0.56

618 Appendix J Frederik Rademakers
Change (in %) in ratio of oxides to Al2O3 between ceramic and slag,metals removed.
SampleN a2OAl2O3
M gOAl2O3
SiO2Al2O3
P2O5Al2O3
K2OAl2O3
C aOAl2O3
T iO2Al2O3
MnOAl2O3
FeOAl2O3
Gordion 21299 - 15.10.2013 9 10 -3 -12 51 24 -12 198 -16
Gordion 22529 - 13.9.2013 -7 1 -4 7 35 60 -8 -28 -17
Gordion 22626 - 15.10.2013 0 16 6 62 28 49 0 -36 28
Gordion 22673 - 15.1.2014 10 -26 -11 -36 -7 -5 -3 -60 -3
Gordion 22673-A - 15.10.2013 14 11 1 -6 85 20 27 -43 17
Gordion 22673-B - 15.10.2013 17 39 1 41 55 74 -8 54 0
Gordion 22829 - 15.10.2013 22 -1 -7 13 101 69 15 -35 -3
Gordion 22958 - 9.4.2013 -5 19 2 -38 0 6 20 -40 44
Gordion 22999 - 13.9.2013 2 -11 -9 -21 18 -3 -19 -95 4
Gordion 23045-A - 15.10.2013 13 12 -1 17 19 -1 29 60 6
Gordion 23045-B - 15.10.2013 -11 38 -2 -40 7 30 9 -20 -3
Gordion 23045-S - 15.10.2013 7 20 -5 -7 25 5 7 55 52
Gordion 23128 - 13.9.2013 -12 41 -2 -46 -30 12 12 66 -3
Gordion 23329 - 9.4.2013 -10 -11 -3 1 0 -4 -7 -36 -15
Gordion 23329 - 15.1.2014 15 4 -4 -5 7 15 21 60 -2
Gordion 23523 - 15.10.2013 6 -9 -3 61 -6 14 29 -26 -6
Gordion 23707 - 9.4.2013 -16 -13 -5 -1 3 -19 -9 -26 -9
Gordion 23707 - 15.1.2014 -24 19 -11 108 13 11 -38 -69 67
Gordion 23778 - 13.9.2013 16 -11 -8 -17 -5 8 2 -108 -9
Gordion 23797 - 9.4.2013 0 12 -5 -7 85 25 28 -27 1
Gordion 25368 - 13.9.2013 7 29 -1 92 37 31 12 -82 16
Gordion 25394 - 9.4.2013 10 45 7 90 39 40 1 90 74
Gordion 25394_A - 13.9.2013 17 11 1 -24 34 24 45 92 10
Gordion 25394_B - 13.9.2013 1 6 -2 -16 43 17 7 57 20
Gordion 25568 - 9.4.2013 -18 57 8 282 267 159 15 180 24
Gordion 25568 - 15.1.2014 12 0 -7 -25 42 8 4 62 23
Gordion 25569-A - 15.10.2013 3 27 1 0 15 6 7 67 4
Gordion 25569-B - 15.10.2013 5 7 -1 -13 26 8 15 14 -1
Gordion 26891 - 9.4.2013 12 -26 -8 -14 2 7 -5 3 -6
Gordion 27609 - 15.10.2013 0 40 11 15 170 61 22 177 12
Gordion 27609-S - 15.10.2013 -11 45 4 145 80 71 6 77 34
Gordion 27613_A 13.9.2013 5 9 0 -11 21 9 35 4 18
Gordion 27613_B - 13.9.2013 27 -5 -2 27 43 14 5 223 4
Gordion 27629 - 15.10.2013 -2 6 -2 -54 4 5 5 35 2
Gordion 27634 - 12.11.2013 8 -3 -3 -43 -12 10 24 71 4
Gordion 27635 (1) - 12.11.2013 -2 5 2 10 24 9 15 -32 11
Gordion 27635 (2) - 12.11.2013 -7 23 -2 -72 -6 26 25 -20 -13
Gordion 27636 - 9.4.2013 9 -2 0 -25 0 17 16 -45 41
Gordion 27638 - 12.11.2013 -4 0 0 -3 21 19 4 0 3
Gordion 27640 - 12.11.2013 14 16 -3 19 13 42 -12 -23 -19
Gordion 27734 (1) - 12.11.2013 0 28 -2 228 203 133 -32 138 13
Gordion 28218 - 12.11.2013 17 15 -4 213 60 54 -10 93 79
Gordion 28236 - 9.4.2013 -18 93 -2 47 -16 4 13 636 13
Gordion 28877 - 9.4.2013 4 -13 -5 -34 0 8 -10 146 -10
Gordion 28932 (1) - 12.11.2013 -3 10 -2 -28 -9 13 16 35 -5
Gordion 28932 (2) - 12.11.2013 -9 19 3 4 21 25 -9 123 -5
Average change 4 12 -1 17 38 29 8 29 9

APPENDIX K
Oxide phases in crucible slag
A full list of oxides occurring in the crucible slag has been established, which is sum-
marised here. The predominant types of oxides are Fe-bearing, Ca-bearing, Cu-bearing,
Sn-bearing and Pb-bearing phases, with Ag-rich phases occurring in only two crucibles.
Their varying occurrence is interpreted in section 8.3.
Terminology adapted from mineralogy (as explained in section 5.2.3) is employed. The oc-
currence of particular phases in certain crucibles is not plotted onto the ternary diagrams,
as has been done in Appendix D, because of the tight compositional clustering of crucible
slag in these diagrams (Figure 8.7).
Section K.1
Fe-bearing oxides
Most of the oxides in the crucible slag contain some FeO and it is a component of the
glassy slag matrix, too. Fe-based oxides are listed here.
1. Olivine: Olivine of an intermediate fayalite (Fe2SiO4) - forsterite (Mg2SiO4) compo-
sition (with minor Ca: Fe/Mg/Ca ≈ 14/8/1) is encountered in one crucible (Gordion-
22958). These chain-like crystals are shown in Figure K.1.
Another olivine-like phase has been encountered in two samples (Gordion-25569-
B and -28932 (1)), with approximate (Fe,Mg,Ca,Na,K)2(Si,Al)O4 composition, where
Fe/Mg/Ca/Na/K ≈ 71/12.5/8/5/3.5 and Si/Al ≈ 3/1. This corresponds to a fayalite-
dominated mixture of the fayalite-forsterite solid solution series, with additional Ca
619

620 Appendix K Frederik Rademakers
content (the monticellite (CaMgSiO4) - kirschsteinite (CaFeSiO4) olivine solution se-
ries forms very limited solid solution with the fayalite-forsterite series (Klein and
Dutrow, 2007, Fig. 19.1, p. 485)) and limited Na and K. The olivine crystals found
in these two samples (single occurrence), shown in Figure K.2, appear to be residual
mineral fragments rather than oxides formed during the metallurgical process.
2. Spinel: Spinel is the most common iron oxide found in these crucibles, with occur-
rences ranging from almost pure magnetite (Fe3O4) to more diluted forms with up
to 3.5 at% Sn and 3.5 at% Cu substituting for Fe (typically associated with copper
or bronze prills, indicative of their formation through preferential oxidation of iron
from these prills). Furthermore, Fe is sometimes substituted by up to 8 at% Mg, 6
at% Al, 3.5 at% Si, 1.3 at% Ca and 1.5 at% Ti. Rare substitutions of 0.8 and 0.4 at% Ni
and Co occur together with Cu and Sn. The average spinel composition is approxi-
mately (Fe,Mg,Al)3O4 with Fe/Mg/Al ≈ 11/1/1. Some examples are shown in Figure
K.3.
Other spinel-like oxides are encountered in three samples. These oxides have a more
significant silica content (up to 7 at%), and their structure is quite different from the
‘normal’ spinel described above, again indicative of a residual rather than newly-
formed nature (see Figure K.4).
Furthermore, a chrome-rich spinel has been noted in two crucibles. These crystals
have an average Cr/Fe/Al/Mg ratio ≈ 6/3/3/2. Some examples are shown in Figure
K.5.
Finally, titanium-rich spinel is noted in many of the crucibles. Its average composi-
tion is 23 at% Fe, 11 at% Ti, 3 at% Mg, 1.5 at% Si and 1.5 at% Al, with 60 at% oxygen.
Some examples are shown in Figures K.6 and K.2b. As Figure K.6c shows, the ‘high-
Ti spinel’ sometimes exhibits two distinct phases, one relatively enriched in iron, the
other relatively enriched in titanium.

Frederik Rademakers Appendix K 621
Figure K.1: Olivine (light grey chains) in Gordion-22958
(a) Gordion-25569-B (b) Gordion-28932 (1)
Figure K.2: Olivine-like oxides (bright, angular-shaped, ‘dotted’)

622 Appendix K Frederik Rademakers
(a) Spinel (light grey), Gordion-22958 (b) Spinel (light grey), Gordion-25568-A
(c) Spinel (medium grey) associated with medium-
tin, iron-rich (15-25 wt% Sn, 0.5-0.75 wt% Fe)
bronze prills (light grey) and burnt off tin oxide crys-
tals (white), Gordion-27635 (2)
(d) Spinel cluster (medium grey), Gordion-26891
(e) Spinel cluster (medium grey) with iron-rich (7
wt% Sn, 1.3-3.9 wt% Fe) bronze prills, Gordion-
27609-S
(f) Spinel cluster (light grey) with high-tin, iron-rich
leaded (35-39 wt% Sn, 1.1-2.3 wt% Fe, 0-1.6 wt% Pb)
bronze prills (white), Gordion-25568-B
Figure K.3: Spinel

Frederik Rademakers Appendix K 623
Figure K.4: ‘High-silica spinel’ (bright, angular-shaped, ‘dotted’), Gordion-27635 (1)
(a) Chrome-rich spinel, Gordion-27635 (1) (b) Chrome-rich spinel, Gordion-27609
Figure K.5: Chrome-rich spinel (bright)

624 Appendix K Frederik Rademakers
(a) High-Ti spinel, Gordion-27638
(b) High-Ti spinel, Gordion-27635 (1) (c) Two phases in high-Ti spinel, Gordion-27635 (1)
Figure K.6: Titanium-rich spinel (bright)

Frederik Rademakers Appendix K 625
Section K.2
Ca-bearing oxides
Lime is an important component of all crucible slag, as shown in section 8.2.2. It occurs in
both the glassy phase and particular oxides, discussed below.
1. Plagioclase: A medium grey phase, with approximate labradorite composition, or
65% anorthite (CaAl2Si2O8) - 35 % albite (NaAlSi3O8). These two minerals form a
complete solid solution series at elevated temperatures. Typically, 0.2 at% potassium
and 0.4 at% Fe are present. This mineral is similar to the plagioclase found in the
remnant mafic rock fragments of the crucible ceramic fabric and occurs in nearly all
crucibles. It appears that some of the original plagioclase sometimes survives when
the slag is not very developed. In better developed, more liquid slag, newly formed
plagioclase crystals are formed, which tend to exhibit finer, more elongated shapes.
Some examples of plagioclase are shown in Figure K.7 (and Figure K.5a, dark grey).
2. Pyroxene: The second important lime-rich phase is pyroxene of approximate augite
composition: (Ca,Na)(Mg,Fe,Ti)(Si,Al)2O6. It is particularly lime-rich, with very low
Na content (0.2 at%). The ratios between Mg, Fe and Ti and Si and Al are ±9/5/1 and
±7/2 respectively. Some examples are shown in Figure K.8 and the background of
Figures K.4, right (medium grey) and K.5b (light grey).
A few samples contain a phase similar to this augite, but further enriched in CaO
(approximate composition Ca2(Fe,Mg,Al)Si2O7), illustrated in Figure K.9.
3. K-feldspar: A phase with approximate KAl2Si4O12-composition occurs in Gordion-
22673-B, associated with lead oxides and silicates (see section K.5). This approx-
imates dehydrated muscovite (KAl2Si4O10(OH)2) or some form of K-feldspar (e.g.,
orthoclase KAlSi3O8, with added alumina and silica). The presence of potassium in
Gordion-22763 is discussed further in section 8.3.9.
4. Anhydrite: Anhydrous calcium sulphate (CaSO4) has been noted in one crucible
(Gordion-28877), in association with Cu2ClO2-Cu2ClO3 (see section K.3), and is shown
in Figure K.10. It occurs at the slag surface and is most likely a (rare) weathering
product.
5. Calcium-magnesium peroxide: A rare occurrence of calcium-magnesium peroxide
((Ca,Mg)O2, with Ca/Mg≈5) is found in a charcoal inclusion in Gordion-23797, shown
in Figure K.11.

626 Appendix K Frederik Rademakers
Na2O MgO Al2O3 SiO2 P2O5 K2O CaO TiO2 FeO
Glassy phase 1.8 11.8 12 53 0.2 1.0 13.1 1.9 5.9
St. dev. 1.7 3.9 3 3 0.4 0.9 4.5 0.6 1.5
Ceramic 3.0 3.8 18 51 0.5 1.9 10.4 1.6 9.2
Table K.1: Composition of glassy slag background (11 measurements) in Gordion cru-
cibles, compared to average ceramic composition (Appendix J)
6. Malayaite: See section K.4.
Other singular occurrences of crystals with compositions intermediate between pyroxene
and plagioclase (not well crystallised from glassy matrix) are not listed here. The ‘slag
background’, or glassy matrix, is a Ca-Mg-Al-(Fe-)silicate, with average composition given
in Table K.1. Note the high magnesia and lime content, which is further discussed in sec-
tion 8.2.5.

Frederik Rademakers Appendix K 627
(a) Remnant plagioclase (in rock fragment) in
porous transitional zone
(b) Remnant plagioclase in poorly developed slag
(c) Remnant plagioclase (left) in deeper, less devel-
oped slag, and newly formed plagioclase (right) in
more developed slag. The bright, rounded phase is
Cu-Cl-oxide
(d) Plagioclase, Gordion-22958
(e) Plagioclase, Gordion-25568 (f) Plagioclase, Gordion-27638
Figure K.7: Plagioclase (dark grey)

628 Appendix K Frederik Rademakers
(a) Pyroxene (medium grey), Gordion-23707 (b) Pyroxene (medium grey) with spinel (light grey),
Gordion-25569-B
(c) Pyroxene (light grey), Gordion-25394-B (d) Pyroxene (light grey) with tin oxide (white, angu-
lar) and bronze prills (white), Gordion-27609-S
Figure K.8: Pyroxene
(a) Gordion-21299 (b) Gordion-22673-A
Figure K.9: High-Ca augite (medium grey)

Frederik Rademakers Appendix K 629
Figure K.10: Anhydrite (dark grey) in between Cu2ClO2-Cu2ClO3 (light grey) in Gordion-
28877
Figure K.11: Ca-Mg-peroxide (dark grey) in charcoal inclusion in Gordion-23797

630 Appendix K Frederik Rademakers
Section K.3
Cu-bearing oxides
Various copper-bearing oxides occur in the Gordion crucible slag:
1. Cuprite: Most crucibles contain some cuprite (Cu2O), which sometimes includes
minor amount of Al, Si, Cl, Ca and Fe. It is however far less abundant than Cu2ClO2-
Cu2ClO3, which occurs in similar quantities to cuprite in the Pi-Ramesse crucibles.
Examples are shown in Figure K.12 and tiny cuprite prills (white) can be seen in
Figure K.8a.
2. Cu2ClO2-Cu2ClO3: A range of copper-chlorine oxides occur with compositions vary-
ing from ±Cu2ClO2 to Cu2ClO3. In some cases, copper is substituted by up to 6 at%
Sn or up to 3.5 at% Si, 3 at% K, 3 at% Ca, 5 at% Fe and/or 1.3 at% Pb. These phases
are very abundant and typically present as (post-depositional) corrosion products.
They produce the conspicuous green products on the crucible interior. Some exam-
ples are shown in Figure K.13 and Figures K.7c. Figure K.14 shows three different
occurrences of copper-chlorine oxide in a single sample.
A few occurrences exist where this copper-chlorine oxide incorporates lead (result-
ing in ±Cu3Pb2Cl3O2). Examples are shown in Figure K.15.
3. Delafossite: In three crucibles, a phase similar to delafossite (CuFeO2) occurs, with
an approximate (Cu,Sn)(Fe,Mg,Al,Si,Ca)O2 composition (Cu/Sn≈10, Fe/Si/Mg/Al/Ca
≈ 5/2/1/1/1 and sometimes a few at% Ti or Pb). Some examples are shown in Figure
K.16.
4. Cu-Sn oxides: A range of copper-tin oxides occur, with highly variable composition.
Examples of these bronze oxidation products are shown in Figure K.17.
5. Cu(-Sn) silicates: A whole range of copper silicates, copper-tin silicates and copper-
tin-iron silicates occurs, the compositions of which are too variable to meaningfully
summarise and illustrate. These are products of the variable oxidation of bronze and
interaction with the crucible slag.
6. CuCl: See section 8.2.4.

Frederik Rademakers Appendix K 631
(a) Cuprite prills (bright), Gordion-27636 (b) Cuprite prills (bright) in between plagioclase
(dark grey), Gordion-23797
(c) Cuprite (light grey) crystallised in pore, Gordion-
23797
Figure K.12: Cuprite

632 Appendix K Frederik Rademakers
(a) Copper-chlorine oxide prills (light grey) in
deeper slag, Gordion-28877
(b) Copper-chlorine oxide prills (bright) in deeper
slag, Gordion-25394
(c) Copper-chlorine oxide corrosion (light grey)
around metallic bronze core (bright), Gordion-
22958
(d) Copper-chlorine oxide (light grey) with tin oxide
(white), Gordion-25394
(e) Copper-chlorine oxide crystals (light grey) in
pore, with tin oxide (white), Gordion-22999
(f) String of copper-chlorine oxide (light grey, ar-
rows) running through slag with spinel (light grey,
slightly darker), Gordion-23329
Figure K.13: Cu2ClO2-Cu2ClO3

Frederik Rademakers Appendix K 633
(a) Pore filled with copper-chlorine oxide (light
grey)
(b) Copper-chlorine oxide (light grey) in between
other oxides in dross layer
(c) Copper-chlorine oxide (medium-light grey) at
interior crucible surface (with thin Cu2S layer, light
grey), running to interior
Figure K.14: Cu2ClO2-Cu2ClO3 in Gordion-28932 (2)
Figure K.15: Cu3Pb2Cl3O2 (white) in dross layer of Gordion-22673 (tin oxide is light grey)

634 Appendix K Frederik Rademakers
(a) Gordion-22626 (b) Gordion-25569-A
(c) Laths in Gordion-25569-A (d) Laths (close), Gordion-25569-A
Figure K.16: Delafossite (white)
Figure K.17: Variable Cu-Sn oxides in Gordion-22626 and -22673-A

Frederik Rademakers Appendix K 635
Section K.4
Sn-bearing oxides
The same two tin oxide types noted for Pi-Ramesse crucibles are found in Gordion:
1. Tin oxide: SnO2 crystals occur abundantly in 61% of the analysed Gordion crucibles.
The shape of these newly formed crystals shows the same variability as those seen in
the Pi-Ramesse crucibles (see sections D.4 and 5.4.5.1 for further discussion), with
some examples shown in Figure K.18.
There are no clear examples of residual mineral cassiterite (see section 5.4.5.2 for
examples) in the Gordion crucibles. The few examples showing some resemblance
to mineral grains (though not convincing) are shown in Figure K.19. These clusters
are mostly re-crystallised, but stand out due to the absence of associated copper-,
iron- or other oxides (which point to tin burning out of bronze).
2. Malayaite: An oxide similar to malayaite (CaSnO(SiO4)) occurs, though significant
substitution occurs, resulting in an approximate (Ca,Mg)(Sn,Fe)O((Si,Al)O4) com-
position, with Ca/Mg ≈ 12/1, Sn/Fe ≈ 7/4 and Si/Al ≈ 2/1. It has been noted in 26%
of the Gordion crucible samples, typically in association with SnO2 crystals. Some
examples are shown in Figure K.20.
3. Cu-Sn oxides and silicates: See section K.3.

636 Appendix K Frederik Rademakers
(a) Around (tin-depleted) leaded bronze prill,
Gordion-23045-S
(b) Gordion-23797
(c) With bronze core, Gordion-23329 (d) With copper (oxide) in crystal core, Gordion-
23797
(e) Cluster, Gordion-25394 (f) Cluster with Fe- and Cu-oxides, Gordion-22958
Figure K.18: SnO2 (bright, angular)

Frederik Rademakers Appendix K 637
(a) Only good example of possible residual cassi-
terite, Gordion-25394-C
(b) Residual cassiterite (upper right)? Gordion-
25394-A
(c) Strongly re-crystallised cassiterite? Gordion-
25394-C
(d) Fully re-crystallised cassiterite? Gordion-25394-
C
Figure K.19: Examples of (somewhat) cassiterite-like SnO2 (bright)

638 Appendix K Frederik Rademakers
(a) Malayaite (light grey) with SnO2 (white),
Gordion-25568
(b) Malayaite (light grey) with SnO2 (white) and Cu-
(Cl-)oxides (light-medium grey), Gordion-25568
(c) Malayaite (medium grey) with bronze prills (light
grey), Gordion-25568
(d) Malayaite with tin oxide and iron-rich prills with
spinel, Gordion-25394
Figure K.20: Malayaite

Frederik Rademakers Appendix K 639
Section K.5
Pb-bearing oxides
Low lead levels occur in some of the copper and tin oxides (section K.3), but several lead-
based oxides occur in some crucibles.
1. Lead oxides and silicates: Lead oxides and silicates of variable composition (±Pb3O4
and±(Pb,Cu)(Fe,Al)(Na,Mg,K,Ca)Si2O7) were measured in 20% of Gordion crucibles.
In a few cases, lead-chlorine oxides ((Cu,Pb)3ClO - Pb3ClO2 and Pb2Ca3(P,Cl)3O11)
have been noted too. Some examples are shown in Figure K.21.
2. Lead sulphate: PbSO4 (with 1-7 at% Cu) has been noted in Gordion 23128 (Figure
K.22).
3. Lead-potassium sulphite/sulphate: A prill with approximate PbK2S2O7 composition
(or potassium sulphate K2SO4 + lead sulphite PbSO3) has been noted in Gordion-
27640, with a Cu2ClO3 layer surrounding it, as shown in Figure K.23.

640 Appendix K Frederik Rademakers
(a) Lead oxides (with copper and tin oxides) sur-
rounding cuprite prill
(b) Lead oxides (with copper and tin oxides) in
drossy zone
(c) Lead-chlorine oxides with K-feldspar in drossy
zone
Figure K.21: Lead oxides in Gordion-22763-B
(a) Copper prill with cuprite edge and lead sulphate (b) Fully oxidised prill (all cuprite) with lead sul-
phate prills and tin oxide
Figure K.22: Lead sulphate in Gordion-23128

Frederik Rademakers Appendix K 641
(a) PbK2S2O7 (large white prill, lower left) with
copper-chlorine oxide rim (light grey) and sur-
rounding SnO2 (white)
(b) PbK2S2O7 with copper-chlorine oxide rim and
surrounding SnO2, close-up
(c) PbK2S2O7 crack filling and copper-chlorine ox-
ide
Figure K.23: PbK2S2O7 in Gordion-27640

642 Appendix K Frederik Rademakers

APPENDIX L
Composition of metallic prills
Oxidised prills are omitted. Where an abundance of 1+ is noted, this refers to one mea-
sured prill, but probably more of similar composition present in the crucible slag. Micro
refers to tiny prills dispersed throughout the crucible slag, which are too small to measure.
Composition of metallic prills in crucible slag (in wt%)Sample Abundance Cu Sn Fe As Sb Co Ni Pb Ag Zn S Cl
Gordion 21299 - 15.10.2013 /
Gordion 22529 - 13.9.2013
Multi 95-96 4-5
Multi 1 0.5 91 7.5
Multi 95.2 2.7 0.4 0.6 1.1
Multi 90-94 0-1 6-10
Gordion 22626 - 15.10.2013
Multi 99.4 0.6
1+ (small, 3 φ) 44.6 17 37.4 1
→ phase a 75.1 13.5 7.3 4.1
→ phase b2.6 97.4
3.5 96.5
→ phase c 5.1 1.8 93.1
1 (small, 2 φ)
→ phase a1.9 98.1
2.6 97.4
→ phase b62.2 30.6 7.2
63.6 23.7 10.1 2.7
Gordion 22673 - 15.1.2014 /
In corr layerMulti 70.8 27.7 1.5
Multi 63.5 0.5 36
Gordion 22673-A - 15.10.2013Multi 82-92 7.5-16.5 0.5-1.5
1+ 73.4 25.1 1.5
Gordion 22673-B - 15.10.2013 /
Gordion 22829 - 15.10.2013 /
Gordion 22958 - 9.4.2013
1+ 65.8 32.5 0.6 1.1
1+ 92.8 7.2
Corrosion 52.2 17.3 1.5 1.9 27.1
1+ 57.2 42.3 0.5
Gordion 22999 - 13.9.2013 Multi 92-94 6-8
Gordion 23045-A - 15.10.2013 /
Gordion 23045-B - 15.10.2013
Multi 81.5-86 10-16 1.1-1.4 1.4-3
1+ 75.9 20.4 1.4 2.3
Multi 62.5-64.5 32.8-33.8 1.5-2.1 1-1.6
Gordion 23045-S - 15.10.2013
1+ (CuCl) 63.5 0.4 36.2
1+ (Cu5Pb2O7) 31.9 41.6 26.5
1+ 97 1.2 1.8
1+ 98.1 0.6 1.3
643

644 Appendix L Frederik Rademakers
Composition of metallic prills in crucible slag (in wt%)Sample Abundance Cu Sn Fe As Sb Co Ni Pb Ag Zn S Cl
Gordion 23128 - 13.9.2013Multi 100
1+ 97 3
Gordion 23329 - 9.4.2013 Multi 90.7-91.1 5.1-5.7 3.5-4.2
In corr layer Multi 97-99 1-3
Gordion 23329 - 15.1.2014
1 98.1 1.9
Inclusion 80.1 19.9
Inclusion (ox) 21.5 64.9 10.3
1+ 95.8 1.3 2.9
1+ 98.8 1.2
Gordion 23523 - 15.10.2013 /
Gordion 23707 - 9.4.2013 Multi 97-98 2-3
In corr layer /
Gordion 23707 - 15.1.20141+ 66.8 33.2
Multi 96.7-99 1-3.3
Gordion 23778 - 13.9.2013
Multi 89-91 7.5-9.5 1.5-2
Multi 73-74 23-24 1-1.5 1-2 0-0.9
Multi 66.7-67.7 30-31 0.7-1 1.3-1.6
Gordion 23797 - 9.4.20131+ 57.6 42.4
1+ 45.8 51.6 2.7
Gordion 25368 - 13.9.2013
1+ 60.5 39.5
Pb inclusion 55.2 36.3 8.5
Multi 71-74 25-28.5 0.5-0.6
1+ 93.5 6.1 0.5
Gordion 25394 - 9.4.2013 1+ 88.8 7.9 3.3
Gordion 25394_A - 13.9.2013 Multi (tiny) 81-83 13-14.6 1.4-1.8 1.1-2.8
Gordion 25394_B - 13.9.2013 1+ 98.7 1.3
Gordion 25568 - 9.4.2013
1 (large, 3 φ) 73.6 22.8 0.1 3.5
→ phase a 84 16
→ phase b 67-69 31-33
→ phase c 55-61 11.5 27.5-33.5
Multi 82-89 11-15 0.5-09 0-1.1
1+ 87.6 7 4.4 1.1
1+ (corr) 95.5 3.1 1.4
Multi 60-74 23-34 0-8
Multi 85.5-97.5 2.5-14.5
1+ 91.8 7.2 1.1
Gordion 25568 - 15.1.2014 Multi 56-61 35-39 1.1-2.3 0.6-0.9 1.5-1.6
Gordion 25569-A - 15.10.2013 Multi 99 1
Gordion 25569-B - 15.10.2013 Multi 92-98.5 0-4 1.5-4
Gordion 26891 - 9.4.2013
Multi 96.5-99.5 0-0.5 0.5-3
1+ 90 5.9 4.1
1+ 62.7 1.5 1.5 3.4 31
1 99.1 0.9
Pb inclusion 62.1 1.4 0.8 35.7
1 99.1 0.9
Inclusion approximately Pb4Cu5Cl4O6Corrosion Cu2O corrosion
1 97.4 2.6
Inclusion approximately Pb6Cu3Cl5O5
Gordion 27609 - 15.10-2013 /
Gordion 27609-S - 15.10.2013
1+ (CuCl) 64.2 35.8
1+ 92.8 6.4 0.8
Multi 88-95 4-11 0-4 0-1
Gordion 27613_A 13.9.2013 /
Gordion 27613_B - 13.9.2013 /
Gordion 27629 - 15.10.2013 /
Gordion 27634 - 12.11.2013 1 (in pore) 2.9 0.7 96.4
Gordion 27635 (1) - 12.11.2013 /
Gordion 27635 (2) - 12.11.2013
1+ 75 21.6 2 1.4
Multi 74-84 15-25 0.5-0.8
1+ 98.4 1.6
Gordion 27636 - 9.4.2013
1+ 88.1 10.2 1.7
1+ 91.7 6.9 1.5
1+ 90.4 7.4 2.2
Gordion 27638 - 12.11.2013 1+ (tiny)7.5 90.6 1.9
(+ 1-3 wt% Al, Si and Ca)
Gordion 27640 - 12.11.2013
1+ 96.5 3.5
1+ 94.7 0.7 0.6 3.9
Multi 93-95 4-5 1-2
Multi 94-95 2.6-3.1 0.8-1.1 1.7

Frederik Rademakers Appendix L 645
Composition of metallic prills in crucible slag (in wt%)Sample Abundance Cu Sn Fe As Sb Co Ni Pb Ag Zn S Cl
In corr layer /
Gordion 27734 (1) - 12.11.2013
1+ 97.6 2.4
1+ 75.4 22.6 1 0.9
Multi 62-66 33.5-37 0.4-1.2 0-0.8
Gordion 28218 - 12.11.2013 1+ 92.1 7.1 0.8
Gordion 28236 - 9.4.2013 1+100
(with Cu-Cl-ox corrosion)
Gordion 28877 - 9.4.2013 Multi 96-99 1-4
Gordion 28932 (1) - 12.11.2013
Multi 93-95 3-6.5 0.5-1.4 0-1.6
1+ 99 1
1+ 98.7 0.6 0.7
Gordion 28932 (2) - 12.11.2013 Multi 99-99.6 0.4-1

646 Appendix L Frederik Rademakers

APPENDIX M
Metals analysis
Section M.1
Analysis of metal spills and objects
Five samples of corroded metal spills and objects were analysed by the author (one from
find bag 25545 and four from 22611, which contains several more corroded pieces). Sam-
ples were mounted in resin, ground and polished (procedure as outlined for crucibles,
sections 3.2.3 and 3.3.3), and analysed by optical microscopy and SEM-EDS. Detailed dis-
cussion of the various corrosion products is beyond the scope of this research. The aim
here is to approximate the original alloy composition of the (partially) corroded samples.
All compositional results are presented in wt%.
Find bag 25545 contains samples from Operation 1, Locus 7, Lot 14, phase 410.18 (Late
Phrygian)1 and find bag 22611 contains samples from Operation 1, Locus 82, Lot 162,
phase 420 (Late Phrygian)2.
M.1.1 Gordion-25545
This sample of a metal spill is entirely corroded, with only tiny metallic fragments remain-
ing. Some remnant dendritic structure can be seen, indicative of an as cast structure. The
1Oval pit, cut above ruins of Building I, east end of trench. Lot took out fine ashy brown soil, charcoal
‘stains’. Dark ‘greasy’ soil, lumps of mud brick; hard yellow clayey lense at bottom.2Description C, Appendix I.
647

648 Appendix M Frederik Rademakers
corrosion products are predominantly copper oxides and chloride(-oxide)s, with variable
amounts of tin and lead. Minor Fe and Ni are noted in some areas as well. This is illus-
trated in Figure M.1 and Table M.1. Some of the oxides (e.g., tin oxides, third image) were
probably formed at high temperature before post-depositional corrosion of the spill. The
exact original composition of this spill is difficult to reconstruct, but it was most likely a
leaded tin bronze.
M.1.2 Gordion-22611: ring
This sample appears have been cast into a ring-shaped form with a rectangular edge and
subsequently corroded, as shown in Figure 8.35. Some micrographs are shown in Figure
M.2, with matching compositions in Table M.2. The ring has a metal core, with both lead-
rich and cuprite inclusions, and with various oxide and chloride(-oxide) corrosion prod-
ucts surrounding and penetrating the metal core. Its bulk composition is approximately
90-92 wt% Cu, 6-7 wt% Sn and 1-1.5 wt% Pb.
M.1.3 Gordion-22611: large fragment
This is the largest fragment in find bag 22611, shown in Figure 8.36. Micrographs are
shown in Figures M.3 and M.4, with matching compositions in Table M.3.
It is characterised by a metallic core (varying from pure copper to leaded tin bronze with
approximately 6-12 wt% Sn and 0-2 wt% Pb) with large amounts of SnO2 high-temperature
crystals, formed during oxidising casting conditions. Image 6, spectrum 3 shows the core
of such a tin oxide crystal filled with highly leaded copper.
Surrounding (and in some areas penetrating) this metallic core, various oxide and chloride(-
oxide) corrosion products occur. This object probably had a similar original composition
to Gordion-22611 ring.
M.1.4 Gordion-22611: medium fragment
Micrographs are shown in Figure M.5, with matching compositions in Table M.4.
This sample is a solid metallic prill with a dendritic, as cast structure, and limited corro-
sion (chloride and sulphide oxide) on its exterior surface. The prill consists of leaded tin
bronze, with an approximate composition of 89-90 wt% Cu, 8-9 wt% Sn and 1.5-2 wt% Pb.
The lead is present as insoluble inclusions (Cu-Pb-Cl oxides) in a dendritic tin bronze (tin
content varies from 2 to 26 wt% between the dendrite core and outer dendrite layers). This

Frederik Rademakers Appendix M 649
lead was probably originally present as metallic droplets dispersed throughout the bronze,
but preferentially corroded post-depositionally to (Cl-)oxides. Note the minor presence of
antimony as well.
M.1.5 Gordion-22611: small fragment
Micrographs are shown in Figure M.6, with matching compositions in Table M.5.
This sample is again a small drop with metal core and corroded exterior. No lead is present
in this prill. It appears to be a tin bronze with an approximate tin content of 10-11 wt% Sn,
with intergranular corrosion connected to the exterior corrosion layer, comprising copper
and copper-tin oxides and chloride(-oxide)s.

650 Appendix M Frederik Rademakers
Figure M.1: Gordion-25545

Frederik Rademakers Appendix M 651
O Si S Cl K Ca Fe Ni Cu As Sr Sn Pb Total
Image 1
Spectrum 1 24.3 13.0 13.4 2.4 46.9 100
Spectrum 2 35.5 64.5 100
Image 2
Spectrum 1 22.5 4.1 8.3 0.5 33.7 1.1 27.1 2.8 100
Spectrum 2 18.7 047 1.8 62.4 1.1 13.6 1.9 100
Spectrum 3 23.3 2.4 10.1 39.8 1.1 20.4 2.9 100
Spectrum 4 19.5 0.3 1.7 65.9 0.8 11.8 100
Spectrum 5 30.5 2.0 0.3 4.7 0.9 21.5 2.2 35.2 2.8 100
Image 3
Spectrum 1 28.2 1.4 70.5 100
Spectrum 2 18.6 0.4 0.5 59.3 0.9 18.4 2.0 100
Spectrum 3 15.0 2.4 74.1 0.5 6.8 1.2 100
Image 4
Spectrum 1 5.6 1.3 0.6 2.1 46.0 0.9 42.3 1.2 100
Spectrum 2 23.9 3.7 2.3 0.9 0.5 12.6 2.1 49.8 4.2 100
Spectrum 3 0.3 0.8 1.9 59.9 37.0 100
Spectrum 4 22.4 0.7 14.9 51.0 9.3 1.7 100
Image 5
Spectrum 1 20.1 17.8 62.2 100
Spectrum 2 10.2 0.6 0.7 87.5 1.1 100
Spectrum 3 19.5 10.9 1.4 68 100
Spectrum 4 26.7 15.2 0.4 16.5 1.0 2.1 6.1 32.0 100
Table M.1: Compositional analysis Gordion-25545 (in wt%)

652 Appendix M Frederik Rademakers
Figure M.2: Gordion-22611: ring

Frederik Rademakers Appendix M 653
O P S Cl Fe Cu Mo Sn Pb Total
Image 1
Frame analysis 1.7 1.3 0.4 89.6 7.1 100
Spectrum 2 92.6 7.4 100
Spectrum 3 0.4 94.2 5.4 100
Image 2
Frame analysis 92.2 6.3 1.5 100
Spectrum 2 14.5 12.9 72.6 100
Spectrum 3 11.5 8.5 80.0 100
Spectrum 4 10.5 88.7 0.8 100
Spectrum 5 11.6 88.4 100
Image 3
Spectrum 1 13.7 20.3 66.0 100
Spectrum 2 13.3 15.5 71.2 100
Spectrum 3 20.5 79.5 100
Spectrum 4 22.6 2.9 74.6 100
Spectrum 5 93.8 6.2 100
Spectrum 6 0.4 93.3 6.3 100
Image 4
Spectrum 1 12.5 84.3 2.2 1.0 100
Spectrum 2 34.3 65.7 100
Spectrum 3 13.3 3.4 0.3 52.0 5.9 25.0 100
Spectrum 4 95.2 4.8 100
Image 5
Spectrum 1 0.5 92.4 7.2 100
Spectrum 2 32.6 67.4 100
Spectrum 3 11.3 0.6 2.0 70.7 1.7 13.8 100
Spectrum 4 13.8 10.5 5.1 70.6 100
Spectrum 5 2.3 33.6 64.2 100
Image 6
Frame analysis 2.2 0.6 90.3 6.9 100
Spectrum 2 0.4 96.2 3.4 100
Spectrum 3 0.3 92.7 7.0 100
Spectrum 4 18.2 12.7 76.6 100
Spectrum 5 20.4 79.6 100
Spectrum 6 20.8 79.2 100
Spectrum 7 10.6 0.3 89.1 100
Table M.2: Compositional analysis Gordion-22611: ring (in wt%)

654 Appendix M Frederik Rademakers
Figure M.3: Gordion-22611: large fragment

Frederik Rademakers Appendix M 655
Figure M.4: Gordion-22611: large fragment

656 Appendix M Frederik Rademakers
O Si S Cl Fe Co Cu As Sn Sb Pb Total
Image 1
Frame analysis 3.4 0.4 81.3 12.9 2.0 100
Image 2
Frame analysis 2.0 0.4 89.7 6.3 1.6 100
Image 3
Frame analysis 5.3 0.6 3.8 0.6 74.9 0.7 12.0 2.3 100
Image 4
Spectrum 1 8.1 6.8 4.8 6.5 73.8 100
Spectrum 2 8.8 4.0 7.5 3.2 76.5 100
Spectrum 3 5.6 10.5 4.6 3.4 75.8 100
Spectrum 4 26.6 2.4 71.1 100
Spectrum 5 26.7 0.6 72.7 100
Spectrum 6 25.3 1.6 73.1 100
Image 5
Spectrum 1 14.9 11.1 1.0 73.1 100
Spectrum 2 1.5 92.9 4.0 1.5 100
Spectrum 3 10.4 0.3 89.4 100
Image 6
Spectrum 1 9.1 5.5 6.0 4.0 75.4 100
Spectrum 2 6.3 21.9 3.9 4.5 63.5 100
Spectrum 3 93.4 6.6 100
Spectrum 4 1.0 99.0 100
Spectrum 5 9.1 6.9 84.0 100
Spectrum 6 100 100
Spectrum 7 100 100
Spectrum 8 100 100
Image 7
Spectrum 1 11.3 8.5 3.6 14.0 62.6 100
Spectrum 2 26.0 2.0 72.0 100
Spectrum 3 16.6 1.2 4.2 0.9 10.2 1.8 5.3 19.7 39.6 100
Spectrum 4 100 100
Image 8
Spectrum 1 13.2 7.3 5.0 26.1 48.4 100
Spectrum 2 100 100
Spectrum 3 27.9 1.8 70.3 100
Image 9
Spectrum 1 34.3 65.7 100
Spectrum 2 100 100
Spectrum 3 9.7 0.3 90.1 100
Image 10
Spectrum 1 12.0 0.5 20.7 50.3 13.4 1.0 2.2 100
Spectrum 2 3.0 32.5 64.5 100
Spectrum 3 12.1 2.4 72.4 11.4 1.8 100
Image 11
Spectrum 1 3.2 31.6 65.2 100
Spectrum 2 3.0 32.6 64.4 100
Spectrum 3 10.6 1.0 0.4 87.1 1.0 100
Spectrum 4 22.3 16.1 0.3 61.3 100
Spectrum 5 22.8 17.0 60.2 100
Table M.3: Compositional analysis Gordion-22611: large fragment (in wt%)

Frederik Rademakers Appendix M 657
Figure M.5: Gordion-22611: medium fragment

658 Appendix M Frederik Rademakers
O S Cl Cu As Sr Sn Sb Pb Total
Image 1
Frame analysis 89.7 8.4 2.0 100
Image 2
Frame analysis 90.3 8.2 1.5 100
Image 3
Frame analysis 89.0 9.0 2.1 100
Image 4
Spectrum 1 3.8 10.3 29.3 0.8 55.9 100
Spectrum 2 14.7 32.2 53.1 100
Spectrum 3 13.8 29.4 1.0 55.8 100
Spectrum 4 3.1 4.8 20.5 1.8 69.8 100
Spectrum 5 72.6 26.1 1.3 100
Spectrum 6 70.9 27.4 1.7 100
Spectrum 7 74.3 1.0 24.7 100
Spectrum 8 97.8 2.2 100
Spectrum 9 97.5 2.5 100
Spectrum 10 96.2 3.8 100
Spectrum 11 90.2 9.8 100
Spectrum 12 89.1 10.9 100
Spectrum 13 88.1 10.6 1.3 100
Spectrum 14 0.4 88.5 8.0 3.2 100
Image 5
Spectrum 1 88.0 9.0 3.1 100
Spectrum 2 90.6 8.2 1.2 100
Spectrum 3 90.8 7.9 1.4 100
Spectrum 4 90.4 8.1 1.5 100
Spectrum 5 89.4 8.9 1.6 100
Image 6
Spectrum 1 35.6 64.4 100
Spectrum 2 16.7 10.7 4.8 1.4 66.5 100
Spectrum 3 15.6 10.7 3.8 69.9 100
Table M.4: Compositional analysis Gordion-22611: medium fragment (in wt%)

Frederik Rademakers Appendix M 659
Figure M.6: Gordion-22611: small fragment
O Mg Si Cl Fe Cu Sn Total
Image 1
Frame analysis 7.1 0.5 0.4 77.6 14.4 100
Spectrum 2 90.2 9.8 100
Spectrum 3 89.3 10.7 100
Spectrum 4 24.9 1.0 1.5 41.6 31.0 100
Spectrum 5 12.4 81.2 6.4 100
Image 2
Spectrum 1 89.6 10.4 100
Spectrum 2 11.8 0.3 82.7 5.2 100
Spectrum 3 21.4 0.9 15.6 55.8 6.3 100
Image 3
Spectrum 1 22.1 17.5 60.5 100
Spectrum 2 24.1 1.6 14.8 52.9 6.7 100
Spectrum 3 14.3 3.1 76.2 6.4 100
Image 4
Spectrum 1 89.6 10.4 100
Spectrum 2 89.1 11.0 100
Spectrum 3 13.9 0.3 74.1 11.7 100
Spectrum 4 24.9 0.9 1.2 1.0 20.9 51.1 100
Table M.5: Compositional analysis Gordion-22611: small fragment (in wt%)

660 Appendix M Frederik Rademakers
Section M.2
MASCA Report
A succinct report on some metal samples from Gordion was prepared by Pigott et al.
(1991), of which the results are briefly reproduced here. PIXE as well as microscopic anal-
ysis of etched sections was undertaken. Contextual data for the samples is given in Table
M.6. Results of their analysis are given in Table M.7.
Reference Artefact OP Locus Lot Phase Date Context
YH 32328 spiral fragment 2 87 317 530 650 - Islamic MP Good
YH 22882B amorphous lump/prill 2 66 57 430 650 - Islamic MP Prime
YH 22882A folded sheet 2 66 57 430 650 - Islamic - MP Prime
YH 23257B amorphous lump/prill 7 21 28 370 400 - Islamic - LP Prime
YH 30995 nail (or stud) 2 82 257 480 650- Islamic - MP Good?
YH 23736 triangular lump 1 98 223 430 700 - Islamic Prime
YH 31915 arrow (spear?) head 12 27 35 540 650 - 500 MP Good?
YH 29997 rod, circular section 14 39 90 870 Old-Hittite - 700 Prime
YH 23085 rod, flattened 1 94 191 430 700 - Islamic Good
Table M.6: Contextual data for analysed samples
Reference Cu As Sn Pb Cl Micro-structure
YH 32328 80.2 0.467 15.00 0.689 1.118 cast - cast/annealed - intergranular corrosion
YH 22882B 82.9 0.651 11.05 1.695 2.196 as cast - heavy intergranular corrosion
YH 22882A 79.9 0.127 14.64 0.131 2.513 cold worked/annealed - heavy intergranular corrosion
YH 23257B 93.6 0.108 4.33 0.939 0.048 as cast - solid to Cu-CuO eutectic with SnO2 laths
YH 30995 95.3 0.148 3.47 0.072 0.004 cold worked - inhomogenous annealing
YH 23736 88.6 0.129 10.20 < 0.025 0.018 as cast, gas pores - corroded dendrites, matte inclusions
YH 31915 79.2 0.052 16.40 1.285 1.972 as cast (rapid cooling), heavily corroded
YH 29997 76.8 0.479 20.03 < 0.031 1.013 as cast - heavy intergranular corrosion, intragranular SnO2 inclusions
YH 23085 87.1 0.521 6.65 0.039 4.043 too heavily corroded
Table M.7: Results of PIXE analysis and microscopic investigation

APPENDIX N
Moulds
Pictures of tentatively identified moulds, discussed in section 8.5, are shown here, as well
as a few drawings.
Full discussion is beyond the scope of this project, but these varied fragments serve as an
indicator for the range of shapes that would have been cast in Gordion.
661

662 Appendix N Frederik Rademakers
Figure N.1: Two mould fragments with angular shapes

Frederik Rademakers Appendix N 663
Figure N.2: Possible sprue, through which metal would have been poured into the mould
Figure N.3: Layered mould fragment, possibly indicating use of existing ceramic with ad-
ditional clay layer

664 Appendix N Frederik Rademakers
Figure N.4: Three mould fragments for elongated shapes, possibly rods

Frederik Rademakers Appendix N 665
Figure N.5: Example of ring-shaped moulds

666 Appendix N Frederik Rademakers
Figure N.6: Example of ring-shaped moulds (see Figure 8.37)

Roman Thrace Appendices
667

668 Frederik Rademakers

APPENDIX O
Bulk Compositions
In this appendix, compositional data for each of the Roman assemblages is presented. The
bulk composition of both crucible ceramic and crucible slag is given in the first two tables,
while the final three tables show the ratios of elements to Al2O3 for ceramic, slag and the
change between them respectively.
Section O.1
Nicopolis bulk compositions
Average ceramic composition. All results in wt%, normalised to 100%.Sample Na2O MgO Al2O3 SiO2 P2O5 K2O CaO TiO2 FeO CuO ZnO SnO2 PbO
N1 0.1 0.8 9 84 0 1.4 0.7 0.7 3.5 0 0 0 0
Std. dev. (5 ms) 0.1 0.1 1 1 0.1 0.1 0.2 0.6 0.2 0.1 0.3 0.1 0.1
Min. 0 0.7 8 82 0 1.3 0.5 0.3 3.3 0 0 0 0
Max. 0.3 0.9 10 85 0.1 1.5 1.0 1.7 3.8 0.2 0.3 0 0.2
N2 (1) - A 1.0 3.0 13 59 0.3 3.1 14.6 0.7 5.3 0.6
Std. dev. (5 ms) 0.1 0.1 1 2 0.1 0.2 0.7 0.2 0.3 0.2
Min. 0.9 2.8 12 56 0.2 2.9 13.6 0.4 4.7 0.3
Max. 1.2 3.1 13 60 0.5 3.4 15.4 0.8 5.6 0.8
N2 (1) - B 1.4 2.0 12 64 1.3 3.3 9.7 0.8 5.0 0.3
Std. dev. (5 ms) 0.1 0.2 0 2 0.3 0 0.8 0.1 0.3 0.2
Min. 1.2 1.8 12 61 0.8 3.2 9.0 0.7 4.7 0
Max. 1.4 2.3 13 66 1.8 3.3 11.0 0.9 5.3 0.6
N2 (2) - A 1.3 2.2 12 64 0.9 3.1 10.6 0.7 4.7 0.4
Std. dev. (5 ms) 0.1 0.2 1 1 0.2 0.2 1.3 0.1 0.2 0.2
Min. 1.1 2.0 11 63 0.6 2.9 9.1 0.6 4.4 0.2
Max. 1.4 2.5 13 65 1.1 3.4 12.6 0.9 5.0 0.7
N2 (2) - B 1.3 2.3 12 63 0.8 3.0 11.4 0.7 5.0 0.3
Std. dev. (5 ms) 0.2 0.1 1 1 0.1 0.2 2.0 0.1 0.4 0.2
Min. 1.0 2.2 12 60 0.6 2.8 10.0 0.7 4.5 0
Max. 1.4 2.5 13 64 1.0 3.2 14.9 0.9 5.6 0.5
N3 0.4 0.7 9 83 0.2 2.0 0.8 0.5 3.4 0.1 0 0.4
Std. dev. (5 ms) 0.2 0.1 1 3 0.2 0.4 0.1 0.1 0.5 0.1 0.1 0.2
669

670 Appendix O Frederik Rademakers
Average ceramic composition. All results in wt%, normalised to 100%.Sample Na2O MgO Al2O3 SiO2 P2O5 K2O CaO TiO2 FeO CuO ZnO SnO2 PbO
Min. 0.3 0.6 7 80 0 1.7 0.7 0.4 2.6 0 0 0
Max. 0.6 0.8 10 86 0.4 2.5 1.0 0.7 3.9 0.3 0.1 0.6
N4 0.7 0.9 22 69 0.2 2.0 1.7 1.0 2.5 0.1
Std. dev. (5 ms) 0.1 0.1 2 2 0.4 0.1 1.2 0.3 0.1 0.1
Min. 0.6 0.7 20 66 0 1.9 0.9 0.6 2.3 0
Max. 0.7 1.0 24 72 0.9 2.3 3.8 1.4 2.6 0.2
N4 (exterior) 1.8 1.6 8 70 1.5 5.2 8.3 0.4 2.8 0
Std. dev. (5 ms) 0.3 0.6 1 5 0.7 1.0 4.5 0.1 0.2 0.1
Min. 1.5 1.0 6 63 0.6 4.1 3.1 0.3 2.5 0
Max. 2.2 2.4 9 78 2.4 6.6 13.2 0.6 3.0 0.1
N5 0.9 0.9 24 65 0.1 3.0 1.9 0.8 2.5 0.3 0 0
Std. dev. (5 ms) 0.2 0.3 3 2 0.1 1.0 1.2 0.1 0.2 0.4 0.2 0.1
Min. 0.7 0.5 20 62 0 2.0 0.8 0.7 2.3 0 0 0
Max. 1.2 1.2 27 67 0.2 4.2 3.3 1.0 2.8 1.1 0.2 0.1
N5 (exterior) 1.7 1.5 14 59 0.9 6.4 9.3 0.8 3.6 2.5 0.2 0.2
Std. dev. (5 ms) 0.3 0.5 2 3 0.6 1.0 3.0 0.3 0.5 1.4 0.3 0.1
Min. 1.2 0.8 12 56 0.2 5.2 6.1 0.5 3.1 1.1 0 0
Max. 2.0 1.9 18 62 2.0 7.5 12.5 1.2 4.3 4.5 0.7 0.3
N6 0.4 0.8 7 83 1.5 3.1 0.4 3.2 0.1 0.3 0.2
Std. dev. (5 ms) 0.1 0.1 1 2 0.2 0.4 0.1 0.4 0.2 0.2 0.3
Min. 0.2 0.7 6 81 1.2 2.4 0.2 2.7 0 0 0
Max. 0.6 1.0 8 86 1.7 3.5 0.5 3.6 0.3 0.6 0.6
N6 (interior ceramic) 0.3 0.5 5 87 1.3 0.7 0.4 2.5 0.2 0.4 1.8
Std. dev. (5 ms) 0.1 0.2 1 3 0.3 0.4 0.1 0.3 0.2 0.3 2.4
Min. 0.2 0.3 5 82 1.0 0.2 0.3 2.1 0 0 0.2
Max. 0.4 0.7 6 89 1.7 1.3 0.6 2.7 0.5 0.7 6.1
Average slag composition. All results in wt%, normalised to 100%.Sample Na2O MgO Al2O3 SiO2 P2O5 K2O CaO TiO2 FeO CuO ZnO SnO2 PbO
N1 0.8 1.3 6 35 1.9 4.0 19.4 0.3 22.1 1.5 1.0 4.2 2.5
Std. dev. (5 ms) 0.2 0.1 1 2 0.5 0.6 2.5 0.1 2.3 0.5 0.2 0.6 1.0
Min. 0.6 1.2 5 33 1.5 3.5 16.4 0.2 19.7 0.8 0.7 3.5 1.1
Max. 1.0 1.5 7 38 2.6 5.0 22.0 0.3 25.1 2.1 1.3 5.0 3.5
N2 (1) 1.1 2.5 12 61 1.2 4.6 10.8 0.8 6.0 0.5
Std. dev. (5 ms) 0.2 0.8 2 5 0.7 0.9 0.7 0.3 1.6 0.2
Min. 0.9 1.5 9 58 0.5 3.2 9.8 0.5 4.2 0.4
Max. 1.3 3.6 13 69 2.3 5.3 11.4 1.2 8.6 0.8
N2 (2) 1.2 3.0 12 59 0.4 3.5 13.4 0.7 6.6 0.5
Std. dev. (5 ms) 0.1 0.3 0 3 0.1 0.5 0.8 0.1 1.8 0.4
Min. 1.1 2.7 11 56 0.3 3.0 12.2 0.7 4.2 0
Max. 1.4 3.3 12 63 0.6 4.1 14.0 0.8 8.2 0.9
N3 1.0 1.0 7 68 0.5 2.0 3.0 0.3 5.5 2.9 3.9 5.6
Std. dev. (5 ms) 0.3 0.3 1 8 0.3 0.6 0.8 0.1 1.5 3.1 3.2 4.3
Min. 0.7 0.7 5 57 0.2 1.3 2.2 0.1 3.7 0.5 0.6 1.6
Max. 1.5 1.3 8 78 0.8 2.6 4.2 0.5 7.2 7.6 8.7 12.9
N4 3.4 1.0 9 78 0.2 2.3 2.6 0.6 3.1 0.1
Std. dev. (5 ms) 0.7 0.1 1 1 0.1 0.2 0.8 0.1 0.2 0.1
Min. 2.8 0.9 8 77 0.1 2.0 1.6 0.4 2.8 0
Max. 4.1 1.2 10 80 0.4 2.7 3.7 0.7 3.4 0.2
N5 2.5 0.9 14 64 0.3 1.9 6.9 0.6 4.9 2.1 0.9 1.0
Std. dev. (5 ms) 0.1 0.1 2 6 0.1 0.4 0.6 0.2 2.3 1.6 1.2 1.8
Min. 2.3 0.7 13 54 0.2 1.2 6.0 0.4 3.6 0.1 0.3 0
Max. 2.7 1.0 16 67 0.5 2.3 7.7 0.8 8.9 4.5 3.2 4.2
N5 (lump) 0.7 1.6 16 65 0.5 3.5 3.6 1.0 6.4 0.9 0 0
Std. dev. (5 ms) 0.3 0.1 1 1 0.1 0.4 0.9 0.2 1.0 0.9 0.1 0.2
Min. 0.3 1.6 15 63 0.3 3.1 2.6 0.6 5.1 0.1 0 0
Max. 1.2 1.7 17 67 0.7 3.9 4.8 1.1 7.7 2.4 0 0.3
N6 0.2 0.6 6 63 1.9 3.4 0.4 2.4 0.9 5.8 16.1
Std. dev. (5 ms) 0.2 0.1 2 14 1.1 0.7 0.2 0.9 0.5 5.2 11.3
Min. 0.1 0.4 3 40 1.0 2.3 0.1 1.4 0.4 1.4 4.5
Max. 0.6 0.8 9 74 3.6 4.0 0.6 3.1 1.7 14.6 33.0

Frederik Rademakers Appendix O 671
Ceramic. Ratio of oxides to Al2O3, metals removed.Sample
N a2OAl2O3
M gOAl2O3
SiO2Al2O3
P2O5Al2O3
K2OAl2O3
C aOAl2O3
T iO2Al2O3
FeOAl2O3
N1 0.01 0.09 9.33 0 0.16 0.08 0.08 0.39
N2 (1) - A 0.08 0.23 4.54 0.02 0.24 1.12 0.05 0.41
N2 (1) - B 0.12 0.17 5.33 0.11 0.28 0.81 0.07 0.42
N2 (2) - A 0.11 0.18 5.33 0.08 0.26 0.88 0.06 0.39
N2 (2) - B 0.11 0.19 5.25 0.07 0.25 0.95 0.06 0.42
N3 0.04 0.08 9.22 0.02 0.22 0.09 0.06 0.38
N4 0.03 0.04 3.14 0.01 0.09 0.08 0.05 0.11
N4 (exterior) 0.23 0.20 8.75 0.19 0.65 1.04 0.05 0.35
N5 0.04 0.04 2.71 0 0.13 0.08 0.03 0.10
N5 (exterior) 0.12 0.11 4.21 0.06 0.46 0.66 0.06 0.26
N6 0.06 0.11 11.86 0 0.21 0.44 0.06 0.46
N6 (interior ceramic) 0.06 0.10 17.40 0 0.26 0.14 0.08 0.50
Slag. Ratio of oxides to Al2O3, metals removed.Sample
N a2OAl2O3
M gOAl2O3
SiO2Al2O3
P2O5Al2O3
K2OAl2O3
C aOAl2O3
T iO2Al2O3
FeOAl2O3
N1 0.13 0.22 5.83 0.32 0.67 3.23 0.05 3.68
N2 (1) 0.09 0.21 5.08 0.10 0.38 0.90 0.07 0.50
N2 (2) 0.10 0.25 4.92 0.03 0.29 1.12 0.06 0.55
N3 0.14 0.14 9.71 0.07 0.29 0.43 0.04 0.79
N4 0.38 0.11 8.67 0.02 0.26 0.29 0.07 0.34
N5 0.18 0.06 4.57 0.02 0.14 0.49 0.04 0.35
N5 (lump) 0.04 0.10 4.06 0.03 0.22 0.23 0.06 0.40
N6 0.03 0.10 10.50 0 0.32 0.57 0.07 0.40
Change (in %) in ratio of oxides to Al2O3 between ceramicand slag, metals removed.
SampleN a2OAl2O3
M gOAl2O3
SiO2Al2O3
P2O5Al2O3
K2OAl2O3
C aOAl2O3
T iO2Al2O3
FeOAl2O3
N1 1100 144 -38 ∞ 329 4057 -36 847
N2 (1) -21 25 -5 -8 39 11 0 20
N2 (2) -8 30 -6 -50 17 18 0 32
N3 221 84 5 221 29 382 -23 108
N4 1087 172 176 144 181 274 47 203
N4 (exterior) 607 389 179 1963 615 1243 10 208
N5 376 71 69 414 9 523 29 236
N5 (lump) 17 167 50 650 75 184 88 284
N5 (exterior) 224 186 56 1443 266 739 71 147
N6 -42 -13 -11 / 48 28 17 -13

672 Appendix O Frederik Rademakers
Figure O.1: Change in the ratio C aO/Al2O3 vs M gO/Al2O3, P2O5/Al2O3, K2O/Al2O3, N a2O/Al2O3 and
SiO2/Al2O3, between ceramic and slag (fragments N4 and N5)

Frederik Rademakers Appendix O 673
Section O.2
Philippopolis bulk compositions
O.2.1 P1-P5: ceramic/slag
No clear separation between ceramic and slag, see section 11.1.2.1.
0.4 wt% CoO in sample Bul - P4 - 16-01-2014 has been omitted from the tables below.
Average ceramic/slag composition. All results in wt%, normalised to100%.
Sample Na2O MgO Al2O3 SiO2 P2O5 K2O CaO TiO2 FeO CuO ZnO SnO2 PbO
P1 2.5 1.6 14 55 0.6 3.3 4.7 0.6 4.7 2.3 8.1 2.7
Std. dev. (9 ms) 0.8 0.4 3 8 0.4 0.9 8.0 0.2 0.8 0.9 3.3 2.3
Min. 1.7 0.9 8 44 0 1.9 1.5 0.4 3.4 1.2 1.2 0.8
Max. 4.0 2.3 18 71 1.4 4.9 26.1 1.0 6.2 3.8 11.3 8.1
P2 0.9 0.7 4 14 2.6 0.8 4.4 0.1 3.1 24.7 5.5 21.2 17.9
Std. dev. (7 ms) 0.8 0.6 3 12 2.7 0.8 1.5 0.2 1.7 9.0 2.9 9.1 5.8
Min. 0 0.1 1 3 0.2 0 2.4 0 0.5 14.3 1.7 9.6 11.4
Max. 2.0 1.7 9 37 6.8 2.2 6.5 0.5 6.0 38.8 10.5 38.6 27.9
P3 2 17 4.2 5.5 1.2 25.2 7.9 21.8 14.8
Std. dev. (2 ms) 2 0 2.8 4.9 0.4 3.5 0.7 18.3 4.2
Min. 0 16 2.2 2.0 1.0 22.7 7.4 8.8 11.8
Max. 4 17 6.2 9.0 1.5 27.6 8.4 34.7 17.7
P4 1 7 3.7 1.4 0.9 56.3 1.6 20.9 5.4
Std. dev. (4 ms) 2 5 3.5 1.7 1.8 15.5 3.1 6.8 1.1
Min. 0 1 0 0 0 36.2 0 14.2 4.1
Max. 4 14 8.3 3.4 3.6 72.8 6.2 29.6 6.5
P5 1.1 4 21 1.2 0.8 11.4 1.4 28.8 19.9 5.0 5.6
Std. dev. (3 ms) 0.3 1 5 0.6 0.7 4.3 0.5 16.9 4.8 0.9 0.8
Min. 0.8 2 16 0.7 0.2 7.0 1.1 17.6 14.8 4.2 5.0
Max. 1.3 5 26 1.9 1.5 15.5 2.0 48.2 24.3 6.0 6.5
Ceramic/slag. Ratio of oxides to Al2O3, metals removed.Sample
N a2OAl2O3
M gOAl2O3
SiO2Al2O3
P2O5Al2O3
K2OAl2O3
C aOAl2O3
T iO2Al2O3
FeOAl2O3
P1 0.18 0.11 3.93 0.04 0.24 0.34 0.04 0.34
P2 0.23 0.18 3.50 0.65 0.20 1.10 0.03 0.78
P3 8.50 2.10 2.75 0.60
P4 5.75 3.08 1.17 0.75
P5 0.28 5.25 0.30 0.20 2.85 0.35
O.2.2 P6-P9
2 wt% SO2 in sample Bul - P8 - 17-02-2014 has been omitted from the tables below.
Average ceramic and slag compositions. All results in wt%, normalisedto 100%.
Sample Na2O MgO Al2O3 SiO2 P2O5 K2O CaO TiO2 FeO CuO ZnO Ag2O SnO2 PbO
P6 (ceramic) 1.2 0.8 21 62 1.1 4.7 2.2 0.3 5.6 0.2 0.3 0
Std. dev. (5 ms) 0.2 0.1 3 5 0.4 0.9 0.4 0.2 2.6 0.2 0.4 0.2
Min. 1.0 0.7 16 58 0.6 3.7 1.8 0.2 4.0 0 0 0
Max. 1.6 1.0 24 71 1.6 6.1 2.8 0.6 10.0 0.5 0.8 0.2
P6 (interior) 2.6 1.4 16 51 1.1 3.6 6.0 0.3 2.5 12.5 1.1 2.3
Std. dev. (5 ms) 0.6 0.5 4 5 0.3 1.1 1.6 0.1 0.7 6.0 0.5 1.1
Min. 1.9 0.7 11 44 0.5 2.0 4.2 0.2 1.4 4.9 0.4 0.9

674 Appendix O Frederik Rademakers
Average ceramic and slag compositions. All results in wt%, normalisedto 100%.
Sample Na2O MgO Al2O3 SiO2 P2O5 K2O CaO TiO2 FeO CuO ZnO Ag2O SnO2 PbO
Max. 3.4 2.2 21 55 1.3 5.0 7.6 0.4 3.3 20.2 1.9 3.7
P6 (exterior) 1.2 1.2 22 56 1.7 5.9 6.6 0.5 4.1 0.3 0.3 0.1
Std. dev. (2 ms) 0.5 0.5 2 7 1.2 0.3 5.4 0.2 0.6 0.3 0.3 0.3
Min. 0.6 0.6 20 47 0.6 5.5 2.2 0.2 3.4 0 0 0
Max. 1.6 1.8 24 62 3.2 6.3 14.3 0.7 4.7 0.7 0.6 0.4
P7 (ceramic) 1.4 12 47 11.1 2.9 5.8 4.0 4.1 11.6 0.3 0
Std. dev. (1 ms) 0 0 0 0 0 0 0 0 0 0 0
Min. 1.4 12 47 11.1 2.9 5.8 4.0 4.1 11.6 0.3 0
Max. 1.4 12 47 11.1 2.9 5.8 4.0 4.1 11.6 0.3 0
P7 (dross) 0.4 1 6 2.4 0.1 1.6 0.3 49.7 35.3 2.0 0.9
Std. dev. (6 ms) 0.2 1 4 3.5 0.1 1.3 0.3 13.8 12.4 3.8 1.1
Min. 0.2 0 1 0 0 0.3 0 24.1 18.4 0 0.1
Max. 0.8 2 13 9.2 0.3 3.7 0.6 62.9 49.5 9.8 3.0
P8 (ceramic) 2.4 1.9 18 64 0.3 3.8 2.7 0.7 5.3 0 0 0 0
Std. dev. (5 ms) 0.3 0.1 0 0 0.1 1.0 0.1 0.1 0.4 0.1 0.2 0.2 0.2
Min. 2.0 1.7 18 64 0.1 3.1 2.5 0.6 4.8 0 0 0 0
Max. 2.6 2.0 19 65 0.4 5.5 2.8 0.9 5.9 0.2 0.3 0.3 0.2
P8 (slag) 3.5 1.5 12 46 3.9 3.5 7.1 0.6 3.8 0.9 7.1 0.3 8.2
Std. dev. (4 ms) 0.7 0.6 3 4 1.0 1.0 1.1 0.3 1.3 0.8 2.3 0.9 3.7
Min. 2.6 0.8 10 41 2.5 2.2 5.6 0.4 2.8 0.1 4.1 0 2.7
Max. 4.1 2.1 15 50 5.0 4.6 8.2 1.0 5.4 1.7 9.1 1.4 10.7
P8 (exterior) 2.2 2.2 18 64 0.3 3.5 2.4 0.8 6.0 0 0.1 0.4 0.3
Std. dev. (3 ms) 0.1 0.3 2 5 0.2 0.5 0.4 0.1 1.3 0.1 0.1 0.2 0.2
Min. 2.1 1.8 15 61 0.1 3.0 2.0 0.7 4.8 0 0 0.1 0.2
Max. 2.3 2.5 19 70 0.5 4.1 2.7 0.8 7.4 0.1 0.2 0.6 0.5
P9a (ceramic A) 2.4 1.1 14 72 0.1 3.4 2.0 0.5 3.1 0.1 0.1 0.5 0.2
Std. dev. (2 ms) 0.3 0.4 1 5 0.2 1.7 0.3 0 0.2 0.1 0.1 0.5 0
Min. 2.2 0.9 13 69 0 2.3 1.7 0.5 3.0 0 0.1 0.2 0.2
Max. 2.6 1.4 15 76 0.3 4.6 2.2 0.5 3.3 0.2 0.2 0.8 0.2
P9a (slag A) 2.7 0.6 12 43 1.4 2.5 6.4 0.3 2.2 10.5 1.1 13.6 4.0
Std. dev. (2 ms) 1.1 0 1 3 1.0 0.1 3.9 0.1 0.8 6.3 0.9 4.3 2.5
Min. 2.0 0.6 11 41 0.7 2.4 3.6 0.2 1.6 6.0 0.5 10.6 2.2
Max. 3.5 0.7 12 45 2.1 2.6 9.1 0.4 2.7 14.9 1.8 16.7 5.8
P9a (slag B) 3.1 0.8 14 59 0.2 3.8 4.0 0.4 3.6 4.4 3.5 2.6 0.6
Std. dev. (5 ms) 0.4 0.2 1 4 0.3 1.5 0.4 0.1 1.3 2.3 1.9 1.0 0.3
Min. 2.5 0.5 13 54 0 2.6 3.6 0.2 1.6 2.4 1.7 1.7 0.4
Max. 3.5 1.0 16 64 0.6 6.4 4.4 0.6 5.4 7.7 6.8 4.0 1.1
P9b (ceramic A) 2.5 0.9 15 71 0.2 3.3 2.2 0.6 3.9 0.1 0 0.4 0
Std. dev. (5 ms) 0.8 0.2 2 3 0.2 1.2 0.5 0.3 0.9 0.2 0.2 0.4 0.1
Min. 1.6 0.7 12 68 0 1.8 1.6 0.4 3.1 0 0 0 0
Max. 3.8 1.2 18 74 0.5 5.1 2.9 1.2 5.4 0.3 0.2 1.0 0.2
P9b (slag A) 2.8 1.0 8 34 0.9 1.4 3.7 0.3 5.0 17.0 7.6 11.8 6.5
Std. dev. (5 ms) 1.0 0.2 2 10 0.5 0.5 0.6 0.1 2.0 9.5 5.3 6.4 2.9
Min. 1.7 0.6 6 27 0.4 0.8 3.0 0.1 2.9 6.5 3.3 6.9 3.8
Max. 4.0 1.2 11 50 1.6 2.1 4.5 0.4 7.5 26.8 15.8 21.2 9.7
P9b (ceramic B) 2.5 0.9 15 71 0.3 2.6 2.9 0.5 3.5 0.2 0.3 0.4 0.1
Std. dev. (5 ms) 0.6 0.1 2 5 0.2 0.7 0.8 0.2 0.4 0.4 0.2 0.4 0.1
Min. 1.4 0.8 11 66 0.1 1.9 1.8 0.3 3.0 0 0.1 0 0
Max. 3.0 1.0 17 79 0.7 3.5 3.8 0.9 3.8 0.8 0.7 0.9 0.2
P9b (slag B) 3.3 0.9 11 47 0.4 2.2 3.9 0.3 4.3 10.6 9.2 5.2 1.6
Std. dev. (5 ms) 0.5 0.2 2 7 0.3 0.6 0.7 0.1 0.7 1.8 3.5 1.9 0.4
Min. 2.8 0.7 9 36 0.1 1.5 3.3 0.2 3.7 8.4 7.2 3.1 1.3
Max. 3.8 1.2 13 54 1.0 3.1 5.1 0.4 5.4 13.0 15.2 7.8 2.2
Ceramic and slag. Ratio of oxides to Al2O3, metals removed.Sample
N a2OAl2O3
M gOAl2O3
SiO2Al2O3
P2O5Al2O3
K2OAl2O3
C aOAl2O3
T iO2Al2O3
FeOAl2O3
P6 (ceramic) 0.06 0.04 2.95 0.05 0.22 0.10 0.01 0.27
P6 (interior) 0.16 0.09 3.19 0.07 0.23 0.38 0.02 0.16
P6 (exterior) 0.05 0.05 2.55 0.08 0.27 0.30 0.02 0.19
P7 (ceramic) 0.12 4.06 0.96 0.25 0.50 0.35
P7 (dross) 0.40 6.00 2.40 0.10 1.60 0.30
P8 (ceramic) 0.13 0.11 3.56 0.02 0.21 0.15 0.04 0.29
P8 (slag) 0.29 0.13 3.83 0.33 0.29 0.59 0.05 0.32
P8 (exterior) 0.12 0.12 3.56 0.02 0.19 0.13 0.04 0.33
P9a (ceramic A) 0.17 0.08 5.14 0.01 0.24 0.14 0.04 0.22
P9a (slag A) 0.23 0.05 3.58 0.12 0.21 0.53 0.03 0.18

Frederik Rademakers Appendix O 675
Ceramic and slag. Ratio of oxides to Al2O3, metals removed.Sample
N a2OAl2O3
M gOAl2O3
SiO2Al2O3
P2O5Al2O3
K2OAl2O3
C aOAl2O3
T iO2Al2O3
FeOAl2O3
P9a (slag B) 0.22 0.06 4.21 0.01 0.27 0.29 0.03 0.26
P9b (ceramic A) 0.17 0.06 4.73 0.01 0.22 0.15 0.04 0.26
P9b (slag A) 0.35 0.13 4.25 0.11 0.18 0.46 0.04 0.63
P9b (ceramic B) 0.17 0.06 4.73 0.02 0.17 0.19 0.03 0.23
P9b (slag B) 0.30 0.08 4.27 0.04 0.20 0.35 0.03 0.39
Change (in %) in ratio of oxides to Al2O3 between ceramicand slag, metals removed.
SampleN a2OAl2O3
M gOAl2O3
SiO2Al2O3
P2O5Al2O3
K2OAl2O3
C aOAl2O3
T iO2Al2O3
FeOAl2O3
P6 184 130 8 31 1 258 31 -41
P6 (exterior) -5 30 -16 32 17 65 37 -43
P7 (dross) 237 48 151 -59 218 -13
P8 119 18 8 1850 38 294 29 8
P8 (exterior) -8 16 0 0 -8 -11 14 13
P9a (slag A) 31 -36 -30 1533 -14 273 -30 -17
P9b (slag A) 110 108 -10 744 -20 215 -6 140
P9b (slag B) 80 36 -10 82 15 83 -18 68

676 Appendix O Frederik Rademakers
Section O.3
Serdica bulk compositions
Average ceramic composition. All results in wt%, normalised to 100%.Sample Na2O MgO Al2O3 SiO2 P2O5 SO3 K2O CaO TiO2 FeO CuO ZnO As2O3 Ag2O SnO2 PbO
S1 (A) 1.0 1.5 22 64 0.4 4.3 0.7 1.1 5.1
Std. dev. (4 ms) 0.3 0.2 2 2 0.4 0.4 0.2 0.2 1.2
Min. 0.7 1.2 20 61 0.1 3.8 0.4 0.9 3.4
Max. 1.3 1.7 24 66 0.9 4.6 0.8 1.3 6.2
S1 (B) 1.9 2.3 19 63 0.8 3.5 2.5 0.9 5.6
Std. dev. (2 ms) 0.1 0 0 1 0.2 0.1 0.1 0.1 0.2
Min. 1.8 2.3 19 63 0.7 3.5 2.4 0.8 5.4
Max. 2.0 2.3 19 64 0.9 3.6 2.6 1.0 5.7
S3 1.2 1.3 24 64 4.0 0.9 1.1 4.1
Std. dev. (5 ms) 0.3 0.2 1 2 0.2 0.2 0.2 0.2
Min. 0.9 1.1 22 62 3.8 0.7 0.9 3.8
Max. 1.6 1.6 25 66 4.3 1.3 1.3 4.3
S4 5.9 0.3 25 58 0.5 4.3 0.4 1.8 0.3 2.6 0.1 0.6 0 0.1
Std. dev. (5 ms) 0.2 0.2 1 1 0.1 0.1 0.2 0.5 0.2 1.0 0.3 0.6 0.2 0.2
Min. 5.7 0 24 56 0.5 4.2 0.3 1.4 0.1 1.8 0 0.1 0 0
Max. 6.1 0.6 27 59 0.7 4.4 0.7 2.6 0.6 4.3 0.4 1.6 0.3 0.3
S5 1.2 1.0 24 61 3.1 1.3 1.3 6.3 0.1 0.4 0.2
Std. dev. (4 ms) 0.2 0.2 1 1 0.7 0.2 0.1 0.5 0.1 1.0 0.2
Min. 1.0 0.8 23 60 2.5 1.1 1.1 5.7 0 0 0
Max. 1.4 1.2 25 62 3.9 1.5 1.4 6.7 0.1 1.9 0.5
S6 (vitr. ceramic) 3.2 1.1 15 64 0.6 4.8 3.3 2.6 3.8 1.2 0.7
Std. dev. (8 ms) 0.6 0.2 1 6 0.4 0.8 0.6 0.8 4.7 0.8 0.5
Min. 2.4 0.7 13 53 0.1 3.8 2.4 1.4 0.1 0.1 0.2
Max. 4.1 1.3 16 70 1.2 6.5 4.4 3.5 12.8 2.4 1.3
S7 0.2 0.6 14 79 0 3.4 0.2 0.2 1.1 0.2 0.4
Std. dev. (4 ms) 0.1 0.1 1 1 0.1 0.2 0 0.2 0.1 0.2 0.2
Min. 0.1 0.5 14 79 0 3.2 0.2 0 1.0 0 0.1
Max. 0.4 0.7 15 80 0.1 3.5 0.2 0.4 1.3 0.5 0.6
S9 4.2 1.1 15 69 0.4 4.0 2.9 1.8 1.6 0.5
Std. dev. (6 ms) 0.5 0.2 1 3 0.4 0.3 0.9 0.2 1.6 0.6
Min. 3.7 0.7 13 66 0 3.7 2.3 1.6 0.6 0
Max. 5.1 1.3 16 72 0.9 4.3 4.6 2.1 4.8 1.4
S10 0.9 0.5 12 80 3.3 0.6 1.0 0.2 1.2
Std. dev. (6 ms) 0.3 0.2 3 4 0.4 0.4 0.4 0.2 0.4
Min. 0.5 0.4 9 74 2.9 0.1 0.5 0 0.6
Max. 1.3 0.8 17 84 3.8 1.4 1.4 0.4 1.5
S11 0.1 0.7 14 81 2.9 0.2 1.1 0
Std. dev. (4 ms) 0.2 0.2 3 4 0.5 0.1 0.2 0.1
Min. 0 0.5 11 76 2.5 0.1 0.9 0
Max. 0.3 0.9 17 84 3.5 0.3 1.4 0.2
Average slag composition. All results in wt%, normalised to 100%.Sample Na2O MgO Al2O3 SiO2 P2O5 SO3 K2O CaO TiO2 FeO CuO ZnO As2O3 Ag2O SnO2 PbO
S1 2.3 2.0 15 55 0.7 6.8 2.4 3.9 0.7 8.7 3.1
Std. dev. (4 ms) 1.2 0.4 3 5 0.3 4.7 0.6 2.3 0.2 2.0 4.1
Min. 1.0 1.8 12 48 0.4 3.5 1.5 2.5 0.5 6.8 0.7
Max. 4.0 2.5 18 59 1.0 13.4 2.8 7.4 0.9 11.4 9.3
S3 (bloated) 9.1 1.1 21 59 0.6 4.0 0.9 0.9 3.0
Std. dev. (5 ms) 2.2 0.4 3 4 0.4 0.4 0.3 0.1 0.9
Min. 6.9 0.7 18 53 0.2 3.4 0.5 0.8 1.9
Max. 12.7 1.5 24 65 1.2 4.6 1.3 1.0 3.9
S4 7.5 0.6 16 40 1.0 0.8 2.8 3.3 0.9 2.5 13.0 1.3 6.0 0.9 3.9
Std. dev. (5 ms) 0.4 0.3 3 4 0.1 0.4 0.5 0.4 0.2 0.3 4.9 0.3 0.9 1.3 0.8
Min. 7.0 0.2 12 35 0.8 0.4 2.2 2.9 0.7 1.9 8.4 0.9 4.6 0.2 3.0
Max. 8.0 0.8 18 44 1.1 1.4 3.2 3.8 1.2 2.8 19.4 1.7 6.9 3.3 5.0
S4 (exterior) 5.6 2.7 17 38 3.9 0.2 6.0 16.1 1.4 6.6 1.8 0.1 0.4 0.1 0.3
Std. dev. (5 ms) 0.6 0.2 1 2 0.2 0.5 0.6 3.2 0.1 0.7 0.9 0.3 0.4 0.1 0.2
Min. 5.0 2.5 16 36 3.7 0 5.4 10.8 1.3 5.9 0.7 0 0 0 0
Max. 6.5 3.1 17 40 4.2 0.7 6.9 19.1 1.5 7.7 2.9 0.5 0.9 0.2 0.5

Frederik Rademakers Appendix O 677
Average slag composition. All results in wt%, normalised to 100%.Sample Na2O MgO Al2O3 SiO2 P2O5 K2O CaO TiO2 FeO CuO ZnO Ag2O SnO2 PbO Bi2O3
S5 0.3 1.5 13 27 1.2 1.1 0.5 7.0 8.0 13.5 5.0 22.5
Std. dev. (5 ms) 0.3 0.5 3 12 0.9 0.7 0.3 3.6 3.3 5.5 0.5 11.2
Min. 0 1.0 9 13 0.3 0.2 0.2 4.1 3.6 7.7 4.4 13.7
Max. 0.5 2.1 17 37 2.6 2.1 0.8 13.3 12.4 20.2 5.6 41.4
S5 (exterior) 1.5 1.7 22 57 8.2 2.2 1.0 6.1
Std. dev. (5 ms) 0.1 0.9 2 4 1.9 1.0 0.4 2.4
Min. 1.4 0.8 19 52 6.6 1.0 0.4 2.9
Max. 1.6 3.2 24 62 11.1 3.8 1.4 9.4
S6 (corrosion/dross) 1.1 1.2 7 29 3.0 1.8 6.7 3.3 32.2 11.1 3.1
Std. dev. (6 ms) 1.0 0.4 3 13 1.2 1.1 3.5 2.3 9.7 5.4 1.4
Min. 0 0.8 1 8 1.2 0.2 1.7 0.8 24.8 5.6 2.2
Max. 2.1 1.9 10 39 4.4 3.1 11.4 7.1 50.5 18.7 6.0
S7 1.6 1.6 14 64 1.0 3.8 5.6 0.3 1.8 4.4 1.6
Std. dev. (5 ms) 0.6 0.3 4 4 0.2 1.2 1.3 0.1 0.6 4.0 0.4
Min. 0.9 1.2 8 58 0.6 2.3 3.6 0.1 1.3 1.1 1.0
Max. 2.3 2.0 20 69 1.2 4.9 6.7 0.4 2.4 9.0 2.0
S7 (exterior) 0.6 0.9 16 72 0.6 3.8 2.0 0.1 1.1 0.8 2.7
Std. dev. (1 ms) 0 0 0 0 0 0 0 0 0 0 0
Min. 0.6 0.9 16 72 0.6 3.8 2.0 0.1 1.1 0.8 2.7
Max. 0.6 0.9 16 72 0.6 3.8 2.0 0.1 1.1 0.8 2.7
S8 0.7 0.4 7 50 2.0 1.3 0.5 3.7 0.7 33.9
Std. dev. (5 ms) 0.2 0.2 2 16 0.3 0.5 0.3 1.6 0.4 15.9
Min. 0.4 0.2 5 29 1.6 0.7 0.2 1.8 0.3 14.7
Max. 0.8 0.6 10 68 2.4 2.0 0.9 5.8 1.2 51.7
S9 3.4 1.2 12 51 1.1 1.9 4.4 2.3 17.1 5.5
Std. dev. (1 ms) 0 0 0 0 0 0 0 0 0 0
Min. 3.4 1.2 12 51 1.1 1.9 4.4 2.3 17.1 5.5
Max. 3.4 1.2 12 51 1.1 1.9 4.4 2.3 17.1 5.5
S10 (glazed) 1.8 0.7 14 74 4.4 1.1 0.9 0.1 2.2
Std. dev. (4 ms) 0.3 0.2 2 3 0.5 0.5 0.3 0.3 0.2
Min. 1.3 0.4 13 71 3.6 0.5 0.7 0 1.9
Max. 2.0 0.9 17 77 4.9 1.6 1.4 0.4 2.3
S11 2.9 1.1 15 68 3.8 2.1 3.0 5.0
Std. dev. (5 ms) 1.2 0.3 1 2 0.3 0.9 1.2 4.7
Min. 1.5 0.7 14 64 3.2 1.1 1.5 0.4
Max. 4.4 1.5 16 70 4.1 3.4 4.2 11.4
Sulphur has been omitted from the ‘ratio tables’ below.
Ceramic. Ratio of oxides to Al2O3, metals removed.Sample
N a2OAl2O3
M gOAl2O3
SiO2Al2O3
P2O5Al2O3
K2OAl2O3
C aOAl2O3
T iO2Al2O3
FeOAl2O3
S1 (A) 0.05 0.07 2.91 0 0.20 0.03 0.05 0.23
S1 (B) 0.10 0.12 3.32 0 0.18 0.13 0.05 0.29
S3 0.05 0.05 2.67 0 0.17 0.04 0.05 0.17
S4 0.24 0.01 2.32 0 0.17 0.02 0.07 0.01
S5 0.05 0.04 2.54 0 0.13 0.05 0.05 0.26
S6 (vitr. ceramic) 0.21 0.07 4.27 0.04 0.32 0.22 0 0.17
S7 0.01 0.04 5.64 0 0.24 0.01 0.01 0.08
S9 0.28 0.07 4.60 0.03 0.27 0.19 0 0.12
S10 0.08 0.04 6.67 0 0.28 0.05 0 0.08
S11 0.01 0.05 5.79 0 0.21 0.01 0 0.08
Slag. Ratio of oxides to Al2O3, metals removed.Sample
N a2OAl2O3
M gOAl2O3
SiO2Al2O3
P2O5Al2O3
K2OAl2O3
C aOAl2O3
T iO2Al2O3
FeOAl2O3
S1 0.15 0.13 3.67 0.05 0.16 0.26 0.05 0.58
S3 (bloated) 0.43 0.05 2.81 0 0.19 0.04 0.04 0.14
S4 0.47 0.04 2.50 0.06 0.18 0.21 0.06 0.16
S4 (exterior) 0.33 0.16 2.24 0.23 0.35 0.95 0.08 0.39
S5 0.02 0.12 2.08 0 0.09 0.08 0.04 0.54
S5 (exterior) 0.07 0.08 2.59 0 0.37 0.10 0.05 0.28
S6 (dross) 0.16 0.17 4.14 0.43 0.26 0.96 0 0.47
S7 0.11 0.11 4.57 0.07 0.27 0.40 0.02 0.13
S7 (exterior) 0.04 0.06 4.62 0.04 0.25 0.13 0 0.07
S8 0.10 0.06 7.14 0 0.29 0.19 0.07 0.53

678 Appendix O Frederik Rademakers
Slag. Ratio of oxides to Al2O3, metals removed.Sample
N a2OAl2O3
M gOAl2O3
SiO2Al2O3
P2O5Al2O3
K2OAl2O3
C aOAl2O3
T iO2Al2O3
FeOAl2O3
S9 0.29 0.10 4.38 0.09 0.16 0.37 0 0.20
S10 (glazed) 0.13 0.05 5.29 0 0.31 0.08 0 0.06
S11 0.19 0.07 4.53 0 0.25 0.14 0 0.20
Change (in %) in ratio of oxides to Al2O3 between ceramicand slag, metals removed.
SampleN a2OAl2O3
M gOAl2O3
SiO2Al2O3
P2O5Al2O3
K2OAl2O3
C aOAl2O3
T iO2Al2O3
FeOAl2O3
S1 (rel. to A) 53 10 11 ∞ -13 98 -1 97
S1 (rel. to B) 237 96 26 ∞ -18 717 -7 150
S3 (bloated) 767 -3 5 / 14 14 -6 -16
S4 99 213 8 ∞ 2 1189 -22 1202
S4 (exterior) 40 1224 -4 ∞ 105 5819 14 3135
S5 -54 177 -18 / -29 56 -29 105
S5 (exterior) 36 85 2 / 189 85 -16 6
S6 (dross) -26 134 -3 971 -20 335 / 172
S7 700 167 -19 ∞ 12 2700 50 64
S7 (exterior) 170 36 -18 ∞ 2 811 -74 -10
S9 3 40 -5 252 -40 92 / 66
S10 (glazed) 13 5 529 / 31 8 / 6
S11 2607 47 -22 / 22 880 / 155

Frederik Rademakers Appendix O 679
Section O.4
Stara Zagora bulk compositions
Average compositions. All results in wt%, normalised to 100%.Sample Na2O MgO Al2O3 SiO2 P2O5 K2O CaO TiO2 FeO CuO ZnO
Part A - interior slag 3.7 1.1 16 58 0.7 3.8 10.8 0.4 2.5 1.0 2.2
Std. dev. (5 ms) 1.7 0.3 4 5 0.2 0.7 5.8 0.1 0.4 0.7 1.0
Min. 1.8 0.8 10 53 0.4 3.0 3.8 0.3 2.0 0 1.1
Max. 5.6 1.5 20 62 1.0 5.0 15.7 0.6 2.9 1.8 3.2
Part A - remnant ceramic 2.3 0.7 20 64 0.3 3.2 3.7 0.4 2.6 1.0 2.0
Std. dev. (3 ms) 0.2 0.2 4 2 0.1 0.3 2.0 0.1 0.4 0.2 0.6
Min. 2.1 0.5 16 61 0.2 2.9 2.1 0.4 2.2 0.9 1.5
Max. 2.5 0.9 23 65 0.5 3.5 6.0 0.5 3.0 1.2 2.6
Part A - central vitr. 2.1 0.9 17 55 0.8 3.8 11.6 0.5 2.2 2.8 2.8
Std. dev. (5 ms) 0.2 0.2 4 5 0.3 0.8 3.1 0.2 0.3 1.5 1.5
Min. 1.9 0.6 10 51 0.5 2.8 7.4 0.3 1.8 1.4 1.0
Max. 2.4 1.0 21 62 1.1 4.9 15.2 0.9 2.7 5.2 4.8
Part B - glaze 3.2 1.3 13 68 0.3 5.9 4.0 0.5 2.6 0.9 0.1
Std. dev. (5 ms) 0.4 0.3 1 5 0.2 0.7 1.7 0.1 0.3 0.6 0.1
Min. 2.7 1.1 12 64 0.1 5.0 1.6 0.4 2.2 0.2 0
Max. 3.8 1.8 15 73 0.5 6.8 6.1 0.6 3.0 1.4 0.2
Part B - top 4.2 1.3 12 69 0.2 4.3 3.1 0.5 3.3 1.7 0.1
Std. dev. (3 ms) 0.4 0.1 1 1 0.2 0.1 1.1 0.2 0.3 1.2 0.1
Min. 3.8 1.2 11 67 0 4.3 2.0 0.4 3.0 1.0 0
Max. 4.6 1.4 13 70 0.3 4.4 4.1 0.7 3.6 3.0 0.3
Ceramic and slag. Ratio of oxides to Al2O3, metals removed.Sample
N a2OAl2O3
M gOAl2O3
SiO2Al2O3
P2O5Al2O3
K2OAl2O3
C aOAl2O3
T iO2Al2O3
FeOAl2O3
Part A - interior slag 0.23 0.07 3.63 0.04 0.24 0.68 0.03 0.16
Part A - remnant ceramic 0.12 0.04 3.20 0.02 0.16 0.19 0.02 0.13
Part A - central vitr. 0.12 0.05 3.24 0.05 0.22 0.68 0.03 0.13
Part B - glaze 0.25 0.10 5.23 0.02 0.45 0.31 0.04 0.20
Part B - top 0.35 0.11 5.75 0.02 0.36 0.26 0.04 0.28
Changes relative to zone A remnant ceramic (%)
Part A - interior slag 101 96 13 192 48 265 25 20
Part A - central vitr. 7 51 1 214 40 269 47 0
Part B - glaze 114 186 63 54 184 66 92 54
Part B - top 204 210 80 11 124 40 108 112

680 Appendix O Frederik Rademakers

APPENDIX P
Composition of metallic prills
Oxidised prills are omitted. Where an abundance of 1+ is noted, this refers to one mea-
sured prill, but probably more of similar composition present in the crucible slag. Micro
refers to tiny prills dispersed throughout the crucible slag, which are too small to measure.
Section P.1
Nicopolis metallic prills
Composition of metallic prills in crucible slag (in wt%)Sample Abundance Cu Sn Fe Pb S
N1 /
N2 (1) /
N2 (2)
Multi 96.3-98.9 1.1-3.7
Multi 96.5-97.5 0.7-1.1 1.78-2.4
Multi 94.5-97.2 2.3-3.6 0-1.2 0.5-0.8
N3
Multi 60.9-66.6 33.4-39.1
1+ 35.1 64.4 0.5
Multi 58.1-70.8 27.5-40.8 1.1-1.7
N4 /
N5
1+ 86.9 8.8 2.9 1.4
Lump, 1+ 99.6 0.4
N6Multi 95.8-97.2 2.8-4.2
1+ 65.1 34.9
681

682 Appendix P Frederik Rademakers
Section P.2
Philippopolis metallic prills
One prill omitted for P4: 61.5 wt% Cu, 36.0 wt% Sn, 0.9 wt% Co and 1.6 wt% Pb.
Composition of metallic prills in crucible slag (in wt%)Sample Abundance Cu Sn Fe As Sb Ni Pb Ag Zn P S Cl
P1Multi 100
Multi 85.5-89.6 0-1.0 0-0.4 0-0.2 5.5-6.5 4.4-7.8
P2
1+ 85.1 14.9
Multi 54.2-62.6 36.1-41.6 1.2-4.2
Multi 77.0-95.9 2.4-19.6 1.4-3.4
1+ 97.2 1.5 1.3
P31+ 76.2 18.8 1.8 3.2
Corroded, multi 90.9-98.3 1.7-9.1
P41+ 64.3 34.3 1.4
Corroded, multi 85.8-97.5 2.5-14.2
P5 Multi 100
P6
1+ 70.5 3.0 26.5
Ceramic 100
Exterior, multi 1.8-4.2 86.2-95.5 0.3-12.0
1+ 2.0 87.2 0.9 10.0
P7 Multi 91.7-98.3 1.7-8.3
P8
Multi 90.3-95.4 4.6-9.7
1+ 1.9 97.9 0.2
1+ 77.7 0.9 9.7 4.9
Multi 1.1-5.1 69.5-83.5 0.5-2.9 1.6-4.5 13.4-18.1
1+ 1.1 94.8 0.4 3.7
1+ 1.9 82.9 0.8 14.4
1+ 86.5 13.5
P9a
Multi 100.0
Multi 85.2-99.2 0.8-14.8
Secondary slag, multi 99.1 0.9
P9b
Multi 76.9-86.8 11.1-21.0 1.7-3.1
Multi 73.3-73.5 22.3-24.4 0.7-0.8 1.5-3.5
1+ 77.9 0.5 21.6
Secondary slag - Multi 99.4-99.5 0.5-0.6

Frederik Rademakers Appendix P 683
Section P.3
Serdica metallic prills
Composition of metallic prills in crucible slag (in wt%)Sample Abundance Cu Sn Fe As Sb Ni Pb Au Ag Cd Zn S Cl
S1
1+ 2.5 97.5
Multi 1.4-1.6 95.2 3.1-3.3
1+ 1.2 24.1 44.6 2.5 27.6
1+ 23.4 49.5 27.0
1+ 10.2 5.0 71.6 12.7 0.5
S2 /
S3 /
S4
Multi 81.8-89.8 0.4-0.7 3.2-9.3 2.8-12.6
1+ 89.9 6.0 4.1
1+ 67.1 20.2 12.7
Partially corr.89.3-89.9 5.9-6.6 3.5-4.8
20.8-38.0 0.3-1.4 60.678.9
Partially corr.
89.5 0.5 5.1 5.0
28.9 1.3 69.8
17.8 82.2
Exterior, multi 84.1-84.5 0.5-0.6 6.4-6.6 5.0-5.3 3.4-3.6
Multi 90.0-92.0 0.5-0.7 3.4-5.2 2.6-5.2
1+ 97.1 1.3 1.6
1+ 88.9 5.9 5.1
S5
1+ 1.3 7.6 90.9 0.2
Multi 0.8-1.1 1.7-5.0 93.9-97.4
Multi 1.0-1.2 98.8-99.0
Multi 5.4-8.0 92.0-94.6
Multi 92.3-94.1 5.9-7.7
Partially corr.0.9-1.1 98.9-99.1
91.6 8.4
S61+ 58.8 33.0 1.2 4.5 2.5
1+ 58.1 34.9 1.2 4.5 1.2
S7
1+ 91.3 6.1 0.5 1.4 0.7
Exterior, 1+ 83.6 12.7 0.4 2.2 1.1
1+ 87.5 9.3 1.6 1.6
Multi 87.3-87.4 11.0 1.6-1.7
S8 /
S9
1+ 76.8 17.0 0.4 0.8 5.0
Multi 66.1-66.2 20.6-31.7 0.5-9.4 1.5-3.8
1+ 63.5 35.4 1.1
Multi 5.3-7.2 92.8-94.7
S10 1+ 5.8 94.2
S11 Multi 1.2-2.0 0.6-3.4 95.3-97.4

684 Appendix P Frederik Rademakers
Section P.4
Stara Zagora metallic prills
Composition of metallic prills in crucible slag (in wt%)Sample Abundance Cu Sn Fe Pb Zn
STZ1
Part A - interior
1+ 88.3 7.4 0.6 3.7
1+ 90.9 6.1 1.3 1.7
1+ 97.7 0.7 1.6
Multi 71.9-85.0 10.4-19.6 4.6-8.5
Multi 88.9-91.3 8.3-10.4 0.4-0.7
1+ 7.2 92.8
Part A - central
Multi 100.0
Multi 96.1-98.7 1.3-3.9
1+ 97.4 0.9 1.7
1+ 99.7 0.3
Part B1+ 100
1+ 99.6 0.4


![Thracian Religion [A Companion to Ancient Thrace]](https://static.fdokumen.com/doc/165x107/63461a68f474639c9b05265b/thracian-religion-a-companion-to-ancient-thrace.jpg)