
Interrogation of a dynamic visualization during learning
18
Learning and Instruction 14 (2004) 257–274 www.elsevier.com/locate/learninstruc Interrogation of a dynamic visualization during learning Richard Lowe Department of Education, Curtin University, GPO Box U1987, Perth 6845, WA, Australia Abstract Because animations can depict situational dynamics explicitly, they have the potential to help learners build coherent, high-quality mental models of complex change processes. Fur- ther, interactive animations provide opportunities for learners to deal with available infor- mation selectively and so avoid excessive processing demands. However, to be instructionally effective, the selected subsets of information must have high domain and task relevance. Approaches used by domain novices to interrogate an interactive animation of a complex dynamic system as they prepared for a subsequent prediction task were explored. Subjects searched the animation in order to learn generalizations upon which to base their predictions. Spatial and temporal strategies employed tended to be narrowly focused upon individual graphic features or localized groups while broader relational aspects required for coherence were neglected. The findings suggest that in order to build satisfactory mental representations from interactive animations, learners may require specific guidance regarding search strategies and targets. # 2004 Elsevier Ltd. All rights reserved. Dynamic visualizations are increasingly common in educational materials across a range of subject disciplines and levels of study. Animation is a type of dynamic visualization that is becoming particularly prevalent in multimedia learning envir- onments such as those currently proliferating on the Internet. However, this explosion in the use of animation is occurring well in advance of adequate research-based accounts of how people cognitively process and learn from such resources (see Scaife & Rogers, 1996). As a result, instructional designers lack prin- cipled guidance as to what characteristics should be included in animations to maximise their educational effectiveness. Until quite recently, design advice tended Tel.: +61-8-9266-2186; fax: +61-8-9266-2547. E-mail address: [email protected] (R. Lowe). 0959-4752/$ - see front matter # 2004 Elsevier Ltd. All rights reserved. doi:10.1016/j.learninstruc.2004.06.003
Transcript of Interrogation of a dynamic visualization during learning

� Tel.: +61-8-9266-218
E-mail address: r.k.lo
0959-4752/$ - see front
doi:10.1016/j.learninstru
6; fax: +61-8-9266-2547.
[email protected] (R. Lowe).
matter # 2004 Elsevier Ltd. All rights reserved.
c.2004.06.003
Learning and Instruction 14 (2004) 257–274
www.elsevier.com/locate/learninstruc
Interrogation of a dynamic visualization duringlearning
Richard Lowe �
Department of Education, Curtin University, GPO Box U1987, Perth 6845, WA, Australia
Abstract
Because animations can depict situational dynamics explicitly, they have the potential tohelp learners build coherent, high-quality mental models of complex change processes. Fur-ther, interactive animations provide opportunities for learners to deal with available infor-mation selectively and so avoid excessive processing demands. However, to beinstructionally effective, the selected subsets of information must have high domain and taskrelevance. Approaches used by domain novices to interrogate an interactive animation of acomplex dynamic system as they prepared for a subsequent prediction task were explored.Subjects searched the animation in order to learn generalizations upon which to base theirpredictions. Spatial and temporal strategies employed tended to be narrowly focused uponindividual graphic features or localized groups while broader relational aspects required forcoherence were neglected. The findings suggest that in order to build satisfactory mentalrepresentations from interactive animations, learners may require specific guidance regardingsearch strategies and targets.# 2004 Elsevier Ltd. All rights reserved.
Dynamic visualizations are increasingly common in educational materials across
a range of subject disciplines and levels of study. Animation is a type of dynamic
visualization that is becoming particularly prevalent in multimedia learning envir-
onments such as those currently proliferating on the Internet. However, this
explosion in the use of animation is occurring well in advance of adequate
research-based accounts of how people cognitively process and learn from such
resources (see Scaife & Rogers, 1996). As a result, instructional designers lack prin-
cipled guidance as to what characteristics should be included in animations to
maximise their educational effectiveness. Until quite recently, design advice tended

R. Lowe / Learning and Instruction 14 (2004) 257–274258
to be very general in nature (e.g. Milheim, 1993). While this is beginning to changeas a result of recent empirical work (e.g. Mayer & Moreno, 2002), a far greaterunderstanding of the processes that learners use when studying animated infor-mation is needed as a foundation for principled design. This article reports anexploratory investigation of how learners interrogated an interactive animated dis-play in order to extract information required to complete a prediction task. Theinvestigation explored relationships among the characteristics of the animated con-tent, the strategies learners used to interrogate the animation, and their success inpredicting key changes in the content over time.
1. Text versus pictures versus animations
Comparisons of the information processing requirements of text and diagramshave been used to explain why pictorial representations can have advantages overtext for presenting certain types of information to learners (Larkin & Simon, 1987;Winn, Li, & Schill, 1991). One such advantage is that diagrams can present impor-tant aspects of the information in a visually explicit fashion that is simply not poss-ible with text due to fundamental differences in the representational systemsinvolved (see Betrancourt, Bisseret, & Faure, 2001). It appears that the explicitnessof diagrammatic representation can facilitate comprehension of the subject matterbecause it obviates the need for learners to perform the burdensome mental manip-ulations of information that would be required to comprehend a text-based presen-tation of the same content. In essence, this additional and wasteful cognitiveprocessing is necessary when there is a poor match between the nature of textualrepresentation and key characteristics of the subject matter being represented.A good match between the representational medium and characteristics ofthe phenomenon being represented is considered instructionally desirable (e.g.Dijkstra, 1997).
The comparisons of text and diagrams referred to here typically concern the waytheir different visuospatial characteristics impact on information processing taskssuch as search and the detection of relationships. It is possible to take this theme(of the benefits of presenting content explicitly) one step further and make a similarargument to support claims that animations are superior to static depictions asaids to learning. In addition to visuospatial characteristics, this further steprequires dynamic characteristics to be taken into account when considering the con-sequences for information processing. At best, static depictions can present implicitrepresentations only of dynamic content. They therefore require learners to inferthe situational dynamics. This can be seen as imposing a processing burden some-what analogous to that involved in determining visuospatial properties of a situ-ation from a purely textual representation. In contrast, animations have theadvantage of being able to present the situational dynamics explicitly and appro-priately so that the majority of learners’ processing capacity could be devoted tocomprehending the content directly.
However the review by Tversky, Morrison, and Betrancourt (2002) suggests cau-tion in assuming the superiority of animated over static presentations because the

259R. Lowe / Learning and Instruction 14 (2004) 257–274
depictions being compared may not present equivalent sets of information aboutthe subject matter. In cases where animation has been found superior to staticdepiction, the benefits may not in fact be primarily due to differences in the cogni-tive or computational properties of the two forms of representation (Cheng, Lowe,& Scaife, 2001).
2. Educational potential of animations
Even in cases where animations and static depictions are comparable in terms oftheir content information, it does not necessarily follow that the cognitive and/orcomputational properties of animations would give them an edge over static depic-tions. Despite the superficial plausibility of arguments for the superiority of anima-tions based on explicitness, various counter-arguments have been advanced on thebasis of other aspects of the information processing likely to be involved (e.g.Lowe, 1999). In traditional animation, the material is presented in a pre-determ-ined manner that plays from start to finish without the possibility of viewer controlover aspects such as the length of the animated sequence viewed, its pace, and itsdirection. However, learners could be disadvantaged if their comprehension pro-cesses cannot keep pace with the speed at which an animation presents its infor-mation (Hegarty, Narayanan, & Freitas, 2002). With older analog presentationtechnologies such as films and videotapes, it was normally either impractical or atthe very least inconvenient for the individual viewer to ‘interrogate’ the infor-mation in a flexible way.
In contrast to the pre-determined animation delivery regime of the recent past,computer technology now allows animation to offer a high degree of learner con-trol. Interactive animation that can be freely interrogated by learners may help toreduce the likelihood of information processing problems. However, it is importantto consider how this interactive potential can be put to best educational use(Aldrich, Scaife, & Rogers, 1998). Learners must be able to take advantage of theavailable interactivity. This is as much a matter of exploration strategy as it is ofthe fundamental perceptual and cognitive processing of the information viewed.Learners need to locate temporal segments containing thematically relevant chan-ges then interrogate those located segments in a productive fashion. The dynamicmaterial in animations can undergo various types of change including:
. Form change (‘transformation’) that involves alterations in graphic entities withrespect to properties such as size, shape, colour, and texture.
. Position change (‘translation’) that involves the movement of whole entities fromone location to another which can be perceived with respect to the border of theanimation or other material within the animated display.
. Inclusion change (‘transition’) that involves the appearance or disappearance ofentities (either fully or partly). This can occur in various ways such as entitiesedging in and out of the display at its borders or entities being added to, orremoved from, other parts of the display.

R. Lowe / Learning and Instruction 14 (2004) 257–274260
Although the capacity to depict these changes gives animations the advantage ofbeing able to represent dynamic situations explicitly, such changes also conferproperties on these depictions that have perceptual and cognitive implications notpresent with static pictures. Further, the provision of interactive facilities for inter-rogating animations is likely to have its own perceptual and cognitive consequencesfor learning. Models concerned with the processing of graphic information proposedby workers such as Mayer (1994); Narayanan and Hegarty (2000), and Schnotz,Bockheler, and Grzondziel (1999) emphasise the importance of relational aspects inthe building of coherent mental representations from pictorial materials. For anima-tions, this would entail dealing with patterns of information that involve both spa-tial and temporal relations. Each of these different types of information patterninghas its own distinctive implications for processing (such the conventions of left toright versus before and after as indications of causal relations). The nature of thestrategies adopted for interrogating interactive animations is therefore likely to be akey determinant of success in extracting crucial information not only about the indi-vidual graphic entities comprising an animation, but also about their relationships.
3. Extracting information from interactive animation
In a previous study involving animated weather maps and meteorological predic-tion (Lowe, 2000), learning results appeared to be closely related to dynamic con-trast between different types of display components. It was inferred thatinappropriate field-ground distinctions associated with this dynamic contrast effectmeant that learners preferentially extracted perceptually conspicuous informationwhile neglecting more subtle yet thematically relevant aspects of the meteorologicalmarkings. In addition, the relationships between the markings they drew in theirpredictions tended to be confined to local rather than broader aspects of the dis-play.
With specialist static pictures, novices in the depicted domain are typicallyunaware of the most productive spatial locations to examine for relevant infor-mation (Lowe, 1989). However, with animated pictures there is the additionalpossibility of a similar lack of awareness in novices’ examination of temporallyseparated locations. Zhang (1997) suggests that the processing biases resultingfrom perceptual saliency characteristics of some external representations may haveunfavourable results. Because the perceptual salience of material in animations canbe associated with both visuospatial and dynamic properties, the effects of thesetwo characteristics of animated displays on the extraction of information should beconsidered.
4. Searching in space and time
Evidence is accumulating that learners’ extraction of information from anima-tions can be deficient in at least two broad respects (Lowe, 2003). In some cases, itseems that learners tend to under-process the presented information because of

261R. Lowe / Learning and Instruction 14 (2004) 257–274
lack of requirements for cognitive engagement (‘underwhelming’). In other cases,the reverse situation seems to apply in which despite engaging with the animationintensively, learners are unable to process the presented material satisfactorily dueto the excessive cognitive demands imposed (‘overwhelming’). These excessivedemands are associated with aspects of animation such as the high informationload (particularly, if the subject matter is complex) and the temporally distributednature of the presentation. In such cases, it appears that learners adapt by applyingattention selectively to a subset only of the presented information. The associatedcompetition for attention between different graphic elements constituting the ani-mated display is likely to result in effects analogous to the split-attention effectsthat have been investigated between pictures and text (e.g. Mayer & Moreno,1998). Limiting the scope of attention in this way therefore has implications for theeffectiveness of search.
Fundamental to effective search processes is success in extracting thematicallyrelevant information from animations. Ferguson and Hegarty (1995) characterizestatic diagrams as often being underspecified, a characteristic that can result inproblems for learners in decomposing the whole display properly into appropriategraphic elements (features). Animations present the additional challenge of decom-posing the temporal sequence into events involving features in the display that arethematically relevant (feature events). Winn (1993) has offered a tentative accountof how learners search static diagrammatic displays for information that empha-sizes the search’s iterative nature. This notion is of course highly applicable tointeractive animations that are repeatedly interrogated for information but involvestemporal as well as spatial iterative search. A possible advantage of such iterativeprocessing, particularly for complex information, is that subsets of informationcould be selected in each pass and processed in a serial fashion rather than simul-taneously (Pollock, Chandler, & Sweller, 2002). However, this additional searchdimension means that the task can be intrinsically more complex (demanding), andso learners need to find ways to cope with the associated demands and still main-tain processing.
5. Strategies
Cognitive load considerations (Sweller, 1999) highlight the importance of con-trolling the demands on working memory in order to facilitate productive learningactivity, something that can be done either externally by way of instructionaldesign or internally by way of the strategies learners adopt. Opportunities for suchcontrol are available with respect to both the spatial and temporal dimensions ofinteractive animation. Constrained spatial interrogation strategies could be used tolimit the proportion of the total display area searched and constrained temporalinterrogation strategies could be used to limit the proportion of the total displayperiod searched.
Previous studies of how learners use interactive animation (Lowe, 2000, 2003)suggest considerable variety in the strategies used by domain novices to interrogate

R. Lowe / Learning and Instruction 14 (2004) 257–274262
the available information. In particular, there appeared to be wide variations inhow comprehensively the set of information provided in the animation was sear-ched and in the amount of attention given to relational aspects of the informationthat are the basis for coherence formation. Different classes of spatial strategy canbe envisaged that may be categorized according to (a) the fraction of the area cov-ered by display that is considered and the locations involved and (b) the extent towhich the contents of those considered areas are related to each other:
(i)
E xclusive strategies that concentrate on a specific feature to the exclusion ofothers within a particular narrowly defined location.(ii)
I nclusive strategies that also limit their scope to a narrowly defined locationbut include the various features it contains.(iii)
I ntra-regional strategies that are wider in scope than the previous strategies inthat they deal with the features in different locations within a broader region.(iv)
I nter-regional strategies that span individual broad regions.In addition, different classes of temporal strategy can be envisaged that may becategorized according to (a) the fraction of the period covered by the display thatis considered and the locations involved and (b) the extent to which the contents ofthose considered periods are related to each other:
(i)
C onfined strategies that concentrate on a small and highly localized section ofthe total animation sequence (such as the first few frames).(ii)
D istributed strategies that also concentrate on a small proportion of the totalanimation but involve frames that are spread throughout the whole sequence.(iii)
A bstractive strategies that are wider in scope than the previous strategies inthat they survey the animation for several occurrences of a particular featureevent then try to abstract a general principle from all available instances.(iv)
I ntegrative strategies that seek out combinations of feature events that changein association with each other.Each of the above lists of spatial and temporal strategies is arranged hier-archically according to how much they should constrain information processingdemand. Strategies towards the bottom of each list could be assumed to be moredemanding for those who are novices in the depicted domain because they requirea greater amount and variety of information to be taken into account.
6. The task
In the present study, subjects interrogated an interactive animated Australiansummer weather map sequence in order to make a prediction about how themeteorological markings on a given static weather map (the ‘Original’) could beexpected to change over a 24 hour period. The Original map used for this task wasa typical summer weather map but not one of those comprising the animated

263R. Lowe / Learning and Instruction 14 (2004) 257–274
sequence. The task therefore required subjects to extract and apply informationavailable in the animation to a new situation that, while closely related to the fun-damental meteorological events depicted in the animation, nevertheless differedfrom it somewhat in terms of superficial appearance.
7. How weather maps change
On a broad scale, the whole Australian summer weather map area can be div-ided into two meteorologically distinct regions that approximately correspond tothe northern and southern halves of the map (Fig. 1). The sharply contrastingdynamic behaviour of the features occupying these regions arises from their verydifferent meteorological origins.
The northern half tends to be populated by two main types of meteorologicalfeature for which form change is a highly salient characteristic: persistent HeatLows and Cyclones. In contrast, in the southern half of the map the two major fea-ture types are fast-moving Highs and Cold Fronts for which position change is aconspicuous characteristic. These more transient southern features both exhibitinclusion change with respect to the weather map boundary (i.e. particular instan-ces of these features periodically enter and leave the display). Although the north-ern and southern halves of the Australian weather map area are highlyindividualistic, nevertheless a substantial degree of coordination exists among themarkings across the intermediate zone. This coordination between the northern andsouthern regions is additional to coordination in the pattern of markings withineach region.
Fig. 1. Australian summer weather map showing northern and southern meteorological regions and
their main change types in the animated sequence.

R. Lowe / Learning and Instruction 14 (2004) 257–274264
8. Using interactive animation successfully
Central to the potential of interactive animations in education is the learner’scapacity to use the interactive facilities effectively to interrogate the animated infor-mation appropriately. A theoretical analysis of the challenges faced by domainnovices in attempting to search such animations productively suggests that they areill-equipped to cope with this interrogation. Under these circumstances, a prag-matic response for novices might be to adopt expedient, low-level, piecemeal strate-gies that help them constrain information processing demands rather thanattempting more sophisticated strategies that would be necessary for extractingimportant relational information from the display.
The present study examined learners’ interrogation of an interactive animationand how their approaches were shaped by intrinsic properties of the animated for-mat. It addressed the following specific questions:
(i)
W hat types of strategies do learners who are novices in a specific domainspontaneously invoke when interrogating an interactive animation?(ii)
H ow are these strategies related to the visuospatial and dynamic character-istics of the animation?(iii)
W hat are the consequences of these strategies in terms of their success inextracting key aspects of the presented domain content?9. Procedure
Subjects were 12 undergraduate students from the Department of Education atCurtin University in Australia with no specialized knowledge of meteorology. Thestages in the procedure were: (i) a learning task, (ii) a ‘replay’ task, and (iii) anapplication task. Subjects’ responses for all these tasks were recorded on video. Forthe learning task, subjects were given the A4-sized Original Australian weathermap and asked to draw on a separate blank map the pattern of meteorologicalmarkings they would expect to appear 24 hours after those shown on the Original.
Subjects were instructed to interrogate the animation via its video-like controlsin order to help them complete the learning task prediction. After completing thisprediction, they ‘replayed’ a demonstration of how they interrogated the animationwhile at the same time explaining the actions they had taken (using the mouse withone hand and pointing out the relevant material on their drawing with the otherhand). Finally, they carried out an application task in which, without support fromthe animation, they applied what they had learnt. The present paper deals withstages one and two of this investigation.
10. Data analysis
Data reported here are based on (a) the sets of predicted meteorological mark-ings drawn during the learning task, (b) subjects’ interrogation of the animation in
265R. Lowe / Learning and Instruction 14 (2004) 257–274
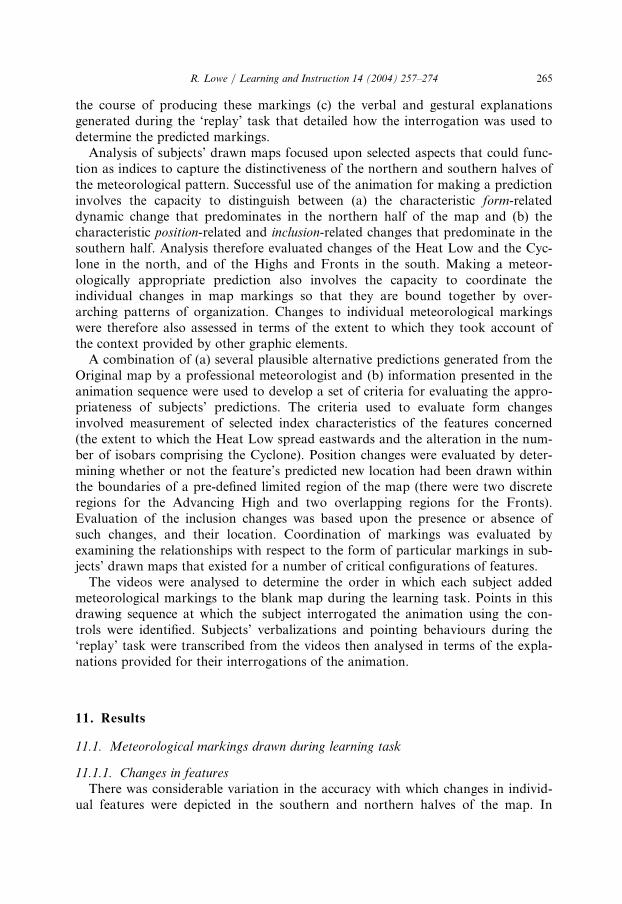
the course of producing these markings (c) the verbal and gestural explanationsgenerated during the ‘replay’ task that detailed how the interrogation was used todetermine the predicted markings.
Analysis of subjects’ drawn maps focused upon selected aspects that could func-tion as indices to capture the distinctiveness of the northern and southern halves ofthe meteorological pattern. Successful use of the animation for making a predictioninvolves the capacity to distinguish between (a) the characteristic form-relateddynamic change that predominates in the northern half of the map and (b) thecharacteristic position-related and inclusion-related changes that predominate in thesouthern half. Analysis therefore evaluated changes of the Heat Low and the Cyc-lone in the north, and of the Highs and Fronts in the south. Making a meteor-ologically appropriate prediction also involves the capacity to coordinate theindividual changes in map markings so that they are bound together by over-arching patterns of organization. Changes to individual meteorological markingswere therefore also assessed in terms of the extent to which they took account ofthe context provided by other graphic elements.
A combination of (a) several plausible alternative predictions generated from theOriginal map by a professional meteorologist and (b) information presented in theanimation sequence were used to develop a set of criteria for evaluating the appro-priateness of subjects’ predictions. The criteria used to evaluate form changesinvolved measurement of selected index characteristics of the features concerned(the extent to which the Heat Low spread eastwards and the alteration in the num-ber of isobars comprising the Cyclone). Position changes were evaluated by deter-mining whether or not the feature’s predicted new location had been drawn withinthe boundaries of a pre-defined limited region of the map (there were two discreteregions for the Advancing High and two overlapping regions for the Fronts).Evaluation of the inclusion changes was based upon the presence or absence ofsuch changes, and their location. Coordination of markings was evaluated byexamining the relationships with respect to the form of particular markings in sub-jects’ drawn maps that existed for a number of critical configurations of features.
The videos were analysed to determine the order in which each subject addedmeteorological markings to the blank map during the learning task. Points in thisdrawing sequence at which the subject interrogated the animation using the con-trols were identified. Subjects’ verbalizations and pointing behaviours during the‘replay’ task were transcribed from the videos then analysed in terms of the expla-nations provided for their interrogations of the animation.
11. Results
11.1. Meteorological markings drawn during learning task
11.1.1. Changes in featuresThere was considerable variation in the accuracy with which changes in individ-
ual features were depicted in the southern and northern halves of the map. In
R. Lowe / Learning and Instruction 14 (2004) 257–274266
general, the predictions of changes in the southern half of the map tended to bemore reasonable than those in the northern half. For the southern half, all but oneof the subjects drew the Advancing High in an acceptable position. The remainingsubject positioned the High center correctly but showed the High as an open fea-ture (i.e. not a closed loop) rather than as a closed cell. All subjects positioned thegroup of Fronts appropriately overall (but many subtle form changes in theseFronts were poorly handled). All but one of the subjects maintained the inclusionof the large retreating High that was crossing the eastern border of the map butfive subjects failed to include the small isobar fragment in the extreme south westcorner (that should actually have edged further into the display).
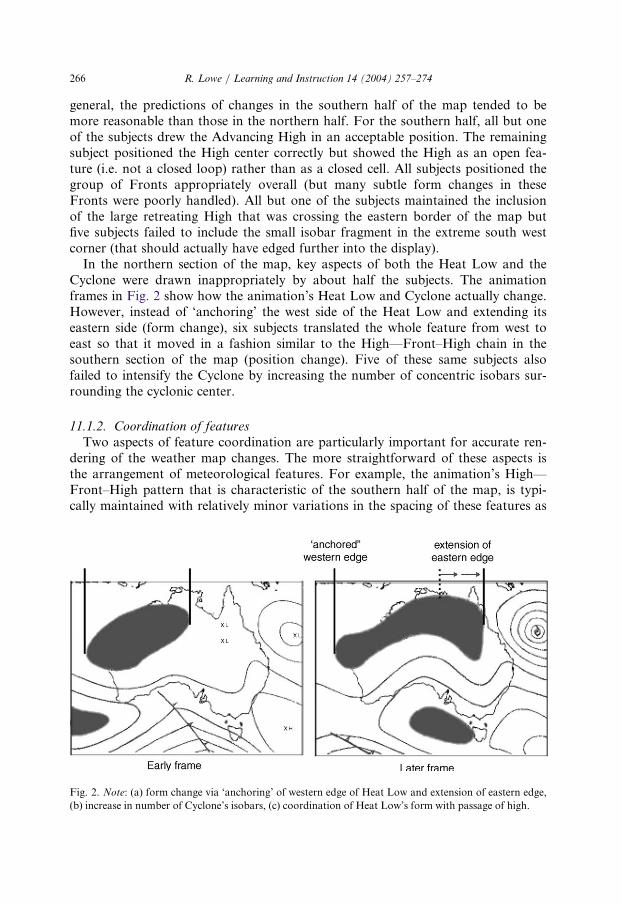
In the northern section of the map, key aspects of both the Heat Low and theCyclone were drawn inappropriately by about half the subjects. The animationframes in Fig. 2 show how the animation’s Heat Low and Cyclone actually change.However, instead of ‘anchoring’ the west side of the Heat Low and extending itseastern side (form change), six subjects translated the whole feature from west toeast so that it moved in a fashion similar to the High—Front–High chain in thesouthern section of the map (position change). Five of these same subjects alsofailed to intensify the Cyclone by increasing the number of concentric isobars sur-rounding the cyclonic center.
11.1.2. Coordination of featuresTwo aspects of feature coordination are particularly important for accurate ren-
dering of the weather map changes. The more straightforward of these aspects isthe arrangement of meteorological features. For example, the animation’s High—Front–High pattern that is characteristic of the southern half of the map, is typi-cally maintained with relatively minor variations in the spacing of these features as
Fig. 2. Note: (a) form change via ‘anchoring’ of western edge of Heat Low and extension of eastern edge,
(b) increase in number of Cyclone’s isobars, (c) coordination of Heat Low’s form with passage of high.

267R. Lowe / Learning and Instruction 14 (2004) 257–274
they progress from west to east across the map area. Similarly, the general posi-tions of the Heat Low and Cyclone in the northern half of the map (located overthe land and the sea, respectively) are largely maintained during the course of theanimation. This aspect of feature coordination occurs within each of these broadregions (i.e. intra-regional coordination). However, there are also more subtleaspects of feature coordination that occur between the broad northern and south-ern regions of the map (i.e. inter-regional coordination).
For the materials used in this study, an aspect that is particularly critical forproducing a high-quality prediction is the inter-regional coordination of the HeatLow in the north with the Advancing High and Fronts in the south (Fig. 3). As theHigh traverses the map, the eastward extent of the Heat Low and the shape of itssouthern edge change; for part of the Fronts’ progress from west to east, the HeatLow develops a lobe that moves across the map in concert with the Fronts. Boththese types of form change are ‘echoed’ in the intervening isobars between the fea-tures involved.
A coordination score for these two intra-regional and two inter-regional aspectsof subjects’ drawings was determined by allocating one point each for acceptableposition, shape, and alignment of the features concerned. Scoring was done using atemplate based upon a professional meteorologist’s estimate of the plausible rangeof these characteristics in the predicted meteorological pattern. Wilcoxon signedranks test indicated that the combined coordination score for the two intra-regional aspects was significantly greater than the corresponding score for the twointer-regional aspects (Mintra ¼ 4:9; SD ¼ 0:7; Minter ¼ 3:0; SD ¼ 1:0; Z ¼ 3:1,p < 0:005). Subjects’ drawings thus exhibited better coordination of meteorologicalfeatures within each of the northern and southern regions than between these tworegions. While deficiencies in the position and alignment of features both con-tributed to the poor inter-regional coordination scores, problems with shaping ofthe features (i.e. form) were particularly pronounced. Fig. 4 presents illustrative
Fig. 3. Coordination of form of Heat Low with passage of Front. Note allignment of lobe on southern
edge of Heat Low with Front.

R. Lowe / Learning and Instruction 14 (2004) 257–274268
examples of the ways in which the form of the Heat Low was drawn essentially
independently of the broader context of the position of features in the southern
half of the map.
11.2. Interrogation frequency and strategies
Subjects varied considerably in how often they interrogated the animation dur-
ing their drawing sequences. The six subjects who produced the least appropriate
predictions for the northern half of the map carried out far fewer interrogations,
(M ¼ 3:2, SD ¼ 1:5) than the six most successful subjects, (M ¼ 9:2, SD ¼ 1:9).
Periods of interrogation tended to precede the drawing of perceptually well-defined
features (High, Front, etc.). Although these features were often separated from
each other by one or more intervening isobars, subjects generally ‘skipped-over’
these separating lines and worked from one main feature to the next. Interroga-
tions were typically quite localized and limited in scope (often confined to the
immediate region of a particular feature of current interest). The skipped isobars
were usually dealt with only after the well-defined features had been drawn and
appeared to be treated as if they had much lower status than other aspects of the
map. This is reflected in the comments that were made during the learning task
(‘do I have to do all these lines as well?’), the comparative lack of interrogation
that appeared to be specifically concerned with establishing the characteristics of
the intervening isobars, and the relative absence of discussion of these markings
during the replay task.Subjects also tended to be highly selective in their interrogation of the animation
sequence; once a general overview had been gained, a relatively small proportion of
the total frames comprising the animation were usually studied so the temporal
scope of much interrogation activity was very limited. On the basis of data from
the replay task, the frequencies with which subjects used various categories of spa-
Fig. 4. Lack of Coordination of form of Heat Low with southern features. (grey shaded area shows
appropriate form of Heat Low ex animation).

269R. Lowe / Learning and Instruction 14 (2004) 257–274
tial and temporal interrogation strategies were determined (see Appendix A forrepresentative examples of statements reflecting different strategies). For both spa-tial and temporal interrogation, records of subjects’ verbalizations and pointingbehaviour indicated they typically used one or two of the four strategies and thesetended to be those that would help constrain their search (Fig. 5).
Subjects’ transcripts provided some indication that they were limiting the scopeof their interrogation in order to make a complex and demanding task more man-ageable:
I just wanted to open with ‘day one’ because I got confused if I went any fur-ther. . .like there was too much to take in.
An effect of this limitation in scope appears to have been to restrict consider-ation of relationships between markings to the confines of the particular meteoro-logical region (southern or northern) in which they occurred. With one exception,strategies targeting more sophisticated relationships amongst weather map compo-nents (i.e. inter-regional and integrative strategies) were not in evidence. In fact,this single exception was a case of the subject concerned incorrectly inferring arelationship between a northern and a southern feature on the basis of an incom-plete survey of the animation. In contrast to the subjects who produced moreappropriate predictions generally, this subject did not adopt an abstractive strategybut relied on a single instance based on a very limited temporal sampling of thewhole animated sequence.
11.3. Pathway details
Although the High—Front–High chain moves in a general west-to-east directionoverall, the details of this movement for the component features vary according toparticularities of the context. For example, Highs tend to shift somewhat north-ward as they move into the Australian Bight, then return southwards around
Fig. 5. Number of subjects using particular spatial strategies (exclusive, inclusive, intra-regional, inter-
regional) and temporal strategies (confined, distributed, abstractive, integrative).
R. Lowe / Learning and Instruction 14 (2004) 257–274270
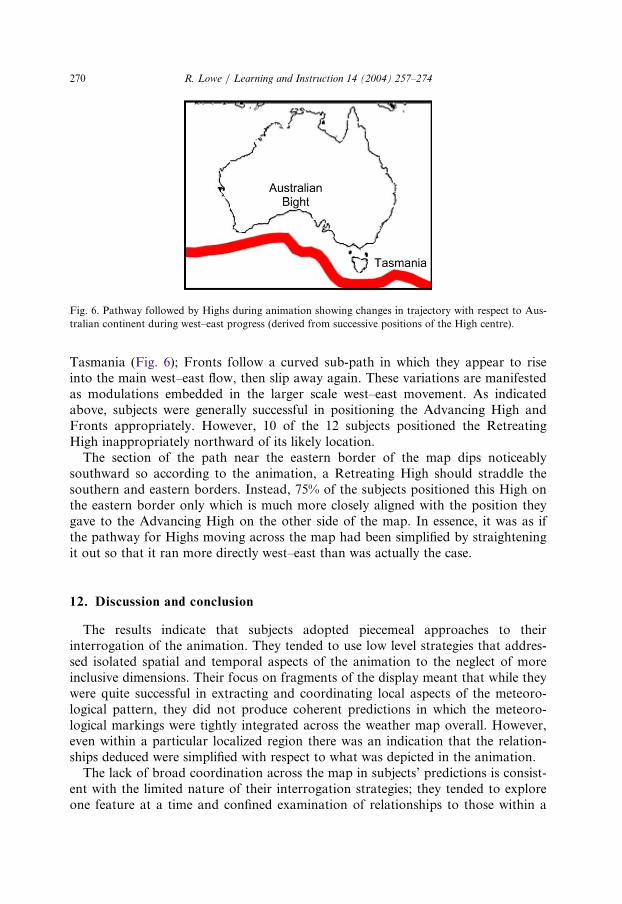
Tasmania (Fig. 6); Fronts follow a curved sub-path in which they appear to riseinto the main west–east flow, then slip away again. These variations are manifestedas modulations embedded in the larger scale west–east movement. As indicatedabove, subjects were generally successful in positioning the Advancing High andFronts appropriately. However, 10 of the 12 subjects positioned the RetreatingHigh inappropriately northward of its likely location.
The section of the path near the eastern border of the map dips noticeablysouthward so according to the animation, a Retreating High should straddle thesouthern and eastern borders. Instead, 75% of the subjects positioned this High onthe eastern border only which is much more closely aligned with the position theygave to the Advancing High on the other side of the map. In essence, it was as ifthe pathway for Highs moving across the map had been simplified by straighteningit out so that it ran more directly west–east than was actually the case.
12. Discussion and conclusion
The results indicate that subjects adopted piecemeal approaches to theirinterrogation of the animation. They tended to use low level strategies that addres-sed isolated spatial and temporal aspects of the animation to the neglect of moreinclusive dimensions. Their focus on fragments of the display meant that while theywere quite successful in extracting and coordinating local aspects of the meteoro-logical pattern, they did not produce coherent predictions in which the meteoro-logical markings were tightly integrated across the weather map overall. However,even within a particular localized region there was an indication that the relation-ships deduced were simplified with respect to what was depicted in the animation.
The lack of broad coordination across the map in subjects’ predictions is consist-ent with the limited nature of their interrogation strategies; they tended to exploreone feature at a time and confined examination of relationships to those within a
by Highs during animation showing changes in trajecto
Fig. 6. Pathway followed ry with respect to Aus-tralian continent during west–east progress (derived from successive positions of the High centre).

271R. Lowe / Learning and Instruction 14 (2004) 257–274
single meteorological region. Spatial and temporal restriction of subjects’ search
suggests a response to a demanding processing situation that is based on simple
off-loading of information rather than approaches such as conceptual grouping of
visuospatial and dynamic components into a smaller number of meaningful chunks
(a strategy that should be available to those with more expertise in the depicted
domain). Both the quantity and quality of interrogation appeared to play a role in
how successfully subjects extracted information from the animation.A major deficiency in subjects’ predicted maps was the failure to integrate the
intervening isobars that occupy the space between the more perceptually conspicu-
ous features. The animation shows the behaviour of these markings as highly coor-
dinated with fluctuations in other aspects of the meteorological pattern but this
crucial aspect was not reflected subjects’ predictions. Evidence from subjects’ stra-
tegies suggests that these markings were not accorded the same status as other fea-
tures and were selectively neglected during search in favour of perceptually
conspicuous features that had been allocated a dynamic ‘field’ rather than a
‘ground’ role in the display.As with previous studies of this animation, there are indications that changes in
position were more likely to be extracted than changes in form. There is a range of
possible explanations for this preferential extraction. It may be that position chan-
ges are intrinsically more compelling than form changes, although this would need
to be investigated by comparing changes that were ‘equivalent’ in their extent and
complexity (perhaps not the case in this animation). Alternatively, the nature of
the position changes in this animation may have been simpler to cope with in terms
of their information processing requirements. Another possibility is that the pos-
ition changes in this animation were so perceptually compelling compared with the
form changes that they had a ‘swamping’ effect which diluted the effect of changes
in form. A somewhat different type of explanation is that subjects construed chan-
ges in position as more important (and therefore more worthy of attention) than
form changes. Clarification of this relationship between form and position changes
is an important issue for designers of animations.The results of this study suggest that merely providing interactive facilities that
allow learners to interrogate an animation may not be particularly beneficial with
respect to learners’ extraction of thematically relevant information. It seems that it
is not sufficient to offer learners who are novices in a domain an accurate, compre-
hensive dynamic depiction of a dynamic referent situation and expect them to be
able to interrogate it productively on their own. Designers of educational anima-
tions may need to adopt a more proactive role in manipulating the way content is
presented so that the presentation goes far beyond being simply a dynamic record
of events as they would happen in the referent situation. On the basis of findings
from the present study, these manipulations would need to address those infor-
mation processing consequences of animations that appear to limit the extent to
which learners can extract thematically relevant material from such depictions.

R. Lowe / Learning and Instruction 14 (2004) 257–274272
Appendix A. Examples of subject statements reflecting spatial and temporal
strategies
A.1. Spatial strategies
Exclusive:
. . . I looked at this here [FRONT IN ANIMATION], a cold front I think, and it
seems to be moving away during the day so I sort of applied the same thing to
this one [FRONT ON MAP] and made it move away. . .
Inclusive:
. . . I’ve taken the lines back, these ones here [FRONTS] and watched the lines
[FRONTS] and the lines traveling with it [FRONTAL ISOBARS] so I made
mine the same. . .
Intra-regional:
. . . this one [HIGH] was originally over here [WESTERN EDGE] and because it
was moving from left to right, it moved across to there [HIGH TO THE EAST]
and these are the new isobars that are coming in [ISOBARS ON WESTERN
EDGE]. . .
Inter-regional:
. . . originally they [CYCLONE ISOBARS] were quite strong here and tight cir-
cles but as this [HIGH] was moving on they became looser and they circles, the
spaces between them, became larger. . .
A.2. Temporal strategies
Confined:
. . . I used mainly the first day because it is quite similar to the original. . . I was
going through the rest of the sequence originally but it didn’t look anything like
it. Otherwise I was confusing myself if I went on and looked at the rest of the
sequence. . .
Distributed:
. . .So with the High, I followed that from about the same place [in the ani-
mation] . . .With the Low, I found a section that was smaller, like that, right at
the start of the animation. . . and the Fronts down the bottom, I just followed
them over a day and they seemed to move quite quickly, like right across
Tasmania. . .
Abstractive:

273R. Lowe / Learning and Instruction 14 (2004) 257–274
. . . [Early transcript] I noticed the Lows up here (I’m assuming they’re Lows)stayed fairly stationary although there was some movement on this side. . .[Latertranscript]. Up here [HEAT LOWS] I tried to see what they’d do over the fullperiod [=7 DAYS], whether they’d move much. . .
References
Aldrich, F., Scaife, M., & Rogers, Y. (1998). Getting to grips with ‘interactivity’: helping teachers assess
the educational value of CD Roms. British Journal of Educational Technology, 29, 321–332.
Betrancourt, M., Bisseret, A., & Faure, A. (2001). Sequential display of pictures and its effect on mem-
orization. In J-F. Rouet, J. J. Levonen, & A. Biardeau (Eds.), Integrating text and graphics in com-
puter-supported learning environments: Cognitive and instructional issues, (pp. 111–118). Amsterdam:
Elsevier.
Cheng, P., Lowe, R., & Scaife, M. (2001). Cognitive science approaches to diagram use. Artificial Intelli-
gence Review, 15, 79–94.
Dijkstra, S. (1997). Educational media and technology. In S. Dijkstra, N. Seel, F. Schott, & R.
Tennyson (Eds.), Instructional design: International perspectives, Vol. 1. (pp. 137–143). Hillsdale, NJ:
Lawrence Erlbaum Associates.
Ferguson, E. L., & Hegarty, M. (1995). Learning with real machines or diagrams: application of knowl-
edge to real-world problems. Cognition and Instruction, 13, 129–160.
Hegarty, M., Narayanan, N. H., & Freitas, P. (2002). Understanding machines from multimedia and
hypermedia presentations. In J. Otero, J. A. Leon, & A. Graesser (Eds.), The psychology of science
text comprehension (pp. 357–384). Hillsdale, NJ: Lawrence Erlbaum.
Larkin, J. H., & Simon, H. A. (1987). Why a diagram is (sometimes) worth ten thousand words. Cogni-
tive Science, 11, 65–99.
Lowe, R. K. (1989). Search strategies and inference in the exploration of scientific diagrams. Educational
Psychology, 9, 27–44.
Lowe, R. K. (1999). Extracting information from an animation during complex visual learning. Eur-
opean Journal of Psychology of Education, 14, 225–244.
Lowe, R. K. (2000). Animation of diagrams: an aid to learning? In M. Anderson, P. Cheng, & V.
Haarslev (Eds.), Theory and application of diagrams (pp. 475–478). Heidelberg: Springer.
Lowe, R. K. (2003). Animation and learning: selective processing of information in dynamic graphics.
Learning and Instruction, 13, 247–262.
Mayer, R. E. (1994). Visual aids to knowledge construction: building mental representations from pic-
tures and words. In W. Schnotz, & R. W. Kulhavy (Eds.), Comprehension of graphics (pp. 125–138).
Amsterdam: North-Holland.
Mayer, R. E., & Moreno, R. (1998). A split-attention effect in multimedia learning: evidence for dual
processing systems in working memory. Journal of Educational Psychology, 90, 312–320.
Mayer, R. E., & Moreno, R. (2002). Animation as an aid to multimedia learning. Educational Psy-
chology Review, 14, 87–99.
Milheim, W. D. (1993). How to use animation in computer assisted learning. British Journal of Edu-
cational Technology, 24, 171–178.
Narayanan, N. H., & Hegarty, M. (2000). Communicating dynamic behaviours: are interactive multi-
media presentations better than static mixed-mode presentations? In M. Anderson, P. Cheng, & V.
Haarslev (Eds.), Theory and application of diagrams (pp. 178–193). Heidelberg: Springer.
Pollock, E., Chandler, P., & Sweller, J. (2002). Assimilating complex information. Learning and instruc-
tion, 12, 61–86.
Scaife, M., & Rogers, Y. (1996). External cognition: how do graphical representations work? Inter-
national Journal of Human–Computer Studies, 45, 185–213.
Schnotz, W., Bockheler, J., & Grzondziel, H. (1999). Individual and co-operative learning with inter-
active animated pictures. European Journal of Psychology of Education, 14, 245–265.

R. Lowe / Learning and Instruction 14 (2004) 257–274274
Sweller, J. (1999). Instructional design in technical areas. Melbourne: ACER.
Tversky, B., Morrison, J. B., & Betrancourt, M. (2002). Animation: can it facilitate?. International Jour-
nal of Human–Computer Studies, 57, 247–262.
Winn, W. D. (1993). An account of how readers search for information in diagrams. Contemporary Edu-
cational Psychology, 18, 162–185.
Winn, W. D., Li, T-Z., & Schill, D. (1991). Diagrams as aids to problem solving: their role in facilitating
search and computation. Educational Technology Research and Development, 39, 17–29.
Zhang, J. (1997). The nature of external representations in problem solving. Cognitive Science, 21,
179–217.