Visualization techniques for program comprehension
73
Visualization techniques for program comprehension A literature review François Lemieux Martin Salois Defence R & D Canada – Valcartier Technical Memorandum DRDC Valcartier TM 2005-535 February 2006
-
Upload
khangminh22 -
Category
Documents
-
view
5 -
download
0
Transcript of Visualization techniques for program comprehension

Visualization techniques for programcomprehensionA literature review
François Lemieux
Martin Salois
Defence R & D Canada – ValcartierTechnical Memorandum
DRDC Valcartier TM 2005-535
February 2006
Author
François Lemieux
Approved by
Yves van ChesteinHead/Information and Knowledge Management
Approved for release by
Gilles BérubéChief Scientist
Her Majesty the Queen as represented by the Minister of National Defence, 2006
Sa majesté la reine, représentée par le ministre de la Défense nationale, 2006
Abstract
Understanding software is becoming more complex as programs are getting everbigger. Many believe that the key to this problem is better visualization. The ob-jective of this document is to provide an as thorough as possible overview of thisfield. This is the starting point for further research and development in this criticalarea. Over 140 papers and nearly as many tools were reviewed for this purpose.This document presents the most relevant and significant ones. Further work willbe required to identify the most promising approaches to include visualization incurrent research projects.
Résumé
Comprendre un logiciel devient de plus en plus complexe à mesure que les pro-grammes deviennent de plus en plus gros. Plusieurs croient que la clé de ce pro-blème réside dans une meilleure visualisation. L’objectif de ce document est defournir une vue aussi complète que possible de ce domaine. Ceci est le point dedépart pour la recherche et le développement dans ce secteur critique. Plus de 140documents et presque autant d’outils ont été examinés dans ce but. Ce documentprésente les plus pertinents et les plus importants. Des recherches supplémentairesseront requises pour déterminer les approches les plus prometteuses pour inclure lavisualisation dans les projets de recherche courants.
DRDC Valcartier TM 2005-535 i

This page intentionally left blank.
ii DRDC Valcartier TM 2005-535

Executive Summary
The objective of this document is to provide an as thorough as possible overview ofthe techniques of program visualization and comprehension, as it is today. Over 140documents and nearly as many tools were reviewed for this purpose. Only the mostpromising or significant ones are presented in this document. One thing is certain,this domain of research is quite active. There are way too many prototypes and toolsto try them all. Candidates that show promises and warrant more investigation areSHriMP, Graphviz, aiSee, and Walrus.
The different aspects and criteria to take into account when comparing and trying tochoose a visualization are presented. By refining these aspects and criteria, futurework will try to come up with the best combination of tools possible. The goal is tospeed up the process of understanding large software systems.
This work is relevant to the Canadian Forces for many reasons. First of all, mili-tary systems are becoming ever more complex while the need for interoperabilitykeeps increasing. Getting systems to interoperate within a reasonable time framedepends on the speed at which the analyst can understand the programs. Goodsoftware visualization and comprehension techniques and tools will help force de-velopers to maximize their development and maintenance effort, thereby decreasingthe response time for critical operations. Furthermore, from a security standpoint,it is imperative to understand new software threats as fast as possible. The sametool can be used to decrease the time required to understand a threat and developcountermeasures. The tool could further be used by DND’s many developers andcontractors to speed up the development and maintenance of any software system.For example, when replacing a system by another in a system of systems, such atool could greatly reduce the time needed. Another example where this can be use-ful is in the acquisition process for new software. Comparing different alternativesrequires a basic understanding of the potential systems. An appropriate visualiza-tion and comprehension tool would greatly improve this process.
Finally, this work could potentially lead to collaboration between DRDC, universi-ties, and the industry.
François Lemieux, Martin Salois; 2006; Visualization techniques for programcomprehension; DRDC Valcartier TM 2005-535; Defence R & D Canada –Valcartier.
DRDC Valcartier TM 2005-535 iii

Sommaire
L’objectif de ce document est de fournir une vue aussi complète que possible destechniques de la visualisation et de compréhension de programme, tel qu’elles sontà ce jour. Plus de 140 documents et presque autant d’outils ont été examinés dans cebut. Seuls les plus pertinents et les plus importants sont présentés dans ce document.Une chose est sûre, ce domaine de recherche est très actif. Il y a beaucoup trop deprototypes et d’outils pour les essayer tous. Les candidats ayant du potentiel sontSHriMP, Graphviz, aiSee et Walrus.
Les différents aspects et critères à considérer quand vient le temps de comparer et dechoisir une visualisation sont présentés. En améliorant ces aspects et ces critères, defuturs travaux essaieront de trouver la meilleure combinaison d’outils possible. Lebut étant d’accélérer le processus de compréhension d’un grand système logiciel.
Ces travaux sont pertinents pour les Forces canadiennes pour plusieurs raisons. Pre-mièrement, les systèmes militaires sont de plus en plus complexes alors que le be-soin en interfonctionnement ne fait qu’augmenter. Réussir à faire interopérer lessystèmes dans un temps raisonnable dépend de la rapidité avec laquelle l’analystepeut comprendre les programmes. Un bon outil de visualisation et compréhensionlogicielle aidera les ingénieurs des Forces à maximiser leurs efforts de développe-ment et de maintenance, réduisant ainsi leur temps de réponse pour les opérationscritiques. De plus, d’un point de vue de sécurité, il est impératif de comprendreles nouvelles menaces logicielles le plus rapidement possible. Le même outil peutêtre utilisé pour diminuer le temps requis pour comprendre la menace et développerdes contre-mesures. L’outil peut aussi être utilisé par les nombreux développeurs etcontracteurs du MDN pour accélérer le développement et la maintenance de n’im-porte quel système logiciel. Par exemple, lorsque vient le temps de remplacer unsystème par un autre dans un système de systèmes, un tel outil pourrait grande-ment réduire le temps requis. Un autre exemple où cet outil pourrait être utile estdans le processus d’acquisition d’un nouveau logiciel. Comparer les différentes al-ternatives requiert une compréhension de base des systèmes potentiels. Un outil devisualisation de compréhension approprié améliorerait grandement ce processus.
Finalement, ces travaux offrent un potentiel de collaboration entre RDDC, les uni-versités et l’industrie.
François Lemieux, Martin Salois; 2006; Les techniques de visualisation pour lacompréhension de programme; DRDC Valcartier TM 2005-535; R & D pour ladéfense Canada – Valcartier.
iv DRDC Valcartier TM 2005-535
Table of Contents
Abstract . . . . . . . . . . . . . . . . . . . . . . . . . . . . . . . . . . . . . i
Résumé . . . . . . . . . . . . . . . . . . . . . . . . . . . . . . . . . . . . . i
Executive Summary . . . . . . . . . . . . . . . . . . . . . . . . . . . . . . . iii
Sommaire . . . . . . . . . . . . . . . . . . . . . . . . . . . . . . . . . . . . iv
Table of Contents . . . . . . . . . . . . . . . . . . . . . . . . . . . . . . . . v
List of Figures . . . . . . . . . . . . . . . . . . . . . . . . . . . . . . . . . . viii
List of Tables . . . . . . . . . . . . . . . . . . . . . . . . . . . . . . . . . . x
Acknowledgements . . . . . . . . . . . . . . . . . . . . . . . . . . . . . . . xi
1 Introduction . . . . . . . . . . . . . . . . . . . . . . . . . . . . . . . 1
1.1 Essential References . . . . . . . . . . . . . . . . . . . . . . 1
1.2 Active Research Groups . . . . . . . . . . . . . . . . . . . . 2
2 An Introduction to Software Visualization . . . . . . . . . . . . . . . 3
2.1 Terminology . . . . . . . . . . . . . . . . . . . . . . . . . . . 3
2.1.1 Program Visualization . . . . . . . . . . . . . . . . . 4
2.1.2 Algorithm Visualization . . . . . . . . . . . . . . . . . 6
2.1.3 Other Definitions . . . . . . . . . . . . . . . . . . . . 6
2.2 A Brief History . . . . . . . . . . . . . . . . . . . . . . . . . 6
2.3 Taxonomy . . . . . . . . . . . . . . . . . . . . . . . . . . . . 7
3 Techniques . . . . . . . . . . . . . . . . . . . . . . . . . . . . . . . 8
3.1 The Nassi-Shneiderman Diagram . . . . . . . . . . . . . . . . 10
3.2 Graph Layouts . . . . . . . . . . . . . . . . . . . . . . . . . . 11
3.2.1 Tree Layouts . . . . . . . . . . . . . . . . . . . . . . 13
3.2.2 Hierarchical Layouts . . . . . . . . . . . . . . . . . . 15
DRDC Valcartier TM 2005-535 v
3.2.3 Orthogonal Layouts . . . . . . . . . . . . . . . . . . . 15
3.2.4 Force-based Layouts . . . . . . . . . . . . . . . . . . 15
3.2.5 Others . . . . . . . . . . . . . . . . . . . . . . . . . . 18
3.3 Space-filling . . . . . . . . . . . . . . . . . . . . . . . . . . . 21
3.3.1 Tree-maps . . . . . . . . . . . . . . . . . . . . . . . . 21
3.3.2 Sunburst . . . . . . . . . . . . . . . . . . . . . . . . . 21
3.4 Information Murals . . . . . . . . . . . . . . . . . . . . . . . 23
3.4.1 Line and Pixel Representations . . . . . . . . . . . . . 23
3.4.2 Execution Murals . . . . . . . . . . . . . . . . . . . . 24
3.5 Interaction and Navigation . . . . . . . . . . . . . . . . . . . 26
3.5.1 Scrolling or Panning . . . . . . . . . . . . . . . . . . 26
3.5.2 Focus and Context Views . . . . . . . . . . . . . . . . 26
3.5.3 Multiple Views . . . . . . . . . . . . . . . . . . . . . 29
3.6 Animation . . . . . . . . . . . . . . . . . . . . . . . . . . . . 30
3.7 Virtual Environments . . . . . . . . . . . . . . . . . . . . . . 31
3.8 Auralization . . . . . . . . . . . . . . . . . . . . . . . . . . . 32
4 Systems . . . . . . . . . . . . . . . . . . . . . . . . . . . . . . . . . 33
4.1 Graph Visualization Systems . . . . . . . . . . . . . . . . . . 34
4.2 Tree-map Systems . . . . . . . . . . . . . . . . . . . . . . . . 36
4.3 Information Mural Systems . . . . . . . . . . . . . . . . . . . 37
4.4 Algorithm Animation Systems . . . . . . . . . . . . . . . . . 39
4.5 Run-time Visualization Systems . . . . . . . . . . . . . . . . 41
4.6 Software Exploration Systems . . . . . . . . . . . . . . . . . 42
4.7 Auralization Systems . . . . . . . . . . . . . . . . . . . . . . 45
vi DRDC Valcartier TM 2005-535

5 Evaluating a Software Visualization Systems . . . . . . . . . . . . . . 45
6 Conclusion and Future Work . . . . . . . . . . . . . . . . . . . . . . 46
References . . . . . . . . . . . . . . . . . . . . . . . . . . . . . . . . . . . . 48
List of Acronyms . . . . . . . . . . . . . . . . . . . . . . . . . . . . . . . . 56
DRDC Valcartier TM 2005-535 vii
List of Figures
1 Venn diagram showing the relationships between the various formsof software visualization . . . . . . . . . . . . . . . . . . . . . . . . 4
2 Binary versus assembly . . . . . . . . . . . . . . . . . . . . . . . . . 8
3 Improvement of a program’s source code appearance . . . . . . . . . 9
4 Nassi-Shneiderman structured flowchart technique . . . . . . . . . . . 10
5 The Nassi-Shneiderman technique extended for Java code . . . . . . . 11
6 Mindmap of application areas for graph layout . . . . . . . . . . . . . 12
7 Classical top-down tree layout . . . . . . . . . . . . . . . . . . . . . 13
8 Radial view of tree layout . . . . . . . . . . . . . . . . . . . . . . . . 13
9 A Microsoft Windows tree-view of the directory structure . . . . . . . 14
10 The cone tree: A 3-D layout technique . . . . . . . . . . . . . . . . . 14
11 The call graph layout is a natural representation of software structures 16
12 Sample 3-D call graph layout . . . . . . . . . . . . . . . . . . . . . . 17
13 Orthogonal layout of UML class diagram . . . . . . . . . . . . . . . 17
14 Spring Layout of a control-flow graph . . . . . . . . . . . . . . . . . 18
15 Hyperbolic layout of 3,000 nodes connected by 10,000 edges . . . . . 19
16 Clustering technique applied to a tree graph . . . . . . . . . . . . . . 19
17 A combined call and control-flow graph . . . . . . . . . . . . . . . . 20
18 Examples of Symmetric Layout . . . . . . . . . . . . . . . . . . . . 20
19 Tree-map: A 2-D space-filling visualization technique . . . . . . . . . 22
20 StepTree: Extending a tree-map to 3-D . . . . . . . . . . . . . . . . . 22
21 Sequence of frames from the SunBurst visualization technique . . . . 23
22 Line representation using different scaling of color-coded program text 24
viii DRDC Valcartier TM 2005-535

23 The principle of pixel representation technique . . . . . . . . . . . . . 25
24 Execution mural view of message traces from an object-orientedprogram . . . . . . . . . . . . . . . . . . . . . . . . . . . . . . . . . 25
25 Fish-eye views . . . . . . . . . . . . . . . . . . . . . . . . . . . . . . 27
26 SHriMP’s fisheye view . . . . . . . . . . . . . . . . . . . . . . . . . 28
27 The perspective wall of information technique . . . . . . . . . . . . . 28
28 SHriMP’s multiple views of a Java Program . . . . . . . . . . . . . . 29
29 Variation on a conventional tree-map, implemented in VRML . . . . . 31
30 Visualization of Java code within Software World . . . . . . . . . . . 32
31 The CallStax technique . . . . . . . . . . . . . . . . . . . . . . . . . 33
32 aiSee graph visualization . . . . . . . . . . . . . . . . . . . . . . . . 35
33 Walrus tool for visualizing large directed graphs in a 3-D space . . . . 36
34 Interactive SeeSys system embodying the tree-Map technique . . . . . 37
35 SeeSoft . . . . . . . . . . . . . . . . . . . . . . . . . . . . . . . . . 38
36 Mural of object-oriented message trace . . . . . . . . . . . . . . . . . 38
37 Mural of parallel message trace . . . . . . . . . . . . . . . . . . . . . 38
38 Elements of the sv3D visualization framework . . . . . . . . . . . . . 39
39 sv3D directly supports user interaction by eliminating occlusionusing transparency control . . . . . . . . . . . . . . . . . . . . . . . 40
40 Visualizations produced by the Polka algorithm animation system . . 40
41 Output from the Zeus algorithm animation system . . . . . . . . . . . 41
42 Screenshot of GROOVE showing an object-oriented design . . . . . . 42
43 Different outputs of the Vmax system . . . . . . . . . . . . . . . . . 43
44 Creole is an Eclipse plugin to explore Java code . . . . . . . . . . . . 44
DRDC Valcartier TM 2005-535 ix

45 Jambalaya is a Protégé plugin to visualize onthologies andknowledge bases . . . . . . . . . . . . . . . . . . . . . . . . . . . . 44
List of Tables
1 Mapping between gathering information techniques andvisualization techniques . . . . . . . . . . . . . . . . . . . . . . . . . 34
x DRDC Valcartier TM 2005-535
Acknowledgements
The authors wish to thank Mr. Philippe Charland for his invaluable insights and hisconsiderable editing work.
DRDC Valcartier TM 2005-535 xi

This page intentionally left blank.
xii DRDC Valcartier TM 2005-535
1 Introduction
It is generally accepted that software development and maintenance is difficult andcostly. Programs are becoming ever more complex and harder to understand. Somereasons for this include, but are not limited to:
• Increase in functionalities — millions of lines of code is common
• Evolution of the requirements as the program is used — systems must fre-quently be modified to meet these changing requirements
• High turnover rate in development and support personnel
As a result, complex software is rarely understood completely by the developers andeven less so by the maintainers. Moreover, it is a very time-consuming and arduoustask to understand complex system behaviors from source code. An example is thereplacement of a system by another in a system of systems. Any tool that can speedup the understanding of the existing systems can greatly reduce the time and thecost associated with this task.
The field of software engineering has approached those problems in a number ofways. One key solution that has emerged is software visualization. This field ofresearch seeks to make programs and algorithms easier to understand using variousvisualization techniques and cognitive approaches.
The main objective of this document is to provide a concise overview of the mostsignificant aspects of software visualization and program comprehension. It is theresult of a thorough survey of the literature on the subject, and even loosely-relatedsubjects. Over 140 papers were read and classified and nearly as many tools werereviewed. Only the most relevant and significant ones were kept and are discussedin this document.
It is very difficult to classify the field of software visualization and program com-prehension in clear-cut categories. This document tries to separate the techniques(Section 3) from the actual software systems that try to implement them (Section 4).This is followed by a discussion on how to evaluate these systems to find the best fitfor the need (Section 5). But first, the remainder of this section gives the essentialreferences and active groups in this field and the next section gives an introductionto software visualization and its terminology.
1.1 Essential References
Stasko et al [1] provide an excellent and comprehensive overview of software visu-alization. This book integrates knowledge, suggests principles, provides perspec-
DRDC Valcartier TM 2005-535 1
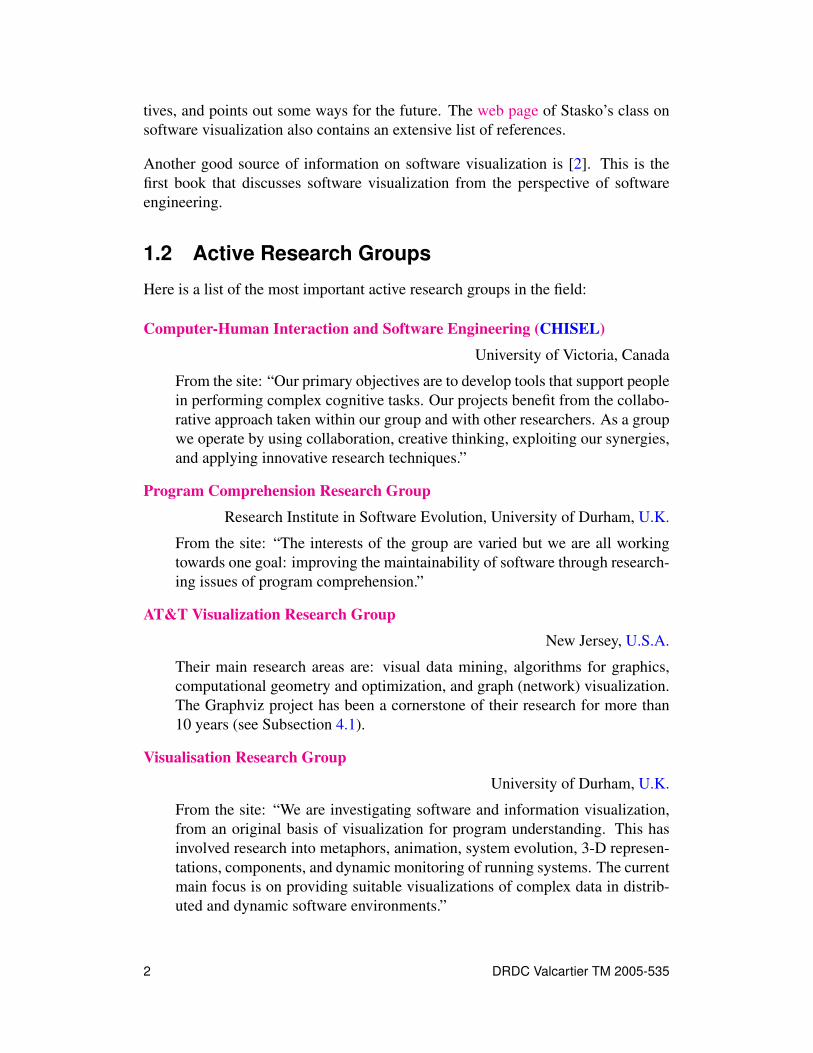
tives, and points out some ways for the future. The web page of Stasko’s class onsoftware visualization also contains an extensive list of references.
Another good source of information on software visualization is [2]. This is thefirst book that discusses software visualization from the perspective of softwareengineering.
1.2 Active Research Groups
Here is a list of the most important active research groups in the field:
Computer-Human Interaction and Software Engineering (CHISEL)
University of Victoria, Canada
From the site: “Our primary objectives are to develop tools that support peoplein performing complex cognitive tasks. Our projects benefit from the collabo-rative approach taken within our group and with other researchers. As a groupwe operate by using collaboration, creative thinking, exploiting our synergies,and applying innovative research techniques.”
Program Comprehension Research Group
Research Institute in Software Evolution, University of Durham, U.K.
From the site: “The interests of the group are varied but we are all workingtowards one goal: improving the maintainability of software through research-ing issues of program comprehension.”
AT&T Visualization Research Group
New Jersey, U.S.A.
Their main research areas are: visual data mining, algorithms for graphics,computational geometry and optimization, and graph (network) visualization.The Graphviz project has been a cornerstone of their research for more than10 years (see Subsection 4.1).
Visualisation Research Group
University of Durham, U.K.
From the site: “We are investigating software and information visualization,from an original basis of visualization for program understanding. This hasinvolved research into metaphors, animation, system evolution, 3-D represen-tations, components, and dynamic monitoring of running systems. The currentmain focus is on providing suitable visualizations of complex data in distrib-uted and dynamic software environments.”
2 DRDC Valcartier TM 2005-535

The Information Interfaces GroupGVU Center at Georgia Tech, U.S.A.
This is an HCI research group. From the site: “The group develops waysto help people understand information via user interface design, informationvisualization, peripheral awareness techniques, and software agency. Theyseek to utilize computing technologies to help people make sense, make betterjudgments, and learn from all the information available to them.”
2 An Introduction to Software Visualization
This section provides an overall introduction to software visualization. It starts withan overview of the concepts that rule software visualization as it seems to be under-stood today. Next, a very brief recapitulation of the history of this young domain,or rather where to find this information, is presented. Finally, a brief discussion ontaxonomies in this discipline follows.
2.1 Terminology
It appears there is no consensus in the literature for an accepted definition of theoverarching forms of software visualization. Each project visualizes a specific kindof information. Different sources put emphasis on different concepts in their def-initions. However, a good starting point can be found in [3], in which the authorsdivide the field as shown in Figure 1.
Before giving any definitions, let us look at what the word visualization meanswhen it refers to as software visualization.
Because visualization contains the root “visual”, a majority of people believes thatvisualization only deals with making pictures. Indeed, the common and most pop-ular definition of “visual” only refers to images that people can see with their eyes.In the context of computer programs, however, Grant [4] says that “visual meansvisible on a computer display and visualization is communicating data with graph-ics.” Another point of view suggests the conveyance of mental images [5]: “Thepower or process of forming a mental picture or vision of something not actuallypresent to the sight”. McCormick et al put the emphasis on the process of commu-nication: “The study of mechanisms in computers and in humans which allow themin convert to perceive, use, and communicate visual information” (cited in [4]).
These last two definitions are the most interesting. They propose that a visualizationcan be the result of any combination of the human senses. This is a much broaderdefinition.
DRDC Valcartier TM 2005-535 3

Figure 1: Venn diagram showing the relationships between the various forms ofsoftware visualization [3]
There does not seem to be a formal definition of software visualization either. Themost well-known defines it as “the use of the crafts of typography, graphic design,animation, and cinematography with modern human-computer interaction technol-ogy to facilitate both the human understanding and effective use of computer soft-ware” [5]. Going back to Figure 1, it can be seen that it encompasses all of this. Thenext subsections explain the concepts of this Venn diagram in more detail. Note,however, that visual programming and programming by demonstration are specialcases, as described below.
2.1.1 Program Visualization
Myers [6] defines program visualization as “the program is specified in a conven-tional, textual manner, and the graphics is used to illustrate some aspect of the
4 DRDC Valcartier TM 2005-535
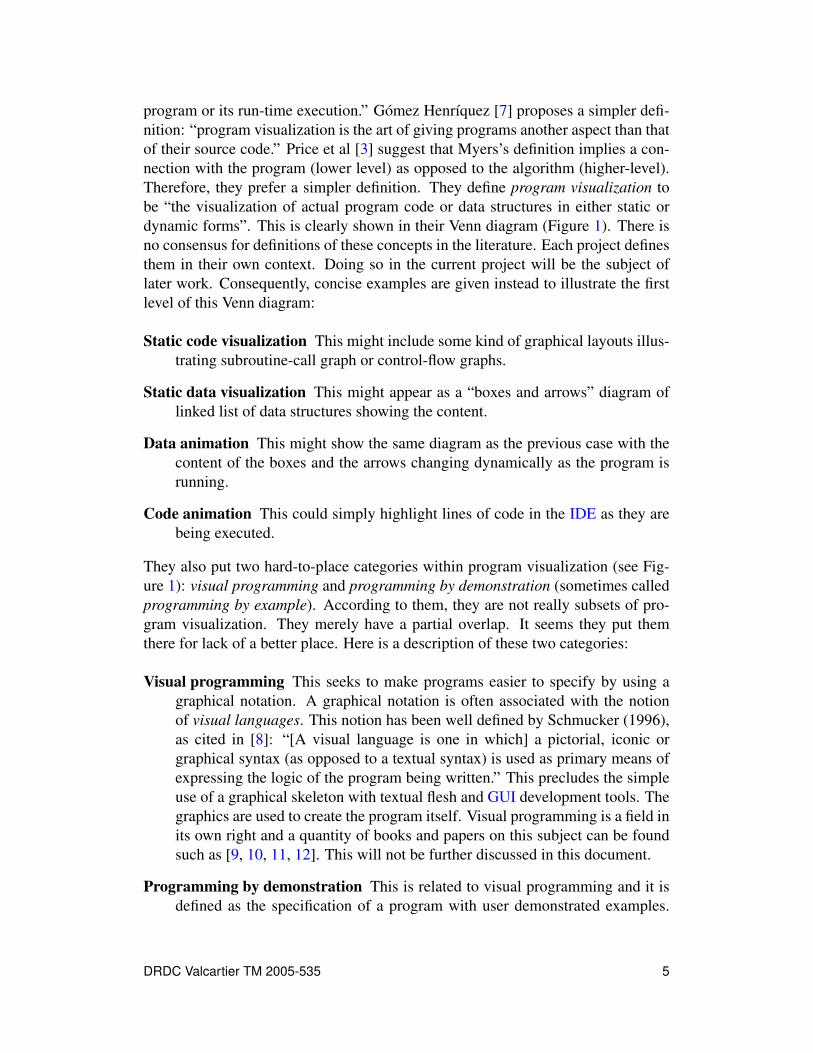
program or its run-time execution.” Gómez Henríquez [7] proposes a simpler defi-nition: “program visualization is the art of giving programs another aspect than thatof their source code.” Price et al [3] suggest that Myers’s definition implies a con-nection with the program (lower level) as opposed to the algorithm (higher-level).Therefore, they prefer a simpler definition. They define program visualization tobe “the visualization of actual program code or data structures in either static ordynamic forms”. This is clearly shown in their Venn diagram (Figure 1). There isno consensus for definitions of these concepts in the literature. Each project definesthem in their own context. Doing so in the current project will be the subject oflater work. Consequently, concise examples are given instead to illustrate the firstlevel of this Venn diagram:
Static code visualization This might include some kind of graphical layouts illus-trating subroutine-call graph or control-flow graphs.
Static data visualization This might appear as a “boxes and arrows” diagram oflinked list of data structures showing the content.
Data animation This might show the same diagram as the previous case with thecontent of the boxes and the arrows changing dynamically as the program isrunning.
Code animation This could simply highlight lines of code in the IDE as they arebeing executed.
They also put two hard-to-place categories within program visualization (see Fig-ure 1): visual programming and programming by demonstration (sometimes calledprogramming by example). According to them, they are not really subsets of pro-gram visualization. They merely have a partial overlap. It seems they put themthere for lack of a better place. Here is a description of these two categories:
Visual programming This seeks to make programs easier to specify by using agraphical notation. A graphical notation is often associated with the notionof visual languages. This notion has been well defined by Schmucker (1996),as cited in [8]: “[A visual language is one in which] a pictorial, iconic orgraphical syntax (as opposed to a textual syntax) is used as primary means ofexpressing the logic of the program being written.” This precludes the simpleuse of a graphical skeleton with textual flesh and GUI development tools. Thegraphics are used to create the program itself. Visual programming is a field inits own right and a quantity of books and papers on this subject can be foundsuch as [9, 10, 11, 12]. This will not be further discussed in this document.
Programming by demonstration This is related to visual programming and it isdefined as the specification of a program with user demonstrated examples.
DRDC Valcartier TM 2005-535 5
The idea is that users may not have the advanced programming skills requiredto construct a program. Cypher [13] provides an excellent survey of this sub-ject. This will not be further discussed in this document either.
2.1.2 Algorithm Visualization
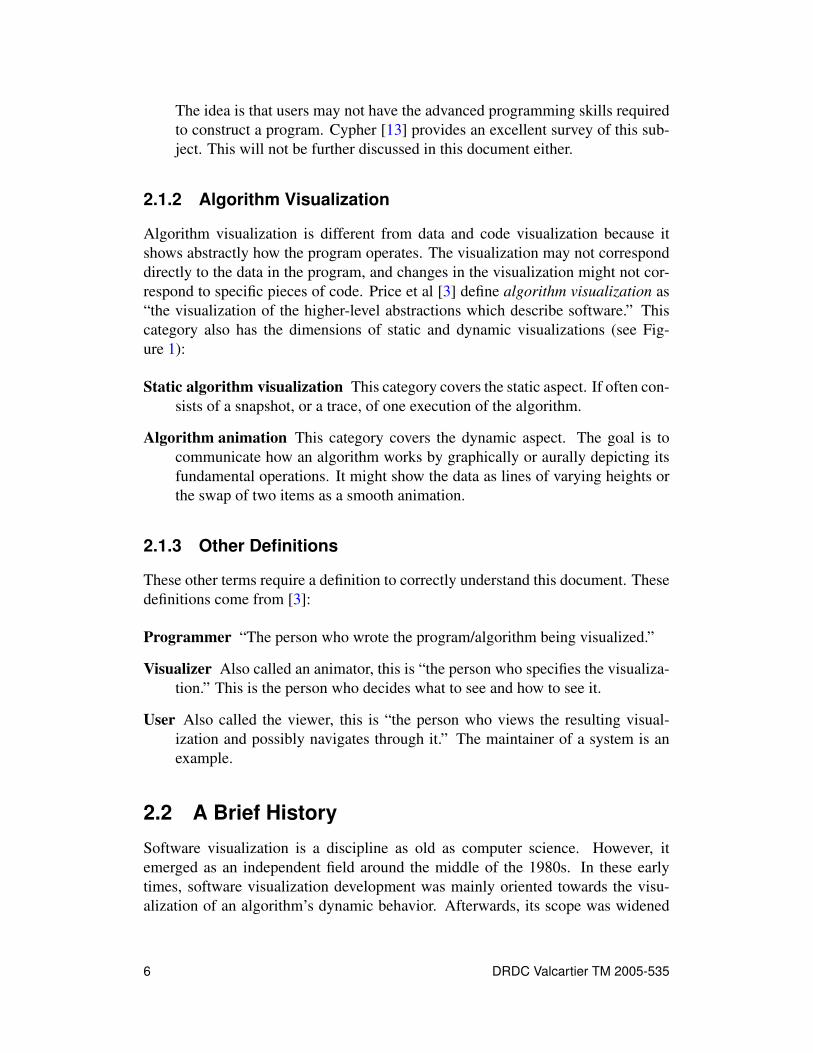
Algorithm visualization is different from data and code visualization because itshows abstractly how the program operates. The visualization may not corresponddirectly to the data in the program, and changes in the visualization might not cor-respond to specific pieces of code. Price et al [3] define algorithm visualization as“the visualization of the higher-level abstractions which describe software.” Thiscategory also has the dimensions of static and dynamic visualizations (see Fig-ure 1):
Static algorithm visualization This category covers the static aspect. If often con-sists of a snapshot, or a trace, of one execution of the algorithm.
Algorithm animation This category covers the dynamic aspect. The goal is tocommunicate how an algorithm works by graphically or aurally depicting itsfundamental operations. It might show the data as lines of varying heights orthe swap of two items as a smooth animation.
2.1.3 Other Definitions
These other terms require a definition to correctly understand this document. Thesedefinitions come from [3]:
Programmer “The person who wrote the program/algorithm being visualized.”
Visualizer Also called an animator, this is “the person who specifies the visualiza-tion.” This is the person who decides what to see and how to see it.
User Also called the viewer, this is “the person who views the resulting visual-ization and possibly navigates through it.” The maintainer of a system is anexample.
2.2 A Brief History
Software visualization is a discipline as old as computer science. However, itemerged as an independent field around the middle of the 1980s. In these earlytimes, software visualization development was mainly oriented towards the visu-alization of an algorithm’s dynamic behavior. Afterwards, its scope was widened
6 DRDC Valcartier TM 2005-535
to deal with other aspects of the programs. Static and dynamic visualizations ofsource code or the display of quantitative information about parallel executions areboth examples that came later.
Software visualization is considered as a discipline of commercial interest since themid 1990s only.
Very few papers deal with the historic aspect overall. Two good sources about thesoftware visualization research and development are [5] and [14]. The last onesketches out in more detail the early history of software visualization.
2.3 Taxonomy
Many researchers have come up with valid taxonomies to help classify, quantify,and describe the different types of software visualization. Roman and Cox [15]offer a simple taxonomy. Myers [6] proposes two taxonomies, one for visual pro-gramming and one for program visualization.
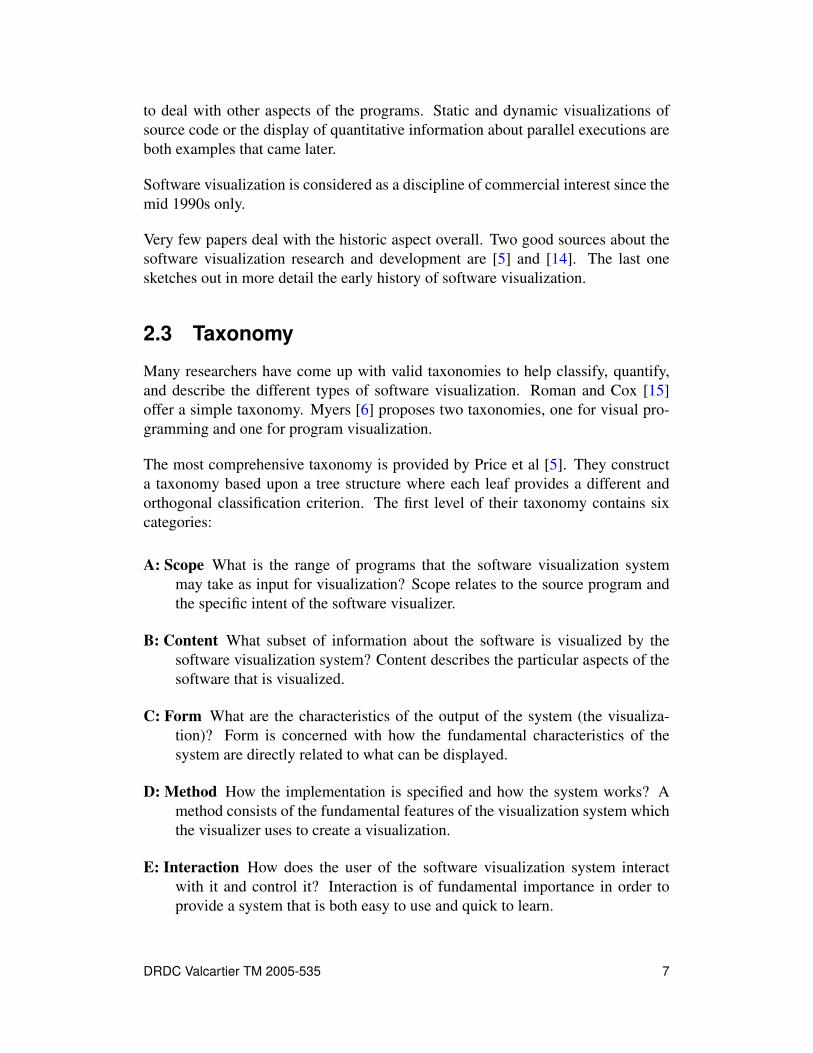
The most comprehensive taxonomy is provided by Price et al [5]. They constructa taxonomy based upon a tree structure where each leaf provides a different andorthogonal classification criterion. The first level of their taxonomy contains sixcategories:
A: Scope What is the range of programs that the software visualization systemmay take as input for visualization? Scope relates to the source program andthe specific intent of the software visualizer.
B: Content What subset of information about the software is visualized by thesoftware visualization system? Content describes the particular aspects of thesoftware that is visualized.
C: Form What are the characteristics of the output of the system (the visualiza-tion)? Form is concerned with how the fundamental characteristics of thesystem are directly related to what can be displayed.
D: Method How the implementation is specified and how the system works? Amethod consists of the fundamental features of the visualization system whichthe visualizer uses to create a visualization.
E: Interaction How does the user of the software visualization system interactwith it and control it? Interaction is of fundamental importance in order toprovide a system that is both easy to use and quick to learn.
DRDC Valcartier TM 2005-535 7
sub_401000 proc neararg_0 = dword ptr 8
55 push ebp8B EC mov ebp, esp68 D8 80 40 00 push offset aHelloHowOldAreE8 7C 00 00 00 call _printf ;"Hello, how old are you? "83 C4 04 add esp, 48B 45 08 mov eax, [ebp+arg_0]50 push eax68 F4 80 40 00 push offset aD ; "%d"E8 54 00 00 00 call _scanf83 C4 08 add esp, 85D pop ebpC3 retn
sub_401000 endp
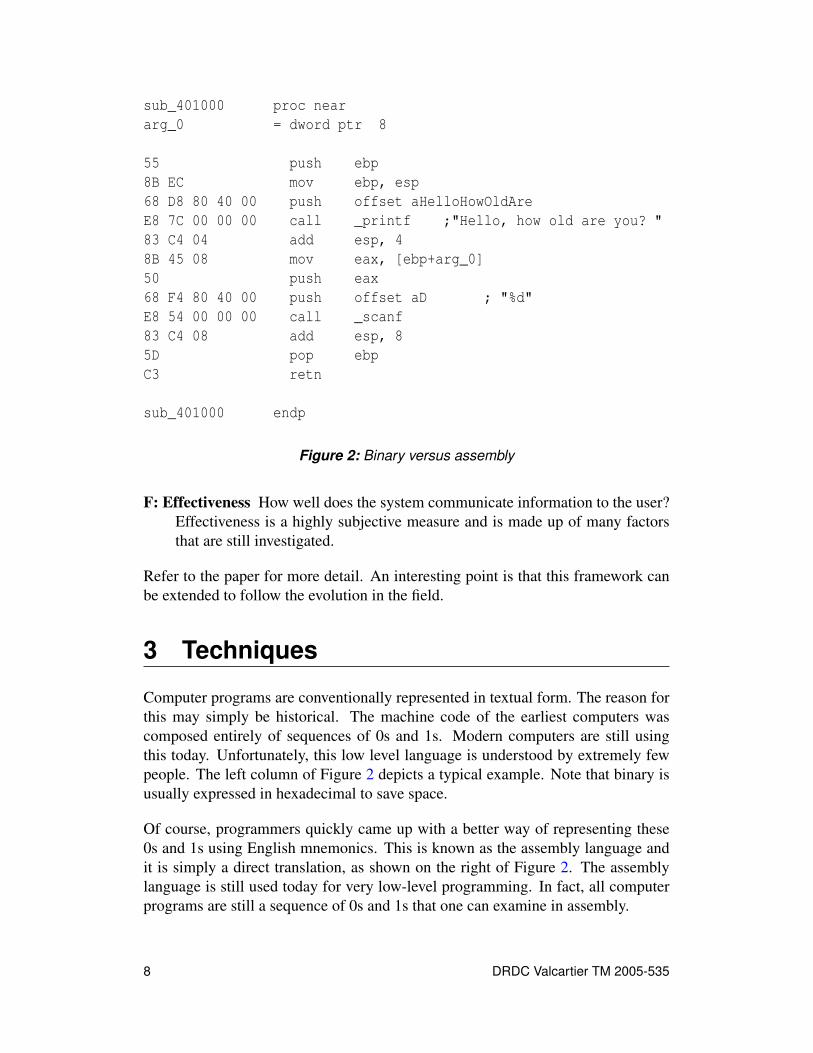
Figure 2: Binary versus assembly
F: Effectiveness How well does the system communicate information to the user?Effectiveness is a highly subjective measure and is made up of many factorsthat are still investigated.
Refer to the paper for more detail. An interesting point is that this framework canbe extended to follow the evolution in the field.
3 Techniques
Computer programs are conventionally represented in textual form. The reason forthis may simply be historical. The machine code of the earliest computers wascomposed entirely of sequences of 0s and 1s. Modern computers are still usingthis today. Unfortunately, this low level language is understood by extremely fewpeople. The left column of Figure 2 depicts a typical example. Note that binary isusually expressed in hexadecimal to save space.
Of course, programmers quickly came up with a better way of representing these0s and 1s using English mnemonics. This is known as the assembly language andit is simply a direct translation, as shown on the right of Figure 2. The assemblylanguage is still used today for very low-level programming. In fact, all computerprograms are still a sequence of 0s and 1s that one can examine in assembly.
8 DRDC Valcartier TM 2005-535

/*This is a wonderful program*/#include <stdio.h>
void input(int *ageP){
printf("Hello, how old are you? ");scanf("%d", ageP);
}
void output(int age){
printf("You are %d years old! Wow! That’s very old!", age);}
int main(int argc, char* argv[]){
int age;input(&age);output(age);return 0;
}
Figure 3: Improvement of a program’s source code appearance
However, it was not long before someone came up with an even better way ofprogramming: the high-level programming languages. Basic, C/C++, and Javaare just some examples of such languages that are used today. An example of aC program is shown in Figure 3. Although not specific to C, notice the use ofcolors, fonts, spacing, and indentation. These simple devices from the printing andpublishing industry came up later. Based on syntax and layout rules, they havebeen shown to significantly enhance the readability and understandability of thecode. Nowadays, modern programming environments also use other elements suchas collapsible items, pictures, and animated tracking (e.g. debugging.)
Furthermore, considerable efforts have been devoted to the field of effective pro-gram appearance. Also called enhanced program appearance or effective programrepresentation, these techniques try to enhance the construction of programs to fa-cilitate their reading, comprehension, and effective use. Baecker and Marcus [16]suggest that enduring programs should be made perceptually and cognitively moreaccessible and more usable. They demonstrate this in the SEE visual compiler pro-totype.
DRDC Valcartier TM 2005-535 9

Figure 4: Nassi-Shneiderman structured flowchart technique [17]
Despite all of these improvements, textual representation turns out to be a very lim-ited way of visualizing a program. Just imagine the case of large programs that arecomposed of millions of lines of code. Another example, where this is especiallytrue, is the case of program discovery and comprehension. Trying to understandone’s own code is difficult enough when it becomes that large, just imagine tryingto understand someone else’s! Therefore, practitioners and researchers continuallystrive to find better visualization techniques.
Many such techniques have been developed over time to try to visualize both struc-tural and behavioral software information. The rest of this section outlines the mostsignificant techniques.
3.1 The Nassi-Shneiderman Diagram
Many alternative ways of converting program text into a graphical form have beenexperimented in the 1970s. One relevant technique has been developed by Nassiand Shneiderman [18] to counter the unstructured nature of standard flowcharts.Shown in Figure 4, the basic structure of a Nassi-Shneiderman diagram is a rectan-gle that is subdivided in smaller rectangles that represent instructions. A conditionalinstruction is separated by two triangles representing the alternatives (yes/no.) Every-
10 DRDC Valcartier TM 2005-535
a)
b)
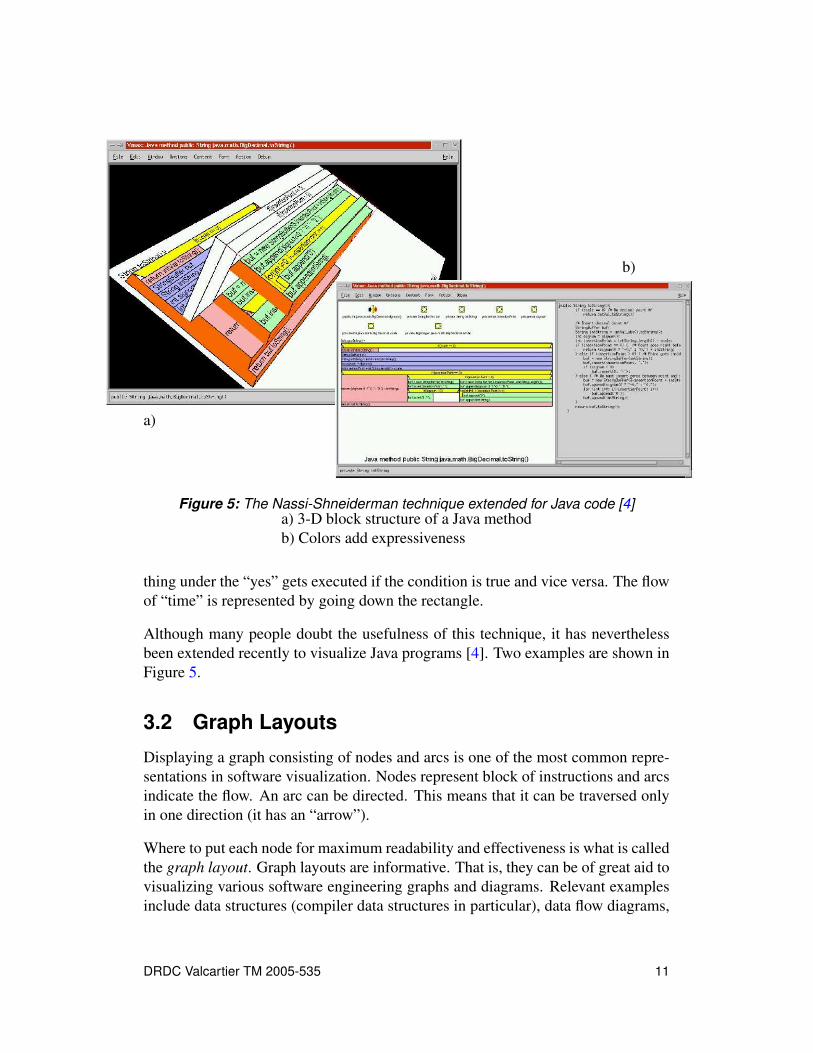
Figure 5: The Nassi-Shneiderman technique extended for Java code [4]a) 3-D block structure of a Java methodb) Colors add expressiveness
thing under the “yes” gets executed if the condition is true and vice versa. The flowof “time” is represented by going down the rectangle.
Although many people doubt the usefulness of this technique, it has neverthelessbeen extended recently to visualize Java programs [4]. Two examples are shown inFigure 5.
3.2 Graph Layouts
Displaying a graph consisting of nodes and arcs is one of the most common repre-sentations in software visualization. Nodes represent block of instructions and arcsindicate the flow. An arc can be directed. This means that it can be traversed onlyin one direction (it has an “arrow”).
Where to put each node for maximum readability and effectiveness is what is calledthe graph layout. Graph layouts are informative. That is, they can be of great aid tovisualizing various software engineering graphs and diagrams. Relevant examplesinclude data structures (compiler data structures in particular), data flow diagrams,
DRDC Valcartier TM 2005-535 11
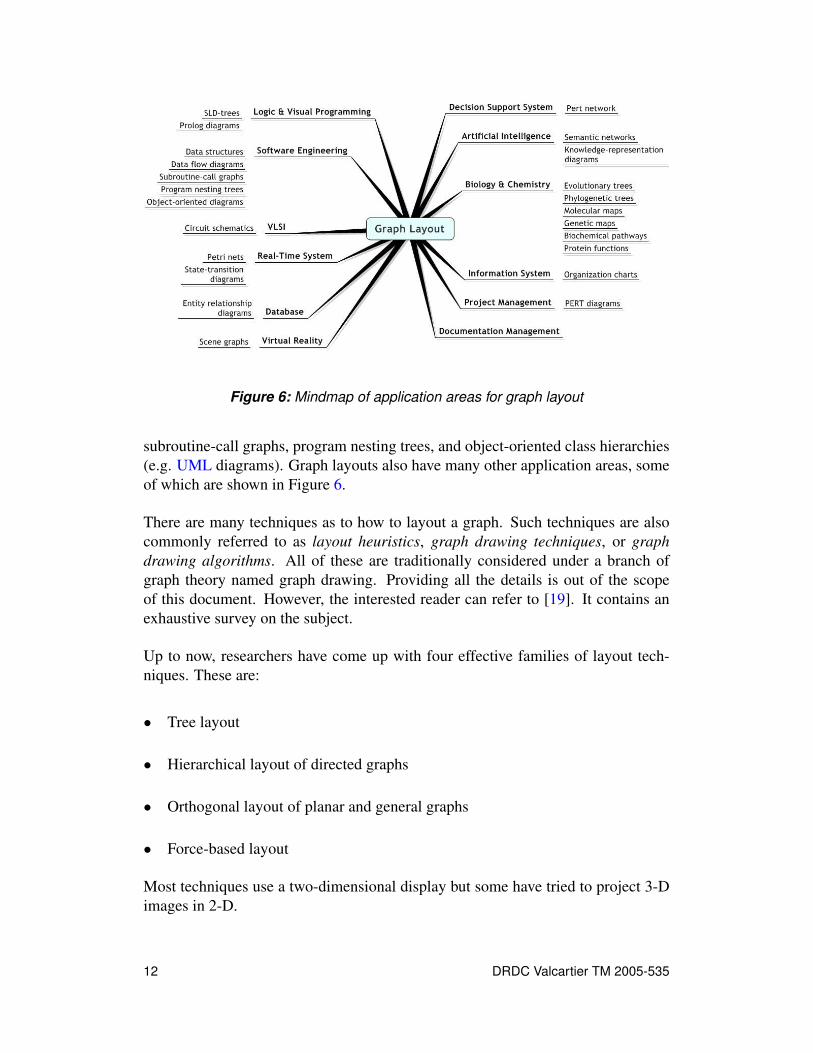
Figure 6: Mindmap of application areas for graph layout
subroutine-call graphs, program nesting trees, and object-oriented class hierarchies(e.g. UML diagrams). Graph layouts also have many other application areas, someof which are shown in Figure 6.
There are many techniques as to how to layout a graph. Such techniques are alsocommonly referred to as layout heuristics, graph drawing techniques, or graphdrawing algorithms. All of these are traditionally considered under a branch ofgraph theory named graph drawing. Providing all the details is out of the scopeof this document. However, the interested reader can refer to [19]. It contains anexhaustive survey on the subject.
Up to now, researchers have come up with four effective families of layout tech-niques. These are:
• Tree layout
• Hierarchical layout of directed graphs
• Orthogonal layout of planar and general graphs
• Force-based layout
Most techniques use a two-dimensional display but some have tried to project 3-Dimages in 2-D.
12 DRDC Valcartier TM 2005-535

Figure 7: Classical top-down tree layout [21]
Figure 8: Radial view of tree layout [20]
3.2.1 Tree Layouts
A tree layout positions children nodes below their common ancestor. There are sev-eral alternatives to drawing trees. The algorithm given by Reingold and Tilford isprobably the best-known [20]. It can be adapted to produce top-down (see Figure 7)as well as left-to-right tree structures. This same structure could be positioned dif-ferently by placing nodes on concentric circles according to their depth in the tree(see Figure 8).
Most users are familiar with a tree layout as they are very often used to describe thefile hierarchy on computer systems (Figure 9).
A cone tree is a variation that displays hierarchical information in 3-D (Figure 10).
DRDC Valcartier TM 2005-535 13

Figure 9: A Microsoft Windows tree-view of the directory structure
Figure 10: The cone tree: A 3-D layout technique [22]
14 DRDC Valcartier TM 2005-535
This solution was developed to maximize the effective use of available screen spaceand enable a visualization of the whole structure.
3.2.2 Hierarchical Layouts
A hierarchical layout can be used to represent a directed graph. It emphasizesthe dependence between objects by assigning nodes to a discrete level, so that theedges are directed somewhat uniformly from top to bottom. Such directed graphsare usually drawn with Sugiyama’s algorithm [23] or one of its numerous varia-tions or improvements. These techniques are perhaps the most common methodsof visualizing a software structure.
In Figure 11, a node in the graph represents a function and an edge represents a callbetween functions. Function call graphs may be animated as a visual representationof how a program executes and color-coded to show “hot spots” [24].
The work of [25] on visualization for software engineering involves extending thecall graph to three dimensions. A sample 3-D call graph is shown in Figure 12. Inthis technique, the selected file is shown in front with a fully expanded layout whilethe other files are shown as tags and/or in a more compressed layout. Hexagonalboxes represent collapsed files.
3.2.3 Orthogonal Layouts
An orthogonal layout has edges running horizontally or vertically. These edges areconstrained to 90-degree bends to reduce the number of edge crossovers and thearea covered by the graph. This type of layout has been well studied and practi-cal techniques have been discovered [26]. The best results have been achieved onorthogonal drawings of planar graphs, as illustrated by the layout of a UML classdiagram in Figure 13.
3.2.4 Force-based Layouts
There are many possibilities to apply force-based models to a graph layout. Twoespecially interesting techniques, spring embedder [28] and simulated annealing,have attracted more attention in the literature. The latter has its origin in the area ofstatistical mechanisms but it has been mostly applied to circuit schematic layouts.It will not be further discussed in this document.
The general idea behind the spring embedder technique is that two nodes with de-pendencies are more attracted to each other than two nodes without. A link becomesa spring between two nodes that can extend or compress depending on the forces in
DRDC Valcartier TM 2005-535 15

Figure 11: The call graph layout is a natural representation of software structures
16 DRDC Valcartier TM 2005-535
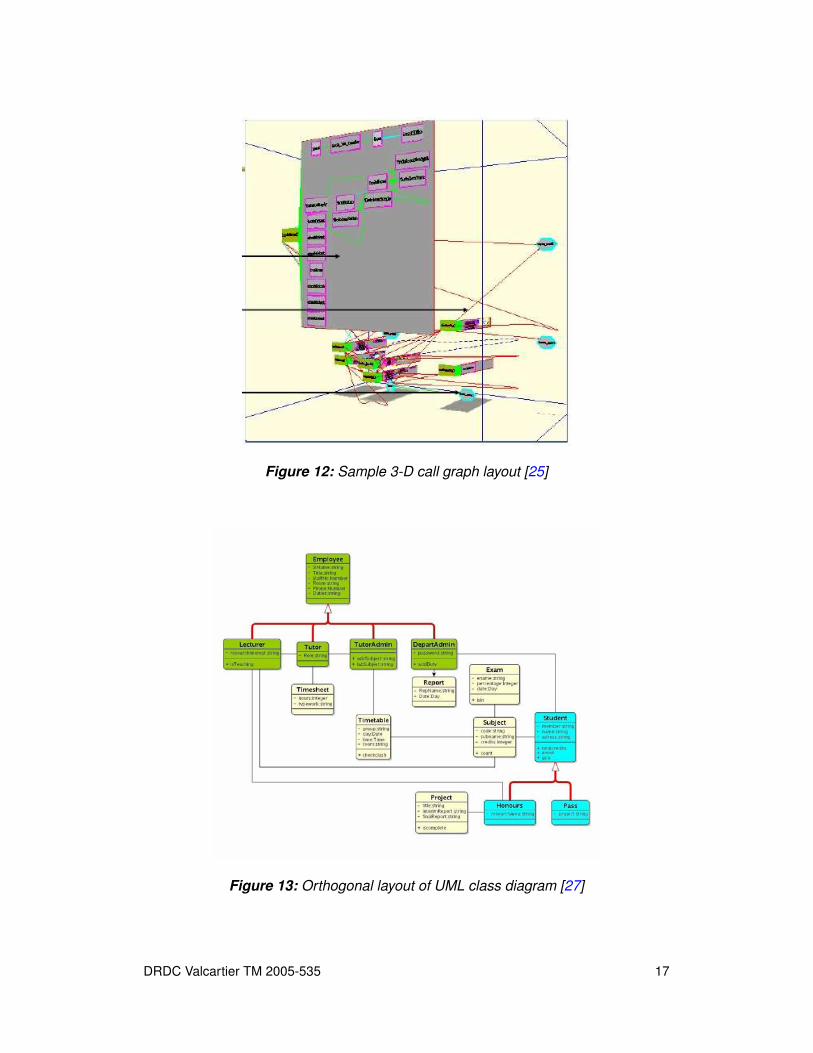
Figure 12: Sample 3-D call graph layout [25]
Figure 13: Orthogonal layout of UML class diagram [27]
DRDC Valcartier TM 2005-535 17
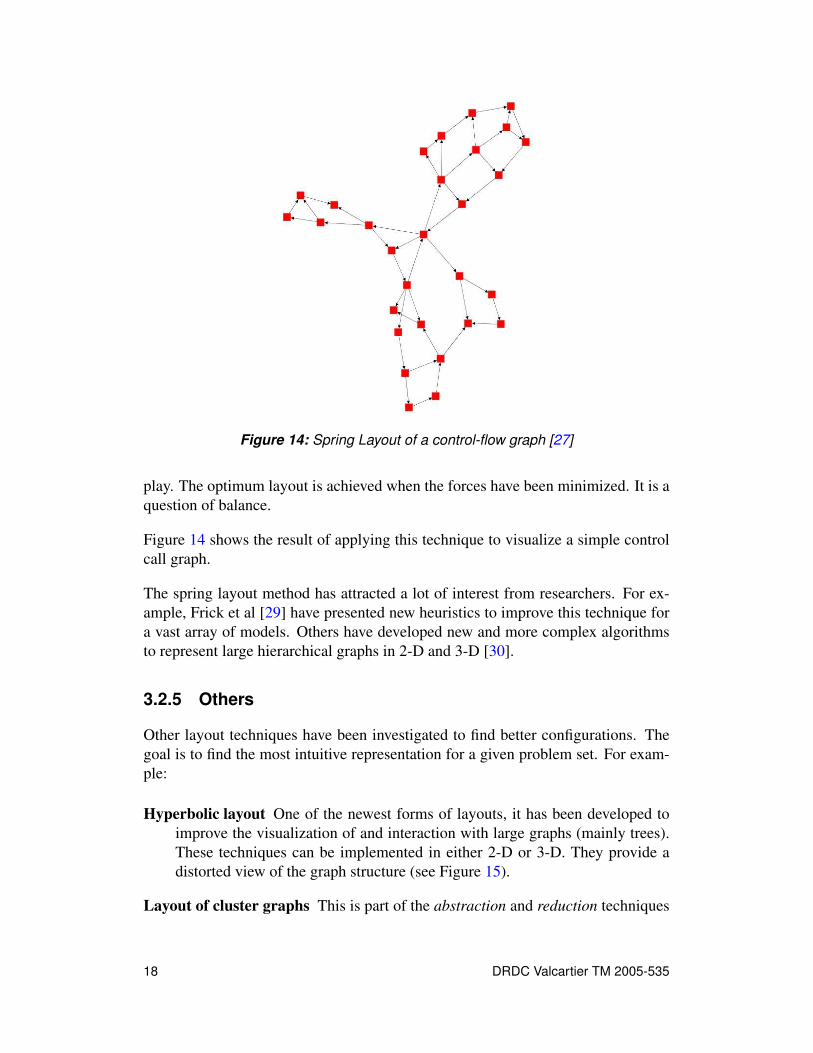
Figure 14: Spring Layout of a control-flow graph [27]
play. The optimum layout is achieved when the forces have been minimized. It is aquestion of balance.
Figure 14 shows the result of applying this technique to visualize a simple controlcall graph.
The spring layout method has attracted a lot of interest from researchers. For ex-ample, Frick et al [29] have presented new heuristics to improve this technique fora vast array of models. Others have developed new and more complex algorithmsto represent large hierarchical graphs in 2-D and 3-D [30].
3.2.5 Others
Other layout techniques have been investigated to find better configurations. Thegoal is to find the most intuitive representation for a given problem set. For exam-ple:
Hyperbolic layout One of the newest forms of layouts, it has been developed toimprove the visualization of and interaction with large graphs (mainly trees).These techniques can be implemented in either 2-D or 3-D. They provide adistorted view of the graph structure (see Figure 15).
Layout of cluster graphs This is part of the abstraction and reduction techniques
18 DRDC Valcartier TM 2005-535

Figure 15: Hyperbolic layout of 3,000 nodes connected by 10,000 edges [31]
(a) (b)
Figure 16: Clustering technique applied to a tree graph [20]a) full nodes in the backgroundb) grouping nodes under a super-node representation
that have been applied to reduce the visual complexity of a graph (see Fig-ure 16). Clustering techniques are gaining momentum and should receive a lotof attention in the future.
Nested Graph Hierarchy This is an augmentation to the graph concept. A nodecan contain a nested graph and this can go on to arbitrary depth. This forms ahierarchically organized inclusion tree of graphs (see Figure 17).
Symmetric layout This technique attempts to find groups of symmetrical patternsin a graph by applying transformations that do not modify the informationconveyed by the graph (Figure 18).
A general problem with most of the current graph layout techniques is that theyare only applicable to relatively small graphs. In general, it is almost impossible
DRDC Valcartier TM 2005-535 19
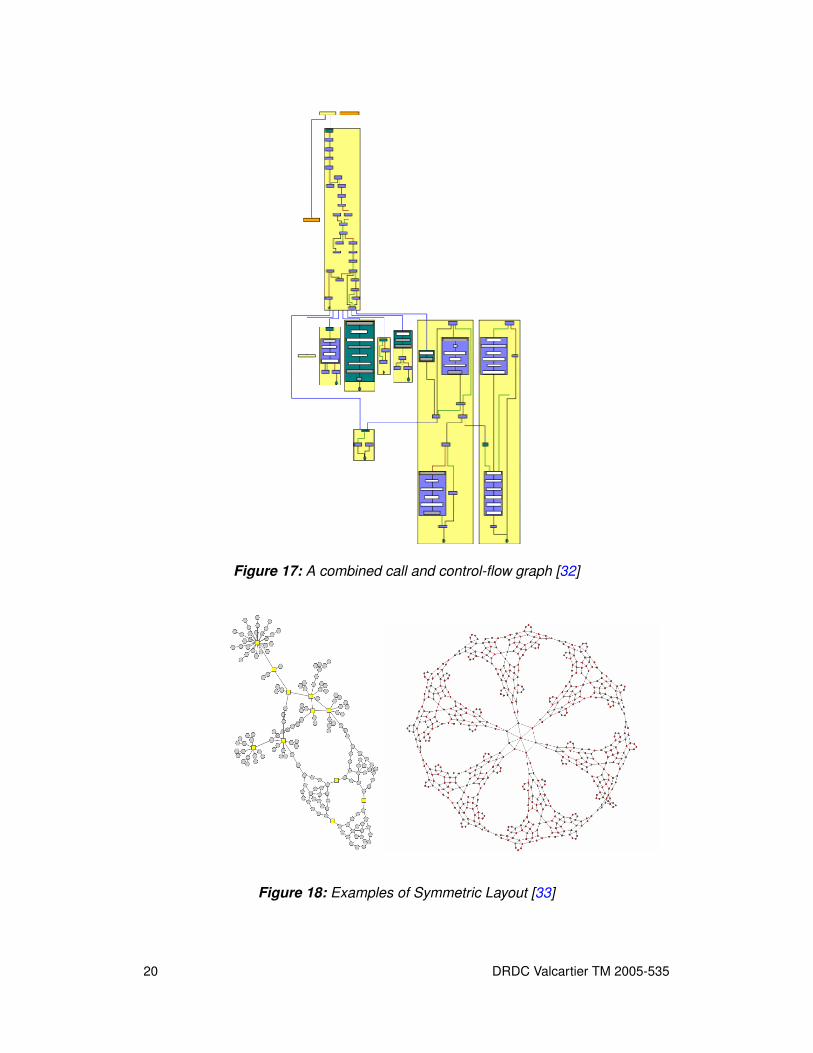
Figure 17: A combined call and control-flow graph [32]
Figure 18: Examples of Symmetric Layout [33]
20 DRDC Valcartier TM 2005-535
to create a graph with thousands of nodes and keep its planarity or try to minimizeedge crossings.
Often the most obvious and practical solution is simply to layout a spanning treefor the graph. A spanning tree is a complex mathematical technique that segmentsa large graph in smaller ones. It will not be discussed in more detail here. A longlist of algorithms to compute spanning trees for graphs can be found, both for thedirected and undirected cases. See [34] for examples.
3.3 Space-filling
Space-filling techniques are designed to present the maximum amount of structuredinformation in the minimum amount of space. There are two main techniques inthis category:
• Tree-map
• Sunburst
3.3.1 Tree-maps
Tree-maps were first developed by Ben Shneiderman at the Human-Computer In-teraction Laboratory (HCIL) of the University of Maryland during the 1990s [35].A tree-map is a 2-D space-filing visualization technique in which each node is arectangle whose area is proportional to a given metric for the corresponding soft-ware component (e.g. number of lines of code, number of descendants). Anothermetric can be used to calculate the order in which the boxes are drawn (e.g. al-phabetical order, number of relationships, etc.) Colors can be used to add anotherdimension of information. This type of layout allows a quick visual comparisonbetween different node attributes. An example is shown in Figure 19.
A group at Lulea University of Technology in Sweden developed a 3-D Tree-mapfor file browsing that shows the depth in the tree as the height of the box (Figure 20).Their study showed benefits for the 3-D layout for the task of identifying the deepestdirectory [37].
3.3.2 Sunburst
The SunBurst technique [38] is an alternative space-filling visualization that uses aradial layout instead of the usual rectangular one. In SunBurst, items in a hierarchyare laid out radially, with the top of the hierarchy at the center and deeper leavesfarther away from the center. The radial angle of an item and its color correspond
DRDC Valcartier TM 2005-535 21

Figure 19: Tree-map: A 2-D space-filling visualization technique (adaptedfrom [36])
Figure 20: StepTree: Extending tree-map to 3-D [37]
22 DRDC Valcartier TM 2005-535
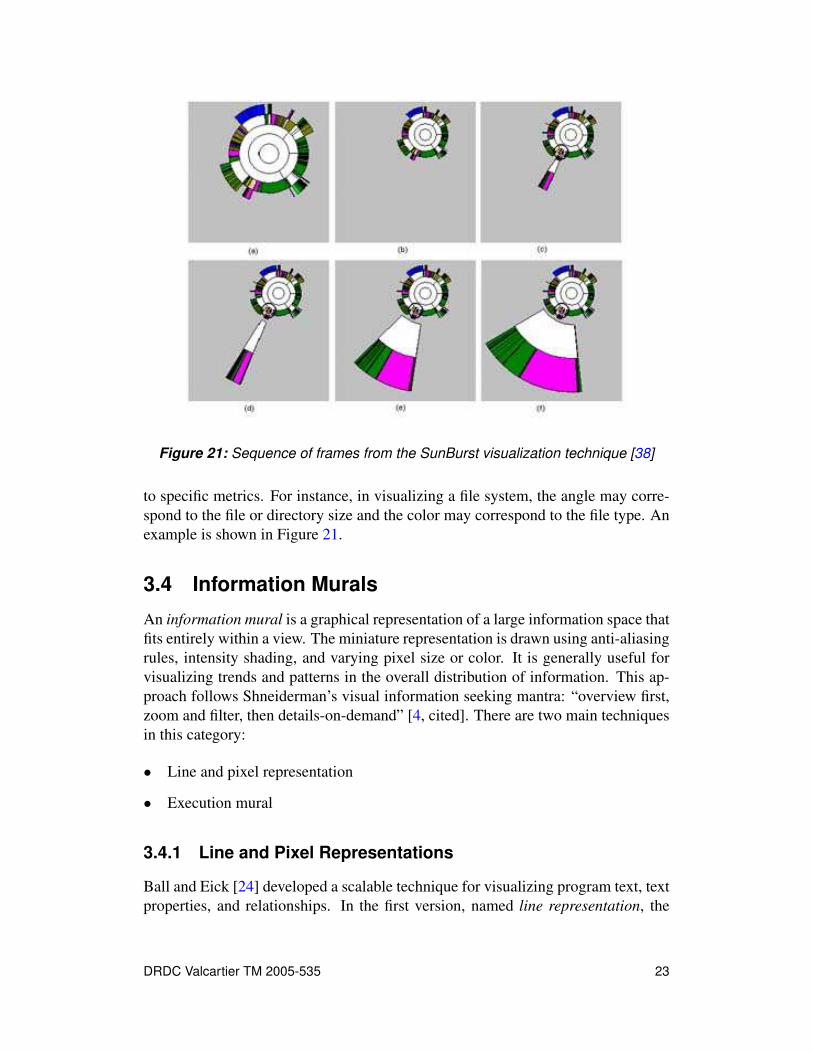
Figure 21: Sequence of frames from the SunBurst visualization technique [38]
to specific metrics. For instance, in visualizing a file system, the angle may corre-spond to the file or directory size and the color may correspond to the file type. Anexample is shown in Figure 21.
3.4 Information Murals
An information mural is a graphical representation of a large information space thatfits entirely within a view. The miniature representation is drawn using anti-aliasingrules, intensity shading, and varying pixel size or color. It is generally useful forvisualizing trends and patterns in the overall distribution of information. This ap-proach follows Shneiderman’s visual information seeking mantra: “overview first,zoom and filter, then details-on-demand” [4, cited]. There are two main techniquesin this category:
• Line and pixel representation
• Execution mural
3.4.1 Line and Pixel Representations
Ball and Eick [24] developed a scalable technique for visualizing program text, textproperties, and relationships. In the first version, named line representation, the
DRDC Valcartier TM 2005-535 23

(a) (b) (c)
Figure 22: Line representation using different scaling of color-coded programtext [24]
a) full text representationb) smaller fontsc) each line of text is reduced to a row of pixels
technique reduces each line of the program text to a single row of pixels, wherelength and indentation correspond to the original code (Figure 22).
They generalized this technique to increase the information density by a factor often. Figure 23 illustrates the principle. Each column represents a single file. Eachline of code uses color-coded pixels ordered from left to right in rows within thecolumns. That way, it is possible to visualize over a million lines of code on astandard high-resolution monitor (e.g. 1280x1024).
Different applications of this technique have been shown to be helpful in visualizingcode version history, differences between releases, and static properties of code.It is also useful for code profiling, program slicing, and identifying hot spots inprogram execution (e.g. bottlenecks).
3.4.2 Execution Murals
Jerding and Stasko [40] go beyond Ball and Eick’s representation with a techniquecalled execution mural. This technique provides a quick insight into various phasesof the execution of object-oriented programs. Figure 24 illustrates this technique.
24 DRDC Valcartier TM 2005-535

Figure 23: The principle of pixel representation technique [24]
Figure 24: Execution mural view of message traces from an object-orientedprogram [39]
DRDC Valcartier TM 2005-535 25
The upper portion of the view is the focus area where a subset of the messages canbe examined in detail. The bottom portion is a navigational area that includes amural of the entire message trace and a navigation rectangle that indicates wherethe focus area fits within the entire execution.
3.5 Interaction and Navigation
Many approaches have incorporated interaction and navigation techniques to en-hance information visualization. Many believe that, in visualization systems, navi-gational techniques are as important as the visual aspect itself. There are three mainaspects to interaction and navigation:
• Scrolling or panning
• Focus and context views
• Multiple views
3.5.1 Scrolling or Panning
The simplest technique is to provide a mechanism for scrolling or panning througha detailed visualization display. For example, the ubiquitous scrollbar provides twoimportant cues to the user:
Size It gives a quick idea of how much is visible out of the entire information space.
Position It gives a quick idea of where the visible area is with respect to everythingelse.
Scrollbars, however, do not provide semantic information about the content. Asdescribed below, adding zooming to a single view allows the user to shift from avery detailed display to a more global overview.
3.5.2 Focus and Context Views
When drawing a map to help a lost friend, one does not draw a picture-perfectmap. One indicates the landmarks, such as a bridge or a large building. This is thecontext. Then one draws more detail around the precise area of interest. This is thefocus.
This idea is used in visualization systems with techniques such as the fish-eye view.Generally, these are known as different lens that the user can apply to look at therepresentation with a different focus and/or a different context [20].
26 DRDC Valcartier TM 2005-535
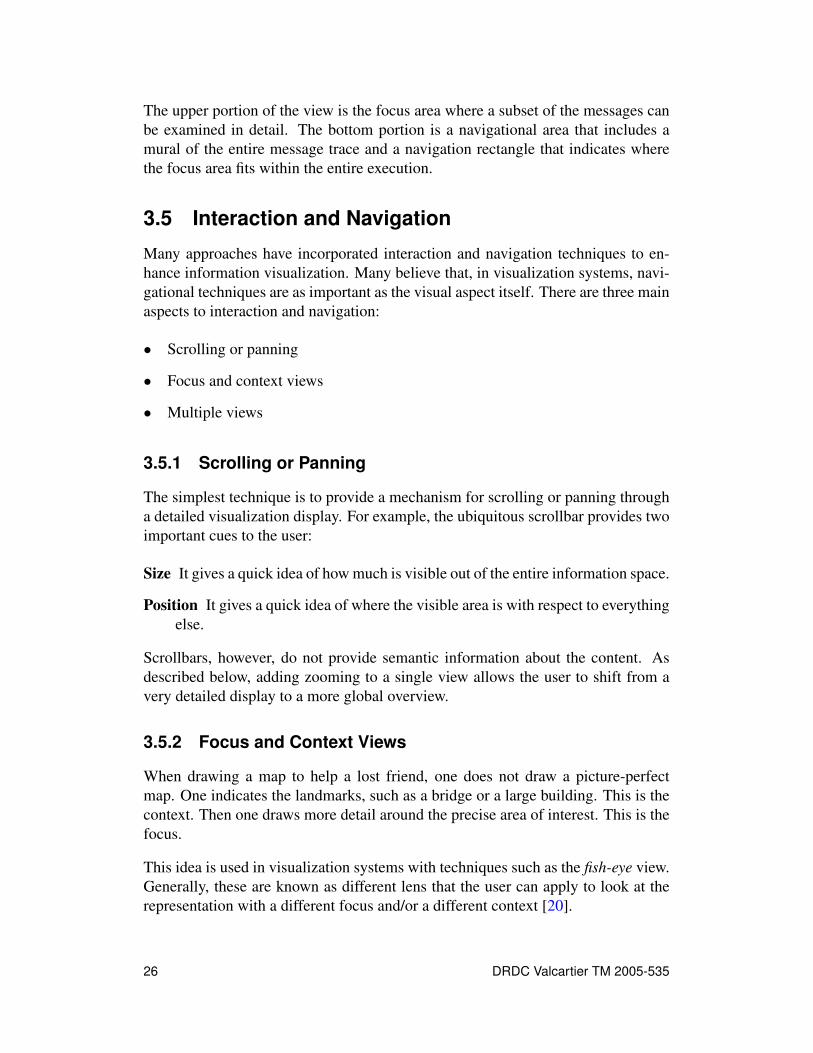
(a) (b)
Figure 25: Fish-eye views [20]a) cartesian fish-eyeb) polar fish-eye
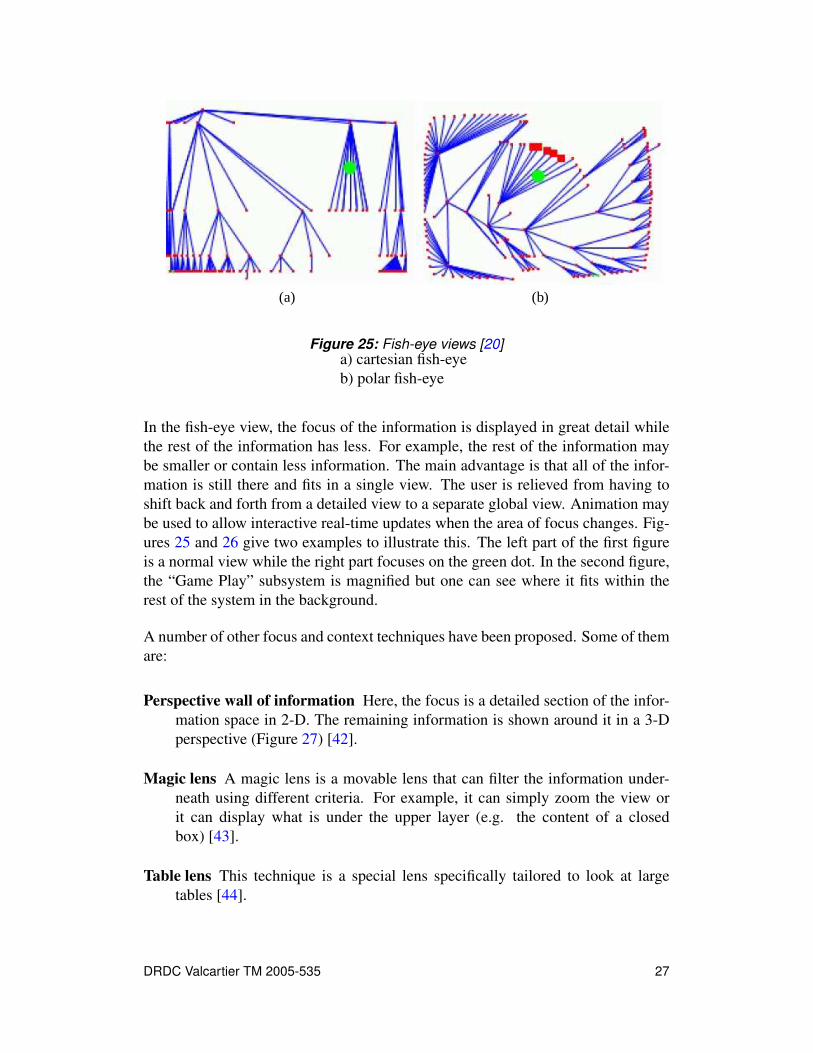
In the fish-eye view, the focus of the information is displayed in great detail whilethe rest of the information has less. For example, the rest of the information maybe smaller or contain less information. The main advantage is that all of the infor-mation is still there and fits in a single view. The user is relieved from having toshift back and forth from a detailed view to a separate global view. Animation maybe used to allow interactive real-time updates when the area of focus changes. Fig-ures 25 and 26 give two examples to illustrate this. The left part of the first figureis a normal view while the right part focuses on the green dot. In the second figure,the “Game Play” subsystem is magnified but one can see where it fits within therest of the system in the background.
A number of other focus and context techniques have been proposed. Some of themare:
Perspective wall of information Here, the focus is a detailed section of the infor-mation space in 2-D. The remaining information is shown around it in a 3-Dperspective (Figure 27) [42].
Magic lens A magic lens is a movable lens that can filter the information under-neath using different criteria. For example, it can simply zoom the view orit can display what is under the upper layer (e.g. the content of a closedbox) [43].
Table lens This technique is a special lens specifically tailored to look at largetables [44].
DRDC Valcartier TM 2005-535 27
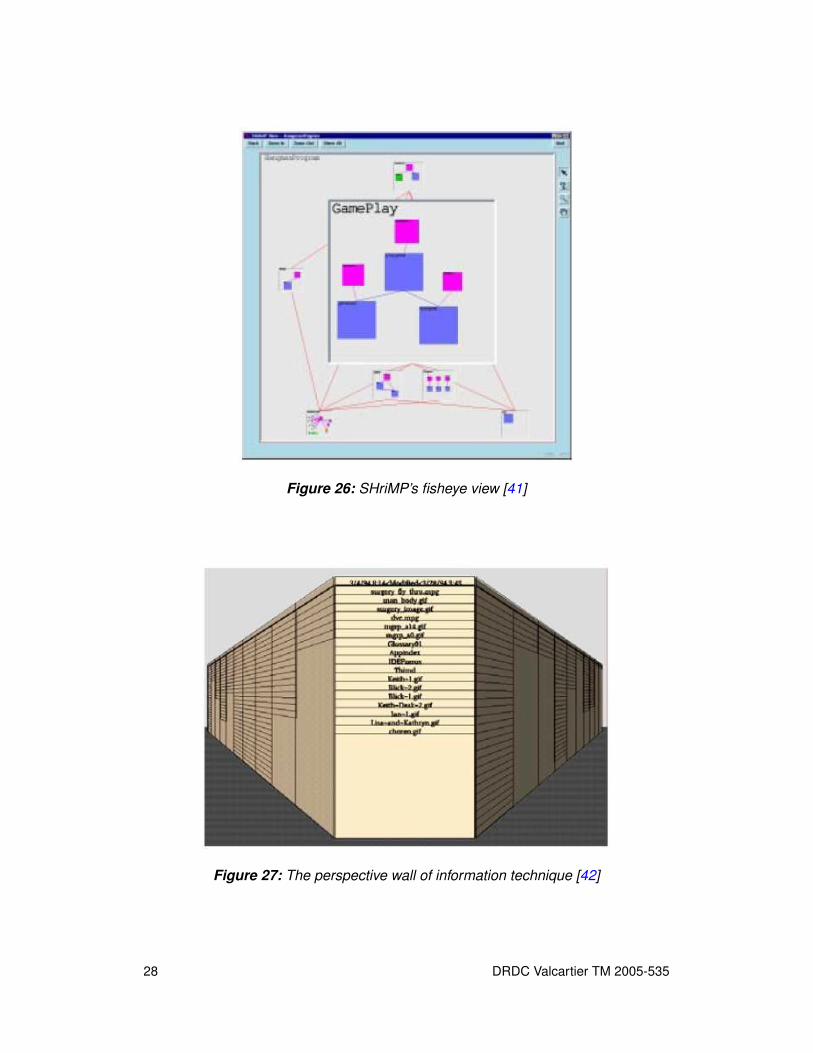
Figure 26: SHriMP’s fisheye view [41]
Figure 27: The perspective wall of information technique [42]
28 DRDC Valcartier TM 2005-535
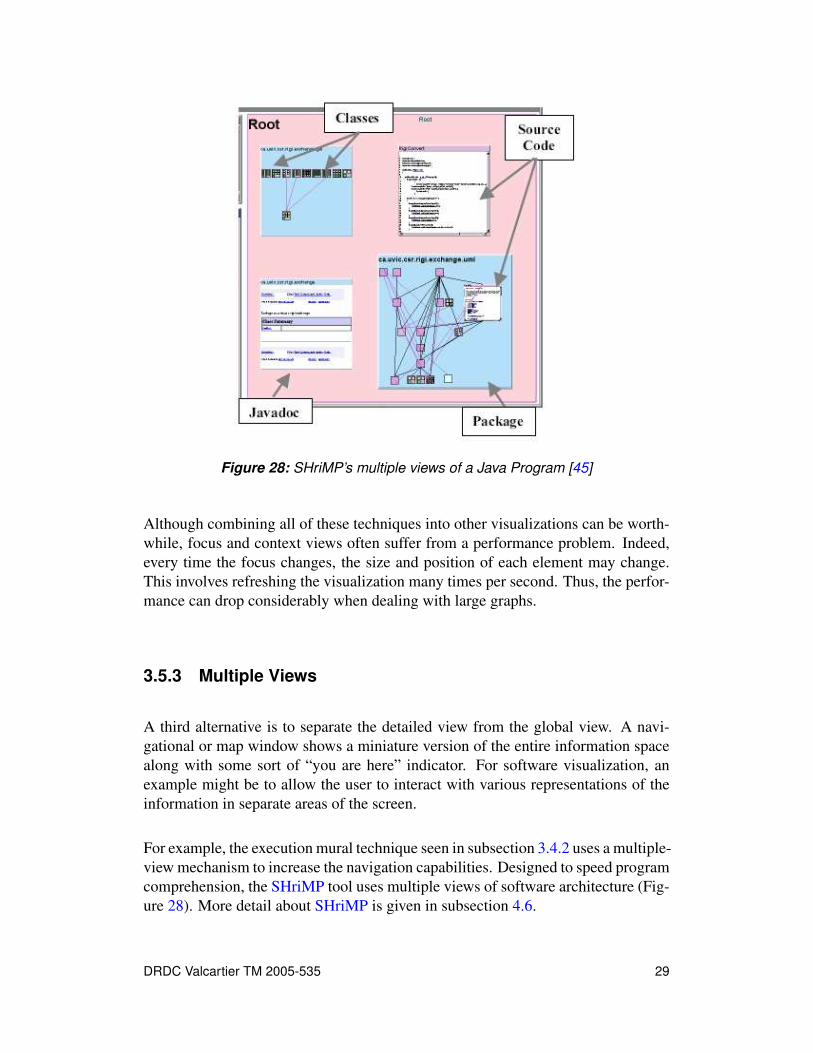
Figure 28: SHriMP’s multiple views of a Java Program [45]
Although combining all of these techniques into other visualizations can be worth-while, focus and context views often suffer from a performance problem. Indeed,every time the focus changes, the size and position of each element may change.This involves refreshing the visualization many times per second. Thus, the perfor-mance can drop considerably when dealing with large graphs.
3.5.3 Multiple Views
A third alternative is to separate the detailed view from the global view. A navi-gational or map window shows a miniature version of the entire information spacealong with some sort of “you are here” indicator. For software visualization, anexample might be to allow the user to interact with various representations of theinformation in separate areas of the screen.
For example, the execution mural technique seen in subsection 3.4.2 uses a multiple-view mechanism to increase the navigation capabilities. Designed to speed programcomprehension, the SHriMP tool uses multiple views of software architecture (Fig-ure 28). More detail about SHriMP is given in subsection 4.6.
DRDC Valcartier TM 2005-535 29
3.6 Animation
A software visualization animation is simply a series of operations that illustratethe behavior of a program. It displays the transitions between different states of theprogram. It can either concentrate on the data and its structure (e.g. data flow) oron the behavior of the program (e.g. control flow.)
Animating visual displays has mostly been investigated in the area of algorithm vi-sualization. Brown [46] presents a taxonomy that may be used to analyze algorithmanimation displays in detail. He also gives an overview of algorithm animationtechniques [47].
Multiple algorithm animation techniques have been reported in the literature:
Multiple views It is generally more effective to use several views to illustrate thevarious aspects of even a simple algorithm.
State cues They reflect the dynamic behavior of an algorithm. Animators can showchanges in the state of data structures by changing their graphical representa-tion on the screen. State cues link different views together by representingspecific abstractions the same way in every view.
Static historic A static view of an algorithm’s history lets the user focus on thecrucial events, i.e., the places where significant changes occur in time.
Continuous versus discrete transitions The graphical representation of a changeto a data structure can either be incremental (smooth and continuous) or dis-crete. The link between the changes can be more difficult to “see” if thechanges are discrete. Stasko [48] concentrates on smooth transitions.
Multiple algorithms Being able to run several algorithms simultaneously lets theuser compare and contrast them easily.
Input data selection The choice of input data strongly influences the messageconveyed by an animation. Different techniques take into account the amountof data and their implementation patterns.
Colors The right use of colors can enhance and complement all of the above tech-niques. It is usually applied in five distinct ways:
• Encode the state of data structures
• Highlight activity
• Tie views together
• Emphasize patterns
• Make the history visible
30 DRDC Valcartier TM 2005-535

Figure 29: Variation on a conventional tree-map, implemented in VRML [49]
3.7 Virtual Environments
More recent works show promises with techniques that use virtual environmentsas a basis for visualization. This approach is being considered to overcome theproblem that a very large amount of information needs to be displayed on a verysmall screen.
Churcher et al [49] have experimented with virtual environments by implementingthe tree-map metaphor in a Virtual Reality Modelling Language (VRML). The viewshown in Figure 29 is useful to emphasize the relationship between a weighted tree-map (lower part) and its original structure (upper part).
Knight and Munro [50, 51] have investigated an innovative solution to the problemof visualizing Java code. In this 3-D virtual word called Software World, the code isrepresented as buildings and districts in a city environment. Higher levels of detailare shown in a map-like style using techniques that fit a large amount of informationinto a finite space. They believe that using an urban environment takes advantageof the user’s natural perception. The world has different visualization levels:
World The software system as a whole
Country A package within the system/world
City A file from the software system
District A class contained within the specific file/city
DRDC Valcartier TM 2005-535 31

Figure 30: Visualization of Java code within a Software World [51]
Building A method within a class/district
Figure 30 shows two examples of a java system as a world.
Young and Munro [52] present a non standard visualization of a call graph struc-tures within a virtual reality environment. Called CallStax, their technique is dif-ferent in that it represents the paths through the graph rather than the graph as anetwork. As shown in Figure 31, CallStax uses the extra dimension to maximizethe amount of information and interactivity through this environment.
3.8 Auralization
The main idea behind auralization is to convert changes in the program state intosounds. Very few experiences on auralization have been published until now. Fran-cioni et al [53] were among the first researchers to use non-speech audio for soft-ware visualization. Other applications can be found in [54]. One experience usesaudio in algorithm animations to:
• Reinforce visuals
• Convey patterns
• Replace visuals
• Signal exceptional conditions
32 DRDC Valcartier TM 2005-535
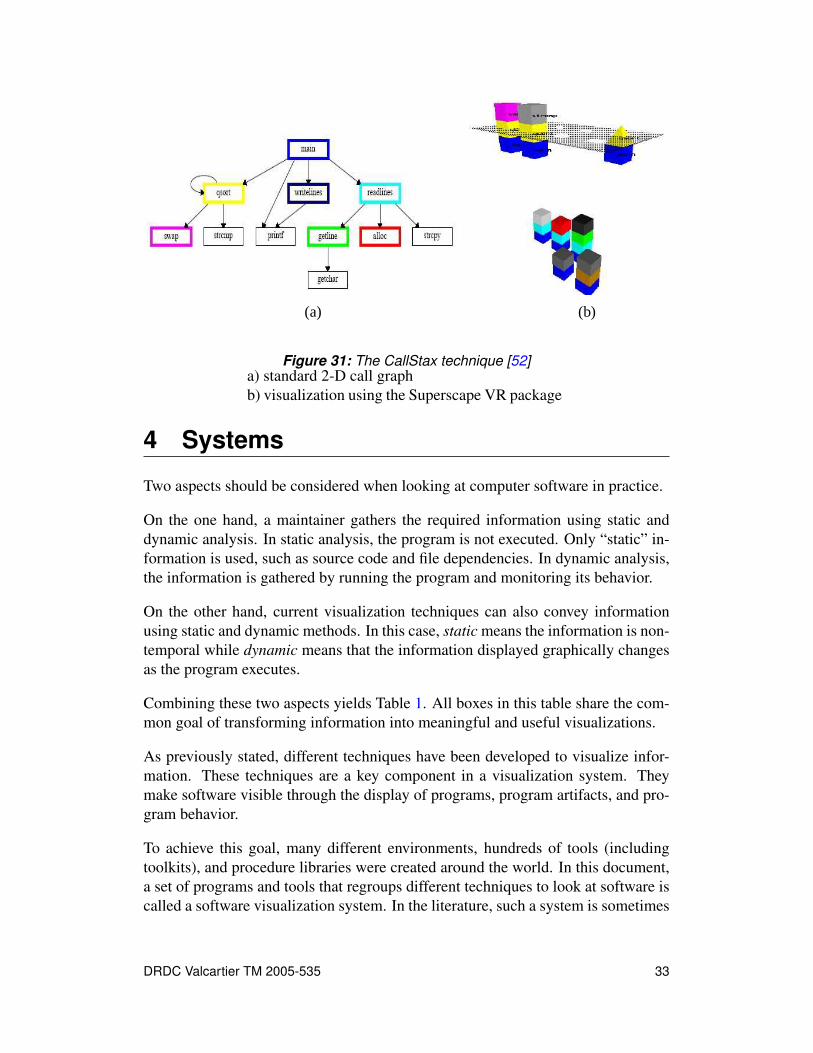
(a) (b)
Figure 31: The CallStax technique [52]a) standard 2-D call graphb) visualization using the Superscape VR package
4 Systems
Two aspects should be considered when looking at computer software in practice.
On the one hand, a maintainer gathers the required information using static anddynamic analysis. In static analysis, the program is not executed. Only “static” in-formation is used, such as source code and file dependencies. In dynamic analysis,the information is gathered by running the program and monitoring its behavior.
On the other hand, current visualization techniques can also convey informationusing static and dynamic methods. In this case, static means the information is non-temporal while dynamic means that the information displayed graphically changesas the program executes.
Combining these two aspects yields Table 1. All boxes in this table share the com-mon goal of transforming information into meaningful and useful visualizations.
As previously stated, different techniques have been developed to visualize infor-mation. These techniques are a key component in a visualization system. Theymake software visible through the display of programs, program artifacts, and pro-gram behavior.
To achieve this goal, many different environments, hundreds of tools (includingtoolkits), and procedure libraries were created around the world. In this document,a set of programs and tools that regroups different techniques to look at software iscalled a software visualization system. In the literature, such a system is sometimes
DRDC Valcartier TM 2005-535 33

Table 1: Mapping between gathering information techniques and visualizationtechniques
Visualization techniquesStatic (Sv) Dynamic(Dv)
Static(Si)
Visualizingnon-temporalinformation
Animating staticinformationInformation
gatheringtechniques Dynamic
(Di)
Visualizing a snapshotor trace of program
execution
Visualizing ananimation of program
execution
referred to as a tool, an environment, or a library.
It is very difficult to find a comprehensive overview of these systems that includesevery commercial, free, and prototype systems. A few references on multiple sys-tems with succinct descriptions exist [20, 55, 56, 57]. Additionally, very few studieshave tried to classify these systems according to the type of analysis. For exam-ple, a classification according to the level of metric information that is gathered.Low-level information consists of program properties (e.g. source code, number oflines, etc.), while high-level consists of abstracted data (e.g. algorithms, classes,etc.) Myers [6] has used this approach to classify around twenty visualization sys-tems according to whether they illustrate code/data/algorithms or convey static ordynamic information. Others claim that the key point of a suitable classificationframework must take into account the level of interaction with the user in the spe-cific context usage. More recently, Tilley and Huang [58] have proposed a task-oriented classification with three distinct classes: static, interactive, and editable.According to them, this type of classification will ultimately map common activi-ties of program comprehension to specific forms of software visualization.
Consequently, it is very difficult to produce a summary of all the systems that havebeen developed. Given the quantity of systems, it would be next to impossible totest them all and have something significant to say about each one. However, manyhave been tested for the current projects. The rest of this section presents somerelevant systems in more detail. These systems were chosen as being representa-tive and illustrate many of the techniques previously presented. A technical notewill be published shortly as an addendum to this document. It will list all tools,environments, libraries, systems, etc. that were found, along with their fact sheet.
4.1 Graph Visualization Systems
These systems use graphical representations for the navigation and analysis of soft-ware information. Although dynamic graph layouts seem more appropriate in the
34 DRDC Valcartier TM 2005-535
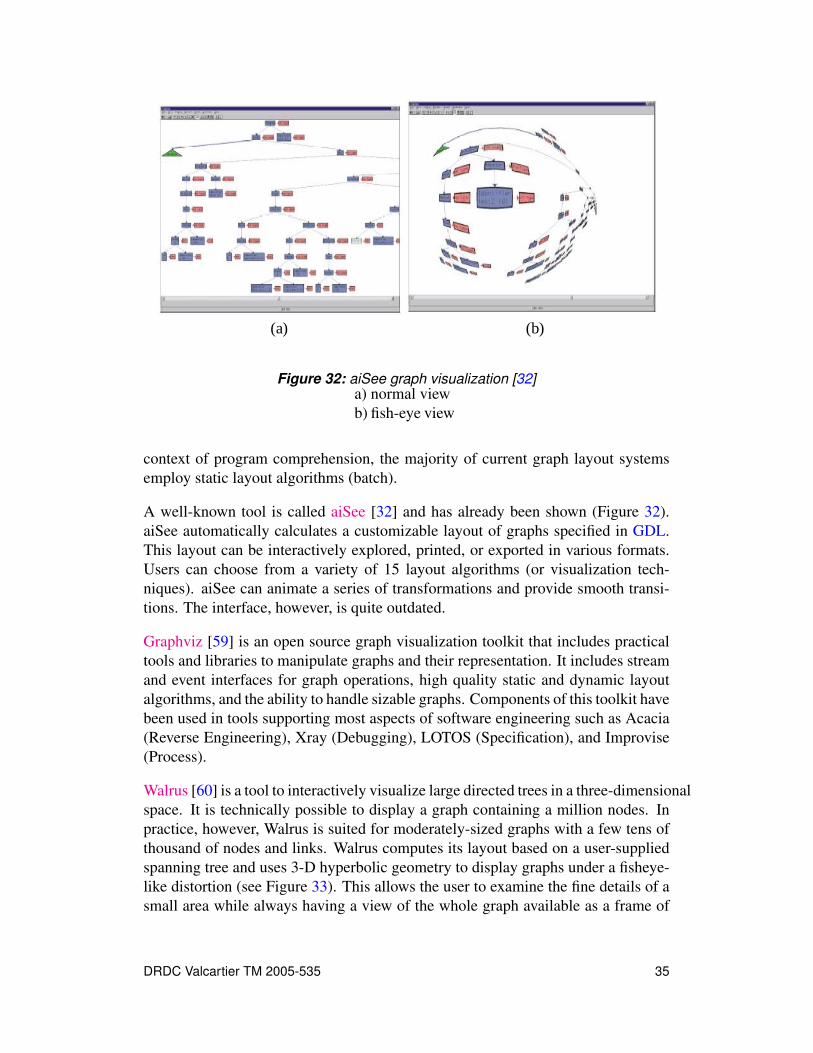
(a) (b)
Figure 32: aiSee graph visualization [32]a) normal viewb) fish-eye view
context of program comprehension, the majority of current graph layout systemsemploy static layout algorithms (batch).
A well-known tool is called aiSee [32] and has already been shown (Figure 32).aiSee automatically calculates a customizable layout of graphs specified in GDL.This layout can be interactively explored, printed, or exported in various formats.Users can choose from a variety of 15 layout algorithms (or visualization tech-niques). aiSee can animate a series of transformations and provide smooth transi-tions. The interface, however, is quite outdated.
Graphviz [59] is an open source graph visualization toolkit that includes practicaltools and libraries to manipulate graphs and their representation. It includes streamand event interfaces for graph operations, high quality static and dynamic layoutalgorithms, and the ability to handle sizable graphs. Components of this toolkit havebeen used in tools supporting most aspects of software engineering such as Acacia(Reverse Engineering), Xray (Debugging), LOTOS (Specification), and Improvise(Process).
Walrus [60] is a tool to interactively visualize large directed trees in a three-dimensionalspace. It is technically possible to display a graph containing a million nodes. Inpractice, however, Walrus is suited for moderately-sized graphs with a few tens ofthousand of nodes and links. Walrus computes its layout based on a user-suppliedspanning tree and uses 3-D hyperbolic geometry to display graphs under a fisheye-like distortion (see Figure 33). This allows the user to examine the fine details of asmall area while always having a view of the whole graph available as a frame of
DRDC Valcartier TM 2005-535 35
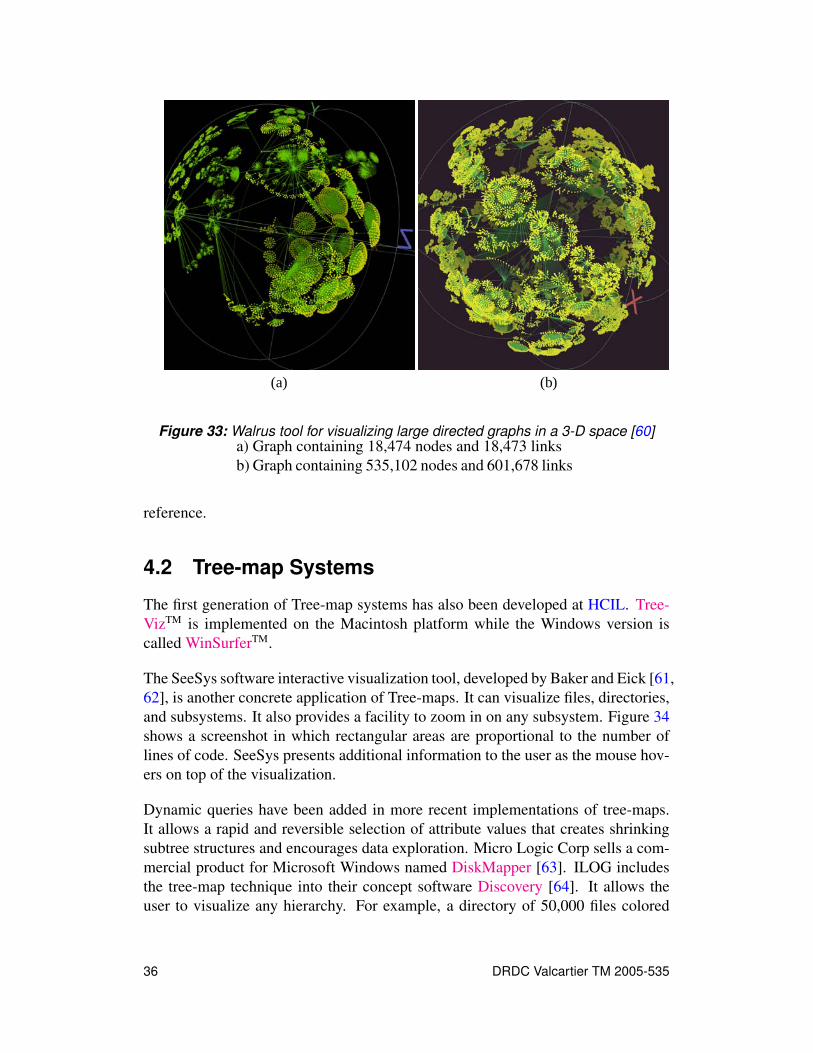
(a) (b)
Figure 33: Walrus tool for visualizing large directed graphs in a 3-D space [60]a) Graph containing 18,474 nodes and 18,473 linksb) Graph containing 535,102 nodes and 601,678 links
reference.
4.2 Tree-map Systems
The first generation of Tree-map systems has also been developed at HCIL. Tree-VizTM is implemented on the Macintosh platform while the Windows version iscalled WinSurferTM.
The SeeSys software interactive visualization tool, developed by Baker and Eick [61,62], is another concrete application of Tree-maps. It can visualize files, directories,and subsystems. It also provides a facility to zoom in on any subsystem. Figure 34shows a screenshot in which rectangular areas are proportional to the number oflines of code. SeeSys presents additional information to the user as the mouse hov-ers on top of the visualization.
Dynamic queries have been added in more recent implementations of tree-maps.It allows a rapid and reversible selection of attribute values that creates shrinkingsubtree structures and encourages data exploration. Micro Logic Corp sells a com-mercial product for Microsoft Windows named DiskMapper [63]. ILOG includesthe tree-map technique into their concept software Discovery [64]. It allows theuser to visualize any hierarchy. For example, a directory of 50,000 files colored
36 DRDC Valcartier TM 2005-535

Figure 34: Interactive SeeSys system embodying the tree-Map technique [62]
according to their type.
4.3 Information Mural Systems
Techniques from information murals can be integrated to create a software visual-ization system. By adding panning and zooming capabilities, such a system can bestand-alone or part of a global view with more detailed informational displays.
SeeSoft [24] is a system that produces line-oriented software metrics out of sourcecode. Figure 35a is a view of 48,913 lines of C code spread across 68 files. It usesthe pixel representation technique (Subsection 3.4.1). Colors indicate the nestedlevel, pink being the highest.
Another example from SeeSoft is showcasing the hot spots of a program execution(see Figure 35b). Here, the color of each line represents the number of times the linewas executed. Red represents high execution frequency while blue is low. Linesthat were not executed in this run are shown in grey. Finally, white represents linesthat are not executable, such as declarations, comments, and static arrays.
Proof-of-concept information mural systems are being developed to support pro-gram comprehension during design recovery, validation, and reengineering tasks.Figures 36 and 37 show two examples of applications built using the optimizedmural technique detailed in [39]. In this technique, the lines of a source code filemap to a single row of pixels in the miniature representation.
DRDC Valcartier TM 2005-535 37

a)
b)
Figure 35: SeeSoft [24]a) Static properties of a C programb) Hot spots in program execution
Figure 36: Mural of object-oriented message trace (over 50,000 messages) [39]
Figure 37: Mural of parallel message trace (executing on 16 processors) [39]
38 DRDC Valcartier TM 2005-535
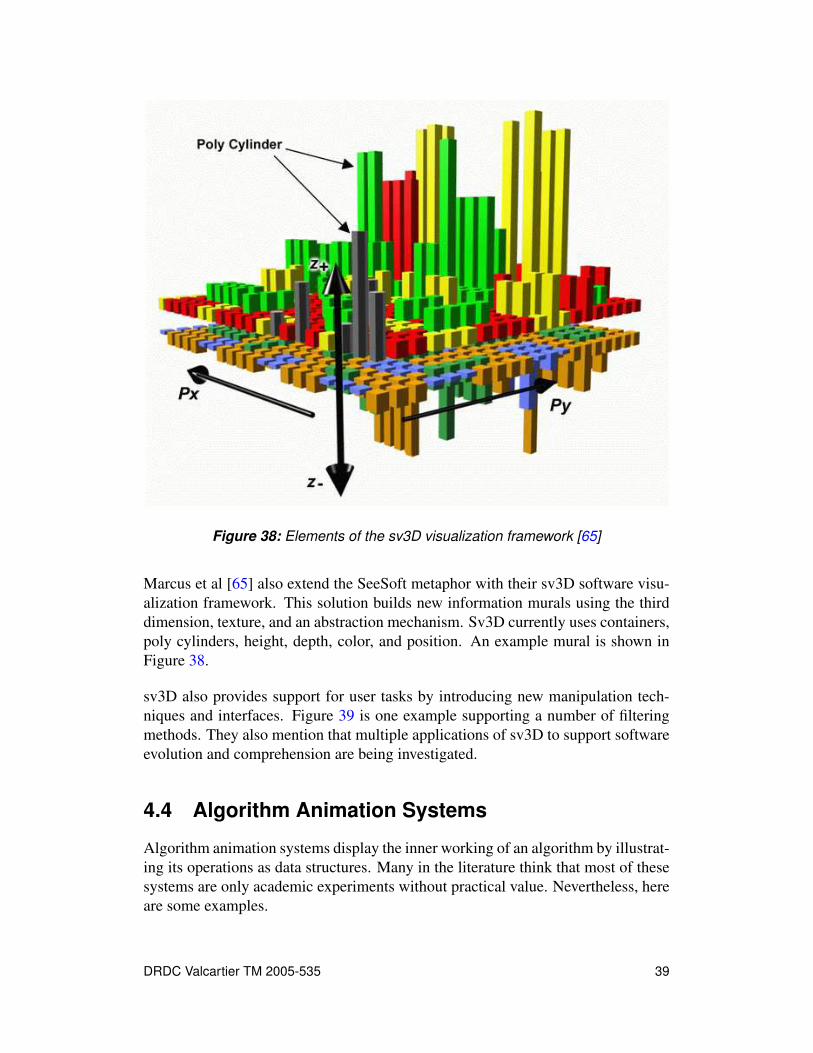
Figure 38: Elements of the sv3D visualization framework [65]
Marcus et al [65] also extend the SeeSoft metaphor with their sv3D software visu-alization framework. This solution builds new information murals using the thirddimension, texture, and an abstraction mechanism. Sv3D currently uses containers,poly cylinders, height, depth, color, and position. An example mural is shown inFigure 38.
sv3D also provides support for user tasks by introducing new manipulation tech-niques and interfaces. Figure 39 is one example supporting a number of filteringmethods. They also mention that multiple applications of sv3D to support softwareevolution and comprehension are being investigated.
4.4 Algorithm Animation Systems
Algorithm animation systems display the inner working of an algorithm by illustrat-ing its operations as data structures. Many in the literature think that most of thesesystems are only academic experiments without practical value. Nevertheless, hereare some examples.
DRDC Valcartier TM 2005-535 39
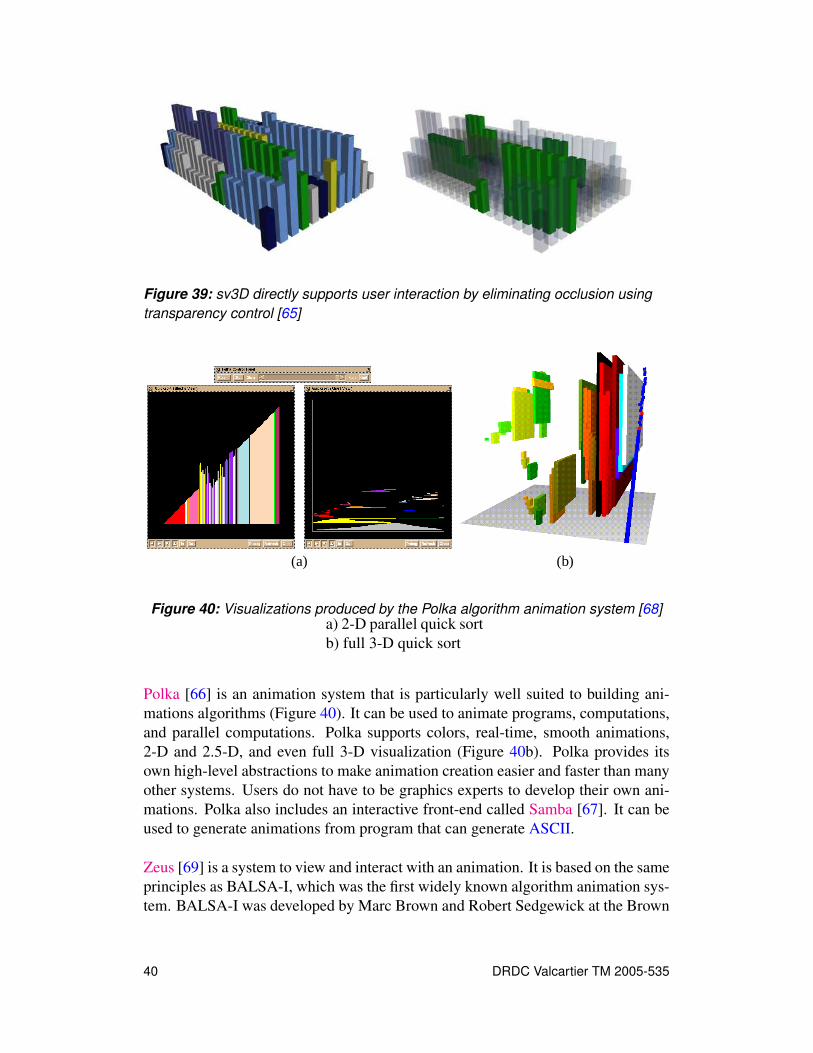
Figure 39: sv3D directly supports user interaction by eliminating occlusion usingtransparency control [65]
(a) (b)
Figure 40: Visualizations produced by the Polka algorithm animation system [68]a) 2-D parallel quick sortb) full 3-D quick sort
Polka [66] is an animation system that is particularly well suited to building ani-mations algorithms (Figure 40). It can be used to animate programs, computations,and parallel computations. Polka supports colors, real-time, smooth animations,2-D and 2.5-D, and even full 3-D visualization (Figure 40b). Polka provides itsown high-level abstractions to make animation creation easier and faster than manyother systems. Users do not have to be graphics experts to develop their own ani-mations. Polka also includes an interactive front-end called Samba [67]. It can beused to generate animations from program that can generate ASCII.
Zeus [69] is a system to view and interact with an animation. It is based on the sameprinciples as BALSA-I, which was the first widely known algorithm animation sys-tem. BALSA-I was developed by Marc Brown and Robert Sedgewick at the Brown
40 DRDC Valcartier TM 2005-535

Figure 41: Output from Zeus algorithm animation system [70]
University in 1984. Both Zeus and BALSA-I use the concept of annotating algo-rithms with interesting events. They allow the creation of multiple views that areupdated when they receive events. Figure 41 shows Zeus in operation. Setting up anew animation is a heavy task because the algorithm must be implemented withinthe Zeus framework. The programmer must manually insert calls to perform theanimation actions. This requires an a priori detailed knowledge of the algorithm.
4.5 Run-time Visualization Systems
Run-time visualization systems display the dynamic execution of a program for thepurpose of debugging, profiling, and understanding the program’s behavior. Run-time visualization differs from algorithm animation in its purpose and degree ofabstraction. The former monitors the real production code and reveals real datafor analysis, while the latter is an abstraction built to understand the algorithms in-volved. For example, run-time visualization can be used to display program state-ments, threads, and object usage.
GROOVE [71] is a system that uses animation to illustrate the run-time behaviorof an object-oriented system. With this system, programmers can better understandthe class hierarchy and relationships. Figure 42 is a simple view from the GROOVEsystem. Triangles represent classes, circles represent instances, and rectangles rep-resent functions. An animated arrow is an invocation (method call). Colors illus-trate class hierarchies and relationships. A certain degree of effort is required tocreate visualizations. Thus, it would be difficult to use the system for anything butsmall programs.
University of Washington Program Illustrator (UWPI) [72] offers a source levelrun-time debugger for Pascal programs. It allows to single step source code in-structions. It also provides an automatic visualization of the data in the program.A layout strategist module, written in Lisp, uses artificial intelligence techniques to
DRDC Valcartier TM 2005-535 41
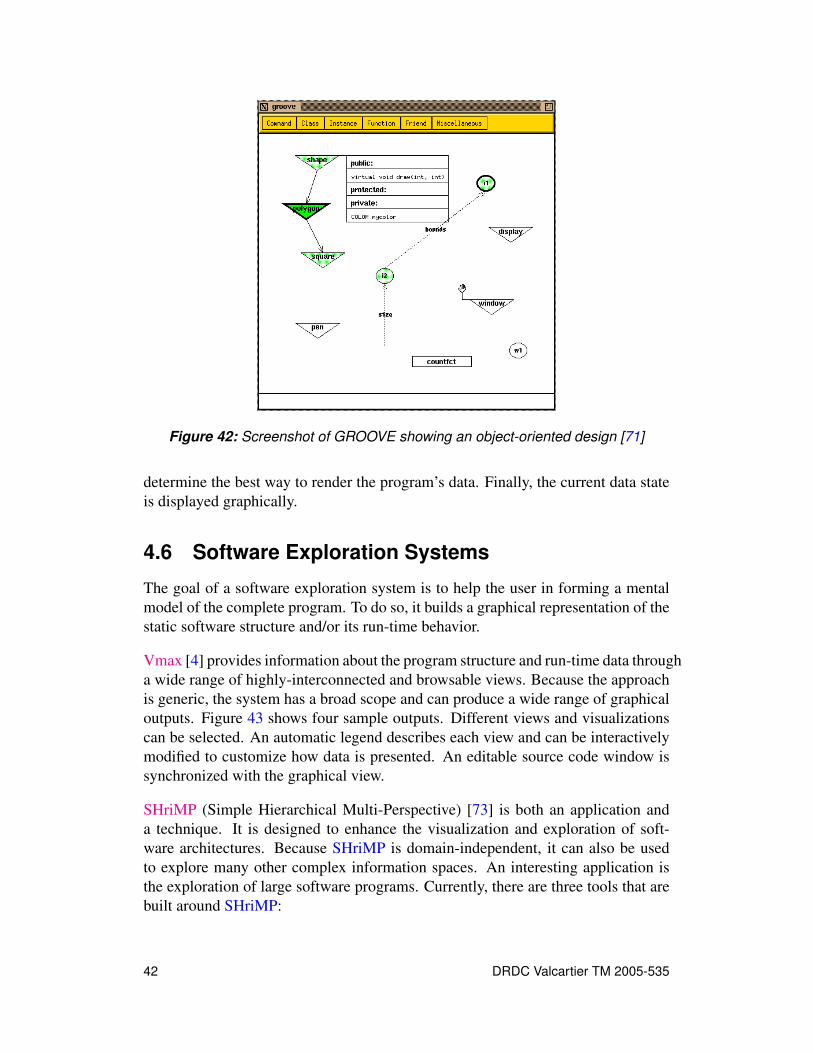
Figure 42: Screenshot of GROOVE showing an object-oriented design [71]
determine the best way to render the program’s data. Finally, the current data stateis displayed graphically.
4.6 Software Exploration Systems
The goal of a software exploration system is to help the user in forming a mentalmodel of the complete program. To do so, it builds a graphical representation of thestatic software structure and/or its run-time behavior.
Vmax [4] provides information about the program structure and run-time data througha wide range of highly-interconnected and browsable views. Because the approachis generic, the system has a broad scope and can produce a wide range of graphicaloutputs. Figure 43 shows four sample outputs. Different views and visualizationscan be selected. An automatic legend describes each view and can be interactivelymodified to customize how data is presented. An editable source code window issynchronized with the graphical view.
SHriMP (Simple Hierarchical Multi-Perspective) [73] is both an application anda technique. It is designed to enhance the visualization and exploration of soft-ware architectures. Because SHriMP is domain-independent, it can also be usedto explore many other complex information spaces. An interesting application isthe exploration of large software programs. Currently, there are three tools that arebuilt around SHriMP:
42 DRDC Valcartier TM 2005-535

(a) (b)
(c) (d)
Figure 43: Different outputs of the Vmax system [4]a) method control flow b) run-time data in a graphc) cross referencing d) class hierarchy
Stand-Alone SHriMP A stand-alone Java application that visualizes graph-baseddata formats such as GXL, RSF, XML, and XMI.
Creole An Eclipse plugin that lets the user explore Java code visually. It can showthe code’s structure and the links (references, accesses, etc.) between its dif-ferent pieces (Figure 44).
Jambalaya A plugin created for the Protégé tool that uses SHriMP to visual-ize ontologies and knowledge bases. Protégé is “an ontology editor and aknowledge-base editor.” It has been developed at Stanford University to allowa domain expert to build a knowledge base by creating and modifying reusableontologies and problem-solving methods (Figure 45).
DRDC Valcartier TM 2005-535 43
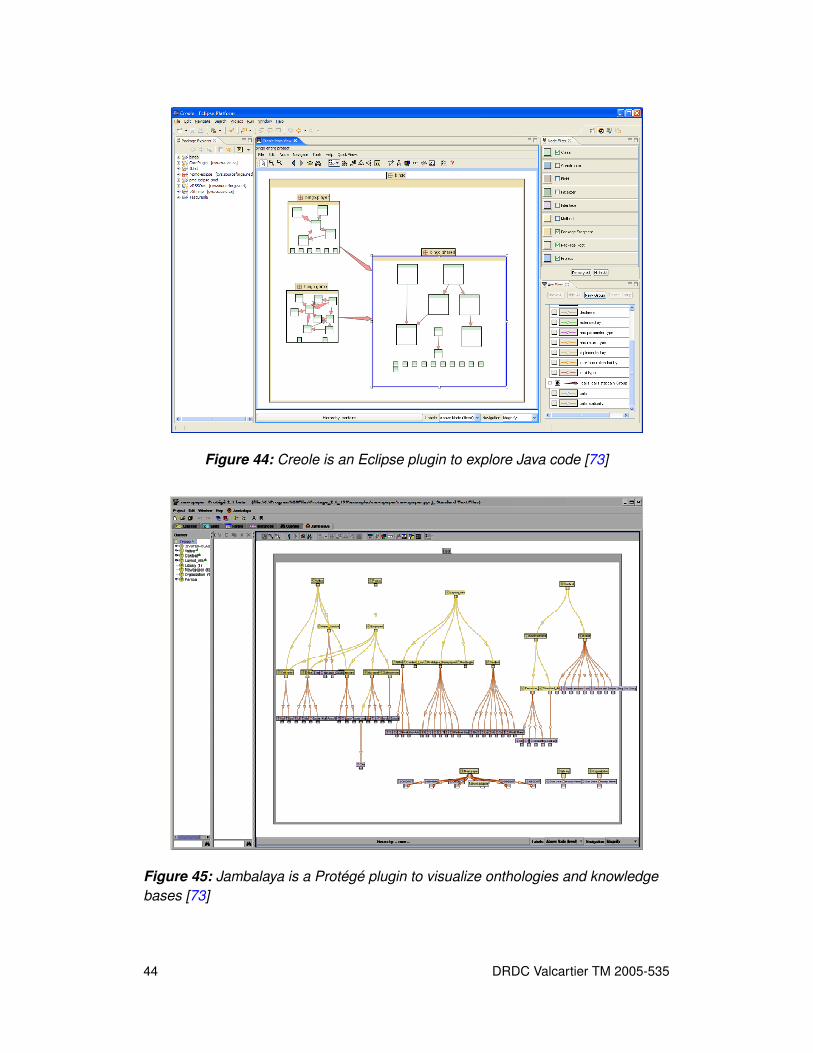
Figure 44: Creole is an Eclipse plugin to explore Java code [73]
Figure 45: Jambalaya is a Protégé plugin to visualize onthologies and knowledgebases [73]
44 DRDC Valcartier TM 2005-535
4.7 Auralization Systems
LogoMedia is a well-known system that supports user-defined code and data pro-gram auralization [74, 75]. With the help of control and data probes, it makes aspecific sound just before a line is executed. These probes could be also insertedwith a graphical editor.
There is not much research in this area. Software visualization concentrates almostexclusively on the visual sense. However, it is possible that human ears could beuseful for certain things in software comprehension. . .
5 Evaluating a Software VisualizationSystems
It is now obvious that many software visualization techniques are available. How-ever, to what extent are they efficient and effective in assisting with software devel-opment and maintenance? Are there any methods to evaluate them quantitativelyor qualitatively? These questions were not discussed much until the end of the1990s. Experts in the field noticed that these tools were pretty slow in penetratingthe software engineering market so they decided to find out why.
However, very few studies were published. Lately, there has been an upsurge in thisarea but many of the analyses were not performed using a formal approach. Otherswere purely qualitative and used existing taxonomies as a reference [76, 4, 77]. Stillothers were more quantitative and measured the impact of visualization systemson performing very specific tasks [77, 78]. It is therefore difficult to generalize ameaningful and generic method to evaluate a system.
It is worth looking more closely at some of these existing methods.
For example, Charland et al [79] recently conducted a qualitative study to observeand evaluate how commercial software comprehension tools can help architects inunderstanding large programs. They noticed that software comprehension toolsgenerally do not provide the appropriate viewpoints, abstraction levels, and filtersthat are needed to understand a complex software architecture. The limit of existingsystems is around 1,000 classes. More than that and the existing tools lose theirusefulness.
Bassil and Keller [77] are one of the few to have performed a quantitative eval-uation. They address various functional, practical, cognitive, and code analysisaspects that users might be looking for in a software visualization tool.
DRDC Valcartier TM 2005-535 45
Buchsbaum et al [78] have conducted work of a more industrial nature. They exam-ined the effectiveness of visualization techniques as an aid to software infrastruc-ture comprehension. Their results help to formulate the general requirements forsoftware visualization and program comprehension tools.
Storey [80] also reports on many studies on this subject. From these studies, theessential characteristics that contribute to the efficiency of a visualization can beextracted. These four, mutually non exclusive, aspects are:
Cognitive aspect It seems imperative that how a system is used should suit a par-ticular comprehension strategy. This strategy should be based on a formalcognitive model and should be tailored for the specific characteristics of themaintainer, program, and tasks to perform.
Output aspect This concerns the characteristics of the system that are directly re-lated to what can be displayed. Software visualizations can be very large andcomplex, both spatially and temporally. Thus, the choice of an appropriatemetaphor and it representation model is imperative.
Interaction aspect Tools are often not easy to install, learn, and use. Hence, thisadds an additional cognitive overhead to the user. This could be alleviated byproviding good navigation facilities and meaningful orientation cues. Present-ing the information in an order that contributes to software comprehension isalso a must. In the future, interacting with ever more complex software willunconditionally require facilities for advanced navigation through large infor-mation spaces.
Computation aspect This aspect asks questions such as what is the primary targetmedium for the visualization system? How big is the screen? Nowadays, it iscommon to have two or more monitors. The graphical capabilities of standarddesktops are getting ever more powerful. Hence, it is expected that virtualreality environments will soon become a popular target medium for softwarevisualization systems.
This interpretation conforms to the classification model proposed by Price et al [5].In fact, their taxonomy is one of the most formal, much more than the ones pre-sented earlier. It would be inefficient to go into more detail in this overview.
6 Conclusion and Future Work
As seen in this document, much research has been performed in the last few yearsto enhance visualization techniques and tools. In theory, most of these systems are
46 DRDC Valcartier TM 2005-535
dedicated to complex program comprehension. However, very few of these systemsprovide a visualization that allows a useful mental model to be created in the mindof the user.
Over 140 papers and nearly as many tools were read, explored, and tested for thisliterature review. Only the most promising or significant ones are presented in thisdocument. One thing is certain, this domain of research is quite active. There areway too many prototypes and tools to try them all. Candidates that show promisesand warrant more investigation are SHriMP (Subsection 4.6), Graphviz [59], aiSee,and Walrus (the last three are discussed in Subsection 4.1).
A technical note will be published shortly as an addendum to this document. It willlist all tools, environments, libraries, systems, etc. that were found, along with theirfact sheet.
This literature review was conducted to try to find out as much as possible on avail-able systems and techniques. Refining the aspects and criteria defined in Section 5,future work will try to come up with the best combination of tools possible. Thegoal is to speed up the process of understanding large software systems.
DRDC Valcartier TM 2005-535 47

References
1. Stasko, John T., John B. Domingue, J., Brown, Marc H., and Price, Blaine A.,(Eds.) (1998). Software visualization: programming as a multimediaexperience, The MIT Press. ISBN: 0-262-19395-7.
2. Zhang, Kang, (Ed.) (2003). Software Visualization : From Theory to Practice,1 edition ed. The International Series in Engineering and Computer Science.The University of Texas at Dalas, U.S.A.: Kluwer Academic Publishers.ISBN: 1402074484.
3. Price, Blaine A., Baecker, Ronald, and Small, Ian (1998). An Introduction toSoftware Visualization. In Stasko, John, Domingue, John, Brown, Marc H.,and Price, Blaine A., (Eds.), Software visualization: programming as amultimedia experience, Ch. 1, pp. 3–27. The MIT Press.
4. Grant, Calum A. McK. (1999). Software Visualization in Prolog. Ph.D. thesis.Queens College, Cambridge. http://www.cl.cam.ac.uk/Research/Reports/TR511-camg100-software-visualization-in-prolog.pdf.Read the PDF. http://www.cl.cam.ac.uk/Research/Rainbow/vmax Vmax onlyruns under UNIX.
5. Price, Blaine A., Baecker, Ronald M., and Small, Ian S. (1993). A PrincipledTaxonomy of Software Visualization. Journal of Visual Languages andComputing, 4(3), 211–266.http://kmdi.utoronto.ca/RMB/papers/p9.pdf. Read the PDF.
6. Myers, Brad A. (1989). Taxonomies of Visual Programming and ProgramVisualization. (Technical Report 15213-3890). School of Computer ScienceCarnegie Mellon University.http://www-2.cs.cmu.edu/~bam/papers/vltax2.pdf. Read the PDF.
7. Gómez Henríquez, Luis M. (2001). Software Visualization: An Overview.Informatique - Revue des organisations suisses d’informatique, (2).http://www.svifsi.ch/revue/pages/issues. Read the PDF.
8. Cox, Philip T. (2005). Introduction to Visual Programming. Training was heldat DRDC Valcartier.
9. Shu, N.C., (Ed.) (1988). Visual Programming, Van Nostrand Reinhold Co.New York, NY, USA.http://portal.acm.org/citation.cfm?id=59606&dl=ACM&coll=GUIDE.ISBN:0-442-28014-9.
48 DRDC Valcartier TM 2005-535
10. Chang, Shi-Kuo (1990). Principles of Visual Programming Systems, Ch. 1.NJ,: Prentice-Hal. Englewood Cliffs. http://woorisol.knu.ac.kr/VU/Graduate/Course/Mul/presentation/jskim.pdf. Read the PDF.
11. Glinert, Ephraim P., (Ed.) (1990). Visual Programming Environments:Applications and Issues, Los Alamitos, Calif. : IEEE Computer Society Press,c©1990. http://www.worldcatlibraries.org/wcpa/ow/0a83e98615ea17f5a19afeb4da09e526.html. ISBN: 08186897490818659742.
12. Glinert, Ephraim P., (Ed.) (1990). Visual Programming Environments:Paradigms and Systems, Los Alamitos, Calif. : IEEE Computer Society Press,c©1990. http://www.worldcatlibraries.org/wcpa/ow/b2a5c116e3528f94a19afeb4da09e526.html. ISBN: 08186897490818689730 0818659734.
13. Cypher, Allen, (Ed.) (1993). Watch What I Do: Programming byDemonstration, Cambridge, Mass. : MIT Press.http://www.worldcatlibraries.org/wcpa/ow/23904ff2ec9ab9f5a19afeb4da09e526.html. ISBN: 0262032139.
14. Baecker, Ronald and Price, Blaine A. (1998). The Early History of SoftwareVisualization. In Stasko, John, Domingue, John, Brown, Marc H., and Price,Blaine A., (Eds.), Software visualization: programming as a multimediaexperience, Ch. 2, pp. 29–34. The MIT Press.
15. Roman, Gruia-Catalin and Cox, Kenneth C. (1992). Program visualization:The art of mapping programs to pictures. (Technical Report WUCS-92-06).School of Engineering and Applied Science Washington University. Read thePDF.
16. Baecker, Ronald and Marcus, Aaron (1998). Printing and Publishing CPrograms. In Stasko, John, Domingue, John, Brown, Marc H., and Price,Blaine A., (Eds.), Software visualization: programming as a multimediaexperience, Ch. 4, pp. 45–61. The MIT Press.
17. SmartDraw (2005). Nassi-Shneiderman Diagram Examples.http://www.smartdraw.com/examples/software-nassi.
18. Nassi, Isaac and Shneiderman, Ben (1973). Flowchart techniques forstructured programming. ACM SIGPLAN Notices, 8(8), 12–26.
19. Di Battista, Giuseppe, Eades, Peter, Tamassia, Roberto, and Tollis, Ioannis G.(1994). Algorithms for Drawing Graphs: an Annotated Bibliography.Computational Geometry: Theory and Applications, Vol. 4. Read the PDF.
DRDC Valcartier TM 2005-535 49
20. Herman, Ivan, Melançon, Guy, and Marshall, M. Scott (2000). GraphVisualization and Navigation in Information Visualization: A Survey. IEEETransactions on Visualization and Computer Graphics, 6(1), 24–43.
21. Hong, Seokhee (2004). Information Visualization. Academic course. Read thePDF. Acdemic course COMP4048 - University of Sidney, Australia.
22. Robertson, George G., Mackinlay, Jock D., and Card, Stuart K. (1991). ConeTrees: animated 3D visualizations of hierarchical information. In Conferenceon Human Factors in Computing Systems Proceedings of the SIGCHIconference on Human factors in computing systems: Reaching throughtechnology, pp. 189 – 194. http://portal.acm.org/citation.cfm?id=108883&dl=ACM&coll=portal.ISBN:0-89791-383-3.
23. Sugiyama, Kozo, Tagawa, Shojiro, and Toda, Mitsuhiko (1981). Methods forVisual Understanding of Hierachical System Structures. IEEE Transactions onSystems, Man, and Cybernetics, SMC-11(2), 109–125.
24. Ball, Thomas A. and Eick, Stephen G. (1996). Software Visualization in theLarge. IEEE Computer, 29(4), 33–43. http://pfp7.cc.yamaguchi-u.ac.jp/~ichikawa/iv/resources/softvis_copyright.pdf. Read the PDF.
25. Reiss, Steven P. (1998). Visualization for Software Engineering -Programming Environments. In Stasko, John, Domingue, John, Brown,Marc H., and Price, Blaine A., (Eds.), Software visualization: programming asa multimedia experience, Ch. 18, pp. 259–276. The MIT Press.
26. Tamassia, Roberto (1990). Planar Orthogonal Drawings of Graphs. InProceedings of the IEEE International Symposium on Circuits and Systems.
27. yWorks (2005). Gallery of Graph Layouts. http://www.yworks.com/en/products_yfiles_practicalinfo_gallery.htm.
28. Eades, Peter (1984). A Heuristic for Graph Drawing. CongressusNumerantium, 42, 149–160.
29. Frick, Arne, Ludwig, Andreas, and Mehldau, Heiko (1994). A Fast AdaptiveLayout Algorithm for Undirected Graphs - Extended Abbstect and SystemDemonstration. In Tamassia, Roberto and Tollis, Ioannis G., (Eds.), GD ’94:Proceedings of the DIMACS International Workshop on Graph Drawing, Vol.894, pp. 388–403. Berlin, Germany: Springer-Verlag.http://citeseer.ist.psu.edu/frick94fast.html. Read the PDF. ISBN:3-540-58950-3.
50 DRDC Valcartier TM 2005-535

30. Gajer, Pavel, Goodrich, Michael T., and Kobourov, Stephen G. (2000). A FastMulti-Dimensional Algorithm for Drawing Large Graphs.http://citeseer.ist.psu.edu/gajer00fast.html. Read the PDF.
31. Munzner, Tamara (2000). Interactive Visualization of Large Graphs andNetworks. Ph.d. dissertation. Stanford University.http://graphics.stanford.edu/papers/munzner_thesis.
32. Informatik, AbsIn Angewandte (2005). aiSee Graph Visualization UserDocumentation for Windows - Version 2.2.00. http://www.aisee.com.
33. TomSayer (2005). Image Galery. http://www.tomsawyer.com/gallery/gallery.php?PHPSESSID=61eb30c9b3877f635883b9f3d8d7906a.
34. Jungnickel, Dieter (2005). Graphs, Networks and Algorithms, 2nd ed. Vol. 5 ofAlgorithms and Computation in Mathematics. Springer Verlag.http://www.springer.com/sgw/cda/frontpage/0,,4-151-22-32106033-0,00.html. ISBN: 3-540-21905-6.
35. Shneiderman, Ben (1992). Tree visualization with Treemaps: A 2-DSpace-Filling Approach. ACM Transactions on Graphics, 11(1), 92–99.
36. Johnson, Brian and Shneiderman, Ben (2001). Tree-Maps: A Space-FillingApproach to the Visualization of Hierarchical Information Structures.http://www.cs.umd.edu/class/spring2002/cmsc838f/cyntrica.ppt.Read the PDF.
37. Bladh, Thomas, Carr, David A., and Scholl, Jeremiah (2004). ExtendingTree-Maps to Three Dimensions: A Comparative Study. In Masoodian, M.,Jones, S., and Rogers, B., (Eds.), The 6th Asia-Pacific Conference onComputer-Human Interaction (APCHI 2004).http://www.sm.luth.se/csee/csn/visualization/filesysvis.php.Read the PDF.
38. Stasko, John T. and Zhang, Eugene (2000). Focus+Context Display andNavigation Techniques for Enhancing Radial, Space-Filling HierarchyVisualizations. In IEEE Symposium on Information Visualization (InfoVis2000), pp. 57–65. IEEE Computer Scociety Press.http://www.cc.gatech.edu/gvu/ii/sunburst. Read the PDF.
39. Jerding, Dean F. and Stasko, John T. (1997). The Information Mural: ATechnique for Displaying and Navigating Large Information Spaces.(Technical Report GIT-GVU-97-24). Graphics, Visualization, and UsabilityCenter College of Computing Georgia Institute of Technology Atlanta, GA30332-0280. http://www.cc.gatech.edu/gvu/ii/mural. Read the PDF.Replaces Technical Report GIT-GVU-96-25.
DRDC Valcartier TM 2005-535 51
40. Jerding, Dean F. and Stasko, John T. (1995). The Information Mural: ATechnique for Displaying and Navigating Large Information Spaces. InProceedings of the IEEE Information Visualization Conference, pp. 43–50.http://www.cc.gatech.edu/gvu/ii/mural. Read the PDF.
41. Storey, Margarett-Anne, Wong, Kenny, Fracchia, F. David, and Müller,Hausi A. (1997). On Integrating Visualization Techniques for EffectiveSoftware Exploration. In IEEE Symposium on Information Visualization(InfoVis ’97), pp. 38–45.http://www.cs.uvic.ca/~mstorey/papers/infovis97.pdf. Read thePDF.
42. Mackinlay, Jock D., Robertson, George G., and Card, Stuart K. (1991). Theperspective wall: detail and context smoothly integrated. In CHI ’91:Proceedings of the SIGCHI conference on Human factors in computingsystems, pp. 173–176. New York, NY, USA: ACM Press. ISBN:0-89791-383-3.
43. Stone, Maureen C., Fishkin, Ken, and Bier, Eric A. (1994). The Movable Filteras a User Interface Tool. In CHI ’94: Proceedings of the ACM Conference onHuman Factors and Computing Systems, pp. 306–312. Boston, Massachusetts:ACM Press.
44. Rao, Ramana and Card, Stuart K. (1994). The Table Lens: Merging GraphicalRepresentations in an Interactive Focus+Context Visualization for TabularInformation. In Proceedings CHI 94, pp. 318–322. ACM Press.
45. Storey, Margaret-Anne, Best, Casey, and Michaud, Jeff (2001). SHriMPViews: An Interactive Environment for Exploring Java Programs. In 9thInternational Workshop on Program Comprehension, IEEE Computer Society.http://www.cs.uvic.ca/~mstorey/papers/iwpc2001.pdf. Read thePDF. ISSN:1092-8138.
46. Brown, Marc H. (1998). A Taxonomy of Algorithm Animation Displays. InStasko, John, Domingue, John, Brown, Marc H., and Price, Blaine A., (Eds.),Software visualization: programming as a multimedia experience, Ch. 3, pp.35–42. The MIT Press.
47. Brown, Marc H. and Hershberger, John (1998). Fundamental Techniques forAlgorithm Animation Displays. In Stasko, John, Domingue, John, Brown,Marc H., and Price, Blaine A., (Eds.), Software visualization: programming asa multimedia experience, Ch. 7, pp. 80–101. The MIT Press.
48. Stasko, John T. (1998). Smooth, Continuous Animation for PortrayingAlgorithms and Processes. In Stasko, John, Domingue, John, Brown, Marc H.,
52 DRDC Valcartier TM 2005-535

and Price, Blaine A., (Eds.), Software visualization: programming as amultimedia experience, Ch. 8, pp. 101–118. The MIT Press.
49. Churcher, Neville, Keowen, Lachlan, and Irwin, Warwick (1999). VirtualWorlds for Software Visualisation. In SoftVis99.http://www.cosc.canterbury.ac.nz/research/RG/svg/softvis99.Read the PDF.
50. Knight, Claire and Munro, Malcolm (1999). Comprehension with[in] VirtualEnvironment Visualisations. In Internationl Workshop on ProgramComprehension (IWPC).http://vrg.dur.ac.uk/papers/getpaper.php3?id=9. Read the PDF.
51. Knight, Claire and Munro, Malcolm (2000). Mindless Visualisations. In The6th ERCIM “User Interfaces for All” Workshop.http://vrg.dur.ac.uk/papers/getpaper.php3?id=19. Read the PDF.
52. Young, Peter and Munro, Malcolm (1997). A New View of Call Graphs forVisualising Code Structures. (Technical Report 03/97). University of Durham.http://citeseer.ist.psu.edu/57145.html. Read the PDF.
53. Francioni, Joan M., Albright, Larry, and Jackson, Jay Alan (1991). Debuggingparallel programs using sound. In PADD ’91: Proceedings of the 1991ACM/ONR workshop on Parallel and distributed debugging, pp. 68–75. NewYork, NY, USA: ACM Press. http://www.acm.org/pubs/articles/proceedings/onr/122759/p68-francioni/p68-francioni.pdf. ISBN:0-89791-457-0.
54. Brown, Marc H. and Hershberger, John (1998). Program Auralization. InStasko, John, Domingue, John, Brown, Marc H., and Price, Blaine A., (Eds.),Software visualization: programming as a multimedia experience, Ch. 10, pp.137–144. The MIT Press.
55. Khuri, Sami (2001). General Purpose Algorithm Animation Systems. PersonalHome Page, Professor San José State Universuty.http://www.mathcs.sjsu.edu/faculty/khuri/inv_links1.html.
56. Daigle, Sylvain, Lavoie, Yvan, and Salois, Martin (2003). The State of the Artin Program Visualization. (DRDC External Client Report ECR 2003-205).Defence Research & Development Canada - Valcartier. Val-Bélair, Qc. Readthe PDF.
57. COSIN, Research Group. Work Package 3 - Collection of visualization tools.http://i11www.ira.uka.de/cosin/tools/index.php. UniversityKaslsruhe (UNIKARL), Germany.
DRDC Valcartier TM 2005-535 53
58. Tilley, Scott and Huang, Shihong (2002). Documenting Software Systems withViews III: Towards a Task-Oriented Classification of Program VisualizationTechniques. In SIGDOC ’02: Proceedings of the 20th annual internationalconference on Computer documentation, pp. 226–233. New York, NY, USA:ACM Press. ISBN: 1-58113-543-2.
59. Gansner, Emden R. and North, Stephen C. (2000). An open graph visualizationsystem and its applications to software engineering. Software — Practice andExperience, 30(11), 1203–1233.http://www.graphviz.org/Documentation.php. Read the PDF.
60. Caida (2005). Walrus -Graph Visualization Tool.http://www.caida.org/tools/visualization/walrus.
61. Baker, Marla J. and Eick, Stephen G. (1999). Space-filling softwarevisualization, pp. 160–182. San Francisco, CA, USA: Morgan KaufmannPublishers Inc.http://portal.acm.org/citation.cfm?id=300679.300716#.ISBN:1-55860-533-9.
62. Baker, Marla J. and Eick, Stephen G. (2001). SeeSys: Space-Filling Software.http://www.cs.umd.edu/class/spring2001/cmsc838b/presentations/Jaime_Spacco/SeeSys.ppt. Read the PDF.
63. Micro Logic Corp. DiskMapper.http://www.miclog.com/dm/index.shtml.
64. Baudel, Thomas, Haible, Bruno, and Sander, Georg (2003). Visual DataMining with ILOG Discovery. In Liotta, Giuseppe, (Ed.), Conference GraphDrawing BaudelHS03, Vol. 2912 of Lecture Notes in Computer Science, pp.502–503. Springer. http://www.ilog.com/products/jviews/conferences/DiscoveryGD2003.pdf. ISBN: 3-540-20831-3.
65. Marcus, Andrian, Feng, Louis, and Maletic, Jonathan I. (2003). 3DRepresentations for Software Visualization. In Proceedings of the 2003 ACMsymposium on Software visualization, pp. pp. 27–36. San Diego, California.http://www.sv3d.org/softvis2003.pdf. Read the PDF.ISBN:1-58113-642-0.
66. Stasko, John T. (1998). Smooth, Continuous Animation for PortrayingAlgorithms and Processes. In Stasko, John, Domingue, John, Brown, Marc H.,and Price, Blaine A., (Eds.), Software visualization: programming as amultimedia experience, Ch. 8, pp. 101–118. The MIT Press.
54 DRDC Valcartier TM 2005-535
67. Stasko, John T. (1996). Using Student-Built Algorithm Animations asLearning Aids. (Technical Report GIT-GVU-96-19). Georgia Institute ofTechnology. Atlanta, GA.ftp://ftp.cc.gatech.edu/pub/gvu/tech-reports/1996/96-19.ps.Z.Read the PDF.
68. Stasko, John T. (2005). Software Visualization. Academic course.http://www.cc.gatech.edu/classes/AY2005/cs7450_spring/Talks/19-softvis.pdf. Read the PDF. Course number: CS 7450 – InformationVisualization.
69. Brown, Marc H. (1992). An introduction to Zeus: audiovisualization of someelementary sequential and parallel sorting algorithms. In CHI ’92:Proceedings of the SIGCHI conference on Human factors in computingsystems, pp. 663–664. New York, NY, USA: ACM Press.http://doi.acm.org/10.1145/142750.143075. Read the PDF. ISBN:0-89791-513-5.
70. Systems Research Center (SRC). Algorithm Animation at SRC.http://www.research.compaq.com/SRC/zeus/home.html.
71. Shilling, John J. and Stasko, John T. (1994). Using Animation to designObject-Oriented Systems. Object Oriented Systems, 1(1), 5–19.http://www.cc.gatech.edu/gvu/softviz/ooviz/ooviz.html.
72. Henry, Robert R. (1990). Announcing the University of Washington ProgramIllustrator. http://compilers.iecc.com/comparch/article/90-07-001.
73. CHiSEL (2005). SHriMP (Simple Hierarchical Multi-Perspective).http://www.thechiselgroup.org/shrimp.
74. DiGiano, Christopher J. and Baecker, Ronald M. (1992). Program auralization:sound enhancements to the programming environment. In Proceedings of theconference on Graphics interface ’92, pp. 44–52. San Francisco, CA, USA:Morgan Kaufmann Publishers Inc.http://portal.acm.org/citation.cfm?id=155294.155300#. ISBN:0-9695338-1-0.
75. DiGiano, Christopher J., Baecker, Ronald M., and Owen, Russell N. (1993).LogoMedia: a sound-enhanced programming environment for monitoringprogram behavior. In CHI ’93: Proceedings of the SIGCHI conference onHuman factors in computing systems, pp. 301–302. New York, NY, USA:ACM Press. http://portal.acm.org/citation.cfm?id=169059.169229&dl=portal&dl=ACM&type=series&idx=169059&part=Proceedings&WantType=Proceedings&title=Conference%20on%
DRDC Valcartier TM 2005-535 55
20Human%20Factors%20and%20Computing%20Systems#. ISBN:0-89791-575-5.
76. Hyrskykari, Aulikki (1995). Development of Program Visualization Systems.Technical Report. Department of Computer Science University of Tampere.P.O. Box 607 SF-33101 Tampere Finland.http://www.cs.uta.fi/reports/pdf/A-1995-3.pdf. Read the PDF.
77. Bassil, Sarita and Keller, Rudolf K. (2001). A Qualitative and QuantitativeEvaluation of Software Visualization Tools. Workshop on SV-ICSE.http://www.cs.brown.edu/research/softvis/papers/Bassil_WorkshopOnSV-ICSE-2001_FINAL.pdf. Read the PDF.
78. Buchsbaum, Adam, Chen, Yih-Farn, Huang, Huale, Koutsofios, Eleftherios,Mocenigo, John, Rogers, Anne, Jankowsky, Michael, and Mancoridis, Spiros(2001). Visualizing and Analyzing Software Infrastructures. IEEE Software,18(5), 62–70.http://ieeexplore.ieee.org/xpls/abs_all.jsp?arnumber=951497.Read the PDF.
79. Charland, Philippe, Dany, Dessureault, Lizotte, Michel, Ouellet, David, andNécaille, Christophe (2006). Using software analysis tools to understandmilitary applications. (DRDC Technical Memorandum TM 2005-425).Defence Research & Development Canada - Valcartier. Val-Bélair, Qc. Readthe PDF.
80. Storey, Margarett-Anne (2003). Designing a Software Exploration Tool Usinga Cognitive Framework. In Zhang, Kang, (Ed.), Software Visualization : FromTheory to Practice, Ch. 5, pp. 113–147. Kluwer Academic Publishers.
List of Acronyms
ASCII American Standard Code for Information Interchange
CHISEL Computer-Human Interaction and Software Engineering
DND Department of National Defence
DRDC Defence Research & Development Canada
GDL Graph Description Language
GUI Graphical User Interface
GVU Graphics, Visualization and Usability
56 DRDC Valcartier TM 2005-535

GXL Graph eXchange Language
HCI human-computer interaction
HCIL Human-Computer Interaction Laboratory
IDE Integrated Development Environment
MDN Ministère de la Défense Nationale
RDDC Recherche et Développement pour la Défense Canada
RSF Rigi Standard Format
SHriMP Simple Hierarchical Multi-Perspective
U.K. United Kingdom
UML Unified Modeling Language
U.S.A. United States of America
UWPI University of Washington Program Illustrator
VRML Virtual Reality Modelling Language
XMI XML Metadata Interchange
XML Extensible Markup Language
DRDC Valcartier TM 2005-535 57

DOCUMENT CONTROL DATA(Security classification of title, body of abstract and indexing annotation must be entered when document is classified)
1. ORIGINATOR (the name and address of the organization preparing the document.Organizations for whom the document was prepared, e.g. Centre sponsoring acontractor’s report, or tasking agency, are entered in section 8.)
Defence R & D Canada – Valcartier2459 Pie-XI Blvd North, Québec, QC, Canada
2. SECURITY CLASSIFICATION(overall security classification of the documentincluding special warning terms if applicable).
UNCLASSIFIED
3. TITLE (the complete document title as indicated on the title page. Its classification should be indicated by the appropriateabbreviation (S,C,R or U) in parentheses after the title).
Visualization techniques for program comprehension
4. AUTHORS(Last name, first name, middle initial. If military, show rank, e.g. Doe, Maj. John E.)
Lemieux, François ; Salois, Martin
5. DATE OF PUBLICATION (month and year of publication of document)
February 2006
6a. NO. OF PAGES (totalcontaining information. IncludeAnnexes, Appendices, etc).
71
6b. NO. OF REFS (total cited indocument)
80
7. DESCRIPTIVE NOTES (the category of the document, e.g. technical report, technical note or memorandum. If appropriate, enter the type of report,e.g. interim, progress, summary, annual or final. Give the inclusive dates when a specific reporting period is covered).
Technical Memorandum
8. SPONSORING ACTIVITY (the name of the department project office or laboratory sponsoring the research and development. Include address).
Defence R & D Canada – Valcartier2459 Pie-XI Blvd North, Québec, QC, Canada
9a. PROJECT OR GRANT NO. (if appropriate, the applicable research anddevelopment project or grant number under which the document waswritten. Specify whether project or grant).
15BP02
9b. CONTRACT NO. (if appropriate, the applicable number under whichthe document was written).
10a. ORIGINATOR’S DOCUMENT NUMBER (the official document numberby which the document is identified by the originating activity. Thisnumber must be unique.)
DRDC Valcartier TM 2005-535
10b. OTHER DOCUMENT NOs. (Any other numbers which may beassigned this document either by the originator or by the sponsor.)
11. DOCUMENT AVAILABILITY (any limitations on further dissemination of the document, other than those imposed by security classification)
( X ) Unlimited distribution( ) Defence departments and defence contractors; further distribution only as approved( ) Defence departments and Canadian defence contractors; further distribution only as approved( ) Government departments and agencies; further distribution only as approved( ) Defence departments; further distribution only as approved( ) Other (please specify):
12. DOCUMENT ANNOUNCEMENT (any limitation to the bibliographic announcement of this document. This will normally correspond to the DocumentAvailability (11). However, where further distribution beyond the audience specified in (11) is possible, a wider announcement audience may beselected).

13. ABSTRACT (a brief and factual summary of the document. It may also appear elsewhere in the body of the document itself. It is highly desirable that theabstract of classified documents be unclassified. Each paragraph of the abstract shall begin with an indication of the security classification of theinformation in the paragraph (unless the document itself is unclassified) represented as (S), (C), (R), or (U). It is not necessary to include here abstracts inboth official languages unless the text is bilingual).
Understanding software is becoming more complex as programs are getting ever bigger. Many believe thatthe key to this problem is better visualization. The objective of this document is to provide an as thorough aspossible overview of this field. This is the starting point for further research and development in this criticalarea. Over 140 papers and nearly as many tools were reviewed for this purpose. This document presents themost relevant and significant ones. Further work will be required to identify the most promising approachesto include visualization in current research projects.
14. KEYWORDS, DESCRIPTORS or IDENTIFIERS (technically meaningful terms or short phrases that characterize a document and could be helpful incataloguing the document. They should be selected so that no security classification is required. Identifiers, such as equipment model designation, tradename, military project code name, geographic location may also be included. If possible keywords should be selected from a published thesaurus. e.g.Thesaurus of Engineering and Scientific Terms (TEST) and that thesaurus-identified. If it not possible to select indexing terms which are Unclassified, theclassification of each should be indicated as with the title).
visualization technique, software understanding, program comprehension, software visualization, cognitiveaid