Individual Differences in Sentence Comprehension - Center ...
14
Individual Differences in Sentence Comprehension: A Functional Magnetic Resonance Imaging Investigation of Syntactic and Lexical Processing Demands Chantel S. Prat, Timothy A. Keller, and Marcel Adam Just Abstract & Language comprehension is neurally underpinned by a net- work of collaborating cortical processing centers; individual dif- ferences in comprehension must be related to some set of this network’s properties. This study investigated the neural bases of individual differences during sentence comprehension by examining the network’s response to two variations in pro- cessing demands: reading sentences containing words of high versus low lexical frequency and having simpler versus more complex syntax. In a functional magnetic resonance imaging study, readers who were independently identified as having high or low working memory capacity for language exhibited three differentiating properties of their language network, name- ly, neural efficiency, adaptability, and synchronization. First, greater efficiency (defined as a reduction in activation associated with improved performance) was manifested as less activation in the bilateral middle frontal and right lingual gyri in high- capacity readers. Second, increased adaptability was indexed by larger lexical frequency effects in high-capacity readers across bilateral middle frontal, bilateral inferior occipital, and right temporal regions. Third, greater synchronization was ob- served in high-capacity readers between left temporal and left inferior frontal, left parietal, and right occipital regions. Synchronization interacted with adaptability, such that func- tional connectivity remained constant or increased with in- creasing lexical and syntactic demands in high-capacity readers, whereas low-capacity readers either showed no reliable dif- ferentiation or a decrease in functional connectivity with in- creasing demands. These results are among the first to relate multiple cortical network properties to individual differences in reading capacity and suggest a more general framework for understanding the relation between neural function and indi- vidual differences in cognitive performance. & INTRODUCTION Reading comprehension is a complex skill in which there are systematic individual differences in ability, even among college students. Proficiency differs at sev- eral levels of language processing. For example, good readers are faster and more accurate at word recognition (e.g., Bell & Perfetti, 1994) and comprehension of syn- tactically complex sentences (e.g., Just & Carpenter, 1992) than are poor readers. Individual differences in these abil- ities must ultimately be underpinned by individual differ- ences in brain functioning. Our goal in the current study was to determine what facets of brain activity during sen- tence comprehension were related to behavioral mea- sures of sentence comprehension skill. Neuroimaging research has provided important infor- mation about how various types of linguistic demands affect brain activity. Caplan and Alpert (1998), for exam- ple, found an increase in regional cerebral blood flow in the left pars opercularis as a function of increasing syn- tactic complexity. Keller, Carpenter, and Just (2001) ex- tended these findings by investigating the relative effects of syntactic complexity and lexical frequency on neural processes by orthogonally manipulating the two varia- bles. They found that syntactic complexity and lexical frequency manipulations independently caused increases in the traditional left peri-sylvian language areas. Addi- tionally, they found an interaction between lexical fre- quency and syntactic complexity such that when the demand of both manipulations was high, extreme in- creases in activation were observed across a distributed network of language-related areas. The current study used functional magnetic resonance imaging (fMRI) to investigate individual differences in the neural responses to lexical and syntactic processing demands by studying readers with high or low language processing capacity, as indexed by the Daneman and Carpenter (1980) Reading Span Test (RST). Individual differences in the ability to execute cogni- tive processes must ultimately be underpinned by indi- vidual differences in neural functioning, but it is unclear what facets of neural functioning are most closely relat- ed to behavioral measures. Our goal was to determine which properties of brain activation were associated with individual differences in comprehension ability. Newman and Just (2005) outlined a set of neural operating Carnegie Mellon University D 2007 Massachusetts Institute of Technology Journal of Cognitive Neuroscience 19:12, pp. 1950–1963
-
Upload
khangminh22 -
Category
Documents
-
view
4 -
download
0
Transcript of Individual Differences in Sentence Comprehension - Center ...

Individual Differences in Sentence Comprehension: AFunctional Magnetic Resonance Imaging Investigation
of Syntactic and Lexical Processing Demands
Chantel S. Prat, Timothy A. Keller, and Marcel Adam Just
Abstract
& Language comprehension is neurally underpinned by a net-work of collaborating cortical processing centers; individual dif-ferences in comprehension must be related to some set ofthis network’s properties. This study investigated the neuralbases of individual differences during sentence comprehensionby examining the network’s response to two variations in pro-cessing demands: reading sentences containing words of highversus low lexical frequency and having simpler versus morecomplex syntax. In a functional magnetic resonance imagingstudy, readers who were independently identified as havinghigh or low working memory capacity for language exhibitedthree differentiating properties of their language network, name-ly, neural efficiency, adaptability, and synchronization. First, greaterefficiency (defined as a reduction in activation associated withimproved performance) was manifested as less activation inthe bilateral middle frontal and right lingual gyri in high-
capacity readers. Second, increased adaptability was indexedby larger lexical frequency effects in high-capacity readersacross bilateral middle frontal, bilateral inferior occipital, andright temporal regions. Third, greater synchronization was ob-served in high-capacity readers between left temporal andleft inferior frontal, left parietal, and right occipital regions.Synchronization interacted with adaptability, such that func-tional connectivity remained constant or increased with in-creasing lexical and syntactic demands in high-capacity readers,whereas low-capacity readers either showed no reliable dif-ferentiation or a decrease in functional connectivity with in-creasing demands. These results are among the first to relatemultiple cortical network properties to individual differencesin reading capacity and suggest a more general framework forunderstanding the relation between neural function and indi-vidual differences in cognitive performance. &
INTRODUCTION
Reading comprehension is a complex skill in whichthere are systematic individual differences in ability,even among college students. Proficiency differs at sev-eral levels of language processing. For example, goodreaders are faster and more accurate at word recognition(e.g., Bell & Perfetti, 1994) and comprehension of syn-tactically complex sentences (e.g., Just & Carpenter, 1992)than are poor readers. Individual differences in these abil-ities must ultimately be underpinned by individual differ-ences in brain functioning. Our goal in the current studywas to determine what facets of brain activity during sen-tence comprehension were related to behavioral mea-sures of sentence comprehension skill.
Neuroimaging research has provided important infor-mation about how various types of linguistic demandsaffect brain activity. Caplan and Alpert (1998), for exam-ple, found an increase in regional cerebral blood flow inthe left pars opercularis as a function of increasing syn-tactic complexity. Keller, Carpenter, and Just (2001) ex-tended these findings by investigating the relative effects
of syntactic complexity and lexical frequency on neuralprocesses by orthogonally manipulating the two varia-bles. They found that syntactic complexity and lexicalfrequency manipulations independently caused increasesin the traditional left peri-sylvian language areas. Addi-tionally, they found an interaction between lexical fre-quency and syntactic complexity such that when thedemand of both manipulations was high, extreme in-creases in activation were observed across a distributednetwork of language-related areas. The current studyused functional magnetic resonance imaging (fMRI) toinvestigate individual differences in the neural responsesto lexical and syntactic processing demands by studyingreaders with high or low language processing capacity, asindexed by the Daneman and Carpenter (1980) ReadingSpan Test (RST).
Individual differences in the ability to execute cogni-tive processes must ultimately be underpinned by indi-vidual differences in neural functioning, but it is unclearwhat facets of neural functioning are most closely relat-ed to behavioral measures. Our goal was to determinewhich properties of brain activation were associated withindividual differences in comprehension ability. Newmanand Just (2005) outlined a set of neural operatingCarnegie Mellon University
D 2007 Massachusetts Institute of Technology Journal of Cognitive Neuroscience 19:12, pp. 1950–1963

principles proposed to underlie ‘‘intelligent’’ or skilledcognitive functioning. They propose that intelligentbehavior involves efficient use of neural resources, adapt-ability to changing demands, and coordination or syn-chronization of cortical networks. In the current article,we quantify neural efficiency, adaptability, and synchro-nization and examine them in high- and low-capacityreaders to better understand the neural underpinningsof skilled language processing.
Most existing attempts to link individual differences incognition with brain function have focused primarily onmeasures of neural efficiency. Maxwell, Fenwick, Fenton,and Dollimore (1974) were among the first to link cog-nitive abilities with neural efficiency. In an electrophys-iological exploration of good and poor readers, theyfound evidence that good readers had more efficientneural processes (as indexed by lower power spectra inelectroencephalogram) than did poor readers. Early pos-itron emission tomography studies used glucose meta-bolic rates as indices of neural efficiency (e.g., Boivinet al., 1992; Haier et al., 1988). fMRI studies have at-tempted to measure neural efficiency in terms of theactivation volume, which can be measured as the totalnumber of voxels activated above some threshold value.Generally, the finding in both methodologies is thatmore proficient cognitive functioning in a given domainis associated with fewer activated voxels in a brain regionthat centrally participates in the processing in that do-main (e.g., Newman, Carpenter, Varma, & Just, 2003;Reichle, Carpenter, & Just, 2000; Boivin et al., 1992;Haier et al., 1988). For example, in a sentence–pictureverification task, participants with higher verbal abilities,as indexed by reading span scores, had lower activationvolumes in typical language regions (e.g., Broca’s area)when engaging in verbal strategies. Similarly, individualswith higher visual–spatial skills, as indexed by mentalrotation tasks, had lower activation volumes in typicalvisual association regions (e.g., parietal cortex) when en-gaging in spatial strategies (Reichle et al., 2000). Thelower activation volume in more proficient individualscan be interpreted as using fewer neural resources toperform a given set of computations, and thus, can bethought of as neural efficiency. An individual’s languagecapacity may therefore be correlated with indices of neu-ral efficiency during sentence comprehension.
A second hallmark of an intelligent system is its abilityto dynamically adapt to changing demands. Brain imag-ing studies provide evidence of such adaptation in termsof the activation of brain areas on an as-needed basis.Although a modal set of areas activates for any giventask, additional areas may be recruited to deal with in-creasing demands. For example, Just, Carpenter, Keller,Eddy, and Thulborn (1996) found that as sentence com-plexity increases, right hemisphere homologues of typ-ical left hemisphere language regions become activated.Existing evidence suggests that individual differences inintelligence may be linked to differential neural adapt-
ability to task demands. Larson, Haier, LaCasse, and Hazen(1995) examined glucose metabolic rates as a functionof task difficulty in individuals with high and averagereasoning abilities. They found that individuals withhigh reasoning ability had higher metabolic rates duringhard tasks, whereas individuals with average reasoningability had higher metabolic rates during easy tasks. Inan electrophysiological investigation of cognitive train-ing, Neubauer, Grabner, Freudenthaler, Beckmann, andGuthke (2004) found that higher-IQ individuals showedgreater decreases in cortical activation as a function oftraining than did lower-IQ individuals. Therefore, com-prehension ability may reflect differences in adaptabilityof an individual’s neural network in the face of changingdemands.
A third attribute of an intelligent system is the abilityto coordinate the activities of its component subsystems.The various anatomical regions involved in processing atask must be able to effectively communicate and syn-chronize their processes for the system to function well.In a language task, this means that the areas responsiblefor executing subcomponent processes must collaborateto synthesize the information necessary for comprehen-sion. Such collaboration may be reflected in functionalneuroimaging studies by the correlation of the activa-tion time series in a given region with the activationtime series of another region. The extent to which theactivation levels of two regions rise and fall in tandemis taken as a reflection of the degree to which the tworegions are functionally connected, and the term thatis widely used to refer to the activation time series cor-relation is functional connectivity (Friston, 1994). Al-though functional connectivity is a description of thesynchronization of activation between remote corticalregions, it does not provide direct evidence that theactivity of one region causes activity in another region,or that the regions are directly communicating. It, nev-ertheless, provides a useful characterization of brain ac-tivity at the network level. This level of description isparticularly appropriate for evaluating the response ofan intelligent system to task demands, and it may pro-vide new insight into the nature of individual differencesbetween such systems. Functional connectivity researchhas provided some evidence that as task demands in-crease, functional connectivity also increases, for exam-ple, as a function of working memory load (e.g., Diwadkar,Carpenter, & Just, 2000), reflecting the need for tightercoordination in more demanding conditions. Functionalconnectivity has also been shown to increase with learn-ing, at the same pace as the increase in performance, againindicating that the system coordination is an importantfacet of its effectiveness (Buchel, Coull, & Friston, 1999).In a working memory task, Otsuka and Osaka (2005)found that younger individuals who perform better onthe task had higher functional connectivity than older in-dividuals who perform poorly on the task. It is possiblethat differences in comprehension ability may also reflect
Prat, Keller, and Just 1951

differences in functional connectivity between involvedbrain regions.
In this study, we compared neural efficiency (amount ofactivation), adaptability (changes in activation as a func-tion of lexical frequency or syntactic complexity), and syn-chronization (correlation between time courses of activationfor various regions in an active network) in high- andlow-capacity readers, as indexed by the Daneman andCarpenter (1980) RST. Our goal was to discover the re-lation between characteristics of brain activation and thebehavioral characteristics associated with high- and low-capacity readers.
METHODS
Participants
Forty right-handed, native English-speaking CarnegieMellon undergraduate students participated in this ex-periment. All individuals were paid for their partici-pation. The Daneman and Carpenter (1980) RST wasadministered to all participants. Data from 23 of the40 participants were reported in Keller et al. (2001) with-out regard to individual differences, and an additional17 participants who met the selection criteria wererecruited for this study. Only individuals receiving ascore of 2.5 or below or 4.0 or above (approximatelythe top and bottom fifths of the population tested) wereselected to participate in this study. Five of the 40 par-ticipants were excluded due to excessive head motion,leaving 18 who were classified as high-capacity (meanage = 21.6 years, SD = 4.2 years; mean reading span =4.4, SD = 0.51, 6 men) and 17 who were classified aslow-capacity (mean age = 22.4 years, SD = 4.1, meanreading span = 2.3, SD = 0.26, 13 men1).
Materials
The study materials consisted of 80 sentences and com-prehension probes used previously by Keller et al.(2001), who modified them from a set of sentences usedby Just et al. (1996). They orthogonally crossed syntac-tic complexity (two-clause active-conjoined and object-relative sentences) and lexical frequency (high and lownoun frequency) to form four experimental conditions,with 20 sentences in each condition. All sentences weresimilar in overall structure, consisting of two clausesand a final prepositional phrase. Sentences in the high-frequency condition contained nouns that occurredmore than 70 times per million, according to Kuceraand Francis (1967) word frequency norms, whereas sen-tences in the low-frequency condition contained nounsthat occurred less than thrice per million. Half of thecomprehension probes were true, and the other halfwere false. Half of the comprehension probes referredto information in the first clause of the sentence, whereas
the other half referred to information in the secondclause of the sentence. Sample stimuli appear in Table 1.
Procedure
All participants came in for behavioral testing and prac-tice 1 to 2 days before their scan. Participants receivedthe RST and the Edinburgh Handedness Inventory(Oldfield, 1971) prior to scanning.
During the fMRI scan, sentences were projected indi-vidually onto a plastic screen attached to the roof of thebore of the scanner. Participants viewed the sentencesthrough a pair of mirrors attached to the head coil, withthe display subtending a visual angle of approximately308. Participants were instructed to read each sentencefor comprehension and to press a button when theywere finished. The button press initiated presentationof the comprehension probe. Participants responded tothe probe by pressing one of two buttons to indicate‘‘true’’ or ‘‘false.’’ Five sentences of the same type werepresented sequentially in an epoch, and there were fourepochs of each of the four conditions (sixteen totalexperimental epochs) with six baseline epochs inter-leaved. During the baseline epochs, participants wereinstructed to fixate on a centered ‘‘X’’ for 24 sec. Epochswere separated from each other by 6 sec of rest. Sen-tence reading time, probe reading and response time,and accuracy were recorded during the scan.
fMRI Acquisition Parameters
The imaging data were collected on a 3.0-T whole-bodyGeneral Electric Signa scanner, retrofitted for echo-planar imaging (EPI), at the University of Pittsburgh Mag-netic Resonance Research Center. Images were acquired
Table 1. Sample Stimuli (from Keller et al., 2001)
High-frequency Nouns
Active-conjoined
The writer attacked the king and admitted the mistake atthe meeting.
Object-relative
The writer that the king attacked admitted the mistake atthe meeting.
Low-frequency Nouns
Active-conjoined
The pundit attacked the regent and admitted the gaffe atthe conclave.
Object-relative
The pundit that the regent attacked admitted the gaffe atthe conclave.
1952 Journal of Cognitive Neuroscience Volume 19, Number 12

using a GE quadrature birdcage head coil. A T2*-sensitivegradient-echo EPI pulse sequence with TR = 3000 msec,TE = 25 msec, and a flip angle of 908 was used to acquirefunctional images. Fourteen adjacent oblique–axial sliceswere acquired in an interleaved sequence, with 5 mmslice thickness, 1 mm slice gap, a 40 � 20 cm FOV, and a128 � 64 matrix size, resulting in an in-plane resolution of3.125 � 3.125 mm.
DATA ANALYSIS METHODS
Behavioral Data
Sentence reading times and error rates to comprehen-sion probes were analyzed using 2 (reading capacity) �2 (syntactic complexity) � 2 (lexical frequency) analysesof variance (ANOVAs). Reading capacity was a between-participants variable, and syntactic complexity and lexicalfrequency were within-participant variables. All effectswere tested at a significance level of p < .05, unless oth-erwise indicated.
Voxelwise Analyses of the Distributionof Activation
The data were analyzed using SPM2 (Wellcome Depart-ment of Imaging Neuroscience; www.fil.ion.ucl.ac.uk/spm) to compare the distribution of activation for high-and low-capacity readers. Images were corrected forslice acquisition timing, motion-corrected, normalizedto the Montreal Neurological Institute (MNI) template,resampled to 2 � 2 � 2 mm voxels, and smoothed withan 8-mm Gaussian kernel to decrease spatial noise.Statistical analyses were performed on individual andgroup data by using the general linear model as imple-mented in SPM2 (Friston et al., 1995). For individualparticipants, a fixed-effects model was used to estimateparameters and incorporated a high-pass filter with acutoff of 512 sec and an AR(1) correction for serialautocorrelation. Group analyses were performed usinga random-effects model. Contrasts reflecting the groupdifferences in the distribution of activation relative tofixation across conditions, the group differences in thesyntactic effect (collapsing across lexical frequency con-ditions) and the group differences in the lexical fre-quency effect (collapsing across syntactic complexityconditions) were computed. Possible differences in de-activation (relative to fixation condition) were excludedfrom the analysis. Unless otherwise mentioned, a heightthreshold of p < .001 and an extent threshold of 6 voxelswere used.
Region-of-Interest Analyses of theVolume of Activation
Four anatomical ROIs, originally defined by Tzourio-Mazoyer et al. (2002) in a cortical parcellation carriedout on the MNI single-subject T1-weighted dataset, were
selected in the left hemisphere and four in their righthemisphere homologues to encompass the main clus-ters of activation in both group activation maps acrossall sentence-minus-fixation contrasts. The four ROIs perhemisphere included inferior frontal (including the sub-regions of the pars opercularis and pars triangularis),temporal (including the superior and middle temporalgyri), parietal (including the subregions of the angulargyrus, posterior supramarginal gyrus, and intraparietalsulcus) and inferior occipital (inferior occipital gyrus).Figure 1 provides a schematic representation of theROIs. The number of voxels activated in each ROI abovethe height threshold of p < .05, corrected for multiplecomparisons, was calculated for each participant inde-pendently, for each of the four sentence conditions.The data for each ROI were analyzed separately using 2(reading capacity) � 2 (syntactic complexity) � 2 (lexicalfrequency) ANOVAs. Reading capacity was a between-participants variable; Syntactic complexity and lexical fre-quency were within-participant variables. All effects weretested at a significance level of p < .05, unless other-wise indicated.
Functional Connectivity
The functional connectivity was computed separately foreach participant as a correlation between the activationtime courses (averaged over all of the activated voxels)in a pair of ROIs. The anatomical ROIs were the sameones used in the volume analysis described above,except that the pars opercularis was excluded from thefrontal region, and the angular and supramarginal gyriwere excluded from the parietal region because activa-tion in these areas differed greatly between the high-and low-capacity groups. A subject was excluded fromany analysis in which the number of voxels activated ineither of the ROIs constituting the pair was less than 8.The time course of signal intensity was extracted foreach participant over the activated voxels within the ROIfrom the normalized and smoothed images that were
Figure 1. Schematic depiction of the ROIs used for distribution of
activation analyses.
Prat, Keller, and Just 1953
low-pass filtered and had the linear trend removed.2
Fisher’s r to z transformation was applied to the corre-lation coefficients for each participant prior to averagingand statistical comparison of the two groups. The datafor each ROI pair were analyzed separately using 2(reading capacity) � 2 (syntactic complexity) � 2 (lexicalfrequency) ANOVAs. All effects were tested at a signifi-cance level of p < .05, unless otherwise indicated.
RESULTS
Behavioral Data
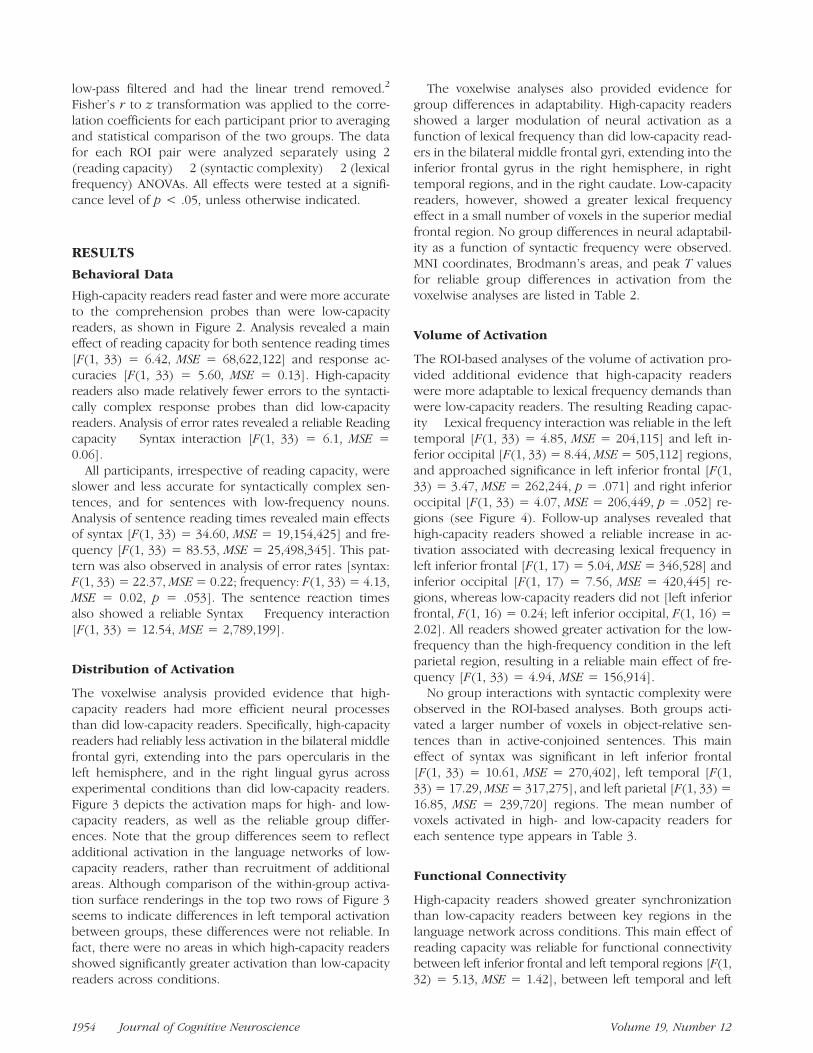
High-capacity readers read faster and were more accurateto the comprehension probes than were low-capacityreaders, as shown in Figure 2. Analysis revealed a maineffect of reading capacity for both sentence reading times[F(1, 33) = 6.42, MSE = 68,622,122] and response ac-curacies [F(1, 33) = 5.60, MSE = 0.13]. High-capacityreaders also made relatively fewer errors to the syntacti-cally complex response probes than did low-capacityreaders. Analysis of error rates revealed a reliable Readingcapacity � Syntax interaction [F(1, 33) = 6.1, MSE =0.06].
All participants, irrespective of reading capacity, wereslower and less accurate for syntactically complex sen-tences, and for sentences with low-frequency nouns.Analysis of sentence reading times revealed main effectsof syntax [F(1, 33) = 34.60, MSE = 19,154,425] and fre-quency [F(1, 33) = 83.53, MSE = 25,498,345]. This pat-tern was also observed in analysis of error rates [syntax:F(1, 33) = 22.37, MSE = 0.22; frequency: F(1, 33) = 4.13,MSE = 0.02, p = .053]. The sentence reaction timesalso showed a reliable Syntax � Frequency interaction[F(1, 33) = 12.54, MSE = 2,789,199].
Distribution of Activation
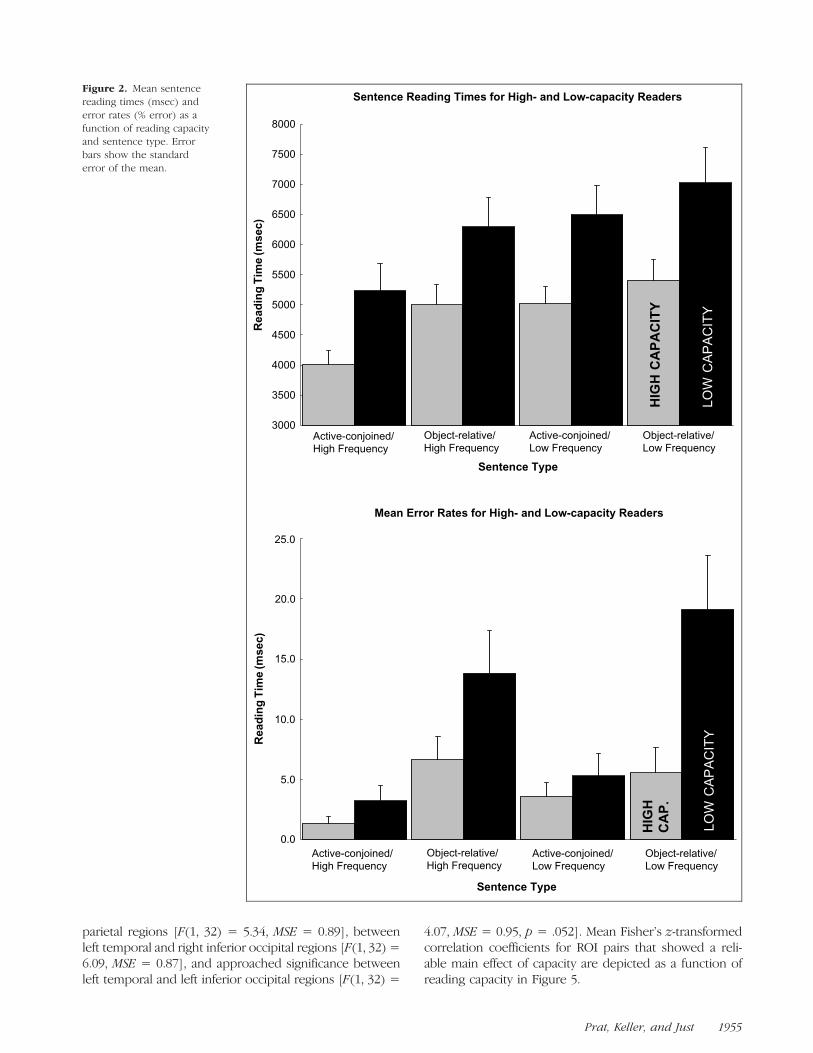
The voxelwise analysis provided evidence that high-capacity readers had more efficient neural processesthan did low-capacity readers. Specifically, high-capacityreaders had reliably less activation in the bilateral middlefrontal gyri, extending into the pars opercularis in theleft hemisphere, and in the right lingual gyrus acrossexperimental conditions than did low-capacity readers.Figure 3 depicts the activation maps for high- and low-capacity readers, as well as the reliable group differ-ences. Note that the group differences seem to reflectadditional activation in the language networks of low-capacity readers, rather than recruitment of additionalareas. Although comparison of the within-group activa-tion surface renderings in the top two rows of Figure 3seems to indicate differences in left temporal activationbetween groups, these differences were not reliable. Infact, there were no areas in which high-capacity readersshowed significantly greater activation than low-capacityreaders across conditions.
The voxelwise analyses also provided evidence forgroup differences in adaptability. High-capacity readersshowed a larger modulation of neural activation as afunction of lexical frequency than did low-capacity read-ers in the bilateral middle frontal gyri, extending into theinferior frontal gyrus in the right hemisphere, in righttemporal regions, and in the right caudate. Low-capacityreaders, however, showed a greater lexical frequencyeffect in a small number of voxels in the superior medialfrontal region. No group differences in neural adaptabil-ity as a function of syntactic frequency were observed.MNI coordinates, Brodmann’s areas, and peak T valuesfor reliable group differences in activation from thevoxelwise analyses are listed in Table 2.
Volume of Activation
The ROI-based analyses of the volume of activation pro-vided additional evidence that high-capacity readerswere more adaptable to lexical frequency demands thanwere low-capacity readers. The resulting Reading capac-ity � Lexical frequency interaction was reliable in the lefttemporal [F(1, 33) = 4.85, MSE = 204,115] and left in-ferior occipital [F(1, 33) = 8.44, MSE = 505,112] regions,and approached significance in left inferior frontal [F(1,33) = 3.47, MSE = 262,244, p = .071] and right inferioroccipital [F(1, 33) = 4.07, MSE = 206,449, p = .052] re-gions (see Figure 4). Follow-up analyses revealed thathigh-capacity readers showed a reliable increase in ac-tivation associated with decreasing lexical frequency inleft inferior frontal [F(1, 17) = 5.04, MSE = 346,528] andinferior occipital [F(1, 17) = 7.56, MSE = 420,445] re-gions, whereas low-capacity readers did not [left inferiorfrontal, F(1, 16) = 0.24; left inferior occipital, F(1, 16) =2.02]. All readers showed greater activation for the low-frequency than the high-frequency condition in the leftparietal region, resulting in a reliable main effect of fre-quency [F(1, 33) = 4.94, MSE = 156,914].
No group interactions with syntactic complexity wereobserved in the ROI-based analyses. Both groups acti-vated a larger number of voxels in object-relative sen-tences than in active-conjoined sentences. This maineffect of syntax was significant in left inferior frontal[F(1, 33) = 10.61, MSE = 270,402], left temporal [F(1,33) = 17.29, MSE = 317,275], and left parietal [F(1, 33) =16.85, MSE = 239,720] regions. The mean number ofvoxels activated in high- and low-capacity readers foreach sentence type appears in Table 3.
Functional Connectivity
High-capacity readers showed greater synchronizationthan low-capacity readers between key regions in thelanguage network across conditions. This main effect ofreading capacity was reliable for functional connectivitybetween left inferior frontal and left temporal regions [F(1,32) = 5.13, MSE = 1.42], between left temporal and left
1954 Journal of Cognitive Neuroscience Volume 19, Number 12
parietal regions [F(1, 32) = 5.34, MSE = 0.89], betweenleft temporal and right inferior occipital regions [F(1, 32) =6.09, MSE = 0.87], and approached significance betweenleft temporal and left inferior occipital regions [F(1, 32) =
4.07, MSE = 0.95, p = .052]. Mean Fisher’s z-transformedcorrelation coefficients for ROI pairs that showed a reli-able main effect of capacity are depicted as a function ofreading capacity in Figure 5.
Figure 2. Mean sentence
reading times (msec) and
error rates (% error) as a
function of reading capacityand sentence type. Error
bars show the standard
error of the mean.
Prat, Keller, and Just 1955
pwilliams
Text Box
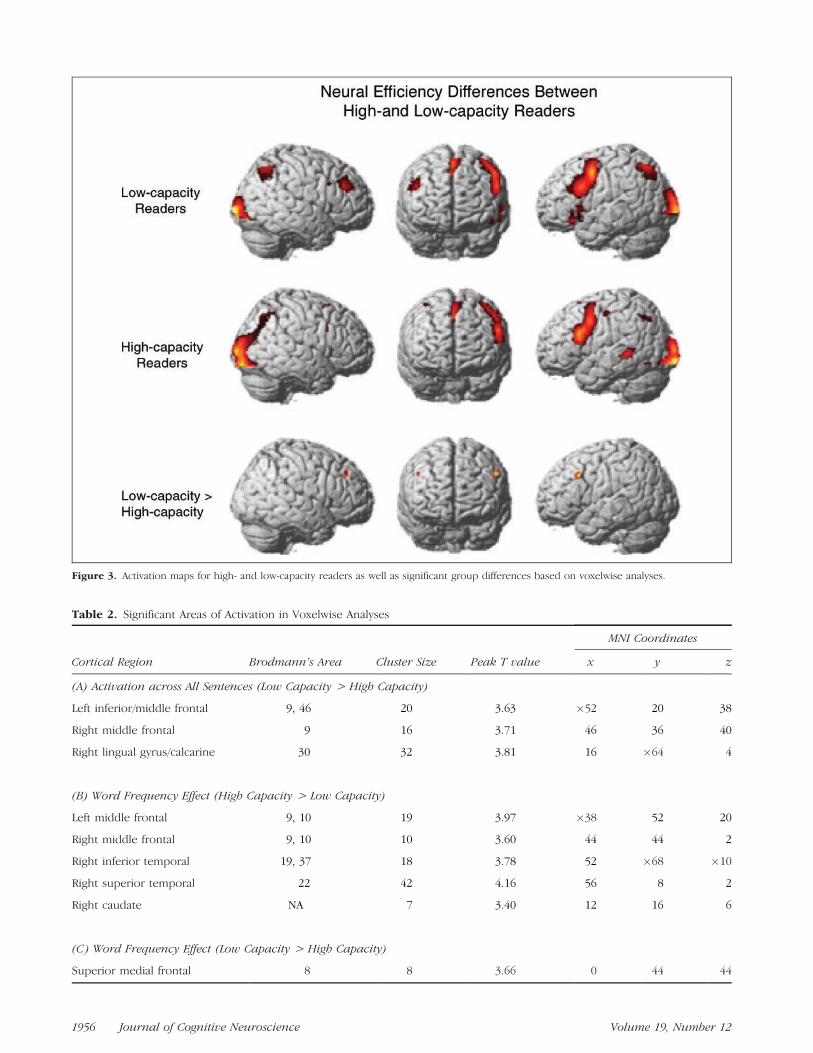
Table 2. Significant Areas of Activation in Voxelwise Analyses
MNI Coordinates
Cortical Region Brodmann’s Area Cluster Size Peak T value x y z
(A) Activation across All Sentences (Low Capacity > High Capacity)
Left inferior/middle frontal 9, 46 20 3.63 �52 20 38
Right middle frontal 9 16 3.71 46 36 40
Right lingual gyrus/calcarine 30 32 3.81 16 �64 4
(B) Word Frequency Effect (High Capacity > Low Capacity)
Left middle frontal 9, 10 19 3.97 �38 52 20
Right middle frontal 9, 10 10 3.60 44 44 2
Right inferior temporal 19, 37 18 3.78 52 �68 �10
Right superior temporal 22 42 4.16 56 8 2
Right caudate NA 7 3.40 12 16 6
(C) Word Frequency Effect (Low Capacity > High Capacity)
Superior medial frontal 8 8 3.66 0 44 44
Figure 3. Activation maps for high- and low-capacity readers as well as significant group differences based on voxelwise analyses.
1956 Journal of Cognitive Neuroscience Volume 19, Number 12

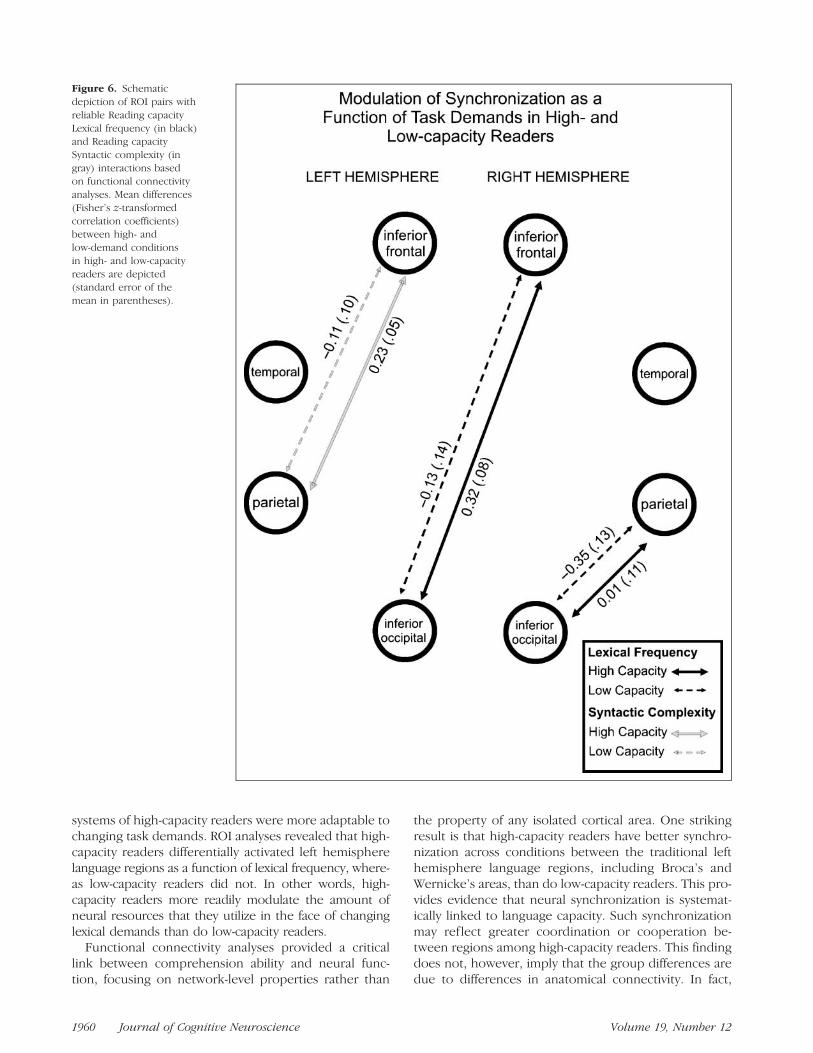
Functional connectivity analyses extended the evi-dence that high- and low-capacity readers were differ-entially sensitive to the lexical frequency manipulation.This Reading capacity � Lexical frequency interactionwas reliable for functional connectivity between rightinferior frontal and left inferior occipital regions [F(1,17) = 5.47, MSE = 0.23], and between right parietal andright inferior occipital regions [F(1, 30) = 4.57, MSE =0.26]. Reading capacity � Lexical frequency interactionsbetween left inferior frontal and left inferior occipital[F(1, 32) = 3.35, MSE = 0.16, p = .077] and between leftparietal and right inferior occipital [F(1, 33) = 4.05,MSE = 0.24, p = .052] approached significance. Follow-
up analyses between right inferior frontal and left infe-rior occipital regions revealed that high-capacity readersshowed significant increases in functional connectivitywith decreasing lexical frequency [F(1, 7) = 15.63,MSE = 0.17), whereas low-capacity readers showed noreliable effects of lexical frequency (F < 1). Follow-up an-alyses between right parietal and right inferior occipitalregions showed a slightly different pattern. High-capacityreaders did not show significant effects of lexical frequency(F < 1) between these regions; however, low-capacityreaders showed a significant decrease in functional con-nectivity as a function of decreasing lexical frequency[F(1, 15) = 7.39, MSE = 0.50]. Therefore, high-capacity
Figure 4. Reading capacity �Lexical frequency interaction
based on ROI analyses. Mean
number of voxels activatedin high- and low-capacity
readers as a function of lexical
frequency are depicted. Errorbars show the standard error
of the mean.
Prat, Keller, and Just 1957

readers were able to either increase or maintain syn-chronization as a function of decreasing lexical frequen-cy, whereas low-capacity readers either maintained ordecreased synchronization as a function of decreasinglexical frequency.
Functional connectivity analyses also provided evi-dence that high- and low-capacity readers were differ-entially sensitive to syntactic complexity, consistent withexisting behavioral results. This Reading capacity �Syntax interaction was reliable between left inferiorfrontal and parietal regions [F(1, 32) = 7.73, MSE =0.22] and approached significance between left temporaland left inferior occipital [F(1, 32) = 3.9, MSE = 0.19,p = .057] and between right inferior frontal and right tem-poral [F(1, 17) = 4.14, MSE = 0.06, p = .058] regions.Follow-up analyses revealed that high-capacity readersshowed significantly increased functional connectivity asa function of increased syntactic complexity [F(1, 16) =15.19, MSE = 0.20], whereas low-capacity readers did notshow modulations in functional connectivity as a func-
tion of syntactic complexity [F(1, 16) = 1.10, MSE =0.05, p > .30]. Therefore, as the syntactic processingdemand increased, high-capacity readers showed in-creased synchronization between cortical regions inthe language network, whereas low-capacity readersshowed no change in synchronization. Mean Fisher’sz-transformed correlation coefficients for ROI pairs thatshowed reliable interactions between reading capacityand lexical frequency or between reading capacity andsyntactic complexity are depicted as a function of read-ing capacity in Figure 6.
This experiment provided additional evidence thatfunctional connectivity changes in the face of differingtask demands. Across individuals, functional connectivitywas higher for active-conjoined sentences than for object-relative sentences, resulting in a reliable main effect ofsyntactic complexity across most of the ROI pairs tested.Synchronization between left parietal and bilateral tempo-ral regions was also higher for high-frequency words thanfor low-frequency words, resulting in a reliable main effect
Table 3. Mean Number of Voxels Activated for High- and Low-capacity Readers in the Four Sentence Types (Standard Errorsof the Mean Appear in Parentheses)
ROI
High-capacity Readers
Active Object Relative
High Frequency Low Frequency High Frequency Low Frequency
Left inferior frontal 199 (44) 331 (75) 308 (45) 453 (79)
Left temporal 264 (96) 401 (112) 373 (124) 509 (124)
Left parietal 288 (60) 332 (67) 307 (52) 457 (80)
Left inferior occipital 842 (138) 1003 (124) 834 (119) 980 (150)
Right inferior frontal 60 (31) 114 (59) 66 (24) 109 (48)
Right temporal 8 (5) 27 (24) 10 (6) 23 (20)
Right parietal 206 (64) 214 (75) 152 (51) 237 (70)
Right inferior occipital 725 (93) 831 (112) 691 (89) 804 (114)
Low-capacity Readers
Active Object Relative
High Frequency Low Frequency High Frequency Low Frequency
Left inferior frontal 351 (84) 351 (62) 446 (73) 377 (70)
Left temporal 311 (72) 354 (67) 452 (94) 376 (84)
Left parietal 395 (70) 412 (50) 468 (72) 525 (94)
Left inferior occipital 1181 (143) 1105 (146) 1149 (146) 1050 (138)
Right inferior frontal 36 (20) 80 (35) 55 (32) 49 (22)
Right temporal 45 (38) 54 (49) 75 (65) 52 (50)
Right parietal 215 (47) 241 (49) 219 (48) 245 (56)
Right inferior occipital 1051 (128) 928 (92) 964 (104) 999 (101)
1958 Journal of Cognitive Neuroscience Volume 19, Number 12

of lexical frequency. In addition, Syntactic complexity �Lexical frequency interactions were observed throughoutmany of the ROI pairs tested. In the high-frequency con-ditions, functional connectivity tended to be highest foractive sentences; however, in the low-frequency con-ditions, functional connectivity was highest for object-relative sentences. This interaction was significant forfunctional connectivity between a number of ROI pairs,primarily those involving left parietal and inferior occipitalregions. Reliable F statistics are reported in Table 4.
DISCUSSION
The results of this study suggest that individual differ-ences in reading ability are characterized by multipledimensions of brain function. These findings are consis-
tent with previous research suggesting that skilled per-formance is associated with more efficient neural systems.Across conditions, high-capacity readers showed lowerlevels of activation than did low-capacity readers, espe-cially in the bilateral middle frontal gyri and right lingualgyrus. This suggests that high-capacity readers did notdraw as heavily upon frontal planning/strategic networksand occipital word recognition areas as low-capacity read-ers did. Although they utilized fewer neural resources,high-capacity readers were faster and more accurate dur-ing the sentence comprehension task. Thus, the evidencesuggests that high-capacity readers’ processing was moreefficient (used fewer resources) overall than was low-capacity readers’.
In addition, this study extends previous research byexploring individual differences in neural adaptability.The results of this investigation suggest that the neural
Figure 5. Schematic
depiction of ROI pairs with
reliable main effects of reading
capacity based on functionalconnectivity analyses. Mean
functional connectivities
(Fisher’s z-transformedcorrelation coefficients) in
high- and low-capacity readers
are depicted (standard error
of the mean in parentheses).
Prat, Keller, and Just 1959
systems of high-capacity readers were more adaptable tochanging task demands. ROI analyses revealed that high-capacity readers differentially activated left hemispherelanguage regions as a function of lexical frequency, where-as low-capacity readers did not. In other words, high-capacity readers more readily modulate the amount ofneural resources that they utilize in the face of changinglexical demands than do low-capacity readers.
Functional connectivity analyses provided a criticallink between comprehension ability and neural func-tion, focusing on network-level properties rather than
the property of any isolated cortical area. One strikingresult is that high-capacity readers have better synchro-nization across conditions between the traditional lefthemisphere language regions, including Broca’s andWernicke’s areas, than do low-capacity readers. This pro-vides evidence that neural synchronization is systemat-ically linked to language capacity. Such synchronizationmay reflect greater coordination or cooperation be-tween regions among high-capacity readers. This findingdoes not, however, imply that the group differences aredue to differences in anatomical connectivity. In fact,
Figure 6. Schematic
depiction of ROI pairs with
reliable Reading capacity �Lexical frequency (in black)and Reading capacity �Syntactic complexity (in
gray) interactions basedon functional connectivity
analyses. Mean differences
(Fisher’s z-transformed
correlation coefficients)between high- and
low-demand conditions
in high- and low-capacity
readers are depicted(standard error of the
mean in parentheses).
1960 Journal of Cognitive Neuroscience Volume 19, Number 12

important interactions between reading capacity andboth lexical and syntactic demands were observed, sug-gesting that group differences in functional connectivityare not completely explained by static differences in anat-omical connectivity. As demand of any type increased,the neural networks of high-capacity readers were ableto either maintain or increase synchronization. In con-trast, the neural networks of low-capacity readers eitherremained constant or became less functionally coordi-nated as demands increased.
We interpret the relative differences found in func-tional connectivity as suggestive of differences in inter-regional communication, coordination, or cooperation.We note, however, that the operational definition offunctional connectivity used in the current study is onlyone of many that have been used in the rapidly expand-ing literature (see Horwitz, 2003, for a review), and thatbecause functional connectivity is a description of thecorrelation in the temporal dynamics of activation be-tween regions, other interpretations of the linkage toreading capacity are possible. For example, the lefthemisphere language areas of high-capacity readersmight respond more similarly to a common linguisticinput than those of low-capacity readers, and such adifference could drive the correlation between the ac-tivation time series in the absence of direct communica-tion between the regions. However, the known anatomicalconnections among left hemisphere language areas andthe necessity for integration of information computed indifferent regions for sentence comprehension make suchinterpretations less plausible. Future individual differencesinvestigations using analysis techniques that examine effec-tive connectivity (defined as the influence one region hason another; Friston, 1994), such as structural equationmodeling (McIntosh & Gonzalez-Lima, 1994) or dynamiccausal modeling (Friston, Harrison, & Penny, 2003), mayprovide additional insight into the causal mechanisms be-hind the differences in functional connectivity found here.
In this experiment, reading capacity was not onlycharacterized by baseline differences in neural efficiencyand synchronization. Rather, neural adaptability, as dis-cussed above, may necessarily involve synchronizationin order to function optimally. We propose that optimalcognitive functioning may require recruitment AND syn-chronization of brain regions in the face of increasingtask demands. This combination of adaptability and syn-chronization appears to be a hallmark of comprehen-sion skill. Consequently, this study illustrates the utilityof functional connectivity as a potential tool for indexingindividual differences in task proficiency. Moreover, itillustrates that individual differences need not be local-ized to a particular node in the cortical network, but tothe nature of the co-functioning of two or more nodes.
The individual differences measure used in this exper-iment, reading span, is a measure of verbal working mem-ory capacity. Reading span scores are reliably highlycorrelated both with specific linguistic skills (e.g., making
Table 4. ANOVA Statistics for Significant FunctionalConnectivity Analyses, by ROI
ROI Pair df F MSE
(1) Main Effect of Syntax
Left inferior occipital–Left parietal 1, 33 17.41 0.62
Left inferior occipital–Right inferior occipital 1, 33 24.65 0.63
Left inferior occipital–Right parietal 1, 30 24.14 0.53
Left parietal–Right inferior occipital 1, 33 17.77 0.51
Left parietal–Right parietal 1, 30 16.94 0.30
Left temporal–Right inferior occipital 1, 32 13.17 0.43
Left temporal–Right parietal 1, 29 6.28 0.23
Left temporal–Right temporal 1, 10 8.77 0.29
Right inferior occipital–Right parietal 1, 30 16.22 0.51
Right inferior occipital–Right temporal 1, 10 6.02 0.20
Right parietal–Right inferior frontal 1, 9 7.37 0.16
(2) Main Effect of Lexical Frequency
Left temporal–Left parietal 1, 32 5.17 0.24
Right temporal–Left parietal 1, 10 9.87 0.16
(3) Frequency � Syntax Interactions
Left inferior occipital–Left parietal 1, 33 33.84 1.19
Left inferior occipital–Left temporal 1, 32 21.22 1.04
Left inferior occipital–Left inferior frontal 1, 32 7.77 0.33
Left inferior occipital–Right inferioroccipital
1, 33 28.11 0.50
Left inferior occipital–Right parietal 1, 30 21.23 0.50
Left inferior occipital–Right inferior frontal 1, 17 16.81 0.65
Left parietal–Right inferior occipital 1, 33 22.99 0.84
Left parietal–Right parietal 1, 30 10.63 0.23
Left parietal–Right inferior frontal 1, 17 4.93 0.17
Left temporal–Right inferior occipital 1, 32 13.62 0.71
Left temporal–Right parietal 1, 29 5.98 0.23
Left temporal–Right temporal 1, 10 5.53 0.23
Left inferior frontal–Right inferior occipital 1, 32 6.10 0.25
Left inferior frontal–Right temporal 1, 29 9.32 0.22
Left inferior frontal–Right inferior frontal 1, 10 6.22 0.09
Right inferior occipital–Right Parietal 1, 30 21.65 0.44
Right parietal–Right temporal 1, 17 14.34 0.52
Right temporal–Right inferior frontal 1, 17 12.18 0.33
Prat, Keller, and Just 1961

inferences, detecting ambiguity) and with more general-ized tests of reading comprehension ability (e.g., VerbalScholastic Aptitude Test, Nelson–Denny Reading Test)across a variety of experiments (see Daneman & Merikle,1996, for a meta-analysis). Working memory measures, ingeneral, correlate quite well with measures of reasoningability (Kyllonen & Christal, 1990) and general fluidintelligence (Engle, Tuholski, Laughlin, & Conway, 1999),even when crystallized intelligence is controlled for(Buehner, Krumm, Ziegler, & Pluecken, 2006). Therefore,our characterization of skilled neural systems in individ-uals with high working memory capacity may ultimatelybe generalizeable to individual differences in reading abil-ity and general intelligence measures.
This experiment represents the first attempt at char-acterizing the individual differences inherent in skilledneural systems. Previous neuroimaging investigations ofindividual differences have focused primarily on neuralefficiency of specific brain regions. We argue that anaccurate characterization of the neural basis of individualdifferences in cognition must include system-level de-scriptions. Given the complexities inherent in brainfunctioning and the multiple dimensions in which anyindividual may be skilled, it is not surprising that nosingle neural variable can explain the observed behaviordifferences in sentence comprehension.
Acknowledgments
This research was supported by the National Institute of Men-tal Health Grant no. MH029617 and by the National Institutesof Health Grant no. T32 MH19102.
Reprint requests should be sent to Chantel S. Prat, Center forCognitive Brain Imaging, Carnegie Mellon University, Pittsburgh,PA 15213-3890, or via e-mail: [email protected].
Notes
1. Because there were proportionately more men in the low-capacity group than in the high-capacity group, analyses ofneural activation and synchronization were conducted usinggender as a covariate. SPM analysis of brain activation revealedthe same reading capacity effects reported in the manuscriptwhen controlling for sex, although at a reduced significancelevel ( p = .003), presumably due to the large amount ofshared variance between sex and reading capacity in this sub-ject pool. Effects of sex were also observed (men > women inthe supplementary motor area; women > men in the bilateralsuperior temporal area), but did not overlap with the readingcapacity results reported in this manuscript. There were nomain effects of gender on region-of-interest (ROI)-based analy-ses of activation or neural synchronization.2. Because the duration of trials was dependent on the par-ticipant’s reaction time, our original data analysis excludedimages from the ends of longer-duration trials in order toequate the number of images used for calculating the func-tional connectivity across conditions and participants. It wasnoted, however, that low-capacity readers may be particularlyaffected by the truncation process, as their reading times werereliably longer, on average, than were high-capacity readers. Ata reviewer’s request, we conducted an additional analysis on
the complete dataset. Our results were remarkably similar inthe two analyses, with main effects of group reaching signif-icance in the complete dataset and approaching significancein the truncated dataset. Only the analysis of the complete,untruncated dataset is reported in this manuscript.
REFERENCES
Bell, L. C., & Perfetti, C. A. (1994). Reading skill: Some adultcomparisons. Journal of Educational Psychology, 86,244–255.
Boivin, M. J., Giordani, B., Berent, S., Amato, D. A., Lehtinen,S., Koepp, R. A., et al. (1992). Verbal f luency and positronemission tomographic mapping of regional cerebral glucosemetabolism. Cortex, 28, 231–239.
Buchel, C., Coull, J. T., & Friston, K. (1999). The predictivevalue of changes in effective connectivity for humanlearning. Science, 283, 1538–1541.
Buehner, M., Krumm, S., Ziegler, M., & Pluecken, T. (2006).Cognitive abilities and their interplay: Reasoning, crystallizedintelligence, working memory components, and sustainedattention. Journal of Individual Differences, 27, 57–72.
Caplan, D., & Alpert, N. (1998). Effects of syntactic structureand propositional number on patterns of regional cerebralblood flow. Journal of Cognitive Neuroscience, 10, 541–553.
Daneman, M., & Carpenter, P. A. (1980). Individual differencesin working memory and reading. Journal of VerbalLearning and Verbal Behavior, 19, 450–466.
Daneman, M., & Merikle, P. M. (1996). Working memory andlanguage comprehension: A meta-analysis. PsychonomicBulletin & Review, 3, 422–433.
Diwadkar, V. A., Carpenter, P. A., & Just, M. A. (2000).Collaborative activity between parietal and dorso-lateralprefrontal cortex in dynamic spatial working memoryrevealed by fMRI. Neuroimage, 12, 85–99.
Engle, R. W., Tuholski, S. W., Laughlin, J. E., & Conway, A. R. A.(1999). Working memory, short-term memory, and generalf luid intelligence: A latent variable approach. Journal ofExperimental Psychology: General, 128, 309–331.
Friston, K. J. (1994). Functional and effective connectivity inneuroimaging: A synthesis. Human Brain Mapping, 2, 56–78.
Friston, K. J., Harrison, L., & Penny, W. D. (2003). Dynamiccausal modeling. Neuroimage, 19, 1273–1302.
Friston, K. J., Holmes, A. P., Worsley, K. J., Poline, J., Frith,C. D., & Frackowiak, R. S. J. (1995). Statistical parametricmaps in functional imaging: A general linear approach.Human Brain Mapping, 2, 189–210.
Haier, R. J., Siegel, B. V., Nuechterlein, K. H., Hazlett, E., Wu,J. C., Paek, J., et al. (1988). Cortical glucose metabolic ratecorrelates of abstract reasoning and attention studied withpositron emission tomography. Intelligence, 12, 199–217.
Horowitz, B. (2003). The elusive concept of brain connectivity.Neuroimage, 19, 466–470.
Just, M. A., & Carpenter, P. A. (1992). A capacity theory ofcomprehension: Individual differences in working memory.Psychological Review, 99, 122–149.
Just, M. A., Carpenter, P. A., Keller, T. A., Eddy, W. F., &Thulborn, K. R. (1996). Brain activation modulated bysentence comprehension. Science, 274, 114–116.
Keller, T. A., Carpenter, P. A., & Just, M. A. (2001). The neuralbases of sentence comprehension: A fMRI examination ofsyntactic and lexical processing. Cerebral Cortex, 11,223–237.
Kucera, H, & Francis, W. N. (1967). Computational analysisof present-day American English. Providence, RI: BrownUniversity Press.
1962 Journal of Cognitive Neuroscience Volume 19, Number 12

Kyllonen, P. C., & Christal, R. E. (1990). Reasoning ability is(little more than) working memory capacity?! Intelligence,14, 389–433.
Larson, G. E., Haier, R. J., LaCasse, L., & Hazen, K. (1995).Evaluation of a ‘‘mental effort’’ hypothesis for correlationsbetween cortical metabolism and intelligence. Intelligence,21, 267–278.
Maxwell, A. E., Fenwick, P. B. C., Fenton, G. W., & Dollimore,J. (1974). Reading ability and brain function: A simplestatistical model. Psychological Medicine, 4, 274–280.
McIntosh, A. R., & Gonzalez-Lima, F. (1994). Structuralequation modeling and its application to network analysisin functional brain imaging. Human Brain Mapping, 2,2–22.
Neubauer, A. C., Grabner, R. H., Freudenthaler, H. H.,Beckmann, J. F., & Guthke, J. (2004). Intelligence andindividual differences in becoming neurally efficient. ActaPsychologica, 116, 55–74.
Newman, S., & Just, M. A. (2005). The neural bases ofintelligence: A perspective based on functionalneuroimaging. In R. J. Sternberg & J. Pretz (Eds.), Cognition
and intelligence: Identifying the mechanisms of the mind(pp. 88–103). New York: Cambridge University Press.
Newman, S. D., Carpenter, P. A., Varma, S., & Just, M. A. (2003).Frontal and parietal participation in problem solving in theTower of London: fMRI and computational modeling ofplanning and high-level perception. Neuropsychologia, 41,1668–1682.
Oldfield, R. C. (1971). The assessment of analysis of handedness:The Edinburgh inventory. Neuropsychologia, 9, 97–113.
Otsuka, Y., & Osaka, N. (2005). An fMRI study of verbalworking memory: Effects of aging on ACC–PFC networkconnectivity. Japanese Journal of Physiological Psychologyand Psychophysiology, 23, 11–18.
Reichle, E. D., Carpenter, P. A., & Just, M. A. (2000). The neuralbasis of strategy and skill in sentence picture verification.Cognitive Psychology, 40, 261–295.
Tzourio-Mazoyer, N., Landeau, B., Papathanassiou, D., Crivello,F., Etard, O., Delcroix, N., et al. (2002). Automatedanatomical labeling of activations in SPM using amacroscopic anatomical parcellation of the MNI MRIsingle-subject brain. Neuroimage, 15, 273–289.
Prat, Keller, and Just 1963