Interpreting the complex line profiles in the stellar spectra
8
Interpreting the complex line profiles in the stellar spectra E. Danezis a, * , E. Lyratzi a,b , L.C ˇ . Popovic ´ c , M.S. Dimitrijevic ´ c,d , A. Antoniou a a University of Athens, Faculty of Physics, Department of Astrophysics, Astronomy and Mechanics, Panepistimioupoli, Zographou 157 84, Athens, Greece b Eugenides Foundation, Syngrou 387, 175 64 P. Faliro, Greece c Astronomical Observatory, Volgina 7, 11060 Belgrade, Serbia d Observatoire de Paris, 92195 Meudon Cedex, France article info Article history: Available online xxxx Keywords: Hot emission stars Active galactic nuclei Satellite absorption components Discrete absorption components abstract In this review we present our recent investigation of the complex absorption lines in spectra of hot emis- sion stars. The lines are created in a material ejected from stars (here we call it density regions around the objects). Particularly we present a model (GR model) which is developed to study satellite or discrete absorption components (SACs or DACs). Using the model we are able to extract kinematical parameters (rotational, radial and random velocity) and some physical parameters (full width at half maximum, opti- cal depth in the center of the line, column density and absorbed or emitted energy) of the density regions. Ó 2009 Elsevier B.V. All rights reserved. 1. Introduction The definition of hot emission stars is that they present emis- sion lines of the Balmer series, which, superposed with the respec- tive absorption lines, construct PCygni profiles. Besides that, they may also present PCygni profiles in the UV region (such as in the case of the resonance lines of Si IV, C IV, N V, Mg II, and the N IV spectral line) and IR excess in their spectra. Additionally, another characteristic of hot emission stars, which also distinguish them from the classical hot stars, is the violent mass ejection, like flares, from active regions. Specifically, hot emission stars are rapid rota- tors and when the rotational velocity takes a critical value, the star ejects plasma violently from a zone around the equator (Underhill and Doazan, 1982, Part II, Chapter 10). The ejected plasma maybe evolves to a thin spherical shell around the star (Meilland et al., 2006). Some times we have repeated ejection of mater (Danezis, 1984). This means that we can detect not one, but many successive thin and independent spherical shells around the star. These spher- ical shells rotate rapidly because they lie near the rapidly rotating star and they are the origin of the very broad spectral lines that present rotational velocities with values about the critical. The mass ejection may last for quite long time and results to the fact that near the stars the ejected plasma could form spiral streams due to turbulence and the stellar rotation. These structures form density regions such as shells, blobs or puffs (Underhill, 1975; Hen- richs, 1984; Underhill and Fahey, 1984; Bates and Halliwell, 1986; Grady et al., 1987; Lamers et al., 1988; Waldron et al., 1992; Waldron et al., 1994; Cranmer and Owocki, 1996; Rivinius et al., 1997; Kaper et al., 1996; Kaper et al., 1997; Markova, 2000). These spherical blobs, arising from spiral streams or turbulences, are the origin of a group of satellite spectral lines with intermediate or low broadening. The thin spherical shells evolve to an equatorial disk (Meilland et al., 2006) that far away from the star becomes a clas- sical stellar wind. As a result, the material that comes from the star, has not the form of a classical stellar wind near the star. Conse- quently, the stellar wind models may be used for the outer regions of the equatorial disk, but not for the inner layers. Additionally, near hot emission stars we can detect density re- gions that have the characteristics of chromospheres, corona and post-coronal regions (Franco and Stalio, 1983, Part II, Chapter 13; Franco et al., 1983; Underhill and Doazan, 1982). Besides, we de- tect the corona of hot emission stars in X-rays and in UV we detect the post-coronal regions (Si IV, C IV, N IV, N V lines etc.). Investiga- tions of line profiles of UV lines, can give us more information about these regions, as e.g. the velocity of outflow, rotation of sub-regions, etc. Here, we give an overview of our recent investigations of com- plex UV lines in hot emission stars. We study the density regions which are formed due to violent mass ejection from the star, lie near the star and cannot be considered as regions of a classical stel- lar wind. These density regions are the ones that create the ob- served complex profiles of the spectral lines. This paper is organized as follows: In Section 2 we discuss observational facts and problems connected with peculiar and complex spectral line profiles of hot emission stars; in Section 3 we describe GR model, in Section 4 we give some results of our recent investigation and in Section 5 we outline our conclusions. 1387-6473/$ - see front matter Ó 2009 Elsevier B.V. All rights reserved. doi:10.1016/j.newar.2009.07.004 * Corresponding author. Tel.: +30 210 7276792. E-mail addresses: [email protected] (E. Danezis), [email protected] (E. Lyratzi), [email protected] (L.C ˇ . Popovic ´), [email protected] (M.S. Dimitrijevic ´), [email protected] (A. Antoniou). New Astronomy Reviews xxx (2009) xxx–xxx Contents lists available at ScienceDirect New Astronomy Reviews journal homepage: www.elsevier.com/locate/newastrev ARTICLE IN PRESS Please cite this article in press as: Danezis, E., et al. Interpreting the complex line profiles in the stellar spectra. New Astron. Rev. (2009), doi:10.1016/ j.newar.2009.07.004
Transcript of Interpreting the complex line profiles in the stellar spectra

New Astronomy Reviews xxx (2009) xxx–xxx
ARTICLE IN PRESS
Contents lists available at ScienceDirect
New Astronomy Reviews
journal homepage: www.elsevier .com/locate /newastrev
Interpreting the complex line profiles in the stellar spectra
E. Danezis a,*, E. Lyratzi a,b, L.C. Popovic c, M.S. Dimitrijevic c,d, A. Antoniou a
a University of Athens, Faculty of Physics, Department of Astrophysics, Astronomy and Mechanics, Panepistimioupoli, Zographou 157 84, Athens, Greeceb Eugenides Foundation, Syngrou 387, 175 64 P. Faliro, Greecec Astronomical Observatory, Volgina 7, 11060 Belgrade, Serbiad Observatoire de Paris, 92195 Meudon Cedex, France
a r t i c l e i n f o a b s t r a c t
Article history:Available online xxxx
Keywords:Hot emission starsActive galactic nucleiSatellite absorption componentsDiscrete absorption components
1387-6473/$ - see front matter � 2009 Elsevier B.V. Adoi:10.1016/j.newar.2009.07.004
* Corresponding author. Tel.: +30 210 7276792.E-mail addresses: [email protected] (E. Dane
Lyratzi), [email protected] (L.C. Popovic), mdimDimitrijevic), [email protected] (A. Antoniou).
Please cite this article in press as: Danezis, E.,j.newar.2009.07.004
In this review we present our recent investigation of the complex absorption lines in spectra of hot emis-sion stars. The lines are created in a material ejected from stars (here we call it density regions around theobjects). Particularly we present a model (GR model) which is developed to study satellite or discreteabsorption components (SACs or DACs). Using the model we are able to extract kinematical parameters(rotational, radial and random velocity) and some physical parameters (full width at half maximum, opti-cal depth in the center of the line, column density and absorbed or emitted energy) of the density regions.
� 2009 Elsevier B.V. All rights reserved.
1. Introduction Grady et al., 1987; Lamers et al., 1988; Waldron et al., 1992;
The definition of hot emission stars is that they present emis-sion lines of the Balmer series, which, superposed with the respec-tive absorption lines, construct PCygni profiles. Besides that, theymay also present PCygni profiles in the UV region (such as in thecase of the resonance lines of Si IV, C IV, N V, Mg II, and the N IVspectral line) and IR excess in their spectra. Additionally, anothercharacteristic of hot emission stars, which also distinguish themfrom the classical hot stars, is the violent mass ejection, like flares,from active regions. Specifically, hot emission stars are rapid rota-tors and when the rotational velocity takes a critical value, the starejects plasma violently from a zone around the equator (Underhilland Doazan, 1982, Part II, Chapter 10). The ejected plasma maybeevolves to a thin spherical shell around the star (Meilland et al.,2006). Some times we have repeated ejection of mater (Danezis,1984). This means that we can detect not one, but many successivethin and independent spherical shells around the star. These spher-ical shells rotate rapidly because they lie near the rapidly rotatingstar and they are the origin of the very broad spectral lines thatpresent rotational velocities with values about the critical. Themass ejection may last for quite long time and results to the factthat near the stars the ejected plasma could form spiral streamsdue to turbulence and the stellar rotation. These structures formdensity regions such as shells, blobs or puffs (Underhill, 1975; Hen-richs, 1984; Underhill and Fahey, 1984; Bates and Halliwell, 1986;
ll rights reserved.
zis), [email protected] ([email protected] (M.S.
et al. Interpreting the complex
Waldron et al., 1994; Cranmer and Owocki, 1996; Rivinius et al.,1997; Kaper et al., 1996; Kaper et al., 1997; Markova, 2000). Thesespherical blobs, arising from spiral streams or turbulences, are theorigin of a group of satellite spectral lines with intermediate or lowbroadening. The thin spherical shells evolve to an equatorial disk(Meilland et al., 2006) that far away from the star becomes a clas-sical stellar wind. As a result, the material that comes from the star,has not the form of a classical stellar wind near the star. Conse-quently, the stellar wind models may be used for the outer regionsof the equatorial disk, but not for the inner layers.
Additionally, near hot emission stars we can detect density re-gions that have the characteristics of chromospheres, corona andpost-coronal regions (Franco and Stalio, 1983, Part II, Chapter 13;Franco et al., 1983; Underhill and Doazan, 1982). Besides, we de-tect the corona of hot emission stars in X-rays and in UV we detectthe post-coronal regions (Si IV, C IV, N IV, N V lines etc.). Investiga-tions of line profiles of UV lines, can give us more informationabout these regions, as e.g. the velocity of outflow, rotation ofsub-regions, etc.
Here, we give an overview of our recent investigations of com-plex UV lines in hot emission stars. We study the density regionswhich are formed due to violent mass ejection from the star, lienear the star and cannot be considered as regions of a classical stel-lar wind. These density regions are the ones that create the ob-served complex profiles of the spectral lines.
This paper is organized as follows: In Section 2 we discussobservational facts and problems connected with peculiar andcomplex spectral line profiles of hot emission stars; in Section 3we describe GR model, in Section 4 we give some results of ourrecent investigation and in Section 5 we outline our conclusions.
line profiles in the stellar spectra. New Astron. Rev. (2009), doi:10.1016/

2 E. Danezis et al. / New Astronomy Reviews xxx (2009) xxx–xxx
ARTICLE IN PRESS
2. Peculiar and complex spectral line profiles – observationsand problems
Almost all the stars of the same spectral type and luminosityclass present the same absorption lines in their spectra. However,in the UV spectral region, some hot emission stars (Oe and Be stars)present some absorption components that should not appear intheir spectra, according to the classical physical theory (Fig. 1).
In the case of hot emission stars we call the absorption spectrallines, not corresponding to any known absorption line of the samespectral type stars, discrete absorption components (DACs) (Batesand Halliwell, 1986).
However, DACs are not unknown absorption spectral lines, butspectral lines of the same ion and the same wavelength as a mainspectral line, shifted at different Dk, as they are created in differentdensity regions which rotate and move radially with differentvelocities (Danezis, 1984; Danezis, 1987; Danezis et al., 1991;Danezis et al., 2003; Lyratzi and Danezis, 2004).
Fig. 1. Comparison of Mg II resonance lines between the spectrum of a normal Bstar and the spectrum of an active Be star that presents complex and peculiarspectral lines. As we can observe the Be star presents some absorption componentsthat do not appear in the spectrum of the classical B star.
Fig. 2. DACs arise from (a) the thin spherical envelope around hot emission sta
Please cite this article in press as: Danezis, E., et al. Interpreting the complexj.newar.2009.07.004
The origin of DACs is an important problem that has been stud-ied by many researchers. Some of them have suggested mecha-nisms that allow the existence of structures which cover all or asignificant part of the stellar disk, such as shells, blobs or puffs(Underhill, 1975; Henrichs, 1984; Underhill and Fahey, 1984; Batesand Halliwell, 1986; Grady et al., 1987; Lamers et al., 1988; Wal-dron et al., 1992; Waldron et al., 1994; Cranmer and Owocki,1996; Rivinius et al., 1997; Kaper et al., 1996; Kaper et al., 1997;Markova, 2000), interaction of fast and slow wind components,co-rotation interaction regions (CIRs), structures due to magneticfields or spiral streams as a result of the stellar rotation (Underhilland Fahey, 1984; Cranmer and Owocki, 1996; Kaper et al., 1996;Kaper et al., 1997; Kaper et al., 1999; Mullan, 1984a,b; Mullan,1986; Prinja and Howarth, 1988; Fullerton et al., 1997; Cranmeret al., 2000). According to these ideas, DACs result from indepen-dent high density regions in the stellar environment, which havedifferent rotational and radial velocities.
Our proposition is that since hot emission stars are surroundedby thin spherical envelopes which evolve to a disk in the equatorialplane, the density regions which create the observed DACs in thestellar spectra may be either the thin spherical shells around thestar or apparent spherical density regions that lie in the discaround the star (Fig. 2).
Another problem of this group of hot emission stars is the pres-ence of very complex profile of the spectral lines that we cannotproduce theoretically. This means that we could not know thephysical conditions that exist in the high density regions that con-struct these spectral lines. In order to explain this complex lineprofile our scientific group proposed the SACs phenomenon (satel-lite absorption components). If the regions that construct the DACsrotate with large velocities and move radially with small velocities,the produced lines have large widths and small shifts. As a result,they are blended among themselves as well as with the main spec-tral line and thus they are not discrete. In such a case the name dis-crete absorption components is inappropriate and we use thename: satellite absorption components (SACs) (Danezis, 1984;Danezis, 1987; Lyratzi and Danezis, 2004; Danezis et al., 2006; Sah-ade et al., 1984; Sahade and Brandi, 1985). The existence of SACsresults to the formation of the complex structure of the observedspectral feature.
As we can deduce from the above, the DACs and SACs are twoaspects of the same phenomenon. In Fig. 3 it is clear that the MgII line profiles of the star AX Mon (HD 45910), which presents DACsand the star HD 41335, which presents SACs are produced in thesame way. The only difference between them is that the compo-nents of HD 41335 are much less shifted and thus they are blendedamong themselves.
Similar phenomena can also be detected as an effect of theejected plasma around peculiar stars. Around the Wolf-Rayet star
rs or (b) (apparent) spherical density regions in the disc around the stars.
line profiles in the stellar spectra. New Astron. Rev. (2009), doi:10.1016/

E. Danezis et al. / New Astronomy Reviews xxx (2009) xxx–xxx 3
ARTICLE IN PRESS
WR 104 we can detect density regions of matter, quite away fromthe stellar object, able to produce peculiar profiles (Fig. 4).
It is very important to point out that we can detect the samephenomenon in the spectra of some active galactic nuclei (AGN).In Fig. 5 (down) we can see the C IV UV doublet of an AGN (PG
Fig. 3. DACs of the Mg II line profiles of the star AX Mon (HD 45910) and SACs of thestar HD 41335 are produced in the same way. The black line presents the observedspectral line’s profile and the grey one the model’s fit. All the components whichcontribute to the observed features are shown separately.
Fig. 4. Density regions of matter, able to produce peculiar profiles can be detectedaround the Wolf-Rayet star WR 104. (This figure is taken from (Tuthill et al., 1999)).
Fig. 5. DACs phenomena in AGNs spectra: similarity of DACs phenomenon in Bestar’s HD 45910 spectrum (Mg II doublet) with AGNs PG 0946+301spectrum (C IVdoublet).
Please cite this article in press as: Danezis, E., et al. Interpreting the complex line profiles in the stellar spectra. New Astron. Rev. (2009), doi:10.1016/j.newar.2009.07.004
4 E. Danezis et al. / New Astronomy Reviews xxx (2009) xxx–xxx
ARTICLE IN PRESS
0946+301). The values of radial displacements and the ratio of theline intensities indicate that the two observed C IV shapes presentDACs phenomenon similar with the DACs phenomenon that we de-tect in the spectra of hot emission stars (HD 45910, up).
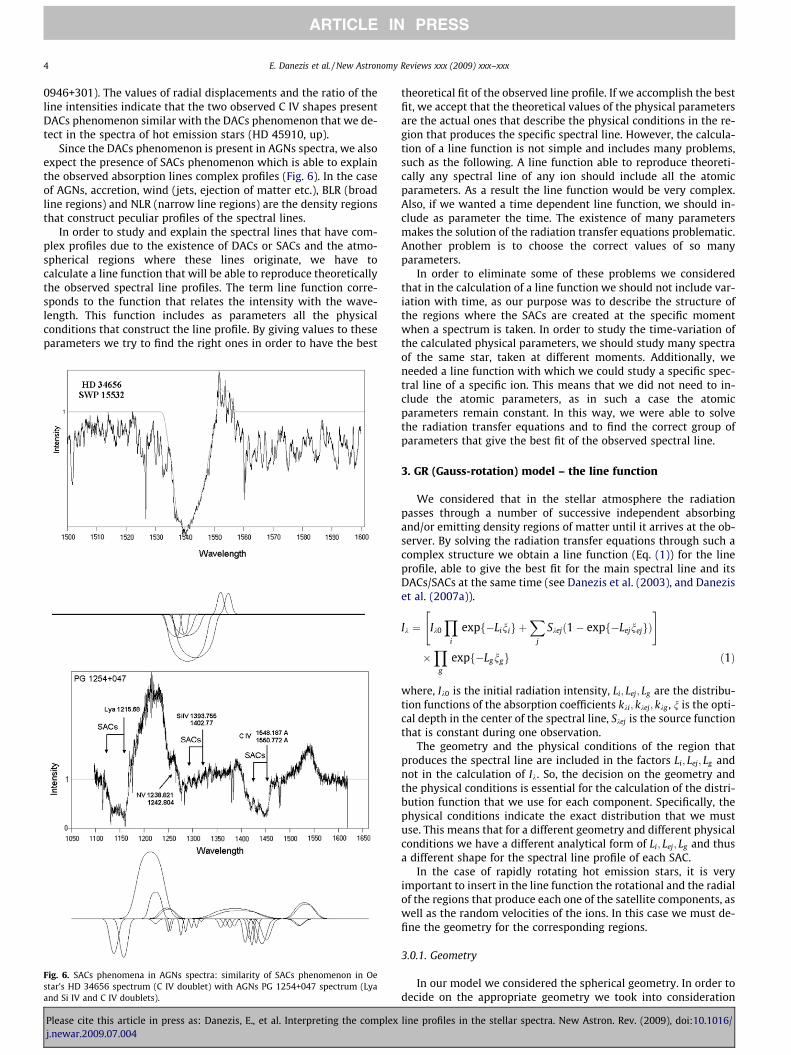
Since the DACs phenomenon is present in AGNs spectra, we alsoexpect the presence of SACs phenomenon which is able to explainthe observed absorption lines complex profiles (Fig. 6). In the caseof AGNs, accretion, wind (jets, ejection of matter etc.), BLR (broadline regions) and NLR (narrow line regions) are the density regionsthat construct peculiar profiles of the spectral lines.
In order to study and explain the spectral lines that have com-plex profiles due to the existence of DACs or SACs and the atmo-spherical regions where these lines originate, we have tocalculate a line function that will be able to reproduce theoreticallythe observed spectral line profiles. The term line function corre-sponds to the function that relates the intensity with the wave-length. This function includes as parameters all the physicalconditions that construct the line profile. By giving values to theseparameters we try to find the right ones in order to have the best
Fig. 6. SACs phenomena in AGNs spectra: similarity of SACs phenomenon in Oestar’s HD 34656 spectrum (C IV doublet) with AGNs PG 1254+047 spectrum (Lyaand Si IV and C IV doublets).
Please cite this article in press as: Danezis, E., et al. Interpreting the complexj.newar.2009.07.004
theoretical fit of the observed line profile. If we accomplish the bestfit, we accept that the theoretical values of the physical parametersare the actual ones that describe the physical conditions in the re-gion that produces the specific spectral line. However, the calcula-tion of a line function is not simple and includes many problems,such as the following. A line function able to reproduce theoreti-cally any spectral line of any ion should include all the atomicparameters. As a result the line function would be very complex.Also, if we wanted a time dependent line function, we should in-clude as parameter the time. The existence of many parametersmakes the solution of the radiation transfer equations problematic.Another problem is to choose the correct values of so manyparameters.
In order to eliminate some of these problems we consideredthat in the calculation of a line function we should not include var-iation with time, as our purpose was to describe the structure ofthe regions where the SACs are created at the specific momentwhen a spectrum is taken. In order to study the time-variation ofthe calculated physical parameters, we should study many spectraof the same star, taken at different moments. Additionally, weneeded a line function with which we could study a specific spec-tral line of a specific ion. This means that we did not need to in-clude the atomic parameters, as in such a case the atomicparameters remain constant. In this way, we were able to solvethe radiation transfer equations and to find the correct group ofparameters that give the best fit of the observed spectral line.
3. GR (Gauss-rotation) model – the line function
We considered that in the stellar atmosphere the radiationpasses through a number of successive independent absorbingand/or emitting density regions of matter until it arrives at the ob-server. By solving the radiation transfer equations through such acomplex structure we obtain a line function (Eq. (1)) for the lineprofile, able to give the best fit for the main spectral line and itsDACs/SACs at the same time (see Danezis et al. (2003), and Daneziset al. (2007a)).
Ik ¼ Ik0
Yi
expf�Linig þX
j
Skejð1� expf�LejnejgÞ" #
�Y
g
expf�Lgngg ð1Þ
where, Ik0 is the initial radiation intensity, Li; Lej; Lg are the distribu-tion functions of the absorption coefficients kki; kkej; kkg , n is the opti-cal depth in the center of the spectral line, Skej is the source functionthat is constant during one observation.
The geometry and the physical conditions of the region thatproduces the spectral line are included in the factors Li; Lej; Lg andnot in the calculation of Ik. So, the decision on the geometry andthe physical conditions is essential for the calculation of the distri-bution function that we use for each component. Specifically, thephysical conditions indicate the exact distribution that we mustuse. This means that for a different geometry and different physicalconditions we have a different analytical form of Li; Lej; Lg and thusa different shape for the spectral line profile of each SAC.
In the case of rapidly rotating hot emission stars, it is veryimportant to insert in the line function the rotational and the radialof the regions that produce each one of the satellite components, aswell as the random velocities of the ions. In this case we must de-fine the geometry for the corresponding regions.
3.0.1. Geometry
In our model we considered the spherical geometry. In order todecide on the appropriate geometry we took into consideration
line profiles in the stellar spectra. New Astron. Rev. (2009), doi:10.1016/

E. Danezis et al. / New Astronomy Reviews xxx (2009) xxx–xxx 5
ARTICLE IN PRESS
that the spectral line profile is reproduced in the best way whenwe consider spherical symmetry for the independent density re-gions. Such symmetry has been proposed by many researchers(Waldron et al., 1992; Rivinius et al., 1997; Kaper et al., 1996; Ka-per et al., 1997; Kaper et al., 1999; Markova, 2000; Lamers et al.,1982; Bates and Gilheany, 1990; Gilheany et al., 1990; Cidale,1998). However, the independent layers of matter, where a spec-tral line and its SACs are created, could lie either (i) around the star,in which case spherical symmetry is justified, or (ii) at a greaterdistance from the star, where the spherical symmetry can not bejustified (see also Lyratzi et al., 2007).
(i) Independent density regions of matter that lie around thestar (see Fig. 2a): In this case we consider the existence ofa classical spherical symmetry of the thin spherical envelopearound hot emission stars.
(ii) Independent density regions of matter that lie at a greaterdistance from the photosphere (see Fig. 2b): we considerthe existence of independent density regions such as blobs,which cover all or a substantial fraction of the stellar disk,which exist in the disc around hot emission stars. Theseregions, do not present spherical symmetry around the star,but they may present local spherical symmetry around theirown center and they form spectral line profiles which areidentical with those deriving from a spherically symmetricstructure. So, even if the density regions are not sphericallysymmetric, through their effects on the line profiles, theyappear as spherically symmetric structures to the observer.
The way the density regions of the second case are formed isshown in Fig. 4. The star ejects mass with a specific radial velocity.The stream of matter is twisted, forming density regions such asco-rotating interaction regions (CIRs), structures due to magneticfields or spiral streams as a result of the stellar rotation (Underhilland Fahey, 1984; Cranmer and Owocki, 1996; Kaper et al., 1996;Kaper et al., 1997; Kaper et al., 1999; Mullan, 1984a,b; Mullan,1986; Prinja and Howarth, 1988; Cranmer et al., 2000). This meansthat hydrodynamic and magnetic forces take effect as centripetalforces, resulting to the outward moving matter twisting and mov-ing around the star. Some parts of these streams cut off and formthe observed high density regions (shells, blobs, puffs, spiralstreams).
3.0.2. Physical conditions
Depending on the physical conditions that we consider for thecalculations of the factors Li; Lej; Lg , the functions e�Lini andSkejð1� e�Lejnej Þ that correspond to the absorption and the emissionsatellite component, respectively, may take the form of differentdistribution functions, such as Gauss, Lorentz or Voigt distributionfunction. However, a very important point is that in this case we donot use the pure mathematical distributions that do not includeany physical parameter, but the physical expression of these distri-butions that are the following.
1. If Li has the form Lk ¼ e�aðk�k0Þ2 , where a ¼ 12ðDkwidthÞ2
, the line func-
tion e�Lini that defines well an absorption line, has the form of aGauss distribution.
2. If Li has the form Lk ¼ 11þbðk�k0Þ2
, where b ¼ 12ðDkwidthÞ2
, the line func-
tion e�Lini that defines well an absorption line, has the form of aLorentz distribution.
3. If Li has the form Lk ¼R þp
2�p
2f ðx;ðk�k0Þ
ffiffiap
;KÞ dx
V0, where a ¼ 1
2ðDkwidthÞ2;
V0 ¼Rþp
2�p
2f ðx;0;KÞdx and 0 6 K , the line function e�Lini that
defines well an absorption line, has the form of a Voigt distribu-
Please cite this article in press as: Danezis, E., et al. Interpreting the complexj.newar.2009.07.004
tion. Similarly, if we put the above expressions of Li (cases 1–3)in the emission line function Skejð1� e�Lejnej Þ, it will take the formof a Gauss, Lorentz or Voigt distribution.
Besides the above distribution functions, we had to consider thefact that hot emission stars are rapid rotators and present violentmass ejection, producing density regions that create the observedDACs or SACs and which also rotate quickly around their own cen-ter. According to this, we should accept that the rapid rotation ofthe density regions is one of the main broadening factors of thespectral lines originating from them. This means that the rotationof the density regions should be included in the calculations ofour model, in order to be able to reproduce the observed spectrallines.
As a first step, our scientific group constructed a distributionfunction L that considers as the only reason of the line broadeningthe rotation of the regions that produce the spectral lines. Wecalled it rotation distribution (see Danezis et al., 2003; Lyratziet al., 2007). However, it is known that in a gaseous region we al-ways detect random motions, which must be taken into consider-ation as a second reason of line broadening (Doppler broadening).The distribution function that expresses these random motions isthe Gaussian. This means that in order to have a spectral line thathas as broadening factors the rotation of the regions and the ran-dom motions of the ions, we should construct a new distributionfunction L that would include both of these reasons (rotation andrandom motions). Our scientific group constructed this distribu-tion function L (Eq. (2)) and named it Gaussian-rotation distribu-tion (GR distribution).
LfinalðkÞ ¼ffiffiffiffipp
2k0z
Z p2
�p2
erfk� k0
rffiffiffi2p þ k0z
rffiffiffi2p
cos h
� ��
� erfk� k0
rffiffiffi2p � k0z
rffiffiffi2p
cos h
� ��cos hdh ð2Þ
where, k is the wavelength of each point of the spectral line profile,k0 ¼ klab � Dkrad, where k0 is the wavelength of the center of the ob-served spectral line which is shifted from the laboratory wave-length klab of the spectral line at Dkrad, from which we calculatethe radial velocity Vrad of the density region, z ¼ Vrot
c , from whichwe calculate the rotational velocity Vrot of the density region, r isthe Gaussian typical deviation from which we calculate the randomvelocity Vrand of the ions as Vrand ¼ rc
ffiffiffiffiffiffiffiffi2 ln 2p
k0and erf ðxÞ ¼ 2
p
R x0 e�u2 du, is
the known error function (see also Danezis et al., 2007a).The analytical form and the calculations of the GR distribution
function can be found in Danezis et al. (2007a).Using the GR model, we can calculate some important parame-
ters of the density region that construct the DACs/SACs. Directly,we can calculate the apparent rotational velocities of absorbingor emitting density layers ðVrotÞ, the apparent radial velocities ofabsorbing or emitting density layers ðVradÞ, the Gaussian typicaldeviation of the ion random motions ðrÞ and the optical depth inthe center of the absorption or emission components ðnÞ. Indi-rectly, we calculate the random velocities of the ions ðVrandÞ, thefull width at half maximum (FWHM), the absorbed or emitted en-ergy (Ea,Ee) and the column density (CD) (see also Danezis et al.,2005).
3.1. Main aspects of the GR model
First of all, we should point out that with GR model we canstudy and reproduce specific spectral lines. This means that wecan study specific density regions in the plasma surrounding thestudied object. These density regions lie near the star and areformed by the plasma which is violently ejected from the stellaractive regions. This means that the material that comes from the
line profiles in the stellar spectra. New Astron. Rev. (2009), doi:10.1016/

6 E. Danezis et al. / New Astronomy Reviews xxx (2009) xxx–xxx
ARTICLE IN PRESS
star has not the form of a classical stellar wind. In order to con-struct a general model we need to study with the proposed modelmany density regions that produce spectral lines of different ioni-zation potential, meaning different temperature and thus differentdistance from the studied object.
3.1.1. The simple case of only one component (simple spectral lines)The line function of the GR model (Eq. (1)) is able to reproduce
any spectral line profile, regardless of the number of the line’s com-ponents (DACs or SACs). This means that it can be used for anynumber of absorbing or emitting regions. As a result it may alsobe used in the simple case that i ¼ 1 and j ¼ 0 or i ¼ 0 and j ¼ 1,meaning when we deal with simple, classical absorption or emis-sion spectral lines, respectively. This means that we can calculateall the important physical parameters, such as the rotational, theradial and the random velocities, the optical depth, the columndensity and the absorbed or emitted energy, for all the simpleand classical spectral lines in all the spectral ranges.
3.1.2. The case of many absorption or emission componentsIn the GR line function (Eq. (1)) the final profile that is produced
by a group of absorption lines is given by the product of the linefunctions of each SAC. On the other hand, the final profile that isproduced by a group of emission lines is given by the addition ofthe line functions of each SAC. The addition of a group of functionsis completely different than the multiplication of functions. Thespectral line profile that results from the addition of a group offunctions is exactly the same with the profile that results from acomposition of the same functions. On the contrary, the productof a group of functions is completely different from the composi-tion of the same functions. As a result, we can use the compositionof functions for the emission lines, but not for a group of absorp-tion components. This means that in such a case we can not referto the law of reversion of the spectral lines.
The function Iki ¼ e�Lini reproduces the spectral line profileformed by the i density region (profile of one component). In thecase of the GR distribution function (Eq. (2)), for each quadrupletof the parameters VrotðiÞ;VradðiÞ;VrandðiÞ and nðiÞ we have a differentprofile. This results to the existence of only one quadruplet ableto give the best fit of the i component.
3.1.3. Fitting criteriaIn order to accept as best fit of the observed spectral line, what
is given by the quadruplet ðVrotðiÞ;VradðiÞ;VrandðiÞ; nðiÞÞ of all the calcu-lated SACs, we must adhere to all the physical criteria andtechniques.
First of all, it is necessary to have the superposition of the spec-tral region that we study with the same region of a classical star ofthe same spectral type and luminosity class, in order to identify theexistence of spectral lines that blend with the studied ones and theexistence of SACs.
The resonance lines, as well as those that form in regions closeto each other (small difference in ionization potential), must havethe same number of SACs and the same values for Vrot;Vrad andVrand. Besides, in the cases of resonance lines and of lines of thesame ion and the same multiplet, the ratio of the values of n mustbe the same as the ratio of the respective intensities.
The final criterion to accept or reject a best fit is that the calcu-lated values of the physical parameters should not go against theclassical physical theory.
Fig. 7. Radial velocities of the regions that create the Si IV resonance lines as afunction of the spectral subtype, in a sample of 68 Be stars (Lyratzi et al., 2007).
3.1.4. Method for the fitting of a spectral lineIn order to conclude to the group of the parameters which give
us the best fit, we use the model by the following two methods:
Please cite this article in press as: Danezis, E., et al. Interpreting the complexj.newar.2009.07.004
� In the first method we consider that the main reason of the linebroadening of the main line and the satellite components is therotation of the region which creates the components of theobserved feature and a secondary reason is the thermal Dopplerbroadening. This means that we start fitting the line using themaximum Vrot . Then, we include Doppler broadening, in orderto accomplish the best fit (rotation case).
� In the second method, we consider the opposite. This means thatin this case the main reason of the line broadening of the mainline and the satellite components is supposed to be the thermalDoppler broadening and the secondary reason is the rotation ofthe region which creates the components of the observed fea-ture. This means that we start fitting the line using the maxi-mum Doppler broadening. Then we include the rotation of theregion, by increasing Vrot , in order to accomplish the best fit(Doppler case).
In both of the above cases (rotation case and Doppler case) wecheck the correct number of satellite components that constructthe whole line profile. First we try to fit with one component.We add another one only when we see that we cannot fit with onlyone component. We keep adding components until we accomplishthe best fit. Finally, we fit using the number of the components thatgive the best difference graph between the fit and the real spectralline (step by step, component by component). Then we fit usingone component less than in the previous fit. The F-test betweenthem allows us to take the correct number of satellite componentsthat construct in the best way the whole line profile.
The F-test between these two cases indicates the best way to fitthe spectral lines. When the F-test cannot give definite conclusionon which case we should use, we still could obtain informationabout the limits of Vrot and r. If the F-test gives similar values, thenthe rotation case defines the maximal Vrot and the minimal r andthe Doppler case defines the minimal Vrot and the maximal r.
The profile of every main spectral line and its SACs is fitted bythe function e�Lini , in the case of an absorption component or bySkejð1� e�sej Þ, in the case of an emission component. These func-tions produce symmetrical line profiles. However, we know thatmost of the spectral lines that we have to reproduce are asymmet-ric. This fact is interpreted as a systematical variation of the appar-ent radial velocities of the density regions where the main spectralline and its SACs are created. In order to approximate those asym-metric profiles we have chosen a classical method. This is the sep-aration of the region, which produces the asymmetric profiles ofthe spectral line, in a small number of sub-regions, each of whichis treated as an independent absorbing shell. In this way we canstudy the variation of the density, the radial shift and the apparentrotation as a function of the depth in every region which producesa spectral line with an asymmetric profile. All the above must betaken into account during the evaluation of our results and oneshould not consider that the evaluated parameters of those sub-re-gions correspond to independent regions of matter, which form themain spectral line or its SACs. In this case we could use asymmetric
line profiles in the stellar spectra. New Astron. Rev. (2009), doi:10.1016/

Fig. 8. Rotational velocities of the regions that create the Si IV resonance lines as afunction of the spectral subtype, in a sample of 68 Be stars (Lyratzi et al., 2007).
Fig. 9. Radial velocities VradÞ in the C IV region (left) and in the N V region (right) asa function of the spectral subtype. We detect two levels of radial velocities in bothregions. The first level has high values (between �3000 and �1500 km s�1 in the CIV region and between �2300 and �1500 km s�1 in the N V region) and the secondlevel has low values (between �500 and �20 km s�1 in the C IV region and between�500 and �100 km s�1 in the N V region) (Antoniou et al., 2008).
Fig. 10. The random velocities of the CIV and NV density regions, as a function ofthe apparent rotational velocities, in a sample of 20 Oe stars.
E. Danezis et al. / New Astronomy Reviews xxx (2009) xxx–xxx 7
ARTICLE IN PRESS
distributions (e.g. Maxwell). This means that we could fit the ob-served profile with an asymmetric mathematical distribution.However, until now we do not have an expression of the distribu-tion function Li that would correspond to a Maxwell distributionand which would include physical parameters. As a result, evenif we could fit the observed profile with a mathematical asymmet-ric distribution, we would not be able to calculate any physicalparameter. In order to be able to calculate some physical parame-ters, we use the above mentioned way.
Fig. 11. Timescale changes of the apparent rotational velocities ðVrotÞ (km/s) of theC IV resonance lines ðkk1548:155;1550:774 ÅÞ for the independent density regionsof matter which create the five satellite components in the spectra of the Oe star HD93521. The low value (about 400 km/s) in the first component has been testedcarefully (Danezis et al., 2007b).
4. Some results from our studies with Gauss-rotational model
As we have already mentioned, with GR model, we can calculatemany parameters of the regions where the studied spectral linesare created. Such parameters are the apparent rotational and radialvelocities, the random velocities of the ions, as well as the fullwidth at half maximum, the optical depth in the center of the line,the column density and the absorbed or emitted energy of theindependent density regions of matter which produce the SACs/DACs of the studied spectral lines. Here we present some results
Please cite this article in press as: Danezis, E., et al. Interpreting the complexj.newar.2009.07.004
of our studies on hot emission stars (see also Lyratzi et al., 2005;Lyratzi et al., 2007; Danezis et al., 2007b; Antoniou et al., 2008).In Figs. 7 and 8 we give the results of our study of 68 Be stars (Lyr-atzi et al., 2007). Specifically, Figs. 7 and 8 show the radial and therotational velocities of the regions that create the Si IV resonancelines as a function of the spectral subtype, respectively. From thecalculation of the above mentioned parameters we can study therelations between them. In a study of 20 Oe stars, we calculated
line profiles in the stellar spectra. New Astron. Rev. (2009), doi:10.1016/

Fig. 12. Timescale changes of the radial velocities ðVradÞ (km/s) of the kk 1548.155,1550.774 Å C IV resonance lines for the independent density regions of matterwhich create the five satellite components in the spectra of the Oe star HD 93521(Danezis et al., 2007b).
8 E. Danezis et al. / New Astronomy Reviews xxx (2009) xxx–xxx
ARTICLE IN PRESS
the kinematical parameters of the density regions that create theSACs/DACs (Fig. 9) and the relation among these parameters(Fig. 10). Fig. 9 shows the radial velocities ðVradÞ in the C IV region(up) and in the N V region (down) as a function of the spectral sub-type. We detect two levels of radial velocities in both regions(Antoniou et al., 2008). In Fig. 10 we present the relation betweenthe rotational and random velocities of the density regions thatcreate the C IV (a) and the N V (b) spectral lines, in the studied20 Oe stars. Finally, in a statistical study of the Oe star HD 93521(Danezis et al., 2007b) we calculated the timescale changes ofthe kinematical parameters of the density regions that create theC IV resonance lines (Figs. 11 and 12).
5. Conclusions
In this review we discuss the complex absorption lines in spec-tra of hot emission stars and quasars. We propose the GR modelthat can describe such complex spectral line taking into accountthe ejection of material (radial velocity) as well as rotational andmicro-turbulent velocity in the density region around the objects.In brief, the results of our study are as follows:
1. We applied successfully the GR model to a great number ofspectral lines of hot emission stars and quasars.
2. We were able to explain the origin of DACs phenomenon and topropose the SACs phenomenon in order to explain the complexstructure of the observed profiles of many spectral lines that arecreated in the environment of hot emission stars. Especially, wewere able to reproduce and explain the complex profiles of thespectral lines that are created in the plasma condensationsformed in the density regions of hot emission stars (such asthe post-coronal regions). These regions lie near the star andare formed by the plasma which is violently ejected from thestellar active regions. This means that the material that comesfrom the star has not the form of a classical stellar wind.
By the calculation of a number of parameters for the first time,we are able to study the physical laws that exist in the regionswhere the spectral lines that present DACs and SACs are created.
Please cite this article in press as: Danezis, E., et al. Interpreting the complexj.newar.2009.07.004
Acknowledgements
This research project is progressing at the University of Athens,Department of Astrophysics, Astronomy and Mechanics, under thefinancial support of the Special Account for Research Grants, whichwe thank very much. This work also was supported by Ministry ofScience and Technological Development of Serbia, through the pro-jects ‘‘Influence of collisional processes on astrophysical plasmaline shapes” and ‘‘Astrophysical spectroscopy of extragalacticobjects”.
References
Antoniou, A., Danezis, E., Lyratzi, E., Nikolaidis, D., Popovic, L.C., Dimitrievic, M.S.,2008. JPhCS 133a, 2028.
Bates, B., Gilheany, S., 1990. MNRAS 243, 320.Bates, B., Halliwell, D.R., 1986. MNRAS 223, 673.Cidale, L.S., 1998. ApJ 502, 824.Cranmer, S.R., Owocki, S.P., 1996. ApJ 462, 469.Cranmer, S.R., Smith, M.A., Robinson, R.D., 2000. ApJ 537, 433.Danezis, E. 1984. The Nature of Be Stars, Ph.D. Thesis, University of Athens.Danezis, E. 1987. IAU, Colloq. No. 92, Physics of Be Stars, Cambridge University
Press.Danezis, E., Theodossiou, E., Laskarides, P.G., 1991. Ap&SS 179, 111.Danezis, E., Nikolaidis, D., Lyratzi, V., Stathopoulou, M., Theodossiou, E., Kosionidis,
A., Drakopoulos, C., Christou, G., Koutsouris, P., 2003. Ap&SS 284, 1119.Danezis, E., Nikolaidis, D., Lyratzi, V., Popovic, L.C., Dimitrijevic, M.S., Theodossiou,
E., Antoniou, A., 2005. Mem. Soc. It. Suppl. 7, 107.Danezis, E., Popovic, L.C., Lyratzi, E., Dimitrijevic, M.S., 2006. AIP Conf. Proc. 876,
373.Danezis, E., Nikolaidis, D., Lyratzi, E., Popovic, L.C., Dimitrijevic, M.S., Antoniou, A.,
Theodossiou, E., 2007a. PASJ 59, 827.Danezis, E., Antoniou, A., Lyratzi, E., Nikolaidis, D., Popovic, L.C., Dimitrievic, M.S.,
Theodossiou, E. 2007. Long term variability of the coronal and post-coronal C IVregion of the Oe star HD 93521” in UV astronomy: stars from birth to death. In:Gómez de Castro, Ana I., Barstow, Martin A. (Eds.), Proceedings of the JointDiscussion No. 4 During the IAU General Assembly of 2006, EditorialComplutense, Madrid, p. 113.
Franco, M.L., Stalio, R., 1983. MmSAL 54, 537.Franco, M.L., Stalio, R., Kontizas, E., Kontizas, M., 1983. A&A 122, 97.Fullerton, A.W., Massa, D.L., Prinja, R.K., Owocki, S.P., Cranmer, S.R., 1997. A&A 327,
699.Gilheany, S., Bates, B., Catney, M.G., Dufton, P.L., 1990. Ap&SS 169, 85.Grady, C.A., Sonneborn, G., Chi-chao, Wu., Henrichs, H.F., 1987. ApJ Suppl. 65, 673.Henrichs, H.F. 1984. In: Rolfe, E., Battrick, B. (Eds.), Proceedings of the Fourth
European IUE Conference, ESA SSSP-218, p. 43.Kaper, L., Henrichs, H.F., Nichols, J.S., Snoek, L.C., Volten, H., Zwarthoed, G.A.A., 1996.
A&A Suppl. 116, 257.Kaper, L., Henrichs, H.G., Fullerton, A.W., Ando, H., Bjorkman, K.S., Gies, D.R., Hirata,
R., Dambe, E., McDavid, D., Nichols, J.S., 1997. A&A 327, 281.Kaper, L., Henrichs, H.F., Nichols, J.S., Telting, J.H., 1999. A&A 344, 231.Lamers, H.J.G.L.M., Gathier, R., Snow, T.P., 1982. ApJ 258, 186.Lamers, H.J.G.L.M., Snow, T.P., de Jager, C., Langerwerf, A., 1988. ApJ 325, 342.Lyratzi, E., Danezis, E., 2004. AIP Conf. Proc. 740, 458.Lyratzi, E., Danezis, E., Nikolaidis, D., Popovic, L.C., Dimitrievic, M.S., Theodossiou, E.,
Antoniou, A., 2005. Mem. Soc. It. Suppl. 7, 114.Lyratzi, E., Danezis, E., Antoniou, A., Nikolaidis, D., Popovic, L.C., Dimitrievic, M.S.
2007. The complex structure of the Si IV 1393.755, 1402.77 Å regions of 68 Be-type stars in UV astronomy: stars from birth to death. In: Gómez de Castro, AnaI., Barstow, Martin A. (Eds.), Proceedings of the Joint Discussion No. 4 During theIAU General Assembly of 2006, Editorial Complutense, Madrid, p. 137.
Lyratzi, E., Danezis, E., Popovic, L.C., Dimitrijevic, M.S., Nikolaidis, D., Antoniou, A.,2007. PASJ 59, 357.
Markova, N., 2000. A&A Suppl. 144, 391.Meilland, A., Stee, Ph., Zorec, J., Kanaan, S., 2006. A&A 455, 953.Mullan, D.J., 1984a. ApJ 283, 303.Mullan, D.J., 1984b. ApJ 284, 769.Mullan, D.J., 1986. A&A 165, 157.Prinja, R.K., Howarth, I.D., 1988. MNRAS 233, 123.Rivinius, Th., Stahl, O., Wolf, B., Kaufer, A., Gang, Th., Gummersbach, C.A., Jankovics,
I., Kovacs, J., Mandel, H., Peitz, J., Szeifert, Th., Lamers, H.J.G.L.M., 1997. A&A 318,819.
Sahade, J., Brandi, E., 1985. Rev. Mex. Astron. Astrofis. 10, 229.Sahade, J., Brandi, E., Fontela, J.M., 1984. A&A Suppl. 56, 17.Tuthill, P., Monnier, J., Danchi, W., 1999. Nature 398, 487.Underhill, A.B., 1975. ApJ 199, 691.Underhill, A.B., Doazan, V. 1982. B Stars With and Without Emission Lines, NASA
SP–456, Part II, Chapters 10, 13.Underhill, A.B., Fahey, R.P., 1984. ApJ 280, 712.Waldron, W.L., Klein, L., Altner, B., 1992. ASP Conf. Series 22, 181.Waldron, W.L., Klein, L., Altner, B., 1994. ApJ 426, 725.
line profiles in the stellar spectra. New Astron. Rev. (2009), doi:10.1016/