Interpretation of Heart Sound Signal through Automated ...
10
HEART RESEARCH Open Journal http://dx.doi.org/10.17140/HROJ-2-105 Heart Res Open J ISSN 2377-164X Interpretation of Heart Sound Signal through Automated Artifact-Free Segmentation A. Kishore Kumar and Goutam Saha * Department of Electronics and Electrical Communication Engineering, Indian Institute of Technology, Kharagpur 721302, India Research * Corresponding author Goutam Saha, PhD Professor Department of Electronics and Electrical Communication Engineering Indian Institute of Technology Kharagpur 721302, India E-mail: [email protected] Article History Received: February 27 th , 2015 Accepted: March 9 th , 2015 Published: March 10 th , 2015 Citation Kumar AK, Saha G. Interpretation of heart sound signal through automat- ed artifact-free segmentation. Heart Res Open J. 2015; 2(1): 25-34. doi: 10.17140/HROJ-2-105 Copyright ©2015 Saha G. This is an open ac- cess article distributed under the Creative Commons Attribution 4.0 International License (CC BY 4.0), which permits unrestricted use, distribution, and reproduction in any medium, provided the original work is properly cited. Volume 2 : Issue 1 Article Ref. #: 1000HROJ2105 Page 25 ABSTRACT Purpose: Digital recording of heart sounds commonly known as Phonocardiogram (PCG) signal, is a convenient primary diagnostic tool for analyzing condition of heart. Phono- cardiogram aids physicians to visualize the acoustic energies that results from mechanical aspect of cardiac activity. PCG signal cycle segmentation is an essential processing step to- wards heart sound signal analysis. Sound artifacts due to inappropriate placement of stetho- scope, body movement, cough etc. makes segmentation difficult. Artifact-free segmented heart sound cycles are convenient for physicians to interpret and it is also useful for computerized automated classification of abnormality. Methods: We have developed a framework which selects good quality heart sound subse- quences which are artifact-free and reused the features involved in this processing in segmenta- tion. In this work, we have used information contained in frequency subbands by decomposing the signal using Discrete Wavelet Packet Transform (DWPT). The algorithm identifies the parts of the signal where artifacts are prominent and it also detects major events in heart sound cycles. Results: The algorithm shows good results when tested on normal and five commonly occur- ring pathological heart sound signals. An average accuracy of 93.71% is registered for artifact- free subsequence selection process. The cycle segmentation algorithm gives an accuracy of 98.36%, 98.18% and 93.97% respectively for three databases used in the experiment. Conclusions: The work provides a solution for artifact-free segmentation of heart sound cy- cles to assist interpretation of heart sound by physicians in objective analysis through record- ing in a computer. It is also useful for development of an automated decision support system on heart sound abnormality. MAIN KEY FINDINGS • Artifact free subsequence detection is preferable over attempt to reduce the effect of artifacts due to overlap of information content. • DWPT is useful for detection of artifact contaminated subsequences due to its ability to pro- vide for more detailed information of higher frequency components. • DWPT features of subsequence detection can be reused for automatic segmentation of heart sound. • The artifact-free segmented heart sound cycle detection system can work in real-time. KEYWORDS: Heart Sounds; PCG Signal; Discrete Wavelet Packet Transform; Segmentation; Artifact removal; Artifact-free subsequence. ABBREVIATIONS: PCG: Phoncardiogram; HS: Heart Sound; DWT: Discrete Wavelet Trans- form; DWPT: Discrete Wavelet Packet Transform; ASS: Artifact-free Subsequence Selection;
-
Upload
khangminh22 -
Category
Documents
-
view
3 -
download
0
Transcript of Interpretation of Heart Sound Signal through Automated ...
HEART RESEARCH
Open Journalhttp://dx.doi.org/10.17140/HROJ-2-105
Heart Res Open J
ISSN 2377-164X
Interpretation of Heart Sound Signal through Automated Artifact-Free Segmentation
A. Kishore Kumar and Goutam Saha*
Department of Electronics and Electrical Communication Engineering, Indian Institute of Technology, Kharagpur 721302, India
Research*Corresponding author Goutam Saha, PhD Professor Department of Electronics and Electrical Communication Engineering Indian Institute of Technology Kharagpur 721302, India E-mail: [email protected]
Article HistoryReceived: February 27th, 2015 Accepted: March 9th, 2015Published: March 10th, 2015
CitationKumar AK, Saha G. Interpretation of heart sound signal through automat-ed artifact-free segmentation. Heart Res Open J. 2015; 2(1): 25-34. doi: 10.17140/HROJ-2-105
Copyright©2015 Saha G. This is an open ac-cess article distributed under the Creative Commons Attribution 4.0 International License (CC BY 4.0), which permits unrestricted use, distribution, and reproduction in any medium, provided the original work is properly cited.
Volume 2 : Issue 1Article Ref. #: 1000HROJ2105
Page 25
ABSTRACT
Purpose: Digital recording of heart sounds commonly known as Phonocardiogram (PCG) signal, is a convenient primary diagnostic tool for analyzing condition of heart. Phono-cardiogram aids physicians to visualize the acoustic energies that results from mechanical aspect of cardiac activity. PCG signal cycle segmentation is an essential processing step to-wards heart sound signal analysis. Sound artifacts due to inappropriate placement of stetho-scope, body movement, cough etc. makes segmentation difficult. Artifact-free segmented heart sound cycles are convenient for physicians to interpret and it is also useful for computerized automated classification of abnormality.Methods: We have developed a framework which selects good quality heart sound subse-quences which are artifact-free and reused the features involved in this processing in segmenta-tion. In this work, we have used information contained in frequency subbands by decomposing the signal using Discrete Wavelet Packet Transform (DWPT). The algorithm identifies the parts of the signal where artifacts are prominent and it also detects major events in heart sound cycles.Results: The algorithm shows good results when tested on normal and five commonly occur-ring pathological heart sound signals. An average accuracy of 93.71% is registered for artifact-free subsequence selection process. The cycle segmentation algorithm gives an accuracy of 98.36%, 98.18% and 93.97% respectively for three databases used in the experiment.Conclusions: The work provides a solution for artifact-free segmentation of heart sound cy-cles to assist interpretation of heart sound by physicians in objective analysis through record-ing in a computer. It is also useful for development of an automated decision support system on heart sound abnormality.
MAIN KEY FINDINGS
• Artifact free subsequence detection is preferable over attempt to reduce the effect of artifacts due to overlap of information content.• DWPT is useful for detection of artifact contaminated subsequences due to its ability to pro-vide for more detailed information of higher frequency components.• DWPT features of subsequence detection can be reused for automatic segmentation of heart sound.• The artifact-free segmented heart sound cycle detection system can work in real-time.
KEYWORDS: Heart Sounds; PCG Signal; Discrete Wavelet Packet Transform; Segmentation; Artifact removal; Artifact-free subsequence.
ABBREVIATIONS: PCG: Phoncardiogram; HS: Heart Sound; DWT: Discrete Wavelet Trans-form; DWPT: Discrete Wavelet Packet Transform; ASS: Artifact-free Subsequence Selection;
HEART RESEARCH
Open Journalhttp://dx.doi.org/10.17140/HROJ-2-105
Heart Res Open J
ISSN 2377-164X
Page 26
LPF: Lowpass filter, DB: Database; FAR: False Acceptance Ra-tio; FRR: False Rejection Ratio.
INTRODUCTION
Stethoscope sound is used as primary tool for detecting murmurs in heart signals. This is an audio clue and somewhat subjective, as interpretation depends on the training and skills of the physician. There is a possibility of mishearing impor-tant indications, while listening to the heart sounds by using a stethoscope.1 It has been reported that there is a constant decline in competency on cardiac auscultation and this lack of abil-ity to either hear or interpret an abnormality, starts in medical school.2 Phonocardiogram based approach can be useful here in providing a visual clue in addition to audio clue. Here an electronic stethoscope is used to pick up heart sounds and with proper signal conditioning, the digitized version of heart sound is collected in the computer. The difficulty with this machine based approach is the presence of artifact in the data collection process when a stethoscope is placed on the chest. A human lis-tener has the capacity of appreciating heart sound part by sepa-rating it from the artifact and then focusing on a heart sound cycle to interpret the murmurs based on its location, say sys-tole, diastole or type say crescendo, decrescendo etc. But for a computer based visual representation, there is a need to develop efficient algorithm to separate artifact-free subsequences of heart sound and also extract respective segmented heart sound cycles for further analysis and interpretation. There is an additional requirement to perform algorithmic processing in real-time, so that it is useful as a primary diagnostic tool.
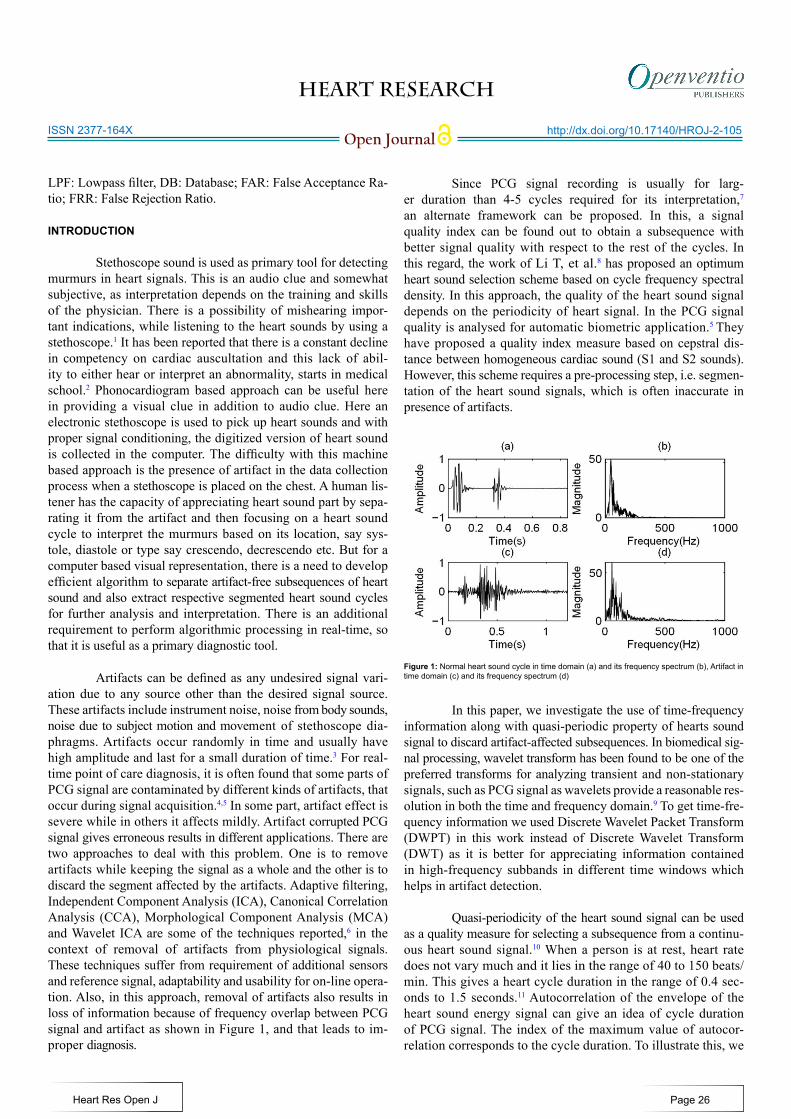
Artifacts can be defined as any undesired signal vari-ation due to any source other than the desired signal source. These artifacts include instrument noise, noise from body sounds, noise due to subject motion and movement of stethoscope dia-phragms. Artifacts occur randomly in time and usually have high amplitude and last for a small duration of time.3 For real-time point of care diagnosis, it is often found that some parts of PCG signal are contaminated by different kinds of artifacts, that occur during signal acquisition.4,5 In some part, artifact effect is severe while in others it affects mildly. Artifact corrupted PCG signal gives erroneous results in different applications. There are two approaches to deal with this problem. One is to remove artifacts while keeping the signal as a whole and the other is to discard the segment affected by the artifacts. Adaptive filtering, Independent Component Analysis (ICA), Canonical Correlation Analysis (CCA), Morphological Component Analysis (MCA) and Wavelet ICA are some of the techniques reported,6 in the context of removal of artifacts from physiological signals. These techniques suffer from requirement of additional sensors and reference signal, adaptability and usability for on-line opera-tion. Also, in this approach, removal of artifacts also results in loss of information because of frequency overlap between PCG signal and artifact as shown in Figure 1, and that leads to im-proper diagnosis.
Since PCG signal recording is usually for larg-er duration than 4-5 cycles required for its interpretation,7
an alternate framework can be proposed. In this, a signal quality index can be found out to obtain a subsequence with better signal quality with respect to the rest of the cycles. In this regard, the work of Li T, et al.8 has proposed an optimum heart sound selection scheme based on cycle frequency spectral density. In this approach, the quality of the heart sound signal depends on the periodicity of heart signal. In the PCG signal quality is analysed for automatic biometric application.5 They have proposed a quality index measure based on cepstral dis-tance between homogeneous cardiac sound (S1 and S2 sounds). However, this scheme requires a pre-processing step, i.e. segmen-tation of the heart sound signals, which is often inaccurate in presence of artifacts.
In this paper, we investigate the use of time-frequency information along with quasi-periodic property of hearts sound signal to discard artifact-affected subsequences. In biomedical sig-nal processing, wavelet transform has been found to be one of the preferred transforms for analyzing transient and non-stationary signals, such as PCG signal as wavelets provide a reasonable res-olution in both the time and frequency domain.9 To get time-fre-quency information we used Discrete Wavelet Packet Transform (DWPT) in this work instead of Discrete Wavelet Transform (DWT) as it is better for appreciating information contained in high-frequency subbands in different time windows which helps in artifact detection.
Quasi-periodicity of the heart sound signal can be used as a quality measure for selecting a subsequence from a continu-ous heart sound signal.10 When a person is at rest, heart rate does not vary much and it lies in the range of 40 to 150 beats/min. This gives a heart cycle duration in the range of 0.4 sec-onds to 1.5 seconds.11 Autocorrelation of the envelope of the heart sound energy signal can give an idea of cycle duration of PCG signal. The index of the maximum value of autocor-relation corresponds to the cycle duration. To illustrate this, we
Figure 1: Normal heart sound cycle in time domain (a) and its frequency spectrum (b), Artifact in time domain (c) and its frequency spectrum (d)
HEART RESEARCH
Open Journalhttp://dx.doi.org/10.17140/HROJ-2-105
Heart Res Open J
ISSN 2377-164X
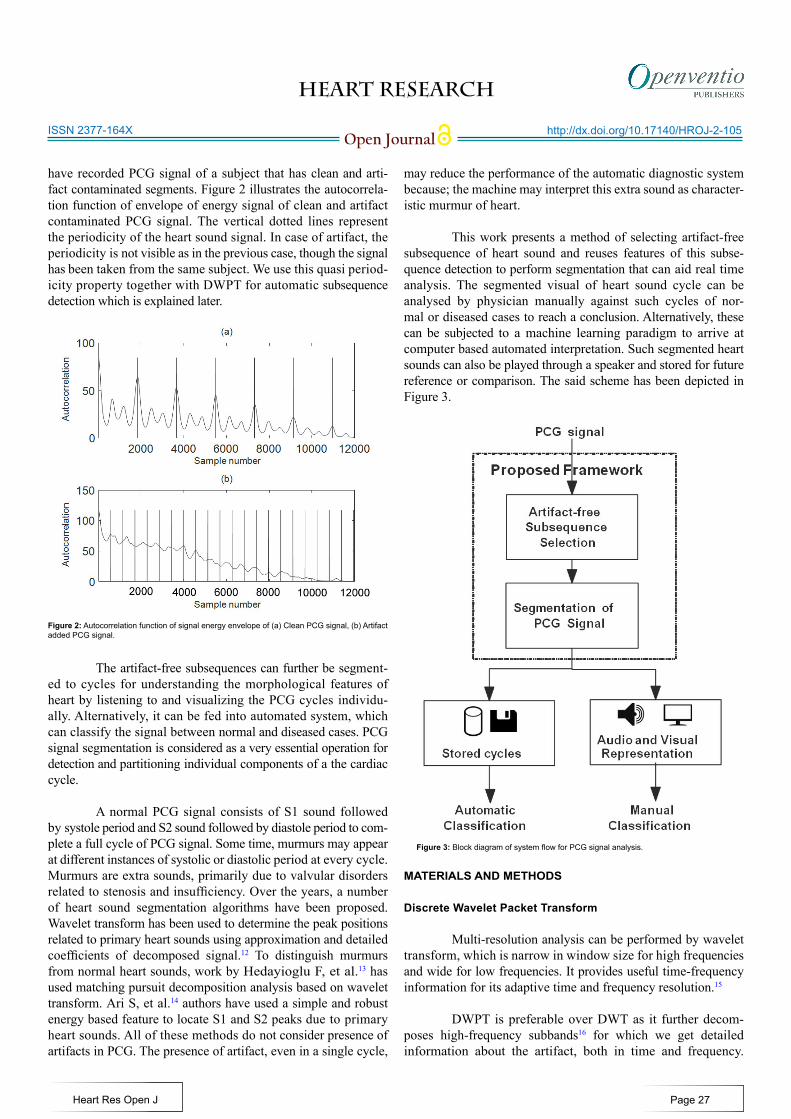
have recorded PCG signal of a subject that has clean and arti-fact contaminated segments. Figure 2 illustrates the autocorrela-tion function of envelope of energy signal of clean and artifact contaminated PCG signal. The vertical dotted lines represent the periodicity of the heart sound signal. In case of artifact, the periodicity is not visible as in the previous case, though the signal has been taken from the same subject. We use this quasi period-icity property together with DWPT for automatic subsequence detection which is explained later.
The artifact-free subsequences can further be segment-ed to cycles for understanding the morphological features of heart by listening to and visualizing the PCG cycles individu-ally. Alternatively, it can be fed into automated system, which can classify the signal between normal and diseased cases. PCG signal segmentation is considered as a very essential operation for detection and partitioning individual components of a the cardiac cycle.
A normal PCG signal consists of S1 sound followed by systole period and S2 sound followed by diastole period to com-plete a full cycle of PCG signal. Some time, murmurs may appear at different instances of systolic or diastolic period at every cycle. Murmurs are extra sounds, primarily due to valvular disorders related to stenosis and insufficiency. Over the years, a number of heart sound segmentation algorithms have been proposed. Wavelet transform has been used to determine the peak positions related to primary heart sounds using approximation and detailed coefficients of decomposed signal.12 To distinguish murmurs from normal heart sounds, work by Hedayioglu F, et al.13 has used matching pursuit decomposition analysis based on wavelet transform. Ari S, et al.14 authors have used a simple and robust energy based feature to locate S1 and S2 peaks due to primary heart sounds. All of these methods do not consider presence of artifacts in PCG. The presence of artifact, even in a single cycle,
may reduce the performance of the automatic diagnostic system because; the machine may interpret this extra sound as character-istic murmur of heart.
This work presents a method of selecting artifact-free subsequence of heart sound and reuses features of this subse-quence detection to perform segmentation that can aid real time analysis. The segmented visual of heart sound cycle can be analysed by physician manually against such cycles of nor-mal or diseased cases to reach a conclusion. Alternatively, these can be subjected to a machine learning paradigm to arrive at computer based automated interpretation. Such segmented heart sounds can also be played through a speaker and stored for future reference or comparison. The said scheme has been depicted in Figure 3.
MATERIALS AND METHODS
Discrete Wavelet Packet Transform
Multi-resolution analysis can be performed by wavelet transform, which is narrow in window size for high frequencies and wide for low frequencies. It provides useful time-frequency information for its adaptive time and frequency resolution.15
DWPT is preferable over DWT as it further decom-poses high-frequency subbands16 for which we get detailed information about the artifact, both in time and frequency.
Figure 3: Block diagram of system flow for PCG signal analysis.
Page 27
Figure 2: Autocorrelation function of signal energy envelope of (a) Clean PCG signal, (b) Artifact added PCG signal.
HEART RESEARCH
Open Journalhttp://dx.doi.org/10.17140/HROJ-2-105
Heart Res Open J
ISSN 2377-164X
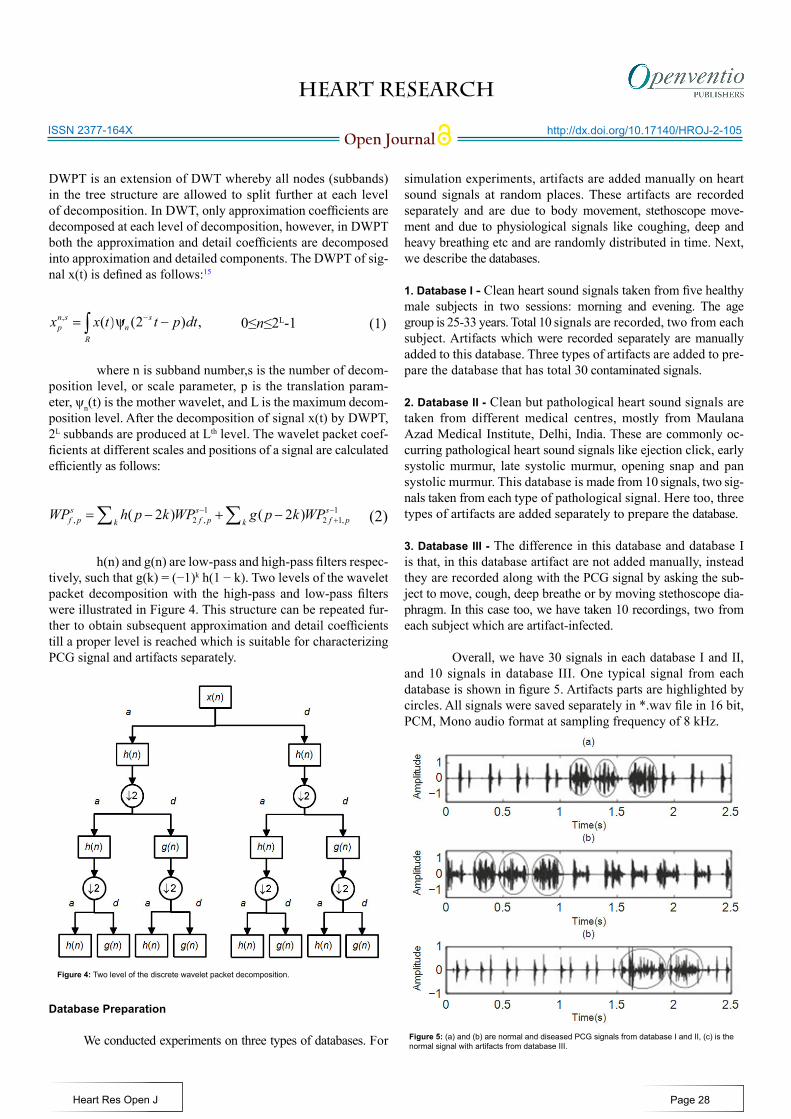
DWPT is an extension of DWT whereby all nodes (subbands) in the tree structure are allowed to split further at each level of decomposition. In DWT, only approximation coefficients are decomposed at each level of decomposition, however, in DWPT both the approximation and detail coefficients are decomposed into approximation and detailed components. The DWPT of sig-nal x(t) is defined as follows:15
where n is subband number,s is the number of decom-position level, or scale parameter, p is the translation param-eter, ψn(t) is the mother wavelet, and L is the maximum decom-position level. After the decomposition of signal x(t) by DWPT, 2L subbands are produced at Lth level. The wavelet packet coef-ficients at different scales and positions of a signal are calculated efficiently as follows:
h(n) and g(n) are low-pass and high-pass filters respec-tively, such that g(k) = (−1)k h(1 − k). Two levels of the wavelet packet decomposition with the high-pass and low-pass filters were illustrated in Figure 4. This structure can be repeated fur-ther to obtain subsequent approximation and detail coefficients till a proper level is reached which is suitable for characterizing PCG signal and artifacts separately.
Database Preparation
We conducted experiments on three types of databases. For
simulation experiments, artifacts are added manually on heart sound signals at random places. These artifacts are recorded separately and are due to body movement, stethoscope move-ment and due to physiological signals like coughing, deep and heavy breathing etc and are randomly distributed in time. Next, we describe the databases.
1. Database I - Clean heart sound signals taken from five healthy male subjects in two sessions: morning and evening. The age group is 25-33 years. Total 10 signals are recorded, two from each subject. Artifacts which were recorded separately are manually added to this database. Three types of artifacts are added to pre-pare the database that has total 30 contaminated signals.
2. Database II - Clean but pathological heart sound signals are taken from different medical centres, mostly from Maulana Azad Medical Institute, Delhi, India. These are commonly oc-curring pathological heart sound signals like ejection click, early systolic murmur, late systolic murmur, opening snap and pan systolic murmur. This database is made from 10 signals, two sig-nals taken from each type of pathological signal. Here too, three types of artifacts are added separately to prepare the database.
3. Database III - The difference in this database and database I is that, in this database artifact are not added manually, instead they are recorded along with the PCG signal by asking the sub-ject to move, cough, deep breathe or by moving stethoscope dia-phragm. In this case too, we have taken 10 recordings, two from each subject which are artifact-infected.
Overall, we have 30 signals in each database I and II, and 10 signals in database III. One typical signal from each database is shown in figure 5. Artifacts parts are highlighted by circles. All signals were saved separately in *.wav file in 16 bit, PCM, Mono audio format at sampling frequency of 8 kHz.
1 1, 2 , 2 1,( 2 ) ( 2 )s s s
f p f p f pk kWP h p k WP g p k WP− −
+= − + −∑ ∑ (2)
Figure 4: Two level of the discrete wavelet packet decomposition.
Figure 5: (a) and (b) are normal and diseased PCG signals from database I and II, (c) is the normal signal with artifacts from database III.
0≤n≤2L-1 (1)
Page 28
, ( ) (2 ) ,n s sp n
R
x x t t p dtψ −= −∫ ψ
HEART RESEARCH
Open Journalhttp://dx.doi.org/10.17140/HROJ-2-105
Heart Res Open J
ISSN 2377-164X
Development Framework
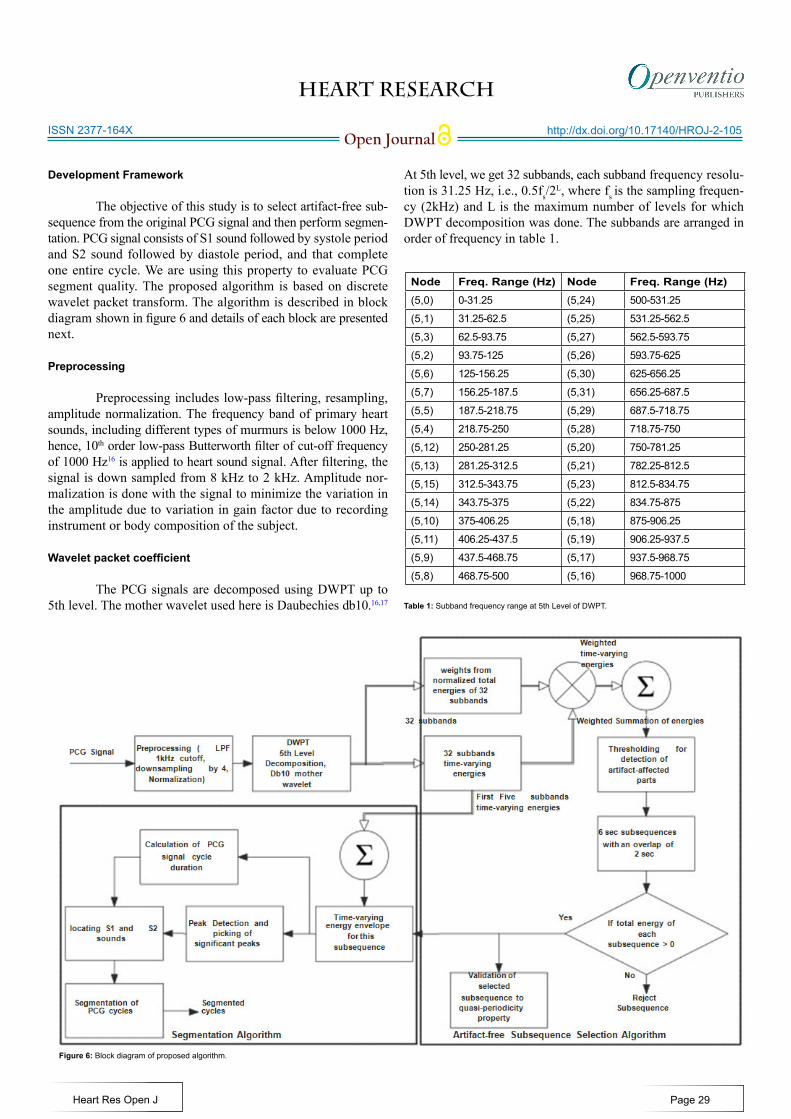
The objective of this study is to select artifact-free sub-sequence from the original PCG signal and then perform segmen-tation. PCG signal consists of S1 sound followed by systole period and S2 sound followed by diastole period, and that complete one entire cycle. We are using this property to evaluate PCG segment quality. The proposed algorithm is based on discrete wavelet packet transform. The algorithm is described in block diagram shown in figure 6 and details of each block are presented next.
Preprocessing
Preprocessing includes low-pass filtering, resampling, amplitude normalization. The frequency band of primary heart sounds, including different types of murmurs is below 1000 Hz, hence, 10th order low-pass Butterworth filter of cut-off frequency of 1000 Hz16 is applied to heart sound signal. After filtering, the signal is down sampled from 8 kHz to 2 kHz. Amplitude nor-malization is done with the signal to minimize the variation in the amplitude due to variation in gain factor due to recording instrument or body composition of the subject.
Wavelet packet coefficient
The PCG signals are decomposed using DWPT up to 5th level. The mother wavelet used here is Daubechies db10.16,17
At 5th level, we get 32 subbands, each subband frequency resolu-tion is 31.25 Hz, i.e., 0.5fs/2
L, where fs is the sampling frequen-cy (2kHz) and L is the maximum number of levels for which DWPT decomposition was done. The subbands are arranged in order of frequency in table 1.
Figure 6: Block diagram of proposed algorithm.
Node Freq. Range (Hz) Node Freq. Range (Hz)(5,0) 0-31.25 (5,24) 500-531.25
(5,1) 31.25-62.5 (5,25) 531.25-562.5
(5,3) 62.5-93.75 (5,27) 562.5-593.75
(5,2) 93.75-125 (5,26) 593.75-625
(5,6) 125-156.25 (5,30) 625-656.25
(5,7) 156.25-187.5 (5,31) 656.25-687.5
(5,5) 187.5-218.75 (5,29) 687.5-718.75
(5,4) 218.75-250 (5,28) 718.75-750
(5,12) 250-281.25 (5,20) 750-781.25
(5,13) 281.25-312.5 (5,21) 782.25-812.5
(5,15) 312.5-343.75 (5,23) 812.5-834.75
(5,14) 343.75-375 (5,22) 834.75-875
(5,10) 375-406.25 (5,18) 875-906.25
(5,11) 406.25-437.5 (5,19) 906.25-937.5
(5,9) 437.5-468.75 (5,17) 937.5-968.75
(5,8) 468.75-500 (5,16) 968.75-1000
Table 1: Subband frequency range at 5th Level of DWPT.
Page 29
HEART RESEARCH
Open Journalhttp://dx.doi.org/10.17140/HROJ-2-105
Heart Res Open J
ISSN 2377-164X
Artifact-free Subsequence Selection (ASS) algorithm
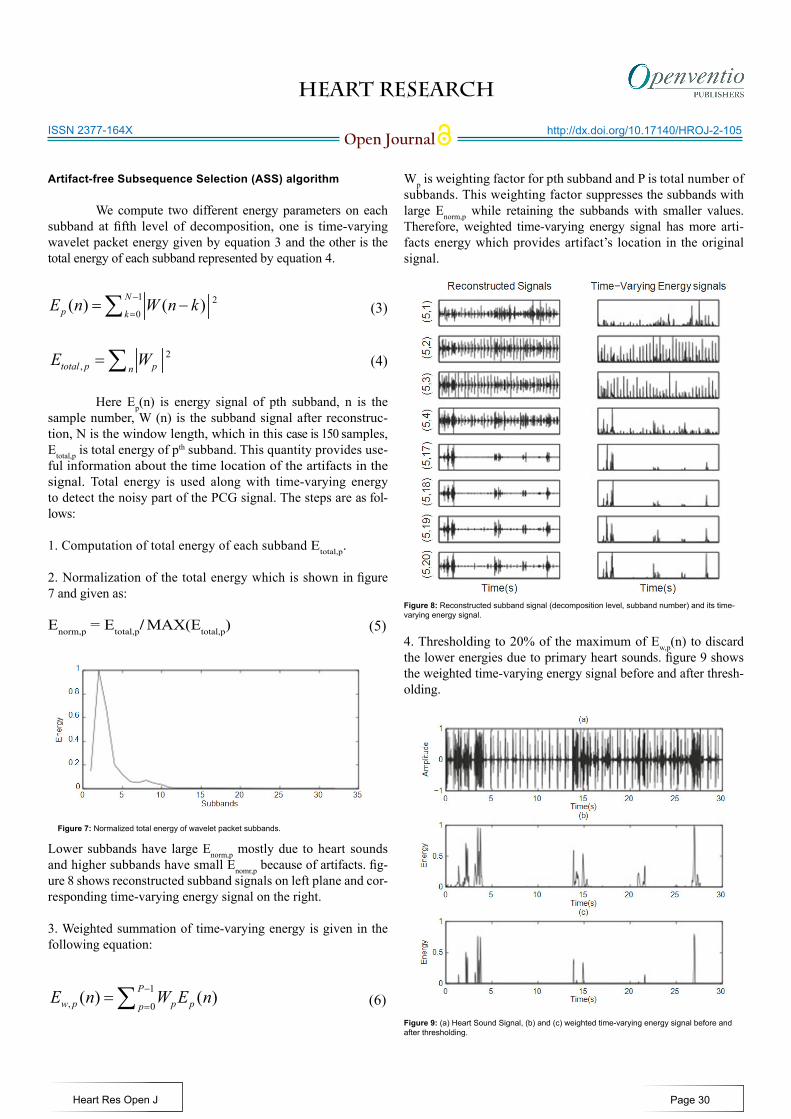
We compute two different energy parameters on each subband at fifth level of decomposition, one is time-varying wavelet packet energy given by equation 3 and the other is the total energy of each subband represented by equation 4.
Here Ep(n) is energy signal of pth subband, n is the sample number, W (n) is the subband signal after reconstruc-tion, N is the window length, which in this case is 150 samples, Etotal,p is total energy of pth subband. This quantity provides use-ful information about the time location of the artifacts in the signal. Total energy is used along with time-varying energy to detect the noisy part of the PCG signal. The steps are as fol-lows:
1. Computation of total energy of each subband Etotal,p.
2. Normalization of the total energy which is shown in figure 7 and given as:
Enorm,p = Etotal,p/ MAX(Etotal,p)
Lower subbands have large Enorm,p mostly due to heart sounds and higher subbands have small Enomr,p because of artifacts. fig-ure 8 shows reconstructed subband signals on left plane and cor-responding time-varying energy signal on the right.
3. Weighted summation of time-varying energy is given in the following equation:
Wp is weighting factor for pth subband and P is total number of subbands. This weighting factor suppresses the subbands with large Enorm,p while retaining the subbands with smaller values. Therefore, weighted time-varying energy signal has more arti-facts energy which provides artifact’s location in the original signal.
4. Thresholding to 20% of the maximum of Ew,p(n) to discard the lower energies due to primary heart sounds. figure 9 shows the weighted time-varying energy signal before and after thresh-olding.
1 20
( ) ( )Np k
E n W n k−
== −∑ (3)
(4)2,total p pn
E W=∑
(5)
Figure 7: Normalized total energy of wavelet packet subbands.
1, 0
( ) ( )Pw p p pp
E n W E n−
==∑ (6)
Figure 8: Reconstructed subband signal (decomposition level, subband number) and its time-varying energy signal.
Figure 9: (a) Heart Sound Signal, (b) and (c) weighted time-varying energy signal before and after thresholding.
Page 30
HEART RESEARCH
Open Journalhttp://dx.doi.org/10.17140/HROJ-2-105
Heart Res Open J
ISSN 2377-164X
5. Next, the energy signal of figure 9(c) is segmented into subse-quences of length six seconds with an overlap of two seconds so that we have total seven segments from each 30 seconds heart sound signal. The total energy of each subsequence is computed; if its value is greater than zero, the subsequence will be discarded. Corresponding subsequences from the original PCG signal are rejected. 6. The clean subsequences are tested for quasi-periodicity prop-erty of PCG signals using the autocorrelation function of en-velope of energy signal which has been explained in section I. Cycle duration is considered in the range of 0.4 seconds to 1.5 seconds. Moreover, quasi-periodicity property of PCG signal helps to improve false rejection or false acceptance parameter by providing additional parametric support
Segmentation of PCG Cycles
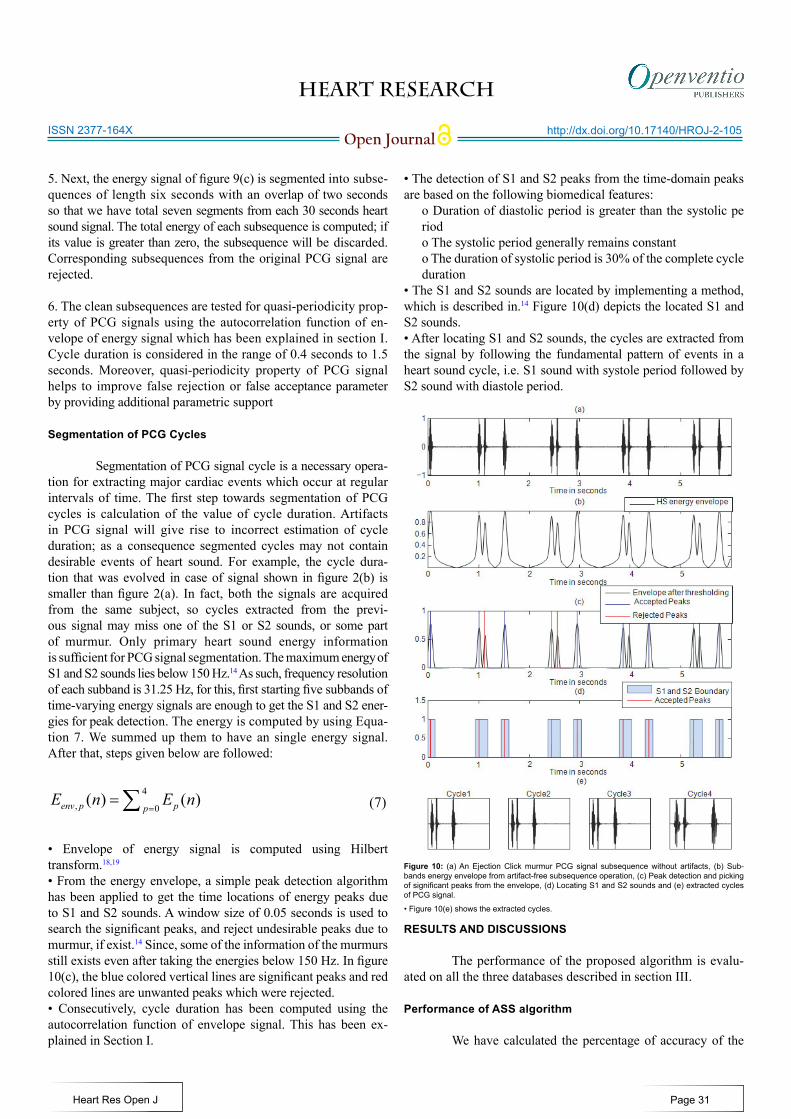
Segmentation of PCG signal cycle is a necessary opera-tion for extracting major cardiac events which occur at regular intervals of time. The first step towards segmentation of PCG cycles is calculation of the value of cycle duration. Artifacts in PCG signal will give rise to incorrect estimation of cycle duration; as a consequence segmented cycles may not contain desirable events of heart sound. For example, the cycle dura-tion that was evolved in case of signal shown in figure 2(b) is smaller than figure 2(a). In fact, both the signals are acquired from the same subject, so cycles extracted from the previ-ous signal may miss one of the S1 or S2 sounds, or some part of murmur. Only primary heart sound energy information is sufficient for PCG signal segmentation. The maximum energy of S1 and S2 sounds lies below 150 Hz.14 As such, frequency resolution of each subband is 31.25 Hz, for this, first starting five subbands of time-varying energy signals are enough to get the S1 and S2 ener-gies for peak detection. The energy is computed by using Equa-tion 7. We summed up them to have an single energy signal. After that, steps given below are followed:
• Envelope of energy signal is computed using Hilbert transform.18,19
• From the energy envelope, a simple peak detection algorithm has been applied to get the time locations of energy peaks due to S1 and S2 sounds. A window size of 0.05 seconds is used to search the significant peaks, and reject undesirable peaks due to murmur, if exist.14 Since, some of the information of the murmurs still exists even after taking the energies below 150 Hz. In figure 10(c), the blue colored vertical lines are significant peaks and red colored lines are unwanted peaks which were rejected.• Consecutively, cycle duration has been computed using the autocorrelation function of envelope signal. This has been ex-plained in Section I.
• The detection of S1 and S2 peaks from the time-domain peaks are based on the following biomedical features:
o Duration of diastolic period is greater than the systolic pe riodo The systolic period generally remains constanto The duration of systolic period is 30% of the complete cycle duration
• The S1 and S2 sounds are located by implementing a method, which is described in.14 Figure 10(d) depicts the located S1 and S2 sounds.• After locating S1 and S2 sounds, the cycles are extracted from the signal by following the fundamental pattern of events in a heart sound cycle, i.e. S1 sound with systole period followed by S2 sound with diastole period.
RESULTS AND DISCUSSIONS
The performance of the proposed algorithm is evalu-ated on all the three databases described in section III.
Performance of ASS algorithm
We have calculated the percentage of accuracy of the
4, 0
( ) ( )env p ppE n E n
==∑ (7)
Figure 10: (a) An Ejection Click murmur PCG signal subsequence without artifacts, (b) Sub-bands energy envelope from artifact-free subsequence operation, (c) Peak detection and picking of significant peaks from the envelope, (d) Locating S1 and S2 sounds and (e) extracted cycles of PCG signal.
Page 31
• Figure 10(e) shows the extracted cycles.
HEART RESEARCH
Open Journalhttp://dx.doi.org/10.17140/HROJ-2-105
Heart Res Open J
ISSN 2377-164X
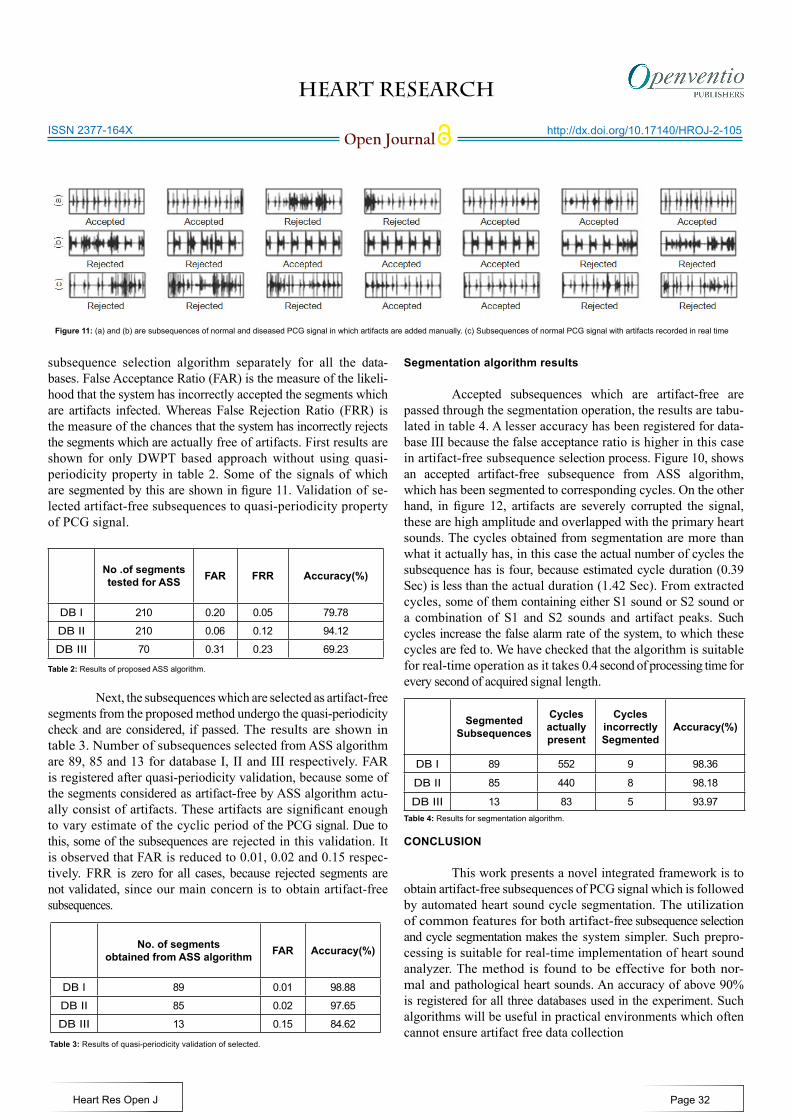
subsequence selection algorithm separately for all the data-bases. False Acceptance Ratio (FAR) is the measure of the likeli-hood that the system has incorrectly accepted the segments which are artifacts infected. Whereas False Rejection Ratio (FRR) is the measure of the chances that the system has incorrectly rejects the segments which are actually free of artifacts. First results are shown for only DWPT based approach without using quasi-periodicity property in table 2. Some of the signals of which are segmented by this are shown in figure 11. Validation of se-lected artifact-free subsequences to quasi-periodicity property of PCG signal.
Next, the subsequences which are selected as artifact-free segments from the proposed method undergo the quasi-periodicity check and are considered, if passed. The results are shown in table 3. Number of subsequences selected from ASS algorithm are 89, 85 and 13 for database I, II and III respectively. FAR is registered after quasi-periodicity validation, because some of the segments considered as artifact-free by ASS algorithm actu-ally consist of artifacts. These artifacts are significant enough to vary estimate of the cyclic period of the PCG signal. Due to this, some of the subsequences are rejected in this validation. It is observed that FAR is reduced to 0.01, 0.02 and 0.15 respec-tively. FRR is zero for all cases, because rejected segments are not validated, since our main concern is to obtain artifact-free subsequences.
Segmentation algorithm results
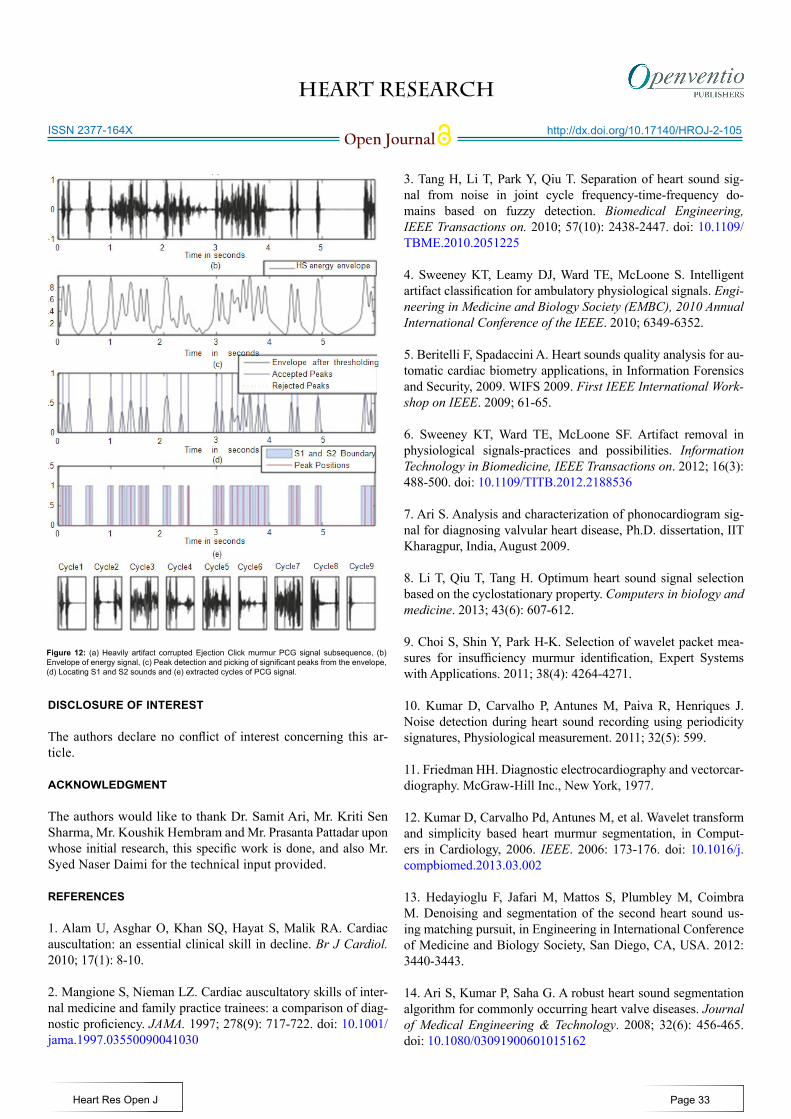
Accepted subsequences which are artifact-free are passed through the segmentation operation, the results are tabu-lated in table 4. A lesser accuracy has been registered for data-base III because the false acceptance ratio is higher in this case in artifact-free subsequence selection process. Figure 10, shows an accepted artifact-free subsequence from ASS algorithm, which has been segmented to corresponding cycles. On the other hand, in figure 12, artifacts are severely corrupted the signal, these are high amplitude and overlapped with the primary heart sounds. The cycles obtained from segmentation are more than what it actually has, in this case the actual number of cycles the subsequence has is four, because estimated cycle duration (0.39 Sec) is less than the actual duration (1.42 Sec). From extracted cycles, some of them containing either S1 sound or S2 sound or a combination of S1 and S2 sounds and artifact peaks. Such cycles increase the false alarm rate of the system, to which these cycles are fed to. We have checked that the algorithm is suitable for real-time operation as it takes 0.4 second of processing time for every second of acquired signal length.
CONCLUSION
This work presents a novel integrated framework is to obtain artifact-free subsequences of PCG signal which is followed by automated heart sound cycle segmentation. The utilization of common features for both artifact-free subsequence selection and cycle segmentation makes the system simpler. Such prepro-cessing is suitable for real-time implementation of heart sound analyzer. The method is found to be effective for both nor-mal and pathological heart sounds. An accuracy of above 90% is registered for all three databases used in the experiment. Such algorithms will be useful in practical environments which often cannot ensure artifact free data collection
Figure 11: (a) and (b) are subsequences of normal and diseased PCG signal in which artifacts are added manually. (c) Subsequences of normal PCG signal with artifacts recorded in real time
No .of segments tested for ASS FAR FRR Accuracy(%)
DB I 210 0.20 0.05 79.78
DB II 210 0.06 0.12 94.12
DB III 70 0.31 0.23 69.23
No. of segments obtained from ASS algorithm FAR Accuracy(%)
DB I 89 0.01 98.88
DB II 85 0.02 97.65
DB III 13 0.15 84.62
Table 3: Results of quasi-periodicity validation of selected.
Table 4: Results for segmentation algorithm.
Segmented Subsequences
Cycles actually present
Cycles incorrectly Segmented
Accuracy(%)
DB I 89 552 9 98.36
DB II 85 440 8 98.18
DB III 13 83 5 93.97
Page 32
Table 2: Results of proposed ASS algorithm.
HEART RESEARCH
Open Journalhttp://dx.doi.org/10.17140/HROJ-2-105
Heart Res Open J
ISSN 2377-164X
DISCLOSURE OF INTEREST
The authors declare no conflict of interest concerning this ar-ticle.
ACKNOWLEDGMENT
The authors would like to thank Dr. Samit Ari, Mr. Kriti Sen Sharma, Mr. Koushik Hembram and Mr. Prasanta Pattadar upon whose initial research, this specific work is done, and also Mr. Syed Naser Daimi for the technical input provided.
REFERENCES
1. Alam U, Asghar O, Khan SQ, Hayat S, Malik RA. Cardiac auscultation: an essential clinical skill in decline. Br J Cardiol. 2010; 17(1): 8-10.
2. Mangione S, Nieman LZ. Cardiac auscultatory skills of inter-nal medicine and family practice trainees: a comparison of diag-nostic proficiency. JAMA. 1997; 278(9): 717-722. doi: 10.1001/jama.1997.03550090041030
3. Tang H, Li T, Park Y, Qiu T. Separation of heart sound sig-nal from noise in joint cycle frequency-time-frequency do-mains based on fuzzy detection. Biomedical Engineering, IEEE Transactions on. 2010; 57(10): 2438-2447. doi: 10.1109/TBME.2010.2051225 4. Sweeney KT, Leamy DJ, Ward TE, McLoone S. Intelligent artifact classification for ambulatory physiological signals. Engi-neering in Medicine and Biology Society (EMBC), 2010 Annual International Conference of the IEEE. 2010; 6349-6352.
5. Beritelli F, Spadaccini A. Heart sounds quality analysis for au-tomatic cardiac biometry applications, in Information Forensics and Security, 2009. WIFS 2009. First IEEE International Work-shop on IEEE. 2009; 61-65.
6. Sweeney KT, Ward TE, McLoone SF. Artifact removal in physiological signals-practices and possibilities. Information Technology in Biomedicine, IEEE Transactions on. 2012; 16(3): 488-500. doi: 10.1109/TITB.2012.2188536
7. Ari S. Analysis and characterization of phonocardiogram sig-nal for diagnosing valvular heart disease, Ph.D. dissertation, IIT Kharagpur, India, August 2009.
8. Li T, Qiu T, Tang H. Optimum heart sound signal selection based on the cyclostationary property. Computers in biology and medicine. 2013; 43(6): 607-612.
9. Choi S, Shin Y, Park H-K. Selection of wavelet packet mea-sures for insufficiency murmur identification, Expert Systems with Applications. 2011; 38(4): 4264-4271.
10. Kumar D, Carvalho P, Antunes M, Paiva R, Henriques J. Noise detection during heart sound recording using periodicity signatures, Physiological measurement. 2011; 32(5): 599.
11. Friedman HH. Diagnostic electrocardiography and vectorcar-diography. McGraw-Hill Inc., New York, 1977.
12. Kumar D, Carvalho Pd, Antunes M, et al. Wavelet transform and simplicity based heart murmur segmentation, in Comput-ers in Cardiology, 2006. IEEE. 2006: 173-176. doi: 10.1016/j.compbiomed.2013.03.002 13. Hedayioglu F, Jafari M, Mattos S, Plumbley M, Coimbra M. Denoising and segmentation of the second heart sound us-ing matching pursuit, in Engineering in International Conference of Medicine and Biology Society, San Diego, CA, USA. 2012: 3440-3443.
14. Ari S, Kumar P, Saha G. A robust heart sound segmentation algorithm for commonly occurring heart valve diseases. Journal of Medical Engineering & Technology. 2008; 32(6): 456-465. doi: 10.1080/03091900601015162
Figure 12: (a) Heavily artifact corrupted Ejection Click murmur PCG signal subsequence, (b) Envelope of energy signal, (c) Peak detection and picking of significant peaks from the envelope, (d) Locating S1 and S2 sounds and (e) extracted cycles of PCG signal.
Page 33
HEART RESEARCH
Open Journalhttp://dx.doi.org/10.17140/HROJ-2-105
Heart Res Open J
ISSN 2377-164X
15. Safara F, Doraisamy S, Azman A, Jantan A, Ranga S. Wavelet packet entropy for heart murmurs classification. Advances in bio-informatics. 2012; 2012. doi: 10.1155/2012/327269
16. Choi S. Detection of valvular heart disorders using wavelet packet decomposition and support vector machine. Expert Sys-tems with Applications. 2008; 35(4): 1679-1687. doi: 10.1016/j.eswa.2007.08.078 17. Choi S, Shin Y, Park H-K. Selection of wavelet packet mea-sures for insufficiency murmur identification. Expert Systems with Applications. 2011; 38(4): 4264-4271. doi: 10.1016/j.eswa.2010.09.094 18. Feldman M. Nonparametric identification of asymmetric non-linear vibration systems with the hilbert transform. Journal of Sound and Vibration. 2012; 331(14): 3386-3396. doi: 10.1016/j.jsv.2012.02.025
19. Mondal A, Kumar AK, Bhattacharya P, Saha G. Boundary estimation of cardiac events s1 and s2 based on hilbert transform and adaptive thresholding approach. Medical Informatics and Telemedicine (ICMIT), 2013 Indian Conference on. IEEE. 2013: 43-47. doi: 10.1109/IndianCMIT.2013.6529406
Page 34