international society for soil mechanics and geotechnical ...
Upload
khangminh22Category
view
2download
0
INTERNATIONAL SOCIETY FOR
SOIL MECHANICS AND
GEOTECHNICAL ENGINEERING
This paper was downloaded from the Online Library of the International Society for Soil Mechanics and Geotechnical Engineering (ISSMGE). The library is available here: https://www.issmge.org/publications/online-library This is an open-access database that archives thousands of papers published under the Auspices of the ISSMGE and maintained by the Innovation and Development Committee of ISSMGE.
The paper was published in the proceedings of XVI Pan-American Conference on Soil Mechanics and Geotechnical Engineering (XVI PCSMGE) and was edited by Dr. Norma Patricia López Acosta, Eduardo Martínez Hernández and Alejandra L. Espinosa Santiago. The conference was held in Cancun, Mexico, on November 17-20, 2019.

Technical Session #4
“Unsaturated Soils”
Eduardo ROJAS
Dr. Eduardo Rojas is a Civil Engineer from CeNETI (Mexico) and got his master and
PhD degrees at the Institut de Méchanic de Grenoble (France). He is presently a research-
professor at the University of Querétaro, Mexico. He is chairman of the Geotechnical
Section of the Postgraduate program and president of the Technical Committee on
Unsaturated Soils of the Mexican Society of Geotechnical Engineering. He has been
entitled as National Researcher from the National Research Agency and has obtained the
González Flores Award in the area of Research from the Mexican Society of
Geotechnical Engineering. He has been granted three times the Alejandrina Award in
Research and Technology by the University of Querétaro. He has written 3 books and
published 72 peer reviewed papers. He is consultant engineer for retaining walls, shallow
and deep foundations and foundations for expansive soils. He also has been involved in
projects for the the levelling of inclined buildings.
From Research to Applied Geotechnics
N.P. López-Acosta et al. (Eds.)
© 2019 The authors and IOS Press.
This article is published online with Open Access by IOS Press and distributed under the terms
of the Creative Commons Attribution Non-Commercial License 4.0 (CC BY-NC 4.0).
doi:10.3233/ASMGE190011
149
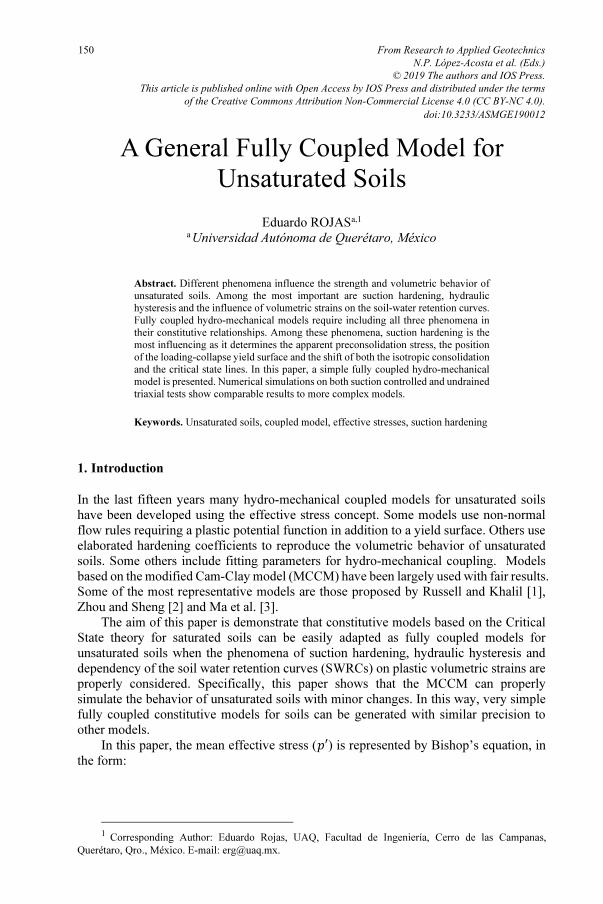
A General Fully Coupled Model for
Unsaturated Soils
Eduardo ROJASa,1 a
Universidad Autónoma de Querétaro, México
Abstract. Different phenomena influence the strength and volumetric behavior of unsaturated soils. Among the most important are suction hardening, hydraulic hysteresis and the influence of volumetric strains on the soil-water retention curves. Fully coupled hydro-mechanical models require including all three phenomena in their constitutive relationships. Among these phenomena, suction hardening is the most influencing as it determines the apparent preconsolidation stress, the position of the loading-collapse yield surface and the shift of both the isotropic consolidation and the critical state lines. In this paper, a simple fully coupled hydro-mechanical model is presented. Numerical simulations on both suction controlled and undrained triaxial tests show comparable results to more complex models.
Keywords. Unsaturated soils, coupled model, effective stresses, suction hardening
1. Introduction
In the last fifteen years many hydro-mechanical coupled models for unsaturated soils
have been developed using the effective stress concept. Some models use non-normal
flow rules requiring a plastic potential function in addition to a yield surface. Others use
elaborated hardening coefficients to reproduce the volumetric behavior of unsaturated
soils. Some others include fitting parameters for hydro-mechanical coupling. Models
based on the modified Cam-Clay model (MCCM) have been largely used with fair results.
Some of the most representative models are those proposed by Russell and Khalil [1],
Zhou and Sheng [2] and Ma et al. [3].
The aim of this paper is demonstrate that constitutive models based on the Critical
State theory for saturated soils can be easily adapted as fully coupled models for
unsaturated soils when the phenomena of suction hardening, hydraulic hysteresis and
dependency of the soil water retention curves (SWRCs) on plastic volumetric strains are
properly considered. Specifically, this paper shows that the MCCM can properly
simulate the behavior of unsaturated soils with minor changes. In this way, very simple
fully coupled constitutive models for soils can be generated with similar precision to
other models.
In this paper, the mean effective stress (��) is represented by Bishop’s equation, in
the form:
1 Corresponding Author: Eduardo Rojas, UAQ, Facultad de Ingeniería, Cerro de las Campanas,
Querétaro, Qro., México. E-mail: [email protected].
From Research to Applied Geotechnics
N.P. López-Acosta et al. (Eds.)
© 2019 The authors and IOS Press.
This article is published online with Open Access by IOS Press and distributed under the terms
of the Creative Commons Attribution Non-Commercial License 4.0 (CC BY-NC 4.0).
doi:10.3233/ASMGE190012
150

�� � �� � �� (1)
where �� � � � �� is the mean net stress defined as the total stress (�) in excess of air
pressure (��). The term �� represents the suction stress where � is Bishop’s parameter
and � � �� � �� represents suction with �� as the water pressure. Bishop’s parameter
can be obtained through a porous-solid model described in the next section.
When loading is preceded by drying in soil samples, the phenomenon of suction
hardening occurs. It is one of the most influencing phenomena when modeling the
behavior of unsaturated soils. This phenomenon arises because the components of the
effective stress: suction and net stresses, act independently one from the other. When a
soil dries, the apparent preconsolidation stress increases in a quantity dependent on the
increment of suction stress. Consider Figure 1(a) representing the volumetric behavior
of the soil in the axes logarithm of the effective mean stresses (��) versus void ratio (e).
Suppose that a saturated normally consolidated soil is initially subjected to a mean net
stress ��� indicated by point 0 in Figure 1(a). If this sample is subjected to drying, the
mean effective stress increases in the quantity ����, where �� represents the maximum
suction reached at drying and �� represents the value of Bishops parameter at this suction.
This behavior is sketched in Figure 1(b) in the axes of mean effective stress against
suction. During drying, the mean effective stress moves from 0 to A in Figure 1(a). If at
this stage, the sample is loaded by an increment of the mean net stress, an initial elastic
behavior occurs (path AB) until the apparent preconsolidation stress (��� ) is reached. This
apparent preconsolidation stress (point B) is represented by the mean effective stress at
the end of drying (point A) added by the suction stress (����) as indicated in Figure 1(b).
If the net mean stress increases further, elastoplastic strains occur (dotted path beyond B
in Figure 1(a)). This means that the increment in the apparent preconsolidation stress
after drying (point B) with respect to the initial preconsolidation stress (���) is twice the
suction stress ����, as indicated in Figure 1(b). Therefore, the loading collapse yield
surface (LCYS) runs parallel to the drying path at a horizontal stress equal to the suction
stress ���� (see Figure 1(b)). In other words, when the effective stress increases in the
quantity �����, the apparent preconsolidation stress increases in the quantity ������. This explains why unsaturated soils rapidly show highly preconsolidated behavior when
suction increases. This increase of twice the suction stress increment for the
preconsolidation stress is not considered by most constitutive models. The Barcelona
Basic Model considers this phenomenon by coupling the displacements of the LCYS
with those of the suction increase yield surface (SIYS).
In contrast, when the effective stress increases by a net stress increment ��� beyond
the LCYS, the apparent preconsolidation stress (��� ) only increases in this same quantity.
Suction hardening not only affects the position of the isotropic consolidation line (ICL)
but it pulls along the critical state line (CSL) as reported by different researchers (see for
example Wheeler and Sivakumar [4]) The shift of both lines is indicated in Figure 1(a)
where ���� and ��� represent the position of the CSL for suction equal 0 and ��,
respectively.
Related to this phenomenon comes another issue. When suction hardening is taken
into consideration to include the shift of the ICL and CSL in the constitutive model, an
anisotropic hardening of the yield surface in the effective mean stress (��� against the
deviator stress (� ) plane occurs. Consider the elliptic yield surface of the MCCM
depicted in Figure 1(b). When suction hardening occurs, the ICL and the CSL displaces
in the quantity ����. However, the critical state point (center) of an ellipse showing
E. Rojas / A General Fully Coupled Model for Unsaturated Soils 151

isotropic hardening only displaces in the quantity ���� �⁄ . Therefore, in order to displace
the CSL in the quantity ����, anisotropic hardening of the elliptic yield surface has to be
considered as shown in Figure 1(b). In spite of this, most constitutive models do not
include anisotropic hardening in their developments.
Figure 1. (a) Suction hardening displaces the ICL and the CSL in the quantity ����, (b) the yield surface shows anisotropic hardening.
Moreover, suction stress (and therefore suction hardening) does not keep increasing
with suction but it shows a maximum value and then decreases for sandy and silty soils
E. Rojas / A General Fully Coupled Model for Unsaturated Soils152

subjected to drying (Rojas [5], Lu et al. [6]). Consider a saturated soil sample subjected
to drying up to suction ��. As suction increases, elastoplastic strain occurs (path 0A in
Figure 2(a)) and the LCYS runs aside the drying path as indicated by line LCYSB in
Figure 2(b). Observe that in this last figure, the effective mean stress (horizontal axis) is
plotted in logarithmic scale, and therefore, the drying path and the LCYSB do not run
parallel to each other as previously shown in Figure 1(b). If at some point, suction stress
reaches its maximum value (point A, in Figure 2), the drying path curves to the left hand
side and shows the shape sketched in Figure 2(b). When the maximum suction stress is
reached, the apparent preconsolidation stress reaches its maximum value ���� � and the
SIYS is locked at this position indicated by line SIYSmax in Figure 2(b). Because further
drying produces the effective stress to reduce, soil sample shows a volumetric elastic
rebound (path AB in Figure 2(a)). Therefore, from the maximum suction stress and for
increasing values of suction, the LCYSB shows a vertical slope (line CC’ in Figure 2(b)).
This means that at this stage, no further yielding occurs with increasing values of suction.
This behavior has been experimentally reported by Cunningham et al. [7] and Fleureau
et al. [8]. If at the end of drying (point B), the soil is loaded by a net stress increase, it
shows an initial elastic recompression (path BC) until the apparent preconsolidation
stress is reached (point C) with a maximum suction hardening value of ������. With
further loading, the sample shows elastoplastic behavior (path CD). By the end of loading
the LCYS has displaced to the position indicated by line LCYSD.
2. Hydraulic model
The hydraulic model employed here has been presented elsewhere (Rojas [5] and [9])
and will be only briefly described here. According to an equilibrium analysis, Bishop’s
parameter can be expressed as:
� � � � �� � (2)
where � and � represent the saturated and unsaturated fractions of the soil,
respectively, and �� is the degree of saturation of the unsaturated fraction. The saturated
fraction represents the volume of all solids exclusively surrounded by saturated pores
added by the volume of these pores and divided by the total volume of the soil. The
unsaturated fraction represents the volume of solids surrounded by a combination of
saturated and dry pores added by the volume of these pores and divided by the total
volume of the soil. Finally, the degree of saturation of the unsaturated fraction is the
volume of saturated pores divided by the total volume of pores both within the
unsaturated fraction of the sample. For fully coupled models, these three parameters
depend on the current value of suction and the whole wetting-drying and loading-
unloading paths applied to the soil sample. Their value can be obtained using a porous-
solid model based on the pore size distribution (PSD) and grain size distribution of the
material (Rojas [5]). The PSD of a soil can be obtained indirectly from the porous-solid
model when the experimental SWRCs at wetting and drying are provided. This can be
accomplished, by successively proposing different values for the mean size and standard
deviation for bonds and sites until the best fit between numerical and experimental curves
is reached. This procedure is eased by the fact that bonds control the drying curve while
the wetting curve is controlled by sites (Dullien [10]).
E. Rojas / A General Fully Coupled Model for Unsaturated Soils 153

Figure 2. Loading after elastic rebound during drying. (a) Volumetric behavior and (b) stress path and yield surfaces at different stages.
3. Mechanical model
Anisotropic hardening was included in the model by Loret and Khalil [11]. This model
considers a yield surface that can modify the position of the critical state with respect to
the apparent preconsolidation stress. This feature was implemented by splitting the yield
E. Rojas / A General Fully Coupled Model for Unsaturated Soils154

surface in two ellipses that meet horizontally at the critical state in the axes of effective
mean stress versus deviator stress. Here a similar approach is considered except that the
two curves forming the yield surface can have different shapes (not only ellipses) and
therefore a large number of combinations can be considered for the geometry of the yield
surface in addition to the position of the critical state. The proposed equations for the left
(dilating behavior) and the right side (compressive behavior) of the yield surface are:
��� ���������� ��� � |�� � � ��
� |��� �
��� � � �� � ��
�� ����� � � �����
� |�� � � ��� |��� �
(3)
where a1 and a2 represent the exponent of the left and right side of the yield surface,
respectively, while b is the ratio between the preconsolidation effective stress and the
effective mean stress at the critical state. The left and right side of the yield surface are
established according to the position of the critical mean stress ��̅�� .
Equations (3) ensures that for any combination of values where a1, a2 > 1, and 0 < b
< 1, both segments of the yield surface meet horizontally at the critical state and reach
vertically the effective mean stress axis. Different combinations for parameters a1, a2 and
b are represented in Figure 3. The three numbers for each surface, represent the values
of parameters a1, a2 and b, in this order.
Figure 3. Different shapes and positions of the critical state for the yield surface in the (p’, q) plane.
When few experimental results are available, the yield surface can take the usual
ellipsoidal shape of the MCCM (a1 = a2 = 2) while the position of the critical state with
respect to the preconsolidation stress (parameter b) can take values in the range between
0.4 - 0.6.
Accordingly, the stiffness matrix for the mechanical model used herein is similar to
the Modified Cam Clay Model and results in:
�
����
���
����
���
����
���
� ���� ��� ���� ���
������������
������������ ��� �����
��������� �������� ������������������
�
E. Rojas / A General Fully Coupled Model for Unsaturated Soils 155

��� ������ � �
�� ���!������� � ��
��������� ��������
�������� ����������
����������������
�����
" #����� $ (4)
with
% � & ���
�� ������ ��
' ( �
��������
�����!�������"�
�����) (5)
!� � �⟨��⟩� ⟨�#⟩ , �
���-� , !# � �⟨��⟩� ⟨�#⟩� � ��� , !$ � �⟨��⟩� �⟨�#⟩� � ���, !% � �⟨��⟩� ⟨�#⟩��.
� can take the value � or # depending which side of the yield surface hits the stress
path: � for the left side and # for the right side. Similarly, ⟨��⟩ and ⟨�#⟩ represent the
step function for the left and right side of the yield surface, respectively, and can take the
value 1 or 0, depending on the side reached by the stress path. It can be observed that the
stiffness matrix remains symmetric which makes this model suitable for finite elements
algorithms.
The elastic behavior is considered dependent on the effective mean stress and current
void ratio. In this way, the bulk (.) and shear modulus (/) are given by the equations:
. � � 00 ��1 / �
�� � �2��� � 2� � � 0�0 ��1 (6)
where 2 represents the Poison ratio and 1 the slope for the URL. Finally, the common
hardening law for the yield surface is adopted here
���� �
3���4 � 5 �� � (7)
Then, in order to simulate the behavior of unsaturated soil samples during triaxial
tests, the proposed model requires the following parameters: M, λ, κ, ν, a1, a2 and b in
addition to the grain size distribution, the main wetting and drying retention curves for a
certain confining stress and the initial state of the sample (e0, ����, �̅�, ��, ��).
4. Numerical and experimental comparisons
Two sets of controlled suction drained triaxial tests performed by different authors where
compared with the numerical results to verify the precision of the proposed model. The
first set of tests was carried out by Futai and Almeida [12]. These authors performed
suction controlled triaxial tests on undisturbed tropical soil samples obtained at the
depths of 1 and 5 m. The PSD of samples obtained at 1m in depth show a bi-modal
structure and were chosen for the simulations presented here. The degree of saturation
during sampling was of the order of 80 to 96%. Suction in the triaxial cells was controlled
E. Rojas / A General Fully Coupled Model for Unsaturated Soils156

using the axis translation technique. Volume change of soil samples in the triaxial cell
were obtained using an automated rolling diaphragm device. Some isotropic tests at
different values of suction were also performed and are shown in Figure 4. These results
were used to obtain the values of parameters 4 and 1. A set of saturated triaxial tests
were performed on this material and reported elsewhere (Futai and Almeida [13]). These
tests were used to obtain parameters M, a1, a2 and f of the soil. Figure 5 shows the
experimental points with the numerical fitting for these tests. The adopted values of the
parameters of the model are listed in Table 1.
Figure 4. Experimental isotropic compression tests performed at different suctions (in MPa) and numerical fitting to set model parameters. Experimental data after Futai and Almeida [12].
(a)
Figure 5. Experimental results from saturated samples at different confining stresses (in MPa) and numerical fitting to set model parameters. Experimental data after Futai and Almeida [13].
0.8
0.9
1
1.1
1.2
0.1 1
Vo
id r
ati
o
Mean net stress (MPa)
Ex (0) Ex (0.1) Ex (0.3)
N (0) N (0.1) N (0.3)
0
0.5
1
1.5
0 0.05 0.1 0.15 0.2 0.25 0.3
Devia
tor
str
ess (
MP
a)
Vertical strain
0.025 (Ex) 0.2 (Ex) 0.6 (Ex)
0.025 (N) 0.2 (N) 0.6 (N)�������
E. Rojas / A General Fully Coupled Model for Unsaturated Soils 157

(b)
Figure 5. (continued) Experimental results from saturated samples at different confining stresses (in MPa) and numerical fitting to set model parameters. Experimental data after Futai and Almeida [13].
Table 1. Parameters of the model for test reported by Futai and Almeida [13].
Parameter M λ κ v a1 a2 f
Value 1.3 -0.25 -0.04 0.25 1.8 2.0 0.6
The experimental and numerical results of tests performed at two constant values of
suction (0.1 and 0.3 MPa) and different confining stresses are shown in Figure 6.
(a)
Figure 6. Experimental and numerical results comparison for triaxial tests at suctions of 0.1 and 0.3 MPa and different confining stresses (in MPa). Experimental data after Futai and Almeida [12].
-0.15
-0.1
-0.05
0
0.05
0.1
0 0.05 0.1 0.15 0.2 0.25 0.3
Vo
lum
etr
ic s
train
Vertical strain
0.025 (Ex) 0.2 (Ex) 0.6 (Ex)
0.025 (N) 0.2 (N) 0.6 (N)
�������
0
0.5
1
1.5
2
0 0.05 0.1 0.15 0.2 0.25 0.3De
via
tor
str
es
s (
MP
a)
Vertical strain
0.025 (Ex) .05 (Ex) 0.2 (Ex) 0.4 (Ex)
0.025 (N) 0.05 (N) 0.2 (N) 0.4 (N)
�������
E. Rojas / A General Fully Coupled Model for Unsaturated Soils158

(b)
(c)
Figure 6. (continued) Experimental and numerical results comparison for triaxial tests at suctions of 0.1 and 0.3 MPa and different confining stresses (in MPa). Experimental data after Futai and Almeida [12].
-0.15
-0.1
-0.05
0
0.05
0.1
0 0.05 0.1 0.15 0.2 0.25 0.3
Vo
lum
etr
ic s
tra
in
Vertical strain
0.025 (Ex) 0.05 (Ex) 0.2 (Ex) 0.4 (Ex)
0.025 (N) 0.05 (N) 0.2 (N) 0.4 (N)
�������
0
0.5
1
1.5
2
0 0.05 0.1 0.15 0.2 0.25 0.3De
via
tor
str
es
s (
MP
a)
Vertical strain
0.025 (Ex) 0.05 (Ex) 0.2 (Ex) 0.5 (Ex)
0.025 (N) 0.05 (N) 0.2 (N) 0.5 (N)
�������
E. Rojas / A General Fully Coupled Model for Unsaturated Soils 159

(d)
Figure 6. (continued) Experimental and numerical results comparison for triaxial tests at suctions of 0.1 and 0.3 MPa and different confining stresses (in MPa). Experimental data after Futai and Almeida [12].
Although numerical results fit well with saturated experimental data, some
differences are observed when modeling unsaturated samples. In general, for samples
tested at a suction of 0.1 MPa, the numerical deviator stress at failure results smaller with
respect to experimental results (see Figure 6(a)) except for the test performed at a
confining stress of 0.05 MPa. In contrast the predicted volumetric strain during shearing
show larger values during compression (see Figure 6(b)). For samples tested at a suction
of 0.3 MPa, the numerical results agree better with experimental data except for the
sample tested at a confining stress of 0.5 MPa. In that sense, the experimental results in
the stress-strain plot (Figure 6(c)) show some inconsistencies related to the low stiffness
and strength of this sample with respect to the other tests performed at the same suction
(see Figure 6(c)).
The second set of experiments was performed by Garakani, et al [14]. They
conducted suction controlled triaxial tests in a modified triaxial cell. Suction was
controlled using the axis translation technique. Volume changes in the triaxial cell and
soil sample were measured using automated volume change devices. These volume
changes were corrected after a careful calibration of the equipment. Before shearing,
samples were subjected to suction equilibrium followed by isotropic compression.
Suctions varied from 0.1 to 0.4 MPa while isotropic stresses varied from 0.05 to 0.4 MPa.
Figure 7 shows some numerical and experimental comparisons for triaxial tests
performed at a constant suction of 0.4 MPa and different confining stresses. Table 2
shows the parameters used to simulate these tests.
Table 2. Parameters of the model for test reported by Garakani et al. [14].
Parameter M λ κ ν a1 a2 b
Value 1.15 -0.25 -0.015 0.25 2.0 1.8 0.5
-0.15
-0.1
-0.05
0
0.05
0.1
0 0.05 0.1 0.15 0.2 0.25 0.3
Vo
lum
etr
ic s
tra
in
Vertical strain
0.025 (Ex) 0.05 (Ex) 0.2 (Ex) 0.5 (Ex)
0.025 (N) 0.05 (N) 0.2 (N) 0.5 (N)
�������
E. Rojas / A General Fully Coupled Model for Unsaturated Soils160
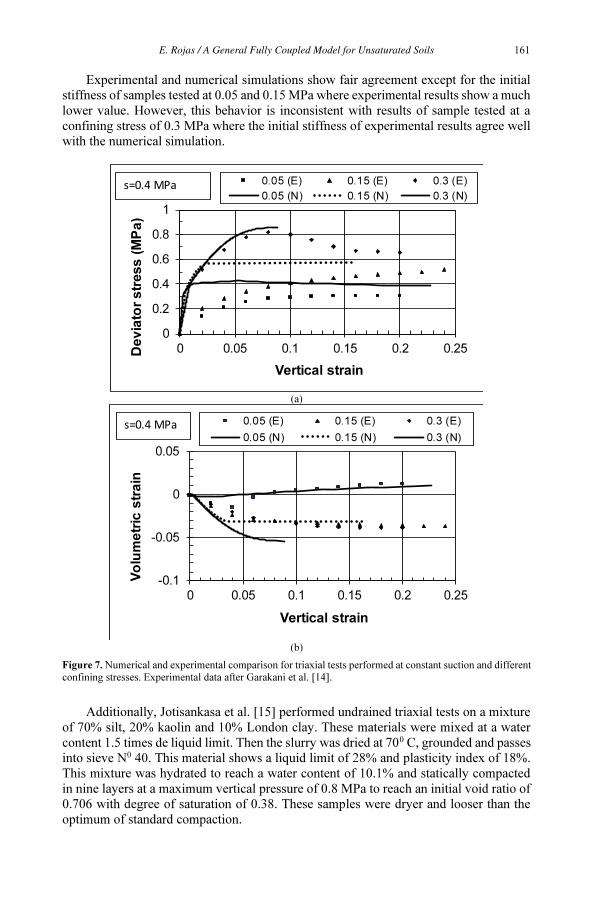
Experimental and numerical simulations show fair agreement except for the initial
stiffness of samples tested at 0.05 and 0.15 MPa where experimental results show a much
lower value. However, this behavior is inconsistent with results of sample tested at a
confining stress of 0.3 MPa where the initial stiffness of experimental results agree well
with the numerical simulation.
(a)
(b)
Figure 7. Numerical and experimental comparison for triaxial tests performed at constant suction and different confining stresses. Experimental data after Garakani et al. [14].
Additionally, Jotisankasa et al. [15] performed undrained triaxial tests on a mixture
of 70% silt, 20% kaolin and 10% London clay. These materials were mixed at a water
content 1.5 times de liquid limit. Then the slurry was dried at 700 C, grounded and passes
into sieve N0 40. This material shows a liquid limit of 28% and plasticity index of 18%.
This mixture was hydrated to reach a water content of 10.1% and statically compacted
in nine layers at a maximum vertical pressure of 0.8 MPa to reach an initial void ratio of
0.706 with degree of saturation of 0.38. These samples were dryer and looser than the
optimum of standard compaction.
0
0.2
0.4
0.6
0.8
1
0 0.05 0.1 0.15 0.2 0.25De
via
tor
str
es
s (
MP
a)
Vertical strain
0.05 (E) 0.15 (E) 0.3 (E)
0.05 (N) 0.15 (N) 0.3 (N)�������
-0.1
-0.05
0
0.05
0 0.05 0.1 0.15 0.2 0.25
Vo
lum
etr
ic s
tra
in
Vertical strain
0.05 (E) 0.15 (E) 0.3 (E)
0.05 (N) 0.15 (N) 0.3 (N)�������
E. Rojas / A General Fully Coupled Model for Unsaturated Soils 161
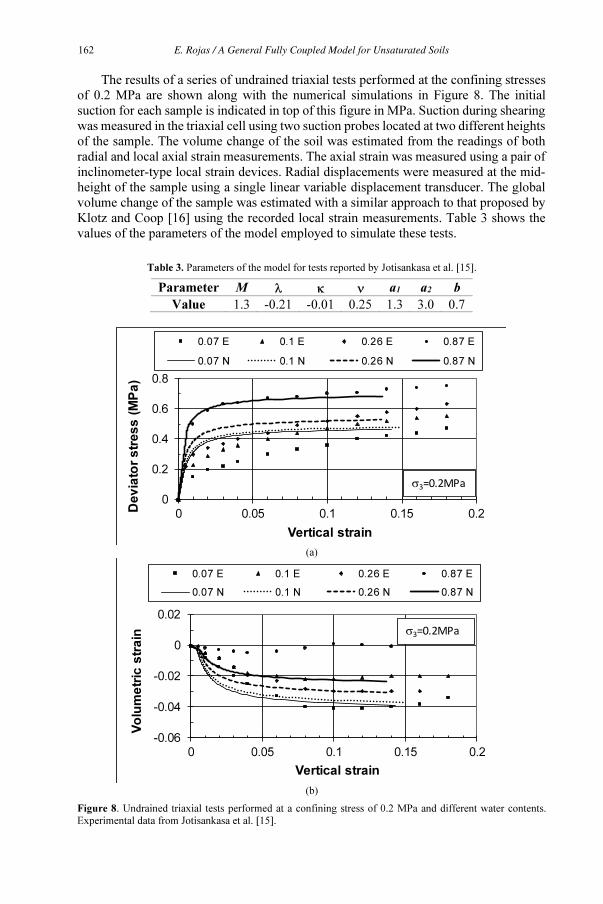
The results of a series of undrained triaxial tests performed at the confining stresses
of 0.2 MPa are shown along with the numerical simulations in Figure 8. The initial
suction for each sample is indicated in top of this figure in MPa. Suction during shearing
was measured in the triaxial cell using two suction probes located at two different heights
of the sample. The volume change of the soil was estimated from the readings of both
radial and local axial strain measurements. The axial strain was measured using a pair of
inclinometer-type local strain devices. Radial displacements were measured at the mid-
height of the sample using a single linear variable displacement transducer. The global
volume change of the sample was estimated with a similar approach to that proposed by
Klotz and Coop [16] using the recorded local strain measurements. Table 3 shows the
values of the parameters of the model employed to simulate these tests.
Table 3. Parameters of the model for tests reported by Jotisankasa et al. [15].
Parameter M λ κ ν a1 a2 b
Value 1.3 -0.21 -0.01 0.25 1.3 3.0 0.7
(a)
(b)
Figure 8. Undrained triaxial tests performed at a confining stress of 0.2 MPa and different water contents. Experimental data from Jotisankasa et al. [15].
0
0.2
0.4
0.6
0.8
0 0.05 0.1 0.15 0.2
De
via
tor
str
es
s (
MP
a)
Vertical strain
0.07 E 0.1 E 0.26 E 0.87 E
0.07 N 0.1 N 0.26 N 0.87 N
������
-0.06
-0.04
-0.02
0
0.02
0 0.05 0.1 0.15 0.2
Vo
lum
etr
ic s
tra
in
Vertical strain
0.07 E 0.1 E 0.26 E 0.87 E
0.07 N 0.1 N 0.26 N 0.87 N
������
E. Rojas / A General Fully Coupled Model for Unsaturated Soils162

(c)
Figure 8. (continued) Undrained triaxial tests performed at a confining stress of 0.2 MPa and different water contents. Experimental data from Jotisankasa et al. [15].
Related to the strength, the numerical simulations show fair agreement. Related to
the volumetric strain, discrepancies occur mainly for the sample tested at the initial
suction of 0.87 MPa in Figure 8(b) where the model predicts compression while the
experimental results show a small dilation. In spite of these discrepancies, the variation
in suction during shearing is well predicted by the model as shown in Figure 8(c).
5. Conclusions
By including the phenomena of suction hardening, the shift of retention curves with
volumetric strains and the hysteresis of the SWRCs, the modified Cam-Clay model can
fairly simulate the behavior of unsaturated soils. The inclusion of these phenomena does
not affect the symmetry of the stiffness matrix which results advantageous for analysis
based on the finite element method. In this way, this model keeps the simplicity of the
modified Cam-Clay model.
The yield surface proposed herein can adopt different shapes and includes the
phenomenon of anisotropic hardening meaning that the location of the critical state point
on the yield surface displaces according to the suction hardening phenomenon.
References
[1] Russell A and Khalil N. (2006). “A unified bounding surface model for unsaturated soils”. International
Journal for Numerical and Analytical Methods Geomechanics, 30: 181-212. [2] Zhou A and Sheng D. (2015). “An advanced hydro-mechanical constitutive model for unsaturated soils
with different initial densities”. Computers & Geotechnics, 63: 46-66. [3] Ma T, Wei C, Wei H and Li W. (2015). “Hydraulic and mechanical behavior of unsaturated silt:
experimental and theoretical characterization”. International Journal Geomechanics, 16(6): D4015007:1-13.
[4] Wheeler SJ and Sivakumar V. (1995). “An elastoplastic critical state framework for unsaturated soil”. Géotechnique; 45: 35-53.
[5] Rojas E. (2008). “Equivalent stress equation for unsaturated soils. Part II: The porous-solid model”.
E. Rojas / A General Fully Coupled Model for Unsaturated Soils 163

International Journal of Geomechanics, 8, 291-300. [6] Lu N, Kim YK, Lee SJ and Lee SR. (2012). “Relationship between the soil-water characteristic curve and
suction stress characteristic curve: experimental evidence from residual soils”. Journal of the Geotechnical Geoenvironmental Engineering, 138: 47-57.
[7] Cunningham MR, Ridley AM, Dineen K and Burland JB. (2003). “The mechanical behavior of reconstituted unsaturated silty clay”, Géotechnique, 53: 183-194.
[8] Fleureau J-M, Kheirbek-Saoud S, Soemitro R. and Taibi S. (1993). “Behavior of clayey soils on drying-wetting pahs”. Canadian Geotechnical Journal, 30: 287-296.
[9] Rojas E. (2013). Towards a unified soil mechanics theory, Bentham Science Publishers, Open access ebook, UAE, 190 p. [10] Dullien FAL. Porous media, fluid transport and pore structure, Academic Press, USA; 1992.
[11] Loret B and Khalil N. (2002). “Effective stress elastic-plastic model for unsaturated porous media”. Mechanics of Materials, 34: 97-116.
[12] Futai MM and Almeida SS. An experimental investigation of the mechanical behavior of an unsaturated gneiss residual soil. Géotechnique 2005; 55: 201-213.
[13] Futai MM and Almeida SS. Yield, strength, and critical state behavior of a tropical saturated soil. J Geotech Geoenviron Engng, 2004; 130: 1169-1179.
[14] Garakani AA, Haeri SM, Khosravi A and Habibagahi G. (2015). “Hydro-mechanical behavior of undisturbed collapsible loessial soils under different stress state conditions”. Engineering Gelogy, 195: 28-41.
[15] Jotisankasa A., Coop M. and Ridley A. (2009). “The mechanical behavior of an unsaturated compacted silty clay”. Géotechnique, 59, 415-428.
[16] Klotz E. U. and Coop M. R. (2002). “On the identification of critical state lines for sand”. ASTM Geotech.
Test. J., 25(3), 289-302.
E. Rojas / A General Fully Coupled Model for Unsaturated Soils164
Copyright © 2022 FDOKUMEN