Automated Photogrammetric Network Design Using the Parisian Approach
International Relations: A Network Approach 1
International Relations: A Network Approach
Zeev Maoz School of Government and Policy and
Department of Political Science Tel-Aviv University
Tel-Aviv 69978, Israel [email protected]
Lesley G. Terris Department of Political Science
Tel-Aviv University Tel-Aviv 69978, Israel [email protected]
Ranan D. Kuperman
Department of Political Science University of Haifa Haifa 31905, Israel
Ilan Talmud Department of Sociology and Anthropology
University of Haifa Haifa 31905, Israel
February, 2003
Prepared for presentation at a the Gilman Conference on New Directions in Interna-tional Relations, Yale University February 21-23, 2003

International Relations: A Network Approach
1. Introduction Over the last twenty years, the study of international has made revolutionary leaps in a number of fields. We have learned more about the causes of war and the con-ditions for peace in the past twenty years than we had in the preceding eighty years of the twentieth century. Despite continuing debates in the field, the scientific study of interna-tional relations can tell us—in as precise terms as possible in the social sciences—that joint democracy, participation in international organizations, alliances, and—to a lesser extent—economic interdependence reduce significantly the probability of dyadic conflict and war. They can also tell us that geographic contiguity, a history of past conflict, parity in military capabilities, and the international status of dyad members (major powers, re-gional powers, vs. small powers) increase significantly the probability of international conflict between states (Russett and Oneal 2000).
We know, for example, that there is enormous inequality in terms of national and dyadic conflict involvement patterns: a vast majority of the states have been involved in a small number of disputes and wars, while few states have been involved in the vast ma-jority of disputes and wars. The same applies for dyadic conflict patterns: a small fraction of politically relevant dyads are responsible for the vast majority of MIDs and wars in the past two centuries. These dyads are composed mostly of enduring rivals; dyads the members of which repeatedly fight each other. The characteristics of these dispute prone states and dyads are also clearly discernible. The high-risk population in terms of expo-sure to conflict consists of powerful, economically developed, states that have many neighbors, as well as politically unstable states. Jointly democratic dyads tend to be pa-cific (Maoz, 2000a).
Despite these dramatic strides in knowledge accumulation, the empirical study of
international politics is still characterized by significant puzzles. Much of the knowledge gained over the past few years was due to the abandonment of the systemic level of analysis in favor of an almost exclusive focus on the dyadic level. National level studies of international relations using quantitative data have also been quite rare recently. At-tempts to combine levels of analysis in the study of important questions such as the relationship between democracies and war reveal important puzzles (Maoz, 2001, Ray, 2001). The same applies for the relationship between alliances and international conflict (Maoz, 2000b). The decline in popularity of systemic studies of world politics, however, does not diminish the importance of this level in our ability to reach a comprehensive understanding of international processes over time. Nor does the focus on dyadic level diminish from the fact that certain trends in international relations over the last two cen-turies have assumed regional patterns. For example, Ward and Gleditsch (2000) argue persuasively for a spatial effect on the relationship between democratization and war.
These points pose us with an old/new challenge. How do we develop a better
understanding of international relations that is (a) general, i.e., focuses on the entire set of units that we wish to study (i.e., states, dyads, regions, global systems), (b) dynamic, i.e., allows us to trace changes over time in the phenomena under study, (c) multi-level, i.e., allows us to meaningfully connect processes at one level of aggregation to processes at other levels of aggregation, and (d) logically-coherent, i.e., embedded in a unifying logical framework rather than based on distinct and loosely-related theoretical frameworks.

International Relations: A Network Approach 2
In this paper we seek to provide the general contours of an approach that may well meet these challenges. We offer a conceptual and methodological scheme that iden-tifies international relations as a set of networks, networks that are interrelated to each other at a given point in time, and over time. We suggest that this framework can provide us new and more general insights into the evolution of international relations, in the sense that it has the potential of meetings all of the elements of the challenge we posed above. We identify the basic characteristics of the network approach to international politics. We discuss some of the directions this approach may be taken and some ways of better fitting the network approach to the study of international politics. We illustrate some of the advantages of this network through the use of an example with alliance data. We conclude with a brief discussion of the theoretical and empirical implications of this approach. We start with a very brief overview of the network literature. 3. Network Literature: General Approach and IR Applications1 Wasserman and Faust (1994: 10-11) note that the development of social network analysis has evolved independently in several social science disciplines. Pioneering studies in this genre evolved in sociology, social psychology, and anthropology. From there, so-cial network approaches have proliferated into all of the social science disciplines (Wasserman and Faust, 1994: 5-6). The social network approach can be likened to the rational choice approach: both contain a set of fundamental assumptions and analytical tools that can be applied to a wide variety of problems across substantive disciplines. Network analysis consists of a series of analytical measures that allow systematic description of the system of relationship and among units. Some measures describe the entire system of relationships. Other measures allow description of subsystems. Still other allow comparison of subgroups of the system. Finally, a host of measures allows comparison between and among units (Wasserman and Faust, 1994). Because it offers a unified framework for describing social relations at various levels, network analysis al-lows a wide variety of applications. In that respect, as we will argue, we can adapt it easily to the analysis of international relations.
Whereas the rational choice approach has received significant attention in inter-national relations research, the social network approach has rarely been used in international relations. In its infancy, this approach was used to study transaction flows in the international system (Brams, 1966, 1969). Since then, there is little evidence of the use of network approaches by IR scholars to examine international problems. On the other hand, a number of sociologists attempted to study aspects of the “world system” through network approaches (e.g. Snyder and Kick, 1979, Steiber, 1979; Nemeth and Smith, 1985; Van Rossem, 1986). Knoke (1990) who reviews the literature on political networks almost does not mention international relations applications by political scien-tists.
One of the few recent attempts to examine international political problems using
a network analytic approach was Maoz (2001) who applied a rather rudimentary network conception in an attempt to resolve the level of analysis problem in the democratic peace phenomenon. This effort seemed quite promising in that it suggested that the democratic 1 This is a very brief and superficial review of the network literature. Wasserman and Faust (1994)
offer a comprehensive review of social network studies. Knoke (1990) offers a comprehensive review of the use of network approaches in political science. Maoz, Terris, and Kuperman (2002) offer a more elaborate review of network literature as it relates to international relations.
International Relations: A Network Approach 3
peace puzzle can be resolved through a better understanding of the interaction of de-mocratic states with their politically relevant international environment (PRIE). This attempt led us to develop a more systematic and general network conceptualization of international politics (Maoz, Terris, and Kuperman, 2002; Maoz, Terris, Kuperman, and Talmud, 2002). In these papers we argued that it is possible to develop a multilayered and evolutionary perspective of international politics using a networks approach. Our ap-proach in these papers was systemic. It is useful to focus on the latter paper in order to demonstrate the potential use of this approach.
In that paper, we argued that the evolution of the international system could be
traced by examining the ebb and flow of changes in different types of international net-works. Some of these networks are relational; they describe how actors are linked with other actors in terms of certain ties, such as formal alliances. Some of these networks are affiliational: they describe how actors are organized in terms of their affiliation with some attributes—such as their ethnic composition and their regime structure. This paper at-tempts to trace the evolution of the international system in terms of changes in a number of networks including alliance networks, democratic networks, and ethnic networks. We showed that several characteristics of alliance networks (such as their density and clique structure) tend to positively affect the extent of international conflict in the system. Likewise, the density of ethnic networks has an inverse effect on the extent of interna-tional conflict. Finally, in the twentieth century, the structure of democratic networks had a significantly dampening effect on the level of conflict and war in the international sys-tem.
These findings suggest that a general understanding of systemic structure has a
significant potential for the study of war and peace in international politics. This under-standing, however, must be couched in a suitable network-related framework. This is to what we turn to next.
3. International Relations Are About Networks Social interactions in general, and international interactions, in particular, can be conceived of as a set of networks. A network is a group of units bound together by a certain rule, link, or other type of connection. We can describe these interactions from the point of view of a specific unit—individual, or state—for example, the relations of the United States with its allies. We can describe these interactions from the point of view of a subset of the units—for example, the politics of NATO. We can describe these interactions from the perspective of the entire system—for example, the polarity of the alliance configuration in the international system prior to World War I. The problem is, however, that our se-lection of units of analysis and of a given substantive problem determines in many respects our general choice of theoretical models, methods, and the substantive results. As these examples indicate, it would be difficult to use a unified theory and an identical set of methods to study the US behavior towards its allies, the politics of NATO, and the effect of the polarity of the system on the outbreak of WWI. J. David Singer’s classical essay on the level of analysis problem (1961) makes this point very clear.
Moreover, when we wish to study the relationship among types of relations: for example between IGO membership, alliances, regime type and conflict, we run into complex theoretical and methodological problems that typically require us to reduce the problem by focusing on a specific level of analysis and by reducing its complexity through some choices of units, subsets of data (e.g., political relevance), and by methodo-
International Relations: A Network Approach 4
logical devices that provide for controls. But these reductions carry a price: they reduce our ability to generalize. If we could preserve all our analyses within a unifying frame-work that contains an integrated set of concepts, theories, and methods, we could achieve a better sense of cumulation. In most cases, however, we use different concepts for different problems, rely on different theoretical frameworks and different method-ologies, and our substantive findings differ so much that cumulation is rendered difficult, if not impossible.
Consider for example Russet and Oneal’s (2001) triangle of factors—democracy,
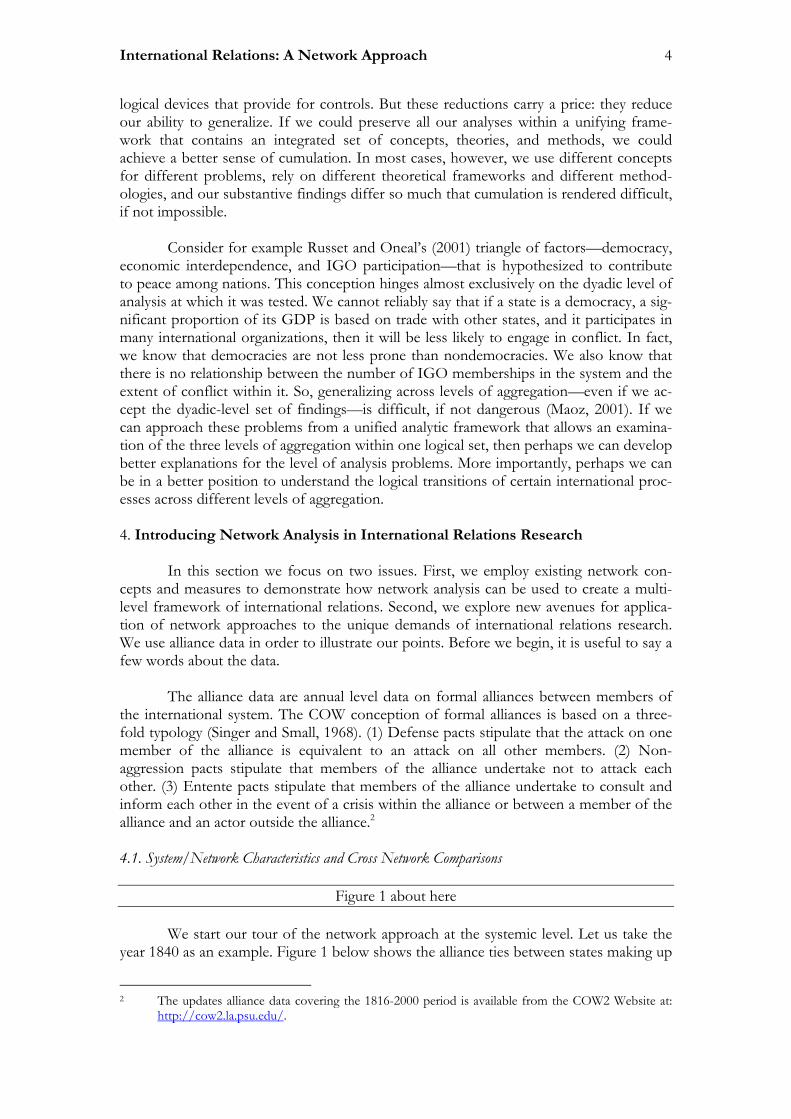
economic interdependence, and IGO participation—that is hypothesized to contribute to peace among nations. This conception hinges almost exclusively on the dyadic level of analysis at which it was tested. We cannot reliably say that if a state is a democracy, a sig-nificant proportion of its GDP is based on trade with other states, and it participates in many international organizations, then it will be less likely to engage in conflict. In fact, we know that democracies are not less prone than nondemocracies. We also know that there is no relationship between the number of IGO memberships in the system and the extent of conflict within it. So, generalizing across levels of aggregation—even if we ac-cept the dyadic-level set of findings—is difficult, if not dangerous (Maoz, 2001). If we can approach these problems from a unified analytic framework that allows an examina-tion of the three levels of aggregation within one logical set, then perhaps we can develop better explanations for the level of analysis problems. More importantly, perhaps we can be in a better position to understand the logical transitions of certain international proc-esses across different levels of aggregation. 4. Introducing Network Analysis in International Relations Research In this section we focus on two issues. First, we employ existing network con-cepts and measures to demonstrate how network analysis can be used to create a multi-level framework of international relations. Second, we explore new avenues for applica-tion of network approaches to the unique demands of international relations research. We use alliance data in order to illustrate our points. Before we begin, it is useful to say a few words about the data. The alliance data are annual level data on formal alliances between members of the international system. The COW conception of formal alliances is based on a three-fold typology (Singer and Small, 1968). (1) Defense pacts stipulate that the attack on one member of the alliance is equivalent to an attack on all other members. (2) Non-aggression pacts stipulate that members of the alliance undertake not to attack each other. (3) Entente pacts stipulate that members of the alliance undertake to consult and inform each other in the event of a crisis within the alliance or between a member of the alliance and an actor outside the alliance.2 4.1. System/Network Characteristics and Cross Network Comparisons
Figure 1 about here We start our tour of the network approach at the systemic level. Let us take the year 1840 as an example. Figure 1 below shows the alliance ties between states making up
2 The updates alliance data covering the 1816-2000 period is available from the COW2 Website at:
http://cow2.la.psu.edu/.

International Relations: A Network Approach 5
the interstate system that year. We will call this as the adjacency matrix of alliances in 1838. What this matrix describes is the set of 30 states (listed lexicographically as the leftmost column and the topmost row), and the existence of alliance ties between a set of states. For the time being, we look at alliance relations in binary terms only. The matrix shows only direct links between states. Note that this matrix is a square n×n symmetric matrix (such that each entry aij=aji).3 One way of examining the attributes of this particular ma-trix is by measuring its density, by
1 12 1
n n
iji j
aD
n= ==
−
∑∑ (1.1)
Where D is the density of the matrix. This simply measures the proportion of alliance ties of all possible alliance ties in the system. As noted, the matrix given in Figure 1 provides only first-order alliance ties. What it does not show is indirect, that is, second-, third-, …n-1 degree alliance ties between states. To get this information, we calculate a reachability matrix, R, defined as
1
1
ni
iR A
−
=
=∑ (1.2)
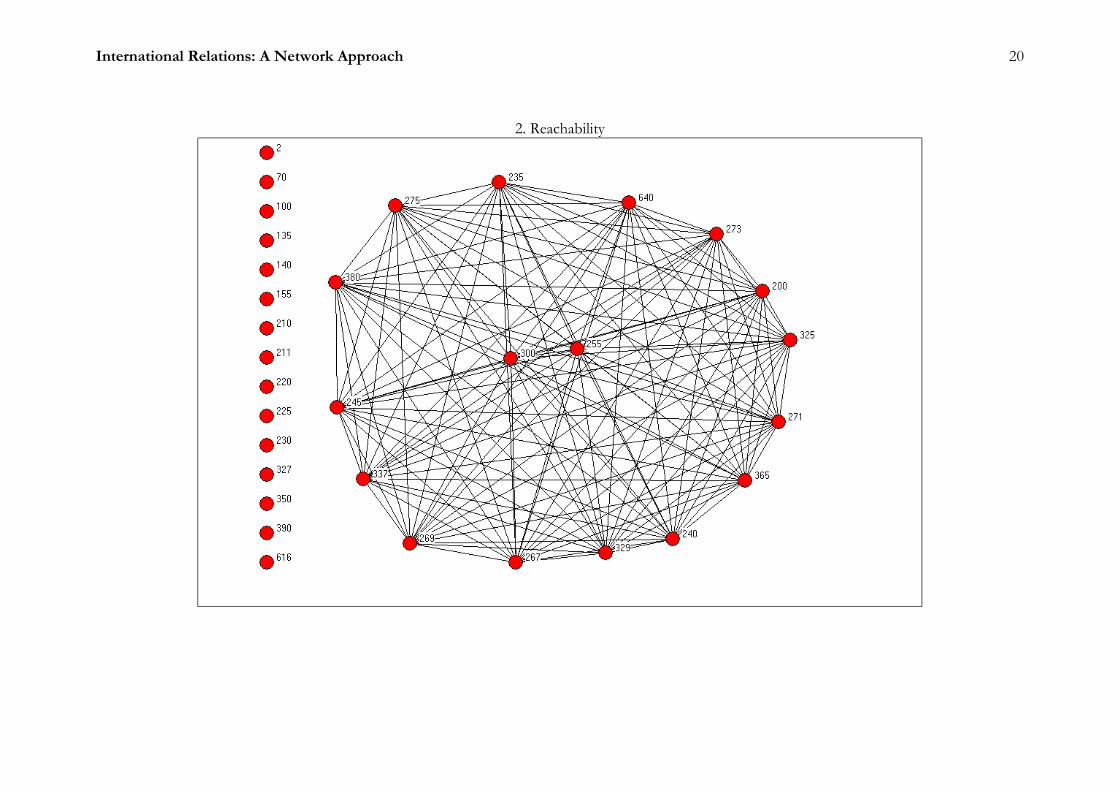
Specifically, the first-order adjacency matrix can be denoted as A1. When squared, the product matrix A2 contains all the second-order alliance relations (the allies of my ally). For example, in the first order adjacency matrix, Sardinia (state #325) is connected with Austria-Hungary (state #300) who is connected with Hanover (state #240). However, Sardinia does not have a direct alliance with Hanover. When the squared adjacency ma-trix A2 is multiplied again by the initial adjacency matrix, we get third-order alliance ties, and so forth. The sum of all adjacency matrices (normalized to a binary matrix) tells us if two states are reachable, that is, if there is any kind of alliance tie—direct or indirect—between them.4 Networks can be represented by directed on (as in our case) non-directed graphs. In order to show the difference between a description of an alliance system based on first-order adjacency and an alliance system based on reachability, consider Figure 2 We can compare the densities of the first order adjacency matrix, 0.104 with the density of the reachability matrix (0.283) and see that the density of the latter is almost three times that of the former. This implies that looking only at direct alliance ties between states causes considerable omission.
Figure 2 about here There are additional ways of examining this system of alliances. One is to exam-ine the clique structure of this system. Briefly a clique is a set of three or more actors who are directly connected with each other.5 In this system, there are two cliques, shown in Table 1. (This can also be inferred from Figure 2.1, but it is more difficult.) 3 Diagonal entries are set to zero, because nonzero entries on the main diagonal have a special
meaning in network analysis. 4 We will discuss below problems of interpreting reachability matrices in the context of such links as
alliances, and ways of dealing with these problems. 5 There is also the concept of N-cliques that refers to cliques the members of which are tied to one
another through N indirect nodes. For example cliques of 2nd order are cliques that are made up of

International Relations: A Network Approach 6
Table 1: Clique Affiliation Matrix6
State Clique 1 Clique 2 200 0 1 240 1 0 245 1 0 255 1 1 267 1 0 269 1 0 271 1 0 273 1 0 275 1 0 300 1 1 365 0 1 640 0 1
Total 9 5
The clique structure allows us to calculate a new measure of network polarization (Maoz, 2003), as follows.
1 12
1 1 1 1 1
( )1
( | ) ( | , )
k N N k k
ij rj ijj i r i i j i
NPI POL CO
a a CO
max POl N Max CO N k
− −
= = = + = = +
=
− = −
∑∑∑ ∑∑
i
i (1.3)
Where NPI is the network polarization index. It is a product of two elements. First, the column polarization index, POL stipulates the extent to which a given clique is polarized with respect to all other members in the system. This index is a ratio of the sum of squared differences between any two rows within a given column, divided by a theoretical maximum squared rank differences given the row-dimension of the clique affiliation matrix. Second the Clique Overlap index CO stipulates the degree of member-ship overlap across cliques. The degree of clique overlap is the ration of the number of members that any two cliques have in common, divided by the maximum possible over-lap in a clique affiliation matrix of size N×k. The NPI varies from zero (no polarization) to one (maximum polarization). In our case, NPI = 0.334, indicating a fairly low level of polarization.
Because these indices control for the size of the system, they can provide a way of describing changes in the alliance structure of the international system over time. For example, if we take the alliance system of 1938 as another point, the density of the sys-tem then went up to 0.278, and the network polarization index went down to 0.201.
members that are tied to each other either directly (e.g., have a direct alliance with each other), or through one indirect member (members i and j are indirectly aligned if both are aligned with k).
6 This is a reduced matrix for the purpose of illustration. The full matrix is a N×k matrix with N the total number of actors in the system and k the number of cliques. In our formulation, the clique affiliation matrix is organized such that the columns are ordered by declining sizes of cliques.
International Relations: A Network Approach 7
There are quite a few other measures that describe properties of this system, but this provides a fairly good sense of the ability to characterize an international system at a given point in time as an alliance network, as well as to compare a given system over time. We can also compare different attributes of the system, by comparing two or more networks at a given point in time. In order to demonstrate that, let us employ the second type of network, affiliation network. An affiliation network is represented by an N×k matrix that has the members of the system as rows, and a certain set of groups at its columns. For example, if we wish to examine the club participation habits of members of a management group, we can list all managers in rows and a list of social clubs in the col-umns. Each entry in the matrix will tell us if a certain manager i is a member of club j. In order to transform the affiliation matrix into an adjacency matrix, we simply multiply the affiliation matrix by its transpose, so that '
n n n k k nA X X× × ×= (1.4)
The derived adjacency matrix has a special structure. Its main diagonal consists of the number of affiliations of each of its elements. So if a given manager was a member in four clubs, the affiliation matrix will have four nonzero entries in the row corresponding to this manager, and the derived adjacency matrix will have the number four in the di-agonal entry corresponding to this manager.
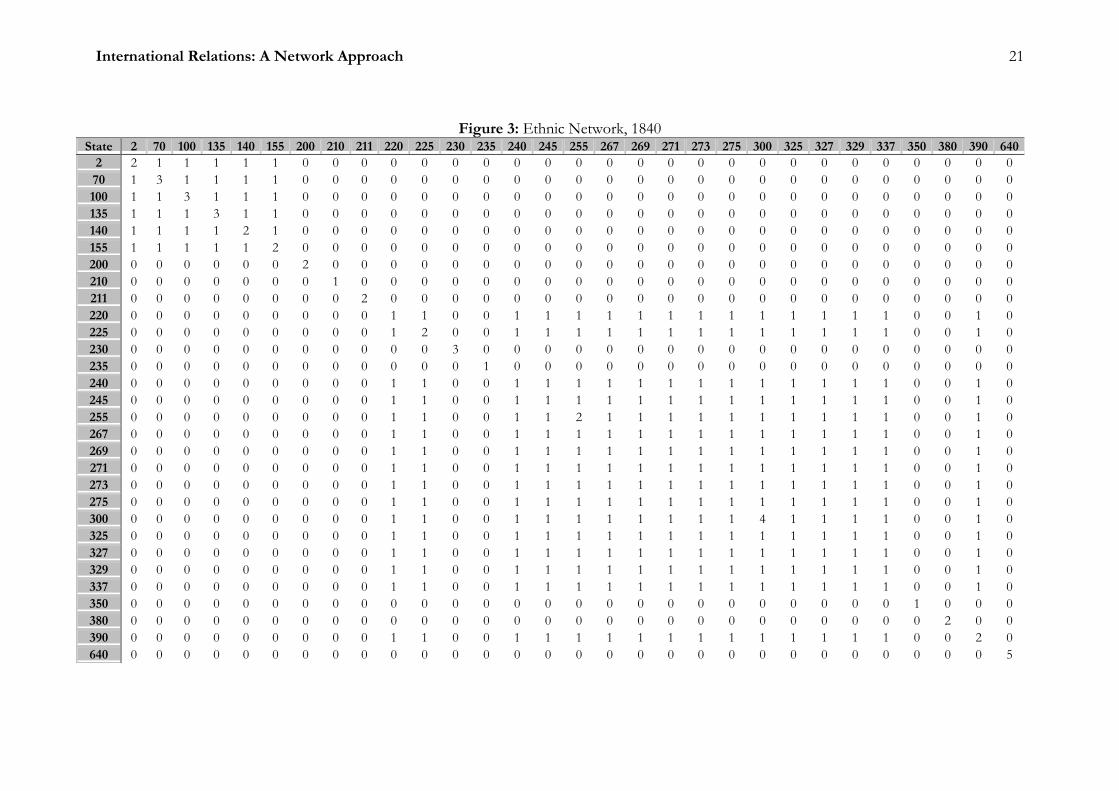
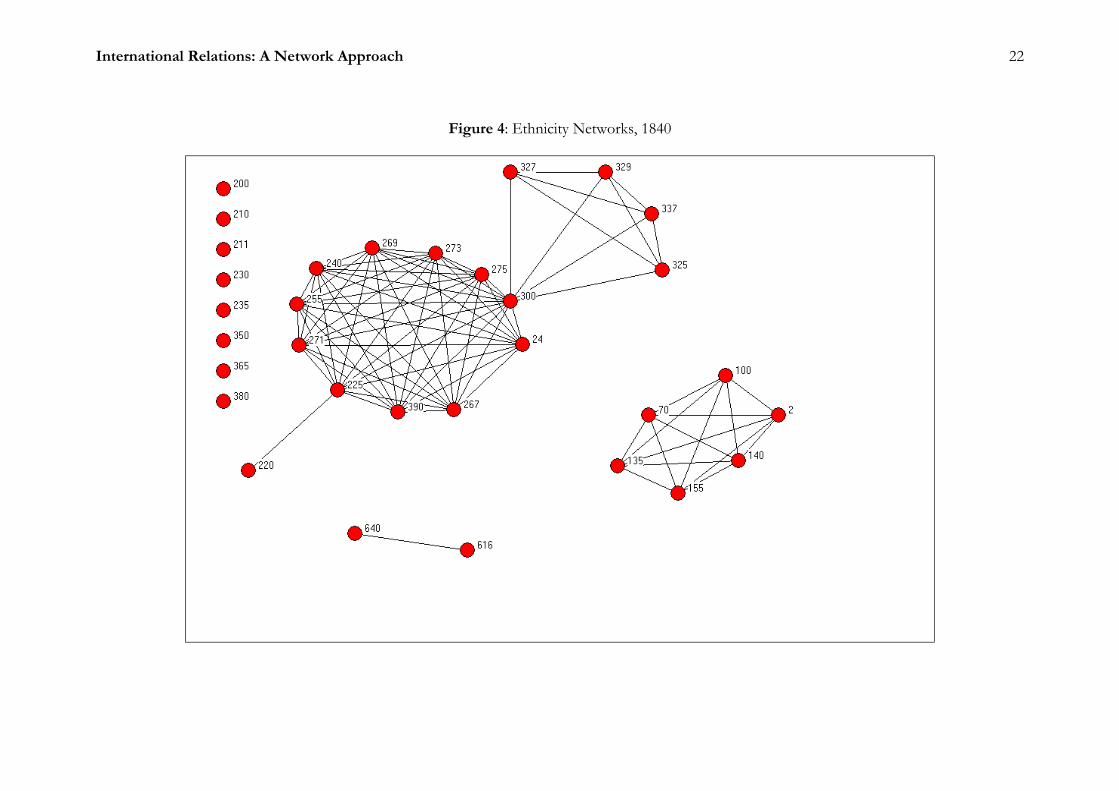
Let us examine the ethnic composition of the system as a network as a reference for cross-network comparison. We use the ethnic dataset compiled by Phil Schaffer at the University of Michigan for this purpose. In contrast to the other datasets that are coded on a yearly basis, this dataset is coded once every decade, and includes all ethnic, religious, and linguistic groups that exist in a given state. We employ only the ethnic divi-sion and include groups that accounted for ten percent of the population or more. Ethnic composition is also an affiliation network of size N×203, where N represents all independent states for a given decade. The breakdown of the ethnic dataset to groups that accounted for ten percent or more of a given state’s population, gives us a subset of 203 groups out of a maximum of 675 ethnic groups listed in the Schaffer dataset. So for the year 1840, the adjacency network is given in Figure 3. The graphic representation of the first-order adjacency matrix is given in Figure 4.
Figures 3 and 4 about here
In this matrix each entry aij denotes whether or not two states i and j share in common one or more ethnic groups that account for ten percent or more of their re-spective populations. We can now compare the alliance and ethnic network in terms of their statistical attributes, such as density and network polarization. But we can also compare these two networks by examining the overlap in the matrices. One way of doing this is to overlay the alliance and ethnic networks on each other. We recode the ethnic network such that each entry that is off-diagonal receives an arbitrary score of 5. We then subtract the alliance matrix for 1840 from the ethnic matrix, and then by interpreting the numbers in the resulting matrix we can examine the degree of overlap. Table 2 shows this comparison.
Table 2: A Comparison of Alliance and Ethnic Networks, 1840

International Relations: A Network Approach 8
Measure Alliance Network
Ethnic Network
Overlap
Density 0.283 0.274 Network Polarization Index 0.334 0.201 Alliances with ethnic affiliation7 0.790 Nonaligned ethnic affiliations8 0.525
This comparison reveals that the density of the two networks is roughly similar, but the alliance network is more polarized than the ethnic network. We can see that from the graphs representing the two networks (Figures 2 and 4). The alliance network is composed of two cliques that share two members in common. The ethnic network is composed of three cliques, two of which have one member in common and one (the Western Hemisphere clique) shares no member in common with the other cliques.
As noted, beyond the conventional measures of network attributes, we can exam-
ine how much overlap there exists between or among different networks that have exactly the same members (Maoz, Terris, and Kuperman, 2002). If we look at the two networks, we can see that—taking the alliance network as a baseline—its overlap with the ethnic network is nearly 80 percent. This implies that about 80 percent of the states that shared alliance ties with each other also shared considerable ethnic overlap with their allies. On the other hand, if we take the ethnic network as a baseline, its overlap with the alliance network is only slightly less than 50%. That means that about half of the mem-bers of the network who share ethnic affinities, also share security alliances.
The network approach allows us to systematically compare a set of networks that
have exactly the same nodes in common. However, we still need to develop methodolo-gies that ally comparison of networks over time, when membership in the system changes. Current network approaches offer an approach to such a comparison through log-linear estimation procedures that are based on network characteristics (Faust and Skvoretz, 2002). We believe that these approaches are unsatisfactory, because they rely on too many assumptions about the relationship between network attributes and similar-ity. However, these efforts are promising in that have the potential of developing systematic measures of similarity and differences across different types of networks and over time. We now turn to subsystem characteristics. 4.2. Subsystem/Subnetwork Characteristics There are several ways of treating subsystems in network analysis. One is to iden-tify subsystems on terms that are extraneous to the network. For example, dividing the international system into regional subsystems, or into major/minor power subsystems represents such a partitioning. Another way to do so is to derive subsystems endoge-
7 Proportion of all alliance ties in the alliance network the member of which share one or more
ethnic group that accounts for at least 10% of their repsective populations. 8 Proportion of all network members that share one or more ethnic group that accounts for at least
10% of their population that also share an alliance tie.
International Relations: A Network Approach 9
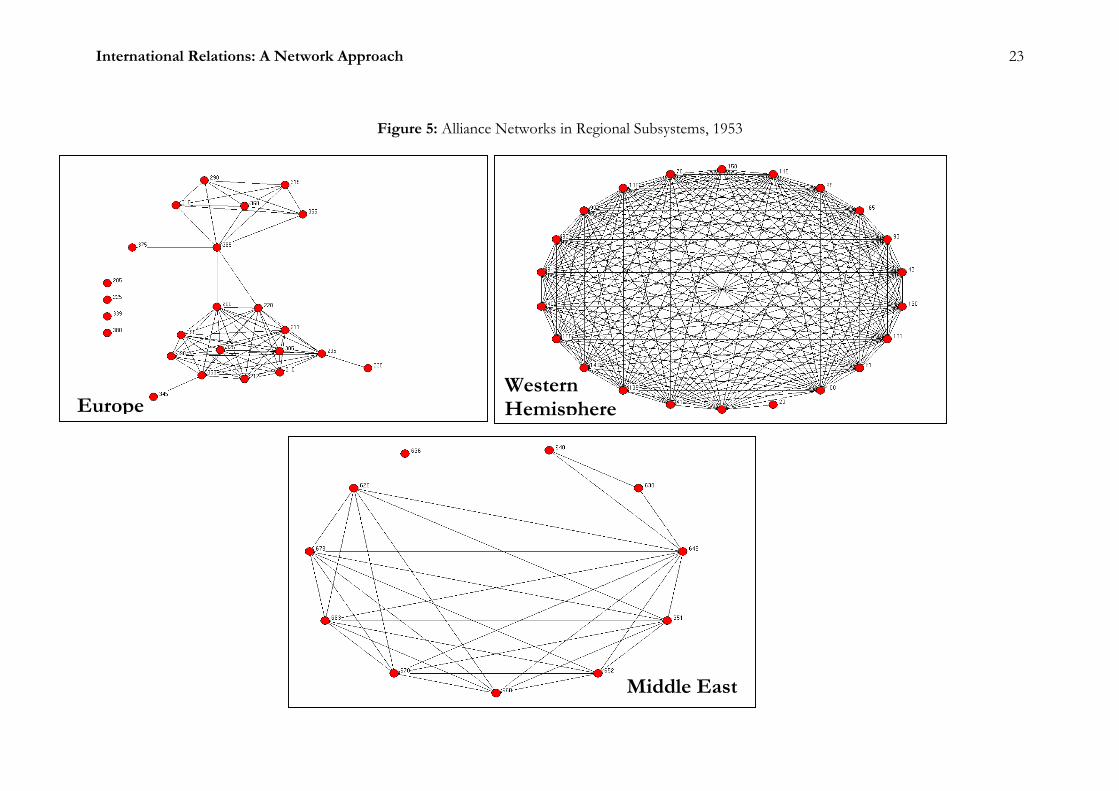
nously. For example, deriving cliques or n-cliques9 allows examining relations within the system in terms of existing ties among members. Let us illustrate the first approach. For that purpose, we take the alliance network of the year 1953 and examine three regional subsystems: The Western Hemisphere, Europe, and the Middle East. Consider Figure 5 below.10
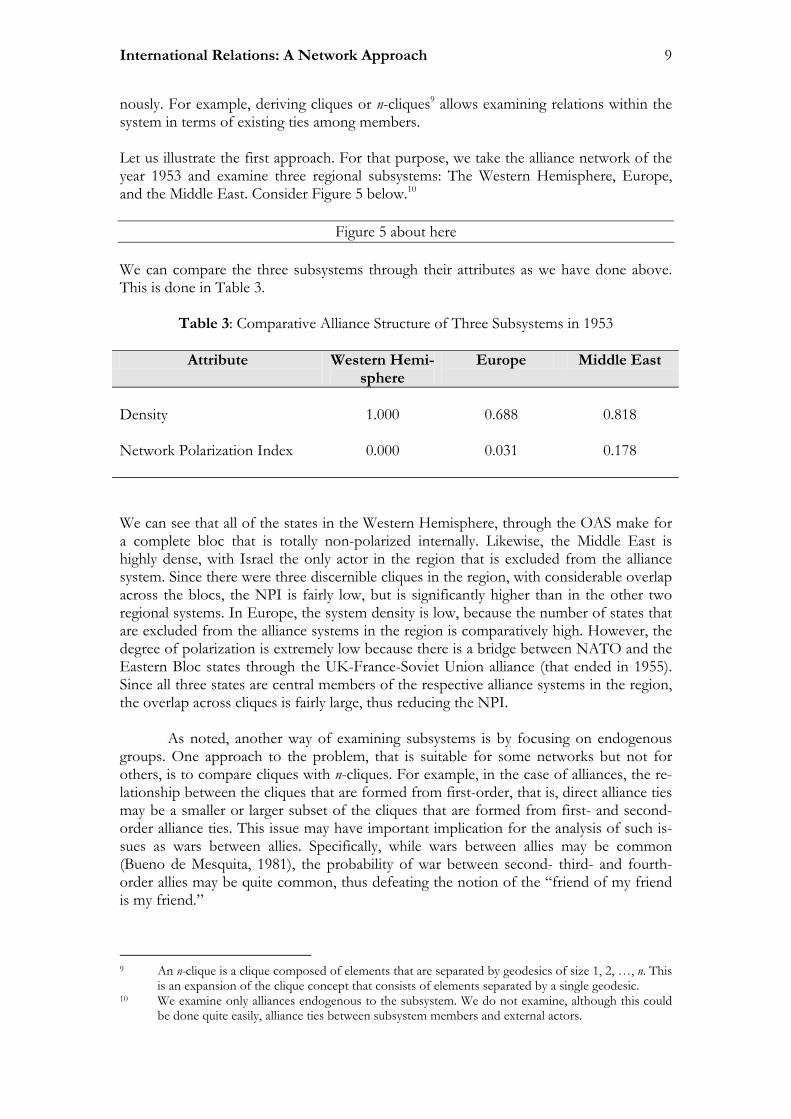
Figure 5 about here We can compare the three subsystems through their attributes as we have done above. This is done in Table 3.
Table 3: Comparative Alliance Structure of Three Subsystems in 1953
Attribute Western Hemi-sphere
Europe Middle East
Density 1.000 0.688 0.818 Network Polarization Index 0.000 0.031 0.178 We can see that all of the states in the Western Hemisphere, through the OAS make for a complete bloc that is totally non-polarized internally. Likewise, the Middle East is highly dense, with Israel the only actor in the region that is excluded from the alliance system. Since there were three discernible cliques in the region, with considerable overlap across the blocs, the NPI is fairly low, but is significantly higher than in the other two regional systems. In Europe, the system density is low, because the number of states that are excluded from the alliance systems in the region is comparatively high. However, the degree of polarization is extremely low because there is a bridge between NATO and the Eastern Bloc states through the UK-France-Soviet Union alliance (that ended in 1955). Since all three states are central members of the respective alliance systems in the region, the overlap across cliques is fairly large, thus reducing the NPI. As noted, another way of examining subsystems is by focusing on endogenous groups. One approach to the problem, that is suitable for some networks but not for others, is to compare cliques with n-cliques. For example, in the case of alliances, the re-lationship between the cliques that are formed from first-order, that is, direct alliance ties may be a smaller or larger subset of the cliques that are formed from first- and second-order alliance ties. This issue may have important implication for the analysis of such is-sues as wars between allies. Specifically, while wars between allies may be common (Bueno de Mesquita, 1981), the probability of war between second- third- and fourth-order allies may be quite common, thus defeating the notion of the “friend of my friend is my friend.”
9 An n-clique is a clique composed of elements that are separated by geodesics of size 1, 2, …, n. This
is an expansion of the clique concept that consists of elements separated by a single geodesic. 10 We examine only alliances endogenous to the subsystem. We do not examine, although this could
be done quite easily, alliance ties between subsystem members and external actors.

International Relations: A Network Approach 10
Moreover, deriving network properties such as polarity based on the first-order clique structure may be different from the polarity of the system based on n-clique struc-ture of second- or third-order.
Consider the clique structure of the system in terms of alliances in 1840 and 1953
in terms of the relationship between first order cliques and second order cliques. This is given in Table 4.
Table 4: Clique and n-Clique Polarization of Alliances, 1840 and 1953
Year Clique Polariza-
tion 2-Clique Polariza-
tion 3-Clique Polariza-
tion
1840 0.317 0.201 0.000
1953 0.249 0.218 0.181
The results of this table show an interesting difference in the alliance networks in the two periods. Whereas the initial clique polarizations of the two years are fairly close, the decline in the system polarization based on 2- and 3-clique levels declines dramati-cally in 1840 but less so in 1953. What this implies is that the connectedness of the alliance structures in 1840 is much higher than it is in 1953. This can also be seen in Fig-ures 2.1. and 2.2. In fact, this analysis suggests that we reach an alliance structure that is completely closed system (that is all states that are in alliance with each other become indirect allies of all other states that are aligned) when we get to the third-order alliance relationship between states. This is not the case in 1953. The alliance structure of the third-order clique structure is more cohesive than the first order set, but not completely cohesive.
Thus, the subsystemic analysis may provide useful insights into the regional or
substantive structure of different subsystems and to the interrelationship between a sys-temic structure and subsystemic structure. 4.3. Dyadic Analysis
It seems that in recent years almost all the innovations that could be done in dy-adic analysis were indeed done. We examined in many studies all possible dyads in the system. We examined theoretically meaningful subsets of the dyadic population (e.g., po-litically relevant dyads, enduring rivalries), and we developed measures that can characterize dyads (e.g., the joint democracy measures, the weak link measures, the joint trade and interdependence measures, the joint IGO membership measures, and so forth).
In several recent studies (e.g., Bennett, 1997; Maoz, 2000b, 2001) it was noted
that in studying dyadic processes, it is important to identify—beyond the characteristics of the dyad itself—also the relationship between dyad members and their respective en-vironments. For example, Bennett (1997) argued that in order to understand rivalry termination, it is important to examine whether dyad members develop new rivalries that offset the tendency to fight in the focal rivalries. Maoz (1996, 2000b, 2001) argued that in order to understand conflict patterns within dyadic structures it is important to under-stand the general attributes of the threat perception (defined either in terms of alliances in each state’s environment that do not include the focal state, or conflict directed at the
International Relations: A Network Approach 11
focal states from other states in its environment). Likewise, Maoz argued that the level of democratization and the level of political stability in each state’s environment may affect their tendency to fight with each other.
Network theory has developed a set of interesting indices to examine how and to
what extent members of a dyad are equivalent in terms of structure or role (Wasserman and Faust, 1994: 347-375; Van Rossem, 1996; Snyder and Kick, 1979). Briefly, structural equivalence measures the degree of similarity or dissimilarity in a dyad in terms of the ties between each of the dyad members and third parties. A dyad ij is structurally equivalent if the ties between actor i and all other members of the network k (k≠i, j) are exactly the same as the ties between actor j and all k’s. There are several measures of structural equivalence but we will focus here on a correlation-based measure (Wasserman and Faust, 1994: 368-369). The advantage of this measure is that it can resolve the dispute between other measures that have been developed in the IR literature to measure simi-larities between states on a dyadic level (e.g., Bueno de Mesquita, 1981; Signorino and Ritter, 1999). Briefly, the measure of structural equivalence is obtained from the adja-cency matrix (it could also be obtained from the reachability matrix) using the usual Pearson r product-moment correlation formula (for multiple networks, the multiple cor-relation coefficient can be substituted for the bivariate r coefficient):
. . . .
, 1 , 1
2 2 2 2. . . .
, , 1 , , 1 , , 1 , , 1
( )( ) ( )( )
( ) ( ) ( ) ( )
n n
ki j kj j ik i jk ji j i j
ij n n n n
ki i jk i kj j jk ji j k i j k i j k i j k
x x x x x x x xr
x x x x x x x x
= =
= = = =
− − + − −=
− + − + − + −
∑ ∑
∑ ∑ ∑ ∑ (1.5)
The measure of structural equivalence has a number of important advantages
over the more traditional measures of affinity. First, it considers how similar or dissimilar are members of a dyad in terms of their relations to all third parties. Second, this similar-ity can be based only on primary relations or on second- third- … n-1-order relations. Third, and perhaps most importantly, this measure of structural equivalence can be per-formed on a single network or on several networks with the same actors. For structural equivalence measured on several types of networks, we use the multiple correlation co-efficient, instead of the bivariate correlation coefficient (Wasserman and Faust, 369).
To illustrate this measure consider figure 6 that provides a combined, alliance-
ethnic structural equivalence matrix of the 1840 set of networks.
Figure 6 about here This figure suggests that the structural equivalence measures of states within the Western Hemisphere are generally positive and high, and so are the structural equiva-lence measures of the German states. The structural equivalence measures of the Italian states are generally lower. Again, this demonstration suggests a powerful new approach to dyadic analysis.11 4.4. Monadic (Nation-Level) Characteristics 11 It must be noted that there are ways of developing triadic, quadradic, and other types of analyses.
But we genrally refer to these as subsystemic analyses.

International Relations: A Network Approach 12
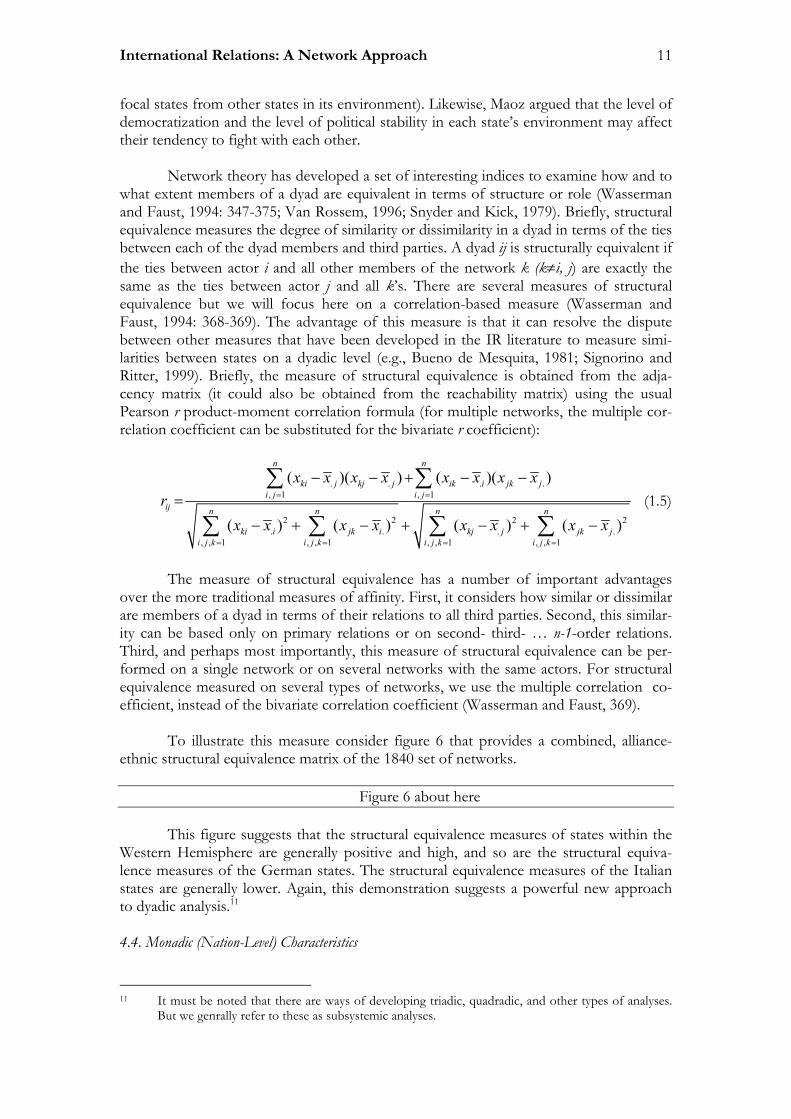
In the mid 1970s, several studies attempted to examine prestige-related issues of states (e.g., Gochman, 1975; Ray, 1974; Midlarsky, 1975). These authors attempted to develop a number of measures of national prestige based on such attributes as diplomatic missions, IGO memberships, and alliances. These measures were then related to the con-flict behavior of states. Network approaches have a diverse number of prestige and centrality-related measures based on the relationship of a state with other members of the network (Wasserman and Faust, 1994: 169-219). Briefly, the Degree Centrality of a state is the num-ber of nodes to which this state is directly connected. (We can do this on both first order adjacency matrices as well as on reachability matrices.) The Closeness Centrality of the state takes into account the length of the paths (geodesics) from each state to all other states. The Betweenness Centrality measures the extent to which a state serves as a bridge between any two other states. Finally, the Eigenvector Centrality measures the eigenvector of the principal eigenvalue of a distances matrix between states. Wasserman and Faust (1994) discuss at length the functions of these and other measures. So we will not elaborate here. However, in order to demonstrate these measures, Table 5 provides a sense of sev-eral measures of centrality of the various states based both on alliance networks and on ethnic networks for the year 1840. The bottom row for each two sets of columns pro-vides the correlation between the centrality measures based on alliances and the same centrality measure based on ethnicity. All measures are standardized to be proportions of a total in order to give a comparative sense of these measures. Table 5: Standardized Centrality Measures Based on Alliances and Ethnicity Networks:
All States, 1840
International Relations: A Network Approach 13
Alliances Ethnicity Alliances Ethnicity Alliances Ethnicity Alliances Ethnicity2 0.000 0.030 0.021 0.025 0.000 0.000 0.000 0.000
70 0.000 0.030 0.021 0.025 0.000 0.000 0.000 0.000100 0.000 0.030 0.021 0.025 0.000 0.000 0.000 0.000135 0.000 0.030 0.021 0.025 0.000 0.000 0.000 0.000140 0.000 0.030 0.021 0.025 0.000 0.000 0.000 0.000155 0.000 0.030 0.021 0.025 0.000 0.000 0.000 0.000200 0.060 0.000 0.041 0.021 0.242 0.000 0.035 0.000210 0.000 0.000 0.021 0.021 0.000 0.000 0.000 0.000211 0.000 0.000 0.021 0.021 0.000 0.000 0.000 0.000220 0.000 0.006 0.021 0.039 0.000 0.000 0.000 0.009225 0.000 0.067 0.021 0.040 0.000 0.241 0.000 0.086230 0.000 0.000 0.021 0.021 0.000 0.000 0.000 0.000235 0.010 0.000 0.040 0.021 0.000 0.000 0.004 0.000240 0.080 0.061 0.041 0.040 0.000 0.000 0.093 0.085245 0.080 0.061 0.041 0.040 0.000 0.000 0.093 0.085255 0.110 0.061 0.041 0.040 0.146 0.000 0.104 0.085267 0.080 0.061 0.041 0.040 0.000 0.000 0.093 0.085269 0.080 0.061 0.041 0.040 0.000 0.000 0.093 0.085271 0.080 0.061 0.041 0.040 0.000 0.000 0.093 0.085273 0.080 0.061 0.041 0.040 0.000 0.000 0.093 0.085275 0.080 0.061 0.041 0.040 0.000 0.000 0.093 0.085300 0.130 0.085 0.041 0.040 0.488 0.759 0.107 0.090325 0.020 0.024 0.040 0.039 0.125 0.000 0.013 0.013327 0.000 0.024 0.021 0.039 0.000 0.000 0.000 0.013329 0.010 0.024 0.039 0.039 0.000 0.000 0.002 0.013337 0.010 0.024 0.040 0.039 0.000 0.000 0.013 0.013350 0.000 0.000 0.021 0.021 0.000 0.000 0.000 0.000365 0.040 0.000 0.041 0.021 0.000 0.000 0.034 0.000380 0.010 0.000 0.040 0.021 0.000 0.000 0.004 0.000390 0.000 0.061 0.021 0.040 0.000 0.000 0.000 0.085616 0.000 0.006 0.021 0.022 0.000 0.000 0.000 0.000640 0.040 0.006 0.041 0.022 0.000 0.000 0.034 0.000
Correlation 0.659 0.396 0.794 0.815
Degree Cent . Close Cent . Between Cent . Egnvector Cent .
As we have noted for the system level measures, the correlations between the
centrality of states based on alliance ties is generally correlated at a medium or fairly high level with its centrality score based on ethnicity-related affinities. We can see that states
that are ranked high on alliance-related centrality tend to rank highly on ethnicity-related centrality and vice versa. These measures demonstrate, then, how network analysis can be used to derive status and prestige properties of states on multiple indices. The tradi-
tional measures of status inconsistency that were applied to international politics can now be expanded considerably in order to get a more diverse sense of states’ structural posi-
tion and prestige, and to relate these measures to states’ behavior. This section demonstrates how network approaches can be used to develop cross-level-of-analysis characteristics of both the system and subsets of actors making up this system. It also demonstrates how international relations can be treated as a set of networks among states. It also showed how network approaches can serve as an over-arching framework for a multitude of descriptive and analytic studies of international politics. In order to highlight this issue, the next section provides a systematic description of changes in international politics over time in terms of alliances and ethnic networks.
International Relations: A Network Approach 14
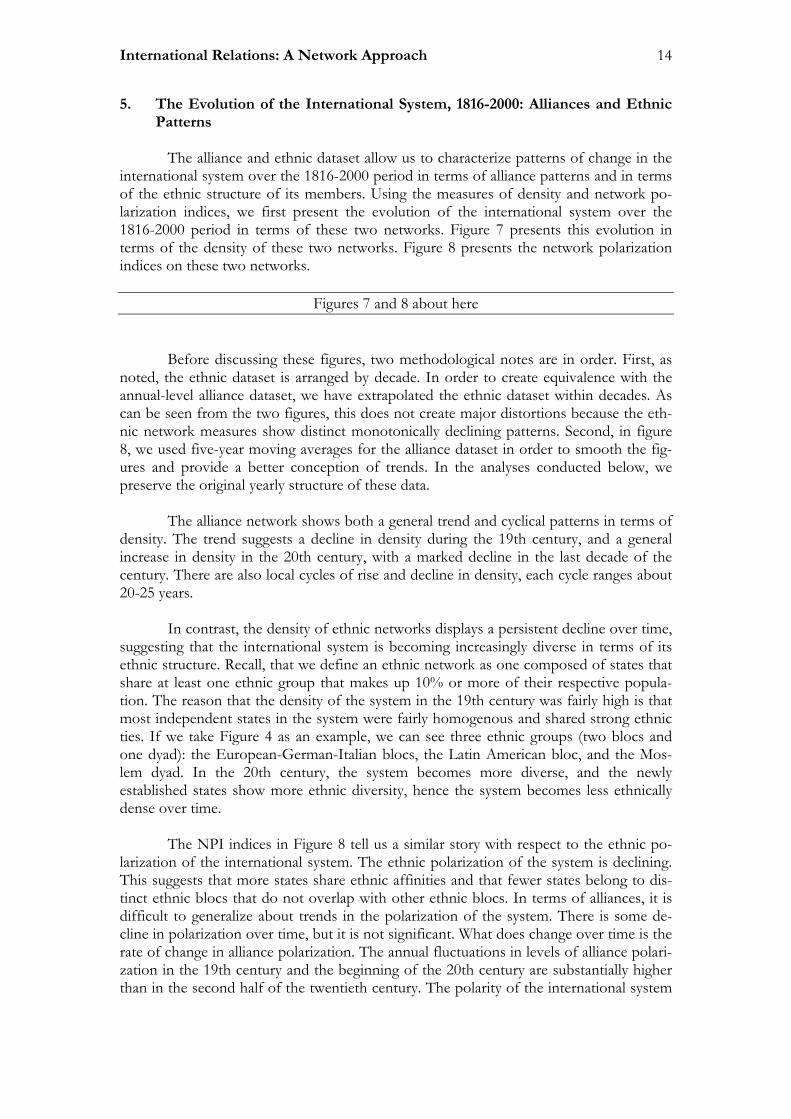
5. The Evolution of the International System, 1816-2000: Alliances and Ethnic Patterns
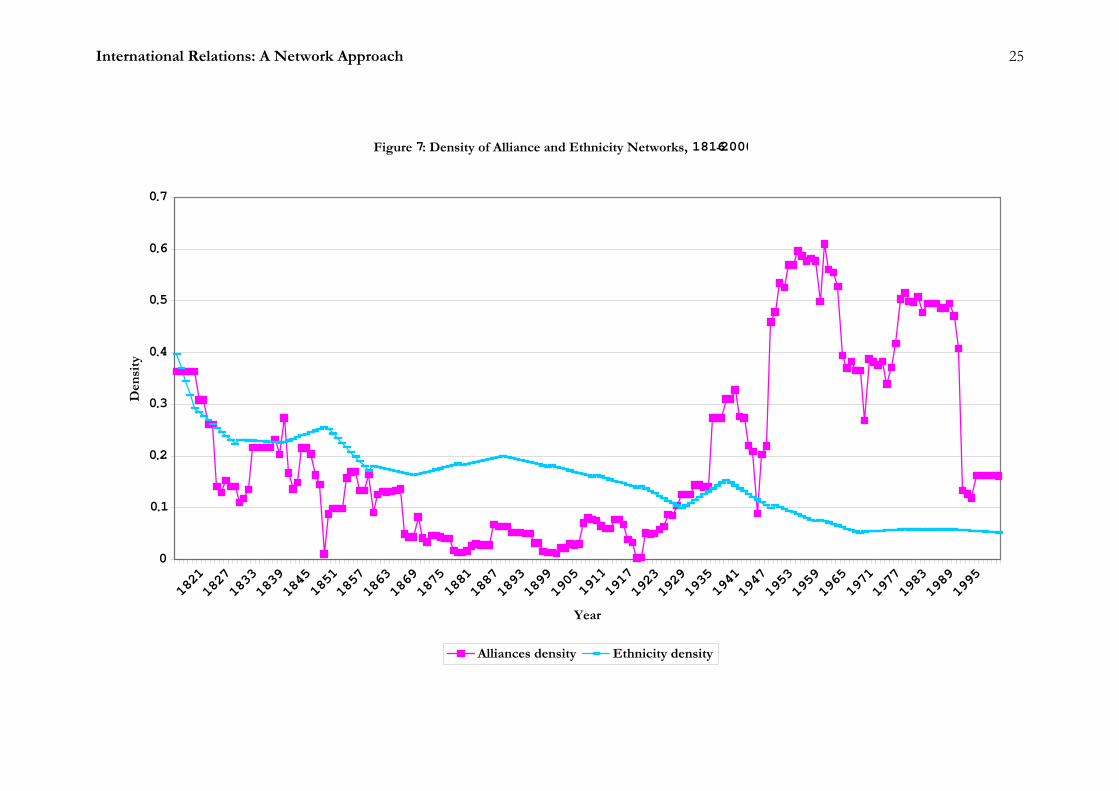
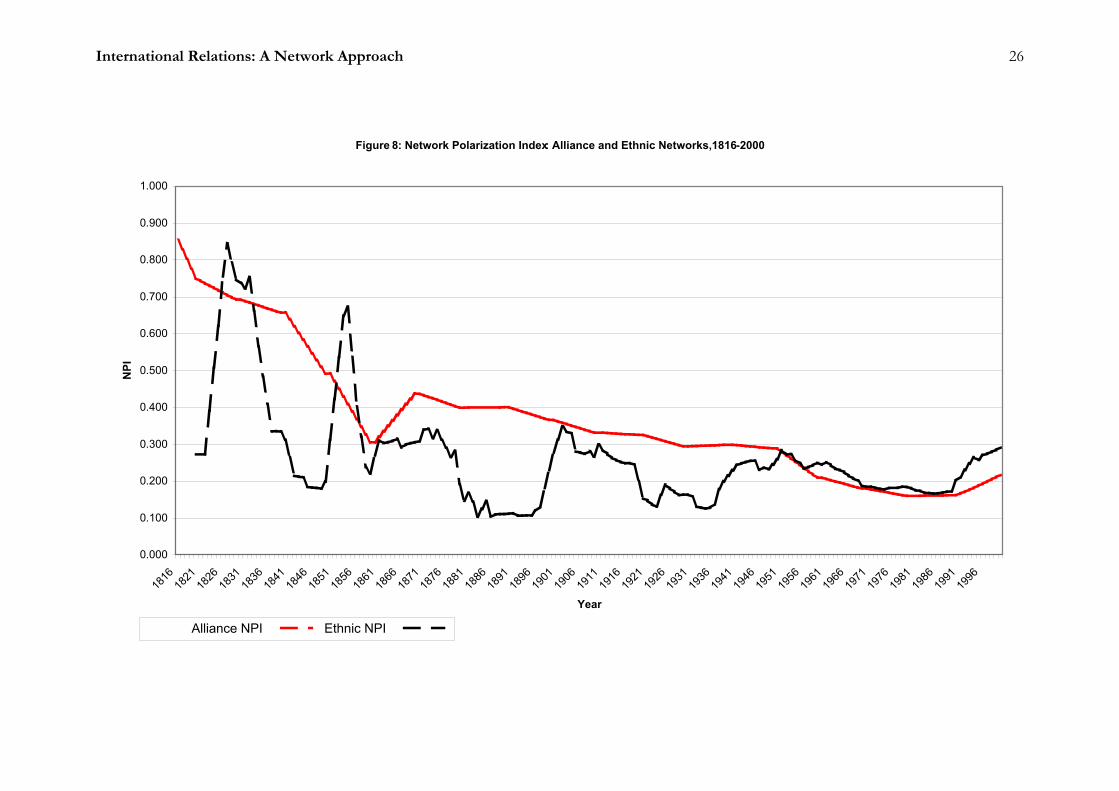
The alliance and ethnic dataset allow us to characterize patterns of change in the international system over the 1816-2000 period in terms of alliance patterns and in terms of the ethnic structure of its members. Using the measures of density and network po-larization indices, we first present the evolution of the international system over the 1816-2000 period in terms of these two networks. Figure 7 presents this evolution in terms of the density of these two networks. Figure 8 presents the network polarization indices on these two networks.
Figures 7 and 8 about here Before discussing these figures, two methodological notes are in order. First, as noted, the ethnic dataset is arranged by decade. In order to create equivalence with the annual-level alliance dataset, we have extrapolated the ethnic dataset within decades. As can be seen from the two figures, this does not create major distortions because the eth-nic network measures show distinct monotonically declining patterns. Second, in figure 8, we used five-year moving averages for the alliance dataset in order to smooth the fig-ures and provide a better conception of trends. In the analyses conducted below, we preserve the original yearly structure of these data.
The alliance network shows both a general trend and cyclical patterns in terms of density. The trend suggests a decline in density during the 19th century, and a general increase in density in the 20th century, with a marked decline in the last decade of the century. There are also local cycles of rise and decline in density, each cycle ranges about 20-25 years.
In contrast, the density of ethnic networks displays a persistent decline over time, suggesting that the international system is becoming increasingly diverse in terms of its ethnic structure. Recall, that we define an ethnic network as one composed of states that share at least one ethnic group that makes up 10% or more of their respective popula-tion. The reason that the density of the system in the 19th century was fairly high is that most independent states in the system were fairly homogenous and shared strong ethnic ties. If we take Figure 4 as an example, we can see three ethnic groups (two blocs and one dyad): the European-German-Italian blocs, the Latin American bloc, and the Mos-lem dyad. In the 20th century, the system becomes more diverse, and the newly established states show more ethnic diversity, hence the system becomes less ethnically dense over time.
The NPI indices in Figure 8 tell us a similar story with respect to the ethnic po-
larization of the international system. The ethnic polarization of the system is declining. This suggests that more states share ethnic affinities and that fewer states belong to dis-tinct ethnic blocs that do not overlap with other ethnic blocs. In terms of alliances, it is difficult to generalize about trends in the polarization of the system. There is some de-cline in polarization over time, but it is not significant. What does change over time is the rate of change in alliance polarization. The annual fluctuations in levels of alliance polari-zation in the 19th century and the beginning of the 20th century are substantially higher than in the second half of the twentieth century. The polarity of the international system
International Relations: A Network Approach 15
in terms of alliance structure has declined not in absolute terms, but rather in terms of shifts from one year to the other.
These data provide us a sense of changes in the characteristics of the system over
time in terms of standard measures of density and network polarization. We can charac-terize these changes in terms of other measures discussed here, and examine the relationship between and among these attributes. We can also examine the changes on the national level, dyadic level, and subsystemic level.
We conclude the empirical demonstration by examining the effect of the charac-
teristics of the ethnic structure and the alliance structure of the interstate system on the level of conflict in it over time. The dependent variables are the number of MID dyads and the number of war dyads per year. MID and war data are derived from the Dyadic MID dataset (Maoz, 1999). In addition to the density and NPI measures, we used a measure of democratic networks initially developed by Maoz (2001) and further devel-oped in the context of a network analysis of the international system (Maoz, Terris, Kuperman, and Talmud, 2002). This measure is the average proportion of democratic states in politically relevant networks (Maoz, 2001). Since we observed cyclical patterns of alliance polarization, we use a quadratic specification for this variable (NPI, NPI2). For the war case, we use the rate of change in alliance NPI to examine how changes in alli-ance polarization affect the frequency of war in the system. The results of these analyses are given in Table 6 below.
Table 6: The Effects of Alliance and Ethnic Network Indicators on the Fre-
quency of MIDs and Wars, 1816-1992 Autoregressive Poisson Regression
Independent Variable Entire Period 19th Century 20th Century
Number of MID Dyads per year (Autoregressive Poisson Model) Constant 3.151**
(0.297) 3.913** (0.996)
4.587** (0.988)
Alliance Density 2.175** (0.335)
-0.435 (2.979)
1.950** (0.437)
Ethnic Density 8.732** (2.677)
-0.304 (6.753)
7.964 (5.801)
Alliance NPI 0.382 (1.211)
-1.309 (1.822)
4.898 (4.557)
Alliance NPI Squared -1.111 (1.584)
1.264 (1.957)
-14.210 (11.137)
Ethnic NPI -5.999** (1.299)
-3.471* (1.499)
-5.771* (3.066)
Prop. Democratic Networks
-0.457 (0.631)
-0.938 (1.809)
-3.635** (1.276)
Rho 1 0.339** (0.076)
-0.056 (0.127)
0.541** (0.112)
Rho 2 0.219** (0.078)
0.149 (0.131)
N Pseudo R2
178 0.576
82 0.120
96 0.469
Number of War Dyads per Year
International Relations: A Network Approach 16
Independent Variable Entire Period 19th Century 20th Century Constant 4.264**
(0.921) 6.372** (1.523)
3.675** (1.246)
Alliance Density 1.143 (0.720)
6.206 (5.332)
2.614** (0.781)
Ethnic Density -11.638* (5.158)
-17.044 (13.425)
-19.125* (8.494)
Change in Alliance NPI -0.104 (0.233)
-0.603 (0.422)
0.050 (0.275)
Ethnic NPI -9.471** (2.202)
-4.946+ (2.913)
18.057** (5.418)
Prop. Democratic Networks
-2.148* (1.104)
-1.212 (3.023)
-9.321** (1.705)
Rho 1 0.785** (0.051)
0.237** (0.314)
0.789** (0.081)
Rho 2 N Adjusted R2
176 0.604
83 0.189
93 0.643
The results of Table 6 suggest that alliance density increases the frequency of MIDs and the frequency of war (in the twentieth century only). The network polarization indices for alliances do not show significant association with MIDs, but the rate of change in alliance NPI does (not shown in the table). The proportion of democratic network is negatively associated with MIDs and wars in the twentieth century. The models do a far better job in accounting for MIDs and wars in the twentieth century, than they do for the nine-teenth century. These results offer a preliminary sense of how the structure of the system, measured in network attributes, can provide us with insights with respect to the level of stability and instability in it over time. 6. Conclusion This study sought to demonstrate the potential contribution of network ap-proaches to the study of world politics. This approach was shown to offer a comprehensive framework that offers considerable potential for dealing with a wide vari-ety of issues in international politics. In particular: 1. It offers us an approach to systematically map change and stability in interna-
tional politics in terms of a wide variety of relational and affiliational attributes. 2. It offers us a meaningful way to compare a large number of relationships and at-
tributes of members of the system across space and over time. 3. It allows a comprehensive framework for dealing with the level of analysis prob-
lem in international politics. 4. It offers new insights into the relationship between structural features of the in-
ternational system and the behaviors of its members. As noted, this is a feasibility study that offers a mere demonstration of the power of a networks approach to international politics. It is important to note that this approach would probably require significant modifications to fit into the modes of analysis that are

International Relations: A Network Approach 17
required in order to meaningfully analyze international politics. We would have to de-velop methodologies that allow comparisons of networks over time with varying numbers of actors. We will need to develop new measures that are better suited to tap the complexities of the international system or its subsystems. However, as some soci-ologists who examined the world system using a network approach demonstrated, the potential of this approach is extremely promising. Subsequent studies will demonstrate more clearly to what extent this approach can sharpen our methodological tools and em-pirical knowledge of the evolution of world politics.

Figure 1: Alliance Network, 1840
2 70 100 135 140 155 200 210 211 220 225 230 235 240 245 255 267 269 271 273 275 300 325 327 329 337 350 365 380 390 616 640 2 0 0 0 0 0 0 0 0 0 0 0 0 0 0 0 0 0 0 0 0 0 0 0 0 0 0 0 0 0 0 0 0 70 0 0 0 0 0 0 0 0 0 0 0 0 0 0 0 0 0 0 0 0 0 0 0 0 0 0 0 0 0 0 0 0 100 0 0 0 0 0 0 0 0 0 0 0 0 0 0 0 0 0 0 0 0 0 0 0 0 0 0 0 0 0 0 0 0 135 0 0 0 0 0 0 0 0 0 0 0 0 0 0 0 0 0 0 0 0 0 0 0 0 0 0 0 0 0 0 0 0 140 0 0 0 0 0 0 0 0 0 0 0 0 0 0 0 0 0 0 0 0 0 0 0 0 0 0 0 0 0 0 0 0 155 0 0 0 0 0 0 0 0 0 0 0 0 0 0 0 0 0 0 0 0 0 0 0 0 0 0 0 0 0 0 0 0 200 0 0 0 0 0 0 0 0 0 0 0 0 1 0 0 1 0 0 0 0 0 1 0 0 0 0 0 1 1 0 0 1 210 0 0 0 0 0 0 0 0 0 0 0 0 0 0 0 0 0 0 0 0 0 0 0 0 0 0 0 0 0 0 0 0 211 0 0 0 0 0 0 0 0 0 0 0 0 0 0 0 0 0 0 0 0 0 0 0 0 0 0 0 0 0 0 0 0 220 0 0 0 0 0 0 0 0 0 0 0 0 0 0 0 0 0 0 0 0 0 0 0 0 0 0 0 0 0 0 0 0 225 0 0 0 0 0 0 0 0 0 0 0 0 0 0 0 0 0 0 0 0 0 0 0 0 0 0 0 0 0 0 0 0 230 0 0 0 0 0 0 0 0 0 0 0 0 0 0 0 0 0 0 0 0 0 0 0 0 0 0 0 0 0 0 0 0 235 0 0 0 0 0 0 1 0 0 0 0 0 0 0 0 0 0 0 0 0 0 0 0 0 0 0 0 0 0 0 0 0 240 0 0 0 0 0 0 0 0 0 0 0 0 0 0 1 1 1 1 1 1 1 1 0 0 0 0 0 0 0 0 0 0 245 0 0 0 0 0 0 0 0 0 0 0 0 0 1 0 1 1 1 1 1 1 1 0 0 0 0 0 0 0 0 0 0 255 0 0 0 0 0 0 1 0 0 0 0 0 0 1 1 0 1 1 1 1 1 1 0 0 0 0 0 1 0 0 0 1 267 0 0 0 0 0 0 0 0 0 0 0 0 0 1 1 1 0 1 1 1 1 1 0 0 0 0 0 0 0 0 0 0 269 0 0 0 0 0 0 0 0 0 0 0 0 0 1 1 1 1 0 1 1 1 1 0 0 0 0 0 0 0 0 0 0 271 0 0 0 0 0 0 0 0 0 0 0 0 0 1 1 1 1 1 0 1 1 1 0 0 0 0 0 0 0 0 0 0 273 0 0 0 0 0 0 0 0 0 0 0 0 0 1 1 1 1 1 1 0 1 1 0 0 0 0 0 0 0 0 0 0 275 0 0 0 0 0 0 0 0 0 0 0 0 0 1 1 1 1 1 1 1 0 1 0 0 0 0 0 0 0 0 0 0 300 0 0 0 0 0 0 1 0 0 0 0 0 0 1 1 1 1 1 1 1 1 0 1 0 0 1 0 1 0 0 0 1 325 0 0 0 0 0 0 0 0 0 0 0 0 0 0 0 0 0 0 0 0 0 1 0 0 1 0 0 0 0 0 0 0 327 0 0 0 0 0 0 0 0 0 0 0 0 0 0 0 0 0 0 0 0 0 0 0 0 0 0 0 0 0 0 0 0 329 0 0 0 0 0 0 0 0 0 0 0 0 0 0 0 0 0 0 0 0 0 0 1 0 0 0 0 0 0 0 0 0 337 0 0 0 0 0 0 0 0 0 0 0 0 0 0 0 0 0 0 0 0 0 1 0 0 0 0 0 0 0 0 0 0 350 0 0 0 0 0 0 0 0 0 0 0 0 0 0 0 0 0 0 0 0 0 0 0 0 0 0 0 0 0 0 0 0 365 0 0 0 0 0 0 1 0 0 0 0 0 0 0 0 1 0 0 0 0 0 1 0 0 0 0 0 0 0 0 0 1 380 0 0 0 0 0 0 1 0 0 0 0 0 0 0 0 0 0 0 0 0 0 0 0 0 0 0 0 0 0 0 0 0 390 0 0 0 0 0 0 0 0 0 0 0 0 0 0 0 0 0 0 0 0 0 0 0 0 0 0 0 0 0 0 0 0 616 0 0 0 0 0 0 0 0 0 0 0 0 0 0 0 0 0 0 0 0 0 0 0 0 0 0 0 0 0 0 0 0 640 0 0 0 0 0 0 1 0 0 0 0 0 0 0 0 1 0 0 0 0 0 1 0 0 0 0 0 1 0 0 0 0

International Relations: A Network Approach 19
Figure 2: A Graphic Representation of the 1840 Alliance System 1. First-order adjacency
Note: Numbers are COW state numbers
International Relations: A Network Approach 20
2. Reachability
International Relations: A Network Approach 21
Figure 3: Ethnic Network, 1840 State 2 70 100 135 140 155 200 210 211 220 225 230 235 240 245 255 267 269 271 273 275 300 325 327 329 337 350 380 390 640
2 2 1 1 1 1 1 0 0 0 0 0 0 0 0 0 0 0 0 0 0 0 0 0 0 0 0 0 0 0 0 70 1 3 1 1 1 1 0 0 0 0 0 0 0 0 0 0 0 0 0 0 0 0 0 0 0 0 0 0 0 0 100 1 1 3 1 1 1 0 0 0 0 0 0 0 0 0 0 0 0 0 0 0 0 0 0 0 0 0 0 0 0 135 1 1 1 3 1 1 0 0 0 0 0 0 0 0 0 0 0 0 0 0 0 0 0 0 0 0 0 0 0 0 140 1 1 1 1 2 1 0 0 0 0 0 0 0 0 0 0 0 0 0 0 0 0 0 0 0 0 0 0 0 0 155 1 1 1 1 1 2 0 0 0 0 0 0 0 0 0 0 0 0 0 0 0 0 0 0 0 0 0 0 0 0 200 0 0 0 0 0 0 2 0 0 0 0 0 0 0 0 0 0 0 0 0 0 0 0 0 0 0 0 0 0 0 210 0 0 0 0 0 0 0 1 0 0 0 0 0 0 0 0 0 0 0 0 0 0 0 0 0 0 0 0 0 0 211 0 0 0 0 0 0 0 0 2 0 0 0 0 0 0 0 0 0 0 0 0 0 0 0 0 0 0 0 0 0 220 0 0 0 0 0 0 0 0 0 1 1 0 0 1 1 1 1 1 1 1 1 1 1 1 1 1 0 0 1 0 225 0 0 0 0 0 0 0 0 0 1 2 0 0 1 1 1 1 1 1 1 1 1 1 1 1 1 0 0 1 0 230 0 0 0 0 0 0 0 0 0 0 0 3 0 0 0 0 0 0 0 0 0 0 0 0 0 0 0 0 0 0 235 0 0 0 0 0 0 0 0 0 0 0 0 1 0 0 0 0 0 0 0 0 0 0 0 0 0 0 0 0 0 240 0 0 0 0 0 0 0 0 0 1 1 0 0 1 1 1 1 1 1 1 1 1 1 1 1 1 0 0 1 0 245 0 0 0 0 0 0 0 0 0 1 1 0 0 1 1 1 1 1 1 1 1 1 1 1 1 1 0 0 1 0 255 0 0 0 0 0 0 0 0 0 1 1 0 0 1 1 2 1 1 1 1 1 1 1 1 1 1 0 0 1 0 267 0 0 0 0 0 0 0 0 0 1 1 0 0 1 1 1 1 1 1 1 1 1 1 1 1 1 0 0 1 0 269 0 0 0 0 0 0 0 0 0 1 1 0 0 1 1 1 1 1 1 1 1 1 1 1 1 1 0 0 1 0 271 0 0 0 0 0 0 0 0 0 1 1 0 0 1 1 1 1 1 1 1 1 1 1 1 1 1 0 0 1 0 273 0 0 0 0 0 0 0 0 0 1 1 0 0 1 1 1 1 1 1 1 1 1 1 1 1 1 0 0 1 0 275 0 0 0 0 0 0 0 0 0 1 1 0 0 1 1 1 1 1 1 1 1 1 1 1 1 1 0 0 1 0 300 0 0 0 0 0 0 0 0 0 1 1 0 0 1 1 1 1 1 1 1 1 4 1 1 1 1 0 0 1 0 325 0 0 0 0 0 0 0 0 0 1 1 0 0 1 1 1 1 1 1 1 1 1 1 1 1 1 0 0 1 0 327 0 0 0 0 0 0 0 0 0 1 1 0 0 1 1 1 1 1 1 1 1 1 1 1 1 1 0 0 1 0 329 0 0 0 0 0 0 0 0 0 1 1 0 0 1 1 1 1 1 1 1 1 1 1 1 1 1 0 0 1 0 337 0 0 0 0 0 0 0 0 0 1 1 0 0 1 1 1 1 1 1 1 1 1 1 1 1 1 0 0 1 0 350 0 0 0 0 0 0 0 0 0 0 0 0 0 0 0 0 0 0 0 0 0 0 0 0 0 0 1 0 0 0 380 0 0 0 0 0 0 0 0 0 0 0 0 0 0 0 0 0 0 0 0 0 0 0 0 0 0 0 2 0 0 390 0 0 0 0 0 0 0 0 0 1 1 0 0 1 1 1 1 1 1 1 1 1 1 1 1 1 0 0 2 0 640 0 0 0 0 0 0 0 0 0 0 0 0 0 0 0 0 0 0 0 0 0 0 0 0 0 0 0 0 0 5
International Relations: A Network Approach 22
Figure 4: Ethnicity Networks, 1840
International Relations: A Network Approach 23
Figure 5: Alliance Networks in Regional Subsystems, 1953
Europe Western Hemisphere
Middle East

International Relations: A Network Approach 24
Figure 6: Structural Equivalence of Alliance and Ethnic Patterns, 1840
2 70 100 135 140 155 200 210 211 220 225 230 235 240 245 255 267 269 271 273 275 300 325 327 329 337 350 365 380 390 616
2
70 0.94100 0.95 0.97135 0.94 1.00 0.97140 1.00 0.94 0.95 0.94155 0.95 0.97 1.00 0.97 0.95200 -0.10 -0.09 -0.09 -0.09 -0.10 -0.09210 0.00 0.00 0.00 0.00 0.00 0.00 0.00211 0.00 0.00 0.00 0.00 0.00 0.00 0.00 1.00220 -0.04 -0.04 -0.04 -0.04 -0.04 -0.04 -0.04 0.00 0.00225 -0.14 -0.13 -0.13 -0.13 -0.14 -0.13 -0.16 0.00 0.00 0.00230 0.00 0.00 0.00 0.00 0.00 0.00 0.00 1.00 1.00 0.00 0.00235 -0.04 -0.04 -0.04 -0.04 -0.04 -0.04 0.00 0.00 0.00 -0.02 -0.06 0.00240 -0.20 -0.18 -0.19 -0.18 -0.20 -0.19 0.02 0.00 0.00 0.20 0.61 0.00 -0.09245 -0.20 -0.18 -0.19 -0.18 -0.20 -0.19 0.02 0.00 0.00 0.20 0.61 0.00 -0.09 1.00255 -0.22 -0.20 -0.21 -0.20 -0.22 -0.21 0.17 0.00 0.00 0.18 0.54 0.00 0.18 0.89 0.89267 -0.20 -0.18 -0.19 -0.18 -0.20 -0.19 0.02 0.00 0.00 0.20 0.61 0.00 -0.09 1.00 1.00 0.89269 -0.20 -0.18 -0.19 -0.18 -0.20 -0.19 0.02 0.00 0.00 0.20 0.61 0.00 -0.09 1.00 1.00 0.89 1.00271 -0.20 -0.18 -0.19 -0.18 -0.20 -0.19 0.02 0.00 0.00 0.20 0.61 0.00 -0.09 1.00 1.00 0.89 1.00 1.00273 -0.20 -0.18 -0.19 -0.18 -0.20 -0.19 0.02 0.00 0.00 0.20 0.61 0.00 -0.09 1.00 1.00 0.89 1.00 1.00 1.00275 -0.20 -0.18 -0.19 -0.18 -0.20 -0.19 0.02 0.00 0.00 0.20 0.61 0.00 -0.09 1.00 1.00 0.89 1.00 1.00 1.00 1.00300 -0.27 -0.25 -0.26 -0.25 -0.27 -0.26 0.10 0.00 0.00 0.14 0.42 0.00 0.14 0.71 0.71 0.81 0.71 0.71 0.71 0.71 0.71325 -0.10 -0.09 -0.09 -0.09 -0.10 -0.09 0.07 0.00 0.00 -0.04 -0.01 0.00 -0.04 0.02 0.02 -0.01 0.02 0.02 0.02 0.02 0.02 0.18327 -0.08 -0.07 -0.08 -0.07 -0.08 -0.08 -0.09 0.00 0.00 -0.03 0.05 0.00 -0.03 -0.03 -0.03 -0.06 -0.03 -0.03 -0.03 -0.03 -0.03 0.26 0.76329 -0.09 -0.08 -0.09 -0.08 -0.09 -0.09 -0.10 0.00 0.00 -0.04 0.01 0.00 -0.04 -0.07 -0.07 -0.09 -0.07 -0.07 -0.07 -0.07 -0.07 0.31 0.86 0.86337 -0.09 -0.08 -0.09 -0.08 -0.09 -0.09 0.10 0.00 0.00 -0.04 0.01 0.00 -0.04 0.07 0.07 0.03 0.07 0.07 0.07 0.07 0.07 0.27 0.89 0.86 0.73350 0.00 0.00 0.00 0.00 0.00 0.00 0.00 1.00 1.00 0.00 0.00 1.00 0.00 0.00 0.00 0.00 0.00 0.00 0.00 0.00 0.00 0.00 0.00 0.00 0.00 0.00365 -0.08 -0.07 -0.08 -0.07 -0.08 -0.08 0.76 0.00 0.00 -0.03 -0.13 0.00 0.49 0.12 0.12 0.32 0.12 0.12 0.12 0.12 0.12 0.26 0.13 -0.07 -0.08 0.16 0.00380 -0.04 -0.04 -0.04 -0.04 -0.04 -0.04 0.00 0.00 0.00 -0.02 -0.06 0.00 1.00 -0.09 -0.09 0.18 -0.09 -0.09 -0.09 -0.09 -0.09 0.14 -0.04 -0.03 -0.04 -0.04 0.00 0.49390 -0.13 -0.12 -0.13 -0.12 -0.13 -0.13 -0.15 0.00 0.00 0.29 0.94 0.00 -0.06 0.67 0.67 0.59 0.67 0.67 0.67 0.67 0.67 0.48 0.00 0.06 0.03 0.03 0.00 -0.12 -0.06616 -0.04 -0.04 -0.04 -0.04 -0.04 -0.04 -0.04 0.00 0.00 -0.02 -0.06 0.00 -0.02 -0.09 -0.09 -0.10 -0.09 -0.09 -0.09 -0.09 -0.09 -0.12 -0.04 -0.03 -0.04 -0.04 0.00 -0.03 -0.02 -0.06640 -0.09 -0.08 -0.09 -0.08 -0.09 -0.09 0.64 0.00 0.00 -0.04 -0.14 0.00 0.43 0.07 0.07 0.24 0.07 0.07 0.07 0.07 0.07 0.17 0.10 -0.08 -0.09 0.13 0.00 0.86 0.43 -0.13 0.00
International Relations: A Network Approach 25
Figure 7: Density of Alliance and Ethnicity Networks, 1816-2000
0
0.1
0.2
0.3
0.4
0.5
0.6
0.7
182118
2718
3318
3918
4518
5118
5718
6318
6918
7518
8118
8718
9318
9919
0519
1119
1719
2319
2919
3519
4119
4719
5319
5919
6519
7119
7719
8319
8919
95
Year
Den
sity
Alliances density Ethnicity density
International Relations: A Network Approach 26
Figure 8: Network Polarization Index: Alliance and Ethnic Networks, 1816-2000
0.000
0.100
0.200
0.300
0.400
0.500
0.600
0.700
0.800
0.900
1.000
1816
1821
1826
1831
1836
1841
1846
1851
1856
1861
1866
1871
1876
1881
1886
1891
1896
1901
1906
1911
1916
1921
1926
1931
1936
1941
1946
1951
1956
1961
1966
1971
1976
1981
1986
1991
1996
Year
NPI
Alliance NPI Ethnic NPI
International Relations: A Network Approach 27

References Brams, Steven J. 1969. The Structure of Influence Relationships in the International Sys-
tem. In James N. Rosenau (ed.). International Politics and Foreign Policy (2nd edition). New York: Free Press, pp. 583-599.
1966. Transaction Flows in the International System. American Political Science
Review, 60(4): 880-898. Bueno de Mesquita, Bruce 1981. The War Trap. New Haven: Yale University Press. Faust, Katherine and John Skvoretz 2002. Comparing Networks Across Space and Time,
Size and Species, Sociological Methodology, 32(1): 267-299. Gochman, Charles S. 1975. Status, Conflict, and War: The Major Powers, 1920-1975.
Ph.D. Dissertation. The University of Michigan. Knoke, David 1990. Political Networks: The Structural Perspective. Cambridge: Cambridge
University Press. Maoz, Zeev 2001. Democratic Networks: Connecting National, Dyadic, and Systemic
Levels-of-Analysis in the Study of Democracy and War. In Zeev Maoz and Azar Gat (eds.). War in a Changing World. Ann Arbor: University of Michigan Press, pp. 141-188.
2000a. Pacifism and Fightaholism in International Politics: A Structural His-
tory of National and Dyadic Conflict, 1816-1992. Paper presented at the annual meeting of the Peace Science Society (International). New Haven, CT: October 28-30.
———— 2000b. The Street-Gangs of World Politics: The Origins, Management, and
Consequences of International Alliances, 1816-1986. In John A. Vasquez (ed.). What do We Know about War? Boulder, CO: Rowman and Littlefield.
1999. Dyadic MID Dataset. http://spirit.tau.ac.il/zeevmaoz/dyadmid.html. Maoz, Zeev, Lesley Terris, and Ranan Kuperman 2002. International Networks and Sys-
tem Stability. Paper presented at the annual meeting of the International Studies Association, New Orleans, March 24-27.
Maoz, Zeev, Lesley Terris, Ranan Kuperman, and Ilan Talmud 2002. International Net-
works and the Evolution of the International System, 1816-1990. Paper presented at the Peace Science Society (International), Tucson, AZ. October 28-30.
Midlarsky, Manus I. 1975. On War: Political Violence in the International System. New York:
Free Press. Nemeth, R. J. and D.A. Smith 1985. International Trade and World System Structure.
Review 8(4): 517-560.
International Relations: A Network Approach 2
Ray, James, L. 2001. Integrating Levels of Analysis in World Politics, Journal of Theoretical Politics
1974. Status Inconsistency and War Involvement Among European States,
1816-1970. Ph.D. Dissertation. University of Michigan. Russett, Bruce and John Oneal 2001. Triangulating Peace: Democracy, Interdependence, and In-
ternational Organization. New York: Norton. Singer, J. David 1961. The Level-of-Analysis Problem in International Relations. In
Klaus Knorr and Sidney Verba (eds.) The International System: Theoretical Essays. Princeton, NJ: Princeton University Press, pp. 77-92.
Singer J. David and Melvin Small 1968.Alliance Aggregation and the Onset of War. In J.
David Singer (ed.). Quantitative International Politics: Insight and Evidence. New York: Free Press, pp. 247-286.
Signorino, Curtis S. and Jeffery M. Ritter 1999. Tau-b or Not Tau-b: Measuring the Simi-
larity of Foreign Policy Positions. International Studies Quarterly, 43(1): 115-144. Snyder, David and Edward L. Kick 1979. Structural Position in the World System and
Economic Growth, 1955-1970. American Journal of Sociology, 84(4): 1096-1126. Steiber, Steven 1979. The World System and World Trade: An Empirical Exploration of
Conceptual Conflict. Sociological Quarterly, 20(1): 23-36. Van Rossem, Ronald 1996. The World System Paradigm as General Theory of Devel-
opment: A Cross-National Test. American Sociological Review, 61(2): 508-527. Ward, Michael D. and Christian Gleditsch 2000. War and Peace in Space and Time: The
Role of Democratization. International Studies Quarterly, 44(1): 1-29. Wasserman, Stanley and Katherine Faust 1994. Social Network Analysis: Methods and Appli-
cations. Cambridge: Cambridge University Press.
Copyright © 2022 FDOKUMEN