All smiles are positive, but some smiles are more positive than others
Ecological Modelling 107 (1998) 127–143
Network synergism: Emergence of positive relations inecological systems
Brian D. Fath *, Bernard C. Patten
Institute of Ecology, Uni6ersity of Georgia, Athens, GA 30602, USA
Received 24 April 1997; accepted 26 November 1997
Abstract
Traditional evolutionary theory depicts survival of the fittest as a difficult existence based on danger, conflict andstrife. But, another view is emerging of a more synergistic organization in which ecosystems on the whole providehospitable conditions for life. This world is populated by organisms mutually adapted and beneficial by virtue of theirdirect and indirect interactions. Many examples of mutualism have been explicitly observed (Bronstein, J.L., 1991. Bull.Ecol. Soc. Am. 72, 6–8; Cushman, J.H., Beattie, A.J., 1991. Trends Ecol. Evol. 6, 193–195; Casti, J.L., Karlqvist, A.(Eds.), 1995. Cooperation and Conflict in General Evolutionary Processes, Wiley, New York, 435 pp.), and we viewmutualism as an implicit consequence of indirect interactions and ecosystem organization. This paper extends amethodology based on input-output analysis that models these synergistic relationships (Patten, B.C., 1991. TheoreticalStudies of Ecosystems: The Network Perspective, pp. 288–351; Patten, B.C., 1992. Ecol. Modell. 62, 29–69). We showfor simple storage-flow models that direct zero-sum resource transactions between organisms, when considered incontext of the whole-system organization, produce integral (direct plus indirect) relationships more positive than thedirect ones. This phenomenon, ‘network synergism’, is demonstrated for two simple networks and a complete threecomponent model. We also show, by looking at a limiting case, that system-wide synergism is ubiquitous, occurringin all models of any size or complexity. Network synergism emerges in these models because of three network properties:symmetry, indirectness and openness. © 1998 Elsevier Science B.V. All rights reserved.
Keywords: Indirect effects; Interaction webs; Mutualism; Network analysis; Synergism; Utility analysis
1. Introduction
The interplay between individuals and their surroundings produces a connected web of life: a coevolvedecosystem. A dominant influence on the behavior of this web is the exchange of conservative resources
* Corresponding author. Tel.: +1 706 5426035; fax: +1 706 5426040; e-mail: [email protected]
0304-3800/98/$19.00 © 1998 Elsevier Science B.V. All rights reserved.
PII S 0 304 -3800 (97 )00213 -5

B.D. Fath, B.C. Patten / Ecological Modelling 107 (1998) 127–143128
(energy, nutrients or other matter) between organisms. A major premise of network analysis is that theseorganisms and exchanges can be represented as a collection of storages and flows. Resources in thenetwork transfer between connected storage components by direct interactions. Indirect interactions arethose which do not proceed directly between two components. Therefore, higher order indirect interac-tions between organisms are determined by the organization of the entire ecological network. Below, wedescribe a methodology to investigate ecological relationships based on both direct and indirect interac-tions. One consequence of this approach is the discovery that integral (direct plus indirect) networkrelations are more positive than direct network interactions in the same models. This result provided theorigin of the term ‘network synergism’. The emergence of network synergism can be interpretedecologically and tracked mathematically with three properties: symmetry, indirectness and openness.
We define transactions, relations and synergy to provide a framework for thinking about the direct andindirect interactions between organisms in an ecosystem. A ‘transaction’ is the direct, observable transferof conservative resources between two organisms, and a ‘relation’ is the direct and indirect consequenceof these transfers. Whereas a transaction is physical, a relation is conceptual and can occur betweenorganisms which are not connected via direct transactions. For example, predation is the name of therelation associated with the transaction of feeding in which one organism (predator) has a net gain inresources and the other (prey) has a net loss. Many relations arise only from indirect interactions. Twoorganisms without a direct transaction between them compete if they use the same resource, i.e. apparentcompetition (Holt, 1977), because the common prey mediates the competition relation between the othertwo organisms. By identifying the conceptual relationship between transacting (direct) and non-transact-ing (indirect) organisms, the general organization of entire systems can be investigated. ‘Synergy’ occurswhen the net sum of all the relations in a model is positive. We contend that the overall net relation inany ecological network is synergistic.
1.1. Transactions
Resource transactions couple biota and abiota together in interactive networks that constitute anecosystem. All ecosystems have a primary input transfer of energy, usually the photosynthetic capture ofsolar radiation, and a final output transfer of energy in the form of unusable heat. In addition to theradiant energy exchange, material energy stores are transferred by interactions between organisms. Sinceecosystem boundaries pass both energy and matter, they are open thermodynamic systems. Systemopenness is an important property in realizing integral positive relations. The thermal energy gradientestablished by the difference between solar (6000 K) and terrestrial (300 K) surfaces pushes the systemsaway from equilibrium. This property has long been recognized. It drives the system from the ‘bottom-up’(White, 1978; Power, 1992) because without primary producers there would be no energy available to thehigher trophic levels.
While resource transactions drive through ecosystems by ‘bottom-up’ processes, many transfer mecha-nisms derive from ‘top-down’ activities (Hairston et al., 1960; Paine, 1966, 1974) of organisms functioningas agents for their own survival. A prominent example of top-down activity is feeding, leading to conflictas a dominant perception of ecological organization. However, we believe that ecological networks arisefrom a synthesis of bottom-up and top-down processes (Hunter and Price, 1992) and the combination ofdirect and indirect interactions which follow. There are many direct and indirect interactions in anecosystem (Yodzis, 1988; Strauss, 1991; Menge, 1995). Indirectness, as we use the term, is simply a lackof direct connectedness between components. Indirect effects are mediated by transactions which relatecomponents that are not directly connected. For example, in a flow from k� j� i, the flows from k� jand j� i are direct, whereas, the flow from k to i is indirect and mediated by j. Although there is no directtransaction between k and i, there is a relation. If analyzed separately as two 2-component networks (k� jand j� i ), this relation would not be evident. It is only apparent when the 3-component network is

B.D. Fath, B.C. Patten / Ecological Modelling 107 (1998) 127–143 129
analyzed as one system. From this perspective, ecosystem behavior and relations are holisticallyconstituted. Since indirect effects are often more significant than direct effects (Higashi and Patten, 1989),it is necessary to investigate the network’s relations using a methodology which incorporates the indirecteffects.
1.2. Relations
Qualitative value-oriented direct and indirect relations between system parts can be identified byordered pairs (Burkholder, 1954). Nine such pairs are definable using + , − and 0 (Patten, 1991, 1992;Table 1). The principal relations empirically studied in ecology are competition, predation and mutualism.These relations are generally identified by isolating the organisms from their ecosystem. As a result, it isalso unclear as to whether the relations are direct or indirect, and indirect effects are effectively ignoredor assumed to be non-existent. By our definition, a transaction is the direct transfer of a resource, andtherefore, a direct relation based on a transaction must be either predation (+ ,− ) or altruism (− ,+ )where one component has a net gain at the expense of the other. With neutralism (0,0), there is no netgain between the components which generally indicates the absence of transactions. Neutralism can alsooccur if the opposing flows are equal. The six other relations occur only as the result of indirectinteractions within the system. The two-predator one-prey example mentioned above, which is investi-gated more thoroughly to follow, is an example of competition as an indirect relation. All competitionand mutualism relations are the indirect consequences of transactions. These indirect relations can beinvestigated using network utility analysis, which accounts for both bottom-up and top-down interactionsin connected systems.
2. Methods
2.1. Network utility analysis
Input-output analysis was developed by Leontief (1966) to analyze the interdependence of industries inan economy (Miller and Blair, 1985). Input-output analysis can also be used to analyze the interdepen-dence of organisms in an ecosystem (Hannon, 1973). An environmental extension of input-output analysisdescribes the distribution of resources throughout the interior of a system (Patten, 1978). In thisapproach, each component is envisaged as a partition of two mutually exclusive halves, one comprisingof all the inflow and the other comprising of the outflow. The traditional organism-environment dualityseparates the component from the environment. However, in network utility analysis this view isreconfigured such that each component consists of two environments, one which acts upon it, and theother which is acted upon by it. The component itself is part of two environments, one receiving and onegenerating. The input or receiving flows are the terminus of all the interactions leading up to thecomponent, and the outflows from the component are the source or generator of new interactions.
Table 1Ecological relations specified by binary interactions
−0+
(+,0) anabolism (+,−) predation0 (+,+) mutualism(0,+) commensalism (0,0) neutralism− (0,−) amensalism(−,+) altruism (−,0) catabolism+ (−,−) competition

B.D. Fath, B.C. Patten / Ecological Modelling 107 (1998) 127–143130
Fig. 1. Three component food chain with 10% transfer efficiency.
Network analysis captures both bottom-up and top-down processes in the sense of being source andterminally oriented, respectively. That is, an output environment issues from every component (source),and an input environment ends at every component (terminus). By looking backward through theinteractions which led up to the component, the input environment captures the top down activity and theforward looking output environments generates bottom up activity.
For a value-oriented network analysis, we borrow a second concept from economics, utility. ‘Utility’ isdefined as the value of a specific product or currency relative to the value of an entire asset. For example,$1 has more utility to a laborer in a day $10 were earned compared to the utility of the same dollar duringa day $100 were earned. Since utility is based on the net flow between components, it is possible to havenegative utility. For example, the utility from the employer to the laborer would be negative (we assumethere is a positive flow into the employer which comes from a negative flow of consumers, etc.). Ecologicalutility uses this concept based on the flow of energy, nutrients, or other matter between two componentsin a model. In network utility analysis, the transactional flow is normalized by the total flow through thecomponent (Patten, 1991, 1992). Utility is bi-directional measuring both the top-down and bottom-upprocesses. Flow into a component normalized by the total inflow is always positive and gives the relativedependence of the component on that particular flow. This is a measure of bottom-up control. The flowout of a component normalized by the total outflow is negative and is the relative loss to the receivingcomponent. This is a measure of top-down influences. Even in the simple economic example above we seethe possibility of infinite regress as we trace the flows back to their origin. In order to analyze a network,the system must be bounded. Those components not captured within the boundary are considered to beexternal to the network and make up the system’s environment. No model can contain all variables, andthe environment is always explicitly present.
In model systems previously studied, the total utility assessed over the entire web of interactions isgreater than that associated with individual components (Patten, 1991, 1992). That is, integral (direct plusindirect) relations are more positive than direct relations. Below, we describe the first analytical proof forthese previous numerical results. Two simple ecological models and a universally connected model of thesame order are investigated to demonstrate the existence of network synergism in simple ecosystems. Weconsider that a gain of resources provides positive utility and a loss of resources negative utility. Theoriginal methodology to analytically determine integral utility for any network is described in context ofthese examples.
3. Results—network synergism is demonstrated in three ecological models
3.1. Three component food chain
To demonstrate how network synergism arises in simple systems, we first apply the network utilitymethodology to a three component food chain. In this model, X1, which receives a constant input, is

B.D. Fath, B.C. Patten / Ecological Modelling 107 (1998) 127–143 131
grazed by X2, which is preyed upon by X3 (Fig. 1). A dimensional direct flow matrix, F= ( fij), isconstructed based on the transactions within the system. Regardless of the choice of units, all elements inF must be consistent. By our convention, flows are from columns j=1,…,n to rows i=1,…,n. In Fig. 1,f21=10 and f32=1, and the flow matrix for this network is (Eq. (1)):
F=ÃÆ
È
0f21
0
00
f32
000ÃÇ
É=ÃÆ
È
0100
001
000ÃÇ
É(1)
The flow matrix includes all the flows between the components within the system but does not include theinteractions between the components and the environment. A separate input column vector and outputrow vector are needed to represent these flows. The elements of the input vector are fi0]0 with at leastone element strictly greater than zero. Since each component is open and dissipating, the elements of theoutput vector are f0i\0, for i=1,…,n elements. The internal and external flows are used to calculate thetotal throughflow at each component. When the system is in steady state, the sum of the inflows equalsthe sum of the outflows, and we define a single throughflow row vector, T, whose elements, Ti, are equalto (Eq. (2)):
Ti= %n
j=0
fij= %n
j=0
fji (2)
The direct relation between each pair of components is given by a net flow matrix D= (dij)= ( fij− fji).This skew symmetric matrix (dij= −dji) is normalized by the total throughflow at each component, Ti,to represent the ecological utility. For Fig. 1, T= [100,10,1]. A similar procedure (Ulanowicz and Puccia,1990) originally motivated this approach. Normalization gives a direct utility matrix, D, where dij= ( fij−fji)/Ti. D is interpreted as direct utility because the net flow is expressed relative to the total flow at eachnode i. For Fig. 1,
D=ÃÃ
Ã
Ã
Ã
Æ
È
0
f21
T2
0
− f21
T1
0
f32
T3
0
− f32
T2
0
ÃÃ
Ã
Ã
Ã
Ç
É
=ÃÃ
Ã
Ã
Ã
Æ
È
0
1
0
−110
0
1
0
−110
0
ÃÃ
Ã
Ã
Ã
Ç
É
(3)
The direct utility matrix in Eq. (3) can be used to show the relative strength of direct bottom-up andtop-down control in the network. A food chain has strong bottom-up control because there is only asingle pathway for the higher trophic components to receive input. There is complete dependence on theimmediately preceding flow (as seen by the ones on the lower sub-diagonal). There is no direct bottom-upcontrol of X1 on X3 (d31=0). However, there is an indirect bottom-up control which is obvious, andformally demonstrated later. The top-down control is relatively low since only 10% of the flow moves onto the next trophic level. The rest of the flow exits the network to the environment. The value of 10%transfer was arbitrarily chosen, and in general the strength of direct top-down control is dependent on thetransfer efficiency between trophic levels.
The dimensional net flow matrix, D, is retrieved by multiplying the diagonal matrix associated with thethroughflow vector by the direct utility: D=T& *D, where:

B.D. Fath, B.C. Patten / Ecological Modelling 107 (1998) 127–143132
T& =diag(T)=ÃÃ
Ã
Æ
È
T1
0�0
0T2
�0
……·· ·…
00�
Tn
ÃÃ
Ã
Ç
É
(4)
The direct qualitative relations within a system are determined by pairing signs (i, j ) and ( j, i ) from eitherD or D (Patten, 1991, 1992). Signs are expressed in sign only matrices, sgn(D) and sgn(D) (Eq. (5)):
sgn(D)=sgn(D)=ÃÆ
È
0+0
−0+
0−0ÃÇ
É(5)
The relation between X2 and X1, sgn(d21,d12)= (+ ,− ), and between X3 and X2, sgn(d32,d23)= (+ ,− ), ispredation directed from row to column in each case. That between X1 and X3 is neutralism, sgn(d31,d13)=(0,0). D gives only direct utilities in the system.
We can identify indirect utilities associated with path sequences of length k by computing Dk. Thelength of the path sequence is equal in value to the power of D. For example, D2 (D2=D�D, where � ismatrix multiplication) gives utilities associated with paths of length 2, and D3 gives utilities over paths oflength 3, etc. (Patten, 1991, 1992). An integral utility matrix, which accounts for the contribution of alldirect and indirect interactions, is found by summing all powers of D. That is,
U¡
integral
=
=
I¡
initial input
+
+
D¡
direct
+
+
D2+D3+D4+ ···¡
indirect(6)
where I=D0. Each component in the model is actively open to exchange with its external environment.Some components explicitly receive external flows and all components transmit outflows to the environ-ment. This actual and potential openness is represented in the first term of the power series. U is anintegral utility matrix because its elements represent the total non-dimensional utility associated withtransactions of the same order expressed between the components by powers of D (Patten, 1991, 1992).An analytic representation of U is:
U= %�
k=0
Dk= (I−D)−1= [det(I−D)]−1adj(I−D) (7)
Here det( · ) is the determinant and adj( · ) the adjoint matrix. The infinite power series in Eq. (7) convergesonly when all the eigenvalues of D are strictly less than one in magnitude. The eigenvalues for a foodchain can be determined entirely by the transfer efficiencies between the trophic levels. A three componentfood chain fails the eigenvalue convergence criterion when the sum of the two efficiencies is greater thanor equal to one. The eigenvalues associated with the example in Fig. 1 are 0.4472 i, −0.4472 i and 0.Therefore, the series converges and the following algebraic and numeric integral utility matrices arecalculated:

B.D. Fath, B.C. Patten / Ecological Modelling 107 (1998) 127–143 133
U=1
1+f21
T1
+f32
T2
1+f32
T2
1
1
− f21
T1
1
1
f21 f32
T1T2
− f32
T2
1+f21
T1
ÃÃ
Ã
Ã
Ã
Ç
É
=ÃÃ
Ã
Ã
Ã
Æ
È
11125656
−1125656
1120−1121112
ÃÃ
Ã
Ã
Ã
Ç
É
(8)ÃÃ
Ã
Ã
Ã
Æ
È
Eq. (8) is used to show the strength of bottom-up and top-down control of the entire networkorganization. The diagonal elements are all positive indicating each component is a self-mutualist. Notsurprisingly, X3 is not completely dependent on X2 but also on X1 (d31,d13) since this is the original sourceof flow. It is interesting to see that X2 is no longer solely controlled by X1 (d23,d32). The indirect bottom-upcontrol of X1 on X3 is explicitly demonstrated, and there is also positive top-down control on X1 by X3.Analogous to direct utility, D=T& �D, we define a dimensionalized (with units same as the throughflow)integral utility matrix, Y= (yij), as:
Y=T& �U (9)
and for this example:
Y=1
1+f21
T1
+f32
T2
�1+
f32
T2
�T1
T2
T3
− f21
T2
T3
f21 f32
T2
− f32�1+
f21
T1
�T3
=ÃÃ
Ã
Ã
Ã
Æ
È
275325356
−25325356
56
−561112
ÃÃ
Ã
Ã
Ã
Ç
É
(10)ÃÃ
Ã
Ã
Ã
Æ
È
ÃÃ
Ã
Ã
Ã
Ç
É
The signs of the elements of U and Y are used to determine the qualitative integral relations in thesystem. The analytic Y matrix in Eq. (10) is the same for all 3×3 food chain models. From this, we seethat the sign of each element in Y cannot change by changing the amount of flow through the system. Thestructure of the network would have to change in order to change the signs. In this simple model, thesigns, which determine the relations, are invariant to changes in the amounts of flow. For thethree-component food chain, the integral sign only matrix is (Eq. (11)):
sgn(U)=sgn(Y)=ÃÆ
È
+++
−++
+−+ÃÇ
É(11)
Note the absence of zeros in sgn(U) compared to sgn(D) in Eq. (4). Integrated networks usually havenon-zero indirect relations even when lacking direct transactions. Comparison of sgn(D) and sgn(U)shows that direct and integral relations between X2 and X1, and X3 and X2 are the same. That is,sgn(d21,d12)=sgn(u21,u12)= (+ ,− ) and sgn(d32,d23)=sgn(u32,u23)= (+ ,− ). However, the relation be-tween X3 and X1 is transformed from direct neutralism to integral mutualism: sgn(d31,d13)= (0,0) butsgn(u31,u13)= (+ ,+ ). Higher powered relations between X1 and X3 propagate through the system givingrise to indirect mutualism. Flow from X1 benefits X3 (as mediated by X2), and X1 benefits from thepresence of X3 because X2 is suppressed by X3. Indirect influences are detected by our methodology whichaccounts for both forward and backward ecosystem processes.

B.D. Fath, B.C. Patten / Ecological Modelling 107 (1998) 127–143134
In addition to increased positive qualitative relations, network synergism can be quantitativelyillustrated by adding together the total utility (all the elements) in the dimensional utility matrix. Anotherway to test for synergism is to show that the ratio of positive utility to negative utility in the system isgreater than one (Patten, 1991, 1992). This is mathematically equivalent to the method in Eq. (12),however, Eq. (12) is more easily calculated for general cases. We recommend using the ratio method whenanalyzing empirical models because it gives a relative measure of ‘synergism’ regardless of the size orthroughflow of the model. In the direct utility matrix, D, the sum of the elements is equal to zero becausethe matrix is skew symmetric. We test for network synergism by adding the elements of the dimensionalintegral utility matrix.
%n
j=1
%n
i=1
yij\0 (12)
If the sum is greater than zero (Eq. (12)), then the network has been transformed from a zero-sumsituation to one in which positive utility is dominant, and network synergism occurs. Network synergismarises because the integral utility matrix incorporates indirect effects in the open network. For the examplein Fig. 1, the sum of the elements of the integral utility matrix is 102.58. Since the sum of the elementsis greater than zero, network synergism is demonstrated. We can also show that, for the general threecomponent food chain model, network synergism always occurs. In a food chain, T2= f21 and T3= f32, soy12 and y23, cancel with y21 and y32, and hence, the sum of the elements is always greater than zero (Eq.(13)):
%n
j=1
%n
i=1
yij=T1T2
f21T1+ f212 + f32T1
�T1+
f32
f21
T1+ f21+3f32+f21 f32
T1
�(13)
3.2. Three component competition web
In the second example, we show network synergism in a model with two predators feeding on acommon prey (Fig. 2). This structure is examined by algebraic analysis, without numerical exemplifica-tion. Several steps are omitted and left to the reader for verification. Matrices for this model are (Eq.(14)):
Fig. 2. Three component competition network with two predators feeding on a common prey.

B.D. Fath, B.C. Patten / Ecological Modelling 107 (1998) 127–143 135
F=ÃÆ
È
0f21
f31
000
000ÃÇ
É, D=Ã
Ã
Ã
Ã
Ã
Æ
È
0
f21
T2
f31
T3
− f 21
T1
0
0
− f31
T1
0
0
ÃÃ
Ã
Ã
Ã
Ç
É
, sgn(D)=ÃÆ
È
0++
−00
−00ÃÇ
É(14)
The series convergence test is always satisfied for this structure and the generalized U matrix derived fromEq. (7) is:
U=1+f21 f21
T1T2
+f31 f31
T1T3
ÃÃ
Ã
Ã
Ã
Æ
È
1
f21
T2
f31
T3
− f21
T1
1+f31 f31
T1T3
− f21 f31
T1T3
− f31
T1
− f21 f31
T1T2
1+f21 f21
T1T2
ÃÃ
Ã
Ã
Ã
Ç
É
(15)
For this system, f21=T2 and f31=T3, so we can simplify Eq. (15) as follows (Eq. (16)):
U=T1
T1+ f21+ f31
ÃÃ
Ã
Ã
Ã
Æ
È
1
1
1
− f21
T1
1+f31
T1
− f21
T1
− f31
T1
− f31
T1
1+f21
T1
ÃÃ
Ã
Ã
Ã
Ç
É
(16)
From Eq. (9) we get (Eq. (17)):
Y=T1
T1+ f21+ f31
ÃÃ
Ã
Ã
Ã
Æ
È
T1
T2
T3
− f21�1+
f31
T1
�T2
− f21T3
T1
− f31
− f31T2
T1�1+
f21
T1
�T3
ÃÃ
Ã
Ã
Ã
Ç
É
(17)
The main diagonal elements of U and Y are again positive. The direct predatory relations between X2 andX1, and X3 and X1 remain unchanged. However, the integral relation between X2 and X3 is competition,sgn(u32,u23)= (− ,− ). This model proves mathematically our earlier observation that competition isexpressed between two predators using a common resource without a direct transaction between them.Using Eq. (12) to test for network synergism gives (Eq. (18)):

B.D. Fath, B.C. Patten / Ecological Modelling 107 (1998) 127–143136
Fig. 3. Three component complete network. This structure contains as subsystems all one, two and three component models.
%n
j=1
%n
i=1
yij=T1�
T1− f21− f31+T2+T2+f31T2
T1
−f31T2
T1
+T3−f21T3
T1
+T3+f21T3
T1
�T1+ f21+ f31
(18)
and, since T2= f21 and T3= f31 (Eq. (19)),
%n
j=1
%n
i=1
yij=T1(T1+T2+T3)
T1+T2+T3
=T1 (19)
Positive utility exceeds negative utility for this system structure. Therefore, the overall system organizationof this competition network is synergistic.
3.3. Three component complete digraph
Each of the above examples is a subset of the general Y matrix for a 3×3 complete graph (Fig. 3). Theintegral utility matrix for this model is (Eq. (20)):
Y=1
det(I−D)
ÃÃ
Ã
Ã
Ã
Æ
È
T1+T1( f23−f32)2
T2T3
f21−f12+( f13−f31)( f32−f23)
T3
f31−f13+( f12−f21)( f23−f32)
T2
f12−f21+( f13−f31)( f32−f23)
T3
T2+T2( f13−f31)2
T1T3
f32−f23+( f12−f21)( f31−f13)
T1
f13−f31+( f12−f21)( f23−f32)
T2
f23−f32+( f12−f12)( f31−f13)
T1
T3+T3( f12−f21)2
T1T2
ÃÃ
Ã
Ã
Ã
Ç
É
(20)where (Eq. (21))
det(I−D)=T1T2T3+T1( f23− f32)2+T2( f31− f13)2+T3( f21− f12)2
T1T2T3
(21)

B.D. Fath, B.C. Patten / Ecological Modelling 107 (1998) 127–143 137
Since det(I−D) is strictly positive, it does not have an effect on the relationship (i.e. sign) between theelements of Y. Also, the diagonal elements of Y are clearly always positive. In the two examples given,integral qualitative relations depended only on the structure (how the components are connected together)of the system. However, in the complete graph these relations cannot be determined without knowing themagnitudes of the flows. Although it is therefore impossible to determine ‘a priori’ the integral relationsfor the system, the overall organization can still be shown to be quantitatively synergistic. When a directflow does not exist, the integral relation is determined only by the indirect relations in the system. Summingall elements in Y shows that direct flows cancel and integral utility is determined by the indirect interactions:
%n
i=1
%n
j=1
yij=1
det(I−D)�
T1T2T3+T1( f23− f32)2
T2T3
+T2( f13− f31)2
T1T3
+T3( f12− f21)2
T1T2
+2( f13− f31)( f32− f23)
T3
+2( f12− f21)( f23− f32)
T2
+2( f12− f21)( f31− f13)
T1
�(22)
It can be shown that the righthand-side of Eq. (22) is always positive, so the 3×3 system is always synergistic.
3.4. Network synergism is inherent in connected systems
We want to show that based on the methodology described above network synergism occurs in all ecologicalmodels regardless of size and complexity. The easiest way to show this is by investigating the limiting casewhere the sum of the elements of the integral utility matrix is a minimum. The sum of the elements of Uis a minimum when the system exerts the maximum top-down (negative) control. A system with onecomponent acting as a sink for flow from all the other components has maximum top-down control (Fig.4). If we let the nth component be the sink, then the flow matrix, F, is (Eq. (23)):
F=ÃÃ
Ã
Æ
È
00�0
fn1
00�0
fn2
……· · ·……
00�0
fn,n−1
00�00
ÃÃ
Ã
Ç
É
(23)
Fig. 4. Network in which the nth component acts as a sink for flow from all n−1 components.

B.D. Fath, B.C. Patten / Ecological Modelling 107 (1998) 127–143138
We also use the fact that each element of D is bounded, −15dij51, to produce a direct utilitymatrix in which each of its elements takes on its minimum value. Conceptually, we realize this byletting Tn� fni, and fni�Ti, for i=1,…,n−1 (Eq. (24)).
D=ÃÃ
Ã
Æ
È
00�00
00�00
……·· ·……
00�00
−1−1�
−10
ÃÃ
Ã
Ç
É
(24)
In this system, the donating (source) components are strongly controlled by the sink component.Nearly all flow from the donating components goes to the sink (low dissipation, high transfer effi-ciency). Also, the sink is weakly controlled by the source components because most of the flow intothe sink comes from outside the system along the flow fn0. In this situation there is minimal bottom-up control and maximal top-down control. The integral utility matrix is (Eq. (25)):
U=ÃÃ
Ã
Æ
È
10�00
01
· · ·00
……·· ·……
00�10
−1−1�
−11
ÃÃ
Ã
Ç
É
(25)
with the sum of the elements equal to one. If we let T= [T1,T2,T3,...,Tn ], be a general throughflowvector, the dimensional utility matrix, Y=T& �U, is (Eq. (26)):
Y=ÃÃ
Ã
Æ
È
T1
0�00
0T2
· · ·00
……·· ·……
00�
Tn−1
0
−T1
−T2
�−Tn−1
Tn
ÃÃ
Ã
Ç
É
(26)
and
%n
j=1
%n
i=1
yij=Tn (27)
Eq. (27) shows that the sum of the elements of the integral utility matrix is equal to the throughflowof the sink component for this limiting case. Since this is the minimum value for the sum of theelements of Y, the sum is strictly positive in all cases. By this methodology, network synergism isinherent in all systems. Physically, the above limiting case is not realizable because there must be somenon-zero flow from each component to the environment. Including dissipation would have the effectof raising the values of the elements of D by making them less negative (dij\−1). This would resultin raising the value of the sum of the elements of U and Y as well. The network synergism in suchsystems would be even greater.
For completeness, we also investigate the maximum value of utility in a system. This occurs in asystem which has maximum bottom-up (positive) control. The structure which has maximum bottom-up control is a food chain because all the flow to the next component is dependent on the precedingcomponent. In order to get the upper bound for the utility in a system, we look at a limiting case inwhich fij�Ti, and Ti� fji for i=1,…,n. The direct utility matrix in this case is (Eq. (28)):

B.D. Fath, B.C. Patten / Ecological Modelling 107 (1998) 127–143 139
D=ÃÃ
Ã
Æ
È
010�0
001�0
000
· · ·…
………·· ·1
000�0
ÃÃ
Ã
Ç
É
(28)
Here, the flow up the food chain is strongly controlled by the receiving component, and this flow has littlecontrol on the donating component (maximal bottom-up control, minimal top-down control). Theintegral utility matrix is (Eq. (29)):
U=ÃÃ
Ã
Æ
È
111�1
011�1
001
· · ·…
………·· ·1
000�1
ÃÃ
Ã
Ç
É
(29)
with the sum of the elements equal to (n2+n)/2. Again, using the throughflow vector T= [T1,T2,T3,...,Tn ],the dimensional utility matrix is (Eq. (30)):
Y=ÃÃ
Ã
Æ
È
T1
T2
T3
�Tn
0T2
T3
�Tn
00
T3
· · ·…
………·· ·Tn
000�
Tn
ÃÃ
Ã
Ç
É
(30)
with (Eq. (31))
%n
j=1
%n
i=1
yij=T1+2T2+3T3+ ···+nTn (31)
Interestingly, the maximum utility in a system is dependent on the number of components in the model.Using these limiting cases, we are able to define the lower and upper bound for the integral utility in anecological model. In the dimensional integral utility matrices, the magnitude of utility depends on theflows. Even without knowledge of the values of these flows, the range given above makes it clear thatnetwork synergism is exhibited in all models.
4. Conclusion
Neo-Darwinian theory asserts that nature is a world of danger, conflict and strife. Here, however,network synergism, a property inherent in patterns of ecosystem transactions, is given an analytical basisand is demonstrated for simple networks. Since the values of the direct utility are bound, −15dij51,we determined the range of the values for the integral utility and showed that the minimum value for thesum of the elements is always greater than zero. Network synergism occurs in all models regardless of thesize or complexity of the system. As stated in the introduction, the emergence of network synergism can

B.D. Fath, B.C. Patten / Ecological Modelling 107 (1998) 127–143140
be interpreted ecologically and tracked mathematically with three properties: symmetry, indirectnessand openness.
All transactions of conservative substances are skew symmetric in that the loss from the donat-ing component is equal and opposite to the gain of the receiving component. In network utilityanalysis, this skew symmetry is captured in the dimensionalized net flow matrix D. The dimen-sionless direct interaction matrix, D, used in the power series to generate integral utility, isproportional to D. Therefore, it has similar attributes. For example, the determinant of a skewsymmetric matrix is positive (given real elements) because positive odd order paths cancel negativeodd order paths leaving only even order terms, which in a skew symmetric matrix are always posi-tive (Scott, 1880). Calculating a determinant is analogous to tracing paths through the network. Theskew symmetry of D is responsible for the positive value of det(I−D) that occurs in all cases(Appendix A). Since det(I−D) is always positive, I−D is always invertible. Also, the factor 1/(det(I−D)) in each element of U is positive and does not effect the system relationships. The conser-vation principle provides the constraint of symmetry which contributes to the positive quality of thenetwork.
Indirect relations contribute greatly to the integral relations in a system. These indirect relations arerepresented in the higher powered terms of Eq. (6). The indirectness is evident in the integral matricesbecause elements of both qualitative (sgn(U) and sgn(Y)) and quantitative (U and Y) integral matricesare non-zero. This indicates that even component pairs lacking direct transactions interact indirectlyreinforcing the often-stated idea that all of nature is connected together. The potential for networksynergism is high in sparsely connected networks since zero elements in the direct transaction matrixfill in with non-zero indirect relations. Thus, indirect relations, not direct transactions, provide overallpositive utility to system components. Indirectness manifested through network holism is an essentialbasis for network synergism.
Ecosystems are open thermodynamic systems. They incorporate inflows from their external environ-ment and pass matter and energy back to the environment through their outflows. This opennessseems to be the dominant contributor to network synergism. Mathematically, their ability to interactwith the environment is captured in the first term on the right-hand side of Eq. (6). This term allowsfor the importation and exportation of flow-based utility into the system by opening it to externalinputs. One consequence of openness is that the diagonal elements of U and Y are always positive.The value of these elements is generally quite large compared to non-diagonal elements and con-tributes heavily to the overall positive character of the integral utility matrix. The positive diagonalelements reflect that organisms function as self-mutualists in environmentally open networks. Positivediagonal elements can be shown to hold for all static open networks of any size or complexity, sothese results are completely general (Appendix A).
In conclusion, network utility theory provides a method for determining qualitative and quantita-tive relations derived from conservative transactions between all components of integrated systems.These relationships can be used to quantify the extent to which top-down and bottom-up controlare operating in the system. What is less intuitive is that the sum of the integral utility in a systemis always positive. Network synergism is an inherent property of networks arising from these directresource transactions. We believe this holds over many levels of organization, from cells to eco-systems, and that it is an important cause and consequence of the self-organization widely ascribed tocomplex adaptive systems. Moreover, since these results are general, this methodology is not limitedto ecosystem analysis, but also has application in other areas where network analysis is used, namelyeconomics. Due to network symmetry, indirectness and openness, more positive than negative utilityemerges in the integral interaction matrix. These results give a basis to begin to explore the ideathat systems are more mutualistic and cooperative than is currently portrayed by neo-Darwiniantheory.

B.D. Fath, B.C. Patten / Ecological Modelling 107 (1998) 127–143 141
Acknowledgements
We would like to thank Craig Barber and Luis Suarez for their valuable discussions, and Michael Fath,Chris Miller, Edward Gardiner and Hans Stigter for suggestions and encouragement on earlier drafts ofthe manuscript. The comments of two anonymous reviewers were helpful and appreciated.
Appendix A
Given an n×n matrix, D= (dij), defined by
dij=fij− fji
Ti
,
where, fij50 and Ti=Sj=0n fij=Sj=0
n fji. Then �I−D�]1, where � · � is the determinant.Proof: Let S be an n×n skew symmetric matrix (sij= −sji) and �lI−S� be the corresponding
characteristic function (Eq. (32)):
�lI−S�=ln− (tr1S)ln−1+ (tr2S)ln−2− ···− (−1)n(trn−1S)l+ (−1)n(trnS) (32)
where, trk(S) is the trace of the kth order. The trace of the kth order of a square matrix is the sum of
the determinants of all�n
k�
matrices of order (k×k) which can be formed by intersecting any k rows with
the same k columns. Since �S�=0 for k odd, trkS=0 for k odd (Scott, 1880). Also trkS are squares fork even (Turnbull, 1945). Therefore, (Eq. (33))
�lI−S�=ln+Qln−2+Rln−4+ ··· (33)
where Q, R,… are sums of squares which are positive. To find �I−S�, we let l=1 which gives (Eq. (34)):
�I−S�=1+Q+R+ ··· (34)
where Q,R,… are still sums of squares. Therefore, �I−S�]1.Next, let P�Rn, P= (p1, p2,…pn) Ö i=1,…,n : pi]0, and s=diag(P)�S, where (Eq. (35))
diag(P)=ÃÃ
Ã
Æ
È
p1
00.0
0p2
0.0
00p3
.0
……………
000.
pn
ÃÃ
Ã
Ç
É
(35)
We call s quasi-skew symmetric because it can be written as the product of a constant diagonal matrixand a skew symmetric matrix. The characteristic function for s can be written as (Eq. (36)):
�lI−s�=ln− (tr1s)ln−1+ (tr2s)ln−2− ···− (−1)n(trn−1s)l+ (−1)n(trns) (36)
B.D. Fath, B.C. Patten / Ecological Modelling 107 (1998) 127–143142
However, since
�PS�= �P��S� and �P�= Pni=1
pi (37)
we get (Eq. (38)):
�s�=ÃÃ
Ã
Ã
Ã
p1s11
p2s21
.pnsn1
p1s12
p2s22
.pnsn2
…………
p1s1n
p2s2n
.pnsnn
ÃÃ
Ã
Ã
Ã
=�
Pni=1
pi
�ÃÃÃ
Ã
Ã
s11
s21
.sn1
s12
s22
.sn2
…………
s1n
s2n
.snn
ÃÃ
Ã
Ã
Ã
(38)
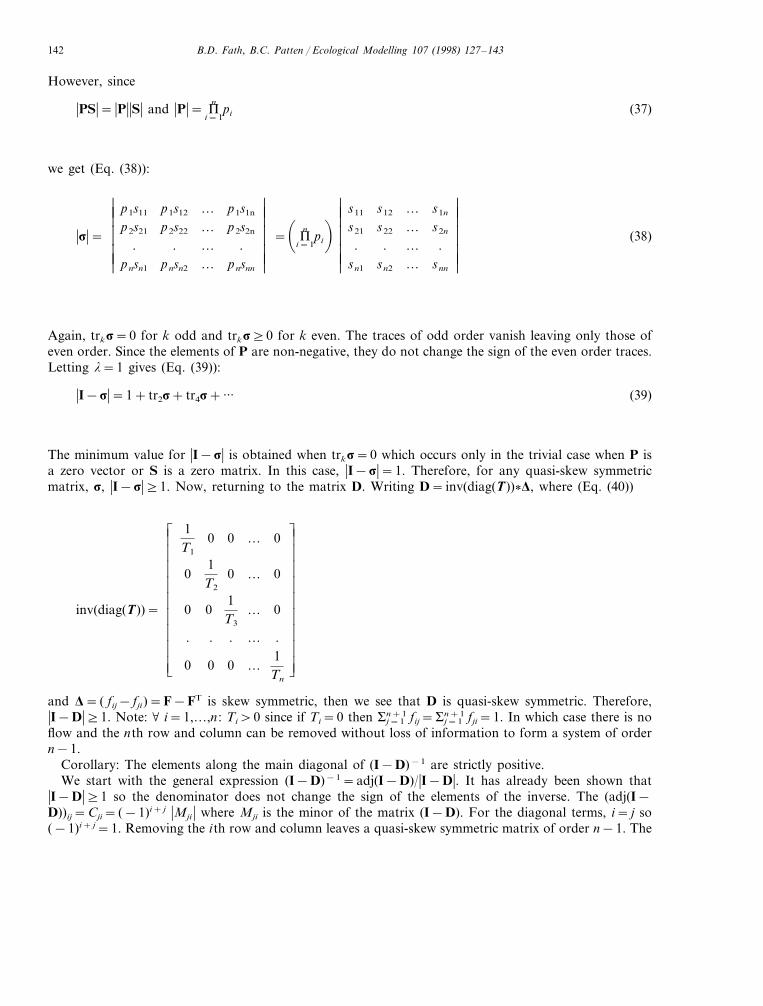
Again, trks=0 for k odd and trks]0 for k even. The traces of odd order vanish leaving only those ofeven order. Since the elements of P are non-negative, they do not change the sign of the even order traces.Letting l=1 gives (Eq. (39)):
�I−s�=1+ tr2s+ tr4s+ ··· (39)
The minimum value for �I−s� is obtained when trks=0 which occurs only in the trivial case when P isa zero vector or S is a zero matrix. In this case, �I−s�=1. Therefore, for any quasi-skew symmetricmatrix, s, �I−s�]1. Now, returning to the matrix D. Writing D= inv(diag(T))�D, where (Eq. (40))
1T1
0 0 … 0
01
T2
0 … 0
inv(diag(T))=ÃÃ
Ã
Ã
Ã
Ã
Ã
Ã
Ã
Æ
È
0 01
T3
… 0ÃÃ
Ã
Ã
Ã
Ã
Ã
Ã
Ã
Ç
É
. . . … .
0 0 0 …1
Tn
and D= ( fij− fji)=F−FT is skew symmetric, then we see that D is quasi-skew symmetric. Therefore,�I−D�]1. Note: Ö i=1,…,n : Ti\0 since if Ti=0 then Sj=1
n+1 fij=Sj=1n+1 fji=1. In which case there is no
flow and the nth row and column can be removed without loss of information to form a system of ordern−1.
Corollary: The elements along the main diagonal of (I−D)−1 are strictly positive.We start with the general expression (I−D)−1=adj(I−D)/�I−D�. It has already been shown that
�I−D�]1 so the denominator does not change the sign of the elements of the inverse. The (adj(I−D))ij=Cji= (−1)i+ j �Mji � where Mji is the minor of the matrix (I−D). For the diagonal terms, i= j so(−1)i+ j=1. Removing the ith row and column leaves a quasi-skew symmetric matrix of order n−1. The

B.D. Fath, B.C. Patten / Ecological Modelling 107 (1998) 127–143 143
results above show that �I−s�]1 for a quasi-skew symmetric matrix regardless of order. We have shownthat all three parts which make up (I−D)−1:�I−D�, (−1)i+ j, and adj(I−D), are all positive for thediagonal elements, therefore, all diagonal elements of (I−D)−1 are strictly positive.
References
Burkholder, P.R., 1954. Cooperation and conflict among primitive organisms. Am. Sci. Oct., 601–631.Casti, J.L., Karlqvist, A. (Eds.), 1995. Cooperation and Conflict in General Evolutionary Processes. Wiley, New York, 435 pp.Hairston, N.G., Smith, F.E., Slobodkin, L.B., 1960. Community structure, population control, and competition. Am. Nat. 94,
421–424.Hannon, B., 1973. The structure of ecosystems. J. Theor. Bio. 41, 535–546.Higashi, M., Patten, B.C., 1989. Dominance of indirect causality in ecosystems. Am. Nat. 133, 288–302.Holt, R.D., 1977. Predation, apparent competition, and the structure of prey communities. Theor. Pop. Bio. 12, 197–227.Hunter, M.D., Price, P.W., 1992. Playing chutes and ladders: bottom-up and top-down forces in natural communities. Ecology 73,
724–732.Leontief, W.W., 1966. Input-Output Economics. Oxford University Press, New York, 257 pp.Menge, B.A., 1995. Indirect effects in marine rocky intertidal interaction webs: patterns and importance. Ecol. Monogr. 65, 21–74.Miller, R.E., Blair, P.D., 1985. Input-Output Analysis: Foundations and Extensions. Prentice Hall, Englewood Cliffs, NJ, 464 pp.Paine, R.T., 1966. Food web complexity and species diversity. Am. Nat. 100, 65–75.Paine, R.T., 1974. Intertidal community structure: experimental studies on the relationship between a dominant competitor and its
principal predator. Oecologia 15, 93–120.Patten, B.C., 1978. Systems approach to the concept of environment. Ohio J. Sci. 78, 206–222.Patten, B.C., 1991. Network ecology: indirect determination of the life-environment relationship in ecosystems. In: Higashi, M.,
Burns, T. (Eds.), Theoretical Studies of Ecosystems: The Network Perspective. Cambridge University Press, New York, pp.288–351.
Patten, B.C., 1992. Energy, emergy and environs. Ecol. Modell. 62, 29–69.Power, M.E., 1992. Top-down and bottom-up forces in food webs: do plants have primacy? Ecology 73, 722–746.Scott, R.F., 1880. Treatise on the Theory of Determinants and their Applications in Analysis and Geometry. Cambridge University
Press, Cambridge, 251 pp.Strauss, S.Y., 1991. Indirect effects in community ecology: their definition, study and importance. Trends Ecol. Evol. 6, 206–210.Turnbull, H.W., 1945. The Theory of Determinants, Matrices, and Invariants. Blackie, London, 368 pp.Ulanowicz, R.E., Puccia, C.J., 1990. Mixed trophic impacts in ecosystems. Coenosis 5, 7–16.White, T.R.C., 1978. The importance of relative shortage of food in animal ecology. Oecologia 33, 71–86.Yodzis, P., 1988. The indeterminancy of ecological interactions. Ecology 69, 508–515.
.
Copyright © 2022 FDOKUMEN