International Journal on Advances in Telecommunications
233
-
Upload
khangminh22 -
Category
Documents
-
view
3 -
download
0
Transcript of International Journal on Advances in Telecommunications


The International Journal on Advances in Telecommunications is published by IARIA.
ISSN: 1942-2601
journals site: http://www.iariajournals.org
contact: [email protected]
Responsibility for the contents rests upon the authors and not upon IARIA, nor on IARIA volunteers,
staff, or contractors.
IARIA is the owner of the publication and of editorial aspects. IARIA reserves the right to update the
content for quality improvements.
Abstracting is permitted with credit to the source. Libraries are permitted to photocopy or print,
providing the reference is mentioned and that the resulting material is made available at no cost.
Reference should mention:
International Journal on Advances in Telecommunications, issn 1942-2601
vol. 3, no. 3 & 4, year 2010, http://www.iariajournals.org/telecommunications/
The copyright for each included paper belongs to the authors. Republishing of same material, by authors
or persons or organizations, is not allowed. Reprint rights can be granted by IARIA or by the authors, and
must include proper reference.
Reference to an article in the journal is as follows:
<Author list>, “<Article title>”
International Journal on Advances in Telecommunications, issn 1942-2601
vol. 3, no. 3 & 4, year 2010, <start page>:<end page> , http://www.iariajournals.org/telecommunications/
IARIA journals are made available for free, proving the appropriate references are made when their
content is used.
Sponsored by IARIA
www.iaria.org
Copyright © 2010 IARIA

International Journal on Advances in Telecommunications
Volume 3, Number 3 & 4, 2010
Editor-in-Chief
Tulin Atmaca, IT/Telecom&Management SudParis, France
Editorial Advisory Board
Michael D. Logothetis, University of Patras, Greece
Jose Neuman De Souza, Federal University of Ceara, Brazil
Eugen Borcoci, University "Politehnica" of Bucharest (UPB), Romania
Reijo Savola, VTT, Finland
Haibin Liu, Aerospace Engineering Consultation Center-Beijing, China
Advanced Telecommunications
Tulin Atmaca, IT/Telecom&Management SudParis, France
Rui L.A. Aguiar, Universidade de Aveiro, Portugal
Eugen Borcoci, University "Politehnica" of Bucharest (UPB), Romania
Symeon Chatzinotas, University of Surrey, UK
Denis Collange, Orange-ftgroup, France
Todor Cooklev, Indiana-Purdue University - Fort Wayne, USA
Jose Neuman De Souza, Federal University of Ceara, Brazil
Sorin Georgescu, Ericsson Research, Canada
Paul J. Geraci, Technology Survey Group, USA
Christos Grecos, University if Central Lancashire-Preston, UK
Manish Jain, Microsoft Research – Redmond
Michael D. Logothetis, University of Patras, Greece
Natarajan Meghanathan, Jackson State University, USA
Masaya Okada, ATR Knowledge Science Laboratories - Kyoto, Japan
Jacques Palicot, SUPELEC- Rennes, France
Gerard Parr, University of Ulster in Northern Ireland, UK
Maciej Piechowiak, Kazimierz Wielki University - Bydgoszcz, Poland
Dusan Radovic, TES Electronic Solutions - Stuttgart, Germany
Matthew Roughan, University of Adelaide, Australia
Sergei Semenov, Nokia Corporation, Finland
Carlos Becker Westphal, Federal University of Santa Catarina, Brazil
Rong Zhao, Detecon International GmbH - Bonn, Germany
Piotr Zwierzykowski, Poznan University of Technology, Poland
Digital Telecommunications

Bilal Al Momani, Cisco Systems, Ireland
Tulin Atmaca, IT/Telecom&Management SudParis, France
Claus Bauer, Dolby Systems, USA
Claude Chaudet, ENST, France
Gerard Damm, Alcatel-Lucent, France
Michael Grottke, Universitat Erlangen-Nurnberg, Germany
Yuri Ivanov, Movidia Ltd. – Dublin, Ireland
Ousmane Kone, UPPA - University of Bordeaux, France
Wen-hsing Lai, National Kaohsiung First University of Science and Technology, Taiwan
Pascal Lorenz, University of Haute Alsace, France
Jan Lucenius, Helsinki University of Technology, Finland
Dario Maggiorini, University of Milano, Italy
Pubudu Pathirana, Deakin University, Australia
Mei-Ling Shyu, University of Miami, USA
Communication Theory, QoS and Reliability
Eugen Borcoci, University "Politehnica" of Bucharest (UPB), Romania
Piotr Cholda, AGH University of Science and Technology - Krakow, Poland
Michel Diaz, LAAS, France
Ivan Gojmerac, Telecommunications Research Center Vienna (FTW), Austria
Patrick Gratz, University of Luxembourg, Luxembourg
Axel Kupper, Ludwig Maximilians University Munich, Germany
Michael Menth, University of Wuerzburg, Germany
Gianluca Reali, University of Perugia, Italy
Joel Rodriques, University of Beira Interior, Portugal
Zary Segall, University of Maryland, USA
Wireless and Mobile Communications
Tommi Aihkisalo, VTT Technical Research Center of Finland - Oulu, Finland
Zhiquan Bai, Shandong University - Jinan, P. R. China
David Boyle, University of Limerick, Ireland
Bezalel Gavish, Southern Methodist University - Dallas, USA
Xiang Gui, Massey University-Palmerston North, New Zealand
David Lozano, Telefonica Investigacion y Desarrollo (R&D), Spain
D. Manivannan (Mani), University of Kentucky - Lexington, USA
Himanshukumar Soni, G H Patel College of Engineering & Technology, India
Radu Stoleru, Texas A&M University, USA
Jose Villalon, University of Castilla La Mancha, Spain
Natalija Vlajic, York University, Canada
Xinbing Wang, Shanghai Jiaotong University, China
Ossama Younis, Telcordia Technologies, USA

Systems and Network Communications
Fernando Boronat, Integrated Management Coastal Research Institute, Spain
Anne-Marie Bosneag, Ericsson Ireland Research Centre, Ireland
Huaqun Guo, Institute for Infocomm Research, A*STAR, Singapore
Jong-Hyouk Lee, INRIA, France
Elizabeth I. Leonard, Naval Research Laboratory – Washington DC, USA
Sjouke Mauw, University of Luxembourg, Luxembourg
Reijo Savola, VTT, Finland
Multimedia
Dumitru Dan Burdescu, University of Craiova, Romania
Noel Crespi, Institut TELECOM SudParis-Evry, France
Mislav Grgic, University of Zagreb, Croatia
Christos Grecos, University of Central Lancashire, UK
Atsushi Koike, Seikei University, Japan
Polychronis Koutsakis, McMaster University, Canada
Chung-Sheng Li, IBM Thomas J. Watson Research Center, USA
Artur R. Lugmayr, Tampere University of Technology, Finland
Parag S. Mogre, Technische Universitat Darmstadt, Germany
Chong Wah Ngo, University of Hong Kong, Hong Kong
Justin Zhan, Carnegie Mellon University, USA
Yu Zheng, Microsoft Research Asia - Beijing, China
Space Communications
Emmanuel Chaput, IRIT-CNRS, France
Alban Duverdier, CNES (French Space Agency) Paris, France
Istvan Frigyes, Budapest University of Technology and Economics, Hungary
Michael Hadjitheodosiou ITT AES & University of Maryland, USA
Mark A Johnson, The Aerospace Corporation, USA
Massimiliano Laddomada, Texas A&M University-Texarkana, USA
Haibin Liu, Aerospace Engineering Consultation Center-Beijing, China
Elena-Simona Lohan, Tampere University of Technology, Finland
Gerard Parr, University of Ulster-Coleraine, UK
Cathryn Peoples, University of Ulster-Coleraine, UK
Michael Sauer, Corning Incorporated/Corning R&D division, USA

International Journal on Advances in Telecommunications
Volume 3, Numbers 3 & 4, 2010
CONTENTS
CARMA: A Distance Estimation Method for Internet Nodes and its Usage in P2P
Networks
Gennadiy Poryev, National Technical University of Ukraine, Ukraine
Hermann Schloss, Logica Deutschland GmbH & Co. KG, Germany
Rainer Oechsle, Trier University of Applied Sciences, Germany
114 - 128
Improving IPTV QoE taking the suitable MPEG-2/MPEG-4 Quantizer based on Jitter,
Delay and lost packets measurements
Alejandro Canovas, Universidad Politécnica de Valencia, Spain
Miguel Garcia, Universidad Politécnica de Valencia, Spain
Jaime Lloret, Universidad Politécnica de Valencia, Spain
Marcelo Atenas, Universidad Politécnica de Valencia, Spain
Rafael Rizo, France Telecom R&D, ORANGE LABS, Barcelona, Spain
129 - 139
User Equipment Energy Efficiency versus LTE Network Performance
Kari Aho, Magister Solutions Ltd., Finland
Tero Henttonen, Renesas Mobile Corporation, Finland
Jani Puttonen, Magister Solutions Ltd., Finland
Lars Dalsgaard, Nokia, Finland
Tapani Ristaniemi, University of Jyväskylä, Finland
140 - 151
Universal Ground Control Station for Heterogeneous Sensors
Axel Bürkle, Fraunhofer IOSB, Germany
Florian Segor, Fraunhofer IOSB, Germany
Matthias Kollmann, Fraunhofer IOSB, Germany
Rainer Schönbein, Fraunhofer IOSB, Germany
152 - 161
Secure Video for Android Devices
Raimund Ege, Northern Illinois University, USA
162 - 171
Evaluation of Spectrum Occupancy in an Urban Environment in a Cognitive Radio
Context
Alexandru Martian, Politehnica University of Bucharest, Romania
Calin Vladeanu, Politehnica University of Bucharest, Romania
Ioana Marcu, Politehnica University of Bucharest, Romania
Ion Marghescu, Politehnica University of Bucharest, Romania
172 - 181
Decentralized Spectrum and Power assignment in OFDMA Femtocells: Exploiting 182 - 192

Different Levels of Coordination
Francisco Bernardo, Universidad de Sevilla, Spain
Ramon Agustí, Universitat Politècnica de Catalunya, Spain
Jorge Cordero, Universidad de Sevilla, Spain
Carlos Crespo, Universidad de Sevilla, Spain
Advanced Consideration of a Caller Pre-Validation Against Direct Spam Over Internet
Telephony
Jürgen Müller, Hochschule Darmstadt University of Applied Sciences, Germany
Michael Massoth, Hochschule Darmstadt University of Applied Sciences, Germany
193 - 202
Dynamic Spectrum Sharing in Cognitive Radio Networks: a Solution based on Multiagent
Systems
Usama Mir, Université de Technologie de Troyes, France
Leila Merghem-Boulahia, Université de Technologie de Troyes, France
Dominique Gaiti, Université de Technologie de Troyes, France
203 - 214
Low Complexity Enhanced Hybrid Spectrum Sensing Architectures for Cognitive Radio
Equipment
Ziad Khalaf, SUPELEC/IETR, France
Amor Nafkha, SUPELEC/IETR, France
Jacques Palicot, SUPELEC/IETR, France
Mohamed Ghozzi, R-Interface, Ercom Group, France
215 - 227
Software Defined Radio Certification in Europe: Challenges and Processes
Gianmarco Baldini, Joint Research Centre, European Commission, Italy
Dimitrios Symeonidis, Joint Research Centre, European Commission, Italy
228 - 238
A Mathematical Framework for the Performance Evaluation of an All-Optical Packet
Switch with QoS Differentiation
John Vardakas, University of Patras, Greece
Ioannis Moscholios, University of Peloponnese, Greece
Michael Logothetis, University of Patras, Greece
Vassilios Stylianakis, University of Patras, Greece
239 - 251
A Media Delivery Framework for On Demand Learning in Manufacturing Processes
Martin Zimmermann, University of Applied Sciences Offenburg, Germany
252 - 262
Distributed Control and Signaling using Cognitive Pilot Channels in a Centralized
Cognitive Radio Network
Nicolás Bolívar, Universitat de Girona, Spain
José Marzo, Universitat de Girona, Spain
263 - 270

An Improved Multi-band Speech Enhancement Method for Colored Noise Estimation
and Reduction
Radu Mihnea Udrea, Politehnica University of Bucharest, Romania
Dragos Nicolae Vizireanu, Politehnica University of Bucharest, Romania
Claudia Cristina Oprea, Politehnica University of Bucharest, Romania
Ionut Pirnog, Politehnica University of Bucharest, Romania
271 - 280
Performance Analysis of Multiuser DS-UWB system with Orthogonal and Non-
orthogonal code under synchronous and Asynchronous transmission with UWB channel
models
Himanshu B. Soni, G H Patel college of Engineering & Technology, India
U.B. Deasi, Indian Institute of Technology Hyderabad, India
S. N. Merchant, Indian Institute of Technology -Bombay, India
281 - 289
A Semantic-oriented Framework for System Diagnosis
Manuela Popescu, University of Besançon, France
Pascal Lorenz, University of Haute Alsace, France
Jean Marc Nicod, University of Besançon, France
290 - 310
ICI Reduction Through Shaped OFDM in Coded MIMO-OFDM Systems
Wei Xiang, University of Southern Queensland, Australia
Julian Russell, University of Southern Queensland, Australia
Yafeng Wang, Beijing University of Posts and Telecommunications, Beijing
311 - 323
Performance Comparative Study of eXtended Satellite Transport Protocol over
Traditional Satellites Networks and Nanosatellite Constellations
Maria-Mihaela Burlacu, University of Haute Alsace, France
Pascal Lorenz, University of Haute Alsace, France
Joséphine Kohlenberg, IT/Télécom SudParis, France
324 - 337

114
International Journal on Advances in Telecommunications, vol 3 no 3 & 4, year 2010, http://www.iariajournals.org/telecommunications/
2010, © Copyright by authors, Published under agreement with IARIA - www.iaria.org
CARMA: A Distance Estimation Methodfor Internet Nodes and its Usage in P2P Networks
Gennadiy PoryevNational Technical University of Ukraine “KPI”
Kiev, [email protected]
Hermann SchlossLogica Deutschland
GmbH & Co. KGHennef, Germany
Rainer OechsleTrier University of Applied Sciences
Trier, [email protected]
Abstract—Topological distance estimation is the key to theefficiency in distributed systems and peer-to-peer networks.Contrary to many existing or proposed methods, which usuallyrequire the exchange of messages between the nodes, wehave developed a metric, which is computed purely within anode, and which is based on the preloaded and precomputedtopological structure of the Internet. Many distributed systemsand applications may benefit from this metric, since it estimatesthe topological distance between any arbitrary pair of nodesin the Internet. As a proof of concept we have first shownthe correlation between our metric and a few establisheddistance indicators, such as hop count or round trip time of amessage. Then, we employed this metric as an “edge weight”representing the connection quality between two network nodesand we used it for the construction of a multicast overlaynetwork based on a Minimum Spanning Tree approximation.According to the evaluation results, this metric correspondsfairly well to the actual measured distances. By using this met-ric, our approach minimizes communication costs and avoidsextraneous communication needed for latency measurements.
Keywords-Internet, Topology, Distance Estimation Method
I. INTRODUCTION
Since the beginning of the 21st century the usage, scaleand diversity of peer-to-peer (P2P) networks widened signif-icantly, and the application scope of P2P systems has beennotably extended. Being previously considered as a meansfor file sharing or instant messaging, today’s P2P networksserve as a basic infrastructure for a wide range of innovativeapplication scenarios such as VoIP, multimedia on-demand,software delivery, massive multiuser environments or onlinegames.
The initial driving motivation behind P2P systems was torelieve load stress from centralized server farms. However,the intrinsic asymmetry of end-user broadband data linkshave caused Internet Service Providers (ISP) to increasemaintenance and upgrade cost of the “last mile” hardwarein order to keep quality of service steady. Some ISPs hadalso introduced controversial measures to detect and forciblyshape end-user bandwidth for traffic recognized as P2P,affecting file sharing networks in particular.
For this reason, researches in the area of P2P systems areaiming to optimize P2P traffic and consider the inherently
clustered nature of the Internet as a potential leverage mech-anism. The general idea is to maximize network throughputinside the particular network clusters while minimizing thetraffic usage between such clusters. The scope of the clusteris not defined clearly, and there is usually more than oneclustering layer.
In this paper, we propose a locally computed approach fortopological distance estimation that does not rely on third-party non-guaranteed external infrastructures and considerits usage in P2P networks.
The rest of this paper is organized as follows. In SectionII we first take a look at related work dealing with trafficoptimization in P2P networks and consider then severalapplication-level multicast approaches, based on a MinimumSpanning Tree (MST) or on its approximation. Afterwardsin Section III, we describe the computation of the CombinedAffinity Reconnaissance Metric Architecture (CARMA) met-ric [1]. In Section IV we consider two application scenarios,which benefit from the utilization of the CARMA metric: a)the selection of peers – network nodes that may serve therequested content – and b) the construction of the CARMA-based Multicast Infrastructure (CARMIn), based on theMST approximation method. Then in Section V we discussthe experimental validation of the CARMA metric andexplain the flavor distribution, anomalies and statistical char-acteristics. As the evaluation results show (Section V), ourCARMIn multicast tree achieves a good MST approximationwith respect to a communication cost metric and avoids –due to utilization of CARMA – extraneous communicationneeded for latency measurements. In Section VI we providea brief overview of our contribution and discuss our futureplans.
II. RELATED WORK
Usenet [2] was introduced 30 years ago as one of thefirst P2P networks. However, only at the end of the 1990sP2P applications have achieved a breakthrough and becomevery popular because of the widespread use of file sharingplatforms like Napster [3]. Nowadays, there is a wide varietyof P2P file sharing networks. Among them are Gnutella

115
International Journal on Advances in Telecommunications, vol 3 no 3 & 4, year 2010, http://www.iariajournals.org/telecommunications/
2010, © Copyright by authors, Published under agreement with IARIA - www.iaria.org
[4], eDonkey2000 (ED2K) [5] and BitTorrent [6]. In [7] amulticast P2P overlay is described that is used for contentdistribution in large-scale enterprise networks. The proposedapproach reduces the completion time compared to BitTor-rent without wasting additional resources.
Various surveys suppose that 30% to 50% of today’s end-user-generated traffic is caused by P2P applications. In [8]the authors claim that most P2P systems use application-level routing based on the overlay topology and completelyneglect the topology of the underlying transport network.Because of this, P2P systems cause a lot of extraneoustraffic. In order to avoid this traffic, the authors proposethe ISP-aided neighbor selection by considering the nodeproximity in the underlying network at the application-level.
The authors of [9] have recently described the design,deployment and evaluation of an approach, minimizing theexpensive cross-ISP traffic. The authors show that the ap-plication of their approach significantly reduces the latencydelays. The P4P architecture [10] also aims towards theminimization of the network traffic. In order to achieve theirobjective, the authors take into account the conditions of theunderlying network layer during the overlay construction.
According to [11] the consideration of a node’s topolog-ical locality is the key to efficient communication in P2Psystems. It improves performance and increases availability,since the probability of transmission failures increases withthe distance and depends also on bandwidth conditions.
Modern network modeling environments that deal withnetwork topology rarely take locality into account. Most ofthem use either the network latency metric measured in timeunits between request and response (ping), or the hop countmetric measured as the number of nodes between sourceand destination hosts [12]. We deem the ping method asgenerally unreliable as it heavily depends on link speeds andbandwidth conditions. For example, a zero-loaded end-userADSL link can produce slower pings than an almost fullyloaded Gbps link. As shown in [13] standard routing tracemethods may also be unreliable and affected by bandwidthconditions or indicating non-existent links due to trafficswitch-overs.
A number of researches have proposed schemes thatinvolve building the external (in relation to the P2P overlay)infrastructures dedicated to keeping track of the condition ofintra-network and inter-network links, remembering explic-itly measured routing paths and delivering path predictionon their basis. Such schemes, for instance, include P4P [10]and iPlane [14]. Other proposals, such as [15] are concernedwith an active intervention into the P2P exchange protocolsto augment traffic usage patterns in accordance with ISPpolicies.
Contrary to the methods employing external infrastruc-tures for distance estimation, we propose an approach basedon the preloaded and precomputed topological structure ofthe Internet and running locally on client machines. By using
our distance estimation method, clients are able to create amulticast overlay at the application-level without relying ona central instance or external infrastructures.
While the problems of scalable data localization have beenexhaustively addressed, the problem of reducing multicastcosts in very large, global scale environments still remainsinadequately considered. In [16] the authors state that mul-ticast has become an important communication primitive inP2P networks. The authors note that the consideration ofcommunication cost caused by multicast overlays is a criticalissue in P2P networks due to dynamic and rapidly changingnetwork topology conditions.
In [17] the authors argue that nowadays the networkinfrastructure itself becomes a precious resource. They statethat the construction methods of multicast trees consider-ably influence the network load and that current availablestrategies often waste too many network resources. In orderto adjust the multicast tree infrastructure to the physicalnetwork conditions the authors propose the use of transmis-sion delays between peers as a performance metric. On thebasis of this metric, the authors construct a network friendlymulticast tree. However this metric cannot be applied inadvance without transmitting a message between two peers.
To address this issue of reducing multicast costs in ourwork, we propose the construction of an application-levelmulticast infrastructure, based on an MST approximation.The MST problem is one of the most popular and importantproblems in the research area of graph theory, distributedcomputing and networks. In opposition to the theoreticalmodels where we usually have a global knowledge of allnodes and the corresponding distances for the MST construc-tion, in a realistic network (e.g., the Internet) a node neitherknows all other nodes involved in the same applicationscenario nor exact distances between these nodes.
The ALMI (Application Level Multicast) project [18]uses a central instance for MST computation. In [19] theauthors propose a MST-based multicast cluster for P2Pvideo streaming and show that the utilization of the MSTapproach reduces the network traffic. However, since hereall network nodes are considered for MST construction,high management and maintenance costs can be expectedin large scale networks. In our CARMIn approach we avoidthe additional communication by using the CARMA metricand address the question of a distributed approximation of anMST that is, constructing a suboptimal spanning tree whosecommunication cost is near-optimal.
Similar to our approach, [20] have considered the problemof the construction of suboptimal spanning trees. In [21]the authors propose the construction of a Nearest NeighborTree (NNT) instead of an MST. To ensure both acceptablemulticast costs and latency delays JXTA [22] nodes alwaysconnect to the nearest node (in terms of latency) achieving anMST approximation, too. However, the quote in [23] “Thereis no satisfactory approximation algorithm known for the

116
International Journal on Advances in Telecommunications, vol 3 no 3 & 4, year 2010, http://www.iariajournals.org/telecommunications/
2010, © Copyright by authors, Published under agreement with IARIA - www.iaria.org
MST problem” encouraged us to address this problem inour work.
In [24] the authors propose a binning scheme by adjustingadjacent nodes to certain bins depending on their RoundTrip Time (RTT) distance to certain landmark severs. Tobe more exact, a node measures its round-trip time toeach of these landmarks and orders these landmarks inascending order. Nodes having the same order of landmarksare considered closer than nodes having different order. Thisapproach significantly reduces the amount of communicationnecessary for the capturing of node distances. However,the communication with the landmark servers for the RTTmeasurements is required.
Several MST or NNT-based approaches readjust theirinfrastructures when nodes are joining or leaving the infras-tructure. However under churn (i.e., peers arriving and de-parting at a high rate) this readjustment makes them uselessfor large scale application scenarios. Thus in our CARMInapproach only direct neighbors are involved into joiningand leaving of peers in this way avoiding the readjustment.Similar to our approach in [25], the authors propose theOrchard algorithm for building and maintaining application-level multicast trees taking into account the problem ofchurn.
III. CARMA METRIC
The Internet is in no way a uniform structure. Thereare large backbone networks involved in international andintercontinental links, national-tier ISPs, end-user-servicingISPs, hosting companies and end-users. Network latency andquality of service are accordingly very different dependingon the link speed from tens of Gbps to less than 56Kbps for dial-up modems. On the scale of a country, theInternet structure used to be organized rather sporadically –individual ISPs established arbitrary links among themselvesand to foreign upstream ISPs. This had lead to peeringconflicts and situations in which a message to a neighboringhouse traveled halfway the continent.
To alleviate this problem, Internet Exchange Points (com-monly abbreviated as IX or IXP) were introduced. Usu-ally, a number of national telecom operators create thededicated facility to which all national ISPs then connect.Thus, consumer traffic within the scope of an IX does nottravel expensive international or satellite links. This helpsbalance mutual peering and to ensure lower maintenancecosts per ISP, allowing lower prices for end-users. Developedcountries are used to having more than one nationwide IX.From the customer point of view, it is generally assumed thattraffic within a single IX scope flows faster and is cheaperthan between different IXes. The presence of an IX can alsoprovide for a lower hop count in the packet path. Figure1 depicts an Internet segment consisting of some networks,which are grouped by Autonomous Systems (AS) [26]. Someof these ASes are connected to a single IX.
AS AS
ASAS
AS
AS
IX
Figure 1. Example of an Internet segment covered by an IX
In network-based applications, we often need globalknowledge of all network nodes and distances between thesenodes. This information is usually managed by a centralinstance or may be inferred from external infrastructures.By having this knowledge, nodes in a network are ableto construct complex infrastructures and achieve efficientcommunication at the application as well as at the networklayer.
Without relying on a central instance or external infras-tructures, clients usually apply either ping or hop countmethods to estimate node distances. The problem herebyis that even if the ping or hop count methods would providereasonable and reliable results, there is no way to applythese methods to a pair of foreign IP addresses. That is,it is easy to measure the ping or hop distance from thenode a to the node b or to the node c. But there is noway to measure the ping distance between the nodes b andc from the node a. That means, if clients are interestedin this kind of information, they have to explicitly requestthis information from corresponding nodes, which causes asignificant communication overhead.
To sum up, the construction of complex structures re-quires either additional communication between nodes (indecentralized P2P systems), or is not scalable due to theexistence of a Single Point of Failure (in P2P systems witha central instance) managing relevant information, which isa big drawback in global scale networks.
In order to sidestep these drawbacks, in our work we em-ploy decentralized P2P systems and propose the combinedaffinity metric, which is calculated locally on each node.This metric is calculated given the remote IP address ofthe peer and all information then can be implicitly inferredfrom it. The “combined” adjective in the CARMA acronymmeans that despite our work’s prevailing focus on only thefirst layer of the proposed metric, its design does, however,contain several additional components that can be includedin a metric calculation in the future, as follows:
1) average response time to keep-alive requests;2) average hop count to the destination, including the
possibility of its change during communication [13];

117
International Journal on Advances in Telecommunications, vol 3 no 3 & 4, year 2010, http://www.iariajournals.org/telecommunications/
2010, © Copyright by authors, Published under agreement with IARIA - www.iaria.org
3) bandwidth and average consumption at the moment ofdecision, including preset constraints;
4) “gratitude” and “greed” values calculated as theamount of traffic the remote party had provided andconsumed respectively.
Generally speaking, we consider CARMA as three-layered, with the first layer being the locality awarenessexpressed in flavors (see their explanations below), a secondlayer that utilizes additional traffic but does not involveactual P2P communication (see Section V-A), and a thirdlayer that requires active communication to remote partiesover a compatible protocol.
CARMA works by initially preloading structural infor-mation from publicly accessible services called RegionalInternet Registries (RIRs) and converting it into an internalgraph-like data structure. Unlike solutions based on thePlanetLab infrastructure or those using RouteViews, the RIRservices and databases are mandatorily public, essential forthe functioning of the Internet and therefore much morereliable. The pieces of information important to CARMAinclude the delegated-latest-* databases of registered IPv4ranges, Autonomous System Numbers (ASNs) and variousWHOIS databases of registered subranges and AutonomousSystem Sets (ASSETs).
Since the RIR database expansion rate is relatively slowand the IPv4 address space is nearing its exhaustion,CARMA only needs to update its locally cached data fromthose databases once every few days. Once loaded, CARMAbuilds a model to approximate the Internet topology withsome simplifications, resulting in 4 structural layers asfollows: a) IPv4 ranges are divided into b) subranges but atthe same time they also belong to c) Autonomous Systems(ASes), which are joined into sets called d) AS-SETs orASSETs. It is assumed that lower layer entities are explicitlyconnected through their common upper-layer entity, and AS-SETs are arbitrarily connected to each other. It is understoodthat such assumptions in the model are more optimistic thanwhat happens in reality, as there may be ASes that spreadworldwide, for example. However, exceptions like this arenot numerous and pertain only to the departments of thefew telecom operators specializing in providing transoceanicand transcontinental links. Therefore, Internet end-users areunlikely to be encountered in the ranges assigned to suchASes.
Let’s take a closer look at IPv4 ranges and subranges,ASes, and ASSETs (with examples from the RIPE registry,which is responsible for Europe):
IPv4 range – a subset of an IPv4 address space definedby the first address of the range and a host count. Notethat the host count is not necessarily a power of 2 asimplied by the Classless Inter-Domain Routing (CIDR) rulesnow commonly used for Internet routing. There are recordsthat specify an arbitrary number of nodes, but for practicalreasons such definitions are subsequently augmented by
r i p e n c c |EU| i pv4 |1 4 3 . 6 5 . 0 . 0 |6 5 5 3 6 |1 9 9 0 0 3 2 6 | a s s i g n e dr i p e n c c |EU| i pv4 |1 4 3 . 9 3 . 0 . 0 |6 5 5 3 6 |1 9 9 4 0 4 1 3 | a s s i g n e dr i p e n c c |NO| i pv4 |1 4 3 . 9 7 . 0 . 0 |6 5 5 3 6 |2 0 0 7 0 1 0 4 | a s s i g n e dr i p e n c c |EU| i pv4 |1 4 3 . 9 9 . 0 . 0 |6 5 5 3 6 |1 9 9 0 0 9 0 7 | a s s i g n e d
Listing 1. Excerpt from a database file with IP ranges
r i p e n c c |EU| asn |2 8 5 7 |1 |1 9 9 3 1 2 2 7 | a l l o c a t e dr i p e n c c |EU| asn |2 8 5 8 |1 |1 9 9 4 0 1 1 2 | a l l o c a t e dr i p e n c c |SE | asn |2 8 5 9 |1 |1 9 9 4 0 1 2 7 | a l l o c a t e dr i p e n c c |EU| asn |2 8 6 0 |1 |1 9 9 4 0 1 1 8 | a l l o c a t e d
r o u t e : 1 4 3 . 9 3 . 1 9 2 . 0 / 1 8d e s c r : FH−RPL−NETo r i g i n : AS2857mnt−by : AS2857−MNTchanged : weiss@uni−mainz . de 20001220s o u r c e : RIPE
Listing 2. Excerpt from database files with AS definitions and relations
CARMA to contain a power of 2 number of nodes. IPv4ranges are defined in the delegated-file (see Listing 1).
AS – a registered Autonomous System. Every AS has anumerical identifier known as Autonomous System NumberASN. AS definitions are also listed in the delegated-filealong with the ISO country code and the date of allocation.However, this file does not specify a relationship betweenIPv4 ranges and ASes. For this relationship CARMA usesthe ripe.db.route.gz file (see Listing 2). The latter file con-tains definition blocks, each block specifies an IPv4 range(this time in proper CIDR notation), and related ASes.This information is used to establish relationships betweenranges and ASes listed in the delegated-files. Note thata relationship between an IPv4 range and an AS is notunambiguous: The same range can be announced underdifferent ASes; some ASes or ranges listed in the delegated-file may not be linked at all, and some relationships specifiedin ripe.db.route.gz may contain ASes and IPv4 ranges, whichare unspecified in the delegated-file. The incidence of suchinconsistencies is low, however.
IPv4 subrange – a subset of the IPv4 address space de-fined by the addresses of the first and last address of the sub-range. These definitions are listed in the ripe.db.inetnum.gz-file (see Listing 3). The subranges differ from ranges inthat they are not explicitly related to an AS. Subranges aregenerally smaller in terms of address space. A vast majorityof them are derived from splitting up ranges. It is thereforepossible to establish a relationship between one or moresubranges and a single range, although not all ranges aresplit into subranges. When parsing information from this file,one should take care to check for sanity of the subrangesspecified. For instance, a subrange may specify an entireIPv4 address space, or a subrange may even have a netmasklength such as 3 bits and may thus be much larger than anIPv4 range. Such cases are dictated by the internal workingsof the WHOIS server software but are obviously invalid for

118
International Journal on Advances in Telecommunications, vol 3 no 3 & 4, year 2010, http://www.iariajournals.org/telecommunications/
2010, © Copyright by authors, Published under agreement with IARIA - www.iaria.org
ine tnum : 1 4 3 . 9 3 . 3 2 . 0 − 1 4 3 . 9 3 . 6 3 . 2 5 5netname : FH−RPL−NETd e s c r : F a c h h o c h s c h u l e T r i e rd e s c r : Rechenzent rumd e s c r : S c h n e i d e r s h o fd e s c r : D−54293 T r i e rc o u n t r y : DEadmin−c : KM624−RIPEtech−c : RB373−RIPEs t a t u s : ASSIGNED PImnt−by : TRANSKOM−MNTchanged : hos tmas t e r@t ranskom . n e t 20050207s o u r c e : RIPE
Listing 3. Excerpt from a database file with IPv4 subranges
as−s e t : AS−DECIX−CONNECTEDd e s c r : ASN of DE−CIX membersd e s c r : DE−CIX , t h e German I n t e r n e t Exchangeadmin−c : AN6695−RIPEtech−c : WT6695−RIPEtech−c : DM6695−RIPEtech−c : SJ6695−RIPEn o t i f y : not i fy@de−c i x . n e tmnt−by : DECIX−MNTs o u r c e : RIPEchanged : au to−upd@de−c i x . n e t 20091011members : AS42. . .members : AS2828members : AS2857members : AS2914. . .members : AS65333
Listing 4. Excerpt from a database file with ASSET definitions
CARMA and therefore filtered out of the model.AS set or ASSET – a topological junction point that may
declare an arbitrary number of ASes and other ASSETs andfacilitate connectivity among them. It is assumed that theinformation flow between two ASes belonging to the sameASSET does not take a route via other ASSETs. UnlikeASes, ASSETs have alphanumeric identifiers. In terms ofCARMA, an IX point is an ASSET with a significant numberof member ASes (usually hundreds), although, technically,every ASSET can be considered as a kind of IX as there isusually no explicit requirement in terms of member count.The definitions for ASSETs can be found in the ripe.db.as-set.gz file (see Listing 4).
When all database files are processed, the resulting in-complete graph reflects the Internet topology as close as itcould be done without having access to Border GatewayProtocol (BGP) information. It is not necessary to deviseany graph-walking algorithm to calculate the affinity valuesubsequently called flavor, because the purpose of CARMAis to estimate the affinity of two given nodes, not calculatingan exact hop count. The proposed flavors of the remote nodein relation to the originator node are given below in the orderof corresponding tests undertaken by CARMA:
1) Subrange identifies the presence of the remote node’sIP address in the same IPv4 subrange specified in theripe.db.inetnum.gz database file dealing with admin-
istrative IP subranges. However, if such a presenceis found, CARMA does not immediately return thisflavor, because subranges may overlap with differentnetmask lengths, which in turn may happen to beshorter than that of the corresponding range (see be-low). This flavor identifies the presence of the remotenode most likely within the scope of operation of asingle router or the same network operations center.For example, this could be for end-users connected tothe same point of presence of a telecom operator, ornodes within a university network, which usually havesingle upstream ISP.
2) Range identifies the presence of the remote node’sIP address in the same IPv4 range specified in thedelegated-file or the ripe.db.route.gz WHOIS excerptsdealing with ASNs and IPv4 delegations. If the sub-range lookup yielded any results, the ranges found areexamined and compared in terms of netmask length.In this case, the range flavor is only returned if theshortest range netmask is shorter than or equal tothat of a subrange, otherwise the subrange flavor isreturned. This ensures that the subrange flavor is neverreturned for allocations larger than the correspondingrange, even if they overlap. This flavor means that bothnodes most likely reside within the scope of the samedepartment or the same small organization, and thatthe traffic between these nodes is unlikely to traveloutside of the single business network of their ISP.
3) AS identifies the presence of the remote node’s IPaddress within the address space allocated to the sameAS as defined in the ripe.db.route.gz file. Althoughthis fact does not guarantee such an immediate con-nectivity as the previous flavors, packets are unlikelyto travel networks outside this AS, since an AS is thebasic Internet routing entity [26]. This flavor suggeststhat the traffic between two nodes is handled by theISP internally, and that incoming traffic from outsideof the Internet destined to one node undergoes thesame routing rules as traffic to the other node.
4) ASSET/IX states that both nodes belong to differentASes announced by the same ASSET, which mayhappen to be an IX if the number of member links islarge enough (not every ASSET is an IX, but all IXesare ASSETs). The immediate advantage of this knowl-edge is not obvious, but in developing countries thedifference in quality of service may largely depend onthis flavor to the extent that network speed and latencydiffer by some orders of magnitude for nodes withinand outside of the same IX. In such national Internetconfigurations ISPs often implement mandatory trafficshaping policies to limit the packet flow to and fromoutside of the IX.
5) ASSET-link indicates that the node addresses belongto different ASes, which belong to different ASSETs,

119
International Journal on Advances in Telecommunications, vol 3 no 3 & 4, year 2010, http://www.iariajournals.org/telecommunications/
2010, © Copyright by authors, Published under agreement with IARIA - www.iaria.org
and at least one ASSET includes the other ASSET.6) Backbone indicates that the node addresses belong to
different ASes, which belong to different ASSETs, andboth ASSETs are declared within the scope of a thirdASSET.
7) Distant identifies that all previous CARMA affinitytests had failed to yield a positive match, and the rel-ative locality of the originator and target node cannotbe reliably estimated. Therefore they are assumed tobe located topologically far away.
By using these flavors any arbitrary pair of IP addressescan be assigned to an affinity cluster, which in the mostcases corresponds to the real topological distance betweenthese nodes.
IV. CARMA-BASED APPLICATION SCENARIOS
In this section we take a look at two application scenarios,which benefit from the CARMA distance estimation method.The first scenario considers a preselection of peers in a P2Pfile sharing application. The second scenario discusses theconstruction of a multicast infrastructure in P2P networksbased on an MST approximation.
A. CARMA-based Peer Selection
Regardless of the differences in their protocols and im-plementations, there is something common in all file sharingnetworks. That is, after the request for a published entity isprocessed by either the indexing server or other nodes, aresponse is obtained in the form of a list of peers. Whetherthis is done using Distributed Hash Tables (DHT) such asKademlia [27], indexing servers or message flooding [4], theresult will contain at least a list of IP addresses and ports.
¿From this point on, it is completely up to the clientsoftware to decide which nodes should be queried and inwhat order. From our previous experiences of analyzing theED2K and BitTorrent network traffic from a single node, wefound out that the client software usually performs queriesin the order, which was initially reported by the network orindex servers.
By their design ED2K clients will query every knownsource and will attempt to place themselves in the down-load queue of every source they managed to successfullynegotiate with. The other (receiving) side will organize thedownload queue initially according to the FIFO principle.Modern clients (eMule [28] and its numerous clones) alsofeature a reward system, which advances inbound clients inthe queue according to the amount of related traffic theyhad provided to the node. This is supposed to discourageleeching but also has obvious drawbacks in delaying newnodes that do not have any part of the content yet.
Although eMule provides a few tuning methods suchas queue rotation, speed and chunk management basedon the popularity of the file, none of them takes intoaccount anything related to connectivity (client bandwidth,
network latency etc.), let alone the geographical location ortopological affinity.
In the popular BitTorrent network, the number of peers forhighly-demanded content can easily reach tens of thousands,whereas for most end-user nodes it is quite impractical toinitiate more than a hundred connections simultaneously,even when having high-speed links.
The BitTorrent protocol is simpler than ED2K. It does notfeature any reward system, and due to the per-content swarmisolation BitTorrent is generally faster. Also, a tracker maynot report all peers to the client initially. However, this isusually circumvented later by the peer exchange and DHTmechanisms.
Recently there have been some advances in the local-ity awareness for BitTorrent networks. Popular nationwidetrackers (rutracker.org, for instance) have introduced so-called “retrackers” – dedicated secondary servers. Theseservers are optionally connected to a primary database, butmainly supposed to only return a peer list local to a specificnetwork scope. This scope usually consists of an IP addresspool allocated to customers of a particular ISP, or, morefrequently, contains the private unroutable IP ranges of alocal intranet. This provides for a significant speed burst foraffected ISP clients, but it is a very simple method that onlyallows for a two-tier locality awareness.
We believe that it is essential to not leave the peerselection process to pure luck. In our previous researchin the area of file-sharing networks [29] we figured out amethod, which could be used to improve the performance ofthese networks. The key to the performance improvement isthe consideration of CARMA distance estimation flavors forthe arrangement of the peer query order. That is, choosingthe peers with the lowest flavors would reduce the networklatency and increase the exchange speed. In Section V-A weevaluate the quality of the CARMA metric and its impactto peer selection in file sharing applications.
B. CARMIn - CARMA-based Multicast Infrastructure
In this section we propose a multicast infrastructure basedon an MST approximation. For a large scale number of net-work nodes the construction of an MST as a communicationtree T will lead to unacceptable high network maintenancecosts in the case of joining, leaving or failing of nodes.Hence, we have to find a tradeoff between the minimizationof multicast costs and latency delays on the one hand andacceptable network maintenance costs on the other hand.
One problem of constructing an MST in real networks isthe fact that we do not know exact distances between thenodes (latency delays) as we do in a graph theoretical setting.Measurements of the round trip latency between nodes forthe purpose of distance acquisition by sending extraneousping messages induce an inacceptable high communicationoverhead in large scale networks and hence have to beavoided. As mentioned before, CARMA flavors indicate the

120
International Journal on Advances in Telecommunications, vol 3 no 3 & 4, year 2010, http://www.iariajournals.org/telecommunications/
2010, © Copyright by authors, Published under agreement with IARIA - www.iaria.org
Algorithm 1: Join OperationInput: node n, spanning tree T = (V,ET , w) and
bootstrapping set BS ⊆ V ;Output: T ′ = (V ′, E′T , w) including n;begin
if V 6= ∅ thenArrange v ∈ BS such that∀ vi ∈ BS : w(vi, n) ≤ w(vi+1, n) holds;E′T = ET
⋃{n, v1}, where v1 is the first node
in BS;
V ′ = V⋃{n};
node locality by telling whether a remote peer belongs tothe same subnet, the same AS, the same IX, and so on.Therefore, in our approach we utilize the CARMA flavorsas a distance substitute for a spanning tree approximation.
Another problem that we have to address, is the lack ofglobal knowledge needed for a spanning tree construction.Most of the existing P2P networks designed for provisionof application-level multicast use a bootstrapping process,which returns a list of nodes identified by their IP addressesthat are presumed to be online. That is, the initial knowledgeof a node is limited to these nodes delivered from thebootstrapping process. In our work we assumed this list tocontain between logN and
√N entries, where N is the
number of network nodes.In our CARMIn approach we rely on the NNT principle,
where a new node connects to the nearest (in terms oftopological distance) known network node.
In our approach we model the Internet as an undirectedand connected graph G = (V,E,w). Hereby V stands forthe set of vertices vi, 1 ≤ i ≤ |V |, representing networknodes, E is the set of edges ei,j = {vi, vj} representing thelogical connections between nodes, and w : E → N is aweight function assigning a weight to an edge. Generally,the weight function w returns latency time (in milliseconds)of the edge e. However, in this special case it represents aCARMA flavor. On the basis of this graph, we have to createa near-optimal approximation of an MST T = (V,ET , w)where ET ⊆ E. T is per definition a connected graph with-out cycles. In the following we describe the key operationsof our approach.
On joining (Algorithm 1), the new node first arrangesnodes from the bootstrapping set BS depending on theirCARMA flavor, and then connects to an arbitrary node witha flavor identifying best network conditions to this node.
Figure 2(a) shows a CARMIn multicast overlay withfive nodes. Hereby the nodes b and c belong to the samesubrange, the nodes c and e to the same AS, the nodes aand c to the same ASSET, and the nodes c and d belong tothe same ASSET link.
Algorithm 2: Leave OperationInput: node n, spanning tree T = (V,ET , w) and
neighbor set N ⊆ V ;Output: spanning tree T ′ = (V ′, E′T , w) without n;begin
if degree(n) > 1 thenIdentify v ∈ N such that the condition∀ vi ∈ N : w(v, n) ≤ w(vi, n) holds;Advise all vi ∈ (N \ {v}) to connect to vi;
E′T = ET ;forall the vi ∈ V with {vi, n} ∈ ET do
E′T = E′T \ {vi, n};V ′ = V \ {n};
a b
c
d e
4 1
5 3
(a) Before leaving of node c
a b
d e
4
5 3
(b) After leaving of node c
Figure 2. CARMIn multicast overlay
On leaving (Algorithm 2), the leaving node identifiesthe node v with the lowest CARMA flavor from all ofits neighbors N and then advises all remaining neighborsN \ {v} to create a connection with v.
Figure 2(b) represents the above depicted CARMIn over-lay after the leaving of node c. As proposed, all remainingnodes create connections with the nearest neighbor of cwhich is node b.
These definitions of join and leave operations ensurethat our approximation is connected and cycle-free (keycharacteristics of a tree) at any stage of the overlay networkconstruction. However, if a hub node – maintaining a sig-nificant number of connections – fails, these characteristicsmay be violated.
In order to guarantee that our MST approximation alwayssatisfies these characteristics independent of node failures,we introduce a backup routine. According to this routine,each node notifies its direct neighbors about its connectionsand the corresponding connection quality. That is, a networknode always knows all of its direct neighbors and all theirneighbors including the corresponding CARMA flavors (2-hop neighborhood).
If the node nf fails, nodes in its neighborhood N will beaware of nf ’s nearest node vi, and thus are able to create

121
International Journal on Advances in Telecommunications, vol 3 no 3 & 4, year 2010, http://www.iariajournals.org/telecommunications/
2010, © Copyright by authors, Published under agreement with IARIA - www.iaria.org
connections to vi in analogy to the regular leave operation.The special feature of the proposed CARMIn approach
is the fact, that only the local knowledge of 2-hop neigh-borhood (no global knowledge) is required for maintaininga multicast infrastructure. Although CARMIn can be usedwith any other distance estimation or measurement method,it benefits from the utilization of CARMA, since in thisway, no additional communication is required for distanceestimation. Therefore, CARMIn may be considered as apotential application of the CARMA metric in practice.
We evaluate the quality and cost of our CARMIn MSTapproximation in Section V-B by comparing it with othermulticast approaches.
V. EVALUATION RESULTS
In this section we evaluate the quality of the CARMA-based peer selection and of the CARMA-based MST approx-imation by taking a closer look at the quality of the CARMAdistance estimation, and by comparing our CARMA-basedmulticast approach with other multicast infrastructures.
A. Evaluation of the CARMA-based Peer Selection
The extensive test-runs of CARMA were conducted froma site residing in the customer’s address pool of the ISPUkrTelecom for two IPv4 address pools obtained from twoof the most popular public trackers of BitTorrent swarmsin the Ukraine, namely RuTracker [30] and TorrentsNetUA[31]. These trackers differ significantly in one key aspect,which is important to highlight and validate the CARMAadvantages, namely the different percentages of nodes withinthe same national IX as the vantage point from which theexperiments were conducted. From observing the outcomeof the ”country resolution” feature (which is done by simplyquerying WHOIS servers for the ”country” field) in the pop-ular BitTorrent client µTorrent, we estimate that RuTrackerhas roughly one-fifth Ukrainian users while TorrentsNetUAharbors about 95% active users from within the Ukrainianexchange point (UA-IX) at any given time. If CARMA isable to confirm such a prevalence, it would be a good sign,prompting the validity of its mathematical model.
Due to established technological and business practicesof member ISPs participating in UA-IX, the bandwidth andprice for the traffic inside and outside of UA-IX may differsignificantly, up to some orders of magnitude. In spite ofthis, CARMA has large optimization potential. If CARMA-based peer selection rules were to be implemented in, forexample, popular BitTorrent clients operating under UA-IXor a similar national Internet setup, far fewer nodes wouldhave to connect outside of their exchange points and manymore nodes would be able to choose their peers among thosewith a more likely higher bandwidth availability.
We decided to use a modified ICMP traceroute methodin our software. It is assumed that the first IPv4 addressfrom a given address pair is the address of the node where
the software runs. The software performs a series of specialICMP traceroute requests towards the second address. Themodified ICMP traceroute method differs from the standardversion of the traceroute tool as follows:
• ICMP protocol – much like the Windows version oftraceroute ICMP is used rather than UDP, which iscommon in its GNU counterpart. This is mostly becausethe primary runtime environments for CARMA areMicrosoft Windows x86 and x64, where easy to useICMP ping functions are part of the programmer-friendly IP Helper API.
• No DNS queries – IP addresses of intermediate nodesare not resolved into their host names, neither their IPaddresses are indicated, because our evaluation methodis only interested in the number of nodes.
• Speedy and Smart Verification – unlike the traceroutecommand-line tool, the reply timeout is set to onesecond. If the last responded node is not the intendedtarget, or the reply timeout occurs anywhere on thepath, the whole query is restarted. This restart can onlyhappen three times. If the target node is not reachedon the second and third attempt, the hop count isassumed to be the largest number of intermediate nodesfound in all three passes. This effectively eliminates theinfluence of accidental network lags, which may causepremature ping timeouts of more than one second.
This modified ICMP traceroute method was tested froman asymmetric end-user ADSL connection within the UA-IX, characterized by an average response time of around50 milliseconds from the nodes of its immediate IX neigh-borhood and of less than 300 milliseconds from the nodesabroad. The tests indicated that an average measurementsession for an address pair lasts anywhere from less thanhalf a second, if the target node responds to ICMP requests,to no more than 5 seconds, if it does not respond becauseof timeout, and no more than 3 seconds, if it does notrespond because of reported network or host unreachability.Nevertheless, the sampling of each of the thousand addresspairs requires about 1 hour to complete.
The ICMP measurement module was integrated into theCARMA batch-processing software such that for every pro-cessed address-pair the real hop count can be measured andwritten together with the computed CARMA flavor value,unless an ICMP loophole is detected (which was the casefor about 2 address pairs per thousand). We consider thegathered statistics later in the course of this section as well.
To obtain a broad spectrum of CARMA affinity flavorsas well as hop counts, both trackers were used to gathersampling swarms. However, the volumes of swarms dif-fer significantly: RuTracker was able to produce a swarmof 3610 peers while TorrentsNetUA struggled to achieve900. The reason for this was that RuTracker features themandatory enabling of the DHT and peer exchange (PEX)

122
International Journal on Advances in Telecommunications, vol 3 no 3 & 4, year 2010, http://www.iariajournals.org/telecommunications/
2010, © Copyright by authors, Published under agreement with IARIA - www.iaria.org
Figure 3. Screenshot of CARMA concept demonstration tool
mechanisms. Both are features of the BitTorrent protocol [6]allowing a list of new peers from already connected peers tobe gotten. DHT and PEX essentially provide a large peer listwithin a few seconds, instead of the usually limited numberof bootstrap peers provided otherwise by tracker alone.
The sampling swarm from RuTracker consisted of 3610peer nodes of which a small, but notable percentage was be-lieved to belong to the UA-IX address space. TorrentsNetUAprovided a sampling swarm of 891 peer nodes of which thevast majority was expected to belong to the UA-IX. Eachpeer was processed by the CARMA software against theaddress of its own host machine (also within the UA-IX,see Figure 3), and then the apparent network distance fromthe host machine to the peer node was measured in terms ofa hop count. Figure 3 shows a screenshot of the CARMAconcept demonstration tool with a pair of IPv4 addressesas input and their computed flavor with a portion of thecalculation logic logfile.
The experiment took about 5 hours to complete. Due to itsextended duration, the test-runs were performed in the timeperiod between 01:00 and 06:00 UTC, during which theaverage Internet traffic volumes generated by the end-usersin Russian and Ukrainian segments are at their lowest. Thiswas done to ensure the most favorable conditions for ourmodified ICMP traceroute tool, including the low occurrenceof traffic switchovers. We also have observed that nighttimedoes not cause the numbers of the peers participating in theBitTorrents swarms to drop. This is because the majorityof active BitTorrent users either operate so-called seedboxes(dedicated servers customized for BitTorrent) or keep theircomputers turned on during the night to gain the advantages
0 0.1 0.2 0.3 0.4 0.5 0.6
distant
backbone
asset-link
asset
as
range
subrange
TorrentsNetUA RuTracker
Figure 4. Normalized flavor breakup for the sampling swarms
of the lower nighttime traffic prices.The preliminary analysis of the obtained data revealed
several key insights into the functioning of CARMA. Thevisible abundance of ASSET-flavored peers is due to thefact that RuTracker historically harbors a large Ukrainianuser base. CARMA was able to identify almost 19% ofparticipating users in all tested swarms as Ukrainian, as mostof the end-users of Ukrainian ISPs are topologically “under”two major IX points, namely UA-IX and DataGroup-IX [32].This would trigger the ASSET flavor for most of them iftested by CARMA against a Ukrainian address.
Figure 4 represents the normalized percentage breakupof the sampling swarms obtained from the TorrentsNetUA(upper bar) and RuTracker (lower bar) trackers. First, theTorrentsNetUA flavor breakup in Figure 4 shows that thequantity of distant nodes is 2.5% of the whole swarm space,which is consistent with our predictions. It should be notedhowever, that in rare occasions this flavor could denotean IPv4 address space registered within the Ukraine andactually operating under UA-IX, if, for some reason, thestored information of its linkage is wrong. Conversely, notall backbone-flavored nodes belong to UA-IX either, as,for example, many Russian IPv4 addresses were flavoredas backbone because of an intermediate link between theUkrainian and Russian major IX points by TeliaSonera AB.
Secondly, the notable low percentage of ASSET-linkflavored nodes in both cases may indicate the similarly lowlikelihood of encountering an arbitrary cross-AS link notmediated by the higher-level ASSET, or a general trendtowards building hierarchical routing policies within thenational Internet exchange setups, which is consistent withthe conclusions drawn in [32].
Also surprising is the fact that none of the nodes hadfallen into the subrange flavor. This may have happened dueto either the small sample size, or because the subrangeannounced for the host machine address matched the samerange, in which case CARMA chooses the latter.

123
International Journal on Advances in Telecommunications, vol 3 no 3 & 4, year 2010, http://www.iariajournals.org/telecommunications/
2010, © Copyright by authors, Published under agreement with IARIA - www.iaria.org
Meanwhile, our primary goal for this validation wasto ensure that the affinity flavor predicted by CARMAcorresponds to the topological distance in the network. Itis well understood that the nature of these two parameters(flavor and hop count) is completely different and that thenumerical representation of the resulting CARMA flavor hasno physical meaning unlike the hop count. Still they have tocorrespond with enough accuracy to prove the effectivenessof CARMA as a traffic-less, purely computational distanceestimation metric. To prove the point, we decided to employtwo well-known methods of mathematical statistics, such asthe chi-square criterion and one-way analysis of variance(abbreviated one-way ANOVA). Strictly speaking, the latteris formally not suitable for analyzing data of digital orotherwise discrete nature, as it was designed for normallydistributed data. But we decided to use it anyway due to thesignificantly large sample size.
However, before calculating the statistical criteria, theresults must undergo a sanity test. To give an impressionof the nature of the results, the significant portion of themis shown on Figure 5 depicting the accordance betweenCARMA flavors and hop counts for the RuTracker samplingswarm. The horizontal axes correspond to CARMA flavors(symbolic names) and traceroute hop counts (numeric),while the vertical axis corresponds to the number of oc-currences. It is apparent from Figure 5 that within eachflavor the hop count distribution is more or less gradualand dome-like (increasing and decreasing slowly along thehop count axis). But at the farthest corner of the graph wesee one distinct verge reaching about 100 occurrences for asmall hop count with backbone and distant flavors. Figure6 reveals anomalous occurrences in the hop count flavordistribution: underlined values are those flagged by CARMAas topologically very far while having traceroute hop countsextremely low (2 and 3).
To determine the causes of such anomalies, we conductedmanual traceroute runs on the addresses, which yieldedspecific combinations, such as backbone:3, distant:2 anddistant:3. Traceroute unexpectedly stopped at the second andthird hop and no subsequent nodes replied at all. Sincethis behavior was observed only from our vantage point(many LookingGlass servers traced the route to these nodeswithout any problem), future versions of the CARMA batchprocessing software [1] should include mechanisms to filterout bogus results caused by temporary malfunctions of ISProuters.
The parameters relevant to the chi-square criterion wereautomatically calculated by the CARMA batch processingsoftware for both passes, see Table I. As the probabilitylevels for both samples are far below 0.001, we concludethat the correspondence between the predicted CARMAflavor and the actual hop count does exist and is certain.We now proceed to apply the one-way ANOVA method todetermine the influence level. We define the influence level
Figure 5. Flavors and hop counts of the RuTracker swarm
rang
e
as
asse
t
asse
t-lin
k
back
bone
dist
ant
1 0 0 0 0 0 0 2 90 96 0 0 0 4 3 0 29 0 0 94 69 4 0 7 2 0 1 2 5 0 0 5 1 6 6 6 0 0 30 0 27 19
Figure 6. Anomalous occurrences in the hop count flavor distribution
as the ratio of the Sum of Squares (SS) between groups andthe total SS, see Table II. As can be seen from the table,the correspondences between the chosen parameters (hence,influence levels) are 31.425% and 8.684% for RuTrackerand TorrentsNetUA, respectively. The lower influence levelfor the sample obtained from TorrentsNetUA swarm couldbe explained by its topologically constrained nature, in thesense that distant flavored nodes were much less frequent.
RuTracker TorrentsNetUADegrees of freedom (d) 120 75chi-square (χ2) 3722.86 413.20Probability (p) p < 0.001 p < 0.001
Table ISTATISTICAL PARAMETERS RELEVANT TO THE CHI-SQUARE CRITERION

124
International Journal on Advances in Telecommunications, vol 3 no 3 & 4, year 2010, http://www.iariajournals.org/telecommunications/
2010, © Copyright by authors, Published under agreement with IARIA - www.iaria.org
RuTracker TorrentsNetUARange variance 0 0.941AS variance 1.029 2.083ASSET variance 9.949 1.585ASSET-Link variance 6.466 4.933Backbone variance 8.576 3.802Distant variance 10.937 0.177SS between groups 14785.941 215.419SS among groups 32265.495 2265.020SS total 47051.436 2480.439Level of influence 31.425% 8.684%
Table IISTATISTICAL PARAMETERS RELEVANT TO VARIANCE ANALYSIS
However, both levels of influence are quite optimistic.In order to get an impression of the value of the CARMA
distance estimation method returning a distance flavor andthe corresponding hop count, we compared it with theresults of the ping method returning the round trip timeof a message in milliseconds. Therefore, we first measuredthe CARMA distance (flavor and hop count) between theUniversity of Applied Sciences in Trier (Germany) and 17other universities. Then we sorted these results in ascendingorder. Afterwards we measured the ping distance to theseIP addresses. As the results in Table III show, for 4 of17 positions (less than 25%) the ping order differs fromthe CARMA order. Based on these results we claim thatCARMA provides a feasible approximation for node dis-tances in the Internet. Moreover, as the results show, 4 of 17IP addresses were not accessible by the ping method. Thisbehavior indicates a significant drawback of the ping andtraceroute methods already described in Section II: SomeISPs are filtering those requests. Therefore ping or tracerouterequests cannot guarantee that a valid result will be returned.This fact may be considered as a definite advantage ofCARMA compared to ping and traceroute, since CARMAalways returns a result.
It is understood that the results obtained in this set of theexperiments are rather preliminary and are somewhat lackingthe concrete proof of explicit performance improvement incase CARMA is implemented in BitTorrent client software.The purpose of this paper, however, is to evaluate thefeasibility of the CARMA model in P2P applications ingeneral by comparing it with traditional network distancemetrics.
B. Quality and Cost of the CARMIn MST Approximation
The problem of minimizing communication costs can bereduced to the problem of finding a Minimum Communi-cation Cost Spanning Tree (MCT) [33][34] known to beNP-hard. This problem is formalized in [35] as follows:having a set of peers V = {v1, . . . , vn} there is a matrixRn×n = (ri,j) of communication requirements where ri,jrepresents the expected communication from vi to vj . Thedistances between peers are stored in a distance matrix
Destination Flavor Hops Ping [ms]143.93.54.111 1 3 4136.199.199.105 2 9 7131.246.120.51 3 11 882.165.77.114 3 13 12143.169.9.245 3 15 -193.1.101.61 3 16 39193.232.113.151 3 17 47141.20.5.188 3 17 26163.1.13.189 3 20 24130.92.253.230 3 22 -131.180.77.26 5 12 17217.21.43.11 5 18 51169.229.131.81 5 26 166131.130.70.8 6 14 -217.173.193.11 6 15 -77.47.133.2 6 16 53128.112.132.86 6 20 106
Table IIICARMA VS. PING COMPARISON
Wn×n = (wi,j), where wi,j represents the latency time forsending a message from vi to vj . [35] denotes the distancedist(vi, vj , G) between two arbitrary nodes vi and vj in anetwork graph G as the minimum sum of the edge weightsfrom W along any path connecting vi and vj in G. Forevery two peers vi and vj a spanning tree T = (V,ET , w)(ET ⊆ E) contains a unique path of length dist(vi, vj , T ).The communication cost over the network tree is defined as:
C(T ) =∑i,j
ri,j · dist(vi, vj , T )
The algorithm proposed in [35] guarantees a O(log2 |V |)approximation of the considered problem.
However, in a P2P system we cannot exactly specifythe expected amount of communication ri,j between twoarbitrary nodes vi and vj . By assuming that ri,j = 1,∀ 1 ≤ i, j ≤ |V |, [36] proposes the reduction of multicastcosts by using an MST approximation. Hereby the multicastcost C(ET ) is denoted as the cost for propagating a messageto all recipients in the group, which is the sum of all edgeweights in the tree representing latency delays along anypath taken by the message:
C(ET ) =∑e∈ET
w(e)
We use the C(ET ) metric as the quality function for thecomparison of different approaches.
In order to provide meaningful results, we compareour CARMIn approach with some of the existing P2Papproaches supporting application-level multicast such asALMI, JXTA, and HiOPS [36]. To extend the range ofour evaluation, we have also considered a RANDOM in-frastructure, where a new node builds up connections to arandomly selected node from the bootstrapping set. Figure 7shows MST approximations by using the above mentionedapproaches in networks with 100 nodes.

125
International Journal on Advances in Telecommunications, vol 3 no 3 & 4, year 2010, http://www.iariajournals.org/telecommunications/
2010, © Copyright by authors, Published under agreement with IARIA - www.iaria.org
(a) ALMI (b) JXTA (c) HiOPS (d) CARMA (e) RANDOM
Figure 7. MST approximations in networks with 100 nodes
To compare these networks with respect to the commu-nication cost C(ET ), we set up a simple simulation envi-ronment. Using this environment, we can create an arbitrarynumber of network nodes, interconnect them according to agiven algorithm and then compute the communication costmetric C(ET ). We have performed several evaluation runswhere we randomly created 10, 500, 1000, 1500, 2000,2500, 3000, 3500, 4000, 4500, and 5000 nodes intercon-necting them with ALMI, JXTA, HiOPS, CARMIn andRANDOM infrastructures. After each run, we computed thecommunication cost C(ET ) in milliseconds needed for thepropagation of a multicast message to all existing nodes.
As Figure 8 shows, the JXTA and ALMI approachesrelying on global knowledge do provide low C(ET ) values.But as mentioned before, these do not scale in terms of alarge number of users. As expected, the RANDOM infras-tructure incurs the highest communication cost. The scalableCARMIn approach provides nearly the same C(ET ) valuesas does the HiOPS overlay, but relies only on local knowl-edge as does the RANDOM infrastructure, by this meansproviding a good trade-off between construction and com-munication costs. The binning approach [24] would showalmost the same behavior in terms of the communicationscost as the CARMIn approach. However, CARMIn doesnot require any additional communication for ordering thenodes in the bootstrapping set, whereas nodes following thebinning approach have to contact the landmark servers.
We denote the metric describing the knowledge i.e., thenumber of nodes, which should be known by a new nodeto join the multicast infrastructure, as K(V ). In order toconstruct an MST, ALMI requires global knowledge of allinvolved nodes K(V ) = |V |. A new JXTA node requires thesame amount of knowledge K(V ) = |V | in order to identifythe nearest node. In HiOPS and CARMIn the amount ofknowledge is variable and depends on the initial settings. Forour comparison in [1] we have used bootstrapping lists forCAMRA and HiOPS with up to K(V ) =
√|V | nodes. Only
the RANDOM infrastructure does not require any globalknowledge. Here it is enough to know only one node. Figure9 represents the respective amounts of knowledge.
We denote the metric describing the running time com-plexity i.e., the construction cost of any multicast tree as
Figure 8. Communication cost C(ET )
Figure 9. Amount of knowledge K(V)
O(T ). The running time complexity for the MST construc-tion is dominated by sorting of edges i.e., node distances[37]. The sorting complexity is given by
O(T ) = O(log |E||E|) = O(log |V |2|E|)= O(2 log |V ||E|) = O(log |V ||E|).
Because of this sorting complexity the same constructioncost is needed for construction of the JXTA-NNT. Asdiscussed in [1], in HiOPS only rendezvous nodes (|VR| =√|V |) are involved in the MST construction. Assuming
that the implication |VR| =√|V | ⇒ |ER| =
√|E|

126
International Journal on Advances in Telecommunications, vol 3 no 3 & 4, year 2010, http://www.iariajournals.org/telecommunications/
2010, © Copyright by authors, Published under agreement with IARIA - www.iaria.org
Figure 10. Construction cost O(T)
holds, the construction cost of the HiOPS infrastructureequates to O(T ) = O(log
√|V |
√|E|). According to the
CARMIn approach, the nodes from the bootstrapping list(√V ) have to be sorted depending on their CARMA
distance. Thus, the construction cost here corresponds toO(T ) = O(log
√|V |
√|E|) due to sorting complexity too.
The construction of the RANDOM infrastructure does notrequire any nameable construction cost (O(T ) = O(1)).Figure 10 compares the considered multicast approacheswith respect to required construction costs. As shown bythis figure, the construction cost of ALMI and JXTA infras-tructures is simply too high.
As the evaluation results show, a clear performanceimprovement of CARMIn over the RANDOM approachis observed. With respect to other algorithms computingan optimal MST (ALMI) or relying on global knowledge(JXTA), the simplicity of the CARMIn approach (lowerconstruction cost, local knowledge) is the advantage, butthe multicast cost deteriorates. Moreover CARMIn doesprovide a more scalable solution than HiOPS, since due tothe utilization of CARMA it does not require any additionalcommunication. Therefore, in large-scale application scenar-ios, which cannot rely on global knowledge and do not haveexact information about node distances, we would prefer ourCARMIn approach to all other considered approaches.
VI. CONCLUSION AND FUTURE WORK
By design, CARMA is meant to be dynamically changingas the communication goes on, reflecting and adapting tothe changes in bandwidth conditions. The life-cycle of aCARMA-capable node in a P2P network starts with thedownloading of the most recent IP and AS allocationdatabases from all regional Internet registries and compilingthem into an easily indexable internal format. This may taketens of minutes to complete, depending on the CPU speedand bandwidth. Although the RIR databases are updateddaily, their growth rate is rather low. Therefore, the startupsequence to refresh the data may be called less frequently
than once a day.In this paper we also have partially addressed the second
layer of CARMA, leaving active measurements of band-width as well as the integration of CARMA into P2P clientsoftware for future publications. Under the assumption thatthe traceroute hop count represents, to a certain degree, a realtopological distance, an experimental validation indicatedthat the correspondence between predicted flavors and actualtopological distances exists and is significant.
The most obvious and straightforward leveraging mech-anism for CARMA is peer list reordering. As mentionedin Section IV-A, a P2P client starts to actively request thedownloading of a file upon receiving a list of peers who hadearlier indicated the possession of the desired content. In allof the P2P clients that we analyzed, either no precedence isgiven to any peer from the list or it has nothing to do withtopological affinity. In fact, in many practical scenarios, evennot all peers from the list are queried until the downloadingis stopped. However, if the peer list is very large and diverseenough in terms of topological distance and bandwidthconditions, the corresponding precedence mechanism canensure a significant burst of performance by choosing peersthat are likely (according to their CARMA flavor) to providehigher transfer speeds and lower latency.
Therefore, in our future work we would like to addressthe complete second and third layers of CARMA, calculatedby direct measurements involving additional traffic. Theselayers may be expressed as weighted scores by which allpeer priorities are then fine-tuned within the boundaries oftheir respective first-layer flavors. It should be noted that animplementation of the second CARMA layer will requiremodifications to the existing software, and that the thirdCARMA layer will require extensions to existing protocolsin order to have any impact on the performance. In thiscase, the life-cycle of a CARMA-capable node is extendedto include the following steps after the initial startup andpeer list ordering based on the first-layer flavors:
1) an additional check is performed using the secondlayer of CARMA in such a way that the original orderis not substituted, but rather fine-tuned;
2) at this point, the actual communication to remoteparties is initiated; if connections are setup using aCARMA-enabled protocol, the third layer is utilizedby the parties providing bandwidth conditions and re-lated information to each other; using this information,peer lists may once again be reordered placing less-loaded nodes at higher positions.
If a peer exchange mechanism is enabled, newly reportednodes must go through all layers of CARMA in order to beplaced in the peer list.
We plan to demonstrate the effectiveness of the CARMAapproach by performing extensive experiments using theset of BitTorrent client software with plugin support thatallow peer ordering to be manipulated. If this proves to be

127
International Journal on Advances in Telecommunications, vol 3 no 3 & 4, year 2010, http://www.iariajournals.org/telecommunications/
2010, © Copyright by authors, Published under agreement with IARIA - www.iaria.org
effective, we plan to integrate CARMA into real-life P2Pnetworks. We are currently developing a software library,implementing CARMA under the LGPL license to assistsoftware engineers wishing to optimize the performance oftheir P2P applications.
REFERENCES
[1] G. Poryev, H. Schloss, and R. Oechsle, “CARMA Based MSTApproximation for Multicast Provision in P2P Networks,” inProceedings of the 2010 Sixth International Conference onNetworking and Services (ICNS ’10). Washington, DC, USA:IEEE Computer Society, 2010, pp. 123–128.
[2] S. Daniel, J. Ellis, and T. Truscott, “USENET - A GeneralAccess UNIX at Network,” 1980.
[3] Napster-Homepage, Access date: January 2011. [Online].Available: www.napster.com
[4] M. Jovanovic, F. Annexstein, and K. Berman, “ScalabilityIssues in Large Peer-to-Peer Networks - a Case Studyof Gnutella,” 2001. [Online]. Available: citeseer.ist.psu.edu/jovanovic01scalability.html
[5] eDonkey2000 Homepage, Access date: January 2011.[Online]. Available: http://tinyurl.com/ed2klink
[6] B. Cohen, “Incentives Build Robustness in BitTorrent,” in theFirst Workshop on the Economics of Peer-to-Peer Systems,2003.
[7] R. Bustos, A. Aguilar, K. Makki, and R. K. Ege, “Multicast-P2P Content Distribution in Large-Scale Enterprise Net-works,” in IEEE Symposium on Computers and Communi-cations (ISCC 2008), 2008, pp. 487–494.
[8] A. Feldmann and V. Aggarwal, “ISP-Aided Neighbor Selec-tion in P2P Systems,” in IETF P2P Infrastructure Workshop(P2Pi), Berlin, Germany, May 2008.
[9] D. R. Choffnes and F. E. Bustamante, “Taming the Torrent: aPractical Approach to Reducing Cross-isp Traffic in Peer-to-Peer Systems,” SIGCOMM Comput. Commun. Rev., vol. 38,no. 4, pp. 363–374, 2008.
[10] H. Xie, A. Krishnamurthy, A. Silberschatz, and R. Y. Yang,“P4P: Explicit Communications for Cooperative Control Be-tween P2P and Network Providers,” DCIA P2P MARKETCONFERENCE, 2008.
[11] J. Kubiatowicz, “Extracting Guarantees from Chaos,” Com-mun. ACM, vol. 46, no. 2, pp. 33–38, 2003.
[12] G. Lucas, A. Ghose, and J. Chuang, “On Characterizing Affin-ity and its Impact on Network Performance,” in Proceedingsof the ACM SIGCOMM workshop on Models, methods andtools for reproducible network research (MoMeTools ’03).New York, NY, USA: ACM, 2003, pp. 65–75.
[13] B. Augustin, X. Cuvellier, B. Orgogozo, F. Viger, T. Fried-man, M. Latapy, C. Magnien, and R. Teixeira, “AvoidingTraceroute Anomalies with Paris Traceroute,” in Proceedingsof the 6th ACM SIGCOMM conference on Internet measure-ment (IMC ’06). New York, NY, USA: ACM, 2006, pp.153–158.
[14] H. Madhyastha, T. Isdal, M. Piatek, and C. Dixon, “iPlane: AnInformation Plane for Distributed Services,” in Proceedingsof the 7th USENIX Symposium on Operating Systems Designand Implementation. USENIX, 2006, pp. 367–380.
[15] T. Karagiannis, P. Rodriguez, and K. Papagiannaki, “ShouldInternet Service Providers Fear Peer-Assisted Content Distri-bution?” in Proceedings of the 5th ACM SIGCOMM confer-ence on Internet measurement (IMC ’05). New York, NY,USA: ACM, 2005, pp. 63–76.
[16] T. Jiang and A. Zhong, “A Multicast Routing Algorithm forP2P Networks,” in GCC 2003, 2003, pp. 452–455.
[17] T. Peng, Q. Zheng, and Y. Jin, “Transmission Latency basedNetwork Friendly Tree for Peer-to-Peer Streaming,” j-jucs,vol. 15, no. 9, pp. 2011–2025, 2009, http://www.jucs.org/jucs 15 9/transmission latency based network.
[18] D. Pendarakis, S. Shi, D. Verma, and M. Waldvogel, “ALMI:an Application Level Multicast Infrastructure,” in Proceedingsof the 3rd conference on USENIX Symposium on InternetTechnologies and Systems (USITS’01). Berkeley, CA, USA:USENIX Association, 2001, pp. 5–5.
[19] K. Radab and A. U. Haque, “A Minimum Spanning TreeAlgorithm for Efficient P2P Video Streaming System,” in The12th International Conference on Advanced CommunicationTechnology (ICACT 2010), 2010, 2010, pp. 93 – 97.
[20] D. Peleg and V. Rubinovich, “A Near-Tight Lower Boundon the Time Complexity of Distributed Minimum-WeightSpanning Tree Construction,” SIAM J. Comput., vol. 30, no. 5,pp. 1427–1442, 2000.
[21] M. Khan and G. Pandurangan, “A Fast DistributedApproximation Algorithm for Minimum Spanning Trees,”Distributed Computing, vol. 20, no. 6, pp. 391–402,April 2008. [Online]. Available: http://dx.doi.org/10.1007/s00446-007-0047-8
[22] JXTA-Homepage, Access date: January 2011. [Online].Available: https://jxta.dev.java.net
[23] E. Michael, “Distributed Approximation: a Survey,” SIGACTNews, vol. 35, no. 4, pp. 40–57, 2004.
[24] S. Ratnasamy, M. Handley, R. Karp, and S. Shenker,“Topologically-aware Overlay Construction and Server Se-lection,” in Proceedings of Twenty-First Annual Joint Confer-ence of the IEEE Computer and Communications Societies(INFOCOM 2002), vol. 3, 2002, pp. 1190– 1199 vol.
[25] J. J. D. Mol, D. H. J. Epema, and H. J. Sips, “TheOrchard Algorithm: P2P Multicasting without Free-Riding,”in Proceedings of the Sixth IEEE International Conferenceon Peer-to-Peer Computing. Washington, DC, USA: IEEEComputer Society, 2006, pp. 275–282. [Online]. Available:http://portal.acm.org/citation.cfm?id=1157740.1158270
[26] J. Hawkinson and T. Bates, “Guidelines for Creation,Selection, and Registration of an Autonomous System (AS),”RFC 1930 (Best Current Practice), Internet Engineering TaskForce, mar 1996. [Online]. Available: http://www.ietf.org/rfc/rfc1930.txt

128
International Journal on Advances in Telecommunications, vol 3 no 3 & 4, year 2010, http://www.iariajournals.org/telecommunications/
2010, © Copyright by authors, Published under agreement with IARIA - www.iaria.org
[27] P. Maymounkov and D. Mazieres, “Kademlia: A Peer-to-PeerInformation System Based on the XOR Metric,” 2002, http://www.cs.rice.edu/Conferences/IPTPS02/109.pdf.
[28] eMule Homepage, Access date: January 2011. [Online].Available: http://www.emule-project.net
[29] G. Poryev, T. Rudyk, and O. Sulima, “Traffic Regulationand Reputation Handling in the BitTorrent Peer-to-Peer Net-works,” National Technical University of Ukraine “KPI”,Tech. Rep., 2008.
[30] RuTracker-Homepage, Access date: January 2011. [Online].Available: http://rutracker.org
[31] TorrentsNetUA-Homepage, Access date: January 2011.[Online]. Available: http://torrents.net.ua
[32] V. Furashev, V. Zubok, and D. Lande, “Parameters of theUkrainian Internet segment as a complex network,” in Pro-ceedings of the Open Informatics and Computer Technologies,vol. 40, pp. 235–242, 2008.
[33] P. Crescenzi and V. Kann, “A compendium of NPOptimization Problems.” [Online]. Available: http://www.nada.kth.se/∼viggo/wwwcompendium/node77.html#4555
[34] M. R. Garey and D. S. Johnson, Computers and Intractability:A Guide to the Theory of NP-Completeness. W. H. Freeman,1979.
[35] D. Peleg and E. Reshef, “Deterministic Polylog Approxima-tion for Minimum Communication Spanning Trees,” in Pro-ceedings of the 25th International Colloquium on Automata,Languages and Programming (ICALP ’98). London, UK:Springer-Verlag, 1998, pp. 670–681.
[36] H. Schloss, R. Oechsle, J. Botev, M. Esch, A. Hoehfeld, andI. Scholtes, “HiOPS Overlay - Efficient Provision of Multicastin Peer-to-Peer Systems,” in 16th IEEE International Confer-ence on Networks (ICON 2008), New Delhi, India, 2008, pp.1–6.
[37] J. B. Kruskal, “On the Shortest Spanning Subtree of a Graphand the Traveling Salesman Problem,” Proc. Am. Math. Soc.,vol. 7, pp. 48–50, 1956.

129
International Journal on Advances in Telecommunications, vol 3 no 3 & 4, year 2010, http://www.iariajournals.org/telecommunications/
2010, © Copyright by authors, Published under agreement with IARIA - www.iaria.org
Improving IPTV QoE taking the suitable MPEG-2/MPEG-4 Quantizer based on Jitter, Delay and lost packets measurements
Alejandro Canovas1, Miguel Garcia1, Jaime Lloret1, Marcelo Atenas1 and Rafael Rizo2 1Universidad Politécnica de Valencia, Camino Vera s/n, 46022, Valencia, Spain
2France Telecom R&D, ORANGE LABS, Barcelona, Spain, [email protected], [email protected], [email protected], [email protected], [email protected]
Abstract — The main issue in Digital Terrestrial Television and in IPTV networks is the Quality of Experience received by the end users. For this reason, mechanisms to automatically measure the video quality of the images received by the user are needed. In this paper, we analyze video quantization in order to determine an optimal quantizer_scale factor value for its transmission. Then, it is used as an automatic measure to improve the video quality received by the end user. The paper shows the measurements taken for Objective and subjective Video Quality, Video Quality Metric and the bandwidth consumed for several types of video quality. We use the jitter, delay and lost packets measurements in order to take the appropriate quantizer. Finally, we show the visual comparison between a high quantizer_scale factor and a reference video. Our work shows that an optimal quantizer_scale factor can be used to save bandwidth in an IPTV network or to improve the Video Quality for the same bandwidth consumption. Finally, we present some discussions of the measurements gathered and some comments of other authors.
Keywords – MPEG-2/MPEG-4 Quantizer, Video Quality, IPTV.
I. INTRODUCTION MPEG-2 and MPEG-4 encoding are standards that are
widely used by the digital television industry [1]. Although, nowadays, MPEG-2 is the most used, MPEG-4 is gaining ground because it provides good quality image with lower bandwidth consumption [2]. The application fields where MPEG-4 can be applied are Digital Television, interactive graphical applications and interactive multimedia, while providing high audiovisual data compression to store or stream video and, at the same time, audio and video quality. MPEG-4 reduces the data rate in half, with the same image quality than MPEG-2. This will increase the offer and the plurality of channels and, at the same time, the scalability of network services. MPEG-4 compression is based on visual-objects coding [3] and uses further coding tools, like System Decoder Model, Sync Layer, Flexible Multiplex, etc. [4], to achieve higher compression factors than MPEG-2, thus it needs less bandwidth for its transmission, but MPEG-2 is the most used codec in Digital Terrestrial Television and in IPTV networks, because it has lower complexity and hardware requirements at the end user.
MPEG-2 compression format is quite used for video storage in hardware devices (DVD, SVCD, etc) and to transmit real time video in several Digital Video Broadcasting (DVB) standards [5]:
• DVB-T: This system transmits compressed digital audio, video and other data in a MPEG-2 transport stream, using COFDM modulation.
• DVB-S: This system increases the data transmission capacity and digital television via a satellite UH11 using the MPEG-2 format, and QPSK modulation.
• DVB-C: This system transmits MPEG-2 or MPEG-4 family digital audio/video stream, using several QAM modulations with channel coding.
DVB system has been used as a basis to standardize the Internet Protocol Television (IPTV). It includes MPEG-2 DVB services [6] encoded with MPEG-2 technology and encapsulated in MPEG-2 Transport Stream (MPEG-2 TS) [7]. But, MPEG-4 can be also added in this transport stream. Moreover, it covers Live Media Broadcast services (i.e TV or radio styles), Media Broadcast with Trick Modes and Content on Demand services (CoD). The goal of DVB-IP is to specify technologies on the interface between an IP based network and a DVB-IP Set-top-Box, which uses a protocol stack for DVB IP services. A diagram of the protocol stack is given in Figure 1.
Once DVB services are encoded, the video content is packaged and encapsulated. This involves inserting and organizing video data into individual packets. The encapsulation of the video content is done using MPEG-2 TS, where all MPEG-2 TS will be encapsulated in Real time Transport Protocol (RTP) according to RFC 1889 [8] in conjunction with RFC 2250 [9], and RFC 768 [10] as the transport layer protocol.
Initially, MPEG-4 doesn't define a transport layer [11]. There are only two adjustments on the MPEG-2 TS to transport MPEG-4 streams. The first one is defined in RFC 3016, which is based in RTP packets [12]. The second one is DMIF, or Delivery Multimedia Integration Framework, which is an interface between the application and the transport. It allows the MPEG-4 application developer to stop worrying about MPEG-4 transport. A single application can run on different transport layers.
The message fields used in the transport stream of the MPEG-2 based DVB content over IP are the following ones: a standard IP header, an UDP header, a RTP header and an integer number of 188 bytes MPEG-2 TS packets, see Figure 2. The maximum size of IP datagram (65535 octets for IPv4) is limited. In the case of an Ethernet-based network, with a Maximum Transfer Unit (MTU) of 1492 or 1500 bytes, the number of MPEG-2 TS packets is 7.

130
International Journal on Advances in Telecommunications, vol 3 no 3 & 4, year 2010, http://www.iariajournals.org/telecommunications/
2010, © Copyright by authors, Published under agreement with IARIA - www.iaria.org
Figure 1. Protocol stack for DVB-IP services
Figure 2. Message to transport MPEG-2 based DVB content
The main challenge in current IPTV systems is to provide high Quality of Experience (QoE) to the user, but using noninvasive methods while the network is being monitored.
In the paper with reference [13] we analyze MPEG-2/MPEG-4 quantization in MPEG-2 TS packets, as a noninvasive method to evaluate the video quality function. It is useful because it allows us to measure the QoE perceived by the IPTV customer. Several quantizer scales are used to evaluate, which of them are better according to the bandwidth, objective video quality, etc. In this paper, we have extended [13] by adding many more tests and adding more variables for our comparison. Moreover, we now have another conclusion: QS=4 is better taking into account the Bandwidth, Jitter, Delay, Lost Packets, VQM, MOS and subjective analysis, while in [13] the best one was QS=2.
The remainder of this paper is organized as follows. Section II explains some work related with video MPEG-2 and MPEG-4 encoding and user video-quality perception. Section III explains the general concept of quantization. The system architecture used to perform our test is presented in Section IV. Section V shows the measurements obtained when different quantization scales are used in order to find the optimal quantizer_scale factor. Objective and subjective video quality for IPTV is shown in Section VI. Section VII shows the jitter, delay and lost packets test. Section VIII provides some discussions of the measurements gathered and the ones taken from other authors. Finally, Section IX draws the conclusion and indicates further research.
II. RELATED WORK There are several works published where the authors
improve the efficiency of the MPEG-2 and MPEG-4 algorithms by modifying some of their parameters.
In [14], Zhenzhong Chen and King Ngi Ngan review the recent advances in rate control techniques for video coding. The video quantization is used to reduce the bit rate of the
compressed video signal. It lets meet the size or bandwidth limitation properly. The rate control algorithms recommended for the video coding standards are briefly described and analyzed. Moreover, the recent advances, such as new concepts in rate-distortion modeling and quality constrained control, are presented. With these techniques, the rate control performance can be improved.
An example is given in [15], where O. Verscheure et al. analyze how the user-perceived quality is related to the average encoding bitrate for a variable bitrate (VBR) MPEG-2 video. They show why simple distortion metrics may lead to inconsistent interpretations. Furthermore, for a given coder setup, they analyze the effect of packet loss on the user-level quality. Finally, they demonstrate that, when jointly studying the impact of coding bit rate and packet loss, the reachable quality is upperbound and exhibits one optimal coding rate for a given packet loss ratio.
The authors in [16] describe a complete practical two-pass MPEG-2 encoding system that can be tuned to produce a variable bit rate (VBR) stream in a second pass. In a first pass, the video sequence is encoded with constant bit rate (CBR), while statistics concerning coding complexity are gathered. Next, the first-pass data is processed to prepare the control parameters for the second pass, which performs the actual VBR compression. They conclude their paper saying that the second-pass VBR sequences visually appear to have a higher overall quality than the ones coded with CBR. For VBR to visually outperform CBR, a mix of “easy” scenes and “difficult” scenes is always required.
Sung-Hoon Hong et al. propose a rate control scheme using a rate-distortion (R-D) estimation model, which produces a consistent picture quality between consecutive frames, in [17]. Their rate control scheme ensures that the video buffers do not underflow and overflow by satisfying the buffer constraint. Their simulation results show that their control scheme achieves 0.52-1.84 dB peak signal-to-noise

131
International Journal on Advances in Telecommunications, vol 3 no 3 & 4, year 2010, http://www.iariajournals.org/telecommunications/
2010, © Copyright by authors, Published under agreement with IARIA - www.iaria.org
ratio (PSNR) gain over MPEG-2 Test Model 5 (TM5) rate control and maintains very consistent quality within a frame as well as between frames.
Another paper where the authors try to improve the efficiency of the encoders is shown in [18]. The authors optimize the operational control of MPEG-2, H.263, MPEG-4, and H.264/AVC encoders respect to their rate-distortion efficiency using Lagrangian optimization techniques. The performance of the H.264/AVC compliant encoder in all experiments clearly demonstrates the potential importance of this standard in future applications of video streaming as well as interactive video coding.
In [19] Zhihai He and Sanjit K. Mitra present an adaptive estimation scheme to estimate linear relationship between the coding bit rate and the percentage of zeros among the quantized transform coefficients. Based on the linear source model and the adaptive estimation scheme, a unified rate control algorithm is proposed for various standard video coding systems (MPEG-2, H.263, and MPEG-4). This algorithm is outperformed with other algorithms providing more accurate and robust rate control with very low computational complexity and implementation cost.
If a system makes a change in the quantizer, this may be more efficient in the transcoding process. In [20], the authors present a rate control scheme for MPEG-2 to H.264 transcoder. They construct an analytic model to set a reasonable initial quantization parameter (QP) for the first frame at the beginning of transcoding. The QP for each frame and each macroblock are adjusted by QPs extracted from the incoming MPEG-2 pictures to avoid consuming bits without video quality gain. They demonstrate by the experiment results that their algorithm improves overall quality for transcoded video while retaining smooth quality.
Finally, an efficient conversion scheme in order to apply the already existent DCT-domain transcoding schemes to MPEG-2/H.264 transcoding is proposed in [21]. Their scheme consists of two conversion steps: the quantization conversion and the DCT conversion. The quantization conversion changes the MPEG-2 quantization step size (Qstep) to the new H.264/AVC Qstep. Additionally, it can improve PSNR performance by reducing the reconstruction errors caused in the pixel-domain transcoder. Their experimental results show that the proposed scheme reduces computational complexity by 5-11% and improves video quality by 0.1- 0.5 dB compared with other solutions.
In this work we analyze the quantizer scale factor (QS) based on the measurements taken of the jitter, delay and lost packets. This study allows us to improve the quality of experience (QoE) in IPTV networks.
III. QUANTIZATION Quantization is basically a process for reducing the
precision of the Discrete Cosine Transform (DCT) coefficients in an encoder. This is very important, since lower precision implies a lower bit rate in the compressed data stream. The quantization process involves the division of the integer DCT coefficients by integer quantization values. The result is an integer and fraction, and the fractional part must be rounded according to the rules
defined by MPEG [22]. The result is the quantized value that is transmitted to the decoder.
For reconstruction, the decoder must first dequantize the quantized DCT coefficients in order to reproduce the DCT coefficients computed by the encoder. Essentially, the Inverse Quantization (IQ) scales every element by a unique quantized weight. Since some precision was lost quantizing, the reconstructed DCT coefficients are necessarily approximations to the values before quantization.
After entropy decoding, the two-dimensional array of coefficients, QF[v][u], is inverse quantized to produce the reconstructed DCT coefficients, F[v][u]. In MPEG, IQ consists of three stages: Inverse Quantization Arithmetic, Saturation, and Mismatch Control. The inverse quantization arithmetic produces F’’[v][u] coefficients [22]. For DCT coefficients matrix expression 1 is used:
" , ∑ ∑ 2 , 2 ,
| , |,
1 , , 32⁄ 1 (1)
Where, 2n represents the multiplier intra DC, the
intra_dc_mult factor, for n ∈ {0, 1, 2, 3}. It is derived from the data element intra_dc_ precision (in case of MPEG-2, it is estimated according to Table 7-4 of the ITU-T Recommendation H.262 [22], in case of MPEG-4, it is estimated according to [3]). The a variable depends of the intrablocks (see expression 2), when the three conditions are complied it doesn't get a null value, otherwise, only operates with the second one. The second part of expression 1 depends of the value of k (seen in expression 3), the luminance and chrominance.
⎩⎨⎧
=01
a others
kuv 1,0,0 ===
(2)
⎩⎨⎧
=01
k sintrablocknon
sintrablock
−
(3)
The quantizer_scale factor (QS) is an integer and is encoded with a 5-bit fixed-length code. Thus, it has values in the range {1,....,31}. 0 value is not allowed. Each weighting coefficient, W[w][v][u]; w = 0 ... 3; v =0...7; u = 0... 7, is represented on an 8-bit integer. The operator /’ represents the integer division with truncation of the result towards zero.
One of the main uses of QS is for bit rate adaptation. The higher the QS value, the lower the bit rate, but a lower bit rate means a less picture quality, therefore the QS value must be chosen so as to minimize perceived distortion in the reconstructed picture.
In an encoder, the QS can be changed at the start of coding of each macroblock. Each time it is changed, the new value must be coded in the bitstream and there is coding overhead in doing this. In the case of IPTV this is done using MPEG-2 TS packets. Therefore, the QS can be retrieved very simply in the IQ block of the MPEG decoder, without adding extra devices, in an IPTV receiver (Set-Top-Box).

132
International Journal on Advances in Telecommunications, vol 3 no 3 & 4, year 2010, http://www.iariajournals.org/telecommunications/
2010, © Copyright by authors, Published under agreement with IARIA - www.iaria.org
IV. SYSTEM ARCHITECTURE The system is divided into two main parts: the server
level and the user level. Both are linked by a communication network based on TCP / IP.
At the user level, the system is based almost in the preprocessing and transmission of uncompressed images in PNG format with a resolution of 1920x1080. The videos were generated from 14315 uncompressed PNG images [23] and encoded and quantized using ffmpeg software [24]. We made 8 video sequences with the following characteristics:
• MPEG-2 and MPEG-4 coding • 720x576 of resolution • 25 fps • 120 seconds long • QS {1, 2, 4, 6, 8, 10, 16, 31}, see [13]. Figure 3 shows the steps from the preprocessing of
encoding of the uncompressed PNG images until they are transported to the end user. In the preprocessing stage, after the PNG images are encoded, we obtain a standard definition television (SDTV) MPEG1 video with a resolution of 720x576 dpi. This video will be the reference video used for the different tests. This video is later compressed in MPEG-2 and MPEG-4 format. Then, they are quantized to different QS for each format. In the transport stage, the videos are packaged in MPEG-2 TS and transmitted by the server in broadcasting to the network. We used VLC Media Player [25] as IPTV video server to send the SDTV MPEG-2 Transport Streams for both compressions types.
The IPTV network (shown in Figure 3) has been simulated using a PC placed in a Fast Ethernet network. The final user has a commercial set-top box to watch the video from the TV. It can also be observed directly from PC.
At the user level, we have also installed the VLC Media player. There, we can see the captured video and measure it subjectively. On the other hand, we installed the Clearsight Analyzer Software [26] in user's PC. It lets us capture and analyze the MPEG-2 TS packets. We measured the video quality at the receiver, and estimated the Mean Opinion Score (MOS). There is also installed a sniffer at the user level, which allows us to obtain the QoS parameter values of the video transmission (jitter, delay and lost packets). These measures will serve to evaluate the QS.
Our network architecture uses IPv4 because nowadays the most of commercial set-top boxes only use IPv4, but it can be implemented in an IPv6 network with IPv6 set top boxes easily.
V. QS ANALISYS In order to analyze the optimal QS, we encoded several
videos with the different QS values shown in the previous section. The Video Quality (VQ) results, obtained by the IPTV analyzer software of each video transmitted through our test bench, is shown in Figures 4 and 5. The VQ is measured in MOS values. In order to obtain the MOS, we compare the captured video with the video reference. MOS is an ITU (International Telecommunication Union) standardized term [27], used as a methodology for the subjective assessment of the quality of television pictures. MOS scores are rated on a scale from 1 to 5, where 5 is the best possible score, and indicates the degree of the user’s satisfaction. In Figure 4 and 5, the best scores are obtained for QS {1, 2}, which provide a medium-high VQ value (4 at the MOS scale), while the rest of QSs have VQ values below 4. So, we can say that optimal QS, is 1 or 2 according our needs. If we want the best video quality without considerer the file size we will choose 1, but if we take into account the size of the video, we will select QS equal 2. However the tests were conducted using fixed QS in the video encoder. But in practice, a commercial MPEG encoder often uses variable QS, which assigns different values to intraframe or interframe, even to macro-blocks contained in each of them. For that reason, an average QS of 4 could be the highest value used by a video encoder. It seems that, according to the values of Figure 4 and 5, QS values upper than 4 will give fair or poor VQ. To check the results, we used an objective video quality method [28]; which is used traditionally to determine the video quality in presence of impairments. This will be discussed at the next section. Furthermore, in order to analyze, which is the best QS for video streaming, we used new testing measures as jitter, delay and packet lost, which will be explained in next sections.
Another important aspect in the QS analysis is the used instantaneous bandwidth. In Figures 6 and 7, the bandwidth used by MPEG-2 and MPEG-4 videos, and their respective QS, is shown. The appearance of traffic peaks on all graphs, with the same behavior, indicates that the tests have been conducted with the same sequence of images. Analyzing MOS and BW results we see that Q1 and Q2 have practically the same quality and features. According to [29], a MOS between 3.1 and 4.0 is acceptable. These videos are high quality, but the bandwidth needed for transmission is very high. Quantification values higher than Q8 are below the acceptable MOS. This reflects will serve for further analysis.
Figure 3. Encoding process and location of IPTV devices

133
International Journal on Advances in Telecommunications, vol 3 no 3 & 4, year 2010, http://www.iariajournals.org/telecommunications/
2010, © Copyright by authors, Published under agreement with IARIA - www.iaria.org
Figure 4. Video Quality in MOS value using the MPEG-2 codec quantizer
Figure 5. Video Quality in MOS value using the MPEG-4 codec quantizer
Figure 6. Bandwidth used by MPEG-2 video with different QS
Figure 7. Bandwidth used by MPEG-4 video with different QS
VI. OBJECTIVE AND SUBJECTIVE VIDEO QUALITY The goal of the objective video quality assessment is to
design quality metrics in order to predict the perceived video quality automatically. The subjective video quality is a tool for the evaluation of videos from the point of view of the observer.
A video signal, whose quality is being evaluated, can be thought of as a sum of the reference signal and an impairment signal. We may assume that the loss of quality is directly related to the strength of the impairment signal. Therefore, a natural way to assess the quality of an image is to quantify the error between the distorted signal and the reference signal, which is fully available in Full Reference (FR) quality assessment [28]. But this is a problem because these videos of reference require a large amount of storage and, in many cases, it is impossible to obtain it. Reduced-reference (RR) [30] quality assessment does not assume the complete availability of the reference signal, only a partial
reference information that is available through an ancillary data channel. Partial reference information could be Packet Loss Rate (PLR), is the probability that a packet is dropped at any router, or I/B/P Frames Statistics Losses (FSL), while in our case is QS.
In our case we will quantify the error between the distorted signal and the reference signal using Video Quality Metric VQM [31]. VQM uses the zero value as the best possible value; this means that there is no error between the reference video and the impairment video. The results of MPEG-2 and MPEG-4 are shown in Figures 8 and 9 respectively. In both Figures, the best value is QS1 and the worst QS31, although the difference is lower in MPEG-4. This verify that the larger the QS, the lower image quality (as we mentioned in the previous sections). We can see that when there are errors, the MPEG-4 video is seen with higher quality image than the MPEG-2 video because lower values of VQ are obtained. Again, QS2 was the optimal value.
00
00

134
International Journal on Advances in Telecommunications, vol 3 no 3 & 4, year 2010, http://www.iariajournals.org/telecommunications/
2010, © Copyright by authors, Published under agreement with IARIA - www.iaria.org
Figure 8. Objective video quality for MPEG-2
Figure 9. Objective video quality for MPEG-4
Figure 10. Visual comparison between a video with lost packets (at the bottom), QS31 video (in the middle), and the reference video
(at the top)
Figure 10 shows a visual comparison between a video with lost packets (at the bottom), QS31 video (in the middle) and the reference video (at the top). In the video with loss packets we can see that when losses occur in the network, there is a lack of information in the video and pixels appears empty or with adjacent information. In the QS31 video, we can see that it has color degradation, figure pixelation, and it loses clarity. These issues are given due to the high value of QS. This information allows us to compare the video received with the reference. Videos with QS31 and QS16 do not exceed the minimum requirements of subjective assessment because the end user does not get a good picture quality.
VII. JITTER, DELAY AND LOSS PACKETS TEST The latest set of tests conducted in this work has been to
measure the jitter, delay and lost packets. The aim is to find how these parameters affect the QS. Finally, we will gather all the measurements and select an optimal value of QS. In order to perform this experiment, we added changes in the network parameters by applying different values of jitter, delay and lost packets in the video transmission in a controlled manner. It has been done by using the software NetDisturb [32]. Based on our previous experiments [13] we will only analyze QS1, QS4, QS6, QS8 and Q10. We will cause 0.1% ,1% and 3% of loss packets in the network during the a IPTV channel transmission because higher values than these ones, give very low video quality results as it is shown in Figure 10 (bottom). The results can be seen in the following test bench.
In Figure 11, the average delay when there is a loss of 0.1% for several values of quantizer (Q) in the MPEG-2 encoding can be observed. When the value of Q increases, the instant average delay is higher. The behavior of the delay is the same regardless of the Q value. If we have a low Q the file size to be transmitted is greater, so the number of packets to transmit will be bigger. For example, when Q=1 we have an average delay lower than 2 milliseconds, but the number of packets transmitted is approximately 70000. But when Q=6, the delay is lower than 5 milliseconds and the transmitted packets are approximately 24000.
0 0

135
International Journal on Advances in Telecommunications, vol 3 no 3 & 4, year 2010, http://www.iariajournals.org/telecommunications/
2010, © Copyright by authors, Published under agreement with IARIA - www.iaria.org
Figure 11. Delay when the loss rate is 0.1% for different Q of
MPEG-2 videos.
Figure 12. Delay when the loss rate is 1% for different Q of
MPEG-2 videos.
In Figure 12, we can see that we obtained similar results, but in this case the losses introduced in the network were 1%. We can say that in a network with 0.1% and 1% losses, in the case of MPEG2 encoding, the behavior of the delay is very similar.
Finally, in Figure 13, we show the delay for a network with a loss of 3%. In this case, the delay follows the same behavior such as the previous figures but the average values are slightly smaller when there is a low Q. In this case, the delay increases for higher Q compared to Figures 11 and 12. This phenomenon can be seen when we have Q=1 (the delay decreases compared to the delays with a loss of 1% and 0.1%) and Q=10 (the delay increases)
We have also evaluated the delay compared to a loss rate for different Q of MPEG4 video encoding (see Figures 14, 15 and 16). With a loss rate of 0.1%, with Q=1, the observed delay is lower than 2 milliseconds, while with Q=4 this delay increases almost up to 4 milliseconds. Moreover, as we see in Figure 14, increasing the value of Q, the delay is also increased. This behavior is also obtained in the figures related to MPEG-2.For a network loss rate of 1%, the behavior of the delay is the one obtained in Figure 15. In this figure we see that for a Q=1 the delay is lower than 2 milliseconds and in the case of Q=4 this delay is lower than 4 milliseconds. With a loss rate of 3% in MPEG-4 videos, we obtained the delay shown in Figure 16. In this case, we see that the delay is slightly higher compared to loss rates of 0.1% -1%. This difference in delay is very small but exists.
As a general conclusion related to the delay measurements, we can say that, regardless of the codec used, there are Q values, which contribute with lower delays, but the number of transmitted packets is higher when we use small QS. Besides, this delay is referenced to belay between packets. For this reason when we have more packets, the intermediate devices will need more resources to give the same service. In all cases, the delay is lower than 20 milliseconds, an acceptable delay in the transmission of IPTV channels.
In the Figures 17, 18, 19, 20, 21 and 22, we can observe the instantaneous average jitter using MPEG-2 and MPEG-4
encoded videos for different loss rates. In Figure 17, we analyze the jitter for a loss rate of 0.1%. In this case, we observe that the measurements obtained have an exponential behavior. It can be seen that the video with Q=4 has the smallest jitter, something that can be taken into account for the IPTV transmission.
When we have a loss rate of 1%, the behavior of the jitter follows the graph shown Figure 18. In this case, the jitter has an exponential behavior. We have also observed that when Q increases, the jitter is reduced. For an efficient IPTV transmission, it is the better to have a small jitter, but we can't choose the highest Q value because the video quality is very poor.
Figure 19 shows the jitter measurements obtained for a rate loss of 3%. In this case, we see that the behavior is not the same as that obtained in the previous figures. This is because packet losses are already quite high and the jitter doesn't follow any specific distribution. We observed that the Q=4 value has the smallest jitter values (around 1500 packets), then this jitter value increases. We must indicate that the jitter values obtained in this figure are very small and therefore they will not affect to the transmission of IPTV channels.
In the MPEG4 encoding, the jitter obtained for different Q and a loss rate of 0.1% is seen in Figure 20. In this case, the behavior of this parameter is also exponential. In figure 20 we observe that the values of Q=1 and Q=6 are the ones that provide lowest jitter. In this figure, we can see that the value of Q=10 has the worst jitter value introduced into the network. Figure 21 shows the obtained jitter for various Q values when the loss rate increases to 1%. In this case, the Q value that introduces more jitter to the IPTV transmission is the Q=8, having the other cases much lower jitter values.
Finally, the jitter obtained for a loss rate of 3% is represented in the Figure 22. In this case, we see that the behavior doesn't follow any pattern. The Q value, which introduces lowest jitter is when we encode the video with Q=8. Otherwise, when there is higher jitter, the Q=1 is the quantizer, which provides higher jitter values to the IPTV transmission.
0 0

136
International Journal on Advances in Telecommunications, vol 3 no 3 & 4, year 2010, http://www.iariajournals.org/telecommunications/
2010, © Copyright by authors, Published under agreement with IARIA - www.iaria.org
Figure 13. Delay when the loss rate is 3% for different Q of
MPEG-2 videos.
Figure 14. Delay when the loss rate is 0.1% for different Q of
MPEG-4 videos
Figure 15. Delay when the loss rate is 1% for different Q of
MPEG-4 videos
Figure 16. Delay when the loss rate is 3% for different Q of
MPEG-4 videos
Figure 17. Jitter when the loss rate is 0.1% for different Q of
MPEG-2 videos.
Figure 18. Jitter when the loss rate is 1% for different Q of
MPEG-2 videos.
0 0
0 0
0 0

137
International Journal on Advances in Telecommunications, vol 3 no 3 & 4, year 2010, http://www.iariajournals.org/telecommunications/
2010, © Copyright by authors, Published under agreement with IARIA - www.iaria.org
Figure 19. Jitter when the loss rate is 3% for different Q of
MPEG-2 videos.
Figure 20. Jitter when the loss rate is 0.1% for different Q of
MPEG-4 videos
Figure 21. Jitter when the loss rate is 1% for different Q of
MPEG-4 videos
Figure 22. Jitter when the loss rate is 3% for different Q of MPEG-
4 videos
VIII. DISCUSSION Authors of reference [33] recommend a maximum loss of
5 consecutive IP packets every 30 minutes in SDTV. They say that between 0.5% and 1.5% of packet loss is acceptable. We have taken this into account when we made our test. For this reason we don't presented loss packet values higher than 3%.
Authors of reference [34] recommend that delay bounds for the various grades of perceived performance in terms of human interaction can be defined as: Good (0ms-150ms), Acceptable (150ms-300ms), Poor (> 300ms). Moreover, the authors of reference [29] suggest the following jitter values to be reasonably reliable to determine the grade of perceived performance: Good (0ms-20ms), Acceptable (20ms-50ms), Poor (> 50ms).
The jitter values of our test bench ranges between 200 ms and 2 ms and, for delay values between 2 and 30 ms. Therefore, we see that there are videos that don't satisfy this consideration, like the ones p given by QS31.
We made a subjective analysis of the video quality. It is shown in Figure 23. In the first line of the figure we see an image of the reference video (first in the left), an image of the QS4 video (second) and the difference between them (third). In the second line we see an image of the reference video (first in the left), an image of the QS6 video and the difference between them.
With this information and the information taken from the previous sections, we can deduce that the optimum values of QS are both QS4 and QS6 for MPEG-2 and MPEG-4 videos. Taking into account the extreme values of QS31 and QS1, we built the comparative shown in table I. In that table the average values for the different measures taken respect to the optimal values of QS31 and QS1is shown.
IX. CONCLUSION In this paper, we have analyzed the QS as visual quality
parameter. QS can be calculated at the decoder by extracting the information encoded in MPEG-2 TS packets, and, then, it could be used in VQ in order to create a reduced reference model to be used in the estimation of the QoE of the user .
0
0
0

138
International Journal on Advances in Telecommunications, vol 3 no 3 & 4, year 2010, http://www.iariajournals.org/telecommunications/
2010, © Copyright by authors, Published under agreement with IARIA - www.iaria.org
Figure 23. Subjective Video Quality for QS4 (first line) and QS6 (second line).
TABLE I. AVERAGE VALUES WITH SEVERAL QS FOR MPEG2 AND MPEG4 CODECS
Jitter_01% (ms)
Jitter_1% (ms)
Jitter_3% (ms)
Delay_0.1%(ms)
Delay_1%(ms)
Delay_3% (ms)
BW (bps) MOS
QS1 2 74.98 10.41 1.4 1.86 1.57 1.37 37355.7 4.20 4 23.98 10.41 1.48 1.75 1.57 1.6 31452.7 4.06
QS4 2 3.95 41.87 1.65 2.98 3.01 2.68 19000.93 3.36 4 18.96 1.58 1.6 3.88 3.56 3.61 13898.6 3.40
QS6 2 25.99 48.57 1.37 4.65 6.42 13.17 12029.7 2.92 4 50.23 1.39 1.42 6.31 5.87 5.99 8406.34 2.94
QS31 2 91.84 143.69 1.29 21.84 22.11 20.92 2377.25 0.7 4 204.39 136.53 1.39 26.73 26.98 26.99 1833.02 0.64
We reached the conclusion that QS4 and QS6 are the
optimum values when we include changes in the network and the network conditions are not optimum. Moreover, QS4 provide better video quality. IPTV service providers will require less bandwidth when QS4 and QS6 MPEG-4 videos are stream to the network. Therefore, we have shown that an optimal quantizer_scale factor can be used to save bandwidth in an IPTV network or to improve the Video Quality for the same bandwidth consumption.
In [13] we have demonstrated that the best QS value was equal to 2. However, in this paper we have added the bandwidth, jitter, delay and packet loss measurements in order to test the IPTV channel performance and the VQM and MOS. Now, we have demonstrated that the best QS values have been QS4 and QS6 when these parameters are included between the parameters taken into account. Moreover, in [13] we used a DVD video as a reference and then we codded it to MPEG-2 and MPEG-4, in this paper we have coded the raw video to MPEG-2 and MPEG-2 directly.
Reduced reference models are the next challenges for perceptual visual quality measurement techniques in multimedia services over digital television networks. Our future work will be focused on adding these results to the VQ algorithms in order to produce an efficient QoE to the user.
ACKNOWLEDGEMENTS This research has been fully supported by France
Telecom, Orange Labs, Spain.
REFERENCES [1] The MPEG handbook: MPEG-1, MPEG-2, MPEG-4. John
Watkinson. Focal Press, UK, 2001 [2] R. Koenen, “Overview of the MPEG-4 standard”, ISO/IEC
JTC1/SC29/WG11 N1730, Luglio 1997. [3] Coding of Audio-Visual Objects, Part-2 Visual, Amendment 4:
Streaming Video Profile, ISO/IEC 14 496-2/FPDAM4, July 2000.

139
International Journal on Advances in Telecommunications, vol 3 no 3 & 4, year 2010, http://www.iariajournals.org/telecommunications/
2010, © Copyright by authors, Published under agreement with IARIA - www.iaria.org
[4] Hill, Alberto Daniel. "MPEG-4 sobre CATV". Other thesis, Universidad Católica de Uruguay Dámaso Antonio Larranga, Facultad de Ingienería y Tecnologías. 2003.
[5] ETSI TR 102 033 V1.1.1. “Digital Video Broadcasting (DVB); Architectural framework for the delivery of DVB-services over IP-based networks”. April 2002. Available at http://www.etsi.org/deliver/etsi_tr/102000_102099/102033/01.01.01_60/tr_102033v010101p.pdf [July 2010]
[6] U. Reimers, “Digital Video Broadcasting (DVB): the International Standard for Digital Television”. Springer-Verlag New York, Inc. 1998.
[7] ISO/IEC 13818-1. “Information technology - Generic coding of moving pictures and associated audio information: Systems”. 2007.
[8] H. Schulzrinne, S. Casner, R. Frederick and V. Jacobson. “RFC1889 - RTP: A Transport Protocol for Real-Time Applications”. January 1996. Available at http://www.rfc-editor.org/rfc/rfc1889.txt [July 2010]
[9] D. Hoffman, G. Fernando, V. Goyal and M. Civanlar. “RFC2250 - RTP Payload Format for MPEG1/MPEG2 Video”. January 1998. Available at http://www.rfc-editor.org/rfc/rfc2250.txt [July 2010]
[10] J. Postel. “RFC768 - User Datagram Protocol”. August 1980. Available at http://www.rfc-editor.org/rfc/rfc768.txt [July 2010]
[11] ISO/IEC 11172-3, "Coding of Moving Pictures and Associated Audio for Digital Storage Media at up to about 1.5 Mbit/s, Part 3: Audio" (1992).
[12] Y. Kikuchi, T. Nomura, S. Fukunaga, Y. Matsui, H. Kimata. RFC 3016. RTP Payload Format for MPEG-4 Audio/Visual Streams.November 2000. Available at http://www.rfc-editor.org/rfc/rfc3016.txt
[13] Marcelo Atenas, Miguel Garcia, Alejandro Canovas, Jaime Lloret, A MPEG-2/MPEG-4 Quantizer to Improve the Video Quality in IPTV services, The Sixth International Conference on Networking and Services (ICNS 2010), Cancun (Mexico), March 7-13, 2010.
[14] Z. Chen and K. N. Ngan, “Recent advances in rate control for video coding”. Signal Processing: Image Communication, Vol. 22, Issue 1, Pages 19-38, January 2007.
[15] O. Verscheure, P. Frossard, and M. Hamdi, 1998. “MPEG-2 video services over packet networks: Joint effect of encoding rate and data loss on user-oriented QoS”. 8th Int. Workshop on Network and Operating Systems Support for Digital Audio and Video, Cambridge, UK., July 8-10, 1998.
[16] P. H. Westerink, R. Rajagopalan and C. A. Gonzales, "Two-pass MPEG-2 variable-bit-rate encoding". IBM Journal of Research and Development, Digital multimedia technology, vol. 4, number 4, pp. 471. 1999.
[17] S. H. Hong, S. J. Yoo, S. W. Lee, H. S. Kang, and S. Y. Hong. “Rate Control of MPEG Video for Consistent Picture Quality”. IEEE Transactions on Broadcasting, vol. 49, no. 1, pp. 1-13, March 2003.
[18] O. Werner, “Requantization for Transcoding of MPEG-2 Intraframes” IEEE Transactions on Image Processing, Vol. 8, No. 2, pp. 179-191, February 1999
[19] Z. He and S. K. Mitra. “A Linear Source Model and a Unified Rate Control Algorithm for DCT Video Coding”. IEEE Transactions on Circuits and Systems for Video Technology, vol. 12, no. 11, pp. 970-982. Nov. 2002.
[20] J. Yang, Q. Dai, W. Xu and R. Ding. “A rate control algorithm for MPEG-2 to H.264 real-time transcoding”. Proceedings of SPIE 2005, pp. 1995–2003, 2005.
[21] J. K. Lee and K. D. Chung. “Quantization/ DCT Conversion Scheme for DCT-domain MPEG-2 to H.264/AVC Transcoding”. IEICE Trans. Commun., vol. E87-B, no.7. pp. 1-9. July 2004
[22] ITU-T “Recommendation H.262, ISO/IEC 13818-2: Generic coding of moving pictures and associated audio information: Video”, February 2000. Available at http://webstore.iec.ch/preview/info_isoiec13818-2%7Bed2.0%7Den.pdf [July 2010]
[23] Big Buck Bunny uncompressed PNG files: Available at http://media.xiph.org/BBB/ [July 2010]
[24] ffmpeg software. Available at http://ffmpeg.org [July 2010] [25] VLC Media Player. Available at http://www.videolan.org/vlc/ [July
2010] [26] ClearSight Analyzer Software. Available at
http://www.flukenetworks.com/fnet/en-us/StreamIt?Document=3780533&sot=true [July 2010]
[27] ITU-R “Recommendation BT.500: Methodology for the subjective assessment of the quality of television pictures”, June 2002. Available at http://www.itu.int/rec/R-REC-BT.500/en [July 2010]
[28] ITU-T, “Recommendation J.144: Objective perceptual video quality measurement techniques for digital cable television in the presence of a full reference”, March, 2004. Available at http://www.itu.int/rec/T-REC-J.144/en [July 2010]
[29] Prasad Calyam, Mukundan Sridharan, Weiping Mandrawa, Paul Schopis “Performance Measurement and Analysis of H.323 Traffic”, Passive and Active Measurement Workshop (PAM) Proceedings published by Springer in Lecture Notes in Computer Science, 2004.
[30] ITU-T, “Recommendation J.246: Perceptual audiovisual quality measurement techniques for multimedia services over digital cable television networks in the presence of a reduced bandwidth reference”, August, 2008. Available at http://www.itu.int/rec/T-REC-J.246/en [July 2010]
[31] Elecard Video Quality Estimator. Available at http://www.elecard.com/products/products-pc/professional/video-quest/ [July 2010]
[32] NetDisturb. Available at http://www.zti-telecom.com/brochuresN/NetDisturb%20Literature.pdf [July 2010]
[33] Tim Rahrer, Riccardo Fiandra, Steven Wright. Triple-play Services Quality of Experience (QoE) Requirements and Mechanisms. DSL Forum Working Text. WT-126. Feb.2006.
[34] ITU-T Rec. G.114 (05/2003) One-way transmission time. Available at http://www1.cs.columbia.edu/~andreaf/new/documents/other/T-REC-G.114-200305.pdf [July 2010]
140
International Journal on Advances in Telecommunications, vol 3 no 3 & 4, year 2010, http://www.iariajournals.org/telecommunications/
2010, © Copyright by authors, Published under agreement with IARIA - www.iaria.org
1
User Equipment Energy Efficiency versus LTENetwork Performance
Kari Aho∗, Tero Henttonen§, Jani Puttonen∗, Lars Dalsgaard†, Tapani Ristaniemi‡∗ Magister Solutions Ltd., Hannikaisenkatu 41, FIN-40100, Jyvaskyla, Finland.
E-mail: {kari.aho, jani.puttonen}@magister.fi† Nokia, P.O.BOX 45, FIN-00045 Nokia Group, Finland
E-mail: {lars.dalsgaard}@nokia.com‡ University of Jyvaskyla, P.O. Box 35, FIN-40014, Jyvaskyla, Finland.
E-mail: {tapani.ristaniemi}@jyu.fi§ Renesas Mobile Corporation, Porkkalankatu 24, FIN-00180 Helsinki, Finland
E-mail: {tero.henttonen}@renesasmobile.com
Abstract—The purpose of this article is to analyze the trade-off conditions between battery saving opportunities at the userterminal and Long Term Evolution network performance. Toachieve the goal Voice over IP with discontinuous receptionand a vast amount of different settings, including on duration,inactivity and discontinuous reception cycle timers, have beenstudied. An adaptive discontinuous reception with synchronizingthe on duration time with the Voice over IP packet arrival hasbeen proposed to minimize the delays caused by discontinuousreception. In addition, a channel quality indicator preamble timehas been introduced to enable channel quality indicator updateprior the on duration period. The quality of service and batterysaving opportunities have been evaluated with a dynamic systemsimulator enabling detailed simulation of multiple users and cellswith realistic assumptions. It can be concluded that high batterysaving, i.e. increased talk-time opportunities, can be achievedwithout compromising the performance when discontinuous re-ception is properly adapted. Adaptive discontinuous receptionand channel quality indicator preamble can effectively mitigatethe capacity loss when more stricter DRX settings enabling higherenergy efficiency at the terminal are applied.
Keywords-DRX, VoIP, Battery savings, Energy Efficiency, Ca-pacity, CQI, Preamble, Adaptivity
I. I NTRODUCTION
High peak data rates, low round trip times and highQualityof Service (QoS)enabled by current and upcoming wirelesscellular technologies such asLong Term Evolution (LTE)[3][4] have driven the increase of wireless (data) subscribersto whole new levels. Despite of the fact that the growth isfueled by various innovative data services, the simple voicecall service and especiallyCircuit Switched (CS)voice callsstill remain as the main source of revenue for the cellularoperators. However, the situation with CS voice is startingto change: Future systems, such as LTE, support onlyPacketSwitched (PS)services meaning that voice calls would alsohave to be delivered via PS domain. Thus, this leads tosituation where voice services are offered through Voice overIP (VoIP) protocols [5]. One of the benefits of sole PS systemfrom the operator perspective is lowerCapital Expenditure(CAPEX)and Operating Expense (OPEX)due to not havingnetwork elements for both CS (voice) and PS (data).
Generally, the requirement for successful penetration of IPbased voice services, such as VoIP, is that the voice qualityshould be comparable to what is available using traditionalCS voice [6]. There are numerous factors affecting VoIP QoS,which include, e.g., delay, packet loss and packet corruption.These performance indicators are challenges especially inthewireless domain due to more unreliable transmission media.Reliability in LTE networks is addressed through severalradio resource management technologies such asHybrid ARQ(HARQ), Link Adaptation (LA), Channel Quality Indication(CQI), Packet Scheduling (PS)and shortTransmission TimeInterval (TTI)of 1 ms. The purpose of this article is to addressLTE performance together with discontinuous reception andVoIP. Discontinuous reception cycles aim to improve theenergy efficiency at the terminal by allowing possibilitiestoturn off the receiver circuitry during certain times. That kindof solutions are parallel as battery consumption at the terminalcan very well become the limiting factor in providing satisfac-tory user experience along side of the network performance.
The rest of this article is organized as follows. Section IIcovers the motivation and related studies, which are followedby description of modeling and simulation assumptions relatedaspects in Section III. After those, simulation scenario ispresented before simulation results and analysis. Conclusion ispresented in Section V and finally in the Appendix reliabilityanalysis of the used research tool and results is covered.
II. M OTIVATION AND RELATED STUDIES
Optimizing the VoIP over LTE performance in terms of QoSand the usage of radio resources has been studied in severalarticles [7][8][9]. From those it may be concluded that whilethe overall VoIP capacity may be control channel limited, thesituation can be improved effectively by utilizing either packetbundling or semi-persistent packet scheduling. However, sincethe battery life of small hand-held devices might also verywell become a limiting factor in providing satisfactory userexperience, a prominent option to prolong the battery life isto use downlinkDiscontinuous Reception (DRX)cycles inconjunction with VoIP in LTE. DRX cycles, introduced by

141
International Journal on Advances in Telecommunications, vol 3 no 3 & 4, year 2010, http://www.iariajournals.org/telecommunications/
2010, © Copyright by authors, Published under agreement with IARIA - www.iaria.org
2
Third Generation Partnership Project (3GPP)in [10] and [11],allow an idleUser Equipment (UE)(i.e. UE that is currentlynot scheduled, i.e. neither transmitting nor receiving) tosavebattery by turning off the radio receiver for a predefined period(according to predefined, network-signaled parameters). Thisproduces battery savings at the cost of somewhat reducedscheduling opportunities at theEvolved Node-B (eNB).
Discontinuous reception has previously been studied bothrelated to 3rd Generation systems as well as to LTE in severalarticles. In [12], the effects of DRX cycles and related timersto the queue lengths, packet waiting times, and the powersaving factor were studied in Rel’99 wideband code divisionmultiple access networks. The study showed quantitativelyhow to select appropriate DRX cycle values and the relatedinactivity timer for various traffic patterns. In [13] the scopeis extended to consider DRX together with delay sensitiveVoIP service over high speed downlink packet access, andthe paper indicated that there are possibilities for high powersavings but VoIP capacity can be compromised if improperparametrization is applied for DRX.
In [14] the DRX in LTE has been compared to DRX of3rd Generation networks and it is concluded that LTE DRX isable to achieve more efficient battery usage through the use ofshort and long DRX cycles. In [15] an analysis of DRX withbest-effort type of traffic over LTE networks was conducted.The paper showed with a single user simulations that a 95 %reduction of the UE power consumption with a moderate 10-20 % loss in throughput was achievable. In [16] the analysisis extended to a short DRX cycle and an inactivity timer.Both the short DRX cycle and inactivity timer aim to provideadaptibility to the variable traffic patterns. Both mechanismsimprove the performance over a pure static DRX in termsof throughput and power consumption. However, short DRXwith inactivity timer shows a gain of 0-3 times over DRXwith just an inactivity timer. In [17] the DRX in LTE hasbeen analyzed with video streaming and VoIP applications.It is concluded that DRX can save about 40-45 % of UEbattery power without significantly impacting video quality;while for VoIP applications the saving can be approximately60 %. However, the estimations are based on simple analyticalcalculations.
A part of the results in this article have earlier beenpublished in conference articles [1] and [2]. In [1] we havestudied DRX in a LTE network with high number of VoIPusers. The focus was on the impact of DRX cycles andrelated timers on the system capacity as well as on batterysaving opportunities. In [2] we proposed a CQI preamble forimproving the VoIP performance with DRX. In this article,we have extended the work presented in [1] and [2] inseveral ways. We introduce an adaptive DRX, where the onduration time and VoIP packet arrival times are synchronizedfor buffering delay minimization. The CQI preamble scheme isanalyzed with higher UE velocity where most of the CQI gainshave been lost proving that most of the loss caused by DRXarise from the usage of out-dated CQI information. Finally,astatistical confidence analysis of the used simulation toolispresented at the end.
Our focus has been to study the combination of VoIP
Fig. 1. Skeleton simulator
and DRX, since the performance degradation due to DRXis expected to be the highest with real-time delay sensitivetraffic. Secondly, most of the previous work has focused onradio resource point of view of DRX and not on the batterysaving opportunities. However, the DRX parameterization isclearly a trade-off between the capacity and battery savings.Finally, our analysis have been performed with a fully dynamicsystem simulator capturing the effects of dynamic nature ofmobility.
III. M ODELING AND SIMULATION ASSUMPTIONS
The purpose of this section is to cover briefly the modelingissues related to dynamic system simulator used in thesestudies. Previously general modeling issues are presentedbriefly in [18] and VoIP specific issues, e.g., in [7]. In thefollowing subsections the most critical aspects in terms ofthispaper are discussed.
A. Overview of the simulator
The general principle of all network simulators is quitemuch the same, where the simulation is configured throughparameters, simulations are run with certain modeling assump-tions and details and statistics are gathered e.g. by means ofaverages, cumulative distribution functions and time traces.For examples of other network simulators, see [19] and [20].
The simulator used for generating results is a fully dynamicsystem simulator, which means that the element of timepassing is considered in details: channel conditions change,users move, traffic arrives at uplink and/or downlink buffer,scheduling happens and data is sent in downlink and/oruplink. The simulator works according to step-wise simulationprinciple: at each step, actions are executed in certain orderbefore proceeding to the next step. The actions that are donedepend on which features are turned on in the simulator (e.g.DRX can be turned off fully so that no UE uses it) and onesimulation lasts for a certain number of predefined steps.
1) Simulator library: The simulator utilizes a library builtfor the purpose of enabling fast simulator development. Thelibrary is coded in C++, and contains many ready-made andtested implementations (i.e. sub-libraries) for e.g. propagation,channel, traffic and mobility models, as well as general pur-pose tools like scenario creation modules, parameter reader,random number distributions and simulation statistics collec-tion utilities. At the heart of the library, there is also a so-calledskeleton simulator: a built-in model of a simple simulator thatdynamically loads simulator modules and executes them in thedesired order. This is depicted in Fig. 1.
This kind of modularization of functionalities into stand-alone libraries enables code reuse in the future: For example,

142
International Journal on Advances in Telecommunications, vol 3 no 3 & 4, year 2010, http://www.iariajournals.org/telecommunications/
2010, © Copyright by authors, Published under agreement with IARIA - www.iaria.org
3
several simulators may use the exact same modules that dothe same basic functions of the simulators, which enableseasier comparison between such simulators. For example, [21],which shows a comparison of real network VoIP capacity forHSPA and LTE, was done with two such simulators, whichenabled an easy comparison of just the system differenceswithout a massive campaign of verification simulations ensur-ing the modeling is compatible between the simulators. Alsonew simulators can be created with small effort by taking theskeleton and adding the needed modules on top of that.
2) Simulator structure:The most important part of sim-ulator is theSignal to Interference plus Noise Ratio (SINR)calculation engine: It is abstracted so that the SINR is alwayscalculated between two radio objects (typically eNB andUE, but UE-to-UE is also possible). Since these objects alsocontain the information about the antennas, relative positionand any UE-specific information (such as UE-specific randomnumber sequences for determining the current channel con-ditions), the interference calculation can be abstracted quiteeasily. Further, there is a class calledPhysical Resource Blocks(PRB) manager that acts as an initiator for the calculationbetween the radios: Newly scheduled PRBs are inserted to thePRB manager, which then (at the end of each step) handlesthe calculation of C and I for those PRBs that currently exist.At the end of each TTI, the existing PRBs are destroyed,keeping the interference calculation machinery generic (i.e.easily maintainable and modifiable if need be) and safelyisolated from the actual scheduling decisions.
The rest of the simulator consists of inter-working betweenmodules:
• UEs and eNBs are modeled as entities with aconnec-tion object joining them together, representing the activeRadio Resource Control (RRC)connection.
• The tasks of the UE are to monitor the relevant down-link channels (i.e.Physical Control Format IndicatorChannel (PCFICH), Physical Downlink Control Channel(PDCCH), Physical Downlink Shared Channel (PDSCH)and Physical Broadcast Channel (P-BCH)) and transmitdata in uplink when triggered by protocol stack and whenscheduled to transmit.
• The UE also maintains measurements of serving cell andneighbor cells, which may trigger measurement reportaccording to eNB-configured RRC reporting configura-tion. The UE may also notice a connection failure (calledRadio Link Failure (RLF)) and take appropriate actionsafter that (see [10] for further details).
• The tasks of the eNB are to transmit downlink data toUEs when necessary, handle the scheduling for uplinkand downlink and decide on handovers for UEs.
• The connection object contains information relevant toboth UE and eNB, like scheduling assignments, UL/DLdata generation and protocol stacks handling the data. Theconnection also maintains the linking between eNB andUE, enabling an easy process when handover happens:The linked eNB is simply exchanged for another andappropriate actions done separately within the UE andsource/target eNBs, but there is no need to create/destroyall objects related to traffic models and data buffers since
these common parts are handled within the connectionobject that remains.
• In general, many algorithms (such as DRX, CQI orhandover measurements) are further separated to theirown modules as much as possible: Keeping the simulatoras object-oriented makes it relatively easy to maintain andextend.
B. VoIP Traffic
VoIP traffic is used in the simulations to model an IP basedvoice call. The traffic model used is closely based on AMRcodec, and a figure illustrating the anatomy of a VoIP call isshown in Fig. 2. For more detailed description, see below.
• A VoIP call consists of both downlink and uplink traffic.The duration of each VoIP call is randomly distributedaccording to truncated negative exponential distribution.The mean, minimum and maximum value of the distri-bution are given as parameters.
• A VoIP call can be in two states: Active or DTX.The states have different packet generation patterns andthe duration of each state is distributed according toparametrized negative exponential distribution. The rel-ative time a user spends in Active state determines theVoice Activity Factor (VAF)of the call: For example, a50 % VAF means that on average, a user spends half ofits time in Active state and half in DTX state.
• Only downlink direction is consideredin these simula-tions, but the simulator supports simultaneous traffic inuplink and downlink (e.g. synchronized so that DTX inuplink occurs when downlink is in Active and vice versa).
• During Active period, fixed-size packets (i.e. AMR voicepackets) are generated at constant intervals. In this study,VoIP packet is assumed to be 38 bytes and the interarrivaltime between packets is 20 ms [22].
• During DTX period, fixed-sizeSilence Descriptor (SID)packets, used for generating comfort noise, are transmit-ted at constant intervals. In this study, the SID packetsize is assumed to be 14 bytes and the SID packets aregenerated at 160 ms intervals.
• Robust Header Compression (ROHC)is not modeledexplicitly but ideal ROHC is assumed by taken it intoaccount in packet sizes.
• The characteristics of a VoIP call are fully parametrized,and can be varied between the simulations. It is alsopossible to have a mix of different types VoIP calls inthe same simulation.
The traffic model described above is the same as describedin [22], but could also be further enhanced by considering e.gthe effect of explicit ROHC or jitter in packet arrival (i.e.the
Fig. 2. Voice over IP traffic model

143
International Journal on Advances in Telecommunications, vol 3 no 3 & 4, year 2010, http://www.iariajournals.org/telecommunications/
2010, © Copyright by authors, Published under agreement with IARIA - www.iaria.org
4
Fig. 3. De-coupled TD/FD-scheduler
packet arrival would not always be constant but could varya little. However, in this paper, we concentrate on the basicmodel, to better account the basic interactions between DRXand VoIP.
C. Scheduling and Resource Allocation
In this study, we assume dynamic resource allocation forVoIP over LTE, i.e. we model a scheduler in the eNB thattakes care of physical resource allocations for users. EachTTI,the eNB sends the scheduling allocations for users connectedto the eNB inPhysical Downlink Control Channel (PDCCH),and UEs read the scheduling assignments and act accordingly(i.e. do nothing, transmit on uplink or receive in downlink).Since the scheduler is fully up to eNB implementation, thereis no clear default behavior how the scheduling is done, buttypically the scheduler assigns resources based based on eachuser’s channel conditions: each user sends aChannel QualityIndication (CQI) report to eNB either at periodic intervals orwhen requested by the eNB.
Thus, the scheduler could vary the resource allocation ofeach user on a TTI basis. But this kind of fully dynamicscheduling of VoIP packets requires high amount of PDCCHresources, since each allocation for a UE consumes controlchannel resources each time it is signaled. Moreover, thescheduling assignments can be coded separately, i.e. theymay consume different amount of resources depending on theselected coding scheme, so the limited availability of PDCCHresources also results in a varying amount UEs that can bescheduled per TTI. However, in general in this study we areassuming static amount of users (i.e.,Maximum SchedulableUsers (MSU)) that can scheduled per TTI, i.e., PDCCH is notexplicitly modeled. Exclusion of explicit PDCCH modeling isdone to better account the basic interactions between DRXand VoIP. The MSU value was chosen by estimating theaverage PDCCH capacity, though. Still, the impact of realisticPDCCH following modeling aspects from [23] and simulationprinciples from [24] are briefly addressed in this paper.
The scheduler used in these simulations has been a de-coupledTime Domain (TD)-Frequency Domain (FD)sched-uler, presented in [18] and depicted in Fig. 3. This means thatthe scheduling is done in two stages: First, a TD-schedulerselects the candidates for the scheduling (up to MSU users).
Next, a FD-scheduler chooses which resources (i.e.PhysicalResource Blocks (PRBs) to assign to which candidate. Afterthis, the scheduling allocations are sent to the users. Note, thatif PDCCH is explicitly modeled, then MSU in TD scheduleris not limiting the amount of scheduling candidates, but thePDCCH resource check is done in between TD and FDschedulers.
Scheduling decisions done in TD-scheduler are based onHead-of-Line (HoL)packet delay, i.e., the user with the oldestpacket in the buffer (i.e. the packet with the largest delay)isselected first in order to prioritize users who have the worst-delayed packets. In FD-scheduler, the candidates from TD-scheduler are treated in the order of delay: The first candidateis allocated the best PRBs based on CQI information sent bythat user, and then the same is done for the next candidateand so on. The PRBs are assigned until it is deemed thatthe user gets enough PRBs to empty its data buffer1 orthere are no more PRBs available or the maximum limit ofallocated PRBs for one user is reached. Finally, it should benoted that both HARQ retransmissions and control message(e.g. handover command in downlink, measurement reportin uplink) transmissions are prioritized by TD- and FD-schedulers since these types of traffic are considered criticalfor the call.
D. Performance Evaluation Criteria
While the simulation enables a wide variety of possiblestatistics, here we present the simulation results throughacomparison ofQuality of Service (QoS) criterionandBatterySaving Opportunities (BSO).
1) The QoS Criterion: The QoS criterion, also calledsystem capacitylater in this paper, is defined as a combinationof user and celloutage levels: A user is in outage if too manyof its packets are dropped or have large enough delay, and acell is in outage if too many of its users are in outage. Moreprecisely,
• A cell is in outage if more than 5 % of its users are inoutage.
• A single user is in outage if 2 % or more of the packets(monitored over the whole call) are not received correctlywithin 50 ms (one-way) time.
Note 1: In addition to monitoring delay at the receiving end,packets can also be discarded at the transmitting sideif the delay of the packets in the buffer reach thediscard delay threshold.
Note 2: The 50 ms delay limit is called the radio networkDelay Budget, and is based on ITU e-Model re-quirements for good quality voice [25] as well as toslightly stricter benchmarking requirements ofNextGeneration Mobile Networks (NGMN)and 3GPPevaluations [26] for VoIP.
Since it is very difficult (and not even realistic) to achieveexactly the same load in each cell even within one simulation,the overall system capacity is interpolated from a large setof
1With some additional limitations: In this paper one user may be assignedresources so that it is able to send up to a maximum of two packetsduringone TTI. This is calledpacket bundling

144
International Journal on Advances in Telecommunications, vol 3 no 3 & 4, year 2010, http://www.iariajournals.org/telecommunications/
2010, © Copyright by authors, Published under agreement with IARIA - www.iaria.org
5
Fig. 4. Power Consumption Reference Model
simulated user amounts per cell (which lead different outagelevels / cell). The target level for this interpolation is levelwhere at most 5 % of users would be in outage, which is theabsolute upper limit according to the QoS criterion describedabove.
2) Battery Saving Opportunity:The BSO is presented asthe time a user spends in DRX state, i.e. the time during whichthe UE can be in reduced state of activity. The battery savingopportunities are calculated according to model presentedin3GPP contribution R2-071285 [27] and illustrated in Figure4. Power consumption levels are calculated with and withoutDRX from which the relative power savings are finally calcu-lated. In the power calculations one TTI is assumed to be thetime used to receive one transmission. Time spent in activestate, deep sleep and light sleep are collected for each calland the total ’Active with data Rx’, illustrated in Figure 4,iscalculated for each call in a following manner:
Rxactive = (NV oIPPackets +NSIDPackets)× Txmean, (1)
where Txmean is the average number of transmissions,NV oIPPackets and NSIDPackets represent the total numberof VoIP/SID packets per call.NV oIPPackets andNSIDPackets
are defined as follows:
NPackets = (tcall × µ)/tIA. (2)
In Equation 2µ represents the voice activity factor,tcall thetotal length of the call andtIA interarrival time for packets(SID or VoIP).
E. Discontinuous Reception (DRX)
The discontinuous reception (DRX) feature was introducedto LTE as a network-configured feature (meaning it can be alsoturned off) that provides improved battery saving opportunitiesfor the UE. DRX is specified at MAC level (see [11]), but is
Fig. 5. Diagram of DRX operation
turned on by eNB by RRC (see [28]) signaling when eNBtransmits the DRX parameters to the UE.
DRX consists of a cycle of alternating active period (calledOn Duration in MAC specification), during which UE func-tions just as without DRX, and an inactive period (also referredas DRX period), during which UE is not mandated to receivePDCCH (which means any scheduling assignment during thattime would be lost so in practice eNB will not schedule theUE during that time) and can save power by turning off itsreceiver hardware. A set of timers, illustrated in Figure 5 andcovered below, further control the operation of DRX cycle:
1) DRX Cycle Timer:specifies the periodic repetition ofthe on duration (active) time, which is followed by a possibleperiod of inactivity time.
2) On Duration Timer (ODT): represents the minimumtime in Downlink (DL) subframes that the UE is required tomonitor the PDCCH at each DRX Cycle.
3) Inactivity Timer (IAT): specifies the number of con-secutive subframes that UE shall stay active and monitorPDCCHs. Timer is (re-)started every time when the UE isscheduled and successfully decodes a PDCCH indicating newdata transmission.
4) HARQ Round Trip Time (RTT):specifies the minimumamount of subframes before a DL HARQ re-transmission isexpected by the UE. UE can enter to inactivity during RTT ifnot otherwise required to monitor the PDCCH.
5) Retransmission Timer (RTxT):specifies the maximumnumber of consecutive subframe(s) that UE waits for incomingretransmission after HARQ RTT. UE is not allowed to enterinactivity while retransmission timer is running in order tobe able to receive the HARQ transmissions. However, whenHARQ transmissions are prioritized, as the case is in thisstudy, the retransmission timer does not have substantialimpact. RTxT is stopped when retransmission is received.
F. CQI preamble concept
According to 3GPP specifications ([10], [11], [28]) UE onlyhas to do measurements once during a DRX cycle, whichmeans that the UE will typically do measurements (CQI orother) only during the active period. However, performingthe measurements, processing and transmitting them and eNBreceiving the measurements consumes time, so the activetime may have passed before up-to-date CQI information isavailable in the e-Node B scheduler. Moreover, the lack ofup-to-date information can lead to lowered performance. Thisprocedure is illustrated in Fig. 6.
Fig. 6. Example of CQI measurement procedure with normal DRX.Assuming total CQI delay 3, on duration 2 and DRX cycle 7 TTIs

145
International Journal on Advances in Telecommunications, vol 3 no 3 & 4, year 2010, http://www.iariajournals.org/telecommunications/
2010, © Copyright by authors, Published under agreement with IARIA - www.iaria.org
6
Fig. 7. Example of CQI measurement procedure with CQI preamble.Assuming total CQI delay 3, on duration 2 and DRX cycle 7 TTIs
To avoid possible performance loss, this paper considers aso-called CQI preamble scheme as a potential enhancementfor the CQI measurement operation described above. With theCQI-preamble scheme, a CQI preamble time is applied beforethe actual on duration time takes place. During preamble timethe UE turns its receiver circuitry on to perform and reportthe CQI measurements in addition to other possibleRadioResource Management (RRM)measurements. Naturally, whenperforming the measurements, the normal requirements, suchas CQI measurement granularity and the CQI measurementperiod (i.e. minimum time since previous measurement), stillapply. With the preamble scheme UEs could be scheduledwith up-to-date CQI information for any potential DL datatransmission as Fig. 7 illustrates. The downside of this oper-ation is increased activity time, which leads to higher powerconsumption and shorter talk time from the UE/user point ofview.
The current 3GPP specifications already allow this kind ofimproved operation. UE is allowed to do CQI measurements(and fall back to inactivity) before actual on duration. Though,according to [11] UE is not allowed to send the CQI reporton PUCCH before the active time / on duration begins. Thus,from the UE side, CQI Tx part of the preamble scheme wouldbe achieved through slightly prolonged on duration to allowthe transmission. Changes could, however, be needed for thee-Node B scheduling: eNB should consider the time when thelast CQI report has been received from a UE that has its onduration started / ongoing. Once CQI report is received duringpreamble time or within CQI requirements (e.g., period) UEbecomes schedulable, not before. Also, changes could alsopossibly be needed in eNB implementation for evaluatingand indicating the length of CQI preamble time for DRXpurposes. CQI preamble time consists of the time before CQIis measured, transmitted, received and processed. In this paperpreamble length is estimated to be as long as the total sum ofCQI delay (defined through parameters) and the time that ittakes to measure the CQI (1 TTI). Moreover, UEs are assumedto be active throughout the preamble time to better understandthe ’worst-case’ scenario.
G. Adaptive DRX
As described above, DRX operates in predefined cyclesof active and inactive states. Moreover, different UEs can(and should) be allocated with slightly different offset fromwhich their cycle timers start so that even amount of candidateset for scheduling remains balanced in the downlink. Thatis handled by eNB, which signals the DRX configurations
Fig. 8. Example of possible problems without adaptive DRX
Fig. 9. Simulation scenario
to each UE. However, if the offset setting and timers areconfigured ’blindly’, i.e. without considering the expectedpacket arrival times, possible problems could occur especiallyfor delay critical services such as VoIP. Fig. 8 illustratesthis through simple example: Blind offset setting can leadto situation where a single VoIP packet can have additionaldelay of 18 ms, which, in the context of the typical 50 msdelay budget, means that almost 40 % of the delay budget isalready consumed before the first transmission, thus reducingthe time for possible retransmissions.
To mitigate the negative effects of offset setting this papershows that DRX offset could be adapted to the data flow tim-ing. In terms of the example presented in Fig. 8 it would meanthat instead of having the DRX cycle starting 2 TTIs before thepacket generation (blind setting) the DRX would be adapted tostart during the time when packets are generated. This couldbe achieved in real networks, e.g., by monitoring the data flowsome time before configuring the DRX. Even though there canbe some jitter for the packets in real networks, on average theadapted offset would not cause as high additional delays asthe blind offset would in the worst case.
IV. SIMULATION SCENARIO AND RESULTSANALYSIS
Simulations were run in a hexagonal macro cellular scenariowith three tiers, see Fig. 9. Scenario consists of 7 active basestations withInter Site Distance (ISD)of 500 m. Each basestation has 3 sectors resulting into layout containing 21 activecells. Statistics are collected from 6 middle cells. Third,i.e.,the outer tier is simulated as interfering tier, which adapts tothe load of the statistic cells. Users are not allowed to moveto the third tier but only within two inner tiers. The mainsimulation parameters are shortly listed in Table I.
In the following subsections the performance of VoIP overLTE downlink is analyzed with respect to system capacity andpower saving opportunity criteria covered in Section III-D.The analysis for the trade-off between increased talk-timeopportunities and LTE performance is based on vast amount

146
International Journal on Advances in Telecommunications, vol 3 no 3 & 4, year 2010, http://www.iariajournals.org/telecommunications/
2010, © Copyright by authors, Published under agreement with IARIA - www.iaria.org
7
TABLE ISIMULATION PARAMETERS.
Simulation time 1 million stepsTime resolution 1 step, i.e., 0.0714 mse-Node B Max. Tx power 46 dBmTransmission TimeInterval (TTI) 1 msPathloss model Modified
Okumura-Hata [29]Channel profile Typical Urban (TU)UE velocity [3, 30] kmphHandover Hard, 3 dB thresholdMSU [8, PDCCH]CQI resolution 2 PRBs per CQI (fullband)CQI delay 2 msCQI measurement period 5 msVoIP packet size 38 bytes [22]VoIP packet 20 msinterarrival timeSID packet size 14 bytesSID packet 160 msinterarrival timeVoIP call length Negative exponential
distribution,truncated, mean 20 s
min 5 smax 60 s
Activity / Silence Negative exponentialperiod length distribution,
mean 2.0 sLayer 3 packet 50 msdiscard thresholdMax. VoIP packet delay 50 msHARQ transmissions (max.) 7HARQ RTT 8 TTIsRetransmission Timer 10 TTIsOn duration timer [1, 2, 3, 4] TTIsInactivity timer [2, 10, 20] TTIsDRX cycle timer [10, 20, 40] TTIs
of different DRX adjustments and enhancements, includingon duration, inactivity and DRX cycle timers as well as CQIpreamble scheme and adaptive DRX.
A. On Duration Timer Impact
Figure 10 shows the impact of on duration timers (fixedinactivity timer of 2 TTIs) to the LTE downlink performancein terms of maximum number of VoIP users that can be servedper cell with acceptable QoS. The power saving opportunitiesfor those cases are illustrated in Figure 11, respectively.Asthose Figures show, with DRX cycle timer 10 TTIs the onduration results in significant power saving opportunitieswithonly minor impacts on DL capacity, providing that the timervalue is higher than one TTI. Similar trend can be seen with20 TTI cycle with the exception that the LTE performancenumbers are lower than with 10 TTI but at the same timethe power saving opportunities are higher (75-90 % versus55-80 %). The reason behind the poor performance when theon duration is one TTI is that the scheduling opportunitiesare very scarce and with high probability there will be manyusers competing of that scheduling slot. Competition resultsinto missed scheduling opportunities, which again leads tohighly increased queuing delays for VoIP packets due to DRXcycles. Increased queuing delays lead to increased amount ofdiscarded packets already at the transmitting end and thus
Cycle 10 TTIs Cycle 20 TTIs Cycle 40 TTIs150
200
250
300
350
Cap
acity
per
cel
l
VoIP DL Capacity, On duration timers
No DRXOn duration 1 TTIsOn duration 2 TTIsOn duration 3 TTIsOn duration 4 TTIs
Fig. 10. VoIP DL capacity, ODTs, IAT 2 TTIs
Cycle 10 TTIs Cycle 20 TTIs Cycle 40 TTIs0
0.1
0.2
0.3
0.4
0.5
0.6
0.7
0.8
0.9
1
Pow
er c
onsu
mpt
ion
ratio
DL Power saving opportunities, on duration timers
No DRXOn duration 1 TTIsOn duration 2 TTIsOn duration 3 TTIsOn duration 4 TTIs
Fig. 11. DL power saving opportunities, ODTs, IAT 2 TTIs
to poor performance also from the system level perspective.Similar phenomena is seen and emphasized when the cyclelength is very long. However, long cycles could possibly betaken into use when the cell is not fully loaded, assuming thatDRX adapts to the different system loads.
B. Inactivity Timer Impact
The trade-off between VoIP DL capacity and DL powersaving opportunities when inactivity timer is also varied on topof on duration and DRX cycle timers is shown in Figure 12and 13. When compared to on duration timer results presentedabove the longer inactivity timer does not provide much highercapacity improvements, especially with cycles 10 and 20 TTIs.Power saving opportunities are also much lower when longerinactivity timer is used. With cycle 40 TTIs the inactivitytimer can provide benefits as the cycle is so long that userswill have multiple packets to be transmitted once they becomeactive from DRX. Thus, longer inactivity timer allows userstodeplete their packet buffers and possibly transmit new packetsarriving their buffers while the inactivity timer is running.However, this combined effect of prolonged inactivity and on

147
International Journal on Advances in Telecommunications, vol 3 no 3 & 4, year 2010, http://www.iariajournals.org/telecommunications/
2010, © Copyright by authors, Published under agreement with IARIA - www.iaria.org
8
Cycle 10 TTIs Cycle 20 TTIs Cycle 40 TTIs150
200
250
300
350
Cap
acity
per
cel
l
VoIP DL Capacity
No DRXIAT 2 TTIs, ODT 2 TTIsIAT 2 TTIs, ODT 3 TTIsIAT 10 TTIs, ODT 2 TTIsIAT 10 TTIs, ODT 3 TTIsIAT 20 TTIs, ODT 2 TTIsIAT 20 TTIs, ODT 3 TTIs
Fig. 12. VoIP DL capacity with different IATs and ODTs
Cycle 10 TTIs Cycle 20 TTIs Cycle 40 TTIs0
0.1
0.2
0.3
0.4
0.5
0.6
0.7
0.8
0.9
1
Pow
er c
onsu
mpt
ion
ratio
DL Power saving opportunities
No DRXIAT 2 TTIs, ODT 2 TTIsIAT 2 TTIs, ODT 3 TTIsIAT 10 TTIs, ODT 2 TTIsIAT 10 TTIs, ODT 3 TTIsIAT 20 TTIs, ODT 2 TTIsIAT 20 TTIs, ODT 3 TTIs
Fig. 13. DL power saving opportunities with different IATs and ODTs
duration timer together with long cycle cannot reach signifi-cantly difference in power savings to justify the compromisein the system capacity. More optimal trade-off point can beachieved with timer settings described above.
C. DRX Performance with Realistic PDCCH
To further verify the trends presented above the performanceof DRX is studied with realistic PDCCH modeling. Thismeans that PDCCH resources can be exhausted even with afew users and PDCCH transmission can be erroneous leadingto varying amount of users that can be scheduled per TTI.Previously presented results assumed fixed number of usersthat can be scheduled per TTI (MSU).
The performance of DRX with different activity timersand realistic PDCCH is illustrated in Figure 14 and 15. Asthe capacity Figure shows the absolute capacity numbers areon lower level, which indicates that the averaged number ofschedulable users per TTI is actually a bit lower than the onethat was assumed in this study as a basis (MSU 8). Apart fromthe absolute numbers the performance follows the same trendspresented without detailed PDCCH modeling.
Cycle 10 TTIs Cycle 20 TTIs Cycle 40 TTIs150
200
250
300
350
Cap
acity
per
cel
l
VoIP DL Capacity
No DRXOn duration 1 TTIsOn duration 2 TTIsOn duration 3 TTIsOn duration 4 TTIs
Fig. 14. VoIP DL capacity, realistic PDCCH
Cycle 10 TTIs Cycle 20 TTIs Cycle 40 TTIs0
0.1
0.2
0.3
0.4
0.5
0.6
0.7
0.8
0.9
1
Pow
er c
onsu
mpt
ion
ratio
VoIP capacity vs. Power saving, Max bundled PDUs 2, Inactivity timer 2 TTI
No DRXOn duration 1 TTIsOn duration 2 TTIsOn duration 3 TTIsOn duration 4 TTIs
Fig. 15. DL power saving opportunities, realistic PDCCH
D. Performance with CQI Preamble
DRX and CQI preamble scheme (see Section III-F) perfor-mance in terms of VoIP capacity and power saving opportu-nities are illustrated in Figs. 16 and 17, respectively. In thosefigures three types of DRX scenarios are presented in additionto ’no DRX’ case:
• Ideal CQI, which equals to the case where CQI is updatedregardless of the DRX and power savings are unaffected.In reality this would not be possible but it is consideredas a reference to benchmark the performance.
• Normal DRX, which equals to the case where normalDRX settings are used and thus CQI is updated only whenUE is active.
• Preamble 3, which equals to the proposed scheme whereUE wakes up before the actual on duration time toperform the measurements and to send them to e-NodeB. Preamble length of 3 TTIs is assumed for this study.
When normal DRX operation is compared to the case withideal CQI feedback (or no DRX case) it can be seen thatthe VoIP capacity is rather sensitive to the up-to-date CQIinformation availability. With cycle length of 20 TTIs thedifference between those is around 15 % and with cycle of

148
International Journal on Advances in Telecommunications, vol 3 no 3 & 4, year 2010, http://www.iariajournals.org/telecommunications/
2010, © Copyright by authors, Published under agreement with IARIA - www.iaria.org
9
Cycle 10 TTIs Cycle 20 TTIs Cycle 40 TTIs0
50
100
150
200
250
300
350VoIP DL capacity
Cap
acity
per
cel
l
no DRXIdeal CQI, On duration 2 TTIsIdeal CQI, On duration 3 TTIsCQI Preamble 3 TTIs, On duration 2 TTIsnormal DRX, On duration 2 TTIsnormal DRX, On duration 3 TTIsnormal DRX, On duration 4 TTIs
Fig. 16. VoIP DL capacity with and without DRX preamble, 3 kmph
Cycle 10 TTIs Cycle 20 TTIs Cycle 40 TTIs0
0.1
0.2
0.3
0.4
0.5
0.6
0.7
0.8
0.9
1DL Power saving opportunities
Pow
er c
onsu
mpt
ion
ratio
no DRXIdeal CQI, On duration 2 TTIsIdeal CQI, On duration 3 TTIsCQI Preamble 3 TTIs, On duration 2 TTIsnormal DRX, On duration 2 TTIsnormal DRX, On duration 3 TTIsnormal DRX, On duration 4 TTIs
Fig. 17. DL power saving opportunities with and without DRX preamble,3 kmph
40 TTIs even more. Moreover, as it can be seen from Fig. 16,mere increase of on duration time might not be adequate asUE can be scheduled at any point during that time, likely withoutdated CQI information. This implies that some mechanismto guarantee newer CQI information for scheduling should beconsidered, CQI preamble scheme for instance.
When CQI preamble scheme is benchmarked against normalDRX cycle of 10 TTIs with different activity timer valuesit can be seen from Fig. 16 that preambles do not provideextra value as the capacity is not compromised with so shortcycle. However, even though (normal) DRX cycle of 10 TTIsimplies roughly 30-45 % power consumption versus ’no DRX’the higher cycles imply possibilities for even higher powersavings, as Fig. 17 shows. Thus, more focus should be paidon longer cycles, which could guarantee longer UE talk times.
With CQI preamble scheme and longer cycles of 20 oreven 40 TTIs the deterioration in terms of VoIP capacity withDRX can be mitigated quite well. The gain from preamblescheme over normal DRX becomes higher when the DRXcycle length is longer, which is quite intuitive as then theCQI information available in the scheduler is older (without
Cycle 10 TTIs Cycle 20 TTIs0
20
40
60
80
100
120
140
160
Cap
acity
per
Cel
l
VoIP DL Capacity
No DRXNormal DRX, on duration 2 TTIsIdeal CQI, on duration 2 TTIs
Fig. 18. VoIP DL capacity with and without ideal CQI, 30 kmph
preambles). Preamble scheme can even outperform ’ideal CQI’case in some situations due to preamble scheme forcing theperiodic CQI measurements being synchronized with datatransmissions. With ’ideal CQI’ the periodic reporting happensevery 5 ms regardless of the data flow / DRX.
In terms of downlink power saving opportunities the per-formance of CQI preamble scheme is expectedly lower thanwith normal DRX operation, as Fig. 17 implies. However, asthe performance in terms of system capacity is much morerobust against potential losses, the loss in battery savings withpreambles can be considered as acceptable to guarantee moresatisfactory service provision. Moreover, this paper evaluatedonly the scheme where UE stays active for the whole durationof preamble time but in principle after the UE has performedthe measurements the UE could fall back to inactivity beforeactual on duration. By turning receiver circuitry off duringthose periods higher battery savings could be expected.
Finally, the findings and conclusions from CQI impact withDRX are confirmed in Fig. 18 where VoIP performance withall users moving with higher velocity is illustrated. As [30]indicates and this study confirms with higher UE velocity thefrequency selectivity gain of CQI is lost to most extent andthus no additional gain could be achieved even with ’idealCQI’.
E. Performance with Adaptive DRX
Finally, the purpose of this section is to cover how adaptiveDRX presented in Section III-G affects to the performance.Figs. 19 and 20 illustrate the performance in capacity andpower consumption ratio, respectively. As the capacity figureshows, adaptive DRX can provide noticeable gains, especiallywith longer cycles than 10 TTIs where practically no lossesare seen if on duration is long enough. In terms of batterysavings the adaptive DRX leads to slight increase in batteryconsumption. This due to the fact that blind offset setting couldfurther induce the packet bundling and reduce the amount ofretransmissions due to increased delays and thus reduce thetime needed to keep receiver circuitry active.

149
International Journal on Advances in Telecommunications, vol 3 no 3 & 4, year 2010, http://www.iariajournals.org/telecommunications/
2010, © Copyright by authors, Published under agreement with IARIA - www.iaria.org
10
Fig. 19. VoIP DL capacity, adaptive DRX
Fig. 20. DL power saving opportunities, adaptive DRX
V. CONCLUSION
The purpose of this article was to evaluate the trade-offconditions between energy efficiency at the user terminal andLTE performance. That goal is achieved by studying VoIPover LTE with various DRX related timers, which limit thescheduling freedom of users while increasing battery savingopportunities at the terminal. Increased power saving oppor-tunities lead to increased talk-times for the terminals andthusmore satisfactory user experience. The study was conductedwith dynamic system simulator modeling LTE network withhigh level of detail.
This article indicates that for dynamic and PDCCH con-trolled scheduling, short DRX cycle timers together withappropriate on-duration timer is an attractive choice for LTEenergy efficiency: Substantial power saving opportunitiesareachievable with minor trade-off in terms of maximum VoIPover LTE DL capacity. Regardless, this article also points outthat in lower load situations different (more stricter) DRXadjustments could be used as then the capacity might not becompromised and the power savings would be higher. Thisarticle also shows that prolonging inactivity timer togetherwith on duration and DRX cycle timers does not justify the
TABLE IICONFIDENCE INTERVALS FOR INTERPOLATEDVOIP CAPACITY
Capacity [UEs/cell]
MEAN 260.305STANDARD DEVIATION 3.85448CONFIDENCE INTERVAL, 90 % ± 0.44 %CONFIDENCE INTERVAL, 95 % ± 0.52 %CONFIDENCE INTERVAL, 99 % ± 0.69 %
slightly increased performance (capacity) as the trade-off inbattery saving opportunities is too high.
VoIP performance in terms of capacity may, however, bereduced by some extent if sub-optimal DRX settings arechosen. One main reason for reduced performance, especiallywith long cycles, is linked to outdated CQI information.CQI preamble scheme, introduced in this paper, mitigates thereduced performance quite well in terms of VoIP capacitywhen dynamic user scheduling is assumed. Moreover, theimprovements can be achieved with acceptable trade-off interms of battery saving opportunities.
Finally, this study introduces concept where DRX (offset)would adapt the data flow. The result show significant im-provement in terms of capacity in situations where blind DRXconfiguration show losses. Moreover, adaptive DRX bringsonly minor impact to the power consumption ratio.
VI. A CKNOWLEDGMENTS
This study is a collaborative work between Magister So-lutions Ltd., University of Jyvaskyla, Nokia, Nokia WirelessModem Research (nowadays a part of Renesas Mobile Corpo-ration) and Nokia Siemens Networks. The authors would liketo thank all of their co-workers and colleagues for their com-ments and support. Finally, special thanks go to Hannu-HeikkiPuupponen from University of Jyvaskyla for his contributionson providing confidence analysis results.
APPENDIX
Research tool used in this study was presented brieflyabove. This appendix is aimed to deepen the presentation byproviding statistical confidence analysis for the used systemlevel tool.
Statistical analysis is based on evaluating the performancewith a few selected test cases, namely VoIP simulationswith different random number generator seeds. Based on theseed all random generators are initialized, these include e.g.starting position and direction of the movement for the UEs.Even though, all of the simulation results depend on randomprocesses, the results are reproducible with certain levelofaccuracy, which is defined in this appendix.
An interval estimation can be used to define a confidenceinterval, which means that the sampleφ, is within a definedinterval with a certain probability. This probability can beexpressed as follows
P (a ≤ φ ≤ b) = 1− α (3)
where the interval[a, b] is a(1−α)×100% confidence intervalof φ. A probability that theφ is not within the interval is

150
International Journal on Advances in Telecommunications, vol 3 no 3 & 4, year 2010, http://www.iariajournals.org/telecommunications/
2010, © Copyright by authors, Published under agreement with IARIA - www.iaria.org
11
α. When the number of samplesn is ≤ 30 the standardizednormal distribution,N(0, 1), can be used to define confidentialinterval, which is
(x− zα/2 × s/√n, x+ zα/2 × s/
√n). (4)
In Eq. 4 thex is the average value,zα/2 is the critical valuetaken from the standardized normal distributionN(0, 1), s isthe standard deviation andn is the number of samples i.e. inthis case the number of simulation runs.
The simulation environment used for confidence analysis isthe same macro cellular layout used for DRX studies. Mainparameters are as well similar to the simulations presentedabove with the exception that dynamic scheduling MSU isassumed to be 6. This is done so that simulations take PDCCHrestrictions better into account.
Confidence intervals are calculated for radio system capacityi.e. at the point where 5 % VoIP users are in outage. Capacityis interpolated from different cell loads i.e. from anotheronewhere the system outage level is below 5 % and another whereit is above that. Thus, the required simulation amounts forconfidence analysis equal two timesn = 31.
The results for dynamic LTE system level tool are shownin Table II. As that table shows the difference even with thehighest confidence interval are very minor. Thus, this givesthe confidence that the results produced with the tool for thisstudy are also well within the required level of reliabilityandreproducibility.
REFERENCES
[1] K. Aho, T. Henttonen, J. Puttonen, and T. Ristaniemi, “Trade-Offbetween Increased Talk-Time and LTE Performance,” inProceedingsof International Conference on Networks (ICN), April 2010.
[2] K. Aho, T. Henttonen, J. Puttonen, and L. Dalsgaard, “Channel QualityIndicator Preamble for Discontinuous Reception,” inProceedings ofIEEE Vehicular Technology Conference (VTC’S10), May 2010.
[3] H. Ekstrom and A. Furuskar and J. Karlsson and M. Meyer and S.Parkvall and J. Torsner and M. Wahlqvist, “Technical Solutions for the3G Long Term Evolution,”IEEE Communications Magazine, vol. 44,pp. 38–45, March 2006.
[4] A. Toskala, H. Holma, K. Pajukoski, and E. Tiirola, “UTRANLongTerm Evolution in 3GPP,” inProceedings of IEEE International Sympo-sium on Personal, Indoor and Mobile Radio Communications (PIMRC),September 2006.
[5] F. Persson, “Voice over IP Realized for the 3GPP Long TermEvolution,”in Proceedings of IEEE Vehicular Technology Conference (VTC’F07),September 2007.
[6] Requirements for Evolved UTRA (E-UTRA) and Evolved UTRAN (E-UTRAN), 3GPP TR 35.913, Rev. v9.0.0, December 2009.
[7] J. Puttonen, T. Henttonen, N. Kolehmainen, K. Aschan, M. Moisio, andP. Kela, “Voice-over-IP Performance in UTRA Long Term EvolutionDownlink,” in Proceedings of IEEE Vehicular Technology Conference(VTC’S08), May 2008.
[8] Y. Fan, P. Lunden, M. Kuusela, and M. Valkama, “Performanceof VoIPon EUTRA Downlink with Limited Channel Feedback,” inProceed-ings of International Symposium on Wireless CommunicationSystems(ISWCS’08), October 2008.
[9] D. Jiang, H. Wang, E. Malkamki, and E. Tuomaala, “PrincipleandPerformance of Semi-Persistent Scheduling for VoIP in LTE System,” inProceedings of International Conference on Wireless Communications,Networking and Mobile Computing (WiCom’07), September 2007, pp.2861–2864.
[10] Evolved Universal Terrestrial Radio Access (E-UTRA) and EvolvedUniversal Terrestrial Radio Access Network (E-UTRAN); Overall de-scription; Stage 2, 3GPP TS 36.300, Rev. v9.3.0, March 2010.
[11] Evolved Universal Terrestrial Radio Access (E-UTRA) Medium AccessControl (MAC) protocol specification, 3GPP TS 36.321, Rev. v9.2.0,March 2010.
[12] S.-R. Yang and Y.-B. Lin, “Modeling UMTS DiscontinuousReceptionMechanism,” inIEEE Transactions on Wireless Communications, vol. 4,January 2005, pp. 312–319.
[13] K. Aho and I. Repo and T. Nihtila and T. Ristaniemi, “Analysis ofVoIP over HSDPA Performance with Discontinuous Reception Cycles,”in Proceedings of International Conference on Information Technology(ITNG), April 2009.
[14] L. Zhou, H. Xu, H. Tian, Y. Gao, L. Du, and L. Chen, “PerformanceAnalysis of Power Saving Mechanism with Adjustable DRX Cycles in3GPP LTE,” inProceedings of IEEE Vehicular Technology Conference(VTC’F08), September 2008.
[15] T. Kolding, J. Wigard, and L. Dalsgaard, “Balancing Power Saving andSingle User Experience with Discontinuous Reception in LTE,” in Pro-ceedings of IEEE International Symposium on Wireless CommunicationSystems 2008 (ISWCS’08), October 2008.
[16] J. Wigard, T. Kolding, L. Dalsgaard, and C. Coletti, “Onthe UserPerformance of LTE UE Power Savings Schemes with DiscontinuousReception in LTE,” inProceedings of IEEE International Conferenceon Communications (ICC’09), June 2009.
[17] C. Bontu and E. Illidge, “DRX Mechanism for Power Savingin LTE,”IEEE Communications Magazine, vol. 47, pp. 48–55, June 2009.
[18] P. Kela, J. Puttonen, N. Kolehmainen, T. Ristaniemi, T. Henttonen, andM. Moisio, “Dynamic Packet Scheduling Performance in UTRA LongTerm Evolution Downlink,” inProceedings of International Symposiumon Wireless Pervasive Computing (ISWPC), May 2008.
[19] D. Bultmann and M. Muhleisen and K. Klagges, “openWNS - openWireless Network Simulator,” inProceedings of the European Wireless,May 2009.
[20] J. C. Ikuno, M. Wrulich, and M. Rupp, “System Level Simulation of LTENetworks,” inProceedings of the IEEE Vehicular Technology Conference(VTC’S10), May 2010.
[21] K. Aho, I. Repo, J. Puttonen, T. Henttonen, M. Moisio, J.Kurjenniemi,and K. Chang, “Benchmarking of VoIP over HSDPA and LTE Per-formance with Realistic Network Data,” inProceedings of the IEEEInternational Symposium on Wireless Pervasive Computing (ISWPC),May 2010.
[22] R. Cuny and A. Lakaniemi, “VoIP in 3G Networks: An End-to-End Quality of Service Analysis,” inProceedings of IEEE VehicularTechnology Conference (VTC’S03), Jeju Island, Korea, April 2003.
[23] D. Lopez, C. U. Castellanos, I. Z. Kovacs, F. Frederiksen, and K. I.Pedersen, “Performance of Downlink UTRAN LTE Under ControlChannel Constraints,” inProceedings of IEEE Vehicular TechnologyConference (VTC’S08), May 2008.
[24] J. Puttonen, H.-H. Puupponen, K. Aho, T. Henttonen, andM. Moisio,“Impact of Control Channel Limitations on the LTE VoIP Capacity,”in Proceedings of the International Conference on Networks (ICN’10),April 2010.
[25] One-way transmission time, ITU recommendation G.114, 2003.[26] “LTE Physical Layer Framework for Performance Verification,” 3GPP
TSG RAN WG1 LTE contribution R1-070674, February 2007.[27] “DRX Parameters in LTE,” 3GPP TSG RAN WG2 LTE contribution
R2-071285, March 2007.[28] Evolved Universal Terrestrial Radio Access (E-UTRA) RadioResource
Control (RRC) protocol specification, 3GPP TS 36.331, Rev. v9.1.0,December 2009.
[29] Selection procedures for the choice of radio technologies of theUMTS, Universal Mobile Telecommunications System (UMTS 30.03)TR 101.112, Rev. v3.1.0, November 1997.
[30] N. Kolehmainen, J. Puttonen, P. Kela, T. Ristaniemi, T. Henttonen, andM. Moisio, “Channel Quality Indication Reporting Schemes for UTRANLong Term Evolution Downlink,” inProceedings of IEEE VehicularTechnology Conference (VTC’S08), May 2008.

151
International Journal on Advances in Telecommunications, vol 3 no 3 & 4, year 2010, http://www.iariajournals.org/telecommunications/
2010, © Copyright by authors, Published under agreement with IARIA - www.iaria.org
12
Kari Aho received his M.Sc., L.Sc. and Ph.D.degrees in information technology in the field ofmobile telecommunications from the University ofJyvaskyla in 2006, 2009 and 2010, respectively.His Master’s, Licentiate and Ph.D. thesis focusedon various third generation cellular network perfor-mance enhancements, which were addressed mainlythrough VoIP and MBMS services. Currently he isworking as project manager at Magister Solutions inthe area of future HSPA evolution. Current researchinterests are VoIP performance, uplink transmit di-
versity and downlink multipoint transmission and reception issues.
Tero Henttonen received his M.Sc. degree in ap-plied mathematics from the University of Helsinkiin 2001. His master’s thesis focused on compressedmode effects in WCDMA. He is currently workingas Principal Researcher at Renesas Mobile Corpora-tion, with research areas related to 3GPP Long TermEvolution; especially on mobility performance andheterogeneous networks. Current research interestsinclude mobility in LTE-A and in heterogeneousnetworks.
Jani Puttonen received his M.Sc. and Ph.D. degreein information technology in the field of telecommu-nications from the University of Jyvaskyla in 2003and 2006, respectively. His Ph.D. thesis focused onIP level mobility management in heterogeneous net-works. He is currently working as a Senior ResearchScientist at Magister Solutions with research areasrelated to 3GPP Long Term Evolution; especiallyRAN features and performance. Current researchinterests are Minimization of Drive Tests and SelfOrganizing/Optimizing Networks.
Lars Dalsgaard received his M.Sc. degree inTelecommunications from Aalborg University in1995. His master’s thesis focused on applyingOFDM multicarrier transmission within GSM. Heis currently working as a senior specialist at NokiaDevices within work areas related to 3GPP LongTerm Evolution with special focus on UE perfor-mance, power consumption and mobility. Currentinterests include mobility and Carrier aggregationwithin LTE-A, mobility in general including 3GPPinter-system and heterogeneous network.
Tapani Ristaniemi was born in Kauhava, Finland,in 1971. He received the M.Sc. in mathematicsin 1995, Ph.Lic. in applied mathematics in 1997,and Ph.D. in telecommunications in 2000 from theUniversity of Jyvaskyla, Jyvaskyla, Finland. During2001-2003 he was a professor of telecommunica-tions at the Department of Mathematical Informa-tion Technology, University of Jyvaskyla, and 2003-2006 a professor of wireless data communications,Institute of Communications Engineering, TampereUniversity of Technology, Finland. In 2006 he joined
the University of Jyvaskyla, where he holds a professorship of computerscience. His research interests include signal processingfor communications,biosignal processing and system engineering for wireless communications.

152
International Journal on Advances in Telecommunications, vol 3 no 3 & 4, year 2010, http://www.iariajournals.org/telecommunications/
2010, © Copyright by authors, Published under agreement with IARIA - www.iaria.org
Universal Ground Control Station for Heterogeneous Sensors
Axel Bürkle, Florian Segor, Matthias Kollmann, Rainer Schönbein Fraunhofer Institute of Optronics, System Technologies and Image Exploitation IOSB
Karlsruhe, Germany {axel.buerkle, florian.segor, matthias.kollmann, rainer.schoenbein}@iosb.fraunhofer.de
Abstract—Today, a wide range of sensors and mobile systems – both aerial and ground-based – are available for surveillance and reconnaissance tasks. For example, they provide first responders with current information about the situation at the operation site. In many cases those systems have their own dedicated control and exploitation station. The joint control of heterogeneous sensors and platforms, as well as the exploitation and fusion of heterogeneous data is a challenge. The surveillance system AMFIS presented in this paper is an integration platform that can be used to interconnect system components and algorithms. The specific tasks that can be performed using AMFIS include surveillance of scenes and paths, detection, localization and identification of people and vehicles as well as collection of evidence. The major advantages of this ground control station are its capability to display and fuse data from multiple sensor sources and the high flexibility of the software framework to build a variety of surveillance applications.
Keywords - ground control station; sensors; unmanned aerial vehicles; security; surveillance; disaster management
I. INTRODUCTION
This paper presents a generic surveillance system and its control station called AMFIS. AMFIS is a component based modular construction kit currently under development as a research prototype. It has already served as the basis for developing specific products in the military and homeland security market. Applications have been demonstrated in exercises for the European Union under the PASR program (Preparatory Action for Security Research), German Armed Forces, and the defense industry. The tasks that have to be supported by such products are complex and involve among other tasks, control of sensors, mobile platforms and coordination with a control center.
The surveillance system AMFIS [1] is an adaptable modular system for managing mobile as well as stationary sensors. The main task of this ground control station is to work as an ergonomic user interface and a data integration hub between multiple sensors mounted on light UAVs (unmanned aerial vehicles) or UGVs (unmanned ground vehicles), stationary platforms (network cameras), ad hoc networked sensors, and a superordinated control center.
The AMFIS system is mobile and portable, allowing it to be deployed and operated anywhere with relative ease. It can supplement existing stationary surveillance systems or act as a surveillance system on its own if no preexisting
infrastructure is available. The sensor carriers in this multi-sensor system can be combined in a number of different setups in order to meet a variety of specific requirements. At present, the system supports optical sensors (infra-red and visible) and alarms (PIR, acoustic, visual motion detection). There are plans to add support for chemical sensors in the future.
AMFIS has established standardized interfaces and protocols to integrate and control different kinds of sensors. This “plug and sense” approach allows the seamless integration of new sensors with a minimal effort. If necessary, all sensor data is automatically converted by dedicated services to a format usable by the ground control station.
After a short survey of related work an overview of the application scenarios is presented, followed by a detailed description of the apparatus in Section IV. Sections V and VI outline selected services and introduce a commercial flight platform modified to reach a higher level of autonomy and extending the ground control station presented in Section IV. Finally, in Section VII some first practical results are shown.
II. STATE OF THE ART
To the best of our knowledge, the combination of heterogeneous sensors and sensor platforms (ground, air, water) in an open homogeneous system allowing the fusion of various sensor data to generate a complex situation picture is quite a unique project. The integration of different sensors into one system has already been realized in previous systems but mainly in order to create specialized individual solutions tailored to individual customer requirements. Many projects deal with the development of supervision systems, new sensor platforms or control of sensors. The combination of these innovative supervision and reconnaissance attempts to one modular system has not yet been done.
Systems similar to AMFIS are the ground stations of the French company Aerodrones [2] and the American company AII [3], both developed as stand-alone control stations for multiple airborne drones. Another example is the product of the US company Defense Technologies [4], which focuses on military standardized interfaces to control different sensor platforms on the ground, in the air and in the water.
In contrast to AMFIS, Aerodrones and AII deal exclusively with airborne sensor platforms. Defense Technologies does not commit itself in the kind of used sensor platforms and is therefore more similar to AMFIS.

153
International Journal on Advances in Telecommunications, vol 3 no 3 & 4, year 2010, http://www.iariajournals.org/telecommunications/
2010, © Copyright by authors, Published under agreement with IARIA - www.iaria.org
AII and Defense Technologies are concentrating on military solutions while AMFIS is mainly intended for civil applications.
III. APPLICATION SCENARIOS
The security feeling of our society has significantly changed during the past years. Besides the risks arising from natural disasters, there are dangers in connection with criminal or terroristic activities, traffic accidents or accidents in industrial environments.
Even though a lot of effort is put into protecting threatened or vulnerable infrastructure, most threats cannot be foreseen in their temporal and local occurrence, so that stationary in situ security and supervision systems are not present. Such ad hoc scenarios require quick situation-related action.
Possible scenarios that deal with these specifications are the supervision of big events or convoys for security reasons, natural and man-made disasters such as earthquakes or major fire control but also intrusion of unauthorized persons into sites and buildings, e.g., to take hostages or place explosives.
Especially in the civil domain, in case of big incidents there is a need for a better data basis to support the rescue forces in decision making. The search for buried people after a building collapses or the clarification and location of fires at big factories or chemical plants are possible scenarios addressed by our system. Only in the minority of cases the rescue forces can rely on an already available sensor infrastructure at the incident site. If there were sensors available, there is a significant chance they will be destroyed or at least partially corrupted. A transportable sensor system to be used remotely at the site of the event is proposed to close this gap.
The micro UAVs used in AMFIS can deliver a highly up-to-date situation picture from the air during a conflagration in a chemical factory or a similar scenario. Ground robots can enter the building in parallel to the fire-fighting work and penetrate areas, which are not yet accessible for the fire fighter and search for injured people or unknown sources of fire without endangering human life. Additionally, the mobile sensor platforms can be complemented by stationary systems. These can be temperature sensors for the fire aftercare or the measuring of the fire development and expansion or vibration and motion sensors to use in a collapsed building. These sensors can be used to prevent or at least to warn of any further structural changes in a collapsed building by detecting vibration and movement in the debris. The UAVs or ground robots can also act as platforms to deploy sensors at points of interest.
Besides the system’s capability of ad hoc deployment during disasters or accidents, AMFIS can also be used as a versatile protection and supervision system. Premises or vulnerable infrastructures can be monitored with all types of sensors and actuators. Equipping the perimeter with motion detectors and cameras is a typical setup. In addition, mobile ground robots can patrol the area and respond to events. Other tasks that can arise are the detection of danger potential, the supervision of scenes and ways or the
localization, tracking and identification of people and vehicles.
When several sensor systems and platforms are used in a complex scenario at the same time, conventional control systems designed as single use- and controlling-systems quickly reach their limits. First of all, every subsystem needs its own console and a specially trained operator due to the fact that each system has its own interface. Secondly the fusion and synchronized filing of sensor and status data from different systems is not an easy task.
The control of the individual sensors and platforms from the situation center is hardly practicable on account of the complexity, delay in the data transfer and distance to the place of action (often several kilometers).
As a connection between the sensors and the situation center an authority directly on the site of the event is necessary, which processes the reconnaissance missions independently. That includes steering sensor platforms, controlling sensors as well as filtering and densification of sensor data so that only information relevant for decisions like situation reports, alarms and critical video sequences are transmitted in an appropriate way to the situation center.
An analysis of the demands in complex scenarios incorporating micro UAVs has shown that at least two operators are necessary on the ground control station to deal with the requirements and problems arising from such a scenario. One operator is exclusively responsible for the control and supervision of the mobile sensor platforms. The second operator looks after the evaluation of the sensor data streams and the communication with the situation center.
According to a recent Frost & Sulivan report [5] micro UAVs are already used in vast and diverse civil applications. Some of the tasks that can be supported with UAVs in general include but are not limited to: enhancing agricultural practices, police surveillance, pollution control, environment monitoring, fighting fires, inspecting dams, pipelines or electric lines, video surveillance, motion picture film work, cross border and harbor patrol, light cargo transportation, natural disaster inspection, search and rescue, and mine detection.
Figure 1. A team of micro UAVs
Obviously some of these tasks are not suitable for single
micro UAVs due to their limited operating range and payload. With groups or swarms of micro UAVs (Figure 1) it is possible to realize scenarios that are inefficient or even not

154
International Journal on Advances in Telecommunications, vol 3 no 3 & 4, year 2010, http://www.iariajournals.org/telecommunications/
2010, © Copyright by authors, Published under agreement with IARIA - www.iaria.org
feasible with a single micro drone. Some situations where cooperating MAVs (micro aerial vehicles) add value include:
• A wider area has to be searched. A team of MAVs can increase coverage and reduce the time required.
• A UAV loses connection to the ground control station because it moved too far or the signals are blocked by an obstacle. In a group of UAVs, one of them can be “parked” in reach of the ground control station and act as relay station.
• Several intruders enter the site. They later split up, each taking different directions. A single drone would have to decide, which person to follow, while a swarm of UAVs can form subgroups and track each intruder individually.
• The duration of surveillance exceeds battery life time. In a team, assignments can be planned accordingly and another UAV can take over the task of an out-of-battery drone.
• A threat has to be monitored with different sensor types. For example, an intruder who is tracked visually suddenly places an object. Besides the visual sensor some CBRNE (chemical, biological, radiological, nuclear, and explosive) detection devices are needed. Since the payload of a single quadrocopter is very limited, a swarm could carry different sensors.
• Multi-sensor capability can also be used to visually control the action of different drones. For example an infrared sensor equipped UAV could be employed by the operator located at the ground control station to navigate a chemical sensor equipped micro UAV through a dark building.
These use cases illustrate that there is a need for the
coordinated use of micro UAVs. The combination with other sensor platforms, such as UGVs (unmanned ground vehicles) or stationary sensors, adds further value to the system.
IV. SYSTEM OVERVIEW
In order to be adaptable to a wide range of different requirements and applications, AMFIS was developed as a mobile and generic system, which delivers an extensive situation picture in complex surroundings - even with the lack of stationary security technology. In order to achieve maximum flexibility, the system is implemented open and mostly generalized so that different stationary and mobile sensors and sensor platforms can be integrated easily with minimal effort (Figure 2), establishing interoperability with existing assets in a coalition such as UAVs.
The system is modular and can be scaled arbitrarily or be adapted by choosing the modules suitable to the specific requirements. Because of the open interfaces, the accumulated data can be delivered on a real-time basis to foreign systems (e.g., command and control systems or exploitation stations, cf. Figure 3).
The AMFIS system can be divided into a mobile ground control station, which can control and coordinate different
UAVs, land vehicles or vessels (sensor platforms), as well as stationary autonomous ad hoc sensor networks and video cameras. Depending on the used sensors and sensor platforms, the system is extended with suitable broadcasting systems for the transmission of the control signals and the sensor data (e.g., video recordings.)
Figure 2. The AMFIS ground control station serves as integration
platform for various sensors and vehicles
By the universal approach, the system is able to link with a wide range of sensors and can be equipped with electric-optical or infrared cameras, with movement dispatch riders, acoustic, chemical or radiation sensors depending on the operational aim. If supported or even provided by the manufacturer, these sensors can be mounted on mobile sensor platforms or be installed in fixed positions. The only requirement such sensors have to fulfill in a mobile scenario is that they work properly without the need for any pre-existing infrastructure.
Figure 3. AMFIS interfaces
The AMFIS system is scalable and can be extended to
any number of workstations. Due to this fact several sensor platforms can be coordinated and controlled at the same time. The most different sensor platforms can be handled in a similar manner by a standardized pilot's working station that in turn minimizes the training expenditure of the staff and raises the operational safety. The user interface is

155
International Journal on Advances in Telecommunications, vol 3 no 3 & 4, year 2010, http://www.iariajournals.org/telecommunications/
2010, © Copyright by authors, Published under agreement with IARIA - www.iaria.org
automatically adapted according to the sensor or sensor platform at hand by using standardized descriptions.
Data fusion is one of the most important tasks of a multi sensor system. Without merging the data from different sensors the use of such a system is very limited. Linking data of sensors that complement each other can generate an entire situation picture.
All information gathered during the operation is immediately available to the crew of the ground control station, in which a GIS-supported, dynamic situation picture plays a central role. At the same time all received data is archived and stored into databases, e.g., a CSD (Coalition Shared Data) [6] or SSD (SOBCAH Shared Data) [7]. This serves the perpetuation of evidence and allows an additional subsequent analysis of the events.
Figure 4. The AMFIS ground control station and its user interface The open interface concept supports the integration of
AMFIS in existing security systems so that data can be exchanged on a real-time basis with other guidance, supervision or evaluation systems. Mission planning, manual and automatic vehicle guidance, sensor control, local and temporal linking (coalescence) of sensor data, the coordination of the people on duty, reporting and the communication with the leading headquarters in the situation center belongs to the other tasks of a reconnaissance system.
Combination of sensor events and appropriate actions are implemented by predefined rules with an easy to use production system for situation specific adaptations.
A. User Interface
The user interface of the AMFIS ground control station at Fraunhofer IOSB consists of three workstations (Figure 4). Basically, the system is designed such that each display can be used to interact with each function allocated by AMFIS. The standard setup consists of two workstations with one operator each, and one situation awareness display in between that supports both operators. The duties of the two operators can be divided into sensor and vehicle control, called pilot working place, and data fusion, archiving, exploitation and coordination tasks.
The user interface of the latter working place primarily provides a function for the visualization of sensor data streams. Therefore the operator gains access to the accumulated data. His task is to obtain and keep an overview
of the situation and to inform the higher authorities about important discoveries. He provides the associated data so that external systems or personnel can utilize that information. It is incumbent on him to mark important data amounts and to add additional information when necessary. Furthermore, he is the link to the pilot and coordinates and supports the pilot in his work. The analyst as well as the pilot relies on the central geographical information system-supported situation representation that provides an overview of the whole local situation. The geographical relation is established here and the situation and position of the sensors and sensor platforms can be visualized. This includes for example, the footprints of cameras or the position and heading of UAVs or UGVs.
The pilot's workstation is designed to control many different sensor platforms. It is not clear from the start, which sensor platforms will be used in the future and it is also not clear, which situation information will be provided by the different systems, or which information is needed to control the future platforms in a proper way. For this purpose the pilot workstation provides a completely adaptable user interface, which allows selectively activating or deactivating the required displays. For example, an artificial horizon is completely useless in order to control a stationary swiveling camera but very helpful for controlling an airborne drone. The surface can be adapted to the particular circumstances and is configurable for a wide range of standard applications. No matter what sensor platform the user is currently controlling or supervising, the task is the same. He does not have to switch between different proprietary control stations. The user interface is identical except for individual volitional or necessary adaptations.
B. System and Software Architecture
The physical sensors and sensor carriers are mapped logically to the so-called sensor web. This is a tree structure describing the real-world entities: The root node, the sensor web itself, connects to different sensor networks, each representing a number of similar sensor carriers, for example a team of UAVs. Each of those sensor networks is made up of one or more sensor nodes, equal to a physical sensor carrier (e.g., a single UAV), which in turn contain numerous sensors (e.g., camera, GPS receiver, etc.). The sensor web is permanently stored in a database, from which an XML file is generated at runtime by the central message hub of the AMFIS ground control station, the Connector.
The standard communications protocol within AMFIS is based on XML messages transported via TCP socket. To ease the use of this protocol, implementations exist in various runtime environments (e.g., .NET, Java), encapsulating the XML-handling and offering the user an object-oriented view of the messages. When a client application connects to the Connector, it first receives the aforementioned XML-version of the sensor web followed by a steady stream of XML messages, each containing metadata (e.g., sensor values, commands, etc.) originating from or destined to one of the sensors in the sensor web.
A client application can be anything from a GUI application to a low-level service:

156
International Journal on Advances in Telecommunications, vol 3 no 3 & 4, year 2010, http://www.iariajournals.org/telecommunications/
2010, © Copyright by authors, Published under agreement with IARIA - www.iaria.org
• The various GUI applications of the user interface, most importantly the analyst’s interface, the situation overview and the pilot’s interface. Those applications offer a visual representation of received metadata to the user, for example by displaying the current geographical locations of the various sensor carriers in the map, and transmit commands to the sensor carriers, for example a user-generated waypoint for a UAV.
• A number of services running in background, notably the video server, offering time shifting and archiving for both video and metadata (more on video management within AMFIS see below), the rules engine, the flight path planning tool and the multi-agent system, all supporting the user by automating certain processes (see Section V).
• Drivers for various sensor carriers, for example a dedicated control software for UAVs, which translates high-level flight commands like waypoints into the proprietary RS232-based control protocol of the respective drone, and in turn generates metadata XML status messages containing the current position, heading, remaining flight time etc.
• Interfaces to third-party applications or networks, for example superior command centers.
The current implementation of the communication
protocol is strictly multicast-based: Every message sent to the Connector is relayed to every connected client application, leaving it to the respective application to decide what to do with it. For future versions, a subscription-based model is planned.
The protocol relies on lower-level protocols such as TCP to ensure delivery of the messages. Since most of the messages contain live status data, they are transferred in a fire-and-forget manner, thus eliminating possible race conditions within the Connector.
While all metadata – be it sensor values, commands or user-generated textual comments – is transmitted via XML, the extensive amount of video data accumulated by the various cameras has to be processed and stored by other means. A central application within AMFIS is the video server, which receives and records all available network video streams along with incoming XML messages. Since the analyst’s interface heavily relies on the capability to go back in time and review critical situations, the video server serves the dual purpose of both recording the video streams for later archival as well as providing time shifting-enabled streams to other clients. If required the video server can store (and later play back) the accumulated data using a standard MySQL database.
In order to interface with third-party systems, it can become necessary to transcode available data into another format. Upon request, the video server can spawn a so-called transcoder process, multiplexing video and metadata into a single stream to be transmitted to a remote command center. To receive incoming commands from a command center, an XMPP client (Extensible Messaging and Presence Protocol,
formerly Jabber [8][9]) has been implemented, which seamlessly integrates into the AMFIS ground control station.
Figure 5 shows a logical representation of the AMFIS system.
Sensor Node
(e.g. UAV)
Sensor
(e.g. Voltmeter)
Sensor
(e.g. GPS
Receiver)
Sensor
(e.g. Camera)
Sensor Node
(e.g. Stationary
PTZ Camera)
Sensor
(e.g. Camera)
Sensor
(e.g. Heading
Sensor)
Analyst Interface
(GUI Application)
Video Server
(Service)
Pilot Interface
(GUI Application)
Database
Archiving
Dedicated
Sensor Carrier
Control Software
(Driver)
Situation
Overview
(GUI Application)
Plugin-Based Sensor
Carrier Control
Software
Vid
eo D
ata
(live
)Playback
Interface to External
Command Center
(Interface)
Video & Metadata
(Non-AMFIS Format)
Video/
Metadata
Multiplexer
AMFIS ConnectorM
etad
ata
(Com
man
ds /
Sta
tus Dat
a)
Up-
/ Dow
nlin
k
(Pro
prie
tary
CO
TS F
orm
at)
Rule Engine /
Multi-Agent
System / ...
(Service)
Metadata
(Commands / Status Data)
Figure 5. AMFIS system overview
V. AMFIS SERVICES
In addition to being an integration platform, AMFIS offers a number of support services related to surveillance and reconnaissance tasks. Those services facilitate resource planning, sensor and vehicle coordination, sensor data exploitation, and training. Three of these services, i.e., rule-based event response, photo flight and simulation, are described in the following paragraphs.
A. Rule-Based Event Response
This service is a support system for the automatic combination and selection of sensor data sources in a surveillance task. Autonomous reactions, e.g., responding to an intrusion alert triggered by a motion detector, are very important during a surveillance scenario. Therefore a solution was developed, which grants users an easy, powerful and versatile platform for defining reactions.
The implementation is universal so that the support system can be adapted to several scenarios at different

157
International Journal on Advances in Telecommunications, vol 3 no 3 & 4, year 2010, http://www.iariajournals.org/telecommunications/
2010, © Copyright by authors, Published under agreement with IARIA - www.iaria.org
individual sites. This is accomplished by the use of rule sets, which are created site and task specific. These rules contain work flows which are pushed if a certain predefined event occurs. Thus, for example, a watchman can be automatically informed or a UAV can be sent off for reconnaissance of a defined area without any user interaction.
The support component in AMFIS is implemented with the Drools rules engine [10] using production rules for representing procedural task knowledge. The engine uses the Rete algorithm, which repeatedly assesses the current situation and selects the rules to execute. Drools is open source and contains a well developed rule language.
The rule language is based on the when-then schema (Figure 6). Additionally, Boolean logic, methods of compiled Java source code and their return values can be used.
rule “rule” when sensor triggers alarm <additional preconditions> then camera turns to sensor position drone flies to sensor position end
Figure 6. Layout of a rule The integration of the rule-based event response
application into the AMFIS system is depicted in Figure 7.
AMFIS
AmfisCom
Controller
Rule Engine
Sensors Cameras UAVs
fetches data and executes actions
creates and updates data structures
Rules Priorities
describe actions
dependent on data
determine which
actors react
AMFIS
Connector
Figure 7. Integration of a rule engine
The rule engine uses AmfisCom, a communication
library for interfacing the AMFIS Connector (cf. Section IV.B) to establish a connection to the Connector Service, the message hub of AMFIS, and receives data. Data structures containing e.g., positions and IDs of sensors, cameras and UAVs are created and updated with the received data. When there is an alarm message it can be assigned to its corresponding sensor through the unique ID. After this initialization phase the rule interpretation starts. When a rule becomes applicable messages are sent to the corresponding assets (cameras, UAVs, etc) to change their positions accordingly. Furthermore, every camera has a priority list of
targets. Before the message is sent, this list is evaluated. Only if the new target has at least the same priority as the current target, the camera pans to the new target.
Additionally, a tool providing a graphical user interface has been developed. It facilitates the definition of rules and the creation of priority lists for cameras. The rules can be assembled by clicking and saved as XML file. These files are editable by the user at any time. Furthermore, the rule engine can import these files and convert the content into the specific rule language.
B. Photo flight
The photo flight service assists the operator in obtaining an up-to-date situation picture of a site. One or more UAVs with camera payloads fly to defined waypoints and capture high resolution still images. These images are later combined to a mosaic. The photo flight service manages the available assets (i.e., UAVs and payloads) and automatically calculates flight paths based on a user-defined area of interest.
In the flight path planning tool, the user can define any polygonal shape on the map. He then selects one or more UAVs from a list of available drones, which is distributed by the AMFIS Connector. The Connector provides the necessary information about all drones and their current payloads. For each selected UAV the user is requested to enter some variable parameters like desired photo flight height or safety height. The safety height parameter is an additional safety feature that defines individual cruising heights in order to prevent collisions between UAVs.
After that, the operator can start the photo flight or add/remove additional drones to/from the list. Once all necessary information has been entered correctly and the “Calculate” button is clicked, the planning algorithm starts and shows the resulting flight path on the map (Figure 8).
Figure 8. GUI of the flight path planning service
Additionally, the flight path planning service offers the
possibility to export the calculated waypoints in an AMFIS specific file format or upload the points directly to the respective UAV using the Connector.

158
International Journal on Advances in Telecommunications, vol 3 no 3 & 4, year 2010, http://www.iariajournals.org/telecommunications/
2010, © Copyright by authors, Published under agreement with IARIA - www.iaria.org
C. Simulation
In order to assess different cooperation strategies for teams of UAVs and other assets, a simulation tool has been developed. The tool is also useful when it comes to training and briefing of the operators. Modeling and visualization of scenarios was done using a computer game engine with corresponding editing tools. An interface between AMFIS and the engine has been implemented. It allows full control of the virtual entities as well as feedback from the virtual world. The simulation tool is fully integrated into the AMFIS ground control station allowing seamless combination of virtual and real assets. Virtual vehicles can be monitored and controlled analogous to real assets through the AMFIS situation map, whereas real UAVs can be displayed in the virtual world next to simulated components.
Figure 9. The AMFIS simulation component
An example scenario that simulates an intrusion has been
realized (Figure 9). Besides the UAVs and the actors in the scenario, sensors have also been modeled. Different kinds of sensors such as motion detectors, cameras, ultra sonic or LIDAR (light detection and ranging) sensors can be modeled with their specific characteristics. The simulation tool can determine if an object lies within the range of a sensor. This helps evaluate and optimize the use of different sensing techniques.
The intelligence of team members is implemented in software agents as described in Section VI.C. They interface with the simulation engine using the same control command interface as the actual quadrocopters. This subsequently can allow the simulation to be transferred to the real world without changes to the agents.
VI. AUTONOMOUS SENSOR PLATTFORMS
AMFIS as an open and generic system supports the simultaneous operation of a large number of sensors and sensor platforms. While the handling of single platforms is already well understood, control and coordination of several mobile platforms can be a challenging task.
For this purpose one of the research focuses lies on the improvement of the application of multiple miniature UAVs.
Our approach is to increase the level of autonomy of each drone. Therefore a vast amount of effort has been put into the selection of the flight platform. Such a platform preferably comes with a range of sensors and an advanced internal control system with autonomous flight features, which minimizes the regulation need from outside. When it comes to flying autonomously, the system has to be highly reliable and possess sophisticated safety features in case of malfunction or unexpected events.
Figure 10. Sensor platform AirRobot 100-B
Other essential prerequisites are the possibility to add
new sensors and payloads and the ability to interface with the UAV’s control system in order to allow autonomous flight. A platform that fulfils these requirements is the quadrocopter AR100-B by AirRobot. It can be both controlled from the ground control station through a command uplink and by its payload through a serial interface.
A. UAV Control Hardware
To support the pilot at his work at the ground control station and to give him the possibility to supervise multiple flying sensor platforms at the same time, several steps are necessary. The first step is to enhance the hardware in order to reach a higher level of autonomy. Therefore, a payload was developed, which carries a processing unit that can take over control and thereby steer the quadrocopter.
Due to space, weight and power constraints of the payload, this module has to be small, lightweight and energy-efficient. On the other hand, a camera as a sensor system should not be omitted. An elegant solution is the use of a “smart” camera, i.e., a camera that not only captures images but also processes them. Processing power and functionalities of modern smart cameras are comparable to those of a PC. Even though smart cameras became more compact in recent years, they are still too heavy to be carried by a quadrocopter such as the AR100-B. In most applications, smart cameras remain stationary whereby their weight is of minor importance. However, a few models are available as board cameras, i.e., without casing and the usual plugs and sockets (Figure 11). Thus, their size and weight are reduced to a minimum. The camera that was chosen has a freely programmable DSP, a real-time operating system and several interfaces (Ethernet, I²C, RS232). With its weight of only 60g (without the lens), its compact size and a power consumption of 2.4W, it is suitable to replace the standard video camera payload.

159
International Journal on Advances in Telecommunications, vol 3 no 3 & 4, year 2010, http://www.iariajournals.org/telecommunications/
2010, © Copyright by authors, Published under agreement with IARIA - www.iaria.org
Figure 11. A programmable camera module controls the UAV
The camera can directly communicate with the drone’s
controller though a serial interface. The camera receives and processes status information from the UAV such as position, altitude or battery power, and is able to control it by sending basic control commands or GPS-based waypoints.
A drawback of the board camera is its lack of an analogue video output thus rendering the quadrocopter’s built-in video downlink useless. Image data is only available through the camera’s Ethernet interface. To enable communication between the smart camera and the ground control station, a tiny WiFi module was integrated into the payload. The WiFi communication link allows streaming of live video images, still shots and status information from the UAV to the ground control station. Furthermore, programs can be rapidly uploaded to the camera during operation.
Currently, the above enhanced UAVs are able to perform basic maneuvers, such as take-off, fly to position, and landing, all autonomously. Furthermore, a software module was implemented, that calculates the footprint of the camera, i.e., the geographic co-ordinates of the current field of view. In the future we will also use the camera’s image processing capabilities to generate control information. As a safety feature, it is always possible for the operator to override autonomous control and take over control manually.
B. Communication Infrastructure
For a single UAV communication usually consists of two dedicated channels, an uplink channel for control commands and a downlink channel for video and status information. In present UAVs, each of these channels has its own communication technique in a special frequency band. In complex scenarios that require multiple UAVs there has to be twice as many RF channels as UAVs used. These channels are all point-to-point connections, which, if at all, see the other UAVs only as interferer. There is no channel between two UAVs; all communication goes via the base station.
Besides this direct control of UAVs, there is a more abstract way, which can use the benefits of an intelligent payload. The group of UAVs receives complex tasks, which they will fulfill autonomously. This kind of control however brings the standard system with up- and downlink to its limits because it poses demands, which cannot be fulfilled with the standard communication:
• No interference between communication of multiple UAVs (ideally: use of multihopping)
• Adding UAVs to the swarm must not require a new RF channel
• Opening of data channels to transmit the results to the base-station
• Opening of control channels to transmit any kind of commands to the UAV
• Sending broadcast messages to all UAVs • Opening direct communication channels between
UAVs In addition to the new demands, the standard
requirements for UAVs still must maintain the following: • Monitor the status of every UAV in the air • Manual control of every UAV as fallback function To fulfill these needs the (video-) downlink is replaced
by a module capable of using networking communications. In our prototype we use a WiFi module because of its high data rates and good range, though other technologies might be feasible too. The UAV’s uplink channel is retained as fallback control option in case of an emergency.
With the WiFi network, we implemented a communication solution that meets the demands listed above. This solution differentiates between UAV and base-station, i.e., the ground control station. There is only one base-station within the network. A base-station monitors the status of every UAV assigned to it. It also acts as gateway to other system components.
Our communication setup uses four types of channels (cf. Figure 12):
• Broadcast channel a channel, which offers random access to every subscriber in the network
• Control channel a dedicated channel between a UAV and the base-station to transmit status information from the UAV and to receive commands from the base-station
• Data channel a dedicated channel between UAV and the base-station to send results of task i.e., images
• Co-op channel this channel is opened between two UAVs if one of them needs assistance to finish a task
Figure 12. Communication channels between UAVs and the ground
control station

160
International Journal on Advances in Telecommunications, vol 3 no 3 & 4, year 2010, http://www.iariajournals.org/telecommunications/
2010, © Copyright by authors, Published under agreement with IARIA - www.iaria.org
1) Broadcast channel The broadcast channel is mainly used for initializing the
other channels. If a UAV is not assigned to a base-station it will look for a base-station on this channel. Also if a UAV needs assistance to finish a job, e.g., when its battery runs low or it needs a UAV with another sensor, the UAV calls for assistance on this channel. Through the broadcast channel it is possible to reach all UAVs with a single message. If a UAV, for example, detects an obstacle it can inform all other UAVs in the group. Another main feature of this channel is communicating new tasks. When this task is transmitted to the whole group instead of a single UAV, the decision regarding which UAV best fits the needs for this task can be done by the group.
2) Control channel The control channel is a dedicated channel between a
UAV and a base-station. Over this channel a UAV sends its status as well as an “Alive” Message. These data make it possible to monitor the UAVs in the base-station. The second feature of this channel is a command uplink to the UAV. It can be used to transmit tasks as well as to configure the UAV. Reconfiguring can be done by changing internal parameters of the UAV or by uploading new software modules.
3) Data channel The data channel sends results (usually video images) to
the base-station. The format of the data has to be predefined.
4) Co-op channel The co-op channel is opened between two UAVs, if
necessary. If the UAV has a task, which cannot be done on its own, it seeks a wingman over the broadcast channel. If there is an idle UAV, which can assist, a co-op channel is opened between the two drones. Over this channel the UAV has the possibility to send subtasks to the wingman. After completion, it receives the results over the co-op channel.
Replacing the standard downlink with a networking
module is a big step towards autonomy of each UAV. With this adaptive communication solution it is possible to set up an expandable network of UAVs. The implemented channels provide communication links between all subscribers in the net.
C. UAV Control Software
The second step to reaching a higher level of autonomy is based on the development of a multi-agent system to implement team collaboration. An agent-based framework is implemented where the individual entities in a team of UAVs are represented by software agents. The agents implement the properties and logic of their physical counterparts. Their behavior defines the reaction to influences in the environment, such as alarms generated by sensors in the AMFIS network.
An agent is “...any entity that can be viewed as perceiving its environment through sensors and acting upon its environment through effectors” [11]. Incorporating that
“An agent is a computer system, situated in some environment that is capable of flexible autonomous action in order to meet its design objectives” [12], a multi-agent system appears to perfectly meet the challenges of realizing an intelligent swarm of autonomous UAVs.
Software agents are computational systems that inhabit some complex dynamic environment, which sense and act autonomously in this environment, and by doing so, realize a set of goals or tasks, for which they are designed [13]. Hence, they meet the major requirements for a suitable architectural framework: to support the integration and cooperation of autonomous, context-aware entities in a complex environment.
The agent-based approach allows a natural system modeling approach facilitating the integration of flight platforms, sensors, actuators and services. The core-agents of the multi-agent system presented in this paper are based on the following three agent classes:
• Action Listener: This agent has two basic tasks: connecting the agent system to the AMFIS ground control station and managing the different Teamleader Agents (see below). The Action Listener receives messages from the AMFIS Connector and sends corresponding commands or data to the relevant Teamleader Agents. Through the Action Listener, the operator can directly task a UAV, bypassing the agents’ logic.
• Teamleader Agent: A team leader agent controls a group of agents consisting of at least one other agent. It co-ordinates higher tasks and assigns sub-tasks to team members, for examples areas they have to monitor. A team leader is always aware of the positions and capabilities of all team members. A team leader itself can be controlled by a superordinate team leader.
• Universal Agent: This agent represents a single UAV. Every drone must be assigned to a team leader. The Universal Agent manages all basic behaviors and data of the UAV it represents. Basic behaviors are for example the direct flight to a waypoint and receiving and handling messages from the team leader.
UAVs in a team can be equipped with different payloads, for example cameras or gas sensors. Therefore, specific agents exist, such as Video Agents and Sensor Agents, which inherit the basic behaviors from the Universal Agent. Additionally, they also have their own specific behaviors. By this separation in universal and specific agents, adaptations of the general behavior or the specific behavior can be made very efficiently, i.e., only one agent has to be modified. For example, if we want to change the behavior to fly to a waypoint we only have to do that in the Universal Agent, not in the specific payload agent.
The communication between the agents of one team is direct. It is not possible to directly communicate with a Universal Agent of another team. Communication to a Universal Agent of another team has to go through the corresponding Teamleaders. A communication between two

161
International Journal on Advances in Telecommunications, vol 3 no 3 & 4, year 2010, http://www.iariajournals.org/telecommunications/
2010, © Copyright by authors, Published under agreement with IARIA - www.iaria.org
agents in different teams is usually not necessary, because every team has its own task.
The use of this multi-agent system is not limited to UAVs. As well, it can be applied to coordinate a heterogeneous fleet of ground and air assets.
VII. RESULTS
Figure 13 shows a high-resolution situation picture generated with AMFIS using its photo flight tool presented in Section V.B. The picture is geo-referenced and can be overlaid onto the existing GIS-based, dynamic situation map.
Figure 13. Situation picture generated with the AMFIS photo flight tool
(ca. 9500 x 9000 pixel)
CONCLUSION
The presented surveillance and reconnaissance system AMFIS with its extensions is constantly under development. Due to its generic nature, it forms a rather universal integration platform for new sensors, platforms, interfaces, supporting application programs and customized solutions. The knowledge gained from the participation in various exercises is constantly used to optimize the ergonomics of the work stations and to improve the algorithms for data fusion. The advancement of sensor technology and robotics, increasing processing power, progress in information and network technology provide continuous input for the permanent development and optimization of the AMFIS system.
Presently, the human is still the most important link in the supervision chain. The operator must evaluate the data, which is delivered by the sensors and derive decisions to meet the existing dangers. Lastly, it is a person that is accountable and bears the responsibility for the resultant action, not the supporting machine.
The above introduced duties of the situation analysis and situation response are so versatile and complicated that further research is inevitable to fully automate them. Up to
now, humans are still indispensable in their varied roles as head of operations, pilot, analyst, watchman etc. The AMFIS system with its ability to integrate different sensors, sensor platforms and data sources can support and assist people with those tasks.
With the use of the mobile AMFIS system in industry, as well as at authorities and organizations like fire brigade, search and rescue services, and police, the geographical and information data bases can be improved decisively. With the gathered reconnaissance information fused or linked to information extracted from different sources, the task forces deploying the AMFIS system can be better protected and coordinated and decision making in critical situations can be optimized.
ACKNOWLEDGMENT
The authors would like to thank their colleagues and students who have contributed to the work presented in this paper, especially Sandro Leuchter, Thomas Partmann, Sven Müller, Steffen Burger, Frederic Schumacher, and Torsten Großkurth.
REFERENCES
[1] F. Segor, A. Bürkle, T. Partmann, R. Schönbein, “Mobile Ground Control Station for Local Surveillance,“ In: ICONS 2010, The Fifth International Conference on Systems, 11-16 April 2010, Menuires, The Three Valleys, France.
[2] AERODRONES, France, http://www.aerodrones.com, 2011.
[3] AAI Corporation, USA, http://www.aaicorp.com, 2011.
[4] Defense Technologies, Inc., USA, http://www.dtiweb.net, 2011.
[5] Frost & Sullivan, “Advances in platform technologies for unmanned aerial vehicles,” Technical Insights Report D1B0, San Antonio, TX, 2009.
[6] B. Essendorfer and W. Müller, “Interoperable sharing of data with the Coalition Shared Data (CSD) server,” North Atlantic Treaty Organization (NATO)/Research and Technology Organization (RTO): C3I in crisis, emergency and consequence management, 2009.
[7] B. Essendorfer, E. Monari, and H. Wanning, “An integrated system for border surveillance,” In: R. Ege (ed.), ICONS 2009: The Fourth International Conference on Systems, 1-6 March 2009, Gosier, Guadeloupe/France.
[8] RFC 3920: “Extensible Messaging and Presence Protocol (XMPP): Core,” The Internet Engineering Task Force (IETF), 2004.
[9] RFC 3921: “Extensible Messaging and Presence Protocol (XMPP): Instant Messaging and Presence,“ The Internet Engineering Task Force (IETF), 2004.
[10] M. Proctor, M. Neale, M. Frandsen, S. Griffith Jr., E. Tirelli, F. Meyer, and K. Verlaenen, “Drools Documentation (V. 4.0.4),” 2008, http://downloads.jboss.com/drools/docs/4.0.4.17825.GA/html_single/index.html
[11] S. J. Russell and P. Norvig, “Artificial Intelligence: A Modern Approach,” Prentice Hall, ISBN 9780137903955, 2003.
[12] N. R. Jennings, K. Sycara, and M. Wooldridge, “A roadmap of agent research and development,” Journal of Autonomous Agents and Multi-Agent Systems, 1(1), pp. 7–38, ISSN 1387-2532, 1998.
[13] P. Maes, “Agents that reduce work and information overload,” Communications of the ACM 37, 7 (July 1994), pp. 30-40, ISSN 0001-0782, 1994.

162
International Journal on Advances in Telecommunications, vol 3 no 3 & 4, year 2010, http://www.iariajournals.org/telecommunications/
2010, © Copyright by authors, Published under agreement with IARIA - www.iaria.org
Secure Video for Android Devices
Raimund K. Ege Department of Computer Science
Northern Illinois University
DeKalb, IL 60115, USA
Abstract—Android is rapidly gaining market share
among smart phones with high-speed next-generation
Internet connectivity. A whole new generation of users is
consuming rich content that requires high throughput.
Applications like FaceBook and YouTube have reached
mobile devices. Multimedia data, i.e. video, is becoming
easily accessible: large multi-media files are being
routinely downloaded. Peer to-peer content delivery is
one way to ensure the volume that can be efficiently
delivered. However, the openness of delivery demands
adaptive and robust management of intellectual property
rights. In this paper we describe a framework and its
implementation to address the central issues in content
delivery: a scalable peer-to-peer-based content delivery
model, paired with a secure access control model that
enables data providers to reap a return from making
their original content available. Our prototype
implementation for the Android platform for mobile
phones is described in detail.
Keywords-broadband video sharing; peer-to-peer
content delivery; access control; Android video client
I. INTRODUCTION
The Apple iPhone, and now increasingly Android-
based smart phones, have ushered in a new era in
omni-present broadband media consumption. Services such as iTunes, YouTube, Joost and Hulu are
popularizing delivery of audio and video content to
anybody with a broadband Internet connection. High
bandwidth internet connectivity is no longer limited to
reaching PCs and laptops: a new generation of devices,
such as netbooks and smart phones, is within reach of
3G/4G telecommunication networks.
In this paper we describe a new “app” for Android
phones that delivers video in a secure and managed
way. Figure 1 shows a screenshot of the Android home
screen featuring our new Oghma secure multi-media
delivery “app.” Delivering multimedia services has many
challenges: the ever increasing size of the data requires
elaborate delivery networks to handle peek network
traffic. Another challenge is to secure and protect the
property rights of the media owners. A common
approach to large-scale distribution is a peer-to-peer
model, where clients that download data immediately
become intermediates in a delivery chain to further
clients. The dynamism of peer-to-peer communities
means that principals who offer services will meet
requests from unrelated or unknown peers. Peers need
to collaborate and obtain services within an
environment that is unfamiliar or even hostile.
Figure 1. Oghma on Android Home Screen
Therefore, peers have to manage the risks involved
in the collaboration when prior experience and
knowledge about each other are incomplete. One way

163
International Journal on Advances in Telecommunications, vol 3 no 3 & 4, year 2010, http://www.iariajournals.org/telecommunications/
2010, © Copyright by authors, Published under agreement with IARIA - www.iaria.org
to address this uncertainty is to develop and establish
trust among peers. Trust can be built by either a trusted
third party [2] or by community-based feedback from
past experiences [3] in a self-regulating system.
Conventional approaches rely on well-defined access
control models [4] [5] that qualify peers and determine authorization based on predefined permissions. In such
a complex and collaborative world, a peer can benefit
and protect itself only if it can respond to new peers
and enforce access control by assigning proper
privileges to new peers.
The general goal of our work is to address the trust
in peers which are allowed to participate in the content
delivery process, to minimize the risk and to maximize
the reward garnered from releasing data in to the
network. In our prior work [9][15] we focused on
modeling the nature of risk and reward when releasing
content to the Internet. We integrated trust evaluation for usage control with an analysis of risk and reward.
Underlying our framework is a formal computational
model of trust and access control. In the work reported
here we focus on the implementation aspects of the
framework.
Our paper is organized as follows: the next section
will elaborate on how the data provider and its peers
can quantify gain from participating in the content
delivery. It also explains our risk/reward model that
enables a data source to initially decide on whether to
share the content and keep some leverage after its release. Section III describes our prototype architecture
that is based on a bittorrent-style of peer-to-peer
content delivery. A central tracker manages peers and
maintains a database of trust information. Peers can
serve both as source and as consumer of data. Section
IV introduces our prototype client for the Android
platform. Section V elaborates on details of the Java
implementation of the tracker, source and peer
processes. Data is exchanged using the Stream Control
Transmission Protocol (SCTP) which improves over
the current standard-bearers Transmission Control
Protocol (TCP) and User Datagram Protocol (UDP) for multi-stream session-oriented delivery of large multi-
media files over fast networks. Data is secured using a
PKI-style exchange of public keys and data encryption.
The paper concludes with our perspective on how
modern content delivery approaches will usher in a
new generation of Internet applications.
An earlier version of this paper appeared in the
Proceedings of the Fifth International Conference on
Systems (ICONS 2010) [1].
II. UNITS OF RISK AND REWARD
We assume that the data made available at the
source has value. Releasing the data to the Internet
carries potential for reaping some of the value, but also
carries the risk that the data will be consumed without rewarding the original source. There is also a cost
associated with releasing the data, i.e. storage and
transmission cost. For example, consider a typical
“viral” video found on YouTube.com: the video is
uploaded onto YouTube.com for free, stored and
transmitted by YouTube.com and viewed by a large
audience. The only entity that is getting rewarded is
YouTube.com, which will accompany the video
presentation with paid advertising. The person that
took the video and transferred it to YouTube.com has
no reward: the only benefit that the original source of
the video gets is notoriety. In order to provide a model or framework to asses
risk and reward, we need to quantize aspects of the
information interchange between the original source,
the transmitting medium and the final consumer of the
data. In a traditional fee for service model the reward
“R” to the source is the fee “F” paid by the consumer
minus the cost “D” of delivery:
The cost of delivery “D” consist of the storage cost at
the server, and the cost of feeding it into the Internet. In the case of YouTube, considerable cost is incurred
for providing the necessary server network and their
bandwidth to the Internet. YouTube recovers that cost
by adding paid advertising on the source web page as
well as adding paid advertising onto the video stream.
YouTube’s business model recognizes that these paid
advertisings represent significant added value. As
soon as we recognize that the value gained is not an
insignificant amount, the focus of the formula shifts
from providing value to the original data source to the
reward that can be gained by the transmitter. If we
quantify the advertising reward as “A” the formula now becomes:
Even in this simplest form, we recognize that “A” has
the potential to outweigh “D” and therefore reduce the
need for “F”. As YouTube recognizes, the reward lies
in “A”, i.e. paid ads that accompanies the video.
In some of our prior work [8] we focused on
mediation frameworks that capture the mutative nature
of data delivery on the Internet. As data travels from a
source to a client on lengthy path, each node in the
path may act as mediator. A mediator transforms data from an input perspective to an output perspective. In
the simplest scenario, the data that is fed into the
delivery network by the source and is received by the
ultimate client unchanged: i.e. each mediator just

164
International Journal on Advances in Telecommunications, vol 3 no 3 & 4, year 2010, http://www.iariajournals.org/telecommunications/
2010, © Copyright by authors, Published under agreement with IARIA - www.iaria.org
passes its input data along as output data. However,
that is not the necessary scenario anymore: the great
variety of client devices already necessitate that the
data is transformed to enhance the client’s viewing
experience. We apply this mediation approach to each
peer on the path from source to client. Each peer may serve as a mediator that transforms the content stream
in some fashion. Our implementation employs the
stream control transmission protocol (SCTP) which
allows multi-media to be delivered in multiple
concurrent streams. All a peer needs to do is add an
additional stream for a video overlay message to the
content as it passes through.
The formula for reward can now be extended into
the P2P content delivery domain, where a large number
of peers serve as the transmission/storage medium.
Assuming “n” number of peers that participate and
potentially add value the formula for the reward per peer is now:
pii
n
i
ip FADFR
)((1
and are now the delivery cost and value incurred
at each peer that participates in the P2P content
delivery. is the fee potentially paid by each peer.
is the fee paid to the data source provider. Whether or
not the data originator will gain any reward depends on
whether the client and the peers are willing to share
their gain from the added value. In a scenario where
clients and peers are authenticated and the release of
the data is predicated by a contractual agreement, the
source will reap the complete benefit.
In our model we quantify the certainty of whether
the client and peers will remit their gain to the source
with a value of trust “T”: T represents the trust in the client that consume that data, T represents the trust in
each peer that participates in the content delivery. The
trust is evaluated based on both actual observations and
recommendations from referees. Observations are
based on previous interactions with the peer.
Recommendations may include signed trust-assertions
from other principals, or a list of referees that can be
contacted for recommendations. The trust value,
calculated from observations and recommendations, is
a value within the [0, 1] interval evaluated for each
peer that requests to be part of the content delivery. Our model enables an informed decision on whether
to accept a new peer based on the potential additional
reward gained correlated to the risk/trust encumbered
by the new peer.
III. PROTOTYPE ARCHITECTURE
Peer-to-peer (P2P) delivery of multimedia aims to
deliver multi-media content from a source to a large
number of clients. For our framework, we assume that
the content comes into existence at a source. A simple example of creating such multimedia might be a video
clip taken with a camera and a microphone, or more
likely video captured via a cell phone camera, and then
transferred to the source. Likewise the client consumes
the content, e.g. by displaying it on a computing device
monitor, which again might be a smart phone screen
watching a YouTube video. We further assume that
there is just one original source, but that there are many
clients that want to receive the data. The clients value
their viewing experience, and our goal is to reward the
source for making the video available.
In a P2P delivery approach, each client participates in the further delivery of the content. Each client
makes part or all of the original content available to
further clients. The clients become peers in a peer-to-
peer delivery model. Such an approach is specifically
geared towards being able to scale effortlessly to
support millions of clients without prior notice, i.e. be
able to handle a “mob-like” behavior of the clients.
The exact details of delivery may depend on the
nature of the source data: for example, video data is
made available at a preset quality using a variable-rate
video encoder. The source data stream is divided into fixed length sequential frames: each frame is identified
by its frame number. Clients request frames in
sequence, receive the frame and reassemble the video
stream which is then displayed using a suitable video
decoder and display utility. The video stream is
encoded in such a fashion that missing frames don’t
prevent a resulting video to be shown, but rather a
video of lesser bit-rate encoding, i.e. quality, will result
[7]. We explicitly allow the video stream to be quite
malleable, i.e. the quality of delivery need not be
constant and there is no harm if extra frames find their
way into the stream. It is actually a key element of our approach that the stream can be enriched as part of the
delivery process.
In our approach, multi-media sources are advertised
and made available via a central tracking service: at
first, this tracker only knows the network location of
the source server. Clients that want to access the source
do so via the tracker: they contact the tracker, which
will respond with the location of the source. The
tracker will also remember (or track) the clients as
potential new sources of the data. Subsequent client
requests to the tracker are answered with all known locations of sources: the original and the known
clients. Clients that receive locations of sources from
the tracker issue frame requests immediately to all

165
International Journal on Advances in Telecommunications, vol 3 no 3 & 4, year 2010, http://www.iariajournals.org/telecommunications/
2010, © Copyright by authors, Published under agreement with IARIA - www.iaria.org
sources. As the sources deliver frames to a client, the
client stores them. The client then assumes a server
role and also answers requests for frames that they
have received already, which will enable a cascading
effect, which establishes a P2P network where each
client is a peer. Every client constantly monitors the
rate of response it gets from the sources and adjusts its
connections to the sources from which the highest
throughput rate can be achieved.
Figure 2 shows an example snapshot of a content delivery network with one source, one tracker, 2
intermediate peers and one client. The source is where
the video data is produced, encoded and made
available. The tracker knows the network location of
the source. Clients connect to the tracker first and then
maintain sessions for the duration of the download: the
2 peers and the single client maintain an active
connection to the tracker. The tracker informs the peers
and client which source to download from: peer 1 is
fed directly from the source; peer 2 joined somewhat
later and is now being served from the source and peer 1; the client joined last and is being served from peer 1
and peer 2. In this example, peer 1 and 2 started out as
clients, but became peers once they had enough data to
start serving as intermediaries on the delivery path
from original source to ultimate client.
IV. ANDROID CLIENT
We chose the new and emerging Android platform
to implement a proof-of-concept client for a mobile
device. Android is part of the Open Handset Alliance
[10]. Android is implemented in Java and therefore
offers a flexible and standard set of communication
and security features.
Figures 3, 4, 5 and 6 show four sample screen shots
taken from the Android system. It shows our Oghma Secure P2P media client. Figure 3 shows the login
screen to our Oghma mobile client. It uses OpenID[6]
user credentials and allows to establish a connection to
a tracker URL.
Once the tracker has authenticated the new client it
will respond with a list of available video streams
(Figure 4). After the user has made a selection, the
screen shown in Figure 5 appears. Once a sufficient
read-ahead buffer has been accumulated, the video
stream starts playing on the Android device (Figure 6).
tracker
Figure 2. P2P Content Delivery Network
source
peer 2 peer 3
peer 1

166
International Journal on Advances in Telecommunications, vol 3 no 3 & 4, year 2010, http://www.iariajournals.org/telecommunications/
2010, © Copyright by authors, Published under agreement with IARIA - www.iaria.org
Figure 3. Oghma Login Screen
Figure 5. Video download is starting
Figure 4. Oghma Stream Selection Screen
Figure 6. Oghma Video Delivery Screen

167
International Journal on Advances in Telecommunications, vol 3 no 3 & 4, year 2010, http://www.iariajournals.org/telecommunications/
2010, © Copyright by authors, Published under agreement with IARIA - www.iaria.org
Figure 7. Tracker maintains peer database
V. IMPLEMENTATION DETAIL
Our implementation framework features 3 types of
participants:
A. tracker, where all information on the current status
of the content delivery network is maintained and
all access decisions are made.
B. source, where the data is available for further
dissemination. The original source is the first
source. Peers that have downloaded and consumed
the data can become new sources.
C. client, where the consumption of the data occurs.
A. Tracker
The core of the content delivery model is the tracker.
The tracker knows the location of the original/first
source. The tracker maintains a database of peer
information: each peer is authenticated with an OpenID
and carries historical data on past peer behavior. Peers that wish to participate in the content
delivery must first locate the tracker. A peer will start
by establishing a connection to a tracker. Peers use
their openID and password to login to the tracker. The
peer will transmit its public key to the tracker, which
will consider the request from a new peer and gather
the necessary data on the trust in the new peer. If the
peer is new and not yet listed in the tracker(s) database,
then a new entry is created.
Figure 7 shows the tracker’s graphical user
interface: the center of the screen shows peers that have been accepted into the P2P content delivery
network; the bottom of the screen shows a log of
access requests from other peers. Figure 8 shows the
security information, i.e. the public key, for the peer
with openId “[email protected].”

168
International Journal on Advances in Telecommunications, vol 3 no 3 & 4, year 2010, http://www.iariajournals.org/telecommunications/
2010, © Copyright by authors, Published under agreement with IARIA - www.iaria.org
Figure 8. Security information
B. Source
At least one source must exist for the content delivery
network to get started. The source first establishes
contact with the tracker. It generates a PKI [11]
public/private key par and transmits its public key to
the tracker. It then stands ready for data requests from
clients. If a request from a client is received, it requests
the client’s public key from the tracker and uses a Diffie-Hellman key agreement algorithm [12] to
produce a session key. The session is then used by the
source to encrypt all data that is sent to the client.
C. Client
The key to a smooth scaling of this ad-hoc p2p
network is the algorithm used by the client to request
frames from a source (either the original source or another client). A client consists of three processes:
1) a process to communicate with the tracker. The
client initiates the negotiation with the tracker to
enable the tracker’s decision on whether the peer
is admitted into the content delivery network.
Upon success, the tracker informs the client which
sources the client should use accompanied by their
public keys. The client will update the tracker on
its success in downloading the source data;
2) a process to request data from the given sources.
Fragments or frames may be requested from
multiple sources. Frames that are received are
decrypted using a session key that is established
via a key agreement using the public key of the
data source.
3) a process to sequence the frames/fragments
received from sources and to assemble them into a usable media stream.
Our prototype uses the Java implementation [13] of the
SCTP [14] transport layer protocol. SCTP is serving in
a similar role as the popular TCP and UDP protocols.
It provides some of the same service features of both,
ensuring reliable, in-sequence transport of messages
with congestion control. We chose SCTP because of its
ability to deliver multimedia in multiple streams. Once
a client has established a SCTP association with a
server, packages can be exchanged with high speed and
low latency. Each association can support multiple streams, where the packages that are sent within one
stream are guaranteed to arrive in sequence. Each

169
International Journal on Advances in Telecommunications, vol 3 no 3 & 4, year 2010, http://www.iariajournals.org/telecommunications/
2010, © Copyright by authors, Published under agreement with IARIA - www.iaria.org
source can divide the original video stream into set of
streams meant to be displayed in an overlay fashion.
Streams can be arranged in a way that the more
streams are fully received by a client, the better the
viewing quality will be. When sending a packet over a
SCTP channel we need to provide an instance of the MessageInfo class, which specifies which stream the
packet belongs to. The first stream is used to deliver a
basic low quality version of the video stream. The
second and consecutive streams will carry frames that
are overlaid onto the primary stream for the purpose of
increasing the quality. In our framework we also use
the additional streams to carry content that is “added
value”, such as advertising messages or identifying
logos. The ultimate client that displays the content to a
user will combine all streams into one viewing
experience.
The second feature of SCTP we use is its new class “SctpMultiChannel” which can establish a one-to-
many association for a single server to multiple clients.
The SctpMultiChannel is able to recognize which
client is sending a request and enables that the response
is sent to that exact same client. This is much more
efficient than a traditional “server socket” which for
each incoming request spawns a subprocess with its
own socket to serve the client. Figure 9 shows the Java
source code where an incoming request is received.
Each packet that is received on the channel carries a MessageInfo object which contains information on the
actual client that is the actual other end point of this
association. The Java code on line 06 retrieves the
“association” identity from the incoming message
“info” instance. The association is then used to send
the response via the same SctpMultiChannel instance
but only to the actual client that had requested the
frames. The code on line 17 shows that a new outgoing
message info instance is created for the same
“association” that carried the incoming request. The
message info instance is then used to send the response
packet to the client. The code to receive SctpMultiChannel packets is logically similar to any
UPD or TCP style of socket receive programming.
Figure 10 shows a sample.
Figure 9. Source receives request for frame
01 SocketAddress socketAddress = new InetSocketAddress(port);
02 channel = SctpMultiChannel.open().bind(socketAddress);
03 MessageInfo info;
04 while ((info = channel.receive(bb, null, null)) != null) {
05 // determine requestor
06 Association association = info.association();
07 // determine which frame range
08 bb.flip();
09 int fromFrame = bb.getInt();
10 int toFrame = bb.getInt();
11 // send frames to requestor
12 for (int i=fromFrame; i<= toFrame; i++) {
13 bb.clear();
14 bb.putInt(i);
15 bb.put(framePool.getFrame(i));
16 bb.flip();
17 channel.send(bb,
MessageInfo.createOutgoing(association, null,0));
18 }
19 }

170
International Journal on Advances in Telecommunications, vol 3 no 3 & 4, year 2010, http://www.iariajournals.org/telecommunications/
2010, © Copyright by authors, Published under agreement with IARIA - www.iaria.org
Figure 10. Client receives frame
The three major components of the framework are
implemented as “SourceMain”, “TrackerMain” and
“ClientMain”, which are composed from classes that
implement the core behavior of maintaining communication sessions, accepting requests for frames
and delivering them, and requesting and receiving
frames. The major classes are FrameRequestor and
FrameServer. The original source starts out as the sole
instance of FrameServer. The first client starts out as
the sole instance of FrameRequestor. As the client
accumulates frames it then also instantiates a
FrameServer that is able to receive requests from other
clients. A client that contains both a FrameRequestor
and FrameServer instance becomes a true peer in the
P2P content delivery framework. In summary, tracker, source and client together
contribute to build a highly efficient delivery network.
VI. CONCLUSION
In this paper we have described a model and
framework for a new generation of content delivery networks. We have described a prototype
implementation that follows a bittorrent-style of P2P
network, where a tracker disseminates information on
which sources are available to download from, and
includes a Java-based client for the Android platform
for smart phones. Such P2P content delivery has great
potential to enable large scale delivery of multimedia
content.
Our framework is designed to enable content
originators to assess the potential reward from
distributing the content to the Internet. The reward is quantified as the value added at each peer in the
content delivery network and gauged relative to the
actual cost incurred in data delivery but also correlated
to the risk that such open delivery poses.
Consider the scenario we described earlier in the
paper: a typical “viral” video found on YouTube.com:
the video is uploaded onto YouTube.com for free,
stored and transmitted by YouTube.com and viewed by
a large audience. The only entity that is getting a
reward is YouTube.com, which will accompany the
video presentation with paid advertising. The only
01 SocketAddress socketAddress =
new InetSocketAddress(peer.address, peer.port);
02 SctpChannel channel = SctpChannel.open(socketAddress, 1, 1);
03 // send requested frame range to peer
04 ByteBuffer byteBuffer = ByteBuffer.allocate(128);
05 byteBuffer.putInt(fromFrame);
06 byteBuffer.putInt(toFrame);
07 byteBuffer.flip();
08 channel.send(byteBuffer, MessageInfo.createOutgoing(null, 0));
09 // here is where we read response
10 byteBuffer = ByteBuffer.allocate(64000);
11 while ((channel.receive(byteBuffer, null, null)) != null) {
12 byteBuffer.flip();
13 int frame = byteBuffer.getInt();
14 System.out.print("Message received: " + frame);
15 …

171
International Journal on Advances in Telecommunications, vol 3 no 3 & 4, year 2010, http://www.iariajournals.org/telecommunications/
2010, © Copyright by authors, Published under agreement with IARIA - www.iaria.org
benefit that the original source of the video gets is
notoriety.
Using our model, the original data owner can
select other venues to make the video available via a
peer-to-peer approach. The selection on who will
participate can be based on how much each peer contributes in terms of reward but also risk. Peers will
have an interest in being part of the delivery network,
much like YouTube.com has recognized its value.
Peers might even add their own value to the delivery
and share the proceeds with the original source.
Whereas in the YouTube.com approach the reward
is only reaped by one, and the original source has
shouldered all the risk, i.e. lost all reward from the
content, our model will enable a more equitable
mechanism for sharing the cost and reward. Our model
might just enable a new and truly openness of content
delivery via the Internet.
REFERENCES
[1] Raimund K. Ege. Trusted P2P Media Delivery to Mobile Devices. Proceedings of the Fifth International
Conference on Systems (ICONS 2010), pages 140-145,
Menuires, France, April 2010.
[2] Y. Atif. Building trust in E-commerce. IEEE
Internet Computing, 6(1):18–24, 2002.
[3] P. Resnick, K. Kuwabara, R. Zeckhauser, and E.
Friedman. Reputation systems. Communications of the ACM, 43(12):45–48, 2000.
[4] E. Bertino, B. Catania, E. Ferrari, and P. Perlasca. A logical framework for reasoning about access control
models. In SACMAT ’01: Proceedings of the sixth
ACM symposium on Access control models and
technologies, pages 41–52, New York, NY, USA,
2001.
[5] S. Jajodia, P. Samarati, M. L. Sapino, and V. S.
Subrahmanian. Flexible support for multiple access control policies. ACM Transaction Database System,
26(2):214–260, 2001.
[6] OpenID, http://www.openid.net. [accessed September 22, 2010]
[7] C. Wu, Baochun Li. R-Stream: Resilient peer-to-peer streaming with rateless codes. In Proceedings of
the 13th ACM International Conference on
Multimedia, pages 307-310, Singapore, 2005.
[8] R. K. Ege, L. Yang, Q. Kharma, and X. Ni. Three-
layered mediator architecture based on dht.
Proceedings of the 7th International Symposium on
Parallel Architectures, Algorithms, and Networks (I-
SPAN 2004), Hong Kong, SAR, China. IEEE
Computer Society, pages 317–318, 2004.
[9] L. Yang, R. Ege, Integrating Trust Management into Usage Control in P2P Multimedia Delivery,
Proceedings of Twentieth International Conference on
Software Engineering and Knowledge Engineering
(SEKE'08), pages 411-416, Redwood City, CA, 2008.
[10] Open Handset Alliance, http://www.
openhandsetalliance.com/. [accessed November 19,
2010]
[11] Gutmann, P., 1999. The Design of a Cryptographic Security Architecture, Proceedings of
the 8th USENIX Security Symposium, pages 153-168,
Washington, D.C., 1999.
[12] Network Working Group, Diffie-Hellman Key
Agreement Method, Request for Comments: 2631, RTFM Inc., June 1999.
[13] java.net – The Source for Java Technology Collaboration, The JDK 7 Project,
http://jdk7.dev.java.net. [accessed September 22, 2010]
[14] R. Stewart (ed.), Stream Control Transmission
Protocol, Request for Comments: 4960, IETF Network
Working Group, September 2007,
http://tools.ietf.org/html/rfc4960. [accessed September
22, 2010]
[15] Raimund K. Ege, Li Yang, Richard Whittaker. Extracting Value from P2P Content Delivery.
Proceedings of the Fourth International Conference on
Systems (ICONS 2009), pages 102-108 Cancun,
Mexico, March 2009.

172
International Journal on Advances in Telecommunications, vol 3 no 3 & 4, year 2010, http://www.iariajournals.org/telecommunications/
2010, © Copyright by authors, Published under agreement with IARIA - www.iaria.org
Evaluation of Spectrum Occupancy in an Urban Environment in a Cognitive Radio Context
Alexandru Marţian, Călin Vlădeanu, Ioana Marcu, Ion Marghescu Department of Telecommunications
Faculty of Electronics, Telecommunications and Information Technology Politehnica University of Bucharest
1-3 Iuliu Maniu, Bucharest 6, 061071, Romania e-mail: [email protected], [email protected], [email protected], [email protected]
Abstract — Lack of frequency spectrum is becoming one of the major problems in the telecommunication field with the introduction of several new radio communication technologies. Cognitive Radio (CR) technology promises to be one possible solution to this problem, by allowing access of unlicensed users in licensed bands, based on an opportunistic approach and without interfering with the licensed (primary) user. In order to identify which frequency bands are more suitable for such purposes, it is necessary to evaluate the degree in which licensed bands are actually used. Although some measurement campaigns have already been carried out, most of them were done in the USA and only a few in other locations worldwide. This paper presents results of a measurement campaign conducted in Bucharest, Romania, covering the frequency range from 25 MHz up to 3.4 GHz. An overview of the various spectrum sensing methods available for evaluating the spectral occupancy is presented. The measurement results are confronted with the frequency allocation table published by the national authority for communications and an analysis of the obtained data is being made.
Keywords - spectrum occupancy; spectrum sensing; cognitive radio; measurement campaign.
I. INTRODUCTION Radio frequency spectrum is a resource of fundamental
importance in wireless communication systems. During recent years a multitude of wireless applications and services were developed, and as a result, the need for new frequency bands increased. As most of the available spectrum has already been allocated, the lack of spectrum resources has become a serious problem.
In order to address this problem, one possible approach is to create user equipment devices that are able to dynamically detect free spectrum resources and use them in order to improve overall spectrum usage. A first step in this direction was the introduction of Software Defined Radio (SDR), devices where components that have been usually implemented in hardware (e.g. filters, amplifiers, modulators/demodulators, etc.) are instead implemented by
means of software. Such an approach allows the equipment to be easily reconfigured in order to receive and transmit different radio protocols by selecting which part of the software is to be used.
J. Mitola III introduced in 1999 the cognitive radio (CR) term, which can be defined as a wireless communication system that allows spectrum sharing over a wide frequency range and that is able to handle multiple radio access technologies [2].
An application of CR that would greatly contribute to an increased spectral efficiency is to allow unlicensed users access to licensed bands. In order to avoid any harmful interference to the primary (licensed) system, CR equipment should include the following functionality:
• Frequency-agility and re-configuration of radios; • Spectrum sensing, in order to be aware of the
surrounding radio environment; • Capability of discerning between secondary and
primary systems and avoidance of interference to the primary system;
• Spectrum management, in order to achieve effective co-existence and radio resource sharing with primary systems.
The spectrum sensing functionality is a key element of any CR equipment, allowing it to detect accurately the spectrum holes.
Although there are several ways in which cognitive radio spectrum sensing can be performed, a first classification can be made according to how the information is shared between CR devices in the following two categories:
• Non-cooperative spectrum sensing: This form of spectrum sensing occurs when a CR acts on its own. The CR device configures itself according to the signals it can detect.
• Cooperative spectrum sensing: Within a cooperative CR spectrum sensing system, sensing is performed by a number of different radios within the CR network. Typically, a central station will receive information from a variety of radios in the network, process it and adjust the overall CR network accordingly.

173
International Journal on Advances in Telecommunications, vol 3 no 3 & 4, year 2010, http://www.iariajournals.org/telecommunications/
2010, © Copyright by authors, Published under agreement with IARIA - www.iaria.org
The current work represents an extension of a paper presented at the AICT 2010 conference [1]. The paper presents the results of a measurement campaign regarding spectrum occupancy conducted in Bucharest, Romania. These results represent just a preliminary work as the collected data is just instantaneous. Further measurements including long time measurements and data collected from other rural locations have been done and the results have been published in [3].
The paper is organized as follows. At first, results obtained during several other measurement campaigns are commented. Section II contains a description of the equipment used for performing the measurements. An overview of the various conventional spectrum sensing methods is given in Section III. The methodology and results of the measurements are presented in Section IV. During Section V, the measurement results are being analyzed from the cognitive radio perspective. Finally, in Section VI, the conclusion is being drawn and aspects concerning the future work are presented.
A. Related Work Several measurement campaigns concerning spectrum
occupancy were conducted worldwide [4]-[11], most of them were carried out the in the USA [4]-[5] and only a few in other locations worldwide, including Singapore [6], Germany [7]-[9], New Zeeland [10] and Spain [11], in urban or suburban scenarios. Results of a measurement campaign conducted in Chicago, USA showed a mean occupancy as low as 17.4% in the frequency band 30 to 3000 MHz [4]. Studies were also targeted at narrower frequency bands, like the public safety ones, and the benefits of cooperative sensing were highlighted [5]. During spectrum measurements taken over 12 weekday periods for a wider frequency band up to 5850 MHz in Singapore a mean occupancy value of only 4.54% was obtained [6]. The difference between indoor and outdoor locations was discussed in [7] based on measurements performed in Aachen, Germany.
Spectrum power measurements during a large public event (the 2006 Football World Cup in Germany) are presented in [8] and [9]. The campaign was conducted in 2 different cities, Dortmund and Kaiserslautern, and the measurements were taken in the proximity of football stadiums during match days. The obtained results clearly indicated a strong interdependency between spectrum occupancy values and different stages of the football match. Data collected throughout the measurement campaign was analyzed in order to find suitable methods for evaluating the vacancy of spectrum bands due to time-dependent statistics, including average channel allocation, average run length and amount of runs.
The measurement campaign conducted in urban Barcelona goes as high as 7075 MHz, using 2 different discone antennas, a low-noise amplifier and a high performance spectrum analyzer [10]. Three different metrics were used for evaluating the spectrum occupancy: power spectral density, instantaneous evolution of the temporal spectrum occupancy and duty cycle as a function of
frequency. For the entire frequency band between 75MHz and 7075MHz the measured spectrum occupancy was quite low 17.78%, but if for the frequency area below 1 GHz the spectrum usage was moderate, for the are above 2 GHz the spectrum remained mostly underutilized.
However, as frequency spectrum regulations differ considerably between regions and even countries, it is important to obtain results from as many different scenarios as possible, in order to analyze the possible situations that a CR user equipment might encounter.
II. SPECTRUM SENSING METHODS Several spectrum sensing methods can be used in order to
decide if a certain frequency band is available for opportunistic access [12]-[15]. For each of the described methods, a short description of the principle used is given, and the strengths and weaknesses of the method are underlined.
A. Energy Detection The energy detection method provides an optimal
detection in cases where the primary user signal is unknown [13]. The received radio frequency energy or the received signal strength indicator is measured and compared to a precomputed threshold to determine whether the spectrum is occupied or not.
The energy can be measured in several ways. When using an analogue implementation, a pre-filter with fixed bandwidth is required. However, this solution is not suitable for simultaneous sensing of narrowband and wideband signals, situation that is very often expected considering modern communication systems. More flexibility can be obtained when using a digital implementation, because of FFT-based spectral estimates. In this case, various bandwidth types are supported, which will allow simultaneous sensing of multiple signals.
The advantages of the energy-detection methods are universal applicability, relative low computational complexity and reduced amount of prior signal knowledge required.
The most serious drawbacks of the energy detection method are that it is highly susceptible to changes in the background noise spectral density and to the presence of in-band interference. Another major disadvantage, specific to cognitive radio scenarios, is that the energy detection method cannot distinguish the primary systems from the secondary ones sharing the same channel. This becomes a critical challenge when multiple primary systems are present in the same area where cognitive radio equipment operates.
B. Matched Filtering A filter matched to a received signal has an impulse
response equal to a conjugated and time-reversed version of the received signal [15]. This matched filter represents an optimal detection method as it provides a maximum signal-to-noise ratio (SNR) output in the presence of additive white Gaussian noise (AWGN). The output of the matched filter is compared to a threshold in order to decide if the signal

174
International Journal on Advances in Telecommunications, vol 3 no 3 & 4, year 2010, http://www.iariajournals.org/telecommunications/
2010, © Copyright by authors, Published under agreement with IARIA - www.iaria.org
corresponding to a primary system is present or not. The binary decision that has to be made is
*
01
1
, [ ] [ ]
,
N
nH if y n x n
H otherwise
λ=
• ≤
•
∑ (1.1)
where λ represents the threshold, [ ]y n represents the
unknown signal and *[ ]x n represents a time-reversed version of the assumed signal.
In order to apply this matched filtering method, a priori knowledge is required about the signal that is to be detected, at both physical and medium access control layers. Fortunately, for most of the actual communication systems there is enough information available (e.g., pilot subcarrier synchronization sequence in OFDM systems, midamble sequence in GSM systems) in order to allow signal detection using this method.
Between the advantages offered by the matched filtering method can be mentioned optimality for AWGN channels, relative low computational complexity needed and the possibility to be applied to most licensed systems.
The most important disadvantages of this method are sensitivity to imperfect synchronization and poor performance in non-AWGN channels. A further drawback of the matched filtering method is that a CR equipment that operates in an area where multiple possible primary systems could be present will need a dedicated receiver for every kind of primary system. This will generate an increase of the complexity and will make the implementation of such equipment a significant challenge, even in case of programmable realization.
A variant of matched-filtering detection is tone detection. In this particular case, the presence of a tone of finite strength is detected, and this presence implies the presence of a particular signal associated with that tone’s frequency. Matched filtering or Fourier analysis of a narrow frequency band around the expected tone frequency can be used in order to detect the presence of this tone.
C. Cyclostationary Feature Detection Spectral correlation is a statistical property that is
characteristic for cyclostationary signals [15]. One or several probabilistic parameters (e.g., mean, autocorrelation, probability density function, nth-order moment, or nth-order cumulant) of cyclostationary signals are periodic functions in time domain. An example of how the cyclostationary detection can be performed is the following. First, the cyclic autocorrelation function ( )xRα τ of the observed signal
( )x t is computed as
2
* 2
2
1( ) lim ( 2) ( 2)
Tj t
x TT
R x t x t e dtT
α πατ τ τ −
→∞−
= + −∫ (1.2)
where α denotes a cyclic frequency. Further on, the spectral correlation function (SCF) ( )xS fα is calculated as the discrete Fourier transformation of the cyclic autocorrelation function:
2( ) ( ) j fx xS f R e dα α π ττ τ
∞−
−∞
= ∫ (1.3)
It can be proved that
2*
2
( )
1lim lim ( , ) ( , )
2 2
x
Z
T TT ZZ
S f
X t f X t f dtTZ
α
α ατ τ
→∞ →∞−
=
= + −∫(1.4)
where
2
2
2
( , ) ( )t T
j fuT
t T
X t f x u e duπ+
−
−
= ∫ (1.5)
Finally, the detection is concluded by looking for the
unique cyclic frequency corresponding to a maximum value in the SCF plane.
The most important advantage of the cyclostationary detection method consists in its insensitivity to noise and co-channel insensitivity. The reason for that is that noise has no spectral correlation, and the SCF can reflect only the spectral correlation properties of a single signal if the cyclic frequency is unique to that signal. A further advantage of the cyclostationary detection method is applicable to nearly all the modern communication signals. This method can work also with lower SNR than the energy detection method, as it exploits the information embedded in the received signal.
The main disadvantage of the cyclostationary detection method is that the cyclic frequency has to be be known by the secondary user. It also requires a more complex implementation and a longer observation time than in case of the energy detection method. This may cause the cyclostationary detector to be inefficient in case of spectrum holes of short time duration.
D. Wavelet Detection The wavelet detection method is particularly suitable in
case of wideband signals, as it presents advantages in terms of implementation and flexibility compared to the conventional approach of using multiple narrowband bandpass filters [15].
The entire frequency band of a wideband signal is modeled as a series of consecutive frequency sub-bands, in order to identify spectrum holes. The power spectral characteristic is smooth within each sub-band, but changes abruptly on the border of two neighboring sub-bands. By using a wavelet transform of the power spectral density of

175
International Journal on Advances in Telecommunications, vol 3 no 3 & 4, year 2010, http://www.iariajournals.org/telecommunications/
2010, © Copyright by authors, Published under agreement with IARIA - www.iaria.org
the observed signal [ ]x n , the singularities of the power spectral density ( )S f can be located and the available frequency bands can be identified.
The main weakness of the wavelet detection method is related to the high sampling rates needed when building a wavelet detector for large bandwidth signals.
E. Delay-and-Multiply Detection Another sensing technique is the delay-and-multiply
signal detector, which multiplies the collected data block with a delayed and conjugated version of itself in order to generate an additive sine-wave component the presence of which can be detected by using Fourier methods [14]. The presence of the tone implies the presence of the signal, and the exact frequency of the tone provides a parameter estimate for the signal, usually equal to the symbol rate (chip rate for direct sequence spread spectrum signals).
The delay-and-multiply detector is a simple exploitation of cyclostationarity in that it employs a quadratic transformation to generate a spectral line. This is only possible for CS signals.
The strengths of the delay-and-multiply detector are that it can provide superior sensitivity relative to the energy detectors, is robust to uncertainties in the noise power and interference parameters, and is computationally less expensive than more thorough methods that exploit the cyclostationarity property. Its main weaknesses are that it is not applicable to a large number of signals and that optimum performance requires knowledge of the optimum delay, which in turn requires knowledge of the transmitter filtering applied to the signal to be detected. That is, the optimum delay for rectangular-pulse signals is half the symbol interval, but for signals that have been filtered with a square-root raised-cosine filter, the optimum delay is zero.
F. Swiss Army Knife Solutions In order to improve the overall sensing performance it
would be possible to implement a spectrum-sensing device that contains a highly specialized detector for each type of signal that has to be detected: a matched filter for DVB-T, a delay-and-multiply detector for DSSS, an energy detector for GSM, etc. This kind of sensing strategy is called a Swiss Army knife (SAK) solution because of the disparate nature, computational requirements, and achievable performance of the various signal-specific sensors [14]. A possible approach would be to make a choice between the various available detectors depending of the frequency band that is scanned, which could provide information about what type of licensed signals are expected in the respective frequency area.
III. MEASUREMENT EQUIPMENT The measurement campaign has been carried out from
the top of the main building of our Department, which proves to be an excellent location for such a purpose. The terrace has direct line of sight with several FM transmitters, Analog and DVB-T TV transmitters, GSM and UMTS base stations and several other stations (GPS location: latitude 44°26'01" N, longitude 26°03'27" E, MSL altitude 150m,
relative altitude 30m). The headquarters of the governmental agency for special telecommunications is also located just a few hundreds of meters away from the measurement location. A bird’s eye view of the surrounding area is presented in Figure 1.
Figure 1. Bird’s eye view of the measurement location (Copyright (c) 2009 Microsoft Corporation and/or its suppliers, One Microsoft Way,
Redmond, Washington 98052-6399 U.S.A.).
For the frequency bands below 1 GHz a wideband
discone antenna (Sirio SD1300N, specified from 25 to 1300 MHz) was used, mounted on the building terrace. The antenna has an omnidirectional pattern in the horizontal plane and was connected using a low-loss RF cable to a high performance signal analyzer (Anritsu MS2690A - 50 Hz to 6 GHz, average noise level -155 dBm/Hz at 2 GHz), located in a laboratory on the last floor of the building. Although the length of the cable was approximately 20m, the cable attenuation was less than 5 dB. For the frequency bands above 1 GHz a directional antenna (Aaronia Hyperlog 4060, 400 MHz to 6 GHz) was used. In this case, a short cable of 1.5 m (SUCOFLEX 104PEA) was used and the insertion loss was lower than -1dB. During the measurements, the spectrum analyzer was configured as described in Table I.
TABLE I. SPECTRUM ANALYZER CONFIGURATION
Parameter Value Frequency sub-bands
1. 25-230 MHz 2. 230-400 MHz 3. 400-470 MHz 4. 470-766 MHz 5. 766-880 MHz 6. 880-960 MHz 7. 960-1525 MHz 8. 1525-1710 MHz 9. 1719-1880 MHz 10. 1880-2200 MHz 11. 2200-2400 MHz 12. 2400-2500 MHz 13. 2500-2690 MHz 14. 2690-3400 MHz
Resolution/video bandwidth (RBW/VBW)
300 kHz / 300 kHz (sub-bands 2, 3, 5, 6, 8, 9, 11, 12, 13)
1 MHz / 1MHz (sub-bands 1, 4, 7, 10, 14) Sweep time 5 ms Reference level 0 dBm Attenuation 10 dB Detection type Pos & Neg Trace points 10001

176
International Journal on Advances in Telecommunications, vol 3 no 3 & 4, year 2010, http://www.iariajournals.org/telecommunications/
2010, © Copyright by authors, Published under agreement with IARIA - www.iaria.org
The performed measurements covered the frequency range from 25 MHz to 3400 MHz, the whole band being further divided into 14 sub-bands according to the type of service and the bandwidth of the allocated signal.
The measurement equipment is shown in Figures 2 and 3.
(a) (b)
Figure 2. Antennas used during the measurements: (a) Sirio SD1300N and (b) Aaronia Hyperlog 4060.
Figure 3. Signal analyzer as used during measurements.
The MathWorks MATLAB environment and the Anritsu
Signal Viewer application were the software tools used for processing and analyzing the data obtained during the measurement campaign.
IV. MEASUREMENT RESULTS As it was already described in Section II, the energy
detection method is the only method that does not require any a priori knowledge about the evaluated signals, and this is the method that was used in order to evaluate the
occupancy in the several frequency bands presented in Table I.
In order to estimate correctly the noise floor, a sliding window of 1000 samples was used for each of the frequency bands. A mean value of the samples contained in the sliding window was calculated and the lowest mean value, corresponding to an unoccupied frequency area, was chosen as the noise floor of the corresponding frequency band. To mitigate the effects of high-power noise samples in false activity detection, a second sliding window with a calculated width of 100 KHz was used in order to mean out such samples and to minimize the false alarm probability. To illustrate the effect of this second window, an example is presented in Figure 4 for the frequency band from 470 to 766 MHz.
(a)
(b)
Figure 4. Spectral occupancy for the 470-766 MHz frequency band (a) before and (b) after applying the 100 kHz sliding window.
In Figure 4 (a) the original captured signal can be seen,
and in Figure 4 (b) can be noticed the signal obtained after processing. In case of this frequency band, the width of 100 kHz chosen for the window results in a number 3 consecutive samples to be taken into account when processing the signal.
A parameter of great importance when using the energy detection method for taking decision about the availability of a certain frequency band is the value chosen for the energy threshold.
If the value used for the threshold is too high weak signals will be treated as noise and this would result in an underestimation of the actual occupancy. In Figure 5 (a), an example is presented for the frequency band from 470 to 766 MHz. The mean noise value is represented with the red line, and the value chosen for the threshold is represented with a green line. It can be noticed that when choosing a value of 11dB for the threshold, several low-power signals are below the threshold level.
On the other hand, choosing a too low value for the threshold will increase the false alarm probability caused by high-power noise samples and this would cause an overestimation of the actual occupancy. In Figure 5 (b), for the same frequency band a value of 3dB is chosen for the threshold, and several noise samples raise above the threshold level.

177
International Journal on Advances in Telecommunications, vol 3 no 3 & 4, year 2010, http://www.iariajournals.org/telecommunications/
2010, © Copyright by authors, Published under agreement with IARIA - www.iaria.org
(a)
(b)
(c)
Figure 5. Spectral occupancy for the 470-766 MHz frequency band for 3 different values of the threshold: (a) 11dB (b) 3dB and (c) 5dB.
By analyzing the signals measured during the campaign,
a value of 5 dB for the threshold was chosen, as it allows detection of the weakest measured signal and in the same time is high enough to avoid false detections. This situation is illustrated in Figure 5 (c).
The results listed in Table II were obtained by using this threshold value of 5dB for all the 14 different frequency sub-bands.
TABLE II. SPECTRUM OCCUPANCY IN THE 25-3400 MHZ FREQUENCY RANGE
Frequency range (MHz)
Possible applications according to TNABF
[8]
Measured Occupancy
(%)
Mean Occupancy
(%) 25 - 230 FM radio, Aero/Marine,
Fixed/Mobile, Military, other
28.44
27.79
12.19
230 - 400 Military, Mobile 11.09 400 - 470 Analogue/Digital
Terrestrial Mobile, Meteorology, other
18.37
470 - 766 Analogue TV, DVB-T 40.02 766 - 880 Military, TV, DVB-T,
Cordless, Military, other 12.30
880 - 960 GSM, E-GSM, Military 46.80 960 - 1525 Aero/Naval, Navigation,
Radar, Military, Radio astronomy
2.36
8.56 1525 - 1710 Satellite Mobile,
Military, Meteorology 4.08
1710 - 1880 GSM 1800, other 22.86 1880 - 2200 UMTS/IMT 2000,
DECT, other 14.50
2200 - 2400 SAP/SAB, Military 2.89
3.80
2400 - 2500 ISM, RFID, RLAN, other
9.42
2500 - 2690 UMTS/IMT 2000, Military
2.21
2690 - 3400 Military, Radar, Navigation,
Meteorology, other
3.7
Table II lists the effect of choosing different values for the threshold on the occupancy measured in the 25 to 230 MHz frequency band.
TABLE III. INFLUENCE OF THRESHOLD VALUE OVER MEASURED OCCUPANCY
Energy detection threshold (dB)
Measured occupancy (%)
3 41.53 5 28.44 7 22.32 9 19.60 11 18.18
As it can be noticed, the measured occupancy decreases
when raising the value of the threshold, because the low-energy signals visible in Figure 4 are being ignored.
All the measurements have been carried out during daytime in weekdays, when higher values for spectral occupancy are expected, comparing to nighttime or weekends.
V. MEASUREMENT ANALYSIS Although most of the frequency range between 25 MHz
and 1GHz shows a relative high occupancy, there are bands with some potential for cognitive radio applications. The lowest occupancy percent was measured in the 230 to 400 MHz band (Figure 7), however most of this band is for the moment licensed for military applications.
The frequency band 470-766 MHz is currently used mostly for analog TV broadcasting. Several analog TV broadcasting stations can be noticed in Figure 9 (the level for the station located on 506 MHz is higher then average, as the broadcast antenna is located on the same building from where the measurements were performed). However, although for the moment the occupancy is quite high at 40.02%, this might change in the near future, with the introduction of DVB-T. Test broadcasting for DVB-T is already being performed in the Bucharest area, corresponding signals can be noticed in Figure 9 on 546 MHz (channel 30) and 738 MHz (channel 54). New measurements will have to be conducted in order to evaluate spectral occupancy in this frequency range, once the digital TV broadcasting technology will completely replace the analog one (analog TV broadcasting in Romania is only allowed until 1 January 2012, due to European regulations). Furthermore, the broadcast area for both DVB-T and analog TV stations is limited around big cities, which will result in a lower occupancy for this band in rural environment.
In the frequency band 766 to 880 MHz (Figure 10) only a test DVB-T broadcast station (778 MHz, channel 59) was detected during the measurements, although other possible applications are allowed conforming to the governmental agency responsible for frequency allocation in Romania [16].
The 880-960 MHz and 1710-1880 MHz (Figures 11 and 12) are licensed for the GSM 900 and 1800 systems. In the frequency bands corresponding to the downlink communication direction (925-960 MHz for GSM 900 and 1805-1880 MHz for GSM 1800) a high power level was

178
International Journal on Advances in Telecommunications, vol 3 no 3 & 4, year 2010, http://www.iariajournals.org/telecommunications/
2010, © Copyright by authors, Published under agreement with IARIA - www.iaria.org
measured during the whole band, as the locations of base station antennas was close to the measurement location and the transmit power employed is considerably higher than the one used in case of mobile stations. Although in frequency bands corresponding to the uplink communication direction (880-915 MHz and 1710-1785 MHz) the measured occupancy was extremely low, it should be noted the measurement location and the low transmit power of mobile stations might cause an underestimation of the actual occupancy. CR equipment activating in these bands should have a detection mechanism capable of recognizing low-power signals with energy close to the noise floor, in order to avoid interference to primary users active in the area.
The overall spectrum occupancy measured in frequency bands located above 1 GHz was extremely low (mean occupancies of less than 10%), which make most of this frequency bands potential candidates for CR applications. Occupancies higher than 10% were obtained for sub-bands 9, where the GSM 1800 systems are licensed, and 10, licensed for UMTS/IMT 2000 systems. In both cases, it is again to be noticed that the measured occupancy is much higher for the downlink direction compared to the uplink direction, especially for the UMTS systems where spread spectrum signals are used.
The ISM band 2400 to 2500 MHz is a very good opportunity for testing CR prototype devices, as the measured occupancy is quite low (9.42%) and there are a multitude of commercially available hardware devices operating in this frequency range.
VI. CONCLUSION AND FUTURE WORK Results obtained during the measurement campaign
conducted in an urban environment in Bucharest, Romania clearly indicate that there are several frequency bands that allow opportunistic access for future CR applications. The frequency range analyzed was 25 MHz to 3.4 GHz, and the mean occupancy ratio over the whole band was as low as 12.19%.
Although the values for spectrum occupancy were higher than the ones obtained for the frequency sub-bands above 1GHz, there were two sub-bands, 2 (230-400 MHz) and 5 (766-880 MHz), where the measured occupancy was lower, close to 10%.
In case of the frequency sub-bands above 1 GHz, there are several sub-bands where spectrum occupancy values lower than 5% were obtained (960 – 1525 MHz, 1525 – 1710 MHz, 2200 – 2400 MHz, 2500 – 2690 MHz, 2690 – 3400 MHz). All these bands offer good opportunities for testing of CR prototypes and development of CR networks.
In order to increase the relevance of the obtained data, measurements over longer periods of time and in wider frequency bands (up to 6 GHz) will be performed.
Related to the methodology used for choosing the threshold in case of the energy detection method, another fact that should be taken into account for future analysis is the mean sensitivity of the licensed user equipment that operates in the corresponding frequency band.
Although the results obtained up to now were collected exclusively in an urban environment, further measurement
campaigns targeted at suburban and rural environments are intended, in order to obtain a complete picture of the perspectives for future CR applications.
ACKNOWLEDGMENT This work was supported by the CNCSIS-UEFISCSU
Romania under Grants PNII-RU-TE, no. 18/12.08.2010 and PN-II-“Idei” no. 116/01.10.2007.
REFERENCES [1] A. Marţian, I. Marcu, and I. Marghescu, “Spectrum Occupancy in an
Urban Environment: A Cognitive Radio Approach, ” in Proc. 6th Advanced International Conference on Telecommunications (AICT 2010), Barcelona, May 2010, pp 25-29.
[2] J. Mitola III, “Cognitive Radio for Flexible Mobile Multimedia Communications,” in Proc. IEEE International Workshop on Mobile Multimedia Communications, pp. 3-10, 1999.
[3] A. Marţian, A. Achim, O. Fratu, I. Marghescu, “Analysis of Frequency Spectrum Usage from a Cognitive Radio Perspective, 3rd International Workshop on Cognitive Radio and Advanced Spectrum Management, ” COGART 2010, November 08-10, 2010, Rome, Italy.
[4] M. A. McHenry, P. A. Tenhula, D. McCloskey, D. A. Roberson, and C. S. Hood, “Chicago spectrum occupancy measurements & analysis and a long-term studies proposal,” in Proc. of Workshop on Technology and Policy for Accessing Spectrum (TAPAS), Boston, MA, USA, August 2006
[5] S. D. Jones, E. Jung, X. Liu, N. Merheb, and I.-J. Wang, “Characterization of spectrum activities in the U.S. public safety band for opportunistic spectrum access,” in Proc. 2nd IEEE International Symposium on New Frontiers in Dynamic Spectrum Access Networks (DySPAN 2007), Apr 2007, pp. 137–146.
[6] M. H. Islam, C. L. Koh, S. W. Oh, X. Qing, Y. Y. Lai, C. Wang et al., “Spectrum Survey in Singapore: Occupancy Measurements and Analyses,” in Proc. 3rd International Conference on Cognitive Radio Oriented Wireless Networks and Communications (CrownCom 2008), May 2008, pp. 1–7.
[7] M. Wellens, J. Wu, and P. Mähönen, “Evaluation of spectrum occupancy in indoor and outdoor scenario in the context of cognitive radio,” in Proc. Second International Conference on Cognitive Radio Oriented Wireless Networks and Communications (CrowCom 2007), Aug 2007, p. 8.
[8] O. Holland, P. Cordier, M. Muck, L. Mazet, C. Klöck and T. Renk, “Spectrum Power Measurements in 2G and 3G Cellular Phone bands during the 2006 Football World Cup in Germany,” IEEE Symposium on New Frontiers in Dynamic Spectrum Access Networks (DySPAN), April 2007, pp. 575 – 578.
[9] T. Renk, V. Blaschke, F. K. Jondral, “Time-dependent Statistical Analysis of Measurements for the Evaluation of Vacant Spectrum Bands,” XXIX U.R.S.I. General Assembly, Chicago, Illinois, August 2008.
[10] R. I. C. Chiang, G. B. Rowe, and K. W. Sowerby, “A quantitative analysis of spectral occupancy measurements for cognitive radio,” in Proc. IEEE 65th Vehicular Technology Conference (VTC 2007 Spring), Apr 2007, pp. 3016–3020.
[11] M. Lopez-Benitez, F. Casadevall, A. Umbert, J. Perez-Romero, R. Hachemani, J. Palicot and C. Moy, “Spectral Occupation Measurements and Blind Standard Recognition Sensor for Cognitive Radio Networks,” Proc. 4th International Conference on Cognitive Radio Oriented Wireless Networks and Communications (Crowncom 2009), June 22-24, 2009, pp. 1-9.
[12] A. Ghasemi, E. S. Sousa, “Spectrum sensing in cognitive radio networks: the cooperation-processing tradeoff,” in Wireless Communications and Mobile Computing, vol. 7, no. 9, Nov. 2007, pp. 1049-1060.
[13] C. Vlădeanu, A. Marţian, “Spectrum Sensing Algorithms used in Cognitive Radio Systems,” in Cognitive Radio Technology and

179
International Journal on Advances in Telecommunications, vol 3 no 3 & 4, year 2010, http://www.iariajournals.org/telecommunications/
2010, © Copyright by authors, Published under agreement with IARIA - www.iaria.org
Reconfigurable Communication Systems Workshop, 7th International Conference Communications 2008, Bucharest, June 2008, pp 21-26.
[14] B. Fette, Cognitive Radio Technology, 2nd Edition, Academic Press, 2009.
[15] K.-C. Chen, R. Prasad, Cognitive Radio Networks, John Wiley & Sons, 2009.
[16] Autoritatea Naţională pentru Administrare şi Reglementare în Comunicaţii, “Tabelul Naţional de Atribuire a Benzilor de Frecvenţă”, available online at: http://www.igcti.ro/Portals/57ad7180-c5e7-49f5-b282-c6475cdb7ee7/TNABF%202009.pdf, January 2011.
40 60 80 100 120 140 160 180 200 220-120
-100
-80
-60
-40
-20
0
Frequency (MHz)
Pow
er (d
Bm
)
Analog TV StationsFM Radio Channels Proffesional/Private Mobile Radio
Figure 6. Instantaneous Spectrum Occupancy results: 25 to 230 MHz.
240 260 280 300 320 340 360 380 400-110
-100
-90
-80
-70
-60
-50
Frequency (MHz)
Pow
er (d
Bm
)
TETRA
Figure 7. Instantaneous Spectrum Occupancy results: 230 to 400 MHz.
400 410 420 430 440 450 460 470-120
-110
-100
-90
-80
-70
-60
-50
-40
-30
-20
-10
Frequency (MHz)
Pow
er (d
Bm
)
Public Cellular Netw orksWideband Mobile Netw orks
Figure 8. Instantaneous Spectrum Occupancy results: 400 to 470 MHz.

180
International Journal on Advances in Telecommunications, vol 3 no 3 & 4, year 2010, http://www.iariajournals.org/telecommunications/
2010, © Copyright by authors, Published under agreement with IARIA - www.iaria.org
500 550 600 650 700 750
-100
-80
-60
-40
-20
0
Frequency (MHz)
Pow
er (d
Bm
)
Analog TV Stations
DVB-TDVB-T
Figure 9. Instantaneous Spectrum Occupancy results: 470 to 766 MHz.
770 780 790 800 810 820 830 840 850 860 870 880-110
-100
-90
-80
-70
-60
-50
-40
Frequency (MHz)
Pow
er (d
Bm
)
DVB-T
Figure 10. Instantaneous Spectrum Occupancy results: 766 to 880 MHz.
880 890 900 910 920 930 940 950 960-120
-100
-80
-60
-40
-20
0
Frequency (MHz)
Pow
er (d
Bm
)
EGSM + GSM Uplink EGSM + GSM Dow nlink
Figure 11. Instantaneous Spectrum Occupancy results: 880 to 960 MHz.

181
International Journal on Advances in Telecommunications, vol 3 no 3 & 4, year 2010, http://www.iariajournals.org/telecommunications/
2010, © Copyright by authors, Published under agreement with IARIA - www.iaria.org
1720 1740 1760 1780 1800 1820 1840 1860 1880-130
-120
-110
-100
-90
-80
-70
-60
-50
-40
-30
-20
Frequency (MHz)
Pow
er (d
Bm
)
GSM 1800 Uplink GSM 1800 Dow nlink
Figure 12. Instantaneous Spectrum Occupancy results: 1710 to 1880 MHz.
1900 1950 2000 2050 2100 2150 2200-110
-100
-90
-80
-70
-60
-50
-40
-30
Frequency (MHz)
Pow
er (d
Bm
)
UMTS / IMT 2000
Figure 13. Instantaneous Spectrum Occupancy results: 1880 to 2200 MHz.

182
International Journal on Advances in Telecommunications, vol 3 no 3 & 4, year 2010, http://www.iariajournals.org/telecommunications/
2010, © Copyright by authors, Published under agreement with IARIA - www.iaria.org
Decentralized Spectrum and Power assignment in OFDMA Femtocells: Exploiting Different Levels of Coordination
Francisco Bernardo*, Ramon Agustí†, Jorge Cordero*, Carlos Crespo*
*Signal Theory and Communications Department Universidad de Sevilla
Seville, Spain [email protected]; [email protected]; [email protected]
†Signal Theory and Communications Department Universitat Politècnica de Catalunya
Barcelona, Spain [email protected]
Abstract—This paper focuses on the task of spectrum assign-ment and the transmission power in the context of downlink OFDMA femtocell deployments. Concretely, the paper studies the impact of different levels of coordination between femto-cells in a decentralized framework to perform spectrum and transmission power assignment. Two cooperative schemes are proposed, named non-communicative and communicative re-spectively. In the first case, each femtocell decide the spectrum and power assignment based on users’ reported measurements, which are employed to sense intercell interference, including that from other femtocells or from macrocells in two-layer deployments. In the second case, femtocells are allowed to ex-plicitly communicate other nearby femtocells the radio re-source usage. Performance results have been obtained for a realistic indoor femtocell deployment with and without macro-cell interference. The paper shows that both schemes based on self-organization can lead to sensible performance improve-ments over non-cooperative (selfish) schemes in terms of spec-tral efficiency and power consumption reductions. Finally, the dynamic response of the framework to changes in the network deployment has been analyzed.
Keywords- femtocell; self-organization; OFDMA; coordination; performance tradeoff
I. INTRODUCTION
Self-organization is taking an important role in femtocell (FC) deployments [1][2]. Femtocells are small range and low cost user-deployed base stations introduced at a considerable amount of random locations such as users’ homes and with end connectivity through a DSL (Digital Subscriber Line) backhaul. Differently from Wi-Fi access points, they are deployed in a network operator’s frequency licensed band, allowing the extension of indoor coverage and thus increas-ing network capacity. However, FC deployments introduce several technical challenges that have to be overcome [3]. For instance, the assignment of frequency resources to FCs to mitigate intercell interference cannot be performed as in typical macrocell (MC) scenarios. In that case, the spectrum assignment task is carried out off-line during the network deployment phase, once the exact MCs’ transmitter positions are known, usually requiring a lot of human supervision. On the other hand, the high number of FC transmitters and espe-cially the random and distributed nature of the FC deploy-ment would make unpractical the success of such manual configuration of the spectrum in use. Hence, it becomes ne-
cessary to include appropriate capabilities in each FC so that FCs can automatically reconfigure the spectrum assignment and minimize the human interaction. This is one of the main reasons to use self-organization to manage FC deployments.
Self-organization is the ability of a system composed of several entities to adopt a particular structure and perform certain functions to fulfill a global purpose without any ex-ternal supervisor or central dedicated control entity [4]. In the field of mobile cellular networks, several tasks have been identified to adjust network parameters including self-configuration in pre-operational state, self-optimization in operational state, and self-healing in case of failure of a net-work element [5], bringing operational and capital expendi-tures reductions. Therefore, activities in several projects and standardization bodies are steered to study the automation of network procedures [6], [7].
The main characteristics of a self-organized system are its distributed nature and the localized interactivity between system elements. That is, each entity performs its operation based only on the information retrieved from other entities in its vicinity. Hence, self-organization clearly takes a relevant role in the context of FCs networks. For instance, [8] propos-es a self-optimization scheme for frequency planning in the context of OFDMA (Orthogonal Frequency Division Mul-tiple Access) FCs. It has been agreed that OFDMA radio access interfaces offer appealing properties such as robust-ness against multipath fading and high spectral flexibility. Then, as shown in [8], OFDMA FCs facilitate the develop-ment of such dynamic self-organization mechanisms, and proof of that is that they are being included in the latest spe-cifications for LTE (Long-Term Evolution) system [9]. On the other hand, [10] presents a self-optimization scheme for the coverage (transmission power) in CDMA (Code Division Multiple Access) FCs in the presence of MC interference. However, it is expected that in OFDMA FCs, high transmis-sion power reductions can be obtained. That is, the high spectral flexibility of OFDMA can allow finding spectrum assignments that enable a FC to operate in an ‘interference free’ state. Then, transmission power could be reduced from maximum power to a lower level for acceptable communica-tions taking only into account thermal noise. Hence, energy saving is attained, being in line with recent trends within green communications [11] that pursue an efficient resource (energy) usage to reduce CO2 emissions.
More recently, other approaches to simultaneously op-timize the spectrum assignment and transmission power in OFDMA FCs have been proposed [1][12]. However, the

183
International Journal on Advances in Telecommunications, vol 3 no 3 & 4, year 2010, http://www.iariajournals.org/telecommunications/
2010, © Copyright by authors, Published under agreement with IARIA - www.iaria.org
impact of the different coordination methods between FCs in the decentralized resource assignment problem has not been addressed.
This paper proposes a decentralized framework to jointly self-optimize the spectrum assignment and the transmission power for the downlink of an OFDMA FC deployment with-in the coverage area of an OFDMA MC deployment, and analyzes the performance of several coordination levels be-tween FCs. Concretely, two cooperative schemes where each FC takes into account the spectrum and power usage in near-by FCs are compared. The two strategies are named commu-nicative and non-communicative schemes depending on whether an explicit exchange of information between FCs is allowed. We have tested the framework over a realistic in-door FC scenario with and without MC interference. Numer-ical results show that, compared with reference schemes, the self-optimization framework can improve overall spectral efficiency (in bits/s/Hz) while quality-of-service (QoS) of ongoing users’ sessions is preserved. Moreover, the self-optimization of the transmission power allows to save energy and to reduce intercell interference. Also, an analysis of the dynamic response of the framework reveals that the commu-nicative scheme can react better to changes in the FCs dep-loyment than the non-communicative scheme. On the other hand, the communicative scheme requires from signaling between FCs to exchange the resource utilization messages.
In the following, Section II introduces the deployment scenarios in OFDMA FCs and the different levels of coordi-nation. Next, Section III presents the self-organized frame-work whereas Section IV describes the self-optimization algorithms for spectrum assignment and transmission power. Then, the simulation model is presented in Section V, and obtained results are discussed in Section VI. Finally, Section VII states conclusions of this work.
II. OFDMA FEMTOCELL DEPLOYMENTS
In the following, the spectrum allocation and the different levels of coordination in OFDMA FCs are presented.
A. Spectrum Allocation
In general, OFDMA FCs will co-exist with large cover-age operator-deployed OFDMA MCs, leading to a two-layer deployment (i.e., one layer for MCs and another for FCs). Since an OFDMA radio interface divides the available spec-trum in several frequency subchannels, two or more cells using the same subchannel can interfere each other. This is particularly crucial in an OFDMA radio interface, because intercell interference dramatically reduces the data rate that users in a given cell can obtain. Therefore, intercell interfe-rence in the MC layer is mitigated through the use of Fre-quency Reuse Factors [13], where the available spectrum is distributed among MCs following a fixed regular pattern. Furthermore, interference between FCs in the FC layer can-not be in general neglected due to FCs’ proximity, (e.g., in dense scenarios like buildings with at least one FC per home/office), and then appropriate interference avoidance methods are needed.
Nevertheless, one of the main challenges in the two-layer
scenario is the management of the potential cross-layer in-tercell interference, due to the uncontrolled appearance of FCs from the network operator point of view. As depicted in Fig. 1, one of the simplest mechanisms to avoid the cross-layer interference is to employ an orthogonal spectrum dep-loyment, where the macro- and femto- cell layers use differ-ent spectrum bands and spectrum management is indepen-dently performed for each layer. However, this deployment can reduce overall system capacity. On the contrary, co-channel spectrum assignment shares the available spectrum band between the MC and the FC layers, increasing the available capacity for each one but at the cost of complex management of the intercell interference. For instance, it has been determined that the MC coverage can decay dramatical-ly around FCs due to the excessive interference leaked by FCs [14][15]. Moreover, it has been showed that [16] impor-tant capacity gains can be obtained in the MC layer by deriv-ing indoor users to FC layer, where this gain depends on the MC transmit power configuration affecting the interference produced to the FC layer.
Figure 1. Possible spectrum allocations in OFDMA two-layer
deployments
B. Levels of Coordination
For FC deployments, an operator-controlled spectrum as-signment as in the MC case is unfeasible whereas decentra-lized approaches provide the necessary independency so that FCs can autonomously react to network changes. Neverthe-less, some kind of coordination between FCs is needed to converge to appropriate solutions.
Different levels of coordination are possible depending on the information that a given FC handles to make its deci-sion. This is sketched in Fig. 2 where three distinct coordina-tion levels have been distinguished. First, resource assign-ment strategies can be classified between non-cooperative and cooperative. Non-cooperative strategies only take into account, for each FC, information from the own FC, without considering the actions taken by other cells in the surround-ings. Then, they fall in a sort of selfish strategies and usually are used as reference approaches from comparison purposes. For instance, random schemes such as those used in [17][18] equally divide the available spectrum band into V portions,

184
International Journal on Advances in Telecommunications, vol 3 no 3 & 4, year 2010, http://www.iariajournals.org/telecommunications/
2010, © Copyright by authors, Published under agreement with IARIA - www.iaria.org
and each FC randomly selects one of them. The greater V , the lower the probability that two adjacent FCs use the same portion, but also the lower the available capacity in each FC.
On the other hand, cooperative schemes do take into ac-count information about resource assignment in other nearby cells in order to plan the spectrum assignment accordingly. Two subtypes can be distinguished named as non-communicative and communicative. The non-communicative scheme bases on the feedback of the users to analyze the spectrum and power usage in nearby cells including both other FCs and MCs. Hence it relies on users’ measurements reports that are periodically sent to the FCs base station in uplink. On the other hand, the communicative scheme addi-tionally allows that FCs can exchange explicit information regarding their spectrum and power usage. This can be done through the wireless interface or though the DSL backhaul. The main benefit of the communicative scheme is that a giv-en FC manages the exact resource assignment decision taken by other cells in the surroundings, so that its decision could be more accurate and not only relies on users’ measure-ments. In fact, we will see in the results section the impact of the measurements report period on the communicative and non-communicative strategies, showing that it could degrade the performance of the non-communicative schemes. How-ever, communicative schemes suppose an additional signal-ing overhead for the wireless or DSL interface.
III. SYSTEM MODEL AND FUNCTIONAL ARCHITECTURE
Fig. 3 depicts the system model and functional architec-ture for each OFDMA FC. Fig. 3(a) shows an autonomous FC surrounded by other cells (in general macro- and/or fem-to- cells). Each FC performs autonomous spectrum assign-ment and transmission power decisions with the objective of improving FC’s spectral efficiency while guaranteeing FC users’ QoS and optimizing power consumption.
An OFDMA radio interface is considered in downlink for users’ data transmission, where a system bandwidth, W , is
divided into N subchannels 1, , , , .n N Hence the
bandwidth of each subchannel is /B W N Hz. Moreover, time is divided into frames. The minimum radio resource block assignable to users is one subchannel per frame. On the other hand, there is an uplink control channel where users send instantaneous (frame-by-frame) measurements report messages. As it is explained in the following, these reports provide to the FC the means to approximate, channel status in the short-term to perform the link adaptation for each es-tablished downlink communication link, and cell status in the medium-term to perform reliable spectrum and power assignment.
The functional architecture is depicted in Fig. 3(b). It is a hierarchical architecture where the operation of the FC is divided into two timescales.
A. Short-term
In the short-term, the FC schedules users’ transmissions into the OFDMA time-frequency grid following standard scheduling strategies, which are implemented in the Short-Term Scheduler (STS) functional block. Moreover, STS also performs link adaptation. That is, users’ transmission bitrate is variable by means of Adaptive Modulation and Coding (AMC), where an appropriate modulation and coding scheme is associated to each instantaneous quality measure-ment of the channel (i.e., Signal to Interference plus Noise Ratio: SINR) [19]. The detailed SINR thresholds for each modulation and coding rate considered are given in Table I.
B. Medium-term
In the medium-term (seconds or tens of seconds), the FC changes (if needed) the usage of spectrum and transmission power. To this end, the Self-optimization functional block is introduced as depicted in Fig. 3(b).
The core of the self-optimization block is the self-optimization algorithms (explained in next section) that de-termine which subchannels the FC should use and the trans-mission power per subchannel. The FC executes these algo-rithms following a self-optimization period of L frames, so that each FC is periodically reacting to changes in its envi-ronment, that is, changes in the perceived interference affect-ing the performance of the FC.
Figure 2. Levels of coordination between FCs.
Figure 3. (a) Proposed system model and (b) functional architecture for a
single FC with self-organization capabilities.

185
International Journal on Advances in Telecommunications, vol 3 no 3 & 4, year 2010, http://www.iariajournals.org/telecommunications/
2010, © Copyright by authors, Published under agreement with IARIA - www.iaria.org
The Status Observer module is in charge of building the cell status given as an input to the self-optimization algo-rithms. The cell status consists of (i) the average intercell interference plus thermal noise per subchannel nI , (ii) the
average pathloss in downlink in the FC DLPL , and (iii) the average spectral efficiency in bits/s/Hz. The average in-tercell interference per subchannel and downlink pathloss in the FC can be obtained from the measurement reports given by users. It is worth mentioning that these measurements are usual in mobile cellular systems to perform typical radio resource management procedures like, e.g., handovers [20]. Then users are periodically reporting these measurements averaged during a measurements period of l frames. In or-der to have the most up-to-date information, only the metrics obtained during last period prior the execution of the self-optimization algorithms are passed to them. Moreover, the average spectral efficiency can be estimated by the FC by averaging the quotient between the short-term FC throughput and the assigned bandwidth to the FCs during the last mea-surements period. Note that nI can include both the MC and the other FC interference. Then, the proposed scheme will be able to adapt in a general co-channel MC and FC deploy-ment.
Finally, notice that if two adjacent FCs execute simulta-neously the self-optimization algorithms, then the stability of the framework would be compromised, since both FCs would try to change the spectrum and power assignment at the same time without knowing the final solution of the other FC respectively. Then, in order to minimize the probability that two FCs execute the self-optimization algorithms simul-taneously, each FC randomly selects, from the next L frames after switch-on, the initial frame where the self-optimization period starts. Then, since large values of L are expected, then the probability that two adjacent FCs choose the same initial frame can be very low. Moreover, as it will be seen in the results section, it is desirable that l L so that the measurements taken during the last measurement period before the execution of the self-optimization algo-rithms reflect the latest stable up-to-date information. In oth-er words, a short measurements period reduces the probabili-ty that neighboring FCs of a given FC change the spectrum and power assignment during the last measurement period, thus compromising the accuracy of the measurements.
IV. SELF-OPTIMIZATION ALGORITHMS
In the following, two strategies (non-communicative and communicative) to optimize the spectrum assignment and transmission power of a FC are presented.
A. Cooperative and non-communicative strategy
In the non-communicative strategy, only measurements reported by users to de FC base station are considered.
1) Spectrum assignment Regarding the spectrum assignment, the strategy divides
the decision into two stages. In the first one the algorithm decides the number of subchannels, C , that the FC needs in order to fulfill in average with users’ throughput expecta-tions. Assume that there are U users in the FC and that the
-thu user is satisfied if the assigned throughput is above QoS target target ,uth . Then, the number of subchannels is
computed as:
target,
1max min , ,1
U
uu
thC N
B
, (1)
where B is the subchannel bandwidth in Hz, and is the average spectral efficiency (provided by Status Observer).
Basically, the expression in (1) computes C by dividing the total requested throughput in the FC between the esti-mated cell capacity for that FC. In addition, 1 is a mar-gin factor to allow the estimation of the number of subchan-nels to be conservative. That is, some extra subchannels could be needed to cope with instantaneous fluctuations of the wireless channel, affecting the spectral efficiency per subchannel, which could be punctually lower than . Final-ly, notice that C is bounded to a minimum of one subchan-nel and, to a maximum of N system available subchannels.
In the second stage, the spectrum assignment algorithm sorts the N available system subchannels in increasing order depending on the average intercell interference during the last period ( nI ). Then, the C first sorted subchannels are selected. Hence, the spectrum assignment algorithm in each FC tends to use the best subchannels according to the inter-cell interference perceived by its users. Finally, it is assumed that, after switch-on, a FC initially selects a random spec-trum assignment.
2) Power assignment Once the spectrum assignment is decided, the transmis-
sion power for each assigned subchannel, nP , is adjusted as:
max min( ) max min , ,DLn nP dBm I PL P P . (2)
Based on the definitions given in the section before, the
term DLnI PL stands for the transmission power needed in average to have an average SINR of 0 dB. Hence, the power
TABLE I. ADAPTIVE MODULATION AND CODING TABLE
Modulation [bits/s/Hz]
Coding Rate
Achievable spectral efficiency
[bits/s/Hz]
SINR threshold [dB]
- - 0 < 0.9
2 (QPSK) 1/3 0.66 ≥ 0.9
2 (QPSK) 1/2 1 ≥ 2.1
2 (QPSK) 2/3 1.33 ≥ 3.8
4 (16QAM) 1/2 2 ≥ 7.7
4 (16QAM) 2/3 2.66 ≥ 9.8
4 (16QAM) 5/6 3.33 ≥ 12.6
6 (64QAM) 2/3 4 ≥ 15.0
6 (64QAM) 5/6 5 ≥ 18.2

186
International Journal on Advances in Telecommunications, vol 3 no 3 & 4, year 2010, http://www.iariajournals.org/telecommunications/
2010, © Copyright by authors, Published under agreement with IARIA - www.iaria.org
adjustment in (2) tends to set the transmission power so that an average SINR of dB is attained in the FC. Notice that
nP is maintained between the range [ minP , maxP ]. minP is a minimum power necessary to avoid excessive power reduc-tion in the absence of intercell interference (a possible situa-tion in an OFDMA interface depending on the subchannel assignment in the femtocell and other adjacent femtocells). On the other hand, maxP is the maximum power per sub-channel in dBm due to maximum FC power limitation. Fi-nally, it is considered that after switch-on a FC starts with
maxP in all assigned subchannels.
B. Cooperative and communicative scheme
The communicative scheme takes into account explicit information exchanged between FCs. In this case, we assume that after the execution period of L frames each FC k in-forms the other FCs in the set of neighboring FCs, k ,
about the set of subchannels, k , that the FC is planning to
use. Each FC can build the set of neighboring FCs, k , us-ing the measurement information reported by its users. Also, in case that a MC layer is present (i.e., co-channel spectrum allocation), the FC will add to k the strongest MC (attend-ing to received channel power from MCs), m, and will com-pute m from measurements of the MC activity. Notice that, in this paper, direct communication of the FCs with the MC is not allowed. However, this communication could be ex-ploited if, for instance, the operator broadcasts some infor-mation about the MC deployment to FCs through the DSL backhaul.
1) Spectrum assignment As in the non-communicative strategy, the spectrum as-
signment algorithm is divided into two stages. In the first stage the number of subchannels needed C is computed following (1), which considered the requested throughput by users in the FC and the estimated capacity.
In the second stage, the spectrum assignment algorithm exploits the information collected from nearby FCs:
First selects the subchannels that are not used by any FC in the set of neighboring FCs (i.e., all subchan-nels n that fulfill that jn kj ).
If the number of selected subchannels is still lower than C , then the FC selects from the remaining sub-channels not selected in the previous step those with the lowest intercell interference nI .
Basically, the communicative algorithm pursues the same objective as the non-communicative one, since it tries, for a given FC, to minimize the interference received from other FCs (and strongest MC). What makes the difference is that the communicative algorithm uses the exact assignment in the set of neighboring FCs and this is key advantage regard-ing the adaptability of the algorithm as it will be seen in the results section.
2) Power assignment As for the power assignment, it would be also possible
for the FCs to exchange the transmission power per chunk
and then it would be feasible to estimate the expected inter-cell interference received by users. However, this requires that users also report the estimated pathloss for all the cells in the set of neighboring FCs, thus increasing the signaling overhead. Then, we have opted for using the same procedure as for the non-communicative scheme where the intercell interference nI per subchannel computed by Status Observer from measurements reports is used.
V. SIMULATION MODEL
We consider a downlink OFDMA-based scenario with a total of N 12 subchannels of 375 kHz available in the sys-tem. The scenario is composed of 7 MCs and 12 FCs inside a building as depicted in Fig 4. MC radius is 500 m and the building is situated at approximately 200 m of the central MC. Each one of the offices has 20x20 m2, and the FC is located at the office’s center. For indoor coverage, the COST 231 Multi-Wall Model (MWM) is used [21]. Height of the building’s walls is 4 m. Inner walls are considered as ‘nar-row’ walls (i.e., with small penetration losses), whereas ex-ternal walls are considered as ‘thick’ walls. Penetration losses for doors and windows are also considered. Propaga-tion model parameters and other default simulation values are presented in Table II.
On the other hand, indoor users in FCs are static and al-ways have data ready to be sent (i.e., full-buffer traffic mod-el), so that each user tries to obtain as much capacity as poss-ible. However, a user is satisfied when a given throughput threshold target,uth is reached. Finally, the well-known propor-
tional fair scheduling [22] strategy is considered for resource assignment to users in the short-term according to functional architecture presented in Section III.
We will consider an orthogonal and co-channel spectrum allocation for the FC deployment. For the orthogonal spec-trum allocation simply the MC layer is not considered, so that the N subchannels do not have MC interference. On the other hand, the co-channel allocation considers a MC dep-loyment with a FRF3 spectrum assignment, i.e., the central MC uses one third of the spectrum and the rest of the MCs alternate one of the other 2 subbands.
Besides, we consider two distributions of the users in the FC scenario, named in the following as homogeneous and heterogeneous distributions. In the homogeneous distribu-tion, 4 users are deployed in each office (i.e., FC) whereas in the heterogeneous distribution, half of the offices has 8 users and the rest 4 users.
Figure 4. Scenario layout and building detail

187
International Journal on Advances in Telecommunications, vol 3 no 3 & 4, year 2010, http://www.iariajournals.org/telecommunications/
2010, © Copyright by authors, Published under agreement with IARIA - www.iaria.org
VI. RESULTS
A. Tunig of the self-optimization algorithms
In this section we first assess the behavior of both the communicative and non-communicative schemes with regard to the value of the margin factor ( ) and average target SINR ( ).
Fig. 5 and Fig. 6 show the evolution of the dissatisfaction probability (i.e., a QoS metric as the probability that the us-er’s throughput is below the satisfaction throughput target), spectral efficiency, and transmission power consumption per subchannel for different values of and respectively. These results are presented for the orthogonal and co-channel spectrum allocation and for 1024 and 2048 kbits/s (kbps) of requested throughput per user, with a homogeneous distribu-tion
It can be seen in Figures that a better performance (i.e., lower dissatisfaction probability and transmission power and higher spectral efficiency) is achieved for an orthogonal spectrum allocation than for a co-channel allocation. This is because of the higher intercell interference that this latter allocation produces due to the presence of MCs.
More into details, it can be seen that increasing the mar-gin factor has a positive effect on dissatisfaction probabili-ty since this augments the number of estimated needed sub-channels (see (1)). Hence more capacity is set per FC. How-ever, this also increases the intercell interference between FCs (and also the MC) and thus the spectral efficiency is reduced. Also, the transmission power per subchannel is in-creased. Hence, there is a tradeoff on the selection of the
margin factor. For instance a value around between 1.2 and 1.6 would be adequate for avoiding too high dissatisfaction probability and too low spectral efficiency. On the other hand, increasing the value of the target SINR in the power assignment algorithm (see (2)) has a logical positive impact on the dissatisfaction probability and spectral efficiency, since the power assignment tends to augment the average SINR in the FC. However, a too high target SINR does not translates into an improvement on dissatisfaction probability and spectral efficiency, and alternatively only produces an unnecessary increment of the transmitted power (and FC consumption). Thus, again, there is a tradeoff where in this case a value between 15 and 20 dB for the target SINR is adequate.
Nevertheless, the optimal values for and can change depending on the scenario (e.g., the traffic load, the FCs deployment, etc.) and thus a static selection of these values can be inaccurate in some cases. Then self-tuning mechanisms for these parameters appear as a potential im-provement that should be studied in future work.
B. Performance comparison
In the following, we compare the performance of the co-operative (communicative and non-communicative) schemes for spectrum and power assignment in FCs with a non-cooperative scheme. As stated previously in Section II.B, a random spectrum assignment with constant power is usually taken as a reference for a non-cooperative scheme in litera-ture [17][18]. In this scheme, the spectrum is divided into V =3 equal portions and each FC randomly selects one of them to operate after switch-on.
Results are presented in terms of spectral efficiency, dis-satisfaction probability, and transmission power consump-tion per subchannel. We have considered three different thre-sholds for the satisfaction throughput as 512, 1024, 2048 kbits/s, so that the behavior of the non-cooperative and coop-erative strategies with different QoS requirements are as-sessed.
Fig. 7 and Fig. 8 show the performance comparison for the orthogonal and co-channel spectrum allocation respec-tively. Both Figures show the same qualitative performance, but, Fig. 8 attains lower spectral efficiency, slightly higher the dissatisfaction probability, and higher power consump-tion because of the presence of the MC layer, which increas-es the intercell interference. Fig. 7(a-c) and Fig. 8(a-c) show the performance comparison for the homogeneous distribu-tion of the users in the building. Comparing the non-cooperative and the cooperative strategies, the cooperative schemes (communicative and non-communicative) demon-strates the best trade-off between QoS fulfillment and spec-tral efficiency. For instance, for 512 kbits/s satisfaction throughput, they obtain the best spectral efficiency with a reduced dissatisfaction probability. On the other hand, for 2048 kbits/s satisfaction throughput, each FC demands a higher number of subchannels to cope with the traffic de-mand, what translates into a higher intercell interference and hence into a reduction of the spectral efficiency. However, compared with the non-cooperative strategy, the cooperative schemes considerably reduce the dissatisfaction probability.
TABLE II. SIMULATION PARAMETERS
Frame time fT 2 ms
Subchannel bandwidth B 375 kHz
Carrier Frequency 2 GHz
Number of subchannels N 12 subchannels
UE thermal noise -174 dBm/Hz
UE noise factor 9 dB
STS strategy Proportional Fair
PF Averaging window 50 frames [22]
MC Radius 500 m
MC Antenna height 20 m
Power per subchannel (macro) 32.2 dBm
Minimum distance to FC 1 m
Antenna Patterns Omnidirectional
Pmax -0.7 dBm
Pmin -7 dBm
Av. SINR target 16 dB
Margin factor 1.3
Trigger period L 5000 frames
Measurements period l 500 frames
Path Loss model Cost 231 multi-wall model Penetration losses
[external wall, inner wall, door, window][15,10,3,1] dB
Shadowing standard deviation 8 dB
Small Scale Fading Model ITU Ped. A

188
International Journal on Advances in Telecommunications, vol 3 no 3 & 4, year 2010, http://www.iariajournals.org/telecommunications/
2010, © Copyright by authors, Published under agreement with IARIA - www.iaria.org
Moreover, regarding the power consumption, the cooperative schemes can achieve important energy savings, especially in the orthogonal spectrum allocation and for low throughputs. In this case, due to low intercell interference, FCs can oper-ate near the minimum power per subchannel with compro-mising neither the spectral efficiency nor the dissatisfaction probability. Notice that in the presence of MC interference (co-channel spectrum allocation) the FCs react by increasing the power per subchannel.
It is worth to remark the close performance that both the communicative and non-communicative schemes demon-strate, although a slightly better performance is attained by the communicative scheme. This reveals that both schemes are adequate for spectrum and power optimization in FCs attending to performance. However, results in next subsec-tion reveal that other aspects should be taken into account such as the tradeoff between signaling overhead and dynam-ic response.
Moreover, it is important to highlight the effect of a hete-rogeneous spatial distribution of the traffic load as shown in Fig. 7(d-e) and Fig. 8(d-e). There, the benefits of the cooper-ative schemes are appreciable even with lower satisfaction throughputs than those achieved in the homogeneous case. Notice that, in general, a heterogeneous distribution of the
load will be common in real scenarios. Thus, this calls for using adaptive approaches such as the proposed cooperative schemes.
Finally, as an example of the SINR improvements that self-organization could bring to FC deployments, Fig. 9 shows the SINR distribution in the proximities of the build-ing for both the orthogonal and co-channel spectrum alloca-tion. The spectrum and power assignments for the non-cooperative and the non-communicative schemes in the ho-mogeneous distribution with 512 kbits/s are considered (ana-logous results have been found for the other tests and the communicative strategy). Points outside the building are taken as if they were connected to the central MC when ap-plicable (co-channel). It can be seen that, the cooperative scheme considerably ameliorates overall FC’s SINR with respect to the non-cooperative scheme. Concretely, in co-channel spectrum allocation the cooperative scheme does not create interference in the MC layer (brown color) whereas the non-cooperative scheme reduces in several dBs the SINR in the building’s surroundings. It has been determined that in the former, FC layer self-organizes so that each FC uses dif-ferent subchannels to those used by the central MC. Howev-er, it is appreciable a considerable reduction of the SINR in the FCs compared with the orthogonal spectrum allocation.
1 1.2 1.4 1.6 1.8 2 2.2 2.40
5
10
15
20
25
30(a) Average Dissatisfaction
[%]
Margin Factor ()
1024kbps Orthogonal
1024kbps Co-Channel
2048kbps Orthogonal
2048kbps Co-Channel
1 1.2 1.4 1.6 1.8 2 2.2 2.42.5
3
3.5
4
4.5
5
(b) Average Spectral efficiency
[bit
s/s/
Hz]
Margin Factor ()
1024kbps Orthogonal
1024kbps Co-Channel
2048kbps Orthogonal
2048kbps Co-Channel
1 1.2 1.4 1.6 1.8 2 2.2 2.40.2
0.3
0.4
0.5
0.6
0.7
0.8
0.9
1
1.1(c) Average power per chunk
[mW
]
Margin Factor ()
1024kbps Orthogonal
1024kbps Co-Channel
2048kbps Orthogonal
2048kbps Co-Channel
Figure 5. Impact of margin factor parameter on self-optimization algorithms performance
0 5 10 15 20 25 30 350
5
10
15
20
25
30(a) Average Dissatisfaction
[%]
SINR target () [dB]
1024kbps Orthogonal
1024kbps Co-Channel
2048kbps Orthogonal
2048kbps Co-Channel
0 5 10 15 20 25 30 353
3.2
3.4
3.6
3.8
4
4.2
4.4
4.6
4.8
5
(b) Average Spectral efficiency
[bit
s/s/
Hz]
SINR target () [dB]
1024kbps Orthogonal
1024kbps Co-Channel
2048kbps Orthogonal
2048kbps Co-Channel
0 5 10 15 20 25 30 350.2
0.3
0.4
0.5
0.6
0.7
0.8
0.9
1
1.1(c) Average power
[mW
]
SINR target () [dB]
1024kbps Orthogonal
1024kbps Co-Channel
2048kbps Orthogonal
2048kbps Co-Channel
Figure 6. Impact of target SINR on self-optimization algorithms performance

189
International Journal on Advances in Telecommunications, vol 3 no 3 & 4, year 2010, http://www.iariajournals.org/telecommunications/
2010, © Copyright by authors, Published under agreement with IARIA - www.iaria.org
512 1024 20480
20
40
60
80
100
Satisfaction Throughput [kbits/s]
[%]
(a) Av. Dissatisfaction Prob. (Homogeneous Traffic)
Orthogonal: Non-Cooperative
Orthogonal: Non-Communicative
Orthogonal: Communicative
512 1024 20480
20
40
60
80
100
Satisfaction Throughput [kbits/s]
[%]
(d) Av. Dissatisfaction Prob. (Heterogeneous Traffic)
Orthogonal: Non-Cooperative
Orthogonal: Non-Communicative
Orthogonal: Communicative
512 1024 20483.6
3.8
4
4.2
4.4
4.6
4.8
5
Satisfaction Throughput [kbits/s][b
its/
s/H
z]
(b) Av. Spectral efficiency (Homogeneous Traffic)
Orthogonal: Non-Cooperative
Orthogonal: Non-Communicative
Orthogonal: Communicative
512 1024 20483.6
3.8
4
4.2
4.4
4.6
4.8
5
Satisfaction Throughput [kbits/s]
[bit
s/s/
Hz]
(e) Av. Spectral efficiency (Heterogeneous Traffic)
Orthogonal: Non-Cooperative
Orthogonal: Non-Communicative
Orthogonal: Communicative
512 1024 20480.2
0.3
0.4
0.5
0.6
0.7
0.8
0.9
1
Satisfaction Throughput [kbits/s]
[mW
]
(c) Av. Power per Chunk (Homogeneous Traffic)
Orthogonal: Non-Cooperative
Orthogonal: Non-Communicative
Orthogonal: Communicative
512 1024 20480.2
0.3
0.4
0.5
0.6
0.7
0.8
0.9
1
Satisfaction Throughput [kbits/s][m
W]
(f) Av. per Chunk (Heterogeneous Traffic)
Orthogonal: Non-Cooperative
Orthogonal: Non-Communicative
Orthogonal: Communicative
Figure 7. Performance comparision between random and self-organized schemes with orthogonal spectrum deployment.
512 1024 20480
20
40
60
80
100
Satisfaction Throughput [kbits/s]
[%]
(a) Av. Dissatisfaction Prob. (Homogeneous Traffic)
Co-Channel: Non-Cooperative
Co-Channel: Non-Communicative
Co-Channel: Communicative
512 1024 20480
20
40
60
80
100
Satisfaction Throughput [kbits/s]
[%]
(d) Av. Dissatisfaction Prob. (Heterogeneous Traffic)
Co-Channel: Non-Cooperative
Co-Channel: Non-Communicative
Co-Channel: Communicative
512 1024 20483.6
3.8
4
4.2
4.4
4.6
4.8
5
Satisfaction Throughput [kbits/s]
[bit
s/s/
Hz]
(b) Av. Spectral efficiency (Homogeneous Traffic)
Co-Channel: Non-Cooperative
Co-Channel: Non-Communicative
Co-Channel: Communicative
512 1024 20483.6
3.8
4
4.2
4.4
4.6
4.8
5
Satisfaction Throughput [kbits/s]
[bit
s/s/
Hz]
(e) Av. Spectral efficiency (Heterogeneous Traffic)
Co-Channel: Non-Cooperative
Co-Channel: Non-Communicative
Co-Channel: Communicative
512 1024 20480.2
0.3
0.4
0.5
0.6
0.7
0.8
0.9
1
Satisfaction Throughput [kbits/s]
[mW
]
(c) Av. Power per Chunk (Homogeneous Traffic)
Co-Channel: Non-Cooperative
Co-Channel: Non-Communicative
Co-Channel: Communicative
512 1024 20480.2
0.3
0.4
0.5
0.6
0.7
0.8
0.9
1
Satisfaction Throughput [kbits/s]
[mW
]
(f) Av. per Chunk (Heterogeneous Traffic)
Co-Channel: Non-Cooperative
Co-Channel: Non-Communicative
Co-Channel: Communicative
Figure 8. Performance comparision between random and self-organized schemes with orthogonal spectrum deployment.

190
International Journal on Advances in Telecommunications, vol 3 no 3 & 4, year 2010, http://www.iariajournals.org/telecommunications/
2010, © Copyright by authors, Published under agreement with IARIA - www.iaria.org
It has been checked that, for each FC, this is mainly because of the interference produced by the other MCs, rather than by other FCs. Hence, in general, the interference from MCs distinct of the MC where FCs are deployed cannot be neg-lected.
C. Dynamic response
This section studies the dynamic response of the pro-posed framework, that is, the ability of the different FCs ex-ecuting the self-optimization algorithms to adapt to changes in the network deployment. In the following, results are giv-en for the orthogonal spectrum allocation with homogeneous traffic and a throughput target per user of 512 kbits/s.
Fig. 10 shows the adaptability (in terms of the time evo-lution of (a) dissatisfaction probability, (b) spectral efficien-cy and (c) transmission power per subchannel) of the non-cooperative, non-communicative and communicative schemes for the FC deployment. The figure shows a case where the central MC is activated at time instant 50 (time is normalized to the self-optimization period). Thus, at this moment, FCs in the building perceive an abrupt increment of the intercell interference in the subchannels used by the MC. Three different ratios of the measurements report period ( l ) to the self-optimization period ( L ) are evaluated. A high value (e.g., /l L =1) supposes that it is very probable that neighboring FCs of a given FC also change the spectrum and power assignment during the last measurement period. Hence, some averaged measurements during the last mea-surements period can be inaccurate.
It can be seen in all subplots of Fig. 10 that the response of the non-cooperative scheme does not depend on /l L , since the spectrum assignment is randomly selected without taking into account measurements. On the other hand, the non-communicative and communicative strategies show very different behaviors. For /l L =1, both algorithms demon-strate a very fast response to the increment on intercell inter-ference. However, the non-communicative scheme reveals a
poor performance since the measurements information that is taken is not up-to-date (i.e., neighbors of a FC were changing their resource assignment during the last measurements pe-riod). On the other hand, the communicative scheme achieves a good performance, since the spectrum assignment in a FC is based on the latest spectrum assignment sent by other FCs. Nevertheless, for /l L =0.1, both schemes show a very similar and good performance, although the response of the FC deployment to the activation of the central MC is slower. In this case, since l L , it is less probable for a given FC that another neighbor FC changes the spectrum assignment during the last measurement period, thus suppos-ing an improvement in performance of the non-communicative scheme.
Fig. 11 and Fig. 12 illustrate how the FCs in the building self-organize the spectrum and the power assignment after the activation of the central MC for /l L =1 and /l L =0.1 respectively. Figures show evolution of the average spectral efficiency for seven time instants around the activation of the central MC (time instant 50). Notice that, after MC activa-tion, the spectral efficiency dramatically decays for all FC, but at time instant 70 (20 executions later), the spectral effi-ciency has increased for the communicative scheme. This is also the case for the non-communicative scheme in Fig. 12, although in Fig 11. the inaccuracy of the measurements avoids proper self-organization of the FC deployment.
Finally, it is important to remark that the success of the communicative scheme has an associated cost in terms of signaling overhead. Qualitatively, in order to communicate with adjacent FCs, each FC under the communicative scheme, has to transmit k · ( )s idNb b · (1 / )fLT bits/s.
Here, k is the number of neighboring FCs, sb , is the num-ber of bits needed to encode spectrum usage per subchannel,
idb is the number of bits devoted to code FC’s identification,
and fT is the frame time and thus (1/ )fLT is the update
frequency that depends on the self-optimization period. On the other hand, the signaling needed for measurements in a given FC is U · sinr( )In PLlNb b b · (1/ )flT bits/s, where U
is the number of users in the FC, sinrb are the bits needed to report instantaneous SINR per subchannel for frame-by-frame short-term scheduling, Inb and PLb the bits needed to
report intercell interference and pathloss respectively, and l the measurements period in frames.
Since the signaling for measurements is present in both the non-communicative and communicative schemes, and the signaling for communication of the FCs is exclusive of the communicative scheme, quotient between the signaling and for communication and the signaling needed for mea-surements can be used as a metric to analyze the signaling overhead of the communicative scheme. Fig. 13 shows this quotient for different values of k , N and U , and with respect to the value of L . All magnitudes are encoded with 8 bits and 500l frames and fT =2 ms. Certainly, the signal-
ing overhead demonstrates an inverse relation with the self-optimization period L . Then low values of L can yield to a
Figure 9. SINR comparision in the surroundings of the building.

191
International Journal on Advances in Telecommunications, vol 3 no 3 & 4, year 2010, http://www.iariajournals.org/telecommunications/
2010, © Copyright by authors, Published under agreement with IARIA - www.iaria.org
high signaling overhead of around 20%, especially for a low number of users and a high number of neighboring FCs as shown in Fig. 13. However, notice that for a high number of users in the FC, the signaling overhead tends to be negligi-ble, since in this case the signaling for measurements is do-minant.
VII. CONCLUSIONS
This paper has shown that self-organization is a suitable approach when facing resource management in OFDMA FC
networks. Concretely, self-optimization algorithms for both spectrum and transmission power per OFDMA subchannel assignment have been proposed, showing that the inclusion of these algorithms can bring notable performance improve-ments, especially in two-layer deployments with MCs and heterogeneous spatial distribution of the traffic load.
Moreover, it has been determined that the effect of MCs distinct of the MC where FCs are deployed cannot be neg-lected. That is, those MCs could negatively interfere FCs producing a performance reduction. Hence, multicell MC deployments should be used in two-layer MC and FC per-
0 20 40 60 80 1000
5
10
15
20
25
time [self-opt period]
[%]
(a.1) Average Dissatisfaction Probability (l/L=1)
Non-coop.
Non-commun.
Commun.
0 20 40 60 80 1003.5
4
4.5
5
time [self-opt period]
[bit
s/s/
Hz]
(b.1) Average Spectral Efficiency (l/L=1)
Non-coop.
Non-commun.
Commun.
0 20 40 60 80 1000
0.2
0.4
0.6
0.8
1
time [self-opt period]
[mW
]
(c.1) Average Power per subchannel (l/L=1)
Non-coop.
Non-commun.
Commun.
0 20 40 60 80 1000
10
20
30
40
time [self-opt period]
[%]
(a.2) Average Dissatisfaction Probability (l/L=0.5)
Non-coop.
Non-commun.
Commun.
0 20 40 60 80 1003.5
4
4.5
5
time [self-opt period]
[bit
s/s/
Hz]
(b.2) Average Spectral Efficiency (l/L=0.5)
Non-coop.
Non-commun.
Commun.
0 20 40 60 80 1000
0.2
0.4
0.6
0.8
1
time [self-opt period]
[mW
]
(c.2) Average Power per subchannel (l/L=0.5)
Non-coop.
Non-commun.
Commun.
0 20 40 60 80 1000
10
20
30
40
time [self-opt period]
[%]
(a.3) Average Dissatisfaction Probability (l/L=0.1)
Non-coop.
Non-commun.
Commun.
0 20 40 60 80 1003.5
4
4.5
5
time [self-opt period]
[bit
s/s/
Hz]
(b.3) Average Spectral Efficiency (l/L=0.1)
Non-coop.
Non-commun.
Commun.
0 20 40 60 80 1000
0.2
0.4
0.6
0.8
1
time [self-opt period]
[mW
]
(c.3) Average Power per subchannel (l/L=0.1)
Non-coop.
Non-commun.
Commun.
Figure 10. Dynamic response of the compared strategies under different ratios of the measurements and self-optimization periods
t=40L
t=45L
t=50L
(a) Non-cooperative Strategy
t=55L
t=60L
t=65L
t=70L
3.5 bits/s/Hz
4 bits/s/Hz
4.5 bits/s/Hz
5 bits/s/Hz
t=40L
t=45L
t=50L
(b) Non-communicative Strategy
t=55L
t=60L
t=65L
t=70L
3.5 bits/s/Hz
4 bits/s/Hz
4.5 bits/s/Hz
5 bits/s/Hz
t=40L
t=45L
t=50L
(c) Communicative Strategy
t=55L
t=60L
t=65L
t=70L
3.5 bits/s/Hz
4 bits/s/Hz
4.5 bits/s/Hz
5 bits/s/Hz
Figure 11. Average spectral efficiency per FC for compared schemes (l/L=1).
t=40L
t=45L
t=50L
(a) Non-cooperative Strategy
t=55L
t=60L
t=65L
t=70L
3.5 bits/s/Hz
4 bits/s/Hz
4.5 bits/s/Hz
5 bits/s/Hz
t=40L
t=45L
t=50L
(b) Non-communicative Strategy
t=55L
t=60L
t=65L
t=70L
3.5 bits/s/Hz
4 bits/s/Hz
4.5 bits/s/Hz
5 bits/s/Hz
t=40L
t=45L
t=50L
(c) Communicative Strategy
t=55L
t=60L
t=65L
t=70L
3.5 bits/s/Hz
4 bits/s/Hz
4.5 bits/s/Hz
5 bits/s/Hz
Figure 12. Average spectral efficiency per FC for compared schemes (l/L=0.1).

192
International Journal on Advances in Telecommunications, vol 3 no 3 & 4, year 2010, http://www.iariajournals.org/telecommunications/
2010, © Copyright by authors, Published under agreement with IARIA - www.iaria.org
formance evaluations, rather than single-cell MC plus FCs, as usual in certain studies.
The paper has also studied the effectiveness of different levels of coordination between FCs. Communicative and non-communicative approaches have been compared, reveal-ing that the performance of both schemes can be very close. However, when analyzing the dynamic response of the FC deployment under one scheme or the other, it has been ob-served that the relation between the measurements period and the self-optimization period can considerably degrade the performance of the non-communicative scheme. On the other hand, the communicative scheme demonstrates a ro-bust behavior in this respect. The main drawback of the communicative scheme is the need of designing signaling interfaces between FCs, and the additional signaling that communication between FCs adds to the system. Finally, it is worth remarking the low complexity of the proposed self-optimization algorithms, showing that the simple inclusion of autonomous and adaptive mechanism could bring enorm-ous performance benefits.
ACKNOWLEDGMENT
This work has been performed in the framework of the Spanish Research Council under COGNOS grant TEC2007-60985. Also, the European Regional Development Funds (FEDER) have supported this work.
REFERENCES [1] F. Bernardo, R. Agustí, J. Cordero, and C. Crespo, “Self-optimization
of Spectrum Assignment and Transmission Power in OFDMA Femtocells,” Sixth Advanced International Conference on Telecommunications (AICT 2010), pp. 404-409, 2010
[2] J. Zhang and G. de la Roche, “Femtocells – Technologies and Deployment,” Wiley, January 2010
[3] V. Chandrasekhar, J. Andrews, and A. Gatherer, “Femtocell networks: a survey,” IEEE Commun. Mag., vol.46, no.9, pp.59-67, Sept. 2008
[4] C. Prehofer and C. Bettstetter, “Self-organization in communication networks: principles and design paradigms,” IEEE Commun. Mag., vol.43, no.7, pp. 78-85, Jul. 2005
[5] E. Bogenfeld and I. Gaspard (editors) “Self-x in Radio Access Networks,” Available at: https://www.ict-e3.eu/project/dissemination/whitepapers/whitepapers.html. Dec. 2008. [online][Last accessed 20/01/2011]
[6] INFSO-ICT-216284 Self-Optimisation and Self-Configuration in Wireless Networks (SOCRATES) Project, http://www.fp7-socrates.org/?q=node/1 [Last accessed 20/01/2011]
[7] D.N. Knisely, T. Yoshizawa, and F. Favichia, “Standardization of FCs in 3GPP,” IEEE Commun. Mag., vol.47, no.9, pp.68-75, Sept. 2009.
[8] D. Lopez-Perez, A. Ladanyi, A. Juttner, and Jie Zhang, “OFDMA femtocells: A self-organizing approach for frequency assignment,” IEEE 20th International Symposium on Personal, Indoor and Mobile Radio Communications, 2009, pp.2202-2207, 13-16 Sept. 2009.
[9] 3GPP TS36.300 v8.0.0 “Evolved Universal Terrestrial Radio Access (E-UTRA) and Evolved Universal Terrestrial Radio Access Network (E-UTRAN); Overall description; Stage 2”, Mar. 2007
[10] H. Claussen, L. T. W. Ho, and L. G. Samuel, “Self-optimization of coverage for FC deployments,” in Proc. Wireless Telecommunications Symposium (WTS), 2008.
[11] M. A. Marsan, L. Chiaraviglio, D. Ciullo, and M. Meo, “Optimal energy savings in cellular access networks,” Proc. IEEE International Conference on Communications 2009 (ICC'09), GreenComm Workshop, Jun. 2009.
[12] Q, Su, et al., “A distributed dynamic spectrum access and power allocation algorithm for Femtocell networks,” International Conference on Wireless Communications & Signal Processing, 2009 (WCSP 2009), pp.1-5, 13-15 Nov. 2009
[13] Z. Wang and R.A Stirling-Gallacher, “Frequency reuse scheme for cellular OFDM systems,” Electronics Letters, vol.38(8), pp.387-388, 2002
[14] J. Espino and J. Markendahl, “Analysis of Macro - Femtocell Interference and Implications for Spectrum Allocation,” 20th Personal, Indoor and Mobile Radio Communications Symposium 2009 (PIMRC-09) Tokyo, Japan, 13-16 September, 2009
[15] J. Góra and T. E. Kolding, “Deployment Aspects of 3G Femtocells,” 20th Personal, Indoor and Mobile Radio Communications Symposium 2009 (PIMRC-09) Tokyo, Japan, 13-16 September, 2009
[16] H. Claussen and D. Calin, “Macrocell Offloading Benefits in Joint Macro and Femtocell Deployments,” 20th Personal, Indoor and Mobile Radio Communications Symposium 2009 (PIMRC-09) Tokyo, Japan, 13-16 September, 2009
[17] D. López-Perez, A. Valcarce, G. de la Roche, and J. Zhang, “OFDMA Femtocells: a roadmap on interference avoidance,” IEEE Comm. Mag., vol.47, no.9, pp.41-48, Sept. 2009.
[18] V. Chandrasekhar and J.G. Andrews, “Spectrum allocation in tiered cellular networks,” IEEE Trans. on Comm., vol. 57(10) pp. 3059 - 3068 Oct. 2009
[19] M.S. Al-Janabi, C.C. Tsimenidis, B.S. Sharif, and S.Y. Le Goff, “Adaptive MCS Selection with Dynamic and Fixed Subchannelling for Frequency-Coherent OFDM Channels,” Int. Journal on Advances in Telecommnications, vol. 2(4), pp. 131-141, Mar. 2009
[20] E. Dahlman, S. Parkvall, J. Skold, and P. Beming, “3G Evolution,: HSPA and LTE for Mobile Broadband”, Second Edition, Academic Press (Elsevier), 2008
[21] COST (European Co-operation in the Field of Scientific and Technical Research), COST 231 Book, Final Report. Chapter 4, Propagation Prediction Models.
[22] C. Wengerter, J. Ohlhorst, and A.G.E. von Elbwart, “Fairness and throughput analysis for generalized proportional fair frequency scheduling in OFDMA,” IEEE 61st VTC 2005-Spring. Jun. 2005
200 400 600 800 1000 1200 1400 1600 1800 20000
2
4
6
8
10
12
14
16
Self-optimization period L [frames]
[%]
N=12, k=12, U=1
N=24, k=6, U=1
N=36, k=1, U=1
N=12, k=12, U=8
N=24, k=6, U=8
N=36, k=1, U=8
Figure 13. Signaling overhead of the communicative scheme over the non-
communicative scheme

193
International Journal on Advances in Telecommunications, vol 3 no 3 & 4, year 2010, http://www.iariajournals.org/telecommunications/
2010, © Copyright by authors, Published under agreement with IARIA - www.iaria.org
Advanced Consideration of a Caller Pre-ValidationAgainst Direct Spam Over Internet Telephony
Jurgen Muller and Michael MassothDepartment of Computer Science
Hochschule Darmstadt University of Applied SciencesDarmstadt, Germany
e-mail: {juergen.mueller, michael.massoth}@h-da.de
Abstract—Spam over Internet Telephony as the distributionof unwanted voice messages over Voice over Internet Protocolnetworks is an upcoming threat. It is harder to prevent thane-mail spam since its content is not available before the victim isannoyed. This is even more difficult if the spam is sent directlyto the victim’s user equipment, bypassing the proxies of theservice provider. Hence, this messages cannot be filtered, sincethe proxies are no longer participating in the transaction. Thisarticle presents a pre-validation mechanism, which ensures aminimum level of trust about the caller. It assumes that a legalregistered user does not send any spam, since his service providerwill penalize him if he does so. Therefore, the pre-validationmechanism sends some requests to the presence server of theprovider and the user equipment of the caller to validate theirexistence. This enables the knowledge to allow a call attempt ofan unknown user.
Index Terms—Communication system security; Telephoneequipment; Telephony; Spam
I. INTRODUCTION
Spam over Internet Telephony (SPIT) is an upcomingproblem in the internet and telecommunication society. Thissection gives a brief overview on SPIT. A lot of groups areaffected. There are individuals and companies that use Voiceover Internet Protocol (VoIP) because it is cheap. Additionally,there are spammers who want to send unsolicited calls.
Regarding a study of the German Federal Office for Infor-mation Security, about 98.5 % of e-mails received in Germanyin 2008 were spam [2]. It would not be possible to use VoIPproperly if this amount of spam would arrive in the VoIPnetworks. However, it is not described clearly if the whole98.5 % are spam or unwanted e-mails in general.
The MessageLabs Intelligence Reports provides on amonthly basis the latest thread trend, including the spampropagation [3]. Therefore, the e-mail spam rate in the last18 month was in an average on a level of about 90.5 %, asdepicted in Figure 1.
In addition to annoyance, there is a big problem with costcaused by spam. According to a prediction of Ferris Research,the worldwide cost for spam grew up to $130 billion in2009 [4].
A new kind of view on the spam phenomenon is given ina report by McAfee [5]. The authors describe herein that thewhole amount of annual spam leads to a power consumptionof 33 billion kilowatt-hours. That amount corresponds to the
electricity used in 2.4 million homes in the United States ofAmerica.
VoIP has been designed to reduce telephony-related cost.First of all, providers want to save money, but this meansa reduction of cost for spammers as well. Sending spam viainternet telephony is much cheaper than sending it by a publicswitched telephone network.
Indeed, the distribution of e-mail spam is cheap as well.However, there is a major advantage of SPIT over e-mail spam:It is harder to detect. Therefore, more SPIT gets through to acallee than spam e-mails arrive in a mailbox.
The group of victims in addition grows. The number ofresidential, small- or home office VoIP subscribers grew 24 %in 2009 to 132 million worldwide [6]. 10.3 million of thisVoIP users resides in Germany 2010 [7]. In the future, thetotal number of mobile VoIP users will reach 288 million bythe end of 2013 [8].
This article is structured as follows: Section II introduces theprocess of SPIT and its two types. In Section III, all existingdefense mechanisms that could be applicable against SPIT areintroduced. The proposed caller pre-validation mechanism isintroduced in Section IV. Section V describes how this mech-anism could be attacked. Section VI contains a performanceanalysis of the proposed mechanism. A look forward and anintroduction to future improvements are given in Section VII.
II. BACKGROUND
It is important to know how SPIT works in order tounderstand it. As shown in Figure 2, there are three steps [9].First of all, the spammer needs to collect addresses to sendhis messages to. The next step is the session establishment.The message itself is sent to the callee in the third step. Themost relevant step is the address gathering, because this stepenables the attack.
Gathering
Step 1 Step 2 Step 3
Gatheringaddresses
Sessionestablishment
Sendingmessage
Fig. 2. The three steps of Spam over Internet Telephony [9].

194
International Journal on Advances in Telecommunications, vol 3 no 3 & 4, year 2010, http://www.iariajournals.org/telecommunications/
2010, © Copyright by authors, Published under agreement with IARIA - www.iaria.org
Oct 10May 09 Jun 09 Jul 09 Aug 09 Sep 09 Oct 09 Nov 09 Dec 09 Jan 10 Feb 10 Mar 10 Apr 10 May 10 Jun 10 Jul 10 Aug 10 Sep 10
80 %
70 %
90 %
100 %
84.8 %
96.0 %97.5 %
94.3 % 95.3 %93.6 % 94.7 % 93.5 %
91.3 %93.1 % 92.3 % 91.8 % 90.7 %
93.0 %90.4 %
90.4 % 89.4 % 88.5 %86.4 %
84.1 %81.5 %
83.9 %
90.7 % 89.9 % 90.2 % 89.3 % 88.9 %
89.5%
88.1 %
92.8 %
87.5 %
92.2 % 91.7 %
91.6 %
Germany Global
89.4 %
90.4 %
Fig. 1. E-mail spam rate between May 2009 and October 2010 [3].
A. Gathering Addresses
The question of interest is how spammers are able to acquirethese addresses. Surveys show that there are at least fiveoptions to achieve this objective [9][10][11]:
• Trading: On the internet, there are several opportunitiesto buy whole lists of addresses. This is the easiest wayto gather addresses.
• Harvesting: Spammers use so-called bots, which areautomatically searching for addresses in the internet. Thiscan be done by scanning page code for strings in specialsyntaxes. For example a SIP URI mainly consists of thesub strings “sip:” and the @-sign. Furthermore, spammerssteadily get more addresses just by waiting.
• Active scanning (with permanent SIP URIs): The spam-mer needs a valid account in the network of the desiredprovider to launch this attack. However, he has to findout how addresses are put together among this provider.Next, the spammer starts an automated test call to eachpossible SIP URI. A successful call attempt identifies anassigned address.
• Active scanning (with temporary SIP URIs): This possi-bility is very similar to active scanning. The difference isthat there is no message being sent via the infrastructureof the provider. Instead, they are sent directly to thecallee’s user equipment. Since spammers do not know thecorrect domain part of the temporary SIP URI, they haveto figure out the range of IP addresses that are assigned bythe corresponding provider. So, the spammer has to checkeach possible combination of user name and IP address.
• Passive scanning: An active scan implies the possibilityof detection by a network administrator. Therefore, aspammer can host a web site or hotline and offer, forinstance, a value-added service. Each user who wants touse that service has to register himself on the web siteor to call a certain hotline. Every number who calls thishotline or is sent via the registration form can be storedfor a SPIT attack.
The active scan attack is the most interesting source ofaddresses. A spammer could achieve three lists during hisscan. The first one contains all addresses that are assigned andcurrently registered, i.e., the addresses that responded with a
Originatinguser agent
IncomingSIP proxy
OutgoingSIP proxy
Terminatinguser agent
RTP
SIP
SIP
SIP SIP
Fig. 3. The regular SIP trapezoid.
200 OK response. A second list contains the addresses thatare assigned but currently not registered, i.e., the addressesthat responded with a 480 Temporarily Unavailable. The lastlist holds unassigned addresses that answered with a 404 NotFound response. The last one could be used for future scanattacks.
B. Session Establishment
The spammer could start to launch the spam attack itself,as soon as he collected enough addresses. Therefore, he has toestablish a connection to each victim. He has two possibilitiesto establish these connections because he can gain two listsof assigned addresses (i.e., permanent and temporary SIP URIlists) [9]:
• SPIT via Proxy: The spammer uses the permanent SIPURI list to send his messages via the proxies of theprovider.This so called SPIT via Proxy is the most usual form ofSPIT. The messages sent by the spammer first arrive atproxies belonging to the provider, as shown in Figure 3.These proxies are able to take some actions against SPITand redirect it to its destination.The provider is able to challenge the caller before heaccepts his messages, too. So, only known and trustedusers are able to participate in the system.
• Direct SPIT: A spammer usually does not want that

195
International Journal on Advances in Telecommunications, vol 3 no 3 & 4, year 2010, http://www.iariajournals.org/telecommunications/
2010, © Copyright by authors, Published under agreement with IARIA - www.iaria.org
Originatinguser agent
IncomingSIP proxy
OutgoingSIP proxy
Terminatinguser agent
RTP
SIP
Fig. 4. SIP trapezoid within a direct connection.
his messages are rejected. Therefore, he can use thetemporary SIP URI list.Direct SPIT is a bit different from SPIT via Proxy, asshown in Figure 4. The message is sent directly to thecallee’s user equipment using the temporary SIP URI.Where is the disadvantage for a detection system inthis case? No proxy is involved in the message flowand no filtering can be applied to the message. Mostuser equipments are not designed to handle spam bythemselves. It is very likely that spammers would usethis form of SPIT because of these problems.This is the reason why Direct SPIT is the most dangerousform of SPIT. A mechanism is needed that is able toanalyze the message flow within the user equipment.However, there are only few processing resources in theuser equipment for this kind of processing available.
The session establishment in the Direct SPIT scenario is muchmore dangerous, because no VoIP proxy is involved in thisprocess. Indeed, temporary SIP URIs are only assigned forrelatively short periods of time. Therefore, a spammer mustpossess a very up-to-date list of addresses to perform an attackthis way. Nevertheless, a secure mechanism is required toprevent legitimate VoIP users from this attack due to the veryhigh threat of it.
C. Sending Message
The transmission of the message itself can start after theconnection is established. There are multiple possibilities forthe sending process, related to the sort of message. They differin terms of distribution or message type and can be describedas follows:
• Call center: A call center consists of several people whotalk to their customers personally. The assignment of acall center agent to a customer is usually performed bya computer system. Therefore, it can produce a lot ofSPIT. However, such a call center requires a lot of moneyto operate, because of costs for employees, rooms, andequipment.
• Calling bot: A calling bot is a piece of software thatestablishes connections to the victims automatically. Assoon as the session is built up, a prerecorded message
is transmitted, then the session is terminated. It is inex-pensive in comparison to a call center, because no staffor large rooms are required. Nevertheless, it is able todistribute a high amount of SPIT.
• Ringtone SPIT: Some user equipments are capable tounderstand the Alert-Info header field [12] of an INVITErequest. It specifies an alternative ring tone to the useragent. The ring tone is referred to with a UniformResource Identifier (URI). This URI contains an audioadvertisement as an alternative ring tone. Therefore, thecallee does not have to accept the call to get the message.His own user equipment starts immediately to play thismessage to him.
The most problematic SPIT source is a call center, becauselegitimate call centers exist, too. This legitimate call centerstraffic is hard to differentiate from those sent from illegal callcenters.
Regardless of the SPIT source, additional purposes arepossible. Most SPIT messages are sent with the intent toadvertise a product or service. Unfortunately, there is thepossibility of a SPIT message with the only aim to disturbthe callee. Therefore, all kinds of annoying VoIP calls areconsidered as SPIT in the scope of this article.
D. Relevance of Spam over Internet Telephony
To determine the influence of SPIT on networks and societyis difficult. Anyway, no empirical survey concerning SPITexists so far.
One opportunity to find out its influence is to look at theimpact of e-mail spam. Regarding to Jennings, costs causedby spam consists of three main components [4]. As depictedin Figure 5, the major component (85 %) is a loss of userproductivity. This term refers to all costs, which are caused ifan employee is not able to perform his work. An employeehas to take a break from his work to check his e-mail account.He has to check each e-mail to be able to delete spam, to lookfor false positives, etc. Then he has to continue his originalwork after that, which needs some extra time.
It is highly probable that this will be a major factor regard-ing SPIT as well. It is even worse than that. An employeehas to check his e-mails manually before he loses time of hisoriginal work. SPIT disturbs him for each incoming message,because his phone rings automatically.
Additionally, SPIT requires much more network resourcesthan e-mail spam. This is because of the fact that VoIPconsumes much more bandwidth than e-mails.
III. RELATED WORK
There are a lot of techniques that could be applied againstSPIT. However, only some of them are applicable to DirectSPIT. These techniques are introduced in this section.
A powerful technique against e-mail spam is content filter-ing. Unfortunately, this is not applicable against SPIT.
Content filters have a lot of time to check the mail beforeit is sent to the recipient. Unfortunately, the content of a callis not available in advance. However, SPIT has to be detected

196
International Journal on Advances in Telecommunications, vol 3 no 3 & 4, year 2010, http://www.iariajournals.org/telecommunications/
2010, © Copyright by authors, Published under agreement with IARIA - www.iaria.org
User productivity cost
Help desk cost
Soft- and hardwarecost
85 %
5 %
10 %
Fig. 5. Percentage of economic damage caused by e-mail spam [4].
Fig. 6. Categories of techniques against SPIT.
before the phone is ringing, because the callee is actuallyannoyed when that happens.
So, it is important to look at the capabilities of the avail-able user equipment. A usual phone is not able to processlarge amounts of data or to store much information. Sometechniques against SPIT are depicted in Figure 6. These arediscussed in more detail in the following.
A. Identity-based Techniques
Identity-based techniques attempt to avoid SPIT by theanalysis of static information. They are able to fend spamutilizing only few resources in hardware and processing time.These techniques are the following:
• White listing: A white list is a list, which contains acollection of addresses of trusted users. Only calls from
addresses that are present in this list are allowed toconnect to the callee. The decision is made by comparingthe address of the sender to the entries in this list.An attacker needs good knowledge about the socialconnections of his victim to bypass white listing. It is avery strong protection against unwanted communications,but on the opposite side is it too strong. All regular peoplecannot contact a protected user as long as they are notlisted.
• Black listing: A black list is the technique opposite towhite listing. All calls from addresses on the list arerejected.It is rather easy to bypass black listing. An attacker onlyhas to change the source of his message, after he realizesthat he is blocked. A service provider has to be verycareful before he black lists a participant, because he mustavoid listing a legitimate one.
• Gray listing [13]: The main disadvantage of black- andwhite listing is that the caller has to be known in advance.In this case, a gray list is applicable. Here, an initial callattempt is generally rejected. If the caller starts a secondcall attempt in a given time, his call gets connected tothe callee.This technique is rather simple to bypass for an attackerby calling a second time if the first time misses. However,it is annoying for the caller to be rejected after an initialcall attempt if he is not known in advance (e.g., a bankclerk).
• Device fingerprinting [14]: This technique analyzes thestructure of the message or user equipment behavior todecide whether to accept the call attempt or not. There-fore, knowledge about behavior and message structure ofwell-known user equipment has to be available. The callattempt gets connected if its structure or the calling userequipment’s behavior is successfully identified.This technique uses the assumption that spammers usetheir own self made soft phones, which are able todistribute more SPIT. An attacker who uses a commonsoft phone cannot be rejected by this technique. However,a spammer only has to imitate a known soft phone if hemakes his own one.
• Reputation systems [15]: Each user gets an individualrating derived from user-based evaluations. Users withgood ratings are allowed to call and users with bad ratingsare blocked.This technique originates from e-commerce. Therefore,it suffers the same problems with reputation mafias.These try to increase (ballot stuffing) or decrease (badmouthing) the reputation score [16]. This could be doneby a botnet, for example.
The techniques belonging to this group are the easiest toimplement in user equipment. Only device fingerprinting needstoo much up-to-date information to work properly. So, itcannot be used to fend Direct SPIT directly.

197
International Journal on Advances in Telecommunications, vol 3 no 3 & 4, year 2010, http://www.iariajournals.org/telecommunications/
2010, © Copyright by authors, Published under agreement with IARIA - www.iaria.org
TABLE ICPT EXAMPLE FOR REQUEST INTENSITY [17].
B. Interactive Techniques
Interactive techniques are designed to increase the cost forthe distribution of SPIT. Their purpose is to raise that cost asmuch as possible to make SPIT too expensive for the sender.A description of these techniques follows:
• Intrusion detection [17]: This technique analyses thenetwork traffic and compares it to usual traffic. It isdesigned for multiple network attack, but can also be usedagainst SPIT. Intrusion detection cancels the call attemptif the traffic looks similar to an attack.The decision whether a flow is an attack or not is madewith a conditional probability table (CPT). This CPTcontains expected information about request intensity, er-ror response intensity, number of destinations, etc. Manytransmitted INVITE requests may be a probable indicatorfor SPIT, as depicted in Table I. Unfortunately, thereis no knowledge about SPIT attacks and their behavior.Therefore, the CPT of the intrusion detection system canonly be filled with information based on assumptions.
• Payments at risk [18]: The caller has to send a smallamount of money to the callee. He gets his money backif the callee declares that the call was desirable. Thistechnique leads to a direct increase of costs.Unfortunately, this technique generates a huge amount offinancial transactions. Furthermore, it is problematic ifthe SPIT is initiated by a soft phone, which is remote-controlled by a bot.
• Turing tests [19]: A Turing test has the purpose todifferentiate between human and machine. Therefore, asound file is played to the caller. The sound file containsa short voice message, maybe in a dialect or containingbackground noise. Here, the sound file is relayed to ahuman, who solves it. The caller gets connected if herepeats this message correctly.This technique can be bypassed by a relay attack. There-fore, the sound file is relayed to a human, who solves it.This can be done by a call center, for example.
• Computational puzzle [15]: A computational puzzle isdesigned to increase the required hardware resources andcalling time of the spammer. The calling user equipmenthas to calculate a task, which is very hard to solve.The caller gets connected after the correct result istransmitted.However, a computational puzzle is not able to prevent
a victim from SPIT. The soft phone of a spammer isable to solve the task as well. Therefore, the result of acomputational puzzle is only an increase of processingtime at the caller.
• Honeypot [15]: Honeypots try to bind resources of spam-mers as long as possible. An incoming call is processedvery slowly to bind the spammer’s user equipment.A honeypot can be used as a SPIT monitoring system aswell. It records all information about incoming SPIT and,therefore, allows an analysis of it.
Turing tests and computational puzzles are the weakest ofthese techniques. A spammer still gets connected even ifa computational puzzle is in use. A Turing test does notrepresent a prevention for SPIT that is sent from a call centre.However, this group of techniques needs too many resourcesto run on user equipment and hence to be implemented within.
C. Preventive Techniques
Preventive techniques have the purpose to avoid SPIT beforeit occurs. The main goal is to keep spammers from gatheringaddresses.
Unfortunately, these techniques are not designed to work onuser equipments. They concern the behavior of the user. Thiscannot be done by any equipment.
IV. CALLER PRE-VALIDATION MECHANISM
The callee’s user equipment has to decide about the con-fidentiality of an incoming call. Therefore, a pre-validationmechanism is presented in this section.
A. Requirements
The pre-validation mechanism has to fulfill some require-ments in order to be useful. Furthermore, it has to matchsome additional requirements, because it will be used in ourresearch project Next Generation Telco Factory (NextFactor).They have the objective to enable a better integration as wellas higher security. These requirements are the following:
• Standard compliant: The concept should work withoutany changes or preconditions to the equipment of thecaller and service provider. A mechanism without thisconstraint would not work while the spammer uses a non-compliant soft phone or service provider. Furthermore, allrequests should be used in their specified meaning.
• Open source software: The NextFactor research projectuses open source software from its very beginning. Thisdemands to use future open source components to fulfillthe license requirements of the ones, currently in use.These yet used software is under the terms of the GNUGeneral Public License version 2 (GPLv2) [20]. There-fore, the future software must also be compliant to thislicense.
These requirements should improve the quality of the re-sulting mechanism. The standard conformity is important, toensure success.

198
International Journal on Advances in Telecommunications, vol 3 no 3 & 4, year 2010, http://www.iariajournals.org/telecommunications/
2010, © Copyright by authors, Published under agreement with IARIA - www.iaria.org
Alice Bob
INVITE
100 Trying
200 OK
180 Ringing
ACK
Fig. 7. Progression of a usual incoming call.
B. Analysis
Even with the lot of techniques presented in Section III,there is no feasible protection against Direct SPIT possible.The most techniques are designed to work in the proxies of theprovider’s network. Unfortunately, these proxies are bypassedby Direct SPIT. A technique is needed that is able to preventDirect SPIT with the capabilities of usual user equipments.
Three problems could be identified:• Lack of information in the user equipment: Most tech-
niques require very up-to-date information to work prop-erly. A listing technique cannot act against a spammerbefore the list does not know that he is a spammer. Thisinformation is much easier to distribute between proxiesof the provider’s network.
• Lack of processing power: For example, an intrusiondetection mechanism requires too much processing powerto run efficiently on a user equipment.
• Lack of time: The user equipment starts to ring immedi-ately, after an initial INVITE request arrives, as shown inFigure 7. This is expressed with the optional 180 Ringingresponse sent back after the arriving INVITE request (andthe also optional 100 Trying response). Therefore, thereis no time left to do any validation. Nevertheless, it is stilltoo late at the moment the phone starts ringing, becausethis disturbs the callee.
Let assume, that the callee’s user equipment has enoughtime. It needs at least a little information about the caller,to verify his existence. There is only one INVITE requestavailable at that time. Anyway, there is useful informa-tion about the caller in the SIP URI of the request (e.g.,sip:[email protected]):
• The user name (i.e., “alice”).• The name or IP address of the provider being used (i.e.,
“example.com”).It is important to keep the 180 Ringing response until
validation succeeds. Therefore, the user equipment has timeto validate the caller.
C. Concept
The user equipment has only a little information aboutthe caller, as explained above. Now it has to validate itscorrectness. However, there is still no guarantee that SPIT willnot occur. It can only be assured that the caller is registered.This is important, because it is very likely that spammers useDirect SPIT, since they do not want to use valid accounts. Thenamed provider is able to admonish a user, after he sends SPIT
if he is a registered user of the provider. There are two stepsto perform after separating the 100 Trying and 180 Ringingresponse, as visible in Figure 8:
• Check the existence of the caller at the provider.• Check the existence of the caller’s user equipment.The call attempt can be rejected if this information is not
correct, because the caller is not trustable. The call estab-lishment can proceed if the existence of the calling user isconfirmed.
Therefore, a way to validate the existence of the userat the named provider is needed. The SIP Specific EventNotification [19] is helpful to do this. It provides several eventpackages for different scenarios. The following event package-based mechanism and event packages are applicable to theDirect SPIT:
• Presence event package [21]: This package allows get-ting information about the presence state of a user. Apresence state is the willingness and ability of a user tocommunicate. It is widely common in instant messaging.The subscriber is notified if the requested user changeshis presence state (e.g., from “present” to “away”).
• INVITE-initiated dialog event package [22]: This pack-age has the purpose to inform a subscriber if the requesteduser changes his dialog state. It is usable with all SIP mes-sages that result in a dialog (e.g., INVITE, SUBSCRIBE).The requesting user gets a NOTIFIY request if such adialog changes his state (e.g., “terminate”).
• Dialog Event foR Identity VErification (DERIVE) [23]:This mechanism makes use of the INVITE-initiated di-alog event package to verify that the current caller is inthe correct state (i.e.,“Proceeding”). Besides, the state isverified that the caller is a known member of the allegedservice provider. The outcome of the use of DERIVE canresult in three cases.The call is verified if the SUBSRIBE request is answeredwith a 200 OK response. The correct state of the calleris confirmed in the following NOTIFY request.The call cannot be verified if the service provider ofthe caller does not support the Dialog Event Package.A 489 Bad Event response returns to show this. Nev-ertheless, the call attempt is accepted, because it is notmandatory to support this event package.The call attempt is suspicious if the answer indicates that
Caller Provider Bob
Call attempt
In progress
Exists the caller?
Telephone is ringing
Answer
Call accepted
Step 1
Step 2Exists the user agent of the caller?
Answer
Fig. 8. Conceptual changes in a call attempt.

199
International Journal on Advances in Telecommunications, vol 3 no 3 & 4, year 2010, http://www.iariajournals.org/telecommunications/
2010, © Copyright by authors, Published under agreement with IARIA - www.iaria.org
Fig. 9. Overview of DERIVE operation [23].
the caller is not currently in the proceeding state. There-fore, the call attempt is rejected with a 434 SuspiciousCall response.
The next validation step can be started if the user’s existenceat the provider has been validated. It is desired to validate theuser equipment of the caller. This validation is important, be-cause otherwise probable spammers are able to send messageswith incorrect IP addresses.
Spammers are not able to start a bidirectional communica-tion with an incorrect IP address, maybe it is only desired todisturb the callee. Therefore, spammers only have to send oneINVITE request, because most user equipments starts to ringimmediately.
A request can be sent to the calling equipment directly tovalidate the user equipment. The following three requests arethe most suitable:
• MESSAGE: This request transmits a text message to itsdestination. The use of this request has some disadvan-tages. A second validation could be started if the recipientwants to validate the request as well. This leads to a loopif he uses the same validation. Additionally, it is possibleto annoy a uninvolved third user if the caller sends anassigned IP address.
• INVITE: The purpose of the INVITE request is to es-tablish a phone call. It has the same disadvantages as theMESSAGE request. Additionally, it is possible to connectthe callee to a premium rate service with high rates, forexample. However, the callee has to act by himself tobecome a victim of such an attack.
• OPTIONS: The OPTIONS request is normally used todetermine the capabilities of user equipment. A commu-nication is not established, so the disadvantages of theabove requests do not apply here. The receiving userequipment does not act recognizably for its user and,therefore, does not annoy him.
D. Proof of Concept
The presented concept was implemented with An-droid 1.5 [24] and the VoIP client sipdroid 1.0.8 [25].
The Presence Event Package is used to validate the existenceof the user at the provider, as depicted in Figure 10. Thisdecision is made because the Dialog Event Package requestssome information, which has nothing to do with the existence
Caller Provider Bob
486 Busy Here / 200 OK
INVITE
100 Trying
SUBSCRIBE
200 OK
NOTIFY
200 OK
200 OK
OPTIONS
180 Ringing
ACK
Step 1
Step 2
Fig. 10. Released changes in a call attempt.
of the user. Using the presence state fits better to this task. It isa more expressive information about the “current” existence.
The validation of the user equipment is done by sendingthe OPTIONS request, because this is the only request withoutthe disadvantage of possible annoyances. However, the contactheader field of the NOTIFY request is validated before theOPTIONS request is sent. The OPTIONS request is not sent ifit contains the temporary SIP URI of the caller. The existenceof the user equipment is validated by comparing its address tothe sender’s address of the INVITE request, instead of sendingthe OPTIONS request. Therefore, the transmission time forthis request is saved.
E. Restrictions
The presented mechanism is not able to work in everypossible network configuration. Most of all, a presence serveris required, which is not mandatory for a standard SIP config-uration. However, future VoIP networks most likely include apresence server, as the IP Multimedia Subsystem (IMS) [26]concept becomes more popular. A 434 Suspicious Call re-sponse [23] could be sent out if the caller has no presenceserver available. Therefore, he gets adequate information whyhis call attempt is rejected.
Another scenario where no pre-validation is applicable isan anonymous caller. Anonymous calls are still known frompublic switched telephony. These calls are often mistrusted,because the callee expects that the caller has something tohide. In the sense of this behavior is it most fitting to senta 433 Anonymity Disallowed response [27] to the caller. Acaller who really wants to call the callee can see the reasonof the rejection and call again without anonymity.
V. ATTACKING SCENARIO
The proposed caller validation has a main vulnerability. Letassume that the attacker has at least one valid account (i.e.,sip:[email protected]) in the provider’s network of thetarget, as depicted in Figure 11. The spammer calls Bob by histemporary SIP URI from a second unregistered account (i.e.,sip:[email protected]). Then the INVITE request containsthe information that it is allegedly sent from the registered

200
International Journal on Advances in Telecommunications, vol 3 no 3 & 4, year 2010, http://www.iariajournals.org/telecommunications/
2010, © Copyright by authors, Published under agreement with IARIA - www.iaria.org
account. The provider confirms this request and sends aNOTIFY request, due to the fact that this account is registered.
This NOTIFY request must contain the header field “con-tact”. It is not specified, which address has to be written inthere. Hence, two possible scenarios can occur:
• The contact address in this message contains the tempo-rary SIP URI of the registered account. Therefore, theuser equipment rejects the call attempt, because it differsfrom the one in the INVITE request.
• The contact address does not contain the temporarySIP URI. Instead, there is maybe the address of thepresence server. Now, the OPTIONS request is sent to thepermanent SIP URI. However, this message is transmittedto the registered account of the spammer that really exists.So, the validation succeeds, too.
The proposed caller validation mechanism offers no protectionin the second scenario. However, this attack works only if thepresence server does not sent the temporary SIP URI of thespoofed account.
VI. PERFORMANCE ANALYSIS
It is obvious that the proposed mechanism requires moretime to process than a normal call attempt. This sectioncontains an analysis about this durational increase and itsamount.
A. System Under Test
To determine the difference in processing time, a systemwith a 1.66 GHz dual core processor, 2 GB memory anda 6 Mbps internet connection was used. The SIP proxy ofthe provider was located in Denver (USA) Caller and calleewere located in Darmstadt (Germany). The distance betweenDenver and Darmstadt is about 8,000 km, which results in200 ms round-trip time with 17 hops. The caller pre-validationprototype was launched inside the Android Emulator.
B. Key Performance Indicator
One key performance indicator was defined to ensure stableand comparable measurement results. The start trigger of thetime measurement is at the arrival of the INVITE request, as
example.comsip:[email protected]
sip:[email protected]:[email protected]
5. phone is ringing
3. validate existanceat the provider
1. registration
4. validate existance of the equipment2. call attempt
Fig. 11. Successful attacking scenario.
Caller Provider Bob
486 Busy Here / 200 OK
INVITE
100 Trying
SUBSCRIBE
200 OK
NOTIFY
200 OK
200 OK
OPTIONS
180 Ringing
ACK
Starttrigger
Stoptrigger
Fig. 12. Start and stop trigger of the service processing time.
depicted in Figure 12. The stop trigger is at the sending of the180 Ringing response.
The measurement takes place at the user equipment. Thisshould reduce the distortion of the first and last messagetransmission to the caller, which does not depend on the pre-validation mechanism. The rest of the session establishingprocess was not measured, because it is the same as withoutcaller pre-validation. The test sequence was repeated a hundredtimes.
C. Test Results
The regular sipdroid needs an average of 2.821 s to producean answer, the prototype sends the answer after 5.240 s. Afive-number summary of the results is listed in Table II anddepicted in the box plot in Figure 13. It is obvious that themaximum results are outliers, because they are that muchaway from the box. Both clients show a similar behavior inprocessing and answering. This leads to the assumption thatthe mechanism has no negative influences on stability.
To confirm this assumption, the 95 % confidence intervalwas calculated. Itis shown in Table III and Figure 14. Bothexpected values are located within the same range. The maindifference is that the caller pre-validation prototype requiresabout 2.5 s longer to process an answer. These 2.5 s containsa round-trip delay of 0.2 s per message to Denver and hence
TABLE IIFIVE-NUMBER SUMMARY OF THE TEST RESULTS.
0,000 s 1,000 s 2,000 s 3,000 s 4,000 s 5,000 s
Sipdroid
Prototype
6,000 s 7,000 s
Fig. 13. Box plot.

201
International Journal on Advances in Telecommunications, vol 3 no 3 & 4, year 2010, http://www.iariajournals.org/telecommunications/
2010, © Copyright by authors, Published under agreement with IARIA - www.iaria.org
TABLE IIIVALUES OF THE 95 % CONFIDENCE INTERVAL.
2,500 s 3,000 s 3,500 s 4,000 s
Sipdroid
4,500 s 5,000 s 5,500 s 6,000 s
5 x
0 x
10 x
15 x
20 x
25 x
Prototype
Fig. 14. 95 % confidence interval.
is smaller if a local provider is used.These additional 2.5 s are only relevant to the caller. A callee
never notices this time span, because his user equipment doesnot ring until it is done. Furthermore, this is an additionaltime needed for spammers. They can send less spam per hourif a huge number of their victims use this mechanism. So, thisapproach could be treated as an interactive technique to makespamming unprofitable.
It has to be mentioned that these results are based on aprototype that still needs some optimization. Its only purposewas to provide a proof of concept.
VII. CONCLUSION AND FUTURE WORK
The defense against Direct SPIT is relevant for a largenumber of internet users who want to communicate overthe internet via VoIP. The caller pre-validation mechanismintroduced in this article is able to fend Direct SPIT sent fromunregistered users. This is important because it is probable thatspammers use Direct SPIT from unregistered accounts in orderto be undetectable. However, the presented mechanism is onlyable to validate the correctness of the given user information.Furthermore, even a registered user is able to send SPIT. Thereis no guarantee that SPIT will not occur while using thismechanism. However, the caller’s provider is capable to takemeasures against such users.
The prototype is currently in an alpha phase. It has to beimplemented more efficiently, because a delay of 2.5 s isstill a lot of time. This delay is indeed only observable for acaller – but this can be a legitimate caller, too. Therefore, thetransmission of the SUBSRIBE and OPTIONS requests haveto be made in parallel. The goal is to drop the delay to 50 %of the achieved value. The comparison of the temporary SIP
URI in the NOTIFY and INVITE request can be performedafter all responses have arrived.
Furthermore, an analysis has to be conducted regardingopportunities to fix the weakness in the attacking scenariodescribed in Section V. If it is possible to fix the vulnerability,this would be included in the concept as well as in theprototype.
Additionally, the blocked callers could be added to a gray-or black list to save some time and processing power for anadditional call attempt.
The prototype will be included into other VoIP clientsas soon as it will be running robustly and more efficiently.Therefore, an implementation for a research project of theDepartment of Computer Science will be made.
VIII. ACKNOWLEDGEMENTS
We would like to thank Rachid El Khayari from the Fraun-hofer Institute for Secure Information Technology for his wisesupport, which makes this work possible. We would also liketo thank our valuable reviewers especially Torsten Wiens forhis extensive and high quality comments.
REFERENCES
[1] J. Muller and M. Massoth, “Defense against direct spam over internettelephony by caller pre-validation,” in Proceedings, The Sixth AdvancedInternational Conference on Telecommunications (AICT 2010), 9-15May 2010, Barcelona, Spain, J. E. Guerrero, Ed. Los Alamitos, CA,USA: IEEE Computer Society, 2010, pp. 172–177.
[2] The IT Security Situation in Germany in 2009, Federal Office forInformation Security, Bonn, Germany, Jan. 2009.
[3] MessageLabs Intelligence August 2010, MessageLabs, New York, NY,USA, Aug. 2010.
[4] R. Jennings, “Cost of spam is flattening,” Ferris Research Blog,http://www.ferris.com/2009/01/28/cost-of-spam-is-flattening-our-2009-predictions/ 20.01.2011.
[5] The Carbon Footprint of Email Spam Report, McAfee, Santa Clara, CA,USA, 2009.
[6] M. Machowinski and D. Myers, “Trend toward hosted and businessvoip services seen across three new reports,” Infonetics Research PressRelease, Apr. 2010.
[7] Federal Association for Information Technology, Telecommunicationsand New Media, “Erstmals mehr als 10 millionen nutzer von internet-telefonie,” Press statement, Apr. 2010.
[8] E. Potter, “Number of mobile voip users will approach 300 million by2013,” In-Stat Press Release, Mar. 2010.
[9] R. El Khayari, N. Kuntze, and A. U. Schmidt, “Spam over internettelephony and how to deal with it,” in Proceedings of the ISSA 2008Innovative Minds Conference, 7 - 9 July 2008, School of Tourism & Hos-pitality, H. S. Venter, M. M. Eloff, J. H. P. Eloff, and L. Labuschagne,Eds. Johannesburg, South Africa: University of Johannesburg, 2008.
[10] Why Am I Getting All This Spam?, Center for Democracy & Technology,Washington, DC, USA, Mar. 2003.
[11] T. Eggendorfer, No Spam! Wie Spam gar nicht erst entsteht, 1st ed.Frankfurt am Main, Germany: Software & Support, 2005.
[12] J. Rosenberg, H. Schulzrinne, G. Camarillo, A. Johnston, J. Peterson,R. Sparks, M. Handley, and E. Schooler, “Sip: Session initiation proto-col,” RFC 3261, IETF, Jun. 2002.
[13] E. Harris, “The next step in the spam control war: Greylisting,”http://projects.puremagic.com/greylisting/whitepaper.html 20.01.2011.
[14] H. Yan, K. Sripanidkulchai, H. Zhang, Z.-Y. Shae, and D. Saha,“Incorporating active fingerprinting into spit prevention systems,” in 3rdAnnual VoIP Security Workshop, Berlin, Germany. New York, NY,USA: ACM, 2006.
[15] J. Rosenberg and C. Jennings, “The session initiation protocol (sip) andspam,” RFC 5039, IETF, Jan. 2008.

202
International Journal on Advances in Telecommunications, vol 3 no 3 & 4, year 2010, http://www.iariajournals.org/telecommunications/
2010, © Copyright by authors, Published under agreement with IARIA - www.iaria.org
[16] C. Dellarocas, “Immunizing online reputation reporting systems againstunfair ratings and discriminatory behavior,” in The 2nd ACM Conferenceon Electronic Commerce (EC 2000), Minneapolis, MN, USA – October17 - 20, 2000, A. Jhingran, J. K. MacKie-Mason, and D. Tygar, Eds.New York, NY, USA: ACM, 2000, pp. 150–157.
[17] M. El Baker Nassar, R. State, and O. Festor, “Intrusion detection mech-anisms for voip applications,” in 3rd Annual VoIP Security Workshop,Berlin, Germany. New York, NY, USA: ACM, 2006.
[18] M. Abadi, A. Birrell, M. Burrows, F. Dabek, and T. Wobber, “Bankablepostage for network services,” in Advances in Computing Science –ASIAN 2003: Progamming Languages and Distributed Computation, 8thAsian Computing Science Conference Mumbai, India, December 10-12, 2003, Proceedings, ser. Lecture Notes in Computer Science, V. A.Saraswat, Ed., vol. 2896. Berlin / Heidelberg, Germany: Springer, 2003,pp. 72–90.
[19] H. Tschofenig, E. Leppanen, S. Niccolini, and M. Arumaithurai, “Com-pletely automated public turing test to tell computers and humans apart(captcha) based robot challenges for sip,” Internet-Draft, IETF, Feb.2008, expired: 28.08.2008.
[20] GNU General Public License Version 2, Free Software Foundation,Boston, MA, USA, Jun. 1991.
[21] J. Rosenberg, “A presence event package for the session initiationprotocol (sip),” RFC 3856, IETF, Aug. 2004.
[22] J. Rosenberg and H. Schulzrinne, “An invite-initiated dialog eventpackage for the session initiation protocol (sip),” RFC 4235, IETF, Nov.2005.
[23] J. Kuthan, D. Sisalem, R. Coeffic, and V. Pascual, “Dialog event for iden-tity verification,” Internet-Draft, IETF, Oct. 2008, expired: 28.04.2009.
[24] Open Handset Alliance, “Android.com,” http://www.android.com/20.01.2011.
[25] P. Merle, “sipdroid - project hosting on sip/voip client for android,”http://www.sipdroid.org/ 20.01.2011.
[26] Technical Specification Group Services and System Aspects, “Ip multi-media subsystem (ims); stage 2 (release 10),” 3rd Generation PartnershipProject, Technical Specification TS 23.228 V10.3.1, Jan. 2011.
[27] J. Rosenberg, “Rejecting anonymous requests in the session initiationprotocol (sip),” RFC 5079, IETF, Dec. 2007.

203
International Journal on Advances in Telecommunications, vol 3 no 3 & 4, year 2010, http://www.iariajournals.org/telecommunications/
2010, © Copyright by authors, Published under agreement with IARIA - www.iaria.org
Dynamic Spectrum Sharing in Cognitive Radio Networks: a Solution based on Multiagent Systems
Usama Mir, Leila Merghem-Boulahia, Dominique Gaïti ICD/ERA, UMR 6279,
Université de Technologie de Troyes, 12 rue Marie Curie, 10010 Troyes Cedex, France
{usama.mir, leila.merghem_boulahia, dominique.gaiti}@utt.fr
Abstract— In modern day wireless networks, spectrum utilization and allocation are static. Generally, static spectrum allocation is not a feasible solution considering the distributed and dynamic nature of wireless devices, thus some alternatives must be ensured in order to allocate spectrum dynamically and to mitigate the current spectrum scarcity. An effective technology to ensure dynamic spectrum usage is cognitive radio, which seeks the unutilized spectrum holes opportunistically and shares them with the neighboring devices. Using cognitive radio capabilities, the nodes are not restrained to static spectrum utilization, rather they can choose it on demand. However, dynamic spectrum usage raises several challenges, which need to be addressed in detail. These challenges include efficient allocation of spectrum between licensed (or primary) and cognitive radio (or secondary) users in order to maximize spectrum utilization and to avoid device level interferences. To this extend, we develop a novel solution for spectrum allocation using multiagent system cooperation that enables secondary user devices to utilize the amount of available spectrum, dynamically and cooperatively. The key aspect of our design is the deployment of agents on each of the primary and secondary user devices that cooperate in order to have a better use of the spectrum. For cooperation, contract net protocol is used, allowing spectrum to be dynamically allocated by having a series of message exchanges amongst the devices. Simulation results show that our solution achieves up to 80% of the whole utility within the span of few messages, and provides an effective mechanism for dynamic spectrum allocation. Keywords- Multiagent Systems; Cognitive Radio; Dynamic Spectrum
Sharing; Contract Net Protocol; Cooperation; Ad hoc Networks.
I. INTRODUCTION In most of the modern day applications, radio spectrum
allocation and sharing is a static function, in which the spectrum is assigned to a particular dominant primary (or licensed) user [3], for a long period of time in order to avoid interferences and collisions. Parallel to this, to deal with increasing user demands, dynamic spectrum allocation for new wireless networks is necessary. However, since existing wireless networks occupy extensive parts of the radio spectrum, there is no sufficient spectrum available to all the new unlicensed wireless networks [1] [25]. Thus, research has to be done to address this problem via dynamic sharing and assignment of spectrum. For example,
in USA, Federal Communication Commission (FCC) considers to allow sharing of unused portions of TV bands to promote dynamic use of spectrum [2] [4].
One effective technology to alleviate the problem of static spectrum assignment and to maximize dynamic spectrum usage is cognitive radio (CR) [17], a radio in modern wireless systems, in which a CR (or a secondary user) node changes its parameters (transmission or reception) to share the spectrum dynamically and to avoid the interference with the other primary or secondary users. The parameter alteration is done by having some knowledge about the radio environment factors such as radio frequency (RF) signals, device level interferences, etc. To achieve efficient and dynamic allocation of spectrum between highly distributed CR devices, a balanced, simple and cooperative approach is necessary. Research is therefore in progress on exploring the cooperative spectrum sharing techniques in CR networks. Similar to CR network, a multiagent system (MAS) [21] [27] is a system composed of multiple autonomous agents, working individually or in groups (through interaction) to solve particular tasks. Like CR nodes, agents work dynamically to fulfill their user needs and no single agent has a global view of the network. Each agent maintains its local view and shares its knowledge (when needed) with other agents to solve the assigned tasks.
Recent advances in technology (especially in the domain of programmable integrated circuits and distributed artificial intelligence) have created an opportunity for us to develop a new class of intelligent, autonomous, and interactive CR devices [8]. These devices can then be used in a wide variety of network domains (WLAN [48], WRAN [49], MANETs [23]). In addition, an efficiently designed CR with a software agent deployed on it would be capable of interacting with neighboring radios to form a dynamic, loosely-coupled and infrastructure-less collaborative network. While CR physical architecture and its sensing capabilities have received considerable attention [5] [28], the question of how to share radio resources in cooperative scenarios is also an important research issue for current researchers [3] [8] [22].
Therefore, in this paper, a MAS based strategy is proposed for dynamic spectrum allocation. Specifically, we consider a

204
International Journal on Advances in Telecommunications, vol 3 no 3 & 4, year 2010, http://www.iariajournals.org/telecommunications/
2010, © Copyright by authors, Published under agreement with IARIA - www.iaria.org
cooperative MAS [29] [36], in which the agents are deployed over primary and secondary1 user devices. By cooperative MAS we mean that the primary user agents exchange a tuple of messages and help neighboring secondary user agents to improve their spectrum usage. Moreover, the cooperation mechanism we develop is similar to that of contract net protocol (CNP) [10] [30], in which the individual secondary user (SU) agent should send messages to the appropriate neighboring primary user (PU) agents whenever needed and, subsequently, the related PU agents should reply to these agents in order to make spectrum sharing agreements. We propose that the SU agents should take their decisions based on the amount of spectrum, time and price proposed by the PU agents and should start spectrum sharing whenever they find an appropriate offer (without waiting until the reception of all the neighboring PU agents’ responses [14]). Then, after completely utilizing the desired spectrum, SU agents should pay the agreed price to the respected PU agents.
In fact, this work is divided into following four parts: First, we present a brief state of the art on various
available approaches for spectrum sharing using multiagent systems, game-theoretical approaches and medium access control solutions.
Second, we detail four different scenarios, in which spectrum sharing challenges need to be addressed in details. We also propose some initiative measures, which are necessary to be taken for efficient utilization of the available spectrum in the mentioned scenarios.
Third, we present a cooperative framework with the related spectrum sharing algorithms. The proposed MAS is cooperative where PU agents exchange a series of messages to share their spectrum with the requesting SU agents. The more complex scenarios with agents’ competitive behaviors will be examined as a part of our future study.
Finally, we conduct extensive simulations to verify the working of the proposed cooperative algorithms for dynamic spectrum sharing in the context of cognitive radio networks.
The rest of the paper is organized as follows. The following
section briefly presents related works. Section III presents four scenarios, in which dynamic spectrum sharing is a vital issue. In Section IV, we describe spectrum allocation problem with the help of an example. In Section V, we propose our model with the interlinked working of various modules and their related algorithms. The experimental setup, some results and discussions are given in Section VI. Section VII concludes our work with the future perspectives.
1 The words cognitive, secondary and unlicensed user will be used
interchangeably throughout the article.
II. PRIOR WORK Research has been going around for several years in order to
apply multiagent systems for decision making process and resource sharing. A rather new application of multiagent systems is for efficient allocation of spectral resources in CR networks. In TABLE I, we give the similarities between an agent and a CR. Basically, both of them are aware of their surrounding environments through interactions, sensing, monitoring and they have autonomy and control over their actions and states. They can solve the assigned tasks independently based on their individual capabilities or can work with their neighbors by having frequent information exchanges.
TABLE I. COMPARISON BETWEEN AN AGENT AND A CR
Agent Cognitive radio Environment awareness via past
observations Sensing empty spectrum portions and
primary user signals Acting through actuators Deciding the bands/channels to be
selected Interaction via cooperation Interaction via beaconing
Autonomy Autonomy Working together to achieve shared
goals Working together for efficient
spectrum sharing Contains a knowledge base with local and neighboring agents’ information
Maintains certain models of neighboring primary users’ spectrum
usage In literature, few strands of work have focused on spectrum
sharing using MAS [13] [37]; but in these works, several limitations exist. For example, in [37], a MAS is used for information sharing and spectrum assignments. All the participating agents deployed over access points (APs), form an interacting MAS, which is responsible for managing radio resources across collocated WLANs. The authors have not provided any of the algorithms and results for their approach. The work in [13] considers a distributed and dynamic MAS based billing, pricing and resource allocation mechanism where the agents work as the auctioneers and the bidders to share the spectrum dynamically. The protocol used for radio resource allocation between the CR devices and operators is termed as multi-unit sealed-bid auction, which is based on the concept of bidding and assigning resources. The ultimate aim of using auctions is to provide an incentive to CR users to maximize their spectrum usage (and hence the utility), while allowing network to achieve Nash Equilibrium (a solution concept, where each user is assumed to know the equilibrium strategies of the other users, and no user has anything to gain by changing its own strategy). Auctions have traditional drawbacks of users’ untruthful behaviors, which can cause serious drawbacks to the working of loyal users.
Game-theory has also been exploited for spectrum allocations in CR networks [6] [11] [18] [19] [39]. In game-theoretical approaches, each SU has one individual goal i.e., to maximize its spectrum usage and the Nash equilibrium is considered to be the

205
International Journal on Advances in Telecommunications, vol 3 no 3 & 4, year 2010, http://www.iariajournals.org/telecommunications/
2010, © Copyright by authors, Published under agreement with IARIA - www.iaria.org
optimal solution for the whole network (or game). Furthermore, it incorporates two basic assumptions: first, the rationality assumption, that is, the participating primary and secondary users are rational so that they always choose strategies that maximize their individual gain. And, second, the users’ common knowledge assumption, which includes the definitions of their preference relationship. These assumptions may behave well by allowing each user (or player) to rationally decide on its best action, although in most of the competitive games, sometimes users can provide false information in order to maximize their profits and thus can affect the whole network performance.
According to some current research works, spectrum sharing problems are similar to medium access control (MAC) issues [9] [32], where several users try to access the same channel and their access should be shared with the neighboring users to avoid the interferences. Generally, in MAC-based spectrum sharing solutions, when a CR user uses a channel, it sends a busy signal to the neighboring users through a control channel in order to avoid the interference. To estimate control signals, the authors of [20] suggest a fast fourrier transform-based radio design, which enables CR users to detect the carrier frequency of a control signal without causing any harmful collisions to the neighboring users. Others [23] suggest the use of a global plan to exchange the control information between CR devices. However, maintaining global plans needs a large amount of frequent information to be exchanged between CR users causing complex device level architectural overheads.
III. SPECTRUM SHARING SCENARIOS Here, we provide some of the possible scenarios, which need
the development of new solutions for dynamic spectrum sharing. These scenarios are addressed as a part of a Franco-German project TEROPP [46]. This project aims at developing various efficient spectrum management solutions. Up till now, our contribution to this project is the development of a cooperative approach for opportunistic spectrum allocation. In these scenarios, the current spectrum assignments are static and inter-device collision is a big issue. Therefore, efficient solutions are needed in order to enable dynamic spectrum usage and to avoid interferences. The scenarios are divided into four different domains as follows: (1) Spectrum sharing and interference avoidance in ISM bands, (2) Spectrum sharing in cellular networks, (3) Opportunistic spectrum utilization in TV bands, and (4) Spectrum allocation in ad hoc networks. After detailing and suggesting possible initiatives towards dynamic spectrum access, we will describe our cooperative framework as a solution to enable spectrum sharing under ad hoc network domain. Precisely, multi-hop architectures, topology changes and arrival and departure of nodes at any time are the reasons for developing a cooperative solution for dynamic spectrum sharing under ad hoc network setting.
A. Spectrum Sharing and Interference Avoidance in ISM Bands Recently, WLAN [26] has been adopted as a common
technology by internet home users and companies. Characterized by cheap devices and reasonable data-rates, WLANs can be deployed anywhere. Designed to operate over license-free ISM (Industrial, Scientific and Medical) bands, WLANs are restricted to employ only few orthogonal channels, which is more than enough to provide wireless access in a residential area. However, the huge increment in the number of WLANs operating in the same location introduced a new interference level that could be anarchic. This interference is considered to be the main limitation for WLANs performance and it introduces new challenges to all the neighboring technologies that operate in the ISM bands [26]. Similar problems may arise with the deployment of LTE femto-cells [40]. These small cells, located at a home or a building, can provide better coverage and higher capacity in indoor environments. However, they suffer from interference caused by the neighboring femto-cells. The common point of introducing these two cases is that the interference is most of the times unwanted and it needs to be avoided.
As an interference avoidance solution, we foresee a cooperative environment where the devices in a WLAN or LTE cell can have CR capabilities, which allow them to optimize frequency reuse. They can also select an alternative spectrum portion, in case of any interference. Then, they can send the newly searched spectrum portion information to the neighboring devices in order to avoid the possible collisions. B. Spectrum Sharing in Cellular Networks
This scenario explains the spectrum sharing issues for cellular networks where the area is administrated by a central entity (such as a base station) and it is able to impose basic etiquettes to the users [7]. The mobile users (having CR capabilities), can perform signal measurements and can apply the etiquettes in order to contribute to an efficient use of the available spectrum. These etiquettes may be in the form of behavioral rules, such as, using correct MAC address, switching to a convenient base station and transmitting measurement reports. In such a context, distributed operational modes will be privileged and different overlay functions may be implemented such as rendezvous facilities [16], in order to optimize frequency reuse and to enable efficient usage of available bands.
A hospital can be considered as an application example of this scenario, where the number of users cannot be determined in a precise way. With the CR capability, a given terminal (a doctor’s iPhone or a PDA) might be able to sense the best possible spectrum band. This band can then be shared and coordinated with the neighboring devices by having a series of interactions using multiagent systems and by taking into account the number of current users and their priorities. The shared band information can then be sent to the BS agent for the administrative purposes.

206
International Journal on Advances in Telecommunications, vol 3 no 3 & 4, year 2010, http://www.iariajournals.org/telecommunications/
2010, © Copyright by authors, Published under agreement with IARIA - www.iaria.org
C. Opportunistic Spectrum Utilization in TV Bands The European countries are working on improving their TV
services by stopping the broadcast of PAL (phase alternative line) signals and using DVB-T (digital video broadcasting- transmitter) standards instead [41]. This process will create a sufficient amount of unused spectrum resources especially in the case of digital dividend [45]. Let us explain the exploitation of ultra high frequency (UHF) bands to understand the concept of numerical dividend. Generally, UHF bands are split in channels, where channels 21 to 69 were originally assigned to TV services. These channels are 8MHz in width, and the channel 21 corresponds to the bands 470-478 MHz. A DVB-T covers a city and its neighboring sectors, and uses 6 UHF channels to broadcast 36 TV programs. For example, in France, nearly 100 DVB-transmitters are used for broadcasting TV programs [42]. In a given place, we can expect that the TV services use only 6 among 49 UHF channels, leaving 43 channels as unutilized. These huge amounts of empty spectral resources justify the world interest for TV bands.
In a conference held under WRC’07 (World Radiocommunication Conference) [44], discussions about the utilization of the TV bands have already been started. The researchers have decided to assign the UHF channels 60 to 69 to IMT (International mobile telecommunication) services. Another initiative is taken by the European countries with the creation of the task group 4 (TG4) [43]. TG4 is responsible for measuring the performance of DVB-transmitters in order to utilize the unused TV bands opportunistically. These measurements will then be compared with the results obtained from mobile devices working in WiMAX.
To summarize, we provide here a few steps to be taken for the opportunistic utilization of spectral resources in digital dividend as following:
At first, DVB-transmitters must have the capabilities of
cognitive radios for sensing, characterizing and monitoring the unutilized TV bands. This is possible with the development of efficient signal processing techniques.
Then, because DVB-transmitters normally share their spectral resources with the radio microphones, therefore more precise spectrum sharing techniques must be deployed.
Finally, some techniques must be ensured in order to differentiate between a DVB-T and a microphone signal.
D. Spectrum Allocation in Ad hoc Networks Here, we give an example of an SU equipped with CR
capabilities and agent functionalities. The user is in a remote or an emergency situation, where it does not have direct access to radio resources and its access technology requires an energy that the user does not own. In this situation (as shown in Figure 1),
SU senses the nearby signals of primary users PU1 and PU2 (step 1) and cooperates with the agents deployed on them (step 2). This cooperation process allows SU to act on primary users’ responses by utilizing their available spectrum (step 3). Thus, the cognitive radio capability of an SU plays the role of interoperability, such that it can receive the information about neighboring users’ spectrum bands and their access technology. Likewise, the role of the deployed agent is to cooperate and modify SU’s software configuration by loading the necessary algorithms that fit the best to the current state (step 4).
Figure 1. Description of an ad hoc scenario
Figure 2. Ad hoc WLAN with three primary and six secondary users
IV. PROBLEM STATEMENT In the above scenario, we have presented the role of an agent
and a CR in an ad hoc emergency situation. However, considering a more general and practical perspective, we address the spectrum allocation challenges in a private ad hoc area or a well identified administrated perimeter such as a campus, a conference center or a hospital. Note that our proposed algorithms can also be easily applied for the emergency ad hoc network scenario.
. In our proposed scenario (Figure 2), there is an ad hoc WLAN [15], deployed in the area with sets of primary PU = (PU1, PU2 ….. PUn) and secondary SU = (SU1, S2 …… SUm) users. To allow nodes to communicate, the agents are deployed

207
International Journal on Advances in Telecommunications, vol 3 no 3 & 4, year 2010, http://www.iariajournals.org/telecommunications/
2010, © Copyright by authors, Published under agreement with IARIA - www.iaria.org
at each of them Whenever an SU device detects an empty portion of the spectrum as needed by its user, its agent starts communicating with the relative PU agent (having that empty spectrum part), until a spectrum sharing agreement is been made.
A. Formalization Let G = (N, A) be a directed network consisting of a set of
mobile nodes N such that (SU PU)N and a set of directed arcs A. Each directed arc (i, j) A connects a secondary user SUi to a primary user PUj. Similarly, we can denote the directed arc (j, i) A to show the direction of connection from PUj to SUi. The secondary users are cooperating with the neighboring primary users to have a spectrum sharing deal. We assume that sij is the amount of spectrum a secondary user ‘i’ is desiring to get from a primary user ‘j’. Similarly, tij is the amount of time, for which ‘i’ wants to utilize the spectrum and pij is the price it is willing to pay to ‘j’. For the primary user ‘j’ on the other hand, sji is the amount of spectrum it is willing to share with ‘i’, tji is the respected time limit and pji is the price it is expecting to get after sharing its spectrum. We can formulate the above model for each secondary user ‘i’ as:
Maximize
Ajiijijts
),(
(1)
Subject to Minimize
Ajiijp
),(
SUN (2)
Similarly for primary users: Maximize
Aijjip
),(
(3)
Subject to Minimize ji
Aijjits
),(
PU N (4)
And lji ≤ sji ≤ uji where lji and uji are the lower and upper bounds of available
spectrum of primary user ‘j’. This means that the secondary user ‘i’ cannot ask for an amount of spectrum above this limit.
B. An Example In static circumstances, the spectrum portions are assigned to
primary users and in response the internet service providers get their spectrum price. As an example consider a primary user PUj, who has bought a portion of a spectrum of the size of 8MB (Figure 3). During the peak office timings (t0-t1), the assigned portion may remain busy (or used) due to high user traffic such as for video conferencing and lecturing, but most of the other times (t1-t2 and t3-tn) the spectrum can remain unused. Obviously at free timings, PUj can utilize its spectrum portion for other activities (e.g., watching video songs) but generally people prefer these kinds of activities to be performed on week-ends.
With our proposed solution, a given secondary user SUi will be able to choose the best spectrum band/channel dynamically. This choice is made in cooperation with the agent embarked on PUj [35], by taking into account the amount of spectrum needed, the respected time limit and the related price.
Figure 3. An example of a primary user’s spectrum utilization during a day
V. COOPERATIVE SOLUTION FOR DYNAMIC SPECTRUM SHARING
In this section, we explain the proposed cooperative spectrum sharing scheme, with primary and secondary user’s internal architectures and their algorithmic behaviors.
A. Agent We start here by defining an agent as a dynamic and loosely
coupled unit, having the capabilities of performing a task autonomously, based on the knowledge received from its environment and/or through other agents’ interactions. These loosely-coupled units then work together to form a multi-agent system [21] [27]. Generally, an agent is appropriate and relevant for an SU node in a sense that it allows the introduction of various artificial intelligence (AI) techniques [12] to CR networks and helps an SU node to behave more efficiently by having frequent interactions with its neighboring devices. Once in place, cooperative multiagent systems have the potential of increasing the SU capabilities in a variety of ways. For example, a single SU agent is limited in its knowledge (and information) about spectrum access, but a bundle of SU agents can collectively identify spectrum holes and can communicate them to other nodes.
B. Contract Net Protocol In multiagent literature, several approaches exist for
cooperation [12]. Amongst these approaches, contract net protocol (CNP) [30] [34] is the most simple way for agents’ cooperation and decision making. In CNP (Figure 4), the collection of agents is called contract net and several agents can form these nets in order to solve the assigned tasks. Each agent can either be a manager or a contractor. Basically, the manager agent initiates a task to the contractor agents by sending Call for Proposals (CfPs) messages. As a result, various eligible

208
International Journal on Advances in Telecommunications, vol 3 no 3 & 4, year 2010, http://www.iariajournals.org/telecommunications/
2010, © Copyright by authors, Published under agreement with IARIA - www.iaria.org
contractors show their interest (in solving the task) by sending their proposals. The manager selects the best proposal (via accept) and the contract is then awarded to the selected contractor. The selected contractor solves the assigned task as agreed with the corresponding manager. Due to its simple and efficient nature, our proposed approach is based on bilateral message exchange and task allocation mechanisms of CNP.
Figure 4. Message exchange in CNP
C. Working of the Proposed Solution The SU based design (Figure 5 and algorithm. 1) consists of
the following five different interlinked modules.
First, the dynamic spectrum sensor (DSS) is used to sense the empty spectrum portions (or spectrum holes). Several techniques exist for spectrum sensing such as PU’s weak signal and its energy detection [28], cooperative centralized detection [5], etc. For DSS, it is necessary that the sensing is performed by considering a real-time dynamic environment, because it is not obvious at what time a spectrum band is occupied or when it is free.
The second module spectrum characterizer (SC)
characterizes the spectrum holes based on the Shannon’s theorem [33] to create a capacity based descending ordered list of all available PUs.
Secondary user interface (SUI), which is the third part sends
a request message to the SU device agent, whenever a user wants to have a portion of spectrum (for internet surfing, watching high quality videos, etc).
The fourth part, agent’s knowledge module (AKM) gets PU
characterization information from SC, which serves as a motivation for agents that subsets of PUs having vacant spectrum spaces are available. This list is not permanent rather it is updated and maintained on regular time intervals based on the information provided by SC module. Moreover, AKM creates a CfP message based on the inputs from SUI and SC:
CfP (SUID, s, t, d)
where SUID is the secondary user ID (or the secondary user’s agent identification) and it is used to help PU to reply back to the corresponding SU, s is the amount of spectrum needed by the SU, t is the desired time limit (or holding time) for the spectrum utilization, and d is the deadline to receive the primary users’ proposals.
Finally, agent coordination module (ACM) geo-casts the
CfP to the neighboring (and currently available) PU agents. By available PUs, we mean that the PU agents have not yet left the one-hop neighborhood and they have some unused spectrum to share. Moreover, ACM is also responsible for selecting the most suitable received proposal.
Having received the CfPs, the interested PU agents send their
proposals to the corresponding SU agents. The proposal is in the following form:
Proposal (PUID, s, t, p)
where PUID is the primary user’s agent identification, s is the amount of spectrum PU is willing to give to the respected SU, t is the proposed spectrum holding time, and p is the price PU is willing to receive. Note that the PU agent only contains AKM and ACM modules, where AKM manages the neighborhood information and ACM selects the most suitable CfP via cooperation.
Figure 5. Working of CR and agent modules
Each PU maintains an ordered list of CfPs in its cache based on the values of s and t for the purposes of future cooperation (algorithm 2). At the same time, the receiving SU locally sorts fetched proposals and an accept message is sent to the most suitable proposal. The information of selected PU is also sent to AKM (of SU) for future interactions. In case of an accept message from the selected SU, the spectrum sharing is started based on agreed parameters from both the sides. PU can still respond to further CfPs if it wants its other unused spectrum portions to be shared. If the PU receives a reject message from SU, it continues sending proposals to further available CfPs, for which the deadline is not yet expired.

209
International Journal on Advances in Telecommunications, vol 3 no 3 & 4, year 2010, http://www.iariajournals.org/telecommunications/
2010, © Copyright by authors, Published under agreement with IARIA - www.iaria.org
Above we have presented a cooperative framework for spectrum allocation that can generate highly effective behavior in dynamic environments and achieve better utility of the participating agents. The proposed solution is based on multiagent system cooperation with the deployment of agents over primary and secondary users. The experimental evaluations presented in the following section will confirm the efficiency of our proposal for dynamic spectrum allocations.
VI. EXPERIMENTS AND RESULTS In this section, we present some simulation results,
conducted in order to validate the working and performance of the proposed spectrum allocation algorithms. We start by examining the achieved utility of both primary and secondary users and then compare the time values, for which the spectrum is being utilized. We also present the spectrum gain and loss with the amount of messages used for cooperation. The words (PU, PU agent, SU, SU agent respectively) are used interchangeably throughout the following section.
A. Simulation Setup We perform our simulations under the assumption of a noiseless and mobile ad hoc network. By mobile ad hoc we mean that the nodes in the neighborhood of each of the SUs change. We randomly place a number of primary and secondary users in a specified area where each of the devices contains an agent deployed over it for cooperation purposes. For simplicity, two different fixed values of times (such as T1 and T2) are assumed, where “Time 1” (T1) represents the short-term case and “Time 2” (T2) is the longer period. When T1 is considered, the SU agents can ask for an amount of spectrum within one hour limit (i.e., 0T1 60Minutes) and similarly this limit is within two hours, as in case of T2 (i.e., 0 T2120Minutes). These two approximations capture the same amount of time values in real wireless environments without delving into complex situations. Our simulation starts with the total number of 6 SUs and 4 PUs, and for each next round there is an addition 10 agents (i.e., 6 SUs and 4 PUs). The simulation is conducted for 10 subsequent rounds, with a total of 20 hours per day, for both T1 and T2 respectively and the average values of parameters are taken to draw the graphs. The PU agent’s utility is calculated as the price paid by SU agents for spectrum utilization divided by the amount of spectrum it has shared for the respected time period (holding time) as required by the SUs. The SU agent’s utility is represented as its spectrum usage for the required time divided by the corresponding price paid to the PUs. Thus, by assigning weights or priorities to each of the mentioned parameters, the appropriate utility values for both the primary and secondary users are chosen. We assume that each PU has random available spectrum portions and the neighborhood of SUs and PUs is randomly changing. Also, we follow the assumption that once agreed, PUs would not be able to withdraw their commitments and they
Algorithm 1: Behavioral Algorithm for an SU Init – Let PU be the set of primary users in secondary user agent’s one-hop neighborhood and ℓ is the time interval based on the information provided by the SC module in order to maintain capacity based ordered list of primary users.
/* SU characterizes each primary user on the basis of capacity*/ For each i{ iЄ PU) } do Eval (SNR(i))
/* SNR: is the primary user’s signal to noise ratio obtained through DSS */
Eval (B(i)) /* B: bandwidth of PU given by DSS*/
C(i)= B(i) log2 [1 + SNR(i)] /* c: capacity calculated using Shannon’s theorem*/
End For /*Sending of CfP message*/ If PU != {}
For each i Є PU /*Geo-cast CfP*/ Send CfP (SUID, s, t, d) to PU(i)
End for End If /*L is a list for saving received proposals*/ For each received proposal ‘m’ do
Characterize m using
)()()(
mpmtms and add it in L
End For If L={} and the deadline to receive proposals has expired
Recreate CfP Else If L={i} where i is the only element in L and deadline for proposal reception has expired
Send an accept message to i Else
Send accept to primary user corresponding to the best proposal Send reject to all other primary users
End If
Algorithm 2: Behavioral Algorithm for a PU
While busyflag = false do If received message = CfP
/*K is a list for saving received CfPs*/ For each received CfP ‘n’ do
Characterize n using
)()()(
ntnsnp
and add it in K,
where p(n) is related price according to required spectrum
End For For best CfP in K do
Construct a proposal (PUID,s,t,p) and send it to corresponding secondary user
End For End If If received message = accept
Start spectrum sharing with selected secondary user End If If received message = reject OR some unused spectrum parts are still available
Continue analyzing further CfPs for spectrum sharing
Else Set busyflag = true
End If End While

210
International Journal on Advances in Telecommunications, vol 3 no 3 & 4, year 2010, http://www.iariajournals.org/telecommunications/
2010, © Copyright by authors, Published under agreement with IARIA - www.iaria.org
should share their spectrum with the corresponding SUs for the agreed time period. Further, the total number of cooperation messages (CfP, proposal, accept and reject) generated in the system, determine the cooperation cost. Thus, the cooperation strategy that is better (both between T1 and T2) in terms of less number of messages and, which gives good utility values is considered as the most cost efficient. The total number of resources successfully shared (over the number of resources required) presents the success rate, while the number of non-allocated spectrum portions (due to disagreements between primary and secondary user agents) measures the overall spectrum loss. All the experiments were realized using JADE [47] on a PC with 3GB memory and 2.4 GHZ dual processor.
B. Results In Figure 6, we compare the average utility of each primary
and secondary user at T1 with those at T2 for different numbers of users (10, 20, 30…). The figure depicts that when time limit is T2, the utilities are a bit less compared to the results obtained at T1. This is because the environment is mobile and some of the users are slightly hesitant to share their spectrum for longer periods. We observe that when there are 10 agents, the average utility values are almost identical for both T1 and T2, showing the optimal behavior. But in other cases, the average utility values are different, showing that the performance of agents in terms of their average utility values has decreased slightly with the increased number of agents. Figure 7 illustrates the spectrum resource requirements and utilization over time periods T1 and T2. In the beginning (with 10 required resources), all of them are completely shared; whereas when the required spectrum resources arrives at the middle values (such as 30 to 40), approximately 90% of them are shared. This spectrum sharing trend continues following the same pattern reaching bigger values (such as 50 and 60), with achieved sum of resources comprised between 45 and 50. Thus, the performance degradation in terms of spectrum sharing is not high, even with large resource requirements. Our approach is also relative to time, because in CR networks the spectrum holding time is one of the most important factors to be considered. Again, we run the simulation with several values of primary and secondary user agents. Figs. 8 and 9 plot the overall mean times (or holding time), for which the spectrum is required and utilized for a total of 10 to 120 agents. When time limit is T1, the results are almost fully satisfied, for 80 to 120 agents, while the time values are somewhat lesser at T2. Both the results are super linear and coherent with those of Figure 7, which displays that the spectrum sharing remains high even with the larger number of agents.
Figure 6. Agents’ percentage utilities
Figure 7. Spectrum resource requirement and utilization by SUs
Figure 10 depicts the maximum number of supported SUs by the neighboring PUs. Supported SUs are those, which have completely gained the required spectrum. We observe that when there are 10 to 15 PUs, the number of supported SUs is literally the same for both T1 and T2. This means, for limited number of agents even if the time values are high, the number of supported SUs is almost the same. However, with large number of agents (more than 50), the number of supported SUs at T2 are slimly lesser than T1. Therefore, in ad hoc situations, if we increase the time values along with an increment in number of agents, the results will be slightly less optimal.
Figure 8. Spectrum holding time at T1

211
International Journal on Advances in Telecommunications, vol 3 no 3 & 4, year 2010, http://www.iariajournals.org/telecommunications/
2010, © Copyright by authors, Published under agreement with IARIA - www.iaria.org
Figure 9. Spectrum holding time at T2
Figure 10. Supported SUs
The number of cooperation messages transmitted and received in the entire system with the success rate (in percentage) is shown in Figure 11 (and Table II). According to Figure 11, the values of exchanged messages are almost leveled off for the middle periods (from 30 to 70 agents). Further, Table II depicts that the average number of messages (per agent) remains between 4 to 5 even with the increased number of agents. We can also see that the approach is linear in terms of messages and success rate. Particularly when time limit is T2 (around 90 to 120 agents), the performance of the approach substantially degrades (reaching below 80%), but nevertheless it remains steady.
Figure 11. Number of messages with success rate
TABLE II. SUCCESS RATE AND NUMBER OF MESSAGES AT T1 AND T2
Number of messages
Success rate (in %)
No of agents
T1 T2 T1 T2 10 45 41 100 98.7 20 81 72 90 85 30 117 115 88.23 84 40 159 161 87.31 82 50 185 176 86 82 60 253 261 85 80 70 271 262 84.41 79.3 80 325 366 82 80 90 388 392 82 78.53 100 416 434 81 77.26 110 475 483 80.5 78.77 120 503 516 80 77.42
Another important aspect of our approach is the analysis of
how the performance varies as the amount of participating agents increases. In this context, Figs. 12 and 13 show the overall spectrum loss, which is the loss caused by the unused spectrum, due to spectrum sharing disagreements. As the agents’ demands augment, the percentage of spectrum loss grows on a steady pace. This is because some of the SUs are not able to find non-busy PUs or due to the relative change in their neighborhood. From the figures, it is also clear that the amount of overall spectrum loss (for both the time limits T1 and T2) is minimum (10 to 15%), when the number of users are at the middle stages (i.e., around 50). Spectrum loss then reaches bit higher values (16 to 22%), with increase number of agents, but still there is not a rapid degradation in the overall system performance. Note that the other factors such as collisions, device level interferences and delays are not considered here.
C. Discussion Related to Results The above experiments and results prove that our solution is
an effective one in order to provide dynamic spectrum sharing for CR networks and it can provide better utility of agents with the exchange of few cooperation messages. However, there are some important points related to our results, which need further discussion. First, we assume that the ad hoc environment is interference free; however, this assumption is not always true. In reality, the transmission power of most of the devices is so high that they can easily interrupt the working flow of neighboring devices, causing interferences. Thus, addressing spectrum sharing under interference enabled ad hoc networks is still an issue and several researchers are working on solving this issue to the modest details [31] [38].
Next issue is related to the limited number of agents we have used to perform our experiments. Since, JADE only allows a maximum of 100 to 120 agents on a single machine; therefore we have only shown the behavior of our approach with limited number of agents. In order to prove the consistent working of our model with large number of agents, we are working on

212
International Journal on Advances in Telecommunications, vol 3 no 3 & 4, year 2010, http://www.iariajournals.org/telecommunications/
2010, © Copyright by authors, Published under agreement with IARIA - www.iaria.org
developing mathematical model based on Markov chain. This model will also help us to verify other parameters such as communication cost and agents’ utility. Though, these mentioned issues need to be addressed in detail, still our model is flexible enough to replicate the real-world network settings where spectrum sharing can be performed in the similar cooperative way.
Figure 12. Spectrum loss at T1
Figure 13. Spectrum loss at T2
VII. CONCLUSION AND FUTURE PERSPECTIVES In this paper, we developed a cooperative framework for
spectrum allocation that can generate highly effective behavior in dynamic environments and achieve better utility of the participating devices. The proposed approach is based on multiagent system cooperation and implemented by deploying agents on cognitive radio and primary user devices. Experimental evaluations confirm the efficiency of our algorithms for distributed and decentralized environments. The results show that the proposed approach can absorb the high spectrum sharing demands by introducing the cooperation between primary and secondary user devices. Furthermore, the proposed approach improves the overall utility and minimizes the spectrum loss with a minimum communication cost. The spectrum allocation success rate is almost 80% even with large number of agents. While we only proposed a specific cooperation strategy to maximize system utility, the proposed
cooperation framework can be extended towards minimizing other key problems such as inter secondary user interferences and collisions. We intend to examine this problem as a part of our continuing work. We are currently working on a mathematical analysis of our approach using Markov chain. In addition, the proposed approach assumes that nodes are highly cooperative while in real systems, nodes can be selfish or competitive, so more precise work is needed to explore the competitive behaviors. We will also try to compare the results with game-theoretical approaches to have an even better validation of our work.
ACKNOWLEDGEMENT This work was co-funded by ANR (French Research Agency) via grant ER502-505E ("Technologies for terminals in opportunistic radio applications") and by Higher Education Commission (HEC) Pakistan.
REFERENCES [1] “Spectrum policy task force report,” ET Docket No. 02–135, (November
2002). [2] “Unlicensed Operation in the TV Broadcast Bands,” Federal
Communications Commission, First Report and Order and Further Notice of Proposed Rulemaking. 06-156, October 2006.
[3] B. Canberk, I.F. Akyildiz, and S. Oktug, “Primary user activity modelling using first-difference filter clustering and correlation in cognitive radio networks,” Elsevier Science Journal on Ad hoc Networks, vol. 7, pp. 810-836, 2009.
[4] C. R. Stevenson, C. Cordeiro, E. Sofer, and G. Chouinard, “Functional requirements for the IEEE 802.22 WRAN standard,” Technical Report, September 2005.
[5] D. Cabric, S.M. Mishra, and R.W. Brodersen, “Implementation issues in spectrum sensing for cognitive radios,” Proc. Asilomar Conference on Signals, Systems and Computers, pp. 772–776, 2004.
[6] D. Niyato and E. Hossain, “Competitive pricing for spectrum sharing in cognitive radio networks: dynamic game, inefficiency of Nash equilibrium, and collusion,” IEEE Journal on Selected Areas in Communications, vol. 308, pp. 192-202, 2008.
[7] D. Raychaudhuri and X. Jing, “A spectrum etiquette protocol for efficient coordination of radio devices in unlicensed bands,” Proc. IEEE International Symposium on Personal Indoor (PIMRC 03), pp. 172–176, 2003.
[8] E. Jung and X. Liu, “Opportunistic spectrum access in heterogeneous user environments,” Proc. IEEE New Frontiers in Dynamic Spectrum Access Networks (DySPAN 08), pp. 1-11, 2008.
[9] F. Akyildiz, W-Y. Lee, M. C. Vuran, and S. Mohanty, “NeXt generation/dynamic spectrum access/cognitive radio wireless networks: A survey,” International Journal of Computer and Telecommunications Networking, vol. 50, pp. 2127-2159. 2006.
[10] F-S. Hsieh, “Developing cooperation mechanism for multi-agent systems with Petri nets,” Engineering Applications of Artificial Intelligence Journal, vol. 22, pp. 616-627, 2009.
[11] G. Hosseinabadi, H. Manshaei, and J-P. Hubaux, “Spectrum sharing games of infrastructure-based cognitive radio networks,” Technical report on LCA-REPORT-08-027, 2008.
[12] G. Weiss, “A modern approach to distributed artificial intelligence,” MIT press, 2000, USA.
[13] H. J. Kloeck and F. Jondra, “Multi-agent radio resource allocation,” ACM Mobile Networks and Applications, vol. 11, pp. 813-824, 2006.
[14] H. M. Kelash, H. M. Faheem, and M. Amoon, “A multiagent system for distributed systems management,” Transactions on, Engineering, Computing and Technology, vol. 11, 2006.

213
International Journal on Advances in Telecommunications, vol 3 no 3 & 4, year 2010, http://www.iariajournals.org/telecommunications/
2010, © Copyright by authors, Published under agreement with IARIA - www.iaria.org
[15] I. Doghri and H.K.-B. Ayed, “Towards fair P2P auctions over MANETs,” Proc. International Conference on Computer and Information Technology, pp. 658-663, 2008.
[16] I. Romdhani, M. Kellil, H- Y. Lach, A. Bouabdallah, and H. Bettahar, “Mobility-aware rendezvous point for mobile multicast sources,” Proc. International Wired/Wireless Internet Communications conference (WWIC 04), pp. 62-73, 2004.
[17] J. Mitola, “Cognitive radio: an integrated agent architecture for software defined radio,” PhD Thesis, KTH Royal Institute of Technology, Sweden, 2000.
[18] J. O’Neel, “Analysis and design of cognitive radio networks and distributed radio resource management algorithms.” PhD Thesis, Virginia Tech, USA, 2006.
[19] J. Zhang and Q. Zhang, “Stackelberg game for utility-based cooperative cognitive radio networks,” Proc. ACM International Symposium on Mobile Ad hoc Networking and Computing (MOBIHOC 09), pp. 23-32, 2009.
[20] K- C. Huang, X. Jing, and D. Raychaudhuri, “MAC protocol adaptation in cognitive radio networks: an experimental study.” Proc. International Conference on Computer Communications and Networks (ICCCN 09), pp.1-6, 2009.
[21] K. P. Sycara, “Multiagent systems,” Artificial Intelligence Magazine, vol. 19, pp. 79-92, 1998.
[22] K.R. Chowdhury, M.D. Felice, and I.F. Akyildiz, “TP-CRAHN: A transport protocol for cognitive radio ad hoc networks,” Proc. IEEE Conference on Computer Communications (INFOCOM’ 09), pp. 2482-2490, 2009.
[23] L. Ma, X. Han, and C-C. Shen, “Dynamic open spectrum sharing MAC protocol for wireless ad hoc networks,” Proc. IEEE New frontiers Dynamic Spectrum Access Networks (DySPAN’05), pp. 203-213, 2005.
[24] L. Panait, and S. LukeOn, “Cooperative multi-agent systems learning: state of the art,” Proc. Autonomous Agents and Multi-Agent Systems (AAMAS’05), pp. 387–434, 2005.
[25] M. Mchenry, “Spectrum white space measurements,” New America Foundation Broadband Forum, June 2003.
[26] M. Sawan, H. Yamu, and J. Coulombe, “Wireless smart implants dedicated to multichannel monitoring and microstimulation,” IEEE Circuits and Systems Magazine, vol. 5, pp. 21-39, 2005.
[27] M. Wooldridge, “An Introduction to Multiagent Systems,” John Wiley & Sons Press, 2002, England.
[28] N. Sahai, Hoven, and R. Tandra, “Some fundamental limits in cognitive radio,” Proc. Allerton Conference on Commonunication, Control and Computing, 2004.
[29] P.J. Denning and C. Martell, “Coordination,“ Springer Verlag, 1998, USA. [30] R. G. Smith, “The contract net protocol: High-level communication and
control in a distributed problem solver,” IEEE Transactions on Computation, vol. 29, pp. 1104–1113, 1980.
[31] S. J. Kim and G. B. Giannakis, “Optimal resource allocation for MIMO ad hoc cognitive radio networks,” Proc. International Conference on Communication, Control and Computation, pp. 39-45, 2008.
[32] S. Kumar, V. S. Raghavan, and J. Deng, “Medium access control protocols for ad hoc wireless networks: a survey,” International Journal of Ad hoc Networks, vol. 4, pp. 326-358, 2006.
[33] T. C. Clancy, “Dynamic Spectrum Access in Cognitive Radio Networks,” PhD Thesis, University of Maryland, USA, 2006.
[34] T. Sugawara, T. Hirotsu, S. Kurihara, and K. Fukuda, “Effects of fluctuation in manager-side controls on contract net protocol in massively multi-agent systems,” Proc. IEEE International Conference on Distributed Human-Machine Systems (DHMS’08), 2008.
[35] U. Mir, L. Merghem-Boulahia, and D. Gaïti, “Utilization of a cooperative multiagent system in the context of cognitive radio networks,” Proc. IEEE International Workshop on Modelling Autonomic Communications Environments (MACE’09), pp. 100-104, 2009.
[36] U. Mir, L. Merghem-Boulahia, and D. Gaïti, “A cooperative multiagent based spectrum sharing”. in Proc. Advanced International Conference on Telecommunications (AICT’10), pp. 124-130, Barcelona, 2010.
[37] X. Jiang, H. Ivan, and R. Anita, “Cognitive radio resource management using multi-agent systems,” Proc. Conference on Consumer Communications and Networking, (CCNC’07), pp. 1123-1127, 2007.
[38] Y. Su and M. Schaar, M, “A new perspective on multi-user power control games in interference channels,” IEEE Transactions on Wireless Communications, vol. 8, pp. 2910–2919, 2009.
[39] Z. Ji and K. Liu, “Dynamic spectrum sharing: A game theoretical overview,” IEEE Communications Magazine, vol. 45, pp. 88-94, 2007.
[40] http://mobiledevdesign.com/tutorials/lte-femtocells-0603/, Feb. 03, 2011 [41] http://www.dvb.org/ , Jan. 12, 2011 [42] http://www.dvb.org/about_dvb/dvb_worldwide/france/, Jan. 31, 2011 [43] http://www.ero.dk/TG4, June. 06, 2010 [44] http://www.itu.int/ITU-R/index.asp?category=conferences&rlink=wrc-
07&lang=en, Sept. 02, 2007 [45] http://ec.europa.eu/information_society/policy/ecomm/radio_spectrum/topi
cs/reorg/pubcons_digdiv_200907/index_en.htm, Sept. 04, 2009 [46] TEROPP,http://era.utt.fr/fr/projets_de_recherche/carnot_teropp.html, Jan.
11, 2011 [47] http://jade.tilab.com/, July. 07, 2010 [48] http://ayman.elsayed.free.fr/msc_student/wlan-tutorial.pdf, June 2002 [49] http://ieeexplore.ieee.org/stamp/stamp.jsp?tp=&arnumber=4085653, Feb.
08, 2007

214
International Journal on Advances in Telecommunications, vol 3 no 3 & 4, year 2010, http://www.iariajournals.org/telecommunications/
2010, © Copyright by authors, Published under agreement with IARIA - www.iaria.org
APPENDIX Abbreviations
ACM agent coordination module, 6
AI artificial intelligence, 5
AKM agent’s knowledge module, 6
APs access points, 2
CfP call for proposal, 6
CNP contract net protocol, 2
CR cognitive radio, 1
DSS dynamic spectrum sensor, 6
DVB-T digital video broadcasting- transmitter, 4
FCC federal communication commission, 1
ISM industrial, scientific and medical, 3
JADE java application development framework, 8
LTE long term evolution, 3
MAC medium access control, 3
MANETs mobile ad hoc networks, 1
MAS multiagent system, 1
PAL phase alternative line, 4
PDA personal digital assistant, 3
PU primary user, 2
PUID primary user’s agent identification, 6
RF radio frequency, 1
SC spectrum characterizer, 6
SU secondary user, 2
SUI secondary user interface, 6
SUID secondary user’s agent identification, 6
TG4 task group 4, 4
UHF ultra high frequency, 4
WRAN wireless regional area network, 1
WLAN wireless local area network, 1
WRC world radiocommunication conference, 4

215
International Journal on Advances in Telecommunications, vol 3 no 3 & 4, year 2010, http://www.iariajournals.org/telecommunications/
2010, © Copyright by authors, Published under agreement with IARIA - www.iaria.org
Low Complexity Enhanced Hybrid SpectrumSensing Architectures for Cognitive Radio
EquipmentZiad Khalaf, Amor Nafkha, and Jacques Palicot
SUPELEC/IETRSUPELEC,Avenue de la Boulaie,CS 47601
35576 Cesson Sevigne Cedex, FranceEmail: {ziad.khalaf,amor.nafkha,jacques.palicot}@supelec.fr
Mohamed GhozziR-Interface, Ercom Group
9 Grand’Rue 13002 Marseille, FranceEmail: [email protected]
Abstract—Spectrum sensing enables detecting opportunities inlicensed bands in order to access unused portions of the licensedspectrum. In this paper we propose two low complexity detectorsbased on a combination of two well-known and complementarysignal detection mechanisms: energy detection and mono-cycledetection, which exploits cyclostationarity property of the signals.In the first algorithm the mono-cycle detector iteratively correctsthe thresholds of a double threshold energy detector, that willfinally converge to the performance of the mono-cycle detector.The second algorithm uses the mono-cycle detector to directlyestimate the noise level N0, which is used to fix the thresholdof the radiometer. Simulation results conducted on differentenvironments show promising performances of the proposeddetectors especially in low SNR.
Index Terms—Cognitive Radio, Spectrum sensing, Energydetector, Detection features.
I. INTRODUCTION
The term “Cognitive Radio”, defined by J.Mitola [2] wasreused by the FCC [3] to define a class of radio systems thatcontinuously perform spectrum sensing, dynamically identifyvacant (unused) spectrum and then operate in this spectrum ata time when it is not used by incumbent radio systems.
The increasing in telecommunication services number andrates has led to a growing demand of spectrum resources. Theobjective of cognitive terminals is to obtain independently anddynamically radio frequencies to access the network. Largeparts of the spectrum allocated to licensed radio services(referred to as primary users, PUs) have exclusive accessrights. However, secondary users (SUs) can still access op-portunistically to the spectrum held by the PUs when they arenot using it.
As they do not have full access rights, SUs must guaranteeto not cause harmful interference to PUs. Hence they need tomonitor the spectrum continuously to detect if PUs resumedtheir communications. For that purpose, it has been suggestedby the FCC to use Cognitive Radio based technology to helpSUs filling these requirements. In that case Cognitive Radios(CRs) must stop and transfer their activities to another vacantband. CRs need to be more sensitive than PUs and efficient atlower SNR to detect PUs signals.
Various spectrum sensing techniques have been presented asnoticed in [4] including the classical likelihood ratio test (LRT)[5], energy detection (ED) [5]–[7], matched filtering (MF)detection [5], [8], cyclostationary detection (CSD) [9]–[13],and some newly emerging methods such as eigenvalue-basedsensing [14]–[16], wavelet-based sensing [17], covariance-based sensing [18], and blindly combined energy detection[19]. In this paper, our focus is on energy and cyclostationarydetection. However, for other different methods of spectrumsensing in cognitive radio, we advise the readers to refer to[4], [20]. Energy detection is the simplest detection method butneeds the exact knowledge of the noise level N0; furthermore,a wrong estimation is known to seriously impact the detectionperformance [6]. Cyclostationary detection was proposed as analternative since noise is stationary whilst telecommunicationsignals are rather cyclostationary. The advantage of cyclosta-tionary methods is that it does not need any knowledge aboutthe noise level N0 and allows the detection at low SNR.However, one major drawback of cyclostationary detectionis that it requires high computation time and needs a highsampling rate. In this paper, we propose a modified version(M-HSD) of the HSD proposed in [1], and an Enhanced HSD(EHSD) algorithms that combine cyclostationary and energydetection, to detect the free spectrum. Taking into consider-ation the limitations of the energy detector performance dueto presence of noise uncertainty and background interference,the idea of this paper is to reduce the uncertainty over thenoise level N0 using the help of cyclostationary detection.Two kind of strategies can be applied, the first one (M-HSD)uses an iterative approach: at the beginning of the sensing,we can usually fix two thresholds ξ1 and ξ2 for the energydetector. Then, the detection is given by the following process:if the energy detector criteria is greater (resp. smaller) than ξ2(resp. ξ1) then this indicates the presence (resp. absence) ofthe primary user signal. Else if the energy detector criteria isinside the interval [ξ1, ξ2], then cyclostationary detection canbe applied and based on its decision, the hybrid architecturecan iteratively adjust the thresholds of the energy detector,to finally converge to the performance of the cyclostationary

216
International Journal on Advances in Telecommunications, vol 3 no 3 & 4, year 2010, http://www.iariajournals.org/telecommunications/
2010, © Copyright by authors, Published under agreement with IARIA - www.iaria.org
detector. The second approach (EHSD) consists in directly es-timating the noise level N0 using the cyclostationary detectorand uses this estimation to obtain the appropriate threshold ofthe radiometer.
The remaining part of the paper is organized as follows. InSection II, we present the system model adopted throughoutthis work. We briefly describe energy and cyclostationarydetectors in Section III. The proposed HSD architecture willbe recalled in Section IV. The M-HSD architecture will bepresented in Section V. In section VI, EHSD algorithm is pro-posed. Section VII presents simulation results and discussions.Finally, Section VIII presents the conclusions of this study andmakes some suggestions for future work.
II. SYSTEM MODEL
The spectrum sensing detection problem consists of collect-ing a set of N samples y1, y2, ..., yN from a given frequencyband B, processing the data by a Neyman-Pearson receiver,which takes the form of a Likelihood Ratio Test (LRT) anddeciding for that frequency band whether or not a primary useris present. Let y denotes the vector formed by N samples,y = [y(1), .., y(N)]t, where the samples are realizations ofthe random variables Y1, Y2, ..., YN , respectively. The LRTcompares a statistic λ to a fixed threshold ν. The statisticλ is the ratio between the joint Probability Density Function(PDF), pY (y|H1), of the N samples given that a primaryuser is present and the joint PDF, pY (y|H0), of N samplesgiven that no primary user is present. H1 and H0 denote thebinary hypotheses that a primary user is present and absent,respectively. This ratio is called Likelihood Ratio (LR). Thethreshold ν is determinated by constraining the probability offalse alarm to a specified value.
The binary hypotheses (H0, H1) are defined in a way suchthat, under hypothesis H1 and k ∈ [1, .., N ], the kth collectedsample, y(k), is composed of a primary user signal sample,x(k) ∼ N (0, σ2
x), affected in different ways by the channel,h(k) ∼ N (0, 1), plus an additive Gaussian noise sample,n(k) ∼ N (0, σ2
n), where N (m,σ2) denotes the normaldistribution with mean m and variance σ2. Under hypothesisH0, the kth sample, y(k), consists of the additive Gaussiannoise sample n(k). Hence,{
H0 : y(k) = n(k)H1 : y(k) = h(k)x(k) + n(k)
The LRT then takes the form
λ =pY (y|H1)
pY (y|H1)≶H0
H1ν
For λ > ν, H1 is decided, otherwise H0 is decided.Assuming that the samples are statistically independent, thejoint PDF pY (y|Hi); i ∈ {0, 1}, is nothing but the product ofthe N marginal PDFs of the samples. Specifically,
pY (y|Hi) =
N∏k=1
pYk(yk|Hi); i ∈ {0, 1}
The performance of any spectrum sensing methods is in-dicated by two probabilities: the detection probability, Pd,which defines the probability of the sensing algorithm havingdetected the presence of the primary signal under the hypoth-esis H1; probability of false alarm, Pfa, which defines theprobability of the sensing algorithm claiming the presence ofthe primary signal under the hypothesis H0. In the hypothesistesting problem, where we have to decide whether the primarysignal is present or absent, two kinds of errors can occur:• A false alarm occurs when it is decided that the primary
signal is present even though it is not.• A miss detection occurs when it is decided that the
primary signal is not present even though it is.The performance, of sensing algorithm, is usually presented
using a family of curves showing the detection probabilityPd as function of the false alarm probability Pfa (Cf. Figure1). The test is good when these curves are located abovethe chance line that characterizes pure hazard. In literature,this representation is called ROC curve (Receiver OperationalCharacteristic) [21].
Fig. 1. Example of ROC curve showing the probability of detection Pd
according to the probability of false alarm Pfa
III. SENSING METHODS
A. Generalities
The optimal sensing detector needs to know the values ofchannels gain, noise and primary user’s variance. In practice,we may have no knowledge about the values of some or allof these parameters. In these cases, an approximation of theoptimal test is done in the case of Gaussian signals with lowlevel compared to noise (assumed white and Gaussian). It isgiven by the locally optimal test [21], which uses only secondorder statistics of the signal. Application of Taylor’s theoremyields the following statistical test:
Z =1
N20T
∫ T/2
−T/2
∫ T/2
−T/2Rxx(u, v)y(u)y(v)dudv ≶H0
H1ξ (1)
With Rxx(u, v) is the autocorrelation function and T is thelistening duration before the detector takes any decision. Thus,the new detector calculates a quadratic transformation of

217
International Journal on Advances in Telecommunications, vol 3 no 3 & 4, year 2010, http://www.iariajournals.org/telecommunications/
2010, © Copyright by authors, Published under agreement with IARIA - www.iaria.org
the received signal and compares the result to a detectionthreshold. However, in the case of low SNR, it is shownin [22] that this locally optimal detector remains valid evenin the case where the signals of interest are not Gaussian.Depending on the chosen statistical model of the observationx(t), two types of detectors can be derived. For a stationarymodel, the detector is the energy detector or radiometer. It isa simple detector with low complexity and reduced time ofcomputation, but has the disadvantage of being sensitive to abad estimate of the noise level N0. For a cyclostationary modelof x(t), the detector is the mono or multi-cycles detector. Thisdetector is able to detect in low SNR, and is insensitive tothe poor estimate of noise level, but has the disadvantage ofan important computing time.
B. Energy Detection
When the statistical model of the signal of interest x(t) ischosen to be stationary, the autocorrelation function Rxx(u, v)becomes dependent only of the difference u− v and it can bewritten under this form: Rxx(u, v) = Rxx(u− v).
By performing variable changes according to:
u = t+τ
2
v = t− τ
2(2)
we obtain the following local optimal detector form [23]:
Zro =1
N20
∫ ∞−∞
Rxx(τ)Ryy(τ)T dτ (3)
where Ryy(τ)T is the correlogram of y(t) defined by :
Ryy(τ)T ,
{1T
∫ (T−|τ |)/2−(T−|τ |)/2 y(t−
τ2 )y(t+
τ2 )dt, |τ | ≤ T
0 elsewhere
Using the Parseval theorem [5] applied to (3), the statisticaltest becomes:
Z =1
N20
∫ ∞−∞
Sxx(f)PT (f)df (4)
With PT (f) the peridogram of y(t) given by:
PT (f) =1
T| YT (f) |2
and
YT (f) =
∫ T/2
−T/2y(t) exp−i2πft dt
Hence the local optimal detector computes the periodogram ofthe observed signal y(t). The obtained result is then correlatedwith the ideal. Since the power spectral density Sxx(f) cannotbe known a priori, we replace it in (4) by a non zero constantS0 over all the band [−B/2, B/2] of the received signal toobtain the new statistical test:
Zr =S0
N20
∫ B/2
−B/2PT (f)df (5)
The obtained detector is called radiometer or energy detectorwhose statistical test is proportional to the energy of the
received signal. The application of the Parseval theorem to(5) results in the following statistical test in the time domain:
Zr ∝1
T
∫ T
0
y(t)2dt (6)
Where the symbol ∝ indicates proportionality. Urkowitz [7]studied the energy detector with the statistic test X , whichis equal to second term of equation (6). The block diagramof a radiometer is given in Figure 2. Urkowitz studied alsothe expression of the probability density function of thestatistic X and showed that for a large time-bandwidth product(BT > 250) the statistic X follows a Gaussian law under bothconditions: noise alone, or signal plus noise, with mean µj+1
and variance σ2j+1 (j ∈{0,1}) given by:
H0 µ1 = N0BT, σ21 = N2
0BTH1 µ2 = N0BT (SNR+ 1), σ2
2 = N20BT (2SNR+ 1)
(7)where SNR refers to the signal to noise ratio defined as:
SNR =ExN0B
with Ex the power of the signal x(t) over the duration T . Theprobability of detection Pd and of false alarm Pfa becomes:
Pfa = Q
{ξ − µ1
σ1
}and
Pd = Q
{ξ − µ2
σ2
}with
Q(u) =1√2π
∫ ∞u
exp−v2/2 dv
Then, for a desired false alarm probability Pfa,des, we cancompute the adequate detection threshold ξ0 using the follow-ing equation:
ξ0 = µ1 + σ1Q−1(Pfa,des) = G(Pfa,des)N0 (8)
with:G(Pfa,des) = BT +
√BTQ−1(Pfa,des)
Fig. 2. Block scheme of the energy detector.

218
International Journal on Advances in Telecommunications, vol 3 no 3 & 4, year 2010, http://www.iariajournals.org/telecommunications/
2010, © Copyright by authors, Published under agreement with IARIA - www.iaria.org
1) Energy detection limits: The good performance of theradiometer is accurate if the noise spectral density N0 isperfectly known at the receiver. In a classical communica-tion between transmitter and receiver, there is a preliminaryexchange of data, which are known by the receiver, who isable to determine a good estimation of the noise level N0.This cooperative aspect between transmitter and receiver isunfortunately absent in the case of detection of free bandsbecause no data exchange is driven between terminals inopportunistic radio access. Subsequently, the estimated noiselevel N0 is not exempt from error especially when the testedband is occupied. As the detection threshold is proportional toN0 (Cf. (8)), it can not be determined with accuracy, leadingto more degradation of the radiometer performance.
2) Ideal Radiometer Performance: Let Pd,des designate,the desired detection probability, u′ = Q−1(Pd,des) and v′ =Q−1(Pfa,des). It is shown in [6] that for large time-bandwidthproduct BT , the minimum signal to noise ratio snrm thatguarantees a desired probability of false alarm Pfa,des and adesired probability of detection Pd,des is given by:
snrm =v′√BT
+u′
BT
[u′ −
√u′2 +BT + 2v′
√BT
]The variation of this ratio depends on the time-bandwidth
product BT as shown in Figure 3.
Fig. 3. the variation of the minimum signal to noise ratio snrm thatguarantees the desired probability of false alarm Pfa and a desired probabilityof miss detection Pm, versus the time-bandwidth product BT. When the noiselevel N0 is perfectly known, snrm decreases as the product BT increases.
For different values of probability Pfa,des and probability ofdetection Pd,des, the required snrm for detection decreases asthe time-bandwidth product BT increases. It should be notedthat BT is proportional to the number of observations availablewhen the received signal is sampled.
3) Non Ideal Radiometer: Let N0 be an estimated valueof the noise level N0 and ξ0 the corresponding threshold ofdetection. In the case of an under-estimation of N0 i.e., N0 <N0, Figure 4 shows that a bad decision is performed when
the energy X of the signal is located in the interval [ξ0, ξ0].In the case of free bands detection, this bad decision resultsin the declaration of an occupied strip while it is free, causingan increase of the probability of false alarm.
Fig. 4. Decision error in the case of an under-estimation of noise level N0.This bad decision results in the declaration of an occupied strip while it isfree, causing an increase of the probability of false alarm.
However, in the case of an over-estimation of noise levelN0 i.e., N0 > N0, Figure 5 shows that a wrong decision ismade when the energy of the received signal X is locatedin the interval[ξ0, ξ0]. In terms of free bands detection, thiserror results in declaring that the tested band is free, whileit is occupied, which provides a more important missingprobability. Consequently, the uncertainty on the noise level
Fig. 5. Decision error in the case of an over-estimation of noise level N0.This error results in declaring that the tested band is free, while it is occupied,which provides a more important missing probability, and causes interferenceto the PU.
leads in one case to an under-exploitation of free bands bysecondary users and in another case to more interferencesgenerated to the primary users. To overcome undesirableeffects of uncertainty on the value of N0, it has been proposedin [6] to use a different detection threshold given by:
ξ0 = Uξ0
Where U is the peak-to-peak uncertainty on the estimation ofnoise level N0 given by:
U =1 + ε21− ε1
≥ 1
Here, ε1 and ε2 give the range of uncertainty on the estimationof N0:
(1− ε1)N0 ≤ N0 ≤ (1 + ε2)N0
Thus, the expression of snrm [6] becomes:
snrm ≈ (U − 1) +O
(1√BT
)

219
International Journal on Advances in Telecommunications, vol 3 no 3 & 4, year 2010, http://www.iariajournals.org/telecommunications/
2010, © Copyright by authors, Published under agreement with IARIA - www.iaria.org
The term (U − 1) determinates the minimum SNR under,which detection is more regardless of possible parametersPfa,des, Pd,des and the observation time T of the detector. Inthe particular case where Pfa,des = 1−Pd,des = 0.01, Figure6 shows the evolution of the snrm as a function of BT fordifferent values of U . Whatever U nil or not, the value of snrmdecreases as the BT product increases. In contrast, if U 6= 0(presence of uncertainty), the decay tends asymptotically toits limit U − 1. For example, for U = 3 dB, the value ofsnrm limit is 2 dB. Despite its low complexity and ease ofimplementation, the radiometer does not perform a reliabledetection of free bands especially if the uncertainty regardingthe noise level is important or the SNR is low.
Fig. 6. When the value of U is different from zero (presence of uncertainty),the value of snrm decreases as the BT product increases, and tendsasymptotically to its limit U − 1.
C. Cyclostationary Detection
When the cyclostationary model is adopted for the signalof interest x(t), the autocorrelation function Rxx(u, v) isexpressed as a function of the cyclic autocorrelation
Rxx =∑α
Rxx(α, u− v) expiπα(u+v) (9)
By replacing Rxx(u, v) in (1) by its expression in (9), and byperforming variables changes according to (2), we obtain thestatistical test of the multi-cycle’s coherent detector:
Zmc =∑α
1
N20
∫ B
−BRxx(α, τ)
∗Ryy(α, τ)Bdτ
With Ryy(α, τ)B is the cyclic periodogram of the observationy(t) whose expression is presented in [24]. The local optimaldetector computes the correlogram of the observation overall cyclic frequencies contained in the detected signal andthe obtained result is then correlated with the ideal cyclicautocorrelation of the expected signal.
In the frequency domain after applying Parseval’s theorem,this statistic test is written as follows:
Zmc =∑α
1
N20
∫ ∞−∞
Sxx(α, f)∗Syy(α, f)Bdf
With Syy(α, f)B is the cyclic periodogram of the observa-tion y(t). In practice, the implementation of the multi-cyclesdetector is impossible due to the non-knowledge of the idealfunctions Rxx(α, τ) or Sxx(α, τ) of the signals to detect. Infact, their phases can not be known in advance because theexpected signals are random. To overcome this indeterminacyon the phase, two alternatives are possible [24]. In the firstalternative, the implementation of the statistic Zmc occurs inan adaptive manner. This means that for each calculation ofZmc, a phase search is made according to the maximizationof the statistic Zmc. If this is not enough, a second alternativeis to detect a single frequency at a time:
Zα =∣∣ ∫ ∞−∞
Sxx(α, f)∗Syy(α, f)Bdf
∣∣ H0
≶H1
ξ
For α = 0, the obtained detector is the optimal radiometer. Forα 6= 0, the detector is called coherent mono-cycle detector.In a noisy environment of a known spectral density N0,Gardner [10] and Izzo [25] show that, the optimal radiometerdetector (with perfect knowledge of N0) is better than thecoherent mono-cycle detector. In [26], different noise modelswas considered: Gaussian, non-Gaussian, white and non-white.The author concluded that in a realistic situation characterizedby a variable noise level, the optimal performance of theradiometer is becoming significantly degraded and signifi-cantly lower than those of mono-cycle detector. Furthermore,the author shows the superiority of mono-cycle detector in anoisy environment characterized by additive interference. Inliterature, many other cyclic methods of detection / estimationexist. For example, Zivanovic and Gardner [11] define thedegree of cyclostationarity of a random process by:
DCS =
∑α6=0
∫∞−∞ |Rxx(α, τ)|
2dτ∫∞−∞ |Rxx(0, τ)|2dτ
It involves measuring the distance between the correlationof the process of interest and the correlation of the mostclose stationary process. We can also define the degree ofcyclostationarity to a process on a specific frequency α by:
DCSα =
∫∞−∞ |Rxx(α, τ)|
2dτ∫∞−∞ |Rxx(0, τ)|2dτ
Although the authors of [11] did not mention the problemof detection, this notion of degree of cyclostationarity canbe useful for detection by comparing DCS (or DCSα) toa threshold value given by a criterion such as Pfa is constant.Hurd and Gerr [27] proposed a test for the presence ofcyclostationarity based on the calculation of the normalizedspectral correlation:
γ(αp, αq,M) =|∑M−1m=0 IN (αp+m)I∗N (αq+m)|2∑M−1
m=0 |IN (αp+m)|2∑M−1m=0 |IN (αq+m)|2

220
International Journal on Advances in Telecommunications, vol 3 no 3 & 4, year 2010, http://www.iariajournals.org/telecommunications/
2010, © Copyright by authors, Published under agreement with IARIA - www.iaria.org
with IN (α) =∑N−1n=0 x(n)exp
(−iπα), αk = 2πk/N andM a smoothing parameter. The presence on the plot ofγ(αp, αq,M) varying with αp of dark lines parallel to thediagonal indicate the cyclostationarity of the signal x(t).Hence the detection is performed in a visual manner.Dandawate and Giannakis [13] proposed tests for the pres-ence of cyclostationarity at a given frenquency based on thefollowing decision rule:
Z ∝ C(T )
kx Σ−1kx C(T )′kx
H0
≶H1
ξG
where C(T )
kx is an estimation vector of the kth order cumulantsof the process x(t), C
(T )′kx the transpose of the vector C
(T )
kx ,Σkx the covariance matrix of C
(T )
kx and ξG the detectionthreshold. Unlike the two previous methods, the authors findthe distribution of the statistic Z under the two hypothesesH0 and H1. This allows, thereafter, to calculate for a givenprobability of false alarm the appropriate threshold ξG. Verypresent in the literature, this test is used in the recognitionof standards accessible to software radio terminals [28] orin the detection of free channels on the GSM frequencyband [29]. In these examples, systems to be detected are apriori known permitting a cyclostationarity test over a reducednumber of frequencies. In this paper, we choose to retain thistest of cyclostationarity to be the cyclic detector used in ourdifferent proposed solutions, which will be discussed in thenext sections.
D. Limits of the sensing methods
The last two methods (Energy and cyclostationary detection)present many advantages but have some limits; in fact whena band is tested, the detection system delivers a decision suchas free or occupied band, without giving more details on thecontents of this band in particular in the case of occupation ofthis band. However, a band may not be completely occupiedi.e., sub-intervals of this band are free as we can see fromthe example of Figure 7. Subsequently, a limitation of thissolution is that existing communication opportunities may bemissed when the tested bandwidth is much larger than the sizeof these opportunities.
Fig. 7. Example of missed opportunity for communication in the case of alarge tested range of frequencies
IV. HYBRID DETECTOR
A. Generalities
As we have seen in Section I, the secondary user undertakesto not create interference to primary users by unwanted accessto their frequency bands. For that purpose, secondary usershave to perform periodic verifications of these bands. Themore often these verifications are done, the lower becomesthe risk of interference. Subsequently, periodic scanning ofthe spectrum is subjected to time constraint especially thatthe number of bands shared with the primary user can beimportant.
Computationalcomplexity
insensitivityof noise
a prioriknowledge
Detectionin lowSNR
radiometer + - noise levelN0
-
cyclostationaryDetector.
- + cyclic fre-quencies
+
TABLE ICOMPARISON OF PROPERTIES OF ENERGY (RADIOMETER) AND
CYCLOSTATIONARY DETECTOR. THE (+) INDICATES A ADVANTAGE AND(-) INDICATES AN INCONVENIENT
B. detector architecture
Table I gives features comparison between energy andcyclostationnarity detectors. Except its noise sensitivity, whichdegrades its detection in low SNR, energy detector is the bestsolution to detect free bands because no a priori information isneeded. Furthermore, it is a very simple method to implement.On the contrary, cyclostationnarity detection is very robustbut computationnaly extensive and needs the prior knowledgeof cyclic frequencies in order to take a quick decision. Ifthis information is unknown, the process becomes too muchcomplicated and it will not be possible to implement it (today)in a real time manner. However, reading carefully table I, itappears that these two methods are complementary. Thereforeit is the reason why we propose our hybrid architecture in[1], which permits to detect quickly with minimum a prioriinformation free bands, by taking advantage of both methods.This hybrid architecture, which is presented in Figure 8 is aniteratively adaptative architecture as it is explained in [1]. Inthe next section we introduce the M-HSD algorithm, which isthe same as the HSD proposed in [1] but this time we addedbuffer1 and buffer2 in order to take soft decisions overthe modifications of the thresholds ξ1 and ξ2. The benefit ofusing buffers gives stability for operating at low SNRs as itis explained in the next section.
V. DECISION RULE OF THE M-HSD ALGORITHM
We first assume that N0 is constant with respect to time.Let Xi be the energy of the received signal x(t) during anobservation time T after the iteration i, B the bandwidth of thetested band, ξ1 and ξ2 two thresholds that are first initializedat 0 and +∞ respectively. ξG, which is the threshold of the

221
International Journal on Advances in Telecommunications, vol 3 no 3 & 4, year 2010, http://www.iariajournals.org/telecommunications/
2010, © Copyright by authors, Published under agreement with IARIA - www.iaria.org
Fig. 8. Hybrid Spectrum sensing Detector (HSD) architecture as it wasproposed in [1].
cyclostationary block that is defined in order to respect thedesired Pfa,des, is fixed using the central χ2 table as describedin [13].
At the beginning of the sensing, the energy detector calcu-lates the energy X of the received signal after an observationtime T . Then if X falls inside the interval [ξ1, ξ2], the energydetector can not make a direct decision of type signal presentor signal absent. In that case, the adaptation stage presentedin Figure 8 will call the cyclostationary block (which a prioriknows the cyclic frequency α of the signal of interest) to makethe decision. After the decision of the cyclic test is taken, if it isof the type signal present (resp. signal absent), the calculatedvalue X is then saved in a buffer called buffer2 of size N2,(resp. buffer1 of size N1).
The algorithm continues in the same way except whenbuffer2 (resp. buffer1) is full. In this case, the adaptationstage starts to modify the value of the threshold ξ2 (resp. ξ1)according to the average of buffer2, (resp. buffer1) andthen the oldest value in the buffer will be replaced by the newcalculated one (Xi after the iteration i).
At any time, if the calculated value X is outside the interval[ξ1, ξ2], the adaptation stage will take automatic decision oftype signal absent (resp. signal present) depending on whetherX is less than ξ1 (resp. greater than ξ2) avoiding the use ofthe cyclic test.
The process is repeated making the interval [ξ1, ξ2] smallerand smaller. Two cases, high and low SNR, need to be studiedin order to analyze the M-HSD architecture limits, whichwill be explained in the next paragraph. Figure 9 shows thealgorithm of the M-HSD method.
It should be noted that at low SNR, the test of “Dandawateand Giannakis” can easily make errors (the two types of errorsdescribed in part II), so the values that should be saved inbuffer1 might be saved in buffer2 and inversely. But the
Fig. 9. The M-HSD algorithm (a Modified version of the HSD algorithm[1]). The major modification is the addition of buffer1 and buffer2 inorder to make soft modifications over ξ1 and ξ2.
use of buffers can make a “dilution” of these errors over thevalues of ξ1 and ξ2.
Using the M-HSD algorithm, will practically reduce thecomplexity from that of a cyclostationary detector: O(N2 +0, 5Nlog2N), before the buffers are full, to the one of a ra-diometer: O(Nlog2N) at the convergence phase. At this point,the M-HSD detector will present a detection performance closeto that of the cyclostationary detector.
A. Analytical Study of the M-HSD algorithm Using OrderStatistics
In this section, for simplicity reasons, we assume that thebuffers’ size is one. In order to study the M-HSD architecturein a statistical point of view, we will use the order statisticstool. The Kth order statistic of a statistical sample denotedX(k) is equal to its Kth smallest value. The first order statistic(or smallest order statistic) is always the minimum of the

222
International Journal on Advances in Telecommunications, vol 3 no 3 & 4, year 2010, http://www.iariajournals.org/telecommunications/
2010, © Copyright by authors, Published under agreement with IARIA - www.iaria.org
sample, that is:
X(1) = min{X1, ..., Xn}
Similarly, for a sample of size n, the nth order statistic (orlargest order statistic) is the maximum, that is:
X(n) = max{X1, ..., Xn}
if f(x) is the probability density function of the randomvariable X and F (x) its cumulative distribution function, thenit is shown in [30] that the density probability of the kth orderstatistic is given by:
fX(k)(x) =
n!
(k − 1)!(n− k)!F (x)k−1 (1− F (x))n−k f(x)
(10)for the special case k = 1, (10) becomes:
fX(1)(x) = n[1− F (x)]n−1f(x) (11)
and for k = n, (10) becomes:
fX(n)(x) = nF (x)n−1f(x) (12)
Now, using the distributions of X under H0 (resp. X underH1) from (7) in (11) (resp. (12)), we can obtain the distri-butions of ξ1 and ξ2 (in (13) and (14) respectively) after niterations of the algorithm M-HSD under the hypotheses H0
and H1 respectively:
fξ1(k=1)(x) =n
2σ1√2π
[1 + erf
(x− µ1
σ1√2
)]n−1e− 1
2
(x−µ1σ1
)2
(13)and :
fξ2(k=n)(x) =n
2σ2√2π
[1− erf
(x− µ2
σ2√2
)]n−1e− 1
2
(x−µ2σ2
)2
(14)
B. M-HSD algorithm limits
• High SNR case: if the signal is received at a good SNR,the performance of the cyclic test will be ideal (Pfagclose to zero and Pdg close to one where Pfag and Pdgare respectively the observed false alarm and detectionprobability of the cyclostationary block). So the savedvalues in each buffer will be from the same population(signal in buffer2 and noise in buffer1). The variablesξ1 and ξ2 will never meet and ξ1 will always be smallerthan ξ2. This is due to the fact that the signal is wellseparated from the noise as shown in Figure 10, whichrepresents the variation of the probability density functionof ξ1 and ξ2 for different number of iterations at 0 dB.Figure 11 represents the expected values of the distribu-tion of ξ1 under H0 and ξ2 under H1 over the numberof iterations (obtained using (14) and (13)). It is clearthat ξ1 and ξ2 are not going to meet even after a hugenumber of iterations (109 iterations, Cf. Figure 10). Thenafter the convergence of the M-HSD algorithm, the cyclicblock will be very rarely used because it is very rarethat the statistic Xi falls between ξ1 and ξ2 leading to aradiometer complexity and to perfect decisions.
Fig. 10. The variation of the probability density function of ξ1 (resp. ξ2)under H0 (resp. H1) for different number of iterations at 0 dB, plotted using(13) (resp. (14)).
Fig. 11. The expected values of ξ1 (resp. ξ2) under H0 (resp. H1) as functionof the iterations number n at 0 dB, plotted using a numerical calculus using(13) (resp. (14)) and the Matlab tool.
• Low SNR case: If the signal is received at a low SNR,the received signal will be very close to the noise level,then ξ2 will soon be less than ξ1 after a small number ofiterations as we can see in Figure 12. Moreover, with lowSNR, the cyclic test can easily misdetect in it decisions(for example the values saved in the buffers may not befrom the same population). In this case, it would be betterto change ξ2 instead of changing ξ1. This fact induces astrong degradation of the detection performance. Onceξ1 becomes greater than ξ2, the M-HSD algorithm willfix ξ1 = ξ2 and will stop its evolution. In this case theM-HSD algorithm has reached its detection limit.
VI. THE ENHANCED HSD ALGORITHM (EHSD)
An Enhanced architecture of this last one can be studied aswell to improve the detection at lower SNR. It consists indirectly estimating the noise level N0. We will keep the samealgorithm of the M-HSD architecture but with just making fewmodifications: N1 will be chosen to be big enough to makea good estimation of the noise level N0. Moreover, we willkeep ξ2 in the architecture to reduce the detection complexityas much as possible. Directly when buffer1 is full, we willcalculate its mean µ1. Then, the EHSD algorithm will use the

223
International Journal on Advances in Telecommunications, vol 3 no 3 & 4, year 2010, http://www.iariajournals.org/telecommunications/
2010, © Copyright by authors, Published under agreement with IARIA - www.iaria.org
Fig. 12. The expected values of ξ1 (resp.ξ2) under H0 (resp. H1) as functionof the iterations number n at −10 dB, plotted using a numerical calculus using(39) (resp. (40)) and the Matlab tool. We can observe that ξ2 will soon beless than ξ1 after a small number of iterations at low SNR.
following equation to estimate N0:
N0 =µ1
BT
Using this estimation of N0, we can estimate ξ0 thatguarantees the Pfa,des from the equation bellow:
ξ0 = G(Pfa,des)N0
EHSD is a little more complex than M-HSD, because we willneed to repeat the cyclostationary test at least N1 times tobe able to estimate ξ0, (the size of buffer1 in the EHSDalgorithm is usually bigger than the size of buffer1 in the M-HSD algorithm). Figure 13 shows the algorithm of the EHSDmethod.
A. EHSD Performance
Let D0 (resp. D1) designate the event that the cyclicdetector has chosen H0 (resp. H1). If we assume that for agiven SNR the cyclic detector can make false alarms underH0 and good detections under H1 independently of the valueof the calculated variable X , then we can write:
E(X|H1, D0) = µ2 (15)
and
E(X|H0, D0) = µ1 (16)
where E(.) denotes the expectation operator.Recall the partition probability theorem stated below:
E(X|D0) =P (H1|D0)E(X|H1, D0)
+ P (H0|D0)E(X|H0, D0)
Using the assumptions of (15) and (16), we can write:
E(X|D0) = P (H1|D0)µ2 + P (H0|D0)µ1 (17)
by applying Bayes equality we can write:
P (H1|D0) =P (D0|H1)P (H1)
P (D0)(18)
Fig. 13. Algorithm of the EHSD architecture. Only few modifications overthe M-HSD algorithm are done.
P (H0|D0) =P (D0|H0)P (H0)
P (D0)(19)
We can express the probability that the cyclic detectorchooses H0 in terms of P (H1), P (H0), Pfag , and Pdg:
P (D0) = (1− Pfag)P (H0) + (1− Pdg)P (H1) (20)
now considering the following definition:
γ =P (H0)
P (H1)
where γ represents the characteristic of the environment (freeor occupied). Using (18), (19) and (20), equation (17) be-comes:
E(X|D0) = (1− δ)µ2 + δµ1 (21)
where
δ =1− Pfag
1− Pfag + 1−Pdgγ

224
International Journal on Advances in Telecommunications, vol 3 no 3 & 4, year 2010, http://www.iariajournals.org/telecommunications/
2010, © Copyright by authors, Published under agreement with IARIA - www.iaria.org
Or for all δ we have:
(1− δ)µ2 + δµ1 ≥ µ1
Therefore we conclude that:
E(X|D0) ≥ µ1
This means that we always have an over estimation of thenoise level N0 (ξ0 ≥ ξ0), wish implies that the false alarmconstraint will always be respected in the EHSD method (theobserved false alarm is then less or equal to the desired falsealarm). Using (21) we can find a theoretical approximation forthe expression of the relative error over the estimated thresholdξ0 defined by Errorrel = ξ0−ξ0
ξ0, as function of the SNR.
For large N1, we can write:
µ1 ≈ E(X|D0)
then:N0 ≈
E(X|D0)
TW
Using the result given by (21) we can write:
N0 ≈(1− δ)µ2 + δµ1
TW
so Errorrel can be approximated by:
Errorrel ≈GTW ((1− δ)µ2 + δµ1)− G
TW µ1
GTW µ1
after simplifying it, we will obtain:
Errorrel ≈SNR
γ1−Pfag1−Pdg + 1
(22)
Fig. 14. The theoretical approximation of the relative error over the thresholdξ0, simulated using the approximation (22).
Observing the curve in Figure 14, we can check that forhigh SNRs (when the cyclic test is perfect), the term 1 −Pdg goes to zero as well as global expression of Errorrel.In that case, an excellent estimation of ξ0 can be done. Forlower SRN , the term 1 − Pdg is not zero anymore becausethe cyclostationary test is no more an ideal test inducing anerror over the estimation of ξ0. This error reaches its maximumbefore it starts to decrease because the SNR term becomesvery small. Physically this error reduction is due to the factthat the signal is too weak and thus close to the noise level.
VII. SIMULATION RESULTS AND DISCUSSION
In the simulations, we used a 4-PSK modulation at 20Khz where α = 1
Tsis the cyclic frequency used in the
cyclostationary detector a priori known, and Ts refers to thesymbol period of the 4-PSK. We set N1 and N2 equal to30 in the simulation of the M-HSD algorithm, while for theEHSD algorithm, we used N1 = 100 and N2 = 30. The time-bandwidth product BT is equal to 4500 and an equiprobabilistenvironment (γ = 1) was used, unless otherwise stated whilesimulating the different architectures.
Fig. 15. The variation of ξ1 and ξ2 at -5 dB using M-HSD algorithm,with γ = 1, N1 = 30, and N2 = 30. Each mark on the curves indicatesa modification of ξ1 and ξ2. One can notice that the cyclostationary test isless and less used, as the number of iterations increases, inducing a lowercomplexity.
Figure 15 presents the evolution of ξ1 and ξ2 over theiterations of the M-HSD algorithm at −5 dB. We have fixedξG to guarantee a Pfa less than 1%. Each mark on the curvesin Figure 15 indicates a modification of ξ1 or ξ2. We canobserve that there are lots of marks at the beginning, whichmeans that the cyclostationary test is frequently used at thisstage, but after a while, the cyclostationary test is much lessutilised inducing a lower complexity.
Fig. 16. Simulated detection probability as function of SNR of the M-HSD(using N1=N2=30), and EHSD (using N1=100, and N2=30) architectureswith a Pfa,des fixed at 1%, also compared to the cyclic test and to the idealradiometer under the same conditions.
In order to compare detection performances of the differentabove mentioned techniques, we simulate the variation of the

225
International Journal on Advances in Telecommunications, vol 3 no 3 & 4, year 2010, http://www.iariajournals.org/telecommunications/
2010, © Copyright by authors, Published under agreement with IARIA - www.iaria.org
Fig. 17. Simulation result of the relative error of the estimated thresholdξ0 as function of the SNR using the EHSD algorithm, compared to thetheoretical approximation given in (22).
probability of detection as function of SNR, for the M-HSD and EHSD, using the same Pfa,des = 1%. We alsocompare the obtained results with the curves representingthe performance of the cyclic test and the ideal radiometer.The simulated results are shown in Figure 16, where we canobserve that the performance of the M-HSD algorithm are nearthe cyclostationary detector, which means that M-HSD hasreached the performance of the cyclic test with a radiometercomplexity. Now if we take a look at the EHSD algorithmperformance, which also has a radiometer complexity at steadystate, we can see that it is able to detect at 100%, with anobserved Pfa smaller 1% starting at −8 dB, versus −3 dBfor the cyclic test, and so achieving a gain of 5 dB in terms ofSNR. It should be noted that the EHSD algorithm is a littlemore complex than M-HSD algorithm at the beginning of thesensing process since it needs a larger buffer1 to achieve agood estimation of N0.
Figure 17 validates the approximation given in (22) of therelative error of the threshold ξ0 as function of the SNR. Thisapproximation is very close to the simulation results especiallyat low and high SNR. It can be concluded that when thecyclostationary test starts detecting at 100% (at −3 dB), wecan have then a perfect estimation of ξ0. An important remarkis that for example, at −8 dB, we have a maximum error overthe threshold estimation and we can still detect at 99% (Cf.Figure 16). This fact is explained by Figure 18, that showsthe PDF of X under both, H0 and H1 at −8 dB using (7).We can observe that these densities are still well separated at−8 dB. In consequence this error of estimation does not havea significant impact over the detection performances. At thematter of fact we can observe that ξ0 is located on the tail ofthe PDF of X under H1.
A. The Influence of the Environment γ over the Performanceof the M-HSD and EHSD Algorithms
As we have already seen, the state of the channel (freeor occupied) can be characterized by the variable γ as theratio between P (H0) and P (H1). If we look closely at Figure12, we note that the point of intersection of the two curves
Fig. 18. The distribution of the statistic X under the two hypothesis H0
and H1 obtained using (7) of Urkowitz at −8 dB. We have found that in thissituation ξ0 is located on the tail of the PDF of X under H1, that is whywe can still obtain good detection performance although the estimation errorover ξ0 is maximal.
that presents the expectation of ξ1 and ξ2, under respectivelyH0 and H1, does not depend solely on the SNR of thereceived signal but also on how the sequence of the eventsfree channel or occupied channel is occurring while using theM-HSD algorithm. Also if we look at (22), which gives therelative error in estimating the optimal threshold when usingthe EHSD algorithm, we can check that it depends also onthe environment characteristic γ. This is the reason why it isinteresting to observe the influence of the environment overthe performance of our different proposed architectures.
We have used two extreme simulation environments toobserve the variation of the performance of the M-HSDdetector. The first is γ = 99 (P (H0) = 99%) and thesecond is γ = 0.01. We observe in Figure 19 that theperformance effectively varies depending on the environmentγ. For γ = 99, which signifies that 99% of the time theband is free, ξ1 keeps increasing, causing a reduction of thedetection performance. This environment (γ >> 1) is not thatone favorable for the M-HSD algorithm because it will haveits detection performance close to the cyclostationary detector( at−4 dB M-HSD detects up to 100% versus −3 dB for thecyclic detector), so the major advantage in this case is thelower complexity of the M-HSD algorithm.
However, when γ = 0.01 (P (H1) = 99%) ξ2 keeps decreas-ing, which allows better detection results. In this case a gainof 2 dB is observed compared to the cyclic detector. MoreoverM-HSD is still less complex, and detects significantly betterthan the cyclostationary detector. Then, we conclude that theM-HSD algorithm ensures a gain between one and two dBover the detection performance of the cyclic detector with adecreasing complexity.
Now we simulate the EHSD architecture in both environ-ments, γ = 99 and γ = 0.01. For γ = 99, the observedperformance in Figure 20 is close to the ideal radiometerperformance. This result is explained in (22), which showsthat the relative error is inversely proportional to γ. So forγ = 99 this error is almost zero for all the SNR. Therefore the

226
International Journal on Advances in Telecommunications, vol 3 no 3 & 4, year 2010, http://www.iariajournals.org/telecommunications/
2010, © Copyright by authors, Published under agreement with IARIA - www.iaria.org
Fig. 19. Simulated detection probability under different SNRs, of the M-HSD(using N1=N2=30), with Pfa,des fixed at 1% using γ = 99 and γ = 0.01,also compared to Giannakis test under the same conditions.
estimated threshold ξ0 is very close to the optimal thresholdξ0, which explains the obtained result. As for γ = 0.01, thesame formula (22) shows that for low SNR the relative errorover the estimation of the optimal threshold is high because γis less than 1. But for high SNR, we have Pdg close to one,which makes the relative error decreases to zero. Then we canobserve that the performance of the EHSD is always betterthan that of the M-HSD algorithm. In fact there is always aminimum gain of 2 dB over the cyclic detector, and if theenvironment is favorable (γ >> 1) to the EHSD algorithm,we may even reach the performance of the ideal radiometer.
Fig. 20. Simulated detection probability under different SNRs, of the EHSD(using N1=100, and N2=30), with Pfa,des fixed at 1% using γ = 99,γ = 1 and γ = 0.01, also compared to the ideal radiometer under the sameconditions.
Another way of comparing performance is to plot the ROCcurves already defined in part II. For γ = 1, we simulate fordifferent SNRs the ROC curve of both M-HSD and EHSD.For a relatively good SNR (−5 dB), we can check in Figure21 that both architectures present the same performance. Butfor lower SNR (−10 dB), we can observe in Figure 22 thesuperiority of the EHSD over the M-HSD algorithm in termsof detection. Although both EHSD and M-HSD converge to aradiometer complexity at steady state, EHSD has always betterperformance than M-HSD. Therefore it is better to use EHSDinstead of M-HSD.
Fig. 21. ROC curves of the M-HSD and the EHSD at -5 dB, for γ = 1.We observe that in these conditions M-HSD and EHSD present the sameperformance.
Fig. 22. ROC curves of the M-HSD and the EHSD at -10 dB, for γ = 1. Weobserve that in these conditions EHSD presents better detection performancecompared to M-HSD.
VIII. CONCLUSION
Spectrum sensing is subject to time constraints. For this rea-son, we have proposed adaptive architectures, which combinetwo systems. The first system is a low complexity detector,but it is very sensitive to a bad estimation of the noise levelN0. As for the second, it is a more complex system basedon cyclostationary detection, but it is insensitive to a poorestimation of N0. These new adaptive architectures allow thesensing at lower SNR and with a decreasing algorithmiccomplexity. In a Gaussian noise environment the obtainedresults are promising as it was shown by the performedsimulations. Future work will include the study of differentchannel types with a variable N0. A study of the convergencetime and power consumption of the proposed architectures areunder investigation.
ACKNOWLEDGMENT
The authors would like to thank Wassim Jouini for hiscomments and insightful discussions regarding this work.
REFERENCES
[1] Z. Khalaf, A. Nafkha, J. Palicot, and M. Ghozzi, Hybrid SpectrumSensing Architecture for Cognitive Radio Equipment, AICT’10, May2010, Barcelona, Spain.

227
International Journal on Advances in Telecommunications, vol 3 no 3 & 4, year 2010, http://www.iariajournals.org/telecommunications/
2010, © Copyright by authors, Published under agreement with IARIA - www.iaria.org
[2] J. Mitola, Cognitive Radio An Integrated Agent Architecture for SoftwareDefined Radio, PhD thesis, Royal Institute of Technology (KTH), May2000.
[3] Spectrum Efficiency Working Group. Report of the Spectrum EfficiencyWorking Group. Technical report, FCC, November 2002.
[4] Y. Zeng, Y. Liang, A. T. Hoang, and R. Zhang, A Review on Spec-trumSensing for Cognitive Radio: Challenges and Solutions, EURASIPJournal on Advances in Signal Processing Volume 2010, Article ID381465, October 2009.
[5] S. M. Kay, Fundamentals of Statistical Signal Processing: DetectionTheory, vol. 2, Prentice Hall, Upper Saddle River, NJ, USA, 1998.
[6] P.M. Fishman, Radiometric detection of spread-spectrum signals in noiseof uncertain power, IEEE Transactions on Aerospace and ElectronicSystems, vol. 28, pp. 654-660, July 1992.
[7] H. Urkowitz, Energy detection of unknown deterministic signals, Pro-ceedings of the IEEE, vol. 55, no. 4, pp. 523-531, 1967.
[8] H. S. Chen, W. Gao, and D. G. Daut, Signature based spectrum sensingalgorithms for IEEE 802.22 WRAN, in Proceedings of the IEEE Interna-tional Conference on Communications (ICC 07), pp. 6487-6492, Glasgow,Scotland, June 2007.
[9] M. Ghozzi, Detection cyclostationnaire des bandes de frequences libres.PhD thesis, 2008.
[10] W.A. Gardner and C.M. Spooner, Signal interception: Performanceadvantages of cyclic feature detectors, IEEE Transaction on Communi-cations, vol. 40, January 1992.
[11] W.A. Gardner and G. Zivanovic, Degrees of cyclostationary and theirapplication to signal detection and estimation, Signal processing, vol. 22,March 1991.
[12] W. A. Gardner, Exploitation of spectral redundancy in cyclostationarysignals, IEEE Signal Processing Magazine, vol. 8, no. 2, pp. 14-36, 1991.
[13] A.V. Dandawate and G.B. Giannakis, Statistical tests for presence ofcyslostationarity, IEEE Transactions on Information Theory, vol. 42, pp.2355-2369, September 1994.
[14] Y. H. Zeng and Y.-C. Liang, Eigenvalue-based spectrum sensing algo-rithms for cognitive radio, IEEE Transactions on Communications, vol.57, no. 6, pp. 1784-1793, 2009.
[15] F. Penna, R. Garello, and M. A. Spirito, Cooperative spectrum sensingbased on the limiting eigenvalue ratio distribution in wishartmatrices,IEEE Communications Letters, vol. 13, no. 7, pp. 507-509, 2009.
[16] L. S. Cardoso, M. Debbah, P. Bianchi, J. Najim, Cooperative SpectrumSensing Using Random Matrix Theory, invited paper, Proc. ISPWC 2008,May 2008, Santorini, Greece.
[17] Z. Tian and G. B. Giannakis, A wavelet approach to wideband spectrumsensing for cognitive radios, in Proceedings of the 1st InternationalConference on Cognitive Radio Oriented Wireless Networks and Com-munications (CROWNCOM 07), Mykonos, Greece, June 2007.
[18] Y. H. Zeng and Y.-C. Liang, Spectrum-sensing algorithms for cognitiveradio based on statistical covariances IEEE Transactions on VehicularTechnology, vol. 58, no. 4, pp. 1804-1815, 2009.
[19] Y. H. Zeng, Y.-C. Liang, and R. Zhang, Blindly combined energydetection for spectrum sensing in cognitive radio, IEEE Signal ProcessingLetters, vol. 15, pp. 649-652, 2008.
[20] A. Sahai, S. M. Mishra, R. Tandra, and K. A. Woyach, Cognitive radiosfor spectrum sharing, IEEE Signal Processing Magazine, vol. 26, no. 1,pp. 140-145, 2009.
[21] H.L. Van Trees, Detection, estimation, and modulation theory, Part III.Wiley, 1971.
[22] D. Middleton, Canonically optimum threshold detection, IEEE Transac-tions on information Theory, vol. 12, pp. 230-243, April 1966.
[23] B. Zayen, A. Hayar, K. Kansanen, Blind Spectrum Sensing for CognitiveRadio Based on Signal Space Dimension Estimation, ICC’09, IEEEInternational Conference on Communications, June 14-18, 2009, Dresden,Germany.
[24] W.A. Gardner, Introduction to random processes with applications tosignals and systems. New York : McGraw-Hill, 1989.
[25] L. Izzo, L. Paura and M. Tanda, Signal interception in non-gaussiennoise, IEEE Transaction on Communications, vol. 40, pp. 1030-1037,June 1992.
[26] P. Rostaing, Detection de signaux modules en exploitant leurs proprietescyclostationnaires : Application aux signaux sonar. PhD thesis, Universitede Nice - Sophia Antipolis, 1997.
[27] H.L. Hurd and N.L. Gerr, Graphical methods for determining thepresence of periodic correlation Journal of Time Series Analysis, vol.12, no. 4, pp. 337-350, 1991.
[28] M. Oner and F. Jondral, Air interface recognition for a software radiosystem exploiting cyclostationarity,in Proc. IEEE PIMRC’04, Barcelona,Spain, vol. 3, pp. 1947-1951, September 2004.
[29] M. Oner and F. Jondral, Extracting the channel allocation informationin a spectrum pooling system exploiting cyclostationarity, in Proc. IEEEPIMRC’04, vol. 1, pp. 551-555, September 2004.
[30] A. Papoulis and S.U.Pillai, Probability, Random Variables and Stochas-tic Processes, Mc Graw Hill, 2002.

228
International Journal on Advances in Telecommunications, vol 3 no 3 & 4, year 2010, http://www.iariajournals.org/telecommunications/
2010, © Copyright by authors, Published under agreement with IARIA - www.iaria.org
Software Defined Radio Certification in Europe: Challenges and Processes
Gianmarco Baldini Security Technology Assessment Unit
Joint Research Centre, European Commission Ispra, Italy
email: [email protected]
Dimitrios Symeonidis Security Technology Assessment Unit
Joint Research Centre, European Commission Ispra, Italy
email: [email protected]
Abstract— Standardization and certification of Software Defined Radio technologies are closely related. This paper describes the current standardization efforts for Software Defined Radio technologies in Europe and the related certification processes with a specific focus to the public safety and military domain. This paper describes the regulatory and technical requirements for the certification of Software Defined Radio in the European context, which is characterized by various political entities and governmental institutions. We describe the development of an European Software Defined Radio certification process through a networked approach and we identify the main components including the Development and Testing tools, References Implementation, the Waveform Repository and the Issue Tracking system. The main stakeholders in the certification processes are identified and their roles are described. This paper describes also two specific certification processes, which are particularly important for Software Defined Radio technology: performance benchmark certification and security certification. Performance benchmark certification is used to evaluate the performance of Software Defined Radio against specific technical requirements. Security certification is needed to ensure that the Software Defined Radio platform and the waveforms validate security requirements. The conclusion is that Software Defined Radio certification at European level requires a comprehensive framework, which includes organizational, procedural and technical elements1.
Keywords - Software Defined Radio, Certification, Performance Benchmarking
I. INTRODUCTION The concept of Software Defined Radio dates back to the
1992 when Joseph Mitola described it in [2]. For a number of years the focus of software defined radio
(SDR) research was on military applications. The JTRS (Joint Tactical Radio Systems) program [3] and [4] is intended to permit the Military Services to operate together in a “seamless” manner via wireless voice, video, and data communications through all levels of command, including
1 the views expressed are those of the authors and cannot be regarded as stating an official position of the European Commission.
direct access to near real-time information from airborne and battlefield sensors.
JTRS is envisioned to function more like a computer than a conventional radio and is to be upgraded and modified to operate with other communications systems by the addition of software as opposed to redesigning hardware - a more costly and time-consuming process. A single JTRS radio with multiple waveforms can replace many separate radios, simplifying maintenance. The additional advantage is that because JTRS is "software programmable", they will also provide a longer functional life. Both features can offer potential long-term cost savings to the military organizations.
For the public safety community, SDR developments were primarily part of the internal research and development activities of land mobile radio vendors. The Public Safety domain was not the primary focus of SDR industrial vendors. However, several incidents over the past several years have suggested that public safety community may use evolving SDR and cognitive radio technology to address critical public safety communications challenges.
Interoperability has been a long-standing challenge in public safety communications. We have numerous examples in which responders with incompatible radios have been unable to communicate during a natural disaster or an emergency/crisis situation. The challenges of interoperability in public safety communication have been described by a number of sources including [5] and [6].
The application of SDR to mitigate or resolve
interoperability barriers in the Public Safety domain has been the focus of the FP7 PASR WINTSEC project [7].
The WINTSEC (Wireless INTeroperability for SECurity) project aims to explore a mix of complementary solutions to overcome the barriers for wireless interoperability across different security agencies, taking into account the constraints of the security services and legacy systems and equipment. WINTSEC studies the deployment of standardized Internetworking layer at Core Network level and Software Defined Radio (SDR) added value for Base Station and Terminal. WINTSEC addresses information assurance, elaborates the European “SDR Architectural Framework” and the concepts for the “SDR Certification Environment”.

229
International Journal on Advances in Telecommunications, vol 3 no 3 & 4, year 2010, http://www.iariajournals.org/telecommunications/
2010, © Copyright by authors, Published under agreement with IARIA - www.iaria.org
Certification of the equipment and software is an essential process in the Public safety or Defence domains. This is particularly important for the introduction of new technologies like SDR, which must be validated against specific operational and technical requirements.
Because of its high degree of reconfigurability and ease of programming, SDR is a technology enabler for cognitive radio (CR). Cognitive radio is a radio or wireless communication device that is able to change dynamically its transmission or reception parameters by using the information collected or sensed on the external environment. Cognitive radios can also potentially enable Dynamic Spectrum Allocation (DSA), where the allocation of spectrum bands to communication services can change depending on time and context (see [8] and [10]). The use of SDR as an enabler of CR makes the certification activity even more important, because a badly configured or faulty SDR can negatively affect other wireless communication services in the same coverage area through harmful wireless interference. The need for a certification process for SDR as a CR and DSA enabler, are described in [9] as part of the standardization work of IEEE P1900.3.
Reference [9], identifies four testing areas for
certification: • Over the Air. A Provisioning Testing, which
verifies the ability of a device to correctly obtain & install applications over the air.
• Security Testing to ensure that security requirements are validated.
• Performance Testing to validate the time constraints and
• Stress testing to verify the robustness of the implementation when stretched to the limits of system resources.
The paper acknowledges that SDR certification is a difficult task because SDR is a complex system with a large potential state space. The validation and certification of non-functional attributes (e.g., security) is particularly challenging for SDR products.
The complexity of SDR certification is also discussed in [11], where the vast amount of SW and HW combinations is identified as one of the biggest challenge in the certification process.
A preliminary study on SDR standardization and certification is provided by the same authors in [1], but the paper does not address performance benchmarking and security certification, which is investigated in this paper.
This paper will provide a survey of the SDR
standardization and certification status in Europe and a proposal for a SDR certification framework and related tools.
The paper is structured in the following sections: section
II describes the status of SDR standardization and certification in USA and Europe with the identification of the main challenges. The certification framework is proposed in section III, which describes the main elements of the SDR
certification process including the reference implementations, the certification of API compliance, certification tools, the structure of the certification network, the waveform libraries and the issue tracking workflow. Two specific certification processes are then presented in the following sections. Benchmark certification is described in section IV, while security certification is described in section V. Finally section VI concludes the paper.
II. SDR STANDARDIZATION AND CERTIFICATION The initial drive for standardization has been the JTRS
program, which proposed the Software Communications Architecture (SCA) as a framework to integrate the hardware and software components.
SCA is a framework for developing SDR systems and we can define a framework as a set of cooperating classes that make up a reusable design for a specific class of software.
The interfaces among the classes and the other elements of the framework must be clearly defined to facilitate the activity of development, integration and validation.
The goals of the SCA are to: a) provide portability of applications between
different SCA implementations, b) Reduce development time of new waveforms
through the ability to reuse design modules; c) Build on evolving commercial frameworks and
architectures. SCA is based on CORBA as a middleware to provide the
communications among the main components and functions of the framework, which are:
• Radio management functions, • Domain Manager, • Application Factories, • Applications, • Device Managers and • Devices
The portability concept is quite important for SCA and it
is a basis for the certification process. SCA and SDR are mostly investigated in the Wireless Innovation Forum, which is (from reference [12]):
“Established in 1996, the Wireless Innovation Forum™ is a non-profit international industry association dedicated to promoting the success of next generation radio technologies. The Forum's 100-strong membership comprises world class technical, business and government leaders from EMEA, Asia and the Americas who are passionate about creating a revolution in wireless communications based on reconfigurable radio. Forum members span commercial, defense and civil government organizations at all levels of the wireless value chain and include service providers, operators, manufacturers, developers, regulatory agencies, and academia.” The Wireless Innovation forum is very active in the Defence domain even if a number of deliverables have been created for the Public Safety and Commercial domain as well.
In USA, the Federal Communication Commission (FCC) has adopted rule changes to address the certification of SDR

230
International Journal on Advances in Telecommunications, vol 3 no 3 & 4, year 2010, http://www.iariajournals.org/telecommunications/
2010, © Copyright by authors, Published under agreement with IARIA - www.iaria.org
equipment in [13], where SDR is considered a new class of equipment with streamlined equipment authorization. The purpose of the action is to modify certification rules to accommodate the flexibility offered by SDR. Specifically, FCC amended the equipment authorization rules to permit equipment manufacturers to make changes in the frequency, power and modulation parameters without the need to file a new equipment authorization application with the Commission. The action also permitted electronic labeling so that a third party may modify a radio's technical parameters without having to return it to the manufacturer for re-labeling. The certification rules were updated in [14] to further facilitate the development and deployment of SDR and CR. Specifically, the action eliminated the rule for a manufacturer to supply radio software to the Commission upon request because this may become an unnecessary barrier to entry.
The action also required the manufacturer to supply a
high level operational description of the radio software that controls its RF characteristics for SDR certification. Security aspects were also addressed by requesting software controls to limit operation to authorized frequency bands.
In [14], FCC does not allow the Telecommunications
Certification Bodies (TCBs) to certify SDR equipment. SDR certification is required to be carried out at FCC labs. The reason is because software defined radio is a new technology; TCBs will not be permitted to certify software defined radios until the Commission has more experience with them and can properly advise TCBs on how to apply the applicable rules.
The European context is more complex because of the
geopolitical diversity and the presence of national certification centers and processes.
The European Software Radio Architecture (ESRA) is an on going standardization activity at European level. The goals are to ensure waveform portability and SDR reconfigurability. The ESRA standardization activity will be implemented through existing projects at European level like ESSOR [15], WINTSEC and its follow-up EULER, which is focused on the application of SDR for improved joint interoperability in Public Safety and defense.
Many organizations and industries in Europe are involved in this process. The (EDA) European Defence Agency is a main player in this process.
At the same time, ETSI (European Telecommunications
Standards Institute) started a similar initiative to conduct feasibility studies for the standardization of a wider concept of SDR technology called RRS (Reconfigurable Radio Systems), which are defined as follows (from [16]):
“The group of technologies for Cognitive Radio and for Software Defined Radio are all technologies for Reconfigurable Radio Systems (RRS). Such systems exploit the capabilities of reconfigurable radio and networks and
self-adaptation to a dynamically changing environment, with the aim to ensure end-to-end connectivity.”
In comparison to EDA, which is focused on the military and public safety domain, the main target domains of ETSI RRS are the commercial domain and the public safety domain. ETSI RRS is composed by four working groups: WG1 for system design, WG2 for handset architecture, WG3 for functional architecture and WG4 for Public Safety domain.
From a standardization point of view, the ETSI RRS is performing work that is complementary to the IEEE SCC41 and IEEE 802 activities, with a focus on SDR standards beyond the IEEE scope, CR/SDR standards addressing the specific needs of the European Regulatory Framework and
CR/SDR TV White Space standards adapted to the digital TV signal characteristics in Europe.
Currently, there are no specific working items on the certification of SDR/CR equipment, but the TC maintains a close link with other ETSI TCs and organizations to ensure conformance of SDR/CR to the European regulatory framework. Technical standards on the SDR architecture are currently under definition.
The main challenge of SDR certification in Europe is
currently the lack of technical standards for SDR/CR technology against which certification should be executed.
The WINTSEC project has laid the foundations of
ESRA, which however has not yet reached the level of a standard but rather an architectural framework; the items defined in the ESRA document are not actual requirements but mere recommendations. The ongoing EULER project [17], which is expected to provide further ESRA recommendations extensions, will not also propose a standard.
However, certification is valid against a published standard; no certification can exist against an architectural framework. The consequence is that any certification guidelines described in the deliverables of the WINTSEC project are designed against a future, ESRA-derived standard, and that they are described as “compliance evaluation procedures” rather than “certification procedures”.
The concept of compliance evaluation is significantly less rigid than the concept of certification for a number of reasons: a) evaluation is a much more informal, less authoritative procedure where the steps and requirements can be adapted to each specific test case; b) compliance evaluation can be performed on any relatively mature version of the product under test as it deals mostly with general properties of it, rather than specific details; c) the result of evaluation is a report elaborating on the estimate of each property's compliance to the guidelines; d) evaluation procedures are often related to new, rapidly evolving technological domains, where a standard and certification procedure would quickly become outdated or hinder development.

231
International Journal on Advances in Telecommunications, vol 3 no 3 & 4, year 2010, http://www.iariajournals.org/telecommunications/
2010, © Copyright by authors, Published under agreement with IARIA - www.iaria.org
It is advisable that a set of guidelines/directives accompanied by compliance evaluation procedures evolves into a standard and certification procedure as the technological domain involved matures.
In Europe, certification of wireless equipment is driven by the Radio and Telecommunications Terminal Equipment Directive (R&TTE) that came into force in April 2000 in Europe. With the exception of a few categories of equipment, the Directive covers all equipment, which uses the radio frequency spectrum. A basic requirement is that radio equipment shall be so constructed to effectively use the spectrum allocated to terrestrial/space radio communication and orbital resources so as to avoid harmful interference. The adaptation of the R&TTE directive for SDR technology has been investigated by the Telecommunications Conformity Assessment and Market Surveillance Committee (TCAM), which is the standing Committee assisting the European Commission in the management of the R&TTE Directive 99/5/EC. In TCAM, the specific sub-group TGS (TCAM Group on SDR) was created to investigate SDR regulation with respect to the R&TTE Directive. Based on a TGS report provided to TCAM in 2006 (“Conclusions concerning the regulatory aspects of SDR with respect to the R&TTE Directive”), and on discussions in TCAM, the European Commission draw some conclusions to particular discussion points, but the discussion was not finalized.
Two deployment models for SDR technology are
considered: • Vertical mode, where the terminal
reconfiguration can only be done (and authorized) through the equipment manufacturer (who also takes the responsibility).
• Horizontal model, where the reconfigurations can be authorized by different actors. The software only needs a declaration of standard compliance. This responsibility can be taken by different actors.
The following conclusions were presented:
• For downloaded SW, a digital marking (e.g., CE marking) is recommended.
• It is recommended to maintain, in the SDR devices, a history of software changes.
• SDR equipment would be considered as a "relevant component", in the meaning of Article 2 of the R&TTE Directive.
• Harmonized standards covering SDR devices should contain countermeasures against illegal programming and hacks for equipment, which are at risk.
Future versions of the R&TTE Directive may incorporate
additional elements for SDR certification. In summary, we can identify the following challenges for
SDR certification in Europe:
• SDR technical standards should be defined for all the relevant domains: military/public safety and commercial.
• Identify who should have the responsibility of the final product or its components including software waveforms, SDR HW platform and software framework (e.g., SCA). This is especially important for a horizontal market.
• The European SDR certification process should address the geopolitical diversity of Europe and the existing national organizations and certification centers.
• Ensure that SDR technology validates harmonized radio-spectrum regulations at European level and non-harmonized regulations at national level.
• Ensure that all the certified waveforms and SDR platforms are managed in a controlled environment and accessible to end-users across Europe.
III. PROPOSAL OF A SDR CERTIFICATION FRAMEWORK The purpose of this section is to describe a SDR
certification framework, which is able to address the challenges, describes in the previous section.
The certification framework is based on the following elements:
• Reference implementation, which complements existing or future standards on SDR. Reference implementations are useful to resolve ambiguities in the standards definition.
• Procedures and tools to certify API compliance • Use of Reference platforms against which
waveforms should be certified. • A European certification network to address the
geopolitical diversity of Europe. • A repository of waveform libraries, which can be
accessed by end-users across Europe. • A waveform usage and issue tracking to manage
issues and changes in the versions of the waveforms.
The SDR certification framework addresses the horizontal model, which is the most complex of the SDR certification and deployment models.
The following stakeholders are identified:
• SDR HW platform manufacturers, which are responsible for designing and deploy the SDR HW platforms
• The SW waveforms designers, which are responsible for the creation of SW waveforms in accord to specific standards and specifications.
• The telecom provider, which provides the network deploying SDR technology.
• The user/subscriber of the SDR platform and the network.

232
International Journal on Advances in Telecommunications, vol 3 no 3 & 4, year 2010, http://www.iariajournals.org/telecommunications/
2010, © Copyright by authors, Published under agreement with IARIA - www.iaria.org
• The administrative organizations, which include the European and national spectrum regulators and the authorities, which manage the use (and certification) of SDR technology in the market.
• The certification authorities, which may be industry or government representatives.
A. Reference Implementation Naturally, a large effort is made during the design of a
standard to be as concise, consistent and complete as possible. However, it is realistically inevitable that any standard contains ambiguities, gaps or sometimes even contradictions in its definition. This runs contrary to the goal of standard compliance, which is seamless interoperability between components or systems.
A trend that is becoming more and more prevalent is for any standard to be complemented by a reference implementation. This is an open, free and complete software implementation of the standard, usually defined by a neutral, impartial, independent and trusted entity. The goal of such an activity is to clarify the standard, while at the same time encouraging wide adoption.
Any ambiguities in the wording of the standard should be easily resolvable by consulting the source code of the reference implementation. Furthermore, any contradictions inside the standard definition should be discovered during the development of the reference implementation, and the standard drafting body (or consortium) should be notified, in order to rectify them. It is therefore evident that two-way flow of information between the standard drafting body and the developers of the reference implementation is necessary to improve the quality of the standard.
The reference implementation should be thoroughly documented, as the goal is clarity. A high-level language should be preferred, since code readability should be preferred over efficiency in a reference implementation. Finally, the code should be extensively cross-referenced to the articles and clauses of the related standard, in order to improve the tracking of the design choices in the reference implementation.
B. Certifying API Compliance The outcome of a software standard is often a set of
Application Programming Interfaces (APIs), which allow other programs or modules to interface with and exploit the capabilities of software components. Therefore, an important activity of the certification process for standard compliance is to check compliance to the resulting API.
Certification of a component's compliance to a given API
is usually done by executing a software test tool (or set of tools) that thoroughly checks the existence of all the functions and data structures defined in the API in the component under test and their robustness (stress testing). For example a method might be called with a predefined set of arguments, and the result would be compared to the expected result. This is commonly called Unit Testing. Part of the stress testing process might be calling methods with erroneous/invalid input parameters; in this case, an error
should be returned by method and the software executable under test should not enter in an undefined state. For example, the software executable should not crash or hang.
Unit testing has a set of limitations: it can only follow a limited number of execution paths, and therefore it can only test for the existence of a limited number of errors. In other words, unit testing cannot guarantee the absence of errors.
Finally, while unit testing can confirm the existence and correct operation (under normal conditions and under stress) of all the methods and objects in an API, it cannot test for the existence of additional methods and/or objects (extensibility).
Development tools could also be used for testing and
validation of the waveform and SDR framework (e.g., SCA) code. In the early days of computer programming, source code was written in a single long file using a plain text editor. The target had single processor architecture. Today, especially in the SDR context, the common practice is to create first a platform-independent model of a component, then a platform-specific model, and then generate code for multiple architectures (e.g., GPP, DSP and FPGA).
Therefore, complex and powerful Integrated Development Environments (IDEs) are used throughout the industry. These IDEs provide a long series of additional features to the developer, such as syntax highlighting, auto completion, build automation, debugging, version control, built-in documentation, configuration management and others.
Often these tools include (either built-in, or in the form of plug-ins) compliance testing functionalities for a specific standard. This is highly beneficial for the process of pre-certification, as it allows developers to test their code for standard compliance parallel to their coding efforts (two of the four basic Extreme Programming activities), rather than test for compliance towards the end of the development process, when it actually might be too late. The reference implementation might be instrumental in this compliance testing process.
Example of Development and Testing Tools are the CRC's SCA Architect and Prismtech's Spectra CX, which are both based on the Eclipse IDE.
C. Reference Platforms While part of the certification testing of a waveform's
components might occur on the source code or the configuration/interface files, some of the tests will inevitably need to be run on the full, ported waveform, which is downloaded and activated on the SDR platform.
While it would be possible to select a high-quality SDR platform (i.e., the reference platform), against which all waveforms should be run for certification testing, several problems arise from this approach:
1. Such a choice would give the manufacturer of the
SDR platform an undeniable and unfair advantage over their competitors, as they would be able to claim to be the “preferred platform provider”. Furthermore, such a choice would tie the European

233
International Journal on Advances in Telecommunications, vol 3 no 3 & 4, year 2010, http://www.iariajournals.org/telecommunications/
2010, © Copyright by authors, Published under agreement with IARIA - www.iaria.org
SDR Certification community to a single vendor, denying all the benefits of market competition like costs reduction, supply chain diversification, etc).
2. The standard must be meticulously implemented in
the waveform and reference platform. Otherwise, a single reference platform would create a de facto standard, which might slightly differ from the paper standard; waveform developers would be forced to comply with this de facto standard to pass certification.
As a solution to these problems, it is suggested to adopt
multiple reference platforms for certification testing. A waveform under test would be ported, loaded and run on multiple platforms. A certification failure on a single platform would require further examination, but might hint to an incompatibility of the underlying platform. Instead, certification failure on two or more platforms would still require further examination, but it would indicate that most probably the error lies in the waveform under test.
The relationship among the various certification activities
is described in Figure 1.
Figure 1 The relationships among different certification areas.
In the first phase, the SDR platforms and the waveforms are separately tested and certified for compliance to the standards. If these steps are successful, the next phase is the certification of the combinations of SDR platforms (i.e., HW) and Waveforms (i.e., SW).
An important certification activity is the conformance to
the regulatory framework (e.g., the spectrum regulations) for the areas where the SDR Platforms and Waveforms are supposed to operate. For example, the SDR should not generate harmful interference to licensed users.
The validation activity should also include the case of roaming where a SDR device is used in different contexts with different national spectrum regulations.
At the end of the certification process, the certification body should release a compliance certificate, which includes the spectrum regulations considered in the testing activity.
D. SDR Certification Network The technical requirements for the certification of SDR
and its components must be mapped to a certification procedure. SDR certification tools need to be developed, either from scratch, or (more likely) building upon existing certification tools (e.g., the xUnit test framework). Then these procedures can be executed (using test tools) on a network of certification centers throughout Europe.
Some characteristics of this network:
• A centralized certification authority would not execute actual certification of products; instead it would prepare, monitor and accredit the certification centers, making sure that they are compliant to the shared certification procedures and tools.
• Location transparency of the certification process is a necessary requirement. It means that it shouldn't be easier to pass certification at one centre rather than another.
• Certification laboratories might be included in the process; these would be industrial champions or centres of excellence in a specific technological area (e.g., FPGAs), and would perform partial certification in that area for components developed by themselves or others. This is an extension of the concept of self certification.
• Redundancy should be considered to address occasionally increasing certification workload, or problems in the certification process.
A description of the structure of the European SDR
certification network is provided in Figure 2, where Waveform and SDR platform certification centers are dependent on the national certification centre, which are connected to the centralized certification and accreditation authority. Note that centre for the validation against spectrum regulations can be affiliated both to a national centre and the centralized centre to include testing of roaming functionality among different nations.
The optimum number of certification centers is difficult
to decide: some European larger countries might choose to create more than one certification centre, while smaller countries may decide to share the cost with other countries, or depend on larger countries for their certification needs.

234
International Journal on Advances in Telecommunications, vol 3 no 3 & 4, year 2010, http://www.iariajournals.org/telecommunications/
2010, © Copyright by authors, Published under agreement with IARIA - www.iaria.org
NA
NA
Central Certification andAccreditation authority NA
NANA
NA
NA
NA
National certification authority
Waveform certification centre
SDR platform certification centre
Conformance to spectrum regulations
NA
NA
Central Certification andAccreditation authority NA
NANA
NA
NA
NA
NA
Central Certification andAccreditation authority NA
NANA
NA
NA
NA
National certification authority
Waveform certification centre
SDR platform certification centre
Conformance to spectrum regulations
Figure 2 The structure of a potential European SDR certification network
In addition to the benefits of redundancy and national independence achieved by having a network of certification centers instead of a single one, the network would mitigate the risk of a slightly different, de facto standard created by a single certification centre as in the case of multiple reference platforms.
Finally, it would be mutually beneficial to maintain a close relationship with the US SDR certification centers (e.g., JTeL), to exchange know-how and possibly share procedures and tools.
E. Waveform Libraries The creation of a central repository to maintain and
distribute software modules is a common practice today. This approach provides the following advantages:
• A central repository provides more control for the storage and maintenance of certified software modules.
• The customers have easier access to a central repository.
• It is easier to implement automatic download and updates for new versions/features.
• It is easier to apply specific signatures on the certified software modules.
A similar approach is proposed to store the certified SDR
Waveforms: a common, centralized repository (called “Waveform Libraries”) of all the waveforms that have passed certification against the standards. This would facilitate over-the-air (OTA) downloads of complete waveforms as well as upgrades of waveforms and components. At the same time this repository would be a valuable tool during the certification process, by storing the results of the tests and keeping a history of past certifications.
Because of the presence of various administration authorities in Europe, it is suggested to have a distributed,
redundant architecture for this repository, possibly with one instance per certification centre and one per national authority; limited, stripped-down versions of the repository might even be included in the local, encrypted storage of the SDR base stations and terminals in the field.
CentralRepository
NationalRepository
NationalRepository
NationalRepository
NationalRepository
Waveform repository
Waveform developer
Certification center
Submit waveform for certification
Delivery of certified waveform to the repository
User
Retrieves Waveform
Certificate Authority
Digital signatures
Repository Manager Figure 3 Waveform Repositories
Such a repository could include source code, binary files of the waveforms, or both. Additionally, it would certainly include configuration files, model/interface files (UML, IDL, etc), other meta-data related to deployment and use (such as performance requirements), and documentation files both for the porting/certification process and for the deployment/usage.
Some additional tags should accompany each waveform in the repository: information about certification status, the version of the standard with which the waveform complies, the communications protocol implemented, the license scheme, the owner of the waveform, etc. It will also include the information on the SDR platforms against which the waveform has been certified.
The structure of the waveform libraries is described in Figure 3, where the main stakeholders are present. The waveform developer submits the waveform for certification to the certification centre. After the certification, the waveform is stored in the national and centralized repository together with the information described above. The certificate authority can add digital signatures to the waveform to guarantee the security for the software download. Finally, the customer can collect or download the waveforms.
F. Waveform Usage & Issue Tracking Alongside the waveform libraries discussed above, two
additional tools are needed in the European SDR ecosystem to keep track of waveform usage and reported issues.
One tool is used to track waveform usage in customers. Tracking waveform usage would be useful to understand the needs of the end-users/customers, to introduce upgrades (using a push-mode, rather than a pull-mode in order to deploy upgrades to all the users of a specific waveform or component), and possibly also for licensing and fees collection. A waveform usage directory (WUD) could be

235
International Journal on Advances in Telecommunications, vol 3 no 3 & 4, year 2010, http://www.iariajournals.org/telecommunications/
2010, © Copyright by authors, Published under agreement with IARIA - www.iaria.org
used to identify gaps in the SDR ecosystem and it would allow the central authorities to know which customers are using the waveforms. This tool can also be used to improve the efficiency of technical support and customization, but identifying which categories of customers are using specific waveforms.
The other tool is a centralized issue tracking system (ITS) that is integrated with the Waveform Libraries and the WUD. Its objective is to report and track any issue related to the malfunction of certified SDR platforms and waveforms or a request for an enhancement. The centralized ITS will store the list of all the available waveforms and it will allow customers to report issues.
The ITS will be based on a classical issues tracking flow. Once a new issue is reported by a customer, the issue tracking process will verify whether the issue reported is a known issue (i.e., a duplicate of another issue already registered in the ITS), if it is an enhancement request, if it is not really a waveform issue, but a deployment/configuration issue on the side of the end-user, or if it actually is a new issue that needs to have the developer's attention. When an issue is resolved by the developer, the ITS combined with the WUD would allow for efficient distribution of the update to all the users of the affected waveform or component.
Finally, the centralized Issue Tracking System would allow the involved partners and supervising authorities to collect statistics about the quality of the waveforms and waveform components (thus measuring the performance of waveform developers), as well as the performance of the support organizations.
IV. PERFORMANCE BENCHMARKING CERTIFICATION SDRs are generally considered soft real-time systems, in
the sense that signal processing has to keep up with the data rate of the communications system. In other words, the result of a calculation must not only be accurate, but it must also be completed by a certain deadline, otherwise it will not validate the operational requirements.
Each SDR waveform has specific performance requirements that need to be fulfilled, in order for it to run in real-time. These requirements might include definite processing speed from a processing core, a certain bandwidth or latency between processing cores, or the availability of certain components (e.g., an OCXO, or an RF front-end with a certain frequency range).
A. Performance Metrics In order to compare the performance available on the
platform with the performance required by the waveform, it is necessary to have a common way of describing and measuring these performance requirements and capabilities.
This task is more or less complex if an SDR Set operates in single-mode than when it operates in multi-mode. With single-mode we mean that a single waveform will execute on the platform at any single moment, while with multi-mode we mean that multiple waveforms will execute on the
platform at any single moment, with voice, video and data bridges between them. A terminal will probably operate in single mode most of the time, while a base-station is most likely to operate in multi-mode.
In multi-mode, we should differentiate between the nominal (zero-load) performance that the platform can provide, and the actually available performance when one or more waveforms are already running on the platform.
B. Performance Benchmarking Measuring the performance capacities of an SDR
platform and the performance requirements of a SDR waveform is a valuable activity both during design phase and deployment phase.
Specifically, performance benchmarking during the design phase of a platform or of a waveform can allow developers to identify components that are performance hogs and focus their optimization efforts on these bottlenecks. On the other hand, performance benchmarking is essential when making purchasing or waveform porting decisions: it enables authorities to determine the feasibility of a waveform porting onto a platform by providing assurance that the waveform performance requirements will be satisfied by the platform hardware and software resources. Furthermore, once porting feasibility has been guaranteed, benchmarking can drive the adaptation effort of the porting.
Therefore the benchmarking has to start early in the design or porting process in order to limit the cost and time of the porting effort.
C. Processing Cores Benchmarking CPU benchmarking might be the most widely studied
and applied type of benchmarking in the computer industry. A wide selection of both open-source and proprietary solutions are available for CPU benchmarking; some of these tools are based on integer or floating point arithmetic, others on linear algebra operations, and others still on compression or audio/video encoding algorithms. Here we mention only three of the most widely accepted CPU benchmarks: EEMBC's Coremark, HPL (High Performance Linpack) and Livermore loops. With minor modifications these tools could be ported to the SDR domain and be used in benchmarking GPPs/FPGAs and DSPs in SDR platforms.
Each SDR HW component may be used for specific tasks. For example, DSPs concentrate mainly on FIR/IIR filters, FFT calculations and codec implementations, so naturally these are the kinds of operations benchmarked. An example of DSP benchmarking is BDTi's DSP Kernel Benchmarks: a proprietary solution that executes 12 different types of benchmarks on each processor.
However, many of the graphics cards used for gaming
PCs can be considered DSPs. In fact, several efforts are currently under way to exploit the DSP potential of commercial graphics processing units (GPUs) using either

236
International Journal on Advances in Telecommunications, vol 3 no 3 & 4, year 2010, http://www.iariajournals.org/telecommunications/
2010, © Copyright by authors, Published under agreement with IARIA - www.iaria.org
nVidia's CUDA or Apple's OpenCL for signal processing. Furthermore, General Purpose Graphics Processing Unit (GPGPUs) such as the Cell processor (found in Sony's Playstation 3) or Intel's Larrabee show promising potential for mixed generic and signal processing applications, which makes them a good fit for SDR applications. See [18] for a description of the use of GPGPU to realize SDRs on desktop computers with distributed resources. In both the above cases, a multitude of benchmarking tools already exists.
D. Benchmarking the entire SDR platform In addition to the procedures discussed above, which
target specific components of an SDR platform, it is important to complement them with benchmarks that test the SDR platform as a whole; these types of tests often reveal bottlenecks that might go undetected by examining individual components separately.
The MPrime application is one such test. MPrime was originally developed to search for prime Mersenne numbers; however, due to the very intense performance requirements it imposes on the underlying platform, it is often used to stress-test computing systems for stability. Other such stress-testing tools are the FurMark (a closed-source, Windows-only fur-rendering performance and stability test for the GPU), or distributed computing clients such as the University of Berkeley's BOINC.
Another tool that could be used for benchmarking the SDR platform as a whole is the Phoronix suite (see Figure 4), probably the most widely used open-source test suite for Linux operating systems. It includes tests for the processor, memory, disk, and graphics and also for the system as a whole.
Figure 4 Phoronix Test Suite v2.2.0.
E. Power consumption benchmarking Another architectural area, which requires performance
benchmarking, is power consumption/power efficiency. This is an issue that is increasingly seeing the attention of both
industry and academia, and a rather problematic area for the SDR domain (especially for handheld/portable radios) due to lower power efficiency of the more generic hardware (both processing and RF) used in SDR compared to the specialized hardware used in traditional legacy communications systems.
An example of benchmark tool for power consumption is
PowerTop, an open-source tool released by Intel in 2007 as part of the LessWatts effort. PowerTop measures and tries to estimate the power consumption of software processes and device drivers, thereby identifying the culprits and guiding the effort of developers to minimize power consumption. This tool was successfully used in improving the power consumption of the Firefox browser and of several device drivers and kernel subsystems.
F. Benchmarking of SDR waveforms While measuring the performance of a SDR platform is
useful in the design, purchasing and waveform porting phases; it is instrumental to measure also the performance of an SDR waveform before porting or deployment.
OProfile is a system-wide profiler for Linux systems, which allows developers to receive real-time statistics about the resource usage of all a waveform's components with low overhead (usually less than 1%), in addition to several post-processing tools for analyzing these statistics. OProfile uses hooks in the Linux kernel to raise interrupts, and can be used both on x86 and on ARM processors.
OProfile is sponsored by some major companies such as IBM and RedHat. An OProfile plug-in exists for the Eclipse development framework, on which both Prismtech's and Zeligsoft's SDR development environments are based.
G. Benchmark cheating Several incidents have been reported in recent years of
cheating in CPU benchmarks, 3D accelerator benchmarks, Java VM benchmarks and others. This is commonly called as “benchmark cheating”. It is therefore important that statistically rigorous techniques are used when evaluating the performance of SDR components and systems in order to avoid deceptive advertising and other irregularities:
• Run not one, but multiple different benchmark tools on the target in order to avoid “on-demand” benchmarks, i.e., benchmarks that favor one system vendor over the others.
• Run each of the benchmark tools on the device-under-test (DUT) a sufficiently large number of times, and clearly describe the statistical analysis on the vector of the results that led to the final benchmark output, so as to avoid e.g., reporting of only the best result obtained or arbitrarily discarding unfavorable results.

237
International Journal on Advances in Telecommunications, vol 3 no 3 & 4, year 2010, http://www.iariajournals.org/telecommunications/
2010, © Copyright by authors, Published under agreement with IARIA - www.iaria.org
Finally, [19] describe tools from theoretical computer science including randomization, one-way functions, and trapdoor functions, which are used to improve the robustness of benchmarks against cheating.
V. SECURITY CERTIFICATION As described in the previous sections, software
portability should include security mechanisms, which guarantees the authenticity of the waveform and the trust of the SDR platform and waveforms.
The certification process is based on certification criteria, which are defined on the basis of regulations, standards and industry specifications. There are usually two certification processes: one process to certify the SDR platform, which includes the HW platform, RTOS and software framework and the second process for the waveform certification. Additionally, a certification process should be established for the security requirements. Security certification is an essential protection against security threats like download of malicious software, masquerading of a SDR node and denial of service (DoS). The security certification process for SDR can be based on similar processes already defined in the computing domain like the Common Criteria [20]. Among other things, Common Criteria are used to develop Protection Profiles, which identify the security requirements, and Assurance Levels, which describe the rigor of testing and evaluation. The combination of Protection Profiles and Assurance Levels results in a Security Target against which the certification process can evaluate a product. This model is appropriate for the future use of SDR in different markets: military, public safety and commercial with different security requirements and equipment costs. For each domain, we can define different types of protection profiles and security targets.
In comparison to conventional wireless equipment, the
security certification process is particularly complex for SDR equipment because of the complexity of the technology and because various stakeholders could be involved in the certification process. A description of the challenges in the certification of non-functional requirements like security is provided in [9], which notes that certifications for security requirements are intrinsically different and more complex from those covering functional or process requirements, as they need to model the user as malicious for all the potential security threats and this increases the number of test cases.
An additional level of complexity is the presence of supplementary stakeholders like the certificate authority, which should be part of the certification process. The number and the role of the stakeholders depend on the related domain: military, public safety and commercial domain. In the military and public safety domains there are usually well defined security certification processes for conventional equipment, which can be adapted to SDR technology.
VI. CONCLUSIONS AND FUTURE WORK Standardization is still an ongoing process, with multiple
stakeholders involved. The goal of a European SDR standard is to facilitate waveform portability and system interoperability. To ensure these benefits, a network of certification centres accompanied by the relevant certification procedures and tools needs to be developed. These concepts were studied in the context of a European SDR Architectural Framework inside the WINTSEC project. The importance of performance metrics was described, as they're particularly important in order to validate the operational requirements in the public safety domain. Possible pitfalls were identified, including sensitive issues, either political or commercial. The need for Waveform Libraries, as well as a Waveform Usage & Issue Tracking directory were explained. Performance and Security aspects are particularly important in SDR technologies This paper described metrics, processes and tools for Performance benchmarking with special focus on mitigating the risk of performance cheating. This paper also described SDR security certification and the relationship to Common Criteria.
Future work will focus on the definition of a comprehensive framework for security certification of SDR equipment. The framework will include identification of the main stakeholders and related roles, certification processes and the link to the standardization activity.
ACKNOWLEDGMENT Part of this work was performed in the project
WINTSEC which has received research funding from the European Community's Seventh Framework program. This paper reflects only the authors' views and the European Community is not liable for any use that may be made of the information contained therein.
REFERENCES [1] D. Symeonidis and G. Baldini, "European Standardization and SDR
Certification," (AICT 2010), The Sixth Advanced International Conference on Telecommunications, pp. 136-141, May 9-15, 2010, Barcelona, Spain.
[2] J. Mitola III, "Software radios-survey, critical evaluation and future directions ," Telesystems Conference, 1992. NTC-92., National , vol., no., pp.13/15-13/23, 19-20 May 1992.
[3] D. R. Stephens, B. Salisbury and K. Richardson, “JTRS infrastructure architecture and standards,” in Military Commun. Conf., 2006.MILCOM 2006, Oct. 2006, pp. 1–5.
[4] “The Joint Tactical Radio System (JTRS) and the Army’s Future Combat System (FCS): Issues for Congress” by Andrew Feickert. CRS Report for Congress. Order Code RL33161. November 17, 2005.
[5] “Why Can’t We Talk? Working Together To Bridge the Communications Gap To Save Lives”. A Guide for Public Officials by US National Task Force on Interoperability. February 2003.
[6] US SAFECOM program. Web site http://www.safecomprogram.gov. Last accessed 03/01/2011.

238
International Journal on Advances in Telecommunications, vol 3 no 3 & 4, year 2010, http://www.iariajournals.org/telecommunications/
2010, © Copyright by authors, Published under agreement with IARIA - www.iaria.org
[7] V Blaschke, F. K. Jondral and S. Nagel, “Wireless Interoperability for Security - WINTSEC,” Nov. 2007, Software Defined Radio Technical Conf. Product Exposition November 2007.
[8] J.M. Chapin, and W.H. Lehr, "Cognitive Radios For Dynamic Spectrum Access - The Path to Market Success for Dynamic Spectrum Access Technology," Communications Magazine, IEEE, vol.45, no.5, pp.96-103, May 2007.
[9] J. Giacomoni and D.C. Sicker, "Difficulties in providing certification and assurance for software defined radios," New Frontiers in Dynamic Spectrum Access Networks, 2005. DySPAN 2005. 2005 First IEEE International Symposium on, vol., no., pp.526-538, 8-11 Nov. 2005.
[10] I. F. Akyildiz, W. Lee, M. C. Vuran and S. Mohanty, “NeXt generation/dynamic spectrum access/cognitive radio wireless networks: a survey”. Computer Networks 50, 13 (Sep. 2006), 2127-2159.
[11] T. Ulversoy, "Software Defined Radio: Challenges and Opportunities," Communications Surveys & Tutorials, IEEE , vol.12, no.4, pp.531-550, Fourth Quarter 2010.
[12] Wireless Innovation Forum (ex Software Defined Radio Forum). http://www.wirelessinnovation.org. Last accessed 03/01/2011.
[13] Federal Communication. Commission, “In the matter of Authorization and Use of Software Defined Radios, First Report and Order,” Sept. 2001, FCC 01-264, ET Docket No. 00-47.
[14] Federal Communications Commission, “In the matter of facilitating opportunities for flexible, efficient, and reliable spectrum use employing cognitive radio technologies, report and order,” Mar. 2005, FCC 05-57, ET Docket No. 03-108.
[15] ESSOR project announcement on European Defence Agency website, http://www.eda.europa.eu/genericitem.aspx?area=News&id=54. Last accessed 03/01/2011.
[16] ETSI Reconfigurable Radio System Technical Committee. www.etsi.org.. Last accessed 03/01/2011.
[17] EULER project website, http://www.euler-project.eu/. Last accessed 03/01/2011.
[18] P. Szegvari and C. Hentschel, “An Universal Framework for Scalable Software Defined or Cognitive Radios Running on Desktop Computers” December. 2009, SDR'09 Technical Conference & Product Exposition.
[19] J. Cai, A. Nerurkar and Min-You Wu, "Making benchmarks uncheatable," Computer Performance and Dependability Symposium, 1998. IPDS '98. Proceedings. IEEE International , vol., no., pp.216-226, 7-9 Sep 1998.
[20] NIAP Common Criteria Evaluation and Validation Scheme. Available: http://www.niap-ccevs.org/cc-scheme/. Last accessed 18/01/2011.

239
International Journal on Advances in Telecommunications, vol 3 no 3 & 4, year 2010, http://www.iariajournals.org/telecommunications/
2010, © Copyright by authors, Published under agreement with IARIA - www.iaria.org
A Mathematical Framework for the Performance Evaluationof an All-Optical Packet Switch with QoS Differentiation
John S. Vardakas∗,Ioannis D. Moscholios†, Michael D. Logothetis∗, and Vassilios G. Stylianakis∗∗WCL, Dept. of Electrical and Computer Engineering
University of Patras, Patras, 265 04, Greece,Emails: {jvardakas,m-logo,stylian}@wcl.ee.upatras.gr†Dept. of Telecommunications Science and TechnologyUniversity of Peloponnese, 221 00, Tripolis, Greece,
Email: [email protected]
Abstract—In this paper we propose a mathematical frame-work for the performance evaluation of an all-optical packetswitch, in terms of packet blocking probability. We providethe analytical models for several QoS differentiation schemes,including wavelength conversion, packet dropping, pre-emptivedropping, fiber delay lines, and wavelength reservation. Wedemonstrate the accuracy of the proposed models by comparingthe analytical results with that of simulation; the results arefound to be quite satisfactory.
Keywords-optical packet switching; wavelength division mul-tiplexing; packet blocking probability; markov chains; qualityof service.
I. INTRODUCTION
Wavelength Division Multiplexing (WDM) is the mostpromising solution for the efficient utilization of the enor-mous bandwidth of an optical fiber [2]. In WDM opticalnetworks, the bandwidth of an optical fiber is partitionedinto multiple data channels, in which different messagescan be transmitted simultaneously. Nowadays, the WDMtechnology is deployed in point-to-point architectures, whereelectronic devices are used to switch optical signals. How-ever, traditional electronic packet switches are not suitablefor handling such high bandwidth due to limitations ofelectronic processing speeds and due to the significant costof high speed Optical-Electronic-Optical (O-E-O) converters[3]. Optical Packet Switching (OPS) is a promising sub-wavelength switching approach, since it is capable of dy-namically allocating network resources with fine granularityand excellent scalability. In OPS networks the packet pay-load remains in the optical domain during the entire packettransmission from the origin to the destination node [4].Even though the packet payload is switched transparentlywithout O-E-O conversion, the packet header requires elec-tronic processing. A long term approach of the OPS is toprocess, buffer and forward the entire packet (both headerand payload) in the optical domain.
A vital problem in OPS networks is the resolution ofpacket contention which occurs at a switching node when-ever two or more packets are switched on the same output
wavelength, at the same time. In electrical packet-switchednetworks, contention is resolved with the store-and-forwardtechnique, where packets that lost the contention are storedin a memory module, in order to be sent out at a later timeto an available output port. This is possible because of theavailability of electronic Random-Access Memory (RAM).Since there is no equivalent all-optical RAM technology, op-tical packet switches need to implement different approachesfor contention resolution.
In OPS networks, popular contention resolution schemesinclude the use of Fiber Delay Lines (FDLs) [5], [6],wavelength conversion [7], [8] and deflection routing [9].FDLs provide constant delay to optical packets, to avoidpacket blocking and loss, when all output ports are busyupon packet arrival. Even though employing FDLs makesthe switch bulky and expensive, especially in cases wherelarge amount of data needs to be buffered [10], packetcontention finds a straightforward solution by incorporatingFDLs readily. Wavelength converters are used in an OPSswitch to resolve optical packet blocking by transmittinga contending optical packet on another wavelength of thesame fiber. Deflection routing is another way to minimizepacket losses by routing packets, which lose the contention,to nodes different than their preferred next hop nodes, withthe prospect that they will eventually reach their destinations[11]. The latter solution is not preferred in delay-sensitiveservices, such as real-time or interactive applications, be-cause it may cause packet misordering upon arrival at thedestination node.
Apart from wavelength conversion which is the mostpromising solution for optical packet blocking, other res-olution schemes such as wavelength reservation, packetdropping and pre-emptive drop policy, must be employed,in order to provide Quality of Service (QoS) differentiation.Wavelength reservation is an access restricted scheme, wherea number of wavelengths are reserved to benefit high priorityservice-classes [12]. In packet dropping, packets belongingto low priority service-classes are dropped with a certainprobability, before destined to an output port [13]. In the

240
International Journal on Advances in Telecommunications, vol 3 no 3 & 4, year 2010, http://www.iariajournals.org/telecommunications/
2010, © Copyright by authors, Published under agreement with IARIA - www.iaria.org
Figure 1. Generic configuration of an all-optical packet switch with Finput/output fibers and W wavelengths per fiber.
pre-emptive drop policy, high priority packets pre-empt lowpriority packets (currently in transmission) in the case ofcontention.
The performance evaluation of an OPS switch, in termsof Packet Blocking (Loss) Probability (PBP), attracts no-table research efforts [12]-[17]. We concentrate on Øverby’sworks [12]-[15], where analytical models for the PBP cal-culation in an all-optical packet switch, under the afore-mentioned QoS differentiation schemes, are presented. In[14], Øverby studied QoS differentiation schemes withwavelength converters for an asynchronous bufferless OPSswitch, while the absence of wavelength converters wasinvestigated in [15]. In all cases only two service-classeswere considered (low and high priority) with infinite numberof traffic sources. The utilization of FDLs in a slottedoptical shared-buffer cross-connect is studied in [16], wherea single service-class is considered. In [17] the authorspresent an analytical model for the calculation of the PBPin an all-optical packet switch equipped with tunable opticalwavelength converters shared per output fiber that supportsservice-classes with different priorities.
In this paper, we extend our work presented in [1] andwe propose analytical loss models for the PBP calculationin an all-optical packet switch that accommodates multipleservice-classes of finite population, and supports QoS dif-ferentiation among them. The finite population assumptionis essential, because the number of input ports in an all-optical packet switch is limited. Our study begins with thePBP determination in an all-optical packet switch with fullwavelength conversion capability. The switch may operatewithout any QoS differentiation scheme, or adopt the inten-tional packet dropping policy, or the wavelength reservationpolicy (a number of wavelengths are reserved for eachservice-class). In addition, we study the all-optical packetswitch which utilizes a number of FDLs in each outputwavelength, by considering two cases: i) Packets belongingto a low priority service-class are intentionally forwarded toan FDL, before attempting to reach an output wavelength.In this way their arrival rate is reduced and therefore theprobability that high-priority packets will occupy an output
wavelength is increased. ii) Packets of a low priority service-class are not allowed to access the output wavelengths, whenthe number of occupied output wavelengths exceeds a pre-defined threshold. In that case, packets of the high-priorityservice-class are forwarded to an FDL.
Furthermore, we study the case of the absence of wave-length converters in the switch, where the QoS differentia-tion is employed either with the intentional packet droppingpolicy, or the pre-emptive drop policy. All the proposedmodels are computationally efficient since they are based onsimple recurrent formulas. Our analysis is validated throughsimulation; the accuracy of the proposed models is found tobe quite satisfactory.
The rest of the paper is organized as follows. In SectionII, we present the analytical model for the PBP calculation inwith full wavelength conversion capability in the case wherei) no QoS differentiation scheme is applied (subsection II.A),ii) the intentional packet dropping policy is applied (subsec-tion II.B), iii) the wavelength reservation policy is applied(subsection II.C), iv) the combination of the wavelengthreservation policy and the intentional packet dropping policyis applied (sub-section II.D), and v) a number of FDLs isequipped in the switch (sub-section II.E). In Section III wepresent the analytical model for the PBP calculation in anall-optical switch without wavelength conversion capabilityi) under the intentional packet dropping policy (subsectionIII.A), and ii) under the pre-emptive drop policy (subsectionIII.B). Section IV is the evaluation section. Finally, weconclude is Section V.
II. ALL-OPTICAL PACKET SWITCH WITH WAVELEGNTHCONVERSION CAPABILITY
Fig. 1 shows the considered architecture of an all-opticalpacket switch with full wavelength conversion capability.The switch has F input and output fibers, while eachinput/output fiber supports W wavelengths. The bandwidthcapacity of each wavelength is C bits/sec. Each one ofthe output fibers corresponds to a specific destination node.The OPS network accommodates K service-classes withdifferent QoS priorities; service-class 1 has the lowest prior-ity, while service-class K has the highest priority. Arrivingpackets at the switch are switched to the appropriate outputfiber according to the packet header which is processedelectronically. Since wavelength conversion is supported bythe switch, a packet can be switched to any wavelength ofthe destination fiber, as long as at least one wavelength isavailable at the time instant the packet arrives at the switch.The arrival rate of service-class k packets (k ∈ [1,K]) isdenoted as λk. We assume that the length of the packets isexponentially distributed with mean lp, which is the samefor all service-classes. The latter assumption is adoptedin order to define the same service-time for each service-class; therefore, if a packet is accepted for service throughan available wavelength, the time that this wavelength is

241
International Journal on Advances in Telecommunications, vol 3 no 3 & 4, year 2010, http://www.iariajournals.org/telecommunications/
2010, © Copyright by authors, Published under agreement with IARIA - www.iaria.org
occupied is µ−1 = lp/C, where µ is the service rate ofthe wavelength, (exponentially distributed). In the followingsubsections we present the analytical models for the PBPcalculation both without any QoS differentiation scheme,and with QoS differentiation schemes: the intentional packetdropping policy, the wavelength reservation policy, and theutilization of FDLs. Although our analysis targets at the PBPcalculation in one destination fiber, it can be applied to anyoutput fiber of the all-optical packet switch.
A. Absence of QoS differentiation scheme
The absence of a QoS differentiation scheme means thatall service-classes have the same priority; therefore, the PBPis the same for all service-classes. The calculation of the PBPis based on the knowledge of the occupancy distribution ofthe wavelengths in the fiber. To this end, we formulate aMarkov chain with the state transition diagram of Fig. 2,where state irepresents the number of occupied wavelengthsin the fiber. We denote the total packet arrival rate froman input wavelength byλ =
∑Kk=1 λk.We also indicate the
number of input wavelengths that offer traffic to the fiberunder study, as Rf , f ∈ [1, F ], where Rf = F ·W , if weassume that all output fibers have the same traffic load. Thetransition from state [i-1] to state [i] of the Markov chainoccurs [Rf -(i-1)]·λ times per unit time. This is because instate [i-1] the number of input wavelengths which have notbeen used for a connection establishment with an output portis Rf − (i − 1), while the call arrival rate is aggregated toλ, since a packet from any service-class is required for theoccupation of the wavelength. The reverse transition, fromstate [i] to state [i-1] is realized i times per unit time, where µis the service rate of a wavelength. The probability P(i) that iwavelengths are occupied in the fiber can be derived from therate balance equations of the state transition diagram of Fig.2. We use the classical method for deriving the distributionP(i) which is described in [18]. More specifically, from theglobal balance equations (rate-out = rate-in), we obtain thefollowing steady-state equation:
P (i− 1)[(Rf − (i− 1))λ] + P (i+ 1)[(i+ 1)µ] == P (i)[(Rf − i)λ+ iµ]
(1)
where P (i) = 0 for i < 0 and i > W . By writing (1) fori = 0 to i − 1, and summing up side by side, we get thefollowing recurrent formula:
P (i) =λ
µ
Rf − (i− 1)
iP (i− 1) (2)
Consecutive applications of (2) yields the equation thatgives the probability P(i) that i wavelengths (i=0,1,. . . ,W)are occupied in the output fiber:
P (i) =
(λ
µ
)i·∏ij=1 [Rf − (j − 1)]
i!· P (0) (3)
Figure 2. State transition diagram of the number of occupied wavelenthsin the output fiber f , for the case of no QoS differentiation scheme.
The probability P(0) that the fiber is empty can be derivedusing the normalization condition,
W∑i=0
P (i) = 1 (4)
Therefore, the probability P(0) is given by the followingformula:
P (0) =
[W∑n=0
(λ
µ
)n ∏nj=1 [Rf − (j − 1)]
n!
]−1
(5)
It should be noted that the distribution of (3) is thewell-known Engset distribution. The PBP is determined by(3) when i=W, i.e. P(W), since an input packet cannot beserviced when all the wavelengths are occupied. As a result,in the absence of any QoS differentiation scheme, the PBPis the same for all service-classes.
B. The intentional packet dropping policy
In the intentional packet dropping policy, a service-classk packet is dropped with a constant probability pk, beforereaching the output fiber. Since the first service-class hasthe lowest priority and the K-th service-class has the highestpriority, p1 > p2 > ... > pK = 0 i.e. a K-th service-classpacket cannot be dropped. In order to favor specific service-classes, the values of the dropping probabilities pk shouldbe selected appropriately. In this case, the occupancy distri-bution of the wavelengths in the fiber could be derived fromthe state transition diagram of Fig. 2, with the substitution:
λ =
K∑k=1
λk(1− pk) (6)
Following the same concept as in the case of no QoSdifferentiation scheme, the distribution of the occupiedwavelengths in the output fiber is given by (3) and (5), whereλ is given by (6). The PBP of a service-class k packet isgiven by:
Bk = pk + (1− pk)P (W ) (7)
since a service-class k packet can be blocked when thesystem is at any state with probability pk, or at the laststate (when all wavelengths are occupied) with probability(1−pk)P (W ). Especially for the K-th service-class, the PBP

242
International Journal on Advances in Telecommunications, vol 3 no 3 & 4, year 2010, http://www.iariajournals.org/telecommunications/
2010, © Copyright by authors, Published under agreement with IARIA - www.iaria.org
is determined by P(W), given that the K-th service-class hasthe highest priority and pk = 0.
C. The Wavelength Reservation Policy
In the wavelength reservation policy a number of wave-lengths in the output fiber is reserved exclusively for eachservice-class. More precisely, a service-class k packet isaccepted for service, when more than tk wavelengths areavailable in the fiber. In order to reduce the PBP of the highpriority service-classes, we assume that t1 > t2 > ... >tK .The occupancy distribution of the fiber is described bythe Markov chain of Fig. 3, where the arrival rate λ(i) isgiven by:
λ(i) =
K∑k=1
λkDk(i) (8)
where Dk(i) is a parameter that equals to 1, if the numberof the free wavelengths is less than or equal to tk, or equalsto 0, if the number of the free wavelengths is more thantk; therefore, from the state transition diagram of Fig. 3 wederive the recursive formula:
P (i) =(Rf − (i− 1))
µ · i
K∑k=1
λkDk(i− 1) · P (i− 1) (9)
where:Dk(i− 1) =
{1, for i ≤W − tk0, for i > W − tk
(10)
Eq. (9) can be solved by setting P(0)=1, (P(i)=0, i<0), andnormalizing each value over the summation
∑Wi=0 P (i). The
PBP calculation of service-class k is based on the summationof the probabilities of the blocking states [W-tk] to [W], andis given by the formula:
Bk =
W∑j=W−tk
P (j) (11)
D. A combination of the intentional packet dropping andthe wavelength reservation policies
Under the intentional packet dropping policy, a low pri-ority packet is dropped with a constant probability, evenwhen the number of the occupied wavelengths is low (atthe time instant of the dropping). An alternative solutioncould be the activation of the intentional packet droppingpolicy, only when the number of occupied wavelengths inthe fiber exceeds a pre-defined threshold. In this way wefavor the high priority service-classes only when the numberof the available output wavelengths is low. Since the firstservice-class has the lowest priority and the K-th service-class has the highest priority, the dropping probabilities forthe K service-classes are defined as p1 > p2 > ... > pK = 0,while the thresholds for the activation of the dropping policyare defined as t1 > t2 > ... > tK = 0; therefore packets of
Figure 3. State transition diagram of the number of occupied wavelenthsin the output fiber f , for the case of QoS differentiation scheme.
the highest priority cannot be dropped. In this case, the oc-cupancy distribution of the fiber is described by the Markovchain of Fig. 3, where the arrival rate of packets is givenby (6) only when the number of the occupied wavelengthsexceeds the threshold W-tk for the specific service-class,while, the arrival rate of service-class k packets equals toλk, only when the number of the occupied wavelengths inthe fiber is less than W-tk, therefore:
λ(i) =
{ ∑Kk=1 λk(1− pk), if i ≥W − tk∑Kk=1 λk, if i < W − tk
(12)
Following the same concept as in the case of no QoSdifferentiation scheme and based on the state transitiondiagram of Fig. 3 we derive the recursive formula:
P (i) =(Rf − (i− 1))
µ · iλ(i− 1) · P (i− 1) (13)
Eq. (13) can be solved by setting P(0)=1, (P(i)=0, i<0),and normalizing each value over the summation
∑Wi=0 P (i).
The PBP calculation is based on the fact that a service-classk packet can be blocked at any one of the states from [W-tk] to [W] with probability pk, or at the last state (when allwavelengths are occupied) with probability (1-pk)P(W):
Bk =
W∑j=W−tk
pkP (j) + (1− pk)P (W ) (14)
It should be noted that if t2=W, then the set of equations(12)-(14) calculates the PBP in an all-optical switch, whichsupports 2 service-classes, under the intentional packetdropping policy (sub-section II-B), using the same valuesfor the dropping probabilities pk. Furthermore, if p2 = 1,the same set of equations calculates the PBP in an all-optical switch, which supports 2 service-classes, under thewavelength reservation policy (sub-section II-C), using thesame values for the parameters tk.
E. Utilization of FDLs
Optical buffering using FDLs could be used in severalways in order to provide QoS differentiation. We considertwo cases in which the OPS network supports 2 service-classes with different priorities. In the first case, only lowpriority packets are forwarded to FDLs before attemptingto reach an output wavelength. In the second case, whenthe number of occupied wavelengths exceeds a pre-defined

243
International Journal on Advances in Telecommunications, vol 3 no 3 & 4, year 2010, http://www.iariajournals.org/telecommunications/
2010, © Copyright by authors, Published under agreement with IARIA - www.iaria.org
threshold, packets that belong to the high priority service-class are forwarded to an FDL module before attempting toreach an output wavelength. In the following sub-sections weprovide the analysis for the PBP calculation in both cases.
1) Delaying low priority packets through FDLs: Weconsider the case where low priority packets are forwardedto FDLs before attempting to reach an output wavelength.In this way the arrival rate λ1 of the low priority packetsis reduced and the high priority packets have increasedprobability to reserve an output wavelength. We assume thateach wavelength is equipped with a module that contains anequal number of L FDLs. The length of each FDL is denotedby lFDL; thus, the delay that a packet suffers during itstransmission through an FDL is equal to the transmissiondelay plus the propagation delay of a packet:
h =lpC
+lFDLc
=lpC
+lFDL · n
co(15)
where c = co/n is the speed of light in the optical fiber,co is the speed of light in the vacuum (3 · 108m/sec)and n is the refractive index of the optical fiber. Sincethe mean length packet lp is exponentially distributed andlFDL · n/cois constant, h is also exponentially distributed.
The procedure of the postponement of the low prioritypackets through an FDL can be modeled as a loss systemwith a finite number of input traffic sources and L FDLs asthe number of servers, as shown in Fig. 4. The number of theinput traffic sources for each set of FDLs is not constant;it is a function of the number i of occupied wavelengthsand consequently, the number of the input traffic sourcesto the FDL module of a wavelength is (Rf -i). Moreover,the arrival rate of each input traffic source is λ1, since,only packets from the first service-class enter FDLs and theservice time of FDLs is equal to h. This system can bedescribed analytically by the Engset distribution:
qi (j) = (λ1 · h)j ·∏jm=1 [(Rf − i)− (m− 1)]
j!· qi (0)
(16)The probability qi(0) that FDLs are empty, when i wave-
lengths are occupied in the output fiber, can be derivedusing the normalization condition,
∑Lm=0 qi (m) = 1. The
probability that a low priority packet will find all L FDLsoccupied is given by qi(L); in this case the low prioritypacket is blocked and lost.
Since the number of the input ports to an FDL module isa function of the occupied wavelengths, it is possible that incase of high wavelength occupancy, the low priority packetscan not be blocked because of the unavailability of an FDL;they are only delayed by their transmission through an FDL.This situation occurs when the number of the input trafficsources is less than the numbers of FDLs in the FDL module.Therefore, the rate by which the packets egress the FDLs and
request access to the wavelength is L·1/h, when the numberof input ports is larger than L; if this number is less thanL, no packets are blocked in the FDLs and the egress rateof the packets is (Rf − i) · 1/h. This rate is added to therate of the high priority packets, which is (Rf − i) · λ2. Inthe case of (Rf − i) < L, in order to achieve the reductionof the arrival rate of the low priority packets, this delay hasto be larger than the inter-arrival time of the packets. Thetotal arrival rate of packets, when i output wavelengths areoccupied in the output fiber, is given by:
λ(i) =
{(Rf − i) · λ2 + L · 1h if L < (Rf − i)(Rf − i) ·
(λ2 +
1h
)if L ≥ (Rf − i)
(17)In order to calculate the distribution of the occupied
wavelengths in the output fiber we construct the Markovchain of Fig. 5. By following the same procedure as in thecase of no QoS differentiation scheme and based on the statetransition diagram of Fig. 5, we derive the recursive formula:
P (i) =λ (i− 1)
i · µ· P (i− 1) (18)
Eq. (18) can be solved by setting P(0)=1, (P(i)=0, i<0),and normalizing each value over the summation
∑Wi=0 P (i).
The PBP of low and high priority service-classes are respec-tively given by:
B1 =∑W−1i=0 P (i) · qi(L) + P (W )
B2 = P (W )(19)
since a low priority packet can be blocked when the systemis at any state with probability qi(L) (blocked in the FDLmodule), or at the last state (when all wavelengths areoccupied) with probability P(W).
2) Combining the wavelength reservation policy withthe utilization of FDLs: We consider the case where thenumber of wavelengths is divided into two groups. Thefirst group consists of W − WT wavelengths which areavailable for servicing packets of both service-classes. Ifthe number of the occupied wavelengths in the output fiberexceeds the threshold W − WT , then only packets of thehigh priority service-class are forward to an FDL module.Each one of the remaining WT wavelengths (of the secondgroup of wavelengths) is equipped with L FDLs. Packets thategresses the FDLs are able to attempt reaching one of theWT wavelengths. Following the assumptions for the FDLs,presented in the previous sub-section, we define the arrivalrate of the packets, when i output wavelengths are occupiedas:
λ(i) =
(Rf − i) · (λ1 + λ2) if i ≤W −WT
L · 1h if i > W −WT and L < (Rf − i)(Rf − i) · 1h if i > W −WT andL ≥ (Rf − i)
(20)
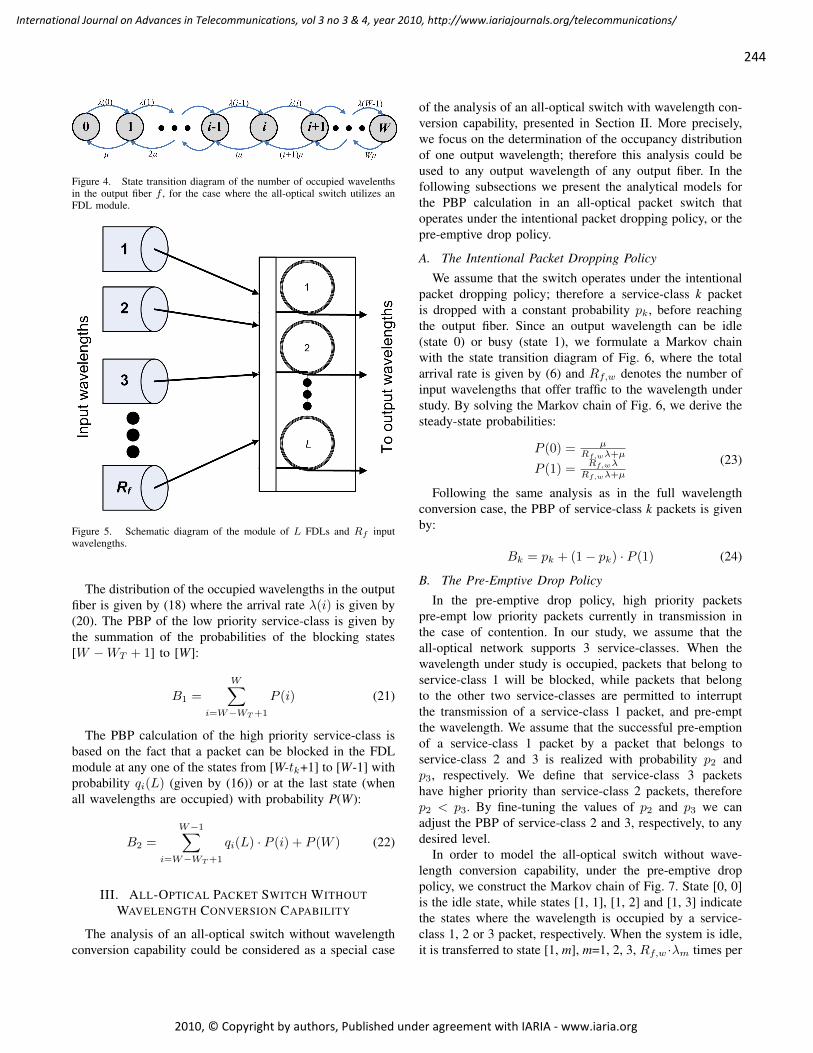
244
International Journal on Advances in Telecommunications, vol 3 no 3 & 4, year 2010, http://www.iariajournals.org/telecommunications/
2010, © Copyright by authors, Published under agreement with IARIA - www.iaria.org
Figure 4. State transition diagram of the number of occupied wavelenthsin the output fiber f , for the case where the all-optical switch utilizes anFDL module.
Figure 5. Schematic diagram of the module of L FDLs and Rf inputwavelengths.
The distribution of the occupied wavelengths in the outputfiber is given by (18) where the arrival rate λ(i) is given by(20). The PBP of the low priority service-class is given bythe summation of the probabilities of the blocking states[W −WT + 1] to [W]:
B1 =
W∑i=W−WT+1
P (i) (21)
The PBP calculation of the high priority service-class isbased on the fact that a packet can be blocked in the FDLmodule at any one of the states from [W-tk+1] to [W-1] withprobability qi(L) (given by (16)) or at the last state (whenall wavelengths are occupied) with probability P(W):
B2 =
W−1∑i=W−WT+1
qi(L) · P (i) + P (W ) (22)
III. ALL-OPTICAL PACKET SWITCH WITHOUTWAVELENGTH CONVERSION CAPABILITY
The analysis of an all-optical switch without wavelengthconversion capability could be considered as a special case
of the analysis of an all-optical switch with wavelength con-version capability, presented in Section II. More precisely,we focus on the determination of the occupancy distributionof one output wavelength; therefore this analysis could beused to any output wavelength of any output fiber. In thefollowing subsections we present the analytical models forthe PBP calculation in an all-optical packet switch thatoperates under the intentional packet dropping policy, or thepre-emptive drop policy.
A. The Intentional Packet Dropping Policy
We assume that the switch operates under the intentionalpacket dropping policy; therefore a service-class k packetis dropped with a constant probability pk, before reachingthe output fiber. Since an output wavelength can be idle(state 0) or busy (state 1), we formulate a Markov chainwith the state transition diagram of Fig. 6, where the totalarrival rate is given by (6) and Rf,w denotes the number ofinput wavelengths that offer traffic to the wavelength understudy. By solving the Markov chain of Fig. 6, we derive thesteady-state probabilities:
P (0) = µRf,wλ+µ
P (1) =Rf,wλ
Rf,wλ+µ
(23)
Following the same analysis as in the full wavelengthconversion case, the PBP of service-class k packets is givenby:
Bk = pk + (1− pk) · P (1) (24)
B. The Pre-Emptive Drop Policy
In the pre-emptive drop policy, high priority packetspre-empt low priority packets currently in transmission inthe case of contention. In our study, we assume that theall-optical network supports 3 service-classes. When thewavelength under study is occupied, packets that belong toservice-class 1 will be blocked, while packets that belongto the other two service-classes are permitted to interruptthe transmission of a service-class 1 packet, and pre-emptthe wavelength. We assume that the successful pre-emptionof a service-class 1 packet by a packet that belongs toservice-class 2 and 3 is realized with probability p2 andp3, respectively. We define that service-class 3 packetshave higher priority than service-class 2 packets, thereforep2 < p3. By fine-tuning the values of p2 and p3 we canadjust the PBP of service-class 2 and 3, respectively, to anydesired level.
In order to model the all-optical switch without wave-length conversion capability, under the pre-emptive droppolicy, we construct the Markov chain of Fig. 7. State [0, 0]is the idle state, while states [1, 1], [1, 2] and [1, 3] indicatethe states where the wavelength is occupied by a service-class 1, 2 or 3 packet, respectively. When the system is idle,it is transferred to state [1, m], m=1, 2, 3, Rf,w ·λm times per

245
International Journal on Advances in Telecommunications, vol 3 no 3 & 4, year 2010, http://www.iariajournals.org/telecommunications/
2010, © Copyright by authors, Published under agreement with IARIA - www.iaria.org
Figure 6. State transition diagram of the number of occupied wavelenthsin the output fiber of the switch without wavelength conversion, under theintentional packet dropping policy.
unit time, where Rf,w is the number of input wavelengthsthat offer traffic to the wavelength under study. When thesystem is at state [1, 1], it can be transferred to state [1,2] Rf,w · λ2 · p2 times per unit time. This transition refersto the case where a service-class 1 packet is pre-empted bya service-class 2 packet. Similarly, when the system is atstate [1, 1], it can be transferred to state [1, 3] Rf,w ·λ3 · p3times per unit time, when a service-class 3 packet pre-emptsa service-class 1 packet. Solving the Markov chain of Fig.7, we obtain the following state probabilities:
P (0, 0) = µRf,w(λ1+λ2+λ3)+µ
P (1, 1) =λ3Rf,wµ
(Rf,w(λ1+λ2+λ3)+µ)(λ3Rf,wp3+λ2Rf,wp2+µ)
P (1, 2) =λ2Rf,w(λ3Rf,wp3+p2Rf,w(λ3+λ2)+µ)
(Rf,w(λ1+λ2+λ3)+µ)(λ3Rf,wp3+λ2Rf,wp2+µ)
P (1, 3) =λ3Rf,w((λ3+λ1)Rf,wp3+λ2Rf,wp2+µ)
(Rf,w(λ1+λ2+λ3)+µ)(λ3Rf,wp3+λ2Rf,wp2+µ)
(25)A service-class 3 packet is blocked when the system is
at state [1, 3] or either at state [1, 2], or at state [1, 1]and pre-emption fails. Similarly, a service-class 2 packetis blocked when the system is at state [1, 2] or either atstate [1, 3], or state [1, 1] and pre-emption fails. A service-class 1 packet is blocked when the system is at states [1,2] or [1, 3] or [1, 1] and pre-emption by a service-class 2or 3 packet successfully occurs. Therefore the PBP of thethree service-classes (B1, B2 and B3, respectively) can becalculated using the formulas:
B1 = P (1, 3) + P (1, 2) + P (1, 1)(1 + p3λ3
λ1+ p2λ2
λ1)
B2 = P (1, 3) + P (1, 2) + (1− p2)P (1, 1)B3 = P (1, 3) + P (1, 2) + (1− p3)P (1, 1)
(26)
IV. EVALUATION
In this section, we evaluate the proposed analytical modelsthrough simulation. To this end, we simulate the differentfunctions of the all- presented in section II and III, byusing the Simscript II.5 simulation tool [19]. We examinethe blocking performance of the all-optical packet switch,with or without wavelength conversion, by providing twoapplication examples.
Figure 7. State transition diagram of the number of occupied wavelenthsin the output fiber of the switch without wavelength conversion, under thepre-emptive drop policy.
In the first example we consider an all-optical packetswitch with wavelength conversion capability. The numberof the input/output fibers are F=10, while each fiber supportsW=8 wavelengths. The capacity of each wavelength is C=10 Gbit/sec. Packets that belong to K=2 service-classesarrive at the switch and they are switched to the appropriateoutput fiber. We calculate the PBP in one output fiber,while considering that an equal traffic load is offered toevery output fiber, i.e. Rf = F · W . The length of thepackets that belong to all service-classes is exponentiallydistributed with mean value of 15 Kbytes. In Table I wepresent analytical and simulation PBP results for the case ofno QoS differentiation policy versus the arrival rate per idleinput wavelength. Since no QoS differentiation scheme isconsidered, the PBP is the same for the two service-classes.The comparison between analytical and simulation resultsreveals that the accuracy of the proposed analytical modelis completely satisfactory.The effect of the application of the intentional packet
Table IANALYSIS VERSUS SIMULATION FOR THE PBP IN THE CASE OF NO
QOS DIFFERENTIATION SCHEME
Arrival rate (packets/sec) Packet Blocking Probability (PBP)1st serv. 2nd serv. Analysis(%) Simulation
Mean (%) 95% Conf. Interval500 1000 0.00766 0.00756 6.2 ×10⁻⁵
750 1250 0.04858 0.04820 7.5 ×10⁻⁴
1000 1500 0.17883 0.17742 2.6 ×10⁻³
1250 1750 0.48379 0.47999 5.6 ×10⁻³
1500 2000 1.04937 1.04114 9.1 ×10⁻³
1750 2250 1.94094 1.92571 2.8 ×10⁻²
2000 2500 3.18720 3.16220 4.3 ×10⁻²

246
International Journal on Advances in Telecommunications, vol 3 no 3 & 4, year 2010, http://www.iariajournals.org/telecommunications/
2010, © Copyright by authors, Published under agreement with IARIA - www.iaria.org
dropping policy to the PBP is shown in Table II. A packetthat belongs to the first service-class is dropped with aconstant probability p1=0.05, while packets that belong tothe second service-class cannot be dropped. As Table IIshows, the model’s accuracy is satisfactory. We notice thatthe PBP of the second service-class is reduced, comparedto the corresponding results of Table I, while the PBP ofthe first service-class is increased. This is due to the factthat 5% of the first service-class packets are dropped, beforereaching an output wavelength; therefore packets that belongto the second service-class have privileged access to theoutput wavelengths. Moreover, in Figs. 8 and 9 we presentanalytical PBP results for both service-classes, respectively,versus the packet arrival rate, for various values of thedropping probability p1. We consider 7 arrival-rate points(1, 2, . . . , 7) in the x-axis of Figs. 8 and 9. Point 1 corre-sponds toλ = (500, 1000)packets/sec, and in the successivepoints the values of λ1, λ2 are equally increased by 250packets/sec. The last Point 7 corresponds to (2000, 2500).Comparison of the results of Figs. 8 and 9 clearly revealsthat the PBP of the first service-class strongly increases withthe increase of the dropping probability p1, while the PBPof the second service-class is softly affected by this increase.
The effect of the wavelength reservation policy on thePBP is presented in Table III. We assume the same scenariofor the all-optical switch as in the two previous cases, whilet1=1 out of W=8 wavelengths are reserved for the packetsof the second service-class (note that t2=0). As the resultsreveal, the accuracy of the presented analytical model isquite satisfactory.
The impact of the increase of the wavelength thresholdt1 to the PBP of both service-classes can be monitored inFigs. 10 and 11. In particular, Figs. 10 and 11 illustratethe PBP of both service-classes against the arrival rate,for different values of the threshold t1. We employ thesame arrival-rate points, as the ones used in Figs. 8 and9. The study of these figures reveals that the increase oft1 results to the PBP decrease of the second service-class;the reverse performance is observed for the PBP of the firstservice-class. The explanation for this behavior is as follows:for high values of t1 more wavelengths are reserved for
Table IIANALYSIS VERSUS SIMULATION FOR THE PBP IN THE CASE OF THE
INTENTIONAL PACKET DROPPING POLICY
Arrival rate PBP 1st service-class PBP 2nd service-class1st 2nd Analysis(%) Simulation Analysis(%) Simulation500 1000 5.0058 4.964±6.9×10⁻² 0.006 0.006±3.4×10⁻⁵
750 1250 5.0374 4.995±6.6×10⁻² 0.039 0.039±1.7×10⁻⁴
1000 1500 5.1428 5.099±7.1×10⁻² 0.151 0.149±2.3×10⁻³
1250 1750 5.3932 5.348±4.2×10⁻² 0.414 0.411±6.2×10⁻³
1500 2000 5.8662 5.817±1.5×10⁻² 0.912 0.904±2.1×10⁻²
1750 2250 6.6243 6.569±4.5×10⁻² 1.709 1.696±2.9×10⁻²
2000 2500 7.7002 7.636±6.0×10⁻² 2.842 2.819±6.0×10⁻²
Figure 8. Analytical PBP results versus the arrival rate for different valuesof the dropping probability p1, for the first service-class of the first example,under the intentional dropping policy.
Figure 9. Analytical PBP results versus the arrival rate for different valuesof the dropping probability p1, for the second service-class of the firstexample, under the intentional dropping policy.
the second service-class, thus packets that belong to thisservice-class have increased probability to access the outputwavelengths of the output fiber, compared to packets thatbelong to the first service-class.
The evaluation of the combination of the intentionalpacket dropping policy and the wavelength reservation pol-icy is realized through the comparison of analytical andsimulation PBP results versus the packet arrival rate, aspresented in Table IV. The results were obtained under thefirst application example, while the dropping probability ofthe first service-class is p1= 0.05 and t1 = 1 out of 8wavelengths are reserved for the second service-class. As theresults of the Table IV reveal, the accuracy of the proposedanalytical model is quite satisfactory. Since the results of

247
International Journal on Advances in Telecommunications, vol 3 no 3 & 4, year 2010, http://www.iariajournals.org/telecommunications/
2010, © Copyright by authors, Published under agreement with IARIA - www.iaria.org
Figure 10. Analytical PBP results versus the arrival rate for differentvalues of the threshold t1, for the first service-class of the first example,under the intentional packet dropping policy.
Table IV were obtained by considering that only t1=1 outof 8 wavelengths are reserved for the second service-class,there is a small benefit for packets of this service-class, overpackets of the first service-class. The effect of the number ofwavelengths that are reserved for the high priority service-class is depicted in Figs. 12 and 13. More precisely, Figs. 12and 13 show the PBP of the two service-classes, respectively,versus the arrival rate, for different values of the thresholdt1, while the dropping probability p1 is kept constant andequal to 0.05. As the results of Figs. 12 and 13 reveal, theincrease of the value of t1 has a small influence on the PBPperformance of the high priority second service-class. On theother hand, increasing t1 results in higher PBP values for thelow priority service-class. Therefore, in order to benefit thehigh priority service-class, both the dropping probabilitiespk and the thresholds tk should be carefully adjusted.
The first application example is also employed in order toevaluate the analytical models for the PBP calculation in anall-optical switch that utilizes FDLs. In the case where lowpriority packets are delayed by their transmission through anumber of FDLs, we consider that each wavelength in the
Table IIIANALYSIS VERSUS SIMULATION FOR THE PBP IN THE CASE OF THE
WAVELENGTH RESERVATION POLICY
Arrival rate PBP 1st service-class PBP 2nd service-class1st 2nd Analysis(%) Simulation Analysis(%) Simulation500 1000 0.0518 0.0512±5.5×10⁻⁴ 0.0051 0.0050±8.9×10⁻⁵
750 1250 0.2485 0.2459±2.1×10⁻³ 0.0299 0.0295±1.1×10⁻⁴
1000 1500 0.7611 0.7534±5.4×10⁻³ 0.1074 0.1058±4.4×10⁻³
1250 1750 1.7585 1.7407±2.1×10⁻² 0.2828 0.2787±8.2×10⁻³
1500 2000 3.3528 3.3189±3.5×10⁻² 0.6023 0.5937±1.9×10⁻²
1750 2250 5.5705 5.5142±5.9×10⁻² 1.1011 1.0854±6.7×10⁻²
2000 2500 8.3572 8.2728±9.0×10⁻² 1.7961 1.7704±8.4×10⁻²
Figure 11. Analytical PBP results versus the arrival rate for differentvalues of the threshold t1, for the second service-class of the first example,under the intentional packet dropping policy.
output fiber is equipped with a module that contains an equalnumber of L = 4 FDLs. The length of each FDL is denotedby lFDL = 5 km, while the refractive index of the fiber thatis used for the construction of the FDLs is n=1.55. In TableV we present analytical and simulation PBP results for thetwo service-classes against the arrival rate. The comparisonof analytical and simulation results reveals that the accuracyof the proposed analytical model is satisfactory.
We also study the effect of the number of the FDLs ineach FDL module, to the PBP of both service-classes. Fig.14 presents analytical PBP results of both service-classes,versus the number of FDLs. We assume that the length ofeach FDL is lFDL = 5 km, while the packet arrival rateof both service-classes is (λ1, λ2)=(300,500) packets/sec.Fig. 14 shows that when more FDLs are used in the FDLmodule, the PBP of the low priority service-class decreases;the reverse behavior is observed for the high priority service-class. For higher number of FDLs the PBP of both service-classes becomes the same and increases with further increaseof the number of FDLs. This is due to the fact that when
Table IVANALYSIS VERSUS SIMULATION FOR THE PBP IN THE CASE OF THE
COMBINATION OF THE WAVELENGTH RESERVATION AND THEINTENTIONAL PACKET DROPPING POLICY
Arrival rate PBP 1st service-class PBP 2nd service-class1st 2nd Analysis(%) Simulation Analysis(%) Simulation500 1000 0.0097 0.0096±2.2×10⁻⁴ 0.0074 0.0073±5.4×10⁻³
750 1250 0.0573 0.0565±5.8×10⁻³ 0.0464 0.0459±3.5×10⁻³
1000 1500 0.2061 0.2032±8.9×10⁻³ 0.1735 0.1717±6.8×10⁻³
1250 1750 0.5434 0.5356±1.8×10⁻² 0.4697 0.4650±2.5×10⁻²
1500 2000 1.1566 1.1401±3.0×10⁻² 1.0197 1.0094±4.0×10⁻²
1750 2250 2.1091 2.0789±4.1×10⁻² 1.8874 1.8683±5.8×10⁻²
2000 2500 3.4251 3.3761±8.0×10⁻² 3.1014 3.0701±6.8×10⁻²

248
International Journal on Advances in Telecommunications, vol 3 no 3 & 4, year 2010, http://www.iariajournals.org/telecommunications/
2010, © Copyright by authors, Published under agreement with IARIA - www.iaria.org
Figure 12. Analytical PBP results versus the arrival rate for differentvalues of the threshold t1, for the first service-class of the first example,under the wavelength reservation with intentional packet dropping policy.
Figure 13. Analytical PBP results versus the arrival rate for differentvalues of the threshold t1, for the second service-class of the first example,under the wavelength reservation with intentional packet dropping policy.
few FDLs are employed, most of the low priority packets areblocked in the FDL module and high priority packets haveincreased probability to find an available output wavelength.By installing more FDLs in the FDL module, the differencebetween the PBP of both service-classes is reduced, whilehigher number of FDLs corresponds to higher input packetsources to the switch, which results in higher PBP for bothservice-classes.
Apart from the number of FDLs installed in each FDLmodule, another parameter that affects PBP is the lengthof each FDL. In Fig.15 we present analytical PBP resultsof both service-classes versus the length of an FDL. Weassume that each FDL module consists of L = 4 FDLs,while the packet arrival rate of both service-classes is (λ1,
Figure 14. Analytical PBP results versus the number of FDLs for the twoservice-classes of the first example, for the case of delaying low prioritypackets through FDLs.
λ2)=(300,500) packets/sec. Fig. 15 shows that the increaseof the FDL length results in a PBP decrease of the highpriority service-class, while the PBP of the low priorityservice-class has a decrease up to a certain value of the FDLlength; after this point the PBP increases. The explanationfor this behavior is as follows. When the FDL length issmall, the delay that low priority packets experience is lowand therefore the rate by which packets egress the FDLis high, compared to the rate when the FDL length islarge. In the latter case, fewer low priority packets requestservice through an output wavelength; therefore high prioritypackets have privileged access to the output wavelengths.
The analytical model for the combination of the wave-length reservation policy with the utilization of FDLs isevaluated by comparing analytical and simulation results,as they are presented in Table VI. In particular, in TableVI we present analytical and simulation PBP results, fordifferent values of packet arrival rate, for both service-classes. We consider the first application example, whileeach wavelength in the output fiber is equipped with amodule that contains an equal number of L = 4 FDLs.Also, the length of each FDL is denoted by lFDL = 5
Table VANALYSIS VERSUS SIMULATION FOR THE PBP IN THE CASE OF
DELAYING LOW PRIORITY PACKETS THROUGH FDLS
Arrival rate PBP 1st service-class PBP 2nd service-class1st 2nd Analysis(%) Simulation Analysis(%) Simulation200 400 0.2887 0.2845±3.2×10⁻⁴ 0.0245 0.0241±2.4×10⁻⁴
300 500 1.0291 1.0144±2.1×10⁻³ 0.0344 0.0339±2.5×10⁻⁴
400 600 2.3961 2.3619±3.3×10⁻³ 0.0474 0.0467±3.2×10⁻⁴
500 700 4.3752 4.3127±5.8×10⁻³ 0.0639 0.0630±5.5×10⁻⁴
600 800 6.8585 6.7605±9.1×10⁻³ 0.0847 0.0835±7.6×10⁻⁴
700 900 9.7035 9.5648±4.2×10⁻³ 0.1103 0.1087±1.3×10⁻³
800 1000 12.771 12.589±6.6×10⁻² 0.1414 0.1394±2.1×10⁻³

249
International Journal on Advances in Telecommunications, vol 3 no 3 & 4, year 2010, http://www.iariajournals.org/telecommunications/
2010, © Copyright by authors, Published under agreement with IARIA - www.iaria.org
Figure 15. Analytical PBP results versus the length of each FDL forthe two service-classes of the first example, for the case of delaying lowpriority packets through FDLs.
km and 2 out of 8 wavelengths are reserved for the highpriority service-class. As the results reveal, the accuracy ofthe proposed analytical model is satisfactory. We also studythe impact of the wavelength threshold WT to the PBP.To this end, Fig. 16 and 17 presents analytical PBP resultsof both service-classes, respectively, versus the arrival rate,for different values of the parameter WT . We consider 7arrival-rate points (1, 2, . . . , 7) in the x-axis of Figs. 16and 17. Point 1 corresponds to (λ1, λ2) = (500, 1000)packets/sec, and in the successive points the values of λ1,λ2 are equally increased by 250 packets/sec. Thus, Point7 corresponds to (2000, 2500). As it was anticipated, theincrease of WT results in the increase of the difference ofPBP of the two service-classes, since more wavelengths arededicated to exclusively service high priority packets.
In the second application example, we consider an all-optical switch without wavelength conversion capability. Thenumber of the input fibers are again F=10, while each fibersupports W=8 wavelengths. The capacity of each wavelengthis C= 10 Gbit/sec. Packets that belong to K=3 service-classes
Table VIANALYSIS VERSUS SIMULATION FOR THE PBP IN THE CASE OF THE
COMBINATION OF THE WAVELENGTH RESERVATION AND THEUTIZATION OF FDLS
Arrival rate PBP 1st service-class PBP 2nd service-class1st 2nd Analysis(%) Simulation Analysis(%) Simulation500 1000 0.0615 0.0606±1.4×10⁻⁴ 0.0091 0.0090±2.2×10⁻⁴
750 1250 0.2879 0.2838±5.5×10⁻⁴ 0.0557 0.0552±7.7×10⁻⁴
1000 1500 0.8611 0.8488±4.9×10⁻³ 0.2148 0.2126±1.3×10⁻³
1250 1750 1.9447 1.9169±7.3×10⁻³ 0.5937 0.5877±2.8×10⁻³
1500 2000 3.6289 3.5770±3.1×10⁻² 1.2946 1.2815±6.9×10⁻³
1750 2250 5.9101 5.8256±4.5×10⁻² 2.3779 2.3538±2.8×10⁻²
2000 2500 8.7080 8.5835±6.6×10⁻² 3.8501 3.8112±8.2×10⁻²
Figure 16. Analytical PBP results for the first service-class of the firstexample, under the combination of the wavelength reservation policy andthe utilization of FDLs.
Figure 17. Analytical PBP results for the second service-class of the firstexample, under the combination of the wavelength reservation policy andthe utilization of FDLs.
arrive at the switch and they are switched to the same outputwavelength. We study the blocking performance of a singlewavelength, considering that an equal traffic load is offeredto every output fiber, i.e. Rf,w = F · W . The droppingprobability of the second and third service-classes is p2 =0.01 and p3 = 0.02, respectively, while packets from thefirst service-class are not dropped. In Fig. 18 we presentanalytical PBP results of the three service-classes, where thearrival rate is the same for all service-classes. As the resultsreveal, packets of the second and third service-classes sufferhigher blockings, compared to packets of the first service-class. The same scenario is used to study the pre-emptiondrop policy. The successful pre-emption of a service-class

250
International Journal on Advances in Telecommunications, vol 3 no 3 & 4, year 2010, http://www.iariajournals.org/telecommunications/
2010, © Copyright by authors, Published under agreement with IARIA - www.iaria.org
Figure 18. Analytical PBP results for the three service-classes of thesecond example, under the intentional packet dropping policy.
Figure 19. Analytical results PBP for the three service-classes of thesecond example, under the pre-emption drop policy.
3 packet by a packet that belongs to service-class 2 and1 is realized with a probability p2 = 0.1 and p1 = 0.2,respectively. In Fig. 19 we present analytical PBP results ofthe three service-classes. As the results reveal, the PBP ofthe 3rd service-class is higher, compared to the PBP of the1st and 2nd service-classes.
V. CONCLUSION
In conclusion, we propose analytical models for the calcu-lations of PBP in an all-optical packet switch, under severalQoS differentiation schemes. Packets that belong to multipleservice-classes arrive from a finite number of input portsand attempt to gain access to an output wavelength. PBPis derived by the steady-state equation of one-dimensionalMarkov chains. The accuracy of the proposed calculations
is quite satisfactory as was verified by simulations. In ourfuture work we shall extend this analysis, in order to furtherstudy the effect of the implementation of FDLs and examinethe deflection routing to the blocking performance of the all-optical switch.
ACKNOWLEDGMENT
This work was supported by the research programCaratheodory, of the Research Committee of the Universityof Patras, Greece.
REFERENCES
[1] J. S. Vardakas, I. D. Moscholios, and M. D. Logothetis, ”Ananalytical Study of an All-Optical Packet Switch with QoSSupport”, in Proc. of the 6th IARIA Advanced InternationalConference on Telecommunications - AICT 2010 , Barcelona,Spain, May 9-14, 2010.
[2] B. Mukherjee, “Optical WDM networks”, Springer, 2006.
[3] N. Bouabdallah, “Sub-wavelength solutions for next generationoptical networks”, IEEE Communications Magazine, August2007, pp. 36-43.
[4] R. V. Caenegem, D. Colle, M. Pickavet, P. Demeester, K.Christodoulopoulos, K. Vlachos, E. Varvarigos, L. Stam-poulidis, D. Roccato, and R. Vilar, “The design of an all-opticalpacket switching network”, IEEE Communications Magazine,November 2007, pp. 52-61.
[5] N. H. Harai, N. Wada, F. Kubota, and Y. Shinoda, “Multi-stage fiber delay line buffer photonic packet switch for asyn-chronously variable-length packets”, IEICE Transactions onCommunications, vol. E88-B, no. 1, January 2005, pp. 258-265.
[6] D. Hwrter, M. C. Chia, and Andonovic, “Buffering opticalpacket switches”, IEEE/OSA Journal of Lightwave Technol-ogy., vol. 16, no. 12, December 1998, pp.2081-2094.
[7] S. L. Danielsen, P. B. Hansen, and K. E. Stubkjear, “Wave-length conversion in optical packet switching”, IEEE/OSAJourmal of Lightwave Technology, vol. 16, December 1998,pp. 20952108.
[8] V. Eramo and M. Listanti, “Packet loss in a bufferless opticalWDM switch employing shared tunable wavelength convert-ers”, IEEE/OSA Jourmal of Lightwave Technology, vol. 18,December 2000, pp. 18181833.
[9] S. Yao, B. Mukherjee, S.J.B. Yoo, and S. Dixit, “A unifiedstudy of contention-resolution techniques in optical packet-switched networks”, IEEE/OSA Journal of Lightwave Tech-nology, vol. 21, no. 3, March 2003, pp. 672683.
[10] Z. Zhang and Y. Yang, “Performance modeling of bufferlessWDM packet switching networks with limited-range wave-length conversion”, IEEE Transactions on Communications,vol. 54. no. 8, August 2006, pp. 1473-1480.
[11] J. P. Jue, “An algorithm for loopless deflection in photonicpacketswitched networks”, in Proc. of IEEE International Con-ference on Communications, ICC 2002, vol. 5, New York,USA, 28 April - 2 May 2002.

251
International Journal on Advances in Telecommunications, vol 3 no 3 & 4, year 2010, http://www.iariajournals.org/telecommunications/
2010, © Copyright by authors, Published under agreement with IARIA - www.iaria.org
[12] H. Øverby and N. Stol, “A teletraffic model for servicedifferentiation in OPS networks”, in proc. of the 8th Opto-electronic and Communications Conference, Shanghai, China,13-16 October 2003, pp. 677678.
[13] H. Øverby, N. Stol and M. Nord, “Evaluation of QoS differ-entiation mechanism in asynchronous bufferless optical packet-switched networks”, IEEE Communications Magazine, vol. 44,no. 8, August 2006, pp. 52-57.
[14] H. Øverby, and N. Stol, “QoS differentiation in asynchronousbufferless optical packet switched networks”, Wireless Net-works, vol. 12 no. 3, 2006, pp. 383-394.
[15] H. Øverby and N. Stol. “Quality of service in asynchronousbufferless optical packet switched networks”, Telecommunica-tion Systems, 27(24), 2004, pp. 151179.
[16] A. G. Fayoumi and A. P. Jayasumana, “A surjective-mapping based model for optical shared-buffer cross-connect”,IEEE/ACM Transactions on Networking, vol. 15, no. 1, Febru-ary 2007, pp. 226-233.
[17] V. Eramo, M. Listanti and R. Tiberio, “Performance evalua-tion of QoS-aware optical packet switches”, in Proc. of IEEEInternational Conference on Communications (ICC 2008) ,Beijing, China, 19-23 May 2008.
[18] H. Akimaru, K. Kawashima, “Teletraffic theory and applica-tions”, Springer-Verlag, 1993.
[19] Simscript II.5, http://www.simscript.com/

252
International Journal on Advances in Telecommunications, vol 3 no 3 & 4, year 2010, http://www.iariajournals.org/telecommunications/
2010, © Copyright by authors, Published under agreement with IARIA - www.iaria.org
A Media Delivery Framework for On Demand Learning in Manufacturing Processes
Martin Zimmermann Production Systems Engineering
University of Applied Sciences Offenburg 77654 Offenburg, Germany
Abstract — This paper presents a streaming-based E-Learning environment where closer integration between learning and work is achieved by integrating multimedia services into manufacturing processes. It contains a comprehensive and detailed explanation of the proposed E-Learning streaming framework, especially the adaption of streaming services to mobile environments. We first analyze several scenarios where E-Learning streaming services can be integrated into manufacturing processes. To allow systematic and tailor-made integration, we develop a model and a specification language for E-Learning streaming services and apply the model using practical scenarios from real manufacturing processes. Adaption of multimedia streaming services to mobile devices is discussed based on Synchronized Multimedia Integration Language (SMIL). Last, we comment on the benefits of using E-Learning streaming services as part of manufacturing processes and analyze the acceptance of the developed system. The key components of our E-Learning environment are 1) an xml based streaming service specification language, 2) adaption of multimedia E-Learning services to mobile environments, and 3) Web Services for searching, registration, and creation of E-Learning streaming services.
Keywords - Just-in-time Learning, Media Streaming Services, Manufacturing Processes, Mobile Devices, Push Service, Pull Service, SMIL, Web Services.
I. INTRODUCTION This article is an extended and revised version of the
conference paper entitled “On Demand Learning in Manufacturing Processes” [1]. It contains a more comprehensive and detailed explanation of the proposed E-Learning framework, especially the adaption of multimedia streaming services to mobile environments.
Most E-Learning projects tend to separate learning activities from everyday work. This paper presents an approach where closer integration between learning and work is achieved by integrating multimedia services into manufacturing processes. A major challenge to which companies must respond is the integration of advanced E-Learning technologies. What is actually needed is a learning “on demand”, embedded into work processes, responding to both requirements from the work situation and from employee interests, a form of learning crossing boundaries of e-learning and performance support.
The goal of E-Learning services integration in manufacturing processes is, through the development of new IT solutions, to accelerate and enhance the ability of manufacturing industry to capitalize on the emergence of a powerful global information infrastructure.
Manufacturing processes involve the control and management of manufacturing systems ranging from basic assembly processes to the high-tech manufacture of pharmaceutical, telecommunications and electronic equipment. Categories for such manufacturing processes are assembly line / flow shop, and cellular manufacturing / group technology. As an example, in case of assembly line based processes a line of dissimilar machines are grouped in the line (sometimes more than one to balance flow). Innovation, productivity, flexibility, and continuous improvement are key ingredients to success in the constantly evolving world of manufacturing.
Multimedia networking services support monitoring, controlling and supervising production processes in order to achieve high levels of efficiency and environmentally friendly production. The new flexibility of workers and work environments makes traditional conceptions of training in advance, in rather large units and separate from work activities, more and more obsolete. Manufacturing scenarios where E-Learning services can be integrated are shown in Fig. 1.
Computer networks provide a rich environment for constructing such interactive, intelligent, active, and collaborative learning environments. They offer certain distinguished advantages over traditional learning environments. In a traditional learning environment, employees are required to gather at a certain time and place to attend a lesson. In contrast, on demand-based learning allows employees from geographically separated locations to join lessons.
The proposed method adopts the client-server architecture to support multimedia content transmission. A media server may be a single machine or a group of machines to manage contents of the Internet-based learning system. It handles requests from users for push and pull services. In particular, it determines and schedules the required e-learning contents with optimal details to transmit to the users.
The following E-Learning streaming services can be identified:

253
International Journal on Advances in Telecommunications, vol 3 no 3 & 4, year 2010, http://www.iariajournals.org/telecommunications/
2010, © Copyright by authors, Published under agreement with IARIA - www.iaria.org
• Pull (on demand) service: Allows on demand access to remote E-Learning content, e.g., video content illustrating configuration of a Computerized Numerical Control (CNC) machine.
• Push service: As an example, a push channel from a remote expert to the manufacturing personal (“how to configure / operate a machine”). Live audio and video (expert) as well as media files can be delivered (see Fig. 1).
• Push service: For recording a failure scenario during a manufacturing process (by recording the voice comments of a worker and by recording the machine status by video). This multimedia documentation can be used later to analyse details.
A further service type are peer to peer and multiparty conferences, e.g., for maintenance and remote diagnosis: teleoperation and remote diagnosis and maintenance of distant plant and production equipment can be achieved by using peer to peer E-Learning streaming services.
Figure 1. E-Learning services in manufacturing processes
The remainder of this document is as follows. Section II makes a comparative digest into related work in this field of interest. In Section III, we discuss a XML-based language, which allows specification of E-Learning streaming services while Section IV presents a generic SMIL-based adaptation methodology suitable to adapt E-Learning services to different access mechanisms, device capabilities and user preferences. Section V outlines the architecture and describes the major components and technologies to solve the problems stated in Section I. Finally, Section VI gives a brief summary and concludes with a note on future work.
II. RELATED WORK Khasawneh et al. present a framework for an on-demand E-
learning management system that make use of broadband network for the delivery of distributed "educational activities" such as distributed courses, tutoring sessions, lectures,
workshops, etc. [2]. The developed scheme is tailored towards personalized learning using distributed information in a dynamic and heterogeneous learning setting, i.e., a connected network of learning management entities and educational systems where learners are individually supported in accessing distributed resources. However it is restricted to on demand scenarios and multimedia files.
Borissova et al. introduce a framework for design and development of an interactive multimedia E-learning system for engineering training [3]. The main goal of the project is to encourage low cost developing of effective and customized e-learning systems for engineering training by using popular and inexpensive software tools especially for virtual simulation of engineering system operations.
The Venice [4] project proposes a Web Services-based framework for VoIP applications. By using a service oriented architecture, the authors aim at easing the integration of supplementary services, the compatibility between different signaling layer protocols for call control and the installation of software updates on client devices. However, the Venice project is specifically tailored to VoIP scenarios, i.e., the authors do not address reusability between different multimedia applications nor provide a generic platform for the development of these.
Based on a distributed messaging middleware, the Global Multimedia Collaboration System (Global MMCS) [5][6] provides a framework for an audio/video collaboration system, which bridges the gaps between nowadays multimedia applications by providing a common signaling protocol with gateways to existing protocols like SIP or H.323 [10]. However, the authors do not address other multimedia applications and the reuse of components between these.
In [7], an approach is suggested to combine the areas of e-learning and Web Services, by providing electronic learning offerings as (individual or collections of) Web Services as well. It elaborates on this by showing how content providers and content consumers (i.e., learners) can communicate appropriately through a Web Service platform with its common description, publication, and retrieval functionalities. However, it does not support live channels.
The JSR 309 [16] is designed to provide server-based Java applications with multimedia capabilities. It targets a large range of applications from simple ring-back tone applications to complex conferencing applications, by providing: media network connectivity to establish media streams, IVR functions to play/record/control multimedia contents from file or streaming server, ways to join/mix IVR function to network connection to create conferences and call bridges. However the proposed API approach is restricted to Java based applications and it does not support enhanced VoIP functions, e.g., ring groups or call queues. It mainly provides low level objects like players, recorders, mixers and connections that developers can manipulate or combine together to obtain all the multimedia capabilities.
Scholz et al. present a generic framework for multimedia applications consisting of a set of reusable Web Service components, a modeling language based on finite state

254
International Journal on Advances in Telecommunications, vol 3 no 3 & 4, year 2010, http://www.iariajournals.org/telecommunications/
2010, © Copyright by authors, Published under agreement with IARIA - www.iaria.org
automata and a compiler [17]. The authors concentrate on the signaling plane protocols, especially their similar structure and purpose, i.e., the definition of possible states for both, client and server, and the transitions between these states via the exchange of messages.
Chou et al. describe a service-oriented communication (SOC) paradigm based on Web Services for real-time communication and converged communication services over IP [11]. This approach extends Web Services from a methodology for service integration to a framework for SOC. In particular, it introduces the generic Web Services-based application session management (WS-session), the two-way full duplex Web Services interaction for communication, and the development of Web Services Initiation Protocol.
In [12], a mobile streaming media CDN (Content Delivery Network) architecture is presented in which content segmentation, request routing, prefetch scheduling, and session handoff are controlled by SMIL [13] (Synchronized Multimedia Integrated Language) modification. The approach concentrates on the segmentation aspect, which is important for mobile users.
Oliveira et al. present a proposal to solve the problem of the adaptation of multimedia services in mobile contexts [19]. The approach combines context-awareness techniques with user interface modeling and description to dynamically adapt telecommunications services to user resources, in terms of terminal and network conditions. The solution is mainly characterized by the approach used for resolving the existing dependencies among user interface variables, which is based on the constraints theory, and by the mechanism for acquiring the user context information, which uses the Parlay/OSA interfaces.
III. SPECIFICATION OF E-LEARNING SERVICES To overcome the restrictions of traditional learning
environments discussed in Section I, we present a novel concept for a model-driven development and deployment of E-Learning streaming services. Its central idea is the specification of E-Learning services in terms of manufacturing resources, media objects, and delivery policies. By using Web Services for composition of E-Learning streaming services, we facilitate reuse, customizability and technology-independence.
A. Media Streaming Model The information model in Fig. 2 represents a model of our
E-Learning streaming services (UML class diagram). Different fundamental components (represented by rectangles) of the system are shown in the form of classes and relationships.
Manufacturing processes are composed of manufacturing resources, e.g., manufacturing automation devices, equipment & machinery, material & manufactured parts, and manufacturing personnel. E-Learning streaming services are related to such manufacturing processes and / or single manufacturing resources. As an example, for a single machine a video on demand can be requested by the manufacturing personal to study the detailed configuration steps for such a machine.
According to the model in Fig. 2 an E-Learning service can be described by its media objects (e.g., audio and / or video objects), related manufacturing resource, distribution and replication policy, and the quality of service used for content delivery. Media streams can also be categorized according to how the media objects are delivered.
Fig. 2 shows how pull services, push services and conference services inherit from the E-Learning base class. This generalization relationship indicates that these sub classes are considered to be a specialized form of the super class (E-learning). In pull services data delivery is initiated and controlled from a client whereas in push services a server initiates data transfer and controls the flow. Content Caching means to replicate media objects across different E-Learning servers. Such content caches improve application performance by storing frequently requested content closer to end users of the content and by offloading servers from repetitive requests.
Figure 2. E-Learning service model
Conference services support scheduled and ad-hoc conferences. Such conferences contain the following attributes: date and time when the conference will take place, the invited participants and as an optional part the leader, the agenda as well as conference documents.
B. Use Case: Live training The following scenario (Fig. 3) illustrates one of our
implemented key use cases, a technical training (how to configure and operate a machine) for a computerized numerical control machine (CNC) as the related manufacturing resource.
The operator shows the handling of a machine to the distributed audience (video). A background speaker (at a separate location, e.g., office) explains the configuration steps (video / audio). To enable the interaction between the speaker and the learning community, each participant is offered an audio back channel. In the scenario there are different QoS requirements, e.g., for the video transmission showing the manufacturing machine a high resolution and frame rate is required.

255
International Journal on Advances in Telecommunications, vol 3 no 3 & 4, year 2010, http://www.iariajournals.org/telecommunications/
2010, © Copyright by authors, Published under agreement with IARIA - www.iaria.org
Figure 3. Example E-Learning scenario
C. XML Specification For the specification of the properties of an E-Learning service we use XML. A specification of an E-Learning service is a structured composition of autonomous objects (see Fig. 4):
• Resources or manufacturing processes (category, type, keywords).
• A collection of media objects, e.g., audio and video objects (live or files) together with temporal relationships.
• Distribution policy, e.g., push or pull
• Roles and related media objects, e.g., speaker role.
This information can be used later, e.g., by the manufacturing personal, for searching and accessing E-Learning services.
Fig. 4 illustrates the specification of the live training scenario introduced in subsection A. The first part contains the description of manufacturing resources related to the E-Learning service. The list of media objects, which are used in the service is part of the section <MediaObjects> together with the type, bitrates and source.
For specification of temporal relationships we introduce two timing elements: <seq> and <par> similar to SMIL [13]. Both elements represent timing containers: they influence how the timing of their children is defined. A <seq> (sequential) container specifies that its children get processed sequentially: each child, whether it contains media objects or hierarchical structure, is processed when its predecessor ends. Fig. 4 shows the top-level sequential behavior in our E-Learning service: A <par> element specifies that its children play in parallel. Two videos and one audio fragment are rendered starting at the default time of the beginning of the <par> container.
The section <DistributionPolicy> defines the details of media delivery policy. The media streams in Fig. 4 are delivered based on a push policy. This includes also the definition when the media objects must be delivered (date and time), together with the available bit rates. There is also a recording option that allows creation of an archive recording while the live stream is going on.
Finally the roles, e.g., the speaker role are introduced together with a list of media streams, which are consumed and supplied by each role. As an example, the speaker role is a consumer of a video and an audio stream delivered by the role operator.
Figure 4. E-Learning service specification
IV. SMIL-BASED MULTIMEDIA INTERFACES While the modeling and specification approach presented in
the previous section specifically focuses on design time of E-Learning streaming services, this section presents a SMIL-based approach for adaption of multimedia streaming services to mobile devices. After a brief discussion of key differences between traditional devices and mobile devices, we present our concept in detail.
A. Multimedia Devices The acceptance of new E-Learning services will only be
effective if the users have the possibility to access them anywhere, and in any technological circumstances. Ubiquitous access to E-Learning services is becoming increasingly important with the proliferation of wireless devices and technologies. This requirement means that there is a significant challenge of being able to transform E-Learning services in
<StreamingService> <ManufacturingResources> <resource category = ”num control machine” /> <keywords>live training </keywords> </ManufacturingResources> <MediaObjects> <par> <video id = ”videoSpeaker” type = ”live” bitrate= … src = … /> <audio id = ”audioSpeaker” type = live” bitrate= … src = …/> <video id = ”videoOperator” type = ”live” bitrate= … src = … /> . . . <par> </MediaObjects> <DistributionPolicy> <push codec=”MPEG4” date= … time=… recording=”yes” file = … </push> </DistributionPolicy> <Roles> <role name=”Speaker”/> <consumerOf> <video id=”videoOperator” /> <audio id = ”audioLearningCommunity”… /> </consumerOf> <supplierOf> . . . </supplierOf> </role> . . . </Roles> . . . </StreamingService>

256
International Journal on Advances in Telecommunications, vol 3 no 3 & 4, year 2010, http://www.iariajournals.org/telecommunications/
2010, © Copyright by authors, Published under agreement with IARIA - www.iaria.org
order to adapt them to a great variety of delivery contexts, i.e., various devices.
Examples in our manufacturing scenarios include:
• Mobile devices that are used by a problem solution team to display just in time information that is relevant to manufacturing problem, e.g., a previously recorded video showing a failure scenario.
• Ubiquitous collaborative learning via cell phones or PC tablets that allow the learner to play an active role in both the knowledge building process and decision making anywhere, anytime.
• Mobile technologies can provide situated learning by extending the learning/training environment beyond the production areas into authentic and appropriate contexts of use.
However, there are a number of key differences between a traditional device such as a PC and a mobile device, such as a PDA. These include especially screen size and resolution, data input capabilities, as well as browser features.
The screen size and resolution capabilities of a traditional PC are quite different from that on a mobile device. PCs have large screens of 15 inches or more with typical display resolutions of 1280 x 1024 or higher. Mobile display resolutions start at around 128 x 128, barely 1/100th of the available resolution on a PC. Although mobile device display resolutions on smart-phones are typically 240 x 320 and can reach 640 x 480 or greater, the physical size of the display is limited by the requirement to have a small pocket-sized device. Increasing the resolution provides more dots-per-inch, but delivers limited benefit on such a small screen. The available screen estate is important when designing E-Learning services for mobile devices, and simply reformatting existing content is not appropriate.
The data input capabilities on mobile devices are restricted compared to PCs. Most mobile devices have only a numeric keyboard and entering text requires multi-tap key entry. The data input constraints should be considered when designing the mobile application, and data entry should be as limited as possible.
B. Adaption of Multimedia Streaming Services Among the alternatives that may be considered as
standardized multimedia formats, i.e., HTML5, MHEG, MPEG-4 and SMIL, we decided to choose SMIL. The main reason behind this choice is the SMIL-based E-Learning streaming specification language (Section III), which is also based on SMIL. The well-designed and extensive SMIL language elements for adaption of multimedia streaming services to mobile devices is another reason.
SMIL (Synchronized Multimedia Integration Language) is a W3C recommended XML-based markup language, which facilitates the construction of accessible multimedia applications for the internet and mobile devices. Collections of XML elements and attributes can be used to describe the temporal and spatial coordination of one or more media objects. SMIL defines markup for timing, layout, animations,
visual transitions, and media embedding, among other things. SMIL allows the presentation of media items such as text, images, video, and audio, as well as links to other SMIL presentations, and files from multiple web servers.
A SMIL application references to media objects, not the media data itself, and instructions on how those media objects should be combined spatially and temporally. Relations between media objects (and substructures) are described, and the computation of the timeline follows from this. The main temporal composition operators available are parallel composition, sequential composition and selection of optional content. Composition is hierarchical: nodes cannot become active unless all of their ancestors are active. The declarative containment model has one large advantage: SMIL presentations can adapt automatically to varying bandwidth conditions and alternate content with different durations. The hierarchical temporal composition model represents also a container for timed metadata, and allows structure-based deep linking into the content.
There are several alternatives available for making an E-Learning service compatible with different (mobile) devices:
• Resize the base layout: requires analyzing the used mobile devices and creating a layout that is not bigger than the most restrictive presentation environment. This is very safe strategy, but it can lead to frustration among E-Learning participants who have more sophisticated devices.
• Use device default layout: if no layout section is defined in a presentation, the SMIL player can place objects where it thinks they fit best. While this sounds attractive, it usually results in all content being stacked on top of all other content. The result is rarely pleasing or useful.
• Explicitly allow media objects to be scaled: SMIL provides values for media object placement that allow media objects to be scaled. While this is potentially useful, small devices will often have trouble when scaling media objects and especially video.
• Define multiple layouts using SMIL content control: this is the most useful way of handling multiple devices. SMIL provides a wealth of facilities for providing alternative layouts within one application.
In the following, we illustrate how to apply multiple layouts based on SMIL. One valuable SMIL feature in this context, especially for mobile devices, is the content control. It can be used to select over a number of layouts or media objects based on system properties. It is based on the switch element, which allows only one of its child elements to be chosen, the first one which is acceptable. It can be used anywhere in a SMIL document.
The general layout and some positioning models used in our E-Learning example are shown in Fig. 5. SMIL supports the notion of a top-level container window (called either the root-layout or top-Layout, which contains one or more regions. Each region defines a rectangular collection of pixels and a region stacking order (called the z-index).

257
International Journal on Advances in Telecommunications, vol 3 no 3 & 4, year 2010, http://www.iariajournals.org/telecommunications/
2010, © Copyright by authors, Published under agreement with IARIA - www.iaria.org
The layout contains the root-layout container window (not shown) and several media rendering regions. Some of the regions are assigned an explicit stacking order, others take the default of their parent (in this case, the default for the root is ‘0’). Each region contains positioning information when screen space is used.
Fig. 5 illustrates three layout strategies for different devices. Depending on the available display area, the video objects part of the E-Learning service are handled in a different way. A standard layout containing three regions (Fig. 5 a): Two video regions, one for the speaker and one for the operator; an additional region for a text object, illustrating additional information, e.g., specification of configuration steps in a manufacturing scenario.
Fig. 5 illustrates also two different layout strategies for mobile devices:
• Fig. 5 c shows a simple positioning model on a small device where only the video of the operator is visible (accompanied by the speaker audio);
• The layout in Fig 5 b shows an overlapping layout, i.e., the small video (speaker) is part of the main video region. SMIL handles such overlaps by giving all regions z-index stacking levels. When two regions overlap, the region
with the higher z-index "covers" the other with its overlap. In environments where bandwidth is restricted a image of the speaker could be played instead of the speaker’s video.
Figure 5. Layout strategies for different devices
The code fragment in Fig. 6 provides an overview of how SMIL handles layout such diversity of devices. One consideration for mobile devices is to add additional content control to address the needs of small devices.
Fig. 6 shows several layout sections within a common switch statement. Every visual media object must be assigned to a region, which is a rectangular area that is places within the root-layout area. The first section contains the standard layout,
which has been designed for a display area of 1024 pixels high and 1280 pixels wide (or greater). If this room is available, then the base layout will always be used, i.e., two video regions and an additional text region (not shown in Fig. 6). If a smaller display is available, a second layout is used. This layout could use relative values instead of absolute positioning. It also could allow certain media to be scaled. Rather than using the id attribute of the region element to define region names, the regionName attribute is used. This allows multiple layouts to be defined that create regions with the same name. In the body section, a reference to a region is made. The player will select the appropriate layout for the device used during playback.
Figure 6. Layout strategies in SMIL
There are several SMIL profiles developed for use on mobile telephones. While these provide general guidance to manufacturer and industry standardization groups, most handset vendors do not directly implement SMIL. Instead, the embed SMIL functionality in layered standards that include signally, packaging and transport protocols that are optimized for mobile handsets. One such layer set of protocols is developed by 3GPP: the third-generation partnership platform. One common packaging of SMIL in this environment is via MMS, the multimedia messaging system.
SMIL 3.0 contains elements and attributes which provide for runtime content choices and optimized content delivery:
• BasicContentControl: contains content selection elements and predefined system test attributes.
• CustomTestAttributes: contains author-defined custom test elements and attributes.
• PrefetchControl: containing presentation optimization elements and attributes.
<switch> <layout systemScreenSize="1024X1280"> ... define a standard layout ... ... 3 regions: 2 video regions and ... ... 1 text region ... <region regionName="videoOperator" left="0" width="784 . . . /> <region regionName="videoSpeaker" . . . left="784" . . ./> </layout> <layout systemScreenSize="480X640"> ... define a smaller layout ... ... 2 overlapping video regions ... <region regionName="videoOperator" left="0" . . . z-index="1" /> <region regionName="videoSpeaker" . . . left="0" z-index="2"/> </layout> <layout> ... define a small and simple layout ... ... 1 video region ... </layout> <switch>

258
International Journal on Advances in Telecommunications, vol 3 no 3 & 4, year 2010, http://www.iariajournals.org/telecommunications/
2010, © Copyright by authors, Published under agreement with IARIA - www.iaria.org
• SkipContentControl: specifies attributes that support selective attribute evaluation.
• RequiredContentControl: defines the systemRequired attribute to specify the namespace prefixes of modules required to process a particular SMIL file.
For example, the BasicContentControl attributes define a list of test attributes that can be added to language elements, as allowed by the language designer. Conceptually, these attributes represent Boolean tests. When any of the test attributes specified for an element evaluates to false, the element carrying this attribute is ignored.
The example in Fig. 7 is based on test attributes part of BasicContentControl. It uses the bandwidth related <switch> statement with one that considers display size as well. The second video (speaker video) in Fig. 7 will only be activated if the bitrate is 34400 (or greater) and the screen size is at least 480x640.
Figure 7. Bandwidth related switch statement
We tested the E-Learning scenarios in two devices, a PDA and a laptop, both with the Microsoft Internet Explorer browser as the SMIL player. Microsoft Internet Explorer implements the SMIL profile designated by XHTML+SMIL. This choice had the advantages of being supported by a disseminated browser (even in PDAs and other mobile devices) and of supporting the Web forms mechanism, which was an essential condition for implementing user input capabilities. The main disadvantage was related with the different approach taken by the XHTML+SMIL profile for managing the presentation spatial layout. This profile bases its layout functionality on the XHTML and Cascading Style Sheets layout model and does not use the construction defined by the layout language elements of the SMIL szandard. However, the presentations generated by both approaches are equivalent, in what concerns spatial layout.
V. SERVICE ORIENTED ARCHITECTURE This section presents an open and flexible service-
oriented architecture for the dynamic composition and execution of E-Learning streaming services. First, we introduce a set of Web Services and explain how a streaming service is initialized including the dynamic creation and composition of remote streaming components. Then, media streaming to Apple iPhone is illustrated as an example. Finally, we highlight details on the experiences from the E-learning designer’s point of view as well as from the end user perspective.
A service-oriented architecture (SOA) is basically a set of services interacting with each other and coordinating some activity. Service providers and service consumers are the two main entities acting on behalf of a user. The Web Service technology additionally addresses a standardized description of a service’s functionality using an XML dialect [14]. Using the Web Service Description Language (WSDL) [8], a service provider describes the functionality (interface) of a service in a platform, language, and operation system neutral way while a service requestor talks to these services using SOAP over HTTP (or other transport protocols).
A. E-Learning Streaming Services Streaming services are managed by a set of Web Services
(see Fig. 8). Such a Web Service is a URL-addressable software resource that performs operations and provides answers. In our case, the operations offered by the service interface are (see Fig. 8):
• searchStreamingService: allows searching a streaming service (based on the elements and attributes which form the xml service specification (e.g., category of a manufacturing resource, type of media object, distribution policy, etc.).
• registerStreamingService: enables validation and registration of new streaming services
• createStreamingService: instantiates streaming software components and establishes interconnections between components.
• startStreamingService: the operation is typically invoked by a scheduler (in case of push based services, driven by date and time values).
• subscribeToStreamingService: allows users to subscribe to (future) streaming services (e.g., a remote video based training related to a certain CNC machine). When a new media streaming service is registered or started, a user will be notified automatically by the service manager (as soon as such a service has been registered to the xml database).
Figure 8. Operations part of the Web Service
After searching a streaming service, the client (e.g., RTSP media player) requests depending on its role the related SMIL specification which defines the layout and temporal relationships between media objects. In the next step (step 7 in
PARAMETERS RESULT
registerStreamingService
createStreamingService
requestStreamingService
service specification (xml) result code
service id result code
searchStreamingService keywords, categorytime, datedelivery policy (e.g. pull)
list ofservices
OPERATION
service id result code[rtsp channel]
subscribeToStreamingService keywords. categorytime, datedelivery policy (e.g pull)
result code[futurenotifications]
startStreamingService service id result code
... <par> <video src="videoOperator.mpg" ... /> <switch> <video region="videoSpeaker" src="videoSpeaker.mpg" systemBitrate="34400" systemScreenSize="480X640"/> </switch> </par> ...

259
International Journal on Advances in Telecommunications, vol 3 no 3 & 4, year 2010, http://www.iariajournals.org/telecommunications/
2010, © Copyright by authors, Published under agreement with IARIA - www.iaria.org
Fig. 9) it will set up three network channels with all involved RTSP servers. Media data is delivered using the RTP over UDP, as shown in Fig. 9, step 8.
Figure 9. E-Learning Web Services
A full-duplex TCP connection is used for control and negotiation. A simplex UDP channel is used for media data delivery using the RTP packet format. A full-duplex UDP channel called RTCP is used to provide synchronization information to the client and packet loss information to the server. RTSP initiates and controls delivery. The XML service description includes references to media streams, using the URL method rtsp.
According to our service specification language, the following properties of E-Learning services can be used as part of a query:
• Manufacturing resources, e.g., category or keywords
• Media objects properties, e.g., recorded live training
• Distribution policy, e.g., on demand service
• QoS properties, e.g., bitrate, or used codec
• Date / time duration attributes
B. Software Components Our approach is based on a clear separation of a streaming
service specification and its implementation by a distributed application and can be used for different streaming paradigms, e.g., push and pull services.
The following figure (Fig. 10) illustrates the user interface and the management interface. The services are managed by a service manager, which provides in the current implementation
a simple interface to search, and start (request) services. Moreover, a management interface enables creation of new services, and deletion of existing services. Service specifications are stored as XML documents in a XML database.
A new e-Learning streaming service specification is first analyzed by a Web Service (operation create). Driven by a component library, which contains existing streaming components, such as encoders, media servers, etc., and a set of configuration rules, a Web Service creates a distributed streaming application configuration. Based on such a service specification, the service manager also supports retrieval of existing services.
Figure 10. User interface and management interface
Push services are started automatically according to the specified date and time values. Starting a service means to create the required streaming components, e.g., an encoder and a media server component as well as to establish the communication relationships. Before a new service is created, a consistency checker is responsible to test the availability of nodes, and media objects according to the definition as part of a service specification. A service specification is then analyzed by a Web Service, which will select appropriate streaming software components.
Multimedia services are stored as XML documents in a XML database. We use Apache’s Xindice, which is a database designed from the ground up to store XML data or what is more commonly referred to as a native XML database. Advantages are: faster for XML than other databases, no mapping to relational required, quick fragment retrieval provided, and optimized XML querying supported.
The prototype has been implemented using the PHP programming language and the PHP Web Services Development Pack nusoap [9] for the creation of and access to Web Services. We use the existing media server components from RealNetworks, and the OSS software Asterisk [15] as a VoIP server. The first (subjective) test results based on implementation of push and pull services as well as conference management are very promising. However, the used OSS VoIP system Asterisk does not offer scheduled conferences, i.e., a direct mapping to the Asterisk conference management functions is not possible. Information related to scheduled

260
International Journal on Advances in Telecommunications, vol 3 no 3 & 4, year 2010, http://www.iariajournals.org/telecommunications/
2010, © Copyright by authors, Published under agreement with IARIA - www.iaria.org
conferences is stored in a xml database. As the prototype is still under development, an objective measurement of processing time and delay has not yet been made.
C. Streaming to Mobile Devices We use a commercial media delivery platform from
RealNetworks (Helix Mobile Server) [20] which supports live and on-demand streaming of 3GPP content to any standards-compliant media player. The server supports 3GPP Release 4 Specifications including the .3gp file format and the payload formats associated with MPEG-4, AMR, AAC and H.263. It also implements 3GPP Release 5 Specifications including AMRwideband and enhancements for RTP and RTSP. The Helix Media Delivery Platform supports the various methods used by the Apple devices to access media complete with support for Android, Symbian and Windows 7 Mobile OS clients.
Another reason why we decided to use Helix Mobile Server is the Custom Statistics Reporting facility. When deploying media streaming services to mobile devices, it is important to have accurate statistical information on client usage. The Helix Media Delivery platform, i.e., the Helix Mobile Servers as well as Helix Clients have a statistics-reporting mechanism through which media players can relay back playback statistics to the media server, either at end of a session or on an interval basis. This feature is used to gather statistics about usage of E-Learning streaming services.
We do not use Java Media Framework, because it is not stable enough, especially for long running streaming applications.
In the following, media streaming to Apple iPhone is illustrated as an example. From the user’s point of view, the starting point of such a scenario for mobile environments is the request of a SMIL file, which contains the layout specification and the required audio and video files. In the case of Apple mobile devices, the methods used for accessing media objects is very different than delivering content through RTSP (as other mobile clients use) or RTMP (as Adobe flash media players use). Apple has implemented a client-driven system for downloading full or segmented audio and video files through the HTTP or HTTPS protocol. With on-demand media files, these are delivered to the Apple device by converting the original source media file into a series of 10 second segmented media files encapsulated in a MPEG-2 media stream (.ts container) and making them available to be delivered to the client through http or https.
After creating the MPEG-2 TS segments, an index file (.m3u8) is created (or updated if the content is live) that lists the order of and URLs to each segmented media file (Fig. 11). This index file is also known as a playlist and will also include some additional information about the content itself (segment length, if content is encrypted where the decryption key can be found, multirate bandwidth information etc). After receiving the index file, the iPhone OS media client downloads each segment files listed in the playlist using HTTP(S) and plays back the media in order listed. Once the device reads the playlist and works out the bandwidth available (if required for
a multi-rate clip) the client then requests the relevant .TS media segment for playback to start (step 5 in Fig. 11 below).
Helix Media Server has the ability to on-the-fly segment (and optionally encrypt) a correctly formatted on-demand media file into the structure required by the Apple device (.ts media segments and m3u8 playlist as seen in step 4 in Fig. 11 above). This process happens instantaneously on the first request by an Apple device (step 3 in Fig. 11) and the playlist is then sent back to the device (step 5 in Fig. 11).
Figure 11. Streaming to Apple mobile devices
Once the device received the playlist and calculated the available bandwidth (if required for a multi-rate E-Learning service) the client then requests the relevant .ts media segment for playback to start (step 6 in Fig. 11).
D. User Experience The goal of the project was also to evaluate the user
interfaces and the usage of the E-Learning streaming services. Two actors have to be regarded to analyze the acceptance of the system: the designer of an E-Learning streaming service (i.e., person responsible for specification of E-Learning streaming services in terms of manufacturing resources, media objects, delivery options, and device adaption policies) as well as the end user accessing on-demand or push streaming services. As in any E-Learning environment streaming services also need to be user centered taking into account the user’s characteristics and abilities interacting with the environment and learning materials, and comply with usability.
Designers of E-Learning streaming services have a strong tendency towards reusing designs that worked well for them in the past. However, currently our system does not provide templates for typical E-Learning scenarios. Additionally, the E-Learning specification based on XML files, especially the adaption part which deals with mobile devices was not well accepted. Based on the XML schema for the specification language a graphical user interface will be implemented better suited and more accepted by developers of streaming services.
In a production environment robust and easy to use search functions are one of the key requirements. Our original search functions had to be improved. Context-driven search results, driven by the concrete manufacturing resources, which are part

261
International Journal on Advances in Telecommunications, vol 3 no 3 & 4, year 2010, http://www.iariajournals.org/telecommunications/
2010, © Copyright by authors, Published under agreement with IARIA - www.iaria.org
of a single work place are regarded to be important for the machine operators. As an example, depending on the available machine(s), which are part of a single work place, the search functions have to offer the “right” E-Learning services related to the given local manufacturing resources.
The most accepted E-Learning streaming services are on demand video services. From the production management point of view, push services are essential for quality improvements. Such services allow a “just in time” documentation of occurred failures, during runtime of a machine by ad hoc video and audio recordings. These recordings can be analyzed later and appropriate solutions can be developed to improve manufacturing processes.
The challenge of mobile devices is to understand and explore how best they can be used to support learning, training, and performance support. The use of mobile technologies should not be viewed as isolated activities; instead, they should be viewed as richly ubiquitous, and effective collaborative devices having during maintenance, or helping to diagnose during a manufacturing process problem solving effort.
As well as the limited screen size and data input capabilities, the use cases for mobile devices should also be considered when designing E-Learning services and content for mobile devices. Services which are used on-the-go should be made available on the mobile. Just taking an existing PC-based E-Learning service and reformatting it for the mobile phone is rarely the right solution.
Due to the variation in screen resolution and browser markup support, it is necessary to optimize E-Learning content for the specific type of mobile device. This involves designing an appropriate layout for mobile devices, i.e., applying the appropriate mobile page flow, etc. It is also necessary to resize videos and images based on the device resolution.
In order to optimize the content based on the mobile device type, it is necessary to identify the type of device or browser. This can be done automatically using the SMIL attributes for content control. When the device is identified, the characteristics of that device required for content optimization can be retrieved from the SMIL application. The necessary information includes screen resolution, the number and size of regions, etc.
The following research questions are essential for user acceptance of mobile devices:
• What types of training and / or performance support can be effectively delivered via mobile devices that are consistent with the E-Learning environment for manufacturing processes?
• How is the mobile technology training/performance support integrated within the identified E-Learning environment, taking into consideration the identified E-Learning environment’s system architecture?
• What are the existing mobile technologies “best practices” that can be applied to the identified E-Learning environment?
The most interesting metric for the media server performance is the number of concurrent users the server can support. In [22], several streaming use cases are described and tested to report the number of successful streams as well as streams that failed to complete correctly. Streams that died or could not even start were reported as errors. Performance results indicate that the network connection is the bottleneck for HTTP streaming while the CPU is the bottleneck for RTSP based streaming. However, in our case we have a maximum number of 10 parallel streams, i.e., we could not observe any server bottlenecks.
VI. CONCLUSION AND FUTURE WORK In this paper, we have presented a service-oriented
architecture for E-Learning streaming services – realized using Web Services technology. The major contributions and extensions of our approach aim to provide a high level specification of E-Learning services in terms of user roles, media objects, distribution policies, etc. The introduced Web Service supports creation of tailor-made media streaming applications, using existing software components, e.g., media server or VoIP software components.
The work presented in this paper is also proposal to solve the problem of the dynamic adaptation of multimedia services in heterogeneous device contexts, especially in case of mobile devices. We presented a generic SMIL-based adaptation methodology suitable for the adaptation of multimedia services according to different conditions of access devices and networks.
We report the current status of our prototype. The prototype has shown that our XML based language is well suited for automatic generation of implementations. At implementation level, the different aspects are integrated in a general object-oriented architecture supporting modularity and reuse of software. The deployment of new service operations is very easy to accomplish due to the modular structure of the service oriented architecture and the well designed and easy to use PHP development pack nusoap.
Currently, the evolution of E-Learning is mainly driven by then convergence of two traditionally separate worlds: just in time learning and Web 2.0 tools, such as social networks. Learning takes place through conversations about content and grounded interaction about problems and actions, i.e., employees learn from each other through communities of practice, blogs, wikis, and other forms of self-published content. Another trend that has emerged in E-learning over the past years is that there has been a steady shift away from traditional PCs to mobile devices. The type of mobile learning we expect in the future will be much more akin to performance support - checklists, quick guides and short ‘how to’ videos, e.g., a video illustrating configuration or handling of a complex machine.
Future work will concentrate on the extension of the service model to support additional functionality, e.g., application sharing as well as the integration of authentication services (authentication of users). Another objective is to improve the search functions by a recommendation system to identify interesting E-Learning material based on the current context

262
International Journal on Advances in Telecommunications, vol 3 no 3 & 4, year 2010, http://www.iariajournals.org/telecommunications/
2010, © Copyright by authors, Published under agreement with IARIA - www.iaria.org
(e.g., location) and the user’s personal ontology, similar to the approach introduced by Woerndl et al. [21].
ACKNOWLEDGEMENTS The proposed framework is part of a multimedia project,
financed by the state government of Baden-Württemberg in Germany.
REFERENCES
[1] M. Zimmermann, “On Demand Learning in Manufacturing Processes - Implementation by Integrated Multimedia Streaming Services”, AICT 2010, pp. 106-111, 2010 Sixth Advanced International Conference on Telecommunications, 2010.
[2] B. Khasawneh and S, A. El-Seoud, “Framework for on-demand e-learning resources allocation and distribution”, OERAD International Journal of Computing & Information Sciences, Vol. 4, No. 2, 2006.
[3] D. Borissova and I. Mustakerov, “A Framework of Multimedia E-Learning Design for Engineering Training”, ICWL 2009, in LNCS 5686, pp. 88–97, 2009, Springer, Berlin Heidelberg, 2009.
[4] M. Hillenbrand, J. Götze, and P. Müller, Voice over IP - Considerations for a Next Generation Architecture. In EUROMICRO-SEAA, pp. 386–395, IEEE Computer Society, 2005.
[5] A. Uyar, W. Wu, H. Bulut, and G. Fox, “Service-Oriented Architecture for a Scalable Videoconferencing System”, In Proc. of IEEE Int. Conf. on Pervasive Services 2005, pp. 445–448, IEEE Computer Society, 2005.
[6] W. Wu, G. Fox, H. Bulut, A. Uyar, and T. Huang, “Service Oriented Architecture for VoIP conferencing”, In Int. Journal of Communication Systems, Special Issue on Voice over IP - Theory and Practice, volume 19, pp. 445–462, John Wiley & Sons, 2006.
[7] G. Vossen, P. Westerkamp, "E-Learning as a Web Service," ideas, Seventh International Database Engineering and Applications Symposium (IDEAS'03), 2003.
[8] E. Christensen, F. Curbera, G. Meredith, and S. Weerawarana, “Web Services Description Language (WSDL) 1.1”, http://www.w3.org/TR/wsdl, 2001
[9] http://sourceforge.net/projects/nusoap/, Retrieved December 29, 2010, from http://sourceforge.net/projects/nusoap
[10] ITU. Recomm. H.323 (1999), “Packet-based multimedia communications systems”.
[11] L-L. Wu Chou and L. Feng, “Web Services for communication over IP”, In: Communications Magazine, IEEE, Volume: 46, Issue: 3, 136-143, 2008.
[12] T. Yoshimura, “Mobile Streaming Media CDN Enabled by Dynamic SMIL”, WWW2002, May 7-11, 2002, Honolulu, Hawaii, USA, ACM 1-58113-449-5/02/0005, 2002.
[13] SMIL: http://www.w3.org/TR/smil20, Retrieved December 29, 2010, from http://www.w3.org/TR/smil20.
[14] D. Fallside, “XML Schema Part 0: Primer”, http://www.w3c.org/TR/xmlschema-0, 2001.
[15] Asterisk[16] T. Ericson and M. Brandt, “JSR 309 - Overview of Media Server
Control API”, Public Final Draft, Media Server Control API v1.0, 2009.
: The Open Source Telephony Project, http://www.asterik.org
[17] A. Scholz, “WS-AMUSE - Web Service architecture for multimedia services”, International Conference on Software Engineering, In Proceedings of the 30th international conference on Software engineering,
[18] Leipzig, Germany, 2008.
http://java.sun.com/javase/technologies/desktop/media/jmf/index.jsp, Retrieved December 29, 2010, http://java.sun.com
[19] J. M. Oliveira and E. Carrapatoso, “Dynamic Generation of SMIL-Based Multimedia Interfaces”, JOURNAL OF MULTIMEDIA, Vol. 3, No. 4, 2008.
[20] RealNetworks, Inc., “Helix Media Delivery Platform for Mobile Networks”, RealNetworks White Paper, Series Version 2.1, 2010.
[21] W. Woerndl, G. Groh, and A. Hristov, “Individual and Social Recommendations for Mobile Semantic Personal Information Management”, International Journal on Advances in Internet Technology, vol 2 no 2&3, ISSN: 1942-2652, 2009.
[22] Y.-J. Lee., O.-G. Min, and H.-Y Kim, “Performance evaluation technique of the RTSP based streaming server”, Proceedings of the Fourth Annual ACIS International Conference on Computer and Information Science (ICIS), 2005.

263
International Journal on Advances in Telecommunications, vol 3 no 3 & 4, year 2010, http://www.iariajournals.org/telecommunications/
2010, © Copyright by authors, Published under agreement with IARIA - www.iaria.org
Abstract—In this paper, a cognitive radio network (CRN)
model is presented. In this model, the control of the CRN is
distributed among the frequency spectrum considered for
transmission using cognitive pilot channels (CPCs). This control
is performed by using frequency-division and time-division
multiplexing techniques. Frequency-division is used to divide
the spectrum into predetermined frequency slots in which
cognitive radio users (CRUs) communicate. Then, the frequency
slots are divided into sub-frequency slots, some of which are
defined as CPC and used by the CRUs to communicate with a
central cognitive base station (CCBS) and to determine
availability in a frequency slot. Time-division is used to
determine if a primary user (PU) has accessed the channel used
by CRUs. Using this time-division approach, presence of PUs is
detected. We have designed a CRN able to work with today’s
available technologies and CRU devices that use different
frequency bands of operation. Since in terms of energy, this
control can be very inefficient because at specific periods of time
the network might be completely used, a method for energy
reduction in a centralized cognitive radio network (CRN) is
presented. Results of the performance of the network will be
presented in terms of the number of CRU and the time these
CRUs use the CPCs for control.
Index Terms— Cognitive Pilot Channel; Cognitive Radio
Networks; Dynamic Spectrum Access; Medium Access Control
I. INTRODUCTION
A basic model for controlling and signaling a Cognitive
Radio Network (CRN) was presented in [1]. Considering that
fixed spectrum licensing has produced apparent scarcity in
the wireless frequency spectrum [2-3], strategies such as
Cognitive Radio (CR) have been suggested for efficient
spectrum occupation. The CR systems have the ability to
detect free frequency slots in the spectrum, i.e. “white
spaces”, and to allocate the CR communications in these
white spaces by using dynamic spectrum access (DSA)
mechanisms [4-6]. CR has already been considered as the
main technology for IEEE standards, such as IEEE 802.22,
which is the standard for Wireless Regional Area Network
(WRAN) using white spaces in the TV frequency spectrum
and for standards related to DSA networks that are comprised
in the IEEE SCC41 [2-3, 6].
In general, a CRN should be able to perform 4 tasks
efficiently, spectrum sensing, spectrum decision, spectrum
sharing, and spectrum mobility [5]. Spectrum sensing refers
to the identification of the most likely white spaces in a
specific time. Spectrum decision refers to the process of
deciding in which white spaces to allocate communications
[5]. The spectrum sharing function consists on maximizing
the cognitive radio users (CRUs) performance without
disturbing Primary Users (PUs) and other CRUs; this is one
of the main challenges for opportunistic spectrum access
(OSA) in CRN [5, 7]. Spectrum mobility is the CRU ability to
leave the frequency portion of the spectrum occupied when a
PU starts using the same frequency portion and then, to find
another suitable frequency slot for communication [5].
Spectrum sensing and spectrum mobility must be guaranteed
in order to implement an efficient CR Medium Access
Control (MAC).
Several CR MAC protocols have been developed over the
premise of the presence of a dedicated common control
channel [8, 9]. In this CR MAC approach, all CRU must be
able to communicate in this common control channel. Thus,
the CR capacity is under-utilized, since data communications
cannot be sent or received on the common control channel.
The CR MAC protocols that improve this performance are
based on multi-channel MAC protocols. This approach can be
considered for efficient spectrum utilization because the CRN
must operate in different frequency bands. The main
difference between multi-channel and CR MAC protocols is
that in the CR MAC protocols, the presence of PUs is
considered. Multi-channel MAC protocols can be categorized
in dedicated control channel, split phase, common hopping,
and default hopping [10]. Other than the aforementioned
dedicated control channel approach, these multi-channel
MAC protocols need some kind of user synchronization to
determine the control channel beforehand. Furthermore, in
multi-channel MAC protocols, all CRU must be able to use
the same frequency channels, which is not always the case in
heterogeneous systems. A comparison among our proposal,
CPCDF-MAC, multi-channel MAC protocols from [10] and
existing CR MAC protocols from [8] is shown in Table I.
Distributed Control and Signaling using Cognitive Pilot Channels in a Centralized
Cognitive Radio Network
Nicolás Bolívar and José L. Marzo Broadband Communications and Distributed Systems Group (BCDS)
Universitat de Girona
Girona, Spain
E-mail: [email protected], [email protected]

264
International Journal on Advances in Telecommunications, vol 3 no 3 & 4, year 2010, http://www.iariajournals.org/telecommunications/
2010, © Copyright by authors, Published under agreement with IARIA - www.iaria.org
The utilization of beacons was suggested as a solution for
spectrum sharing in [11], using these beacons to control the
devices medium access into the frequency bands.
Architectures with more than one beacon have been proposed
to improve performance [12]. Decisions based on channel
occupancy are performed by combining the information
obtained in these beacons using data fusion techniques. The
most common data fusion techniques to decide whether a
particular frequency band is occupied are voting rules and
logical operations [13]. In these proposals, the beacons are
sent by the PU through a cooperative control channel or a
beacon channel, with the latter being considered a better
option in [14]. This approach has two main disadvantages for
implementation in a CRN with today’s available
technologies; the first is that a new set of primary users must
exist or new hardware must be developed since the PUs
should inform the nearby CRU about their presence, and the
second disadvantage is that a new channel must be reserved
for the beacon signals.
A cognitive pilot channel (CPC) is a solution proposed in
the E2R project for enabling communication among
heterogeneous wireless networks. The CPC consists on
controlling frequency bands in a single or various “pilot”
channels, which is analogue to the beacon proposal. In both
CPC and beacons proposal, there are “in-band” transmission,
i.e. information transmitted in the same logical channels of
the data transmission, and “out-band” transmission, i.e.
information transmitted in different channels of the data
transmission. Studies have been conducted in [15-18] to
define the quantity of information that should be transmitted
in the CPC, the bandwidth for each CPC, and the “out-band”
and the “in-band” transmission or other solutions with a
combination of both. The IEEE P1900.4 group, part of the
IEEE SCC41, has accepted CPC as part of the architecture for
the CR Access [16].
In the E2R project, for achieving communication between
heterogeneous nodes and networks, and also scalability, a
large band is divided into several sub-bands with one local
CPC (LCPC). This LCPC is used for accessing a network,
and informing the devices about the operator, frequencies and
radio access technologies in this network [15-16]. In [17],
CPC is considered for radio environment discovery,
reconfiguration support and terminal radio environment
information and context awareness. We expand the use of
CPC in order to control the CRN. The objective is to build a
CRN using today’s available technologies that are able to
support heterogeneous frequency CRU devices, i.e. CRU that
use different operation frequencies, while using the spectrum
as effectively as possible.
To control the CRN, joint time and frequency control for
assuring effective spectrum sharing are used. For transmitting
channel availabilities, network discovery and channel
petitions, a frequency-based approach using beacons in a CPC
is proposed. The utilization of the CPCs instead of a
dedicated control channel allows heterogeneous systems to
communicate in our CRN. In a first approach, a central
cognitive base station (CCBS) sends beacons via parallel
communication in sub-channels of all available frequency
slots. With this approach, the use of all available frequency
bands for communications was guaranteed. When a CRU
requested access in the CRN, the CRU already knew which
channels were available because of these beacons. However,
in terms of energy, transmitting through every available
channel would be inefficient. This is because the entire
wireless spectrum channels would be occupied in a specific
moment. Considering this problem, new alternatives are
explored to reduce the energy used for signaling cognitive
radio users (CRU) channel availability.
Among the strategies that might be applied to decrease this
amount of energy are: reducing the number of channels
and/or amount of time/symbols used for signalization, and
recognizing patterns of transmission. Since the network is
centralized, collisions on entrance of CRUs are reduced.
Considering that CRUs might also be capable of recognizing
patterns of occupancy, to reduce the energy used for sensing,
signaling and transmission. For this reason, Cognitive Radio
technology has also been considered as an alternative to
reduce energy consumption for wireless communications [19].
In [20], we explained the use of a distributed control and a
centralized database for reducing the amount of energy used
to signal this availability in the CRN. A complementary
control based on a time-division approach, in which the PU
entrances are detected via time slots, is also used. Finally, in
this paper we present the performance of the network using
this energy reduction method in our CRN with distributed
control.
The remainder of this paper is organized as follows:
Section II introduces the model of the network. Section III
presents the expected results of our proposal and Section IV
provides a discussion of our work.
II. PROPOSED MODEL
A. CCBS Control Architecture
The proposed model of the CRN is an infrastructure-based
architecture for effective spectrum access, sharing and
management. The main reason for using a centralized model
is to concentrate wideband spectrum sensing and spectrum
decision in the central station and, as a consequence, to
TABLE I. COMPARISON AMONG CR MAC PROTOCOLS
Protocol Specific
Control
Channel
Time
Synchronizat
ion Needed
Multiple
Transceivers
Support for
Heterogeneous
Frequency Devices
Common Control
Channel
Yes No No No
Common Hoping/
Default Hoping
Sequence
No Yes No Partial
OSA-MAC Yes Yes No No
HC-MAC/ OS-
MAC
Yes No No No
CPCDF-MAC
(Proposal)
No Yes Yes Yes

265
International Journal on Advances in Telecommunications, vol 3 no 3 & 4, year 2010, http://www.iariajournals.org/telecommunications/
2010, © Copyright by authors, Published under agreement with IARIA - www.iaria.org
reduce operations and the hardware required in the CRU
devices. A basic representation of the centralized CRN model
can be seen in Fig. 1. The elements of our CRN are the CCBS
and the CRUs, which operate and coexist with the PUs.
In Fig. 1, CRU1 is communicating with the CCBS
(CCBS1), while PU1 is communicating with PU2. PU1
transmission is within the range of the CCBS1 and CRU1.
This means that the communication between CRU1 and
CCBS1 must be performed in a different frequency slot than
the one that the PUs is using. Hence, in order to ease CR
operation, a CR radio spectrum model that uses fixed
frequency slots for both CR frequency sensing and CR
medium access is proposed. A frequency/time representation
of the corresponding scenario is also shown in Fig. 1.
In the proposed architecture, we assume that the
management of the network is performed in the CCBS, which
permits to reduce the amount of processes from the CR users
(CRU)’ terminals and therefore, keeping those terminals
simple while using today’s available technologies. We
address the spectrum sharing problem, since we assume that
the CCBS decides which channel to assign for each CRU,
according to the available channels and the characteristics of
the CRU. The architecture of a CCBS is shown in Fig. 2.
The CCBS is composed of two major modules, information
and processing module and transceiver module is proposed.
The information and processing module is divided in five
sub-modules: sensing, database, digitalization, channel
control and communications. In the sensing sub-module, the
CCBS scans the analog radio frequency spectrum, which is
assumed to be perfectly and continuously sensed. In the
digitalization sub-module, the analog sensed signal is
digitalized within predefined frequency slots. An
Analog/Digital (A/D) converter is used considering the
thresholds determined for each channel according to the
location. A logical “1” is then assigned if a communication
exists in a frequency slot; otherwise a logical “0” is assigned.
This information is stored as a vector in the database sub-
module, which also provides the specifications of the location
that are loaded into the digitalization sub-module. In
addition, the database sub-module stores information related
to the CRU frequency assignments from the channel control
and the communication sub-modules. The channel control
sub-module uses a frequency subdivision of the frequency
slots (sub-frequency slots). In those sub-frequency slots,
CCBSs and CRUs exchange both control and data
information. The channel control sub-module is responsible
for controlling which CRUs are communicating and the
frequency slots used. In this sub-module, CRUs are assigned
free frequency slots to communicate. This information is sent
in a vector to the control of the transceiver module, while it is
also kept in the database. Fig. 3 shows the division in
frequency and sub-frequency slots. Finally, the
communications sub-module is responsible of data
communication, which uses the frequency slot that has been
defined in the previous sub-module.
Fig. 2. CCBS Control Architecture
Fig. 1. CRN Model

266
International Journal on Advances in Telecommunications, vol 3 no 3 & 4, year 2010, http://www.iariajournals.org/telecommunications/
2010, © Copyright by authors, Published under agreement with IARIA - www.iaria.org
The Transceiver Module is divided into 3 sub-modules,
control, communication and coordination. These sub-modules
are responsible for communicating the information coming
from the information and processing module with the control
module of the CRUs, the communication module of the
CRUs, and with other CCBSs for cooperation, respectively.
This architecture allows cooperation among the base stations
of adjacent CRNs by using in each sub-channel a logical OR
with the data from other CCBS. However, in this paper we
are not considering the possible coordination among CRN.
In this paper, only the CRN control is studied; the control
algorithm for the CCBS is represented in Fig. 4. In this
figure, the frequency spectrum sensing and A/D conversion
block represent the equivalent processes that are shown in the
CCBS Algorithm. On the other hand, the channel control
block from Fig. 2 is divided into CCBS Control Broadcast
Transmission, CCBS-CRU Control Communication and the
time synchronization needed. It is worth to mention that both
database storage and information and control
transmission/reception are considered for the algorithm as
part of the CCBS Control Broadcast Transmission and
CCBS-CRU Control Communication processes.
In the following section, the control of the system is
explained, considering the control processes of the CCBS
Algorithm. The algorithm is also related to each of the
required dynamic functionalities for CRN, Dynamic Spectrum
Access (DSA), Dynamic Spectrum Sharing (DSS) and
Dynamic Spectrum Management (DSM) [7].
B. CCBS – CRU Control
The CCBS-CRU Control Communication is performed
under three different scenarios, CRU network discovery, CRU
medium access and while CRU data communication is being
transmitted. DSA is present for the first two scenarios, DSS
for the last two, while DSM only occurs for the last one. For
the CR network discovery and from the CRU perspective, the
process is as follows. When a new CRU enters into a CCBS
range, this CRU scans in its possible transmission channels,
and sends in an available channel an identification frame that
consists on: petition to enter, ID of the device, and type of
device. This frame is sent in a frequency-based approach,
since a CRU can enter for the first time to the network at any
moment. When the CCBS receives this request, acknowledges
the CRU type of device, keeps this information into memory,
and sends a confirmation message. The CRU then waits for
confirmation of the corresponding CCBS, and synchronizes
itself with the CCBS.
From the CCBS perspective, a broadcast signal is first sent
in one or more of all the available frequency slots in which
CRUs are able to communicate. This is the CCBS Control
Broadcast Transmission process in Fig. 4. Since a CRU can
enter to the CRN at any moment, time synchronization does
not exist yet, and a frequency beacon mechanism is proposed.
This consists in a two bit signal sent in the first two sub-
frequency slots shown in Fig. 3 of all the available channels.
The set of values corresponding to control are detailed in
Table II.
When a CRU is trying to use the CRN, a message
containing the identification frame is received from the CRU,
and the process in the CCBS consists on determining if the
information received is valid, i.e. no errors in the reception, if
the CRU can access the CRN, and if both conditions are
fulfilled, the CRU is accepted and its presence in the network
is stored in the database.
According to the channel and device characteristics, the
CRU medium access might be performed in a time-based
approach or a frequency-based approach. Since the analysis
for the 2 bit message is the same for both frequency division
and time division based approaches, the case for the
frequency-based approach is explained, without losing
generality. The process for the CRU Medium Access to the
network is then similar to the previously shown process for
Fig. 3. Frequency slot and sub-frequency slot division of the spectrum
TABLE II. DISTRIBUTION OF CONTROL BITS FOR THE
PROPOSED ARCHITECTURE
Bit 1/Bit 2 Process
00 CCBS and CRU coordination for using a
channel
01 CRU request to use a channel
10 CCBS announcing availability
11 Frequency Slot occupied, CRU must leave
immediately
no
SENSING
(from Frequency
Spectrum -
Analog) and
DIGITALIZATION
(A/D Conversion)
Frequency slot
free (fsi = 0)?
Secondary (CRU)
transmission? (DB
Search)
CCBS CONTROL
BROADCAST
TRANSMISSION
CCBS-CRU
CONTROL
COMMUNICATION
CCBS TIME
SYNCHRONIZATION
yes yes
no
i = 0 i = N-1
Fig. 4. CCBS Algorithm per each frequency slot i (fsi)

267
International Journal on Advances in Telecommunications, vol 3 no 3 & 4, year 2010, http://www.iariajournals.org/telecommunications/
2010, © Copyright by authors, Published under agreement with IARIA - www.iaria.org
network admission. The differences are that the CRU is
already present in the network, so there is no need to
communicate the identification frame again and that after
being admitted in a channel, data communication is the
process that continues in the next time slot. The CCBS-CRU
Control Communication process can be described then as in
Fig. 5. When the CCBS receives information from a CRU in
a communication channel, the CCBS compares this
information with its database. If the CCBS does not identify
this information as coming from a known CRU, the CRU
admission process is started. If the CRU is already registered
in the CRN, but this CRU is not communicating, the CRU
confirmation process is activated. In the case this CRU has
been already assigned a frequency slot, the data
communication process is performed.
When a CRU data communication is already established,
and since PU communication can enter at any moment, a
time-based approach is implemented in order to discover PU
presence. This frequency and time system allows the
elimination of a dedicated control channel for spectrum
sharing. Using the slotted predefinition, if a transmission is
received in a moment no transmission should be performed,
we assume that a PU is communicating and, then, the channel
is evacuated and the process of assigning a channel restarts,
keeping into memory the last information that was going to
be transmitted. For effective use of the wideband spectrum,
we also propose a multi-channel approach, since several
cognitive users might communicate in different channels. For
the analysis of the system, we consider each communication
channel separately, since it is transparent for the CRU in
which channel is transmitting. An example of the time-based
approach for determining PU entrance in the operation range
of a CRN is depicted in Fig. 6, which shows the utilization in
time of a frequency slot by both PU and CRUs.
In [20], two additional characteristics are added to the
CRN model of [1] to reduce broadcast transmissions. The first
one is that CRU synchronization will be performed as
follows: Since CRUs know the duration of the time slot, the
CRU will search during a time slot in its channels for
continuous transmission. If a CRU finds a PU-free channel,
the device will send a signal for announcing that this CRU
wants to access the network. A channel occupied by a CRU
will be identified because of the time slots used for control, so
this scheme will not introduce collisions among CRUs.
The second reduction consists on using the ability the
CCBS has to identify the channels every CRU in the network
is able to use. In this manner, the CCBS will only send a new
broadcast transmission for each channel petition. This means
that now, the entire wireless frequency spectrum considered
for the CRN domain will not be used at several moments.
Using these alternatives, the flux diagram from Fig. 5
presents two cases: a CRU wants to access the CRN, and
another CRU exists in one of the CRU devices’ available
channels. In this case, the new CRU senses the occupation,
and when the device senses no transmission, it synchronizes
with the CRN and could send its network admission petition
or use a free channel to transmit, since the CRU device is
already synchronized in time with the CRN.
The other case is that no CRU is communicating in the
network within the available channels for the new CRU
device. In this situation, only PUs could be using the
channels; this means that the CRU is not able to recognize
the time slot that must be used for synchronization. The CRU
then uses its time sensing capability to detect that a channel is
being occupied for more time that the time-slot duration, so
the CRU does not transmit through that channel. Next, the
CRU device must find another channel to synchronize. If
there is no available channel for this CRU, this device cannot
access the CRN. When an available channel is found, the
CRU then simply sends a petition to use the channel that the
CCBS responds in the corresponding time slot, so the new
CRU can be now synchronized to the network.
In Fig, 7, an example of the CRU admission in the CRN is
shown by using the same example as in Fig. 5. CRU 3, which
has three channels for communications, “senses” its
environment. Channel 1 is being used by a PU, so this
Fig. 6. Frequency slot utilization by both PU and CRUs (in time)
START
CRU already
communicating?
DATA
COMMUNICATION
END
CRU already in the
network?
CRU
ADMISSION
(Discovery)
CRU
CONFIRMATION
(Medium Access)
no
yes
yes
RECEIVE
INFORMATION
FROM CRU
Fig. 5. CRU Admission in the CRN from the CCBS perspective

268
International Journal on Advances in Telecommunications, vol 3 no 3 & 4, year 2010, http://www.iariajournals.org/telecommunications/
2010, © Copyright by authors, Published under agreement with IARIA - www.iaria.org
channel is unavailable to CRU transmission. Channel 2 is
occupied by CRU1. This makes the channel unavailable for
CRU 3 use, but CRU 3 can detect the time slot position using
CRU 1 transmission. Using that information, CRU 3 can
access Channel 3 in time t2.
III. RESULTS
In this section, the difference in expected transmission
generated by both CRU interference to PU, and CRUs not
having a frequency slot (channel) to transmit, which will be
called transmission errors, will be analyzed. Due to the fact
that none of the CR-MAC protocols shown in Table I present
support for heterogeneous devices, no comparison is
performed in this section. Results will be presented in terms
of the number of CRU users and the relation of time dedicated
for the Cognitive Control Algorithm.
In [20], a simulation is then performed in MATLAB to
show the obtained results. The values used are the following:
number of channels (n) = 128, number of sub-channels (m) =
256, control time/ (control + data) time = 1/10, and time
duration (td) = 500 units of time. In Fig. 8, channel
occupancy and power used when the CCBS sends broadcast
signaling to announce availability is shown.
As expected, when CCBS sends broadcast transmission,
every channel is occupied either by PUs (thick blue lines) or
the CCBS broadcast transmission (thin lines). In Fig. 9, the
power used and channel occupancy in the proposal is shown.
In Fig. 9, power used with the new model when CCBS in
[1] would be sending broadcast transmission is shown. In this
case, thick lines represent PU transmission, while thin lines
represent CRU sending information to the CCBS. CRU lines
in this case are thicker than in the previous model, since more
information is sent in the first communication. This data is
not sent later, as in [1], unless the information is asked to be
submitted again by the CCBS
The results show that in [20], in terms of energy reduction,
the modifications provide the advantage of eliminating CCBS
broadcasting transmission in all available channels, as
explained in the previous section. This means a reduction per
unit of time of (number of available channels) x (broadcasting
transmission time) x (power used for beacon transmission).
The reduction might be also seen when CRUs are
communicating or requesting communications. As some
CRUs might be using or requesting channels, the energy
decrease is not as straightforward as in the admission process.
This reduction depends not only on the usage of the network,
but on the numbers of requests at a specific moment.
An important measure for a CRN is how much information
in terms of bits is lost due to interference to PU and how
much CRUs interferes PUs. Using the same parameters, n =
128, m = 256, td = 500, a simulation is performed. In Fig. 10,
the information lost for the new model due to PU and CRU
interference is shown.
Fig. 9. Power used in the new model in t = 481, when CCBS in [3] would send
broadcast transmission.
Fig. 8. Power used in the model presented in [3] in t = 481, when CCBS sends
broadcast transmission.
Fig. 7. Frequency slot utilization by both PU and CRUs (in time)

269
International Journal on Advances in Telecommunications, vol 3 no 3 & 4, year 2010, http://www.iariajournals.org/telecommunications/
2010, © Copyright by authors, Published under agreement with IARIA - www.iaria.org
The results show that transmission errors decrease when
the portion of the time that is used for control increases;
however, the data that could be transmitted in the same
amount of time also decreases. Effective transmission errors,
which we define as Eff. Trans. Errors = Transmission
Errors/Data Transmitted, might provide then a better
guidance for choosing a Control/(Control+Data) rate for the
CRN. Fig. 11 shows the effective transmission errors per
CRU number.
Results are very similar for different control time / control
plus data time ratios. This is expected from the construction
of the algorithm. Errors due to channel unavailability, defined
as availability errors, in average, are shown in Fig. 12.
Results from Fig. 12 show that the availability errors are
quite random; however, when the number of repetitions
increases, we might conclude these errors are dependent on
the CRU Number since more users might be trying to use the
same number of channels. Combining these results with the
ones from Fig. 11, and since the idea is to transmit as much
data and less control information as possible, we conclude
that it is possible to construct a CRN using a CPC with a low
Control/(Control+Data) ratio.
IV. DISCUSSION
The results indicate that a basic CR-MAC protocol can be
implemented through CPC channels. Using this premise, a
CRN composed by total heterogeneous wireless frequency
devices could be developed. A comparison with a common
control channel based CR-MAC, for future work, will permit
to infer if better results could be obtained combining a
common control channel approach with the CPC approach.
The expected results are that controlling a CRN using a
CPC, while not significant, still affect the performance of the
PU compared to a CRN controlled by a common control
channel, while allowing the presence of heterogeneous
frequency CRU. Lowering the transmission and availability
errors is also a must in future proposals. The results will be
compared with the obtained in other CPC proposals such as
in [16] and [18].
The results also indicate that a reduction in energy
transmission due to signalization can be achieved by using
the basic CRU sensing properties. Since the CRU can only
detect values above a specific threshold for a determined
period of time, the CRU might detect PU transmission due to
its continuity, and CRU transmission due to its periodicity.
Using that property, broadcasting transmissions, which are
the ones that contribute to energy waste are reduced. Another
advantage of using this property is that the CCBS is already
aware of the available channels of each CRU. This is because
in the admission process, each CRU has already indicated its
characteristics. Considering that the CCBS has this
knowledge, direct channel assignation can be performed, so
broadcast transmission is also reduced.
On the other hand, broadcasting signaling would still be
needed in some cases. The minimum number of channels to
communicate with all CRUs in the CRN can be found
according to the characteristics of the CRU, and the access
control would be performed through those channels. Further
works will be developed in this area to find the trade-offs for
applying this combined approach while still guaranteeing
effective heterogeneous communication.
ACKNOWLEDGMENT
The authors would like to thank Enrique Rodríguez-Colina
for all his collaboration in the description of the model used
in this paper. Part of this work was supported by the
Department of Universities, Research and Information
Society (DURSI) of the Government of Catalonia, European
Social Funds (SGR-1202); by a FI Grant from the
Government of Catalonia, in accordance with the Resolution
IUE/2681/2008, and also by the Spanish Government
(TRION MICINN TEC2009 - 10724)
Fig. 11. Effective Transmission Errors
Fig. 10. Transmission Errors
Fig. 12. Availability Errors

270
International Journal on Advances in Telecommunications, vol 3 no 3 & 4, year 2010, http://www.iariajournals.org/telecommunications/
2010, © Copyright by authors, Published under agreement with IARIA - www.iaria.org
REFERENCES
[1] N. Bolívar, J. L. Marzo and E. Rodríguez-Colina, “Distributed Control
using Cognitive Pilot Channels in a Centralized Cognitive Radio
Network,” in the Sixth Advanced International Conference in
Telecommunications, pp. 30-34, May 2010, ISBN: 978-0-7695-4021-4.
[2] Overview of SCC41 and the 1900.x Working Groups. IEEE.
http://grouper.ieee.org/groups/scc41/. Retrieved 2011-01-18.
[3] M. Muck, S. Buljpre, P. Martigne, A. Kousaridas, E. Patouni, M.
Stamatelatos, K. Tsagkaris. J.Yang, O. Holland, “IEEE P1900.B:
Coexistence Support for Reconfigurable, Heterogeneous Air Interfaces,” in
IEEE Dyspan 2007, pp. 381-389, April 2007.
[4] J. Mitola III and G. Q Maguire, Jr., “Cognitive Radio: Making Software
Radios More Personal,” IEEE Personal Communications (Wireless
Communications), vol.6, no. 4, pp. 13-18, August 1999.
[5] I. F. Akyildiz, W. Y. Lee, M. C. Buran, and S. Mohanty, “A survey on
spectrum management in cognitive radio networks,” IEEE
Communications Magazine, vol. 46, no. 4, pp. 40-48, April 2008.
[6] IEEE 802 LAN/MAN Standards Committee 802.22 WG on WRANs
(Wireless Regional Area Networks). IEEE. http://www.ieee802.org/22/.
Retrieved 2011-01-18.
[7] F. Wang, M. Krunz, and S. Cui, “Spectrum Sharing in Cognitive Radio
Networks,” in IEEE 27th Conference on Computer Communications,
INFOCOM 2008, pp. 36-40, April 2008.
[8] H. Wang, H. Qin, and L. Zhu, “A Survey on MAC Protocols for
Opportunistic Spectrum Access in Cognitive Radio Networks,” in IEEE
International Conference on Computer Science and Software Engeneering
2008, pp. 214-218, December 2008.
[9] S. - Y. Lien, C. - C. Tseng, and K. - C. Chen, “Carrier Sensing based
Multiple Access Protocols for Cognitive Radio Networks,” in IEEE
Conference on Communications 2008, ICC 2008, pp. 3208-3214, May
2008.
[10] A. Yau, P. Komisarczuk, and P. D. Teal, “On Multi-Channel MAC
Protocols in Cognitive Radio Networks,” in Australasian
Telecommunication Networks and Applications Conference 2008,
ATNAC 2008, pp. 300-305, December 2008.
[11] A. P. Hulbert, “Spectrum Sharing Through Beacons,” in IEEE 16th
International Symposium on Personal, Indoor and Mobile Radio
Communications, pp. 989-993, September 2005.
[12] S. Mangold, A. Jarosch, and C. Monney, “Operator Assisted Cognitive
Radio and Dynamic Spectrum Assignment with Dual Beacons – Detailed
Evaluation,” in First International Conference on Communication System
Software and Middleware 2006, pp. 1-6, August 2006.
[13] Z. Quan, S. Cui, H. V. Poor, and A. H. Sayed, “Collaborative Wideband
Sensing for Cognitive Radios,” IEEE Signal Processing Magazine, vol. 25,
no. 6, pp. 60-73, November 2008.
[14] A. Ghasemi, and E. S. Sousa, “Interference Aggregation in Spectrum-
Sensing Cognitive Wireless Networks,” IEEE Journal of Selected Topics
in Signal Processing, vol 2, no. 1, pp. 41-56, February 2008.
[15] End to end efficiency. E3. https://ict-
e3.eu/project/technical_highlights/5_enablers/enablers_2009_10.html.
Retrieved 2011-01-18.
[16] M. Filo, A. Hossain, A. R. Biswas, R. Piesiewicz, “Cognitive Pilot
Channel: Enabler for Radio Systems Coexistence,” Second International
Workshop on Cognitive Radio and Advanced Spectrum Management
2009, CogART 2009, pp. 17-23, May 2009.
[17] End to End Reconfigurability II (E2R II) White Paper, “The E
2R II
Flexible Spectrum Management (FSM) Framework and Cognitive Pilot
Channel (CPC) Concept – Technical and Business Analysis and
Recommendations,” pp. 1-52, November 2007.
[18] O. Sallent, J. Pérez-Romero, R. Agustí, P. Cordier, “Cognitive Pilot
Channel Enabling Spectrum Awareness,” IEEE Conference on
Communications Workshops 2009, ICC Workshops 2009, pp. 1-6, June
2009.
[19] J. Palicot, M. Katayama, A. Nafkna, G.Ravera, M.Massoth, J. Perez-
Romero, “Challenges in Advanced Communications and Services,” Panel
AICT 2010, IARIA Panels, May 2010.
[20] N. Bolívar and J. L. Marzo, “Energy Reduction for Centralized Cognitive
Radio Networks with Distributed Cognitive Pilot Channels,” Accepted at
2010 Latincom, September 2010.

271
International Journal on Advances in Telecommunications, vol 3 no 3 & 4, year 2010, http://www.iariajournals.org/telecommunications/
2010, © Copyright by authors, Published under agreement with IARIA - www.iaria.org
An Improved Multi-band Speech Enhancement Method for Colored Noise Estimation and Reduction
Radu Mihnea Udrea, Dragos Nicolae Vizireanu, Claudia Cristina Oprea, Ionut Pirnog Telecommunications Department
“Politehnica” University of Bucharest 313, Splaiul Independentei, Sector 6, 060042
Bucharest, Romania [email protected], [email protected], [email protected], [email protected]
Abstract—There are many situations where speech is affected by different kind of acoustic noise. We propose an improved spectral subtraction method for the reduction of colored acoustic noise added to the speech. Our implementation uses a multi-band spectral over subtraction method to reduce the colored noise. We use a non-linear Bark scale distribution to estimate the over-subtraction factor. The noise power spectral density is estimated, using a time-recursive algorithm, by tracking the minimum of the noisy speech spectrum in each frequency band. Simulations show a better quality in terms of Itakura Saito distance and perceptual evaluation of quality for the enhanced speech. Using the proposed speech enhancement method, a very good speech quality with less musical noise and with minimal speech distortion is obtained.
Keywords-speech enhancement; spectral subtraction; noise estimation; critical band.
I. INTRODUCTION The speech signal is often accompanied by the
background noise of the environment. There are many negative effects when processing the degraded speech for some applications like: voice command systems, voice recognition, speaker authentication, hands-free systems.
The main objective of speech enhancement is to improve the perceptual aspects of speech such as overall quality or intelligibility. Enhancement techniques can be classified as single channel and dual channel or multi channel enhancement techniques. Single channel enhancement techniques apply to situations in which only one acquisition channel is available. In multi channel enhancement techniques, a reference signal for the noise is available and hence adaptive noise cancellation technique can be applied.
The spectral subtraction method is a well-known single channel noise reduction technique. The basic spectral subtraction technique proposed by Boll [2] apply subtraction of the noise spectrum estimate over the speech spectrum. The conventional power spectral subtraction method substantially reduces the noise levels in the noisy speech. However, it also introduces an annoying distortion in the speech signal called musical noise. Due to the inaccuracies in the short-time noise spectrum estimate, large spectral variations exist in the enhanced spectrum causing these distortions.
Berouti [3] proposed an important variation of spectral subtraction for reduction of residual musical noise. The proposed method subtracts an overestimate of the noise power spectrum from the speech power spectrum. This operation minimizes the presence of residual noise by decreasing the spectral excursions in the enhanced spectrum. The over-subtraction factor provides a degree of control over the noise removal process between periods of noise update.
A nonlinear approach to the subtraction procedure was proposed in recent studies [4], [5], [6], [7], which takes into account the variation of the signal-to-noise ratio across the entire speech spectrum. The real-world noise spectrum is not flat, therefore the noise signal does not affect the speech signal uniformly over the whole spectrum. Hence, it becomes imperative to estimate a suitable factor that will subtract just the necessary amount of the noise spectrum from each frequency sub-band, to prevent destructive subtraction of the speech while removing most of the residual noise.
Noise spectrum estimation is also a challenging situation. Several noise-estimation algorithms have been proposed for speech enhancement applications. For rather stationary noise sources, the noise power spectral density (PSD) can be estimated by tracking the minimum of the noisy speech spectrum in each frequency band [8], [9]. However, in case of non-stationary noise sources, more advanced methods can be used [10].
In this paper we used a modified spectral over-subtraction approach that allows better and more suppression of the noise. We propose to use the noise PSD estimation to compute the a posteriori SNR in each frequency subband. Then we calculate the corresponding over-subtraction factor and we apply the nonlinear multi-band spectral subtraction that reduces colored noise, using a different over-subtraction factor in each frequency band.
This paper is organized as follows: a overview of the spectral subtraction methods is presented in Section II. Section III presents the human auditory system and the critical band and Bark scale model of speech analysis. Section IV describes the time-recursive averaging type of algorithms in which the noise spectrum is estimated in order to be used by the spectral subtraction method. Section V presents the improved multi-band spectral over-subtraction

272
International Journal on Advances in Telecommunications, vol 3 no 3 & 4, year 2010, http://www.iariajournals.org/telecommunications/
2010, © Copyright by authors, Published under agreement with IARIA - www.iaria.org
method proposed to reduce the colored noise. Section VI shows implementation details and experimental results.
II. SPECTRAL SUBTRACTION METHODS
A. Basic Spectral Subtraction Method The spectral subtraction method proposed by Boll [2]
consists in obtaining an estimate of the noise-free signal spectrum by subtracting an estimate of the noise spectrum from the input noisy signal spectrum. The background noise is considered acoustically added to the speech. It is assumed that the background noise remains locally stationary to the degree that its spectral magnitude expected value prior to speech activity equals its expected value during speech activity.
The noise is assumed to be uncorrelated and additive to the speech signal. An estimate of the noise signal is measured during silence or non-speech activity in the signal. We assume that the speech signal ( )s n has been degraded by the additive noise signal ( )d n ,
( ) ( ) ( )y n s n d n= + . (1)
Taking the Discrete Fourier Transform (DFT) of ( )x n gives
( ) ( ) ( )Y k S k D k= + . (2)
The estimate of the noise spectrum is obtained during speech pauses (SP) when
( ) ( )SPy n d n= . (3)
Noise spectrum can be estimated as the average value of ( )SPY k over the speech pauses frames
1
0
1ˆ ( ) ( )i
M
SPi
D k Y kM
−
=
= ∑ , (4)
where M is the number of consecutive frames of SP. The estimate of the clear speech spectrum magnitude can
be obtained as
ˆ ˆ( ) ( ) ( )S k Y k D k= − . (5)
The phase ( )Y kθ of the input signal is used for reconstruction of the estimated signal spectrum based on the fact that for human perception the short time spectral magnitude is more important than the phase for intelligibility and quality. This conclusion was made by Lim and Wang in their work [11], when using the actual phase rather than the degraded speech phase does not improve the quality of the enhanced speech.
Therefore,
j ( )ˆ ˆ( ) ( ) e Y kS k S k θ= . (6)
The time reconstructed speech signal is obtained taken the Inverse Discrete Fourier Transform of ˆ( )S k .
Since the noise spectrum cannot be directly obtained, there are some significant variations between the estimated noise spectrum and the actual noise content present in the instantaneous speech spectrum. This residual spectral content manifest themselves in the reconstructed time signal as varying tonal sounds resulting in a musical disturbance of an unnatural quality. This sounds like a musical noise and is the main drawback of the spectral subtraction method.
B. Generalized Spectral Subtraction A generalized form of the basic spectral subtraction was
proposed by Berouti [3]. The estimate of the enhanced speech is given by
( )1/ˆ ˆ( ) ( ) ( )
pppS k Y k D kα= − , (7)
where p is the exponent of the spectrum and α is a multiplication factor used for over-subtraction of noise spectrum estimate. For 1α = and 2p = we have the Power Spectral Subtraction method.
Power spectral relation after taking DFT from (1) gives
2 2 2
* *
| ( ) | | ( ) | | ( ) |( ) ( ) ( ) ( )
Y k S k D kS k D k S k D k
= + +
+ + (8)
where * ( )S k and * ( )D k are complex conjugates of ( )S k and ( )D k respectively.
Because in our system only the power of the input noisy signal 2| ( ) |Y k can be evaluated, the rest of terms are approximated by their average during non-speech activity period.
If ( )d n is uncorrelated with ( )s n , then
* *{ ( ) ( )} 0 and { ( ) ( )} 0E S k D k E S k D k= = . (9)
The short time power spectrum of the noisy speech can be approximated by
2 2 2( ) ( ) ( )Y k S k D k≈ + . (10)
The noise PSD 2ˆ ( )d kσ is estimated as the average value of the noise power spectrum taken during non-speech activity periods.

273
International Journal on Advances in Telecommunications, vol 3 no 3 & 4, year 2010, http://www.iariajournals.org/telecommunications/
2010, © Copyright by authors, Published under agreement with IARIA - www.iaria.org
{ }22ˆ ( ) ( )d k E D kσ . (11)
A significant improvement to minimize the presence of residual noise and musical noise in the processed speech was proposed by Berouti et al. [3]. The average noise power spectrum is multiplied by the over-subtraction factor α and subtracted from the noisy speech spectrum in order to minimize the residual and musical noise:
2 2 2ˆ ˆ( ) ( ) ( )dS k Y k kα σ= − ⋅ , 1α ≥ . (12)
This method improves the noise suppression better than basic spectral subtraction technique and also eliminates the musical noise. Besides it adapts to wide range of signal to noise ratios.
After subtracting an overestimate of the noise power spectrum the resulting estimated speech spectrum is down-limited at a minimum β level (spectral floor):
2 2 22
2
ˆ ˆ ˆ( ) , if ( ) ( )ˆ( )ˆ ( ), otherwise
d
d
S k S k kS k
k
β σ
β σ
> ⋅= ⋅
, (13)
where the spectral floor parameter was set to 0.001β = . These modifications lead to minimizing the perception of
the narrow spectral peaks by decreasing the spectral excursions and thus lower the musical noise perception.
To reduce the speech distortion caused by large values of α, its value is adapted from frame to frame. The basic idea is to take into account that the subtraction process must depend on the a posteriori SNR of the frame, in order to apply less subtraction with high a posteriori SNR and vice versa.
The a posteriori SNR is calculated for every frame with:
12
010 1
2
0
( )10log
ˆ ( )
N
kN
dk
Y k
kγ
σ
−
=−
=
=∑
∑, (14)
where N is the number of frequency bins of DFT. The over-subtraction factor α can be calculated [8] as:
0
1 20dB3 6dB 20dB20
4.9 6dB
γ
α α γ γ
γ
≥= − − ≤ <
< −
, (15)
where 0 4α = is the desired value of α at 0dBγ = . The over-subtraction factor gives a degree of adaptation
from frame to frame, but it may reduce speech spectral information in the same frame for frequency domains where noise PSD is lower, if noise spectrum is not flat.
α
6
5
4
3
2
1
–20 –10 0 10 20 30
γ [dB]
Figure 1. The over-subtraction factor α dependence over the a posteriori
SNR γ.
C. Multi-Band Spectral Subtraction In real environments, the noise spectrum is not uniform
for all frequencies. For example, in the case of engine noise, most of the noise energy is concentrated in the low-frequency area. To take into account the fact that colored noise affects the speech spectrum differently at different frequencies, a multi-band linear frequency spacing approach to spectral over-subtraction was proposed in [5].
The speech spectrum is divided into a number of non-overlapping bands, and spectral subtraction is performed independently in each band. The estimate of the clean speech spectrum in the i-th band is obtained by:
2 2 2ˆ ˆ( ) ( ) ( )i i i dS k Y k kα σ= − ⋅ , 1i ikν ν +< < , (16)
where k is the frequency bin, iν and 1iν + are the beginning and ending frequency bins of the i-th frequency band and iα is the over-subtraction factor of the i-th band. The over-subtraction factor iα is a function of the a posteriori SNR
iγ of the i-th frequency band.
1
1
2
102
( )10log
ˆ ( )
i
i
i
i
v
ik v
i v
dk v
Y k
kγ
σ
+
+
=
=
=∑
∑. (17)
The over-subtraction factor iα may be calculated for each frequency band as:
1 20dB34 6dB 20dB20
4.9 6dB
i
i i i
i
γ
α γ γ
γ
≥= − − ≤ <
< −
, (18)
The negative values of the estimated spectrum were floored using (13).

274
International Journal on Advances in Telecommunications, vol 3 no 3 & 4, year 2010, http://www.iariajournals.org/telecommunications/
2010, © Copyright by authors, Published under agreement with IARIA - www.iaria.org
Figure 2. Spectrogram of speech affected by colored noise.
Figure 3. Over-subtraction factor α computed for four linearly-spaced
frequency subbands.
In Fig. 2 it is plotted the spectrogram of speech sentence “The sky this morning was clear and light blue” affected by colored noise. Fig. 3 shows the over-subtraction factor computed after dividing the frequency domain into four linearly-spaced frequency subbands. It can be seen that the over-subtraction factor takes different values depending on the SNR in each frequency subband, allowing a better distribution of noise reduction over the entire frequency domain.
Because the human ear sensibility depends nonlinearly on the frequency, a nonlinear frequency spacing approach for
multi-band over-subtraction factor estimation is proposed in this paper. The method is presented in Section V.
III. CRITICAL BANDS AND BARK SCALE The human auditory system is a highly complicated
mechanism. During the last decades, a considerable progress has been made within the research of the human hearing. The field of psychoacoustics examines directly the relationships between acoustic stimuli and the associated sensations. The concept of hearing area refers to the ranges of frequency and sound pressure values within which the human ear generally perceives sound.
The absolute threshold of hearing, also known as the threshold in quiet, signifies the minimum sound pressure level of a pure tone that is enough for the tone to be audible in the absence of any interfering voices, i.e., in quiet.
A prominent contributor to the idea of auditory filters was Fletcher who measured the detection threshold of a sinusoidal signal in the presence of a bandpass noise masker. In his experiment, the noise power density was held constant and its centre frequency was always the same as the signal frequency. As the noise bandwidth was increased, the threshold of the signal also increased at first, but after a certain noise bandwidth had been achieved, the signal threshold levelled off.
Basically, the power spectrum model suggests that the peripheral auditory system contains a bank of linear overlapping bandpass filters called auditory filters. It is assumed that when trying to detect a signal in a noisy environment, only one filter whose centre frequency is close to the frequency of the signal is being used. According to the model, this auditory filter blocks out most of the noise and only the part passing through the filter affects the masking of the signal. In reality, the perception of complex signals, e.g. speech, depends on the outputs of several auditory filters and not just one.
Figure 4. Shape of the auditory filter [12].

275
International Journal on Advances in Telecommunications, vol 3 no 3 & 4, year 2010, http://www.iariajournals.org/telecommunications/
2010, © Copyright by authors, Published under agreement with IARIA - www.iaria.org
0 3 6 9 12 15 18 21 24Bark
critical-band rate
0 0.25 0.5 1 2 4 8 16kHz 0.125
frequency Figure 5. Frequency in Hertz and the critical-band rate scale in Bark [13].
The assumption of linear auditory filters is also incorrect since, strictly speaking, the shape of the filter changes slightly with the input level. As the level of the stimulus is increased, the slope on the low-frequency side of the auditory filter becomes less sharp while the high-frequency skirt becomes steeper. This is illustrated in Fig.4.
In his band-widening experiment, Fletcher introduced the concept of critical bandwidth (CB), denoting the noise bandwidth limit at which the detection threshold of the signal (tone) ceased to increase. For simplicity, he thought that the auditory filter could be approximated as having a rectangular shape and a passband width equal to CB. Fletcher suggested that, with this rectangular model, CB could be evaluated by measuring the threshold of a sinusoidal signal in broadband white noise [12]. In this method, the power of the tone and the power spectral density of the noise masker are first measured. The noise power within the same critical band with the signal is then equal to the product of the measured power spectral density and the CB of the band in question.
The critical bandwidth can also be explained based on the physical structure of the inner ear. Each point on the basilar membrane (BM) responds only to a certain range of frequencies, which leads to the idea that these different points correspond to auditory filters with different centre frequencies [12].
A commonly used scale for specifying the critical bands is the Bark scale which divides the audible frequency range of 16 kHz into 24 bands. Fig. 5 illustrates the relationship between the frequency in Hertz and the critical-band rate in Bark [13].
An approximate analytical expression to describe the conversion from linear frequency, f, into the critical band number z (in Bark) is [13]:
( ) ( )2( ) 13arctan 0.76 3.5arctan / 7.5z f f f= + , (19)
and the critical bandwidth (in Hz) for a given centre frequency can be evaluated by
( ) ( )0.69225 75 1 1.4BW f f= + + . (20)
In the above equation f is given in kHz. By the definition of the Bark scale, each critical band has a width of one Bark.
Table 1 shows the correspondence between Bark scale and the frequency limits for the corresponding CB [13].
Table 1. CRITICAL BANDWIDTH AS A FUNCTION OF CENTER FREQUENCY AND CRITICAL BAND [13].
CB rate Center frequency Frequency CB bandwidth
Bark Hz Hz Hz
0 50 20 80 1 150 100 100
2 250 200 100 3 350 300 100
4 450 400 110 5 570 510 120 6 700 630 140
7 840 770 150 8 1000 920 160
9 1170 1080 190 10 1370 1270 210 11 1600 1480 240
12 1850 1720 280 13 2150 2000 320
14 2500 2320 380 15 2900 2700 450
16 3400 3150 550 17 4000 3700 700 18 4800 4400 900
19 5800 5300 1100 20 7000 6400 1300
21 8500 7700 1800 22 10500 9500 2500 23 13500 12000 3500
24 15500
IV. NOISE ESTIMATION The noise signal typically has a nonuniform effect on the
spectrum of the speech. Each spectral component will typically have a different effective SNR. Consequently, we can estimate and update individual frequency bands of the noise spectrum whenever the effective SNR at a particular frequency band is extremely low. This observation led to the recursive-averaging type of algorithms [8],[9] in which the noise spectrum is estimated as a weighted average of past noise estimates and the present noisy speech spectrum.
The time-recursive algorithms have the following form:
( ) ( ) ( ) ( )( ) ( ) 22 2ˆ ˆ, , 1, 1 , ,d dk k k k Y kσ λ δ λ σ λ δ λ λ= − + − , (21)
where ( ) 2,Y kλ is the speech magnitude spectrum squared
(periodogram), ( )2ˆ ,d kσ λ denotes the estimate of the noise power spectral density (PSD) at frame λ and frequency k

276
International Journal on Advances in Telecommunications, vol 3 no 3 & 4, year 2010, http://www.iariajournals.org/telecommunications/
2010, © Copyright by authors, Published under agreement with IARIA - www.iaria.org
and ( ),kδ λ is the smoothing factor, which is time and frequency dependent.
In [9], the smoothing factor ( ),kδ λ is chosen to be a sigmoid function of the a posteriori SNR ( )kγ λ :
( ) ( )( )1.5
1,1 k
ke τ γ λ
δ λ− −
=+
, (22)
where the τ is a parameter with values in the range 15 30τ≤ ≤ , and ( )kγ λ is an approximation of the a posteriori SNR given by:
( )( )
( )
2
102
1
,1 ˆ ,
10
k
dm
Y k
m k
λγ λ
σ λ=
=−∑
. (23)
Also, a different function was proposed for computing ( ),kδ λ :
( ) 1, 1 min 1,( )k
kδ λγ λ
= −
, (24)
used to ensure that ( , )kδ λ is in the range of [0,1] . The recursive algorithm given in (21) and (24) can be
explained as follows: • If speech is present, the a posteriori estimate ( )kγ λ will
be large and therefore ( , ) 1kδ λ ≈ . Consequently, we will have ( ) ( )2 2ˆ ˆ, 1,d dk kσ λ σ λ≡ − according to (21). The noise update will cease and the noise estimate will remain the same as the previous frame’s estimate.
• If speech is absent, the a posteriori estimate ( )kγ λ will be small and therefore ( , ) 0kδ λ ≈ . As a result,
( ) 22ˆ , ( , )d k Y kσ λ λ≡ and the noise estimate will follow the PSD of the noisy spectrum in the absence of speech.
The main advantage of using the time smoothing factor
( , )kδ λ given by (22) or (24), as opposed to using a fixed value for ( , )kδ λ , is that these factors are time and frequency dependent. This means that the noise PSD will be adapted differently and at different rates in the various frequency bins, depending on the estimate of the a posteriori SNR ( )kγ λ in that bin. This is particularly suited in situations in which the additive noise is colored.
A different and simpler approach [14] to recursive averaging noise estimation is to choose a fixed smoothing factor and to control the update of the noise PSD based on the comparison of the estimated a posteriori SNR to a threshold.
Figure 6. Estimated noise PSD (dashed line) for a frequency bin 30k =
compared with real noise spectral distribution (continuous line).
( ) ( ) ( ) ( )( )
222
2
ˆ 1, 1 , , if ( )ˆ ,ˆ 1, , otherwise
v kv
v
k Y kk
k
δ σ λ δ λ γ λ εσ λ
σ λ
⋅ − + − <= −
.(25)
If the a posteriori SNR ( )kγ λ is found to be smaller than a specified threshold ε, suggesting speech absence, then the noise spectrum is updated, else, if the a posteriori SNR is found to be larger than a specified threshold, suggesting speech presence, then the noise spectrum update is stopped.
The threshold ε can have significant effect on the noise spectrum estimation. If ε is chosen too small, then the noise spectrum is not updated often enough and is underestimated. Else, if ε is chosen too large, then the noise spectrum is overestimated. Simulations in [14] showed that choosing
2.5ε = gave a good compromise. The estimated power of the noise is computed from the
noise PSD of each frame:
( ) ( )1
2 2
0
1ˆ ˆ ,N
v vk
kN
σ λ σ λ−
−
= ∑ , (26)
where N is the number of frequency bins. In Fig. 6 there are represented the estimated noise PSD
(with red-dashed line) for a frequency bin 30k = compared with real noise spectral distribution (represented with continuous line) at the same frequency bin.
V. THE PROPOSED OVER-SUBTRACTION METHOD The main drawback of the spectral subtraction method is
the residual noise resulted as the difference between the estimated noise spectrum and the actual noise content present in the instantaneous speech spectrum. This residual spectral content manifest themselves in the reconstructed time signal as varying tonal sounds resulting in a musical like noise.

277
International Journal on Advances in Telecommunications, vol 3 no 3 & 4, year 2010, http://www.iariajournals.org/telecommunications/
2010, © Copyright by authors, Published under agreement with IARIA - www.iaria.org
This residual noise can be reduced by a good estimation of the noise PSD and by using the multi-band spectral over-subtraction. Because the human ear sensibility depends nonlinearly on the frequency, a nonlinear frequency spacing approach for multi-band over-subtraction factor estimation is proposed in this paper.
The speech spectrum is divided into N non-overlapping bands over the Bark scale of frequency distribution, and spectral subtraction is performed independently in each band. Also, for the noise spectrum estimate, we used the noise PSD estimated ( )2ˆ ,d kσ λ at frame λ and frequency k using (21) or (25).
The estimate of the clean speech spectrum in the i-th band is obtained by:
2 2 2ˆ ˆ( ) ( ) ( , )i i i dS k Y k kα σ λ= − ⋅ , 1i ikν ν +< < , (27)
where iν and 1iν + are the beginning and ending frequency bins of the i-th frequency critical band according to Table 1, and iα is the over-subtraction factor of the i-th critical band.
The over-subtraction factor iα is a function of the a posteriori SNR iγ of the i-th frequency band.
In this paper we propose to use the time-recursive estimation of the a posteriori SNR ( )iγ λ at frame λ for the i-th frequency band:
1
1
2
102
( , )( ) 10log
ˆ ( , )
i
i
i
i
w
k wi w
dk w
Y k
k
λγ λ
σ λ
+
+
=
=
=∑
∑. (28)
The over-subtraction factor iα is calculated for each frequency band as
1 ( ) 20dB34 ( ) 6dB ( ) 20dB204.9 ( ) 6dB
i
i i i
i
γ λ
α γ λ γ λ
γ λ
≥= − − ≤ <
< −
. (29)
In the frequency domain of 0-4 kHz, specific for the speech signal, there are 16 critical bands. Experiments showed that there is computational inefficient to separate the spectrum into such a large number of intervals. An equivalent performance is obtained if there are grouped together 3 or 4 critical bands, therefore the spectrum analysis to be performed in a total number of 4 or 5 frequency domains, keeping the nonlinearity frequency spacing given by the human auditory system.
Number of bands
Figure 7. The Itakura-Saito (IS) distance for a variable number of
frequency band analysis
VI. IMPLEMENTATION AND EXPERIMENTAL RESULTS The speech signals, sampled at a frequency of 8 kHz, are
degraded by the various noise types with segmental SNR’s of -5 and 0 dB. Different types of noise taken from the Noisex92 database [15] are added to the speech signal. The noise is chosen with varying spectral distribution simulating colored noise (car engine, factory noise, babble noise).
We used both linear and nonlinear frequency spacing for multi-band spectral over-subtraction, in which the over-subtraction factor iα is computed as in equation (29) for each frequency band. To determine the number of bands that gives an optimal speech quality, we varied the number of bands from 1 to 8 and examined speech enhancement using both types of frequency spacing.
Objective and subjective quality evaluation methods were applied to establish the performance of the algorithms presented in this study.
The Itakura-Saito (IS) distance method is used as an objective measure to evaluate the performance of the algorithm. The IS measure is based on the similarity or difference between the all-pole model of the clean signal and the corrupted or processed speech signal.
In Fig. 7, the mean IS values are plotted as a function of the number of bands. These values are obtained using the proposed time-recursive estimation for the a posteriori SNR used in the over-subtraction factor and a multi-band linear scaled frequency at 0, 5, 10 and 15 dB SNR An improvement in terms of the IS distance can be seen when the number of bands increases from one to six; afterwards, the improvement in quality is no longer perceivable.
Also, we used the ITU-T Recommendation P.862 (PESQ) [16] to obtain a perceptual evaluation of the enhanced speech quality. The Mean Opinion Score (MOS) obtained in the evaluation process is between 0 and 5 where 0 represents a very annoying distortion of the perceived signal and 5 represents imperceptible quality degradation.

278
International Journal on Advances in Telecommunications, vol 3 no 3 & 4, year 2010, http://www.iariajournals.org/telecommunications/
2010, © Copyright by authors, Published under agreement with IARIA - www.iaria.org
Table 2. PESQ MOS EVALUATION FOR THE ENHANCED SPEECH QUALITY In
put S
NR
Spec
tral
Su
btra
ctio
n
Standard multi-band spectral subtraction
Time recursive estimation for multi-band spectral
subtraction
No. of bands 2 3 4 5 6 2 3 4 5 6
0dB 1.75 1.79 1.82 1.85 1.84 1.84 1.88 1.87 2.00 2.03 2.01
5dB 1.85 1.90 1.99 1.97 1.98 1.97 1.99 2.00 2.07 2.05 2.03
10dB 2.26 2.41 2.44 2.46 2.45 2.40 2.49 2.49 2.55 2.52 2.50
15dB 2.82 2.86 2.88 2.90 2.89 2.84 2.92 2.93 2.95 2.93 2.92 In Table 2 the simulations show that for a single band
analysis the results are similar with the standard spectral over-subtraction method. The MOS is increasing when using more than one band, having a maximum when there are four bands, for both methods. Increasing the number of bands more than four bands does not give an increasing of quality since the resolution in frequency analysis is getting worse. A better quality can be noticed for the time recursive estimation of the noise PSD.
Subjective listening tests indicate that, using the multi-band approach and the time-recursive estimation, a very good speech quality with less musical noise and with minimal speech distortion is obtained.
Fig. 8 and Fig. 9 show the spectrograms for speech of speech sentence “The sky this morning was clear and light blue” affected by train noise and car engine noise, at a SNR of 10dB, and the spectrograms of the enhanced speech obtained with standard spectral subtraction, spectral over-subtraction using single-band subtraction factor, multi-band spectral over-subtraction using four linearly-spaced frequency bands, multi-band spectral over-subtraction using four non-linear Bark spaced bands and multi-band spectral subtraction using the time-recursive estimation of the noise PSD.
CONCLUSIONS This paper presents an improved spectral subtraction
method that takes into account the non-uniform effect of colored noise on the speech spectrum. A nonlinear frequency spacing approach for multi-band over-subtraction factor estimation is based on the fact that human ear sensibility varies nonlinear in frequency spectrum. This gives a better perceived quality to the enhanced speech.
Also, time-recursive estimation of the noise PSD is used to compute the multi-band over-subtraction factor in the nonlinear frequency spacing approach. The proposed method reduces the residual musical tones that appear in the case of conventional power spectral subtraction. Simulations with different types of noise show a better quality for the enhanced speech when using time recursive multi-band spectral subtraction.
ACKNOWLEDGMENT The work has been funded by the Sectoral Operational
Programme Human Resources Development 2007-2013 of the Romanian Ministry of Labour, Family and Social Protection through the Financial Agreement POSDRU/89/1.5/S/62557.
REFERENCES [1] R. M. Udrea, D. N. Vizireanu, C. C. Oprea, and I. Pirnog, “A time-
recursive adaptive algorithm for colored noise reduction in speech enhancement,” Sixth Advanced International Conference on Telecommunications AICT 2010, pp.187-190, Barcelona, May 2010.
[2] S.F. Boll, “Suppression of acoustic noise in speech using spectral subtraction,” IEEE Trans. Acoustic, Speech and Signal Processing, vol. 27, Apr. 1979, pp. 113-120.
[3] M. Berouti, R. Schwartz, and J. Makhoul, “Enhancement of speech corrupted by acoustic noise,” Proc. IEEE Int. Conf. Acoust., Speech and Signal Proc., Apr. 1979, pp. 208-211.
[4] C. T. Lin, “Single-channel speech enhancement in variable noise-level environment,” Systems, Man and Cybernetics, Part A, IEEE Trans. , Volume: 33 , Issue: 1, Jan. 2003, pp 137–143.
[5] S. Kamath and P. Loizou, “A multi-band spectral subtraction method for enhancing speech corrupted by colored noise,“ Proc. of ICASSP-2002, Orlando, FL, May 2002.
[6] R. M. Udrea and S. Ciochină, “Speech enhancement using spectral oversubtraction and residual noise reduction,” Proc. of the Symposium “SCS 2003”, Vol II, Iaşi, Romania, July 2003, pp. 165-169.
[7] R.M. Udrea, N. Vizireanu, S. Ciochina, and S. Halunga, “Nonlinear spectral subtraction method for colored noise reduction using multi-band Bark scale,” Signal Processing, Vol. 88 Issue 5, ISSN: 0165-1684, May 2008, pp. 1299-1303.
[8] I. Cohen, “Noise spectrum estimation in adverse environments: Improved minima controlled recursive averaging,” IEEE Trans. Speech Audio Processing, vol. 11, no 5, pp. 466-475, Sept. 2003.
[9] L. Lin, W.H. Holmes, and E. Ambikairajah, “Adaptive noise estimation algorithm for speech enhancement,” Electronics Letters, vol. 39, no. 9, pp 754–755, May 2003.
[10] R. C. Hendriks, J. Jensen, and R. Heusdens, “Noise tracking using DFT domain subspace decompositions,” IEEE Trans. Audio Speech and Language Processing, vol. 16, no. 3, pp. 541–553, March 2008.
[11] D.L. Wang and J.S. Lim, “The unimportance of phase in speech enhancement,” IEEE Trans. On Acoustics, Speech, and Signal Processing, vol. 30, no.4, Aug. 1982, pp. 679-681.
[12] B. Moore, “An introduction to the psychology of hearing,” 4th ed., London, Academic press,1997.
[13] E. Zwicker and H. Fastl, “Psychoacoustics,” 1st ed., Berlin, Springer. 1990.
[14] H. G. Hirsch and C. Ehrlicher, "Noise estimation techniques for robust speech recognition," Proc. 20th IEEE Inter. Conf. Acoust. Speech Signal Process., ICASSP-95, Detroit, Michigan, pp. 153-156, 8-12 May 1995.
[15] A.P. Varga, H.J.M. Steeneken, M. Tomlinson, and D. Jones, "The NOISEX-92 Study on the Effect of Additive Noise on Automatic Speech Recognition," Tech. Rep., Speech Research Unit, Defense Research Agency, Malvern, U.K., 1992.
[16] ITU-T, Perceptual evaluation of speech quality PESQ, an objective method for end-to-end speech quality assessment of narrowband telephone networks and speech codecs, ITU-T Recommendation P.862, 2000.

279
International Journal on Advances in Telecommunications, vol 3 no 3 & 4, year 2010, http://www.iariajournals.org/telecommunications/
2010, © Copyright by authors, Published under agreement with IARIA - www.iaria.org
(a) (b)
(c) (d)
(e) (f)
Figure 8. Spectrograms of speech affected by train noise at 10dB SNR (a) and of the enhanced speech obtained with: standard spectral subtraction (b),
spectral over-subtraction using single-band subtraction factor (c), multi-band spectral over-subtraction using four linearly-spaced bands (d),
multi-band spectral over-subtraction using four non-linear Bark spaced bands (e), multi-band spectral subtraction using the time-recursive estimation of the noise PSD (f).

280
International Journal on Advances in Telecommunications, vol 3 no 3 & 4, year 2010, http://www.iariajournals.org/telecommunications/
2010, © Copyright by authors, Published under agreement with IARIA - www.iaria.org
(a) (b)
(c) (d)
(e) (f)
Figure 9. Spectrograms of speech affected by car noise at 10dB SNR (a) and of the enhanced speech obtained with: standard spectral subtraction (b),
spectral over-subtraction using single-band subtraction factor (c), multi-band spectral over-subtraction using four linearly-spaced bands (d),
multi-band spectral over-subtraction using four non-linear Bark spaced bands (e), multi-band spectral subtraction using the time-recursive estimation of the noise PSD (f).

281
International Journal on Advances in Telecommunications, vol 3 no 3 & 4, year 2010, http://www.iariajournals.org/telecommunications/
2010, © Copyright by authors, Published under agreement with IARIA - www.iaria.org
Performance Analysis of Multiuser DS-UWB system with Orthogonal andNon-orthogonal code under synchronous and Asynchronous transmission with UWB
channel models
Prof. Himanshu B. SoniProfessor
GCETV.V.Nagar, India
sony [email protected]
Prof. U. B. desaiDirector
IIT- HyderabadHyderabad, [email protected]
Prof. S. N. MerchantProfessor
IIT- BombayMumbai, India
Abstract—In this paper we have considered the downlinkmultimedia transmission with Direct Sequence-Ultra wideband(DS-UWB) [1] communication system. We have evaluatedperformance of DS-UWB system under multiuser scenario. Wehave investigated performance of the system under synchronousand asynchronous transmission. We have discussed the effectof orthogonal and non-orthogonal code selection with effect ofdifferent UWB pulse selection. Also the performance of DS-UWB with non-orthogonal code is compared with TH-PAMUWB [2]. We have considered AWGN and UWB channel modelfor simulation.
Keywords-UWB; Synchronous-Asynchronous transmission;UWB channel model.
I. I NTRODUCTION
Ultra wideband (UWB) was known as Impulse radio [3],[4] as in principle, it uses the extremely short pulses for highspeed data transmission. UWB promises to provide effectivehigh speed data transmission in wireless personal area net-works (WPAN) [5], [6]. In future WPAN networks (IEEE802.15.3a, IEEE 802.15.4a), UWB will be the candidate atphysical layer for enabling several Mbps data rate, which isquite higher than Bluetooth’s data rate.
FCC assigned unlicensed spectrum of 3.1 GHz -10.6 GHzfor UWB communication [7]. Signal with the fractionalbandwidth (Bf ) of more than 20 % at -10 dB emissionpoints is considered as a UWB signal. Where fractionalbandwidth is defined as a ratio of signal bandwidth to itscentre frequency. New industrial definition for UWB signalis the signal which occupies bandwidth of more than 500MHz in assigned frequency range, is considered as UWBsignal [7]. For multiple access in UWB literatures [3], [8]suggest method based on Time Hopping (TH) technique.This access technique can be used with Pulse PositionModulation (PPM) or Pulse Amplitude Modulation (PAM)technique. Depending upon modulation scheme TH UWBsignal is known as TH-PPM UWB [9], [10] or TH-PAMUWB [2]. Also Direct Sequence UWB (DS-UWB) approachproposed in [1] is same as TH-PAM UWB except minordifference. In all TH-UWB method single bit duration (Tb) is
divided into number of frames (Nf ) each with equal durationof (Tf ). Further each frame duration (Tf ) is divided intonumber of chips(Nc) of duration (Tc). During each chipperiod (Tc) UWB radio signal, which is Gaussian pulse orits derivative is transmitted depending upon unique TH code.UWB signal comprised of sub-nano second duration pulses.A sequence of pulses(Nf ) are used to encode a transmittedsymbol. In TH-PPM, UWB pulse will take additional delayof δ at the beginning of chip duration when data bit′1′ istransmitted. In TH-PAM instead of using shift ofδ, antipodalsignal is used for data bit′1′ and ′0′.
In this paper, we have considered DS-UWB [1] method asa multiple access technique for multimedia transmission. Wehave considered downlink communication under multiuserenvironment. In this situation each user signal is identifiedwith unique Pseudo random (PN) code. Here we investigatedthe performance of multiuser UWB system with DS-UWBunder synchronous and asynchronous transmission. Also theeffect of selection of orthogonal and non-orthogonal codeis discussed with both the transmission schemes. Effect ofselection of UWB pulse shape is discussed. Finally wehave compared performance of DS-UWB multiuser systemwith TH-PAM UWB multiuser system with non-orthogonalcodes.
Paper is organized as follows, In Section II, we havediscuss the general scenario for downlink communicationwith multimedia transmission under multiuser environment.In section III the system model for DS-UWB is discussed. Insection IV we have described the system model for TH-PAMUWB. Section V discusses different UWB channel model.In section VI we showed simulation results with AWGNand UWB channel for synchronous and asynchronous trans-mission. Also effect of selection of code is discussed indetail. Performance comparison with TH-PAM UWB hasbeen discussed in section VI. Finally in Section VII, weconclude our work and discuss future scope in Section VIII.This work is an extension of our previously published paper[11].

282
International Journal on Advances in Telecommunications, vol 3 no 3 & 4, year 2010, http://www.iariajournals.org/telecommunications/
2010, © Copyright by authors, Published under agreement with IARIA - www.iaria.org
II. M ULTIMEDIA TRANSMISSION SCENARIO FORUWBCOMMUNICATION
Figure 1 shows multimedia transmission scenario withUWB for multiuser environment. where different users (orMultimedia devices) data is transmitted by UWB device.Here, we have considered that this UWB device transmitsdata by, DS-UWB [1] or by other TH access technique [2],[9], [10]. We considered that this UWB device transmits dataunder two cases as synchronous and asynchronous transmis-sion. This UWB device adds all users signal and transmitsinformation together over downlink channel. Hence UWBdevice itself adds multiuser interference (MUI) in system.
To make uniformity throughout discussion we have con-sidered all multimedia devices data as different users dataand performance is discussed by considering multiuser en-vironment for multimedia transmission.
PC Scanner
HDTV
Plotter
Printer
UWB
Device
.
.
.
.
.
.
Multimedia
Devices
UWB
Channel
Other
source
Figure 1. Multimedia Transmission scenario for UWB communication.
III. DS-UWB SYSTEM
A. System Model DS-UWB
For Ultra wideband transmission, DS-UWB multiple ac-cess scheme is proposed in [1]. In DS-UWB one bit duration(Tb) is divided into number of frames (Nf ) each with equalduration (Tf ) such thatTb=Nf Tf . During each frameUWB pulse is transmitted which is Gaussian monocycle orScholtz Monocycle. This pulse is a subnano second pulse.In Multiuser environment DS-UWB signal is represented as
s(k)(t) =
∞∑
i=−∞
Nf−1∑
j=0
d(k)(i) w(t − jTf)
s(k)(.) is kth user signal,d(k)i is kth user bipolar spreaded
data, which is defined asd(k)i = b
(k)i c
(k)i . Where b
(k)i is
kth user raw data andc(k)i is kth user code.Nf is number
of frames per bit,w(.) is UWB pulse. Before transmissionUWB device combines the entire users signal.
B. Receiver Configuration for DS-UWB
Received signal is contaminated by multipath fading andAWGN which is given as
r(t) =
∫ ∞
0
h(τ, t)s(t − τ) dτ + n(t)
Whereh(τ, t) is channel response,n(t) is AWGN ands(t)is
s(t) =N
∑
k=1
∞∑
i=−∞
Nf−1∑
j=0
d(k)i w(t − jTf)
N is total number of users in the system. For synchronoustransmissionτ is zero. Here receiver is correlation basedreceiver as described in [1]. In which locally templatep(t) isgenerated and data is recovered by correlation receiver. Tem-
platep(t) is defined asp(t) =Nf−1∑
j=0
w(t − jTf). Correlation
receiver outputZ which is defined asz =Tb∫
0
r(t)p(t)dt.
Using z decision is made in favour of transmitted data bit.After this particular user data is demodulated by codec(k)(.).
IV. TH-PAM UWB SYSTEM
A. System Model for TH-PAM UWB system
In literature [2] TH-PAM UWB system is considered forUltra wideband communication. In TH-PAM UWB singlebit duration (Tb) is divided intoNf number of frames eachwith equal durationTf , so Tb = NfTf . Further each frameis divided intoNc chips with chip duration ofTc such thatNcTc ≤ Tf . During each frame UWB pulse is transmittedwhich is either Gaussian monocycle or Scholtz Monocycle.UWB pulse occupy one chip slot depending on time hoppingcodecj which can take value such that0 ≤ cj ≤ Nc − 1.During each bit durationNf UWB pulses are transmittedby TH-PAM transmitter. For modulation antipodal pulsesare used. TH-PAM UWB signal is represented as
s(k)(t) =
∞∑
i=−∞
Nf−1∑
j=0
d(k)(i) w(t − jTf − c
(k)j Tc)
WhereS(k)(.) is kth user signal,d(k)(i) is kth user bipolar
data, Nf is number of frames per bit andw(.) is UWBpulse.
B. Receiver Configuration for TH-PAM UWB system
Received signal is contaminated by multipath fading andAWGN which is given as
r(t) =
∫ ∞
0
h(τ, t)s(t − τ) dτ + n(t)

283
International Journal on Advances in Telecommunications, vol 3 no 3 & 4, year 2010, http://www.iariajournals.org/telecommunications/
2010, © Copyright by authors, Published under agreement with IARIA - www.iaria.org
Whereh(τ, t) is channel response,n(t) is AWGN ands(t)is
s(t) =N
∑
k=1
∞∑
i=−∞
Nf−1∑
j=0
d(k)(i) w(t − jTf − c
(k)j Tc)
N is total number of users in the system. Here receiver iscorrelation based receiver. In which locally templatep(t)is generated and data is recovered by correlation receiver.Correlation templatep(t) for kth user is defined as,
p(t) =
Nf−1∑
j=0
w(t − jTf − c(k)j Tc)
Correlation receiver generate outputZ, which is given as
z =Tb∫
0
r(t)p(t)dt. Using z decision is made in favour of
transmitted data bit.In DS-UWB and TH-PAM UWB, we have considered
AWGN channel so for equiprobable binary symbols corre-lation receiver gives optimum results.
V. UWB CHANNEL MODEL
In wireless channel multipath fading [12] will take placedue to scattering, reflection and refraction. This fading canbe slow fading or fast fading, which will change parameterof received signal envelope and phase. This fading problemis more critical in indoor channel due to presence of manyscatterers. So perfect channel modelling is required forimproving performance of receiver.
By considering the assumption of static scatter the Chan-nel impulse response(CIR) for time-invariant channel isgiven as,
h(t) =
N∑
n=0
αnδ(t − τn) (1)
Here N is number of multipath components,αn is attenu-ation fornth path andτn is delay fornth path. In UWB thechannel model is based on Saleh-Valenzuela model [13].
A. UWB channel model recommendation by IEEE 802.15.3aworking group
IEEE 802.15.3a working group has suggested channelmodel for indoor UWB communication. This model shouldbe used for evaluating the performance of different physicallayer proposal. This proposed model is based of inputgiven by [13]–[21]. UWB channel model is cluster basedmodel. In this model(SV model) the same pulses multipathcomponents are grouped in to cluster. This cluster arrival ismodelled as a Possion process with arrival rate ofλ as,
P (Tn|Tn−1) = λe−λ(Tn−Tn−1) (2)
Here,Tn is time of arrival fornth cluster andTn−1 is timearrival of (n − 1)th cluster. In each cluster the multipathcomponents of same pulse is also model as a Possion processwith arrival rate of∆ as,
P (τni|τ(n−1)i) = ∆e−∆(τni−τ(n−1)i) (3)
Here,τni is time of arrival of thenth pulse in theith clusterandτ(n−1)i is time of arrival of the(n−1)th pulse in theith
cluster. The gain of thenth pulse inith cluster is complexrandom variable as
Ani 6 Θni (4)
with,
p(Ani) =2Ani
E[
|Ani|2]e
−A2
ni
E[|Ani|2] (5)
and
p(Θni) =1
2πwith0 ≤ Θni ≤ 2π (6)
Here,
E[
|Ani|2]
= E[
|A00|2]
e−T nΓ e−
τniγ (7)
A00 is the energy of the first path of the first cluster,Γandγ power decay profile for cluster and components withincluster respectively. IEEE working group has suggestedsome variation in this SV model to make it more realisticchannel model for UWB as, multipath gain amplitudesare considers as log-normal distributed. The UWB channelmodel is described as,
h(t) = X
N∑
n=1
K(n)∑
k=1
αnkδ(t − Tn − τnk) (8)
X is log-normal distributed which represent the gain ofchannel.N is number of clusters,K(n) is the number ofmultipath components of same UWB pulse within theN th
cluster. αnk is magnitude of component inN th cluster.τnk is delay of component inN th cluster. The channelcoefficientαnk = ±(1)nkβnk , whereβnk is the log-normaldistributed channel coefficient of multi-path componentsk
for cluster n.βnk is defined asβnk = 10xnk20 Wherexnk
is assumed to be a Gaussian random variable withµnk
mean andσ2nk variance. The random variablexnk is further
decomposed as,
xnk = µnk + ξn + ζnk (9)
Whereξn andζnk are two Gaussian random variables whichrepresent the variation of the channel coefficient on eachcluster and in each path within cluster respectively.

284
International Journal on Advances in Telecommunications, vol 3 no 3 & 4, year 2010, http://www.iariajournals.org/telecommunications/
2010, © Copyright by authors, Published under agreement with IARIA - www.iaria.org
Finally channel model of UWB channel is described by,
h(t) = X
N∑
n=1
K(n)∑
k=1
αnkδ(t − Tn − τnk) (10)
With following parameters,The cluster arrival rate ofλ
UWB pulse arrival rate with in cluster is∆Power decay profile of cluster and pulse with cluster isΓandγ
The variance ofσ2ξ and σ2
ζ for variation of fluctuationsof channel coefficient for cluster and pulse within clusterrespectively.
This parameters are defined for different four cases ofUWB communication as mentioned in table I below,
Table IPARAMETERS FORUBW CHANNEL MODEL
Case Λ λ Γ γ σξ σζ
Case A 0.0233 2.5 7.1 4.3 3.3941 3.3941Case B 0.4 0.5 5.5 6.7 3.3941 3.3941Case C 0.0667 2.1 14 7.9 3.3941 3.3941Case D 0.0667 2.1 24 12 3.3941 3.3941
Here Case A is Line of sight(LOS) communication be-tween transmitter and receiver with maximum separationbetween them is 2 meter, Case B is Non line of sight(NLOS)communication between transmitter and receiver with max-imum separation between them is 2 meter, Case C isNLOS with 8 meter of maximum TR separation. Case Dis Extreme NLOS multipath channel with maximum TRseparation of 8 meter. Based on IEEE 802.15.3a channelmodel recommendation, figure 2, 3, 4, 5 illustrate thefour typical power delay profile (PDP) of UWB channelmodel. From this PDP it is clear that in channel model caseA the first received component has highest energy comparedto subsequent component. So in this case if we use partialRAKE with lower fingers then we can expect good result.From figure 3 it can be seen that near to several strongestpeak smaller peaks are surrounded. This indicates thatchannel response is combinations of the several overlappingclusters. Also the strongest peak is not first one but is canoccur at any position in sequence due to reflections fromscatterer. So here partial RAKE will not give expected resultbut we have to select the strongest component in clusterhence SRAKE is required to use. From channel model Cfigure 4, it can be seen that here channel is more timedispersive. Components are available up to around 70 nsec,while in case A and B it is available up to around 40 nsec.This indicate that here we have to use selective RAKE toachieve desired result. From figure 5 it can be seen thatchannel in this case is more time dispersive and componentsare available till 150nsec. So here the effective data rate goesdown to achieve the ISI free communication. In this case
more fingers required to consider for achieving good SNRat receiver.
Figure 2. Power Delay Profile for Channel model A, LOS (0-4 mt).
Figure 3. Power Delay Profile for Channel model B, NLOS (0-4, mt).
VI. SIMULATION RESULTS
Here we have investigated performance of DS-UWBsystem under synchronous and asynchronous transmissionwith orthogonal and non-orthogonal code. We investigatedperformance under AWGN channel. Bit error rate is usedas performance comparison criterion. Also performance ofDS-UWB is compared with TH-PAM UWB [2] with non-orthogonal code. For DS-UWB simulation parameters areshown in Table 1. For TH-PAM UWB simulation parametersare shown in Table 2. In both the cases performance isevaluated with Gaussian pulse shape and Scholtz monocycleas a UWB pulse.

285
International Journal on Advances in Telecommunications, vol 3 no 3 & 4, year 2010, http://www.iariajournals.org/telecommunications/
2010, © Copyright by authors, Published under agreement with IARIA - www.iaria.org
Figure 4. Power Delay Profile for Channel model C, NLOS (4 to 8mt).
Figure 5. Power Delay Profile for Channel model D, extreme NLOS (upto 8 mt).
Figure 6 shows performance of DS-UWB with orthog-onal code under synchronous transmission. Here it canbe seen that with compared to two user case almost 1dB more power is required when number of users areeight in system with Gaussian pulse as a UWB signal.When Scholtz monocycle is considered as a UWB pulsealmost same behaviour is observed. When Gaussian pulseshape is selected, under both the cases of two and eightusers performance is better compared to Scholtz monocycle.This improvement factor is around 1 dB. Figure 7 showsthe performance of DS-UWB with orthogonal code underasynchronous transmission. Here almost same performanceis achieved with two and eight users under selection ofGaussian UWB pulse and Scholtz UWB pulse. From figure
Table IISIMULATION PARAMETERS FORDS-UWB SYSTEM
DS-UWB Parameters
Number of users 2 and 8Data rate 62.5 Mbps
Number of frames (Nf ) 8Frame duration (Tf ) 2nsec
UWB pulse duration (Tp) 0.5nsecPulse shape factor(τ ) 0.25nsec
Async. transmission Delay < 2nsec
Table IIISIMULATION PARAMETERS FORTH-PAM UWB SYSTEM
TH-PAM UWB Parameters
Number of users 2 and 8Data rate 62.5 Mbps
Number of frames (Nf ) 8Frame duration (Tf ) 2nsec
Number of chips (Nc) 3Chip duration (Tc) 0.67nsec
UWB pulse duration (Tp) 0.5nsecPulse shape factor(τ ) 0.25nsec
Async. transmission Delay < 2nsec
6 and 7 we can see that almost same performance is achievedin DS-UWB with orthogonal code under synchronous andasynchronous transmission. If numbers of users are morethan eight then system performance degrade as code wouldlose its orthogonality property as number of frames (Nf ) areeight in DS-UWB. Under asynchronous transmission if theasynchronous transmission delay (τ ) will more than frameduration (Here2nsec) then performance also degrade.
Figure 8 and 9 shows performance of DS-UWB with non-orthogonal code under synchronous and asynchronous trans-mission respectively. From figure 8 it can be seen that systemperformance degrades by large amount under synchronoustransmission. From figure 8 it is clear that non-orthogonalcode should not be selected under synchronous transmission.Also it can be seen that with Gaussian UWB pulse shapeimprovement factor is almost 1 dB compared to Scholtzmonocycle as UWB pulse. In figure 9 performance underasynchronous transmission is shown with non-orthogonalcode. Here almost 2dB improvement is achieved with twousers compared to eight users case with both, Gaussian andScholtz UWB signal. From figure 7 and 9 it can be seenthat DS-UWB system performs better with orthogonal codeunder asynchronous transmission.
Also we have compared performance of DS-UWB withTH-PAM UWB [2] with non-orthogonal code. Here Gaus-sian pulse shape is considered as UWB pulse for comparisonin both the cases. Here we evaluated the performance fornon-orthogonal code. To accommodate large number of userunder orthogonal code we need to select more chips/frameswhich actually puts limitation on effective data rate. InTH-PAM UWB number of chips (Nc) are three and toaccommodate eight users with orthogonal code require eight

286
International Journal on Advances in Telecommunications, vol 3 no 3 & 4, year 2010, http://www.iariajournals.org/telecommunications/
2010, © Copyright by authors, Published under agreement with IARIA - www.iaria.org
−1 0 1 2 3 4 5 6 7 8 910
−4
10−3
10−2
10−1
100
[Eb/N0] in dB
Ave
rage
BE
R o
ver
100
sam
ple
path
BER for DS−UWB with Orthogonal code under Synchronous transmission(2 & 8 users)
8 users Average BER(Gaussian Pulse)2 users Average BER(Gaussian Pulse)8 users Average BER(Scholtz Monocycle)2 users Average BER(Scholtz Monocycle)
Figure 6. Avg. BER with orthogonal code and Synchronous transmission.
−1 0 1 2 3 4 5 6 7 8 910
−4
10−3
10−2
10−1
100
[Eb/N0] in dB
Ave
rage
BE
R o
ver
100
sam
ple
path
BER for DS−UWB with Orthogonal code under Asynchronous transmission(2 & 8 users)
8 users Average BER(Gaussian Pulse)2 users Average BER(Gaussian Pulse)8 users Average BER(Scholtz Monocycle)2 users Average BER(Scholtz Monocycle)
Figure 7. Avg. BER with orthogonal code and Asynchronous transmission.
chips (Nc) which is not possible for the case which wehave considered here in simulation. In TH-PAM UWB,selection of orthogonal code is possible if we select eightchips (Nc) by reducing data rate in system (parameter inTable 2). From figure 10 we can see that DS-UWB performsbetter compared to TH-PAM UWB under synchronous andasynchronous transmission. Under asynchronous transmis-sion this improvement factor is of 1dB with eight users. Forless interfering signals this improvement factor will be more.Figure 11 shows performance of DS-UWB under differentusers condition with orthogonal and non-orthogonal codewith synchronous and asynchronous transmission.
Figure 12,13, 14 and 15 shown performance of DS-UWBwith Different UWB channel model. Here in simulation we
−2 0 2 4 6 8 10 1210
−3
10−2
10−1
100
[Eb/N0] in dB
Ave
rage
BE
R o
ver
100
sam
ple
path
BER for DS−UWB with Non−Orthogonal code under Synchronous transmission(2 & 8 users)
8 users Average BER(Gaussian Pulse)2 users Average BER(Gaussian Pulse)8 users Average BER(Scholtz Monocycle)2 users Average BER(Scholtz Monocycle)
Figure 8. Avg. BER with Non-orthogonal code and Synchronoustrans-mission.
−2 0 2 4 6 8 1010
−4
10−3
10−2
10−1
100
[Eb/N0] in dB
Ave
rage
BE
R o
ver
100
sam
ple
path
BER for DS−UWB with Non−Orthogonal code under Asynchronous transmission(2 & 8 users)
8 users Average BER(Gaussian Pulse)2 users Average BER(Gaussian Pulse)8 users Average BER(Scholtz Monocycle)2 users Average BER(Scholtz Monocycle)
Figure 9. Avg. BER with Non-orthogonal code and Asynchronoustransmission.
have consider perfect equalization of UWB channel. Figure12 and 13 shows the performance of DS-UWB with UWBchannel model A and B. Figure 12 shows the performance ofUWB system with two and eight users under asynchronoustransmission with non orthogonal code as a signature wave-form. Except the synchronous transmission all parametersfor simulation is same in Figure 13 as 12. From Figure13 it is seen that under synchronous transmission for betterperformance orthogonal codes are required.
Figure 14 and 15 shows the performance of DS-UWB sys-tem with UWB channel model C and D. Same observationas channel model A and B is seen here.

287
International Journal on Advances in Telecommunications, vol 3 no 3 & 4, year 2010, http://www.iariajournals.org/telecommunications/
2010, © Copyright by authors, Published under agreement with IARIA - www.iaria.org
−2 0 2 4 6 8 10 1210
−5
10−4
10−3
10−2
10−1
100
[Eb/N0] in dB
Ave
rage
BE
R o
ver
100
sam
ple
path
BER comparison between DS−UWB & TH−PAM with Non−Orthogonal code for Sync./Async.tran.
DS−UWB Synchronous transmission (8 user)DS−UWB Asynchronous transmission (8 user)TH−PAM Synchronous transmission (8 user)TH−PAM Asynchronous transmission (8 user)
Figure 10. Avg. BER comparison with TH-PAM and DS-UWB with sync.and Async. transmission(8 users).
2 3 4 5 6 7 810
−4
10−3
10−2
10−1
100
Number of Users
Ave
rage
BE
R o
ver
100
sam
ple
path
BER for DS−UWB with diffrent users condition for (Eb/N0=7dB)
BER for Non−orthogonal case with Sync. transmissionBER for Non−orthogonal case with Async. transmissionBER for Orthogonal case with Sync. transmissionBER for Orthogonal case with Async. transmission
Figure 11. BER Performance with different users under different codewith Sync and Async. transmission.
VII. C ONCLUSION
Here we have investigated performance of multiuser DS-UWB system with orthogonal and non-orthogonal codeunder synchronous and asynchronous transmission. BER isevaluated for each case with AWGN channel. Here it isseen that DS-UWB system performs equally with orthogonalcode under synchronous and asynchronous transmission.When asynchronous transmission is considered in DS-UWBwith non-orthogonal code, almost 2dB improvement isachieved with two users compared to eight users case. Sys-tem performance degrade drastically when non-orthogonal
0 1 2 3 4 5 6 7 8 910
−4
10−3
10−2
10−1
100
[Eb/N0] in dB
Ave
rage
BE
R o
ver
100
sam
ple
path
Avg. BER with Non Ortho. code & Async. Trans. with UWB channel model A and B
8 users Average BER Ch. Model−A2 users Average BER Ch. Model−A8 users Average BER Ch. Model−B2 users Average BER Ch. Model−B
Figure 12. BER Performance with different users under Non Ortho. codewith Async. Transmission (UWB ch. Model A B).
0 1 2 3 4 5 6 7 8 910
−2
10−1
100
[Eb/N0] in dB
Ave
rage
BE
R o
ver
100
sam
ple
path
Avg. BER with Non Ortho. code & sync. Trans. with UWB channel model A and B
8 users Average BER Ch. Model−A2 users Average BER Ch. Model−A8 users Average BER Ch. Model−B2 users Average BER Ch. Model−B
Figure 13. BER Performance with different users under Non Ortho. codewith Sync. Transmission (UWB ch. Model A B).
codes are used under synchronous transmission. Under samesituation system performs little better with asynchronoustransmission. Also DS-UWB system perform better com-pared to TH-PAM UWB in multiuser environment. Non-orthogonal code with higher spreading factor can be selectedin multiuser DS-UWB system when all users transmit dataunder asynchronous transmission. In multiuser environmentasynchronous transmission is the more general case so inmultiuser DS-UWB system non-orthogonal code can bechosen for increasing the capacity. Gaussian pulse shapegives better performance compared to Scholtz mono cycle asUWB pulse. For synchronous transmission orthogonal code

288
International Journal on Advances in Telecommunications, vol 3 no 3 & 4, year 2010, http://www.iariajournals.org/telecommunications/
2010, © Copyright by authors, Published under agreement with IARIA - www.iaria.org
0 1 2 3 4 5 6 7 8 910
−3
10−2
10−1
100
[Eb/N0] in dB
Ave
rage
BE
R o
ver
100
sam
ple
path
Avg. BER with Non Ortho. code & Async. Trans. with UWB channel model C and D
8 users Average BER Ch. Model−C2 users Average BER Ch. Model−C8 users Average BER Ch. Model−D2 users Average BER Ch. Model−D
Figure 14. BER Performance with different users under Non Ortho. codewith Aync. Transmission (UWB ch. Model C D).
0 1 2 3 4 5 6 7 8 910
−2
10−1
100
[Eb/N0] in dB
Ave
rage
BE
R o
ver
100
sam
ple
path
Avg. BER with Non Ortho. code & sync. Trans. with UWB channel model C and D
8 users Average BER Ch. Model−C2 users Average BER Ch. Model−C8 users Average BER Ch. Model−D2 users Average BER Ch. Model−D
Figure 15. BER Performance with different users under Non Ortho. codewith Sync. Transmission (UWB ch. Model C D).
is required with multiuser DS-UWB system.
VIII. F UTURE WORK
In this paper the system performance is evaluated withcorrelation based receiver. We will extend our work andensure the performance of DS-UWB and other types ofUWB system under multiuser environment with adaptivemultiuser detection techniques [22].
REFERENCES
[1] B. R. Vojcic and R. L. Pickholtz, “Direct-Sequence CodeDivision Muliple Access for Ultra-Wide Bandwidth ImpulseRadio,” Proc. of MILCOM2003, pp. 898–902, October 2003.
[2] Z. Bai and Kyungsup, “Performance Analysis of TH-PAMof UWB System and Coded Scheme,”Proceedings of Inter-national conference on Wireless communications, Networkingand Mobile Computing, pp. 296–299, September 2005.
[3] Maria-Gabreilla, D. Benedetto, and B. R.Vojcic, “UltraWide-band Wireless Communication: A tutorial,”Journal of com-munications and networks, vol. 5, pp. 290–302, December2003.
[4] M. Z. Win and R. A. Scholtz, “Impulse radio -How it Works,”IEEE Communications letter, vol. 2, pp. 10–12, January 1998.
[5] H. Jin and M. J. Kim, “Ultra-Wideband Communications Sys-tems for Home Entertainment Network,”IEEE Transaction onconsumer Electronics, vol. 49, pp. 302–311, May 2003.
[6] H. Zhang, T. Udagawa, T. Arita, and M. Nakagawa, “HomeEntertainment Network: Combination of IEEE 1394 and UltraWideband Solutions,”IEEE Conference on Ultra WidebandSystems and Technologies, pp. 141–145, October 2002.
[7] L. Yang and G. B. Giannakis, “Ultra-Wideband Communica-tions -An idea whose time has come,”IEEE Signal ProcessingMagazine, pp. 26–58, November 2004.
[8] M. Z. Win and R. A. Scholtz, “Ultra-Wide BandwidthTime-Hopping Spread-Spectrum Impulse Radio for WirelessMultiple-Access Communications,”IEEE Transactions oncommunications, vol. 48, pp. 679–691, April 2000.
[9] B. Hu and N. Beaulieu, “Accurate Evaluation of Multiple-Access Performance in TH-PPM and TH-BPSK UWB Sys-tems,” IEEE Transactions on communications, vol. 52,pp. 1758–1765, October 2004.
[10] G.Durisi and S.Benedetto, “Performance Evaluation ofTH-PPM UWB Systems in the Presence of Multiuser Interfer-ence,” IEEE Communications Letter, vol. 7, pp. 224–226,May 2003.
[11] H.B.Soni, U.B.Desai, and S.N.Merchant, “Performanceanal-ysis of multiuser ds-uwb system with orthogonal and non-orthogonal code under synchronous and asynchronous trans-mission,” The Fourth International Conference on Wirelessand Mobile Communications (ICWMC08), pp. 247–252, Oct2008.
[12] W. C. Y. Lee, “Mobile communications engineering, theoryand applications,”McGraw-Hill, 1997.
[13] A. Saleh and R.A.Valenzuela, “A statistical model for indoormultipath propagation,”Journal on selected Area in commu-nications, vol. 5, pp. 128–137, February 1987.
[14] S. S. Ghassemzadeh and V. Tarokh, “Uwb path loss charac-terization in residential environments,”IEEE Radio frequencyIntegrated circuits symposium, pp. 501–504, June 2003.
[15] M. Pendergrass and W.C.Beelar, “Empirically basedstatistically ultra-wideband(uwb) channel model,”availableat http://grouper.ieee.org/groups/802/15/pubs/2002/jul02/02294rlp802-15SG3a−EmpiricallybasedUWBchannelmodel.ppt, July2002

289
International Journal on Advances in Telecommunications, vol 3 no 3 & 4, year 2010, http://www.iariajournals.org/telecommunications/
2010, © Copyright by authors, Published under agreement with IARIA - www.iaria.org
[16] J. Foerster and Q. Li, “Uwb channel mod-elling contribution from intel,” available athttp://grouper.ieee.org/groups/802/15/pubs/2002/jul02/02279r0P802-15SG3a − Channel − model − cont −intel.doc, June2002.
[17] V. Hovinen, M. Hamalainen, and T. Patsi, “Ultra widebandindoor radio channel models: Preliminary results,”IEEE con-ference on Ultra wideband systems and technologies, pp. 75–79, May 2002.
[18] J. Kunisch and J. Pamp, “Measurement results and modellingaspects for the uwb radio channel,”IEEE conference on Ultrawideband systems and technologies, pp. 19–23, May 2002.
[19] S. Ghassemzadeh and V. Tarokh, “The ultra-wideband indoor path loss model,”available athttp://grouper.ieee.org/groups/802/15/pubs/2002/jul02/02277rlP802-15SG3a− 802.15 − UWB − propagation−path
[20] A. Molisch, M. Z. Win, and D. Cassioli, “Theultra- wide bandwidth indoor channel: fromstatistical model to simulations,” available athttp://grouper.ieee.org/groups/802/15/pubs/2002/jul02/02284r0P802-15SG3a − The − Ultra − Wide −
Bandwidth− Indoor−Channel− from− statistical−model − to− simulatons.pdf, June2002.
[21] R. Cramer, R. A. Scholtz, and M.Z.Win, “Evaluation ofan indoor ultra-wideband propagation channel,”availableat http://grouper.ieee.org/groups/802/15/pubs/2002/jul02/02286r0P802-15SG3a − Evaluation − of − an −
indoor − Ultra − wideband − propagation −
channel.doc, July2002.
[22] S. Verdu′, “Multiuser Detection,” Cambridge UniversityPress, pp. 166–204, 1998.

290
International Journal on Advances in Telecommunications, vol 3 no 3 & 4, year 2010, http://www.iariajournals.org/telecommunications/
2010, © Copyright by authors, Published under agreement with IARIA - www.iaria.org
A Semantic-oriented Framework for System Diagnosis
Manuela PopescuUniversity of Besançon
Francemanuela.popescu@univ-
fcomte.fr
Pascal LorenzUniversity of Haute Alsace
Jean Marc NicodUniversity of Besançon
fcomte.fr
Abstract - In the field of system and networkdiagnosis, there is a variety of modeling andinference methods reported in literature. However,very few are focusing on the validation andknowledge transfer in case of similar symptoms.Many researchers targeted the use of a genericdiagnosis framework, semantic-oriented solutions,and temporal aspects related to diagnosis validation.Event correlation and action triggering are essentialfor an accurate diagnosis decision. However, noindustry-wide solution was considered so far. In thisarticle, we are proposing an adaptive framework fordiagnosis validation and transfer of informationfrom successful outcomes for future use andoptimization of the diagnostic activity. It is shownthat this mechanism allows a post-validation ofsuccessful diagnosis actions, optimizing thediagnosis process and increasing its accuracy. Weare presenting a series of ontology-drivenmechanisms for system diagnosis. Mainly, weintroduce event ontology and concepts related tosemantic tag clouds and show how to manage theactivities to build an ontology-based diagnosis.Additionally, we consider temporal aspects relatedto diagnosis validation. Event correlation andaction triggering are essential for an accuratediagnosis decision. There are several time-relatedchallenges referring to event timestamps, timelyevent correlations, and timely corrective actions, inboth absolute time (precise moment), or relativetime (between events, actions, and events andactions). We consider a series of temporal operatorsdefining the event relative temporal position thatallows a more fine grain interpretation of the systembehavior. A combination of proposed mechanismsis used to complete the main functions of a diagnosisengine.
Keywords - system diagnosis, diagnosis validation,knowledge transfer; ontology-based diagnosis;semantic tag clouds; progressive ontology; temporalfeatures.
I. INTRODUCTION
System and network diagnosis is vital if networkinfrastructures are to function efficiently andmaintain reliable delivery of service to customers.There are various management and controlmechanisms acting on a system to monitor security,performance, optimization and so on. In case offaulty or unexpected behavior, diagnosis is usuallythe main activity triggered by the symptoms of thesystem under supervision.
Figure 1 depicts a very high level view of thediagnosis process. Collectors have been developed toassemble systems health data parameters. Theseparameters can fall within normal value ranges(accepted, desired, expected, etc.), or they can reflectan unhealthy situation (value not recognized, out ofrange, denied by policy, inconsistent or out ofcontext). A formalized set of this data constitutes thesymptoms of the network under consideration.System problems can thus be identified and the mostsuitable solution for healing is computed andimplemented. A validation step is then necessary toassess the success of the repair. Validation is alsoperformed to prevent illness, following smallparameters variation from accepted range, or after acalm period.
We can identify two loops of the diagnosis process:(a) one loop deals with measuring the systemparameters (system state, events, i.e., pre-conditions)and taking the most suitable actions; this is referredto as the diagnosis loop and (b) a second loop dealswith validating that the corrective actions wereindeed successful; this is referred to as the validationloop. The validation loop has two main goals: (a) toestablish the new state of the system, i.e., post-conditions and (b) to gather knowledge on how tosolve future similar situations, in case the actionstaken were considered successful. In general, there islittle or no cross-interaction between these two loops.

291
International Journal on Advances in Telecommunications, vol 3 no 3 & 4, year 2010, http://www.iariajournals.org/telecommunications/
2010, © Copyright by authors, Published under agreement with IARIA - www.iaria.org
Figure 1. Diagnosis Theory [17, 25]
In addition, we introduce the concept of Quality ofDiagnosis (QoD) into the validation loop to helpmake accurate decisions, based on past successfulactions applied to similar situations.
However, there are too many actions in a systemgenerating an unmanageably large number of events.It is estimated that a maximum of 8% of these eventsare considered by diagnosis systems; the rest of themare being discarded. Additionally, there is a diversityof technology domains driven by special diagnosismechanisms. Mapping those mechanisms in aheterogeneous environment and correlating thediagnosis actions overwhelm the operators in NOCs(Network Operation Centers), leading tounsatisfactory solutions.
Towards an automated diagnosis, we introduce aprogressive ontology (leading to progressivediagnosis) and therefore “progressive validation” ofsuccessful actions. This is intended to solve potentialconflicts of the post-conditions of the actions alreadyvalidated as “successful” and to evaluate the accuracyof the diagnosis actions (preciseness versuspermanent damage). The basis is the definition ofevent ontology, followed by several conceptsidentifying the cause of a symptom and potentialdiagnosis actions.
The complexity of networks and distributedsystems gives rise to management challenges whenunexpected situations occur. There is anoverwhelming number of feedback events comingfrom the system in the form of status reports towardsthe monitoring and management applications andhuman operators. Actually, very few of these events,less than 10%, can be considered for potential statusunderstanding and remedy. Given the numbers, it isinevitable that many relevant events are dropped. Theremedy actions can come too late (and sometimes beuseless). There are numerous managementapplications in commercial use. However, the varietyof the systems to be managed, their complexity, andthe fact that most of the successful decisions are
rarely recorded, rise serious challenges in the abilityto accurately handle unexpected situations.
Some of the multiple causes leading to the currentstate are (i) lack of successful validation of correctiveactions, (ii) heterogeneity of the events to be handled,and (iii) incomplete correlation and timesynchronization between status reports, decisionprocessing and corrective actions.
A step towards automated diagnosis wasintroduced in [23], where an event ontology and aprogressive diagnosis ontology were proposed. Eventdependencies captured by ontology and specificevent relations were formalized. Probable cause andrecommended actions were associated with events.Additionally, an augmented specification for actionswas proposed to help the validation loop. Bothproposals had as a target the reuse of knowledge forproblem fixing, identification of recommendeddiagnosis actions, and validation of successfulactions.
The third identified challenge is time-related; thisrefers to event timestamps, timely event correlations,and timely corrective actions, in both absolute time(precise moment), or relative time (between events,actions, and events and actions). This aspect is moredifficult, as many events issued at differenttimestamps might be processed for eventcompression/aggregation. The correct adoption oftemporal aspects can solve potential conflicts amongthe post-conditions of the actions already validated as“successful” and helps evaluate the accuracy of thediagnosis actions (preciseness versus permanentdamage).
In this paper, we introduce a generic framework,propose an event ontology, highlight the relevance oftemporal aspects, identify the challenging issues, andpropose a new timestamp approach. We consider aseries of temporal operators defining event relativetemporal position that allows a more fine graininterpretation of the system behavior. A combinationof proposed mechanisms is used to complete themain functions of a diagnosis engine.
II. RELATED WORKS
There is a variety of approaches dealing with thecollection and actions-taking loop of the diagnosisprocess. However, very few solutions are focusing onthe validation and knowledge transfer in case ofsimilar symptoms.
2.1 Diagnosis Approaches
There are many modeling and inference methods ofdiagnosis, deriving from different areas of computer

292
International Journal on Advances in Telecommunications, vol 3 no 3 & 4, year 2010, http://www.iariajournals.org/telecommunications/
2010, © Copyright by authors, Published under agreement with IARIA - www.iaria.org
science, including artificial intelligence, graphtheory, neural networks, information theory andautomata theory [1]. The most widely used diagnosistechniques are expert or knowledge-based systems[2] (rule-, model- and case-based systems, decisiontrees and neural networks). Rule-based techniquesprovide a powerful tool for eliminating the leastlikely hypotheses in small systems [3]. However,deep knowledge regarding the relationships amongsystem entities was included [5, 6, 7] to addressshortcomings related to the inability to learn fromexperience, inability to deal with new problems anddifficulty in updating the system knowledge [4].Model traversing techniques [8, 9] use formalrepresentation of a system with clearly definedrelationships among network entities. Modeltraversing techniques reported in literature useobject-oriented representation of the system [10].They are usually event-driven and naturally enablethe design of distributed fault localization algorithms.Graph-theoretic techniques employ a FaultPropagation Model (FPM) [9], which is a graphicalrepresentation of all faults and symptoms occurringin the system and commonly take the form ofcausality or dependency graphs. Some graph-theoretic techniques include divide and conqueralgorithm [11], context-free grammar [12], codebooktechnique [13], belief-network approach, andbipartite causality graphs [14].
Despite a vast research effort, there are openproblems regarding diagnosis in complex systems,such as multi-layer fault diagnosis, distributeddiagnosis, temporal correlation fault diagnosis inmobile ad hoc networks and root-cause analysis in aservice-oriented environment.
2.2 Validation and Knowledge Transfer
Two challenging post diagnosis and repair actionsare (1) validation and (2) knowledge acquisition andtransfer.
For validation, an audit must be performed on thesystem status to assess the success of the repairactions. Knowledge acquisition and transferregarding successful repair actions require a formalrepresentation of the system, specification of thesymptoms and the actions taken in particular cases, aswell as a methodology to have this informationavailable to facilitate later diagnosis of similarsituations.
The main prior knowledge needed for diagnosis isthe set of system failures and the relationshipbetween the observed symptoms and the failures.Previous knowledge may be explicit, such as a tablelookup, or may be deducted from some domainknowledge. This represents deep, model-based
knowledge. Alternatively, or in addition to thisknowledge, information may come from pastexperience with the system. This type of knowledgeis known as shallow, compiled, evidential or processhistory-based knowledge [15].
To understand the system behavior expressed byissued events, we need to see how to instruct thediagnosis engine to trigger appropriate actions. Aprimary condition is to understand the informationcarried out by an event. Despite more than 3 decadesof efforts, no common event syntax and semanticwere achieved. Most of the existing solutions targeta special area and it is rarely normalized; therefore,diagnosing heterogeneous systems is a challenge.
Log files represent the most used informationsource. Parsing the log files is the only way to extractthe event information. Some log files have minimalevent information, whereas others contain a varietyof unstructured information. Since the amount of logfile event is very large, the event processing shouldhandle the file index of events already processed,especially whether the system is rebooted. Severallog files may contain event information, e.g., Sysloglog files, system console log files, applicationmessage files, etc. While log files are the mostdifficult source of events, Syslog files have a certaindegree of structure. However, all log files requiremore normalization to help parsing and automateevent processing.
Syslog messages (associated with Unixenvironments) are tailored as a free-form textmessage together with some defined fields, such asseverity, facility, timestamp, etc. [17].
The structure of SNMP (Simple NetworkManagement Protocols) messages is based on SNMPMIB (Management Information Base) Model, whichis quite complex to be handled &&3]. However, thisstructure facilitates the normalization of thesemessages into a common format. An SNMP agent canasynchronously send SNMP messages to a trapreceiver (SNMPv2). The mechanism called informs isprovided by SNMPv2c that adds a reply message to atrap, as an acknowledgement. However, notificationis not ensured to reach the destination. Since bothSNMPv2c and SNMPv3 can deliver SNMPnotifications via traps or informs method, the sendingagent can select the mechanism to be used. Thisraises coordination challenge concerning messagestructure and information contained in it. Amanagement process can poll with a given frequencyvarious state parameters and built complex eventstructure based on the collected information. There isno validation of a successful action after a diagnosisaction is performed.

293
International Journal on Advances in Telecommunications, vol 3 no 3 & 4, year 2010, http://www.iariajournals.org/telecommunications/
2010, © Copyright by authors, Published under agreement with IARIA - www.iaria.org
The RMON (Remote Monitoring) mechanismdefines a generalized threshold-based alarm, whichgenerates in turn an RMON event that eventuallycauses a SNMP notification [20].
Other devices can use a Syslog to trap converter, asa unified mechanism to send traps or informs.However, most of details contained in the messagetext must be parsed for further processing, as forSyslog events.
Events can be generated at any level; the networkmanagement system itself can generate events usingany of the mechanisms identified above.
Event formats were proposed for specializeddomains, such as intrusion detection reports andvulnerability reports, but no event dependency orinstruction on how to manage them were proposed. Aproposal to direct event management was proposed in[25], where the event itself carries the processinginstructions. The instructions were derived from theevent source point of view, with no correlation withother events.
Most of the current attempts failed because of thecomplexity of target systems, leading to huge eventmodels, practically describing unmanageablesituations.
It appears that ontology per domain is moresuitable; the initial condition is to have an eventontology. Definitively, inter-domains ontologymatching is a challenge; however, it allows tacklingthe problem step-by-step.
2.3 Temporal Aspects
Temporal features are related to several genericaspects concerning (i) inaccurate (wrong, un-synchronized, or missing) clocks, (ii) loss of events,and (iii) hierarchical event processing at layersexposing different clocks. These are somehow relatedto event propagation skew but also to differentsyntactic and semantic implementation decisions ofthe timestamps (including time zones). One approachin dealing with real-time measurements ofpropagation skew uses a statistical evaluation toupdate the timer values [27].
Some diagnostic constraints might be temporal. In[23], temporal constraints are used for event tags todefine the event ontology and to detect the relativetemporal constraints. Walzer et al. [28] use specificoperators for time-intervals with quantitativeconstraints in rule-based systems to trigger certainactions. In the following sections, we present themain approaches used to specify temporal aspects onevents and actions.
2.3.1 Temporal aspects for events
Timestamps are usually carried by the eventsthemselves; basic events possess special timestampfields that are instantiated when an event instanceoccurs. Timestamps are storing time in the nativeformat of the platform in which the event processingruns. There are two standard ways to represent thetime: (i) using the universal time, or (ii) using timezones. Since one still needs to preserve the zoneindication for a device for hourly performancereports, the representation in the universal time isonly for the computational point of view. Anotherstandard way to represent the time is the UNIX-format time as a four-byte integer that represents theseconds elapsed since January 1, 1970. For the samereasons, the time zone of the source device should bestored.
An event might have multiple timestamps; thesource timestamp (not always present), the logginghost timestamp, the console timestamp, and theprocessing timestamp. Temporal correlation andevent aggregation should consider all thesetimestamps.
Event processing and correlation need a time-basedlogic to express the relative position of start / end/duration of the events [24]. While attempts wereidentified for classifying the relative position of theevents, no particular commercial solutions are knownwhere a full range of temporal situations is used.
2.3.2 Temporal Aspects for Actions
An enhanced action model was proposed in [23].One temporal aspect is related to the triggeringcondition (guard). Others temporal aspects arerelated to the temporal dependencies between actions,i.e., some action must start at a given period after oneaction was triggered or was deemed successfullyfinished.
A diagnosis-oriented augmented action definitionwas introduced in [23], as follows.
action::= <<guard><ID><post-conditions><mode><conflicting>,
where
ID::= READ | WRITE | DELETE | CHANGE | , etc.
mode ::= <potential | recommended | successful<context>>,
withpotential: any diagnosis action that is designated asbeing related to a potential domain

294
International Journal on Advances in Telecommunications, vol 3 no 3 & 4, year 2010, http://www.iariajournals.org/telecommunications/
2010, © Copyright by authors, Published under agreement with IARIA - www.iaria.org
recommended: any potential action that is perceivedas solving a given problem, eventually based on adiagnoses historysuccessful: when post-conditions were validated astrue
context: <d:D, c:C>
d:D is d instance of Domainc:C is c instance of Cloud
Also in [23], we associated the notion of“conflicting” with a given action, which designatesthe actions a potential action is in conflict with, in agiven domain:
conflicting ::= <a1, a2,… ak | ai:A>
A <guard> is acting as pre-conditions and igniter(initial timestamp), and the <post-conditions> areexpected to be true (after the action is consideredsuccessfully performed). In general, actions areapplied following a simple rule:
IF <pre-conditions>
THEN <action> WITH <post-conditions>
Post-conditions are assumed to hold. Acomposition of actions, a plan, is a set of relatedactions and it is used to specify dependenciesbetween actions. This is schematically represented inFigure 2. The model can be summarized as follows,where a plan is introduced as a temporal combinationof atomic actions (see ID above) [29].
policy::= IF <pre-cond> THEN {<> 1<action>1<plan>}
[ELSE {<> 1<action> 1<plan>} <action>1<plan>}] <post-cond>]
Figure 2. A plan ─ actions: a1, a2, a3; timedurations: x, y, z
Based on the analysis of the state of the art, weconclude that there is a need for a unified timestampsapproach and a set of operators that must be used insynchronism to express the dependency betweenevents, between actions, or between events andactions [25, 26].
In this article, we propose a representation oftemporal features allowing various semantics used tocorrelate the events and the actions.
III. A SITUATION-BASED DIAGNOSIS SYSTEM
Let us first introduce the basic concepts used toformalize the system used here for validation,knowledge acquisition and transfer.(1) Symptoms are external manifestations of failures.
They can be observed as alarms, which alert of apotential failure. The alarms can originate frommanagement agents via management protocolmessages (SNMP traps, CMIP EVENT-REPORT etc.) from management systemsmonitoring the network status (ping) system log-files or character stream sent by externalequipment [1].
(2) We introduce the concept of situation asrepresenting the symptoms and the failure stateof the system in consideration.
(3) A problem represents the failure state of thesystem and possible causes. This concept allowsus to deal with events which might not bedirectly observable. Many types of events mightnot be directly observable due to (i) theirintrinsically unobservable nature, (ii) localconnective mechanisms built into a managementsystem that destroy evidence of fault occurrenceor (iii) lack of management functionality neededto provide evidence that a fault occurred. Thestate of the system implicitly represents thesekind of un-observable events.
(4) A context represents a subset of states (includingsystem topology, dependencies, configuration,etc.), services and their users, at a given time.
(5) We also introduce the use of Quality ofDiagnosis (QoD) into the validation loopmentioned in Figure 1. This concept will drivemore accurate decisions, based on pastsuccessful actions applied to similar situations.
We classify the states of a system in 3 types,associated with symptoms and probable causes, asshown in Figure 3.
a1
a2
a3
xy
z

295
International Journal on Advances in Telecommunications, vol 3 no 3 & 4, year 2010, http://www.iariajournals.org/telecommunications/
2010, © Copyright by authors, Published under agreement with IARIA - www.iaria.org
Figure 3. Basic concepts relationship
The system states of type X are states producingobservable symptoms that indicate failures, thesystem states of type Y are states producing non-observable events of failure and the system states oftype Z are behaviorally expected states that are notassociated with failures.
3.1 Approach on Diagnosis Loop
As shown in on Figure 1, three related concepts areneeded for a successful repair: (i) symptoms, asdefined above, (ii) problems, as a set of potentialcauses based on the situations and (iii) diagnosisactions (most suitable) in a given situation. Theseconcepts are applied in successive steps.
Let S, P, D, E, and A be the set of Symptoms,Problems, Diagnosis, Events, and Actionsrespectively. The diagnosis process can besummarized by (1).
(E)S P D(A) (1)
Let si, pi, di, ei and ai represent a given instance of asymptom, problem, diagnosis, event and actionrespectively.
We introduce three types of symptoms, based onthe completeness of the information coming from thesystem.
(1) Reactive - A set of events may reflect a set ofproblems that can be repaired by a set of diagnosisactions. In particular, the set of events may bereceived is a certain time window. In the case ofreactive symptoms, most of the events occurspontaneously, i.e., SNMP traps, informs [16].
(i) Time-agnostic diagnosis:[e1, e2, e3….en] {pi} {di}
(ii) Time-oriented diagnosis (temporal context)[e1, e2, e3….en]t1 {pi}t1 {di}t1
(2) Proactive - A set of events may be missing justone extra event before being able to infer a set ofproblems associated with the system. Depending onthe nature of the event still to come, a different set ofproblems can be inferred. For proactive symptoms,new information can be solicited, for example, usingpolling mechanisms via specialized queries. InSNMP, GET state or the value of a parameter, is asolution. The decision of triggering such queriesbelongs to the diagnosis engine that might identify apotential symptom.
[e1, e2, e3….en-1] + [en] {pi}[e1, e2, e3….en-1] + [e’n] {p’i}
It is important to notice that the nature of theexpected event might lead to different classes ofproblems.
(3) Pre-emptive - When a symptom is not complete, athreshold might be set on an expected set of events.This threshold depends on the type of events(Boolean, Integer, etc.). When the expected eventsare crossing the threshold (1) will take place. Asimplified representation is shown below.
[e1, e2, e3….en-1] + [threshold on {ei}]{pi},
where “threshold” is used in a general sense, e.g.,belonging to a class of events, occurring in a
temporal vicinity (ε) of en-1, or at least of delay of (δ)from en-1.
All three types of symptoms described above arecontext-independent. When the context is taken intoconsideration, the relationship (1) becomes:
(E)S [P, C] D(A) (2)
where C is the set of possible contexts.
Most of the time, systems experience differentproblems in different contexts, leading to differentdiagnosis, i.e.,
[e1, e2, e3….en]t1 + [context1]{pi} {di}[e1, e2, e3….en]t2 + [context2]{p’i} {d’i}
The main manifestation of the diagnosis is the setof actions and their results (post-conditions of therespective actions). Generally, it is assumed that thepost-conditions are true. However, potentiallyconflicting repair actions might leave the system in aquestionable (or unknown) state, even when the post-conditions of each action hold.

296
International Journal on Advances in Telecommunications, vol 3 no 3 & 4, year 2010, http://www.iariajournals.org/telecommunications/
2010, © Copyright by authors, Published under agreement with IARIA - www.iaria.org
In the next section, we propose and analyze avalidation loop based on QoD.
3.2 Approach on Validation Loop
In general, diagnosis consists of a set of potentialactions intended to fix a situation in a given context.Only some of them might be successful for a givenproblem in a given context.
The goal of the validation loop is to determine thesuccessful diagnosis actions in the given situation,and to transfer this knowledge to the diagnosis enginefor use in future similar situations.
We are introducing the QoD into the validationloop, as shown in Figure 4.
Figure 4. QoD
The QoD module is a dedicated validation engine,which interacts through three specialized interfaceswith the system and the diagnosis loop. In particular,it receives diagnosis feedback from specializedsystem agents via the Interface I2 and asks foradditional information (i.e., for audits) via theInterface I1. QoD communicates the diagnosis resultsto the Diagnosis Loop via the Interface I3. I3 can alsobe used by the diagnosis loop to ask the QoD forauditing information related to a given situation.
A diagnosis action has a set or pre-conditions andguarantees a set of post-conditions. QoD deals withvalidation (or evaluation) of post-conditions.Therefore, the QoD engine acts only during-diagnosisor post-diagnosis.
<pre-conditions><action-id> (3)
<post-conditions>
Based on the framework presented here, in thefollowing section we propose the QoD mechanism.
3.3 QoD Mechanism
We identify two behavioral modes of the QoDengine: (i) listening mode and (ii) audit mode. In thelistening mode, the QoD is waiting for input from theembedded agents or from the diagnosis loop. Theaudit mode can be triggered (i) by the diagnosis loopfollowing the application of a set of repair actions toresolve a situation (ii) for a given time period or (iii)can be scheduled periodically/frequently.
At the end of the audit process, QoD returns to thediagnosis loop the subset of successful actions fromall possible actions taken to repair a certain situation,in a certain context.
[S, C, {successful actions}] (4) Diagnosis Loop
By request from the diagnosis loop, QoD canmonitor: (a) a given action, (b) a set of given actions,or (c) all potential actions. The diagnosis loopprovides the set of actions to be monitored, QoDbeing solely a validation engine.
The diagnosing actions are taken as part of thediagnosis loop. The successful actions, determined bythe validation loop, will be the ones that make thesystem pass from a state of type X to a state of typeZ.
Definition of a successful action
if{statei}{actioni} {statej}
where{statei} ∈ X ∧{statej} ∈ Z
then{actioni} is successful
Note: An action can be successful in one context andfailure in another context.
The validation loop will transfer the informationregarding successful actions to the diagnosis loop foroptimizing the diagnosis loop activity. The format ofthe information returned to the diagnosis loop canhave 2 forms:
(1) The successful action, composed of pre-conditions, id and post-conditions as well asthe symptom, problem and context.
[<pre-cond><id><post-cond> | <S,P,C>]
(2) The successful action, composed of pre-conditions, id and post-conditions as well as

297
International Journal on Advances in Telecommunications, vol 3 no 3 & 4, year 2010, http://www.iariajournals.org/telecommunications/
2010, © Copyright by authors, Published under agreement with IARIA - www.iaria.org
a pointer. The pointer indicates the list of<S,P,C> in which the action in considerationwas successful. The validation engine isresponsible for keeping and updating thislist.
[<pre-cond><id><post-cond> | <pointer>]where<pointer> = {…<S,P,C>i, <S,P,C>j…}
We present below an algorithmsummarizing the QoD mechanism.
Algorithm
input:System states, X, Y, ZS, P, Cai
pre-condition ai = statei
post-condition ai = statej
update type [ one action, pointer ]if statei∈ X ∧ statej ∈ Zthen
forward <ai> <S,P,C>or
update <ai><pointer>where
<pointer> ={…<S,P,C>i, <S,P,C>j…}
In summary, the QoD engines takes as input thepossible system states and their type (X , Y or Z), thesymptom, problem, context, the action to validate, theinitial system state (pre-condition), the final systemstate (post-condition) and the update type. If theinitial system state is of type X and the final systemstate is of type Z, then (1) forward to the diagnosisloop the action and the set <S,P,C> or (2) update thepointer, where the pointer represents the list of allpossible <S,P,C> combinations known so far inwhich the action under consideration is successful.
To tackle the problem, we propose an ontology fordiagnosis composed of (i) an event ontology, (ii) tagand semantic diagnosis tag clouds, and diagnosisclouds matching.
3.4 Event Ontology
To address the issues described in the previoussections, we propose here an event ontology.
The three main concepts of the ontology are: (1)Event, (2) Domain and (3) Event Manager.
An Event is a software message that indicatessomething of importance has happened. A Domain isdefined as a technological area, such as VPN orVoIP, a sub-network or specific management area,such as fault, security. An Event Manager providesreal-time information for immediate use and logsevents for summary reporting used to analyzenetwork performance.
The main relations between these concepts aredepicted in Figure 5. The Events are owned by theEvent Manager. Also, an Event refers to a Domain.
Figure 5. Event Ontology Main Concepts
In addition to the main relationships between anEvent, Manager and Domain, an Event is defined byexplicitly-declared event ID, source, version,timestamp, priority, and free-text (see Figure 2). Anevent can be stored at an URL, Library-ID,Repository or Log Server. These locations can beexplicitly-declared or found as a result of a search.An Event can be referred to by another Event or canrefer to another Event. Also, an Event can be similarto another Event. The ontology identifies therelationship between events ( example “is-similar-to<event>”,”refers-to <domain>” etc.) and themanagement properties of a given event (e.g., “can-be-accessed-by <application>”, “can-be-modified-by <application/human>” etc.).

298
International Journal on Advances in Telecommunications, vol 3 no 3 & 4, year 2010, http://www.iariajournals.org/telecommunications/
2010, © Copyright by authors, Published under agreement with IARIA - www.iaria.org
Figure 6. Details of the Event Ontology
In Figure 6, an Event depends on a Manager by <is-owned-by> relation that can be refined in a few inheritingrelations such as <can-be-accessed-by>, <can-be-modified-by>, or <can-be-deleted-by>. As an example, the lastrelation defines what managers have rights to delete aparticular event. If we combine with the proposal from [25],the manager is also instructed how to proceed.
Expanding the ontology from Figure 5, we illustrate inFigure 7 the main concepts and the core relations. Apart thedependency relations, we also consider the aggregationrelation, where events are aggregated during the processing.The main relation <is-owned-by> is specialized in a fewrelations, as managers can be specialized too.
Figure 7. Adding relations to the main concepts(UML notation)
A domain instance can be one of the specialties that havebeen illustrated in Figure 6.
3.5 Semantic Tag Clouds
The first challenge in deriving semantic clouds is thecomplexity, when considering all the expansions of thediagnosis domains. As an example, let us consider thefollowing tag subdivisions targeting fault diagnosis (List 1).We have a coarse grain tag embedded hierarchy, while afine grain tag list can be progressively developed. As a note,each time a tag expansion is made, a validation is required.
• TAGS• IPv6, IPTV
• fault in IPv6• fault in IPTV
• security IPv6• security sensors• IPTV with IPv6• IPTV
management• Refined /TAG list/
• latent fault, authentication, M5, IPSec,link-Syslog, CLI-Z
List 1. Example of Tag List
Event
is similar-to
refers-to
is-referred-by
Dom
refers-to
Domain
Manager
is-owned-by
can-be-accessed-by
can-be-modified-by
can-be-deleted-by
…..

299
International Journal on Advances in Telecommunications, vol 3 no 3 & 4, year 2010, http://www.iariajournals.org/telecommunications/
2010, © Copyright by authors, Published under agreement with IARIA - www.iaria.org
Two concepts are considered in defining (identifying) tags,as expressed in Figure 8.
Figure 8. Hierarchical tags and their relations
As suggested by List 1, tags have a hierarchy within eachdomain; this defines a special dependency relation betweentags. Also, at each layer, tags may embed differentassociations (e.g., port-85 and SNMP traps).
During the diagnosis activities, tags are relevant, butwithout the tag relationships, no much progress can beachieved. One step ahead is to form tag clouds; a tag cloudrefers to a tag list focusing on a particular domain (seeFigure 9).
Figure 9. Tag Clouds and Semantic Tag Clouds
As an example, we localize in Figure 9 (a) a tag cloudconcerning real-time fault diagnosis. We identify a series ofrelationships between a given CLI (Command LineInterface), a SNMP-trap that refers to a given port, on one
side, and between latent fault and real-time tags, on theother side (Figure 9 (b)).
3.6 Mapping Semantic Clouds in a Context
Let us assume that there are two semantic clouds, asshown in Figure 10. Semantic cloud#1 defines the tags andtheir relationships for a fault related to a power supply issue,while Semantic cloud #2 relates to a potentially real-timeand latent fault.
Figure 10. Cross-semantics of Semantic Tag Clouds
An appropriate diagnosis is triggered by linking the portID and the card ID, then identifying the SNMP trap definedfor power-supply behaviors. With these cross-semanticconnections, one can identify the potential CLI leading tothe situation, or a particular fault on power supply.
As mentioned before, the number of events produced by asystem exceeds by far the capacity of processing them. Anaccurate selection of those events ‘of interest’ reduces theburden of monitoring and diagnosing and leads to a moreadapted solution.
On the other side, the event mediation is less processconsuming as both the diagnosis engine and the validationengine [17] refer to the same event ontology.
3.7 Progressive Ontology
A diagnosis engine is validating successful diagnosisactions based on a given set of semantic tag clouds. Asexpected, since the technology evolves, new devices andapplications are developed. We adopt a series of heuristicson validating new semantic tags and new semantic tagclouds.
3.7.1 New Semantic Tags
For the purpose of ontology control, the followingheuristic was experimented:
x latent fault
x real-time
x Port XYZ
x SNMP-trap-X
x CLI-Z
x latent fault
x real-time
x Port XYZ
x SNMP-trap-X
x CLI-Z
a)
b)
x latent fault
x real-time
x Port XYZ
x SNMP-trap-X
x CLI-Z
x fault
x power-supplyx Card XYZ
x SNMP-trap-Y
x CLI-W
Semantic cloud #1 Semantic cloud #2
tag
tag tag tag
tagtag tag
tag

300
International Journal on Advances in Telecommunications, vol 3 no 3 & 4, year 2010, http://www.iariajournals.org/telecommunications/
2010, © Copyright by authors, Published under agreement with IARIA - www.iaria.org
STARTNew tag TAG1. Temporary accept a ‘tag’2. Set a threshold of its use for a time window3. If the diagnosis engine uses it in that time window, theninsert it as permanent in the ‘tag cloud’4. Then consider tag relations based on the diagnosis-context (situation)5. If the diagnosis engine do not use the new tag in the giventime window, add it to the list of potential tags to beconsidered in the future, but avoid definitive insertionEND
Heuristic #1. Inserting a New Semantic Tag
The tag inventory process keeps a few records concerninga specific tag, e,g., the cloud it belongs to, if it is on apotential tag list, or whether it was declined for a list ofclouds.
3.7.2 Semantic Tag Cloud State
As the technology evolves, building new tag clouds andmaintaining the created and validated ones are current cloudmanagement activities. To accurately communicate to adiagnosis engine what clouds can be used, we introducedthe cloud state. Cloud state belongs to {progressive, in_test,validated, obsolete}.
The state progressive denotes a cloud that it is in abuilding phase; it can be updated, but not used in adiagnosis process. In_test represents a cloud that achieved acertain degree of completeness; in this state, differentdiagnosis are tested and mapped against the cloud semanticrelations to validate them. The state validated is declared bythe diagnosis engines; it allows a semantic tag cloud to beused in the diagnosis decisions. Obsolete is declared whennone of the components of a cloud is in use any more.
3.7.3 Inter-clouds Relations
The main achievements with ontology are building smallmodels and link them via relations. Therefore, buildinginter-clouds relations are crucial for diagnosis. Theprocedure is captured by the following heuristic:
START1. Identify the clouds potentially related2. Identify the intra-cloud relationships3. Validate the cloud status4. Build inter-clouds relationships and validate them5. Identify for each semantic tag cloud:
a. “one-hop” related cloudsb. type of relationship
/start/cloud1<->end/cloud2/
END
Heuristic #2. Steps for building inter-cloud relations
3.7.4 Specific Aspects in Defining Tags
Tags are context-driven; they are defined without a globalview, by different teams. Building inter- and intra-cloudrelations is conditioned by a full understanding of thesemantic of a tag and its relations with other tags. Thefollowing aspects are considered: (i) temporary tags, (ii)synonymous tags, and (iii) ambiguous tags. Some of thetags are originally embedded into a given cloud; until atleast one relation with the existing tags is identified, it islabeled as ‘temporary’. Synonymous tags are more difficultto be identified; tag definition is usually human-driven, ifthere is no formal semantic behind tag definitions.Ambiguous tags can be identified inter- and intra-clouds.Disambiguation is achieved by either duplicating a given tagin two tags with dissimilar identifications, or by reducingthe semantic of a considered tag.
3.7.5 Diagnosis Actions Associated with Tag Clouds
In the proposed progressive ontology, each semantic tagcloud has attached a list of suggested potentially successfuldiagnosis actions.
Figure 11. Semantic tag clouds and associate actions (UMLnotation)
We depict in Figure 11 the diagnosis counter-part of eventontology modeling, i.e., the required actions. There are anumber of diagnosis potential actions associated with a
Semantic
Tag Cloud
Tag Tag
Relation
Action Bag
Potential Actions
Recommended Actions
action plan
intra-cloud
associated-action
inter-cloud

301
International Journal on Advances in Telecommunications, vol 3 no 3 & 4, year 2010, http://www.iariajournals.org/telecommunications/
2010, © Copyright by authors, Published under agreement with IARIA - www.iaria.org
semantic cloud. A subset of them is recommended, based onthe successful diagnosis history. In triggering a diagnosisdecision, we consider two potential solutions: an action, or aplan. A plan is a predefined combination of some actions,implying parallelism, serialization, and temporal relationsbetween actions.
There are some aspects when associating many tagsemantic clouds and the actions belonging to them. Withina semantic tag cloud, some actions are defined with specialguards (for validating the triggering), or explicitly specifyconflicting actions (in given conditions). When two or moresemantic tag clouds are mapped some conflicts mightdisappear, while emerging conflicts may occur, too. To dealwith all these aspect a better formalism is needed to expressstructures, relationships, actions, and constraints during thediagnosis activity (and its validation). The following sectiondeals with some of these aspects.
3.8 Timestamps
This section describes aspects related to timestamps,event correlation with temporal operators and gives anexample of use of temporal operators.
In a hierarchical model, an event model should allowmultiple timestamps, depending on the event hosting andprocessing. In an XML-like specification, we introduce forthe device (source), host (server), and processing application(management application or console), the timestamp and thetime zone a source, host or processing application belongsto.
TABLE I: Timestamp specification_______________________________<time><device_time> device_time></device_time><device_zone> device_time_zone</device_zone><server_time> server_time</server_time><server_zone> server_time_zone</server_zone>< processor_time> event_processor_time</processor_time><processor_zone> processor_time_zone</processor_zone></time>
The timestamp of the event is best set by the eventproducer (device_time). The timestamp representing themoment of event registration on the server, server_time is ofrelevance for correlation. Finally, the timestamp of theentity performing correlation or event processing is relevantfor synchronization among multiple such event processingsystems.
Any of these three entities can belong to different timezones that should be considered when temporal prioritiescount.
The values of these parameters are set by various entities.Some protocols provide the capability to supply the time inthe occurred event, or the time when the event producer sent
the event. With the Network Time Protocol (NTP) the timefrom event producers will be the most accurate.Alternatively, the time registered by the event processingsystem might be considered.
We advocate the following representation, similar toSyslog protocol, e.g., device_time: Jan 1 14:22:45represents the local time on the device at the time themessage is signed. For devices with no clocks, device_time:Jan 1 00:00:00 should be the representation.
3.8.1 Event Correlation with Temporal Operators
Temporal relations are used to build time-dependent eventcorrelations between events. For instance, we may correlatethe alarms that happened within the same 10-minutesperiod, which means the correlation window is 10 minutes.We abstract an event and consider only the temporalaspects.
Let e1 and e2 be two events defined on a time interval:
T1 = [t1, t1’]T2 = [t2, t2’]and e1 within T1
e2 within T2
two events occurring within the time intervals T1 and T2,respectively.
The following temporal relations R(t) or R are identified:
R(t):: = {after(t), follows(t), before(t), precedes(t)}
R ::= {during, starts, finishes, coincides, overlaps}
The following deductions hold:
after: e2 after(t) e1 t2 > t1+t
follows: e2 follows(t) e1 t2 t1'+t
before: e2 before(t) e1 t1' t2'+t
precedes: e2 precedes(t) e1 t1 t2'+t
during: e2 during e1 t2 t1 and t1' t2’'
starts: e1 starts e2 t1 = t2
finishes: e1 finishes e2 t1' = t2’
coincides : e2 coincides with e1 t2 = t1 and t1' = t2’
overlaps: e1 overlaps(ε) e2 t2’ t1’ ± ε > t2 t1 ± εwhere ε is the accepted threshold formeasurement variation.

302
International Journal on Advances in Telecommunications, vol 3 no 3 & 4, year 2010, http://www.iariajournals.org/telecommunications/
2010, © Copyright by authors, Published under agreement with IARIA - www.iaria.org
With respect to the algebraic properties of the temporalrelations,
- all are transitive, except overlaps,- starts, finishes, conincides are also symmetric
relations.
3.8.2 Example of Using Temporal Operators
In [22], time-oriented diagnosis was defined as
[e1, e2, e3….en]t1 {pi}t1 {di}t1,
where
pi, di, and ei represent a given instance of a problem,diagnosis, and event, respectively.
As an example, let us consider the instantiation:
[e1, e2, e3] | e2 follows(x) e1 & e2 overlaps(ε) e3} p123 d123
where x is the time duration between e1 and e2.
As a note,[e1, e2, e3] | e2 precedes(x) e1 & e2 overlaps(ε) e3}
p’123 d’123
represents a different problem and therefore, a differentdiagnosis.
In the case that the above specification designates a givendiagnosis and it is determined that e1 did not follow e2 aftertime x, a diagnosis engine issues an anomaly (no concretediagnosis is derived).
An event has a series of event attributes, which werepresent as:
e = (f1, f2, f3…, fn)where f: (value:V),
where V is the type of the attribute
Examples of event attributes that we consider are:
f1: IDf2: sourcef3: timestampf4: timezonef5: English text defining the potential causeetc.
e.f3 represents the value of attribute f3 in event e.
The operators on relative event position (follows,overlaps, etc.) are related to the attributes f3 and f4.
Figure 12.Timestamp and timezone event fields
In this example, e1.f4 and e2.f4’ are known, since theyrepresent the timezones of the sources of the two events.Only e1.f3 and e2.f3’ need to be set by the local clocks. Let usassume that:
clk1 sets e1.f3 and clk2 sets e2.f3’,where clk is the local clock of the event source.
|clk1-clk2| ≤ ε12,where ε12 is the clock skew between the two localclocks for two domains represented by two semanticclouds [23].
e2 follows(x) e1 is computed as follows:(e1.f3 + ε12) + x ˂ e2.f3 (for the same time zone)
For different time zones, this becomes:[(e1.f3 + ε12) ■ Abs(e1.f4)] + x ˂ (e2.f3) ■ Abs(e2.f4),
where ■ Abs(e.f4) represents the operator fornormalizing the time between timezones.
Following the same logic, e2 overlaps(ε) e3 for differenttime zones is computed as follows:
|(e2.f3) ■ Abs(e2.f4) - (e3.f3) ■ Abs(e3.f4)|˂ ε23
where|x| is the absolute value of xandε23 represents an acceptable error.
These event-based computations are performed each timea diagnosis is triggered and validated.
In the next section we will use this example in thediagnosis scenario.
3.9 Using Temporal Features for Diagnosis
This section presents a formal specification of theontology-based diagnosis, considering temporal relations.Let us assume that the diagnosis engine and the Quality ofDiagnosis (QoD) engine introduced in [22] have to triggerthe following operations: INTERPRET, APPLY,VALIDATE and MARK.- Diagnosis engine: INTERPRET events from the system.- Diagnosis engine: APPLY the diagnosis actions.- Quality of Diagnosis engine:
VALIDATE the diagnosis actions.and
MARK successful actions.

303
International Journal on Advances in Telecommunications, vol 3 no 3 & 4, year 2010, http://www.iariajournals.org/telecommunications/
2010, © Copyright by authors, Published under agreement with IARIA - www.iaria.org
The APPLY, VALIDATE and MARK functions wereshown in [23]. We reconsider the example withINTERPRET functionality as well.
As discussed in [23], there is a semantic tag hierarchywithin each domain, with special dependency relationsbetween semantic tags. Within a domain, semantic tags andtheir relations form a semantic tag cloud; a domain mighthave multiple semantic tag clouds associated with it. Let usassume that a system is represented by two semantic tagclouds (Figure 13). Semantic cloud #1 defines the tags andtheir relationships for a fault related to a power supply whileSemantic cloud #2 relates to a potentially real-time andlatent fault.
Figure 13. Two Semantic Tag Clouds [23]
When some event patterns occur and diagnosis actionsmust be triggered (and validated), the Diagnosis Engineinterprets the events from the system and applies thediagnosis actions. Next, the Quality of Diagnosis enginevalidates the actions and marks the successful actions.
The following algorithm is used by the engines to performthe required actions for a given occurrence of combinationsof events. A particular series of events occurs as shown inthe INTERPRET part of the following algorithm (we usethe ‘.’ Notation, i.e., a.b means the property ‘b’ of theinstance ‘a’). When the conditions (2) and (3) explained inSection III hold, the necessary condition to enter the rest ofthe algorithm is met.
START
INTERPRETIF {[e1, e2, e3] | e2 precedes(x) e1 & e2 overlaps e3}
CLOCK = t0
AND e1 belongs to cloud1
AND e2 belongs to cloud2
AND e3 belongs to cloud2
AND x < t0
THENERROR
ELSEASSUME
e2 precedes(x) e1 & e2 overlaps e3 = = TRUEAND
IF there is exist rc < cloud1, cloud2>AND cloud1.state = activeAND cloud2.state = activeANDIF there is rdto <e1, domain1>
AND tag1 belongs to domain1
AND tag1 belongs to cloud1
AND tag2 belongs to domain2
AND there is rT <tag1, tag2>AND there is rCA1 <cloud1, {action1}>AND there is rCA2 <cloud2, {action1}>
WITHaction1 = {a1, a3, a6}ANDaction2 = {a1, a5, a7}
THEN
APPLY {{a1, a3, a5, a6, a7} – {a1.conflicting a3.conflicting a5.conflicting a6.conflicting a7.conflicting}
VALIDATEa1.post-conditions = TRUEa3.post-conditions = TRUEa5.post-conditions = TRUEa6.post-conditions = TRUEa7.post-conditions = TRUE
MARKa1.mode = successfula3.mode = successfula5.mode = successfula6.mode = successfula7.mode = successful
END
Legend (for details, see [18]):rC: RC | rC ::= <c1: C, c2: C>, cloud to cloud relationrT: RT | rt ::= <t1: T, t2: T>, tag to tag relationrCA: RCA | rCA ::= <c :C, {ai : A | pi: P}>, cloud to actionrelationrdto: RDto | rdto ::= <e:E, d:D>, event to domain relation.
IV. CASE STUDY
The concepts proposed in this paper areimplementable, at-large, but considerations must betaken when designing new systems to follow the formalapproach. In this section, we highlight the mainchallenges of a full implementation of the proposeddiagnosis solutions. While fixing legacy systems

304
International Journal on Advances in Telecommunications, vol 3 no 3 & 4, year 2010, http://www.iariajournals.org/telecommunications/
2010, © Copyright by authors, Published under agreement with IARIA - www.iaria.org
remains a complex problem, avoiding the same errorsfor newly designed systems seems be to the mostappropriate approach. We illustrate partial solutions fordifferent concepts introduced via a case studysimulation. The case study is conducted in connectionwith Cisco DFM (Device Fault Manager).
4.1 Challenges in Implementing the New Approach
Two main complementary contributions wereproposed in this paper, namely: (i) a new mechanismfor validating diagnosing actions, while promoting thereuse of diagnosis actions in similar situations, and (ii)a new approach on events and actions. While theusefullenss of each new concept and mechanism washighlighted when they were introduced, developping alarge scale system using these concepts requiressubstantial effort and time.
There are several “de facto” constraints indevelopping a totally new diagnosis approach. In thefollowing sections, we consider the most importantchallenges, based on our experience in validating ourapproach.
4.1.1 Customized Event Model used by DifferentSystems
One difficulty in validating our approach is relatedto the customized model used by differentsystem/network devices/software to construct and sendan event. To complicate the task further, evensubsequent releases of the same entity might exposedifferent event models. For this reason, any previousdiagnosis algorithms and diagnostic systems becomeobsolete. Since designing and implementing a newevent is relatively easy, there are thounsands of uselessevents (not easily captured by any diagnosis algorithmor system) and, consequenlty, thousands of “exceptionhandling” cases; the latter are usually sent to a humanoperator in NOCs (Network Operating Centers).
Even in cases when a standard is available, therecommendations are too generic . For example, in ITUrecommendation X.745 [81], the parameter status canbe “mandatory”, “optional”, “conditional” or “notapplicable”. Aditionally, an‘implementstion status” (“implemented” or “not-implemented”) needs to be considered (Figure 14)._____________________________________________<parameter><parameter status>:: = mandatory | optional |conditional | not applicable or out of scope<implementation status> ::= implemented | notimplemented<parameter/>
Figure 14. Recommendations for Event Parameters
In this case, even if an event model is enforced, thevalue of parameter status and implementation status arenot helpful, since, for the same event definition, somefeatures might not be mandatory or implemented.
In other cases, the implementaiton of the events isvery customized and leaves little opportunity for syntaxharmonization, yet alone consideration for the semanticaspects. For example, Figure 15 presents a Syslog eventissued by Cisco’s GSR (Gigabit Switch Router) [30]._____________________________________________%EE48-3-ALPHAERR: [chars] error: cpu int [hex]mask [hex]\n addr [hex] data hi [hex] data lo [hex]parity [hex]\n fs [hex],pf [hex], prep [hex] (pc [hex]),pc1 [hex]\n plu int [hex] int en [hex] err en [hex] err[hex] ecc [hex]\n tlu int [hex] err [hex] ecc [hex], mip[hex] (pc [hex]), pc2 [hex]\n pst [hex], cam [hex], nf[hex], pop [hex] (pc [hex]), ssram adr [hex] err [hex]\npipe ctl [hex] avl [hex] end [hex] fatal [hex], gather[hex]\n xmb read [hex] rclw1 [hex] rclw2 [hex] rclr[hex]\n tailw1 [hex] tailw2 [hex] tail [hex]\n sts1 [hex]sts2 [hex]\n pcr regs: fs [hex] prep [hex] plu [hex] pc1[hex] tlu [hex] dummy [hex] mip [hex] pc2 [hex] mtch[hex] post [hex] pop [hex] gthr [hex]_____________________________________________
Figure 15. Example of a Syslog Event issued by GSR(Cisco)
We see that there are many different types offormats for the events. Automating extraction of usefulinformation from event text message is close toimpossible. To extract a useful piece of information, ortoken, a diagnosis tool has to know the format aprioriand write “rules” to parse messages into tokens, whenthe messages are generated from various sources.Currently, Syslog messages are generated by numeroussources: various IOS protocol code modules, devicedriver code module, etc. Updating all these sourcesimplies changing tens of millions of lines of code, atask close to impossible.
We note here that SNMP traps have a standardformat, using ASN1 (Abstract Syntax Notation One)[30]. An example of an SNMP trap notification isshown in Figure 16.
4.1.2 Events are Issued in Isolation
The second challenging aspect consists in the factthat change reports (events) are issued in isolation, withan implicit semantic on their potentially related events.This is due to the fact that the events are designed bythe entity designers; they do not have a full picture ofwhere the entity will be used, its interactions, etc.
Most of the diagnosis decisions are human-heldheuristics. In many cases, intuition plays a major role.Some diagnosis decisions are experience-based, and

305
International Journal on Advances in Telecommunications, vol 3 no 3 & 4, year 2010, http://www.iariajournals.org/telecommunications/
2010, © Copyright by authors, Published under agreement with IARIA - www.iaria.org
very rarely based on rigourous knowledge processing.As a drawback, accuracy and correctness migth lead toa late diagnosis.
To illustate the difficulty in dealing with legacysystems for a correct diagnosis, we consider twoexamples.
First, let us consider the example of a SNMP trapnotification as shown in Figure 16. SNMP MIBs definethese kind of messages in a standard way byNOTIFICATION-TYPE. The varbind will indicateneighbor = xxx.yy.zzz.mm; status = Down. Despite themore formalized straucture of SNMP traps, a toolcannot syntactically “tokenize” the message followingthe same approach, unless the message is somehowrecognized. This means that a tool user or developer hasto know the message format, write a “rule” to recognizethe format, then, when the message arrives with theprefix “%BGP-5-ADJCHANGE”, that relevant “rule”can be triggered to tokenize the text content._____________________________________________Nov 11 11:52:40.735: %BGP-5-ADJCHANGE:neighbor xxx.yy.zzz.mm Down - Peer closed thesession_____________________________________________
Figure 16. Example of a SNMP Trap Notification
Writing such rules is a cumbersome activity,especially since a rule needs to be written for eachevent. Additioanlly, having millions of rules is notscalable, raises conflicts, and diagnosis decisions cometoo late._____________________________________________VSEC-6-VLANACCESSLOGNP: vlan [dec] (port[dec]/[dec]) denied ip protocol = [dec] [int] -> [int],[dec] packet(s)_____________________________________________
Figure 17. A Report Syslog Event
Next, let us consider the example presented inFigure 17. To understand the explanation of the Syslogmessage shown here, a special rule must be written.The rule should capture that this message indicates thatan IP packet from the identified VLAN and physicalport that matches the VACL log criteria was detected.The first [dec] is the VLAN number, the second[dec]/[dec] is the module/port number, the third [dec] isthe L4 protocol type, and the fourth [dec] is the numberof packets received during the last logging interval. Thefirst [int] is the source IP address, and the second [int]is the destination IP address.
As a conclusion, the huge volume of events issuedby a system, the large variation in both synatax andsemantic, gives little chance to have a general diagnosisapproach that covers all the cases, for all system
entities. While fixing legacy systems remains acomplex problem, avoiding the same errors for newlydesigned systems seems be to the most appropriateapproach.
4.2 Validation of the Paper Proposal
We can summarize that the paper presents a step-by-step system diagnosis approach by proposing a way todefine events (with a well defined syntax andsemantic), and their links with potentially relatedevents. Instead of a “unique format”, we proposed anontology-based approach, per small domains.
While writing rules has proven to be a tediousactivity, if not almost impossible, discovering eventpatterns, associating a potential list of recommendeddiagnosis actions for each pattern, and keeping track ofsuccesfull actions (via diagnosis validation engine)seems to be a feasable approach.
4.2.1 Industrial Connection of the Solution – CiscoDevice Fault Manager (DFM)
We recall that the status on the network elements iscaptured via notifications, polling, etc., and abehavioral deviation may be identified. The simulationswere performed in connection with Cisco DFM (DeviceFault Manager) [30], which will be briefly presentedbelow.
Cisco’s Device Fault Manager (DFM) is aspecialized software offering real-time assistance forsystem diagnosis. The main activities it performs are:(i) Monitors and displays the operational networkhealth data;(ii) Analyzes the events triggered in the network anddetermines when a possible fault has occurred, and(iii) Sends notifications to pre-determined users throughGraphical User Interface display or through a series ofconfigurable notifications.
Figure 18 [30] shows the tasks performed by DFMand the relations with other components. The softwareconstantly gathers information from system elements,analyzes and prioritizes the data, and sends theappropriate notifications.
DFM can send three types of notifications:(i) SNMP Trap Notifications – DFM processes the trapsand events it receives, and generates its own traps withthe format defined in CISCO-EPM-NOTIFICATION-MIB [30].(ii) E-mail Notification - DFM sends e-mail messageswith the information about the event and the alert thatcaused it.(iii) Syslog Notification - DFM generates Syslogmessages that can be forwarded to Syslog daemons onremote systems.

306
International Journal on Advances in Telecommunications, vol 3 no 3 & 4, year 2010, http://www.iariajournals.org/telecommunications/
2010, © Copyright by authors, Published under agreement with IARIA - www.iaria.org
Figure 18. DFM Architecture [30]
DFM uses the concept of subscriptions to allow thespecification of the elements needed for its activity.SNMP Trap Notification subscriptions, or E-mailsubscriptions, have the following elements in common:(i) Devices, representing the devices of interest;(ii) Alert Severity and Status;(iii) Event Severity and Status (the names of the eventscan also be customized);(iv) Recipients, representing one or more hosts toreceive the SNMP traps or uses to received the e-mails,and(v) Name, needed to uniquely identify the subscription.
DFM analyzes the events as they arrive, or polls theelements regularly. When an event or alert occurs thatmatches a subscription, a notification is sent. An eventtrigger can be either normal polling, a threshold thatwas exceeded, or a trap that was received.
A category of traps are generated by systemelements, but are not processed by DFM; these rereferred to as pass-through traps. They appear in theAlerts and Activities Display of the software, if theywere generated by a device managed by DFM. Thesoftware can be configured to forward pass-throughtraps from managed or unmanaged devices to otherelements. If DFM does not know which devicegenerated the trap, it ignores the trap.
DFM perform system elements polling via twomechanisms:(i) Using a high-performance, asynchronous ICMPpoller with two threads.(ii) Using the SNMP poller, which has ten synchronousthreads running in parallel.
The two polling mechanisms are coordinated foroptimal results.
4.2.2 Event Definition
In the previous sections, we presented a way todefine an event; we applied this approach for a limitednumber of events, as a proof of concept for theproposal. The progressive approach we adopted for thevalidation was to develop the event features,represented in fields, in a context, as shown in Figure19.
Figure 19. A Progressive, Context-oriented, EventDefinition
We started with a basic set of fields (features), witha precise syntax and semantic. Then, we consideredextended features in a domain. This helped control thediagnosis rules in a particlar context. For example, thereare specific rules in SLA domain, such as SLAviolations, SLA penalties, etc. In our simulation, theSLA domain and performance domain were considered.This approach was facilitated by the fact that, for eachdomain, there are well defined and accepted concepts,i.e., semantic tags. For each such domain, we built asemantic tag cloud. Therefore, bridging between asemantic tag cloud belonging to the performancedomain and another one belonging to the SLA domainwas easier.
4.2.3 Symptoms-Problems-Diagnosis Rules
Based on the trio S-P-D (symptoms-problems-diagnosis), a diagnosis process was triggered,performed by the “diagnosis engine” and based on theframework presented in Figure 20.
In Figure 20, the “management console”, the“management system (mgmt)”, and the “device faultmanager” are existing components. Since we were notfocusing on gathering network events and status, aDFM-like input was used for the simulation. As thecurrent network entities do not issue events in therequired form to apply our strategy, we rather usedtransformation processes to get the information asneeded.
normalized_form sla usageperformancevoice_over_x
field_1 field_k…
syslog
(device)
syslog
(server)
layer_1 layer_m
.
messag
unstructured_msg
extension…

307
International Journal on Advances in Telecommunications, vol 3 no 3 & 4, year 2010, http://www.iariajournals.org/telecommunications/
2010, © Copyright by authors, Published under agreement with IARIA - www.iaria.org
The selected events were normalized first (“1” inFigure 20) following the general process pictured inFigure 19. The QoD engine (“2” in Figure 27) took asinput the status of monitored parameters (counters,CPU, memory, ports, etc.), while (“3” in Figure 27)processed the coming events to identify patterns, and,hence, correlate them, and sent the recommendedactions associated with a given pattern to the mgmt(DFM) (actually, to the operator console). It also storedthe situation (set of the watched states) when a set ofthe recommended actions are issued. In a realenvironment, it also stores the status of the system afterone or more selected actions are declared “successful”.This allows the finding of a more rapid solution whenthe same situation occurs.
Figure 20. Simulation Architecture Considering DFMfeatures
It is expected that a validation takes place, eitherpreventively (for preventive diagnosis), following asmall variation in the normal behavior, after adiagnosis, or a stable period.
Implementation of the diagnosis decisions is basedon the same symptom-problem-diagnostic trioparadigm. Based on symptoms sent by NEs (NetworkElements) to the monitoring and diagnosis applications,or polled by these applications themselves, a set ofproblems (or only one single problem) becomecandidates for leading to a diagnostic. Upon theconfidence degree of the diagnosis engine, moreinformation may be polled from the NEs to complete,make more accurate, or re-validate a status with thefinal goal of triggering the most suitable action on themanaged system, or providing the most accuratediagnosis (best-practices, recommended actions,reports) to the network operator or managing systems.
S-P-D may be executed on different engines, as theymay be distributed; in our case, we used one singlediagnosis engine.
Recursive receiving/polling actions may beperformed at any stage of processing, within S, P, andD processes.
4.2.4 Events Processing
The first step in the simulation process was tonormalize the input events, as shown in Figure 21. Themain achievement of the normalization was that thesame property represented by the field value of anevent, will always be on the same position in thenormalized event, regardless of its initial position in thenon-normalized input event. Obviously, there are emptyfields in the normalized event for use when new eventtypes arrive, with new fields/features. Following anontology model previously described, the normalizedevents also included pointers to other event types thatan event has relations to.
Figure 21. Event Normalization
Post-event normalization, several operations wereneeded to process the events in terms of their numberand referring to the problems they report. The eventsfalling within a specified time window were considered.We recall that a group of events that are correlated formwhat we refer to as a pattern. We used the followingoperators to identify the patterns in our simulation:(i) Compression [a, a,...,a] aCompression is done when identical alarms areproduced by the same network element and they havethe same message contents except timestamps.Compression is the task of reducing multipleoccurrences of identical alarms into a singlerepresentative of the alarm.(ii) Filtering [a , p(a)< H] ØFiltering is the most widely used operation to reducethe number of alarms presented to the operator. If someparameters p(a) of alarm a, e.g., priority, type, locationof the network element, timestamp, severity, etc., do
event normalization
device statussituation
patterns
patterns
mgmt
device fault manager
pollingtrap
QoDdiagnosis engine
1
2
3
management
console
actions

308
International Journal on Advances in Telecommunications, vol 3 no 3 & 4, year 2010, http://www.iariajournals.org/telecommunications/
2010, © Copyright by authors, Published under agreement with IARIA - www.iaria.org
not fall into the set of predefined legitimate values H,then alarm a is simply discarded or sent into a log file.(iii) Suppression [a , C] ØSuppression is a context-sensitive process in which anevent a is temporarily inhibited depending on thedynamic operational context C of the networkmanagement process. Temporary suppression ofmultiple alarms and control of the order of theirexhibition is a basis for dynamic focus monitoring ofthe network management process.(iv) Count [n* a] bCount results from counting the number of repeatedarrivals of identical alarms. When a pre-definedthreshold is met, the specified number of alarms aresubstituted by a new alarm.(v) Escalation [n* a, p(a)] a, p'(a), p'>pEscalation assigns a higher value to some parameterp'(a) of alarm a, usually the severity, depending on theoperational context, for example, the number ofoccurrences of the event.(vi) Generalization [a, ab] bAlarm a is replaced by its super class b. Alarmgeneralization has a potentially high utility for networkmanagement. It allows one to deviate from a low-levelperspective of network events and view the situationsfrom a higher level.(vii) Specialization [a, ab] bSpecialization is the opposite procedure of alarmgeneralization. It substitutes an alarm with a morespecific subclass of this alarm.(viii) Temporal relation [a T b] cTemporal relation T between a and b allows them to becorrelated depending on the order and time of theirarrival.(ix) Clustering [a, b, ..T,,,,] cClustering allows the creation of complex correlationpatterns using logical operators (and), (or), and(not) over component terms. The terms in the patterncould be primary network alarms, or previously definedcorrelations (following the event ontology).
These operators were applied to the normalizedevents to identify several patterns in our time window.Each event contains information on the source of theevent. The “state” of all event sources in a pattern wasgathered by polling the sources themselves. Thesestates acted as “pre-conditions” to the diagnosisprocess. An example of a pattern format is presentedbelow:{(e1, source1, status1), (e2, source2, status2)} ::=pattern1
The sources of the events in a pattern are part of asemantic tag cloud, which is associated with a set ofrecommended actions. For each pattern, if all thesources belong to the same semantic tag cloud, therecommended actions associated with that cloud are
forwarded to the management console. If the sources ina pattern belong to multiple semantic clouds, a union ofthe recommended actions of all these semantic clouds isforwarded to the management console.
4.2.5 Actions Triggering
When the diagnosis P-D rule identifies specificactions to be triggered, different rules may be in placewith respect to triggering rights, such as:(i) Only the network operator may be allowed toperform the suggested actions. In this case, thediagnosis must be human-understandable, accurate,unambiguous, and feasible. This is mainly related to theevent format and specification of the diagnosis actions.DFM uses appropriate Tcl_Tk (Tool CommandLanguage Toolkit) scripts to determine if a messageneeds to be sent to a human operator of to othermanagement applications for processing.(ii) The diagnosis engine itself is automaticallytriggering the diagnosis actions. This was not yetexperimented.(iii) Other management applications are in charge of thediagnosis actions and their results.
In one of these manners, the recommended actionsare applied and the diagnosis engine is notified to pollthe new states of the event sources determine the “post-conditions”. If the post-conditions hold, the action ismarked as “successful” for use in future similarsituations.
4.2.6 Points to Consider for Implementation
There are several points to consider whenimplementing the system proposed in this paper. Webriefly mention some of them in this section.
(i) Console information is crucial in detecting severecrashes allowing a key message to describe theprobable cause. In some situations, the device is notlonger able to send the message to some server, or anyother device. Commonly, Cisco routers are configuredto send console events as Syslog messages. However,even in the case of crashes, the messages printer justbefore can help diagnose the nature of the problem.
(ii) Cisco IOS devices (IOS 11.2 and above) can beconfigured to send Syslog messages to a Syslogmessage-trap converter. Several SNMP notificationshave been pre-configured, while others are enabled.Certain are mandatory (coldStart, warmStart,authenticationFailure, linkDown, linkUp,egpNeighborLoss). Since authenticationFailure andLinkUp/LinkDown may trigger a lot of events, one canapply some selective thresholds. Alternatively, a pollingprocedure may be started on those parameters causingthese events. Equally, link state notification should be

309
International Journal on Advances in Telecommunications, vol 3 no 3 & 4, year 2010, http://www.iariajournals.org/telecommunications/
2010, © Copyright by authors, Published under agreement with IARIA - www.iaria.org
enabled only for some objects, devices, and especiallyfor LinkDown.
(iii) For those entities that require eventconfiguration, one can use an approach where thedevice checks the trigger point and generates the eventsaccording to the threshold type (no need to collect andfilter data). The risk of this method is that events can belost for many reasons other than non-crossing thresholdpoints. Threshold on devices are called agent-basedthreshold. SNMP MIB and RMON MIB allow settingthresholds on devices. Alternatively, data can becollected at a management station and analyzed againstthe appropriate threshold. This kind of setting is callednetwork management system-based triggering.
V. CONCLUSION AND FUTURE WORK
The concepts proposed in this paper areimplementable, at-large, but considerations must betaken when designing new systems for follow theformal approach. In this section, we highlighted themain challenges of a full implementation of theproposed diagnosis solutions. While fixing legacysystems remains a complex problem, avoiding the sameerrors for newly designed systems seems be to the mostappropriate approach. We illustrated partial solutionsfor different concepts introduced via a case studysimulation.
As a result, the successfully marked actions can bere-used as recommended actions when similar eventpatterns occur. When an event pattern inventory exists,a similar algorithm is associated with each pattern. Inthis case, the Diagnosis Engine behavior is acombination of all these algorithms.
We presented an adaptive framework for diagnosisvalidation and transfer of information from successfuloutcomes for future use and optimization of thediagnostic activity. It was shown that the currentdiagnosis techniques needs validation of successfulactions and a process for knowledge transfer. Weintroduced the QoD, an engine that validates thesuccessful actions and transfer knowledge for use insimilar situations. This new approach pave the way toadaptive diagnosis, where only those previouslyclassified as “successful actions” are deemed to beapplied in similar situations.
Towards automation, a few open issues are in ourplans for future exploration and solutions. Criteria forsymptom similarly must de defined and experimentedin different contexts. Metrics for measuring accuracyof the QoD evaluation should be derived per technologydomain and domain context. We intend to explore aprogressive ontology (leading to progressive diagnosis)and therefore “progressive validation” of successfulactions. This is intended to solve potential conflicts ofthe post-conditions of the actions already validated as
“successful” and to evaluate the accuracy of thediagnosis actions (preciseness versus permanentdamage). A specific target is to propose a flow engine,as an instantiation of the QoD that identifies context-based temporal patterns of successful or failurediagnosis actions.
VI. REFERENCES
[1] M. Steinder and A. S. Sethi, A survey of faultlocalization techniques in computer networks, Scienceof Computer programming 53 (2004) 165-194[2] A. Patel, G. McDermott, and C. Mulvihill,Integrating network management and artificialintelligence, in: B.Meandzija, J.Westcott (Eds.),Integrated Network Management I, North-Holland,Amsterdam, 1989, pp. 647–660[3] I. Katzela, Fault diagnosis in telecommunicationsnetworks, Ph.D. Thesis, School of Arts and Sciences,Columbia University, New York, 1996[4] L. Lewis, A case-based reasoning approach to theresolution of faults in communications networks, in:H.G. Hegering, Y. Yemini (Eds.), Integrated NetworkManagement III, North-Holland, Amsterdam, 1993, pp.671–681[5] M. Frontini, J. Griffin, and S. Towers, Aknowledge-based system for fault localization in widearea network, in: I. Krishnan, W. Zimmer (Eds.),Integrated Network Management II, North-Holland,Amsterdam, 1991, pp. 519–530[6] J. Goldman, P. Hong, C. Jeromnion, G. Louit, J.Min, and P. Sen, Integrated fault management ininterconnected networks, in: B. Meandzija, J. Westcott(Eds.), Integrated Network Management I, North-Holland, Amsterdam, 1989, pp. 333–344[7] C. Joseph, J. Kindrick, K. Muralidhar, and T. Toth-Fejel, MAP fault management expert system, in:B.Meandzija, J.Westcott (Eds.), Integrated NetworkManagement I, North-Holland, Amsterdam, 1989, pp.627–636[8] B. Gruschke, Integrated event management: Eventcorrelation using dependency graphs, in: A.S. Sethi(Ed.), Ninth Internet. Workshop on DistributedSystems: Operations and Management, University ofDelaware, Newark, DE, October 1998, pp. 130–141[9] S. Kätker and K. Geihs, A generic model for faultisolation in integrated management systems, Journal ofNetwork and Systems Management 5 (2) (1997) 109–130[10] K. Houck, S. Calo, and A. Finkel, Towards apractical alarm correlation system, in: A.S. Sethi, F.Faure-Vincent, Y. Raynaud (Eds.), Integrated NetworkManagement IV, Chapman and Hall, London, 1995, pp.226–237

310
International Journal on Advances in Telecommunications, vol 3 no 3 & 4, year 2010, http://www.iariajournals.org/telecommunications/
2010, © Copyright by authors, Published under agreement with IARIA - www.iaria.org
[11] I. Katzela and M. Schwartz, Schemes for faultidentification in communication networks, IEEE/ACMTransactions on Networking 3 (6) (1995) 733–764[12] A.T. Bouloutas, S. Calo, and A. Finkel, Alarmcorrelation and fault identification in communicationnetworks, IEEE Transactions on Communications 42(2–4) (1994) 523–533[13] S. Kliger, S. Yemini, Y. Yemini, D. Ohsie, and S.Stolfo, A coding approach to event correlation, in: A.S.Sethi, F. Faure-Vincent, Y. Raynaud (Eds.), IntegratedNetwork Management IV, Chapman and Hall, London,1995, pp. 266–277[14] M. Steinder and A. S. Sethi, End-to-end servicefailure diagnosis using belief networks, in: R. Stadler,M. Ulema (Eds.), Proc. Network Operation andManagement Symposium, Florence, Italy, April 2002,pp. 375–390[15] V. Venkatasubramanian, R. Rengaswamy, K. Yin,and S. N. Kavuri, “A review of process fault detectionand diagnosis, Part I: Quantitative model-basedmethods,” Computer and Chemical Engineering,vol.27, pp.293–311, 2003.[16] W. Stallings, SNMP, SNMPv2, and CMIP: ThePractical Guide to Network-Management Standards,Addison-Wesley Publishing Company, 1993, ISBN 0-201-63331-0[17] M. Popescu, P. Lorenz, and J.M. Nicod, Anadaptive Framework for Diagnosis Validation, TheProceedings of The Third International Conference onAdvanced Engineering Computing and Applications inSciences (ADVCOMP) 2009. IEEE Press, pp. x-y[18] Cisco IOS Network Management ConfigurationGuide, 2008http://www.cisco.com/en/US/docs/ios/netmgmt/configuration/guide/nm_esm_syslog_ps6441_TSD_Products_Configuration_Guide_Chapter.html (last accessedDecember 2009)[19] W. Stallings, SNMP, SNMPv2, and CMIP: ThePractical Guide to Network-Management Standards,Addison-Wesley Publishing Company, 1993, ISBN 0-201-63331-0[20] Network Management System: Best practicesWhite Paper, 2008http://www.cisco.com/en/US/tech/tk869/tk769/technologies_white_paper09186a00800aea9c.shtml (lastaccessed December 2009)[21] Augmented Bachus-Naur formhttp://web.mit.edu/macdev/mit/doc/www/devdoc/Augmented%20BNF.html[22] M. Popescu, P. Lorenz, and J.M. Nicod, AnAdaptive Framework for Diagnosis Validation, TheProceedings of The Third International Conference onAdvanced Engineering Computing and Applications inSciences, ADVCOMP 2009, Sliema, Malta, pp. 123-129, IEEE Press
[23] M. Popescu, P. Lorenz, M. Gilg, and J.M. Nicod,Event Management Ontology: Mechanisms andSemantic-driven Ontology, The Proceedigns of TheSixth International confernces on Networking andServcies, ICNS 2010, Cancun, Mexico, pp. 129 - 136,IEEE Press
[24] W. Stallings, SNMP, SNMPv2, and CMIP: ThePractical Guide to Network-Management Standards,Addison-Wesley Publishing Company, 1993, ISBN 0-201-63331-0
[25] M. Popescu et al., US Patent 7275017, Method andapparatus for generating diagnoses of network problems
[26] L. Lamport, TLA: Temporal logic of Actions,http://research.microsoft.com/enus/um/people/lamport/tla/tla.html (last accessed August 12, 2010)
[27] R. Griffith, J.L. Helelrstein, G. Kaiser, and Y.Diao, Dynamic Adaptation of Temporal EventCorrelation for QoS Management in DistributedSystems, 2006 www.cs.columbia.edu/techreports/cucs-055-05.pdf (last accessed August 2, 2010)
[28] K. Walzer, T. Breddin, and M. Groch, Relativetemporal constraints in the RETE algorithm forcomplex event detection, Proceedigns of the SecondInternational Conference on Distributed Event-basedSystems, 2008, pp. 147-155
[29] M. Popescu, Temporal-oriented policy-drivennetwork management, Master Thesis, McgillUniversity, Canada 2000, p. 140
[30] M. Popescu, Semantic Mechanisms for Cross-
Domain System Diagnosis Mécanismes Sémantiques
pour le Diagnostic des Systèmes, PhD Thesis,
University of Besançon, France, 2010

311
International Journal on Advances in Telecommunications, vol 3 no 3 & 4, year 2010, http://www.iariajournals.org/telecommunications/
2010, © Copyright by authors, Published under agreement with IARIA - www.iaria.org
ICI Reduction Through Shaped OFDM in CodedMIMO-OFDM Systems
Wei Xiang, Julian RussellFaculty of Engineering and Surveying
University of Southern QueenslandToowoomba, QLD 4350
E-mail: [email protected]
Yafeng WangWireless Theories & Technologies Laboratory
Beijing University of Posts and TelecommunicationsBeijing 1000876, China
E-mail: [email protected]
Abstract—The default pulse shaping filter in the conventionalmultiple-input and multiple-output (MIMO) based orthogonalfrequency division multiplexing (OFDM) system is a rectangularfunction, which unfortunately is highly sensitive to frequencysynchronization errors and the Doppler spread. Shaped OFDMis able to considerably alleviate the effect of inter-carrier in-terference (ICI) as well as reduce the out-of-band frequencyleak. In this paper, we study various pulse shaping functions andinvestigate their efficacy for reducing the ICI in the space-timeblock coded MIMO-OFDM system. We compare a new shapingpulse termed harris-Moerder pulse with several other popularNyquist pulses such as the raised-cosine pulse and better thanraised-cosine pulse. Our simulation results confirm that pulseshaping using a suitable shaping function other than the defaultrectangular one can alleviate ICI and thus achieve better biterror rate (BER) performance. Furthermore, it is demonstratedthat the harris-Moerder shaping pulse is the most successful onein suppressing ICI.
Index Terms—Pulse shaping, inter-carrier interference (ICI)reduction, orthogonal frequency-division multiplexing (OFDM),multiple-input and multiple-output (MIMO), space-time coding,Rayleigh fading channel.
I. INTRODUCTION
Orthogonal frequency-division multiplexing (OFDM) [1],[2] has become an attractive modulation technology with wideemployment in a variety of current telecommunications stan-dards such as asymmetric digital subscribe line (ADSL) forhigh-speed wired Internet access, digital audio broadcasting(DAB), and digital terrestrial TV broadcasting (DVB). Morerecently, OFDM has made remarkable inroads into current andfuture wireless standards, e.g., WLAN (IEEE 802.11a/g/n),WiMAX (IEEE 802.16), 3GPP long term evolution (LTE), andIMT-Advanced.
OFDM is essentially a block modulation technique, whichconverts a wideband frequency selective fading channel intoa number of parallel narrowband orthogonal sub-carriers thatexperience only flat fading. The primary advantages of OFDMlies in its ability to cope with severe frequency-selective fadingdue to multi-path without complex equalization filters. OFDMis able to attain high frequency efficiency as opposed toconventional frequency-division multiplexing techniques byoverlapping the orthogonal sub-carriers. However, this advan-tage comes at the expense of the sensitivity to frequency offsetleading to inter-channel interference and hence performance
degradation.Meanwhile, multiple-antenna technology, also dubbed
multiple-input and multiple-output (MIMO), is emerging asan enabling technique to achieve high data rate and spectralefficiency by simultaneously transmitting parallel data streamsover multiple antennas [3], [4]. The essential idea behindMIMO technology is space-time signal processing in whichboth the time and spatial dimensions are exploited throughthe use of multiple spatially distributed antennas. As such, aMIMO system effectively transforms multi-path propagation,traditionally treated as a nemesis for wireless communications,into user benefits.
The inaugural concept of MIMO was pioneered in BellLabs in middle 1990s. Telatar studied MIMO system capacityunder Gaussian channels in 1995 [5], while Foschini inventedthe layered space-time architecture in 1996 [6]. To realisethe enormous capacity of MIMO systems, Wolniansky estab-lished the world’s first MIMO testbed based upon the verticalBell Laboratories layered space-time (V-BLAST) algorithm in1997 [8], which achieved unprecedented spectral efficiency of20-40 bit/s/Hz in indoor rich scattering propagation environ-ments. V-BLAST breaks input data into parallel sub-streamsthat are transmitted through multiple antennas [6], [7], [9]. Theastonishingly high spectral efficiency stem from parallel sig-nal transmission resulting in remarkable spatial multiplexinggains. Another important category of MIMO techniques thatstrive to maximize diversity gains in lieu of rate increase istermed space-time coding, including space-time block codes(STBCs) [10], [11] and space-time trellis codes (STTCs) [12].The third type of MIMO technology exploits channel stateknowledge at the transmitter side through decomposing thechannel coefficient matrix using singular value decomposition(SVD). The decomposed unitary matrices via SVD can beused to configure pre- and post-filters at the transmitter andreceiver to achieve near optimum MIMO capacity [4].
MIMO and OFDM technologies can be used in conjunctionto provide broadband wireless services for future fourth-generation (4G) wireless communications systems [13]. Fora wideband MIMO channel whose fading is frequency selec-tive, the complexity of optimum maximum likelihood (ML)MIMO detection grows exponentially with the product of thebandwidth and the delay spread of the channel. To this end,

312
International Journal on Advances in Telecommunications, vol 3 no 3 & 4, year 2010, http://www.iariajournals.org/telecommunications/
2010, © Copyright by authors, Published under agreement with IARIA - www.iaria.org
MIMO-OFDM is preferred over MIMO-SC (single-carrier) inthat OFDM modulation is employed to overlay on MIMO so asto convert a frequency-selective MIMO channel into multipleflat fading subchannels. MIMO-OFDM can be implemented asspace-time coded OFDM (ST-OFDM), space-frequency codedOFDM (SF-OFDM), or space-time-frequency coded OFDM(STF-OFDM) [14]. In this paper, we restrict our systemmodel to ST-OFDM as the focus of the paper is on reducinginter-carrier interference (ICI) using pulse shaping in MIMO-OFDM.
In a MIMO-OFDM system, inter-symbol interference (ISI)caused by multi-path propagation (time dispersion) can beeliminated by adding a frequency guard interval dubbed thecyclic prefix (CP) between adjacent OFDM symbols. However,the CP offer no resilience against frequency dispersion, wherecarrier frequency offset is introduced due to the Dopplerspread. This causes a loss of orthogonality between the sub-carriers, and thus results in ICI. The frequency-localization ofthe pulse shaping filter in the MIMO-OFDM system plays acritical role in alleviating the sensitivity to frequency offsetand thus reducing ICI caused by the loss of orthogonality.Another important benefit of pulse shaping is to reduce out-of-band frequency leak and hence increase spectral efficiency.For conventional MIMO-OFDM systems, the pulse shapingfilter is a rectangular function, which exhibits a poor frequencydecay property, and is thus highly sensitive to frequencysynchronization errors and Doppler spread. This observationhas motivated recent studies on the design of better pulseshaping functions for OFDM.
Shaped OFDM can reduce the effect of single tone interfer-ence such as produced by an in-band jammer. If an interferingsignal has an integer number of cycles per OFDM frameinterval, it will interfere only with one sub-carrier. However,if the interfering signal has a non-integer number of cycles,it will contribute a component to every OFDM sub-carrier.Therefore, a jammer within the OFDM band could projectinto all OFDM sub-carriers due to the side lobes of thesinc(x) frequency response. However, using pulse shapingthe interference could be isolated to a few OFDM channelsby suppressing the side lobes with an appropriate window tofilter the basis signal set [15].
Pulse shaping in MIMO-OFDM aims to replace the basicrectangular pulse which performs poorly in dispersive chan-nels. Unfortunately, while the majority of work on MIMO-OFDM has been focused on the system design, and channel es-timation and synchronization, limited research to date has beendedicated to this important niche area of research for MIMO-OFDM. Several approaches to pulse shaping for OFDMsystems have been tried including Hermite waveforms [16]and Weyl-Heisenberg (or Gabor) frames [17]. In [18], theauthors examined the use of pulse shaping to reduce thesensitivity of OFDM to carrier frequency offset. Several pulseshaping filters such as the rectangular pulse, raised-cosinepulse and the so-called “better than” raised-cosine pulse [19]were compared in [20]. The authors advocated that the “betterthan” raised-cosine pulse gave the best performance in the
reduction of ICI. The effects on ICI reduction of severalwidely used Nyquist pulses including the Franks pulse, theraised-cosine pulse, and the “better than” raised-cosine pulsewere compared in [24]. The Franks pulse [25] was reportedto give the best performance. In [21], a new pulse shapewas proposed and compared against Nyquist-I pulses [22].Improved performance results for the proposed pulse shapewere reported. Most recently, another new pulse termed thesinc with modified phase was proposed to reduce ICI in OFDMsystems in [23].
In this paper, we investigate the effect of impulse shapingon ICI reduction for the space-time block coded MIMO-OFDM communications system. Although the above studieshave reported results on the performance of various shapingpulses on the resistance to carrier frequency offset in OFDMsystems, to the best of our knowledge, we are unable tofind any published work on pulse shaping for MIMO-OFDMsystems in the literature to date. More importantly, we willinvestigate the performance of a new shaping pulse dubbedthe harris-Moerder pulse [26] on ICI reduction in codedMIMO-OFDM systems. We will present simulation resultsusing various OFDM pulse shapes in different time-varyingwireless fading channels, showing, among other things, howthe channel model used has a significant effect on the final biterror rate (BER). Our comparative studies demonstrate thatthe harris-Moerder pulse outperforms other popular Nyquistpulses.
The remainder of this paper is organized as follows.Section II describes the software defined modules of thetransceiver. Section III describes the various channel mod-els used. Section IV describes the pulse shapes transmitted.Section V presents the bit error rate results obtained in thesimulation, while in Section VI conclusions are presented forfurther research.
II. MIMO-OFDM TRANSCEIVER MODEL
A. System Model
In this paper, we consider the space-time block codedMIMO-OFDM communications systems. The transceiver ar-chitecture of the system is illustrated in Fig. 1. As can beobserved from the figure, the MIMO-OFDM transceiver iscomprised of the quadrature phase shift keying (QPSK) mod-ulator, the space-time block coding component over OFDMwith a cyclic prefix, the interleaver and block coding trans-mitting through various terrestrial Rayleigh fading channels.The system is able to achieve diversity gains in the space,time and frequency domains as well as coding gains from theinterleaving and block coding. SBTC is implemented usingthe well-known Alamouti scheme [10] with two transmit andtwo receive antennas.
For the MIMO-OFDM transceiver model depicted in Fig. 1,denote by NT , NR, and N the number of transmit and receiveantennas, and the number of sub-carriers, respectively. For theAlamouti scheme, we have NT = NR = 2.

313
International Journal on Advances in Telecommunications, vol 3 no 3 & 4, year 2010, http://www.iariajournals.org/telecommunications/
2010, © Copyright by authors, Published under agreement with IARIA - www.iaria.org
STC STC
IFFT
IFFT
FFT
FFT
SP
PS
Channel
parameter
estimator
STC
QPSK
I & Q
QPSK
I & Q
SP
PS
PS
PS
Fig. 1. Transceiver block diagram for the space-time block coded MIMO-OFDM communications system.
B. ICI AnalysisFor the system model shown in Fig. 1, the complex envelope
of the N -subcarrier OFDM block with pulse shaping sentthrough the ith transmit antenna can be expressed as
xi(t) = ej2πfctN−1∑k=0
di,kp(t)e2πfkt (1)
where j is the imaginary unit, fc is the carrier frequency,fk is the sub-carrier frequency of the kth sub-carrier, p(t) isthe time-limited pulse shaping function, and di,k is the datasymbol sent through the kth sub-carrier of the ith transmitantenna, where i = 1, 2, · · · , NT , and k = 0, 1, · · · , N . Thedata symbol di,k is assumed uncorrelated with zero mean andnormalized average symbol energy
E[di,kd∗i,m] =
{1, k = m
0, k 6= m(2)
where ∗ denotes the complex conjugate operator.To ensure that the sub-carriers are mutually orthogonal, the
following relationship must hold∫ +∞
−∞p(t)ej2πfkte−j2πfmtdt =
{1, k = m
0, k 6= m.(3)
Equation (3) implies that the Fourier transform of the pulseshaping function p(t) must have spectral nulls to guaranteeorthogonality at the frequencies of fk = ±kW/N , where Wis the total available bandwidth, and k = 1, 2, · · · , N .
It is well known that wireless fading channel distortionand the crystal oscillator frequency mismatch between thetransmitter and receiver will introduce the carrier frequencyoffset 4f and the phase error θ. Consequently, this introducesa multiplicative factor at the OFDM receiver. As a result, thereceived signal is expressed as [20]
r(t) = e(j2π4ft+θ)N−1∑k=0
dkp(t)e2πfkt. (4)
Note that the transmit antenna index i is dropped in the aboveequation for ease of exposition.
The output from the mth sub-carrier correlation demodula-tor is given as
dm =
∫ +∞
−∞r(t)e−j2πfmtdt
= dmejθ
∫ +∞
−∞p(t)ej2π4ftdt
+ ejθN−1∑k 6=mk=0
dk
∫ +∞
−∞p(t)ej2π(fk−fm+4f)tdt. (5)
With some further mathematical manipulation, the averageICI power for the mth data symbol can be shown as [20]
σmICI =
N−1∑k 6=mk=0
∣∣∣∣P (k −mT +4f)∣∣∣∣2 (6)
where P (f) is the Fourier transform of the pulse functionp(t). Denote by γSIR the ratio of the average signal power toaverage ICI power ratio, which can be obtained as
γSIR =|P (4f)|2∑N−1
k 6=mk=0
∣∣P (k−mT +4f)∣∣2 . (7)
It is evident from (6) that the average ICI power for themth symbol average across different sequences is contingenton the number of sub-carriers N and the spectral magnitudesof P (f) at the frequencies of ((k−m)/T +4f), k 6= m, k =0, 1, · · · , N − 1.
As indicated in (3), P (f) is designed to have spectralnulls at the frequency points of (k − m)/T . Therefore, (6)is evaluated to zero providing 4f = 0. However, we have4f 6= 0 under realistic channels. The focus of our researchis to find a new pulse shaping function which is able tominimize (6).

314
International Journal on Advances in Telecommunications, vol 3 no 3 & 4, year 2010, http://www.iariajournals.org/telecommunications/
2010, © Copyright by authors, Published under agreement with IARIA - www.iaria.org
III. PULSE SHAPES
The data pulse input into the inverse fast Fourier transform(IFFT) modulator, and transmitted as a complete pulse on onesub-carrier, has a very large bandwidth due to the steep edgesof the square pulse [2]. The data pulse can be shaped to reducethe side lobes, which then also reduces the amount of energytransmitted out of band and the resultant channel effects. Thisis termed shaped OFDM.
Shaped OFDM can reduce the effect of single tone interfer-ence such as produced by an in-band jammer. If an interferingsignal has an integer number of cycles per OFDM frameinterval it will interfere only with one subcarrier, however ifthe interfering signal has a non-integer number of cycles it willcontribute a component to every OFDM sub-carrier. Thereforea jammer within the OFDM band could project into all OFDMsub-carriers due to the side lobes of the sinc(x) frequencyresponse, however using pulse shaping the interference couldbe isolated to a few OFDM channels by suppressing the sidelobes with an appropriate window to filter the basis signal set.
One measure of success of a specific pulse shape is howmuch it reduces the spectral side lobes of the transmittedsignal. The other main cause of degradation in OFDM isthe ICI between sub-carriers, which can also be reduced withpulse shaping. The shaping also introduces controlled ISI attimes other than the samples taken during the receiver decisiontimes.
Another major advantage of shaping the OFDM signal isto reduce sensitivity to carrier frequency offset errors due toa time varying channel and Doppler effects, thereby destroy-ing the orthogonality between channels. The most commonrectangular pulse prec(t), expressed as follows, does not offerrobustness even to modest frequency offset.
prec(t) =
{1
T, −T2 ≤ |t| ≤
T2
0, otherwise.(8)
Some simulation work has showed that in an OFDM systemeven a simple Gaussian shaped pulse, with a spread width of10% of the symbol time, will reduce the sensitivity of thesystem to a frequency offset by a factor of almost 6 dB [28].
An additional advantage of shaping is that an interferingtone in the frequency band of the OFDM sub-carriers mayinterfere with all the sub-carriers however the interferencemay be isolated to a few sub-carriers by replacing the squareenvelope with a shaped envelope. The envelope can be astandard window or the impulse response of a low pass filterapplied to the basis signal set.
Pulse shaping can be then be done with polyphase filters. Awindow shaped envelope has high adjacent ICI and low ISI,while a filter shaped envelope has high ISI and low adjacentICI, allowing a trade-off between the two by shaping thefilter accordingly. Equalization can be added after the IFFTor polyphase filter to suppress the interference and decouplethe adjacent channels and time frames
In this section, we compare five different shaping pulses.We start with the classic raised-cosine pulse, which although
does reduce side lobes but is not the optimum pulse shape. Agreater side lobe suppression can be obtained with a “betterthan raised-cosine pulse” as described in [20]. The third andfourth pulse shapes tested are the duo-binary pulse and thetriangular pulse. The last shaping pulse introduced is therecently proposed harris-Moerder window [15], which is amodified square root Nyquist pulse using a harris taper. It willbe demonstrated with simulation results present in Section Vthat the harris-Moerder pulse is the best performing shapingpulse in the sense of reducing ICI and achieving the best BERperformance for the shaped MIMO-OFDM system.
A. Raised-Cosine Pulse
A commonly used pulse shape is the raised-cosine pulse,i.e., the frequency domain reciprocal of the time domainNyquist pulse, which significantly suppresses spectral re-growth (side lobes) and ICI. When side lobes are suppressedthe width of the pulse is increased.
The time domain expression of the raised-cosine pulseshaping function denoted as prc(t) is given at the bottom ofthe next page, where α is the roll-off factor, and 0 ≤ α ≤ 1.As α approaches to zero, the pulse shape becomes closer to arectangular.
Let Prc(f) represent the Fourier transform of the raised-cosine pulse. The time and frequency representations prc(t)and Prc(f) of the raised-cosine pulse are shown in Fig. 2.
5 10 15 20 25−0.1
0
0.1
0.2
0.3
0.4
0.5
0.6
Samples
Am
plitu
de
Time domain
0 0.2 0.4 0.6 0.8−100
−80
−60
−40
−20
0
20
Normalized Frequency (×π rad/sample)
Mag
nitu
de (
dB)
Frequency domain
Fig. 2. Time and frequency domain representation of the raised-cosine pulse.
B. Better Than Raised Cosine Pulse
Recently, a new shape of pulse has been discovered thatcan increase the BER performance of the OFDM system [19],including reducing even further the ICI [20]. This pulse shapehas been termed the better than raised cosine (BTRC) pulse.The mathematical expression for the time domain represen-tation of the BTRC pulse is given at the bottom of the nextpage.
Fig. 3 shows the time domain representation of the pulsefor three different values of α. At an α of 0.5, the BTRC

315
International Journal on Advances in Telecommunications, vol 3 no 3 & 4, year 2010, http://www.iariajournals.org/telecommunications/
2010, © Copyright by authors, Published under agreement with IARIA - www.iaria.org
pulse samples are divided into three parts equally between theleading edge, the flat top and the trailing edge. At an α of 0mthe BTRC pulse becomes a square wave. It can be observedthat the BTRC pulse requires a large number of samples toachieve leading and trailing edges with detailed shape, andmost of these samples are in the flat top. It is noted that boththe raised-cosine and BTRC pulses collapse the rectangularpulse. The normalized frequency response of the BTRC pulseat α = 1 is shown in Fig. 4.
−20 −15 −10 −5 0 5 10 15 200
0.2
0.4
0.6
0.8
1
BTRC pulse in time domain
α = 0α = 0.5α = 1
Fig. 3. Time domain representation of the better than raised-cosine pulsewith three different α values.
Experimental and theoretical results indicate that pbtrc(t)outperforms the rectangular and raised-cosine pulses in thereduction of the average ICI power. Calculations show that fora minimum average signal power to ICI ratio (SIR) of 25 dB,when using the raised-cosine pulse, the normalized frequencyoffset must be less than 0.1052. In contrast, the tolerablenormalized frequency offset may be as large as 0.1844 whenone uses the BTRC pulse.
10 20 30 400
0.2
0.4
0.6
0.8
1
Samples
Am
plitu
de
Time domain
0 0.2 0.4 0.6 0.8−140
−120
−100
−80
−60
−40
−20
0
20
40
Normalized Frequency (×π rad/sample)
Mag
nitu
de (
dB)
Frequency domain
Fig. 4. Time and frequency domain representations of the better than raised-cosine pulse at α = 1.
C. Duo-Binary
The duo-binary pulse is designed to minimize ISI in a band-limited channel (all real channels are band limited). This shapewhere controlled ISI is introduced is classified as a partialresponse signal. Its spectrum decays to zero smoothly [29].
The duo-binary pulse shape is given as follows
x(t) = sinc(2Wt) + sinc(2Wt− 1) (11)
where W is the bandwidth and the sinc function is definedas sin(x)/x. A symbol rate of 2W , being the Nyquist rate,is achieved thereby giving greater bandwidth efficiency com-pared to the raised cosine pulse.
The properties of this pulse can be further enhanced byprecoding the signal using modulo two subtraction on theoriginal data sequence to prevent error propagation duringdetection.
D. Triangular Pulse
Using an up-sampling rate of four samples on the BTRCpulse has the effect of reducing it to a triangular shape with
prc(t) =
1
T, 0 ≤ |t| ≤ T (1−α)
2
1
2T
{1 + cos
[π
αT
(|t| − T (1− α)
2
)]}, T (1−α)
2 ≤ |t| ≤ T (1+α)2
0, otherwise.
(9)
pbtrc(t) =
1
T, 0 ≤ |t| ≤ T (1−α)
2
1
Te
(−2ln2αT (|t|−T (1−α)
2 )), T (1−α)
2 ≤ |t| ≤ T2
1
T
{1− e
(−2ln2αT (T (1+α)
2 −|t|))}
, T2 ≤ |t| ≤
T (1+α)2
0, otherwise.
(10)

316
International Journal on Advances in Telecommunications, vol 3 no 3 & 4, year 2010, http://www.iariajournals.org/telecommunications/
2010, © Copyright by authors, Published under agreement with IARIA - www.iaria.org
values of 0, 0.5, 1, 0.5, 0.
E. harris-Moerder PulseAn improvement on the standard root raised-cosine (RRC)
filter is the recently proposed harris-Moerder pulse [26]. Thisis an improved Nyquist pulse that reduces ISI by eliminatingdistortion associated with truncation of the standard RRC filterimpulse response. The pulse is generated using the Parkes-McClelllan (or Remez) algorithm [26].
A comparison of the harris-Moerder pulse, using 20 symbolsin the filter and specifying equi-ripple side lobes, with thestandard root raised-cosine filter, is shown in Fig. 5.
50 100 150 200−0.1
0
0.1
0.2
0.3
0.4
0.5
0.6
Samples
Am
plitu
de
Time domain
0 0.2 0.4 0.6 0.8−140
−120
−100
−80
−60
−40
−20
0
20
Normalized Frequency (×π rad/sample)
Mag
nitu
de (
dB)
Frequency domain
Fig. 5. Comparison of the harris-Moerder pulse (20 symbols, equiripple sidelobes, green pulse on right) with a root raised cosine filter (left pulse in blue).
As will be shown in Section V, the harris-Moerder pulse willremarkably reduce ICI and thus improve the BER performanceof the MIMO-OFDM system in comparison with other shapingpulses.
F. EqualizationISI is caused by both channel distortion, which varies with
time, and the overlapping raised cosine signal pulses after thereceiver filter, which is a fixed amount set by the transmitterand receiver filters. The signal can be therefore be describedby three components as follows
yk = ak +
∞∑n=0n 6=k
anxk−n + nk (12)
where ak represents the desired information symbol at thekth sampling instant, and nk is the noise at the kth samplinginstant. The middle term on the right hand side of (12) is theISI term.
The fixed ISI renders the signal virtually unintelligible andneeds to be removed. The simplest method to remove this fixedISI is with a standard zero-forcing equalizer (ZFE). However,a ZFE equalizer has the serious disadvantage of amplifyingnoise. A minimum mean square error (MMSE) equalizer thattolerates a specified amount of ISI is used in the simulationsas will be presented in Section V.
IV. TERRESTRIAL FADING CHANNEL MODELS
As aforementioned, the wireless fading channel in conjunc-tion with pulse shaping has a considerable influence on theperformance of the MIMO-OFDM communications system.In this section, we look into various terrestrial air channelmodels.
Terrestrial radio reception normally suffers degradation byfading due to multi-path reception of reflected signals thatresult in statistical cancelation or addition of the receivedsignal. For simplicity, a radio channel is often modeled as a flatfading channel with independent identically distributed (i.i.d.)complex Gaussian coefficients. However, real channels are notso simple and the un-modeled parameters can have significantpositive or negative effects depending upon the characteristicsof the signal transmitted.
In a wireless fading channel with additive white Gaussiannoise (AWGN), signals that do not include a direct pathcomponent follow a Rayleigh distribution, which means thesquare of the path gains are exponentially distributed. ARayleigh distribution is therefore a more realistic air channelmodel than a basic Gaussian model.
The Rayleigh distribution is a specific case of the twoparameter Weibull distribution [30]
f(T ) = β/η (T/η)β−1
e−(T/η)β
(13)
where the shape or slope parameter β equals two, and thescale parameter η is variable. As the ratio of the LOS signalpower over the multi-path signal power increases (called the Kfactor), the Rician distribution tends to an AWGN distribution.As the ratio decreases, the Rician tends towards the Rayleighdistribution.
When the bandwidth of the transmitted signal is narrowenough to be within the coherence bandwidth, where allspectral components of the transmitted signal are subject tothe same fading attenuation, then this ideal case is describedas a flat fading channel. A channel is slow fading if thesymbol period is much smaller than the coherence time, andquasi-static if the coherence time is in the order of a “blockinterval”.1
It is obviously easier to compensate for fading in a flatchannel than the one where fading is non-linear. Diversitytechniques over fading channels non correlated in time, fre-quency and space are used to reduce the effects of fading andtherefore improve the spectral efficiency of the air channel.
The following wireless fading channel models are used inour simulations.
A. Jakes Model
Practical models for mobile communications assume thereare many multi-path components and all have the sameDoppler spectrum with each multi-path component being itself
1It is noted, however, that different authors use considerably differentdefinitions of a “block”, some mean no fading over one whole transmittedframe while others mean over either one or even two sampled symbol periods.The simulation results in this work assume constant fading over one symbolperiod.

317
International Journal on Advances in Telecommunications, vol 3 no 3 & 4, year 2010, http://www.iariajournals.org/telecommunications/
2010, © Copyright by authors, Published under agreement with IARIA - www.iaria.org
the sum of multiple rays. The first model to take into accountboth Doppler effects and amplitude fading effects was devisedby Jakes in 1974 [31].
The Doppler effect of a moving receiver is described by theclassical Jakes spectrum, which gives a “bathtub” shape of sig-nal power against velocity, with singularities at the minimumand maximum Doppler frequencies. The basic Jakes channelfading model incorporating this Doppler shift simulates timecorrelated Rayleigh fading waveforms.
The model assumes that N equal strength waves arrive ata moving receiver with uniformly distributed angles, comingfrom 360◦ around the receiver antenna, as illustrated in Fig. 6.The fading waveforms can therefore be modeled with N + 1complex oscillators. This method, however, still creates un-wanted correlation between waveform pairs.
uniformly
distributed
arrival angles
Fig. 6. Jakes model of multi-path interference.
B. Dent’s Model
The unwanted correlation of Jake’s model is removed ina modification by Dent et al. The unwanted correlation canbe corrected by using orthogonal functions generated byWalsh-Hadamard codewords to weigh the oscillator valuesbefore summing so that each wave has equal power [32]. Theweighting is achieved by adjusting the Jake’s model so thatthe incoming waves have slightly different arrival angles αn.
The modified Jakes model is given by
T (t) =
√( 2
N0
) N0∑n=1
[cos(βn) + i sin(βn)
]cos(ωnt+ θn)
(14)
where the normalization factor√
(2/N0) gives rise toE{T (t)T ∗(t)} = 1, N0 = N/4, i =
√(−1), βn = π ∗ n/N0
is phase, θ is initial phase that can be randomized to providedifferent waveform realisations, and ωn = ωM cos(αn) is theDoppler shift.
Dent’s model successfully generates uncorrelated fadingwaveforms thereby simulating a Rayleigh multi-path air chan-nel. The “bathtub” shaped power spectrum distribution (PSD)of Rayleigh fading based on Dent’s model is estimated by theperiodogram as shown in Fig. 7. For an input data stream x(n)
that is a zero-mean, stationary random process and its discreteFourier transform (DFT) denoted by X(w), the periodogramis defined as I(w) = |X(w)|2/N , where N is the data length.
0 0.2 0.4 0.6 0.8 1 1.2 1.4 1.6 1.8−60
−50
−40
−30
−20
−10
0
10
20
Normalized Frequency (×π rad/sample)
Pow
er S
pect
ral D
ensi
ty (
dB/ r
ad/s
ampl
e)
Periodogram PSD Estimate
Dent’s model
Fig. 7. Power spectrum distribution of Rayleigh fading using Dent’s model.
C. Auto-regressive Model
Most fading models assume Rayleigh fading in an isotropicchannel. However, this assumption is not always valid. In anattempt to add directional fading to the model, an autore-gressive approach has been successfully developed in [33].Furthermore, it has been proved that the classical Jakes modelintroduces fading signals that are not wide sense stationary,and the auto-regressive model remedies this shortcoming.
The periodogram of the autoregressive model, shown inFig. 8, is still a “bath tub” shape, albeit with a narrower cut-offthan Dent’s model.
0 0.2 0.4 0.6 0.8 1 1.2 1.4 1.6 1.8−60
−50
−40
−30
−20
−10
0
10
20
Normalized Frequency (×π rad/sample)
Pow
er S
pect
ral D
ensi
ty (
dB/ r
ad/s
ampl
e)
Periodogram PSD Estimate
Auto−regression model
Fig. 8. Power spectrum distribution of Rayleigh fading using the auto-regressive model.

318
International Journal on Advances in Telecommunications, vol 3 no 3 & 4, year 2010, http://www.iariajournals.org/telecommunications/
2010, © Copyright by authors, Published under agreement with IARIA - www.iaria.org
D. Stanford University Interim Models
For the purposes of the IEEE 802.16 standard onLAN/MAN air interfaces, the IEEE have adopted and modifieda series of models called the Stanford University Interim(SUI) models [34]. These channel models for fixed wirelessapplications cover six scenarios of terrain and environment forthe 1-4 GHz band.
The SUI models are different from the previous modelssince they assume time-variant (frequency-selective) channels.As a result, they need to be modeled with a tapped delay linein lieu of a more simple transfer function. Each tap representsthe path of a different delayed frequency. Although there aretheoretically an infinite number of frequencies, it has beenfound that modeling with three taps is accurate enough.
The SUI model differs from the simpler Rayleigh fadingdistribution in that it does not exhibit the typical Rayleigh PSDof the previous two models. The difference is most noticeablein the PSD estimate where the power spectral density at thehigh end of the spectrum does not increase asymptotically butinstead tapers to zero forming a “half bathtub” shape, as shownin the periodogram Fig. 9.
0 0.1 0.2 0.3 0.4 0.5 0.6 0.7 0.8 0.9 1−120
−100
−80
−60
−40
−20
0
20
40
60
Normalized Frequency (×π rad/sample)
Pow
er S
pect
ral D
ensi
ty (
dB/ r
ad/s
ampl
e)
Periodogram PSD Estimate
SUI model 3
Fig. 9. SUI-3 PSD showing tapering at high frequency.
E. Tropospheric Model
The tropospheric (non-ionospheric) communications in theVHF (30 to 300 MHz) and UHF (300 MHz to 3 GHz)bands can cover several hundred kilometers. In these bandsoxygen and water vapor absorb RF energy with the loss beingdependent on frequency and atmospheric conditions such ashumidity. The previous models would not be suitable for thisenvironment. The frequency selective absorption characteris-tics can be modeled by a transfer function of the followingform
H(f) = Hej0.02096f [106+N(f)]l (15)
where N(f) is the complex refractivity of the atmosphere inparts per million. The resulting channel model can be simu-lated using finite impulse response filtering techniques [35].
An example of a tropospheric model for microwave com-munication between fixed antenna towers is Rummler’s model.This is a line of sight model with a very small number ofmulti-path components resulting in very slow fading [35].
The channel model becomes especially important in the caseof designing MIMO algorithms since these are especially sen-sitive to the channel matrix properties. Some authors [36] cau-tion that since results for realistic channels are still unknownthe predicted gains of MIMO systems may be premature.
V. SIMULATION RESULTS
In this section, we present experimental simulation resultsto demonstrate the performance improvements of shaping thecoded MIMO-OFDM system using the various time-limitedpulse shaping functions discussed in Section III. We willfirst show the the frequency responses of shaped OFDM sub-carriers using these shaping pulses, followed by the presenta-tion of the BER curves to demonstrate the error performanceof the MIMO-OFDM system over wireless fading channels.
A. System Configuration Parameters
The OFDM signals are generated with a 64-point IFFT,thereby givingv 64 sub-carriers conforming to the IEEE802.11 standard. The baseband frequencies therefore rangefrom 512 KHz to 32.8 MHz. Assuming a typical bandwidthof 16.56 MHz (as in 802.11a), the channel separation is16.56/64 = 258.74 KHz and the OFDM frame duration is3.86 µs. To counter ISI, the cyclic prefix added is set at 25%of the OFDM block, thereby adding another 0.96 µs to thetransmitted frame. The data bit frame length is 131072 bits,while the IQ symbol frame length is 524288.
Error detection and correction is performed by using a linearblock coder of codeword length of 4 and parity length of2. Optimum results for the MMSE equalizer are obtainedexperimentally by varying firstly the roll-off factor, a valueof 0.495 is found optimum, and secondly varying the symbolnoise power, a value of 6 is optimum. The optimum parametersare found by empirical try and error methods.
B. Frequency Spectrum of Shaped OFDM Signal
The frequency response of the OFDM sub-carrier signals atthe transmitter after the IDFT modulation and shaping usinga standard root raised-cosine filter is shown in Fig. 10. Thefiltered signal shows a sidelobe suppression of about 30 dB.At the receiver the signal was passed through a second rootraised cosine pulse prior to input to the DFT demodulator.The resulting frequency response of a subcarrier is shown inFig. 11.
The frequency response of the OFDM demodulated output,without shaping and with shaping using the raised-cosine pulsefilter at the receiver after demodulation is shown in Figs. 12and 13. With the shaped OFDM the 64 sub-carriers can clearlybe seen approximately 20 dB above the noise, while in theunshaped signal, the subcarriers cannot be seen amongst thenoise.

319
International Journal on Advances in Telecommunications, vol 3 no 3 & 4, year 2010, http://www.iariajournals.org/telecommunications/
2010, © Copyright by authors, Published under agreement with IARIA - www.iaria.org
0 1000 2000 3000 4000 5000 6000 7000 8000 9000 10000−70
−60
−50
−40
−30
−20
−10
0
10
20
30
Frequency
20 lo
g10
ampl
itude
Frequency response of shaped modulated subcarrier
Fig. 10. Frequency response of the shaped OFDM signal at the transmitterusing the root raised-cosine filter.
0 500 1000 1500 2000 2500−40
−30
−20
−10
0
10
20
30
Frequency
20 lo
g10
ampl
itude
Frequency response of shaped subcarrier after Rx Rcos filter
Fig. 11. Frequency response of the shaped OFDM signal after passingthrough the receiver root raised-cosine filter and before the the DFT.
0 2 4 6 8 10 12
x 104
0
10
20
30
40
50
60
70
80
Frequency
20 lo
g10
ampl
itude
Frequency response of OFDM demodulated signal AWGN & Faded (not shaped)
Fig. 12. Frequency response of demodulated (not-shaped) OFDM.
0 2 4 6 8 10 12
x 104
−60
−40
−20
0
20
40
60
80
Frequency
20 lo
g10
ampl
itude
Frequency response of demodulated shaped OFDM subcarrier & AWGN & Faded
Fig. 13. Frequency response of demodulated shaped OFDM showing thesub-carriers.
The frequency response of an OFDM sub-carrier through araised-cosine pulse is shown in Fig. 14, whereas the samepulse after equalization with five coefficients is shown inFig. 15. The axes of the two plots are the same for comparisonpurposes. It can be observed how the MMSE equalization, us-ing only five coefficients, suppresses the out of band sidelobesby about 40 dB.
0 1000 2000 3000 4000 5000 6000 7000 8000 9000 10000−160
−140
−120
−100
−80
−60
−40
−20
0
20
40Raised cosine shaped subcarrier #22 at Rx before equalisation. Frequency domain
Fig. 14. Frequency response of raised-cosine shaped OFDM sub-carriersbefore equalization.
Figs. 16 and 17 show an OFDM sub-carrier shaped usingthe harris-Moerder pulse before equalization, and after equal-ization using seven equalization coefficients. The graphs havethe same axis scales for comparison. The equalization can beseen to be very effective even though the MMSE equalizer usesless than half the number of coefficients as there are samplesin the harrise-Moerder shaping pulse.

320
International Journal on Advances in Telecommunications, vol 3 no 3 & 4, year 2010, http://www.iariajournals.org/telecommunications/
2010, © Copyright by authors, Published under agreement with IARIA - www.iaria.org
0 1000 2000 3000 4000 5000 6000 7000 8000 9000 10000−160
−140
−120
−100
−80
−60
−40
−20
0
20
40Raised cosine shaped subcarrier #22 at Rx after equalisation. Frequency domain
5 equalising coefficients
Fig. 15. Frequency response of raised-cosine shaped OFDM sub-carriersafter equalization.
0 100 200 300 400 500 600 700 800 900 1000−90
−80
−70
−60
−50
−40
−30
−20
−10
0
10harris shaped subcarrier #22 at Rx before equalisation. Frequency domain
Fig. 16. OFDM sub-carrier no. 22 with harris-Moerder pulse (20symbols, equi-ripple side lobes) before equalization.
0 100 200 300 400 500 600 700 800 900 1000−90
−80
−70
−60
−50
−40
−30
−20
−10
0
10harris shaped subcarrier #22 at Rx after equalisation. Frequency domain
7 equalisation co−efficients
Fig. 17. harris-Moerder pulse equalized with seven coefficients (20symbols, equiripple side lobes).
C. BER Performance Results
First of all, we plot several basic performance curves inFig. 18 for the baseline MIMO-OFDM system using theAlamouti STBC scheme without pulse shaping.
Fig. 18. Comparisons of the BER performance curves for STC, STC OFDMand STC OFDM under Rayleigh fading.
1) Raised Cosine and harris-Moerder Pulse ShapedOFDM: Shaping the OFDM pulse significantly improves theBER. As shown in Fig. 19, a Matlab designed raised cosinepulse, divided between the transmitter and receiver as rootraised cosine filters, achieves about a 3 dB improvement overnon shaped MIMO-OFDM. it can be seen that shaping withthe harris-Moerder pulse at the transmitter increases the BERby more than 2 dB over raised cosine shaped MIMO-OFDM.The Rayleigh fading in these cases uses the auto-regressivemodel.
2) DuoBinary Pulse Shaped OFDM: The standard DuoBi-nary pulse, 61 samples long and equalised with the maximumnumber of coefficients (61) could not successfully be over-lapped in the time domain when up-sampled by a factor offour. Fig. 20 shows the best results obtained, leveling out atan error rate of about 12% at an SNR around 6 dB.
Increasing the upsampling rate by double, to eight samples,gives better results, as shown in Fig. 21. However, curiouslythe BER curve for an AWGN channel follows the shape of aRayleigh fading channel.
3) BTRC Pulse Shaped OFDM: The least successful pulseshape is the BTRC pulse. Equalisation is unsatisfactory, agreater upsampling rate is required than for other pulsesmeaning that it would be less practical to implement than otherpulse shapes since sampling hardware would have to work atmuch higher speeds. Although this pulse shape was previouslyused successfully in OFDM to reduce the effects of unwantedfrequency offset [37], the authors used an OFDM pulse lengthof the same length as the the BTRC pulse shaping filter.Additionally, since there was no time domain overlap therewas no need to implement equalisation in their simulation.

321
International Journal on Advances in Telecommunications, vol 3 no 3 & 4, year 2010, http://www.iariajournals.org/telecommunications/
2010, © Copyright by authors, Published under agreement with IARIA - www.iaria.org
0 2 4 6 8 10 12 1410
−5
10−4
10−3
10−2
10−1
100
QPSK STC OFDM 2 Tx & 2 Rx Antennas, (SampleRate 4, Bits 32768)
using Ebit
/N0 ≡ SNR
SNR
BE
R
STC OFDM with AWGN onlySTC OFDM Rayleigh Jakes (AR) STC harris Shaped OFDM Jakes (AR)STC harris Shaped OFDM AWGN onlySTC rcos Shaped OFDM AWGN onlySTC rcos Shaped OFDM Jake’s (AR)STC Triangle Shaped OFDM Jake’s (AR)STC Triangle Shaped OFDM AWGN only
Fig. 19. Comparison of STC OFDM with AWGN only (not faded) with STCOFDM, STC Shaped OFDM (raised cosine), STC Shaped OFDM (harris-moerder) filter, equalized with 5 and 7 coefficients respectively, using theauto-regressive model of Rayleigh fading.
0 2 4 6 8 10 12 1410
−4
10−3
10−2
10−1
100
QPSK STBC OFDM 2 Tx & 2 Rx Antennas, (SampleRate 4, Bits 8192)
SNR
BE
R
STC OFDM with AWGN onlySTC OFDM Rayleigh Jakes (AR) STC harris Shaped OFDM Jakes (AR)STC harris Shaped OFDM AWGN onlySTC rcos Shaped OFDM AWGN onlySTC rcos Shaped OFDM Jake’s (AR)STC DuoBinary Shaped OFDM AWGN
DuoBinary Pulse
Fig. 20. DuoBinary pulse shaped OFDM with very high BER.
For an over-sampling of 8 and an α of 0.1 the BER curvestill is not as good as unshaped STC OFDM in an AWGNchannel. For the extreme case of an over sampling rate greaterthan the pulse width (therefore no time domain overlap) theBTRC gives the best results for an AWGN channel, as shownin Fig. 22. It should be noted that using the BTRC pulse inthis manner is not a comparison under like conditions with theother modulation techniques.
4) Triangular Pulse Shaped OFDM: Modifying the BTRCpulse by truncating the long flat top of the pulse, and up-sampling at a rate four, inadvertently produced a triangularwave with values [0 0.5 1 0.5]. The BER of the triangular pulse
0 2 4 6 8 10 12 1410
−4
10−3
10−2
10−1
100
QPSK STBC OFDM 2 Tx & 2 Rx Antennas, (SampleRate 4, Bits 8192)
SNR (using Ebit
/N0 ≡ SNR)
BE
R
STC OFDM with AWGN onlySTC OFDM Rayleigh Jakes (AR) STC harris Shaped OFDM Jakes (AR)STC harris Shaped OFDM AWGN onlySTC rcos Shaped OFDM AWGN onlySTC rcos Shaped OFDM Jake’s (AR)STC DuoBinary Shaped OFDM AWGN
DuoBinary UpSampled × 8 (AWGN channel)
Fig. 21. DuoBinary pulse shaped OFDM upsampled by eight.
0 1 2 3 4 5 6 7 8 9 1010
−5
10−4
10−3
10−2
10−1
100
QPSK STBC OFDM 2 Tx & 2 Rx Antennas, (SampleRate 4, Bits 16384)
SNR (using Ebit
/N0 ≡ SNR)
BE
R
STC OFDM with AWGN onlySTC OFDM Rayleigh Jakes (AR) STC harris Shaped OFDM Jakes (AR)STC harris Shaped OFDM AWGN onlySTC rcos Shaped OFDM AWGN onlySTC rcos Shaped OFDM Jake’s (AR)STC BTRC Shaped OFDM AWGN only
BTRCover−sampled × 32
Fig. 22. Comparison of STC BTRC shaped OFDM (black line, alpha = 0.5and upsampling by 32) with STC OFDM with AWGN only (not faded) withSTC OFDM, STC shaped OFDM (raised cosine).
were very similar to the raised cosine pulse at this sample rate,as shown in Fig. 23.
Not all possible variations of pulse shapes and equalisationparameters under different fading environments have beentested here. There may be versions that are optimised undersome circumstances and not under others.
VI. CONCLUSIONS
In this paper, we investigate the efficacy of impulse shapingin reducing the ICI for the space-time block coded MIMO-OFDM communications system. Little existing work is knownabout the influence of pulse shaping for space-time coded

322
International Journal on Advances in Telecommunications, vol 3 no 3 & 4, year 2010, http://www.iariajournals.org/telecommunications/
2010, © Copyright by authors, Published under agreement with IARIA - www.iaria.org
0 2 4 6 8 10 12 1410
−5
10−4
10−3
10−2
10−1
100
QPSK STC OFDM 2 Tx & 2 Rx Antennas, (SampleRate 4, Bits 32768)
using Ebit
/N0 ≡ SNR
SNR
BE
R
STC OFDM with AWGN onlySTC OFDM Rayleigh Jakes (AR) STC harris Shaped OFDM Jakes (AR)STC harris Shaped OFDM AWGN onlySTC rcos Shaped OFDM AWGN onlySTC rcos Shaped OFDM Jake’s (AR)STC Triangle Shaped OFDM Jake’s (AR)STC Triangle Shaped OFDM AWGN only
Fig. 23. Comparison of STC OFDM, STC shaped OFDM (raised cosine),STC Triangular shaped OFDM, STC shaped OFDM (harris-moerder), (underboth AWGN and Jake’s auto-regressive model of Rayleigh fading.
MIMO-OFDM systems. This work studies various shapingpulses and reports on their effect on alleviating the ICI forthe MIMO-OFDM system. More importantly, we investigatethe shaping performance of the new harris-Moerder pulse.
Simulation results are presented to demonstrate that shapingthe OFDM pulse significantly improves on the system BERperformance. Our results clearly indicate that the new harris-Moerder pulse outperforms other popular Nyquist pulses in thesense of improve the BER of the OFDM system. Moreover,the underlying channel model used has a significant effect onthe BER.
The system could most likely be improved by adding furtherfeatures, albeit at a cost of increasing the computationalcomplexity. The optimum number of equalisation coefficientsfor each shape still needs to be determined. Adaptive pulseshaping by varying the parameters of the pulse shapes couldalso be explored for optimum performance in a time variantchannel.
ACKNOWLEDGEMENT
We are grateful to Professor fred harris (sic) at San DiegoState University for his assistance with the harris-Moerderpulse shape in this work.
This work is partly supported by the International ScienceLinkages established under the Australian Government’s inno-vation statement Backing Australia’s Ability.
REFERENCES
[1] J. Russell and W. Xiang, “Pulse shaping in MIMO COFDM overRayleigh fading channels,” in Proc. International Conference onWireless and Mobile Communications (ICWMC’09), Cannes, France,Aug. 2009, pp. 174-178.
[2] R. Prasad, OFDM for Wireless Communications Systems, Boston, M.A.,Artech House, 2004.
[3] D. Gesbert, M. Shafi, D-S. Shiu, P. J. Smith, and A. Naguib, “Fromtheory to practice: An overview of MIMO space-time coded wirelesssystems,” IEEE J. Sel. Areas Commun., vol. 21, no. 3, pp. 281-302,Apr. 2003.
[4] A. J. Paulraj, D. A. Gore, R. U. Nabar, and H. Bolcskei, “An overviewof MIMO communications - a key to gigabit wireless,” Proc. IEEE, vol.92, no. 2, pp. 198-218, Feb. 2004.
[5] E. Telatar, “Capacity of multi-antenna Gaussian channels,” EuropeanTransactions on Telecommunications, vol. 10, no. 6, pp. 585-595,Nov./Dec. 1999.
[6] G. J. Foschini, “Layered space-time architecture for wireless commu-nication in a fading environment when using multi-element antennas,”Bell Labs Tech. J., vol. 1, no. 2, pp. 41-59, Autumn 1996.
[7] G. D. Golden, G. J. Foschini, and R. A. Valenzuela, “Detection algorithmand initial laboratory results using V-BLAST space-time communicationarchitecture,” Electronics Letters, vol. 35, no. 1, pp. 14-16, Jan. 1999.
[8] P. W. Wolniansky, G. J. Foschini, G. D. Golden, and R. A. Valenzuela,“V-BLAST: an architecture for realizing very high data rates over therich-scattering wireless channel,” Proc. IEEE International Symposiumon Signals, Systems, and Electronics (ISSSE’98), Pisa, Italy, Sep.-Oct.1998, pp. 295-300.
[9] A. Benjebbour, H. Murata, and S. Yoshida, “Comparison of orderedsuccessive receivers for space-time transmission,” in Proc. IEEE 54thVehicular Technology Conference (VTC’01 Fall), Atlantic City, NJ, Oct.2001, pp. 2053-2057.
[10] S. Alamouti, “A simple transmit diversity technique for wirelesscomminications,” IEEE J. Sel. Areas Commun., vol. 16, no. 8, pp.1451-1458, Oct. 1998.
[11] V. Tarokh, H. Jafarkhani, and A. R. Calderbank, “Space-time blockcodes from orthogonal designs,” IEEE Trans. Inform. Theory, vol. 45,no. 5, pp. 1456-1467, Jul. 1999.
[12] V. Tarokh, N. Seshadri, and A. R. Calderbank, “Space-time codes forhigh data rate wireless communication: Performance criterion and codeconstruction,” IEEE Trans. Inform. Theory, vol. 44, no. 2, pp. 744-765,Mar. 1998.
[13] G. L. Stuber, J. R. Barry, S. W. Mclaughlin, Y. Li, M. A. Ingram, andThomas and G. Pratt, “Broadband MIMO-OFDM wireless communica-tions,” Proc. IEEE, vol. 92, no. 2, pp. 271-294, Feb. 2004.
[14] G. B. Giannakis, Z. Liu, X. Ma, and S. Zhou, Space-Time Coding forBroadband Wireless Communications, Hoboken, NJ, Wiley-Interscience,2003.
[15] D. Vuletic, W. Lowdermilk, and f. harris, “Advantage and implementa-tion considerations of shaped OFDM signals,” in Proc. 37th AsilomarConference on Signals, Systems and Computers, Pacific Grove, CA,Nov. 2003, pp. 683-687.
[16] I. Trigui, M. Siala, S. Affes, A. Stephenne, and H. Boujemaa, “Optimumpulse shaping for OFDM/BFDM systems operating in time varyingmulti-path channels,” in Proc. IEEE Globecom’07, Washington, DC,Nov. 2007, pp. 3817-3821.
[17] H. Bolcskei, “Efficient design of pulse shaping filters for OFDMsystems,” in Proc. SPIE on Wavelet Applications in Signal and ImageProcessing VII, Denver, CO, USA, Jul. 1999, pp. 625-636.
[18] J. Armstrong, “Analysis of new and existing methods of reducingintercarrier interference due to carrier frequency offset in OFDM,” IEEETrans. Commun., vol. 47, pp. 365-369, Mar. 1999.
[19] N. C. Beaulieu, C. C. Tan, and M. O. Damen, “A ‘better than’ Nyquistpulse,” IEEE Commun. Lett., vol. 5, vol. 9, pp. 367-368, Sep. 2001.
[20] P. Tan and N. C. Beaulieu, “Reduced ICI in OFDM systems using the“better than” raised-cosine pulse,” IEEE Commun. Lett., vol. 8, vol. 3,pp. 135-137, Mar. 2004.
[21] H-A M. Mourad, “Reducing ICI in OFDM Systems using a proposedpulse shape,” Wireless Person. Commun., vol. 40, pp. 41-48, 2006.
[22] A. Assalini and A. M. Tonello, “Improved Nyquist pulses,” IEEECommun. Lett., vol. 8, vol. 2, pp. 87-89, Feb. 2004.
[23] N. D. Alexandru and A. L. Onofrei, “ICI reduction in OFDM systemsusing phase modified sinc pulse,” Wireless Person. Commun., vol. 53,pp. 141-151, 2010.
[24] P. Tan and N. C. Beaulieu, “Analysis of the effects of Nyquist pulse-shaping on the performance of OFDM systems with carrier frequencyoffset,” European Transactions on Telecommunications, vol. 20, pp.9-22, 2009.
[25] L. E. Franks, “Further results on Nyquist’s problem in pulse transmis-sion,” IEEE Transactions Communications Technology, vol. 16, no. 4,pp. 337-340, 1968.

323
International Journal on Advances in Telecommunications, vol 3 no 3 & 4, year 2010, http://www.iariajournals.org/telecommunications/
2010, © Copyright by authors, Published under agreement with IARIA - www.iaria.org
[26] f. harris, C. Dick, S. Seshagiri, and K. Moerder, “An improved square-root Nyquist shaping filter,” in Proc. Software Defined Radio TechnicalConference and Product Exposition, Orange County, CA, Nov. 2005.
[27] T. Pollet, M. V. Bladel, and M. Moeneclaey, “BER sensitivity of OFDMsystems to carrier frequency offset and Wiener phase noise,” IEEE Trans.Commun., vol. 43, no. 2/3/4, pp. 191-193, Feb./Mar./Apr. 1995.
[28] H. Nikookar and B. G. Negash, “Frequency offset sensitivity reductionof multicarrier transmission waveshaping,” in Proc. IEEE Conferenceon Personal Wireless Communications, Hyderabad, India, Dec. 2000,pp. 444-448.
[29] J. Proakis and M. Salehi, Digital Communications, New York, McGraw-Hill, 2007.
[30] W. Weibull, “A statistical distribution function of wide applicability,” J.Appl. Mech.-Trans. ASME, vol. 18, no. 3, pp. 293-297, 1951.
[31] W. C. Jakes, Microwave Mobile Communications, New York, JohnWiley & Sons, 1976.
[32] P. Dent, G. E. Bottomley, and T. Croft, “Jakes fading model revisited,”Electron. Lett., vol. 29, vol. 13, pp. 1162-1163, Jun. 1993.
[33] K. E. Baddour and N. C. Beaulieu, “Autoregressive modeling for fadingchannel simulation,” IEEE Wireless Commun., vol. 4, no. 4, pp. 1650-1662, Jul. 2005.
[34] IEEE 802.16.3c-01/29r4, “Channel models for fixed wireless applica-tions,” IEEE 802.16 Broadband Wireless Access Working Group, Jul.2001.
[35] W. Tranter, K. Shanmugan T. Rappaport, and K. Kosbar, Communi-cations Systems Simulation with Wireless Applications, Upper SaddleRiver, NJ, Prentice Hall, 2004.
[36] M. Debbah and R. Muller, “MIMO channel modeling and the principleof maximim entropy,” IEEE Inf. Theory, vol. 51, no. 5, pp. 1667-1690,May 2005.
[37] P. Tan and N. C. Beaulieu, “Improved BER performance in OFDMsystems with frequency offset by novel pulse-shaping,” in Proc. IEEEGlobecom’04, Dallas, TX, Nov.-Dec. 2004, pp. 230-236.

324
International Journal on Advances in Telecommunications, vol 3 no 3 & 4, year 2010, http://www.iariajournals.org/telecommunications/
2010, © Copyright by authors, Published under agreement with IARIA - www.iaria.org
Performance Comparative Study of eXtended Satellite Transport Protocol over
Traditional Satellites Networks and Nanosatellite Constellations
Maria-Mihaela BURLACU
Dept. MIPS/GRTC, University of Haute Alsace Colmar, France
e-mail: [email protected]
Pascal LORENZ
Dept. MIPS/GRTC, University of Haute Alsace Colmar, France
e-mail: [email protected]
Joséphine KOHLENBERG
Dept. RST, IT/Télécom SudParis Evry, France
e-mail: [email protected]
Abstract—The design of efficient communication mechanisms
for small satellite networks is a challenging task, requiring the
definition and implementations of specific protocols and
architectures appropriate to space’s critical conditions. In this
paper, we have proposed a specific nanosatellite mission and we
have evaluated various nanosatellite constellations, using SaVi
simulator, in order to identify the best constellation which
satisfies mission requirements in terms of coverage and minimal
number of nanosatellites. Next, XSTP (eXtended Satellite
Transport Protocol) has been identified as candidate protocol for
nanosatellite networks. Foremost, we implement XSTP in NS-2
simulator. The simulations were done for LEO traditional
satellite network and nanosatellite constellation respectively.
Finally, through analysis and simulations in NS2, we evaluated
the performance of XSTP over traditional satellite networks and
nanosatellite networks. Also, we were interested to compare
XSTP performance to some TCP clones, in case of a high BER
environment. The specific scenarios, implementations aspects
and simulation approaches are presented in detail along with the
respective results.
Keywords - transport protocol; nanosatellite; constellation; STP;
XSTP; simulation.
I. INTRODUCTION
Traditional satellite missions are extremely expensive to design, build, launch and operate. Consequently, both the space industry and the research community have started directing their attention to missions involving many, small, distributed and inexpensive satellites. Furthermore, many space projects in universities laboratories are focused on the development of micro-, nano- and pico-satellites for both scientific and educational purposes.
New concepts arise as small satellite domain imposes itself as a particular field. Therefore, the concept of constellation became popular because of its potential to
perform coordinated measurements for remote control missions and its capacity of long-term mission. A satellite constellation is a group of similar satellites, with coordinated ground coverage, that are synchronized to orbit the Earth in some optimal way. Also, formation flying mission aims to replace a large satellite with a "virtual satellite" – a cluster of smaller satellites, flying in very precise relative positions.
Making small satellites more cost-effective demands new technologies that must be certified for spaceflight. Certainly, there is a higher risk associated with uncertified technology. Thus, a small satellite mission is the best way to perform a first flight verification.
The small satellite technology has opened a new era of satellite engineering by decreasing space mission cost, without reducing the performance. However, the biggest long-term challenge for the small satellite community is to develop a robust commercial market capable of industrializing the process of building small satellites.
The proliferation of low-cost, “micro-“, “nano-“ and “pico-satellite” missions in low-earth orbit has presented new challenges to the research community.
The unique challenges imposed by nanosatellite networks (e.g., onboard resources, limited communications opportunities, limited bandwidth, scalability, redundancy, power availability, high-speed node mobility, the type of communication among satellites, assigning or not a separate communication channel for positioning, timing and synchronization issues) requires us to revise communication protocol design, network management, and to consider novel routing mechanisms to accomplish “more with less”.
In order to identify candidate protocols that can be used or adapted for small satellite networks, we conducted a study of routing mechanisms in traditional satellite network, Ad Hoc network and sensor networks. This study is part of PERSEUS (Projet Etudiant de Recherche Spatiale Européen

325
International Journal on Advances in Telecommunications, vol 3 no 3 & 4, year 2010, http://www.iariajournals.org/telecommunications/
2010, © Copyright by authors, Published under agreement with IARIA - www.iaria.org
Universitaire et Scientifique) program, launched by CNES (Centre National d'Etudes Spatiales) in June 2005 [1, 2]. Based on this study, XSTP (eXtended Satellite Transport Protocol) has been identified as transport protocol targeted for small satellite constellations.
The main objective of this paper is to propose a dedicated nanosatellite constellation mission and a nanosatellite constellation model. Various nanosatellite constellation configurations have been evaluated in order to identify the optimal constellation which satisfies the mission objectives. Secondly, the performance of XSTP-probing mechanism, proposed by Maged E. Elaasar in paper [3] is evaluated, through NS2 simulations, in satellite network and nanosatellite network scenarios respectively.
The reminder of the paper is organized as follows. Section II describes the mission that we envisaged for our nanosatellite constellation. Then, Section III presents the nanosatellite network model that we proposed in order to accomplish our mission. Section IV briefly explains STP and XSTP protocols, with a point on XSTP-probing mechanism. The simulation configuration, the performance metrics and the implementation solution are described in Section V. Simulation results in terms of nanosatellite constellation configurations and XSTP performance are discussed in Section VI and Section VII. Finally, Section VIII concludes the paper.
II. MISSION DESCRIPTION
Worldwide, there are a lot of unexploited regions in terms of mineral resources. Indeed, the Simpson Desert (in Australia) is rich in uranium, the Sahara Desert is rich in iron ore and salt, the Atacama Desert (Chile) is rich in iron and copper ore. Therefore, it is highly likely that in the near future, industrial companies will exploit those areas for their precious wealth.
As mentioned in paper [1], the global demand for lithium, the lightweight metal used to make high-powered batteries for cell phones, laptops, and hybrid cars, is expected to triple in the next 15 years. Fifty to 70 percent of the world’s supply of this critical mineral is contained in just one place – Bolivia’s Uyuni salt flats, shown in Fig. 1.
The United States Geological Survey [5] says that 5.4 million tons of lithium could potentially be extracted in Bolivia, compared with 3 million in Chile, 1.1 million in China and just 410,000 in the United States.
Therefore, we focus on the Salar de Uyuni, the world's largest salt flat desert of 10,582 square kilometers. It is located in the southwest Bolivia (Fig. 1), near the crest of the Andes, and is elevated 3,656 meters above the mean sea level.
At present, the reserves of lithium are at the centre of the attentions of several multinationals, as well as the government. The latter intends to build its own pilot plant with a modest annual production of 1,200 tons of lithium and to increase it to 30,000 tons by 2012. [6]
Comibol, the state agency that oversees mining projects, is investing about $6 million in a small plant near the village
of Río Grande on the edge of Salar de Uyuni, where it hopes to begin Bolivia’s first industrial-scale effort to mine lithium from the white, moonlike landscape and process it into carbonate for batteries. [17]
Figure 1. Salar de Uyuni viewed from space, with Salar de Coipasa in the
top left corner.
Considering this context, we propose to deploy a nanosatellite operator that provides communications services (voice, SMS and images) for an industrial company in charge of lithium resources exploitation in Salar de Uyuni desert. It is important to mention that this small satellites system can be applied to any similar remote area. Unless stated differently, in this paper, the term “nanosatellite” means any satellite with a mass of 50 kg.
Figure 2. Mission concept basic elements.
Figure 2 presents all the elements of our mission, which implies high-level processes from mission analysis and design to cost estimation models.
Firstly, we have investigated the existing Bolivian mobile operators and theirs coverage areas. There are 3 mobile operators:

326
International Journal on Advances in Telecommunications, vol 3 no 3 & 4, year 2010, http://www.iariajournals.org/telecommunications/
2010, © Copyright by authors, Published under agreement with IARIA - www.iaria.org
- Telefonica Celular De Bolivia S.A. (TELECEL BOLIVIA), operating within GSM850 band;
- Entel SA, operating within GSM1900 band; - Nuevatel PCS De Bolivia SA, operating within
GSM1900 band. As seen in Fig. 3, 4 and 5, none of the operators have
coverage over or close to the Salar de Uyuni desert.
Figure 3. TELECEL BOLIVIA coverage map.
Figure 4. Entel SA coverage map (Credits : 2009 GSM Association;
Europa Technologies Ltd.).
Figure 5. Nuevatel PCS De Bolivia SA coverage map (Credits : 2009
GSM Association; Europa Technologies Ltd.).
Secondly, an analysis of possible needs of the industrial company personnel yields the following requirements:
1. Continuous coverage of the target area (24h/24). 2. Mobile terminals with voice and data capabilities
(e.g., voice, SMS, imaging). 3. Group Voice communications among on-site
personnel. The network architecture should be ’flexible’ in that it
is able to provide direct coverage to the area without having to go through a hierarchical command center.
Our system architecture is divided into three segments:
• Space segment is represented by the nanosatellite constellation;
• Ground segment is represented by Mobile Ground Station (or MGS). Based on the same principle as the i-c@r, used to provide WiFi Internet over a certain area via satellite, we can consider a similar, modified MGS, with an S-band transceiver to ensure the satellite link via a 3m wide satellite dish.
• User segment is represented by Mobile User Terminals (or MUT) with voice and data capabilities.
III. NANOSATELLITE CONSTELLATION MODEL
The design of a satellite constellation is very complex due to all the factors that need to be considered, from orbit elements to perturbations that act on each satellite.
Specifying all orbit elements for each satellite of the constellation is inconvenient and overwhelming. A reasonable approach is to begin with satellite constellation in circular orbits and at common inclination angle and altitude. In this case, the period, velocity and node rotation rate will be the same for all satellites.
The constellation size and structure has a strong impact on the system’s cost and performance, so it is necessary to evaluate various constellation designs and to explain the reasons for final choice.
In paper [7], James R. Wertz states that if the regions of interest do not include the poles, then an equatorial constellation may provide all the coverage with a single orbital plane, which leads to flexibility, multiple performance plateaus and graceful degradation.
Thus, Salar de Uyuni desert is placed on 20º S latitude so, a constellation having several equatorial nanosatellites with enough altitude to provide the appropriate coverage at the smallest elevation angle (ε) is the best solution for our mission.
The formal mathematical problem definition could be written as: Objectives: min Ns and max Cov
Constraints: Subject to
Altitude 500 Km ≤ h ≤ 2000 Km
Minimum elevation angle 5º ≤ εmin ≤ 30º Given: Latitude L = 20º S
Sun-synchronous, equatorial orbit

327
International Journal on Advances in Telecommunications, vol 3 no 3 & 4, year 2010, http://www.iariajournals.org/telecommunications/
2010, © Copyright by authors, Published under agreement with IARIA - www.iaria.org
The purpose is to find the best constellation design which satisfies simultaneously the two mission objectives:
1. the number of nanosatellites has to be minimized; 2. the coverage of the desert has to be maximized (the
nanosatellite has to stay as long as possible over the target area so, time in view need to be maximized).
We model our problem as a box with inputs and outputs. Therefore, some parameters are defined as input data for a constellation module (box) that will delivers output data. Fig. 6 illustrates key inputs and outputs of the constellation module.
Figure 6. Inputs and outputs of constellation module.
Two vectors were defined: design vector and constants vector. The first one contains the attributes that will distinguish and differentiate alternative nanosatellite constellations. The latter contains attributes that will not differentiate alternative system architectures. For example, the latitude of Salar de Uyuni dessert is a constant value of 20º regardless of the other attributes of the architecture.
Six variables – minimum number of nanosatellites, constellation altitude, minimum elevation angle, number of satellites per orbital plane, number of orbital planes in the constellation, and maximum Time in view – make up the design vector.
Latitude (L), inclination angle (i) and γ angle are variables of constant vector.
Our nanosatellite constellation model includes some assumptions that simplify numerical calculations. We assumed that nanosatellites are placed on an equatorial, sun-synchronous LEO type orbit and it is passing near a target represented by a ground station. Also, we assume that Earth is a perfect sphere, an adequate assumption for most mission geometry applications. For precise calculation, a correction for oblateness must be applied. In our calculations, we neglected the Earth’s rotation in the short period for which the nanosatellite passes over the interested area.
Figure 7 illustrates computational geometry of satellite.
Figure 7. Computational geometry of satellite parameters.
According to Fig. 7, the area of the Earth, excluding icecaps is calculated as:
�� � ������ � 2 ��� � (1)
The Earth area is:
������ � 4���� (2)
The area of every icecap is:
��� � � 2���� �1 � cos�� (3)
By replacing Eq. 2 and Eq.3 in Eq. 1, we obtain:
�� � 4���� cos� (4)
The area that needs to be covered is:

328
International Journal on Advances in Telecommunications, vol 3 no 3 & 4, year 2010, http://www.iariajournals.org/telecommunications/
2010, © Copyright by authors, Published under agreement with IARIA - www.iaria.org
� � 2���� �1 � cos ����� (5)
We estimated the minimum number of nanosatellites needed to cover the surface S as:
�� � ! (6)
By replacing Eq. 4 and Eq. 5 in Eq. 6:
�� � � "#$%&'"#$()*+
(7)
As James R. Wertz states in paper [7], for communications, the satellite must be more than 5º above the horizon. In practice, we select a specific value of εmin and we use this value. This parameter has a major influence on other computed parameters.
Given minimum elevation angle εmin, we define the maximum Earth central angle λmax, the maximum nadir angle ηmax, measured at the satellite from nadir to the ground station and the maximum slant range Dmax at which the satellite will still be in view. All these parameters are calculating using formulas presented in paper [15]:
sin .��� � sin/ cos 0�12 (8)
���� � 345567 8 9:9:;�
cos 0�12< � 0�12 (9)
.��� � 3457=> 8 9:9:;�
cos 0�12< (10)
���� � 90° � 0�12 � .��� (11)
B��� � ��$CD()*+$CD E)*+
(12)
The maximum time in view Tmax for any point P on the surface of the Earth occurs when the satellite passes overhead:
F��� � G ()*+&HI° (13)
The orbit period P of each satellite may be calculated as a function of the constellation altitude h:
G � 1.658669 10'N ��� O P�Q/� (14) The area access rate as the satellite sweeps over the
ground for the target region is:
SS� � �TU$CD(V (15)
where KA=2.55604187*108. According to Eq. (7), (9) and (13), we observe some
interesting variations useful for space segment dimensioning:
• the minimum number of nanosatellites is increasing as the minimum elevation angle is increasing, for the same altitude;
• for the same elevation angle, the minimum number of nanosatellites is decreasing as the altitude is increasing;
• the maximum time in view of any given point on Earth is increasing as the altitude is increasing, for the same elevation angle.
We have validated our nanosatellite network model with small satellites constellations currently in orbit. Two examples are important to be mentioned here: RapidEye constellation [15] and Disaster Monitoring Constellation (DMC) [16].
IV. STP AND XSTP OVERVIEW
This section discusses the Satellite Transport Protocol (STP) and explains the general design of XSTP protocol. There is a particular focus on XSTP-probing mechanism as it is most relevant to this paper.
A. Satellite Transport Protocol
The Satellite Transport Protocol (STP), proposed by Katz and Henderson [8, 9] is a transport protocol, which is specifically optimized for the unique constraints of satellite network environment. STP is found to outperform TCP in environments characterized by high BER, severe asymmetry and varying RTTs, typically characteristics of LEO satellite links.
Based on paper [4], the main features of STP can be summarized as follows: � Enforcing the separation between data and control
information in order to minimize the control overhead in smaller data segments;
� Mechanism that adapts to the amount of rate control required in the network, ranging from no rate control to explicit rate control. Unlike TCP, which uses a self-clocking property, STP depends on a delayed send timer to pace transmissions uniformly over the estimated RTT. The main benefit of the pacing mechanism is the reduction of the risk of introducing large bursts to the network.
� Segment type overloading for supporting a fast connection start mechanism.
� Efficient acknowledgement strategy STP employs an automatic repeat request (ARQ) mechanism that uses selective negative acknowledgements (NACK). By using this mechanism, only segments reported missing by receivers are retransmitted. The advantage is lower reverse link traffic when the loss is negligible and a speedy recovery when the loss is severe. In contrast with TCP, there is no RTO mechanism in STP, which makes it more resilient to RTT variations.
Finally, it is important to mention that even if STP includes many of the basic principles found in TCP, it is only functionally but not semantically equivalent to it. Unfortunately, the STP protocol inherits the congestion control bias from its ancestor protocols (i.e., TCP, SSCOP [10]). Although the protocol can efficiently recover from multiple losses in the same round trip, its error recovery tactics can negatively affect its overall performance.
B. eXtended Satellite Transport Protocol
XSTP is a software implementation of the STP protocol in the PIX (Protocol Implementation Framework for Linux) framework. [11] The protocol is used to host a new error control strategy, called XSTP-probing. Typically, XSTP protocol can be deployed on top of a network protocol (e.g., IP). The protocol provides a reliable connection-oriented byte streaming service to application protocols (e.g., FTP).
An XSTP session is composed of one lower and one upper session. Fig. 8 depicts a typical configuration for a

329
International Journal on Advances in Telecommunications, vol 3 no 3 & 4, year 2010, http://www.iariajournals.org/telecommunications/
2010, © Copyright by authors, Published under agreement with IARIA - www.iaria.org
communication suite including XSTP. As Maged E. Elaasar explains in paper [3], when such a suite is initialized, an instance of the XSTP protocol is created, configured and then installed in the appropriate location in the protocol hierarchy. Once there, application level protocols can use the service of the protocol to manipulate XSTP sessions.
Figure 8. PIX protocol and session configurations including XSTP. [3]
An XSTP session plays double role (sender and receiver), which implies defining two new classes: an XSTP sender and an XSTP receiver. An instance of each of those classes is created in the private state of the session’s object. As depicted in Fig. 9, these two instances play the sending and receiving roles of the session.
Figure 9. XSTP class diagram. [3]
C. XSTP-probing mechanism
The aim of developing the XSTP-probing mechanism was to stretch the STP protocol’s ability to adapt to the different types of error found in LEO satellite networks.
According to papers [3, 4], the goal of any error control strategy is to adapt the sender’s transmission rate to the varying error conditions in the network. This goal is usually accomplished by taking an aggressive attitude when the error is detected to be transient and a conservative one, when it is persistent. The XSTP-probing mechanism makes no exception to this principle.
The mechanism is triggered upon detecting a segment loss to assess the level of congestion in the network. If congestion is detected, the mechanism responds by invoking congestion control; otherwise, it resumes with Immediate Recovery (restoring congestion window to the same level as before probing).
Additionally, this mechanism evaluates the connection for possible error free conditions and only transmitting in
those windows. As described in paper [4], it suspends new data transmission upon detecting a loss and initiates a probing cycle to collect RTT statistics on the connection. Then, it compares these RTT statistics to the RTT estimate available when the loss was discovered. It is interesting to observe that the duration of that probing cycle is proportional to the level of error in the network, which helps the connection sit out the error conditions. After the cycle is finished and if congestion is detected by proliferating RTTs, congestion control is immediately invoked. Otherwise, transmission levels are restored without taking any action. Finally, the missing segments are immediately retransmitted. Fig. 10 presents the basic algorithm of XSTP-probing mechanism.
Figure 10. XSTP-probing mechanism.[3]
The XSTP–probing mechanism is implemented as a configurable option on the XSTP session. The mechanism is modeled as a class called XSTPProbing. For a more comprehensive overview of STP, XSTP and its probing mechanism, the interested reader is directed to papers [3] and [4].
V. SIMULATION CONFIGURATION
The performance of a protocol for varying network conditions and settings can effectively be evaluated using simulations. This section describes simulation environment, performance metrics and test scenarios.
A. Simulation environment
To analyze the performance of XSTP protocol, we have implemented the proposed protocol in the discrete-event network simulator NS-2 [12]. We used TCP modules corresponding to common variants of TCP (e.g., New Reno, Reno, SACK, Tahoe, Vegas), and wrote two new simulation modules for STP and XSTP.
We used SaVi simulator [13] for evaluating various nanosatellite constellations in terms of coverage area. SaVi

330
International Journal on Advances in Telecommunications, vol 3 no 3 & 4, year 2010, http://www.iariajournals.org/telecommunications/
2010, © Copyright by authors, Published under agreement with IARIA - www.iaria.org
allows satellite orbits and coverage simulations, in two and three dimensions and is particularly useful for simulating satellite constellations.
B. Simulation scenarios
Using NS2 simulations, XSTP-probing mechanism is tested in various error conditions and performance is quantified.
We defined two scenarios – one-way communication, aiming to meet symmetric channels, and bidirectional communication for considering asymmetric channels. Each time, we quantify the performance metrics defined in Section V.E.
C. XSTP implementation solution
XSTP protocol is a derived class from STP class, the latter being derived from transport Agent class. Firstly, TCP like congestion mechanism is implemented. Then, we extended STP to XSTP by implementing the probing mechanism, described in Section IV.C, with 3 configuration parameters:
- Maximum number of trackable probe exchanges (MAX_PROB);
- Number of requested probe exchanges (REQ_PROB); - RTT tolerance ratio (RTT_TOL). The simulation configuration consists of 2 network
nodes: source node and destination node. In the first scenario, the destination node is considered as a well of data, while in the second one, both endpoints are going to play the role of transmitter / receiver at the same time.
As Fig. 11 illustrates, we attach an XSTP agent to the source node and a STPSink agent to the destination node. Because an XSTP agent does not generate application data, we connected it to a FTP traffic generator so that we can send large data packets.
By using a background HTTP traffic generator, HTTP traffic is added for emulating the current use of WWW. The purpose was not to block the network, but to add a variability component to simulation.
Figure 11. Nodes configuration.
The size of packages sent by the source node is 1000 bytes. The size of receiver’s window is fixed to 200 and the initial size of transmitter’s congestion window is 1. The maximum number of trackable probes is set to 4, and the number of consecutive RTT measurements sufficient to finish the probing cycle is set to 2. The polling frequency is set to 3 per RTT, and when the probing mechanism is triggered, the polling rate becomes 1 per RTT. The duration of every simulation is 60 seconds. The BER varies between 10-8 and 10-3.
Due to the random behavior of the Web traffic, every simulation is repeated four times and the final results are calculated by making the average between the intermediate simulation results.
Table 1 presents the simulation parameters.
TABLE I. SIMULATION PARAMETERS
Parameter Value
Sender buffer size 64 Kb
Receiver buffer size 64 Kb
MSS (maximum segment size) 1000 bytes
Maximum window size 64 segments
Sender’s initial congestion window 1 segment
Maximum burst size 8 segments
Initial RTT 0.08 s
D. Simulation network topologies
For all the envisaged scenarios, we have used two network topologies:
• a satellite network (Fig. 12) based upon the LEO satellite constellation proposed by Teledesic [14];
• a nanosatellite network (Fig. 13) based on SaVi simulations and numerical results presented in Section VI.
Figure 12. Satellite network model.

331
International Journal on Advances in Telecommunications, vol 3 no 3 & 4, year 2010, http://www.iariajournals.org/telecommunications/
2010, © Copyright by authors, Published under agreement with IARIA - www.iaria.org
Figure 13. Nanosatellite network model
Table 2 presents the main constellations parameters, while table 3 summarizes data link parameters.
TABLE II. CONSTELLATION PARAMETERS
Parameter Satellite
constellation Nanosatellite constellation
Nominal altitude 1375 km 1500 km
No. of planes 12 1 No. of satellites/plane 24 9
Planes separation distance in altitude 2 km - Nominal inclination 84.7 ° 0º
Minimum Earth elevation angle 40º 15º Orbital period 113.23 min 115.98 min
TABLE III. DATA LINK PARAMETERS
Parameter Satellite
constellation Nanosatellite constellation
Uplink frequency 28.6 - 29.1 GHz VHF, UHF Downlink frequency 18.8- 19.3 GHz S band (2-4GHz)
Uplink data rate 2 Mbps 32 Kbps Downlink data rate 64Mbps 1 Mbps
Inter-satellite link (ISL) rate 100 Mbps 256 Kbps ISL propagation delay 10 ms 50 ms
Ground-to-satellite link propagation delay
5 ms 15 ms
E. Performance metrics
The relevant performance metrics defined for NS2 simulations are based on paper [4]:
1) Effective throughput is defined as the average data rate (bps) as seen by the data link session and it is calculated using the following formula:
WXXY5Z=[Y ZP46\]P^\Z � ��1_12� �1`��1�a ��1�2 �1�� (16)
2) Transmission overhead is defined as the percentage
of extra bytes expended in the reliable transmission of the original data bytes. The transmission overhead is calculated, in %, using the following formula:
F43>7b=77=6> 6[Y4PY3c � ���� �1`�'��1_12� �1`���1_12� �1`� 100 (17)
3) Efficiency describes the channel utilization. It is
defined as the ratio between the packet original size and the total size of transmitted data:
dP3>>Ye YXX=5=Y>5f � ��1_12� �1`����� �1`� (18)
4) Reverse channel utilization describes the backwards
channel utilization. It shows the protocol efficiency on asymmetric links where the bandwidth is not the same in both directions. It is calculated using the following formula:
�Y[Y47Y 5P3>>Ye \Z=e=g3Z=6> � h�ijk��l ��1_12� �1`��1�a ��1�2 �1�� (19)
VI. SAVI SIMULATION RESULTS
This section presents SaVi simulation results in terms of coverage. Table 4 describes the parameters for four types of nanosatellite constellations simulated in our study. The numerical calculations of these parameters were made based on equations defined in Section III.
According to Table 4, we observe that constellation C4 satisfies our mission objectives because:
• it has a minimum number of nanosatellites (9 nanosatellites);
• it offers a coverage band between 0º and 22º S latitude, thus assuring a total coverage of Salar de Uyuni Desert;
• the time in view of every nanosatellite is maximized.
Therefore, constellation C4 has been implemented in NS2 for studying the XSTP performance over nanosatellite networks.

332
International Journal on Advances in Telecommunications, vol 3 no 3 & 4, year 2010, http://www.iariajournals.org/telecommunications/
2010, © Copyright by authors, Published under agreement with IARIA - www.iaria.org
TABLE IV. CONSTELLATION CANDIDATES
Constellation C1 C2 C3 C4
Minimum number of nanosatellites within the constellation (Nmin)
18 14 14 9
Coverage latitude 0º - 18º 0º - 19º 0º - 20º 0º - 22º
Maximum Time in view (Tmax) 8.9 min 10.62 min 10.73 min 15.17 min
Minimum elevation angle (εmin) 15º 10º 15º 15º
Number of orbital planes (Np) 1 1 1 1
Constellation altitude (h) 800 km 800 km 1000 km 1500 km
Orbital period (P) 100.87min 100.87 min 105.11 min 115.98 min
Number of orbits per day (Od) 14.23 14.23 13.66 12.38
Maximum slant range (Dmax) 2032 km 2367 km 2408.38 km 3258.45 km
Maximum Earth central angle (λmax) 15.87º 18.95º 18.38º 23.55º
Area Access Rate (AAR) 1.38*106 km2/min 1.645*106 km2/min 1.53*106 km2/min 1.76*106 km2/min
Nanosatellite velocity (v) 7.4561 m/s 7.4561 m/s 7.3507 m/s 7.1136 m/s
For Fig. 14 to 17, satellite coverage, represented in
yellow/red, is intended to give an idea of the number of nanosatellites visible from a point on Earth. The higher the number of nanosatellites covering a point, the deeper the shade of red is. Also, coverage decay, illustrated in shades of blue, gives an idea of where a satellite footprint has been and is going, even when you look at a still map snapshot.
Constellation C1 is constituted of 18 nanosatellites placed on an equatorial orbit at 800 km of altitude and having a minimum elevation angle of 15°. As seen in Fig
14, the coverage area will be between 0 and 18 ° of latitude S, but our target region is situated at 20° S latitude. Thus, this configuration does not satisfy our mission goal in terms of coverage.
Figure 14. Coverage of nanosatellite constellation including 18 nanosatellites placed on a LEO, equatorial orbit at an altitude of 800 Km
and minimum elevation angle of 15º
Figure 15. Coverage of nanosatellite constellation including 14 nanosatellites placed on a LEO, equatorial orbit at an altitude of 800 Km
and minimum elevation angle of 10º
With the purpose of obtaining the desired coverage, we modified the minimum elevation angle of 10º and we obtained constellation C2 of 14 nanosatellites placed at 800 km of altitude. Unfortunately, the coverage area (Fig. 15) will be between 0º and 19º S latitude, solution that still not corresponds to our mission. Additionally, this constellation might suffer of bad visibility, given the natural and manmade obstacles that would block nanosatellites at lower elevation angles out of view.
Knowing that Salar de Uyuni desert has a flat surface, we thought that a minimum elevation angle of 15º is
sufficient to have visibility at any given point on the desert. Thus, a possible solution to our coverage problem seems to be constellation altitude increasing. By increasing altitude at 1000 km and for εmin=15º, we obtain constellation C3 of 14 nanosatellites (Fig. 16). This constellation defines a coverage band between 0º and 20º S latitude, solution that satisfy the second mission objective (the coverage), but not the first one (minimizing the number of nanosatellites within the constellation).

333
International Journal on Advances in Telecommunications, vol 3 no 3 & 4, year 2010, http://www.iariajournals.org/telecommunications/
2010, © Copyright by authors, Published under agreement with IARIA - www.iaria.org
Figure 16. Coverage of nanosatellite constellation including 14 nanosatellites placed on a LEO, equatorial orbit at an altitude of 1000
Km and minimum elevation angle of 15º
Figure 17. Coverage of nanosatellite constellation including 9 nanosatellites placed on a LEO, equatorial orbit at an altitude of 1500
Km and minimum elevation angle of 15º
Our numerical calculations have showed that the number of nanosatellites is decreasing with altitude increasing. Considering this type of variation and for minimizing the number of nanosatellites, a solution might be to increase constellation altitude to a value that satisfies our requirements. Thus, for an altitude of 1500 Km and εmin=15º, we obtain constellation C4 of 9 nanosatellites (Fig. 17), which is the best architecture that satisfy our two mission goals.
VII. NS2 SIMULATION RESULTS
In this section, NS2 simulation results for satellite network and nanosatellite network scenarios are reported and discussed. Also, we were interested to compare XSTP performance to some TCP clones, in case of a high BER environment.One-way transmission scenario
In this scenario we consider symmetric channels. Fig. 18a and Fig. 18b illustrate effective throughput
variation with respect to BER for satellite network and nanosatellite network respectively. For both networks, XSTP outperforms all TCP clones for high BER
conditions (10-3), mainly due to its probing mechanism. Unlike XSTP, STP and TCP clones reduce their transmission rate at every error detection.
In satellite network scenario, TCP Sack has a comparative throughput to STP and XSTP (roughly, 1400 Kbps) for low BER, but a significant difference is observed as BER increases.
Compared to satellite network case, in nanosatellite scenario, TCP Sack outperforms XSTP only for low BER environment. For high BER rates, XSTP assures 2 times more effective throughput than TCP clones. Also, TCP Vegas has the best performance among TCP clones due to its robust detection mechanism that minimize packet losses. We have also noticed that effective throughput of TCP clones is significantly reduced. The reason is that the latter make a processing operation after congestion detection, which is not the case of XSTP that makes the difference between an error due to congestion and an error due to transmission.
Figure 18. Effective throughput variation (one-way scenario): a) satellite network; b) nanosatellite network.

334
International Journal on Advances in Telecommunications, vol 3 no 3 & 4, year 2010, http://www.iariajournals.org/telecommunications/
2010, © Copyright by authors, Published under agreement with IARIA - www.iaria.org
Figure 19. Transmission overhead variation (one-way scenario): a) satellite network; b) nanosatellite network.
Fig. 19a and Fig. 19b illustrates overhead variation as a function of BER for satellite network and nanosatellite network respectively.
Overhead packets are supplementary packets transmitted over the network. More the protocol is powerful less overhead packets are transmitted. Protocol designers have always tried to minimize the overhead. In the satellite networks domain, reducing overhead means minimizing the energy spent uselessly by the satellite, knowing that the energy used for overhead transmission is because the energy spent during overhead transmission is considered as lost energy. Considering this, our simulations shows that XSTP protocol consumes less energy than TCP clones for overhead transmission thus, it has more energy for data transmission.
According to Eq. (17) and Eq. (18), overhead test is complement to efficiency test. Unlike efficiency, the overhead increases with BER increasing.
During probing cycle, receiver sends one POLL per RTT and stops data transmission in order to avoid data losses, reducing this way the number of control packets. At the end of this cycle and if there is no congestion, sender doesn’t reduce its congestion window; thus, it
gives user the possibility to send much more data over the network.
Contrary, STP maintains 3 POLL per RTT and because it doesn’t stop data transmission during polling cycle, the number of control packets increases due to successive losses. This is the raison why STP has much more overhead than XSTP.
As seen in Fig. 19a and Fig. 19b, XSTP has the lowest overhead, offering two times less than NewReno, Reno, Tahoe and Sack, in case of low BER conditions (10-8–10-
6). We have also noticed that among TCP clones, TCP Vegas has the biggest overhead for high BER conditions and the lowest value for low BER. This means that its congestion control mechanism is better than other TCP mechanisms in a low BER environment.
One of the most important aspects in satellite networks is energy consumption. Researchers have always tried to minimize the energy spend by satellites for data transmission. Channel efficiency shows channel utilization. In case of significant amount of data user, efficiency is closed to 1, which means that channel is well used. Contrary, if efficiency is closed to 0, the channel is not well exploited.
Figure 20. Channel efficiency (one-way scenario): a) satellite network; b) nanosatellite network.
According to Fig. 20a and Fig. 20b, STP and XSTP have a slightly higher performance than TCP clones for low BER conditions, thus exploiting better the
communication channel. For both networks (i.e., satellite and nanosatellite), for high BER conditions (10-3), TCP Vegas attains the lowest channel efficiency, which is four

335
International Journal on Advances in Telecommunications, vol 3 no 3 & 4, year 2010, http://www.iariajournals.org/telecommunications/
2010, © Copyright by authors, Published under agreement with IARIA - www.iaria.org
times less than the other protocols. In other words, in high BER conditions, Vegas lose a lot of data packets.
Generally, reverse channel is used for ACKs transmission. Reverse channel bandwidth varies as a
function of the number of ACKs transmitted over the channel, their type and size. It is important to mention that reverse channel bandwidth has to be minimized at the very most due to satellite link asymmetry.
Figure 21. Reverse channel utilization (one-way scenario): a) satellite network; b) nanosatellite network.
Fig. 21a and Fig. 21b illustrates reverse channel variation with respect to BER for satellite and nanosatellite scenarios respectively. We have noticed that XSTP and STP bandwidth for reverse channel increases with BER increasing; this means that XSTP needs a low bandwidth for reverse channel. Instead, reverse channel bandwidth for TCP clones decreases with BER increasing. The explanation of these variations lies directly on every protocol’s principle of using bandwidth.
In fact, TCP clones use reverse channel for acknowledgements transmission. Thus, the ACKs are sent when data packets are received, which explains why TCP clones use a lot of bandwidth in low BER conditions. In other words, if there are no losses, the reverse channel bandwidth is increasing as many packets are received. Contrary, in high BER conditions, receiver doesn’t transmit many ACKs; therefore, reverse channel bandwidth decreases.
Unlike TCP clones, STP and XSTP send STAT and USTAT messages over the reverse channel. When BER is low, receiver sends many small size STAT messages that
demand a low reverse channel bandwidth. For high BER, reverse channel utilization is significant due to large size USTAT messages that demand a lot of bandwidth.
An important remark is that XSTP needs a lower reverse channel bandwidth than STP because the number of STAT messages transmitted during probing cycle is decreasing as the number of POLL per RTT decreases (1 STAT message per POLL).
In case of STP, the number of POLL per RTT remains unchanged (i.e., 3 POLL per RTT) during Polling cycle. Because STP doesn’t suspend transmission, it sends many USTAT messages even when BER is high.
A. Bidirectional transmission scenario
In this scenario, data transmission is made in both ways (a node is sender and receiver too). As compare to one-way communication case, data rate of all protocols decreases because of reverse path transmission.
XSTP effective throughput has a smoothness decrease as compare to one-way scenario.
Figure 22. Effective throughput variation (bidirectional scenario): a) satellite network; b) nanosatellite network.
As seen in Fig. 22a, XSTP has a comparative performance with STP and TCP clones for low BER conditions. Instead, XSTP outperforms all TCP clones in
case of high BER (10-3), by offering an effective throughput almost 30 times more than TCP clones.

336
International Journal on Advances in Telecommunications, vol 3 no 3 & 4, year 2010, http://www.iariajournals.org/telecommunications/
2010, © Copyright by authors, Published under agreement with IARIA - www.iaria.org
In nanosatellite scenario (Fig. 22b), STP attains the best performance for low BER environment (10-7). For example, the effective throughput of STP is better than TCP Sack because STP doesn’t use a timeout for ACKs reception.
For both network types considered in our simulations, we have also observed that TCP Vegas is strongly influenced by reverse path transmission, having, even in low BER conditions, a data rate 3 times less than the other protocols.
Figure 23. Transmission overhead variation (bidirectional scenario): a) satellite network; b) nanosatellite network.
In case of satellite network, by comparing Fig. 19a and Fig. 23a, we observed that XSTP offers 3 times less overhead than in one-way scenario, for high BER conditions. Also, all protocols have almost the same performance for high bit error rates, except for Vegas which still has the worst performance.
For nanosatellite scenario (Fig. 23b), STP, XSTP and Vegas attain an overhead two times less than the other
protocols for low BER (10-7 – 10-5). Instead, for high BER (10-3), TCP Sack offers the lowest overhead, which is 2 times less than STP and 0.6 times less than XSTP.
The main difference is that the overhead does not increase as much as in one-way transmission when the BER is very high. This is due to the fact that all protocols decrease their transmission rate when there are other transmissions on the reverse channel.
Figure 24. Channel efficiency (bidirectional scenario): a) satellite network; b) nanosatellite network.
Figure 24 presents channel efficiency variation with respect to BER for satellite network and nanosatellite network respectively. XSTP remains the best protocol with regard to STP and TCP clones.
Considering satellite network case (Fig. 20a and Fig. 24a), we observe a significant improvement of XSTP efficiency with respect to the first scenario (78% versus 33%), for high BER conditions (10-3). Same trend is seen
for nanosatellite network scenario (Fig. 20b and Fig. 24b), where XSTP efficiency is 3 times more in bidirectional transmission for BER=10-3.
Our simulations have shown that, in high BER environment, XSTP efficiency for nanosatellite network is better than in case of conventional satellite network (90% versus 78%).

337
International Journal on Advances in Telecommunications, vol 3 no 3 & 4, year 2010, http://www.iariajournals.org/telecommunications/
2010, © Copyright by authors, Published under agreement with IARIA - www.iaria.org
Figure 25. Reverse channel utilization (bidirectional scenario): a) satellite network; b) nanosatellite network.
Generally, all the explanations given for one-way scenario remains valid. We have noticed that the curves follow the same shape as in the one-way transmission, by regarding Fig. 21 and Fig. 25. TCP Sack uses a lot of bandwidth for reverse channel. Interestingly, TCP Vegas uses a low reverse channel bandwidth (2.83 Kbps), for high BER conditions, performing much better than STP and XSTP (Fig. 13a).
VIII. CONCLUSION AND FUTURE WORK
In this paper, we have proposed a small satellite mission intended to deploy a nanosatellite network over a specific desert region (Salar de Uyuni Desert). Also, a nanosatellite constellation model is proposed for the envisaged mission. Several nanosatellite constellations are simulated and analyzed in order to find the best nanosatellite configuration which responds to our mission objectives.
After STP and XSTP protocol description, we presented simulation results of XSTP implementation for a conventional satellite network and nanosatellite network respectively. According to our simulations, XSTP has shown its efficiency by proving that it is useless to continue data transmission during loss detection and to invoke directly congestion control procedure, which induces a degradation of effective bandwidth. Also, XSTP attained higher effective throughput, much lower overhead, and better channel efficiency as compare to TCP clones. In spite of all these performances, XSTP protocol for satellite networks is not perfect. We propose here some future research guidelines concerning XSTP protocol. We observed that transmission overhead on the return channel is significant in high BER conditions (10-3) and this need to be reduced. Also, at the probing-mechanism level, the decision principle needs to be improved in order to discriminate between congestion and other types of errors that might be found in satellite networks. Another important aspect is the energy level spent during probing cycle. An interesting research will be to find how can we measure and quantify this energy. Other future studies could be directed towards XSTP performance over other types of topologies (i.e., Flower
constellation, clusters, hybrid constellation – conventional satellites and nanosatellites). Another proposal is a comparison study between XSTP probing and TCP probing mechanisms, considering that both protocols can be configured with similar set of parameters as in our survey. This comparison might show the most effective mechanism in terms of adaptation to various satellite links errors. Finally, probing mechanism could be studied in wireless communication context or in a similar domain characterized by various types of communications errors.
REFERENCES
[1] http://www.perseus.fr/presentation.php; March 30th, 2010
[2] http://www.cnes.fr/web/CNES-fr/6115-communiques-de-presse.php?item=1313; March 30th, 2010
[3] Maged E. Elaasar – “XSTP: eXtended Satellite Transport Protocol”, Master Thesis, Ottawa-Carleton Institute for Computer Science, Carleton University, Ottawa, Canada, January 8th, 2003
[4] Maged E. Elaasar, Zheyin Li, Michel Barbeau, and Evangelos Kranakis – “The eXtended Satellite Transport Protocol: Its Design and Evaluation”, 17th Annual AIAA/USU Conference on Small Satellites
[5] http://www.nytimes.com/2009/02/03/world/americas/03lithium.html; September 5th, 2010
[6] http://en.wikipedia.org/wiki/Salar_de_Uyuni; July 8th, 2010
[7] James R. Wertz, Wiley J. Larson - “Space Mission Analysis and Design”, 3rd edition, 2007, Space Technology Library, Microcosm Press and Springer
[8] Thomas R. Henderson and Randy H. Katz - “Transport Protocols for Internet-Compatible Satellite Networks”, IEEE Journal on Selected Areas of Communications, 1999
[9] R. Katz – “Satellite Transport Protocol”, PhD thesis, Dec. 1999
[10] T. Henderson and R. Katz – “Satellite transport protocol (STP): An SSCOP-based transport protocol for datagram satellite networks”, Proceedings of 2nd Workshop on Satellite-Based Information Systems, 1997
[11] M. Barbeau – “Protocol implementation framework for Linux (PIX), Technical report, 2002
[12] http://www.isi.edu/nsnam/ns/; February 5th, 2010
[13] http://savi.sourceforge.net/; September 8th, 2010
[14] http://web.archive.org/web/19981206074614/www.teledesic.com/tech/details.html; September 7th, 2010
[15] http://www.rapideye.de/; September 8th, 2010
[16] http://www.dmcii.com/; September 8th, 2010
[17] http://www.landcoalition.org/cpl-blog/?p=1387; September 8th, 2010

www.iariajournals.org
International Journal On Advances in Intelligent Systems
ICAS, ACHI, ICCGI, UBICOMM, ADVCOMP, CENTRIC, GEOProcessing, SEMAPRO,BIOSYSCOM, BIOINFO, BIOTECHNO, FUTURE COMPUTING, SERVICE COMPUTATION,COGNITIVE, ADAPTIVE, CONTENT, PATTERNS, CLOUD COMPUTING, COMPUTATION TOOLS
issn: 1942-2679
International Journal On Advances in Internet Technology
ICDS, ICIW, CTRQ, UBICOMM, ICSNC, AFIN, INTERNET, AP2PS, EMERGING
issn: 1942-2652
International Journal On Advances in Life Sciences
eTELEMED, eKNOW, eL&mL, BIODIV, BIOENVIRONMENT, BIOGREEN, BIOSYSCOM,BIOINFO, BIOTECHNO
issn: 1942-2660
International Journal On Advances in Networks and Services
ICN, ICNS, ICIW, ICWMC, SENSORCOMM, MESH, CENTRIC, MMEDIA, SERVICECOMPUTATION
issn: 1942-2644
International Journal On Advances in Security
ICQNM, SECURWARE, MESH, DEPEND, INTERNET, CYBERLAWS
issn: 1942-2636
International Journal On Advances in Software
ICSEA, ICCGI, ADVCOMP, GEOProcessing, DBKDA, INTENSIVE, VALID, SIMUL, FUTURECOMPUTING, SERVICE COMPUTATION, COGNITIVE, ADAPTIVE, CONTENT, PATTERNS,CLOUD COMPUTING, COMPUTATION TOOLS
issn: 1942-2628
International Journal On Advances in Systems and Measurements
ICQNM, ICONS, ICIMP, SENSORCOMM, CENICS, VALID, SIMUL
issn: 1942-261x
International Journal On Advances in Telecommunications
AICT, ICDT, ICWMC, ICSNC, CTRQ, SPACOMM, MMEDIA
issn: 1942-2601