Advances in Social Sciences Research Journal – Vol.1, No.8 ...
222
Advances in Social Sciences Research Journal – Vol.1, No.8 Publication Date: December 30, 2014 DOI:10.14738/assrj.18.683 Dodig, M. (2014). Canonical Relations of Sensomotoric Reactions to Light and Sound Stimulus. Advances in Social Sciences Research Journal, 1(8), 613 Copyright © Society for Science and Education, United Kingdom 1 Volume 3, Issue 1 – January 2016 ISSN 2055-0286
-
Upload
khangminh22 -
Category
Documents
-
view
0 -
download
0
Transcript of Advances in Social Sciences Research Journal – Vol.1, No.8 ...
Advances in Social Sciences Research Journal – Vol.1, No.8 Publication Date: December 30, 2014 DOI:10.14738/assrj.18.683
Dodig, M. (2014). Canonical Relations of Sensomotoric Reactions to Light and Sound Stimulus. Advances in Social Sciences Research Journal, 1(8), 6-‐13
Copyright © Society for Science and Education, United Kingdom 1
Volume 3, Issue 1 – January 2016 ISSN 2055-0286
Advances in Social Sciences Research Journal (ASSRJ) Vol.3, Issue 1 January-‐2016
TABLE OF CONTENTS EDITORIAL ADVISORY BOARD
DISCLAIMER
II III
Appraisal of the Roles of Metropole and Satellite in the Stunted Development of African Nation State Nigeria Ali Haruna Alhaji Ahmadu Ibrahim
1
Social Studies Teachers’ Conceptualizations and Practices of Democracy in Upper Classes in Primary Schools in Botswana Mavis B. Mhlauli
8
The Assessment and Supervision of China’s Systemically Important Insurers Da Wang
20
Entrepreneurship and Innovation in E-‐Business Maruf Hasan Harris Ui
31
Teacher’s Classroom Management Practices for Increasing Effectiveness in Climate Change in Nigeria. Kabiru Mohammed Badau (Ph.D)
43
The Use of New Information and Communication Technologies as an Education Tool in the Fight Against HIV/AIDS in Fundong, Norhtwest Region, Cameroon Tohnain Nobert Lengha
51
The Leadership Styles of Basic School Head Teachers: What Teachers Say Vincent Mensah Minadzi Boadu Kankam
61
A Survey of Overconfidence Investor Generation Y Wisudanto SM Soeharto F Ismiyanti IM Narsa
72
The Role of Customer Satisfaction in a Relation of Experiential Marketing and Customer Loyalty Bagus Nurcahyo
78
Advances in Social Sciences Research Journal (ASSRJ) Vol.3, Issue 1 January-‐2016
Impact of Water Pollution on Human Health in the Central African Republic Francklin Kamba Frank Sangija
90
Head teachers’ Supervision of Curriculum Implementation: Implications on Provision of Quality Secondary Education in Kenya Jennipher Atieno Awiti Henry Onderi Pamela Raburu
116
Thinking about Research Paradigms in Educational Research Shiyun Wang Pengju Zhu
129
Strategy Analysis of the 2022 Winter Olympics in Hebei Province Dong Hui Huamei Zhong
134
School Management and its Effectiveness in Lower Secondary Education in Uganda: Examining Perceptions of the Practitioners James Wokadala, PhD
141
A Systematıc Approach For Increasıng The Success Of Kıtchen Interıor Desıgn Wıthın The Context Of Spatıal User Requırements Dr. Deniz Ayşe Yazıcıoğlu Prof. Dr. Alaattin Kanoğlu
155
Partnership For Peace, Tackling The Threats And Raising The Prospects For Justice In Rivers State Fidelis Allen
167
The Role of Capital Ratios in Predicting Bank Distress: Evidence from the Nigerian Banks Haruna Mohammed Aliero (PhD) Nasiru Mukhtar Gatawa (PhD) Alhaji Kabiru (M. Sc.)
174
Intergenerational Learning – Children Singing Along with Older People – Possibilities and Complications in a Project Context Lena Nilsson Margaretha Herrman
187
CEDAW Right of non-‐discrimination and State Obligations in connection to Trafficking in Women Prof. Dr. Netkova Bistra Prof.Dr. Ismail Zejneli
201
Potential Sources of Modern Day Slavery William R. DiPietro
210
Advances in Social Sciences Research Journal (ASSRJ) Vol.3, Issue 1 January-‐2016
EDITORIAL ADVISORY BOARD
Prof. David Edelman University of Cincinnati, Ohio
United States
Dr. Prince Bull North Carolina University
United States
Dr. Jim Concannon Westminster College
United States
Dr. Hang Nguyen The Royal Melbourne Institue of Technology (RMIT University)
Australia
Dr. Khalik Salman Mid Sweden University
Sweden
Dr. Jill Morgan University of Wales: Trinity St David
United Kingdom
Dr. Michael Grabinski Neu-‐Ulm University of Applied Sciences (HNU)
Germany
Dr. Mahyar Arefi University of Cincinnati, Ohio
United States
Dr. Patrick Velte Leuphana Universität Lüneburg
Germany

Advances in Social Sciences Research Journal (ASSRJ) Vol.3, Issue 1 January-‐2016
DISCLAIMER
All the contributions are published in good faith and intentions to promote and encourage research activities around the globe. The contributions are property of their respective authors/owners and ASSRJ is not responsible
for any content that hurts someone’s views or feelings etc.

Advances in Social Sciences Research Journal – Vol.3, No.1 Publication Date: Jan. 25, 2016 DoI:10.14738/assrj.31.1725.
Haruna, A., & Ibrahim, A. A. (2016). Appraisal of the roles of Metropole and Satelite in the Stunted Development of African Nation State Nieria. Advances in Social Sciences Research Journal, 3(1) 01-‐07.
Copyright © Society for Science and Education, United Kingdom 1
Appraisal of the Roles of Metropole and Satellite in the Stunted Development of African Nation State Nigeria
Ali Haruna
Department of Sociology Yobe State University P.M.B 1144 Damaturu
Yobe State, Nigeria
Alhaji Ahmadu Ibrahim Department of Sociology
Yobe State University P.M.B 1144 Damaturu Yobe State, Nigeria
Abstract
Issues relating to government in post -‐colonial states in Africa are replete with tales of woes when considered within the ambit of development, especially in this era of globalization. Many orthodox views hold the industrialized western nations of the north culpable. On the other hand, the nascent economic theorists of western origin implicate the fragile economic structures and institutions of governance and leadership as being responsible for Africa’s underdevelopment status. While the debate is on, some others view African status as endogenously inherent in her leadership response to the crises of poverty, food security political instability, technological development and other critical malaise. This paper explores the extent to which these views can be relevant explicate the failure of post-‐colonial states in Africa, with particular reference to Nigeria, in this discourse. The paper implicates the roles played by Nigerian comprador leadership, response to the call for economic political and cultural liberalization as the underlying factors responsible to the failure of the post-‐colonial Nigerian state.
Keywords: Appraisal, Satellite, Stunted, Development, African.
INTRODUCTION
Many countries in Africa are past colonies of Western Europe powers like England, France and Portugal. It should be noted that Nigeria is a past colony of Britain. The arrival of Portuguese ships on the west of Africa in the 15th century marked the beginning of countries of European colonization of the Africa continent that has left in its wake horrendous legacies – social economic, cultural and political – which have helped to keep a potentially virile continent in perpetual stagnation. Before its contact with the Europeans, Africa was a land that could boast of flourishing kingdoms, trade and commerce with well-‐developed systems of administration under their kings and their councils (Rodney, 1972: 147). The colonial era which started with slave trade saw the supply of about 200 million young men and women, on annual basis, to Europe (Rodney, ibid:86). This led to massive depletion in human and economic resources with its attendant impoverishment of the continent of Africa. This is so because the human resources that could have been harnessed and crystallized for economic and leadership development in Africa were sold off to Europe and America (Frank,
Haruna, A., & Ibrahim, A. A. (2016). Appraisal of the roles of Metropole and Satelite in the Stunted Development of African Nation State Nieria. Advances in Social Sciences Research Journal, 3(1) 01-‐07.
URL: http://dx.doi.org/10.14738/assrj.31.1725. 2
1966; Rodney, 1972; Eke, 1983; Emeagwahi; 2004 Ogunbamila, 2005 in Iherohanma and Oguoma, 2010:411). In trying to assess the conditions of the post-‐colonial African States, and Nigeria in particular, it is germane to examine the nature and style of political leadership that the so called colonial masters offered, and also the type of economy that was bequeathed to the African continent by the colonialists on the eve of their departure. Furthermore, an examination of what the Nigerian nation state attains after over 50 years of flag independence is apposite. Commenting on the situation of post-‐colonial states of Africa Mawere (2009) lamented thus, the post-‐colonial Africa experience has not had any material influence on poverty reduction, to the extent that the continent’s political system are high up on the global agenda that is dominated by the continents former colonial powers as if to confirm that there was no serious appreciation of the implications of political independence on transformation and economic development by the architects of the decolonization project. There is no doubt that colonialism was underpinned by a clear agenda whose outcome was evident. What is less clear is the agenda of Africa’s post-‐colonial masters. To date, almost every country in Africa is still haunted by historical injustices and oppressive structures that were bequeathed to the post-‐ colonial leadership. As such, Nigeria is not an exception. This is an aspect which informs the weak institutions of states, flawed legislative system and constant struggle for political power to the detriment of the well-‐being of many nations, which could have moved on a path of development as part of modern societies.
THOERITICAL INSIGHTS For the purpose of this study the dependency theory of Henrique Cardoso, A.G. Frank, Samir Amin and Rodney,could best offer an explanation to the situation at hand, as the framework of analysis. Dependency simply states that crucial economic decisions are made not by the countries that are being developed but by the foreigners whose interest are safe guarded. The foreigners use their economic power to buy political power in the countries that they penetrate. In another word, it is a political pressure by the imperialist metropolis or even military intervention, (Offion, 1980). This collusion between alien economic and political power distort both the economy and the policy of the dependent countries. Out of this arise political alliances between the domestic and foreign bourgeoisies. The vicious circle of the process is now complete because just as the metropolis exploits the colonies, so does the domestic colonial bourgeoisie class exploit the rest of the population,(Offion ibid). The exploitative and expressive nature of this relationship in disfavor of the satellite countries was very salient in the failure of post-‐colonial-‐Africa states. The colonial experience of the post-‐colonial Africa states which lasted for over a century inevitably led to the alternation of their values, their psyche and consequently their developmental progress (Alanana, 2006). The dependency theory highlighted in the foregoing is not without its shortcomings or limitations.It seems to have taken and excessively exaggerated the view of the role of external forces in the failure of the post-‐colonial African states without taking into cognizance the salient internal factors which conspired to aggravate the problem. For example, indiscipline and corrupt leadership, ethnic squabbles, religious bigotry, etc. all contributed to the failure.Also the dependency theory relied too heavily on economic exploitation of the satellites. It ignored the cultural rape and the unfavorable socio-‐political and administrative structures bequeathed to the post-‐colonial leaders which were tailored
Advances in Social Sciences Research Journal (ASSRJ) Vol.3, Issue 1 January-‐2016
Copyright © Society for Science and Education, United Kingdom 3
towards failure. Despite these however, the theory still provide the platform for understanding the global inequality. Development of Post-‐colonial States’ Underdevelopment It is very much clear that post-‐colonial African state’s creation was arbitrary and did not take into cognizance the historical and cultural differences of the people. Their creation is based on the administrative whims of the members of Berlin conference in 1945. This has created an endemic problem of cohesion in most past colonial states in Africa. This further led to the emergence of ethnic militias who engaged the post-‐colonial administration in bitter altercation and coups that in consequence crippled the socio economic and political development of those states. In the case of Nigeria, it has witnessed a lot of coups, counter-‐coups, civil war, ethno-‐religious violence etc. Post-‐colonial African elites failed their peoples because they could not rise to the occasion when it mattered most. They lacked qualities of purposeful leadership. They were content to direction from the elsewhere colonial masters on policy direction. There are evident cases of corruption and administrative ineptitude in Nigeria. Symptoms of Failure of Post Colonial African States There abound glaring evidences that support the popular claim that post-‐colonial African states have failed. The manifest features of acute underdevelopment in most of these states of Africa cannot stand erect in the international arena. In most of the post-‐colonial African states there are high infant mortality rate and high child mortality state. All these states are heavily dependent on foreign technology, goods and services, high rate of unemployment, excruciating poverty level; high level of illiteracy among the populace (Rodney, 2009). Also diplomatic failure in post-‐colonial African states is manifested via the high rate of political instability, electoral violence, and insecurity. All these abound in Nigeria. Sustained civil war and ethnic religious crises have claimed the lives of many in these post-‐colonial states. Examples of such states are Nigeria, Liberia, Angola, Sudan, Somalia, Serialeone, Ethiopia, to mention but a few. Other features of these failed states are corruption, failed institutions arising from policy inconsistencies, human rights violation and lack of adherence to the rule of law. Causes of The Failure of Post-‐Colonial African States It appeared that the euphoria of independence and the unanticipated load and pleasure of leadership paraphernalia it bestowed on those involved in the anti-‐colonial struggle and emergent Africa leaders blurred the vision of these nationalists. This is because, the incipient national consciousness to have derailed soon after independence instead of crystallizing into a limited and strong continent. It was not able to rationalize, galvanize and re-‐direct the popular resistant movement in terms of the cardinal need for national unity and development. Yet, the continent had the natural endowments human and material resources that were the attractions to the colonial masters. African leaders, at the expiration of the period of relationship and nationalist struggle were overwhelmed by the enormity of legacies that followed the devolution or shift of power at independence (Eke, 1983; Nwabuezw, 1999). It could be interpreted that the development structures and policies by the colonialists never
Haruna, A., & Ibrahim, A. A. (2016). Appraisal of the roles of Metropole and Satelite in the Stunted Development of African Nation State Nieria. Advances in Social Sciences Research Journal, 3(1) 01-‐07.
URL: http://dx.doi.org/10.14738/assrj.31.1725. 4
allowed space for the emergent leaders in Africa to revolt against the structures or still that these leaders did not realized. The necessity to reform the inherited development structure to the needs of Africa the post-‐colonial Africa states as a successor to the colonial states was fundamentally a political construction.
POLITICAL FACTORS Political instability in Africa may own much of its causes to internal factors. However, the interpenetration of external factors especially geo-‐political and economic interests of the international community constantly play a significant role in undermining the very process and institutions that are expected to nurture democracy and to instill a sense of stability for societal development(Ongayo, 2008). Combination to such factors as unequal development, poverty, disease, violence and the manipulative tendencies of the local elites, political and economic stability in Africa is constantly under threat. This threat is however not emanating from within the continent but from external interests whose thirst for African resources continue to shape the dynamics in areas related to governance.
ECONOMIC FACTORS Resources in Africa if well managed are capable of providing for its entire population, hence the potentials for a more stable environment. However, it is well documented that stolen wealth from Africa often end up in banks abroad (Africa Focus Bulletin, 2006), be it money stolen by the political elite. The case of Mobutu of Zaire, Abacha of Nigeria, and Daniel Arap Moi of Kenya, just to mention a few all end up in banks in the western capitals. A lot of litigations instituted by the anti-‐graft agencies in Nigeria are receiving the attention of the judiciary at present. The post-‐colonial African states experience has not had any material positive influence on poverty reduction to the extent that the continent’s political and economic challenges are quite high. Poverty has become a master problem, widely acclaimed internationally as deserving urgent attention, especially in the sub-‐Sahara Africa countries, which include Nigeria. In these countries, abject poverty has increased, widened, depeened and has become ramified engulfing an overwhelming majority of the population. Poverty anywhere is a threat to peace and security (Adekunle, 1975). The Neo-‐colonialist economic policies of most of the post-‐colonial Africa states only fine-‐tuned the mode of explanation of these states.The much touted nationalization or indigenization of the economy of the post-‐colonial African states was mere facade. In most cases the comprador elites still front for the colonial masters as chairmen of companies whose controlling shares were owned.
STATES FACTORS The African states did not emerge through evolution. That is through gradual grouping of indigenous societies. Despite the existence of institutional frameworks that are supposed to guide processes and delivery of essential services, the continued weakening of these institutions through political mechanization and predatory nature of African elites; working in cohorts with external interests, also contributes further to the undermining of stability in Africa. These tendencies exacerbate resources, ethnic rivalry and more recently the emergence of electoral violence.
Advances in Social Sciences Research Journal (ASSRJ) Vol.3, Issue 1 January-‐2016
Copyright © Society for Science and Education, United Kingdom 5
LEADERSHIP FACTORS Leadership implies critical management of critical resources endowments in a country.Africans are endowed with critical indigenous knowledge, traditional technologies and wealth (Gakuru, 2005). Indigenous knowledge encompasses traditional knowledge, innovations, technologies and practices. The question however is; have African leaders and government ensure these technologies and knowledge are harnessed to achieve diversified economy, food security, job and employment generation, entrepreneurship, leadership, capacity building and wealth creation. According to Iherioha Nma and Oguoma (2010) there is the get-‐rich-‐quick mania in Africa, especially among the political leaders. The inordinate ambition for wealth accumulation is an offshoot of corrupt practices which are aspects of underdevelopment. African leaders appear to be ingrained in stealing public money and eventually remitting same to other foreign banks. Yet, the industrialized countries that claim to be corrupt-‐free accommodate such practices. These acts have no multiplier effects on national economy since the booties are not invested for regeneration. There are poor human capital development and poor healthy development policies and programmes in almost all countries in Africa. This is attested to by the number of qualified Africans. Insecurity and poverty account for the brain drain (Emaegwali, 2004). A health nation is a wealthy nation.
EDUCATIONAL FACTORS Post-‐colonial African states are characterized by regional imbalance especially in terms of education. This is due to irresponsible leadership coupled with the faulty band legacy of colonial education. The education sector of African countries is in neglect, unequipped with facilities to provide necessary skills and manpower development for the services of their states. Comrade Samora Michel, President of Frelimo and Peoples Republic of Mozambique, in 1977, in an acceptance speech on the award of Doctorate Degree of Law, stressed the effects of colonial education on the youth of his country. According to Michel, colonial education provided by the imperialists was not intended to prepare the youths for the services of their countries but for perpetuation of the exploitation of the post-‐colonial states. In the same vein, Rodney’s (2009) acknowledged that the colonialists provided education for underdevelopment of Africa. It is unfortunate that, at present, only an insignificant number of Nigerian universities are listed in the league of the top 1000 best universities in the world. Furthermore, Nigerian education is more of theoretical than functional and practical.
LEGITIMACY FACTORS The legitimacy of the inherited rights/obligations structure becomes an issue that is often used to obscure the abuse of the states by post-‐colonial African states leaders, Mawere, (2009). The reversal of the right to land, minerals and others resources that often have a colonial and political origin becomes the pre occupation of the post-‐colonial African states with little or no regard to the consequences on poverty alleviation and economic progress. Yes, we can have rights to our land and minerals, but do we have a plan to meet the obligations inherent in exercising such rights to the benefit of the collective course.
Haruna, A., & Ibrahim, A. A. (2016). Appraisal of the roles of Metropole and Satelite in the Stunted Development of African Nation State Nieria. Advances in Social Sciences Research Journal, 3(1) 01-‐07.
URL: http://dx.doi.org/10.14738/assrj.31.1725. 6
Positive Aspects of Post Colonial African States Since the aim of this paper is to assess the popular claims that the post-‐colonial African states are failed states, it is imperative, having examined the area of failure, to look at some of the favourable aspects of these states. The emergence of the modern African cities has been traced to the advent of colonialism. Smythe and Smythe, (1960) assert that these groups were trained to read and write and then got employed as clerical assistants in colonial administrations. Others were the returns slaves who had acquired western education and valuable skills (Anyandele, 1974). These later became the torch bearers of the struggle for the independence of their various territories. Colonial experience created this political awareness. It is an undeniable fact that most of the major roads and railways in African states, especially Nigeria are what the colonial regime bequeathed to them. It is lamentable that after fifty years of independence the colonial railway line is what we are still using and we cannot even maintain them.
CONCLUSION A lot has been written on the role of the metropole in the sordid, underdeveloped state of the satellite. It is the opinion of this paper that this over-‐trodden path (of pointing accusing fingers) should be jettisoned because it now amount to self-‐mockery. The position of this paper is that if the West is responsible for the failure of post-‐colonial African states then these states owe themselves duty to subscribe to the suggestion of A.G Frank to break away. Before and after independence most of these African states produced and are still producing sizeable numbers of intellectual elites as well as economic elites and technocrats who were and still are, at vantage position to positively shape the destinies of their perspective states and take Africa of the straggle hold of neo-‐colonial domination and economic improvements. Sovereign states of Africa can choose to close their doors on the so-‐called exploiter nations and look inward. Africa has vast fertile land. Agriculture was the main occupation of the people. What happened to agriculture? Where are the rubber plantations? Where is the oil palm plantation? Where are the groundnut and cotton pyramid? Malaysia, the world in highest producer of oil palm came to Nigeria to beg for palm seeds about eighteen years ago. Why does Nigeria spend millions to refine crude oil outside their country when we have refineries that should have been maintained with fewer amounts? Nigeria has many dams and rivers as well as much sunshine why can’t she generate enough electricity for industries and other domestic use? Why does Africa complain of brain drain when it fails to create conductive environment for them to stay and develop their societies? Much money has been spent by the executive arm of government globe trolling in the name of negotiating with those in the Diasporas to come home when there are no infrastructures on ground to attract those in the Diaspora back home. What happened to the result of the researches and inventions that African intellectuals have made especially in science and technology? What of the Ogbunigwe’ that the Igbos invented during the civil war?
Advances in Social Sciences Research Journal (ASSRJ) Vol.3, Issue 1 January-‐2016
Copyright © Society for Science and Education, United Kingdom 7
The failure of the post-‐colonial African states should be laid at the door step of the African elites who have had all it takes to transform their societies for the best but, in criminal perfidy, have shunned that responsibility. This paper contends and concludes that post-‐colonial African states are where they are, by CHOICE! References
1. Ayandele, E.A. (1974), The Educated Elite in Nigeria Society. University Press, 1974.
2. Eke P.P (1983), Colonialism and Social Structure: An InauguralLecture. Ibadan: University of Ibadan
3. Gakuru CC. (2005) Indigenous Technology and wealth Creation a case of a report of the 2005 a regional youth congress and exposition on youth empowerment/wealth creation. Hilton Nairobi, Kenya
4. Iheriohanma, E.B.J and Oguoma, O. (2010) governance, leadership crises and underdevelopment in Africa: An explorative Discuss. European Journal of social sciences volume 12 No 3 (2010).
5. Offiong, A. D (Imperialism and Dependency. Fourth Dimension Publishers, Enugu, Nigeria.
6. Odekunle F. (1975) Victims of Property crime in Nigeria, parliamentary investigations in Zaria. Zaria A.B.U. Press.
7. Ong’aya, A.O (2008) political instability in Africa where the problems lies and alternative perspectives seminar presented at stitching national Exfgoed Hotel De Wereld, Wagering 19th September, 2008.
8. Rodney W. (2009) How Europe underdeveloped. Africa Pana publishing, Abuja, Lagos, Pretoria
9. Smythe H and smyth M. (1960) the new Nigeria Elite. California standard university Press.
Advances in Social Sciences Research Journal – Vol.3, No.1 Publication Date: Jan. 25, 2016 DoI:10.14738/assrj.31.1748.
Mhlauli, M. B. (2016). Social Studies Teacher’s Conceptualizations and Practices of Democracy in Upper Classes in Primary Schools in Botswana. Advances in Social Sciences Research Journal, 3(1) 08-‐19.
Copyright © Society for Science and Education, United Kingdom 8
Social Studies Teachers’ Conceptualizations and Practices of Democracy in Upper Classes in Primary Schools in Botswana
Mavis B. Mhlauli
University of Botswana, Faculty of Education Private Bag 00702, Gaborone, Botswana.
Abstract
The purpose of this study was to interrogate the social studies teachers’ conceptualizations and practices on democracy in upper classes in primary schools in Botswana. The study was undertaken in upper classes in six primary schools in Botswana for a period of three months. The theoretical underpinnings of my study are based on what Asante (2010) refers to as Afrocentricity, which basically focuses on relocating the African people historically, socially, economically, politically and philosophically in an effort to decolonize their minds. For its methodology, the study was qualitative in nature and used the naturalistic inquiry paradigm. Data were collected through interviews, participant observations and focus group discussions. Data were analyzed using the constant comparative technique. The findings of the study revealed that even though teachers conceptualize democracy from a liberal point of view, they seem to be moving the center as they also take into account the contextual and socio-‐cultural factors. The conclusion drawn from this study is that teachers have a deep understanding of democracy, however, lack pedagogical content knowledge of democracy. The study recommends that teachers be constantly in-‐serviced on how to develop practical skills when teaching topical issues like democracy as they contribute directly towards they type of citizens they produce.
Keywords: Primary Education, Social Studies, Democracy, Afrocentricity, Naturalistic Inquiry, Pegagogy, Teachers’ Conceptualizations.
INTRODUCTION
The role of democracy in the teaching of social studies in primary schools in Botswana or any other democratic nation emerging or prime is an undisputed phenomenon. Social studies as a subject within the primary school curriculum has been charged with a mammoth task of educating citizens in a democracy. The task of social studies in insuring that the democratic project becomes viable and vibrant within the school is arguably the most important one if the aim is to develop highly critical and participatory citizens. The most important question then is “What is democracy understood to mean?” Democracy is a highly contested concept of which some scholars even suggest that it is meaningless to define (Adeyemi, 2006; Mautle, 2000) since it does not have one true meaning (Crick, 1989). From a general perspective, Crick (1989) articulates the meaning and usage of the concept democracy, that, democracy can be traced to the Ancient Greeks through the works of Plato’s attack on democracy and Aristotle’s highly qualified defense of democracy. In simple terms, drawing from the earliest definitions democracy: Is simply demos (the mob, the many) and kracia (rule). Plato attacked democracy as being the rule of many, the poor and the ignorant over –what should be, he thought-‐the rule of the few as the wise and the disinterested. His fundamental distinction was between knowledge and opinion: democracy is thus the rule of mere opinion (Crick, 1989, 15).
Advances in Social Sciences Research Journal (ASSRJ) Vol.3, Issue 1 January-‐2016
Copyright © Society for Science and Education, United Kingdom 9
This definition lays a foundation for the definition of democracy as used in various places and contexts. In Botswana democracy is defined in relation to giving people a voice and opportunity to participate in the affairs of their lives. It is stated that “democracy involves giving each mature person a voice in the running of affairs and the chance to participate, directly or through representatives, in decisions affecting his life”(Education for Kagisano, 1977, p. 25). Democracy can also be defined as a system of government that represents the people and responds to their needs and expectations, and that would essentially be undergirded by a transparent process of public responsibility and accountability (Abdi, 2008). Chief Linchwe (1989) of the Bakgatla ba ga Kgafela (ethnic group) in Botswana provides an interesting definition of democracy. In defining democracy, he asserts that democracy is a relative term and can be defined in several ways, that: It is not a matter of theory but a way of life. It is the latter that makes a difference for the average citizen for it involves a modus of vivendi or an arrangement for the peaceful coexistence of people in a society. It entails a covenant between the ruled and the rulers to create within the community mutual respect for all citizens and a collective responsibility for everybody’s political and material survival (Chief Linchwe, 1989, p. 99). The definition outlined above provides a deeper understanding of democracy in Botswana as it emphasizes collective responsibility, peaceful coexistence, survival of citizens and sees it as a way of life as opposed to the liberal definitions that revolve around participation and voice. Nnoli (1989) in trying to define democracy sees it in terms of elections and that the equality of the individual to vote goes hand in hand with freedom of speech and association as well as fairness with the electoral mission. However, Chachange (2001) is very critical about the conceptualization of democracy as elections in Africa of which Botswana is part, that these forms of politics have sworn more seeds of discord since they defend the politics of exclusion and inclusion, privileges and denials. The contention is that the winning and losing of votes is based on mobilization, and that this mobilization includes other forms of identities, imagined or real and as a result the winner ends up excluding the very people who voted him to power. Given all these definitions, one is inclined to support Crick (1989) that democracy is not meaningless but rather means different things to different people. These definitions provide a lens through which democracy within the Botswana context can be viewed and reinforce the notion that it means different things to different people. Democracy and Education in Botswana The implementation of democracy in education has implications for the stakeholders, teachers and the curriculum (Education for Kagisano, 1977). It is believed that all the stakeholders such as the community, parents, professional workers in education and students must have a direct voice through school committees like the Parents Teachers Associations (PTA). Teachers and other educational professionals must play an active role in the decision making process involving schools (Education for Kagisano, 1977). This means that they have to be consulted about any changes in their conditions of service, participate in the syllabus changes and curriculum reform. The curriculum should include teaching about democratic institutions and how they work. This involves incorporating practical experiences of democratic institutions through visits to the Kgotla, local council chambers or Parliament and instilling democratic

Mhlauli, M. B. (2016). Social Studies Teacher’s Conceptualizations and Practices of Democracy in Upper Classes in Primary Schools in Botswana. Advances in Social Sciences Research Journal, 3(1) 08-‐19.
URL: http://dx.doi.org/10.14738/assrj.31.1748. 10
values in students (Education for Kagisano, 1977). The kgotla is a traditional forum by which individuals and the community achieve some consensus about solutions to issues and problems they are faced with. It is led by the Kgosi (Chief) who acts as chair, mediator and adjudicator on tribal matters. It is against this backdrop that this study sought to explore the social studies teachers’ views, ideas, experiences and practices on the teaching of democracy in primary schools. It should be borne in mind that democracy is not genetically inherited; it should be learned, nurtured and practiced for it to grow (Mhlauli 2010; Harber and Serf, 2006). Its growth and sustenance is dependent on the ability of the school curriculum and teachers to be able to address it in practical terms, hence the need to find out from these teachers if they practice or teach democracy in their social studies classrooms. Purpose of Study The sought to interrogate the social studies teachers’ ideas, experiences and practices in teaching democracy in upper classes in primary schools in Botswana. Research Questions (RQ’s) The study was guided by the following Research Questions (RQ);
1. What are the social studies teachers’ understandings of democracy in upper classes in primary schools in Botswana?
2. What are the social studies teachers’ classroom practices on the teaching of democracy in upper classes in primary schools in Botswana?
3. What recommendations can be made (if any) to promote the teaching of democracy in primary schools?
THEORETICAL FRAMEWORK
The theoretical underpinnings of this study are based on what Asante (2010) refers to as Afrocentricity. Asante further asserts that Afrocentricity advances the “profound need for African people to be re-‐located historically, economically, socially, politically and philosophically” (Asante, 2010 , p.1). Afrocentricity as a theory of change intends to relocate the African persons from decenteredness that is; from being alienated and disoriented from their own cultural and political heritage (Asante, 2010). It is this notion of decenteredness that makes this theory appealing to me as helps in deconstructing how knowledge is constructed and perceived. The political idea of democracy as perceived and understood by teachers in this study is interesting as it debunks the notion that democracy is a solely western thought hence augmenting the notion that it is a relative concept. The way teachers perceive democracy in this study shows the extent to which teachers are also moving to the center (Merryfield, 2008) on how they interpret democracy from a cultural perspective as it involves the ideas and experiences of people who have been left out of the process of knowledge construction. Afrocentricism as a theory uses experience as the basis of knowledge as well as promoting dialogue (Ladson-‐Billings, 1994).
LITERATURE REVIEW Since literature on democracy is abundant, the review in this case will be contextual. It specifically addresses the nexus between the two main conceptions of democracy in Botswana and a critical analysis of Botswana’s democracy in order to bring the teachers’ understandings and practices of democracy in Botswana into perspective. This is important in that it provides a rationale for understanding the teachers’ views, ideas and practices on democracy as understood by them.
Advances in Social Sciences Research Journal (ASSRJ) Vol.3, Issue 1 January-‐2016
Copyright © Society for Science and Education, United Kingdom 11
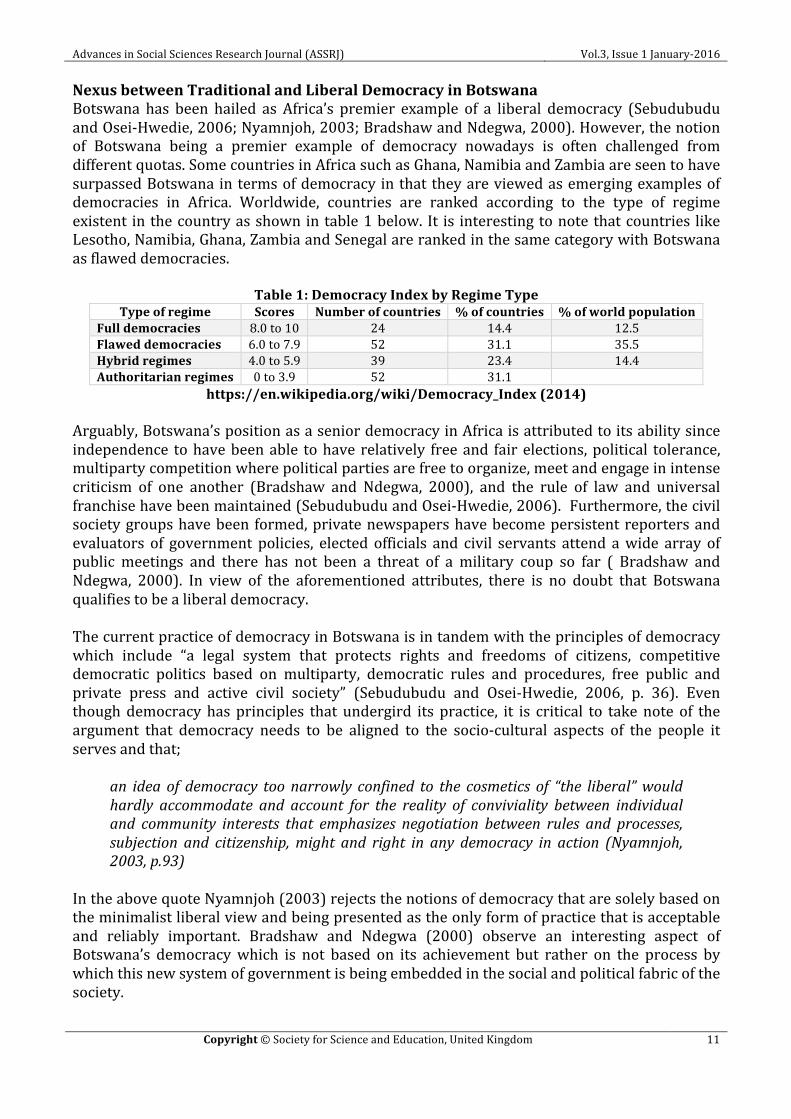
Nexus between Traditional and Liberal Democracy in Botswana Botswana has been hailed as Africa’s premier example of a liberal democracy (Sebudubudu and Osei-‐Hwedie, 2006; Nyamnjoh, 2003; Bradshaw and Ndegwa, 2000). However, the notion of Botswana being a premier example of democracy nowadays is often challenged from different quotas. Some countries in Africa such as Ghana, Namibia and Zambia are seen to have surpassed Botswana in terms of democracy in that they are viewed as emerging examples of democracies in Africa. Worldwide, countries are ranked according to the type of regime existent in the country as shown in table 1 below. It is interesting to note that countries like Lesotho, Namibia, Ghana, Zambia and Senegal are ranked in the same category with Botswana as flawed democracies.
Table 1: Democracy Index by Regime Type Type of regime Scores Number of countries % of countries % of world population
Full democracies 8.0 to 10 24 14.4 12.5 Flawed democracies 6.0 to 7.9 52 31.1 35.5 Hybrid regimes 4.0 to 5.9 39 23.4 14.4 Authoritarian regimes 0 to 3.9 52 31.1
https://en.wikipedia.org/wiki/Democracy_Index (2014) Arguably, Botswana’s position as a senior democracy in Africa is attributed to its ability since independence to have been able to have relatively free and fair elections, political tolerance, multiparty competition where political parties are free to organize, meet and engage in intense criticism of one another (Bradshaw and Ndegwa, 2000), and the rule of law and universal franchise have been maintained (Sebudubudu and Osei-‐Hwedie, 2006). Furthermore, the civil society groups have been formed, private newspapers have become persistent reporters and evaluators of government policies, elected officials and civil servants attend a wide array of public meetings and there has not been a threat of a military coup so far ( Bradshaw and Ndegwa, 2000). In view of the aforementioned attributes, there is no doubt that Botswana qualifies to be a liberal democracy. The current practice of democracy in Botswana is in tandem with the principles of democracy which include “a legal system that protects rights and freedoms of citizens, competitive democratic politics based on multiparty, democratic rules and procedures, free public and private press and active civil society” (Sebudubudu and Osei-‐Hwedie, 2006, p. 36). Even though democracy has principles that undergird its practice, it is critical to take note of the argument that democracy needs to be aligned to the socio-‐cultural aspects of the people it serves and that;
an idea of democracy too narrowly confined to the cosmetics of “the liberal” would hardly accommodate and account for the reality of conviviality between individual and community interests that emphasizes negotiation between rules and processes, subjection and citizenship, might and right in any democracy in action (Nyamnjoh, 2003, p.93)
In the above quote Nyamnjoh (2003) rejects the notions of democracy that are solely based on the minimalist liberal view and being presented as the only form of practice that is acceptable and reliably important. Bradshaw and Ndegwa (2000) observe an interesting aspect of Botswana’s democracy which is not based on its achievement but rather on the process by which this new system of government is being embedded in the social and political fabric of the society.
Mhlauli, M. B. (2016). Social Studies Teacher’s Conceptualizations and Practices of Democracy in Upper Classes in Primary Schools in Botswana. Advances in Social Sciences Research Journal, 3(1) 08-‐19.
URL: http://dx.doi.org/10.14738/assrj.31.1748. 12
In Botswana the kgotla, as a traditional institution complements modern democracy with its openness and democratic customs (Sebudubudu and Osei-‐Hwedie, 2006). The Kgotla as a community institution serves a variety of roles which revolve around political, administrative and judicial functions (Patterson, 2006). Sebudubudu and Osei-‐Hwedie (2006) trace the historical functions of the Kgotla that; traditionally, the kgotla has been a place where tribesmen met to discuss tribal affairs and developmental issues. However, since independence the kgotla has been used by both politicians (Ministers, Members of Parliament and Councilors) and government’s officials (Civil Servants) to explain government policies and programs and to solicit views and support from the public. Inherent to the kgotla system is that everyone is free to speak irrespective of their social position or standing. The freedom of speech exercised in kgotla meetings is entrenched in some Setswana proverbs such as “Mmualebe o bua la gagwe” meaning that “everyone has a right to speak his/her mind”; “Mafoko a kgotla a mantle otlhe” meaning that “all views aired at the kgotla are precious” ( Mhlauli, 2010). It is interesting to take note of the argument that:
contrary to caricatures in accounts insensitive to alternative philosophies of rights in Africa, Tswana customs in democracy not only acknowledge the individual’s rights to participate in communal affairs…but provide against a kgosi abusing his authority through constant reminders that a king only attains that position through his followers (Kgosi ke kgosi ka batho) or ‘by grace of his tribe” (Nyamnjoh, 2006, p. 83).
This view as noted in Nyamnjoh (2006) acknowledges the differences in the conceptualizations of democracy that take into consideration the contextual factors as well as their socio-‐cultural aspects. As shown in the Botswana context, democracy guards against the abuse of power by the chief and advocates for the people’s voice and rights. The kgotla system is also popularly known for its adherence to the Tswana political culture of aversion of public conflict and to seek consensus on major issues and decisions. During the pre-‐colonial times the chief discussed important matters in private with his headmen and advisors prior to any public discussions. At the kgotla, the advisors and headmen would speak first to present a consensus position (Bradshaw and Ndegwa, 2000). After independence the Kgotla has been used for both traditional and political gatherings. Members of Parliament and Ministers also use the kgotla as a means to explain their roles and responsibilities, government policies, solicit views and mobilize people’s participation on issues of national interest (Sebudubudu and Osei-‐Hwedie, 2006). It is this hybrid system of democracy that Ndegwa (2001) refers to as the “African democratic experiment” which some scholars believe has led to Botswana’s success story of democracy today (Patterson, 2006; Sebudubudu and Osei-‐Hwedie, 2006; Bradshaw and Ndegwa, 2000). However, there are noticeable problems with the kgotla as a two way communication structure between the public and members of parliament and among the many are: dwindling attendance, failure to listen to community views, predominance of men as speakers at kgotla meetings, the reluctance of women to participate, youth reluctance to attend kgotla meetings and its highly centralized decision making process (Preece and Mosweunyane, 2004). The proliferation of mass media, in particular, social media such as facebook threatens the existence and functionality of the kgotla as nowadays announcements and information dissemination is done through television, newspapers and the internet. These modes of
Advances in Social Sciences Research Journal (ASSRJ) Vol.3, Issue 1 January-‐2016
Copyright © Society for Science and Education, United Kingdom 13
communication are fast, efficient and not time consuming; hence they have become more favorable than the traditional kgotla meetings or gatherings (Mhlauli, 2010). Given these changing dynamics within the fabric of the Botswana society it remains to be seen as to whether the traditional kgotla system will continue to flourish, be sustained and beat all odds. A Critique of Botswana’s Democracy Though Botswana has been hailed as a “senior” democracy in the African continent (Sebudubudu and Osei-‐Hwedie, 2006), scholars in the field have expressed concern on the fragility of Botswana’s highly centralized government and its authoritarian liberalism (Ndegwa, 2001, Maundeni, 2003, Good, 2004). Good (2004) is critical of what he terms the liberal political economy of Botswana which he argues is characterized by an executive presidency with extensive powers of control and influence that is differentiated, episodic and latent. Furthermore, there are some noticeable flaws in Botswana’s democracy emanating from a combination of a weak parliament, weak opposition, weak civic associations and a struggling media. The notion of a weak opposition is augmented by Maundeni (2003) who argues that though regular national elections are held with more than three competing political parties, the same party always wins. However, it is interesting that the historical link between traditional chiefs who are not democratically elected and yet control the local kgotla meetings, and their representation in Parliament and House of Chiefs is viewed as a major constraint to Botswana’s democratization process (Maundeni, 2003). Democracy and Schools in Botswana The way democracy is understood and practiced in Botswana has implications on the teaching of democracy in primary schools in that there is a clear disconnect between what takes place in the classroom and society (Mhlauli, 2010). The curriculum focuses on democracy as defined and practiced in western liberal thought in terms of participating in elections, voting during elections and community activities but falls short in connecting those ideals to the traditional form of democracy which is characterized by, among other things, consensus, consultation and ascribed status. Even though a combination of traditional and western types of democracy is practiced, it is publicly and officially denied (Mautle, 2000; Mhlauli, 2010). This poses problems for teachers who have to constantly grapple with insuring that they relate what students learn to their everyday life experiences.
RESEARCH METHODOLOGY This was a qualitative study that employed the naturalistic inquiry paradigm. Naturalistic inquiry is said to demand a natural setting (Lincoln & Guba, 1985, 189) hence this study was conducted in upper classes in six primary schools in Botswana for a period of three months. It is, therefore, understood that naturalistic inquirers begin their research with the belief that constructions of realities cannot be separated from the world in which they occur or are experienced, therefore, emphasizing the relationship between time and context to understanding the phenomena under study (Lincoln & Guba, 1985). Due to the nature of naturalistic inquiry, I found it suitable for the design of my study as it was flexible, required more time in the natural setting and allowed the study to take shape and form as it progressed. Participants The study was undertaken among eleven social studies teachers in upper classes in six primary schools in one of the major villages in the central district in Botswana. For purposes of this study, this major village was named Maretlweng village (Pseudonym). Of the eleven teachers, four were males and seven were females. The teachers’ age ranged between 30 and 55 years,

Mhlauli, M. B. (2016). Social Studies Teacher’s Conceptualizations and Practices of Democracy in Upper Classes in Primary Schools in Botswana. Advances in Social Sciences Research Journal, 3(1) 08-‐19.
URL: http://dx.doi.org/10.14738/assrj.31.1748. 14
where four teachers were between 30 and 35 years, three were between 36 and 45 years, two were between 46 and 50 and two were between 51 and 55 years. In this study, purposive sampling was used to select the teachers who participated in this study. This type of sampling requires that one establishes criteria, bases, or standards necessary for units to be included in the investigation (Patton, 1990). Therefore, these teachers were chosen on the basis of a set criterion that; they are experts in the area of social studies, have taught social studies for more than three years, are implementers and gatekeepers of the curriculum and can explain better what they do best. The naturalistic inquirer prefers purposive sampling because it allows for the increase of the scope and range of data and the likelihood that a full array of multiple realities will be uncovered, it also maximizes the researcher’s ability to devise grounded theory that “ takes account of local conditions, local mutual shaping’s, and local values” (Lincoln & Guba, 1985, p. 40). For this study, a type of purposive sampling known as snowball or chain sampling was used to select the participants. The teachers who were identified at the beginning were requested to refer the researcher to other teachers in other schools who met the set criteria. After identifying such teachers, they were interviewed individually to get the final group that participated in the study. Those identified as potential participants were requested if they would like to participate in the study and that participation was voluntary. Pseudonyms were used to protect the confidentiality and anonymity of the participants. Data Sources Qualitative methods which included individual interviews, participant observation and focus groups were used for data collection. A total of 43 interviews, 22 participant observations and 2 focus group discussions were conducted over a period of three months (January-‐April, 2010). Individual interviews were used to solicit more in depth ideas on issues and problems encountered in their teaching; this informed the classroom observations and further interviews. The questions were based on what the teachers’ think (ideas and views) as opposed to asking content knowledge. The social studies teachers were observed in different settings such as; classrooms and other outside activities in debate clubs, sports activities, staffroom and traditional music practices in an effort to understand what they do and why they do what they do in relation to citizenship development through social studies and to listen to their normal chats and gossips. The data obtained through observations was used to construct follow up interview questions and vice-‐versa. Focus groups were used to enable both the participants and researcher to see how the individual responses contributed during discussions differ from or reinforce those of peers. Focus groups have their limitations in that they compromise confidentiality. Data Analysis This study adopted grounded theory techniques for data analysis (Strauss and Corbin, 1994). Data analysis involved making sense of what the researcher has seen, heard, and read. It also requires analyzing, categorizing, synthesizing, searching for patterns and interpreting the data (Glesne, 1999). Data were analyzed inductively using the constant comparative analysis (Merriam, 1998; Patton, 1990). Data collected were immediately transcribed, coded and categorized in order to inform the next interviews and focus groups. The constant comparative analysis technique is said to be a process that “combines inductive category coding with a simultaneous comparison of all social incidents observed and coded (LeCompte & Preissle, 1993, p.256). Data analysis took place at the same time with data collection and questions raised during transcription were used to shape the questions for the next interviews.

Advances in Social Sciences Research Journal (ASSRJ) Vol.3, Issue 1 January-‐2016
Copyright © Society for Science and Education, United Kingdom 15
FINDINGS AND DISCUSSIONS
Teachers’ Understandings of Democracy Teachers expressed different views and ideas on democracy which indicated that they understand democracy as participation, rights and responsibilities and freedom to choose. Their interpretation of democracy was based on the liberal thought as well as the socio-‐cultural perspective. This was seen where teachers focused on defining democracy through a combination of western and contextual lens. One of the teachers in explaining democracy during an interview had this to say: Democracy means doing things in an open and transparent way which is accepted and by the majority. Democracy also calls for freedom, freedom of movement, freedom of speech, freedom of expression. Another teacher during interviews mentioned that:
For me democracy means, freedom of speech, freedom of movements, respecting one another’s right and responsibilities
Teachers’ clearly conceptualized democracy from a liberal point of view as conceptualized in western thought and during their focus group discussions one of them had this to say:
Democracy means “Govt of the people, by the people, for the people” It means that we should understand one another and make sure that everybody is on board. Democracy is concerned with transparency, consultation and consensus. (This was followed by the other teachers nodding towards this showing agreement)
Their understanding of democracy also revolved around the kgotla as a cultural site for people to express their views regarding community and national issues. During focus group discussions another teacher said:
I value democracy as it allows people to say their views without fear that is why there is a saying in Setswana that “ Mafoko a kgotla a mantle otlhe” ( All that is said by the Chief is good). This in totality sums up the idea of democracy in Botswana as exercised in the Kgotla . At Kgotla meetings, people are consulted on the development of their communities or country as awhole which can be done by the President, Member of Parliament, or Councilors. Having said that, it is one way of strengthening democracy
To support what the previous teacher had said, one of them quickly commented that;
Yes…democracy is usually shown during Kgotla meetings where everyone is allowed to say their views regardless of their gender, socio-‐economic background or ethnic group.
The teachers; conceptions of democracy are not surprising as Botswana is highly regarded as a shining example of liberal democratic country as asserted by various scholars (Sebudubudu and Osei-‐Hwedie, 2006; Bradshaw and Ndegwa, 2000; Nyamnjoh, 2006). What is also interesting is that the curriculum also defines from a liberal point of view, hence making it
Mhlauli, M. B. (2016). Social Studies Teacher’s Conceptualizations and Practices of Democracy in Upper Classes in Primary Schools in Botswana. Advances in Social Sciences Research Journal, 3(1) 08-‐19.
URL: http://dx.doi.org/10.14738/assrj.31.1748. 16
difficult for teachers to move away from the textbooks to include their way of understanding democracy. Despite this minimalist liberal view of democracy portrayed in the curriculum, teachers also found ways of interpreting democracy from a socio-‐cultural lens which basically enriched their discussions and ideas. This view is supported by scholars such as Nyamnjoh (2006) who acknowledges the differences in the conceptualizations of democracy that take into consideration the contextual factors as well as their socio-‐cultural aspects. The inclusion of the socio-‐cultural aspects in the teachers’ conceptualizations of democracy is a welcome development as it works towards decolonizing knowledge and including the voices and lived experiences of these teachers, hence knowledge construction from an African perspective. Justification for Teacher Practices on Democracy All the teachers felt that they teach democracy in their classroom because they believe it is an important aspect of citizenship development which is the core business of the social studies curriculum in schools. To them teaching about democracy was important for was important in that it prepared learners to vote during elections in future. In an interview one of the teachers emphasized that:
They (Students) should possess democratic knowledge. They should take part in the affairs of the nation and their communities. In democratic knowledge they need to know the process of elections, voting choosing leaders and participate in every aspect pertaining to the development of their communities and country at large.
Teachers also believed that democracy should be taught from a tender age in order to teach these children responsibility from a tender age. This was seen as important in that children will be able to sustain democracy as a national principle and a political ideology within Botswana. In expressing their justification for teaching democracy, Teachers had this to say:
The best way is that people need to be taught to understand the real meaning of democracy and they need to taught starting from the classroom whereby they can choose their own monitors or their own prefects who can present their ideas to the teacher.
The most important thing that has to be done I think is to teach our children about democracy at an early stage. I think not much has been done to teach democracy in schools. I want our children to live democracy-‐ That is talking, eating, dreaming and sleeping democracy-‐ by so doing we will be able to maintain our democracy.
For instance we teach citizens about the importance of taking part during elections. If they take part in elections it means that they are choosing their own government.
Democracy teaches about equality and human rights. So, young citizens of Botswana need to learn about these things if we want to maintain the peace and stability that we are enjoying right now.
Students need to be taught ideals of democracy-‐ such values as “botho” (being humane); friendship, loyalty; love; tolerance.
Their arguments revolved around the need to teach democracy extensively in schools in order to maintain peace and stability that is enjoyed by all Batswana (People of Botswana). They also saw a relationship between citizenship and democratic education and viewed the as important

Advances in Social Sciences Research Journal (ASSRJ) Vol.3, Issue 1 January-‐2016
Copyright © Society for Science and Education, United Kingdom 17
to avoid unplanned wars or civil wars and that it also contributes to unity in diversity within Botswana. Chachange (2001) warns that this minimalist view of justifying the need for teaching democracy for voting purposes destroys the very essence of democracy as a political thought. Teachers’ Pedagogies on Democracy All the teachers believed that democracy is a participatory event and that it should be reflected and acted upon in the classroom. The mentioned that they all used varied child-‐centred pedagogies that enhance democratic education in their classrooms such as debates, group work, discussions, role play and research. Excerpts below indicate what teachers said regarding their pedagogies on democratic education in their classrooms:
I use child centered methods where pupils can analyze and see things for themselves. Debates help them develop issues of assertiveness, develop reasoning and become independent thinkers but not neglecting other people’s views. Group work helps them accept one another as some are slow learners but this method allow them to contribute. It is through group work that leaders are developed
Through various activities such as debates, clubs and prefects. Prefects are taught to develop good leadership skills through workshops that we do once every month. We want them to be good leaders of tomorrow. Role play, as they role play I think it makes them to fully participate because when you are involved in a role play you are taking part. This will help them in the future when there is an activity that is being done they have to be fully involved not being speechless. During the focus group discussions I asked the teachers to ranks the methods of teaching that they said they used and their ranking is captured below;
1. Group work-‐ Students share ideas; cooperate; communicate; decision making through consensus
2. Class presentations 3. Question and Answer 4. Discussions 5. Inquiry-‐ develops communication skills, research skills 6. Debate because it promotes discussion 7. Projects-‐ Students research on their own and develop ideas 8. Excursions/ Field Trips-‐ These are rarely carried out because they are costly, lack of
funds and resources. Their ranking of the methods of teaching that they use was quite surprising in that the most important methods of teaching that promote democracy such as discussions, debates excursions were ranked lowly and some were omitted such as decision making, deliberation and real life encounters or projects that develop certain skills in a democracy (Mhlauli, 2010). Through lesson observations it was clear that teachers were not using any participatory or child-‐centred methods in that most of the time they were mostly using the question and answer technique followed by what they termed group work. To them group work was a sitting arrangement more than a task oriented activity. These findings are in tandem with what
Mhlauli, M. B. (2016). Social Studies Teacher’s Conceptualizations and Practices of Democracy in Upper Classes in Primary Schools in Botswana. Advances in Social Sciences Research Journal, 3(1) 08-‐19.
URL: http://dx.doi.org/10.14738/assrj.31.1748. 18
Mhlauli and Muchado (2013) found that there are contradictions in what teachers say they do and what actually transpires in their classrooms when it comes to teacher practices.
CONCLUSIONS AND RECOMMENDATIONS The conclusions drawn from this that is that democracy in Botswana is complex as understood by the social studies teachers in upper classes in primary schools. The most intriguing point is that teachers are cognizant of the contextual and socio-‐cultural aspects of democracy in Botswana hence the hybrid model that they have adopted that combines the liberal and traditional forms of democracy as practiced in Botswana. The most authentic challenge for teachers in social studies classroom lies with their classroom practices and pedagogies of democratic education in order to make it live and vibrant. The study, therefore, recommends that; 6.1. Teacher Education should put more emphasis on the teaching of democracy as it is not
genetically inherited through in-‐service programs. 6.2. Teachers need to be encouraged to use democratically inclined pedagogies such as
dialogue, discussions, deliberation, decision making and case studies in order to re-‐orient their students towards a culture of negotiation, perspective consciousness, intercultural and cross-‐cultural understanding.
6.3. Teacher education needs to revamp its pedagogical aspects of learning in order to help teachers to be to turn their classrooms into microcosms of democracy.
6.4. Schools should develop teams that deal with pedagogical innovation to keep abreast with global trends on pedagogy.
References
1. Asante M.K. (2010). Afrocentricity: The theory of Social Change. http://multiworldindia.org/wcontent/uploads/2010/05/Afrocentricity.pdf . Retrieved 15 December, 2015
2. Bradshaw, Y. & Ndegwa, S.N. (2000). The uncertain promise of Southern Africa. Bloomington: Indiana University Press.
3. Chachange, (2001). Nation building and ethnicity: Towards a Re-‐conceptualization of democracy in Africa. UTAFITI(New Series) Special issue, 4, 151-‐178
4. Chief Linchwe II. (1989). The role a chief can play in Botswana’s democracy. In J. Holm and P. Molutsi (Eds). Democracy in Botswana: The proceedings of a symposium held in Gaborone, 1-‐5 August 1988, pp.99-‐ 102. Gaborone: Botswana Society.
5. Crick, B. (1989). Keynote speech: on democracy. In J. Holm and P. Molutsi (Eds). Democracy in Botswana: The proceedings of a symposium held in Gaborone, 1-‐5 August, 1988, pp. 13-‐23. Gaborone: Botswana Society
6. Glesne, C. (2006). Becoming qualitative researchers: An introduction (3rd Ed.). New York: Pearson.
7. Harber, C. and Serf, J. (2006). Teacher education for a democratic society in England and South Africa. Teaching and teacher education, 22, 986-‐967.
8. https://en.wikipedia.org/wiki/Democracy_Index Retrieved: 9 July, 2015.
9. Ladson-‐Billings, G. (1994). The dreamkeepers: successful teachers of African American Children. San Francisco: Jossey-‐Bass
10. LeCompte, M.D. & Preissle, J. (1993). Ethnography and qualitative design in educational research. New York: Academic press.
11. Lincoln, Y. & Guba, E. (1985). Naturalistic inquiry. Beverly Hills CA: Sage
12. Maundeni, Z. (2003). Democracy and democratization in Botswana. Seminar paper, Department of political and administrative studies, Gaborone: University of Botswana.
Advances in Social Sciences Research Journal (ASSRJ) Vol.3, Issue 1 January-‐2016
Copyright © Society for Science and Education, United Kingdom 19
13. Mautle, G. (2000). Social studies in Botswana. In M.B. Adeyemi (Ed). Social studies in African education, pp. 157-‐168. Gaborone: Pyramid.
14. Merriam, S. (1998). Qualitative research and case study applications in education. San Francisco: Jossey-‐ Bass.
15. Merryfield, M.M. (2008). Decolonizing social studies and global education. In A.A. Ali andG. Richardson(Eds).Decolonizing Democratic Educationpp. 87-‐95: Trans-‐Disciplinarydialogues. Rotterdam: Sense publishers.
16. Mhlauli, M.B. (2010). Social studies teachers’ perceptions and practices for educating citizens in a democracy in upper classes in primary schools in Botswana. PhD dissertation. Columbus: The Ohio State University. https://etd.ohiolink.edu/ap/10?0::NO:10:P10_ACCESSION_NUM:osu1291140441
17. Mhlauli M.B. and Muchado, J.A. (2013). Teacher talk versus practice: Contradictions and dilemmas in social studies classrooms in Botswana. International Journal of Asian Social Science 3 (4), 1043-‐1062)
18. Ndegwa, S.N. (2001). A decade of democracy in Africa. Journal of Asian and African studies, 36(1), 1-‐17.
19. Nnoli, O. (1989). Democracy in Botswana: a Pan-‐African perspective. In J. Holm and P. Molutsi (Eds). Democracy in Botswana: The proceedings of a symposium held in Gaborone, 1-‐5 August 1988, pp. 266-‐272. Gaborone: Botswana Society.
20. Nyamnjoh, F.B. (2006). Insiders & Outsiders: citizenship and xenophobia in contemporary Southern Africa. New York: Zed books.
21. Nyamnjoh, F.B. (2003). Chieftaincy and the negotiation of might and right in Botswana democracy. Journal of contemporary African studies, 21: 2, 233-‐250.
22. Nyamnjoh, F.B. (2006). Insiders & Outsiders: citizenship and xenophobia in contemporary Southern Africa. New York: Zed books.
23. Patterson, S. (2006). Economic growth in Botswana in the 1980’s: A model for Sub-‐Saharan Africa. Tenton, New Jersey: Africa world press.
24. Patton, M. Q. (1990). Qualitative evaluation and research methods (2nd Ed). Newbury Park: Sage.
25. Republic of Botswana (1977). National Commission on Education (Education for Kagisano). Gaborone: Government Printer.
26. [26] Sebudubudu, D. and Osei-‐Hwedie, B. (2006). Pitfalls of parliamentary democracy in Botswana. Afrika Spectrum, 41 (1), 35-‐53
Advances in Social Sciences Research Journal – Vol.3, No.1 Publication Date: Jan. 25, 2016 DoI:10.14738/assrj.31.1751.
Wang, D. (2016). The Assessment and Supervision of china’s Systemically Important Insurers. Advances in Social Sciences Research Journal, 3(1) 20-‐30.
Copyright © Society for Science and Education, United Kingdom 20
The Assessment and Supervision of China’s Systemically Important Insurers
Da Wang
School of Insurance Central University of Finance and Economics
Abstract
On July 19, 2013, the International Association of Insurance Supervisors (IAIS) announced the first list of Global Systemically Important Insurers (G-‐SII). Ping An Group, a China’s insurance company, is the only insurer coming from the Asian-‐Pacific region. The entrance of Ping An brought wide attention and research on the problem of systemically importance in China. This research is studying the systemic importance of 9 insurance groups in China. Basing on the financial data of the 9 insurance groups, this paper calculates the weight using the Entropy Method, and ranks the 9 insurance groups by using the Index Method. Meanwhile, this paper comes up with some proposals for the assessment and supervision of China’s Systemically Important Insurers to promote the stable development of the insurance industry and the whole financial system.
Key words: Systemically Importance;Indicator Method;Assessment and Supervision
INTRODUCTION
On July 19, 2013, the Financial Stability Board (FSB) announced the first list of Global Systemically Important Insurers (G-‐SII). There are nine insurance groups on the list. They are Prudential Financial,MetLife,American International Group,Allianz SE,AXA,AVIVA,Prudential,Generali and Ping An Group Ping An Group, a China’s insurance company, is the only insurer coming from the Asian-‐Pacific region. The entrance of Ping An demonstrates that with the rapid development of China’s insurance market, some China’s insurance companies are playing an important role in the global insurance industry. Moreover, it also reminds domestic regulators that in order to promote the steady development of insurance industry and maintain financial stability, assessment method of China’s Systemically Important Insurers should be established. With the rapid development of China’s insurance market, some insurance companies are expanding their scale, complicating the business and having wide connection to other financial institutes. The development of these companies will infect the insurance industry even the whole financial system. China’s insurance supervisors should design the assessment standard of China’s systemically important insurers to identify the systemic importance of the insurers to guarantee the stable development of the insurance industry and the whole financial industry. This paper refers to the assessment method of International Association of Insurance Supervisors and combines the real situation of China’s insurance institutes to assess China’s systemically important insurers basing on the Index Method. The arrangement of other parts of this paper is as follows: the second part is the Literature Review. This part introduces both
Advances in Social Sciences Research Journal (ASSRJ) Vol.3, Issue 1 January-‐2016
Copyright © Society for Science and Education, United Kingdom 21
the method of studying the systemically important financial institutes and the method of International Association of Insurance Supervisors. The third part is the assessment of China’s systemically important insurers. This paper uses the Entropy Method to calculate the weight of every index and adopts the Index Method to calculate the score of the sample to rank the 9 China’s insurance groups. And the fourth part is the proposals for the supervision of China’s systemically important insurers. Basing on the results, this paper comes up with some advices for the assessment and supervision. And the last part is the conclusion.
LITERATURE REVIEW The Assessment Method of SIFIs There are two main research method used to study the Systemically Important Financial Institutes, the Index Method and the Market Method respectively. The Index Method indicates that the international financial regulators set several indexes according to the understanding of the core features of the systemically important financial institutes. The principle of the Market Method is focusing on the risk management from different perspectives. In October 2009, three international financial regulators International Monetary Fund (IMF), Financial Stability Board (FSB) and Bank for International Settlements (BIS) came up with the identification criterion and assessment method of SIFIs. There are three kinds of main indexes to assess systemically importance: size, substitutability and interconnectedness. Later, the index “global activity” is added up into the main indexes. In July 2011, the Financial Stability Board (FSB) and the Basel Committee on Banking Supervision came up with aggregative indicator system to identify Global Systematically Important Banks. This system includes five main indexes: size, cross-‐jurisdictional activity, interconnectedness, substitutability and complexity. In China, Zhang and Wu (2011) uses entropy evaluation method to determine the weight of indicators impacting the systematically important banks. They find out that size, complexity, substitutability and interconnectedness are the main indicators. The weights of complexity and interconnectedness are 22.7% and 64.1% respectively. The most important indicator of complexity is financial derivative assets and liabilities, and the most important indicator of interconnectedness is trading financial assets and liabilities. Xiao and Liu (2012) use the assessment methodology of Basel Committee on Banking Supervision to assess and sequence systemically importance of 16 China’s listed commercial banks. They are classified into 3 categories: the 5 nationalized banks are in the first category, the joint-‐stock commercial banks are in the second category and the city commercial banks are in the third category. Ba and Gao (2012) come up with the assessment methodology of systemically important banks, which suits the development of China’s banks. They use the methodology to assess 16 China’s banks to find out that the systemically importance of the 4 nationalized banks (Bank of China, the Agricultural Bank of China, the Industrial and Commercial Bank of China, and the China Construction Bank) is much higher than the other commercial banks. The Market Method is based on the model of risk management of the financial market. It assesses the Systemically important financial institutes in the respect of one’s risk extent to the whole financial system. The Market Method has several analytical perspectives since there are
Wang, D. (2016). The Assessment and Supervision of china’s Systemically Important Insurers. Advances in Social Sciences Research Journal, 3(1) 20-‐30.
URL: http://dx.doi.org/10.14738/assrj.31.1751. 22
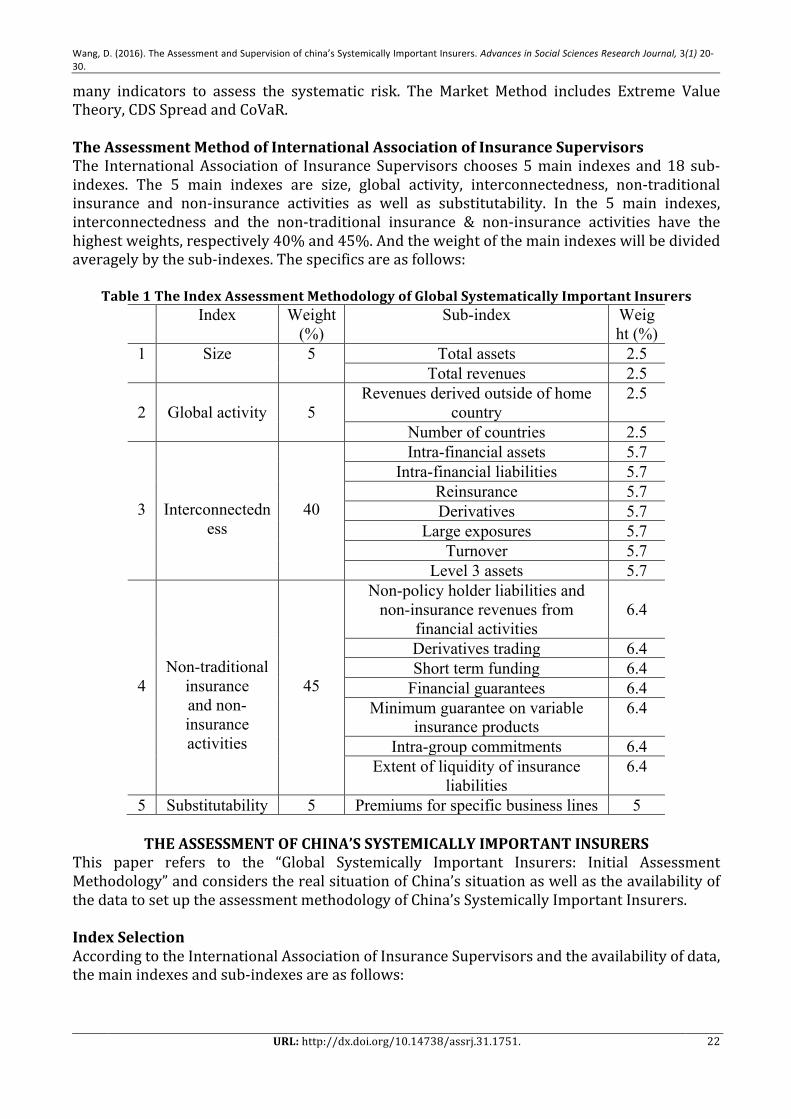
many indicators to assess the systematic risk. The Market Method includes Extreme Value Theory, CDS Spread and CoVaR. The Assessment Method of International Association of Insurance Supervisors The International Association of Insurance Supervisors chooses 5 main indexes and 18 sub-‐indexes. The 5 main indexes are size, global activity, interconnectedness, non-‐traditional insurance and non-‐insurance activities as well as substitutability. In the 5 main indexes, interconnectedness and the non-‐traditional insurance & non-‐insurance activities have the highest weights, respectively 40% and 45%. And the weight of the main indexes will be divided averagely by the sub-‐indexes. The specifics are as follows:
Table 1 The Index Assessment Methodology of Global Systematically Important Insurers Index Weight
(%) Sub-index Weig
ht (%) 1 Size 5 Total assets 2.5
Total revenues 2.5
2
Global activity
5 Revenues derived outside of home
country 2.5
Number of countries 2.5
3
Interconnectedness
40
Intra-financial assets 5.7 Intra-financial liabilities 5.7
Reinsurance 5.7 Derivatives 5.7
Large exposures 5.7 Turnover 5.7
Level 3 assets 5.7
4
Non-traditional insurance and non-insurance activities
45
Non-policy holder liabilities and non-insurance revenues from
financial activities
6.4
Derivatives trading 6.4 Short term funding 6.4
Financial guarantees 6.4 Minimum guarantee on variable
insurance products 6.4
Intra-group commitments 6.4 Extent of liquidity of insurance
liabilities 6.4
5 Substitutability 5 Premiums for specific business lines 5
THE ASSESSMENT OF CHINA’S SYSTEMICALLY IMPORTANT INSURERS This paper refers to the “Global Systemically Important Insurers: Initial Assessment Methodology” and considers the real situation of China’s situation as well as the availability of the data to set up the assessment methodology of China’s Systemically Important Insurers. Index Selection According to the International Association of Insurance Supervisors and the availability of data, the main indexes and sub-‐indexes are as follows:
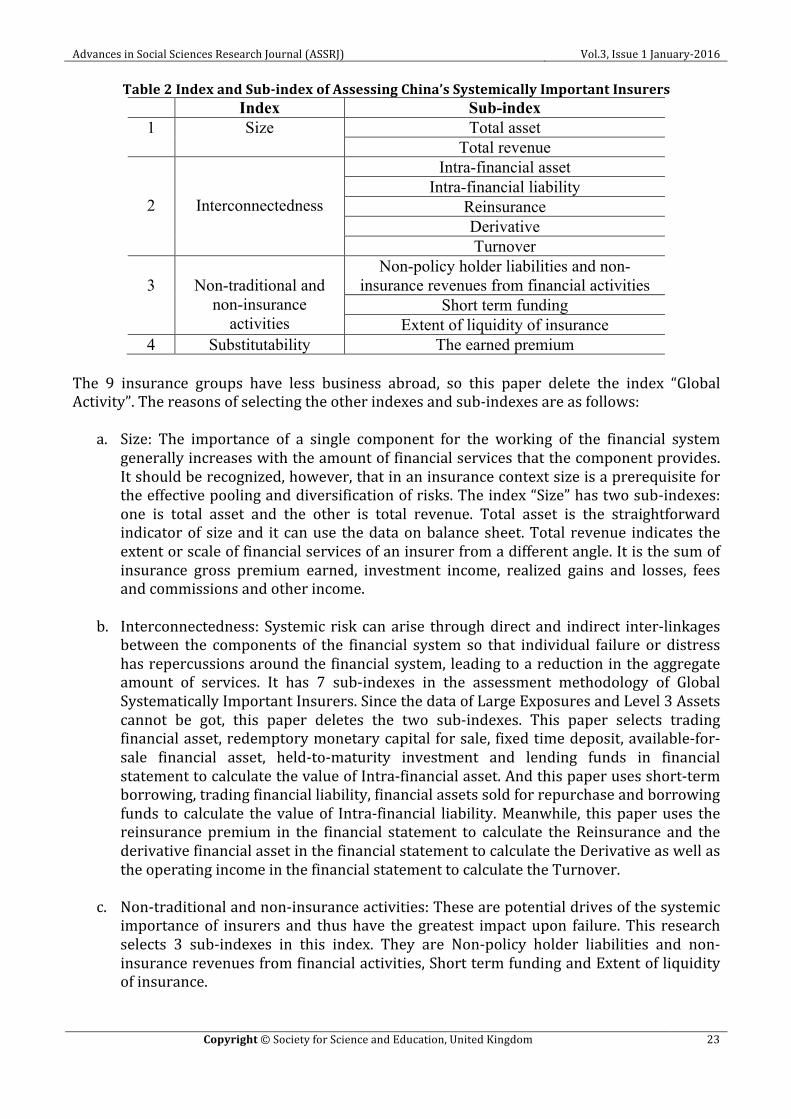
Advances in Social Sciences Research Journal (ASSRJ) Vol.3, Issue 1 January-‐2016
Copyright © Society for Science and Education, United Kingdom 23
Table 2 Index and Sub-‐index of Assessing China’s Systemically Important Insurers Index Sub-index
1 Size Total asset Total revenue
2
Interconnectedness
Intra-financial asset Intra-financial liability
Reinsurance Derivative Turnover
3
Non-traditional and
non-insurance activities
Non-policy holder liabilities and non-insurance revenues from financial activities
Short term funding Extent of liquidity of insurance
4 Substitutability The earned premium The 9 insurance groups have less business abroad, so this paper delete the index “Global Activity”. The reasons of selecting the other indexes and sub-‐indexes are as follows:
a. Size: The importance of a single component for the working of the financial system generally increases with the amount of financial services that the component provides. It should be recognized, however, that in an insurance context size is a prerequisite for the effective pooling and diversification of risks. The index “Size” has two sub-‐indexes: one is total asset and the other is total revenue. Total asset is the straightforward indicator of size and it can use the data on balance sheet. Total revenue indicates the extent or scale of financial services of an insurer from a different angle. It is the sum of insurance gross premium earned, investment income, realized gains and losses, fees and commissions and other income.
b. Interconnectedness: Systemic risk can arise through direct and indirect inter-‐linkages
between the components of the financial system so that individual failure or distress has repercussions around the financial system, leading to a reduction in the aggregate amount of services. It has 7 sub-‐indexes in the assessment methodology of Global Systematically Important Insurers. Since the data of Large Exposures and Level 3 Assets cannot be got, this paper deletes the two sub-‐indexes. This paper selects trading financial asset, redemptory monetary capital for sale, fixed time deposit, available-‐for-‐sale financial asset, held-‐to-‐maturity investment and lending funds in financial statement to calculate the value of Intra-‐financial asset. And this paper uses short-‐term borrowing, trading financial liability, financial assets sold for repurchase and borrowing funds to calculate the value of Intra-‐financial liability. Meanwhile, this paper uses the reinsurance premium in the financial statement to calculate the Reinsurance and the derivative financial asset in the financial statement to calculate the Derivative as well as the operating income in the financial statement to calculate the Turnover.
c. Non-‐traditional and non-‐insurance activities: These are potential drives of the systemic
importance of insurers and thus have the greatest impact upon failure. This research selects 3 sub-‐indexes in this index. They are Non-‐policy holder liabilities and non-‐insurance revenues from financial activities, Short term funding and Extent of liquidity of insurance.
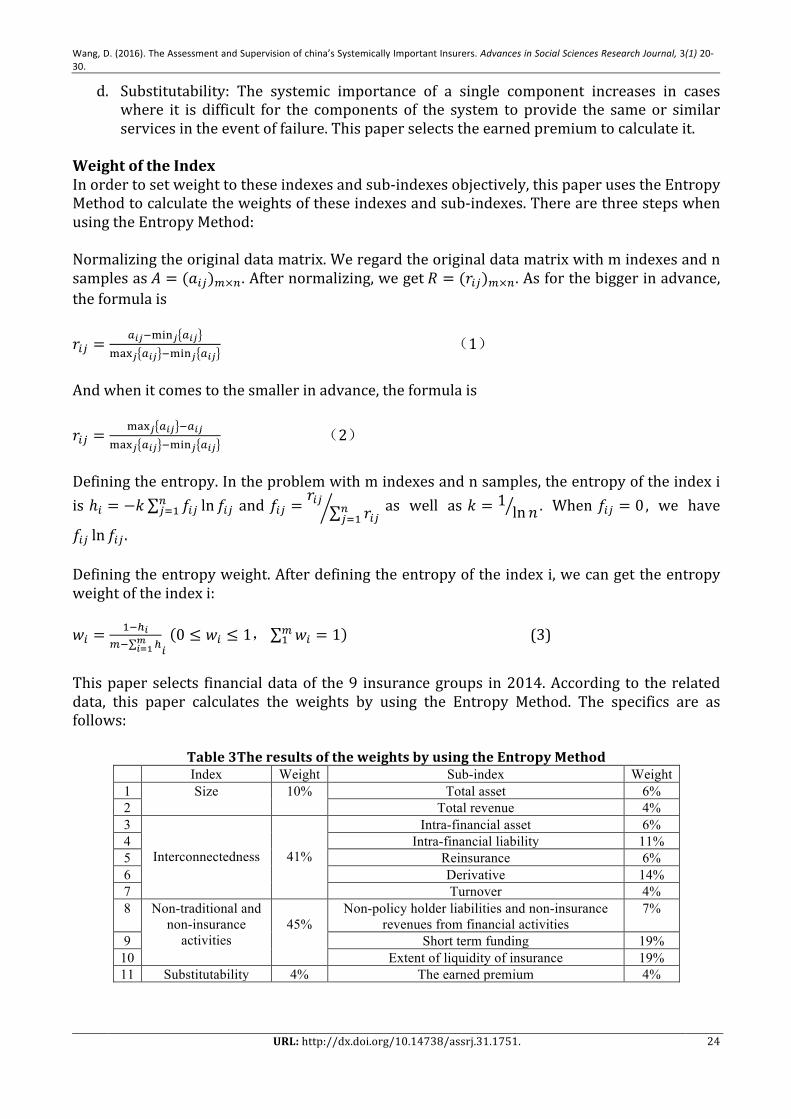
Wang, D. (2016). The Assessment and Supervision of china’s Systemically Important Insurers. Advances in Social Sciences Research Journal, 3(1) 20-‐30.
URL: http://dx.doi.org/10.14738/assrj.31.1751. 24
d. Substitutability: The systemic importance of a single component increases in cases where it is difficult for the components of the system to provide the same or similar services in the event of failure. This paper selects the earned premium to calculate it.
Weight of the Index In order to set weight to these indexes and sub-‐indexes objectively, this paper uses the Entropy Method to calculate the weights of these indexes and sub-‐indexes. There are three steps when using the Entropy Method: Normalizing the original data matrix. We regard the original data matrix with m indexes and n samples as 𝐴 = (𝑎!")!×!. After normalizing, we get 𝑅 = (𝑟!")!×!. As for the bigger in advance, the formula is 𝑟!" =
!!"!!"#! !!"!"#! !!" !!"#! !!"
(1)
And when it comes to the smaller in advance, the formula is 𝑟!" =
!"#! !!" !!!"!"#! !!" !!"#! !!"
(2)
Defining the entropy. In the problem with m indexes and n samples, the entropy of the index i is ℎ! = −𝑘 𝑓!" ln 𝑓!"!
!!! and 𝑓!" =𝑟!"
𝑟!"!!!!
as well as 𝑘 = 1ln𝑛 . When 𝑓!" = 0 , we have
𝑓!" ln 𝑓!" . Defining the entropy weight. After defining the entropy of the index i, we can get the entropy weight of the index i: 𝑤! =
!!!!!! !!
!!! !0 ≤ 𝑤! ≤ 1, 𝑤! = 1!
! (3)
This paper selects financial data of the 9 insurance groups in 2014. According to the related data, this paper calculates the weights by using the Entropy Method. The specifics are as follows:
Table 3The results of the weights by using the Entropy Method Index Weight Sub-index Weight
1 Size 10% Total asset 6% 2 Total revenue 4% 3
Interconnectedness
41%
Intra-financial asset 6% 4 Intra-financial liability 11% 5 Reinsurance 6% 6 Derivative 14% 7 Turnover 4% 8 Non-traditional and
non-insurance activities
45%
Non-policy holder liabilities and non-insurance revenues from financial activities
7%
9 Short term funding 19% 10 Extent of liquidity of insurance 19% 11 Substitutability 4% The earned premium 4%
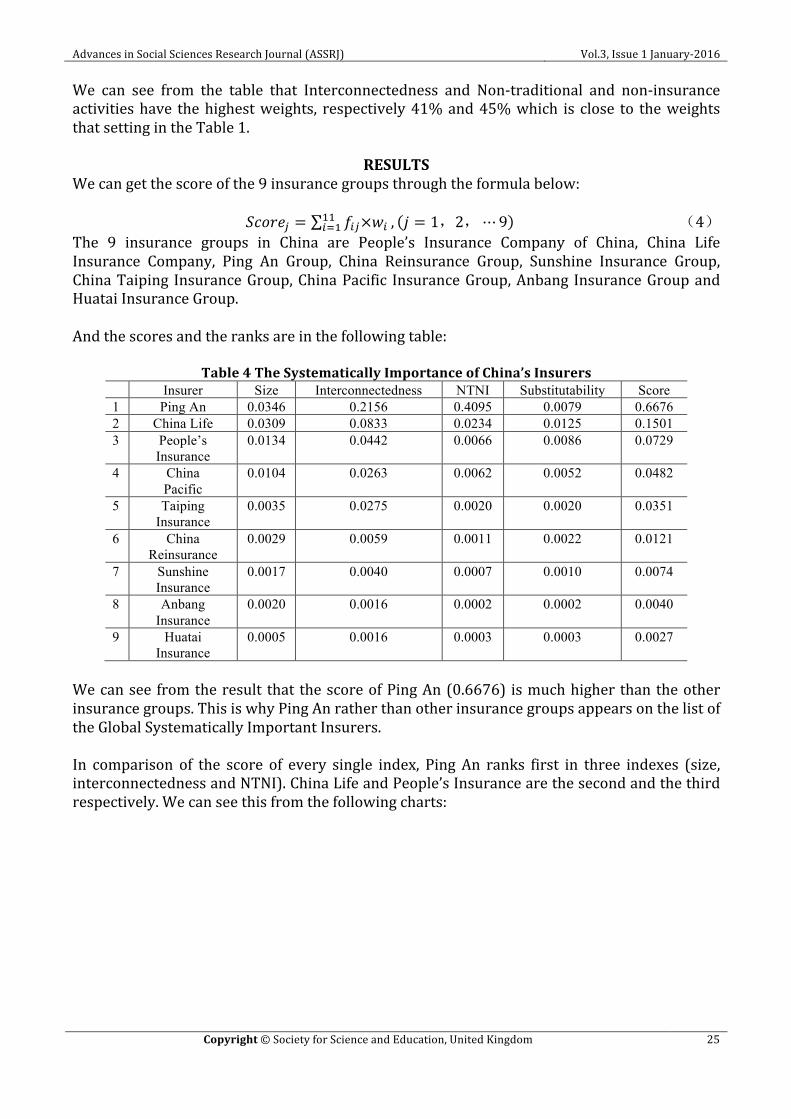
Advances in Social Sciences Research Journal (ASSRJ) Vol.3, Issue 1 January-‐2016
Copyright © Society for Science and Education, United Kingdom 25
We can see from the table that Interconnectedness and Non-‐traditional and non-‐insurance activities have the highest weights, respectively 41% and 45% which is close to the weights that setting in the Table 1.
RESULTS We can get the score of the 9 insurance groups through the formula below:
𝑆𝑐𝑜𝑟𝑒! = 𝑓!"×𝑤!!!
!!! , 𝑗 = 1,2,⋯ 9 (4) The 9 insurance groups in China are People’s Insurance Company of China, China Life Insurance Company, Ping An Group, China Reinsurance Group, Sunshine Insurance Group, China Taiping Insurance Group, China Pacific Insurance Group, Anbang Insurance Group and Huatai Insurance Group. And the scores and the ranks are in the following table:
Table 4 The Systematically Importance of China’s Insurers Insurer Size Interconnectedness NTNI Substitutability Score 1 Ping An 0.0346 0.2156 0.4095 0.0079 0.6676 2 China Life 0.0309 0.0833 0.0234 0.0125 0.1501 3 People’s
Insurance 0.0134 0.0442 0.0066 0.0086 0.0729
4 China Pacific
0.0104 0.0263 0.0062 0.0052 0.0482
5 Taiping Insurance
0.0035 0.0275 0.0020 0.0020 0.0351
6 China Reinsurance
0.0029 0.0059 0.0011 0.0022 0.0121
7 Sunshine Insurance
0.0017 0.0040 0.0007 0.0010 0.0074
8 Anbang Insurance
0.0020 0.0016 0.0002 0.0002 0.0040
9 Huatai Insurance
0.0005 0.0016 0.0003 0.0003 0.0027
We can see from the result that the score of Ping An (0.6676) is much higher than the other insurance groups. This is why Ping An rather than other insurance groups appears on the list of the Global Systematically Important Insurers. In comparison of the score of every single index, Ping An ranks first in three indexes (size, interconnectedness and NTNI). China Life and People’s Insurance are the second and the third respectively. We can see this from the following charts:
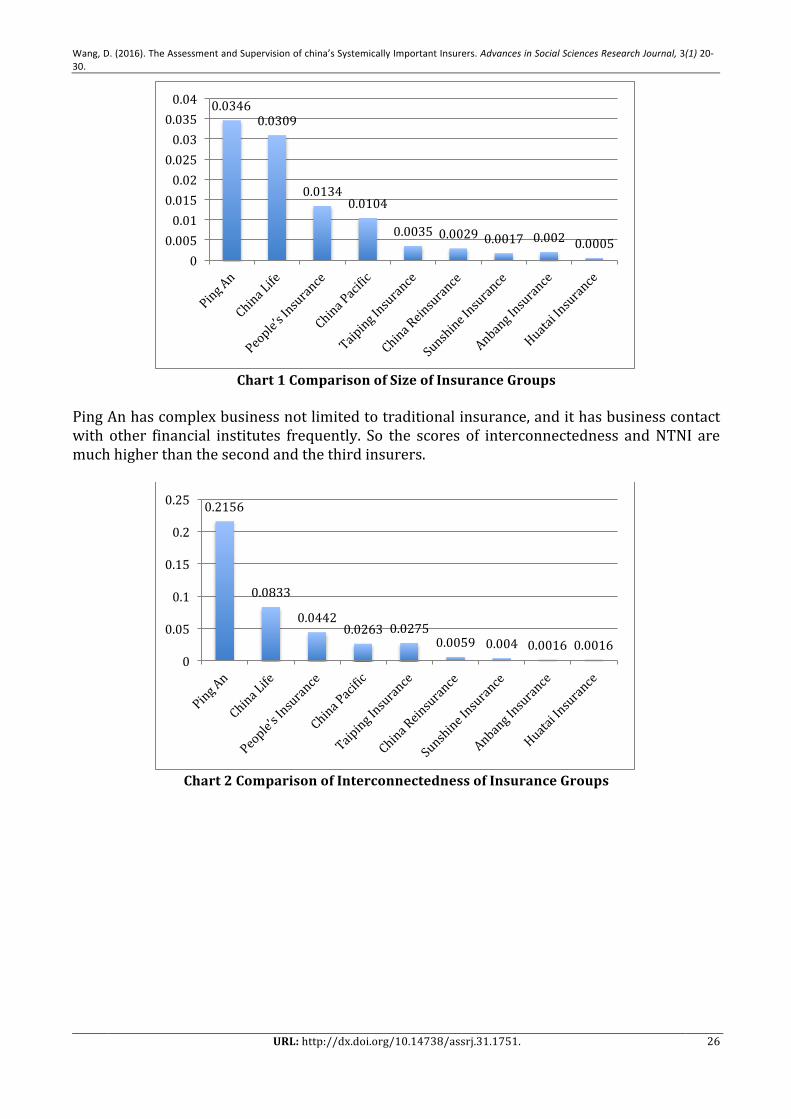
Wang, D. (2016). The Assessment and Supervision of china’s Systemically Important Insurers. Advances in Social Sciences Research Journal, 3(1) 20-‐30.
URL: http://dx.doi.org/10.14738/assrj.31.1751. 26
Chart 1 Comparison of Size of Insurance Groups
Ping An has complex business not limited to traditional insurance, and it has business contact with other financial institutes frequently. So the scores of interconnectedness and NTNI are much higher than the second and the third insurers.
Chart 2 Comparison of Interconnectedness of Insurance Groups
0.0346 0.0309
0.0134 0.0104
0.0035 0.0029 0.0017 0.002 0.0005 0
0.005 0.01 0.015 0.02 0.025 0.03 0.035 0.04
0.2156
0.0833
0.0442 0.0263 0.0275
0.0059 0.004 0.0016 0.0016 0
0.05
0.1
0.15
0.2
0.25

Advances in Social Sciences Research Journal (ASSRJ) Vol.3, Issue 1 January-‐2016
Copyright © Society for Science and Education, United Kingdom 27
As for the index of substitutability, China Life ranks first since it is the largest life insurance
company in China.
Chart 4 Comparison of Substitutability of China’s Insurance Groups
POLICY PROPOSALS OF CHINA’S SIIS’ ASSESSMENT AND SUPERVISION
The Assessment Methodology of China’s Systematically Important Insurers The first question of supervision of the G-‐SIIs is assessing and identifying the Systematically Important Insurers. The accuracy of the assessment methodology will exert huge influence on the effect of the supervision policy. Higher or lower assessment of systematically importance will exert adverse impact. So it is crucial to identify the Systematically Important Insurers accurately. We should take part in the supervision reform of international insurance industry actively and refer to the assessment method and policy measures of G-‐SII to set up the assessment method of China’s SIIs. First, we should establish the assessment method of national systematically important insurers in accordance with the situation of China’s insurance industry. The assessment method should combine the Index Method of G-‐SIIs with the Market Method. Although both domestic and international researches of Systematically Important Insurers are less, we can also refer to the
0.4095
0.0234 0.0066 0.0062 0.002 0.0011 0.0007 0.0002 0.0003 0
0.05 0.1 0.15 0.2 0.25 0.3 0.35 0.4 0.45
0.0079
0.0125
0.0086
0.0052
0.002 0.0022 0.001
0.0002 0.0003 0
0.002
0.004
0.006
0.008
0.01
0.012
0.014
Wang, D. (2016). The Assessment and Supervision of china’s Systemically Important Insurers. Advances in Social Sciences Research Journal, 3(1) 20-‐30.
URL: http://dx.doi.org/10.14738/assrj.31.1751. 28
researches about the assessment of Systematically Important Financial Institutes and Systematically Important Banks. Second, data is the key when assessing the systematically important insurers and the lack of data is the main problem at the moment. The number of listed insurance companies is limited. There is not enough open data to use. We should set up a database to follow and update the assessment result of systematically important insurers. Third, we should realize the deviation and serious consequences of assessing the systematically important insurers. Overestimation will increase the cost of the financial system while underestimation will reduce the effectiveness of the supervision. Since the systemic risk varies constantly, we should update the assessment method and assessment data now and again to reduce the negative effect on financial supervision. Last, we should implement differential supervision basing on the extent of systematically importance of different insurance companies. Policy Proposals for Supervision of China’s Systematically Important Insurers In order to reduce the moral hazard and negative externality when the systematically important insurers close down, International Association of Insurance Supervisors formulates the supervision policy of Systematically Important Insurers basing on the features of the Systematically Important Insurers. International Association of Insurance Supervisors advises supervision departments of every country to adopt the following measures:
1. Strengthening supervision. Basing on the Insurance Core Principles, Key Attributes and the Common Frame, International Association of Insurance Supervisors comes up with measures of strengthening supervision. There are three items: First, the establishment and implement of systemic risk management plan; Second, strengthening liquidity plan and management. We should establishing the liquidity strategy and policy of risk management aiming at non-‐traditional and non-‐insurance activities and the interconnectedness of financial market; Third, to separate the non-‐traditional and non-‐insurance activities effectively. On the purpose of reducing the systematically importance, we should separate the non-‐traditional and non-‐insurance activities from the traditional insurance business and limit or prohibit some special business.
2. Disposing effectively. When disposing the Systematically Important Insurers effectively,
stockholders and unsecured creditors should bear the losses to protect the profit of policyholders. And we should ensure that the Systematically Important Insurers without possibility of existing in the market to exit in an ordered way. The exit will bring no serious damage to the financial system or losses to the taxpayers.
3. Improving the ability of absorbing losses. The Global Systematically Important Insurers
should have stronger ability of absorbing losses to cope with large risk in global range. In the view of improving insurers’ ability of absorbing losses, International Association of Insurance Supervisors focuses on establishing supervision criterion of global solvency. International Association of Insurance Supervisors comes up with two methods: one is capital method and the other is balance sheet method. The capital method sets some proportion of supervision capital as supplementary capital. The
Advances in Social Sciences Research Journal (ASSRJ) Vol.3, Issue 1 January-‐2016
Copyright © Society for Science and Education, United Kingdom 29
balance sheet method adds items inside and outside the balance sheet to calculate the supplementary capital.
With the rapid development of China’s insurance industry, China’s insurance companies will bring larger and larger impact to international insurance industry. Thus, it is necessary to refer to international supervision measures to strengthen the supervision of China’s insurance companies. First, identifying insures of systemically importance. Regulators should confirm the list of China’s Systematically Important Insurers basing on the situation of China’s insurance industry and the four indicators( size, interconnectedness, non-‐traditional insurance and non-‐insurance activities and substitutability). If the range of Systematically Important Insurers is too wide, it will reduce the efficiency of financial supervision. However, if the range of Systematically Important Insurers is too narrow, it will threat the financial stability. Second, strengthening supervision. China Insurance Regulatory Commission will follow and refer to the reform advice of international financial supervision institutes. Improving the supplementary capital and proportion of common stock to enhance insurers’ ability of absorbing losses. As the core indicator, improving the ability of solvency can prevent the excessive market behavior and enhance the potential ability of absorbing losses to avoid the systemic risk. Establishing the strict supervision requirement and criterion in liquidity reserve. We should test the liquidity of non-‐traditional insurance and non-‐insurance activities with the systematically importance termly. Third, Completing the requirement of information disclosure to improve the transparency of insurance market. Large insurance groups should publish the relationship of insurers and financial system, the relationship of departments of insurers and data of systemically importance. Meanwhile, a large insurance company should have the ability of offering information in short time which is an important part in recover from and dealing with the plan. Last, establishing risk response mechanism of systematically important insurers. Setting the mechanism of burden sharing between creditors and stockholders. The stockholders and unsecured creditors should bear the losses to protect the profits of policyholders and taxpayers reaching the purpose of reducing moral hazard of insurers. Completing liquidation mechanism of systematically important insurers and introducing the bridge institutes. When one insurer faces up to business trouble, the bridge institutes take over the core business to ensure the ordered exit of systematically important insurers which avoids the systemic risk to the whole financial system.
CONCLUSION With the development of China’s insurance industry, China’s insurers will step into the ranking of international market. There are more and more insurance companies appearing on the list of Systematically Important Insurers , which is an opportunity and a challenge. Our government should encourage and support China’s insurers to join in the Global Systematically Important Insurers. This paper comes up with some supervision proposals for China’s Systematically Important Insurers. China Insurance Regulatory Commission should make explicit requirement in strengthening supervision, information disclosure and effective disposal.
Wang, D. (2016). The Assessment and Supervision of china’s Systemically Important Insurers. Advances in Social Sciences Research Journal, 3(1) 20-‐30.
URL: http://dx.doi.org/10.14738/assrj.31.1751. 30
This paper tries to identify China’s Systematically Important Insurers basing on the Index Method. However, since the lack of some data and limitation of the method, some questions need further discussion. Identifying the Systematically Important Insurers is a permanent job and I will make more researches in this respect to make more achievements. Reference Chen Z, “Are Banks too Big to Fail?” [R]. Working Paper, DNB, 2010 (232): 3-‐6
Chao X, Methods of Identifying Systematically Important Financial Institutes, [J]. International Financial Research, 2011,(11):57-‐64
FSB. Intensity and Effectiveness of SIFI Supervision [R]. November 2010.
FSB. Effective Resolution of Systemically Important Financial Institutions: Recommendations and Timelines [R]. Financial Stability Board, 2011
Huang, Zhou and Zhu. ”Assessing the Systemic Risk of A heterogeneous Portfolio of Banks during the Recent Financial Crisis” [J]. BIS Working Paper No 296, 2010:1-‐43
IAIS. Global Systematically Important Insurers: Policy Measures [R]. 2013
IAIS.Global Systematically Important Insurers: Initial Assessment Methodology [R]. 2013
Jun C, The Establishment of Systematically Important Financial Institutes’ Assessment Criterion, [J]. Western Finance, 2010,(4):45-‐52
Shu B , Jian G, Assessment of China’s Systematically Important Banks Basing on the Indicator Method, [J] Research of Finance, 2012(9): 48-‐56
Xia Yang, The Function of Insurance Industry in the Stability of Financial System, [J] Insurance Research, 2010,(2):15-‐28
Advances in Social Sciences Research Journal – Vol.3, No.1 Publication Date: Jan. 25, 2016 DoI:10.14738/assrj.31.1767.
Hasan, M., & Ui, H. (2016).Entrepreneurship and Innovation in E-‐Business. Advances in Social Sciences Research Journal, 3(1) 31-‐42.
Copyright © Society for Science and Education, United Kingdom 31
Entrepreneurship and Innovation in E-‐Business
Maruf Hasan School of Mechanical an Manufacturing Engineering
The University of New South Wales, Sydney 2052, Australia
Harris Ui School of Mechanical an Manufacturing Engineering
The University of New South Wales, Sydney 2052, Australia
Abstract The fast growth and business successes of eBay, Amazon.com, priceline.com, etc. and the bankruptcy of numerous dot.com companies worldwide in the late 1990s has held potent management implications for IT innovation and entrepreneurial organizations worldwide. Entrepreneurship and innovation are emerging disciplines for proactively responding to changes in the e-‐commerce world. This paper explores the synergies between entrepreneurship and innovation and investigates their roles in organisational development in general and dot.com companies in particular. Keywords: innovation, entrepreneurship, e-‐commerce, business, technology
INTRODUCTION
Digital technology has transformed the economy. Value creation for customers has shifted from the physical good to an economy that favors service, information and intelligence as the primary source of the value creation. At the centre of this economy transformation is e-‐commerce. E-‐commerce is closely links and relates to the use of Internet. Internet-‐enabled business practices have actually engaged the world very quickly and with exponential growth rates in the use of internet continuously occurring. The Internet is a crucial aspect of the information economy and it provides new stages for business and allows access to new markets. E-‐commerce is believed to have created a new role, impact as well as another dimension for business applications. The dot-‐com crash in year 2000 has created new challenges and new opportunities to entrepreneurs. In this competitive world, e-‐entrepreneurship and innovation assist organization to gain competitive advantage to hold key to their e-‐business success. Globalization and information technologies are radically changing the face of business and organizations. There is a growing interest in the use of e-‐commerce as a means to perform business transactions over the internet. In the past few years, the term of e-‐commerce is everywhere across the entire world. People define e-‐business in various ways and images that it has no standard definition. E-‐business or e-‐commerce is often interpreted as selling products over the internet. In its broader sense, e-‐commerce can be interpreted as the use of electronic transmission mediums to engage in the exchange, including buying and selling, of products and services requiring transportation, either physically or digitally, from location to location. Electronic commerce involves all sizes of transaction bases and it requires the digital transmission of transaction information.
Hasan, M., & Ui, H. (2016).Entrepreneurship and Innovation in E-‐Business. Advances in Social Sciences Research Journal, 3(1) 31-‐42.
URL: http://dx.doi.org/10.14738/assrj.31.1767. 32
In commercial point of view, e-‐commerce can also be defined as transaction activities between firms and individuals, also it involves in the exchange of money, goods or duties. This definition clearly excludes email, telephone, fax, as well as internal computing accomplished by accounting sales, inventory, treasure, personnel or executive information systems. In short way of expressing this definition will be by excluding inter-‐organisational systems in total. There are many forms of commercial transactions that can occur in daily life from business to business or B2B such as electronic data interchange, auction markets etc. Commercial transactions can also occur in B2C or business to consumers, such as retailing in the internet and electronic brokerages. E-‐commerce has tried to take advantage of economies in single point keying to reduce errors and cycle time, a high degree of customizability of product or services to meet customer needs and customer interaction with databases at very low marginal cost.
LITERATURE REVIEW The purpose of this paper is to investigate and analyze the role of entrepreneurship and innovation in e-‐business. A review of principal and current literature on e-‐business perspective of entrepreneurship and innovation was undertaken to collate the existing theories about the two and to explore the conceptual relationships between them. Innovation For many years, R & D (research and Development) has been closely associated with technological innovation. Invention is the narrowest definition of innovation. According to Drucker (1994), there were seven basic sources of opportunities to innovate but only one of them was to do with inventing something new. Therefore, innovation is more than invention and does not have to be technical. There are numerous examples of social and economic inventions. Innovation is a proposed theory or design concept that synthesizes extant knowledge and techniques to provide a theoretical basis for a new concept (Sundbo, 1998). Innovation thus has many stages and is multidimensional. The most prominent innovation dimensions can be expressed as dualisms; radical versus incremental, product versus process; and administrative versus technological. Innovation can be radical and incremental. Radical innovations refer to discontinuous, revolutionary, original, basic or pioneering innovations. Incremental innovations are small improvements made to enhance and extend the establishment processes, products and services. Kanungo (1998) stated that product innovations reflects change in the end product or service offered by the organizations, whereas process innovation represents changes in the way firms produce end products or services. Some researchers have categorized innovation into technological and administrative innovations. Technological innovation is about the adoption of a new idea that directly influences the basic output processes whereas administrative innovations include changes that affect the policies, allocation of resources, and other factors associated with social structure of the organization. For the purpose of this research, innovation is defined broadly to include new products, new processes, new services, new forms of organisation, new markets, and the development of new skills and human capital. Maintaining a Competitive Advantage with E-‐commerce E-‐commerce is becoming a key aspect in differentiating products an services from one another. For many mature industries, the commoditization of product offerings is reality. In these cases, differentiation is becoming more difficult and more costly, thus placing further stress on profit margins. Organisations that take advantage of e-‐business may be able to offer substantial forms of differentiation, enabling enterprises to achieve more significant margins. They can
Advances in Social Sciences Research Journal (ASSRJ) Vol.3, Issue 1 January-‐2016
Copyright © Society for Science and Education, United Kingdom 33
enhance their services, augment their products with web-‐based information, or speed up search an information processes. A sustainable competitive advantage is a competitive improvement that cannot easily or quickly be emulated by competitors in the short-‐term. As technology is often easily copied or purchased, it does not automatically create a sustainable competitive advantage. Competitive advantage base on the new information systems can, however often is maintained: dynamics of IT in the organization lie in the interactions between the technology an business context. The success of IT applications lies in fitting with specific organizational strategies. Competitors within a short to medium period of time will not be able to duplicate the major factor of these contexts, including business strategies, organizational structures, corporate culture and politics. The notable names in the internet e-‐commerce have entered existing markets or created new markets using web technologies at a time when the entry cost to those markets or create new markets using web technologies at a time when the entry cost to those markets were low an the elements of surprise was greatest. In producing technologically sophisticate sites an developing their supply chain logistics, they have considerably raise the entry cost for newcomers to those markets. They nee to continue to develop their sites and their service to keep ahead of the competition but their most precious asset is the brand name that they, as first movers, have established for themselves. Identifying the Strategic Opportunities of E-‐business Innovation E-‐business innovations are digital transformation of business processes which has a profound effect upon existing business practices (Pulley et al., 2000). In addition to that, according to Singh (2004), e-‐business innovations are about embracing change to company culture, which has been generally described as a system of shared meaning within an organization determining the way employees act. E-‐business in organizations is linked with the internet and the growth in the use and application of computers. The identification and establishment of strategic opportunities of e-‐business for the firm will lead to an understanding of the innovation and its justification for improved business, competitiveness and customer service. Hackbarth and Kettiger (2000) suggest a four stage strategic breakout model addressing initiation, diagnosis of the industry environment, breakout to establish a strategic target and transition or plotting a migration path, emphasizing need to innovate away from traditional strategic approaches using the term ‘breakout’ to show the need for new marketplace structures and business revenue models. It has been suggested for a short term planning horizon for e-‐business projects, an iterative strategic planning cycle to incorporate the pace of technological change, an informational power bases for access, control and manipulation of critical information instead of a positional power base and the core focus to be on customers rather than the factory and the production of goods. Kalakota et al. (2000) emphasis that the focus of e-‐business strategy may differ depending on the evolutional state of e-‐business, suggesting that the focus will transform from selling channels to value-‐chain integration and creation of values networks. The strategic importance of e-‐business should be carefully analysed on the basis that it contributes positively to the competitive advantage edge of a company through the benefits it offers. The speed at which change may occur in e-‐business is indicated by the speed which new access technologies are adopted. Although an entrepreneur may have a strategic plan to introduce s-‐business and associated changes, the responsibility for the choice of implementation and financial evaluation of e-‐business innovation is invariably given to technical staffs, who sometimes fail to perceive e-‐business as part of company strategy. Other
Hasan, M., & Ui, H. (2016).Entrepreneurship and Innovation in E-‐Business. Advances in Social Sciences Research Journal, 3(1) 31-‐42.
URL: http://dx.doi.org/10.14738/assrj.31.1767. 34
issues to consider are the financial position of the organsiation for the required investment, the ability of a company in terms of resources to accommodate e-‐business, and if the innovation will conform to the business strategy of the organization. Entrepreunership According to Johnson (2001), entrepreneurship in its narrowest sense involves capturing ideas, converting them into products or services and then building a venture to take the product to market. A noticeable trend in the study of entrepreneurship in recent years has been drifted away from the subject of small business towards the concept of entrepreneurship. This present study reflects this trend by emphasizing the concept of entrepreneurship itself, rather than the personality or psychology of small business entrepreneurs. Entrepreneurship represents organizational behaviour. The key elements of entrepreneurship include risk taking, pro-‐activity and innovation (Miller, 2002). However, Slevin and Covin (1990) have argued that these elements are not sufficient to ensure organizational success. They maintained that a successful firm not only engages in entrepreneurial managerial behaviour, but also has the appropriate culture and organizational structure to support each behavior. Every huge and well-‐known company in existence such as Coca Cola, Hewlett-‐Packard, Dell, and etc. were once established as a point start-‐up by a combination of an entrepreneur and an idea. E-‐commerce start-‐ups are no different in this sense: the entrepreneur is critical to the start-‐up’s early development. The entrepreneur has the idea that evolves into a vision for a business. And although the Internet boom made entrepreneurship seem commonplace, the subsequent crash illustrated the difficulties of successful entrepreneurship. The Conceptual Relationship between Entrepreneurship and Innovation The economics of innovation, in particular, have attracted increased attention in recent years (Grupp, 2001; Arora et al., 2002; Stoneman, 1995). Sundbo (1998) summarized the basic theories of the economics of innovation and identified three competing paradigms in the current theoretical discussion of innovation:
1. the entrepreneur paradigm 2. the technology-‐economics paradigm 3. The strategic paradigm
The entrepreneur paradigm can be tracked back to the 1930s when Schumpeter (1934) first attempted to establish a linkage between entrepreneurs and innovation in theory, and viewed the entrepreneur as innovator. He maintained that innovation contributed to the growth of the economy because entrepreneurs produced innovations. The concept of entrepreneur as innovator underpins the entrepreneur paradigm in which the role of the entrepreneur is highlighted in the innovation process. According to this paradigm, only a person who founds a new company on the basis of a new idea can be called an entrepreneur. Entrepreneurship is viewed as a creative act and an innovation. Entrepreneurship is about creating something that did not previously exists. The creation adds value to the individual and the community, and is based upon perceiving and capturing an opportunity (Johnson, 2001). Legge and Hindle (1997) also expressed a similar thought. They regarded entrepreneurship as a change of state, a dynamic process and a unique event. They also believed that people who led teams and organizations to introduce innovations were entrepreneurs. Entrepreneurs seek opportunities, and innovations provide the instrument by which they might succeed. Corporate entrepreneurship often refers to the introduction of a new idea, new products, a new organizational structure, a new production process, or the establishment of a new
Advances in Social Sciences Research Journal (ASSRJ) Vol.3, Issue 1 January-‐2016
Copyright © Society for Science and Education, United Kingdom 35
organisation by (or within) an existing organization. As Kalakota et al. (1999) have observed that innovation requires three basic components; the infrastructure; the capital; and the entrepreneurial capacity needed to make the first to work. As time flies, the market evolves so does the basic components in linking the entrepreneurship and innovation. Entrepreneurship is linked with seven basic components in detail which includes finance, accounting, media, technology, strategic management, operation logistics and marketing. Innovation is the specific tool of entrepreneurship by which entrepreneurs exploit change as an opportunity for a different business or service. There is a considerable overlap between entrepreneurship and innovation. Moreover, innovation has to address market needs, and requires entrepreneurship to achieve commercial success.
METHODOLOGY This research paper aims to give a better understanding of the complementary nature of entrepreneurship and innovation through an empirical study of e-‐commerce companies. In order to acquire decent results, the authors has decided to use current literature review on entrepreneurship and innovation and case study analysis from different sources. In addition to this, interviews were conducted to examine the perceptions of entrepreneurs in e-‐commerce regarding entrepreneurship and innovation and the factors affecting the development and integration of entrepreneurship and innovations. The main purpose of the literature review was to collate the existing theories and basic knowledge about the entrepreneurship and innovation and to explore the conceptual relationships between them. A review of the current literature on e-‐commerce as well as entrepreneurship and innovation was conducted. In addition web research was conducted to support the literature review. The sources provided by the web research were the most convenient and the fastest due to its accessibility. The analysis of some case studies has been done to support the literature review. Six case studies were undertaken to explore organizational behaviour and practice, entrepreneurship and innovation in e-‐commerce companies. In addition to the case studies, interviews were conducted in several companies to explore the conceptual relationship between entrepreneurship and innovation in e-‐commerce, and the factors affecting the development and integration of entrepreneurship and innovation. These interviews focused on how these e-‐commerce companies have been managed, how they have succeeded and what lessons can be learned from the experiences. Six companies participated in the interview. Case Studies The companies that were selected for the case studies encompass various business sectors: (ex; online book retailer, manufacturing company, pharmaceutical industry etc) operating in different nations and cultures, and moreover have different histories, varying in size and length of time in operation. Only three case studies are reported because of space limitation. Case study 1 (Company A) Company A is a successful online retailer who received an award for the most entrepreneurial internet site. In the beginnings the owners dreamt up the idea for a business that could take orders for gifts using the Web and which made sure that deliveries met deadlines. The company was founded in 1998. The business plan was developed in early 1999 and implementation of it started in mid 1999. The owners invested around $80,000 predicting that profitability would be achieved in 4 years by 2003. The website was first launched in July 1999.
Hasan, M., & Ui, H. (2016).Entrepreneurship and Innovation in E-‐Business. Advances in Social Sciences Research Journal, 3(1) 31-‐42.
URL: http://dx.doi.org/10.14738/assrj.31.1767. 36
The website had around 55,000 viewers each month in its first 3 months of operation and by Christmas 1999 the company was delivering gifts to around 30,000 homes. In April 2000 they successfully raised a further $15 million capital to scale up the business, making investments in online ordering and fulfillment operations in terms of staffing and infrastructure. Company A now employs around 60-‐70 employees and was consistently ranked in the top 10 Australian e-‐tailing websites during 2001. It has evolved its business model through various alliances and acquisitions and the development of other services and reward program for partners. When company A was first established, there were two options for online retail business that were being considered by the founder. These are product-‐driven or build a business around customer need. The owners thought that the latter would be higher risk but more sustainable in the long run. From the outset they counted on two revenue streams, corporate gifts and individual gifts. The owners recognized that they were a direct marketing company and getting customers to the company website was the first problem that needed to be addressed. The owners took less costly approach in building their brand, believing that there were much smarter ways to make an income and attract and keep a loyal customer base. They implemented a number of coordinated strategies that provided discount incentives to get customers online and ordering from them, and believed that combining this with a superior shopping experience and customer service would give them the best change of getting customers back again without the discount incentives. The owners’ view was that spending big on marketing would not only add to their costs but it would also take their focus off the main game, preventing them from investing in the core of the business – the technology, the people and automation. They preferred to build slowly and steadily from the ground up, managing growth so that the customer experience would not be compromised. One of Company A’s unique feature in the early days was the website itself – clean, uncluttered and easy to use, with a sophisticated search function to search by age, relationship, interest, occasion, price range and personality type to help customers find what they are looking for and a simple and yet user-‐friendly payment process that notes customer details so that they do not have to be re-‐entered when ordering again. Drop down boxes clearly tell the customer what they will have to pay for delivery, when they can expect it to arrive. This was vastly different from many other e-‐retailers websites at the time, which were difficult to use and navigate. Company A’s success rests on creativity and ideas and then implementation and execution. The company uses technology to gear up the whole business around unparalleled service levels instead of competing primarily on price, even though they often sell at around 5-‐10 percent below the retail price. This explains to a large extent why much of the process, including most technology and design work, is retained in-‐house. The key exception is the credit card security system, which was purchased from an established name the business. In order to assure a superior customer service experience, Company A recognized that it needed to have control over the whole end-‐to-‐end customer experience. Customer’s or shopper’s experience has been a major determinant whether they would return again. It is a core guiding principle for the company, and timely delivery with a product was central to this. The owner believed that control over fulfillment as essential to ensuring customer satisfaction and being able to develop a loyal customer base so he decided that the company would fill its own orders and allocate the cost of packing and delivery to its marketing budget. Case study 2 (Company B) Company B was the first company to move book retailing from bricks and mortar industry on line. On top of that, no company so far has done more to show how the Web overturns conventional assumptions about distribution than Company B. Company B has become

Advances in Social Sciences Research Journal (ASSRJ) Vol.3, Issue 1 January-‐2016
Copyright © Society for Science and Education, United Kingdom 37
synonymous with e-‐commerce and it is one of the few Internet brands recognized all over the world. It is the most visited e-‐commerce website in the USA, and one of the top two or three in the UK, France, Germany and Japan. The Company B model is simple yet attractive. Company B began operating in 1995 by an innovative computer science graduate who realised the potential of e-‐commerce on the internet early so he conducted an analysis of 20 product groups and performed a value analysis of each one. The outcome of his analysis was books because of the category’s larger size, greater diversity, and lower risk. The owner also believed that the large number of books title available made book selling an aptly-‐suited retail business on the Internet. Unlike the traditional bookstores, Company B kept a small inventory of books on hand which are usually the best selling items and ordered the books directly from book distributors or publishing houses when orders were place by customers using its Website. This business model, unlike that of bricks and mortar booksellers, allowed Company B to achieve inventory turns equivalent to 70 per year, as opposed to an industry average among traditional booksellers of approximately 2.7. The owner believed that convenience, selection, price and customer service were the key factor of success for consumer buying books on the Internet especially in Company B. Like many e-‐business websites, Company B offered customers the opportunity to place orders at any time of the day, seven days a week. Visitors could browse through company’s 1.1 million plus title catalogue by searching for a particular book by author, title, subject, or keyword. The entire inventory was seven times the inventory of the world’s largest mega-‐bookstore and 30 times the size of an average mall bookstore. Approximately one-‐third of the company’s book inventory was available at 105 off suggested retail price. It provides a simple and user-‐friendly service for the customers when they order the books for the first time – simple 12 step procedure that involved providing name, mailing address, email address, and credit card information. According to the owner, delivering the books ordered within the time frame promised was crucial to the company’s reputation. During 1997, the war of electronic bookselling was fought along seven dimensions. They were pricing policies, customer acquisition, associates/affiliate programs, personalization, customer service, user navigation, and legal challenges. In 1997, Company B sustained an operating loss of approximately $27.6 million on net sales of $148 million, compared with a loss of 45.8 million on $15.7 million sales in 1996. Despite these losses, the owner felt that the company was succeeding along the three dimensions of strategy that would position the company for long term success: extending the company’s brand position in the online world; providing outstanding value to users through users superior online shopping experiences; and achieving significant sales volume to realize economies of scale. During 1999, Company B had aggressively franchised in several ways. These included the addition of new product categories, increased distribution capacity, international growth and strategic partnership with several key online retailers. As Company B expanded its retail categories to auction items, electronics, toys, home improvement, software and video games, the owner noted that the complexities of running the business increased and each individual product category was now managed by a general manager who oversaw a management team. To support the expanded product categories, Company B increased its distribution capacity to 5 million square feet and it had seven distribution centres in 1999. In addition to U.S. operations, Company B’s United Kingdom and German sites were also in the top 10 most visited Website and leading e-‐commerce site for each respective country. Besides expanding its own operations, the company took equity in
Hasan, M., & Ui, H. (2016).Entrepreneurship and Innovation in E-‐Business. Advances in Social Sciences Research Journal, 3(1) 31-‐42.
URL: http://dx.doi.org/10.14738/assrj.31.1767. 38
several other e-‐commerce companies as a way to allow its customer to receive a wider range of products and services as well as to generate additional revenue from these companies by helping them sell to the Company B’s customer base. Rapid and continuous innovation in the electronic commerce area has been Company B’s heritage. For instance, in 1995 Company B was the first company to truly harness the power of the rapidly expanding Internet to provide an online book retailing service to customers. It has also been the first company to enable customer to search for and order, hard-‐to-‐find books as easily as bestsellers. Company B offered the ‘one-‐click’ program which streamlines the buying process by storing detailed customer information, including credit card numbers. In addition to that Company B has been the first on-‐line company to use collaborative-‐filtering technology, which analyses a customer’s purchases and suggests other books that people with similar purchase histories have bought. Such valuable information has proven effective in capturing new markets online and mass customization. Furthermore, Company B has been the first online company to introduce two innovative processes to facilitate customer purchases. Through its acquisition of another company in 1998, Company B has developed comparison-‐shopping that gives customers a way of finding products that it does not sell directly. Reciprocally, Company B’s affiliates program, which numbers over quarter of a million participants, directs customers from other sites to Company B store site. Company B has also been the first online company to provide customer with reminders and tracking of their orders through e-‐mail alerts. Consequently, Company B’s innovative history suggests that the company could become a dominant provider of online shopping behaviors in the future. As such, Company B has stayed ahead of competition by rapid and continuous innovation. It must be pointed out all these innovations are quickly imitated by other e-‐commerce companies. Although competitors were able to free ride on the technology and Company B’s innovations, Company B’s 20 months head start online over its closer rival has resulted in the company B retailing over five times as many books, and acquiring five times as many customers. Being first to market and continuous innovations have enables Company B to achieve the following:
• A highly recognizable and trusted brand name. • Company B has been able to assemble a great store of information on the buying habits
of each to its customers. As such, the company has been able to be proactive and second guess what customer want.
• Company B is able to forecast demand more accurately and thus is able to get a better deal from publishers.
• By being first to market, Company B has set the industry standards. Case study 3 (Company C) This particular case study concerns about a successful online wine shop, Company C. It was founded in 1995 by two fantastic entrepreneurs ideas. On January 1995, Company C, one of the most popular wine-‐buying sites on the Internet was created by two entrepreneurs. Company C provides a neat yet simple and therefore quickly downloadable graphics combined with flowering description of wine to replace a real-‐world retailing environment. Custom-‐designed tasting charts with ratings of each wine and photographs of vineyards provided an information-‐based alternative for the traditional customer activity of cradling a bottle or scrutinizing a label.
Advances in Social Sciences Research Journal (ASSRJ) Vol.3, Issue 1 January-‐2016
Copyright © Society for Science and Education, United Kingdom 39
Company C announced averaging more than 1,500 visitors a day to its Website in November, 1995, and its revenues increasing 20% per month. Company C was devoting millions in investment capital to developing its site, automating order fulfillment, building a database to track website usage and orders, and developing its brand through advertising. However, due to heavy investment in automaton and technology, Company C had yet to reach profitability in large part. Company C website was designed and build and maintained largely by in-‐house operation. The site was designed to be attractive, but simple, with few graphics to ensure that it would load quickly when accessed by users with slower connection to internet. The textual content of the company website was provided by one of the two owners. In addition to the website, Company C operated a mailing list in which the company would discuss new wines, good wine and food combinations, the state of the current crop, and other items of interest. Company C has one operations manager whose primary responsibilities included maintaining relationships with the vineyards that supplied the company and overseeing order fulfillment. The company believed that their customers were people interested in a good class of wine with diner, but not wine connoisseurs. Their deal target was a woman or man with moderate to high income, who was interested in learning more about the wine. Company C advertised on the Web itself, buying advertising space on other websites that the owners believed were visited by the kind of people they targeted, instead of employing direct mail. Their advertisements allowed the viewers of the advertisement to click on it and more to their home website. Company C implemented a registration process whereby the site could store customer’s billing and credit card information to facilitate faster purchasing. The registration process surveyed customers with only a few questions about themselves, because the company believed his target customers were time constrained and that there were only a limited number of categories of customer information that the company could use. Survey data represented only a small part of what Company C learned on an ongoing basis about customers using its site. Such information was augmented by automated records on customer behaviour with the site, including the number of visits made to each part, the internet address of the computer used by each visitor, the amount of time spent looking at each page and what pages a user returned to during subsequent visits. It seemed likely that much of Company C’s appeal to customers lay in its friendly, personal interactions with users through an interface that delivered service that was preferred over physical retailing channels.
DISCUSSION AND CONCLUSIONS The study has explored the synergies between entrepreneurship and innovation in e-‐commerce through a review of principal literature in this field, case study analysis, web researches and interviews with dot.com companies. The results of this study have shown that entrepreneurship and innovation is a crucial factor for the long term sustainability of e-‐commerce and e-‐business. Results drawn from the study are summarized under the following headings: E-‐commerce Opportunities and Lessons Gained after Dot-‐Com Crash The dot-‐com crash phenomenon that happened in year 2000 was caused by poor investment and business practices. Essentially, many people borrowed too much money, set up websites and internet-‐based businesses and spent too much money on advertising, trying to attract people to their websites. But many of these initial attempts at new economy businesses were not based on sound business principles. Some of them had no clear plan about how to generate
Hasan, M., & Ui, H. (2016).Entrepreneurship and Innovation in E-‐Business. Advances in Social Sciences Research Journal, 3(1) 31-‐42.
URL: http://dx.doi.org/10.14738/assrj.31.1767. 40
a sound revenue stream, much less a profit stream. Dot.com crash however has created new opportunities to the e-‐commerce world. New market conditions have created a dynamic environment, where high rates of innovation require organizations to embrace a flexible strategy. It is through the alignment of the organisation’s strategy and processes that the sustainable competitive advantage will be provided. Understanding the Disruptive Attributes of E-‐commerce The internet is transforming the rules of competition and inventing new value propositions. The changes made possible by the internet are strategic and fundamental. Entrepreneurs in the traditional brick-‐and-‐mortar business facing the challenge of transforming their businesses in the digital economy must be able to understand the disruptive nature of e-‐commerce. Some of the major disruptive attributes brought by e-‐commerce are: economics of exchanging information, connectivity and interactivity, sped of change, industrial context, network economies of scale, economies of abundance and merchandise exchange. Entrepreneurs must be able to identify and take advantage of these key performance attributes to create new product and services, reach new markets, build customer loyalty, achieve market leadership, optimize business processes, enhance human capital and harness technology. Spotting E-‐business Trends and Patterns In order to create effective strategies, companies must be able to spot trends as soon as possible. Trend spotting requires entrepreneurs to learn to identify and to take advantage of the discontinuous change the future inevitably brings and the resulting unsettling shifts arriving on an uncertain schedule. This provides an entirely new landscape for entrepreneurs to navigate, and only the trend spotters can hope to conquer it. Accurately identifying trends helps business analyze and synthesize consumer behaviour, eliminate uncertainty, and identify new opportunities. Trend spotting is not just for entrepreneurs looking to start new companies or for marketers attempting to sell old products in new packages. It is useful for identifying new business opportunities as well. The smart entrepreneur stands at the forefront of trends, such as wireless before they become mainstream. First Movers in E-‐commerce First movers in e-‐commerce are subject to exogenous, competence destroying jolts from lack of regulations, new entrants and new technologies that could lead to the erosion of competitive advantage very rapidly. Empirical studies conducted by the authors show evidence to suggest that the critical resources in the e-‐commerce industry that result in competitive advantage are largely intangible assets and capabilities, such as innovativeness, technical expertise and knowledge. Companies like company B are not effectively protected from imitation by legal, financial or easy to imitate tangible barriers, but by knowledge barriers. Several points of lessons can be gained from Company B case about the first mover advantage in the e-‐commerce world. The three critical factors to stay ahead of late movers are speed, continuous innovations, and patenting. Company B sustains its momentum in the competitive market by continuously develop new innovations in order to stay ahead of late movers. Company B and many other e-‐commerce companies are leveraging patent to protect their innovations and sustain their first mover advantage. E-‐commerce businesses operate in an age of new realities. Thus, a fundamental shit in thinking is necessary for coping with these realities. While mortar and bricks companies have struggled to try to sustain their advantage, if fact, in e-‐commerce no organization can build a competitive advantage that is sustainable. In e-‐commerce it seems that every advantage erodes. So in this
Advances in Social Sciences Research Journal (ASSRJ) Vol.3, Issue 1 January-‐2016
Copyright © Society for Science and Education, United Kingdom 41
new business environment, e-‐commerce organizations must actively work to re-‐create a new competitive advantage through continuous innovation, speed of implementation and patenting. Issues and Challenges Facing Entrepreneurship and Innovation in E-‐commerce Today’s e-‐commerce operates in a highly competitive marketplace where sustainable competitive advantage is almost impossible as there are minimal barriers to new entrants and competitors in the marketplace. Innovation faces constant challenges of imitation and erosion. There have been different views in the literature about the benefits of first movers in the e-‐business marketplace. A general belief in e-‐commerce world is that it is safer and cheaper to imitate the first mover in the e-‐business environment, where there is higher level of technical uncertainty and a rapid rate of technological innovation. The issues facing e-‐commerce today are that entrepreneurship and innovation need to respond closely to market need and gain market creditability. Ideally, there should be credibility build within the marketplace before the conception of the business. In addition, the intangibility of an online service needs to be addressed in order to build brand awareness. Entrepreneurs in Identifying and Evaluating new Opportunities and Innovations The electronic marketplace presents an extraordinarily challenging environment for entrepreneurs and their organizations. The fast acceleration and availability of technology is shaping a new economy, with different forms of distribution, marketing, selling and arranging work becoming observable. Attributes of this economy include collapsing boundaries between firms, suppliers, customers and competitors. Since e-‐commerce is relatively new, the foundation will support the future market has yet to be solidly defined where much of the thinking and building needed to harness its potential has just begun. Internet firms that emphasize innovation and rapid response to change may e best positioned for recognizing and identifying new opportunities and ideas for their business. Identifying new opportunities can be critical in initiating innovation and change associated with improvements in products/services, technological capabilities, and seeking alternative markets and opportunities. Those internet firms which adopt a more conservative and defensive e-‐business strategy of retaining their market positioning may not fully value innovations associated with incorporating additional marketing strategies or improving business processes. One personal attribute that may serve as critical link in determining whether the firm uses new opportunity information to develop and integrate e-‐commerce innovation is the pro-‐activity or proactive personality of the entrepreneur. The proactive personality is defined as one who takes action to influence environmental change. Proactive personalities includes scan for opportunities, show initiative, take action, and persevere until they reach closure by bringing about change. From the review of the principal literature and from cases studies conducted by the authors, the results revealed that e-‐commerce firms that emphasize a market leadership position and rapidly respond to changes within their environment were more likely to identify and assess new opportunities and ideas for their business. It is suggested that internet firms that emphasize constant change with their strategic orientation may be positioned for success in this new form of entrepreneurship. In conclusion, entrepreneurship and innovation should be regarded as ongoing, everyday practices in organizations.
Hasan, M., & Ui, H. (2016).Entrepreneurship and Innovation in E-‐Business. Advances in Social Sciences Research Journal, 3(1) 31-‐42.
URL: http://dx.doi.org/10.14738/assrj.31.1767. 42
ACKNOWLEDGEMENT This is an extended version of a paper that was presented in Global Congress of Manuacturing and Management in Brisbane, Australia References Arora, A, Fosfuri, A and Gambardella, A (2002), “ Markets for Technology: The Economics of Innovation and Corporate strategy”, MIT Press, Cambridge.
Drucker, P.F. (1994), Innovation and Entrepreneurship: Practice and Principles, Heinemann, London.
Grupp, H (2001), Managing New Product Development and Innovation: A MicroeconomicToolbox., Edward Elgar, Cheltenham. Informatio
Hackbarth, G and Kettinger, W (2000), “ Building and e-‐business strategy”,Information System Management, Summer, pp. 78-‐93
.Johnson, D. (2001), “What is innovation and entrepreneurship? Lesson for large organizations”, Industrial and Commercial Training, vol 33, No. 4, pp. 135-‐140.
Kalakota, R., Robinson, M, and Tapscott, D., (1999), E-‐Business: Roadmap for Success, Addison-‐Wesley, Harlow.
Kanungo, R.N. (1998), Entrepreneurship and Inoovation: Models for Development, Sage, London.
Legge, J. and Hindle, K (1997), Entrpreneurship: How Innovators Create the Future, MacMillan Publishers, Melbourne.
Miller, T. (2002), “Top Ten Lessons From the Internet Shakeout”, Webmergers.com,
Available online at: http://www.webmergers.com/editorial/article.php?id=48
Pully, M.L., McCarthy, J. and Taylor, S. (2000), “E-‐Leadership in the networked economy”, Leadership in Action, vol. 20 (3), pp. 1-‐7.
Schumpeter, J. (1934), The Theory of Economic Development, Harvard (reproduced 1961, New York).
Singh, M and Waddell, D (2004), “E-‐Business Innovatin and Change Management”, IRM Press, London.
Slevin, D.P. and Covin, J.G. (1990), “Juggling entrepreneurial style and organizational structure – how to get your act together”, Sloan Management Review, Winter Issue, pp. 43-‐53.
Stoneman, P. (1995), Handbook of the Economics of Innovation and Technological Change, Blackwell, Oxford.
Sundbo, J. (1998), The Theory of Innovation: Entrepreneurs, Technology and Strategy, Edward Elgar, Massachusetts.

Advances in Social Sciences Research Journal – Vol.3, No.1 Publication Date: Jan. 25, 2016 DoI:10.14738/assrj.31.1765.
Badau, K. M. (2016). Teacher’s Classroom Management Practices for Increasing Effectiveness in Climate change in Nigeria. Advances in Social Sciences Research Journal, 3(1) 43-‐50.
Copyright © Society for Science and Education, United Kingdom 43
Teacher’s Classroom Management Practices for Increasing Effectiveness in Climate Change in Nigeria.
Kabiru Mohammed Badau (Ph.D)
Modibbo Adama University of Technology, Yola Adamawa State.
Abstract
Classroom environment and cultures as well as the ways in which both students and learning are organized and managed increase teachers’ effectiveness in climate change. The effective teacher manages the large number of relatively diverse students who occupy these classrooms within the environment. The importance of physical environment, climate culture, organization and management of classroom within the larger context of teachers effectiveness is mostly clearly seen by noting that beginning or novice teachers takes longer time to be effective in the classroom. This paper discuss classroom management practices for teacher effectiveness in terms of environment climate culture, organization and management in a climate change. Conclusion and recommendations on managing classroom for increasing teacher effectiveness in climate change for policy makers and educational planners in Nigeria were offered.
Keyword: Teachers classroom management Practces, Increasing Effectiveness, Climate change
INTRODUCTION
Increased access to secondary education places great demands on the quality of the teaching force. During the 1990s, the increase in the school-‐age population out spaced the growth in the number of teachers in Nigeria. Deteriorating working conditions and low salaries are discouraging people from entering the teaching profession. The majority of secondary school teachers have at least, Nigerian Certificate of Education (NCE) qualification, and frequently no professional training at all (UNESCO, 2002). As Hallak (2000) pointed out, enrolment rates are up in but the quality of education has been suffering. Education for all is all very well, but good quality education for all is another story”. A growing body of evidence suggests that schools can make a great difference in terms of student achievement and a substantial portion of that difference is attributable to teachers. Specifically, differential teacher effectiveness is a strong determinant of differences in student learning. This far outweigh the effects of differences in class size and class heterogeneity in climate change (Darling-‐ Hammond, 2000). Students who are assigned to one ineffective teacher after another have significantly lower achievement and learning (that is, gains in achievement) than those who are assigned to a sequence of several highly effective teachers (Sanders and Rivers, 1996). Thus, the impact of teacher effectiveness seems to be additive and cumulative. Climate Change Climate change is a change in the statistical distribution of the weather proffering when that change lasts for an extended period of time (i.e decades to millions of years). Climate change may refers to change in average weather conditions or in the time variation conditions (Wikipedia, 2015).

Badau, K. M. (2016). Teacher’s Classroom Management Practices for Increasing Effectiveness in Climate change in Nigeria. Advances in Social Sciences Research Journal, 3(1) 43-‐50.
URL: http://dx.doi.org/10.14738/assrj.31.1765. 44
Since most teachers teach in classrooms, the physical aspects of these classrooms and the perceptions of these classrooms by their students can either enhance or constrain their effectiveness in a climate change. If they are to reduce the imbalance between teaching and learning in climate change in creating such classrooms, teachers can alters or manipulate the physical environment, climate culture organizational management. Teachers can organization classrooms to promote effective teaching and learning and manage the large numbers of relatively diverse students who occupy these classrooms in a climate change (Hay Mcber, 2000). What Factors Contribute to Teachers Effectiveness in a Climate Change Some factors which contribute to teacher effectiveness in climate change is described as teachers characteristics. These are stable traits that are related to, and influence, the way teachers practice their profession. Hay Mcber (2000) presented four clusters of the characteristic: Professionalism, thinking/reasoning, expectations and leadership. It is important to note, however that the influence of a teacher characteristics on teacher effectiveness is not direct. Rather, it is moderated or mediated by their effect on the way in which teachers organize their classrooms and operate within them(Badau,2012). What is an Effective Teacher in a Climate Change Effective teachers are those who achieve the goals which they set for themselves or which they have set for them by others e.g. Ministries of Education, legislators and other government officials, school administrators. As a consequence, those who study and attempt to improve teacher’s effectiveness must be cognizant of the goals imposed on teachers or the goals that teachers establish for themselves, or both (Badau, 2011). Effective teacher must therefore stress the knowledge and skills needed to attain the goals, and must be able to use that knowledge and those skills appropriately if these goals are to be achieved. Teacher effectiveness links teacher’s competence and teacher performance with the accomplishment of teacher goals (Badau, 2012). An effective teacher according to Anderson, Krathwohl, Airasian, Cruikshank, Mayer, Aintrich, Raths and Wittrock (2001) posses the following qualities:
a. Ability to be aware of and actively pursue goals b. Take teaching as intentional and reasoned act c. The goals of a teacher should be concerned, either directly or indirectly with their
students learning. d. The teachers may not be in every aspect of their profession.
The Role of Teachers in Student Learning Teachers and the instruction they give their students are only two of a complex set of factors that have an impact on student learning. One of the fundamental truths in education is that the knowledge, skills, aptitudes, attitudes and values with which students leave school or a particular teacher’s classroom are influenced to a great extent by the knowledge, skills, aptitudes, attitudes and values that students possess when they enter a school or classroom (Badau, 2011). These are the result of some intricate and complex combination of their genetic composition and the environment to which they have been exposed in their homes. To complicate matters further, early differences among children are often magnified by their parents decisions concerning the school to which they send their children and teachers and parents decisions as the programmes that are implemented in that school (Adegbkile & Adeyemi, 2008). Teachers can and do have a tremendous impact on the learning of their students over extended periods of time. Individual teachers can and do have profound effects on individual students. Teacher’s impact on student learning depends not only on teachers

Advances in Social Sciences Research Journal (ASSRJ) Vol.3, Issue 1 January-‐2016
Copyright © Society for Science and Education, United Kingdom 45
possession of the knowledge and skills needed to facilitate student learning, but also on their knowing when to use that knowledge and those skills to achieve the goals they establish or accept for their students (Badau, 2012). A Conceptual Framework A conceptual framework for increasing classroom teachers effectiveness according to Anderson (2004) contains six concepts:
1. Teacher’s characteristic 2. Students characteristic 3. Curriculum 4. Teaching 5. Classroom 6. Learning
The Concept of Classroom Management Practices The concept of classroom management practices for increasing teacher’s effectiveness in climate change which is the concern of this paper includes the physical environment, the psychological environment (climate) and the socio-‐cultural environment (culture) as well as the ways in which both students and learning are organized and managed within these environment (Eguare, 2005). Teachers set the tone for their classrooms, partly by establishing classroom rules and routines and engaging’ in preventive management behaviours. These rules, routines and behaviours, in turn, influence student’s behaviour in the classroom. Since most teachers teach in classrooms, the physical aspects of these classrooms and the perception of these classroom by their students can either enhance or constrain their effectiveness (Sofolahan, 1995). If they are to reduce the imbalance between teaching and learning, teachers must create classrooms that are conducive to both effective teaching and effective learning. In creating such classrooms, teachers can alter or manipulate the physical environment, the psychological environment, or both. Paints, wall coverings, craft work and plants can be used to enhance the attractiveness of the physical environment. Equipment, books and other materials can be added to increase the learning opportunities within the physical environment (Ali, 1992). Unlike physical environment, psychological environments exist only in the minds of those who live in these environments. Several students were asked to describe or draw the physical environment of a classroom, their descriptions or drawings would probably be quite similar. if these same students were asked to describe the psychological environment of the same classroom, their descriptions may differ greatly. One students may see it as a warm and inviting place, while another may see it as cold and exclusive (Obioha, 1991). These differences in students perception of the classroom climate where they exist, make classroom teaching much more difficult. To facilitate the task of classroom teaching, teachers need to create a psychological environment that is perceived positively and similarly by students. A positive classroom climate is necessary in order to bring out the best in students. Similar or shared perceptions are needed to create a meaningful workable classroom culture. The culture of the classroom is the system of belief, values and modes of constraining reality that is shared by the teachers and the students. The classroom culture defines the standards for perceiving, become active and evaluating the actions of those in the classroom (Goodenough, 1981). Thus, while classroom climate deals with the psychological environment of the classroom as it is perceived
Badau, K. M. (2016). Teacher’s Classroom Management Practices for Increasing Effectiveness in Climate change in Nigeria. Advances in Social Sciences Research Journal, 3(1) 43-‐50.
URL: http://dx.doi.org/10.14738/assrj.31.1765. 46
by individual students, classroom culture deals with the psychological environment as it should be perceived by all of the students in the classroom(Osho, 1991) The Physical Environment The physical environment of the classroom includes variables such as the way in which the classroom is arranged, the equipment and materials that are placed in the classroom, the number of students and adults in the classroom and the way in which students are seated or otherwise arranged in the classroom (Weinstein, 1987). When the teacher is presenting information to an entire class of students, each student should have an unobstructed view of the teacher or of the information presented by the teacher. When students are expected to engage in discussion with other student, the physical arrangement of the classroom should facilitate rather than inhibit this discussion (Awomolo, 1994).When materials and equipment are needed, they should be readily available and in good working order. Differences between classrooms in terms of other physical environment do exist in Nigeria. Furthermore, the relationship between these differences in the physical environment and differences in student learning also exist. Farrel (1989) found that children who have access to textbooks and other learning materials learn more than those who do not and the more books they have the more they learn. \ Classroom Climate Classroom climate can influence student learning directly. In this regard, Walberg (1987) suggested that differences in classroom climate account for approximately 30 percent of the variance in cognitive, affective and behavioural outcomes of schooling, beyond the variance accounted for by input measures such as ability at the time of entering the school or achievement Walberg further suggested that three components of classroom climate have been found to be consistently related to student learning; effect, task and organization. When combined, these three components suggest that effective teachers are able to create classroom that students perceive to be writing, task oriented and well organized. Hay McBer (2000) identified a set of nine factors that define an effective classroom climate. These factors are clarity, fairness, interest, order, participation, physical environment, safety, standards and support. Classroom Culture Classroom culture can be defined in terms of shared values and beliefs. To the extent that inviting classrooms, task oriented classrooms and well organized classrooms are valued by all in the classrooms. These features become part of the classroom culture. The elements that help define the classroom culture include the roles and responsibilities of students and teachers, relationships between teachers and students and among students themselves, and the importance and nature of learning. If teachers continuously talk while students are expected to seat quietly and listen, these roles soon become part of the classroom culture (Ozumba, 1978). If students are supposed to treat others with respect, this expectation becomes part of the classroom culture. If completing work on time is more important than the quality of the work submitted, this too becomes part of the classroom culture. Effective classroom cultures in terms of powerful learning form a comprehensive description of classroom culture, one that includes concerns for the classroom, the curriculum instruction and learning, teachers and students. There is emphasis on mutual respect, behavioural self control, authentic learning, inclusive instruction, teachers as learning leaders, and students as empowered learners. Student achievement is greater within this type of classroom culture (Finna, Schneped, Anderson,2003).

Advances in Social Sciences Research Journal (ASSRJ) Vol.3, Issue 1 January-‐2016
Copyright © Society for Science and Education, United Kingdom 47
Classroom Organization Classroom organization refers to the academic and social arrangements of students within classrooms. Classroom can be composed of students who are either similar or quite different in terms of their ability, achievement, motivation and the like. Within their classrooms, teachers can teach or work with the entire class of students, smaller groups of students, or individual students. Also, within the classroom, students can be expected to work on their own or with other students in so called “Co-‐operative groups” (Johnson and Johnson, 1989). Teachers can organize both homogenous and heterogeneous classrooms in one of the three ways for instructional purposes; whole class, small groups or individual students. Whole class instruction is predominant in Nigeria,within an individual student organization. The primary role of the teacher is to present information, demonstrate procedure and ask questions within the individual student organization (Sofolahan, 1995). The role of the teacher is to circulate among students, monitoring their work and providing assistance as needed. The role of the teacher in cooperative groups in this classroom organization is to introduce the task, ensure that the instructions are understood by the students, ensure that each group has sufficient materials and equipment to complete the task successful, and serve as a resource as needed by the groups as they go about completing the task. Effective teachers see all three classroom arrangement as useful tools and tend to provide a balanced combination of each of them, utilizing whole class instruction, individual student work and cooperative learning as needed to fulfill the various learning goal (Obeamata, 1995). Classroom Management Classroom management pertains to the ways in which teachers promote positive, cooperative and task oriented behaviour and deal with misbehaviors and disruptive behaviour. In this regard, two key aspects of classroom management have been identified: preventing behavioural problems from occurring and reactive to behavioural problems once they have occurred (Anderson, 2000). The latter aspect is often referred to as “discipline”. More effective classroom managers differ from less effective classroom managers in their ability to prevent problems from occurring, not in their ability to react successfully to behavioural problems when they occur. The establishment of rules and routines and the use of certain teacher behaviours are two factors associated with effective preventive classroom management (Gamoron, 2002). In general, rules are prohibitions on student behaviour and, as a consequence, are often stated negatively. Do not talk without raising your hand is a rule used by teachers in many schools. Routines on the other hand are sequences of steps which students are to follow as they perform classroom activities that occur with some degree of regularity (Akiri & Ugbrugho, 2009). Routines established by teachers in many classrooms include those for entering and learning the classroom, participating in class discussions or conversations with the teacher, completing and submitting home work, and taking quizzes and tests (Eguare, 2005). In order for rules and routines to be effective, they must be planned in advance, be relatively few in number, be communicated clearly to students and have explicit consequence if they are not respected (Osho, 1991). At least initially, compliance with the rules and routines must be monitored, praise should be given as appropriate to those students who do comply, and sanctions or punishments consistently meted out to those who do not Rules and routines must be introduced and put into practice very early on in the school year, preferably first two weeks of

Badau, K. M. (2016). Teacher’s Classroom Management Practices for Increasing Effectiveness in Climate change in Nigeria. Advances in Social Sciences Research Journal, 3(1) 43-‐50.
URL: http://dx.doi.org/10.14738/assrj.31.1765. 48
school to establish the expectations vis-‐à-‐vis student behaviour in the classroom. Eventually, explicit and meaningful rules and routines should enable students to behave appropriately without direct teacher supervision and interaction, The teacher’s goal is to develop student’s inner self control, not merely to exert control over them (Good & Brophy, 1987). The behaviours associated with preventive classroom management include with-‐it-‐ness, group alerting, over-‐lappingness, momentum, accountability, providing variety and challenge in seat work (Evertson and Rendolph, 1999; Wang, Haertel and Walberg, 1999). Classroom management must therefore not be seen as an end in itself but as a contributing factor in student learning.
CONCLUSION The physical environment and socio-‐cultural environment, ways in which both students and learning are organized and managed within these classroom environments are important within the larger context of increasing teacher’s effectiveness. This is most clearly seen by noting that beginning or novice teachers spend large amounts of time to manage the classroom environments and how to organize and manage students and learning. Furthermore, this increased amount of time dedicated to the environments and organizing and managing students and learning in the classroom has been found to be detrimental to learning. Thus, one may reasonably conclude that until novice teachers are able to properly manage classroom environment, organized their classroom and manage their students in the classroom, they are unable to focus their attention and efforts on the teaching learning process. As a consequence, their efforts to increase their effectiveness as teachers in climate change are limited. Recommendations on Classroom Management Practices for Increasing Teachers Effectiveness in a Climate Change The following recommendations on classroom management practices according to Anderson (2004) will increase teacher effectiveness in a climate change in Nigeria. i. Teachers should create attractive and functional classrooms. Part of the functionality of
classrooms concerns the availability of the necessary equipment and materials ii. Teachers should create a classroom environment that is warm, yet business like. This
requires that equal emphasis be placed on the academic and socio emotional needs of the students.
iii. Teachers should work diligently to establish a classroom culture based on explicit values and believe. These values and belief should provide the basis for the way in which teachers and students relate to one another, as well as the expectations for behavior, effort and learning.
iv. When introducing new content to students, whole class instruction, actively led by the teacher, is preferable to small group or individual student instruction.
v. Cooperative learning groups should be formed within the classroom as needed to achieve particular objectives.
vi. When working with individual students or small groups, teachers must remain aware of the rest of the students in the class, taking actions as necessary to keep them involved in learning and their mind on the task.
vii. Standards for appropriate, pro-‐social classroom behaviour should be communicated to students at the beginning of each term or year.
viii. Teachers should reinforce positive, pro-‐social behaviour, especially with students who have a history of behavioral problems.
Advances in Social Sciences Research Journal (ASSRJ) Vol.3, Issue 1 January-‐2016
Copyright © Society for Science and Education, United Kingdom 49
ix. Consistent equitable sanctions and punishment for inappropriate behavior should be administered to all students who do not comply with behavioral requirements.
x. Teachers should keep the amount of non-‐instructional time in classroom to a minimum by beginning and ending lessons on time, maintaining the flow of classroom activities, maintaining a fairly rapid pace, and implementing meaningful and efficient rules and routines.
xi. Teachers should convey to their students that they are consistently aware of what is going on in the classroom, are able to handle several tasks or activities at the same time when you are not likely to be distracted from the primary purpose of the lesson that they are conducting and expect students to be responsible for their Recommendations for Policy makers and Educational Planners for Improving Teachers Classroom Management Practices in order to Increase Effectiveness in a Climate Change
The following recommendations according to Anderson(2004) are intended to help policy makers and educational planners to make it possible for teachers classroom management practices to be effective in climate change in Nigeria.
1. Policy-‐makers and educational planners must ensure that teachers have the resources they need to create attractive and functional classrooms.
2. Once adequate resources have been made available, teachers must know on how best to use these resources to create appropriate classroom environments.
3. Departments of teacher education should emphasize the importance of classroom organizational culture in increasing teacher effectiveness.
4. Seminars should be offered, which help teachers understand the benefits of appropriate classroom cultures as well as how to establish such cultures.
5. Clear policies must be established for classroom organization, both the way in which students are assigned to classrooms and the acceptable organizational configurations or patterns within the classroom.
6. In order to help school administrators and teachers to understand and properly implement these policies, a series of in-‐service training should be designed and implemented.
References Adegbkile J. A and Adeyemi, B.A. (2008). Enhancing Quality Assurance Through Teachers Effectiveness. Educational Research and Review, 32 261-‐65
Akiri, A. & Ugborugho, N.M. (2009). Teacher Effectiveness and Students Academic Performance in Public Secondary Schools in Delta State, Nigeria. Study Home Comm. SC 3(2),167-‐113.
Ali,A. (1992).The Need for Performance Based Teachers Education in Nigeria. Teachers Education Schools. A working Guide in Sokoto. Journal of Education, 1(3), 161-‐175.
Anderson, L.W. (2004). Increasing Teacher Effectiveness. Paris: UNESCO
Anderson, L.W; Krathwohly D.R.; Airasian, P.W , Cruikshank, K.A: Mayer, R.E; Pintrich,P.R;Raths,I;Wittrock,W.C.( Eds). (2001).A Taxonomy for learning,teaching and assessing. A revision of Bloom Taxonomy of Educational objectives. Newyork: Longman Publishers.
Anderson, L.W (2000), Why should Reduced Class Size Lead to Increased Student Achievement?In Wang, M.C&Finn,J.D. How small classes help teachers to do their best. Philadelphia, P.A: Temple University.
Awomolo, P. (1994). Assessing Teachers Effectiveness. Ibadan: Addictive Publishing LTD
Badau, K.M. (2011). Assessment of Secondary School Teacher Effectiveness in the Classroom in Adamawa and Taraba States of Nigeria, ATBU Journal of Technology and Educational Research (JOTER) 4 (3) 68-‐73.
Badau, K. M. (2016). Teacher’s Classroom Management Practices for Increasing Effectiveness in Climate change in Nigeria. Advances in Social Sciences Research Journal, 3(1) 43-‐50.
URL: http://dx.doi.org/10.14738/assrj.31.1765. 50
Badau, K.M. (2012). Assessing Increased Teachers Effectiveness in Secondary School Classrooms in Adamawa State of Nigeria. Multidisciplinary Journal Empirical Research , 10 (i), 1-‐9
Darling-‐Hammond, l. (2000). “Teacher Quality and Student Achievement: A Review of State Policy Evidence “ In Educational Policy Analysis Archives, 8 (1).
Eguare, O.S. (2005) Teachers Perception of Pedagogical Effectiveness Among Senior Secondary School English language Teachers. Nigerian Journal of Professional Teachers, 1 (1), 117-‐ 127.
Everton, C.M& Randolph, C.H (1999). Perspective on Classroom Management in Learning Centered Classroom . In Waxman,H.C(HJ) Directions for Teaching Practice and Research. Mccutchan: Berkeley C A.
Farell, J. P. (1989. “International Lessons for School Effectiveness; The view from the Developing World”. In: Homes,M.,Lerthwood,K&Musella,D.F (Eds),Educational Policy forEffective Schools. Toronto: Ontario Institute for Studies in Education Press.
Finnan, C., Schneped, K.C&, Anderson, L.W. (2003). “Powerful Learning Environments; The Critical Link Between School Culture and Improvements in Student Learning”. In Journal of Education for Students Placed at Risk, 8(4),
Gamaron, A. (2002). Standard in Quality and Ability Grouping in Schools CES, Briefing, 25, 1-‐4). Edinburgh: Centre for Educational Inequality.
Good, T.L& Brophy, J.E. (1987). Looking in Classrooms (4th ed.)New York: Harper and Row
Goodenough, W. (1981).Culture, Language and Society Dunkin (MJ). The International Encyclopedia of Teaching and Teacher Education, Oxford Pergamon Press.
Hallak, J. (2000)”Education: Quality Counts”. In OECD observation.
Hay McBer, F. (2000). Research into Teacher Effectiveness: A model of Teacher Effectiveness Research Report, No. 216.
Johnson, D.W& Johnson, R.T. (1989). “Cooperative Learning” In. Anderson, L.W (Ed) The Effective Teache. New York: Random House
Obeamata, J.O (1995). Education. Unprofitable Industry in Nigeria. A Postgraduate School Interdisciplinary Research Course
Obioha P. (1991). A Conceptual Model for Teachers Effectiveness Research . Unpublished Materials, Faculty of Education , University of Jos.
Osho, P. (1991). Teachers Variables and Students Achievement. Unpublished Paper Presentation at Ondo State College of Education, Ondo.
Ozumba, K. E. (1978). State of Art Review of Teachers Effectiveness in Africa. In: O. R. Cottawa.
Sanders,W.L Rivers, J.C (1996). Cumulative and Residual Effects of Teachers on Future Student Academic Achievement.Knoxville. University of Tenessee Value-‐Added Research and Assessment Center.
Sofolahan, A. (1995). Attributes of Teachers Effectiveness. Unpublished B.Ed Project of Obafemi Awolowo University Ile-‐Ife
UNESCO, (2002). The Statistical Profile of the Teaching Profession. Paris: Geneva
Walberg , H.J. (1987). Evaluating Educational Performance. A sourcebook of Methods, Instruments and Examples. McCutchan: Berkeley, E.A
Wang, M.C., Haertel, G.D& Walberg, H.J, (1999). “Towards a Knowledge Base for School learning. In Waxman H.C Walberg, (H.J) New Directions for Teaching Practice and Reserch. McCutchan:Berkeley C.A.
Weinstein, C.T (1987). In: M.J Dunkin (Ed) The international Encyclopedia of Teaching and Teacher education. Oxford: Pergamon Press.
Wikipedia, Free Encyclopedia, https://en.Wiipedia.org/wiki/climatechange
Walberg, H. J. (1984). Psychological Enrolment” in: Dunkin, D. J. (Ed). The International Encyclopedia of Teaching and Teacher Education. Oxford: Pergamon Press
Advances in Social Sciences Research Journal – Vol.3, No.1 Publication Date: Jan. 25, 2016 DoI:10.14738/assrj.31.1310.
Lengha, T. N. (2016). The Use of New Information and Communication Technologies as an Education Tool in the Fight Against HIV/AIDS in Fundong, Northwest Region, Cameroon. Advances in Social Sciences Research Journal, 3(1) 51-‐60.
Copyright © Society for Science and Education, United Kingdom 51
The Use of New Information and Communication Technologies as an Education Tool in the Fight Against HIV/AIDS in Fundong,
Norhtwest Region, Cameroon
Tohnain Nobert Lengha Department of Agricultural Extension and Rural Sociology,
Faculty of Agronomy and Agricultural sciences, University of Dschang, Cameroon
Abstract
Fundong, a rural town found in the Northwest Region of Cameroon is located on latitude 10° 14’W and 11°15’ E, between longitudes 6° 27’ and 8° 26’N. The town enjoys the privilege of being, not just the headquarter of Boyo Division, but also of Fundong Central Sub-‐Division. The incidence of HIV/AIDS is critical in the area as there are several practices like the scarification of the body to apply concoctions common in the area which, may help predispose the population to HIV/AIDS infection. The affluence that characterise this small rural town favours high-‐risk behaviours, which expose individuals concerned to HIV/AIDS. In order to address the main objective of the study, which is the use of information and communication technologies in the fight against HIV/AIDS, data were collected at the group and household levels. At the community level, the researchers administered questionnaires and conducted focus group discussions with people of different occupational backgrounds. In the case of this study, 56% of the respondents are aware of the existence of the HIV/AIDS pandemic although constant electricity failure and the absence of radio signals in some of the localities hinder people from receiving general information, including that relating to HIV/AIDS from new information and communication channel including a rural radio station based in Fundong town. Cursory observations during fieldwork reveal that sensitisation on the HIV/AIDS pandemic have been going on in Fundong although the population still face numerous problems in an attempt to get informed and educated on this global disease-‐ HIV/AIDS. These problems concern those related to sensitisation, the information sources, and the messages emanating from these sources as well as the problem of access to the new information and communication technologies themselves. Key words: Aids, Information, communication, pandemic, Fundong,
INTRODUCTION
From the information available, the first cases of HIV/AIDS were identified in Cameroon in 1986 with 21 cases declared. Since this date, the epidemic has rapidly propagated within the sexually active population. The cumulated number of new cases reported up to 1999 was 20 419. The prevalence rate at this point has therefore evolved as follows: 0.5% in 1987; 2.1% in 1991; 3.8% in 1996; 7.2% in 1998, 11% in the year 2000 and 5.3% in 2010. Analysis according to sex and according to age highlights the following points: (i) youths are the most affected by the virus with 43 % of seropositifs found between the 15 and 35 years age bracket; (ii) women are more affected than the men with a sex ratio of 2 males to 3 females and (iii) transmission is more through heterosexual channels, 90% of infections occur during non protected sexual relationships while blood transfusion and mother to child transmission covers 10 % of the cases reported.
Lengha, T. N. (2016). The Use of New Information and Communication Technologies as an Education Tool in the Fight Against HIV/AIDS in Fundong, Northwest Region, Cameroon. Advances in Social Sciences Research Journal, 3(1) 51-‐60.
URL: http://dx.doi.org/10.14738/assrj.31.1310. 52
Previous projections indicate that in 2001, some 1 500 000 Cameroonians were living with HIV/AIDS with more than 150 000 children as orphans. The epidemiological situation was then characterised by the rapid increase in the seropositive status of HIV/AIDS patients in the population notably the youths, women, uniform officials, long journey drivers and commercial sex workers. The situation here presented is not much different from that observed in Fundong which was our study site in this article. The question therefore remains as to what approaches exist that can be used to change people’s behaviours towards adapting non-‐risky behaviours that cannot expose them to HIV/AIDS? In this matter, it is argued that amongst the many ways that could be used to change people’s behaviour, one of the effective tools remains Information and Communication Technologies (ICTs) especially the New ones (NICTs. The current debate however remains as to whether the funding of research on NICTs in the façade of HIV/AIDS patients should not be considered a luxury. This notwithstanding, there is an equal consensus in the literature that NICTs should be used as part of a package of important tools in the fight against HIV/AIDS. But it seems there is little material in Cameroon especially in rural areas in addressing the specific uses of NICTs in HIV/AIDS related activities. This research sought to do exactly this; that is addressing the state of the art in the use of NTICs in the fight against HIV/AIDS in Rural Fundong The Study area Fundong Rural Council, which was part of Wum Divisional Council before 1964, became known as Kom/Bum Rural Council by 1967. It became the Fundong Rural Council in 1974 when its seat was transferred from Njinikom to Fundong. Fundong later became the headquarters of the newly created Boyo Division on the 1st of September 1992 by presidential decree No 72/187 of 1st September 1992. However, this division is made up of four subdivisions as follows.
Sub-‐Division Capital
Belo Belo
Bum Fonfuka
Fundong Central Fundong
Njinikom Njinikom
It is bounded to the South and West by Mezam, to the North by Menchum, North-‐West by Donga-‐Mantung, East by Bui and to the South-‐East by Ngokitunjia Divisions. These are administrative divisions found in this Northwest region of Cameroon. Fundong is located on latitude 10° 14’W and 11°15’ E, between longitudes 6° 27’ and 8° 26’N. The town enjoys the privilege of being, not just the headquarter of Boyo Division, but also of Fundong Central Sub-‐Division, as mentioned above. According to Fundong Rural Council Budget (2009/2010), the population of Fundong central subdivision stands at about 66,310 (sixty-‐six thousand, three hundred and ten) inhabitants. This represents about 9.95 percent of the total population of the country Cameroon. Fundong Central Sub-‐Division, according to the national census hosts the only urban centre in the Division.

Advances in Social Sciences Research Journal (ASSRJ) Vol.3, Issue 1 January-‐2016
Copyright © Society for Science and Education, United Kingdom 53
Education Fundong has a total of three secondary grammar schools including a government Bilingual High School, two Technical Secondary Schools and one Teacher Training College. The population of these schools is estimated at 1722 (one thousand seven hundred and twenty-‐ two), representing 1.14 percent of the population of Fundong Central Subdivision (Annual Report of the Divisional Delegate of National Education, Boyo Division for 2009/2010 School Year) There are a total of 24 Government Primary Schools, 05 Cameroon Baptist Convention (CBC) Schools, 08 Catholic Schools, 03 Presbyterian Schools, and two unauthorised nursery schools in the Sub-‐Division. The population of all these schools put together stands at 9,456 (nine thousand four hundred and fifty-‐six). Of this number, 4514 (47.7%) are girls and 4942 (52.3%) are boys. Religious and Ethnic Constitution The dominant religions in the area are Catholicism and Protestantism, which respectively represent 49% and 36%. However, the main Protestant religions are the Baptist and the Presbyterians followed closely by the Full Gospel Church and the Christian Missionary Fellowship, in that order. Muslims make up a minority of the religious population i.e. 3% of the population according to the findings on the field. Fundong is made up of two main tribes, the Kom-‐ and the Mbororo tribes, with the former being the dominant tribe. The Mbororos who are in the minority are dominantly found in Fundong town where they occupy vast land both as cattle rearers, butchers and petty traders. Other inhabitants of the town are workers involved in various activities, such as technicians, farmers and civil servants, all coming from various corners of the country. Social Tissue The town has its own fare share of associations and social groups. There are 51 Farming Groups, 06 Social Groups, 03 Hausa/Fulani Women Groups, 06 Buyam-‐Sellam Groups, and 06 Animal Husbandry Groups. More interestingly, there is an association in the area that regroups all HIV/AIDS victims. This association known as faaso’o1 which in the local language means take it easy, is led by the victims themselves in collaboration with the Catholic Reverend Sisters and Plan International which is a Yaounde-‐based International Non-‐Governmental Organisation that intervenes in the domain of health. Again, according to the 2009/2010 Annual Report of the Delegation of Youth and Civic education in the area, there are eight (08) traditional leisure houses where locally made liquor is sold besides nine (09) modern leisure houses. In the category of modern leisure houses, there are four (04) nightclubs. These clubs facilitate interaction of the youths in the area, with its concomitant effects. There are other practices common in the area that may help predispose the population to HIV/AIDS infection. This rural town as most localities in the west region of Cameroon, is noted for its practice of approved polygamy among the sub-‐chiefs, title-‐men as well as among the poor, the illiterate, the lowly educated and the non-‐Christians. In general, polygamy has a potential for relatively uncontrolled sex, especially as the men are often on the look for new wives. Their sex attitudes therefore, could involve unprotected or extra marital sex, which exposes the actors to the risk of HIV/AIDS infection.
Lengha, T. N. (2016). The Use of New Information and Communication Technologies as an Education Tool in the Fight Against HIV/AIDS in Fundong, Northwest Region, Cameroon. Advances in Social Sciences Research Journal, 3(1) 51-‐60.
URL: http://dx.doi.org/10.14738/assrj.31.1310. 54
Fundong is also noted for traditional medical practices. The main instrument used by practitioners in carrying out their activities is the razor blade, often for incising the skin to rub in medicine. Since some practitioners may not be sensitive to the basic rules of hygiene, they use one blade on more than one patient without sterilization. Infected blood from patients could contaminate healthy persons. All these have the potential for exposing the populations to HIV/AIDS infection in the area. Economic Activities The major economic activity of the area is agriculture, much of which is for subsistence purposes. However, the population is heavily involved in the cultivation of coffee, an important cash crop in Cameroon. Farm products such as potatoes, maize, groundnuts and beans are also grown and sold to people from other areas including the citizens of Gabon a neighbouring country to Cameroon. Another major economic activity of the area is cattle rearing. The Hausa/Fulani are those who largely control this activity, with a few Kom natives participating. Kom is the main tribe of this locality of Cameroon Access to New Information and Communication Technologies (NICTs) In relation to access to New Information and Communication Technologies, the town is covered by a mobile telephone company (MTN) transmitter installed in Mbam village, which makes access to information through the mobile phone possible. The orange mobile telephone net work is also widely used in the area for communication. It is worth noting that, because of its high altitude, the Fundong area received MTN mobile telephone signals even before the company installed its antenna there. This alone has attracted several development endeavours to the area. Besides, the area is also connected to the regional headquarters Bamenda, by a tarred road which further facilitates movement to this rural town. The presence of the above communication facilities including mobile telephone signals is an added boost to the socio-‐economic development of this place. It suffices to mention that this factor can also contribute to the populations’ knowledge of HIV/AIDS. In addition, there are more than three (03) computer centres in the town with some of them training people on informatics and other computer related programs. Before the introduction of the state owned fix and mobile telephone Company (CAMTEL) network in the area, the absence of an adapted telephone network was a great hindrance for this area to be connected to the rest of the world through the Internet. Level of Urbanisation The rate of urbanisation in Fundong is fast increasing and with the presence of a tarred road linking this town to the Regional headquarters, Bamenda, as mentioned above, this rural town will soon acquire the full status of an urban centre. Once the ring road connecting this locality to other areas of the region is fully developed, Fundong will indeed be a veritable crossroads, serving as a transit locality for travellers leaving Bamenda, in Mezam Division to Nkambe, in Donga-‐Mantung Division in the far northwest of Bamenda. The daily and weekly market days in Fundong also facilitate the rural/urban interaction. During weekly markets, buyers and sellers come from as far as from the nearby Western Region to buy and sell their goods. Market days are unusually busy with people of all walks of life flocking the drinking spots (both traditional and modern) until late in the night. As an administrative and political rural town, it hosts both the administrative and political structures of the division. The affluence that characterizes this small city encourages high-‐risk behaviours, which expose individuals concerned to HIV/AIDS.
Advances in Social Sciences Research Journal (ASSRJ) Vol.3, Issue 1 January-‐2016
Copyright © Society for Science and Education, United Kingdom 55
In order to address our main objective, which is the use of information and communication technologies in the fight against HIV/AIDS, data were collected at the level of community, groups and households. At the community level, we administered questionnaires and conducted focus group discussions with people of different occupational backgrounds. The main groups that were questioned included farmers, students, tradipractitioners, tailors, technicians, teachers, hairdressers, drivers, housewives, the unemployed and traders. To cover all the categories of persons to be investigated upon, we divided the study zone into four major parts, with each of them covering both the purely rural and the semi-‐ urban areas. For the semi-‐urban areas the survey covered Fundong central town itself and the other surrounding localities chosen according to their potential influences on the population. These included areas with a high density of leisure activities as the teachers’ quarter (towards the northern part of the locality) and Fundong Hausa quarter. The major tools used in the survey were unstructured questionnaires and focus group discussions, which enabled us to understand how NICTs could be used in the fight against HIV/AIDS in the area. Altogether, four focus group discussions (FGD) were conducted and 738 unstructured questionnaires administered to the population. In the sample, 54.8% were males while 43.5% were females. Of this number, 50.1% were married, 49.9% single with 57.7% involved in polygamous marriages, while 40.3% in monogamous marriages. Considering the religious background of the population studied 60.94% were Catholics, 32.63% Protestants, 3.43% Moslems and the rest were pagans.
EFFECTIVE CONSUMPTION OF NICTS IN FUNDONG The rapid diffusion of NICTs could be essential in the fight against HIV/AIDS although relative lack of literacy and numeracy characterize most Cameroonian regions. The poor who are often in the remote areas as well as in the urban fringes are handicapped by limited availability of information sources about HIV/AIDS, which the non-‐poor take for granted. In the case of this study, 56% of the respondents are aware of the HIV/AIDS pandemic. In the light of this, the survey aimed at providing an overview of the role of the new information and communication technologies in the fight against HIV/AIDS in the rural areas with an example of this rural town. The question here is to know whether NICTs could offer any means of fighting this pandemic among the rural households in Fundong. And if yes, how could these NICTs (including those surrounding the world-‐wide web) be used in the fight against HIV/AIDS? The study is based on the premise that successful fight against HIV/AIDS calls for the conscious and active consumption of these NICTs by the population at every stage of the fighting process. This is because the fight against HIV/AIDS cannot be effective without changes in attitude and behaviour among the people concerned. Therefore, the introduction of NICTs through a planned and systemic use of communication channels, inter-‐personal channels, audio-‐visual and mass media could be a useful tool in the fight against HIV/AIDS. From the findings, the radio is the most widely used source of general information in the area, being listened to by 63% of the respondents. Nevertheless, its accessibility is still limited by the lack of available means for the maintenance of equipment. Also, constant electricity failure and the absence of radio signals in some of the localities hinder people from receiving general information, including that relating to HIV/AIDS from this source. The language barrier is another impediment for the effective use of the source of information because information
Lengha, T. N. (2016). The Use of New Information and Communication Technologies as an Education Tool in the Fight Against HIV/AIDS in Fundong, Northwest Region, Cameroon. Advances in Social Sciences Research Journal, 3(1) 51-‐60.
URL: http://dx.doi.org/10.14738/assrj.31.1310. 56
received is either in English or French and hence makes it difficult for many people to understand the messages transmitted. Nevertheless at the moment, there is a rural radio in the area which transmits mostly in the local language. This is justified by the fact that 45.6% of the respondents have not attained the primary school level, and only 16.9% and 1.3% is of secondary school and university levels respectively. The level of formal education of respondents as revealed by the above statistics explains why messages transmitted in English or French languages may not be accessible to a greater majority (45.6%) of the respondents. Again, the radio is the most widely used source of information on HIV/AIDS in the area, because findings indicate that respondents get information about the disease from it on a daily-‐ (60.2%), weekly-‐ (24.9%) and monthly basis (14.9%). Therefore, despite the irregular power supply that characterizes this area, the radio continues to play its role as a reliable information channel about HIV/AIDS related issues. Other sources of information that are relatively used in the area are television (24.4%), newspapers (18%) and associations (10%) to obtain information related to HIV/AIDS. Also, the town crier is used in providing information about HIV/AIDS in the area. From the survey, most of the respondents affirmed that they receive information about HIV/AIDS from the churches. And a greater percentage of them (40%) claim that the church could be the best channel for information concerning this pandemic. Unlike with the other sources mentioned above, the church seems to pose little problems to the respondents as they could receive information from churches even in the local languages. The kwifon, which is the Fon’s instrument of secular authority, although not mentioned in this area as one of the information sources about HIV/AIDS plays an important role in the communication system of Fundong people. For instance, the information from the Kwifon is usually dispatched through a town crier. Therefore, kwifon is not identified as a source of information in the analyses. As the respondents pointed out, this killer disease which could terminate the population had pushed the traditional authorities to talk about it even in markets or market days and at prominent death celebration grounds in the area. The implication of kwifon in informing the people about HIV/AIDS is proof of the impact that this pandemic is having in the area. Its ravaging effects have pushed the traditional administration to use all its communication strategies to enable the population fight against it at the local level. Although 90% of the respondents fully know about the existence of this pandemic and consider it principally as a killer disease, they do not still know what causes it. However, 67% of them think that it is caused by sexual intercourse while a negligible percentage (20%) thinks that a virus causes it. When probing to know whether sexual intercourse in essence is the cause of HIV/AIDS, most of the respondents further specify that it is caused by sexual intercourse with a contaminated partner. To an extent the respondents do not distinguish between the causes of HIV/AIDS and the mode of transmission. When asked to know what are the modes of transmission, analyses still show that it is transmitted through sexual intercourse, although greater emphasis is laid on transmission through instruments like blades used by tradipractitioners who play a dominant role in the health system of the area. Effective consumption of NICTs according to respondents’ occupations The main occupations that were identified in the area are: farming, technical works like domestic electrical wiring, shoe mending, woodwork; tradipractitioners, petty trading, students, hair dressers, housewives, tailors and long distant drivers. From the findings, 45.6% of the respondents have not attended any school, while 36.3% have attended primary school education, 16.9% have secondary school level education and 1.3% have university education. It
Advances in Social Sciences Research Journal (ASSRJ) Vol.3, Issue 1 January-‐2016
Copyright © Society for Science and Education, United Kingdom 57
should also be noted that a greater number of non-‐school attendants are noticed among the farmers. These statistics are important because the effective consumption of NICTs through which messages are diffused in the English and French languages will depend on respondents’ educational level, which in turn will determine their (messages) consumption rates. However, for the largely uneducated population, local communication channels such as the town criers could play an important role in informing them about the disease. Messages diffused by town criers are done in the local language (itanghikom2). This source of information had a score of 16.2%. The major sources of information that the respondents say furnish them with messages on HIV/AIDS related issues are the radio, the newspapers, billboards and sociocultural associations. However, 80% of the farmers listen to the radio on a daily bases while 20% get the information from newspapers and billboards which are in limited supply in the area, as they are available only on a weekly or monthly basis. These sources of information supply messages about the causes, manifestations, mode of transmission, prevention and on how the disease can be prevented. Analysis of messages received by respondents from the radio it is reveal that this pandemic is caused mainly by unprotected sexual intercourse, blood transfusion and the careless use of contaminated instruments by traditional healers. General manifestations are weight loss, severe vomiting, and diarrhoea. As earlier mentioned, the respondents are unable to distinguish between the cause and the modes of transmission of HIV/AIDS. The major causes of HIV/AIDS in Fundong are thought to be sexual intercourse (61%), blood transfusion (20%), and the use of contaminated instruments (14%). The respondents think that this pandemic is transmitted through the following channels: sexual abuses or intercourse (61%), blood transfusion (20%) and through the use of unsterilized instrument both by medical doctors and especially tradipractitioners (19%). From FGD with the population, HIV/AIDS is principally transmitted through blood transfusion. Most interesting was the stress laid on transmission through tradipractioners whose method of cure is said to be very unskillful with the use of the same instrument on several persons at the same time. Even those who talked about the use of condoms insist very much on its proper usage and some even say that condoms transmit HIV/AIDS. We also identified five main modes of prevention as follows: the use of condoms (39%), abstinence (33%), fidelity (14%), avoiding blood transfusion (13%) and voluntary screening (1%). Although the use of condoms is indicated to be the most preferred by the respondents, they still emphasized during the focus group discussions that the use of condoms is a means to encourage youths to practice illicit sex. One of the indications that the respondents effectively use or consume new information and communication technologies, is that; many of them understand messages transmitted by the sources preferred. The messages preferred for sensitization are: abstinence, fidelity and the use of condoms.

Lengha, T. N. (2016). The Use of New Information and Communication Technologies as an Education Tool in the Fight Against HIV/AIDS in Fundong, Northwest Region, Cameroon. Advances in Social Sciences Research Journal, 3(1) 51-‐60.
URL: http://dx.doi.org/10.14738/assrj.31.1310. 58
The sources of information preferred by the respondents and which have helped to change their behaviour especially through the messages received (software) are: the radio (70%), the television (27%), newspapers (22%) and sociocultural associations (12%). It seems paradoxical for the population to claim that the sensitization on the use of condoms is a way to encourage sex and at the same time prefer the use of condoms as a message that could change people’s behaviour towards HIV/AIDS. During the FGD, respondents talked of a selected audience for the distribution or sensitisation on condoms. Furthermore, they stressed that polygamous partners should use condoms if fidelity fails. In another perspective, individuals who can not abstain from sex should cultivate the habit of using condoms with their partners. We were equally intrigued by the fact that although these people propose condoms as the preferred message that could change their attitudes towards HIV/AIDS, they manifest fear towards possible side effects upon usage. Therefore, the use of condoms is simply preferred because as they claim, sex is a phenomenon that one cannot avoid. New information and communication technologies as well as those surrounding the World Wide Web, like the Internet, are not well known in the area due either to ignorance or to the absence of the telephone network in most of the areas. However, those who use them or know about them are either leaders of associations or individuals that frequent the provincial headquarters, Bamenda or that are able to own a CAMTEL telephone internet, MTN or Orange tool kits.
IMPACT OF NICTS ON CHANGE IN HIGH RISK BEHAVIOUR Concerning behavioural change by the preferred messages received from the prominent sources of information used in the area, people’s attitudes have been greatly influenced by the latter. Generally, information received from the channels mentioned by the respondents has, on the one hand generated fear in most of the people, and on the other hand made people to be aware of its ravaging effects. Although the respondents are principally polygamists (57.7%) in their matrimonial regimes for those who are married (50.1%), the question that is persistent especially among the women is whether their fidelity with partners could oblige the men to remain same. Most of the respondents (64.4%) affirmed that their religion has contributed a lot to enable them change their behaviour by remaining faithful to their partners. Despite all these, the study has shown that messages transmitted to the people through the various information channels have helped to change their behaviour enormously. For instance, the fear of being stigmatised that was formerly the problem of most people has been broken. Some people even come out and identify themselves as HIV/AIDS carriers without fear of being stigmatised and abandoned. In the area, there is an association for those living with HIV/AIDS. This association which regroups all persons living with HIV/AIDS is known as fasoo which in the local language means courage. International and local philanthropic organisations present in the area have sponsored and are still sponsoring some income generating activities by this group especially those that do not need the use of muscles like the rearing of fowls. It is also worth mentioning that members of this association are not exclusively the HIV/AIDS patients. Those who take care of them and who are also committed members of the group are not carriers. They play a very vital role in the group as they demonstrate to them that HIV/AIDS is just a disease as any other one and therefore, patients do not need to be abandoned or isolated. This initiative indicates the role that associations play in the area, not only to fight against HIV/AIDS, but also to sensitise people about the pandemic. Therefore, the associations and the churches have done much to change people’s attitudes towards HIV/AIDS.
Advances in Social Sciences Research Journal (ASSRJ) Vol.3, Issue 1 January-‐2016
Copyright © Society for Science and Education, United Kingdom 59
DIFFICULTIES OR PROBLEMS Cursory observations during fieldwork reveal that sensitisation on the HIV/AIDS pandemic have been going on in Fundong. The associations involved in this, as earlier mentioned, include the Mbororo Sociocultural and Development Association (MBOSCUDA), religious associations, and other associations. In spite of these, the findings of the study have revealed that there still remain many grey areas. Respondents still face numerous problems in an attempt to get informed and educated on this global disease-‐ HIV/AIDS. These problems concern those related to sensitisation, the information sources, and the messages emanating from these sources and the problem of access to the new information and communication technologies. HIV/AIDS campaigns and sensitisation, for instance, have raised quite a number of problems or experienced a lot of difficulties in the area. Prominent among these problems or difficulties is the case of people not believing that HIV/AIDS exist, and this attitude is being fuelled by the youths of between the 15-‐20 age brackets. Those who do not believe that HIV/AIDS exist (adults are implicated) attribute it to witchcraft or slow poison. To them most of the people who die of HIV/AIDS must have either been killed by their enemies or by ancestral spirits. Some even conclude that it is the whitman’s idea to discourage sex and control black or African population. Some believe that the condom manufacturers want to sell their condoms and that the government is conniving with them to benefit from the sales. Also, there is general fear that condoms are causing cancer and even prostrate problems in the community. They give as backing to this claim the absence of continuously free condoms, except during campaigns. The findings equally show that the HIV/AIDS activists are often victims of attacks and molestation as they go about the business of sensitising the people. These facilitators are often accused of encouraging sex among youths through the distribution of condoms. The respondents even claim that condoms have instead increased unwanted pregnancies and exposed users to the pandemic. This is because of public demonstration and distribution of condoms to a non-‐selected audience. One of the respondents stated “one day, I met my nine year old girl with a condom given to her in school by those who came to sensitise people on HIV/AIDS. The fact is that if I did not see it she could have met a person to find out how it could be used and probably this person would have used that opportunity to have sex with her, which could even lead to her being contaminated with HIV/AIDS”. Again, in the course of sensitisation, some remote communities accuse activists with the belief that they are HIV/AIDS carriers who have come to distribute to the population under the pretext of sensitisation. Another difficulty that sensitisation has often encountered in Fundong is that, not only do the people say AIDS does not exist, they equally say condoms are not effective, especially the ones sold around the area. According to this group of respondents, condoms have holes, are lined with viruses, and can make one impotent. This, perhaps, are excuses given by those who do not want to use condom during sex. They claim that those sensitising give the erroneous impression that the condom remains the magic solution to HIV/AIDS. This makes curious youths to want to try it, and in the process land into trouble, by either getting pregnant or getting infected. The emphasis on condoms has brought about friction among couples, as wives, who suspect their husbands, whether rightly or wrongly, demand the use of condoms during sex. Our results further show that AIDS sensitisation in the area has made some people to believe that there is already a cure for the disease, so they can now be reckless.

Lengha, T. N. (2016). The Use of New Information and Communication Technologies as an Education Tool in the Fight Against HIV/AIDS in Fundong, Northwest Region, Cameroon. Advances in Social Sciences Research Journal, 3(1) 51-‐60.
URL: http://dx.doi.org/10.14738/assrj.31.1310. 60
Other categories of problems/ difficulties are those associated with the information sources as well as the messages, which they transmit. A summary of some of the problems from our results across socio-‐ professional groups, beginning with the sources include poor radio and television signals, which makes it impossible for all areas to receive television. There are also insufficient magazines dedicated to HIV/AIDS in the area and newspapers are largely inaccessible. On the part of the messages transmitted through the various information sources, the difficulties encountered by the respondents include such things as the level of language used, which is usually high; controversy surrounding the effectiveness of condoms; and the poor production of posters, which are often crowded with messages. Bibliography Abega, S. C. 1995, « Apprentissage et vécu de la sexualité chez les jeunes camerounais de 15 à 30 ans », 2ème rapport, OMS, Université Yaoundé I, Yaoundé.
Aka Dore, 1991, Comportement sexuel, connaissances et attitudes vis-‐à-‐vis du risque d’infection par le virus de SIDA dans les villes moyennes africaines (cas de Bertoua-‐Cameroun) IFORD, Yaoundé.
Balepa M., Fotso M. et Barriere B., Enquête Démographique et de Santé au Cameroun 1991, Beat Songue, P. 1993, SIDA et prostitution au Cameroun, Paris, l’Harmattan.1996,
Brouard, N. et Dackam Ngatchou R, 1988, « Le SIDA en Afrique : Conséquences sur l’évolution future de la mortalité », Congrès africain de Population, Dakar, UNIESP.
Brucker, G, 1994, « Femmes d’Afrique, le droit à la prévention » in SIDAFRIQUE, Bull des Circles OPALS, 2ème trimestre 1994.
Kamgno H., 1993, “Rôle, statut de la femme et SIDA : Cas du village de Mindourou à l’est Cameroun » in les Annales de l’IFORD, vol. 16 (1-‐2), Yaoundé, décembre.
Le Courrier ACP-‐UE n° 126, mars-‐avril 1991, « SIDA, l’Etat actuel de l’épidémie.
Ndumbe P., Watonsi E., Nyambi P., Mbaya P., Yanga D., 1991, “Sexually transmitted infection in selected high risk populations in Cameroon”, AIDS update, London.
Tchupo J.P., 1990, « La résistance au changement de conduits sexuels face au SIDA, Etude psychosociologique des obstacles à l’utilisation des préservatifs : Les cas des étudiants des facultés de l’université de Yaoundé », Mémoire de Maîtrise en Psychologie, Département de Philosophie, Université de Yaoundé.
Trebucq L. J.P., Salla R. ; Domatob A., Foumane V., Kenzeta J.J., Gelas H., 1986, Comportements sexuels à risques d’infection à VIH en milieu scolaire à Yaoundé, Ministère de la Santé, OCEAC.
Advances in Social Sciences Research Journal – Vol.3, No.1 Publication Date: Jan. 25, 2016 DoI:10.14738/assrj.31.1749.
Minadzi, V. M., & Kankam, B. (2016). The Leadership Styles of Basic School Head Teachers: What Teachers Say. Advances in Social Sciences Research Journal, 3(1) 61-‐71.
Copyright © Society for Science and Education, United Kingdom 61
The Leadership Styles of Basic School Head Teachers: What Teachers Say
Vincent Mensah Minadzi
College of Distance Education, University of Cape Coast, Ghana
Boadu Kankam Department of Arts & Social Sciences, University of Cape Coast, Ghana
Abstract
The purpose of the study was to find out how basic school teachers differ in their perception of the leadership styles of their head teachers within the context of communication, decision-‐making, instructional leadership. The study adopted descriptive survey and stratified random sampling procedure to sample 269 teachers from 94 public basic school teachers in the South Tongu District. Questionnaire was the main research instrument used to collect data from respondents and its reliability coefficient of the questionnaire was .85 which was deemed to be reliable. The data was analysed using independent t-‐test with Predictive Analytical Software (PASW) version 18. The study revealed that there was no statistically significant difference between the ways male and female basic school teachers perceive their head teachers’ leadership styles in the South Tongu District. It was also found out that teachers perceived favourably the leadership styles of their head teachers. It was recommended that basic school head teachers be given workshops to improve upon their decision-‐making skills since they were perceived less by respondents in that area. Also, it was recommended that head teachers should be encouraged to peer reviewed their colleagues so that those who are not doing well could learn from those who are performing creditably.
BACKGROUND TO THE STUDY
Leadership in every human institution is very important in that where there is no leader, there is likelihood of chaotic situation; everybody does what he or she likes. Leading people is of course, a tremendous challenge, a great deal of opportunity, and a serious responsibility (Nahavandi, 2006). According to him, today’s world, more than ever, needs leaders who are effective and can understand the complex nature of our ever-‐changing global environment, who will have the intelligence to face the complex problems and be sensitive as well as the ability to empathize with their followers in order to challenge them to strive for excellence. Pierce and Newstrom (2000) could not have put it better when they asserted that being a leader is a very difficult job – a great deal of information has to be gathered and processed, a constant series of problems must be solved and decision made, followers have to be convinced to pursue specific course of action, set backs have to be overcome, competing interests have to be satisfied and finally risks have to be taken in the face of uncertainty. Educational institutions like any other institutions need leaders with substance who know what to do and how best to do it. Around the world, education is viewed as the most important strategy for the development of society especially in a resource-‐deficit country like Ghana (Aikaman & Unterhalter, 2005). Studies have shown that it is the human capital that determines the development of a country and not the natural resources a country has (Nsubuga, 2003). Nsubuga argued that the principal institution mechanism by which human capital is developed is through formal educational systems.

Minadzi, V. M., & Kankam, B. (2016). The Leadership Styles of Basic School Head Teachers: What Teachers Say. Advances in Social Sciences Research Journal, 3(1) 61-‐71.
URL: http://dx.doi.org/10.14738/assrj.31.1749. 62
In Ghana, the formal education system comprises basic school (kindergarten, primary and junior high school), senior high school and tertiary, comprising colleges of education, polytechnics and the universities. The concern of the study however, is the basic level which is the bedrock of formal education in Ghana. The growing nature of school enrolment at the basic level as a result of free and Compulsory Universal Basic Education (fCUBE), introduction of capitation grants, and school feeding programmes in 2005 and 2006 respectively, as well as high demand for better improvement in education delivery, call for a second look at those at the helm of affairs and who are supposed to render account. This is so because a study conducted by EdQual (Quality Education) in Ghana and Tanzania in the late 2000s indicated that 25 per cent and 40 per cent of head teachers respectively, did not take part in any leadership training. This means that most of them rely on try and error in the discharge of their legitimate duties (Oduro & Dachi, 2010). The study also indicated that majority of head teachers of primary schools in the study area did not recognize themselves as leaders who must adopt strategies as change agents in their schools. On the contrary, they see their positions as administrators whose main responsibility is to take custody of school property, attend meetings and implement directives from the district office. It is said that these head teachers lack the courage to take initiatives in their various schools as leaders who are entrusted the human, capital and physical resources to achieve the desired goals. This definitely does not sound good if the head teachers are expected to manage the human capitals at their disposal for the improvement of quality education in Ghana. Leadership at work in educational institutions is a dynamic process where the individual is not only responsible for the group’s tasks, but also actively seeks collaboration and commitment of all members in attaining the objective of the group (Cole, 2002). Maicibi (2005) says that without proper leadership style of principals, effective teaching and learning cannot be achieved in schools. He concludes that even if a school has all the required institutional materials and financial resources, they will not be effectively used if the teachers are not motivated by the leadership style of the principal. The literature on leadership reveals that effective leadership is an important component of securing and sustaining school achievement. There is enough evidence that consistently show that effective leaders can exercise a strong influence on students’ performance (Liethwood, Jantzi & Steinbach, 1999). It is believed that for a school to achieve effectiveness and improvement in academic achievement, school leadership should no longer reside in a single person or certain administrators; it needs to be distributed among the major educational players across all levels (Jackson, 2002; Day et al., 2006; Fullan, 2001, 2006; Gronn, 2002; Harris, 2003; Lambert, 2003; Marks & Printy, 2003; Spillane, 2006). This implies that the head teacher who is the leader of the school should not be the sole figure who wields a lot of power to effect policies and programmes in the school. It is in agreement of this that Fullan (2001) says that the teacher is the key to change in a school. Again, Pellicer and Anderson (1995) found that in most effective schools, leadership is a shared responsibility between teachers and head teachers. Other researchers (Jenkins, Zimmerman, & Jenkins, 2001) believe that when that happens the school can continually be transformed and improved through nurturing the leadership capacities of teachers.
Advances in Social Sciences Research Journal (ASSRJ) Vol.3, Issue 1 January-‐2016
Copyright © Society for Science and Education, United Kingdom 63
STATEMENT OF THE PROBLEM It is believed that the kind of relationship that exists between the leader and the follower affects the institution, more especially if the leader is perceived as being a dictator. Lord, Brown and Freiberg (1999) wrote, “the interpersonal relation of the superiors to subordinates affects subordinates’ identification and self-‐concepts, which in turn, are critical determinants of social and organizational process” (p. 170). Put into the language of schools, the relationship between principal and teacher affects how the teachers perceive their roles in the school and that perception, in turn helps to influence the success or failure of the school. Other researchers have also supported this view by saying that leader-‐ follower relationship from the point of view of the follower is a major determinant of the effectiveness of the leader (Blasé, 1988; Liethwood & Jantzi, 1997; Lord et al 1999; Shum & Cheng, 1997). Again in the language of education, how teachers perceive the relationship they have with their principals influence the effectiveness of principal leadership. Leadership problems in schools affect teaching and learning seriously. If teachers are not motivated by the styles of their heads, they cannot deliver the curriculum in the class. The school leader’s ability to manage the financial and human capital is a great asset if the school is to function well. In the words of Atta (as cited in Entsuah, 2005), the head master/mistress is the chief executive officer of the school and for the school to succeed or fail depends on him/her. This means that the ways teachers perceive the environment in which they are operating affect how they deliver the curriculum. Based on comments and observations from the teachers in the study area to the effect that some head teachers practice autocratic leadership styles and are not concerned about their welfare would necessarily trigger a research in order to ascertain the scientific fact. One wonders which leadership styles are the best for educational institutions especially at the basic school level. Again, it is important to find out whether male and female basic school teachers perceive leadership styles as the same.
PURPOSE OF THE STUDY The purpose of the study was to find out how basic school teachers differ in their perception and how they perceive the leadership styles of their head teachers within the context of communication, decision-‐making, instructional leadership and staff concern. Research Question
1. How do basic school teachers differ in their perception of the leadership styles of their head teachers?
2. How do basic school teachers perceive the leadership styles of their head teachers? Review of Related Literature This section of the article discusses literature relating to the topic on the following;
COMMUNICATION AND LEADERSHIP Communication is the process of conveying information and meaning (Lussier & Achua, 2001). They say that true communication takes place only when all parties understand the message (information) from the same perspective. At all organisational or institutional levels, it has been estimated that at least 75 percent of each working day is consumed in communication. Communication is a major powerful tool for leaders because effective communication is part of leadership style. Empirical research proves the statement that effective leaders are also effective communicators; there is a positive relationship between communication competency and leadership performance (Pheng & Lee, 1997; Bass, 1999).
Minadzi, V. M., & Kankam, B. (2016). The Leadership Styles of Basic School Head Teachers: What Teachers Say. Advances in Social Sciences Research Journal, 3(1) 61-‐71.
URL: http://dx.doi.org/10.14738/assrj.31.1749. 64
Good interpersonal as well as communication skills drive effective leadership (Cullen, 1999; Mitchell & Winkleman, as cited in Lussier & Achua, 2001). Organisations or institutions with effective communication systems are more likely to be successful. This implies that institutions or organisations with poor communication channels are more prone to failures. One important aspect of organisational communisations is to convey the mission, vision and the values so that all the members understand the big picture of what the group is trying to attain. However, a research conducted in 10,000 firms indicates that leaders are not doing effective job in that area (Lussier & Achua, 2001). In leadership, how well you give instructions directly affects your ability to motivate your subordinates as well as their job satisfaction with your supervisory leadership (Klimoski & Hayes, 1980).
DECISION MAKING AND LEADERSHIP The uncertainty, ambiguity, and the ever-‐changing circumstances of today’s world means that head of institutions have the guts to make difficult decisions (Lussier & Achua, 2001) that positively affect the institutions. Decision making are of two types; individual and group (team) decision making. Some people relied on both individual and group (team) decision making when it comes to solving problems. It is evident that group decision making is preferred over individuals when; one, relevant information and expertise are scattered among different people; two, when participation is needed to obtain necessary commitment; three, when concentrating power in a single individual hurts group cohesion and finally, when controversial decision need to be made (Lussier & Achua, 2001). It is important to note that group decision making improves decision quality, allowed responsibility to be diffused among several people, help people appreciate the nature of the problems and the reasons for the final choice of solution, and it is likely to result in higher commitment by all in the group. However, group decision making usually takes a longer time than decision taken by the leader alone. It may also end up being a poor compromise rather than an optimal solution, when team or group members cannot agree among themselves about the group’s objectives and priorities. Several factors have been associated with effective team decisions. Some of these factors are; group size and composition, members’ status, group cohesiveness, traits and values of group members and quality of leadership (McGath, 1999).
INSTRUCTIONAL LEADERSHIP As instructional leader, the principal is the pivotal point within the school who affects the quality of individual teacher instruction, the height of students’ achievement, and the degree of efficiency in the school functions. According to Findley and Findley (1992) “if a school is to be an effective one, it will be because of instructional leadership of the principal” (p. 102). Research on effective school showed that the principal plays an essential role in bringing about conditions that characterise effective schools (Flath, 1989). In the study of instructional leadership, (Kroeze, as cited in Flath, 1989) has identified some qualities such as; goal emphasis (set instructional goals, high expectations and focus on students achievement), coordination and organisation, power and discretionary decision making and human relation. Moreover, Anderson and Pigford (1987) have identified five qualities of effective instructional leadership. These qualities are:
1. Have vision: Work toward a shared understanding of the goals, progress toward their achievement and coordinate curriculum, instrument and assessment.

Advances in Social Sciences Research Journal (ASSRJ) Vol.3, Issue 1 January-‐2016
Copyright © Society for Science and Education, United Kingdom 65
2. Translate the vision into action: Work as a team, emphasise school wide goals and expectation.
3. Create supportive environment: Promote an academically-‐oriented, orderly, and purposeful school climate.
4. Know what is going on in the school: Find out what teachers and students are doing and how well they are doing it.
5. Act on knowledge: Intervene as necessary accommodating different teacher personalities, styles, and teaching strategies (p. 67–68)
Fulan (1991) in his studies also found out that schools operated by principals who were perceived by their teachers to be strong instructional leaders exhibited significantly great gain scores in achievement in reading and mathematics than did school operated by average and weak instructional leaders. Thus, perception could be included as a strong determinant of effectiveness.
METHODOLOGY Research Design Broadly speaking, a study design refers to the plan and schedule of work, or a process of creating an empirical test to support or reject a knowledge claim (Gall, Borg & Gall, 1996). The descriptive survey was the design used for the study. The descriptive survey is which describes the nature of a phenomenon and finds answers to research questions. Since the study involves collecting data in order to test research questions concerning the current status of the teachers’ perception of their head teachers’ leadership style, descriptive survey design was appropriate (Gay, 1992). For the purpose of this study, cross-‐sectional survey type was used. A cross-‐sectional survey collects information from a sample that has been drawn from predetermined population (Fraenkel & Wallen, 2006). Population The larger group to which one hopes to apply the results of a study is the population (Fraenkel & Wallen, 2006). There are about 122 schools in the South Tongu District. Teachers in these schools constituted the target population. Ninety-‐four schools with teacher population of 919 (accessible population) out of which samples were selected for the study. Sample and Sampling Procedure The researcher selected 179 males (30% of 611) and 90 females (30% of 308) in the 94 basic schools (63 primary and 31 J.H.S) (Krejcie and Morgan, 1970). A proportional stratified random sampling technique was employed to select the sample for the male and female. The proportional stratified random sampling is a technique in which certain subgroups, or strata, are selected for the sample in the same proportion as they exist in the population (Gay, 1996). The study was to find the difference in the perception of male and female basic school teachers’ of their heads , so it was necessary to have their representation in the sample. As many as 179 males and 90 females in the 94 basic schools were selected. Research Instrument Closed-‐ended type of questionnaire was used. Highly structured closed-‐ ended items are useful in that they can generate frequencies of response amenable to statistical treatment and analysis. They also enable comparisons to be made across groups in the sample (Oppenheim, 1992).

Minadzi, V. M., & Kankam, B. (2016). The Leadership Styles of Basic School Head Teachers: What Teachers Say. Advances in Social Sciences Research Journal, 3(1) 61-‐71.
URL: http://dx.doi.org/10.14738/assrj.31.1749. 66
Data Analysis A software known as Statistical Package for Service Solution (SPSS) was used to analyze and show results of the study. The first research question was analysed using Statistical Package for Software Solution (SPSS) to run the frequency distribution while the research question two was analyzed using independent sample t-‐test since the researcher wanted to find out the differences in the perception of males and females with regard to the leadership styles of their head teachers and the fact that the variables are nominal. The demographic data was used in computing the differences in the perceptions of male and female respondents. This was also done with the help of SPSS.
RESULTS AND DISCUSSION Research Question: How do male and female basic school teachers differ in their perception of the leadership styles of their head teachers? The research question focused on the gender differences among basic school teachers regarding their perception of the leadership styles adopted by the head teachers. In order to achieve this objective, an independent sample t-‐test was conducted to compare the perception of basic school teachers regarding the leadership styles adopted by their head teachers. Four dimensions of leadership styles were used. Each of the styles was made up of many items. These items were pulled together to form each of the styles. The styles or variables used were communication, concern, instructional leadership and decision making. The descriptions of the measurement of these variables have been done in the preceding discussion. As discussed earlier, these items were pulled together with the help of Test Analytics for Surveys (TAfS), a tool of Predictive Analytic Software (PASW) Version 18.0. The results are presented in the Table 1. Table 1: Differences in the Perception of Male and Female Basic School Teachers regarding the
Leadership Styles of their Head teachers (N = 258)
Leadership Styles Gender N Mean Std. Dev. t-values p-values
Communication Male 167 3.190 .605 -.166 .868
Female 91 3.203 .617
Concern Male 167 3.093 .469 -.663 .508
Female 91 3.133 .459
Instructional
leadership
Male 167 3.093 .469 -.663 .508
Female 91 3.133 .459
Decision making Male 167 2.661 .797 -.267 .790
Female 91 2.689 .819 Source: Field Data, 2013
Table 1 contains finding on the gender differences regarding basic school teachers’ perception of their head teachers leadership styles used in their respective schools. The results in the table show that there were no statistically significant gender difference in the perception of basic school teachers regarding the use of communication by their head teachers as leadership style for male teachers (Mean = 3.190, SD = .605) and female teachers (Mean = 3.203, SD = .617), [t =

Advances in Social Sciences Research Journal (ASSRJ) Vol.3, Issue 1 January-‐2016
Copyright © Society for Science and Education, United Kingdom 67
-‐.166, df = 256, p = .868]. Even though there was no statistically significant gender difference regarding basic school teachers’ perception on the communication style used by their head teachers as leadership style, female teachers seem to perceive it more positively than male teachers. The finding supports the views of Newcomb and Ashkanasy (2002) who posited that leaders use communication as the basis for goal attainment focusing on the final desirable result. Expressing the importance of communication, Newcomb and Ashkanasy further indicate that how a leader delivers a message can be more important than the content of the message. In a school setting, school leaders do the right thing by promoting educational restructuring and innovation, focusing on building vision, encouraging collaborative participation and raising the role of followers to that of leaders. Similarly, the results in the Table 1 show that there were no statistically significant gender difference in the perception of basic school teachers with regard to show of concern by their head teachers as leadership style for male teachers (Mean = 3.093, SD = .469) and female teachers (Mean = 3.133, SD = .459), [t = -‐.663, df = 256, p = .508]. The results again indicate that there were no statistically significant gender differences regarding basic school teachers’ perception of the instructional leadership and decision making styles used by their respective head teachers in the various schools. Even though there were no statistical significant gender difference regarding basic school teachers’ perception of the concern, instructional leadership and decision making styles used by their head teachers as leadership styles, female teachers seemed to perceive them more positively than male teachers. The findings that teachers perceived concern, instructional leadership and decision making leadership style positively regarding the adoption of these styles by their head teachers are in line with the comments of Fulan (1991) who indicated in his studies that schools operated by principals who were perceived by their teachers to be strong instructional leaders, decision makers, communicators and show concern to their fellow workers exhibited significant gain scores in achievement than school operated by average and weak instructional leaders, decision makers nor weak communicators. However, the findings are incongruent with the work of Brailsford (2001) who found that teachers’ gender, age and level of education had a significant influence on their perception of the kind of leadership styles of their principals. The same findings were reported in the study of Lee (1995). The findings that there are no statistically significant gender difference regarding teachers perception of the kind of leadership styles used by their head teachers contradicts the work of Entsuah (2005) that was carried out in Shama Ahanta East Metropolis of the Western region of Ghana. The findings of Entsuah was that male and female teachers showed some differences in their perception of their head teachers’ leadership style and behaviour in terms of decision-‐making, supervision, school community relations, material and financial resources and maintenance of interpersonal relations. Research Question 2: How do basic school teachers perceive the leadership styles of their head teachers? Based on the four-‐point scale, a theoretical mean ranges based on the recommendation of Cohen (1988) were derived and used to segregate respondents into strongly agree (3.5 – 4), agree (2.5 – 3.4), disagree (1.5 – 2.4) and strongly disagree (1 – 1.4). The relevant mean values are presented in Table 2. They were calculated with the help of Test Analytics for Surveys

Minadzi, V. M., & Kankam, B. (2016). The Leadership Styles of Basic School Head Teachers: What Teachers Say. Advances in Social Sciences Research Journal, 3(1) 61-‐71.
URL: http://dx.doi.org/10.14738/assrj.31.1749. 68
(TAfS), a tool of Predictive Analytic Software (PASW) Version 18.0, which is used for coding data and analysing verbatim responses to close and open-‐ended questionnaire and produces tables and charts directly to enable data interpretation. Table 2: Basic School Teachers’ Perceptions of the Leadership Styles of their Head teachers (N =
258)
Leadership Styles Mean Median Std. Dev. Skewness
Communication 3.195 3.250 .608 -.265
Concern 3.107 3.143 .465 -.145
Instructional leadership 3.107 3.143 .465 -.145
Decision making 2.671 2.833 .803 -.179 Source: Field Data, 2013.
As contained in Table 2, basic school teachers agreed (mean > 2.4) to all the leadership styles used for the study. In other words, they perceived the four leadership styles positively and that their head teachers used these styles. However, the basic school teachers perceived communication (Mean = 3.195, Std. Dev. = .608) more positively than any of the leadership styles followed by concern (Mean = 3.107, Std. Dev. = .465) and instructional leadership (Mean = 3.107, Std. Dev. = .465). The table further depicts that decision making (Mean = 2.671, Std. Dev. = .803) was the least leadership style that the basic school teachers indicated that their head teachers practiced. The work of Gyansah (2000) is consistent with this finding that respondents were not comfortable with decision-‐making style of their head teachers. However, it is inconsistent with the earlier finding of Arku (2007) who found out that most (77%) respondents were satisfied with the decision-‐making style in their respective schools. This aspect of the finding is not good for the purpose of teaching and learning. Curricular activities would suffer if everybody is not brought on board in the management of schools. Communication is a major powerful tool for leaders because effective communication is part of leadership style. The finding that teachers perceived their head teachers to be using communication in their style of leadership is consistent with the submission of Bass (1999) who indicated that effective leaders are also effective communicators and that there is a positive association between communication competency and leadership performance. This result is a good sign for the country’s quest for quality education because according to Mitchell and Winkleman (1999) good interpersonal as well as communication skills drive effective leadership. Mitchell and Winkleman further posited that schools with effective communication systems are more likely to be successful. This implies that schools with poor communication channels are more prone to failures. The finding further corroborates the views of Achua and Lussier (2001) who commented that one important aspect of leaders effective use of communication is to convey the mission, vision and the values so that all the members understand the big picture of what the group is trying to attain. However, a research conducted by Achua and Lussier in 10,000 firms indicates that leaders are not doing effective job in that area of communication. Similar finding was made by Bampo-‐Addo (2006) who said that majority (87.5%) of respondents were dissatisfied with the communication style of their leaders. The findings of Achua and Lussier as well as Bampo-‐Addo are incongruent with the results of the current study.

Advances in Social Sciences Research Journal (ASSRJ) Vol.3, Issue 1 January-‐2016
Copyright © Society for Science and Education, United Kingdom 69
The finding that basic school teachers perceived the instructional leadership style of their head teachers positively support the views of Findley and Findley (1992) who commented that as instructional leader, the principals or head teachers are the pivotal points within the school who affect the quality of individual teacher instruction, the height of students’ achievement, and the degree of efficiency in the school functions. According to Findley and Findley, if a school is to be an effective one, it will be because of instructional leadership of the principal. The finding of Entsuah (2005) also gave evidence to the fact that teachers perceived their head teachers as instructional leaders. Research on effective school showed that the principal plays an essential role in bringing about conditions that characterise effective schools (Flath, 1989). This finding implies that any curriculum implementation would succeed since the head teachers are seen to be leading the change in that direction. It is highly a good sign that need to be encouraged in all educational endeavours
KEY FINDING 1. It was revealed that there was no statistically significant difference between the
perception of male and female basic school teachers in the South Tongu District with regard to their head teachers’ leadership styles. What this means that leadership is no more the preserve of men as it used to be.
2. Basic schoolteachers perceived favourably the leadership styles of their head teachers in the four domains – decision-‐making, instructional leadership, concern for staff and communication. It indicates that any curriculum implementation programme in the district would be successful since teachers perceive positively their head teachers leadership styles.
CONCLUSIONS
The outcome of the finding was important as far as leadership issues in our educational institutions is concerned because it was in contrast to the long held view that leadership is the preserve of men. There is no doubt that if equal opportunities are created for both males and females, there would not be much difference in terms of achievements in the area of academics. Finally, it can be said that the issue of leadership is a dicey one because it appeared that there is no single style that is appropriate in all situations. What it therefore means is that, different situations call for the particular leadership styles to be used. The inability of head teachers to adopt situational leadership would not augur well for the educational enterprise since it could seriously undermine the efforts by various stakeholders to improve teaching and learning.
RECOMMENDATIONS It is therefore recommended that equal platforms be created for both female and male teachers to assume leadership positions. It is also suggested that everybody be involved in the decision-‐making process. Workshops and seminars should be organised for head teachers to improve upon their decision-‐making skills since they seem not to be doing well in this area. References Aikaman, S., & Unterhalter, E. (2005). Beyond access: Transformational policy and practice for gender equality in education. London: Oxford.
Allan, T. H. (1981). Situational management roles: A conception model. Dissertation Abstracts International, 42(2), 465.
Anderson, L., & Pigford, A. (1987). Removing administrative impediments to instructional improvement efforts. Theory Into Practice, 26(1), 67 – 71.
Minadzi, V. M., & Kankam, B. (2016). The Leadership Styles of Basic School Head Teachers: What Teachers Say. Advances in Social Sciences Research Journal, 3(1) 61-‐71.
URL: http://dx.doi.org/10.14738/assrj.31.1749. 70
Arku, M. G. (2007). The perception of teachers and students of the leadership effectiveness of their head masters in the Ga West District of Greater Accra. Unpublished dissertation. University of Cape Coast, Ghana.
Bampoh-‐Addo, H. (2006). The perception of teachers and administrators on communication in the administration of Senior Secondary Schools in Awutu-‐Efutu-‐Senya District in the Central Region of Ghana. Unpublished dissertation. University of Cape Coast, Cape Coast.
multifactor leadership questionnaire. Redwood City, CA: Mindgarden Inc.
Bass, M. (1999). Does transactional-‐transformational leadership paradigm transcend
Beverly, R. B. (2001). Teacher perception of middle school principal leadership behaviour [ Published Thesis]. Seton Hall University.
Blasé, J. (1988). The politics of favouritism: A qualitative Analysis of the teachers’ perspective. [Electronic version]. Educational Administration Quaterly, 24(2), 152-‐ 177
Borg, M., & Gall, M. D. (1996). Educational research: An introduction. New York: Longman.
Cohen, L., Manion, L., & Morrison, K. (2007). Research methods in education (6thed.). New York: Francis & Taylor e-‐Library.
Cole, G. A. (2002). The administrative theory and workers’ motivation. Zaria. Zaria Institute of Administration Press Ltd.
Cullen, D. (1999). Developing Managers: Motivation and Leadership Make Management Team Thrive over the Long Haul. Fleet Owner, 55 – 56.
Day, D., Gronn, P., & Salas, S. (2006). Leadership in team-‐based organisations: On the
Entsuah, S. (2005). Teachers’ perception of effectiveness of leadership behaviour of school heads of basic schools in Shama Ahanta East Metropolis of Western Region of Ghana. Unpublished dissertation. University of Cape Coast, Cape Coast.
Findley, B., & Findley, D. (1992). Effective schools: The role of the principal. Contemporary Education, 63(2), 102–104.
Flath, B. (1989). The principal as instructional leader. ATA Magazines, 69(3), 19 – 22, 47 – 49.
Fraenkel, J. R., & Wallen, N. E. (2006). How to design and evaluate research in education (6thed.). New York: Palgrave Macmillan.
Fullan, M. (1991). The new meaning of educational change. New York: Teachers College Press.
Gay, L.R. (1996). Educational research: Competencies for analysis and evaluation research
Gronn, P. (2002). Distributed leadership as a unit of analysis. Leadership Quarterly, 13, 423 – 451.
Gyansah, S. T. (2000). A study of teachers and students perception of head masters’ leadership effectiveness in senior secondary schools in the Akwapim North District of the Eastern Region of Ghana. Unpublished master’s thesis. University of Cape Coast, Cape Coast.
Harris, A. (2003). Teacher leadership and school improvement. In A. Harris, C. Day, D. Hopkins, M. Hadfield, A. Hargreves, & C. Chapman, (Eds.), Effective leadership for school improvement (pp72–83). London: Routledge, Falmer.
Jackson, D. (2002). The School Improvement Journey: Perspectives on leadership. School Leadership and Management, 20(1), 61 – 79.
Jerkins, K., Zimmerman, S., & Jerkins, D. (2001). Developing teacher leaders for school improvement. UCEA Paper on Teacher Leadership.
Klimoski, R. S., & Hayes, N. J. (1980).Leaders’ Behaviour and Subordinates’ Motivation. Personnel Psychology, 543 – 555.
Kouzes, J. M., & Posner, B. Z. (1995). The leadership challenges (2nded.). San Francisco:
Krejcie, R. V., & Morgan, D. W. (1970). Determining sample size for research activities. Educational Psychological Management, 30, 607–610.
Lambert, L. (2003). A framework for shared leadership. Educational Leadership, 59(8), 37 – 40.
Advances in Social Sciences Research Journal (ASSRJ) Vol.3, Issue 1 January-‐2016
Copyright © Society for Science and Education, United Kingdom 71
Lee, A. B. (1995). An investigation of the leadership styles of principals in selected secondary schools in the district of Muar, Johor. Published master’s thesis. Utara University, Malaysia.
Liethwood, K., & Jantzi, D. (1997). Explaining variation in teachers’ perception of principal’s leadership: A replication [Electronic version]. Journal of Educational Administration, 35(4), 321-‐331.
Liethwood, K., Jantzi, D., & Steinbach, R. (1999). Changing leadership for changing times. Philadelphia, PA: Open University Press.
Lord, R. G., Brown, D. J., & Frieberg, S. J. (1999). Understanding the dynamics of leadership: The role of follower self-‐concepts in the leader/follower relationship. Organisational Behaviour and Human Decision Process, 78(3), 167 – 203.
Lussier, R. N. & Achua, C. F. (2001). Leadership: theory, application and skill development. Virginia: Thomson Learning.
Maicibi, N. A. (2003). Pertinent issues in employees management. Kampala : P. K. Graphics (U) Ltd
Marks, H., & Printy, S. (2003). Principal leadership and school performance: An integration of transformational and transactional leadership. Educational Administration Quarterly, 39(3), 370–393.
McGrath, M. (1999). Ten steps to better decisions. Electronic Business, 23–24.
Mitchell, D., & Winkleman, M. (1999).Eighth Annual CE Growth 100 Index. Chief Executive, 40–46.
Nahavandi, A. (2006). The art and science of leadership (4thed). Upper Saddle River. New Jersey: Pearson Education, Inc.
Newcombe, M. J. & Ashkanasy, N. M. (2002). The role of affect and affective congruent in perception of leaders: an experimental study. The Leadership Quarterly, 13, 601 – 614.
Nsubuga, Y. K. K. (2003). Development and expansion of secondary education in Uganda: Experiences and challenges. A seminar paper presented at the annual head teachers workshop in Kampala.
Nsubuga, Y. K. K. (2008). Analysis of leadership styles and school performance of secondary schools in Kampala. Published Thesis. Nelson Mandela Metropolitan University.
Oduro, G. K. T., & Dachi, H. (2010). Primary school leadership for quality improvement in Ghana and Tanzania. EdQual, 6, 2 – 6.
Oppeiheim, A. N. (1992). Questionnaire design, interviewing and attitude measurement. London: Pinter
Pellicer, L. O., & Anderson, L. W. (1995). A book for teacher leaders. Thousand Oaks, CA: Corwin Press.
Pierce, J. L., & Newstrom, J. L. (2000). The manager’s bookshelf. Upper Saddle River. New Jersey: Prentice-‐Hall Inc.
Shum, L. C., & Cheng, L. C. (1997). Perceptions of women principal leadership and teachers’ work attitudes: [Electronic version]. Journal of Educational Administration, 35(2), 165 – 184.
Spillane, J. (2006). Distributed leadership. San Francisco: Hossey-‐Bass.
Advances in Social Sciences Research Journal – Vol.3, No.1 Publication Date: Jan. 25, 2016 DoI:10.14738/assrj.31.1787.
Wisudanto, Seoharto, S. M., Ismiyanti, F., & Narsa, I. M. (2016). A Survey of Overconfidence Investor Generation Y. Advances in Social Sciences Research Journal, 3(1) 72-‐77.
Copyright © Society for Science and Education, United Kingdom 72
A Survey of Overconfidence Investor Generation Y
Wisudanto Faculty of Economics and Business
Universitas Airlangga, Surabaya, Indonesia
S. M. Soeharto Faculty of Economics and Business
Universitas Airlangga, Surabaya, Indonesia
F. Ismiyanti Faculty of Economics and Business
Universitas Airlangga, Surabaya, Indonesia
I. M. Narsa Faculty of Economics and Business
Universitas Airlangga, Surabaya, Indonesia
Abstract Generation Y is a generation that has a unique, have different behavior with the previous generation and considerably larger than Generation X. In the case of investments, during the next five to ten years generation Y potential to become the biggest investor in the capital market, and who can understand the behavior of their investment will benefit. This study aims to determine Overconfidence investors generation Y. Overconfidence level of capital market investors was measured using Calibration assessment test. Assessment aimed at Generation Y, who is studying at the University and has become an investor in the capital market. The results could represent how overconfidence level of generation Y, which has the potential to become the largest investor in the total population.
Keywords: Generation Y, Overconfidence, capital market investor.
INTRODUCTION
Generation Y in some literature has several distinctive features; they are the dominant consumer groups in decision-‐making, and elusive (Drake-‐Bridges and Burgess, 2010). Heavily dependent on technology and the Internet (Lester et al., 2006), striking differences in consumption patterns from previous generations (B. Valentine and L. Powers, 2013). At the time when generation Y trading in the stock market, will interact with previous generations so that they are required to have the ability to analyze macro and micro economic factors, and management companies. Also, they have to face the perceptions and preferences of investors in the capital market that integrate diverse. Recent events in the capital market categorized as an event that cannot predict or uncertainty. Human life every day to face the uncertain situation, dealing with uncertainty is the central challenge in our lives. To manage uncertainty, people must make predictions behavior of individuals, groups, social systems, economies and international engagements. Investors in the capital market must make decisions with limited time, and information in a world of
Advances in Social Sciences Research Journal (ASSRJ) Vol.3, Issue 1 January-‐2016
Copyright © Society for Science and Education, United Kingdom 73
uncertainty. Perception and memory are imprecise filters of information, too much information is difficult to deal with (Ackert and Deaves, 2009). Therefore, investors developed shortcuts or heuristic to come up with reasonable decisions. Unfortunately, these heuristics lead to bias, especially when used in uncertainty situation. Overconfidence is the tendency for someone to overestimate his or her knowledge, abilities, and the precision of his or her information, about the future and his or her ability to control or to be over-‐optimistic about their predictions. (Fischhoff et al., 1977; Sarah Lichtenstein and Fischhoff, 1977). Overconfidence behavior in the capital market will result in high transaction activity, the excessive frequency, and volume of transactions, resulting in high transaction costs, the smaller the rate of return, and lead to inefficient capital markets (Barber and Odean, 2000; Griffin and Tversky, 1992; Odean, 1998). Many marketing research literature suggests that Generation Y is more than three times size of Generation X, and it the largest consumer market in America since the Baby Boomers (Nayyar, 2001) (Nayyar, 2001; Neuborne and Kerwin, 1999). Generation Y has approximately than 67 million members in The Indonesia who were born between 1981 and 1995 and 15% become Frist or middle manager at where they work (Konadi and Iba, 2011). Given the value of generation Y and potential to become the largest investor in the capital market. It is important to know how they behavioral specifically level of overconfidence as an investor. Overconfidence measured by using a calibration assessment test (S Lichtenstein et al., 1982) to undergraduate students and postgraduate, at the Faculty of Economics and Business, University of Airlangga. The result of the study will allow for the development of behavioral finance that will attempt to a future investment decision.
THEORETICAL STUDY AND LITERATURE Generation Y Generational theorists suggest that the environment at global level tends to develop distinctive consumer behavior patterns for different generations (Strauss and Howe, 2000). Generation Y ranges from people who were born between 1981 to 1995 and in 2015 member of Generation Y ranged from age 20 to 34 (Solka et al., 2011). The size of Generation Y is three times bigger than Generation X, and it is the largest consumer market in America. (Nayyar, 2001; Neuborne and Kerwin, 1999). Generation Y is trustful, more tolerant, and better traveled than many of their parents. However, what set them apart from previous generations is that they are deeply concerned about social issues (Strauss and Howe, 2000). Generation Y is different from the previous generation; They are more likely to trust and reward socially responsible companies with purchase more products, working at that company, and more liable to the message of the business because they have a deep commitment (Furlow, 2011). Technology and the Internet have significantly influenced generation Y from a very early age, they have had access to fast information, and they are eager to achieve their objectives in a short period, thus patience is not a virtue of most individuals in Y Generation. Generation Y attracted to a wide variety of media, regularly using blogs, social media network to express openly their interest and feelings (Hershatter and Epstein, 2010). Many retailers use this connection to communication with Generation Y to get feedback and insight from this audience (Engel et al., 2011). Overconfidence Many literature reference overconfidence as the tendency for someone to overestimate his or her knowledge, abilities, and the precision of their information, about the future and their

Wisudanto, Seoharto, S. M., Ismiyanti, F., & Narsa, I. M. (2016). A Survey of Overconfidence Investor Generation Y. Advances in Social Sciences Research Journal, 3(1) 72-‐77.
URL: http://dx.doi.org/10.14738/assrj.31.1787. 74
ability to control or to be over-‐optimistic about their predictions (Fischhoff et al., 1977; Sarah Lichtenstein and Fischhoff, 1977). Knowledge consists of two things, Frist what someone believes to be truth and second how confident he or she is in that belief. One of the ways to validate the level of confidence is to look at the calibration of a set of such confidence statements (S Lichtenstein et al., 1982). Someone is good calibration if, over the long run, for all propositions that are true is equal to the probability assigned. The quality of people’s probability assessment sets an upper limit on the quality of their function in uncertain environments. Someone who has a low average level of overconfidence (has a high degree of knowledge) able to predict more accurately, meaning that although the results of the prediction still deviate from the default prediction, the prediction deviation or error is relatively small. Conversely, people who have a high average level of overconfidence tends to predict inaccurately, meaning predictions deviate far from the predicted value by default. The implication is that people who have a relatively high value of overconfidence are someone who does not or lacks sufficient knowledge, causing high prediction error that will eventually lead to the prediction accuracy is relatively small (Fischhoff et al., 1977; S Lichtenstein et al., 1982). Overconfidence is injurious behavior so that it will have profound implication for capital markets. Overconfidence has four implications; Frist, if the investor is overconfidence, they overreact to private information and under-‐react to the news (Daniel et al., 1998). Second, the profit of market causes the excessive trading volume by overconfidence investors (Admati and Pfleiderer, 1988). Third, the excessive trading volume of overconfidence investor contributes to excessive volatility (Statman et al., 2004). Fourth, overconfidence investor underestimates risk and exchange more in riskier securities (Chuang and Lee, 2006). Finally, the presence of irrational investors (including investors overconfident) has created imbalances stock market prices, increasing the risk of the market resulting in lower efficiency of the market (Shefrin and Statman, 1985).
METHODS This study is to survey a narrower group of Generation Y individuals, specifically college-‐aged generation Y investor who represents enormous potential investor and have better financial literacy. Overconfidence measured by using a calibration assessment test (S Lichtenstein et al., 1982) to undergraduate students and postgraduate, at the Faculty of Economics and Business, University of Airlangga. Respondents of the survey area range in age from 20 to 35 years old, college-‐age students participated voluntarily and no incentive for their cooperation. A Quota sampling approach was used to obtain a representation of investor from six provinces in Indonesia ( Jakarta, Jawa Barat, Jawa Tengah, Jawa Timur, Jogjakarta, dan Bali) and gender brackets under investigation. The survey conducted in two stages; Frist to collect a respondent profile of investor for the present study were generated using phenomenological interviews (Thompson et al., 1989) with online media. Second, after selection of the respondent profile for research, we do a calibration assessment test. Respondent should access: http://uastec.net/ovstatis/ to participate the online test, respondents must answer twenty questions about prediction.
RESULT Subjective probability assessments play a fundamental role in decision-‐making; it is necessary to rely on to assess the prospect of some future event. Someone calibrated if over the long run, for all statements assigned a given probability. The proportions true equals the probability

Advances in Social Sciences Research Journal (ASSRJ) Vol.3, Issue 1 January-‐2016
Copyright © Society for Science and Education, United Kingdom 75
assigned judges’ calibration can empirically evaluate by observing his or her probability assessments. Two hundred and ten respondents participated in the frist round of data collection, one hundred and ten respondents are female, and a hundred are male ( 52% female and 48% male) with a mean of 29 years old. The second round of data collection, after selected based on a representation of investor from six provinces in Indonesia and range in age, we have one hundred and forty-‐four respondents (each province represented by twenty-‐four). 72 male, and 72 Female (50% male and 50% female) with a mean of 26 years old. The survey results showed that the highest level of overconfidence is 17 and the lowest is 2,1 with an average of 7,5. The average level overconfidence of female is higher (7,95) than male (7,18), but there no statistically significant differences level overconfidence between male and female (Tabel 1).
Based on the respondent obtained, there are 22 investors who as a graduate student and 122 undergraduate students (Table 2).
An investor who as undergraduate students have a higher level (7,92) average of overconfidence than an investor who as a graduate student (5,55), and there is statistically significant difference between graduate and undergraduate investor (Table3). Overconfidence level difference is due to the investors who have the background of graduate education has been getting material on financial literacy better when in class, and they are a much better experience when making investments.
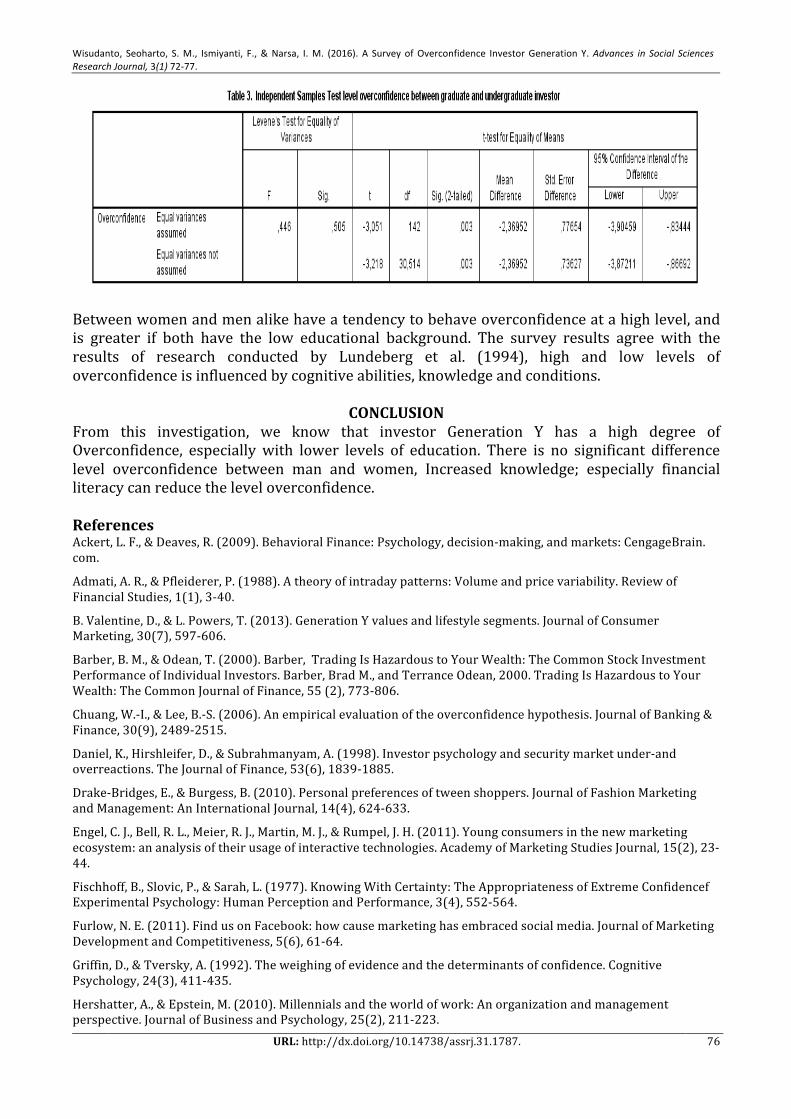
Wisudanto, Seoharto, S. M., Ismiyanti, F., & Narsa, I. M. (2016). A Survey of Overconfidence Investor Generation Y. Advances in Social Sciences Research Journal, 3(1) 72-‐77.
URL: http://dx.doi.org/10.14738/assrj.31.1787. 76
Between women and men alike have a tendency to behave overconfidence at a high level, and is greater if both have the low educational background. The survey results agree with the results of research conducted by Lundeberg et al. (1994), high and low levels of overconfidence is influenced by cognitive abilities, knowledge and conditions.
CONCLUSION From this investigation, we know that investor Generation Y has a high degree of Overconfidence, especially with lower levels of education. There is no significant difference level overconfidence between man and women, Increased knowledge; especially financial literacy can reduce the level overconfidence. References Ackert, L. F., & Deaves, R. (2009). Behavioral Finance: Psychology, decision-‐making, and markets: CengageBrain. com.
Admati, A. R., & Pfleiderer, P. (1988). A theory of intraday patterns: Volume and price variability. Review of Financial Studies, 1(1), 3-‐40.
B. Valentine, D., & L. Powers, T. (2013). Generation Y values and lifestyle segments. Journal of Consumer Marketing, 30(7), 597-‐606.
Barber, B. M., & Odean, T. (2000). Barber, Trading Is Hazardous to Your Wealth: The Common Stock Investment Performance of Individual Investors. Barber, Brad M., and Terrance Odean, 2000. Trading Is Hazardous to Your Wealth: The Common Journal of Finance, 55 (2), 773-‐806.
Chuang, W.-‐I., & Lee, B.-‐S. (2006). An empirical evaluation of the overconfidence hypothesis. Journal of Banking & Finance, 30(9), 2489-‐2515.
Daniel, K., Hirshleifer, D., & Subrahmanyam, A. (1998). Investor psychology and security market under-‐and overreactions. The Journal of Finance, 53(6), 1839-‐1885.
Drake-‐Bridges, E., & Burgess, B. (2010). Personal preferences of tween shoppers. Journal of Fashion Marketing and Management: An International Journal, 14(4), 624-‐633.
Engel, C. J., Bell, R. L., Meier, R. J., Martin, M. J., & Rumpel, J. H. (2011). Young consumers in the new marketing ecosystem: an analysis of their usage of interactive technologies. Academy of Marketing Studies Journal, 15(2), 23-‐44.
Fischhoff, B., Slovic, P., & Sarah, L. (1977). Knowing With Certainty: The Appropriateness of Extreme Confidencef Experimental Psychology: Human Perception and Performance, 3(4), 552-‐564.
Furlow, N. E. (2011). Find us on Facebook: how cause marketing has embraced social media. Journal of Marketing Development and Competitiveness, 5(6), 61-‐64.
Griffin, D., & Tversky, A. (1992). The weighing of evidence and the determinants of confidence. Cognitive Psychology, 24(3), 411-‐435.
Hershatter, A., & Epstein, M. (2010). Millennials and the world of work: An organization and management perspective. Journal of Business and Psychology, 25(2), 211-‐223.
Advances in Social Sciences Research Journal (ASSRJ) Vol.3, Issue 1 January-‐2016
Copyright © Society for Science and Education, United Kingdom 77
Konadi, W., & Iba, Z. (2011). Bonus Demografi Modal Membangun Bangsa yang Sehat dan Bermartabat.
Lester, D. H., Forman, A. M., & Loyd, D. (2006). Internet shopping and buying behavior of college students. Services Marketing Quarterly, 27(2), 123-‐138.
Lichtenstein, S., & Fischhoff, B. (1977). Do those who know more also know more about how much they know? Organizational Behavior and Human Performance, 20(2), 159-‐183. doi: http://dx.doi.org/10.1016/0030-‐5073(77)90001-‐0
Lichtenstein, S., Fischhoff, B., & LD, P. (1982). Calibration of probabilities: The state of the art to 1980. 306-‐334.
Lundeberg, M. A., Fox, P. W., & Punćcohaŕ, J. (1994). Highly confident but wrong: Gender differences and similarities in confidence judgments. Journal of educational psychology, 86(1), 114.
Nayyar, S. (2001). Inside the mind of Gen Y. American Demographics, 23(9), 6.
Neuborne, E., & Kerwin, K. (1999). Generation y. Business Week, 46-‐50.
Odean, T. (1998). Volume, volatility, price, and profit when all traders are above average. The Journal of Finance, 53(6), 1887-‐1934.
Shefrin, H., & Statman, M. (1985). The disposition to sell winners too early and ride losers too long: Theory and evidence. The Journal of Finance, 40(3), 777-‐790.
Solka, A., Jackson, V. P., & Lee, M.-‐Y. (2011). The influence of gender and culture on Generation Y consumer decision making styles. The International Review of Retail, Distribution and Consumer Research, 21(4), 391-‐409.
Statman, M., Thorley, S., & Vorkink, K. (2004). Investor Overconfidence and Trading Volume.
Strauss, W., & Howe, N. (2000). Millennials rising: The next great generation, New York: Vintage.
Thompson, C. J., Locander, W. B., & Pollio, H. R. (1989). Putting consumer experience back into consumer research: The philosophy and method of existential-‐phenomenology. Journal of consumer research, 133-‐146.
Advances in Social Sciences Research Journal – Vol.3, No.1 Publication Date: Jan. 25, 2016 DoI:10.14738/assrj.31.1774.
Nurcahyo, B, (2016). The Role of Customr Satisfaction in a Relation of Experiential Marketing and Customer Loyalty. Advances in Social Sciences Research Journal, 3(1) 78-‐89.
Copyright © Society for Science and Education, United Kingdom 78
The Role of Customer Satisfaction in a Relation of Experiential Marketing and Customer Loyalty
Bagus Nurcahyo
Department of Management Faculty of Economics, Gunadarma University
Abstract
The purpose of the research is to know if there is any influence from the element of experiential marketing to the customer’s satisfaction and the influence of customer’s satisfaction in their loyalty. 200 students collage involve in this research as respondent. Hypothesis testing used is path analysis. The result of the research shows that customer satisfaction has no role in the relation of experiential marketing and costumer loyalty.
Keyword: sense,feel, think, act, relate, experiential marketing, customer satisfaction,costumer loyalty
INTRODUCTION
The development of science and implementation of the marketing system had been developed. It causes of changes in consumers that expect a new thing that can satisfy what they want, not just the fulfillment of basic needs. Business continues to flourish to this day and it was followed by the development of marketing strategies. In the previus decade we just know the basic concept of marketing and now the concept has evolved in the direction of consumers who increasingly want something new. This is also done in order to continue to compete with competitors out there both in the same industry or not. The existence of competitiveness, the development of increasingly sophisticated technology is a bit of some of the factors that will improve the innovation and creativity of the producers in order to attract more consumers. One that can be used as an alternative to create something different from the experience, that is where the consumer perceived experience into a point or a reference from the manufacturer. Experience has now become very concerned because apart from the products or services offered but the sensation of what consumers get after purchasing the product or service being offered is something new. Today the world has entered the era of experiential economy. Experiential marketing is a marketing concept involving emotional development and the psychology of consumers for goods or services offered by marketers. Experiential marketing is the process of identifying and satisfying customers need and Aspirations profitability, engaging them through two-‐way communications that bring brand personalities to life and add value to the target audience. Can be interpreted experiential marketing is the process of identifying and satisfying customer needs and aspirations favorable, involves using two-‐way communication so that the give personality to the brand to be able to live and be an added value to target customers.

Advances in Social Sciences Research Journal (ASSRJ) Vol.3, Issue 1 January-‐2016
Copyright © Society for Science and Education, United Kingdom 79
According to Kertajaya (2007: 228) there was some element of experience where experiential marketing can be presented through the five elements, namely sense, feel, think, act, and relate. Briefly explained that the sense is a marketing approach with the aim to feel by creating a sensory experience through reviews to touch, feel, and smell, in other words that related to the five senses, which includes about styles, themes and colors. Feel elements include the feel of the mood and feelings or positive emotions when consuming. Whereas think is creative thinking that appears in the minds of consumers will be a brand / company or customers are invited to engage in creative thinking. Act marketing strategy designed to create customer experience-‐related body movements or in other words, movement and interactions that arise. And the latter relate that attempts to connect themselves with others, himself with a brand or company, and culture. When consumers make a purchase of a product or service and turn out products or services match or even surpass what he expects there will be a repeat purchase will establish the existence of a loyalty to the product. So before the formation of customer loyalty, there must be the satisfaction of consumers because of the satisfaction that would later be assumed to be an effect on customer loyalty. According to Hasan (2008: 83) customer loyalty is defined as a person who buys, especially those that buy regularly and repeatedly. Customer is a person who continuously and repeatedly came to a similar place to satisfy his desire to have a product or obtain a service, and pay for products or services. Tourism Park is one of the offers given to customers with experiential marketing so that consumers can feel a different experience. In case of how customer choose the torism park in Jakarta area, the aim of this study is to examine how the experiential marketing influence the customer satisfaction and how the customer satisfaction will affect the customer loyalty.
THEORETICAL FRAMEWORK The Concept of Marketing According to Hasan (2008: 1) marketing is a concept of science in business strategy that aims to achieve sustained satisfaction for stakeholders (customers, employees, shareholders). When a change occurs, the value of the marketing concept will also change to follow the demands of stakeholders and market developments. While understanding the marketing proposed by Kotler et.al. (2008: 6) is the process by which companies create value for customers and build strong relationships with customers with the aim to capture value from customers. Kotler and Keller (2009: 6) states that there will always be a need for sales. But the goal of marketing is to make selling are plentiful. The aim of marketing is to know and understand the customer so well that the product or service to fit the needs, ideally, marketing should result a customer who is ready to buy. Thus it takes only ensure products and services are available. Thus, it can be said that marketing is the way for a good or service can get into the consumers and marketing always changes according to the demands that exist, the need for the development strategy of the company to continue to compete in the market is necessary.

Nurcahyo, B, (2016). The Role of Customr Satisfaction in a Relation of Experiential Marketing and Customer Loyalty. Advances in Social Sciences Research Journal, 3(1) 78-‐89.
URL: http://dx.doi.org/10.14738/assrj.31.1774. 80
Consumer Behavior Consumer behavior according to Schiffman and Kanuk (2010) is defined as behavior that is shown in the search, buy, use, evaluate, and spent the services that they hope will satisfy their needs. Hasan (2008: 129) consumer behavior is a complex psychological responses, which appear in the form of a behavior typical actions as individuals are directly involved in the effort to obtain and use the product, as well as determining the decision-‐making process in the purchase of products. Understanding cunsumer behavior, the company will be able to give appropriate satisfaction and better serve its customers. Consumer behavior can be defined as the activity of individual activities that are directly involved in obtaining and using goods and services, including the decision-‐making process on the preparation and determination of the activities of these activities. According Rangkuti (2009) consumer behavior is an action that is directly involved in obtaining, consuming, and spent products and services, including the decision processes that precede and follow this action. Customer Loyalty Literally loyal means faithful, or can be interpreted as a loyalty. This loyalty arise without coercion, but arises from the consciousness of his own in the past. Efforts are being made to create customer satisfaction is more likely to influence consumer attitudes. While the concept of customer loyalty is more emphasis on purchasing behavior. Hurriyati (2008: 128) describes customer loyalty is the last in-‐depth customer commitment to re-‐subscribe or re-‐purchase of products or services consistently selected, in the future, although the influence of the business situation and marketing efforts have the potential to cause changes in behavior. According to Hasan (2008: 83) customer loyalty is defined as a person who buys, especially those that buy regularly and repeatedly. Customer is a person who continuously and repeatedly came to a similar place to satisfy his desire to have a product or obtain a service, and pay for products or services. Customer loyalty is one of the core objectives are pursued in modern marketing. This is due to the loyalty expected the company will benefit over the long-‐term mutual relationship that exists within a certain time. Kotler and Keller (2009: 153) argues, creating a close relationship with customers is the dream of all marketers and it is often the key to long-‐term marketing success. From the various descriptions, customer loyalty is an attitude that becomes impulse behavior to make purchases of products / services of a company that includes aspects of feeling in it, especially those who buy regularly and repeatedly with high consistency, but not only buy remanufactured goods and services, but will also have a commitment and a positive attitude towards companies that offer products / services.

Advances in Social Sciences Research Journal (ASSRJ) Vol.3, Issue 1 January-‐2016
Copyright © Society for Science and Education, United Kingdom 81
Thus, it can be conclude that customer loyalty is the attitude of customer attachment to an item or service because of the satisfaction derived consumers to consume goods or services. Experiential Marketing In the field of management understanding of the experience is personal events with emotional significance that is created by the interaction with the related product or brand stimulation. According Novia (2012) experiential marketing is a marketing method that is relatively new, which is delivered to the world of marketing. This approach is considered to be very effective because it fits with the times in which entrepreneurs emphasize the quality of service and something which is an added value for companies to differentiate their business with a competitor's. According to Kertajaya (2007) and Putri and Astuti (2010: 193) experiential marketing is a marketing concept that aims to establish a loyal customer by touching the emotions of customers by creating positive experiences and give a feeling positive towards their services and products through sources such as the external network, consumption, standards set. The goal of experiential marketing is the provision of such value to the consumer experience. Criteria of performance seen from the level of consumption occurred. The main key of experiental marketing is the emergence of emotions that lead to a squeeze connection with consumers. According to Kusumawati (2011: 76) the concept of experiential marketing is divided into two major parts, namely:
- Strategic Experiential Marketing is using the whole approach to sensory experiences, feelings / affective, cognitive, physical and lifestyle, as well as the relationship with culture or certain references which eventually able to give an imagination that have an impact on the value of the experience on a product or service. Strategic Experiential Marketing includes the following dimensions:
a. Sense Marketing b. Feel Marketing c. Think Marketing d. Act Marketing e. Relate Marketing - Experiential Provider is the component that allows the formation of memorable
experience that includes communications, visual identity, product presence, co-‐branding, spatial environment, web sites and people. Experiential provider strive to give good attention to consumers individually or per group, presents a communicative style of communication, dialogue, so as to provide experience and empathy to consumers.
This research try to explore the strategic experiential marketing through those dimensions. Sense Marketing According Kertajaya in Musfar and Novia (2012: 3) sense marketing is a way to touch the consumers emotions through consumer experience that can be gained through the senses (eyes, ears, tongue, skin and nose) that they have to product and service. According to Rini

Nurcahyo, B, (2016). The Role of Customr Satisfaction in a Relation of Experiential Marketing and Customer Loyalty. Advances in Social Sciences Research Journal, 3(1) 78-‐89.
URL: http://dx.doi.org/10.14738/assrj.31.1774. 82
(2009: 16) sense is the intangible aspects that can be felt from a product that can be captured by the five human senses, such as sight, sound, taste, smell, and touch. Feel Marketing According Andreani (2007) states that the feeling is not just a beauty concerns but the mood and emotions of the soul that can evoke happiness or sadness. Musfar and Novia (2012: 3) said feel marketing directed against the feelings and emotions of consumers with the aim of influencing the experience that starts from a soft mood up with strong emotions to the pleasure and pride. Think Marketing In general, humans think in two ways: convergent and divergent. Convergent way of thinking enables companies to narrow the customers thought that the company can steer customers on a theme that is intended by the customer. While divergent thinking how to make customers have a broad idea so that the company can steer customers on many different themes. According to Rini (2009) think marketing is the strategyconducted by the company to challenge the consumer, by providing problem solving experiences and encourage customers to interact cognitively or creatively with the company or product. Act Marketing Putri and Astuti (2010) argues that act marketing is part of the Strategic Experiential Modules (SEM’s). Act marketing designed to create consumer experiences in relation to the physical body, lifestyles, and interactions with others. For example in hospitality services are welcoming guests with friendly, smiley face, etc. It can provide an experience to the customer to feel at home and comfortable. According to Andreani (2007) the act relating to the real behavior and lifestyle. This is related to how to get people to do something and express his lifestyle. Relate Marketing According to Andreani (2007) relate marketing related to one's culture and the reference group that can create a social identity. A marketer should be able to create a social identity for its customers with the products or services offered. According to Saraswati, Arifin and Yulianto (2013: 3) relate marketing is the main attraction deepest desire for customers to the formation of self-‐improvement, social and economic status, and self-‐image. Customer Satisfaction Tjiptono (2008: 24) argues that customer satisfaction is an an evaluation after-‐purchase where the selected alternative is at least equal or exceed customer expectations, while dissatisfaction arise if the results do not meet expectations. Kotler and Keller (2009: 150) said the company will act with the measure of customer satisfaction on a regular basis as one of the keys to retaining customers is customer satisfaction. Highly satisfied customers generally remain loyal for longer periods, to buy again when the company introduced new products and updating old products. Research Framework Experiential marketing consisting of sense, feel, think, act and relate is one marketing strategy. Experiential marketing offers different things, where the experience of consumers who will be the target. The first element of experiential marketing: sense is the element that gives appeal to
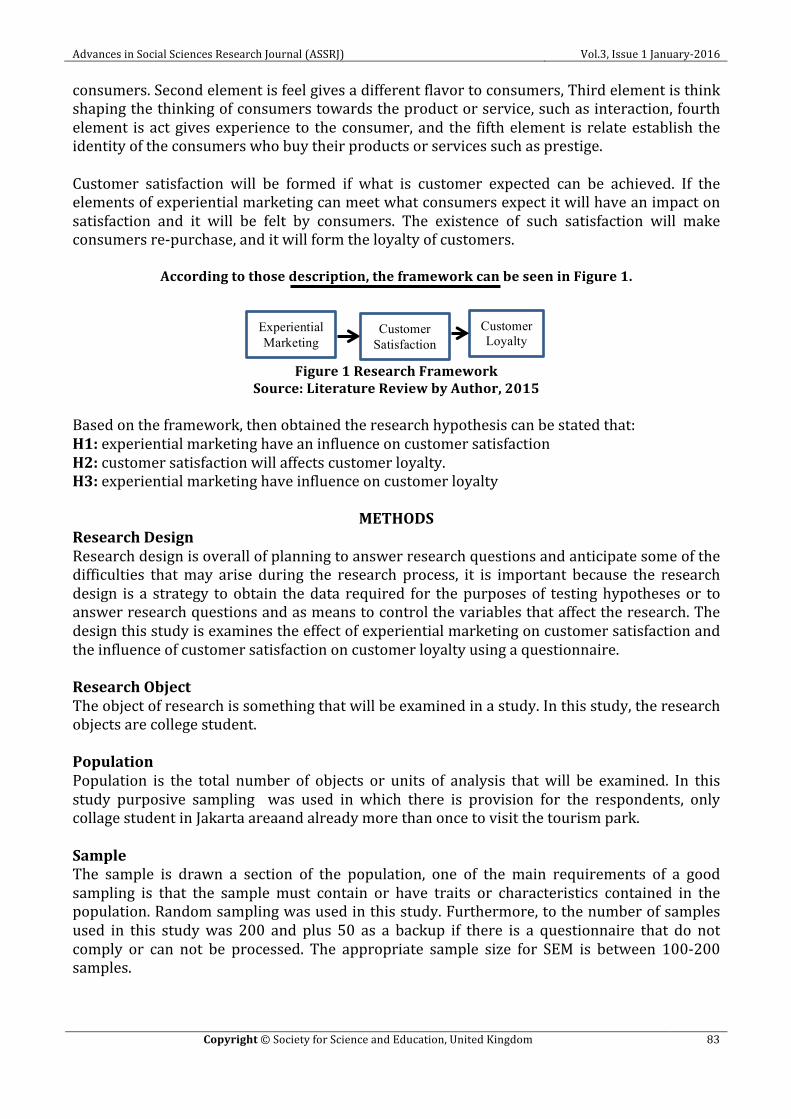
Advances in Social Sciences Research Journal (ASSRJ) Vol.3, Issue 1 January-‐2016
Copyright © Society for Science and Education, United Kingdom 83
consumers. Second element is feel gives a different flavor to consumers, Third element is think shaping the thinking of consumers towards the product or service, such as interaction, fourth element is act gives experience to the consumer, and the fifth element is relate establish the identity of the consumers who buy their products or services such as prestige. Customer satisfaction will be formed if what is customer expected can be achieved. If the elements of experiential marketing can meet what consumers expect it will have an impact on satisfaction and it will be felt by consumers. The existence of such satisfaction will make consumers re-‐purchase, and it will form the loyalty of customers.
According to those description, the framework can be seen in Figure 1.
Figure 1 Research Framework
Source: Literature Review by Author, 2015 Based on the framework, then obtained the research hypothesis can be stated that: H1: experiential marketing have an influence on customer satisfaction H2: customer satisfaction will affects customer loyalty. H3: experiential marketing have influence on customer loyalty
METHODS Research Design Research design is overall of planning to answer research questions and anticipate some of the difficulties that may arise during the research process, it is important because the research design is a strategy to obtain the data required for the purposes of testing hypotheses or to answer research questions and as means to control the variables that affect the research. The design this study is examines the effect of experiential marketing on customer satisfaction and the influence of customer satisfaction on customer loyalty using a questionnaire. Research Object The object of research is something that will be examined in a study. In this study, the research objects are college student. Population Population is the total number of objects or units of analysis that will be examined. In this study purposive sampling was used in which there is provision for the respondents, only collage student in Jakarta areaand already more than once to visit the tourism park. Sample The sample is drawn a section of the population, one of the main requirements of a good sampling is that the sample must contain or have traits or characteristics contained in the population. Random sampling was used in this study. Furthermore, to the number of samples used in this study was 200 and plus 50 as a backup if there is a questionnaire that do not comply or can not be processed. The appropriate sample size for SEM is between 100-‐200 samples.
Experiential Marketing
Customer Satisfaction
Customer Loyalty
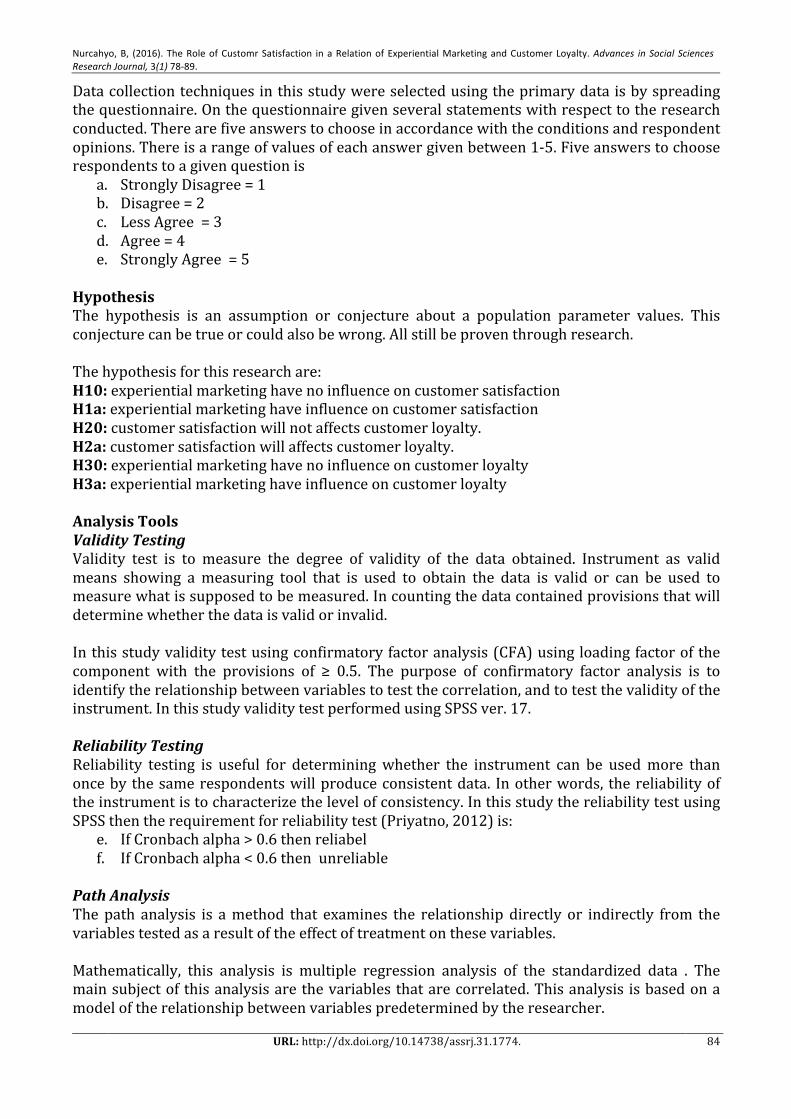
Nurcahyo, B, (2016). The Role of Customr Satisfaction in a Relation of Experiential Marketing and Customer Loyalty. Advances in Social Sciences Research Journal, 3(1) 78-‐89.
URL: http://dx.doi.org/10.14738/assrj.31.1774. 84
Data collection techniques in this study were selected using the primary data is by spreading the questionnaire. On the questionnaire given several statements with respect to the research conducted. There are five answers to choose in accordance with the conditions and respondent opinions. There is a range of values of each answer given between 1-‐5. Five answers to choose respondents to a given question is
a. Strongly Disagree = 1 b. Disagree = 2 c. Less Agree = 3 d. Agree = 4 e. Strongly Agree = 5
Hypothesis The hypothesis is an assumption or conjecture about a population parameter values. This conjecture can be true or could also be wrong. All still be proven through research. The hypothesis for this research are: H10: experiential marketing have no influence on customer satisfaction H1a: experiential marketing have influence on customer satisfaction H20: customer satisfaction will not affects customer loyalty. H2a: customer satisfaction will affects customer loyalty. H30: experiential marketing have no influence on customer loyalty H3a: experiential marketing have influence on customer loyalty Analysis Tools Validity Testing Validity test is to measure the degree of validity of the data obtained. Instrument as valid means showing a measuring tool that is used to obtain the data is valid or can be used to measure what is supposed to be measured. In counting the data contained provisions that will determine whether the data is valid or invalid. In this study validity test using confirmatory factor analysis (CFA) using loading factor of the component with the provisions of ≥ 0.5. The purpose of confirmatory factor analysis is to identify the relationship between variables to test the correlation, and to test the validity of the instrument. In this study validity test performed using SPSS ver. 17. Reliability Testing Reliability testing is useful for determining whether the instrument can be used more than once by the same respondents will produce consistent data. In other words, the reliability of the instrument is to characterize the level of consistency. In this study the reliability test using SPSS then the requirement for reliability test (Priyatno, 2012) is:
e. If Cronbach alpha > 0.6 then reliabel f. If Cronbach alpha < 0.6 then unreliable
Path Analysis The path analysis is a method that examines the relationship directly or indirectly from the variables tested as a result of the effect of treatment on these variables. Mathematically, this analysis is multiple regression analysis of the standardized data . The main subject of this analysis are the variables that are correlated. This analysis is based on a model of the relationship between variables predetermined by the researcher.
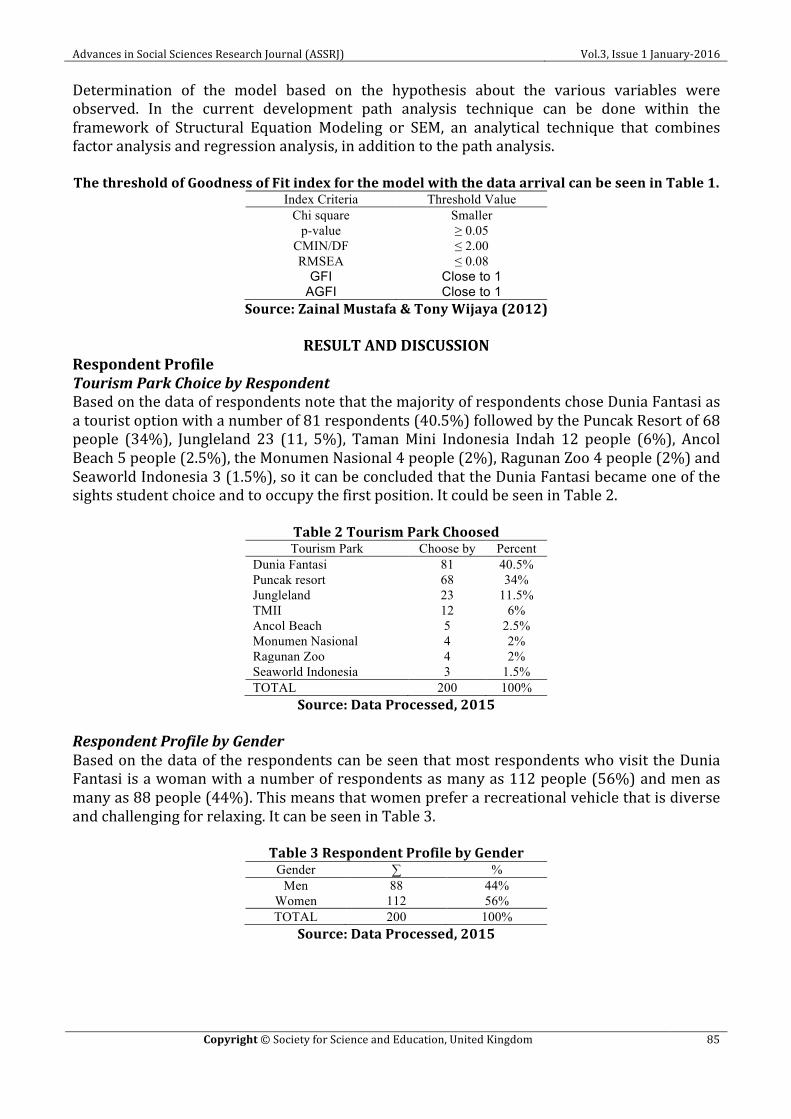
Advances in Social Sciences Research Journal (ASSRJ) Vol.3, Issue 1 January-‐2016
Copyright © Society for Science and Education, United Kingdom 85
Determination of the model based on the hypothesis about the various variables were observed. In the current development path analysis technique can be done within the framework of Structural Equation Modeling or SEM, an analytical technique that combines factor analysis and regression analysis, in addition to the path analysis. The threshold of Goodness of Fit index for the model with the data arrival can be seen in Table 1.
Index Criteria Threshold Value Chi square Smaller
p-value ≥ 0.05 CMIN/DF ≤ 2.00 RMSEA ≤ 0.08
GFI Close to 1 AGFI Close to 1
Source: Zainal Mustafa & Tony Wijaya (2012)
RESULT AND DISCUSSION Respondent Profile Tourism Park Choice by Respondent Based on the data of respondents note that the majority of respondents chose Dunia Fantasi as a tourist option with a number of 81 respondents (40.5%) followed by the Puncak Resort of 68 people (34%), Jungleland 23 (11, 5%), Taman Mini Indonesia Indah 12 people (6%), Ancol Beach 5 people (2.5%), the Monumen Nasional 4 people (2%), Ragunan Zoo 4 people (2%) and Seaworld Indonesia 3 (1.5%), so it can be concluded that the Dunia Fantasi became one of the sights student choice and to occupy the first position. It could be seen in Table 2.
Table 2 Tourism Park Choosed Tourism Park Choose by Percent
Dunia Fantasi 81 40.5% Puncak resort 68 34% Jungleland 23 11.5% TMII 12 6% Ancol Beach 5 2.5% Monumen Nasional 4 2% Ragunan Zoo 4 2% Seaworld Indonesia 3 1.5% TOTAL 200 100%
Source: Data Processed, 2015 Respondent Profile by Gender Based on the data of the respondents can be seen that most respondents who visit the Dunia Fantasi is a woman with a number of respondents as many as 112 people (56%) and men as many as 88 people (44%). This means that women prefer a recreational vehicle that is diverse and challenging for relaxing. It can be seen in Table 3.
Table 3 Respondent Profile by Gender Gender ∑ %
Men 88 44% Women 112 56% TOTAL 200 100%
Source: Data Processed, 2015
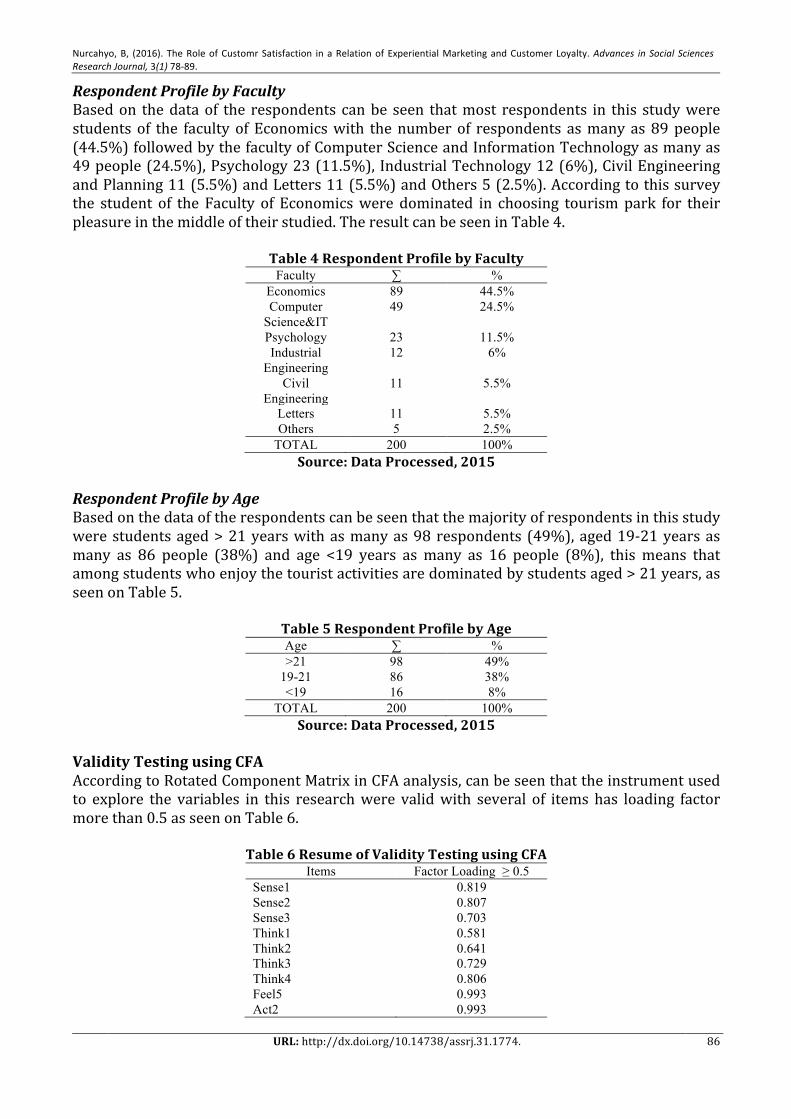
Nurcahyo, B, (2016). The Role of Customr Satisfaction in a Relation of Experiential Marketing and Customer Loyalty. Advances in Social Sciences Research Journal, 3(1) 78-‐89.
URL: http://dx.doi.org/10.14738/assrj.31.1774. 86
Respondent Profile by Faculty Based on the data of the respondents can be seen that most respondents in this study were students of the faculty of Economics with the number of respondents as many as 89 people (44.5%) followed by the faculty of Computer Science and Information Technology as many as 49 people (24.5%), Psychology 23 (11.5%), Industrial Technology 12 (6%), Civil Engineering and Planning 11 (5.5%) and Letters 11 (5.5%) and Others 5 (2.5%). According to this survey the student of the Faculty of Economics were dominated in choosing tourism park for their pleasure in the middle of their studied. The result can be seen in Table 4.
Table 4 Respondent Profile by Faculty Faculty ∑ %
Economics 89 44.5% Computer
Science&IT 49 24.5%
Psychology 23 11.5% Industrial
Engineering 12 6%
Civil Engineering
11 5.5%
Letters 11 5.5% Others 5 2.5%
TOTAL 200 100% Source: Data Processed, 2015
Respondent Profile by Age Based on the data of the respondents can be seen that the majority of respondents in this study were students aged > 21 years with as many as 98 respondents (49%), aged 19-‐21 years as many as 86 people (38%) and age <19 years as many as 16 people (8%), this means that among students who enjoy the tourist activities are dominated by students aged > 21 years, as seen on Table 5.
Table 5 Respondent Profile by Age Age ∑ % >21 98 49%
19-21 86 38% <19 16 8%
TOTAL 200 100% Source: Data Processed, 2015
Validity Testing using CFA According to Rotated Component Matrix in CFA analysis, can be seen that the instrument used to explore the variables in this research were valid with several of items has loading factor more than 0.5 as seen on Table 6.
Table 6 Resume of Validity Testing using CFA Items Factor Loading ≥ 0.5
Sense1 0.819 Sense2 0.807 Sense3 0.703 Think1 0.581 Think2 0.641 Think3 0.729 Think4 0.806 Feel5 0.993 Act2 0.993
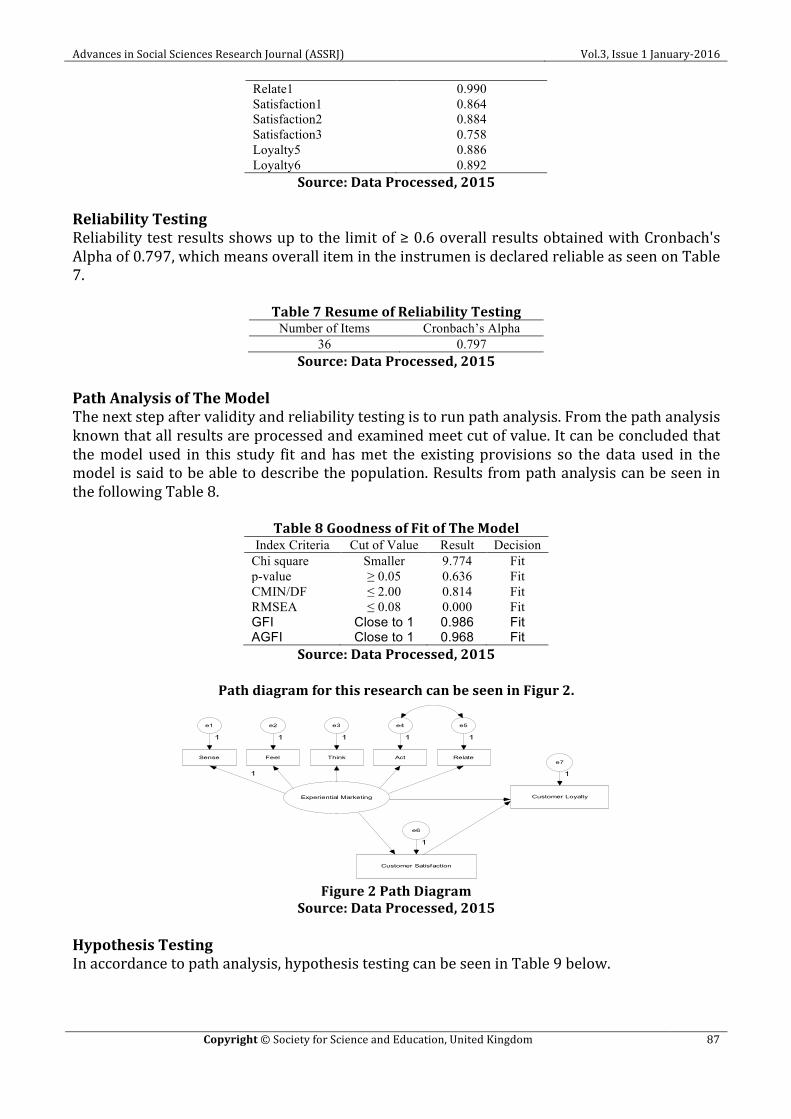
Advances in Social Sciences Research Journal (ASSRJ) Vol.3, Issue 1 January-‐2016
Copyright © Society for Science and Education, United Kingdom 87
Relate1 0.990 Satisfaction1 0.864 Satisfaction2 0.884 Satisfaction3 0.758 Loyalty5 0.886 Loyalty6 0.892
Source: Data Processed, 2015 Reliability Testing Reliability test results shows up to the limit of ≥ 0.6 overall results obtained with Cronbach's Alpha of 0.797, which means overall item in the instrumen is declared reliable as seen on Table 7.
Table 7 Resume of Reliability Testing Number of Items Cronbach’s Alpha
36 0.797 Source: Data Processed, 2015
Path Analysis of The Model The next step after validity and reliability testing is to run path analysis. From the path analysis known that all results are processed and examined meet cut of value. It can be concluded that the model used in this study fit and has met the existing provisions so the data used in the model is said to be able to describe the population. Results from path analysis can be seen in the following Table 8.
Table 8 Goodness of Fit of The Model Index Criteria Cut of Value Result Decision
Chi square Smaller 9.774 Fit p-value ≥ 0.05 0.636 Fit CMIN/DF ≤ 2.00 0.814 Fit RMSEA ≤ 0.08 0.000 Fit GFI Close to 1 0.986 Fit AGFI Close to 1 0.968 Fit
Source: Data Processed, 2015
Path diagram for this research can be seen in Figur 2.
Figure 2 Path Diagram
Source: Data Processed, 2015 Hypothesis Testing In accordance to path analysis, hypothesis testing can be seen in Table 9 below.
Experiential Marketing
Customer Satisfaction
Customer Loyalty
Sense
e1
1
1
Feel
e2
1
Think
e3
1
Act
e4
1
Relate
e5
1
e6
1
e7
1

Nurcahyo, B, (2016). The Role of Customr Satisfaction in a Relation of Experiential Marketing and Customer Loyalty. Advances in Social Sciences Research Journal, 3(1) 78-‐89.
URL: http://dx.doi.org/10.14738/assrj.31.1774. 88
Table 9 Hypothesis Testing using Path Analysis Hypothesis C.R. P Decision
Customer Satisfacti
on ß
Experiential
Marketing 1.912 .056 Accepted
Ha
Customer Loyalty ß
Customer Satisfactio
n 7.275 *** Accepted
Ha
Customer Loyalty ß
Experiential
Marketing -.791 .429 Rejected
Ha
Source: Data Processed, 2015 Based on Table 9, it showed that hypothesis 1 accepted, so it can be said that experiential marketing have influence to customer satisfaction. Hypothesis 2 accepted, it means that customer satisfaction will influence customer loyalty, while hypothesis 3 rejected, means experiential marketing not affected to customer loyalty. According to this result, it can be said that customer satisfaction perform depends on experiential marketing strategy used by the producer while the customer satisfaction rising it will strengthen customer loyalty but directly, experiential marketing will not influence customer loyalty. It means, this research found that customer satisfaction has fully mediation role in the relation of experiential marketing with customer loyalty.
CONCLUSION From the hypothesis testing it can be concluded that experiential marketing have an influence on customer satisfaction with estimate regression weight 0.210 and p-‐value 0.056. Customer satisfaction have an influence on customer loyalty with estimate regression weight 0.375 and p-‐value less than 0.0001. And experiential marketing does not have influence on customer loyalty with estimate regression weight -‐0.063 and p-‐value 0.429. According to those conclusion it can be said that customer satisfaction have fully mediation role in the relation of experiential marketing and cutomer loyalty. This result has implication that management should concern in the develop strategic experiential marketing, especially if their business is in service area, because in the business of service they should give good experience to their consumer so they will have satisfy with the business and they will become loyal. For future research suggested to use subject widely, because more widely the subject will imply to the generalized of the result, may use more various variable, because many variable affected customer satisfaction out there that will bring implication to the result. References Andreani, Fransisca. 2007. Experiential Marketing (Sebuah Pendekatan Pemasaran). Jurnal Manajemen Pemasaran, Vol. 2, No. 1, April 2007: 1-‐8
Hasan, Ali. 2008. Marketing. Jakarta: MedPress
Hurriyati, Ratih. 2008. Bauran Pemasaran dan Loyalitas Konsumen. Alfabeta : Bandung
Kertajaya, Hermawan .2007. Hermawan Kertajaya On Service. Mizan Pustaka

Advances in Social Sciences Research Journal (ASSRJ) Vol.3, Issue 1 January-‐2016
Copyright © Society for Science and Education, United Kingdom 89
Kotler et al. 2008. Prinsip Prinsip Pemasaran. Jakarta : Erlangga
Kotler, P., dan Keller, K. L., 2009, Manajemen Pemasaran. Edisi Ketiga Belas. Jilid Kedua, Erlangga : Jakarta.
Kusumawati, Andriani. 2011. Analisis Pengaruh Experiential Marketing Terhadap Kepuasan Konsumen dan Loyalitas Pelanggan : Kasus
Hypermart Malang Town Square (MATOS). Jurnal. Vol. 3 No.1.
Musfar, Tengku Firli dan Novia, Vivi. 2012. Pengaruh Experiential Marketing Terhadap Customer Loyalty Pada Pelanggan Restoran Koki Sunda di Pekanbaru. Jurnal Ekonomi. Vol. 20, No. 4: 1-‐16 90
Novia, V. 2012. Pengaruh Experiential Marketing Terhadap Customer Loyalty Sunda di Pekanbaru. Jurnal Manajemen hal 1-‐15
Priyatno, Duwi. 2012. Cara Kilat Belajar Analisis Data Dengan SPSS 20. Yogyakarta: Andi
Putri, Yuwandha Anggia dan Astuti, Sri Rahayu Tri. 2010. Analisis Pengaruh Experiential Marketing terhadap Loyalitas Pelanggan Hotel “X” Semarang. Jurnal. Vol. 12, No. 2
Rangkuti, F. 2009. Strategi Promosi yang Kreatif dan Analisis Kasus Integrated Marketing. Penerbit Gramedia Pustaka Utama. Jakarta. 91
Rini, E.S. 2009. Menciptakan Pengalaman Konsumen dengan Experiential Marketing. Jurnal Manajemen Bisnis. Vol 2, No 1: 15-‐20.
Saraswati, Riza, Zainul Arifin dan Edy Yulianto. 2014. Pengaruh Experiential Marketing Terhadap Loyalitas (Studi Pada Pelanggan Taman Indie Resto Malang). Jurnal Administrasi Bisnis. Vol 6, No. 1.
Tjiptono, Fandi. 2008. Manajemen Jasa. Andi : Jogyakarta.

Advances in Social Sciences Research Journal – Vol.3, No.1 Publication Date: Jan. 25, 2016 DoI:10.14738/assrj.31.1764.
Kamba, F., & Sangija, F. (2016). Impact of Water Pollution on Human Health in the Central African Republic. Advances in Social Sciences Research Journal, 3(1) 90-‐115.
Copyright © Society for Science and Education, United Kingdom 90
Impact of Water Pollution on Human Health in the Central African Republic
Francklin Kamba
College of Resources and Environment Southwest University BeiBei Chongqing, 400715, P.R.China
Frank Sangija
College Food science and Technology Southwest University BeiBei District, Chongqing
Shiqiang Wei
College of Resources and Environment Southwest University BeiBei Chongqing, 400715, P.R.China
Abstract
Bacterial contamination of waters and their impacts on human health in the Central African Republic is a pollution problem that goes far back in time. Today, water quality is impaired, including the contamination of fecal microorganisms, excessive use of agrochemicals, uncontrolled discharges from industries and solid and liquid waste from households and municipal. Most of people in Central Africa use water directly from the wells and rivers water for their domestic activities include drinking. These works highlight the bacteriological and nitrate pollution of surface and groundwater streams and how can impair public health. Many reports concluded that this pollution came from poor sanitation wastes/extracts. Other studies have revealed the presence of nitrates and coliform bacteria in groundwater in agricultural areas it concludes that, this pollution comes from the reuse of untreated wastewater in agriculture. Rivers and lakes seem to be most contaminated sources because are most exposed to waste. Human activities and poor municipal waste control contribute to water pollution and results to serious health problems. Main data in this review study are collected in various existing studies by many researchers and published in international and national journals, but also by non-‐governmental organizations and the Central African Government reports. Key words: clean water, water pollution, contamination, pathogenic microorganisms.
INTRODUCTION
The freshwater resources of the planet are facing increasing threats (GWP, 2009). Access to clean water is at the heart of most public health problems facing developing countries including the Central African Republic. However, significant pressures on water supplies in various parts of the world are contributing to a worrying deterioration in their quality (Wikipédia/Geopolitics of Water, 2009). The World Health Organization estimates that nearly 500 million people each year are affected by waterborne diseases, and 20 million of these people die although microbiological quality of water remains the primary public health concern worldwide (Gantzer et al., 1998; UN, 2007; Constantine et al., 2007). Among the factors responsible for these infections bacteria take a great concern for polluted water. Louis Pasteur portrayed that "we drink 90% of our diseases." Additionally, bacterial contamination in water environment is a natural phenomenon in which man plays the role of primary
Advances in Social Sciences Research Journal (ASSRJ) Vol.3, Issue 1 January-‐2016
Copyright © Society for Science and Education, United Kingdom 91
contaminant, but also secondary receiver of bacteria present in the medium (Gantzer et al., 1998). Currently, water quality is impaired, including the excessive use of agrochemicals, uncontrolled discharges from industries, solid and liquid waste from households (Saab et al., 2007; Abu Jawdeh et al., 2000). Preservation of water quality and its equitable use are necessary for sustainable development and its contribution to maintaining health (Makoutodé et al., 1999). Unfortunately, in Central Africa, more than three quarter of the population suffers from diseases of or poor quality of the raw material essential for human life. This kind of terrible living conditions favor the deaths of nearly 10,000 people a day, 20 times the number killed in wars in which a large majority of child (Tomkins et al., 2004). Despite the measures taken and efforts on the international level, water is still and remains at the center of much debate (Dinar, 2000; Marino and Boland 1999). Water is treated as an infinite free good and the issues that are related are many. Water rate the social life of the family or village (Alley et al., 2002). Water is part of our natural environment like the air we breathe and the land that supports us and feeds us; it is a familiar part of our everyday life (Nguimalet et al., 1999). In 1980, in developing countries excluding China, 3 out of 5 people had no water (Alley 2002 & SEM 2002). However, water supplies are adequate they are daily threats by pollution while demand increases. According to a UN report, the Central African population is increasing exponentially while water availability is declining. Microbiological infections are the most common water related diseases mainly caused by three types of organisms which are bacteria, viruses and protozoa (Zogo, 1980; Health Canada, 2003). In developing countries water problem is more serious because of the lack of good governance, lack of professional and even financial hardship (PCRWR, 2000). The Central African Republic as well as other developing countries always have water shortage and rampant pollution. To regress these infectious and parasitic diseases transmitted by water, International Decade of Drinking Water and Sanitation (IDWSSD, 1981-‐1990) promoted a policy to raise the level of health and population production of drinking water available (Director Inter institutional Cooperation Committee for the Decade, 1990; WHO, 1994; Comlanvi, 1994). Despite the immense of freshwater resources of Central Africa, the country continued to suffer from polluted water and faces a major challenge in the water sector: which is increasing in low rate of access to quality drinking water with total absence of bacteria fecal contamination from its rapidly growing population. (WHO, 1993, MSP 2001; Miquel, 2003). CAR suffered decades (2003-‐2013) of underinvestment, exacerbated by the destruction of facilities during the conflict that greatly deteriorating infrastructure and water services in the country. The access to safe drinking water rate is 25% which is one of the lowest amount in Central Africa (Mokofio et al., 1991). CAR is sufficiently endowed with water resources enabling it to meet the needs of the population (MMEH, 1999). Unfortunately, these resources are also at risk of bacteriological, chemical and biological pollution, especially in areas of very high concentrations of people (ASNA, 2010). In the current difficult situation the country unfortunately not reach the seventh goal of the Millennium Development Goals (MDGs) of drinking water. This review, quoted example of excellent detailed study by (Mokofio et al., 1991) on the bacteriological quality of water from wells, boreholes sources in some districts of the city in Bangui. Results of study conducted by (Mokofio et al., 1991) show that almost all wells and
Kamba, F., & Sangija, F. (2016). Impact of Water Pollution on Human Health in the Central African Republic. Advances in Social Sciences Research Journal, 3(1) 90-‐115.
URL: http://dx.doi.org/10.14738/assrj.31.1764. 92
surface water is contaminated by fecal germs and pollution is the most important that the district is low altitude (see results in table 1 below). Private Wells and well maintained drilling generally have a low level of pollution. The poor quality of drinking water available in the country forces the population to obtain a costly alternative in the form of mineral water available commercially packaged in plastic bottles. However, this water commercially available is also not completely suitable due to lack of proper monitoring in of processing plants (Roseman, 2005). The low purchasing power of the population is an obstacle. Given this situation, the majority of the Central African population is exposed to contaminated water that can cause health problems. According Capo-‐Chichi (2009), many population are still using untreated water from well or the waterways, for drinking, even in cities where treated water is supplied. However, they usually contain potential contaminants including pathogenic microorganisms such as bacteria (Goss, 1998). Indeed, some bacteria, such as fecal coliforms represented by Escherichia coli (E. coli), can be harmful to humans and some other animals .Thus the pollution of these water sources does not spare withholding water installed in the Ubangi River, which feeds the unique water Distribution Company of Central Africa (SODECA. People who handle these waters without treatment for various needs are exposed to all kinds of waterborne diseases. The exponential pollution of these water sources in Central Africa and its impact on human and environmental health is a subject of great concern. Central African government and development partners or investors should put particular emphasis on this problem of water pollution and their effects on human health, because 75% of water in Central African population are supplied from wells, boreholes and surface water (Aziz et al., 2005 ), surface water is another main source of drinking water and other domestic uses. The present review aims to determine the bacteriological pollution of raw water from drilling water, wells and surface water in different parts of the Central African capital.
CHEMICAL CONTAMINANTS IN WATER (DIFFERENT POLLUTANTS) A pollutant is a natural substance and outcome of human activities that, when present in excessive amounts in the environment can have harmful effects on living things. According to the famous Swiss alchemist Paracelsus physician (1493-‐1541) "Nothing is poison, everything is poison, only the dose makes the poison. “This Observation applies to pollutants, some of which are active at extremely low doses (of the order of gram per liter of water billionth) .However some substances are more toxic than others and are more harmful to human health and the environment. According to Tchobanoglous and Schroeder (1985) these substances are considered to be biological and chemical impurities from the water (see table below) which are pathogens (viruses, bacteria and protozoa), inorganic pollutants (salts and acids), and ions (nitrates, phosphates, sulfates Ca+2, Mg+2 and F-‐). In Central Africa, the most commonly encountered substances in groundwater and surface water are: calcium, chloride, magnesium, sodium, potassium, bicarbonates, sulfates, phosphates, and nitrates. Traces of other ions such as lead, copper, iron, manganese, and arsenic can also occur, these chemical elements found in the state of traces in water and when they exceed a limit, they are harmful and cause serious health problems in humans and other organisms in the biotope. In the Central African industrial urban effluent discharges, pesticides and fertilizers in agriculture as well as livestock wastes are the main sources of pollution.
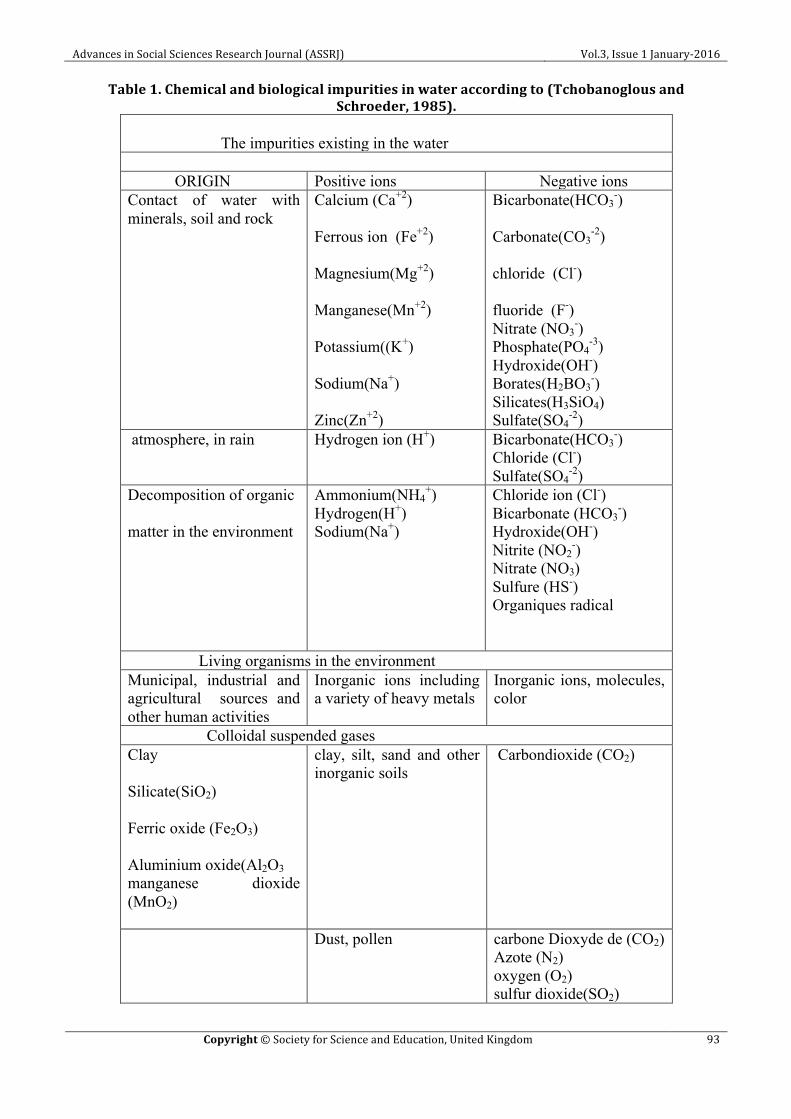
Advances in Social Sciences Research Journal (ASSRJ) Vol.3, Issue 1 January-‐2016
Copyright © Society for Science and Education, United Kingdom 93
Table 1. Chemical and biological impurities in water according to (Tchobanoglous and Schroeder, 1985).
The impurities existing in the water
ORIGIN Positive ions Negative ions
Contact of water with minerals, soil and rock
Calcium (Ca+2) Ferrous ion (Fe+2) Magnesium(Mg+2) Manganese(Mn+2) Potassium((K+) Sodium(Na+) Zinc(Zn+2)
Bicarbonate(HCO3-)
Carbonate(CO3
-2) chloride (Cl-) fluoride (F-) Nitrate (NO3
-) Phosphate(PO4
-3) Hydroxide(OH-) Borates(H2BO3
-) Silicates(H3SiO4) Sulfate(SO4
-2) atmosphere, in rain Hydrogen ion (H+) Bicarbonate(HCO3
-) Chloride (Cl-) Sulfate(SO4
-2) Decomposition of organic matter in the environment
Ammonium(NH4+)
Hydrogen(H+) Sodium(Na+)
Chloride ion (Cl-) Bicarbonate (HCO3
-) Hydroxide(OH-) Nitrite (NO2
-) Nitrate (NO3) Sulfure (HS-) Organiques radical
Living organisms in the environment Municipal, industrial and agricultural sources and other human activities
Inorganic ions including a variety of heavy metals
Inorganic ions, molecules, color
Colloidal suspended gases Clay Silicate(SiO2) Ferric oxide (Fe2O3) Aluminium oxide(Al2O3 manganese dioxide (MnO2)
clay, silt, sand and other inorganic soils
Carbondioxide (CO2)
Dust, pollen carbone Dioxyde de (CO2) Azote (N2) oxygen (O2) sulfur dioxide(SO2)
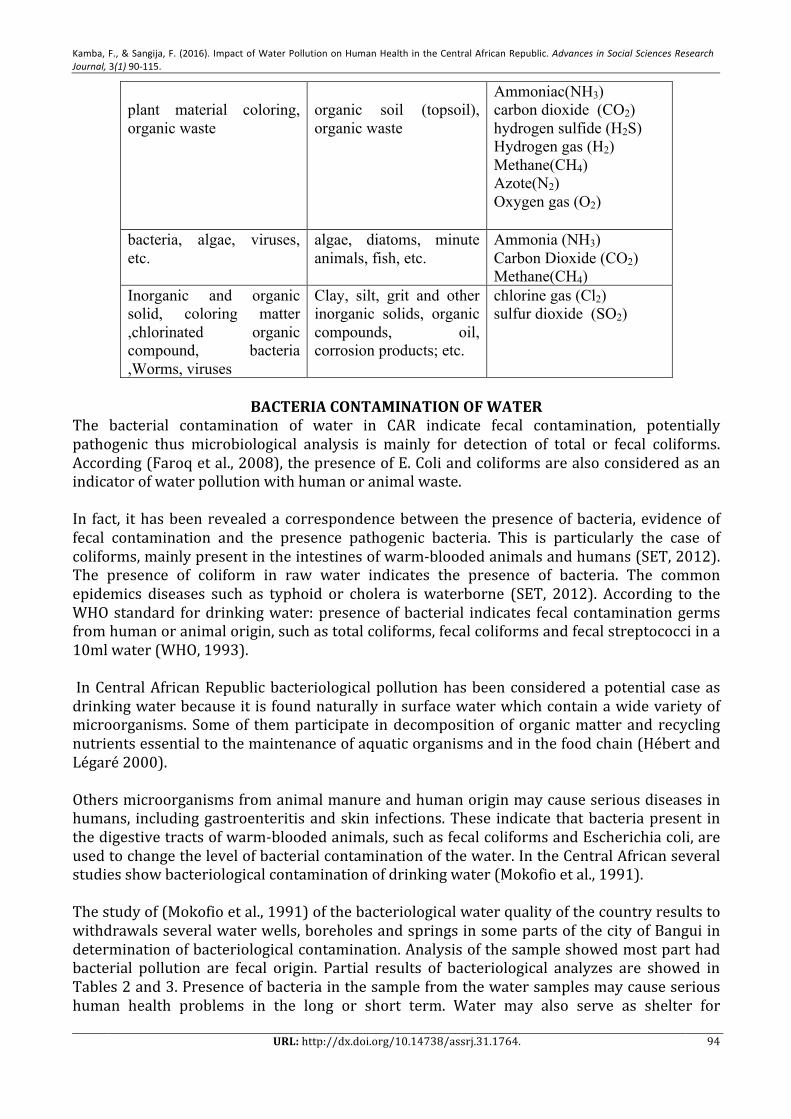
Kamba, F., & Sangija, F. (2016). Impact of Water Pollution on Human Health in the Central African Republic. Advances in Social Sciences Research Journal, 3(1) 90-‐115.
URL: http://dx.doi.org/10.14738/assrj.31.1764. 94
plant material coloring, organic waste
organic soil (topsoil), organic waste
Ammoniac(NH3) carbon dioxide (CO2) hydrogen sulfide (H2S) Hydrogen gas (H2) Methane(CH4) Azote(N2) Oxygen gas (O2)
bacteria, algae, viruses, etc.
algae, diatoms, minute animals, fish, etc.
Ammonia (NH3) Carbon Dioxide (CO2) Methane(CH4)
Inorganic and organic solid, coloring matter ,chlorinated organic compound, bacteria ,Worms, viruses
Clay, silt, grit and other inorganic solids, organic compounds, oil, corrosion products; etc.
chlorine gas (Cl2) sulfur dioxide (SO2)
BACTERIA CONTAMINATION OF WATER
The bacterial contamination of water in CAR indicate fecal contamination, potentially pathogenic thus microbiological analysis is mainly for detection of total or fecal coliforms. According (Faroq et al., 2008), the presence of E. Coli and coliforms are also considered as an indicator of water pollution with human or animal waste. In fact, it has been revealed a correspondence between the presence of bacteria, evidence of fecal contamination and the presence pathogenic bacteria. This is particularly the case of coliforms, mainly present in the intestines of warm-‐blooded animals and humans (SET, 2012). The presence of coliform in raw water indicates the presence of bacteria. The common epidemics diseases such as typhoid or cholera is waterborne (SET, 2012). According to the WHO standard for drinking water: presence of bacterial indicates fecal contamination germs from human or animal origin, such as total coliforms, fecal coliforms and fecal streptococci in a 10ml water (WHO, 1993). In Central African Republic bacteriological pollution has been considered a potential case as drinking water because it is found naturally in surface water which contain a wide variety of microorganisms. Some of them participate in decomposition of organic matter and recycling nutrients essential to the maintenance of aquatic organisms and in the food chain (Hébert and Légaré 2000). Others microorganisms from animal manure and human origin may cause serious diseases in humans, including gastroenteritis and skin infections. These indicate that bacteria present in the digestive tracts of warm-‐blooded animals, such as fecal coliforms and Escherichia coli, are used to change the level of bacterial contamination of the water. In the Central African several studies show bacteriological contamination of drinking water (Mokofio et al., 1991). The study of (Mokofio et al., 1991) of the bacteriological water quality of the country results to withdrawals several water wells, boreholes and springs in some parts of the city of Bangui in determination of bacteriological contamination. Analysis of the sample showed most part had bacterial pollution are fecal origin. Partial results of bacteriological analyzes are showed in Tables 2 and 3. Presence of bacteria in the sample from the water samples may cause serious human health problems in the long or short term. Water may also serve as shelter for

Advances in Social Sciences Research Journal (ASSRJ) Vol.3, Issue 1 January-‐2016
Copyright © Society for Science and Education, United Kingdom 95
arthropod vectors or certain parasites in the transmission of diseases such as malaria, yellow fever, filariasis, schistosomiasis, onchocerciasis (Mokofio et al., 1991). But for public health accept that diarrhea is one of the main causes of waterborne disease in Central Africa (Mokofio et al., 1991)
Table 2: Partial results of bacteriological analyzes of water from the well (P) in the district Malimaka (350 ml altitude), (Mokofio et al., 1991)
Origin of water
Depth in (m) envir
Ph Germ numbers with 100 ml of water Results interpretation
coliforms Escherichia
streptococcus Clostridium
P1 10 6 >100 50 22 5 NDW
P2 10 5.5
>100 22 10 3 NDW
P3 10 6 >100 20
20
10
NDW
P4 10 6 >100 50 50 13 NDW
P5
10
6
>100 20 10 10 NDW
P6 10 6 >50 10 5 3 NDW
Legend: NDW = Not Drinking Water GBWQ = Good Bacteriological Water Quality Table 3: Partial results of analyzes of water from the well (P), sources (S) and drilling (d) in the
Gobongo area (450 m) Origin of water.
Depth in m
Ph Germ numbers with 100 ml of water. Results interpretation
Coliforme totaux
Escherichia
streptococcus
Clostridium.
P1 20 m (environ)
6 50 20 0 10 NDW
P2 « 6 16 4 15 3 NDW P3 « 6 50 10 20 7 NDW P4 « 5.5 2 0 0 0 NDW P5 « 6 30 10 5 2 NDW S6 – a « 5.5 20 10 7 1 NDW S6 – b « 5.5 1 0 0 0 GBWQ S7 – a « 5.5 50 20 10 5 NDW S7 – b « 5.5 2 0 0 0 GBWQ F8 50m 6.5 0 0 0 0 GBWQ
Légend S w = source of water taken from the collection basin S b = sample taken directly to the output of the source

Kamba, F., & Sangija, F. (2016). Impact of Water Pollution on Human Health in the Central African Republic. Advances in Social Sciences Research Journal, 3(1) 90-‐115.
URL: http://dx.doi.org/10.14738/assrj.31.1764. 96
NDW = Not Drinking Water GBWQ = Good Bacteriological Water Quality The results of the bacteriological analysis of water show that all samples were polluted by the presence of coliforms. They are contaminated with fecal coliform and total coliform. Presence of these pathogens in a volume of 100 ml in water sample indicates that waters are not consistent with the recommended limits and are out of the WHO standards (WHO, 1994). The government is insisted to teach the population on water treatment at the family level like use of hypochlorite also it need to plan for the expansion of the network of National Water Company in the framework of a comprehensive sanitation policy to avoid the impact of groundwater pollution on the health of CAR.
Table 4. Potential sources of bacterial contamination of water in the Central (Government report 1999)
industrial Food industries. Natural Ru off. agricultural Livestock manure:
• Discharged to streams (directly or indirectly).Underground storm water drains and fertilized land with animal dopings.
urban Municipal Wastewater: • untreated • not disinfected; • spills and leads to treatment plants; • sewer overflows. • Runoff (Storm water).
rural Domestic wastewater unserved buildings (homes and businesses): • direct discharge of untreated sewage; • septic tank overflows; • Resurgence of septic fields. • Run off.
BACTERIOLOGICAL CONTAMINATION SOURCES
In CAR sources of bacteriological contamination of water are manifold. Government report in 1999 shows contaminations from different places which are urban, rural, agricultural, Industrial and natural. Contamination of waters in CAR are most often caused by permanent risk of exogenous pollution (runoff of rainfall, wastewater discharges, waste fire, infiltration latrines, etc.). According to Desjardins (1997) claimed that the high bacteriological contamination is mostly caused by spills of domestic and agricultural discharges. Also pollution is caused by intense activities around the water point or a large commercial farm (see photos below). Water pollution consists of spills, runoff, discharges, direct or indirect deposits of organic and inorganic materials may increase water degradation.
Photos below show an overflowing landfill unauthorized on the edges of the river water pollution source in CAR (Rodier, 1996; Faurie et al., 1999).
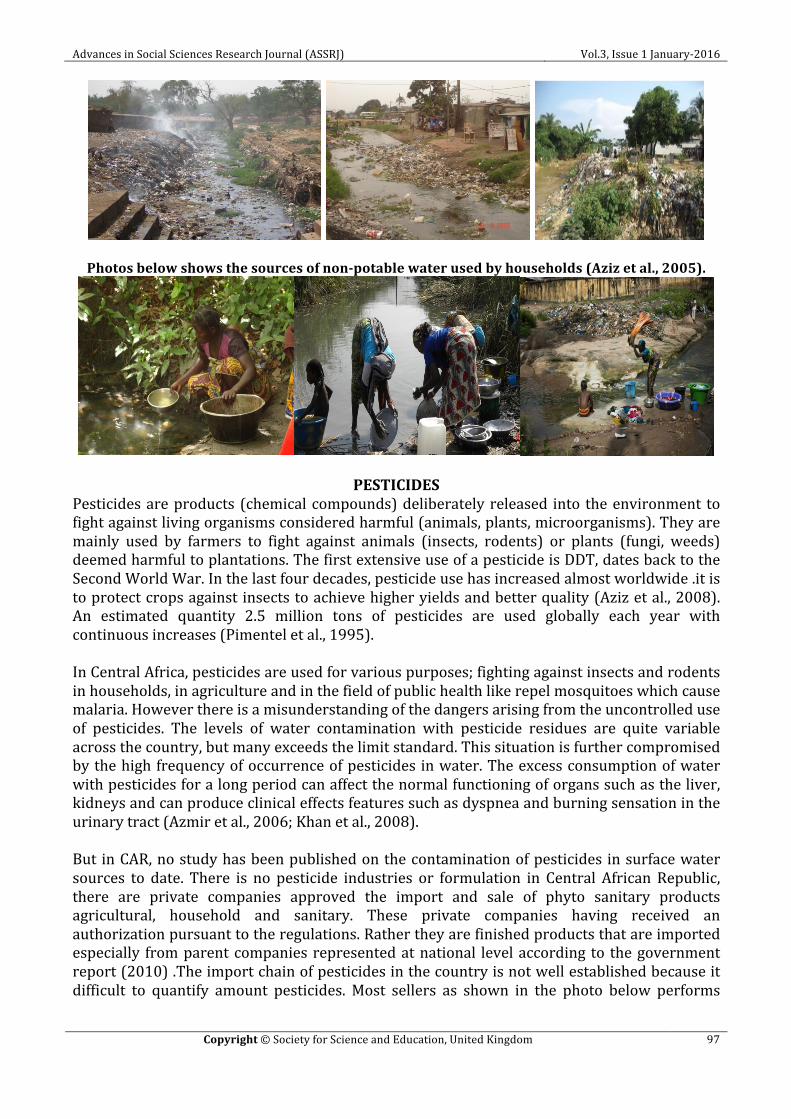
Advances in Social Sciences Research Journal (ASSRJ) Vol.3, Issue 1 January-‐2016
Copyright © Society for Science and Education, United Kingdom 97
Photos below shows the sources of non-‐potable water used by households (Aziz et al., 2005).
PESTICIDES Pesticides are products (chemical compounds) deliberately released into the environment to fight against living organisms considered harmful (animals, plants, microorganisms). They are mainly used by farmers to fight against animals (insects, rodents) or plants (fungi, weeds) deemed harmful to plantations. The first extensive use of a pesticide is DDT, dates back to the Second World War. In the last four decades, pesticide use has increased almost worldwide .it is to protect crops against insects to achieve higher yields and better quality (Aziz et al., 2008). An estimated quantity 2.5 million tons of pesticides are used globally each year with continuous increases (Pimentel et al., 1995). In Central Africa, pesticides are used for various purposes; fighting against insects and rodents in households, in agriculture and in the field of public health like repel mosquitoes which cause malaria. However there is a misunderstanding of the dangers arising from the uncontrolled use of pesticides. The levels of water contamination with pesticide residues are quite variable across the country, but many exceeds the limit standard. This situation is further compromised by the high frequency of occurrence of pesticides in water. The excess consumption of water with pesticides for a long period can affect the normal functioning of organs such as the liver, kidneys and can produce clinical effects features such as dyspnea and burning sensation in the urinary tract (Azmir et al., 2006; Khan et al., 2008). But in CAR, no study has been published on the contamination of pesticides in surface water sources to date. There is no pesticide industries or formulation in Central African Republic, there are private companies approved the import and sale of phyto sanitary products agricultural, household and sanitary. These private companies having received an authorization pursuant to the regulations. Rather they are finished products that are imported especially from parent companies represented at national level according to the government report (2010) .The import chain of pesticides in the country is not well established because it difficult to quantify amount pesticides. Most sellers as shown in the photo below performs
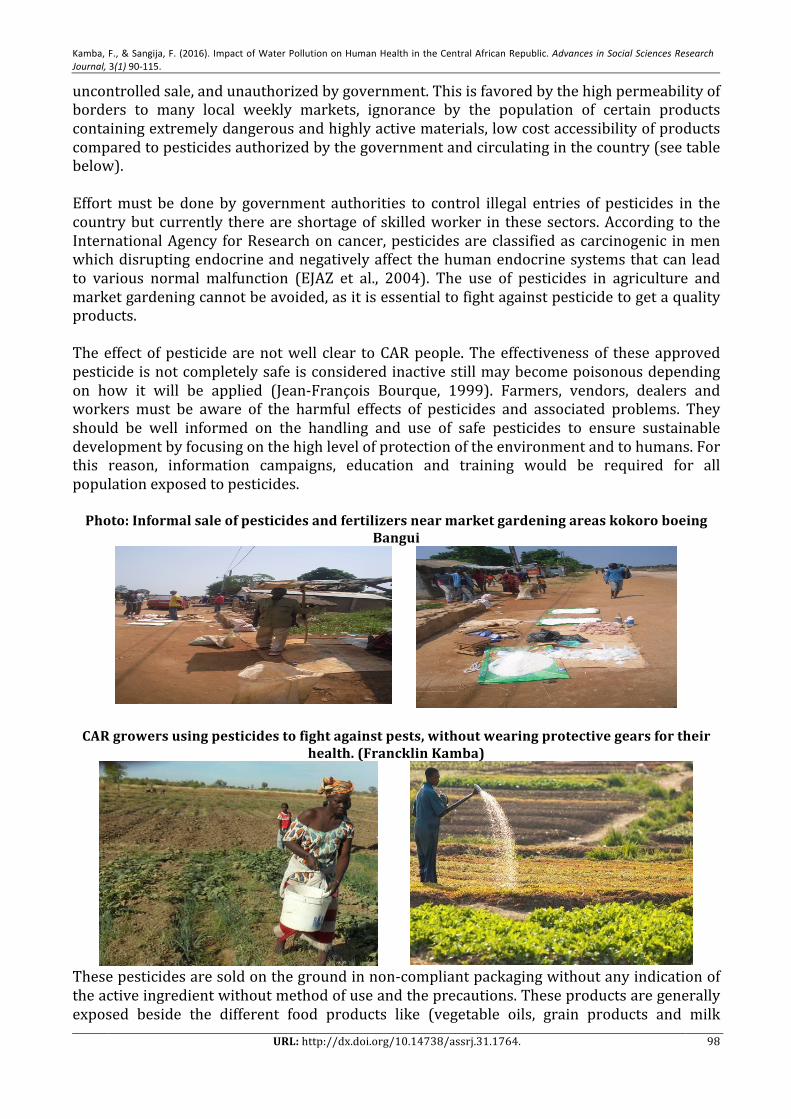
Kamba, F., & Sangija, F. (2016). Impact of Water Pollution on Human Health in the Central African Republic. Advances in Social Sciences Research Journal, 3(1) 90-‐115.
URL: http://dx.doi.org/10.14738/assrj.31.1764. 98
uncontrolled sale, and unauthorized by government. This is favored by the high permeability of borders to many local weekly markets, ignorance by the population of certain products containing extremely dangerous and highly active materials, low cost accessibility of products compared to pesticides authorized by the government and circulating in the country (see table below). Effort must be done by government authorities to control illegal entries of pesticides in the country but currently there are shortage of skilled worker in these sectors. According to the International Agency for Research on cancer, pesticides are classified as carcinogenic in men which disrupting endocrine and negatively affect the human endocrine systems that can lead to various normal malfunction (EJAZ et al., 2004). The use of pesticides in agriculture and market gardening cannot be avoided, as it is essential to fight against pesticide to get a quality products. The effect of pesticide are not well clear to CAR people. The effectiveness of these approved pesticide is not completely safe is considered inactive still may become poisonous depending on how it will be applied (Jean-‐François Bourque, 1999). Farmers, vendors, dealers and workers must be aware of the harmful effects of pesticides and associated problems. They should be well informed on the handling and use of safe pesticides to ensure sustainable development by focusing on the high level of protection of the environment and to humans. For this reason, information campaigns, education and training would be required for all population exposed to pesticides. Photo: Informal sale of pesticides and fertilizers near market gardening areas kokoro boeing
Bangui
CAR growers using pesticides to fight against pests, without wearing protective gears for their
health. (Francklin Kamba)
These pesticides are sold on the ground in non-‐compliant packaging without any indication of the active ingredient without method of use and the precautions. These products are generally exposed beside the different food products like (vegetable oils, grain products and milk
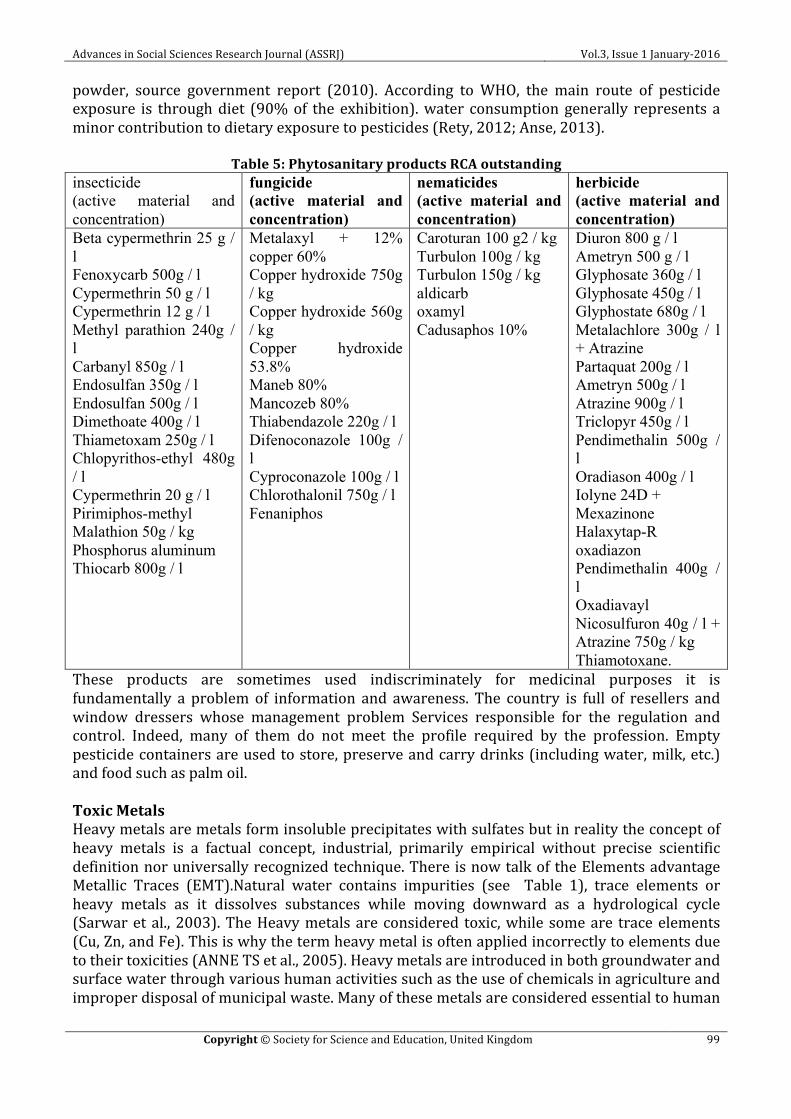
Advances in Social Sciences Research Journal (ASSRJ) Vol.3, Issue 1 January-‐2016
Copyright © Society for Science and Education, United Kingdom 99
powder, source government report (2010). According to WHO, the main route of pesticide exposure is through diet (90% of the exhibition). water consumption generally represents a minor contribution to dietary exposure to pesticides (Rety, 2012; Anse, 2013).
Table 5: Phytosanitary products RCA outstanding insecticide (active material and concentration)
fungicide (active material and concentration)
nematicides (active material and concentration)
herbicide (active material and concentration)
Beta cypermethrin 25 g / l Fenoxycarb 500g / l Cypermethrin 50 g / l Cypermethrin 12 g / l Methyl parathion 240g / l Carbanyl 850g / l Endosulfan 350g / l Endosulfan 500g / l Dimethoate 400g / l Thiametoxam 250g / l Chlopyrithos-ethyl 480g / l Cypermethrin 20 g / l Pirimiphos-methyl Malathion 50g / kg Phosphorus aluminum Thiocarb 800g / l
Metalaxyl + 12% copper 60% Copper hydroxide 750g / kg Copper hydroxide 560g / kg Copper hydroxide 53.8% Maneb 80% Mancozeb 80% Thiabendazole 220g / l Difenoconazole 100g / l Cyproconazole 100g / l Chlorothalonil 750g / l Fenaniphos
Caroturan 100 g2 / kg Turbulon 100g / kg Turbulon 150g / kg aldicarb oxamyl Cadusaphos 10%
Diuron 800 g / l Ametryn 500 g / l Glyphosate 360g / l Glyphosate 450g / l Glyphostate 680g / l Metalachlore 300g / l + Atrazine Partaquat 200g / l Ametryn 500g / l Atrazine 900g / l Triclopyr 450g / l Pendimethalin 500g / l Oradiason 400g / l Iolyne 24D + Mexazinone Halaxytap-R oxadiazon Pendimethalin 400g / l Oxadiavayl Nicosulfuron 40g / l + Atrazine 750g / kg Thiamotoxane.
These products are sometimes used indiscriminately for medicinal purposes it is fundamentally a problem of information and awareness. The country is full of resellers and window dressers whose management problem Services responsible for the regulation and control. Indeed, many of them do not meet the profile required by the profession. Empty pesticide containers are used to store, preserve and carry drinks (including water, milk, etc.) and food such as palm oil. Toxic Metals Heavy metals are metals form insoluble precipitates with sulfates but in reality the concept of heavy metals is a factual concept, industrial, primarily empirical without precise scientific definition nor universally recognized technique. There is now talk of the Elements advantage Metallic Traces (EMT).Natural water contains impurities (see Table 1), trace elements or heavy metals as it dissolves substances while moving downward as a hydrological cycle (Sarwar et al., 2003). The Heavy metals are considered toxic, while some are trace elements (Cu, Zn, and Fe). This is why the term heavy metal is often applied incorrectly to elements due to their toxicities (ANNE TS et al., 2005). Heavy metals are introduced in both groundwater and surface water through various human activities such as the use of chemicals in agriculture and improper disposal of municipal waste. Many of these metals are considered essential to human
Kamba, F., & Sangija, F. (2016). Impact of Water Pollution on Human Health in the Central African Republic. Advances in Social Sciences Research Journal, 3(1) 90-‐115.
URL: http://dx.doi.org/10.14738/assrj.31.1764. 100
health (Midra et al., 2005). But the overload cause pollution of water result to serious health problems in living organisms including humans. Heavy metals can also contaminate the environment during an industrial activities. For example of pollution "red mud" in Hungary in 2010 that contaminate soils and waterways due to the rupture of a reservoir of an aluminum bauxite plant (letelegramme.com, 2010). In Central Africa, the heavy metals are present in groundwater and surface water, their concentrations often exceed the maximum permissible concentrations recommended by the WHO for drinking water (Adia Jacques Touchard at al., 2011), and the results of its research are described succinctly in this review as follows: Iron (Fe) is one of the most abundant metals on earth and it is essential for the normal physiology of the living organism its deficiency or overloading can be harmful to both plants and animals (Anonymous, 2008). Iron concentrations in groundwater CAR respectively vary between 0,13mg / l and 2.4 mg / whereas the WHO suggests maximum iron concentrations is 0.3 mg / l for drinking water. All the drilling of the country contain iron, 50% have higher levels as recommended by WHO standard mainly due to the presence of iron-‐rich granitic rocks in this area. According to a study by (Adia et al., 2005), the presence of iron in the waters come from the alteration of the surrounding formations, rich Ferro manganese. Ph conditions and redox potential favorable its solubilization to Fe+2 involve their way into the water. Low doses poses no health problems however, high concentrations of natural water resources can be a possible risk to human health and the environment. compared to the deficit, iron overload or overexposure is a less common condition but it can lead to more serious health problems such as cancer (Beckmann at al., 1999), heart and liver diseases (Milman et al, 2001; Rasmussen et al., 2001;. Yang et al, 1998) diabetes (Perez of Nanclares at al., 2000) as well as diseases neuro -‐ degenerative (Berg .D et al., 2001). Manganese (Mn) is a natural mineral found in surface waters and in groundwater, but human activities also contribute much to its introduction into waters sources (EPA 2004). In Central African contamination of drinking water by manganese does not pose much problem because its contents vary from 0 to 0,025mg / L, while WHO recommends 0.4 mg / L for drinking water. Manganese (Mn) as Iron (Fe) comes from weathering of rocks, higher doses than 20 mg /L. Manganese is an essential trace element for all life forms (Emsley, 2003) because it regulates many enzymes in the body (Cosgrave and Zhang, 2004). Excessive doses of manganese causes severe disorders in the nervous system with the brain as main target (Cosgrave and Zhang, 2004). According to (Barbeau and al., 1984) manganese in its worst form can lead to permanent neurological disorder with symptoms similar to Parkinson's disease. However, exposure to manganese in water is normally substantially lower than the intake of food (EPA, 2006). Cadmium (Cd) is a toxic element, safe standard for cadmium concentrations in water according to WHO is 0,003mg / l. In CAR cadmium concentrations in groundwater are above the safe limit set by WHO. This toxic metal can cause acute gastrointestinal problems such as vomiting and diarrhea (Nordberg.GF, 2004). However chronic exposure to cadmium for some time can lead to kidney damage and reproductive problems (Free et al., 1993). Arsenic (As) is inorganic compounds which are carcinogenic to humans being (AFSSA, 2004.). Epidemiological studies have shown that exposure to arsenic via inhalation or ingestion of contaminated water was responsible for lung, skin and bladder diseases. Other studies also
Advances in Social Sciences Research Journal (ASSRJ) Vol.3, Issue 1 January-‐2016
Copyright © Society for Science and Education, United Kingdom 101
suggest the existence of an association between exposure to arsenic in drinking water and the development of prostate cancers of the liver and kidney (IARC, 2001). Arsenic is recognized as a major threat to public health, contamination of water by this metal is a major human health problem in many countries of the world including Argentina, Bangladesh, Chile, China, Mauritania India, Vietnam, Mexico, Nepal, Thailand and the United States of America (Islam-‐UI-‐Haque at al., 2007). In CAR lever of arsenic to the groundwater and surface water exceed the standard set by the WHO which is (10 ppb (ug /L). However, the issue of arsenic is a major issue in the country because no specific study on water contamination by arsenic has been published. Still the effect of arsenic is unknown to the public while it contamination is a serious health problem to society. Arsenic at high doses and long exposure may cause melanosis, buffy melanosis, hyperkeratosis, cardiovascular disease, and disease of black feet, neuropathy and cancers (Caussy, 2005). Zinc (Zn) and copper (Cu) are essential to human health (Solomon et al., 1998), over consumption is harmful to human health (Fosmire et al., 1990). Maximum acceptable concentrations for drinking water is 3mg / l for Zn and 2mg / l Cu. In surface water and groundwater in the country, both heavy metals are usually found below the limit set by the WHO (Adia et al., 2005). Mercury (Hg) is a chemical element with atomic number 80 it is part of the transition metals and persistent bio accumulative toxin (Weisse et al., 2001). It is introduced into the environment from various natural and human activities (Weiss et al., 2001). According to the WHO standard mercury concentrations in water should not exceed 0.001 mg / l In CAR. Many studies are needed in level of mercury in water in CAR because mercury is a potentially dangerous for human health and environment. They transmitted through food chain. Aquatic environment transform mercury into methyl mercury which is most toxic form (Awafolu et al., 2003). Mercury disrupts the production of neurotransmitters and reduces the significant production of hormones, including thyroid hormone and testosterone in the human body (Fatoki et al., 2003). Nitrates and Nitrites Nitrates (No3) are chemical compounds naturally present in low concentrations in the environment, especially in groundwater, surface water and soils. It source from the fixation of atmospheric nitrogen by plants and then from the decomposition of organic material. The nitrogen compounds in the soil are carried by rainwater into rivers and lakes. Nitrites (No2), present in water in low concentrations or in feed are usually result of metabolic processes in the body nitrates (IARC, 2001) In Central Africa, the concentrations of nitrates in the water is between 0mg / l and 0,35mg / l and lower than WHO standards (Adia Trouchard Jacques et al., 2011). The low concentration of nitrates shows that agricultural activities not intensive and no much use of fertilizer and pesticides. Nitrates are natural compounds that enter the nitrogen cycle, this element is essential for life including the development of .the nitrates found in plants, sometimes can be excessive amounts in drinking water. (The Curier et al., 1998). WHO recommends 3 mg / l for drinking water in the CAR, all drilling analyzed comply with this standard, the average is 0,04mg / l with a variation of 0.01 mg / l 0,38mg / l (Adia et al., 2005) .The relevant epidemiological data on the risk of cancer related to nitrates in water are very rare and do not assess risk accurately (Inca, 2009) .Currently, some studies found an association between the

Kamba, F., & Sangija, F. (2016). Impact of Water Pollution on Human Health in the Central African Republic. Advances in Social Sciences Research Journal, 3(1) 90-‐115.
URL: http://dx.doi.org/10.14738/assrj.31.1764. 102
consumption of water rich in nitrates and the occurrence of cancers, still not yet implemented in the general population (Ward, 2009; ORS, 2007). Sulfate (SO4) is a salt form by the combination of sulfuric acid with a base. Its concentrations in water (boreholes) in Central Africa vary between 0 mg / 31mg the / l and meet the WHO standard (Mokofio et al., 1991), while WHO recommends 250mg / l for drinking water. The presence of this element in water is generally related to the nature of geological formation and industrial discharges but currently there is no industrial discharges in drilling. Doses of between 1 mg / l and 2mg / l have a mild laxative effect in adults. However higher concentrations can affect gastrointestinal and diarrheal disorders (Desbordes, 2001) Chromium (Cr) is the metallic chemical element of atomic number 24, is also one of the most common elements in the earth's crust and water. In CAR no study published in water contamination by chromium, but however, chromium is toxic and plays a very important role in the metabolism of carbohydrates in the body (Cefalu et al., 2004).It also cause skin diseases, cancers, irritants and even diseases related to the digestive, excretory, respiratory and reproductive system (Anonymous, 2009). Fluorine (F) is a chemical element of atomic number 9 and is part of halogens, it is the most electronegative of all. In CAR boreholes Fluoride ranging from 0.2 mg /l and 1. 06mg / l, these concentrations meet the WHO standard for safe drinking water which is 1.5mg / l (Adia Jacques et al., 2011). But excess of fluorine in groundwater cause dental and skeletal fluorosis. The Aluminium (Al), the chemical element of atomic number 13, WHO report recommend its amount in drinking-‐water be 0.2 mg / l (Adia Jacques et al., 2011), aluminum content in the groundwater in CAR ranges between 0mg / the 0.09mg / l. Aluminum usually comes from accidental pollution by industries or by dissolving rock and higher doses, it causes color problems. Chlorine (Cl) is usually used for disinfection of drinking water. It must be analyzed primarily chlorination operation to prevent excessive dose in water. WHO recommends a level of 5 mg / l. Water drillings in CARS have no chlorine problem, doses vary from 0.09 to 1 mg / L. In the above situation toxic metals in surface water or groundwater in the country show a wide variation in the level of contamination due to their higher concentration against the recommended. Table 6: Comparison to WHO standards for drinking water according to studies from Central
(ADIA Jacques et al., 2011). Item / substance
Symbol / formula
Concentration normally found in groundwater in CAR
Guidelines set by WHO
Aluminum Al 0- 0.09mg/l 0.2 mg/l
Ammonium NH4+ No value for lack of studies No constraints
Antimony Sb No value for lack of studies 0.02 mg/l
Arsenic As No value for lack of studies 0.01 mg/l

Advances in Social Sciences Research Journal (ASSRJ) Vol.3, Issue 1 January-‐2016
Copyright © Society for Science and Education, United Kingdom 103
Asbestos No guideline value
Barium Ba No value for lack of studies 0.7 mg/l
Barium Be No value for lack of studies No guideline value
Boron B No value for lack of studies 0.5mg/l
Cadmium Cd > to the WHO standard 0.003 mg/l
Chlorine Cl 0.09-1mg/l No value but one can note a taste from 250 mg / l
Chrome Cr+3, Cr+6 No value for lack of studies chrome total : 0.05 mg/l
Couleur No guideline value
Copper Cu2+ 2mg/l 2 mg/l
Cyanide CN- No value for lack of studies 0.07 mg/l
Dissolved Oxygen
O2 No value for lack of studies No guideline value
Fluorine F 0.2 -1.06mg/l 1.5 mg/l
Hardness mg/l CaCO3 No value for lack of studies 200 ppm
Hydrogen sulphide
H2S No value for lack of studies 0.05- 1 mg/L
Iron Fe 0.13mg/let 2.4mg/l No guideline value
Lead Pb No value for lack of studies 0.01 mg/l
Manganese Mn 0 – 0.025mg/l 0-4 mg/l
Mercury Hg No value for lack of studies inorganique : 0.006 mg/l
Molybdenum Mb No value for lack of studies 0.07 mg/l
Nickel Ni No value for lack of studies 0.07 mg/l
Nitrate and nitrite
NO3, NO2 No value for lack of studies 50 and 3 mg / l (short term exposure) 0.2 mg / l (long term exposure)
Turbidity not listed
Ph The PH varies between 5.40 and 7.1 with an average 6.58
No guideline value but an optimum between 6.5 and 9.5
selenium Se No value for lack of studies 0.01 mg/l
Money Ag No value for lack of studies No guideline value
sodium Na No value for lack of studies No guideline value
sulfate SO4 0 -31mg/l 500 mg/l
Tin Sn No value for lack of studies No value guide: slightly toxic
TDS No guide optimum value but below
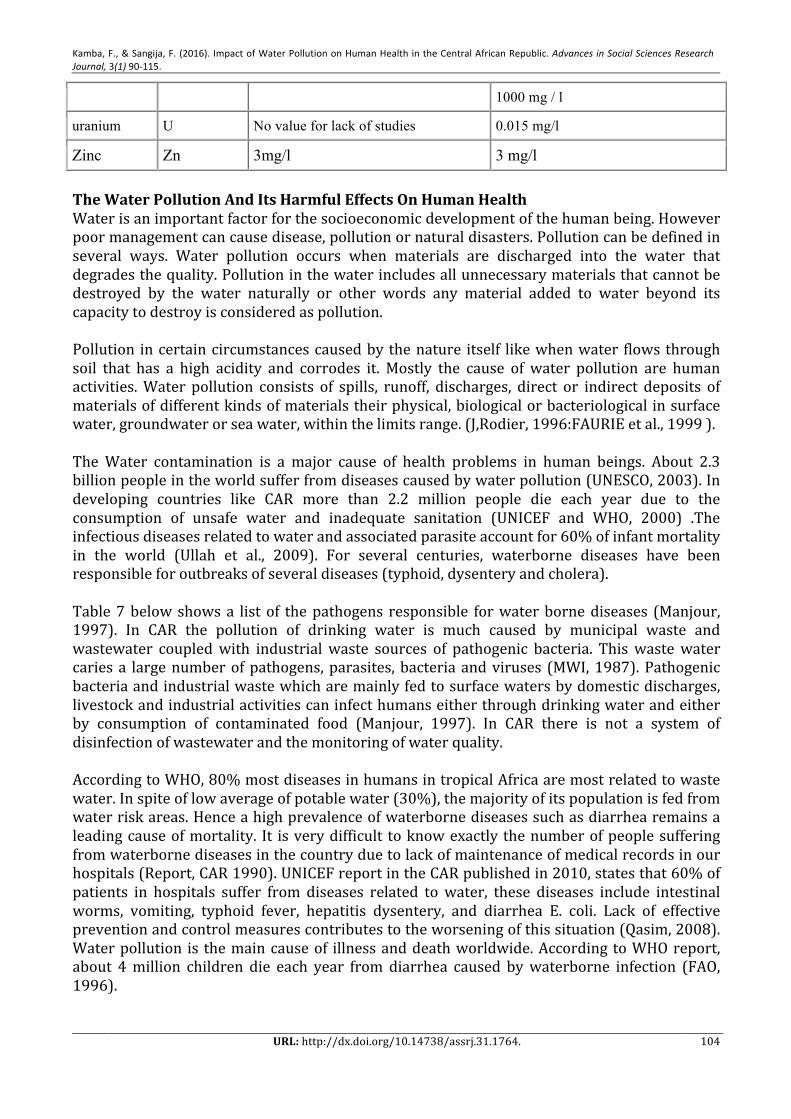
Kamba, F., & Sangija, F. (2016). Impact of Water Pollution on Human Health in the Central African Republic. Advances in Social Sciences Research Journal, 3(1) 90-‐115.
URL: http://dx.doi.org/10.14738/assrj.31.1764. 104
1000 mg / l
uranium U No value for lack of studies 0.015 mg/l
Zinc Zn 3mg/l 3 mg/l The Water Pollution And Its Harmful Effects On Human Health Water is an important factor for the socioeconomic development of the human being. However poor management can cause disease, pollution or natural disasters. Pollution can be defined in several ways. Water pollution occurs when materials are discharged into the water that degrades the quality. Pollution in the water includes all unnecessary materials that cannot be destroyed by the water naturally or other words any material added to water beyond its capacity to destroy is considered as pollution. Pollution in certain circumstances caused by the nature itself like when water flows through soil that has a high acidity and corrodes it. Mostly the cause of water pollution are human activities. Water pollution consists of spills, runoff, discharges, direct or indirect deposits of materials of different kinds of materials their physical, biological or bacteriological in surface water, groundwater or sea water, within the limits range. (J,Rodier, 1996:FAURIE et al., 1999 ). The Water contamination is a major cause of health problems in human beings. About 2.3 billion people in the world suffer from diseases caused by water pollution (UNESCO, 2003). In developing countries like CAR more than 2.2 million people die each year due to the consumption of unsafe water and inadequate sanitation (UNICEF and WHO, 2000) .The infectious diseases related to water and associated parasite account for 60% of infant mortality in the world (Ullah et al., 2009). For several centuries, waterborne diseases have been responsible for outbreaks of several diseases (typhoid, dysentery and cholera). Table 7 below shows a list of the pathogens responsible for water borne diseases (Manjour, 1997). In CAR the pollution of drinking water is much caused by municipal waste and wastewater coupled with industrial waste sources of pathogenic bacteria. This waste water caries a large number of pathogens, parasites, bacteria and viruses (MWI, 1987). Pathogenic bacteria and industrial waste which are mainly fed to surface waters by domestic discharges, livestock and industrial activities can infect humans either through drinking water and either by consumption of contaminated food (Manjour, 1997). In CAR there is not a system of disinfection of wastewater and the monitoring of water quality. According to WHO, 80% most diseases in humans in tropical Africa are most related to waste water. In spite of low average of potable water (30%), the majority of its population is fed from water risk areas. Hence a high prevalence of waterborne diseases such as diarrhea remains a leading cause of mortality. It is very difficult to know exactly the number of people suffering from waterborne diseases in the country due to lack of maintenance of medical records in our hospitals (Report, CAR 1990). UNICEF report in the CAR published in 2010, states that 60% of patients in hospitals suffer from diseases related to water, these diseases include intestinal worms, vomiting, typhoid fever, hepatitis dysentery, and diarrhea E. coli. Lack of effective prevention and control measures contributes to the worsening of this situation (Qasim, 2008). Water pollution is the main cause of illness and death worldwide. According to WHO report, about 4 million children die each year from diarrhea caused by waterborne infection (FAO, 1996).
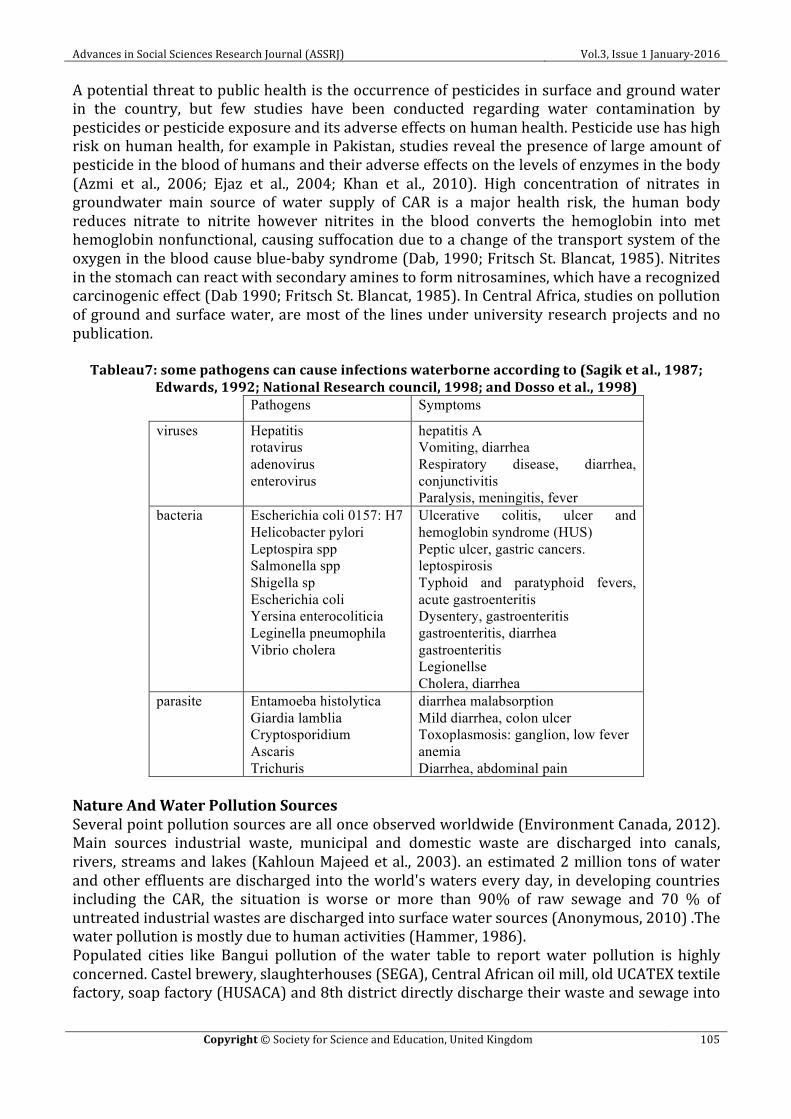
Advances in Social Sciences Research Journal (ASSRJ) Vol.3, Issue 1 January-‐2016
Copyright © Society for Science and Education, United Kingdom 105
A potential threat to public health is the occurrence of pesticides in surface and ground water in the country, but few studies have been conducted regarding water contamination by pesticides or pesticide exposure and its adverse effects on human health. Pesticide use has high risk on human health, for example in Pakistan, studies reveal the presence of large amount of pesticide in the blood of humans and their adverse effects on the levels of enzymes in the body (Azmi et al., 2006; Ejaz et al., 2004; Khan et al., 2010). High concentration of nitrates in groundwater main source of water supply of CAR is a major health risk, the human body reduces nitrate to nitrite however nitrites in the blood converts the hemoglobin into met hemoglobin nonfunctional, causing suffocation due to a change of the transport system of the oxygen in the blood cause blue-‐baby syndrome (Dab, 1990; Fritsch St. Blancat, 1985). Nitrites in the stomach can react with secondary amines to form nitrosamines, which have a recognized carcinogenic effect (Dab 1990; Fritsch St. Blancat, 1985). In Central Africa, studies on pollution of ground and surface water, are most of the lines under university research projects and no publication. Tableau7: some pathogens can cause infections waterborne according to (Sagik et al., 1987;
Edwards, 1992; National Research council, 1998; and Dosso et al., 1998) Pathogens Symptoms
viruses Hepatitis rotavirus adenovirus enterovirus
hepatitis A Vomiting, diarrhea Respiratory disease, diarrhea, conjunctivitis Paralysis, meningitis, fever
bacteria Escherichia coli 0157: H7 Helicobacter pylori Leptospira spp Salmonella spp Shigella sp Escherichia coli Yersina enterocoliticia Leginella pneumophila Vibrio cholera
Ulcerative colitis, ulcer and hemoglobin syndrome (HUS) Peptic ulcer, gastric cancers. leptospirosis Typhoid and paratyphoid fevers, acute gastroenteritis Dysentery, gastroenteritis gastroenteritis, diarrhea gastroenteritis Legionellse Cholera, diarrhea
parasite Entamoeba histolytica Giardia lamblia Cryptosporidium Ascaris Trichuris
diarrhea malabsorption Mild diarrhea, colon ulcer Toxoplasmosis: ganglion, low fever anemia Diarrhea, abdominal pain
Nature And Water Pollution Sources Several point pollution sources are all once observed worldwide (Environment Canada, 2012). Main sources industrial waste, municipal and domestic waste are discharged into canals, rivers, streams and lakes (Kahloun Majeed et al., 2003). an estimated 2 million tons of water and other effluents are discharged into the world's waters every day, in developing countries including the CAR, the situation is worse or more than 90% of raw sewage and 70 % of untreated industrial wastes are discharged into surface water sources (Anonymous, 2010) .The water pollution is mostly due to human activities (Hammer, 1986). Populated cities like Bangui pollution of the water table to report water pollution is highly concerned. Castel brewery, slaughterhouses (SEGA), Central African oil mill, old UCATEX textile factory, soap factory (HUSACA) and 8th district directly discharge their waste and sewage into
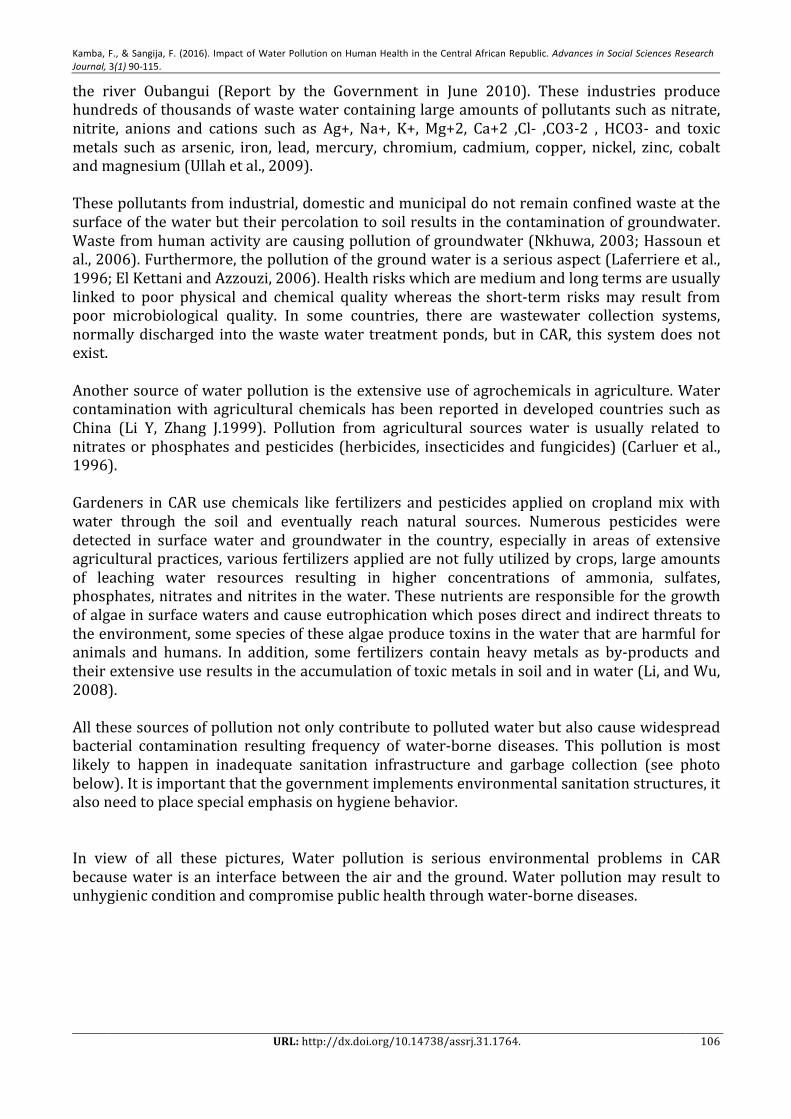
Kamba, F., & Sangija, F. (2016). Impact of Water Pollution on Human Health in the Central African Republic. Advances in Social Sciences Research Journal, 3(1) 90-‐115.
URL: http://dx.doi.org/10.14738/assrj.31.1764. 106
the river Oubangui (Report by the Government in June 2010). These industries produce hundreds of thousands of waste water containing large amounts of pollutants such as nitrate, nitrite, anions and cations such as Ag+, Na+, K+, Mg+2, Ca+2 ,Cl-‐ ,CO3-‐2 , HCO3-‐ and toxic metals such as arsenic, iron, lead, mercury, chromium, cadmium, copper, nickel, zinc, cobalt and magnesium (Ullah et al., 2009). These pollutants from industrial, domestic and municipal do not remain confined waste at the surface of the water but their percolation to soil results in the contamination of groundwater. Waste from human activity are causing pollution of groundwater (Nkhuwa, 2003; Hassoun et al., 2006). Furthermore, the pollution of the ground water is a serious aspect (Laferriere et al., 1996; El Kettani and Azzouzi, 2006). Health risks which are medium and long terms are usually linked to poor physical and chemical quality whereas the short-‐term risks may result from poor microbiological quality. In some countries, there are wastewater collection systems, normally discharged into the waste water treatment ponds, but in CAR, this system does not exist. Another source of water pollution is the extensive use of agrochemicals in agriculture. Water contamination with agricultural chemicals has been reported in developed countries such as China (Li Y, Zhang J.1999). Pollution from agricultural sources water is usually related to nitrates or phosphates and pesticides (herbicides, insecticides and fungicides) (Carluer et al., 1996). Gardeners in CAR use chemicals like fertilizers and pesticides applied on cropland mix with water through the soil and eventually reach natural sources. Numerous pesticides were detected in surface water and groundwater in the country, especially in areas of extensive agricultural practices, various fertilizers applied are not fully utilized by crops, large amounts of leaching water resources resulting in higher concentrations of ammonia, sulfates, phosphates, nitrates and nitrites in the water. These nutrients are responsible for the growth of algae in surface waters and cause eutrophication which poses direct and indirect threats to the environment, some species of these algae produce toxins in the water that are harmful for animals and humans. In addition, some fertilizers contain heavy metals as by-‐products and their extensive use results in the accumulation of toxic metals in soil and in water (Li, and Wu, 2008). All these sources of pollution not only contribute to polluted water but also cause widespread bacterial contamination resulting frequency of water-‐borne diseases. This pollution is most likely to happen in inadequate sanitation infrastructure and garbage collection (see photo below). It is important that the government implements environmental sanitation structures, it also need to place special emphasis on hygiene behavior. In view of all these pictures, Water pollution is serious environmental problems in CAR because water is an interface between the air and the ground. Water pollution may result to unhygienic condition and compromise public health through water-‐borne diseases.
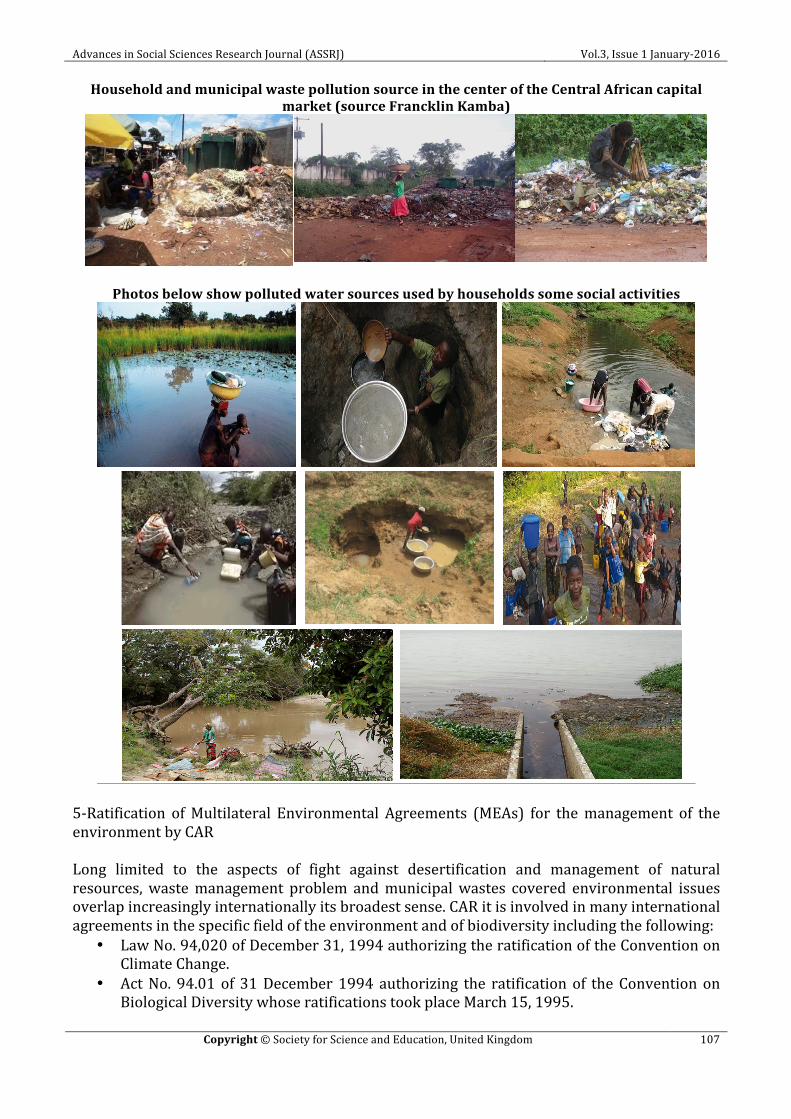
Advances in Social Sciences Research Journal (ASSRJ) Vol.3, Issue 1 January-‐2016
Copyright © Society for Science and Education, United Kingdom 107
Household and municipal waste pollution source in the center of the Central African capital market (source Francklin Kamba)
Photos below show polluted water sources used by households some social activities
5-‐Ratification of Multilateral Environmental Agreements (MEAs) for the management of the environment by CAR Long limited to the aspects of fight against desertification and management of natural resources, waste management problem and municipal wastes covered environmental issues overlap increasingly internationally its broadest sense. CAR it is involved in many international agreements in the specific field of the environment and of biodiversity including the following:
• Law No. 94,020 of December 31, 1994 authorizing the ratification of the Convention on Climate Change.
• Act No. 94.01 of 31 December 1994 authorizing the ratification of the Convention on Biological Diversity whose ratifications took place March 15, 1995.
Kamba, F., & Sangija, F. (2016). Impact of Water Pollution on Human Health in the Central African Republic. Advances in Social Sciences Research Journal, 3(1) 90-‐115.
URL: http://dx.doi.org/10.14738/assrj.31.1764. 108
• Law No. 08 002 of 01.01.2008 authorizing the ratification of the basel Convention on the Control of Trans boundary Movements of Hazardous Wastes and their Disposal; biodiversity including among others.
• The Common Regulation on Control of Consumption Substances that Deplete the Ozone Layer in Space CEMAC.
• Law No. 08 003 of 01.01.2008 authorizing the ratification of the Stockholm Convention on Persistent Organic Pollutants (POPS).
• Law No. 08 004 of 01.01.2008 authorizing the Ratification of the Protocol Kyoto on Greenhouse Gases.
• Law No. 08 005 of 01.01.2008 authorizing the Ratification of the Protocol Cartagena on Biosafety.
• Law No. 08 006 of 01.01.2008 authorizing the ratification of Beijing amendments on substances that deplete the ozone layer.
• Law No. 08 007 of 01.01.2008 authorizing the ratification of Copenhagen amendments on Substances that Deplete the Ozone layer.
• Law No. 08 008 of 01.01.2008 authorizing the ratification of the Montreal Amendments on Substances that Deplete the Ozone Layer.
• Law No. 08 009 of 01.01.2008 authorizing the ratification of the London Amendments relating to substances that deplete the ozone layer.
But in reality the country lacked the proper a general law on the protection of the environment, and it was from 2007 that the Environmental Law has been devoted explicitly by the Law No. 07,018 December 2007 on the environment code of the Central African Republic, was the first law of the country for the protection of the environment .this order takes another led to the creation of 3 organization under the following articles:
1. Art.7: 11: has created a National Commission for the Environment and Sustainable Development in abbreviated (NCA), ion SLR body. The NCA is a body composed of I State Representatives, Elected Representatives, Local Government and Non-‐Governmental Organizations. The organization and functioning of the NCA are defined by a decree of the Council of Ministers.
2. Art. 8: 11 is created Central Agency for Environment and Sustainable Development, in abbreviated (ACEDD.) The Articles of ACEDD are approved by a Decree of the Council of Ministers.
3. Art.9: 11 is created a National Environment in shortens Fund (FNE) for financing activities in the field of the environment, among others fed by taxes and special charges relating to the environment. The Statutes of FNE are approved by a Decree of the Council of Ministers.
Finally, the Law N0 06..001mdu April 12, 2006 on the code of the water in the Central African Republic, this law also led to the creation of four organizations based on the following items:
1. Art.33: There shall be a National Water Council and Abstract Sanitation (CONEA) responsible for the supervision of water resources management structures. The CONEA is a body composed of state representatives, elected officials, communities, non-‐governmental organizations, associations of water users and the specialized agencies. To integrate the effective participation of primary stakeholders, the Council may be decentralized to the watersheds. The organization and functioning of CONEA are defined by a Decree of the Council of Ministers. Art. 34: There shall be a National Agency of Water and Sanitation of the abstract (NAEA). The organization and functioning of the NAEA are fixed by a Decree of the Council of Ministers.
2. Art.35: We created a Water Agency Sector Basins abbreviated (ABSE.)
Advances in Social Sciences Research Journal (ASSRJ) Vol.3, Issue 1 January-‐2016
Copyright © Society for Science and Education, United Kingdom 109
The organization and functioning of the ABSE are fixed by a Decree of the Council of Ministers.
1. Art.36: There shall be a Water Sector Regulatory Agency and Sanitation in abbreviated (ARSEA). The organization and functioning of the ARSEA are fixed by a Decree of the Council of Ministers.
2. Art.37: There shall be a National Fund for Water and Sanitation in the abstract (FNEA). The organization and functioning of FNEA are fixed by a Decree of the Council of Ministers.
All these laws and policies were designed to prevent pollution of water and provide safety drinking water to the population at affordable costs. Although laws and policies have been approved from time to time, no clear strategy has been developed to date for their implementation. Similarly, the environmental impact assessment system (EIA) is mandatory but it is rarely followed in the public sector. Environmental courts have been established in all major cities of the country, for the judgment and supervision of environmental issues still are not effective. The main obstacles for implementation are insufficient budgets, poor coordination and poor communication between the responsible authorities such as provincial and local entities. Political interference cannot be excluded from the factors hindering the implementation of environmental laws.
CONCLUSION Sources of water supply in CAR are highly polluted and impair public health because most pollutants exceed their required range. Water is a major basic need to people of CAR although is highly polluted. Pesticides observed in all water samples from different sources within the country exceed their safety limits. This review clarifies the effect of pollution and its possible sources and how they cause different diseases to human. The shallow aquifers, accessible by sinks, appear highly contaminated with organic substances of human and animal origin. Various human activities, particularly the disposal of municipal waste, domestic and untreated industrial are the main sources of water pollution in the country. Bacteriological pollution for drinking water were the cause of waterborne disease in the country. Regular surveys should be conducted in different parts of the country to get a clear picture of water-‐related diseases. Increase in urban population accelerate the problem water pollution. Fighting against water pollution is necessary to be enforced by government and must comply with laws and regulations applicable to the environmental management which will help to minimize the source of water pollution. For better achievement of water management all people starting from family level, private and public sectors must be involved in environment management campaign. It’s important to implement training on environmental remediation system which will provide hygienic education to the public.
RECOMMENDATIONS Water is basic need to human life, its preservation is important to all people. People behavior toward water pollution must changes in order to fight against sources of pollution: The following recommendations are made that can help to control or reduce the problems compromise quality of water in Central Africa.
• Public awareness campaigns should be launched to inform the population about the importance of safe drinking water.
Kamba, F., & Sangija, F. (2016). Impact of Water Pollution on Human Health in the Central African Republic. Advances in Social Sciences Research Journal, 3(1) 90-‐115.
URL: http://dx.doi.org/10.14738/assrj.31.1764. 110
• Campaigns against sewage and other sources of marine pollution. • There should be enough distance between the wastewater and drinking water supply
lines to prevent cross contamination. • The public should be trained to adapt water management at home. • There should be a renovation of the old rusty pipes and the water distribution network. • It is necessary to switch to an intermittent water supply system continuously to avoid
widespread contamination from surface water or contaminated wells. • The need to educate people to treat water at the family level through the use of
hypochlorite using a dropper. • The need to plan for the expansion of the network of National Water Company in the
framework of a comprehensive sanitation policy. • There should be continuous monitoring of the quality of drinking water throughout the
country in both rural and urban areas. • Disposal of industrial waste water should be strictly controlled and all industries should
be required to adapt the treatment of their waste water. • Avoid the use of herbicides, pesticides and artificial fertilizers in gardens and houses
and buy organic food. • The community of farmers and market gardeners have to be well informed on the
handling and use of pesticides and proper application of fertilizers to minimize the contribution of agricultural practices on water pollution.
• Requested the public authorities to disclose and reduce questionable chemicals in the water.
• Compost kitchen scraps and garden to reduce water pollution caused by the discharges • It is necessary to the existence and strict law enforcement, without any compromise on
the quality of public drinking water. • Put pressure on governments so that they act more to protect surface and groundwater
from pollution. References
1. Adia et al., 2005. lithostratigraphic characterization surveys adia 5 eujournal.org/index.php/esj/article/viewFile/1175/1728.
2. ADIA JACQUES TOUCHARD, (2011) VILLAGE WATER AND PROMOTING HEALTH IN THE CONTEXT OF VULNERABILITY AND landlocked Case under prefecture of the Central Bossangoa.
3. ALLEY D., O. DREVET-‐Dabbous, ETIENNE J., et al, 2002. -‐ "Domestic del'eau management and sanitation." In: Water, gender and development: experiencesFrench cooperation in SSA. GRET, AFD, Ministry of Foreign Affairs, Ed Gret. 43-‐73.
4. ALLEY D., O. Devret-‐Dabbous, ETIENNE J., et al, 2002 -‐. Water, gender andSustainable Development: Experiences of French cooperation in AfricaSaharan (abstract). GRET, AFD, Ministry of Foreign Affairs, Ed.
5. Anonymous (2010), .Assessment of surface water for drinking quality; 2008. Directorate ofLand Reclamation Punjab, Irrigation and Power Department, Canal Bank,Mughalpura, Lahore, Pakistan.
6. Anonymous. World Water Day 22.03.2010; 2010. Retrieved from www.worldwaterday2010.info,United Nations
7. Abu Jawdeh et al, 2000; Saab et al, 2007: Solid and liquid waste from households
8. Anne and Isabelle F. TS, 2005. Contamination Soil: Soil Transfer to Plants. Ed. EDP Sciences and ADEME, Angers Cedex, 413 p.
9. ASNAn,(2010): Developing the Integrated Management Plan of National Action of Water Resources (PANGIRE).
Advances in Social Sciences Research Journal (ASSRJ) Vol.3, Issue 1 January-‐2016
Copyright © Society for Science and Education, United Kingdom 111
10. AFSSA, 2004. Evaluation of the health risks associated with exceeding the limit of quality of arsenic in water intended for huma consumption
11. Azmi MA Naqvi SNH, MA Azmi, Aslam M. Effect of pesticide residues is health and different enzyme levels in the blood of farm workers from Gadap (rural area) Karachi-‐Pakistan. Chemosphere 2006; 64: 1739-‐44.
12. Berg D, Gerlach M, YoudimMB, Double KL, Zecca L, Riederer P, et al. Brain iron pathwaysand their relevance to Parkinson's disease. J Neurochem 2001; 79:225–36.
13. Bhutta MN, Ramzan M, Hafeez CA. Ground water quality and availability in Pakistan.
14. Barbeau. A. Manganese and extrapyramidal disorders (a critical review and tribute toDr. George C. Cotzias). NeuroToxicol 1984; 5:13–35.
15. Carluer et al., 1996: impacts of agricultural intensification on the quality of surface water and groundwater.
16. CAR: Sectoral Action Plan Water and Sanitation, Water and Sanitation Sector Committee Action Plan 2008-‐2010 Sector, October 2009 Financing plan, the Water and Sanitation Sector Committee in 2009.
17. Caussy D. Afield guide for detection, management and surveillance of arsenicosis cases.Regional Office for South-‐East Asia: World Health Organization; 2005.
18. Cefalu WT, Hu FB: Role of chromium in human health and in diabetes. Diab Care2004; 27:2741–51.
19. Comlanvi FM. 1994. Improving the quality of water wells in the city of Cotonou: case of some neighborhoods. Memory improvement, protection the environment. Ab-‐Calavi, CPU, 78 p.Concentrations in patients with fractures of long bones treated surgically.
20. CREPA, 2003. Study on the perceptions and behaviors vis-‐à-‐vis the populations water, hygiene and sanitation .degradation due to pesticide use in Pakistan12th International conference is integrated management diffuse pollution (IWA DIPCON 2008), Khon Kaen University, Thailand; 25-‐29th August, 2008; 2008. p. 226-‐7.
21. DESBORDES A. (2001): Pollution of groundwater in Picardy. http://www.u picardie.fr/-‐ucham/desbordes.htm.
22. Desjardins R. 1997. Processing Eaux.2è revised edition of the Polytechnique school of Montreal; 304.
23. Dinar, A. 2000. The political economy ofwater pricing reforms. New-‐York: Oxford.
24. Director Interinstitutional Cooperation Committee for the Decade. 1990. Impact of IDWSSD Water and Sanitation Diarrheal Diseases on. WHO: Geneva; 178.
25. Environment Canada. 2002. Guidelines for water quality to protect the uses of water for agricultural purposes www.ec.gc.ca/ceqg rcqe/Francais/ceqg/water/default.cfm.Environmental Council & the Mercury Solution Team; 2001.
26. Dab, 1990; Fritsch St. Blancat, 1985: treats irrigation.
27. EPA.(2006): National drinking water standards. United States Environmental Protection Agency.
28. FAO, 1982. Resistance to pesticides and crop loss assessment -‐ 3 Report of the Expert Group 3session. Rome, FAO, 39 p.fromwww.worldwaterday2010.info, UnitedNations.
29. Ejaz S, Akram W, Lim CW, Lee JJ, Hussain I. Endocrine disrupting pesticides: a leading cause of cancer among rural people in Pakistan. Exp Oncol 2004; 26:98-‐105.
30. Emsley J. Manganese. Nature's building blocks: an A–Z guide to the elementsUSA: Oxford University Press; 2003. p. 249–53
31. Fatoki OS, Awofolu R. Levels of Cd, Hg and Zn in some surface waters from the Eastern Cape Province, South Africa. Water SA 2003; 29:375–80.
32. Gantzer C, F Lucena, Schwartzbrod L, J. 1998. Jofre viral contamination of the water environment indicators: myth or reality? Virology Journal, 2 (2): 117-‐125.
33. GENERAL MANAGEMENT OF THE COMPANY WATER: Drinking water supply in urban and in rural areas. Communication to the National Seminar on health issues and health perspective for all by the
Kamba, F., & Sangija, F. (2016). Impact of Water Pollution on Human Health in the Central African Republic. Advances in Social Sciences Research Journal, 3(1) 90-‐115.
URL: http://dx.doi.org/10.14738/assrj.31.1764. 112
year 2000. Bangui, 20-‐25 June 1988.Ministère of Public Health and Social Affairs Bangui (CAR), Document 20 pages.
34. Gkw-‐IGIP (1979): Sanitation Bangui (wastewater). Design Report, I, unpublished.
35. Hammer MJ. Water and wastewater technology. New York, USA: John Wiley Inc.; 1986.
36. Hébert, S., and S. Légaré (2000). Monitoring the water quality of rivers and small streams. Quebec Branch of monitoring the state of the environment, Ministry of Environment, No. ENV 2001 0141, Report No. 123 QE, 24 p. and 3 appendices.
37. Health Canada (2002) Summary of recommendations for the quality of drinking water in Canada. April. Ottawa.
38. Health Canada. 2001. Summary of recommendations for the quality of drinkingwaterinCanada,p.7.nwww.hcsc.gc.ca/ehp/dhm/catalogue/dpc_pubs/sommaire pdf.
39. MWI,(1987):Mediterranean Water Institute, appreciation of health risks related to the reuse of waste water, in: Research on the development of a protocol apprehension of related health risks to the use of wastewater -‐Ministry of environment, p 1-‐16
40. IARC,( 2011): Toxicity and carcinogenicity.
41. Inca,( 2009):Water pollution and cancer risk.
42. J. Rodier, BAZIN C., BROUTIN JP, P. Chambon, CHAMPSAM H., RODIL L., (1996): Analysis of water: natural water, waste water, sea water Technical Edition Dunod, Paris. , 1384p.
43. J.Rodier , 1978. Analysis of Water: Natural Water, Waste Water, Sea Water Chemistry, Physical Chemistry, Bacteriology, Biology (Sixth Edition, again. Draw). Wiley: Paris; 1135 p.
44. JagIin, S. 2000. Diversify to integrate? The difficult regulation of drinking water supply modes in cities in SSA. Meetings of regional innovation.
45. Land Reclamation Punjab, Irrigation and Power Department, Canal Bank, Mughalpura, Lahore, Pakistan.
46. Jean Francois,Bourque, François Gauthier, Benoit Gingras and Onil Samuel. Herbicides in industrial environments:Common sense, best practices, publications of Québec, 1998, 87 p.
47. Jean-‐François. Bourque,( 1999). :So what will happen to them .... Act or the regulations on permits and certificates for the sale and use of pesticides
48. Kahlown MA, Majeed A. Water-‐resources situation in Pakistan: challenges and future strategies. Water resources in the south: present scenario and future prospec-‐tsIslamabad, Pakistan: Commission on Science and Technology for SustainableDevelopment in the South (COMSATS; 2003. p. 21–39
49. Laferriere, Minville JJ, J Lavoie, P. 1996. Payment pork industry and the risk Related to human health. Bull. Environm Health Information, Quebec, 7 (2): 1-‐4
50. Letelegramme.com 2010. Écotoxicologie.Fr; classification test pollutants.
51. Li Y, Zhang J. Agricultural diffuse pollution from fertilisers and pesticides in China.
52. Water Sci Technol 1999; 39:25–32
53. Li DP, Wu ZJ. Impact of chemical fertilizers application on soil ecological environment.Ying Yong Sheng Tai Xue Bao 2008; 19:1158–65.
54. Desbordes.M, Deutsch AD Frérot A. (1990): For a policy of training and information in urban hydrology. In: Management of water, Proceedings of the Symposium December 4-‐6, Presses Highways, Paris, 702-‐708.
55. MAKOUTODE M., AK ASSANI, OUENDO EM, VD and Agueh DIALLO P., (1999). Quality and Water Management mode rural wells in Benin: case of the sub-‐prefecture of Grand-‐Popo. Medicine Black Africa, 46 (11), pp 474-‐478.
56. Makoutodé million Assani AK, Ouendo EM, Agueh VD, 1999. P. Diallo and water quality management mode of rural wells in Benin: case of the sub-‐prefecture of Grand-‐Popo. Medicine Black Africa, 46 (11): 7UN. 2007. Water a shared responsibility, 2nd World Report United Nations on the development of water resources) (www.unesco.org/ water / WWAP / index_fr.shtml.
Advances in Social Sciences Research Journal (ASSRJ) Vol.3, Issue 1 January-‐2016
Copyright © Society for Science and Education, United Kingdom 113
57. Miquel G. 2003. Water Quality and Sanitation, Report on the quality of water and sanitation in France No. 705.http: //www.assemblee-‐nationale.fr/ 12 / folders / 030705.asp 38.
58. Milman N, Pedersen P, Steig T, Byg KE, Graudal N, Fenger K. Clinically overt hereditary hemochromatosis in Denmark 1948–1985: epidemiology, factors of significance for long-‐term survival, and causes of death in 179 patients. Ann Hematol 2001; 80:737–44.
59. Midrar-‐Ul-‐Haq, Khattak RA, Puno HK, Saif MS, Memon KS.: Surface and ground water contamination in NWFP and Sindh provinces with respect to trace elements. Int JAgri Biol 2005.; 7:214–7.
60. MOKOFIO F., RENAUDETJ. OPANDYC. BASTARDG. ABEYEJ. YETEM.L. TOUABEJ., GONDAOL. VOHITOJ.A. (1991). Quality Bacteriological study wells, springs and boreholes in the city Bangui: First results and outlook; Medicine Black Africa, 38.
61. NguimaletC. R. (2000): Water approaches the town site of Bangui (Central African Republic): a review of test since the colonial outpost to today. Univ. Bangui (CAR), 25 p. Unpublished.
62. NGUIMALET C.-‐R., 2004. The cycle and water management in Bangui (Central African Republic). Hydrogeomorphological approach the site of an African capital, PhD Thesis, Geography, Planning and Urban Development, Université Lumière Lyon 2 (France), Lyon, 449 p.
63. NGUIMALET C.-‐R., 2005, water consumption and health risks in the popular districts of Bangui. Poster, Promotion of scientific and technical culture, "Caravan of science" in CAR, 15 June to 27 August 2005, Bangui.
64. Nordberg,GF. Cadmium and health in the 21st century-‐historical remarks and trends for the future. Biometals 2004; 17:485–9.
65. PCRWR. Arsenic Contamination in Ground Water of Southern Punjab Phase I. Islamabad, Pakistan... Pakistan council for Research in Water Resources (PCRWR; 2008c p 12-‐28 Retrieved from http://www.pcrwr.gov.pk/Arsenic_SP/ASP_TOC .htm.
66. Planned behavior in understanding wastepaper recycling. Environment and behavior.
67. Perez de Nanclares G, Castano L, Gaztambide S, Bilbao JR, Pi J, Gonzalez ML, et al. Excessiron storage in patients with type 2 diabetes unrelated to primary hemochroma-‐tosis. N Engl J Med 2000; 343:890–1.
68. Qasim M. Twin cities: Water-‐borne diseases on the rise, The NEWS, Sunday, July 20, 2008, Pakistan, 2008.
69. Jaglin,s, Quince H., H. Conan, Stephen J., the usher A. Morel, Tamiatto M. (1998) -‐ For the sustainable management of water supply systems in small towns and cities in Africa. Communication at the International Conference "Water and Sustainable Development", UNESCO, 19 to 21 March, Paris, 6 p.
70. Report government: JICA (1999 b) Study on the development of groundwater Bangui (Central African Republic). Seminar documents. June 1999, 40 p.
71. Report government:J.O.R.C.A. 2008 07 018 OF LAW N ° 28 December 2007 PORT ANT CODE VENVIRONNEMENT OF THE CENTRAL AFRICAN REPUBLIC.
72. Rasmussen.ML, FolsomAR, CatellierDJ, TsaiMY, GargU, Eckfeldt JH. Aprospective studyof coronary heart disease and the hemochromatosis gene (HFE) C282Y mutation: the atherosclerosis risk in communities (ARIC) study. Atherosclerosis 2001; 154:739–46.
73. Report government:Sector Action Plan 2008-‐2010, October 2009: Plan of Actions Water and Sanitation Sector, Sector Committee Water and Sanitation Policy and national strategies for water and sanitation, Ministry of Mines and Water, 2006; Activity reports of the DGH 2008.
74. Rety ,j (2012): Water pollution and cancer risk.
75. Rosemann N. Drinking water crisis in Pakistan and the issue of bottled water. The case of Nestlé's‘Pure Life’. Pakistan: Swiss Coalition of Development Organizations and Action aid; 2005. Retrieved from http://www.alliancesud.ch/en/policy/water/ downloads/nestle-‐pakistan.pdf.
76. Rport government:JORCA / October 2008: ACT NO 06 001 OF INTERESTS April 12, 2006 WATER CODE OF THE CENTRAL AFRICAN REPUBLIC.
77. Report CAR, 1999: Support for the National Dialogue on Water, Sanitation and Hygiene in Central African Republic: State of Places, COWI Consortium 2007
Kamba, F., & Sangija, F. (2016). Impact of Water Pollution on Human Health in the Central African Republic. Advances in Social Sciences Research Journal, 3(1) 90-‐115.
URL: http://dx.doi.org/10.14738/assrj.31.1764. 114
78. Saab HB, N Nassif, Samrani Gela, Daoud R, S Medawar, Ouaïni N. 2007. Monitoring bacteriological quality of surface waters (river Nahr Ibrahim, Lebanon).
79. Sarwar G, Khan J, Iqbal R, Afridi AK, Khan A, Sarwar R. Bacteriological analysis ofdrinking water from urban and peri-‐urban areas of Peshawar. Journal of Postgraduate Medical Institute, Khyber Medical College, Peshawar 2004; 18:64–9.
80. SET,(2012):Solidarity Economy Team March 14, 2012 in Ecology. Bacteriological pollution. The water pollution is an alteration making it unsuitable for consumption and, more often, disrupting ... Historically, the biggest epidemics such as typhoid and cholera was transmitted by water.
81. SODECA General Directorate of Water (1995) -‐ Draft policy and national strategies for water and sanitation in CAR. Ministry of Energy, Mines and Water Resources, DGH / CNEA, Bangui (CAR).
82. SODECA:General Directorate of Water (2002) -‐ General Analysis of the Water Sector of the situation documentaries lights and regional surveys. Report Component of Institutional Management, Bangui (CAR), 35 p. + Annexes.95. Directorate General of Mines.
83. Solomons NAW, M2 Ruz. Trace element requirements în humans: an update. J3 Trace Elem Med Exp 1998; 11: 177-‐95.
84. State of Places, COWI Consortium 2007: Support for the National Dialogue on Water, Sanitation and Hygiene in Central African Republic.Support for the National Dialogue on Water, Sanitation and Hygiene in Central African Republic: State of Places, COWI Consortium 2007.Synthesis on the hydrology of the RCA, 1996 C.FEIZOURE.
85. Tchobanoglous, G. et E.D. Schroeder (1985) Water Quality -‐ Characteristics, Modeling, Modification. Addison Wesley. 744 p.
86. Tchobanoglous, G., F. L. Burton et H. D. Stensel (2003). Wastewater Engineering, Treatment and Reuse. Metcalf & Eddy Inc., McGraw-‐Hill, 4th edition, 1819 p.
87. TOMKINS A. (2000): Malnutrition, morbidity and mortality in children and their mothers. Proc.Nutr.Soc. 59, 135-‐146.
88. Ullah R, Malik RN, Qadir A. Assessment of groundwater contamination in an industrial city, Sialkot, Pakistan. Afr J Environ Sci Technol 2009; 3:429–46.
89. UNDP WHO (1972) -‐City Bangui: Sanitation and drainage. Technical Report on the storm water drainage and solid residues. Municipal Sanitation Service, Bangui (CAR), 46 p.
90. UNDP-‐WHO (1972): City of Bangui: Sanitation and drainage. Technical Report on the storm water drainage and solid residues. Municipal Sanitation Service, Bangui (CAR), 46 p. + Cards, profiles along the main and secondary collectors.
91. UNESCO. Water for people water for life. The United Nations World Water Development Report; 2003. United Nations Educational, Scientific and Cultural Organization (UNESCO) and Berghahn Books.
92. UNESCO. Water for people water for life. The United Nations World Water Development Report; 2003. United Nations Educational, Scientific and Cultural
93. UNICEF and WHO (2004). Meeting the MDG drinking water and sanitation target.
94. UNICEF, WHO and WSSCC (2000). Global water supply and sanitation assessment2000 report. Geneva, Switzerland, 80p.University Press.
95. Ward, 2009. ORS 2007: Too much of a good thing Nitrate from nitrogen fertilizers and cancer
96. W.H.O (World Health Organization) Joint Monitoring Program (JMP). 2010. Central African Republic Estimates for the use of Improved Drinking-‐Water Sources.‖ http://www.wssinfo.org/resources/documents.html. 2010b. Central African Republic Estimates for the use of Improved Sanitation Facilities.‖ http://www.wssinfo.org/resources/documents.html.
97. Weiss L, Wright S. Mercury on the road to zero. Recommended strategies to eliminate mercury releases from human activities in Oregon by 2020. Oregon: Oregon
98. WHO (1989). The use of wastewater in agriculture and aquaculture: recommendations referred to health. Report of a Scientific Group del'OMS, Technical Report Series 778.

Advances in Social Sciences Research Journal (ASSRJ) Vol.3, Issue 1 January-‐2016
Copyright © Society for Science and Education, United Kingdom 115
99. WHO. 1986. Quality Guidelines for Drinking Water. Hygiene criteria supporting documentation (Vol. 2, 1ièree dn). WHO: Geneva; 341 p.
100. WHO. 1993. Guidelines for Drinking-‐Water Quality, 2nd ed., Vol. 1. Recommendations. Chemical aspects. World Health Organization of the United Nations, Geneva. http://www.who.int/water sanitation health / dwq / 2edvol2p2a.pdf.
101. WHO. 1994. Quality Guidelines for Drinking Water: Recommendations (2nd edn). Flight. 1. World Health Organization; 202 p.
102. WHO. 2000. Quality Guidelines for Drinking Water Criteria and Hygiene Supporting documentation (2nd edn). Flight. 2. World Health Organization; 1050 p. Accessible a: ww.who.int/water sanitation health / GDWQ / Summary tables / 26 UN. 2007. Water a shared responsibility, the second United Nations World Report on the development of water resources) (www.unesco.org/ water / WWAP / index_fr.shtml.
103. WHO. 2000. Quality Guidelines for Drinking Water. Hygiene criteria supporting documentation (Vol. 2, 2eédn).
104. WHO. 2002. Emerging and epidemic-‐prone diseases. In Global Defense against the Infectious Disease Threat. World Health Organization: Geneva; 205 p.
105. WHO. Fluorides and oral health. WHO Technical Report Series 846Word Health.
106. WHO. Guidelines for drinking water quality. Geneva, Switzerland: World Health.
107. WHO. Guidelines for drinking-‐water quality. Geneva: World Health Organization;
108. WHO/UNICEF. (2005), Water for Life: Making it Happen, WHO/UNICEF, Geneva.
109. Wikipedia / Geopolitics of Water 2009. The problem of pollution http://fr.wikipedia.org/wiki/G%C3%A9opolitiquede the% # The probl.C3.A8me 27eau pollution
110. World Health Organization (WHO). Quality Guidelines for Drinking Water: Quality control of drinking water for the supply of small communities; 1986, 121 P.
111. World Health Organization. Celebration of the International Decade Action Water Source of Life: 2005-‐2015; World Water Day. Guide awareness. WHO; 2005.
Advances in Social Sciences Research Journal – Vol.3, No.1 Publication Date: Jan. 25, 2016 DoI:10.14738/assrj.31.1779.
Awiti, J. A., Onderi, H., & Raburu, P. (2016). Head Teachers’ Supervision of Curriculum Implementation: Implications on Provision of Quality Secondary Education in Kenya. Advances in Social Sciences Research Journal, 3(1) 116-‐128.
Copyright © Society for Science and Education, United Kingdom 116
Head teachers’ Supervision of Curriculum Implementation: Implications on Provision of Quality Secondary Education in
Kenya
Jennipher Atieno Awiti School of Education, Jaramogi Oginga Odinga
University of Science and Technology
Henry Onderi School of Education, Jaramogi Oginga Odinga
University of Science and Technology
Pamela Raburu School of Education, Jaramogi Oginga Odinga
University of Science and Technology
Abstract This study sought to find out how the head teachers’ supervision of curriculum implementation influences provision of quality education in Kisumu East Sub-‐County Secondary schools, Kenya. The study population consisted of 13 public and 4 private secondary schools in Kisumu East Sub-‐County. The total population of the study was 1114. Out of these 924 were Form Four candidates, 174 teachers and 17 head teachers. The study used a sample size of 382 consisting of 308 Form Four candidates, 58 teachers selected using simple random sampling. A total of 16 head teachers were selected using purposive sampling technique. The instrument validity was ascertained by use of a four-‐point scale rating by experienced colleagues to ascertain the relevance of the questions while instrument reliability was ascertained using Split-‐Half Technique. Piloting was done in 4 schools in the neighboring Kisumu Central Sub-‐County to ascertain Face validity of the instruments. The research design employed in the study was descriptive survey. Questionnaires, interviews and document analysis were used to obtain data. Quantitative data analysis was done using descriptive and inferential statistics with the aid of SPSS version 21 and co-‐relational techniques. Qualitative data from interviews were analyzed using Thematic Analysis. The findings of the study indicated that there was a strong relationship between head teacher supervision, curriculum implementation and provision of quality education in Kisumu East Sub-‐County. Challenges faced by head teachers included teacher and student truancy, teacher resistance to supervision exercise, financial constraints hampering quality education provision, interschool transfers and high student dropout rate among others. The study recommended that the head teachers, as internal Quality Assurance Officers at the school level should attend supervision training sessions offered by Kenya Educational Management Institute.
Key words: Instructional Supervision, Curriculum Implementation, Quality education provision
INTRODUCTION
Supervision has been a neglected area of educational management for a long time (UNESCO, 2007 Module 2). One of the main roles of any school is to monitor the quality of education (UNESCO, 2007 Module 8). According to UNESCO (2009) in Paris, Secondary education in many
Advances in Social Sciences Research Journal (ASSRJ) Vol.3, Issue 1 January-‐2016
Copyright © Society for Science and Education, United Kingdom 117
countries is seen as ineffective, of poor quality and ill-‐adapted to contemporary social and economic needs. Teachers are poorly trained and the head teachers’ teams lack training suited to the growing diversity and complexity of the tasks facing them (UNESCO, 2009). In India, Sindhi (2013) writing on ‘Does quality assurance in school education ensure transparency and accountability?’ suggested that if school authorities adopt a proper quality assurance mechanism for their schools and monitor quality continuously with respect to different identified indicators and appropriate actions, such an approach would help the management and the teachers to become aware of their responsibilities with regard to establishing quality in their management and teaching functions. In Nigeria, Sabitu and Ayandola (2012) noted that instructional supervision occupies a unique place in the entire education system so becoming extremely necessary to give it prominent attention. However, according to Utake (2012) there is a tendency for some modern school head teachers to shy away from supervision of instruction and they rather occupy themselves with inspecting school building projects, soliciting for funds from Parents Teachers Associations (PTA) and the public, attending to visitors and other less necessary administrative chores (Adebanjo, 2009). The Government of Kenya noted in its Master plan of education and training (1997-‐2010) that the majority of schools fall short of providing for the learning needs of their students leading to poor academic performance (Mumo, Kadenyi and Kiboss, 2014). In agreement with this, Sindhi (2013) in India and Gathara (2010) in Kenya wrote that education has become a competitive human enterprise in the 21st Century and should be accorded high priority. As President Uhuru Kenyatta, Kenya noted, investment in Education for the youth is set to transform the country’s economy by 2030 (Oduor, 2014). The President further noted that with increased access to learning, many young people would benefit from acquiring skills for entering gainful employment or business. The reason for emphasizing on quality education is to give learning a meaning. In 2014, the KCSE examinations results indicated that Kisumu East Sub-‐County attained bottom position in Kisumu County with only 5 candidates managing a mean score of B+ and 22 with B plain. (Kisumu County Examinations Analysis Document, 2014). The latest Joint Evaluation Test (JET, 2015) showed below average scores of 3.4636 (Republic of Kenya, MoEST Kisumu East Sub-‐County 2015 Results Analysis). According to UNESCO (2009), if Supervision is enhanced then the teachers’ job performance is monitored enabling timely corrective measures to be implemented to ensure improvement of teacher competencies and general professional growth. Literature Review According to Darling-‐Hammond (1997), the highest quality teachers are those who are most capable of helping their students to learn and have deep mastery of their subject matter and pedagogy This affects retention and educational quality since student achievement, especially beyond the basic skills, depends largely on teachers’ command of subject matter and their ability to use that knowledge to help students learn (Mullens, Murnane and Willet 1996). In Pennsylvania, Farley (2010) carried out a study on instructional supervision whose aim was to describe performance criteria, supervisory practices, and the impact these practices had on instruction in three cyber-‐schools enrolling full-‐time students. The findings were that
Awiti, J. A., Onderi, H., & Raburu, P. (2016). Head Teachers’ Supervision of Curriculum Implementation: Implications on Provision of Quality Secondary Education in Kenya. Advances in Social Sciences Research Journal, 3(1) 116-‐128.
URL: http://dx.doi.org/10.14738/assrj.31.1779. 118
performance criteria were similar for both traditional and online teachers in sampled schools. However, the study by Farley (2010) Pennsylvania has not fully developed clear methods of curriculum supervision as opposed to this current study that looked at well established head teachers’ supervisory practices and how they influence quality education provision in the Sub-‐County. . Similarly, in Uganda, Nzabonimpa-‐Buregya (2013) carried out a study on influence of secondary school head teachers’ general and instructional supervisory practices on teacher work performance. The findings of this study indicated that limited general and instructional supervision was commonplace in secondary schools in Uganda. However, the current study concentrated on only one aspect of supervision, Instructional supervision, for a more intense understanding of supervisory practices. In the same way in West Africa, Frempong (2011) conducted a study in Cape Coast on factors contributing to poor performance of students in the basic education certificate examination in selected public junior high schools in Effutu Municipality. The findings were that contributions to poor academic performance of students included inadequate teaching and learning materials, inability to complete the syllabus among other factors. However, the study by Frempong (2011) described above did not show how head teachers get involved in supervising implementation of curriculum programs, a gap which the current study sealed. In relation to the above studies, in Kenya, Muriithi (2014) carried out a study to investigate the influence of head teachers’ instructional supervision strategies on curriculum implementation in public schools in Imenti South district. The findings were that internal instructional supervision helped teachers to improve in assessment and evaluation, which further influenced curriculum implementation. The study by Muriithi (2014) however concentrated on the cognitive aspect of the curriculum implementation and neglected the quality aspect of innovation and ability to make correct decisions for personal and social gains, which this study sought to find out in Kisumu East Sub-‐County Secondary schools.
RESEARCH METHODOLOGY The study adopted a mixed design which is a research design in which the researcher collects and analyzes data, integrates the findings, and draws inferences using both qualitative and quantitative approaches in a single study (James and Busher, 2009). It adopted both techniques because the combination makes it possible to arrive at a richer and more complete description covering fairly all aspects of the phenomena under investigation. The target population was focused on 17 secondary schools in Kisumu East Sub County, with a total target population of 924 candidates, 17 head teachers and 174 trained teachers. The number of students and teachers were arrived at according to Mugenda and Mugenda (2006) and Bragg (2011), who asserted that a third (33%) of a population is an adequate sample size for a survey study. Therefore, out of 924, 308 candidates were selected and 58 teachers selected from 174. Out of 17 head teachers, 16 head teachers were sampled in the study using purposive sampling technique since one school was new and did not have candidate classes. Questionnaires, Interview schedules and document analysis were used for data collection in the study. According to Orodho (2012), a questionnaire is used to obtain facts and opinions about a phenomenon from people who are informed on a particular issue. In this study, questionnaires were used to collect data from both teachers and students. Interview schedule
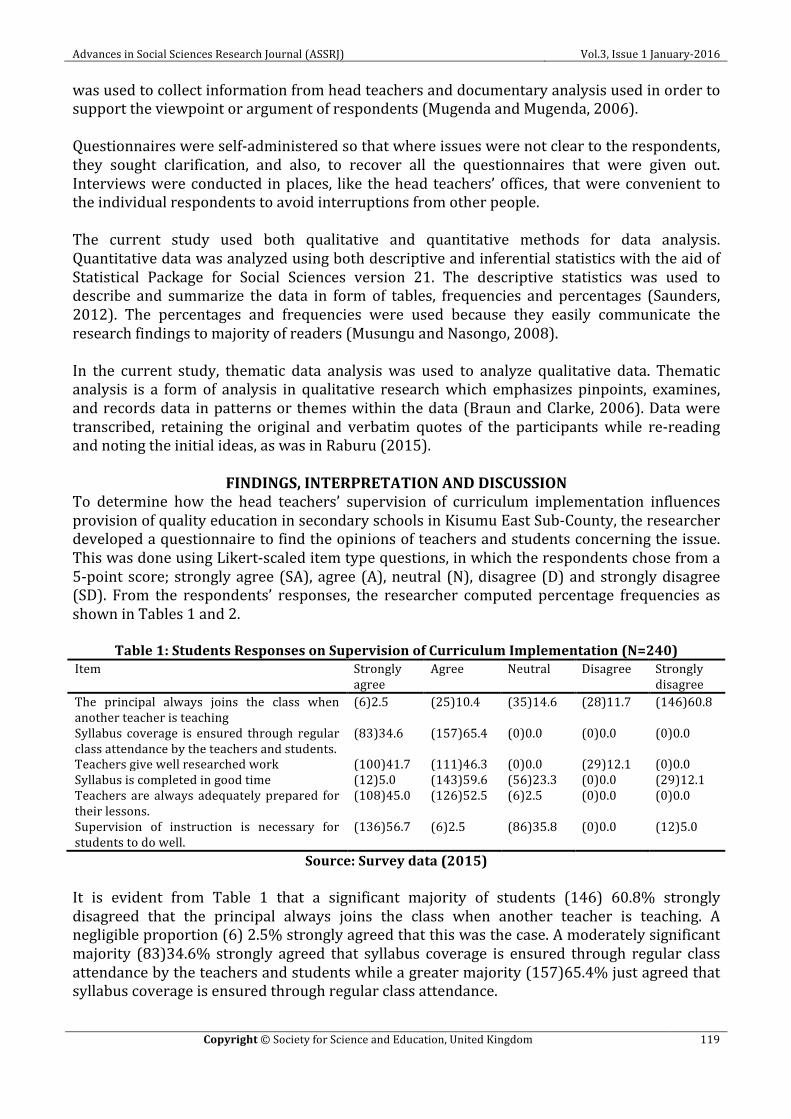
Advances in Social Sciences Research Journal (ASSRJ) Vol.3, Issue 1 January-‐2016
Copyright © Society for Science and Education, United Kingdom 119
was used to collect information from head teachers and documentary analysis used in order to support the viewpoint or argument of respondents (Mugenda and Mugenda, 2006). Questionnaires were self-‐administered so that where issues were not clear to the respondents, they sought clarification, and also, to recover all the questionnaires that were given out. Interviews were conducted in places, like the head teachers’ offices, that were convenient to the individual respondents to avoid interruptions from other people. The current study used both qualitative and quantitative methods for data analysis. Quantitative data was analyzed using both descriptive and inferential statistics with the aid of Statistical Package for Social Sciences version 21. The descriptive statistics was used to describe and summarize the data in form of tables, frequencies and percentages (Saunders, 2012). The percentages and frequencies were used because they easily communicate the research findings to majority of readers (Musungu and Nasongo, 2008). In the current study, thematic data analysis was used to analyze qualitative data. Thematic analysis is a form of analysis in qualitative research which emphasizes pinpoints, examines, and records data in patterns or themes within the data (Braun and Clarke, 2006). Data were transcribed, retaining the original and verbatim quotes of the participants while re-‐reading and noting the initial ideas, as was in Raburu (2015).
FINDINGS, INTERPRETATION AND DISCUSSION To determine how the head teachers’ supervision of curriculum implementation influences provision of quality education in secondary schools in Kisumu East Sub-‐County, the researcher developed a questionnaire to find the opinions of teachers and students concerning the issue. This was done using Likert-‐scaled item type questions, in which the respondents chose from a 5-‐point score; strongly agree (SA), agree (A), neutral (N), disagree (D) and strongly disagree (SD). From the respondents’ responses, the researcher computed percentage frequencies as shown in Tables 1 and 2.
Table 1: Students Responses on Supervision of Curriculum Implementation (N=240) Item Strongly
agree Agree Neutral Disagree Strongly
disagree The principal always joins the class when another teacher is teaching
(6)2.5 (25)10.4 (35)14.6 (28)11.7 (146)60.8
Syllabus coverage is ensured through regular class attendance by the teachers and students.
(83)34.6 (157)65.4 (0)0.0 (0)0.0 (0)0.0
Teachers give well researched work (100)41.7 (111)46.3 (0)0.0 (29)12.1 (0)0.0 Syllabus is completed in good time (12)5.0 (143)59.6 (56)23.3 (0)0.0 (29)12.1 Teachers are always adequately prepared for their lessons.
(108)45.0 (126)52.5 (6)2.5 (0)0.0 (0)0.0
Supervision of instruction is necessary for students to do well.
(136)56.7 (6)2.5 (86)35.8 (0)0.0 (12)5.0
Source: Survey data (2015) It is evident from Table 1 that a significant majority of students (146) 60.8% strongly disagreed that the principal always joins the class when another teacher is teaching. A negligible proportion (6) 2.5% strongly agreed that this was the case. A moderately significant majority (83)34.6% strongly agreed that syllabus coverage is ensured through regular class attendance by the teachers and students while a greater majority (157)65.4% just agreed that syllabus coverage is ensured through regular class attendance.

Awiti, J. A., Onderi, H., & Raburu, P. (2016). Head Teachers’ Supervision of Curriculum Implementation: Implications on Provision of Quality Secondary Education in Kenya. Advances in Social Sciences Research Journal, 3(1) 116-‐128.
URL: http://dx.doi.org/10.14738/assrj.31.1779. 120
On the question of whether teachers gave well researched work, (100)41.7% of the students highly agreed and (111)46.3% just agreed that the case was true. A small majority, (29) 12.1% disagreed that this was true. This means that to some extent, teachers did poorly researched work, compromising quality of education provision in the Sub-‐County. It was surprising that only (12)5.0% highly agreed that the syllabus was completed in time (143)59.6% just agreed and (29) 12.1% strongly disagreed that the syllabus was completed in good time. This finding was a strong indication that quality of education in the Sub-‐County was compromised and students sent to the National examinations rooms when not fully prepared. Less than half (108)45.0% of the students highly agreed that their teachers are always adequately prepared for their lessons. More than half (126)52.5% just agreed and (6)2.5% strongly disagreed that this was true. Therefore it is possible to conclude that some teachers did not prepare for their lessons well. On whether supervision of instruction was necessary for students to do well, more than half of the students (136)56.7% highly agreed that this was true. However a moderate majority of the students (86)35.8% were neutral, (6)2.5% just agreed and a small group of (12)5.0% strongly disagreed that supervision is necessary for students to perform well. This shows that a significant majority wanted supervision to take place as they (students) desired to do better and prepare for the challenges outside school.
Table 2: Teachers Responses on Supervision of Curriculum Implementation (N=45) Item Strongly
agree Agree Neutral Disagree Strongly
disagree Head teacher visits the classroom to ensure teacher content delivery is in line with recommended syllabus.
(0)0.0 (45)100.0 (0)0.0 (0)0.0 (0)0.0
Head teacher evaluates teacher to improve instructional practices
(0)0.0 (15)33.3 (30)66.7 (0)0.0 (0)0.0
Furnishes teachers with useful professional material and resources
(0)0.0 (30)66.7 (0)0.0 (15)33.3 (0)0.0
Head teachers are undertaking internal supervision of curriculum.
(0)0.0 (30)66.7 (15)33.3 (0)0.0 (0)0.0
The time allotted for curriculum instruction is adequate.
(0)0.0 (15)33.3 (0)0.0 (30)66.7 (0)0.0
Head teachers go round to observe teachers in the classroom.
(0)0.0 (0)0.0 (15)33.3 (30)66.7 (0)0.0
Teachers are committed to proper use of instructional time
(0)0.0 (30)66.7 (15)33.3 (0)0.0 (0)0.0
Head teachers visit classroom to oversee how teachers organize group work
(0)0.0 (0)0.0 (30)66.7 (15)33.3 (0)0.0
Head teachers supervise effectively as expected. (0)0.0 (30)66.7 (15)33.3 (0)0.0 (0)0.0 Head teachers are not bold to point out the teachers’ mistakes to them.
(0)0.0 (30)66.7 (0)0.0 (0)0.0 (15)33.3
Head teachers discriminate and are not fair and firm
(0)0.0 (15)33.3 (15)33.3 (0)0.0 (15)0.0
Head teachers provide a time table for smooth coordination and teaching.
(0)0.00 45(100.0) (0)0.0 (0)0.0 (0)0.0
Head teachers have knowledge and skills of supervision
(15)33.3 (15)33.3 (0)0.0 (0)0.0 (15)33.3
Head teachers are sufficiently trained in supervision.
(15)33.3 (15)33.3 (15)33.3 (0)0.0 (0)0.0
Students have adequate learning and teaching materials.
(0)66.7 (30)66.7 (0)0.0 (15)33.3 (0)0.0
Source: Survey data (2015)
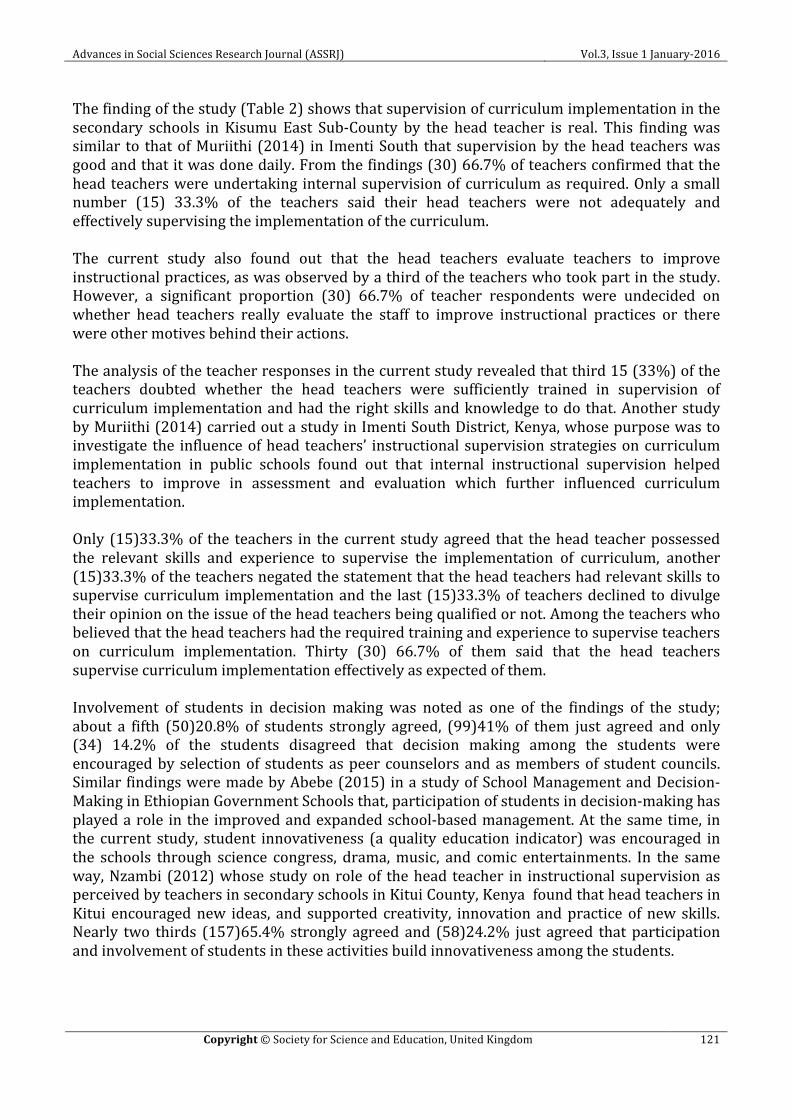
Advances in Social Sciences Research Journal (ASSRJ) Vol.3, Issue 1 January-‐2016
Copyright © Society for Science and Education, United Kingdom 121
The finding of the study (Table 2) shows that supervision of curriculum implementation in the secondary schools in Kisumu East Sub-‐County by the head teacher is real. This finding was similar to that of Muriithi (2014) in Imenti South that supervision by the head teachers was good and that it was done daily. From the findings (30) 66.7% of teachers confirmed that the head teachers were undertaking internal supervision of curriculum as required. Only a small number (15) 33.3% of the teachers said their head teachers were not adequately and effectively supervising the implementation of the curriculum. The current study also found out that the head teachers evaluate teachers to improve instructional practices, as was observed by a third of the teachers who took part in the study. However, a significant proportion (30) 66.7% of teacher respondents were undecided on whether head teachers really evaluate the staff to improve instructional practices or there were other motives behind their actions. The analysis of the teacher responses in the current study revealed that third 15 (33%) of the teachers doubted whether the head teachers were sufficiently trained in supervision of curriculum implementation and had the right skills and knowledge to do that. Another study by Muriithi (2014) carried out a study in Imenti South District, Kenya, whose purpose was to investigate the influence of head teachers’ instructional supervision strategies on curriculum implementation in public schools found out that internal instructional supervision helped teachers to improve in assessment and evaluation which further influenced curriculum implementation. Only (15)33.3% of the teachers in the current study agreed that the head teacher possessed the relevant skills and experience to supervise the implementation of curriculum, another (15)33.3% of the teachers negated the statement that the head teachers had relevant skills to supervise curriculum implementation and the last (15)33.3% of teachers declined to divulge their opinion on the issue of the head teachers being qualified or not. Among the teachers who believed that the head teachers had the required training and experience to supervise teachers on curriculum implementation. Thirty (30) 66.7% of them said that the head teachers supervise curriculum implementation effectively as expected of them. Involvement of students in decision making was noted as one of the findings of the study; about a fifth (50)20.8% of students strongly agreed, (99)41% of them just agreed and only (34) 14.2% of the students disagreed that decision making among the students were encouraged by selection of students as peer counselors and as members of student councils. Similar findings were made by Abebe (2015) in a study of School Management and Decision-‐Making in Ethiopian Government Schools that, participation of students in decision-‐making has played a role in the improved and expanded school-‐based management. At the same time, in the current study, student innovativeness (a quality education indicator) was encouraged in the schools through science congress, drama, music, and comic entertainments. In the same way, Nzambi (2012) whose study on role of the head teacher in instructional supervision as perceived by teachers in secondary schools in Kitui County, Kenya found that head teachers in Kitui encouraged new ideas, and supported creativity, innovation and practice of new skills. Nearly two thirds (157)65.4% strongly agreed and (58)24.2% just agreed that participation and involvement of students in these activities build innovativeness among the students.
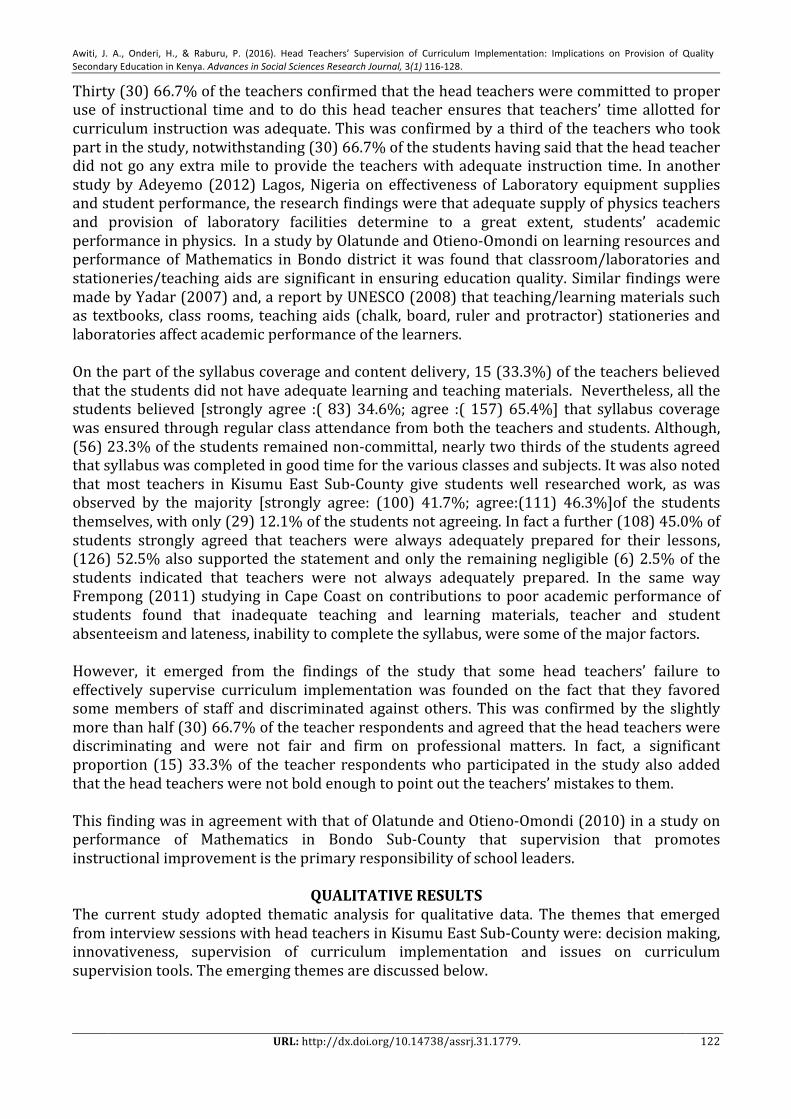
Awiti, J. A., Onderi, H., & Raburu, P. (2016). Head Teachers’ Supervision of Curriculum Implementation: Implications on Provision of Quality Secondary Education in Kenya. Advances in Social Sciences Research Journal, 3(1) 116-‐128.
URL: http://dx.doi.org/10.14738/assrj.31.1779. 122
Thirty (30) 66.7% of the teachers confirmed that the head teachers were committed to proper use of instructional time and to do this head teacher ensures that teachers’ time allotted for curriculum instruction was adequate. This was confirmed by a third of the teachers who took part in the study, notwithstanding (30) 66.7% of the students having said that the head teacher did not go any extra mile to provide the teachers with adequate instruction time. In another study by Adeyemo (2012) Lagos, Nigeria on effectiveness of Laboratory equipment supplies and student performance, the research findings were that adequate supply of physics teachers and provision of laboratory facilities determine to a great extent, students’ academic performance in physics. In a study by Olatunde and Otieno-‐Omondi on learning resources and performance of Mathematics in Bondo district it was found that classroom/laboratories and stationeries/teaching aids are significant in ensuring education quality. Similar findings were made by Yadar (2007) and, a report by UNESCO (2008) that teaching/learning materials such as textbooks, class rooms, teaching aids (chalk, board, ruler and protractor) stationeries and laboratories affect academic performance of the learners. On the part of the syllabus coverage and content delivery, 15 (33.3%) of the teachers believed that the students did not have adequate learning and teaching materials. Nevertheless, all the students believed [strongly agree :( 83) 34.6%; agree :( 157) 65.4%] that syllabus coverage was ensured through regular class attendance from both the teachers and students. Although, (56) 23.3% of the students remained non-‐committal, nearly two thirds of the students agreed that syllabus was completed in good time for the various classes and subjects. It was also noted that most teachers in Kisumu East Sub-‐County give students well researched work, as was observed by the majority [strongly agree: (100) 41.7%; agree:(111) 46.3%]of the students themselves, with only (29) 12.1% of the students not agreeing. In fact a further (108) 45.0% of students strongly agreed that teachers were always adequately prepared for their lessons, (126) 52.5% also supported the statement and only the remaining negligible (6) 2.5% of the students indicated that teachers were not always adequately prepared. In the same way Frempong (2011) studying in Cape Coast on contributions to poor academic performance of students found that inadequate teaching and learning materials, teacher and student absenteeism and lateness, inability to complete the syllabus, were some of the major factors. However, it emerged from the findings of the study that some head teachers’ failure to effectively supervise curriculum implementation was founded on the fact that they favored some members of staff and discriminated against others. This was confirmed by the slightly more than half (30) 66.7% of the teacher respondents and agreed that the head teachers were discriminating and were not fair and firm on professional matters. In fact, a significant proportion (15) 33.3% of the teacher respondents who participated in the study also added that the head teachers were not bold enough to point out the teachers’ mistakes to them. This finding was in agreement with that of Olatunde and Otieno-‐Omondi (2010) in a study on performance of Mathematics in Bondo Sub-‐County that supervision that promotes instructional improvement is the primary responsibility of school leaders.
QUALITATIVE RESULTS The current study adopted thematic analysis for qualitative data. The themes that emerged from interview sessions with head teachers in Kisumu East Sub-‐County were: decision making, innovativeness, supervision of curriculum implementation and issues on curriculum supervision tools. The emerging themes are discussed below.

Advances in Social Sciences Research Journal (ASSRJ) Vol.3, Issue 1 January-‐2016
Copyright © Society for Science and Education, United Kingdom 123
Decision Making is regarded as the cognition process resulting in the selection of a belief or a course of action among several alternative possibilities or, the thought process of selecting a logical choice from the available options, (McClafferty, 2015). The current study sought to find out if schools in Kisumu East Sub-‐County enabled their students to develop this ability. From the interview with head teachers it emerged that one way of encouraging students to make decisions is to allow them to choose their own Student Council. The current method of selecting what was originally ‘the prefect body’ changed to a system where students organize themselves in some sort of campaign rallies where other students select the most convincing candidate to represent them in given positions in the school.
‘In this manner, they are encouraged to develop the skill of making their own decisions on who is to be included in the Student Council…such leaders can be ‘removed from further leadership’ if they do not measure up to the expectations of the student body who elected them’ (Head Teacher 6).
This means that students in Kenya, and in Kisumu East in particular are allowed to make informed choices from their own internal interactions. This enables them to choose their own leaders, whom in their view give them the kind of leadership they expect in the school. De Grauwe and Lugaz (2011) in a study of Kenya, Uganda and Lesotho wrote on strengthening local actors: the pathway to decentralization, that greater decentralization of educational decision-‐making is becoming the common aspiration of many developing countries. A head teacher explained that:
‘..once the student council has been chosen, any adjustment to the school program must be done in consultation with the students. Students must have a meeting to forward their ideas to the administration’ Head Teacher 4.
In agreement with this finding, Luck (2011) in a study ‘School principals’ effectiveness and leadership quality in educational management, found out that in some Asian countries like Malaysia, School management has improved because it involves students and communities in the school decision-‐making. Head Teachers on Innovativeness. Innovation may well be the most important educational issue of the day according to Moyle, (2010) which means the skill and imagination to create new things. Innovativeness refers to cleverness, creativity, ingenuity, inventiveness, originality. When asked if students were encouraged to be innovative, a few head teachers answered that students were encouraged to be innovative by creating talent days where best talents were awarded while all head teachers agreed that students are encouraged to present talent items during school occasions like parents’ day, prize-‐giving days or such other related school functions. One of the head teachers retorted:
‘One of the dimensions of the school innovation issue pertains to the capabilities required by young people to have a successful life and so contribute to economic, social and individual well being, and also to align the nature and structure of school life with the contemporary culture. For this reason we must ensure that the type of education offered gets the best in the learners through creating talent days which are awarded

Awiti, J. A., Onderi, H., & Raburu, P. (2016). Head Teachers’ Supervision of Curriculum Implementation: Implications on Provision of Quality Secondary Education in Kenya. Advances in Social Sciences Research Journal, 3(1) 116-‐128.
URL: http://dx.doi.org/10.14738/assrj.31.1779. 124
immediately and on school academic days in which their parents are present to boost their morale..’ (Head Teacher 11).
This means that the schools in Kisumu East Sub-‐county are interested in giving their students space to be creative and develop their talents. However majority of the head teachers said innovativeness was encouraged through the Ministry of Education guidelines concerning co-‐curricular activities, like ball games, athletics, science congress, drama and music festivals. One of the head teachers reported:
‘The Ministry of Education has pre-‐prepared Term dates which guide the school activities during different seasons the whole year, like athletics season in First term and Music and Drama season in Second Term..we have no choice but to train the young talents during the given dates and school calendar’. (Head Teacher 10).
This means that the Ministry of Education is very instrumental in ensuring that the young talents are developed in the country. The schools are responsible for the implementation of the same. Supervision of Curriculum Implementation Due to lack of time to undertake supervisory duties it emerged that many head teachers used Management By Walking Around, (MBWA) method to supervise their teachers. It was found that some head teachers make timetables of sorts where class attendance can be noted by class secretaries signing in when teachers have taught their classes. According to Nancy Austine (2013) and Kelly (2015) and expounding on Tom Peter’s (1982) most successful book, ‘In search of Excellence’, Management by Walking Around refers to managers spending some part of their time listening to problems and ideas of their staff, while wandering around an office or plant. The idea of this practice is to listen and respond to ideas or problems voiced and take effective action about them. A head teacher cited:
‘When we walk around the classes especially the early morning lessons, teachers are motivated to attend to their classes in time, students are motivated to attend those lessons in time and a cordial relationship is developed between the teacher and the head teacher. Other teachers who come to school late, missing their first lessons are motivated to come earlier in to attend their next lessons, some, to be in ‘good books’ with the head teacher but others, out of fear of being asked to explain’ (Head Teacher 7)
This finding was in line with what Tom Peters (1982) stipulated in the book ‘Essential Skills for an excellent career’ that Management By Wandering About helps in accessibility to staff who then gain from the manager’s experience, approachability, trust, business knowledge, accountability morale and productivity (Kelly, 2015). In contrast to Head Teacher 7, another head teacher explained why he does not use the MBWA approach to supervision:
‘We have a mechanism by which we can monitor the activities even from the office. All class representatives, (formerly class monitors have an empty outline of the time table where they insert the name of each teacher and subject, to mark ‘taught’ or ‘missed’ accordingly. They also indicate the time the teachers enter and leave the classes so

Advances in Social Sciences Research Journal (ASSRJ) Vol.3, Issue 1 January-‐2016
Copyright © Society for Science and Education, United Kingdom 125
that we can know the time wasters and invite them for further follow up discussions.’ (Head Teacher 12)
For this reason, head teachers are in control even from the office without having to hang around classes and create fear and despondency among the teachers and students. Learning still goes on smoothly yet the head teacher is in touch with all that goes on in the classes. The Head Teacher and Tools for Curriculum Supervision It was established, from the head teachers’ interview, particularly from the private schools, did not have supervisory tools to use in Curriculum implementation monitoring. Findings from a study by Nzabonimpa-‐Buregya (2013) in Uganda also indicated that head teachers, to a great extent in private secondary schools did not carry out instructional supervision although they did some informal classroom visits.
‘we design our own supervisory tools within the school. We do not have any prescribed guideline from the Ministry of Education to use for monitoring Curriculum Implementation’ (Head Teacher10).
Similar findings were made in Ethiopia in a study by Abebe (2014) who found that teachers lacked awareness and orientation on the significance of school-‐based supervisory activities, lack of supervision manuals in schools and shortage of allocated budget for supervisory activities. Another head teacher in one private school confessed that there were no supervisory tools in the school.
‘We do not have any supervisory documents in the school. For supervision, the head teacher ensures that all classes are attended and all teachers must comply’ (Head Teacher 11.
If head teachers carried out their supervisory roles well, there was bound to be remarkable efficiency in the work carried out by subordinates. However, some head teachers, particularly from the higher achieving schools said,
‘policy guidelines are available for supervision like the Education Act, TSC Act, Basic Education Act, Procurement Act and the like..these are the guidelines from which we extract our own, according to our own school environment’ (Head Teacher 2).
Lack of visitation from the Quality assurance Officers is an indication that head teachers did not receive advisory services which they could expect from the officers, especially on supervisory methods of curriculum implementation. This finding was similar to those of Mobegi et.al. (2010), who found that quality assurance officers did not visit schools in Gucha district, making head teachers unable to receive correct advisory services on Curriculum implementation.
CONCLUDING REMARKS The study concludes that actual supervision of curriculum implementation is weak in Kisumu East Sub-‐county. This could explain the low scores by students in KCSE exams with only a few schools able to post high scores. It is important for the quality assurance officers from the Ministry of Education to regularize their visits to the schools in order for curriculum implementation supervision to be further strengthened. The study concluded that there is a

Awiti, J. A., Onderi, H., & Raburu, P. (2016). Head Teachers’ Supervision of Curriculum Implementation: Implications on Provision of Quality Secondary Education in Kenya. Advances in Social Sciences Research Journal, 3(1) 116-‐128.
URL: http://dx.doi.org/10.14738/assrj.31.1779. 126
strong positive correlation between head teachers’ supervision of curriculum implementation and provision of quality education in Kisumu East Sub-‐County. References Abebe, W. (2012). A working paper on School Management and Decision-‐Making in Ethiopian Government schools: Evidence from the young lives: Qualitative school survey. Young lives, an international study of childhood poverty. www.younglives.org.uk
Adeyemo, S. A. (2012). Influence of Teacher supply and the provision of Laboratory Facilities on student achievement in Physics. European Journal of Educational Studies 4(3), 2012, Ozean Publications.
Bertalanffy, V.L. (1950). An Outline of General Systems Theory. British Journal for the philosophy of Science. Vol. 1 No. 2.
Burnard, P., Gill, P., Stewart, K., Treasure, E. & Chandwick, B. (2015). Analysing
and Presenting Qualitative Data. British Dental Journal Current Issue. RSS Feed Publications. www.nature.com/bdj/journal/v204.htm. Published Online.
Darling-‐Hammond, L. (1997). Doing What Matters most: Investing in Quality teaching.
De Grauwe, A. & Lugaz, C. (2011). Strengthening Local Actors: The path to Decentralizing Education; Kenya, Uganda and Lesotho. Paris International Institute for Educational Planning and UNESCO
Farley, G.C. (2010). Instructional supervision: A descriptive study focusing on the observation and evaluation of teachers in Cyberschools. University of Pennsylvania. ERIC Web site:http://www.proquest.com/en-‐Us/products/desertations/individuals.shtml.
Frempong, E. (2011). Factors contributing to poor performance of students in the basic education certificate examination in selected public junior high schools in Effutu Municipality, University of Winneba.
Glanz, J., College, W. Shulman, V., Sullivan, S. (2007). Impact of Instructional Supervision on Student achievement: Can we make the connection? A paper presented at the annual conference of the American Educational Research Association (AERA), Chicago.
Grauwe, A. (2007). Transforming School Supervision in to a tool for Quality Improvement. International Review of Education, 53, 709-‐714.
James, N. & Busher, H. (2009). Qualitative Data Analysis. www.sagepub.com/schuttlsw7e pp.34-‐37
Kisumu County Documents (2015). https://en.m CC BY-‐SA 3.0
Kisumu County (2014). Examinations Results Analysis. Examinations department 2014.
Kisumu East Sub-‐County Education office documents (2015). Official schools
Returns. Kisumu East Sub County.[
Kothari, C.R. (2011). Research Methodology, Methods and Techniques. New Age International Publishers, New Delhi.
Likert, R. (1931). A Technique for the measurement of attitudes. Archives of Psychology. New York: Columbia University Press.
Luck, T.L. (2011). School Principals’ Effectiveness and Leadership quality in educational management, Johor: Mara University of Technology
McClafferty, (2015). 5 Simple Ways to Improve Decision-‐making. www.forbes.com/sites.
Ministry of Education & Ministry of Higher Education, Science and Technology. Sessional Paper No…of 2012. A policy Framework for Education and Training: Reforming Education in Kenya. Task Force Report. (2012). Republic of Kenya.
Minisrty of Education Statistics (2015). Education For All 2015: the 2015 National Review – Unesdoc efa 2015 review @ unesco.co.org.
Mobegi, F.O., Ondigi, A.B. & Odhiambo P.O. (2010). Secondary School Head teachers’ Quality Assurance Strategies and Challenges in Gucha District, Kenya. Educational Research and Reviews. Vol 5(7) pp. 408-‐414. http//www.academicjournals.org/ERRZ ISSN 1990-‐3839 Academic Journals.
Advances in Social Sciences Research Journal (ASSRJ) Vol.3, Issue 1 January-‐2016
Copyright © Society for Science and Education, United Kingdom 127
Mugenda, A. & Mugenda, O. (2006). Research Methodology: Qualitative and Quantitative Approach. ACTS Press, Nairobi.
Mumo, R.M., Kadenyi, M.M. & Kiboss, J.K. (2014). Instructional Supervisory Skills used for Academic Performance by Head Teachers in (KCSE) in Public Schools in Machakos. International Journal of Education and Research. Vol. 2 No. 10, Oct. 2014
Muriithi, M.M. (2014). Influence of head teachers’ Instructional Supervision Strategies on Curriculum Implementation in Public Primary schools in Imenti South District, Kenya. Compiled and produced by Kenya Information Preservation Society.
Musungu, L.L.& Nasongo, J.W. (2008). The Head-‐teachers’ Instructional role in academic achievement in Secondary Schools in Vihiga District, Kenya. Educational research and Review Vol. 3 (10) pp 316-‐323 ISSN 1990-‐3839.
Nyanza Province (2013). KCSE Examinations Results Analysis. Examinations department 2013.
Nzabonimpa-‐Buregeya, J. (2013). Influence of Head Teachers’ General and Instructional Supervisory Practices on Teachers’ Work Performance in Secondary Schools in Entebbe Municipality, Wakiso District, Uganda. Makerere University eric.ed.gov/ED527043pdf
Nzambi, N.P. (2012). Role of the Head Teachers in Instructional Supervision as perceived by Teachers in Secondary Schools in Kitui District, Kitui County, Kenya. Kenyatta University. Ir-‐library.ku.ac.ke/bitstream/handle/12345678/7277.
Oduor, A. (2014). TSC Officials Boycott Ministry’s Meeting over Clash The Standard Newspaper, March 14th.
Olatunde, Y., and Otieno-‐Omondi, K. (2010). Teaching-‐Learning resources and Academic Performance in Mathematics in Secondary Schools in Bondo District. Asian Social Science Vol. 6. No. 12. Dec. 2010. www.ccsenet.org/ass.
Orodho, P. (2012). Techniques of writing Research proposals and reports, Nairobi: Reata Printers.
Peters, T. (1982) In Search Of Excellence. Essential Skills for an Excellent Career. www.mindtools.com/pages/articlenewTMM-‐72htm.
Raburu, P.A. (2015). Motivation of Women Academics and Balancing Family and Career. Journal of Education and Social Research Vol 5 pg. 359-‐370.
Republic of Kenya, (2010). Master Plan on Education and Training, 1997-‐2010. Republic of Kenya 1998.
Republic of Kenya, Ministry of Education, Science and Technology State Department of Education (2015). Kisumu East Sub-‐County Form Four 2015 Result Analysis. Analyzed by ICT Solutions, Kisumu.
Saunders, M. (2012). Research Methods for Business Students. Pearson Custom Publishing 6th edition
Sindhi, S. (2013). Does Quality Assurance in School Education Ensure Transparency and Accountability? Counter Currents Org
Sullivan, S & Glanz, J. (2000). Supervision that improves teaching. Thousand Oaks: Crown Press.
The Kenya Institute of Education Order. (2010). Republic of Kenya. Ministry of Education.
UNESCO. (2000). Education for All 2000 Assessment. Dakar: UNESCO.
UNESCO. (2005). Challenges of Implementing Free Primary Education in Kenya: Assessment report, UNESCO, Nairobi Office.
UNESCO. (2007) Module 2. Supervision: A Key Component of a Quality monitoring System Module International Institute for Educational Planning, (IIEP) 7-‐9 rue Eugene-‐Delacroix 75116 Paris.
UNESCO. (2008) Module 8. Background Paper Prepared for the Education for All Global Monitoring Report, 2008. 2008/ED/EFE/MRT/P1/12
UNESCO. (2008). Challenges of Implementing Free day secondary education in Kenya: Experiences from Districts, Nairobi, UNESCO.
UNESCO. (2008). EFA Global Monitoring report. Paris. UNESCO.
UNESCO. (2009). The New roles of Secondary school head teachers. UNESCO
Interagency Group on Secondary Education. ED – 2009/WS/57. France.

Awiti, J. A., Onderi, H., & Raburu, P. (2016). Head Teachers’ Supervision of Curriculum Implementation: Implications on Provision of Quality Secondary Education in Kenya. Advances in Social Sciences Research Journal, 3(1) 116-‐128.
URL: http://dx.doi.org/10.14738/assrj.31.1779. 128
Utake, M.A. (2012). The nature and purpose of supervision for quality assurance in schools. Research in Education 18, 18 (1).
Voltruba, L. (1988). Development in Water Science. Elsevier Science Publishing Company 52 Vanderbilt Avenue, New York N.Y. 10017.
Yadar. K. (2007). Teaching of Life Sciences. New Delhi. Aumol Publications Ltd. India

Advances in Social Sciences Research Journal – Vol.3, No.1 Publication Date: Jan. 25, 2016 DoI:10.14738/assrj.31.1708.
Wang, S., & Zhu, P. (2016). Thinking About Research Paradigms in Educational Research. Advances in Social Sciences Research Journal, 3(1) 129-‐133.
Copyright © Society for Science and Education, United Kingdom 129
Thinking about Research Paradigms in Educational Research
Shiyun Wang Continuing Education College, Hebei University
Baoding City, Hebei Province, P.R.China.
Pengju Zhu Education College, Hebei University
Baoding City, Hebei Province, P.R.China.
Abstract In this essay, I will consider the question “what is research” and discuss the three important research paradigms. The three important research paradigms are positivistic, interpretive and critical paradigms. First of all, I try to explain the definition of research deeply. Many scholars give us many different definitions of research, these definitions explain the research from different aspects, and they have respective characteristics. At the same time, I will try to make clear what educational research is. Secondly, I focus on the nature and significance of research paradigms and reasons why these are important in thinking about research. Thirdly, I will comment on the characteristics of “good” and “bad” research in terms of my own experience. Finally, I will analyze qualitative approaches and quantitative approaches; my purpose is to explain why so much research in education employs qualitative approaches.
Key words: research paradigms; positivistic paradigm;interpretive paradigm;critical paradigm
Views on the definition of research As Cohen, Manion & Morrison, (2000, p.1) said, “Research is concerned with understanding the world and that this is informed by how we view our world(s), what we take understanding to be, and what we see as the purpose of understanding.” Obviously, research is an approach to search for truth. There are another two important approaches with this goal, they are experience and reasoning. When we compare research, experience and reasoning, we can find that research is best way than experience and reasoning to search for truth. in other words, “research is a combination of both experience and reasoning and must be regarded as the most successful approach to the discovery of truth, particularly as far as the natural sciences are concerned” (Borg, 1963, cited in Cohen, Manion & Morrison, 2000, p.5). As for the definition of research, Burns (1994) thinks that “research is a systematic investigation to find answers to a problem.” My view about the definition of research was very oversimplified before I studied the Research Methods in Education. In my mind, research was the process of investigation and should have the aims, methods and results. The purpose of a research, I thought was that the people want to improve or prove something. In my group discussion on the meaning of the research, the members considered research as a systematic investigation for some situations and relations in order to make clear some problems about nature and society. After the systematic study of Research Methods in Education, I had a deeply understanding on the definition of research. I now like the definition of research that Kerlinger (1970) gives us, Kerlinger considers that research is “the systematic, controlled, empirical and critical investigation of hypothetical propositions about the presumed relations among natural

Wang, S., & Zhu, P. (2016). Thinking About Research Paradigms in Educational Research. Advances in Social Sciences Research Journal, 3(1) 129-‐133.
URL: http://dx.doi.org/10.14738/assrj.31.1708. 130
phenomena” (cited in Cohen, Manion & Morrison, 2000, p.5). As for educational research, According to Clark (2005), educational research is “widely construed as the scientific investigation of the causes of ‘effective’ teaching.” I think that educational research is systematic investigation in the educational field; the purposes are to judge and evaluate the educational situation; such investigation is useful to improve educational action and quality. Views on Research paradigms There are many research paradigms in the research field. Now, there are three important research paradigms to be analyzed and discussed, they are positivistic, interpretive and critical. Paradigms are connected with assumptions about social and natural reality. Like the definition of paradigm, “A paradigm has come to mean a set of over-‐arching and interconnected assumptions about the nature of reality” (Cowie, 2006, cited in handout of Research Method in Education). There are many different assumptions about social reality. For example, ontological assumptions, epistemological assumptions, human assumptions, methodological assumptions. These assumptions determine that which paradigm should be used in research process. As a researcher, he/she must clear that which paradigm he/she position. I will discuss the three important paradigms, positivistic paradigm, interpretive paradigm and critical paradigm. Positivistic paradigm There are many analyses about positivistic paradigm and positivism. According to comte (1855, p.2), “positivism is the philosophical state in which one discovers by reason and observation the actual laws of phenomena” (Cited in Peca, 2000, p.5). In the positivistic paradigm, the researchers try to make an assumption of human behaviour first, and then use complex methods to prove the assumption. The purpose of the researcher is to build a ‘rational edifice’. (Cohen, Manion & Morrison, 2000, p.23). From ontological position, positivistic paradigm as a kind of perspective of reality is that an objective reality exists in nature and society independently; objective reality is knowable (Berger&Luckmann, 1966, cited in Peca, 2000, p.2). From epistemological position, positivists have explained that research and knowledge are independent. “Researchers should remain objective—inquiry should be value free” (Cowie, 2006, cited in handout of Research Method in Education). These viewpoints have a common basic: natural and human phenomena can be learned and discovered by objective actions and means; human phenomena are essentially the same as the Natural phenomena. Positivistic paradigm request researcher investigate the society issue like they study physical phenomena, the individual points is inhibited (Oldroyd, 1986, cited in Cohen, Manion & Morrison, 2000, p.8). According to Douglas (1973), positivistic paradigm has two main ideas: human phenomena are rule-‐governed; using methods of natural science into the search of human behavior (Cited in Cohen, Manion & Morrison, 2000, p.22). Interpretive paradigm According to Carroll and Swatman (2000, p236), “interpretive understanding is the researcher’s understanding of the participants’ subjective understanding.” That is to say, the interpretive paradigm is trying to understand the subjective world. The researchers explain the world from their own point of view. The Interpretive paradigm focuses on understanding the meaning of social phenomena, human activities and experience by actors. The interpretive paradigm emphasizes the understanding of individuals. In the Interpretive paradigm, the researchers sum up theory according to the experience and understanding. Like Cohen, Manion & Morrison said (2000, p23), Interpretive paradigm request researchers to “begin with individuals and set out to understand their interpretations of the world around them”.
Advances in Social Sciences Research Journal (ASSRJ) Vol.3, Issue 1 January-‐2016
Copyright © Society for Science and Education, United Kingdom 131
Critical paradigm The last important paradigm that I want to consider is Critical paradigm. The Positivistic paradigm and interpretive paradigm both neglect the political and ideological factors in educational research. Critical paradigm considers the political, ideological and power factors in educational research. According to Fay (1987) and Morrison (1995), “critical theory is explicitly prescriptive and narrative, entailing a view of what behaviour in a social democracy should entail” (Cited in Cohen, Manion & Morrison, 2000, p.28). That is to say, the critical paradigm is trying to change the condition of inequity and illegitimacy, so that all members of the society can enjoy equality and democracy (Cohen, Manion & Morrison, 2000, p.28). Comparing the three paradigms, I think that critical paradigm is preferable. Firstly, critical paradigm requests researcher use critical perspective to analyze the situations and problems, and then changing the inequitable and illegitimate factors. According to Cohen, Manion & Morrison (2000, p.28), critical paradigm is “not merely to understand situations and phenomena but to change them.” Secondly, Compared with positivistic paradigm and interpretive paradigm, critical paradigm is most complete. Critical paradigm thinks about the influence of the political, ideological and power factors in educational research. Views on good or bad research Research is very complex process. Researchers should consider many issues. These issues are concerned with criterion for judgment which is good research. Some issues will be discussed below. Firstly, researchers should consider about the validity and reliability. Validity is important factor for research. The purpose of the research is finding the truth. A research is useless when it loses validity. Validity has been considered in different aspects, for example, internal validity, content validity, construct validity, and so on. Good researches should avoid invalidity in the process of the research. (Cohen, Manion & Morrison, 2000) Reliability is also important issue for good research. It is concerned with “precision and accuracy”. (Cohen, Manion & Morrison, 2000) According to American Educational Research Association (1982, p.1589), “reliability concerns the extent to which measurements are repeatable, that is, when different persons make the measurements on different occasions, with supposedly alternative instruments for measuring the same thing” (Cited in Campbell & husbands, 2000, p.41). Secondly, as a researcher, they have to consider the ethics issue in educational and social research. In educational research, there are 13 ethical issues that have been discussed widely in the literature, for example, “Anonymity”, “Accuracy of Reports”, “protecting Vulnerable Subjects”, “Disclosure”, and so on (Bournot-‐Trites & Belanger, 2005). At the same time, as researchers, they should show their respect to participants, for example, avoiding privacy questions when they doing research process (Cohen, Manion & Morrison, 2000). Thirdly, researcher should take into account the relationship between research and practice. Four hypotheses should be considered: “the persuasiveness and authority of research, the relevance of research, the accessibility of research and the stability (and instability) of the education system” (Kennedy, 1997)
Wang, S., & Zhu, P. (2016). Thinking About Research Paradigms in Educational Research. Advances in Social Sciences Research Journal, 3(1) 129-‐133.
URL: http://dx.doi.org/10.14738/assrj.31.1708. 132
Views on Qualitative and quantitative research A lot of research works in education employs qualitative approaches. I will analyze the qualitative and quantitative approaches below. The purpose is trying to explain why so much research in education employs qualitative approaches. According to Burns (1994), “qualitative forms of investigation tend to be based on a recognition of the importance of the subjective, experiential ‘lifeworld’ of human beings.” The research field of the qualitative research is subjective world of human beings, for example, the viewpoint of the participants about events and the world. Compared with qualitative research, quantitative research is “based on observations that are converted into discrete part that can be compared to other units by using statistical analysis (Maykut & Morehouse, 1994, p.3).” Quantitative research observe the world with objective view, it tries to establish general laws or principles, it believes that the “social reality is objective and external to the individual” (Burns, 1994). We can see that the qualitative approach and quantitative approach each have distinguishable characteristics; they have different research fields and different point of view about the world. Qualitative research is a good research approach for educational investigation. As Burns (1994) said, qualitative approach is very important for investigating the “relationship(s), causes, effects, and even dynamic processes in school settings.” Qualitative approach can provide the effective and in-‐depth information on “teacher interpretations and teaching style” as well as emphasize the “subtleties in pupil behavior and response”. At the same time, it can give the “reason for action”.
CONCLUSION In this paper, I have explained “what is research” and discussed the three important research paradigms: positivistic, interpretive and critical paradigms. I have considered the definitions and characteristics of each. The characteristics of “good” and “bad” research have been discussed. Finally, I have discussed the qualitative research and quantitative research. Educational research can help the researcher develop the knowledge of educational research as well as improve the educational level. References
1. Bournot-‐Trites, M & Belanger, J. (2005). Ethical Dilemmas Facing Action Researchers. The journal of educational thought; Calgary. Rerieved Jan 21, 2006, from Academic research library database.
2. Burns, R. (2000). Introduction to research methods. (First edition). Melbourne: Longman. ISBN: 0582911877..
3. Campbell, J & Husbands, C (2000). On the Reliability of OFSTED Inspection of Initial Teacher Training: a case study. British Educational Research Journal; Oxford. Rerieved Jan 21, 2006, from Academic research library database.
4. Carroll, JM & Swatman, PA. (2000). Structured-‐case: a methodological framework for building theory in information systems research. European Journal of Information Systems; Basingstoke. Rerieved Jan 21, 2006, from Academic research library database.
5. Clark, C. (2005). The structure of educational research. British Educational Research Journal; Oxford. Rerieved Jan 21, 2006, from Academic research library database.
6. Cohen, L., Manion, L. & Morrison K. (2000). Research methods in education. (5th edition). London: Routledge/faomer. ISBN: 0415195411.
7. Cowie, B. (2006). Handout on Research Method of Education. University of Waikato, School of Education, Hamiltom, New Zealand.
8. Kennedy, M. (1997). The connection between research and practice. Educational Research, 26 (7), 4-‐12. ISSN: 0013189X.

Advances in Social Sciences Research Journal (ASSRJ) Vol.3, Issue 1 January-‐2016
Copyright © Society for Science and Education, United Kingdom 133
9. Maykut, P. & Morehouse, R. (1994). Beginning qualitative research: a philosophic and practical guide. London ; Washington, D.C. : Falmer Press. ISBN: 0750702729.
10. Peca, K. (2000). Positivism in Education: Philosophical, Research, and Organizational assumptions. U.S. New Mexico. Retrieved Jan 20, 2006, from ERIC database.
Advances in Social Sciences Research Journal – Vol.3, No.1 Publication Date: Jan. 25, 2016 DoI:10.14738/assrj.31.1773.
Hui, D., & Zhong, H. (2016). Strategy Analysis of the 2022 Winter Olympics in Hebei Province. Advances in Social Sciences Research Journal, 3(1) 134-‐140.
Copyright © Society for Science and Education, United Kingdom 134
Strategy Analysis of the 2022 Winter Olympics in Hebei Province
Dong Hui
Physical Education College ,Hebei University 54 road, Baoding City, Hebei Province, P.R.China.
Huamei Zhong
Physical Education College ,Hebei University 54 road, Baoding City, Hebei Province, P.R.China.
Abstract
Based on the research situation analysis of preparations for the current large-‐scale sport events by the method of literature review and according to the actual situation of Hebei Province, this article analyzes the challenges and opportunities brought by the 2022 Winter Olympics to Hebei Province and puts forward proposals for the preparations. In the run-‐up to the 2022 Winter Olympics, the biggest challenge to Hebei Province will be traffic, sports science and technology service and the lack of experience on preparations and management for sport event. The holding of Winter Olympics will facilitate industrial transformation and upgrade and boost the economic development and cultural transmission of Heibei Province. Positive strategy shall be adopted during the preparation period of 2022 Winter Olympics and cooperation between the governments of Beijing and Hebei Province shall be strengthened. Hebei Province shall implement the talent introduction strategy, strengthen infrastructure construction and establish sport event schedule, management system, evaluation mechanism and security assurance system.
Keywords::Hebei Province, Winter Olympics, Strategies
FOREWORD
2022 Beijing Winter Olympics will be the first Winter Olympics held by megacity in the history, which will lead the Winter Olympics into a brand new era . 2022 Winter Olympics is a joint bid made by Beijing and Zhangjiakou and most of the competitions will be held in Zhangjiakou. Zhangjiakou is only about 249 km from Beijing and its Chongli County has natural perfect condition for winter competition events. But it is relatively outdated in the following aspects as traffic, science and technology and infrastructure. As the main venue of 2022 Winter Olympics, Beijing owns the unique conditions as the experience of holding international sport events, perfect traffic, developed infrastructure and all kinds of talents. But as one of the main venues, Zhangjiakou has no experience on holding international sport events ever. Under the guide of the vision of “clean ice and snow, date of passion”, what measures shall be adopted by Hebei Province to meet 2022 Winter Olympics? Based on the analysis of challenges and opportunities brought by Winter Olympics to Hebei Province, this paper will analyze the preparation strategy for 2022 Winter Olympics elaborately.
STUDY ON THE PREPARATIONS FOR LARGE-‐SCALE SPORT EVENTS As for studies on preparations for large-‐scale sport events, Li Yanxia and Wang Zhihui (2006) have analyzed the role played by lease in large-‐scale sport events by the methods of literature review and interview .Jiang Zhixue has analyzed the preparations from science and technology.
Advances in Social Sciences Research Journal (ASSRJ) Vol.3, Issue 1 January-‐2016
Copyright © Society for Science and Education, United Kingdom 135
He holds that preparing for Olympic Games shall rely on sports science and technology to integrate sports talents, increase the intensity of reward for scientific preparations and increase project approval for scientific research subjects . Nie Domgfeng and Li Shaocheng (2008) have studied the preparing strategies of Beijing Olympic Games through analyzing the changes of guideline from bidding for to preparing . Wang Wei (2008) has set forth the preparing experience of 2008 Beijing Olympic Games from the following aspects as objective, Olympics concept, system, innovation, frugality and the people's livelihood, ect. .Through analyzing, Miao Xiangjun (2008) thinks that the preparing system of Olympics shall includes the following elements as target, personnel, resources, process, system, structure and culture ect. and shall be composed of such typical subsystems as decision, command, proposals, execution, operation, supervision, feedback and ensuring etc. Specialized management system and regular working system constitute the preparing institutional system of Olympics .By analyzing the London mode of Olympics preparations, Ren Hai (2012) holds that legal system platform, organizing mechanism and atmosphere are important for preparations of Olympic Games . Zong Wei and Shi Lifeng thinks that it is the foundation to attract numerous people to participate in, the objective to spread healthy sportsmanship, the emphasis to show favorable city image and the opprtunity to carry forward excellent sports culture . Yi Xin (2013) has analyzed its preparation and implementation process of London Olympic Games from the visual angle of urban development and set forth the features and problems of cooperative development mode reflected in large-‐scale sport events . The scholars mentioned above have analyzed the key elements of preparing for Olympic Games from such aspects as economy, objective, process and Olympics culture. Different cities shall prepare that Olympic Games according to their own resource situation and the purpose of bidding for Olympics. As one of the host cities of 2022 Beijing Winter Olympics, Zhangjiakou city of Hebei Province will face what kind of challenge? What strategy shall be adopted to prepare 2022 Winter Olympics?
THE CHALLENGE AND OPPORTUNITY FOR HEBEI PROVINCE PREPARING FOR THE WINTER OLYMPICS
The challenge to Hebei Province brought by Beijing Winter Olympics The challenge to the traffic of Hebei Province As traffic is the essential condition to hosting a perfect Winter Olympics, the transport infrastructure of Zhangjiakou City still needs to be improved. According to the official website data collected by Zhangjiakou Statistical Bureau (see Figure 1 below) , the highway mileage of Zhangjiakou was increasing slowly year-‐on-‐year from 2010, and dropped in 2014. The year-‐on-‐year growing rate of expressway mileage began to drop from 2011 till to be zero in 2014. By December, 2014, the highway total mileage of Zhangjiakou is 20,452 km and the expressway total mileage is 769 km. As the national political and cultural center, Beijing owns very convenient traffic network, the world biggest Beijing Capital International Airport, Beijing Station, Beijing West Railway Station and Beijing North Station stretching to railway junctions of all directions. As a result, the out-‐dated traffic facilities will be the biggest challenge to Zhangjiakou.

Hui, D., & Zhong, H. (2016). Strategy Analysis of the 2022 Winter Olympics in Hebei Province. Advances in Social Sciences Research Journal, 3(1) 134-‐140.
URL: http://dx.doi.org/10.14738/assrj.31.1773. 136
Figure 1 The highway mileage of Zhangjiakou Shi from 2007 to 2014
Data source: Zhangjiakou Statistical Bureau Official Website The challenge to sports science and technology service of Hebei Province Science and technology have been one of the key factors for supporting all-‐level sport events and sports science and technology is also the guarantee for successful hosting of sport events. As a natural ski resort, Zhangjiakou has only host Chongli International Skiing Festival, and hasn't host large-‐scale international sport event ever, so it lacks experience for preparing large-‐scale international sport event and talents reserve. The vision of 2022 Beijing Winter Olympics is "clean ice and snow, date of passion". Clean ice and snow need neat environment. As the motif of green Olympics, environment will be the major limiting factor for Hebei Province to prepare 2022 Winter Olympics. Thus, the limited experience on security scientific and technical service, venue scientific and technical service and environmental management scientific and technical service and the lack of scientific manpower will be the biggest challenge to Zhangjiakou for preparing the Winter Olympics. Limited preparations and management experience on sport events As one of the largest cities in China, Beijing hosted all levels of international sport events such as Summer Olympic Games, Asian Games, World Championship and China Tennis Open etc. Beijing has the experience of hosting all levels of sport events and management experience, while Zhangjiakou and even the whole Hebei Province have limited experience of host large0-‐scale sport events. Talents are the core of sport event managements and the subject of dominating and operating sport events, while Hebei Province lacks the sport events management personnel. Yi Jiandong, a famous expert, holds that the biggest challenge for Zhangjiakou to prepare the Winter Olympics is talent shortage including foreign language talents and other specialized talents in relevant fields and the limited experience on organizing and management . So, the limited preparation and management experience on hosting sport events and the lack of sports management talents will be the biggest challenge for Hebei Province to prepare 2022 Winter Olympics. The development opportunity to Hebei Province brought by Beijing Winter Olympics The biggest opportunity brought by the successful applying for the Winter Olympics to Hebei Province is to lead industry transformation and make leisure service industry to be an economic growth point. The high speed development of secondary industry is at the cost of ecological environment. As a result, Hebei Province has to suffer hazy all the time. The host of
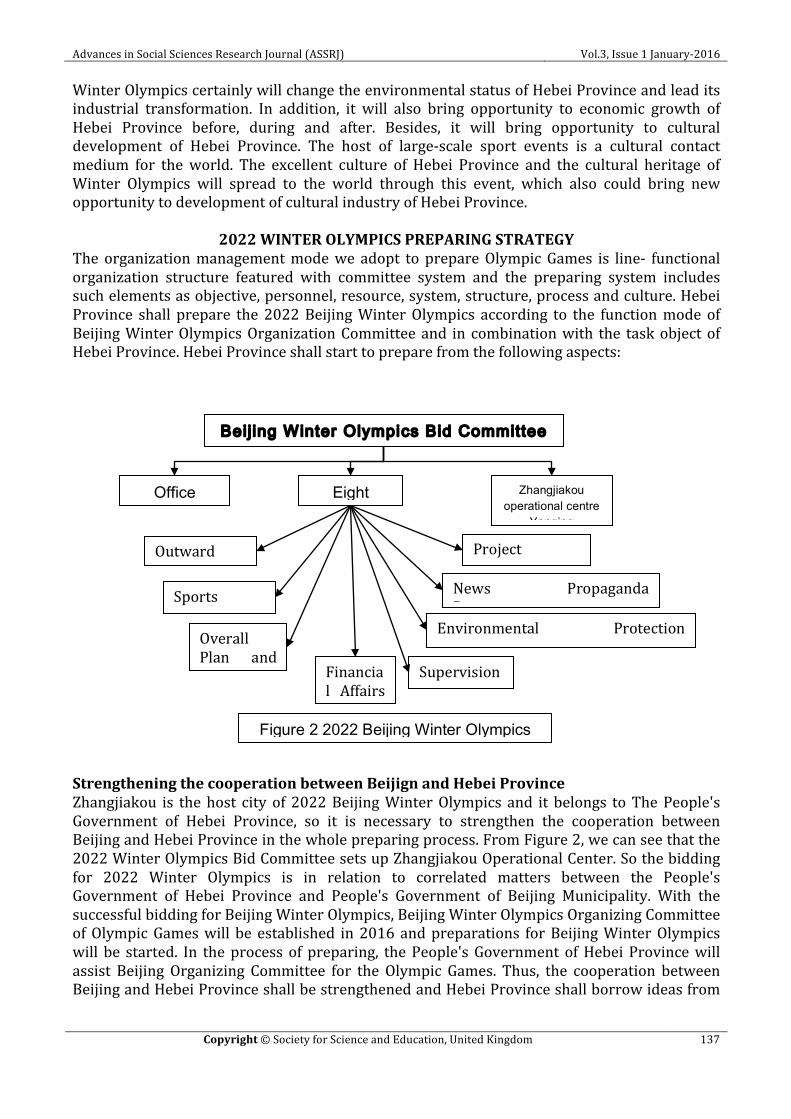
Advances in Social Sciences Research Journal (ASSRJ) Vol.3, Issue 1 January-‐2016
Copyright © Society for Science and Education, United Kingdom 137
Winter Olympics certainly will change the environmental status of Hebei Province and lead its industrial transformation. In addition, it will also bring opportunity to economic growth of Hebei Province before, during and after. Besides, it will bring opportunity to cultural development of Hebei Province. The host of large-‐scale sport events is a cultural contact medium for the world. The excellent culture of Hebei Province and the cultural heritage of Winter Olympics will spread to the world through this event, which also could bring new opportunity to development of cultural industry of Hebei Province.
2022 WINTER OLYMPICS PREPARING STRATEGY The organization management mode we adopt to prepare Olympic Games is line-‐ functional organization structure featured with committee system and the preparing system includes such elements as objective, personnel, resource, system, structure, process and culture. Hebei Province shall prepare the 2022 Beijing Winter Olympics according to the function mode of Beijing Winter Olympics Organization Committee and in combination with the task object of Hebei Province. Hebei Province shall start to prepare from the following aspects:
Strengthening the cooperation between Beijign and Hebei Province Zhangjiakou is the host city of 2022 Beijing Winter Olympics and it belongs to The People's Government of Hebei Province, so it is necessary to strengthen the cooperation between Beijing and Hebei Province in the whole preparing process. From Figure 2, we can see that the 2022 Winter Olympics Bid Committee sets up Zhangjiakou Operational Center. So the bidding for 2022 Winter Olympics is in relation to correlated matters between the People's Government of Hebei Province and People's Government of Beijing Municipality. With the successful bidding for Beijing Winter Olympics, Beijing Winter Olympics Organizing Committee of Olympic Games will be established in 2016 and preparations for Beijing Winter Olympics will be started. In the process of preparing, the People's Government of Hebei Province will assist Beijing Organizing Committee for the Olympic Games. Thus, the cooperation between Beijing and Hebei Province shall be strengthened and Hebei Province shall borrow ideas from
Beijing Winter Olympics Bid Committee
Overall Plan and Legal
Outward Liaison
Office
News Propaganda Department
Project Planning
Sports Department
Environmental Protection Department
Supervision & Audit
Zhangjiakou operational centre
Yanqing
Eight department
Financial Affairs and
Figure 2 2022 Beijing Winter Olympics Bid Committee Institutional Framework
Hui, D., & Zhong, H. (2016). Strategy Analysis of the 2022 Winter Olympics in Hebei Province. Advances in Social Sciences Research Journal, 3(1) 134-‐140.
URL: http://dx.doi.org/10.14738/assrj.31.1773. 138
the experience of Beijing preparing large-‐scale sport events and follow the command of Beijing Organizing Committee for the Olympic Games to work based on the resource current state of itself. Implement talent introduction strategy As a host city with limited experience on hosting sport events, sport event talents are very important for Hebei Province to undertake the largest international sport events for the first time. The human resource work analysis of sport events shall be concentrated to pre-‐competition. The targeted and experienced recruitment and employment of human resource shall be divided into hiring and recruit. In addition, the human resource recruitment for sport events lacks excellent talents in our country . As talents are the core in the process of preparing and hosting, Hebei Province shall formulate scientific sport events talent introduction strategy before starting to prepare the 2022 Winter Olympics to make up the talent shortage in sport event management and operation for Beijing Winter Olympics. Improve infrastructure construction Infrastructure construction is very important for Zhangjiakou to host a perfect Winter Olympics. Infrastructure includes sports halls, traffic facilities, urban infrastructure and medical facility etc. Hebei Province shall complete urban planning, urban infrastructure's building and renovation to serve the competitors and spectators of Beijing Winter Olympics. After the 2022 Winter Olympics, Heibei Province will host 2022 Paralympic Games. Urban infrastructure shall be constructed by the principle of humanization on the basis of showing historical background of the urban culture so as to better serve for the disabled athletes on living and competition. Establish sport events preparation plan and management system Large-‐scale sport events need scientific preparation plan and management system to design the building of sport events venue, traffic facilities and medical structure during the preparation. Hebei Province shall formulate sport event preparation plan according to the requirements of Beijing Organizing Committee for the Olympic Games and in combination with the actual condition of Zhangjiakou and formulate appropriate sport events management system. As the co-‐organizer, the People's Government of Hebei Province shall reasonably coordinate sport event preparation, make it to be the focus and difficult point of "13th Five-‐year Plan" , increase scientific research project approval and settle the scientific research problem in the process of preparing. The preparation plan of sport event includes venue infrastructure construction plan, sport event service plan, Winter Olympics’ culture propaganda and scientific research breakthrough and the management system includes human resources management system, venue management system, scientific and technical service management system, finance management and information management etc. Establish sport event evaluation mechanism On the basis of establishing sport event preparation plan, sport event evaluation mechanism shall also be established. The host of large-‐scale sport event will have effects on Zhangjiakou and even on Hebei Province. According to statistics, 2008 Beijing Olympic Games' contribution to the growth of GDP of China accounted for 0.3 % every year, and to the growth of GDP of Beijing accounted for 2% . According to the venue building plan of 2022 Winter Olympics, 4 venues and 2 temporary venues will be built in Zhangjiakou and another 2 venues will be renovate. Sports venues will be the physical object legacy for Zhangjiakou, which promotes the development of economy and society of Zhangjiakou. The host of Beijing Winter Olympics will have a strong impact on Zhangjiakou and even on Hebei Province. Facing opportunity, Hebei
Advances in Social Sciences Research Journal (ASSRJ) Vol.3, Issue 1 January-‐2016
Copyright © Society for Science and Education, United Kingdom 139
Province shall establish sport event evaluation mechanism evaluating the effects on economy, culture and society brought by the sport event. The sport event shall be prepared according to the assessment report to maximize the economic benefit, social effect and cultural effect. Security assurance system shall be established in advance As sport events are significant public events, safety accidents happen occasionally. Currently, riot events happen frequently in the process of international sport events which even become the aim of terrorist attack. Therefore, it is very important to strengthen scientific management of security work. Scientific and effective security assurance system shall guarantee that the sport event could be hosted safely and create a relaxing environment for citizens and spectators to live and watch games . Heibei province shall establish security assurance system in advance according to requirements of OCOG (Organizing Committee of Olympic Games) in preparation and make assessment to security assurance system. In addition, it also strengthens the safety education for citizens and potential spectators, strengthens the training of security personnel, organizes security drill periodically and actively propagandizes the importance of security via media.
SUMMARY Based on the research situation analysis of preparations for the current large-‐scale sport events by the method of literature review and according to the actual situation of Hebei Province, this article analyzes the challenges and opportunities brought by the 2022 Winter Olympics to Hebei Province and puts forward proposals for the preparations. In the run-‐up to the 2022 Winter Olympics, the biggest challenge to Hebei Province will be traffic, sports science and technology service and the lack of experience on preparations and management for sport event. The holding of Winter Olympics will facilitate industrial transformation and upgrade and boost the economic development and cultural transmission. Positive strategy shall be adopted during the preparation period of 2022 Winter Olympics and cooperation between the governments of Beijing and Hebei Province shall be strengthened. Hebei Province shall implement the talent introduction strategy, strengthen infrastructure construction and establish sport event schedule, management system, evaluation mechanism and security assurance system.Hebei Province will make up for its insufficient on talent, traffic, and science and technology through implementing overall Beijing Winter Olympics preparation strategy and lay the foundation for hosting a successful Winter Olympics. Bibliography
1. Sun Ke, .2022 Beijing Beijing Winter Olympics: Reform, Transformation and Guide-‐-‐Yi Jiandong and Zhang Bin Dialogues, [J]. Sports and Science, 2015, 36 (5) : 1-‐9.
2. Li Ynaxia, Wang Zhihui, Li Zhuangzhi, The Function of Lease in Large-‐scale Sport Events, Beijing Sport University Academic Journal, 2006 29 (7): 865-‐867.
3. Jiang Xuezhi, The Opprtunity and Challenge to Sports Science and Technology of China in Preparing 2008 Olympic Games, [J]. Wuhan Institute of Physical Education Academic Journal, 2007, 41(1): 1-‐5.
4. Nie Dongfeng, Li Shaocheng, Analysis on the Development of Strategic Guiding Thoughts for Bidding for and Preparing Beijing Olympic Games, [J]. Science, Economy and Society, 2008 26 (111): 126-‐128.
5. Wang Wei, The Preparing Experience on Beijing Olympic Games, [J]. Current Affairs Report, 2008, (9): 36-‐43.
6. Miao Xiangjun, The Organization Management Theory and Empirical Research on Preparing Olympic Games, [J] .2008 .2008 31 (12): 1635-‐1641.
7. Ren Hai, London Mode of Olympic Games' Preparations, [J]. Sports and Science, 2012, 33(4): 1-‐4.

Hui, D., & Zhong, H. (2016). Strategy Analysis of the 2022 Winter Olympics in Hebei Province. Advances in Social Sciences Research Journal, 3(1) 134-‐140.
URL: http://dx.doi.org/10.14738/assrj.31.1773. 140
8. Zong Wei, Shi Lifeng, Zhang Rui, The Current State and Countermeasures of Nanjing Youth Olympic Games' Preparations, [J]. Sport Adult Education Learned Journal, 2012, 28 (5): 32-‐33.
9. Yi Xin, The Preparation and Implementation of London Olympic Games -‐-‐The Features and Problem Existing in Cooperative Development Mode of Current Important Events, [J]. Architecture and Culture,2013, (10). (10).: 84-‐88.
10. Wang Hao, First Beijng and Zhangjiakou Winter Olympics Economic Forum: Co-‐Existence of Challenge and Chance for Zhangjiakou [ EB/OL ]. CHINANEWS, http://www. chinanews.com/gn/2015/11-‐01/7599373. shtml. Visited on December 6, 2015.
11. Wen Lan, Human Resource Management Theory and Practice Study of Large-‐scale Sport Event [D]. Doctoral Dissertation of Tianjin University, Tianjin : 2010.10.
12. Yi Jiandong, The Outline of Effect on China Economy and Social Development Brought by Large-‐scale Sport Event [J]. Shandong Sports Technology, 2005,21(6): 1-‐7.
13. Dong Jie, The Main Problems Existing in Hosting Large-‐scale Sport Events and Relevant Causes and Countermeasures [J]. Sport and Science, 2012, 33(3): 42-‐52.
Advances in Social Sciences Research Journal – Vol.3, No.1 Publication Date: Jan. 25, 2016 DoI:10.14738/assrj.31.1768.
Wokadala, J. (2016). School Management and Its Effectiveness in Lower Secondary Educaion in Uganda: Examining Perceptions of the Practitioners. Advances in Social Sciences Research Journal, 3(1) 141-‐154.
Copyright © Society for Science and Education, United Kingdom 141
School Management and its Effectiveness in Lower Secondary Education in Uganda: Examining Perceptions of the
Practitioners
James Wokadala, PhD Lecturer, College of Business and Management Sciences
Makerere University, Kampala, Uganda
Abstract This paper evaluates effectiveness of lower secondary schools in Uganda with specific focus on how school leadership and management practices impact on students’ achievement. The study used both quantitative and qualitative approaches considering teachers and students as units of analyses. Results indicate that school success is associated with effective instructional leadership, teacher involvement in decision making and policy implementation, teaching and learning in safe as well as orderly school environment, regular and objective monitoring of student achievement, improved relations between teachers and parents. Effective Instructional leadership in efficient schools culminated into positive behavior reinforcement and recognition to students showing exceptional accomplishments and appropriate behavior approaches compared to opportunism that engulfed low achieving schools with less regard to moral principles. Moreover, teachers are often disappointed over little influence to effect decisions even in matters where their interests are involved. In either of the schools, it is pertinent that promoting academic excellence and fostering students’ learning and progress remains crucial tests of effective schooling. Keywords: Efficiency, Effectiveness, school management, Uganda
BACKGROUND
Effective schools are by large regarded as those having high academic achievements considering the intake and the variable inputs. It is also important to establish how schools resources are utilized taking into account the technical efficiency aspects. This view point stipulates offering good quality education for the given meager input resources. Effectiveness studies rely on identifying effective schools mainly based on matriculation scores, student family background, school resources and their management as well as school-‐community relations. Such studies often apply multi-‐level modeling techniques using individual or institutional data (Kirjavainen, 2008). Though the literature available establishes the link between education inputs, processes and outputs, there is scanty evidence on quality of institutions and quality of policy implementation as pre-‐requisites for better learning outcomes in lower secondary education in Uganda. In related studies, analytical methods such as qualitative techniques have been often used to establish the relationship between school management practices and its school efficiency (e.g. Dodd, 2006; Portela and Camanho, 2007). Moreover, quantitative studies that explain efficiency differences mainly employed explanatory factors related to school resources and competition, students’ attributes and family background (e.g. Wokadala, 2012; Kirjavainen and Loikkanen, 1998). There is less empirical evidence on school and classroom processes that are critical in promoting social or affective outcomes despite increased funding to the education sub-‐sector. As Reynolds (2010) emphasizes that, policy led solutions imposed on schools are
Wokadala, J. (2016). School Management and Its Effectiveness in Lower Secondary Educaion in Uganda: Examining Perceptions of the Practitioners. Advances in Social Sciences Research Journal, 3(1) 141-‐154.
URL: http://dx.doi.org/10.14738/assrj.31.1768. 142
not the answer but better approaches, methods and evidence are the practical solutions that make schools work better. This study therefore is set to address the following research questions:
1. How are the perceptions on school management process from educator’s point of view (supply side) in efficient and inefficient schools?
2. How are the perceptions on school management process from learner’s point of view (demand side) given the school efficiency levels?
The study is based on semi-‐structured interviews and secondary (quantitative) data. The quantitative information aided in identifying the efficiency distributions of the case schools while the qualitative data entailed information on perceptions, experiences and views as voiced by the respondents. The interview data was analyzed based on school efficiency categories and then themes emerging from interview texts. Previous approaches (e.g. Dodd, 2006; Sammons et al., 1998) analyzed schools management practices and views based on within different categories of school efficiency (i.e. less and more efficient schools). Another study by Kirjavainen (2008) classified the schools into groups based on the themes. As uniqueness, this investigation employs a combination of the two approaches iteratively as well as considering views from both educators (teachers) and learners (students). The interview text was classified into themes and then discussed the responses based on the classification of school efficiency distribution as it gave further insight into the evaluation of school effectiveness and students’ achievements. In particular, emerging issues arising from the analysis indicate that, school effectiveness is associated with effective instructional leadership, to a greater extent focused school mission, students’ central learning skills, conducive school environment, regular assessment, monitoring of student achievement, improved school and community relations as well as expectations for student achievement and school success. It is noteworthy that the identification of efficiency distribution is based on Data Envelopment Analysis (DEA) and the scores are interpreted as efficiencies. The DEA outputs were measured as the average scores in the matriculation examination in Biology, English and Mathematics subjects respectively (Wokadala, 2011). The rest of the paper is arranged as follows. Section two provides reviews arising from previous research as well as characteristics of effective schools; the third section provides the methodological approach with selection of the sample as well as descriptive statistics of case schools. The fourth section provides the results and interpretation; section five discusses the results and gives implications as well as conclusion.
PREVIOUS RESEARCH ON SCHOOL EFFICIENCY AND EFFECTIVENESS Efficiency and Effectiveness in School Context One of the studies on school effectiveness was undertaken by Dodd (2006) who investigated relationship between school characteristics and efficiency on English secondary schools. The qualitative aspect of the study aimed at establishing why efficient schools were rated so, and identifying the practices that explain the efficiency levels. The results identified several factors common in efficient schools and these were school ethos that emphasized learning and achievement as well as effective leadership. One major shortcoming to the study was its focus on only efficient schools with no comparison group. The efficiency differences of Portuguese secondary schools using the DEA technique to identify efficiency distributions in stage one of analysis were evaluated (Portela and Camanho, 2007). The qualitative study verified results of the efficiency analysis and identified efficient school practices of benchmark schools as well as

Advances in Social Sciences Research Journal (ASSRJ) Vol.3, Issue 1 January-‐2016
Copyright © Society for Science and Education, United Kingdom 143
characteristics that differentiated the benchmark schools from other schools. However, this study hardly provided the clear methodology for sampled data and analysis, which posed major shortcoming. The effectiveness of 12 inner city schools in London was also studied. The study examined differences in various schools outcomes in relation to school processes after taking into account school input resources and student intake (Rutter et al., 1979). Later on, another study evaluated six inner London secondary schools of the 94 schools (Sammons et al., 1998). The results revealed that effective schools were characterized by high expectations and emphasis on student achievement, shared school vision and commitment among staff, strong head teacher leadership with support from senior management team, appreciating quality of teaching and learning as well as effective teacher-‐parent relationship policies and practices. Similar findings were noted in related studies (e.g. Levine and Lezotte, 1990; Scheerens and Bosker, 1997). One major drawback of these studies was the small sample size and its distribution to show representativeness. The study by Kirjavainen (2008) analyzed the views of staff on school efficiency of nine Finnish general upper secondary schools that were mostly in upper and lower efficiency distribution measured with stochastic frontier analysis. Teachers and principals were interviewed on their views about students’ performance, staff relations, school management, curriculum work, parent-‐school relations, teacher training and evaluation. Results indicated that appreciating and caring for students as well as professional staff relations were recognized in efficient schools while frustration at low performance characterized inefficient schools. The study falls short of scope and target sample. Views from students were largely ignored and study considered a sample of nine schools that were within easy reach (i.e. within 150km radius) to limit the amount of travel. However, this current investigation, besides teachers, also examines the views of students on school climate, expectations in achievements and home-‐school relations, as this would provide insights from the demand side of view. Moreover, a nationally representative sample of 24 schools was chosen consisting of both efficient and inefficient schools with a view to establish the practices exhibited in efficient schools and also identify challenges common to failing schools. Characteristics of Effective Schools Instructional leadership: A leader is the key agent who brings about change in many of the factors affecting school effectiveness. Successful leadership involves strength of purpose and sharing of leadership positions with sub-‐ordinates (Sammons et al., 1995). Purkey and Smith (1983) conclude that leadership is necessary to initiate and maintain school improvement. In the current study, views on teachers’ involvement in school management as well as design of students’ friendly instructional lessons for instruction effectiveness are also investigated. Shared vision and focused school mission: Schools are more effective when staff build consensus on the aims and values of the school through; Unity of purpose that involves a consensus on values (Levine and Lezotte, 1990); articulating school mission and values consistently (Kirjavainen, 2008); collaboration with stakeholders in the execution of school values and goal setting (Sammons et al., 1995). Moreover, views on basic principle of “effective learning for all” are emphasized in the current study as these features can provide more insights on equity issues and value for money.

Wokadala, J. (2016). School Management and Its Effectiveness in Lower Secondary Educaion in Uganda: Examining Perceptions of the Practitioners. Advances in Social Sciences Research Journal, 3(1) 141-‐154.
URL: http://dx.doi.org/10.14738/assrj.31.1768. 144
Orderly, safe and secure learning environment: An orderly atmosphere is necessary for stimulating learning and is related to students’ academic achievement (Mortimore et al., 1988). The most effective way of encouraging order and purpose amongst learners is through reinforcement of good practice of learning and behavior as well as evaluation feedback (Creemers, 1994). In the current study, aspects related to; school conduct rules and disciplinary procedures as well as recognition in their achievements are also emphasized. Expectations for student achievement and school success: High expectations correspond to a more active role for teachers in helping pupils to learn. These expectations are most likely to be operationalized where there is strong will and emphasis on academic achievement, where progress on achievement is regularly monitored as well as orderly learning environment (Sammons et al., 1995; Kirjavainen, 2008). Expectations can be achieved if not only when they are made, but also when effectively communicated to students and supported/challenged to achieve them. Assessment and monitoring of student achievement: Levine and Lezotte (1990) recognized the monitoring of student progress as a factor often cited in effective schools research but argued that there has been little agreement about defining the term or providing guidance for practice. Scheerens (1992) in a review of school effectiveness research argued that proper evaluation is an essential pre-‐requisite to effectiveness-‐enhancing measures at all levels. In effect, for effective monitoring, information sharing among stakeholders is vital as well as regularly using assessment data to plan for improvement. Opportunities for teaching and learning: The importance of teaching and learning at the classroom level to school effectiveness are evident (Mortimore, 1993; Creemers, 1994). This is reflected in maximization of learning time, including the proportion of the day given to academic subjects (Levine and Lezotte, 1990), the proportion of time in lessons devoted to learning (Rutter et al., 1979) or to interaction with students (Mortimore et al., 1988). In context, more views on curriculum content designed in the interest of all students’ abilities as well as supplemental activities are investigated. School, community and parents relations: Community-‐school effects for the learning process can be a powerful force for improvement (Mortimore, 1993; Coleman, 1994). In some related studies, parental involvement has been proved insufficient in itself and could present barriers to those not within the clique (Mortimore et al., 1988). Moreover, aspects of community resources used to support school activities as well as views on frequent communication between teachers and parents mainly to discuss students’ progress are also emphasized under this study. Teachers’ involvement in decision making: The involvement of staff in policy decisions, management and curriculum planning as well as consultation with them about financial decisions in one way or another correlate with school effectiveness (Mortimore et al., 1988). Teacher involvement in decision-‐making and the development of school happen through a sense of ‘ownership’ (Muijs & Reynolds, 2010). In this study, teachers’ participation in school planning and budgeting as well as monitoring the implementation of school policies and procedures are also considered.
METHODOLOGICAL APPROACH This section provides insight of the appropriate methods that have been employed to address the stated objectives. The section outlines the selection criteria of the case schools considering

Advances in Social Sciences Research Journal (ASSRJ) Vol.3, Issue 1 January-‐2016
Copyright © Society for Science and Education, United Kingdom 145
their efficiency levels, the conceptual framework guiding the analysis, description of case schools as well as description of survey instruments. Conceptual Framework Most studies (e.g. Scheerens, 1990 &1992 Rutter et al., 1979) stress the importance of conceptualization and measurement of processes at different levels of the educational system. This particular study utilizes the modified conceptual framework as developed by Scheerens (1990) (Figure 1). The conceptual model is regarded integrated as it draws heavily on production functions, instructional as well as school effectiveness literature. School effectiveness analysis can be at different levels (i.e. school, class and student) as well as casual effects that can be direct, indirect or interaction in nature. Direct effects could be between school level factors and outputs, but also indirect effects mediated by classroom-‐level conditions. The input variables are related to the educator (teacher), learner (student) and school while the output indicator is achievement (matriculation examinations). However, both the input and output indicators are not the main focus of the investigation but are reflected in the framework for completeness.
Figure 1: A Framework for Evaluating School Effectiveness
Source: By Author based on Scheerens (1990) and Wokadala (2011). Note: Safe school environment, monitoring performance, school-‐home relations, and expectations to achievements are investigated in context of supply (educator) and demand (learner) side point of view The context factors are conditions from the broader school environment that are regarded as achievements stimulants. The process mechanisms are divided into three levels, namely the school-‐level (Effective leadership, clear/focused mission, safe school environment, decision
Inputs Educator, School & learner characteris-tics
Objectives
PROCESSES Outputs
Matriculation Examinations
Context Community, Stimulating & Supportive Environments from Local & National Education systems
School-‐level 1. Effective leadership 2. Clear/focused mission 3. Safe school environment 4. Decision making 5. School-community/parents relations
Classroom-‐level 1. Learning opportunities 2. Monitoring performance 3. Staff expectations
Student-‐level 1. Student expectations in achievement and time on task 2. Attitude to school environment & motivation to achieve
Efficiency Effectiveness

Wokadala, J. (2016). School Management and Its Effectiveness in Lower Secondary Educaion in Uganda: Examining Perceptions of the Practitioners. Advances in Social Sciences Research Journal, 3(1) 141-‐154.
URL: http://dx.doi.org/10.14738/assrj.31.1768. 146
making, school-‐community/parent relations), classroom-‐level (Learning opportunities, monitoring performance, staff expectations) and student-‐level (Student expectations in achievement and time on task, attitude to school environment & motivation to achieve) respectively. This study also considered demand side views, mainly articulated by students, as equally crucial to instruction and achievement as well as providing basis for monitoring and promoting educational aspirations at three levels. It is noteworthy that this study mainly deals with the quality of policy implementation in the school environment with specific focus on management practices and instructional leadership with general view to generate theoretical explanations for the differences in educational outcomes associated with school system, students and contexts (e.g. Levine and Lezotte, 1990; Sammons et al., 1995). Selection of the sample schools Initially, a sample of 283 schools was used to estimate technical efficiency scores using the DEA model (see Appendix I) and based on cross sectional data collected in 2009. At this stage, 24 case schools (8 efficient & 16 inefficient) were selected for further analysis using the qualitative approach (see Appendix II). The case schools were selected to show representativeness in efficiency status, geographical distribution and school ownership based on Variable Returns to Scale (VRS) technical efficiency scores. The time lag between 2009 (when the initial data for DEA was collected) and the present case data is nearly two years, which however may not significantly affect comparability of the two sets of data as discussed by Sammons et al. (1998). It could be argued that changes in school resources and behavior usually occur slowly, most probably the between cohorts operated under similar environment. Concerning the case schools, their location varied from rural to urban areas as well as ownership (i.e. 17 government aided schools and 7 private). A total of 69 teachers (including head teachers) were interviewed. Majority of the head teachers and teachers were male (52, 75%) compared to female counterparts. Most of the head teachers had averagely 5 years of working experience in leadership positions and 11 years in teaching. Since the selection of the teachers was somewhat purposive, majority (62%) of them taught English subjects followed by 25%, mathematics and the rest (13%) biology subjects respectively. The study included a total of 191 students (102 Male and 89 female) participants all from grade two. Research Instrument The research instruments for teachers and students were designed based on earlier school effectiveness studies conducted (e.g. Purkey and Smith, 1983; Levine and Lezotte, 1990; Scheerens and Bosker, 1997; Teddlie and Reynolds, 2000). The questionnaire included questions concerning the school as an entity, head teacher, teachers, students as well as parents. Specifically, teacher questionnaire included statements related to: effectiveness instructional leadership; clear and focused school mission; school safety, orderly school environment; expectations for student achievement and school success; assessment and monitoring of student achievement; opportunities for student learning; school-‐community relations, and teachers involvement in decision making. Student questionnaire contained statements related to: positive school climate; school safety and orderly environment; expectations in their achievement as well as time on task; monitoring of student progress; and home-‐school relations respectively. The responses were recorded on likert scale with strongly agree (coded 4) and strongly disagree (coded 1). After each theme, participants were asked to provide possible explanations for their choices made under each theme. The questions for head teacher and teacher were similar allowing for comparability of the data.

Advances in Social Sciences Research Journal (ASSRJ) Vol.3, Issue 1 January-‐2016
Copyright © Society for Science and Education, United Kingdom 147
RESULTS The ethos from educators (teachers) point of view The results in Table 1 indicate the features and teachers’ echoes from both efficient and inefficient schools together with ANOVA (F-‐statistics) tests that establish the significance of difference in mean scores. The results indicate that instructional leadership in both kinds of schools is reflected in school management making instructional effectiveness the highest priority. Specifically, in efficient schools, the head teacher encourages and shares leadership roles with other staff (95.8%); the instructional lessons are designed to allow active students’ participation (100%) as well as teachers having access to variety of instructional materials to use in teaching and learning program (91.7%). “There is always some level of delegation from top management and teacher responsibility for the delegated service is accountable for his/her action” [Teacher, East 1]. Though there is support (82.2%) on prioritizing instructional effectiveness in inefficient schools, majority views did not agree that frequent communication occurs between head teacher and other staff. Often, such schools are characterized by one way kind of communication (i.e. top-‐down). There were voices of concern on part of lack of internal promotions of staff (say from ‘subject’ to ‘class’ teacher) and less motivation for teachers, thus often making teachers not to care about student learning. Moreover, there were concerns on poor working condition of the teachers and this in a way has eroded their ethical conduct. There was indifferent view from both kinds of schools on teachers’ knowledge of the existing school purpose and goals, and that school is well aligned within subject areas. In efficient schools, all respondents were positive that school mission is regularly communicated to students and parents, and that ‘schools use Effective Learning for All as basic principle’ is supported by 95.7% of respondents. The school mission that portrays the very existence of school is often visible on billboards and classroom walls [Head teacher, East 1]. In inefficient schools, there is less support (28.9%) on the views that school goals are consistent with teacher goals and that staff participate in review of school strategic plan is supported by 31.1 percent of respondents (Table 1). Table 1: Proportion of teachers supporting the statement in Efficient and Inefficient schools
Statements/Items Efficient (N=24)
In- efficient (N=45)
F-tests (ANOVA)
Effectiveness Instructional leadership
All teachers make instructional effectiveness the highest priority 0.958 0.822 1.66 Head teacher encourages and shares leadership with other teachers 0.958 Instructional lessons allow all students to actively participate in the learning 1.000 Teachers have access to a variety of teaching resources 0.917 Frequent communication occurs between head teacher and other staff 0.333
Clear and focused school mission
Teachers and students are aware of school purposes and goals 1.000 0.756 0.77 School curriculum has been aligned within subject areas and grade levels 1.000 0.711 0.24 School mission is effectively communicated to students and parents 1.000 School mission uses “Effective Learning for All” as the basic principle 0.957 Goals of teachers are consistent with school goals 0.289 School strategic plan is periodically reviewed and monitored by staff 0.311
Safe, positive and orderly school environment
School conduct rules and procedures are taught and consistently implemented
0.917 0.867 1.25
Disciplinary procedures are implemented in a fair and consistent manner 1.000 0.467 8.31** Students, parents and school staff share responsibility for school behavior 0.917 0.778 13.8*** Both head teacher, teachers and students respect and trust each other 0.916 Both teachers and students believe in positive behavior reinforcement 1.000 Students and teachers have a positive attitude towards the school 0.889 Students and teachers are recognized for their accomplishments 0.422
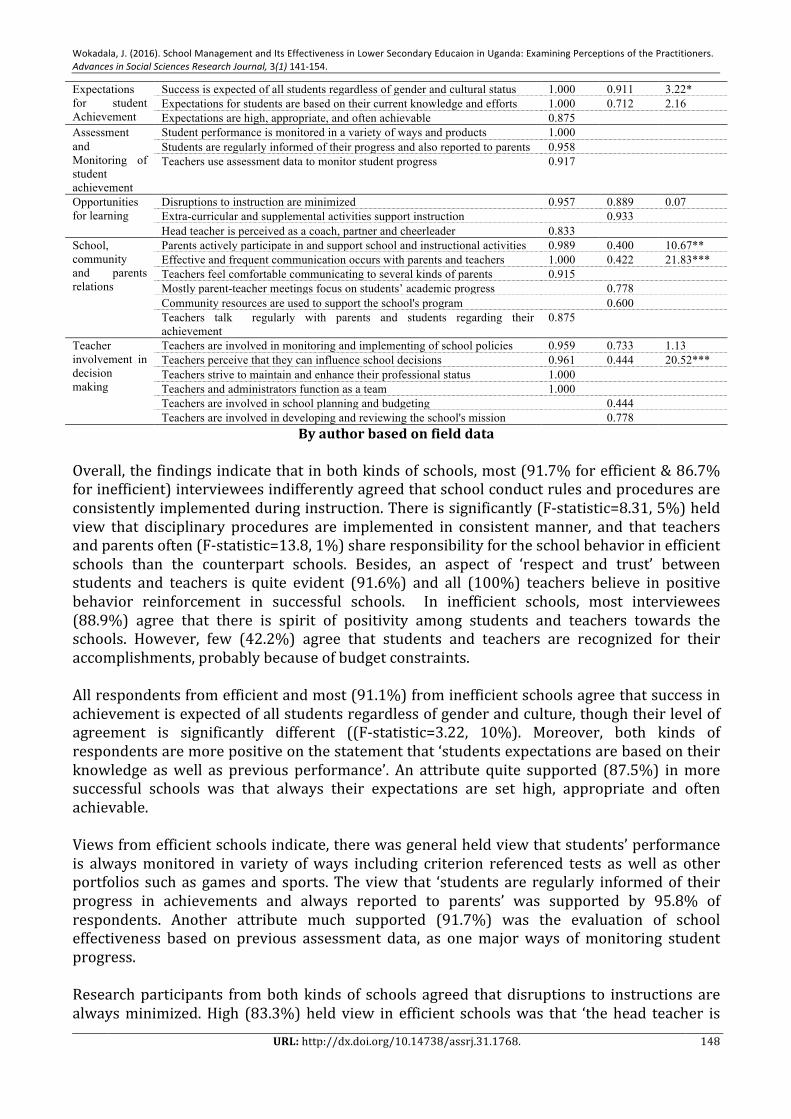
Wokadala, J. (2016). School Management and Its Effectiveness in Lower Secondary Educaion in Uganda: Examining Perceptions of the Practitioners. Advances in Social Sciences Research Journal, 3(1) 141-‐154.
URL: http://dx.doi.org/10.14738/assrj.31.1768. 148
Expectations for student Achievement
Success is expected of all students regardless of gender and cultural status 1.000 0.911 3.22* Expectations for students are based on their current knowledge and efforts 1.000 0.712 2.16 Expectations are high, appropriate, and often achievable 0.875
Assessment and Monitoring of student achievement
Student performance is monitored in a variety of ways and products 1.000 Students are regularly informed of their progress and also reported to parents 0.958 Teachers use assessment data to monitor student progress 0.917
Opportunities for learning
Disruptions to instruction are minimized 0.957 0.889 0.07 Extra-curricular and supplemental activities support instruction 0.933 Head teacher is perceived as a coach, partner and cheerleader 0.833
School, community and parents relations
Parents actively participate in and support school and instructional activities 0.989 0.400 10.67** Effective and frequent communication occurs with parents and teachers 1.000 0.422 21.83*** Teachers feel comfortable communicating to several kinds of parents 0.915 Mostly parent-teacher meetings focus on students’ academic progress 0.778 Community resources are used to support the school's program 0.600 Teachers talk regularly with parents and students regarding their achievement
0.875
Teacher involvement in decision making
Teachers are involved in monitoring and implementing of school policies 0.959 0.733 1.13 Teachers perceive that they can influence school decisions 0.961 0.444 20.52*** Teachers strive to maintain and enhance their professional status 1.000 Teachers and administrators function as a team 1.000 Teachers are involved in school planning and budgeting 0.444 Teachers are involved in developing and reviewing the school's mission 0.778
By author based on field data Overall, the findings indicate that in both kinds of schools, most (91.7% for efficient & 86.7% for inefficient) interviewees indifferently agreed that school conduct rules and procedures are consistently implemented during instruction. There is significantly (F-‐statistic=8.31, 5%) held view that disciplinary procedures are implemented in consistent manner, and that teachers and parents often (F-‐statistic=13.8, 1%) share responsibility for the school behavior in efficient schools than the counterpart schools. Besides, an aspect of ‘respect and trust’ between students and teachers is quite evident (91.6%) and all (100%) teachers believe in positive behavior reinforcement in successful schools. In inefficient schools, most interviewees (88.9%) agree that there is spirit of positivity among students and teachers towards the schools. However, few (42.2%) agree that students and teachers are recognized for their accomplishments, probably because of budget constraints. All respondents from efficient and most (91.1%) from inefficient schools agree that success in achievement is expected of all students regardless of gender and culture, though their level of agreement is significantly different ((F-‐statistic=3.22, 10%). Moreover, both kinds of respondents are more positive on the statement that ‘students expectations are based on their knowledge as well as previous performance’. An attribute quite supported (87.5%) in more successful schools was that always their expectations are set high, appropriate and often achievable. Views from efficient schools indicate, there was general held view that students’ performance is always monitored in variety of ways including criterion referenced tests as well as other portfolios such as games and sports. The view that ‘students are regularly informed of their progress in achievements and always reported to parents’ was supported by 95.8% of respondents. Another attribute much supported (91.7%) was the evaluation of school effectiveness based on previous assessment data, as one major ways of monitoring student progress. Research participants from both kinds of schools agreed that disruptions to instructions are always minimized. High (83.3%) held view in efficient schools was that ‘the head teacher is

Advances in Social Sciences Research Journal (ASSRJ) Vol.3, Issue 1 January-‐2016
Copyright © Society for Science and Education, United Kingdom 149
perceived as a coach, partner and cheerful leader’ in the management and instruction while in failing schools, an aspect of ‘extra-‐curricular and supplemental activities as tools to support instruction’ was also emphasized (93.3%). In the current secondary school curriculum, competitions in co-‐curricular activities across schools, districts as well as regions have been emphasized. Most interviewees from efficient schools agreed that parents actively participate and support instructional activities (98.9%) as well as maintaining frequent communication between them and teachers (100%), compared to lowly held views from counterpart schools. Moreover, in successful schools, there was also high held view that ‘teachers feel comfortable communicating with different types of parents’ (91.5%) and further emphasize that such communication regularly centers on students’ achievement (87.5%). From inefficient schools, 60.0% of interviewees agree that community resources are used to support school activities. Besides, most (77.8%) respondents support the view that parents-‐teacher conferences focus on ways in which students can be assisted in becoming more successful. Majority of interviewees from both kinds of schools agree that teachers participate in monitoring the implementation of school policies and procedures, but there is significantly (F-‐statistic=20.52, 1%) different view that teachers can influence school decisions. All views in efficient schools indicate that teachers not only strive to maintain and enhance their professional statuses, but also together with administrators, function as a team. Whilst in less able schools, most (77.8%) interviewees agree that teachers’ are involved in developing and reviewing schools’ mission and goals but there is less support (44.4%) for the view that teachers are involved in school planning and budgeting (Table 1). The ethos from learners (students) point of view Students’ ethos as presented in Table 2 is further explained as follows: In successful schools, most (89.1%) students stated their parents are aware and usually support the schools’ disciplinary rules as opposed to 46.5% support (F-‐statistic=3.71, %%) from inefficient schools. Moreover, majority (87.5%) of the interviewees from efficient schools agreed with the statement that ‘school buildings are always clean and they are proud of the their school’, whilst dissenting view emerged from less able schools with few (27.6%) of them emphasizing that school conduct rules are fair and always obeyed by the students. In efficient schools, majority of interviewees were more positive about teachers and fellow students respecting and mutually trusting each other (93.8%), a behavioral approach that has been echoed by the teachers as well. There is majority (84.4%) view that students are not absent from school quite often. However, in the failing schools, majority (80.3%) of students agreed they feel safe at school but weakly (45.6%) supported the view that the school gives rewards to students and teachers for their accomplishments. Students from both kinds of schools agree, though at significantly (F-‐Statistic, 10%) different levels that their teachers expect them to do their best and succeed irrespective of their cognitive skills. For instance, among inefficient schools, students were less positive (45.7%) on the statement that ‘teachers expect all of them to succeed, no matter whom they are’, implying that teachers’ expectations on their success is rather irrational. This opinion was also emphasized by teachers that expectations are often matched with actions.
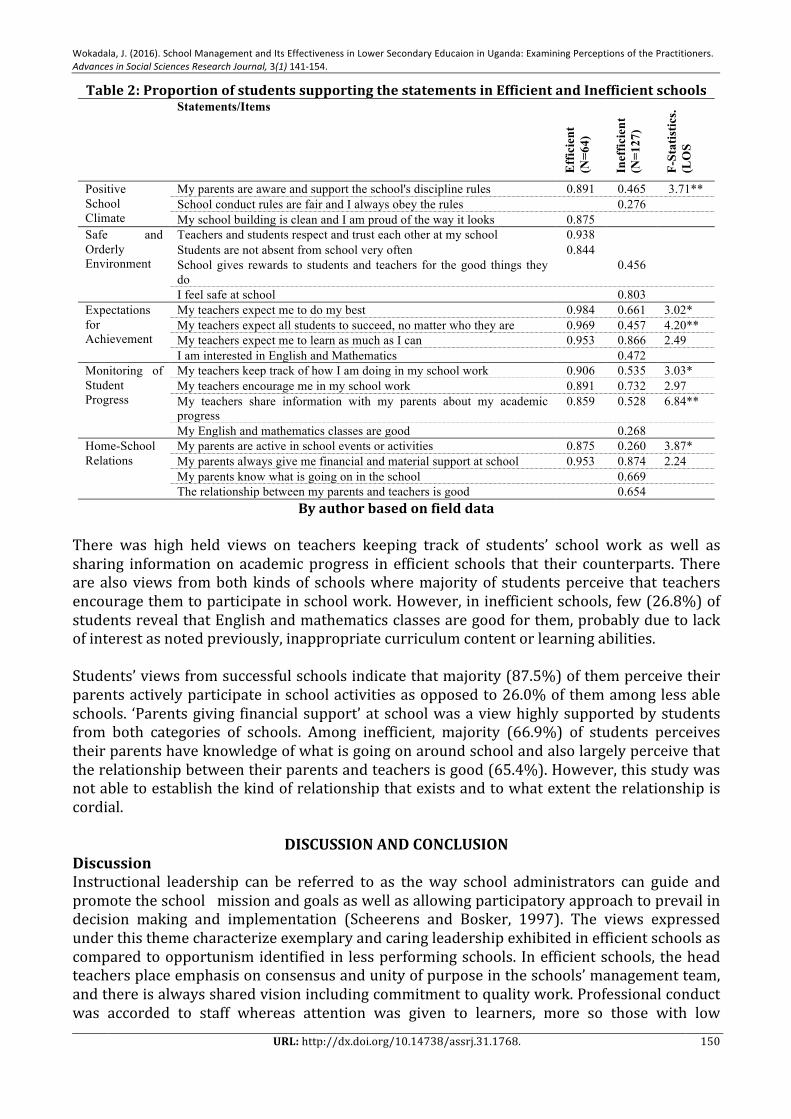
Wokadala, J. (2016). School Management and Its Effectiveness in Lower Secondary Educaion in Uganda: Examining Perceptions of the Practitioners. Advances in Social Sciences Research Journal, 3(1) 141-‐154.
URL: http://dx.doi.org/10.14738/assrj.31.1768. 150
Table 2: Proportion of students supporting the statements in Efficient and Inefficient schools Statements/Items
Eff
icie
nt
(N=6
4)
Inef
ficie
nt
(N=1
27)
F-St
atis
tics.
(LO
S
Positive School Climate
My parents are aware and support the school's discipline rules 0.891 0.465 3.71** School conduct rules are fair and I always obey the rules 0.276 My school building is clean and I am proud of the way it looks 0.875
Safe and Orderly Environment
Teachers and students respect and trust each other at my school 0.938 Students are not absent from school very often 0.844 School gives rewards to students and teachers for the good things they do
0.456
I feel safe at school 0.803 Expectations for Achievement
My teachers expect me to do my best 0.984 0.661 3.02* My teachers expect all students to succeed, no matter who they are 0.969 0.457 4.20** My teachers expect me to learn as much as I can 0.953 0.866 2.49 I am interested in English and Mathematics 0.472
Monitoring of Student Progress
My teachers keep track of how I am doing in my school work 0.906 0.535 3.03* My teachers encourage me in my school work 0.891 0.732 2.97 My teachers share information with my parents about my academic progress
0.859 0.528 6.84**
My English and mathematics classes are good 0.268 Home-School Relations
My parents are active in school events or activities 0.875 0.260 3.87* My parents always give me financial and material support at school 0.953 0.874 2.24 My parents know what is going on in the school 0.669 The relationship between my parents and teachers is good 0.654
By author based on field data There was high held views on teachers keeping track of students’ school work as well as sharing information on academic progress in efficient schools that their counterparts. There are also views from both kinds of schools where majority of students perceive that teachers encourage them to participate in school work. However, in inefficient schools, few (26.8%) of students reveal that English and mathematics classes are good for them, probably due to lack of interest as noted previously, inappropriate curriculum content or learning abilities. Students’ views from successful schools indicate that majority (87.5%) of them perceive their parents actively participate in school activities as opposed to 26.0% of them among less able schools. ‘Parents giving financial support’ at school was a view highly supported by students from both categories of schools. Among inefficient, majority (66.9%) of students perceives their parents have knowledge of what is going on around school and also largely perceive that the relationship between their parents and teachers is good (65.4%). However, this study was not able to establish the kind of relationship that exists and to what extent the relationship is cordial.
DISCUSSION AND CONCLUSION Discussion Instructional leadership can be referred to as the way school administrators can guide and promote the school mission and goals as well as allowing participatory approach to prevail in decision making and implementation (Scheerens and Bosker, 1997). The views expressed under this theme characterize exemplary and caring leadership exhibited in efficient schools as compared to opportunism identified in less performing schools. In efficient schools, the head teachers place emphasis on consensus and unity of purpose in the schools’ management team, and there is always shared vision including commitment to quality work. Professional conduct was accorded to staff whereas attention was given to learners, more so those with low

Advances in Social Sciences Research Journal (ASSRJ) Vol.3, Issue 1 January-‐2016
Copyright © Society for Science and Education, United Kingdom 151
cognitive abilities, implying that head teacher should not only be active, but should have detailed knowledge of the workings of the school. The culture of open discussion on matters of management concern and constructive criticism among teachers in successful schools was tolerated as compared to manipulative syndrome in less able schools, where teachers felt uneasy to exchange ideas and give challenging opinions as such actions were somewhat considered illegal. Decision making is joint process in which not only the school leader opinions affect final results or take effect but rather teachers’ opinions as well. The views expressed could be characterized as participative in successful schools as compared to submissive in failing ones, where teachers’ felt that somebody would dictate from above. School success comes through staff sharing ideas, observing each other and giving feedback, learning from each other as well as working together to improve school program. Though most teachers try to maintain and enhance professionalism, they are often disappointed over little influence to effect decisions. Noteworthy, improved transparency and shared authority are attributes to be emphasized. Moreover, teachers’ opportunities to influence ‘change’ in school development should be further emphasized by school leadership by acknowledging the fact that running a school single handedly can be rather difficult or impossible. In effect, teachers should feel free to articulate their views on school matters especially where students’ and teachers’ interests are involved. It was evident that successful schools are more likely to be calm rather than chaotic places. Positive behavior reinforcement and recognition to students showing exceptional accomplishments and appropriate behavior approaches is evident mainly in successful schools. In effect, there is need to emphasize and maintain a task-‐oriented orderly climate in schools as well as emphasizing self-‐control among students as a source of positive ethos. A school becomes more effective as it becomes more orderly, a pre-‐requisite for effective learning. It has quite emerged that for effective monitoring of school activities, opinions by both top management and teachers should be tolerated even in situations of sharp differences. Views expressed from efficient schools can be described as results oriented relative to inefficient counterparts. Monitoring of student progress was less prioritized activity in less successful schools in that academic assessment of students occurs less often with less follow-‐up tasks. Improving school effectiveness may require support from outside agencies such as school communities as well as parents through using regular and sustainable established contacts and networks (Kirjavainen, 2008; Purkey & Smith, 1983). It was evident that efficient schools were regularly in contact with parents as key school stakeholders. Views expressed by interviewees from successful schools reveal sense of ownership and co-‐existence as compared to loose-‐relations (in inefficient schools) between teachers and parents/community. In the former, teachers are comfortable communicating with parents to discuss the successes and challenges facing the students as well as school administration. On the contrary, parents-‐teacher relationship in inefficient schools is rather weak. This in part is blamed on parents most of whom give less attention to not only their children during schooling, but also less support to school activities. This situation is further complicated when schools are resource constrained and parents are reluctant to materially support their students to stay at school. The introduction of Universal Secondary Education (USE) policy in 2007 partly meant to lessen the economic burden on part of parents, and their role in support of school activities and programs was not strongly emphasized and enforced. This policy in effect positions parents in weak end

Wokadala, J. (2016). School Management and Its Effectiveness in Lower Secondary Educaion in Uganda: Examining Perceptions of the Practitioners. Advances in Social Sciences Research Journal, 3(1) 141-‐154.
URL: http://dx.doi.org/10.14738/assrj.31.1768. 152
of school stakeholder-‐ship while overburdening the teachers culminating into school management challenges.
CONCLUSION In conclusion, the relationship between school management and its effectiveness has been established using qualitative measures as demonstrated through thematic analysis. Of significance is this study analyzed the views of teachers and students from schools with differing efficiency distribution. The results indicate schools’ efficiency status was reflected in leadership and management styles. Leadership style exhibited in efficient schools imply both teachers and students were relevant. In similar sense, the students’ views on teachers were trustful and were confident about their abilities. This kind of administrative practice could be emphasized in failing schools. In efficient schools, the head teacher and teachers’ roles were clear and performed with minimal interruptions from either party implying every teacher was responsible for his/her actions, as compared to inefficient schools where some teachers were hesitant to participate in decision making largely because they feared taking responsibility for their decisions and actions. Tense relations in failing schools are unnecessary as teachers may divert focus from core responsibilities. The parents-‐teacher relationship in inefficient is rather loose and seen as an obstacle to children achievement. Therefore, parents’ involvement in school activities should be emphasized if not made compulsory so that both parties should share the burden and pride of school costs and achievements. Given the complex nature of the school faced with societal transformation and educational change. There is need for school managers to consider school as learning organization, to continue learning, keeping up to-‐date with advances in understanding best practices. This effort can provide knowledge of the features of the learning school that stresses the need for learning. Moreover, it was quite evident that school success does not only depend on structures, teaching patterns but also encompasses understanding of life and actions that reflect its broader goal and strategic objectives, that are regarded as hallmarks for successful school management and instruction. It is noteworthy to point out research gaps as this will guide future research effort on similar or related topics. There have been efforts to establish the correlates of school effectiveness considering the technical efficiency levels, from both the educators and learners point of view. Not significant effort was made to directly obtain parents views on similar themes, due to practical reasons related to funding and time constraints, but rather information on parents’ attitudes and actions on the research theme were obtained indirectly from teachers and students. Coleman (1994) rightly noted that, parental involvement in child schooling is crucial and should not be ignored. Therefore, obtaining the parents’ views on this subject would go long way to not only establish significance of parental support to school activities but also school performance as a whole. However, future investigations to include parents and community is recommended and encouraged.
APPENDIX I Measuring School Technical Efficiencies School technical efficiencies were estimated using DEA, a method used to transform inputs into outputs more exactly via an output oriented BCC (Banker, Charnes, and Cooper) model as developed by Banker, Charnes and Cooper (1984). Schools as Decision Making Units (DMUs) are expected to make the best use of available mix to achieve the highest level of outputs. Inputs considered in this estimation were teacher-‐student ratio, classroom-‐student ratio, physical facility index and proportion of certified teachers while outputs were matriculation
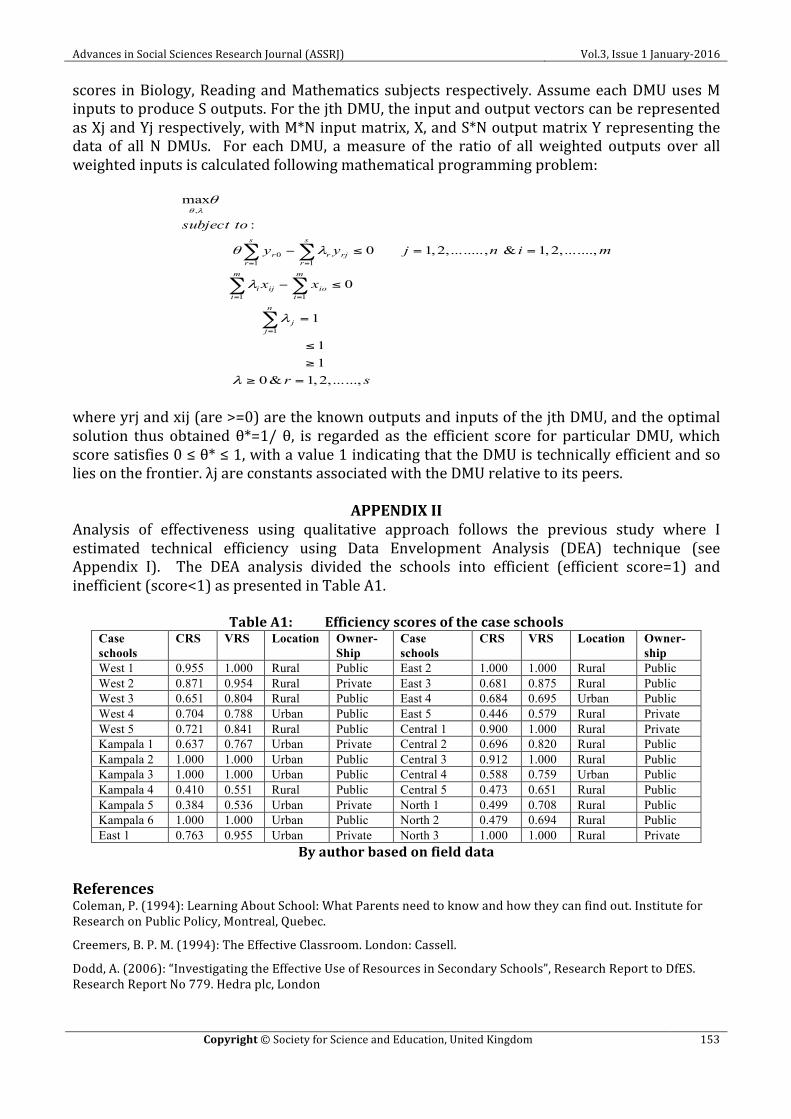
Advances in Social Sciences Research Journal (ASSRJ) Vol.3, Issue 1 January-‐2016
Copyright © Society for Science and Education, United Kingdom 153
scores in Biology, Reading and Mathematics subjects respectively. Assume each DMU uses M inputs to produce S outputs. For the jth DMU, the input and output vectors can be represented as Xj and Yj respectively, with M*N input matrix, X, and S*N output matrix Y representing the data of all N DMUs. For each DMU, a measure of the ratio of all weighted outputs over all weighted inputs is calculated following mathematical programming problem:
sr
xx
minjyy
tosubject
n
jj
m
iio
m
iiji
s
rrjr
s
rr
......,,2,1&011
1
0
.......,,2,1&........,,2,10
:
max
1
11
110
,
=≥
≥
≤
=
≤−
==≤−
∑
∑∑
∑∑
=
==
==
λ
λ
λ
λθ
θλθ
where yrj and xij (are >=0) are the known outputs and inputs of the jth DMU, and the optimal solution thus obtained θ*=1/ θ, is regarded as the efficient score for particular DMU, which score satisfies 0 ≤ θ* ≤ 1, with a value 1 indicating that the DMU is technically efficient and so lies on the frontier. λj are constants associated with the DMU relative to its peers.
APPENDIX II Analysis of effectiveness using qualitative approach follows the previous study where I estimated technical efficiency using Data Envelopment Analysis (DEA) technique (see Appendix I). The DEA analysis divided the schools into efficient (efficient score=1) and inefficient (score<1) as presented in Table A1.
Table A1: Efficiency scores of the case schools Case schools
CRS VRS Location Owner- Ship
Case schools
CRS VRS Location Owner- ship
West 1 0.955 1.000 Rural Public East 2 1.000 1.000 Rural Public West 2 0.871 0.954 Rural Private East 3 0.681 0.875 Rural Public West 3 0.651 0.804 Rural Public East 4 0.684 0.695 Urban Public West 4 0.704 0.788 Urban Public East 5 0.446 0.579 Rural Private West 5 0.721 0.841 Rural Public Central 1 0.900 1.000 Rural Private Kampala 1 0.637 0.767 Urban Private Central 2 0.696 0.820 Rural Public Kampala 2 1.000 1.000 Urban Public Central 3 0.912 1.000 Rural Public Kampala 3 1.000 1.000 Urban Public Central 4 0.588 0.759 Urban Public Kampala 4 0.410 0.551 Rural Public Central 5 0.473 0.651 Rural Public Kampala 5 0.384 0.536 Urban Private North 1 0.499 0.708 Rural Public Kampala 6 1.000 1.000 Urban Public North 2 0.479 0.694 Rural Public East 1 0.763 0.955 Urban Private North 3 1.000 1.000 Rural Private
By author based on field data References Coleman, P. (1994): Learning About School: What Parents need to know and how they can find out. Institute for Research on Public Policy, Montreal, Quebec.
Creemers, B. P. M. (1994): The Effective Classroom. London: Cassell.
Dodd, A. (2006): “Investigating the Effective Use of Resources in Secondary Schools”, Research Report to DfES. Research Report No 779. Hedra plc, London
Wokadala, J. (2016). School Management and Its Effectiveness in Lower Secondary Educaion in Uganda: Examining Perceptions of the Practitioners. Advances in Social Sciences Research Journal, 3(1) 141-‐154.
URL: http://dx.doi.org/10.14738/assrj.31.1768. 154
Kirjavainen, T. & Loikkanen, H.A. (1998): “Efficiency Differences of Finnish Senior Secondary Schools: An application of DEA and Tobit analysis”, Economics of Education Review, 17 (4), 377-‐394.
Kiryavainen, T. (2008): “Understanding Efficiency Difference of Schools: Practitioners’ Views on Students, Staff Relations, School Management and the Curriculum”, VATT Discussion Papers 450, Helsinki: Government Institute of Economic Research.
Levine, D.U. & Lezotte, L.W. (1990): Unusually Effective Schools: A Review and Analysis of Research and Practice. Madison, WI: National Center for Effective Research and Development.
Mortimore, P. (1993): “School Effectiveness and the Management of Effectiveness Learning and Teaching”, School Effectiveness and School Improvement, 4(4), 290-‐310.
Mortimore, P., Sammons, P., Stoll, L., Lewis, D. & Ecob, R. (1988): School Matters: The Junior Years. Somerset: Open Books (Reprinted in 1995 by Paul Chapman: London).
Muijs, D. & Reynolds, D. (2010): Effective Teaching: Research and Practice. London: Paul Chapman.
Portela, M.C. and Camanho, A. S. (2007): “Performance Assessment of Portuguese Secondary Schools”, Working paper, Economics 07/2007. Universidade Catolica Portuguesa (porto). http://dspace.feg.porto.ucp.pt:8080/dspace/
Purkey, S.C. & Smith, M.S. (1983): “Effective Schools: A Review”, The Elementary School Journal, 83, 427-‐452.
Reynolds, D. (2010): Failure Free Education? The Past, Present and Future of School Effectiveness and School Improvement. London: Routledge.
Rutter, M., Maughan, B., Mortimore, P. & Ouston, J. (1979): Fifteen Thousand Hours: Secondary Schools and Their Effects on Children. Boston: Harvard University Press.
Sammons, P., Hillman, J. & Mortimore, P. (1995): Key Characteristics of Effective Schools: A Review of School Effectiveness Research. London: OFSTED.
Sammons, P., Thomas, S., Mortimore, P., Walker, A., Cairns, R. & Bausor, J. (1998): “Understanding Differences in Academic Effectiveness: Practitioners’ Views”, School Effectiveness and School Improvement, 9, 286-‐309.
Scheerens, J. (1990): “School Effectiveness Research and the Development of Process Indicators of School Functioning”, School Effectiveness and School Improvement, Vol.1, 61-‐80.
Scheerens, J. (1992): Effective Schooling: Research, Theory and Practice. London: Cassell.
Scheerens, J. & Bosker, R. (1997): The Foundations of Educational Effectiveness. Oxford/New York/ Tokyo, Pergamon.
Wokadala, J. (2011): “Evaluating technical efficiencies of lower secondary schools in Uganda: A non-‐parametric approach”, African Educational Research Journal, Number 2 (2011), pp. 36-‐54.
Wokadala, J. (2012): “Exploring technical efficiencies of Rural and Urban Lower Secondary Schools in Uganda”, Journal of Educational Planning and Administration, Vol.26 (2), April 2012, pp. 343-‐364
Advances in Social Sciences Research Journal – Vol.3, No.1 Publication Date: Jan. 25, 2016 DoI:10.14738/assrj.31.1804.
Yazicioglu, D. A., & Kanoglu, A. (2016). A Systematic Approach for Increasing the Success of Kitchen Interior Design Within the Cotext of Spatial User Requirements. Advances in Social Sciences Research Journal, 3(1) 155-‐166.
Copyright © Society for Science and Education, United Kingdom 155
A Systematıc Approach For Increasıng The Success Of Kıtchen Interıor Desıgn Wıthın The Context Of Spatıal User
Requırements
Dr. Deniz Ayşe Yazıcıoğlu Istanbul Technical University, Interior Architecture Department
Taşkışla, 34437 Taksim Istanbul/Turkey
Prof. Dr. Alaattin Kanoğlu Istanbul Technical University, Architecture Department
Taşkışla, 34437 Taksim Istanbul/Turkey
Abstract One of the most studied areas for increasing the performance of interior design is the kitchen. The reason for this is it’s being the most important area of work compared to other areas from which high performance in many criteria is expected such as functionality, durability and hygiene. As a result of the literature survey carried out within the purview of the study as to increasing the design performance it was found that scientific efforts for increasing the performance of kitchen design is divided into two groups. The first group consists of those germane to industrial kitchen products. Studies in the other group provide information as regards basic design rules for increasing the kitchen design performance. There was no study on establishing the relation between "basic design rules" and "user requirements" in a systematic way for increasing the kitchen design performance in these obtained resources. As such, the purpose of this study is establishment of a systematic classification in which a relational link between the design rules proposed for increasing the performance of kitchen design with user requirements in kitchen is created. The scope of the study is limited to only one of the user's requirements with an eye to reach more accurate results. In line with this identified scope and purpose, the methodology of the study is determined as which of the user requirements will be discussed in the first phase with the reasons thereof. Subsequently, a literature survey was conducted and the set of design rules for increasing the kitchen design success was created. A systematic classification in which the relational link has been established between the design rules and user requirements at the last phase. Keywords: Performance based design, kitchen interior design, designer performance.
INTRODUCTION
One of the most studied areas for increasing the performance of interior design is the kitchen. The reason for this is it’s being the most important area of work compared to other areas from which high performance in many criteria is expected such as functionality, durability and hygiene. Researches conducted as to the issue have revealed the fact that 30% of all the works done at home consists of meal preparation and actions associated to this [1; 2]. Another study has revealed that much as an average of two hours is spent in the kitchen during the day, the cupboards are opened and closed more than 80 times during this time of and activities as to different functions are repeated more than 50 times [3]. Furthermore, kitchen is the area which is renewed mostly by34% and again it is the most costly area in terms of design in a house [4; 5; 6]. In addition to all these, kitchen is the area for a designer which has to be resolved almost in all projects. [7; 8; 9].
Yazicioglu, D. A., & Kanoglu, A. (2016). A Systematic Approach for Increasing the Success of Kitchen Interior Design Within the Cotext of Spatial User Requirements. Advances in Social Sciences Research Journal, 3(1) 155-‐166.
URL: http://dx.doi.org/10.14738/assrj.31.1804. 156
In this context, when the scientific studies carried out on performance of kitchen design were examined, it was observed that Palma and Rehman [10] addressed the issue of oven-‐range cooker technology design in rural residential kitchens in order to increase the kitchen performance in different cultures and living standards. On the other hand Demirkan and Olguntürk [11] identify the design criteria for adults, elderly, disabled and for those with vision problems in order to project certain areas and kitchen within the house in terms of design performance for adults more correctly. Morishita et al.[12] [12] propose an electronic system in their study in which the counter height is adjusted automatically by changing according to the user’ actions for cooking meals for increasing the kitchen design performance. Cline [13] is observed to examine the performance of kitchen design criteria defined for users with disabilities. Rivet [14] 's study is as to the performance of kitchen ventilation systems. Mak and Francis [15] discussed the issue of thermal comfort and natural ventilation performance of the kitchen. 42 different window sizes were tried on a typical kitchen and measurements were taken while doing so and it was revealed that the minimum window size required to ensure thermal comfort in a kitchen should be at least 23:33% of the total area of the kitchen. Panwar [16] evaluates the kitchen design performance regarding the effective use of gas in the stoves. Lamkins [17] examined the performance of the kitchen sink systems. It is emphasized in the studies of O'Heir [18] and Stander et al.[19] that use of industrial products equipped with digital technology in the kitchen will increase the design performance of the space. Lyon et al. [20] have evaluated the way of cooking depending on the user's age and examined the design performance of the kitchens within this context. Boynton Child [21] mentions that grouping kitchen tools according to the way of usage will provide time saving for users and as a result kitchen design performance will increase. When the works of Asensio and Ubach [22] Baden-‐Powell [23], Beamish et al. [24] Beazley [25], Bouknight [26], Cerver [27], Conran [28], David[29], Edic and Edic[5], Jankowsk[30], King[31], Lester and McGuerty [32], Lovett[33], Maney [34], Mielke [35] and Rand and Perchuk [36] are examined it is observed that they describe the basic design principles of the projecting process for increasing the kitchen design performance. In Grandjean [37], Panero and Zelnik [38] and Pheasant [39]'s works, standards as to human measure to increase the interior and kitchen design performance and design criteria based on these measures are mentioned. As a result of the entire literature survey conducted within the purview of the study, it has been determined that scientific studies to increase the performance of the kitchen design are mainly divided into two groups. The first group is those related to performance of the industrial kitchen products. The studies in the other group describe the basic design rules to increase the kitchen design performance [7; 8; 9]. There was no study on establishing the relation between "basic design rules" and "user requirements" in a systematic way for increasing the kitchen design performance in these obtained resources. However, a high performance kitchen design can be achieved only by producing appropriate solutions according to the requirements of the person (s) who will use the kitchen. In other words, there is no systematic classification as to for user requirements the design rules in the literature are proposed. However, such a classification will have the nature of a means to guide the designer is a way towards for increasing the kitchen design performance during the design process.
PURPOSE AND METHODOLOGY The purpose of this study is establishment of a systematic classification in which a relational link between the design rules proposed for increasing the performance of kitchen design with user requirements in kitchen is created. The scope of the study is limited to only one of the user's requirements with an eye to reach more accurate results. In line with this identified scope and purpose, the methodology of the study is determined as which of the user
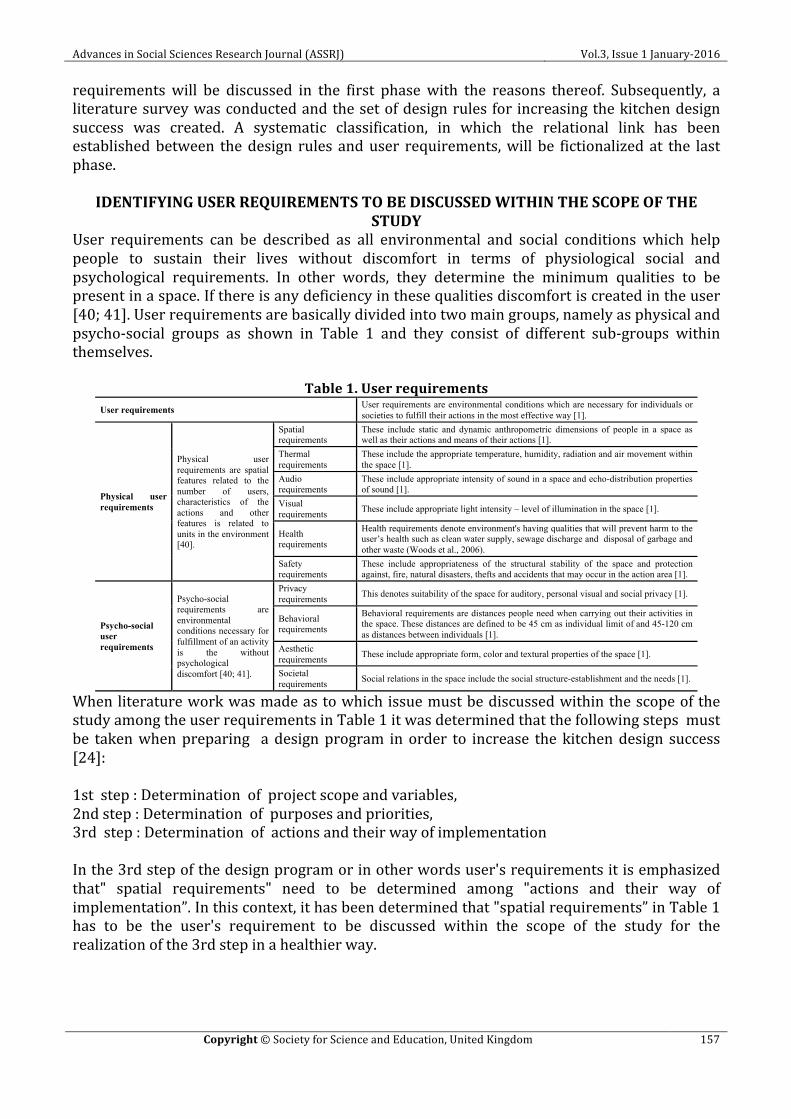
Advances in Social Sciences Research Journal (ASSRJ) Vol.3, Issue 1 January-‐2016
Copyright © Society for Science and Education, United Kingdom 157
requirements will be discussed in the first phase with the reasons thereof. Subsequently, a literature survey was conducted and the set of design rules for increasing the kitchen design success was created. A systematic classification, in which the relational link has been established between the design rules and user requirements, will be fictionalized at the last phase.
IDENTIFYING USER REQUIREMENTS TO BE DISCUSSED WITHIN THE SCOPE OF THE STUDY
User requirements can be described as all environmental and social conditions which help people to sustain their lives without discomfort in terms of physiological social and psychological requirements. In other words, they determine the minimum qualities to be present in a space. If there is any deficiency in these qualities discomfort is created in the user [40; 41]. User requirements are basically divided into two main groups, namely as physical and psycho-‐social groups as shown in Table 1 and they consist of different sub-‐groups within themselves.
Table 1. User requirements User requirements User requirements are environmental conditions which are necessary for individuals or
societies to fulfill their actions in the most effective way [1].
Physical user requirements
Physical user requirements are spatial features related to the number of users, characteristics of the actions and other features is related to units in the environment [40].
Spatial requirements
These include static and dynamic anthropometric dimensions of people in a space as well as their actions and means of their actions [1].
Thermal requirements
These include the appropriate temperature, humidity, radiation and air movement within the space [1].
Audio requirements
These include appropriate intensity of sound in a space and echo-distribution properties of sound [1].
Visual requirements These include appropriate light intensity – level of illumination in the space [1]. Health requirements
Health requirements denote environment's having qualities that will prevent harm to the user’s health such as clean water supply, sewage discharge and disposal of garbage and other waste (Woods et al., 2006).
Safety requirements
These include appropriateness of the structural stability of the space and protection against, fire, natural disasters, thefts and accidents that may occur in the action area [1].
Psycho-social user requirements
Psycho-social requirements are environmental conditions necessary for fulfillment of an activity is the without psychological discomfort [40; 41].
Privacy requirements This denotes suitability of the space for auditory, personal visual and social privacy [1]. Behavioral requirements
Behavioral requirements are distances people need when carrying out their activities in the space. These distances are defined to be 45 cm as individual limit of and 45-120 cm as distances between individuals [1].
Aesthetic requirements These include appropriate form, color and textural properties of the space [1].
Societal requirements Social relations in the space include the social structure-establishment and the needs [1].
When literature work was made as to which issue must be discussed within the scope of the study among the user requirements in Table 1 it was determined that the following steps must be taken when preparing a design program in order to increase the kitchen design success [24]: 1st step : Determination of project scope and variables, 2nd step : Determination of purposes and priorities, 3rd step : Determination of actions and their way of implementation In the 3rd step of the design program or in other words user's requirements it is emphasized that" spatial requirements" need to be determined among "actions and their way of implementation”. In this context, it has been determined that "spatial requirements” in Table 1 has to be the user's requirement to be discussed within the scope of the study for the realization of the 3rd step in a healthier way.
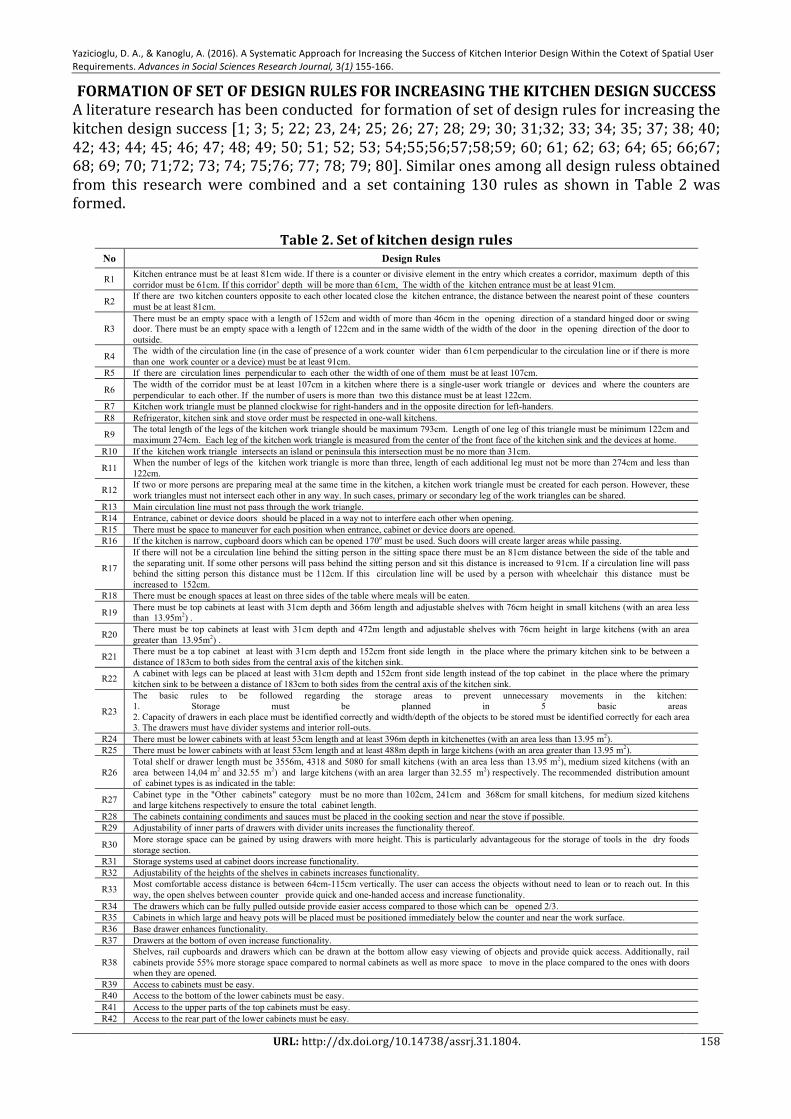
Yazicioglu, D. A., & Kanoglu, A. (2016). A Systematic Approach for Increasing the Success of Kitchen Interior Design Within the Cotext of Spatial User Requirements. Advances in Social Sciences Research Journal, 3(1) 155-‐166.
URL: http://dx.doi.org/10.14738/assrj.31.1804. 158
FORMATION OF SET OF DESIGN RULES FOR INCREASING THE KITCHEN DESIGN SUCCESS A literature research has been conducted for formation of set of design rules for increasing the kitchen design success [1; 3; 5; 22; 23, 24; 25; 26; 27; 28; 29; 30; 31;32; 33; 34; 35; 37; 38; 40; 42; 43; 44; 45; 46; 47; 48; 49; 50; 51; 52; 53; 54;55;56;57;58;59; 60; 61; 62; 63; 64; 65; 66;67; 68; 69; 70; 71;72; 73; 74; 75;76; 77; 78; 79; 80]. Similar ones among all design ruless obtained from this research were combined and a set containing 130 rules as shown in Table 2 was formed.
Table 2. Set of kitchen design rules No Design Rules
R1 Kitchen entrance must be at least 81cm wide. If there is a counter or divisive element in the entry which creates a corridor, maximum depth of this corridor must be 61cm. If this corridor’ depth will be more than 61cm, The width of the kitchen entrance must be at least 91cm.
R2 If there are two kitchen counters opposite to each other located close the kitchen entrance, the distance between the nearest point of these counters must be at least 81cm.
R3 There must be an empty space with a length of 152cm and width of more than 46cm in the opening direction of a standard hinged door or swing door. There must be an empty space with a length of 122cm and in the same width of the width of the door in the opening direction of the door to outside.
R4 The width of the circulation line (in the case of presence of a work counter wider than 61cm perpendicular to the circulation line or if there is more than one work counter or a device) must be at least 91cm.
R5 If there are circulation lines perpendicular to each other the width of one of them must be at least 107cm.
R6 The width of the corridor must be at least 107cm in a kitchen where there is a single-user work triangle or devices and where the counters are perpendicular to each other. If the number of users is more than two this distance must be at least 122cm.
R7 Kitchen work triangle must be planned clockwise for right-handers and in the opposite direction for left-handers. R8 Refrigerator, kitchen sink and stove order must be respected in one-wall kitchens.
R9 The total length of the legs of the kitchen work triangle should be maximum 793cm. Length of one leg of this triangle must be minimum 122cm and maximum 274cm. Each leg of the kitchen work triangle is measured from the center of the front face of the kitchen sink and the devices at home.
R10 If the kitchen work triangle intersects an island or peninsula this intersection must be no more than 31cm.
R11 When the number of legs of the kitchen work triangle is more than three, length of each additional leg must not be more than 274cm and less than 122cm.
R12 If two or more persons are preparing meal at the same time in the kitchen, a kitchen work triangle must be created for each person. However, these work triangles must not intersect each other in any way. In such cases, primary or secondary leg of the work triangles can be shared.
R13 Main circulation line must not pass through the work triangle. R14 Entrance, cabinet or device doors should be placed in a way not to interfere each other when opening. R15 There must be space to maneuver for each position when entrance, cabinet or device doors are opened. R16 If the kitchen is narrow, cupboard doors which can be opened 170o must be used. Such doors will create larger areas while passing.
R17
If there will not be a circulation line behind the sitting person in the sitting space there must be an 81cm distance between the side of the table and the separating unit. If some other persons will pass behind the sitting person and sit this distance is increased to 91cm. If a circulation line will pass behind the sitting person this distance must be 112cm. If this circulation line will be used by a person with wheelchair this distance must be increased to 152cm.
R18 There must be enough spaces at least on three sides of the table where meals will be eaten.
R19 There must be top cabinets at least with 31cm depth and 366m length and adjustable shelves with 76cm height in small kitchens (with an area less than 13.95m2) .
R20 There must be top cabinets at least with 31cm depth and 472m length and adjustable shelves with 76cm height in large kitchens (with an area greater than 13.95m2) .
R21 There must be a top cabinet at least with 31cm depth and 152cm front side length in the place where the primary kitchen sink to be between a distance of 183cm to both sides from the central axis of the kitchen sink.
R22 A cabinet with legs can be placed at least with 31cm depth and 152cm front side length instead of the top cabinet in the place where the primary kitchen sink to be between a distance of 183cm to both sides from the central axis of the kitchen sink.
R23
The basic rules to be followed regarding the storage areas to prevent unnecessary movements in the kitchen: 1. Storage must be planned in 5 basic areas 2. Capacity of drawers in each place must be identified correctly and width/depth of the objects to be stored must be identified correctly for each area 3. The drawers must have divider systems and interior roll-outs.
R24 There must be lower cabinets with at least 53cm length and at least 396m depth in kitchenettes (with an area less than 13.95 m2). R25 There must be lower cabinets with at least 53cm length and at least 488m depth in large kitchens (with an area greater than 13.95 m2).
R26 Total shelf or drawer length must be 3556m, 4318 and 5080 for small kitchens (with an area less than 13.95 m2), medium sized kitchens (with an area between 14,04 m2 and 32.55 m2) and large kitchens (with an area larger than 32.55 m2) respectively. The recommended distribution amount of cabinet types is as indicated in the table:
R27 Cabinet type in the "Other cabinets" category must be no more than 102cm, 241cm and 368cm for small kitchens, for medium sized kitchens and large kitchens respectively to ensure the total cabinet length.
R28 The cabinets containing condiments and sauces must be placed in the cooking section and near the stove if possible. R29 Adjustability of inner parts of drawers with divider units increases the functionality thereof.
R30 More storage space can be gained by using drawers with more height. This is particularly advantageous for the storage of tools in the dry foods storage section.
R31 Storage systems used at cabinet doors increase functionality. R32 Adjustability of the heights of the shelves in cabinets increases functionality.
R33 Most comfortable access distance is between 64cm-115cm vertically. The user can access the objects without need to lean or to reach out. In this way, the open shelves between counter provide quick and one-handed access and increase functionality.
R34 The drawers which can be fully pulled outside provide easier access compared to those which can be opened 2/3. R35 Cabinets in which large and heavy pots will be placed must be positioned immediately below the counter and near the work surface. R36 Base drawer enhances functionality. R37 Drawers at the bottom of oven increase functionality.
R38 Shelves, rail cupboards and drawers which can be drawn at the bottom allow easy viewing of objects and provide quick access. Additionally, rail cabinets provide 55% more storage space compared to normal cabinets as well as more space to move in the place compared to the ones with doors when they are opened.
R39 Access to cabinets must be easy. R40 Access to the bottom of the lower cabinets must be easy. R41 Access to the upper parts of the top cabinets must be easy. R42 Access to the rear part of the lower cabinets must be easy.

Advances in Social Sciences Research Journal (ASSRJ) Vol.3, Issue 1 January-‐2016
Copyright © Society for Science and Education, United Kingdom 159
R43 Access to the rear part of the top cabinets must be easy.
R44 More frequently used objects must be planned in a way that they are stored in the top drawers of the lower cabinets and the lower shelves of the top cabinets. Less frequently used objects can be stored on or under these sections. The least used objects should be stored by placing them in the upper part of the top cabinets. Accordingly, the selection of storage units provide saving on time while working in the kitchen.
R45 Dry food cupboards turning left and right after opening increase functionality.
R46 Dry food systems which can be pulled out used in cupboards or top cabinets consist of wooden based baskets with adjustable heights and coated with steel wire or non-slip flooring material and in this way create storage space for foods and increase functionality.
R47 Undercounter dry food systems must be used for cases with spatial limitations where dry food cupboard systems cannot be used.
R48 Total facing length of wall and lower counter cabinets, drawers and dry food shelves/drawers must be 183cm at two sides from the central axis of the total primary kitchen sink. Front length of storage areas must be at least 1016cm, 1219cm and 1422cm for small kitchens, medium sized kitchens and large kitchens respectively. Storage areas must be intensively between 38cm-122cm vertically.
R49 There must be a drawer or sliding shelf with at least 305cm of front face length in small kitchens (with an area less than 13.95 m2). There must be a drawer or sliding shelf with at least 419cm of front face length in large kitchens (with an area larger than 13.95 m2).
R50 Removability of cabinet doors increases functionality. R51 All devices must be placed at a height 38 cm and 122 cm.
R52 The maximum height for someone sitting in a wheelchair in front of a counter with 51cm-64cm depth to be accessed is 112cm. If there is not such a counter the access distance is between 38 cm and 122cm.
R53 At least 5 pieces of storage units, between 38 cm and 122 cm from the kitchen floor height must be positioned to increase the functionality. R54 There must be a functional interior corner system within at least one of the corner cupboards in the kitchen.
R55 The trashes used for wastes for recycling must be near the kitchen sink. The trashes used for wastes which cannot be recycled can be placed anywhere in the kitchen.
R56 There must be at least two trashes in the kitchen for wastes for recycling and for wastes which cannot be recycled.
R57 The upper surface of the trash must not be higher than 91cm. The trash must be easily accessible and removable without need for lifting upward. A trash which can be removable from the side is the most preferred option.
R58 The knee space must be spared in every possible part of the kitchen sink, oven and range such as the bottom part or immediately next to it. The knee space must be at least 69cm high, 76cm wide and 48cm deep. Height of 69cm can be reduced depending on the increasing of the depth.
R59
The kitchen sink must be fixed lower than 86cm or its height must be adjustable between 74cm and 91cm. The hole of the kitchen sink must not be deeper than 17cm. There must not be a surface with sharp or rough end under the kitchen sink. A knee space must be planned for wheelchair users under the kitchen sink. This knee space must be 91cm in width, 69cm in height and with 20cm depth. If the distance is 43cm in depth, a space with 23cm height from the ground must be left for the toes.
R60 There must be an empty floor space of 76cmx122cm in front of all devices. These areas may overlap and maximum 48cm of the knee space (at the bottom of a device, counter, cabinets etc.) may be part of the total 76cm and/or 122cm clean floor space.
R61 Devices must be easily accessed. R62 All the necessary components of the devices must be easily accessed in the correct positions. R63 At least an area with 152cm diameter including knees and toe space must be allocated so that the wheelchair can rotate.
R64 There must be a T-shaped empty floor space floor space with a body length of minimum of 91cm and with arms with a total length of 152cm on both sides of the body in equal length so that a wheelchair rotation area is functional.
R65 The distance between the side of a dishwasher and a counter, another device or the side of cabinet placed upright to that must be 53cm. The 53cm distance in diagonal placement is the distance from the middle of the side of the kitchen sink to the side of the open door of the dishwasher.
R66 If it is possible to allocate enough free space for counter near the kitchen sink, rising the dishwasher for 15cm-31cm increases functionality. R67 Max. distance between the primary dishwasher and the side of the kitchen sink must be 91cm.
R68 The dishwasher must be positioned in a way to be accessed by more than one person when it is open. For this purpose, a free floor space of at least 76cmx122cm must be left on either side of the dishwasher when its door is open. The dishwasher must not prevent access to this free space allocated for dishwasher or the kitchen sink when the dishwasher is open.
R69 If there will be a kitchen sink in the kitchen, it must be placed between the cooking and preparation area and the refrigerator or across them.
R70 The distance between the oven and the fire-resistant surface above it must be at least 6cm. If this surface is unprotected then the distance must be at least 76cm.
R71 If there will be an obstacle with 51cm-64cm depth in front of the ventilation controls, these controllers should be placed with a height of 38cm-112cm from the ground. If there is not such an obstacle, the placement height must be between 38cm-122cm. Ventilation controllers must be able to be operated with minimal effort, easy to read and with least noise.
R72 If the cooking surface does not have a distance of at least 8cm horizontally and 61cm vertically it must not be placed in front of a window. Flammable curtains must not be placed to the window in the place where there is the cooking surface.
R73 The ideal placement height of the microwave oven must be maximum 137cm from the floor and must be 8cm below the shoulder height. R74 If the microwave oven will be placed under the counter, height of the microwave oven must be maximum at least 38cm from the floor.
R75 The height of the microwave oven from the floor is calculated to be 15cm. below the elbow height or 8cm below the shoulder height when the microwave oven is placed.
R76 Counters at least with two different heights are proposed to be designed for the kitchen. One must be constructed to be between 71cm and 91cm above the floor and the other must be constructed to be between 91cm and 114cm. above the floor.
R77 There must be an empty counter surface at least 335cm long in small kitchens (with an area less than 13.95 m2). Furthermore, 61cm counter depth and min. 38cm gap between the counter are required.
R78 There must be an empty counter surface at least 503cm long in large kitchens (with an area larger than 13.95 m2). Furthermore, 61cm counter depth and min. 38cm gap between the counter are required.
R79 Counter must be accessed easily . R80 The entire surface of the counter must be used easily. R81 The counter surfaces must come out when they are pulled.
R82 There must be a counter with length of at least 61cm on one side and with length of at least 46cm on the other side in secondary sinks (the same rule applies in the corner sinks) in the same height with the kitchen sink.
R83 In case of counters intersecting each other perpendicularly, if the distance of the kitchen sink to the corner in front of the counter is 8cm, there must be an empty counter space for the other counter at least with a distance of 53cm from the same corner.
R84 The distance between the nearest sides of primary dishwasher and the kitchen sink must be not more than 91cm.
R85 If the counter height in the area where the kitchen sink does not continue always the same height there must be a counter with length of at least 61cm on one side and with length of at least 8cm on the other side.
R86 There must be a counter with length of at least 8cm on one side and with length of at least 46cm on the other side in secondary sinks (the same rule applies in the corner sinks) in the same height with the kitchen sink.
R87 If the medicine cabinet is a need for the user it must be planned in washing work area.
R88 Detergents should be stored under the kitchen sink. If the rail cleaning materials basket to be mounted to the kitchen sink cabinet can be removed and carried at any time it will increase functionality.
R89 There must be a counter space at least 38cm in length and 41cm in depth on, under or near the microwave oven.
R90 If the height of the cooking surface is different from the height of the counter there must be a counter space with 31cm length on one side and 38cm on the other side of the cooking surface in the same height with the cooking surface.
R91 A knee space must be created at the bottom of a device oven upper surface of which is 86cm-71cm height above the floor. R92 There will be a counter in the same height with the cooking surface with length of at least 23cm on one side and at least 38cm on the other side. R93 There must be a counter depth of at least 23cm at the back of the device if there is not a blockage at the back of the cooking surface on the island or
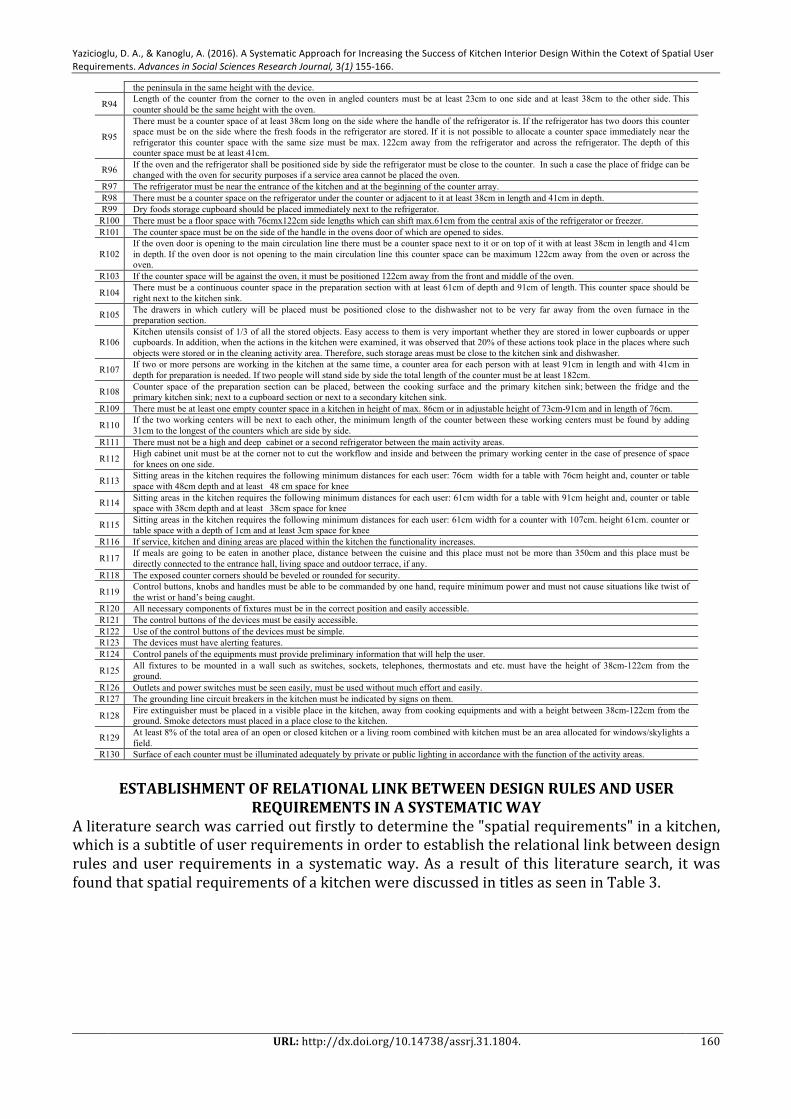
Yazicioglu, D. A., & Kanoglu, A. (2016). A Systematic Approach for Increasing the Success of Kitchen Interior Design Within the Cotext of Spatial User Requirements. Advances in Social Sciences Research Journal, 3(1) 155-‐166.
URL: http://dx.doi.org/10.14738/assrj.31.1804. 160
the peninsula in the same height with the device.
R94 Length of the counter from the corner to the oven in angled counters must be at least 23cm to one side and at least 38cm to the other side. This counter should be the same height with the oven.
R95
There must be a counter space of at least 38cm long on the side where the handle of the refrigerator is. If the refrigerator has two doors this counter space must be on the side where the fresh foods in the refrigerator are stored. If it is not possible to allocate a counter space immediately near the refrigerator this counter space with the same size must be max. 122cm away from the refrigerator and across the refrigerator. The depth of this counter space must be at least 41cm.
R96 If the oven and the refrigerator shall be positioned side by side the refrigerator must be close to the counter. In such a case the place of fridge can be changed with the oven for security purposes if a service area cannot be placed the oven.
R97 The refrigerator must be near the entrance of the kitchen and at the beginning of the counter array. R98 There must be a counter space on the refrigerator under the counter or adjacent to it at least 38cm in length and 41cm in depth. R99 Dry foods storage cupboard should be placed immediately next to the refrigerator.
R100 There must be a floor space with 76cmx122cm side lengths which can shift max.61cm from the central axis of the refrigerator or freezer. R101 The counter space must be on the side of the handle in the ovens door of which are opened to sides.
R102 If the oven door is opening to the main circulation line there must be a counter space next to it or on top of it with at least 38cm in length and 41cm in depth. If the oven door is not opening to the main circulation line this counter space can be maximum 122cm away from the oven or across the oven.
R103 If the counter space will be against the oven, it must be positioned 122cm away from the front and middle of the oven.
R104 There must be a continuous counter space in the preparation section with at least 61cm of depth and 91cm of length. This counter space should be right next to the kitchen sink.
R105 The drawers in which cutlery will be placed must be positioned close to the dishwasher not to be very far away from the oven furnace in the preparation section.
R106 Kitchen utensils consist of 1/3 of all the stored objects. Easy access to them is very important whether they are stored in lower cupboards or upper cupboards. In addition, when the actions in the kitchen were examined, it was observed that 20% of these actions took place in the places where such objects were stored or in the cleaning activity area. Therefore, such storage areas must be close to the kitchen sink and dishwasher.
R107 If two or more persons are working in the kitchen at the same time, a counter area for each person with at least 91cm in length and with 41cm in depth for preparation is needed. If two people will stand side by side the total length of the counter must be at least 182cm.
R108 Counter space of the preparation section can be placed, between the cooking surface and the primary kitchen sink; between the fridge and the primary kitchen sink; next to a cupboard section or next to a secondary kitchen sink.
R109 There must be at least one empty counter space in a kitchen in height of max. 86cm or in adjustable height of 73cm-91cm and in length of 76cm.
R110 If the two working centers will be next to each other, the minimum length of the counter between these working centers must be found by adding 31cm to the longest of the counters which are side by side.
R111 There must not be a high and deep cabinet or a second refrigerator between the main activity areas.
R112 High cabinet unit must be at the corner not to cut the workflow and inside and between the primary working center in the case of presence of space for knees on one side.
R113 Sitting areas in the kitchen requires the following minimum distances for each user: 76cm width for a table with 76cm height and, counter or table space with 48cm depth and at least 48 cm space for knee
R114 Sitting areas in the kitchen requires the following minimum distances for each user: 61cm width for a table with 91cm height and, counter or table space with 38cm depth and at least 38cm space for knee
R115 Sitting areas in the kitchen requires the following minimum distances for each user: 61cm width for a counter with 107cm. height 61cm. counter or table space with a depth of 1cm and at least 3cm space for knee
R116 If service, kitchen and dining areas are placed within the kitchen the functionality increases.
R117 If meals are going to be eaten in another place, distance between the cuisine and this place must not be more than 350cm and this place must be directly connected to the entrance hall, living space and outdoor terrace, if any.
R118 The exposed counter corners should be beveled or rounded for security.
R119 Control buttons, knobs and handles must be able to be commanded by one hand, require minimum power and must not cause situations like twist of the wrist or hand’s being caught.
R120 All necessary components of fixtures must be in the correct position and easily accessible. R121 The control buttons of the devices must be easily accessible. R122 Use of the control buttons of the devices must be simple. R123 The devices must have alerting features. R124 Control panels of the equipments must provide preliminary information that will help the user.
R125 All fixtures to be mounted in a wall such as switches, sockets, telephones, thermostats and etc. must have the height of 38cm-122cm from the ground.
R126 Outlets and power switches must be seen easily, must be used without much effort and easily. R127 The grounding line circuit breakers in the kitchen must be indicated by signs on them.
R128 Fire extinguisher must be placed in a visible place in the kitchen, away from cooking equipments and with a height between 38cm-122cm from the ground. Smoke detectors must placed in a place close to the kitchen.
R129 At least 8% of the total area of an open or closed kitchen or a living room combined with kitchen must be an area allocated for windows/skylights a field.
R130 Surface of each counter must be illuminated adequately by private or public lighting in accordance with the function of the activity areas.
ESTABLISHMENT OF RELATIONAL LINK BETWEEN DESIGN RULES AND USER
REQUIREMENTS IN A SYSTEMATIC WAY A literature search was carried out firstly to determine the "spatial requirements" in a kitchen, which is a subtitle of user requirements in order to establish the relational link between design rules and user requirements in a systematic way. As a result of this literature search, it was found that spatial requirements of a kitchen were discussed in titles as seen in Table 3.

Advances in Social Sciences Research Journal (ASSRJ) Vol.3, Issue 1 January-‐2016
Copyright © Society for Science and Education, United Kingdom 161
Table 3. Spatial requirements of kitchen Spatial Requirements
Activitiy Areas
Circulation Areas
Storage
Cle
anin
g
Prep
aing
Coo
king
Serv
ice
and
eatin
g
Res
ting
Oth
er a
ctiv
ities
Food storage
Kitc
hen
equi
pmen
ts st
orag
e
Cle
anin
g m
ater
ials
and
equ
ipm
ents
stor
age
Was
te S
tora
ge
Shor
t liv
ed fo
od st
ogar
e
Long
live
d fo
od st
orag
e
When the relational links between each design rule in Table 2 spatial requirements in Table 3 was examined one by one the results in Table 4 were obtained.
Table 4. Relational link between “Design Rules” and “Spatial Requirements” Spatial Requirements Spatial Requirements Activitiy Areas
Circ
ulat
ion
area
s
Activitiy Areas
Circ
ulat
ion
area
s
Storage
Cle
anin
g
Prep
aing
Coo
king
Serv
ice
and
eatin
g
Res
ting
Oth
er a
ctiv
ities
Storage
Cle
anin
g
Prep
arin
g
Coo
king
Serv
ice
and
eatin
g
Res
ting
Oth
er a
ctiv
ities
Foof stogare
Kitc
hen
equi
pmen
ts st
orag
e
Cle
anin
g m
ater
ials
and
equ
ipm
ents
stor
age
Was
te S
tora
ge
Food storage
Kitc
hen
equi
pmen
ts st
orag
e
Cle
anin
g m
ater
ials
and
equ
ipm
ents
stor
age
Was
te st
orag
e
No Shor
t liv
ed fo
od st
ogar
e
Long
live
d fo
od st
orag
e
No Shor
t liv
ed fo
od st
orag
e
Long
live
d fo
od st
orag
e
R1 X R66 X R2 X R67 X R3 X R68 X R4 X R69 X X X X R5 X R70 X R6 X R71 X R7 X X X R72 X R8 X X X R73 X R9 X X X R74 X R10 X X X R75 X R11 X X X R76 X R12 X X X R77 X R13 X X X X R78 X R14 X R79 X R15 X R80 X R16 X R81 X R17 X X X X R82 X R18 X X X X R83 X R19 X X R84 X R20 X X R85 X R21 X X R86 X R22 X X X X R87 X R23 X X X X R88 X R24 X X X X R89 X R25 X X X X R90 X R26 X X X X R91 X R27 X X X X R92 X
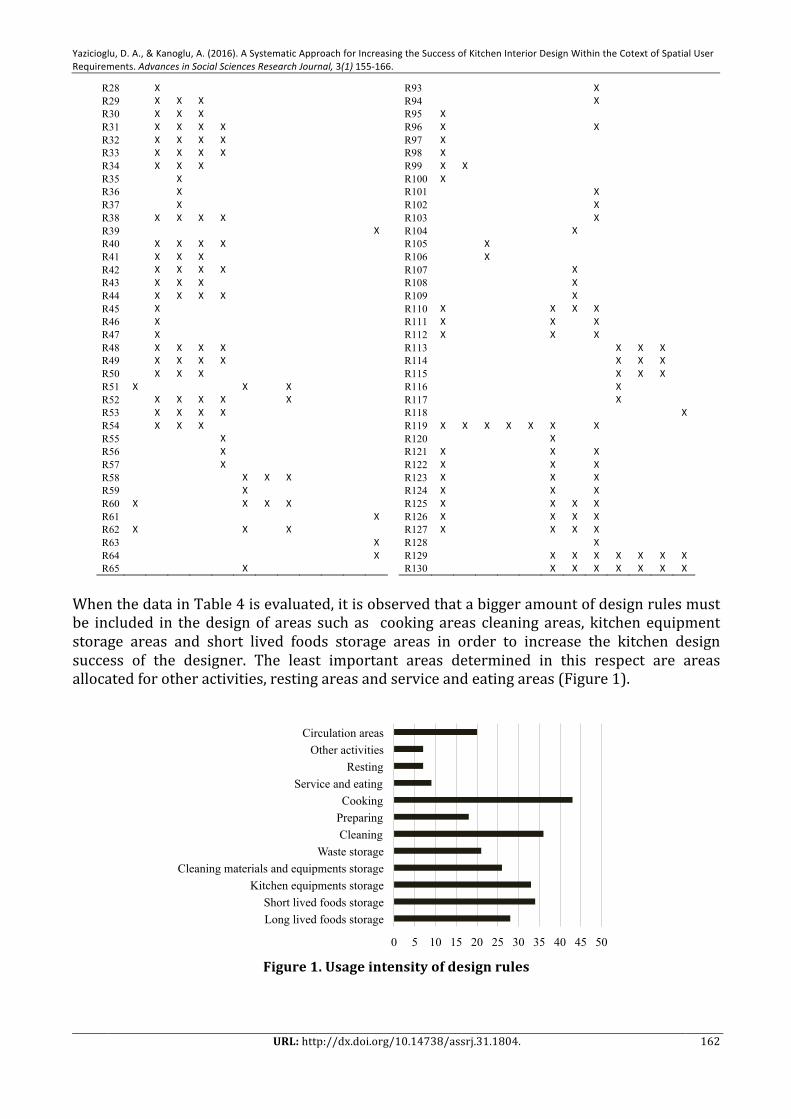
Yazicioglu, D. A., & Kanoglu, A. (2016). A Systematic Approach for Increasing the Success of Kitchen Interior Design Within the Cotext of Spatial User Requirements. Advances in Social Sciences Research Journal, 3(1) 155-‐166.
URL: http://dx.doi.org/10.14738/assrj.31.1804. 162
R28 X R93 X R29 X X X R94 X R30 X X X R95 X R31 X X X X R96 X X R32 X X X X R97 X R33 X X X X R98 X R34 X X X R99 X X R35 X R100 X R36 X R101 X R37 X R102 X R38 X X X X R103 X R39 X R104 X R40 X X X X R105 X R41 X X X R106 X R42 X X X X R107 X R43 X X X R108 X R44 X X X X R109 X R45 X R110 X X X X R46 X R111 X X X R47 X R112 X X X R48 X X X X R113 X X X R49 X X X X R114 X X X R50 X X X R115 X X X R51 X X X R116 X R52 X X X X X R117 X R53 X X X X R118 X R54 X X X R119 X X X X X X X R55 X R120 X R56 X R121 X X X R57 X R122 X X X R58 X X X R123 X X X R59 X R124 X X X R60 X X X X R125 X X X X R61 X R126 X X X X R62 X X X R127 X X X X R63 X R128 X R64 X R129 X X X X X X X R65 X R130 X X X X X X X
When the data in Table 4 is evaluated, it is observed that a bigger amount of design rules must be included in the design of areas such as cooking areas cleaning areas, kitchen equipment storage areas and short lived foods storage areas in order to increase the kitchen design success of the designer. The least important areas determined in this respect are areas allocated for other activities, resting areas and service and eating areas (Figure 1).
Figure 1. Usage intensity of design rules
0 5 10 15 20 25 30 35 40 45 50
Long lived foods storage Short lived foods storage
Kitchen equipments storage Cleaning materials and equipments storage
Waste storage Cleaning Preparing Cooking
Service and eating Resting
Other activities Circulation areas
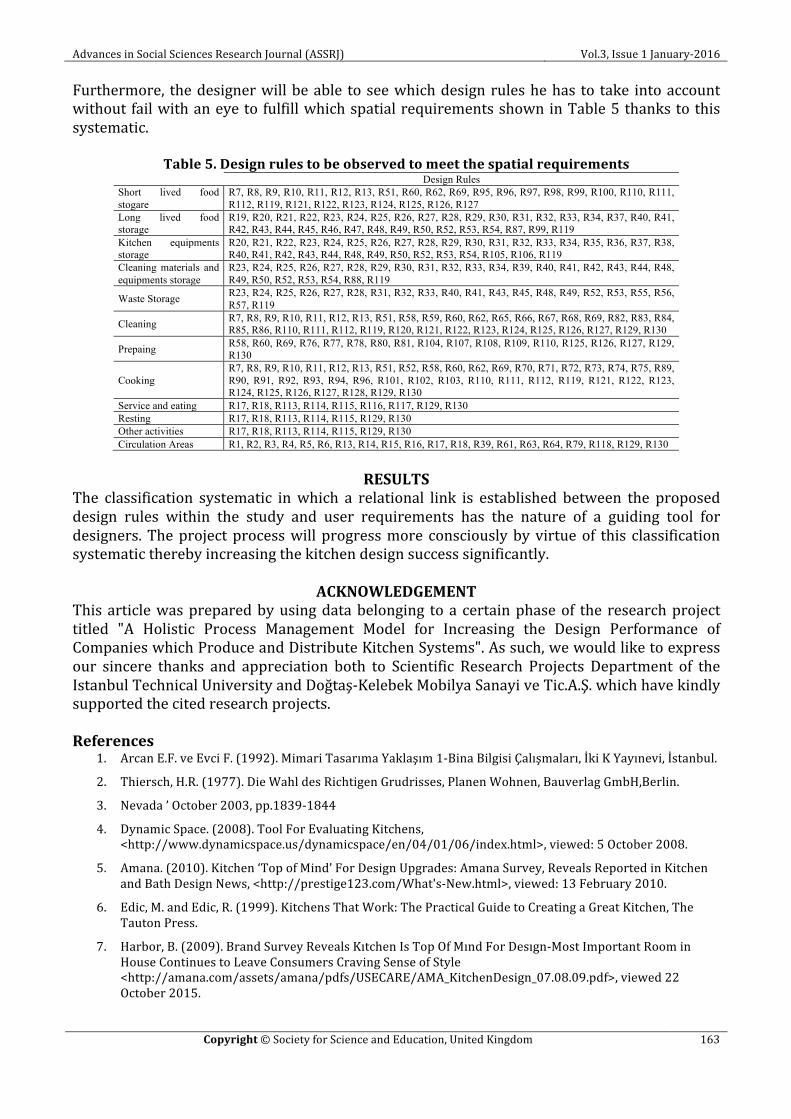
Advances in Social Sciences Research Journal (ASSRJ) Vol.3, Issue 1 January-‐2016
Copyright © Society for Science and Education, United Kingdom 163
Furthermore, the designer will be able to see which design rules he has to take into account without fail with an eye to fulfill which spatial requirements shown in Table 5 thanks to this systematic.
Table 5. Design rules to be observed to meet the spatial requirements Design Rules Short lived food stogare
R7, R8, R9, R10, R11, R12, R13, R51, R60, R62, R69, R95, R96, R97, R98, R99, R100, R110, R111, R112, R119, R121, R122, R123, R124, R125, R126, R127
Long lived food storage
R19, R20, R21, R22, R23, R24, R25, R26, R27, R28, R29, R30, R31, R32, R33, R34, R37, R40, R41, R42, R43, R44, R45, R46, R47, R48, R49, R50, R52, R53, R54, R87, R99, R119
Kitchen equipments storage
R20, R21, R22, R23, R24, R25, R26, R27, R28, R29, R30, R31, R32, R33, R34, R35, R36, R37, R38, R40, R41, R42, R43, R44, R48, R49, R50, R52, R53, R54, R105, R106, R119
Cleaning materials and equipments storage
R23, R24, R25, R26, R27, R28, R29, R30, R31, R32, R33, R34, R39, R40, R41, R42, R43, R44, R48, R49, R50, R52, R53, R54, R88, R119
Waste Storage R23, R24, R25, R26, R27, R28, R31, R32, R33, R40, R41, R43, R45, R48, R49, R52, R53, R55, R56, R57, R119
Cleaning R7, R8, R9, R10, R11, R12, R13, R51, R58, R59, R60, R62, R65, R66, R67, R68, R69, R82, R83, R84, R85, R86, R110, R111, R112, R119, R120, R121, R122, R123, R124, R125, R126, R127, R129, R130
Prepaing R58, R60, R69, R76, R77, R78, R80, R81, R104, R107, R108, R109, R110, R125, R126, R127, R129, R130
Cooking R7, R8, R9, R10, R11, R12, R13, R51, R52, R58, R60, R62, R69, R70, R71, R72, R73, R74, R75, R89, R90, R91, R92, R93, R94, R96, R101, R102, R103, R110, R111, R112, R119, R121, R122, R123, R124, R125, R126, R127, R128, R129, R130
Service and eating R17, R18, R113, R114, R115, R116, R117, R129, R130 Resting R17, R18, R113, R114, R115, R129, R130 Other activities R17, R18, R113, R114, R115, R129, R130 Circulation Areas R1, R2, R3, R4, R5, R6, R13, R14, R15, R16, R17, R18, R39, R61, R63, R64, R79, R118, R129, R130
RESULTS
The classification systematic in which a relational link is established between the proposed design rules within the study and user requirements has the nature of a guiding tool for designers. The project process will progress more consciously by virtue of this classification systematic thereby increasing the kitchen design success significantly.
ACKNOWLEDGEMENT This article was prepared by using data belonging to a certain phase of the research project titled "A Holistic Process Management Model for Increasing the Design Performance of Companies which Produce and Distribute Kitchen Systems". As such, we would like to express our sincere thanks and appreciation both to Scientific Research Projects Department of the Istanbul Technical University and Doğtaş-‐Kelebek Mobilya Sanayi ve Tic.A.Ş. which have kindly supported the cited research projects. References
1. Arcan E.F. ve Evci F. (1992). Mimari Tasarıma Yaklaşım 1-‐Bina Bilgisi Çalışmaları, İki K Yayınevi, İstanbul.
2. Thiersch, H.R. (1977). Die Wahl des Richtigen Grudrisses, Planen Wohnen, Bauverlag GmbH,Berlin.
3. Nevada ’ October 2003, pp.1839-‐1844
4. Dynamic Space. (2008). Tool For Evaluating Kitchens, <http://www.dynamicspace.us/dynamicspace/en/04/01/06/index.html>, viewed: 5 October 2008.
5. Amana. (2010). Kitchen ‘Top of Mind’ For Design Upgrades: Amana Survey, Reveals Reported in Kitchen and Bath Design News, <http://prestige123.com/What's-‐New.html>, viewed: 13 February 2010.
6. Edic, M. and Edic, R. (1999). Kitchens That Work: The Practical Guide to Creating a Great Kitchen, The Tauton Press.
7. Harbor, B. (2009). Brand Survey Reveals Kıtchen Is Top Of Mınd For Desıgn-‐Most Important Room in House Continues to Leave Consumers Craving Sense of Style <http://amana.com/assets/amana/pdfs/USECARE/AMA_KitchenDesign_07.08.09.pdf>, viewed 22 October 2015.

Yazicioglu, D. A., & Kanoglu, A. (2016). A Systematic Approach for Increasing the Success of Kitchen Interior Design Within the Cotext of Spatial User Requirements. Advances in Social Sciences Research Journal, 3(1) 155-‐166.
URL: http://dx.doi.org/10.14738/assrj.31.1804. 164
8. Yazıcıoğlu, D.A. (2014a). A Statistical Data Analysis for Increasing The Kitchen Design Performance, İTÜ AIZ, Spring Vol.11, No.1, pp.174-‐184
9. Yazıcıoğlu, D.A. (2014b). An Analytical Approach on Material Selection For Increasing Design Performance in Interior Architecture Projects, Academic Research International, Vol.5(3), pp.1-‐11.
10. Yazıcıoğlu, D.A. (2014c). An Analytical Approach on Improvement of Kitchen Design Performance In Terms of Psycho-‐Social User Requirements In Turkey, Advances in Social Sciences Research Journal, Vol. 6, No. 1, 2014, s. 179-‐186.
11. Pal, R. C. and Rehman, I. H. (2008) Efficient cookstove technology for improving the kitchen environment and livelihood for women in rural India, International Journal of Ambient Energy, 29:3, 137-‐148.
12. Demirkan, H. and Olguntürk, N. (2013). A priority-‐based ‘design for all’ approach to guide home designers for independent living, Architectural Science Review.
13. Morishita, H., Watanabe, K., Kuroiwa, T., Mori, T. and Sato, T. (2003).Development of Robotic Kitchen Counter: A Kitchen Counter Equipped with Sensors and Actuator for Action-‐adapted and Personally Fit Assistance, Proceedings of the 2003 IEEURSJ, International Conference on Intelligent Robots and Systems, Las Vegas.
14. Cline, H.L. (2006), The Evaluation of Universal Design Kitchen Features by People in Wheelchairs, Virginia Polytechnic Institute and State University, ProQuest, UMI Dissertations Publishing.
15. Rivet, B.(2009), Kitchen Ventilation Systems: Saving Energy Without Sacrificing Performance, Consulting -‐ Specifying Engineer, Vol.46, No.4, 6-‐8.
16. Mak, C. M. and Francis, W. H. (2002) A Study of Natural Ventilation in a Kitchen Using Computational Fluid Dynamics (CFD), Architectural Science Review, 45:3, 183-‐190.
17. Panwar, N. L. (2009). Design and Performance Evaluation of Energy Efficient Biomass Gasifier Based Cookstove on Multi Fuels, Mitigation and Adaptation Strategies for Global Change, Vol.14, No.7, 627-‐633.
18. Lamkins, C.(2011), Kitchen and Bath Design: Sink Systems, Professional Builder.
19. O'Heir, J. (2007), Cooking Up a Digital Kitchen, Dealerscope, Vol.49, No.8, 50.
20. Stander, M., Hadjakos, A., Lochschmidt, N., Klos, C., Renner, B. and Muhlhauser, M.(2012). A Smart Kitchen Infrastructure, Multimedia (ISM), 2012 IEEE International Symposium on, pp. 96-‐99.
21. Lyon, P., Mattsson Sydner, Y., Fjellström, C., Janhonen-‐Abruquah, H. and Schröder, M. (2011), Continuity in The Kitchen: How Younger And Older Women Compare İn Their Food Practices And Use Of Cooking Skills, International Journal of Consumer Studies, Vo.35, No.5, 529-‐537.
22. Boynton Child, G.(1914). The efficient kitchen: definite directions for the planning, arranging and equipping of the modern labor-‐saving kitchen. A practical book forthe home-‐maker, University of California Libraries
23. Asensio, P. and Ubach, M. (2003), Kitchen design: Kuchen design, teNeues Publishing Group, Kempen.
24. Baden-‐Powell, Charlotte. (2005). Architect's Pocket Book of Kitchen Design. Elsevier, Maryland Heights.
25. Beamish, J., Parrott,K., Emmel, J. and Peterson, M.J. (2013). Kitchen Planning-‐Guidelines, Code, Standarts, John Wiley & Sons, Inc., Hoboken, New Jersey.
26. Beazley, M.(1999).The New Kitchen Planner, Ocopus Publishing Group Ltd, London.
27. Bouknight, J.K., (2004). New Kitchen Idea Book, Taunton Press, U.S. Kesseböhmer, Germany.
28. Cerver, F.A.(2006).Ultimate Kitchen Design, The Neues Publishing Company, U.S.A.
29. Conran, T.(2005).Kitchens, Ocopus Publishing Group Ltd., London.
30. David,G.(1994).Smart Kitchen: How to Create a Comfortable, Safe, Energy-‐Efficient, and Environment-‐Friendly Workspace, Ceres Press.
31. Jankowski, W.(2001).Modern Kitchen Workbook: A Design Guide for Planning a Modern Kitchen. Rockport Publishers, Beverly.
32. King, H.T.(2006).Design Ideas For Home Decorating. Creative Homeowner Press, Emeryville.
Advances in Social Sciences Research Journal (ASSRJ) Vol.3, Issue 1 January-‐2016
Copyright © Society for Science and Education, United Kingdom 165
33. Lester, K. and McGuerty, D. (2010). The Complete Guide to Contracting Your Home, F+W Media, Inc., pp.47-‐49.
34. Lovett, S.M.(2006).The Smart Approach to Kitchen Design, Creative Homeowner Press, Emeryville.
35. Maney, S., (2003). The New Smart Approach to Kitchen Design, Creative Homeowner, U.S.A.
36. Mielke, R., (2005). The Kitchen, Feierabend Verlag, Ohg, U.K.
37. Rand, E. and Perchuk, F. (1991).The Complete Book of Kitchen Design. Consumer Reports Books, New York.
38. Grandjean, E.(1973), Ergonomics of the Home, Halstead Press, Division of John Wiley & Sons, New York.
39. Panero, J. and Zelnik, M. (1979).Human Dimension & Interior Space: A Source Book of Design Reference Standards, Watson-‐Guptill Publications, New York.
40. Pheasant,S.(1996).BODYSPACE Anthropometry, Ergonomics, Design, Taylor & Francis, London and Philadelphia.
41. Kıran, A. and Polatoğlu Baytin, Ç. (2006), Bina Bilgisi’ ne Giriş, Yıldız Teknik Üniversitesi Basım-‐Yayın Merkezi, İstanbul.
42. BaÜ. (2005). Mimarlığa Giriş, <http://bauarchitecture.files.wordpress.com/2010/09/ders-‐2.pdf>, viewed 22 March 2014.
43. Afacan, Y. and Demirkan, H.(2010). A priority-‐based approach for satisfying the diverse users’needs, capabilities and expectations: a universal kitchen design case, Journal of Engineering Design Vol. 21, Nos. 2–3, April–June, pp.315-‐343.
44. Anonymous.(2002). Mutfak ve İletişim, Eczacıbaşı, İstanbul.
45. Anonymous.(2009). Mutfak ve Banyolara Özel Donanımlar, Marie Claire Maison-‐Mutfak Banyo Özel Eki, No. April.
46. A Handymans Haven.(2015). Kitchen Planning Guide, <http://www.ahandymanshaven.com/tips-‐guides/kitchen-‐guide/kitchen-‐planning-‐guide/>,Accessed 15 October 2015
47. Altın, M.(2008). Mutfak, Banyo Mobilyaları Ankastre Cihazlar Teknik Bilgi ve Notları, İstanbul.
48. A Street Builders.(2015). Kitchen Design Recommendations, <http://astreetbuilders.com/residential-‐remodeling-‐construction/kitchen-‐design-‐recommendations/>,Accessed 15 October 2015
49. Better Homes and Gardens. (2015). Kitchen Planning Guidelines, <http://www.bhg.com/home-‐improvement/kitchen/planning/kitchen-‐planning-‐guidelines/>, Accessed30 Ekim 2015
50. Blum. (2013). Dynamic Space-‐ A New Kitchen Standard.
51. Calley, E., (2007). Kitchens: Creating Beautiful Rooms From Start to Finish, House Beautiful Design & Decorate, Hearst Corporatin, U.S.A.
52. Cowles, K.W., CKD, CBD and RBC.(2015). Do you know what the rules are for designing a kitchen? Want to discover how to design a really fabulous kitchen? What rules can be bent or broken? What are the Unbreakable Rules? <http://www.kwcowles.com/do-‐you-‐know-‐what-‐the-‐rules-‐are-‐for-‐designing-‐a-‐kitchen-‐want-‐to-‐discover-‐how-‐to-‐design-‐a-‐really-‐fabulous-‐kitchen-‐and-‐what-‐rules-‐can-‐be-‐bent-‐or-‐broken-‐and-‐what-‐are-‐the-‐unbreakable-‐rules/> , Accessed30 Ekim 2015
53. Dynamic Space. (2013). Kitchen zones, <http://www.dynamicspace.com/dynamicspace/us/02/02/index.html>,Accessed 22 Ağustos 2013
54. Dynamic space.(2015a). The history of kitchen zones, <http://www.dynamicspace.com/dynamicspace/us/04/01/06/index.html>, Accessed 22 August 2015
55. Dynamic space.(2015b). Organize contents, <http://www.dynamicspace.com/dynamicspace/us/02/01/index.html>, Accessed 22 August 2015
56. Dynamic Space.(2015c). Choose cabinets with ergonomic benefits, <ttp://www.dynamicspace.com/dynamicspace/us/02/03/index.html>, Accessed 22 August 2015
57. Dynamic Space. (2015d). Cooking, <http://www.dynamicspace.com/dynamicspace/us/02/02/index.html>, Accessed 22 August 2013
Yazicioglu, D. A., & Kanoglu, A. (2016). A Systematic Approach for Increasing the Success of Kitchen Interior Design Within the Cotext of Spatial User Requirements. Advances in Social Sciences Research Journal, 3(1) 155-‐166.
URL: http://dx.doi.org/10.14738/assrj.31.1804. 166
58. Dynamic Space. (2015e). Non-‐consumables, <http://www.dynamicspace.com/dynamicspace/us/02/02/index.html>, Accessed 22 August 2013
59. Dynamic Space. (2015f). Zone Planning, <http://www.dynamicspace.com/dynamicspace/en/04/01/02/index.html>, Accessed 22 December 2015
60. Fix.(2015). Kitchen Space Design-‐Code and Best Practices, <https://www.fix.com/blog/kitchen-‐design-‐best-‐practices/> ,Accessed 15 October 2015
61. Hafele.(2009a). Mobilya Tasarımında Çığır Açan Elektronik Donanımlar.<http://www.hafele.com/tr/news-‐and-‐events/18491.asp> , Accessed 17 December 2009.
62. Hafele. (2009b). Häfele’nin kiler sistemleri ile mutfaklarda depolama alanı yaratın! , Häfele Basın Bülteni, No.April, Häfele San. ve Tic.A.Ş
63. Hafele, (2009c). Häfele Akıllı Mekanlar, Häfele San.ve Tic. A.Ş.
64. Hafele.(2009d). Häfele’den Hayatı Kolaylaştıran Mutfak Donanımları.<http://www.hafele.com/tr/news-‐and-‐events/news/12116.asp>,Accessed 21 December 2009
65. Hafele.(2009e). Häfele’nin Birbirinden Kullanışlı Akıllı Mutfak Aksesuar ve Donanımları, <http://www.hafele.com/tr/news-‐and-‐events/news/9930.asp>,Accessed 21 December 2009
66. Hafele (2009f). Häfele Functionality-‐Video, <http://www.hafele.com/external/functionality/en/HäfeleFunctionality_kitchen.html>,Accessed 21 December 2009.
67. İç Mimarlık. (2009). Mutfak Mekanı Tasarım İlkeleri <http://www.icmimarlik.org/viewtopic.php?t=1079>, Accessed 19 August 2013
68. İnceoğlu,N., 1982.Mimarlıkta Bina Programlama Olgusu, İTÜ, İstanbul.
69. Kesseböhmer. (2009a). EWIVA-‐Kitchen Equipment Cleverly Hidden!, Kesseböhmer, Germany.
70. Kesseböhmer. (2009b). TouchControl-‐One Tap and The Cabinet is Open!, Kesseböhmer, Germany.
71. Kesseböhmer. (2009c). CONVOY, Kesseböhmer, Germany.
72. Kitchens for Cooks.(2008). The Classic Triangle.<http://www.kitchensforcooks.ca/The_Classic_Triangle.html>, accessed 10 October 2008.
73. Kohler Plumbing North America.(2011). Work Triangle Efficiency, <http://www.us.kohler.com/planning/detail.jsp?aid=1115489476735§ion=3&nsection=3&nsubsection=4&nitem=1text>,accessed 28 May 2011.
74. Korur, S., Sayın, S., Oğuzalp, E.H. ve Korkmaz, S. Z. (2006). Konutlarda Kullanıcı Gereksinmelerine Bağlı Olarak Yapılan Cephe Müdahalelerinin Fiziksel Çevre Kalitesine Etkisi, Selçuk Üniversitesi Mühendislik-‐Mimarlık Fakültesi Dergisi, c.21.
75. NKBA.(2008). Kitchen and Bath Planning Guidelines Comparison Chart, <http://www.nkba.org/consumer_tools_statistics.aspx>, Accessed 8 Aralık 2008.
76. NKBA.(2011). Kitchen Planning Guidelines, <http://ocean.otr.usm.edu/~w135249/pdf/id140/NKBA%20Kitchen%20Planning.pdf>, accessed 28 May 2011.
77. NKBA.(2014). Controlling Your Remodeling Budget, <http://www.nkba.org/Learn/Homeowners/Tips/Budgeting/ControllingYourRemodelingBudget.aspx>, Accessed 30 October 2014.
78. NKBA.(2015). Kitchen Planning Guidelines With Access Standards, <http://ocean.otr.usm.edu/~w135249/pdf/id140/NKBA%20Kitchen%20Planning.pdf>,Accessed 30 Ekim 2015
79. Northern Granite and Cabinetry. (2015). Kitchen Planning Guide, <http://www.northerngraniteandcabinetry.com/nkbaguide.php>, Accessed 30 Ekim 2015
80. Polat, D.A., (2005). Mutfak Tasarımında Ergonomi, Mutfak Banyo Seramik, Tasarım Yayın Grubu, Sayı: 51.
81. Yazıcıoğlu, D.A. (2010). Mutfak Tasarım Süreci, Literatür Yayınları, İstanbul.
Advances in Social Sciences Research Journal – Vol.3, No.1 Publication Date: Jan. 25, 2016 DoI:10.14738/assrj.31.1792.
Allen, F. (2016). Partnership for Peace, Tackling the Threats and Raising the Prospects for Justice in Rivers State. Advances in Social Sciences Research Journal, 3(1) 167-‐173.
Copyright © Society for Science and Education, United Kingdom 167
Partnership For Peace, Tackling The Threats And Raising The Prospects For Justice In Rivers State
Fidelis Allen
Associate Professor and Acting Director University of Port Harcourt Centre for Conflict and Gender Studies
Choba, Port Harcourt, Rivers State, Nigeria
Abstract United Nations World Peace Day 2015 was marked with the theme, Partnership for Peace: Dignity for All. This is significant in many ways. First, it drew the attention of civil society groups, governments and all in positions of authority to the urgent need for strengthening inclusive security decision-‐making in a world peppered with violent conflict. Second, deep reflection on the human condition as the basis of analysis of any effort at securing lives and properties, and ensuring peace at the domestic and global fronts, was again brought to the fore. It sent a powerful message: global quest for peace in a world, increasingly threatened by injustice. The paper argues that injustice lies at the heart of many violent conflicts. Elite greed, struggle for power and sharp social and economic inequality in society, have promoted human conditions that are conducive to disharmony, disorder and wars. Meanwhile, peace cannot be secured by increased funding for the purchase of ammunitions or weapons of war alone. To reduce violent conflict, crime and rebellion, the question of economic, social and political inequality has to be addressed. Peace is the result of commitment of all to justice, which has to be defined in terms of respect for human rights and responsiveness to human security needs. Furthermore, which is the main point of this paper, collaborative tackling of threats to peace is a crucial element in securing justice in a society like Rivers State, where many social, political and economic tendencies have played out in recent times. Key Words: Partnership. Peace. Threats. Justice. Rivers. State.
INTRODUCTION
On 19 September 2015, the final day of a training workshop on policy advocacy at the University of Port Harcourt, attended by members of the Rivers State Conflict Management Alliance, one participant narrated a sad story in course of the breakfast informal discussion. It was a life story of gunshot bullet that travelled all the way from an unknown point into the body of a sleeping lad in his parent’s apartment in Port Harcourt, where unusual incidents that impact on personal and collective security seem to have intensified since politics turned sour prior to the 2015 elections. The boy was rushed to the hospital. Fortunately, he is alive today. A similar occurrence on 24 December 2015, killed a woman on board Keke (tricycle) from Okilton Bus Stop to Wimpey/Iwofe junction, Ada George Road. Kidnapping, which once served as a strategy for natural resource nationalism among aggrieved militants in the Niger Delta, is now cheaply utilized by criminal gangs looking for money (Akpan 2010: 33). The media carry regular stories of these incidents. Friends, neighbours, colleagues and acquaintances have been victims. In some parts of the state such as Ahoada, Ogba-‐Egbema, Etche, Emohua and so on, expensive jokes such as threat of kidnap are common as it has become routine to find someone who has either been kidnapped or knows a close person who has been kidnapped. The trauma and fear that seethes within the consciousness of residents remain devastating. Three months ago, a young man returning from work, had hardly

Allen, F. (2016). Partnership for Peace, Tackling the Threats and Raising the Prospects for Justice in Rivers State. Advances in Social Sciences Research Journal, 3(1) 167-‐173.
URL: http://dx.doi.org/10.14738/assrj.31.1792. 168
entered his home when armed young men followed, and shot several bullets at him. He was left in a pool of blood. He died before the wife could reach hospital. There is no question that insecurity in Rivers State, before and after the 2015 elections is a troubling issue. Cases of inter and intra-‐cult clashes, kidnapping, armed robbery and sustained struggle for political power and influence among political elites have continued to make residents jumpy. Many have died from these activities. On the global scene, people are watching with a sense of amazement the flood of refugees from war-‐torn countries (including Syria and Libya) into Europe in search of safety. The bloodcurdling movements with many, mostly children, dying along the way, reinforce the conviction that a peaceful world is urgent. They also remind world leaders of the need for them to be proactive in handling issues that easily lead to large-‐scale violence. Rather than seek peace on the basis of justice, political leaders seem to have been pursuing goals that do not promote peace or are insensitive to conflict. The Niger Delta is a hot-‐blooded region. Despite crash in the price of oil on the global scene, the product, which has continued to serve as the economic mainstay of Nigeria for decades, is extracted in this region. At the same time, the industry is a key point of grievance among those who continue to feel a sense of exclusion from adequate financial benefits from the production and export of the oil-‐-‐-‐local communities. Women, men, youth and children have suffered different degrees of impact from the activities of oil and gas companies. Oil spill and gas flaring are the major causes of pollution in many conflict-‐ridden communities of the region. In part, the emergence of armed groups that fought oil companies and government security in the 1990s is linked to pollution, marginalization and structural issues in the governance of the oil economy. The region has remained volatile. The theoretical narrative of change that focuses on collaborative efforts at addressing these problems demands tools and opportunities for collective understanding and handling of grievances. Against this backdrop, this paper seeks to achieve three objectives: explain what Partnership for Peace for the Dignity of All means to those working for a peaceful Rivers State; identify threats to peace and security in the state, and explain the imperative of tackling the threats from the perspective of partners. Finally, the paper makes recommendations to parties involved in the management of conflict in the state. Partnership For Peace As the theme or the World Peace Day suggests, we have to strengthen our envisioning of a world where every one can work towards the type of peace that is based on justice and dignity for all. In other words, in such a world, every one or group, including the state, can be an agent of peace. Simply, to partner, in this context, would mean collaboration, association or coming together of governments, communities, nongovernmental organizations, and so on, under a common vision of peace through delivery of justice and respect for the dignity of humanity. This, in my view, requires explanation of the correlate concept of peace, which many policy-‐makers and political leaders have either deliberately misinterpreted or misapplied in their efforts to tackle violent conflict. Some have even triggered violent conflicts by interventionist efforts in citizens’ socio-‐economic and political conditions. We have to broaden our understanding of peace beyond the usual error of restricting it to the absence of physical violence, which Johan Galtung refers to as negative peace (Galtung 1964:1). This alone cannot constitute durable peace, especially if injustice characterizes society. His notion of positive peace places the absence of physical violence and structural violence as
Advances in Social Sciences Research Journal (ASSRJ) Vol.3, Issue 1 January-‐2016
Copyright © Society for Science and Education, United Kingdom 169
ingredients. The objective reality however, in a world consistently under intense pressure for violence and structural issues of unjust laws and their applications by rulers, along with oppressive state systems, add to the difficulty in realizing Galtung’s ideal peace. This, in a way, contributes to the image of peace as a mere normative concept meant to drive aspirations toward a less violent world (Grewal 2003). It seems Galtung himself understood and appreciated this difficulty in his subsequent writings. Peace cannot be seen merely in terms of absence of material violence in a society where citizens are faced with severe economic, social, environmental, and political problems that limit their humanity. It has to look at the structure of society, as to whether unjust laws and their application have any role to play in generating painful socio-‐economic and political conditions. This link makes a lot of sense, as issues of human security are integral to the human quest for a world that is less acrimonious and less physically violent. Peace theory, as seen in Galtung and Matsuo’s writings, points to two dimensions of peace: peace value and peace sphere (Matsuo 2005). The former refers to the substance or content of peace, whereas the later has to do with views about those who make peace—agency (Galtung 1969: 167). Regarding peace value, early studies in the field easily saw peace as the absence of war. By this notion, peace is assumed to be in place if there is no war. The atmosphere of desire for prevention of another World War after the second was influential in the perception of those who saw peace as the absence of war. It would shortly become clear that between 1945 and 1960, there was no Third World War, yet developing countries, especially those emerging from colonial control, had come under increasing economic hardship. Gaps between the developed countries and developing countries had started becoming wider with the results of query as to why this was happening. Growing poverty and underdevelopment in the developing world soon convince some scholars that these were clear signs of peacelessness (Dasgupta 1968). In any case, the classical and narrow view of peace which ignore these conditions, will not go away soon. It has continued to inform how states respond to certain threats to national security. Galtung wrote about three types of peace sphere: Universalist, in-‐group/out-‐group and inward oriented. The Universalist view sees the peace of the entire world as crucial. The conceptualization of an annual UN World Day for Peace proceeds from this mindset, as it places importance on the need for all to work for a peaceful world. It has a key element of multilateralism intended to benefit the world. It suggests that violent conflicts in any part of the world should be the concern of the whole world. On the other hand, an in-‐group/out-‐group notion of peace sphere would see peace within groups as the crucial point. Too often, political, economic and social factors underlie the classification of groups with focus on the peace of in-‐groups. Only little interest is placed on the peace of the out-‐group. An inward notion of peace sphere refers to the state of the individual mind. The individual is the object of peace. My conclusion about these notions of sphere of peace is that a much wider scope is imperative. For example, in the spirit of the human security framework, non-‐human elements of environment are part of the peace and security discourses. Tackling Threats to Peace and Security We shall proceed by first laying out the relationship between peace and security. Both concepts have moved closer to each other, in terms of meaning and goal. State-‐centric peace issues in classical context entail protection of the state from external aggression. As noted earlier, the emphasis is on the security of the state. Peace and security then, depends mainly on the use of force. In any case, security has moved beyond the mere state-‐oriented conceptualization to

Allen, F. (2016). Partnership for Peace, Tackling the Threats and Raising the Prospects for Justice in Rivers State. Advances in Social Sciences Research Journal, 3(1) 167-‐173.
URL: http://dx.doi.org/10.14738/assrj.31.1792. 170
focus on human security. The United Nations Commission for Human Rights defines human security as
…to protect the vital core of all human lives in ways that enhance human freedoms and human fulfillment. Human security means protecting fundamental freedoms – freedoms that are the essence of life. It means protecting people from critical (severe) and pervasive (widespread) threats and situations. It means using processes that build on people’s strengths and aspirations. It means creating political, social, environmental, economic, military and cultural systems that together give people the building blocks of survival, livelihood and dignity (Cited in Rubio-‐Marin, Ruth and Dorothy Estrada-‐Tanck 2013).
Apparently, this is a paradigm shift, away from concentration on the security of the state to that of individual and community. The social, economic and political concerns of citizens are by this shift given primary consideration in the response to threats. The use of force, which is common with tackling threats to state security, is undermined when it comes to dealing with human security. In any case, state security has to be complemented by human security in specific ways including protection and empowerment of people. Tackling any threat to security requires identifying the threats. In Rivers State, socio-‐economic and political trends have gradually brought to the fore critical issues of inequality, unemployment, poverty, and proliferation of small arms and light weapons in the context of an oil-‐driven economy. Others include crisis of confidence in the judiciary to deliver justice without bias for or against parties in conflict, intra and inter-‐party rivalry, rising wave of environmental injustice, oil theft and illegal refining. These have posed a major threat to peace and security.
INEQUALITY Inequality in areas of income, healthcare, access to livelihoods, education, political and economic opportunities have risen in Rivers State. Even gender inequality has continued to pose a threat to the advancement of women, when it comes to access to opportunities in many parts of the state. It is important to note that nation-‐wide, 50 percent of the Nigerian population live in poverty. The wealth of the nation is controlled by 10 percent of the population (Ngara et al 2014). This gap is socially injurious. It is more so, for states in the Niger Delta that have seen huge financial in-‐flows from federal allocations. The period between 1999 and last year alone saw huge allocations that ought to have significantly changed living conditions of majority of people in the region, through improved poverty reduction programmes and provision of basic social amenities such as water, affordable healthcare and so on. Not only are many struggling, especially youths, to maintain a balance between inequality and access to better life, majority in the state seem to have gradually come to associate inequality with the country’s corrupt politics. Politics is more or less a profession for many who simply want to line their pockets with the oil money. Whereas it ought to be a game played in the interest of closing gaps in political and economic inequality. As Nick Galasso and Majorie Wood (2015) have argued, economic inequality is destructive and vulnerable to violent conflict.
UNEMPLOYMENT Unemployment poses serious threat to peace and security. Until recently, in the last five years or so, Nigeria experienced consistent economic growth. The country earned more than $600 billion within five-‐decades or so from production and sale of oil. Meanwhile, several hundreds of youth graduating from universities, polytechnics and colleges of education in the country
Advances in Social Sciences Research Journal (ASSRJ) Vol.3, Issue 1 January-‐2016
Copyright © Society for Science and Education, United Kingdom 171
continue to roam the streets of Port Harcourt. Youth unemployment everywhere in the world is a threat to security and stability of society. Unemployed youths are vulnerable to recruitment as foot soldiers to politicians and conflict entrepreneurs (Akinwumi 2006). The first quarter of 2015 saw an increase in unemployment rate in Nigeria. It rose from 6.4 percent in the last quarter of 2014 to 7.50 percent. Unemployment is the number of people actively looking for job. It means the teaming population of young graduates roaming the streets in search of f jobs in Rivers State constitutes severe threat to security as this condition is closely connected to poverty. Any policy agenda for tackling insecurity therefore, has to include job creation. Greed of political class This manifests in attitudes of struggle for political power at the expense of peace of community. There are numerous instances of greed-‐motivated politics. Nothing best describes a situation where politicians struggle at all cost—including killing of opponents-‐-‐ to secure political power. The expected material gains from political positions have led many to undermine morality and human dignity. Greed is one of the closest concepts to describe the intense longwinded scuffles for political advantage at the expense of peace and security in communities. Politicization of the judiciary The judiciary is often said to be the last hope of the common man. It would appear that whenever this hope is lost, violence becomes the choice. This seems to have been the case in Rivers State, when the courts were closed for several months. Rivers state has been marked by large number of cases of violent activities in the form of killing and kidnapping. Some of these problems are reflections of choices by people in dispute who simply prefer violence rather than follow conventional and democratic and peaceful methods of settling disputes. This is a threat to security. Poverty Poverty is a conducive condition for criminality and insecurity of which Rivers State has remained a good case, in spite of the fact that the state has been a key recipient of huge monthly financial allocation from the federal purse for years. Closing the growing poverty gap with increased attention on employment opportunities for youths and women is more than urgent. Neglecting the poor is risky. Cultism Cultism is key social malaise. Politicians—local, state and national-‐-‐ are mainly responsible for the growing threat posed by cultism, for their role in encouraging young people to join through monetary incentives and promise of good times after elections. This is accompanied by drug and increased illegal use of small guns and light weapons. Many, both in rural and urban communities, dread cult groups for the fear of being killed. The implication on the growing culture of violence in the state means, communities have had to be faced with tensions resulting from violent shootings and killings between and among groups supported by politicians from different political parties. Meanwhile, the police and other security agencies continue to say they are doing their best to tackle the problem. In Nigeria, these agencies are controlled centrally from Abuja, as they are unitary in nature. Any political party in control of the executive arm of government would be expected to control the coercive instruments of the state. The growing culture of violence might in part be the result of a belief on the part of some actors, that conflicts can hardly be resolved favourably if the executive and judiciary are under
Allen, F. (2016). Partnership for Peace, Tackling the Threats and Raising the Prospects for Justice in Rivers State. Advances in Social Sciences Research Journal, 3(1) 167-‐173.
URL: http://dx.doi.org/10.14738/assrj.31.1792. 172
the tight control of the ruling party. In a way, we have to be able to see the crucial economic argument, which lays bare economic motives for those dancing to the music played by politicians. Unfortunately, many of these politicians have become victims of fear as well as they are unable to control the monsters that they created. Proliferation of Small Guns and Light Weapons Nigerians were again alerted to the role of politicians in the proliferation of small guns and light weapons in 2014, months before the 2015 elections. The Director-‐General of the National Task Force on Small Arms and Light Weapons, Osita Okeke, accused then serving governors of using their private jets to import guns ahead of the elections (Akomolafe, and Onani. 2015). Although this was difficult to verify, the reality is, there are guns in the hands of young people who use them for criminal activities. This is a source of insecurity in the state. Where and how do people get these weapons? Media reports reveal that illegal importations of guns were carried out before the elections through the ports in Nigeria. It is interesting to note that poor unemployed youths who use these guns are hardly responsible for the importation. Militarization of Oil Producing Communities As with many natural resource dependent countries in Africa, militarization of the oil sector in Nigeria is an issue that has raised several questions about security. Government had depended on raw force to calm youths resisting oil companies and government officials on the basis of unresolved grievances. In 2009, members of armed groups who had undertaken violent campaigns against oil companies and the government were offered amnesty by the federal government. This action has helped to raise hope about already fallen volumes of production of the oil on which Nigerian governments have depended on for the bulk of their revenues and foreign exchange.
CORRUPTION Corruption is a threat to peace and security because it deprives communities of vital resources that should ordinarily be injected into providing basic social amenities. When such resources are diverted or stolen by public officials, the net result would be failure of the state to respond adequately to the needs of citizens. This seems to have been the case with many states in the Niger Delta receiving huge financial allocations from the Federation Account monthly. However, current anti-‐corruption policies of the federal government are being interpreted as ethnically driven against the people of the region. This is a dangerous trend with implications on peace. Oil Pollution Oil related conflicts have dominated the Niger Delta for decades. It has even been said that the political, social and economic fabric of the Nigerian state is currently being configured by the industry, to the extent that it pays the bills and generates the bulk of money needed to run the state. This is not without huge social and environmental costs to communities hosting oil companies. Oil pollution threatens community livelihoods and survival of people who have historically depended on the environment for income. Pollution from illegal refining of oil is an additional burden worsening the situation. Prospects for Justice Government, communities and civil society have a crucial role to play. Tackling these threats requires collaboration at the level of policy formulation, implementation, monitoring and evaluation. With increased awareness on the part of all regarding collaborative security, we can hope for a better Rivers State. Human security has to be at the centre of response by government, groups, and individuals for a change in the direction of a just and peaceful society.
Advances in Social Sciences Research Journal (ASSRJ) Vol.3, Issue 1 January-‐2016
Copyright © Society for Science and Education, United Kingdom 173
Such a society has to work more intensely to reduce inequality and poverty as a basis for securing peace.
CONCLUSION/RECOMMENDATIONS The paper has explained what collaborative security means in context of tackling threats to peace in Rivers State. The 2015 World Peace Day celebrations offered many non-‐governmental organizations an opportunity to organize and send a powerful message of peace to the state, especially to those who have suffered economic and political violence. The paper has argued a human security framework, and need for partnership in securing a just society. Government, in collaboration with industry, donor organizations, communities and non-‐governmental organizations, can create adequate employment opportunities for youth. This can be achieved through following the path of practical engagement of youths in small and fairly large-‐scale agriculture and manufacturing. The educational and vocational routes, which have suffered corruption and nepotism, can be improved upon through merit-‐based mechanisms for selection of youths. References Akinwumi, Olayemi. 2006.Youth Participation in Violence in Nigeria Since the 1980s, Colette D., Z. Beykont, C. Higson-‐Smith and L. Nucci (Eds) International Perspectives on Youth Conflict and Development, New York: University of Oxford Press, p. 73
Akomolafe, Bayo and Emmanuel Onani. 2015: Guns, guns everywhere… New Telegraph, February 17
Akpan, Nseabasi S. (2010) Kidnapping in Nigeria’s Niger Delta: An Exploratory Study Journal of Social Sciences, 24(1): 33-‐42
Daniel, Soni. 2016. Militants give condition to stop bombings in N/Delta, Vanguard, 19
Dasgupta, Sugata .1968. “Peacelesness and Maldevelopment: A New Theme for Peace Research in Developing Nations,” Proceedings of the International Peace Research Association Second Conference, Assen, The Netherlands: Koninklijke Van Gorcum & Comp, vol.2, 19-‐42
Galtung, Johan .1969. "Violence, Peace, and Peace Research," Journal of Peace Research, 6(3), 167-‐191
Galtung, Johan. 1964. An Editorial, Journal of Peace Research, 1 (1) pp.1-‐4
Galtung, Johan .1969, Violence, Peace, and Peace Research, Journal of Peace Research, 6(3), 167-‐191
Galtung, Johan .1981. Social Cosmology and the Concept of Peace, Journal of Peace Research, 18(2), 183-‐199
Galasso, Nick and Majorie Wood. 2015. Africa: Eight Ways to Reduce Inequality, RiversStateNew.com (accessed 15 December 2015)
Grewal, Baljit Singh. 2003. Johan Galtung: Positive and Negative Peace, paper presented at School of Social Science, Auckland University of Technology, 30 August
Matsuo, Masatsugu .2005. Peace and Conflict Studies: A Theoretical Introduction, Hiroshima: Keisuisha
MATSUO, Masatsugu, Concept of Peace in Peace Studies: A Short Historical Sketch file:///Users/fidelisallen/Downloads/conceptofpeace.pdf (accessed 19 September 2015).
Ngara, Christopher Ochanja; Esebonu, Edward Ndem; Ogoh, Augustine Ogbaji & Orokpo, Ogbole F. E. 2014. Poverty, Inequality and the Challenges of Democratic Consolidation in Nigeria’s Fourth Republic Journal of Good Governance and Sustainable Development in Africa, Vol. 2, No 1,
Rubio-‐Marin, Ruth and Dorothy Estrada-‐Tanck. 2013. Violence Against Women, Human Security, and Human Rights of Women and Girls, Reinforced Obligations in the Context of Structural Vulnerability, Aili, Mari Tripp, Mayra Marx Ferree and Christina Ewig (eds) Gender Violence and Human Security: Critical Feminist Perspectives, New York: New York University Press, p. 242
Advances in Social Sciences Research Journal – Vol.3, No.1 Publication Date: Jan. 25, 2016 DoI:10.14738/assrj.31.1757.
Aliero, H. M., Gatawa, N. M., & Kabiru, A. (2016). The Role of Capital Ratios in Predicting Bank Distress: Evidence from the Nigerian Banks. Advances in Social Sciences Research Journal, 3(1) 174-‐186.
Copyright © Society for Science and Education, United Kingdom 174
The Role of Capital Ratios in Predicting Bank Distress: Evidence from the Nigerian Banks
Haruna Mohammed Aliero (PhD)
Department of Economics, Faculty of Social Sciences Usmanu Dnafodiyo University Sokoto
Nasiru Mukhtar Gatawa (PhD)
Department of Economics, Faculty of Social Sciences Usmanu Dnafodiyo University Sokoto
Alhaji Kabiru (M. Sc.)
Department of Economics Shehu Shagari College of Education, Sokoto
Abstract
The study examines the relationship between capital ratios and bank distress in so doing the efficiency of different capital ratios (risk weighted, and non-‐risk weighted) have been compared in predicting bank distress. Secondary data was collected from the Central Bank of Nigeria statistical bulletin for fifteen years (1995-‐2000). The data was analyzed through the use of Ordinary Least Squares method (OLS), Granger causality test and T-‐Test respectively. The results from the study show that the two capital ratios (risk-‐weighted and liquidity ratios) predict distress significantly while the other ratio (equity ratio) proved to be ineffective in predicting bank distress. The result also shows significant difference in the level of efficiency of the three capital ratios in distress prediction. Therefore, the continued use of risk weighted ratio in the prediction of bank distress is suggested, while liquidity ratio is recommended to supplement it. However, liquidity ratio and equity ratio should not be used to replace risk weighted capital ratio as each one of them has its unique importance.
Key Words: Capital ratio, Risk weighted ratio, Bank distress, Nigerian Banks.
INTRODUCTION
An efficient financial system is widely accepted as a necessary condition for effective functioning of the nations’ economy. Therefore, the banking system plays a very important role in promoting economic growth and development through the process of financial intermediation, so that growth in the banking sector of any economy, if transmitted well, could result in growth of the real sector while opposite will be the case, if the financial sector is repressed and inefficient (Sanusi, 2011; Cameroon, 1972). However, the credit and liquidity crises had brought into question one prevailing view that: capital in the banking sector is very crucial for the survival and continuity of the system. Capital adequacy serves as live wire to protect depositors and promote the stability and efficiency of the financial system. Onaolapo (2012) once argued that the importance of capital adequacy to banks cannot be over emphasized because it can serve as a cushion on loaned funds and absorb losses that may likely occur, in addition, it can serve the function for the acquisition of physical assets. Banking crisis usually starts with inability of the bank to meet its financial obligations to its customers. This, in most cases, precipitates runs on banks, the banks will be engaged in massive credit recalls and their customers will be involved in massive withdrawals which sometimes

Advances in Social Sciences Research Journal (ASSRJ) Vol.3, Issue 1 January-‐2016
Copyright © Society for Science and Education, United Kingdom 175
necessitate central bank liquidity support to the affected banks. Also some terminal intervention mechanisms may occur in the form of consolidation (mergers and acquisitions), recapitalization, use of bridge banks, establishment of asset management companies to assume control and recovery of distressed bank assets, and on the extreme outright liquidation of non redeemable banks. Despite the importance of early bank problem identification system in Nigeria, there is no evidence that it has received adequate attention and it is not in use by either bank regulators or any of the banks (Okozie, 2011). The earliest recorded attempt was made by Jimoh (1993), Nyong (1994), Doguwa (1996) and Okozie (2011). An attempt to fill this gap would therefore be worthwhile. Nigerian banking reform was informed, among other things, by the economy’s willingness to comply with the international capitalization standard as enshrined by Basel committee, which was conceived to boost the efficiency and soundness of Nigeria’s banking sector. The regulatory authorities in Nigeria, (the Central Bank of Nigeria (CBN) and Nigerian Deposit Insurance Corporation (NDIC)) used the risk weights capital ratio as proposed by the Basel committee to measure bank’s level of capitalization. This method attaches weights to different risk assets of a bank. The weights attached are uniform for all banks. The truth however is that the risk inherent in these assets cannot be the same for all banks. They would depend on the unique characteristics of the bank and the manner in which the underlying transactions are entered into. In addition, the risk weighted methods is more costly to run than simple capital ratio method and even a well-‐designed risk-‐ weighting scheme may soon become obsolete as a result of the changing nature of the banking and other financial sector participants. The global economy had witnessed distress in the banking sector between 2008 and 2009 with devastating economic and social consequences. Banks are still failing world-‐wide and in Nigeria specifically, between 2009 and 2010 almost half of the banks exhibited one form of distress or the other. This may be a pointer to the fact that early warning system models (EWSs) geared toward identifying weaknesses and vulnerabilities among financial institutions have failed or have been wrongly applied. In line with these problems, various banking regulation have been promulgated, these regulations through proper monitoring of banks are mutually reinforcing and are designed to finally identify and diagnose emerging problems of individual banks with a view to providing most efficient solution directed towards retaining public confidence. The major objective of this paper therefore, is to examine the relationship between capital ratios and Bank distress, as well as to compare the efficiency of different capital ratios in predicting Bank distress. In order to achieve this objective the paper is divided into five parts. Part one is this introduction, part two is the literature review, part three is the methodology and part four contains results and discussion while part five is the conclusion and recommendation.
LITERATURE REVIEW This section reviewed both theoretical and empirical literature to provide a solid ground for our discussion. The theoretical literature reviewed is simply the theory of market failure as it relates to the functioning of financial market. Theoretical literature (Market Failure Theory) The theory describes a situation where the allocation of goods and services by free market is not efficient. Beg et al, (2005) opined that market failure describe the circumstances in which distortions prevent the invisible hand from allocating resources efficiently, thereby causing distress in the banking system. The theory was developed by a large number of economist,
Aliero, H. M., Gatawa, N. M., & Kabiru, A. (2016). The Role of Capital Ratios in Predicting Bank Distress: Evidence from the Nigerian Banks. Advances in Social Sciences Research Journal, 3(1) 174-‐186.
URL: http://dx.doi.org/10.14738/assrj.31.1757. 176
including Pigou, Keynes and Baumol, (Daboub, 2009). The theory concludes that free market do not produce economically efficient or socially just solution to all instance. It explains that the market fail to produce the required result, in which case, economic and social welfare can be improved only by the government intervention. Basher, (1997) explain market failure as divergence between social private calculations which makes the market unreliable source for achieving socially set goals. He further said that market failure occurs when:
• There are no enough markets, • By acting secretively, consumers and producers conceal information, and • Resource allocation is insufficient.
Daboub, (2009) identified sources of market failure to include: imperfect information, market power (monopoly) and presence of negative externalities. Lack of adequate information or ignorance on the part of the Seller or Buyer can result in misrepresentation and hence negates the benefit of competitive markets. Allen, (1959) stated that the second source of market failure is market power (monopoly). This is further supported by Baumol (1977) who explain that the conditions required for pareto optimal distribution of goods and services are not met when there is oligopoly or monopoly power. Market failure results from externalities, is when cost of production become internal to the company producing the goods and therefore, are not paid by the producer. In effect, the company receives productive inputs without paying for them. This is explained in Stiglitz and Weiss (1981) in their study which used the theory to argue that conflict between lenders and borrowers arising from moral hazards imply that lenders may decide that they would rather not make loans available to their customers, thereby creating sub-‐ optimal investment levels and a sharp contraction in economic activity, which further raises the probability of default among borrowers. Market failure theory is also related, since it has brought about the justification of government intervention to fill in the gap left by market oriented system. This is supported by words of Estrella et’ al (2011) who argued that regulators and policy makers worldwide have proposed raising minimum capital requirement and limiting leverage of financial institutions in response to the 2007-‐2009 banking crisis. Empirical Literature After the East Asian crisis, most of the empirical studies trying to identify the nature and origins of systemic banking crisis have focused mainly on macroeconomic factors and institutional variables. At the micro-‐level, the majority of empirical studies on banking failures have focus mainly on the U.S. commercial banking industry. Among the recent contributions in the last decades includes, Thomson (1991), Whalen (1991), Cole and Gunther (1995) and Gonzalez-‐Hermosillo (1999) Cited in Duffo (2004) develop empirical analyses of the contribution of bank fundamentals, systemic and macroeconomic factors in different episodes of banking system problems in the U.S. Southwest (1986-‐1992), Northeast (1991-‐1992), and California (1992-‐1993)]. The common methodology used by these authors has been the use of multivariate logit analysis and proportional hazard models, and their main findings are that measures of bank solvency and risk by CAMEL rating variables, explain the incidence of bank failures after controlling for aggregate factors. Calomiris and Mason (2000) provide the first comprehensive econometric analysis of the causes of bank distress during the Great Depression in the U.S. The authors constructed a
Advances in Social Sciences Research Journal (ASSRJ) Vol.3, Issue 1 January-‐2016
Copyright © Society for Science and Education, United Kingdom 177
model of survival duration and investigate the adequacy of bank fundamental (training programme used by financial institutions in training their personal, to enable them understand key decisions made by bank management) for the period of 1930-‐1933 after controlling the effect of country, state, and national level economic characteristics. They found that bank fundamentals explain most of the incidence of banks failure and argue that ‘contagion’ or liquidity crises are relatively unimportant influence on the bank failure prior to 1933. To date, there is little cross country empirical evidence that documents the relative contribution of micro-‐level bank fundamentals in the contest of the recent systematic banking crises in the nineties Gonzalez-‐Hermosillo (1999) analysed the contribution of bank level fundamentals and macro economic factors for the Mexican banking crisis for 1994-‐1995. The author found that all ex-‐post measures of risk, and the loan to assets ratio are associated with the probability and timing of failure. Rojas Suarez (2001) evaluates an alternative set of indicators based on market that work rather than just relying in accounting figures (CAMEL types variables) in order to identity in advance, impending banking problems using bank levels data of six countries (Korea, Malaysia, Thailand Colombia, Mexico and Venezuela) and applying the signal to noise approach methodology. The author found that the capital to assets ratio has performed poorly as an indicator of banking problem in Latin America and East Asia. On the other hand, interest rates on deposits and spreads have proven to be strong performers. Okozie (2011) used data on bank distress in Nigeria from 1991 to 2004 using OLS Regression, Autoregression and Granger Causality test. The study found that these capital ratios predict bank distress significantly and that there is no significant difference in the level of efficiency of the three capital ratios in distress prediction. West (1985) uses a total of 19 variables to describe the level of soundness of banks in line with CAMEL, the study posits that capital adequacy, assets quality, earning and liquidity are important variables, in the determination of banks distress. The study of Babalola (2009) examined the influence of perceived financial distress and customers attitude towards banking. The result of the study showed that perceived financial distress and bank customers had significant effect on attitude towards banking. The study conclude that perceived bank distress has significant negative influence on attitude towards banking. “Bank failures during banking crises can either result from unwarranted depositor withdrawals during events characterised by contagion or panic, or as a result of fundamental bank insolvency (Calomiris, 2007). The study emphasise that panics or contagion played a small role in bank failure, during or before the Great-‐ depression. Solodu (2003) however observes that banks unsoundness could be traced to economic recession, policy induced shock, poor asset quality, mismatch of assets and liability, over trading, bad management and insider abuses. Bongini et al (2001) investigated the occurrence of bank distress and closure decisions in five East Asian countries (Indonesia, , Korea ,Malaysia, Philipines and Thailand) in order to assess the role of both bank connections with industrial group or influential families and banks micro weaknesses in causing and resolving bank failures. Among the main findings; CAMEL (capital adequacy, assets quality, management competency, earnings and liquidity) types variables, the ratios of lost loan, reserves to capital and net interest income to total income, help predict subsequent distress, and “connections” increase the probability of distress and make closure more likely.
Aliero, H. M., Gatawa, N. M., & Kabiru, A. (2016). The Role of Capital Ratios in Predicting Bank Distress: Evidence from the Nigerian Banks. Advances in Social Sciences Research Journal, 3(1) 174-‐186.
URL: http://dx.doi.org/10.14738/assrj.31.1757. 178
METHODOLOGY
This study makes use of secondary data, which was obtained from the Central Bank of Nigeria (CBN) and the National Deposit Insurance Corporation (NDIC), for a period of fifteen (15) years. The data collected was analysed by the use of Ordinary Least Square (OLS) and Granger causality test. Also, T-‐test was used to compare the efficiency of different Capital ratios in predicting bank distress, following the work of Okozie (2011). In order to achieve the objectives of this study, data of Bank distress and other capital ratios of Deposit Money Banks in Nigeria from 1995 to 2009 were obtained from CBN, NDIC and basically the Internet. Three different capital ratios (Risk weighted ratio, Liquidity ratio and Equity ratio) were used. The ratios are classified into two, namely Risk weighted and Non-‐risk weighted ratios. The risk weighted is represented by Risk weighted ratio (CR1) while Non-‐risk weighted includes liquidity ratio (CR2) and equity ratio (CR3). Model specification The relationship between Bank distress and capital ratios will be investigated using OLS as below: BD = β0 + βi CR + ξ Where: BD = Bank Distress Β0 and βi = constant parameters CR = Capital Ratios i = 1,2,3 where: 1 = Risk weighted ratio 2 = Liquidity ratio 3 = Equity ratio ξ = error term The Specification will be tested using the alternative hypotheses H0 : βi = 0 H1: βi ‹ 0 Granger Causality Test This will be done using two stages. First by testing whether CR is caused by BD and then testing if BD is caused by CR. If the test shows that CR caused BD, but that CR is not caused by BD then we assert that Capital Ratios (CR) caused Bank Distress. To test whether capital ratios causes bank distress, we will Test the null hypothesis that capital ratios do not cause bank distress. Test for stationarity: To ensure that the series are stationary and avoid the consequences of autocorrelation the data was tested for unit roots, using the Dickey-‐Fuller test. The data used for Granger causality test was also tested for consistency to see if data are not lag dependent and amenable to Granger causality test. Comparison of prediction of bank Distress by the different capital ratios A test of difference of means was done to see if the level of efficiencies at which the different capital ratios detect Bank distress differed significantly. The T-‐Test statistics was used through the following formula adopted from (Okezie, 2011):
Advances in Social Sciences Research Journal (ASSRJ) Vol.3, Issue 1 January-‐2016
Copyright © Society for Science and Education, United Kingdom 179
12 2
1 1 2 2
1 2 1 2
( )( 2)
i
i i
TN S N S N NN N N N
µ µ−=
+ +− −
µ1 = Mean of the Risk weighted ratio µi = Mean of other capital ratios S1 and Si = Standard deviation of the ratios N1 and N2 = Sample sizes of the ratios i = 1, 2 (other capital ratios i.e Liquidity and Equity ratio) N1 + N2-‐2 = Degree of freedom for the Test. The following Hypotheses was Tested: H0: µ1 ≠ µi H1: µ1 = µi If H0 is accepted then we say the Risk weighted capital ratio performs significantly different from other capital ratios. If however H0 is rejected we cannot say that the Risk weighted ratio performs significantly different from other capital ratios in detecting Bank Distress.
RESULTS AND DISCUSSION This section presents the analysis of the data and the discussion of the work results. First is the result relating to OLS, the second component relates to Granger causality while the third and the last component is the T-‐test which compared the efficiency of different capital ratios.
TABLE: 1 Dickey-‐Fuller test for Unit Root VARIABLES T. STATISTICS CRITICAL
VALUE
REMARKS
BD (0) -3.3311 -3.000** Stationary
CR1 I(1) -3.820 -3.750*** Stationary
CR2 I(1) -3.757 -3.750* Stationary
CR3 I(1) -5.551 -3.750*** Stationary
Notes: *** = 1%, ** = 5%,* = 10%
Source: computed by Author using STATA. Form the result in table one above, BD (Dependent variable) is stationary at the level value T. Statistics is greater than critical value at 5% level. The CR1 is stationary at the first difference, at 1% level where statistics is greater than critical value. For CR1 the result shows that it is stationary at first difference with 5% level of significance. The result for CR3 is stationary at

Aliero, H. M., Gatawa, N. M., & Kabiru, A. (2016). The Role of Capital Ratios in Predicting Bank Distress: Evidence from the Nigerian Banks. Advances in Social Sciences Research Journal, 3(1) 174-‐186.
URL: http://dx.doi.org/10.14738/assrj.31.1757. 180
1% level of significance at first difference. Therefore, the result shows that all the variables are stationary and they are suitable for OLS.
Table: 2 Regression Result for BD and CR1 Dependent Variable. Co-effecient and t. ratio
Indep. Var.
CR1
-5.577192 (-0.95)*
Constant 0.6914824 (1.34)
R 0.0647
F 0.90
Note:*** = 1%, ** = 5%, * = 10%
Source: computed by the author using STATA From the table 2 above, the relationship between dependent variable (BD) and the independent variable (CR1) could be seen. The table revealed that CR1 has a negative relationship with the BD, significant at 10% level. This negative relationship shows that as CR1 increases, BD decreases. And it also shows that there is 6% degree of association between the two variables. We shall therefore, accept the alternative hypothesis which says: Capital ratios predict bank distress. And reject the null hypothesis that says Capital ratios do not predict bank distress.
Table: 3 Regression Result for BD and CR2 Dependent variable Co-effecient and t. ratio
Independent Variable
CR2
-07324531 (-1.65)**
Constant 0.5404905 (2.59)
R2 0.1726
F 2.71
Notes:*** = 1%, ** = 5%, * = 10% level
Source: computed by the Author using STATA.

Advances in Social Sciences Research Journal (ASSRJ) Vol.3, Issue 1 January-‐2016
Copyright © Society for Science and Education, United Kingdom 181
The table 3 also depicts relationship between BD and CR2, it revealed that there is negative relationship between BD and CR2, while significant at 5% level and therefore, as BD increases the CR2 will decreases, at the 17% degree of association. We therefore, reject the null hypothesis that Capital ratios do not predict bank distress and accept the alternative hypothesis which says: Capital ratios predict bank distress.
Table: 4 Regression Result for BD and CR3 Dependant Variable. Co-eff. and t. Ratio
Independent variable
CR3 0.4850646 (0.99)*
Constant 0.1200869 (1.77)
R2 0.1959
F 3.17
Note: * 10% ,**5%,*** =1% level
Source: computed by the Author using STATA. The table 4 above shows that there is positive relationship between BD and CR3 at 10% level of significance, as the co-‐efficient of CR3 is 0.4850646. Therefore, as CR3 increases the BD will also increase. This make us to accept the null hypothesis which says: Capital ratios do not predict bank distress and reject the alternative hypothesis that says: capital ratios predict bank distress.
Table: 5 Granger Causality Test for BD and CR1 Dep. Var Co-eff. and t- ratio Ind. Var Coeff. and t. ratio Remarks BD lag
0.147513 (0.53)
CR1 Lag
.4211301 (0.06)*
Unidirectional causality running from CR1 to BD CR1 Lag 0.9151492 (6.61)*** BD Lag
-.0071624 (–1.22)
Notes: *** = 1% , ** = 5% * = 10% Levels
Source: computed by the Author using STATA.
The table 5 above present the causal relationship between dependent variable (BD) and independent variable (CR1). The table shows that the coefficient of BD (0.147513) is less than coefficient of CR1 (0.4211301) (while checking for causal relationship from BD to CR1). The T-‐ratio of BD is 0.53 and it is not significant (going by the value of P > ItI = 0.604). The T-‐ratio of CR1 is (0.06)* which is significant at 10% level. This shows that there is no causality running

Aliero, H. M., Gatawa, N. M., & Kabiru, A. (2016). The Role of Capital Ratios in Predicting Bank Distress: Evidence from the Nigerian Banks. Advances in Social Sciences Research Journal, 3(1) 174-‐186.
URL: http://dx.doi.org/10.14738/assrj.31.1757. 182
from BD to CR1. While investigating for causal relationship running from CR1 to BD, the table reveals that the coefficient of CR1 (0.4211301) is greater than that of BD (-‐0.0071624). The t-‐ratio of CR1 is (6.61) significant at 1% level, while that of BD is (-‐1.22) and it is not significant. This however indicate that causality was running from CR1 to BD. The result from the table explain that there is Unidirectional causality running from CR1 to BD. Meaning that changes in CR1 causes changes in bank distress. This is in line with the expectation and with the findings of Estrella et’al (2000).
Table: 6: Granger Causality Test Results for BD and CR2 Dep. Var Coeff. and t- ratio Ind. Var Coff. and t. ratio Remarks BD Lag
-.078722 (0.28)
CR2 Lag
-.830656 (1.58)**
Unidirectional causality running from CR2 to BD CR2 Lag 0.8876332 (4.06)*** BD Lag
.1322021 (1.13)
Note: *** = 1%, ** = 5% ,* = 10% Levels
Source: computed by the Author using STATA.
The table above represent the causal relationship between dependent variable (BD) and independent variable (CR2). The table shows that the coefficient of BD (-‐.078722) is less than coefficient of CR1 (-‐.830656) (while checking for causal relationship from BD to CR2). The t. ratio of BD is 0.28 and it is not significant (going by the value of P > ItI = 0.785 as shown in the appendix). The t. ratio of CR2 is (-‐1.58) significant at 5% level. This shows that there is no causality running from BD to CR2. While looking for causal relationship from CR2 to BD, the table revealed that the coefficient of CR2 (.887632) is greater than that of BD (.1322021). The t. ratio of CR2 is (4.06) significant at 1% level, while that of BD is (1.13) and it is not significant. This indicates that causality was running from CR2 to BD. The result therefore implies that there is Unidirectional causality running from CR2 to BD. Meaning that changes in CR2 causes changes in bank distress, which is in line with the expectation, findings of OLS regression and Okozie (2011).
Table: 7 Granger Causality Test Result for BD and CR3 Dep. Var Coeff. and t- ratio Ind. Var Coeff. and t. ratio Remarks BD lag
0.2847672 (0.92)
CR3 Lag
0.3563104 (-0.86)***
Bidirectional causality running between BD and CR3
CR3 Lag 0.4704753 (1.34)* BD Lag
-0.2781303 (0.92)*
Note: *** = 1%, ** = 5% ,* = 10% Levels
Source: computed by the Author using STATA.

Advances in Social Sciences Research Journal (ASSRJ) Vol.3, Issue 1 January-‐2016
Copyright © Society for Science and Education, United Kingdom 183
The table 7 above presents the causal relationship between the dependent variable (BD) and independent variable (CR3). The result in the table shows that the coefficient of BD (.2847672) is less than coefficient of CR3 (-‐.3063365), while checking for causal relationship from BD to CR1. On the other hand, the T-‐ratio of BD is 0.92 and it is not significant, going by the value of P > ItI = 0.376. The T-‐ratio of CR3 is (-‐0.86) which is significant at 1% level. This shows that there is causality running from CR3 to BD not from BD to CR3. However, while investigating for causal relationship running from CR3 to BD, the table revealed the coefficient of CR3 (.4704753) is greater than the coefficient of BD (-‐.2781303). The T-‐ratio of CR3 is (1.34) and not significant, while that of BD is (-‐0.92) significant at 10% level. This indicate that causality was running from BD to CR3. The result therefore implies the existence of Bidirectional causality running from BD and CR3, and vice-‐versa. This suggests a positive relationship as in the OLS regression result, which contradict our a priori expectation and also the findings of Estrella et’al (2000) and Okozie (2011). Comparison of the Efficiency of the Different Capital Ratios This section compare the efficiency of different capital ratios: the Risk weighted ratio (CR1) and Non risk weighted (liquidity ratio CR2 and equity ratio CR3), using T-‐ Test. The first part compare Risk weighted ratio (CR1) and Non-‐risk weighted ratio CR2. And the second part, compare Risk weighted ratio (CR1) and Non-‐risk weighted ratio CR3.
Table: 8 T-‐ Test Result for CR1 and CR2 Variables Mean Standard Deviation
CR1
CR2
0.087
0.4526
0.0090238
0.111334
Ha: !=0 (0.000)***
Note: *** = 1%, ** = 5% ,* = 10% Levels.
Source: Authors computation using STATA. The table 8 above provides useful statistical information for the two capital ratios (CR1 and CR2) that are compared, including the Mean and Standard Deviation, as well as actual result from the paired T-‐ Test. The Mean for CR1 is .087 with 0.0090238 as Standard deviation compared to CR2 Mean value of 0.4526 and Standard Deviation of 0.111334. The actual result as shown on the absolute value of the paired t-‐test pr ITI > ItI under Ha: mean(diff) !=0 which is 0.0000. This indicates that the variables are not equal at 1% level. In other words there is significant difference between the two capital ratios. We therefore, accept the H0: which says: Risk weighted capital ratios predict banks distress significantly different from other Capital ratios (Liquidity Ratio).
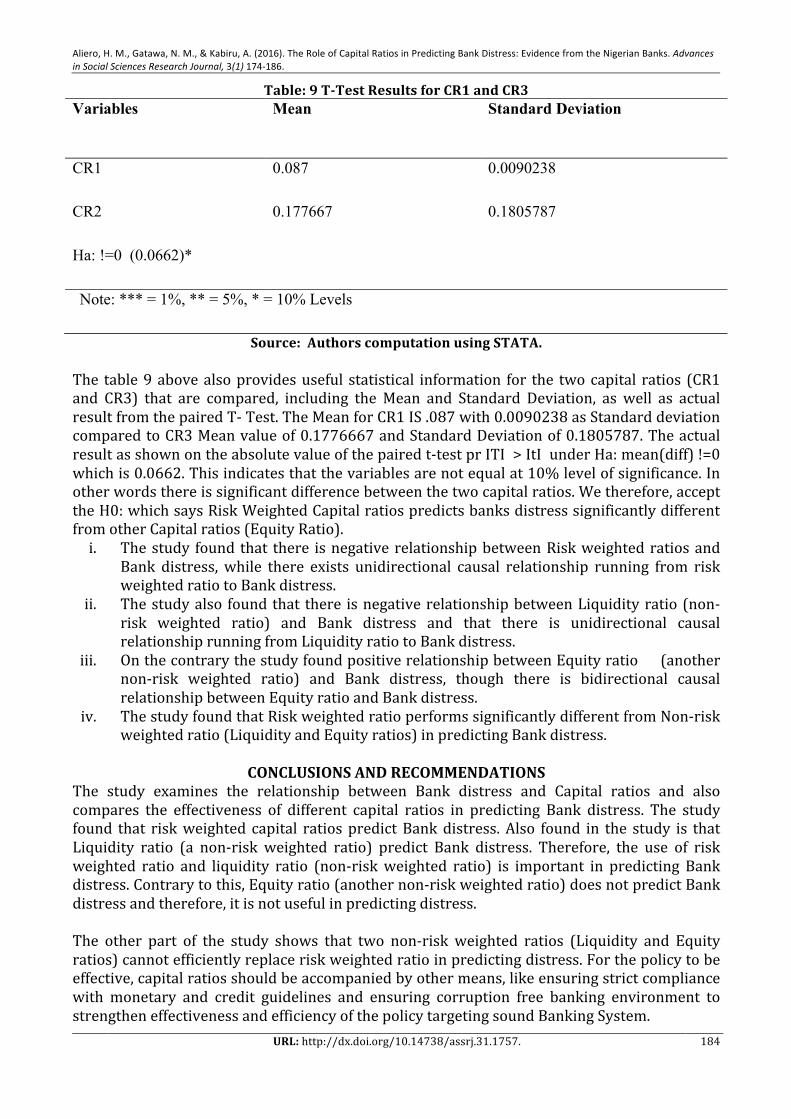
Aliero, H. M., Gatawa, N. M., & Kabiru, A. (2016). The Role of Capital Ratios in Predicting Bank Distress: Evidence from the Nigerian Banks. Advances in Social Sciences Research Journal, 3(1) 174-‐186.
URL: http://dx.doi.org/10.14738/assrj.31.1757. 184
Table: 9 T-‐Test Results for CR1 and CR3 Variables Mean Standard Deviation
CR1
CR2
0.087
0.177667
0.0090238
0.1805787
Ha: !=0 (0.0662)*
Note: *** = 1%, ** = 5%, * = 10% Levels
Source: Authors computation using STATA. The table 9 above also provides useful statistical information for the two capital ratios (CR1 and CR3) that are compared, including the Mean and Standard Deviation, as well as actual result from the paired T-‐ Test. The Mean for CR1 IS .087 with 0.0090238 as Standard deviation compared to CR3 Mean value of 0.1776667 and Standard Deviation of 0.1805787. The actual result as shown on the absolute value of the paired t-‐test pr ITI > ItI under Ha: mean(diff) !=0 which is 0.0662. This indicates that the variables are not equal at 10% level of significance. In other words there is significant difference between the two capital ratios. We therefore, accept the H0: which says Risk Weighted Capital ratios predicts banks distress significantly different from other Capital ratios (Equity Ratio). i. The study found that there is negative relationship between Risk weighted ratios and
Bank distress, while there exists unidirectional causal relationship running from risk weighted ratio to Bank distress.
ii. The study also found that there is negative relationship between Liquidity ratio (non-‐risk weighted ratio) and Bank distress and that there is unidirectional causal relationship running from Liquidity ratio to Bank distress.
iii. On the contrary the study found positive relationship between Equity ratio (another non-‐risk weighted ratio) and Bank distress, though there is bidirectional causal relationship between Equity ratio and Bank distress.
iv. The study found that Risk weighted ratio performs significantly different from Non-‐risk weighted ratio (Liquidity and Equity ratios) in predicting Bank distress.
CONCLUSIONS AND RECOMMENDATIONS
The study examines the relationship between Bank distress and Capital ratios and also compares the effectiveness of different capital ratios in predicting Bank distress. The study found that risk weighted capital ratios predict Bank distress. Also found in the study is that Liquidity ratio (a non-‐risk weighted ratio) predict Bank distress. Therefore, the use of risk weighted ratio and liquidity ratio (non-‐risk weighted ratio) is important in predicting Bank distress. Contrary to this, Equity ratio (another non-‐risk weighted ratio) does not predict Bank distress and therefore, it is not useful in predicting distress. The other part of the study shows that two non-‐risk weighted ratios (Liquidity and Equity ratios) cannot efficiently replace risk weighted ratio in predicting distress. For the policy to be effective, capital ratios should be accompanied by other means, like ensuring strict compliance with monetary and credit guidelines and ensuring corruption free banking environment to strengthen effectiveness and efficiency of the policy targeting sound Banking System.
Advances in Social Sciences Research Journal (ASSRJ) Vol.3, Issue 1 January-‐2016
Copyright © Society for Science and Education, United Kingdom 185
Based on the above conclusions, the following recommendations were offered: i. The use of Risk Weighted Ratio in predicting Bank distress should be continued. This
suggest the need to refocus on targeting capital ratios that are more loss absorbing and harder to arbitrage and on refining risk weightings so as to better align regulatory capital with underlying risk.
ii. Liquidity is also important in prediction of Bank Distress and therefore, the findings recommend that Bank Regulators can use liquidity Ratio (since it has some vital information of Bank Distress) as supplementary or backstop even when more sophisticated measures are available for use.
iii. The study also recommends that regulators should not use Equity ratio as a predictor of Bank Distress as it proved to have positive relationship with the Bank Distress.
iv. The study found that risk weighted ratio predict bank distress differently from other two non-‐ risk weighted ratio (liquidity and equity ratios), it is therefore recommended that non-‐risk weighted ratios should not replace Risk weighted ratio, however liquidity ratio can supplement it.
References Allen, R.G.D. (1964). Mathematical Economics, 2nd Edition, London ; Macmillan
Babalola, S.S. (2009). “Perception of Financial Distress and Customers Attitudes Towards Banking.”Journal of Business and Management vol.4, no. 10.
Baumol, W.J. (1977). Economic Theory and Operation Analysis. Englewood cliffs; Prentice Hall inc.
Begg D., Fisher S. and Donjush Jusch. R. (2005). “Economics” 8thed; McGraw Hill books company (UK) Ltd.
Bongin, P. Classens S, and ferri G. (2001), “The Political Economy of Distress in East Asian Financial Institutions”. Journal of Financial services research, Vol. 19 No. (February) 5-‐25.
Calomoris C.W (2007). Bank Failures in Theory and History: The Great-‐Depression and Other Contagious Events. NBER Working paper No.13597, November.
Calomoris C.W and Mason J. (2000). “Causes of U.S Distress During the Depression” NBER Working paper, No. 7919 (Cambridge MA. National Bureau of Economic Research).
Daboub J. A (2009). “ The Regulation of Genetically Modified Foods: in Whose Interest do We Regulate?” Paper Presented at the School of Business University of Texas at Brownsville, march 24.
Duffo M.A.A (2004). “Bank Fundamentals, Bank Failures and Market Discipline: An Empirical Analysis for Emerging Markets During the Nineties. Unpublished P.hd Thesis
Estrella K., Park S. And Peristiani S. (2000). “Capital Ratios As Predictors of Bank Failure.” FRBNY Economic Policy Review, July 2000.
Gonzelez -‐ Hernosilto B. (1999) “Determinants of Ex-‐ Ante Banking system Distress: A Micro-‐Empirical exploration of some recent Episodes”, IMF working paper, WP/99/33 (Washington, DC: International Monetary Fund).
Granger C .W (1988). “Some Recent Developments in the Concept of Causality.” Journal of Econometrics, Vol. 39, pp. 199-‐211
Jimoh A. (1993). The Role of Early Warning Models in Identification of Problem Banks: Evidence from Nigeria.” Nigerian Financial Review, Vol.6, NO.1 PP.29-‐40.
Nyong. M.A (1994). “Bank Supervision and the Safety Soundness of Banking System: An Early Warning Model Applied to Nigerian Data.” CBN Economic and Financial Review, Vol. 32, 419-‐434
Okezie, A C (2011). “Capital Ratios as Predictors of Distress: A Case Study of the Nigerian Banking System” Global Journal of Human social science, Vol. 11, issues 3.
Onaolopo A.A and Olufemi A.E (2012). “Effect of Capital Adequacy on Profitability of the Nigerian Banking Sectors. “Journal of Money, Investment and Banking”. ISSN 1450-‐2888X, Issue24.

Aliero, H. M., Gatawa, N. M., & Kabiru, A. (2016). The Role of Capital Ratios in Predicting Bank Distress: Evidence from the Nigerian Banks. Advances in Social Sciences Research Journal, 3(1) 174-‐186.
URL: http://dx.doi.org/10.14738/assrj.31.1757. 186
Ready Ratios (2012). “Meaning and Definition of Equity Ratio” financial statement software. Retrieved from www.ReadyRatios.com on 21st December, 2012.
Rojas-‐Surez L. (2001). “Early Warning Indicators of Banking Crises: What works for Emerging Markets” Institute of International Economics Review.
Sanusi, L.S. (2011). “Banks in Nigeria and National Economic Development: a Critical review.” Keynotes Address at the seminar on “Becoming an Economic Driver while applying Banking Regulations.” Organised by Canadian High Commission, Chartered Institute of Bankers of Nigeria and Royal Bank of Canada, March 7th.
Soludo C. (2003). “Implications of Prudential Regulations on Monetary Policy” Being a text of lecture delivered at the in-‐house workshop on Monetary policy Framework, organised by the CBN Abuja 18th September.
Advances in Social Sciences Research Journal – Vol.3, No.1 Publication Date: Jan. 25, 2016 DoI:10.14738/assrj.31.1760.
Nilsson, L., & Herrman, M. (2016). Intergenerational Learning – Children singing Along with Older People – Possibilities and Complications in a Project Context. Advances in Social Sciences Research Journal, 3(1) 187-‐200.
Copyright © Society for Science and Education, United Kingdom 187
Intergenerational Learning – Children Singing Along with Older People – Possibilities and Complications in a Project Context
Lena Nilsson
Department of Health Sciences, Cultural Studies and Education University West, Trollhättan Sweden
Margaretha Herrman
Department of Health Sciences, Cultural Studies and Education, University West, Trollhättan, Sweden
Abstract
Culture for Older People is a project funded by Swedish Arts Council. The aim of the project, managed by heads of department’s för the preschool, the older care and the culture school, is increased well-‐being for older people. In this article one of the activities, Children Singing Along with Older People is scrutinised in an ongoing evaluation. In this subproject, headed by expert music teachers together with preschool teachers and care home staff, five-‐year old preschoolers visit care homes for singing along with the residents. The project is poly-‐motivated; besides improved well-‐being for older people, also enhanced learning for the children and interprofessional learning for staff. The concept musicking, which highlights music as an activity creating community and relations between participators, is used for discussing the meetings between the children and older people. Results are based on observations of activities and interviews with staff. Music is an activity that can be used for enhanced well-‐being and creating relations as well as learning. Nonetheless there are issues in the project that need to be discussed e. g. children’s participation and role, the older’s activity or desire for passivity and support for learning among the staff as well among children and older. Keywords: children, older people, intergenerational, interprofessional, musicking, learning, wellbeing
INTRODUCTION
In this article we explore how five-‐year old preschoolers and older people at care homes meet and sing together. The article is a result of an ongoing evaluation [1], of the project Culture for Older People. The project was created when a municipality was granted funding for the years 2012–2015 from the Swedish Arts Council. Ongoing evaluation means that researchers work together with participants in an interactive process. Ongoing evaluation is used for understanding and learning from complex projects and has been called ‘fifth generation evaluation’ [1]. The project Culture for Older People is managed by the municipal departments of older care, preschool and culture and music in a medium-‐sized community. The overall target is to strengthen the quality of life for the older by giving them possibilities to take part in cultural activities. The project has a collaborative approach, where the local units are working together towards shared goals. Culture for the Older People consists of several subprojects: Children and Older People Singing Together, the Culture Bus, where older can get free transportation to various cultural activities, Singalong, Music and Jazz Visits and Art and Dancing. In the subprojects, care homes work together with preschools, music teachers, professional artists, dance instructors and volunteers. The activities have received

Nilsson, L., & Herrman, M. (2016). Intergenerational Learning – Children singing Along with Older People – Possibilities and Complications in a Project Context. Advances in Social Sciences Research Journal, 3(1) 187-‐200.
URL: http://dx.doi.org/10.14738/assrj.31.1760. 188
considerable attention not only locally but also nationally. The main project and the subprojects are backed by ‘sunshine stories’ told and retold to highlight and legitimatise both the project and the anticipated success. The aim of this article is to scrutinise the subproject Children and Older People Singing Together. The image of children and older together in intergenerational meetings seems to mobilise comprehensive positive responses. The studied subproject is perceived and legitimised as a win-‐win situation where children get a chance to meet older people and older people get visits from the children. Implicitly but not explicitly stated is that children and older people generally enjoy being together and sharing a Swedish musical treasure. A booklet produced for educational purposes by the project management (the heads of the preschool, the older care and the department of culture and music) presents testimonies about joy and happiness among older people, children and staff [2]. Intergenerational music making is supposed to provide entirely positive outcomes. Regardless of their different ages, older people are expected to enjoy performing children’s songs. It is emphasised that music has a healing power. The qualities of music are asserted as a way to reach emotions directly [2]. A three-‐year ongoing evaluation carried out in cooperation with the project management displays stories about joy and delight in meetings between children and older people. However, children’s participation was neither thoroughly discussed nor contested. No reflections were made about advantages and disadvantages of intergenerational meetings or the significance of music as a tool for health promotion. The children’s presence was primarily described in co-‐producing terms. The importance of improving older people’s well-‐being was accentuated. This raised questions about both the older people’s and the preschool children’s presence in the project. What are the benefits for the children and for the older people, respectively, of working intergenerationally? What can be achieved? What does interdepartmental collaboration with music activities mean to the staff involved? The two professional groups rarely work together – meetings between preschool and older care hardly ever occur. Following a brief presentation of the interactive research methods and material is a summary of the subproject Children and Older People Singing Together, as well as short reviews of research on music learning and cultural activities together with theoretical considerations. The resulting analysis concerns three aspects: an older perspective, a child perspective and a working life perspective.
METHODS Ongoing evaluation In spring 2012, researchers from University West, Sweden were invited to take part in the municipal project Culture for the Older People. The method used for this interactive research, an ongoing evaluation [1], comprised involvement in the process in form of participation in project meetings where planning and follow-‐up were carried out. To monitor the progress and gain knowledge about how the different subprojects were designed and implemented, ethnographic methods such as interviews and observations were used. The project management and representatives from the three departments were interviewed and music meetings were observed. The management contributed with their local knowledge. The researchers assisted the process by adding methodological support and theoretical knowledge of work integrated learning . In spring 2015, undergraduate students contributed with additional data through twenty interviews with staff and observations of preschool children singing together with older people on four occasions. The material so far into the project consists of forty interviews, observational notes from five music meetings, a documentary film and different sorts of written material . The analysis is based on the whole of this material. A bachelor thesis, not included here, contains interviews with the children.

Advances in Social Sciences Research Journal (ASSRJ) Vol.3, Issue 1 January-‐2016
Copyright © Society for Science and Education, United Kingdom 189
Preschool children visit care homes In the project Children and Older People Singing Together, 20 five-‐year old preschool children visit a group of about 20 persons living in a care home. Permission from parents is obtained. The visits take place on ten occasions per semester. Two music teachers, two preschool teachers and some of the care staff participate in the music meetings, each of which last about an hour. The intent is to let the same group of children and older persons meet to get to know each other and sing together. Between these meetings, the music teachers visit the children at their preschool for music lessons. The project commenced in 2012 and, to date, the children’s groups have visited several care homes. When talking about the project, the head of the preschool department is keen to point out the strong link to the national preschool curriculum, which emphasises the importance of practising music and children’s ability to arouse emotions and meet other people. These themes recur in many interviews. The children are said to acquire a Swedish song treasure that is at risk of extinction if not used. The intergenerational singing is legitimised as an important means to fulfil the requirements laid down in the national preschool curriculum as the project can develop understandings of society, history and older people’s conditions. The intergenerational meetings are seen to provide insight into societal conditions and facilitate intercultural perspectives where different cultures and ages are incorporated. The head of the preschool department emphasises ongoing work to develop preschool learning in accordance with the curriculum. The revised version of the Swedish preschool curriculum stresses the learning aspect, in terms of both increased achievement in mathematics and science, as well as intercultural approaches [3]. Children shall be given possibilities to develop their ability to create, communicate and convey experiences using e.g. singing, music, rhythm and dance, expressions that are both content and method. Furthermore, the preschool experience shall enhance children’s empathy and compassion. Another assignment is to create a foundation for approaching other human beings with respect and esteem, regardless of background. Older care is regulated by national laws and goals rather than a curriculum. The national goals in relation to older people and older care are to create conditions for equity, participation and security and encourage this population to be able to live a good life after working life ends. The Social Services Act [4] states that care for the older shall be aimed at supporting possibilities to live a life characterised by dignity and well-‐being. Local social welfare committees shall ensure that older people are able to live independently in a safe environment and have an active and meaningful existence in community with others. In addition, the Public Health Agency of Sweden states its support for promoting the health of older people. Thus, there are differences between the preschool curriculum, which stresses learning, and the legal provisions for older care, which underline a good life and do not express anything about music, being creative, skill development or life-‐long learning. As is clear this project is complex and poly-‐motivated [5]. The preschool curriculum calls for development and learning. The Social Service Act [4] and Public Health Policy make demands for the life quality and health of older people. The Swedish Arts Council has funded this project in order to achieve the objectives concerning health, well-‐being and quality of life for older people through participation in cultural activities. The project focuses on the intergenerational and interprofessional meetings between different municipal departments. For the theoretical understanding of these meetings, music as communication and action, i.e. ‘musicking’ [6,7], as well as gerontological perspectives are used [8]. For an ongoing evaluation of the possibilities to develop older care and poly-‐motivated local functions, we will discuss interprofessional learning at work following Guile [5].
Nilsson, L., & Herrman, M. (2016). Intergenerational Learning – Children singing Along with Older People – Possibilities and Complications in a Project Context. Advances in Social Sciences Research Journal, 3(1) 187-‐200.
URL: http://dx.doi.org/10.14738/assrj.31.1760. 190
Muse-‐ical education and ‘musicking’ Making music together and sharing musical experiences can be understood as a kind of dialogue creating meaning and learning, a process of developing community through learning from each other [9]. Two approaches in work with music and small children can be identified: a traditional approach where children are taught how to sing songs and an investigating approach where children are encouraged to explore and discover music [9]. Children’s musical development is influenced by both family and the preschool, but also to a great extent and increasingly by music around them, e.g. through media. New technology brings additional experiences. Children spontaneously produce sounds and invent melodies, lyrics, rhythms and singing games. Thus, Young [9] claims there are good opportunities for joint development of music activities in preschool in order to utilise and increase children’s experiences of music. Musical activities in preschool can be perceived as challenging and difficult to handle [7]. Preschool teachers generally lack extensive training in working with music. Similarly, expert teachers in music usually lack extensive training in working with small children. Thus preschool teachers may not feel comfortable leading musical activities. Furthermore, Ehrlin and Wallerstedt [10] points to alternative ways of using music in preschool, either as a method for developing e.g. language or intercultural understandings or as content for learning in itself. Music can be given a place in the daily work or can be something scheduled on special occasions. Grahn [11] suggests the concepts ‘muse-‐ical learning’ and ‘muse-‐ical play’ to emphasise the linking of musical activities, play and learning. Muse-‐ical learning means a linguistic playfulness on an oral basis together with an aesthetic and sensory experience. Muse-‐ical play is created in an atmosphere of trust, confidence and security. The acoustic design of the room and the ability to see and listen to each other are crucial factors for the participants. Music can provide joy and contact at a deeper level. Music could be an everyday activity where children are the subjects and music is both the content and the means for learning. Muse-‐ical pedagogy refers to preschool teachers’ experience of play as a way of learning. Thus, all preschool teachers could use muse-‐ical learning, which makes music an everyday activity and not a topic exclusively reserved for music experts. The concept of muse-‐ical is distinguished from knowledge-‐oriented music learning. A knowledge-‐oriented attitude can be about learning songs and providing children with a song treasure, while a muse-‐ical attitude is not a method but a way of creating community and a sense of belonging. It includes play, experience and experimentation in order to achieve a holistic approach to learning [11]. Muse-‐ical education has been launched in the Nordic countries by several researchers yet the concept remains uncommon. The term muse-‐ical is connected with communication, playing, and singing, as well as with verbal and physical learning with all senses. Wassrin [7] emphasises that music is an activity and proposes the verb ‘musicking’, which links the activity to participation. According to Small [6], musicking is important both for children and as a lifelong activity:
To music is to take part, in any capacity, in a musical performance. That means not only to perform but also to listen, to provide material for performance /… composing/, to prepare for a performance /…practicing or rehearsing/, or to take part in any activity that can affect the nature of that style of human encounter which is a musical performance [6, p 12].
Small [6] argues that music is not a thing but rather an activity. Those who come together in this activity are participating in musicking. To understand what happens, gestures, positions in the room, looks and facial expressions must be noticed. Such interactions contribute to
Advances in Social Sciences Research Journal (ASSRJ) Vol.3, Issue 1 January-‐2016
Copyright © Society for Science and Education, United Kingdom 191
achieving intersubjectivity between the participants. Wassrin [7] stresses recognising the options offering varied musicking repertoires providing relational learning. Music and health Swedish social policy supports older people in maintaining social networks and a meaningful life. Special attention is given to so-‐called frail older, i.e. older who have limited opportunities to maintain their lifestyle due to age, illness or disability. In recent years, government actors such as the National Board of Health, the Public Health Agency and the Swedish Arts Council have taken initiatives to improve older´s health and social care by supporting their participation in cultural activities. The aims of the initiatives are equal health, empowerment and participation in society as well as equal opportunities to take part in cultural activities. The national goals and visions are applied in the local project Culture for Older People. Older people shall be given opportunities to take part in cultural activities, perceive themselves as involved and experience well-‐being. Culture is considered a general health factor. Participation in cultural activities can promote health [12-‐15] and the positive outcomes can be explained by opportunities for experiences, insight and participation. Positive outcomes have been found over a long time in artistic therapies and cultural activities used in health care [16]. Several research projects have focused on the importance of sensory stimulation through music, dance, art and literature or outdoor activities in combination with traditional care of older people. The experience of flow, or of just having fun, deflects negative thoughts and reduces pain [17].The experience of flow means to forget about yourself and the time passing, and brings feelings of well-‐being. Experiencing and practising art and culture affect people’s mood and perception of the outside world. May [18] describes creative activities as an opportunity for individuals to experience freedom in relation to reality and at the same time explore possibilities of how to tackle difficult experiences. Music as therapy Art, dance and music therapy were formally organised in the twentieth century and, although it has been used in health care for a long time the literature shows few strictly controlled research studies. Music treatments have evolved in the last 20 years. They are for example used for brain injuries – music can reach the still healthy sections of an individual’s brain if it is precisely the type of music that the individual is accustomed to [12]. Music therapy is about stimulating the healthier part of a person, ignoring obstacles, attracting awareness and response, showing respect and closeness as well as improving quality of life [19]. This approach affirms an older person’s right to choose what music to listen to; care staff’s choices are irrelevant. Receptive music therapy is about listening. Expressive music therapy involves creating and practising music. Ruud [20] describes music therapy as a way to bring people into a community. Music therapy can affect the body and increase body movements, evoke memories and emotions and provide relief from stress. Societal music therapy is about networking, participation in social contexts and making contacts, i.e. a way to increase one’s social capital [20]. Group music therapy can be a way to involve senior citizens in communities, which suggests a combination of music therapy for increased well-‐being and music as a civil right [20].

Nilsson, L., & Herrman, M. (2016). Intergenerational Learning – Children singing Along with Older People – Possibilities and Complications in a Project Context. Advances in Social Sciences Research Journal, 3(1) 187-‐200.
URL: http://dx.doi.org/10.14738/assrj.31.1760. 192
Observations/fieldwork To understand the conditions of the subproject Children and Older People Singing Together, five observations of when older and preschool children meet and sing together were carried out. The following excerpt is from the first visit:
We arrived at the care home shortly before the children and found some comfortable chairs in a small lounge close to the main entrance. On the walls were paintings in various techniques, all with floral motifs. A table in the middle of the room was decorated with autumn and harvest illustrations: beautiful leaves, berries, juice in old-‐fashioned glass bottles and jam jars. None of the residents passed this place, but staff members and visitors walked by. Just in time for the singalong, we moved to the dining room, where the care staff had arranged for the activity. The dining room was large and some 20 chairs had been placed in a semi-‐circle where there was also space for wheelchairs and walking frames. On the floor in the middle was a big blanket for the children to sit on. Several residents were already in their chairs. Soon about 20 of them had gathered, supported by the staff. They seemed to be excited about what was about to happen.
The first music teacher, a man with a guitar, appeared. At a distance we could hear the children’s arrival, but once the children had taken off their jackets and hung them in an adjoining closet, they cautiously stepped into the dining room and sat down on the floor. Two preschool teachers followed the children and they also sat down on the blanket. At exactly ten o’clock, the second music teacher, a woman, entered the circle and the singing session began.
The female music teacher started with a conversation about film and technology. The children were expected to be familiar with children’s films and main characters. The children sat close together on the blanket facing both the residents and the music teachers, who led the activity. The preschool teachers held some of the children in their laps. The female music teacher introduced songs in a dialogue with the children. The children were active and gave spontaneous answers. The songs were well-‐known children songs, accompanied with movements. At the end of the session, some of the children became restless and the preschool teachers tried to calm them down.
The session was characterised by a mix of old and new songs. The older persons were repeatedly invited to participate in both the singing and the movements. Their engagement was mostly noticed when they were familiar with the lyrics. Some songs offered motor skills training and rhyming practice. Before the children left, they said goodbye to those they seemed to know best.
This observation represents a typical situation, as confirmed by later observations, interviews and narratives. During the first two years, the procedures for the visits were changed. The music teachers, however, remained the same, and after becoming more confident in their professional roles with the, to them, new groups, i.e. young children and older people, the approach has developed. Interviewed music teachers express that they would like to work together with the same group of older people and children over a long period of time and to have the children placed on chairs between the residents instead of on a blanket on the floor. The children also help the residents play on a jumper guitar familiar to the children. The residents can easily play the instrument when it is placed on their laps, and the children help them pluck the strings. These new elements seem to have facilitated more interaction and
Advances in Social Sciences Research Journal (ASSRJ) Vol.3, Issue 1 January-‐2016
Copyright © Society for Science and Education, United Kingdom 193
communication between the participants, according to the interviewees. One of the music teachers describes the differences:
We introduced something called jumper guitars to play and when we were allowed to continue with the same group, the jumper guitars… the communication and interaction changed a lot (music teacher).
The care staff express that the improved interaction has led to a more confident atmosphere. At the end of the visit, the children usually offer the older some fruit. Eating together is indeed a social phenomenon that makes people come together:
But then I noticed that the children were really relaxed. I could see some residents and children sitting together and they talked to each other, they communicated. Someone put a banana sticker on their nose, and then the children also wanted to have one, so it has become more relaxed (care staff).
ANALYSIS
Benefits for older people Older care is currently a hot topic in the public debate, with a particular focus on the needs for improvement of quality and efficiency. The design of future older care as well as the presumed needs of a growing population of older people rely heavily on beliefs about the social category ‘old’ and older people’s terms, conditions and care. Norberg et al. [21] argue that society is permeated with ageism and that both younger and older people disapprove of old age. Successful aging is closely connected to societal attitudes to aging and older people. There is a need to find ways to improve the care of older people, in order to both reduce costs and increase the life satisfaction in this segment of the population. There is also a need for developing positive attitudes to work in the older care sector. The project Culture for Older People is based on ideas to create new work models that will yield positive outcomes for the care of older people. According to the application for funding submitted to the Swedish Arts Council, the main purpose of the project is to increase well-‐being among older people. As part of this scheme, the preschool children are mobilised as co-‐producers. The stated purpose of the subproject Children and Older People Singing Together is to contribute to older people’s sense of dignity, self-‐esteem and joy. There is also an intention, although seldom expressed, to boost the ability of older individuals with various degrees of memory loss and dementia to speak and recall memories. Staff members have shared many accounts of how older people with memory loss and a limited ability to communicate verbally can suddenly start singing songs correctly. The stories told represent appreciation and joy experienced by the older people. These health and wellbeing outcomes can be explained by comprehensive research concerning health effects of music and social interactions [12-‐15]. Why are older people as a group supposed to like children’s presence and children’s songs? We interpret the origin of the subproject, based on children’s presence as co-‐producers, as having been launched unproblematised and unreflected. The children were suggested to participate, and when the preschool management and the parents gave their consent, the subproject was established without further consideration. Old people are supposed to enjoy spending time with children, and children are supposed to enjoy meeting old people. Older with memory loss are supposed to remember things from their childhood and enjoy singing old children’s songs. This implies that remembering is more important than learning new material. Musical activities and intergenerational singing are expected to contribute to increased well-‐being
Nilsson, L., & Herrman, M. (2016). Intergenerational Learning – Children singing Along with Older People – Possibilities and Complications in a Project Context. Advances in Social Sciences Research Journal, 3(1) 187-‐200.
URL: http://dx.doi.org/10.14738/assrj.31.1760. 194
among older people at the same time as children learn about intercultural conditions. The subproject is described by stories told and retold highlighting all the good things – expressions of joy and happiness observed by the staff among both the older and the children – and these stories become evidence of a fulfilled project goal. Tornstam [8] argues that older people generally feel well and have good contact with friends and family and a rich social life. Nonetheless, older people’s participation in projects tends to be experiments designed to promote ‘good and normal’ ageing. Projects often carry hidden agendas and particular norms and values whereby older people are expected to perform at a certain ‘normal‘ activity level. Activity seems to be an ideal way of life, maybe due to an expected reduction in the need for treatments, i.e. cheaper overall care. Passiveness is not understood as a ‘normal’ condition. Tornstam [8], though, advocates a reverse paradigm, where independence and unproductiveness are present. He emphasises replacing activity with terms such as rest, relaxation and graceful indolence. Thus, the music sessions are, with or without preschool children, not an essential component of care provision. It is not known to us how the old people perceive vocal activities together with children. The care staff, preschool teachers and music teachers interpret the older’s participation as appreciative. Yet, the older are offered a great range of activities, including bingo, pub visits, gymnastics, crosswords, visits to churches and exhibitions, i.e. a lot of activities that are aimed to stimulate. Still, the staff are keen to emphasise that older people, just like Tormstam [8] mentions, sometimes prefer doing nothing:
They want to be left alone just reading or thinking, and that you have to accept! (care staff).
The occasions where children and older people sing together are sometimes likened to a performance or a show. The stories told show that the older look forward to the children’s visit. Even if not all of them take an active part in the singing, the care staff emphasise the importance of such meetings. However, they also bring up practical issues. The set time for the meetings is 10am, a stressful time in older care because of the breakfast routine. Most of them eat their meals rather slowly. The care staff would like greater influence over the planning of the events and some staff members suggest that more spontaneous visits are preferred. The children could visit more often but for a shorter time and maybe do something else than sing together with the older e.g. painting and talking or drinking coffee and juice, as children might do with grandmas and grandpas. So even if the project is looked at as something really desired, there are a lot of proposals for how to make it better. But with these proposals, music as communication would be dismissed and musicking as a learning activity not achieved. Benefits for Children All Swedish preschools must base their work on certain national aims, such as supporting and increasing children’s ability to learn. The children’s participation is legitimised according to the preschool curriculum, e.g. increasing young people’s understanding of older people’s conditions. An implicit objective could also be to make young people more willing to work in older care in the future. Children’s participation is legitimised as conducive to the national aims for preschool education and as co-‐producers of well-‐being for the older persons. This means there is no entirely child perspective in this project. The parents have, as mentioned earlier, given their consent for the children to participate in the singing along with the older people, but the children are not questioned in any significant way. After all, older people’s well-‐being is an overall target but anyway the interviews and observations indicate that children are enjoying the visits. Anyhow they have not chosen to participate and maybe they do not
Advances in Social Sciences Research Journal (ASSRJ) Vol.3, Issue 1 January-‐2016
Copyright © Society for Science and Education, United Kingdom 195
understand the purpose, but the activity may still be acceptable if the children enjoy participating. A traditional way to work with music with small children is to teach them to sing songs. An alternative approach is to let them discover and explore music [9]. Having older people and children meeting to sing together seems to be closer to the traditional view. The booklet discusses transferring a song treasure [2]. Thus, there is not much space for children to discover and explore music during the activities. The music teachers’ conversation with the children is built on a traditional pattern – the teacher asks, the children answer and the teacher evaluates the answer. The activity can be interpreted as routine, as the children are sitting together in a circle and there is little intention to let them act spontaneously or creatively. It is not a music project originating from the children’s wishes or desires. Instead, the children become co-‐producers, helping others to fulfil their intentions, and with the main task of visiting the care homes, which is described as synonymous with meeting another culture:
It is not about children, five years old, performing...the children should be looked at as a part of a whole ... maybe you could understand the older as one part, we (the project management) are also a part, and the children are another, and everyone’s equally important. We are of course the leaders but if one part is missing the project will collapse. The idea is to integrate the children, and that has worked out well. It could have been like a performance has the children just sung their songs, but they did not ... It started like that, but we soon noticed the residents’ increased interest in taking part in the singing. Some songs ended with elements of movement like: reach out your hand! Yes, those are the lyrics and then the children were supposed to stand up, if they dared to of course, because it was voluntary, and take someone’s hand, a resident’s. Some dared while others did not /…/ there are several songs in which residents can participate and the lyrics have the form of questions and answers, songs based on movements. The project is very important and we have understood that the preschool teachers, the music teachers and the care professionals are very satisfied. (Head of the preschool department)
The traditional approach used, during the first two years of the project, does not necessarily exclude the participants from discovering and exploring music. Although the content is not negotiated with the older or the children, the music events are actually kind of musicking [6]including children, older persons and staff from three municipal departments. One of the music teachers talk about the project as an exciting challenge, a completely new way to educate. The music teacher names the work model a result of trial and error, of testing different solutions in terms of e.g. finding appropriate songs and the setup of the room. The importance of the song treasure is generally referred to. The children’s voices and the older songs seem to evoke memories among the older people. The children learn about older people’s conditions today and in the past. These events support the discovery of new ways to understand the environment and develop creative skills. They also support the ability to use various forms of expressions. Yet, a need for caution is expressed as there is a lack of skills and knowledge among staff in older care and music teachers regarding how to work with preschool children. The preschool teachers on the other hand are able to sing with the children but are rarely musically trained or educated in intergenerational activities. If, then, the muse-‐ical perspective is chosen, the music as play can be emphasised [11].
Nilsson, L., & Herrman, M. (2016). Intergenerational Learning – Children singing Along with Older People – Possibilities and Complications in a Project Context. Advances in Social Sciences Research Journal, 3(1) 187-‐200.
URL: http://dx.doi.org/10.14738/assrj.31.1760. 196
Work and Organisational Development It is up to the municipal management now to discuss how Culture for Older People can be implemented in a long-‐term perspective and to credibly show how the project yields both enhanced well-‐being for the older and increased quality of older care. The project Children Singing Together with Older People is legitimatised in a short-‐term perspective by learning and development for children in accordance with the preschool curriculum and increased well-‐being for older people in accordance with national goals for older care. To move from a project status to a model where preschool children continuously meet older in care homes is a challenge that may involve a revision of contemporary care models. After all the care staff are asking for greater influence over how to cooperate with preschools in their neighbourhood, and the preschool sector may need to change its focus to aesthetics and muse-‐ical education, a development corresponding to the preschool teachers’ education [11]. The care staff is not accustomed to intersectoral cooperation. However they see benefits from children’s visits and music activities that tend to stimulate their care recipients. Some preschool teachers like to sing with the children while others prefer the support of music teachers. The music teachers are not used to teaching preschool children, nor are they used to working with older people. For this project to be sustainable, there is a need to consider its poly-‐motivated character [5]. The managements of the three municipal departments legitimise the project from their own perspectives: preschool curriculum and children’s development, older residents’ well-‐being, and culture for older people. The project represents interagency action in a ‘placeless organisation‘ [5, p 343] that is new to all actors. The music meetings occur in a place that is unknown to the children, to the preschool teachers and to the music teachers. To the older persons and the care staff, the place is well known but used in an unfamiliar way. Together, they are creating a new arena for communication and learning. Music meetings between children and older persons are not unusual. The uniqueness of this project is the overall context and the explicit ambitions to relate to the curriculum and the quality of older care. The care staff has suggested cooperation of a more everyday nature. The children could visit to just hang out with the residents. However, that would mean a loss of focus on the music activities. Wassrin [7] suggests a wider conception of music where play, communication and relationships are in focus. This includes the muse-‐ical pedagogy with a playful, exploratory and improvisational approach to learning, an approach that emphasises the preschool teachers’ competence in play rather than in musical performance. Such an approach can be used as a basis for joint development among music school, preschool and older care, where two generations can meet in musicking, together with the professionally active generation between the children and the older persons. The preschool is required to facilitate children’s learning. More rarely is learning understood as relevant for the older. Older care lacks a curriculum and lifelong learning is routinely overlooked. Accepting learning at all ages calls for a shift in perspective, a shift that implies a necessity to discuss whether and, if so, what and when the older want to learn or whether they just want to be left alone. According to the staff, it happens that the older more often spontaneously start to sing in situations unrelated to the musical meetings, and the staff then join in the song:
This weekend, for example, I found myself whistling a tune and suddenly one of the ladies recognised my tune as a song we had sung earlier. She began to sing, and then I had to join in and that triggered other people sitting around a table. They also joined in as they knew the same song. And suddenly there was a singalong and some started to talk about different songs and what kind of music they like (care staff).
Advances in Social Sciences Research Journal (ASSRJ) Vol.3, Issue 1 January-‐2016
Copyright © Society for Science and Education, United Kingdom 197
Interviewed professionals talked about inspiration and increased confidence in their ability to use singing in their everyday work:
We sing more often than we used to. And the singing is more spontaneous, because the woman, the one who always just closes her eyes and sways like this… she did that once … and then all of a sudden she starts to sing Baa Baa Black Sheep. Just like that, she got every word right and this is an old woman ... when she talks it’s often incomprehensible words. Yet, she sang Baa Baa Black Sheep clear and loud, alright! It’s a bit strange, just by talking about the song when no one else was singing... but suddenly it just popped out. It’s kind of cool.… (music teacher).
The latter quote shows the music teacher’s astonishment when realising that the old lady suddenly masters the text of a children’s song. In this case, there is a lack of knowledge about how people with dementia may respond to musical experiences. New understandings seem to be obtained in situations when the preschool and music teachers are prepared for what they may face and understand why older people react in a certain way. The interviewees who had been properly informed by older care staff about for example dementia and how persons with dementia can react seem to have a different understanding of how the music, the children and they themselves contribute to the older’s well-‐being. Increased knowledge of professional conditions and of old people’s conditions has led to partly adapted local conditions in older care. But such learning outcomes generally do not happen. Although there have been some opportunities for the different professional groups to learn about each other’s work, several interviewees stress the need for more interprofessional interaction. A question related to participation in various activities is whether one has been an active consumer of culture earlier in life or not. Active consumption of culture is expected to increase a person’s interest in cultural activities. But if music is regarded as communication (instead of consumption), this indicates a position offering opportunities to acquire a new language of communication if and when for example former ways of communication fail. Then both listening to and practising music in various forms can lead to increased communication through meetings with and talking to children, as different ways of activating and training one’s memory capacities.
DISCUSSION In today’s society, individuals and municipal departments are separated according to functionality and age. Children are referred to specific institutions and frail older to institutions adapted to their needs. Different institutions have their particular orientation. The consequences of such a separation lead to certain knowledge being owned exclusively by staff working in each respective sector. This studied subproject is truly poly-‐motivated [5], aiming at children’s learning and development, older person’s health and well-‐being as well as quality development and staff learning in a middle-‐sized community. It points to a willingness and desire in the community management to evolve and the different staff categories accept the challenge to contribute to a dissemination of knowledge among professionals and departments. The interview results present a number of solutions for a more sustainable development. The staff highlight their ability to cross boundaries and tear down walls between institutions because they see advantages in working together. Even the community management share this idea, yet there are considerable costs associated with some of the changes, and political decisions are required. The placeless organisation finds a common ground in the music meetings, musicking becomes a way of reciprocal communication.
Nilsson, L., & Herrman, M. (2016). Intergenerational Learning – Children singing Along with Older People – Possibilities and Complications in a Project Context. Advances in Social Sciences Research Journal, 3(1) 187-‐200.
URL: http://dx.doi.org/10.14738/assrj.31.1760. 198
Music nn Older Care There seems to be a big difference between learning and remembering when it comes to old people in older care. Remembering seems to be given priority, while learning is not discussed. Older persons with memory loss remembering old children’s songs is considered a success, but there is to our knowledge no discussion supporting old people’s learning of new things. Do old people like to stick to old things? Are they not supposed to learn? Research on music and learning is essentially about children’s musicianship and children’s learning. We would like to, referring to Tornstam [8], suggest the possibility to apply research on music-‐making and learning on the welfare of older people. With the support of Ruud [20], music and joint singing may provide a bridge between generations. It may also contribute to children’s learning, as well as older people’s increased memory capacities, well-‐being and lifelong learning. Such interaction might also be interpreted as something creating contact between people, thus supporting participation in a social context. It could also be interpreted as a type of civil right action for senior citizens [22]. But what also needs to be discussed is the right of older people to be free to choose whether to be active or inactive, i.e. to question accepted norms of what an older person ‘should’ do. We can, though, find activity to be an excellent way to combat ageism if knowledge of terms and conditions are discussed, reflected and collectively shared. Music in Preschool The preschool is regulated by a national curriculum that establishes the children’s right to learn, develop and express themselves. In the project, even professional groups are expected to learn methods from each other, methods that have proved to be successful in the subprojects. Our results show how older care staff try to maintain the positive outcome by arranging singing events or ‘dancing sessions‘ using scarves. They have also discussed inviting nearby preschools. Such examples show that there is a commitment among staff for further work with music and cooperation with preschools. However, at present, there is no intention of having the professionals from the different municipal departments meet and share experiences. There is now an ongoing discussion in the municipality about taking advantage of the knowledge generated by the project and launching an interactive education across department boundaries. Small [6] advocates musicking as a way to involve all participants in a musical community. In this project, that could mean to regard children and older persons as well as the different staff categories as communicating partners making different kinds of actions and experiences and thus all of them are learning. The preschool staff stress the curriculum and the care staff stress the older people’s well-‐being. Those, with an overview, are the music teachers. They express their learning in terms of changes they have made: they have changed the settings, i.e. the placement of chairs and how children and the older care residents are placed. They have also added new instruments. Further, they have changed how they support the dialogue and the interaction. Altogether, this can be understood as an approach for increased interaction, a discovered learning for participants and for the staff.
CONCLUSIONS Our conclusions emerge as a series of issues to discuss – what kinds of norms and values decide what is right or wrong, what is desirable or not, who is supposed to learn and teach and who is supposed to be an actor? There are ethical considerations to make, is it ‘normal’ and ‘natural’ to sing old children’s songs regardless of age? What does it mean to use trial-‐and-‐error methods in preschools or older care? Which types of competence and knowledge are necessary to contribute to a well-‐functioning and high quality standard of care? Even if the main project as well as the subprojects are successful, the norms and values making this success possible need to be discussed. Otherwise there is no foundation for sustainability. These questions highlight the poly-‐motivated character of the project. It is justified both by the
Advances in Social Sciences Research Journal (ASSRJ) Vol.3, Issue 1 January-‐2016
Copyright © Society for Science and Education, United Kingdom 199
children's learning and the well-‐being of older people. Is it possible to combine these goals in the same project? Furthermore, a project is a temporary phenomenon – developing preschool and older care is an ongoing challenge. The staff who participated in the project have shown a great commitment and desire to contribute. Very few of them have been assigned time beyond their normal working hours to participate in the project. To make the project an everyday activity, the involved staff must be given opportunities and time to work together to develop sustainable practices. Otherwise there is a risk that the activities cease or deteriorate in quality. We suggest an ongoing discussion about the older people’s and children’s requests so that each group does not become a tool in an ‘adult decision’. Frail older people and preschoolers are weak groups with little ability to speak for themselves, and their participation in projects must be based on voluntarism, science and support. Some essential issues to be discussed are that the activity must be based on both science and proven experience and voluntary participation ensured. The poly-‐motivated base for the project is enabling and encouraging staff to meet, to exchange experiences and to discuss and plan further intergenerational development. It presupposes the staff are given opportunities for both interprofessional learning to be familiar with each other’s work and ongoing intergenerational meetings. Musicking could be a useful way of working together. References
1. Ahnberg, E., Lundgren, M., Messing, J and von Schantz Lundgren, I. (2010) Följeforskning som företeelse och följeforskarrollen som konkret praktik [Ongoing evaluation as research phenomenon and the research role as concrete practices] Arbetsmarknad & Arbetsliv, 16 (3) 55-‐66.
2. Axelson, C. and Axelson, U. (2013) Musik hela livet: ett studie-‐ och diskussionsmaterial om projektet "Musik för alla äldre" i Vänersborgs kommun. [Music life: a study and discussion material about the project "Music for all older" in Vänersborg].Vänersborg: Vänersborg Municipality.
3. Swedish National Agency for Education (2010). Curriculum for the preschool 98/2010. Stockholm: The Swedish National Agency for Education.
4. Social Services Act 2001:453/2010:427. Stockholm: Ministry of Social Affairs.
5. Guile, David (2011). Interprofessional Learning: Reasons Judgement and Action. Mind, Culture, and Activity 18(4) 342-‐364.
6. Small, C. (1999): Musicking – the meanings of performing and listening. A lecture. Music Education Research. 1 (1) 879-‐21.
7. Wassrin, M. (2013). Musicking: kreativ improvisation i förskolan. [Musicking: creative improvisation in preschool]. Stockholm: Department of Child and Youth Studies, Stockholm University.
8. Tornstam, L. (2005). Åldrandets socialpsykologi. [Ageing Social Psychology] Stockholm: Norstedts.
9. Young, S. (2009). Music 3 – 5. Essential guides for early years practioners. New York: Routledge.
10. Ehrlin, A. and Wallerstedt C. (2014) Preschool teachers’ skills in teaching music: two steps forward one step back Early Child Development and Care 184(12) 1800-‐1811.
11. Grahn M. (2005). Musernas viskningar förr och nu: En studie av det musiska och inriktningen musiskt lärande. En teoretisk analys samt ett empiriskt bidrag från lärarutbildningen. Whispering of the Muses -‐ Long Ago and Today: A Study of a Muse-‐ical Learning Program within Teacher Education Linköping: Linköping University PhD Thesis.
12. Pratt, R. R. (2004). Art, dance, and music therapy. Phys. Med. Rehabil. Clin. N. Am. 15(4) 827-‐841.
13. Rusted, J., Sheppard, L., Waller, J. (2006). A multi-‐centre randomized control group trial on the use of art therapy for older people with dementia. Group Analysis 39(4):517-‐536.

Nilsson, L., & Herrman, M. (2016). Intergenerational Learning – Children singing Along with Older People – Possibilities and Complications in a Project Context. Advances in Social Sciences Research Journal, 3(1) 187-‐200.
URL: http://dx.doi.org/10.14738/assrj.31.1760. 200
14. Östergren, P-‐O. (2011). The economic rationale between culture and health. Assembly of European Regions conference on culture and health. Istanbul, September 20.
15. Särkamö. T et al. (2008). Music listening enhances cognitive recovery and mood after middle cerebral artery stroke. Brain, 131(3), 866-‐876.
16. Konlaan, B.B. (2001). Cultural experience and health: the coherence of health and leisure time acitivities. Umeå University medical dissertation.
17. Czikszentmihályi, M. (1996). Flow. the psychology of optimal experience New York: Harper and Row 1990.
18. May, R. (1994). The Courage to Create. New York: Norton 1994.
19. Andersson, B. and Jungeström, I-‐B (2003) Den spröda tonen: bortom glömskan: en bok om musikterapi och uttryckande konstterapi. [The brittle tone: Beyond forgetfulness: on music therapy and expressive arts therapy] Linköping: Jungeström
20. Ruud, E. (2008). Hvorfor musikk som terapi? [Why music theary] In G. Bjursell, and V. Westerhäll. Kulturen och hälsan. [Culture and Health] Stockholm: Santérus.
21. Norberg, A., Lundman, B. and Santamäki Fischer, R. (2012) Det goda åldrandet. [The Good Ageing] Lund: Studentlitteratur.
22. Pinson, J. (2013). Involving senior citizens in group music therapy. London: Jessica Kingsley.
Advances in Social Sciences Research Journal – Vol.3, No.1 Publication Date: Jan. 25, 2016 DoI:10.14738/assrj.31.1698.
Bistra N. & Zejneli I. (2016). CEDAW Right of Non-‐Siscrimination and State Obligations in Connection to Trafficking in Women. Advances in Social Sciences Research Journal, 3(1) 201-‐209.
Copyright © Society for Science and Education, United Kingdom 201
CEDAW Right of non-‐discrimination and State Obligations in connection to Trafficking in Women
Prof. Dr. Netkova Bistra
SEEU R. Macedonia
Prof.Dr. Ismail Zejneli SEEU R. Macedonia
Abstract
Trafficking in human beings as a practice mostly involves women and is gender determined. Discrimination against women is both a push factor and a product of trafficking in women. The CEDAW (Convention for the Elimination of all forms of Discrimination of Women) is the central reference point in the context of the right to be free from discrimination regarding trafficking in women, since it is an instrument that deals exclusively with gender discrimination in an encompassing way. In 1979, the CEDAW addressed the issue of trafficking in women. This pivotal Convention for the affirmation and implementation of women’s human rights sets out to assure respect for the human rights of women through elimination of all forms of discrimination against them, and thus it recognized trafficking of women as a product of the ongoing discrimination against women. CEDAW distinguishes between negative and positive obligations of states in addressing discrimination against women. It developed a typology of state obligations: the obligation to respect, fulfil and protect with respect to trafficking of women, and women victims. On the bases of the theoretical background the scope of application and the concept of the right affected by the practice of trafficking was established and analysed. The relevant state obligations with respect to the right to be free from discrimination affected by the practice of trafficking and the breaches of obligations in the context of trafficking that amounted to the violations of the right were identified, thus connecting it to the set of positive state obligations under CEDAW and the possible prevention and protections actions that derive from those international standards.
INTRODUCTION
Because trafficking in human beings as a practice mostly involves women and is therefore gender determined, the CEDAW will is the central reference point in the context of the right to be free from discrimination, since it is an instrument that deals exclusively with gender discrimination in an encompassing way. In 1979, the subsequent Convention for the Elimination of all forms of Discrimination of Women addressed the issue of trafficking in women. Even though this pivotal Convention for the affirmation and implementation of women’s human rights sets out to assure respect for the human rights of women through elimination of all forms of discrimination against them, it only recognized trafficking of women as a product of the ongoing discrimination against women. It was silent on the violation of human rights suffered by women in the process and aftermath of trafficking per se. Even though the CEDAW Convention did not define trafficking nor the concept of exploitation of prostitution, it is very significant that they included trafficking in women explicitly, and provides for explicate set of obligations on part of State parties to it with respect to prevention, criminalization and protection of women victims.
Bistra N. & Zejneli I. (2016). CEDAW Right of Non-‐Siscrimination and State Obligations in Connection to Trafficking in Women. Advances in Social Sciences Research Journal, 3(1) 201-‐209.
URL: http://dx.doi.org/10.14738/assrj.31.1698. 202
Scope of application of CEDAW with respect to trafficking in women The Committee on the Elimination of Discrimination against Women, has observed that non-‐discrimination also includes ‘gender-‐based violence, that is, violence that is directed against a woman because she is a woman or that affects women disproportionately, and it includes acts that inflict physical, mental or sexual harm or suffering, threats of such acts, coercion and other deprivations of liberty.’ The Convention on the Elimination of All Forms of Discrimination against Women has a broader application, and covers acts falling within the private sphere. The Committee on the Elimination of Discrimination against Women has pointed out that discrimination under the Convention is not restricted to action by or on behalf of Governments (see Articles 2(e), 2(f) and 5). For example, under Article 2(e) the Convention calls on States Parties to take all appropriate measures to eliminate discrimination against women by any person, organization or enterprise. The Committee, in its concluding observation on Uzbekistan’s periodic report upheld this horizontal application of the Convention especially accenting the possibility of its direct horizontal application in front of domestic courts:
‘166. The Committee expresses its concern that, although the Constitution and the domestic laws provide for the equality of all citizens, they do not contain a definition of discrimination against women modelled on article 1 of the Convention, which prohibits both direct and indirect discrimination. The Committee also expresses its concern about the status of the Convention, and whether its provisions can be directly invoked before the courts.’
Positive obligation streaming from CEDAW Article 2 of the Convention, imposes on the States parties the following obligations: ‘States Parties condemn discrimination against women in all its forms, agree to pursue by all appropriate means and without delay a policy of eliminating discrimination against women and, to this end, undertake:
a) To embody the principle of the equality of men and women in their national constitutions or other appropriate legislation if not yet incorporated therein and to ensure, through law and other appropriate means, the practical realization of this principle;
b) To adopt appropriate legislative and other measures, including sanctions where appropriate, prohibiting all discrimination against women;
c) To establish legal protection of the rights of women on an equal basis with men and to ensure through competent national tribunals and other public institutions the effective protection of women against any act of discrimination;
d) To refrain from engaging in any act or practice of discrimination against women and to ensure that public authorities and institutions shall act in conformity with this obligation;
e) To take all appropriate measures to eliminate discrimination against women by any person, organization or enterprise;
f) To take all appropriate measures, including legislation, to modify or abolish existing laws, regulations, customs and practices which constitute discrimination against women;
g) To repeal all national penal provisions which constitute discrimination against women.’ The Convention provides more positive obligations for the State parties with respect to the conduct of the private persons and different cultures towards women within societies than the
Advances in Social Sciences Research Journal (ASSRJ) Vol.3, Issue 1 January-‐2016
Copyright © Society for Science and Education, United Kingdom 203
ECHR and the ICCPR. In Article 5(a), the Convention recognizes that discrimination against women is often preconditioned by social and cultural norms. To that end, it imposes on governments the duty ‘to modify the social and cultural patterns of conduct of men and women ... which are based on the idea of the inferiority or the superiority of either of the sexes or on stereotyped roles for men and women.’ In that respect, Article 5 lays down the bases for fighting the root-‐causes of trafficking in women and, as such, should be read in conjunction with Article 6 of the CEDAW targeting trafficking in women. Most countries in their state reports have connected Article 5 to Article 6 provision regarding trafficking in women. The Committee in its General Recommendation 19 on Violence against women has reaffirmed the influence of cultural settings on the status of women and its connection to the exploitation of women:
‘11. Traditional attitudes by which women are regarded as subordinate to men or as having stereotyped roles perpetuate widespread practices involving violence or coercion, such as family violence and abuse, forced marriage, dowry deaths, acid attacks and female circumcision. Such prejudices and practices may justify gender-‐based violence as a form of protection or control of women. The effect of such violence on the physical and mental integrity of women is to deprive them of the equal enjoyment, exercise and knowledge of human rights and fundamental freedoms. While this comment addresses mainly actual or threatened violence the underlying consequences of these forms of gender-‐based violence help to maintain women in subordinate roles and contribute to their low level of political participation and to their lower level of education, skills and work opportunities.
12. These attitudes also contribute to the propagation of pornography and the depiction and other commercial exploitation of women as sexual objects, rather than as individuals. This in turn contributes to gender-‐based violence.’
Moreover, the Convention in Articles 7 and 8 provides for the elimination of discrimination against women in the political and public life of a country. In Article 10, prohibits discrimination in education; in Article 11 in the area of employment; in Article 12 in the area of health care; and in Article 13 in other areas of economic and social life. All of these positive obligations, articulated in the Convention with respect to actions of government officials and of private persons as well, target improvement in the status of women in societies and, thus are the corner stone in the prevention and the fight against trafficking in women. It is important to note that the Convention on the Elimination of all Forms of Discrimination against Women prohibits all types of discrimination against women; in Article 6 regards trafficking in women as a form of any such discrimination against women. The CEDAW Committee has addressed trafficking in women in the context of Article 6 of the Convention on the Elimination of All Forms of Discrimination and Trafficking in Women in a very broad manner. By addressing trafficking in women, the CEDAW Committee has recommended to the State Parties a number of practical measures to help eradicating trafficking in women. The Committee has stressed the need for improvement in the area of female employment, stipulating positive obligations that extend to the conduct of private persons. In the concluding observation on Jordan, for example, the CEDAW Committee expressed its concern ‘that women make up only 13.6 per cent of the paid labour force. It also expressed its concern that
Bistra N. & Zejneli I. (2016). CEDAW Right of Non-‐Siscrimination and State Obligations in Connection to Trafficking in Women. Advances in Social Sciences Research Journal, 3(1) 201-‐209.
URL: http://dx.doi.org/10.14738/assrj.31.1698. 204
restrictive employment legislation in the area of night work and regulations on jobs that ban them for women reinforce women's difficulties in obtaining paid employment,’ which in turn, seriously affects the substantive equality of women and men. With respect to the positive obligations that the State has in the area of employment, the CEDAW Committee has pointed out that the States, apart from the obligation to halt the discrimination in society against women with respect to employment also have to eradicate harmful customary practices applied to women by private persons, and to amend legislation in the area of employment in a view not to be discriminatory towards women:
‘293. The Committee is concerned that the State party’s Constitution continues to contain provisions that discriminate against women, in particular in the area of nationality and employment, a fact that is explicitly recognized by the State party. It is further concerned at the slow pace of legislative reform to bring discriminatory legislation into conformity with the provisions of the Convention and to eliminate customary practices that discriminate against women.’
This link between poverty and unemployment on one hand and the trafficking in women on the other has been recognized by the Committee on the Elimination of Discrimination against Women in General Recommendation No. 19:
‘14. Poverty and unemployment increase opportunities for trafficking in women. In addition to established forms of trafficking there are new forms of sexual exploitation, such as sex tourism, the recruitment of domestic labour from developing countries to work in developed countries, and organized marriages between women from developing countries and foreign nationals. These practices are incompatible with the equal enjoyment of rights by women and with respect for their rights and dignity. They put women at special risk of violence and abuse.
Second area of concern is education. Discrimination against women with respect to education is also a significant and serious contributor to trafficking in women. With little or no access to education women and girls have fewer opportunities to find work within their countries. Moreover, they usually do not have information about the dangers of trafficking. Many countries that are origin countries for trafficking have discriminatory educational systems or traditional discriminatory practices connected to education, which have a dramatic impact on women. For example, the CEDAW Committee has addressed this problem in its concluding observations on Nepal (origin country for trafficking in women):
140. The Committee is concerned at the very low literacy rate amongst women, especially in rural and remote areas, and the persistence of both a quantitative and qualitative gender gap at all levels of education. It is also concerned that the Basic Primary Education Programme covers only a small number of girls and women, and that illiterate women are systematically barred from vocational training because of the minimum educational requirements for entry into vocational centres. The Committee is also concerned that school curricula and textbooks convey gender stereotypes and entrench a vision of male superiority.
Third area of concern is violence against women. Violence against women with respect to trafficking in women can be understood in a narrower and broader context. In a narrower context it is one of the root causes or factors that contribute to trafficking in women. For example, the Special Rappourter on Human Rights in her report in 1995 on Violence against
Advances in Social Sciences Research Journal (ASSRJ) Vol.3, Issue 1 January-‐2016
Copyright © Society for Science and Education, United Kingdom 205
Women, its causes and consequences, found that most of the women that end up in prostitution, and as victims to trafficking, have been victims of domestic violence. In a broader context, it can be said that violence against women as a category encompasses trafficking in women as well. Nevertheless, this type of discrimination in private or public life against women has a particularly corrosive effect on women either way. Violence against women encompasses, inter alia, ‘physical, sexual and psychological violence occurring in the family and in the general community, including battering, sexual abuse of children, dowry-‐related violence, rape, female genital mutilation and other traditional practices harmful to women, non-‐spousal violence and violence related to exploitation, sexual harassment and intimidation at work, in educational institutions and elsewhere, trafficking in women, forced prostitution, and violence perpetrated or condoned by the state.’ The CEDAW Committee has addressed violence against women in General Recommendation 19 as well as in its general observations on country reports. One example of progressive attitude towards the criminalization of prostitution and violence against women is that of Sweden, which, in 1998, passed a law that created a new offence: ‘gross violation of a woman’s integrity’ including prostitution as a type of violence against women. In the authors opinion this approach taken by Sweden could be used as a model by other countries willing to achieve gender equality, and to prevent trafficking in women. Trafficking in women as such has been addressed directly by the CEDAW Committee in variety of cases concerning State Reports and General Recommendations. In its General Recommendation 19, the Committee has stated that ‘specific preventive and punitive measures are necessary to overcome trafficking and sexual exploitation.’ The CEDAW Committee has further elaborated state obligations arising under the Convention and not explicitly stated in any of its articles. However, it is through the concluding observations on the State reports, examined below that the Committee has confirmed and entrenched the need for positive action on part of Governments with respect to their positive obligations under the CEDAW to prevent trafficking, to prosecute traffickers and to protect and assist the victims of trafficking. Discrimination against women can occur together with violations of other substantive human rights as violations perpetrated on the victims of such discrimination. For example, the victims of trafficking often face detention and prosecution for illegal status in the countries of destination. Often they are prosecuted for engagement in prostitution, whereas the traffickers and others responsible parties are unpunished or insignificantly punished due to the lower status of women in that society compounded often by prejudice against prostitutes. Consequently, for example, the Committee on the Elimination of Discrimination against Women has urged Uzbekistan to:
‘179. The Committee urges the Government to include in its next report more information and data on the situation of trafficking of women and girls and on progress made in that area. The Committee considers that comprehensive measures should be developed and introduced in order to address the problem effectively, including prevention and reintegration and the prosecution of those responsible for trafficking.’
The importance of having policies that will target trafficking in women is clear in the CEDAW Committee’s concluding observations on Luxembourg. The Committee expressed its concern: ‘that the State party has not developed comprehensive policies to combat trafficking in women and girls.’ In addition, it recommended:
Bistra N. & Zejneli I. (2016). CEDAW Right of Non-‐Siscrimination and State Obligations in Connection to Trafficking in Women. Advances in Social Sciences Research Journal, 3(1) 201-‐209.
URL: http://dx.doi.org/10.14738/assrj.31.1698. 206
‘313. The Committee recommends that the State party develop comprehensive policies and programmes to combat trafficking in women and girls, including measures to prevent trafficking in women and girls, the collection of data, the provision of services for trafficked women and girls and measures to penalize those who are involved in such trafficking.’
In its concluding observations on Lithuania, the CEDAW Committee noted that the omission on the part of the government to identify the victims of trafficking as victims, and consequently penalizing them under the laws on prostitution while circumventing the penalizing of traffickers, pimps and other persons involved in the exploitation creates a situation in which:
‘criminal penalties imposed only on prostitutes entrench sexual exploitation of women” and thereby violate Article 6.’
Furthermore, in the CEDAW Committee’s concluding observations on the Netherlands, the Committee expressed its concern for the huge number of non-‐European women trafficked to and in the Netherlands. It urged the Government of the Netherlands to ensure that trafficked women are provided with full protection in their countries of origin or to grant them asylum or refugee status. This interpretation of discrimination against women vis-‐à-‐vis trafficking in women is most elaborate and useful. It should be adopted by other treaty bodies that could use the CEDAW position elaborated in this text. Moreover, the CEDAW Committee has also concentrated on the effective combating of trafficking in women by relying on the positive obligations flowing from non-‐discrimination. It has done so by expressing its concern about the effective prosecution of traffickers; it also has affirmed the important role of the victims of trafficking as witnesses in trafficking cases in its concluding observations on Germany. The CEDAW Committee has pointed out the importance of adopting legal and non-‐legal measures to target trafficking in women. It has also noted that the cooperation of the receiving country with the country of origin is a step up in the successful fight against trafficking in women and also it can be a tool in the protection of the human rights victims against further violations. The CEDAW Committee, in connection to practices that mitigate discrimination against women, has stressed that practices such as sex phone lines have to be reconsidered since they generally encourage discriminatory views regarding women as sex objects. With respect to the referred to non-‐legal measures, the Committee in General Recommendation 19 has recommended State parties take effective measures to ensure that the media respects and promotes respect for women. The CEDAW Committee has taken the notion of the State’s obligations with respect to trafficking in women a step further by recognizing that in the successful fight and prevention of trafficking in women, measures also must address the demand for prostitution. It also observed that, on a level of protection and assistance the states have to take active steps in order to support and rehabilitate women involved into prostitution. For example, in the CEDAW Committee’s concluding observations on Croatia it stated:
‘38. The Committee urges the State party to step up its efforts to combat trafficking in women and girls, including finalization and implementation of its Operative Plan for Prevention of Trafficking, 2004 to 2008. The Committee further calls on the State party to take all appropriate measures to suppress exploitation of prostitution of
Advances in Social Sciences Research Journal (ASSRJ) Vol.3, Issue 1 January-‐2016
Copyright © Society for Science and Education, United Kingdom 207
women, including through discouraging the demand for prostitution and taking measures to rehabilitate and support women who want to get out of prostitution.’
One mechanism for meeting State’s obligation to promote the rights of women under CEDAW is affirmative action and the adoption of temporary special measures as a method to achieve substantive equality. The text of CEDAW seems to allow for ‘temporary special measures’ in Article 4(1) and cab be said to imply an obligation to adopt ‘temporary special measures’ aimed at achieving substantive equality for women. This is confirmed by the previously conducted analyses noting that the goal of CEDAW is to not only eliminate discrimination against women, but also to eliminate direct and indirect discrimination that will definitely require the use of temporary special measures. This is crucial with respect to the prevention of trafficking and to addressing issues of the causal factors of trafficking. The obligation to take special measures aimed at realizing substantive equality does not rely solely on the ‘temporary measures.’ It also involves as General Comment 25 states, measures that will provide for non-‐identical treatment of women and men recognizing their differences in order to achieve the real substantive equality: ‘it is not enough to guarantee women treatment that is identical to that of men. Rather, biological as well as socially and culturally constructed differences between women and men must be taken into account. Under certain circumstances, non-‐identical treatment of women and men will be required in order to address such differences’. General Comment 25, also stresses that the ‘state parties should clearly distinguish between temporary special measures taken under article 4, paragraph 1 to accelerate the achievement of a concrete goal for women of de facto or substantive equality, and other general social policies adopted to improve the situation of women and the girl child. Not all measures that potentially are, or will be, favourable to women are temporary special measures. The provision of general conditions in order to guarantee the civil, political, economic, social and cultural rights of women and the girl child, designed to ensure for them a life of dignity and non-‐discrimination, cannot be called temporary special measures’. As to the question of remedies available under CEDAW, in General Recommendation 5 the CEDAW Committee announced that the State Parties should make more use of temporary special remedial measures such as positive action, preferential treatment, or quota systems to advance women’s integration into education, employment, politics and economy. The Human Rights Committee has also identified positive state obligations to adopt special measures (and thus differential treatment) through its typology of state obligations. More specifically, the HRC has several times recommended to States to take positive measures especially with regard to women. These positive measures could consist of (additional) training or education in order to enhance employment and higher education possibilities. To some extent, this obligation to adopt differential measures is closely related to an obligation to adopt affirmative action measures. General Comment no 18 on non-‐discrimination explicitly introduced the requirement to take affirmative action, which would flow from the equality principle:
‘the principle of equality sometimes requires States parties to take affirmative action in order to diminish or eliminate conditions which cause or help to perpetuate discrimination prohibited by the Covenant’
Bistra N. & Zejneli I. (2016). CEDAW Right of Non-‐Siscrimination and State Obligations in Connection to Trafficking in Women. Advances in Social Sciences Research Journal, 3(1) 201-‐209.
URL: http://dx.doi.org/10.14738/assrj.31.1698. 208
CONCLUSION All human rights are not absolute and some of them have limitations provided for in their respective article. CEDAW distinguishes between negative and positive obligations, and developed a typology of state obligations: the obligation to respect, fulfil and protect with respect to trafficking of women, and women victims. On the bases of the theoretical background the scope of application and the concept of the right affected by the practice of trafficking was established and analysed. The relevant state obligations with respect to the each relevant right affected by the practice of trafficking and the breaches of those obligations in the context of trafficking that amounted to the violations of the rights concerned were identified, thus connecting it to the set of positive state obligations under CEDAW and the possible prevention and protections actions that derive from those international standards. Bibliography Convention on the Elimination of All Forms of Discrimination against Women entered into force 3 September 1981, Office of the High Commissioner for Human Rights, http://193.194.138.190/html/menu3/b/e1cedaw.htm
Sheila Dauer, Indivisible or Invisible, Women’s Human Rights in Public and Private Sphere, in Women, Gender, and Human Rights A Global Perspective, edited by Marjorie Agosin.
Violence against women: 29/01/92. CEDAW, General recommendation 19, UN Doc. A/47/38, p. 216, para. 6.
Concluding Observations of the Committee on the Elimination of Discrimination Against Women: Uzbekistan, A/56/38.
State report on Tunisia, Committee on the Elimination of Discrimination Against Women, Concluding Observations: Tunisia, U.N. Doc. A/50/38.
Andrea Marie Bertone, Sexual trafficking in Women: International Political Economy and the politics of sex, Gender Issues, winter, 2000 Volume 18, issue 1.
Concluding observation on Jordan, CEDAW/C/2000/I/CRP.3/Add.1/ReIV.1, A/55/38.
Concluding Observations of the Committee on the Elimination of Discrimination against Women: Nigeria, CEDAW/C/2004/I/CRP.3/Add.2/ReIV.1 A/59/3830-‐01-‐2004.
Violence against women: 29/01/92.CEDAW General recommendation 19, A/47/38.
Concluding Observations of the Committee on the Elimination of Discrimination Against Women Nepal CEDAW/C/1999/L.2/Add.5 A/54/38.
Report of the Special Rapporteur on Violence against Women, its causes and consequences, Ms. Radhika Coomaraswamy, Commission on Human Rights, Fifty-‐third session E/CN.4/1997/47.
The Declaration on the Elimination of Violence against Women A/RES/48/104, 20 December 1993.
Donna M. Hughes The ‘Natasha’ Trade: Transnational Sex Trafficking, National Institute of Justice Journal, January 2001
Concluding Observations of the Committee on the Elimination of Discrimination against Women: Uzbekistan, UN Doc. A/56/38.
Concluding Observations of the Committee on the Elimination of Discrimination against Women: Luxembourg, UN Doc. A/58/38.
Concluding Observations of the Committee on the Elimination of Discrimination against Women: Lithuania UN doc. A/55/38 (16 June 2000).
Concluding Observations of the Committee on the Elimination of Discrimination against Women: Netherlands, U.N. Doc. A/56/38, para. 185-‐231 (2001).
Concluding Observations of the Committee on the Elimination of Discrimination against Women Germany, UN doc. A/55/38 (2 February 2000).
Committee on the Elimination of Discrimination Against Women, Concluding Observations: Finland, A/56/38. (2001).

Advances in Social Sciences Research Journal (ASSRJ) Vol.3, Issue 1 January-‐2016
Copyright © Society for Science and Education, United Kingdom 209
Committee on the Elimination of Discrimination against Women, Concluding Observations: Croatia, CEDAW/C/CRO/CC/2-‐3, 28-‐01-‐2005.
Rebecca J. Cook, ‘Obligations to Adopt Temporary Special Measures under the Convention on the Elimination of All Forms of Discrimination against Women’, in I. Boerefijn (ed.), Temporary Special Measures (Antwerp, 2003).
Kristen Henrard, Non-‐discrimination and full and effective equality, in M. Weller (ed.), Jurisprudence Digest: Minority Protection, OUP, 2006.
Advances in Social Sciences Research Journal – Vol.3, No.1 Publication Date: Jan. 25, 2016 DoI:10.14738/assrj.31.1793.
Dipietro W. R. (2016). Potential Source of Modern Day Slavery. Advances in Social Sciences Research Journal, 3(1) 210-‐216.
Copyright © Society for Science and Education, United Kingdom 210
Potential Sources of Modern Day Slavery
William R. DiPietro Professor of Economics
Daemen College
Abstract Globally, the existence and persistence of slavery is a major problem that needs to be addressed. In addition to calling attention to slavery by making slavery a high priority issue on the national agenda, gaining some understanding of the sources of slavery is necessary for governments to effectively deal with slavery. This paper considers four factors as potential determinants of slavery at the national level. They are economic development, population growth, unemployment, and natural resource rental income. Empirically, cross country regression analysis is undertaken to test whether these four factors are of consequence for slavery. The results suggest that each of the four factors is relevant for slavery, with higher levels of economic development leading to lower levels of slavery, and higher population growth, unemployment, or rental income , leading to higher levels of slavery.
INTRODUCTION
It is appalling, but true, that slavery still exists in the modern world. From almost any moral perspective, or from practically any notion of what it means to be civilized, slavery, the ownership of one individual by another, is an abomination. One of the major feasts of the Jewish people, the Passover, celebrates the emancipation of the Jewish people from the cruel fate of slavery. From a Rawlsian point of view, welfare in society can be maximized by making the worst possible state in society as good as possible. As there is almost nothing worse that can be imagined than for a human being to be in slavery, this means, from a Rawlsian perspective, that social welfare is maximized by minimizing slavery. In order to reduce slavery, to be able to devise policies to effectively control slavery, it is first necessary to understand the current causes of slavery, and the conditions that bring it about . The nation state, at the present time, is the preeminent form of political and social organization. Across nations, the amount of slavery varies considerably. The fundamental question is why. What are the reasons for differences in the amount of slavery across nations? This paper investigates whether four potential factors, the level of economic development, population growth, unemployment, and, rent as a source of income are important in explaining differences in the amount of slavery between nations. The paper is broken down into five sections. The first section reviews some of the work that has been done looking at the sources of modern slavery. The second section presents a formal model of modern slavery. The third sections identifies the sources of the variables that are used in the empirical analysis. The fourth section discusses the results of cross country regressions of slavery on economic development and the three other variables considered as potential determinates of slavery. The fifth section closes by offering some concluding remarks.
Advances in Social Sciences Research Journal (ASSRJ) Vol.3, Issue 1 January-‐2016
Copyright © Society for Science and Education, United Kingdom 211
BACKROUND LITERATURE Bales feels that the essence of slavery is, at all times and places, the control of one individual by another thorough actual or potential violence (Bales 2004). His analysis of the historical data shows that the price of slavery today is lower than at any other time in history. He maintains that the price of slavery today is falling due to an increase in the supply of slavery, and attributes the reasons for this increase to rapid population growth, rising level of impoverishment due to widening income disparities between groups from globalization, and the lack of law and order resulting from government corruption. His regression analysis, that uses human trafficking from a country as the dependent variable, indicates that government corruption, infant mortality, the percentage of the population below age fourteen, food production, population pressure, and conflict and social unrest may be important factors for slavery. In addition, his regression analysis, that employs an ordered logit estimator and uses an index of slavery as the dependent variable, shows that GDP per capita and the United Nations Human Development Index are relevant for slavery. Crane looks at slavery from a management perspective (Crane 2011). He develops a comprehensive theory of slavery that considers both the internal organizational capabilities of an organization that can enable it to practice slavery right in the face of illegality, and the external conditions that allows slavery to exist. One of his key organizational capabilities is organizational access to violence and the effective organizational ability to use it. A few of his external conditions include unemployment, poverty, isolation, and government weakness. Arocha considers a host of factors that may influence slavery in a country (Arocha 2005). In her empirics, she uses a categorical index based on expert opinions as her dependent variable , and employs maximum likelihood estimation on an ordered logit model for a cross section of one hundred forty six countries. From the results of her regressions, some of the variables that appear to be relevant for slavery are economic development, political rights, corruption trafficking in and out of a country, external debt, regional location, and fundamental culture. At least with regard to sex slavery, law may be a relevant factor. In their cross country regressions, Jakobsson and Kotsadam find that slacker prostitution laws, when adjusting for one or more of their control variables (population, GDP per capita, the rule of law, and the share of immigrants in the population), significantly increases both trafficking inflow and victims from trafficking (Jakobsson and Kotsadam 2013). Martinsen postulates that there may be a non-‐linear relationship between modern slavery and gender inequality. In her cross country regression analysis, she uses an index of human trafficking outflow for her dependent variable, and finds, when adjusting for population and GDP per capita, a hump shaped relationship between human trafficking outflow and the percentage of women in parliament, and between human trafficking outflow and labor force participation of women (Martinsen 2014). Datta and Bales look at six potential determinants of slavery (state stability risk, women' s economic rights, freedom of speech, access to financial services, Eastern European location, and percentage of men over sixty years in age) in a cross section of thirty seven European countries for 2012 (Datta and Bales 2014). They generate their own estimates of the numbers enslaved by country on the basis of representative survey data, and use the natural logarithm of slavery as their dependent variable. They find that, except for women's economic rights, that all of the other variables are significant at the five percent level of significance or better, with a
Dipietro W. R. (2016). Potential Source of Modern Day Slavery. Advances in Social Sciences Research Journal, 3(1) 210-‐216.
URL: http://dx.doi.org/10.14738/assrj.31.1793. 212
positive estimated coefficient on state stability risk, access to financial services, location in Eastern Europe, and men over sixty, and a negative coefficient on women's economic rights and freedom of speech. Labor migration may be important for human trafficking. Mahmoud and Trebesch hypothesize that human trafficking depends critically on emigration (Mahmoud and Trebesch 2010). They believe that greater emigration reduces the recruitment costs of human trafficking causing greater human trafficking. Mahmoud and Trebesch employ data from household surveys of five Eastern European countries (Belarus, Bulgaria, Moldova, Romania, and Ukraine) experiencing high levels of human trafficking to examine human trafficking. Their regressions indicate, in line with their central contention, that greater migration prevalence by households increases the incidence of human trafficking. Furthermore, their findings suggest that greater awareness of the risks of trafficking by households reduces the incidence of human trafficking. Empirical research on human trafficking is at its beginning stages. At present, there is not a lot of the existing empirical work on human trafficking , and there is a pressing need for more empirical work in the area. Gozdziak and Bump provide a comprehensive bibliography of research on human trafficking (Gozdziak and Bump 2008). Of the two hundred eighteen journal articles they identify, only thirty nine are devoted to empirical research, and, of these, only thirty six appear in peer reviewed publications.
FORMAL MODEL OF SLAVERY The formal model of slavery consists of a single equation with its associated partial derivatives. The equation is as follows. S = f (D, P, U, R) δS/δD< 0, δS/δP> 0, δS/δU> 0, δS/δR> 0 In the equation, S is the amount of slavery, D stands for the level of economic development, P is the rate of population growth, U is unemployment, and R is rental income. The partial derivative of slavery with regard to democracy is positive, but it is negative with regard to the three other variables. It is anticipated that slavery will be negatively related to the level of economic development. Anything that improves the opportunity set of individuals in society is likely to reduce slavery. Higher levels of economic development increase both the quantity and quality of opportunities available to members of society. It is absence of opportunities, or bad, or poor opportunities, that put people in a position to become enslaved. Slavery is also expected to be positively related to population growth. Typically, population growth is highest in the poorest nations, and within nations, among poorest income groups. That is to say, population growth is generally higher for the very people that can least afford to have children, and for which a larger family leads to further misery. Population growth among the poor makes a bad situation worse. In the extreme, it moves them from a barely manageable subsistence lifestyle to a position of indebtedness and of destitution, making them prime targets for enslavement. The third factor is unemployment. Slavery is predicted to be positively related to unemployment. Unemployment makes people more vulnerable, and, therefore, leaves them in a condition more likely to become enslaved. Sustained unemployment eventually places almost anyone in a desperate position in which they are willing to do almost anything to
Advances in Social Sciences Research Journal (ASSRJ) Vol.3, Issue 1 January-‐2016
Copyright © Society for Science and Education, United Kingdom 213
survive, and where they have no means available to defend themselves from any form of exploitation. While underdevelopment, rapid population growth, and high levels of unemployment are factors that may promote conditions that augment the supply of slavery, unlike these three supply factors, the share of natural resource rental income is considered to be a demand factor. For slavery to exist, there must be a set of people who can rationalize to themselves, as well as to others, the existence of slavery, and who are willing and able to buy and sell slaves, and to use and exploit them for their own advantage and purposes. In the modern world, one likely potential source for members of this group, for members in this class, are individuals who derive a substantial share of their incomes from natural resource rents. Economic rents can be obtained without any contribution to production, and tend to promote the development of an aristocratic mind set. The aristocratic mind set, although favoring any and all activities, such as war, that can be used to acquire more land, distains work, and all those who must work in order to survive. Historically, in feudal agrarian societies, rents derived from the land were associated with an extremely powerful class division between aristocrats and others. The more an individual derives his income from rents, the more the aristocratic perspective has a chance to take hold of his being and to become an fundamental part of his identity. With the enormous perceived social distance between themselves and others, aristocrats feel it is their right, that they are entitled, to use, exploit, or enslave, those beneath them. Thus, from the demand side, the incidence of modern slavery in a nation, the percentage of the population that is enslaved, is expected to be positively related to the percentage of natural resources rents to GDP.
VARIABLE SOURCES Slavery is quantified by using the percentage of the population in modern slavery for 2014. The numbers come from the Global Slavery Index web site (The Global Slavery Index 2015). The measure of economic development is GDP per capita for 2010. The source for the data is the World Bank ( World Bank 2014). Population growth , the unemployment rate, and the percentage of natural resource rents to GDP are all for the year 2010. Just like the GDP per capita data, the data for these variables comes from the World Bank.
EMPIRICAL RESULTS Table I shows the results of cross country regressions of slavery, as measured by the percentage of the population in slavery, on the four factors, the level of economic development, population growth, the unemployment rate, and the percentage of natural resource rents to GDP. Table I: Cross Country Regressions Of Slavery On Economic Development And Other Potential
Determiannts (1) (2) (3) (4)
CONSTANT .5663 (10.35)
*
.3754 (6.36) *
.1282 (1.39)
.0990 (1.095)
DEVELOPMENT -‐.0000057 -‐.00000075 -‐.0000068 -‐.0000065
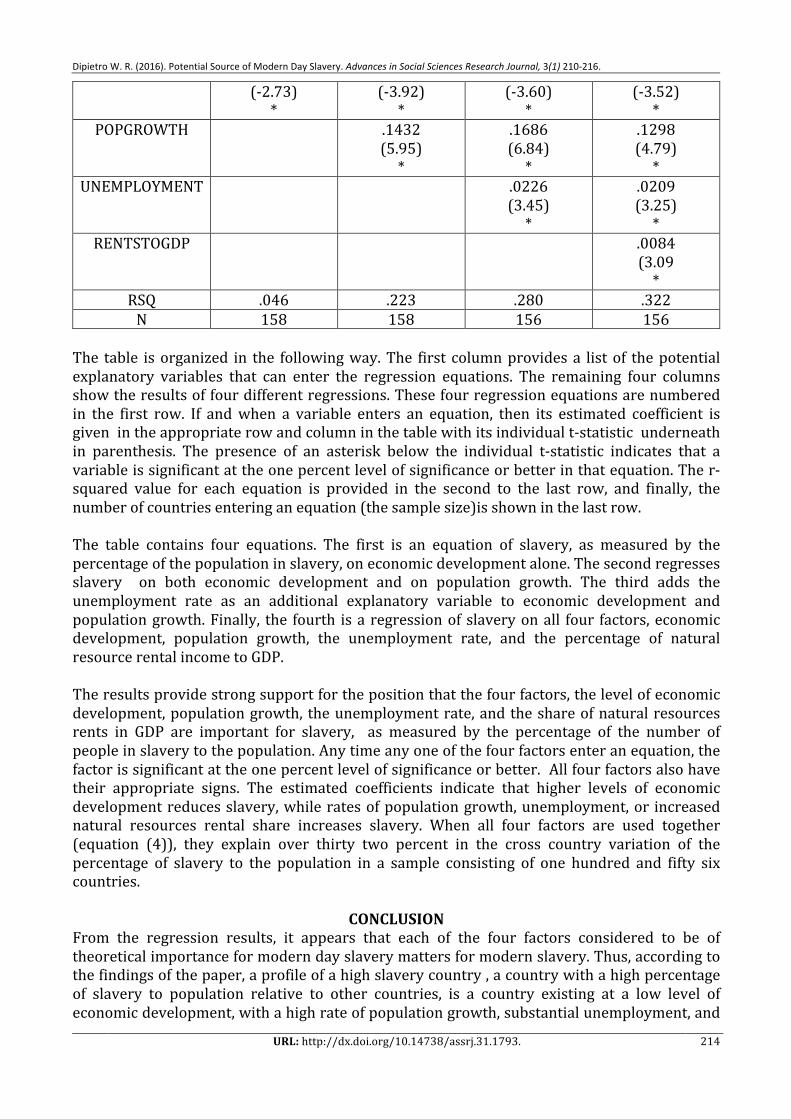
Dipietro W. R. (2016). Potential Source of Modern Day Slavery. Advances in Social Sciences Research Journal, 3(1) 210-‐216.
URL: http://dx.doi.org/10.14738/assrj.31.1793. 214
(-‐2.73) *
(-‐3.92) *
(-‐3.60) *
(-‐3.52) *
POPGROWTH .1432 (5.95) *
.1686 (6.84) *
.1298 (4.79) *
UNEMPLOYMENT .0226 (3.45) *
.0209 (3.25) *
RENTSTOGDP .0084 (3.09 *
RSQ .046 .223 .280 .322 N 158 158 156 156
The table is organized in the following way. The first column provides a list of the potential explanatory variables that can enter the regression equations. The remaining four columns show the results of four different regressions. These four regression equations are numbered in the first row. If and when a variable enters an equation, then its estimated coefficient is given in the appropriate row and column in the table with its individual t-‐statistic underneath in parenthesis. The presence of an asterisk below the individual t-‐statistic indicates that a variable is significant at the one percent level of significance or better in that equation. The r-‐squared value for each equation is provided in the second to the last row, and finally, the number of countries entering an equation (the sample size)is shown in the last row. The table contains four equations. The first is an equation of slavery, as measured by the percentage of the population in slavery, on economic development alone. The second regresses slavery on both economic development and on population growth. The third adds the unemployment rate as an additional explanatory variable to economic development and population growth. Finally, the fourth is a regression of slavery on all four factors, economic development, population growth, the unemployment rate, and the percentage of natural resource rental income to GDP. The results provide strong support for the position that the four factors, the level of economic development, population growth, the unemployment rate, and the share of natural resources rents in GDP are important for slavery, as measured by the percentage of the number of people in slavery to the population. Any time any one of the four factors enter an equation, the factor is significant at the one percent level of significance or better. All four factors also have their appropriate signs. The estimated coefficients indicate that higher levels of economic development reduces slavery, while rates of population growth, unemployment, or increased natural resources rental share increases slavery. When all four factors are used together (equation (4)), they explain over thirty two percent in the cross country variation of the percentage of slavery to the population in a sample consisting of one hundred and fifty six countries.
CONCLUSION From the regression results, it appears that each of the four factors considered to be of theoretical importance for modern day slavery matters for modern slavery. Thus, according to the findings of the paper, a profile of a high slavery country , a country with a high percentage of slavery to population relative to other countries, is a country existing at a low level of economic development, with a high rate of population growth, substantial unemployment, and
Advances in Social Sciences Research Journal (ASSRJ) Vol.3, Issue 1 January-‐2016
Copyright © Society for Science and Education, United Kingdom 215
a relatively large share of national income coming from natural resource rents. In essence, it is likely to be a country with a substantial and growing amount of poor people with little or no opportunities, coupled with an elite that finds no scruples to enslave the masses, and who, politically, may even consider slavery as a necessity in order to keep the lower class in check, and, who, personally, may view the ability to own slaves as a component of their class identity. Policy wise, to reduce slavery, each of the four characteristics of a modern high slave country needs to be addressed. First, economic development needs to be promoted in the high slave country so that more opportunities are available to the people in the country, especially to the poor. This may be extremely difficult, not just economically, because of the enormous economic hurdles that have to be overcome, but politically, since the elites, the people that are in control of the government, are more than contented with the status quo, as they are currently living quite nicely and have high status in the prevailing social structure. Second, population growth needs to be brought under control to avoid a Malthusian trap. The poor need to be educated to use moral means or birth control to have smaller families. Internationally, the ability of people to legally emigrate from high population growth, low opportunities countries to high opportunity, highly developed, countries must become more, not less, of a possibility. Third, unemployment must be reduced. Conditions favorable for business and investment have to be created. The government needs to provide necessary infrastructure . Investment in the country must become profitable and not unduly risky to undertake. Fourth, when substantial rents from natural resources exist, these rents somehow, either through taxation or some other means, need to be channeled away from a renter class, and used for the economic development of the country. References Arocha, Lorena Dominguez. 2005. "Contemporary Forms of Slavery: An empirical Analysis." http://iussp2005.princeton.edu/papers/52594, June, 12, 2015.
Bales, Kevin. 2004. "Testing a Theory of Modern Slavery." http://pclt.cis.yale.edu/glc/events/cbss/Bales.pdf, June 10, 2015.
Datta, Monti Narayan and Kevin Bales. 2014. "Slavery in Europe: Part 2, Testing a Predictive Model." Human Rights Quarterly, 36(2), 277-‐295, http://scholarship.richmond.edu/cgi/viewcontent.cgi?article=1025&context=polisci-‐faculty-‐publications&sei-‐redir=1&referer=http%3A%2F%2Fscholar.google.com%2Fscholar%3Fhl%3Den%26q%3Ddatta%2Band%2Bbales%2Bslavery%2Bin%2Beurope%2Bpart%2B2%252C%2Btesting%2Ba%2Bpredictive%2Bmodel%26btnG%3D%26as_sdt%3D1%252C33%26as_sdtp%3D#search=%22datta%20bales%20slavery%20europe%20part%202%2C%20testing%20predictive%20model%22, June 16, 2015.
Crane, Andrew. 2011. "Modern Slavery as a Management Practice: Exploring the Conditions and Capabilities for Human Exploitation." Academy of Management Review, 38(1), pp. 49-‐69.
Gozdziak, Elzbieta and Micah N. Bump. 2008. "Data and Research on Human Trafficking: Bibliography of Research -‐Based Literature." Georgetown University, Institute for the Study of International Migration, https://repository.library.georgetown.edu/bitstream/handle/10822/551495/Data_research_trafficking.pdf?sequence=1, June 16, 2015.
Jakobsson, Niklas and Andreas Kotsadam. 2013. "The Law and Economics of International Sex Slavery: Prostitiution Laws and Trafficking for Sexual Exploitation." University of Gothenburg, Working Papers in Economics, No. 458, https://gupea.ub.gu.se/bitstream/2077/22825/4/gupea_2077_22825_4.pdf, June 15, 2015.

Dipietro W. R. (2016). Potential Source of Modern Day Slavery. Advances in Social Sciences Research Journal, 3(1) 210-‐216.
URL: http://dx.doi.org/10.14738/assrj.31.1793. 216
Mahmoud, Toman Omar and Christoph Trebesch. 2010. The Economics of Human Trafficking and Labor Migration: Micro-‐evidence from Eastern Europe. Journal of Comparative Economics 38(2), pp. 173-‐188, http://www.iza.org/conference_files/LeIlli2010/trebesch_c4269.pdf, June 15, 2015.
Martinsen, Kristine Gran. 2014. :Modern Slavery-‐An Empirical Analysis of Source Countries of Human Trafficking and the role of Gender Equality." https://www.duo.uio.no/bitstream/handle/10852/40982/1/Modern-‐slavery.pdf, June 15, 2015.
Rawls, John. 1971. A Theory of Justice. Boston: Harvard University Press.
The Global Slavery Index. 2015. The Global Slavery Index for 2014, http://d3mj66ag90b5fy.cloudfront.net/wp-‐content/uploads/2014/11/Global_Slavery_Index_2014_final_lowres.pdf, June 1, 1014.
World Bank. 2014. World Development Indicators, http://databank.worldbank.org/data/views/variableSelection/selectvariables.aspx?source=world-‐development-‐indicators, May 20, 2014.