Mathematics and Mathematics Education in Traditional Vietnam
Upload
khangminh22Category
view
0download
0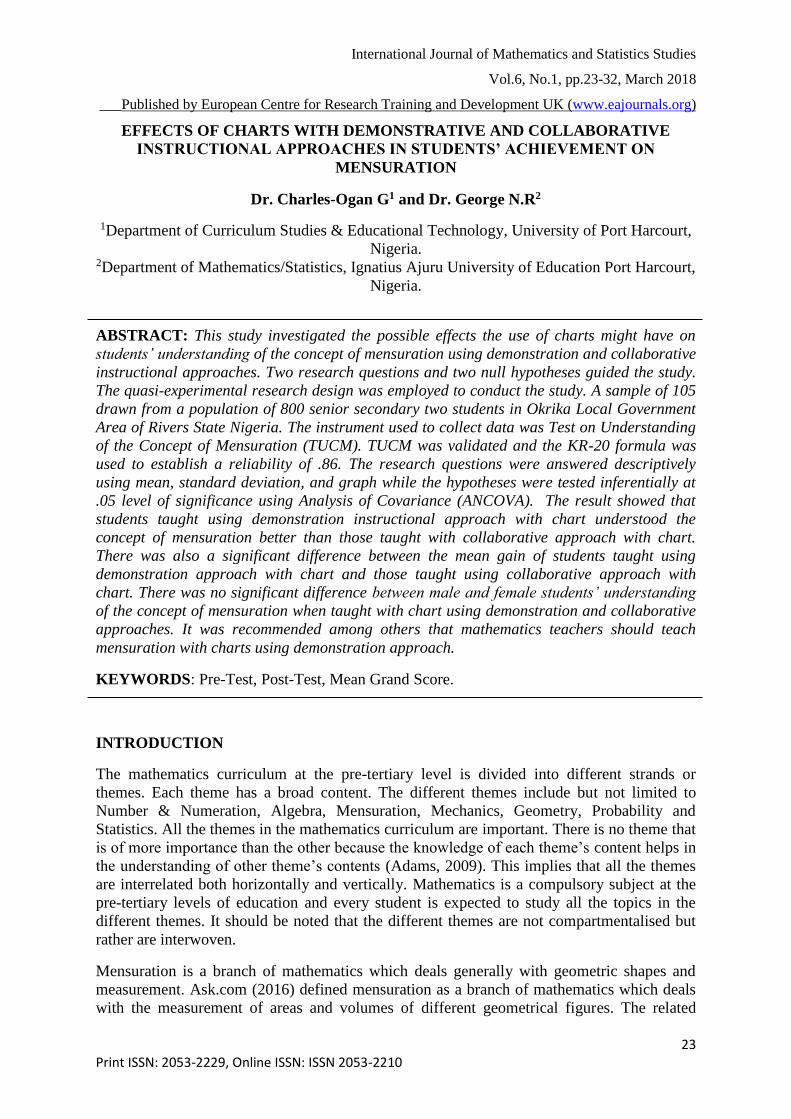
International Journal of Mathematics and Statistics Studies
Vol.6, No.1, pp.23-32, March 2018
___Published by European Centre for Research Training and Development UK (www.eajournals.org)
23 Print ISSN: 2053-2229, Online ISSN: ISSN 2053-2210
EFFECTS OF CHARTS WITH DEMONSTRATIVE AND COLLABORATIVE
INSTRUCTIONAL APPROACHES IN STUDENTS’ ACHIEVEMENT ON
MENSURATION
Dr. Charles-Ogan G1 and Dr. George N.R2
1Department of Curriculum Studies & Educational Technology, University of Port Harcourt,
Nigeria. 2Department of Mathematics/Statistics, Ignatius Ajuru University of Education Port Harcourt,
Nigeria.
ABSTRACT: This study investigated the possible effects the use of charts might have on
students’ understanding of the concept of mensuration using demonstration and collaborative
instructional approaches. Two research questions and two null hypotheses guided the study.
The quasi-experimental research design was employed to conduct the study. A sample of 105
drawn from a population of 800 senior secondary two students in Okrika Local Government
Area of Rivers State Nigeria. The instrument used to collect data was Test on Understanding
of the Concept of Mensuration (TUCM). TUCM was validated and the KR-20 formula was
used to establish a reliability of .86. The research questions were answered descriptively
using mean, standard deviation, and graph while the hypotheses were tested inferentially at
.05 level of significance using Analysis of Covariance (ANCOVA). The result showed that
students taught using demonstration instructional approach with chart understood the
concept of mensuration better than those taught with collaborative approach with chart.
There was also a significant difference between the mean gain of students taught using
demonstration approach with chart and those taught using collaborative approach with
chart. There was no significant difference between male and female students’ understanding
of the concept of mensuration when taught with chart using demonstration and collaborative
approaches. It was recommended among others that mathematics teachers should teach
mensuration with charts using demonstration approach.
KEYWORDS: Pre-Test, Post-Test, Mean Grand Score.
INTRODUCTION
The mathematics curriculum at the pre-tertiary level is divided into different strands or
themes. Each theme has a broad content. The different themes include but not limited to
Number & Numeration, Algebra, Mensuration, Mechanics, Geometry, Probability and
Statistics. All the themes in the mathematics curriculum are important. There is no theme that
is of more importance than the other because the knowledge of each theme’s content helps in
the understanding of other theme’s contents (Adams, 2009). This implies that all the themes
are interrelated both horizontally and vertically. Mathematics is a compulsory subject at the
pre-tertiary levels of education and every student is expected to study all the topics in the
different themes. It should be noted that the different themes are not compartmentalised but
rather are interwoven.
Mensuration is a branch of mathematics which deals generally with geometric shapes and
measurement. Ask.com (2016) defined mensuration as a branch of mathematics which deals
with the measurement of areas and volumes of different geometrical figures. The related
International Journal of Mathematics and Statistics Studies
Vol.6, No.1, pp.23-32, March 2018
___Published by European Centre for Research Training and Development UK (www.eajournals.org)
24 Print ISSN: 2053-2229, Online ISSN: ISSN 2053-2210
parameters which are taught in mensuration include but not limited to types and properties of
geometric shapes (plane or solid), the measurement of the dimensions that form the shapes,
the diagrams and nets of the shapes, the area and volumes of the shapes, the properties of the
shapes, the relationships between the properties of the shapes, the development and use of
formula to solve mensuration problems. A close look at the content of mensuration shows
that it is taught at the pre-primary, primary, post-primary and tertiary institutions. At
whatever level it is taught, the nature of the mensuration contents calls for the teacher to
employ a method that will enhance students’ understanding of the concepts in the theme. The
teaching and learning of the topics in the mensuration theme requires both teacher activities
and students’ activities that are relevant to the understanding of the contents. The content of
mensuration at the senior secondary school requires students to have a pre-requisite
knowledge and understanding of concepts such as measurements, shapes (plane and solid),
lines, angles, nets of solids, interpolation, formulae and numerical computational skills.
Memorization of mensuration formulae by students does not boost their understanding of
mensuration concepts and development of computational skills.
For students to understand the concept of mensuration, the teacher needs to bring in real-life
objects during teaching. But Pancare (2016) posited that the use of visual presentations in the
classroom is a common effective teaching method. Charts are examples of visual
representations. The use of charts as visual representation to teach mensuration will help
students to understand the ideas being taught. This is because there are some mensuration
concepts that the use of only real life objects cannot really represent in totality. Charts play
vital role in developing a better understanding of the mensuration concepts along with
making connections within and between concepts. Alamina (2008) stated that charts are used
by teachers to represent abstract ideas. It is very important that students understand the
mensuration concepts that are taught since they continue to come across mensuration in their
subsequent classes in a spirally integrated mathematics curriculum. Abayomi (2009) opined
that charts help students to make connections and applications. For charts to meet the needs
of students and actually enhance their understanding in mensuration, the charts need to be
well prepared, relevant and appropriate to the particular mensuration concept being taught.
To this end, George (2012) outlined the following as the characteristics of a good
instructional chart.
1. Must have a title
2. Must be bold and centralised.
3. Must not represent so many concepts at a time.
4. Must have margin
5. Must comply to colour harmony rules.
6. Must not be artistic.
7. Must be labelled horizontally.
The use of instructional charts by the teacher to teach topics that fall under mensuration
theme can be done alongside with any of the well-researched teaching methods. The use of
charts for teaching mensuration is highly advantageous because it unfolds a whole lot of
abstract ideas that real life models may not unfold. Odogwu (2015) posited that the unique
International Journal of Mathematics and Statistics Studies
Vol.6, No.1, pp.23-32, March 2018
___Published by European Centre for Research Training and Development UK (www.eajournals.org)
25 Print ISSN: 2053-2229, Online ISSN: ISSN 2053-2210
nature of mathematics (abstract, hierarchy of concepts, use of symbols and notation,
computation, estimation, approximation, visualization, proofs, induction, deduction and
logical reasoning) demands the use of instructional materials in the teaching and learning of
mathematics to enhance students understanding of mathematics concepts and also demystify
any doubt, misconception or wrong belief in the students. Martinelli and Mraz (2013) opined
that charts help to make teaching visible and also make students to understand and use what
they have learnt. In as much as research has shown that the use of charts for instructional
purposes make students understand the concept of mensuration, it is equally important for the
teacher to use the chart effectively. Instructional charts can be used for demonstration,
practical, collaboration, etc. Each of these strategies calls for skilful and effective use of the
chart.
The demonstration instructional approach simply means the use of apparatus (instructional
materials) by the teacher to clearly show and explain the concepts being taught with
convincing reasons or proofs. This approach involves displaying of the right instructional
material, coaching the students with the aid of the instructional material to understand the
concept at hand and drilling the students. On the other hand, the collaborative instructional
approach is a learner-centred setting that allows the students to exchange ideas and interact
with peers and facilitators. The use of demonstration or collaborative approach is
challenging; therefore, the teacher has to possess the required skill.
Struble (2007) asserted that KWL chart is useful to complete formative assessment in the
classroom and it also allows the teachers to find out students’ prior knowledge in a particular
topic in mathematics (geometry and mensuration). Charles-Ogan, Onwioduokit and
Ogunkunle (2014) investigated mathematics laboratory and students’ conception of
mensuration using demonsatration and collaborative approaches and found out that students
who were taught mensuration using demonstration with mathematics laboratory approach
outperformed their counterparts and that gender factor did not significantly affect students’
conception of mensuration.
The Nigerian version of the WAEC Chief examiners report (2012) emphasized that most
students steer clear of answering any question in mensuration. This singular attitude of the
students reveal that something is wrong in the teaching and students’ improper understanding
of the concepts in the mensuration theme. The researchers feel that students do not
understand the mensuration concepts they are taught as a result of insufficient and inadequate
use of instructional charts in addition to whatever real life instructional model that is
available. This study was therefore carried out to investigate the effects of use of charts on
students’ understanding of the concept of mensuration using demonstration and collaborative
instructional approaches.
Problem Statement
Mathematics teachers always complain that mathematics as a subject lack enough
instructional materials to concretize the teaching of mathematics concepts. The commonest
instructional material is the chart. Charts can be bought (industrial) or locally prepared by
either the teachers or the students. The researchers have observed with dismay that most
mathematics teachers carry out instruction on mensuration without the use of charts and the
few that employ charts use it monotonously. How then will students understand the concept
of mensuration and begin to answer questions on them in examination? This study is
therefore set out to explore the possible effects the use of charts may have on students’
International Journal of Mathematics and Statistics Studies
Vol.6, No.1, pp.23-32, March 2018
___Published by European Centre for Research Training and Development UK (www.eajournals.org)
26 Print ISSN: 2053-2229, Online ISSN: ISSN 2053-2210
understanding of the concept of mensuration using demonstration and collaborative
instructional approaches.
Objectives of the Study
This study’s objectives are to:
1. Ascertain the effect of use of charts on students’ understanding of the concept of
mensuration using demonstration and collaboration approaches.
2. Determine the effect of use of charts on the male and female students’ understanding
of the concept of mensuration using demonstration and collaboration approaches.
Research Questions
1. What effect has the use of charts on students’ understanding of the concept of
mensuration using demonstration and collaboration approaches?
2. To what extent does the use of charts affect the male and female students’
understanding of the concept of mensuration?
Hypotheses
Two null hypotheses were tested at .05 significant level.
Ho1: There is no significant difference between the students’ understanding of the concept of
mensuration when taught with charts using demonstration and collaborative approaches.
Ho2: There is no significant difference between the male and female students’ understanding
of the concept of mensuration when taught with charts using demonstration and collaborative
approaches.
METHODOLOGY
This study adopted the pretest-posttest equivalent quasi-experimental intact class research
design. The design was 2X2X3 factorial. Two experimental groups and one control group
were presented. Experimental group one was taught the concept of mensuration with chart
using demonstration instructional approach, experimental group two was taught the concept
of mensuration with chart using collaboration instructional approach while the control group
was taught the same mensuration concepts using the conventional instructional approach. The
study was set in Okrika Local Government Area of Rivers State, Nigeria. The population for
this study was comprised of about eight-hundred (800) senior secondary two (SS2) students
in the six (6) co-educational public senior secondary schools in Okrika Local Government
Area of Rivers State, Nigeria. The sample size was 105 students, drawn from the three
schools. To ensure that there is relationship in the academic ability of the students, the first 35
students based on third term results in mathematics in each of the schools formed the sample
size.
The name of the instrument used to collect data was Test on Understanding of the Concept of
Mensuration (TUCM). TUCM measured students’ understanding of the concept of
mensuration. There were 50 multiple choice questions in TUCM. Each question had four
International Journal of Mathematics and Statistics Studies
Vol.6, No.1, pp.23-32, March 2018
___Published by European Centre for Research Training and Development UK (www.eajournals.org)
27 Print ISSN: 2053-2229, Online ISSN: ISSN 2053-2210
options (lettered A to D). Three of the options were distracters and only one option was the
correct answer. A table of specification which guided the allocation of questions into the
cognitive (lower and higher) learning domains was prepared by the researchers. Each correct
answer was scored one mark and each wrong answer was scored zero mark. The total score
for TUCM was 50. TUCM was face and content validated by two mathematics educators. A
reliability coefficient of 0.86 was established for TUCM based on the data obtained from a
pilot study using the KR-20 Formula, stated thus:
2
11
20
pq
n
nRK
Where n is number of items, p= proportion that answered the items correctly, q= proportion
that answered the items wrongly and 2 = variance of the test scores.
TUCM was used to pre-test students in the two experimental groups and one control group.
After the pretest, the three groups were treated with instructional approach thus:
Group Instructional Approaches
Experiment group 1 - Demonstration approach with chart
Experiment group 2 - Collaborative approach with chart
Control group - Conventional approach
After each group was taught with the above specified instructional approach, a posttest of
TUCM was administered to the three groups. Their responses were graded and their scores
were obtained. The descriptive statistical tool (mean, standard deviation, and graph) was used
to answer the research questions while the hypotheses were tested inferentially at .05 level of
significance using Analysis of Covariance (ANCOVA).
RESULTS
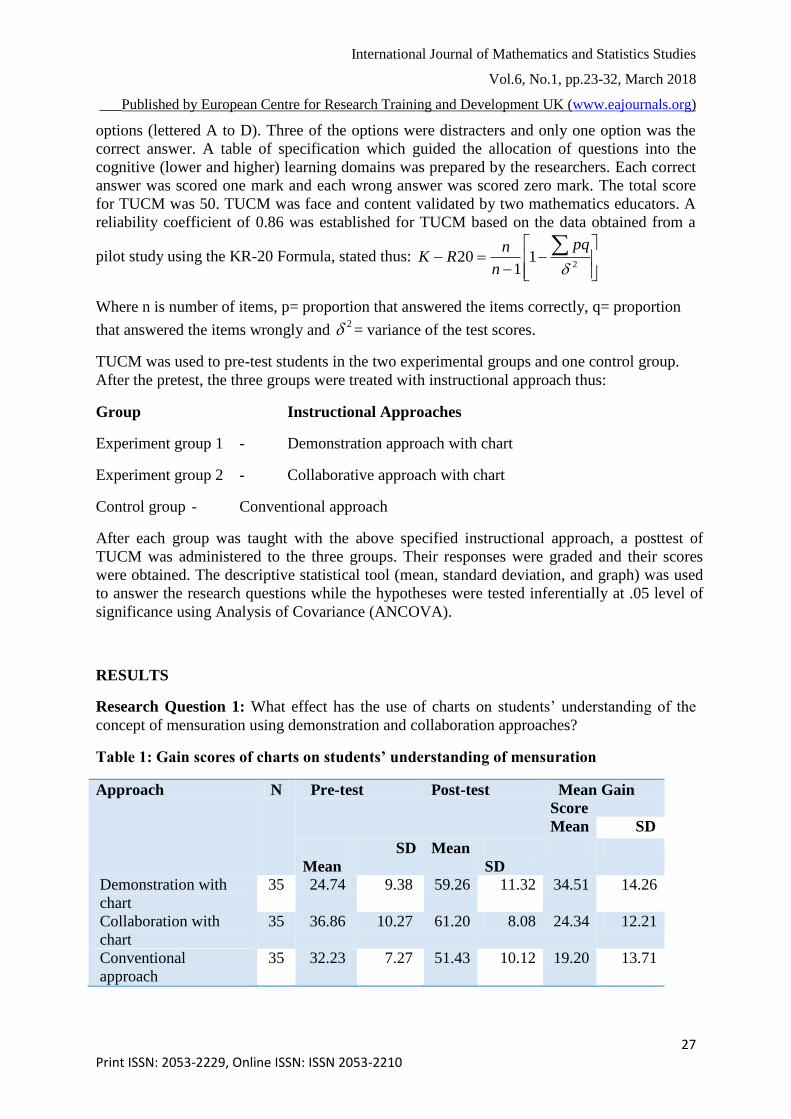
Research Question 1: What effect has the use of charts on students’ understanding of the
concept of mensuration using demonstration and collaboration approaches?
Table 1: Gain scores of charts on students’ understanding of mensuration
Approach N Pre-test Post-test Mean Gain
Score
Mean SD
Mean
SD Mean
SD
Demonstration with
chart
35 24.74 9.38 59.26 11.32 34.51 14.26
Collaboration with
chart
35 36.86 10.27 61.20 8.08 24.34 12.21
Conventional
approach
35 32.23 7.27 51.43 10.12 19.20 13.71
International Journal of Mathematics and Statistics Studies
Vol.6, No.1, pp.23-32, March 2018
___Published by European Centre for Research Training and Development UK (www.eajournals.org)
28 Print ISSN: 2053-2229, Online ISSN: ISSN 2053-2210
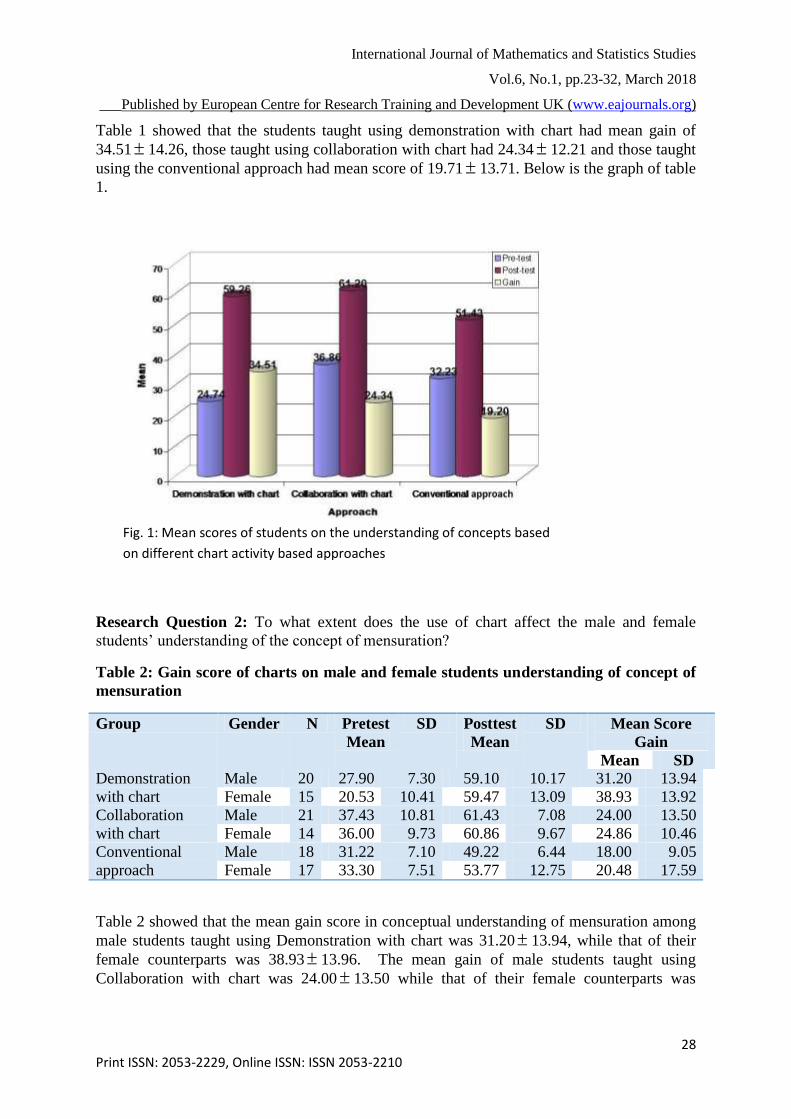
Table 1 showed that the students taught using demonstration with chart had mean gain of
34.51 14.26, those taught using collaboration with chart had 24.34 12.21 and those taught
using the conventional approach had mean score of 19.71 13.71. Below is the graph of table
1.
Research Question 2: To what extent does the use of chart affect the male and female
students’ understanding of the concept of mensuration?
Table 2: Gain score of charts on male and female students understanding of concept of
mensuration
Group Gender N Pretest
Mean
SD Posttest
Mean
SD Mean Score
Gain
Mean SD
Demonstration
with chart
Male 20 27.90 7.30 59.10 10.17 31.20 13.94
Female 15 20.53 10.41 59.47 13.09 38.93 13.92
Collaboration
with chart
Male 21 37.43 10.81 61.43 7.08 24.00 13.50
Female 14 36.00 9.73 60.86 9.67 24.86 10.46
Conventional
approach
Male 18 31.22 7.10 49.22 6.44 18.00 9.05
Female 17 33.30 7.51 53.77 12.75 20.48 17.59
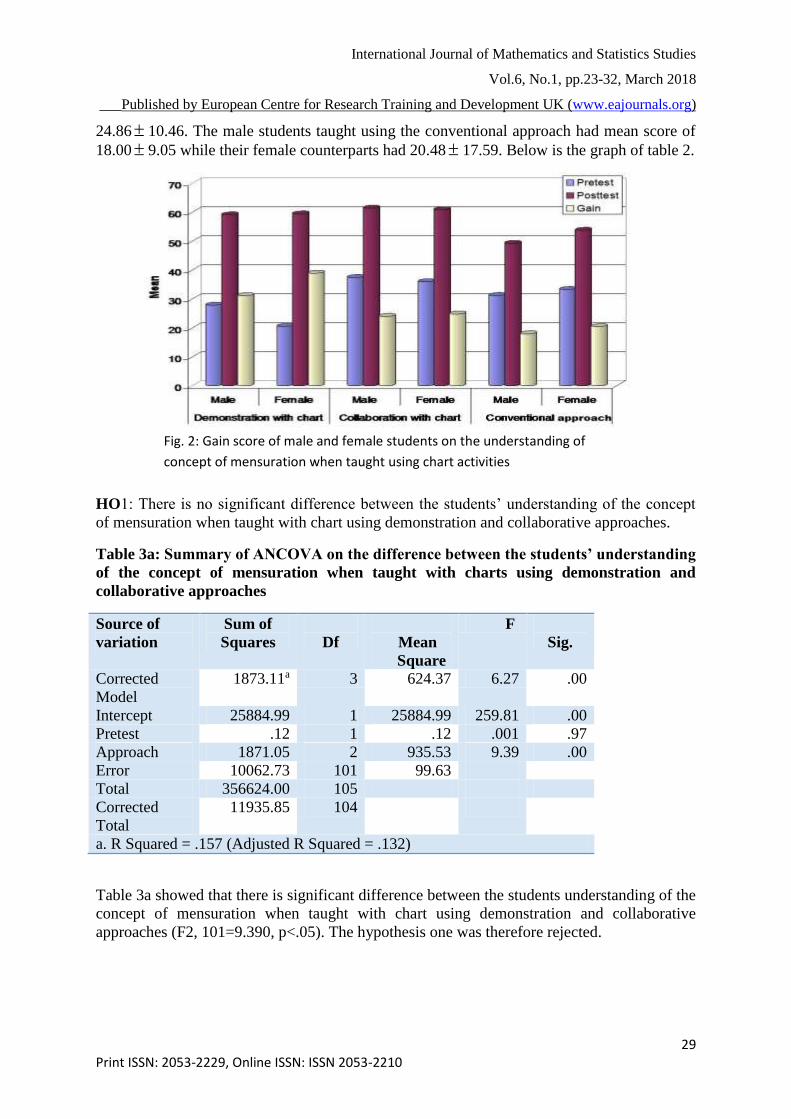
Table 2 showed that the mean gain score in conceptual understanding of mensuration among
male students taught using Demonstration with chart was 31.20 13.94, while that of their
female counterparts was 38.93 13.96. The mean gain of male students taught using
Collaboration with chart was 24.00 13.50 while that of their female counterparts was
Fig. 1: Mean scores of students on the understanding of concepts based
on different chart activity based approaches
International Journal of Mathematics and Statistics Studies
Vol.6, No.1, pp.23-32, March 2018
___Published by European Centre for Research Training and Development UK (www.eajournals.org)
29 Print ISSN: 2053-2229, Online ISSN: ISSN 2053-2210
24.86 10.46. The male students taught using the conventional approach had mean score of
18.00 9.05 while their female counterparts had 20.48 17.59. Below is the graph of table 2.
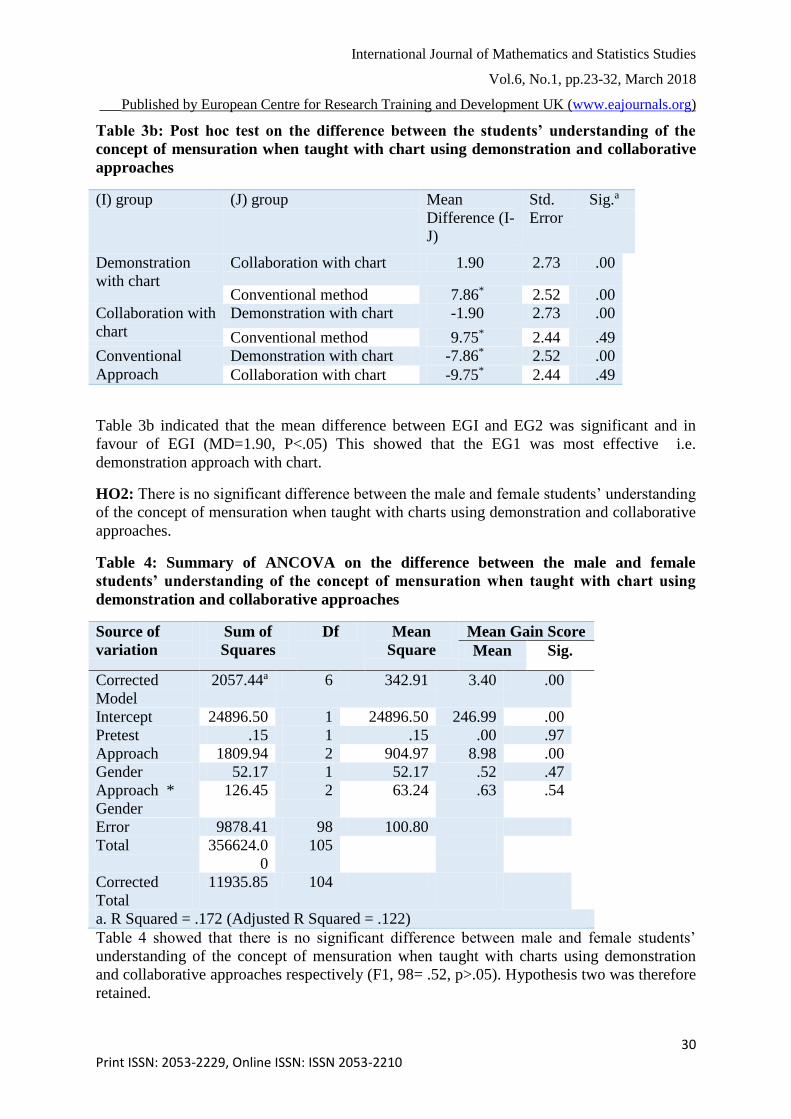
HO1: There is no significant difference between the students’ understanding of the concept
of mensuration when taught with chart using demonstration and collaborative approaches.
Table 3a: Summary of ANCOVA on the difference between the students’ understanding
of the concept of mensuration when taught with charts using demonstration and
collaborative approaches
Source of
variation
Sum of
Squares
Df
Mean
Square
F
Sig.
Corrected
Model
1873.11a 3 624.37 6.27 .00
Intercept 25884.99 1 25884.99 259.81 .00
Pretest .12 1 .12 .001 .97
Approach 1871.05 2 935.53 9.39 .00
Error 10062.73 101 99.63
Total 356624.00 105
Corrected
Total
11935.85 104
a. R Squared = .157 (Adjusted R Squared = .132)
Table 3a showed that there is significant difference between the students understanding of the
concept of mensuration when taught with chart using demonstration and collaborative
approaches (F2, 101=9.390, p<.05). The hypothesis one was therefore rejected.
Fig. 2: Gain score of male and female students on the understanding of
concept of mensuration when taught using chart activities
International Journal of Mathematics and Statistics Studies
Vol.6, No.1, pp.23-32, March 2018
___Published by European Centre for Research Training and Development UK (www.eajournals.org)
30 Print ISSN: 2053-2229, Online ISSN: ISSN 2053-2210
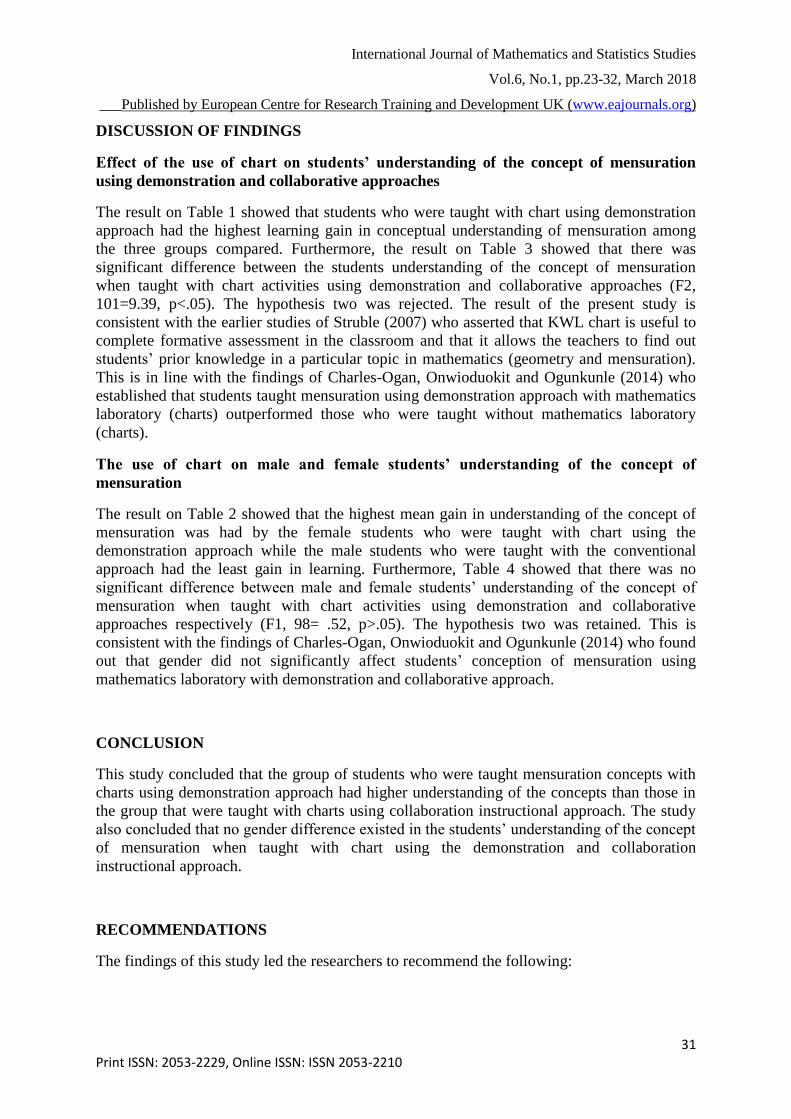
Table 3b: Post hoc test on the difference between the students’ understanding of the
concept of mensuration when taught with chart using demonstration and collaborative
approaches
(I) group (J) group Mean
Difference (I-
J)
Std.
Error
Sig.a
Demonstration
with chart
Collaboration with chart 1.90 2.73 .00
Conventional method 7.86* 2.52 .00
Collaboration with
chart
Demonstration with chart -1.90 2.73 .00
Conventional method 9.75* 2.44 .49
Conventional
Approach
Demonstration with chart -7.86* 2.52 .00
Collaboration with chart -9.75* 2.44 .49
Table 3b indicated that the mean difference between EGI and EG2 was significant and in
favour of EGI (MD=1.90, P<.05) This showed that the EG1 was most effective i.e.
demonstration approach with chart.
HO2: There is no significant difference between the male and female students’ understanding
of the concept of mensuration when taught with charts using demonstration and collaborative
approaches.
Table 4: Summary of ANCOVA on the difference between the male and female
students’ understanding of the concept of mensuration when taught with chart using
demonstration and collaborative approaches
Source of
variation
Sum of
Squares
Df Mean
Square
Mean Gain Score
Mean Sig.
Corrected
Model
2057.44a 6 342.91 3.40 .00
Intercept 24896.50 1 24896.50 246.99 .00
Pretest .15 1 .15 .00 .97
Approach 1809.94 2 904.97 8.98 .00
Gender 52.17 1 52.17 .52 .47
Approach *
Gender
126.45 2 63.24 .63 .54
Error 9878.41 98 100.80
Total 356624.0
0
105
Corrected
Total
11935.85 104
a. R Squared = .172 (Adjusted R Squared = .122)
Table 4 showed that there is no significant difference between male and female students’
understanding of the concept of mensuration when taught with charts using demonstration
and collaborative approaches respectively (F1, 98= .52, p>.05). Hypothesis two was therefore
retained.
International Journal of Mathematics and Statistics Studies
Vol.6, No.1, pp.23-32, March 2018
___Published by European Centre for Research Training and Development UK (www.eajournals.org)
31 Print ISSN: 2053-2229, Online ISSN: ISSN 2053-2210
DISCUSSION OF FINDINGS
Effect of the use of chart on students’ understanding of the concept of mensuration
using demonstration and collaborative approaches
The result on Table 1 showed that students who were taught with chart using demonstration
approach had the highest learning gain in conceptual understanding of mensuration among
the three groups compared. Furthermore, the result on Table 3 showed that there was
significant difference between the students understanding of the concept of mensuration
when taught with chart activities using demonstration and collaborative approaches (F2,
101=9.39, p<.05). The hypothesis two was rejected. The result of the present study is
consistent with the earlier studies of Struble (2007) who asserted that KWL chart is useful to
complete formative assessment in the classroom and that it allows the teachers to find out
students’ prior knowledge in a particular topic in mathematics (geometry and mensuration).
This is in line with the findings of Charles-Ogan, Onwioduokit and Ogunkunle (2014) who
established that students taught mensuration using demonstration approach with mathematics
laboratory (charts) outperformed those who were taught without mathematics laboratory
(charts).
The use of chart on male and female students’ understanding of the concept of
mensuration
The result on Table 2 showed that the highest mean gain in understanding of the concept of
mensuration was had by the female students who were taught with chart using the
demonstration approach while the male students who were taught with the conventional
approach had the least gain in learning. Furthermore, Table 4 showed that there was no
significant difference between male and female students’ understanding of the concept of
mensuration when taught with chart activities using demonstration and collaborative
approaches respectively (F1, 98= .52, p>.05). The hypothesis two was retained. This is
consistent with the findings of Charles-Ogan, Onwioduokit and Ogunkunle (2014) who found
out that gender did not significantly affect students’ conception of mensuration using
mathematics laboratory with demonstration and collaborative approach.
CONCLUSION
This study concluded that the group of students who were taught mensuration concepts with
charts using demonstration approach had higher understanding of the concepts than those in
the group that were taught with charts using collaboration instructional approach. The study
also concluded that no gender difference existed in the students’ understanding of the concept
of mensuration when taught with chart using the demonstration and collaboration
instructional approach.
RECOMMENDATIONS
The findings of this study led the researchers to recommend the following:
International Journal of Mathematics and Statistics Studies
Vol.6, No.1, pp.23-32, March 2018
___Published by European Centre for Research Training and Development UK (www.eajournals.org)
32 Print ISSN: 2053-2229, Online ISSN: ISSN 2053-2210
1. For students to effectively understand the concept of mensuration, mathematics
teachers should use instructional materials such as charts to teach in addition to
available real-life models.
2. Teachers should vary the instructional approaches when they employ charts to teach
mathematics concepts in general and mensuration concepts in specific.
3. Gender of the students should be considered when teaching mensuration.
4. Teachers should endeavour to produce instructional charts for the teaching of abstract
concepts.
5. Mathematics teachers should make a u-turn from the use of conventional approach to
teach mathematics to well researched modern approaches.
REFERENCES
Abayomi, J.J. (2009). Effective teaching of STM subjects in Nigerian secondary schools.
Akure: Faithworth Publishers.
Adams, L.C. (2009). Elements of mathematics curriculum. Port Harcourt. Sammy Printers
Press.
Adams,D.A. (2009). Elements of mathematics curriculum. Lagos: Fair Publishers.
Alamina, J.I. (2008). Fundamental principles of science teaching and learning. Port
Harcourt: Votex Publishers.
Ask.com (2016). What is mensuration in mathematics. Retrieved from
www.ask.com?math/mensuration-mathematics on 15-02-2016.
Charles-Ogan, G, Onwioduokit, F.A. & Ogunkunle, R.A. (2014). Mathematics laboratory and
students’ conception of mensuration using demonstration and collaborative approaches
in Rivers State. Journal of International Academic Research for Multidisciplinary. 2
(7), 245 – 257.
George, N.R. (2012). Principles of teaching mathematics. Course lecture note on MTH 315,
teaching mathematics in senior secondary schools.
Martinelli, M. & Mraz, K. (2013).Increasing the life span of charts. Retrieved from
http://chartchums.wordpress.com on 03/01/2016.
Odogwu, H.N. (2015). A comprehensive guide for teaching mathematics in secondary school.
Lagos: Sibon Books Limited.
Pancare, L. (2016). Visual representation in the teaching of mathematics: A teachers’ guide.
Accra: Sunshine.
Struble, J (2007). Using graphic organizers as formative assessment. Science Scope. 30(5),
69-71.
West African Examination Council (2012). Chief Examiners’ Report, Nigeria.
Copyright © 2022 FDOKUMEN