international journal of conservation science are commercial ...
15
HAL Id: hal-02181968 https://hal.archives-ouvertes.fr/hal-02181968 Submitted on 16 Jul 2019 HAL is a multi-disciplinary open access archive for the deposit and dissemination of sci- entific research documents, whether they are pub- lished or not. The documents may come from teaching and research institutions in France or abroad, or from public or private research centers. L’archive ouverte pluridisciplinaire HAL, est destinée au dépôt et à la diffusion de documents scientifiques de niveau recherche, publiés ou non, émanant des établissements d’enseignement et de recherche français ou étrangers, des laboratoires publics ou privés. INTERNATIONAL JOURNAL OF CONSERVATION SCIENCE ARE COMMERCIAL PIGMENTS RELIABLE REFERENCES FOR THE ANALYSIS OF PAINTINGS? Laura Rampazzi, Cristina Corti To cite this version: Laura Rampazzi, Cristina Corti. INTERNATIONAL JOURNAL OF CONSERVATION SCIENCE ARE COMMERCIAL PIGMENTS RELIABLE REFERENCES FOR THE ANALYSIS OF PAINT- INGS?. International Journal of Conservation Science, Alexandru Ioan Cuza University Publishing House, 2019. hal-02181968
-
Upload
khangminh22 -
Category
Documents
-
view
3 -
download
0
Transcript of international journal of conservation science are commercial ...
HAL Id: hal-02181968https://hal.archives-ouvertes.fr/hal-02181968
Submitted on 16 Jul 2019
HAL is a multi-disciplinary open accessarchive for the deposit and dissemination of sci-entific research documents, whether they are pub-lished or not. The documents may come fromteaching and research institutions in France orabroad, or from public or private research centers.
L’archive ouverte pluridisciplinaire HAL, estdestinée au dépôt et à la diffusion de documentsscientifiques de niveau recherche, publiés ou non,émanant des établissements d’enseignement et derecherche français ou étrangers, des laboratoirespublics ou privés.
INTERNATIONAL JOURNAL OF CONSERVATIONSCIENCE ARE COMMERCIAL PIGMENTS
RELIABLE REFERENCES FOR THE ANALYSIS OFPAINTINGS?
Laura Rampazzi, Cristina Corti
To cite this version:Laura Rampazzi, Cristina Corti. INTERNATIONAL JOURNAL OF CONSERVATION SCIENCEARE COMMERCIAL PIGMENTS RELIABLE REFERENCES FOR THE ANALYSIS OF PAINT-INGS?. International Journal of Conservation Science, Alexandru Ioan Cuza University PublishingHouse, 2019. �hal-02181968�
ISSN: 2067-533X
INTERNATIONAL JOURNAL
OF CONSERVATION SCIENCE
Volume 10, Issue 2, April-June 2019: 207-220
www.ijcs.uaic.ro
ARE COMMERCIAL PIGMENTS RELIABLE REFERENCES
FOR THE ANALYSIS OF PAINTINGS?
Laura RAMPAZZI1,2*, Cristina CORTI1
1Dipartimento di Scienze Umane e dell’Innovazione per il Territorio, Università degli Studi dell’Insubria, via Valleggio
11, 22100 Como, Italy 2Istituto per la Conservazione e la Valorizzazione dei Beni Culturali, Sezione “G. Bozza”, Consiglio Nazionale delle
Ricerche, via Cozzi 53, 20125 Milano, Italy
Abstract
When paintings are examined by spectroscopic techniques, building a robust database is of
major importance, in order to compare the analyses with reliable references and to correctly understand the results. The database, which is usually homemade, should include carefully
chosen commercial pigments, which should be as pure as possible and should correspond to
the expected formula or composition of the historical pigments. Unfortunately, sometimes no correspondence between the names of the pigments used by companies and the actual
composition of some of the colors is ascertained. In some cases, the composition is in fact
made up of different chemical compounds; in others the presence of extenders is revealed, for example gypsum and calcite. In this paper some cases studies are discussed, regarding
commercial pigments analysed by infrared spectroscopy, thermal analysis, X-ray diffraction
and X-ray fluorescence. The results highlighted the importance of checking the purity of commercial pigments and excluding any extraneous compounds while interpreting the results
of analytical survey of paintings.
Keywords: Painting analysis; Pigments; Infrared spectroscopy; Thermogravimetry;
X-ray diffraction; X-ray fluorescence
Introduction
When analyzing painted artifacts (easel and wall paintings, written and wooden
supports) in order to identify the palette used or for conservation and authentication purposes, a
database of the reference painting materials is of major importance, irrespective of the
technique used. Firstly, original pigments in use when the painting was created need to be
identified from artists’ handbooks and manuals, if possible in collaboration with art historians
or archaeologists. Secondly, the modern commercial pigments used for the database need to be
as similar as possible to those used in the past. This is particularly important from an analytical
point of view, as the references should be as pure as possible. In other words the references
should correspond to the expected formula or composition of the historical pigments. Having
characterized the references, the analysts can then decide which analytical techniques are best
for the identification of the pigments presumed to be present in the artifacts, taking into account
any possible matrix interference, and also evaluating the use of non-invasive instruments. The support of a robust database ensures reliable results in terms of the artist's palette. It
may also be useful in revealing forgeries, if a pigment that does not correspond with the historical period or the painter is identified, and if the recipes described in technical manuals
* Corresponding author: [email protected]
L. RAMPAZZI and C. CORTI
INT J CONSERV SCI 10, 2, 2019: 207-220 208
have been used. Particular attention should thus be paid to the names of the pigments, as the same term may be used in the past to refer to more than one pigment and conversely the same pigment can be called different names. The technical names of painting materials may have changed considerably over time, depending on the historical period, the painter, the production recipe, location, or simply due to misunderstandings [1]. The names given to materials occasionally referred to the hue, without relating to the composition that would be expected from the terms. Confusion about names has only partially been overcome with a universally recognized vocabulary [1, 2]. The confusion regarding technical terms also makes it complicated to decipher the historical sources, as one-to-one translations are not always easy. In fact as Michel Pastoreau commented “the color of the painter is not that of the physicist, and that of the physicist is not that of the poet”/“la couleur du peintre n’est pas celle du physicien et que celle du physicien n’est pas celle du poète” [3]. Thus a bibliographic research needs to include the synonyms used for the same pigments in different historical periods and geographical areas, and all the nomenclatures should be listed in the database.
Commercial brands should include a report on how the pigments have been produced together with their composition, and scientists should opt for those prepared following traditional recipes. This is also important for restorers, who during conservation work often have to fill or replace gaps in the paint and need to know the real composition of the products in order to predict the chemical compatibility with the compounds present in the artifact and prevent unwanted secondary reactions.
Based on our experience and in line with the literature [4–8], the purity of commercial pigments is sometimes doubtful, suggesting that the composition needs to be checked and the signals of the extraneous compounds need to be removed in order to obtain results that only refer to unadulterated compounds. The adulteration and substitution of pigments, the substitution of names, the addition of other materials have also been of major concern for painters, particularly when tube paints came into use in the 19th century and painters no longer prepared colors themselves from raw materials, as demonstrated by an analytical campaign on paintings and sample books of this period [9, 10]. Many artists have noted differences in the painting materials they have used over time, unaware that the suppliers had consciously adulterated the pigments without revealing the real formula and key ingredients [11]. In fact, lower-quality and cheaper ingredients were added or substituted the expected pigments components, also to expand the range of colors for sale.
Here we discuss some significant results of analysis of references [12–15] by infrared spectroscopy (FTIR), X-ray diffraction (XRD), X-ray fluorescence (XRF), thermogravimetric analysis (TGA).
We also discussed the so-called Mars pigments, i.e. supposedly artificial ochres that have been produced since the 19th century from iron salts, alum and alkali but have never been extensively characterized before [1, 2, 16]. The term Mars comes after the name of the Roman god of war and is associated with iron. Depending on the addition of alum and on the different temperatures and heating times, and the subsequent different hydration levels, the hue ranges from yellow to violet, and from brown to black. All the varieties were produced starting from Mars yellow, which could be turned by heat to orange, red, and violet. Chemically, the Mars pigments possible are goethite (FeOOH), magnetite (Fe3O4) and hematite (Fe2O3), usually mixed with minerals such as kaolinite, gypsum, calcite and quartz (SiO2). The aim of the characterization by various techniques was to provide new insights into the different composition of each Mars hue.
Experimental
Pigments
The considered pigments were both traditional and synthetic modern products and
manufactured in Italy and Germany from 2015 to 2017. The names refer to the traditional and
ARE COMMERCIAL PIGMENTS RELIABLE REFERENCES FOR THE ANALYSIS OF PAINTINGS?
http://www.ijcs.uaic.ro 209
most widespread ones, not necessarily considering the brand labels.
Infrared spectroscopy
FTIR spectra were recorded on KBr pellets (Sigma-Aldrich FTIR Grade) in transmission
mode, by BioRad Excalibur Series FTS 3000 and Thermo Scientific Nicolet iS10 spectrometer
(detector DTGS) in the 4000–400 cm-1 range, with a resolution of 4 cm-1. Pellets were prepared
by mixing samples and KBr in an agate mortar, pouring the mixture into a press and then
applying a pressure of 6 t/cm2 for 1 minute. Paper-based databases, reference spectra from
literature and web databases were used to identify the species in each FTIR spectrum, by
comparing experimental peaks with reference patterns.
Thermal analysis
Thermal analysis (TGA/DSC) was performed by means of a NETZSCH STA 409 PC
instrument. Samples were placed in alumina crucibles, with the temperature program ranging
from room temperature to 600°C, at a heating rate of 20°C min-1 under pure nitrogen
atmosphere. TG and DSC raw data were corrected on the basis of a background curve.
X-ray fluorescence
X-ray fluorescence analysis was performed by means of a PANalytical Minipal 4
energy-dispersive XRF Bench-Top Spectrometer (30kV, auto-current, no filters, 180 sec of
acquisition). Element recognition was achieved by means of an electronic database.
X-ray powder diffraction analysis
X-ray diffraction analyses were conducted using a Rigaku Miniflex 300 diffractometer
(30kV, 10mA, Cu-Kα radiation (λ = 1.5418Å), 5-55° Theta/2-Theta, step scan 0.02°, scan speed
3°/min). PDXL2 software supporting ICDD (The International Centre for Diffraction Data)
PDF2 databases were used to identify the phases in each X-ray powder spectrum, by comparing
experimental peaks with reference patterns.
Results and Discussion
The pigments were analyzed by FTIR, XRD and XRF. Mars pigments were also
characterized by thermal analysis. The results of the XRD and XRF analyses were interpreted
with the instrument databases, and the TG and FTIR determinations were deciphered on the
basis of references discussed in the literature.
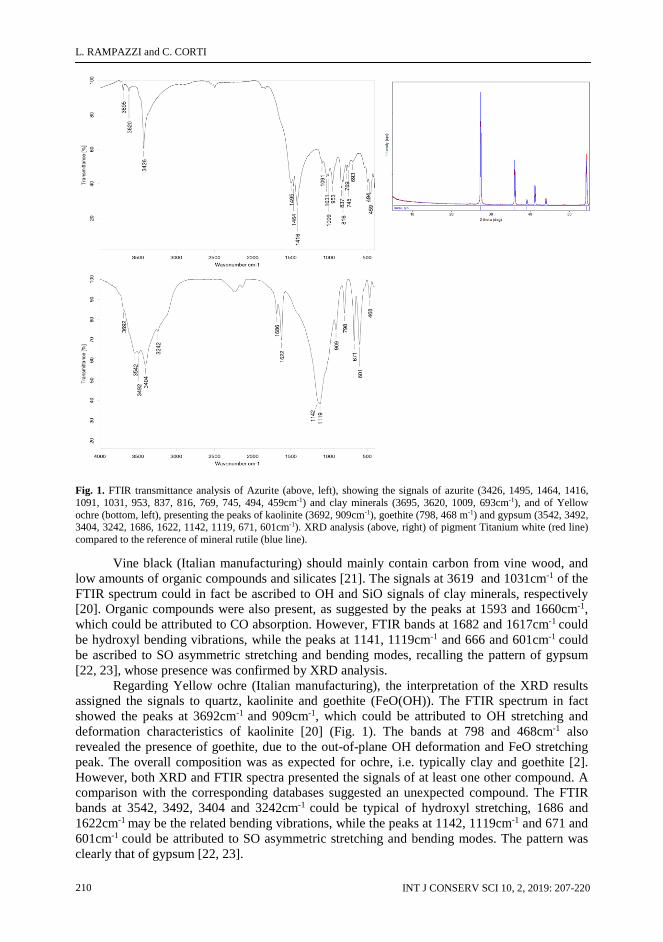
Figure 1 shows the XRD signals of the pigment Titanium white (German manufacturing)
overlapping with the reference of the natural mineral rutile-composed of titanium dioxide-
showing a perfect fitting and proving the correspondence between the composition and what
stated on the label. IR and XRF results confirmed the purity of the pigment, as no peaks were
observed and only the signal of titanium was recorded, respectively.
The same correspondence was observed with Prussian Blue (German manufacturing).
The FTIR spectrum showed an intense peak at 2088 cm-1, which is the typical band of CN
stretching. In addition, the bending peak at 3257 cm-1 and stretching signal at 1611cm-1, which
may be due to HOH and OH signals of interstitial water respectively, the FeC stretching peaks
at 1415, 1043, and 605cm-1, and the FeCN bending modes at 512 and 497cm-1 confirm the
compound described by the manufacturer, which is iron(II, III) hexacyanoferrate(II, III) [17].
XRD results confirmed the attribution.
In some cases, some substances possibly associated with natural occurrences of mineral-
based pigments or due to intentional additives were determined.
Figure 1 shows the FTIR spectrum of pigment Azurite (German manufacturing). The
peaks of carbonate group absorption at 1495, 1464, 1416, 1091, 837, 816, 769, 745cm-1, OH
out-of-plane bending modes at 3426, 1031, 953cm-1, bending CuO signals at 494 and 459 cm-1
are typical of the basic copper carbonate that constitutes this pigment [18, 19]. In addition, we
observed signals at 3695, 3620 and 693cm-1, and a band at 1009cm-1, which undoubtedly are the
typical absorptions of OH and SiO groups contained in clay minerals, respectively [20].
L. RAMPAZZI and C. CORTI
INT J CONSERV SCI 10, 2, 2019: 207-220 210
Fig. 1. FTIR transmittance analysis of Azurite (above, left), showing the signals of azurite (3426, 1495, 1464, 1416,
1091, 1031, 953, 837, 816, 769, 745, 494, 459cm-1) and clay minerals (3695, 3620, 1009, 693cm-1), and of Yellow
ochre (bottom, left), presenting the peaks of kaolinite (3692, 909cm-1), goethite (798, 468 m-1) and gypsum (3542, 3492, 3404, 3242, 1686, 1622, 1142, 1119, 671, 601cm-1). XRD analysis (above, right) of pigment Titanium white (red line)
compared to the reference of mineral rutile (blue line).
Vine black (Italian manufacturing) should mainly contain carbon from vine wood, and
low amounts of organic compounds and silicates [21]. The signals at 3619 and 1031cm-1 of the
FTIR spectrum could in fact be ascribed to OH and SiO signals of clay minerals, respectively
[20]. Organic compounds were also present, as suggested by the peaks at 1593 and 1660cm-1,
which could be attributed to CO absorption. However, FTIR bands at 1682 and 1617cm-1 could
be hydroxyl bending vibrations, while the peaks at 1141, 1119cm-1 and 666 and 601cm-1 could
be ascribed to SO asymmetric stretching and bending modes, recalling the pattern of gypsum
[22, 23], whose presence was confirmed by XRD analysis.
Regarding Yellow ochre (Italian manufacturing), the interpretation of the XRD results
assigned the signals to quartz, kaolinite and goethite (FeO(OH)). The FTIR spectrum in fact
showed the peaks at 3692cm-1 and 909cm-1, which could be attributed to OH stretching and
deformation characteristics of kaolinite [20] (Fig. 1). The bands at 798 and 468cm-1 also
revealed the presence of goethite, due to the out-of-plane OH deformation and FeO stretching
peak. The overall composition was as expected for ochre, i.e. typically clay and goethite [2].
However, both XRD and FTIR spectra presented the signals of at least one other compound. A
comparison with the corresponding databases suggested an unexpected compound. The FTIR
bands at 3542, 3492, 3404 and 3242cm-1 could be typical of hydroxyl stretching, 1686 and
1622cm-1 may be the related bending vibrations, while the peaks at 1142, 1119cm-1 and 671 and
601cm-1 could be attributed to SO asymmetric stretching and bending modes. The pattern was
clearly that of gypsum [22, 23].
ARE COMMERCIAL PIGMENTS RELIABLE REFERENCES FOR THE ANALYSIS OF PAINTINGS?
http://www.ijcs.uaic.ro 211
In some cases the supposed composition of the pigments on the basis of the commercial
names did not match the results of the analytical investigations.
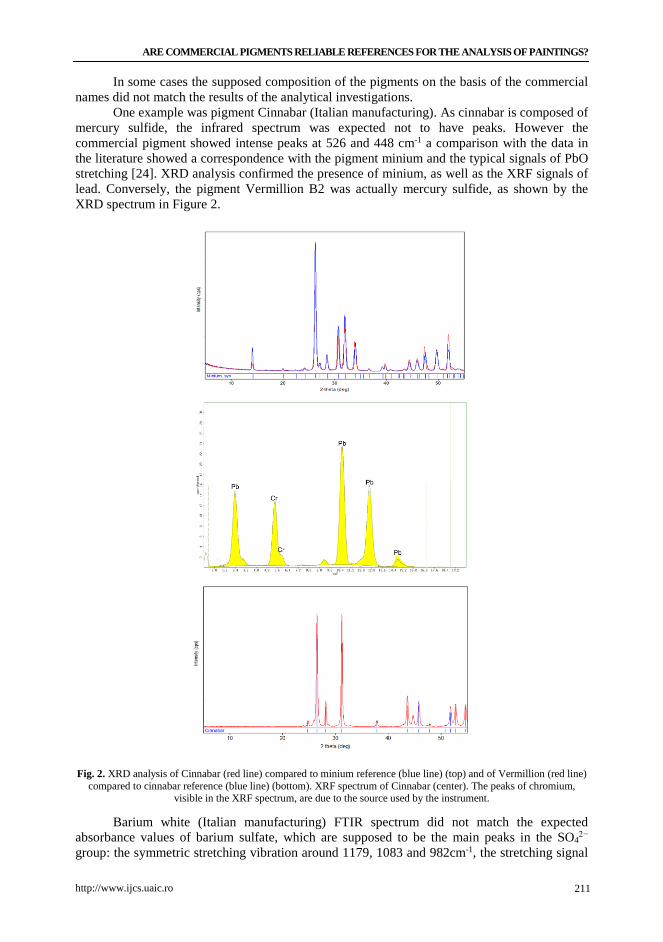
One example was pigment Cinnabar (Italian manufacturing). As cinnabar is composed of
mercury sulfide, the infrared spectrum was expected not to have peaks. However the
commercial pigment showed intense peaks at 526 and 448 cm-1 a comparison with the data in
the literature showed a correspondence with the pigment minium and the typical signals of PbO
stretching [24]. XRD analysis confirmed the presence of minium, as well as the XRF signals of
lead. Conversely, the pigment Vermillion B2 was actually mercury sulfide, as shown by the
XRD spectrum in Figure 2.
Fig. 2. XRD analysis of Cinnabar (red line) compared to minium reference (blue line) (top) and of Vermillion (red line)
compared to cinnabar reference (blue line) (bottom). XRF spectrum of Cinnabar (center). The peaks of chromium, visible in the XRF spectrum, are due to the source used by the instrument.
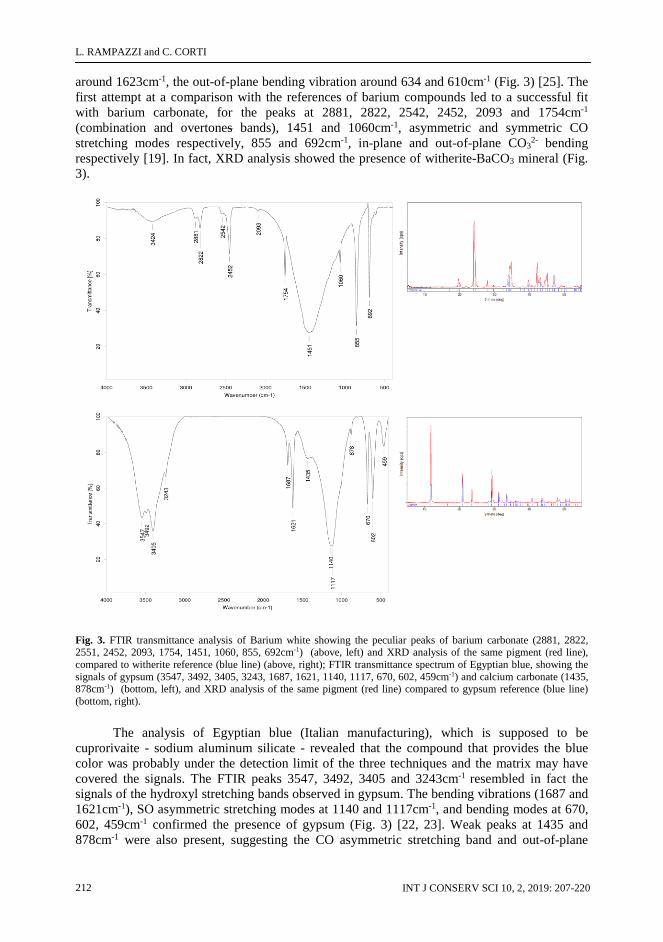
Barium white (Italian manufacturing) FTIR spectrum did not match the expected
absorbance values of barium sulfate, which are supposed to be the main peaks in the SO42−
group: the symmetric stretching vibration around 1179, 1083 and 982cm-1, the stretching signal
L. RAMPAZZI and C. CORTI
INT J CONSERV SCI 10, 2, 2019: 207-220 212
around 1623cm-1, the out-of-plane bending vibration around 634 and 610cm-1 (Fig. 3) [25]. The
first attempt at a comparison with the references of barium compounds led to a successful fit
with barium carbonate, for the peaks at 2881, 2822, 2542, 2452, 2093 and 1754cm-1
(combination and overtones bands), 1451 and 1060cm-1, asymmetric and symmetric CO
stretching modes respectively, 855 and 692cm-1, in-plane and out-of-plane CO32- bending
respectively [19]. In fact, XRD analysis showed the presence of witherite-BaCO3 mineral (Fig.
3).
Fig. 3. FTIR transmittance analysis of Barium white showing the peculiar peaks of barium carbonate (2881, 2822, 2551, 2452, 2093, 1754, 1451, 1060, 855, 692cm-1) (above, left) and XRD analysis of the same pigment (red line),
compared to witherite reference (blue line) (above, right); FTIR transmittance spectrum of Egyptian blue, showing the
signals of gypsum (3547, 3492, 3405, 3243, 1687, 1621, 1140, 1117, 670, 602, 459cm-1) and calcium carbonate (1435, 878cm-1) (bottom, left), and XRD analysis of the same pigment (red line) compared to gypsum reference (blue line)
(bottom, right).
The analysis of Egyptian blue (Italian manufacturing), which is supposed to be
cuprorivaite - sodium aluminum silicate - revealed that the compound that provides the blue
color was probably under the detection limit of the three techniques and the matrix may have
covered the signals. The FTIR peaks 3547, 3492, 3405 and 3243cm-1 resembled in fact the
signals of the hydroxyl stretching bands observed in gypsum. The bending vibrations (1687 and
1621cm-1), SO asymmetric stretching modes at 1140 and 1117cm-1, and bending modes at 670,
602, 459cm-1 confirmed the presence of gypsum (Fig. 3) [22, 23]. Weak peaks at 1435 and
878cm-1 were also present, suggesting the CO asymmetric stretching band and out-of-plane
ARE COMMERCIAL PIGMENTS RELIABLE REFERENCES FOR THE ANALYSIS OF PAINTINGS?
http://www.ijcs.uaic.ro 213
bending vibration of calcium carbonate possibly in low amounts [23]. XRD analysis confirmed
the identification of gypsum, as well as the XRF spectrum.
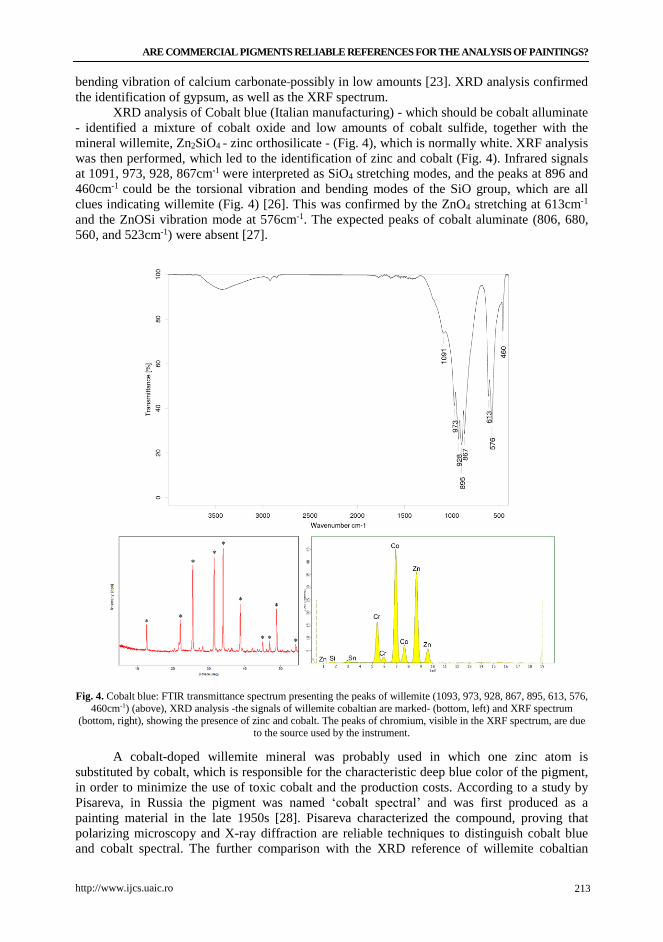
XRD analysis of Cobalt blue (Italian manufacturing) - which should be cobalt alluminate
- identified a mixture of cobalt oxide and low amounts of cobalt sulfide, together with the
mineral willemite, Zn2SiO4 - zinc orthosilicate - (Fig. 4), which is normally white. XRF analysis
was then performed, which led to the identification of zinc and cobalt (Fig. 4). Infrared signals
at 1091, 973, 928, 867cm-1 were interpreted as SiO4 stretching modes, and the peaks at 896 and
460cm-1 could be the torsional vibration and bending modes of the SiO group, which are all
clues indicating willemite (Fig. 4) [26]. This was confirmed by the ZnO4 stretching at 613cm-1
and the ZnOSi vibration mode at 576cm-1. The expected peaks of cobalt aluminate (806, 680,
560, and 523cm-1) were absent [27].
Fig. 4. Cobalt blue: FTIR transmittance spectrum presenting the peaks of willemite (1093, 973, 928, 867, 895, 613, 576,
460cm-1) (above), XRD analysis -the signals of willemite cobaltian are marked- (bottom, left) and XRF spectrum
(bottom, right), showing the presence of zinc and cobalt. The peaks of chromium, visible in the XRF spectrum, are due to the source used by the instrument.
A cobalt-doped willemite mineral was probably used in which one zinc atom is
substituted by cobalt, which is responsible for the characteristic deep blue color of the pigment,
in order to minimize the use of toxic cobalt and the production costs. According to a study by
Pisareva, in Russia the pigment was named ‘cobalt spectral’ and was first produced as a
painting material in the late 1950s [28]. Pisareva characterized the compound, proving that
polarizing microscopy and X-ray diffraction are reliable techniques to distinguish cobalt blue
and cobalt spectral. The further comparison with the XRD reference of willemite cobaltian
L. RAMPAZZI and C. CORTI
INT J CONSERV SCI 10, 2, 2019: 207-220 214
(International Centre for Diffraction Data PDF file 46-1316) and the XRD data reported by
Pisareva for ‘cobalt spectral’ confirmed the co-presence of doped willemite and pure willemite
(Fig. 4). On the basis of this result, the attribution of infrared signals of the pigment Cobalt blue
also to doped willemite cannot be ruled out. Other references report the use of Co - doped zinc
silicate (Zn2−xCoxSiO4), possibly as a coloring agent for ceramic glazes [29, 30].
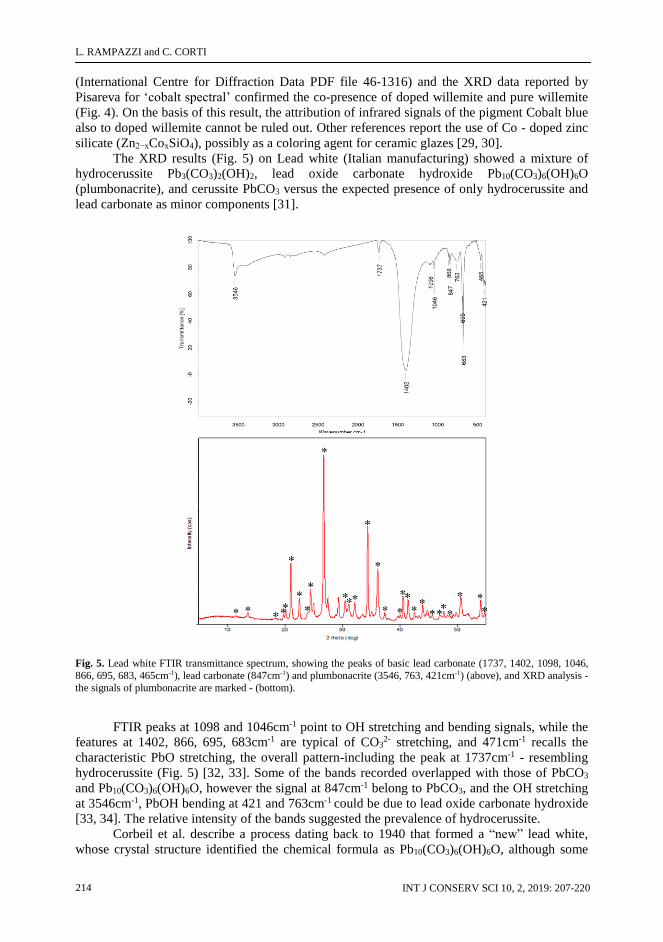
The XRD results (Fig. 5) on Lead white (Italian manufacturing) showed a mixture of
hydrocerussite Pb3(CO3)2(OH)2, lead oxide carbonate hydroxide Pb10(CO3)6(OH)6O
(plumbonacrite), and cerussite PbCO3 versus the expected presence of only hydrocerussite and
lead carbonate as minor components [31].
Fig. 5. Lead white FTIR transmittance spectrum, showing the peaks of basic lead carbonate (1737, 1402, 1098, 1046,
866, 695, 683, 465cm-1), lead carbonate (847cm-1) and plumbonacrite (3546, 763, 421cm-1) (above), and XRD analysis -
the signals of plumbonacrite are marked - (bottom).
FTIR peaks at 1098 and 1046cm-1 point to OH stretching and bending signals, while the
features at 1402, 866, 695, 683cm-1 are typical of CO32- stretching, and 471cm-1 recalls the
characteristic PbO stretching, the overall pattern-including the peak at 1737cm-1 - resembling
hydrocerussite (Fig. 5) [32, 33]. Some of the bands recorded overlapped with those of PbCO3
and Pb10(CO3)6(OH)6O, however the signal at 847cm-1 belong to PbCO3, and the OH stretching
at 3546cm-1, PbOH bending at 421 and 763cm-1 could be due to lead oxide carbonate hydroxide
[33, 34]. The relative intensity of the bands suggested the prevalence of hydrocerussite.
Corbeil et al. describe a process dating back to 1940 that formed a “new” lead white,
whose crystal structure identified the chemical formula as Pb10(CO3)6(OH)6O, although some
ARE COMMERCIAL PIGMENTS RELIABLE REFERENCES FOR THE ANALYSIS OF PAINTINGS?
http://www.ijcs.uaic.ro 215
authors refer to it as 3PbCO32Pb(OH)2PbO [35]. The XRD reference spectrum of the modern
lead white was established and the compound was named ‘plumbonacrite’ due to its nacreous
appearance. Pearlescent white lead may in fact indicate a modern forgery. The speculation
regarding the XRD data of traditional and new lead white discussed by Corbeil clearly
demonstrates the unambiguous identification of the two compounds. Corbeil et al also report the
identification of plumbonacrite in a few 20th century paintings and in a pre-tested permanent
Artists' Oil Colors paint tube labelled “Flake White” and suggest that the compound may form
as a byproduct of the production of traditional lead white. Recently, plumbonacrite was
determined in a painting by Vincent van Gogh and considered by the authors as an intermediate
degradation product of the whitening of minium [36].
The mineral chrysocolla (chrysos and kolla mean gold and glue in Greek, respectively) is
a bright to bluish green basic copper silicate (Cu, Al)2H2Si2O5(OH)4·n(H2O), occurring in
copper deposits and often associated with malachite [1]. It was used as a pigment up to the 17th
century and has been identified in various paintings. The investigation of Chrysocolla (German
manufacturing) by XRD revealed a mixture of malachite, quartz and muscovite. Infrared
spectrum showed peaks at 1497, 1400,1034, 820, 798, 751cm-1 which are the typical carbonate
group absorptions of malachite, as well as 3405cm-1 OH out-of-plane bending and CuO 570cm-1
bending modes [18]. Alternatively, the artificial basic copper carbonate green, also called green
verditer, may be present. In fact, the XRD and FTIR signals of natural and synthetic versions of
the pigments agree very well and differentiation may be possible by only observing the
particles’ features, using SEM or polarization microscopy [31].
Conversely, the particular absorbance peaks of chrysocolla are likely to be OH stretching
at 3618 cm-1, intense stretching vibration of Si-O at 1010cm-l, and 770 and 660cm-l [37, 38].
According to the literature, chrysocolla can be considered as a substitute or an impurity of
malachite, although with a bluer green hue [1]. Many misattributions between malachite and
chrysocolla are thought to have occurred since ancient Rome, since they are both copper
minerals.
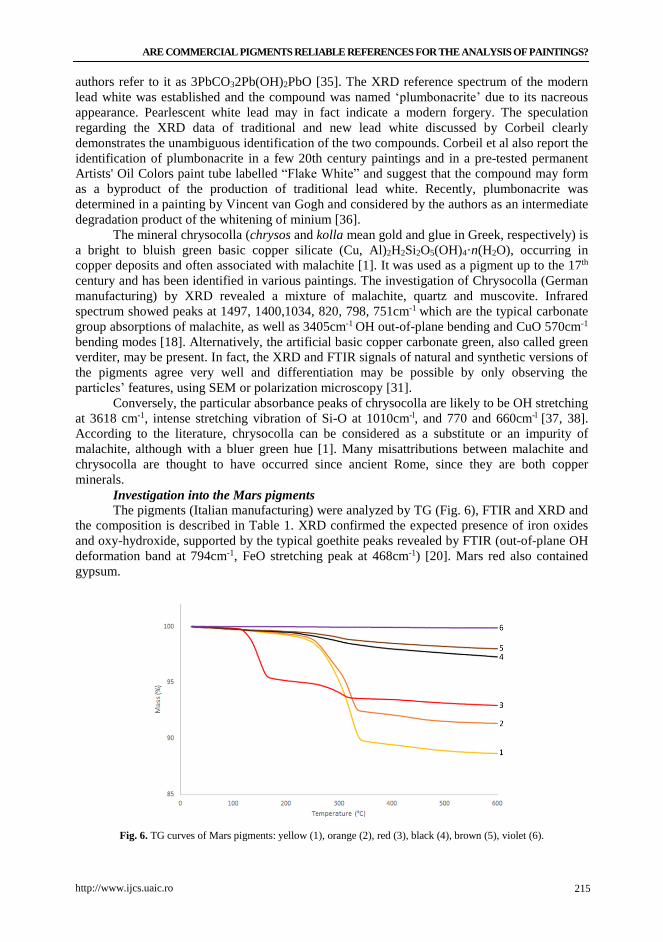
Investigation into the Mars pigments The pigments (Italian manufacturing) were analyzed by TG (Fig. 6), FTIR and XRD and
the composition is described in Table 1. XRD confirmed the expected presence of iron oxides
and oxy-hydroxide, supported by the typical goethite peaks revealed by FTIR (out-of-plane OH
deformation band at 794cm-1, FeO stretching peak at 468cm-1) [20]. Mars red also contained
gypsum.
Fig. 6. TG curves of Mars pigments: yellow (1), orange (2), red (3), black (4), brown (5), violet (6).
L. RAMPAZZI and C. CORTI
INT J CONSERV SCI 10, 2, 2019: 207-220 216
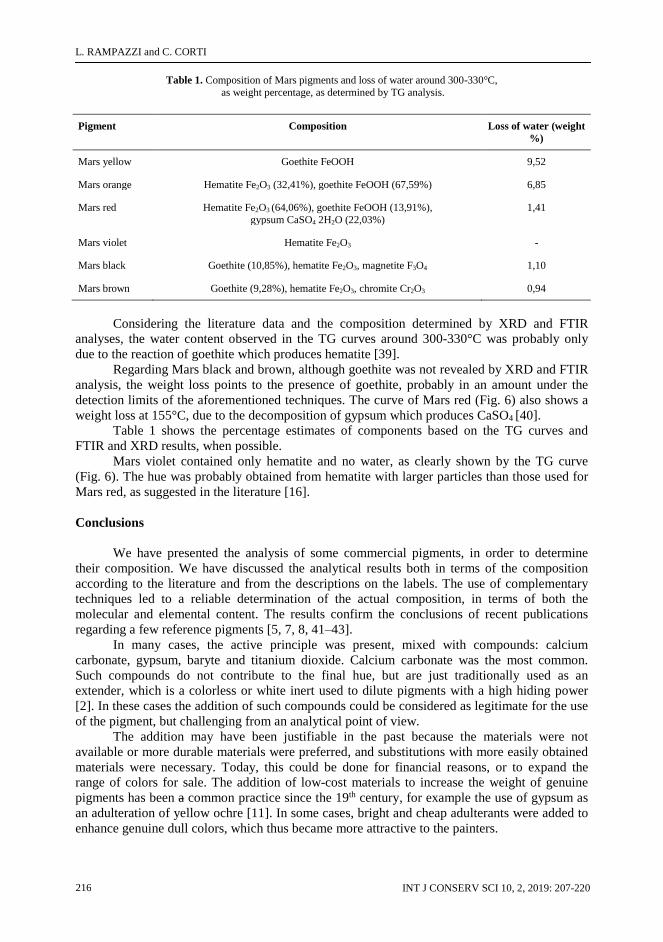
Table 1. Composition of Mars pigments and loss of water around 300-330°C,
as weight percentage, as determined by TG analysis.
Pigment Composition Loss of water (weight
%)
Mars yellow Goethite FeOOH 9,52
Mars orange Hematite Fe2O3 (32,41%), goethite FeOOH (67,59%) 6,85
Mars red Hematite Fe2O3 (64,06%), goethite FeOOH (13,91%),
gypsum CaSO4 2H2O (22,03%)
1,41
Mars violet Hematite Fe2O3 -
Mars black Goethite (10,85%), hematite Fe2O3, magnetite F3O4 1,10
Mars brown Goethite (9,28%), hematite Fe2O3, chromite Cr2O3 0,94
Considering the literature data and the composition determined by XRD and FTIR
analyses, the water content observed in the TG curves around 300-330°C was probably only
due to the reaction of goethite which produces hematite [39].
Regarding Mars black and brown, although goethite was not revealed by XRD and FTIR
analysis, the weight loss points to the presence of goethite, probably in an amount under the
detection limits of the aforementioned techniques. The curve of Mars red (Fig. 6) also shows a
weight loss at 155°C, due to the decomposition of gypsum which produces CaSO4 [40].
Table 1 shows the percentage estimates of components based on the TG curves and
FTIR and XRD results, when possible.
Mars violet contained only hematite and no water, as clearly shown by the TG curve
(Fig. 6). The hue was probably obtained from hematite with larger particles than those used for
Mars red, as suggested in the literature [16].
Conclusions
We have presented the analysis of some commercial pigments, in order to determine
their composition. We have discussed the analytical results both in terms of the composition
according to the literature and from the descriptions on the labels. The use of complementary
techniques led to a reliable determination of the actual composition, in terms of both the
molecular and elemental content. The results confirm the conclusions of recent publications
regarding a few reference pigments [5, 7, 8, 41–43].
In many cases, the active principle was present, mixed with compounds: calcium
carbonate, gypsum, baryte and titanium dioxide. Calcium carbonate was the most common.
Such compounds do not contribute to the final hue, but are just traditionally used as an
extender, which is a colorless or white inert used to dilute pigments with a high hiding power
[2]. In these cases the addition of such compounds could be considered as legitimate for the use
of the pigment, but challenging from an analytical point of view.
The addition may have been justifiable in the past because the materials were not
available or more durable materials were preferred, and substitutions with more easily obtained
materials were necessary. Today, this could be done for financial reasons, or to expand the
range of colors for sale. The addition of low-cost materials to increase the weight of genuine
pigments has been a common practice since the 19th century, for example the use of gypsum as
an adulteration of yellow ochre [11]. In some cases, bright and cheap adulterants were added to
enhance genuine dull colors, which thus became more attractive to the painters.
ARE COMMERCIAL PIGMENTS RELIABLE REFERENCES FOR THE ANALYSIS OF PAINTINGS?
http://www.ijcs.uaic.ro 217
Conversely, we found that in some cases the name of the pigment was completely
misleading in relation to its real composition. For example, the Cinnabar (Italian
manufacturing) sample was supposed to be HgS but was actually composed of minium. This
may be a legacy from Ancient Rome, in fact Pliny the Elder applied the name minium to
cinnabar and minium secondarium to lead tetraoxide, which is minium [44]. After this practice,
the name minium referred both to the pigment cinnabar-HgS-and red lead-Pb3O4. In fact, the
term minium remained confusing for a long time up to the Middle Ages, although later
translations of the name were still unclear [45]. The cost of cinnabar is higher than minium, thus
the confusion of terms also had economic implications. Cennino Cennini described cinnabar as
being often produced in a mixture with minium, and suggests: “Compera sempre cinabro
intero, e non pesto nè macinato. La ragione? Chè le più volte si froda o con minio, o con
matton pesto” (“Always buy vermilion unbroken, and not pounded or ground. The reason?
Because it is generally adulterated, either with red lead or with pounded brick”) [46].
Adulteration has been demonstrated by analyzing medieval paint samples [45].
To the best of our knowledge, the so-called Mars pigments have never been extensively
characterized until now, and our results have better identified the components and estimated the
relative weight percentages, which are responsible for the different hues.
Our results of course do not establish whether substitutions or adulterations occur
routinely in commercial products. The conclusions highlight however that the composition
should always be monitored and that the signals of extraneous compounds should be eliminated
or not considered in the comparison with the actual data from paintings. The compositional data
clearly points to the need (although time-consuming) for a multi-analytical campaign, as one
technique alone is often insufficient for a complete identification. Checking the purity of
pigments before their use in conservation works should be good practice in order to prevent the
problems of turning different colors, drying problems or decreasing stability.
Acknowledgements
The authors heartily acknowledge the Fondazione Banca del Monte di Lombardia for
support, prof. Norberto Masciocchi, prof. Simona Galli, Sveva Colombo, and Elena Lissoni for
suggestions and helpful discussions. References [1] N. Eastaugh, V. Walsh, T. Chaplin, R. Siddall, Pigment Compendium: A Dictionary
and Optical Microscopy of Historical Pigments, Butterworth-Heinemann, Oxford,
2008.
[2] R.J. Gettens, G.L. Stout, Painting Materials: A Short Encyclopaedia, Courier
Corporation, New York, 1966.
[3] M. Pastoureau, La couleur et l’historien, Pigment. Color. l’antiquité Du Moyen Age
(Editor: B. Guineau), Paris, 1990, pp. 21–40.
[4] K. Castro, M. Pérez, M.D. Rodríguez-Laso, J.M. Madariaga, FTIR Spectra Database of
Inorganic Art Materials, Analytical Chemistry, 75(9), (2003) pp. 214A-221A.
doi:10.1021/ac031320e.
[5] A. Vila, N. Ferrer, J.F. García, Colored inks analysis and differentiation: a first step in
artistic contemporary prints discrimination, Analytica Chimica Acta, 588(1), 2007, pp.
96–107. doi:10.1016/j.aca.2007.01.071.
[6] C. Miliani, A. Daveri, B.G. Brunetti, A. Sgamellotti, CO2 entrapment in natural
ultramarine blue, Chemical Physics Letters, 466(4–6), 2008, pp. 148–151.
doi:10.1016/j.cplett.2008.10.038.
[7] E.L. Kendix, S. Prati, R. Mazzeo, E. Joseph, G. Sciutto, C. Fagnano, Far Infrared
L. RAMPAZZI and C. CORTI
INT J CONSERV SCI 10, 2, 2019: 207-220 218
Spectroscopy in the Field of Cultural Heritage, Infrared and Raman Users’ Group
(IRUG), 7, 2010, pp. 8–13.
[8] E.P. Tomasini, E.B. Halac, M. Reinoso, E.J. Di Liscia, M.S. Maier, Micro‐Raman
spectroscopy of carbon‐based black pigments, Journal of Raman Spectroscopy, 43(11),
2012 pp. 1671–1675. doi:10.1002/jrs.4159.
[9] J.H. Townsend, L. Carlyle, N. Khandekar, S. Woodcock, Later nineteenth century
pigments: Evidence for additions and substitutions, The Conservator, 19(1), 1995 pp.
65–78. doi:10.1080/01410096.1995.9995096.
[10] M. Clarke, A nineteenth-century colourman’s terminology, Studies in Conservation,
54(3), 2009, pp. 160–169.
[11] L. Carlyle, Authenticity and adulteration: what materials were 19th century artists really
using?, The Conservator, 17, 1993, pp. 56–60. doi:10.1080/01410096.1993.9995075.
[12] C. Corti, L. Rampazzi, P. Visoná, Hellenistic mortar and plaster from Contrada Mella
near Oppido Mamertina (Calabria, Italy), International Journal of Conservation
Science, 7(1), 2016 pp. 57–70.
[13] A. Sansonetti, J. Striova, D. Biondelli, I. Aliatis, L. Rampazzi, Hidden colours in
stuccowork damaged by fire: A multi-analytical investigation for revealing the original
decorative pattern, Journal of Cultural Heritage, 22, 2016, pp. 1055–1060.
doi:10.1016/j.culher.2015.11.002.
[14] R. Bugini, C. Corti, L. Folli, L. Rampazzi, Unveiling the Use of Creta in Roman Plasters:
Analysis of Clay Wall Paintings From Brixia (Italy), Archaeometry, 59(1), 2017, pp. 84–
95. doi:10.1111/arcm.12254.
[15] L. Rampazzi, V. Brunello, C. Corti, E. Lissoni, Non-invasive techniques for revealing the
palette of the Romantic painter Francesco Hayez, Spectrochimica Acta Part A:
Molecular and Biomolecular Spectroscopy, 176, 2017 pp. 142–154.
doi:10.1016/j.saa.2017.01.011.
[16] K. Helwig, Mars colours: preparation methods and chemical composition, Studies in
Conservation, 43, sup2, 1998 pp. 23–23. doi:10.1179/ sic.1998.Supplement-2.023.
[17] S.N. Ghosh, Infrared spectra of the Prussian blue analogs, Journal of Inorganic and
Nuclear Chemistry, 36, 11, (1974) pp. 2465–2466. doi:10.1016/0022-1902(74)80454-9.
[18] J.A. Goldsmith, S.D. Ross, The infra-red spectra of azurite and malachite,
Spectrochimica Acta Part A: Molecular Spectroscopy, 24(12), 1968 pp. 2131–2137.
doi:10.1016/0584-8539(68)80273-9.
[19] G.C. Jones, B. Jackson, Infrared Transmission Spectra of Carbonate Minerals,
Springer Netherlands, 1993.
[20] M.J. Wilson, Clay Mineralogy: Spectroscopic and Chemical Determinative Methods,
Chapman & Hall, London, 1994.
[21] T. Gatta, L. Campanella, C. Coluzza, V. Mambro, P. Postorino, M. Tomassetti, G. Visco,
Characterization of black pigment used in 30 BC fresco wall paint using instrumental
methods and chemometry., Chemistry Central Journal, 6, Suppl 2:S2, 2012, pp. 1–10.
doi:10.1186/1752-153X-6-S2-S2.
[22] M. Hass, G.B.B.M. Sutherland, The Infra-Red Spectrum and Crystal Structure of Gypsum,
Proceedings of the Royal Society A: Mathematical, Physical and Engineering
Sciences, 236(1207), 1956, pp. 427–445. doi:10.1098/rspa.1956.0146.
[23] M.R. Derrick, D. Stulik, J.M. Landry, Infrared Spectroscopy in Conservation Science,
The Getty Conservation Institute, Los Angeles, 1999.
[24] R.L. Feller, ed., Artists’ Pigments. A Handbook of Their History and Characteristics
- Vol. 1, National Gallery of Art, Washington, 1986.
[25] B. Prameena, G. Anbalagan, V. Sangeetha, S. Gunasekaran, G.R. Ramkumaar, Behaviour
of Indian natural baryte mineral, International Journal of ChemTech Research, 5(1),
2013, pp. 220–231.
ARE COMMERCIAL PIGMENTS RELIABLE REFERENCES FOR THE ANALYSIS OF PAINTINGS?
http://www.ijcs.uaic.ro 219
[26] C.-C. Lin, P. Shen, Sol-gel synthesis of zinc orthosilicate, Journal of Non-Crystalline
Solids, 171(3), 1994, pp. 281–289. doi:10.1016/0022-3093(94)90197-X.
[27] B.H. Berrie, ed., Artists’ Pigments. A Handbook of Their History and Characteristics,
Vol. 4, National Gallery of Art, Washington, 2007. https://books.google.it/books?id=1kE-
PgAACAAJ.
[28] S. Pisareva, A note on cobalt spectral, Studies in Conservation, 50(3), 2005, pp. 190–
192. doi:10.2307/25487744.
[29] D. de Waal, Micro-Raman and portable Raman spectroscopic investigation of blue
pigments in selected Delft plates (17-20th Century), Journal of Raman Spectroscopy,
40(12), 2009, pp. 2162–2170. doi:10.1002/jrs.2389.
[30] E. Ozel, H. Yurdakul, S. Turan, M. Ardit, G. Cruciani, M. Dondi, Co-doped willemite
ceramic pigments: Technological behaviour, crystal structure and optical properties,
Journal of the European Ceramic Society, 30(16), 2010, pp. 3319–3329.
doi:10.1016/j.jeurceramsoc.2010.08.013.
[31] A. Roy, ed., Artists’ Pigments. A Handbook of Their History and Characteristics -
Vol. 2, National Gallery of Art, Washington, 1993.
[32] J. Bessière-Morandat, V. Lorenzelli, J. Lecomte, II. — Détermination expérimentale et
essai d’attribution des vibrations actives en infrarouge de quelques carbonates basiques
métalliques à l’état cristallin, Journal de Physique, 31(4), 1970, pp. 309–312.
doi:10.1051/jphys:01970003104030900.
[33] J. Van der Weerd, A. van Loon, J.J. Boon, FTIR studies of the effects of pigments on the
aging of oil, Studies in Conservation, 50(1), 2005, pp. 3–22. doi:10.2307/25487713.
[34] M.H. Brooker, S. Sunder, P. Taylor, V.J. Lopata, Infrared and Raman spectra and X-ray
diffraction studies of solid lead(II) carbonates, Canadian Journal of Chemistry, 61(3),
1983, pp. 494–502. doi:10.1139/v83-087.
[35] M.-C. Corbeil, P.J. Sirois, A Note on a Modern Lead White, also Known as’ Synthetic
Plumbonacrite’, Studies in Conservation, 52(4), 2007 pp. 281–288.
[36] F. Vanmeert, G. Van der Snickt, K. Janssens, Plumbonacrite Identified by X-ray Powder
Diffraction Tomography as a Missing Link during Degradation of Red Lead in a Van
Gogh Painting, Angewandte Chemie, 127(12), 2015, pp. 3678–3681.
doi:10.1002/ange.201411691.
[37] M.-S. Sun, The nature of chrysocolla from Inspiration mine, Arizona, The American
Mineralogist, 48, 1963, pp. 649–658.
[38] R.L. Frost, Y. Xi, Is chrysocolla (Cu,Al)2H2Si2O5(OH)4·nH2O related to spertiniite
Cu(OH)2?—A vibrational spectroscopic study, Vibrational Spectroscopy, 64, 2013, pp.
33–38. doi:10.1016/j.vibspec.2012.10.001.
[39] S. Goñi-Elizalde, M.E. García-Clavel, Thermal behaviour in air of iron oxyhydroxides
obtained from the method of homogeneous precipitation. Part II. Akaganeite sample,
Thermochimica Acta, 129(2), 1988, pp. 325–334. doi:10.1016/0040-6031(88)87348-9.
[40] J. Adams, W. Kneller, D. Dollimore, Thermal analysis (TA) of lime- and gypsum-based
medieval mortars, Thermochimica Acta, 211, C, 1992, pp. 93–106. doi:10.1016/0040-
6031(92)87010-8.
[41] U. Casellato, P.. A. Vigato, U. Russo, M. Matteini, A Mössbauer approach to the physico-
chemical characterization of iron-containing pigments for historical wall paintings,
Journal of Cultural Heritage, 1(3), 2000, pp. 217–232. doi:10.1016/S1296-
2074(00)01088-8.
[42] C. Montagner, D. Sanches, J. Pedroso, M.J. Melo, M. Vilarigues, Ochres and earths:
Matrix and chromophores characterization of 19th and 20th century artist materials,
Spectrochimica Acta - Part A: Molecular and Biomolecular Spectroscopy, 103, 2013,
pp. 409–416. doi:10.1016/j.saa.2012.10.064.
[43] M.C. Caggiani, A. Cosentino, A. Mangone, Pigments Checker version 3.0, a handy set for
L. RAMPAZZI and C. CORTI
INT J CONSERV SCI 10, 2, 2019: 207-220 220
conservation scientists: A free online Raman spectra database, Microchemical Journal,
129, 2016, pp. 123–132. doi:10.1016/j.microc.2016.06.020.
[44] K.C. Bailey, ed., The Elder Pliny’s Chapters on Chemical Subjects, Part 1, E. Arnold
& Company, London, 1929.
[45] H.G.M. Edwards, D.W. Farwell, E.M. Newton, F.R. Perez, Minium; FT-Raman non-
destructive analysis applied to an historical controversy, The Analyst, 124(9), 1999, pp.
1323–1326. doi:10.1039/a904083h.
[46] C. Cennini, Il libro dell’arte - The Craftsman’s Handbook, Dover Publications, New
York, 1933. ______________________________________ Received: May 29, 2018 Accepted: May 20, 2019