Interface design of a mobile application oriented to packaging ...
71
ESCOLA SUPERIOR DE MEDIA ARTES E DESIGN POLITÉCNICO DO PORTO M MESTRADO SISTEMAS E MEDIA INTERATIVOS Sergio Ereira Marques Junior. . Interface design of a mobile application oriented to packaging sustainability Interface design of a mobile application oriented to packaging sustainability Sergio Ereira Marques Junior 09/2020 ESCOLA SUPERIOR DE MEDIA ARTES E DESIGN POLITÉCNICO DO PORTO Interface design of a mobile application oriented to packaging sustainability Sergio Ereira Marques Junior MESTRADO SISTEMAS E MEDIA INTERATIVOS 09/2020 M
-
Upload
khangminh22 -
Category
Documents
-
view
1 -
download
0
Transcript of Interface design of a mobile application oriented to packaging ...
ESCOLA SUPERIOR DE MEDIA ARTES E DESIGN POLITÉCNICO DO PORTO
M
MESTRADO SISTEMAS E MEDIA INTERATIVOS
Serg
io E
reir
a M
arqu
es Ju
nior
..
Inte
rfac
e d
esig
n o
f a m
obil
e ap
pli
cati
on o
rien
ted
to
pac
kag
ing
sust
ain
abil
ity
Interface design of a mobile
application oriented to
packaging sustainability Sergio Ereira Marques Junior
09/2020
ES
COLA
SU
PER
IOR
DE
MED
IA
AR
TES
E D
ESIG
N PO
LITÉ
CNIC
O
DO
PO
RTO
Inte
rfac
e d
esig
n o
f a m
obil
e ap
pli
cati
on
orie
nte
d t
o p
ack
agin
g su
stai
nab
ilit
y
Serg
io E
reir
a M
arqu
es Ju
nior
MES
TRA
DO
SIST
EMAS
E M
EDIA
INTE
RAT
IVO
S
09
/202
0
M
Politécnico do Porto
Escola Superior de Media Artes e Design
Sergio Ereira Marques Junior
Trabalho de Projeto
Mestrado em Sistemas e Media Interativos
Interface design of a mobile application oriented
to packaging sustainability
Orientação: Pr
(esta versão é definitiva e posterior a apreciação do júri)
of.º Doutor Rui Rodrigues
Vila do Conde, setembro de 2020
Politécnico do Porto
Escola Superior de Media Artes e Design
Sergio Ereira Marques Junior
Interface design of a mobile application oriented
to packaging sustainability
Trabalho de Projeto
Mestrado em Sistemas e Media Interativos
Orientação: Prof.º Doutor Rui Rodrigues
Vila do Conde, setembro de 2020
Sergio Ereira Marques Junior
Trabalho de Projeto
Presidente
Membros do Júri
Mestrado em Sistemas e Media Interativos
Interface design of a mobile application oriented
to packaging sustainability
Prof.º Doutor Manuel Jorge de Abreu Antunes Lima
Escola Superior de Media, Artes e Design (ESMAD) - P. Porto
Escola Superior de Media, Artes e Design - Instituto Politécnico do Porto
Prof.º Doutor Rui Pedro Costa Rodrigues (Orientador)
Prof.º Doutor Nuno Duarte Martins (Arguente)
Escola Superior de Design (ESD) - Instituto Politécnico do Cávado e Ave (IPCA)
ACKNOWLEDGEMENTS
Thanks firstly to my family, for all support and patience through all my career. My
parents that have always give their bests in order to provide me the best possible
academic support. To my partner, for being a true supporter during these two years of
study. To my tutor, Rui Rodrigues, who has been extremely helpful guiding my research
and providing me with the best resources in order to achieve this outcome. To my friends
and class colleagues for the company through this path. To all participants that were
interested in this matter and were available for research purposes.
RESUMO
Este projeto tem como principal finalidade reunir informações sobre materiais
utilizados em embalagens e suas características relacionadas com a sustentabilidade, a
fim de serem aplicadas na aplicação móvel que é desenvolvida em um estágio futuro.
Metodologia e técnicas de User Experience Design (UX) são também descritas, sendo
fundamentais ao processo de desenvolvimento. Um resumo sobre comportamento
humano também é abordado, assim como a criação de uma categorização simples que
classifica diferentes tipos de embalagens de acordo com seus níveis de sustentabilidade.
O propósito deste projeto é idealizar, desenhar e prototipar uma aplicação móvel de
modo a simplificar este tema e assim disponibilizar futuramente esta aplicação ao
público em geral. Uma série de técnicas de UX e seus resultados estão disponíveis neste
documento para servir como suporte ao desenvolvimento da aplicação. O produto final
é um protótipo parcialmente funcional pronto a ser programado. A aplicação demonstra
um potencial significativo com impactos positivos sobre o meio-ambiente através de
seus objetivos.
Palavras-chave: Mobile application; Interface design; User experience design;
Sustainability; Packaging; Circular economy.
ABSTRACT
This project firstly has the purpose of gathering information about packaging
materials and their characteristics related to sustainability in order to be applied in a
mobile application that is developed in a future stage. Methodology and applied User
Experience Design (UX) techniques are described as well, as those are fundamental to
the application development process. An overview of people’s behaviour is also
approached, as well as the creation of a simple categorised system to classify different
packaging types according to how sustainable they are. The purpose of this project is to
simplify the theme and make it available to the general public through the proposed
mobile application. Series of UX techniques and its results are available in this document
in order to support the application development. The final product is a partially
functional prototype ready to be developed in terms of coding. The application shows
significant potential for positive environmental impacts through its purpose.
Keywords: Mobile application; Interface design; User experience design; Sustainability;
Packaging; Circular economy.
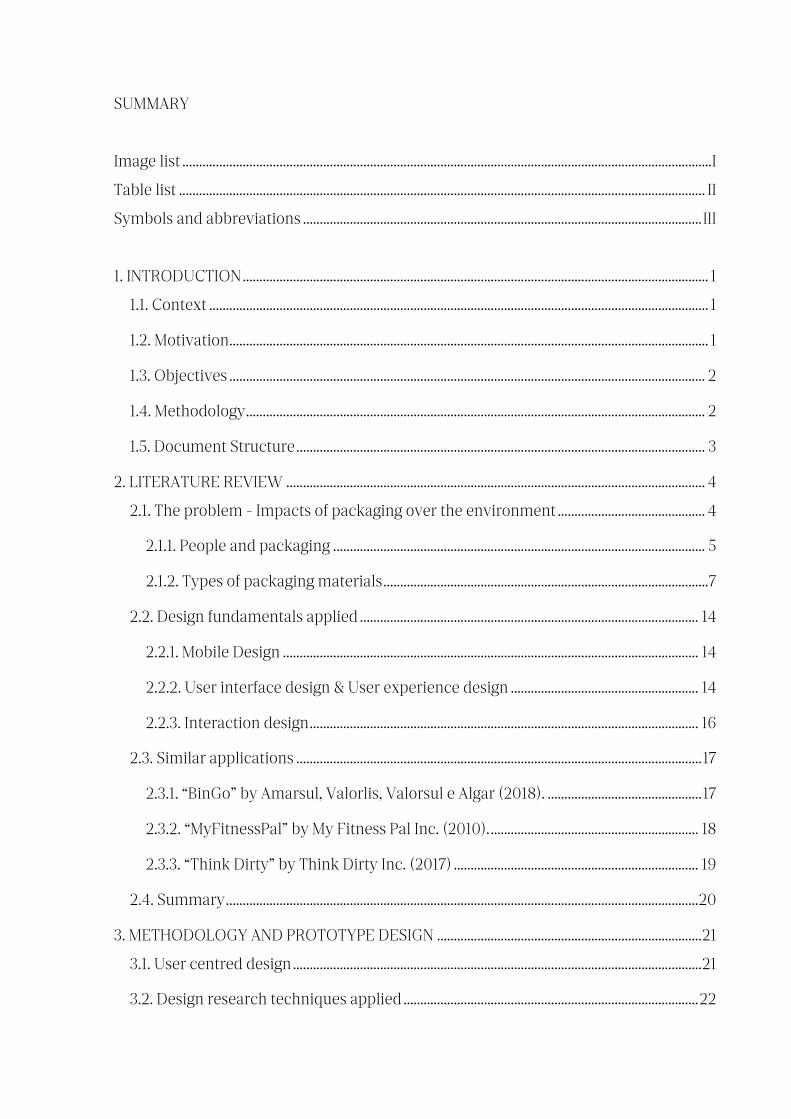
SUMMARY
Image list .............................................................................................................................................................. I
Table list ............................................................................................................................................................. II
Symbols and abbreviations ....................................................................................................................... III
1. INTRODUCTION ........................................................................................................................................... 1
1.1. Context ..................................................................................................................................................... 1
1.2. Motivation ............................................................................................................................................... 1
1.3. Objectives .............................................................................................................................................. 2
1.4. Methodology ......................................................................................................................................... 2
1.5. Document Structure .......................................................................................................................... 3
2. LITERATURE REVIEW ............................................................................................................................. 4
2.1. The problem - Impacts of packaging over the environment ............................................ 4
2.1.1. People and packaging ............................................................................................................... 5
2.1.2. Types of packaging materials ................................................................................................. 7
2.2. Design fundamentals applied ..................................................................................................... 14
2.2.1. Mobile Design ............................................................................................................................ 14
2.2.2. User interface design & User experience design ........................................................ 14
2.2.3. Interaction design .................................................................................................................... 16
2.3. Similar applications ......................................................................................................................... 17
2.3.1. “BinGo” by Amarsul, Valorlis, Valorsul e Algar (2018). .............................................. 17
2.3.2. “MyFitnessPal” by My Fitness Pal Inc. (2010). .............................................................. 18
2.3.3. “Think Dirty” by Think Dirty Inc. (2017) ......................................................................... 19
2.4. Summary ............................................................................................................................................. 20
3. METHODOLOGY AND PROTOTYPE DESIGN ............................................................................... 21
3.1. User centred design .......................................................................................................................... 21
3.2. Design research techniques applied ........................................................................................ 22

3.2.1. Questionnaire ............................................................................................................................ 22
3.2.2. Card sorting ................................................................................................................................ 24
3.2.3. Personas ...................................................................................................................................... 26
3.2.4. System map ............................................................................................................................... 29
3.3. Visual identity ................................................................................................................................... 30
3.3.1. Logo ................................................................................................................................................ 30
3.3.2. Colour palette ............................................................................................................................. 31
3.3.3. Typography ................................................................................................................................. 31
3.3.4. Iconography and interface elements ............................................................................... 32
3.4. Prototype and user-flow ............................................................................................................... 33
3.5. Usability testing ................................................................................................................................ 39
3.5.1 Recruitment ................................................................................................................................. 39
3.5.2 Test description ......................................................................................................................... 39
3.5.3 Participants ................................................................................................................................ 40
3.5.4 Technical restrictions ............................................................................................................ 40
3.5.5 Analysis and results ................................................................................................................. 41
3.6. Summary ............................................................................................................................................. 46
4. CONCLUSION ............................................................................................................................................ 47
4.1. Study limitations ............................................................................................................................... 47
4.2. Future work ....................................................................................................................................... 47
4.3. Final considerations ....................................................................................................................... 48
REFERENCES ................................................................................................................................................. 50
ATTACHMENTS ............................................................................................................................................. 54
Attachment 1 – Questionnaire. ........................................................................................................... 54
Attachment 2 – Visual identity guide. ............................................................................................. 56
Attachment 3 – Post-test questionnaire. ........................................................................................ 58

Image list
Image 1 - Packaging residuals at the beach. ......................................................................................... 5
Image 2 - A to F sustainability scale. ...................................................................................................... 11
Image 3 - BinGo mobile application screenshots. ........................................................................... 18
Image 4 - My fitness pal mobile application screenshots. ........................................................... 19
Image 5 - Think dirty mobile application. .......................................................................................... 20
Image 6 – The virtuous circle (Allen, Chudley., 2012). .................................................................... 21
Image 7 - Persona 1. ...................................................................................................................................... 26
Image 8 - Persona 2. ..................................................................................................................................... 27
Image 9 - Persona 3. ..................................................................................................................................... 28
Image 10 - Application map. ..................................................................................................................... 29
Image 11 - Logo. ............................................................................................................................................... 31
Image 12 - Colour palette. ........................................................................................................................... 31
Image 13 - Typography. .............................................................................................................................. 32
Image 14 - Iconography and interface elements. ............................................................................. 32
Image 15 - Prototype initial paper sketches. ...................................................................................... 33
Image 16 - Prototype initial wireframes. ............................................................................................. 34
Image 17 - Tab studies. ................................................................................................................................ 34
Image 18 - Prototype Illustrator studies. .............................................................................................. 35
Image 19 - User level badges. ................................................................................................................... 35
Image 20 - Recycling Portuguese containers illustrations. ......................................................... 36
Image 21 - User-flow. .................................................................................................................................. 38
Image 22 - Linear scale results from usability testing. .................................................................. 45
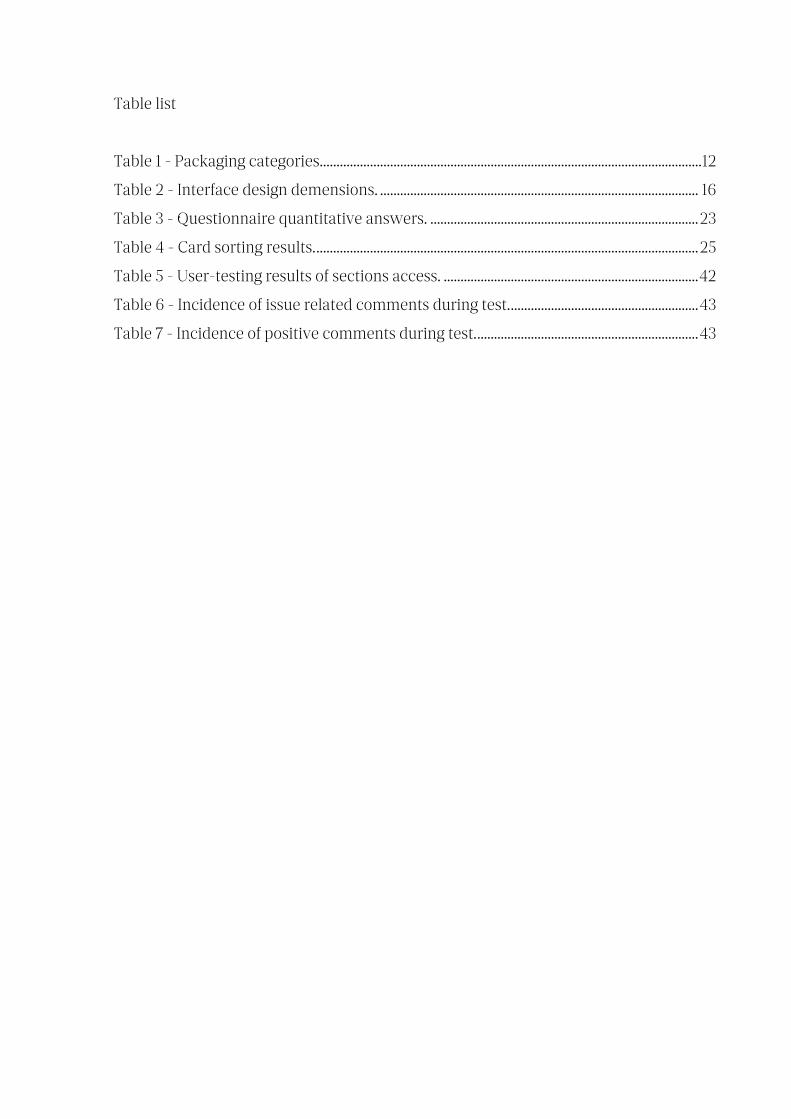
Table list
Table 1 - Packaging categories. ................................................................................................................. 12
Table 2 - Interface design demensions. ............................................................................................... 16
Table 3 - Questionnaire quantitative answers. ................................................................................ 23
Table 4 - Card sorting results. .................................................................................................................. 25
Table 5 - User-testing results of sections access. ............................................................................ 42
Table 6 - Incidence of issue related comments during test. ........................................................ 43
Table 7 - Incidence of positive comments during test. .................................................................. 43
Symbols and abbreviations
App - Mobile application app
HCI - Human-computer interaction
HF - Human factors
IxD - Interaction design
UCD - User centred design
UI - User Interface design
UX - User Experience design
1
1 INTRODUCTION
1.1 Context
The world we are living on today is facing several nature related problems and it is
believed that we as a society, have been triggering part of those problems, like the
increasing temperature in the planet over the last decades being related to air pollution
for example. But not only, and between many problems is the presence of packaging
materials on natural environment. With an initial idea of changing that panorama, this
project consists in developing an application prototype and its interface design based on
studies about retail packaging, packaging materials as well as design studies through
related concepts.
The application, also called by “app” has its concept based on the idea of allowing the
user to read a product’s barcode and easily find information about its packaging, such as
which materials compose it, how to dispose and how long does it take to degrade. The
main goal of the application is to inform and influence people in their decision while
choosing a specific product, considering environmental related aspects, such as its level
of sustainability. Having a tool like that, easily accessible, drives thoughts to a possible
behaviour change where an individual adds sustainability to its list of considerations
when purchasing a product.
1.2 Motivation
Environmental issues are increasing generically on the planet and this matter is in
need of innovative solutions. Packaging has become the reason for innumerable
problems around the planet related to nature pollution like toxic elements, poor water
quality and the increasing world temperature. Particular concerns and interests about
that matter allied with a passion to visual design were the main motivations for this
project. A feeling of need and eager to get to know deeper and apply User Interface, User
Experience Design and Mobile design to a system created individually are a heavy reason
that can be mentioned as it can become an important step in terms of professional career.
Mobile applications are extremely flexible in terms of development, as we know
2
countless games, financial related apps, health related systems and others. Those are
created, most of the times, to bring something positive into human lives, being pleasure,
simplifying tasks, improving knowledge or helping on financial management. Then why
not using that technology in order to reduce environmental problems as well?
Developing a mobile application involving concept, structure and interface has been
a challenge that was wanted for a few years. Not only by enjoying the variety of mobile
apps, but the professional knowledge attached to the whole development process.
1.3 Objectives
This document aims to synthetize the problem presented delivering a good overview
of the actual situation related to packaging management in order to justify the
application concept. Seeks understanding all related design concepts, so they can be
applied at the development phases.
Focusing on the mobile application pretended, which is the outcome of this project,
specific objectives are listed below:
1. To create an easy to use and understand mobile application;
2. To achieve a high-quality interface design product;
3. Provide solutions to user needs when using the system;
4. To motivate the user when using the application.
1.4 Methodology
The first phase of this document is based on analysis from a variety of articles and
books referred to retail packaging, main materials and related environmental impacts.
The information discussed defines the problem approached. Design fields of study that
are relevant to this project are addressed as well, composing a set of concepts that are
present in the empirical phase.
The second phase approach the application design development methodology,
techniques applied and their detailed description as well as results. Techniques involves
user research in order to validate the project’s ideal. In the same phase, the product is
3
also available in its first version, the one used on a usability testing that is also presented
in detail.
Reflexions are exposed at the final phase, where future work and work limitations
are. Conclusions are stablished based on all outcome explored during development.
1.5 Document Structure
This document is structured in four chapters. First, the “INTRODUCTION”, presenting
the project’s context, motivations, main objectives pretended. Document methodology
is approached as well as how it is structured.
The second chapter is called “LITERATURE REVIEW” where there is an introduction
to the problem and related questions, followed by design studies that are considered and
applied in the project.
The third chapter is “METHODOLOGY AND PROTOTYPE DESIGN”, it comprehends
the design research, methodology and all prototype development stages. The final first
version of the prototype is available in this chapter, as usability testing description,
analysis and results.
As the fourth and final chapter, “CONCLUSION” contains future work, process
limitations faced and final considerations.
4
2 LITERATURE REVIEW
2.1 The problem - Impacts of packaging over the environment
The subject that is being approached in this project – and it will be used accordingly
the fundamentals of User Interface Design within a prototype - is the impact of plastic
and other packaging materials over the environment. Other materials such as metals,
papers and glass are concerning as well, but plastic has a longer life and its recyclability
is a bit more complex than the majority of other materials.
Plastic is defined by being a chemical compound that uses polymeric material and
has the capability of being moulded or shaped, usually by the application of heat and
pressure (Rodriguez, 2019). This flexibility is only one of the positive characteristics of
plastic, it is a lasting material, reliable and it requires low production costs as well. There
are different types of plastic with different features, each of them directed for a specific
industrial field of use.
The main use of plastic is seen on packages applied in all kinds of products such as
food, beauty, medicine, electronics, etc. An example of a type of packaging very
commonly used is the plastic bag, it is estimated that one trillion single-used bags are
used per year (Larsen, 2014). A plastic bag potentialize environmental pollution and can
take 1.000 years to degrade, causing a number of problems such as the death of wild
animals, blockage of sewerage systems, rivers and seas pollution and deterioration of a
natural landscape (Riyad, Maher Ali., 2014). It is not hard to imagine other materials and
its consequences, as hundreds of them have their end at landfills or the ocean, as plastic
bags. As a real example of the impact of materials – specially types of plastic – on the
environment, there is this photographic register at Praia Paredes da Vitória located in
Leiria, Portugal. The photo was taken on 24th of December 2019.
5
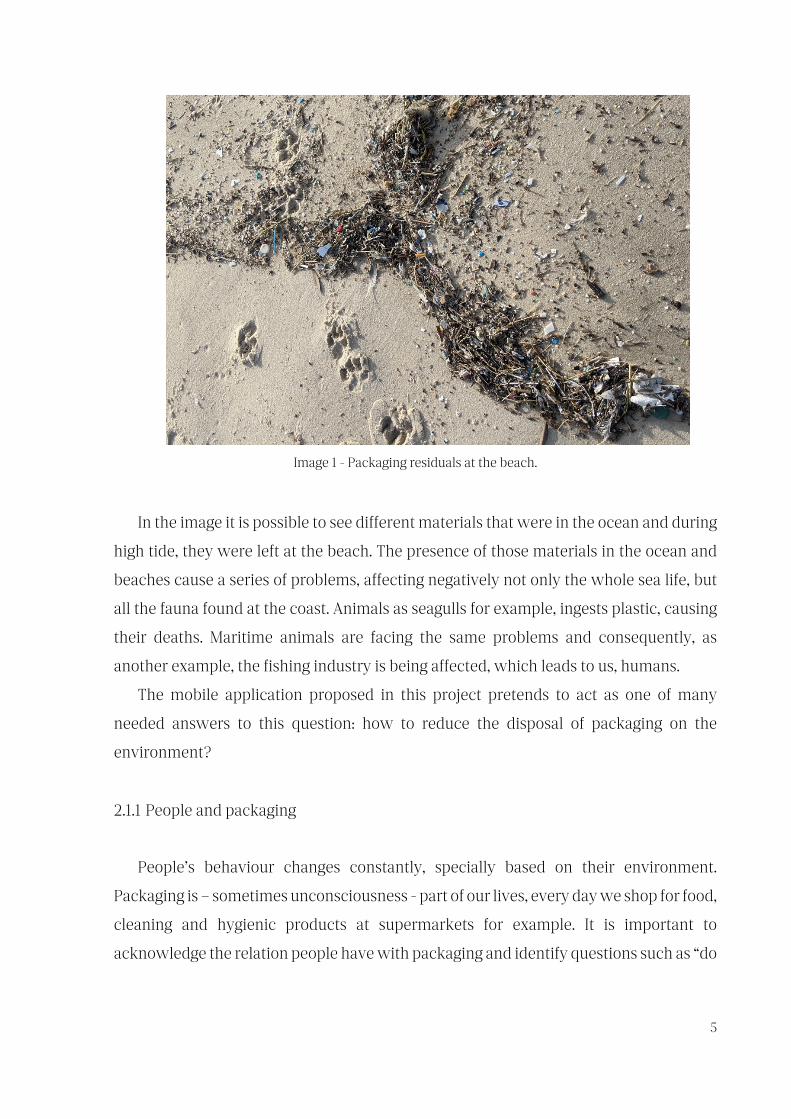
Image 1 - Packaging residuals at the beach.
In the image it is possible to see different materials that were in the ocean and during
high tide, they were left at the beach. The presence of those materials in the ocean and
beaches cause a series of problems, affecting negatively not only the whole sea life, but
all the fauna found at the coast. Animals as seagulls for example, ingests plastic, causing
their deaths. Maritime animals are facing the same problems and consequently, as
another example, the fishing industry is being affected, which leads to us, humans.
The mobile application proposed in this project pretends to act as one of many
needed answers to this question: how to reduce the disposal of packaging on the
environment?
2.1.1 People and packaging
People’s behaviour changes constantly, specially based on their environment.
Packaging is – sometimes unconsciousness - part of our lives, every day we shop for food,
cleaning and hygienic products at supermarkets for example. It is important to
acknowledge the relation people have with packaging and identify questions such as “do
6
most people think about the packaging?” or “do they often think about how to dispose
of packaging?”.
Inside the sustainability universe there is a system called Circular Economy, which is
directly connected to this project. It is defined by being a regenerative system in which
resource input and waste, emission, and energy leakage are minimised by slowing,
closing, and narrowing material and energy loops. This can be achieved through long-
lasting design, maintenance, repair, reuse, remanufacturing, refurbishing, and recycling
(Geissdoerfer, Savaget, Bocken, Hultink., 2017). The engagement to the Circular Economy
can work as a measure to be analysed. These indicators were studied by the European
Commission (2018) and a Final Report about the study was released in October 2018. The
conclusion of this study is relevant for this project and part of it follows:
The consumer survey found that most EU consumers claim to frequently engage
with the Circular Economy. The majority of survey respondents reported that they keep
things they own for a long time (93%), recycle unwanted possessions (78%), and repair
possessions if they break (64%) (see section 3.4). Respondents also reported that their
peers display similar levels of engagement in the Circular Economy. A lower yet
substantial proportion of respondents reported being willing to engage with novel
Circular Economy practices such as leasing products or buying second-hand products. […]
Previous research has found that consumers’ willingness to engage in Circular Economy
activities differs with the nature of the product. […] A majority of respondents also claimed
to be aware of the durability of products they purchased (64%) as well as repair services
(58%). Respondents reported that they frequently looked for durability/reparability
information on products (62% for durability and 55% for reparability). Respondents,
however, often felt that this information was difficult to find, and that they would like
better information on these features.
These findings are in line with previous research which finds that consumers are
generally willing to engage in sustainable consumption, and that this is particularly driven
by their concerns about the environment. (Cerulli-Harms et al., 2018).
According to the results, most part of the European society is concerned about the
environment and it is willing to adjust their behaviour in order to achieve an “eco-
friendlier” way of living. This data is aligned with the mobile application’s concept where
it tends to influence people on changing their behaviour based on a product’s
sustainability information.
7
2.1.2 Types of packaging materials
The selection of packaging materials is essential to keep product quality during
distribution and storage. The function of packaging is to contain a product safely
considering its storage and transportation. In case of food packaging, the goal is to
contain food in a cost-effective way that satisfies industry requirements and consumer
desires, maintains food safety, and minimizes environmental impact (Marsh, Bugusu.,
2007). Materials most used in packaging industry are detailed below.
Glass;
Glass has a long history in food packaging. This material is impermeable to liquids,
gases and vapor, so it keeps product freshness for a long period of time. It is
resistant to high temperatures and it can be sterilised avoiding food poisoning.
The containers made by glass can be shaped in different forms and are
transparent – the product can be seen inside the container – and colour variations
can be applied for light sensitive contents. Glass is fully recyclable and reusable.
The downside of this material is that it is heavy weight, adding costs to
transportation (more fuel to be used resulting in higher levels of pollution.
Metal;
Aluminium;
Aluminium is a lightweight metal commonly used in cans, foil and
laminated paper or plastic. It is highly resistant to corrosion, being a safe
solution to protect its content from the effects of air, temperature and
moisture. The main disadvantage of the aluminium is its high production
cost compared to other materials.
Aluminium foil;
It has the same characteristics of the aluminium; the only difference is that
the foil cannot be made from recycled aluminium without pinhole forms in the
sheets.
8
Laminates and metalized films;
Laminated aluminium is attached to paper and plastic containers, due to
its high value it is usually used with high value products such as spices and
dried food. As a cheapest alternative there are the laminated films which
are more flexible. These materials are recyclable but there is a difficulty in
separating materials in order to proceed with this process.
Tinplate;
Tinplate is an easy recyclable material made from low carbon steel. It is
considered a strong material and it is also light. It can be hermetically
sealed and sterilised due to its tolerance to a certain high temperature. This
packaging is mostly used for processed food, drinks and aerosols.
Tin-free steel;
Like tinplate it has a good strength and formability. It has a good adhesion
for inks and coating, even not being suitable for welding. Another quality
is that this material is highly resistant to corrosion.
Plastic;
Plastic is a chemical compound that can be moulded or shaped usually by the
application of heat and pressure. Plastics used in food packaging has grown due
to the low-cost materials and advantages over tinplate and glass. Following, the
different types of plastic are described in detail.
Polyolefins;
This is the most used packaging type of plastic. Its qualities include
flexibility, strength, lightness, stability, chemical resistance, easy
processability and well suitable for recycling and reuse. There are two
types of derivatives from this type of plastic, the high- and low-density
ones. The high-density polyethylene containers, specially used for milk,
are the most recyclable plastic packages.
9
Polyesters;
The most known used polyester in food packaging is PETE (or PET). The
main applications for this type of plastic are bottles, jars and tubes (mineral
water, for example), trays and blisters, and bags and snacks food wrappers.
It exists as a transparent material as well as white and opaque, so it can
work similar as a glass container and to protect light sensitive products.
Recycled PETE (from soda bottles, for example) is used as fibres, insulation
and another non-food packaging. Polycarbonate and polyethylene
naphthalate (PEN) are polyesters as well. Polycarbonate is clear, heat
resistant and durable, it is mostly used as a replacement to glass, as
returnable / reifiable water bottles and sterilizable baby bottles. PEN has a
superior resistance to high temperatures, allowing hot refiles, rewashing
and reuse. The downside of PEN is that it is 3 to 4 times more expensive
than PET. This variation is suitable for manufacturing bottles for beverages
such as beer.
Polyvinyl chloride;
Called by PVC, polyvinyl chloride is a medium strong material, it has a good
resistance to chemicals (as acids and bases), grease and oil. It is used in
non-food and medical applications. This material is difficult to recycle
because it is hard to identify and separate. Incineration of PVC is harmful
to the environment because of its chlorine content.
Poly Vinylidene chloride;
PVdC serves as an excellent barrier to water vapor, gases and fatty and oily
products. It is commonly in packages for cheese, cured meats, snack foods,
coffee and snack foods. It contains twice the amount of chlorides as PVC,
presenting problems with incineration as well.
10
Polystyrene;
Polystyrene was a relatively low melting point, but it is clear and hard. It
can be moulded by injection and foamed producing a range of different
products. Applications include egg cartons, containers, disposable plastic
cutlery, cups and plates. This material can be recycled or incinerated.
Polyamide;
Originally used in textiles, it is commonly known as nylon. It has similar
thermal properties as PET, so similar qualities. It also provides good
chemical resistance, low gas permeability and toughness.
Ethylene vinyl alcohol;
This type of plastic - EVOH - offers an excellent barrier to oil, fat and
oxygen. It is moisture sensitive and by that, is mostly used in multi-layered
co-extruded films in situations where it is not directly in contact with
liquids.
Laminates and co-extrusions;
These are the two ways of combining different types of plastic. Lamination
bonds together two or more plastics, or other materials as aluminium or
paper, as mentioned in the metal section. In co-extrusions, two or more
layers of plastic are combined, it requires materials that contain similar
thermal properties. Both processes combine different types of materials
and due to that reason, these are complicated to be recyclable. An
advantage is the fact that these processes reduce the amount of packaging
material required so they are considered good for packaging reduction.
Paper;
Paper has poor barrier properties, so it is not used to protect food for long periods
of time. When used in contact with food, is commonly treated, coated, laminated
or combined with other materials such as waxes and resins to improve its
properties.
11
Paperboard;
Often made by multiple layers, paperboard is heavier and thicker than
paper. It is commonly used to make boxes for transport.
Paper laminates.
Based on kraft or sulphite, those can be coated or uncoated papers. To
improve functionality, they are often laminated with plastic or aluminium,
which increases production costs.
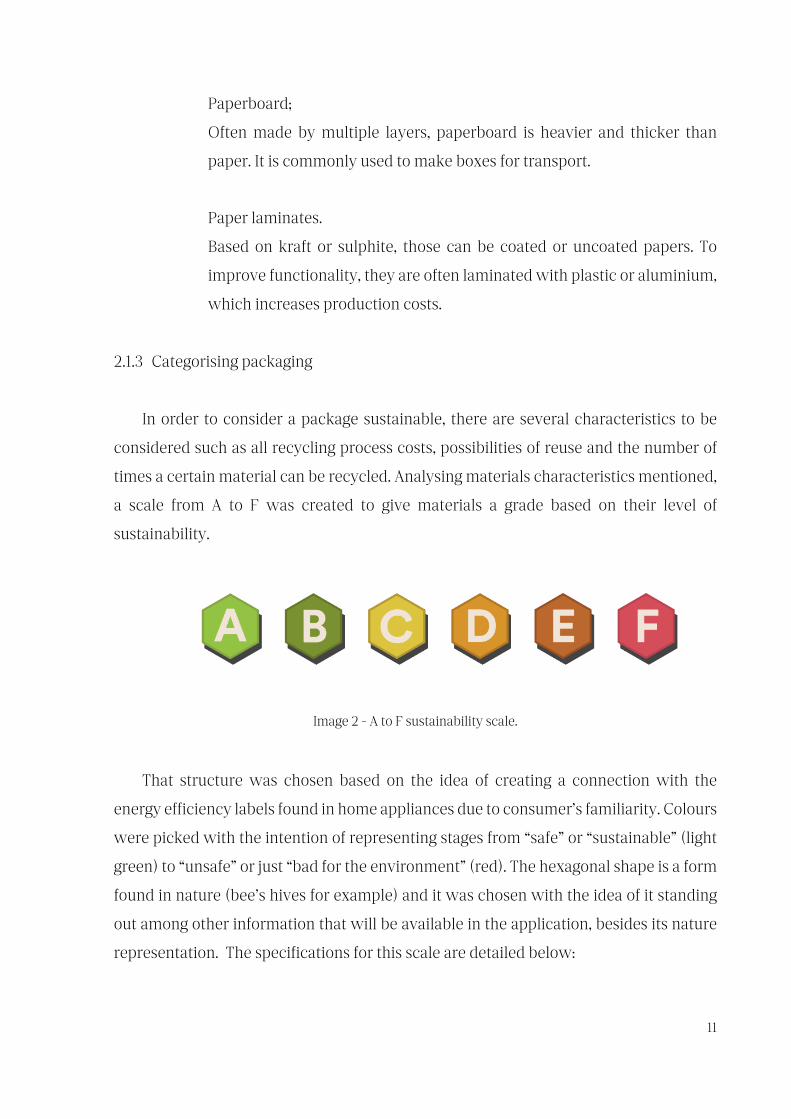
2.1.3 Categorising packaging
In order to consider a package sustainable, there are several characteristics to be
considered such as all recycling process costs, possibilities of reuse and the number of
times a certain material can be recycled. Analysing materials characteristics mentioned,
a scale from A to F was created to give materials a grade based on their level of
sustainability.
Image 2 - A to F sustainability scale.
That structure was chosen based on the idea of creating a connection with the
energy efficiency labels found in home appliances due to consumer’s familiarity. Colours
were picked with the intention of representing stages from “safe” or “sustainable” (light
green) to “unsafe” or just “bad for the environment” (red). The hexagonal shape is a form
found in nature (bee’s hives for example) and it was chosen with the idea of it standing
out among other information that will be available in the application, besides its nature
representation. The specifications for this scale are detailed below:
12
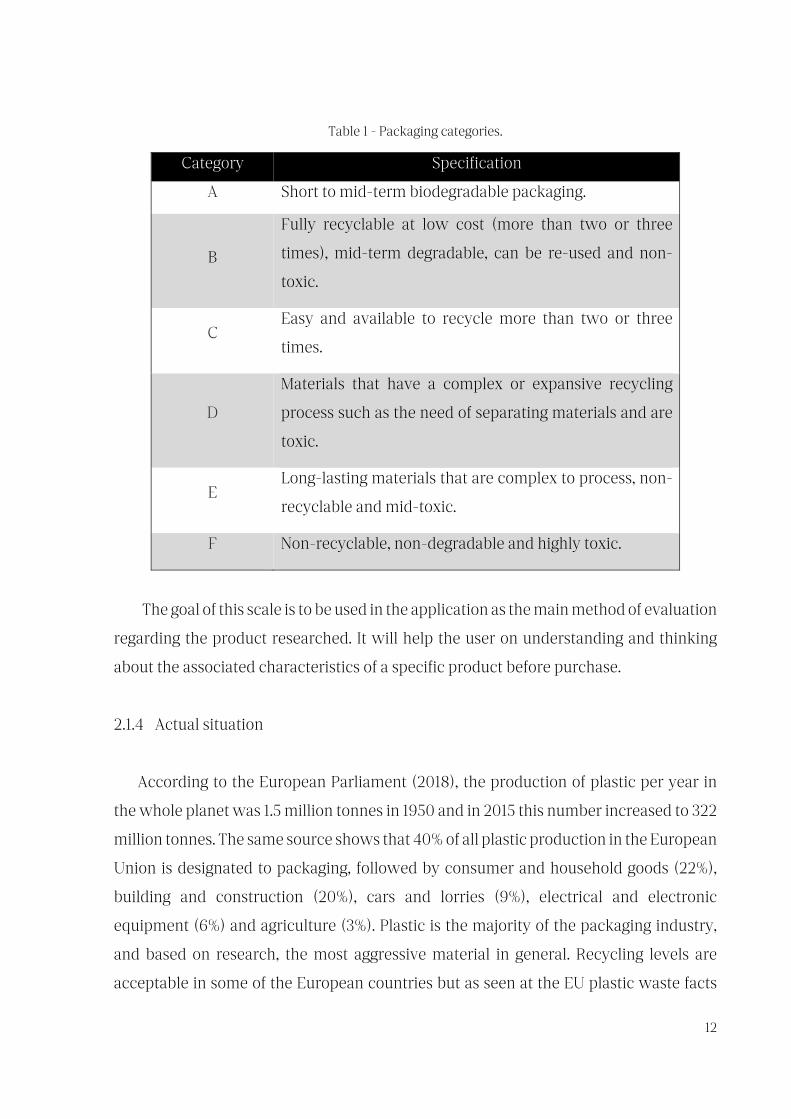
Table 1 - Packaging categories.
Category Specification
A Short to mid-term biodegradable packaging.
B
Fully recyclable at low cost (more than two or three
times), mid-term degradable, can be re-used and non-
toxic.
C Easy and available to recycle more than two or three
times.
D
Materials that have a complex or expansive recycling
process such as the need of separating materials and are
toxic.
E Long-lasting materials that are complex to process, non-
recyclable and mid-toxic.
F Non-recyclable, non-degradable and highly toxic.
The goal of this scale is to be used in the application as the main method of evaluation
regarding the product researched. It will help the user on understanding and thinking
about the associated characteristics of a specific product before purchase.
2.1.4 Actual situation
According to the European Parliament (2018), the production of plastic per year in
the whole planet was 1.5 million tonnes in 1950 and in 2015 this number increased to 322
million tonnes. The same source shows that 40% of all plastic production in the European
Union is designated to packaging, followed by consumer and household goods (22%),
building and construction (20%), cars and lorries (9%), electrical and electronic
equipment (6%) and agriculture (3%). Plastic is the majority of the packaging industry,
and based on research, the most aggressive material in general. Recycling levels are
acceptable in some of the European countries but as seen at the EU plastic waste facts
13
and figures (European Parliament, 2018) there is a lot to progress. Spain in 2015, for
example, registered less than 30% of plastic packaging waste recycling, but this data was
much higher in Lithuania achieving more than 70%, which is a reference of an ideal
situation for a country to be in.
In Portugal there are a few activities happening in that area, like Smart Waste
Portugal, which is a non-profit association with the following objectives:
- Generate opportunities to waste sector and industry; - Produce and disseminate knowledge in the field of waste sector and circular
economy;� - Stimulate actions highlighting the cooperation between the entities operating
in the waste sector;� - Establish preferred contacts with universities, companies, research institutes
and other organizations, public or private, and with similar national, foreign
and international associations;� - Promote dialogue and involvement;� - Stimulate the research and exchange of ideas and projects;� - Implement solutions to the market;� - Provide support and sharing;� - Have common purposes and motivations;� - Create reciprocity, benefits and mutual value;� - Create value and shared talent to compete and win.���
The organization developed a study on the Relevance and Impact of the Waste
Industry in Portugal (Mateus., 2018) in the perspective of the Circular Economy. This
study presents a detailed analysis of the sector and proposes a roadmap to 2030, with
actions and recommendations, in the circular economy area.
The studies mentioned show that this matter is vast and in need of action, every year
we can see more people and companies implementing solutions and achieving good
results, but those are slow meaning that we have a long path ahead of us as society, and
every minor action taken is part of a great change in the planet.
14
2.2 Design fundamentals applied
2.2.1 Mobile Design
This project comprehends a prototype development for a mobile application,
meaning that the objective will be designing for smartphone devices and not desktops,
tablets, smart TV’s or other digital devices, even though, it could potentially be adapted
to some of those devices in the future. There are three types of mobile applications,
mobile web sites, web apps and native apps. A mobile-optimized web site is an iteration
of your computer web site that has been optimised for the mobile context and a mobile
web app is a mobile application that users can access via mobile browser (Hinman,
2012). The application that is being developed in this project is thought to be a native app,
which is a custom-made application that users can download onto their mobile phones
(Hinman, 2012).
An important element to be studied and considered while developing a mobile
application is responsive design, which stands for designing an adaptive interface that
looks efficient on every device considering many different mobile phone screen sizes in
the market. In other words, responsive design is generically defined by Hinman:
“Responsive Web design is a Web design and development approach that asserts that a
site should respond to the screen size, platform, and orientation of the device. As a user
moves from his laptop to an iPad or to a smartphone, the Web site should automatically
reform to accommodate the screen size and functionality of the device.” (2012).
With those in mind, the fields of study presented will be analysed and applied
focused on mobile platforms also considering responsive design. As follow, there are
analysis over User Interface Design, User Experience Design and Interaction Design
directed to the project in question.
2.2.2 User interface design & User experience design
User interface design (UI) is the mean of communication that a system needs to be
able to interact with its user. It is extremely connected to a field of study called human-
15
computer interaction (HCI). Human-computer interaction is the study, planning and
design of how people and computers work together so that a person’s needs are satisfied
in the most effective way (Galitz., 2007). An interface has the objective of being easily
understood by its user as well as to be easy to manipulate. Through an interface people
can see, touch, hear, and even talk, those actions will be recognized by a specific system
and give a response. All possibilities need to be considered and studied accordingly in
order to achieve its objective as its best.
When researching on User Interface Design, User experience design (UX) has to be
considered. According with the Interaction Design Foundation, UX design is more than
interaction design, it also involves user research (finding out who the users are in the first
place), creating user personas (why, and under what conditions, would they use the
product), performing user testing and usability testing, etc. These aspects need to be
defined before the Interface development starts as they support the actual interface
guiding on design decisions.
UX can also be defined as the experience a product or service delivers to people, so
it is not about its function but the way a user interacts with it in order to achieve a certain
objective. In other words, Garrett (2011) explains this definition in his book: “User
experience is not about the inner workings of a product or service. User experience is
about how it works on the outside, where a person comes into contact with it. When
someone asks you what it’s like to use a product or service, they’re asking about the user
experience. Is it hard to do simple things? Is it easy to figure out? How does it feel to
interact with the product?”. Another definition according with Hassenzahl (2013) is that
UX is a field of study that focus on the user and its context of interaction with a product
or service. It considers the psychologic and emotional aspects related to the interaction
and it is analysed in two parts. One, focusing in a particular interaction moment,
considering the action, thoughts and feelings. The second focus on the experience as a
narrative that can vary between users and those outcomes can be incorporated in the
final product.
In this project, UI and UX are applied during the whole development process. UX
research through several techniques that are vital to understand the user, to structure
information and to collect data in order to be analysed and applied at the actual UI
16
development. UI fundaments well translated and applied meaning a higher chance of
having a successful final project.
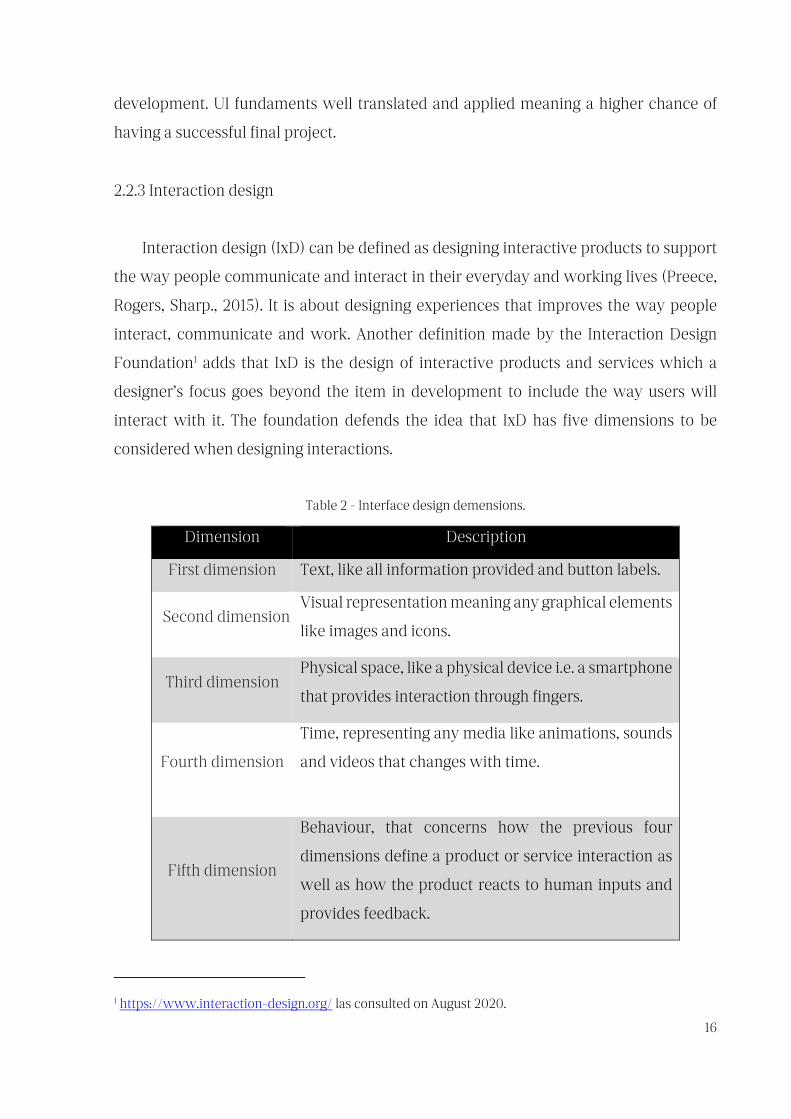
2.2.3 Interaction design
Interaction design (IxD) can be defined as designing interactive products to support
the way people communicate and interact in their everyday and working lives (Preece,
Rogers, Sharp., 2015). It is about designing experiences that improves the way people
interact, communicate and work. Another definition made by the Interaction Design
Foundation1 adds that IxD is the design of interactive products and services which a
designer’s focus goes beyond the item in development to include the way users will
interact with it. The foundation defends the idea that IxD has five dimensions to be
considered when designing interactions.
Table 2 - Interface design demensions.
Dimension Description
First dimension Text, like all information provided and button labels.
Second dimension Visual representation meaning any graphical elements
like images and icons.
Third dimension Physical space, like a physical device i.e. a smartphone
that provides interaction through fingers.
Fourth dimension
Time, representing any media like animations, sounds
and videos that changes with time.
Fifth dimension
Behaviour, that concerns how the previous four
dimensions define a product or service interaction as
well as how the product reacts to human inputs and
provides feedback.
1 https://www.interaction-design.org/ las consulted on August 2020.
17
The project described in this document has as its first dimension, all digital text
displayed through the application. The second comprehends all graphical elements such
as icons, illustrations, photos and representative forms. The third one is represented by
user’s physical device, being a smartphone for example. The fourth represents small
interactive animations like swipes and the transitions in the application, and the fifth
comprehends the whole product as an interactive human tool.
IxD is considered fundamental to all disciplines and fields that are concerned when
researching and designing computer-based systems for people (Preece, Rogers, Sharp.,
2015) and is compound by several components that are directly related to interaction
design such as Academic disciplines, Ergonomics psychology/Cognitive science, Social
sciences, Computer science, Human-computer interaction (HCI), Human factors (HF),
Industrial design, Graphic design and others.
In this project, IxD is approached obviously because it concerns a mobile application,
but we can relate some non-obvious elements to some of those components listed above.
Ergonomics psychology/cognitive science is an element considered when designing a
button and deciding its colour, for example. Social sciences help on understanding users
and their behaviour. Computer science/software engineering is completely related to a
technical side of developing a project like this, just imagining what has to be
programmed in a possible future stage, after design. HCI supporting human behaviour
towards a digital system. Graphic design, which is a base element used for branding, for
example. These are just a few examples of how all those elements are directly connected
to the project by all interaction studies.
IxD studies will be present at mostly stages of the development process of the mobile
application.
2.3 Similar applications
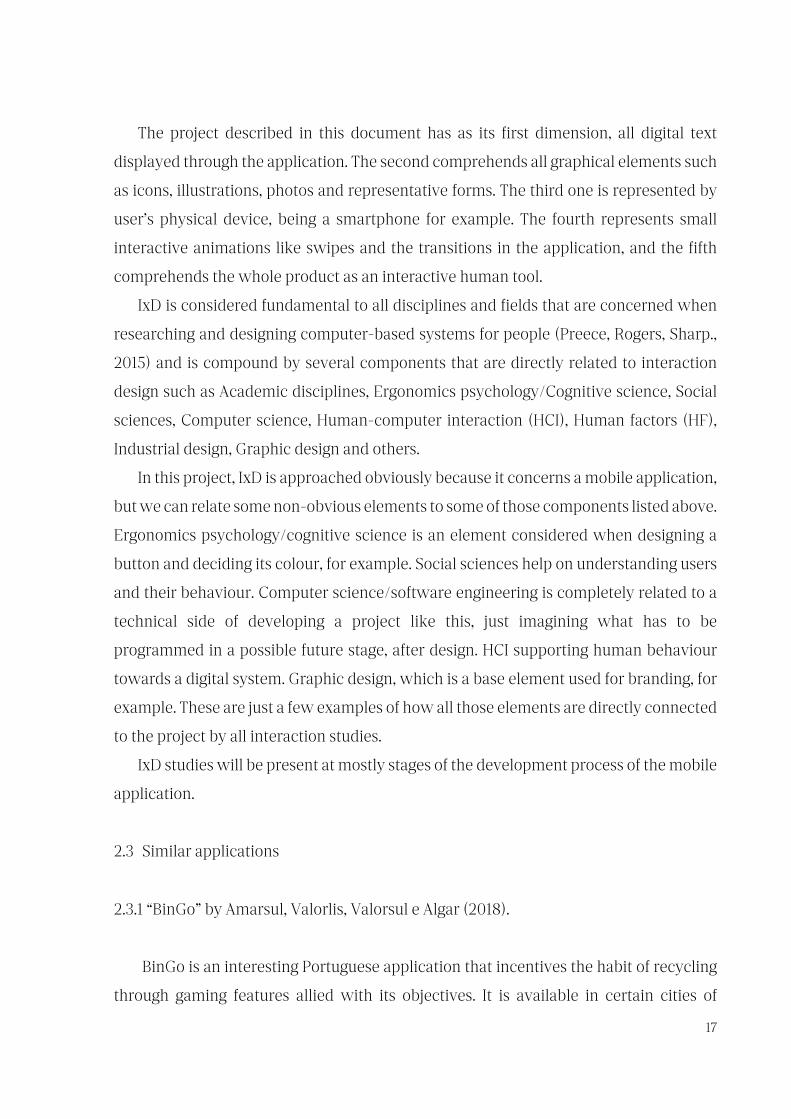
2.3.1 “BinGo” by Amarsul, Valorlis, Valorsul e Algar (2018).
BinGo is an interesting Portuguese application that incentives the habit of recycling
through gaming features allied with its objectives. It is available in certain cities of
18
Portugal where the recycling spots are mapped. The user needs to create an account and
it will be able to collect points by completing missions (tasks) such as checking-in an
“ecoponto”(recycling station) when depositing the right materials to their respective
bins. Points can be exchanged to prizes as supermarket vouchers or cinema tickets.
Every user has its cards as well (reference to a bingo game) and filling up the card, prizes
can be won. There is also a “Ranking” that intrigues competitivity working as another
incentive to the user.
Image 3 - BinGo mobile application screenshots.
Some features from BinGo can be adapted and used in this project, as partnerships
in the future, making real prizes available like supermarket coupons. Guidance they
provide on how to recycle and the interface are very interesting aspects to consider as
well.
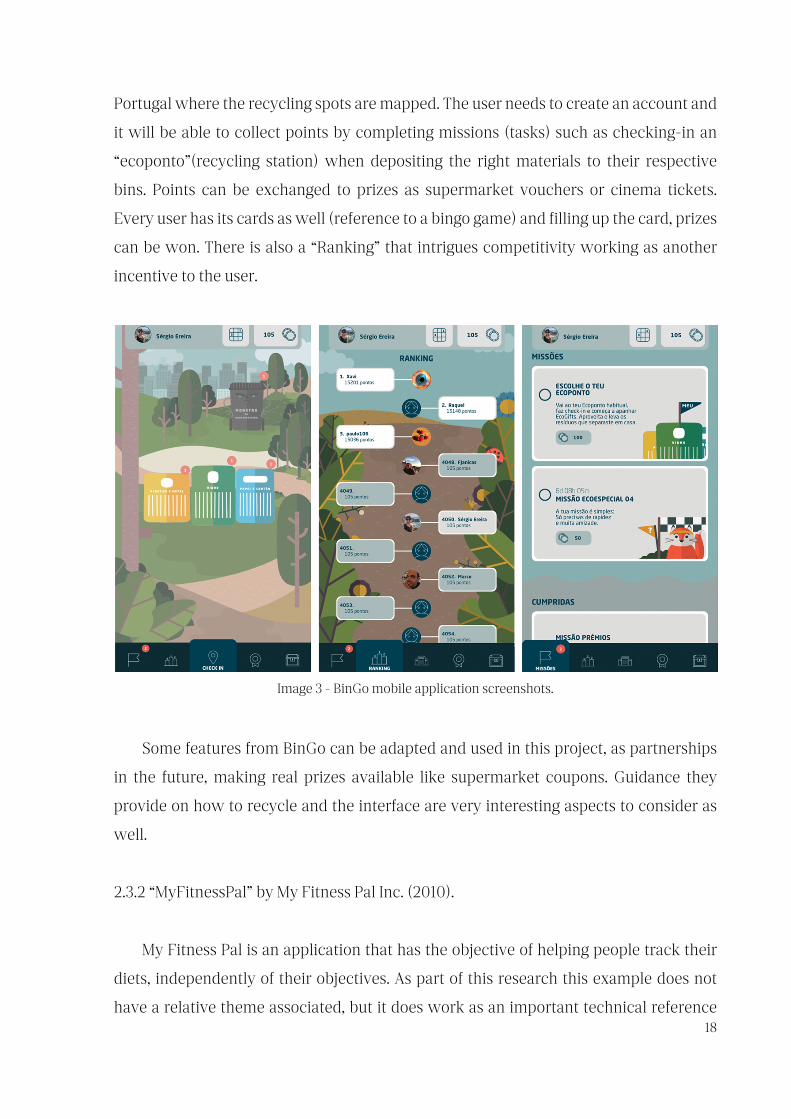
2.3.2 “MyFitnessPal” by My Fitness Pal Inc. (2010).
My Fitness Pal is an application that has the objective of helping people track their
diets, independently of their objectives. As part of this research this example does not
have a relative theme associated, but it does work as an important technical reference
19
since the beginning of the idea as it contains a barcode reader that displays all nutritional
information about a specific product. In case of not having this data in the database, any
person using the app can introduce missing details. This functionality works within a
collaborative database and is the main reference to the same functionality in the mobile
application developed in this project.
Image 4 - My fitness pal mobile application screenshots.
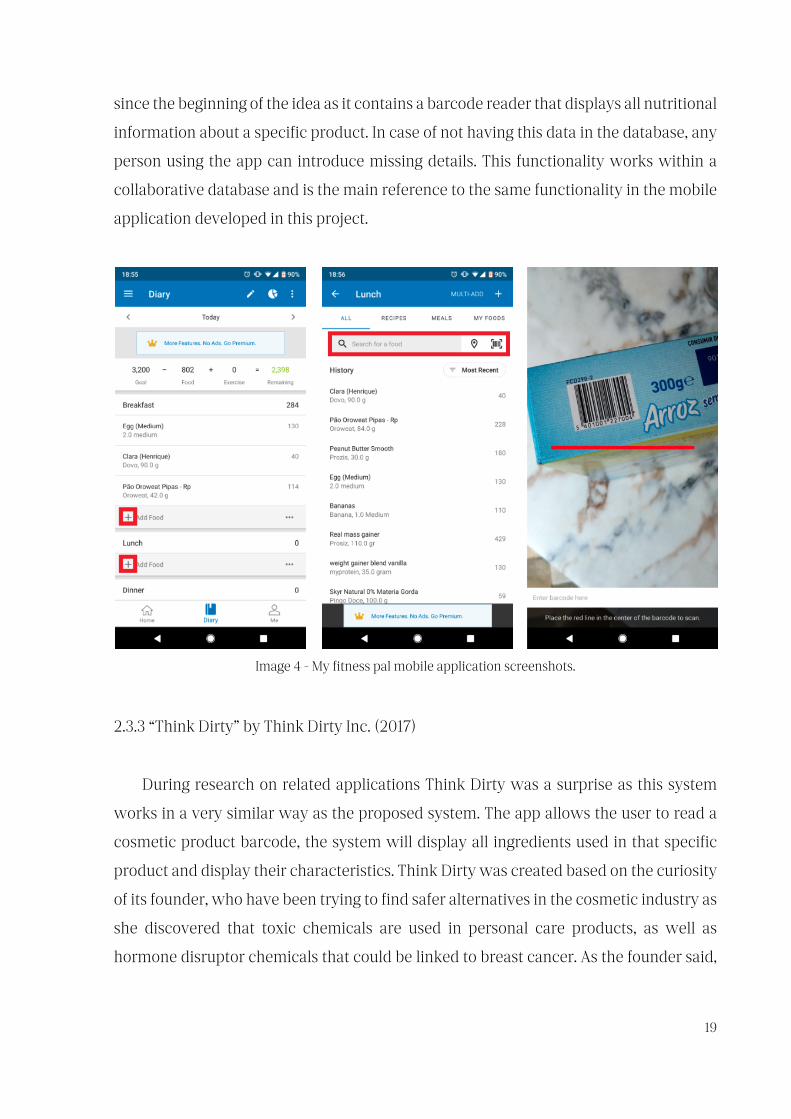
2.3.3 “Think Dirty” by Think Dirty Inc. (2017)
During research on related applications Think Dirty was a surprise as this system
works in a very similar way as the proposed system. The app allows the user to read a
cosmetic product barcode, the system will display all ingredients used in that specific
product and display their characteristics. Think Dirty was created based on the curiosity
of its founder, who have been trying to find safer alternatives in the cosmetic industry as
she discovered that toxic chemicals are used in personal care products, as well as
hormone disruptor chemicals that could be linked to breast cancer. As the founder said,
20
“Think Dirty empowers and educates the consumer on the cosmetic industry by allowing
them to make an informed decision on what products to purchase.”
Image 5 - Think dirty mobile application.
2.4 Summary
This whole chapter was focused on researching all fields related to the project in
question. Firstly, gather information about the environment in Europe and the world
considering packaging pollution and packaging material studies. Those were extremely
important in order to set the categorisation (A to F scale) shown that will be present in
the app. The relation between people and packaging was explored as well in order to
understand the importance general people actually gives to this matter.
In the second half of the chapter, design fields of study were defined and the
connection between them was made in order to recognise that the app design
development have its roots on those concepts. The next chapter exposes all empirical
phases based on this research and associations are along the content.
21
3 METHODOLOGY AND PROTOTYPE DESIGN
3.1 User centred design
Methodology used to develop this project is called “user centred design” (UCD). It
consists of considering the end-user of a product at every stage of the conception and
design process (Allen, Chudley., 2012). The process can start by asking a few questions
about the project, like “who will use the product?”, “why?” and “how?”. UCD is often
used by designers as real users are considered to validate a product through testing
procedures. Consulting the end-user as often as possible using specific techniques will
help making decisions more assertively. The developing process based on UCD can be
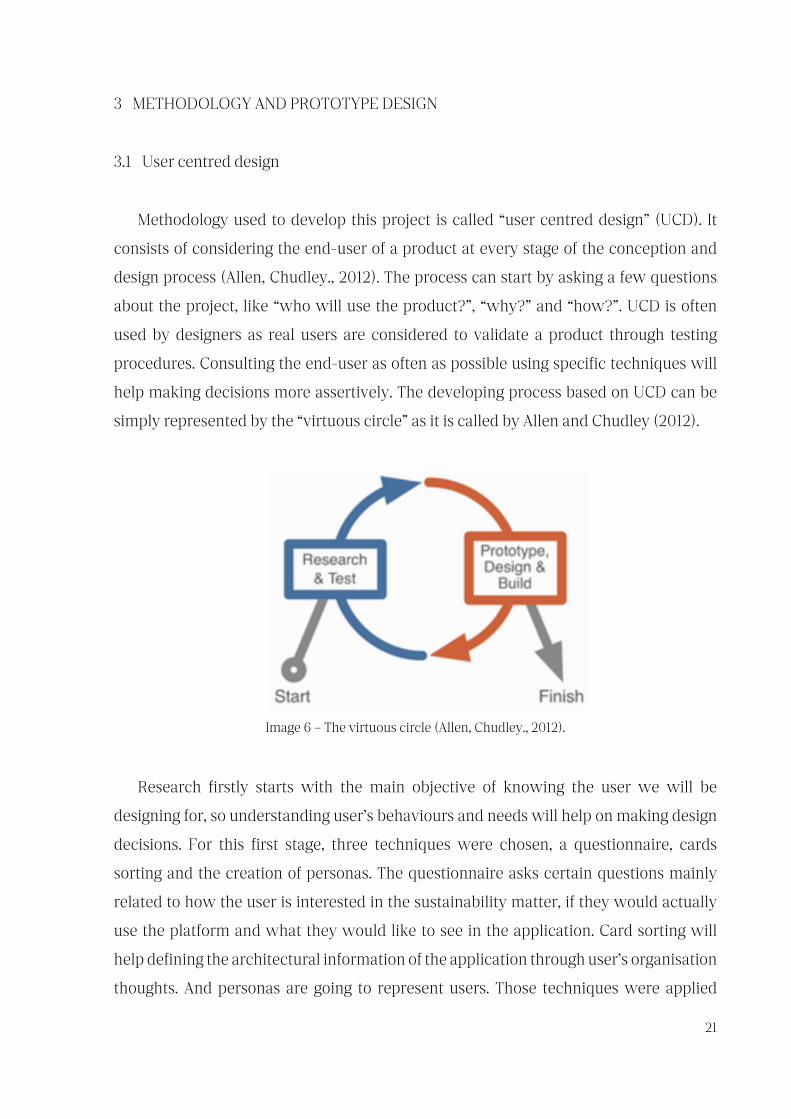
simply represented by the “virtuous circle” as it is called by Allen and Chudley (2012).
Image 6 – The virtuous circle (Allen, Chudley., 2012).
Research firstly starts with the main objective of knowing the user we will be
designing for, so understanding user’s behaviours and needs will help on making design
decisions. For this first stage, three techniques were chosen, a questionnaire, cards
sorting and the creation of personas. The questionnaire asks certain questions mainly
related to how the user is interested in the sustainability matter, if they would actually
use the platform and what they would like to see in the application. Card sorting will
help defining the architectural information of the application through user’s organisation
thoughts. And personas are going to represent users. Those techniques were applied
22
during research and further details about each one of them can be seen at the following
section.
With all data collected from research, the design process starts. When a prototype is
ready, it will be tested with user’s and based on feedback, new design changes are
applied, and that circle is repeated until a faceted final product is achieved.
3.2 Design research techniques applied
There are several techniques known that could be applied in projects such as this.
The selection of techniques to be used depends on project’s objectives and development,
analysing what are the ones that suits better to the process, as well as which ones are
going to bring the most valuable results. Every technique should be adapted accordingly.
Between a great variety of techniques, some of them are surveys card sorting, eye
tracking, A/B testing, user-flows, system analytics.
The first technique chosen for this project is an initial questionnaire, with the
intention of understanding people’s feelings and ideas about the subject matter. A card
sorting exercise is used as well in order to support informational architecture. Personas
are created to represent the user. As a last technique before designing the application, a
system map was created considering previous research results.
3.2.1 Questionnaire
With the idea of understanding people’s behaviour and perception related to
Sustainability and Circular Economy, a generic survey was created (Attachment 1). The
survey will help to extract how possible users imagine functionalities in an application
related to the theme. Those answers could potentially help to improve the functionalities
of the interface.
Questions were created to understand how people are connected within the theme
as well. Some final questions are related to the proposed system, asking people's
opinions on how they would imagine a system like the one that’s being developed. The
survey was released on February 20th, 2020 to a range of people through social media
23
channels (e.g. Facebook) and the E.S.M.A.D.2 secretary also spread it through an email
directed to teachers and Polytechnic of Porto’s students.
91 people answered the form. 86,8% of them have collaborated answering the form
in Portugal, 9,9% in another European country and the remaining 3,3% outside Europe.
In the following table, it is possible to see results for questions that have a scale from 1 to
5 as possible answers, where 1 means “strongly disagree/low/no” and 5, “strongly
agree/high/yes”. Other questions are described further.
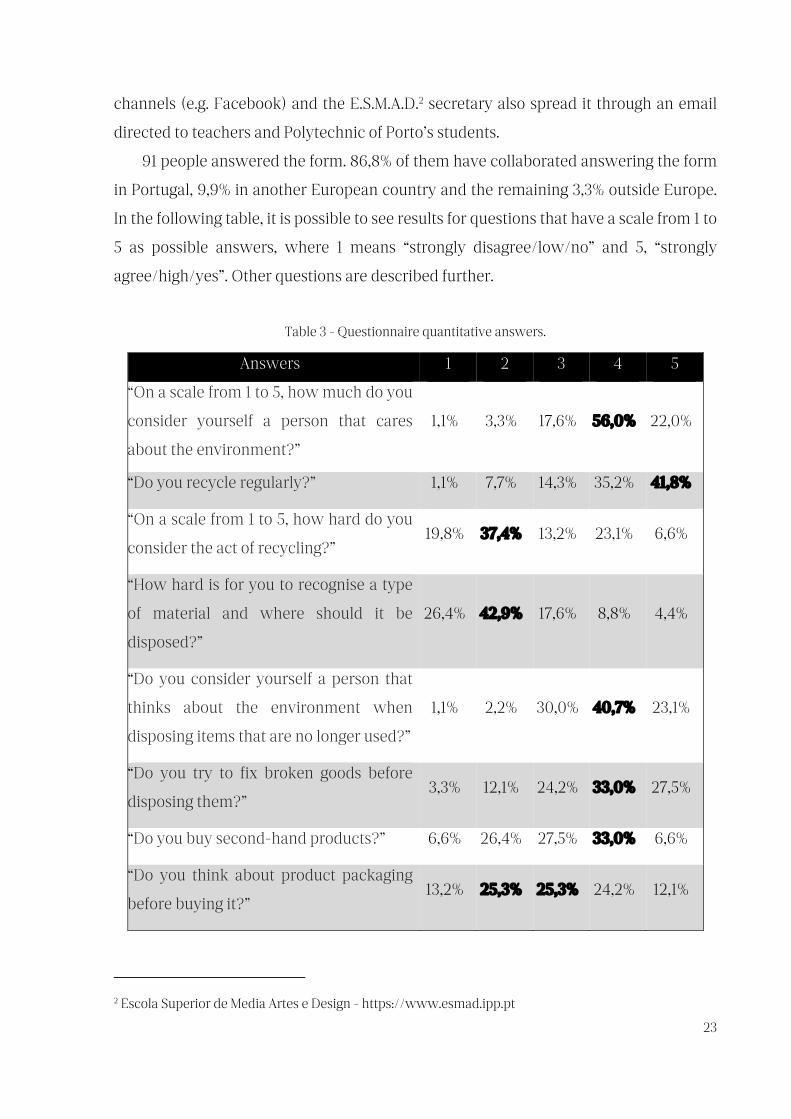
Table 3 - Questionnaire quantitative answers.
Answers 1 2 3 4 5
“On a scale from 1 to 5, how much do you
consider yourself a person that cares
about the environment?”
1,1% 3,3% 17,6% 56,0% 22,0%
“Do you recycle regularly?” 1,1% 7,7% 14,3% 35,2% 41,8%
“On a scale from 1 to 5, how hard do you
consider the act of recycling?” 19,8% 37,4% 13,2% 23,1% 6,6%
“How hard is for you to recognise a type
of material and where should it be
disposed?”
26,4% 42,9% 17,6% 8,8% 4,4%
“Do you consider yourself a person that
thinks about the environment when
disposing items that are no longer used?”
1,1% 2,2% 30,0% 40,7% 23,1%
“Do you try to fix broken goods before
disposing them?” 3,3% 12,1% 24,2% 33,0% 27,5%
“Do you buy second-hand products?” 6,6% 26,4% 27,5% 33,0% 6,6%
“Do you think about product packaging
before buying it?” 13,2% 25,3% 25,3% 24,2% 12,1%
2 Escola Superior de Media Artes e Design - https://www.esmad.ipp.pt
24
Based on the answers, people considered themselves individuals that do care about
the environment and the great majority of attendants do recycle. On “How hard do you
consider the act of recycling?” there are some concerning numbers on “considerably
hard”, the numbers show that there is room for improvement in terms of information
about recycling, maybe clearer and more assertive information is needed. When asking
if people know what circular economy is, 52,7% answered yes, while 47,3% answered
no. Another proof that further information about this matter needs to reach the
population. When questioned if they would be interested in having easy and free access
to information about product packaging and its impacts over the environment, 69
(75,8%) participants said yes, 17 (18,7%) said maybe and 5 (5,5%) said no.
The last question was not mandatory and suggested participants to add ideas of
functionalities and information that they would like to see in an application related to
sustainability.
This questionnaire filtered ideas about the application and worked as an initial guide
when setting functionalities according with people’s needs and wills.
3.2.2 Card sorting
Card Sorting is a technique that comprehends how the user organises, categorises
and group information (Cooper et al., 2014; Garrett, 2011). This technique is used to
develop interface information architecture and can be executed in a laboratory,
individually or in a group, through digital channels, in person or as a workshop (Cooper
et al., 2014). The concept and process are simple, a series of cards are used within a name,
a description, an image or a content. Later, these cards are mixed and distributed
between the users that should group them by concept or category according to their
ideas (Cooper et al., 2014; Garrett, 2011). It is not like having all clear answers from it but
gathering patterns from the results helps to structure the information architecture. Using
an online platform called Optimal Workshop3 an open card sorting – meaning that the
participant can suggest new categories - was created with 15 cards representing the main
3 https://www.optimalworkshop.com
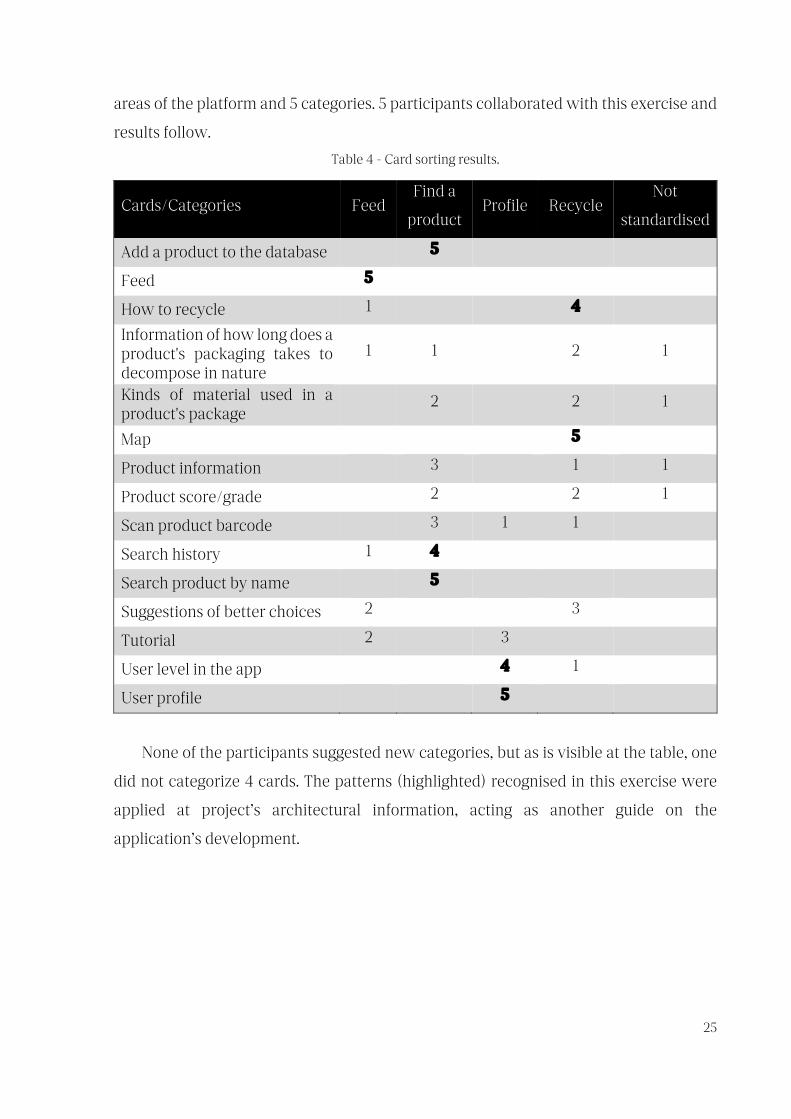
25
areas of the platform and 5 categories. 5 participants collaborated with this exercise and
results follow.
Table 4 - Card sorting results.
Cards/Categories Feed Find a
product Profile Recycle
Not
standardised
Add a product to the database 5
Feed 5
How to recycle 1 4
Information of how long does a product's packaging takes to decompose in nature
1 1 2 1
Kinds of material used in a product's package
2 2 1
Map 5
Product information 3 1 1
Product score/grade 2 2 1
Scan product barcode 3 1 1
Search history 1 4
Search product by name 5
Suggestions of better choices 2 3
Tutorial 2 3
User level in the app 4 1
User profile 5
None of the participants suggested new categories, but as is visible at the table, one
did not categorize 4 cards. The patterns (highlighted) recognised in this exercise were
applied at project’s architectural information, acting as another guide on the
application’s development.

26
3.2.3 Personas
“Personas are fictional characters created to represent an actual user” (Ilama, 2015).
Personas have to be created based on investigation of potential users for a service or
product with an approach centred on the user, using different techniques as in this
project through the questionnaire and informal interviews. The quality of data collected
has an effective impact on the efficiency of the personas in the design process of a
product (Cooper, Reimann, Cronin, & Cooper, 2007). Based on research, the literature
review and answers from the questionnaire, 3 personas were created.
Image 7 - Persona 1.
Persona 1 (Joaquim). A 30 years old male, who lives in a studio apartment in Lisbon. He
works as an architect in a small company. He likes technology and goes to the gym
regularly, usually shop online, uses Instagram and YouTube, has a high level of internet
knowledge and feels comfortable using general software, smartphones and social media.
Joaquim uses a laptop, his smartphone and a smartwatch. Seeks for fast, entertaining,
27
safe, motivational and practical user experience. He usually recycles and considers the
environment daily.
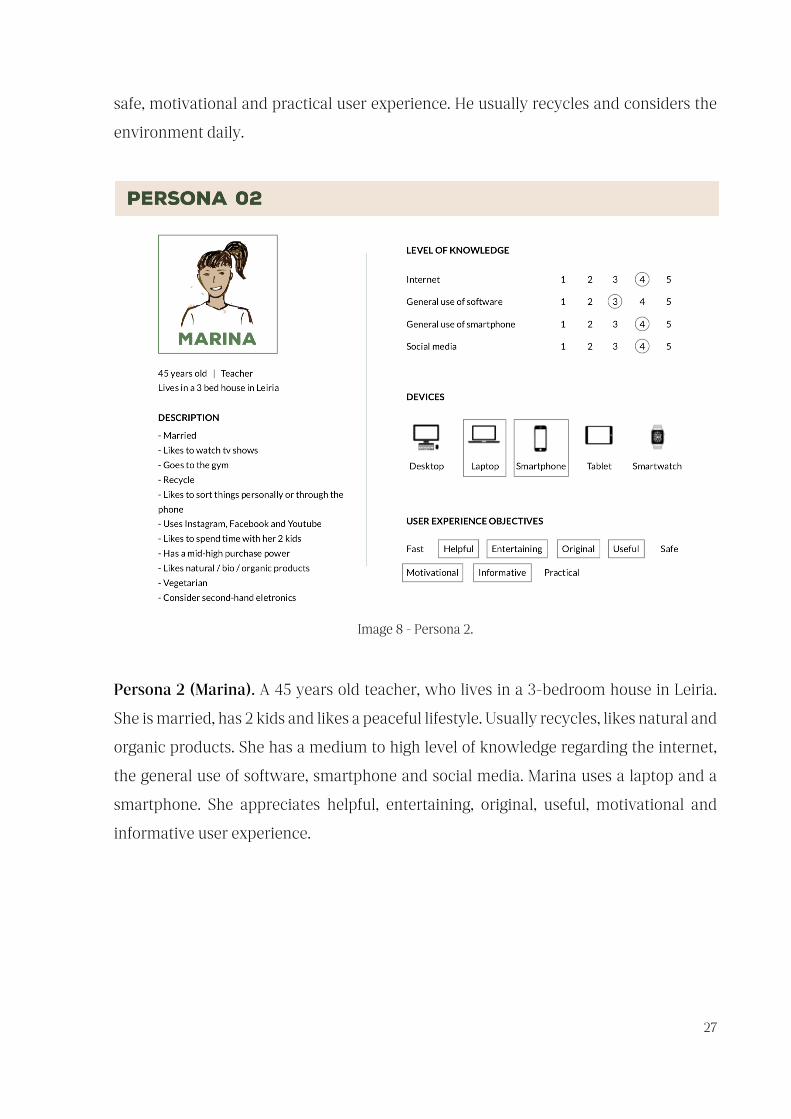
Image 8 - Persona 2.
Persona 2 (Marina). A 45 years old teacher, who lives in a 3-bedroom house in Leiria.
She is married, has 2 kids and likes a peaceful lifestyle. Usually recycles, likes natural and
organic products. She has a medium to high level of knowledge regarding the internet,
the general use of software, smartphone and social media. Marina uses a laptop and a
smartphone. She appreciates helpful, entertaining, original, useful, motivational and
informative user experience.
28
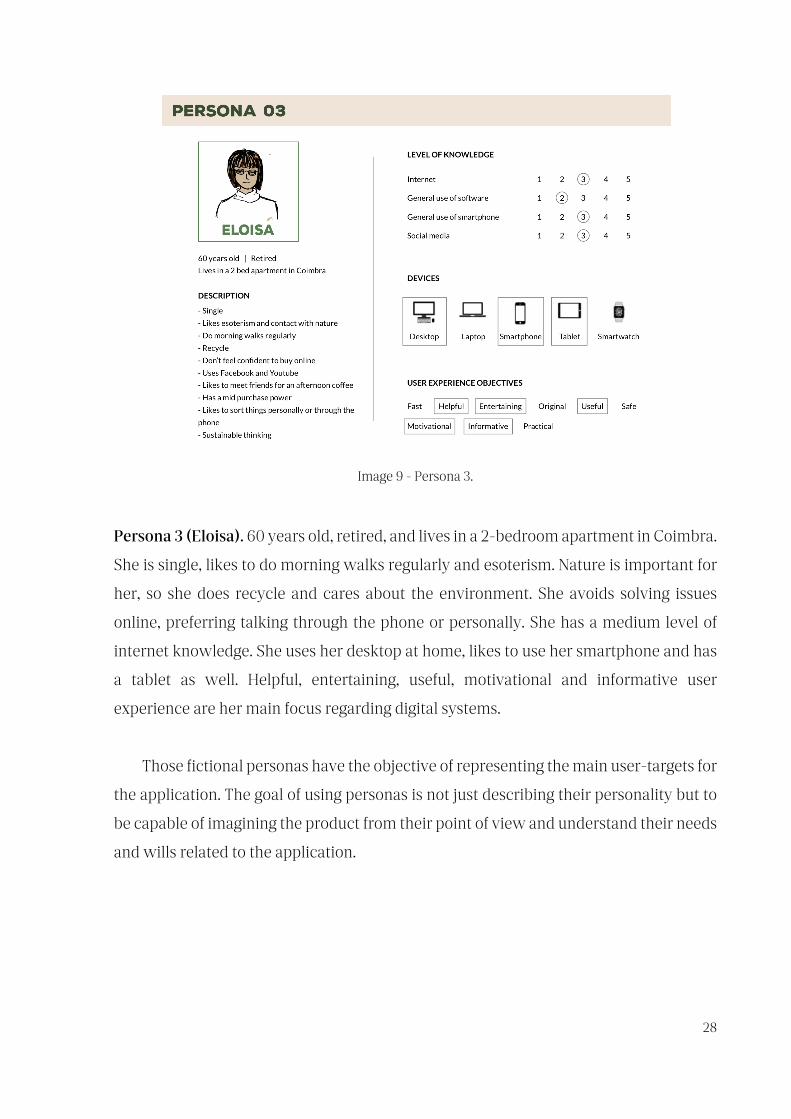
Image 9 - Persona 3.
Persona 3 (Eloisa). 60 years old, retired, and lives in a 2-bedroom apartment in Coimbra.
She is single, likes to do morning walks regularly and esoterism. Nature is important for
her, so she does recycle and cares about the environment. She avoids solving issues
online, preferring talking through the phone or personally. She has a medium level of
internet knowledge. She uses her desktop at home, likes to use her smartphone and has
a tablet as well. Helpful, entertaining, useful, motivational and informative user
experience are her main focus regarding digital systems.
Those fictional personas have the objective of representing the main user-targets for
the application. The goal of using personas is not just describing their personality but to
be capable of imagining the product from their point of view and understand their needs
and wills related to the application.

29
3.2.4 System map
With all information collected from the techniques mentioned before, a system map
was defined. Card sorting results were a great value in order to develop this map as it
helped connecting sections and placing information into certain areas. The map
represents the architecture of the application, the first structure of the system and is
mandatory to the creation of the entire prototype.
Image 10 - Application map.
It contains the most important navigation sections which are five. The main one is
“Scan” which is the main functionality of the application, where the user will be able to
find a product through its barcode or name. The other four sections are “profile”,
“history”, “news” and “recycle”. The “profile” contains user’s personal information like its
name, e-mail, photo and access to the tutorial. “History” will keep record of all product’s
found in the “scan” section. “News” will display sustainability related news and “Recycle”
is a dedicated area to inform about how to recycle based on user’s location. In this section
is also possible to search for a recycling dock near based on GPS location.
This map is the base support to the wireframing development, as with the main
structured defined the focus could be at the interface design of all screens.
30
3.3 Visual identity
Visual identity is a necessary item in this project in order to create a brand identity
to the proposed system. The results from this step will impact on the way people receive
and, together with the interface design, interact with the application. References of
systems in similar areas are valuable to understand and build a digital environment –
based on visual elements, style, colours and typography - where the user will exercise
its actions and probably achieve its objectives. According with Wheeler (2009), a strong
brand identity will help build brand equity through increased recognition, awareness,
and customer loyalty, which in turn helps make a company more successful. In this
project’s visual identity, those elements were initially created:
- Logo�
- Colour palette�
- Typography�
- Iconography and interface elements
Together, those items will be the image of the application and the base of the User
interface design elements as well.
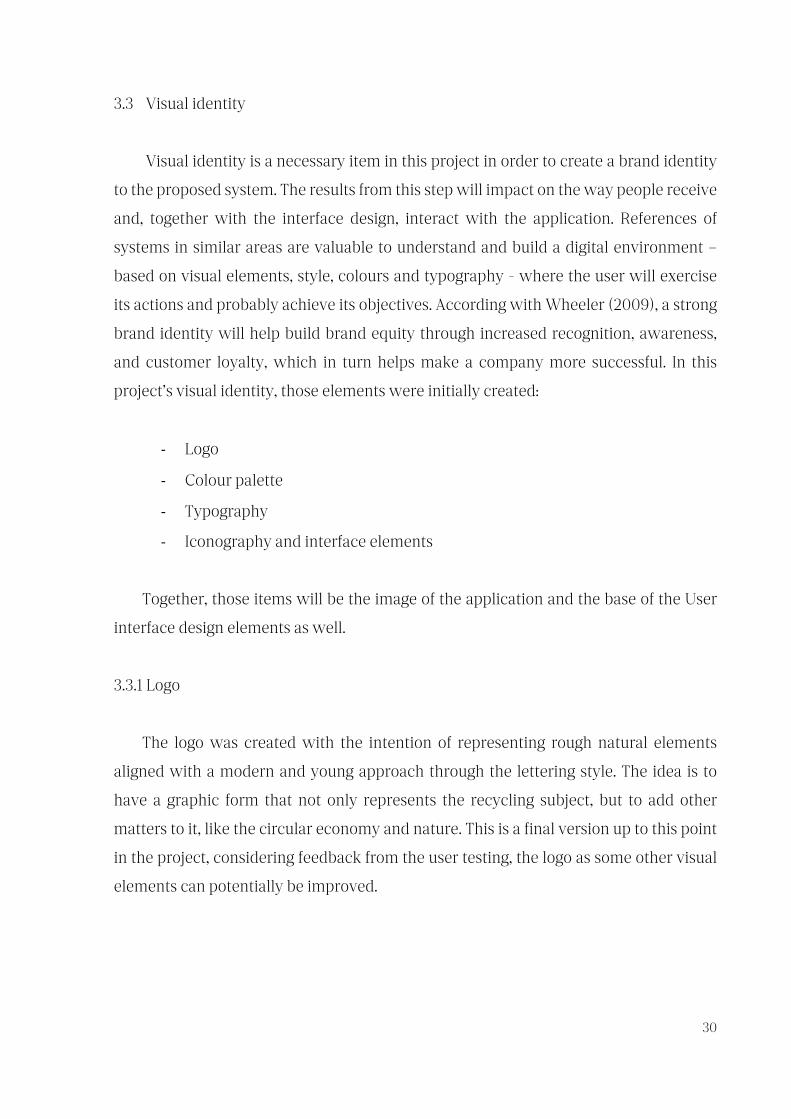
3.3.1 Logo
The logo was created with the intention of representing rough natural elements
aligned with a modern and young approach through the lettering style. The idea is to
have a graphic form that not only represents the recycling subject, but to add other
matters to it, like the circular economy and nature. This is a final version up to this point
in the project, considering feedback from the user testing, the logo as some other visual
elements can potentially be improved.
31
Image 11 - Logo.
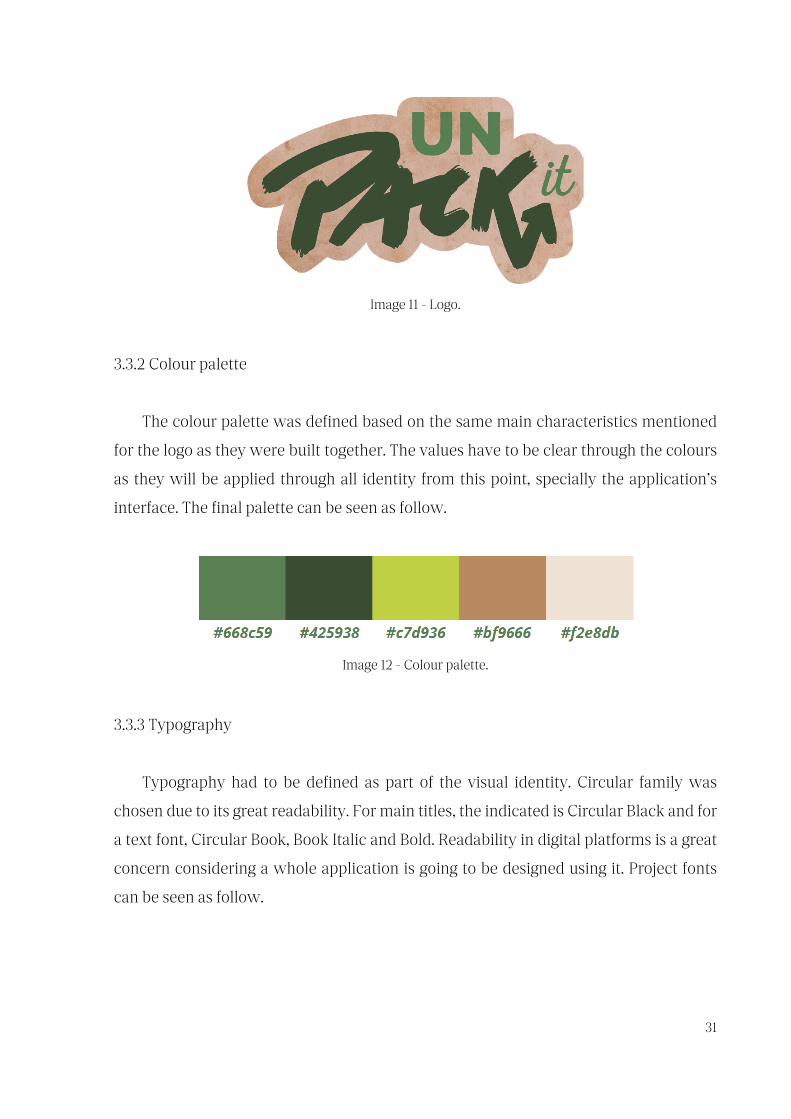
3.3.2 Colour palette
The colour palette was defined based on the same main characteristics mentioned
for the logo as they were built together. The values have to be clear through the colours
as they will be applied through all identity from this point, specially the application’s
interface. The final palette can be seen as follow.
Image 12 - Colour palette.
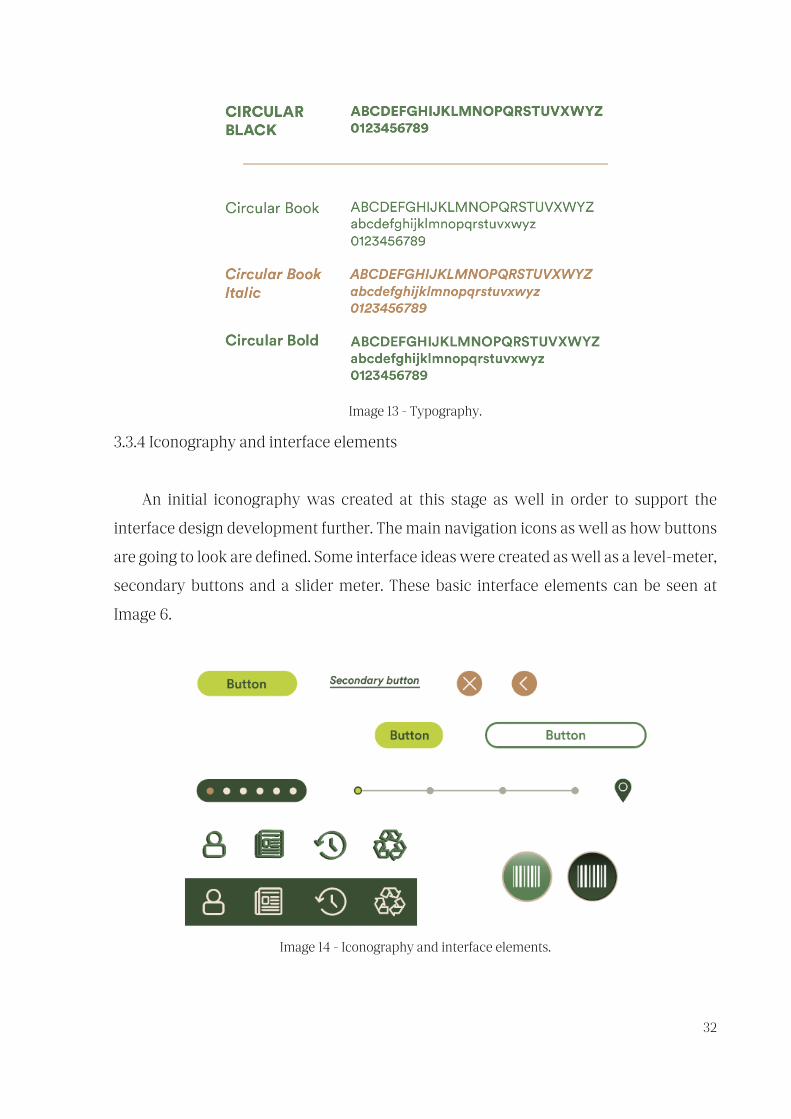
3.3.3 Typography
Typography had to be defined as part of the visual identity. Circular family was
chosen due to its great readability. For main titles, the indicated is Circular Black and for
a text font, Circular Book, Book Italic and Bold. Readability in digital platforms is a great
concern considering a whole application is going to be designed using it. Project fonts
can be seen as follow.
32
Image 13 - Typography.
3.3.4 Iconography and interface elements
An initial iconography was created at this stage as well in order to support the
interface design development further. The main navigation icons as well as how buttons
are going to look are defined. Some interface ideas were created as well as a level-meter,
secondary buttons and a slider meter. These basic interface elements can be seen at
Image 6.
Image 14 - Iconography and interface elements.

33
The complete identity guide can be seen at Attachment 2. These visual concepts will
be represented in the application where they are intended to transport this same feeling
and meaning to the user.
3.4 Prototype and user-flow
Based on all research done until this point, the prototype was created. All outcome
from the UX research through techniques described are applied in this design process.
The system map is already a synthetised result from that data and together with all other
applied techniques, they serve as a surface for this stage. First rough sketches done
manually can be seen.
Image 15 - Prototype initial paper sketches.
The image above shows the first main design ideas based on the informational
structure defined that can be seen at the system map. The main sections of the
application are presented in the sketch being “profile’, “news”, “recycle”, “history” and
the main functionality, “scan”. From this stage, the interface explorations were taken to
digital software - Adobe Illustrator - where some screens were drawn in order to define
a bit more how the information would be displayed.
34
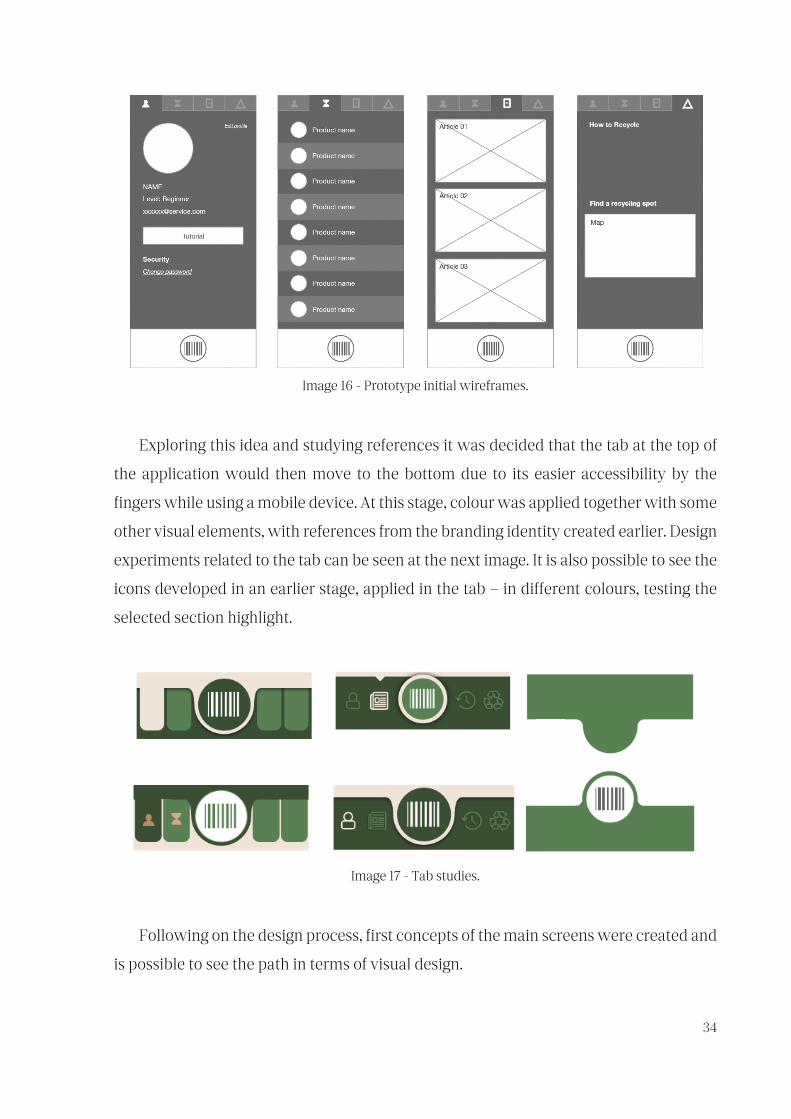
Image 16 - Prototype initial wireframes.
Exploring this idea and studying references it was decided that the tab at the top of
the application would then move to the bottom due to its easier accessibility by the
fingers while using a mobile device. At this stage, colour was applied together with some
other visual elements, with references from the branding identity created earlier. Design
experiments related to the tab can be seen at the next image. It is also possible to see the
icons developed in an earlier stage, applied in the tab – in different colours, testing the
selected section highlight.
Image 17 - Tab studies.
Following on the design process, first concepts of the main screens were created and
is possible to see the path in terms of visual design.

35
Image 18 - Prototype Illustrator studies.
In the “profile” screen, user-levels were added as an extra feature. The idea is to
encourage the user to be active when using the application by its will of achieving higher
levels in the application. The levels will be measured initially by the number of times the
user scans or finds a product as well as the number of new products that are added to
the application. The levels created and its respective visual representation are in the next
image.
Image 19 - User level badges.
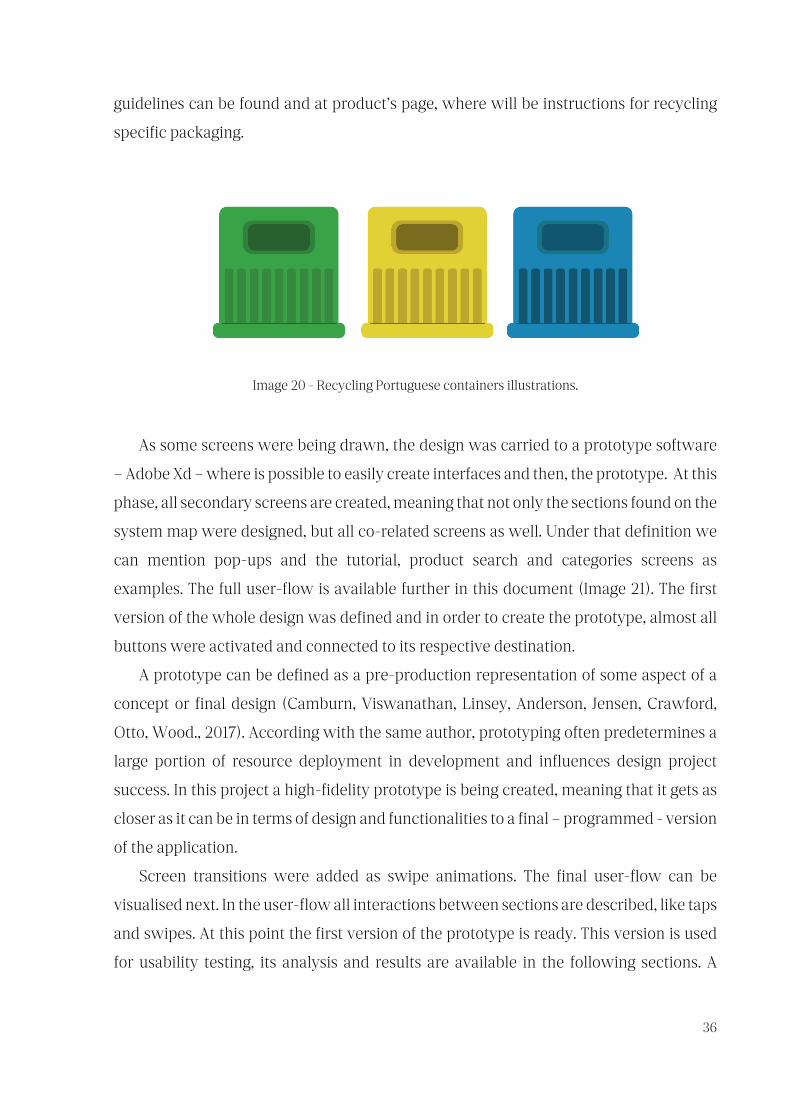
Another visual element created to be in the application are the visual representation
of recycling containers in Portugal (Image 20). The blue, yellow and green containers are
illustrated, and they will be applied in certain sections of the app, where recycling
36
guidelines can be found and at product’s page, where will be instructions for recycling
specific packaging.
Image 20 - Recycling Portuguese containers illustrations.
As some screens were being drawn, the design was carried to a prototype software
– Adobe Xd – where is possible to easily create interfaces and then, the prototype. At this
phase, all secondary screens are created, meaning that not only the sections found on the
system map were designed, but all co-related screens as well. Under that definition we
can mention pop-ups and the tutorial, product search and categories screens as
examples. The full user-flow is available further in this document (Image 21). The first
version of the whole design was defined and in order to create the prototype, almost all
buttons were activated and connected to its respective destination.
A prototype can be defined as a pre-production representation of some aspect of a
concept or final design (Camburn, Viswanathan, Linsey, Anderson, Jensen, Crawford,
Otto, Wood., 2017). According with the same author, prototyping often predetermines a
large portion of resource deployment in development and influences design project
success. In this project a high-fidelity prototype is being created, meaning that it gets as
closer as it can be in terms of design and functionalities to a final – programmed - version
of the application.
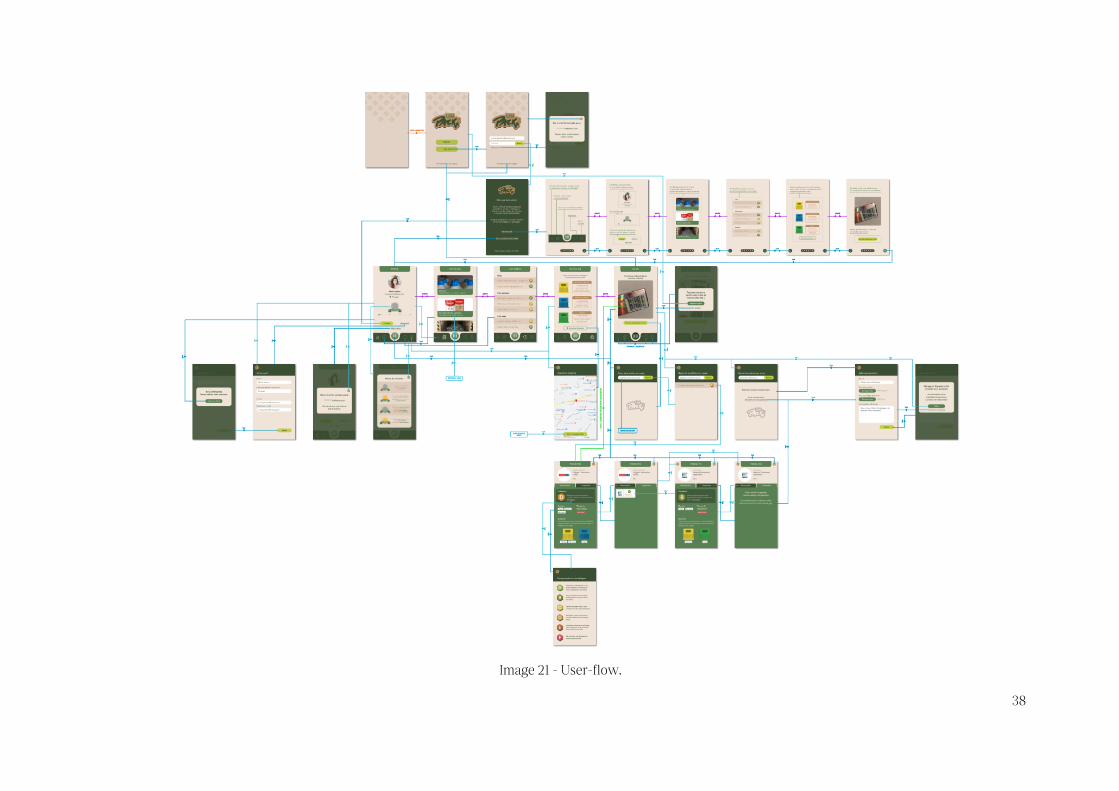
Screen transitions were added as swipe animations. The final user-flow can be
visualised next. In the user-flow all interactions between sections are described, like taps
and swipes. At this point the first version of the prototype is ready. This version is used
for usability testing, its analysis and results are available in the following sections. A
37
prototype video was recorded being possible to see the same interactions tested at the
usability testing. The video is available at https://youtu.be/jRriejEUizE.
With a final version of the prototype, the next step is to run the user testing. Good
quality feedback is expected from it, that will potentially be applied, generating an
improved version of the app.
38
Image 21 - User-flow.
39
3.5 Usability testing
Usability testing is the process of learning about users from users by observing them
using a product to accomplish specific goals of interest to them (Barnum., 2011). The user
testing was designed based on results from all other UX techniques applied in order to
gather the maximum information possible before creating the prototype. Personas
created are extremely important in this phase where real users are testing the system.
The objectives of the user test are to validate the application in terms of usability and
graphical interface as well as to recognise possible flow issues and improvements.
3.5.1 Recruitment
Recruitment was done by the author of this project using social media channels and
personal contacts, specific people that have interests in sustainability matters were
found. Personas were considered at this stage as they represent the application users.
The only information shared with participants was generic, mentioning that the test is
about a prototype of a mobile application and the approximate length of it. It is important
to mention that considering the Covid-19 pandemic situation, some difficulties were
found due to testing limitations. That resulted in a low number of representatives for
Persona 3, which is 60 years old.
3.5.2 Test description
The test was planned to happen during a real time video-call (moderated remote)
due to the actual Covid-19 situation where is advised from the General Health Direction
to avoid human contact. A main requisite is that the participant uses its smartphone to
test the application while the video call is happening in another device. This was applied
to all participants in order to achieve consistency through the process. As soon as the
video call starts, the interviewer explains that the test is about a sustainability application
but that no further information will be provided as the participant perception will be
taken into consideration in a future stage. It is asked to all participants to video record
their interaction with the application and that every thought they might have during the
40
experiment, to be said out loud. This last technique described is called “think aloud
protocol” and is a unique source of information as it generates direct data through the
performance (Jaspers, Steen, Bos, Geenen. 2004). Prototype limitations are also
described such as non-working text fields and external links, being examples of how
they will look in a final version of the system. There is no specific goal for the user to
achieve, the idea is to explore all sections with a free navigation and get conclusions by
themselves. It is also explained that the final stage of the test is a post-test questionnaire
that they are asked to answer after using the prototype. The questionnaire is available at
Attachment 3. When all those steps are concluded, the interviewer provides a link to the
prototype and the participant can start recording its smartphone screen, and finally click
on the link to start the experience. The questionnaire is available at attachment 2.
The interviewer is available and present all the time during the experience for
possible questions, concerns or technical issues. Only the questionnaire was usually
answered by the participant after the video call, where the participant has its own time
and no additional pressure to answer the questions.
3.5.3 Participants
The prototype valuation was realised with a convenience sample of 18 participants
aged from 24 to 55, the average age is 33.44 and the median is 33.5. They are all people
concerned about the environment at a certain level and that have knowledge about the
Portuguese language, as primarily the application is built towards the Portuguese
market. The educational level of all participants is superior, meaning they all have a
bachelor’s degree and their technological level vary from mid-low to high.
3.5.4 Technical restrictions
A few technical issues were faced while doing the tests and their root is related to
the software used, but the exact cause is not known as the prototype works perfectly at
a desktop environment. The first issue was the disappearance of the bottom tab on
screens with scroll, like “news” and “history”, that happened in 5 devices. In those
devices, some destinations were malfunctioning as well, for example a non-clickable
41
button was directing the user to the “product search” section. Adobe Xd was checked
while running the test and that connection did not exist. The one with a higher incidence
of issues was a Nexus 5 Android device, but the tab issue was found on an iPhone8 as
well, meaning that the operational system is not related to the problem. The participant
using the iPhone 8 tried to access the prototype through Safari and Chrome web
browsers and the tab issue persisted on both.
The second issue was that the prototype is not compatible with iPhone 6 or lower
Apple devices, which caused one participant to use the application on desktop as there
were not alternatives.
3.5.5 Analysis and results
Results show a medium experience time actually navigating through the application
of 9 minutes and 30 seconds approximately.From the outcome, is possible to say that in
general, participants found that the application is easy and pleasant to navigate.
The objective of this stage is to organise and analyse all feedback received in order
to implement improvements to the application, this process is part of the project
methodology and can be easily recognised at the virtuous circle presented earlier in this
document. All collected content from screen recording videos with audio comments and
answers to the questionnaire is organise in order to deliver clear results that can lead
into objective conclusion.
Firstly, some sections that are not extremely obvious like the “categories”, “user
levels” and “product suggestion” were chosen in order to identify if people were able to
access them. Due to its importance in the application, the main functionality, “scan” and
the “product page” are added to the selected sections as well. Results are described at
the following table.

42
Table 5 - User-testing results of sections access.
Participant Scan Product
page Categories User levels
Product
suggestions
01 Yes Yes Yes Yes Yes
02 Yes Yes No No Yes
03 Yes Yes Yes Yes Yes
04 Yes Yes Yes No Yes
05 Yes Yes Yes Yes Yes
06 Yes Yes No Yes Yes
07 Yes Yes Yes Yes Yes
08 Yes Yes Yes No Yes
09 Yes Yes Yes No Yes
10 Yes Yes No No Yes
11 Yes Yes Yes No Yes
12 Yes Yes No Yes Yes
13 Yes Yes Yes Yes Yes
14 Yes Yes Yes No Yes
15 Yes Yes Yes Yes Yes
16 Yes Yes No No Yes
17 No Yes No No Yes
18 Yes Yes No No Yes
Analysing the data from this table is possible to identify that “categories” and “user-
levels” are not easy to access as 10 out of 18 participants did not found the user-levels
information and 7 did not found the “categories” page. It is also relevant that the older
participant did not click at the “scan” button and even representing approximately only
5.5% of testers, considering its age, this is a matter to register.
Another valuation method is based on the most common types of comments made
during the test. It is important to mention that even inputting the think aloud into the
test, some participants do not express a good amount of information. In the next two
tables is possible to see how many participants were thinking similarly. The issues
related comments are listed in the first one and the positive ones, in the second.
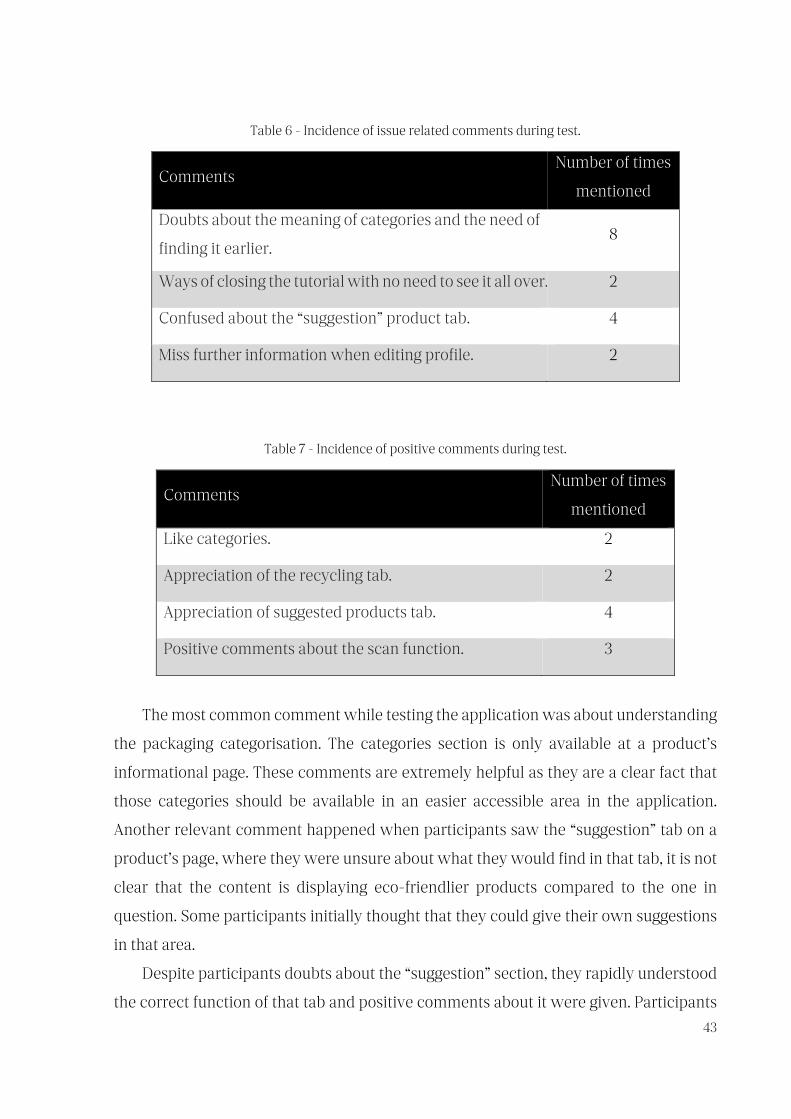
43
Table 6 - Incidence of issue related comments during test.
Comments Number of times
mentioned
Doubts about the meaning of categories and the need of
finding it earlier. 8
Ways of closing the tutorial with no need to see it all over. 2
Confused about the “suggestion” product tab. 4
Miss further information when editing profile. 2
Table 7 - Incidence of positive comments during test.
Comments Number of times
mentioned
Like categories. 2
Appreciation of the recycling tab. 2
Appreciation of suggested products tab. 4
Positive comments about the scan function. 3
The most common comment while testing the application was about understanding
the packaging categorisation. The categories section is only available at a product’s
informational page. These comments are extremely helpful as they are a clear fact that
those categories should be available in an easier accessible area in the application.
Another relevant comment happened when participants saw the “suggestion” tab on a
product’s page, where they were unsure about what they would find in that tab, it is not
clear that the content is displaying eco-friendlier products compared to the one in
question. Some participants initially thought that they could give their own suggestions
in that area.
Despite participants doubts about the “suggestion” section, they rapidly understood
the correct function of that tab and positive comments about it were given. Participants
44
also did positive comments about the scanning function, saying that they would
definitely use the app.
An interesting behaviour through participants is that around half of them firstly
accessed the product’s page through the “history” section and not the “scan”. The reason
for that can be that they initially explored same level sections at the tab and later, they
tried the “scan” which is accessible via a unique centred button, designed to attract more
attention and centred positioned, giving its level of importance in the app.
With the focus on the post-test questionnaire, there were a variety of answers from
the first and second questions. The first question asked, “What do you like the most about
the application?” and answers are all related to the positive environmental impact and
about the application usability. The second question asked, “What do you like the least
about the application?” and the most relevant answers are about the categories being
clearer, 2 answers mentioned the use of colour and 6 were not able to answer, saying
that they liked everything about the application. That feedback enhances the need of
making access to the categories easier. A slightly adjust to some colours through the
app might need some attention as well. The next question is “Which feature would you
likely use the most?” and 66,66% of participants mentioned the scan feature and that
is a positive feedback from users, meaning that the scan is at its correct place in the app
and its functional idea is well designed, but together with minor comments made
through the tests, there is room for improvements.
When questioned about how often would they use it, most of answers just said
that they would use every time they go shopping and this will actually depend on
everyone’s lifestyle, but is important to acknowledge that the participants recognise
the application as an easy tool that can be accessed in their pockets. The questionnaire
follows with a question about any features that they think could be missing in the
application and some answers were simply “no” and apart from those, the most
mentioned was about real rewards, like discount coupons for example, that would
highly incentive users.
From quantitative questions, 66,7% of participants said that the navigation of the
app is good, while 33,3% answered as being very good, being a good feedback when
considering navigation.
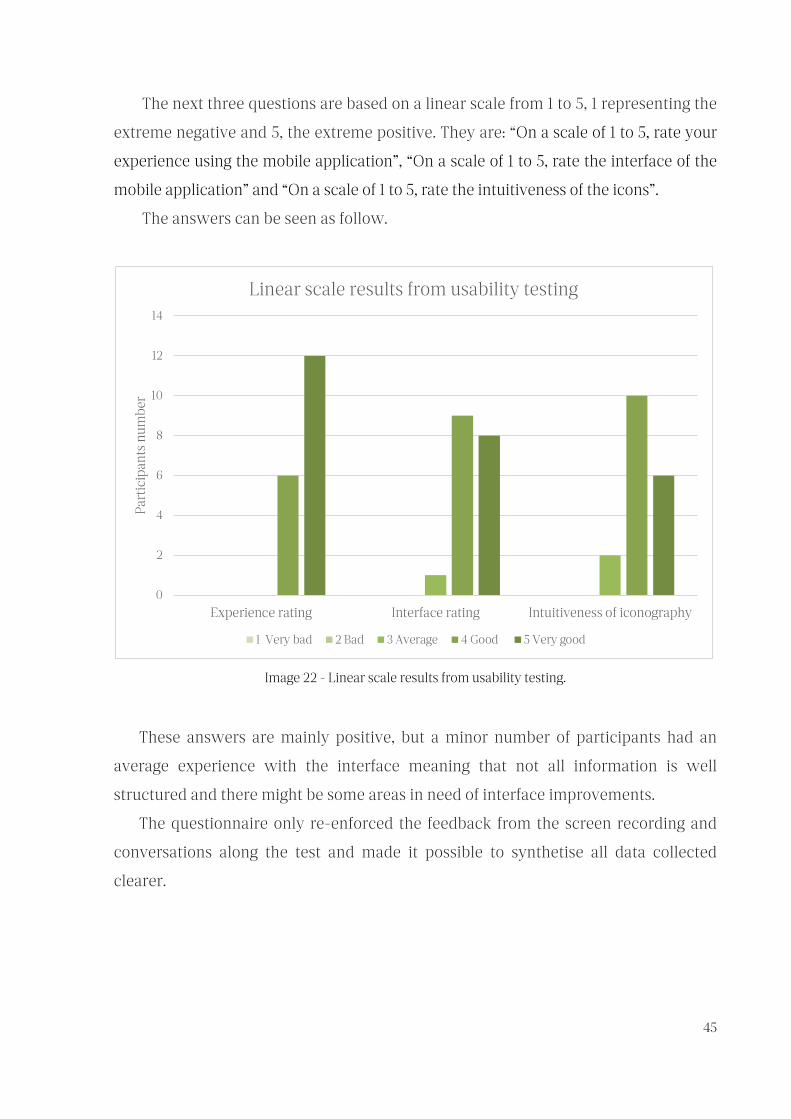
45
The next three questions are based on a linear scale from 1 to 5, 1 representing the
extreme negative and 5, the extreme positive. They are: “On a scale of 1 to 5, rate your
experience using the mobile application”, “On a scale of 1 to 5, rate the interface of the
mobile application” and “On a scale of 1 to 5, rate the intuitiveness of the icons”.
The answers can be seen as follow.
Image 22 - Linear scale results from usability testing.
These answers are mainly positive, but a minor number of participants had an
average experience with the interface meaning that not all information is well
structured and there might be some areas in need of interface improvements.
The questionnaire only re-enforced the feedback from the screen recording and
conversations along the test and made it possible to synthetise all data collected
clearer.
0
2
4
6
8
10
12
14
Experience rating Interface rating Intuitiveness of iconography
Part
icip
ants
num
ber
Linear scale results from usability testing
1 Very bad 2 Bad 3 Average 4 Good 5 Very good
46
3.6 Summary
This chapter expresses the outcomes from all research, which is now applied, done
at the Literature review. Initially approaching design fields of study and techniques, to
the point of actually implementing a series of techniques, which were adapted to fit this
project. Results led to the next stage of this chapter, building an initial visual identity. But
most important, those results guided the prototype and user-flow construction.
The final user-flow presented in this document represent the whole application and
its functionalities as they actually are on the prototype. The latest part of the chapter
describes all phases from the usability testing. From its conception, detailed description,
to analysed results. The outcome from the test is one of the most valuable data collected
in this project as it carries all the research made before this step. This outcome, which is
centred in the user, will lead the future work of the mobile application, guiding the
following work into the most recommended path in order to achieve a high-quality
experience to users.
47
4 CONCLUSION
4.1 Study limitations
On March 2020, quarantine was imposed in European Union as a measure against
proliferation of the SARS-CoV-2, a coronavirus never identified in humans so far. Those
measures partially limited presential research, such as face to face card sorting and the
prototype user testing. Those were done remotely through existent tools that made them
possible. This limitation interfered on the recruitment of representative participants to
the Persona 3, which has 60 years old.
During development stages, it could be said that a lack of experience in terms of UX
and UI was a boundary in certain situations, not impeding any stage, but requesting
further investigation and seek for references. This aspect is described as a limitation but
is a positive outcome from this project as it was mentioned on “Motivations” that one of
the great personal objectives were to develop professional experience in the field. The
mentor of this project has been a key piece, providing quality feedback and guiding the
project very well.
A software limitation, as mentioned briefly before, delivered issues while running
user-testing. Almost 25% of participants had some kind of interactive problems while
testing the prototype facing buttons disappearing and wrong connections inside the
application. Those were not major, but the experience of those participants was
prejudicated, as they had to find other ways of entering a specific section for example.
4.2 Future work
“[…] design and iterations aren’t finished just because a product is shipped. And with
many of our products going digital, pushing updates is easier than ever. We should
always be looking to measure and improve the products we deliver.” (Nunnally, Farkas.,
2017).
The future work of this project is firstly to keep the virtuous circle ongoing, meaning
that all feedback from the user testing will be applied to the interface and new user tests
48
will applied, until a higher quality product is achieved. The main improvements to be
done are:
• Create a clearer and earlier access to the categories section.
• Change the “suggestion” tab title.
• Add profile photo at “edit profile”.
• Add a close button to the tutorial, so it’s possible to close it at any stage.
• User-level area to be recognised as a clickable area.
Those might interfere in certain aspects of the actual application state creating the
need to adjust other elements or screens in the interface, but those are certainly needed
and will impact positively the project.
Focusing on a commercial side, partnerships could be set, working along with retail
brands that are actually on the market could add a great value to the application. Through
partners, the app could also offer higher incentives to the user as mentioned before, to
include real prizes as compensation could increase the number of users, reaching a wider
public.
4.3 Final considerations
Through the presented document all project development stages are described, from
research and applied design techniques, to the final prototype and its results when tested
by real users.
Based on the research presented in this document, the application developed has
potential of guiding users on their buying decision, presenting information about a
product’s package sustainability level. If used on a large scale, the platform can have
positive impacts on the environment, reducing the presence of toxic and non-
biodegradable materials on the environment.
Considering the initial objectives related to the mobile application, at this phase is
possible to say that they were all achieve at a certain level. It is important to recognise
49
the improvements needed in certain aspects of this project and those are clear now
thankfully to the usability testing and further UX techniques. All those objectives are
connected, as so, is recognisable that they all have great areas of improvement.
The UX techniques applied during research phase generated series of results that
helped on product development. Questionnaire results show an interest in an application
as the one developed as well as the necessity of more information channels regarding
the environmental matter. When asked if you consider yourself a person that thinks
about the environment when disposing of items that are no longer used, almost 100% of
answers were placed on medium to a high level of concern about the environment.
Generically, the results from the questionnaire show a high potential of users to the
application, which can be seen as a motivational factor for the future work already
mentioned.
The mobile application presented is also thought to be implemented outside
Portugal, as the recycling guidance is designed to work based on GPS location, adapting
itself to the local market. The language is something that could easily be adapted as well,
elevating the potential of the app to a higher level.
50
REFERENCES
ABRAS, C.; MALONEY-KRICHMAR, D.; PREECE, J. - User-centered design. Encyclopedia
of Human-Computer Interaction. Bainbridge, W. Thousand Oaks: Sage Publications
(2004), 37(4), 445-456.
ALLEN, Jesmond; CHUDLEY, James - Smashing UX Design – Foundations for designing
online user experience. Chichester : Wiley, 2012. ISBN 0-470-66685-2
CAMBURN, Bradley [et al.] - Design prototyping methods: State of the art in strategies,
techniques, and guidelines. Design Science. (2017). 3. 10.1017/dsj.2017.10.
CERULLI-HARMS, Dr Anette [et al.]. - Behavioural Study on Consumers’ Engagement
in the Circular Economy. Luxembourg. Publications Office of the European Union, 2018.
[Consulted on February 2020]. Available at https://op.europa.eu/en/publication-detail/-
/publication/0779f275-f9d6-11e8-a96d-01aa75ed71a1
COOPER, A.; REIMANN, R.; CRONIN, D. - About face 3: the essentials of interaction
design. Indianapolis : Wiley, 2007. ISBN 0-470-08411-3
COOPER, A.; REIMANN, R.; CRONIN, D.; NOESSEL, C. - About face: the essentials of
interaction design. Wiley, 2014. ISBN 1-118-76657-6
GALITZ, Wilbert O. - The Essential Guide to User Interface Design: An introduction to
GUI Design principles and techniques. Third Edition. Indianapolis : Wiley, 2002. ISBN
0-470-05342-3
GARRETT, J. J. - The elements of user experience: user-centered design for the web and
beyond. Second edition. Berkeley : New Riders, 2011. ISBN 0-321-68368-4
GEISSDOERFER, M. [et al.] - The Circular Economy–A new sustainability paradigm?.
Journal of cleaner production. (2017). 143, 757-768.
51
HASSENZAHL, M. - User experience and experience design. The encyclopedia of
human-computer interaction. The interaction design foundation (2011). [Consulted on
May 2020]. Available at interaction-design.org/literature/book/the-encyclopedia-of-
human-computer-interaction-2nd-ed/user-experience-and-experience-design
HINMAN, Rachel. - The Mobile Frontier A guide for designing mobile experiences. New
York : Rosenfeld Media, LLC, 2012. ISBN: 1-933820-55-1
ILAMA, E. - Creating Personas. UX Booth. [Consulted on July 2020]. Available at
https://www.uxbooth.com/articles/creating-personas/
JASPERS, Monique W.M. [et al.] - The think aloud method: a guide to user interface
design. International Journal of Medical Informatics. Elsevier (2004), 73, 781-795.
KUROSU, M. (Ed.). - Human Centered Design. Second International Conference. HCD
2011, Held as Part of HCI International 2011. Orlando : Springer Science & Business Media,
2011. ISBN 978-3-642-21752-4
LARSEN, J. - Plastic Bags Fact Sheet. Earth Policy Institute (2014). [Consulted on July
2020]. Available at
http://www.earth-policy.org/mobile/releases/plastic_bags_fact_sheet
LEBLANC, R. - How Long Will It Take That Bag of Trash to Decompose in a Landfill?
The Balance Small Business (2019). [Consulted on May 2020]. Available at
https://www.thebalancesmb.com/how-long-does-it-take-garbage-to-decompose-
2878033
MARSH, Kennedy.; BUGUSU, Betty. Food Packaging – Roles, Materials and
Environmental Issues. Journal of Food Science (2007). doi: 10.1111/j.1750-3841
52
MATEUS, Augusto. - Study on the Relevance and Impact of Portugal’s Waste Sector on
the Perspective of a Circular Economy. (2018). [Consulted on March 2020]. Available at
http://m.smartwasteportugal.com/fotos/editor2/sumario_ing_versao_finais.pdf
RIYAD, Moharam. MAHER ALI, Maqtari. - The impact of plastic bags on the
environment: A field survey of the City of Sana’a and the surrounding Areas, Yemen.
International Journal of Engineerging Research and Reviews. Yemen (2014). ISSN 2348-
697X. Int. J. Eng. Res. Rev, 2(4), 61-69.
MORAN, K. - Usability Testing 101. Nielsen Norman Group (2019). [Consulted on August
2020]. Available at https://www.nngroup.com/articles/usability-testing-101/
NORMAN, D.; NIELSEN, J. (n.d.). - The Definition of User Experience (UX). [Consulted on
August 2020]. Available at https://www.nngroup.com/articles/definition-user-
experience/
NORMAN, D. - The design of everyday things: Revised and expanded edition. New York
: Basic books, 2013. ISBN 0465072992
NUNNALLY, Brad.; FARKAS, David. - UX Research: Practical Techniques for Designing
Better Products. O’Reilly, 2016. ISBN 9781491951293
Plastic waste and recycling in the EU: facts and figures. European Parliament (2018).
[Consulted on March 2020]. Available at
https://www.europarl.europa.eu/news/en/headlines/society/20181212STO21610/plasti
c-waste-and-recycling-in-the-eu-facts-and-figures
PREECE, J.; SHARP, H.; ROGERS, Y. - Interaction Design: Beyond Human-Computer
Interaction (4th ed.). Wiley publishing, 2015. ISBN 978-1-119-02075-2
RODRIGUEZ, F. - Plastic | Composition, Uses, Types, & Facts. 2019. [Consulted on May
2020]. Available at https://www.britannica.com/science/plastic
53
WHEELER, Alina.- Designing Brand Identity. Third edition. New Jersey : Wiley, 2009.
ISBN 978-0-470-40142-2
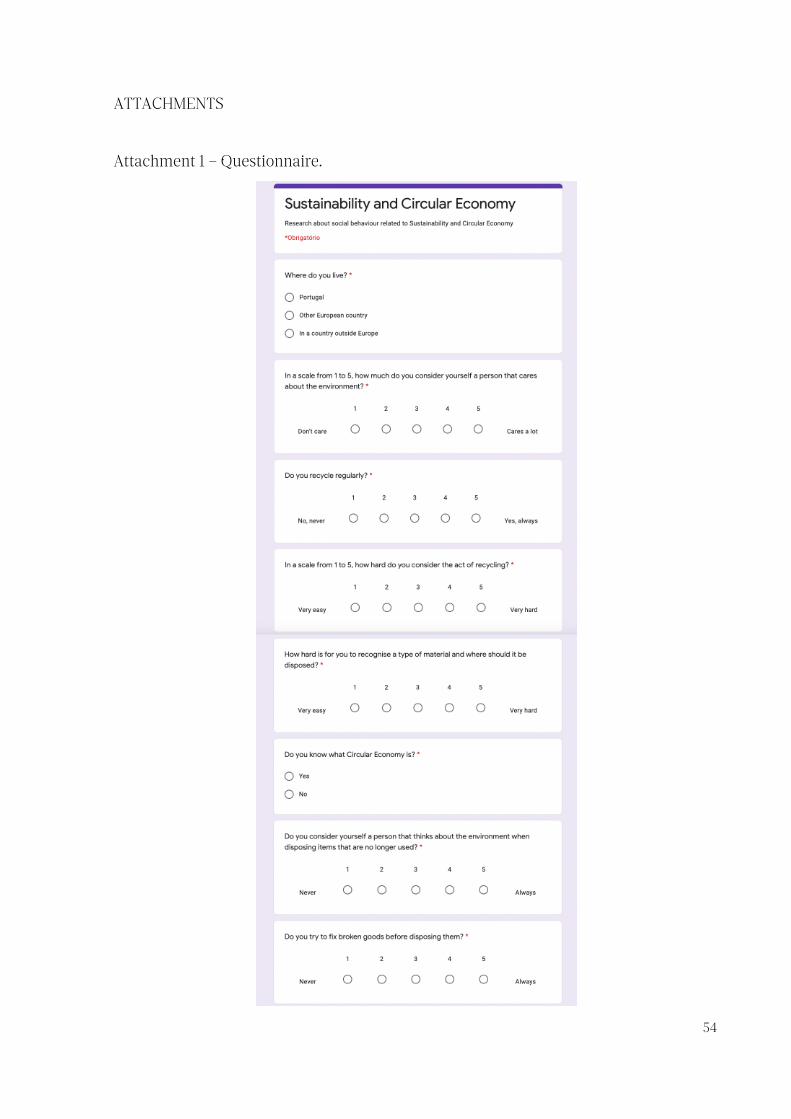
54
ATTACHMENTS
Attachment 1 – Questionnaire.
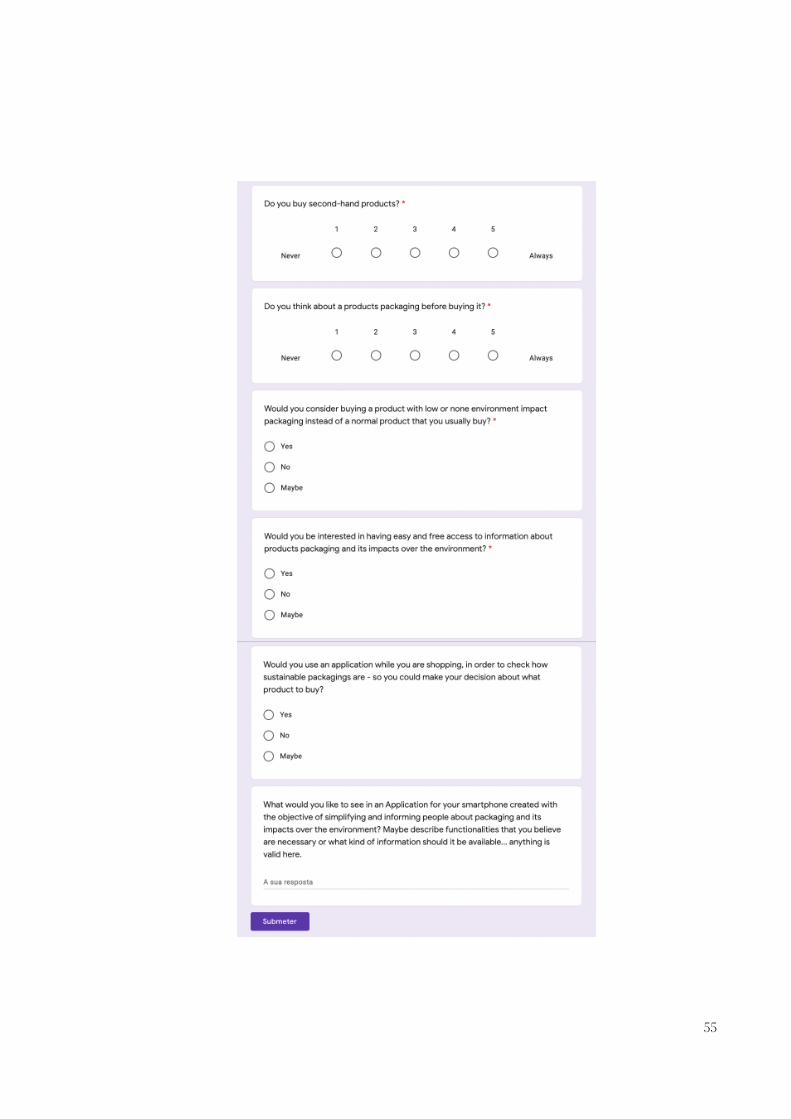
55
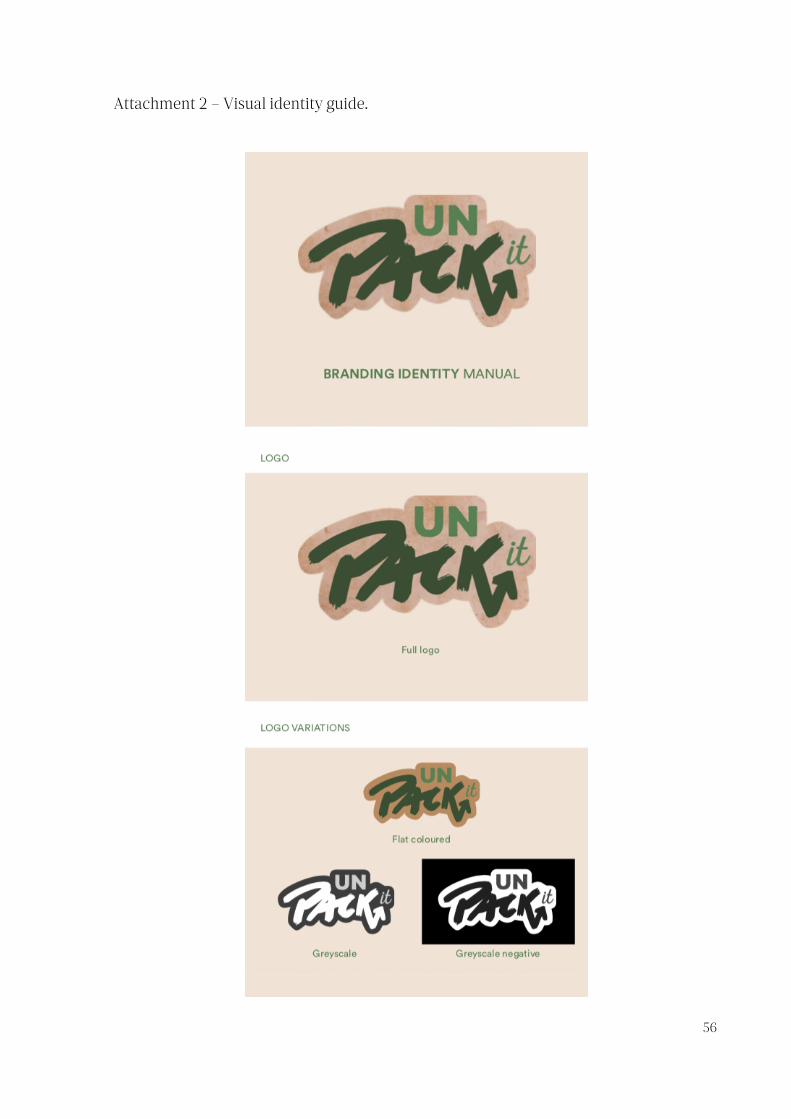
56
Attachment 2 – Visual identity guide.
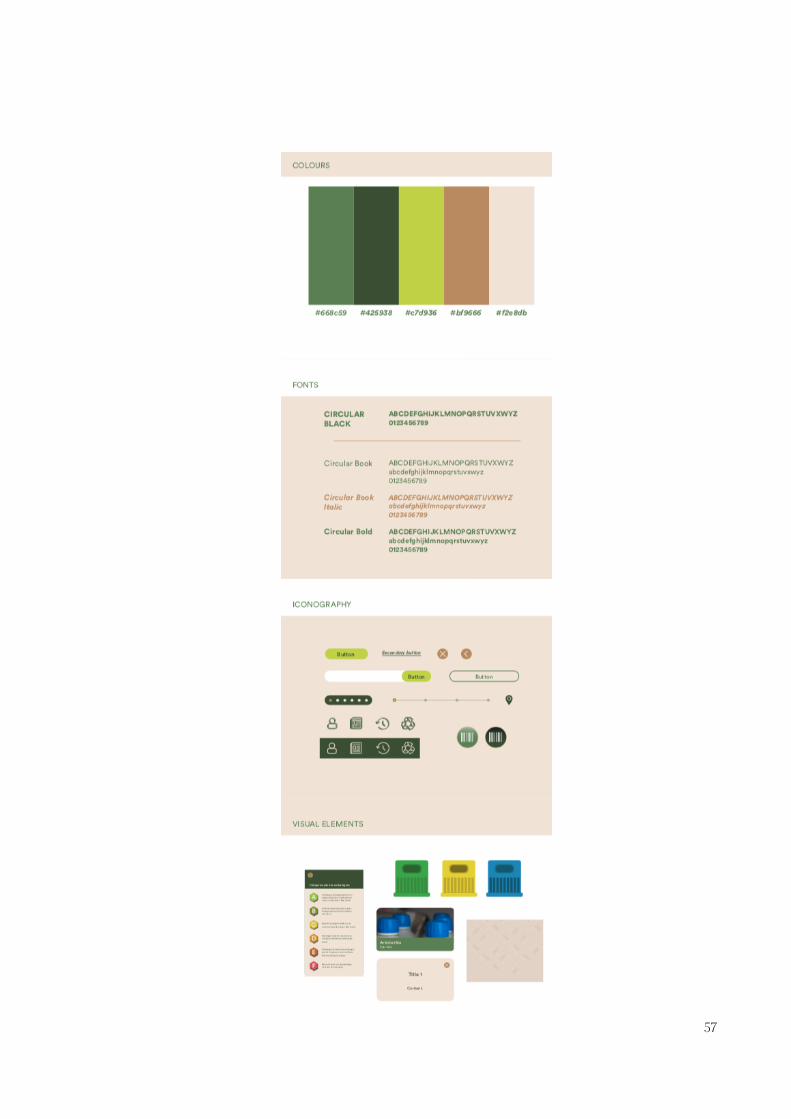
57
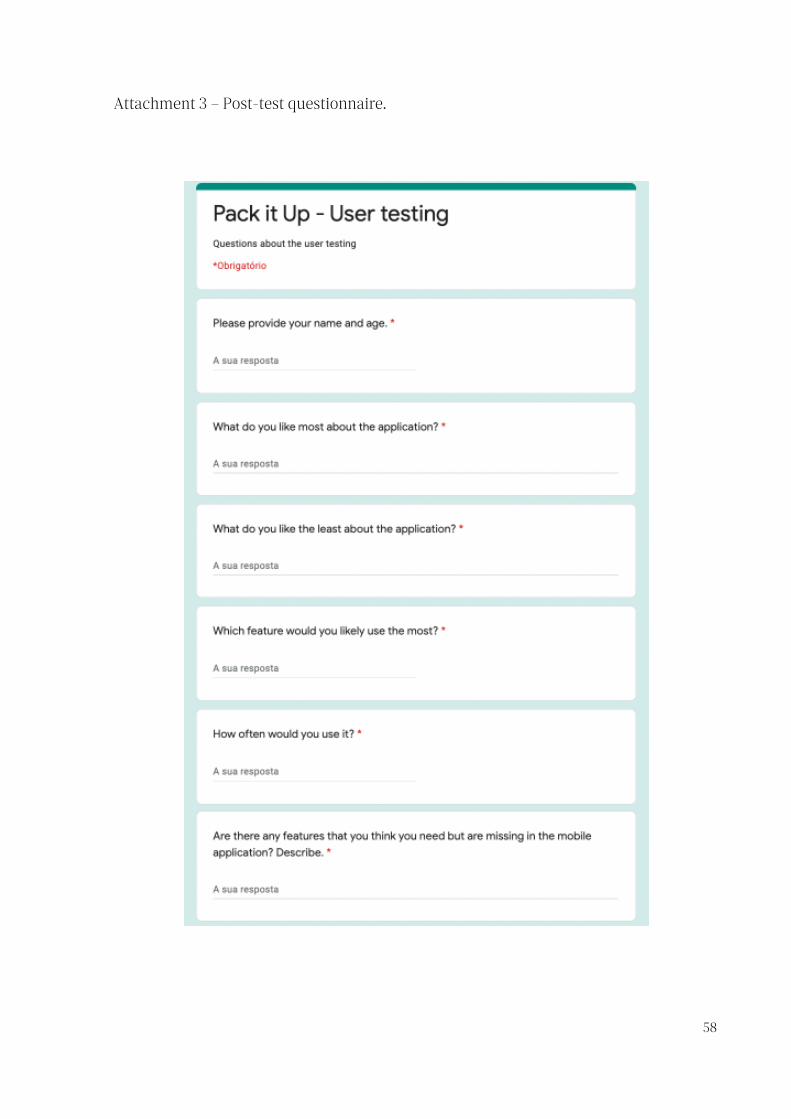
58
Attachment 3 – Post-test questionnaire.
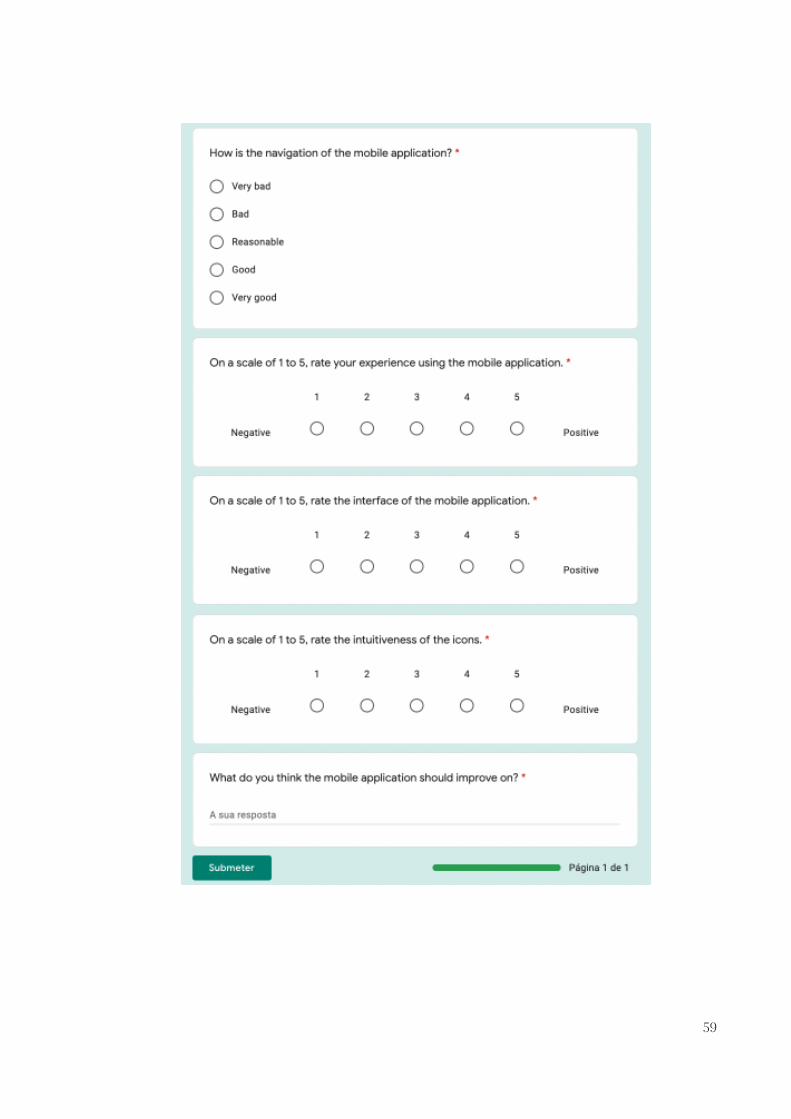
59