
Circulation of the Turkish Straits System under interannual ...
Upload
independentCategory
view
1download
0
720 VOLUME 4J O U R N A L O F H Y D R O M E T E O R O L O G Y
q 2003 American Meteorological Society
Interannual and Seasonal Variability of the Surface Energy Balance and Temperatureof Central Great Slave Lake
WAYNE R. ROUSE, CLAIRE M. OSWALD, AND JACQUELINE BINYAMIN
School of Geography and Geology, McMaster University, Hamilton, Ontario, Canada
PETER D. BLANKEN
Department of Geography, University of Colorado, Boulder, Colorado
WILLIAM M. SCHERTZER
National Water Research Institute, Burlington, Ontario, Canada
CHRISTOPHER SPENCE
Environment Canada, Yellowknife, Northwest Territories, Canada
(Manuscript received 26 September 2002, in final form 5 February 2003)
ABSTRACT
This paper addresses interannual and seasonal variability in the thermal regime and surface energy fluxes incentral Great Slave Lake during three contiguous open-water periods, two of which overlap the Canadian GlobalEnergy and Water Cycle Experiment (GEWEX) Enhanced Study (CAGES) water year. The specific objectivesare to compare the air temperature regime in the midlake to coastal zones, detail patterns of air and watertemperatures and atmospheric stability in the central lake, assess the role of the radiation balance in driving thesensible and latent heat fluxes on a daily and seasonal basis, quantify magnitudes and rates of the sensible andlatent heat fluxes and evaporation, and present a comprehensive picture of the seasonal and interannual thermaland energy regimes, their variability, and their most important controls. Atmospheric and lake thermal regimesare closely linked. Temperature differences between midlake and the northern shore follow a seasonal linearchange from 68C colder midlake in June, to 68C warmer in November–December. These differences are a responseto the surface energy budget of the lake. The surface radiation balance, and sensible and latent heat fluxes arenot related on a day-to-day basis. Rather, from final lake ice melt in mid-June through to mid- to late August,the surface waters strongly absorb solar radiation. A stable atmosphere dominates this period, the latent heatflux is small and directed upward, and the sensible heat flux is small and directed downward into the lake.During this period, the net solar radiation is largely used in heating the lake. From mid- to late August to freezeup in December to early January, the absorbed solar radiation is small, the atmosphere over the lake becomesincreasingly unstable, and the sensible and latent heat fluxes are directed into the atmosphere and grow inmagnitude into the winter season. Comparing the period of stable atmospheric conditions with the period ofunstable conditions, net radiation is 6 times larger during the period of stable atmosphere and the combinedlatent and sensible heat fluxes are 9 times larger during the unstable period. From 85% to 90% of total evaporationoccurs after mid-August, and evaporation rates increase continuously as the season progresses. This rate ofincrease varies from year to year. The time of final ice melt exerts the largest single control on the seasonalthermal and energy regimes of this large northern lake.
1. Introduction
This research on Great Slave Lake is part of the Ca-nadian Global Energy and Water Cycle Experiment(GEWEX) Enhanced Study (CAGES), an undertaking
Corresponding author address: Wayne R. Rouse, School of Ge-ography and Geology, McMaster University BSB 311, Hamilton, ONL8S 4K1, Canada.E-mail: [email protected]
within the Mackenzie GEWEX Study, initiated in orderto better understand and model energy and water cyclesin the Mackenzie River basin (MRB), and to assesschanges to these cycles that may arise from natural cli-mate variability and anthropogenic climate change(Stewart et al. 1998; Rouse et al. 2003).
Great Slave Lake (GSL) (Fig. 1) is the fifth largestlake in North America in terms of surface area (28 568km2), and the mean depth of the main lake, exclusiveof the eastern arm, is estimated from bathymetric anal-
AUGUST 2003 721R O U S E E T A L .
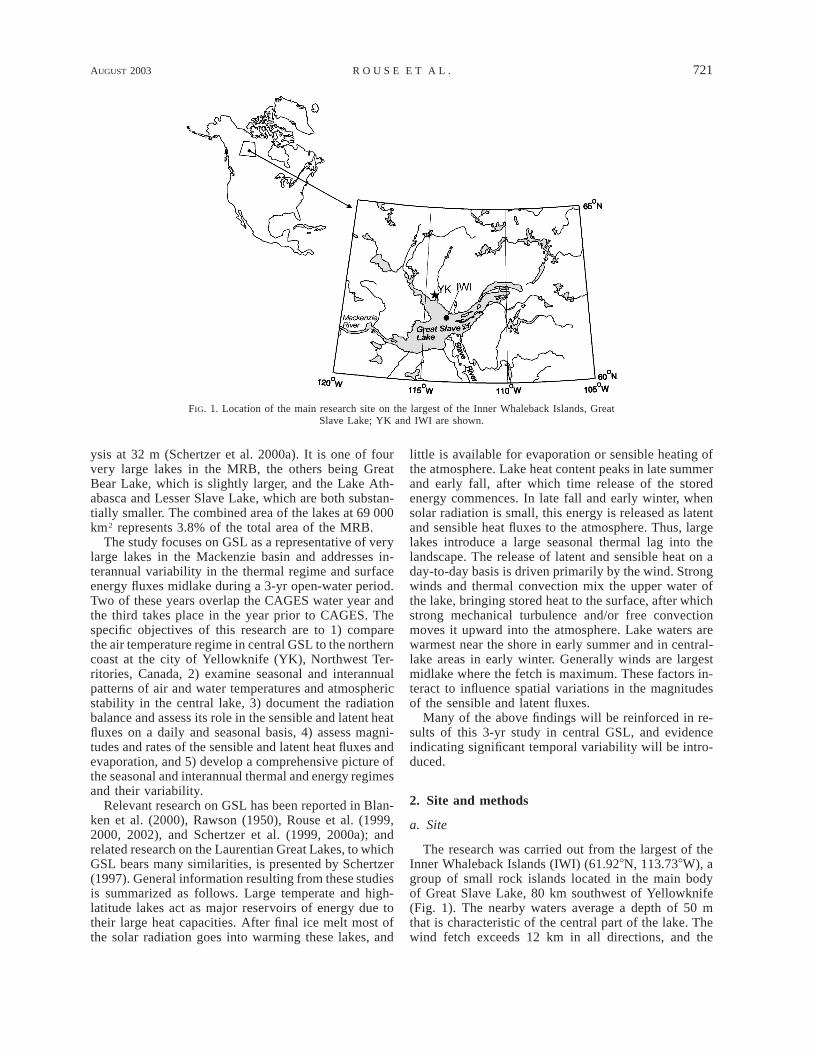
FIG. 1. Location of the main research site on the largest of the Inner Whaleback Islands, GreatSlave Lake; YK and IWI are shown.
ysis at 32 m (Schertzer et al. 2000a). It is one of fourvery large lakes in the MRB, the others being GreatBear Lake, which is slightly larger, and the Lake Ath-abasca and Lesser Slave Lake, which are both substan-tially smaller. The combined area of the lakes at 69 000km2 represents 3.8% of the total area of the MRB.
The study focuses on GSL as a representative of verylarge lakes in the Mackenzie basin and addresses in-terannual variability in the thermal regime and surfaceenergy fluxes midlake during a 3-yr open-water period.Two of these years overlap the CAGES water year andthe third takes place in the year prior to CAGES. Thespecific objectives of this research are to 1) comparethe air temperature regime in central GSL to the northerncoast at the city of Yellowknife (YK), Northwest Ter-ritories, Canada, 2) examine seasonal and interannualpatterns of air and water temperatures and atmosphericstability in the central lake, 3) document the radiationbalance and assess its role in the sensible and latent heatfluxes on a daily and seasonal basis, 4) assess magni-tudes and rates of the sensible and latent heat fluxes andevaporation, and 5) develop a comprehensive picture ofthe seasonal and interannual thermal and energy regimesand their variability.
Relevant research on GSL has been reported in Blan-ken et al. (2000), Rawson (1950), Rouse et al. (1999,2000, 2002), and Schertzer et al. (1999, 2000a); andrelated research on the Laurentian Great Lakes, to whichGSL bears many similarities, is presented by Schertzer(1997). General information resulting from these studiesis summarized as follows. Large temperate and high-latitude lakes act as major reservoirs of energy due totheir large heat capacities. After final ice melt most ofthe solar radiation goes into warming these lakes, and
little is available for evaporation or sensible heating ofthe atmosphere. Lake heat content peaks in late summerand early fall, after which time release of the storedenergy commences. In late fall and early winter, whensolar radiation is small, this energy is released as latentand sensible heat fluxes to the atmosphere. Thus, largelakes introduce a large seasonal thermal lag into thelandscape. The release of latent and sensible heat on aday-to-day basis is driven primarily by the wind. Strongwinds and thermal convection mix the upper water ofthe lake, bringing stored heat to the surface, after whichstrong mechanical turbulence and/or free convectionmoves it upward into the atmosphere. Lake waters arewarmest near the shore in early summer and in central-lake areas in early winter. Generally winds are largestmidlake where the fetch is maximum. These factors in-teract to influence spatial variations in the magnitudesof the sensible and latent fluxes.
Many of the above findings will be reinforced in re-sults of this 3-yr study in central GSL, and evidenceindicating significant temporal variability will be intro-duced.
2. Site and methods
a. Site
The research was carried out from the largest of theInner Whaleback Islands (IWI) (61.928N, 113.738W), agroup of small rock islands located in the main bodyof Great Slave Lake, 80 km southwest of Yellowknife(Fig. 1). The nearby waters average a depth of 50 mthat is characteristic of the central part of the lake. Thewind fetch exceeds 12 km in all directions, and the
722 VOLUME 4J O U R N A L O F H Y D R O M E T E O R O L O G Y
island’s height (above mean water level), width, andlength are approximately 10, 100, and 180 m, respec-tively (Blanken et al. 2000). Temperature comparisonsare made with the airport weather station at Yellowknife.For such comparisons the measurements are standard-ized to meteorological screen height.
b. Radiation balance
Component fluxes of the radiation balance are de-scribed as
Q* 5 K↓ 2 K↑ 1 L↓ 2 L↑, (1)
in which Q* is net all-wave radiation, K↓ is incidentsolar radiation, K↑ is reflected solar radiation, L↓ isincoming longwave sky radiation, and L↑ is outgoinglongwave radiation from the lake surface.
Details of the instrumental setup in 1997 and 1998are given in detail in Blanken et al. (2000) and will onlybe described briefly here. In 1997 a 14-m-long retract-able horizontal boom, positioned 2-m above the meanwater surface, was constructed on the eastern side ofthe island; Q* was measured with a net radiometer (Kippand Zonen, model NR Life) mounted on the end of theboom. Calculations indicated that 95% of the instru-ment’s signal received from the water surface originatedfrom a circle with a radius of 8.7 m. With an averagewater depth of 9 m, radiation measurements were con-sidered free of the island’s influence (Blanken et al.2000). Water surface temperature, Tw0, was measuredwith an infrared thermometer (Everest Interscience,model 4000.GL) also mounted at the end of the boom,with a viewing angle of 458 and a viewing cone of 158;L↑ was determined as L↑ 5 «sTw in which « is surface4
0
emissivity (0.97 for water), and s is the Stefan–Boltz-mann constant. Upward- and downward-facing pyran-ometers (Eppley Laboratories) measured K↓ and K↑,the latter mounted at the end of the boom. All instru-ments were calibrated prior to field installation. Signalswere sampled at 2-s intervals and stored as 10-minmeans in a datalogger (Campbell Scientific, modelCR10X). The 12-V batteries that were charged by a solarpanel supplied power. And L↓ in Eq. (1) was derivedas a residual.
The boom and its instruments were destroyed in 1998by late winter ice thrusting and were replaced with anear-identical setup. The replacement boom and sensorswere again destroyed, this time by high storm waves in1998. In the spring of 1999, a different tack was taken.The equipment was removed to the steep south edge ofthe island. In Eq. (1) Q* was obtained from the com-ponent fluxes.
The IR thermometer (giving L↑) was focused at anangle that took in a large swath of unobstructed water(average depth about 50 m) to the south, but did notinclude the horizon or sky. The value for surface albedo,derived through the previous two field seasons (Blankenet al. 2000), was utilized rather than K↑, which was not
measured. A pyranometer was used to determine K↓,and L↓ was measured using a pyrgeometer (Eppley Lab-oratories). All radiation instruments were routinely cal-ibrated or recalibrated prior to field installation in eachof the years of measurement.
c. Energy balance
The one-dimensional energy balance for the lake isgiven by
Q* 5 Q 1 Q 1 Q ,E H ST (2)
in which QE, QH, and QST are the latent and sensibleheat fluxes and change in stored heat energy in the lake,respectively, QE and QH are positive when directed fromthe surface into the atmosphere, and QST is positive whenthe lake is gaining heat. Measured directly as eddy co-variances, QE and QH (Blanken et al. 2000) give
Q 5 L w9D 9, (3)E y y
Q 5 C w9T9, (4)H a
where Ly and Ca are the latent heat for vaporization ofwater vapor and heat capacity of air, respectively, andw9Dy9 and w9T9 are the eddy covariances of verticalwind and water vapor concentration, and vertical windand air temperature, respectively. The equivalent mil-limeter of evaporated water, E is given by QE/Ly . AHydra eddy covariance system (United Kingdom Hy-drological Institute, Hydra MK2) was employed for theeddy covariance measurements. The Hydra’s character-istics have been described in detail by Shuttleworth etal. (1988) and Blanken et al. (2000). It was mounted 7m above the ground and ran successfully throughout thethree field seasons. Its accuracy, response times, andrunning characteristics were carefully checked prior toeach measurement period. As detailed by Blanken et al.(2000), 80% of the measured eddy fluxes were obtainedfrom within upwind horizontal distances of 4.9, 5.9, and8.4 km, for daytime, neutral, and nighttime periods, re-spectively. This lay well within the fetch distance of 12km to the nearest land. The rate of change of heat storagein the lake in Eq. (2), QST, applies to a one-dimensionalwater column at Inner Whaleback Islands, and is derivedas a residual. This residual compares favorably to QST
calculated calorimetrically for the whole lake bySchertzer et al. (2003).
Additional instruments were positioned 8.5 m abovethe ground (18 m above the water surface) on a Me-teorological Service of Canada (MSC) tower near thecenter of the island. Wind speed, u18, and direction (R.M. Young, model 5310), and relative humidity (used tocalculate vapor pressure, e18) and air temperature (Ta18)(Gill Instruments, model HMP-35D) were all measuredfrom this tower and were recorded in a datalogger(Campbell Scientific, model 21X) as 10-min meansbased on 2-s sampling times. These data were reducedto normal screen measurement height above the lake,
AUGUST 2003 723R O U S E E T A L .
TABLE 1. Periods of instrumental measurements at Inner Whaleback Island. The bracketed number gives total days of measurement as apercent of open-water days.
Period Radiation balance Sensible and latent heat fluxes Water temperature Open-water days
199719981999
25 Jul–9 Sep (26%)27 Jun–6 Aug (19%)12 Jun–15 Dec (102%)
26 Jul–10 Sep (27%)24 Jun–25 Sep (44%)12 Jun–18 Nov (89%)
1 Aug–10 Sep (23%)20 Jun–12 Sep (41%)17 Jun–29 Sep (57%)
176212184
TABLE 2. Dates of FT, FF, air temperature differences (8C) betweenInner Whaleback Island and Yellowknife A (DTa 5 TaIWI 2 TaYK) atFT and FF (DTaFT and DTaFF), and the date on which temperaturesat Inner Whaleback and Yellowknife are the same (DTa 5 0).
Year FT FF DTaFT DTaFF DTa 5 0
199719981999Avg
21 Jun3 Jun
11 Jun12 Jun
14 Dec1 Jan (1999)
12 Dec19 Dec
22.826.026.125.0
2.37.56.65.5
12 Sep30 Aug6 Sep6 Sep
using log-linear relationships, and were used for periodswhen eddy correlation measurements were not made(usually early and late in the open-water season), fordetermining E from mass transfer calculations of thetype
E 5 2K u De,z z (5)
in which Kz is a diffusion coefficient for height z abovethe water surface, uz is horizontal wind speed at heightz, and De is the difference between atmospheric vaporpressure at height z and saturation vapor pressure atwater surface temperature Tw0. As outlined in detail inBlanken et al. (2000), Kz is determined empirically usingmeasured vapor fluxes. Such determinations have beenused widely and successfully in calculating evaporationfrom lakes, small and large (e.g., Harbeck 1962; Quinn1978; Quinn and den Hartog 1981).
d. Water temperatures
A water temperature profile was measured 1 kmsouthwest of the island in 60 m of water. Water tem-peratures, Tw, at depths of 0.7, 5, 10, 15, 20, 25, 35,and 55 m were measured with a thermistor and a da-talogger, each encapsulated in a watertight container(Onset Computer Corp., model TidbiT). Their accuracywas calculated at 0.238C, spanning a 08–238C temper-ature range (Blanken et al. 2000). Temperatures weresampled simultaneously every 15 min. The same stormthat destroyed the boom in August 1998 also destroyedthe water temperature profile, and all of the 1998 datawere lost. Fortunately, measurements from a nearby setof thermistors at similar depths were available and, in1999, a replacement buoy and thermister string at IWI(see, Schertzer et al. 2002) operated successfullythroughout much of the ice-free period. Surface watertemperatures (as shown in Fig. 3) combine observationsfrom the Inner Whaleback Islands and the top level ofthe thermistor string. On a daily average basis, the sur-
face waters in central GSL are mixed sufficiently so thatthermistor measurements at 0.7 m and at the surface arewithin 0.38C of one another.
e. Measurement periods
Periods of measurement of the various fluxes andparameters were variable during the 3 yr with respectto dates and the percentage of the open-water days rep-resented (Table 1). Open-water days are accumulatedfrom the period in spring when there is no longer anyshorefast ice, but there may still be patches of driftingice, through to the establishment of a permanent icecover the following winter. They have been determinedfrom analysis of passive microwave images to determinedates of final spring thaw and final freeze up (Table 2)provided by A. Walker (2001, personal communication),using methodology described in Walker et al. (1999).The percentage of the open-water period that includedmeasurement days for the various parameters variedfrom 19% in 1997 up to all of the open-water periodin 1999 (Table 1).
3. Results
a. Air temperature
The nearest land-based meteorological station to IWIis at the city of YK a straight-line distance of 80 kmfrom IWI. Table 3 indicates that at YK, the three studyyears were all substantially warmer than the long-termaverage for the 7 months spanning the open-water sea-son on GSL. The very pronounced El Nino warming inthe late 1990s is especially evident in early winter of1997 and throughout 1998. Only 2 of the 21 months ofthe study periods were colder than average.
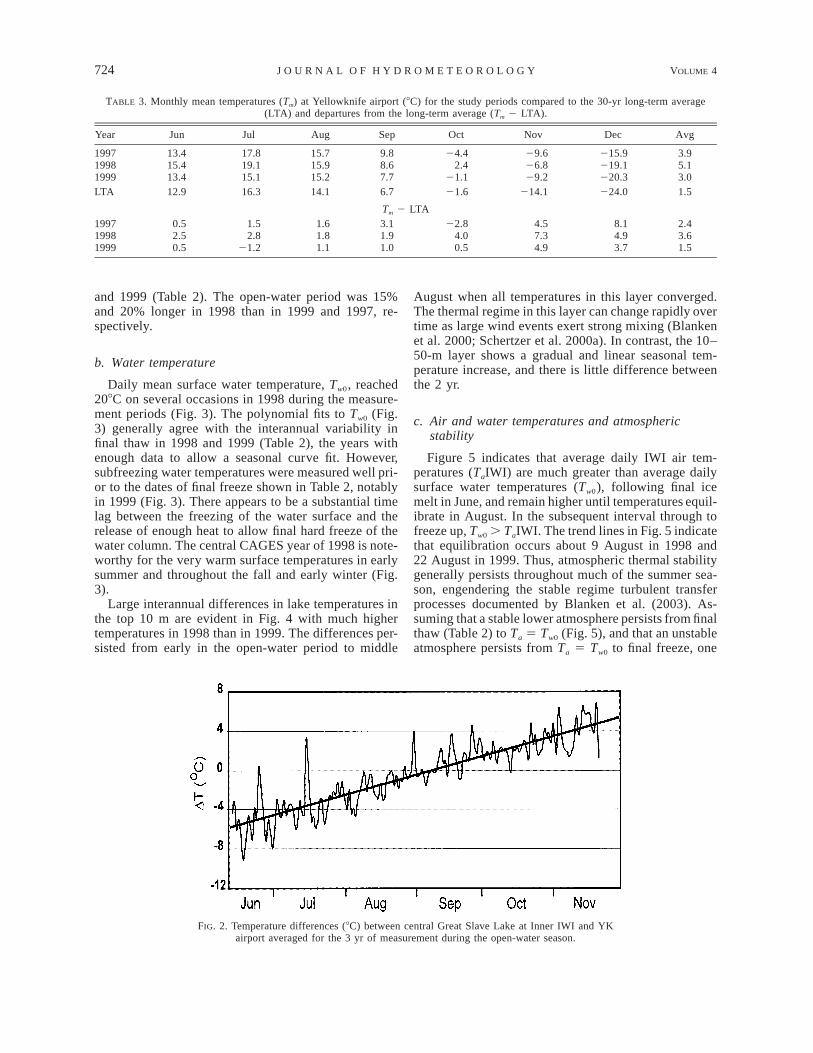
The temperature differences between IWI and YKduring the open-water season can be pronounced (Fig.2). On average, for the 3 yr, these differences, DTa 5TaIWI 2 TaYK, are accurately described by a lineartrend line (Fig. 2) that yields a coefficient of determi-nation r2 5 0.80. Table 2 indicates that on 12 June theaverage date of final thaw (FT) of GSL, DTa 5 25.0,and on 19 December the average date of final freeze(FF), DTa 5 5.5. The date of temperature equilibrationbetween the two sites, DTa 5 0, occurred on 6 Septem-ber. Annual differences in the 3 yr are evident in theopen-water period. In 1998 FT occurred 1 week earlierthan in 1999, and almost 3 weeks earlier than in 1997.In 1998 FF occurred almost 3 weeks later than in 1997
724 VOLUME 4J O U R N A L O F H Y D R O M E T E O R O L O G Y
TABLE 3. Monthly mean temperatures (Tm) at Yellowknife airport (8C) for the study periods compared to the 30-yr long-term average(LTA) and departures from the long-term average (Tm 2 LTA).
Year Jun Jul Aug Sep Oct Nov Dec Avg
199719981999LTA
13.415.413.412.9
17.819.115.116.3
15.715.915.214.1
9.88.67.76.7
24.42.4
21.121.6
29.626.829.2
214.1
215.9219.1220.3224.0
3.95.13.01.5
Tm 2 LTA199719981999
0.52.50.5
1.52.8
21.2
1.61.81.1
3.11.91.0
22.84.00.5
4.57.34.9
8.14.93.7
2.43.61.5
FIG. 2. Temperature differences (8C) between central Great Slave Lake at Inner IWI and YKairport averaged for the 3 yr of measurement during the open-water season.
and 1999 (Table 2). The open-water period was 15%and 20% longer in 1998 than in 1999 and 1997, re-spectively.
b. Water temperature
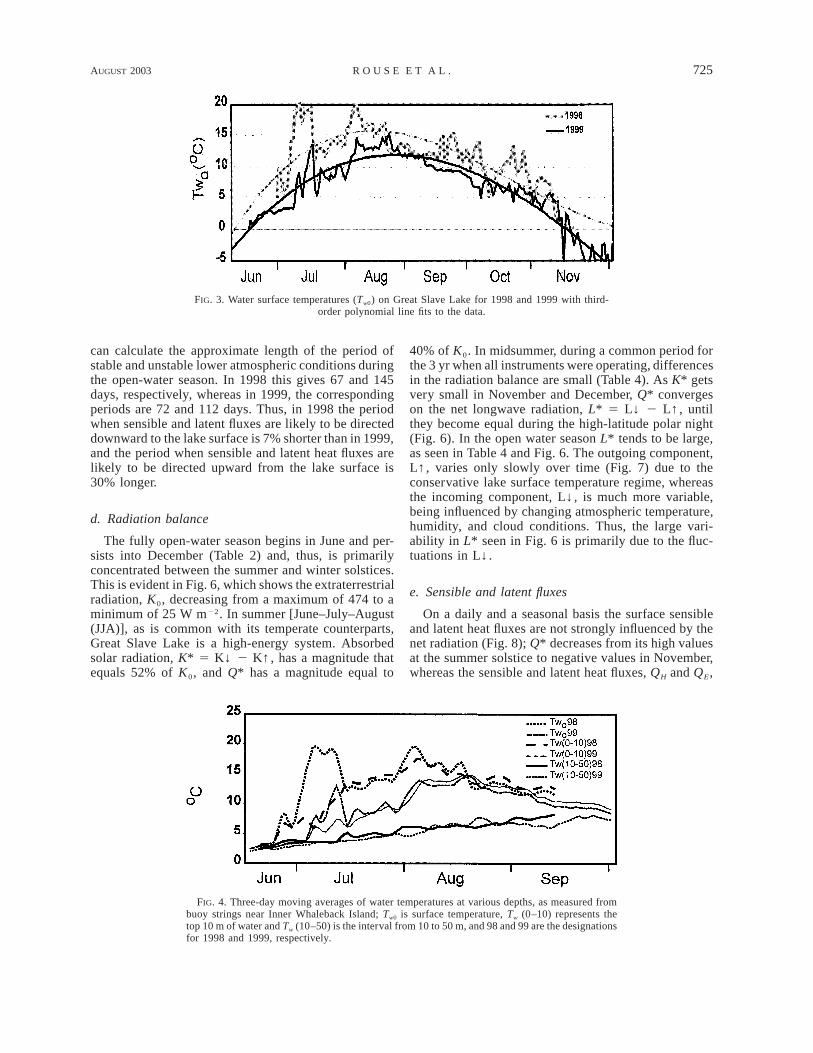
Daily mean surface water temperature, Tw0, reached208C on several occasions in 1998 during the measure-ment periods (Fig. 3). The polynomial fits to Tw0 (Fig.3) generally agree with the interannual variability infinal thaw in 1998 and 1999 (Table 2), the years withenough data to allow a seasonal curve fit. However,subfreezing water temperatures were measured well pri-or to the dates of final freeze shown in Table 2, notablyin 1999 (Fig. 3). There appears to be a substantial timelag between the freezing of the water surface and therelease of enough heat to allow final hard freeze of thewater column. The central CAGES year of 1998 is note-worthy for the very warm surface temperatures in earlysummer and throughout the fall and early winter (Fig.3).
Large interannual differences in lake temperatures inthe top 10 m are evident in Fig. 4 with much highertemperatures in 1998 than in 1999. The differences per-sisted from early in the open-water period to middle
August when all temperatures in this layer converged.The thermal regime in this layer can change rapidly overtime as large wind events exert strong mixing (Blankenet al. 2000; Schertzer et al. 2000a). In contrast, the 10–50-m layer shows a gradual and linear seasonal tem-perature increase, and there is little difference betweenthe 2 yr.
c. Air and water temperatures and atmosphericstability
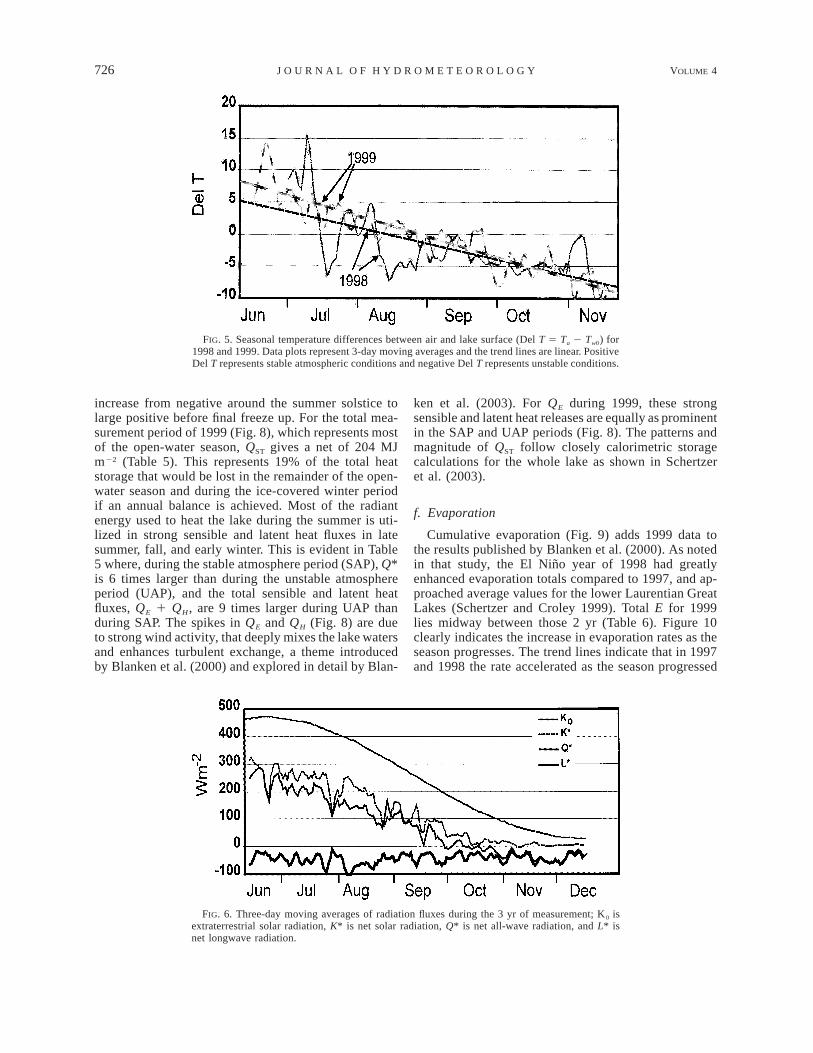
Figure 5 indicates that average daily IWI air tem-peratures (TaIWI) are much greater than average dailysurface water temperatures (Tw0), following final icemelt in June, and remain higher until temperatures equil-ibrate in August. In the subsequent interval through tofreeze up, Tw0 . TaIWI. The trend lines in Fig. 5 indicatethat equilibration occurs about 9 August in 1998 and22 August in 1999. Thus, atmospheric thermal stabilitygenerally persists throughout much of the summer sea-son, engendering the stable regime turbulent transferprocesses documented by Blanken et al. (2003). As-suming that a stable lower atmosphere persists from finalthaw (Table 2) to Ta 5 Tw0 (Fig. 5), and that an unstableatmosphere persists from Ta 5 Tw0 to final freeze, one
AUGUST 2003 725R O U S E E T A L .
FIG. 3. Water surface temperatures (Tw0) on Great Slave Lake for 1998 and 1999 with third-order polynomial line fits to the data.
FIG. 4. Three-day moving averages of water temperatures at various depths, as measured frombuoy strings near Inner Whaleback Island; Tw0 is surface temperature, Tw (0–10) represents thetop 10 m of water and Tw (10–50) is the interval from 10 to 50 m, and 98 and 99 are the designationsfor 1998 and 1999, respectively.
can calculate the approximate length of the period ofstable and unstable lower atmospheric conditions duringthe open-water season. In 1998 this gives 67 and 145days, respectively, whereas in 1999, the correspondingperiods are 72 and 112 days. Thus, in 1998 the periodwhen sensible and latent fluxes are likely to be directeddownward to the lake surface is 7% shorter than in 1999,and the period when sensible and latent heat fluxes arelikely to be directed upward from the lake surface is30% longer.
d. Radiation balance
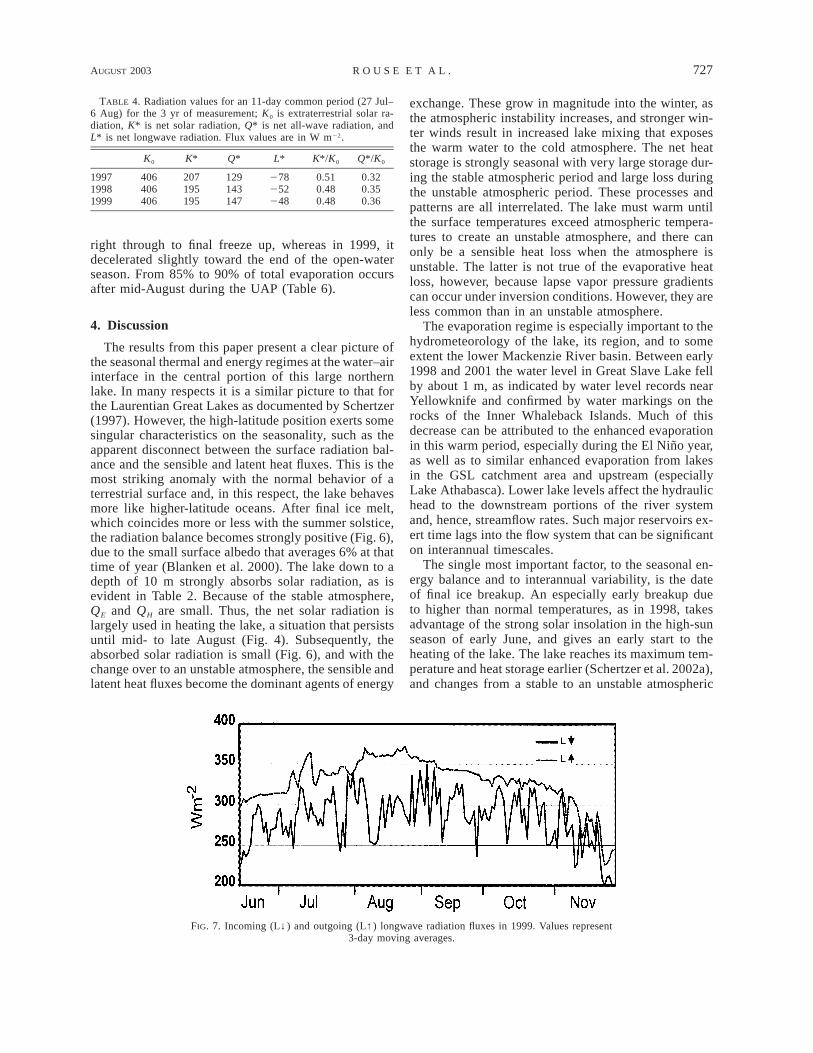
The fully open-water season begins in June and per-sists into December (Table 2) and, thus, is primarilyconcentrated between the summer and winter solstices.This is evident in Fig. 6, which shows the extraterrestrialradiation, K0, decreasing from a maximum of 474 to aminimum of 25 W m22. In summer [June–July–August(JJA)], as is common with its temperate counterparts,Great Slave Lake is a high-energy system. Absorbedsolar radiation, K* 5 K↓ 2 K↑, has a magnitude thatequals 52% of K0, and Q* has a magnitude equal to
40% of K0. In midsummer, during a common period forthe 3 yr when all instruments were operating, differencesin the radiation balance are small (Table 4). As K* getsvery small in November and December, Q* convergeson the net longwave radiation, L* 5 L↓ 2 L↑, untilthey become equal during the high-latitude polar night(Fig. 6). In the open water season L* tends to be large,as seen in Table 4 and Fig. 6. The outgoing component,L↑, varies only slowly over time (Fig. 7) due to theconservative lake surface temperature regime, whereasthe incoming component, L↓, is much more variable,being influenced by changing atmospheric temperature,humidity, and cloud conditions. Thus, the large vari-ability in L* seen in Fig. 6 is primarily due to the fluc-tuations in L↓.
e. Sensible and latent fluxes
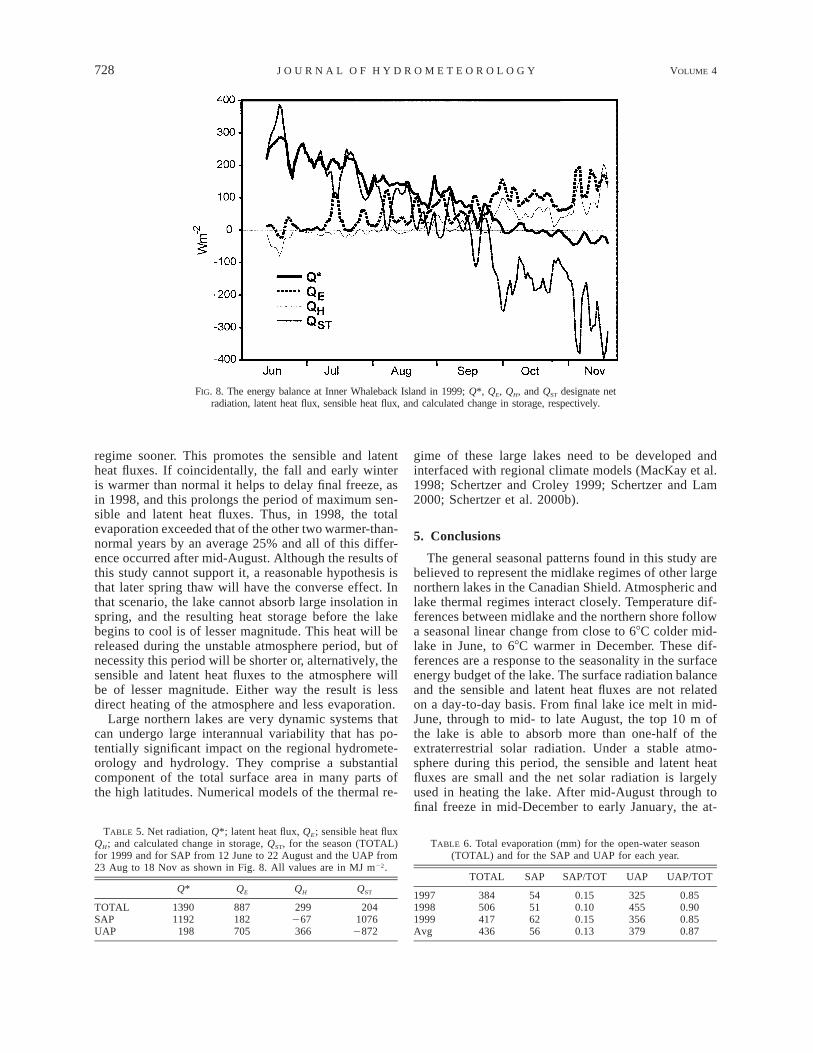
On a daily and a seasonal basis the surface sensibleand latent heat fluxes are not strongly influenced by thenet radiation (Fig. 8); Q* decreases from its high valuesat the summer solstice to negative values in November,whereas the sensible and latent heat fluxes, QH and QE,
726 VOLUME 4J O U R N A L O F H Y D R O M E T E O R O L O G Y
FIG. 5. Seasonal temperature differences between air and lake surface (Del T 5 Ta 2 Tw0) for1998 and 1999. Data plots represent 3-day moving averages and the trend lines are linear. PositiveDel T represents stable atmospheric conditions and negative Del T represents unstable conditions.
FIG. 6. Three-day moving averages of radiation fluxes during the 3 yr of measurement; K0 isextraterrestrial solar radiation, K* is net solar radiation, Q* is net all-wave radiation, and L* isnet longwave radiation.
increase from negative around the summer solstice tolarge positive before final freeze up. For the total mea-surement period of 1999 (Fig. 8), which represents mostof the open-water season, QST gives a net of 204 MJm22 (Table 5). This represents 19% of the total heatstorage that would be lost in the remainder of the open-water season and during the ice-covered winter periodif an annual balance is achieved. Most of the radiantenergy used to heat the lake during the summer is uti-lized in strong sensible and latent heat fluxes in latesummer, fall, and early winter. This is evident in Table5 where, during the stable atmosphere period (SAP), Q*is 6 times larger than during the unstable atmosphereperiod (UAP), and the total sensible and latent heatfluxes, QE 1 QH, are 9 times larger during UAP thanduring SAP. The spikes in QE and QH (Fig. 8) are dueto strong wind activity, that deeply mixes the lake watersand enhances turbulent exchange, a theme introducedby Blanken et al. (2000) and explored in detail by Blan-
ken et al. (2003). For QE during 1999, these strongsensible and latent heat releases are equally as prominentin the SAP and UAP periods (Fig. 8). The patterns andmagnitude of QST follow closely calorimetric storagecalculations for the whole lake as shown in Schertzeret al. (2003).
f. Evaporation
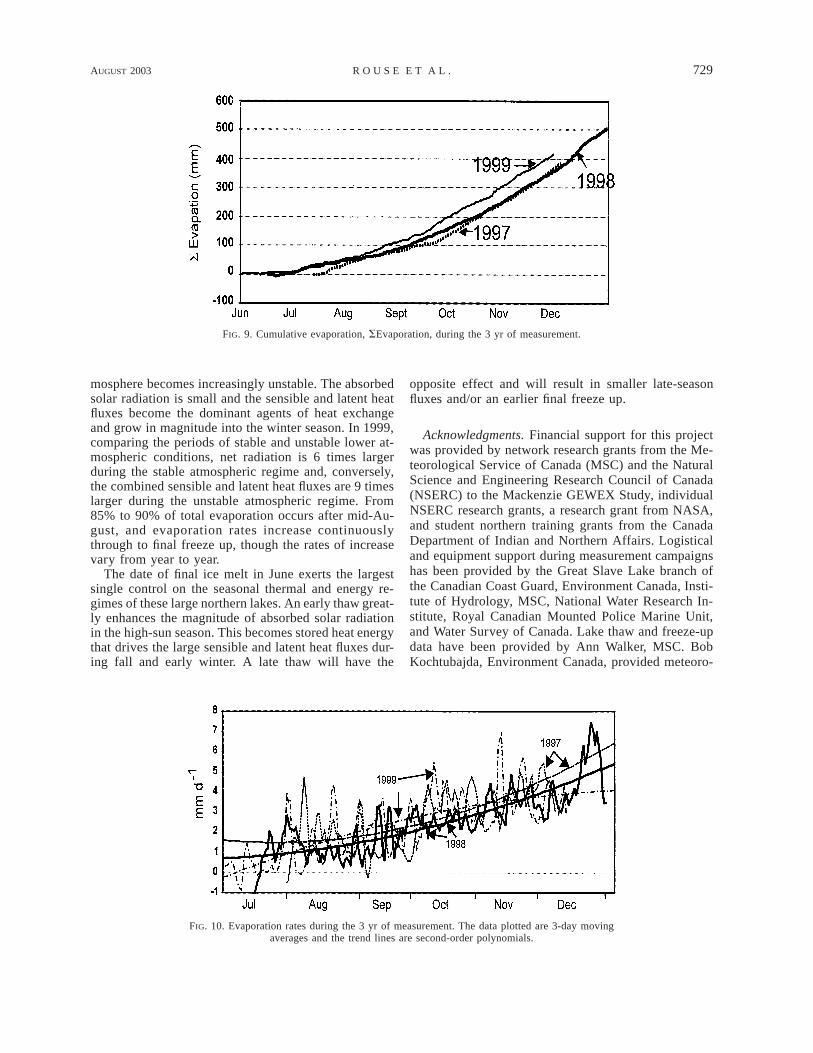
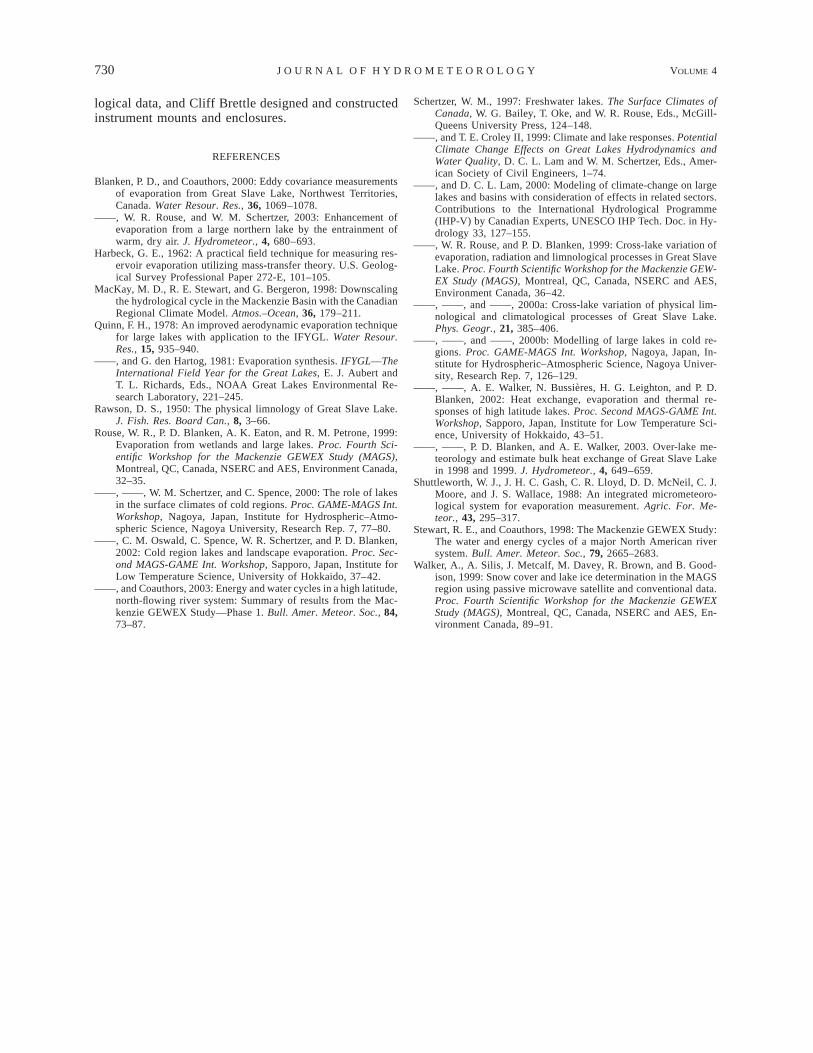
Cumulative evaporation (Fig. 9) adds 1999 data tothe results published by Blanken et al. (2000). As notedin that study, the El Nino year of 1998 had greatlyenhanced evaporation totals compared to 1997, and ap-proached average values for the lower Laurentian GreatLakes (Schertzer and Croley 1999). Total E for 1999lies midway between those 2 yr (Table 6). Figure 10clearly indicates the increase in evaporation rates as theseason progresses. The trend lines indicate that in 1997and 1998 the rate accelerated as the season progressed
AUGUST 2003 727R O U S E E T A L .
TABLE 4. Radiation values for an 11-day common period (27 Jul–6 Aug) for the 3 yr of measurement; K0 is extraterrestrial solar ra-diation, K* is net solar radiation, Q* is net all-wave radiation, andL* is net longwave radiation. Flux values are in W m22.
K0 K* Q* L* K*/K0 Q*/K0
199719981999
406406406
207195195
129143147
278252248
0.510.480.48
0.320.350.36
FIG. 7. Incoming (L↓) and outgoing (L↑) longwave radiation fluxes in 1999. Values represent3-day moving averages.
right through to final freeze up, whereas in 1999, itdecelerated slightly toward the end of the open-waterseason. From 85% to 90% of total evaporation occursafter mid-August during the UAP (Table 6).
4. Discussion
The results from this paper present a clear picture ofthe seasonal thermal and energy regimes at the water–airinterface in the central portion of this large northernlake. In many respects it is a similar picture to that forthe Laurentian Great Lakes as documented by Schertzer(1997). However, the high-latitude position exerts somesingular characteristics on the seasonality, such as theapparent disconnect between the surface radiation bal-ance and the sensible and latent heat fluxes. This is themost striking anomaly with the normal behavior of aterrestrial surface and, in this respect, the lake behavesmore like higher-latitude oceans. After final ice melt,which coincides more or less with the summer solstice,the radiation balance becomes strongly positive (Fig. 6),due to the small surface albedo that averages 6% at thattime of year (Blanken et al. 2000). The lake down to adepth of 10 m strongly absorbs solar radiation, as isevident in Table 2. Because of the stable atmosphere,QE and QH are small. Thus, the net solar radiation islargely used in heating the lake, a situation that persistsuntil mid- to late August (Fig. 4). Subsequently, theabsorbed solar radiation is small (Fig. 6), and with thechange over to an unstable atmosphere, the sensible andlatent heat fluxes become the dominant agents of energy
exchange. These grow in magnitude into the winter, asthe atmospheric instability increases, and stronger win-ter winds result in increased lake mixing that exposesthe warm water to the cold atmosphere. The net heatstorage is strongly seasonal with very large storage dur-ing the stable atmospheric period and large loss duringthe unstable atmospheric period. These processes andpatterns are all interrelated. The lake must warm untilthe surface temperatures exceed atmospheric tempera-tures to create an unstable atmosphere, and there canonly be a sensible heat loss when the atmosphere isunstable. The latter is not true of the evaporative heatloss, however, because lapse vapor pressure gradientscan occur under inversion conditions. However, they areless common than in an unstable atmosphere.
The evaporation regime is especially important to thehydrometeorology of the lake, its region, and to someextent the lower Mackenzie River basin. Between early1998 and 2001 the water level in Great Slave Lake fellby about 1 m, as indicated by water level records nearYellowknife and confirmed by water markings on therocks of the Inner Whaleback Islands. Much of thisdecrease can be attributed to the enhanced evaporationin this warm period, especially during the El Nino year,as well as to similar enhanced evaporation from lakesin the GSL catchment area and upstream (especiallyLake Athabasca). Lower lake levels affect the hydraulichead to the downstream portions of the river systemand, hence, streamflow rates. Such major reservoirs ex-ert time lags into the flow system that can be significanton interannual timescales.
The single most important factor, to the seasonal en-ergy balance and to interannual variability, is the dateof final ice breakup. An especially early breakup dueto higher than normal temperatures, as in 1998, takesadvantage of the strong solar insolation in the high-sunseason of early June, and gives an early start to theheating of the lake. The lake reaches its maximum tem-perature and heat storage earlier (Schertzer et al. 2002a),and changes from a stable to an unstable atmospheric
728 VOLUME 4J O U R N A L O F H Y D R O M E T E O R O L O G Y
FIG. 8. The energy balance at Inner Whaleback Island in 1999; Q*, QE, QH, and QST designate netradiation, latent heat flux, sensible heat flux, and calculated change in storage, respectively.
TABLE 5. Net radiation, Q*; latent heat flux, QE; sensible heat fluxQH; and calculated change in storage, QST, for the season (TOTAL)for 1999 and for SAP from 12 June to 22 August and the UAP from23 Aug to 18 Nov as shown in Fig. 8. All values are in MJ m22.
Q* QE QH QST
TOTALSAPUAP
13901192
198
887182705
299267366
2041076
2872
TABLE 6. Total evaporation (mm) for the open-water season(TOTAL) and for the SAP and UAP for each year.
TOTAL SAP SAP/TOT UAP UAP/TOT
199719981999Avg
384506417436
54516256
0.150.100.150.13
325455356379
0.850.900.850.87
regime sooner. This promotes the sensible and latentheat fluxes. If coincidentally, the fall and early winteris warmer than normal it helps to delay final freeze, asin 1998, and this prolongs the period of maximum sen-sible and latent heat fluxes. Thus, in 1998, the totalevaporation exceeded that of the other two warmer-than-normal years by an average 25% and all of this differ-ence occurred after mid-August. Although the results ofthis study cannot support it, a reasonable hypothesis isthat later spring thaw will have the converse effect. Inthat scenario, the lake cannot absorb large insolation inspring, and the resulting heat storage before the lakebegins to cool is of lesser magnitude. This heat will bereleased during the unstable atmosphere period, but ofnecessity this period will be shorter or, alternatively, thesensible and latent heat fluxes to the atmosphere willbe of lesser magnitude. Either way the result is lessdirect heating of the atmosphere and less evaporation.
Large northern lakes are very dynamic systems thatcan undergo large interannual variability that has po-tentially significant impact on the regional hydromete-orology and hydrology. They comprise a substantialcomponent of the total surface area in many parts ofthe high latitudes. Numerical models of the thermal re-
gime of these large lakes need to be developed andinterfaced with regional climate models (MacKay et al.1998; Schertzer and Croley 1999; Schertzer and Lam2000; Schertzer et al. 2000b).
5. Conclusions
The general seasonal patterns found in this study arebelieved to represent the midlake regimes of other largenorthern lakes in the Canadian Shield. Atmospheric andlake thermal regimes interact closely. Temperature dif-ferences between midlake and the northern shore followa seasonal linear change from close to 68C colder mid-lake in June, to 68C warmer in December. These dif-ferences are a response to the seasonality in the surfaceenergy budget of the lake. The surface radiation balanceand the sensible and latent heat fluxes are not relatedon a day-to-day basis. From final lake ice melt in mid-June, through to mid- to late August, the top 10 m ofthe lake is able to absorb more than one-half of theextraterrestrial solar radiation. Under a stable atmo-sphere during this period, the sensible and latent heatfluxes are small and the net solar radiation is largelyused in heating the lake. After mid-August through tofinal freeze in mid-December to early January, the at-
AUGUST 2003 729R O U S E E T A L .
FIG. 9. Cumulative evaporation, SEvaporation, during the 3 yr of measurement.
FIG. 10. Evaporation rates during the 3 yr of measurement. The data plotted are 3-day movingaverages and the trend lines are second-order polynomials.
mosphere becomes increasingly unstable. The absorbedsolar radiation is small and the sensible and latent heatfluxes become the dominant agents of heat exchangeand grow in magnitude into the winter season. In 1999,comparing the periods of stable and unstable lower at-mospheric conditions, net radiation is 6 times largerduring the stable atmospheric regime and, conversely,the combined sensible and latent heat fluxes are 9 timeslarger during the unstable atmospheric regime. From85% to 90% of total evaporation occurs after mid-Au-gust, and evaporation rates increase continuouslythrough to final freeze up, though the rates of increasevary from year to year.
The date of final ice melt in June exerts the largestsingle control on the seasonal thermal and energy re-gimes of these large northern lakes. An early thaw great-ly enhances the magnitude of absorbed solar radiationin the high-sun season. This becomes stored heat energythat drives the large sensible and latent heat fluxes dur-ing fall and early winter. A late thaw will have the
opposite effect and will result in smaller late-seasonfluxes and/or an earlier final freeze up.
Acknowledgments. Financial support for this projectwas provided by network research grants from the Me-teorological Service of Canada (MSC) and the NaturalScience and Engineering Research Council of Canada(NSERC) to the Mackenzie GEWEX Study, individualNSERC research grants, a research grant from NASA,and student northern training grants from the CanadaDepartment of Indian and Northern Affairs. Logisticaland equipment support during measurement campaignshas been provided by the Great Slave Lake branch ofthe Canadian Coast Guard, Environment Canada, Insti-tute of Hydrology, MSC, National Water Research In-stitute, Royal Canadian Mounted Police Marine Unit,and Water Survey of Canada. Lake thaw and freeze-updata have been provided by Ann Walker, MSC. BobKochtubajda, Environment Canada, provided meteoro-
730 VOLUME 4J O U R N A L O F H Y D R O M E T E O R O L O G Y
logical data, and Cliff Brettle designed and constructedinstrument mounts and enclosures.
REFERENCES
Blanken, P. D., and Coauthors, 2000: Eddy covariance measurementsof evaporation from Great Slave Lake, Northwest Territories,Canada. Water Resour. Res., 36, 1069–1078.
——, W. R. Rouse, and W. M. Schertzer, 2003: Enhancement ofevaporation from a large northern lake by the entrainment ofwarm, dry air. J. Hydrometeor., 4, 680–693.
Harbeck, G. E., 1962: A practical field technique for measuring res-ervoir evaporation utilizing mass-transfer theory. U.S. Geolog-ical Survey Professional Paper 272-E, 101–105.
MacKay, M. D., R. E. Stewart, and G. Bergeron, 1998: Downscalingthe hydrological cycle in the Mackenzie Basin with the CanadianRegional Climate Model. Atmos.–Ocean, 36, 179–211.
Quinn, F. H., 1978: An improved aerodynamic evaporation techniquefor large lakes with application to the IFYGL. Water Resour.Res., 15, 935–940.
——, and G. den Hartog, 1981: Evaporation synthesis. IFYGL—TheInternational Field Year for the Great Lakes, E. J. Aubert andT. L. Richards, Eds., NOAA Great Lakes Environmental Re-search Laboratory, 221–245.
Rawson, D. S., 1950: The physical limnology of Great Slave Lake.J. Fish. Res. Board Can., 8, 3–66.
Rouse, W. R., P. D. Blanken, A. K. Eaton, and R. M. Petrone, 1999:Evaporation from wetlands and large lakes. Proc. Fourth Sci-entific Workshop for the Mackenzie GEWEX Study (MAGS),Montreal, QC, Canada, NSERC and AES, Environment Canada,32–35.
——, ——, W. M. Schertzer, and C. Spence, 2000: The role of lakesin the surface climates of cold regions. Proc. GAME-MAGS Int.Workshop, Nagoya, Japan, Institute for Hydrospheric–Atmo-spheric Science, Nagoya University, Research Rep. 7, 77–80.
——, C. M. Oswald, C. Spence, W. R. Schertzer, and P. D. Blanken,2002: Cold region lakes and landscape evaporation. Proc. Sec-ond MAGS-GAME Int. Workshop, Sapporo, Japan, Institute forLow Temperature Science, University of Hokkaido, 37–42.
——, and Coauthors, 2003: Energy and water cycles in a high latitude,north-flowing river system: Summary of results from the Mac-kenzie GEWEX Study—Phase 1. Bull. Amer. Meteor. Soc., 84,73–87.
Schertzer, W. M., 1997: Freshwater lakes. The Surface Climates ofCanada, W. G. Bailey, T. Oke, and W. R. Rouse, Eds., McGill-Queens University Press, 124–148.
——, and T. E. Croley II, 1999: Climate and lake responses. PotentialClimate Change Effects on Great Lakes Hydrodynamics andWater Quality, D. C. L. Lam and W. M. Schertzer, Eds., Amer-ican Society of Civil Engineers, 1–74.
——, and D. C. L. Lam, 2000: Modeling of climate-change on largelakes and basins with consideration of effects in related sectors.Contributions to the International Hydrological Programme(IHP-V) by Canadian Experts, UNESCO IHP Tech. Doc. in Hy-drology 33, 127–155.
——, W. R. Rouse, and P. D. Blanken, 1999: Cross-lake variation ofevaporation, radiation and limnological processes in Great SlaveLake. Proc. Fourth Scientific Workshop for the Mackenzie GEW-EX Study (MAGS), Montreal, QC, Canada, NSERC and AES,Environment Canada, 36–42.
——, ——, and ——, 2000a: Cross-lake variation of physical lim-nological and climatological processes of Great Slave Lake.Phys. Geogr., 21, 385–406.
——, ——, and ——, 2000b: Modelling of large lakes in cold re-gions. Proc. GAME-MAGS Int. Workshop, Nagoya, Japan, In-stitute for Hydrospheric–Atmospheric Science, Nagoya Univer-sity, Research Rep. 7, 126–129.
——, ——, A. E. Walker, N. Bussieres, H. G. Leighton, and P. D.Blanken, 2002: Heat exchange, evaporation and thermal re-sponses of high latitude lakes. Proc. Second MAGS-GAME Int.Workshop, Sapporo, Japan, Institute for Low Temperature Sci-ence, University of Hokkaido, 43–51.
——, ——, P. D. Blanken, and A. E. Walker, 2003. Over-lake me-teorology and estimate bulk heat exchange of Great Slave Lakein 1998 and 1999. J. Hydrometeor., 4, 649–659.
Shuttleworth, W. J., J. H. C. Gash, C. R. Lloyd, D. D. McNeil, C. J.Moore, and J. S. Wallace, 1988: An integrated micrometeoro-logical system for evaporation measurement. Agric. For. Me-teor., 43, 295–317.
Stewart, R. E., and Coauthors, 1998: The Mackenzie GEWEX Study:The water and energy cycles of a major North American riversystem. Bull. Amer. Meteor. Soc., 79, 2665–2683.
Walker, A., A. Silis, J. Metcalf, M. Davey, R. Brown, and B. Good-ison, 1999: Snow cover and lake ice determination in the MAGSregion using passive microwave satellite and conventional data.Proc. Fourth Scientific Workshop for the Mackenzie GEWEXStudy (MAGS), Montreal, QC, Canada, NSERC and AES, En-vironment Canada, 89–91.
Copyright © 2022 FDOKUMEN