Interaction frequency across the geographical range as a determinant of host specialisation in...
9
Interaction frequency across the geographical range as a determinant of host specialisation in generalist fleas Robert Poulin a, * , Boris R. Krasnov b,c , Georgy I. Shenbrot b,c a Department of Zoology, University of Otago, P.O. Box 56, Dunedin 9054, New Zealand b Mitrani Department of Desert Ecology, Jacob Blaustein Institutes for Desert Research, Ben-Gurion University of the Negev, Sede-Boqer Campus, 84990 Midreshet Ben-Gurion, Israel c Ramon Science Center, P.O. Box 384, 80600 Mizpe Ramon, Israel Received 4 November 2007; received in revised form 31 December 2007; accepted 3 January 2008 Abstract The strength of interspecific interactions varies over geographical scales, and can influence patterns of resource specialisation. Even with gene flow preventing local adaptation of a consumer to particular resources, we might expect that across its entire range, the con- sumer would show some specialisation for the resource types most likely to be encountered across the localities where it occurs. We tested the hypothesis that generalist fleas are more successful at exploiting small mammalian host species with which they co-occur frequently across their geographical range than host species that, though suitable, are encountered less frequently. This hypothesis was tested with data on 121 flea species compiled from field surveys across 35 regions of the Palaearctic. Using abundance (mean number of individual fleas per individual host) as a measure of flea success on a particular host species, positive correlations between flea abundance and the frequency of co-occurrence of a flea with each of its hosts amongst all regions surveyed were found in all but two of the flea species inves- tigated, with one-fifth of these being significant. If overlap in geographical range between flea and host is used as a measure of frequency of encounters instead of the actual proportion of regions where they both occur, similar patterns are observed, though they are much weaker. In a comparative analysis across all flea species, there were significant relationships between the average abundance of fleas and average values of both measures of frequency of encounters (proportion of sites where they co-occur and range overlap), even when correcting for potential phylogenetic influences. The results suggest that for any given flea species, host species more commonly encoun- tered throughout the spatial range of the flea are generally those on which the flea does best. Interaction frequency may be a key deter- minant of specialisation and abundance in host–parasite systems. Ó 2008 Australian Society for Parasitology Inc. Published by Elsevier Ltd. All rights reserved. Keywords: Coevolution; Ectoparasites; Host specificity; Siphonaptera 1. Introduction Interactions between given species are variable in both space and time. This forms the basis of the geographical mosaic theory of coevolution (Thompson, 2005). Both qualitative and quantitative aspects of interspecific interac- tions differ amongst the localities where two or more inter- acting species are found. One reason for this is that, in the vast majority of cases not involving strict specialists, inter- acting species such as hosts and parasites do not have iden- tical geographical ranges. There is overlap between their geographical distributions, such that they co-occur in some localities, but the overlap is rarely perfect, such that a given host species occurs in some localities without a given para- site, and vice versa (Esch et al., 1990; Rohde, 2002; Kras- nov et al., 2005b). This is a basic attribute of most interactions providing the raw material for spatially-struc- tured coevolution (Thompson, 1999, 2005). This spatial structure may also provide an explanation for patterns of specialisation by parasites on their hosts. Because some host species that a parasite could exploit are not present everywhere throughout the parasite’s 0020-7519/$34.00 Ó 2008 Australian Society for Parasitology Inc. Published by Elsevier Ltd. All rights reserved. doi:10.1016/j.ijpara.2008.01.001 * Corresponding author. Tel.: +64 3 479 7983; fax: +64 3 479 7584. E-mail address: [email protected] (R. Poulin). www.elsevier.com/locate/ijpara Available online at www.sciencedirect.com International Journal for Parasitology 38 (2008) 989–997
-
Upload
independent -
Category
Documents
-
view
3 -
download
0
Transcript of Interaction frequency across the geographical range as a determinant of host specialisation in...

Available online at www.sciencedirect.com
www.elsevier.com/locate/ijpara
International Journal for Parasitology 38 (2008) 989–997
Interaction frequency across the geographical range as a determinantof host specialisation in generalist fleas
Robert Poulin a,*, Boris R. Krasnov b,c, Georgy I. Shenbrot b,c
a Department of Zoology, University of Otago, P.O. Box 56, Dunedin 9054, New Zealandb Mitrani Department of Desert Ecology, Jacob Blaustein Institutes for Desert Research, Ben-Gurion University of the Negev,
Sede-Boqer Campus, 84990 Midreshet Ben-Gurion, Israelc Ramon Science Center, P.O. Box 384, 80600 Mizpe Ramon, Israel
Received 4 November 2007; received in revised form 31 December 2007; accepted 3 January 2008
Abstract
The strength of interspecific interactions varies over geographical scales, and can influence patterns of resource specialisation. Evenwith gene flow preventing local adaptation of a consumer to particular resources, we might expect that across its entire range, the con-sumer would show some specialisation for the resource types most likely to be encountered across the localities where it occurs. We testedthe hypothesis that generalist fleas are more successful at exploiting small mammalian host species with which they co-occur frequentlyacross their geographical range than host species that, though suitable, are encountered less frequently. This hypothesis was tested withdata on 121 flea species compiled from field surveys across 35 regions of the Palaearctic. Using abundance (mean number of individualfleas per individual host) as a measure of flea success on a particular host species, positive correlations between flea abundance and thefrequency of co-occurrence of a flea with each of its hosts amongst all regions surveyed were found in all but two of the flea species inves-tigated, with one-fifth of these being significant. If overlap in geographical range between flea and host is used as a measure of frequencyof encounters instead of the actual proportion of regions where they both occur, similar patterns are observed, though they are muchweaker. In a comparative analysis across all flea species, there were significant relationships between the average abundance of fleasand average values of both measures of frequency of encounters (proportion of sites where they co-occur and range overlap), even whencorrecting for potential phylogenetic influences. The results suggest that for any given flea species, host species more commonly encoun-tered throughout the spatial range of the flea are generally those on which the flea does best. Interaction frequency may be a key deter-minant of specialisation and abundance in host–parasite systems.� 2008 Australian Society for Parasitology Inc. Published by Elsevier Ltd. All rights reserved.
Keywords: Coevolution; Ectoparasites; Host specificity; Siphonaptera
1. Introduction
Interactions between given species are variable in bothspace and time. This forms the basis of the geographicalmosaic theory of coevolution (Thompson, 2005). Bothqualitative and quantitative aspects of interspecific interac-tions differ amongst the localities where two or more inter-acting species are found. One reason for this is that, in thevast majority of cases not involving strict specialists, inter-
0020-7519/$34.00 � 2008 Australian Society for Parasitology Inc. Published b
doi:10.1016/j.ijpara.2008.01.001
* Corresponding author. Tel.: +64 3 479 7983; fax: +64 3 479 7584.E-mail address: [email protected] (R. Poulin).
acting species such as hosts and parasites do not have iden-tical geographical ranges. There is overlap between theirgeographical distributions, such that they co-occur in somelocalities, but the overlap is rarely perfect, such that a givenhost species occurs in some localities without a given para-site, and vice versa (Esch et al., 1990; Rohde, 2002; Kras-nov et al., 2005b). This is a basic attribute of mostinteractions providing the raw material for spatially-struc-tured coevolution (Thompson, 1999, 2005).
This spatial structure may also provide an explanationfor patterns of specialisation by parasites on their hosts.Because some host species that a parasite could exploitare not present everywhere throughout the parasite’s
y Elsevier Ltd. All rights reserved.
990 R. Poulin et al. / International Journal for Parasitology 38 (2008) 989–997
geographical range, we can expect selection to favour localadaptation of the parasite to the hosts that are locallyavailable. However, when the host species involved aremobile, gene flow amongst different populations of a para-site species serves to maintain the species’ integrity overlarge spatial scales (Blouin et al., 1995; Anderson et al.,1998; Lampo et al., 1998; McCoy et al., 2003). Thus forthe parasite species as a whole, throughout its entire range,we might expect a degree of specialisation on the host spe-cies that are most likely to be encountered across all local-ities where the parasite occurs (Fox and Morrow, 1981). Ifspecialisation for frequently-encountered host species has agenetic basis, then selection will favour specialisation onthese hosts in many foci and result in the parasite achievinggreater success on these frequent hosts than on host speciesthat are also used but only rarely encountered throughoutthe geographical range.
Here, we test this hypothesis with data on fleas (Sipho-naptera) parasitic on small mammals in the Palaearctic.Fleas are obligate blood-sucking ectoparasites most abun-dant and diverse on small to medium-sized burrowing spe-cies of mammals (Marshall, 1981). In contrast to theimago, flea larvae are usually not parasitic and feed on
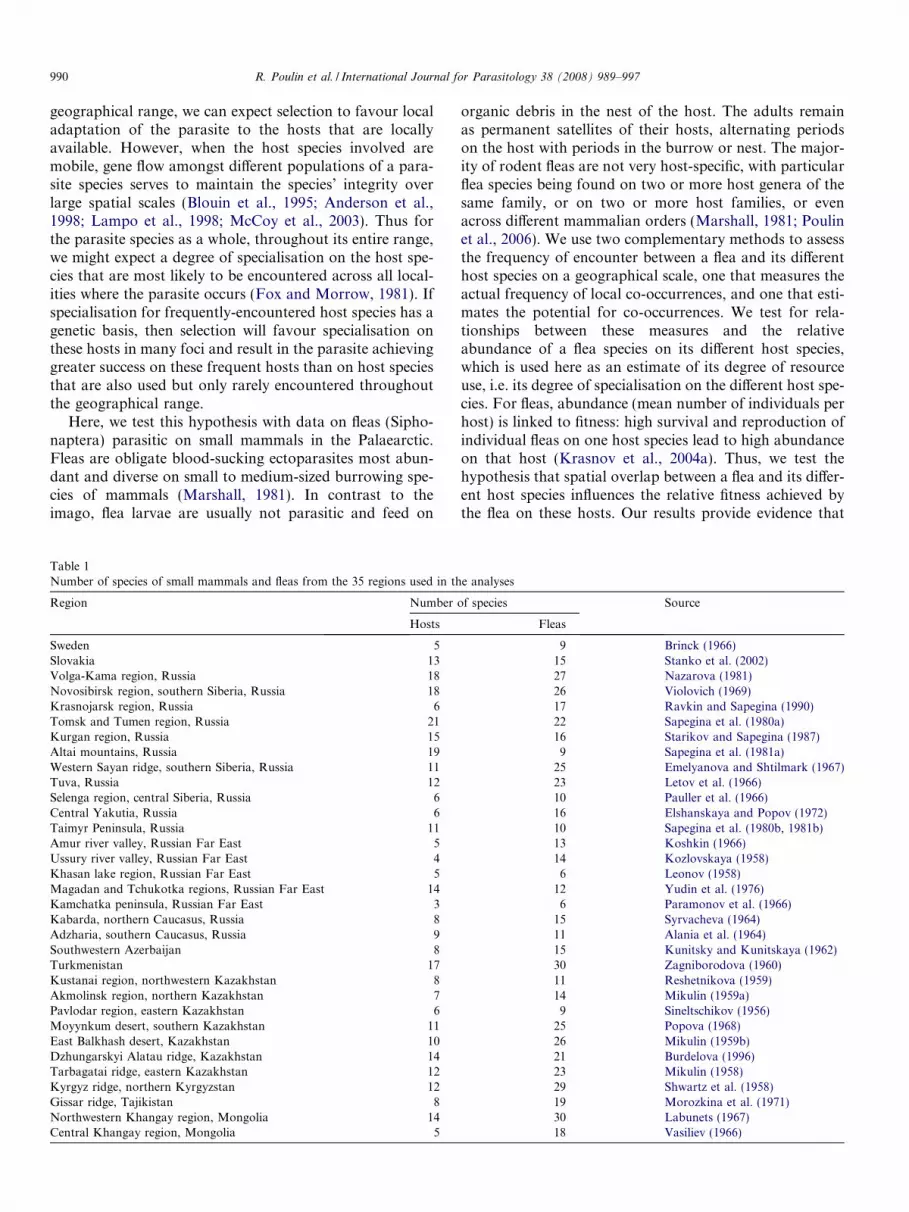
Table 1Number of species of small mammals and fleas from the 35 regions used in th
Region Number
Hosts
Sweden 5Slovakia 13Volga-Kama region, Russia 18Novosibirsk region, southern Siberia, Russia 18Krasnojarsk region, Russia 6Tomsk and Tumen region, Russia 21Kurgan region, Russia 15Altai mountains, Russia 19Western Sayan ridge, southern Siberia, Russia 11Tuva, Russia 12Selenga region, central Siberia, Russia 6Central Yakutia, Russia 6Taimyr Peninsula, Russia 11Amur river valley, Russian Far East 5Ussury river valley, Russian Far East 4Khasan lake region, Russian Far East 5Magadan and Tchukotka regions, Russian Far East 14Kamchatka peninsula, Russian Far East 3Kabarda, northern Caucasus, Russia 8Adzharia, southern Caucasus, Russia 9Southwestern Azerbaijan 8Turkmenistan 17Kustanai region, northwestern Kazakhstan 8Akmolinsk region, northern Kazakhstan 7Pavlodar region, eastern Kazakhstan 6Moyynkum desert, southern Kazakhstan 11East Balkhash desert, Kazakhstan 10Dzhungarskyi Alatau ridge, Kazakhstan 14Tarbagatai ridge, eastern Kazakhstan 12Kyrgyz ridge, northern Kyrgyzstan 12Gissar ridge, Tajikistan 8Northwestern Khangay region, Mongolia 14Central Khangay region, Mongolia 5
organic debris in the nest of the host. The adults remainas permanent satellites of their hosts, alternating periodson the host with periods in the burrow or nest. The major-ity of rodent fleas are not very host-specific, with particularflea species being found on two or more host genera of thesame family, or on two or more host families, or evenacross different mammalian orders (Marshall, 1981; Poulinet al., 2006). We use two complementary methods to assessthe frequency of encounter between a flea and its differenthost species on a geographical scale, one that measures theactual frequency of local co-occurrences, and one that esti-mates the potential for co-occurrences. We test for rela-tionships between these measures and the relativeabundance of a flea species on its different host species,which is used here as an estimate of its degree of resourceuse, i.e. its degree of specialisation on the different host spe-cies. For fleas, abundance (mean number of individuals perhost) is linked to fitness: high survival and reproduction ofindividual fleas on one host species lead to high abundanceon that host (Krasnov et al., 2004a). Thus, we test thehypothesis that spatial overlap between a flea and its differ-ent host species influences the relative fitness achieved bythe flea on these hosts. Our results provide evidence that
e analyses
of species Source
Fleas
9 Brinck (1966)15 Stanko et al. (2002)27 Nazarova (1981)26 Violovich (1969)17 Ravkin and Sapegina (1990)22 Sapegina et al. (1980a)16 Starikov and Sapegina (1987)9 Sapegina et al. (1981a)
25 Emelyanova and Shtilmark (1967)23 Letov et al. (1966)10 Pauller et al. (1966)16 Elshanskaya and Popov (1972)10 Sapegina et al. (1980b, 1981b)13 Koshkin (1966)14 Kozlovskaya (1958)6 Leonov (1958)
12 Yudin et al. (1976)6 Paramonov et al. (1966)
15 Syrvacheva (1964)11 Alania et al. (1964)15 Kunitsky and Kunitskaya (1962)30 Zagniborodova (1960)11 Reshetnikova (1959)14 Mikulin (1959a)9 Sineltschikov (1956)
25 Popova (1968)26 Mikulin (1959b)21 Burdelova (1996)23 Mikulin (1958)29 Shwartz et al. (1958)19 Morozkina et al. (1971)30 Labunets (1967)18 Vasiliev (1966)

R. Poulin et al. / International Journal for Parasitology 38 (2008) 989–997 991
the evolution of host specialisation in fleas is driven byopportunities for interactions with their various host spe-cies across large spatial scales.
2. Materials and methods
2.1. Data set
Data were obtained from published surveys thatreported flea distribution and abundance on small mam-mals (Insectivora, Lagomorpha and Rodentia) in 35 differ-ent regions of the Palaearctic (Table 1). These sourcesprovided data on the average number of individuals of aparticular flea species found on individuals of a particularhost species. The surveys were extensive, conducted overa wide area from spring to autumn and across severalyears, and targeted the entire small mammal communityof each region. In all surveys, most species were capturedusing snap-traps; shrews were also captured using pitfalltraps, sciurids and lagomorphs were hunted, whereas moleswere captured using mole-traps. In total, 1,394,575 individ-ual fleas and 399,462 individual mammals were collected inthe 35 surveys. Only mammal species for which at least 10individuals have been examined per region were included,because estimates of flea abundance could be inaccuratefor smaller samples. Also, only flea species occurring inat least four different mammalian host species across theentire geographical range were included. Flea species withcosmopolitan distributions (e.g., Xenopsylla cheopis, Noso-
psyllus fasciatus) that were likely introduced to manyregions with humans, domestic animals or synantropousrodents (e.g., Mus musculus, Rattus norvegicus) were omit-ted from the analysis, since their broad geographical rangeis of recent origin and would not have allowed much timefor coevolution with hosts. In addition, single findings of aflea species on a host species or in a region were consideredaccidental and were not included in the analysis. Thisresulted in 1349 flea–host associations that involved 121(107 of which occurred in at least two regions) flea speciesparasitising 109 small mammalian species.
2.2. Abundance and co-occurrence measures
We used the mean number of flea individuals per indi-vidual host of a given species as a measure of flea abun-dance. Estimates of parasite abundance may be biased ifsome parasites or hosts are studied more intensively thanothers (Stanko et al., 2002). Consequently, unequal studyeffort amongst host species may result in confounding var-iation in estimates of flea abundance. In addition, hosts ofdifferent sizes can support different numbers of fleas. Toensure that interspecific variation in host sampling effortand body size did not bias estimates of flea abundance,we regressed estimates of flea abundance per host againstthe number of hosts examined and the body surface areaof hosts (estimated from body mass; see Walsberg andWolf, 1995) for each flea species in each region. Estimates
of flea abundance per host were not affected either by sam-pling effort or by host body size (r2 = 0.002, F1, 1347 = 2.57and r2 = 0.001, F1, 1347 = 0.98, both P > 0.1). Conse-quently, we used raw abundance data in subsequentanalyses.
For each flea–mammal species combination, we com-puted the average abundance of the flea on the host acrossall regions in which they both occurred. We then identifiedthe principal host for each flea species across its geograph-ical range, i.e. the mammal species in which the fleaattained its highest average abundance. Other host specieswere considered as auxiliary hosts. The abundance of a fleaon a host species was in each case expressed as a relativevalue, i.e. expressed as a proportion of the value observedon the principal host. Thus, the value for the principal hostis always 1, and values for auxiliary hosts are less than one.The use of relative values instead of absolute values doesnot affect the results of the following analyses, and allowsthe comparison of abundance values that vary greatly inabsolute terms amongst the different parasite species (seePoulin, 2005). The relative values were arcsine-transformedprior to analyses.
The frequency of encounter between a flea and its differ-ent host species was measured in two different ways. First,for each flea–host species combination, we used the pro-portion of regions from which a flea species has beenreported in which the host species also occurs; in otherwords, the number of regions in which both the flea anda particular host were found was divided by the total num-ber of regions in which the flea was found. This serves as anestimate of the actual frequency of local co-occurrencesbetween the parasite and each of its hosts. Second, the geo-graphical range for each flea and host species was deter-mined from distribution maps using the ArcView 3.2software. The maps for fleas are based on published maps(see Krasnov et al., 2005a) and various literature sources;the maps for host species are derived from various sources(see Krasnov et al., 2004b). The standard method for esti-mating geographical range size when an analysis of distri-bution is based on presence-only point data involves theconstruction of a minimal convex polygon (MCP; Fortinet al., 2005). However, this method may significantly over-estimate range size since an estimated geographical rangemight include areas from which a species is absent. Formore accurate estimations of geographical ranges, thea-hull algorithm of geographical range size estimationwas proposed by Burgman and Fox (2003). This algorithmalso produces significant errors in range estimates becauseof the non-uniform distribution of data points and the lowspatial accuracy unavoidable with geo-referencing of pub-lished data (Burgman and Fox, 2003). Consequently, toestimate the size of the geographical range of a species,we combined the MCP method and the GARP algorithm(Stockwell and Peters, 1999). The latter is a genetic algo-rithm that creates ecological niche models for each species.We constructed a MCP around the outermost recordpoints and added around it a 25 km buffer. For species

1 3 5 7 9 11 13 15 17 19 21 23 25 27 29 31 33 35 37 39 41 43Host rank
0.0
0.1
0.2
0.3
0.4
0.5
0.6
0.7
0.8Fr
eque
ncy
of c
o-oc
curr
ence
s
1 3 5 7 9 11 13 15 17 19 21 23 25 27 29 31 33 35 37 39 41 43Host rank
0.0
0.1
0.2
0.3
0.4
0.5
0.6
0.7
Ove
rlap
ping
of g
eogr
aphi
c ra
nges
a
b
Fig. 1. Mean (±SE, arcsin-transformed) frequency of local co-occurrences(a) and geographical range overlap (b) of fleas in their mammalian hosts,as a function of host rank. Host species are ranked from the one in whichflea abundance is the highest on average to the host species in which it isthe lowest. Values are computed across the entire data set; sample sizes are121 flea species for the first four ranks and then decrease rapidly forfurther ranks.
992 R. Poulin et al. / International Journal for Parasitology 38 (2008) 989–997
known from 4 to 5 localities only, the resulting buffer poly-gon was used as an estimation of geographical range. Toestimate geographical ranges of species known from morethan five regions, we used the modelling approach basedon the GARP algorithms (DesktopGARP 1.1.3 software,University of Kansas Biodiversity Research Center). Foreach species, we calculated a set of 60–120 models usingrange and logistic regression methods and their combina-tion. We included only areas that were located inside theoriginal buffer polygon in the estimated geographicalrange, because estimation of the potential distribution ofa species beyond known distributional limits has low reli-ability (Anderson, 2003; Anderson et al., 2003). We over-lapped all models thus obtained and included areas forwhich 90% of models predicted a species’ presence in theestimated geographical range. Finally, for each flea andhost species combination, the proportion of the flea’s geo-graphical range that overlapped with the host range wasused as a measure of range overlap, providing a measureof the potential for local encounters of the flea with thehost.
2.3. Analyses
For each flea species, we performed regressions of eachmeasure of frequency of encounter with a host species (i.e.,actual frequency of local co-occurrences and range over-lap) against average relative abundance of the flea on thathost species, across all the host species used by that flea.The relationship between frequency of local co-occurrencesand average relative abundance was tested only for the fleaspecies (107 out of 121 species) that occurred in more thanone region.
In addition, we performed a comparative analysis acrossall flea species, to test whether fleas that co-occur on aver-age more frequently with their hosts achieve, on average,higher abundance on these hosts. We regressed the meanvalue of each measure of frequency of encounter of a fleaspecies with hosts, averaged across all its hosts, againstthe average relative abundance of this flea on all its hostspecies. These regressions were computed across all fleaspecies (N = 107 flea species for frequency of local co-occurrences, N = 121 for range overlap). Comparisonsacross species performed using species values as data pointsmay be confounded by phylogenetic relationships amongstspecies (Felsenstein, 1985; Harvey and Pagel, 1991). Toavoid the potentially confounding effect of phylogeneticrelationships and to obtain independent data points, weused the independent contrasts method (Felsenstein,1985). The only broad molecular phylogeny of fleas is thatof Whiting et al. (2008); however, it does not include thevast majority of flea species and genera that are part ofour analyses. Therefore, a phylogenetic tree of our flea spe-cies was derived from flea taxonomy (see Krasnov et al.,2005a for details). The initial branch length was set to1.0. To compute independent contrasts, we used thePDAP:PDTREE module (Garland et al., 1993; Midford,
P.E., Garland, T. Jr., Maddison, W., 2005. PDAP:PD-TREE package for Mesquite, Version 1.07, http://mes-quiteproject.org/pdap_mesquite/index.html) implementedin Mesquite Modular System for Evolutionary Analysis(Maddison and Maddison, 2005). Pairs of sister branchesthat diverged long ago can likely yield greater contraststhan pairs of sister branches that diverged recently. Toavoid this, we standardised each contrast by dividing itby its standard deviation (Garland et al., 1992). To verifythat contrasts were properly standardised, we plotted theabsolute values of standardised contrasts against their stan-dard deviation (Garland et al., 1992). No significant linearor non-linear trend was found in these plots, suggestingthat the contrasts were adequately standardised.
3. Results
Overall, there was a total of 121 flea species included inthe analysis. They parasitised 109 species of small mamma-

R. Poulin et al. / International Journal for Parasitology 38 (2008) 989–997 993
lian hosts and, on average, were found on 11.2 ± 0.7 hostspecies across their geographical range. In total, there were1349 flea–host associations that each occurred, on average,in 1.7 ± 0.04 of 35 regions (a low number because ofnumerous associations recorded in only one region). Four-teen flea species occurred in one region only.
Across all fleas, when host species are ranked from theone in which flea abundance is the highest on average tothe host species in which it is the lowest, there is initiallya clear decrease in frequency of local co-occurrences withthe host across hosts ranked from 1 to about 14, afterwhich the decrease weakens considerably (Fig. 1a). How-ever, when the frequency of encounter between flea andhost was estimated using the overlap between the geo-graphical ranges of fleas and hosts, the decrease in the fre-quency of encounters as a function of host rank is weakerand becomes much more erratic beyond rank 12 (Fig. 1b).
In 21 of the 107 flea species investigated that occurred inmore than one region, there was a positive relationshipbetween relative abundance on a host species and the fre-quency of local co-occurrences between the flea and thehost (Table 2; see example in Fig. 2a). Although non-signif-icant because of low power, positive relationshipsdominated the rest of the analyses: negative (albeit non-sig-nificant) correlation coefficients between relativeabundance on a host species and the frequency of localco-occurrences between the flea and the host were found
Table 2Summary of significant regressions of flea relative abundance on mammal hospecies, measured either as the proportion of regions from which a flea speciesco-occurrences; FLO) or as the proportion of the flea’s geographical range th
Flea species Number of host species Measur
Amphipsylla anceps 5 FLORO
Amphipsylla kuznetzovi 8 FLOAmphipsylla schelkovnikovi 4 FLOCitellophilus lebedewi 4 FLOCitellophilus tesquorum 24 FLO
ROCtenophthalmus arvalis 15 FLOCtenophthalmus assimilis 37 FLO
ROCtenophthalmus pisticus 6 FLOFrontopsylla ambigua 4 ROFrontopsylla macrophthalma 5 FLOMegabothris advenarius 13 FLOMonopsyllus indages 11 FLOMonopsyllus sciurorum 10 FLONeopsylla teratura 8 FLO
RONosopsyllus turkmenicus 11 FLOOropsylla alaskensis 5 ROPalaeopsylla soricis 29 FLOParadoxopsyllus repandus 5 FLORhadinopsylla altaica 5 FLORhadinopsylla dahurica 6 FLOXenopsylla gerbilli 13 FLOXenopsylla hirtipes 7 FLO
Slopes of all regressions are positive.
in only two cases out of 107 tests. This pattern alsoemerged from the comparative analysis. The average fre-quency of co-occurrences correlated positively with theaverage relative abundance across the 107 flea species(r2 = 0.10, F1, 105 = 11.0, P < 0.001; Fig. 3a). The samewas true when independent contrasts were used instead ofthe species values (r = 0.39, P < 0.001; Fig. 3b).
A positive relationship between relative abundance on ahost species and the range overlap between the flea and thehost was found in only six of the 121 flea species (Table 2;see example in Fig. 2b). In four of these six species, relativeabundance also correlated positively with the frequency oflocal co-occurrences between the flea and the host. Amongthe 121 flea species, positive relationships again dominated,although not as clearly as when using the frequency of localco-occurrences: negative correlation coefficients betweenrelative abundance on a host species and overlap betweenflea and host geographical ranges were found in 51 of121 flea species, though none of these coefficients differedsignificantly from zero. In the comparative analysis, theaverage overlap between flea and host geographical rangescorrelated positively with the average relative abundance offleas on hosts, across the 121 flea species (r2 = 0.06,F1, 119 = 7.4, P < 0.01; Fig. 4a). The significant positive cor-relation also holds when the two outliers that can be seen inthe right side of Fig. 4a (Leptopsylla nana and Stenoponia
conspecta) are omitted from the analysis (r2 = 0.04,
sts versus the frequency of encounter between a flea and its different hosthas been reported in which the host species also occurs (frequency of localat overlapped with the host range (range overlap; RO)
e of frequency of encounter r2 F p
0.93 46.3 0.0050.94 51.4 0.0010.95 175.6 0.00010.99 217.0 0.00010.99 116.0 0.00010.51 22.4 0.00010.22 5.6 0.020.47 11.5 0.040.15 6.6 0.010.14 5.9 0.020.81 16.7 0.010.99 207.5 0.0040.91 26.2 0.010.64 19.8 0.0010.61 14.1 0.010.77 27.2 0.0010.89 50.3 0.0010.71 14.6 0.010.38 5.4 0.040.87 19 0.020.16 5.3 0.020.99 301.8 0.0010.99 6665.2 0.000010.94 63.6 0.0010.37 6.4 0.020.78 18.2 0.01

0.1 0.2 0.3 0.4 0.5 0.6 0.7 0.8 0.9 1.0Relative abundance
0.0
0.2
0.4
0.6
0.8
1.0
1.2
1.4
1.6
1.8
Freq
uenc
y of
co-
occu
rren
ces
-0.2 0.0 0.2 0.4 0.6 0.8 1.0 1.2 1.4 1.6 1.8Relative abundance
-0.1
0.0
0.1
0.2
0.3
0.4
0.5
0.6
Ove
rlap
of g
eogr
aphi
c ra
nges
a
b
Fig. 2. Relationship between (a) relative abundance of the flea, Mega-
bothris advenarius, on its 13 host species and the frequency of local co-occurrences between flea and host, and (b) relative abundance of the flea,Citellophilus tesquorum, on its 24 host species and range overlap betweenflea and host. All variables are arcsin-transformed.
994 R. Poulin et al. / International Journal for Parasitology 38 (2008) 989–997
F1, 117 = 7.4, P < 0.05). When the confounding effect ofphylogeny was accounted for by using the method of inde-pendent contrasts, the positive relationship between aver-age overlap of geographical ranges and average relativeabundance again proved to be true (r = 0.23, P < 0.01;Fig. 4b).
4. Discussion
On a geographical scale, interactions between given spe-cies are not homogeneous, with many species often existingin some areas in the absence of some of their interactionpartners. This geographical variation provides the essentialraw material for spatially structured coevolution (Thomp-son, 1999, 2005). Local adaptation to different interactionpartners in different localities is unlikely if there is sufficientgene flow amongst populations. However, on a larger scale,if some interaction partners are more common than others,specialisation on the more frequently encountered interac-tion partners is possible, with selection in one locality beingreinforced by similar selection elsewhere. Here, we lookedfor evidence that interaction frequency can influence pat-terns of specialisation in parasites. Our findings are basedon correlations, therefore causal relationships must beinferred with caution. Still, overall our results suggest thatfor any given flea species, host species more commonlyencountered throughout the spatial range of the flea aregenerally those species on which the flea does best. In addi-tion, in comparisons amongst species, flea species exploit-ing mainly hosts that are frequently encountered tend toachieve higher mean abundance than flea species alsoexploiting rarely encountered hosts. These patterns supporta role for interaction frequency in the evolution of special-isation in host-parasite systems.
Two potential caveats require some discussion. First, wehad to exclude ‘specialist’ flea species from the analyses,since the intra-specific regressions we performed requireat least four host species to yield meaningful results. Wetherefore do not know whether the trends observed herewould also apply to fleas exploiting only two or three hostspecies, though there is no reason to expect that they wouldnot. Second, host density may be a confounding factorinfluencing flea abundance. It could be that commonlyencountered host species are also the ones achieving higherlocal density, and that host density per se influences fleaabundance. Indeed, positive relationships between parasiteabundance and host density are a central assumption ofepidemiological models (e.g., Anderson and May, 1978).The surveys from which we compiled our datasets do notprovide reliable data on density of the different host spe-cies. However, the link between host density and flea abun-dance is far from universal. Although the abundance ofsome fleas has been shown to increase with host density(Kotti and Kovalevsky, 1995; Krasnov et al., 2002), abun-dance of other fleas either declines with increasing hostdensity (Zhovty and Kopylova, 1957; Haitlinger, 1981;Stanko et al., 2006) or is completely unaffected by host den-
sity (Stanko et al., 2006). Therefore, variation in densityamongst host species is unlikely to have systematicallybiased our findings.
The patterns obtained using the frequency of co-occur-rences between a flea and its hosts amongst the regions sur-veyed, as a measure of the likelihood of encounters withparticular hosts, were much clearer and stronger than thoseobtained using the overlap between their geographicalranges. The reason for this may be that the former mea-sures the actual or realised frequency of co-occurrences,whereas the latter only provides an estimate of the poten-tial for such co-occurrences. Range overlap is a coarsermeasure that ignores finer-scale variation in habitat types;it is possible for two species to have similar geographicalranges without actually coming into real proximity becauseof different microhabitat preferences (Rosenzweig, 1995;MacDonald, 2001). Thus, results based on the actual pro-portion of localities where a flea co-occurs with a host spe-cies most likely provide a more representative picture of theimportance of interaction frequency.

0.0 0.1 0.2 0.3 0.4 0.5 0.6 0.7 0.8 0.9Average relative abundance
0.1
0.2
0.3
0.4
0.5
0.6
0.7
0.8
0.9
Ave
rage
freq
uenc
y of
co-
occu
rren
ces
-0.4 -0.3 -0.2 -0.1 0.0 0.1 0.2 0.3Contrasts in average relative abundance
-0.4
-0.3
-0.2
-0.1
0.0
0.1
0.2
0.3
Con
tras
ts in
ave
rage
freq
uenc
y of
co-
occu
rren
ces
a
b
Fig. 3. Interspecific relationship between mean relative abundance of aflea and the average frequency of local co-occurrences between the flea andits hosts across 107 flea species using conventional statistics (a) andindependent contrasts (b).
0.0 0.1 0.2 0.3 0.4 0.5 0.6 0.7 0.8 0.9 1.0Average relative abundance
0.0
0.1
0.2
0.3
0.4
0.5
0.6
0.7
0.8
0.9
1.0
1.1
Ave
rage
ove
rlap
of g
eogr
aphi
c ra
nges
a
-0.4 -0.2 0.0 0.2 0.4 0.6 0.8Contrasts in average relative abundance
-0.4
-0.2
0.0
0.2
0.4
0.6
0.8
Con
tras
ts in
ave
rage
ove
rlap
of g
eogr
aphi
c ra
nges
b
Fig. 4. Interspecific relationship between mean relative abundance of aflea and the average overlap between flea and host geographical rangesacross 121 flea species using conventional statistics (a) and independentcontrasts (b).
R. Poulin et al. / International Journal for Parasitology 38 (2008) 989–997 995
The determinants of flea abundance in a particularregion or on a particular host species include more thanthe suitability of the host for the flea. Because fleas spenda significant portion of their life off the host, i.e. in its nestor burrow, physical factors such as temperature andhumidity also play major roles in flea reproduction andsurvival (see Silverman and Rust, 1983; Metzger and Rust,1997; Krasnov et al., 2001a,b). There is substantial visitingand sometimes even sharing of burrows between differentmammal species (Kucheruk, 1983), and local climatic con-ditions will likely be similar for all host burrows present inone region. We might thus expect that these local factors,which are independent of the frequency of co-occurrencesbetween a flea and its many hosts, would override anyinfluence of interaction frequency. The fact that a generaleffect of interaction frequency on flea abundance neverthe-less emerges from our analysis suggests that it is an impor-tant driver of specialisation patterns in fleas.
Fleas parasitic on small mammals are often capable ofexploiting several host species (Marshall, 1981; Poulinet al., 2006). Despite being generalists, they still demonstrate
a certain degree of specialisation, since there is usually aclear distinction between the relative abundance theyachieve on their principal host versus what they achieveon their auxiliary hosts. In other words, a large proportionof the flea population is concentrated on only one or a few ofits many potential host species. Earlier, it has been shownthat host taxonomy is in part responsible for this commonpattern of host use by fleas (Krasnov et al., 2004c). Theabundance achieved by a flea on an auxiliary host speciestends to decrease as a function of the taxonomic or phyloge-netic distance between that auxiliary host and the flea’s prin-cipal host. This influence of host taxonomy appearsindependent of that of interaction frequency, however. Thisis because the geographical ranges of closely related hostspecies, which determine how likely they are to co-occurwith particular fleas, do not overlap more than those ofmore distantly related species, for most major taxa of smallmammals (Fitzpatrick and Turelli, 2006). Therefore, twohost species with similar frequencies of co-occurrences witha flea, are not necessarily also closely related; both thephylogenetic history of a host species and its current spatial

996 R. Poulin et al. / International Journal for Parasitology 38 (2008) 989–997
co-occurrence with a parasite will independently influencepatterns of host use and specialisation.
The influence of interaction frequency with hosts acrossthe whole geographical range of a parasite not only pro-vides evidence of the importance of the spatial componentof coevolution. It also means that the local structure ofparasite populations and communities is determined byextrinsic processes. In other words, the unequal way inwhich parasites use their many host species, i.e. the unevendistribution of parasite individuals within a flea populationamongst the suitable host species that are locally available,might simply be the local manifestation of large-scale evo-lutionary phenomena. This contrasts with the localised pat-terns observed amongst phytophagous insects (Fox andMorrow, 1981), in which inter-population gene flow maybe less extensive than in parasites of mobile vertebrates.The generality of this conclusion will need to be evaluatedwith other host-parasite associations.
Acknowledgements
This is publication no. 596 of the Mitrani Department ofDesert Ecology and no. 241 of the Ramon Science Center.
References
Alania, I.I., Rostigaev, B.A., Shiranovich, P.I., Dzneladze, M.T., 1964.Data on the flea fauna of Adzharia. Proc. Armenian Anti-PlagueStation 3, 407–435 (in Russian).
Anderson, R.M., May, R.M., 1978. Regulation and stability of host-parasite population interactions. I. Regulatory processes. J. Anim.Ecol. 47, 219–247.
Anderson, R.P., 2003. Real vs. artefactual absences in species distribution:tests for Oryzomys albigularis (Rodentia: Muridae) in Venezuela. J.Biogeogr. 30, 591–605.
Anderson, R.P., Lew, D., Peterson, A.T., 2003. Evaluating predictivemodels of species’ distributions: criteria for selecting optimal models.Ecol. Model. 162, 211–232.
Anderson, T.J.C., Blouin, M.S., Beech, R.N., 1998. Population biology ofparasitic nematodes: applications of genetic markers. Adv. Parasitol.41, 219–283.
Blouin, M.S., Yowell, C.A., Courtney, C.H., Dame, J.B., 1995. Hostmovement and the genetic structure of populations of parasiticnematodes. Genetics 141, 1007–1014.
Brinck, G., 1966. Siphonaptera from small mammals in natural foci oftick-borne encephalitis virus in Sweden. Opuscula Entomol. 31, 156–170.
Burdelova, N.V., 1996. Flea fauna of some small mammals in Dzhungar-skyi Alatau. In: Burdelov, L.A. (Ed.), Proceeding of the Conference‘‘Ecological Aspects of Epidemiology and Epizootology of Plague andOther Dangerous Diseases”. Middle Asian Scientific Anti-PlagueInstitute, Almaty, Kazakhstan, pp. 119–120 (in Russian).
Burgman, M.A., Fox, J.C., 2003. Bias in species range estimates fromminimum convex polygons: implications for conservation and optionsfor improved planning. Anim. Conserv. 6, 19–28.
Elshanskaya, N.I., Popov, M.N., 1972. Zoologico-parasitological charac-teristics of the river Kenkeme valley (Central Yakutia). In: Kolosova,L.D., Lukyanova, I.V. (Eds.), Theriology. Nauka Publishing HouseSiberian Branch, Novosibirsk, USSR, pp. 368–372 (in Russian).
Emelyanova, N.D., Shtilmark, F.R., 1967. Fleas of insectivores, rodentsand lagomorphs of the central part of Western Sayan. Proc. IrkutskState Sci. Anti-Plague Inst. Siberia Far East 27, 241–253 (inRussian).
Esch, G.W., Bush, A.O., Aho, J.M., 1990. Parasite Communities: Patternsand Processes. Chapman and Hall, London.
Felsenstein, J., 1985. Phylogenies and the comparative method. Am. Nat.125, 1–15.
Fitzpatrick, B.M., Turelli, M., 2006. The geography of mammalianspeciation: mixed signals from phylogenies and range maps. Evolution60, 601–615.
Fortin, M.J., Keitt, T.H., Maurer, B.A., Taper, M.L., Kaufman, D.M.,Blackburn, T.M., 2005. Species’ geographic ranges and distributionallimits: pattern analysis and statistical issues. Oikos 108, 7–17.
Fox, L.R., Morrow, P.A., 1981. Specialization: species property or localphenomenon? Science 211, 887–893.
Garland, T. Jr., Harvey, P.H., Ives, A.R., 1992. Procedures for theanalysis of comparative data using phylogenetically independentcontrasts. Syst. Biol. 41, 18–32.
Garland Jr., T., Dickerman, A.W.C., Janis, M., Jones, J.A., 1993.Phylogenetic analysis of covariance by computer simulation. Syst.Biol. 42, 265–292.
Haitlinger, R., 1981. Structure of Arthropod communities occurring onMicrotus arvalis (Pall.) in various habitats. I. Faunistic differentiation,dominance structure, arthropod infestation intensiveness in relation tohabitats and host population dynamics. Polish Ecol. Studies 7, 271–292.
Harvey, P.H., Pagel, M.D., 1991. The Comparative Method in Evolu-tionary Biology. Oxford University Press, Oxford.
Koshkin, S.M., 1966. Data on the flea fauna in the Sovetskaya Gavan.Proc. Irkutsk State Sci. Anti-Plague Inst. Siberia Far East 26, 242–248(in Russian).
Kotti, B.K., Kovalevsky, I., 1995. Fleas parasitic on small mammals in thearea between the Amur and Bureya Rivers. Zool. Z. 74, 70–76 (inRussian).
Kozlovskaya, O.L., 1958. Flea (Aphaniptera) fauna of rodents from of theriver Ussury valley in the Khabarovks region. Proc. Irkutsk State Sci.Anti-Plague Inst. Siberia Far East 17, 109–116 (in Russian).
Krasnov, B.R., Khokhlova, I.S., Fielden, L.J., Burdelova, N.V., 2001a.The effect of air temperature and humidity on the survival of pre-imaginal stages of two flea species (Siphonaptera: Pulicidae). J. Med.Entomol. 38, 629–637.
Krasnov, B.R., Khokhlova, I.S., Fielden, L.J., Burdelova, N.V., 2001b.Development rates of two Xenopsylla flea species in relation to airtemperature and humidity. Med. Vet. Entomol. 15, 249–258.
Krasnov, B.R., Khokhlova, I.S., Shenbrot, G.I., 2002. The effect of hostdensity on ectoparasite distribution: an example with a desert rodentparasitized by fleas. Ecology 83, 164–175.
Krasnov, B.R., Khokhlova, I.S., Burdelova, N.V., Mirzoyan, N.S.,Degen, A.A., 2004a. Fitness consequences of density-dependent hostselection in ectoparasites: testing reproductive patterns predicted byisodar theory in fleas parasitizing rodents. J. Anim. Ecol 73, 815–820.
Krasnov, B.R., Shenbrot, G.I., Khokhlova, I.S., Degen, A.A., 2004b. Fleaspecies richness and parameters of host body, host geography and host‘‘milieu”. J. Anim. Ecol. 73, 1121–1128.
Krasnov, B.R., Shenbrot, G.I., Khokhlova, I.S., Poulin, R., 2004c.Relationships between parasite abundance and the taxonomic distanceamong a parasite’s host species: an example with fleas parasitic onsmall mammals. Int. J. Parasitol. 34, 1289–1297.
Krasnov, B.R., Poulin, R., Shenbrot, G.I., Mouillot, D., Khokhlova, I.S.,2005a. Host specificity and geographic range in haematophagousectoparasites. Oikos 108, 449–456.
Krasnov, B.R., Shenbrot, G.I., Mouillot, D., Khokhlova, I.S., Poulin, R.,2005b. Spatial variation in species diversity and composition of fleaassemblages in small mammalian hosts: geographical distance orfaunal similarity? J. Biogeogr. 32, 633–644.
Kucheruk, V.V., 1983. Mammal burrows: their structure, topology anduse. Fauna Ecol. Rodents 15, 5–54 (in Russian).
Kunitsky, V.N., Kunitskaya, N.T., 1962. Fleas of the southwesternAzerbaijan. Proc. Azerbajanian Anti-Plague Station 3, 156–169 (inRussian).

R. Poulin et al. / International Journal for Parasitology 38 (2008) 989–997 997
Labunets, N.F., 1967. Zoogeographic characteristics of the westernKhanday. Proc. Irkutsk State Sci. Anti-Plague Inst. Siberia Far East27, 231–240 (in Russian).
Lampo, M., Rangel, Y., Mata, A., 1998. Population genetic structure of athree-host tick, Amblyomma dissimile, in eastern Venezuela. J. Paras-itol. 84, 1137–1142.
Leonov, Y.A., 1958. Fleas parasitic on rodents of the southern part ofPrimorye (Far East). Proc. Irkutsk State Sci. Anti-Plague Inst. SiberiaFar East 17, 147–152 (in Russian).
Letov, G.S., Emelyanova, N.D., Letova, G.I., Sulimov, A.D., 1966.Rodents and their ectoparasites in the settlements of Tuva. Proc.Irkutsk State Sci. Anti-Plague Inst. Siberia Far East 26, 270–276 (inRussian).
MacDonald, G.M., 2001. Biogeography: An Introduction to Space, Timeand Life. Wiley, Chichester, New York.
Maddison, W.P., Maddison, D.R., 2005. Mesquite: A Modular System forEvolutionary Analysis. Version 1.06. Available from: <http://mesquiteproject.org>.
Marshall, A.G., 1981. The Ecology of Ectoparastic Insects. AcademicPress, London.
McCoy, K.D., Boulinier, T., Tirard, C., Michalakis, Y., 2003. Host-dependent genetic structure of parasite populations: differentialdispersal of seabird tick host races. Evolution 57, 288–296.
Metzger, M.E., Rust, M.K., 1997. Effect of temperature on cat flea(Siphonaptera: Pulicidae) development and overwintering. J. Med.Entomol. 34, 173–178.
Mikulin, M.A., 1958. Data on fleas of the Middle Asia and Kazakhstan. 5.Fleas of the Tarbagatai. Proc. Middle Asian Sci. Anti-Plague Inst. 4,227–240 (in Russian).
Mikulin, M.A., 1959a. Data on fleas of the Middle Asia and Kazakhstan.10. Fleas of the eastern Balkhash desert, Trans-Alakul desert andSungorian Gates. Proc. Middle Asian Sci. Anti-Plague Inst. 6, 205–220(in Russian).
Mikulin, M.A., 1959b. Data on fleas of the Middle Asia and Kazakhstan.8. Fleas of the Akmolinsk region. Proc. Middle Asian Sci. Anti-PlagueInst. 5, 237–245 (in Russian).
Morozkina, E.A., Lysenko, L.S., Kafarskaya, D.G., 1971. Fleas of the redmarmot (Marmota caudata) and other animals inhabiting the Gissarridge. Probl. Part. Danger. Infect. (Works Anti-Plague Establ.) 1,38–44.
Nazarova, I.V., 1981. Fleas of the Volga-Kama Region. Nauka PublishingHouse, Moscow, USSR (in Russian).
Paramonov, B.B., Emelyanova, N.D., Zarubina, V.N., Kontrimavitchus,V.L., 1966. Materials for the study of ectoparasites of rodents andshrews of the Kamchatka peninsula. Proc. Irkutsk State Sci. Anti-Plague Inst. Siberia Far East 26, 333–341 (in Russian).
Pauller, O.F., Elshanskaya, N.I., Shvetsova, I.V., 1966. Ecological andfaunistical review of mammalian and bird ectoparasites in thetularemia focus of the Selenga river delta. Proc. Irkutsk State Sci.Anti-Plague Inst. Siberia Far East 26, 322–332 (in Russian).
Popova, A.S., 1968. Flea fauna of the Moyynkum desert. In: Fenyuk,B.K. (Ed.), Rodents and their Ectoparasites. Saratov University Press,Saratov, USSR, pp. 402–406 (in Russian).
Poulin, R., 2005. Relative infection levels and taxonomic distances amongthe host species used by a parasite: insights into parasite specialization.Parasitology 130, 109–115.
Poulin, R., Krasnov, B.R., Shenbrot, G.I., Mouillot, D., Khokhlova, I.S.,2006. Evolution of host specificity in fleas: is it directional andirreversible? Int. J. Parasitol. 36, 185–191.
Ravkin, Y.S., Sapegina, V.F., 1990. Fleas of rodents of the southern taigaof Priangarje. Bull. Siberian Branch Acad. Sci. USSR, Ser. Biol. Sci. 3,63–68.
Reshetnikova, P.I., 1959. Flea fauna of the Kustanai region. Proc. MiddleAsian Sci. Anti-Plague Inst. 6, 261–265.
Rohde, K., 2002. Ecology and biogeography of marine parasites. Adv.Mar. Biol. 43, 1–86.
Rosenzweig, M.L., 1995. Species Diversity in Space and Time. CambridgeUniversity Press, Cambridge.
Sapegina, V.F., Ravkin, Y.S., Lukyanova, I.V., Sebeleva, G.G., 1980a.Fleas of the forest zone of western Siberia. In: Belyshev, B.F., Ravkin,Y.S. (Eds.), Problems of Zoogeography and Faunal History. NaukaPublishing House Siberian Branch, Novosibirsk, pp. 94–166 (inRussian).
Sapegina, V.F., Yudin, B.S., Dudareva, G.V., 1980b. Materials on thebiology of fleas of Taimyr and Gydanskyi peninsulae. In: Davydova,M.S. (Ed.), Parasitic Insects and Ticks of Siberia. Nauka PublishingHouse Siberian Branch, Novosibirsk, pp. 225–231 (in Russian).
Sapegina, V.F., Lukyanova, I.V., Fomin, B.N., 1981a. Fleas of smallmammals in northern foothills of Altai Mountains and Upper Ob riverregion. In: Maximov, A.A. (Ed.), Biological Problems of Natural Nidi.Nauka Publishing House Siberian Branch, Novosibirsk, pp. 167–176(in Russian).
Sapegina, V.F., Yudin, B.S., Yudina, S.A., 1981b. Fleas of smallmammals in the northern taiga of the southern Taimyr peninsula.Bull. Siberian Branch Acad. Sci. USSR, Ser. Biol. Sci. 1, 96–104.
Shwartz, E.A., Berendiaeva, E.L., Grebenyuk, R.V., 1958. Fleas ofrodents of the Frunze region. Proc. Middle Asian Sci. Anti-PlagueInst. 4, 255–261 (in Russian).
Silverman, J., Rust, M.K., 1983. Some abiotic factors affecting the survivalof the cat flea, Ctenocephalides felis (Siphonaptera: Pulicidae). Envi-ron. Entomol. 12, 490–495.
Sineltschikov, V.A., 1956. Study of flea fauna of the Pavlodar region.Proc. Middle Asian Sci. Anti-Plague Inst. 2, 147–153 (in Russian).
Stanko, M., Krasnov, B.R., Morand, S., 2006. Relationship between hostdensity and parasite distribution: Inferring regulating mechanismsfrom census data. J. Anim. Ecol. 75, 575–583.
Stanko, M., Miklisova, D., Gouy de Bellocq, J., Morand, S., 2002.Mammal density and patterns of ectoparasite species richness andabundance. Oecologia 131, 289–295.
Starikov, V.P., Sapegina, V.F., 1987. Ectoparasites of small mammals offorest-steppe Zauralie. In: Tcherepanov, A.I. (Ed.), Ecology andGeography of Arthropods in Siberia. Nauka Publishing HouseSiberian Branch, Novosibirsk, pp. 76–83 (in Russian).
Stockwell, D.R.B., Peters, D.P., 1999. The GARP modelling system:problems and solutions to automated spatial prediction. Int. J. Geogr.Inform. Syst. 13, 143–158.
Syrvacheva, N.G., 1964. Data on the flea fauna of Kabardino-BalkarianASSR. Proc. Armenian Anti-Plague Station 3, 389–405 (in Russian).
Thompson, J.N., 1999. The raw material for coevolution. Oikos 84, 5–16.Thompson, J.N., 2005. The Geographic Mosaic of Coevolution. Univer-
sity of Chicago Press, Chicago.Vasiliev, G.I., 1966. On ectoparasites and their hosts in relation to the
plague epizootic in Bajan-Khongor aimak (Mongolian People Repub-lic). Proc. Irkutsk State Sci. Anti-Plague Inst. Siberia Far East 26, 277–281 (in Russian).
Violovich, N.A., 1969. Landscape and geographic distribution of fleas. In:Maximov, A.A. (Ed.), Biological Regionalization of the NovosibirskRegion. Nauka Publishing House Siberian Branch, Novosibirsk, pp.211–221 (in Russian).
Walsberg, G.E., Wolf, B.O., 1995. Effects of solar radiation and windspeed on metabolic heat production by 2 mammals with contrastingcoat colours. J. Exp. Biol. 198, 1499–1507.
Whiting, M.F., Whiting, A.S., Hastriter, M.W., Dittmar, K., in press. Amolecular phylogeny of fleas (Insecta: Siphonaptera): origins and hostassociations. Cladistics.
Yudin, B.S., Krivosheev, V.G., Belyaev, V.G., 1976. Small Mammals ofthe Northern Far East. Nauka Publishing House Siberian Branch,Novosibirsk (in Russian).
Zagniborodova, E.N., 1960. Fauna and ecology of fleas on the westernTurmenistan. In: Fenyuk, B.K. (Ed.), Problems of Natural Nidi andEpizootology of Plague in Turkmenistan. Turkmenian Anti-PlagueStation and All-Union Scientific Anti-Plague Institution ‘‘Microb”,Saratov, USSR, pp. 320–334 (in Russian).
Zhovty, I.F., Kopylova, O.A., 1957. Fleas of the Daurian pika in theperiod of the increase of its density. Proc. Irkutsk State Sci. Anti-Plague Inst. Siberia Far East 15, 293–298 (in Russian).