
Facilitating User-System Interaction: The GAIA Interaction Agent
Upload
khangminh22Category
view
0download
0
ARTICLE
Received 20 Sep 2014 | Accepted 14 Dec 2014 | Published 21 Jan 2015
Interaction between emotional state and learningunderlies mood instabilityEran Eldar1,w & Yael Niv1,2
Intuitively, good and bad outcomes affect our emotional state, but whether the emotional
state feeds back onto the perception of outcomes remains unknown. Here, we use behaviour
and functional neuroimaging of human participants to investigate this bidirectional
interaction, by comparing the evaluation of slot machines played before and after an
emotion-impacting wheel-of-fortune draw. Results indicate that self-reported mood instability
is associated with a positive-feedback effect of emotional state on the perception of
outcomes. We then use theoretical simulations to demonstrate that such positive feedback
would result in mood destabilization. Taken together, our results suggest that the interaction
between emotional state and learning may play a significant role in the emergence of mood
instability.
DOI: 10.1038/ncomms7149
1 Princeton Neuroscience Institute, Princeton University, Princeton, New Jersey 08544, USA. 2 Psychology Department, Princeton University, Princeton,New Jersey 08544, USA. w Present address: Wellcome Trust Centre for Neuroimaging, UCL, London WC1N 3BG, UK. Correspondence and requests formaterials should be addressed to E.E. (email: [email protected]).
NATURE COMMUNICATIONS | 6:6149 | DOI: 10.1038/ncomms7149 | www.nature.com/naturecommunications 1
& 2015 Macmillan Publishers Limited. All rights reserved.

What makes you happier, finding a stray dime when in agood mood, or in the middle of a bad day? Outcomesmay be subjectively perceived as better when one is in
a good mood1. But unexpected outcomes can also change one’smood2,3. This would result in a positive feedback loop, in whichimproved outcomes improve mood, which then further improvesperceived outcomes. Conversely, good outcomes could devaluesubsequent outcomes due to diminishing subjective value (thinkabout finding a dime right after winning the lottery). This latterpossibility, which is consistent with prospect theory inbehavioural economics4,5, suggests, in contrast, negativefeedback dynamics. While negative feedback typically promotesstability, positive feedback constitutes a principal cause ofinstability throughout the natural world6–11. Accordingly, wehypothesized that individuals with a positive feedbackrelationship between emotional state and outcomes would tendto suffer from instability of mood, whereas negative feedbackwould be associated with emotionally stability.
We thus set forth to test the effect of a large unexpectedoutcome on emotional state and on the valuation of subsequentoutcomes. Fifty-six human participants played a game in whichthey chose between pairs of slot machines that differed inprobability of dispensing small (25 cent) rewards, learning bytrial-and-error which machine is more rewarding (Fig. 1a). Then,to induce a change in emotional state, we held a wheel of fortune(WoF) draw in which participants either won or lost a relativelylarge sum ($7) at chance. Following this, participants played twomore slot machine games, each with a new set of slot machines. Ifan unexpected outcome induces an emotional state, which thenfeeds back positively onto the perception of outcomes, winning
the WoF draw should make participants happier, and, inaddition, they should value rewards received after the draw morehighly than those received before the draw. Critically, for apositive feedback loop to ensue, subjective valuations mustincrease above and beyond any shift in reference point that maydiminish valuations of subsequent rewards4. Similarly,participants who lose the draw should become less happy andvalue subsequent rewards less highly.
Our results show that an outcome that affects emotional statealso biases the valuation of subsequent outcomes, but only inparticipants who report a tendency to mood instability. Acomputational model suggests that such a bidirectional interac-tion between perceived outcomes and emotional state may, infact, generate mood instability.
Results and DiscussionThe effect of wheel of fortune outcomes on emotional state. Toevaluate emotional state, at 3 points during each slot-machinegame we asked participants to rate how they currently feel. Thedata indicated that the result of the WoF draw significantlyaffected participants’ feeling during the subsequent slot-machinegame (mean mood change: þ 0.38±0.24 for participants whowon the WoF draw versus � 0.97±0.16 for participants who lostthe WoF draw, n¼ 56, t54¼ 4.6, Po10� 5, t test), though bygame 3 this effect was no longer significant (n¼ 56, t54¼ 1.7,P¼ 0.09, t test, for difference between the third and first games;Fig. 1b). In addition, the WoF draw resulted in an increase inpupil diameter, indicating increased emotional arousal12 (meandiameter change across both Win and Lose groups:
–2
–1
0
1
2
Won WoF Lost WoF
1 2 3 GameGame
1 2 3
Won $7 Lost $7
–2
–1
0
1
2High HPS Low HPS
Won WoF Lost WoF
1 12 2 1 12 2
Game 1
20%
40%
60%
Game 2
20%
40%
60%
Game 3
20%
Wheel of Fortune draw
Win
$7
Lose
$7
40%
60%
Test game
Sel
f-re
port
ed fe
elin
g
Sel
f-re
port
ed fe
elin
g
Figure 1 | Experimental design and emotional response. (a) The experiment included three slot-machine games, a wheel of fortune (WoF) draw, and a
test game. Half of the participants won $7 in the WoF draw and half lost $7. In the test phase, participants were asked to choose between slot machines
that they had learned about before and after the draw. Reward obtained during the test game was not revealed until the end of the experiment so as to test
previously learned valuations of the slot machines. (b) Mean self-reported feeling during the three slot-machine games, on a scale of 5 (completely happy)
to � 5 (completely unhappy). Winning the WoF draw improved mood, whereas losing the draw had the opposite effect (n¼ 56, t54¼4.6, Po10� 5, t test).
(c) Mean self-reported feeling during the first and second slot-machine games, as function of HPS score. Participants were divided into equal-sized groups
using a median split on HPS score. Participants with higher HPS scores were more strongly affected by the WoF draw (n¼ 56, F1,52¼8.5, P¼0.005,
ANCOVA HPS�WoF interaction). Error bars, s.e.m; n¼ 56 participants, including data from both behavioural and fMRI experiments.
ARTICLE NATURE COMMUNICATIONS | DOI: 10.1038/ncomms7149
2 NATURE COMMUNICATIONS | 6:6149 | DOI: 10.1038/ncomms7149 | www.nature.com/naturecommunications
& 2015 Macmillan Publishers Limited. All rights reserved.

þ 4.0%±1.0%, n¼ 45, t44¼ 4.1, Po10� 4, t test; there were nosignificant differences between the groups or between game 2 andgame 3). We therefore focused our subsequent analyses on thefirst and second game, that is, the games immediately before andimmediately after the WoF draw.
We next examined whether the degree to which the WoFoutcome affected feeling was correlated with susceptibility tomood instability. To this end, participants completed theInternational Personality Item Pool13 version of the HypomanicPersonality Scale14 (HPS)—a self-report measure that has beenshown to correlate with frequency of good and bad moods15, aswell as with risk of developing bipolar disorder16. A higher HPSscore (indicating less stable mood) was associated with a greaterchange in feeling following the WoF draw (Fig. 1c; n¼ 56,F1,52¼ 8.5, P¼ 0.005, ANCOVA HPS�WoF interaction), butaccounting for differences in baseline mood level (that is, beforethe WoF draw) weakened this result to trend level (n¼ 56,F1,52¼ 3.6, P¼ 0.06, ANCOVA HPS�WoF interaction).
The effect of the WoF on perception of subsequent outcomes.To examine whether the WoF draw affected not only participants’emotional state, but also their subsequent valuations, in a finaltest game participants chose between slot machines that hadappeared before and after the WoF draw, and had objectivelysimilar reward probabilities (Fig. 1a). As predicted, participantswith high HPS scores who won the draw favoured slot machinesthat they had encountered after the draw, whereas participantswith high HPS scores who lost the draw favoured slot machinesencountered before the draw. In contrast, participants with low
HPS scores were not biased by the outcome of the draw. Thisresult was true both for participants who only performed thebehavioural experiment (Fig. 2a; n¼ 30, F1,26¼ 4.1, P¼ 0.05,ANCOVA HPS�WoF interaction), and for a separate group ofparticipants who performed the experiment in a MagneticResonance Imaging (MRI) scanner (Fig. 2b; n¼ 26, F1,22¼ 4.2,P¼ 0.05, ANCOVA HPS�WoF interaction; see SupplementaryFig. 1 for the combined data). Furthermore, this result could notbe explained by an effect of the WoF outcome on the balancebetween exploration and exploitation (see Methods for details).Interestingly, the WoF draw did not bias participants’ explicitvaluations of how likely each machine was to yield reward(n¼ 56, F1,52¼ 0.02, P¼ 0.88, ANCOVA HPS�WoF interac-tion). This is consistent with our hypothesis that the behaviouralbias reflected biased perception of the subjective value of reward,not the frequency of reward.
If biased test-game choices indeed resulted from biasedperception of reward, we should expect to see a correspondingbias in neural responses to rewards in the striatum—a brain areawhere blood-oxygen-level dependent (BOLD) signals have beenshown to reflect a reward prediction error signal that driveslearning and guides future choices17–25 (Fig. 2c). To test for this,we compared striatal BOLD responses with slot machine rewardsbefore and after the WoF draw. Higher HPS score was associatedwith stronger BOLD responses to rewards in the second game forparticipants who won the WoF draw, and weaker responses torewards for participants who lost the draw (Fig. 2d; n¼ 25,F1,21¼ 10.1, Po0.005, ANCOVA HPS�WoF interaction). Thisinteraction between HPS score and WoF outcomes was alsosignificant (n¼ 25, t1,21¼ 2.8, Po0.05, robust regression) under a
–0.5 –0.5
0
0.5High HPS Low HPS
Tes
t gam
e ch
oice
s
Won WoF Lost Wof
0
0.5High HPS Low HPS
Tes
t gam
e ch
oice
s
Won WoF Lost Wof
–1.5
–1.0
–0.5
0
0.5
1.0
r = –0.45
r = 0.69
1.5 2.5 3.5
Str
iata
l res
pons
e to
rew
ard
afte
r m
inus
bef
ore
WoF
(t v
alue
)
Hypomanic personality scale
Won WoF Lost WoFY=16
Z=–6
Y=8
Pos
t-W
oFm
achi
nes
Pre
-WoF
mac
hine
s
Pos
t-W
oFm
achi
nes
Pre
-WoF
mac
hine
s
Figure 2 | Test-game slot-machine choices and striatal response to reward, as a function of HPS score and WoF outcome. (a,b) Difference between
percent choices of post-WoF slot machines and pre-WoF slot machines, in the behavioural experiment (a, n¼ 30 participants, F1,26¼4.1, P¼0.05,
ANCOVA HPS�WoF interaction) and in the fMRI experiment (b, n¼ 26, F1,22¼4.2, P¼0.05, ANCOVA HPS�WoF interaction). (c) A striatal region of
interest was defined at the group level as those voxels within the anatomical boundaries of the striatum that responded more to reward than to no-reward
outcomes throughout the experiment (Po0.0001 uncorrected, GLM). Y and Z indicate MNI coordinates. (d) Striatal response to reward in game 2 (which
followed the WoF draw) compared with game 1, as a function of HPS (GLM), divided according to the outcome of the WoF draw (total n¼ 25). HPS scores
are on a scale of 1 (least hypomanic) to 5 (most hypomanic). The difference between the Win and Lose groups (F1,21¼ 10.1, Po0.005, ANCOVA
HPS�WoF interaction) remained statistically significant when tested using robust regression (t1,21¼ 2.8, Po0.05), indicating that it could not be explained
by the effect of outliers.
NATURE COMMUNICATIONS | DOI: 10.1038/ncomms7149 ARTICLE
NATURE COMMUNICATIONS | 6:6149 | DOI: 10.1038/ncomms7149 | www.nature.com/naturecommunications 3
& 2015 Macmillan Publishers Limited. All rights reserved.
more conservative analysis that accounts for potentialoutliers26,27, as well as when controlling for differences in thebalance between exploration and exploitation (see methods fordetails). Moreover, a whole-brain analysis revealed a similar biasin the BOLD response to reward in reward-sensitive areas outsideof the striatum, and in particular in the ventromedial prefrontalcortex (Supplementary Fig. 2). However, there was no such biasin the BOLD response to the appearance of task stimuli (n¼ 25,P40.05, ANCOVA HPS�WoF interaction; see Methods). Thus,the post-WoF draw bias was not due to a general effect ofemotional state on BOLD responses (for example, due to globaleffects on arousal or attention), but rather was specific to thevaluation of reward.
In sum, our two experiments showed that in participantswhose mood tends to be less stable, a large unexpected outcomeaffected emotional state, and biased reward perception in thesame direction. In contrast, participants with more stable moodshowed no such positive feedback interaction between unex-pected outcomes (and their associated mood) and valuation offuture rewards.
A model of the interaction between mood and learning. Wenext formalized the feedback interaction between emotional stateand reward perception that was evident in our experiments in areinforcement-learning model28 in which positive surprises
(prediction errors) improve mood and negative surprisesworsen mood (see Methods for model equations). In line withprevious work29,30, ‘mood’ was formalized as a runningaverage of recent outcomes. We note that this implementationallows mood both to change gradually due to the aggregatedeffect of multiple outcomes as is considered typical for mood, ormore rapidly, in response to a single highly significant outcome(as is more characteristic of emotions31). Critically, in our model,the effect of mood on subjective perception of reward wascontrolled by a parameter f. If f¼ 1 mood does not bias rewardperception. With f41, mood exerts positive feedback. That is,reward is perceived as larger in a good mood and as smaller in abad mood. Conversely, 0ofo1 corresponds to negative feedback,with reward perceived as smaller in a good mood and as larger ina bad mood.
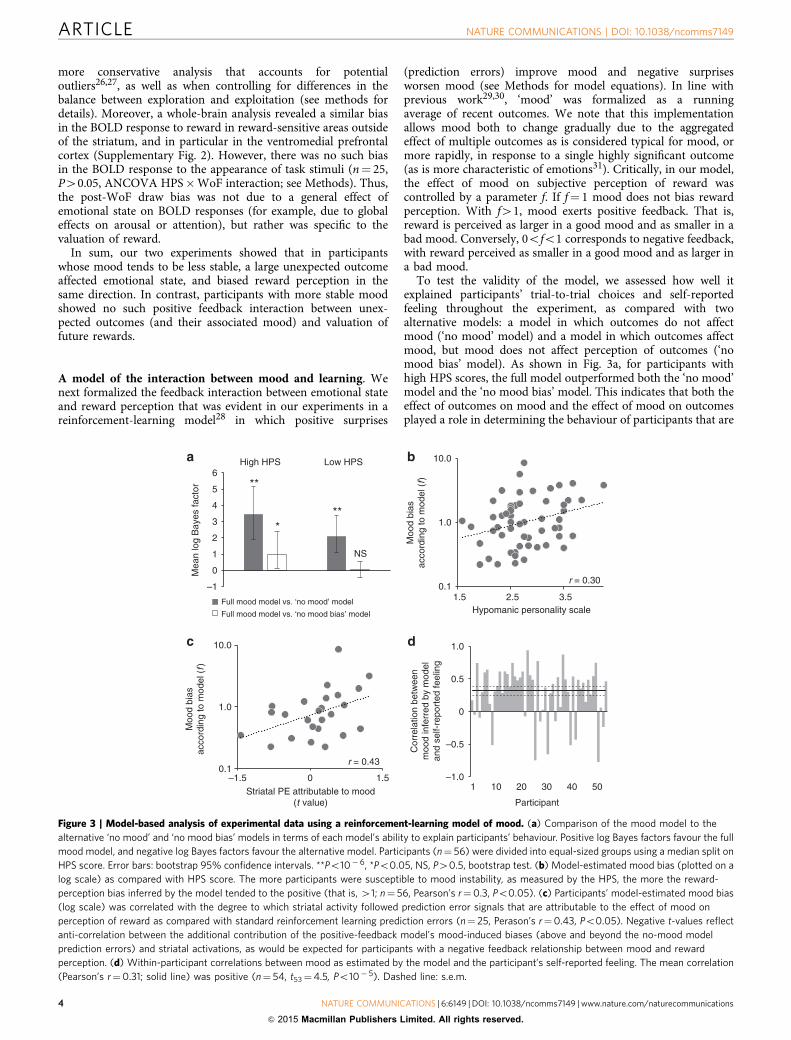
To test the validity of the model, we assessed how well itexplained participants’ trial-to-trial choices and self-reportedfeeling throughout the experiment, as compared with twoalternative models: a model in which outcomes do not affectmood (‘no mood’ model) and a model in which outcomes affectmood, but mood does not affect perception of outcomes (‘nomood bias’ model). As shown in Fig. 3a, for participants withhigh HPS scores, the full model outperformed both the ‘no mood’model and the ‘no mood bias’ model. This indicates that both theeffect of outcomes on mood and the effect of mood on outcomesplayed a role in determining the behaviour of participants that are
–1
0
1
2
3
4
5
6High HPS Low HPS
Mea
n lo
g B
ayes
fact
or
Full mood model vs. ‘no mood’ model
Full mood model vs. ‘no mood bias’ model
**
***
NS
0.1
1.0
10.0
1.5 2.5 3.5Hypomanic personality scale
r = 0.30
0.1
1.0
10.0
–1.5 0 1.5
Moo
d bi
asac
cord
ing
to m
odel
(f)
Striatal PE attributable to mood(t value)
r = 0.43
–1.0
–0.5
0
0.5
1.0
1 10 20 30 40 50
Cor
rela
tion
betw
een
moo
d in
ferr
ed b
y m
odel
and
self-
repo
rted
feel
ing
Participant
Moo
d bi
asac
cord
ing
to m
odel
(f)
Figure 3 | Model-based analysis of experimental data using a reinforcement-learning model of mood. (a) Comparison of the mood model to the
alternative ‘no mood’ and ‘no mood bias’ models in terms of each model’s ability to explain participants’ behaviour. Positive log Bayes factors favour the full
mood model, and negative log Bayes factors favour the alternative model. Participants (n¼ 56) were divided into equal-sized groups using a median split on
HPS score. Error bars: bootstrap 95% confidence intervals. **Po10�6, *Po0.05, NS, P40.5, bootstrap test. (b) Model-estimated mood bias (plotted on a
log scale) as compared with HPS score. The more participants were susceptible to mood instability, as measured by the HPS, the more the reward-
perception bias inferred by the model tended to the positive (that is, 41; n¼ 56, Pearson’s r¼0.3, Po0.05). (c) Participants’ model-estimated mood bias
(log scale) was correlated with the degree to which striatal activity followed prediction error signals that are attributable to the effect of mood on
perception of reward as compared with standard reinforcement learning prediction errors (n¼ 25, Perason’s r¼0.43, Po0.05). Negative t-values reflect
anti-correlation between the additional contribution of the positive-feedback model’s mood-induced biases (above and beyond the no-mood model
prediction errors) and striatal activations, as would be expected for participants with a negative feedback relationship between mood and reward
perception. (d) Within-participant correlations between mood as estimated by the model and the participant’s self-reported feeling. The mean correlation
(Pearson’s r¼0.31; solid line) was positive (n¼ 54, t53¼4.5, Po10� 5). Dashed line: s.e.m.
ARTICLE NATURE COMMUNICATIONS | DOI: 10.1038/ncomms7149
4 NATURE COMMUNICATIONS | 6:6149 | DOI: 10.1038/ncomms7149 | www.nature.com/naturecommunications
& 2015 Macmillan Publishers Limited. All rights reserved.

susceptible to mood instability. In contrast, in participants withlow HPS scores, the modelling results indicated that outcomesaffected mood (that is, the mood model outperformed the ‘nomood’ model), but mood not did not significantly affectperception of outcomes (that is, the ‘no mood bias’ model andthe full mood model accounted for participants’ behaviourequally well).
Next, to determine individual effects of mood on rewardperception, we established the value of f for each participantseparately by fitting the mood model to the participant’s trial-to-trial choices. In line with our hypothesis, a stronger mood bias(that is, higher f) was correlated with self-reported moodinstability as measured by the HPS questionnaire (n¼ 56,Pearson’s r¼ 0.30, Po0.05; Fig. 3b). We then tested whetherparticipants’ striatal prediction error signals were better predictedby a positive-feedback mood model than by the ‘no mood’ and‘no mood bias’ models (both of which make the same predictionsconcerning striatal activity). To do this, for each participant, wegenerated two sequences of reward prediction error signals: onefrom the ‘no mood’ model and one from a mood model withpositive feedback (that is, with f¼ 2.1; see Methods). We thenregressed the fMRI data against a design that included the ‘nomood’ model prediction errors, and the difference between thepositive-feedback mood model prediction errors and the ‘nomood’ model prediction errors. The degree to which BOLDactivity correlates with this difference reflects the degree to whichthe positive-feedback mood model accounted for additionalvariance in the striatal response to rewards, above and beyond theno-mood model32. The results showed that the degree to whichthe additional mood-model component accounted for striatalactivity was correlated with participants’ inferred mood bias(n¼ 25, Pearson’s r¼ 0.43, Po0.05; Fig. 3c). Specifically, striatalprediction errors reflected the additional component predicted bythe positive-feedback mood model in participants whosebehaviour was consistent with a strong positive-feedback bias(that is, f in upper quartile (41.3); mean GLM t-value0.69±0.15), but not in participants whose behaviour indicateda weak or negative-feedback bias (fo1.3; mean GLM t-value� 0.04±0.14).In addition, the mood that the model inferred from
participants’ choices and outcomes accorded with participants’self-reported feeling throughout the experiment (mean Pearson’sr¼ 0.31, n¼ 54, t53¼ 4.5, Po10� 5, t test; Fig. 3d). This matchbetween the model-inferred mood and participants’ feeling heldeven when game 2, which was characterized by a relativelypredictable change in feeling, was excluded from the analysis(mean Pearson’s r¼ 0.27, n¼ 52, t51¼ 2.1, Po0.05, t test). Themodel-inferred mood also predicted BOLD activity in frontal andtemporal brain regions previously shown to distinguish betweenpositive and negative mood33 (mean GLM t-value 0.18±0.06,t25¼ 3.0, Po0.01, t test).
The theoretical consequence for mood instability. Finally, weuse the model to ask what would be the long-term results of such apositive feedback interaction between mood and valuation. Giventhat positive feedback is destabilizing, we specifically tested for thestability of mood over time. To isolate the effects of this feedbackrelationship from environmentally induced instability, we simu-lated repeated encounters with an outcome of value 10. Simulationresults showed that with fr1 the true reward value of 10 waslearned and eventually predicted, as mood did not bias perceptionof reward (Fig. 4a). However, when mood biased perception ofreward so as to exert positive feedback (fZ1.2), good mood led tothe subjective perception, and thus learning, of a higher rewardvalue, eventually leading to disappointment once mood returned to
baseline, which led to subsequent bad mood. Similarly, bad moodresulted in learning of a lower reward value that in turn led topositive surprises and good mood. Thus, mood and learned valueoscillated, failing to converge to the true reward value (Fig. 4b).While these simulations were conducted with a particular set ofparameters (r¼ 10, Zv¼ 0.1, Zh¼ 0.1), a dynamical system analysisof the model showed that oscillations are guaranteed to emerge aslong as there are some prediction errors (that is, vinitar), and thebiasing effect of mood is strong enough relative to the magnitude
of the outcome and update rates (specifically, when f4e1r 1þ Zv
Zh
� �;
see Methods). Moreover, similar dynamics emerged in simulationsconducted with parameters that were inferred from the experi-mental data (Supplementary Fig. 3), with different initial condi-tions (Supplementary Fig. 4), with multiple states and randomoutcomes (Supplementary Fig. 5), and with variants of the modelin which mood was not bound to be between � 1 and 1, or inwhich the effect of mood on reward perception was additiveinstead of multiplicative (Supplementary Fig. 6). It should benoted, however, that fully predicted outcomes (that is, situations inwhich vinit¼ r) are not sufficient for oscillations to emerge. Rather,unexpected changes in outcomes are necessary, with the resultingprediction errors acting as triggers that lead to the emergence ofmood instability (Supplementary Fig. 7), in agreement withobservational studies of bipolar patients34,35.
Thus, mood instability emerges in a wide class of models inwhich unexpected outcomes affect emotional state and emotionalstate affects perception of outcomes, creating a positive feedbackloop. It is important to note, however, that while this class ofmodels provides a parsimonious explanation for our experimentaldata, there could be alternative explanations that do not involvethe effect of mood. In particular, the effect of winning the WoFdraw could, in principle, be explained by an accelerating (that is,convex) utility function in the domain of gains. This explanation,however, proposes a utility function that is counterintuitive andcontradictory to a large body of behavioural economic research36,and it leaves open the question of why only high-HPSparticipants would have a convex utility function. Nevertheless,to establish that mood does indeed destabilize as a result of theprocess that our experimental and theoretical findings suggest,the effect of outcomes on mood would have to be assessed inresponse to multiple, successive mood-affecting outcomes.Finally, we note that it is not necessary for mood itself to affect
Expected valuePrediction errorMood
Expected valuePrediction errorMood
–5
0
5
10
15
–5
0
5
10
15
0 100 200 300Iteration
0 100 200 300Iteration
f =1.2f =1
Figure 4 | Simulations of the interaction between learning and mood
using a reinforcement-learning model. The model was repeatedly exposed
to the same outcome of r¼ 10 for 500 iterations for each setting of f, the
parameter mediating the effect of mood on perception of reward. (a) With
f¼ 1 (no mood bias), the expected value converged quickly to the true value
and mood remained stable. (b) With f¼ 1.2 (perceived reward positively
biased by mood), learned value as well as mood oscillated and did not
converge.
NATURE COMMUNICATIONS | DOI: 10.1038/ncomms7149 ARTICLE
NATURE COMMUNICATIONS | 6:6149 | DOI: 10.1038/ncomms7149 | www.nature.com/naturecommunications 5
& 2015 Macmillan Publishers Limited. All rights reserved.

perception of reward for our theory to explain mood instability.Instead, unexpected outcomes can affect mood as well as biasperception of subsequent outcomes. Thus, perceived outcomescould form the same unstable positive-feedback dynamicsillustrated in our model, and these dynamics could lead tomood instability due to the separate effect of outcomes on mood.
We thus propose our model as a candidate framework forstudying disorders of mood instability. As shown above,the model can account for a cyclical pattern of mood change,as observed in psychiatric conditions such as cyclothymiaand bipolar disorder37. In real life, mood cycles typicallyunfold over months38–41, making it difficult to study the fulloscillatory dynamics in a laboratory experiment. However,our model provides a tool for simulating such cycles based oneasily attainable information regarding the strength of amood-valuation bias in a specific individual. This can be usedto generate predictions concerning future mood dynamics, forinstance, the frequency of mood cycles (for example, in the case ofthe rapid cycling variant37), or the relationship between thetiming and duration of different treatment options andtheir efficacy42. In any case, targeted, longitudinal studies ofpatients would be necessary to determine whether this interactionbetween mood and learning indeed constitutes theneuro-computational process that underlies cyclical fluctuationsof mood in psychiatric conditions.
MethodsParticipants. Thirty-one participants (mean age 21.4, age range 18–33, 25 females)performed the behavioural experiment and 33 different participants (mean age20.6, age range 18–26, 21 females) performed the fMRI experiment. Sample sizeswere determined in line with our previous experience studying across-participantcorrelations of behaviour, fMRI and personality measures43. Specifically, 30participants, divided into two groups of 15, allow detection with a confidence levelof 95% of a difference between a positive and a negative correlation that each equalr¼±0.38 or higher. Participants were from the Princeton University area andgave written informed consent before taking part in the study, which was approvedby the university’s institutional review board. Participants in the behaviouralexperiment received monetary compensation according to their performance onthe task ($14.25-$32.25, mean $23.21). fMRI participants received monetarycompensation for their time ($30), as well as a bonus according to theirperformance ($14.75-$32, mean $23.4).
Stimuli. All visual stimuli were designed in the processing programming envir-onment44. To minimize luminance-related changes in pupil diameter, stimuli weremade isoluminant with the background, to best approximation, by scaling allcolours so as to equate the mean estimated perceived luminance with thebackground. Perceived luminance was estimated by conversion of each pixel’s RGBvalues from standard RGB colour space to the CIE 1976 L*a*b* space45. Soundeffects were obtained from www.freesound.org.
Slot-machine games. Participants played three slot machine games, each invol-ving three different slot machines (nine machines overall). Each machine had adistinct colour and a distinct pattern depicted on it, and some fixed probability ofyielding reward when chosen. Unbeknownst to participants, within each gamethese probabilities were always 0.2, 0.4 and 0.6. On each trial, participants chosebetween two machines that appeared on the screen, and were either rewarded with25 cents or not rewarded, according to the probability associated with the chosenmachine. Participants had 3 s to make their choice. Participants’ choices werefollowed by a short (3.1 s) animation sequence coupled with appropriate soundeffects, in which the handle of the chosen machine moved and its wheels rolleduntil the outcome was revealed. A ‘win’ outcome was indicated by the appearanceof $ signs coupled with a metal ‘ping’ sound, whereas a ‘no win’ outcome wasindicated by the appearance of X signs. The outcome stayed on the screen for 2.5 s.Inter-trial intervals were varied randomly (uniformly) between 7 and 9 s. Eachgame consisted of 42 trials. After the 7th, 21st and 35th trials, participantsresponded to the question ‘how do you feel right now?’, by choosing one out of aseries of figures whose face varied from unhappy to happy (the self-assessmentmanikin46). After the 14th, 28th and 42nd trials, participants were asked toestimate how likely each of the three slot machines in the current game was to yieldreward, between 0 and 100%.
Wheel of fortune. To generate a large prediction error aimed at affecting parti-cipants’ emotional state, we held a single WoF draw between the first and second
slot-machine games. The possible outcomes, a win or loss of $0-$8, were depictedon the wheel, which rolled, slowing down gradually, for 42 s. When the wheelstopped, an indicator above it pointed to the outcome of the draw. The rolling ofthe wheel and the outcome were accompanied by appropriate sound effects.Unbeknownst to participants, the draw was set up so that half of the participantswon $7 and half lost $7. Participants were notified in advance that they would bepaid according to their earnings in the whole experiment. There was no extracompensation to participants who lost in the WoF draw, so this loss was a real one.
Test slot-machine game. To compare between the valuations that participantsformed in different slot-machine games, and specifically, whether the change inemotional state due to the WoF draw affected their valuations, we had participantsplay a final test game that involved all nine machines previously encountered. Thistime, however, the outcomes of choices were not shown, so that participants had torely on what they had learned in previous games. To encourage participants to tryto choose the most rewarding machines, participants were informed that ‘wins’would be tallied towards their overall earnings, and that each slot machine ‘win’would be rewarded with double the regular amount (that is, 50 cents). We wereparticularly interested in choices between slot machines that had similar rewardprobabilities but were encountered in different games. Thus, the test game includedtwo trials with each such pair of machines (18 trials total). Eighteen additionaltrials involved pairs of machines with different reward probabilities. Of these lattertrials, performance on those trials that involved one of the machines that had thehighest reward probability (which we expected participants to recognize if theyperformed the task well) was examined to verify that participants were attentiveand that they understood the task correctly. Data from one participant in thebehavioural study and seven participants in the fMRI study, who did not performabove chance in the test game (P40.1, one-tailed binomial test) were excludedfrom further analysis.
Questionnaires. All participants filled out the international personality itempool13 (IPIP) version of the HPS14. To make sure that the results reflected neitheran effect of the WoF draw on responses to the HPS questionnaire, nor the reverseeffect, of the HPS questionnaire on performance in the experiment, thequestionnaire was administered after the WoF draw in the behavioural experiment,but before the beginning of the experiment in the fMRI experiment. In addition, tomitigate a possible recency effect on choices in the final test game, we separated intime the second and third games, as well as the third and test games, by havingparticipants fill out additional questionnaires, whose results were not analysed.These included the BIS/BAS scales47, and the IPIP version of the NEO PersonalityInventory48. Finally, to verify that the results involving HPS scores did not simplyreflect the association between HPS and extraversion15, the results of all correlationand covariance analyses involving HPS scores were replicated after regressing outextraversion scores from HPS scores.
Pupillometry. A desk-mounted SMI RED 120Hz eye-tracker (SensoMotoricInstruments, MA) was used to measure participants’ left and right pupil diametersat a rate of 60 samples per second while they were performing the behavioural taskwith their head fixed on a chinrest. An SMI iViewX MRI-LR unit was used tomeasure pupil diameter during the functional MRI experiment. Pupil diameter datawere processed to detect and remove blinks and other artefacts. For each trial,baseline pupil diameter was computed as the average diameter over a period of 1 sbefore the beginning of the trial (at the end of the inter-trial interval, at which pointpupil dilation from the previous trial should have subsided). Baseline pupil dia-meter measurements in which more than half of the samples contained artefactswere considered invalid and excluded from the analysis. Only participants with atleast 40 valid trials were included in the pupil diameter analysis (n¼ 25 for thebehavioural experiment, n¼ 20 for the imaging experiment).
fMRI data acquisition and preprocessing. Functional (EPI sequence; 37 slicescovering whole cerebrum; resolution 3� 3� 3mm3 with no gap; repetition time(TR) 2.0 s; echo time (TE) 28ms; flip angle 71�) and anatomical (MPRAGEsequence; 256 matrix; 0.9� 0.9� 0.9mm3 resolution; TR 2.3 s; TE 3.08ms; flipangle 9�) images were acquired using a 3T Skyra MRI scanner (Siemens, Erlangen,Germany). Data were processed using MATLAB and SPM8 (Wellcome TrustCentre for Neuroimaging, UCL). Functional data from one participant containedunusually extensive dropout artefacts in much of the brain including the striatumand were thus excluded from further analysis. Functional data were motion cor-rected prospectively during scanning and retrospectively using SPM. Low-fre-quency drifts were removed with a temporal high-pass filter (cutoff of 0.0078Hz).The data were spatially smoothed using an 8-mm FWHM Gaussian kernel. Imageswere normalized to Montreal Neurological Institute (MNI) coordinates. MNIcoordinates provided by the MNI space utility (http://www.ihb.spb.ru/Bpet_lab/MSU/MSUMain.html), which correspond to the Caudate and Putamen labels inthe Talairach atlas (www.talairach.org), were used to restrict analysis to grey matterwithin the striatum.
ARTICLE NATURE COMMUNICATIONS | DOI: 10.1038/ncomms7149
6 NATURE COMMUNICATIONS | 6:6149 | DOI: 10.1038/ncomms7149 | www.nature.com/naturecommunications
& 2015 Macmillan Publishers Limited. All rights reserved.

General linear model. We used a general linear model (GLM) to examine striatalresponse to reward in the different slot-machine games. The model includedregressors indicating stimulus onset, response onset, ‘reward’ outcome and ‘noreward’ outcome, separately for each slot-machine game, as well as stimulus onsetand response onset regressors for the rating trials. These regressors were convolvedwith SPM’s default hemodynamic response function. In addition, regressors of nointerest reflecting head movement parameters were included in the model. As wewere interested in examining activity in reward-sensitive areas of the striatum,analysis was restricted to a functional region of interest (fROI) that included allgrey-matter voxels within the striatum that responded more to ‘reward’ outcomesthan to ‘no reward’ outcomes throughout the experiment, according to a group-level analysis (Po0.0001 uncorrected; similar results were obtained defining thefROI with FWE correction for multiple comparisons within the striatum(Po0.05)). We then examined activity within this striatal fROI in response to‘reward’ outcomes in the second game (which came immediately after the WoFdraw) compared with the first game (that occurred immediately before the WoFdraw). The resulting t-values were averaged across voxels within the fROI, andregressed against HPS score, WoF outcome, and the interaction between the two,using both the standard ANCOVA analysis and a more conservative robustregression analysis26,27, which accounts for potential outliers by assuming non-Gaussian noise. As a control, to test whether the WoF draw generally biased neuralresponse to the task, we compared response to onset of the stimuli in the secondgame compared with the first game, in voxels that were responsive to stimulusonset according to a group-level analysis (Po0.0001 uncorrected). This latteranalysis was conducted on the whole brain, and then repeated in each cortical lobeseparately, as well as in the striatum, to test for a more localized bias in the BOLDresponse to the task.
Reinforcement learning model. In standard reinforcement learning, the expectedvalue (v) of a stimulus is updated according to a reward prediction error (d), whichreflects the difference between the actual reward obtained (r) and the expectedvalue (i.e., d¼ r–v). This simple framework has proved successful in explaining awide range of behavioural and neural data, including, most importantly, the activityof the midbrain dopamine system, which is thought to signal reward predictionerror49,50. To account for effects of mood on valuation, we modified the model tocompute prediction errors with respect to perceived reward rather than actualreward:
d ¼ rperceived � v ð1Þwhere perceived reward (rperceived) was different from actual reward (r) in that itreflected the biasing effect of mood (m):
rperceived ¼ r � f m: ð2ÞHere, m indicates good (0omo1) or bad (� 1omo0) mood, and f is a positiveconstant that indicates the direction and extent of the mood bias. If f¼ 1 mooddoes not bias the perception of reward. With f41, mood exerts positive feedback asreward is perceived as larger in a good mood and as smaller in a bad mood.Conversely, 0ofo1 corresponds to negative feedback, as reward is perceived assmaller in a good mood and as larger in a bad mood. The biasing effect of mood onreward perception was modelled as a multiplicative effect so as to maintain scaleinvariance51. We note, however, that this choice was not essential, as the sameresults were obtained by modelling the effect of mood on reward perception as anadditive effect.
To model the effects of unexpected outcomes on mood3, we assumed that moodreflects recent prediction-error history (h), tracked using a step-size parameter Zh,
h ¼ hþ Zh d� hð Þ ð3Þand constrained to the range of � 1 to 1 by a sigmoid function:
m ¼ tanh h ð4ÞApart from these modifications, we assumed traditional reinforcement learning,that is, expected values were updated after every trial according to the rewardprediction error with a step size (learning rate) parameter Zv:
v ¼ vþ Zvd: ð5ÞThe model was repeatedly exposed to an outcome of r¼ 10 for 500 iterations.Expected value (v) and mood (m) were initialized as 0. The simulation was repeatedwith different values of the parameter f, which controls the degree to which moodbiases perception of reward.
Model-based behaviour analysis. We used the mood model described above tocharacterize each participant’s trial-to-trial choices. In the model, a Softmaxfunction was used to derive choice probabilities from the expected values of theavailable slot machines, so that the probability P(ct¼ c, t) of choosing slot machinec at trial t was proportional to ebvc;t . The inverse temperature parameter b con-trolled the exclusivity with which choices were directed towards higher-valuedoptions. Thus, the mood model included four free parameters: f, Zh, Zv and b.
We estimated the parameters of the model for each participant individually bycomputing a weighted mean of 1,000,000 randomly sampled parameterizations(importance sampling52), in which each sample was weighted by the likelihood that
it assigned to the observed sequence of choices,Q
t Pðct ; tÞ. Values vc,t werecomputed using the models and the preceding sequence of actual observed choicesc1yt–1 and rewards r1yt–1. The step-size parameters (Zh and Zv), and the inversetemperature parameter (b) were sampled from a uniform distribution between 0and 1, and between 0 and 20, respectively. To avoid biasing the mood model infavour of or against a mood-consistent bias, we sampled the reward perceptionparameter (f) in the log domain from a uniform distribution between ln1/10 andln10. In addition, we compared the mood inferred by the model, based onparticipants’ choices and outcomes, with participants’ rating of their feeling. Forthis purpose, we computed for each participant the correlation between his or hernine feeling self-reports (three self-reports per game) and the mean of the model-inferred mood for each third of each game.
Finally, to test whether our main results might be explained by an effect of theWoF outcome on the balance between exploration and exploitation, rather than byan effect on mood, we fit the ‘no mood’ model to participants’ choices in game 1(before the WoF draw), and, separately, to participants’ choices in game 2 (after theWoF draw). We then repeated the analyses of test game choices and striatalresponses to reward with the inclusion of a control covariate that reflected thechange in the inferred inverse temperature parameter (b) from game 1 to game 2.
Model comparison. We compared the mood reinforcement-learning model,which is described above, with two alternative models: the first ‘no mood’ model issimilar to the full model except that outcomes do not affect mood, which thus staysneutral (that is, equals 0) throughout the experiment. The second ‘no mood bias’model does include an effect of outcomes on mood that is similar to the full model,but does not include an effect of mood on perception of outcomes (that is, theparameter f is set to 1). We assumed Gaussian noise on self-reports, and thus wecomputed the probability of observing a particular self-reported feeling given a
particular model as proportional to e� mreported �mmodelð Þ2 , where mreported is thez-scored feeling reported by the participant, and mmodel is the z-scored moodpredicted by the model at the time of self-report. We compared between the fullmood model and the alternative models in terms of the likelihood that theyassigned to each participant’s data, as measured by the log of the Bayes factor53,which was approximated by the mean log likelihood of each model given 1,000,000random parameterizations. Since log Bayes factors were not normally distributed(n¼ 56, ‘no mood’ model: Po10� 14; ‘no mood bias’ model: Po0.005; one-sampleKolmogorov-Smirnov test54), we used bias-corrected and acceleratedbootstrapping55 (with 1,000,000 samples) to estimate significance.
Model-based fMRI analysis. To generate model-based regressors for the imaginganalysis, both the mood model and the ‘no mood’ model were simulated using eachparticipant’s actual sequence of rewards and choices to produce per-participant,per-trial estimates of the reward prediction error signals dt. To provide an inter-pretable measure for between-participant comparison, we used the same exactmodels to generate fMRI regressors for all participants, by instantiating each of themodels with the group mean estimated parameters. Using the group mean para-meters has the additional advantage of regularizing the individual estimates, whichare otherwise noisy32,56. To test whether striatal activity was biased in line with apositive feedback effect of mood on reward perception, we instantiated the moodmodel using the mean mood bias and mood step-size parameters of participantswhose mood bias parameter was consistent with positive feedback (that is, f41).
To examine the effect of mood on prediction error signals, we decomposed theseries of prediction-error signals generated by the mood model dmood
t into the sumof the prediction-error signals generated by the ‘no mood’ model dstdt and anadditional component dmood
t � dstdt� �
attributable to the effect of mood. We thenused dstdt and dmood
t � dstdt� �
as modulatory regressors in a GLM, which included inaddition regressors for stimulus onset and choice onset, for both choice and ratingtrials, as well as regressors that reflect head movement parameters. We note thatwhile dmood
t and dstdt were, as expected, strongly correlated (n¼ 25, mean Pearsonr¼ 0.96, t24¼ 10.1, Po10� 10, t test), dstdt and dmood
t � dstdt� �
were not significantlycorrelated (n¼ 25, mean Pearson’s r¼ � 0.29, t24¼ � 1.4, P¼ 0.18, t test).Moreover, linear regression does not assign variance that is shared between twocorrelated regressors to either of the regressors. Thus, the GLM coefficients onlyreflect variance that is unique to each regressor. We verified that the striatal ROIsignificantly correlated with the dstdt regressor (n¼ 25, t24¼ 7.1, Po10� 7, t test).The t-values computed for the dmood
t � dstdt� �
regressor then indicated for eachparticipant whether the striatum demonstrated a pattern of activity that is capturedby the positive-feedback mood model, above and beyond the standard model.
Habel et al.33 found nine cortical areas (excluding cerebellum, which we did notscan) that distinguished between positive and negative mood, evoked using astandardized mood-induction procedure. To test whether the mood inferred by themodel matched activity in these brain areas, we created a single ROI composed ofthe nine corresponding spheres, which included all grey-matter voxels within a 5voxel radius from the reported locations. We then conducted a GLM analysis,similar to the one described above, with the addition of a parametric regressorreflecting the changes in mood that were inferred by the model for each participantduring the three slot machine games (the regressor was inverted for those spheresin which Habel et al. reported that activity was inversely related to positive mood).BOLD responses to this regressor were used to assess the degree to which themodel-predicted mood matched activity in the ROI.
NATURE COMMUNICATIONS | DOI: 10.1038/ncomms7149 ARTICLE
NATURE COMMUNICATIONS | 6:6149 | DOI: 10.1038/ncomms7149 | www.nature.com/naturecommunications 7
& 2015 Macmillan Publishers Limited. All rights reserved.

Dynamical system analysis. By substituting57 d, rperceived and m in equations 3and 5 with the corresponding expressions in equations 1, 2 and 4, the model can bereduced to the following two-variable dynamical system:
Dh ¼ Zh r � f tanh h � v� h� �
ð6Þ
Dv ¼ Zv r � f tanh h � v� �
ð7Þ
Given that the model’s update rates (Zh and Zv) have nonzero values, Dh and Dvboth equal zero only when h¼ 0 and v¼ r. Thus, the system’s only fixed point isreached when expected value is equal to the actual reward and mood is neutral. Toexamine whether the system is stable around this fixed point, we derived theeigenvalues (l) of its Jacobian matrix:
l ¼ 12
Zh r ln f � 1ð Þ� Zvð Þ �ffiffiffiffiffiffiffiffiffiffiffiffiffiffiffiffiffiffiffiffiffiffiffiffiffiffiffiffiffiffiffiffiffiffiffiffiffiffiffiffiffiffiffiffiffiffiffiffiffiffiffiffiffiffiffiffiffiffiZh r ln f � 1ð Þ� Zvð Þ2 � 4ZvZh
q ð8Þ
When f ¼ e1r 1þ Zv
Zh
� �, l is complex and its real component equals 0, which indicates
non-converging oscillations around the fixed point. With greater values of f, thereal component of l is positive, indicating that the system moves away from thefixed point. In addition, we know that the system remains bounded, given thatZvo1 and Zho1, we can conclude from equations 6 and 7 that |v| cannot exceed
r � f and |h| cannot exceed 2r � f. Thus, for f � e1r 1þ Zv
Zh
� �, the system does not
approach the fixed point, but rather, continues to fluctuate within a boundedregion. Simulations of the model with different values of f, r, Zv and Zh confirmed
that e1r 1þ Zv
Zh
� �is a critical value of f, beyond which the system oscillates
continuously.
Statistical analysis. Statistical analysis was carried out using MATLAB. We didnot find a significant difference between the behavioural and fMRI groups withrespect to any of the effects of interest, and thus data from both experimentswere pooled together where appropriate. Correlation values reported are Pearsoncorrelation coefficients. Robust regression was performed using default options(bisquare weighting, tuning constant 4.685). Since the parameter f is multiplicative,and was sampled in the log domain, means and correlations involving f werecomputed in the log domain. Owing to the non-additivity of correlationcoefficients, averaging of correlation coefficients was preceded by Fisher r-to-ztransformation and followed by Fisher’s z-to-r transformation58. All results ofANCOVA interaction between HPS score and WoF outcome were replicatedwith the inclusion of a control regressor indicating baseline self-reported mood(measured before the WoF draw). All statistical tests reported are two-tailed.
References1. Ciarrochi, J. & Forgas, J. P. The pleasure of possessions: Affective influences
and personality in the evaluation of consumer items. Eur. J. Soc. Psychol. 30,631–649 (2000).
2. Shepperd, J. A. & McNulty, J. K. The affective consequences of expected andunexpected outcomes. Psychol. Sci. 13, 85–88 (2002).
3. Mellers, B. A., Schwartz, A., Ho, K. & Ritov, I. Decision affect theory: emotionalreactions to the outcomes of risky options. Psychol. Sci. 8, 423–429 (1997).
4. K+oszegi, B. & Rabin, M. A model of reference-dependent preferences. Q. J.Econ. 121, 1133–1165 (2006).
5. Kahneman, D. & Tversky, A. Prospect theory: An analysis of decision underrisk. Econometrica 47, 263–291 (1979).
6. Plahte, E., Mestl, T. & Omholt, S. W. Feedback loops, stability andmultistationarity in dynamical systems. J. Biol. Syst. 3, 409–413 (1995).
7. Held, I. M. & Soden, B. J. Water vapor feedback and global warming 1. Annu.Rev. Energ. Env. 25, 441–475 (2000).
8. Boukal, D. S. & Berec, L. Single-species models of the Allee effect: extinctionboundaries, sex ratios and mate encounters. J. Theor. Biol. 218, 375–394 (2002).
9. Tang, Y., Kesavan, P., Nakada, M. T. & Yan, L. Tumor-stroma interaction:positive feedback regulation of extracellular matrix metalloproteinase inducer(EMMPRIN) expression and matrix metalloproteinase-dependent generationof soluble EMMPRIN. Mol. Cancer Res. 2, 73–80 (2004).
10. Freeman, M. Feedback control of intercellular signalling in development.Nature 408, 313–319 (2000).
11. Tsai, T. Y. C. et al. Robust, tunable biological oscillations from interlinkedpositive and negative feedback loops. Science 321, 126–129 (2008).
12. Bradley, M. M., Miccoli, L., Escrig, M. A. & Lang, P. J. The pupil as a measure ofemotional arousal and autonomic activation. Psychophysiology 45, 602–607(2008).
13. Goldberg, L. R. et al. The international personality item pool and the future ofpublic-domain personality measures. J. Res. Pers. 40, 84–96 (2006).
14. Eckblad, M. & Chapman, L. J. Development and validation of a scale forhypomanic personality. J. Abnorm. Psychol. 95, 214 (1986).
15. Meyer, T. D. The Hypomanic Personality Scale, the Big Five, and theirrelationship to depression and mania. Pers. Indiv. Differ. 32, 649–660 (2002).
16. Kwapil, T. R. et al. A longitudinal study of high scorers on the HypomanicPersonality Scale. J. Abnorm. Psychol. 109, 222–226 (2000).
17. Niv, Y., Edlund, J. A., Dayan, P. & O’Doherty, J. P. Neural predictionerrors reveal a risk-sensitive reinforcement-learning process in the humanbrain. J. Neurosci. 32, 551–562 (2012).
18. Breiter, H. C., Aharon, I., Kahneman, D., Dale, A. & Shizgal, P. Functionalimaging of neural responses to expectancy and experience of monetary gainsand losses. Neuron 30, 619–639 (2001).
19. McClure, S. M., Berns, G. S. & Montague, P. R. Temporal prediction errors in apassive learning task activate human striatum. Neuron 38, 339–346 (2003).
20. O’Doherty, J., Dayan, P., Friston, K. J., Critchley, H. D. & Dolan, R. J. Temporaldifference models and reward-related learning in the human brain. Neuron 38,329–337 (2003).
21. O’Doherty, J. et al. Dissociable roles of ventral and dorsal striatum ininstrumental conditioning. Science 304, 452–454 (2004).
22. Abler, B., Walter, H., Erk, S., Kammerer, H. & Spitzer, M. Prediction error as alinear function of reward probability is coded in human nucleus accumbens.Neuroimage 31, 790–795 (2006).
23. Li, J., McClure, S. M., King-Casas, B. & Montague, P. R. Policy adjustment in adynamic economic game. PLoS. ONE 1, e103 (2006).
24. Preuschoff, K., Bossaerts, P. & Quartz, S. R. Neural differentiation of expectedreward and risk in human subcortical structures. Neuron 51, 381–390 (2006).
25. Hare, T. A., O’Doherty, J., Camerer, C. F., Schultz, W. & Rangel, A. Dissociatingthe role of the orbitofrontal cortex and the striatum in the computation of goalvalues and prediction errors. J. Neurosci. 28, 5623–5630 (2008).
26. Holland, P. W. & Welsch, R. E. Robust regression using iteratively reweightedleast-squares. Commun. Stat. Theory 6, 813–827 (1977).
27. Rousseeuw, P. J. & Leroy, A. M. Robust Regression and Outlier Detection (JohnWiley & Sons, 2005).
28. Sutton, R. S. & Barto, A. G. Reinforcement Learning: An Introduction (MITpress, 1998).
29. Marinier, III R. P., Laird, J. E. & Lewis, R. L. A computational unification ofcognitive behavior and emotion. Cogn. Syst. Res. 10, 48–69 (2009).
30. Katsimerou, C., Heynderickx, I. & Redi, J. A. A computational model for moodrecognition. in User Modeling, Adaptation, and Personalization (Springer,2014).
31. Ekman, P. An argument for basic emotions. Cognition Emotion 6, 169–200(1992).
32. Wittmann, B. C., Daw, N. D., Seymour, B. & Dolan, R. J. Striatal activityunderlies novelty-based choice in humans. Neuron 58, 967–973 (2008).
33. Habel, U., Klein, M., Kellermann, T., Shah, N. J. & Schneider, F. Same ordifferent? Neural correlates of happy and sad mood in healthy males.Neuroimage 26, 206–214 (2005).
34. Ellicott, A., Hammen, C., Gitlin, M., Brown, G. & Jamison, K. Life events andthe course of bipolar disorder. Am. J. Psychiatr. 147, 1194–1198 (1990).
35. Johnson, S. L. et al. Life events as predictors of mania and depression in bipolarI disorder. J. Abnorm. Psychol. 117, 268 (2008).
36. Camerer, C. F., Loewenstein, G. & Rabin, M. Advances in Behavioral Economics(Princeton University Press, 2011).
37. Sadock, B. J. Kaplan & Sadock’s Comprehensive Textbook of Psychiatry(Lippincott, Williams & Wilkins, 2000).
38. Miller, I. W., Uebelacker, L. A., Keitner, G. I., Ryan, C. E. & Solomon, D. A.Longitudinal course of bipolar I disorder. Compr. Psychiatr. 45, 431–440(2004).
39. Judd, L. L. et al. The long-term natural history of the weekly symptomaticstatus of bipolar I disorder. Arch. Gen. Psychiatr. 59, 530–537 (2002).
40. Turvey, C. L. et al. Long-term prognosis of bipolar I disorder. Acta. Psychiatr.Scand. 99, 110–119 (1999).
41. Angst, J. & Preisig, M. Course of a clinical cohort of unipolar, bipolar, andschizoaffective patients. Results of a prospective study from 1959 to 1985.Schweizer. Arch. Neurol. Psychiatr. 146, 5–16 (1995).
42. Sachs, G. S., Printz, D. J., Kahn, D. A., Carpenter, D. & Docherty, J. P. Theexpert consensus guideline series: medication treatment of bipolar disorder.Postgrad. Med. 1, 1–104 (2000).
43. Eldar, E., Cohen, J. D. & Niv, Y. The effects of neural gain on attention andlearning. Nat. Neurosci. 16, 1146–1153 (2013).
44. Reas, C. & Fry, B. Processing: a Programming Handbook for Visual Designersand Artists (MIT Press, 2007).
45. McLaren, K. XIII—The development of the CIE 1976 (L* a* b*) uniform colourspace and colour-difference formula. J. Soc. Dyers Colour 92, 338–341 (1976).
46. Lang, P. J. Behavioral treatment and bio-behavioral assessment: computerapplications. in Technology in Mental Health Care Delivery Systems (edsSidowski, J. B., Johnson, J. H. & Williams, T. A.) 119–137 (Ablex, 1980).
47. Carver, C. S. & White, T. L. Behavioral inhibition, behavioral activation, andaffective responses to impending reward and punishment: the BIS/BAS scales.J. Pers. Soc. Psychol. 67, 319–333 (1994).
48. Costa, P. T. & McCrae, R. R. Neo PI-R Professional Manual (PsychologicalAssessment Resources, 1992).
ARTICLE NATURE COMMUNICATIONS | DOI: 10.1038/ncomms7149
8 NATURE COMMUNICATIONS | 6:6149 | DOI: 10.1038/ncomms7149 | www.nature.com/naturecommunications
& 2015 Macmillan Publishers Limited. All rights reserved.

49. Hollerman, J. R. & Schultz, W. Dopamine neurons report an error in thetemporal prediction of reward during learning. Nat. Neurosci. 1, 304–309 (1998).
50. Pessiglione, M., Seymour, B., Flandin, G., Dolan, R. J. & Frith, C. D.Dopamine-dependent prediction errors underpin reward-seeking behaviour inhumans. Nature 442, 1042–1045 (2006).
51. Chater, N. & Brown, G. D. Scale-invariance as a unifying psychologicalprinciple. Cognition 69, B17–B24 (1999).
52. Bishop, C. M. Pattern Recognition and Machine Learning (Springer, 2006).53. Kass, R. E. & Raftery, A. E. Bayes factors. J. Am. Stat. Assoc. 90, 773–795 (1995).54. Lilliefors, H. W. On the Kolmogorov-Smirnov test for normality with mean and
variance unknown. J. Am. Stat. Assoc. 62, 399–402 (1967).55. Efron, B. Better bootstrap confidence intervals. J. Am. Statist. Assoc. 82,
171–185 (1987).56. Daw, N. D., O’Doherty, J. P., Dayan, P., Seymour, B. & Dolan, R. J. Cortical
substrates for exploratory decisions in humans. Nature 441, 876–879 (2006).57. Strogatz, S. H. Nonlinear Dynamics and Chaos: with Applications to Physics,
Biology, Chemistry, and Engineering (Westview Press, 2001).58. Fisher, R. A. On the ‘probable error’ of a coefficient of correlation deduced from
a small sample. Metron 1, 3–32 (1921).
AcknowledgementsWe thank Peter L Bossaerts, Raymond J. Dolan, Samuel J. Gershman, Waitsang (Jane)Keung, Angela Radulescu, Geoffrey Schoenbaum, Amitai Shenhav and Robert C. Wilson
for technical help and comments on a previous version of the manuscript. This projectwas made possible through grants from the Howard Hughes Medical Institute to E.E.,and from the John Templeton Foundation and Human Frontiers Science Programme toY.N. The opinions expressed here are those of the authors and do not necessarily reflectthe views of the John Templeton Foundation.
Author contributionsAll authors contributed to designing the study. E.E. ran the study and analysed the data.All authors contributed to discussion and interpretation of the findings and writing themanuscript.
Additional informationSupplementary Information accompanies this paper at http://www.nature.com/naturecommunications
Competing financial interests: The authors declare no competing financial interests.
Reprints and permission information is available online at http://npg.nature.com/reprintsandpermissions/
How to cite this article: Eldar, E. and Niv, Y. Interaction between emotional state andlearning underlies mood instability. Nat. Commun. 6:6149 doi: 10.1038/ncomms7149(2015).
NATURE COMMUNICATIONS | DOI: 10.1038/ncomms7149 ARTICLE
NATURE COMMUNICATIONS | 6:6149 | DOI: 10.1038/ncomms7149 | www.nature.com/naturecommunications 9
& 2015 Macmillan Publishers Limited. All rights reserved.

Corrigendum: Interaction between emotional stateand learning underlies mood instabilityEran Eldar & Yael Niv
Nature Communications 6:6149 doi: 10.1038/ncomms7149 (2015); Published 21 Jan 2015; Updated 3 Jan 2017
In the Methods section of this Article under ‘Model comparison’, the log of the Bayes factor is incorrectly reported asbeing approximated by the mean log likelihood of each model given 1,000,000 random parameterizations. The words ‘meanlog likelihood’ should have read ‘log of the mean likelihood’. Furthermore, in panels b and d of Supplementary Fig. 2, thereare errors in the labelling of the y-axes. The word ‘Striatal’ should have read ‘Whole brain’. The correct version of this figure appearsbelow as Fig. 1.
–1.5
–1.0
–0.5
0
0.5
1.0
1.5 2.5 3.5Who
le b
rain
res
pons
e to
rew
ard
afte
r m
inus
bef
ore
WoF
(t v
alue
)
Hypomanic personality scale
Won WoF Lost WoFb
–1.5
–1.0
–0.5
0
0.5
1.0
1.5 2.5 3.5Who
le b
rain
res
pons
e to
rew
ard
afte
r m
inus
bef
ore
WoF
(t v
alue
)
Hypomanic personality scale
Won WoF Lost WoFd
Y=–88
a
Z=–14
Y=28
Y=40
c
Z=–10
Y=28
Figure 1.
DOI: 10.1038/ncomms14149
NATURE COMMUNICATIONS | 8:14149 | DOI: 10.1038/ncomms14149 | www.nature.com/naturecommunications 1
Copyright © 2022 FDOKUMEN