
Inter-relationship between preparation methods, nickel loading, characteristics and performance in...
11
Engineering Applications of Artificial Intelligence 20 (2007) 261–271 Inter-relationship between preparation methods, nickel loading, characteristics and performance in the reforming of crude ethanol over Ni/Al 2 O 3 catalysts: A neural network approach Shoumin Song, Abayomi J. Akande, Raphael O. Idem , Nader Mahinpey Process Systems Engineering Laboratories, Faculty of Engineering, 3737 Wascana Parkway, University of Regina, Regina, Sask, Canada S4S 0A2 Received 17 September 2005; received in revised form 28 June 2006; accepted 28 June 2006 Available online 7 September 2006 Abstract Artificial neural network (ANN) approach was used to design an optimum Ni/Al 2 O 3 catalyst for the production of hydrogen by the catalytic reforming of crude ethanol based on determining the inter-relationships between catalyst-preparation methods, nickel loading, catalyst characteristics and catalyst performance. ANN could predict hydrogen production performance of various Ni/Al 2 O 3 catalysts of various elemental compositions and methods of preparation in the production of hydrogen by the catalytic reforming of crude ethanol in terms of crude-ethanol conversion, hydrogen selectivity and hydrogen yield. Specifically on catalyst design, ANN was used to determine the optimum catalyst conditions for obtaining maximum hydrogen production performance of a Ni/Al 2 O 3 catalyst for the production of hydrogen by the catalytic reforming of crude ethanol. The optimal hydrogen yield was 4.4 mol %, and the associated crude-ethanol conversion and H 2 selectivity for the optimal hydrogen yield were 79.6 and 91.4 mol%, respectively. The optimal catalyst was the one prepared by the coprecipitation method with the optimal nickel loading of 12.4 wt% and an optimal aluminum composition of 42.5 wt%. r 2006 Elsevier Ltd. All rights reserved. Keywords: Artificial neural network; Optimum catalyst design; Crude-ethanol reforming; Hydrogen production; Catalyst characteristics 1. Introduction The Energy Information Administration has projected that world energy consumption will increase by 59% over the next two decades, from 1999 to 2020 (Energy Information Administration, 2001), in which the largest share is still dominated by fossil fuels (oil, natural gas and coal). Carbon dioxide (CO 2 ) emissions resulting from the combustion of these fossil fuels currently are estimated to account for three-fourths of human-caused CO 2 emissions worldwide (Energy Information Administration, 2001). Greenhouse gas emissions, including CO 2 , should be limited, as recommended at the Kyoto Conference, Japan, in December 1997. In this regard, hydrogen (H 2 ) has a significant future potential as an alternative fuel that can solve the problems of CO 2 emissions as well as the emissions of other air contaminants. The demand for hydrogen energy has increased tremendously in recent years essentially because of the recent developments in fuel cell technologies. One of the techniques to produce hydrogen is by the catalytic reforming of hydrocarbons or biomass (e.g., ethanol). The production of hydrogen by steam reforming of pure ethanol has been widely investigated (Athanasio and Verykios, 2004; Leclerc et al., 1998; Jordi et al., 2002; Galvita et al., 2001; Das, 2003; Athanasios and Kondar- idesm, 2002; Klouz et al., 2002) in which various catalysts such as Co/ZnO, Cu–Mn/Al 2 O 3 , and Ni/La 2 O 3 , etc., have been used. In all the cases considered, water was needed as a co-feed to the process. This would imply that there was no need to completely remove the water in the fermenta- tion broth (i.e., crude ethanol) during ethanol-production process. Considering this concept, crude ethanol (a form of biomass) is easy to produce, is free of sulfur, has low toxicity, and is also safe to handle, transport and store. In addition, crude ethanol consists of oxygenated hydrocar- bons, such as ethanol, lactic acid, glycerol, and maltose ARTICLE IN PRESS www.elsevier.com/locate/engappai 0952-1976/$ - see front matter r 2006 Elsevier Ltd. All rights reserved. doi:10.1016/j.engappai.2006.06.014 Corresponding author. Tel.: +1 306 585 4470; fax: +1 306 585 4855. E-mail address: [email protected] (R.O. Idem).
Transcript of Inter-relationship between preparation methods, nickel loading, characteristics and performance in...
ARTICLE IN PRESS
0952-1976/$ - se
doi:10.1016/j.en
�CorrespondE-mail addr
Engineering Applications of Artificial Intelligence 20 (2007) 261–271
www.elsevier.com/locate/engappai
Inter-relationship between preparation methods, nickel loading,characteristics and performance in the reforming of crude ethanol
over Ni/Al2O3 catalysts: A neural network approach
Shoumin Song, Abayomi J. Akande, Raphael O. Idem�, Nader Mahinpey
Process Systems Engineering Laboratories, Faculty of Engineering, 3737 Wascana Parkway, University of Regina, Regina, Sask, Canada S4S 0A2
Received 17 September 2005; received in revised form 28 June 2006; accepted 28 June 2006
Available online 7 September 2006
Abstract
Artificial neural network (ANN) approach was used to design an optimum Ni/Al2O3 catalyst for the production of hydrogen by the
catalytic reforming of crude ethanol based on determining the inter-relationships between catalyst-preparation methods, nickel loading,
catalyst characteristics and catalyst performance. ANN could predict hydrogen production performance of various Ni/Al2O3 catalysts of
various elemental compositions and methods of preparation in the production of hydrogen by the catalytic reforming of crude ethanol in
terms of crude-ethanol conversion, hydrogen selectivity and hydrogen yield. Specifically on catalyst design, ANN was used to determine
the optimum catalyst conditions for obtaining maximum hydrogen production performance of a Ni/Al2O3 catalyst for the production of
hydrogen by the catalytic reforming of crude ethanol. The optimal hydrogen yield was 4.4mol%, and the associated crude-ethanol
conversion and H2 selectivity for the optimal hydrogen yield were 79.6 and 91.4mol%, respectively. The optimal catalyst was the one
prepared by the coprecipitation method with the optimal nickel loading of 12.4wt% and an optimal aluminum composition of 42.5wt%.
r 2006 Elsevier Ltd. All rights reserved.
Keywords: Artificial neural network; Optimum catalyst design; Crude-ethanol reforming; Hydrogen production; Catalyst characteristics
1. Introduction
The Energy Information Administration has projectedthat world energy consumption will increase by 59% overthe next two decades, from 1999 to 2020 (EnergyInformation Administration, 2001), in which the largestshare is still dominated by fossil fuels (oil, natural gas andcoal). Carbon dioxide (CO2) emissions resulting from thecombustion of these fossil fuels currently are estimated toaccount for three-fourths of human-caused CO2 emissionsworldwide (Energy Information Administration, 2001).Greenhouse gas emissions, including CO2, should belimited, as recommended at the Kyoto Conference, Japan,in December 1997. In this regard, hydrogen (H2) has asignificant future potential as an alternative fuel that cansolve the problems of CO2 emissions as well as theemissions of other air contaminants. The demand for
e front matter r 2006 Elsevier Ltd. All rights reserved.
gappai.2006.06.014
ing author. Tel.: +1306 585 4470; fax: +1 306 585 4855.
ess: [email protected] (R.O. Idem).
hydrogen energy has increased tremendously in recentyears essentially because of the recent developments in fuelcell technologies. One of the techniques to producehydrogen is by the catalytic reforming of hydrocarbonsor biomass (e.g., ethanol).The production of hydrogen by steam reforming of pure
ethanol has been widely investigated (Athanasio andVerykios, 2004; Leclerc et al., 1998; Jordi et al., 2002;Galvita et al., 2001; Das, 2003; Athanasios and Kondar-idesm, 2002; Klouz et al., 2002) in which various catalystssuch as Co/ZnO, Cu–Mn/Al2O3, and Ni/La2O3, etc., havebeen used. In all the cases considered, water was needed asa co-feed to the process. This would imply that there wasno need to completely remove the water in the fermenta-tion broth (i.e., crude ethanol) during ethanol-productionprocess. Considering this concept, crude ethanol (a form ofbiomass) is easy to produce, is free of sulfur, has lowtoxicity, and is also safe to handle, transport and store. Inaddition, crude ethanol consists of oxygenated hydrocar-bons, such as ethanol, lactic acid, glycerol, and maltose
ARTICLE IN PRESSS. Song et al. / Engineering Applications of Artificial Intelligence 20 (2007) 261–271262
(Akande et al., 2005). These oxygenated hydrocarbons canbe catalytically reformed completely to H2 and CO2, thelatter of which could be separated from H2 by membranetechnology or other technologies. This provides for CO2
capture for eventual storage or destruction. In the case ofusing crude ethanol, this will result in negative CO2
emissions.A very important aspect for the actualization of the
PEM fuel cell-powered electric vehicles that would usecrude-ethanol-based H2 is the development of a stableactive catalyst for the H2-production process. Such acatalyst should ensure high selectivity and yield and shouldresult in a small-sized reformer for use in a H2-refuelingstation. While there is some information on catalystsdevelopment regarding the steam reforming of pureethanol, there is very little information in the case of thereforming of crude ethanol (Akande et al., 2005). In theliterature, Al2O3 supported Co, Ni or Cu catalysts havebeen employed for pure-ethanol reforming. Also, Idemet al. (2003) indicated that Al2O3-supported Ni catalysts orCu–Mn–Al catalysts are active for crude-ethanol reform-ing. Ni is reported by Luengo et al. (1992) to ensure C–Cbond breakage in ethanol or other oxygenated hydro-carbons while Al2O3 ensures good thermal stability.However, even though Ni/Al2O3 catalysts appear to beactive catalysts, the inter-relationships between preparationmethod, nickel loading, characteristics and performance ofthese catalysts in the reforming of crude ethanol forhydrogen production have not been established. In ourprevious work (Akande et al., 2005), we attempted toexperimentally evaluate these relations with a view todetermining the optimum conditions of catalysts formaximum performance. As is well known, experimentaldetermination of optimum conditions for a catalyst is timeconsuming. Besides, it cannot be ensured that theseoptimum catalyst conditions will be reached. What isrequired is a method that will ensure that all the attributesof the catalysts can be taken into account in determiningthe optimum catalyst. ANN can be a very powerful tool(Jang et al., 1997) for applications in process engineering.Also, the application of ANN in applied catalysis and inchemical engineering has been reported in the literature(Bulsari, 1995; Mackay, 2002). Hou et al. (1997) appliedANN for design of a VSbWSn (P, K, Cr, Mo)/SIALcatalyst for the synthesis of acrylonitrile via propane. Also,Omata et al. (2005) designed a stable Co–MgO catalyst fordry reforming of methane by the aid of ANN technique.Furthermore, it has been shown (http://atom.ecn.purdue.edu/~jmcweb/materials/catalyst.html) that ANN is anadvanced technique that can be used for the developmentof a catalyst. In this context, an ANN approach, whichdoes not necessarily need to be programmed to follow aspecific set of instructions but instead could be used as anadaptive learning algorithm to find a pattern if a setof examples is given, would provide a very useful toolfor optimization. This characteristic of an ANN(Lyster; http://www.nrel.gov/hydrogen/proj_production_
delivery.html; Demuth and Beale) makes it very usefulfor dealing not only with problems that are extremelycomplex to implement but also for problems whosesolution has not been explicitly formulated, such as inNi/Al2O3 catalyst development for crude-ethanol reform-ing. The use of ANN approach to determine these inter-relationships for Ni/Al2O3 catalysts in the catalyticreforming of crude ethanol to produce hydrogen ispresented and discussed in this paper.
2. Application of artificial neural networks in catalyst design
2.1. Artificial neural networks learning process
As illustrated in the literature http://www.doc.ic.ac.uk/~nd/surprise_96/journal/vol4/cs11/report.html, ANNs area type of artificial-intelligence technology, which offers avery strong learning ability, especially for problems withunknown inter-relations or very complicated relationsbetween input dataset and output dataset. The learningprocess can be categorized into supervised learning andunsupervised learning. These are basically the two ways fortraining of the ANNs (Jang et al., 1997).According to Anderson and McNeill (1992), supervised
learning is the most popular method to train the ANN.Training data (including input data and desired outputdata) are fed into the neural networks and the target (orerror function), respectively. Then, the neural networkswith a random weight matrix give an output to the errorfunction to compare with the desired output data. If theerror between the output data from the neural networksand the desired output data is out of the proposed accuracyrange, the training algorithm will adjust the weights to theneural networks. Then, the same data are processed asperformed in the previous case until the error is minimizedto the proposed accuracy range by the training algorithm.Finally, the training process is finished with fixed weights.On the other hand, in the case of unsupervised learning,
the neural networks are trained to govern themselveswithout any external supervision. Consequently, there areno desired output data to modify the interconnectionweights of the trained neural networks. This means that theneural networks with unsupervised learning have noreference. This makes the important feature of unsuper-vised learning to be based on self-organization http://www.statsoft.com/textbook/stneunet.html.A decision as to whether to use supervised learning or
unsupervised learning may not be straightforward. Forsituations where the environmental conditions are wellknown (i.e., the input data and desired output data for theneural networks are well known) the supervised learningfor the neural networks training is more helpful thanthe unsupervised learning (http://www.cs.brandeis.edu/~cs113/classprojects/~jlittman/cs113/Web_Project__231__Unsupervised_Learning.html). However, for situationswhere the desired output data are less known or unknown,then the supervised learning is not appropriate. In this case,
ARTICLE IN PRESSS. Song et al. / Engineering Applications of Artificial Intelligence 20 (2007) 261–271 263
the unsupervised learning is more useful than supervisedlearning (http://www.cs.brandeis.edu/~cs113/classprojects/~jlittman/cs113/Web_Project__231__Unsupervised_Learning.html). In our case, we used the supervised-learning approach.
2.2. Multilayer feed-forward artificial neural networks
configuration
Feed-forward multiple-layers neural networks config-uration was used for this work for the reason that it is themost popular type which is widely in use. The feed forwardneural networks consist of input layer, hidden layers andoutput layer. Each layer has a large number of neurons. Asis well known, the more complicated the configuration ofthe neural networks is, the more powerful are the functionsof the neural networks. In addition, non-linear functionalrelationships are the most basic characteristics in ANNs.This feature makes ANN especially powerful tools in dataprocessing with unknown relations.
In executing the network, the input data are fed into theinput layer, and then the results from the input layerbecome the input data to the hidden layers, summed by theweights plus the bias for the hidden layers. The outputsfrom the hidden layers then become the inputs for theoutput layers. These undergo similar data processing as inthe hidden layers. The final outputs for the entire feed-forward neural networks are produced. During the dataprocessing from the inputs to the outputs of the entireneural networks, each neuron plays a very important role.For example, for any neuron, the output from the neuronis the sum of the total weighted inputs plus a bias, which isexpressed in the following equation (Krose and van derSmagt, 1996):
a ¼ f ðw1;1p1 þ w1;2p2 þ � � � þ w1;RpR þ bÞ,
where w is the weight for each input data for the neuron.
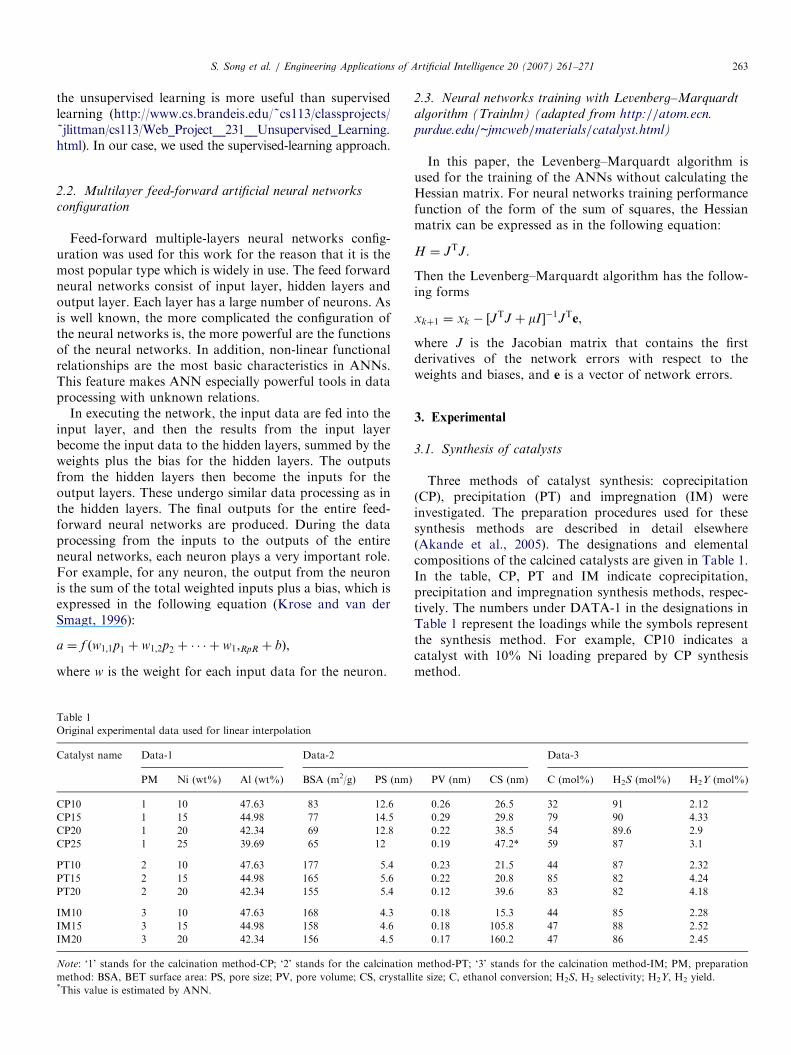
Table 1
Original experimental data used for linear interpolation
Catalyst name Data-1 Data-2
PM Ni (wt%) Al (wt%) BSA (m2/g) PS (nm)
CP10 1 10 47.63 83 12.6
CP15 1 15 44.98 77 14.5
CP20 1 20 42.34 69 12.8
CP25 1 25 39.69 65 12
PT10 2 10 47.63 177 5.4
PT15 2 15 44.98 165 5.6
PT20 2 20 42.34 155 5.4
IM10 3 10 47.63 168 4.3
IM15 3 15 44.98 158 4.6
IM20 3 20 42.34 156 4.5
Note: ‘1’ stands for the calcination method-CP; ‘2’ stands for the calcination
method: BSA, BET surface area: PS, pore size; PV, pore volume; CS, crystall*This value is estimated by ANN.
2.3. Neural networks training with Levenberg–Marquardt
algorithm (Trainlm) (adapted from http://atom.ecn.
purdue.edu/~jmcweb/materials/catalyst.html)
In this paper, the Levenberg–Marquardt algorithm isused for the training of the ANNs without calculating theHessian matrix. For neural networks training performancefunction of the form of the sum of squares, the Hessianmatrix can be expressed as in the following equation:
H ¼ JTJ.
Then the Levenberg–Marquardt algorithm has the follow-ing forms
xkþ1 ¼ xk � ½JTJ þ mI ��1JTe,
where J is the Jacobian matrix that contains the firstderivatives of the network errors with respect to theweights and biases, and e is a vector of network errors.
3. Experimental
3.1. Synthesis of catalysts
Three methods of catalyst synthesis: coprecipitation(CP), precipitation (PT) and impregnation (IM) wereinvestigated. The preparation procedures used for thesesynthesis methods are described in detail elsewhere(Akande et al., 2005). The designations and elementalcompositions of the calcined catalysts are given in Table 1.In the table, CP, PT and IM indicate coprecipitation,precipitation and impregnation synthesis methods, respec-tively. The numbers under DATA-1 in the designations inTable 1 represent the loadings while the symbols representthe synthesis method. For example, CP10 indicates acatalyst with 10% Ni loading prepared by CP synthesismethod.
Data-3
PV (nm) CS (nm) C (mol%) H2S (mol%) H2Y (mol%)
0.26 26.5 32 91 2.12
0.29 29.8 79 90 4.33
0.22 38.5 54 89.6 2.9
0.19 47.2* 59 87 3.1
0.23 21.5 44 87 2.32
0.22 20.8 85 82 4.24
0.12 39.6 83 82 4.18
0.18 15.3 44 85 2.28
0.18 105.8 47 88 2.52
0.17 160.2 47 86 2.45
method-PT; ‘3’ stands for the calcination method-IM; PM, preparation
ite size; C, ethanol conversion; H2S, H2 selectivity; H2Y, H2 yield.
ARTICLE IN PRESS
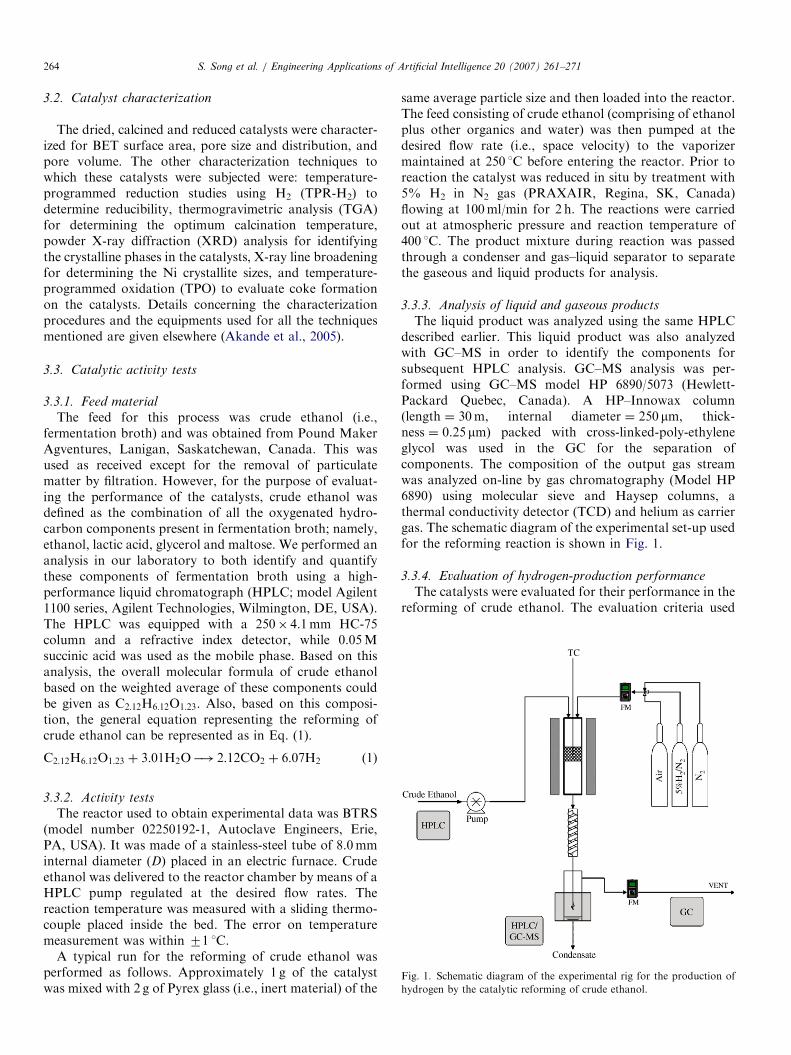
Fig. 1. Schematic diagram of the experimental rig for the production of
hydrogen by the catalytic reforming of crude ethanol.
S. Song et al. / Engineering Applications of Artificial Intelligence 20 (2007) 261–271264
3.2. Catalyst characterization
The dried, calcined and reduced catalysts were character-ized for BET surface area, pore size and distribution, andpore volume. The other characterization techniques towhich these catalysts were subjected were: temperature-programmed reduction studies using H2 (TPR-H2) todetermine reducibility, thermogravimetric analysis (TGA)for determining the optimum calcination temperature,powder X-ray diffraction (XRD) analysis for identifyingthe crystalline phases in the catalysts, X-ray line broadeningfor determining the Ni crystallite sizes, and temperature-programmed oxidation (TPO) to evaluate coke formationon the catalysts. Details concerning the characterizationprocedures and the equipments used for all the techniquesmentioned are given elsewhere (Akande et al., 2005).
3.3. Catalytic activity tests
3.3.1. Feed material
The feed for this process was crude ethanol (i.e.,fermentation broth) and was obtained from Pound MakerAgventures, Lanigan, Saskatchewan, Canada. This wasused as received except for the removal of particulatematter by filtration. However, for the purpose of evaluat-ing the performance of the catalysts, crude ethanol wasdefined as the combination of all the oxygenated hydro-carbon components present in fermentation broth; namely,ethanol, lactic acid, glycerol and maltose. We performed ananalysis in our laboratory to both identify and quantifythese components of fermentation broth using a high-performance liquid chromatograph (HPLC; model Agilent1100 series, Agilent Technologies, Wilmington, DE, USA).The HPLC was equipped with a 250� 4.1mm HC-75column and a refractive index detector, while 0.05Msuccinic acid was used as the mobile phase. Based on thisanalysis, the overall molecular formula of crude ethanolbased on the weighted average of these components couldbe given as C2:12H6:12O1:23. Also, based on this composi-tion, the general equation representing the reforming ofcrude ethanol can be represented as in Eq. (1).
C2:12H6:12O1:23 þ 3:01H2O�! 2:12CO2 þ 6:07H2 (1)
3.3.2. Activity tests
The reactor used to obtain experimental data was BTRS(model number 02250192-1, Autoclave Engineers, Erie,PA, USA). It was made of a stainless-steel tube of 8.0mminternal diameter (D) placed in an electric furnace. Crudeethanol was delivered to the reactor chamber by means of aHPLC pump regulated at the desired flow rates. Thereaction temperature was measured with a sliding thermo-couple placed inside the bed. The error on temperaturemeasurement was within 71 1C.
A typical run for the reforming of crude ethanol wasperformed as follows. Approximately 1 g of the catalystwas mixed with 2 g of Pyrex glass (i.e., inert material) of the
same average particle size and then loaded into the reactor.The feed consisting of crude ethanol (comprising of ethanolplus other organics and water) was then pumped at thedesired flow rate (i.e., space velocity) to the vaporizermaintained at 250 1C before entering the reactor. Prior toreaction the catalyst was reduced in situ by treatment with5% H2 in N2 gas (PRAXAIR, Regina, SK, Canada)flowing at 100ml/min for 2 h. The reactions were carriedout at atmospheric pressure and reaction temperature of400 1C. The product mixture during reaction was passedthrough a condenser and gas–liquid separator to separatethe gaseous and liquid products for analysis.
3.3.3. Analysis of liquid and gaseous products
The liquid product was analyzed using the same HPLCdescribed earlier. This liquid product was also analyzedwith GC–MS in order to identify the components forsubsequent HPLC analysis. GC–MS analysis was per-formed using GC–MS model HP 6890/5073 (Hewlett-Packard Quebec, Canada). A HP–Innowax column(length ¼ 30m, internal diameter ¼ 250 mm, thick-ness ¼ 0.25 mm) packed with cross-linked-poly-ethyleneglycol was used in the GC for the separation ofcomponents. The composition of the output gas streamwas analyzed on-line by gas chromatography (Model HP6890) using molecular sieve and Haysep columns, athermal conductivity detector (TCD) and helium as carriergas. The schematic diagram of the experimental set-up usedfor the reforming reaction is shown in Fig. 1.
3.3.4. Evaluation of hydrogen-production performance
The catalysts were evaluated for their performance in thereforming of crude ethanol. The evaluation criteria used
ARTICLE IN PRESSS. Song et al. / Engineering Applications of Artificial Intelligence 20 (2007) 261–271 265
were crude-ethanol conversion, H2 selectivity and H2 yield.Crude-ethanol conversion was defined according to Eq. (2)while H2 yield and selectivity were defined according toEqs. (3) and (4), respectively.
Crude conversion ðX Þ
¼gmol ðorganicsÞ in� gmol ðorganicsÞ out
gmol ðorganicsÞ in, ð2Þ
where organics ¼ ethanol+lactic acid+glycerol+maltose,
Hydrogen yield ðY Þ ¼gmol ðH2Þ out
6:07� gmol ðorganicsÞ in, (3)
Hydrogen selectivity ðSÞ
¼gmol ðH2Þ out
6:07� gmol ðorganicsÞ in� ConversionðX Þ. ð4Þ
3.4. Linear-interpolation methods
For catalyst development, the analysis or optimizationof parameters may not always be possible because of theavailability of only limited experimental data. At the sametime, it may not be necessary to make unlimited laboratoryexperiments to obtain sufficient data since this could beexpensive and time consuming. For this type of situation,interpolation plays an important role in solving theproblem. Even though interpolation has many differentmethods, we focused mainly on linear-interpolationmethod. Linear interpolation has the ability to predictan unknown value (position, shape, population, etc.) ifany two particular values are known and is based onthe assumptions (http://www.cs.brown.edu/stc/outrea/greenhouse/nursery/interpolation/itworks.html) that (a)two particular values are known, (b) the process ischanging at a constant rate, and (c) there is the desire tofind an unknown data point.
For our situation, the catalyst calcination temperatureand catalyst reduction temperature are set-up to beconstants. Thus, pore volume, pore size, BET surface area,and crystallite size of the catalysts, which form part of thecharacteristics of the calcined Ni/Al2O3 catalysts, were thefocus of the outputs section based on linear interpolation.On the other hand, Ni loading, Al loading and the catalystsynthesis method formed the corresponding inputs section.Some of the input values were derived from linearinterpolation.
With regard to the hydrogen production or the reactionoperation process, the reaction temperature and the crudeethanol weight hourly space velocity (WHSV) were alsoset-up to be constants. In this case, only the Ni loading, Alloading and the catalyst-preparation method formed theinput section some of the values of which were derivedusing linear interpolation. On the other hand, the crude-ethanol conversion, hydrogen selectivity and hydrogenyield formed the output section with some of the valuesderived using linear interpolation. DATA-1, DATA-2 and
DATA-3 in Table 1 are the original experimental data. Asindicated earlier, these data are not enough to feed to theneural networks in order to learn the functions betweenDATA groups. Therefore, it became necessary to obtainsufficient data based on the original data table. It is wellknown that the relationship between catalyst performance(dependent variable) and the characteristics (independentvariable) cannot be theoretically determined betweenpoints. Thus, data for additional points were derived fromtwo approaches: (i) by linear interpolation and (ii) bydrawing a line of best fit through the experimental datasets. The deviation between the two sets of addition datawas less than 4%. The experimental error was also lessthan 4%. Consequently, linear interpolation was used togenerate additional data. The small deviation/error,guarantees the accuracy of the values of the data generated,within limits of the experimental error. As such, this didnot change the trends obtained in our experimental results.
4. Results and discussion
4.1. Neural networks application for the characteristics of
the Ni/Al2O3 catalysts
4.1.1. Neural networks one (NN-1)
It was shown earlier that for our calcined Ni/Al2O3
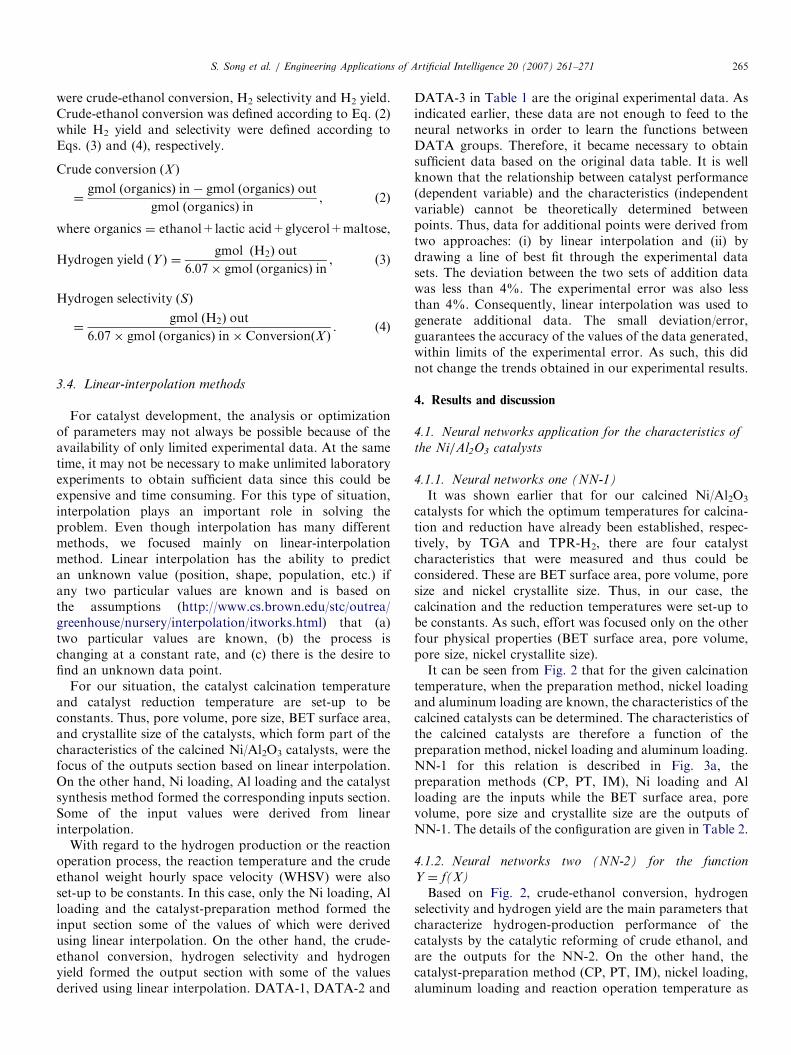
catalysts for which the optimum temperatures for calcina-tion and reduction have already been established, respec-tively, by TGA and TPR-H2, there are four catalystcharacteristics that were measured and thus could beconsidered. These are BET surface area, pore volume, poresize and nickel crystallite size. Thus, in our case, thecalcination and the reduction temperatures were set-up tobe constants. As such, effort was focused only on the otherfour physical properties (BET surface area, pore volume,pore size, nickel crystallite size).It can be seen from Fig. 2 that for the given calcination
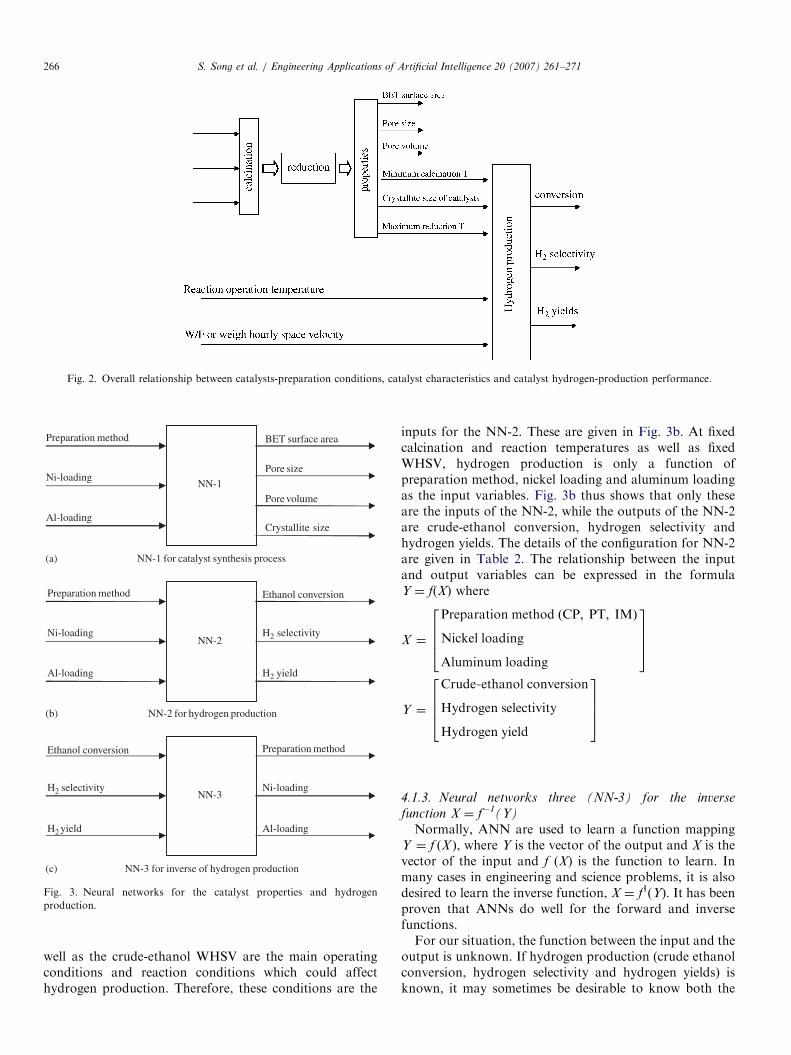
temperature, when the preparation method, nickel loadingand aluminum loading are known, the characteristics of thecalcined catalysts can be determined. The characteristics ofthe calcined catalysts are therefore a function of thepreparation method, nickel loading and aluminum loading.NN-1 for this relation is described in Fig. 3a, thepreparation methods (CP, PT, IM), Ni loading and Alloading are the inputs while the BET surface area, porevolume, pore size and crystallite size are the outputs ofNN-1. The details of the configuration are given in Table 2.
4.1.2. Neural networks two (NN-2) for the function
Y ¼ f(X)
Based on Fig. 2, crude-ethanol conversion, hydrogenselectivity and hydrogen yield are the main parameters thatcharacterize hydrogen-production performance of thecatalysts by the catalytic reforming of crude ethanol, andare the outputs for the NN-2. On the other hand, thecatalyst-preparation method (CP, PT, IM), nickel loading,aluminum loading and reaction operation temperature as
ARTICLE IN PRESS
Fig. 2. Overall relationship between catalysts-preparation conditions, catalyst characteristics and catalyst hydrogen-production performance.
NN-1
NN-3
NN-2
Ni-loading
Preparation method
Al-loading
BET surface area
Pore size
Pore volume
Crystallite size
Preparation method
Ni-loading
Al-loading
Ethanol conversion
H2 selectivity
H2 yield
Ethanol conversion
H2 selectivity
H2 yield
Preparation method
Ni-loading
Al-loading
NN-2 for hydrogen production
NN-1 for catalyst synthesis process
NN-3 for inverse of hydrogen production
(a)
(b)
(c)
Fig. 3. Neural networks for the catalyst properties and hydrogen
production.
S. Song et al. / Engineering Applications of Artificial Intelligence 20 (2007) 261–271266
well as the crude-ethanol WHSV are the main operatingconditions and reaction conditions which could affecthydrogen production. Therefore, these conditions are the
inputs for the NN-2. These are given in Fig. 3b. At fixedcalcination and reaction temperatures as well as fixedWHSV, hydrogen production is only a function ofpreparation method, nickel loading and aluminum loadingas the input variables. Fig. 3b thus shows that only theseare the inputs of the NN-2, while the outputs of the NN-2are crude-ethanol conversion, hydrogen selectivity andhydrogen yields. The details of the configuration for NN-2are given in Table 2. The relationship between the inputand output variables can be expressed in the formulaY ¼ f(X) where
X ¼
Preparation method ðCP; PT; IMÞ
Nickel loading
Aluminum loading
2664
3775
Y ¼
Crude�ethanol conversion
Hydrogen selectivity
Hydrogen yield
2664
3775
4.1.3. Neural networks three (NN-3) for the inverse
function X ¼ f�1(Y)
Normally, ANN are used to learn a function mappingY ¼ f ðX Þ, where Y is the vector of the output and X is thevector of the input and f (X) is the function to learn. Inmany cases in engineering and science problems, it is alsodesired to learn the inverse function, X ¼ f1(Y). It has beenproven that ANNs do well for the forward and inversefunctions.For our situation, the function between the input and the
output is unknown. If hydrogen production (crude ethanolconversion, hydrogen selectivity and hydrogen yields) isknown, it may sometimes be desirable to know both the
ARTICLE IN PRESS
Table 2
Implementation details for NN
Neural network
NN-1 NN-2 NN-3
Feed-forward back propagation Feed-forward back propagation Feed-forward back propagation
Total number of layersa 3 3 3
Neurons per layer 5–5–4 5–5–3 5–5–3
Transfer function Sigmoidal Sigmoidal Sigmoidal
Training algorithmb LM LM LM
Back propagation Back propagation Back propagation
Training epoches 5 79 59
Mean square error 0.008299 0.006934 0.009965
aOne input layer, one hidden layer and one output layer.bLM, Levenberg–Marquardt training algorithm.
S. Song et al. / Engineering Applications of Artificial Intelligence 20 (2007) 261–271 267
catalyst conditions and the reaction operating conditionsthat will yield the known hydrogen production. Thisscenario is given in the NN-3 as described in Fig. 3c. Thedetails of the configuration for NN-3 are also given inTable 2.
4.2. Hydrogen production with neural networks
4.2.1. Using the neural networks to obtain optimal operation
and catalyst conditions for maximum crude-ethanol
conversion, hydrogen selectivity or hydrogen yield
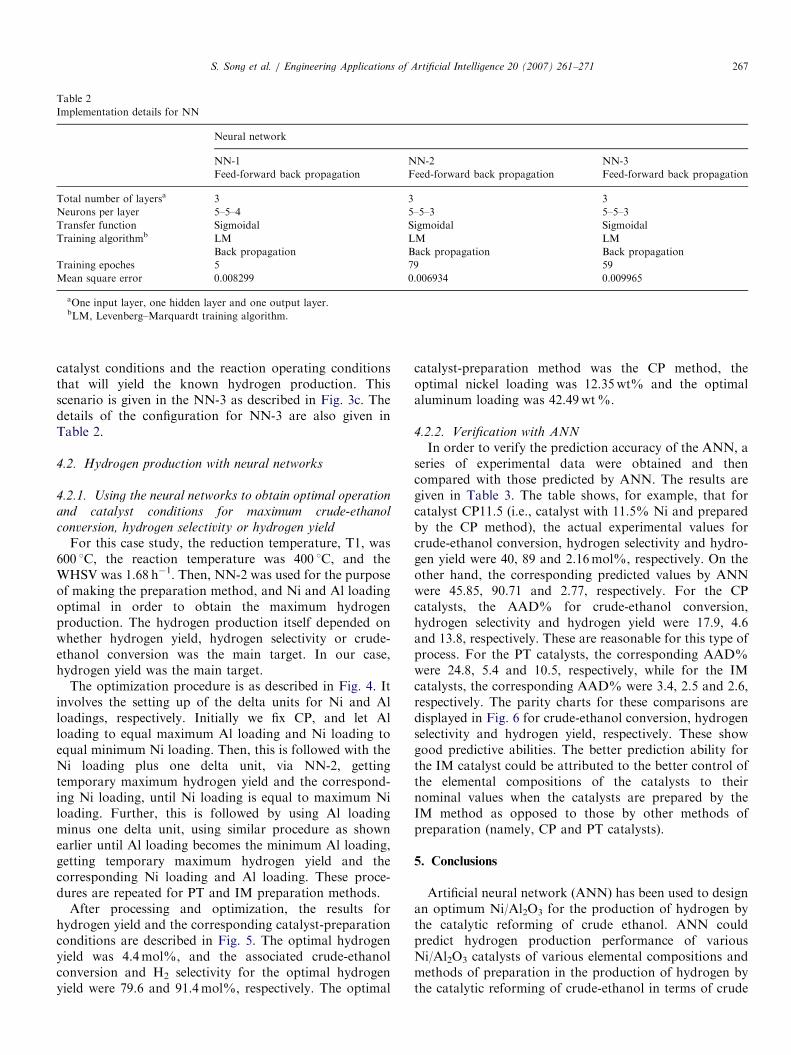
For this case study, the reduction temperature, T1, was600 1C, the reaction temperature was 400 1C, and theWHSV was 1.68 h�1. Then, NN-2 was used for the purposeof making the preparation method, and Ni and Al loadingoptimal in order to obtain the maximum hydrogenproduction. The hydrogen production itself depended onwhether hydrogen yield, hydrogen selectivity or crude-ethanol conversion was the main target. In our case,hydrogen yield was the main target.
The optimization procedure is as described in Fig. 4. Itinvolves the setting up of the delta units for Ni and Alloadings, respectively. Initially we fix CP, and let Alloading to equal maximum Al loading and Ni loading toequal minimum Ni loading. Then, this is followed with theNi loading plus one delta unit, via NN-2, gettingtemporary maximum hydrogen yield and the correspond-ing Ni loading, until Ni loading is equal to maximum Niloading. Further, this is followed by using Al loadingminus one delta unit, using similar procedure as shownearlier until Al loading becomes the minimum Al loading,getting temporary maximum hydrogen yield and thecorresponding Ni loading and Al loading. These proce-dures are repeated for PT and IM preparation methods.
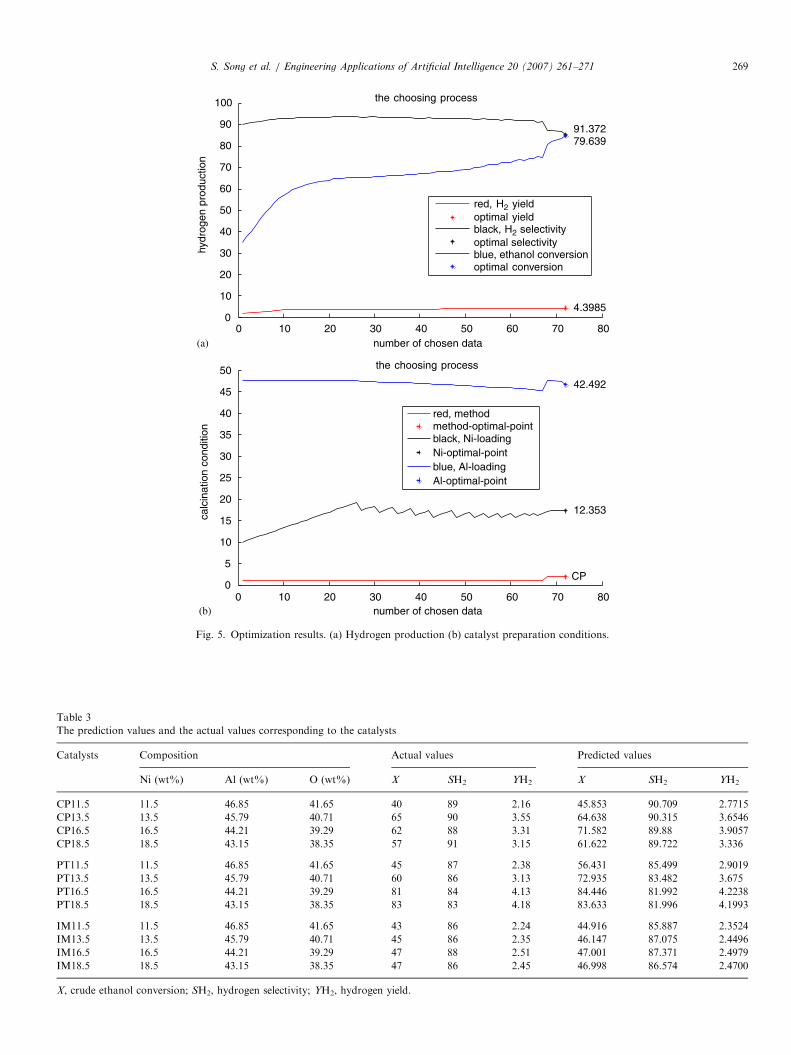
After processing and optimization, the results forhydrogen yield and the corresponding catalyst-preparationconditions are described in Fig. 5. The optimal hydrogenyield was 4.4mol%, and the associated crude-ethanolconversion and H2 selectivity for the optimal hydrogenyield were 79.6 and 91.4mol%, respectively. The optimal
catalyst-preparation method was the CP method, theoptimal nickel loading was 12.35wt% and the optimalaluminum loading was 42.49wt%.
4.2.2. Verification with ANN
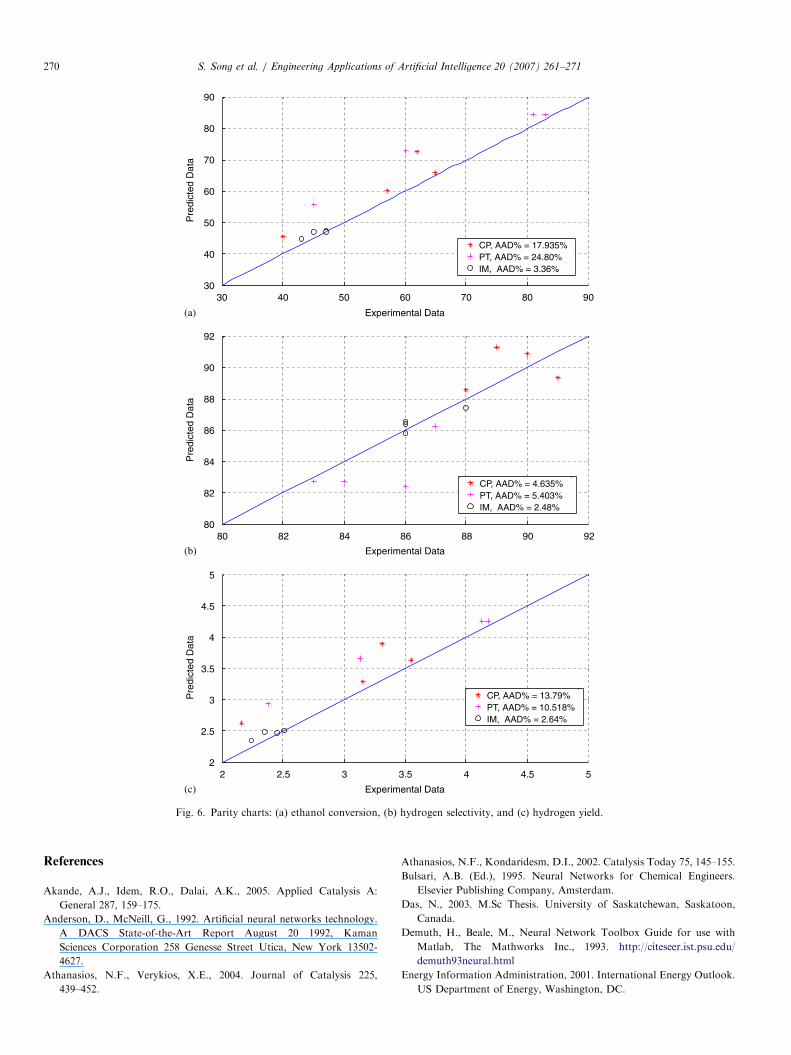
In order to verify the prediction accuracy of the ANN, aseries of experimental data were obtained and thencompared with those predicted by ANN. The results aregiven in Table 3. The table shows, for example, that forcatalyst CP11.5 (i.e., catalyst with 11.5% Ni and preparedby the CP method), the actual experimental values forcrude-ethanol conversion, hydrogen selectivity and hydro-gen yield were 40, 89 and 2.16mol%, respectively. On theother hand, the corresponding predicted values by ANNwere 45.85, 90.71 and 2.77, respectively. For the CPcatalysts, the AAD% for crude-ethanol conversion,hydrogen selectivity and hydrogen yield were 17.9, 4.6and 13.8, respectively. These are reasonable for this type ofprocess. For the PT catalysts, the corresponding AAD%were 24.8, 5.4 and 10.5, respectively, while for the IMcatalysts, the corresponding AAD% were 3.4, 2.5 and 2.6,respectively. The parity charts for these comparisons aredisplayed in Fig. 6 for crude-ethanol conversion, hydrogenselectivity and hydrogen yield, respectively. These showgood predictive abilities. The better prediction ability forthe IM catalyst could be attributed to the better control ofthe elemental compositions of the catalysts to theirnominal values when the catalysts are prepared by theIM method as opposed to those by other methods ofpreparation (namely, CP and PT catalysts).
5. Conclusions
Artificial neural network (ANN) has been used to designan optimum Ni/Al2O3 for the production of hydrogen bythe catalytic reforming of crude ethanol. ANN couldpredict hydrogen production performance of variousNi/Al2O3 catalysts of various elemental compositions andmethods of preparation in the production of hydrogen bythe catalytic reforming of crude-ethanol in terms of crude
ARTICLE IN PRESS
Hydrogen production2=0
Ni=Nimin
Method=1
Al=Almax
NN-2
Hydrogen production2 = Hydrogen production1
Ni_optimal=Ni
Al_optimal=Al
Hydrogen production1>= Hydrogen production2?
Method=1?Delta_Al=(Almax-Almin1)/nDelta Ni=(Nimax-Nimin1)/n
Delta_Al=(Almax-Almin2)/n
Hydrogen production1
Ni=Ni+Delta-Ni
Al=Al-Delta_Al
method=method+1
N
N
Y
Y
Ni=Nimax? N
Y
Al=Almin?
Y
method=3?
N
Y
N
method_optimal=method
Method, Ni_loading, Al_loading Maximum hydrogen
Fig. 4. Optimization procedure.
S. Song et al. / Engineering Applications of Artificial Intelligence 20 (2007) 261–271268
ethanol conversion, hydrogen selectivity and hydrogenyield. Specifically on catalyst design, ANN was usedto determine the optimum catalyst conditions for obtainingmaximum hydrogen-production performance of aNi/Al2O3 catalyst for the production of hydrogen by thecatalytic reforming of crude ethanol. The optimal hydro-
gen yield was 4.4mol%, and the associated crude-ethanolconversion and H2 selectivity for the optimal hydrogenyield were 79.6 and 91.4mol%, respectively. The optimalcatalyst was the one prepared by the CP method with theoptimal nickel loading of 12.4wt% and an optimalaluminum composition of 42.5wt%.
ARTICLE IN PRESS
0 10 20 30 40 50 60 70 800
10
20
30
40
50
60
70
80
90
100 the choosing process
4.3985
91.372 79.639
number of chosen data
hydr
ogen
pro
duct
ion
red, H2 yieldoptimal yieldblack, H2 selectivityoptimal selectivityblue, ethanol conversionoptimal conversion
0 10 20 30 40 50 60 70 800
5
10
15
20
25
30
35
40
45
50 the choosing process
CP
12.353
42.492
number of chosen data
calc
inat
ion
cond
ition
red, methodmethod-optimal-pointblack, Ni-loadingNi-optimal-pointblue, Al-loadingAl-optimal-point
(a)
(b)
Fig. 5. Optimization results. (a) Hydrogen production (b) catalyst preparation conditions.
Table 3
The prediction values and the actual values corresponding to the catalysts
Catalysts Composition Actual values Predicted values
Ni (wt%) Al (wt%) O (wt%) X SH2 YH2 X SH2 YH2
CP11.5 11.5 46.85 41.65 40 89 2.16 45.853 90.709 2.7715
CP13.5 13.5 45.79 40.71 65 90 3.55 64.638 90.315 3.6546
CP16.5 16.5 44.21 39.29 62 88 3.31 71.582 89.88 3.9057
CP18.5 18.5 43.15 38.35 57 91 3.15 61.622 89.722 3.336
PT11.5 11.5 46.85 41.65 45 87 2.38 56.431 85.499 2.9019
PT13.5 13.5 45.79 40.71 60 86 3.13 72.935 83.482 3.675
PT16.5 16.5 44.21 39.29 81 84 4.13 84.446 81.992 4.2238
PT18.5 18.5 43.15 38.35 83 83 4.18 83.633 81.996 4.1993
IM11.5 11.5 46.85 41.65 43 86 2.24 44.916 85.887 2.3524
IM13.5 13.5 45.79 40.71 45 86 2.35 46.147 87.075 2.4496
IM16.5 16.5 44.21 39.29 47 88 2.51 47.001 87.371 2.4979
IM18.5 18.5 43.15 38.35 47 86 2.45 46.998 86.574 2.4700
X, crude ethanol conversion; SH2, hydrogen selectivity; YH2, hydrogen yield.
S. Song et al. / Engineering Applications of Artificial Intelligence 20 (2007) 261–271 269
ARTICLE IN PRESS
30 40 50 60 70 80 9030
40
50
60
70
80
90
Experimental Data
Pre
dict
ed D
ata
80 82 84 86 88 90 9280
82
84
86
88
90
92
Experimental Data
Pre
dict
ed D
ata
2 2.5 3 3.5 4 4.5 52
2.5
3
3.5
4
4.5
5
Experimental Data
Pre
dict
ed D
ata
CP, AAD% = 13.79%PT, AAD% = 10.518%IM, AAD% = 2.64%
CP, AAD% = 4.635%PT, AAD% = 5.403%IM, AAD% = 2.48%
CP, AAD% = 17.935%PT, AAD% = 24.80%IM, AAD% = 3.36%
(a)
(b)
(c)
Fig. 6. Parity charts: (a) ethanol conversion, (b) hydrogen selectivity, and (c) hydrogen yield.
S. Song et al. / Engineering Applications of Artificial Intelligence 20 (2007) 261–271270
References
Akande, A.J., Idem, R.O., Dalai, A.K., 2005. Applied Catalysis A:
General 287, 159–175.
Anderson, D., McNeill, G., 1992. Artificial neural networks technology.
A DACS State-of-the-Art Report August 20 1992, Kaman
Sciences Corporation 258 Genesse Street Utica, New York 13502-
4627.
Athanasios, N.F., Verykios, X.E., 2004. Journal of Catalysis 225,
439–452.
Athanasios, N.F., Kondaridesm, D.I., 2002. Catalysis Today 75, 145–155.
Bulsari, A.B. (Ed.), 1995. Neural Networks for Chemical Engineers.
Elsevier Publishing Company, Amsterdam.
Das, N., 2003. M.Sc Thesis. University of Saskatchewan, Saskatoon,
Canada.
Demuth, H., Beale, M., Neural Network Toolbox Guide for use with
Matlab, The Mathworks Inc., 1993. http://citeseer.ist.psu.edu/
demuth93neural.html
Energy Information Administration, 2001. International Energy Outlook.
US Department of Energy, Washington, DC.
ARTICLE IN PRESSS. Song et al. / Engineering Applications of Artificial Intelligence 20 (2007) 261–271 271
Galvita, V.V., Semin, G.L., Belyaev, V.D., Semikolenov, V.A., Tsiakaras,
P., Sobyanin, V.A., 2001. Applied Catalysis A: General 220, 123–127.
Hou, Z.Y., Dai, Q., Wu, X.-Q., Chen, G.-T., 1997. Applied Catalysis A:
General 161, 183–190.
/http://atom.ecn.purdue.edu/�jmcweb/materials/catalyst.htmlS/http://www.cs.brandeis.edu/�cs113/classprojects/�jlittman/cs113/
Web_Project__231_–_Unsupervised_Learning.htmlS/http://www.cs.brown.edu/stc/outrea/greenhouse/nursery/interpolation/
itworks.htmlS/http://www.doc.ic.ac.uk/�nd/surprise_96/journal/vol4/cs11/report.htmlS/http://www.nrel.gov/hydrogen/proj_production_delivery.htmlS/http://www.statsoft.com/textbook/stneunet.htmlSIdem, R., Ibrahim, H.H., Tontiwachwuthikul, P., Wilson, M., 2003. In:
Gale, J., Kaya, Y. (Eds.), Proceedings of the sixth International
Conference on Greenhouse Gas Control Technologies. Kyoto, Japan,
1–4 October 2002, Pergamon, Oxford, UK, pp. 1825–1828.
Jang, J.-S.R., Sun, C.-T., Mizutani, E., 1997. Neuro-Fuzzy and Soft
Computing. A Computational Approach to Learning and Machine
Intelligence. Prentice Hall, Englewood Cliffs, NJ, pp. 226–229, 301–303.
Jordi, L., Homs, N., Sales, J., Ramirez de la Piscina, P., 2002. Journal of
Catalysis 209, 306–317.
Klouz, V., Fierro, V., Denton, P., Katz, H., Lisse, J.P., Bouvot-mauduit,
S., Mirodatos, C., 2002. Power Sources 105, 26–34.
Krose, B., van der Smagt, P., 1996. An Introduction to Neural Networks,
eighth ed. Faculty of Mathematics and Computer Science, University
of Amsterdam.
Leclerc, S., Mann, R.F., Peppley, B.A., 1998. Evaluation of the catalytic
ethanol-steam reforming process as a source of hydrogen-rich gas for
fuel cells. Prepared for The CANMET Energy Technology Centre
(CETC).
Luengo, C.A., Ciampi, G., Cencig, M.O., Steckelberg, C., A Larbode, M.,
1992. International Journal of Hydrogen Energy 17 (9), 667–681.
Lyster, M.D., Comparison of neural networks and classical curve fitting
for fuel cell.
MacKay, D., 2002. Information Theory, Inference & Learning Algo-
rithms. Cambridge University Press, Cambridge.
Omata, K., Nukui, N., Yamada, M., 2005. Industrial and Engineering
Chemistry Research 44, 296–301.