Intensity–phase characterization of white-light continuum generated in sapphire by 280 fs laser...
8
Intensity–phase characterization of white-light continuum generated in sapphire by 280 fs laser pulses at 1053 nm This article has been downloaded from IOPscience. Please scroll down to see the full text article. 2012 J. Opt. 14 035201 (http://iopscience.iop.org/2040-8986/14/3/035201) Download details: IP Address: 193.136.197.170 The article was downloaded on 09/10/2012 at 11:37 Please note that terms and conditions apply. View the table of contents for this issue, or go to the journal homepage for more Home Search Collections Journals About Contact us My IOPscience
Transcript of Intensity–phase characterization of white-light continuum generated in sapphire by 280 fs laser...
Intensity–phase characterization of white-light continuum generated in sapphire by 280 fs
laser pulses at 1053 nm
This article has been downloaded from IOPscience. Please scroll down to see the full text article.
2012 J. Opt. 14 035201
(http://iopscience.iop.org/2040-8986/14/3/035201)
Download details:
IP Address: 193.136.197.170
The article was downloaded on 09/10/2012 at 11:37
Please note that terms and conditions apply.
View the table of contents for this issue, or go to the journal homepage for more
Home Search Collections Journals About Contact us My IOPscience
IOP PUBLISHING JOURNAL OF OPTICS A: PURE AND APPLIED OPTICS
J. Opt. 14 (2012) 035201 (7pp) doi:10.1088/2040-8978/14/3/035201
Intensity–phase characterization ofwhite-light continuum generated insapphire by 280 fs laser pulses at 1053 nm
Tayyab Imran1 and Goncalo Figueira
GoLP, Associacao EURATOM-IST—Instituto de Plasmas e Fusao Nuclear, Instituto Superior Tecnico,Technical University of Lisbon, 1049-001 Lisbon, Portugal
E-mail: [email protected]
Received 19 August 2011, accepted for publication 9 January 2012Published 2 February 2012Online at stacks.iop.org/JOpt/14/035201
AbstractA white-light continuum is generated in bulk sapphire using 280 fs, 1053 nm centrewavelength pulses at peak powers well above the critical power. The resulting spectrumextends from 400 nm up to at least 1100 nm with good conversion efficiency. A high-passfilter is used to remove the residual peak at the pump wavelength, producing a broad, flatspectrum in the near infrared region. We characterize the intensity and phase of the continuumby using cross-correlation frequency-resolved optical gating. We show that using pump pulsesabove 1 µm is a very interesting approach for generating broad continua with favourablecharacteristics.
Keywords: white-light continuum generation, frequency resolved optical gating, pulsecharacterization
(Some figures may appear in colour only in the online journal)
1. Introduction
The propagation of intense, short laser pulses through atransparent optical medium can modify their temporal, spatialand spectral properties, leading to interesting nonlinearinteractions. A well-known phenomenon, termed the white-light continuum (WLC) or supercontinuum generation(SG), consists in ultrabroadening of the original spectrum,extending from the ultraviolet to the infrared [1–4]. Theprimary process responsible for WLC generation is self-focusing, which causes the pulse to compress in space,resulting in a corresponding increase in the peak intensity [5,6]. The other dominant processes responsible for starting themechanisms leading to spectral broadening are self-phasemodulation, self-steepening [7] and parametric four-photonmixing [8].
1 Current address: School of Science and Engineering, Lahore Universityof Management Sciences (LUMS), Opposite Sector U, DHA, Lahore 54792,Pakistan.
Broadband WLC can now be routinely generated usinge.g. photonic-crystal fibres [9], microstructure fibres [10] orbulk media [11]. The latter approach is more useful for anumber of practical applications, such as providing a generalwhite-light source for nonlinear spectroscopy and microscopy,and more specialized applications such as seed pulses foroptical parametric amplification (OPA), tunable laser sources,pump probe spectroscopy, and pulse compression [12–14].
Since the first observation, many experiments havedescribed the generation of WLC in different solid materials,most of which relied on using conventional sub-100 fs,high repetition rate (∼kHz) Ti:sapphire lasers operating at800 nm [15–18]. At longer wavelengths, Saliminia et al [19]have studied continuum generation in fused silica by usingan optical parametric amplifier (OPA) working at 1.5 µm,and Wang et al [20] have also used a dual OPA at 800 and1054 nm. Bradler et al [21] published a comprehensive surveyon continuum generation in bulk laser host materials over awide range of pump pulse wavelengths (775–1600 nm) tunedby using a noncollinear OPA system. All of these works
12040-8978/12/035201+07$33.00 c© 2012 IOP Publishing Ltd Printed in the UK & the USA
J. Opt. 14 (2012) 035201 T Imran and G Figueira
are mainly focused on the WLC generation, optimization,beam profile and stability. More recently, Antipenkov et alcreated a WLC pumped by 1025 nm pulses and extendingfrom 500 to 1100 nm that was spectrally filtered, amplifiedand compressed to <10 fs duration [22], showing the greatpotential of this technique as a road for generating few-cyclepulses.
Continuum generation in bulk media involves complexcoupling phenomena between spatial and temporal effects [9],posing considerable challenges to an understanding of the roleof the several mechanisms involved. This requires a detailedexperimental study of the continuum characteristics for agiven set of parameters, which in turn is also challengingdue to the extremely broadband nature and the large(∼1000) time–bandwidth product of the pulses. Describinga generic pulse involves a complete knowledge of both theintensity and the phase, either in the spectral or temporaldomain. The time–frequency distribution provided by thecross-correlation frequency-resolved optical gating (XFROG)technique provides a particularly useful representation forthe complex temporal and spectral evolution associated withWLC generation. For instance, in previous experiments theXFROG technique was successfully used for characterizingthe continuum generation in photonic-crystal fibres ormicrostructure fibres [23, 24], and the continuum generatedby 800 nm pulses in bulk media such as CaF2, sapphire andfused silica was measured by using the related techniquesof difference frequency generation XFROG and opticalparametric amplification XFROG [25–28].
In this work, we present a comprehensive evaluation ofcontinuum generation in sapphire pumped by 280 fs, mJ-level,1053 nm, 10 Hz pulses with powers well above (300×) thecritical power, in terms of spectral broadening, efficiency,stability and polarization. We use a multi-shot XFROGtechnique with angle-dithering [23, 29] for characterizingthe spectral phase of the continuum generated, in order toobtain full intensity and phase information. The results thatwe present here are of interest in optimizing femtosecondcontinuum production in solid media using pump pulsesabove 1 µm and in applying it to a number of relevantapplications, such as pulse compression for generatingsub-10 fs laser pulses, or as a source for generating amplified,ultrashort pulses through OPA.
2. Experimental setup
The original pump laser pulses are generated by using thefront end of the multi-terawatt, hybrid Ti:sapphire–Nd:glassL2I laser system [30]. The system starts with a Ti:sapphireKerr-lens mode-locked oscillator (Mira 900F, Coherent Inc.)that delivers a∼120 fs, 76 MHz pulse train with an individualpulse energy of 4 nJ at a central wavelength of 1053 nm.Pulses are then stretched to ∼0.9 ns in an Offner gratingstretcher and directed into a homemade, Nd:YAG pumpedTi:sapphire regenerative amplifier operating at 10 Hz. Heretheir energy is raised up to ∼2 mJ, with an output spectralbandwidth of ∼5 nm. After compression in a double-passgrating setup we obtain ∼280 fs FWHM, mJ-level pulses.
L1
L2sapphire
FM
spectrometer
power
meter
from
regen.
amp.
delay
line
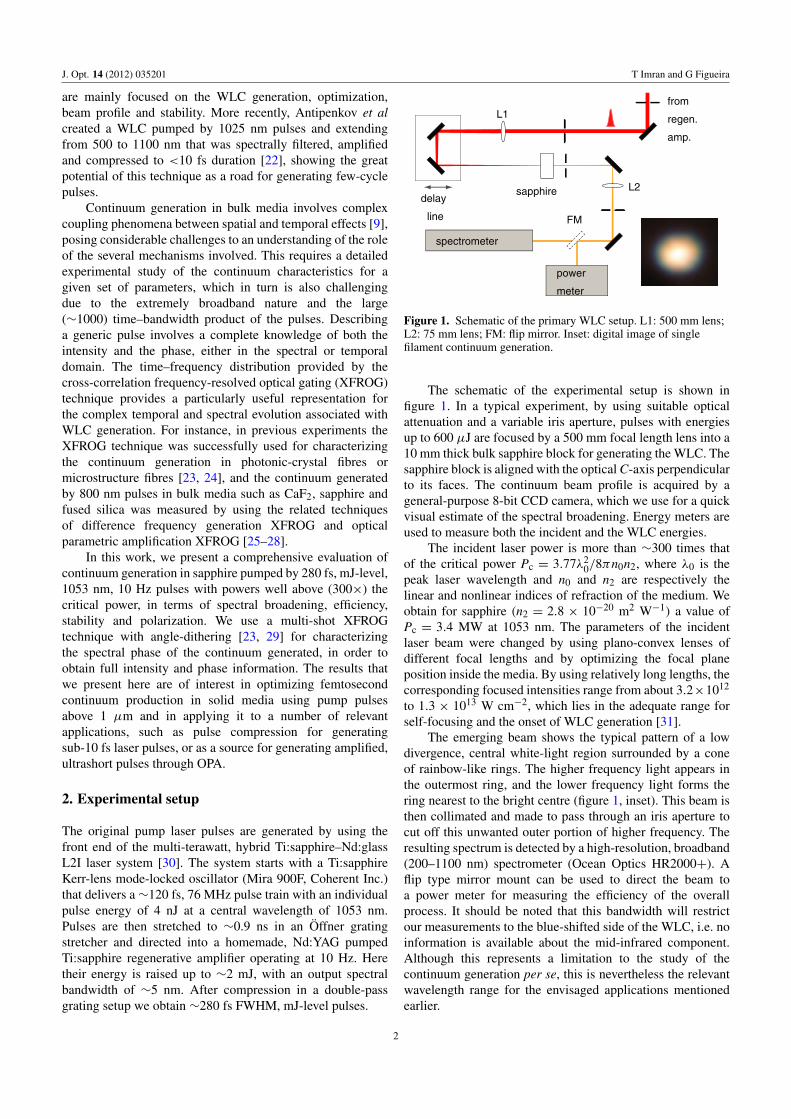
Figure 1. Schematic of the primary WLC setup. L1: 500 mm lens;L2: 75 mm lens; FM: flip mirror. Inset: digital image of singlefilament continuum generation.
The schematic of the experimental setup is shown infigure 1. In a typical experiment, by using suitable opticalattenuation and a variable iris aperture, pulses with energiesup to 600 µJ are focused by a 500 mm focal length lens into a10 mm thick bulk sapphire block for generating the WLC. Thesapphire block is aligned with the optical C-axis perpendicularto its faces. The continuum beam profile is acquired by ageneral-purpose 8-bit CCD camera, which we use for a quickvisual estimate of the spectral broadening. Energy meters areused to measure both the incident and the WLC energies.
The incident laser power is more than ∼300 times thatof the critical power Pc = 3.77λ2
0/8πn0n2, where λ0 is thepeak laser wavelength and n0 and n2 are respectively thelinear and nonlinear indices of refraction of the medium. Weobtain for sapphire (n2 = 2.8 × 10⁻²⁰ m2 W−1) a value ofPc = 3.4 MW at 1053 nm. The parameters of the incidentlaser beam were changed by using plano-convex lenses ofdifferent focal lengths and by optimizing the focal planeposition inside the media. By using relatively long lengths, thecorresponding focused intensities range from about 3.2×10¹²
to 1.3 × 10¹³ W cm−2, which lies in the adequate range forself-focusing and the onset of WLC generation [31].
The emerging beam shows the typical pattern of a lowdivergence, central white-light region surrounded by a coneof rainbow-like rings. The higher frequency light appears inthe outermost ring, and the lower frequency light forms thering nearest to the bright centre (figure 1, inset). This beam isthen collimated and made to pass through an iris aperture tocut off this unwanted outer portion of higher frequency. Theresulting spectrum is detected by a high-resolution, broadband(200–1100 nm) spectrometer (Ocean Optics HR2000+). Aflip type mirror mount can be used to direct the beam toa power meter for measuring the efficiency of the overallprocess. It should be noted that this bandwidth will restrictour measurements to the blue-shifted side of the WLC, i.e. noinformation is available about the mid-infrared component.Although this represents a limitation to the study of thecontinuum generation per se, this is nevertheless the relevantwavelength range for the envisaged applications mentionedearlier.
2
J. Opt. 14 (2012) 035201 T Imran and G FigueiraIn
tens
ity (
a.u.
)
Wavelength (nm)400 500 600 700 800 900 1000 1100
seedWLC
0.01
0.1
1
400 600 800 10000
0.5
1
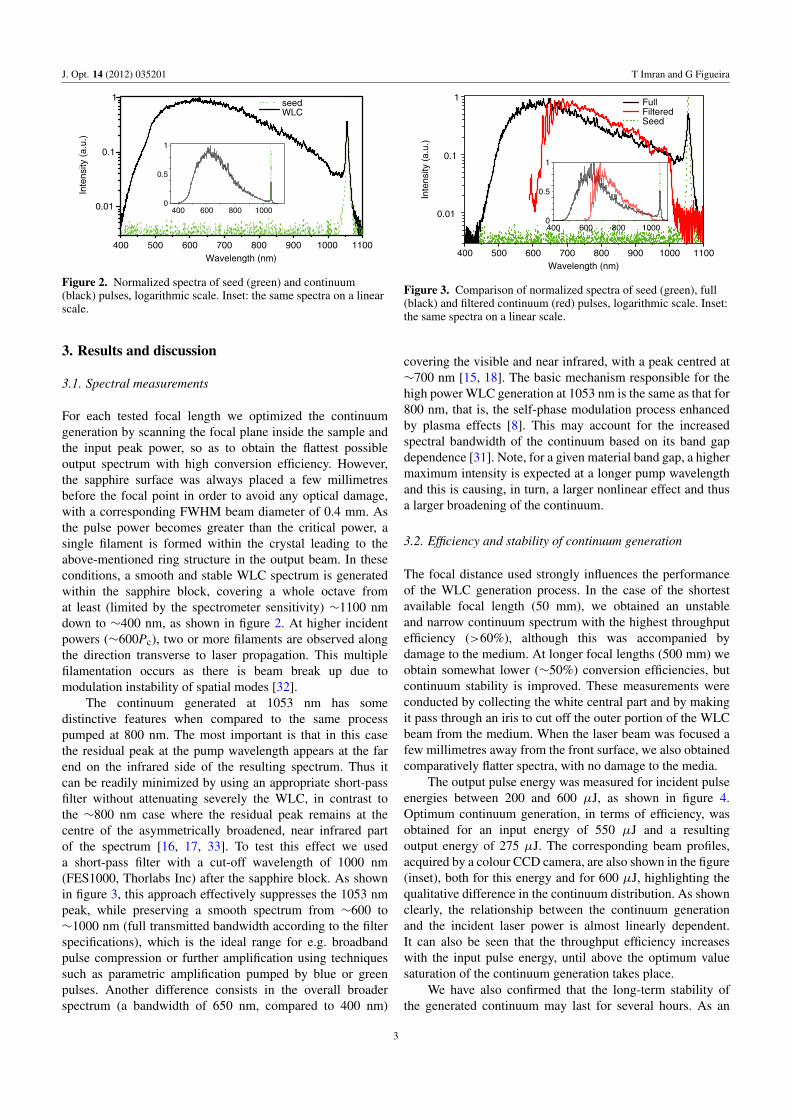
Figure 2. Normalized spectra of seed (green) and continuum(black) pulses, logarithmic scale. Inset: the same spectra on a linearscale.
3. Results and discussion
3.1. Spectral measurements
For each tested focal length we optimized the continuumgeneration by scanning the focal plane inside the sample andthe input peak power, so as to obtain the flattest possibleoutput spectrum with high conversion efficiency. However,the sapphire surface was always placed a few millimetresbefore the focal point in order to avoid any optical damage,with a corresponding FWHM beam diameter of 0.4 mm. Asthe pulse power becomes greater than the critical power, asingle filament is formed within the crystal leading to theabove-mentioned ring structure in the output beam. In theseconditions, a smooth and stable WLC spectrum is generatedwithin the sapphire block, covering a whole octave fromat least (limited by the spectrometer sensitivity) ∼1100 nmdown to ∼400 nm, as shown in figure 2. At higher incidentpowers (∼600Pc), two or more filaments are observed alongthe direction transverse to laser propagation. This multiplefilamentation occurs as there is beam break up due tomodulation instability of spatial modes [32].
The continuum generated at 1053 nm has somedistinctive features when compared to the same processpumped at 800 nm. The most important is that in this casethe residual peak at the pump wavelength appears at the farend on the infrared side of the resulting spectrum. Thus itcan be readily minimized by using an appropriate short-passfilter without attenuating severely the WLC, in contrast tothe ∼800 nm case where the residual peak remains at thecentre of the asymmetrically broadened, near infrared partof the spectrum [16, 17, 33]. To test this effect we useda short-pass filter with a cut-off wavelength of 1000 nm(FES1000, Thorlabs Inc) after the sapphire block. As shownin figure 3, this approach effectively suppresses the 1053 nmpeak, while preserving a smooth spectrum from ∼600 to∼1000 nm (full transmitted bandwidth according to the filterspecifications), which is the ideal range for e.g. broadbandpulse compression or further amplification using techniquessuch as parametric amplification pumped by blue or greenpulses. Another difference consists in the overall broaderspectrum (a bandwidth of 650 nm, compared to 400 nm)
Inte
nsity
(a.
u.)
Wavelength (nm)400 500 600 700 800 900 1000 1100
0.01
0.1
1 FullFilteredSeed
400 600 800 10000
0.5
1
Figure 3. Comparison of normalized spectra of seed (green), full(black) and filtered continuum (red) pulses, logarithmic scale. Inset:the same spectra on a linear scale.
covering the visible and near infrared, with a peak centred at∼700 nm [15, 18]. The basic mechanism responsible for thehigh power WLC generation at 1053 nm is the same as that for800 nm, that is, the self-phase modulation process enhancedby plasma effects [8]. This may account for the increasedspectral bandwidth of the continuum based on its band gapdependence [31]. Note, for a given material band gap, a highermaximum intensity is expected at a longer pump wavelengthand this is causing, in turn, a larger nonlinear effect and thusa larger broadening of the continuum.
3.2. Efficiency and stability of continuum generation
The focal distance used strongly influences the performanceof the WLC generation process. In the case of the shortestavailable focal length (50 mm), we obtained an unstableand narrow continuum spectrum with the highest throughputefficiency (>60%), although this was accompanied bydamage to the medium. At longer focal lengths (500 mm) weobtain somewhat lower (∼50%) conversion efficiencies, butcontinuum stability is improved. These measurements wereconducted by collecting the white central part and by makingit pass through an iris to cut off the outer portion of the WLCbeam from the medium. When the laser beam was focused afew millimetres away from the front surface, we also obtainedcomparatively flatter spectra, with no damage to the media.
The output pulse energy was measured for incident pulseenergies between 200 and 600 µJ, as shown in figure 4.Optimum continuum generation, in terms of efficiency, wasobtained for an input energy of 550 µJ and a resultingoutput energy of 275 µJ. The corresponding beam profiles,acquired by a colour CCD camera, are also shown in the figure(inset), both for this energy and for 600 µJ, highlighting thequalitative difference in the continuum distribution. As shownclearly, the relationship between the continuum generationand the incident laser power is almost linearly dependent.It can also be seen that the throughput efficiency increaseswith the input pulse energy, until above the optimum valuesaturation of the continuum generation takes place.
We have also confirmed that the long-term stability ofthe generated continuum may last for several hours. As an
3
J. Opt. 14 (2012) 035201 T Imran and G Figueira
~275 µJ
100
0
200
300
400
100 200 300 400 500 600 700
~550 µJ
Input (µJ)
Out
put (
µJ)
15
0
30
45
60
% E
ff.
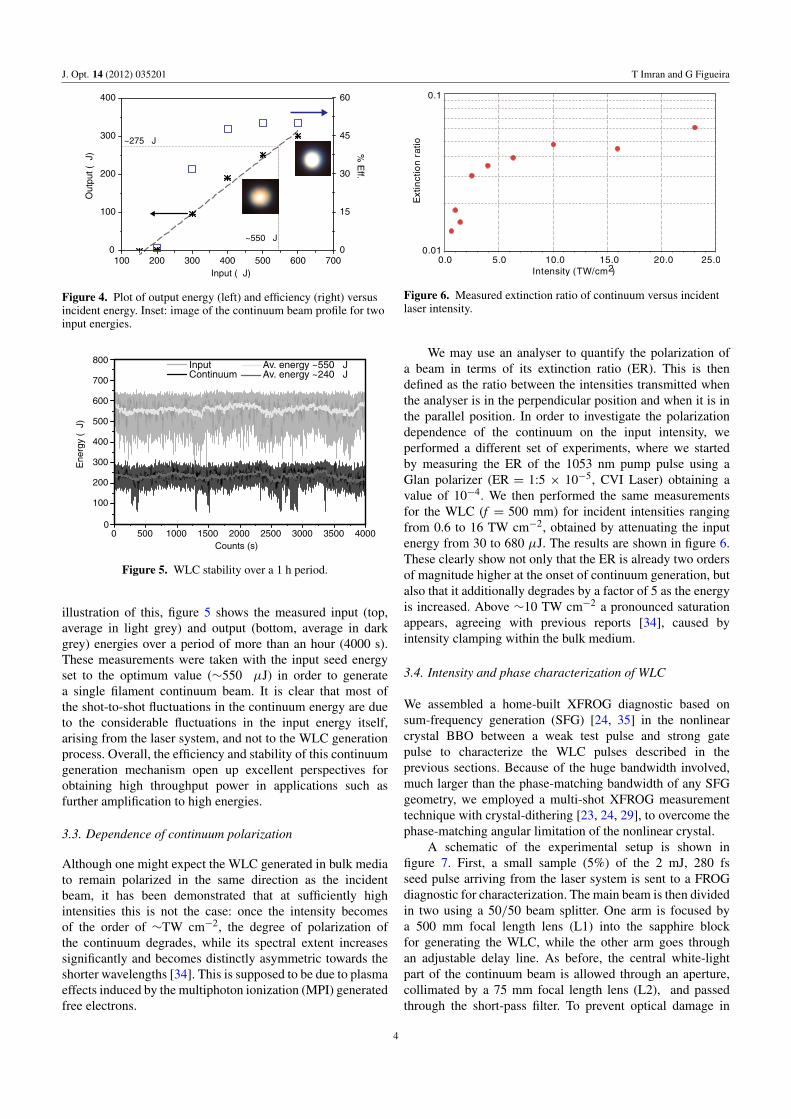
Figure 4. Plot of output energy (left) and efficiency (right) versusincident energy. Inset: image of the continuum beam profile for twoinput energies.
InputContinuum
Ene
rgy
(µJ)
Counts (s)
0
100
200
300
400
500
600
700
800
0 500 1000 1500 2000 2500 3000 3500 4000
Av. energy ~550 µJAv. energy ~240 µJ
Figure 5. WLC stability over a 1 h period.
illustration of this, figure 5 shows the measured input (top,average in light grey) and output (bottom, average in darkgrey) energies over a period of more than an hour (4000 s).These measurements were taken with the input seed energyset to the optimum value (∼550 µJ) in order to generatea single filament continuum beam. It is clear that most ofthe shot-to-shot fluctuations in the continuum energy are dueto the considerable fluctuations in the input energy itself,arising from the laser system, and not to the WLC generationprocess. Overall, the efficiency and stability of this continuumgeneration mechanism open up excellent perspectives forobtaining high throughput power in applications such asfurther amplification to high energies.
3.3. Dependence of continuum polarization
Although one might expect the WLC generated in bulk mediato remain polarized in the same direction as the incidentbeam, it has been demonstrated that at sufficiently highintensities this is not the case: once the intensity becomesof the order of ∼TW cm−2, the degree of polarization ofthe continuum degrades, while its spectral extent increasessignificantly and becomes distinctly asymmetric towards theshorter wavelengths [34]. This is supposed to be due to plasmaeffects induced by the multiphoton ionization (MPI) generatedfree electrons.
Figure 6. Measured extinction ratio of continuum versus incidentlaser intensity.
We may use an analyser to quantify the polarization ofa beam in terms of its extinction ratio (ER). This is thendefined as the ratio between the intensities transmitted whenthe analyser is in the perpendicular position and when it is inthe parallel position. In order to investigate the polarizationdependence of the continuum on the input intensity, weperformed a different set of experiments, where we startedby measuring the ER of the 1053 nm pump pulse using aGlan polarizer (ER = 1:5 × 10⁻⁵, CVI Laser) obtaining avalue of 10−4. We then performed the same measurementsfor the WLC (f = 500 mm) for incident intensities rangingfrom 0.6 to 16 TW cm−2, obtained by attenuating the inputenergy from 30 to 680 µJ. The results are shown in figure 6.These clearly show not only that the ER is already two ordersof magnitude higher at the onset of continuum generation, butalso that it additionally degrades by a factor of 5 as the energyis increased. Above ∼10 TW cm−2 a pronounced saturationappears, agreeing with previous reports [34], caused byintensity clamping within the bulk medium.
3.4. Intensity and phase characterization of WLC
We assembled a home-built XFROG diagnostic based onsum-frequency generation (SFG) [24, 35] in the nonlinearcrystal BBO between a weak test pulse and strong gatepulse to characterize the WLC pulses described in theprevious sections. Because of the huge bandwidth involved,much larger than the phase-matching bandwidth of any SFGgeometry, we employed a multi-shot XFROG measurementtechnique with crystal-dithering [23, 24, 29], to overcome thephase-matching angular limitation of the nonlinear crystal.
A schematic of the experimental setup is shown infigure 7. First, a small sample (5%) of the 2 mJ, 280 fsseed pulse arriving from the laser system is sent to a FROGdiagnostic for characterization. The main beam is then dividedin two using a 50/50 beam splitter. One arm is focused bya 500 mm focal length lens (L1) into the sapphire blockfor generating the WLC, while the other arm goes throughan adjustable delay line. As before, the central white-lightpart of the continuum beam is allowed through an aperture,collimated by a 75 mm focal length lens (L2), and passedthrough the short-pass filter. To prevent optical damage in
4
J. Opt. 14 (2012) 035201 T Imran and G Figueira
L1
L2
L3
L4
BBO
T=5%
ND
sapphire
spectrometer
FROG
delayline
BS
ND
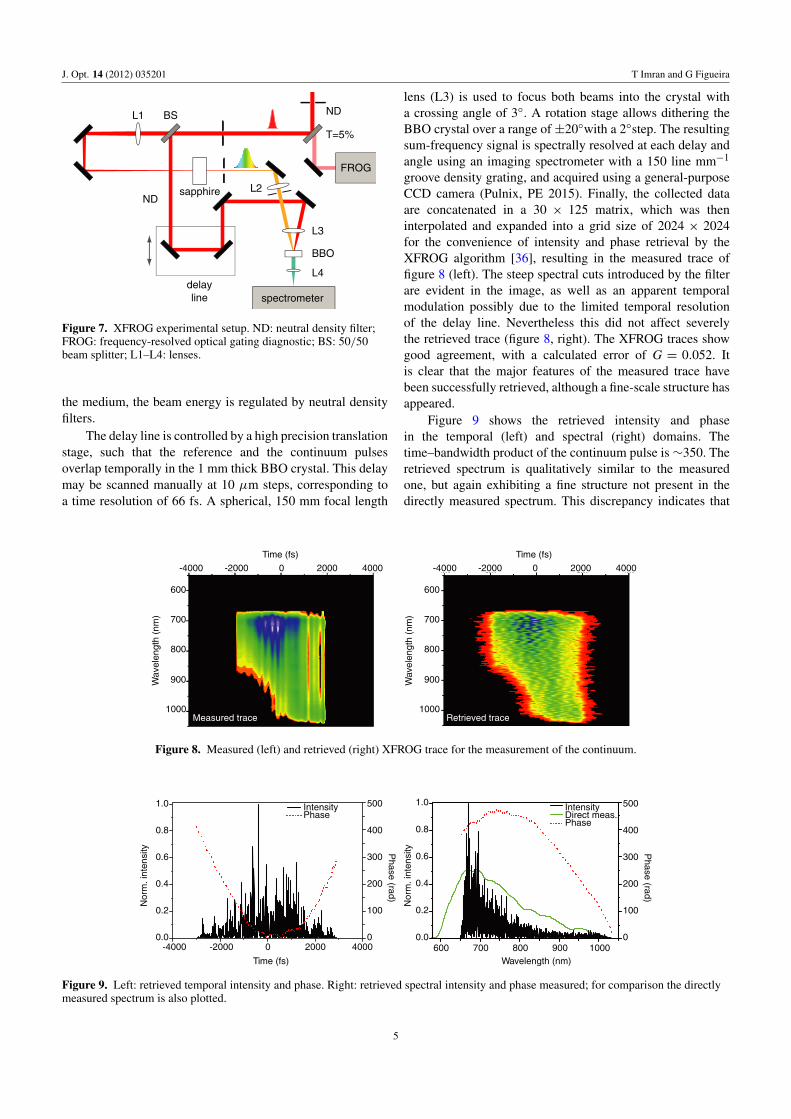
Figure 7. XFROG experimental setup. ND: neutral density filter;FROG: frequency-resolved optical gating diagnostic; BS: 50/50beam splitter; L1–L4: lenses.
the medium, the beam energy is regulated by neutral densityfilters.
The delay line is controlled by a high precision translationstage, such that the reference and the continuum pulsesoverlap temporally in the 1 mm thick BBO crystal. This delaymay be scanned manually at 10 µm steps, corresponding toa time resolution of 66 fs. A spherical, 150 mm focal length
lens (L3) is used to focus both beams into the crystal witha crossing angle of 3◦. A rotation stage allows dithering theBBO crystal over a range of ±20◦with a 2◦step. The resultingsum-frequency signal is spectrally resolved at each delay andangle using an imaging spectrometer with a 150 line mm−1
groove density grating, and acquired using a general-purposeCCD camera (Pulnix, PE 2015). Finally, the collected dataare concatenated in a 30 × 125 matrix, which was theninterpolated and expanded into a grid size of 2024 × 2024for the convenience of intensity and phase retrieval by theXFROG algorithm [36], resulting in the measured trace offigure 8 (left). The steep spectral cuts introduced by the filterare evident in the image, as well as an apparent temporalmodulation possibly due to the limited temporal resolutionof the delay line. Nevertheless this did not affect severelythe retrieved trace (figure 8, right). The XFROG traces showgood agreement, with a calculated error of G = 0.052. Itis clear that the major features of the measured trace havebeen successfully retrieved, although a fine-scale structure hasappeared.
Figure 9 shows the retrieved intensity and phasein the temporal (left) and spectral (right) domains. Thetime–bandwidth product of the continuum pulse is∼350. Theretrieved spectrum is qualitatively similar to the measuredone, but again exhibiting a fine structure not present in thedirectly measured spectrum. This discrepancy indicates that
Figure 8. Measured (left) and retrieved (right) XFROG trace for the measurement of the continuum.
Figure 9. Left: retrieved temporal intensity and phase. Right: retrieved spectral intensity and phase measured; for comparison the directlymeasured spectrum is also plotted.
5
J. Opt. 14 (2012) 035201 T Imran and G Figueira
0
160
140
120
100
80
60
40
20
600 605 610 615 620 625Wavelength(nm)
Inte
nsity
(AU
)
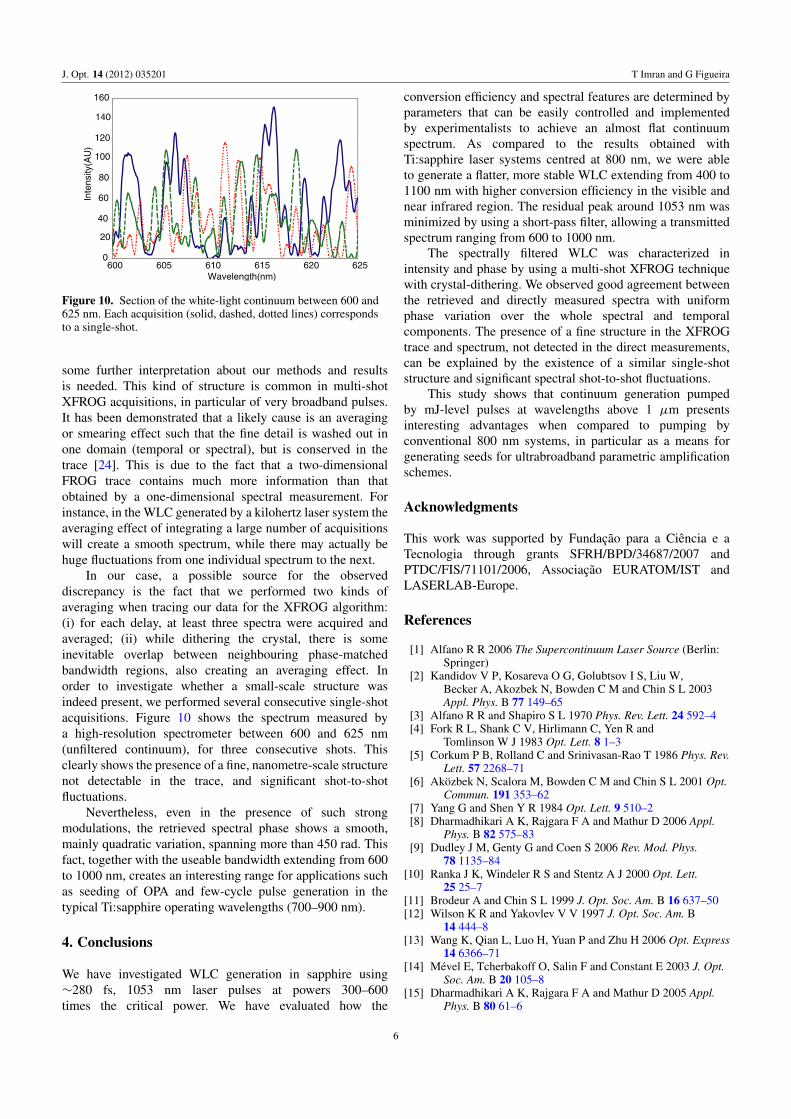
Figure 10. Section of the white-light continuum between 600 and625 nm. Each acquisition (solid, dashed, dotted lines) correspondsto a single-shot.
some further interpretation about our methods and resultsis needed. This kind of structure is common in multi-shotXFROG acquisitions, in particular of very broadband pulses.It has been demonstrated that a likely cause is an averagingor smearing effect such that the fine detail is washed out inone domain (temporal or spectral), but is conserved in thetrace [24]. This is due to the fact that a two-dimensionalFROG trace contains much more information than thatobtained by a one-dimensional spectral measurement. Forinstance, in the WLC generated by a kilohertz laser system theaveraging effect of integrating a large number of acquisitionswill create a smooth spectrum, while there may actually behuge fluctuations from one individual spectrum to the next.
In our case, a possible source for the observeddiscrepancy is the fact that we performed two kinds ofaveraging when tracing our data for the XFROG algorithm:(i) for each delay, at least three spectra were acquired andaveraged; (ii) while dithering the crystal, there is someinevitable overlap between neighbouring phase-matchedbandwidth regions, also creating an averaging effect. Inorder to investigate whether a small-scale structure wasindeed present, we performed several consecutive single-shotacquisitions. Figure 10 shows the spectrum measured bya high-resolution spectrometer between 600 and 625 nm(unfiltered continuum), for three consecutive shots. Thisclearly shows the presence of a fine, nanometre-scale structurenot detectable in the trace, and significant shot-to-shotfluctuations.
Nevertheless, even in the presence of such strongmodulations, the retrieved spectral phase shows a smooth,mainly quadratic variation, spanning more than 450 rad. Thisfact, together with the useable bandwidth extending from 600to 1000 nm, creates an interesting range for applications suchas seeding of OPA and few-cycle pulse generation in thetypical Ti:sapphire operating wavelengths (700–900 nm).
4. Conclusions
We have investigated WLC generation in sapphire using∼280 fs, 1053 nm laser pulses at powers 300–600times the critical power. We have evaluated how the
conversion efficiency and spectral features are determined byparameters that can be easily controlled and implementedby experimentalists to achieve an almost flat continuumspectrum. As compared to the results obtained withTi:sapphire laser systems centred at 800 nm, we were ableto generate a flatter, more stable WLC extending from 400 to1100 nm with higher conversion efficiency in the visible andnear infrared region. The residual peak around 1053 nm wasminimized by using a short-pass filter, allowing a transmittedspectrum ranging from 600 to 1000 nm.
The spectrally filtered WLC was characterized inintensity and phase by using a multi-shot XFROG techniquewith crystal-dithering. We observed good agreement betweenthe retrieved and directly measured spectra with uniformphase variation over the whole spectral and temporalcomponents. The presence of a fine structure in the XFROGtrace and spectrum, not detected in the direct measurements,can be explained by the existence of a similar single-shotstructure and significant spectral shot-to-shot fluctuations.
This study shows that continuum generation pumpedby mJ-level pulses at wavelengths above 1 µm presentsinteresting advantages when compared to pumping byconventional 800 nm systems, in particular as a means forgenerating seeds for ultrabroadband parametric amplificationschemes.
Acknowledgments
This work was supported by Fundacao para a Ciencia e aTecnologia through grants SFRH/BPD/34687/2007 andPTDC/FIS/71101/2006, Associacao EURATOM/IST andLASERLAB-Europe.
References
[1] Alfano R R 2006 The Supercontinuum Laser Source (Berlin:Springer)
[2] Kandidov V P, Kosareva O G, Golubtsov I S, Liu W,Becker A, Akozbek N, Bowden C M and Chin S L 2003Appl. Phys. B 77 149–65
[3] Alfano R R and Shapiro S L 1970 Phys. Rev. Lett. 24 592–4[4] Fork R L, Shank C V, Hirlimann C, Yen R and
Tomlinson W J 1983 Opt. Lett. 8 1–3[5] Corkum P B, Rolland C and Srinivasan-Rao T 1986 Phys. Rev.
Lett. 57 2268–71[6] Akozbek N, Scalora M, Bowden C M and Chin S L 2001 Opt.
Commun. 191 353–62[7] Yang G and Shen Y R 1984 Opt. Lett. 9 510–2[8] Dharmadhikari A K, Rajgara F A and Mathur D 2006 Appl.
Phys. B 82 575–83[9] Dudley J M, Genty G and Coen S 2006 Rev. Mod. Phys.
78 1135–84[10] Ranka J K, Windeler R S and Stentz A J 2000 Opt. Lett.
25 25–7[11] Brodeur A and Chin S L 1999 J. Opt. Soc. Am. B 16 637–50[12] Wilson K R and Yakovlev V V 1997 J. Opt. Soc. Am. B
14 444–8[13] Wang K, Qian L, Luo H, Yuan P and Zhu H 2006 Opt. Express
14 6366–71[14] Mevel E, Tcherbakoff O, Salin F and Constant E 2003 J. Opt.
Soc. Am. B 20 105–8[15] Dharmadhikari A K, Rajgara F A and Mathur D 2005 Appl.
Phys. B 80 61–6
6
J. Opt. 14 (2012) 035201 T Imran and G Figueira
[16] Dharmadhikari A, Rajgara F, Reddy N C, Sandhu A andMathur D 2004 Opt. Express 12 695–700
[17] Nagura C, Suda A, Kawano H, Obara M andMidorikawa K 2002 Appl. Opt. 41 3735–42
[18] Vislobokov N Yu and Sukhorukov A P 2009 Phys. WavePhenom. 17 11–4
[19] Saliminia A, Chin S L and Vallee R 2005 Opt. Express13 5731–8
[20] Wang K, Qian L, Luo H, Yuan P and Zhu H 2006 Opt. Express14 6366–71
[21] Bradler M, Baum P and Riedle E 2009 Appl. Phys. B97 561–74
[22] Antipenkov R, Varanavicius A, Zaukevicius A andPiskarskas A P 2011 Opt. Express 19 3519–24
[23] Dudley J M, Gu X, Xu L, Kimmel M, Zeek E, O’Shea P,Trebino R, Cohen S and Windeler R S 2002 Opt. Express10 1215–21
[24] Gu X, Xu L, Kimmel M, Zeek E, O’Shea P, Shreenath A P,Trebino R and Windeler R S 2002 Opt. Lett. 27 1174–6
[25] Lee D, Gabolde P and Trebino R 2008 J. Opt. Soc. Am. B25 A34–40
[26] Zhang J Y, Shreenath A P, Kimmel M, Zeek E, Trebino R andLink S 2003 Opt. Express 11 601–9
[27] Zhang J Y, Lee C K, Huang J Y and Pan C L 2004 Opt.Express 12 574–81
[28] Liu X, Shreenath A P, Kimmel M, Trebino R, Smith A V andLink S 2006 J. Opt. Soc. Am. B 23 318–25
[29] O’Shea P, Kimmel M, Gu X and Trebino R 2000 Opt. Express7 342–9
[30] Figueira G, Lopes G, Cardoso L, Wemans J, Dias J M,Fajardo M, Leitao C and Mendonca J T 2005 Proc. SPIE5777 636–41
[31] Brodeur A and Chin S L 1998 Phys. Rev. Lett. 80 4406–9[32] Dharmadhikari A K, Dharmadhikari J A and Mathur D 2009
Appl. Phys. B 94 259–63[33] Kolesik M, Katona G, Moloney J V and Wright E M 2003
Phy. Rev. Lett. 91 043905[34] Dharmadhikari A K, Rajgara F A and Mathur D 2006 Opt.
Lett. 31 2184–6[35] Tserma B, Yang B K, Whun K M and Kim J S 2009 J. Opt.
Soc. Korea 13 158–65[36] DeLong K W, Trebino R, Hunter J and White E W 1994
J. Opt. Soc. Am. B 11 2206–15
7