Intelligent Agents-based Networks Security - White Rose ...
203
Intelligent Agents-based Networks Security By Nasser Salem Abouzakhar SUBMITTED FOR THE DEGREE OF DOCTOR OF PHELOSOPHY COMPUTER SCIENCE ENGINEERING FACULTY OF ENGINEERING UNIVERSITY OF SHEFFIELD SEPTEMPER 2004
-
Upload
khangminh22 -
Category
Documents
-
view
0 -
download
0
Transcript of Intelligent Agents-based Networks Security - White Rose ...

Intelligent Agents-based Networks Security
By
Nasser Salem Abouzakhar
SUBMITTED FOR THE DEGREE OF DOCTOR OF PHELOSOPHY
COMPUTER SCIENCE ENGINEERING
FACULTY OF ENGINEERING
UNIVERSITY OF SHEFFIELD
SEPTEMPER 2004

I yemma d baba
To my Parents
Shobana & Salem
Tanetnerit Feliawen
II

Abstract
The growing dependence of modem society on telecommunication and information networks has become inevitable. The increase in the number of networks interconnected over the Internet has led to an increase in security threats. The existing mobile and fixed network systems and telecommunication protocols are not appropriately designed to deal with current developed distributed attacks. I started my research work by exploring the deployment of intelligent Agents that could detect network anomalies and issue automated response actions. An Intelligent Agent (IA) [Knapik et at, 1998] is an entity that carries out some set of operations on behalf of a user or other software with some degree of independence or autonomy. The investigation of the Agents paradigm led to a deep understanding of the underlying problem; therefore, machine learning has turned my attention to Bayesian learning and Fuzzy logic approaches.
A modelled network intrusion detector has been proposed. This model sets Agents with learning capabilities for detecting current as well as similar future distributed network attacks. In order to detect those anomalies as early as possible, the Bayesian network approach has been proposed. This approach is considered to be a promising method in determining suspicious network anomaly events that consequently relates them to subsequent dependent illegitimate activities. This research suggests innovative ways to develop Intelligent Agents that incorporate Bayesian learning to address network security risks associated with the current Networks Intrusion Detection Systems (NIDSs) designs and implementations. Because NIDSs have traditionally focused on detecting attacks, and while detection serves a vital purpose, it does not provide the ultimate solution. As a result, an effective response mechanism to those detected attacks is required to minimise their effect and hence enhance NIDSs capabilities. Therefore, other Agents with Fuzzy intelligence capabilities have been proposed to initiate successful automated response actions. Fuzzy Agents have been proposed to handle this task with the ability to respond quickly and dynamically control the availability of allocated network resources.
The evaluation methodology used to assess the performance of the developed models has been concentrated on detecting as well as predicting unauthorised activities in networks. By means of evaluation and validation, as well as empirical evidence, we are able to determine the effectiveness of the developed models and assumptions. The performance of developed detection model algorithms for unsupervised learning tasks has been evaluated using well known standard methods such as Confusion matrix. The achieved results indicate that the developed model led to a substantial reduction of the false alarms, with significant increase in the detection rates. This research work is operating within the context of two domains the first drawn from the network security community and the other from the machine learning community. It investigates the deployment of both Bayesian Learning as a probabilistic approach and Fuzzy Intelligence as a possibilistic approach to networks security. This is to detect as well as predict future evolving network anomalies, and to effectively respond to those developed attacks and minimise their effects. Consequently, it may provide innovative solutions that can be implemented in a cost-effective manner.
III

Acknowledgements
A number of people helped to make this thesis possible, and I offer my thanks to all of them. I would like to thank the members of the Centre for Mobile Communication Research (C4MCR) at Sheffield for a pleasurable four years in a motivating research work environment. All C4MCR people including previous members have played a significant role in making my graduate studies an interesting time, as well as the interesting technical discussions during the C4MCR regular meetings. Thanks go to members of my PhD progress meetings panel: Gordon Manson, Rob Edward and Marian Gheorghe for their advice and encouragement, despite the fact that all were busy with their own duties and daily commitments. Thanks Marian for chairing the panel. Rob for being a good constructive advisor, and providing me with many helpful comments, thanks for your advice.
This thesis would not have been written without the support of my supervisor Gordon Manson. His guidance, advice and support throughout my PhD research as well as written work including my regular progress reports, published journal and conference papers has been invaluable. He has been an outstanding technical resource by helping me with his useful positive comments in problem solving in general and elaborating many ideas relating to intelligent-based solutions and modelling evaluation in particular. His willingness to honestly respond and feedback to my various questions is highly appreciated.
I also express my deep gratitude to my beloved country "Libya" for its sponsorship to do this research and giving me this opportunity. Fathia, my wife, thanks for her patience, endless support, encouragement, and her understanding while I was working in this research course. She was able to make even tough times enjoyable. Also, my children who have somehow not easily accepted the fact that their father is still a student and spending much of his time at school, thanks for their patience. I would like to express my deepest love to my family, especially my parents for their tireless support and love throughout my life; it is to them that I dedicate my thesis. Finally, I give thanks and praise to God for his care and health.
IV

Publications resulting from this thesis
Journal Papers
[1] NS Abouzakhar and G Manson, An Intelligent Approach to Prevent Distributed Systems Attacks, The Journal of Information Management and Computer Security, Volume 10, Issue 5, October 2002, pp. 203 - 209.
[2] NS Abouzakhar and G Manson, Networks Security Measures using Neuro-fuzzy Agents, The Journal of Information Management and Computer Security, Volume 11, Issue 1, March 2003, pp. 33 - 38.
[3] NS Abouzakhar, A Gani, E Sanchez, S Alhashmi, and G Manson, Towards Intelligent Fuzzy Agents to Dynamically Control the Resources Allocations for a Network under Denial of Service Attacks, PAGES (342- 346), Recent Advances in Computers, Computing and Communications, Editors: N. Mastorakis and V. Mladenov, Electrical and Computer Engineering Series, Edited Book, ISBN: 960-8052-62-9,2002, WSEAS Press.
[4] NS Abouzakhar and G Manson, Detecting Intelligent Cyber-Crime using Naive Learning Paradigm, Submitted to the Journal of Information Management and Computer Security.
[5] NS Abouzakhar and G Manson, Detecting Intelligent Cyber-Crime using Smart Agents Paradigm, Submitted to the Journal of Information Management and Computer Security.
[6] NS Abouzakhar and G Manson, A survey on Recent Research in Intelligent Cyber-crime Detection, Submitted to the International Journal of Computer Security.
[7] NS Abouzakhar and G Manson, Recent Research & Development in Intelligent Intrusion Detection, Submitted to the International Journal of Information Security.
[8] NS Abouzakhar and G Manson, Bayesian Unsupervised Learning Approach to Networks Intrusion Detection and Fuzzy Intelligence Solution to Automated Response Actions, Submitted to IEEE/ACM Transactions on Parallel and Distributed Systems.
V
[9] NS Abouzakhar and G Manson, Evaluation of Intelligent Intrusion Detection Models, Submitted to the International Journal of Digital Evidence.
[10] Abdullah Gani, H. Mouratidis, N. Abouzakhar, and G. Manson, Developing an Intelligent User Manager System for Controlling Smart School Network Resources, the Malaysian Computer Science Journal, Volume 15, No 2, December 2002, pp. 56 - 69.
Conference Papers
[1] N. Abouzakhar, A. Gani, and G. Manson, Counteracting Network Distributed Attacks: An Intelligent Approach to Minimise the TCP/IP Protocol Threats using Agents Technology, Communication Systems, Networks and Digital Signal Processing (CSNDSP' 2002), 3`a International Symposium, 15-17 July 2002, Stafford, UK
[2] N. Abouzakhar, A. Gani, E. Sanchez, S. Alhashmi, and G. Manson, The Role of Intelligent Fuzzy Agents in Detecting and Automatically Responding to Networks Denial Of Service Attacks, PREP Conference, Nottingham, UK, 17-19 April, 2002
[3] N. Abouzakhar, A. Gani, H Mouratidis, and G. Manson, Towards Intelligent and Secured Communication Networks, PREP Conference, Exeter, UK, 14-16 April, 2003
[4] NS Abouzakhar, A Gani and G Manson. The Bayesian Learning Networks Approach to Cyber Crime Detection, PG Networking Conference, John Moore University, Liverpool, UK. 16 - 17th June 2003
[5] A Gani, NS Abouzakhar, and G Manson. The Roles of Intelligent User Manager Agent for Controlling an Access to Network Resources, PG Networking Conference, John Moore University, Liverpool, UK. 17 - 18th June 2002
[6] H. Mouratidis, N. Abouzakhar, A. Gani, and G. Manson, Agent-based Assistants for Health and Social Care Professionals, PREP Conference, Exeter, UK, 14-16 April, 2003
[7] A. Gani, H. Mouratidis, N. Abouzakhar, and G. Manson, Differential Access to Network Resources using Intelligent Agents, PREP Conference, Exeter, UK, 14-16 April, 2003
[8] A. Gani, N. Abouzakhar, G. Manson, UMAS Learning Requirements for Controlling Network Applications, The 16th International Conference on Industrial & Engineering Applications of Artificial Intelligence and Expert Systems, June 23-26,2003, Loughborough, UK.
VI

[9] A. Gani, N. Abouzakhar, and G. Manson, Using Intelligent Multi Agents in Managing Smart School Networks, in the Conference of Computer and Advanced Technology in Education (CATE 2002), IASTED, Cancun, Mexico, 20-22 May, 2002
[10] A Gani, NS Abouzakhar, H Mouratidis, G Manson and F Abouzakhar, Intelligent Agents for Managing Smart School Network Resource, International Conference on Information and Communication Technologies in Education (ICTE 2002), Badajoz, Spain, 13-16 Nov 2002
VII

An award received from a Journal Publisher
An award (The Donn B Parker Award) has been received from Emerald publisher
on 24`h, April 2003, London, as a result of the selection for the paper titled An
Intelligent Approach to Prevent Distributed Systems Attacks". This paper is
published at The Journal of Information Management and Computer Security
(JIM&CS), Volume 10, Issue 5, October 2002, pp. 203 - 209. It has been selected
as the most "Outstanding Paper" in the 2002 volume by Emerald Literati Club
Awards for Excellence 2003, UK.
My supervisor Gordon Manson appears on the left and the in the middle, John
Peters, Director: Research and Author Relations, Emerald (April, 2003).
Vlll

CONTENTS
Abstract .................................................................................................... III
Acknowledgements ................................................................................. IV
Publications resulting from this thesis .................................................. V
An award received from a Journal Publisher .................................. VIII
CONTENTS ............................................................................................ IX
List of Figures ...................................................................................... XIII
List of Tables ........................................................................................ XV
List of Abbreviations .......................................................................... XVI
Chapter 1 ................................................................................................... 1
Introduction ........................................................................................... 1
1.1- Research Outline & Hypotheses ............................................... 2
1.2- The Approach of Intelligent Agents Technology to IDSs ...... 4 1.3- Aim & Objectives .......................................................................
5 1.4- Structure of the Thesis ..............................................................
6
Chapter 2 ................................................................................................... 8
Research Related Work ....................................................................... 8
2.1- Brief History of the Development of IDSs ............................... 8
2.2- The Limitations of Current IDSs ........................................... 10
2.3- Related Research Work ........................................................... 11
2.3.1- State Transition ............................................................................... 13
2.3.2- Neural Networks ............................................................................. 14
2.3.3- Genetic Algorithm .......................................................................... 16
2.3.4- Immunology Approach ................................................................... 18
2.3.5- Agents Paradigm ............................................................................. 20
2.3.6- Reinforcement Learning ................................................................. 22
2.3.7- Bayesian Learning .......................................................................... 25
2.3.8- Fuzzy Logic .................................................................................... 27
2.4- Motivations for Developing Intelligent Agents to Networks Security ........................................................................... 29 2.5- Summary ................................................................................... 32
ix

Chapter 3 ................................................................................................. 34
Distributed Networks Security Concerns ......................................... 34 3.1-Background Statistics ............................................................... 34 3.2-Networks Security Engineering & Management ................... 37 3.3-The Major Risks of Distributed Networks Security .............. 38
3.3.1-Classifications of the Major Risks ................................................... 38 3.3.2-The Approach of Denial of Service (DoS) Attacks ......................... 39 3.3.3-The Evolution of Distributed DoS (DDoS) Attacks ........................ 41 3.3.4- The Limitations of Current Distributed Network Protocols ........... 43
3.4-Types of Intrusion Detection Systems ..................................... 46 3.4.1- Network-based Systems .................................................................. 46 3.4.2- Host-based systems ......................................................................... 46 3.4.3- Application-based systems ............................................................. 47 3.4.4- Hybrid IDSs .................................................................................... 47 3.4.5-Commonly Detected Attacks by NIDSs .......................................... 47
3.5- Incident Response Options in IDSs ........................................ 48 3.6-Summary .................................................................................... 50
Chapter 4 ................................................................................................. 52
Investigation of naive Bayes Approach to IDSs ............................... 52 4.1- Bayesian Probabilistic Approach to Networks Security ...... 52 4.2- Knowledge Engineering and Extraction ................................ 55 4.3- Bayesian Decisions and Knowledge Modelling ..................... 56
4.3.1- Traffic Patterns & Vector Representation ...................................... 57 4.3.2- Statistical Classification .................................................................. 59
4.4-Bayes Learning and Knowledge Extraction ........................... 62 4.4.1- The Dataset Source ......................................................................... 65 4.4.2- Knowledge Extraction .................................................................... 66
4.5- Navie Bayes Supervised Learning and Prediction ............... 70 4.6- Summary ................................................................................... 74
Chapter 5 ................................................................................................. 75
Bayesian Networks & Agents-based IDSs ........................................ 75 5.1- Bayesian Networks Approach to Networks IDSs ................. 76
5.1.1- Bayesian Network Model Representation ...................................... 76 5.2- Learning Bayesian Network from a dataset .......................... 79
5.2.1- Selection of the Graphical Structure Model ................................... 80 5.2.2- Estimation of the Graph Conditional Probabilities ......................... 83
5.3-The Bayesian Unsupervised Learning Detector Models....... 84 5.4-The Experimental Work and Results ..................................... 86
5.4.1-The Experimentations and Observations Strategy ........................... 86 5.4.2-The Conditional Probability Tables and Influence Analysis........... 87 5.4.3-The Developed Detection Models Inference ................................... 89 5.4.4-Bayesian Unsupervised Learning of Dataset Clustering ................. 96
5.5- Summary ................................................................................. 100
X

Chapter 6 ............................................................................................... 102
Evaluation and Performance Measurement .................................. 102 6.1- The Evaluation Methodology ................................................ 102
6.1.1- The Performance Criteria .............................................................. 103 6.2- Modelling & Dataset Validation ........................................... 105
6.2.1- Model's Detection Validation ....................................................... 108 6.3- Learning Prediction Performance ........................................ 109 6.4- The BayesiaLab Package ....................................................... 111 6.5- Learning Evaluation and Analysis ....................................... 111
6.5.1- Confusion Matrix .......................................................................... 111 6.6- Summary ................................................................................. 119
Chapter 7 ............................................................................................... 121
Conclusions ........................................................................................ 121 7.1- Main Research Findings ........................................................ 121 7.2- Major Contributions of the Research .................................. 124 7.3- Limitations and Future Areas for Research ....................... 127
Chapter 8 ............................................................................................... 128
Further work: Investigation of Fuzzy-based Responsive IDSs.... 128 8.1- The Problem ........................................................................... 129 8.2- Intelligent Agents Approach to Fuzzy Logic ....................... 131 8.3- Modelling Intelligent Fuzzy Agents ..................................... 132
8.3.1- Fuzzy Modelling of an Automated Responsiveness ..................... 134 8.3.2- Defining Fuzzy Rules ................................................................... 136 8.3.3- The Defuzzification Process ......................................................... 136
8.4- Modelling Fuzzy Agents- based Intelligent Switched Networks ........................................................................................
138 8.4.1- Transport level of Fuzzy Agency .................................................. 139 8.4.2- Network level of Fuzzy Agency ................................................... 142
8.5- Model Design and Simulation Scenarios .............................
144 8.5.1- The Modelling environment ......................................................... 145 8.5.2- The Developed Model .................................................................. 146
8.6- The Fuzzy Rules Knowledge Base ........................................ 150 8.7- Summary ................................................................................. 152
Appendix A: A sample of the MIT Lincoln Lab training dataset ... 153
Appendix B: A sample of a locally generated training dataset at
C4MCR ................................................................................................. 154
Appendix C: List of network attacks contained within the dataset
of MIT Lincoln Lab ............................................................................. 155
xi

Appendix D: Target Analysis Report ................................................. 163
References ............................................................................................. 177
XII

List of Figures
Figure 2.1: Misuse versus anomaly detection [source: Bace, 2000] ................ 13 Figure 2.2: CP-Net sequence for TCP/IP handshake process ......................... 14 Figure 2.3: Neural network as an IDS model ...................................................
15 Figure 2.4: Learning Agent's interaction with its network environment...... 23 Figure 2.5: Knowledgeable & Learning Agent ................................................ 31 Figure 3.1: CSI Survey of 530 organisations (Types of Attack or Misuse).... 35 Figure 3.2: Amount of losses by attack type in US Dollar ............................... 36 Figure 3.3: Reported incidents ...........................................................................
36 Figure 3.4: A general model for networks security management ................... 37 Figure 3.5: Distributed Denial of Service (DDoS) ............................................ 41 Figure 3.6: A typical time line for DDoS attack ............................................... 42 Figure 3.7: The effects of congestion on throughput .......................................
43 Figure 3.8: Buffer distribution at ISO network layer ......................................
44 Figure 3.9: Passive intrusion detection ............................................................. 48 Figure 3.10: Active intrusion detection .............................................................
48 Figure 3.11: Generic incident response process ...............................................
49 Figure 3.12: Three ways of incident responsiveness ........................................ 49 Figure 3.13: System restoration process ........................................................... 50 Figure 4.1: Profiles of intruders and authorised users behaviour .................. 60 Figure 4.2: Bayesian dataset variable nodes .....................................................
64 Figure 4.3: The developed database ..................................................................
67 Figure 4.4: The naive Bayes developed detector model characterizes target
node association to all other variable nodes ............................................... 70 Figure 4.5: Naive Bayes detector learned icmp and ecr_i (ECHO REPLY)
contributions to smurf .................................................................................. 72
Figure 4.6: Conditional probability distribution ............................................. 73
Figure 5.1: A Generic Bayesian network for detecting network DoS events, as it represents a set of conditional independence assumptions ................... 77
Figure 5.2: The developed Bayesian Detector Model. The local probability distribution(s) associated with each node would be determined to speci fy the conditional distribution for each variable given its immediate parents in the network ...............................................................................................
85 Figure 5.3: The conditional probability table of the srv_count variable node
....................................................................................................................... 88
Figure 5.4 (a): Bayesian detector learns a smurf attack and its dependence on other variable nodes .....................................................................................
90 Figure 5.4 (b): Bayesian detector learns conditional dependence ofsmurf
attack and other variable nodes on protocol variable .............................. . 92 Figure 5.5 (a): Bayesian detector learns the variable nodes contribution to
portsweep attack ........................................................................................... . 93 Figure 5.5 (b): Bayesian detector learns the variable nodes contribution to
buffer over attack ................................................................................. . 94 Figure 5.6: Conditional probability distribution of smurf target variable with
respect to the service variable ..................................................................... . 95
XIII
Figure 5.7: Conditional probability distribution of smurf parameter of the target variable with respect to the srv_count and count variables........... 96
Figure 5.8: Automatic organisation using clustering ....................................... 97 Figure 5.9: Two identified clusters .................................................................... 98 Figure 5.10- Conditional probability distribution of both clusters ................ 99 Figure 6.1: Model's detection validation ......................................................... 108 Figure 6.2: Confusion matrix for the developed Naive bayes detector........ 113 Figure 6.3: Confusion matrix for the developed Bayesian network detector
...................................................................................................................... 114 Figure 8.1: Agents-based NIDS in a relation with a network incoming and
outgoing traffic ........................................................................................... 132 Figure 8.2: Possibility distribution of LowBW ................................................ 133 Figure 8.3: Term set decomposition of the DOS variable .............................. 134 Figure 8.4 (a): Fuzzy representation of DoS attack in terms of BW
consumption ................................................................................................ 135 Figure 8.4 (b): Fuzzy representation of response action in terms of Routing
Allocated Resources or Buffer (RAB) ....................................................... 135 Figure 8.5: Membership functions from fuzzy rules. Membership functions
for RAB are derived from Rules #1 and 2, for a BW consumption of 85%
...................................................................................................................... 137 Figure 8.6: The defuzzification process using bounded range ...................... 137 Figure 8.7: The Fuzzy Agent (ISFA) generates TCP control packets in
response to different conditions to block resources consumption by TCP SYN flooding attacks ..................................................................................
140 Figure 8.8: The FAM for the buffer allocation controller to overcome TCP
SYN harmful events ................................................................................... 141
Figure 8.9: The Fuzzy Agent (ISFA) blocks (discards) the attacking ICMP_ECHOREPLY packets ..................................................................
142 Figure 8.10: The FAM for the buffer allocation controller to overcome Smurf
DoS attack ................................................................................................... 143 Figure 8.11 (a): All incoming traffic has been forwarded to its destinations
...................................................................................................................... 144 Figure 8.11 (b): The incoming traffic from ports 2,3, and 4 is blocked due to
the overwhelming traffic at port 1 ............................................................ 144
Figure 8.12: A developed mathematical model for measuring incoming packets inter-arrival time ..........................................................................
146 Figure 8.13: The detailed structure of the ISFA model .................................
147 Figure 8.14: A high level possibility distribution for BW consumption....... 148 Figure 8.15: The actual measured possibility distribution for the input
variable "TrafficRate" ............................................................................... 148
Figure 8.16: The signal outputs at different stages of ISFA .......................... 149 Figure 8.17: The fuzzy rules base .................................................................... 151
XIV
List of Tables
Table 4.1: Network states of the major components ........................................ 62 Table 4.2: A sample of the dataset ..................................................................... 66 Table 4.3: Variables list of individual network connection ............................. 68 Table 4.4: Content features within a connection suggested by domain
knowledge ...................................................................................................... 68 Table 4.5: Network traffic state variables computed within a2 second time
window ........................................................................................................... 69 Table 5.1: Contingency statistical table ............................................................ 81 Table 5.2: Contingency table collecting the frequencies of cases ................... 84 Table 6.1: ROC curve's measure is used to evaluate the FP vs. FN trade off
...................................................................................................................... 105 Table 6.2: The information loss of smurf event class occurrence ................. 110 Table 6.3: Different outcomes of a two-class prediction ................................ 112 Table 6.4 : List of event parameters' occurrences, reliability and precision of
Naive bayes model ...................................................................................... 115 Table 6.5 : List of event parameters' occurrences, reliability and precision of
Bayesian network model ............................................................................ 116 Table 8.1: Fuzzy Term LowBW ....................................................................... 133
xv

List of Abbreviations
ACL Access Control List ACK Acknowledgement Al Artificial Intelligence BGP Border Gateway Protocol BRL Big Resource Loss BW Bandwidth DIDS Distributed Intrusion Detection System DoS Denial of Service DDoS Distributed Denial of Service HTML Hyper Text Mark up Language IA Intelligent Agent IDSs Intrusion Detection Systems IDS&R Intrusion Detection System and Response ICMP Internet Control Message Protocol IP Internet Protocol ISFA Intelligent Switch Fuzzy Agent KB Knowledge Base KBS Knowledge Base System KE Knowledge Engineering MA Mobile Agent ML Machine Learning MRL Medium Resource Loss NIDS Network-based Intrusion Detection System RAB Routing Allocated Buffer RAR Routing Allocated Resources RIP Routing Information Protocol SNMP Simple Network Management Protocol SRL Small Resource Loss SYN Synchronous TCP Transmission Control Protocol UDP User Data gram Protocol XML Extensible Mark up Language g DoSh High (sever) DoS Fuzzy Membership tTraf Routing Traffic Fuzzy Membership
xv'

CHAPTER 1. INTRODUCTION
Chapter 1
Introduction
With the increase of distributed systems and data telecommunication networks, the need for automated security tools for protecting data and information became an essential requirement. One of those tools used in network security is Intrusion Detection Systems (IDSs). IDSs [Bace et al, 1999] are software or hardware systems that automate the process of monitoring the events occurring in a computer system or a network and analysing them for signs of security violations or unauthorised activities. For most big business and government corporations, the biggest risk of a security breach is loss of income or loss of reputation, either of which can be achieved easily by conspicuous distributed activities such as Denial- of-Service (DoS) attacks. For organisations with more mission or life-critical data online, a DoS attack can literally put people's lives at risk. Distributed DoS (DDoS) attacks are a virulent strain of DoS activities. The difference is that there is no single source of the attack. There could be hundreds or thousands of compromised computer attackers. DDoS activities [Schneier, 2000] are incredibly difficult to defend against. The control of resources allocation in networks is considered to be the vital issue for an effective solution to DoS attacks. Needham [1994] suggests that availability is the major concern of information systems design and hence their security as well. As violations of availability easily lead to considerable interruptions of telecommunication services, they may result in serious disruptions of businesses.
In this thesis an effective solution to the problem will be presented, which indicates possible ways of intelligent detection and automatic response to those types of attacks in order to minimise their effects on network resources availability. In order to achieve that, Intelligent Agents have been developed. An Intelligent Agent (IA) [Knapik et al, 1998] is an entity that carries out some set of operations on behalf of a user or other software with some degree of independence or autonomy. These Agents are able to detect as well as predict future similar network attacks, and are enhanced with Bayesian network capabilities. Bayesian network [Heckerman, 1995] provides a set of learning entities that compute models over data stored within a network, and each model encodes dependencies among all the variables of interest. Also, Fuzzy Intelligent Agents will be
I

CHAPTER 1. INTRODUCTION
presented to handle this task with the ability of launching automated response actions to any degraded network traffic services. Fuzzy logic and fuzzy-based intelligent systems [Knapik et al, 1998] are mathematically based systems that enable computers to deal with imprecise, ambiguous, or uncertain information and situations, i. e. the real world. Within this Multi-Agent environment, all Agents are uniquely identified and able to co-operate with their home devices. Enhancing Agents with Bayesian learning and fuzzy reasoning capabilities would give them the ability to deal with imprecise, ambiguous, or uncertain information and situations. This chapter introduces the research problem, the aim and objectives of the research topic and outlines the thesis structure.
1.1- Research Outline & Hypotheses
The features supplied by intelligent Agents have generated an interest in their integration into network security and Intrusion Detection Systems (IDSs). Given the essential security requirements for any particular information network, this task is complicated by the security management of the Agents themselves. This complication might result from the security issues associated with the intelligent features of some Agents. Also, the unpredictable performances of such security architecture might generally hinder the evolution of the Agents' security applications. However, the features supplied by Agent entities are expected to outweigh any of their limitations.
This research provides an answer to the following question:
Is it possible to have an efficient method to learn and predict future evolving unauthorised network activities as well as having an automated mechanism to respond to those detected attacks in such a way that it effectively controls the allocated resources consumption within a network? For the time being and based on my research experiments and results I would reply with the following answer.
Applying Bayesian methods as a learning detection model to this kind of problem will show how the probabilistic Bayesian detection model identifies network attacks, allowing for the generalization of Network IDSs (NIDSs). The major results achieved from the experiments conducted and from testing the developed model using a real time datasets as well as the explained observations indicate the possibility of improving current IDSs implementations. The Bayesian Learning networks approach is considered to be a promising tool used by intelligent Agents to determine suspicious network anomaly events that consequently relates them to subsequent dependent unauthorised events. While learning detection techniques serve a useful purpose and provide a major solution to the state of the art NIDSs, these techniques do not provide the ultimate solution to the current NIDSs limitations. Therefore, an effective automated response mechanism to those detected attacks is required to minimise their effects and hence enhance NIDSs capabilities.

CHAPTER 1. INTRODUCTION
The automated response mechanism in IDSs is a vital issue for improving the network security, and represents what I call the "last line of defence" against any threatening activities towards network resources. I argue that this mechanism is intended to limit network breaches that could not be either easily detected or avoided. The main network assets that I have considered in my experiments are network servers, routers, switches, firewalls, the applications and any information they occupy, and the resources they allocate for each successful network connection. The intelligent Agents' automated response mechanisms to network attacks introduced in the proposed framework are considerable, because each single response can be characterised by a number of features. By analysing the network traffic abnormalities or event logs behaviour in order to issue the appropriate responses for any confirmed attack, those response actions would be in different forms depending on the type of attack and the targeted resource. In order to make my solution to the problem achievable within given time and considering the practical side of the research regarding this matter (i. e. the automated responsiveness), only part of the response actions by the intelligent Agents in the framework is considered. In this case only network traffic abnormalities are considered. In summary, the major research hypotheses are to
" Investigate possible ways of intelligent detection of network attacks so as to minimise their effects on networks' resources availability. In order to achieve that, Intelligent Agents will be proposed to detect as well as predict future evolving network anomalies. These Agents are enhanced with Bayesian learning capabilities.
Look at the issue of intelligent intrusion detection more closely, and investigate the sort of consequences that will take place with the development of intelligent Agents incorporating Bayesian learning for networks security. Also, to investigate the issue of having effective Agents that are alertly capable of providing detection mechanism to the confirmed network DoS attacks, so that the role of those intelligent Agents within the whole network security architecture is identified. Also, to take into consideration the Quality of Service and network performance requirements.
" Evaluate and validate the developed detection models so to measure their performance. In order to achieve that, standard evaluation and validation methods must be incorporated. Regardless of the methods used to detect unauthorised network activities, the ultimate question would be, how well does our model detect or classify attacks?

CHAPTER 1. INTRODUCTION
1.2- The Approach of Intelligent Agents Technology to IDSs
There has been a large movement within the Artificial Intelligence (AI) research community to apply Intelligent Agents (IAs) technologies to distributed computing and Networking. An Intelligent Agent (IA) [Knapik et al, 1998] [Tecuci, 1998] is an entity that carries out some set of operations on behalf of a user or other software with some degree of independence or autonomy. Intelligent Agents [Bigus et al, 2001] could perform useful tasks for us, make us more productive, and save our time. Intelligent Agents represent an emerging distributed system paradigm. As more and more networking and distributed systems applications are performed, there is more interest in having IA that can perform specific tasks efficiently. One of these tasks is network security in general and intrusion detection in particular. Intelligent Agents, can provide real value to such a problem in this new, interconnected world. Intelligent Agents are able to operate asynchronously and independently of the process that initiated them (autonomously), they help to construct highly robust, fault-tolerant and cost- effective systems. As Agents [Proctor, 2001] are not currently available in any commercial IDSs, this thesis looks at this new paradigm and suggest solutions to some of current IDSs that can be implemented without major modifications to current network systems.
The proposed Intelligent Agents-based approach to intrusion detection in this thesis is based on entities that are capable of performing certain security functions individually or in a distributed form. There are three dimensions [IBM, 1996] that are used to measure the Agents capabilities, which are Agency, Intelligence and Mobility. However, Intelligent Agents [Murch et al, 1999] [Tecuci, 1998] are also able to learn and capable by themselves to acquire and maintain their knowledge. Learning represents modification of behaviour through experience or judgement. Learning Agents could learn from a variety of information sources in the environment. Once tasks are learned, the Agent can then instruct or suggests ways to improve. Integrating machine-learning solutions to Agents [Tecuci, 1998] can take advantage of their complementary natures and using learning techniques to automate the knowledge acquisition process and techniques to enhance the power of the learning methods.
In this thesis the main focus is on how to develop lAs that could learn from a given data. This data comprises a network traffic that is contaminated with different types of network violations and unauthorised activities. This approach has been proposed to overcome the limitation in the existing architecture of having a single entity that does most of the data collection and processing. The suggested lAs can provide a mixture of anomaly detection as well as misuse detection capabilities, with the ability of predicting those evolving network violations. Those Agents could target a specific network event type, signature type, platform, or process depending on the strategy used, and various strategies could be available for governing the location of the analysis and response functions. In order to achieve that lAs are incorporated with Bayesian learning features and hence the focus will only be on the learning elements of lAs and not their mobility features.
4

CHAPTER 1. INTRODUCTION
1.3- Aim & Objectives
This research aims to propose innovative ways to use intelligent Agents to address networks security problems associated with the deployment of current Intrusion Detection Systems (IDSs). It is a response to the rising demand of different organisations and the public sector to provide secured inter-network infrastructures and reasonably protected interconnection with the Internet from different unauthorised activities and security threats. The research also aims to develop Agents models with machine learning capabilities and fuzzy intelligence. This is to indicate that those Agents with such capabilities could play a major role in ensuring network security and effectively overcoming different network resources availability and control issues, as follows:
Developing Agents to intelligently provide real-time detection of network systems attacks, which target telecommunications and QoS protocols or misuse heavy computations, for example computations resulting from cryptographic algorithms. This can be achieved by analysing the network traffic and assets behaviour by continuously monitoring and assessing the status of the most targeted nodes in a particular network such as servers, routers and switches.
Developing Fuzzy Agents to provide appropriate automated response actions based on sufficient analysis of sequence of events for different types and levels of DoS attacks. Also, to ensure accurate information gathering and intelligence in order to avoid any negative consequences, such as overloading network resources. This would provide a step forward to overcome the problems currently limiting Intrusion detection systems capabilities from the point of view of cost and efficiency.
Performing the activities of detecting and automatically responding to different sorts of Distributed DoS (DDoS) attacks and validating those response actions to insure and prove network resources availability. Agents will need to employ Machine Learning techniques such as Bayesian Learning in conjunction with Fuzzy Intelligence capabilities into the system Agents in order to predict future, similar, evolving DoS problems. These Agents would contain the methods of actively interacting with the security experts and intelligently handle their duties. The vital issue here is to embed a learning component in the Agent's behaviour, in such a way that learning would become an essential effect of the Agent's routine tasks. The key issue will be to develop long-life Agents, capable of accumulating knowledge and reuse it to guide further learning.
Providing a mechanism to verify the integrity of the data stored within a network in a real-time fashion, report any detected violations to the network security personnel, at the same time, with the ability to respond accordingly. The possible required responses include ability to dynamically control the availability of allocated resources for different network connections and QoS provisions. This set of required capabilities implies that security services are installed on every network device.
5

CHAPTER 1. INTRODUCTION
Those sorts of areas have been ignored previously by the industry, due to the costs associated with their implementation. However, the recent developments in Agents technology as well as machine learning solutions have encouraged more thought about practical solutions to the underlying problems. This may contribute to the current fast development in the telecommunication services and information networks security using the state of Bayesian learning and fuzzy Agents techniques, so to perhaps offer a solution that can be implemented in a cost- effective manner.
1.4- Structure of the Thesis
This thesis consists of eight chapters.
Chapter two outlines the research background. It discusses a brief history of Intrusion Detection Systems and their limitations. It reviews the state of the art developments and major recent research that is taking place in the area of Intrusion Detection Systems (IDSs) in general and the application of artificial intelligence and machine learning solutions to the current problems of networks security and IDSs in particular. This chapter ends with covering the motivations behind this research work in general and applying intelligent Agents as the evolving distributed systems paradigm in particular.
In chapter three the literature in the field of Distributed Systems and Networks security will be discussed. This chapter aims to provide a summarized background theory to the subject and justify the given proposals. In this chapter, the current network security issues are identified in the context of security engineering and management. It discusses network security threats in general with particular emphasis on Denial of Service (DoS) attacks and its distributed version. Distributed DoS attacks became a reality due to the limitations and openness nature of the Internet. It briefly outlines the major risks in distributed network systems, including the major limitations of current network communication protocols. This chapter ends with the discussion of the Intrusion Detection Systems (IDSs), their approaches and types.
Next chapter investigates Bayesian learning as a probabilistic as well as a predictive approach to Network Intrusion Detection Systems (NIDSs). It covers the concept of Bayesian decisions-based modelling within the context of NIDSs. This chapter discusses the matter of knowledge engineering and extraction, and considers the majors steps involved in NIDS data modelling using vector transformations. A developed Nafve Bayes supervised learning model for detecting network attacks is introduced in this chapter. It also covers the detector model development to extract the variable nodes of the naive Bayesian network automatically from a dataset, which is generated by MIT Lincoln Lab and used to train the developed models and evaluate the research in the field of NIDSs.
CHAPTER 1. INTRODUCTION
Chapter five discusses the further development of Bayesian supervised learning technique which is introduced in the pervious chapter. This modelling technique is further enhanced in this chapter using a powerful learning method known as Bayesian Networks (BNs). BNs have led to the development of learning Directed Acyclic Graphs (DAGs), techniques to extract them directly from datasets of cases, rather than relying on the insight of human domain experts, thus turning BNs into a powerful tool for knowledge extraction. This chapter shows how probabilistically the Bayesian network detects network attacks, allowing for the generalization of NIDSs. It describes the major results achieved from experiments based on real time dataset as well as the observations that explain the achieved results.
Next chapter proposes Fuzzy intelligence capabilities to initiate successful automated response actions. This is to enhance the capabilities of the detection models developed in the previous chapter. While those models provide a major useful purpose in detecting network anomalies, they lack the required intelligent response actions that minimise the effects of those detected network unauthorised activities. In this chapter, intelligent Agents that incorporate Fuzzy logic techniques, have been proposed to handle this task with the ability to respond quickly and dynamically control the availability of allocated network resources. Applying Fuzzy intelligence into this kind of problem has not been previously explored. This chapter investigates Fuzzy logic technique incorporated with an uncomplicated mathematical-based model named N Flip-Fly that leads to achieving self-healing secured switched networks.
In chapter seven the evaluation methodology used to assess the performance of the machine learning methods will be discussed. This includes the performance of detecting as well as predicting unauthorised activities in telecommunication networks using the Bayesian learning technique. By means of evaluation, as well as empirical evidence, it may be possible to determine the effectiveness and the performance of all the developed models and assumptions in chapters five and six. The evaluation and validation criteria as well as the learning prediction performance for this task have been discussed in this chapter, together with a description of the chosen Bayesian learning tool: the BayesiaLab. This chapter covers the performance of the developed detection model algorithm for the unsupervised learning task, using well known standard methods such as confusion matrix.
Finally, Chapter eight is the conclusion, which discusses some of the experiences gained during the previous period of research. It summarises the major findings and research contributions as well as the key issues in the thesis. This chapter suggests some possible research to be carried out in the future. It discusses future possible areas of research in the field, by applying intelligent Agents and machine learning solutions in other aspects of Computer Science and Engineering problems in general, and data telecommunication networks security and management in particular.
7

CHAPTER 2. RESEARCH RELATED WORK
Chapter 2
Research Related Work
This chapter reviews the state of art, developments and major recent research that is taking place in the area of Intrusion Detection Systems (IDSs) in general and applying intelligent Agents and machine learning solutions to the current problems of networks security and IDSs in particular. In this chapter, the motivations behind the development of Intelligent Agents and the main current limitations of IDSs have been discussed. It describes the architecture development of several prior IDSs, as none of them used Bayesian networks-based Agents that are learned from a dataset to build its models and detect network anomalies. Many IDSs employ various techniques for both anomaly and misuse intrusion detection. In all these techniques, an observed behaviour that does not match expected behaviour is flagged due to what might be an intrusion indication. In this chapter, the discussion of already known established systems such as traditional rule-based IDSs and statistical-based IDSs as well as commercial products has been avoided. These types of systems have already been reviewed by many literatures in a great detail. This chapter surveys the most recent state-of-the-art research that is currently taking place in research laboratories. Also, it only focuses on the major current research achievements in this area. The major proposed artificial intelligence and machine learning research solutions to current limitations of IDSs that are covered in this chapter include, Bayesian learning, Fuzzy Logic, Intelligent Agents, Artificial Immune Systems, Neural Networks, Genetic Algorithms, and Reinforcement Learning. All these approaches are still under research at various established research centres either in universities or commercial organisations.
2.1- Brief History of the Development of IDSs
The proliferation of computer networks and the Internet has created new vulnerabilities, which enable intruders around the world to penetrate network resources. This situation led researchers to think about approaches that provide improvements to the traditional security systems. Intrusion detection systems (IDSs) have been proposed as an approach to cope with security problems, due to the growing of the unauthorised access incidents and different security threats,
8
CHAPTER 2. RESEARCH RELATED WORK
such as, eavesdropping communications, masquerading legitimate users, Denial of Service attacks, etc. The main objective of this system is to detect those activities that violate or compromise systems security. Intrusion Detection [McHugh, 2001] [Proctor, 2001] is the process of monitoring the events that take place in a computer system or a network, analysing them for sings of security threats and violations for security policy. Intrusion detection techniques have received a vital attention during the last few years by the security community to protect network systems from different sorts of attacks. Intrusion detection technology has progressed to some degree in the last 15 years. Even though there were around 30 IDS research systems in 1990, this section discusses the most interesting developed achievements.
Intrusion Detection [McHugh, 2001] [Proctor, 2001] [Bace, 2000] has merged the traditional Electronic Data Processing (EDP) and security audit with optimised pattern-matching and statistical techniques. Audit is defined as the process of generating, recording, and reviewing a chronological record of system events. EDP audited mirror those of the manual business audit process. The first EDP audit program was initiated in the mid 1950s. The evolution of fast and increased number of computers during 1970s led to the need for computer security. In 1980 James P. Anderson proposed in his report some changes to computer audit mechanisms to provide information for use by computer security managers to identify computer misuse and when tracking security violations. Dorothy Denning and Peter Neumann researched and developed Intrusion Detection Expert System (IDES) in 1986. It was a model for a real time intrusion detection system and proposed a correlation between rule-based and statistical techniques. In 1992 SRI International developed the IDES prototype system. The Automated Audit Analysis project conducted by Sytek in 1985 demonstrated the capability of distinguishing normal from abnormal system usage.
Multics Intrusion Detection and Alerting System (MIDAS), the first intrusion detection system that monitored an operational system connected to the Internet. It was developed by the National Computer Security Centre (NSC) in 1989 to take data from Dockmaster's answering system audit log to construct session profiles, and then compare these to user profiles of normal behaviour. In 1991 Haystack Labs developed Haystack for US Air Force. It was designed to help security officers detect insider abuse of Air Force Standard Base Level Computers (SBLC). During the late eighties Network Audit Director and Intrusion Reporter (NADIR) was developed by the Computing Division of Los Alamos National Laboratory to monitor user activities on the Integrated Computing Network (ICN) at Los Alamos. NADIR monitors the network by processing audit trails generated by specialised network service nodes; it performs a combination of expert rule-based analysis and statistical profiling.
The first intrusion detection system managed to monitor network traffic was the Network System Monitor (NSM). It was developed at the University of California in 1989, and it was designed to capture the network traffic as the primary data source for its intrusion analysis to detect anomalous activity. The Safeguards, Security Group at Los Alamos National Laboratory, and Oak Ridge National Laboratory developed wisdom and Sense. Wisdom and Sense used the anomaly
9

CHAPTER 2. RESEARCH RELATED WORK
detection approach and performed statistical, rule-based analyses. Screen Applications International Corporation (SAIC) developed Computer Misuse Detection System (CMDS) in 1992. CMDS is a host-based IDS. In 1999 a US Presidential Decision Directive was issued to encourage government sector the use of IDSs, and the Federal Intrusion Detection Network (FIDNet) is created to monitor government sites against network infrastructure attacks. During mid and late nineties the concept of Distributed Intrusion Detection Systems (DIDS) was introduced to overcome the problems associated with networks interconnectivity, which resulted in spreading worms, compromising systems remotely, and the evolving of co-ordinated and distributed network attacks.
2.2- The Limitations of Current IDSs
Current Intrusion Detection Systems are still not performing well [Jansen et at. 2000] [Martino, 1999] [Bace, 2000]. Following is a list of the most shortcomings of IDSs. Some of these shortcomings tend to overlap between different types of IDSs depending on their approaches, as follows:
Efficiency: IDSs often lack the capability of real time detection and analysis. This is because of the difficult nature of the task to achieve. IDSs often slow network systems and are not able to cope with heavy loaded and fast networks. In addition to that, the expensive computations conducted by anomaly detection to maintain system profiles updated for each suspected event and the runtime overheads associated with misuse detection. Current IDSs lack the ability to learn and predict future evolving attacks.
Automated Response Capability: IDSs have traditionally focused on detecting attacks, which provides a useful service. However, it is not the ultimate solution to the problem. There are other issues that need to be taken into account in order to complete the full picture. The immediate analysis for the detected attack would allow the system to act quickly by establishing the proper response action. This would limit the time available for the attacker to operate freely and significantly reduce the attack period as well as its effects.
Lack of Flexibility: Typically IDSs are designed for a specific environment. This has resulted in inflexible deployment of IDSs in a wide range of systems. IDSs should be easily tailored to different environments regardless system pattern changes or any network infrastructure resources upgrade. This is because much of the IDS system has tended to be specific to the environment being monitoring. IDSs should be self-regulated and dynamically re- configurable in order to avoid any IDS restarting so as to adapt to the system or network changes.
Self defence: The current IDSs are facing the problem of the ability to resist attacks that are intended and directed to defeat or compromise them is such away that they become useless. IDSs like any other systems, they are also susceptible to different sorts of attacks. The most critical components of IDSs should be well protected against any attacks. IDSs should be able to defend themselves before trying to protect other systems. The current IDSs are
10

CHAPTER 2. RESEARCH RELATED WORK
lacking survivability features such as Intelligent Mobility, dynamic recovery etc...
No Generic Building Methodology: Generally, designing and building IDSs by following traditional engineering development process is costly. This is due to the lack of structured methodology for developing these systems. The lack of common agreement and wise standards on the applied techniques between IDSs community has led to this situation. Taking into consideration that IDS is still an evolving field of study and therefore more research is required.
False positives: One of the problems that still exist in IDSs. This is because of the way that most IDSs are detecting and analysing security threats. It has been proven that detecting attacks on single isolated components of a particular environment without full linked analysis feature is not enough. Improving IDSs capabilities to accurately detect attacks is the most challenging currently factor facing IDS researchers and developers. False positives can themselves limit the proper automated response feature, which current IDSs are lacking.
Maintenance: The maintenance of IDSs often requires special skills and experience more than just general knowledge of systems security. For example, upgrading the rule sets for expert system shells used in misuse detection to encode and match pattern signatures. This would require sufficient knowledge about modifying the language rules sets used in the intended expert system and avoiding any undesirable interactions between already built and new signatures. Similar considerations may apply to the addition of statistical metrics, which are typically used in anomaly detection to identify unfamiliar asset behaviour.
2.3- Related Research Work
IDSs can detect when an attacker has penetrated a system by exploiting an uncorrected or uncorrectable flaws [Bace, 2000]. It can also serve as a vital function in information networks protection, by bringing the fact that the system has been compromised and attacked to the network manager attention, which should consider all the recovery measures for any resulted damage. There are two primary approaches or methods to analysing events to detect attacks, which are misuse detection and anomaly detection, as follows:
" Misuse detection
In Misuse detection, the data classification engine is built on behaviours described in terms of rules or other pattern descriptors or signatures. Misuse detectors analyse system activity, looking for events or sets of events that match a predefined pattern of events that describe a known attack. These patterns can be precisely written in advance. The problem here is that only a small number of potential attack methods are known, with new ones being developed constantly.
11

CHAPTER 2. RESEARCH RELATED WORK
Expert systems perform misuse detection. Expert systems [Proctor, 2001] [Bace, 2000] make conclusions on information gathered from a knowledge base. The knowledge base contains rules feature different system states based on the incoming data. In this approach, a knowledge engineer who is familiar with the target environment enters knowledge about unauthorised activities as if-then rules. Afterwards, the evaluation process of the entered knowledge is established. The unauthorised activities are specified on the "if part" of the rule, if satisfied, the action on the "then part" of the rule is performed. IDSs such as DIDS, C Language Interpretive Production System (CLIPS) and Computer Misuse Detection Systems (CMDS), which are developed by NASA as well as MIDAS, Intrusion Detection Expert System (IDES), and NIDES utilise this approach. The main problems with these systems are the large amount of data that need to be processed in order to only detect known vulnerabilities as well as expensive management and maintenance.
" Anomaly detection
In anomaly detection, the classification model usually consists of statistical profiles of user or system processes behaviour over time. Anomaly detection is a response to the "attack recognition" problems of pattern matching. Anomaly detectors identify abnormal behaviour (anomalies) on a host or network. Anomaly detectors attempt to evaluate the normal user or system behaviour and consider other irregular activities as an attack. Unfortunately, anomaly detection introduces extremely high rates of false alarms.
Anomaly detectors are primarily statistical in nature. Statistical analysis [Proctor, 2001] can be used for identifying anomalies in behavioural data, damage assessment, and behavioural data forensics. Although [Bace, 2000] there are assertions that statistical analysis may detect malicious activities which exploit previously unknown vulnerabilities that could not be detected by other approaches, these assertions have not yet been proven in developed systems. The main limitations of purely statistical intrusion detection [Kumar, 1995] are, insensitive to the order of occurrences of events, difficult to determine thresholds above which an anomaly should be considered intrusive, and limited types of behaviours that can be modelled using purely statistical methods. The major concern in statistical intrusion detection is the classification of observed user and/or system behaviour. Techniques such as supervised classification which create users profiles based on each user observed behaviour have already been applied. However, unsupervised classification learning techniques are still under research and not been implemented yet.
12

CHAPTER 2. RESEARCH RELATED WORK
Many intrusion detection systems employ techniques for both anomaly and misuse intrusion detection. The techniques used in these systems to detect anomalies are varied. However, both consider observed behaviour that does not match expected activity is flagged because an intrusion might be indicated. Figure 2.1 [Bace, 2000] depicts a general view of the activity space, reflecting the view of misuse detectors, anomaly detectors, and possible gaps between the two. The main difference between both techniques centres on the overlap of the regions representing "normal", "misuse", and "not normal" activities.
Activitie Normal activities eliesed to
Misuse
All System Activities
Figure 2.1: Misuse versus anomaly detection [source: Bace, 20001
IDSs [Jansen, 2000] were conceived of as a form of expert system that observes patterns of activity in user accounts and notifies a system administrator if anything unusual is detected. Network intrusion detection is the attempt to monitor and possibly prevent attempts to intrude into or otherwise compromise network system resources. Most network systems [Cheswick and Bellovin, 1994] employ access controls, which include firewalls and authentication and authorization systems as the first line of defence to protect resources and information. Access controls ensure that all direct access either by users or software is authorized. Access control techniques can be broken, so intrusion detection is considered to be the second line of defence that sets mechanisms put in place to warn unauthorized access attempts. In the following sections, I discuss the main recent techniques that are proposed for IDSs as well as current research approaches to this field.
2.3.1- State Transition
State transition approaches [Bace, 2000] [Kumar, 1995] perform misuse detection and use expressions of system state and state transitions to describe and detect known intrusions. State transition approaches allow the use of optimised pattern- matching techniques in such a way that unauthorised activities are represented as a sequence of successive state transitions of the monitored system. These states are linked by arcs that represent the events required for changing state. Coloured
13

CHAPTER 2. RESEARCH RELATED WORK
Petri Nets (CP-Nets) is one of the major approaches that are available for implementing state transition approaches to misuse intrusion detection. This approach was implemented in the IDIOT system. Figure 2.2 [Bace, 2000] shows the CP-Net pattern for a TCP/IP handshake process for network connection request excluding retransmissions.
TCP1 TCP2 TCP3 T syn RT syn+ack RT ack R
Token 0
Last State Initial State syn packet sent syn+ack packet sent ack packet sent
Figure 2.2: CP-Net sequence for TCP/IP handshake process
Another state-based approach [Kosoresow and Hofmeyr, 1997] that is using finite automata for intrusion detection has been proposed. The finite automata detection model has been generated and an audit data was pre-processed so that commonly occurring sequences of system or network events could be combined into meta- events. Then, the meta-events were used as the alphabet of a finite automation. Sekar et al, [2000] have proposed a different approach that does not use a built in audit system directly. Instead, it accesses the kernel mechanisms, so that the stack can be examined when a call to the operating system takes place. Consequently, it is possible to find the location in the program where the operating system request was made. This approach concentrates on improving the quality of information contained in execution traces whenever states are observed consecutively during training. However, Michael and Ghosh [2002] in Cigital Labs have proposed an approach that is aimed at improving intrusion detection performance with the trace information that happens to be available. This approach presents an algorithm for automatically constructing finite automata from training data. It builds a finite automaton describing normal program behaviour, using audit traces of non-intrusive executions for training data. The finite automaton then treats each sequence of audit events as a string that is either accepted or rejected; a rejection means that the execution generating the audit events is regarded as being anomalous. The finite automaton merely has to accept any training sequence that isn't abnormal. Consequently, it should also reject abnormal audit-event sequences, but since there are no abnormal audit-event sequences in the training data this requirement can not be formalised within the learning algorithm itself.
2.3.2- Neural Networks
Neural networks (NNs) serve to characterise anomalous behaviour using adaptive learning techniques. The basic approach here is to train a neural network on a sequence of incoming user data (commands), therefore neural networks must process a dataset to learn before they can be effective. These dataset represent the current input command sequences of a user, as well as the past n commands, where n is the size of the window of past commands. The neural network model accepts these n commands to predict the next user command. Once the neural
14

CHAPTER 2. RESEARCH RELATED WORK
network is trained using the dataset, the network constitutes the user profile and able to predict the variance of user behaviour from his/her profile.
The researchers [Lippmann et al, 1999] at MIT Lincoln Lab have proposed neural networks to address the faults in IDSs that search for key-strings in reconstructed sequences of the captured network traffic. These systems often do not detect new attacks, and they can have high false alarm rates. The new system uses neural networks to weight key-string counts and generic key-strings selected to detect common actions associated with many attacks. Receiver operating characteristic (ROC) curves were generated to determine the false alarm rate required to detect 80% of all user-to-root attacks. Lippmann et al [1999] claim that their neural network system provided high detection rate at a low false alarm rate for old as well as new attacks. Their classification neural network model correctly labelled all known attacks in the test data for non-stealthy attacks where some evidence of the attack type occurred in the reconstructed sniffed sessions.
Canady [1998] has utilised the analytical strengths of neural networks to identify and classify computer network activity based on limited, incomplete, and nonlinear data sources. While neural networks [Proctor, 2001] are excellent at detecting patterns of deviation between non-parametric datasets, they are not very good at describing the deviation or explaining its significance. However, neural networks are still used in intrusion detection research. Figure 2.3 depicts the use of neural network as an IDS model.
W T3 c m E TE
J8 ä
, ßn
CL c
it Layer dicted user mands
Figure 2.3: Neural network as an IDS model
Coolen et al, [2002], [Bace, 2000] and Cannady [1998] have summarised the major strengths and limitations of neural networks applications in IDSs. The major advantages of neural networks are:
" Self-adaptive: NNs can be trained on the normal event profiles without any specific knowledge of the different metrics. A NN can automatically account for correlation between the various measures that effect the output
" NNs do not use a fixed set of features to define user behaviours, feature selection is irrelevant
15

CHAPTER 2. RESEARCH RELATED WORK
" NNs do not make prior assumptions on expected statistical distribution of metrics
" Able to generalize: NN response is relatively insensitive to minor variations of the input
" Able to abstract: NNs are capable of abstracting the essence of a set of inputs
" Efficient: can deal with the changing characteristics of the subject " Independent of statistical assumptions on the nature of the underlying data
" Able to cope well with noisy data " Fast
The major disadvantages of NNs are:
"A tendency to form mysterious unstable configurations in which the network fails to learn certain things for no apparent reason
" NNs do not provide explanation for the anomalies they find. This made it poorly suited to the needs of security managers
" The initial training period of an NN can be substantial " Testing the quality of a NN is not an easy task " Due to the distributed nature of the behavior profile in NNs, it is hard to
understand by security managers
2.3.3- Genetic Algorithm
This approach characterises anomaly detection to perform analysis of occurring events. Genetic algorithm (GA) [Bace, 2000] utilises encoded forms known as chromosomes with methods that allow combination of mutation of the chromosomes to form new individuals. These algorithms are capable of dealing
with multidimensional optimisation problems in which the chromosome is composed of encoded values for the variables being optimised. Koza [1997] defined Genetic programming as a domain-independent problem-solving approach in which computer programs are evolved to solve, or approximately solve, problems.
In a computer simulation [Koza, 1997] [Koza, 1997], a population of many individuals is generated and a mathematical model is represented by each individual. Each individual has one or more randomly populated chromosomes that are functioning as basic instructions to the individual in a cause (input data) and effect (output behaviour classification) manner. Each individual of subsequent creations pass through randomised mutations. So, a population that pass through many generations destroys individuals with bad performance, hence, allowing individuals with better performance to replicate and mutate themselves during every generation (survival of the fittest). The performance of an individual is measured using a fitness function, which rates the performance of an individual in its environment by comparing the results of the individual's chromosomes with the desired results of the problem.
16

CHAPTER 2. RESEARCH RELATED WORK
The role of GA [Bace, 2000] in intrusion detection process is to identify improved hypothesis, by coding a solution to the problem with a string of bits, and then finding a fitness function to test each individual of the population against some evaluation criteria. At the French Engineering University [Ludovic Me Supelec, 1998], GA is proposed to develop a tool that uses both, anomaly detection as well as misuse detection to classify system events by using a set of hypothesis vectors. In this tool, the iterative process of population creation is achieved by three basic genetic operators, which are randomised once. In promising experimental results to anomaly detection, the mean probability of true positives (accurate detection of unauthorised activities) was 0.996, and the mean probability of false positives (inaccurate detection of legitimate activities) was 0.0044.
Following [Ludovic Me Supelec, 1998] is the general structure of the GA.
Random generation of the first generation Repeat
Individual Selection (Selects the fittest individuals) Reproduction (Promotes exploration of new regions of the search space by crossing over parts of individuals) Mutation (Protects the population against an irrecoverable loss of information)
Until stop criteria is reached
Bridges et al [2000] at the Mississippi State University also used genetic algorithm to tune fuzzy logic sets of their proposed IDS. In their developed ID model, each chromosome consists of a sequence of fuzzy parameters. An initial population of chromosomes is created randomly. The goal is to increase the similarity of rules of legitimate data while decreasing the similarity of rules of intrusive data. A fitness function is defined to reward a high similarity of legitimate data while penalizing a high similarity of intrusive data. The developed GA model evolved a population of chromosomes that represent better solutions to the problem. The major drawbacks of GAs to misuse detection are [Bace, 2000].
GA-based IDS can't take into account attacks characterised by even absence, such as a rule in the form of "programmer does NOT use cc as complier" GA-based IDS can't detect multiple simultaneous attacks, because of the binary expressional form for individual event streams GA-based IDS can't precisely locate attacks in the audit trail. This problem is similar to neural network approach.
17

CHAPTER 2. RESEARCH RELATED WORK
2.3.4- Immunology Approach
This approach [Marchette, 2001] [D'haeseleer, 1996] adapts biological immune systems to intrusion detection mechanisms. It performs both anomaly detection as well as misuse detection techniques. Normally, the organism's immune system is capable of determining which materials are harmless entities and which contain dangerous factors using peptides. Researchers at the University of New Mexico focused on some computer attributes such as system calls that result from running privileged processes could be considered analogous to peptides. This is done by considering strings of system calls of a fixed size n, so-called "n-grams". The basic idea is to generate a collection of "n-grams" which correspond to "self' and to use the number of "non-self' mismatches to determine the likelihood that an anomaly has occurred. In its first phase, a knowledge base was built to contain the profiles of normal behaviour, and any deviations form this profile are considered as anomalous. The second phase used the profiles to monitor subsequent system behaviour for anomalies. For example [Marchette, 2001] we start by defining an alphabet of symbols which correspond to all system calls. Fix a length n, which will be the length of characteristic strings. Afterwards, "normal" operations of the under testing program are kept in a list which contains all observed dependent "n- grams". Consider the following example which consists of six symbols: ABCC FAABECDDBF. This sequence results in a set of 6-grams, as following:
ABCCFA BCCFAA CCFAAB CFAABE FAABEC AABECD ABECDD BECDDB ECDDBF
In this example, there are 66 = 46,656 possible distinct 6-grams. Being confident that one is able to identify a given percentage of all "normal" n-grams for the under testing program, would depend on how long one has to observe the program in question. The outcome of this approach was promising however it remains to be looked at whether it is possible to be made practical. Moreover, this approach did not provide a complete solution to the intrusion detection limitations. Unauthorised activities, such as masquerading and policy violations, do not involve the use of privileged processes, hence, not subject to detection by this approach. The papers [Forrest et al, 2000] [Hofmeyr et al, 1999] [D'haeseleer et a], 1996] have described techniques for developing self-nonself immune system for computers and/or networks intrusion detection.
At the University College London (UCL), Kim et al, [2001] [1999] have evaluated the use of negative selection in an Artificial Immune System (AIS) for network intrusion detection. Forrest et al, [1994] [1997] proposed and used a negative selection algorithm for various anomaly detection problems. This algorithm defines "self' by building the patterns of legitimate activities behaviour
18

CHAPTER 2. RESEARCH RELATED WORK
of a monitored system. The Human Immune System is able to detect a vast number of antigens with a smaller number of antibodies using the development of mature antibodies through the gene expression process. When a new antibody is produced, the gene segments of different gene libraries are randomly selected and concatenated in a random order. However, this process has major problem. The new generated antibody can bind not only to those harmful antigens, but also to essential self cells. In order to prevent this damage, the HIS employs negative selection by only releasing those antibodies which do not bind to any self cell and distributed throughout the whole human body to monitor other living cells.
In their research work, Kim et al, [2001] showed that the negative selection algorithm introduced a severe scaling problem for handling real network traffic data. This research concluded by suggesting that the most appropriate use of negative selection in the AIS is as a filter for invalid detectors, not the generation of competent detectors. If this is the case, I think negative selection could be a useful to for eliminating one of the major problems in the current IDSs, which is the lack of effective automated response actions that could be taken by IDSs when particular anomaly activities take place. This would trigger another research point in this direction. In this thesis, I proposed another approach to achieve that using fuzzy intelligence.
In an interesting paper [Aickelin et al, 2003] the researchers at the University of Nottingham looked at the issue of applying the Human Immune System (HIS) into computer security differently by considering an emerging field of `Danger Theory' (DT) amongst immunologists. DT was proposed to explain current anomalies in the current understanding of how the immune system recognises foreign invaders such as bacteria. Aickelin et al, [2003] argue that DT suggests that the immune system reacts to threats based on the correlation of various (danger) signals and it provides a method of `grounding' the immune response by linking it directly to the attacker. The researchers tried to investigate this correlation to translate the DT into the problem of information and computer security by producing an Artificial Immune System (AIS) that would overcome the limitations of self-nonself discrimination. The major limitations of self-nonself Immune systems are their impracticality and inability of their privileged processes to consider detecting unauthorised activities such as masquerading and policy violations.
The proposed model [Aickelin et al, 2003] considers self-nonself discrimination is no longer essential, and centres on understanding how intrusion scenarios would be detected by reacting to the balance of various types of alerts. The proposed IDS model has been inspired by the difference between two types of alerts, necrotic `bad' and apoptotic `good' cell death alerts, with respect to Antigen Presenting Cells (APCs) activation in the HIS. The apoptosis has a suppressive effect and necrosis a stimulatory immunological effect. In HIS, APCs activate according to the balance of apoptotic and necrotic cells and this activation leads to protective immune response actions. The researchers claim that the APC activation mechanism has the advantage of detecting rapidly spreading viruses or scanning intrusions at an early stage using a number of sensors in the proposed model to report various low-level alerts.
19

CHAPTER 2. RESEARCH RELATED WORK
2.3.5- Agents Paradigm
An Intelligent Agent (IA) [Knapik et al, 1998] [Tecuci, 1998] is an entity that carries out some set of operations on behalf of a user or other software with some degree of independence or autonomy. It is a knowledge-based system that perceives its environment, and acts upon it to realise a set of goals or tasks for which it was designed. An IA can then be described in terms of a space defined by these two dimensions of agency and intelligence. Tecuci [1998] proposed what he called "Disciple Approach", the defining feature of this approach is to build Agents that a person (could be a network security expert) teaches the Agent how to perform domain-specific tasks. This teaching of the Agent is done in much the same way as that of teaching a student or apprentice, by giving the Agent examples and explanations, as well as supervising and correcting its behaviour.
The Autonomous Agents for Intrusion Detection (AAFID) [Balasubramaniyan et al, 1998] [Crosbie et al, 1995] is a prototype of an Agent-based intrusion detection system that was developed at Purdue University. The developed model is a distributed IDS based on multiple independent entities called autonomous Agents working collectively. This approach has been proposed to overcome the limitation in the existing architecture of having a single monolithic entity that does most of the data collection and processing. The system is hierarchically structured in multi-layers and Agents report their findings to transceivers, which perform housekeeping and monitoring operations. The major drawbacks of this approach [Crosbie et al, 1995] is that the autonomous Agents impose an overhead on the system as they will consume both memory and CPU cycles in order to monitor for intrusions as well as the timing cost in training the Agents. However, this is a cost of any intrusion detection system in which the cost must be weighed up against the benefits of having a protection mechanism in place.
The Java Agents for Meta-Learning (JAM) project at Columbia University [Stolfo et al, 1997] [Stolfo et at, 1996] uses intelligent, distributed Java Agents and data mining to learn models of fraud and intrusive behaviour. The JAM focuses on data mining over multiple organisations and learns models of fraudulent credit card transactions. The researchers in this project managed to get a real dataset from the largest banks in USA who provided them with real-world credit card transaction data from which models may be computed to distinguish fraudulent transactions form legitimate ones. In JAM, meta-Learning is used to combine different classifiers (from different learning algorithms). There are four chosen learning algorithms, which are ID3, CART, RIPPER, and Bayes. All the four algorithms have been compared based on the true positive rate (fraud catching) and false positive rate (false alarm) of each learned classifier. The best classifier amongst all generated outputs is Bayes (trained with 50%/50% fraud/non-fraud distribution) with the highest true positive rate and lowest false positive rate of all. In this thesis, the evaluation results indicate that Bayesian networks outperform Bayes classifiers.
20

CHAPTER 2. RESEARCH RELATED WORK
EMERALD (Event Monitoring Enabling Responses to Anomalous Live Disturbances) developed by Porras and Neumann [1997] in SRI International. SRI International's System Design Laboratory has been actively involved in intrusion- detection research since 1983. EMERALC is another Agents-based architecture that utilises a distributed approach to performing intrusion detection. EMERALD environment is a distributed scalable tool applicable for tracking unauthorised activities across large networks. Its approach is to network surveillance, attack isolation, automated response, and event analysis that combine signature analysis and statistical profiling to provide localised real-time protection of network services on the Internet. The central component of EMERALD [Neumann et at, 1999] [Bace, 2000] is the EMERALD Service Monitor, which is similar in form and function to the AAFID autonomous Agent discussed previously. EMERALD is still an ongoing progressive research project by SRI International.
In the Texas University [Carver et a], 2000], a group of researchers proposed a methodology for using intelligent Agents to provide automated intrusion responses. This is to minimise the window of vulnerability between when an intrusion is detected and when action is taken to defend against the attack. The proposed Agents collaborate to protect the computer system against attack and adapt their response tactics until the system administrator can take an active role in the defence of the system. In their published work, [Carver et al, 2000] the paper only describes the functionality of the proposed methodology in a high level manner, as the system has not been simulated or implemented yet. Therefore, the effectiveness of such a model can not be characterised.
At the National Institute of Standards and Technology (NIST), [Mell et at, 2000] [Jansen et at, 1999] [Jansen et at, 2000] an active research about the deployment of mobile Agents into intrusion detection systems has been published. Mobility allows Agents to move between systems in a network, but, introduces additional complexity to Intelligent Agents. A Mobile Agent [Pham et at, 1998] [Lange et at, 1998] is a software entity that can move within a network, able to transport itself from one machine to another, and act on behalf of the user or another entity. At the NIST, the research work has focused on the benefits derived from mobility and those associated with software Agent technology. In their work, they tried to propose a number of improved ways to apply Agent mobility to address the shortcomings of current IDSs such as tracing an attacker or evidence gathering. In a joint project at the Information-technology Promotion Agency (IPA) and the Waseda University in Japan [Asaka et at, 1999] a group of researchers have developed a network IDS called the Intrusion Detection Agent system (IDA), which employs mobile Agents to trace intruders, collecting information only related to the intrusion along the intrusion-route, and decide whether, in fact, an intrusion has occurred. However, [Jansen et at, 2000] the main obstacle to applying mobile Agents to intrusion detection is the security problem. Mobile Agents could introduce vulnerabilities that can be exploited (brain washed) by attackers to propagate a particular attack or subvert detection by the IDS.
21

CHAPTER 2. RESEARCH RELATED WORK
Traditionally, distributed systems applications have used the client-server architecture, in which the client sends its request to the server to process it, and waits for the result to be reported back. Mobile Agents are able to overcome some of the problems associated with the current distributed architectures. The obvious disadvantage of using Mobile Agents is the concern that they will introduce vulnerabilities into the network. However, there is a lot of active research regarding mobile Agents security, and we would expect contributions in this area of research. Never the less, [Garms et al, 2001] for the time being we can use the current authentication and encryption methods that many technologies are capable of, for example Java, which has well developed security functions. In addition to that, Mobile Agents solutions [NIST, 1999] [Greenberg et al, 1998] may not perform fast enough to meet their applications needs. Finally, limited industry experience and modelling tools for formulating Mobile Agents solutions to applications are also factors that need to be taken into consideration.
In the Mitsubishi Electric Research Lab (MERL) and Lotus Research Lab, USA, [Rich et al, 1997], have developed a COLLAborative interface AGENt paradigm (COLLAGEN). The Agents can both communicate with and observe the actions of the user. Agents can watch a user interact with an application and figure out the task that the user is trying to perform and give assistance. One of the Agent's main responsibilities is to maintain the history and context of the collaboration. This approach is useful and can be applied to secure networks by teaching security Agents their daily tasks and how to respond automatically in case of any unauthorised incident or security threat. At MIT [Maes, 1994] identified four ways that learning can occur. First, an Agent can learn by watching over the user's shoulder, observing what the user does and imitating the user. Second, the Agent can offer advice or take actions on the user's behalf and then learn by receiving feedback or reinforcement from the user. Third, the Agent can get explicit instructions from the user. Finally, by asking other Agents collaborate primarily with the user, not with other Agents. The Open Sesame application [Caglayan et al, 1997], on Macintosh an Agent watches a user, learns their behaviour, and offers to automate repetitive tasks.
2.3.6- Reinforcement Learning
Reinforcement Learning [Sutton et at., 1998] [Mitchell, 1997] addresses the question of how an autonomous Agent that senses and acts in its environment can learn to choose optimal actions to achieve it goals. In a Markov Decision Process (MDP) the Agent can perceive the entire state of its environment at each time step. The Agent can perceive a set S of its environment states, and has a set of A of actions to perform. The environment responds by giving the Agent a reward or a punishment based on the Agent's action consequences, and the succeeding state is produced.
The goals of reinforcement learning Agent can be defined by a reward function r, = r(s,, ad that assigns a numerical value in a form of immediate payoff to each distinct action at the Agent may take from each distinct network state st and by producing the succeeding state s, +j = 6(sr, at). For example, the goal of detecting
22
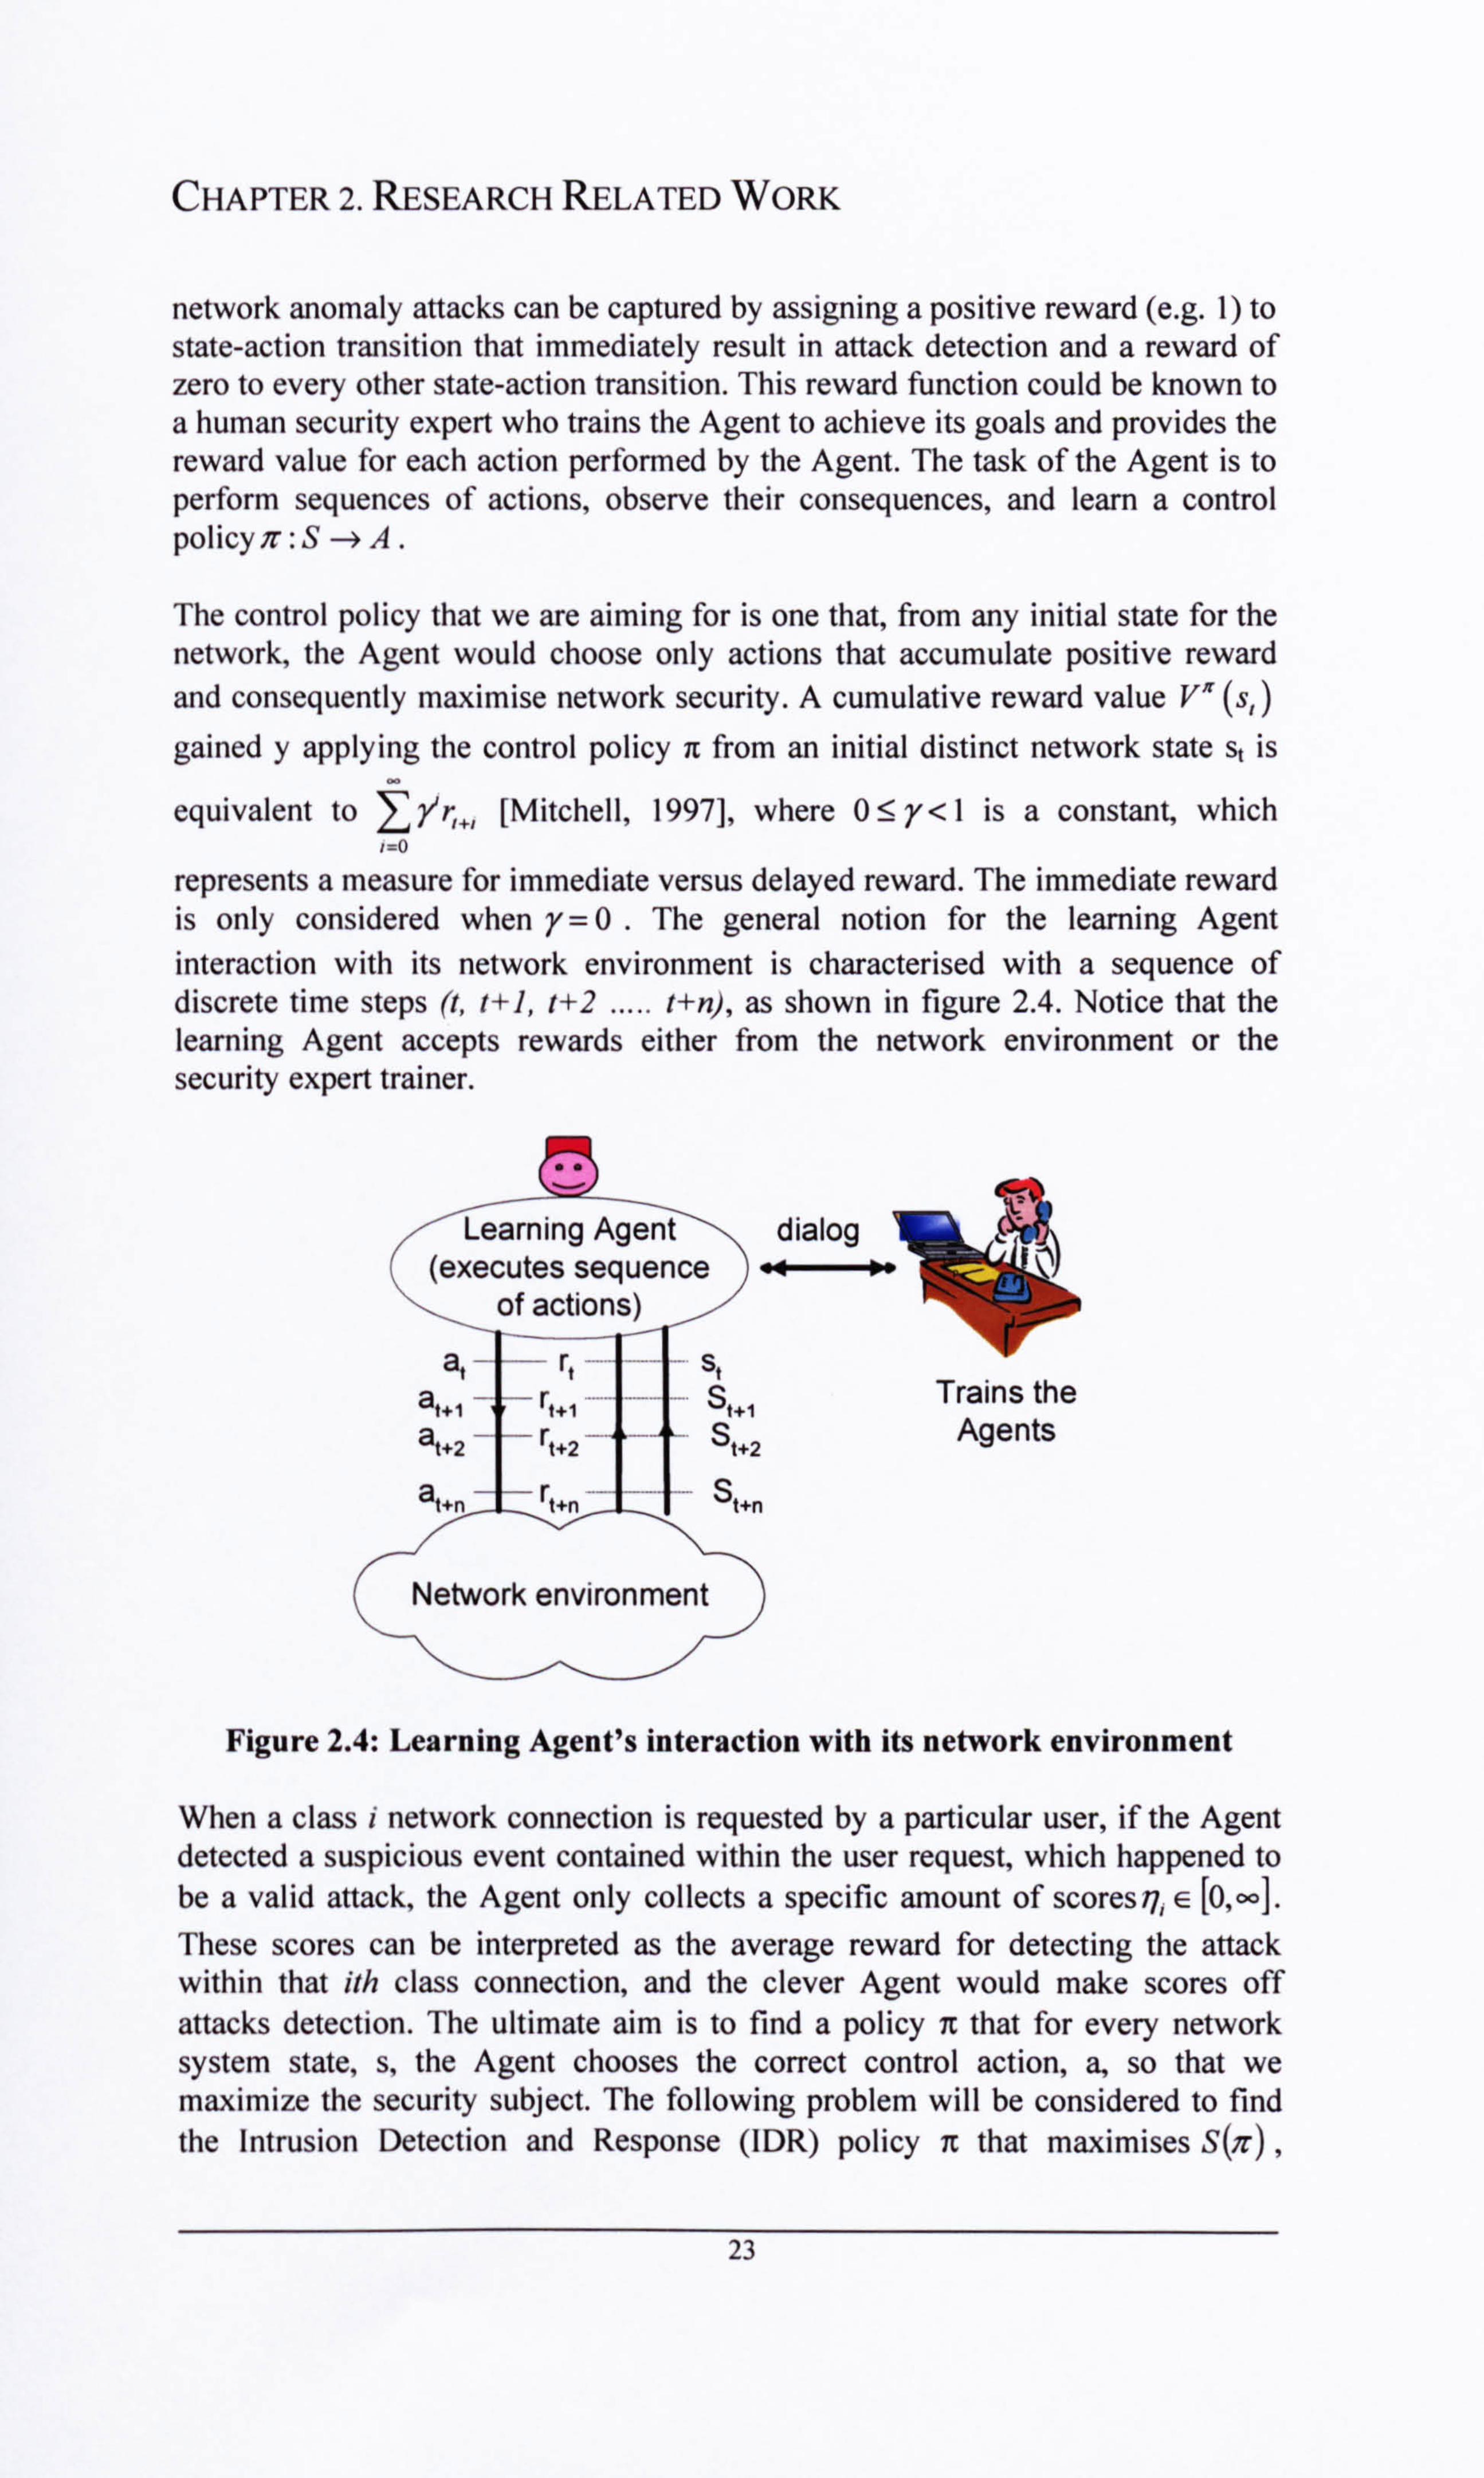
CHAPTER 2. RESEARCH RELATED WORK
network anomaly attacks can be captured by assigning a positive reward (e. g. 1) to state-action transition that immediately result in attack detection and a reward of zero to every other state-action transition. This reward function could be known to a human security expert who trains the Agent to achieve its goals and provides the reward value for each action performed by the Agent. The task of the Agent is to perform sequences of actions, observe their consequences, and learn a control policy is: S-*A.
The control policy that we are aiming for is one that, from any initial state for the network, the Agent would choose only actions that accumulate positive reward and consequently maximise network security. A cumulative reward value V" (s, )
gained y applying the control policy it from an initial distinct network state s, is
equivalent to i yr, +,
[Mitchell, 1997], where 0<_ y<l is a constant, which 1=o
represents a measure for immediate versus delayed reward. The immediate reward is only considered when y=0 .
The general notion for the learning Agent interaction with its network environment is characterised with a sequence of discrete time steps (t, t+], t+2 ..... t+n), as shown in figure 2.4. Notice that the learning Agent accepts rewards either from the network environment or the security expert trainer.
Learning Agent dialog (executes sequence « ----- 0!
of actions)
-- 4 st of+, -- rt+, St+, Trains the
at+z - rt+z --- St+2 Agents
at+n rt+n St+n
Network environment
Figure 2.4: Learning Agent's interaction with its network environment
When a class i network connection is requested by a particular user, if the Agent detected a suspicious event contained within the user request, which happened to be a valid attack, the Agent only collects a specific amount of scores/7, E [0, oo]. These scores can be interpreted as the average reward for detecting the attack within that ith class connection, and the clever Agent would make scores off attacks detection. The ultimate aim is to find a policy it that for every network system state, s, the Agent chooses the correct control action, a, so that we maximize the security subject. The following problem will be considered to find the Intrusion Detection and Response (IDR) policy it that maximises S(, r) ,
23

CHAPTER 2. RESEARCH RELATED WORK
xe (set of all policies), where S(ic) characterises the average network scores under policyn.
We choose the network state description to be asS = (n,, ±x, t) , where n, is the
number of class i connections in progress, x represents an event that occurs at random times indicating for new incoming class i connection request, and t is the included time to facilitate the occurrence of successive events. +x, stands for arrival of a legitimate new class i connection request, -x, stands for arrival of a new class i suspicious connection request. When an event x occurs, the learner Agent has to choose a proper action for that event. The action set is A(s) = {0 = normal, 1 = abnormal) upon a new connection request packet arrival. The actions available at state s, A(s), in general depend on s. For example, if receiving a new connection request at a state s will violate the security constrain, then the action set at that state should be constrained to A(s) ={l} . At some subsequent random time, another event occurs, and this cycle repeats. The Agent only earns scores for detected attacking connection requests r (s, a) = 17, if x= -x and a=1, and r(s, a)=0 , otherwise, where r(s, a) is the reward function
associated with the gained score.
At the University of Johns Hopkins [Awerbuch et al, 2003] a group of researchers have proposed a distributed reinforcement learning in order to develop provably secure traffic routing in ad hoc networks against Byzantine adversaries. The developed flooding-free routing protocol attempts to provide throughput competitive route selection against detected an adversary which benefits from complete collusion of adversarial nodes. This adversary can engage in arbitrary Byzantine behaviour and can mount arbitrary selective adaptive attacks, dynamically changing its attack with each new packet. The results of this work claim validity of their approach.
He et al, [1999] at the University of Maryland, have developed a reinforcement learning-based fast algorithm which learns a Partially Observable Markov Decision Process (POMDP) decision-rule for network proactive fault detection and management. This type of management depends on monitoring the network to obtain the data on which to base manager decisions. However, due to the overhead costs that are associated with this management approach, reinforcement learning- based Agents have been proposed. These Agents take optimal management actions (polling, repairing, etc. ) based on network states and minimising operation costs while observing network status when anomalies arise. For an intelligent Agent, who either resides in a network node or acts as a stand-alone proxy, should react to the changing network environment intelligently instead of solely providing management information base (MIB) entries when being polled. In their proposed model, the solution of the POMDP is used to construct the decision rule for the intelligent managers and Agents.
In a Markov Decision Process (MDP) [Mitchell, 1997] the Agent can perceive the entire state of its environment at each time step. The Agent can perceive a set S of its environment states, and has a set of A of actions to perform. The environment
24

CHAPTER 2. RESEARCH RELATED WORK
responds by giving the Agent a reward or a punishment based on the Agent's action consequences, and the succeeding state is produced. In Partially Observable MDP (POMDP) the environment states are not completely observable and in many practical situations the environment may provide only partial information. In such a scenario, it may be required for the Agent to consider its previous observations together with its currently gathered data in order to decide its actions. Using this approach, network intrusion detection operating in a real time manner would be regarded as a POMDP. However, reinforcement learning [Thottan et al., 1998] [Brown, 2000] can be used for solving POMDP by learning good approximations to the optimal policy. Applying reinforcement learning into network security in general and intrusion detection is a topic of hot debate and a new trend that is still in its primary research stage.
2.3.7- Bayesian Learning
Bayesian learning is a probabilistic as well as an intelligent predictive approach. In Bayesian learning, probability is used to represent uncertainty about the relationship being learned. As a machine learning technique [Lane, 2000], Bayesian approach to Network Intrusion Detection Systems (NIDSs) represents a data intensive domain with a classification as well as a prediction model. Bayesian learning [Heckerman et al. 1995] has two distinct advantages over classical learning. Firstly, it combines prior knowledge and data, as opposed to classical learning, which does not explicitly incorporate user or prior knowledge. Secondly, in Bayesian learning, there is no need to introduce external methods to avoid over fitting. Inference methods [Marchette, 2001] for detecting unauthorised activities in networks either use signature analysis or statistical anomaly detection approaches. The main advantage of the former approach is attack specificity, however, may not be able to generalise. The latter detects attacks probabilistically, allowing for generalization, however, may not be able to specify. Generally, statistics involve the fitting of models to data and making inferences from these models.
Bayesian learning approach [Lane, 2000] to NIDSs represents a data intensive domain with a hierarchical classification model hence, utilises anomaly detection techniques. The upper layers of the hierarchy are computationally intensive that determine the identification and classification features. The lower layers provide a data management mechanism to train developed detector models. The purpose of training is to make predictions for future similar network attacks possible. Bayesian learning discovers consistent useful patterns of system features that can be used to characterise users, software processes, or network activities behaviours. Classifiers are modelled and extracted from large datasets to process system features in order to recognise and discover useful facts such as anomalies. The results of experimental work introduced in the next few sections using live data are promising. However, the developed Bayesian detection models have not been commercialised yet.
25

CHAPTER 2. RESEARCH RELATED WORK
Pikoulas et al, [2001] have used Bayesian forecasting technique to predict the behaviour of computer users. The proposed system is based on Bayesian multivariate statistical model that should determine if a user is acting unpredictably or has changed their normal working patterns. The model has three main stages, observation, evaluation, and One-step prediction. Observation stage is monitoring the user and records its behaviour. Evaluation stage makes a prediction and calculates the result. One-step stage makes a single step prediction once the model is trained in monitoring the user behaviour for fifteen times. The developed model seems reacted as expected to all the tests that were applied. However, relying on only fifteen times of user interactions may not be sufficient enough to train the model and take trustable detection actions.
Valdes et al [2000] have proposed Bayesian Network (BN) based na7ve bayes to present a high-performance and adaptive detection model to analyse bursts of network traffic. The model sensor examines TCP headers hence called eBayes TCP. The eBayes TCP model structure represents the unobservable session class at the root node, and several observed and derived variables form the TCPDUMP data as children. The eBayes TCP is coupled with an eBayes service availability monitor, which learns valid hosts and services in the protected network via a process of unsupervised discovery. The developed model shows an interesting capability in detecting TCP major anomalies. However, the main limitation of the proposed model is that, as a naive Bayes model eBayes TCP assumes conditional independence of the child nodes given the single parent. This is a simplistic assumption and not really characterising the nature of TCP protocol mechanism, taking into consideration the handshake processes and connection request procedures. Other naive Bayes detection models [Schultz et a], 2001] and [Burroughs et al, 2002] have already been proposed to improve current intrusion detection systems.
At the AT&T Labs-Research, [Schonlau et at, 2001] have compared the performance of a number of statistical methods including Bayes One-step Marcov in detecting computer masquerades. The Bayes One-step Markov approach is based on one-step transitions from one command to the next. The approach uses a Bayes factor statistic to test the null hypothesis that the observed one-step command transition probabilities are consistent with the historical transition matrix. This approach seemed performing reasonably acceptable however, it was uniformly inferior to two methods which are Sequence-Match and IPAM (Incremental probabilistic action modelling). This evaluation is based on comparing the produced ROC curves of each method. These curves show the functional relationship between false alarms and missing alarms.
In Hewlett Packard (HP) [Bronstein et al, 2001] developed Bayesian Network model for detecting email anomalies such as mail loops and virus attacks. In their model, they defined `self-awareness' as the ability to autonomously detect behaviour deviations. Also, they defined `self-control' as the ability to respond to this information in a positive manner. However, in [Bronstein et at, 2001] published the `self-awareness' part of their model. Their approach to model BN is rather simple, as only nine variable nodes were considered hence; the BN model is
26

CHAPTER 2. RESEARCH RELATED WORK
manually structured. The detector model has been validated using HP's corporate email service as well as ROC curves. The results were quite promising.
Despite the fact that the developed model by [Schonlau et at, 2001] at the AT&T managed to detect masquerades behaviour, however, the models were only testing one variable of every user commands. In IDSs, it is often required to check for many command variables and identify the inter-relationship amongst them. This is to give a clear insight on whether unauthorised user activities are really taking place. Also, in the BN detection model developed by [Bronstein et at, 2001] at HP, only few variables were considered such as the incoming message rate, to/from ratio and max same size. This could be sufficient for specific email unauthorised activities therefore the BN model is manually structured. I think the developers at HP have not effectively used the capabilities of BN by only considering few variable nodes in their detection model.
Bayesian Network is a powerful tool with the ability of considering tens or even hundreds of variables and learning the inter-relationship between all these variables hence, able to generalise its models. BN has the advantage of being able to detect anomalies probabilistically, allowing for generalization potential. Also, IDSs are often generalised enough in such away to detect many types of anomalies for various applications at different levels. Therefore, in this thesis a dataset of thirty variables that is prepared by MIT Lincoln Lab was used to learn the structure of a proposed Bayesian network detection model. The developed model has been evaluated using ROC curves as well as other standard methods used to validate machine learning algorithms. This thesis discusses the evaluation of the developed detection models.
2.3.8- Fuzzy Logic
Fuzzy Logic [Zadeh, 1994] is defined by its founder in 1965 as, "In a narrow sense, is a logical system that aims at a formalization of approximate reasoning. As such, it is rooted in multi-valued logic, but its agenda is quite different from that of traditional multi-valued logical systems, e. g., Lukasiewicz's logic. In this connection, what should be noted is that many of the concepts which account for the effectiveness of fuzzy logic as a logic of approximate reasoning are not a part of traditional multi-valued logical systems. Among these are the concept of a linguistic variable, canonical form, fuzzy if-then rule, fuzzy quantifiers, and such modes of reasoning as interpolative reasoning, syllogistic reasoning, and dispositional reasoning. In a board sense, fuzzy logic is almost synonymous with fuzzy set theory. Fuzzy set theory, as its name suggests, is basically a theory of classes with non-sharp boundaries. Fuzzy set theory is much broader than fuzzy logic in its narrow sense and contains the latter as one of its branches. Among the other branches of fuzzy set theory are, for example, fuzzy arithmetic, fuzzy mathematical programming, fuzzy topology, fuzzy graph theory, and fuzzy data analysis. What is important to recognise is that any crisp theory can be fuzzified by generating the concept of a set within that theory to the concept of a fuzzy set. Indeed, it is very likely that eventually most theories will be fuzzified in this way. The impetus for the transition from a crisp theory to a fuzzy one derives from the
27

CHAPTER 2. RESEARCH RELATED WORK
fact that both the generality of a theory and its applicability to real-world problems are substantially enhanced by replacing the concept of a set with that of a fuzzy set. "
Bridges et al, [2000] argue that fuzzy logic is appropriate for the intrusion detection problem for two main reasons. Firstly, intrusion detection involves many quantitative features, such as CPU usage time, network connection duration, and the number of different TCP/IP services initiated by the same source address. Secondly, security itself includes fuzziness. Having a quantitative value such as an interval measurement, all values falling inside the interval would be relatively considered normal. Similarly, all values falling outside the interval would be relatively considered anomalous. Fuzzy representation to these quantitative measures could help in smoothing the sudden change between normal and abnormal behaviour.
At the Iowa State University [Dickerson et a], 2001] [Dickerson et at, 2000], a group of researchers designed a fuzzy based anomaly IDS called Fuzzy Intrusion Recognition Engine (FIRE). FIRE is a network IDS that uses fuzzy logic to assess malicious activity against a computer network. It employs a number of agents to perform separate monitoring tasks that are particularly significant to anomaly detection. Some agents perform their own fuzzification of input data sources. All agents communicate with a fuzzy evaluation engine that combines the output results of individual agents using fuzzy rules to trigger alerts that are relatively accurate. The results of the designed system show that it can easily identify port scanning and Denial of Service (DoS) attacks, and is able to detect some of backdoor and Trojan horse attacks. A sample of fuzzy rules used to detect host and port scanning in FIRE are as follows:
If the COUNT of UNUSUAL SDP on PortN is HIGH And the COUNT of DESTINATION HOSTS is HIGH And the COUNT of SERVICE Ports observed s MEDIUM-LOW Then Service Scan of PortN is HIGH
where SDP represents a unique connection between a source, destination, and a service port.
Also, at the Mississippi State University [Bridges et al, 2000], researchers have developed a prototype Intelligent Intrusion Detection System (IIDS) to demonstrate the effectiveness of fuzzy logic techniques in anomaly detection. Fuzzy rules have been developed to look for deviations from stored patterns of normal behaviour. Genetic algorithms are used to tune the fuzzy membership functions and to select an appropriate set of features. The fuzzy rules in IIDS are quite similar to those of FIRE. The fuzzy rule for detecting port scanning in IIDS, as follows:
If the DP = high Then an unusual situation exists.
28

CHAPTER 2. RESEARCH RELATED WORK
where, DP is a fuzzy variable that represent the addressed destination port, and high is a fuzzy set. The degree of membership of the number of destination ports in the fuzzy set high determines whether or not the rule is activated.
In IIDS, Bridges et al [2000] demonstrate that the false positive rate for identifying intrusions obtained when fuzzy frequency episodes were used, were much less than those obtained when non-fuzzy frequency episodes were used. Roberts et al, [2003] at the University of Nottingham have proposed fuzzy rules to replace the signatures identified in SNORT rules. SNORT is a popular and actively developing open-source IDS. Analysing the results found by these new rules produced better understanding of undetected attack patterns by SNORT. Wilamowski [2001] achieved to produce qualitative fuzzy decision system using different fuzzy set operators. Smoother results have been obtained in which the final outcome dependence on correct determination of fuzzy values out of signature attacks. The main limitation of all the previously proposed systems seems to be the lack of automated response actions that could minimise the effects of those detected attacks. In order to achieve that, I proposed a fuzzy based Agents model. Generally, the major shortcomings of fuzzy logic modelling are, firstly, it relies on the information provided by human experts who must be familiar with the target system, secondly, in many occasions fuzzy logic relies on trial and error method.
2.4- Motivations for Developing Intelligent Agents to Networks Security
The motivation for researching about applying Intelligent Agents into networks security stems from the strengths of Intelligent Agents and the current limitations associated with the Intrusion Detection Systems (IDSs). There has been [Knapik et al, 1998] [Tecuci, 1998] a large movement in the Artificial Intelligence (AI) research community to apply at least the basic Al techniques to distributed computing and Networking. As more and more networking and distributed systems applications are performed, there is more interest in having Intelligent Agent (IA) that can perform specific tasks efficiently. Intelligent Agents, can provide real value to businesses and users in this new, interconnected world. Intelligent Agents are able to operate asynchronously and independently of the process that initiated them (autonomously), they help to construct highly robust, fault-tolerant and cost-effective systems.
The limitations of IDSs are inherited from the shortcomings of networking systems and protocols such as TC/IP and QoS protocols. The major limitations of IDSs are discussed in section 2.3. Intelligent Agents-based approach to intrusion detection is based on entities that are capable of performing certain security functions individually or in a distributed form. Agents tend to operate autonomously, could learn from experiences and communication with other similar Agents. They can provide a mixture of anomaly detection as well as misuse detection capabilities, with the ability of responding to detected unauthorised activities. There are three dimensions or axes [IBM, 1996] that are used to measure the Agents capabilities, as follows:
29

CHAPTER 2. RESEARCH RELATED WORK
Agency: deals with the degree of autonomy the Agent has in representing the user to other Agents, applications, and computer systems. Intelligence: refers to the ability of the Agent to capture and apply application domain-specific knowledge and processing to solve problems. Agents can be relatively sophisticated using complex Artificial Intelligence (AI)-based methods and Machine Learning algorithms such as inferencing, learning and automatic control. Mobility: allows Agents to move between systems in a network. Mobility introduces additional complexity to Intelligent Agents. A Mobile Agent [Pharr et al, 1998] [Lange et al, 1998] is a software entity that can move within a network, able to transport itself from one machine to another, and act on behalf of the user or another entity.
The question that might arise is what do we mean by Intelligent Agents? Intelligent Agents use the latest Artificial Intelligence (AI) techniques to provide autonomous, intelligence, there by extending the influences of users across networks. Bigus et at, [2001] assume that intelligent Agents act rationally. They do the things we would do, but not necessarily the same way we would do them. Intelligent Agents could perform useful tasks for us, make us more productive, and save our time. Intelligent Agents represent an emerging distributed system paradigm. The Agents tasks are determined by their applications, and they range from information gathering to e-commerce to telecommunication services to scientific applications and different sorts of distributed computing. Intelligent Agents [Murch et at, 1999] [Tecuci, 1998] are those who basically able to learn and capable by themselves to acquire and maintain their knowledge. Learning represents modification of behaviour through experience or judgement. Learning Agents could learn from a variety of information sources in the environment. Once tasks are learned, the Agent can then instruct or suggests ways to improve. The learning process is gradual and interactive.
Integrating knowledge acquisition and machine-learning (KA & ML) to Agents [Tecuci, 1998] can take advantage of their complementary natures, using machine learning techniques to automate the knowledge acquisition process and knowledge acquisition techniques to enhance the power of the learning methods. As illustrated in Figure 2.5, in such an approach the expert interacts with the knowledge-based system via a (KA & ML) component, which performs most of the functions of the knowledge engineer. This would allow the expert to communicate expertise in a way familiar to him/her and is responsible for building, updating and reorganising the knowledge base. Such an Agent [Hopgood, 2001] [Wooldridge et al, 1995] is said to be deliberative. Since it explicitly represent a symbolic model of the world and makes decisions via logical reasoning based on pattern matching and symbolic manipulation. A deliberative Agent's knowledge [Newell, 1982] determines its behaviour in accordance with Newell's Principle of Rationality, which states that: If an agent has knowledge that one of its actions will lead to one of its goals, then the agent will select that action.
30

CHAPTER 2. RESEARCH RELATED WORK
Domain
Intelligent Agent Learning Agent Expert
INFERENCE ENGINCE Learning Dialog g
bI Knowledge knowledge
KNOWLEDGE Acquisition BASE Engine
Figure 2.5: Knowledgeable & Learning Agent
We might argue that systems such as Network Intrusion Detection Systems (NIDSs) could be qualitatively better using Al techniques than they would be otherwise. Also, Intranets and LANs are particularly interesting environments for intelligent mobile Agents to roam because they require less security than in the case of wide-open Internet. So, my main goal is to think of producing better and smarter systems that are able to learn detecting network anomalies and to respond to them so to minimise their effects. Agents [Proctor, 2001] are not currently available in any commercial IDSs. The realization that everyday there are newly developed network security threats in general and the evolving Denial of Service (DoS) attacks in particular require that these challenges be overcome. Since detecting those DoS attacks is not enough, we need to have an automated response mechanism to act as soon as those attacks are detected to reduce the amount of damage that could take place as a result of those destroying attacks. Also, to reduce the cost associated with manual response mechanisms. This will not only protect our information, it will also protect human's life that is relying on biomedical networks in hospitals. In addition to the need to intelligently respond to the growing threat resulted by the cyber-crime and cyber-terrorism and hence increasing demand by the public sector to have more secure information network infrastructures. The W3 organisation [Miller, 1999] states that protection from DoS attack tools is an active field of current security research. The features
supplied by those Intelligent Agents encouraged me to reason that this new paradigm would improve the current telecommunication and information networks security.
Recently researchers [Bace, 2000] at different academic as well as industrial institutions came up with different proposals to deploy Agents into Intrusion Detection Systems. This approach could utilise a number of autonomous Agents with variable targeting strategies. Each Agent could target a specific event type, signature type, platform, or process depending on the strategy used, and various strategies could be available for governing the location of the analysis and response functions. However, still a lot of research needs to be done in order to improve the Agents capabilities from the point of view of learning and responsiveness. Learning and the ability to respond are considered to be vital features for Agents to operate efficiently. This thesis addresses these issues and investigates the interaction between Intelligent Agents with some learning
31

CHAPTER 2. RESEARCH RELATED WORK
capabilities such as Bayesian learning and Fuzzy intelligence to secure information networks.
2.5- Summary
In this chapter, the state of art developments and major recent research that is taking place in the area of Intrusion Detection Systems (IDSs) in general and applying intelligent Agents and machine learning solutions to the current problems of networks security and IDSs in particular have been discussed. This chapter covered the architecture development of several prior IDSs and their main current limitations. Many IDSs employed various techniques for both anomaly and misuse intrusion detection. In all these techniques, an observed behaviour that does not match expected behaviour is flagged due to what might be an intrusion indication. This chapter surveyed the most recent interesting and state-of-the-art research that is currently taking place in research laboratories and focused on the major current research achievements in this area. The major proposed artificial intelligence and machine learning research solutions to current limitations of IDSs include, State transition models, Neural networks, Genetic algorithms, Immune systems, Agents paradigm, Reinforcement learning, Bayesian learning and Fuzzy logic. All these approaches are still under research at various established research centres either in universities or commercial organisations. The development of all these IDSs is stemmed from the distributed nature and openness of the Internet, which poses a threat to current networked systems.
State transition approaches perform misuse detection and use expressions of system state and state transitions to describe and detect known intrusions. Neural networks (NNs) serve to characterise anomalous behaviour using adaptive learning techniques. Genetic algorithms (GAs) utilise chromosomes with methods that allow combination of mutation of the chromosomes to form new individuals, hence, perform analysis of occurring events. The organism's immune system is capable of determining which materials are harmless entities and which contain dangerous factors using peptides. The Immunology approach adapts biological immune systems to perform both anomaly detection as well as misuse detection techniques. Reinforcement Learning addresses the question of how an autonomous Agent that senses and acts in its environment such as a computer network can learn to choose optimal actions to achieve it goals. The environment responds by giving the Agent a reward or a punishment based on the Agent's action consequences, and the succeeding state is produced. Applying reinforcement learning into network security in general and intrusion detection is a topic of hot debate and a new trend that is still in its primary research stage.
An Intelligent Agent is an entity that carries out some set of operations on behalf of a user or other software with some degree of independence or autonomy. It is a knowledge-based system that perceives its environment, and acts upon it to realise a set of goals or tasks for which it was designed. The "Disciple Approach" defines Agents that a person (could be a network security expert) teaches the Agent how to perform domain-specific tasks. This teaching of the Agent is done in much the same way as that of teaching a student or apprentice, by giving the Agent examples and explanations, as well as supervising and correcting its behaviour.
32

CHAPTER 2. RESEARCH RELATED WORK
Agents that are incorporated with Bayesian learning and Fuzzy intelligence will dramatically enhance their learning and controlling capabilities. This chapter ended with the discussion of the motivations behind the development of Intelligent Agents; as none of the current approaches neither used Bayesian networks-based Agents that are learned directly from a dataset to build its models nor applied Fuzzy intelligence to automate the response actions. The next chapter discusses the major concerns in networks security.
33

CHAPTER 3. DISTRIBUTED NETWORKS SECURITY CONCERNS
Chapter 3
Distributed Networks Security Concerns In this chapter, the current network security issues are identified in the context of security engineering and management. There are a variety of security threats that are often presented in the discussion of networks security. In the following sections, the major risks in distributed network systems are briefly outlined, including the major limitations of current network communication protocols. These limitations have led to the development of evolving distributed attacks, such as Distributed Denial of Service (DDoS) attacks. These attacks have been developed to use the features provided by the distributed nature of the Internet. This chapter ends with the discussion of the Intrusion Detection Systems (IDSs), their approaches and types.
3.1-Background Statistics
The increase in the number of interconnected networks to the Internet has led to an increase in security threats and unauthorized activity. Distributed systems and network security [Atkins et al. 1996] is concerned with protecting the hardware and software resources in a network as well as stored information. In its annual report [CSI, 2004] "CSI/FBI Computer Crime and Security Survey" for 2003, Computer Security Institute (CSI) conducted a survey of 530 organisations across different categories. The statistics indicate that organisations security threats involve different sorts of problems from Denial of Service (DoS), unauthorized access to financial fraud ... etc, as shown in figure 3.1. The 2003 findings show that there is no shortage of attacks. Despite the lower number for aggregate financial losses in 2003, the risk of cyber attacks continues to be high. Even organisations that have deployed a wide range of security technologies can fall victim to significant losses. Although 15% of the organisations could not identify the attacks took place in their networks, only 47% of the organisations (251 of them) could actually quantify their losses, with a total of $201,797,340.
34

CI IAP"I'I? R 3. DIS'1'IMMI'I D NETWORKS SECURITY CONCERNS
Denial of Service
Laptop
Active Wiretap
Telecom Fraud
Unauthorised Access by Insiders
Virus
Financial Fraud
Insider Abuse of Not Access
System Penetration
Telecom Eavesdropping
Sabotage
Theft of Proprietary Info
_-- Jii 70ýj
_1V 2D02
64 Q 2001 69 1
2000
1999
... vo
ii
7
Percentage of Respondents
Source: ('umpurer Seem it) Institute (('Si) 2003: 490 Respondents 92% 2003 C'Sl/FRI Computer ('rime and Security Survey 2002: 455 Respondents 90%
2001: 484 Respondents 91% 2000: 583 Respondents 90% 1999: 460 Respondents 88%
Figure 3.1: CSI Survey of 530 organisations (Types of Attack or Misuse)
The second most expensive computer crime among survey respondents was Denial of Service, with a cost of $65,643,300, as shown in figure 3.2. Dos attacks covered the second most reported incidents (35%) in 2003, see figure 3.3. DoS attacks prevent legitimate users from using normal communication services and network resources. Virtually all organisations use anti-virus software (99%) Lirewalls (98%), and most (92%) employ some measure of access control. Other US government statistics show that cyber crime total losses of companies are about $202,000,000,000 per annum, 300,000 Internet attacks per year, more than 40,000 WWW sites contain some form of hackers tools, and one Internet crime per 20 seconds I Preneel, 2001]. Those figures provide further evidence surrounding the severity of the problem in protecting information networks.
35

CIIAPTER 3. DISTRIBUTED NETWORKS SECURITY CONCERNS
Unauth. Insider Access
Financial Fraud
Telecom Fraud
Theft of Proprietary Into
Virus
Laptop Theft
Insider Net Abuse
Denial of Service
Sabotage
System Penetration
Telecom Eavesdropping
Active Wiretapping
Source: Computer Security Institute (CSI) 2003: 251 Respondents 47% 2003 CSI/I'IRI Computer Crime and Security Survey
Figure 3.2: Amount of losses by attack type in US Dollar
Theft of Transaction
Information 6%
Vandalism 'o
Other
19'.
Financial Fraud
4%
Denial of Service
35%
Source: Computer Security Institute (CSI) 2003 ('SI/P131 Computer Crime and Security Surve
2003: 185 Respondents 35%
Figure 3.3: Reported incidents
36

CHAPTER 3. DISTRIBUTED NETWORKS SECURITY CONCERNS
3.2-Networks Security Engineering & Management
Security engineering [Anderson, 2001] is about building systems to remain dependable in the face of malice, error, or mischance. The engineering discipline
of security focuses on the tools, processes, methods to design, implement, and test complete systems, and to adapt existing systems as their environment evolves. Security engineering requires cross-disciplinary expertise. It includes managing polices and procedures, and managing the individual components within the security architecture including: cryptography and certification methods, firewalls, hardware tamper-resistance, formal methods to knowledge of applied psychology, organisational and audit methods and the law, etc. Security management [King et al. 20011 [Bace, 2000] basically, is the process of managing and maintaining security within the whole organisation network. It has always been an important function within an organisation. In today's high speed networks, with the increasing risk associated with internetworking, the importance of effective security management is essential to an organisation's ability to manage risk and reduce it whenever and wherever possible. Security management provides a framework for the change and incident management procedures, which consequently provides a framework for identifying, responding to, and reviewing security incidents. Figure 3.4 [Race, 2000] shows a general process model to security management for network systems.
Network restored
Intrusion
/ Prevention
Recovery & "Manage Detection & Resolution
ment Response
Intrusion
Attack origin Investigation
Attack identifier! Detected
Figure 3.4: A general model for networks security management
Generally, providing 100% secure system is currently not possible. Security
products provide two primary benefits [Intrusion. com, 2001]: visibility and control. And, it is the combination of these two benefits that make an enterprise's private computer network secure:
" Visibility: the ability to see and understand the nature of the network and the traffic that passes through it. Visibility is paramount to decision making.
37

CHAPTER 3. DISTRIBUTED NETWORKS SECURITY CONCERNS
Control: the ability to affect network traffic including access to the network or parts thereof. Control is paramount to enforcement.
3.3-The Major Risks of Distributed Networks Security
Most organisations have wisely installed filtering routers and firewalls to protect their investment on the Internet; many of these countermeasures can go wrong because of their limitations and can not withstand distributed systems threats, such as DoS and Web vulnerabilities. A useful categorization of network attacks can be classified in terms of passive attacks and active attacks [Stallings, 1999]:
" Passive Attacks These types of attacks are concerned with only either eavesdropping or monitoring of networks traffic. The main aim of the attacker is to obtain information that is being transmitted.
" Active Attacks These types of attacks do involve some modification or disruption of the data traffic within a network. These attacks take three different categories:
1- Masquerade: conducted when the attacker pretends to be a different valid user. 2- Message Modification: which means that a message transmitted within a network is captured, altered, and then retransmitted to a legitimate recipient. 3- Denial of Service (DoS): These attacks prevent legitimate users and network managers from the normal use or management of the communications services and network resources.
In addition to those attacks, the Internet has inherited vulnerable transport and network protocols like TCP/IP, UDP, RIP, and ICMP ... etc. This made it easy for attackers to exploit those protocols and apply different sorts of network security threats.
3.3.1-Classifications of the Major Risks
Distributed systems are more vulnerable than centralised systems because of their frequently widespread geographical locations, and because of their increased complexity. However, the very nature of a distributed system frequently means that facilities can be readily duplicated, thus providing a degree of resilience not readily available in other types of environment. The major risks in information network systems can be classified under three headings, Confidentiality, Integrity, and Availability [Stallings, 1999] [ Jackson et al. 1992], as follows:
Confidentiality: is concerned with preventing unauthorized access to information that is confidential to organisation. Integrity: is concerned with maintaining accuracy, completeness of the information being processed in the system. Availability: is concerned with preventing the failure of computing resources and telecommunication services.
38

CHAPTER 3. DISTRIBUTED NETWORKS SECURITY CONCERNS
Most of the concerns in information network security protection are confidentiality, integrity, and availability. However, there are additional requirements in authentication, authorization, access control, and non-repudiation, which are also significant when implementing security controls [Stallings, 1999]. Network Managers must consider the unique blend of requirements they must manage to adequately protect valuable resources and information in a distributed network, as follows:
" Authentication: is concerned with ensuring that the origin of a message or any electronic data document has to be correctly identified proving that the identity is valid.
" Authorization: is concerned with characterizing polices, rules and procedures. It is a process of granting certain rights to users once they have satisfactorily identified themselves.
" Access Control: is concerned with the requirement to access information or network resources, which may be controlled by the target system. It works closely with the authorization to protect against forbidden use of resources.
" Non-repudiation: is concerned with confirming that the data transaction between the two communicating parties has taken place. It requires that neither the sender nor the receiver of a message be able to deny the transmission. This is in order to protect against the later denying responsibility for involvement in a communication.
3.3.2-The Approach of Denial of Service (DoS) Attacks
It is often much easier to disrupt the operation of a network or system than to actually gain access. Networking protocols such as TCP/IP, which were designed to be used in an open and trusted communities have inherited flaws. In addition, many network operating systems and devices have flaws in their network stacks that weaken their ability to withstand DoS attacks [Schneier, 2000] [Northcutt, 1999]. DoS attacks could cause major damage to vital systems. A company that relies on electronic transaction for its daily businesses could suffer serious financial loss if its systems became inaccessible for even a short duration. DoS attacks could have life-threatening impact in health care operation. Some attackers target Mail servers, others target routers or Web servers. The idea is to flood the target with useless traffic and connection requests until it shuts down. DoS attacks do harm just by the attempt to deliver packets, whether or not the packets would authenticate properly is completely irrelevant. Mandatory authentication would do nothing to prevent these attacks [Schneier, 2000].
39

CHAPTER 3. DISTRIBUTED NETWORKS SECURITY CONCERNS
The four major high level DoS cases have been identified by Leiwo and Zheng, [1997], where any resource request should be denied:
" The user has already allocated too many resources. " The process has already allocated too many resources. " Too much of a particular resource have already been allocated. " The request is acceptable, but no instances of the requested resource are
available.
For the cases 1,2 and 3, it is necessary to specify the amount of available resource, maximum amount of resources a user can allocate, and a maximum amount of resources an individual process can allocate. While there are many tools available to launch DoS attacks, it is important to identify the main types of DoS attacks, so later on to understand how to detect and prevent them. The three most common categories of DoS [Skoudis, 2002] [Northcutt, 1999] are: Bandwidth (BW) consumption, Resource starvation, and Resource exploitation, as follows:
" BW consumption Bandwidth (BW) Consumption represents the most insidious forms of DoS attacks, where the attacker consumes all available BW either locally or remotely. System performance problems will only be detected in DoS or computation- intensive attacks.
" Resource starvation Resource Starvation is meant to consume system resources, such as CPU utilization, queuing buffer or embedded logic chip to handle exceptional conditions. Resource Starvation DoS attacks generally result in unusable system hardware resources.
" Resources exploitation Resource exploitation attacks exploit a flaw in the target system's software in order to cause a processing failure or to cause it to exhaust system processes and resources. Flaws Exploitations represent failures of an application, operating system, or by deliberately execute excessive cryptographic computations, for example at an access control server. These exceptional conditions normally result when a user sends unintended data to a vulnerable element or execute privileged commands, for example to kill local processes in a running server.
40

CHAPTER 3. DISTRIBUTED NETWORKS SECURITY CONCERNS
3.3.3-The Evolution of Distributed DoS (DDoS) Attacks
A DDoS attack [Stein, W3C] [Skoudis, 2002] harnesses the distributed nature of the Internet. It uses many computers to launch a coordinated DoS attack against one or more targets, as shown in figure 3.5. The attacker is able to multiply the effectiveness of the DoS significantly by harnessing the resources of multiple unwitting accomplice computers, which serve as attack platforms. Typically, a DDoS master program is installed on one node using a stolen account. The master program, at a designated time, then communicates to any number of "agents" programs installed on computers anywhere on the Internet. The agents, when they receive the command, initiate the attacks. The master program can initiate hundreds or even thousands of agent programs within seconds. Many other attacks can be mapped into a distributed model. For example, an attacker can set up a group of agents to conduct a more stealthy port scan or network mapping.
uzt.:
1\ _________ _________ _________
IIEEEEE. IIIIi
___ ___ L. )_'L.
. LJ. IE
ýýl! i' Figure 3.5: Distributed Denial of Service (DDoS)
Similarly, an attacker could distribute the work of password cracking among a number of machines, thereby exploiting more processing capacity to crack passwords more quickly. This is how the entire attack from multiple systems compromise to final assault typically occurs. We would expect many tools to use the distributed nature of the Internet in the near future, as reported by the National Infrastructure Protection Centre (NIPC). DDoS attack, for example, is executed by flooding one or more of the site's servers with so many requests that they become unavailable. If legitimate users make normal requests during a DDoS attack, the requests may fail completely.
41

CHAPTER 3. DISTRIBUTED NETWORKS SECURITY CONCERNS
The DDoS attack typically is prefaced by a reconnaissance probe process, which might take just few minutes, hours, days, or even months before the attack takes place. In order for the attackers to have a successful DDoS attack, they should gather as much information as possible about all aspects of the targeted organisation's security position. This will help attackers to end up with a complete footprint of their Internet and remote access presence. Foot printing is necessary to systematically and methodically ensure that all pieces of information related to the targeted organisation's network infrastructure are identified. Reconnaissance probes are often come in the form of a series of whois queries and pings or exploratory packets sent to one or more systems on a network. A complete understanding of the typical network traffic patterns should help identifying a foot printing in progress. Figure 3.6 [Chappell, 2000] shows a typical time line for DDoS attack. Detecting the reconnaissance probes is not an easy task, as sophisticated attackers may intentionally randomise or slow down their reconnaissance actions in order to be undetected [Scambray et al. 2001].
4- Preparation Phase -º
Foot printing and I Compromising I Handlers
Reconnaissance Stage Agents Inform Agents to Start Attack
Compromising Attack Agents Start
Handlers Ordered Attack
Figure 3.6: A typical time line for DDoS attack
42

CHAPTER 3. DISTRIBUTED NETWORKS SECURITY CONCERNS
3.3.4- The Limitations of Current Distributed Network Protocols
Within Connectionless Network Protocol (CLNP) [Halsall, 1996], the flow control is not applied on a per call or end-to-end basis within the Internet. Congestion arises when the packet traffic entering a particular network starts to approach the total resources available within that network to handle them. Since most subnets operate in a store-and-forward mode, the resources include the processing capacity within each router for example, which used to process received packets and the number of memory buffers that are available to store incoming packets waiting to be forwarded on a particular outgoing link.
As the Internet load increases and the rate of arrival of packets traffic increases, so the size of output queues will build up and increasing the delays will be experienced in each network. This signals the start of congestion and, in the limit, if all the buffers become full, the available resources are exceeded. The network is said to be overloaded and delays experienced by packets traffic will increase rapidly. The effect of congestion on the performance of a network is shown in figure 3.7 [Halsall, 1996]. However, as such current congestion control schemes are not perfect the actual throughput is less than that in the ideal case. The difference between the two is a measure of the efficiency of the congestion control scheme.
-Ideal 1.0 ---------- - Depends on Efficiency
" of Control scheme
on
," With Congestion Control s
Without Congestion Control
Deadlock 1.0 Offered Load
Figure 3.7: The effects of congestion on throughput
43

CHAPTER 3. DISTRIBUTED NETWORKS SECURITY CONCERNS
Now, let us consider the distribution and use of the memory buffers associated with the Network Layer. A typical layout is shown in figure 3.8 [Halsall, 1996]. Let us assume that the three-subnet inputs are operating near their maximum capacity and that all received packets from these links, after reassembly, require to be forwarded on the same output link of Subnet 1. If the three links operate at the same rate, the output queue associated with link Subnet I will start to build up, thereby increasing the transit delays experienced by packets using that link. If this condition continues, all the buffers will become full and queued for output link to Subnetl. Any new packets will then be discarded, as there are no free buffers to store them, even though they may require a different output link.
Reassembly Buffers
Receive H ISO HForward process CLNP process
Free buffer pool
Ad OQI AM OQ2 J OQ3
IBI IB2 IB3
Subnet 1II Subnet 211 Subnet 3
IB-Input Buffer OQ-Output Queue
Figure 3.8: Buffer distribution at ISO network layer
Note that increasing the number of buffers does not necessarily ease the problem since this may simply allow a single output queue to become even longer. Therefore, the increased delays experienced by packets waiting to be forwarded in those queues are likely to cause the timers being used by the transport protocol entities to expire. These will start to retransmit the affected packets, and hence will simply increase the load on the affected links. In practice, determining the optimum number of buffers to be queued for a single output link as a percentage of the total number of buffers available is a complex problem and depends on the number of output links and the routing scheme being used. Also, the optimum value is not static since it varies with the loading of the system, thus implying
44

CHAPTER 3. DISTRIBUTED NETWORKS SECURITY CONCERNS
some form of dynamic allocation. Note that this control congestion scheme is not part of the protocol as such, but rather is example of buffer management. In normal circumstances, discarding packets is not an ideal solution since it inevitably leads to an increase in the transit delay associated with the Internet.
In today's Internet, most network systems use First-In First-Out (FIFO) scheduling, Drop-Tail, or Random-Early-Detection (RED) buffer management schemes. These schemes are vulnerable to DoS attacks. The Priority Queuing (PQ) scheduling scheme was designed to give mission-critical programs higher priority than less critical traffic. There are two problems with this scheme [Ye, 2001]. Firstly, as long as attackers can spoof the priority field, priority service misuse could take place, which leads to DoS against legitimate users. Secondly, to assign priorities for all user traffic in an open environment such as the Internet is almost impractical.
Fair Queuing (FQ) scheme [Ye, 2001) restricts every node to an equal share of network bandwidth. This scheme promotes DoS attack, as it makes it easy for any attacker to flood the network resources without being punished, because all users equally share the same bandwidth. This scheme can not guarantee fairness when a network is under DoS attack. The Weighted Fair Queuing (WFQ) gives low- volume traffic flows preferential treatment and allows higher-volume traffic flows to obtain equity in the remaining amount of queuing capacity. This scheme itself is prone to DoS attacks. WFQ enables DoS attackers to generate deliberate excessive short traffic flows, by giving these low-volume traffic flaws a preferential treatment.
In today's Quality of Service (QoS) implementations [Ye, 2001] [Freguson et al, 1999], all current QoS protocols are built on the functionality of the Internet Protocol (IP). Currently, there are two major QoS strategies being proposed, Differentiated Service (Diff-Serv) and Integrated Service (Int-Serv). Diff-Serv sets bits in an IP header field at network boundaries. Diff-Serv is essentially a refined priority-scheduling model, which does not solve the flooding DoS problem. First, the priority set up is determined by boundaries or end-hosts. Policy set up only reflects a sender's request not network conditions. Second, it is possible that crackers can manipulate the bits in ToS/IPv4 fields or TC/IPv6 fields resulting in disrupt-of-service, which leads to DoS to legitimate users. Int-Serv, as a model that predominantly focuses on real-time classes of applications in order to provide guaranteed service for both delay and bandwidth, it does not address the issue of DoS problems.
The QoS aware network is configured to give better service to mission-critical and delay-sensitive applications. Denial of Service (DoS) attacks, which have been proven to work against IP, can be deployed within a QoS enabled environment [Miller, 1999]. However, other new aspects of concern will be raised with respect to the features introduced by QoS. DoS problems would enable attackers to remove availability of resources from providing the QoS that was offered. QoS could be degraded to a noticeably poor level, such as higher packets drop rate, longer delays, bigger jitter and so on. An unauthorised user can take advantage of any QoS protocol by deliberately forcing unnecessary resources reservations to be
45

CHAPTER 3. DISTRIBUTED NETWORKS SECURITY CONCERNS
provided. This act could lead to completely destroying resource availability and consequently severe DoS problems. Therefore, protection measures need to be considered for any network technology that plans to support QoS.
3.4-Types of Intrusion Detection Systems
Currently there are three major types of IDSs, which are Network IDSs, Host IDSs, and Applications IDSs [Bace, 2000] [Proctor, 2001].
3.4.1- Network-based Systems
These types of systems are placed on a network, nearby the system or systems being monitored. They examine the network traffic and determine whether it falls within acceptable boundaries. These IDSs detect attacks by capturing and analysing network packets and listening to a network segment or switch. One network-based IDS (NIDS) can monitor the network traffic affecting multiple hosts that are connected to a network segment, there by protecting those hosts.
For a network intrusion detection system, there are two ways to detect intrusion [PMG, 2001]: string matching and context analysis, as follows:
String Matching: also known as a network gripping in the UNIX world, matches a series of characters to identify a threat. String matching offers tremendous speed in identification and additional signatures are easy to create and customise. The negative aspect of string matching is that it is prone to false-positives. Context Analysis: also known as a signature analysis, builds on string matching by allowing a scripted analysis of the context of the string thereby dramatically reducing false positives. The negative aspect of context analysis is speed; it simply takes longer to detect attacks in context.
3.4.2- Host-based systems
These types of systems actually run on the system being monitored. These examine the system to determine whether the activity in the system is acceptable. This vantage point allows Host-based IDSs to analyse activities with great reliability and precision, determining exactly which processes and users are involved in a particular attack on the operating system. Host-based IDSs can directly access and monitor the data files and system processes usually targeted by attacks. Host-based IDSs normally utilize information sources of two types, operating system audit trails and system logs.
46

CHAPTER 3. DISTRIBUTED NETWORKS SECURITY CONCERNS
3.4.3- Application-based systems
Application-based IDSs are a special subset of Host-based IDSs that analyse the events transpiring within a software application. The most common information sources used by application-based IDSs are the application's transaction log files.
3.4.4- Hybrid IDSs
Hybrid Intrusion Detection combines capabilities from both Host-based and Network-based IDSs [Proctor, 2001]. Hybrid IDS features Compound signatures, which have several advantages in comparison to the other two IDSs. Compound signatures provide a pattern of activity that can be analysed in a trustworthy manner. As most host-based attacks may occur during a session that began with a network-based attack, Compound signatures make it easier to track the full impact of the network attack.
3.4.5-Commonly Detected Attacks by NIDSs
NIDSs commonly report three types of attacks, these are [Bace, 2000] [Northcutt, 1999]:
" System or Network Scanning A scanning attack occurs when an attacker probes a target network or
system by sending different kinds of packets. Using the responses received from the target, the attacker can learn many of the system's characteristics and vulnerabilities.
" System or Network Penetration These sorts of attacks involve an unauthorised acquisition and/or alteration
of system privileges, resources, or data.
" Denial of service Attacks DoS attacks attempt to slow or shut down targeted network systems or
services. DoS cause wasting people's time, system link bandwidth and sometimes crashing a system. In the vast majority of these attacks, the source address is faked or "spoofed". The approach of DoS problems has already been discussed in section 3.2.2.
47

CHAPTER 3. DISTRIBUTED NETWORKS SECURITY CONCERNS
3.5- Incident Response Options in IDSs
Intrusion Detection Systems (IDSs) can be classified as passive or active [Tucker, 1997]: Passive response systems generally operate offline, analyse the audit data
and bring possible intrusions or violations to the attention of the auditor, who then takes appropriate action, see figure 3.9. Active response systems analyse audit data in real time. Besides bringing violations to the attention of the auditor, these systems may take an immediate protective response on the system, see figure 3.10. The protective response can be executed after the violation has occurred, or pre- emptively, to avoid the violation being perpetrated to completion. Protective
responses include killing the suspected process, disconnecting the user, disabling
privileges, or disabling user accounts. The response may be determined in total autonomy by the intrusion detection system or through interaction with the auditor.
Incident ) Target system
History & audit control information database
Alarm for violation
0..
Audit Control
Figure 3.9: Passive intrusion detection
Target system
Incidents to Protective History & be reported response audit control information database
Violation report
ow I Protective action Uo Audi Control
Figure 3.10: Active intrusion detection
48

CHAPTER 3. DISTRIBUTED NETWORKS SECURITY CONCERNS
The incident response [Mandia et al, 2001] consists of real-time decisions and actions of asset managers. These actions are intended to minimize incident-related effects on systems or network assets and to mitigate residual security risk based on available evidence from the incident. A generic incident response process [Amoroso, 1999] can be characterized as shown in figure 3.11, as consisting of a collection of normal and subverted system states, as well as a collection of dormant and active response states.
Incident Lam/ Response Detected j Initiated
n Response
Deteon A sysem uner Process
& Interacts
IntrI0Itd
Resse attack with SystSystem Monrs
Response System Completed /- \ Recovered
Figure 3.11: Generic incident response process
The Response Initiated state [Amoroso, 1999], in which a response to a particular incident is initiated, has three possible ways of responsiveness, human response, automated response, and hybrid response, as shown in figure 3.12.
Intrusion Detection System
Automated Hybrid Human Response Response Response
Set of Automated Response Processes
Figure 3.12: Three ways of incident responsiveness
49

CHAPTER 3. DISTRIBUTED NETWORKS SECURITY CONCERNS
In the System Recovered step of figure 3.11, the system is restored as a result of the incident response activities. This step is considered the most important one in the incident response process. System restoration is not a straight forward process of simply turning things back into normal. However, restoration corresponds to one of the following three situations [Amoroso, 1999]:
Ls Degraded restoration In this case, the system is restored after a particular incident has taken place, but some set of assets or system attributes remain in a degraded or damaged situation. It may be that degraded restoration is an intermediate state in the incident response process that is used as a short-term bridge to a more acceptable restoration state, see figure 3.13.
" Mirrored restoration This case corresponds to restoration of a system from its pre-incident state to exactly the same state after an incident. Currently, very limited automated mechanisms are available to handle this task effectively.
I Incident Interim
System in occurs System in restoration System in Enhanced State Out-of-Service Degraded
State State
Direct enhanced restoration
System in Normal State
Enhanced restoration Restore to normal through intermediate
Figure 3.13: System restoration process
" Improved restoration This case is the best of all in that it allows the incident to provide information that can be used to prevent future occurrences of the incident in question. Intermediate steps through degraded or mirrored restoration states should be considered common in this scenario, as shown in Figure 3.13. IDSs that incorporate a learning element could achieve this task feature.
3.6-Summary
In this chapter we reviewed the main issues related to the current concerns and security problems of distributed network systems. It aimed to provide a summarised background theory to the subject, so later on to justify the given proposals. The major network systems risks have been discussed, including current network security threats in general with particular emphasis on Denial of Service (DoS) attacks and its distributed versions. The current network systems, congestion control and QoS schemes have flaws in their protocol stacks that
50

CHAPTER 3. DISTRIBUTED NETWORKS SECURITY CONCERNS
weaken their ability to withstand DoS attacks. Those attacks could cause a major damage to vital systems. The three most common categories of DoS are Bandwidth (BW) consumption, Resource starvation, and Resource exploitations. Distributed DoS (DDoS) is an evolving network attack that harnesses the distributed nature of the Internet and uses many computers to launch co-ordinated attacks against one or more targets. The current Intrusion Detection Systems (IDSs) can only help to detect network attacks, yet are not able to reduce the damage that DoS can launch against network resources.
This chapter discussed the main types of IDSs, commonly detected attacks. The incident response options for IDSs have been outlined. Those responses consist of real-time decisions and actions, which can be characterised as a collection of dormant and active restoration processes. Improved system restoration is considered to be the most important step of the response action, as it allows the incident to provide information that can be used to prevent future occurrences of the incident in question. In order to achieve that a learning mechanism and intelligent control feature is required. A promising approach for future IDSs might involve these features that utilise machine learning strategies. The next chapter will discuss how Bayesian learning as a probabilistic approach could be incorporated into Networks Intrusion Detection Systems (NIDSs) to detect network anomaly activities. This is to allow NIDSs to learn detecting as well as predicting those evolving network attacks.
51

CHAPTER 4. INVESTIGATION OF NAIVE BAYES APPROACH TO IDSs
Chapter 4
Investigation of naive Bayes
Approach to IDSs
This chapter investigates naive Bayes model as a simple probabilistic as well as a predictive approach to Network Intrusion Detection Systems (NIDSs). In naive Bayes [Wikipedia] the probability can be derived from Bayes theorem that it incorporates independences assumption and hence considered to be an independent feature model. Naive Bayes models can be trained efficiently in a supervised learning setting. This chapter covers the concept of Bayesian decisions-based modelling within the context of NIDSs. It discusses the matter of knowledge engineering and extraction, and considers the major steps involved in NIDS data modelling using vector transformations. A developed naive Bayes supervised learning model for detecting network attacks is introduced. The detector model is developed to extract the variable nodes of naive Bayes model directly from a dataset. This dataset [MIT Lincoln Lab] is generated by MIT Lincoln Lab and used to train the developed models. The purpose of training is to make predictions for future similar network attacks possible. The dataset simulates a network traffic contaminated with different network unauthorised activities. It has been generated to evaluate and enhance the research in the field of NIDSs.
4.1- Bayesian Probabilistic Approach to Networks Security
Naive Bayes modelling incorporates independences assumption amongst its variable nodes. One thing [Witten et al, 2000] that can go wrong with naive Bayes is that if a particular attribute value does not occur in the training set in conjunction with every class value, things go badly wrong. The assumption of navie Bayes that attributes are independent in real life certainly is a simplistic one and hence makes it a good starting point for modelling intrusion detectors. This would enable us to explore the behaviour of the detector in its simplistic Bayes model. Once this achieved, the next step will be to investigate the dependency
52

CHAPTER 4. INVESTIGATION OF NAIVE BAYES APPROACH TO IDSs
amongst our variables of interest and explore how such a dependency affects the detection mechanism. In many practical applications [Wikipedia], parameter estimation for naive Bayes models uses the method of maximum likelihood; in other words, one can work with the naive Bayes model without believing in Bayesian probability or using any Bayesian methods. Bayesianism [Wikipedia] "is the philosophical tenet that the mathematical theory of probability applies to the degree of plausibility of statements, or to the degree of belief of rational agents in the truth of statements; when used with Bayes theorem, it then becomes Bayesian inference. ".
As a machine learning technique [Lane, 2000], Bayesian approach to NIDSs represents a data intensive domain with a classification as well as a prediction model. Inference methods [Marchette, 2001] for detecting network attacks either use signature analysis or statistical anomaly detection approaches. The main advantage of the former approach is attack specificity, however, may not be able to generalise. The latter detects attacks probabilistically, allowing for generalization, however, may not be able to specify. Statistics involve the fitting of models to data and making inferences from these models. For example, given a traffic trace of a network that represents a dataset, we want to classify it either as an attack or not. Regardless of the models used, the ultimate goal would be, how well does our model detect or classify attacks and respond to them later on? Therefore, in any statistical anomaly detection approach, the system requires the estimation of two quantities: the probability of detection (PD) and the probability of false alarm (PFA). In general, it is not possible to simultaneously achieve a PD of I and PFA of 0, and one generally can not simply state the PD and PFA that one wants and design the algorithm to provide them. When we say or hear a statement of the kind "the network has 70% probability of being attacking", this probability expresses a subjective degree of belief, and this leads to the Bayesian formulation of probability. Therefore, we can
" Use a value of I to denote complete certainty that an attacking event will occur
" Use a value of 0 to denote complete uncertainty that an attacking event will not occur
" Intermediate values denote corresponding degrees of belief " Bayesian theorem provides a quantitative method for updating these
probabilities when new data arrives " The prior probability represents our own or agents degree of belief before
the data arrives " After the data has arrived, we use Bayesian theorem to convert this prior
probability into a posterior probability
Suppose that we have received a large amount of traffic packets and found that (for example) the incoming abnormal ICMP ECHOREPLY packets are three times more likely to occur than the legitimate ICMP ECHOREPLY packets. We formalise this by introducing the prior probabilities of an incoming packets belonging to each class Ck. Thus, p (C, ) = 0.75, and p (C2) = 0.25, where C, is
53

CHAPTER 4. INVESTIGATION OF NAIVE BAYES APPROACH TO IDSs
the class of an abnormal ICMP ECHOREPLY packets and C2 is the class of a legitimate ICMP ECHOREPLY packets. Therefore
" If a new packet is to be predicted, then we would assign it to class C, because it has the higher probability of occurring.
" But this implies that all new incoming packets are assigned to this class, even though some packets belong to class C2.
" If we measure a feature of this new packet, then we can combine this information and the prior probabilities to obtain a better classification.
" This is achieved by using Bayesian theorem.
Suppose that the feature variable x, can take any of the values {X'}, I =1,....., M.
p V, Vk) P (C then P(Ck 1 X') =
pýX
where, p (Ck ý X') is the posterior probability, p(Ck) is the prior probability
of Ck ,P (XI ý c) is the class-conditional probability of X' for class Ck, and
p(X') is a normalisation factor. Since the new incoming packet must be assigned
to one of the two classes, P (CI I X') +p (C2 I XI)=1 and
thus p(X')= p(X' I C, ) p(C, )+ p(X' I C2) p(CZ). The prior probabilities p(CI)
and p(C2) are known from trials, the class-conditional probabilities
p (X' I C, ) and p (X' I C2) can be calculated from a probability histogram (see
Figure 4.1). This enables us to calculate p(X').
The posterior probabilities p (C1 I X') and p (C2 I X') can now be calculated as follows:
P r (XI C1) P (ý C)
P(ckix 1_ , k=1,2 l1Y.
p(c, )p(` ' ici) 0-1
Let C be the event that our classifier tell us it has detected an attack (raises an alarm), C, be the event that it really is an attack, and C2 the event that it is false
alarm (for this case, n is equal to 2). Suppose a network receives 1,000,000 packets per day, and of these 20 packets per day correspond to attacks (on average). That means the probability of receiving abnormal (attacking) packets p(C, )= 20 / 1,000,000 =1/ 50,000. Suppose that our detection rate is 99% and false alarm rate 0.1%. This means that the posterior probability p (C, I X') = 0.019,
54

CHAPTER 4. INVESTIGATION OF NAIVE BAYES APPROACH TO IDSs
or about 2%, so only I alarm out of 50 is an attack. If we can get our false alarm rate down to 0.01%, things look a little better: p (C, I X') =0.1653, or about 17%. It takes a false alarm rate of 0.001% (a probability of 10"5) to bring our probability of intrusion given an alarm up to 66%. A security manager may very well ignore a system that is right only 2/3 of the time, but as we have seen, it takes an extraordinary good system to obtain this level of performance. The main problem lies in the huge amount of network packets traffic, and this is what always makes the reduction of false alarms in networks intrusion detection systems (NIDSs) a serious issue.
This version [Witten et al, 2000] of Bayes rule is known as Naive Bayes, because it assumes that the variables are independent. It is only valid to multiply probabilities when the events are independent. The assumption that attributes are independent (given the class) in real life certainly is a simplistic one, especially, when we are dealing with network packets traffic. However, Naive Bayes works very well when tested on actual datasets, particularly when combined with some of the attribute selection procedures, that serve to eliminate redundancy, and hence non-independent attributes.
4.2- Knowledge Engineering and Extraction
Knowledge [Witten et at, 2000] is defined as the accumulation of a set of expectations. If data is characterised as recorded facts, then information is the set of patterns, or expectations, that underlie the data. Knowledge Engineering (KE) [Studer et al. 1998] is about turning the process of constructing Knowledge-based Systems (KBSs) from an art into an engineering discipline. In KE, it is required to develop a formal Knowledge Base (KB) for a particular problem. This requires the analysis of the building and maintenance process itself and the development of appropriate methods, languages and tools specialised for developing Knowledge Base Systems. According to [KEL] Knowledge Engineering is the process used to acquire and structure information about a particular subject. It is about developing automated systems to organise, integrate, and interpret existing knowledge. Knowledge Engineering is an activity that embraces a set of concepts and methodologies dealing with
" Acquisition of Knowledge " Analysis and synthesis of data and information " Integration and interpretation of Knowledge quantities and
qualities
Knowledge acquisition [KEL] is associated with three basic activities, as follows:
" Defining relevant data and information follows from a systematic evaluation of the problem of interest.
" Acquiring information directly from an expert. " Evaluation of the data and information that form the knowledge base for a
particular problem.
55

CHAPTER 4. INVESTIGATION OF NAIVE BAYES APPROACH TO IDSs
Analysis deals with separating or breaking up of any whole into its parts so as to find out their nature, proportion, function, or relationship, e. g., analysis of variance. There are three common approaches to analysis: graphical, numerical, and statistical. Synthesis deals with the putting together of parts or elements so as to form a whole, i. e., it is the antithesis of analysis. There are three common approaches: simulation, optimization, and visualization. Each approach represents a substantial and well-developed discipline that can be further compartmentalized. For example, simulation can be viewed as continuous (systems of differential equations) or discrete (object-oriented simulation). Optimization (in relation to restrictions) includes linear programming, non-linear programming, dynamic programming, and control theory. Visualization includes graphics, animation, and four-dimensional representations. Knowledge integration and interpretation deals with quantitative as well as qualitative information to solve problems, make decisions, and develop plans. The integrative systems are based on technologies adapted from a variety of subject domains, e. g., computer science, engineering, mathematics, cognitive psychology, management science, etc. Several types of integrative systems have been used to address intelligent systems problems: expert systems, intelligent information systems, intelligent database management systems, object-oriented simulation, and knowledge-based systems.
Knowledge Engineering plays a key role in the process of building IDSs, which requires an evaluation of the extant data and information that form the KB. For a quite complicated problem, such as modelling IDS capable of learning to detect and predict future evolving network attacks, a variety of sources and types of data and information are involved. Therefore, it is extremely useful to order and organise extant data and information. KE is focused on collecting, arranging and manipulating knowledge in such a way that the developed IDS model can engage in an intelligent dialogue with for example a network security manager and/or perform learning tasks by itself. In order to effectively practice KE, two main areas need to be considered, which are Knowledge Modelling and Knowledge Extraction.
Studer et at. 1998, argue that due to the important role of knowledge for an expert's problem solving capabilities, the process of building a KBS has been recently seen as a modelling activity. Therefore, building a knowledge base system means building a computer model with the aim of realising problem solving capabilities for problems in the area of concern. However, knowledge is not always directly accessible, but has to be built up and structured during the knowledge acquisition stage. So, knowledge acquisition process is seen as a model construction process.
4.3- Bayesian Decisions and Knowledge Modelling
In Bayesian decision, a decision rule to be made to allow for a classification of patterns. It induces a partitioning of the measurement space into a set of disjoint regions. The decision rule can be stated as "if a measurement vector x lies in
region A, then the pattern belongs to class w, . Suppose that it is required to distinguish the incoming traffic packets of normal content from those with
56

CHAPTER 4. INVESTIGATION OF NAIVE BAYES APPROACH TO IDSs
anomaly ones. This is a two class pattern recognition problem in which the patterns to be classified are the various incoming packets content. One can form an observation vector whose ith component is the sample of the packet content at timet,. The observation vector x is passed to a learning or pattern recognition algorithm which classifies it as being derived from either a normal packet, class w, or from an anomaly packet with attacking content, class w2 . There are two main issues that need to be considered, as follows:
" The patterns are represented by vectors in multidimensional space " It is not possible to have an exact description of the various classes of
objects
Thus [Jang et al. 1997],
" We need to consider vectors and linear transformations (which are represented by matrices), and
"A statistical approach to classification is required
4.3.1- Traffic Patterns & Vector Representation
There are two steps involved for identifying statistical Network Intrusion Detection System (NIDS) with vector transformations. Firstly, structure identification, which involves applying a priori knowledge about each entity within the modelled system, so to determine a class of models in order to conduct the search for the most appropriate model. This class of models is identified by the function y=f (u, 9) , where y is the model's output, u is the input vector, and A is the parameter vector. Secondly, parameter identification, in which after identifying the structure of the model, we need to apply optimization techniques to
determine the parameter vector B=9, which will lead to the resulting
model y=f (u, B) that can describe the system appropriately. The input training dataset will compose of a desired input-output pairs (u,, y) , 1= 1,2,3,..., in, that
represent the input training dataset to the modelled Bayesian NIDS under consideration. The system optimization [Jang et al. 1997] is not a one-pass process, it requires to conduct both structure and parameter identification repeatedly until a satisfactory model is found. The output for a linear model y is given by the linearly parameterized expression:
y= Ofi(u)+BZf2(u)+..... +0. f�(u) (4.1)
where u= [u1....... u1, ]T is the NIDS model input vector that represents the network traffic dataset, f,,....., f, are known detection functions of u input vector, and 8,,....., 8� are unknown parameters to be estimated. Equation (4.1) represents a regression function, and the 6, s are representing the regression coefficients. In
57

CHAPTER 4. INVESTIGATION OF NAIVE BAYES APPROACH TO IDSs
order to identify B, , we have to supply a training dataset, which is in a form of network traffic packets. This dataset composed of data
pairs {(u,, y, ), i =1,2,3....... m}, as they represent the desired input-output pairs of the NIDS model. By substituting each data pair into Equation (4.1) yields a set of linear equations:
f(M)oll +12(UI)e2 +..... +f() en =A J1(u2)e1 +12(u2)02 +..... +ff (u2)en = y2
(4.2)
Jl (Um)el +f2(Um)e2 +..... +fn(Um)On = Ym
Using matrix notation, the preceding equations can be rewritten as:
A0=y (4.3)
where A is an mxn design matrix
f (u, )..... ln(u1) A= :
JI (um )..... fn (um )
0 is an nxI unknown vector: B,
, 0=: en
and y is an mx1 output vector:
YI Y=
Y.
The i'h row of the joint data matrix [A : y], denoted by [aT : y, ], is related to the iah
input-output data pair (u,, y, ) through a, r =[f, (u, ),....., f (u)]. It is necessary to have in >= n, which is always the case in any active data network traffic. This ensures that we always have more data pairs than fitting parameters, such as protocol type, service type, connection duration and so on. The network traffic dataset is often contaminated by noise. This sort of contamination usually leads NIDS systems to inaccurately activate there alert, which is known by false positives and false negatives. Therefore, Equation (4.3) should be modified to incorporate an error vector to count for random noise, false positive or false negative as AG+e = y.
58

CHAPTER 4. INVESTIGATION OF NAIVE BAYES APPROACH TO IDSs
4.3.2- Statistical Classification
Most Network Intrusion Detection Systems (NIDSs) [Stallings, 1999] are primarily concerned with the problem of detecting attacking packets traffic. Therefore, they are considered a two-class classifiers, with the two classes being "attack", which is represented by class I (w, ) and "not an attack", which represented by class 2 (w2). In my developed detection models, I tend to go further and determine what sort of attack it is, so to determine what the potential consequences are, but first and foremost is the detection of the attack. Since we are currently concerned with two classes, and the feature vector x must belong to
one of the classes, p (w, ) +p (w2) =1, a simple decision rule would be, as follows:
IF p(w, Ix)>p(w2lx), THEN w,, ELSE w2
But P(w, 1x)=P(11w)P(w, ),
i=1,2 P(X)
Thus IF Al Iw. )>P(W2),
THEN wl, ELSE w2 P(xIw2) Pk)
This is a Bayesian decision rule, and the left hand side is called the likelihood ratioL(x):
P(XIw1) P(xIwz)
The right hand side is called the likelihood threshold z2, and is assumed to be
known a priori or it can be learnt empirically): rz, - P(W2) ý P(WI)
By examining the likelihood ratio for Gaussian distributions, the measurement vector x reduces to a scalar x that belongs to two classes. Thus, assuming Gaussian distribution, Let
2
P(xl )= I exp
(x
6ý'ý and
_z P(xIw2)=
2 exp
(z
C2
be the class-conditional probabilities.
59

CHAPTER 4. INVESTIGATION OF NAIVE BAYES APPROACH TO IDSs
Figure 4.1 [Stallings, 1999] suggests, in very abstract terms, the nature of the task confronting the designer of an Intrusion Detection System. Although the typical behaviour of an intruder differs from the typical behaviour of an authorised user, there is an overlap in these behaviours. Thus, a loose interpretation of intruder behaviour, which will catch more intruders, will also lead to a number of "false positives, " or authorised users identified as intruders. On the other hand, an attempt to limit false positives by a tight interpretation of intruder behaviour will lead to an increase in false negatives, or intruders not identified as intruders. Thus, there is an element of trade off in the design and practice of any IDS.
Profile of intruder Profile of authorised user behaviour p(x/w) behaviourp(x/w2)
Probability density Towards w, decision Towards w2 d cision function Overlap in observed
or expected behaviour
Average behaviour Average behaviour Measurable behaviour
of intruder[[ of authorised user/I2 parameter
Figure 4.1: Profiles of intruders and authorised users behaviour
IF p(w, )=p(wz)=1,
The Bayesian decision rule will be: (x-, [t, ýz
=
exp IFL(x)=p xi w2
- Q` >1, choose w ' ) (x w
exp 6Z
IF L(x)= pxl w' exp
P(xIw2)
at < I, choose w2
(x-, uz)z eXp -
a2
This condition could be simplified to:
IF (x-p, )2-(x-p2)2 <0, choose w,
IF (x-A)2-(x-p2)2>0, choose w2 Or
60

CHAPTER 4. INVESTIGATION OF NAIVE BAYES APPROACH TO IDSs
IF x<I P2 -' u1),
choose w, l
IF x> (PZ
2 ý' ),
choose w2
Recall that a decision rule for a two-class problem is
IF P(KI W. ) >
P(w2), THEN w,, ELSE w2 P(xIw2) P(Wl)
If the measurement vectors x are characterised by a Gaussian density with mean A and covariance matrix 1:
1, then the likelihood ratio L (x) is
Ftl
1 *exp
I_ý(x-, Iý +1(x-/l2)r1:
2-, 1x-J12/ 22) 2)
and H(x) is defined by H(1)=-21nL(x)
=(x-, u, )T ý, -'(x-, tt, )-(x-, u2)T +InlZ-1
I
r12
and thus, by definition IF H(x) <T, THEN w,, ELSE w2
(w2) is called Gaussian or quadratic classifier. where T= -2 In
p(WI)
Identifying and collecting the major useful data generated by a target system, network protocol and/or application activities are essential for unauthorised activities analysis. This is to ensure the defining vulnerable network states and consequently detecting any signs of network violations and unexpected (abnormal) behaviour, such as DoS activities. Table 4.1 lists the major state components that could be analysed by a Network Intrusion Detection System (NIDS).
61

CHAPTER 4. INVESTIGATION OF NAIVE BAYES APPROACH TO IDSs
Table 4.1: Network states of the major components
Component States Network anomaly Description for events abnormal states
TCP/IP (normal, Violated connection -invalid sequence numbers in a TCP connection abnormal) flow packets establishment -receiving TCP/IP out-of-spec packets
-timing out half-open TCP/SYN handshake process
Application (ON, OFF) Unexpected system -port scanning processes or server -buffer overflow (WWW, DNS, misbehaviour, -files exceeding allocated size ftp, and Email) shutdowns and -unexpected running processes
restarts -repeated failed access attempts to privileged accounts and restricted resources -violations in time consistency between event records, such as time gaps in log files -unexpected cryptographic checksums for sensitive data files, such as password files, Access Control List (ACL), firewall-filtering rules etc..
ICMP (normal, Violated relationship -receiving irrelevant ICMP packets Rxed/Txed abnormal) between resources (Bandwidth (BW) consumption) packet traffic consumed by specific
processes ARP packet (normal, Illogical source and -violated ARP cache traffic abnormal destination addresses QoS provision (normal, Unexpected presence -unexpected QoS request and provision
abnormal) of new services and processes that lead to Theft of Service
PKI (normal, Performance statistics -degradation of computational and cryptography & abnormal} (violated with storage resources (CPU & buffer) Access request previous statistics)
for resources utilization
4.4-Bayes Learning and Knowledge Extraction
In Bayesian statistics [VALPOLA, 2000], probability measures the degree of belief as well as the probabilities of hypotheses and parameters. The probability distribution of a parameter, for instance, quantifies the uncertainty of its value. Bayes Learning, which is based on Bayes theorem constitutes a probabilistic view of learning. The underlying assumption is that there is a set of hypotheses, each having a certain probability of being correct. Receiving more information changes the probabilities from a learner's point of view. The aim in this setting is to be able to find a hypothesis with highest probability of being correct, given a specific set of data or piece of information. In Bayes learning, probability is used to represent uncertainty about the relationship being learned.
62

CHAPTER 4. INVESTIGATION OF NAIVE BAYES APPROACH TO IDSs
Bayesian learning [Heckerman et al. 1995] has two distinct advantages over classical learning. First, it combines prior knowledge and data, as opposed to classical learning, which does not explicitly incorporate user or prior knowledge, so that ad hoc methods are needed to combine knowledge and data. Second, in Bayesian learning methods, there is no need to introduce external methods to avoid over fitting. As a machine learning technique [Lane, 2000], Bayesian learning approach to NIDSs represents a data intensive domain with a hierarchical classification model. The upper layers of the hierarchy are computationally intensive that determine the identification and classification features. The lower layers provide a data management mechanism to train developed detector models. The purpose of training is to make predictions for future similar network attacks possible.
Bayesian learning is able to extract knowledge using the discovery of association amongst variables of interest. Knowledge extraction plays a key part in today's machine learning applications. However, knowledge extraction [Muller, 2000] from a finite set of data poses many problems, because it is a process which can be characterised by:
" Inadequate a priori knowledge about the object of interest " Large number of potential often immeasurable variables that may
describe the target object's behaviour " Noisy and few data samples " Fuzzy objects
Knowledge extraction is relevant to learning and may influence the classification results within each step of the learning process. Therefore, a coherent formalisation of knowledge extraction, would determine a significant role in modelling any learning algorithm in general and Bayesian learning in particular.
Naive Bayes model, offers a supervised learning from a dataset. The supervised learning is facilitated due to the fact that the induction of the model is completely guided throughout the characterization of a particular node. Naive Bayes reads a set of data in attribute-value representation, estimates the posterior probabilities of all classifications, and the highest posterior probability is chosen as the prediction. Naive Bayes would be applied to Bayesian network to feature the target node as the father of all other network nodes. In this structure, knowing the value of the target makes each node independent of the others. The low number of probabilities to be estimated makes this a robust structure with a very fast learning process.
63

CHAPTER 4. INVESTIGATION OF NAIVE BAYES APPROACH TO IDSs
Figure 4.2 shows the variable nodes that represent the dataset being used to determine whether captured network traffic indicates an attack or not. These variable nodes are based on a standard dataset provided by MIT Lincoln Lab. This dataset includes a wide variety of network attacks simulated in a distributed network environment. The next sections discuss in more details, the properties of this dataset.
". "
duration wrong fragment su attempted
""
protocol type urgent
""
service hot
"
flag
"
sro bytes
"
num root
"0
count dirt srv rate
""
srvcount sry-diff_host rate
"""
num file creations serror rate activity type
"""
num piled Jogins num shelIs srv senor rate
"""
logged in num aocess files rerror rate
"". "
dst bytes num compromised is host login srv rerror rate
""""
land root shell is_puest login sanx sry rate
Figure 4.2: Bayesian dataset variable nodes
64

CHAPTER 4. INVESTIGATION OF NAIVE BAYES APPROACH TO IDSs
4.4.1- The Dataset Source
In 1999 MIT Lincoln Labs prepared and managed DARPA Intrusion Detection Evaluation Program. The objective was to survey and evaluate research in intrusion detection. A database contains a standard set of data to be audited, which includes a wide variety of intrusions and network attacks was provided. This set of data is simulated in a military network environment. The 1999 [Heftich et al, 1999] Third International Knowledge Discovery and Data Mining Tools Competition KDD intrusion detection contest uses a version of 1998 dataset. This competition was held in conjunction with KDD-99, The Fifth International Conference on Knowledge Discovery and Data Mining. The competition task was to build a network intrusion detector and a predictive model capable of distinguishing between "bad" connections, called intrusions or attacks, and "good" normal connections. In the year 2000 MIT updated this dataset, hence both datasets are used.
MIT Lincoln Lab set up an environment to acquire several weeks of raw TCP dump data for a local-area network (LAN) simulating a typical U. S. Air Force LAN. They operated the LAN as if it reflects a real Air Force environment, but contaminated with multiple types of network attacks. The last version of the raw training data was about ten gigabytes of compressed binary TCP dump data from several weeks of network traffic. This was processed into more than five million connection records. Similarly, the two weeks of test data yielded around two million connection records. A similar simple sample of this dataset has been generated locally at the Centre for Mobile Communications Research (C4MCR), University of Sheffield. However, we realised that a local generated database similar to MIT generated version would require a lot of time to setup the test-bed, collect the attacking tools as well as a lot of cleaning and data translation processes. Consequently, needs several months to complete the whole project of dataset preparation. Therefore, a decision has been made to use the dataset that already being provided by MIT Lincoln Labs.
The Lincoln Lab dataset represent a sequence of network traffic packets mostly in the form of TCP connections including other different communication protocols traffic. A network connection is a sequence of packets starting and ending at some well defined times, between which data flows to and from a source IP address to a target destination IP address. Networks use some well defined communication processes to complete any required connection. Each dataset record contains information about a number of variables that constitute network connections. Each connection is labelled as either normal, or as an attack, with exactly one specific attack type.
65

CHAPTER 4. INVESTIGATION OF NAIVE BAYES APPROACH TO IDSs
Each connection record consists of about 100 bytes. The attacks fall into four main categories:
" Probing: reconnaissance and other probing, e. g., port scanning, " DoS: Denial-of-Service attacks, such as smurf, " R2L: unauthorized access from a remote node, e. g. guessing password, " U2R: unauthorized access to local super user (root) privileges, such as
various "buffer overflow" attacks.
It is important to note that the test data is not from the same probability distribution as the training data, and it includes specific attack types not in the training data. This makes the task more realistic to develop a detector capable of predicting future similar attacks. Some intrusion experts believe that most novel attacks are variants of known attacks and the "signature" of known attacks can be sufficient to catch novel variants. The datasets contain a total of 24 training attack types, with an additional 14 types in the test data only.
4.4.2- Knowledge Extraction
Items of knowledge (facts, concepts, ideas ... ) are often spread over a given set of data. Recent studies [Fayyad, 1996] [Shen et al. 1996] have indicated that knowledge extraction process can take a great advantage of current powerful knowledge representation and acquisition tools. Knowledge extraction from a dataset involves three main aspects, as follows:
" The model used to extract knowledge, which is Bayesian learning model in our case
" The type of representation for the acquired knowledge, and " The constraints to be over imposed on the representation in order to
judge the validity of the acquired knowledge.
In our dataset, each row represents more than forty variables that determine network connections using different communication protocols. Each row ends with a value that represents whether any particular connection is normal or abnormal (i. e., an attack). Here are two sample lines of the dataset, as shown in Table 4.2. The first line corresponds to the names of the variables and the second as well as the third correspond to the variables information for each particular connection. Note that the activity_type variable represents the target variable node.
Table 4.2: A sample of the dataset
11 duration
protocol_ type service count
srv_, count
serror rate -
arv_serror rate
rerror_ rate srvrerror rate activity-type
22 tcp ft data I 1 0 0 1 0 normal.
0 icmp ecr I 508 508 0 0 1 0 smurf.
66

CHAPTER 4. INVESTIGATION OF NAIVE BAYES APPROACH TO IDSs
The database of the MIT LL incorporated dataset is shown in figure 4.3. In total this database contains the records for about half a million connections.
SepsMors options
Q'eb aor; Q Semicolon [ comm p Presence of tale we
Q space Qo Character and of Wie
Q Ilore conseciAive aerifcd $eperiars
Q Missn9 vdue Q Trrropose
Dios View
service 1 flog ý src_bytes I dsLb1es I-W
udp private SF 105 146 0p udp private SF 105 146 0
udp private SF 105 146 00
udp private SF 105 146 00
udp private SF 105 146 0p
udp doman_u SF 29 0 0p
Udp private SF 105 146 00
udp private SF 105 146 0Ö
lcp Htp SF 223 185 b0 udp private SF 105 146 00
Figure 4.3: The developed database
Stolfo et al, [2000] define higher-level features that help in distinguishing normal connections from attacks. There are several categories of derived features. The "same host" features examine only the connections in the past two seconds that have the same destination host as the current connection, and calculate statistics related to protocol behaviour, service, etc. The similar "same service" features examine only the connections in the past two seconds that have the same service as the current connection. "Same host" and "same service" features are together called time-based traffic features of the connection records. Some probing attacks scan the hosts (or ports) using a much larger time interval than two seconds, for example once per minute. Therefore, connection records were also sorted by destination host, and features were constructed using a window of 100 connections to the same host instead of a time window. This yields a set of so- called host-based traffic features.
Unlike most of the DoS [Heftich et al, 1999] and probing attacks, there appear to be no sequential patterns that are frequent in records of R2L and U2R attacks. This is because the DOS and probing attacks involve many connections to some host(s) in a very short period of time, but the R2L and U2R attacks are embedded in the data portions of packets, and normally involve only a single connection. Useful algorithms for mining the unstructured data portions of packets automatically are an open research question. Stolfo et al. 2000, used domain knowledge to add features that look for suspicious behaviour in the data portions, such as the number of failed login attempts. These features are called "content" features. A complete listing of the set of features defined for the connection records is given in the tables 4.3-4.5 below [Hettich and Bay, 1999].
67

CHAPTER 4. INVESTIGATION OF NAIVE BAYES APPROACH TO IDSs
Table 4.3: Variables list of individual network connection
eature name description Type
duration length (number of seconds) of the continuous
connection
protocol type type of the protocol, e. g. tcp, udp, discrete etc.
service I network. service on the destination, d iscrete e. g., http, telnet, etc.
Fsrc_bytes number of data bytes from source continuous to destination
dst -bytes
number of data bytes from continuous destination to source
flag normal or error status of the discrete connection
land 1 if connection is from/to the same discrete host/port; 0 otherwise
wrong_fragment number of "wrong" fragments continuous
urgent number of urgent packets continuous
Table 4.4: Content features within a connection suggested by domain knowledge
feature name Description type hot number of "hot'' indicators continuous
number of failed login num_failed_logins , continuous
attempts
logged_in 1 if successfully logged in; 0 discrete otherwise number of "compromised"
num_compromised [continuous
conditions 1 if root shell is obtained; 0
root-shell otherwise discrete
1 if -su root" command su_attempted attempted; 0 otherwise discrete
Inum number of "root" accesses continuous
number of file creation num_file_creations continuous operations
num_shells number of shell prompts continuous number of operations on I Facces
access control files r us
Inum-putbound curds number of outbound continuous
68

CHAPTER 4. INVESTIGATION OF NAIVE BAYES APPROACH TO IDSs
commands in an ftp session 1, if the login belongs to the is hot login discrete 'hot" list; 0 otherwise
lis_guest_login I1 if the login is a "guest"login; (discrete 0 otherwise
Table 4.5: Network traffic state variables computed within a2 second time window
Veature name description type
number of connections to the
count same host as the current continuous connection in the past two seconds
ote: The following features refer to these same-host connections. % of connections that have
serror rate "SYN' errors continuous
% of connections that have rerrorr rate
I " continuous REP errors % of connections to the same same srv rate continuous
_ _ service 0 %Y( of connections to different diff srv rate v continuous
_ ices ser number of connections to the
srv count same service as the current continuous _ connection in the past two
seconds Note: The following features refer to these same-service connections. % of connections that have
srv_serror rate - "SYN' errors continuous
% of connections that have [srv_rerror_rate "REP" e ro continuous r rs
srv_diff host-rate /o of connections to different ° hosts continuous
69

CHAPTER 4. INVESTIGATION OF NAIVE BAYES APPROACH TO IDSs
4.5- Navie Bayes Supervised Learning and Prediction
The nave Bayes is dedicated as the learning algorithm and used for characterizing the target node. Figure 4.4 shows the developed na7ve Bayes detector model with a set of nodes that best characterize the nature of network traffic. The model represents a classifier, in which a set of mutually exclusive classes is represented as the root node, and the attributes of the objects to be classified depend on this target variable. The simplifying assumptions made by this model, are that the classes are mutually exclusive and that the attributes are independent given the class. The meaning of this assumption is that, once we know the class to which an object belongs, the relations between its attributes become irrelevant. In the detector model depicted in Figure 4.4, the toot node activity_type represent the set of mutually exclusive classes and the leaf nodes are the dataset given attributes. The activity_type node is set as the target node.
activity type
Figure 4.4: The naive Bayes developed detector model characterizes target node association to all other variable nodes
70

CHAPTER 4. INVESTIGATION OF NAIVE BAYES APPROACH TO IDSs
The model features the level of contribution of each node variable towards the target node activity_type. Based on the given dataset, the analysis of the arcs emphasizes the importance of the role of each arc. The arc's thickness is proportional to the strength of the probabilistic relations between the target node and the other nodes within the network. In order to see the amount of information being contributed by each node to the knowledge of the target node is to monitor the shade of each variable node. The lighter the shade of the square inside the node, the greater the amount of information it carries. The activity_type can be verified by at the naive Bayes detector by investigating the nodes at the network. Figure 4.5 represents the developed detector model output. From the detector output shown in figure 4.5, the developed algorithm model managed in fact to learn the association contribution of some variables towards the target node activity_type.
The detection mode enables the identification of the association probabilities for different states of any variable, by assigning a particular value to any variable. As soon as this kind of variable observation takes place, the probabilities of every node are updated to take the new information into account. The detector model output (monitor) starts by listing the target node variable sub-monitor output. Then we see all the other variable nodes that contributed to the detector knowledge in a form of series of sub-monitors. These sub-monitors have been ordered in terms of the cost and the amount of information associated with each node. The sub-monitors correspond to the most interesting question with respect to the cost and information it brings to the knowledge of the target variable. For example the detector model output indicates that both an ICMP protocol_type and an ecr_i (ECHO_REPLY) service have a major contribution that increases the probability of having a smurf attack.
Figure 4.6 shows the target modality analysis, which allows visualizing for each node (in this case the service node), two kinds of information relative to the target. Firstly, the type of probabilistic relation binding a particular variable and its parameters with the target node variable, that is the smurf activity type. Secondly, the information gain brought by each node (in this case the service node), for the knowledge of the modality of the target node.
71

aiAyjyl.
nwb r-d
w Phi
activity_type output = monitor of the target node "activity_type" of the navie Bayes detector model. The monitor output indicates that there is 52.74% probability of smurf attack
protocol_type output = monitor of an independent variable node "protocol_type" of the navie Bayes detector model. The monitor output indicates that icmp protocol has 53.04% contribution to smurf
service output = monitor of an independent variable node "service" of the navie Bayes detector model. The monitor output indicates that echo reply service has 52.81 % contribution to smurf
Figure 4.5: Nave Bayes detector learned icmp and ecr_i (ECHO_REPLY) contributions to smurf
72
I va«a_trve
a3. ax 7E. 37% 0P ese% wn

CHAPTER 4. INVESTIGATION OF NAIVE BAYES APPROACH TO IDSs
o..
00
" IRC
x»
. ten
aonwn
oanYn_u
Rnpr
RG
Rp_O. la
MIp
IE. p
In
'wu
"Ollw
pop -3 pnntr
P�. *.
"mlp
avrpo
')
" 41rn1 unJ
Rmn.
Figure 4.6: Conditional probability distribution
The conditional probability distribution shown in figure 4.6 indicates that the main service node parameter, ecr i (ECHO_REPLY) is the main contributor to the smurf target node variable. This indicates that Natve Bayes learning detector model works quite well when tested on actual datasets. Particularly, when combined with some of the attribute selection procedures that serve to eliminate redundant as well as non-independent attributes. NaYve Bayes assumption of independency amongst network traffic variables provided quite useful features. Although the underlying structure of the model is quite simple, this model performed well in classification problems with a large number of attributes in which the task is to classify a unit presenting a combination of attribute values into one of the states of the target variable activity_type. The naive Bayes detector model managed to feature the level of association contribution of each node variable towards the target node activity_type. The conditional independence assumptions represented by the detector model allowed the classification to be performed in an efficient way. However, this is a simplistic assumption, especially, when we are dealing with a complex environment such as networking and communication protocols scenario.
73
P(atlack_ryps = smurf service, e) lo

CHAPTER 4. INVESTIGATION OF NAIVE BAYES APPROACH TO IDSs
4.6- Summary
Navie Bayes approach to network intrusion detection as well as a prediction has been investigated. Naive Bayes modelling incorporates independences assumption amongst its variable nodes and hence considered to be an independent feature model. Naive Bayes models can be trained efficiently in a supervised learning setting. The Knowledge Engineering (KE) and extraction incorporated with navie Bayes model determine a major step involved in featuring statistical Network Intrusion Detection Systems (IDSs). A difficulty arises when there are more than a few variables and classes, we would require an enormous number of observations (records) to estimate these probabilities. Naive Bayes gets around this problem by not requiring that we have lots of observations for each possible combination of the variables. Rather, the variables are assumed to be independent of one another and, therefore the probability that a particular network activity type that heavily uses ECHO_REQ service, ICMP protocol, etc. will be a smurf can be calculated from the independent probabilities that a network activity_type uses ECHO-REQ service, ICMP protocol etc. In other words, Naive Bayes model assume that the effect of an variable value on a given class is independent of the values of other variable. This assumption is called class conditional independence. It is made to simplify the computation and in this sense considered to be "Natve".
A nave Bayes supervised learning model for detecting network attacks has been introduced. The detector model is developed to extract the variable nodes directly from a dataset generated by MIT Lincoln Lab. This dataset has been developed to evaluate and enhance the research in the field of networks IDSs. Naive Bayes detector model works very well when tested on actual datasets, particularly when combined with some of the attribute selection procedures that serve to eliminate redundant and hence non-independent attributes. However, naive Bayes assumes independence amongst network traffic variables of interest. This assumption is a fairly strong assumption and is often not applicable. However, bias in estimating probabilities often may not make a difference in practice, especially in data networks environment, it is the order of the probabilities, not their exact values that determine the classifications. In order to overcome this limitation, a Bayesian learning network approach has been proposed. Bayesian network [Heckerman, 1995] provides a set of learning entities that compute models over data stored within a network, and each model encodes dependencies among all the variables of interest. Bayesian network, as a learning detector model corresponds to an adaptive knowledge representation and modelling. Bayesian network is mainly associated with the dynamic organisation of a learning detector and the association discovery of parent variables and their events. Therefore, it automatically gathers information that is contributed to the knowledge of all parameters to the target variable node. Next chapter introduces a developed Bayesian learning network model for detecting as well as predicting those evolving network attacks such as Distributed Denial of Service (DDoS) attacks.
74

CHAPTER 5. BAYESIAN NETWORKS & AGENTS-BASED IDSs
Chapter 5
Bayesian Networks &
Agents-based IDSs
The previous chapter detailed the technique of naive Bayes supervised learning modelling within the context of Network Intrusion Detection Systems (NIDSs). Due to the limitations of this modelling approach such as independence assumptions amongst the model variables, this modelling technique is further developed in this chapter using powerful learning method known as Bayesian Networks (BNs). Bayesian network [Heckerman, 1995] provides a set of learning entities that compute models over data stored within a network, and each model encodes dependencies among all the variables of interest. BNs have led to the development of learning methods to extract them directly from datasets of cases rather than relying on the insight of human domain experts, thus turning BNs into a powerful tool for knowledge extraction. Regardless the methods used to detect network unauthorised activities, the ultimate goal would be, how well does our models detect or classify attacks?
The Bayesian Learning networks approach is considered to be a promising tool
used by the intelligent Agents to determine suspicious networks anomaly events and consequently relating them to the following dependent occurring illegitimate
activities. Applying BNs as a learning detection model into this kind of problem has not been previously explored. This chapter shows how probabilistically Bayesian network detects network attacks, allowing for the generalization of NIDSs. It describes the major results achieved from experiments based on real time dataset as well as the observations that explain the achieved results. While learning detection techniques serve a useful purpose and provide a major solution to the state of art NIDSs, these techniques do not provide the ultimate solution to the current NIDSs limitations. Therefore, an effective automated response mechanism to those detected attacks is required to minimise their effect, hence,
enhance NIDSs capabilities. The further work chapter proposes other type of Agents with Fuzzy intelligence capabilities to initiate successful automated
75

CHAPTER 5. BAYESIAN NETWORKS & AGENTS-BASED IDSs
response actions. Fuzzy intelligent Agents are proposed in the further work chapter to handle this task with the ability to respond quickly and dynamically control the availability of allocated network resources.
5.1- Bayesian Networks Approach to Networks IDSs
A Bayesian network [Heckerman, 1995] [Michael, 1999] is a graphical model that encodes probabilistic relationships among variables of interest. When used in conjunction with statistical techniques, the graphical model has several advantages for data analysis. Bayesian network provides a set of learning entities that compute models over data stored within a network, and each model encodes dependencies among all variables. A Bayesian network can be used to learn causal relationships, and hence can be used to gain understanding about a problem domain such as networks security and to predict the consequences of intervention by combining a prior knowledge and data. Therefore, Bayesian network is considered to be a promising and useful approach in determining suspicious early events in Distributed Denial of Service (DDoS) events and consequently relating them to the following occurring activities. Learning Agents which deploy Bayesian learning approach combine multiple modes that could be learned at different network assets such as switches, servers, and/or firewalls.
5.1.1- Bayesian Network Model Representation
A Bayesian network [Michael, 1999] represents the joint probability distribution for a set of variables. The conditional independence assumptions [Berthold et al, 1999] encoded by a Bayesian network have the further advantage of simplifying the computations of conditional probabilities given some evidence for a set of values observed in the network. Using Bayesian networks, we can easily make predictions about the value of a variable in a given situation by computing the conditional probability distribution of the variable given the values of a set of some other variables in the network. Thus, tasks such as prediction and classification can be efficiently performed.
Figure 5.1 represents the joint probability distribution over the Boolean network traffic variables defined within a Bayesian network constructed from a prior knowledge and data. This network represents a preliminary model of the problem of applying Bayesian solution to a network detector that is able to identify Denial of Service (DoS) activities. In general, a Bayesian network represents the joint probability distribution by specifying a set of conditional independence assumptions (represented by a directed acyclic graph), together with sets of local conditional probabilities. Each variable in the joint space is represented by a node in the Bayesian network. A Bayesian network for a set of variables Y={Y,....... Y�} consists of (1) a network structure S that encodes a set of conditional independence assertions about variables in Y, and (2) a set of Pof local probability distributions associated with each variable. These components define the joint probability distribution of Y. The nodes in S are in one-to-one
76

CHAPTER 5. BAYESIAN NETWORKS & AGENTS-BASED IDSs
correspondence with the variables Y. Given network structure S, the joint probability distribution for Y [Newell, 1982] is given by
n
P(Y>>"""".. y) =f[p(Yi I Parents(Y)) i=1
where Y, denotes both the variable and its corresponding node, and Parents (Y, ) denotes the set of immediate predecessors (parents) of Y, in the
network S as well as the variables corresponding to those parents. Note the values of p(y, I Parents(Y, )) are precisely the values stored in the conditional
probability table associated with node Y.
Figure 5.1: A Generic Bayesian network for detecting network DoS events, as it represents a set of conditional independence assumptions
We begin by determining the variables to model, which have been chosen as follows:
" Incoming sequential destination. port scan = (ISDPS) " Port scan = (PS) " Incoming sequential destination. address scan = (ISDAS) " Host scan = (HS) " Reconnaissance process = (RP) " Excessive CPU computations = (ECC) " Degradation of computational resources = (DCR) " Buffer overflow = (BO) " Degradation of storage resources = (DSR) " Resources exploitation = (RE)
77
The Bayesian network shown in figure 5.1 represents the joint probability distribution over all the indicated Boolean variables and constructed from networks security prior knowledge.

CHAPTER 5. BAYESIAN NETWORKS & AGENTS-BASED IDSs
" Excessive incoming ECHO-REP packets = (EIEP) " Flooded links = (FL) " Delayed queues = (DQ) " Bandwidth consumption = (BWC) " Invalid TCP sequence number packets = (ITSNP) " TCP hijacked session = (THS) " Delayed TCP ACK packets = (DTAP) " Time-out of half-open TCP handshake process = (THTHP) " Receiving out-of-spec TCP packets = (ROTP) " Excessive incoming TCP SYN connection request packets = (EITCRP) " Resources starvation = (RS) " Network Distributed Denial of Service (DDoS) attacks = (NDDoSA)
Consider the node "Time-out of half-open TCP handshake process". The network nodes and arcs represent the assertion that "Time-out of half-open TCP handshake process" is conditionally independent of its non-descendants "Degradation of computational resources" and "Host scan", given its immediate parent "Delayed TCP ACK packets". This means that once we know the value of the variable "Delayed TCP ACK packets", the variables "Degradation of computational resources" and "Host scan" provide no additional information about "Time-out of half-open TCP handshake process". Each node has a local entry table that provides only the conditional probabilities of its own given its parent variables.
The set of local conditional independence assumptions described by the network, describes the full joint probability distribution for the network. One positive feature of Bayesian networks is that they allow a convenient way to represent causal knowledge such as the fact that "Delayed TCP ACK packets" causes "Time-out of half-open TCP handshake process". In the terminology of conditional independence, we express this by stating that that "Time-out of half- open TCP handshake process" is conditionally independent of other variables in the network, given the value of "Delayed TCP ACK packets". Note this conditional independence assumption is implied by the arcs in the Bayesian network of figure 5.1.
From the chain rule of probability, we have p (y) = fl p (y, I y,,....., y, -, ). Now,
1-1 for every Y, , there will be some subset 'r, c{Y,....... Y,
_, } such that Y, and
{Y,,...... Y, _,
} I ic, are conditionally independent given ir, . That is, for any y,
P (Y, I Y1....... y, -, ) =P (y, l am, )
. Therefore, we obtain p (y) =1[p (y, J; t, ) . Also,
we can see that the variable sets (ßt1....... r) correspond to the Bayesian network
parents Parents (Y, ),....., Parents (Y. )) , which in turn fully specify the arcs in the
network structure S.
78

CHAPTER 5. BAYESIAN NETWORKS & AGENTS-BASED IDSs
In order to determine the structure of a Bayesian network we order the variables somehow, and then determine the variables sets that satisfy p(y, I y,....... y, _,
)=p(y, I; c, )for i=1....... n. According to Figure 5.1 of the
network structure, we would use the ordering (ISDPS, ISDAS, ECC, BO, EIEP, ITSNP, DTAP, ROTP, EITCRP, PS, HS, DCR, DSR, FL, THS, THTHP, DQ, RP, RE, BWC, RS, NDDoSA), which represent every Y, node. Therefore
p (ISDPS, ISDAS....... NDDoSA) = p(ISDPS) p(ISDAS)... p (RE I ECC, BO, DCR, DSR)...
p (NDDoSA I ISDPS, ISDAS, ECC, BO,....., RS)
Consequently we obtain the following conditional independencies, by taking the advantage of the locality structure of the parent-child configuration: p (ISDAS I ISDPS) =p (ISDAS)
p (ECC I ISDPS, ISDAS) =p (ECC)
p (RP ISDPS, ISDAS, PS, HS) =p (RP, (ISDPS, ISDAS) I (PS, HS))
p (RE 1 ECC, BO, DCR, DSR) =p (RP, (ECC, BO)1(DCR, DSR) )
p (NDDoSA I ISDPS, ISDAS....... RS) =
p (NDDoSA, (ISDPS, ISDAS....... DQ) I (RP, RE, BWC, RS))
Having specified the relevant variables as well as their dependency, and assigned the conditional probabilities to the nodes, the probabilities are then obtained either from a large dataset, an expert, or a combination of both [Jordan, 1999]. The advantage of the previous description is that the joint probability of the twenty two variables that are indicated in figure 5.1 would require 222 -1= 4194303 independent numbers are significantly reduced when the conditional independence assumptions are exploited.
5.2- Learning Bayesian Network from a dataset
Originally, Bayesian networks (BNs) [Berthold and Hand, 1999] were supposed to rely on domain experts to supply the necessary knowledge about the conditional independence graph including the conditional probability distributions that quantify dependencies. BNs [Monti et al. 1999] are probabilistic networks, provide a powerful formalism for representing and reasoning under uncertainty. The construction of BNs with unusual available domain experts often is a difficult and time consuming task. Knowledge acquisition from experts is an expensive process because the experts can not explicitly interpret their knowledge. However, information is growing rapidly and datasets are becoming increasingly available for different disciplines in general and networks security in particular. Therefore, the construction time of BNs could be considerably decreased by exploiting those prepared datasets. Learning BN graph structure provides much insight into the investigated domain that allows inexpensive knowledge discovery. BNs have led
79

CHAPTER 5. BAYESIAN NETWORKS & AGENTS-BASED IDSs
to the development of learning methods to extract them directly from datasets of cases rather than relying on the insight of human domain experts in general and security personnel in particular, thus turning BNs into a powerful tool for knowledge extraction.
Let us assume that the given dataset (sections 4.3.1 & 4.4.2) has n multivariate cases y= {y,....... y�} from which we need to learn a BN. Each case yk in the dataset is a row vector A= {y�k,...... y,, t} corresponding to a combination of states of I variables. Therefore, y is an nxI matrix. Now, learning [Jensen, 1996]
represents semi-automatic methods using experience to construct or modify a model. So, learning can be divided into two components, qualitative and quantitative learning, as follows [Berthold and Hand, 1998] [Jensen, 1996]:
" Qualitative learning concerns the graphical structure of the model M, specifying the conditional independence assumptions among the variables in Y.
" Given a graph model M, quantitative learning specifies the conditional probabilities associated to the remaining dependencies in the graph model.
5.2.1- Selection of the Graphical Structure Model
In a Bayesian network model [Heckerman, 1996] with n variables, the number of possible structure hypotheses is more than exponential in n. One of the approaches used by statisticians to select the most appropriate model from those structure hypotheses is called model selection. The selected model is considered to be as the correct model. This approach could yield accurate results when applied to Bayesian network structures. Several experimental results have shown that the selection of a single good hypothesis often yields accurate predictions. In this section, a definition is given to what is meant by a good model.
In Qualitative learning, the model selection for the Bayesian graphical model M has to be induced from the dataset. Let M= {M0, M1....... Mm} be the set of models represent a priori and contain the true model of dependence among the variables in Y. Each model in M is assigned a prior probability p(Mj 110), where Mj is the model that specifies the conditional dependencies and Io is the prior information. Let B(» be the parameter vector associated to the conditional dependencies specified by Mj. The given sample information will be used to
compute the posterior probabilities p(M, I I) from which the most probable
model in M can be selected, where I, is the posterior information and I, =10 +y. Also, p(M, I I) - p(Mj 110)p(y I Mj) (Bayesian Theorem), where p(y I Mj) is
the marginal likelihood of Mj. Given the assumptions described above including,
the dataset is complete, and the cases are independent given the parameter vector 9(J) associated toMj. Also, the prior distribution of the parameters is conjugate
80

CHAPTER 5. BAYESIAN NETWORKS & AGENTS-BASED IDSs
to the sampling model p(yI9w») , so that 6V) - D(a,,....... a,,, ) (Dirichlet
distribution) and the parameters are locally and globally independent. In order to select the most probable model, it is therefore sufficient to compute the marginal likelihood p(y I Mj) for a given Bayesian network structure model M [Jensen,
1996] [Cooper et al, 1992] by
I q, P(YI Mi)=1111
r`a; ý) nr(a; ý+n(YI ý; i)) 5.1 '_, j_, r(a1 +n(, T, ))l,., r(a,, k
where r is the Gamma function. When the dataset is complete, 5.1 can be efficiently computed using the hyper-parameters a, + n(y I'Tr) and the precision
a, +n(ir, ) of the posterior distributions of O, .
Suppose that we have a trivial scenario of two node variables, x (Y, ) and y (YZ ),
and a random sample of n cases. Lets assume that Y and YZ are binary variables,
given that Y, -< YZ (Y can not be parent of Y2 ). With this assumption, we left with two possible models to be explored [Berthold and Hand, 1998]:
" Model Mo specifies that the two variables are independent, so we can have
p(y� 10(0)) = Bi, and p(y21 19(0)) = 021, where 0(0) is the parameter vector associated to Mo.
" Model M, specifies that YZ is a parent of Y, , so that we can define
p(Yxl 19(')) = 621 and p(y1 I Y2j, 0(')) =9.
Given Mo, we assume that 62 =(021,022)-D(2,2) and B, = (41,42)- D(2,2), and they are independent. Given M,, we assume that 8,, =(O111,4 2)-D(l, l), and they are independent. Therefore, a priori, the marginal probabilities of y2J , Ylk and Ylk y2j are all uniform and are based on a global prior precision Cr = 4.
Suppose we collect a random sample from a given dataset, the contingency statistics would be as shown in Table 5.1 [Ramoni et a], 1999].
Table 5.1: Contingency statistical table
Y Y2 12 Total I n(Yn I y21) n(Y12 I Y21) n(Y2, ) 2
n(Y,, I Yu) n(Y12 I Y22) n(Y22) Total n(y�) n(y, 2) n
81

CHAPTER 5. BAYESIAN NETWORKS & AGENTS-BASED IDSs
Using a complete dataset, the marginal likelihood under models Mo and M, could be found by applying equation 5.1, as follows [Ramoni et al, 1999]:
2 r(4)r(2+n(Y2j)) z r(4)r(2+n(YJk)). P(YI Mo)=Ili.,
r(4+n)r(2) Hk=º
r(4+n)r(2) '
ý7 Z r(4)r(2+n(Y2j))ý7 2 r(2)r(1+n(Ylk I Y2, )) p(YIMl)=11J'' r4+nr2
flk=' r2+n r1
and the outcome of the following relation would decide which model to chose (model discrimination).
r_ P(Mo 1 Io)P(Y 1 Mo) AM, I Io)P(Y I MI)
So, if r<1, model M, is chosen, if r>I model Mo is chosen, and if r =1 then both
models are equivalent.
As the number of variables increase, [Monti et al, 1999] [Ramoni et al, 1999] the evaluation of all possible models becomes infeasible, so, various heuristic search methods have been proposed to limit the search process to a subset of models. Heuristic search algorithms [Neapolitan, 2004] "are algorithms that search for a solution which is not guaranteed to be optimal, but rather, they often find solutions that are reasonably close to optimal". The most common heuristic search method is known as K2, which was originally proposed by [Cooper et al, 1992]. This method limits its attention to the subset of models that are consistent with a partial ordering among the variables: Y, -< Yj (Y can not be parent of Yj ). So, once a scoring metric is defined, a search for a high-scoring network structure can be carried out. The algorithm assumes a given ordering on the variables and a non- informative prior over parameters and structure. However, equation 5.1 is a product of terms that measures the evidence of each parents-child dependence, which can be exploited to develop search algorithms that work locally. The prior probability distribution over the network structures is assumed to be uniform, therefore, it can be ignored in comparing network structures. The K2 algorithm uses this heuristic to fully exploit the decomposability of 5.1. Having the local contribution of a node Y, and its parents 11, to the overall joint
probability p(y, Mj) by [Ramoni et al, 1999]:
8(YIn, )=11 r(a,, ) r(ak+n(xkI; rU))
82

CHAPTER 5. BAYESIAN NETWORKS & AGENTS-BASED IDSs
The K2 algorithm implements a greedy forward stepping search over the space of network structures. The algorithm continues to add a parent to each node Y, at a time and by computing g(Y, I rl, ). The set II, would be expanded to include the
parent node that gives the largest contribution to g(Y, 111) , and stops if the
probability does not increase any longer.
5.2.2- Estimation of the Graph Conditional Probabilities
Once the graph model is selected, the conditional probabilities of the BN have to be defined. The conditional parameters are represented by the parameters 9= (9,
ßk) , where 0., = p(y; k I'r, , B) , which we are interested in estimating it
from y. The parameter vector 0, = (8, x,....... 9,,,, ) is associated to the conditional
probability distribution of 1I ;r. Let n(y, k I'cy) be the frequency of
pairs (yk 12y) in the dataset, and n(Qr, ) = zkn(yk I rr) be the frequency of , r. By matching the factorisation of the likelihood into parents-child contributions, the joint prior density is
%
A0 110) = III I MY 110) 1=1 J=1
For a complete dataset sample y, local and global independence induce an equivalent factorisation of the posterior density of 0
cý
P(BIli)-1ýP(B, j 1I0)f BýjkYriýy 91 k=t
The prior distribution of B, is assumed to be a Dirichlet distribution with hyper-
parameters Ia., ....... ajC, }, ajk >0 for all ijk. So, we have 0.110 -D
(aU,....... aij,, ) . The prior hyper-parameters a,, k encode the observer's prior belief and, since
aOk -1 plays the role of n(y, k l r) in the likelihood, they can be regarded as frequencies of cases needed to formulate the prior distribution. Therefore, a, = 2:
j a. is the global precision on 6, , which is the parameter vector associated
to the marginal distribution of Y, and a, =a. Since %determines uncertainty, by assuming ask = a/ (c, q, ) for all i, j and k, so that the prior probability of (Y, x I r. ) is simply 11 C1 .
83

CHAPTER 5. BAYESIAN NETWORKS & AGENTS-BASED IDSs
The assumptions of parameter independence and prior Dirichlet distributions imply that the posterior density of0 is a product of Dirichlet densities, and
9, ý 11 -. D(au, +n(Y1, I icy),....., ark +n(Y,,, I2r ))
The information conveyed by the sample is therefore captured by simply updating the hyper-parameters of the distribution of O by increasing them of the frequency
of cases (y,,, k I r) observed by the sample. Therefore, the sample information can be summarized into the contingency tables collecting the frequencies of the parents-child dependency, as shown in Table 5.2 [Ramoni et at, 1999]. This table characterises the conditional probabilities discussed in section 5.4.2 and figure 5.3 for three node variables identified in the given dataset.
Table 5.2: Contingency table collecting the frequencies of cases (Y =Y, kI1, =; ru)
II, Y,
y, l yik ,,, yk, Row Totals
; r1 n(y� 1 irl)... n(Y, k l zn)... n(y� 1x�) n(on)
Zu n(Y, I ffo) ... n(Y, k 11i, )
... n(Y�C, I iry) n(7, )
giq, n(Y, 1 I icq, ) ... n(Y, k 12ca, ) ... n(Y�, 1 irq, ) n(;, 9, )
5.3-The Bayesian Unsupervised Learning Detector Models
Bayesian network models are made of variables represented by nodes and relations between its variables represented by arcs. The simulation tool known as BayesiaLab is used to visualise, model, and inspect the structure of my developed network detector model. In the developed network model, a probabilistic representation is associated to each node. BayesiaLab allows accessing, visualisation and the modification of the probability distributions of any variable node. The SopLEQ learning Method [BayesiaLab Tutorial, 2003] is used by BayesiaLab to discover the association between all nodes of the developed Bayesian network. SopLEQ is a fast search algorithm for association discovery based on a global characterization of the data and on the exploitation of the properties of equivalent Bayesian networks.
In order to develop a learning detector model, a Bayesian network has to be learned from the given dataset provided by MIT Lincoln Lab [MIT Lincoln Lab]. This network corresponds to the learned knowledge of normal and abnormal communications network activities represented by the node "activity_type" and associated with the events of other Bayesian network variable nodes. Figure 5.2
84

CHAPTER 5. BAYESIAN NETWORKS & AGENTS-BASED IDSs
shows a usable representation of the learned network model and its variable nodes. Bayesian network applies adaptive knowledge, which is concerned with the dynamic organisation of the detector and the association discovery of parents' variables while automatically gathering information that is contributed to the knowledge of the target variable. Adaptive knowledge is only available in validation mode. Figure 5.2 shows the marked activity_type node as the target variable and those directly linked variables, which are heavily contributed to its knowledge such as service, protocol
_rype and so on.
nu
L.
activity type wrong ragment
Figure 5.2: The developed Bayesian Detector Model. The local probability distribution(s) associated with each node would be determined to specify the conditional distribution for each variable given its immediate parents
in the network
CHAPTER 5. BAYESIAN NETWORKS & AGENTS-BASED IDSs
5.4-The Experimental Work and Results
With the model learning phase completed, the next step involves the experimentation and validation mode, which gives access to the communication network state, so to interpret the events that are associated with any particular network unauthorised activities. Also, the experimentation and validation mode enables the identification of the conditional probabilities for different states of any variable, by assigning a particular value to any variable. Thus, provides a mechanism for characterising empirical evidence on how the developed detector model performs. As soon as this kind of variable observation takes place, the probabilities of every node are updated to take the new information into account. This inference process would allow the verification of the developed network's consistency from the point of view of the choice of variable nodes and their conditional probabilities. This section covers the major conducted research experiments based on simulated models. The results are shown either in tabular or displays form. Detailed observations and analysis of achieved results are discussed as well to highlight the key points that emerge. The evaluation of the achieved results is conducted using a standard validation methods discussed in chapter 7.
5.4.1-The Experimentations and Observations Strategy
The developed model is using the real time dataset gathered by MIT Lincoln Lab for real time detection. The set of experiments proposed here are made in order to test the developed model in its test bed environment to the extent that it works as it is supposed to, get the expected results, validate it later on, and compare it with other achieved results. The Bayesian prediction mechanism is used for all experimentations and observations.
The objectives of the experimental work and tests are as follows:
" Identification of the conditional probabilities amongst all the dataset variables. Many combinations of network attacks were included in the dataset to characterise how successful the developed learning model is in generalizing and detecting future similar events.
" Characterise empirical evidence on how the developed learning detection model performs. This is to see how many other unauthorised events it could recognise.
" Identify the capability of detecting unseen anomalies previously by the developed model for which it has not been trained.
" Explore the capability of Bayesian learning networks on minimising both false positive and false negative error rates.
" Are Bayesian learning networks able of generalising IDSs?
86

CHAPTER 5. BAYESIAN NETWORKS & AGENTS-BASED IDSs
The central strategy of the experiments involves five main stages, as follows:
Developing the learning detection model by learning Bayesian network from the dataset generated by MIT LL, as shown in Figure 5.2. This dataset deemed a good test bed for the developed models, since it has enough adverse events to enable a meaningful statistical evaluation. The learning process used the whole amount of dataset to simulate the real world. This stage was a very time consuming, due to the high number of variables (40 variable nodes) as well as the number of network connections (more than half a million connections). Generating the conditional probability tables that represent the quantitative part of the probabilistic relations. The conditional probability tables are the most commonly used representation models to describe these distributions. These tables tend to grow exponentially as the number of parents increase. Analyse the developed detection model in order to extract all the knowledge embedded in the Bayesian network variable nodes in general and the target variable node in particular. The inference results would appear on displays that bring information on the probability distribution of the target variable and its relation to all other variable nodes. This stage would also include the influence analysis with respect to every single node in the detector model. This analysis would visualise every variable node from the point of view of the type of probabilistic relations and the information gain binding all variable nodes. Perform Bayesian clustering to the developed model. This is to identify the natural partitions of all homogenous variable nodes within the dataset in an unsupervised way. This stage allows the discovery of the attributes that distinguishes one cluster from the other, i. e., the normal network traffic from the abnormal anomalies. Observations and visual analysis of the output displays of the detector model, and identifying the proper output thresholds to determine anomalies. This is to correlate the output data with the learning detection method, which is sampled overtime. Since the dataset contains many network attacks, a statistically meaningful empirical analysis, at least in this stage would be possible to perform.
5.4.2-The Conditional Probability Tables and Influence Analysis
As the arcs connecting the nodes of the developed detector model shown in figure 5.2 constitute- the qualitative part of the network by indicating the direct probabilistic dependencies, the conditional probability distributions represent the quantitative part, i. e., the type and strength of the probabilistic relations. The most commonly used representation models to describe these distributions are the conditional probability tables. The concept of the conditional probability tables has already been reflected by table 5.2 in section 5.2.2.
87

CHAPTER 5. BAYESIAN NETWORKS & AGENTS-BASED IDSs
The conditional probability table of the srv_count variable is shown in figure 5.3. The srv_count represents the number of connections to the same service as the current connection in the past two seconds. The two column variables count and rerror rate correspond to the combinations of the learned grand parents of the variable node srv
_count. Such dependency could not be determined by naive
Bayes model due to its simplistic assumptions. This makes Bayesian network modelling more effective in providing such useful information. The L1-L6 columns, determine the state intervals for srv_count. The L1-L6 correspond to the probability distributions, conditionally to each case of both count and rerror_rate variables.
Observation 1: The interpretation of the upper left cell at the first line of this table would be: there is 16.667% of chance that the value of srv_count is present when both count and rerror rate are low (L 1 in both variable nodes).
Figure 5.3: The conditional probability table of the srv_count variable node
The most beneficial measure of the conditional probability tables, is that there outcome is featured in the statistical figures, rather than just a binary crisp values. This is what we normally need to see in anomaly detection systems. The problem with the conditional probability tables is the exponential growth of the number of lines with respect to the number of parents, as it's the case for two parents in figure 5.3. Their data acquisition can then become quickly a complicated task. However, learning of the parameters in the dataset makes it is possible to fill them automatically.
Observation 2: The lower right cell at the last line of the conditional probability table indicates that there would be 99.991% of chance that the srv count is present when both variable nodes count and rerror_rate are high (L7 in case of count variable and L3 in case of rerror rate variable).

CHAPTER 5. BAYESIAN NETWORKS & AGENTS-BASED IDSs
5.4.3-The Developed Detection Models Inference
Since the used dataset contains continuous variables, those variables must be made discrete. Therefore, a decision tree has been chosen, because the intervals are selected according to the information they contribute to the target variable. Due to the decision tree's discretisation, with activity
_rype as the target node at
the detector, all continuous contributed variables are automatically cut up into a number of intervals. By considering the knowledge coded by the network detector model and all possible observations made on all nodes, it is possible to display the marginal probability distribution of the target variable node. The detector model displays the probability expressed as a percentage and a bar proportional to the probability.
The target variable node of the developed detector model is called activity_type. It can be verified by the detector by investigating the parents' nodes at the network. This functionality allows the activation of the variables' displays, which bring information on the probability distribution of the target variable. The detector output in figure 5.4 shows the target display, which appears at the top of the output followed by the variables' displays classified by their relevance. The detector output determines the ratio between the information gain and cost.
Observation 3: From the detector output, the algorithm did in fact recognise that there is an ecr_i (ECHO_REPLY) service and an icmp protocol_type association that increases the probability of having a smurf attack. The ecr_i service with a probability of 52.81% and icmp protocol_type with a probability of 53.10% indicate a clear contribution that leads to an increase in the probability of having
smurf attack, which is 52.74%. These levels of high probability figures reduce the false positive as well as the false negative detection rates.
89

CHAPTER 5. BAYESIAN NETWORKS & AGENTS-BASED IDSs
activity type output = indicates that there is 52.74% probability of smurf attack
protocol_type output = this monitor output indicates that icmp protocol has 53.10% contribution to smurf
wrong fragment output = this monitor output indicates that there is an increase of the probability of having the number of wrong fragments to 99.88% that lead to smurf
diffsrv_rate = this monitor output indicates that most of the connections are focused onto one single service which is echo req in this case
srv_diff_host-rate = this monitor output indicates that most of the current connections are targeting the same node or server
duration = indicates that the rate of current connections is high
src_bytes = indicates that the number of data bytes from source to destination is quite high
service output = indicates that echo reply service has 52.81 % contribution to smurf
flag = indicates that 79.71 of current connections are set to final (SF)
hot = indicates that number of hot indicators has no contribution to smurf
dst_bytes = indicates that the no data bytes from dent to source is min
edivkyjype
0.26% apache2 0.35% back 0.02% buffer_overfl... 0.01% rip write 1.40% guess ass... 0.06% Mtptunnel 0.01% imep 0.11% ipsweep 0.01% lend 0.01% loadmodule 1.60% mailborrb 0.30% mscan 0.01% m . *ihop 0.01% named
18.64% neptune 0.04% nmap
19.33% normal 0.01% perl 0.01% phf 0.03% pod 0.12% portsweep 0.24% processtab e 0.01% PS 0.01% rootki 0.24% said 0.53% sen 0.01% sandmal
52.74% sewrf 2.49% srxnpgetattack 0.78% snmpguess 0.01% sqI tack 0.01% teardrop 0.01% udpsiorm 0.51% warezmester 0.01% worm 0.01% stock 0.01% xsrgop 0.01% 1 xterm
protocol type
53.10% icmp 3826% J tcp 8.64%
FW
udp
wrong frogmed Mean : '0.002 Dev 0.071
99.88% 0 0.07% 1 0.05% 3
Jiff srv rate Mean : X055 Dev 0.094
80.10% 1 <-0.045 18.40% o. 0.240 0.56% <=0.670 0.94% >0.670
srv diff host rate Meers 0-026 Dev 0.109
92.86% <=0.000 5.51% <-0.500 1.64% »0.500
duration Mean : 627.593 Dev : 4209.183
95.83% »=0.000 1.93% <=1.000 0.07% ». 2.000 2.17% »2.000
src_bytes Mean: 985730.296 0ev5475284.787
20.42% <=1.000 23.29% <=504.000 53.15% <=1032.000
3.14% i x1032.000
s ervice
0.02% (R<,
001% x11 0.03% Z3950
_ 0.06% euth 0.03% bgp 0.03% courier 0.02% csnet ns 0.03% cif 0.03% daytime 0.03% discard 0.03% domain 1 02% doman_u 0.03% echo 017% eco i
52.81 % ecr 0.03% efs 0.03% exec 0.10% finger 0.27% ftp 0.70% ftp_dete 0.03% gopher 0 02% hostnemes
1311% http 0.03% http_443 0.01% icmp 010% knep4 0.03% iso tsep 0.02% ktogin 0.03% ksheY 0.03% kiep 0.03% 11k 0,03% login 0.03% nIp 0.03% name O D3% netbios_dgm 0.03% netbios_ns 0.03% netbios_ssn 0.03% netstet 0.03% nnsp 0.03% nntp 0.03% ntp u 0.68% other
8 811 . pop_2 1.25% pop_3
0.03% printer 25.14% private
0.03% remote_ob 0.03% rje 0.03% shell 2.63% sma 0.03% sai_net 0.03% sah 0.06% sunrpc 0.02% supdup 0.03% systd 0.62% tenet 0.01% tftp_u 0.01% tim i 0.03% tkne 0.03% urp_I 0.03% uucp 0.03% uucppeth 0.03% vrmet 0.03% whois
flag
0.02% OTH 13.49% REJ
0.45% RSTO 0.02% RSTOSO 030% J RSTR 580% SO 0.03% S1 0.02% S2 011%
1
S3 79.71 1% ý SF
0.05% 1 SH
hot Mean : 0.058 Dev . 1.638
. 000 90.30 %
-2 0.60% <. 2.000
0.10% -2.000
dst_bytes Mean 341001.000 Dev: 877992.794
75.80% x-0.000 0.23% -1 .
000 s 10.86% 1 -293.000 13.11 %I . 293.000
Figure 5.4 (a): Bayesian detector learns a smurf attack and its dependence on other variable nodes
90

CHAPTER 5. BAYESIAN NETWORKS & AGENTS-BASED IDSs
The detector output shown in figure 5.4 (a) indicates that 53.10% probability of using ICMP protocol would lead to smurf attack. So, what would happen if the probability of receiving ICMP protocol packets is increased? Would the probability of having a smurf attack increase? The next observation gives the answer to this question.
Observation 4: This answer has already been indicated in figure 5.4 (b), which shows the maximum ICMP protocol contribution (100 %) to the new smurf attack probabilities. Because of the propagation of the new information, the probability distributions for the majority of nodes have been updated and as we can see that the probability of having a smurf attack increased from 52.74% to 99.32%.
Observation 5: Let's look at the problem from the opposite direction. If the probability of portsweep attack, which represents a reconnaissance process is set to 100%, then the state value of some associated variables would inevitably increase. What characterizes portsweep attack, is the TCP protocol and private service association probability have been increased from 38.26% in figure 5.4 (a) to 97.66% and from 25.14% in figure 5.4 (a) to 79.27% respectively, as shown in figure 5.5 (a). Also, we can notice an increase in the REJ and RSTR flags.
Observation 6: In the case of the buffer_overflow attack, see figure 5.5 (b), the duration variable which represents the length of the connections in seconds has increased from 2.71% in the case of connections lasted > 2.00 seconds (as shown in figure 5.4 (a)) to 51.42% (as shown in figure 5.5 (b)). The approach taken here is completely different from the previous one. In here, we are not only interested in verifying the model. However, the goal is to discover knowledge from the dataset. Bayesian networks learning leads to findings that would never have been
as simple to discover by reading about 500000 records of the dataset.
91

CHAPTER 5. BAYESIAN NETWORKS & AGENTS-BASED IDSs
apache2 back buffer_o
imap ipsweep land loedmodie mailbomb mscen multihop named neptune nmap normal perl phf pod
PS rootki sdrt Segen sendmeY smut
teardrop udpstorm warezma worm zock xsnoop xterm
protocol type
100.00% icmp 0.00% 1 top 0.00% udp
wrong fragmerit Mean : -0.001 0ev : 0.043
99.93% 0 0.06% 1 0.01 T. 13
diff_srv rate Mean : X024 Dev : 0.030
99.70% <=0.045 0.09% <=0.240 0.10% <=0.670 0.11 % »0.670
srv_dift host rate Mean : 6001 6ev : 0.028
99.78% <=0.000 0.09% «. 0.500 0.13% »0.500
duration Mean : 12.450 Dev. 599.268
99.91% <=0.000 0.03% <=1.000 0.01% «-2.000 0.04% . 2.000
src bytes Mean' 31251.395 Dev978127.831
0.12% 1 <=1.000 0.45% 1 <=504.000
99.34% «-1032.000 0.10% -1032.000
fog
0.01% OTH 0.06% J REJ 0.01% RSTO 0.01 % RSTOSO 0.01% RSTR 0.02% J SO 001% Si 0.01% S2 0.01% S3
99.84% WEEMEMEMENIM SF 0.01 % SH
hat Mean 0.009 Dev : 0.673
99.95% <. 0.000 0.03% . 2.000 0.02% -2.000
dst_byles Mean . 1322.304 Dev : 50632.667
90.72% . 2 0 1 0.04% <. 1 . 000 0.19% J - . <29393000 0.05% 1 -293.000
Figure 5.4 (b): Bayesian detector learns conditional dependence of smurf attack and other variable nodes on protocol variable
activiy type
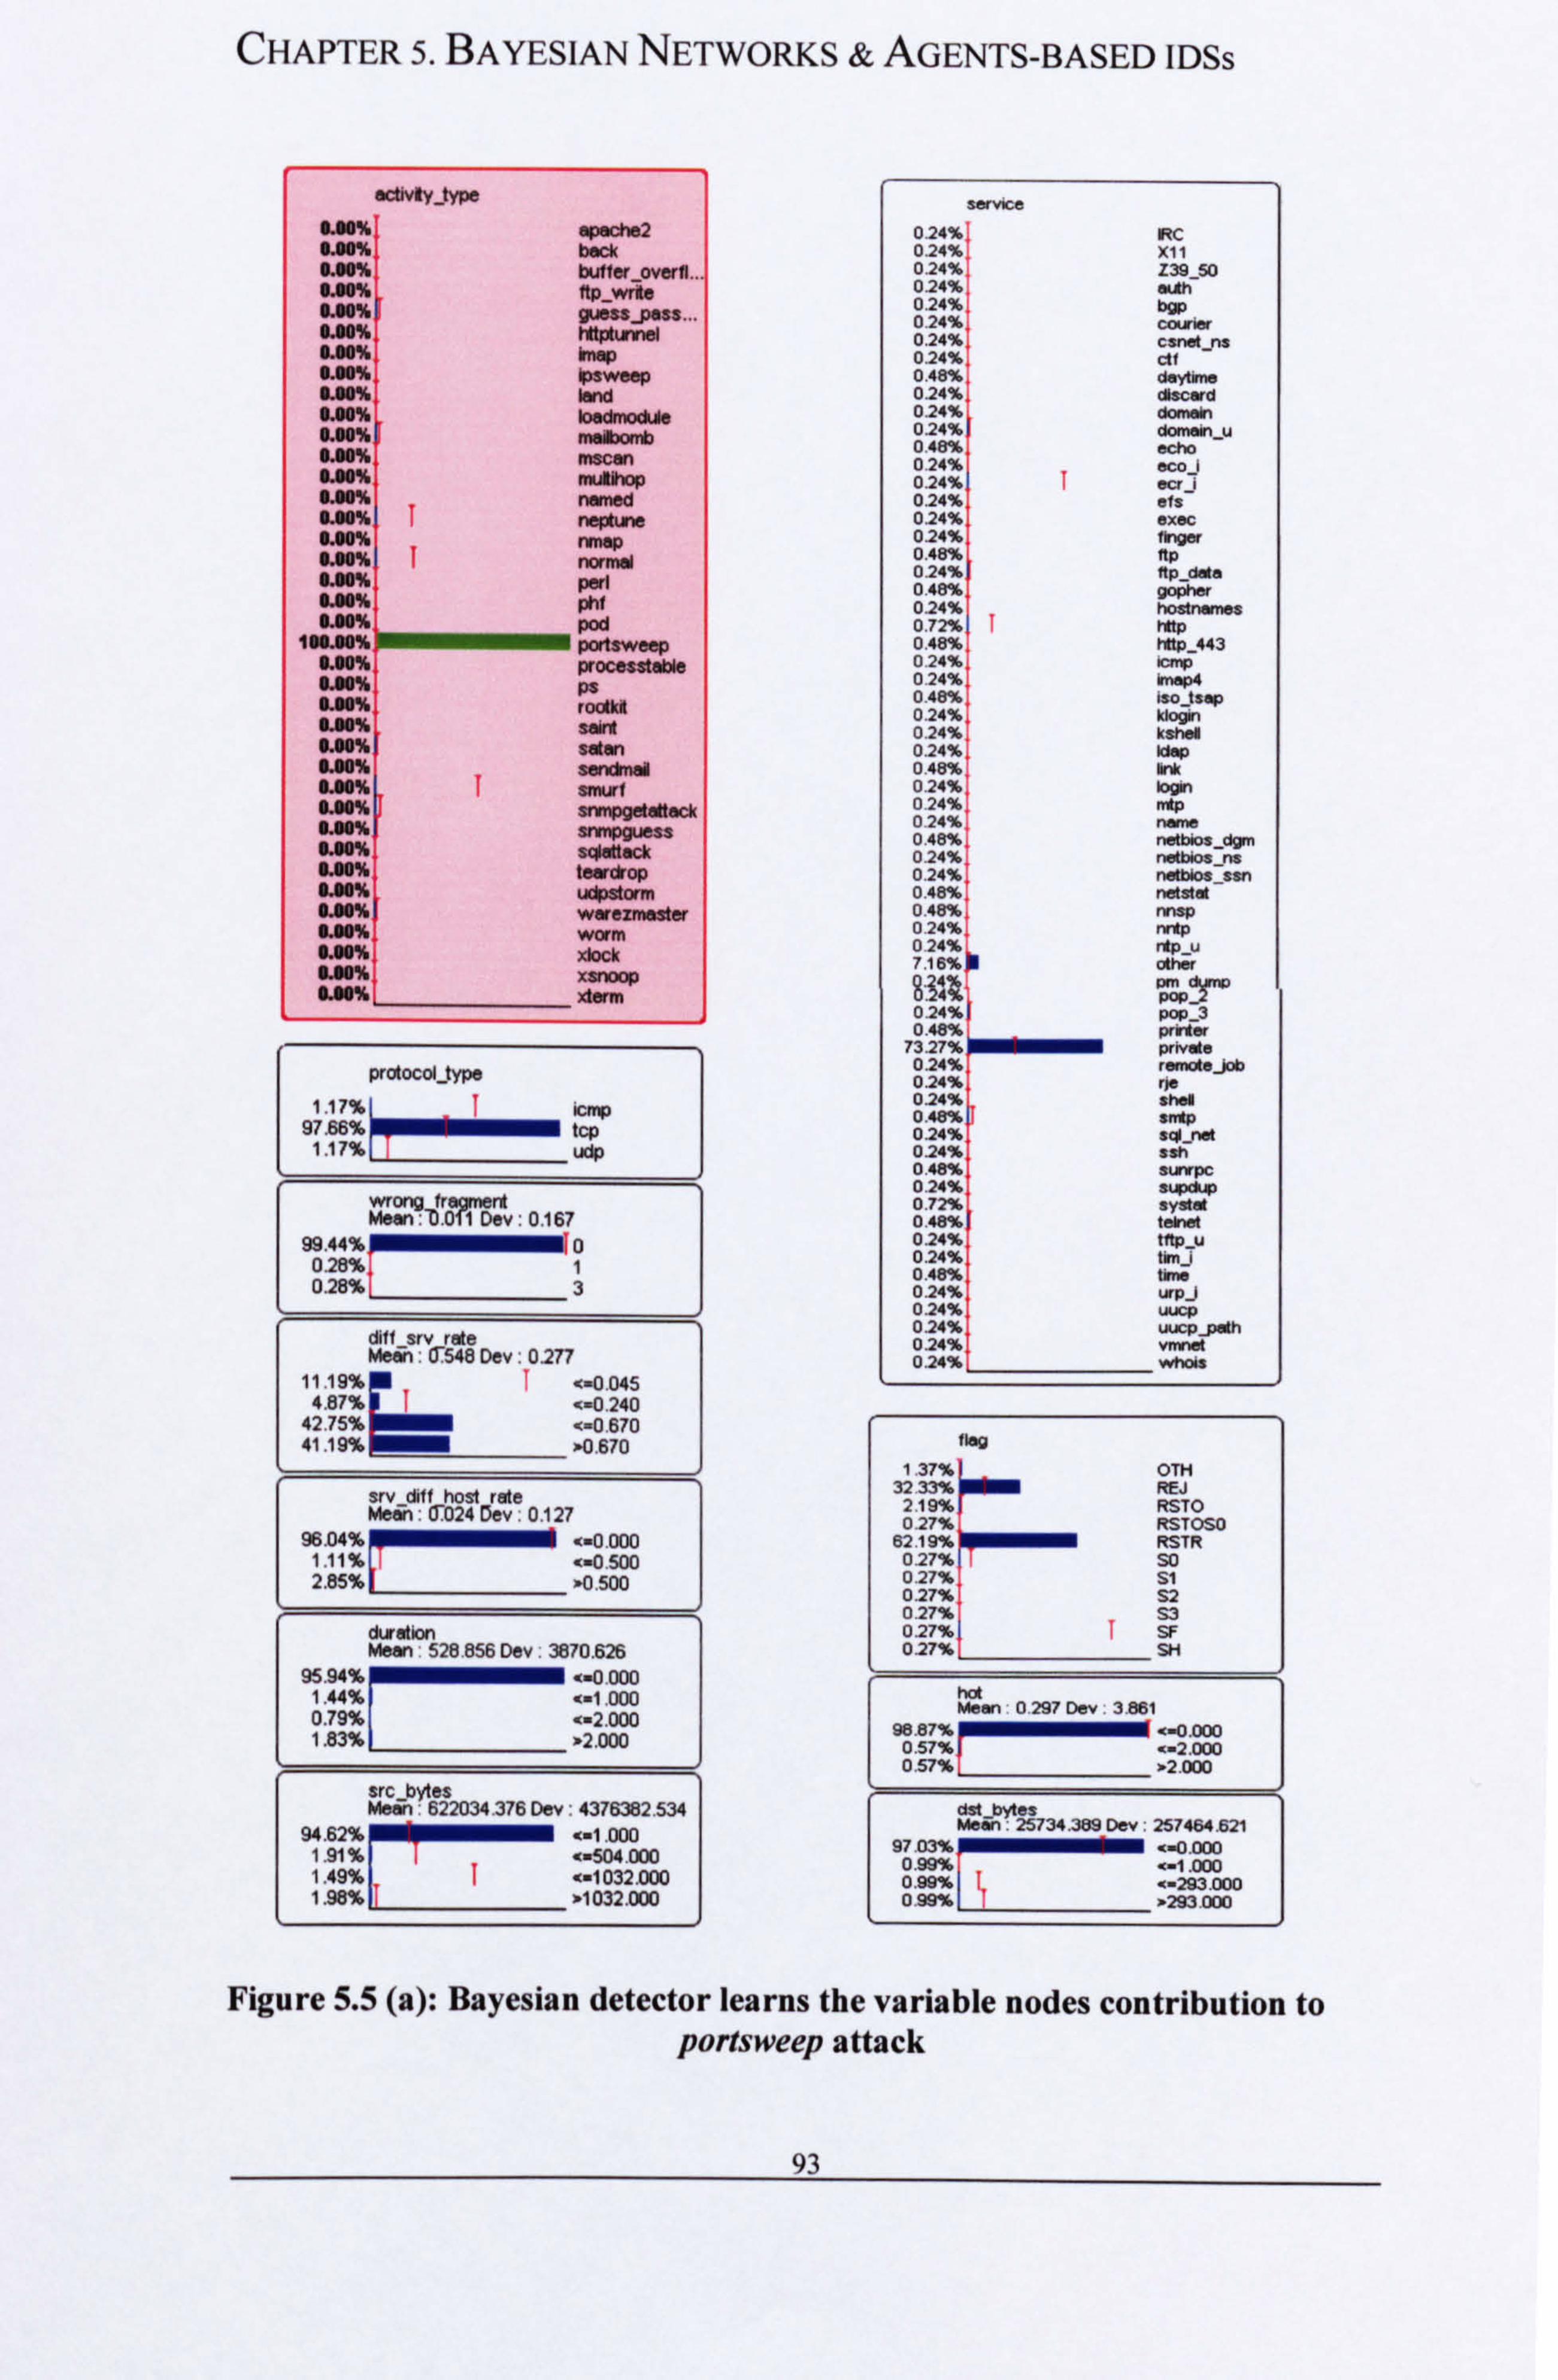
CHAPTER 5. BAYESIAN NETWORKS & AGENTS-BASED IDSs
activity _type
apache2 beck bufter_overn...
O . W% ftp_wrke IL90% guess-pass 0.00% htpttz el 0. /0%, hrop /. /0%ý sweep 0. eo%, ww /AO% 0.00%
loedmocue meiborrb
/. 00%} mscen /A0% mutihop /. W% named 0. /0% J nept ne 0.00% map 0. /0% normal 0. /0% pert /A/% p, r 0.0/% pod
100A0%j portsweep 0.00%1 processteble 0. //% Ps 0. /0%it rootkil /A0% sand /. 00% seen 0. /0% serwlnd 0. /0% smurt
ý 0.00% 1 snmpgetetteck /. 00% srnippuess 0. /0%} sqlatlack 0.00% teardrop 0. /0% udpst m 0.90% werezmester 0.00% worm / Mock 0. /0%L- x 0. b% xlarm erm
protocol type
1.17% ` icmp
1 97.66% tcp 1.117%
jcudp w
Mber1 Ö Ö
71 Dev : 0.167 99.44%=j 0 0.26% 1 0.28% 3
dill srv rate Mean : 4-548 Dev : 0277
11 15%I
v-0.670 4.87% I
.. 0.240 42.75% 0.670 41.19% -0.670
srv cliff host rate Mein : Ob24 Dev . 0.127
96.04% .. 0.000 1.11 % .. 0.500 2.85% . 0.500
duration Mean 528.856 Dev 3870.626
90.79%ý .. 2.000 1.44% .. 1.000 0.79% .. 2.000 1.83% -2.000
src bytes Meen622034.376 0ev: 4376382.534
94.69% 1.. 1.000 1.91 % .. 504.000 1.49% J .. 1032.000 1.98% -1032.000
lieg
1 37% OTH 32 33% REJ
219% RSTO 0.27% RSTOSO
6219% RSTR 027-4 SO 027% S1 0.27% S2 027%
L
53 027% T SF 0.27% SH
hat Mein 02970e' 3.861
98,87% <-0.000 ý 0.57% t. 000 0.57% >2.000
Mein 25734.389 Dev : 257 . 621
7.03% 9
1
--0.000 0.99% «-1.000 0.98% f <-293.000 0.99% T »293.000
Figure 5.5 (a): Bayesian detector learns the variable nodes contribution to portsweep attack
93

CHAPTER 5. BAYESIAN NETWORKS & AGENTS-BASED IDSs
actMy jype
epechez back buffer-o,
OW isw lard kmdrr m ft msca muRh name neptu nmep
perl phi pod portsweep processteble ps rootkt seht eaten
teardrop udpstom werezm, worm xlock
10.32% 79.36% 10.32%
protocol type J icmp
tcp udp
wrong frtýgment Mean ý 160 Dev 0.612
92. ax 10 4.80% 1 4.00% 3
diff srv rate Mein X146 Dev 0.251
72.79% «. 0.045 9.07% 1 <-0.240 9.07% »-0.670 9.07% -0.670
srv dill host rate Wean m1941Dev 0.311
68.19% »-0.000 8.92% «-0.500
22.90% »0.500
duration Mean: 14837.800 Dev: 14423.312
30.67% <-0.000 11.57% 1.000
E:
6.34% <-2.000 51
. 42% 0 »2.000
src bytes Mean. 14541360.588 Dev : 15663234.7
20.08% «-1.000 2163% 1 <-504.000 11.99% «. 1032.000 46.29% -1032.000
service
1 15% RC 1 15% x11 1,15% Z39_50 1 15% euch 1 15% bgp 1 15% courier 1.15% csnet_ns 1.15% ctf 1.15% daytime 1,15% discard 11 5%
, domain
1 15% domain u 1 15% echo 1 15% eco_i 1 15% 1 scr i 1 15% efs 1 15% exec 1 15% finger 2.30% ftp 5.75% ftp_date 1 15% gopher 1 15% hostnemes 1.15% 1 http 1 15% hdtp 443 1 15% kxnp 1 15% m ep4 1.15% iso tsap 1.15% klogin 1.15% kshel 1
. 15% kfep
1,15% Ink 1 . 15% login 1.15% nip 1.15% name 1.15% netblos_dgm 1.16% netbios_ns 1.15% netbios_ssn 1.15% netstet 1.15% nnsp 1.15% nrdp 1 15% rIp_u 1 15% her 1.15% pm dump 1 . 15% _ pop_2 1.15% pop_3 1
. 15% printer
1.15% J private 1.15% remoteJob 1.15% rje 1 . 15% shell 1.15% 1 smtp 1
. 15% sgl_net
1.15% ash 1.15% sunrpc 1.15% supdup 1 15% systet
20.69% telnet 1.15% tffp u 1 15% tkm 1.15% time 1.15% -P j 1.15% uucp 1.15% uucp_path 1.15% vmnet 1.15% w1 ois
flog
3.03% OTH 3.03% T REJ 3.03% RSTO 3.03% RSTOSO 3.03% RSTR 3.03% SO 3.03% Si 3.03% S2 3.03% S3
69.70% T SF 3.03% SH
hot Mean . 26.570 Dev 25.573
32.05% T <-o. ooo 16.68% <-2.000 51 . 27% e2.000
dst_bytes Mean: 1884729. 513 Dev: 1162466.359
9.19% T <-0.000 9.19% <-1 .
000 9.19% T <-293.000
72.44% -293.000
Figure 5.5 (b): Bayesian detector learns the variable nodes contribution to buffer over attack
94
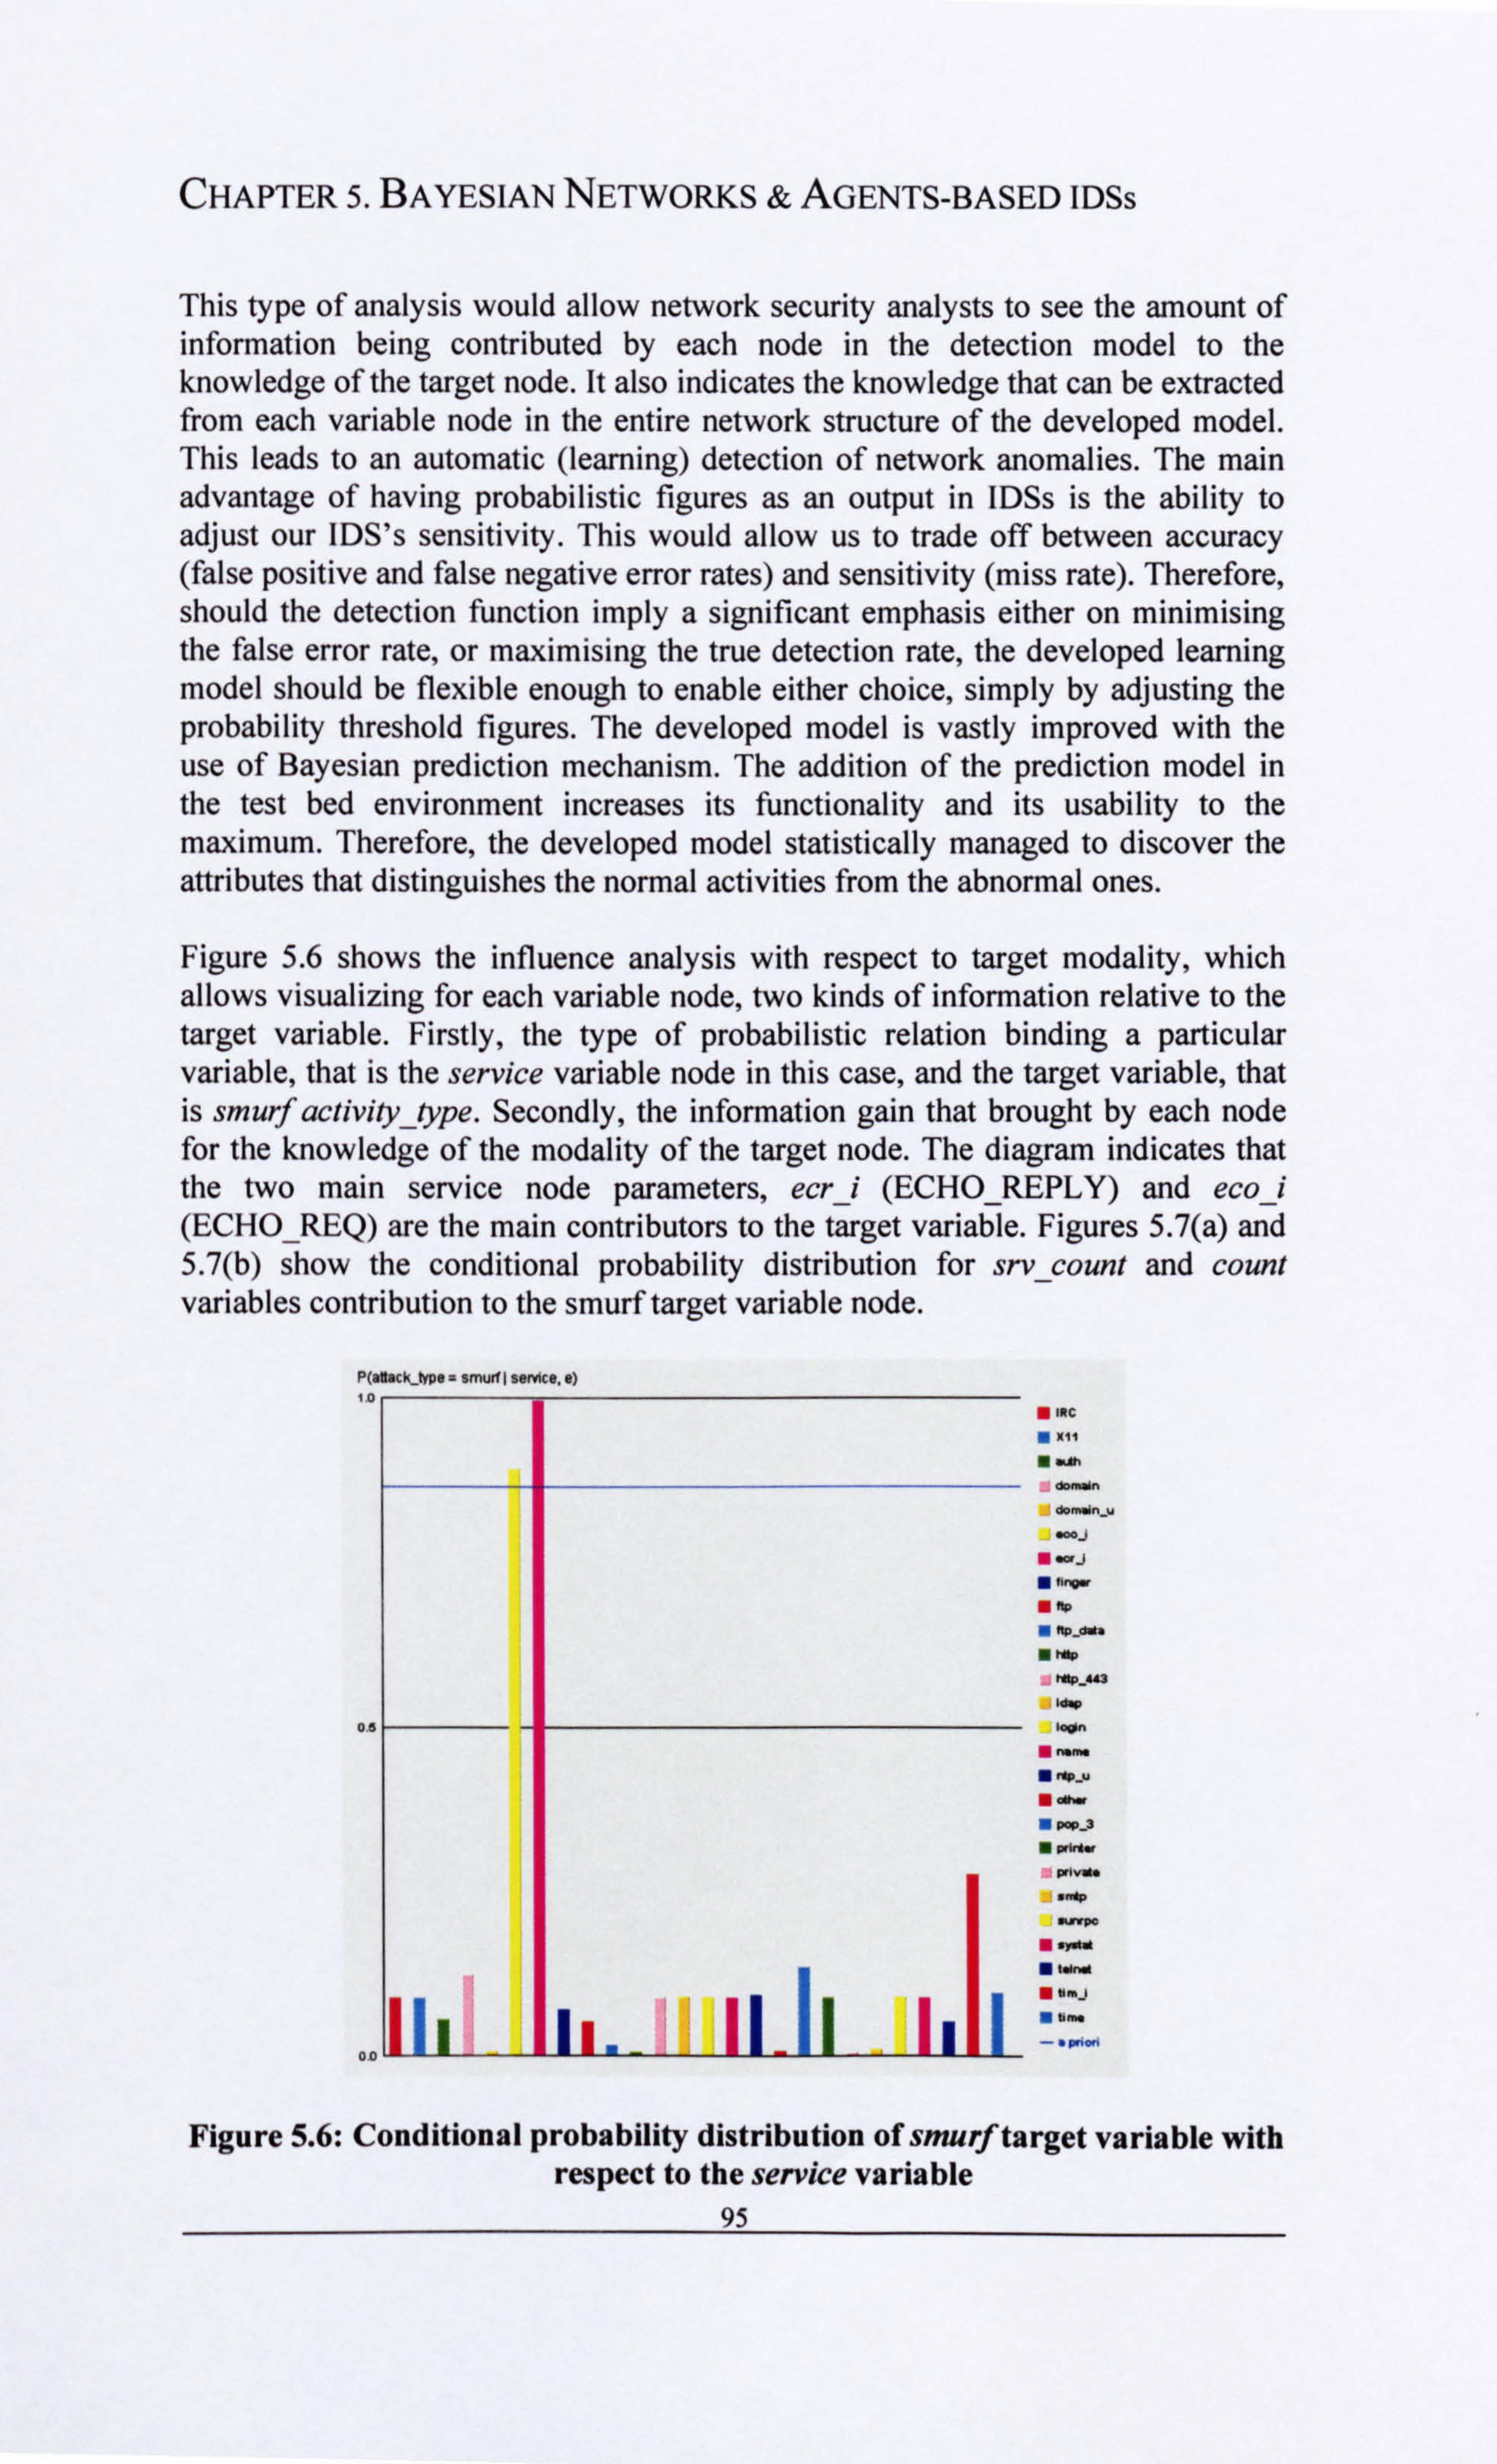
CHAPTER 5. BAYESIAN NETWORKS & AGENTS-BASED IDSs
This type of analysis would allow network security analysts to see the amount of information being contributed by each node in the detection model to the knowledge of the target node. It also indicates the knowledge that can be extracted from each variable node in the entire network structure of the developed model. This leads to an automatic (learning) detection of network anomalies. The main advantage of having probabilistic figures as an output in IDSs is the ability to adjust our IDS's sensitivity. This would allow us to trade off between accuracy (false positive and false negative error rates) and sensitivity (miss rate). Therefore, should the detection function imply a significant emphasis either on minimising the false error rate, or maximising the true detection rate, the developed learning model should be flexible enough to enable either choice, simply by adjusting the probability threshold figures. The developed model is vastly improved with the use of Bayesian prediction mechanism. The addition of the prediction model in the test bed environment increases its functionality and its usability to the maximum. Therefore, the developed model statistically managed to discover the attributes that distinguishes the normal activities from the abnormal ones.
Figure 5.6 shows the influence analysis with respect to target modality, which allows visualizing for each variable node, two kinds of information relative to the target variable. Firstly, the type of probabilistic relation binding a particular variable, that is the service variable node in this case, and the target variable, that is smurf activity
_type. Secondly, the information gain that brought by each node
for the knowledge of the modality of the target node. The diagram indicates that the two main service node parameters, ecr_i (ECHO-REPLY) and eco-i (ECHO_REQ) are the main contributors to the target variable. Figures 5.7(a) and 5.7(b) show the conditional probability distribution for srv_count and count variables contribution to the smurf target variable node.
06
00
Inc
X11
Ooýin
dumm u
eJ
�ror
RP
"pd. rrn
MP -443 Idw
ýn_u
ar
Pep-3
"Pkg.,
MM
"Mr
" Iý
tl. J
X.
Figure 5.6: Conditional probability distribution of smurf target variable with respect to the service variable
95
P(abck-WPe - smuA ss$ ce. e) ýo _

CHAPTER 5. BAYESIAN NETWORKS & AGENTS-BASED IDSs
P(attack_type = smurf I srv_count, e)
1.0
0.5
0.0
P(attack_type = smurf I count, e) 1. o
L1
L2
L3
L4
L5
L6
-a priori
0.5
0.0
LI
L2
L3
L4
L5
L6
L7
-a priori
(a) (b) Figure 5.7: Conditional probability distribution of smurf parameter of the
target variable with respect to the srv count and count variables
The main feature that can be noticed from the detector model output in figures 5.6 and 5.7 is the ability to give statistical figures that determine the rate of detection for any particular unauthorised event with respect to other event. As the future network attacks would have a high probability of being developed versions of the current ones. Also, having those unauthorised activities being identified probabilistically, this means that the developed learning detector would be able to provide similar statistical figures for predicting future similar anomalies.
5.4.4-Bayesian Unsupervised Learning of Dataset Clustering
Bayesian clustering methods [Ramoni et al, 2001] [ Cheeseman et al, 1996] were only recently started for static databases, i. e., under the assumption that the data are independent and identically distributed. Bayesian clustering [Witten et al, 2000] associates instances with clusters probabilistically rather than categorically. In this case, for every instance there is a probability or degree of membership with which it belongs to each of the clusters. The goal of using clustering [Barash et al, 2001 ] is the discovery of natural partitions from the examples given in the dataset. In addition to the association discovery, the clustering algorithm can also be applied to discover the natural partitions for all variables within the dataset. These partitions share a set of common properties.
The data clustering algorithm with automatic selection of the number of classes is used. It allows the network to search for the best number of classes for optimal partition. Also, it allows the clustering of the data in an unsupervised way, in order to find partitions of homogeneous elements. This method clusters network traffic and connection requests with similar expression patterns and regions. The learned model provides a useful insight on the incoming network traffic, protocols, and user requests for connections within each cluster.
The clustering outcome performs an automatic organisation of the nodes as shown in figure 5.8 below. This developed model is based on a naive architecture in which node clusters that is used to model the partitions is the common parent of all the other variables. Unlike the corresponding supervised learning, the values of
96

CHAPTER 5. BAYESIAN NETWORKS & AGENTS-BASED IDSs
node clusters are not observed here. In the automatic selection of the number of classes, the search of the number of clusters is carried out by a random walk that starts with the specified number of clusters and that increases the number of partitions until obtaining empty clusters or reaching the specified maximum number of clusters.
Q dur ion wrone_rapment su attämpted c dill srvrate
nt urgsrd
l
at
;
roror
ý
hý num f ile creations ate
flap u failetl_Iopins num s Is
4r rata
land root ell s ue o same_srv rate Q \\ ý>l CI usters
Figure 5.8: Automatic organisation using clustering
The model features the level of contribution of each node variable towards the target node clusters. Based on the given dataset, the analysis of the arcs emphasizes the importance of the role of each arc. The arc's thickness is proportional to the strength of the probabilistic relations between the target node and the other nodes within the network. In order to see the amount of information being contributed by each node to the knowledge of the target node is to monitor the shade of each variable node. The lighter the shade of the square inside the node, the greater the amount of information it carries. The output characteristics of the two major clusters appear in figure 5.9.

Clusters
100.00% Cluster I OAD% Cluster 2
activity type
4.61 %p apeche2 0.04%i buffer overfl... 0.02% guesspess.. 0.12%ý ipsweep 0.05%i mulihop 0.12%
73.76% named normal
0.01%1 phf 0.26%i pod 1.23% portsweep 7.22%p saint 0.07% sendme 000% smurt
12.36% srmpgetaffack 0,01%1 udpstorm 0.07%, k 0.02%. xsnoop
protocol type
0.66% 67.99%
tc tcp
31.35% udp
duration Mean: 121.627 Dev: 753.511
95.61% «-0.000 2.16%'t «-717.500 2.24%r »717.500
court Mean: 60.054 Day: 99.050
44.55% «0 ý 48. 65% «-. 113131.. 500
3.62% «-493.500 2.96%1 »493.500
service
0.06%1 IRC 0.08%1 x11 0.17%i euth 0.04% domain 511%p domen u 0.21 % _ eco i 0.44%I ecr_I 0.11%1 finger 0.13%i ftp 1.08%
54.44%ý ttp_date http
0.01%1 Mtp 443 0.01% Id. p 0.01%1 login 0.01%1 name 0.06% 6 23%ý
ntp u other . 0.02%i pop-3
0.01 % 27.99%
printer private
3.48% srrtp 0.01 %i surrpc 0.01 %i systd 0.19%i tenet
i 0.01% tknj 0.07% time
srv court
Mean 37 771 Dev. 33.130 27.83%r= -. 1.000 1722%'... -. 2.000 54.95% - 133.500
0.00% »133.500
Clusters
0-011 Cluster I 100.00% Cluster 2
activity-type
0.00% epeche2 0.00%1 butter_overfl... 0.00%1 guess_pess... 0.20% 1 ipsweep 0.00% I multhop 0.00% 0.00%1
named normal
0.00% I phf 0.00% pod 0.00%I portsweep 0.00% saint 0.00% serwineil
99.79% smurf 0.00% srmpgetetteck 0.00%I udpstorm 0.00% I xlock 0.00% xsnoop
protocol-type
100.00% icmp 0.00% tcp 0.00% udp
duration Meere 0.016 Dev: 8.633
100.00% <-0.000 0.00% »-717.500 0.00% -717.500
count Mean 500.620 Dev: 25.961
0.19% »-2.000 0.06% ». 131.500 0.21 % <»93.500
99.54% »493.500
service
0.00%, IRC 0.00%i x11 0.00% i NIh 0.00% domain 0.00%I domain u 0.19%
99.60% eco i ea i
0.00% i finger 0.00% ftp 0.00% ftp_date 0.00% Htp 0.00% http_443 0.00% Idap 0.00%i login 0.00% name 0.00% 0.00%1
ntp_u other
0.00%1 pop_3 0.00% primer 0.00% private 0.00% srrtp 0.00% i sunrpc 0.00% i systat 0.00%i tenet 0.00%i tknI 0.00%, time
srvcaz* Mein: 321.470 Day: 15. 465
0.19% <-1.000 0.00% <=2.000 0.06% <-133.500
99.74% »133.500
Figure 5.9: Two identified clusters
98

CHAPTER 5. BAYESIAN NETWORKS & AGENTS-BASED IDSs
Observation 7: Figure 5.9 shows the characteristics of each cluster created, by setting each state of variable clusters to 100%. The 2nd display (activity
_type) of
figure 5.9 indicates that the two main initiated clusters are the normal and abnormal (smurf activity) network traffic. Figure 5.9 represents a particular type of association, which is meant to be a probabilistic type of clustering. The algorithm identified two major groups that segmented the population naturally into two clusters. Cluster I represents the other mostly used protocols, which are tcp and udp respectively, for normal type of traffic. The detector shows that http protocol service used on top of tcp with less number of connections to the same host as the current connection in the past two seconds as shown in the 5`h display. Also, the output of Cluster I indicates that a less number of connections to the same service as the current connection in the past two seconds as shown in the last display (srv_count variable).
Observation 8: The Cluster 2 represents the network traffic appears in abnormal situation where the attacking protocol-type parameter icmp is used by ecr_i (ECHO_REPLY) service to launch smurf attack. This attack has a very high number of connections to the same host as the current connection in the past two seconds as shown in the 5`h display, which is indicated by the count variable. Also, the output of Cluster 2 indicates that a high number of connections to the same service as the current connection in the past two seconds as shown in the last display (srv_count variable).
Figures 5.10 (a) and (b) show the influence analysis with respect to target modality, which allows visualizing for each cluster, two kinds of information relative to the target cluster. Firstly, the type of probabilistic relation binding a particular cluster, and secondly, the information gain brought for the knowledge of the modality of the target cluster. The diagrams indicate the conditional probability distribution for each cluster variable contribution given both clusters.
P(Clusters = Cluster II Clusters, e) 1.0 " Cluster 1
Cluster 2
0.5 -a priori
0.0
(a)
P(Clusters = Cluster 21 Clusters, e) 1.0 " Cluster 1
Cluster 2
0.5 -a priori
0.0
(b) Figure 5.10- Conditional probability distribution of both clusters
This type of analysis allows network security analysts to see the amount of information being contributed by each node to the knowledge of the target cluster. It also emphasizes the importance of the role of each variable in the entire network structure. The node variables that are near to the cluster are proportional
99

CHAPTER 5. BAYESIAN NETWORKS & AGENTS-BASED IDSs
to the strength of the probabilistic relations that represent the global probability law. The key features in the developed model can be summarised as follows:
" Automatic detection of the two main clusters. " Automatic detection of the variable nodes, which are irrelevant to the
clusters. " Clear clustering in the presence of many such variables. In the given
dataset, 31 variables are used. " Clustering representation describes which clusters each attribute depends
on.
Therefore, the developed model allows the discovery of the attributes that feature one cluster (normal) and distinguish it form the other (abnormal).
5.5- Summary
The Bayesian supervised learning with decisions-based detection modelling technique, which is introduced in chapter 4 has been further developed in this chapter using powerful learning methods known as Bayesian Networks (BNs). The developed Bayesian network learning detector that has been introduced in this chapter is a graphical model that encodes probabilistic relationships among variables of interest. When used in conjunction with statistical techniques, the graphical detector model has several advantages for network traffic analysis. The Bayesian Learning networks approach is considered to be a promising tool used by the intelligent Agents to determine suspicious networks anomaly events and consequently relating them to the following dependent occurring illegitimate activities. BNs are powerful machine learning techniques. They have led to the development of learning detection methods to extract them directly from datasets of cases that is generated by MIT Lincoln Lab. This is to avoid relying on the insight of human security experts, thus turning BNs learning detection into a powerful technique for knowledge extraction in general and networks intrusion detection systems in particular.
This chapter showed how probabilistically Bayesian network detects network attacks, allowing for the generalization of NIDSs. Simulation scenarios as well as experimental results show that the modelled system is effective with minimum false positives and false negatives. While learning detection techniques serve a useful purpose and provide a major solution, these techniques do not provide the ultimate solution to the current NIDSs limitations. As a result, an effective automated response mechanism to those detected attacks is required to minimise their effect, hence, enhance NIDSs capabilities. The further work chapter proposes other Agents with Fuzzy intelligence capabilities to initiate successful automated response actions. Fuzzy intelligent Agents are proposed in chapter 6 to handle this task with the ability to respond quickly and dynamically control the availability of allocated network resources.
Chapter 6 will discuss the evaluation methodology used to assess the performance of the developed learning detection models that are investigated in this chapter. By means of evaluation we should be able to determine the effectiveness and the
100

CHAPTER 5. BAYESIAN NETWORKS & AGENTS-BASED IDSs
performance of all the proposed models and assumptions. The effectiveness of each chosen technique for the supervised and unsupervised learning task will be evaluated using well known standard methods. The evaluation criteria as well as the learning prediction performance for this task will be introduced in the next chapter.
101

CHAPTER 6. EVALUATION AND PERFORMANCE MEASUREMENT
Chapter 6
Evaluation and Performance
Measurement
This chapter discusses the evaluation methodology used to assess the performance of the machine learning technique at detecting as well as predicting unauthorised activities in telecommunication networks using Bayesian methods. By means of evaluation, validation as well as empirical evidence, we will be able to determine the effectiveness and the performance of all the developed models and assumptions in chapters 4 and 5. The evaluation and the learning prediction performance for this task will be discussed, together with a description of the chosen Bayesian learning tool: the BayesiaLab. The performance of both developed detection model algorithms for the supervised and unsupervised learning tasks will be evaluated using well known standard methods such as confusion matrix. This chapter intends to compare both techniques and hence identify their strengths and limitations in general and detecting network anomalies in particular.
6.1- The Evaluation Methodology
Evaluation [Witten et al, 2000] is the key in making significant progress in applying machine learning algorithms to real life problems, such as networks security. However, we need systematic ways to evaluate how different learning methods work and to compare one with another. Also, we need ways of predicting performance based on practical experiments using useful collected data. Evaluating the performance of machine learning schemes on a given problem such as detecting and predicting unauthorised activities within a network is an issue that is not easy as it sounds. So far, in my experiments, it has been assumed that what is being predicted is the ability to classify different instances of normal and abnormal network traffic activities. In some of my other experimental situations, the prediction involves class probabilities rather than only the classes themselves. For example, the developed model predicted the smurf activities and indicated that in a form of a probabilistic figure based on the behaviour of ICMP protocol. Therefore, a mechanism for maximising the success rate of the predictions and counting the cost of making wrong decisions and predictions is needed. In most

CHAPTER 6. EVALUATION AND PERFORMANCE MEASUREMENT
practical machine learning situations, the cost of a misclassification error depends on the type of error it is, whether, for example, a positive signal was erroneously classified as negative or vice versa. When doing machine learning, and evaluating its performance, it is often essential to take these costs into consideration.
The evaluation methodology used is based upon the reliability and precision of unauthorised network activities detection as well as a prediction scheme using Bayesian learning techniques. The evaluation methodology should fulfil the following requirements:
Evaluate the hypothesis that machine learning techniques such as Bayesian learning can be used to differentiate between normal (legitimate) and abnormal (illegitimate) network activities. Develop detection and prediction techniques appropriate for classifying as well as identifying network anomalies. The evaluation should provide acceptable estimation figures for the effectiveness of the classification obtained. Develop an accurate useful procedure of evaluation of the proposed techniques which could be used in the future. This will provide valid methods for comparing results obtained from this research experiments and/or other similar future work.
In order to evaluate intrusion detection system, it is required to know both the probability of detecting an attack known as a True Positive (TP) and the probability of issuing a false alarm known as a False Positive (FP). The majority of current intrusion detection systems report different warning levels that enable security managers to adjust an alert threshold that effectively trades off (TP) for (FP). The security manager will be able to discover more attacks when lowering the threshold, however, will probably increase the false alarms rate. Similarly, the security manager can increase the threshold to decrease false alarms rate however, this may cause the system to miss other additional attacks. By knowing both TP and FP and how they fluctuate with the changes in the threshold, it will be possible to plot that in a diagrammatic form, as we will see in section 6.5. By extracting knowledge from the generated plots, security managers will be able to set thresholds to maintain the required amount of analysis effort and the desired security level.
6.1.1- The Performance Criteria
The evaluation methodology mainly applies five criteria to measure the performance of Bayesian learning-based anomaly detection model. In conjunction with the achieved statistical measurements, I argue that the cost of miss- classification measurement would be a useful measure to consider and that when considered as a focus of attention component, the performance of probabilistic predictions is certainly important.
103

CHAPTER 6. EVALUATION AND PERFORMANCE MEASUREMENT
The performance measurement approach can be summarised as follows:
" Validate whether the simulation model is featuring an acceptable representation of real system given the purpose of the simulation model [Kleijnen, 1999].
" Measure the prediction performance for the developed detector model using the informational loss function [Witten et at, 2000].
" Evaluate the precision of the developed Bayesian network detector model using confusion matrix [Witten et at, 2000].
" Evaluate the performance of the developed models on unseen test set using 10-fold stratified cross-validation [Witten et at, 2000].
The effectiveness of these measures will be summarised and tested for statistical significance of the developed models. The machine learning package used in the above mentioned evaluation experiments and measurement, BayesiaLab, enables the use of several different evaluation features.
One of the methods [Witten et al, 2000] used for counting the cost and evaluating machine learning schemes is known as ROC curves, where the learner is trying to select samples of test instances that have a high proportion of positives. ROC [O'Connell et al, 2002] is a procedure derived from the early days of radar and sonar detection used in the Second World War, hence the name "Receiver Operating Characteristic". ROC is used in signal detection to characterise the trade off between hit rate and false alarm rate over a noisy channel. The ROC curve plots the number of positives included in the sample on the vertical axis (Y- axis), expressed as a percentage of the total number of positives or the true positive rate, against the number of false positives included in the sample, expressed as a percentage of the total number of false positives or the false positive rate, on the horizontal axis (X-axis).
104

CHAPTER 6. EVALUATION AND PERFORMANCE MEASUREMENT
Table 6.1 [Witten et al, 2000] summarises the ROC way of evaluating the same basic trade off, the number of true positives (TP), false positives (FP), true negatives (TN), and false negatives (FN), respectively. A set of instances would be chosen with a high proportion of yes instances and a high coverage of the yes instances. Different technique give different trade offs and can be plotted on the ROC diagram.
Table 6.1: ROC curve's measure is used to evaluate the FP vs. FN trade off Method Plot Axes Explanation of axes
ROC curve TP rate vs. FP rate TP rate TP X100%
TP+FN FP rate FP
X100% FP+TN
The primary goal of my learning detection models, which function as a prediction and classification mechanism, is to predict the performance of a classifier on new data and assess its error rate on unseen data (i. e. a dataset that played no part in the formation of the classifier). The ultimate goal in the anomaly detection task is to identify those potentially unauthorised activities and malicious occurrences in networks while minimising the rate of incorrectly flagging normal behaviours, i. e. false positives. Also, to minimise the rate of failing to identify unauthorised activities and malicious behaviours, i. e. false negatives. Both false positives and false negatives rate of an entire anomaly detection system must be as low as possible.
The dataset used in the experiments were processed by the developed Bayesian network model whose main characteristics are described in chapter 4. This dataset, which is generated by MIT LL contains about half a million instances in a form of network connections using different network as well as application protocols. The learning procedures for developing the Bayesian network detector model received only the dataset as an input. In order to increase the efficiency of the experiments, accommodate all the dataset, and achieve accurate modelling and simulation results, high specification hardware was required. In all of the conducted experiments, the methods used and later on compared, received as input the same training data. Therefore, I was able to quantify the effect of the local structures on the parameter estimation and the structure selection of the developed models.
6.2- Modelling & Dataset Validation
Validation [Kleijnen, 1999] determines whether the simulation model is an acceptable representation of the real system given the purpose of the simulation model. In this case simulation means experimentation, i. e., the model is used instead of the real system. In this case, real data is used rather than simulated data; however, experimentation is done using a simulated model rather than the real system. However, any experimentation calls for statistical analysis, which is only part of the whole validation process. The type of statistical procedure to use depends on the kind of data that is available for the analysis. When a model [Sargent, 1999] is created, it should be developed for a well defined purpose, and its validity and performance determined with respect to that purpose. If the
105

CHAPTER 6. EVALUATION AND PERFORMANCE MEASUREMENT
purpose of a model is to answer particular questions, the validity of the model has to be determined with respect to each question. There are many validation techniques that can be used to validate a particular developed model. In Sargent [1999], sixteen various validation techniques were discussed, and only eight of them were applied here to validate the developed detection model. In addition combinations of the eight selected techniques were used, which is quite acceptable by the Verification and Validation (V&V) community. The other validation techniques are excluded due to their irrelevance to the underlying problem.
Following Sargent [1999], the validation techniques used to validate the developed detection model are.
" Parameter Variability-Sensitivity Analysis: This technique consists of altering the values of the internal parameters of the developed model and its inputs to determine the effects upon the model's behaviour and its output. The same relationships of change should be possible in the real system model.
" Predictive Validation: The model is used to predict the system behaviour, and then comparisons are made between the system's behaviour and the model's forecast to determine if they are the same. The empirical evidence could be used here to make the comparisons.
" Operational Graphics: To obtain various performance measures that graphically indicate the model behaviour with respect to time, i. e., the dynamic behaviours of performance indicators are visually displayed as the simulation model moves through time.
" Historical Data Validation: If historical data exists (or if data is collected on a system for building or testing the model), part of the historical data is used to build the model and the remaining part is used to determine (test) whether the model behaves as the system does.
" Historical Methods: The three historical methods of validation are rationalism, empiricism, and positive economics. Rationalism assumes that everyone knows whether the underlying assumptions of a model are true. Logic deductions are used from these assumptions to develop the correct model. Empiricism requires every assumption, achieved model output and outcome to be empirically validated. Positive economics requires only that the model be able to predict the future and is not concerned with a model's assumptions or structure (causal relationship or mechanism).
" Multistage Validation: proposed by [Naylor and Finger, 1967] to combine the three historical methods of rationalism, empiricism, and positive economics into a multistage process of validation. This validation method consists of, firstly, developing the model's assumptions on theory, observations, general knowledge, and function, secondly, validating the model's assumptions where possible by empirically testing them, and finally, comparing the input-output relationships of the developed model to the real system.
" Traces: This technique traces the behaviour of different types of specific entities in the model to determine if the model's logic is correct and if the necessary accuracy is achieved
106

CHAPTER 6. EVALUATION AND PERFORMANCE MEASUREMENT
" Turing Tests: To consult experts who are knowledgeable about the operations of a system and asked if they can discriminate between system and model outputs.
It is natural [Witten et al, 2000] to measure a classifier's prediction performance in terms of the error rate. If the prediction is correct, then it is counted as a success, otherwise it is an error. Generally, in order to predict the performance of a classifier on new data, such as new incoming network traffic, it is required to assess its error rate on an independent dataset that played no part in the formulation of the classifier. There are two datasets (in the form of network traffic contaminated with different DoS and other attacks) have been provided, the training data and the test data. The training data will be used to come up with the classifiers. Then the test data will be used to calculate the error rate of the final, optimised scheme. Each of the two sets must be chosen independently. The testing data set must be different from training data to get a reliable estimate of the true error rate and to get good performance in the optimisation or evaluation stage. The validation process will be used to optimise parameters of those classifiers, so to evaluate which approach would be more suitable. Provided all samples are representative, the error rate on the test set will give a true indication of future performance.
Generally, it is not a straight forward to tell whether a sample is representative or not. One possible way of evaluating Bayesian Learning approach is to determine the error rate using stratified tenfold cross-validation. Stratification [Witten et al, 2000] is a technique which ensures that random sampling is done in such a way as to guarantee that each class is properly represented in both training and test sets. The standard way of predicting the error rate estimate of a learning technique given a single, fixed sample of data is to use stratified tenfold cross-validation. This technique is adopted in such away that the dataset is divided randomly into ten parts, in each of which the class is represented in approximately the same proportions as in the full dataset. Each part is held out in turn and the learning scheme trained on the remaining nine-tenths, then its error rate is calculated on the holdout set. Thus the learning procedure is executed a total of ten times, on different training sets (each of which have a lot in common). Finally, the ten error estimates are averaged to yield an overall error estimate. The stratified tenfold cross-validation is a standard evaluation technique in practical terms.
Due to the possible substantial variance in an individual tenfold cross-validation and the approximation of the true cross-validation error figure, it is possible to sample from the distribution of cross-validation experiments. This can be achieved by using different random partitions of the given dataset, treating the error rates calculated in these cross-validation runs as different, independent samples from a probability distribution. Therefore, by comparing the average error rate over several cross-validations for the learning model, it is possible to determine whether the mean of a set of samples of the cross-validation estimate is significantly great or significantly less.
107

CHAPTER 6. EVALUATION AND PERFORMANCE MEASUREMENT
6.2.1- Model's Detection Validation
The developed model detection has been validated by comparing its output with EMERALD (Event Monitoring Enabling Responses to Live Disturbances) detection system's output. EMERALD [Marchette, 20011 is SRI's environment for scalable, distributed intrusion detection and network monitoring. Information on EMERALD can be obtained from many recent books on intrusion detection [Amoroso, 1999] [Bace, 2000] [Marchette, 2001]. Figure 6.1 indicates that the developed model output and EMERALD system [Valdes et al, 2001] are detecting buffer_overflow activities. Due to data protection reasons part of the information
on EMERALD's output is hidden. A similar relationship of the developed model change appears in the real EMERALD system as a result of internal parameters changes. However, the developed model's output provides a probabilistic figure to indicate its confirmed prediction.
" yJw.
w- Wnd
phi PDd
P-t-- W ... ý. a. P.
:w rn snýnr anvý
iiI. mi.. 1.. 1. ee.. wd 1klr
i EMERALD Ilftsr rvrr I. III rM. rtYlOr
OLae rvnr lucalluu: - OCS<rver Source. rrs Mim. y1EýtE1ýNpW
EMf BALD DrwluOmeM AUIwY I DrýM Ilmst Ilmf. UI/ULM 11:.: 5: 1. Al 9
Malt List AtrCY SMMMry Bull uvtR: IUSM: YUIIUI { lituw 110 t OV ItQ 1
unv. uhlg..
w 1. Vlvwublu tiwl. 3 f Data 1'A-An tt]. it Vii fna Tf. i: t ylM/M 1/: f]1] r11
fl. w N11s o
CSMwMYNnA1N6 Class rtbt'llne vw, llrB. Count Updates
Target Hall
Sour- UsMrr11M
um Har i Other Details L. eI /tI 14: ]bQ --
'11141 - ýeý.
... _ . Q; ttMb H. oa .dr. atR rwr.: t"l.,. a . r1.1. I. dNý.. JC: 4. at. rw D.::.
W WM1l, i(ý'tMl 14: 7"0 0 IIIr. rJ'J 311t'1; C: 3: =
al Jl.. t. ' Tlt C. 'w b 10]ßt V. ý. ký S': v AUBT
_%v ('ter ': NG I1.. ]l3 "r MC0111Mtd d..
ý . 114' a h. l. '. b. rtk. 'Tq. '. 11«. 11.. l. ß I lain
, l
V VL. <ý-'2T3 4: 11 J ll:: I
"-. ý. f[ r r'.: ' 2ý8 H: 76 i"ý Adml rstrltW H0as
Figure 6.1: Model's detection validation
Validation Remark 1: The conducted experiments in both, the developed model and EMERALD indicate the detection of buffer_overflow event. By altering the parameters' values of the related variables in the developed detection model, the model's probabilistic behaviour and prediction have been affected in a similar way to EMERALD's output. However, the developed model's output provides a probabilistic figure to indicate its confirmed prediction, which is not the case in EMERALD output. This relatively similar relationship has occurred in the developed model as well as the real system, hence confirms both of the validation techniques, the parameter variability-sensitivity analysis and predictive validation, as mentioned earlier in section 6.2.
Validation Remark 2: By knowing the underlying hypothesis of the developed detection model, its mathematical assumptions and its input/output relationships, as indicated in sections 5.2 and 5.4. The model's output can be empirically validated by analysing those relationships. For example, the buffer_overflow
attack can result from an increase in the length of network connections, which is
108

CHAPTER 6. EVALUATION AND PERFORMANCE MEASUREMENT
determined by the model's variable duration, as indicated in section 5.4.3. The developed model's output does not only determine the detection probability, but it also represents a predictive figure for future similar events to buffer overflow when changing the value of the model's variable duration, taking into account the causal relationship amongst the model's variables. This confirms the validation techniques of both, the historical methods and the multistage validation.
6.3- Learning Prediction Performance
The outcome of all the conducted detection experiments is either correct, if the prediction agrees with the actual value for that particular instance, or incorrect, if it does not. When a learning scheme [Witten et al, 2000] such as Bayesian learning is applied, results in either a correct or an incorrect prediction, success is the right measure to use. This is sometimes called a 0-1 loss function. The loss is either I if the prediction is incorrect, or 0 if it is not. One of the well known mechanisms for the evaluation of probabilistic prediction is the informational loss (entropy) function (- 1092 p, ), i=1 to h, where h is the number of variables. The informational loss function represents the information required to express the actual class I with respect to the probability distribution p, p2....... pk . The informational loss function experienced by variable i gives maximum reward to predictors that are capable of predicting the true probabilities accurately. The expected value of the informational loss function, which determines the entropy of the true distribution [Witten et al, 2000]:
-PI 1092 Pl -P21092 Pz -"**'-Pk 1092 Pk
The information loss for the developed detector model in case of predicting a smurf event occurrence is shown in Table 6.2:
109

CHAPTER 6. EVALUATION AND PERFORMANCE MEASUREMENT
Table 6.2: The information loss of smurf event class occurrence
, Event paramete r Predic tion Probability log: P, Entropy Log of Prediction Probability -P, log, P, Apache2 0.0026 -8.587272661 0.022326909 Back ' 0.0035 -8.158429363 0.028554503 Buffer overflow j 0.0002 -12.28771238 0.002457542
_ ftp_wrlte 0.0001 -13.28771238 0.001328771 Guess_password 0.014 -6.158429363 0.086218011
"Httptunnel 0.0006 -10.70274988 0.00642165
Imap 0.0001 -13.28771238 0.001328771 lpsweep 0.0011 -9.828280761 0.010811109 Land 0.0001 -13.28771238 0.001328771 `Loadmodule 0.0001 -13.28771238 0.001328771 Malibomb 0.018 -5.965784285 0.095452549 Macon 0.003 -8.380821784 0.025142465 Multihop 0.0001 -13.28771238 0.001328771 Named 0.0001 -13.28771238 0.001328771 Neptune 0.1864 -2.423526235 0.45174529 Nmap 0.0004 -11.28771238 0.004515085 'Normal 0.1933 -2.371086457 0.458331012 Perl 0.0001 -13.28771238 0.001328771 Phf a .'2 3 0.0001 -13.28771238 0.001328771 Pod 0.0003 -11.70274988 0.003510825 Portsweep 0.0012 -9.702749879 0.0116433 Processtable j 0.0024 -8.702749879 0.0208866 Ps 0.0001 -13.28771238 0.001328771 Rootklt 0.0001 -13.28771238 0.001328771 Saint 0.0024 -8.702749879 0.0208866 Satan ' 0.0053 -7.559791925 0.040066897 Sendmail
"; ; 0.0001 -13.28771238 0.001328771
Smurf 0.5274 -0.923030524 0.486806298 Snmpgetattack 0.0249 -5.327710447 0.13265999 Snmpguess m 0.0078 -7.002310161 0.054618019 'Sglattack 4 0.0001 -13.28771238 0.001328771 Teardrop 0.0001 -13.28771238 0.001328771 Udpstorm 0.0001 -13.28771238 0.001328771 Warezmaster 0.0051 -7.615287038 0.038837964 Worm 0.0001 -13.28771238 0.001328771 Xlock 0.0001 -13.28771238 0.001328771 Xsnoop 0.0001 -13.28771238 0.001328771 Xtertn 0.0001 -13 28771238 0001328771
The total informational loss is 2.0258106
Evaluation Remark 1: The informational loss function depends on the probability assigned to the class that actually occurred. If a very small probability value is assigned to the class that actually occurred, the informational loss function will penalize largely. The maximum penalty, for a zero probability assigned to an event that actually occurred, is infinite. The informational loss of the predicted smurf event class is 2.0268106. This indicates that the developed predictor has only been penalised with a factor of 2 which is much less than infinite. Because of the high probability of a smurf attack compared to the others there is a high likelihood that a smurf attack is tacking place. This is due to the acceptable probability assigned to the detection of smurf which is %52.74. This probability assignment to the occurred event is quite optimistic. If the probability of detecting smurf reaches %100, then the informational loss (entropy) decreases to zero, hence, no penalty at all. The robust predictors [Witten and Frank, 2000] operating under the informational loss function do not assign zero probability to any outcome. This leads to a problem when no information is available about that outcome on which to base a prediction. This problem is known as the zero- frequency problem.
110

CHAPTER 6. EVALUATION AND PERFORMANCE MEASUREMENT
6.4- The BayesiaLab Package
The development of the Bayesian network based detector model and all its experiments and evaluations are achieved using the BayesiaLab machine learning package. This Java-based implementation provided a useful test bed environment for developing and testing all the created models in chapter four and five. BayesiaLab is a machine learning modelling and data mining tool developed by Bayesia to allow researcher to develop Bayesian network based automatic learning models as well as making inference on those developed models. These models capture useful knowledge from a dataset. BayesiaLab features knowledge modelling that takes into consideration the uncertainty of the domain that characterises risk assessment, crisis anticipation and diagnosis.
The BayesiaLab package provides learning algorithms for probabilistic predictions and classifications using naive Bayes, Bayesian networks as well as Bayesian clustering and feature selection. It also provides standard evaluation methods such as confusion matrix for measuring the performance of the developed models. BayesiaLab is the testing and evaluation tool used in this chapter to support validating the developed models. BayesiaLab package has been used in many commercial applications and academic research laboratories, and more information can be found in [BayesiaLab, 2003]. The developed Bayesian network detection model has already been published by Bayesia in their Web site.
6.5- Learning Evaluation and Analysis
In this section, a targeted evaluation will be used to measure the quality of the developed active Bayesian network detector model for the prediction of the target variable node and its parameters with respect to the associated dataset. The evaluation [BayesiaLab, 2003] is carried out using BayesiaLab tool. Once the detection model is learned, it is possible to evaluate its performance on a test set (ideally different from the learning set). The tools that are used for evaluating the developed Bayesian network detection model are as follows:
" Three Confusion Matrices allowing to precisely measure the performance of the model for each modality (occurrence number, reliability: proportion of the cases with a correct prediction, and precision: proportion of the cases where the true value is correctly predicted), and
The following sections will focus on the use of a confusion matrix to evaluate the developed Bayesian network detector model.
6.5.1- Confusion Matrix
The effectiveness of a learning classifier is its ability to make correct classification decisions. There are several evaluation measures used for measuring effectiveness including reliability and precision. Classification could be thought of a number of binary decisions where each entry in an assignment table is given a (0,1) score (a binary yes/on decision). One parameter that is used for evaluation is the cost of making wrong decisions and wrong classifications. Optimizing
111

CHAPTER 6. EVALUATION AND PERFORMANCE MEASUREMENT
classification rate without considering the cost of the errors often leads to inaccurate results. In networks security terms: the cost of incorrectly detecting abnormal network behaviour classification has a different cost to the incorrectly predicted normal classification outcome. In networks intrusion detection, we are mainly concerned with two-class case attack "yes" or no attack "no". The four different possible outcomes of a single prediction are shown in Table 6.3, which is known as the confusion matrix for the two-class case. The true positives (TPs) and true negatives (TNs) are correct classifications. The false positive (FP) is when the outcome is incorrectly predicted as yes (or positive), when it is in fact no (negative). A false negative (FN) is when the outcome is incorrectly predicted as negative when it is in fact positive. These two kinds of error, will generally have different costs, likewise the two types of correct classification will have different benefits.
Table 6.3: Different outcomes of a two-class prediction
Predicted class (or values) Yes No
True or real class (or values)
Yes True Positive (TP) False Negative (FN)
No False Positive (FP) True Negative (TN)
112

CHAPTER 6. EVALUATION AND PERFORMANCE MEASUREMENT
The confusion matrices for the Nave bayes model are shown in figures 6.2 (a), (b), and (c), and those for the Bayesian network model are shown in figure 6.3 (a), (b), and (c). All these figures are produced using BayesiaLab tool [BayesiaLab, 2003]. These matrices give feedback about the performance of the detection
models. Three visualization modes are available, as follows:
1- Occurrence Matrix: number of cases for each Prediction/Real value, as shown in figure 6.2 (a). The predictions of the model appear on the columns, the lines are representing the true (real) values that are in the dataset.
2- Reliability Matrix: ratio between each prediction and the total number of the corresponding prediction (sum of the line) , as shown in figure 6.2 (b)
3- Precision Matrix: ratio between each prediction and the total number of the corresponding real value (sum of the column), as shown in figure 6.2 (c).
TOM Aeci O 4S 54%
(b) TOM Prod n 95.54%
tmnrm Mim
113
(c) Figure 6.2: Confusion matrix for the developed Nave bayes detector
(a) Tam p-M. 9564%

CHAPTER 6. EVALUATION AND PERFORMANCE MEASUREMENT
ra4d aecWim essec
Ta1N RscüWn 95.57%
0- 03 Re"WY Vrec on
(a)
OD% OD% 00% 00% OD% 0.0% 00%
(b) TWI R- 9557%
C-t. w n Ml i
0-rencsa Ra" y ProdaWn
The confusion matrix indicates the classification results down the main diagonal i. e., TPs (assigned values for each abnormal parameter) and TNs (assigned values for normal parameter) values, and small, ideally zero, off-diagonal elements for both FPs (rows) and FNs (columns).
The direct evaluation of a Bayesian network detector modelled for the prediction of a target variable such the activity_type can be realised by computing its total precision and reliability. The precision is the ratio between the number of correct predictions and the total number of predictions i. e., the number of the true positives divided by the number of the true positives plus the false positives, as follows [Witten et al, 2000] [BayesiaLab, 2003]:
Precision = TP
X100% TP+FP
The reliability is the ratio between number of correct predictions i. e., the number of the true positives divided by the number of the true positives plus the false negatives, as follows [Witten et al, 2000] [BayesiaLab, 2003]:
Reliability = TP
X100% TP + FN
114
(c) Figure 6.3: Confusion matrix for the developed Bayesian network detector

CHAPTER 6. EVALUATION AND PERFORMANCE MEASUREMENT
In figures 6.2 & 6.3, both developed models, Bayesian network and Navie bayes detectors in chapters 4 and 5 indicate a high similar total precision of 95.44 % and 95.54% respectively. Tables 6.4 and 6.5 list an alternative view of the main readings of the confusion matrices for the Naive bayes and Bayesian network model respectively. These lists include the number of occurrences for both real and predicted values of all parameters of the activity_type variable as well as the achieved reliability and precision (main diagonal values).
Table 6.4 : List of event parameters' occurrences, reliability and precision of Naive bayes model
1098 1095 99.81 99.54 flow 22 28 53.57 68.18
3 1 100 33.33 sword 4367 4400 98.93 99.7
158 157 96.17 95.56 1 1 100 100
306 415 72.28 98.03 9 21 38.09 88.88
e 2 1 100 50 5000 5077 98.48 100 1053 1073 95.99 97.81
18 3 100 16.66 17 14 64.28 52.94
58001 57975 99.95 99.91 84 84 100 100
60593 52692 95.33 82.9 2 0 0 0 2 2 50 50
87 31 80.64 28.73 354 416 83.89 98.58
le 759 768 98.82 100 16 14 35.71 31.25 13 8 12.5 7.69
736 311 58.06 2.44 1633 2195 68.97 92.711
17 27 29.62 47.05 164091 164324 99.85 10C
ack 7741 15940 41.43 85.311 2406 1376 62.05 36.69
2 1 100 5C 12 1 0 C 2 0 0 C
er 1602 1982 97.31 98.12 2 0 0 C 9 11 45.45 55.55 4 3 33.33 25
13 16 43.75 53.84

CHAPTER 6. EVALUATION AND PERFORMANCE MEASUREMENT
Table 6.5 : List of event parameters' occurrences, reliability and precision of Bayesian network model
Back 1098 1091 100 99.36 Buffer overflow 22 36 43.58 77.27 ftp_write 3 1 100 33.33 Guess_password 4367 4380 99.2 99.49 Httptunnel 158 28 75 13.29 Imap 1 1 100 100 lpsweep 306 679 44.62 99.01 Land 9 14 50 77.77 Loadmodule 2 0 0 C Mailbomb 5000 5016 99.68 100 Mscan 1053 973 98.25 90.78 Multihop 18 40 15 33.33 Named 17 12 33.33 23.52 Neptune 58001 58093 99.79 99.95 Nmap 84 84 100 10C Normal 60593 52811 95.45 83.19 Perl 2 61 3.27 10C Phf 2 0 0 C Pod 87 119 73.1 10C Portsweep 354 398 83.41 93.78 Processtable 759 768 98.82 10C Ps 16 108 3.7 25 Rootkit 13 4 25 7.69 Saint 736 28 53.57 2.03 Satan 1633 2384 67.23 98.1 E Sendmail 17 34 17.64 35.29 Smurf 164091 164094 99.99 10C Snmpgetattack 7741 16462 46.92 99.78 Snmpguess 2406 6 83.33 0.2 Sqlattack 2 2 100 10C Teardrop 12 48 25 10C Udpstorm 2 0 0 C Warezmaster 1602 2377 67.35 99.93 Worm 2 0 0 C Xlock 9 52 13.46 77.77 Xsnoop 4 3 33.33 2E Xterm 13 14 35.71 38.4E
Evaluation Remark 2: The interpretation of the generated confusion matrices results, which are listed in both tables 6.4 & 6.5 is as follows:
" Bayesian network detection model has got a high prediction rate in most of the attacks in comparison to Na7ve bayes. This includes Back, Buffer_overflow, Guess password, Httptunnel, Imap, lpsweep etc...
" In the case of Buffer_overflow unauthorised activity for example, there are 22 cases in the evaluation dataset (Real or True values)
116

CHAPTER 6. EVALUATION AND PERFORMANCE MEASUREMENT
" The prediction reliability for the Apache2 unauthorised activity is 790 * 100% = 99.49% (in case of Bayesian network detection)
790+4 " The prediction precision for the Buffer over unauthorised activity is
790 * 100% = 98.13% (in case of Bayesian network detection)
790+15 " Navie bayes indicated a high precision in detecting a number of attacks
such as ftp_write, land, Perl, Pod, Sglattack, Teardrop and Udpstorm. However, Bayesian network model managed to detect most of these attacks with a reasonable level.
" The Bayesian network model indicated a high reliability figures in detecting most of the attacks and hence outperformed Navie bayes. This is characterised with the contribution of many variable to each others. Also, the dependency feature that is incorporated with Bayesian network led to such a result.
" For those unpredicted parameters i. e., with zero or nearly zero prediction, such as Udpstorm or Worm, the achieved reliability and precision is zero. This is due to the inappropriate representation of those parameters.
" Good classification results correspond to large numbers down the true main diagonal on the confusion matrix and small, ideally zero, off- diagonal elements
Despite the fact that it is possible to bundle the testing data back into the training data, the used testing data used to test the developed model has been kept separate to the training data. The reason for that is because the amount of training data that is used to develop the detector model is already huge. In fact what is important is that error rates are quoted based on the separation of both training data and testing data. This matches the assumption made by Witten et al [2000] that both the training data and the test data are representative samples of the underlying problem. Provided both samples are representative, the error rate on the test set will give a true indication of future performance. The larger the training sample the better the classifier, although the returns begin to diminish once a certain volume of training data is exceeded. And, the larger the test sample, the more accurate the error estimate. However, it is possible to increase our confidence significantly through careful examination of the dataset as well as related experiments. The accuracy of the error estimate can be quantified statistically, as we shall see in the next few sections.
Evaluation Remark 3: The generated Confusion matrices represent an effective measure for the validation of the detection process and on whether a given attack classification is valid or not. They also indicate how effective the developed detector model is from the point of view of reducing false alarms. Tables 6.4 & 6.5 indicate that both developed models led to a substantial reduction of false alarms, with significant increase in detection rates. This verifies that the developed detection techniques actually extracted the right anomaly events for enabling learning detection. The significance levels on the generated Confusion matrices can be used as tuning parameters for affecting a trade-off between
117

CHAPTER 6. EVALUATION AND PERFORMANCE MEASUREMENT
detection rates (i. e., TPs) and false alarms (i. e., FPs). Larger significance levels lead to higher thresholds, and vice versa, as mentioned earlier.
When [BayesiaLab, 2003] one is faced with the problem of predicting the value of a particular variable (the value of the target node), the evaluation of the Bayesian network detection model can be learned from the dataset by using both the number of the processed cases and the number of correct predictions. For all the cases of the dataset, the probability of the target value is inferred and the cases are stored according to their probability in such a way that the most probable cases are placed at the beginning of the list. With a perfect detection model, the cases with the target value (p % of the population) are then placed in the first p% cases. With a random choice of the cases, the expected detection rate is directly given by the selection rate. If someone randomly selects x% of the cases, the expected detection rate of the cases with the target value is x%.
Suppose that one network intrusion detection system receives in average 10000 packets a minute, able to detect 10% (1000 packets) as unauthorised traffic, with another that receives an average 15000 packets a minute, and is able to detect 8% (1200 packets) of unauthorised traffic. Which is better? The answer should now be obvious: it depends on the relative cost of false positives, i. e. packets that are identified as unauthorised that are actually authorised, and false negatives, packets that are identified as authorised that are actually unauthorised. Therefore, Confusion matrices could be used to compare various intrusion detection models and provide a common approach for future intelligent detectors evaluations. However, different intelligent network intrusion detection models are based or trained on different datasets, so it is quite difficult to ensure effective comparison methods unless a common dataset is used for that purpose.
Validation Remark 3: By using the Confusion matrix to measure the developed detection model performance, the model's dynamic behaviour of the detection rate has been indicated with respect to the false positives and the sample data accumulated during the simulation time of the complete dataset. Taking into consideration that only part of the dataset is used for testing purposes. This confirms both of the validation techniques, the operational graphics and historical data validation.
Validation Remark 4: By using different techniques to measure the performance of the developed models such as the informational lose function and confusion matrix, the accuracy of the achieved model's detection performance is quite promising and encouraging. The achieved high levels of reliability and precision of the developed model's prediction as well as the positive comments received from experts working in the area of network security, artificial intelligence and/or machine learning domains, all these confirm the Traces and Turing tests validation techniques. Expert comments and appreciations are either received during conference reviews and presentations, or accepted journal papers for publication, and/or during industrial technical exhibitions.
118

CHAPTER 6. EVALUATION AND PERFORMANCE MEASUREMENT
The evaluation and validation of the developed detection models have been done in the presence of both, normal and anomaly network traffic. This is to establish the performance of the developed detection model. Without normal traffic the total number of false alarms generated by the model for each attack can not be identified, hence, the cost of maintaining the implemented system can not be identified as well. The generated large corpus of normal as well as anomaly network traffic and the developed learning detector model made it possible to do the evaluation and performance measurement. The training data included a few months of background traffic with about 40 different types of automated attacks that are launched against particular victim machines, see appendix A. The training data was labelled indicating attacks and unlabeled test data was used for a blind evaluation. The Confusion matrices are able to determine the attack detection rate as a function of the false alarm rate for the previously unseen test data. Results were analysed separately for each individual network attack using confusion matrix. Good use of the training data has been made to develop a networked type detector based on Bayesian techniques as a probabilistic approach.
6.6- Summary
In this chapter, the evaluation methodology used to measure the performance of both developed detection models Bayesian network and Naive bayes has been discussed. The developed models are trained to detect as well as predict unauthorised activities in telecommunication networks using Bayesian techniques. The evaluation and validation criteria as well as the learning prediction performance for this task have been discussed, together with a description of the chosen Bayesian learning package: the BayesiaLab.
The evaluation methodology applied standard criteria to evaluate the performance of the developed Bayesian learning-based anomaly detection model. In conjunction with the achieved statistical measurements, the performance of probabilistic predictions has been measured. The evaluation approach covered the measurement of the prediction performance for the developed detector model by, applying the informational loss function, evaluating the precision parameter using the confusion matrix and measuring the performances of the models. The machine learning package used in all evaluation experiments and measurement is BayesiaLab. The validation of the developed model is based on various combined techniques acceptable by the Verification and Validation (V&V) community, such as parameter variability-sensitivity analysis, predictive validation, operational graphics, historical data validation, historical methods, multistage validation, traces and Turing tests. In order to achieve a significant confidence, a careful examination of both the dataset as well as related experiments has been carried out.
The evaluation and validation of the developed detection models have been done to establish and measure the performance of the developed detection model. A similar relationship of the developed model change appears in the real EMERAL intrusion detection system as a result of internal parameters changes. However, the Bayesian developed model's output provides a probabilistic figure to indicate its confirmed prediction. Having a probabilistic figure to indicate for a particular attack occurrence other than a black or white output will help in predicting future
119

CHAPTER 6. EVALUATION AND PERFORMANCE MEASUREMENT
similar unauthorised anomalies. According to the generated confusion matrices, Bayesian network detection model has got a high prediction rate in most of the attacks in comparison to Naive bayes. This includes Back, Buffer overflow, Guess_password, Httptunnel, Imap, Ipsweep etc... Navie bayes indicated a high precision in detecting a number of attacks such as ftp_write, land, Perl, Pod, Sglattack, Teardrop and Udpstorm. However, Bayesian network model managed to detect most of these attacks with a reasonable level. The Bayesian network model indicated a high reliability figures in detecting most of the attacks and hence outperformed Navie bayes. This is characterised with the contribution of many variable to each others. Also, the dependency feature that is incorporated with Bayesian network led to such a result.
Although the confusion matrices' results indicate that Bayesian network model outperformed Naive bayes from the point of view of predictions as well as reliability. The generated Confusion matrices represent an effective measure for the evaluation of the detection process and on whether a given attack classification is valid or not. They also indicate how far the developed detector models are effective from the point of view of reducing the false alarms. According to the generated Confusion matrices, both developed model are doing well in this regard. The achieved results indicate that both Bayesian network and Naive bayes are performing well. The achieved results indicate that the developed models led to a substantial reduction of the false alarms, with significant increase in the detection rates. In general, the developed detector models can reliably detect many existing network attacks with low false alarm rates as long as examples of these anomalies are available for training. Also, as a probabilistic based detector, it is able to generalise to new attacks, hence, could minimise the false rate for unknown future anomalies.
120

CHAPTER 7. CONCLUSIONS
Chapter 7
Conclusions This chapter summarises the main findings and research contributions. It discusses future possible areas for research in the field of applying intelligent Agents and machine learning solutions in other aspects. These aspects include Computer Science and Engineering problems in general, and networks security and management in particular.
7.1- Main Research Findings
The Bayesian network applied an adaptive knowledge, which is concerned with the dynamic organisation of the detector model and the association discovery of parents' variables, while automatically gathering information that contributes to the knowledge of the detector target variable. This process represents the learning phase of the model. The validation mode enabled the identification of the conditional probabilities for different states of any network traffic state variable, by assigning a particular value to any variable. The decision tree approach as an inference process, allowed the verification of the Bayesian network's consistency, from the point of view of the choice of nodes and their conditional probabilities. The decision tree has been chosen, because the intervals are selected according to the information they contribute to the target variable. A number of learning methods have been developed to extract Bayesian networks directly from dataset, rather than relying on human limited domain experts. Therefore an existing dataset has been used for that purpose. The MIT Lincoln Lab generated and distributed dataset enabled us to learn and test the Bayesian network-based Network IDS model, so to simulate real time tests. The dataset contains a realistic and operational background network traffic contaminated with many different attack scenarios, such as recon scans and probs, BW consumption, and resources exploitation and starvation related attacks that lead to DDoS attacks.
121

CHAPTER 7. CONCLUSIONS
The activity _type variable, which has been identified as the target node of the
developed Bayesian network detection model can be verified by the detector model and by investigating the parent nodes at the network. The detection results showed that the detector managed to automatically learn the conditional dependence of, for example, the protocol variable as a parent to the target variable smurf activity_type. As the conditional probability of the ICMP protocol increased from 53.10% to 100%, the probability of having a smuf attack has increased from 52.74% to 99.32%. This indicates that the ICMP protocol has a major contribution to the smurf attack probabilities. Therefore, as a result of the propagation of any new information being malicious, the probability distributions for the majority of nodes have been updated accordingly and especially the target node.
Also, the problem was looked at from the opposite direction, when the probability of portsweep attack, which represents a reconnaissance process was set to 100%, then the state value of some associated variables increased. What characterizes portsweep attack is when the TCP protocol and private service association probabilities were increased from 38.26% to 97.66% and from 25.14% to 79.27% respectively. Also, an increase in the REJ and RSTR flags was noticed. In the case of the buff er overflow attack, the duration variable which represents the length of the connections in seconds increased from 2.71% in the case of connections that are lasted > 2.00 seconds to 51.42%. The approach taken here was completely different from the previous one. In this case there is not only as interest in verifying the model, since, the goal here is to discover knowledge from the dataset. Bayesian networks learning leads to findings that would not have been possible to discover by reading 500000 or more records of the dataset.
This type of analysis would allow network security analysts to see the amount of information being contributed by each node in the detection model, to the knowledge of the target node. It also indicates the knowledge that can be extracted from each variable node in the entire network structure of the developed model. This leads to an automatic (learning) detection of network anomalies. The main advantage of having probabilistic figures as an output in IDSs is the ability to adjust the IDS's sensitivity. This would allow a trade off between accuracy (false positive and false negative error rates) and sensitivity (miss rate). Therefore, should the detection function imply a significant emphasis either on minimising the false error rate, or maximising the true detection rate, the developed learning model should be flexible enough to enable either choice, simply by adjusting the probability threshold figures. The developed model is vastly improved with the use of Bayesian prediction mechanism. The addition of the prediction model in the test bed environment increases its functionality and its usability to the maximum. Therefore, the developed model statistically managed to discover the attributes that distinguishes the normal activities from the abnormal ones.
The results showed that Bayesian unsupervised learning models could reliably detect the majority of the existing attacks with a minimum of false alarm rates. The more detailed information about the attack traffic and connections, the more promising is the attack detection models and consequently ensuring better automated response actions to be performed. Because detecting network attacks
122

CHAPTER 7. CONCLUSIONS
did not completely solve the problem, Intelligent Switch Fuzzy Agents (ISFAs) have been proposed to overcome the problem of the overwhelming traffic that causes disruptions within a network switching services. The further work chapter of the research thesis investigated the need to develop intelligent automated response actions, so to minimise the attacks progress time and reduce their effects to as low as possible.
The developed learning models for IDSs are only designed to detect network unauthorized activities. As detection is important to secure networks, however, it does not provide the ultimate solution to the current limitations of IDSs. Therefore, automated response actions to those detected attacks are required, to minimise severe attacks, such as DoS. Intelligent Switch Fuzzy Agents (ISFAs) have been proposed to overcome the problem of the overwhelming traffic that causes disruptions within network switching services. This approach is incorporated with a novel model named N Flip-Fly which enables Fuzzy Agents to deal with the problem in a real-time manner. N Flip-Fly is a valuable process. It is an uncomplicated mathematical-based model. This feature allows the model to behave fast enough without affecting non-blocking (i. e., normal) network traffic. The potential for using Fuzzy-based systems properly can be enormous. According to the simulation results, Fuzzy intelligent Agents are well suited to environments where they need to determine system parameters. Human expert knowledge for describing Fuzzy membership function for network states is required for the model, especially for an environment with a large amount of input/output states, such as switched networks.
In conjunction with speedy blocking packets, there are other issues that could occur within network traffic packets, such as a specific pattern at the source and destination ports within the TCP/IP packets header, or particular protocol packets dominating the traffic, such as ICMP. These and other parameters need to be incorporated into the model in order to achieve an effective, self-healing, secured network. The dynamic method of calculating the drop possibility by the ISFAs, results from the fact that, according to the traffic rate and the switching resources, a different set of fuzzy rules applies. Based on these rules the drop rate possibility is decided. Unlike Random Early Detection (RED), which is used for Differentiated Services (Diff-Serv) QoS provision to set some minimum and maximum dropping thresholds for each class, the ISFA uses dynamic traffic state dependent thresholds. The ISFAs drop packets based on the actual traffic rate of change (inter-arrival rate of packets) i. e. only packets that pose threat to the switch are dropped before put in the queues. Since the whole procedure is independent of the buffer queue length, the problems of fixed packets dropping of the queue thresholds implemented by RED are avoided. Therefore ISFAs managed to provide better congestion control and better switch throughput, hence, self-healing network. The validation of the developed model is based on empirical evidence that is already characterized in the achieved results.
123

CHAPTER 7. CONCLUSIONS
The evaluation methodology applied standard criteria to evaluate the performance of the developed Bayesian learning-based anomaly detection model. In conjunction with the achieved statistical measurements, the performance of probabilistic predictions has been measured. The evaluation approach covered the measurement of the prediction performance for the developed detector model. This was achieved by evaluating the precision parameter using the confusion matrix. The machine learning package was used in all evaluation experiments and measurement is BayesiaLab. The validation of the developed model is based on various combined techniques acceptable by the Verification and Validation (V&V) community, such as parameter variability-sensitivity analysis, predictive validation, operational graphics, historical data validation, historical methods, multistage validation, traces and Turing tests. In order to achieve a significant confidence, a careful examination of both the datasets, as well as related experiments, has been carried out.
The evaluation of the developed detection model was completed in the presence of both normal and anomaly network traffic. This is to establish the performance of the developed detection model. Without normal traffic, the total number of false alarms generated by the model for each attack cannot be identified. Consequently, the cost of maintaining the implemented system may also not be identified. The generated Confusion matrices represented an effective measure of the validation of the detection process and of whether a given attack classification is valid or not. They also indicate to what extent the developed detector model is effective, from the point of view of reducing the false alarms. The achieved results indicate that the developed model led to a substantial reduction of the false alarms, with significant increase in the detection rates. In general, the developed detector model can reliably detect with low false alarm rates many existing network attacks as long as examples of these anomalies are available for training. Also, as a probabilistic based detector, it is able to generalise to new attacks and hence could minimise the false rate for unknown anomalies.
7.2- Major Contributions of the Research
The major contributions of the research are as follows:
The developed detection models of Bayesian network are capable of learning network security breaches. This has been achieved using unsupervised learning by applying adaptive knowledge extraction techniques. The learning models are concerned with the dynamic organisation of the intrusion detection and the association discovery of parents' variables whilst automatically gathering information that is contributed to the knowledge of the detector target variable. This process represents the learning phase of the model. The validation mode enabled the identification of the conditional probabilities for different states of any network traffic state variable, by assigning a particular value to any variable. The decision tree approach as an inference process allowed the verification of the Bayesian network's consistency in terms of the choice of nodes and their conditional probabilities. The decision tree has been
124

CHAPTER 7. CONCLUSIONS
chosen, because the intervals are selected according to the information they contribute to the target variable.
A number of learning methods have been developed to extract Bayesian networks directly from datasets, rather than relying on human, limited domain experts. Therefore, an existing dataset has been used for that purpose. The MIT Lincoln Lab generated and distributed datasets enabled us to learn and test our Bayesian network-based Network IDS model, in order to simulate real time tests. The dataset contains a realistic and operational background network traffic contaminated with many different attack scenarios, such as recon scans and probs, BW consumption, and resources exploitation and starvation related attacks that lead to DoS attacks.
The detection modelling results demonstrated that the developed models managed to automatically learn the conditional dependence of, for example, the protocol variable as a parent to the target variable smurf actfvfty_type. Therefore, as a result of the propagation of any new information being malicious, the probability distributions for the majority of nodes have been updated accordingly and especially the target node.
The evaluation has measured the performance of the developed detection model. The output of the Bayesian developed model provides a probabilistic figure to indicate its confirmed prediction. The existence of a probabilistic figure to indicate a particular attack occurrence other than black or white, for example Emerald IDS's output, will help in predicting future similar unauthorised anomalies.
In order to validate the Bayesian network detector model, standard detection evaluation methods known as informational loss and confusin matrix have been applied. Promising results were obtained and analysed to determine the detection rate of the target variable value. This rate represents the number of responses obtained proportional to the processed cases, which represent the sample size for a previously unseen test data. The performance results are indicated for a sample of DoS attacks. The results demonstrated that Bayesian unsupervised learning models could reliably detect the majority of the existing attacks with minimal false alarm rates. The more detailed information about the network traffic and connections of the attack, then the more promising is the detection model and, consequently, the better the automated response actions to be performed.
The evaluation and validation of the developed detection models have been done to establish and measure the performance of the developed detection model. A similar relationship of the developed model change appears in the real EMERAL intrusion detection system as a result of internal parameters changes. However, the Bayesian developed model's output provides a probabilistic figure to indicate its confirmed prediction. Having a probabilistic figure to indicate for a particular attack occurrence
125

CHAPTER 7. CONCLUSIONS
other than a black or white output will help in predicting future similar unauthorised anomalies. Bayesian network detection model has got a high prediction rate in most of the attacks in comparison to Naive bayes. This includes Back, Buffer overflow, Guess_password, Httptunnel, Imap, Ipsweep etc... Navie bayes indicated a high precision in detecting a number of attacks such as ftp_write, land, Perl, Pod, Sglattack, Teardrop and Udpstorm. However, Bayesian network model managed to detect most of these attacks with a reasonable level. The Bayesian network model indicated a high reliability figures in detecting most of the attacks and hence outperformed Navie bayes. This is characterised with the contribution of many variable to each others. Also, the dependency feature that is incorporated with Bayesian network led to such a result.
The generated Confusion matrices represent an effective measure for the evaluation of the detection process and on whether a given attack classification is valid or not. They also indicate how far the developed detector models are effective from the point of view of reducing the false alarms. Natve bayes model indicated relatively better performance of producing higher true positive rates in comparison to Bayesian network in the case of detecting ipsweep. However, Bayesian network model outperformed NaYve bayes in detecting saint. The achieved results indicate that both Bayesian network and Naive bayes are performing well. The achieved results indicate that the developed models led to a substantial reduction of the false alarms, with significant increase in the detection rates. In general, the developed detector models can reliably detect many existing network attacks with low false alarm rates as long as examples of these anomalies are available for training. Also, as a probabilistic based detector, it is able to generalise to new attacks, hence, could minimise the false rate for unknown future anomalies.
The future work stage has emphasized the need to develop automated response actions using Fuzzy intelligence, in order to minimise the progress time of the attack and to minimise its effects as far as possible. The automated response actions resulting from the simulated Fuzzy intelligence are effectively achieved to control the resources allocation for a network under DDoS attack. Applying Fuzzy logic to such an environment application problem has not been previously researched. My approach extends the first stage proposed and researched Bayesian Learning-based NIDSs, by introducing the Fuzzy logic behaviour to Agent entities in order to specifically address DoS attacks, including their distributed and coordinated versions. This is in order to minimise the time between the detection and the response action.
126
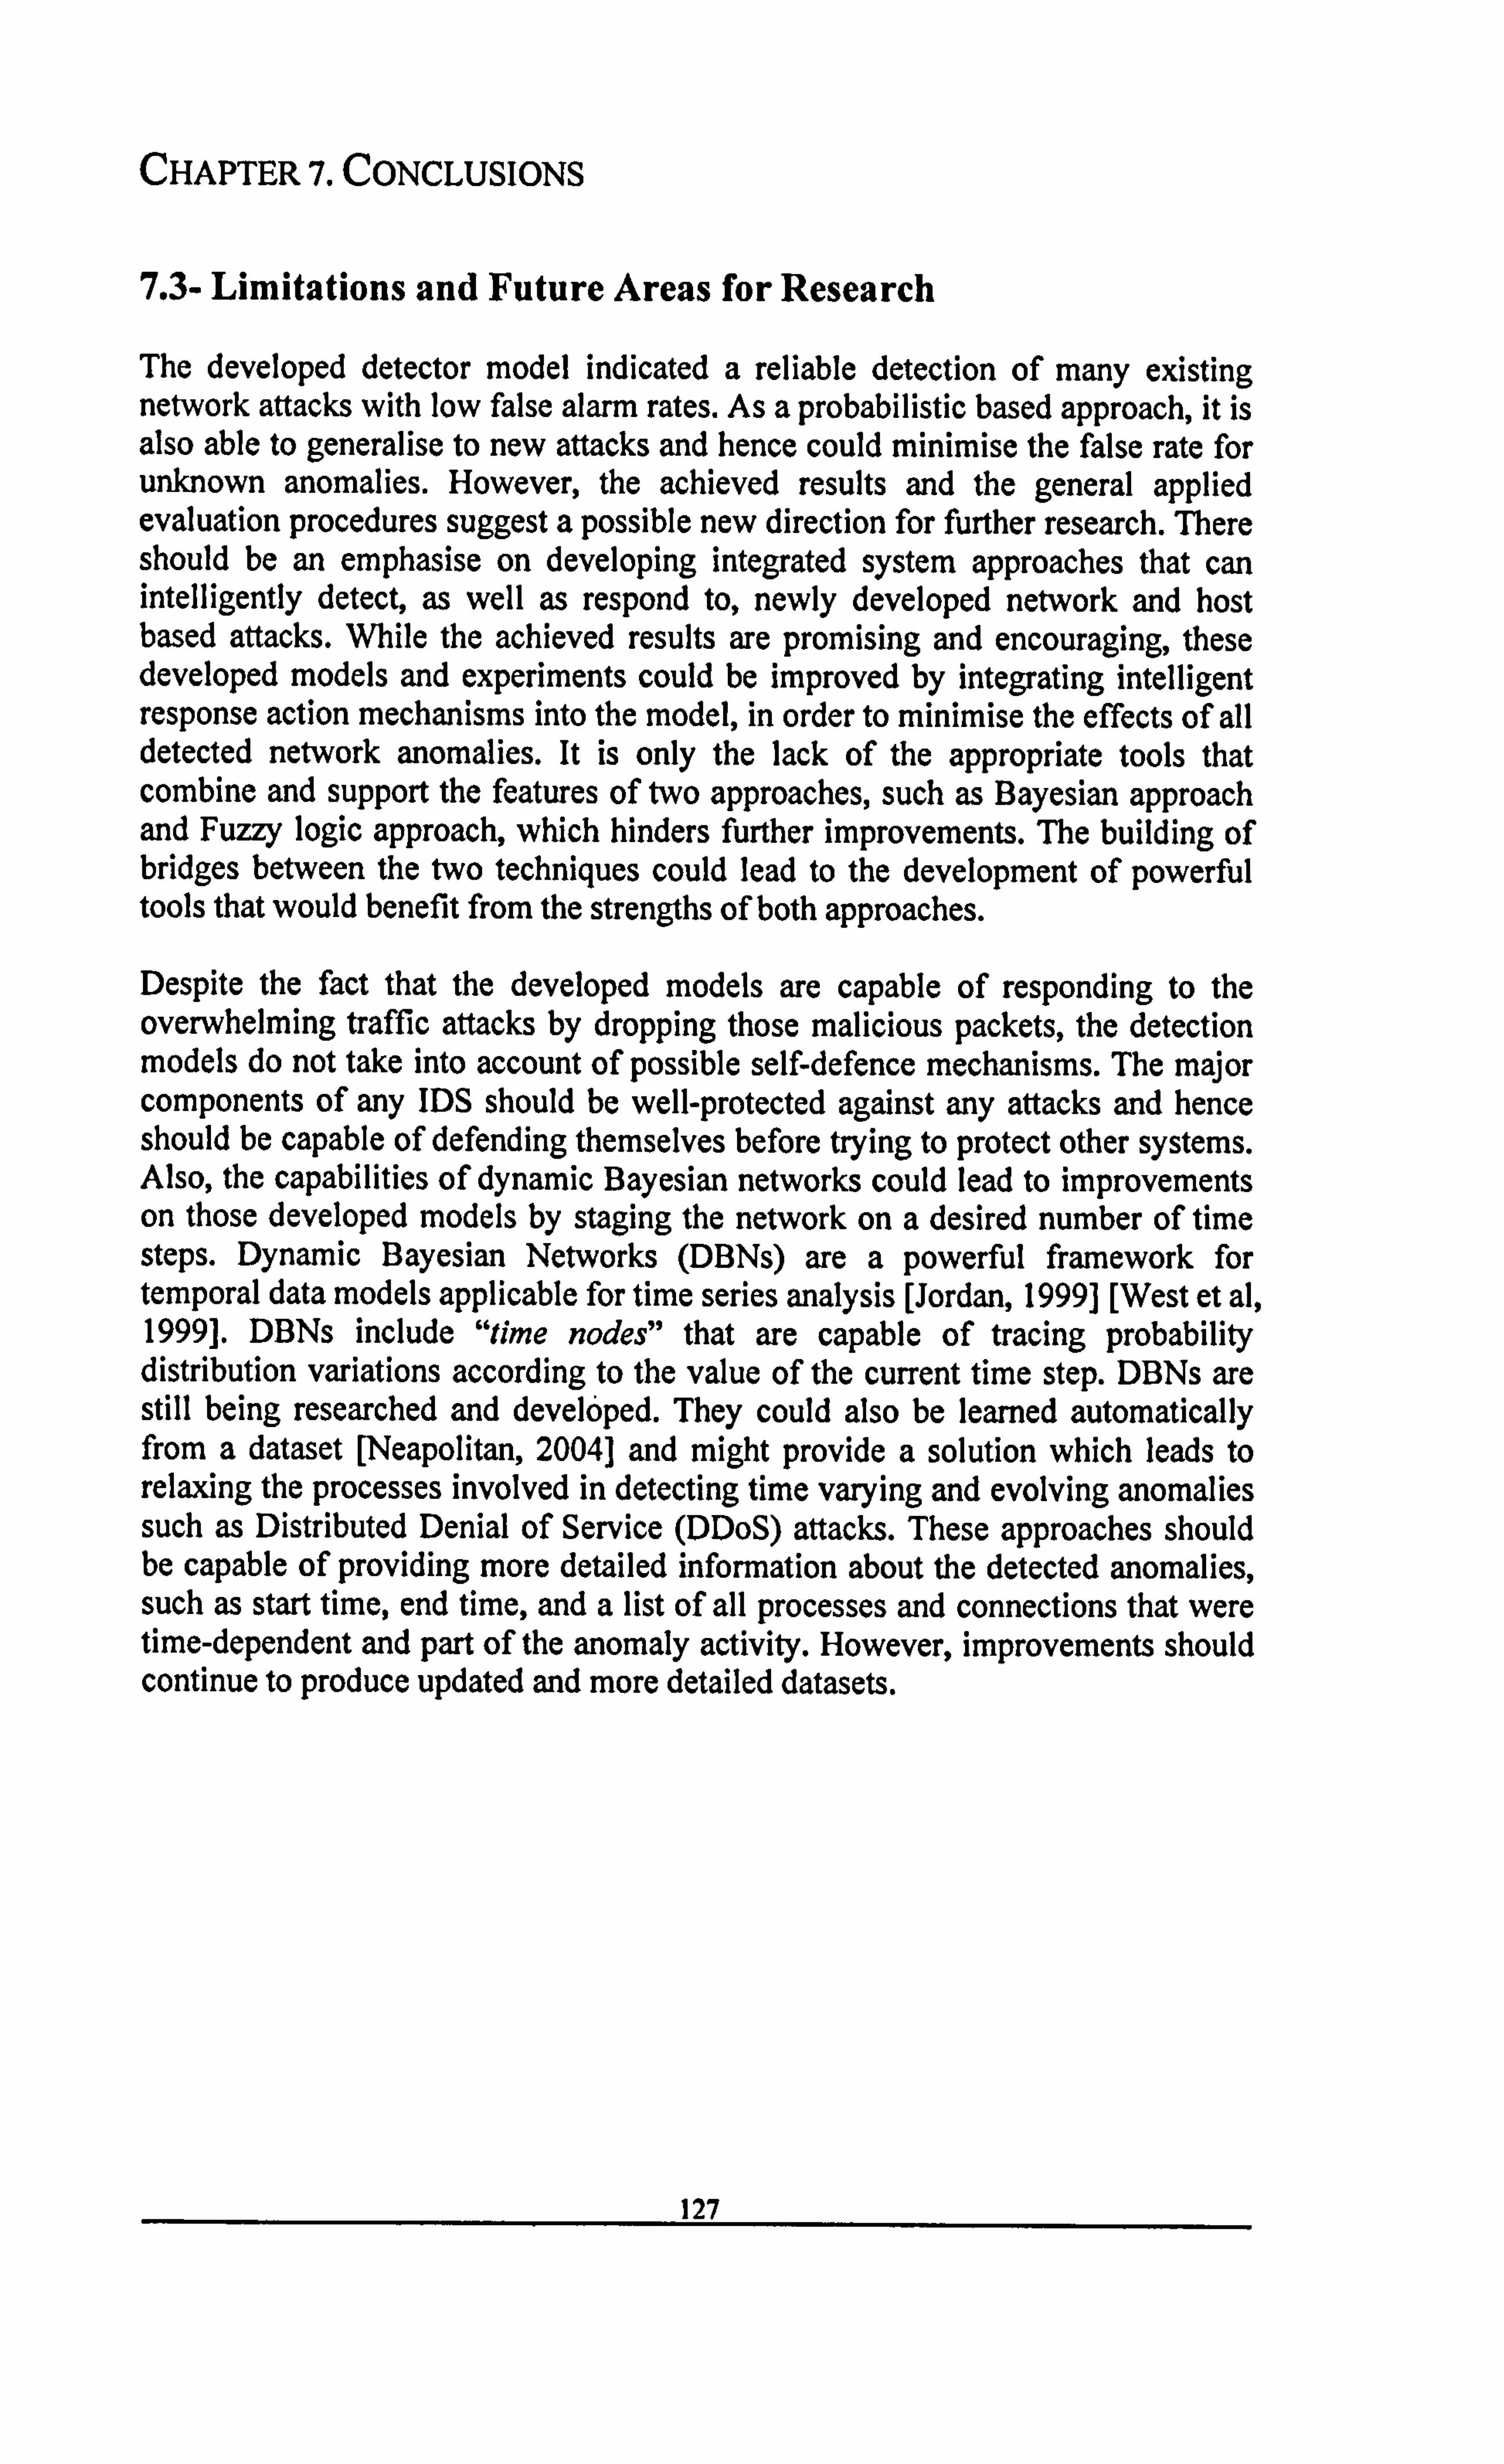
CHAPTER 7. CONCLUSIONS
7.3- Limitations and Future Areas for Research
The developed detector model indicated a reliable detection of many existing network attacks with low false alarm rates. As a probabilistic based approach, it is also able to generalise to new attacks and hence could minimise the false rate for unknown anomalies. However, the achieved results and the general applied evaluation procedures suggest a possible new direction for further research. There should be an emphasise on developing integrated system approaches that can intelligently detect, as well as respond to, newly developed network and host based attacks. While the achieved results are promising and encouraging, these developed models and experiments could be improved by integrating intelligent response action mechanisms into the model, in order to minimise the effects of all detected network anomalies. It is only the lack of the appropriate tools that combine and support the features of two approaches, such as Bayesian approach and Fuzzy logic approach, which hinders further improvements. The building of bridges between the two techniques could lead to the development of powerful tools that would benefit from the strengths of both approaches.
Despite the fact that the developed models are capable of responding to the overwhelming traffic attacks by dropping those malicious packets, the detection models do not take into account of possible self-defence mechanisms. The major components of any IDS should be well-protected against any attacks and hence should be capable of defending themselves before trying to protect other systems. Also, the capabilities of dynamic Bayesian networks could lead to improvements on those developed models by staging the network on a desired number of time steps. Dynamic Bayesian Networks (DBNs) are a powerful framework for temporal data models applicable for time series analysis [Jordan, 1999] [West et al, 1999]. DBNs include "time nodes" that are capable of tracing probability distribution variations according to the value of the current time step. DBNs are still being researched and developed. They could also be learned automatically from a dataset [Neapolitan, 2004] and might provide a solution which leads to relaxing the processes involved in detecting time varying and evolving anomalies such as Distributed Denial of Service (DDoS) attacks. These approaches should be capable of providing more detailed information about the detected anomalies, such as start time, end time, and a list of all processes and connections that were time-dependent and part of the anomaly activity. However, improvements should continue to produce updated and more detailed datasets.
127

CHAPTER 8. FURTHER WORK
Chapter 8
Further work: Investigation of Fuzzy-based Responsive IDSs
Chapter 6 showed the developed learning detection models that are statistically detect network attacks. While those models provide a major useful purpose, they do not provide the ultimate solution to the current NIDSs limitations, mainly the lack of required intelligent response actions that minimise the effects of those detected network unauthorised activities. This chapter proposes Fuzzy logic capabilities to initiate successful automated response actions. Fuzzy logic originally extended Boolean logic to handle truth-values between the extremes of completely true and completely false. Intelligent Agents that incorporate Fuzzy logic techniques have been proposed to handle this task with the ability to respond quickly and dynamically control the availability of allocated network resources. Applying Fuzzy intelligence into this kind of problem has not been previously explored. In today's high speed networks, it is important for network devices to be proactive in such a way that they are able to identify deviations in network traffic and automatically respond to those deviations in a real-time manner. This is to overcome any security problems linked with abnormal traffic before they result in any damage or degradation of network Quality of Service (QoS) provision. Real- time action allows minimising illegitimate traffic packets at an early stage. However, real-time detection and response mechanisms introduce additional overheads that may cause network performance degradation, especially when the network is under heavy use. Therefore, it is necessary to determine optimal policies in order to achieve real-time detection and response. This chapter investigates Fuzzy intelligent approach incorporated with an uncomplicated mathematical-based model. This developed model has been given a name "N Flip- Fly" that leads to achieving self-healing secured switched networks.
128

CHAPTER 8. FURTHER WORK
8.1- The Problem
Learning detection techniques are considered to be useful tools in providing solutions to the current limitations of NIDSs and network systems. However, these techniques do not offer the ultimate solution to those limitations. Therefore, an effective automated response mechanism to those detected abnormal activities is required to minimise their effect and hence enhance NIDSs capabilities. It is important for network devices to be proactive and able to identify deviations in network traffic, consequently, respond to those deviations in a real-time manner. In order to achieve that, network devices need to be more intelligent.
This chapter focuses on network multilayer switching, which is the technology that promises to increase the efficiency of network communications and solve the current Bandwidth problems as well as QoS provision from the point of view of security. A hybrid switching device [lantronix, 2003] is the latest improvement in internetworking technology that combines the packet handling of routers and the speed of switching and hence called routing switches. These switches have optimised hardware, which makes them able to pass data as fast as layer two switches. Besides MAC layer routing, multilayer switches provide routing functionality such as multicast and broadcast containment, some Virtual LAN (VLAN) services, packet filtering and firewalling.
Following is some of the Denial of Service (DoS) security problems that are associated with current network multilayer switching [Vir, 2000] [lantronix, 2003].
"A problem may occur when packets need to be delivered to two different destination ports. If in the input queue, a packet B is waiting behind A whose output buffer is full and destination port is extremely busy, B may have to wait even though its destination port is free.
" Non-blocking switch architecture has been proposed to overcome that problem by for example, having packets forwarded from ports 1 to 4 can not block the forwarding of another packet from port 2 to 3. However, this is not a permanent solution as traffic from port 2 to 4 and 1 to 3 is still blocked.
" Non-blocking architecture proposes switches with buffer that can absorb any temporary bust of traffic. While buffers are needed, they can increase the delay in the switch. That is not good as one of the reasons for improving to switches is low delays.
" Another problem can be overloading of the destination port. If more traffic is directed to a destination port than it can handle, it is going to buffer that. Since buffers are only for temporary bursts, sustained excessive traffic could cause collisions and lead to packets loss and the chances of collision increase if the destination trunk is slow.
" Multilayer routing switches incorporating routers features such as recalculating the checksum, and rewriting the MAC header of every packet. The price paid for this type of intelligent forwarding and filtering is usually calculated in terms of latency, or the delay that a packet experiences inside the switch. Packet processing delays, switch buffer limitations, and the retransmissions that can result slows multilayer switch
129

CHAPTER 8. FURTHER WORK
performance. Therefore, network response times (the user-visible part of network performance) suffers as the load on the network increases, and under heavy loads, small increases in user traffic often results in significant decreases in performance. Regardless the speed of network links and switching throughput, increasing loads (multimedia demanding applications) results in increasing throughput up to a point, then further increases in demand results in rapid deterioration of true throughput. The QoS aware switched network is configured to give better service to mission-critical, and delay-sensitive applications. DoS attacks, which have been proven to work against IP can be deployed within a QoS enabled environment. However, other new aspects of concern will be raised with respect to the features introduced by QoS provision techniques such as Random Early Detection (RED), which implements Differentiated Services (Diff-Serv) QoS. DoS problems would enable attackers to remove availability of resources from providing the QoS that was offered, such as BW consumption. QoS could be degraded to a noticeably poor level, such as higher packets drop rate, longer delays, bigger jitter and so on. This could lead to completely destroying resource availability and consequently severe DoS problems.
Therefore, protection measures need to be considered for any network technology that plans to support QoS. Northcutt [1999] stated that "The interesting advances come by doing limited intrusion detection as a software process in the router or switch. This is a desperately needed future trend. One advantage of this is that we finally achieve real-time, or wire, speed. In all other solutions, we detect the intrusion right after the packet has flown by. In this case, we can literally stop it or divert it to a honey pot". Multilayer switching is not well designed to withstand DoS problems, due to the lack of early intelligent detection and response techniques for DoS.
In this chapter Agents with fuzzy intelligence have been designed and embedded within a modelled network switch to detect and respond to an overwhelming incoming traffic that consumes a switch resources. Some of intelligent NIDSs functionality is proposed to be handled by network switches. This is to overcome some of the security problems linked with abnormal traffic passing through switches before they result in any damage or degradation of network QoS provision. This real-time action allows minimising illegitimate traffic packets at an early stage. However, real-time detection and response mechanisms could introduce additional overheads that may cause network performance degradation, especially when the network is under heavy use. Therefore, it is necessary to determine optimal policies in order to achieve real-time detection and response in switched networks. This chapter proposes Agents with Fuzzy intelligence capabilities to initiate successful automated response actions. Fuzzy intelligent Agents are proposed to handle this task with the ability to respond quickly and dynamically control the availability of allocated network resources.
130

CHAPTER 8. FURTHER WORK
8.2- Intelligent Agents Approach to Fuzzy Logic
Fuzzy logic and fuzzy-based systems [Knapik et al, 1998] are mathematically based systems that enable computers to deal with imprecise, ambiguous, or uncertain information and situations, i. e. the real world. Fuzzy logic originally extended Boolean logic to handle truth-values between the extremes of completely true and completely false. Contrary to Fuzzy logic [Hopgood, 2001], rule-based systems assume that we live in a clear-cut world, where every hypothesis is true, false, or unknown. It also assumes that many systems make use of the closed-world assumption, where by any hypothesis that is unknown is assumed to be false, while this model of reality is useful in many applications, real reasoning process are rarely so clear-cut, such as network security. Zadeh [Cox, 1999], the founder of fuzzy logic concept in 1965, proposed this concept to help computers reason with uncertain and ambiguous information. He stated:
"Traditional methods of systems analysis are unsuited for dealing with systems in which relations between variables do not lend themselves to representation in terms of differential or difference equations. Such systems are the norm in biology, sociology, economics, and, more generally, in fields in which the systems are humanistic rather than mechanistic in nature. The methodology of fuzzy if-then rules serves to increase the machine intelligence quotient (MIQ) and lower the cost of products by making it possible to program their behaviour in the language of fuzzy rules, and thus lessen the need for precision in data gathering and data manipulation. In this context, the use of linguistic variables and fuzzy rules may be viewed as a form of data compression. It is certain to have a wide-ranging impact by showing how fuzzy set theory and fuzzy logic can be employed to exploit the tolerance for imprecision, and how they make it possible to address problems that lie beyond the reach for traditional methods. "
Generally, in information networks security, we are dealing with imprecise and uncertain information such as the event sequences produced in system logs used by IDSs. The problem becomes more complicated when it comes to detecting suspicious or unauthorized activities such as Distributed Denial of Service (DDoS) attacks. This uncertainty led to the weakness of traditional IDSs by either their inability sometimes to detect and analyse this sort of attacks or produce what is known by false positives. Because network hackers' behaviour is not crisp, except in some trivial domains or contexts, it is a tedious and potentially error-prone process to analyse a human's expertise, and keep computer systems deal with using traditional methods and logic. This is especially true when the logic is full of unpredicted expectations.
Enhancing Agents with fuzzy reasoning capabilities can give them the ability to exist within domains where knowledge may not be quite as crisp as we are used to dealing with in traditional computing approaches. Since Agents will exist in the real world, therefore equipping them with fuzzy capabilities would improve their ability to cope with imprecise systems' events and users with uncertain behaviour. Fuzzy-logic [Jang, et al., 1997] provides suitable searching capabilities to retrieve
131

CHAPTER 8. FURTHER WORK
certain patterns in uncertain environment. This feature would help in searching and identifying suspicious network traffic or processes that are semantically related to particular DoS patterns. Because the matches are members related to the target by their percentage of "belonging" to a fuzzy set representing the target pattern, the presentation of the detection results can include some indication of how closely they are related to the target pattern.
8.3- Modelling Intelligent Fuzzy Agents
Figure 8.1 shows a high level Agents-based Network Intrusion Detection System (NIDS). The Agents-based NIDS could also be part of or embedded in a network device, such as a routing switch. The Agents use both the incoming and outgoing traffic information within the network. It would be appropriate to represent the Agent behaviour by fuzzy IF/THEN rules, at a suitable level of precision. In this case, the designer has to manually derive the IF/THEN rules from a dataset or studying network traffic behaviour, which requires a major effort. However, the main features of fuzzy logic [Altrock, 1995] are that it efficiently represents the environment knowledge, and it is easy to verify and optimize.
Agents-based NIDS
Network Services 8
Incoming Resources JOutgoing
Trafc Traffic
Figure 8.1: Agents-based NIDS in a relation with a network incoming and outgoing traffic
Unlike classical set theory [Jang, et at., 1997] where one deals with objects whose membership to a set can be clearly described, in fuzzy set theory membership of an element to a set can be partial, i. e., an element belongs to a set with a certain grade (Possibility) of membership. The key differences between fuzzy and crisp sets are that [Hopgood, 2001]:
" An element has a degree of membership (0-1) of a fuzzy set. " Membership of one fuzzy set does not preclude membership of another.
The limitations of the classical set come from the point of not being reflective to the natural human concepts and thoughts, which tend to be abstract and imprecise. The flaw in classical sets comes from the sharp transition between inclusion and exclusion in a set. More formally a fuzzy set A in a universe of discourse U is characterized by a membership function p4 :U -- [0,1] , which associates each
132

CHAPTER 8. FURTHER WORK
element x of Ua number , u,, (x) in the interval [0,1] which represents the grade of membership of x in the fuzzy set A. Therefore, the definition of a fuzzy set is a simple extension of the definition of a classical set in which the characteristic function is permitted to have any values between 0 and 1. For example, the fuzzy term Bandwidth (BW) consumption might be defined by the fuzzy set as shown in Table 8.1.
Table 8.1: Fuzzy Term LowBW
Bandwidth consumption
Grade of Membership
525 % 1.0 30% 0.8 35% 0.6 40% 0.4 45% 0.2 50% 0.0
If the BW consumption (X), which is the universe of discourse represents a collection of objects denoted generically by x, then a fuzzy set such as LowBW in X is defined as a set of ordered pairs: LowBW ={(XOJULo, Bw(x))Ixe X), where PLOWBW (x) is called the membership function (or MF) for the fuzzy set LowBW, The MF maps each element of X to a membership grade between 0 and 1. So PLowBW (25 %) = 1, , uLOWBW (30 %) = 0.8 and so on. The Grade of membership values constitutes a possibility distribution of the term LowBW.
The table 8.1 can also be shown graphically, as shown in figure 8.2.
1.0
I LowBW
0.0' 1- BW 25 50
consumption (°h)
Figure 8.2: Possibility distribution of LowBW
Each linguistic (fuzzy) variable has an associated fuzzy term set that is the set of values that the fuzzy variable may take. For example, the fuzzy variable BW consumption might have the primary term set (Low, Medium, High), where each primary term represents a specific fuzzy set.
133

CHAPTER 8. FURTHER WORK
8.3.1- Fuzzy Modelling of an Automated Responsiveness
The concept of Denial of Service (DoS) event could be modelled around the variable DoS. The values of the variable DoS can be high (the network suffers low throughput due to excessive BW consumption), or low. Across this range of values, we can view particular ranges as representing various ideas about the network DoS attacks. We might slice up this range in such sections as Big Resource Loss [BRL], Medium Resource Loss [MRL], and Small Resource Loss [SRL]. Figure 8.3 illustrates how DoS is decomposed into a set of fuzzy regions.
DoS
ISRLI 1MRLj IBRLI
U 1
6 I
0 %50 (BW Consumption)
Figure 8.3: Term set decomposition of the DoS variable
These fuzzy regions are not crisply defined however, as the value of network throughput moves up or down; we feel it is more or less compatible with one concept rather than one of the neighbouring concepts. For example, as you move deeper and deeper into the BRL region, the compatibility of the value with MRL begins to decline, and the compatibility with the idea of BRL begins to increase. Each of these semantic partitions becomes a fuzzy set associated with the variable DoS.
Let us consider that we are given the imprecise statement. The chance of DoS attack to take place is high. If DoSh is the fuzzy set of high (severe) DoS attack, then we might define the membership function uDoSh in terms of BW consumption such that:
f[DoSr, (100%) = 1.0 f1DoSh (50%) = 0.3 f1DoSh (90%) = 1.0 uDoSh (40%) = 0.1
, uDoSh (70%) = 0.7 uDoSh (30%) = 0.0 f lDoSh (60%) = 0.5 /LDoSh (20%) = 0.0
134

CHAPTER 8. FURTHER WORK
These values correspond with the reasonably linear membership function as shown in figure 8.4 (a).
1w DoS Medium DoS H DoS
ý as
ý
ý c,,
ý
0 10 30 50 70 90 100 0 10 30 50 70 90 100 Bandwidth Consumption (%) Routing Allocated Resources (%)
Figure 8.4 (a): Fuzzy representation Figure 8.4 (b): Fuzzy representation of of DoS attack in terms of BW response action in terms of Routing
consumption Allocated Resources or Buffer (RAB)
Thus the Bandwidth consumption of 25%, which represents a possibility of DoS attack may have some (non-zero) degree of membership to both fuzzy sets medium and low, see figure 8.4 (a). This is represented by the overlap between the fuzzy sets. The sum of the membership functions for a given value can be arranged to equal 1, but this is not a necessary requirement. The statement "The chance of DoS attack to take place is high" is an example of a fuzzy statement involving a fuzzy set (high routing switch DoS) and a fuzzy set variable (BW consumption) or (allocated buffer). A fuzzy variable is one that can take any value from a global set (e. g., the set of all BW range or allocated buffer size), where each value can have a degree of membership of a fuzzy set (e. g., high DoS) associated with it.
Generally, we cannot give an absolute number for Bandwidth to represent a DoS attack. However, we might say that a BW consumption of greater than 90% would be regarded as a sign of high DoS case. This does not mean that we would eliminate 85% of BW consumption. Also, BW consumption alone is not the only indicator for DoS. Anyway 85% is not a bad DoS picture. We can only look for 90% as the point where we would say that the network is highly DoS attacked. Networks with lower BW consumption might still be of interest but to a lesser degree. As BW consumption increases, the compatibility of the network with the criterion for highly DoS attacked steadily increases. The BW consumption range of 70-90 is still important. There is not any particular point where we would say this is a definite "no" and the next case is a definite "yes" except may be down there at the bottom end, may be just a little above 90%.
135

CHAPTER 8. FURTHER WORK
8.3.2- Defining Fuzzy Rules
If a variable [Hopgood, 2001 ] is set to a value by crisp rules, its value will change in steps as different rules fire. The only way to smooth those steps would be to have a large number of rules. However, only a small number of fuzzy rules are required to produce smooth changes in the outputs as the input values alter. The number of fuzzy rules required is dependent on the number of variables, the number of fuzzy sets, and the way in which the variables are combined in the fuzzy rule condition. Now let us consider the following fuzzy rule base:
Rule #1 " IF BW_CONSUMPTION is Low THEN ALLOCATED BUFFER RESOURCES is Low
Rule #2 " IF BW_CONSUMPTION is Medium THEN ALLOCATED BUFFER RESOURCES is Medium
Rule #3 " IF BW CONSUMPTION is High THEN ALLOCATED BUFFER RESOURCES is High
Suppose the measured BW consumption is 85%, see figure 8.4 (a). As this is a member of both fuzzy sets High and Medium, Rules #2 and 3 will both fire. The Routing Allocated Buffer (RAB), we conclude, will be somewhat high and somewhat medium, see figure 8.4 (b). Figure 8.4 (a) shows the possibility that the BW consumption DoS is high, uDoSh, is about 0.85 and the possibility that BW consumption DoS is medium , uDoS�� is about 0.15. As a result of firing the rules, the possibilities that the Routing Allocated Buffer (RAB) is high and medium, LLRABh and /CRAB, , are set as follows: UtRABh = max[uDoSh, JLRABh ]& pRABm = max[pDoSm , ARAB. J. The initial possibility values for RAB are assumed to be zero if these are the first rules to fire, and thus pRAB,, and pRABm become 0.85 and 0.15, respectively. These values can be passed on to other rules that might have RAB as high or RAB as medium in their condition clauses.
8.3.3- The Defuzzification Process
Deffuzification is particularly important when the fuzzy variable is a control action such as "set RAB", where a specific setting is required. The first step in defuzzification is to adjust the fuzzy set in accordance with the calculated possibilities. A commonly used method is Larsen's product operation rules [Lee, 1990], in which the membership functions are multiplied by their respective possibility values. The effect is to compress the fuzzy sets so that the peaks equal the calculated possibility values, as shown in figure 8.5. The second step for defuzzification is finding the centroid, sometimes called the centre of gravity, centre of mass, or centre of area method. The deffuzzified value is taken as the point along the fuzzy variable axis that is the centriod, or balance point, of all the
136

CHAPTER 8. FURTHER WORK
scaled membership functions taken together for that variable. The deffuzzified value is the balance point along the fuzzy variable axis of this composite shape. When two membership functions overlap, both overlapping regions contribute to the mass of the composite shape. If there are N membership functions with centroids c; and areas a; then the combined centroid C, i. e., the defuzzified value is [Hopgood, 2001]:
NN
ac, a, 8.1 i=1 f=1
DoS Medium DoS High DoS /ý
---------------
Medium High
--------------------------
0 10 30 50 70 80 90 100 Bandwidth Consumption (%)
0 10 30 50 70 90 100 Routing Allocated Buffer (%)
Figure 8.5: Membership functions from fuzzy rules. Membership functions for RAB are derived from Rules #1 and 2, for a BW consumption of 85%
When the fuzzy sets are compressed using Larsen's product operation rule, the values of ci are unchanged from the centroid of the uncompressed shapes, C;, and a; is simply A A. Al is the area of the membership function prior to compression. For isosceles triangles C, is the midpoint along the base, and for right angle triangles Ci is approximately 29% of base length from the upright [Hopgood, 2001]. Therefore, 85% BW consumption would result in Routing Allocated Buffer (RAB) to be adjusted by the switch's Fuzzy Agent to 58.1%, as shown in Figure 8.6.
1 Overlapping area =, makes a double
ry contribution to the 'mass'
i. +
0 10 30 50 70 90 100 Routing Allocated Buffer (%)
Balance point (C) = 58.1% using 6.1
Figure 8.6: The defuzzification process using bounded range 137

CHAPTER 8. FURTHER WORK
The features for incorporating fuzzy logic into Agents would give them some semblance of those qualities that are considered intelligent and are manifold, as we shall see in the next sections. From the foregoing discussion we can see that Intelligent Agents [Murch and Johnson, 1999] incorporating fuzzy logic capabilities would be well suited to environments where they need to maintain autonomy in the face of conditions that would break more rigidly coded solutions with precise logical constructs.
8.4- Modelling Fuzzy Agents- based Intelligent Switched Networks
This section proposes Intelligent Switch Fuzzy Agents (ISFAs) models to overcome some of the limitations that are associated with current NIDSs as well as multilayer network switching. ISFAs are Agents that incorporate a fuzzy intelligence that is designed to respond to Denial of Service (DoS) events, such as an overwhelming useless traffic directed to a particular switched network. Currently network switches vary in their physical design. At the centre of a switch is a type of switching element which controls the ports to which each packet is forwarded. Packet-based switches use two main methods for routing traffic [lantronix, 2003] [Tyson, 2003]:
" Store-and-forward: The switch saves the entire packet to the buffer and analyses it for errors or other problems before forwarding it to its destination. If the packet has an error, it is discarded. Otherwise, the switch looks up the destination address and sends the packet on to the destination node.
" Cut-through: These switches examine the destination address as soon as a packet is detected by the switch before forwarding it to its destination, even as the rest of the packet is coming into the switch. Many switches combine the two methods, using cut-through until a certain error level is reached and then changing over to store-and-forward. Cut-through method provides no error correction.
The three most popular configurations of switching elements in use are [lantronix, 2003] [Tyson, 2003]:
Shared memory: This type of switch stores all incoming packets in a common memory buffer shared by all the switch ports (input/output connections), then sends them out through the correct port to their destinations. Bus architecture: uses an internal transmission path (common bus) that is shared by all of the ports using TDMA. These switches have a dedicated memory buffer for each port, as well as a process to control the internal bus access. Matrix: This type of switch has an internal grid with the input ports and the output ports crossing each other. When a packet is detected on an input port, the destination address is compared to the lookup table to find the appropriate output port. The switch then makes a connection on the grid where these two ports intersect.
138

CHAPTER 8. FURTHER WORK
8.4.1- Transport level of Fuzzy Agency
In order to overcome transport level problems such as TCP SYN, ISFA could respond to TCP SYN flood events by performing several processing steps on every TCP packet received at the switch. The problem here [Scambray et al. 2001 ] [ Criscuolo, 2000] is that most systems allocate a finite number of buffering resources and adds an entry to the connection queue when setting up a potential connections or connection that has not been fully established. Since the SYN ACK is destined for an unavailable host in the TCP SYN attack, the last part of the "three-way handshake" is never completed, the resource allocated is useless and entry remains in the connection queue until a timer expires, typically for about one minute. While most systems can sustain hundreds of concurrent connections to a specific port (for example, 80), it may only take a dozen or so potential connection requests to exhaust all resources allocated to setting up the connection. This can lead to filling up the connection queue and deny TCP services. Current network operating systems allow users to setup the number of TCP concurrent connections as well as their expiring time.
When a concurrent server [Stevens, 1994] invokes a new process to handle each client, the listening server should always be ready to handle the next incoming connection request. That is the underlying reason for using concurrent servers. But there is still a chance that multiple connection requests arrive while the listening server is creating a new process or is busy running other higher priority processes. Each listening end point has a fixed length queue of connections that have been accepted by TCP (i. e., the three-way handshake is complete), but not yet accepted by the application. The application specifies a limit to this queue, commonly called the backlog. This backlog is between 0 and 5, inclusive (Berkeley-derived TCP implementation). However, current network operating systems allow users to set up the backlog. When a connection request arrives (i. e., the TCP SYN segment), an algorithm is applied by TCP to the current number of connections already queued for this listening end point, to see whether to accept the connection or not. The backlog is expected to specify the value by the application to be the maximum number of queued connections allowed for this end point.
Considering [Stevens, 1994] that the backlog value specifies only the maximum number of queued connections for one listening end point. These connections have already been accepted by TCP and are waiting to be accepted by the application. This backlog has no affect whatsoever on the maximum number of established connections allowed by the system or on the number of clients that a concurrent server can handle concurrently. If there is room on this listening end point's queue for this new connection, the TCP module ACKs the SYN and completes the connection. The server application with the listening end point will not see this new connection until the third segment of the three-way handshake is received.
139
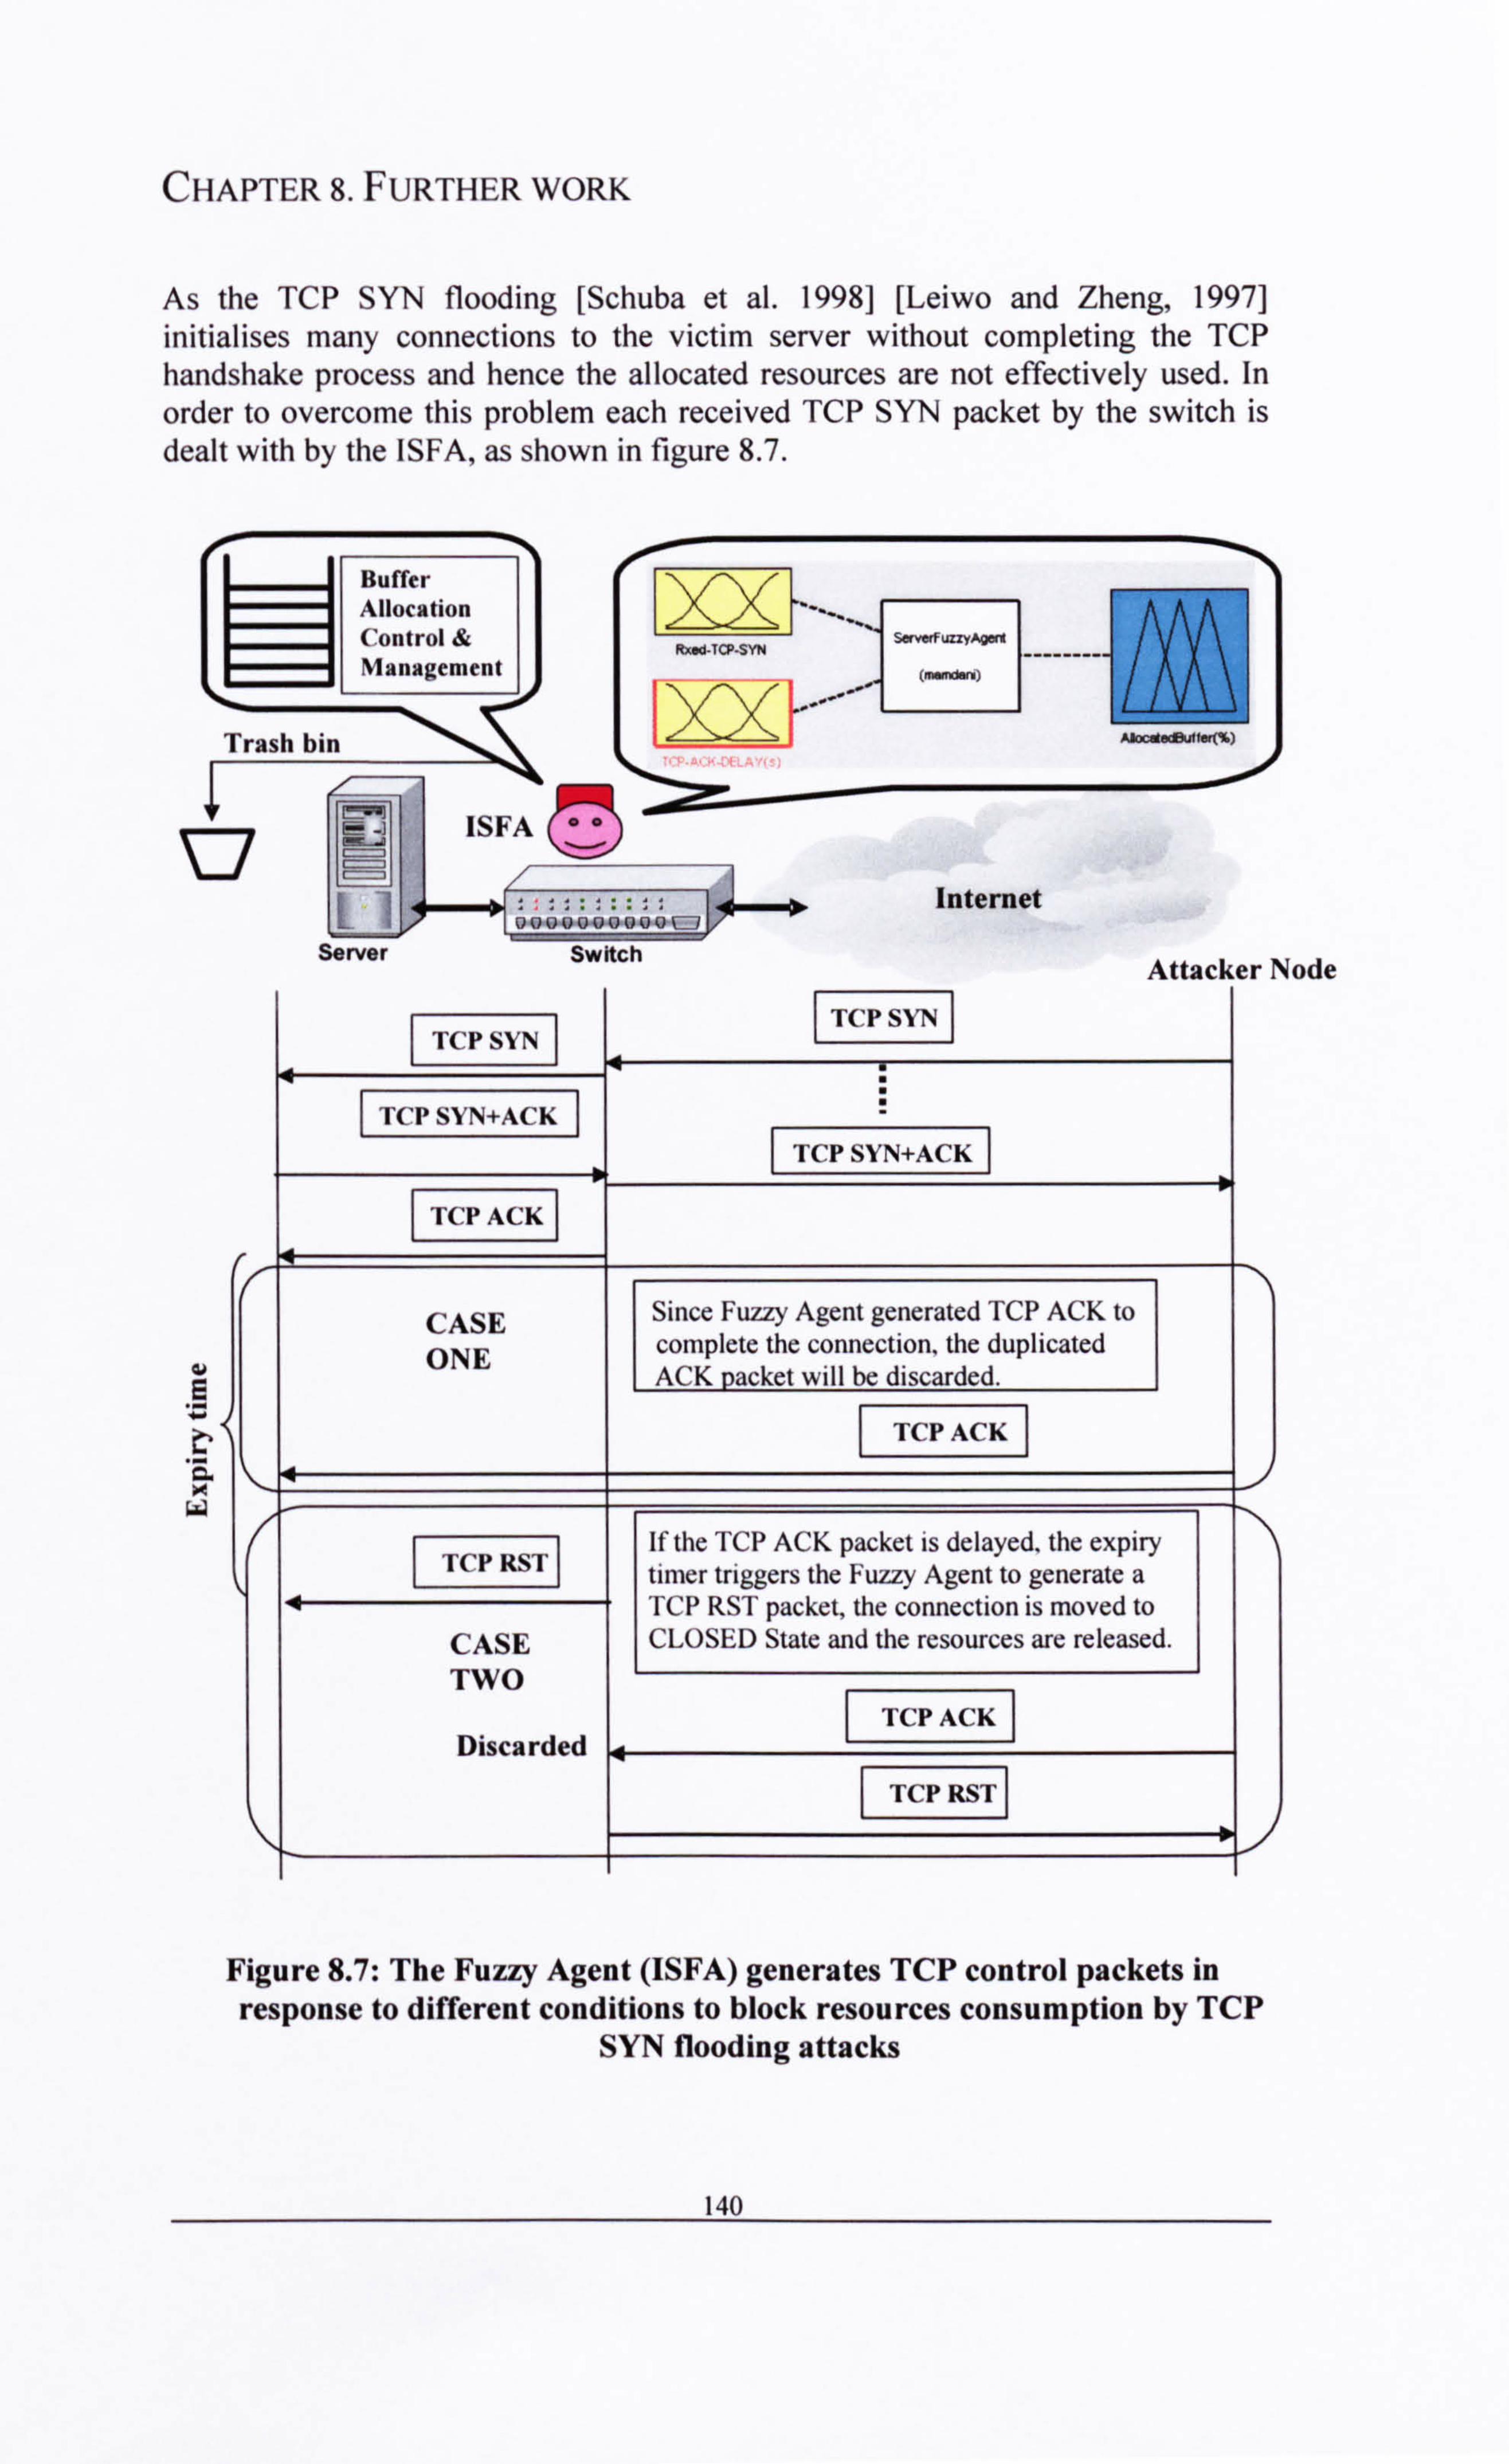
CHAPTER 8. FURTHER WORK
As the TCP SYN flooding [Schuba et al. 1998] [Leiwo and Zheng, 1997] initialises many connections to the victim server without completing the TCP handshake process and hence the allocated resources are not effectively used. In
order to overcome this problem each received TCP SYN packet by the switch is dealt with by the ISFA, as shown in figure 8.7.
Buffer Allocation Control & Management
Trash bin
IWd-iW-STh 1
ýý'"
AbcleýnýaR%)
0 D0060__ O
Server Switch
E
'ä w
Internet
Attacker Node
TCP SYN TCP SYN
TCPSYN+ACK
TCP SYN+ACK
TCP ACK
CASE ONE
Since Fuzzy Agent generated TCP ACK to complete the connection, the duplicated ACK packet will be discarded.
I TCP ACK
TCP RST If the TCP ACK packet is delayed, the expiry tinier triggers the Fuzzy Agent to generate a
CASE TCP RST packet, the connection is moved to CLOSED State and the resources are released.
TWO
Discarded TCP ACK
TCP RST
Figure 8.7: The Fuzzy Agent (ISFA) generates TCP control packets in
response to different conditions to block resources consumption by TCP SYN flooding attacks
140

CHAPTER 8. FURTHER WORK
A sample fuzzy rule situation for preventing deliberate buffer starvation is expressed by the phrase:
" IF Server Rxed-TCP-SYN packets is High AND TCP-ACK-DELAY is High THEN AllocatedBuffer is High
Once the ISFA receives the TCP SYN+ACK packet from the victim server, it generates TCP ACK packet to complete the connection. Any duplicated ACK packet received later on will be discarded by the server. This is according to TCP/IP protocol implementation, as shown in CASE ONE in figure 8.7. However, if the TCP ACK packet is delayed, the expiry timer triggers the ISFA to generate a TCP RST packet, the connection is moved to the CLOSED state and the allocated resources by the server are released. Each TCP connection is allocated resources according to the previously defined fuzzy rule. This will stop the server from exceeding the resource limits. The ISFA will take a decision based on the TCP state machine to determine the correct state actions for each TCP connection. This is to avoid the current TCP protocol modifications, and simultaneously will block exceeding the resources limits.
The Fuzzy buffer allocation is a2*1 (a "two-by-one") process. That means there are two input variables and one solution variable. It is often convenient to think of such a process as a matrix of actions in an M*N array. The Fuzzy states of one input variable form the horizontal axis, and the Fuzzy states of the other input variable form the vertical axis. At the intersection of a row and column is the Fuzzy state of the solution variable. This form of representation, very common in control engineering field, is called a Fuzzy Associate Memory, or FAM. Figure 8.8 shows the Fuzzy Association Memory (FAM) for the buffer allocation controller implemented by the ISFA, which includes all nine required rules.
Rxed-TCP-SYN ii > L ow Medium High
CK TCP DE
Low Low Low High
Medium Low Medium High
High Medium Medium High
Figure 8.8: The FAM for the buffer allocation controller to overcome TCP SYN harmful events
141
CHAPTER 8. FURTHER WORK
8.4.2- Network level of Fuzzy Agency
When ISFA receives a useless damaging type of traffic, it follows particular fuzzy rules defined to overcome a modelled switch buffer overloading. ISFA would detect and automatically respond to any received overwhelming traffic that is for example in the form of an increased number of ICMP_ECHOREPLY traffic. Attackers tend to send IP broadcast ICMP_ECHOREQUEST packets with spoofed source IP addresses to any particular unsecured network or a number of networks in the Internet. These networks would be used for amplifying traffic toward the victim network. The hosts at the amplifying network respond to the broadcast by replying with ICMP_ECHOREPLY packets towards the victim network.
Threats that may lead to Denial of Service (DoS) [Millen, ]992] can be divided into those through resource allocation and those through resource destruction. However, once the ISFA receives this type of traffic, it is supposed to follow the rules identified to overcome this problem and smoothly avoid any deliberate excessive BW consumption and traffic congestion, as shown in figure 8.9. Any received ICMP_ECHOREPLY that does not correspond to any legitimate internal network ICMP_ECHOREQUEST would be discarded by ISFA.
Buffer Allocation Control &
l= _`
Management t}SOMCN4MV4CHOR®LY
nary + ___---___
IWOPHSIOIEQuMT
Trash bin ö0öö0ö000ö
Internal Switch
Network ýSFA Amplifying Attacker Legitimate Network Node Node
ICMP_ECHOREQ ICMP ECHOREQ
ICMP ECHOREPLY ICMP_ECHOREPLY
The hosts at the amplifying network respond to the broadcast by replying with ICMP_ECHOREPLY
packets towards the victim network
Attacker sends IP broadcast ICMP_ECHOREQUEST
packets with spoofed source IP addresses
ICMP_ECHOREQ ICMP ECHOREPLY
ICMP_ECHOREQ ICMP_ECHOREPLY
ICMP ECHOREPLY ICMP ECHOREQ
Figure 8.9: The Fuzzy Agent (ISFA) blocks (discards) the attacking ICMP ECHOREPLY packets
142

CHAPTER 8. FURTHER WORK
A sample fuzzy rule situation is expressed by the phrase:
" IF the Router Spoofed Rxed-ICMP-ECHOREPLY packets is High AND Txed-ICMP-ECHOREQUEST is Low THEN AllocatedBuffer is Low
Figure 8.10 shows the Fuzzy Association Memory (FAM) for the buffer allocation controller implemented by the ISFA, which includes all nine required rules.
Spoofed Rxed- Txed- ICMP-ECHO Low Medium High ICMP- REPLY ECHOREQ
Low Low Low Low
Medium Medium Medium Medium
High High High High
Figure 8.10: The FAM for the buffer allocation controller to overcome Smurf DoS attack
The ISFA (Intelligent Switch Fuzzy Agent) would only allow controlled incoming ICMP-ECHOREQUEST packets from within an organisation's Intranet with friendly known source IP addresses and within the limits specified in the fuzzy
rules. ISFA would represent a network intrusion detection sensor, in which specific threats are being sought. Reducing the number of items a NIDS is looking for will increase its performance [Intrusion. com, 2001]. In this case we can prevent the internal network resources from being particularly overloaded by a DoS event that would consume its BW. The ISFA might not need to update a switch to block source addresses of those ICMP_ECHORELY packets, unless it
makes sure that they do not belong to the internal network or other legitimate
network addresses. In order to improve the controlling process of buffer
management, an extra knowledge about the type of traffic will be required for the switch is likely to receive. The knowledge base is enriched with the traffic characteristics for better decisions making via logical reasoning based on the pattern matching and symbolic manipulation.

CHAPTER 8. FURTHER WORK
8.5- Model Design and Simulation Scenarios
The model design of the Fuzzy Inference System (FIS) for an Intelligent Switch Fuzzy Agent (ISFA) is based on a known behaviour of a modelled network matrix-type 4*4 switch, which is adapted from Mathworks [The Mathworks, 2002]. The modelled switch accepts a traffic that is generated using other network nodes or LANs. These networks are modeled using packet generators. In normal circumstances the packets that are received by the switch are passed to their designated destinations as shown in figure 8.11 (a). The upper 4 scope diagrams represent the packets traffic passes through the 4 input ports of the modeled switch. The lower 4 scope diagrams represent the packets traffic forwarded to its destinations (i. e. the 4 output ports). However, when the switch is subjected to a simulated DoS attack in the form of an overwhelming heavy traffic that consumes the 1S` port BW, the port that carries heavy traffic would dominate the switch by denying the other input ports from being served by the switch, as shown in figure 8.11 (b).
I =PME laffmilliffn
Figure 8.11 (a): All incoming traffic Figure 8.11 (b): The incoming traffic has been forwarded to its from ports 2,3, and 4 is blocked due
destinations to the overwhelming traffic at port 1
The switch model accepts incoming packets from whatever link that triggers any of its input ports. Therefore, it does not really reflect normal switching behaviour. However, the scenario of overloading one particular port with an overwhelming traffic that reduces the switch's performance could be generated using currently available DoS tools.
144

CHAPTER 8. FURTHER WORK
8.5.1- The Modelling environment
MATLAB simulation environment is used to provide the Fuzzy intelligence behaviour and packets traffic generation using Fuzzy logic and Communications toolboxes. MATLAB provides a powerful computing environment for automatic control systems design, signal processing, modelling, analysis, and algorithm development. Its accurate numeric computation and built-in visualisation make it a useful tool to work with complex systems and data arrays. The MATLAB Fuzzy Logic and Communications Toolboxes offer specialised functions and interface tools that speed up the solution of application-specific problems. SIMULINK adds an intuitive block-diagram tool to the MATLAB environment for interactive simulation of non-linear dynamic behaviours, such as network resources allocation. With Real-Time Workshop, it is possible to generate portable code from SIMULINK block diagrams for rapid prototyping and implementation of real-time systems, such as data networks. The Fuzzy Logic Toolbox draws upon these capabilities to provide a powerful tool for fuzzy system design, analysis, and simulation. The following sections describe the use of the Fuzzy Logic Toolbox to design the ISFAs and simulate resources allocation and availability problems resulted from network and transport layers directed Denial of Service (DoS) activities. The experimental work is based on a Fuzzy Agent model built on top of the modelled matrix-type switch that is tested against simulated DoS events.
145

CHAPTER 8. FURTHER WORK
8.5.2- The Developed Model
As the switch's performance is reduced when one of its ports is subjected to a fast heavy traffic load, the inter-arrival time of the received packets has been chosen as an input variable to a fuzzy model. This input parameter would be evaluated by the ISFA in such away that when the inter-arrival time between any incoming successive input packets reaches a predefined threshold value that allows traffic from one particular port to dominate the switch resources, the ISFA discards those packets that facilitate these characteristics. As the input-output data of the switch became available, a mathematical model is developed for fuzzy inference, as shown in figure 8,12. The inversion and integration part of the model is given a name "N Flip-Fly". As the name implies, it inverts the incoming traffic packets and integrates the inter-frame gap of every last adjacent incoming packets accessing a particular port of the modeled network switch.
>t2$ <t=s
Packst 3 Packet2 Ij PacketI Tim* (s)
Inversion
1f (x)dx l x=0
N Flip-Fly
Fuzzy Controller 4,
Packst 9 Packst 2
Figure 8.12: A developed mathematical model for measuring incoming packets inter-arrival time
Therefore, the developed Intelligent Switch Fuzzy Agent (ISFA) has been designed to detect overwhelming traffic and respond to it by controlling its incoming rate in such away that a traffic coming from one particular port does not dominate the switch's resources. The ISFA has been located at the input of each port of the switch. Figure 8.13 shows the detailed design of the ISFA, which
146

CHAPTER 8. FURTHER WORK
includes the inversion process, the integrator, and the fuzzy controller. The Outl test point in figure 8.13 represents the inverted input traffic that normally passes through port I of the switch. Out2 is an integrator output, which gives an indication for the inter-arrival time of the incoming packets that fed to the Fuzzy Inference System (FIS). Out3 is the FIS output, which represents the control decision making process. Finally, Out4 depicts the released packets that constitute a harmless behaviour to the switch. This allows the other input ports to resume their incoming traffic to pass the switch, and being forwarded to their designated destinations, as previously shown in figure 8.11 (a).
C. 4A
Figure 8.13: The detailed structure of the ISFA model
Let us consider modelling the concept of the Smurf DoS event around the variable spoofed Rxed-ICMP-ECHOREPLY packets that are discussed in the previous section. The values of this variable view the speed of such packets received by the switch from outside the internal network. The second variable defined is the Txed- ICMP-ECHOREQUEST packets, which represents the legitimate outgoing ICMP ECHOREQUEST packets from within the internal network. This variable has been chosen in order to compare it with any incoming ICMP-ECHOREPLY packets including the previous attacking packets (i. e., Spoofed Rxed-ICMP- ECHOREPLY) traffic. This is to ensure only the legitimate either Txed ICMP- ECHOREQUEST or Rxed ICMP-ECHOREPIY packets are allocated at the buffer queue within the switch. The allocated buffer represents the consequent variable of the defined fuzzy rules. The defuzzification process adjusts the fuzzy sets of the buffer queue variable in accordance with the calculated possibilities resulted from the antecedent variables. The deffuzified value or balance point would represent the allocated buffer queue at the switch.
147

CHAPTER 8. FURTHER WORK
The rule structure of the ISFA's Fuzzy Inference System (FIS) makes it easy to incorporate the expertise gained about the switch directly to the modelling process. Consequently, a high level possibility distribution for deliberate BW consumption has been identified, as indicated in figure 8.14. figure 8.15 shows the actual input variable possibility distribution, which is the inter-arrival rate.
1.0r
/lDeüberate BW
consumption
0.0
Figure 8.14: A high level possibility distribution for BW consumption
Figure 8.15: The actual measured possibility distribution for the input variable "TrafficRate"
Observation 9: Figure 8.16 indicates the signals that depict different test points of the ISFA model behaviour. The output test points have already been identified
earlier in figure 8.13. The ISFA's ability to control the resources allocated for
routing network traffic, as shown in figure 8.16, indicates that the allocated resources are manageable. The higher rate of incoming spoofed ICMP_ECHOREPLY packets traffic coming towards the internal network could not disallow the ISFA to effectively prevent the switch's buffering resources and network BW from being overloaded. The ISFA managed to drop all of the spoofed received ICMP_ECHOREPLY packets allowing most of the resources allocated for legitimate network traffic. The harmless traffic that is allowed to pass through the switch is depicted in Out4 of figure 8.16. The ISFA continues to monitor and manage the buffer allocation so that it ensures enough storage space for legitimate users, traffic.
148
t, t2 t, Time (s)
input verieWe "TrefficRate"

CHAPTER 8. FURTHER WORK
0 uti
(=2 Out2
=_}
Out3
0ut4
Figure 8.16: The signal outputs at different stages of ISFA
Observation 10: Unlike Random Early Detection (RED) [Rossides et al. 2000], which is used for Differentiated Services (Diff-Serv) QoS provision to set some minimum and maximum dropping thresholds for each class, the ISFA uses dynamic traffic state dependent thresholds. In RED, when the buffer queue size exceeds the minimum threshold, it starts dropping randomly packets based on probability which depends on queue length. If the buffer queue size exceeds the max threshold then every packet is dropped, i. e. drop probability is set to 1. The problem with this approach is that when it starts dropping packets, it does not differentiate between normal and abnormal ones. This is what makes RED vulnerable to Denial of Service (DoS) activities. The ISFAs drop packets based on the actual traffic rate of change (inter-arrival rate of packets) i. e. only packets that pose threat to the switch are dropped before put in the queues. This would minimise the legitimate packets queuing and latency problems and hence increase the throughput of the switch.
Observation 11: The ISFAs offer better ability to linguistically describe the switching dynamics, so to better tune the system according to our class of service policy. The dynamic way of calculating the drop possibility by the ISFAs comes from the fact that according to the traffic rate and the switching resources, a different set of fuzzy rules applies, and based on these rules the drop rate possibility is decided. Since the whole procedure is independent of the buffer
149

CHAPTER 8. FURTHER WORK
queue length, the problems of fixed packets dropping of the queue thresholds implemented by RED [Rossides et al. 2000] are avoided. Therefore ISFAs managed to provide better congestion control and better switch throughput and hence achieving self-healing switched network.
Observation 12: The ISFA is capable of controlling the usage of the queue (backlog) resources allocated for TCP SYN segments in a similar way to the network level traffic, as shown in figure 8.16. The server application specifies the limit to this queue. A highly received TCP SYN packets traffic in conjunction with highly delayed corresponding TCP ACK packets still enables the ISFA to effectively prevent the server application queue from being unnecessarily filled. The ISFA controls the number of connections already queued for any particular listening point, to see whether to accept a new connection or not. This allowed most of the buffering resources to be only allocated for legitimate TCP handshake.
Observation 13: Also, the ISFA is capable of reserving a reasonable amount of the buffer resources for higher received TCP SYN packets with a short delayed TCP ACK packets traffic, as shown in figure 8.16, allowing most of the resources allocated for legitimate TCP handshake. Notice that the amount of buffer reserved in this case does not differ to the previous case, this is because when ISFA
allocates buffer for TCP packets it does not necessarily mean that this amount of allocated buffer has to be filled, and it is only reserved. The full amount of the buffer allocation will not be reached due to the reasons mentioned earlier. The
results indicate that the developed model would establish the required real-time mechanisms, which are essential for any switched network protections.
8.6- The Fuzzy Rules Knowledge Base
When a variable [Jang, et al., 1997] [Hopgood, 2001] is set to a value by crisp rules, its value will change in steps as different rules fire. The only way to smooth those steps would be to have a large number of rules. However, fuzzy rules only require a small number of rules to produce smooth changes in the outputs as the input values alter. Fuzzy rules define variables and values linguistically and are considered to be an efficient tool for quantitative modelling of words or sentences in a natural or artificial language. The number of fuzzy rules required is usually dependent on the number of variables, the number of fuzzy sets, the way in which the variables are combined in the fuzzy rule condition and the nature of the problem.
Observation 14: As the Intelligent Switch Fuzzy Agent (ISFA) is designed in
such away that its Fuzzy Inference System (FIS) is used as a controller, only its
output produces a crisp value. This output crisp value decides whether a particular packet has the right to pass through the switch or not. This is to ensure that there is no single link that could dominate the switching resources. The ISFA uses the Sugeno fuzzy model, which has a typical fuzzy rule IF x is A and y is B then z= f(x, y), when f is a constant, we then have a zero-order Sugeno fuzzy model, which can be viewed either as a special case of the Mamdani fuzzy inference system, which produces fuzzy outputs.

CHAPTER 8. FURTHER WORK
Observation 15: Since ISFA rules has a crisp output, the overall output is obtained via a weighted average, thus avoiding the time-consuming process of defuzzification required in a Mamdani model [Jang, et al., 1997]. The output of the ISFA's FIS represents a two class pattern recognition outcome for decision
making. Figure 8.17 determines the fuzzy rules that have been identified based on the switch behaviour and incoming and outgoing traffic characteristics. It shows the state of the incoming traffic rate within the feature that dominates the switch (i. e., abnormal state), consequently, the fuzzy logic controller response would be at the packet discard state (Response = 0.15).
TrettfcRie "1 Respone - 0.15
0.065 1.085
Figure 8.17: The fuzzy rules base
Observation 16: The ISFA will not allow any buffer allocation for Spoofed- ICMP-ECHOREPLY packets. This will ensure buffer resources availability for legitimate network traffic and avoid deliberate BW consumption, despite the presence of ICMP DoS traffic within the router. Figure 8.16 indicates a smooth buffer allocation for TCP handshake connection establishment. The ISFA will only allow buffer allocation for legitimate received TCP/SYN packets. The ISFA generates TCP ACK for each TCP SYN packet to complete the connection. Any duplicated ACK packet received later on will be discarded. If a TCP ACK packet is delayed, the expiry timer triggers the ISFA to generate a TCP RST packet, the connection is moved to the CLOSED state and the buffer resources are released. This will ensure buffer resources availability for legitimate users and avoid deliberate buffer consumption.
The Fuzzy Agents-based IDS is proposed to overcome the risks associated with the current NIDSs, which have traditionally focused only on detecting those attacks. Fuzzy Agents are considered to be a useful tool to provide intelligently automated response actions in a form of managing resources availability when a DoS takes a place, and provide a solution that can be implemented in a cost- effective manner without any TCP/IP protocol or hardware modifications. In order to use fuzzy modelling and design a FIS, we rely on our own knowledge (common sense, simple physical laws, and so on) of the target system, which is the switch and the traffic that passes through its resources in this case. Therefore, the main two limitation of fuzzy modelling are:
lt relies on the information provided by human experts who must be familiar with the target system Sometime it relies on trial and error method
151

CHAPTER 8. FURTHER WORK
Identifying and collecting the major useful data generated by system, network, protocol, and application activities is essential for analysing the security of network states and detecting signs of network violations and unexpected behaviour.
8.7- Summary
Most of current NIDSs are designed only to detect network attacks. As detection provides a significant role to secure networks, however, it does not solve the security problem completely. Therefore, automated response actions to those detected attacks are required to minimize the effects of the severe attacks, such as Denial of Service (DoS) events. Intelligent Switch Fuzzy Agents (ISFAs) have been proposed to overcome the problem of the overwhelming traffic that causes disruptions within network switching services. This approach is incorporated with a novel model named N Flip-Fly which enables Fuzzy Agents to deal with the problem in a real-time manner. N Flip-Fly is a valuable process. It is an uncomplicated mathematical-based model. This feature allows the model to behave fast enough without affecting non-blocking (i. e., normal) network traffic. The potential for using Fuzzy-based systems properly can be enormous. According to the simulation results, Fuzzy intelligent Agents are well suited to environments where they need to determine system parameters. Human expert knowledge for describing Fuzzy membership function for network states is required for the model, especially for an environment with a large amount of input/output states, such as switched networks.
In conjunction with speedy blocking packets, there are other issues that could take place within network traffic packets, such as a specific pattern at the source and destination ports within the TCP/IP packets header, or particular protocol packets dominate the traffic, such as ICMP. These and other parameters need to be incorporated in the model in order to achieve an effective self-healing secured network. The dynamic way of calculating the drop rate by the ISFAs comes from the fact that based on the traffic rate and the switching resources, a different set of fuzzy rules applies. Based on these rules the drop rate possibility is decided. Unlike Random Early Detection (RED) [Rossiden et al. 2000], which is used for Differentiated Services (Diff-Serv) QoS provision to set some maximum dropping thresholds for each class, the ISFA uses dynamic traffic state dependent thresholds. The ISFAs drop packets based on the actual traffic rate of change (inter-arrival rate of packets) i. e. only packets that pose threat to the switch are dropped before put in the queues. Since the whole procedure is independent of the buffer queue length, the problems of fixed packets dropping of the queue thresholds implemented by RED are avoided. Therefore the developed ISFAs managed to provide better congestion control and better throughput for a switch under denial of service, hence, achieving self-healing network. The validation of the developed model is based on empirical evidence that is already characterized in the achieved results.
152
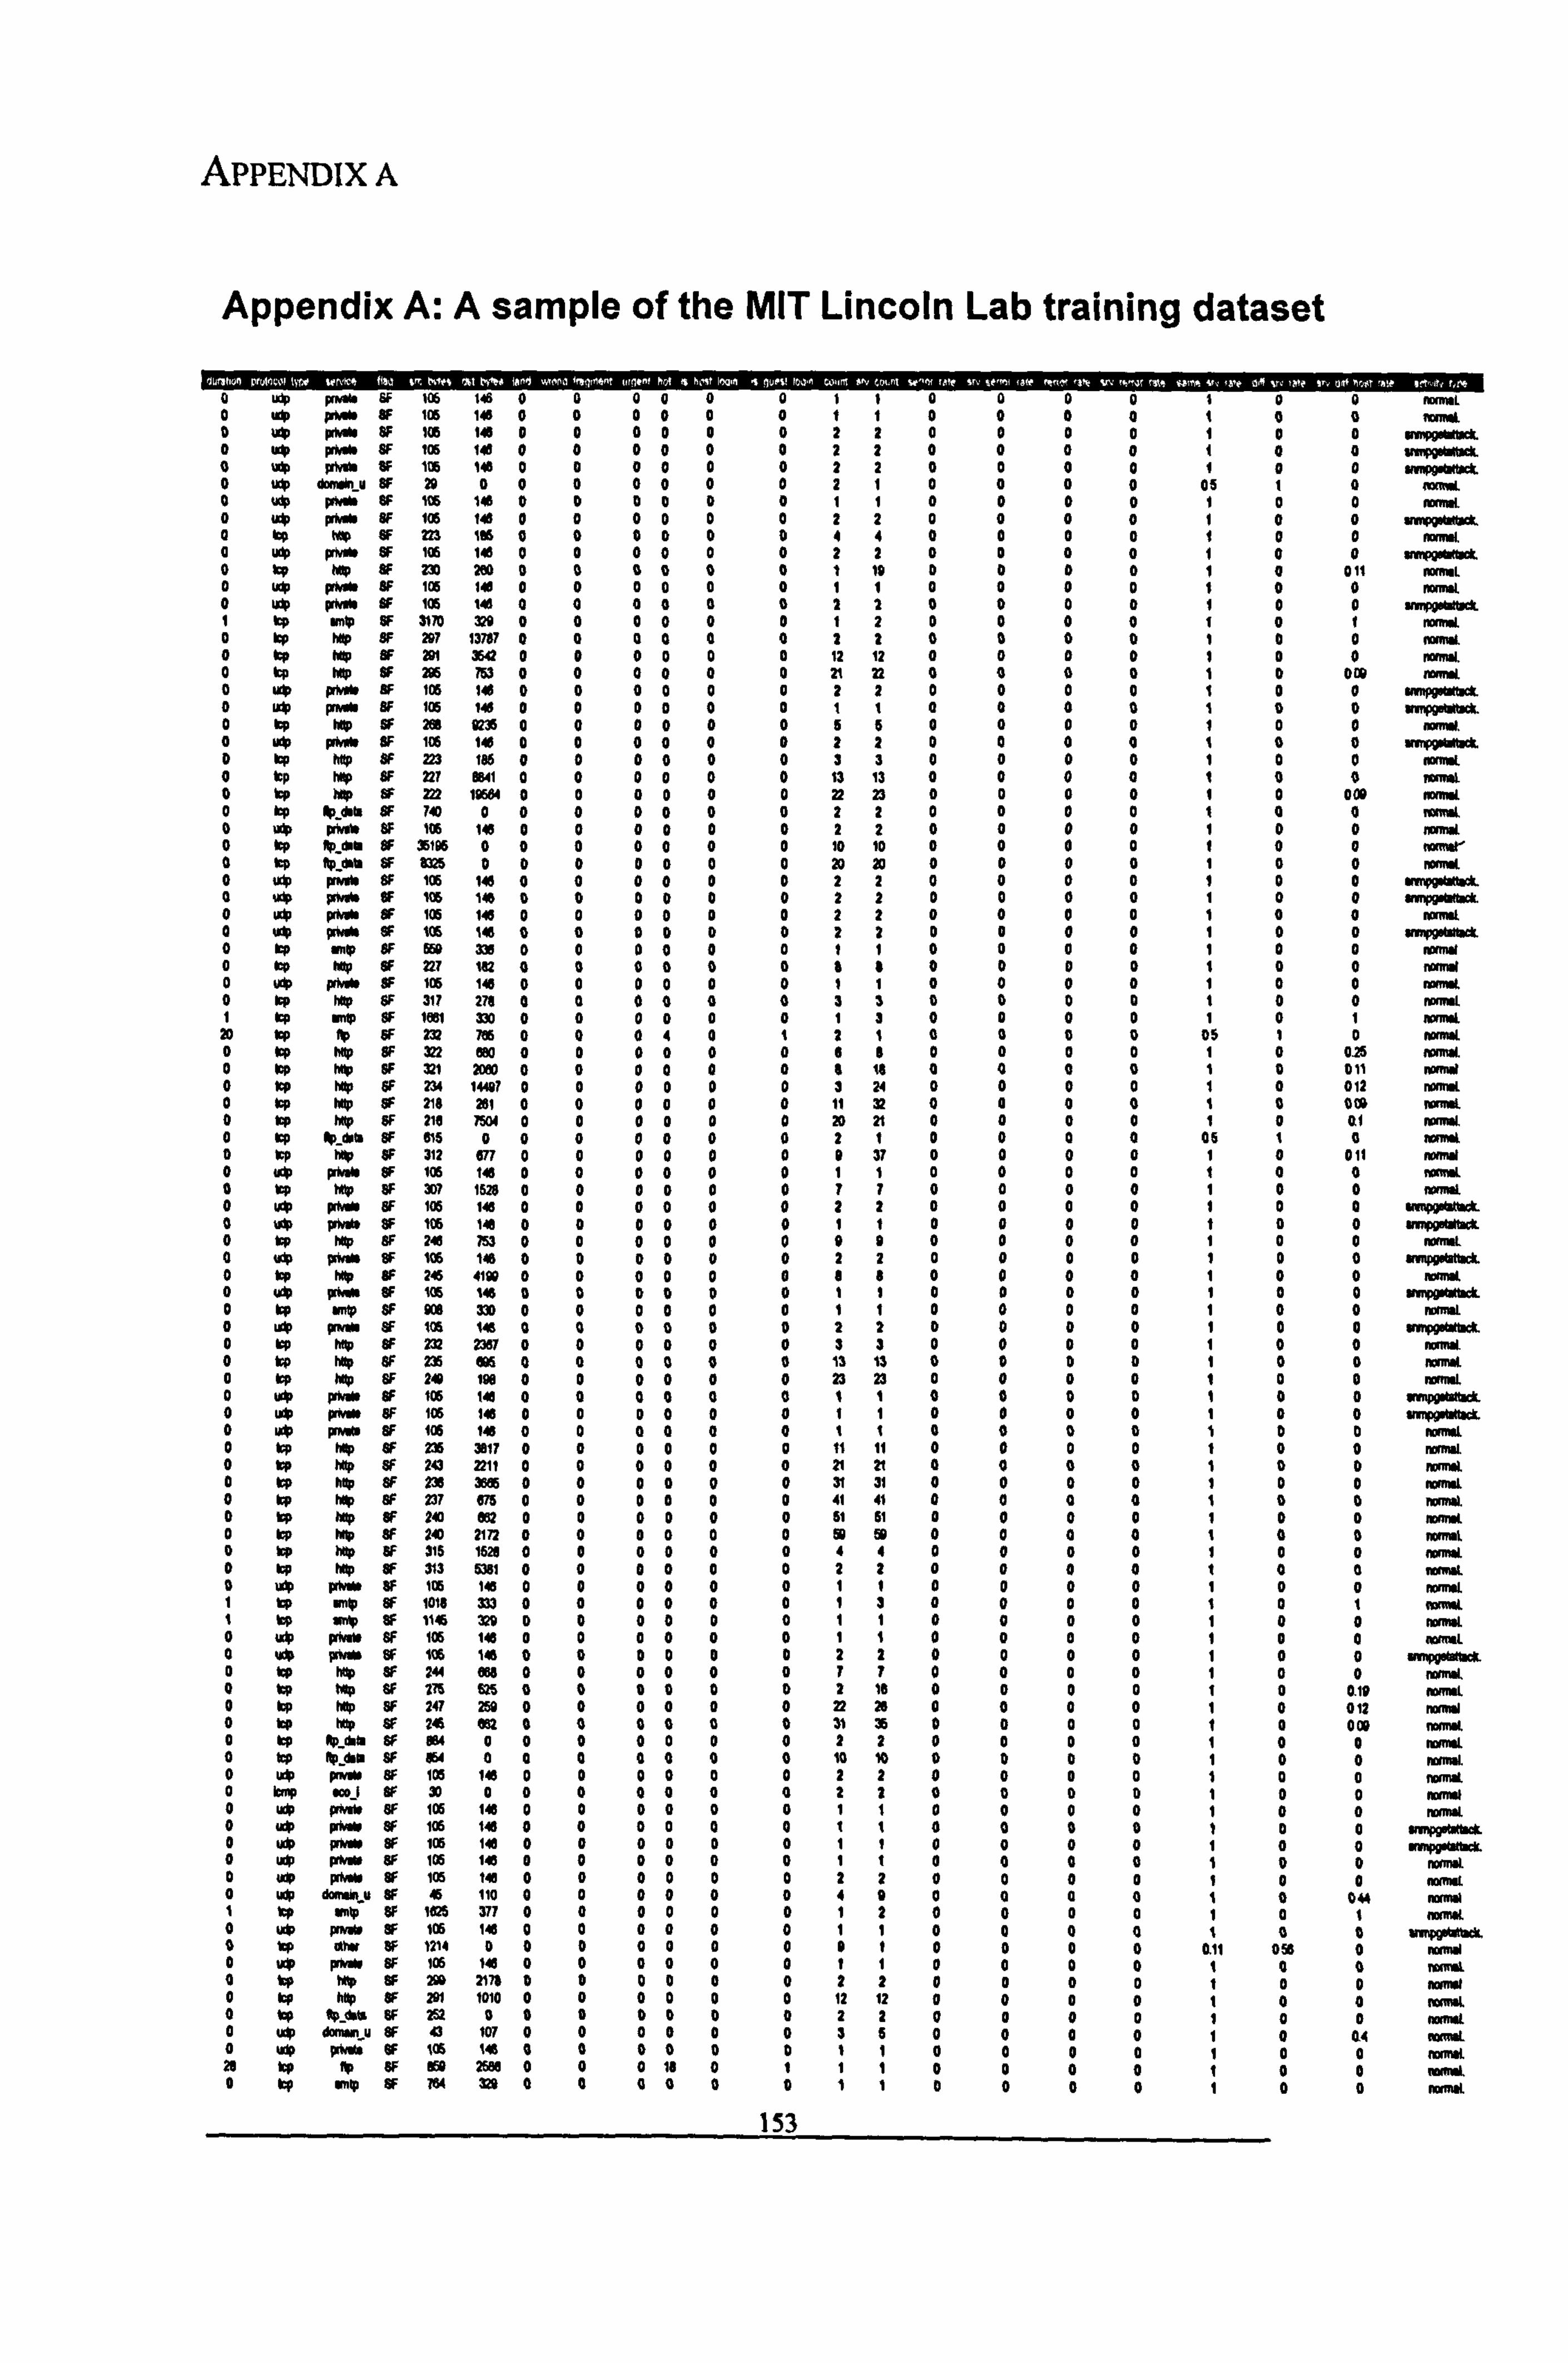
APPENDIX A
Appendix A: A sample of the MIT Lincoln Lab training dataset
0 udp FMM OF +06 115 0 0 0 0 0 0 0 0 0 0 0 0 ýl o udp pp*Y OF 105 146 0 0 0 0 0 0 1 + 0 0 0 0 + O 0 mmýl 0 O p l- OF 106 1: 0 0 0 0 0 0 2 0 0 0 0 0 1 0 0 mngpeurqtlc 0 uý p1AýMb 8F 105 1 0 0 0 0 0 0 2 2 0 0 0 0 1 0 0 wnp0e*odu. 0 udp 7Mt" ßF 106 1M 0 0 0 0 0 0 2 2 0 0 0 0 1 0 0 rn pg*0tadc 0 up tlol! u BF 29 0 0 0 0 O 0 0 2 1 O 0 0 0 05 1 0 tam. L 0 udp prow OF 105 116 0 0 0 0 0 0 0 0 0 0 1 0 0 In L 0 u" Fwb OF 106 itl 0 0 0 0 0 0 2 2 0 0 0 0 1 0 0 . npgNýntl, a Op hip OF 223 156 0 0 0 0 0 0 4 4 0 0 0 0 I 0 0 mmrl. a up p4 * OF 106 1. 0 0 0 0 0 0 2 2 0 0 0 0 1 0 0 wippeeubi#. 0 ty 9191 Sf 270 200 0 0 0 0 0 0 1 10 0 0 0 0 1 0 011 mn. L 0 uy 9191 SF 106 110 0 0 0 0 0 0 + 1 0 0 0 0 1 0 0 oum. l 0 uy pM4 BF 1a5 +tl a 0 0 0 0 0 2 2 0 0 0 0 1 0 0 ýngpemlrk I Op uni OF 3170 220 0 0 0 0 0 O 2 0 0 0 0 + 0 + 90m 1 0 Op Mp OF 207 12707 0 0 11 0 0 0 2 2 0 0 0 0 1 0 0 rAm 0 kp hlp ei 211 2642 o 0 0 0 0 0 12 12 0 0 0 O 1 0 0 nn *. 0 Op 10 ei 2* 761 0 0 0 o 0 0 21 22 0 0 0 0 1 0 030 m. M o Wp pm rO 106 1b 0 0 0 0 0 0 2 2 0 0 0 0 + 0 0 ýp2arnýc 0 Op p, OF 105 1M O o 0 0 0 0 1 1 0 0 0 1 0 0 . 0 kp My OF 26e 0236 0 0 0 0 0 0 6 6 0 0 0 1 0 0 1-10. 0 LO pp0* OF 105 141 0 0 0 0 0 0 2 2 D 0 0 1 0 0 --P~ D IT 1110 OF 223 106 0 0 0 0 0 0 2 3 0 0 0 0 1 0 0 mm a 0 kp hp OF 221 l511 0 0 0 0 0 0 12 10 0 0 0 0 1 0 0 Ma 0 !p lip BF 222 10601 O 0 0 0 0 0 22 23 0 0 0 0 + 0 000 "mw 0 kp Op-4I OF 7r4 0 0 0 0 0 0 0 2 0 0 0 0 0 1 0 0 i I34. 0 u91 pOmO 6F 105 1M 0 0 0 0 0 0 2 2 0 0 0 0 1 0 0 namWl 0 kp 91 ar OF ä1p6 0 0 0 0 O 0 0 10 +0 0 0 0 0 + 0 0 "1"' 0 Op ftp-" 6F 6325 O 0 0 0 0 0 0 20 20 0 O 0 0 1 0 0 *t o udp p1w* OF 105 116 0 0 0 0 0 0 2 2 0 0 0 0 1 0 0 V W4O04* a udp p 91* OF 106 14 0 0 o D 0 O 2 2 0 0 0 1 0 0 rngpýlhdc. 0 udp p91* OF 105 1ý6 0 0 0 0 0 0 2 2 o 0 0 0 1 0 O ndmLL a uip p91* OF t06 1M 0 0 0 0 0 0 2 2 0 0 0 1 0 0 "", "* 0 kp . 1p OF MD 336 0 0 0 0 0 0 1 1 0 0 0 0 1 0 0 w* 0 Op Mp OF 221 102 0 0 0 0 0 0 6 0 0 0 0 0 1 0 0 m114 0 udp p0 SF 105 146 0 0 O 0 O 0 1 1 0 0 0 0 1 0 0 1411. 0 kp hip OF 317 276 0 0 0 0 0 0 2 3 o 0 0 1 0 0 m'M I kp u91 OF 1261 330 0 0 0 0 0 0 1 3 0 0 0 0 1 0 1 rormY 20 kp Ip OF 231 756 0 0 a 4 a 1 2 1 D 0 0 0 05 1 0 M. 01. 0 lop OOp OF 202 680 0 0 O 0 0 0 e e o 0 0 0 + o a15 romW. 0 lop No OF 321 20Bp 0 0 0 0 0 0 6 0 0 0 0 0 011 mm4 0 kp NO OF 231 14407 0 0 0 0 0 0 2 24 0 0 0 0 / 0 012 romrL 0 Icp Mp SF 210 201 0 0 0 0 0 0 11 22 0 0 0 0 00, 1. --L 0 lop Any OF 210 7301 0 0 0 0 0 20 21 0 0 0 0 0 at A-. 9 0 Op bh OF 615 0 0 0 0 0 0 0 2 1 0 0 a a 06 1 0 4o41 0 kp lip OF 212 077 0 0 0 0 0 0 0 27 0 0 0 0 0 011 mmm 0 udp prkA OF 106 148 0 0 0 0 0 0 0 0 0 0 0 0 114041 0 up 1 OF 207 1620 0 0 0 0 0 0 7 7 0 0 0 0 + 0 0 r"w 0 up pf w OF 105 ltl 0 0 0 0 0 0 2 2 0 0 0 0 1 0 0 1mppehluwk. 0 vp pOO. SF 106 ltl 0 0 0 0 0 1 i 0 0 0 0 0 0 140p0.40* 0 Op hvp OF 2* 752 0 0 0 0 0 0 0 0 0 0 0 0 0 0 romrt 0 OV ¶01* OF 106 146 0 0 0 0 0 0 2 2 0 0 0 0 0 rmppehOtl. 0 kp Mp BF 245 4100 0 0 0 0 O 0 e e 0 0 0 0 + 0 0 1410. 0 u9 ¶01* OF 105 116 0 0 0 0 0 0 1 0 0 0 0 + 0 0 rmpp*00* 0 kp - IF 91e 220 0 0 O 0 0 0 1 0 0 0 0 0 0 *1141 0 491 poi OF 105 146 O 0 0 0 0 0 2 2 0 0 0 0 + 0 0 anpgehlhd 0 Op Mo OF 232 2307 0 0 0 0 0 0 5 3 0 0 0 0 + 0 0 n04* 0 kp Mp OF 239 605 0 0 O 0 O 0 12 13 0 0 0 0 0 0 190m, 0 w No OF 240 100 0 0 0 0 0 0 22 22 0 0 0 0 + 0 0 rOM 4 0 udp pO90 OF 106 14 0 0 0 0 0 0 1 1 0 0 0 0 + 0 0 411np90440. t 0 LO, pi. * 6F 106 116 0 0 o O 0 0 1 1 0 0 0 0 1 0 0 anp01hthd. 0 ub pn*a OF 106 1tl 0 0 0 0 0 O 1 + 0 0 D D 1 0 0 mim11 0 kp 6W OF 235 2017 0 0 0 0 0 0 11 11 0 0 0 0 1 0 0 140m11 0 Lp No OF 243 2211 0 0 0 0 0 0 21 21 a 0 D 0 1 0 0 1001* 0 top 6W OF 2m 2896 0 O 0 0 0 0 31 21 0 0 0 0 1 0 o "M LL 0 Op Mq OF 237 075 0 O 0 0 0 U H 0 0 0 0 1 D 0 140,01. 0 UP W OF 240 an 0 0 0 0 0 0 51 61 0 0 0 0 1 0 0 mnM 0 lop Mp OF 210 2172 0 0 0 0 0 0 0 60 0 0 0 0 1 0 0 MWAL 0 kp 6W OF 215 1620 0 0 0 0 0 0 1 0 0 0 0 0 1 0 0 mmN 0 Op 6W OF 313 5361 0 0 0 0 0 0 2 2 0 0 0 0 1 0 0 *1o. L 0 uip p wo 6F 106 116 0 0 0 O 0 0 1 1 0 0 0 0 1 0 0 nomrt + tp 1410 OF 1018 353 0 0 0 0 0 0 1 7 o 0 o 1 0 1 mml. 1 lop up OF 116 700 D 0 0 0 0 0 1 + 0 0 0 1 0 0 n 0111 0 ucb prob OF 105 1M 0 0 0 0 0 1 1 0 0 0 0 1 0 0 W-, 0 U0 pp11Y OF 106 1M 0 0 0 0 0 0 2 2 0 0 0 0 0 0 amppe6vhdc 0 kp 531 OF 244 we 0 0 0 0 0 0 7 7 0 0 0 0 + 0 0 rMA 0 lop 11191 OF 276 525 a o 0 0 0 0 2 fe 0 0 0 0 0 0.10 , 00,43 0 Op 6W SF 247 250 0 0 0 0 0 O 21 2e O 0 0 0 + 0 012 *1* 0 kp Mp OF 246 an 0 D 0 0 0 0 21 76 0 0 O O t 0 0091 m40W. 0 Op 31 dh OF 901 O 0 0 0 0 O 0 2 2 0 0 0 0 + 0 0 W MIL 0 kp op hr SF AW 0 0 0 a O D O 10 10 O O 0 0 + 0 0 m4N. 0 up P. 0 OF 105 1$ 0 0 0 0 0 0 2 2 0 0 0 0 0 0 moo40 0 Imp oo 1 OF 20 0 0 0 0 a a a 2 0 0 0 0 0 0 mmY 0 uc0 pMM OF 105 116 0 0 0 0 0 0 1 1 0 0 0 0 + 0 0 *0111 0 adp PMY ei 106 1 0 0 0 0 a 0 1 + 0 0 0 0 1 0 0 Mn31g1*0* O udp p91* OF 105 110 0 0 0 0 0 0 1 o 0 0 0 0 0 -vg w*0. 0 udp pbl OF 105 1ý0 0 O o 0 0 0 1 0 0 0 0 0 D rom.. O '' pMW OF 105 14 0 0 0 0 0 0 2 2 0 0 0 0 O O rom. t 0 upp doof. u OF 45 110 0 0 0 0 0 0 4 0 0 0 0 0 0 OM mmW 1 kp alp OF 1025 277 0 0 0 0 0 0 1 2 0 0 0 0 1 mMML 0 up pp11* OF 105 141 0 0 0 0 0 0 1 0 0 0 0 L 0 0 U. ""d. 0 up 05i r OF 1214 0 0 O 0 0 0 0 0 0 0 0 0 0.11 056 0 , 0,043 0 VIP p9* OF 106 146 0 0 0 0 0 1 1 0 0 0 0 1 0 0 m. o* 0 kp NO OF 231 2175 0 0 0 0 0 0 2 2 0 0 0 0 1 0 0 mnrl 0 kp 10 OF 201 1010 0 0 0 0 0 0 +2 12 0 0 0 0 1 0 0 1*0W. 0 kp 31_4610OF 252 0 0 0 0 0 0 0 2 2 0 0 0 0 1 0 0 ""W 0 up 0.. WL u OF 43 107 0 0 0 0 0 0 3 5 0 0 0 0 1 0 04 mnW. 0 uv ppl* OF 106 1ý6 0 0 0 0 0 0 1 1 0 0 0 0 1 0 0 mimes 2e Op ro OF 150 2006 0 0 0 1e o 1 1 1 0 0 0 0 + 0 0 W. I. 0 kp wnlp OF 701 220 0 0 a a 0 0 1 1 0 0 0 0 1 0 0 000.1
153

APPENDIX B
Appendix B: A sample of a locally generated training dataset at C4MCR
Frame Time SrcMACAddr DstMACAddr Protocol Description Src Other Addr Dst OtherAddr Type OtherAddr
1 473.631048 LOCAL 00500403B53F SMB R transact OAK 143.167.251.168
2 473.631048 LOCAL 00500403B53F NBT SS: Session Message, Len: 6144 OAK 143.167.251.168
3 473.641062 00500403B53F LOCAL TCP . A...., len: 0, seq: 3418083244-3418083244, ack 143.167.251.168 OAK IP
4 473.641062 00500403B53F LOCAL MSRPC c/o RPC Request: call OxDCC opnum 0x45 con 143.167.251.168 OAK IP
5 473.641062 LOCAL 00500403B53F MSRPC c/o RPC Response: call OxDCC context 0x0 hi OAK 143.167.251.168
6 473.641062 00500403B53F LOCAL MSRPC c%o RPC Request: call OxDCD opnum 0x1A con 143.167.251.168 OAK IP
7 473.641062 LOCAL 00500403B53F MSRPC c%o RPC Response: call OxDCD context 0x0 hi OAK 143.167.251.168
3400 1865.212043 3COM 4A3B46 LOCAL ICMP Echo: From 143.167.251.238 To 143.167.251.229 143.167.251.238 OAK IP
3401 1865.212043 LOCAL 3COM 4A3B46 ICMP Echo Reply: To 143.167.251.238 From 143.167.251.2 OAK 143.167.251.238
3402 1866.233512 3COM 4A3B46 LOCAL ICMP Echo: From 143.167.251.238 To 143.167.251.229 143.167.251.238 OAK IP
3403 1866.233512 LOCAL 3COM 4A3B46 ICMP Echo Reply: To 143.167.251.238 From 143.167.251.2 OAK 143.167.251.238
3404 1866.253540 3COM 6586D0 BROADCAST ARP_RARP ARP: Request, Target IP: 143.167.251.136
3405 1866.273569 0001024005DB BROADCAST NBT NS: Query req. for WORKGROUP <1B> 143.167.251.136 143.167.251.255
3406 1867.024649 0001024005DB BROADCAST NBT NS: Query req. for WORKGROUP <IB> 143.167.251.136 143.167.251.255
3407 1867.244966 3COM 4A3B46 LOCAL ICMP Echo: From 143.167.251.238 To 143.167.251.229 143.167.251.238 OAK IP
3408 1867.244966 LOCAL 3COM 4A3B46 ICMP Echo Reply: To 143.167.251.238 From 143.167.251.2 OAK 143.167.251.238
154

APPENDIX C
Appendix C: List of network attacks contained within the dataset of MIT Lincoln Lab
This Appendix describes the attacks used in dataset to train the developed Bayesian detection model. The first section is an overview of the attacks themselves. It describes the categories that are used to classify the attacks, and describes the various ways an attack could be run. The second section lists every attack in the dataset, it gives a detailed explanation of each attack [MIT Lincoln Lab] [Marchette, 2001] [Northcutt, 1999] [Northcutt et al, 2001 ].
Overview
This section describes the attacks and how they were run. It first defines the four classes of attacks and lists which attacks are in each class.
Attack Classification
An attacker who has access to a local account on a computer User To Root system is able to elevate their privileges by exploiting a bug
in the operating system or a program that is installed on the system.
An attacker who has the ability to send packets to a machine
Remote To Local over a network (but who does not have an account on that machine), gains local access (either as a user or as root) to that machine.
An attacker uses network services to collect information
Probing/Surveillance about a host (such as what services it offers, or what users have accounts on the machine). Such information can often be useful in staging a later attack.
Denial Of Service An attacker who has the ability to send packets traffic to a (DoS) particular machine or a network denies others access to the
resources or services of that machine or network.
155

APPENDIX C
The following table breaks down all the exploit types by category and platform
Classification Solarfis (BSM) SunOS Linux Eject
User To Root Ir fbconfig
Fdformat Ps
Loadmodule Perl
xterm
Dictionary Dictionary Dictionary
Ftp-write Ftp-write Ftp-write
Guest Guest Guest
Phf Phf Phf Remote To Local XIock Xlock Xlock
Xsnoop Xsnoop
[
Xsnoop Imap Named Sendmail
Apache2 Apache2 Apache2
Back Back Back
Denial of Service (DoS)
ý
Mailbomb iNeptu flood)ne(syn I
Mailbomb Neepune(syn flood)
Mailbomb
Neptune(syn flood)
UDP Storm UDP Storm [UDP Storm
Syslogd Teardrop IP Sweep IP Sweep . IP Sweep
Nmap Nmap Nmap
Portsweep . Portsweep Portsweep Probing/Surveillance Process Table Process Table Process Table
Satan Satan Satan
Smurf Smurf Smurf Land
156
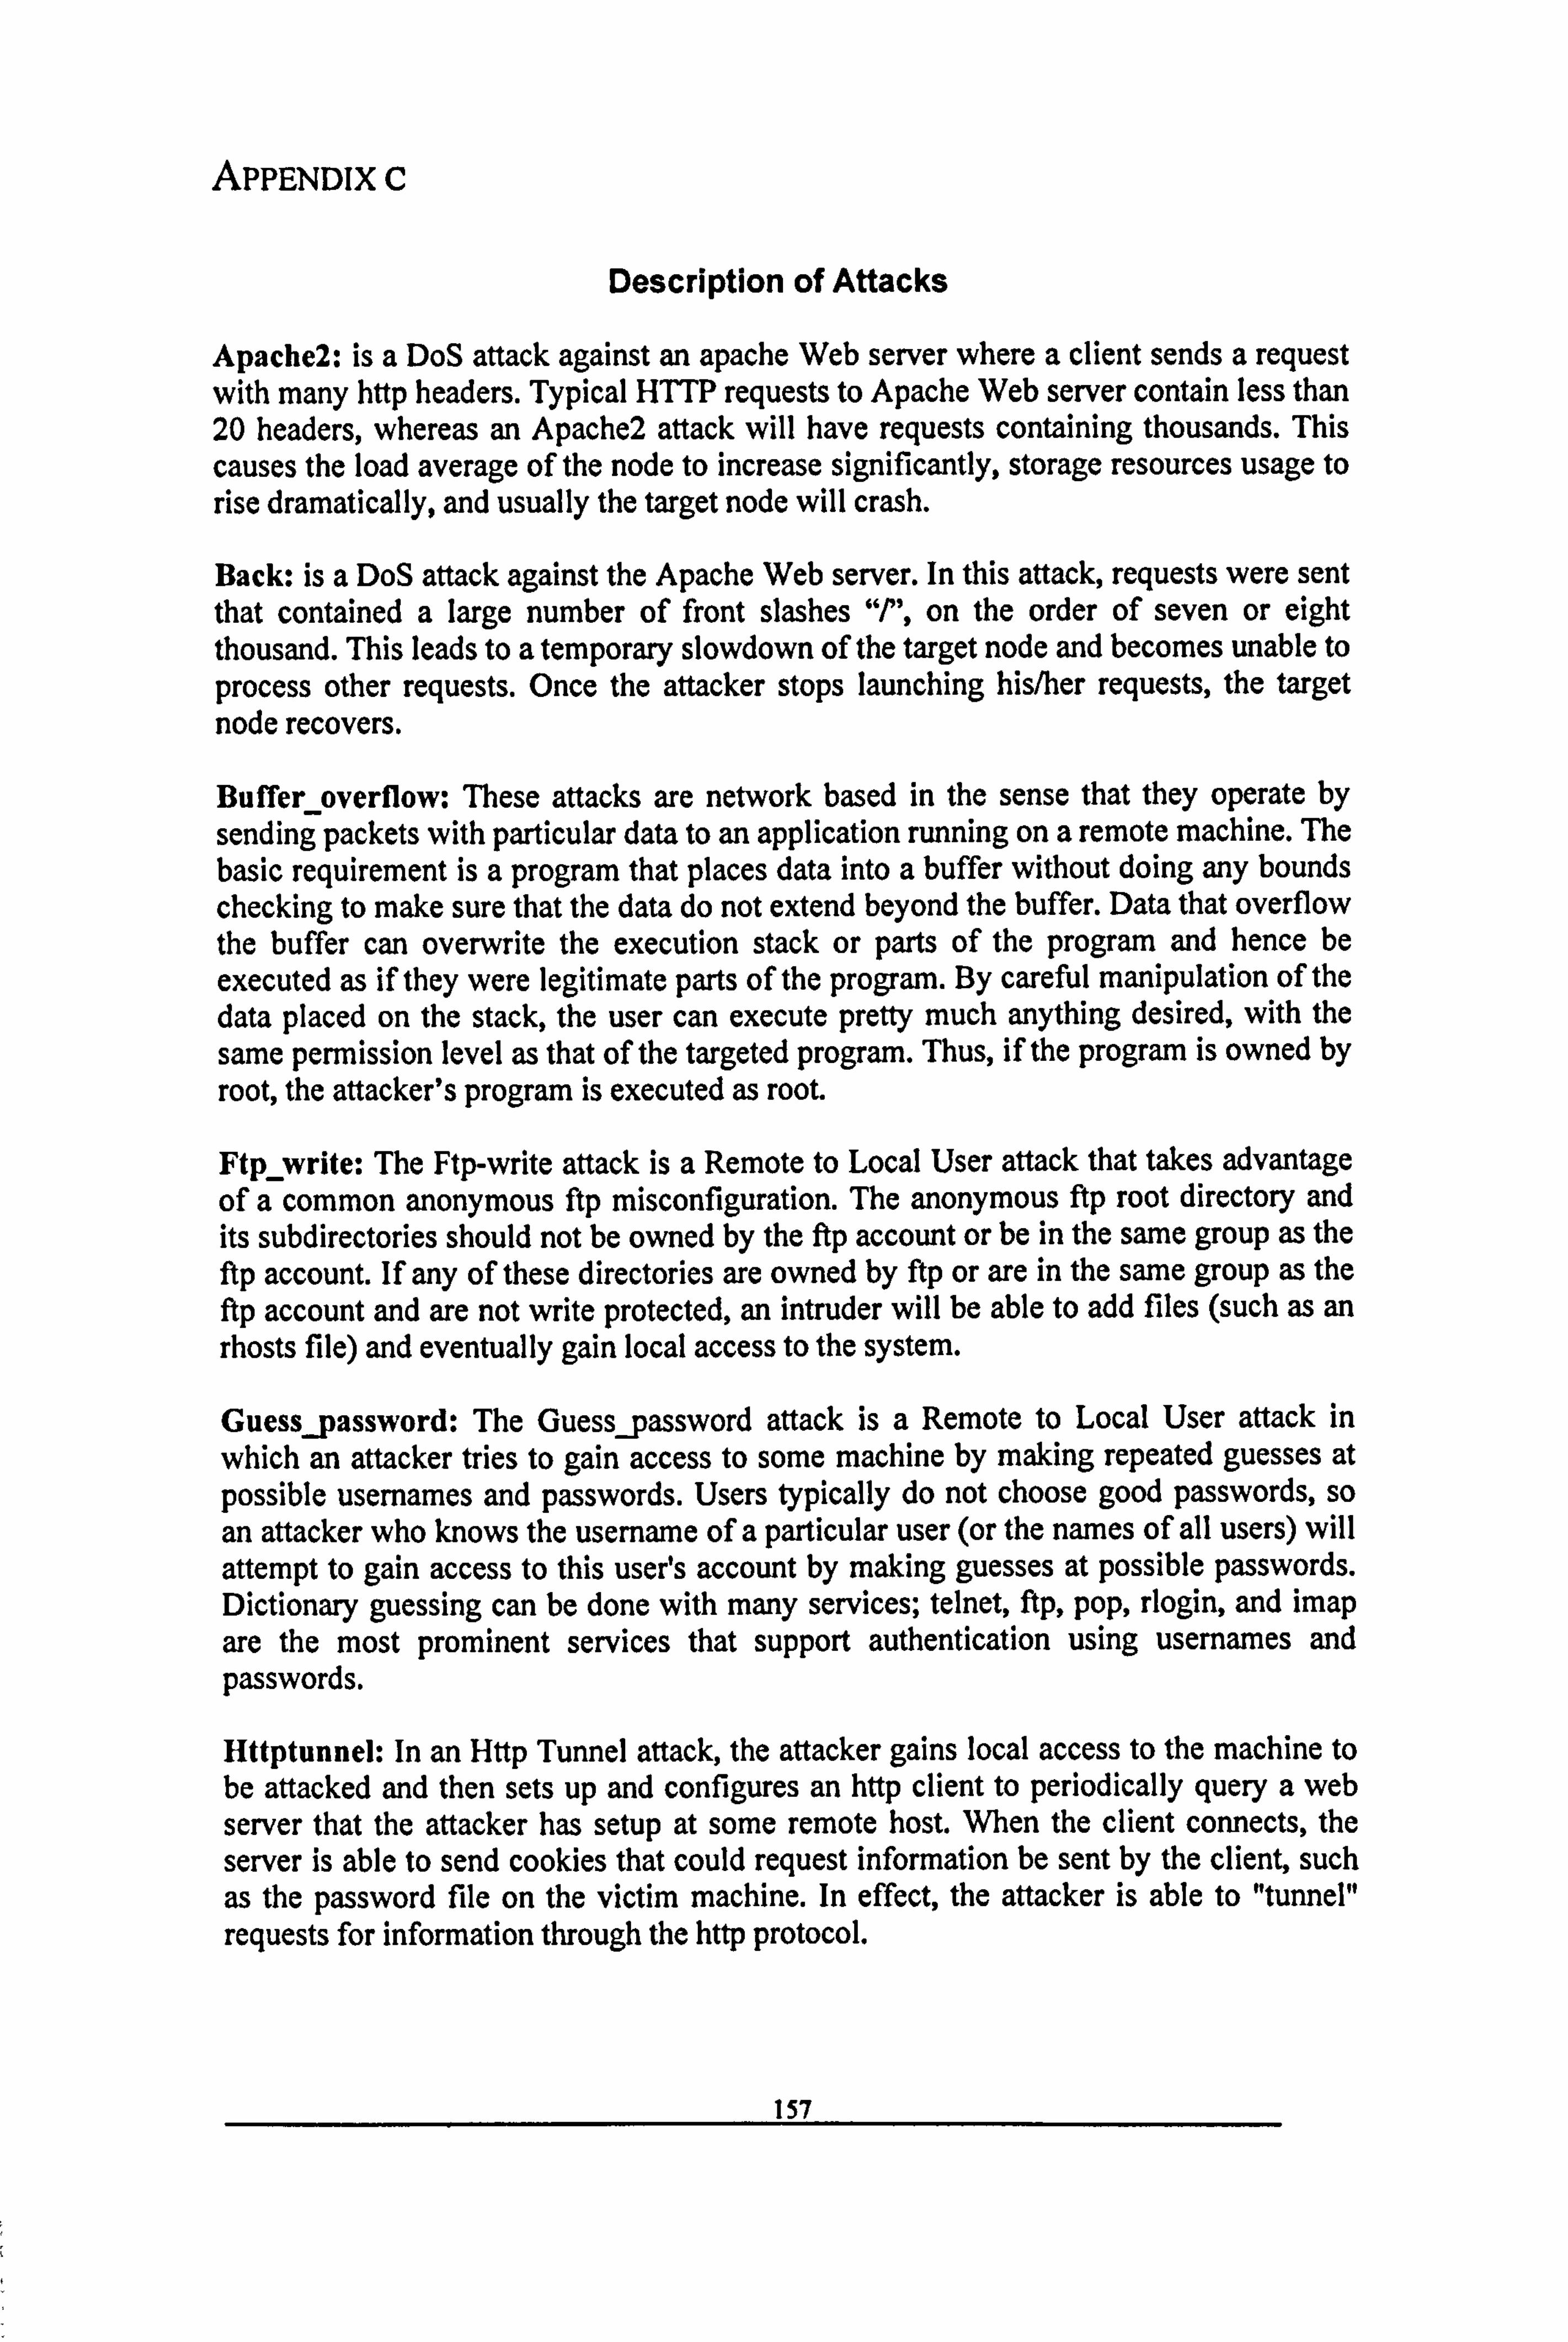
APPENDIX C
Description of Attacks
Apache2: is a DoS attack against an apache Web server where a client sends a request with many http headers. Typical HTTP requests to Apache Web server contain less than 20 headers, whereas an Apache2 attack will have requests containing thousands. This causes the load average of the node to increase significantly, storage resources usage to rise dramatically, and usually the target node will crash.
Back: is a DoS attack against the Apache Web server. In this attack, requests were sent that contained a large number of front slashes "P', on the order of seven or eight thousand. This leads to a temporary slowdown of the target node and becomes unable to process other requests. Once the attacker stops launching his/her requests, the target node recovers.
Buffer overflow: These attacks are network based in the sense that they operate by sending packets with particular data to an application running on a remote machine. The basic requirement is a program that places data into a buffer without doing any bounds checking to make sure that the data do not extend beyond the buffer. Data that overflow the buffer can overwrite the execution stack or parts of the program and hence be executed as if they were legitimate parts of the program. By careful manipulation of the data placed on the stack, the user can execute pretty much anything desired, with the same permission level as that of the targeted program. Thus, if the program is owned by root, the attacker's program is executed as root.
Ftp write: The Ftp-write attack is a Remote to Local User attack that takes advantage of a common anonymous ftp misconfiguration. The anonymous ftp root directory and its subdirectories should not be owned by the ftp account or be in the same group as the ftp account. If any of these directories are owned by ftp or are in the same group as the ftp account and are not write protected, an intruder will be able to add files (such as an rhosts file) and eventually gain local access to the system.
Guess_password: The Guess_password attack is a Remote to Local User attack in
which an attacker tries to gain access to some machine by making repeated guesses at possible usemames and passwords. Users typically do not choose good passwords, so an attacker who knows the username of a particular user (or the names of all users) will attempt to gain access to this user's account by making guesses at possible passwords. Dictionary guessing can be done with many services; telnet, ftp, pop, rlogin, and imap are the most prominent services that support authentication using usernames and passwords.
Httptunnel: In an Http Tunnel attack, the attacker gains local access to the machine to be attacked and then sets up and configures an http client to periodically query a web server that the attacker has setup at some remote host. When the client connects, the server is able to send cookies that could request information be sent by the client, such as the password file on the victim machine. In effect, the attacker is able to "tunnel" requests for information through the http protocol.
157
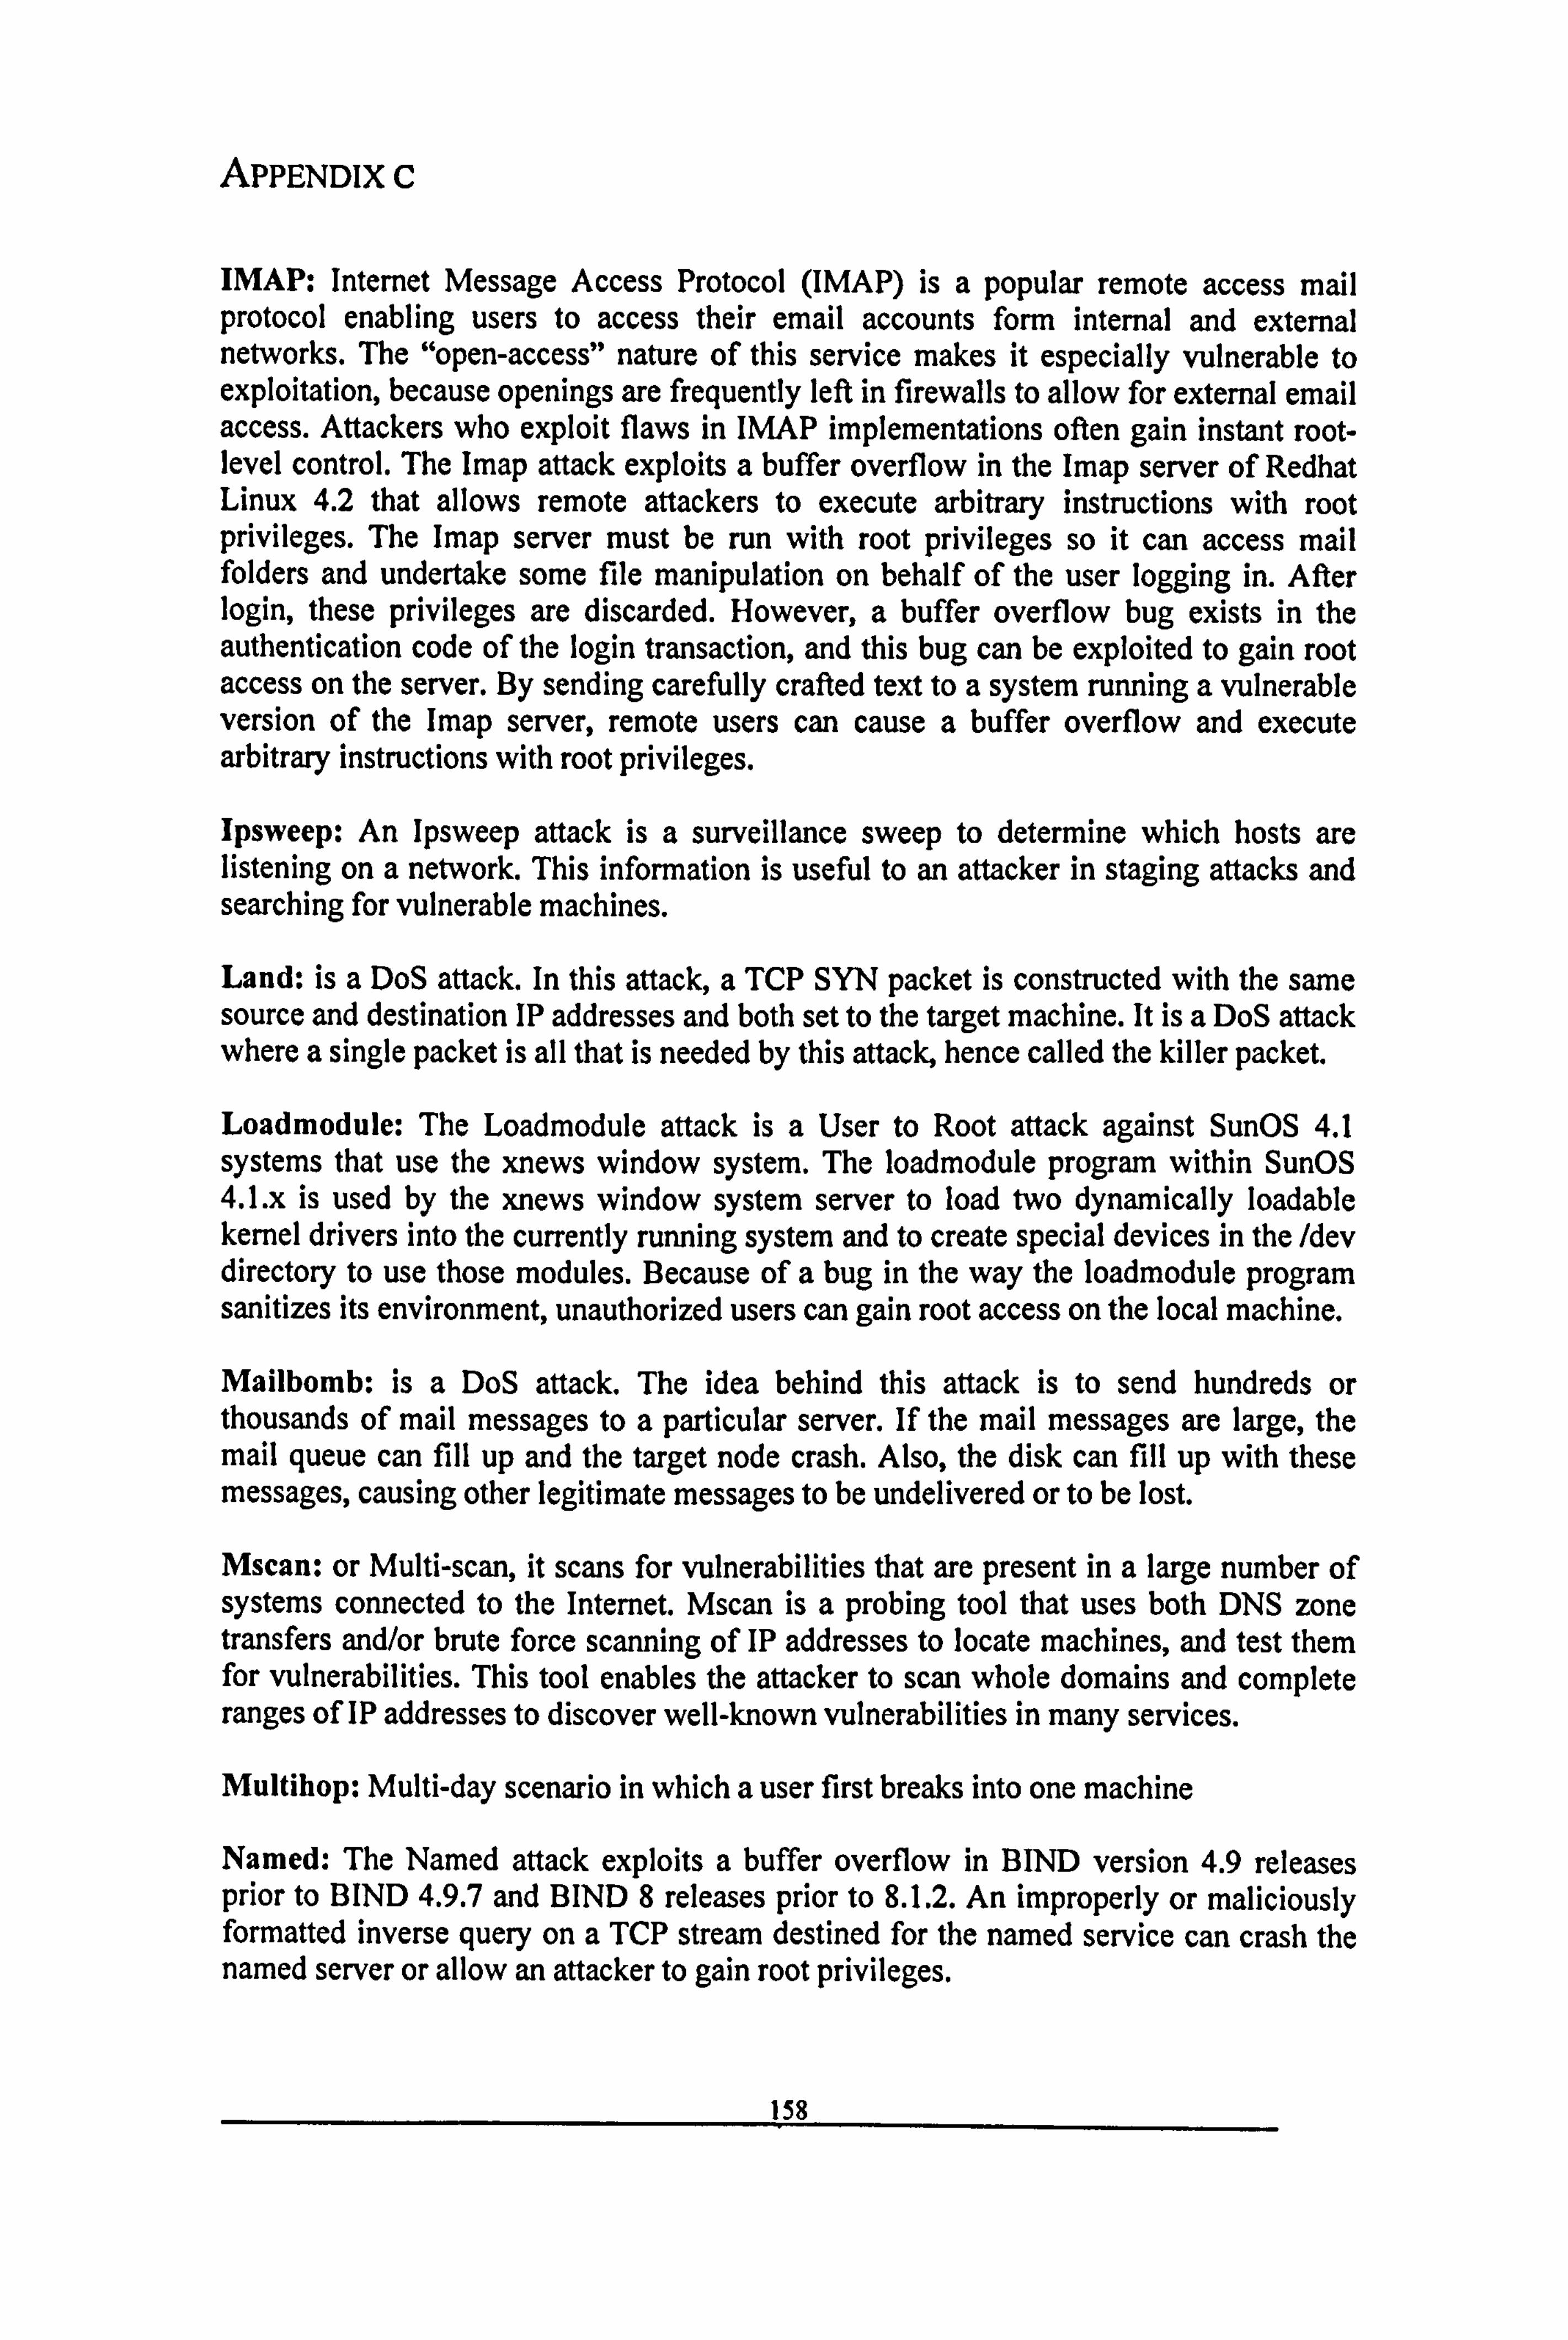
APPENDIX C
IMAP: Internet Message Access Protocol (IMAP) is a popular remote access mail protocol enabling users to access their email accounts form internal and external networks. The "open-access" nature of this service makes it especially vulnerable to exploitation, because openings are frequently left in firewalls to allow for external email access. Attackers who exploit flaws in IMAP implementations often gain instant root- level control. The Imap attack exploits a buffer overflow in the Imap server of Redhat Linux 4.2 that allows remote attackers to execute arbitrary instructions with root privileges. The Imap server must be run with root privileges so it can access mail folders and undertake some file manipulation on behalf of the user logging in. After login, these privileges are discarded. However, a buffer overflow bug exists in the authentication code of the login transaction, and this bug can be exploited to gain root access on the server. By sending carefully crafted text to a system running a vulnerable version of the Imap server, remote users can cause a buffer overflow and execute arbitrary instructions with root privileges.
Ipsweep: An Ipsweep attack is a surveillance sweep to determine which hosts are listening on a network. This information is useful to an attacker in staging attacks and searching for vulnerable machines.
Land: is a DoS attack. In this attack, a TCP SYN packet is constructed with the same source and destination IP addresses and both set to the target machine. It is a DoS attack where a single packet is all that is needed by this attack, hence called the killer packet.
Loadmodule: The Loadmodule attack is a User to Root attack against SunOS 4.1 systems that use the xnews window system. The loadmodule program within SunOS 4.1. x is used by the xnews window system server to load two dynamically loadable kernel drivers into the currently running system and to create special devices in the /dev directory to use those modules. Because of a bug in the way the loadmodule program sanitizes its environment, unauthorized users can gain root access on the local machine.
Mailbomb: is a DoS attack. The idea behind this attack is to send hundreds or thousands of mail messages to a particular server. If the mail messages are large, the mail queue can fill up and the target node crash. Also, the disk can fill up with these messages, causing other legitimate messages to be undelivered or to be lost.
Mscan: or Multi-scan, it scans for vulnerabilities that are present in a large number of systems connected to the Internet. Mscan is a probing tool that uses both DNS zone transfers and/or brute force scanning of IP addresses to locate machines, and test them for vulnerabilities. This tool enables the attacker to scan whole domains and complete ranges of IP addresses to discover well-known vulnerabilities in many services.
Multihop: Multi-day scenario in which a user first breaks into one machine
Named: The Named attack exploits a buffer overflow in BIND version 4.9 releases prior to BIND 4.9.7 and BIND 8 releases prior to 8.1.2. An improperly or maliciously formatted inverse query on a TCP stream destined for the named service can crash the named server or allow an attacker to gain root privileges.
158

APPENDIX C
Neptune: or "SYN flood", is a DoS attack that utilizes a half-open TCP connection. When a TCP connection is not completed within a certain time, the connection "times out" and the allocated resources are freed. If enough connections can be initialized before the timeout occurs, the allocated resources are wasted and the data structure can overflow. The generated packets are spoofed in such away that are unreachable, hence, no particular host responds to the SYN/ACK sent by the target node, forcing the TCP connections to stay open. Refer to section 6.4.1 for more details about this attack.
Nmap: is a program that is useful for collecting data no a network. It is a very powerful tool that is designed for security analysis. It performs a various scans on a system or network to detect vulnerable open ports and other security holes. However, it has been used by attackers to gather information about their targeted networks. Nmap is a general-purpose tool for performing network scans. Nmap supports many different types of portscan options include SYN, FIN and ACK scanning with both TCP and UDP, as well as ICMP (Ping) scanning. The Nmap program also allows a user to specify which ports to scan, how much time to wait between each port, and whether the ports should be scanned sequentially or in a random order. This tool operates by sending different packets to the target node or nodes and monitoring what comes back. For example, it sends packets to a list of ports to determine what services are active. In order to do that, it can use stealthy techniques, such as sending only the SYY flag, the so called "half-open" or SYN scan. It can also send packets with strange flag combinations such as SYN and FIN both set. The purpose of these is to see how the target node and/or its operating system will react. This is known as operating system fingerprinting.
Normal: characterizes a normal network traffic by legitimate users
Perl: The Perl attack is a User to Root attack that exploits a bug in some Perl implementations. Suidperl is a version of Perl that supports saved set-user-ID and set- group-ID scripts. In early versions of suidperl the interpreter does not properly relinquish its root privileges when changing its effective user and group IDs. On a system that has the suidperl, or sperl, program installed and supports saved set-user-ID and saved set-group-ID, anyone with access to an account on the system can gain root access.
Phf: It is an exploit scan that targets Web servers. The Phf attack abuses a badly written CGI script to execute commands with the privilege level of the http server. Any CGI program which relies on the CGI function escape_shell_cmd () to prevent exploitation of shell-based library calls may be vulnerable to attack. In particular, this vulnerability is manifested by the "phf' program that is distributed with the example code for the Apache web server. The attacker is trying to execute a Web CGI-bin on PHF: PHF is a tool that was run on Apache Web servers. It enabled visitors to search phonebook listings. This exploit, however, would allow the attacker to execute arbitrary commands. PHF has a listing in the CVE (Common Vulnerabilities and Exposures) database (under CVE-1999-0067).
Pod: is a DoS Ping of Death attack that affects many operating systems. It has been widely reported that some systems will react in an unpredictable fashion when receiving oversized IP packets. Possible reactions include crashing, freezing, and rebooting.
159

APPENDIX C
Portsweep: Surveillance sweep through many ports to determine which services are supported on a single host.
Processtable: is a novel DoS attack and developed by MIT Lincoln Lab to be used as part of a test of intrusion detection systems. The idea behind this attack comes from the fact that each time an incoming TCP connection is received, a process is forked. By initiating many connections, the attacker can fill up the process table. Once the table is full, no new processes can be spawned, hence, nothing can be done on the target node.
Ps: The Ps attack takes advantage of a race condition in the version of 'ps' distributed with Solaris 2.5 and allows an attacker to execute arbitrary code with root privilege. This race condition can only be exploited to gain root access if the user has access to the temporary files. Access to temporary files may be obtained if the permissions on the /tmp and /var/tmp directories are set incorrectly. Any users logged in to the system can gain unauthorized root privileges by exploiting this race condition.
Rootkit: Multi-day scenario where a user installs one or more components of a rootkit
Saint: SAINT is the Security Administrator's Integrated Network Tool. In its simplest mode, it gathers as much information about remote hosts and networks as possible by examining such network services as finger, NFS, NIS, ftp and tftp, rexd, statd, and other services. The information gathered includes the presence of various network information services as well as potential security flaws. These flaws include incorrectly setup or configured network services, well-known bugs in system or network utilities, and poor policy decisions. Although SAINT is not intended for use as an attack tool, it does provide security information that is quite useful to an attacker. SAINT's behaviour is controlled by a configuration file which allows the user to specify several parameters. The most important parameters are the list of machines to scan, and how heavily to scan these machines (light, normal, or heavy). In light mode, SAINT will probe the victim for dns and rpc vulnerabilities and will look for unsecured NFS mount points. In normal mode SAINT will also check for vulnerabilities in fingerd, rusersd, and bootd, and will perform a portscan on several tcp (70,80, ftp, telnet, smtp, nntp, uucp) and udp (dns, 177) ports. Heavy mode is the same as normal mode except that many more ports are scanned. A Saint scan of a network leaves a distinct signature that will vary depending on the level of scanning being performed. The Saint program performs each scan in a nearly deterministic fashion. To identify a Saint scan, an intrusion detection system needs to be able to recognize the distinct set of network traffic the scan creates.
Satan: is a popular integrity-scanning tool. It is a network probing tool which looks for well-known weaknesses. Satan is an early predecessor of the Saint scanning program. While Saint and Satan are quite similar in purpose and design, the particular vulnerabilities that each tools checks for are slightly different. Satan operates at three different levels, where Level 0 is lightest.
Sendmail: The Sendmail attack exploits a buffer overflow in version 8.8.3 of sendmail and allows a remote attacker to execute commands with superuser privileges. By sending a carefully crafted email message to a system running a vulnerable version of sendmail, intruders can force sendmail to execute arbitrary commands with root privilege.
160

APPENDIX C
Smurf: is a DoS attack that consumes Bandwidth (BW). There are three participants in this attack: the attacker, the target, and an amplifying network that is compromised to launch the attack on behalf of the attack originator. The attacker constructs echo request packets (ping) with the target as the source IP address and the amplifying network as the destination IP addresses. The generated packets are broadcasted by the attacker to maximize the number of responding machines. The nodes at the amplifying network all respond to the echo request with packets traffic destined for the targeted machine or network. Due to the large number of incoming packets, the target machine will not be able to process those packets, hence, legitimate connections will be delayed and buffers will be overloaded. Refer to section 6.4.2 for more details about this attack.
Snmpgetattack: A scenario in which an attacker guesses the SNMP community password and remotely monitors router activity. The SNMP password is set to "public" by default, and is often never changed from this default value.
Sqlattack: Gain access to a shell on a remote system by escaping out of Postgres SQL. Once attackers have access to a shell they may execute other exploits to further elevate their privileges.
Teardrop: is a DoS attack that exploits a flaw in the implementation of TCP/IP stacks. In this scenario, the attacker transmits a series of packets in such away look like normal fragmented packets, but those fragments overlap instead of being disjoint. This leads to crashing the target machine.
Udpstorm: is a DoS attack that causes network congestion and slowdown. When a connection is established between two UDP services, each of which produces output, these two services can produce a very high number of packets that can to a DoS on the machines where services are offered. It causes two targeted machines to attack each other. The idea is that there are a number of ports that will respond with another packet if a packet is received. Echo (port 7) and chargen (port 19) are operating like this. Echo will echo the received packet back, while chargen will generate a stream of characters. Let us consider a UDP packet with destination port 19 and source port 7. The packet generates come characters from the destination machine, headed for the echo port of the source machine. The source machine echoes these packets back, generating even more packets, and so on. Eventually, both machines are spending all their time sending packets back and forth until one or both of them go down.
Warezmaster: Anonymous FTP upload of Warez (usually illegal copies of copywrited software) onto FTP server.
Worm: Attacker releases a self-replicating program which gains access to machines by using a priori knowledge of valid usernames and passwords.
Xlock: In the Xlock attack, a remote attacker gains local access by fooling a legitimate
user who has left their X console unprotected, into revealing their password. An attacker can display a modified version of the xlock program on the display of a user who has left their X display open (as would happen after typing 'xhost +'), hoping to convince the user sitting at that console to type in their password. If the user sitting at the machine
161

APPENDIX C
being attacked actually types their password into the Trojan version of xlock the password will be sent back to the attacker.
Xsnoop: In the Xsnoop attack, an attacker watches the keystrokes processed by an unprotected X server to try to gain information that can be used gain local access the victim system. An attacker can monitor keystrokes on the X server of a user who has left their X display open. A log of keystrokes is useful to an attacker because it might contain confidential information, or information that can be used to gain access to the system such as the username and password of the user being monitored.
Xterm: The Xterm attack exploits a buffer overflow in the Xaw library distributed with Redhat Linux 5.0 (as well as other operating systems not used in the simulation) and allows an attacker to execute arbitrary instructions with root privilege. Problems exist in both the xterm program and the Xaw library that allow user supplied data to cause buffer overflows in both the xterm program and any program that uses the Xaw library. These buffer overflows are associated with the processing of data related to the input Method and preeditType resources (for both xterm and Xaw) and the *Keymap resources (for xterm). Exploiting these buffer overflows with xterm when it is installed setuid-root or with any setuid-root program that uses the Xaw library can allow an unprivileged user to gain root access to the system.
162

APPENDIX D
Appendix D: Target Analysis Report
The target analysis report is an editable report for the target node (in this case, the
activity_type node). This report is generated using BayesiaLab and due to its large
content, part of it has been excluded. The main sections of the report are as follows:
1- Marginal probability distribution: Probability distribution of the target variables
when the analysis knowing the observed variables (context).
2- Node relative significance with respect to the information gain brought by the
node on the knowledge of the target node: List of nodes, sorted by descending
order according to their relative contribution to the knowing of the target
variable. The nodes that do not bring any information do not appear in the list.
That corresponds to the target node analysis described above. 3- Node relative significance with respect to the information gain brought by the
node on the knowledge of the target value: For each value of the target, list of
nodes, sorted by descending order according to their relative contribution to the
knowing of the target value (if the node has only two modalities, this list is
identical to the preceding one). The nodes that do not bring any information do
not appear in this list. That corresponds to the target modality analysis described
above. 4- Modal Value: For each influencing node, description of the modal value with
respect to the context and the observed modality of the target node. This modal
value comes with its probability. This section allows establishing the profile of this target value.
5- A priori Modal Value: For each influencing node, description of the modal value
when the target node is unobserved (but knowing the context). That makes it
possible to define the profile when the target variable is unobserved. 6- Variation: Measure indicating the variation between the modal values of the two
profiles. This value is measured only when these values are identical. Positive
values appear in blue and indicate an information gain to the knowledge of the
node value when the target value is observed. Negative values appear in red. 163

APPENDIX D
When the modal value is not equal to the a priori modal value, the modal value
appears in blue.
VýIarginai Probabilities, smurf 55.00% normal 20.30%
neptune 14.90%
snmpgetattack 2.10%
mscan 1.20% snmpguess 1.10%
saint 0.90% satan 0.70%
apache2 0.40%
warezmaster 0.40% pod 0.30%
processtable 0.30%
mailbomb 0.30% guess_passwd 0.20%
udpstorm 0.20%
portsweep 0.20% ftp write 0.20% multihop 0.20% imap 0.20% sqlattack 0.10% rootkit 0.10%
sendmail 0.10% ipsweep 0.10% land 0.10% xterm 0.10% buffer_overflow 0.10%
nmap 0.10% perl 0.10% xsnoop 0.00% xlock 0.00% worm 0.00% teardrop 0.00% loadmodule 0.00% httptunnel 0.00% back 0.00% ps 0.00%
phf 0.00% named 0.00%
164

APPENDIX D
Tode relative significance with respect to the information gain prought by the node on the knowledge of activity_type src bytes 1.0000
service 0.9626
protocol_type 0.8526 dst_host same src_port_rate 0.8142
count 0.8119
srv_count 0.7217 dst_host_diff_srv_rate 0.6805 dst_host_srv_count 0.6224 dst_host_same_srv_rate 0.6212 flag 0.5717 diff_srv_rate 0.5554 dst bytes 0.4164
same_srv_rate 0.3932 dst_host rerror_rate 0.3532 logged in 0.3056
rerror_rate 0.2533
srv_rerror_rate 0.2210 dst_host_srv_rerror_rate 0.2105 dst_host_serror_rate 0.1798 dst_host_count 0.1795
srv_serror_rate 0.1347 dst_host_srv_serror_rate 0.1261 dst_host_srv_diff_host_rate 0.1260
srv_diff_host_rate 0.1213
serror_rate 0.0555 duration 0.0506
num_root 0.0422
num compromised 0.0422
num_file_creations 0.0331
num_access_files 0.0291 is_host_login 0.0157
num failed logins -0.0120 urgent -0.0202 hot -0.0330 land -0.0341 root-shell -0.0345 wrong_fragment -0.0444 is guest login -0.0531 su_attempted -0.0800 num shells -0.0990
165

APPENDIX D
Node relative significance with respect to the information gain brought by , the node on the knowledge of the target value (DoS & normal activities)
activity type,! smurf (55.007. ) -^ýNode FWtight r Modal Value A priori modal value Variation
protocoltypc 1.0000 icmp 100.00% icmp 56.20% 0.8314 src_bytes 0.7716 <1032.000 100.00% <-1032.000 55.90% 0.8391 srv_count 0.9343 >508.000 78.12% >508.000 44.20% 0.8216 dst_host same srcj)ort rate 0.9172 >0.990 100.00% >0.990 56.90% 0.8135 service 0.8708 ecr i 99.98% ecr i 37.70% 0.7930 count 0.6 990 >302.0 0 079.91% >302.000 45.70% 0.8062 dst host_srvcount 0.4-816F>254 000 99.89% >254.000 68.80% 0.5379 dst_host diff srv_rate 0.4309 <-0.000 100.00% <=0.000 71.10% 0.4920 dst_host_same srv_rate 0.3562 >0.990 99.89% >0.990 75.90% 0.3963 dst bytes 0.3223 <=0.000 99.99% I<0
. 000 77.20% 0.3732 flag 0.2824 SF 100.00% SF 80.70% 0.3094 diff srv_rate 0.2373 <-0.045 99.89% <-0.045 82.40% 0.2778 logged
_in 0.2017 100.00% F O-1 0.2601
same_srv_rate 0.1996 >0.995 99.89% >0.995 82.80% 0.2708 dst_host rerror_rate 0.1879 X0.000 100.00% <=0.000 85.00% 0.2344 rerror rate 0.1671 <=0.000 100.00% <-0.000 86.00% 0.2092
srv rerror rate 0.1539 <0.070 100.00% <=0.070 87.00% 0.2009 dst_host srv_rerror rate 0.1534 <=0.000 99.99% <=0.0 0F 87.10% 0.1991 dst host count 0.1280 >254.000 99.99% >254.000 87.60% 0.1909 dst_host_srv_diff host rate 0.1070 <-0.000 100.00% <=0.000 89.80% 0.1552 dst_host senor rate 0.0931 < 0.000 100.00% <=0.000 91.00% 0.1360
srv_serror rate 0.0863 <=0.000 99.89% <=0.000 91.80% 0.1219
senor rate 0.0833 <=0.000 99.89% <=0.000 92.00% 0.1188 dst_host srv senor rate 0.0820 < 0.000 100.00% <=0.000 92.10% 0.1187
srvdiff host_rate 0.0598 <=0.000 100.00% <=0.000 93.80% 0.0923 duration 0.0389 <=0.000 99.87% <=0.000 95.20% 0.0691 hot 0.0030 <=0.000 100.00% <=0.000 99.20% 0.0116
root shell -0.00 9 F0 100.00% 0 99.60% 0.0058 is_guest_login -0.004610
- 100.00% r_ 99.70% 0.0043
num_compromised -0.0046 <-0.000 99.99% <=0.000 99.70% 0.0041
wrong_fragment _ F-0.006_3 FO 100.00% 0 99.90% 0.0014 num shells -0.0063 <-0.0 00 100.00% <=0.0 00 P-6666% 0.0000 num root -0.0067 <=0.000 100.00% <=0.000 99.90% 0.0014 urgent -0.0067 <-0.000 100.00% <=0.000 99.90% 0.0014
su_attempted -0.0067 0 100.00% [OF 100.00% 0.0000 num failed Jogins -0.0068 <=0A00 99.99% <=0.0 0 F79-9. io
o 0.0013
num file creations [-0.0074 <=0.000 100.00% <=0.000 100.00% 0.0000 land ýý^
-0.0075 j0 100.00% [0-100.00% 0.0000
166

APPENDIX D
num access_files '[--0-. 0076 <-0.000 100.00% <=0.000 100.00% 0.0000 is_host login -0.007710 100.00% r 100.00% 0.0000
, », < :.,
_ _,, « ,., actiyitY_type normal (2030%) -. .. ý. ', ';;; Node Weight Modal Value A priori modal value Variation
service 1.0000 ihttp 57.29% ecr i 57.70%
src bytes 0.9168 <=504.000 93.90% <=/032.000 55.90% f-
count 0.8331 <=88.000 48.64% >302.000 45.70% dstbytes 0.7374 >293.000 63.42% <=0.000 -77.20%1
dst_host_same_src_port rate 0.6639 <-0.000 38.64% >0.990 56.90% logged_in 0.64401 71.47% r0- 83.50% 1
protocol_typc 0.5517 tcp 73.82% icmp 56.20% rsrv_count 0.4630 <=82.000 56.82% >508.000 44.20%
srv_diffhost rate 0.2960 <=0.000 63.21% <=0.000 93.80% -0.5246 dst host count 0.2921 >254.000 46.35% >254.000 87.60% -0.9183 dst host srv_diff host rate 0.28 1 [X0.000 52.45% <=0.000 89.80% -0.7757 dst_host srv_count 0.1515 >254.000 58.17% >254.000 68.80% -0.2 222 dst_host_rerror rate 0.0952 X0.000 98.50% <=0.000 85.00% 0.2126 flag 0.0903 SF 99.93% SF 80.70% 0.3083 dst_host diff srv_rate 0.0887 X0.000 70.75% <=0.000 ,
71.10% -0.0071 dst host srv_serror rate 0.0557 r<--0.000 97.88% <=0.000 92.10% 0.0878 dst host srv_rerror rate 0.0370 <=O. 000 98.76% <=0.000 87.10% 0.1813 dst host same_srv_rate 0.0318 >0.990 80.82% >0.990 75.90% 0.0905 serror rate 0.0 881 <=0.000 99.86% <=0.000 92.00% 0.1183 same_srv_rate 0.0112 >0.995 98.74% >0.995 82.80% 0.2540
srv_rerror rate 0.0056 [x. 070 99.86% <=0.070 87.00% 0.9989 dst_host serror rate Ö. 0037 ý0.000 97.67% <=0.000 91.00% 0.1021 rerror rate 0.0022 . 000 99.79% <=0.000 86.50% 0.2062 land -0.0112
10 -100.00% 100.00% 0.0000 hot -0.0263 <=0.000 99.11% <=0.000 99.20% 0.0059 num shells -0.0335 <=0.000 100.00% <-0.000 100.00% 0.0000 su attempted -0.0442
r0-r1-O0-. 00% to 100.00% 0.0000
num_compromised -0.4453 X0.000 99.96% <=0.000 99.70% 0.0038 is_host login -0.05 44 IÖ 100.00% 100.00% 0.0000 diff srv_ratc -0.0515 <-0.045 98.89% <=0.045 82.40% 0.2631 is_guest_login -0.035810 100.00% 99.70% 0.0043
root_shell -0.0559 r0 99.99% 0 99.60% 0.0056
num_file creations -0.0581 X0.000 100.00% <=0.000 100.00% 0.0000 srv_serror rate -0.0584 <ý. 000 99.86% <=0.000 91.80% 0.1214 duration -0.0752 X0.000 95.05% <=0.000 95.20% -0.0023 wrong fragment -0.0994 _0 99.99% 99.90% 0.0013 num_access_files 1
-0.1010 <=0.000 99.57% <=0.000 100.00% -0.0062 num_failed_logins -0.1 114 <=0.0 00r 99.88% <-0.0 0r 99.90% 0.0011
167

APPENDIX D
urgent -0.1142 < 0.000 99.99% <=0.000 99.90% 0.0013
num root -0.1370 < 0.000 100.00% <=0.000 99.90% 0.0014
Node weight Modal Value A priori modal value Variation flag 1.0000 64.60% SSF 80.70% diff srv_ratc 0.9939 <=0.240 97.70% <=0.043 82.40% ý
same_srv_ratc 0.9546 <-0.325 95.74% >0.995 82.80" r-
dst_host_samc_srv_rate 0.9453 F<--0.080 96.57% >0.990 75.90% f^
dst host diff srvrate 0.9335 >0.040 97.71% <-0.000 71.10%
src bytes 0.9 557 <-1.000 99,95% <=1032.000 SS. 90% f--
dst host srv_count 0.9136 <-20.000 90.70% >254.000 68.80%
service 0.7128 private 90.77% ecr t 57.70% dst_host same src_port_rate 0.5847 [<--0.000 97.83% >0.990 56.90% dsthost rerrorrate 0.4601 >0.970 66.13% <-0.000 85.00%
count 0.4558 «302.000 93.53% >302.000 45.70% r
protocol_type 0.4333 tcp 98.28% icmp 56.20%
srv_rerror rate 0.4172 >0.990 66.27% <-0.070 87.00%1
srv_count - [-0-. 4159[<--82000 [-82.27% F>508000 44.20% dst_host_srv_rerrorraty 0.3840 >0.980 66.33% <=0.000 87.10% r-
rerrorrate .. 35 6 [>0.9 80r 65.73% <=0.000 86.50%
senor rate 0.1104 k0.000 63.75% <=0.000 92.00% -0.4846 dst host srvserror rate 0.1054j<-0.000 67.73% <=0.000 92.10% -0.4435 dst host serror rate 0.0523 X0.000 65.54% <-0.000 91.00% -0.4734 srv_serror rate 0.0271 <Z000 67.11% <=0.000 91.80% -0.4519 dst_bytes -0.0393 [0.000 96.40% <=0.000 i, 77.20% 0.320 3 dst_host srvdiff host rate -0.0669 < 0.000 99.32% <-0.000 89.80% 0.1454
urgent -0.0790 X0.000 100.00% <-0.000 99.90% 0.0014
num_shells -0.0888 X0.000 100.00% <=0.000 100.00% 0.0000 hot 1-0.0927 Z-0.000 99.23% <=0.000 99.20% 0.0004 is_host_login -0.0932 0 100.00% r 100.00% 0.0000
root shell -0.1039 100.00% r 99.60% 0.0058 is-guest login -0.1074
[0 98.97% r 99.70% -0.0106 su attempted 110 100.00% r-I100.00% 0.0000 logged in -0.1138
j- 97.78% r 83.50% 0.2278
wrong_fragm7nt -0.1 44710 000.00% o 99.90% 0.0014
num file creations -0.14 6 [<-0.0 00 99.96% <=0.000 100.00% -0.0006 num compromised -0.1422 <-0.000 99.96% <=0.000 99.70% 0.0037 land 1-0.1454 10 100.00% r 100.00% 0.0000 dst host_count -0.1582 >254.000 98.04% >254.000 87.60% 0.1624 duration -0.16 4 r<-0.000 99.54% <=0.000 95.20% 0.0642
num_failed_logins -0.1694 <-0.000 99.96% <=0.000 99.90% 0.0008
num_access_files -O. 1707 <-0.000 99.99% < 0.000 ; 100.00% -0.0002
168

APPENDIX D
srvdiff host ratc -0.2244 <=0.000 98.84% <=0.000 93.80% 0.0756
num root -0.2291 X0.000 100.00% <-0.000 99.90% 0.0014
activitytype = apache2 (0.40*/9) Node Weight Modal Value A priorl modal value Variation
dst_host_rerror rate 1.0000 < 0.970 85.19% <=0.000 85.00% flag 0.6675 RSTR 65.99% SýF 80.70% r-
dst_hostcount 0.6376 >254.000 84.53% >254.000 87.60% -0.0515 wrong_fragment 0.47 33 J- 99.64%Jo 99.90% -0.0038 hot 0.4788 < 0.000 99.94% <=0.0 0 r-99 20% 0.0107 dst host srv_rerror rate 0.4047 r<--0.000 45.44% <=0.0 00 87.10% -0.9388 dst host diff srvrate 0.3592 <-0.030 52.85% <=0.000 71.10% F^
dst host_srv_count 0.3423 <-254.000 48.90% >254.000 68.80%
serrorrate 0.3201 <-0.000 44.88% <-0.000 92.00% -1.0356 service 0.2936 ýhttp 79.48% ecr ! 57.70%
root_shell 0.2357 i J[-99.67% J 99.60% 0.0010
is_guest login 0.2342 ý 99.78% r0 99.70% 0.0011
protocol_typc 0.2303 tc 96.68% icm 56.20%
num_compromised 0.2246 <-0.000 98.46% <=0.000 99.70% -0.0181 rerror rate 0.2163 X0.000 41.11% <=0.000 r86.50%[7-1.0733
same srvrate 0.1200 >0.995 79.86% >0.995 82.80% -0.0522 duration 0.1175 >2.000 63.34% <=0.0 0' 95.20% dsthost srv _serror rate 0.1008 X0.000 41.87% <=0.000 92.10% -1.1371' logged in 0.0611 79.25% r 83.50%
srv count 0.0173 X82.000 41.85% >508.000 44_20%
urgent 0.0010 X0.000 99.89% <=0.000 99.90% -0.0001 num file creations T 0.0008 X0.000 99.74% <-0.000 100.00% -0.0038 num toot 0.0004 <-0.000 ! 99.58% <=0.000 99.90% -0.0046 land -0.0000
Jo 100.00% 100.00% 0.0000 is host login ^
-0.0001 0 100.00% 10 100.00% 0.0000 dst bytes -0.0008 >293.000 63.41% <=0.000 77.20% dst host same src_port_rate -0.0220 <-0.000 96.67% >0.990 56.90% r-
dst host serror rate -0.0861 X0.780 45.60% <=0.000 91.00% r
diff srv_rate -0.0934 <-0.045 86.28% <=0.045 82.40% 0.0664
src bytes -0.1156 >1032.000 52.30%J<-1032.000 ,
55.90%r-
srv diff host rate -0.1240 <=0.000 70.96% <=0.000 93.80% -0,4026 srvrerror rate -0.157 <-0.950 33.18% <=0.0 00 87.00% -
count -0.1672 <=88.000 43.53% >302.000 45.70%
num access files -0.2004 <Z. 000 99.24% <=0000 ; 100.00% -0.0110 num shells -0.2228 X0.000 99.94% <=0.000 100.00% -0.0008 num_failed Logins -0.2273 <-0.000 98.68% <=0.0 00 ; 99.90% -0. U 178
su attempted -0.4372 r0 99.86% J 100.00% -0.0020
dst host_same srv rate -0.5640 >0.990 50.74% >0.990 75.90% -0.5810
169
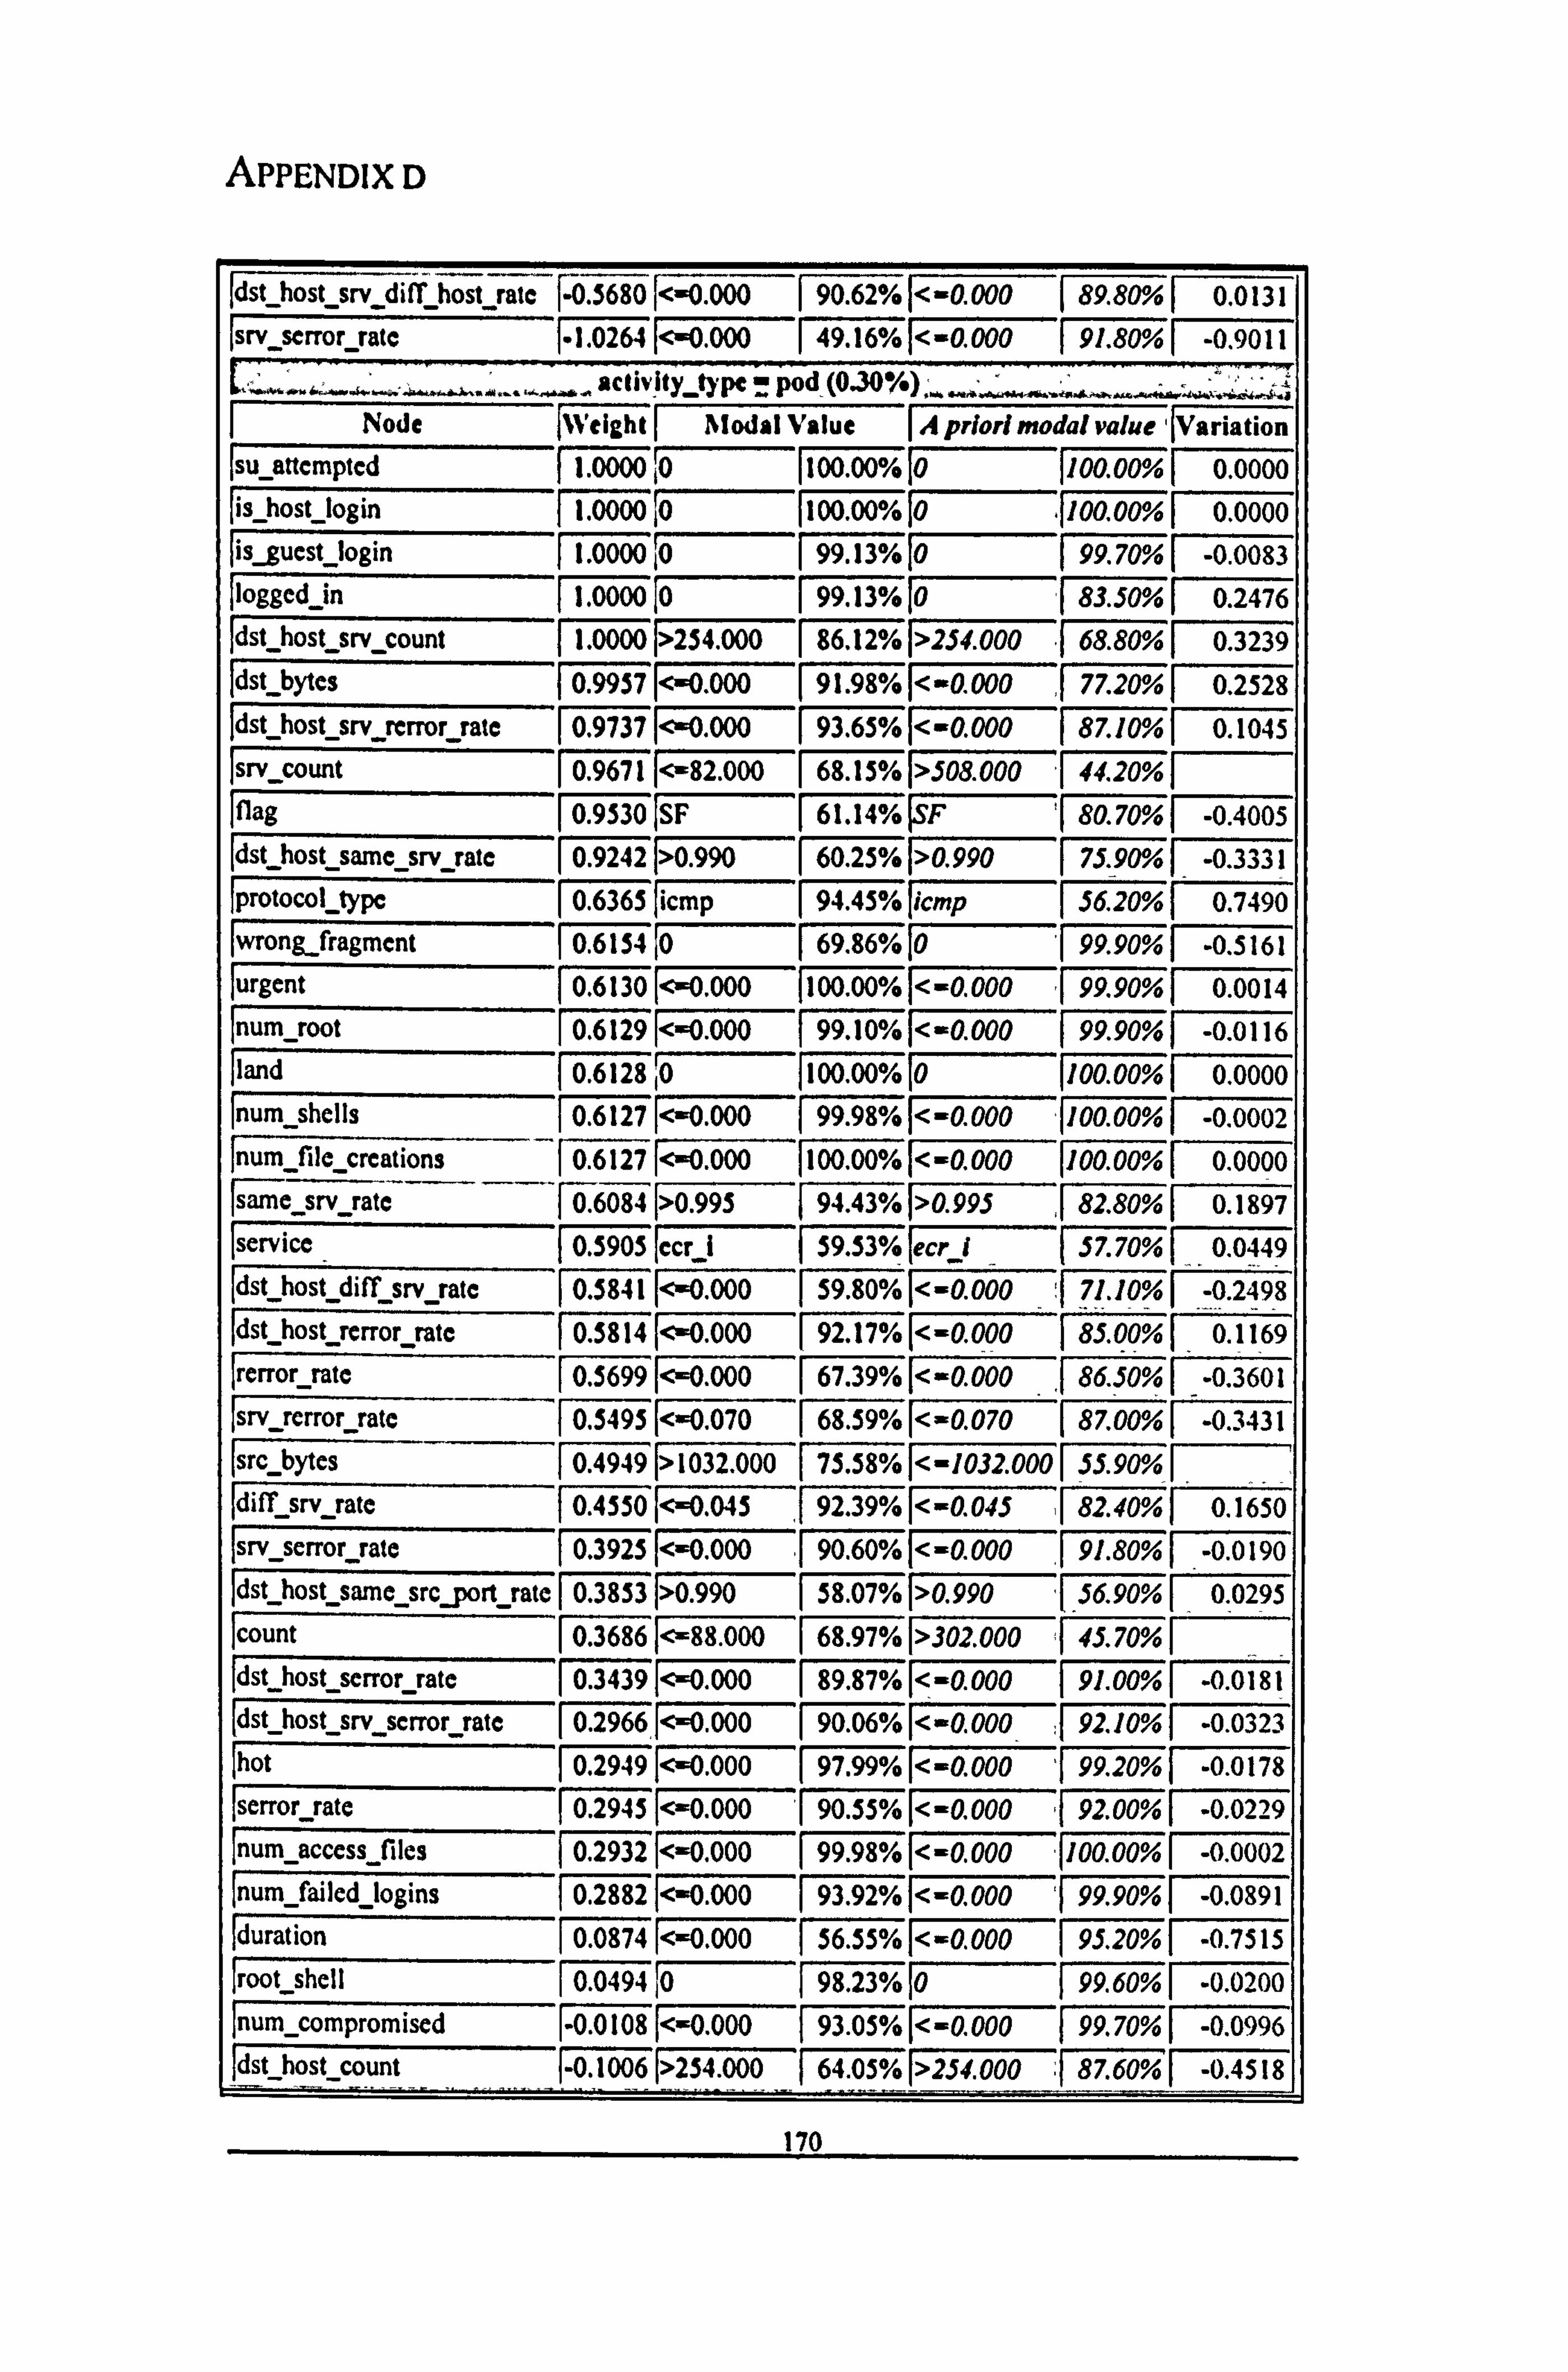
APPENDIX D
dst host srvdift host rate r-O. S680 <kp00 90.62% <-0.000 89.80% 0.0131
srv serror rate "1.0264 <<0.000 49.16% <s0.000 91.80% -0.9011 type-
Node 1Veight Modal Value A priori modal value Variation
su_attempted 1.0000 �0 1100.00-/. 10 100.00% 0.0000 is_host login 1.0000 55 100.00% 0-ý 100.00% 0.0000 is_guest login 1.0000 ý5- 99.13% 99.70% -0.0083 logged in 1.0000 1 99.13% 0- 83.50% 0.2476 dst host srv count 1.0000 >254.000 86.12% >254.000 68.80% 0.3239 dst bytes 0.9957 -0.000 91.98% <-0.000 77.20% 0.2528 dst host_srv_rerror rate 0. -9 7 3-7 F<-0.000 93.65% <-0.000 87.10% 0.1045 srv_count 0.967! X82.000 68.15% >508.000 r44.20%1
flag 0.9530 SF 61.14% FF 80.70% -0.4005 dst host samc_srv_rate 0.92 2 r>0.990 60.25% >0.990 75.90% -0.3331 protocol_type 0.6365 is pf 44.45% kmp 56.20% 0.7490 wrong fragment 0.6134 0 69.86% [0 99.90% -0.5161 urgent 0.6130 <-0.000 100.00% <-0.000 99.90% 0.0014 num_root 0.61 9 7<-0.000 99.10% <-0.000 99.90% -0.0116 land 0.6128 ßr0 100.00% 100.00% 0.0000 num shells 0.6127 <-0.000 99.98% <-0.000 100.00% -0.0002 Inum file
_creations- 0.6127 <-0.000 100.00% <<0.000 100.00% 0.0000
same srv_rate 0.6084 >0.995 94.43% >0.995 82.80% 0.1897 service 0.5905 ecr i 59.53% ecr t 57.70% 0.0449 dst host diff srv rate 0.5841 <-0.000 59.80% <-0.000 71.10% -0.248 dst host rerror rate 0.5814 <-0.000 92.17% <-0.000 85.00% 0.1169 rerror rate 0.5699 <-0.000 67.39% <=0.000 86.50% -0.3601 srv_rerror rate 0.5495 <-0.070 68.59% <=0.070 87.00% -0.3431 src bytes 0.4949 > 1032.000 75.581? Io<-1032.000 55.90% diff srv_rate 0.4550X0.045 92.39% <-0.045 82.40% 0.1650 srv_serror_rate 0.3925 <-0.000 90.60% <-0000 91.80% -0.0190 dst host same_src. j)ort_rate 0.3853 >0.990 58.07% >0.990 56.90% 0.0295 count 0.3686 X88.000 68.97% >302.000 V 45.70% r
dst host senor rate 0.3439 <-0.000 89.87% <<a000 91.00% -0.0181 dst_host srv_senror rate 0.2 666 [<-0.000 90.06% <e0.000 92.10% -0.0323 hot 0.2 449 <-0.000 97.99% <-0.0 0' 99.20% -0.0178 serror rate 0.2945 X0.000 00.55% <<0.000 92.00% -0.2229 num_access_files 0.2932 [<-0.000 99.98% <<0.000 100.00% -0.0002 num_failed logins 0.2882 X0.000 93.92% <=0.000 99.90% -0.0891 duration 0.0874 X0.000 56.55% <-0.000 95.20% -0.5515 root shell 0.04 44 5 98 223% 0 99.60% -0.0200 num_compromised -0.0108 <-0.000 93.05% <<0.0 0r 99.70% -0.9996 dst_host count -0.1006 >254.000 64.05% > 54.000 V 87.60% -0.4518
170

APPENDIX D
dst_host_srv _diff
host rate -0.5176 <-0.000 67.55% <=0.000 89.80% -0.4108 srv diff host rate -0.5505 <=0.000 ! 95.33% <=0.000 93.80% 0.0233
Node Weight Modal Value A priori modal value Variation Isu_attempted 1.0000 0- 100.00% [0 100.00% 0.0000
num_access_files 1.00 0 r<=0.000 98.88% <=0.000 100.00% -0.0163 is_host_login 1.0000 100.00% I0 100.00% 0.0000
urgent 1.0000 <=0.000 99.93% <=0.000 99.90% 0.0004
root_shell 1.00001 98.81 % [0 99.60% -0.0115 dst_host_same_src_port_rate 0.9996 <=0.000 74.15% >0.990 56.90%
srv_serror rate 0.9633 <=0.000 88.51% <=0.000 91.80% -0.0526 rerror rate 0.9242 <=0.000 83.03% <=0.000 86.50% -0.0591" dst host srvrerror rate 0.8588 <=. 000 [-63.25%r<-9.000_ 87.10% -0.4617 dst_host_diff srv_rate 0.7600 <=0.040 51.25% <=0.000 71.10% duration 0.7425 <=1.000 64.69% <=0.000 ". 95.20% ý-
logged_in 0.71811 64.51% [0 - 83.50% -0.3722 service 0.6849 ecr i 49.52% ecr 1 57.70% -0.2205 src_bytes 0.6801 >1032.000 ir -82.00% <=1032.000 55.90% dst_host_srv_serror rate 0.6180 <=0.000 89.49% <=0.000 92.10% -0.0414 land 0.6128 ý0 > 100.00% 0 100.00% 0.0000
num_fle_creations 0.6127 <=0.000 99.86% <=0.000 100.00% -0.0020 num_root 0.6125 <=0.000 99.44% <=0.000 99.90% -0.0067 diff srv_rate 0.6078 <=0.045 83.06% <=0.045 82.40% 0.0115 dst_host_rerror_rate 0.5850 <=0.070 65.05% <=0.000 85.00% [
srv_rerror rate 0.5700 <=0.070 86.94% <=0.070 87.00% -0.0010 ýserror_rate 0.5675 <=0.000 87.88% <=0.000 92.00% -0.0661 dst host_srv_count -x0.5438 <=254.000 66.80% >254.000 68.80%
srvcount 0.5089 <=3.000 66.53% >508.000 44.20%
srv_diff host rate 0.4703 <=0.000 91.10% <=0.000 93.80% -0.0421 dst_host count 0.3113 >254.000 78.29% >254.000 87.60% -0.1622 hot 0.29 8 r<=0.000 99.93% <=0.000
_ 99.20% 0.0106
wrong_fragment 0.2943 0 97.90% [0 99.90% -0.0292 protocol_type 0.2942 tep 57.27% icmp 56.20% is_guest_login 0.2939 0 100.00% FO -[-9-9o 0.0043
num_shells 0.2935 <ý. 000 _
99.93% <=0.000 100.00% -0.0010 same_srv rate 0.2917 >0.995 81.03%0 >0.995 82.80% -0.0312 flag 0.2907 (S-F ^ 83 19% [S-- 80 70% 0.0438
num_failed_logins 0.2882 <-0.000 96.08% <=0.000 99.90% -0.0563 num_compromised 0.2807 <=0.000 94.05% <=0.000 99.70% -0.0842 dst_host srvdiff_host_rate ; 0.2721 <--ý. 000 87.67% <=0.000 89.80% -0.0346 dst_host serror rate 0.2533 <=0.000 86.13% <=0.000 91.00% -0.0 993 dst host
_same srv_rate 0.24 2 [<=0.970 ý 55.38% >0.990 75.90% =
171

APPENDIX D
count 0.2240 <=3.000 61.42% >302.000 ; 45.70% r--
dst bytes .. 0513 <=0.000 54.77% <=0.0 0.77.20% -0.4951
. �Fsýýzý :. ý. Wý ' . em activih_type a udpatorm (0.20%) . "ßiä a.
' s. _ä ßa, I Node Weight Modal Value A priori modal value j Variation logged_in 1.0000 0 99.15% 83.50% 0.2479
wrong _fragment
1.0000 [0 100.00% jo 99.90% 0.0014 land 1.000010 100.00% 1100.00% 0.0000 is_guest_login 1.0000 0^ 100.00% r0 99.70% 0.0043
num_shells 1.0000 F<=-0.000 100.00% <=0.000 100.00% -0.0000 su_attempted 1.0000 99.15% 0 100.00% -0.0123 urgent 1.0000 <=0.000 97.45% <=0.000 99.90% -0.0359. dst host srv
_count 0.9996 <=254.000 46.15% >254.000 68.80% ý
dst host same_srv _rate
0.9976 <=0.970 29.02% >0.990 75.90% ý-
dst_host_srv_serrorrate 0.9946 <=0.000 47.88% <=0.000 92.10% -0.9438 num_compromised 0.9796 r<-=O. 000 90.67% <=0.000 99.70% -0.1370 ldst host srv_rerror rate 0.4428 <=0.000 62.35% <=0.000 87.10% -0.4823 rdst_host
count 0.9215 >254.000 66.86% >254.000 8760% -0.3898 dst host serror rate 10.8532 <=0.000 30.76% <=0.000 91.00% -1.5647 dst host diff srv rate 0.8060 >0.040 38.42% <=0.000 71.10% [-
srv_rerror rate 0.7958 0.070 48.74% <=0.070 8700% -0.8359 _ flag 0.7742 SF 14.52% Si 180.70% -2.4744 srv_count 0.7474 <=3.000 53.09% >508.000 44.20%
same_srv_rate 0.7133 >0.995 52.18% >0.995 82.80% 0.6663 duration 0.6745 <=1.000 51.76% 0.000 95.20% ý-
srv_serror rate 0.6441 <=0.000 47.87% <=0.000 91.80% -09394 dst host_same- srcvort
_rate 0.6395 <=0.020
, 26.52% >0.990 56.90% r-
hot 0.6310 <-0.000 53.07% <=0.000 99.20% -0.9025 serror rate 6.6124 <=0.000 39.33% <=0.000 . 92.00% -1.2261 num_root . 6026 <=0.000 97.44% <=0.000 99.90% -0.0360 dst host rerror_rate 0.5677 <=0.000 34.18% <=0.0 0r 85.00% -1.3142 diff_srv_rate . 0.5547 <=0.045 40.16% <=0.045 82.40% -1.0368 root_shell 0.5218 j 88.90% 1 99.60% -0.1640 count 0.49 18 F<---3.000 31.71% >302.000 Ö 45.70% r
rerror rate 0.4862 <=0.000 38.51% <=0.000 86.50% -1.1675 dst host srv_diff_host_rate 0.4633 <=0.000 85.55% <=0.000 89.80%' -0.0699 num_failed_logins 0.4424 <=0.000 93.21% <=0.000 99.90% -0.1000 service 0.4160, ecr i 73.82% re-c; 71
_ 57.70% 0.3554
src bytes 0.4006 <=1.000 28.22% <=1032.000 55.90% protocol type 7 0.3988 udp 37.64% icmp 56.20% is host_login -0.0 001 0 99.15% 100.00% -0.0124 num_file_creations -PO-0005 <=0.000 ! 100.00% <=0.000 100.00% 0.0000 dst_bytes -0.0823 <=0.000 88.67% <=0.0 0f 77.20% 0.9999
172

APPENDIX D
num_access_files -0.4166 <=0.000 99.99% <=0.000 100.00% -0.0001 srvdiff host rate -0.4459 <=0.0 0 86.42%<=0-000 93.80% -0.1182"
activity_t pe. ýland Node Weight Modal Value A priori modal value Variation
num_access _files
1.0000 <=0.000 99.52% <=0.000 100.00% -0.0069 root_shell 1.00 0 [0 94.72% 10 99.60% -0.0725 is_host login 1.000010 99.76% r? 100.00% -0.0035 is_guest_login 1.0000 99.27% FO-; 99.70% -0.0062 urgent 0.9999 <=0.000 99.28% <=0.000 99.90% -0.0089 num_root 0.9999 <=0.000 98.77% <=0.000 ,,
99.90% -0.0164 num_failed_logins 0.9830 <=0.000 91.71% <=0.000 99.90% -0.1234 hot 0.9811 <=0.000 82.83% <=0.000 99.20% -0.2602 srv_serror rate 0.9728 >0.530 52.90% <=0.000 91.80% dst_host srv_serrorrate 0.9634 <=0.000 36.04% <=0.000 92.10% -1.3538 dst_host_rercor_rate 0.9137 <=0.000 55.62% <=0.000 85.00% -0.6118 dst_host_count 0.8983F>254.000 7 1.59% >254.000 87.60% -0.2912 dst host srvcount 0.8398 >254.000 38.01% >254.000 68.80% -0.8559 flag 0.8076 SO 32.52% SF 80.70% ý
dst_host_sercor rate 0.7967 >0.780 36.85% <=0.000 R 91.00% F
dst host_srv _rerrorrate
0.7767 <=0.000 73.59% <=0.000 87.10% -0.2431 same_srv
_rate 0.7609 >0.995 64.06% >0.995 82.80% -0.3701
diff srv _rate 0.7081 <=0.045 57.90% <=0.045 82.40% -0.5091
senor rate 0.6685 -0.330 41.92% ý<=0-. 000 ^ 92.00%- dst host same src_port-rate' 0.5008 >0.990 49A514>9.990 56.90% -0.4 958 duration
_ 0.4952 <=1.00 45 0° 95.20%
- . 22/0< - 0.000 _-
service 0.3832 ecr i 73.87% ecr t 57.70% 0.3564 dst host_same_srv rate 0.2653 >0.990 52.32% >0.990 75.90% -0.5367 src bytes 0.1553 <=1.000 37.57% <=1032.000 55.90% F
wrong fragment 0.0006 0 99.13% G 99.90% -0.0112 num_file_creations -0.0001 <=6.000 99.88% <=0.000 100.00% -0.0017, dst host_srv_diff_host rate -0.0008 <=0.000 85.59% <=0.000 89.80% -0.0693 terror rate -0.0070 <=0.000 57.06%F<=0.000 86.50% -0.6003 srv_diff host_rate -0.0123 <=0.000 91.13% <=0.000 93.80% -0.0416 protocol_type -0.0135 tcp 58.77% icmp 56.20%
num_compromised -0.0357 <=0.000 91.36% <=0.000 99.70% -0.1261 dst bytes -0.0928 <==0.000 83.95% <=0.000 77.20% 0.2210
srv_count -0.1735 <=3.000 41.73% >508.000 44.20% F
dst_hostdiff srvrate -0.1751 <=0,000 47.21% <=0.000 . 71.10% -0.5907, count -0.1752 <=3.000 28.41% >302.000 45.70% F
srv_rerror rate -0.2844 <=0.070 66.47% <=0.070 87.00% -0.3884 logged_in -0.7590
-98.31% FO- 83.50% 0.2356
su_attempted -0.8246 [ 99.76% j 100.00% -0.0034
173

APPENDIX D
num_shells -0.8246 <=0.000 99.99% <=0.000 100.00% -0.0001 land -0.8246
j 100.00% r "r100.00% 0.0000
activity type=-buffer overflow (0.10%) -
Node Modal Value A priori modal value Variation Weight is_host_login 1.0000 98.39% r0 ! 1100.00% -0.0234 dst host srv_diff host-rate 1.0000 <=0.000 87.85% <=0.0 00 i 89.80% -0.3316 urgent 1.0000 <=0.000 96.68% <=0.000 99.90% -0.0472 dst host_srv_rerror_rate 1.0000 <=0.000 71.62% <=0.000 87.10% -0.2823 is_guest_login 0.9999 0 99.73% 0 99.70% 0.0004
service 0.9822 ecr i 77.46% ecr 1! 57.70% 0.4249 dst host same_srv_rate 0.9752 >0.990 61.46% >0.990 � 75.90% -0.0044 count 0.9119 <=88.000 34.97% >302.000 45.70% r
serror rate 0.9111 =0.000 64.04%F<=9.000 92.00% -0.5226 dst_host count 0.8715 >254.000 74.97% >254.000 87.60% -0.2247 srv_serro-r rate 0.2290 <=0.000 67.60% <=0.000 91.80% -0.4415 dst host_srv_serror rate 0.7959 <=0.000 71.79% <=0.0 00 92.10% -0.3594 dst_host same_src_port_rate 0.6776 >0.990 40.53% >0.990 56.90% -0.4893 same_srv_rate 0.6588 >0.995 74.73% >0.995 82.80% -0.1480 dst_host_serror_rate 0.5542 <=0.000 64.18% <=0.000 91.00% -0.5038 protocol_type 0.4728 tcp 49.70% ýcm-- 56.20% duration 0.3906 <=1.000 45.82% <=0.000 95.20%
src bytes 0.28 8[>1032.000 40.57% <=1032.000 55.90%r-,
num_root 0.2755 <=0.000 91.90% <=0.000 99.90% -0.1204 flag 0.1093 SF 45.30% SF 80.70% -0.8329 root shell 0.0860 [ [77.58%[(- 99.60% hot 0.0330 >2.000 50.33% <=0.000 99.20% logged_in 0.0071 ý- 97.81% [0-� 83.50% 0.2282
wrong fragment 0.0011 ýý 99.23% 99: 90% -0.097 _ su_attempted 0.0000 0 99.39% ro- ; 100.00% -0.0088
num_file_creations -0.0004 <-0.000 99.75% <=0.000 100.00% -0.0037. num_access_files - .. 0 110 000 98.42% "100.00% -0.0229 srv
_diff host rate -0.0073 <-0.000 91.82% <=0.000 93.80% -0.0307
dst bytes -0.0090 <=0.000 84.57% <=0.000 77.20% 0.1316
srv_count -0.1071 <=3.000 38.16% >508.000 44.20% r - dst_host_rerror_rate -0.4830 <=0.000 52.94% <=0.000 r85.00%
-0.6832 dst_host_srv_count -0.5 334 >254.000 47.30% >254.000 68.80% -0.5405 rerror rate -0.5 442 <=0.000 66.20% <=0 000 86.50% -0.3859 diff srv_rate -0.3301 <=0.045 73.70% <=0.045 82.40% -0.6609 num_shells -0.8246 <=0.000 99.88% <=0.000 100.00% -0.0017 land -0.8246
-- 100.00% [0 100.00% 0.0000
num_compromised -0.8533 <=0.000 89.82% <=0.000 99.70% -0.1506 dst_host_diff srv rate -1.0191 <=0.000 60.19% <=0.0 00 71.10% -0.2402
174

i4
hI6i
APPENDIX D
srv_rerror rate -1.3111 <ý. 070 70.451. F< =0.070 87.00% -0.3043 nur failed logins -1.59 8 F<
. 000 93.33% <=0.000 99.90% -0.0981 '. activity_type -teardrop (0.00%), ',,, '; :,; ,,.. ". ý
Node Height Modal Value priori modal value Variation land F? 0 100.00% 100.00% 0.0000 dst_bytes ? <=0A00 84.05% <=0.0 0 077.20% 0.1226 is_host_login [_ ?0 99.24% 0 100.00% -0.0110 protocol_type udp 70.84% icmp 56.20% F_
srv diff host_rate -? <=0.000 96.99% <=0.000 93.80% 0.4482 logged_in .?
Fo 100.00% 83.50% 0.2602 num_root -? <=0.000 98.45% <=0.000 99.90% -0.0 110 diff srv
_rate -? <=0.045 66.38% <=0.045 82.40% -0.3118, dst_host_rerrorrate r
-? <-0.000 46.99% <=0.000 85.00% -0.8553 serror rate -?, <=0.000 59.27% <=0.000 92.00% -0.6344 srv_serror_rate -? <=. 000 60.89% <=0.000 91.80% -0.5923, same_srv_rate .? >0.995 70.97% >0.995 82.80% -0.2225 duration .? <=1,000 ; 59.35%F<=0.000 95.20% dst host_same_srv_rate ? <=0.970 37.63% >0.990 75.90% service ? ecr i 75.90% ecr i 57.70% 0.3956 dst host_count [
-? >254.000 64.3 6% >254.000 87.60% -0.4447 srv_count -? <=3.000 70.74% >508.000 44.20% dst_host_diff srv_rate F
-? F<--0.030 46.28%F<=0.000 71.10%
dst host_serror rate -? <=0.000 45.29% <=0.000 91.00% -1.0065 src bytes -_^rý ? F<--504 000 67.62% <=1032.000 55.90%r dst host_same srcport
_rate ý? <=0.990 , 61.36% >0.990 56.90%
_ root_shell -? OF 95.37% 0 99.60% -0.0626 urgent-? ; x. 000 99.23% <=0.000 99.90% -0.0097 num_shells -? <=0.000 100.00% <=0.000 100.00% 0.0000 su_attempted -? 0 99.99% 0^ 100.00% -0.0001 num_access_files r
-? <=0.000 100.00% <=0.000 100.00% -0.0001 wron g_fragment -? 0 99 99%0 ý0 -- 99 90% 0 0013 num_failed Logins F-y <=0.000 91.73% <=0.000 "; 99.90% -0.1230 num compromised -?
F_=-6-665 88.73% <=0.000 99.70% -0.1682 rer or rate -? <=0.000 63.16% <=0.000 ! 86.50% -0.4537 hot T_.? <=0.000 87.52% <=0.000 ', 99.20% -0.1808 srv_rerror_rate __ '[-? <=0.070 65.62% <=0.0_70'[ 87.00% -0.4069 dst host srv_rerror rate r
-? <=0.000 75.76% <=0.000 87.10% -0.2012 flag -? SF 33.64% SF 80.70% -1.2625 dst host srv_diff hostrate -? <=0.000 84.84% _655, F 89.80% -0.0820 cAUnt-? <=3.000 54.98% >302.000 45.70% F
dst host srv count <=254.000 62.40% >254.000 68.80% [-
dst host_srv serror rate "? <=0.000 55.54% <=0.0 0 092.10% -0.7297
175

APPENDIX D
isguest login F -7
[0- 100.00% T- 99.70% 0.0043
num f le creations -?, X0.000 100.00% <=0.000 100.00% -0.0001
176

REFERENCES
References
Aickelin, U. Bentley, P. Cayzer, S. Kim, J. and McLeod, J. 2003, Danger Theory: The Link between AIS and IDS?, in Proceedings ICARIS-2003,2nd International Conference on Artificial Immune Systems, pp 147-155, Springer, Edinburgh, UK.
Altrock, C. V. 1995, Fuzzy Logic & NeuroFuzzy Applications Explained, The practical, Hands-On Guide to Building Fuzzy Logic Applications, Prentice-Hall, USA.
Amoroso, E. 1999, Intrusion detection: An Introduction to Internet Surveillance, Correlation, Trace Back, Traps, and Response, Intrusion. net.
Anderson, R. 2001, Security Engineering, A Guide to Building Dependable Distributed Systems, Wiley.
Asaka, M. Okazawa, S. Taguchi, A. Goto, S. 1999, A Method of Tracing Intruders by Use of Mobile Agents, Tokyo 113-6591, Japan, INET'99.
Atkins, D. Buis, P. Hare, C. Kelley, R. Nachenberg, C. Nelson, A. B. Philips, P. Ritchey, T. and Steen, W. 1996, Internet Security, Professional Reference, New Riders, USA.
Awerbuch, B. Holmer, D. Rubens, H. 2003, Provably Secure Competitive Routing against Proactive Byzantine Adversaries via Reinforcement Learning, Technical Report, version I.
Bace, R. 2000, Intrusion Detection, Macmillan Technical Publishing, USA.
Bace, R. and Mell, P. 1999, Special Publication on Intrusion Detection Systems, Infidel Inc and National Institute of Standards and Technology (NIST).
Balasubramaniyan, J. Garcia-Fernandez, J. 0. Spafford, E. H. and Zamboni, D. 1998, An Architecture for Intrusion Detection using Autonomous Agents, CERIAS Technical Report 98/05.
Barash, Y. and Freidman, N. 2001, Context-Specific Bayesian Clustering for Gene Expression Data. The Fifth Annual International Conference on Computational Molecular Biology (RECOMB), pages 12-21.
BayesiaLab Tutorial, 2003, http: //www. BayesiaLab. com [accessed on 1St, June 2003].
Berthold, M. and Hand, D. J. 1999, Intelligent Data Analysis, An Introduction, Springer, Italy.
Bigus J. P. and Bigus, J. 2001, Constructing Intelligent Agents Using Java, Professional Developer's Guide Series, Second Edition, Wiley.
177

REFERENCES
Bridges, S. M. and Vaughn, R. M. 2000, Fuzzy Data Mining and Genetic Algorithms Applied to Intrusion Detection, Proceedings of the Twenty-third National Information Systems Security Conference, Baltimore, MD.
Bronstein, A. Das, J. Duro, M. Friedrich, R. 2001, Self-Aware Services: Using Bayesian Networks for Detecting Anomalies in Internet-based Services, HP Laboratories Palo Alto, HPL-2001-23 (R. 1).
Brown, T. X. (2000) Low Power Wireless Communication via Reinforcement Learning, Advances in Information Processing Systems, MIT Press.
Burroughs, D. J. Wilson, L. F. and Cybenko, G. V. 2002, Analysis of Distributed Intrusion, In Proceedings of IEEE International Performance Computing and Communication Conference
Caglayan, A., Snorrason, M., Jacoby, J., Mazzu, J., Jones, R., and Kumar, K. 1997, Learn Sesame: a learning agent, Applied Artificial Intelligence, 11(5): 393-412. Cannady, J. 1998, Artificial Neural Networks for Misuse Detection, Proceedings of the National Information Systems Security Conference (NISSC'98), Arlington, VA.
Carver, C. A. Hill, J. M. D. Surdu, J. R. Pooch, U. W. 2000, A Methodology for Using Intelligent Agents to provide Automated Intrusion Response, Proceedings of the Workshop on information Assurance and Security, NY, 6-7 June.
Chappell, L. 2000, Introduction to Cyber Crime, podbooks. com, USA.
Cheeseman, P. and Sutz, J. 1996, Bayesian classification (AutoClass): Theory and results, Advances in Knowledge Discovery and Data Mining, pp. 153-180. MIT press, Cambridge, USA
Cheswick, W. R. and Bellovin, S. M. 1994, Firewalls and Internet Security, Addison Wesley.
Coolen, R. Luiif, H. A. M. 2002, Intrusion Detection: Generics and State-of-the-Art, Research and Technology Organisation (RTO) of NATO, North Atlantic Treaty Organisation, Technical Report, RTO-TR-049, Prepared by Task Group on Information Assurance, RTG-003 under the RTO Information Systems Technology Panel, Netherlands.
Cooper, G. and Herskovitz, E. 1992, A Bayesian method for the induction of probabilistic networks from data, Machine learning, 9,309-347.
Cox, E. 1999, The Fuzzy Systems Handbook, A Practitioner's Guide to Building, Using, and Manipulating Fuzzy Systems, Second Edition, AP Professional.
Criscuolo, P. J. 2000, Distributed Denial of Service, CIAC-2319.
Crosbie, M. and Spafford, G. 1995, Applying Genetic Programming to Intrusion Detection, Working Notes for the AAAI Symposium on Genetic Programming
178

REFERENCES
Crosbie, M. and Spafford, G. 1995, Active Defence of a Computer System using Autonomous Agents, COAST, Technical Report 95-008.
CSI (Computer Security Institute), 2004, CSI/FBI Computer Crime and Security Survey, Annual Report of 2003
CyberNoters, National Infrastructure Protection Center (NIPC), Available at http: //www. nipc. gov/cybernotes/200I /cyberissue2001-19. pdf [Accessed on 5th, October 2001]
D'haeseleer, P. 1996, An immunological approach to change detection: Theoretical Results. In 9th IEEE Computer Security Foundations Workshop, Pages 110-119.
D'haeseleer, P. Forrest, S. and Helman, P. 1996, An immunological approach to change detection: algorithms, analysis, and implications. In Proceedings of the 1996 IEEE Symposium on Computer Security and Privacy
Dickerson, J. E. Juslin, J. Koukousoula, O. and Dickerson, J. A. 2001, Fuzzy intrusion detection, IFSA World Congress and 20th North American Fuzzy Information Processing Society (NAFIPS) International Conference, Vancouver, British Columbia, Volume 3,1506-1510.
Dickerson, J. E. and Dickerson, J. A. 2000, Fuzzy Network Profiling for Intrusion Detection, Proceedings of NAFIPS 19th International Conference of the North American Fuzzy Information Processing Society, Atlanta, July, 301-306.
Ellsworth, D. CEO, Network Security, Executive Summary, Part one - Intrusion Detection, Secure Communications Corp, Inc
Fayyad, U. M. 1996, Data mining and knowledge discovery: making sense out of data. IEEE Expert, October, pages 20-25.
Forrest, S. and Hofmeyr, S. A. 2000, Immunology as information processing, In L. A. Segel and I. Cohen, editors, Design Principles for the Immune System and Other Distributed Autonomous Systems, Santa Fe Institute Studies I the Sciences of Complexity, Pages 361-387, Oxford University Press, Oxford, UK.
Forrest, S. et al, 1994, Self-Nonself Discrimination in a Computer, Proceeding of the IEEE Symposium on Research in Security and Privacy, Los Alamos, CA: IEEE Computer Society Press.
Forrest, S. et al, 1997, Computer Immunology, Communications of the ACM, 40(10), 88-96
Freguson N. and Schneier, B. 1999, A cryptographic Evaluation of IPSec, Counterpane Internet Security, Inc
Garms, J. and Somerfield, D. 2001, Professional Java Security, Wrox Press.
179

REFERENCES
Greenberg, M. S. Byington, J. C. and Harper, D. G. 1998, Mobile Agents and Security, IEEE Communications Magazine, July, Vol. 36 No. 7. Halsall, F. 1996, Data Communications, Computer Networks and Open Systems, 4'' Edition, ADDISON-WESLEY.
He, Q. Shayman, M. A. 1999, Using Reinforcement Learning for Proactive Network Fault Management, ISR Technical Report, UMCP
Heckerman, D. 1995, a Tutorial on Learning with Bayesian Networks. Technical Report MSR-TR-95-06, Microsoft Corporation.
Heckerman, D. Geiger, D. and Chickering, D. 1995, Learning Bayesian networks: The combination of knowledge and statistical data Machine Learning 20: 197-243.
Heftich, S. A. and B. S. D. 1999, The UCI KDD Archive [http //kdd. ics. uci. edu], Irvine, CA: The University of Claifornia, Dept of Computer Science.
Hofineyr, S. A. and Forrest, S. 1999, Immunology by design: An artificial immune system, In Proceedings of the Genetics and Evolutionary Computation Conference, pages 1289-1296.
Hopgood, A. A. 2001, Intelligent Systems for Engineers and Scientists, Second Edition, CRC Press LLC IBM, 1996, Intelligent Agent Resource Manager, Open Blueprint.
Intrusion. com, Inc. 2001, Maximising the Value of Network Intrusion Detection, The Product management group of Intrusion. com, Inc, A corporate white paper.
ISO 7498-2 1988, Information processing systems, Open Systems Interconnection (OSI), Basic reference model, Part 2: Security architecture.
Jackson, K. M. Hruska, J. and Parker, D. B. 1992, Computer Security Reference Book, Butterworth-Heinemann
Jang, J. S. R. Sun, C. T. Mizutani, E. 1997, Neruro-Fuzzy and Soft Computing: A Computational Approach to Learning and Machine Intelligence, Prentice Hall, USA.
Jansen, W. Mell, P. Karygiannis, T. Marks, D. 2000, Mobile Agents in Intrusion Detection and Resoponse, National Institute for Standards and Technology, Gaithersburg, MD 20815,12`h Annual Canadian Information Technology Security Symposium, Ottawa, Canada.
Jansen, W. Mell, P. Karygiannis, T. and Marks, D. 1999, Applying Mobile Agents to Intrusion Detection and Response, National Institute of Standards and Technology (NIST), Computer Security Division, NIST Interim Report (IR) - 6416.
Jansen, W. Mell, P. Karygiannis, T. and Marks, D. 2000, Mobile Agents in Intrusion Detection and Response, National Institute of Standards and Technology (NISI), the
180

REFERENCES
proceedings of the 12'h Annual Canadian Information Technology Security Symposium, Ottawa, Canada.
Jensen, F. V. 1996, An introduction to Bayesian Networks, UCL, UK.
Jordan, M. I. 1999, Learning in Graphical Models. Kluwer Academic, USA. KDD, 1999, Knowledge Discovery and Data mining Competition, http: //kdd. ics. uci. edu/, [accessed on 01", Dec 2001]
KEL (Knowledge Engineering Lab) http: //kelab. tamu. edu/standard/approach. html, [accessed on 01 °`, Dec 2001 ]
Kim, J. and Bentley, P. J. 2001, Evaluating Negative Selection in an Artificial Immune System for Network Intrusion Detection, Genetic and Evolutionary Computation Conference 2001 (GECCO-2001), San Francisco, pp. 1330 - 1337, July 7-11.
Kim, J. and Bentley, P. 1999, The Human Immune System and Network Intrusion Detection, 7th European Congress on Intelligent Techniques and Soft Computing (EUFIT'99), Aachen, Germany, September 13- 19.
King, C. M. Dalton, C. E. & T. Osmanoglu, T. E. 2001, Security Architecture, Design, Deployment & Operations, RSA PRESS.
Kleijnen, J. P. C. 1999, Validation of Models: Statistical Techniques and Data Availability, Proceedings of the Winter Simulation Conference, Pages 647-654.
Knapik, M. and Johnson, J. 1998, Developing Intelligent Agents for Distributed Systems, Exploring Architecture, Technologies, and Applications, McGraw-Hill
Kosoresow, A. P. and Hofineyr, S. A. 1997, Intrusion detection via system call traces, IEEE Softw, 14,5 (Sept/Oct), 24-42
Koza, J. R. 1997, Genetic Programming, Submitted 18, August 1997 for Encyclopaedia of Computer Science and Technology, Editors: Allen Kent and James G. Williams.
Koza, J. R. 1997, Future Work and Practical Applications of Genetic Programming, In Baeck, T., Fogel, D. B., and Michalewicz, Z. (editors) Handbook of Evolutionary Computation. Bristol, UK: Institute of Physics Publishing and New York: Oxford University Press. Pages H1.1: 1-6.
Kumar, S. 1995, Classification and Detection of Computer Intrusions, A PhD Thesis, the University of Purdue, USA. Lane, T. D. 2000, Machine Learning Techniques for the Computer Security Domain of Anomaly Detection, a PhD Thesis, the University of Purdue.
Lange, D. B. and Oshima, M. 1998, Programming and Deploying Java Mobile Agents with Aglets, Addison Wesley
181

REFERENCES
Lantronix Networking Tutorials, 2003, Network Switching, http: //www. lantronix. com/leaming/tutorials/switching, [accessed on l0'', January 2003]
Lee, C. C. 1990, Fuzzy logic in control systems: fuzzy logic controller, part I, IEEE Transactions on Systems, Man and Cybernetics, vol. 20, pp. 404-418.
Lee, C. C. 1990, Fuzzy logic in control systems: fuzzy logic controller, part II, IEEE Transactions on Systems, Man and Cybernetics, vol. 20, pp. 419-435.
Leiwo, J. and Zheng, Y. 1997, A Method to Implement a Denial of Service Protection Base, Information Security and Privacy, Second Australian Conference, ACISP'97, Sydney, NSW, Australia.
Lippmann, R. P. and Cunningham, R. K. 1999, Using Key-String Selection and Neural Networks to Reduce False Alarms and Detect New Attacks with Sniffer-Based Intrusion Detection Systems, Second International Workshop on Recent Advances in Intrusion Detection (RAID 1999), West Lafayette, IN.
Ludovic Me Supelec, 1998, GASSATA, a Genetic Algorithm as an Alternative Tool for Security Audit Trails Analysis, First International Workshop on the Recent Advances in Intrusion Detection, RAID 98, September, 14-16 1998, Louvain-la-Neuve, Belgium.
Maes, P. 1994, Agents that reduce work and information overload. Communications of the ACM 7,31-40.
Mandia, K. and Prosise, C. 2001, Incident Response, Investigating Computer Crime, McGraw-Hill, USA.
Marchette, D. J. 2001, Computer Intrusion Detection and Network Monitoring, A statistical viewpoint, Springer-Verlag, New York, Inc, USA
Martino, S. A. Mobile Agent Approach to Intrusion Detection, Joint Research Centre- Institute for Systems, Informatics and Safety, Italy, June 1999.
MathWorks, 2002, Stateflow and Stateflow Coder for Complex Logic and State Diagram Modeling, MatLab User's Guide, Version 5.
McHugh, J. 2001, Intrusion and intrusion detection, International Journal of Information Security, 1: 14-35.
Mell, P. Marks, D. and McLarnon, M. 2000, A Denial of Service Resistant Intrusion Detection Architecture, The International Journal of Computer and Telecommunications Networking, Vol. 34, Issue 4, Pages 641-658, ISSN: 1389-1286.
Michael, C. C. and Ghosh, A. 2002, Simple, Tate-Based Approaches to Program-Based Anomaly Detection, ACM Transaction Information and Systems Security, Vol. 5, No. 3, August 2002, Pages 203-237.
Michael, I. J. 1999, Learning in Graphical Models, Kluwer Academic, USA.
182

REFERENCES
Millen, J. K. 1992, A resource allocation model for Denial of Service, IEEE Symposium on Research in Security and Privacy, Oakland, California.
Miller, S. A. 1999, Security Considerations in Quality of Service Architectures, CS 590: Multi-Service Networks Project Report.
MIT Lincoln Lab, http: //www. 1l. mit. edu/IST/ideval/index. html, [accessed on 05th, June 2001].
Mitchel, M. 1997, Machine Learning, McGraw Hill, USA
Mitra, D. Reiman, M. I. Wang, J. 1998, Robust dynamic admission control for unified cell and call QoS in statistical multiplexers, IEEE Journal of Selected Areas in Communications, 16: 5,692-707.
Monti, S. and Cooper, G. F. 1999, Learning Hybrid Bayesian Networks From Data, Learning in Graphical Models, Editor: Michael I. Jordan, Kluwer Academic Publishers, USA.
Murch, R. and Johnson, T. 1999, Intelligent Software Agents, Prentice Hall, USA
Naylor, T. H. and Finger, J. M. 1967, Verification of Computer Simulation Models, Management Science, 14,2, B92-B 101
Neapolitan, R. E. 2004, Learning Bayesian Networks, Prentice Hall, USA.
Needham, R. 1994, Denial of Service, In Proceedings of the 1s` ACM Conference on Computer and Communications Security.
Neumann, P. G. and Porras, P. 1999, Experience with EMERALD to Date, First USENIX Workshop on Intrusion Detection and Network Monitoring, Santa Clara, CA.
Newell, A. 1982, The knowledge level, Artificial Intelligence, vol. 18, pp. 87-127.
NIST, 1999, Applying Mobile Agents to Intrusion Detection and Response, NIST Interim Report (IR)-6416
Northcutt, S. 1999, Network Intrusion Detection, An analyst's handbook, New Rider, USA.
Northcutt, S. Cooper, M. Fearnow, M. Frederick, K. 2001, Intrusion Signatures and Analysis, New Riders, USA
O'Connell, B. and Myers, H. 2002, Information Point: Receiver Operating Characteristics (ROC) curves, Journal of Clinical Nursing, 11,134-136, Blackwell Science Ltd.
183

REFERENCES
Pham, A. and Karmouch, A. 1998, Mobile Software Agents: An Overview, IEEE Communications Magazine, Vol. 36 No. 7.
Pikoulas, J. Buchanan, W. J. Mannion, M. Triantafyllopoulos, K. 2001, An Agent- Based Bayesian Forecasting Model for Enhanced Network Security, Eighth Annual IEEE International Conference and Workshop on the Engineering of Computer Based Systems (ECBS'01), April 17 - 20,2001, Washington DC.
PMG (Product Management Group) of Intrusion. com, Inc. 2001, Maximising the Value of Network Intrusion Detection, A corporate white paper.
Porras, P. A. and Neumann P. G. 1997, Emerald: Even Monitoring Enabling Responses to Anomalous Live Disturbances, Proc. 20th NIST-NCSC National Information Systems Security Conference, Blatimore, MD.
Preneel, B. Katholieke Universiteit, Leuven, 2001, Cryptography: Fundamentals and Applications, Information Security Awareness Workshop, Information Security Solutions Europe ISSE Conference, London, UK.
Proctor, P. 2001, The Practical Intrusion Detection Handbook, Prentice Hall, USA.
Ramoni, M. and Sebastiani, P. 1999, Bayesian Methods, Intelligent Data Analysis, An Introduction, Editors: Michael Berthold and David J. Hang. Springer, Italy
Ramoni, M. Sebastiani, P. and Cohen, P. 2001, Bayesian Clustering by Dynamics, Machine learning, 1-31.
Rich, C. Sidner, C. L. 1997, When Agents Collaborate with People, Readings in Agents, Proceedings of the First International Conference on Autonomous Agents (Agents '97), Edited by Michael N. Huhns & Munindar P. Singh, Association for Computing Machinery, 284-291.
Roberts, T. H. and Aickelin U. 2003, Fuzzy Rule Learning in Intrusion Detection Systems, submitted to JDM & under review.
Rossides, L. Sekercioglu, A. Kohler, S. Pitsillides, A. Phuoc, T-G. and Vassilakos, A. 2000, Fuzzy Logic Controlled RED: Congestion Control for TCP/IP Diff-Serv Architecture, ESIT, Germany.
Sargent, R. G. 1999, Validation and Verification of Simulation Models, Proceedings of the Winter Simulation Conference, Pages 39-48.
Scambray, J. McClure, S. and Kudrtz, G. 2001, Hacking Exposed, Network Security Secrets & Solutions, McGraw-Hill, 2"d Edition, USA.
Schneier, B. 2000, Secrets & lies, Digital Security in a Networked World, Wiley
Schonlau, M. DuMouchel, W. Ju, W. Karr, A. F. Theus, M. Vardi, Y. 2001, Computer Intrusion: Detecting Masquerades, Journal of Statistical Science, Vol. 16, No. 1,1-17.
184

REFERENCES
Schuba, C. L. Krsul, I. V. Kuhn, M. G. Spafford, E. H. Sundaram, A. Zamboni, D. 1997, Analysis of a Denial of Service Attack on TCP, Proceedings of the IEEE Symposium on Security and Privacy.
Schultz, M. G. Eskin, E. Zadok, E. Stolfo, S. 2001, Data Mining Methods for Detection of New Malicious Executables, IEEE Symposium on Security and Privacy
Sekar, R. Bendre, M. Dhurjati, D. And Bollineni, P. 2000, A fast automation-based method for detecting anomalous program behaviors, In Proceedings of the 2000 IEEE Symposium on Security and Privacy, IEEE Computer Society, Los Alamitos, Calif, 144-155.
Shen, W. M. Arens Y. and Knoblock, C. 1996, Query Reformulation for Dynamic Information Integration. Journal of Intelligent Information Systems, 6,99-130.
Skoudis, 2002, Counter Hack, A Step-by-Step Guide to Computer Attacks and Effective Defences, Prentice Hall.
Stallings, W. 1999, Cryptography and Network Security, 2"d addition, Prentice Hall, USA
Stein, L. W3C, Available at www. w3. org/Security/Faq/wwwsf9. html [Accessed 10th, June 2001]
Stephanie A. 2000, Security Considerations in Quality of Service Architectures, CERIAS Tech Report 2000-06.
Stevens, W. R. 1994, TCP/IP Illustrated, Volume One< The Protocols, ADDSON- WESLEY, USA.
Stolfo, S. J. Fan, W. Lee, W. 2000, Cost-basedModeling for Fraud and Intrusion Detection: Results from the JAM Project, Proceedings of the DARPA Information Survivability Conference and Exposition, USA.
Stolfo, S. J. Fan, D. W. Lee, W Prodromidis, A. L. and Chan P. K. 1997, Credit Card Fraud Detection Using Meta-Learning: Issues and Initial Results, Working notes of AAAI Workshop on AI Approaches to Fraud Detection and Risk Management.
Stolfo, S. J. Chan, P. K. Fan, D. Lee, W. Prodromidis, A. 1996, Meta-Learning Agents for Fraud and Intrusion Detection in Financial Information Systems, Technical Report 212-939-70800
Studer, R. Benjamins V. R. Fensel, D. 1998, Knowledge Engineering: Principles and methods, Data & Knowledge Engineering, Elsevier, 25 pp (161-197).
Sutton, R. S. Barto, A. G. 1998, Reinforcement learning, An introduction, MIT Press, USA.
185

REFERENCES
Tecuci, G. 1998, Building Intelligent Agents, An Apprenticeship Multi-strategy Learning Theory, Methodology, tool and Case Studies, Academic Press.
The Mathworks Web Site, http: //www. mathworks. com, [accessed on 1St, January 2002]
Tong, H. Brown, T. 2002, Reinforcement Learning for Call Admission Control and Routing under Quality of Service Constraints in Multimedia Networks, Journal of Machine Learning, 49,111-139
Tucker, A. B. 1997, The Computer Science Engineering Handbook, CRC Press.
Tyson, J. 2003, How LAN Switches Work, http: //www. howstuffworks/lan- switch. htm/printable, [accessed on 10th, January 2003]
Valdes, A. and Skinner, K. 2001, Probabilistic Alert Correlation, Lecture Notes in Computer Science, No. 2212, Recent Advances in Intrusion Detection (RAID 2001), Springer-Verlag.
Valdes, A. Skinner, K. 2000, Adaptive Model-based Monitoring for Cyber Attack Detection, H. Debar, L. Me, and F. Wu (Eds): RAID 2000, LNCS 1907, pp. 80-92, Springer-Verlag, Berlin Heidelberg.
Valpola, H. 2000, a PhD Thesis, Bayesian Ensemble Learning for Nonlinear Factor Analysis, Neural Networks Research Centre, Helsinki University of Technology, Finland.
Vir, R. 2000. LAN Switching, http: //www. cis. ohio-state. edu/ jan/cis788- 97/lan_switching/index. htm, [accessed on 12th, January 2002]
Watkins C. J. C. H. Dayan, P. 1992, Q-learning, Machine Learning, 8,279-292
West, M. and Harrison, J. 1999, Bayesian forecasting and dynamic models, Springer
Wikipedia, Wikipedia Encyclopedia, http: //en. wikipedia. org, [accessed on 28th, October 2004]
Wilamowski, M. M. 2001, Fuzzy Preference Approach for Computer Network Attack Detection, International Joint INNS-IEEE Conference on Neural Networks, Washington DC, July 14-19, pp. 1345-1349.
Witten, I. H. and Frank, E. 2000, Data Mining, Practical Machine Learning Tools and Techniques with Java implementations, Morgan Kaufmann, USA
Wooldridge, M. J. and Jennings, N. R. 1995, Intelligent Agents: theory and practice, Knowledge Engineering Review, vol. 10, pp. 115-152.
Ye, B. 2001, Defeating Denial-of-Service Attacks on the Internet, Verizon Laboratories, Waltham, USA, Information and Communications Security, 3rd International Conference, Xian, China.
186

REFERENCES
Zahed, L. 1994, Fuzzy logic, neural networks, and soft computing, Communications of the ACM, v37 n3 p77 (8)
187