Integration of Letters and Speech Sounds in the Human Brain
12
Neuron, Vol. 43, 271–282, July 22, 2004, Copyright 2004 by Cell Press Integration of Letters and Speech Sounds in the Human Brain nemes) are represented by visual symbols (letters, or graphemes). Learning the correspondences between letters and speech sounds of a language is therefore a Nienke van Atteveldt, 1, * Elia Formisano, 1 Rainer Goebel, 1,2 and Leo Blomert 1 1 Faculty of Psychology crucial step in reading acquisition, failure of which is Department of Cognitive Neuroscience thought to account for reading problems in develop- University of Maastricht mental dyslexia (Frith, 1985). However, in the normal P.O. Box 616 situation, letter-speech sound associations are learned 6200 MD Maastricht and used with high efficiency. At least 90% of school The Netherlands children learn the letter-sound correspondences without 2 F.C. Donders Centre for Cognitive Neuroimaging exceptional effort within a few months (Blomert, 2002), P.O. Box 9101 which is a remarkable achievement, since our brains are 6500 HB Nijmegen not phylogenetically adapted to the requirements for The Netherlands acquiring written language. Associations between sensory events in different mo- dalities can either be defined by natural relations (e.g., Summary the shape and sound of a natural object) or by more artificial relations. In contrast to the culturally defined Most people acquire literacy skills with remarkable associations between letters and speech sounds (Raij ease, even though the human brain is not evolutionarily et al., 2000), lip reading is based on naturally developed adapted to this relatively new cultural phenomenon. associations of speech with visual information (Paulesu Associations between letters and speech sounds form et al., 2003). Therefore, it seems a plausible assumption the basis of reading in alphabetic scripts. We investi- that the perception of speech and the inherently linked gated the functional neuroanatomy of the integration lip movements (hereafter referred to as audiovisual of letters and speech sounds using functional mag- speech) emerged simultaneously during evolution, shap- netic resonance imaging (fMRI). Letters and speech ing the brain for integrating this audiovisual information. sounds were presented unimodally and bimodally in At the behavioral level, it has been reported that congruent or incongruent combinations. Analysis of speech perception can be influenced both by lip move- single-subject data and group data aligned on the ba- ments and by letters. Sumby and Pollack (1954) showed sis of individual cortical anatomy revealed that letters that lip reading can improve speech perception, espe- and speech sounds are integrated in heteromodal cially in situations when the auditory input is degraded. superior temporal cortex. Interestingly, responses to More extremely, lip reading can also change the auditory speech sounds in a modality-specific region of the speech percept, as is shown in the McGurk effect early auditory cortex were modified by simultaneously (McGurk and MacDonald, 1976). Improvement of speech presented letters. These results suggest that efficient perception by simultaneous presentation of print has processing of culturally defined associations between been demonstrated at the level of words (Frost et al., letters and speech sounds relies on neural mecha- 1988) and syllables (Massaro et al., 1988). Dijkstra and nisms similar to those naturally evolved for integrating colleagues reported facilitation and inhibition effects on audiovisual speech. auditorily presented phoneme identity decisions by con- gruent and incongruent letter primes, respectively, sug- Introduction gesting activation of phoneme representations by letters (Dijkstra et al., 1989). Reading is essential to social and economic success A neural mechanism for the integration of audiovisual in the present technological society (National Reading speech has been suggested by Calvert and colleagues Council, 1998). In contrast to spoken language, which (Calvert et al., 1999, 2000) and supported by other neu- is a product of biological evolution, reading and writing roimaging findings on audiovisual speech perception are cultural inventions from the last few thousand years (Sams et al., 1991; Sekiyama et al., 2003; Wright et al., and are only relevant for most people since a few hun- 2003) and lip reading (Calvert et al., 1997; Calvert and dred years (Liberman, 1992). An intriguing question is, Campbell, 2003; Paulesu et al., 2003). Results of these therefore, how it is possible that most people acquire studies suggest that the perceptual gain experienced literacy skills with such remarkable ease even though a when perceiving multimodal speech is accomplished naturally evolved brain mechanism for reading is unlikely by enhancement of the neural activity in the relevant to exist. An interesting hypothesis is that evolutionarily sensory cortices. The left posterior superior temporal adapted brain systems for spoken language provide a sulcus (STS) has been advanced as the heteromodal neural foundation for reading ability, which is illustrated site that integrates visual and auditory speech informa- by the low literacy levels in deaf people (Perfetti and tion and modulates the modality-specific cortices by Sandak, 2000). back projections (Calvert et al., 1999, 2000). Modality- Nowadays most written languages are speech-based specific regions involved in this mechanism are the vi- alphabetic scripts, in which speech sound units (pho- sual motion processing area V5 and auditory association areas in superior temporal cortex. In addition to this interplay between STS and sensory cortices, frontal and *Correspondence: [email protected]
-
Upload
kimkuypers -
Category
Documents
-
view
1 -
download
0
Transcript of Integration of Letters and Speech Sounds in the Human Brain
Neuron, Vol. 43, 271–282, July 22, 2004, Copyright 2004 by Cell Press
Integration of Letters andSpeech Sounds in the Human Brain
nemes) are represented by visual symbols (letters, orgraphemes). Learning the correspondences betweenletters and speech sounds of a language is therefore a
Nienke van Atteveldt,1,* Elia Formisano,1
Rainer Goebel,1,2 and Leo Blomert1
1Faculty of Psychologycrucial step in reading acquisition, failure of which isDepartment of Cognitive Neurosciencethought to account for reading problems in develop-University of Maastrichtmental dyslexia (Frith, 1985). However, in the normalP.O. Box 616situation, letter-speech sound associations are learned6200 MD Maastrichtand used with high efficiency. At least 90% of schoolThe Netherlandschildren learn the letter-sound correspondences without2 F.C. Donders Centre for Cognitive Neuroimagingexceptional effort within a few months (Blomert, 2002),P.O. Box 9101which is a remarkable achievement, since our brains are6500 HB Nijmegennot phylogenetically adapted to the requirements forThe Netherlandsacquiring written language.
Associations between sensory events in different mo-dalities can either be defined by natural relations (e.g.,Summarythe shape and sound of a natural object) or by moreartificial relations. In contrast to the culturally definedMost people acquire literacy skills with remarkableassociations between letters and speech sounds (Raijease, even though the human brain is not evolutionarilyet al., 2000), lip reading is based on naturally developedadapted to this relatively new cultural phenomenon.associations of speech with visual information (PaulesuAssociations between letters and speech sounds formet al., 2003). Therefore, it seems a plausible assumptionthe basis of reading in alphabetic scripts. We investi-that the perception of speech and the inherently linkedgated the functional neuroanatomy of the integrationlip movements (hereafter referred to as audiovisualof letters and speech sounds using functional mag-speech) emerged simultaneously during evolution, shap-netic resonance imaging (fMRI). Letters and speeching the brain for integrating this audiovisual information.sounds were presented unimodally and bimodally in
At the behavioral level, it has been reported thatcongruent or incongruent combinations. Analysis ofspeech perception can be influenced both by lip move-single-subject data and group data aligned on the ba-ments and by letters. Sumby and Pollack (1954) showedsis of individual cortical anatomy revealed that lettersthat lip reading can improve speech perception, espe-and speech sounds are integrated in heteromodalcially in situations when the auditory input is degraded.superior temporal cortex. Interestingly, responses toMore extremely, lip reading can also change the auditoryspeech sounds in a modality-specific region of thespeech percept, as is shown in the McGurk effectearly auditory cortex were modified by simultaneously(McGurk and MacDonald, 1976). Improvement of speechpresented letters. These results suggest that efficientperception by simultaneous presentation of print hasprocessing of culturally defined associations betweenbeen demonstrated at the level of words (Frost et al.,letters and speech sounds relies on neural mecha-1988) and syllables (Massaro et al., 1988). Dijkstra andnisms similar to those naturally evolved for integratingcolleagues reported facilitation and inhibition effects onaudiovisual speech.auditorily presented phoneme identity decisions by con-gruent and incongruent letter primes, respectively, sug-Introductiongesting activation of phoneme representations by letters(Dijkstra et al., 1989).
Reading is essential to social and economic successA neural mechanism for the integration of audiovisual
in the present technological society (National Reading speech has been suggested by Calvert and colleaguesCouncil, 1998). In contrast to spoken language, which (Calvert et al., 1999, 2000) and supported by other neu-is a product of biological evolution, reading and writing roimaging findings on audiovisual speech perceptionare cultural inventions from the last few thousand years (Sams et al., 1991; Sekiyama et al., 2003; Wright et al.,and are only relevant for most people since a few hun- 2003) and lip reading (Calvert et al., 1997; Calvert anddred years (Liberman, 1992). An intriguing question is, Campbell, 2003; Paulesu et al., 2003). Results of thesetherefore, how it is possible that most people acquire studies suggest that the perceptual gain experiencedliteracy skills with such remarkable ease even though a when perceiving multimodal speech is accomplishednaturally evolved brain mechanism for reading is unlikely by enhancement of the neural activity in the relevantto exist. An interesting hypothesis is that evolutionarily sensory cortices. The left posterior superior temporaladapted brain systems for spoken language provide a sulcus (STS) has been advanced as the heteromodalneural foundation for reading ability, which is illustrated site that integrates visual and auditory speech informa-by the low literacy levels in deaf people (Perfetti and tion and modulates the modality-specific cortices bySandak, 2000). back projections (Calvert et al., 1999, 2000). Modality-
Nowadays most written languages are speech-based specific regions involved in this mechanism are the vi-alphabetic scripts, in which speech sound units (pho- sual motion processing area V5 and auditory association
areas in superior temporal cortex. In addition to thisinterplay between STS and sensory cortices, frontal and*Correspondence: [email protected]
Neuron272
parietal regions seem to be involved, although activation speech sounds by contrasting the congruent and incon-gruent bimodal conditions.of these regions is less consistent between the different
studies. Interestingly, the involvement of the left poste- Functional MRI results are typically presented asgroup activation maps whereby the individual data arerior STS in the integration of auditory and visual nonlin-
guistic information has also been reported recently transformed into a standard space and averaged. Thehigh intersubject variability in brain anatomy limits the(Beauchamp et al., 2004; Calvert et al., 2001). These
results suggest that the STS has a more general role in spatial accuracy of group maps produced in this way.We avoided this limitation in two ways. First, our experi-the integration of cross-modal identity information.
As opposed to the integration of lip movements and mental design and visualization methods allowed us toanalyze and present data from individual subjects. Sec-speech sounds, the neural mechanism that mediates
the integration of letters and speech sounds is less clear. ond, we analyzed the group data aligned on the basisof individual cortical anatomy (see Experimental Proce-As yet, the only neuroimaging study that directly investi-
gated this issue using multimodal stimulation was con- dures). A major advantage of cortex-based intersubjectalignment above more traditional methods of spatialducted by Raij and colleagues, who measured magnetic
brain responses to unimodally and bimodally presented normalization is that it increases statistical power whilepreserving high anatomical accuracy in the group re-letters and speech sounds using magnetoencephalog-
raphy (MEG) (Raij et al., 2000). They report a sequence sults.Another important aspect of the present study is thatof processes by which letters and speech sounds may
be integrated, starting with modality-specific activation the stimuli were presented in silent intervals betweensubsequent volume scans (see Experimental Proce-(60–120 ms after stimulus onset) in corresponding sen-
sory cortices, followed by convergence of auditory and dures). This method minimizes the effects of the acous-tic noise produced by fast gradient switching duringvisual activations (around 225 ms) in lateral midtemporal
cortex. Interaction of auditory and visual responses in functional imaging on experimentally evoked auditoryactivation (Jancke et al., 2002; Shah et al., 2000). Thisthe right temporo-occipital-parietal junction started at
280 ms; differential interaction effects for matching and allows a highly accurate investigation of the contributionof auditory brain regions to cross-modal integration pro-nonmatching letters and speech sounds were observed
in the STS at 380–540 ms. Although the time course of cesses and more particularly the processing of letter-speech sound associations.letter-speech sound integration provided by this study
is highly informative, the spatial resolution of MEG limitsthe accuracy by which the exact locations of brain areas Resultsresponsible for the different processes can be deter-mined. Group Results—Unimodal Conditions
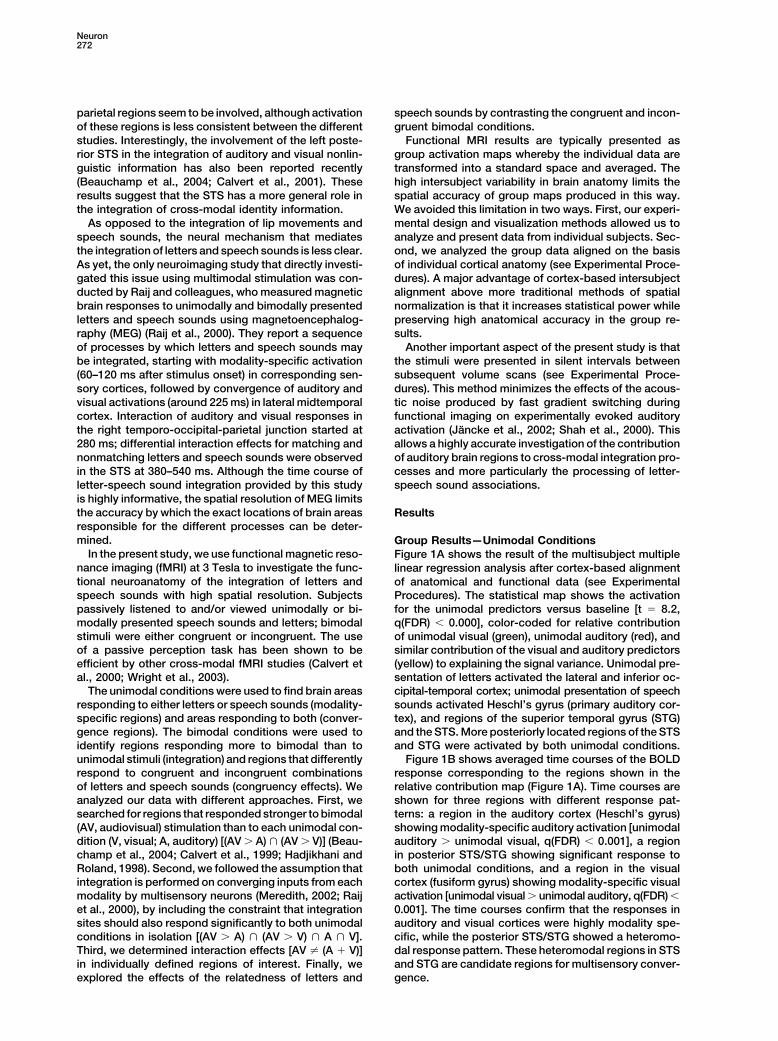
In the present study, we use functional magnetic reso- Figure 1A shows the result of the multisubject multiplenance imaging (fMRI) at 3 Tesla to investigate the func- linear regression analysis after cortex-based alignmenttional neuroanatomy of the integration of letters and of anatomical and functional data (see Experimentalspeech sounds with high spatial resolution. Subjects Procedures). The statistical map shows the activation
for the unimodal predictors versus baseline [t � 8.2,passively listened to and/or viewed unimodally or bi-modally presented speech sounds and letters; bimodal q(FDR) � 0.000], color-coded for relative contribution
of unimodal visual (green), unimodal auditory (red), andstimuli were either congruent or incongruent. The useof a passive perception task has been shown to be similar contribution of the visual and auditory predictors
(yellow) to explaining the signal variance. Unimodal pre-efficient by other cross-modal fMRI studies (Calvert etal., 2000; Wright et al., 2003). sentation of letters activated the lateral and inferior oc-
cipital-temporal cortex; unimodal presentation of speechThe unimodal conditions were used to find brain areasresponding to either letters or speech sounds (modality- sounds activated Heschl’s gyrus (primary auditory cor-
tex), and regions of the superior temporal gyrus (STG)specific regions) and areas responding to both (conver-gence regions). The bimodal conditions were used to and the STS. More posteriorly located regions of the STS
and STG were activated by both unimodal conditions.identify regions responding more to bimodal than tounimodal stimuli (integration) and regions that differently Figure 1B shows averaged time courses of the BOLD
response corresponding to the regions shown in therespond to congruent and incongruent combinationsof letters and speech sounds (congruency effects). We relative contribution map (Figure 1A). Time courses are
shown for three regions with different response pat-analyzed our data with different approaches. First, wesearched for regions that responded stronger to bimodal terns: a region in the auditory cortex (Heschl’s gyrus)
showing modality-specific auditory activation [unimodal(AV, audiovisual) stimulation than to each unimodal con-dition (V, visual; A, auditory) [(AV � A) � (AV � V)] (Beau- auditory � unimodal visual, q(FDR) � 0.001], a region
in posterior STS/STG showing significant response tochamp et al., 2004; Calvert et al., 1999; Hadjikhani andRoland, 1998). Second, we followed the assumption that both unimodal conditions, and a region in the visual
cortex (fusiform gyrus) showing modality-specific visualintegration is performed on converging inputs from eachmodality by multisensory neurons (Meredith, 2002; Raij activation [unimodal visual � unimodal auditory, q(FDR) �
0.001]. The time courses confirm that the responses inet al., 2000), by including the constraint that integrationsites should also respond significantly to both unimodal auditory and visual cortices were highly modality spe-
cific, while the posterior STS/STG showed a heteromo-conditions in isolation [(AV � A) � (AV � V) � A � V].Third, we determined interaction effects [AV � (A � V)] dal response pattern. These heteromodal regions in STS
and STG are candidate regions for multisensory conver-in individually defined regions of interest. Finally, weexplored the effects of the relatedness of letters and gence.
Integration of Letters and Speech Sounds273
Figure 1. Group Results for the UnimodalConditions
(A) Multisubject (n � 16) general linear modelmap of the unimodal predictors against base-line performed on the cortex-based alignedfunctional data. The statistical map is super-imposed on the inflated cortical sheet of theindividual brain used as target brain for thecortex-based intersubject alignment and ontwo axial slices of a template brain normal-ized in Talairach space. Color coding of thesignificantly activated voxels indicates rela-tive contribution of auditory (red) and visual(green) unimodal stimulation to the signalchange in each voxel. Similar contribution ofboth unimodal predictors is indicated byyellow.(B) Averaged time courses of the BOLD re-sponse (in percent signal change) during uni-modal auditory stimulation (red lines) and uni-modal visual stimulation (green lines) inrepresentative regions in auditory cortex, vi-sual cortex, and superior temporal sulcus(STS). Error bars indicate SEM.
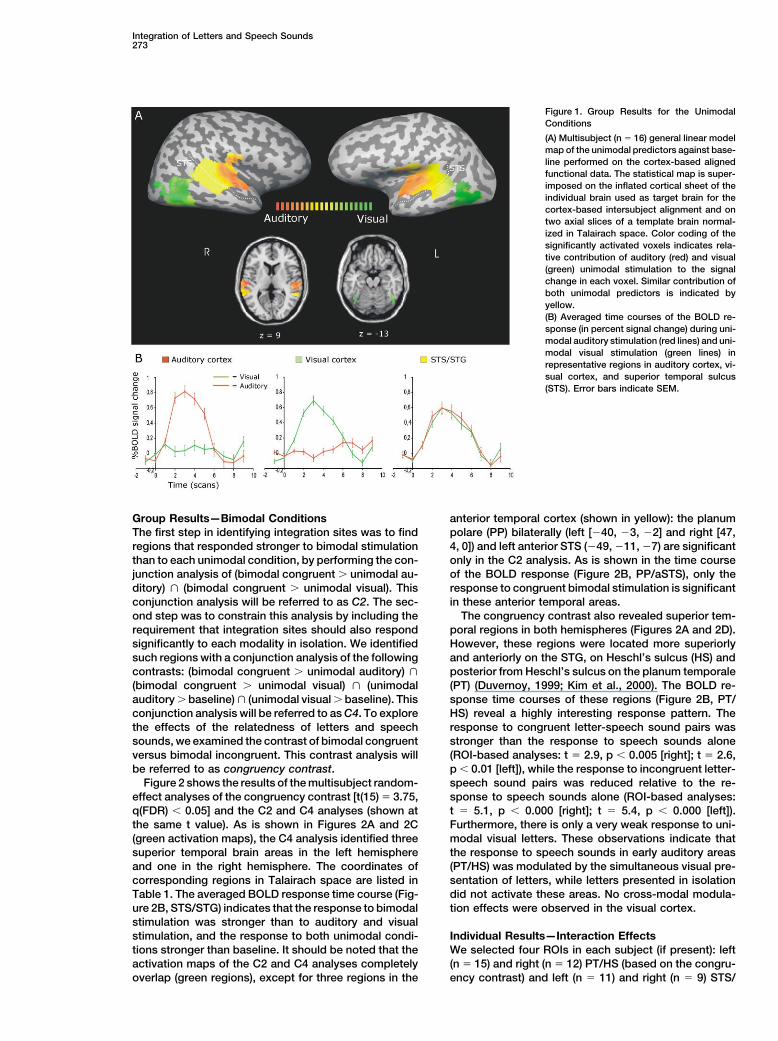
Group Results—Bimodal Conditions anterior temporal cortex (shown in yellow): the planumpolare (PP) bilaterally (left [�40, �3, �2] and right [47,The first step in identifying integration sites was to find
regions that responded stronger to bimodal stimulation 4, 0]) and left anterior STS (�49, �11, �7) are significantonly in the C2 analysis. As is shown in the time coursethan to each unimodal condition, by performing the con-
junction analysis of (bimodal congruent � unimodal au- of the BOLD response (Figure 2B, PP/aSTS), only theresponse to congruent bimodal stimulation is significantditory) � (bimodal congruent � unimodal visual). This
conjunction analysis will be referred to as C2. The sec- in these anterior temporal areas.The congruency contrast also revealed superior tem-ond step was to constrain this analysis by including the
requirement that integration sites should also respond poral regions in both hemispheres (Figures 2A and 2D).However, these regions were located more superiorlysignificantly to each modality in isolation. We identified
such regions with a conjunction analysis of the following and anteriorly on the STG, on Heschl’s sulcus (HS) andposterior from Heschl’s sulcus on the planum temporalecontrasts: (bimodal congruent � unimodal auditory) �
(bimodal congruent � unimodal visual) � (unimodal (PT) (Duvernoy, 1999; Kim et al., 2000). The BOLD re-sponse time courses of these regions (Figure 2B, PT/auditory � baseline) � (unimodal visual � baseline). This
conjunction analysis will be referred to as C4. To explore HS) reveal a highly interesting response pattern. Theresponse to congruent letter-speech sound pairs wasthe effects of the relatedness of letters and speech
sounds, we examined the contrast of bimodal congruent stronger than the response to speech sounds alone(ROI-based analyses: t � 2.9, p � 0.005 [right]; t � 2.6,versus bimodal incongruent. This contrast analysis will
be referred to as congruency contrast. p � 0.01 [left]), while the response to incongruent letter-speech sound pairs was reduced relative to the re-Figure 2 shows the results of the multisubject random-
effect analyses of the congruency contrast [t(15) � 3.75, sponse to speech sounds alone (ROI-based analyses:t � 5.1, p � 0.000 [right]; t � 5.4, p � 0.000 [left]).q(FDR) � 0.05] and the C2 and C4 analyses (shown at
the same t value). As is shown in Figures 2A and 2C Furthermore, there is only a very weak response to uni-modal visual letters. These observations indicate that(green activation maps), the C4 analysis identified three
superior temporal brain areas in the left hemisphere the response to speech sounds in early auditory areas(PT/HS) was modulated by the simultaneous visual pre-and one in the right hemisphere. The coordinates of
corresponding regions in Talairach space are listed in sentation of letters, while letters presented in isolationdid not activate these areas. No cross-modal modula-Table 1. The averaged BOLD response time course (Fig-
ure 2B, STS/STG) indicates that the response to bimodal tion effects were observed in the visual cortex.stimulation was stronger than to auditory and visualstimulation, and the response to both unimodal condi- Individual Results—Interaction Effects
We selected four ROIs in each subject (if present): lefttions stronger than baseline. It should be noted that theactivation maps of the C2 and C4 analyses completely (n � 15) and right (n � 12) PT/HS (based on the congru-
ency contrast) and left (n � 11) and right (n � 9) STS/overlap (green regions), except for three regions in the
Neuron274
Figure 2. Group Results for the Conjunctionand Congruency Analyses
(A) Multisubject (n � 16) general linear modelmaps of the two conjunction analyses (shownin yellow and green) and congruency contrast(shown in orange) performed on the cortex-based aligned functional data. The C2 andC4 maps completely overlap in the green re-gions; yellow regions are additionally acti-vated in the C2 analysis. Maps are superim-posed on the inflated cortical sheet of theindividual brain used as target brain for thecortex-based intersubject alignment. The cor-responding Talairach coordinates are listed inTable 1.(B) Averaged time courses of the BOLD re-sponse (in percent signal change) during bi-modal (congruent, blue lines; incongruent:yellow lines) and unimodal conditions (audi-tory, red lines; visual, green lines) in regionsrepresentative for the different maps shownin (A).(C) Multisubject (n � 16) random-effect gen-eral linear model map of the C4 analysis su-perimposed on sagittal, coronal, and axialviews of the Talairach normalized anatomicalimages of the target brain.(D) Multisubject (n � 16) random-effect gen-eral linear model map of the congruent � in-congruent analysis superimposed on sagittal,coronal, and axial views of the Talairach nor-malized anatomical images of the target brain.[C2, (bimodal congruent � unimodal auditory)� (bimodal congruent � unimodal visual); C4,(bimodal congruent � unimodal auditory) �
(bimodal congruent � unimodal visual) �
(unimodal auditory � baseline) � (unimodalvisual � baseline); PP, planum polare; (a)STS,(anterior) superior temporal sulcus; STG, su-perior temporal gyrus; PT, planum temporale;HS, Heschl’s sulcus; FTS, first transversetemporal sulcus].
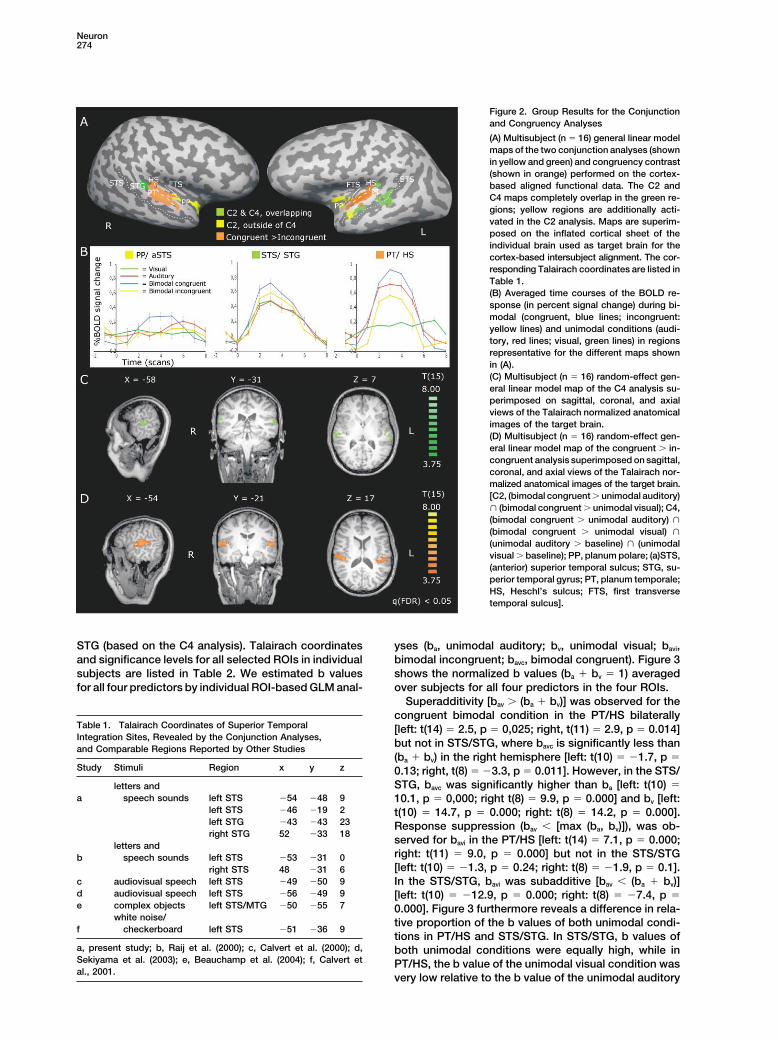
STG (based on the C4 analysis). Talairach coordinates yses (ba, unimodal auditory; bv, unimodal visual; bavi,bimodal incongruent; bavc, bimodal congruent). Figure 3and significance levels for all selected ROIs in individual
subjects are listed in Table 2. We estimated b values shows the normalized b values (ba � bv � 1) averagedover subjects for all four predictors in the four ROIs.for all four predictors by individual ROI-based GLM anal-
Superadditivity [bav � (ba � bv)] was observed for thecongruent bimodal condition in the PT/HS bilaterally
Table 1. Talairach Coordinates of Superior Temporal [left: t(14) � 2.5, p � 0,025; right, t(11) � 2.9, p � 0.014]Integration Sites, Revealed by the Conjunction Analyses,
but not in STS/STG, where bavc is significantly less thanand Comparable Regions Reported by Other Studies(ba � bv) in the right hemisphere [left: t(10) � �1.7, p �
Study Stimuli Region x y z 0.13; right, t(8) � �3.3, p � 0.011]. However, in the STS/STG, bavc was significantly higher than ba [left: t(10) �letters and
a speech sounds left STS �54 �48 9 10.1, p � 0,000; right t(8) � 9.9, p � 0.000] and bv [left:left STS �46 �19 2 t(10) � 14.7, p � 0.000; right: t(8) � 14.2, p � 0.000].left STG �43 �43 23 Response suppression (bav � [max (ba, bv)]), was ob-right STG 52 �33 18
served for bavi in the PT/HS [left: t(14) � 7.1, p � 0.000;letters andright: t(11) � 9.0, p � 0.000] but not in the STS/STGb speech sounds left STS �53 �31 0[left: t(10) � �1.3, p � 0.24; right: t(8) � �1.9, p � 0.1].right STS 48 �31 6
c audiovisual speech left STS �49 �50 9 In the STS/STG, bavi was subadditive [bav � (ba � bv)]d audiovisual speech left STS �56 �49 9 [left: t(10) � �12.9, p � 0.000; right: t(8) � �7.4, p �e complex objects left STS/MTG �50 �55 7 0.000]. Figure 3 furthermore reveals a difference in rela-
white noise/ tive proportion of the b values of both unimodal condi-f checkerboard left STS �51 �36 9
tions in PT/HS and STS/STG. In STS/STG, b values ofa, present study; b, Raij et al. (2000); c, Calvert et al. (2000); d, both unimodal conditions were equally high, while inSekiyama et al. (2003); e, Beauchamp et al. (2004); f, Calvert et PT/HS, the b value of the unimodal visual condition wasal., 2001.
very low relative to the b value of the unimodal auditory
Integration of Letters and Speech Sounds275
Table 2. Talairach Coordinates and Significance Levels for ROIs in Individual Subjects
ROIs in Planum Temporale/Heschl’s Sulcus
Left Hemisphere Right Hemisphere
Subject x y z ta pa x y z ta pa
MP �59 �23 16 2.6 0.005 52 �14 13 2.8 0.01HM �59 �24 12 3.9 0.001 � � � � �
SO �58 �17 10 3.2 0.01 61 �16 13 3.1 0.005PP �61 �22 9 4.2 0.0000 60 �14 7 4.8 0.000SS �49 �11 7 2.8 0.01 52 �16 11 2.7 0.01MJ �47 �20 7 2.6 0.01 � � � � �
MA � � � � � � � � � �
JP �32 �30 9 3.5 0.001 39 �20 9 3.7 0.0005BM �47 �29 16 2.0 0.05 64 �11 14 3.4 0.001CB �49 �11 10 2.0 0.05 � � � � �
MS �47 �16 5 3.6 0.0005 51 �16 12 4.3 0.0000MH �52 �31 17 3.7 0.0005 37 �22 16 2.4 0.05NH �57 �25 7 3.1 0.005 48 �17 15 2.4 0.05KP �56 �19 10 2.7 0.01 64 �19 8 2.2 0.05JK �58 �26 3 4.0 0.0001 59 �12 17 3.6 0.0005RW �51 �12 4 3.6 0.0005 39 �13 5 3.9 0.0005Average �51 �24 10 52 �16 12(Standard deviation) (8) (9) (5) (10) (3) (4)
ROIs in Superior Temporal Sulcus/Gyrus
Left Hemisphere Right Hemisphere
Subject x y z tb pb tc pc x y z tb pb tc pc
MP �53 �50 15 2.1 0.05 2.0 0.05 � � � � � � �
HM �56 �41 6 2.6 0.05 2.2 0.05 66 �22 0 2.7 0.01 4.0 0.0001SO � � � � � � � 47 �31 7 2.1 0.05 2.3 0.05PP �53 �44 10 2.7 0.01 3.5 0.001 53 �34 9 2.1 0.05 2.8 0.01SS �60 �28 �2 2.4 0.05 2.9 0.005 � � � � � � �
MJ � � � � � � � � � � � � � �
MA � � � � � � � � � � � � � �
JP �52 �23 2 2.2 0.05 3.7 0.0005 � � � � � � �
BM � � � � � � � � � � � � � �
CB �57 �22 10 2.4 0.05 2.0 0.05 56 �25 14 2.3 0.05 2.7 0.01MS �56 �41 6 2.3 0.05 5.6 0.0000 58 �36 18 3.3 0.005 5.2 0.0000MH �53 �32 17 2.3 0.05 3.2 0.005 52 �24 21 2.0 0.05 2.4 0.05NH � � � � � � � 62 �37 14 2.4 0.05 2.4 0.05KP �46 �16 1 2.4 0.05 2.1 0.05 � � � � � � �
JK �59 �39 4 2.4 0.05 3.6 0.0005 54 �25 7 2.5 0.05 3.3 0.005RW �54 �22 3 2.5 0.05 3.8 0.0005 39 �42 18 2.2 0.05 2.3 0.05Average �54 �33 7 54 �31 12(Standard deviation) (4) (11) (6) (8) (7) (7)
at and p values for the Congruent versus Incongruent contrast.bt and p values for the Congruent versus Auditory contrast.ct and p values for the Congruent versus Visual contrast.
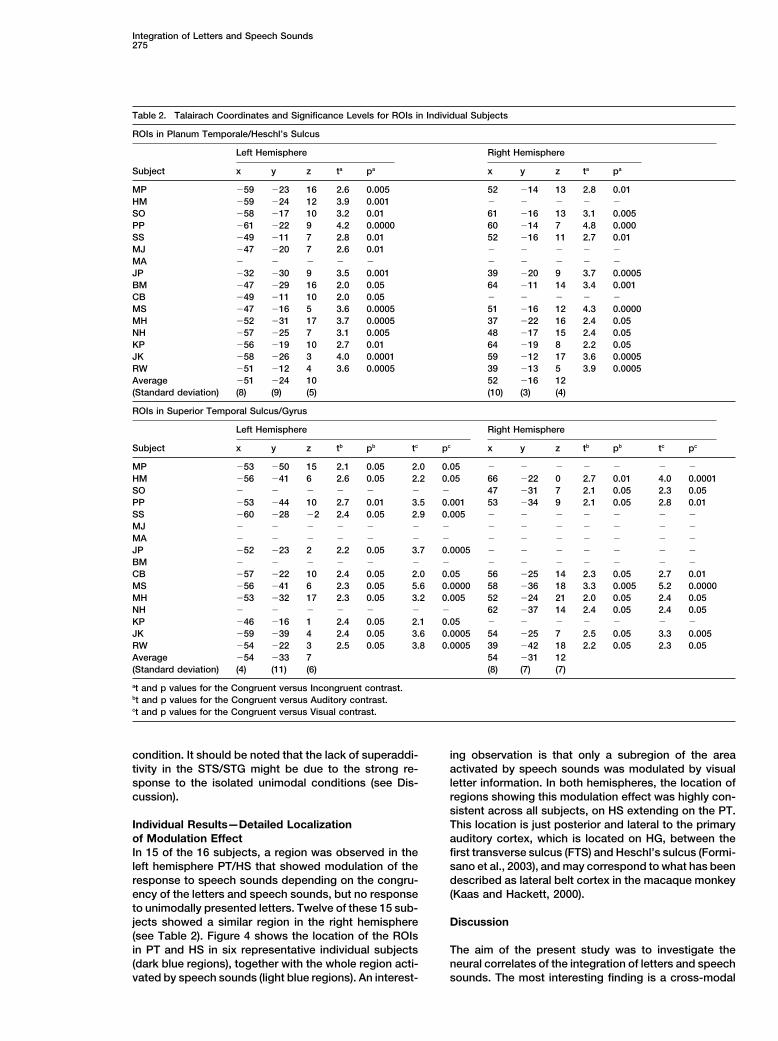
condition. It should be noted that the lack of superaddi- ing observation is that only a subregion of the areaactivated by speech sounds was modulated by visualtivity in the STS/STG might be due to the strong re-
sponse to the isolated unimodal conditions (see Dis- letter information. In both hemispheres, the location ofregions showing this modulation effect was highly con-cussion).sistent across all subjects, on HS extending on the PT.This location is just posterior and lateral to the primaryIndividual Results—Detailed Localization
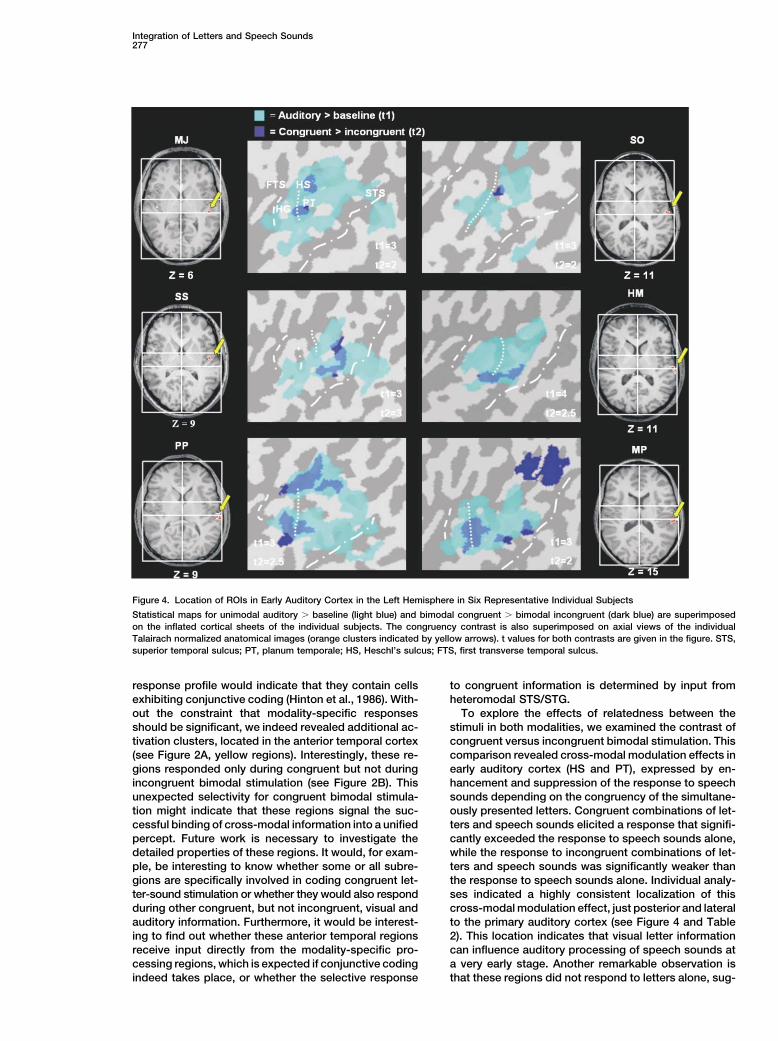
of Modulation Effect auditory cortex, which is located on HG, between thefirst transverse sulcus (FTS) and Heschl’s sulcus (Formi-In 15 of the 16 subjects, a region was observed in the
left hemisphere PT/HS that showed modulation of the sano et al., 2003), and may correspond to what has beendescribed as lateral belt cortex in the macaque monkeyresponse to speech sounds depending on the congru-
ency of the letters and speech sounds, but no response (Kaas and Hackett, 2000).to unimodally presented letters. Twelve of these 15 sub-jects showed a similar region in the right hemisphere Discussion(see Table 2). Figure 4 shows the location of the ROIsin PT and HS in six representative individual subjects The aim of the present study was to investigate the
neural correlates of the integration of letters and speech(dark blue regions), together with the whole region acti-vated by speech sounds (light blue regions). An interest- sounds. The most interesting finding is a cross-modal
Neuron276
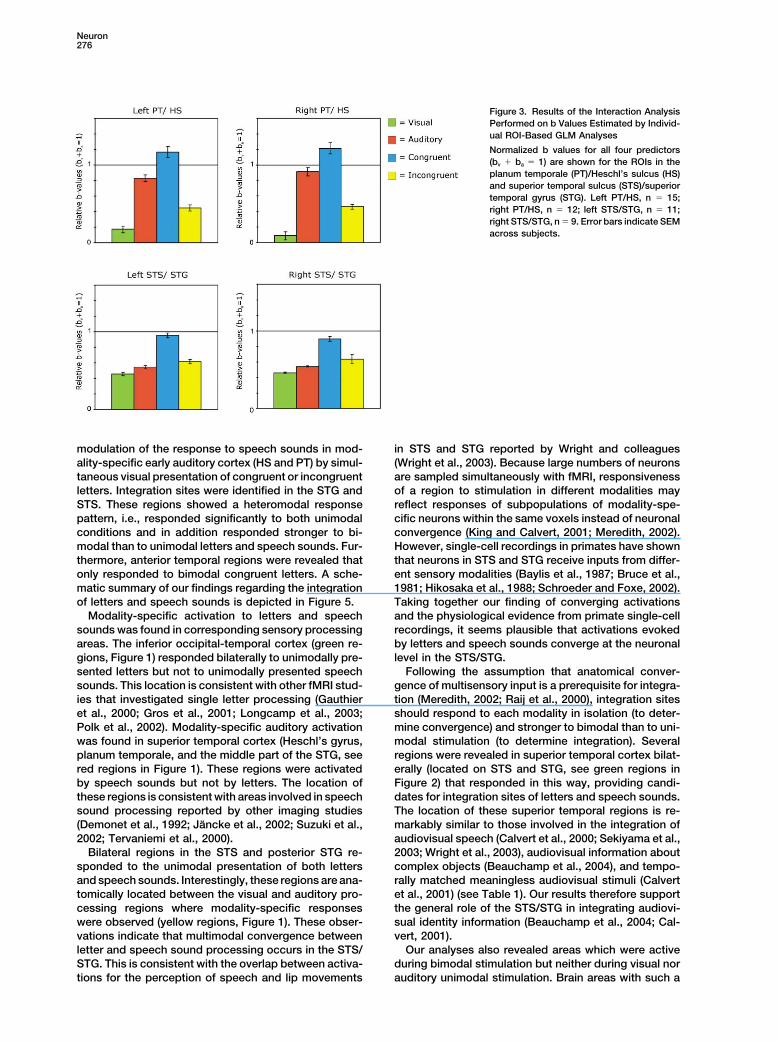
Figure 3. Results of the Interaction AnalysisPerformed on b Values Estimated by Individ-ual ROI-Based GLM Analyses
Normalized b values for all four predictors(bv � ba � 1) are shown for the ROIs in theplanum temporale (PT)/Heschl’s sulcus (HS)and superior temporal sulcus (STS)/superiortemporal gyrus (STG). Left PT/HS, n � 15;right PT/HS, n � 12; left STS/STG, n � 11;right STS/STG, n � 9. Error bars indicate SEMacross subjects.
modulation of the response to speech sounds in mod- in STS and STG reported by Wright and colleagues(Wright et al., 2003). Because large numbers of neuronsality-specific early auditory cortex (HS and PT) by simul-
taneous visual presentation of congruent or incongruent are sampled simultaneously with fMRI, responsivenessof a region to stimulation in different modalities mayletters. Integration sites were identified in the STG and
STS. These regions showed a heteromodal response reflect responses of subpopulations of modality-spe-cific neurons within the same voxels instead of neuronalpattern, i.e., responded significantly to both unimodal
conditions and in addition responded stronger to bi- convergence (King and Calvert, 2001; Meredith, 2002).However, single-cell recordings in primates have shownmodal than to unimodal letters and speech sounds. Fur-
thermore, anterior temporal regions were revealed that that neurons in STS and STG receive inputs from differ-ent sensory modalities (Baylis et al., 1987; Bruce et al.,only responded to bimodal congruent letters. A sche-
matic summary of our findings regarding the integration 1981; Hikosaka et al., 1988; Schroeder and Foxe, 2002).Taking together our finding of converging activationsof letters and speech sounds is depicted in Figure 5.
Modality-specific activation to letters and speech and the physiological evidence from primate single-cellrecordings, it seems plausible that activations evokedsounds was found in corresponding sensory processing
areas. The inferior occipital-temporal cortex (green re- by letters and speech sounds converge at the neuronallevel in the STS/STG.gions, Figure 1) responded bilaterally to unimodally pre-
sented letters but not to unimodally presented speech Following the assumption that anatomical conver-gence of multisensory input is a prerequisite for integra-sounds. This location is consistent with other fMRI stud-
ies that investigated single letter processing (Gauthier tion (Meredith, 2002; Raij et al., 2000), integration sitesshould respond to each modality in isolation (to deter-et al., 2000; Gros et al., 2001; Longcamp et al., 2003;
Polk et al., 2002). Modality-specific auditory activation mine convergence) and stronger to bimodal than to uni-modal stimulation (to determine integration). Severalwas found in superior temporal cortex (Heschl’s gyrus,
planum temporale, and the middle part of the STG, see regions were revealed in superior temporal cortex bilat-erally (located on STS and STG, see green regions inred regions in Figure 1). These regions were activated
by speech sounds but not by letters. The location of Figure 2) that responded in this way, providing candi-dates for integration sites of letters and speech sounds.these regions is consistent with areas involved in speech
sound processing reported by other imaging studies The location of these superior temporal regions is re-markably similar to those involved in the integration of(Demonet et al., 1992; Jancke et al., 2002; Suzuki et al.,
2002; Tervaniemi et al., 2000). audiovisual speech (Calvert et al., 2000; Sekiyama et al.,2003; Wright et al., 2003), audiovisual information aboutBilateral regions in the STS and posterior STG re-
sponded to the unimodal presentation of both letters complex objects (Beauchamp et al., 2004), and tempo-rally matched meaningless audiovisual stimuli (Calvertand speech sounds. Interestingly, these regions are ana-
tomically located between the visual and auditory pro- et al., 2001) (see Table 1). Our results therefore supportthe general role of the STS/STG in integrating audiovi-cessing regions where modality-specific responses
were observed (yellow regions, Figure 1). These obser- sual identity information (Beauchamp et al., 2004; Cal-vert, 2001).vations indicate that multimodal convergence between
letter and speech sound processing occurs in the STS/ Our analyses also revealed areas which were activeduring bimodal stimulation but neither during visual norSTG. This is consistent with the overlap between activa-
tions for the perception of speech and lip movements auditory unimodal stimulation. Brain areas with such a
Integration of Letters and Speech Sounds277
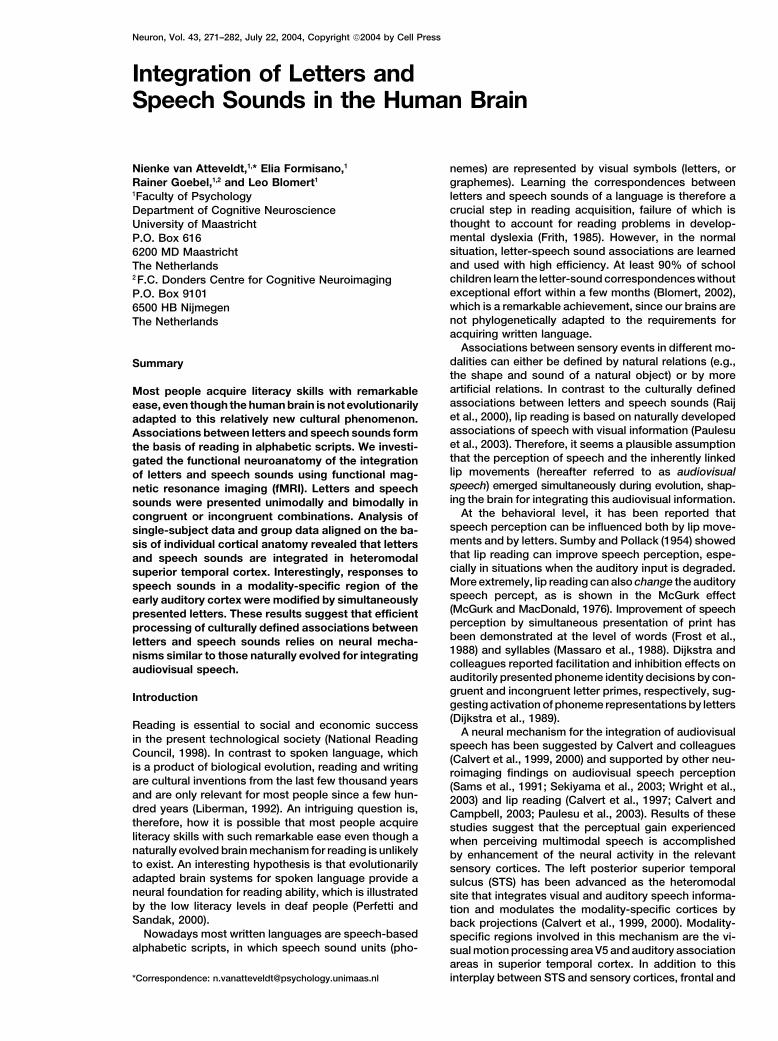
Figure 4. Location of ROIs in Early Auditory Cortex in the Left Hemisphere in Six Representative Individual Subjects
Statistical maps for unimodal auditory � baseline (light blue) and bimodal congruent � bimodal incongruent (dark blue) are superimposedon the inflated cortical sheets of the individual subjects. The congruency contrast is also superimposed on axial views of the individualTalairach normalized anatomical images (orange clusters indicated by yellow arrows). t values for both contrasts are given in the figure. STS,superior temporal sulcus; PT, planum temporale; HS, Heschl’s sulcus; FTS, first transverse temporal sulcus.
response profile would indicate that they contain cells to congruent information is determined by input fromheteromodal STS/STG.exhibiting conjunctive coding (Hinton et al., 1986). With-
out the constraint that modality-specific responses To explore the effects of relatedness between thestimuli in both modalities, we examined the contrast ofshould be significant, we indeed revealed additional ac-
tivation clusters, located in the anterior temporal cortex congruent versus incongruent bimodal stimulation. Thiscomparison revealed cross-modal modulation effects in(see Figure 2A, yellow regions). Interestingly, these re-
gions responded only during congruent but not during early auditory cortex (HS and PT), expressed by en-hancement and suppression of the response to speechincongruent bimodal stimulation (see Figure 2B). This
unexpected selectivity for congruent bimodal stimula- sounds depending on the congruency of the simultane-ously presented letters. Congruent combinations of let-tion might indicate that these regions signal the suc-
cessful binding of cross-modal information into a unified ters and speech sounds elicited a response that signifi-cantly exceeded the response to speech sounds alone,percept. Future work is necessary to investigate the
detailed properties of these regions. It would, for exam- while the response to incongruent combinations of let-ters and speech sounds was significantly weaker thanple, be interesting to know whether some or all subre-
gions are specifically involved in coding congruent let- the response to speech sounds alone. Individual analy-ses indicated a highly consistent localization of thister-sound stimulation or whether they would also respond
during other congruent, but not incongruent, visual and cross-modal modulation effect, just posterior and lateralto the primary auditory cortex (see Figure 4 and Tableauditory information. Furthermore, it would be interest-
ing to find out whether these anterior temporal regions 2). This location indicates that visual letter informationcan influence auditory processing of speech sounds atreceive input directly from the modality-specific pro-
cessing regions, which is expected if conjunctive coding a very early stage. Another remarkable observation isthat these regions did not respond to letters alone, sug-indeed takes place, or whether the selective response
Neuron278
Wright et al., 2003). Because of the intrinsic nature ofthe BOLD response and its limited dynamic range, it ispossible that a superadditive change in the response atthe neuronal level is not reflected in a similarly super-additive change in the BOLD response. Therefore, su-peradditivity is more likely to be found when the re-sponse to one or both of the unimodal conditions isweak or absent (or even negative) than when the BOLDresponse to both modalities is separately already strong.This prediction is confirmed by the findings of Wrightet al. (2003) and by the different response patterns wefind in the anterior temporal cortex, PT/HS, and the STS/STG (see Figures 2B and 3). In the PT/HS, the very weakresponse to unimodal visual stimuli leaves opportunityfor congruent bimodal stimuli to evoke a superadditiveBOLD response. In the anterior temporal cortex, neitherunimodal condition evokes a significant response, sothe response evoked by the congruent bimodal condi-tion exceeds the sum of the unimodal responses even
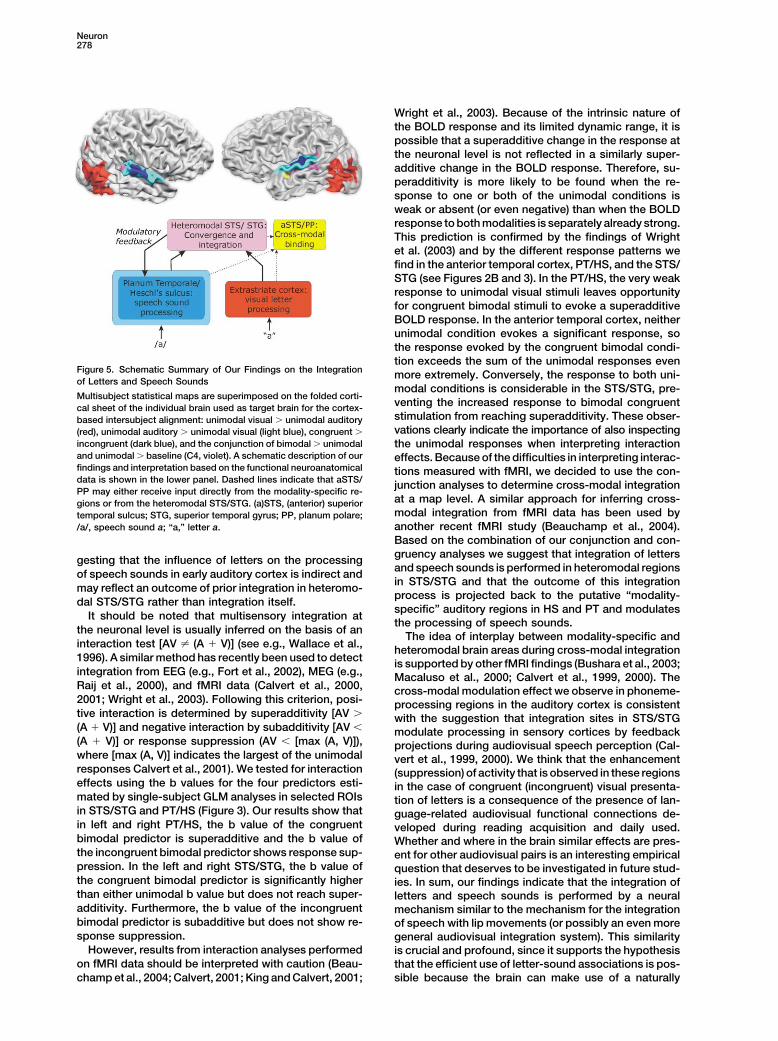
Figure 5. Schematic Summary of Our Findings on the Integration more extremely. Conversely, the response to both uni-of Letters and Speech Sounds
modal conditions is considerable in the STS/STG, pre-Multisubject statistical maps are superimposed on the folded corti-
venting the increased response to bimodal congruentcal sheet of the individual brain used as target brain for the cortex-stimulation from reaching superadditivity. These obser-based intersubject alignment: unimodal visual � unimodal auditoryvations clearly indicate the importance of also inspecting(red), unimodal auditory � unimodal visual (light blue), congruent �
incongruent (dark blue), and the conjunction of bimodal � unimodal the unimodal responses when interpreting interactionand unimodal � baseline (C4, violet). A schematic description of our effects. Because of the difficulties in interpreting interac-findings and interpretation based on the functional neuroanatomical tions measured with fMRI, we decided to use the con-data is shown in the lower panel. Dashed lines indicate that aSTS/ junction analyses to determine cross-modal integrationPP may either receive input directly from the modality-specific re-
at a map level. A similar approach for inferring cross-gions or from the heteromodal STS/STG. (a)STS, (anterior) superiormodal integration from fMRI data has been used bytemporal sulcus; STG, superior temporal gyrus; PP, planum polare;another recent fMRI study (Beauchamp et al., 2004)./a/, speech sound a; “a,” letter a.Based on the combination of our conjunction and con-gruency analyses we suggest that integration of lettersgesting that the influence of letters on the processingand speech sounds is performed in heteromodal regionsof speech sounds in early auditory cortex is indirect andin STS/STG and that the outcome of this integrationmay reflect an outcome of prior integration in heteromo-process is projected back to the putative “modality-
dal STS/STG rather than integration itself.specific” auditory regions in HS and PT and modulates
It should be noted that multisensory integration atthe processing of speech sounds.
the neuronal level is usually inferred on the basis of anThe idea of interplay between modality-specific and
interaction test [AV � (A � V)] (see e.g., Wallace et al., heteromodal brain areas during cross-modal integration1996). A similar method has recently been used to detect is supported by other fMRI findings (Bushara et al., 2003;integration from EEG (e.g., Fort et al., 2002), MEG (e.g., Macaluso et al., 2000; Calvert et al., 1999, 2000). TheRaij et al., 2000), and fMRI data (Calvert et al., 2000, cross-modal modulation effect we observe in phoneme-2001; Wright et al., 2003). Following this criterion, posi- processing regions in the auditory cortex is consistenttive interaction is determined by superadditivity [AV � with the suggestion that integration sites in STS/STG(A � V)] and negative interaction by subadditivity [AV � modulate processing in sensory cortices by feedback(A � V)] or response suppression (AV � [max (A, V)]), projections during audiovisual speech perception (Cal-where [max (A, V)] indicates the largest of the unimodal vert et al., 1999, 2000). We think that the enhancementresponses Calvert et al., 2001). We tested for interaction (suppression) of activity that is observed in these regionseffects using the b values for the four predictors esti- in the case of congruent (incongruent) visual presenta-mated by single-subject GLM analyses in selected ROIs tion of letters is a consequence of the presence of lan-in STS/STG and PT/HS (Figure 3). Our results show that guage-related audiovisual functional connections de-in left and right PT/HS, the b value of the congruent veloped during reading acquisition and daily used.bimodal predictor is superadditive and the b value of Whether and where in the brain similar effects are pres-the incongruent bimodal predictor shows response sup- ent for other audiovisual pairs is an interesting empiricalpression. In the left and right STS/STG, the b value of question that deserves to be investigated in future stud-the congruent bimodal predictor is significantly higher ies. In sum, our findings indicate that the integration ofthan either unimodal b value but does not reach super- letters and speech sounds is performed by a neuraladditivity. Furthermore, the b value of the incongruent mechanism similar to the mechanism for the integrationbimodal predictor is subadditive but does not show re- of speech with lip movements (or possibly an even moresponse suppression. general audiovisual integration system). This similarity
However, results from interaction analyses performed is crucial and profound, since it supports the hypothesison fMRI data should be interpreted with caution (Beau- that the efficient use of letter-sound associations is pos-
sible because the brain can make use of a naturallychamp et al., 2004; Calvert, 2001; King and Calvert, 2001;
Integration of Letters and Speech Sounds279
evolved mechanism for associating visual information mental Procedures), our functional scans did not coverwith speech. the whole brain. Therefore, we cannot exclude the possi-
A feedback mechanism implies that the modulation bility that frontal and parietal brain regions may alsoeffect observed in HS and PT should occur later in time play a role in the proposed mechanism for the integrationthan the convergence and integration in STS/STG. Un- of letters and speech sounds.fortunately, fMRI does not provide temporal informationthat is accurate enough to verify this implication. How- Conclusionever, the time course information on audiovisual letter By using an fMRI design that allowed the investigationintegration provided by Raij and colleagues (Raij et al., of processing in auditory, visual, and heteromodal tem-2000) does support a feedback mechanism: conver- poral brain regions with high spatial accuracy, we re-gence and interaction effects started at 225 ms, while vealed a functional neuronal mechanism for the integra-differences in interaction effects for matching and non- tion of letters and speech sounds. Modality-specificmatching letters and speech sounds did not occur until processing was observed in superior temporal and oc-380–450 ms. More direct support for our proposed feed- cipital temporal cortices, convergence and integrationback mechanism comes from a recent report by Schroeder in the heteromodal STS/STG. Furthermore, we revealedand Foxe (2002). They investigated the laminar profile anterior temporal regions that exclusively responded toand multisensory response properties of neurons in the bimodal congruent letters. A most interesting findingposterior auditory association cortex (presumably cor- was that subregions of early auditory cortex involved inresponding to our PT/HS regions) and the superior tem- speech sound processing, located on Heschl’s sulcusporal sulcus (presumably corresponding to our STS/ and the planum temporale, were influenced by the con-STG regions) of the macaque monkey. In auditory asso- gruency of simultaneously presented letters and speechciation cortex, a laminar input profile for visual stimula- sounds. Because these regions did not respond to let-tion was observed, indicating feedback projections. In ters alone, we interpret this influence as feedback modu-the STS, laminar profiles indicated feedforward conver-
lation from heteromodal STS/STG regions where inte-gence of visual and auditory information. Consistent
gration took place. Our data show that the integrationinformation was provided by the response latencies of
of culturally defined associations between letters andvisual and auditory input: responses to visual and audi-
speech sounds recruits a neural mechanism similar totory stimulation in the STS were coincident, while visual
the naturally evolved neural mechanism for the integra-responses were delayed relative to auditory responses
tion of speech information with lip movements.in the auditory association cortex.The modulation effect observed in the auditory asso-
Experimental Proceduresciation cortex was not observed in the visual associationcortex. This implies that the outcome of the integration Subjectsof letters and speech sounds is projected back to influ- Sixteen healthy native Dutch subjects (3 male, mean age 22 � 2.4,
range 19–27) participated in the present study. All subjects wereence selectively only early auditory processing levels,university students enrolled in an undergraduate study program.but not lower-level visual processing. In contrast, bothWe selected subjects based on a questionnaire including questionssensory systems seem to be related reciprocally duringconcerning (present or history of) reading or other language prob-audiovisual speech perception (Calvert et al., 1999). Anlems. All were right handed, had normal or corrected-to-normal
asymmetry in the representations of associations be- vision, and normal hearing capacity. Subjects gave informed writtentween letters and speech sounds has been reported at consent and were paid for their participation.the behavioral level before (Dijkstra et al., 1993; Hardyet al., 1972). A possible explanation for the observed Stimuli and Task Designunidirectional influence is that speech sounds are con- Stimuli were speech sounds corresponding to single letters and
visually presented single letters. Speech sounds were digitally re-tinuous in time and more variable and therefore morecorded (sampling rate 44.1 kHz, 16 bit quantization) from a femaledifficult to recognize than discrete and invariable letterspeaker. Recordings were band-pass filtered (180–10,000 Hz) andsymbols (Liberman, 1992). This is consistent with theresampled at 22.05 kHz. Only speech sounds that were recognizedfinding of Sekiyama et al. (2003) that visual information 100% correctly in a pilot experiment (n � 10) were selected for the
exerts a stronger influence on auditory processing when fMRI experiment. Selected consonants were b, d, g, h, k, l, n, p, r,speech is less intelligible. The direction of modulatory s, t, z. Selected vowels were a, e, i, y, o, u. Average duration of theeffects between letters and speech sounds may depend speech sounds was 352 (�5) ms, the average sound intensity level
was 71.3 (�0.2) dB. Visual stimuli were lower-case letters corre-on the temporal synchrony of the stimuli (Dijkstra et al.,sponding to the 18 speech sounds. White letters were presented1993; Jones and Callan, 2003), a possibility that will needfor 350 ms on a black background in the center of a computerfurther investigation.screen, printed in “Arial” font at letter-size 40. During fixation periods
A remark should be made about the possible involve- and scanning, a white fixation cross was presented in the center ofment of frontal and parietal brain regions in the integra- the screen.tion of letters and speech sounds. Frontal (Broca’s area, Stimuli were presented in blocks of four different conditions: uni-premotor cortex, anterior cingulate cortex) and parietal modal visual, unimodal auditory, bimodal congruent, and bimodal
incongruent. In the bimodal conditions, visual letters and speech(inferior and posterior parietal cortex) activation hassounds were presented simultaneously. Experimental blocks (20 s)been reported during lip reading and audiovisual speechwere composed of four miniblocks of 5 s (see Figure 6). In theperception (Calvert et al., 1997, 2000; Calvert and Camp-first 1.1 s of each miniblock, one brain volume was acquired (see
bell, 2003; Jones and Callan, 2003; Olson et al., 2002; “Scanning Procedure”). No stimuli were presented in this period,Paulesu et al., 2003; Sekiyama et al., 2003) and are only a fixation cross to keep the eyes of the subjects focused onassociated with speech sound processing and attention. the center of the screen. In the subsequent silent 3.9 s, five stimuli
were presented with a stimulus onset asynchrony (SOA) of 700 ms.Because of methodological considerations (see Experi-
Neuron280
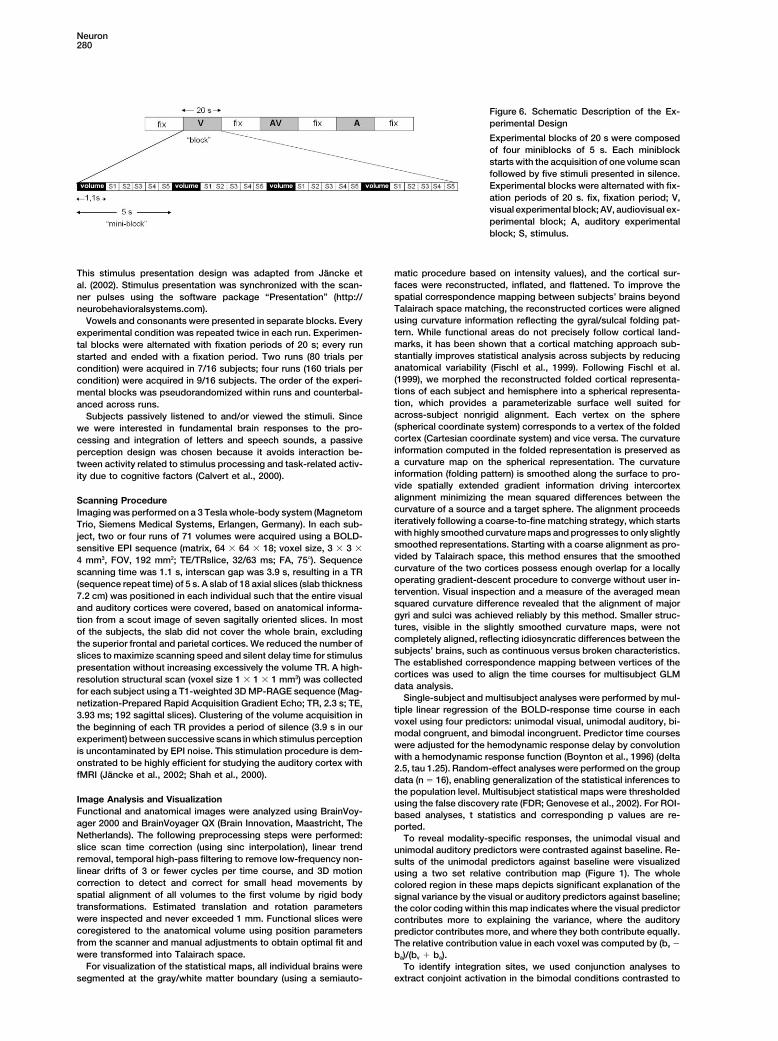
Figure 6. Schematic Description of the Ex-perimental Design
Experimental blocks of 20 s were composedof four miniblocks of 5 s. Each miniblockstarts with the acquisition of one volume scanfollowed by five stimuli presented in silence.Experimental blocks were alternated with fix-ation periods of 20 s. fix, fixation period; V,visual experimental block; AV, audiovisual ex-perimental block; A, auditory experimentalblock; S, stimulus.
This stimulus presentation design was adapted from Jancke et matic procedure based on intensity values), and the cortical sur-faces were reconstructed, inflated, and flattened. To improve theal. (2002). Stimulus presentation was synchronized with the scan-spatial correspondence mapping between subjects’ brains beyondner pulses using the software package “Presentation” (http://Talairach space matching, the reconstructed cortices were alignedneurobehavioralsystems.com).using curvature information reflecting the gyral/sulcal folding pat-Vowels and consonants were presented in separate blocks. Everytern. While functional areas do not precisely follow cortical land-experimental condition was repeated twice in each run. Experimen-marks, it has been shown that a cortical matching approach sub-tal blocks were alternated with fixation periods of 20 s; every runstantially improves statistical analysis across subjects by reducingstarted and ended with a fixation period. Two runs (80 trials peranatomical variability (Fischl et al., 1999). Following Fischl et al.condition) were acquired in 7/16 subjects; four runs (160 trials per(1999), we morphed the reconstructed folded cortical representa-condition) were acquired in 9/16 subjects. The order of the experi-tions of each subject and hemisphere into a spherical representa-mental blocks was pseudorandomized within runs and counterbal-tion, which provides a parameterizable surface well suited foranced across runs.across-subject nonrigid alignment. Each vertex on the sphereSubjects passively listened to and/or viewed the stimuli. Since(spherical coordinate system) corresponds to a vertex of the foldedwe were interested in fundamental brain responses to the pro-cortex (Cartesian coordinate system) and vice versa. The curvaturecessing and integration of letters and speech sounds, a passiveinformation computed in the folded representation is preserved asperception design was chosen because it avoids interaction be-a curvature map on the spherical representation. The curvaturetween activity related to stimulus processing and task-related activ-information (folding pattern) is smoothed along the surface to pro-ity due to cognitive factors (Calvert et al., 2000).vide spatially extended gradient information driving intercortexalignment minimizing the mean squared differences between theScanning Procedurecurvature of a source and a target sphere. The alignment proceedsImaging was performed on a 3 Tesla whole-body system (Magnetomiteratively following a coarse-to-fine matching strategy, which startsTrio, Siemens Medical Systems, Erlangen, Germany). In each sub-with highly smoothed curvature maps and progresses to only slightlyject, two or four runs of 71 volumes were acquired using a BOLD-smoothed representations. Starting with a coarse alignment as pro-sensitive EPI sequence (matrix, 64 � 64 � 18; voxel size, 3 � 3 �vided by Talairach space, this method ensures that the smoothed4 mm3, FOV, 192 mm2; TE/TRslice, 32/63 ms; FA, 75�). Sequencecurvature of the two cortices possess enough overlap for a locallyscanning time was 1.1 s, interscan gap was 3.9 s, resulting in a TRoperating gradient-descent procedure to converge without user in-(sequence repeat time) of 5 s. A slab of 18 axial slices (slab thicknesstervention. Visual inspection and a measure of the averaged mean7.2 cm) was positioned in each individual such that the entire visualsquared curvature difference revealed that the alignment of majorand auditory cortices were covered, based on anatomical informa-gyri and sulci was achieved reliably by this method. Smaller struc-tion from a scout image of seven sagitally oriented slices. In mosttures, visible in the slightly smoothed curvature maps, were notof the subjects, the slab did not cover the whole brain, excludingcompletely aligned, reflecting idiosyncratic differences between thethe superior frontal and parietal cortices. We reduced the number ofsubjects’ brains, such as continuous versus broken characteristics.slices to maximize scanning speed and silent delay time for stimulusThe established correspondence mapping between vertices of thepresentation without increasing excessively the volume TR. A high-cortices was used to align the time courses for multisubject GLMresolution structural scan (voxel size 1 � 1 � 1 mm3) was collecteddata analysis.for each subject using a T1-weighted 3D MP-RAGE sequence (Mag-
Single-subject and multisubject analyses were performed by mul-netization-Prepared Rapid Acquisition Gradient Echo; TR, 2.3 s; TE,tiple linear regression of the BOLD-response time course in each
3.93 ms; 192 sagittal slices). Clustering of the volume acquisition invoxel using four predictors: unimodal visual, unimodal auditory, bi-
the beginning of each TR provides a period of silence (3.9 s in ourmodal congruent, and bimodal incongruent. Predictor time courses
experiment) between successive scans in which stimulus perceptionwere adjusted for the hemodynamic response delay by convolution
is uncontaminated by EPI noise. This stimulation procedure is dem-with a hemodynamic response function (Boynton et al., 1996) (delta
onstrated to be highly efficient for studying the auditory cortex with 2.5, tau 1.25). Random-effect analyses were performed on the groupfMRI (Jancke et al., 2002; Shah et al., 2000). data (n � 16), enabling generalization of the statistical inferences to
the population level. Multisubject statistical maps were thresholdedImage Analysis and Visualization using the false discovery rate (FDR; Genovese et al., 2002). For ROI-Functional and anatomical images were analyzed using BrainVoy- based analyses, t statistics and corresponding p values are re-ager 2000 and BrainVoyager QX (Brain Innovation, Maastricht, The ported.Netherlands). The following preprocessing steps were performed: To reveal modality-specific responses, the unimodal visual andslice scan time correction (using sinc interpolation), linear trend unimodal auditory predictors were contrasted against baseline. Re-removal, temporal high-pass filtering to remove low-frequency non- sults of the unimodal predictors against baseline were visualizedlinear drifts of 3 or fewer cycles per time course, and 3D motion using a two set relative contribution map (Figure 1). The wholecorrection to detect and correct for small head movements by colored region in these maps depicts significant explanation of thespatial alignment of all volumes to the first volume by rigid body signal variance by the visual or auditory predictors against baseline;transformations. Estimated translation and rotation parameters the color coding within this map indicates where the visual predictorwere inspected and never exceeded 1 mm. Functional slices were contributes more to explaining the variance, where the auditorycoregistered to the anatomical volume using position parameters predictor contributes more, and where they both contribute equally.from the scanner and manual adjustments to obtain optimal fit and The relative contribution value in each voxel was computed by (bv �were transformed into Talairach space. ba)/(bv � ba).
For visualization of the statistical maps, all individual brains were To identify integration sites, we used conjunction analyses toextract conjoint activation in the bimodal conditions contrasted tosegmented at the gray/white matter boundary (using a semiauto-
Integration of Letters and Speech Sounds281
each unimodal condition. At each voxel, a new statistical value was S.C., McGuire, P.K., Woodruff, P.W., Iversen, S.D., and David, A.S.(1997). Activation of auditory cortex during silent lipreading. Sciencecomputed as the minimum of the statistical values obtained from
all the specified contrasts. The first step in identifying integration 276, 593–596.sites was to find voxels that were significantly more active during Calvert, G.A., Brammer, M.J., Bullmore, E.T., Campbell, R., Iversen,audiovisual stimulation as compared to both modalities in isolation. S.D., and David, A.S. (1999). Response amplification in sensory-For this purpose, we performed the conjunction analysis with the specific cortices during crossmodal binding. Neuroreport 10, 2619–following two contrasts: (bimodal congruent � unimodal auditory) 2623.� (bimodal congruent � unimodal visual). In the second step, we
Calvert, G.A., Campbell, R., and Brammer, M.J. (2000). Evidenceincluded the constraint that integration sites should show conver-from functional magnetic resonance imaging of crossmodal bindinggence of auditory and visual activity, i.e., respond to both unimodalin the human heteromodal cortex. Curr. Biol. 10, 649–657.conditions in isolation. In other words, two contrasts were addedCalvert, G.A., Hansen, P.C., Iversen, S.D., and Brammer, M.J. (2001).to the conjunction analysis: (bimodal congruent � unimodal audi-Detection of audio-visual integration sites in humans by applicationtory) � (bimodal congruent � unimodal visual) � (unimodalof electrophysiological criteria to the BOLD effect. Neuroimageauditory � baseline) � (unimodal visual � baseline).14, 427–438.To determine interaction effects, we estimated b values for all
four predictors by individual ROI-based GLM analyses and con- Demonet, J.F., Chollet, F., Ramsay, S., Cardebat, D., Nespoulous,trasted the bimodal predictors to the sum of the unimodal b values J.L., Wise, R., Rascol, A., and Frackowiak, R. (1992). The anatomy(ba � bv). For this purpose, we normalized all b values by dividing of phonological and semantic processing in normal subjects. Brainthem by (ba � bv). After this normalization, superadditivity is defined 115, 1753–1768.by bav � 1, and subadditivity by bav � 1, and response suppression
Dijkstra, A., Schreuder, R., and Frauenfelder, U.H. (1989). Graphemeby (bav � [max (ba, bv)]), where [max (ba, bv)] indicates the largest of
context effects on phonemic processing. Lang. Speech 32, 89–108.the unimodal responses (Calvert et al., 2001). We tested for super-
Dijkstra, T., Frauenfelder, U.H., and Schreuder, R. (1993). Bidirec-additivity and subadditivity by one-sample t tests (bav against 1) andtional grapheme-phoneme activation in a bimodal detection task.for response suppression by paired-samples t tests [bav against maxJ. Exp. Psychol. Hum. Percept. Perform. 19, 931–950.(ba, bv)].
To find out which brain regions respond differently to congruent Duvernoy, H.M. (1999). The Human Brain: Surface, Three-Dimen-and incongruent combinations of letters and speech sounds, the sional Sectional Anatomy with MRI and Blood Supply, Second Edi-contrast of bimodal congruent versus bimodal incongruent was per- tion (Wien, NY: Springer-Verlag).formed. Fischl, B., Sereno, M.I., Tootel, R.B.H., and Dale, A.M. (1999). High-
resolution intersubject averaging and a coordinate system for theAcknowledgments cortical surface. Hum. Brain Mapp. 8, 272–284.
Formisano, E., Kim, D.-S., Di Salle, F., van de Moortele, P.-F., Ugurbil,The authors are grateful to Holger Mitterer for his help with preparing
K., and Goebel, R. (2003). Mirror-symmetric tonotopic maps in hu-the stimuli, to Paul Gaalman for his technical assistance, and to
man primary auditory cortex. Neuron 40, 859–869.Peter Hagoort for providing access to the facilities of the F.C Don-
Fort, A., Delpuech, C., Pernier, J., and Giard, M.H. (2002). Dynamicsders Centre. The reported research was supported by grantof cortico-subcortical cross-modal operations involved in audio-048.011.046 of the Dutch Organisation for Scientific Research (NWO)visual object detection in humans. Cereb. Cortex 12, 1031–1039.awarded to L.B.Frith, U. (1985). Beneath the surface of developmental dyslexia. InSurface Dyslexia, K.E. Patterson, J.C. Marshall, and M. Coltheart,Received: January 5, 2004eds. (London: Routledge & Kegan-Paul), pp. 301–330.Revised: May 10, 2004
Accepted: June 16, 2004 Frost, R., Repp, B.H., and Katz, L. (1988). Can speech perceptionPublished: July 21, 2004 be influenced by simultaneous presentation of print? J. Mem. Lang.
27, 741–755.References Gauthier, I., Tarr, J., Moylan, J., Skudlarski, P., Gore, C., and Ander-
son, W. (2000). The fusiform “face area” is part of a network thatBaylis, G.C., Rolls, E.T., and Leonard, C.M. (1987). Functional subdi- processes faces at the individual level. J. Cogn. Neurosci. 12,visions of the temporal lobe neocortex. J. Neurosci. 7, 330–342. 495–504.Beauchamp, M., Lee, K., Argall, B., and Martin, A. (2004). Integration Genovese, C., Lazar, N., and Nichols, T. (2002). Thresholding ofof auditory and visual information about objects in superior temporal statistical maps in functional neuroimaging using the false discoverysulcus. Neuron 41, 809–823. rate. Neuroimage 15, 870–878.Blomert, L. (2002). Dyslexie: Stand van Zaken (Dyslexia: State of Gros, H., Boulanouar, K., Viallard, G., Cassol, E., and Celsis, P.Affairs in The Netherlands). Report for the Dutch Ministry of Health. (2001). Event-related functional magnetic resonance imaging studyIn Dyslexie naar een vergoedingsregeling, R. Reij, ed. (Amstelveen: of the extrastriate cortex response to a categorically ambiguousDutch Health Care Insurance Board). stimulus primed by letters and familiar geometric figures. J. Cereb.Boynton, G.M., Engel, S.A., Glover, G.H., and Heeger, D.J. (1996). Blood Flow Metab. 21, 1330–1341.Linear systems analysis of functional magnetic resonance imaging Hadjikhani, N., and Roland, P.E. (1998). Cross-modal transfer ofin human V1. J. Neurosci. 16, 4207–4241. information between the tactile and the visual representations inBruce, C., Desimone, R., and Gross, C.G. (1981). Visual properties the human brain: a positron emission tomographic study. J. Neu-of neurons in a polysensory area in superior temporal sulcus of the rosci. 18, 1072–1084.macaque. J. Neurophysiol. 46, 369–384.
Hardy, M.H., Smythe, P.C., Stennet, R.G., and Wilson, H.R. (1972).Bushara, K.O., Hanakawa, T., Immisch, I., Toma, K., Kansaku, K., Developmental patterns in elemental reading skills: phoneme-and Hallett, M. (2003). Neural correlates of cross-modal binding. grapheme and grapheme-phoneme correspondences. J. Educ. Psy-Nat. Neurosci. 6, 190–195. chol. 63, 433–436.Calvert, G.A. (2001). Crossmodal processing in the human brain: Hikosaka, K., Iwai, E., Saito, H., and Tanaka, K. (1988). Polysensoryinsights from functional neuroimaging studies. Cereb. Cortex 11, properties of neurons in the anterior bank of the caudal superior1110–1123. temporal sulcus of the macaque monkey. J. Neurophysiol. 60, 1615–
1637.Calvert, G.A., and Campbell, R. (2003). Reading speech from stilland moving faces: the neural substrates of visible speech. J. Cogn. Hinton, G.E., McClelland, J.L., and Rumelhart, D.E. (1986). Distrib-Neurosci. 15, 57–71. uted respresentations. In Parallel Distributed Processing: Explora-
tions in the Microstructutre Of Cognition, D.E. Rumelhart and J.L.Calvert, G.A., Bullmore, E.T., Brammer, M.J., Campbell, R., Williams,
Neuron282
McClelland, eds. (Cambridge, Massachusetts: The MIT Press), pp. subcortical activation with monaural monosyllabic stimulation byfunctional MRI. Hear. Res. 163, 37–45.77–109.
Tervaniemi, M., Medvedev, S.V., Alho, K., Pakhomov, S.V., Roudas,Jancke, L., Wustenberg, T., Scheich, H., and Heinze, H.J. (2002).M.S., van Zuijen, T.L., and Naatanen, R. (2000). Lateralized automaticPhonetic perception and the temporal cortex. Neuroimage 15,auditory processing of phonetic versus musical information: A PET733–746.study. Hum. Brain Mapp. 10, 74–79.Jones, J.A., and Callan, D.E. (2003). Brain activity during audiovisualWallace, M.T., Wilkinson, L.K., and Stein, B.E. (1996). Representationspeech perception: An fMRI study of the McGurk effect. Neuroreportand integration of multiple sensory inputs in primate superior collicu-14, 1129–1133.lus. J. Neurophysiol. 76, 1246–1266.Kaas, J.H., and Hackett, T.A. (2000). Subdivisions of auditory cortexWright, T.M., Pelphrey, K.A., Allison, T., McKeown, M.J., and McCar-and processing streams in primates. Proc. Natl. Acad. Sci. USAthy, G. (2003). Polysensory interactions along lateral temporal re-97, 11793–11799.gions evoked by audiovisual speech. Cereb. Cortex 13, 1034–1043.
Kim, J.-J., Crespo-Facorro, B., Andreasen, N.C., O’Leary, D.S.,Zhang, B., Harris, G., and Magnotta, V.A. (2000). An MRI-basedparcellation method for the temporal lobe. Neuroimage 11, 271–288.
King, A.J., and Calvert, G.A. (2001). Multisensory integration: per-ceptual grouping by eye and ear. Curr. Biol. 11, R322–R325.
Liberman, A.M. (1992). The relation of speech to reading and writing.In Orthography, Phonology, Morphology and Meaning, R. Frost andL. Katz, eds. (Amsterdam: Elsevier Science Publishers B.V.), pp.167–178.
Longcamp, M., Anton, J.L., Roth, M., and Velay, J.L. (2003). Visualpresentation of single letters activates a premotor area involved inwriting. Neuroimage 19, 1492–1500.
Macaluso, E., Frith, C.D., and Driver, J. (2000). Modulation of humanvisual cortex by crossmodal spatial attention. Science 289, 1206–1208.
Massaro, D.W., Cohen, M.M., and Thompson, L.A. (1988). Visiblelanguage in speech perception: lipreading and reading. visible lan-guage 22.
McGurk, H., and MacDonald, J. (1976). Hearing lips and seeingvoices. Nature 263, 747.
Meredith, M.A. (2002). On the neuronal basis for multisensory con-vergence: a brief overview. Cogn. Brain Res. 14, 31–40.
National Reading Council. (1998). Preventing Reading Difficulties inYoung Children (Washington, DC: National Academy Press).
Olson, I.R., Christopher Gatenby, J., and Gore, J.C. (2002). A com-parison of bound and unbound audio-visual information processingin the human cerebral cortex. Cogn. Brain Res. 14, 129–138.
Paulesu, E., Perani, D., Blasi, V., Silani, G., Borghese, N.A., De Gio-vanni, U., Sensolo, S., and Fazio, F. (2003). A functional-anatomicalmodel for lipreading. J. Neurophysiol. 90, 2005–2013.
Perfetti, C.A., and Sandak, R. (2000). Reading optimally builds onspoken language: Implications for deaf readers. J. Deaf Stud. DeafEduc. 5, 32–50.
Polk, T., Stallcup, M., Aguirre, G., Alsop, D., D’Esposito, M., Detre,J., and Farrah, M. (2002). Neural specialization for letter recognition.J. Cogn. Neurosci. 14, 145–159.
Raij, T., Uutela, K., and Hari, R. (2000). Audiovisual integration ofletters in the human brain. Neuron 28, 617–625.
Sams, M., Aulanko, R., Hamalainen, M., Hari, R., Lounasmaa, O.V.,Lu, S.T., and Simola, J. (1991). Seeing speech: visual informationfrom lip movements modifies activity in the human auditory cortex.Neurosci. Lett. 127, 141–145.
Schroeder, C.E., and Foxe, J.J. (2002). The timing and laminar profileof converging inputs to multisensory areas of the macaque neocor-tex. Cogn. Brain Res. 14, 187–198.
Sekiyama, K., Kanno, I., Miura, S., and Sugita, Y. (2003). Auditory-visual speech perception examined by fMRI and PET. Neurosci.Res. 47, 277–287.
Shah, N., Steinhoff, S., Mirzazade, S., Zafiris, O., Grosse-Ruyken,M.L., Jancke, L., and Zilles, K. (2000). The effect of sequence repeattime on auditory cortex stimulation during phonetic discrimination.Neuroimage 12, 100–108.
Sumby, W.H., and Pollack, I. (1954). Visual contribution to speechintelligibility in noise. J. Acoust. Soc. Am. 26, 212–215.
Suzuki, M., Kitano, H., Kitanishi, T., Itou, R., Shiino, A., Nishida,Y., Yazawa, Y., Ogawa, F., and Kitajima, K. (2002). Cortical and