integration of cell signals and gene control
45
ment, membrane potential, and cell shape also may be rele- vant to a cell’s response. Two serious limitations have ham- pered efforts to obtain such a comprehensive view of the nature of cell responses to external signals. First, usually only one or a few aspects of a cell’s response to a signal is easily monitored; second, determining responses in living cells in “real time” poses many technical difficulties. Technological advances are beginning to solve these problems, although neither has been completely overcome. The major question posed in this chapter is how a cell integrates multiple signals and responds in the context of 15 Dividing cells (blue) in the developing spinal cord will differen- tiate into neurons (red). Cells that were engineered to make a differentiation-inhibiting signal (green) cause persistent cell di- vision and reduce the number of differentiated neurons at the left. [Sean G. Megason and Andrew P. McMahon. Adapted from Sean G. Megason and Andrew P. McMahon, 2002, Development 129:2087–2098.] INTEGRATION OF SIGNALS AND GENE CONTROLS I nherent in the full genome contained in most cells is the po- tential to form vastly diverse cell types, which perform an enormous variety of tasks. Each individual cell, however, employs only part of an organism’s complete genetic reper- toire. An array of external hormonal, metabolic, developmen- tal, and environmental signals influence which genes a cell uses at any given time in its life span. Infections also can trigger many responses. A cell’s response to an external signal largely depends on its properties including (1) the inventory, locations, and associations of its proteins and other molecules; (2) its shape and attachments to other cells; and (3) its chromatin structure, which facilitates or blocks access to particular genes. We can think of these properties as a cell’s “memory” deter- mined by its history and response to previous signals. Thus, for instance, a cell can respond to a signal only if it possesses a receptor for that signal. In addition, a cell typically receives more than one signal at a time: for example, a combination of transforming growth factor (TGF) and fibroblast growth factor (FGF), a hormone signal that is interpreted in light of the ambient temperature, or an electrical pulse that is modulated by local ionic conditions. The response to each sig- nal, or condition, is often influenced by another one. This in- tegration of signals can prevent inappropriate responses and permit more nuanced responses to multiple signals. To understand a cell’s response to one or more signals and the effect of its memory on this response, it is useful to monitor changes in the expression of all genes and changes in the locations of organelles, proteins, or other molecules. Signal-induced changes in the intracellular ionic environ- 611 OUTLINE 15.1 Experimental Approaches for Building a Comprehensive View of Signal- Induced Responses 15.2 Responses of Cells to Environmental Influences 15.3 Control of Cell Fates by Graded Amounts of Regulators 15.4 Boundary Creation by Different Combinations of Transcription Factors 15.5 Boundary Creation by Extracellular Signals 15.6 Reciprocal Induction and Lateral Inhibition 15.7 Integrating and Controlling Signals
Transcript of integration of cell signals and gene control
ment, membrane potential, and cell shape also may be rele-vant to a cell’s response. Two serious limitations have ham-pered efforts to obtain such a comprehensive view of thenature of cell responses to external signals. First, usually onlyone or a few aspects of a cell’s response to a signal is easilymonitored; second, determining responses in living cells in“real time” poses many technical difficulties. Technologicaladvances are beginning to solve these problems, althoughneither has been completely overcome.
The major question posed in this chapter is how a cell integrates multiple signals and responds in the context of
15
Dividing cells (blue) in the developing spinal cord will differen-
tiate into neurons (red). Cells that were engineered to make a
differentiation-inhibiting signal (green) cause persistent cell di-
vision and reduce the number of differentiated neurons at the
left. [Sean G. Megason and Andrew P. McMahon. Adapted from Sean G.Megason and Andrew P. McMahon, 2002, Development 129:2087–2098.]
INTEGRATION OF SIGNALS ANDGENE CONTROLS
Inherent in the full genome contained in most cells is the po-tential to form vastly diverse cell types, which perform anenormous variety of tasks. Each individual cell, however,
employs only part of an organism’s complete genetic reper-toire. An array of external hormonal, metabolic, developmen-tal, and environmental signals influence which genes a cell usesat any given time in its life span. Infections also can triggermany responses. A cell’s response to an external signal largelydepends on its properties including (1) the inventory, locations,and associations of its proteins and other molecules; (2) itsshape and attachments to other cells; and (3) its chromatinstructure, which facilitates or blocks access to particular genes.We can think of these properties as a cell’s “memory” deter-mined by its history and response to previous signals. Thus,for instance, a cell can respond to a signal only if it possessesa receptor for that signal. In addition, a cell typically receivesmore than one signal at a time: for example, a combinationof transforming growth factor � (TGF�) and fibroblastgrowth factor (FGF), a hormone signal that is interpreted inlight of the ambient temperature, or an electrical pulse that ismodulated by local ionic conditions. The response to each sig-nal, or condition, is often influenced by another one. This in-tegration of signals can prevent inappropriate responses andpermit more nuanced responses to multiple signals.
To understand a cell’s response to one or more signalsand the effect of its memory on this response, it is useful tomonitor changes in the expression of all genes and changes inthe locations of organelles, proteins, or other molecules. Signal-induced changes in the intracellular ionic environ-
611
O U T L I N E
15.1 Experimental Approaches for Building a Comprehensive View of Signal-Induced Responses
15.2 Responses of Cells to Environmental Influences
15.3 Control of Cell Fates by Graded Amounts of Regulators
15.4 Boundary Creation by Different Combinationsof Transcription Factors
15.5 Boundary Creation by Extracellular Signals
15.6 Reciprocal Induction and Lateral Inhibition
15.7 Integrating and Controlling Signals
its memory, especially in the course of development and celldifferentiation (Figure 15-1). We begin by looking at varioustechniques that are beginning to provide a global view of signal-induced responses. In particular, we describe how thedetermination of whole-genome transcription patterns is asource of new insights into responses to signals. We then con-sider cell responses to certain environmental perturbations inSection 15.2. The next section introduces the concept ofgraded regulators that cause different cell responses, depend-ing on their concentration. This type of system allows cells atdifferent distances from the source of a regulatory moleculeto become different types of cells. We examine how such reg-ulation creates boundaries within an epithelium in earlyDrosophila development, with cells on one side of the bordertaking one path of differentiation and those on the other sidetaking another. The creation of other boundaries by gradedtranscriptional activators and graded extracellular signals isdiscussed in Sections 15.4 and 15.5, respectively. As bordersform, cells reinforce their decisions by signaling across the bor-ders so that compatible adjacent structures form. As illustratedby the examples in Section 15.6, such signaling can either pro-mote or inhibit particular developmental changes in adjacentcells. In the final section, we take a closer look at how signalsare integrated and controlled in different cells.
Although the number of signaling pathways encounteredin this chapter and others may seem overwhelming, there areactually a relatively small number of distinct pathways fortransducing external signals. Primary among them are the in-
tracellular signal-transduction pathways activated by thevarious receptor classes listed in Table 14-1. In addition,cell–cell and cell–matrix adhesions mediated by cadherinsand integrins can initiate intracellular signaling pathways(Chapter 6). The informational complexity needed to createmany cell types and cell properties comes from combiningsignals. Elucidation of the underlying principles and mecha-nisms relevant to all signaling pathways forms the founda-tion for understanding how cells integrate signals to achievea particular identity or other response.
Experimental Approaches for Building a Comprehensive View of Signal-Induced ResponsesSeveral technical advances are helping investigators to dis-cern the totality of the cellular response to signals. Perhapsthe most significant advance is the sequencing of wholegenomes from various organisms and subsequent analysisto identify individual genes and analyze their functions.The data amassed in these genome projects have led to thedevelopment of techniques for monitoring the effects of asignal on the expression of the entire gene set. Using gene-inactivation methods discussed in Chapter 9, researchers canmutate specific genes encoding various components of sig-naling pathways. The phenotypic effects of such mutations
15.1
612 CHAPTER 15 • Integration of Signals and Gene Controls
Cells adjust to their particular environmentalinputs (e.g., oxygen,sugar, and temperature)
Graded signals create different cell types
Combined actions of transcription factors create different cell types
Lateral inhibition signals prevent duplication of unique cell types
Integration of signals allows cells to adjust to their neighbors and to change with time
Food
TF1
TF2
1 2 3 4 5
▲ FIGURE 15-1 Signaling systems and cell responses. Cellsare vibrantly alert detectors, sensing and interpreting informationconstantly to adjust to the environment ( ) and coordinateactivities with surrounding cells. A cell can respond to signals bychanging the genes that it transcribes, altering the cell surface,modifying proteins and enzyme activities, moving materialsbetween compartments, revamping its cytoskeleton, migrating,or dying. A modest number of signaling systems constitutes acore toolbox. Each system is used repeatedly in differentorganisms, in different tissues, and at different times. Signals arecrucial in building multicellular organisms, where different cell
1
types are created by controlled signal transmission andreception. Cells can become different, depending on the amountof a signal ( ), with a larger amount giving rise to one cell fateand a smaller amount to another. New boundaries form betweencells of different types, creating tissues and demarcations withintissues. Different cell types are created by combinations oftranscription factors ( ). Inhibitory signals emitted by cellsundergoing a differentiation step can prevent nearby cells frommaking the same decision ( ), thus preventing duplication ofstructures. Cells generally integrate many signals in deciding howto proceed ( ).5
4
3
2
often provide clues about the functions of pathway compo-nents and the order in which they function. In vitro studies onsignaling in a variety of differentiated cell types and even com-plex tissues are now possible because of recent improvementsin cell- and tissue-culture methods. Certain signal-induced responses can be monitored in living cells with the use of var-ious fluorescent agents and the observation of cells in a flu-orescence microscope. For instance, this technique can revealchanges in the amounts and localization of specific proteins,as well as fluctuations in H� or Ca2� concentrations in thecytosol (see Figures 5-46 and 5-47). Development of addi-tional fluorescent indicator dyes will allow monitoring ofother molecules in living cells.
Genomic Analyses Show EvolutionaryConservation and Proliferation of Genes Encoding Signals and RegulatorsIn Chapter 9, we considered the difficulty and ambiguity inidentifying genes within genomic sequences, especially inhigher organisms. Despite the limitations, genomic analyseshave been sources of exciting and sometimes surprising in-sights or have confirmed earlier conclusions based on the re-sults of other types of studies.
First, the total number of protein-coding genes does notcorrelate in any simple way with standard conceptions aboutanimal complexity (see Figure 9-34). Humans, for instance,have only about 1.75 times as many genes as the roundwormCaenorhabditis elegans. Likewise, C. elegans has about 1.4times as many genes as the fruit fly Drosophila, which exhibitsa much more complex body plan and more complex behavior.
Second, genomic comparisons support the conclusionbased on two decades of developmental genetics researchthat many regulatory genes whose encoded proteins controltissue differentiation, organogenesis, and the body plan havebeen conserved for hundreds of millions of years. For exam-ple, the Pax6 gene is employed in eye development in enor-mously diverse organisms, such as clams, flies, and humans,and the tinman gene is necessary for heart development inflies and humans. As discussed in Section 15.4, the Hox genecluster controls head-to-tail organization of the body in al-most all animals examined to date. Because of the conserva-tion of genes and proteins, the results of experiments on oneorganism are useful guides for research on other organisms.Indeed much of human biology and medicine has been andcontinues to be built on knowledge gained from a broadspectrum of experimental systems.
Third, despite the considerable commonality of genes andproteins among different animals, genomic analyses suggestthat about 30 percent of the genes of each animal organismare unique to that animal. The invertebrates Drosophila andC. elegans have in common certain genes that are not recog-nizable in any of the other genomes analyzed to date. Fliesand worms are believed to have a common ancestor thatarose from an even more ancient ancestor in common withvertebrates. If this view is correct, any genes present in flies
and humans could be expected to be present in worms; like-wise, any genes common to worms and humans would pre-sumably be present in flies. Recent work has revealed that allthree species have about 1500 genes in common, as expected(Figure 15-2). Contrary to expectations, however, about 1250genes common to humans and flies are not found in worms,and about 500 genes common to humans and worms are notfound in flies. Thus organism-specific gene loss occurred inthe evolution of C. elegans and Drosophila subsequent to thetime when the invertebrate and vertebrate lineages diverged.
Fourth, as noted in preceding chapters, duplication ofcertain protein-coding genes and subsequent divergence inthe course of evolution have given rise to gene families. Themembers of a gene family and corresponding protein familyhave close but nonidentical sequences. Genomic analysis andfindings from other studies show that the number of mem-bers in a particular protein family varies in different species.For instance, the transforming growth factor � family of secreted signaling proteins has 28 members in humans butonly 6 in flies and 4 in worms. The semaphorins, which aresignals for neural development, form a 22-member family inhumans; flies have 6 members and worms have 2. Such pro-liferation of genes could give rise to signaling proteins thatcan move different distances through tissue or differ in otherproperties. Alternatively, the members of a gene family maybe differently regulated, thus allowing rather similar proteinsto be produced at different times and places. Both types ofvariation exist, and both allow a moderate number of typesof signals to serve a multitude of purposes.
15.1 • Experimental Approaches for Building a Comprehensive View of Signal-Induced Responses 613
Unknown
Miscellaneous function
Cell and tissue structure
Motility
Transport and trafficking
Protein folding
Signaling and regulation
DNA transcription
Metabolism
▲ FIGURE 15-2 Evolutionary conservation of core
processes in human, fruit fly (Drosophila), and roundworm
(C. elegans) genomes. On the basis of fairly stringent criteria forprotein similarity, humans, flies, and worms have in commonabout 1500 genes distributed among the functional classesshown in this pie chart. About 28 percent of this common set ofgenes encode proteins that function in signaling or gene control.The molecular functions of about one-third of the genes andproteins common to these species are not yet known. [Adaptedfrom J. C. Venter et al., 2001, Science 291:1304.]
In Situ Hybridization Can Detect Transcription Changes in Intact Tissues and Permeabilized EmbryosA common effect of external signals is to alter the pattern ofgene expression by a cell. Signal-induced changes in the ex-pression of particular genes is usually monitored by measuringthe corresponding mRNAs or proteins in the presence and ab-sence of a signal. The total cellular mRNA can be extracted,separated by gel electrophoresis, and subjected to Northernblotting, which detects individual mRNAs by hybridizationto labeled complementary DNA probes (see Figure 9-26).Likewise, cellular proteins can be extracted, separated elec-trophoretically, and subjected to Western blotting, a procedurein which individual proteins separated on the blot are detectedwith specific antibodies (see Figure 3-35). These blotting meth-ods are generally not sensitive enough to determine changeswithin a single cell. The polymerase chain reaction (PCR),however, can amplify a specific mRNA from a single cell sothat it is detectable (see Figure 9-24).
Both Northern blotting and PCR amplification requireextracting the mRNA from a cell or mixture of cells, whichmeans that the cells are removed from their normal locationwithin an organism or tissue. As a result, the location of acell and its relation to its neighbors is lost. To retain suchpositional information, a whole or sectioned tissue or even
a whole permeabilized embryo may be subjected to in situhybridization to detect the mRNA encoded by a particulargene (Figure 15-3). This technique allows gene transcrip-tion to be monitored in both time and space. Immunohis-tochemistry, the related technique of staining tissue withfluorescence-labeled antibodies against a particular protein,provides similar information for proteins, an important ad-vantage for obtaining ideas about protein function from itssubcellular location (see Figures 5-33 and 5-45).
DNA Microarray Analysis Can Assess Expressionof Multiple Genes SimultaneouslyA major limitation of in situ hybridization and blottingtechniques is that the mRNA or protein product of only afew genes can be examined at a time. Thus monitoring theactivity of many genes by these methods requires multipleassays. In contrast, researchers can monitor the expressionof thousands of genes at one time with DNA microarrays(see Figure 9-35). In this technique, cDNAs labeled with afluorescent dye are made from the total mRNA extractedfrom the cells under study. The labeled cDNAs are then hy-bridized to a microscope slide dotted with spots of DNA.Each DNA spot contains a unique sequence from a partic-ular gene, and tens of thousands of genes can be repre-sented on a standard slide. The fluorescence of spots that
614 CHAPTER 15 • Integration of Signals and Gene Controls
(a) (b)
Dorsal
Ventral
NT
Head
Notochord
Notochord
Endoderm
Head
(c)
▲ EXPERIMENTAL FIGURE 15-3 In situ hybridization can
detect activity of specific genes in whole and sectioned
embryos. The specimen is permeabilized by treatment withdetergent and a protease to expose the mRNA to the probe. ADNA or RNA probe, specific for the mRNA of interest, is madewith nucleotide analogs containing chemical groups that can berecognized by antibodies. After the permeabilized specimen hasbeen incubated with the probe under conditions that promotehybridization, the excess probe is removed with a series ofwashes. The specimen is then incubated in a solution containingan antibody that binds to the probe. This antibody is covalentlyjoined to a reporter enzyme (e.g., horseradish peroxidase oralkaline phosphatase) that produces a colored reaction product.After excess antibody has been removed, substrate for the
reporter enzyme is added. A colored precipitate forms where theprobe has hybridized to the mRNA being detected. (a) A wholemouse embryo at about 10 days of development probed forSonic hedgehog mRNA. The stain marks the notochord (redarrow), a rod of mesoderm running along the future spinal cord.(b) A section of a mouse embryo similar to that in part (a). Thedorsal/ventral axis of the neural tube (NT) can be seen, with theSonic hedgehog–expressing notochord (red arrow) below it andthe endoderm (blue arrow) still farther ventral. (c) A wholeDrosophila embryo probed for an mRNA produced during tracheadevelopment. The repeating pattern of body segments is visible.Anterior (head) is up; ventral is to the left. [Courtesy of L. Milenkovicand M. P. Scott.]
hybridize to a cDNA species is measured with an instru-ment that scans the slide. Fluorescing spots thus representactive genes, which have been transcribed into theirmRNAs (see Figure 1-23).
Microarray experiments are commonly used to comparethe mRNAs produced by two different populations of cells:for example, two distinct cell types, the same cell type be-fore and after some treatment, or mutant and normal cells.An example of a microarray-based discovery comes from theresults of studies of cultured fibroblast cells, which have longbeen known to initiate cell division when serum containinggrowth factors is added to the medium. Microarray analysisof gene expression at different times after treatment of fi-broblasts with serum showed that transcription of about 500of the 8613 genes examined changed substantially over time(see Figure 9-36). Transcriptional changes were detectedwithin 15 minutes, with genes encoding proteins that controlprogression through the cell cycle becoming active first.Later, genes encoding proteins with roles in wound healing,such as clotting factors and attractants for immune-systemcells, became active. The production of these proteins sug-gests that proliferating fibroblasts are stimulated by serum toparticipate in wound healing, something that had not beenknown. In retrospect, it makes sense, because the time duringwhich fibroblasts are exposed to serum in an intact organismis when there is a wound. The results show the usefulness ofmicroarrays in revealing unexpected responses by cells.
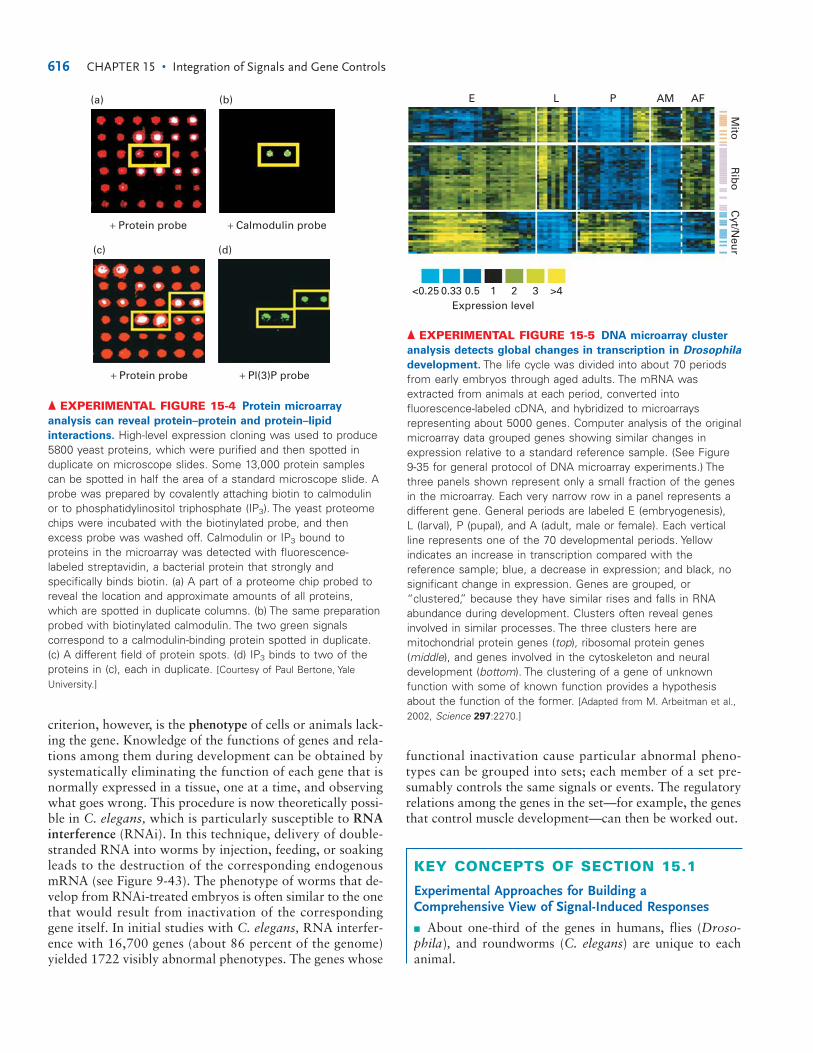
The developmental time course of gene transcription hasbeen assessed with DNA microarrays for the nematode C. elegans and the fly Drosophila. In recent experiments, microarrays representing about 94 percent of the C. elegansgenes were used to monitor transcription at different stagesof development and in both sexes. The results showed thatexpression of about 58 percent of the monitored geneschanges more than twofold during development, and an-other 12 percent are transcribed in sex-specific patterns.Findings from a similar study assessing about one-third of allDrosophila genes showed that transcription of more than 90percent of them changes by twofold or more during devel-opment and that most genes are used repeatedly during de-velopment (Figure 15-5). These results clearly show thatdevelopment is marked by extensive changes in transcrip-tion, with few genes exhibiting a monotonous pattern of un-changing transcription.
In the future, microarray analysis will be a power-ful diagnostic tool in medicine. For instance, par-ticular sets of mRNAs have been found to
distinguish tumors with a poor prognosis from those with agood prognosis (Chapter 23). Previously indistinguishabledisease variations are now detectable. Analysis of tumorbiopsies for these distinguishing mRNAs will help physiciansto select the most appropriate treatment. As more patterns ofgene expression characteristic of various diseased tissues arerecognized, the diagnostic use of DNA microarrays will beextended to other conditions. ❚
Protein Microarrays Are Promising Tools for Monitoring Cell Responses That IncludeChanges in Protein-Binding Patterns
A cell’s response to signals can include not only changesin gene expression, but also alterations in the modifica-tions of proteins and the associations between proteins. Asdiscussed in other chapters, the activities of many proteinsdepend on their association with other proteins or withsmall intracellular signaling molecules (e.g., cAMP orphosphoinositides). Two common examples are the acti-vation of adenylyl cyclase by interaction with Gs� � GTP(see Figure 13-11) and the activation of protein kinase Aby binding of cAMP (see Figure 3-27). The activity ofsome transcriptional regulators (e.g., CREB) also dependon their associating with another protein (see Figure 13-32). The results of systematic studies are beginning toreveal protein–protein associations that are critical for cellfunctioning and how these associations change in responseto signals. For example, scientists have produced largequantities of 5800 yeast proteins (≈80 percent of the totalproteins) by cloning them in high-level expression vectorsin yeast and purifying the individual proteins. In a tech-nique analogous to DNA microarrays, small samples ofthe purified yeast proteins can be spotted on microscopeslides to produce a protein microarray, also called a pro-teome chip.
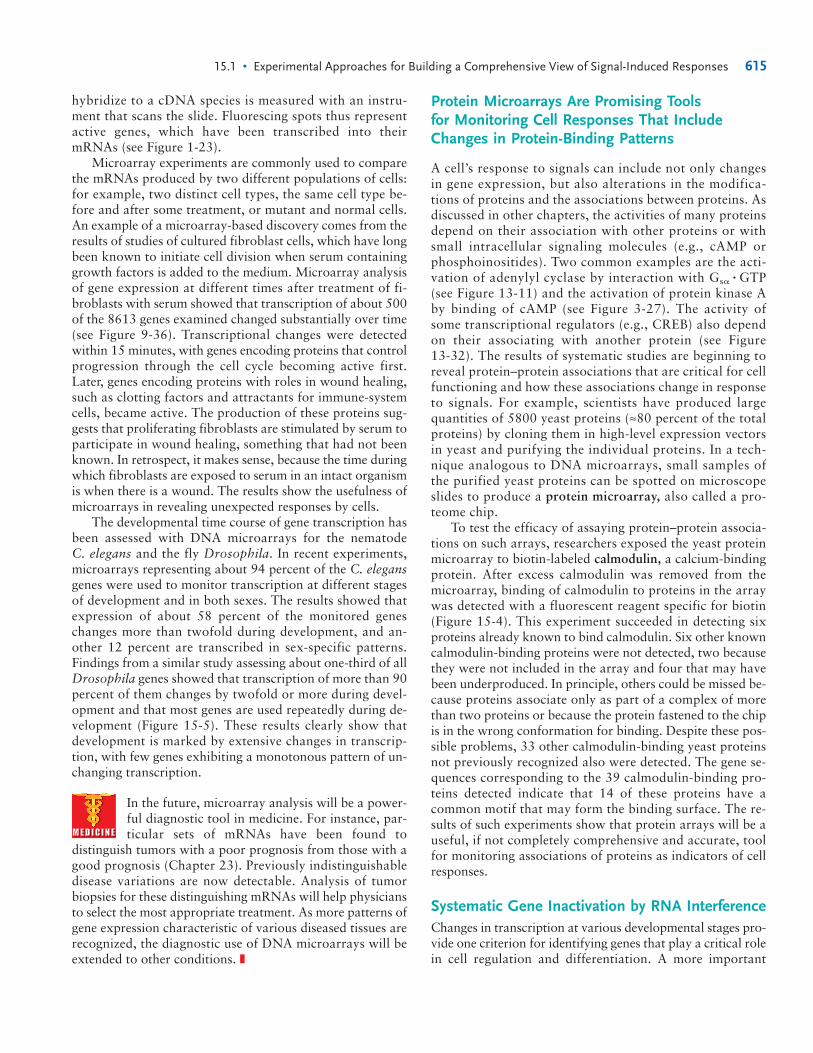
To test the efficacy of assaying protein–protein associa-tions on such arrays, researchers exposed the yeast proteinmicroarray to biotin-labeled calmodulin, a calcium-bindingprotein. After excess calmodulin was removed from the microarray, binding of calmodulin to proteins in the arraywas detected with a fluorescent reagent specific for biotin(Figure 15-4). This experiment succeeded in detecting sixproteins already known to bind calmodulin. Six other knowncalmodulin-binding proteins were not detected, two becausethey were not included in the array and four that may havebeen underproduced. In principle, others could be missed be-cause proteins associate only as part of a complex of morethan two proteins or because the protein fastened to the chipis in the wrong conformation for binding. Despite these pos-sible problems, 33 other calmodulin-binding yeast proteinsnot previously recognized also were detected. The gene se-quences corresponding to the 39 calmodulin-binding pro-teins detected indicate that 14 of these proteins have acommon motif that may form the binding surface. The re-sults of such experiments show that protein arrays will be auseful, if not completely comprehensive and accurate, toolfor monitoring associations of proteins as indicators of cellresponses.
Systematic Gene Inactivation by RNA InterferenceChanges in transcription at various developmental stages pro-vide one criterion for identifying genes that play a critical rolein cell regulation and differentiation. A more important
15.1 • Experimental Approaches for Building a Comprehensive View of Signal-Induced Responses 615
criterion, however, is the phenotype of cells or animals lack-ing the gene. Knowledge of the functions of genes and rela-tions among them during development can be obtained bysystematically eliminating the function of each gene that isnormally expressed in a tissue, one at a time, and observingwhat goes wrong. This procedure is now theoretically possi-ble in C. elegans, which is particularly susceptible to RNAinterference (RNAi). In this technique, delivery of double-stranded RNA into worms by injection, feeding, or soakingleads to the destruction of the corresponding endogenousmRNA (see Figure 9-43). The phenotype of worms that de-velop from RNAi-treated embryos is often similar to the onethat would result from inactivation of the correspondinggene itself. In initial studies with C. elegans, RNA interfer-ence with 16,700 genes (about 86 percent of the genome)yielded 1722 visibly abnormal phenotypes. The genes whose
616 CHAPTER 15 • Integration of Signals and Gene Controls
▲ EXPERIMENTAL FIGURE 15-4 Protein microarray
analysis can reveal protein–protein and protein–lipid
interactions. High-level expression cloning was used to produce5800 yeast proteins, which were purified and then spotted induplicate on microscope slides. Some 13,000 protein samplescan be spotted in half the area of a standard microscope slide. Aprobe was prepared by covalently attaching biotin to calmodulinor to phosphatidylinositol triphosphate (IP3). The yeast proteomechips were incubated with the biotinylated probe, and thenexcess probe was washed off. Calmodulin or IP3 bound toproteins in the microarray was detected with fluorescence-labeled streptavidin, a bacterial protein that strongly andspecifically binds biotin. (a) A part of a proteome chip probed toreveal the location and approximate amounts of all proteins,which are spotted in duplicate columns. (b) The same preparationprobed with biotinylated calmodulin. The two green signalscorrespond to a calmodulin-binding protein spotted in duplicate.(c) A different field of protein spots. (d) IP3 binds to two of theproteins in (c), each in duplicate. [Courtesy of Paul Bertone, YaleUniversity.]
E L P AM AF
Mito
Rib
oC
yt/Neu
r
<0.25 0.33 0.5 1Expression level
2 3 >4
▲ EXPERIMENTAL FIGURE 15-5 DNA microarray cluster
analysis detects global changes in transcription in Drosophila
development. The life cycle was divided into about 70 periodsfrom early embryos through aged adults. The mRNA wasextracted from animals at each period, converted intofluorescence-labeled cDNA, and hybridized to microarraysrepresenting about 5000 genes. Computer analysis of the originalmicroarray data grouped genes showing similar changes inexpression relative to a standard reference sample. (See Figure9-35 for general protocol of DNA microarray experiments.) Thethree panels shown represent only a small fraction of the genesin the microarray. Each very narrow row in a panel represents adifferent gene. General periods are labeled E (embryogenesis), L (larval), P (pupal), and A (adult, male or female). Each verticalline represents one of the 70 developmental periods. Yellowindicates an increase in transcription compared with thereference sample; blue, a decrease in expression; and black, nosignificant change in expression. Genes are grouped, or“clustered,” because they have similar rises and falls in RNAabundance during development. Clusters often reveal genesinvolved in similar processes. The three clusters here aremitochondrial protein genes (top), ribosomal protein genes(middle), and genes involved in the cytoskeleton and neuraldevelopment (bottom). The clustering of a gene of unknownfunction with some of known function provides a hypothesisabout the function of the former. [Adapted from M. Arbeitman et al.,2002, Science 297:2270.]
functional inactivation cause particular abnormal pheno-types can be grouped into sets; each member of a set pre-sumably controls the same signals or events. The regulatoryrelations among the genes in the set—for example, the genesthat control muscle development—can then be worked out.
KEY CONCEPTS OF SECTION 15.1
Experimental Approaches for Building aComprehensive View of Signal-Induced Responses
■ About one-third of the genes in humans, flies (Droso-phila), and roundworms (C. elegans) are unique to eachanimal.
+ Protein probe + Calmodulin probe
(a) (b)
+ Protein probe + Pl(3)P probe
(c) (d)
■ The presence and distribution of specific mRNAs andproteins can be detected in living cells by in situ hybridiza-tion and immunohistochemical staining.
■ DNA microarray analysis allows the full complement ofgenes to be examined for transcriptional changes that oc-cur in response to environmental changes or extracellularsignals and in development (see Figure 15-5).
■ Protein microarrays are proving useful in detecting andmonitoring changes in protein–protein associations (seeFigure 15-4).
■ The function of a gene found to be activated under certainconditions can be tested by inactivating it and observingthe resulting phenotype.
■ Signals, altered environmental conditions, or infection gen-erally evoke not a single response by cells but multiplechanges in the pattern of gene transcription, protein modifi-cations, and associations between proteins. By monitoringthe totality of these individual responses, researchers are de-veloping comprehensive views of how and why cells respond.
Responses of Cells to Environmental InfluencesMuch of this chapter deals with signaling pathways that con-trol how cells change in the course of development. The ma-ture cells of some tissues (e.g., blood and skin) have arelatively short life span compared with that of other types ofcells and are constantly being replaced by the differentiationand proliferation of stem cells (Chapter 22). In a sense, such
15.2
tissues never stop developing. The mature cells of other tis-sues, such as the brain, are long lived; after such tissues reachmaturation, there is little additional differentiation. Maturecells in all tissues, however, are changing constantly in re-sponse to metabolic or behavioral demands as well as to in-jury or infection. In this section, we consider several waysthat cells respond to variations in the demand for two envi-ronmental inputs—glucose and oxygen—or in their levels.
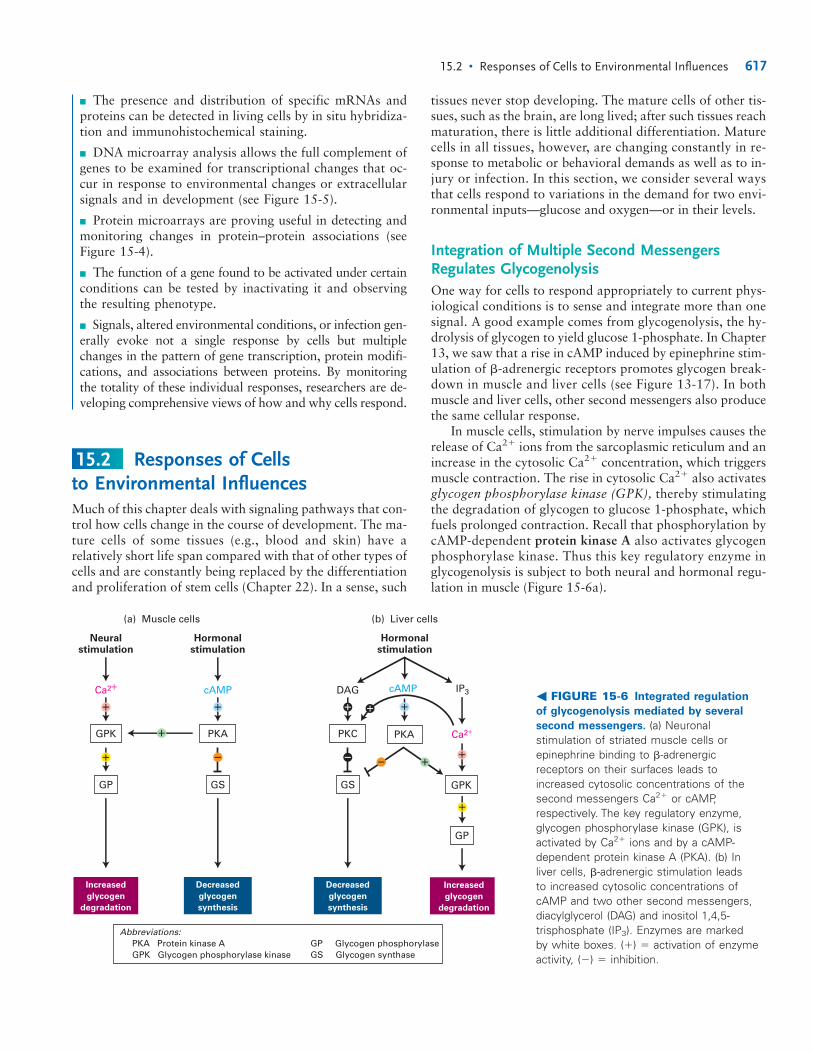
Integration of Multiple Second MessengersRegulates GlycogenolysisOne way for cells to respond appropriately to current phys-iological conditions is to sense and integrate more than onesignal. A good example comes from glycogenolysis, the hy-drolysis of glycogen to yield glucose 1-phosphate. In Chapter13, we saw that a rise in cAMP induced by epinephrine stim-ulation of �-adrenergic receptors promotes glycogen break-down in muscle and liver cells (see Figure 13-17). In bothmuscle and liver cells, other second messengers also producethe same cellular response.
In muscle cells, stimulation by nerve impulses causes therelease of Ca2� ions from the sarcoplasmic reticulum and anincrease in the cytosolic Ca2� concentration, which triggersmuscle contraction. The rise in cytosolic Ca2� also activatesglycogen phosphorylase kinase (GPK), thereby stimulatingthe degradation of glycogen to glucose 1-phosphate, whichfuels prolonged contraction. Recall that phosphorylation bycAMP-dependent protein kinase A also activates glycogenphosphorylase kinase. Thus this key regulatory enzyme inglycogenolysis is subject to both neural and hormonal regu-lation in muscle (Figure 15-6a).
15.2 • Responses of Cells to Environmental Influences 617
Abbreviations: PKA Protein kinase A GPK Glycogen phosphorylase kinase
�
�
� �
� � �
��
�
�
�
�
GP Glycogen phosphorylaseGS Glycogen synthase
(a) Muscle cells (b) Liver cells
Neuralstimulation
Hormonalstimulation
Ca2+ cAMP
PKAGPK PKA Ca2+
GP
GP
GS
PKC
GS GPK
Increased
glycogen
degradation
Decreased
glycogen
synthesis
Increased
glycogen
degradation
Decreased
glycogen
synthesis
DAG cAMP IP3
Hormonalstimulation
� FIGURE 15-6 Integrated regulation
of glycogenolysis mediated by several
second messengers. (a) Neuronalstimulation of striated muscle cells orepinephrine binding to �-adrenergicreceptors on their surfaces leads toincreased cytosolic concentrations of thesecond messengers Ca2� or cAMP,respectively. The key regulatory enzyme,glycogen phosphorylase kinase (GPK), isactivated by Ca2� ions and by a cAMP-dependent protein kinase A (PKA). (b) In liver cells, �-adrenergic stimulation leads to increased cytosolic concentrations ofcAMP and two other second messengers,diacylglycerol (DAG) and inositol 1,4,5-trisphosphate (IP3). Enzymes are marked by white boxes. (�) � activation of enzymeactivity, (�) � inhibition.
In liver cells, hormone-induced activation of phospholi-pase C also regulates glycogen breakdown and synthesis bythe two branches of the inositol-lipid signaling pathway.Phospholipase C generates two second messengers, diacyl-glycerol (DAG) and inositol 1,4,5-trisphosphate (IP3) (seeFigure 13-28). DAG activates protein kinase C, which phos-phorylates glycogen synthase, yielding the phosphorylatedinactive form and thus inhibiting glycogen synthesis. IP3
induces an increase in cytosolic Ca2�, which activates glyco-gen phosphorylase kinase as in muscle cells, leading to gly-cogen degradation. In this case, multiple intracellular signal-transduction pathways are activated by the same signal (Fig-ure 15-6b).
The dual regulation of glycogen phosphorylase kinase re-sults from its multimeric subunit structure (����)4. The �subunit is the catalytic protein; the regulatory � and � sub-units, which are similar in structure, are phosphorylated byprotein kinase A; and the � subunit is the Ca2�-bindingswitch protein calmodulin. Glycogen phosphorylase kinase ismaximally active when Ca2� ions are bound to the calmod-ulin subunit and at least the � subunit is phosphorylated. Infact, the binding of Ca2� to the calmodulin subunit may beessential to the enzymatic activity of glycogen phosphorylasekinase. Phosphorylation of the � and � subunits increases theaffinity of the calmodulin subunit for Ca2�, enabling Ca2�
ions to bind to the enzyme at the submicromolar Ca2� con-centrations found in cells not stimulated by nerves. Thus in-creases in the cytosolic concentration of Ca2� or of cAMP orof both induce incremental increases in the activity of glyco-gen phosphorylase kinase. As a result of the elevated levelof cytosolic Ca2� after neuron stimulation of muscle cells,glycogen phosphorylase kinase will be active even if it is un-phosphorylated; thus glycogen can be hydrolyzed to fuelcontinued muscle contraction in the absence of hormonestimulation.
Insulin and Glucagon Work Together to Maintaina Stable Blood Glucose LevelIn the regulation of glycogenolysis, neural and hormonal signals regulate the same key multimeric enzyme. In contrast,the maintenance of normal blood glucose concentrations depends on the balance between two hormones that elicit dif-ferent cell responses. During periods of stress, the epineph-rine-induced increase in glycogenolysis in liver cells leads toa rise in blood glucose. During normal daily living, however,the blood glucose level is under the dynamic control of in-sulin and glucagon.
Insulin and glucagon are peptide hormones produced bycells within the islets of Langerhans, cell clusters scatteredthroughout the pancreas. Insulin, which contains twopolypeptide chains linked by disulfide bonds, is synthesizedby the � cells in the islets; glucagon, a monomeric peptide,is produced by the � cells in the islets. Insulin reduces thelevel of blood glucose, whereas glucagon increases blood glu-cose. The availability of glucose for cellular metabolism isregulated during periods of abundance (following a meal) or
scarcity (following fasting) by the adjustment of insulin andglucagon concentrations in the blood.
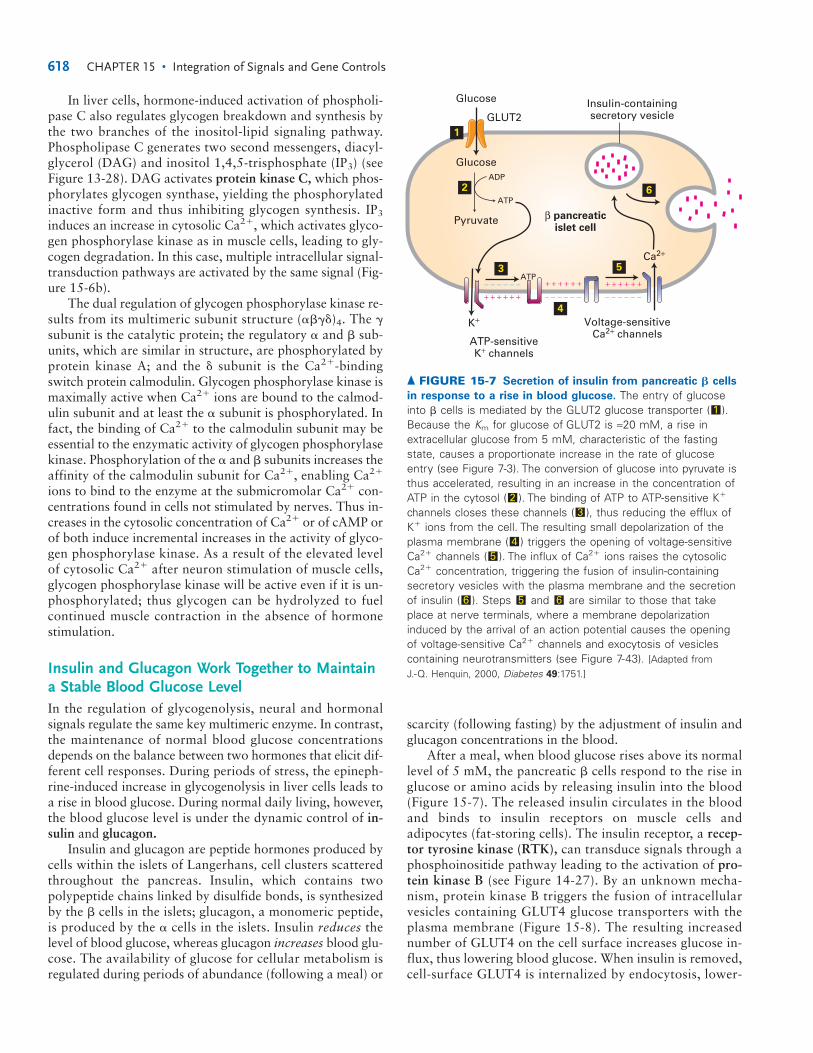
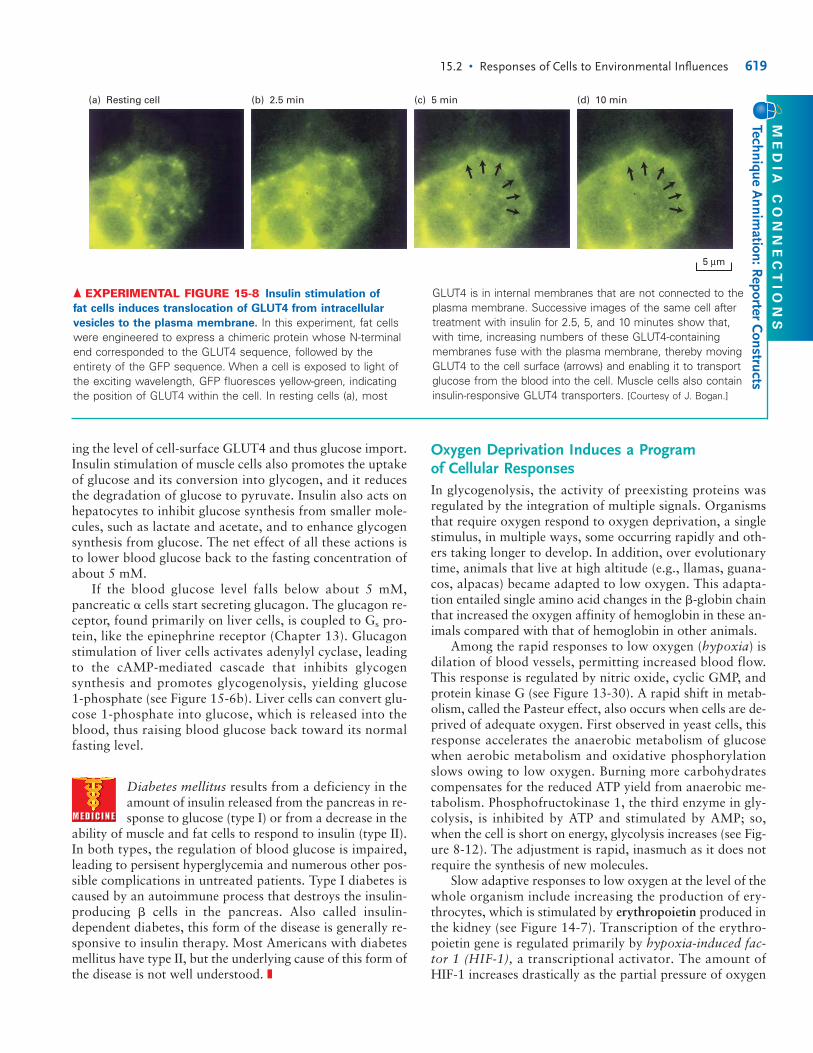
After a meal, when blood glucose rises above its normallevel of 5 mM, the pancreatic � cells respond to the rise inglucose or amino acids by releasing insulin into the blood(Figure 15-7). The released insulin circulates in the bloodand binds to insulin receptors on muscle cells andadipocytes (fat-storing cells). The insulin receptor, a recep-tor tyrosine kinase (RTK), can transduce signals through aphosphoinositide pathway leading to the activation of pro-tein kinase B (see Figure 14-27). By an unknown mecha-nism, protein kinase B triggers the fusion of intracellularvesicles containing GLUT4 glucose transporters with theplasma membrane (Figure 15-8). The resulting increasednumber of GLUT4 on the cell surface increases glucose in-flux, thus lowering blood glucose. When insulin is removed,cell-surface GLUT4 is internalized by endocytosis, lower-
618 CHAPTER 15 • Integration of Signals and Gene Controls
β pancreaticislet cell
Ca2+
K+
Glucose
Pyruvate
ADP
ATP
ATP
Insulin-containingsecretory vesicle
2
1
3
4
5
+ + + + + +
+ + + + + + + + + + + +− − − − − −− − − − − − − − − − − −
ATP-sensitiveK+ channels
Voltage-sensitiveCa2+ channels
GLUT2
6
Glucose
▲ FIGURE 15-7 Secretion of insulin from pancreatic � cells
in response to a rise in blood glucose. The entry of glucoseinto � cells is mediated by the GLUT2 glucose transporter ( ).Because the Km for glucose of GLUT2 is ≈20 mM, a rise inextracellular glucose from 5 mM, characteristic of the fastingstate, causes a proportionate increase in the rate of glucoseentry (see Figure 7-3). The conversion of glucose into pyruvate isthus accelerated, resulting in an increase in the concentration ofATP in the cytosol ( ). The binding of ATP to ATP-sensitive K�
channels closes these channels ( ), thus reducing the efflux ofK� ions from the cell. The resulting small depolarization of theplasma membrane ( ) triggers the opening of voltage-sensitiveCa2� channels ( ). The influx of Ca2� ions raises the cytosolicCa2� concentration, triggering the fusion of insulin-containingsecretory vesicles with the plasma membrane and the secretionof insulin ( ). Steps and are similar to those that takeplace at nerve terminals, where a membrane depolarizationinduced by the arrival of an action potential causes the openingof voltage-sensitive Ca2� channels and exocytosis of vesiclescontaining neurotransmitters (see Figure 7-43). [Adapted from J.-Q. Henquin, 2000, Diabetes 49:1751.]
656
54
32
1
ing the level of cell-surface GLUT4 and thus glucose import.Insulin stimulation of muscle cells also promotes the uptakeof glucose and its conversion into glycogen, and it reducesthe degradation of glucose to pyruvate. Insulin also acts onhepatocytes to inhibit glucose synthesis from smaller mole-cules, such as lactate and acetate, and to enhance glycogensynthesis from glucose. The net effect of all these actions isto lower blood glucose back to the fasting concentration ofabout 5 mM.
If the blood glucose level falls below about 5 mM, pancreatic � cells start secreting glucagon. The glucagon re-ceptor, found primarily on liver cells, is coupled to Gs pro-tein, like the epinephrine receptor (Chapter 13). Glucagonstimulation of liver cells activates adenylyl cyclase, leadingto the cAMP-mediated cascade that inhibits glycogen synthesis and promotes glycogenolysis, yielding glucose 1-phosphate (see Figure 15-6b). Liver cells can convert glu-cose 1-phosphate into glucose, which is released into theblood, thus raising blood glucose back toward its normalfasting level.
Diabetes mellitus results from a deficiency in theamount of insulin released from the pancreas in re-sponse to glucose (type I) or from a decrease in the
ability of muscle and fat cells to respond to insulin (type II).In both types, the regulation of blood glucose is impaired,leading to persisent hyperglycemia and numerous other pos-sible complications in untreated patients. Type I diabetes iscaused by an autoimmune process that destroys the insulin-producing � cells in the pancreas. Also called insulin-dependent diabetes, this form of the disease is generally re-sponsive to insulin therapy. Most Americans with diabetesmellitus have type II, but the underlying cause of this form ofthe disease is not well understood. ❚
Oxygen Deprivation Induces a Program of Cellular ResponsesIn glycogenolysis, the activity of preexisting proteins wasregulated by the integration of multiple signals. Organismsthat require oxygen respond to oxygen deprivation, a singlestimulus, in multiple ways, some occurring rapidly and oth-ers taking longer to develop. In addition, over evolutionarytime, animals that live at high altitude (e.g., llamas, guana-cos, alpacas) became adapted to low oxygen. This adapta-tion entailed single amino acid changes in the �-globin chainthat increased the oxygen affinity of hemoglobin in these an-imals compared with that of hemoglobin in other animals.
Among the rapid responses to low oxygen (hypoxia) isdilation of blood vessels, permitting increased blood flow.This response is regulated by nitric oxide, cyclic GMP, andprotein kinase G (see Figure 13-30). A rapid shift in metab-olism, called the Pasteur effect, also occurs when cells are de-prived of adequate oxygen. First observed in yeast cells, thisresponse accelerates the anaerobic metabolism of glucosewhen aerobic metabolism and oxidative phosphorylationslows owing to low oxygen. Burning more carbohydratescompensates for the reduced ATP yield from anaerobic me-tabolism. Phosphofructokinase 1, the third enzyme in gly-colysis, is inhibited by ATP and stimulated by AMP; so,when the cell is short on energy, glycolysis increases (see Fig-ure 8-12). The adjustment is rapid, inasmuch as it does notrequire the synthesis of new molecules.
Slow adaptive responses to low oxygen at the level of thewhole organism include increasing the production of ery-throcytes, which is stimulated by erythropoietin produced inthe kidney (see Figure 14-7). Transcription of the erythro-poietin gene is regulated primarily by hypoxia-induced fac-tor 1 (HIF-1), a transcriptional activator. The amount ofHIF-1 increases drastically as the partial pressure of oxygen
15.2 • Responses of Cells to Environmental Influences 619
(a) Resting cell (b) 2.5 min (c) 5 min (d) 10 min
5 μm
▲ EXPERIMENTAL FIGURE 15-8 Insulin stimulation of
fat cells induces translocation of GLUT4 from intracellular
vesicles to the plasma membrane. In this experiment, fat cellswere engineered to express a chimeric protein whose N-terminalend corresponded to the GLUT4 sequence, followed by theentirety of the GFP sequence. When a cell is exposed to light ofthe exciting wavelength, GFP fluoresces yellow-green, indicatingthe position of GLUT4 within the cell. In resting cells (a), most
GLUT4 is in internal membranes that are not connected to theplasma membrane. Successive images of the same cell aftertreatment with insulin for 2.5, 5, and 10 minutes show that,with time, increasing numbers of these GLUT4-containingmembranes fuse with the plasma membrane, thereby movingGLUT4 to the cell surface (arrows) and enabling it to transportglucose from the blood into the cell. Muscle cells also containinsulin-responsive GLUT4 transporters. [Courtesy of J. Bogan.]
ME
DIA
C
ON
NE
CT
IO
NS
Technique Annim
ation: Reporter C
onstructs
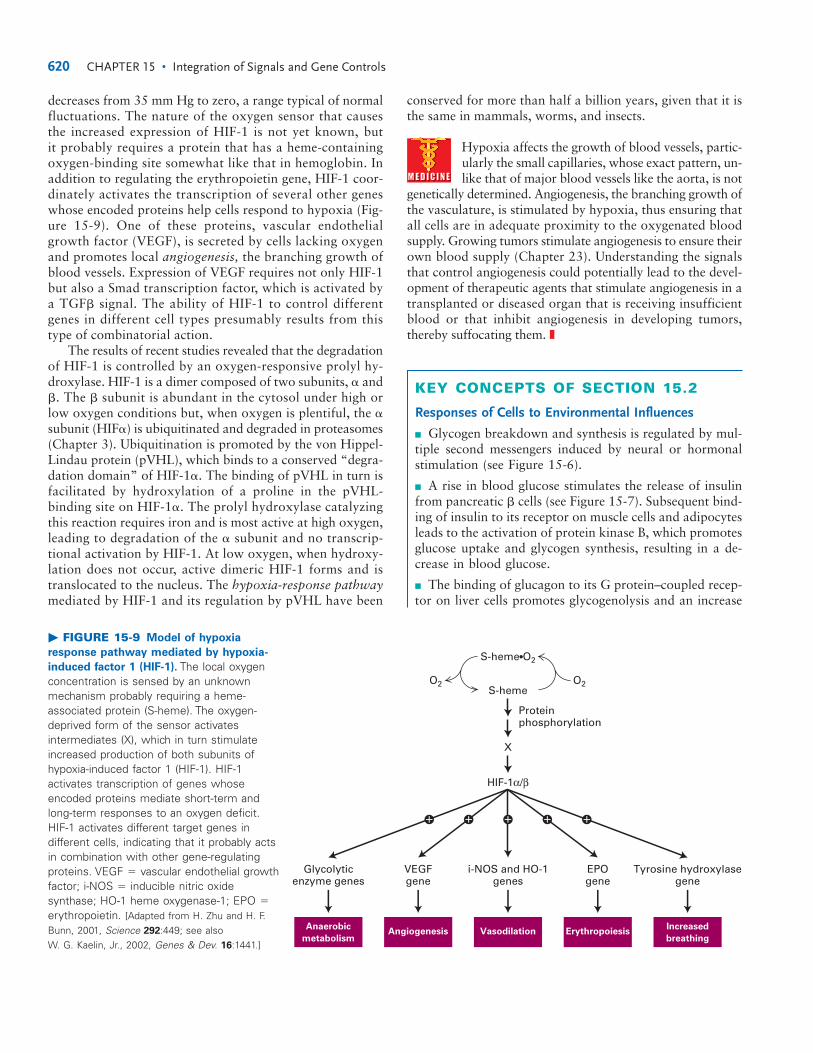
decreases from 35 mm Hg to zero, a range typical of normalfluctuations. The nature of the oxygen sensor that causes the increased expression of HIF-1 is not yet known, but it probably requires a protein that has a heme-containingoxygen-binding site somewhat like that in hemoglobin. Inaddition to regulating the erythropoietin gene, HIF-1 coor-dinately activates the transcription of several other geneswhose encoded proteins help cells respond to hypoxia (Fig-ure 15-9). One of these proteins, vascular endothelialgrowth factor (VEGF), is secreted by cells lacking oxygenand promotes local angiogenesis, the branching growth ofblood vessels. Expression of VEGF requires not only HIF-1but also a Smad transcription factor, which is activated bya TGF� signal. The ability of HIF-1 to control differentgenes in different cell types presumably results from thistype of combinatorial action.
The results of recent studies revealed that the degradationof HIF-1 is controlled by an oxygen-responsive prolyl hy-droxylase. HIF-1 is a dimer composed of two subunits, � and�. The � subunit is abundant in the cytosol under high orlow oxygen conditions but, when oxygen is plentiful, the �subunit (HIF�) is ubiquitinated and degraded in proteasomes(Chapter 3). Ubiquitination is promoted by the von Hippel-Lindau protein (pVHL), which binds to a conserved “degra-dation domain” of HIF-1�. The binding of pVHL in turn isfacilitated by hydroxylation of a proline in the pVHL-binding site on HIF-1�. The prolyl hydroxylase catalyzingthis reaction requires iron and is most active at high oxygen,leading to degradation of the � subunit and no transcrip-tional activation by HIF-1. At low oxygen, when hydroxy-lation does not occur, active dimeric HIF-1 forms and istranslocated to the nucleus. The hypoxia-response pathwaymediated by HIF-1 and its regulation by pVHL have been
conserved for more than half a billion years, given that it isthe same in mammals, worms, and insects.
Hypoxia affects the growth of blood vessels, partic-ularly the small capillaries, whose exact pattern, un-like that of major blood vessels like the aorta, is not
genetically determined. Angiogenesis, the branching growth ofthe vasculature, is stimulated by hypoxia, thus ensuring thatall cells are in adequate proximity to the oxygenated bloodsupply. Growing tumors stimulate angiogenesis to ensure theirown blood supply (Chapter 23). Understanding the signalsthat control angiogenesis could potentially lead to the devel-opment of therapeutic agents that stimulate angiogenesis in atransplanted or diseased organ that is receiving insufficientblood or that inhibit angiogenesis in developing tumors,thereby suffocating them. ❚
KEY CONCEPTS OF SECTION 15.2
Responses of Cells to Environmental Influences
■ Glycogen breakdown and synthesis is regulated by mul-tiple second messengers induced by neural or hormonalstimulation (see Figure 15-6).
■ A rise in blood glucose stimulates the release of insulinfrom pancreatic � cells (see Figure 15-7). Subsequent bind-ing of insulin to its receptor on muscle cells and adipocytesleads to the activation of protein kinase B, which promotesglucose uptake and glycogen synthesis, resulting in a de-crease in blood glucose.
■ The binding of glucagon to its G protein–coupled recep-tor on liver cells promotes glycogenolysis and an increase
620 CHAPTER 15 • Integration of Signals and Gene Controls
� � � � �
Glycolyticenzyme genes
VEGFgene
i-NOS and HO-1genes
Proteinphosphorylation
HIF-1α/β
X
S-heme
S-heme•O2
O2 O2
EPOgene
Tyrosine hydroxylasegene
Anaerobic
metabolismAngiogenesis Vasodilation Erythropoiesis
Increased
breathing
� FIGURE 15-9 Model of hypoxia
response pathway mediated by hypoxia-
induced factor 1 (HIF-1). The local oxygenconcentration is sensed by an unknownmechanism probably requiring a heme-associated protein (S-heme). The oxygen-deprived form of the sensor activatesintermediates (X), which in turn stimulateincreased production of both subunits ofhypoxia-induced factor 1 (HIF-1). HIF-1activates transcription of genes whoseencoded proteins mediate short-term andlong-term responses to an oxygen deficit.HIF-1 activates different target genes indifferent cells, indicating that it probably actsin combination with other gene-regulatingproteins. VEGF � vascular endothelial growthfactor; i-NOS � inducible nitric oxidesynthase; HO-1 heme oxygenase-1; EPO �erythropoietin. [Adapted from H. Zhu and H. F.Bunn, 2001, Science 292:449; see also W. G. Kaelin, Jr., 2002, Genes & Dev. 16:1441.]
in blood glucose by the cAMP-triggered kinase cascade(similar to epinephrine stimulation under stress condi-tions).
■ Two oxygen-sensing mechanisms help cells respond tooxygen deprivation: one mechanism activates transcriptionof hypoxia-induced factor 1 (HIF-1), and the other pro-motes stabilization of HIF-1 by inhibiting its proteasomaldegradation.
■ When cellular oxygen is low, HIF-1 acts with tissue-specific transcription factors to activate the expression ofvarious target genes in different tissues (see Figure 15-9).One protein induced by this pathway is vascular endothe-lial growth factor, which stimulates local angiogenesis toincrease the blood supply and thereby oxygen to oxygen-deprived cells.
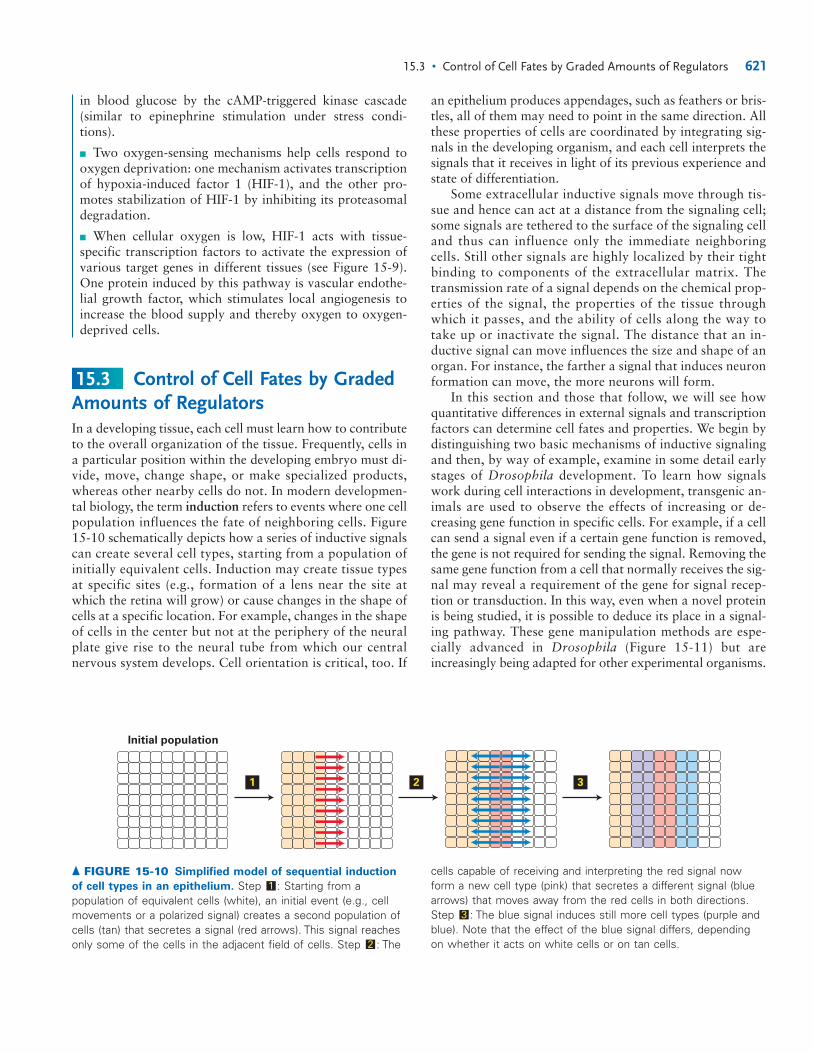
Control of Cell Fates by GradedAmounts of RegulatorsIn a developing tissue, each cell must learn how to contributeto the overall organization of the tissue. Frequently, cells ina particular position within the developing embryo must di-vide, move, change shape, or make specialized products,whereas other nearby cells do not. In modern developmen-tal biology, the term induction refers to events where one cellpopulation influences the fate of neighboring cells. Figure15-10 schematically depicts how a series of inductive signalscan create several cell types, starting from a population ofinitially equivalent cells. Induction may create tissue typesat specific sites (e.g., formation of a lens near the site atwhich the retina will grow) or cause changes in the shape ofcells at a specific location. For example, changes in the shapeof cells in the center but not at the periphery of the neuralplate give rise to the neural tube from which our centralnervous system develops. Cell orientation is critical, too. If
15.3
an epithelium produces appendages, such as feathers or bris-tles, all of them may need to point in the same direction. Allthese properties of cells are coordinated by integrating sig-nals in the developing organism, and each cell interprets thesignals that it receives in light of its previous experience andstate of differentiation.
Some extracellular inductive signals move through tis-sue and hence can act at a distance from the signaling cell;some signals are tethered to the surface of the signaling celland thus can influence only the immediate neighboringcells. Still other signals are highly localized by their tightbinding to components of the extracellular matrix. Thetransmission rate of a signal depends on the chemical prop-erties of the signal, the properties of the tissue throughwhich it passes, and the ability of cells along the way totake up or inactivate the signal. The distance that an in-ductive signal can move influences the size and shape of anorgan. For instance, the farther a signal that induces neuronformation can move, the more neurons will form.
In this section and those that follow, we will see howquantitative differences in external signals and transcriptionfactors can determine cell fates and properties. We begin bydistinguishing two basic mechanisms of inductive signalingand then, by way of example, examine in some detail earlystages of Drosophila development. To learn how signalswork during cell interactions in development, transgenic an-imals are used to observe the effects of increasing or de-creasing gene function in specific cells. For example, if a cellcan send a signal even if a certain gene function is removed,the gene is not required for sending the signal. Removing thesame gene function from a cell that normally receives the sig-nal may reveal a requirement of the gene for signal recep-tion or transduction. In this way, even when a novel proteinis being studied, it is possible to deduce its place in a signal-ing pathway. These gene manipulation methods are espe-cially advanced in Drosophila (Figure 15-11) but areincreasingly being adapted for other experimental organisms.
15.3 • Control of Cell Fates by Graded Amounts of Regulators 621
1 2 3
Initial population
▲ FIGURE 15-10 Simplified model of sequential induction
of cell types in an epithelium. Step : Starting from apopulation of equivalent cells (white), an initial event (e.g., cellmovements or a polarized signal) creates a second population ofcells (tan) that secretes a signal (red arrows). This signal reachesonly some of the cells in the adjacent field of cells. Step : The2
1cells capable of receiving and interpreting the red signal nowform a new cell type (pink) that secretes a different signal (bluearrows) that moves away from the red cells in both directions.Step : The blue signal induces still more cell types (purple andblue). Note that the effect of the blue signal differs, dependingon whether it acts on white cells or on tan cells.
3
622 CHAPTER 15 • Integration of Signals and Gene Controls
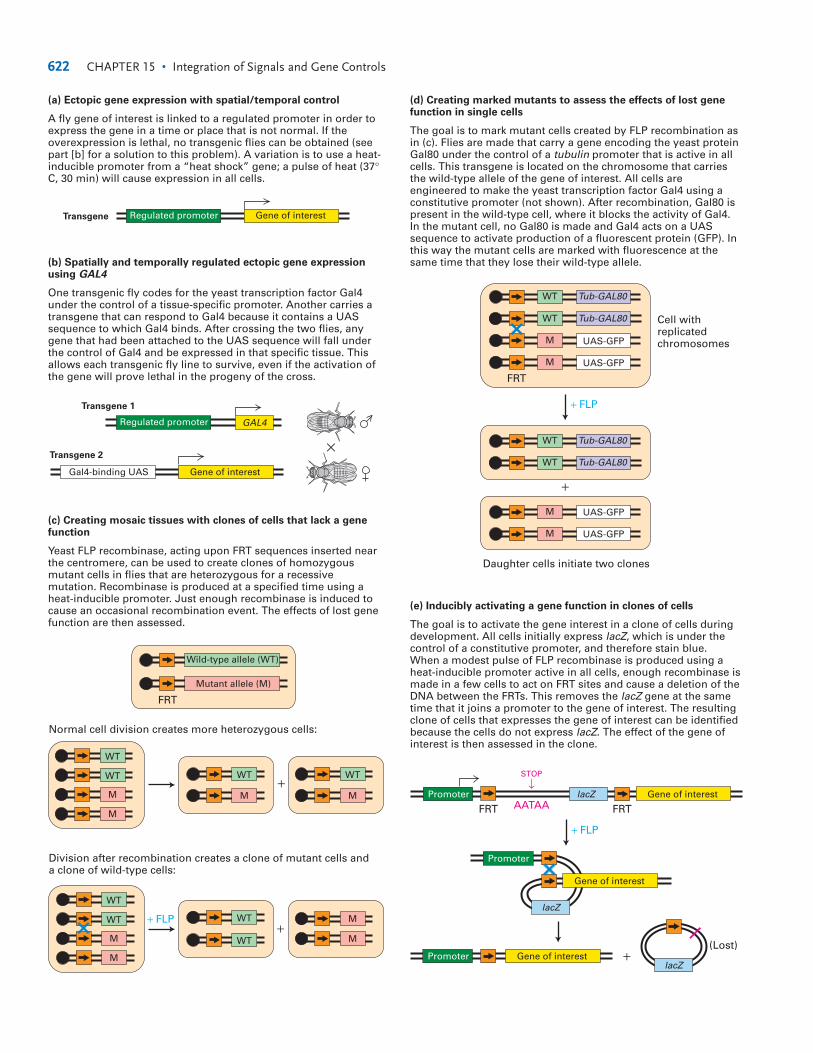
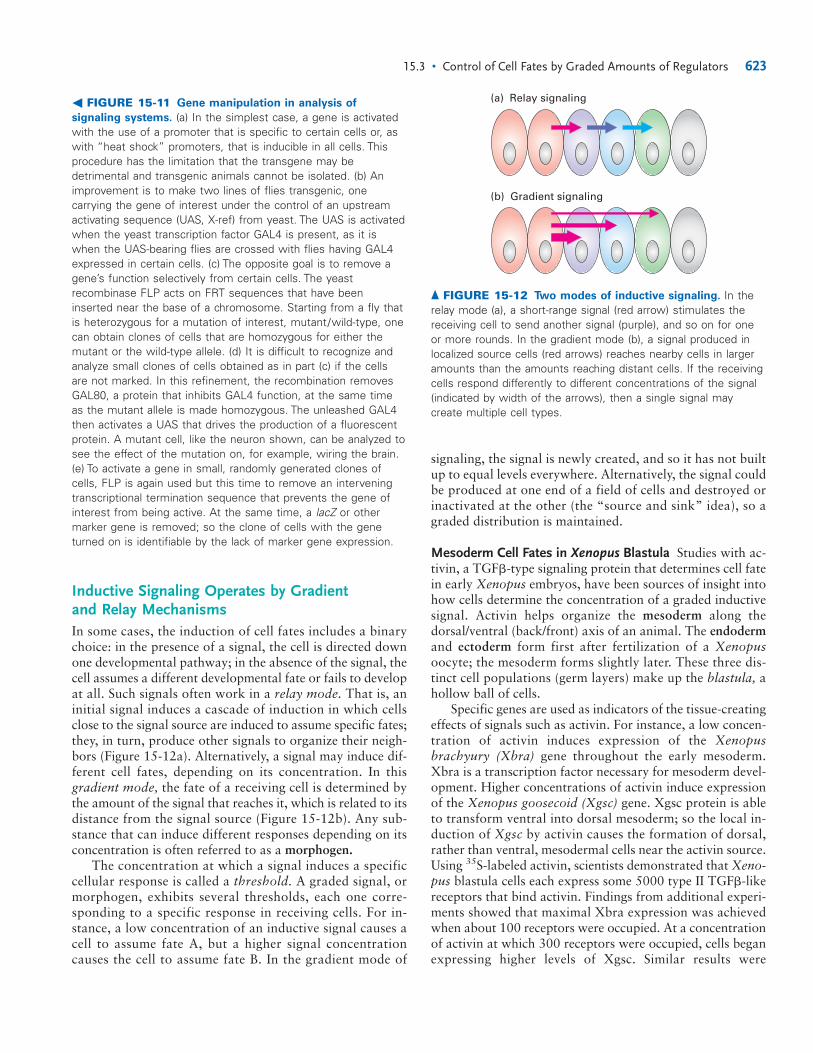
Promoter
(a) Ectopic gene expression with spatial/temporal control
A fly gene of interest is linked to a regulated promoter in order to express the gene in a time or place that is not normal. If the overexpression is lethal, no transgenic flies can be obtained (see part [b] for a solution to this problem). A variation is to use a heat-inducible promoter from a “heat shock” gene; a pulse of heat (37° C, 30 min) will cause expression in all cells.
Transgene Regulated promoter Gene of interest
(b) Spatially and temporally regulated ectopic gene expression using GAL4
One transgenic fly codes for the yeast transcription factor Gal4 under the control of a tissue-specific promoter. Another carries a transgene that can respond to Gal4 because it contains a UAS sequence to which Gal4 binds. After crossing the two flies, any gene that had been attached to the UAS sequence will fall under the control of Gal4 and be expressed in that specific tissue. This allows each transgenic fly line to survive, even if the activation of the gene will prove lethal in the progeny of the cross.
Regulated promoter GAL4
Transgene 1
Transgene 2
Gene of interestGal4-binding UAS
(c) Creating mosaic tissues with clones of cells that lack a gene function
Yeast FLP recombinase, acting upon FRT sequences inserted near the centromere, can be used to create clones of homozygous mutant cells in flies that are heterozygous for a recessive mutation. Recombinase is produced at a specified time using a heat-inducible promoter. Just enough recombinase is induced to cause an occasional recombination event. The effects of lost gene function are then assessed.
Wild-type allele (WT)
Mutant allele (M)
Normal cell division creates more heterozygous cells:
FRT
WT
M
WT
M
WT
M
WT
M
M
WT
M
WT
M
M
WT
WT
+
+
Division after recombination creates a clone of mutant cells anda clone of wild-type cells:
+ FLP
(d) Creating marked mutants to assess the effects of lost gene function in single cells
The goal is to mark mutant cells created by FLP recombination as in (c). Flies are made that carry a gene encoding the yeast protein Gal80 under the control of a tubulin promoter that is active in all cells. This transgene is located on the chromosome that carries the wild-type allele of the gene of interest. All cells are engineered to make the yeast transcription factor Gal4 using a constitutive promoter (not shown). After recombination, Gal80 is present in the wild-type cell, where it blocks the activity of Gal4. In the mutant cell, no Gal80 is made and Gal4 acts on a UAS sequence to activate production of a fluorescent protein (GFP). In this way the mutant cells are marked with fluorescence at the same time that they lose their wild-type allele.
WT Tub-GAL80
WT Tub-GAL80
M UAS-GFP
M UAS-GFP
FRT
+ FLP
Cell withreplicatedchromosomes
WT
WT
Tub-GAL80
Tub-GAL80
M
M
UAS-GFP
UAS-GFP
Daughter cells initiate two clones
+
(e) Inducibly activating a gene function in clones of cells
The goal is to activate the gene interest in a clone of cells during development. All cells initially express lacZ, which is under the control of a constitutive promoter, and therefore stain blue. When a modest pulse of FLP recombinase is produced using a heat-inducible promoter active in all cells, enough recombinase is made in a few cells to act on FRT sites and cause a deletion of the DNA between the FRTs. This removes the lacZ gene at the same time that it joins a promoter to the gene of interest. The resulting clone of cells that expresses the gene of interest can be identified because the cells do not express lacZ. The effect of the gene of interest is then assessed in the clone.
lacZ Gene of interest
Gene of interest
FRT FRT
Promoter
+ FLP
AATAA
STOP
↓
Promoter Gene of interest +lacZ
lacZ
(Lost)
×
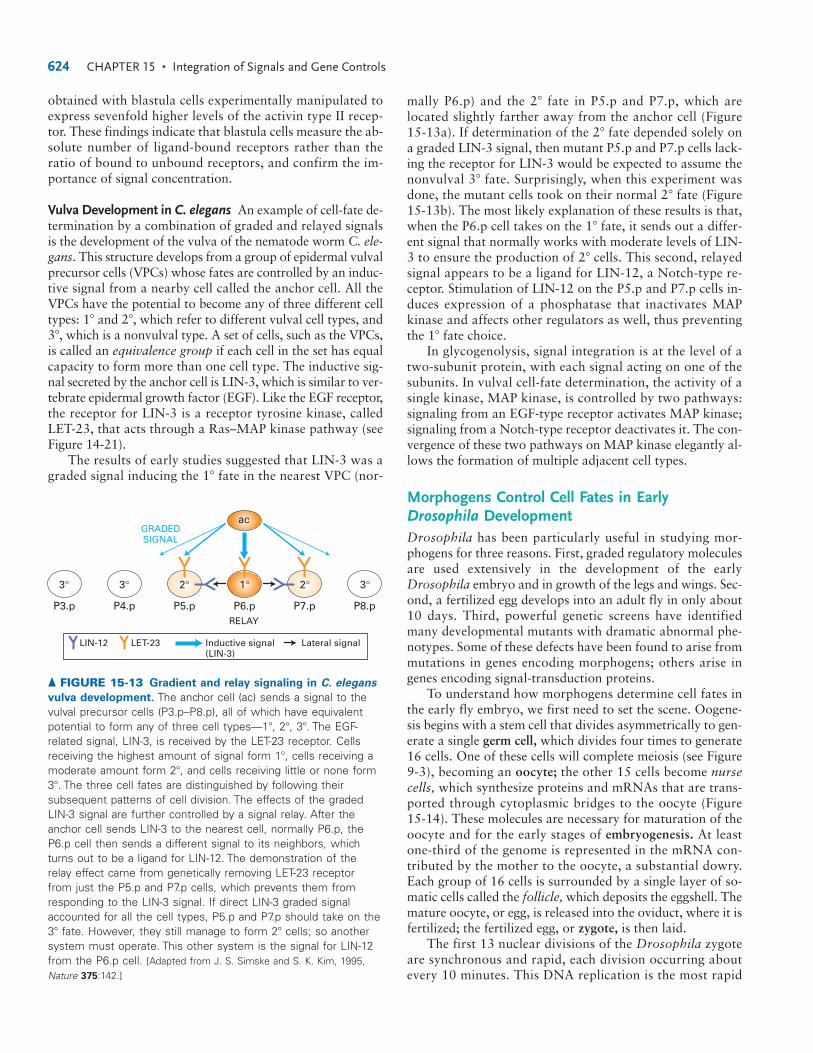
Inductive Signaling Operates by Gradient and Relay MechanismsIn some cases, the induction of cell fates includes a binarychoice: in the presence of a signal, the cell is directed downone developmental pathway; in the absence of the signal, thecell assumes a different developmental fate or fails to developat all. Such signals often work in a relay mode. That is, aninitial signal induces a cascade of induction in which cellsclose to the signal source are induced to assume specific fates;they, in turn, produce other signals to organize their neigh-bors (Figure 15-12a). Alternatively, a signal may induce dif-ferent cell fates, depending on its concentration. In thisgradient mode, the fate of a receiving cell is determined bythe amount of the signal that reaches it, which is related to itsdistance from the signal source (Figure 15-12b). Any sub-stance that can induce different responses depending on itsconcentration is often referred to as a morphogen.
The concentration at which a signal induces a specificcellular response is called a threshold. A graded signal, ormorphogen, exhibits several thresholds, each one corre-sponding to a specific response in receiving cells. For in-stance, a low concentration of an inductive signal causes acell to assume fate A, but a higher signal concentrationcauses the cell to assume fate B. In the gradient mode of
signaling, the signal is newly created, and so it has not builtup to equal levels everywhere. Alternatively, the signal couldbe produced at one end of a field of cells and destroyed orinactivated at the other (the “source and sink” idea), so agraded distribution is maintained.
Mesoderm Cell Fates in Xenopus Blastula Studies with ac-tivin, a TGF�-type signaling protein that determines cell fatein early Xenopus embryos, have been sources of insight intohow cells determine the concentration of a graded inductivesignal. Activin helps organize the mesoderm along the dorsal/ventral (back/front) axis of an animal. The endodermand ectoderm form first after fertilization of a Xenopusoocyte; the mesoderm forms slightly later. These three dis-tinct cell populations (germ layers) make up the blastula, ahollow ball of cells.
Specific genes are used as indicators of the tissue-creatingeffects of signals such as activin. For instance, a low concen-tration of activin induces expression of the Xenopusbrachyury (Xbra) gene throughout the early mesoderm.Xbra is a transcription factor necessary for mesoderm devel-opment. Higher concentrations of activin induce expressionof the Xenopus goosecoid (Xgsc) gene. Xgsc protein is ableto transform ventral into dorsal mesoderm; so the local in-duction of Xgsc by activin causes the formation of dorsal,rather than ventral, mesodermal cells near the activin source.Using 35S-labeled activin, scientists demonstrated that Xeno-pus blastula cells each express some 5000 type II TGF�-likereceptors that bind activin. Findings from additional experi-ments showed that maximal Xbra expression was achievedwhen about 100 receptors were occupied. At a concentrationof activin at which 300 receptors were occupied, cells beganexpressing higher levels of Xgsc. Similar results were
15.3 • Control of Cell Fates by Graded Amounts of Regulators 623
� FIGURE 15-11 Gene manipulation in analysis of
signaling systems. (a) In the simplest case, a gene is activatedwith the use of a promoter that is specific to certain cells or, aswith “heat shock” promoters, that is inducible in all cells. Thisprocedure has the limitation that the transgene may bedetrimental and transgenic animals cannot be isolated. (b) Animprovement is to make two lines of flies transgenic, onecarrying the gene of interest under the control of an upstreamactivating sequence (UAS, X-ref) from yeast. The UAS is activatedwhen the yeast transcription factor GAL4 is present, as it iswhen the UAS-bearing flies are crossed with flies having GAL4expressed in certain cells. (c) The opposite goal is to remove agene’s function selectively from certain cells. The yeastrecombinase FLP acts on FRT sequences that have beeninserted near the base of a chromosome. Starting from a fly thatis heterozygous for a mutation of interest, mutant/wild-type, onecan obtain clones of cells that are homozygous for either themutant or the wild-type allele. (d) It is difficult to recognize andanalyze small clones of cells obtained as in part (c) if the cellsare not marked. In this refinement, the recombination removesGAL80, a protein that inhibits GAL4 function, at the same timeas the mutant allele is made homozygous. The unleashed GAL4then activates a UAS that drives the production of a fluorescentprotein. A mutant cell, like the neuron shown, can be analyzed tosee the effect of the mutation on, for example, wiring the brain.(e) To activate a gene in small, randomly generated clones ofcells, FLP is again used but this time to remove an interveningtranscriptional termination sequence that prevents the gene ofinterest from being active. At the same time, a lacZ or othermarker gene is removed; so the clone of cells with the geneturned on is identifiable by the lack of marker gene expression.
(a) Relay signaling
(b) Gradient signaling
▲ FIGURE 15-12 Two modes of inductive signaling. In therelay mode (a), a short-range signal (red arrow) stimulates thereceiving cell to send another signal (purple), and so on for oneor more rounds. In the gradient mode (b), a signal produced inlocalized source cells (red arrows) reaches nearby cells in largeramounts than the amounts reaching distant cells. If the receivingcells respond differently to different concentrations of the signal(indicated by width of the arrows), then a single signal maycreate multiple cell types.
obtained with blastula cells experimentally manipulated toexpress sevenfold higher levels of the activin type II recep-tor. These findings indicate that blastula cells measure the ab-solute number of ligand-bound receptors rather than theratio of bound to unbound receptors, and confirm the im-portance of signal concentration.
Vulva Development in C. elegans An example of cell-fate de-termination by a combination of graded and relayed signalsis the development of the vulva of the nematode worm C. ele-gans. This structure develops from a group of epidermal vulvalprecursor cells (VPCs) whose fates are controlled by an induc-tive signal from a nearby cell called the anchor cell. All theVPCs have the potential to become any of three different celltypes: 1 and 2, which refer to different vulval cell types, and3, which is a nonvulval type. A set of cells, such as the VPCs,is called an equivalence group if each cell in the set has equalcapacity to form more than one cell type. The inductive sig-nal secreted by the anchor cell is LIN-3, which is similar to ver-tebrate epidermal growth factor (EGF). Like the EGF receptor,the receptor for LIN-3 is a receptor tyrosine kinase, calledLET-23, that acts through a Ras–MAP kinase pathway (seeFigure 14-21).
The results of early studies suggested that LIN-3 was agraded signal inducing the 1 fate in the nearest VPC (nor-
mally P6.p) and the 2 fate in P5.p and P7.p, which are located slightly farther away from the anchor cell (Figure 15-13a). If determination of the 2 fate depended solely ona graded LIN-3 signal, then mutant P5.p and P7.p cells lack-ing the receptor for LIN-3 would be expected to assume thenonvulval 3 fate. Surprisingly, when this experiment wasdone, the mutant cells took on their normal 2 fate (Figure15-13b). The most likely explanation of these results is that,when the P6.p cell takes on the 1 fate, it sends out a differ-ent signal that normally works with moderate levels of LIN-3 to ensure the production of 2 cells. This second, relayedsignal appears to be a ligand for LIN-12, a Notch-type re-ceptor. Stimulation of LIN-12 on the P5.p and P7.p cells in-duces expression of a phosphatase that inactivates MAPkinase and affects other regulators as well, thus preventingthe 1 fate choice.
In glycogenolysis, signal integration is at the level of atwo-subunit protein, with each signal acting on one of thesubunits. In vulval cell-fate determination, the activity of asingle kinase, MAP kinase, is controlled by two pathways:signaling from an EGF-type receptor activates MAP kinase;signaling from a Notch-type receptor deactivates it. The con-vergence of these two pathways on MAP kinase elegantly al-lows the formation of multiple adjacent cell types.
Morphogens Control Cell Fates in EarlyDrosophila DevelopmentDrosophila has been particularly useful in studying mor-phogens for three reasons. First, graded regulatory moleculesare used extensively in the development of the earlyDrosophila embryo and in growth of the legs and wings. Sec-ond, a fertilized egg develops into an adult fly in only about10 days. Third, powerful genetic screens have identifiedmany developmental mutants with dramatic abnormal phe-notypes. Some of these defects have been found to arise frommutations in genes encoding morphogens; others arise ingenes encoding signal-transduction proteins.
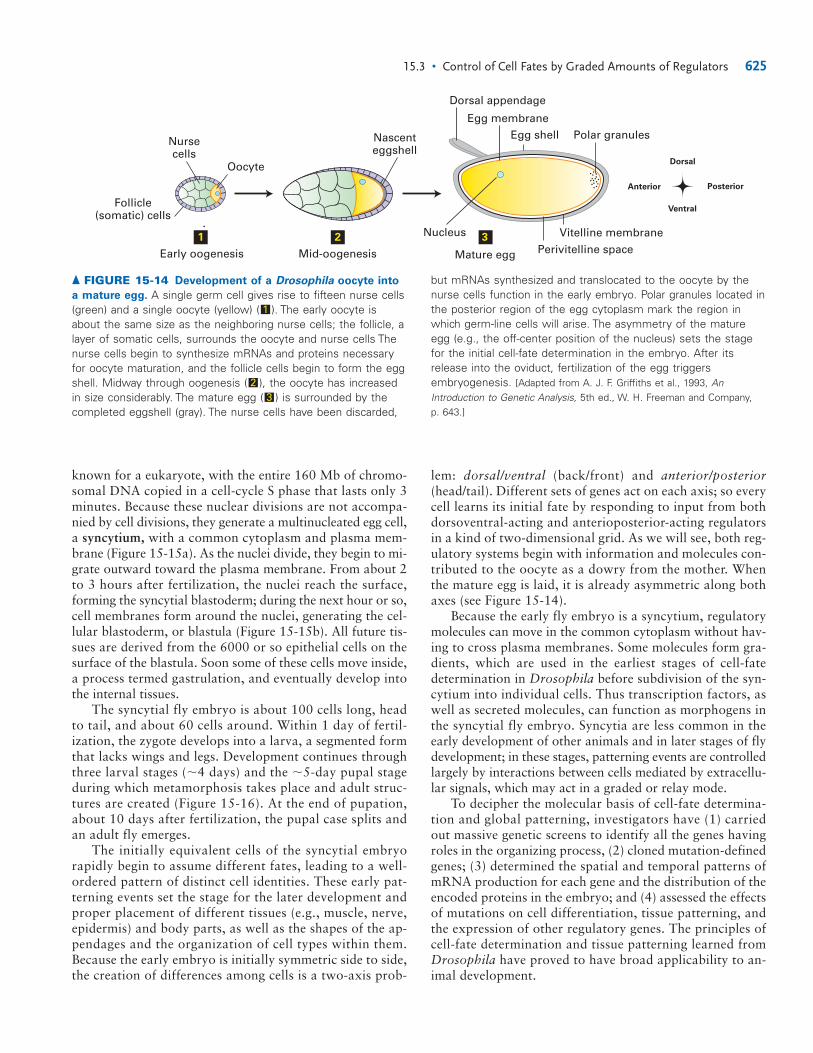
To understand how morphogens determine cell fates inthe early fly embryo, we first need to set the scene. Oogene-sis begins with a stem cell that divides asymmetrically to gen-erate a single germ cell, which divides four times to generate16 cells. One of these cells will complete meiosis (see Figure9-3), becoming an oocyte; the other 15 cells become nursecells, which synthesize proteins and mRNAs that are trans-ported through cytoplasmic bridges to the oocyte (Figure 15-14). These molecules are necessary for maturation of theoocyte and for the early stages of embryogenesis. At leastone-third of the genome is represented in the mRNA con-tributed by the mother to the oocyte, a substantial dowry.Each group of 16 cells is surrounded by a single layer of so-matic cells called the follicle, which deposits the eggshell. Themature oocyte, or egg, is released into the oviduct, where it isfertilized; the fertilized egg, or zygote, is then laid.
The first 13 nuclear divisions of the Drosophila zygoteare synchronous and rapid, each division occurring aboutevery 10 minutes. This DNA replication is the most rapid
624 CHAPTER 15 • Integration of Signals and Gene Controls
P3.p P4.p P5.p P6.p P7.p P8.p
1°2° 2°3° 3°3°
ac
LET-23LIN-12 Inductive signal(LIN-3)
Lateral signal
GRADEDSIGNAL
RELAY
▲ FIGURE 15-13 Gradient and relay signaling in C. elegans
vulva development. The anchor cell (ac) sends a signal to thevulval precursor cells (P3.p–P8.p), all of which have equivalentpotential to form any of three cell types—1, 2, 3. The EGF-related signal, LIN-3, is received by the LET-23 receptor. Cellsreceiving the highest amount of signal form 1, cells receiving amoderate amount form 2, and cells receiving little or none form3. The three cell fates are distinguished by following theirsubsequent patterns of cell division. The effects of the gradedLIN-3 signal are further controlled by a signal relay. After theanchor cell sends LIN-3 to the nearest cell, normally P6.p, theP6.p cell then sends a different signal to its neighbors, whichturns out to be a ligand for LIN-12. The demonstration of therelay effect came from genetically removing LET-23 receptor from just the P5.p and P7.p cells, which prevents them fromresponding to the LIN-3 signal. If direct LIN-3 graded signalaccounted for all the cell types, P5.p and P7.p should take on the3 fate. However, they still manage to form 2 cells; so anothersystem must operate. This other system is the signal for LIN-12from the P6.p cell. [Adapted from J. S. Simske and S. K. Kim, 1995,Nature 375:142.]
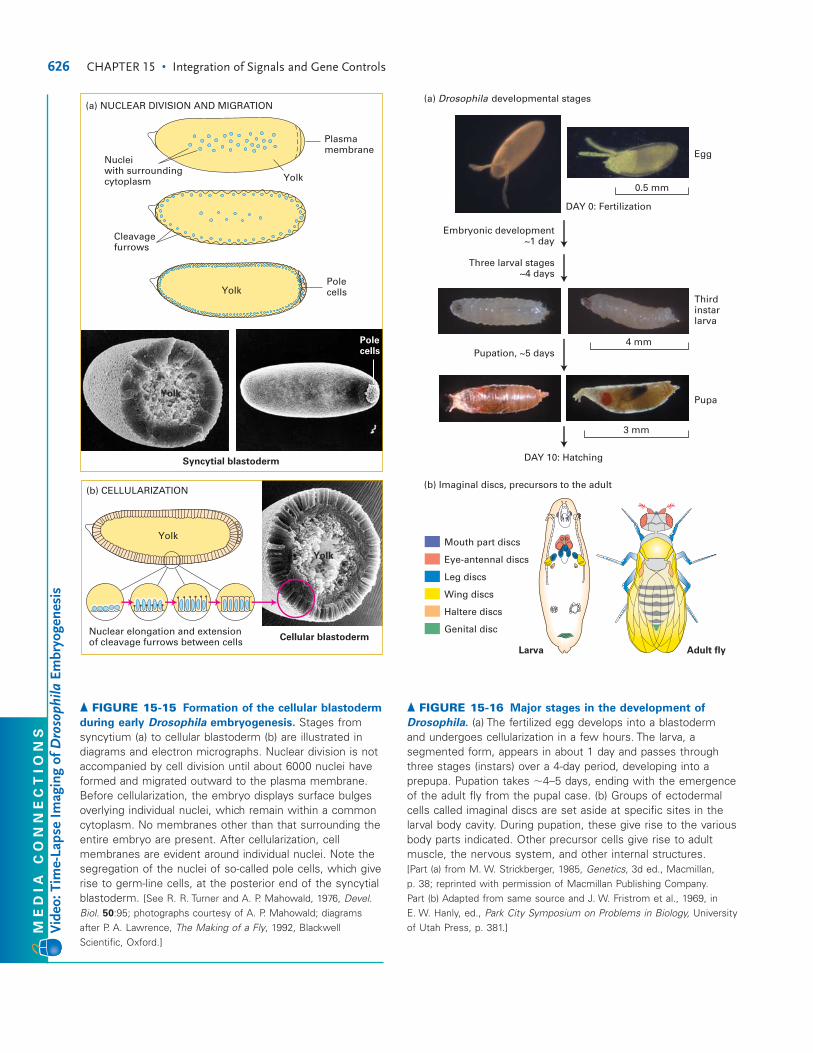
known for a eukaryote, with the entire 160 Mb of chromo-somal DNA copied in a cell-cycle S phase that lasts only 3minutes. Because these nuclear divisions are not accompa-nied by cell divisions, they generate a multinucleated egg cell,a syncytium, with a common cytoplasm and plasma mem-brane (Figure 15-15a). As the nuclei divide, they begin to mi-grate outward toward the plasma membrane. From about 2to 3 hours after fertilization, the nuclei reach the surface,forming the syncytial blastoderm; during the next hour or so,cell membranes form around the nuclei, generating the cel-lular blastoderm, or blastula (Figure 15-15b). All future tis-sues are derived from the 6000 or so epithelial cells on thesurface of the blastula. Soon some of these cells move inside,a process termed gastrulation, and eventually develop intothe internal tissues.
The syncytial fly embryo is about 100 cells long, headto tail, and about 60 cells around. Within 1 day of fertil-ization, the zygote develops into a larva, a segmented formthat lacks wings and legs. Development continues throughthree larval stages (�4 days) and the �5-day pupal stageduring which metamorphosis takes place and adult struc-tures are created (Figure 15-16). At the end of pupation,about 10 days after fertilization, the pupal case splits andan adult fly emerges.
The initially equivalent cells of the syncytial embryorapidly begin to assume different fates, leading to a well-ordered pattern of distinct cell identities. These early pat-terning events set the stage for the later development andproper placement of different tissues (e.g., muscle, nerve,epidermis) and body parts, as well as the shapes of the ap-pendages and the organization of cell types within them.Because the early embryo is initially symmetric side to side,the creation of differences among cells is a two-axis prob-
lem: dorsal/ventral (back/front) and anterior/posterior(head/tail). Different sets of genes act on each axis; so everycell learns its initial fate by responding to input from bothdorsoventral-acting and anterioposterior-acting regulatorsin a kind of two-dimensional grid. As we will see, both reg-ulatory systems begin with information and molecules con-tributed to the oocyte as a dowry from the mother. Whenthe mature egg is laid, it is already asymmetric along bothaxes (see Figure 15-14).
Because the early fly embryo is a syncytium, regulatorymolecules can move in the common cytoplasm without hav-ing to cross plasma membranes. Some molecules form gra-dients, which are used in the earliest stages of cell-fatedetermination in Drosophila before subdivision of the syn-cytium into individual cells. Thus transcription factors, aswell as secreted molecules, can function as morphogens inthe syncytial fly embryo. Syncytia are less common in theearly development of other animals and in later stages of flydevelopment; in these stages, patterning events are controlledlargely by interactions between cells mediated by extracellu-lar signals, which may act in a graded or relay mode.
To decipher the molecular basis of cell-fate determina-tion and global patterning, investigators have (1) carriedout massive genetic screens to identify all the genes havingroles in the organizing process, (2) cloned mutation-definedgenes; (3) determined the spatial and temporal patterns ofmRNA production for each gene and the distribution of theencoded proteins in the embryo; and (4) assessed the effectsof mutations on cell differentiation, tissue patterning, andthe expression of other regulatory genes. The principles ofcell-fate determination and tissue patterning learned fromDrosophila have proved to have broad applicability to an-imal development.
15.3 • Control of Cell Fates by Graded Amounts of Regulators 625
Egg shell
Dorsal appendage
Perivitelline space
Egg membranePolar granulesNurse
cellsNascenteggshell
Oocyte
Follicle(somatic) cells
Dorsal
Ventral
PosteriorAnterior
3
Mature egg
Nucleus2
Mid-oogenesis
1
Early oogenesis
Vitelline membrane
▲ FIGURE 15-14 Development of a Drosophila oocyte into
a mature egg. A single germ cell gives rise to fifteen nurse cells(green) and a single oocyte (yellow) ( ). The early oocyte isabout the same size as the neighboring nurse cells; the follicle, alayer of somatic cells, surrounds the oocyte and nurse cells Thenurse cells begin to synthesize mRNAs and proteins necessaryfor oocyte maturation, and the follicle cells begin to form the eggshell. Midway through oogenesis ( ), the oocyte has increasedin size considerably. The mature egg ( ) is surrounded by thecompleted eggshell (gray). The nurse cells have been discarded,
32
1
but mRNAs synthesized and translocated to the oocyte by thenurse cells function in the early embryo. Polar granules located inthe posterior region of the egg cytoplasm mark the region inwhich germ-line cells will arise. The asymmetry of the matureegg (e.g., the off-center position of the nucleus) sets the stagefor the initial cell-fate determination in the embryo. After itsrelease into the oviduct, fertilization of the egg triggersembryogenesis. [Adapted from A. J. F. Griffiths et al., 1993, AnIntroduction to Genetic Analysis, 5th ed., W. H. Freeman and Company, p. 643.]
626 CHAPTER 15 • Integration of Signals and Gene Controls
Polecells
Polecells
Nucleiwith surroundingcytoplasm
Cleavagefurrows
Yolk
Nuclear elongation and extension of cleavage furrows between cells
(a) NUCLEAR DIVISION AND MIGRATION
(b) CELLULARIZATION
Cellular blastoderm
Syncytial blastoderm
Plasmamembrane
Yolk
Yolk
Yolk
Yolk
▲ FIGURE 15-15 Formation of the cellular blastoderm
during early Drosophila embryogenesis. Stages fromsyncytium (a) to cellular blastoderm (b) are illustrated indiagrams and electron micrographs. Nuclear division is notaccompanied by cell division until about 6000 nuclei haveformed and migrated outward to the plasma membrane.Before cellularization, the embryo displays surface bulgesoverlying individual nuclei, which remain within a commoncytoplasm. No membranes other than that surrounding theentire embryo are present. After cellularization, cellmembranes are evident around individual nuclei. Note thesegregation of the nuclei of so-called pole cells, which giverise to germ-line cells, at the posterior end of the syncytialblastoderm. [See R. R. Turner and A. P. Mahowald, 1976, Devel.Biol. 50:95; photographs courtesy of A. P. Mahowald; diagramsafter P. A. Lawrence, The Making of a Fly, 1992, BlackwellScientific, Oxford.]
Three larval stages~4 days
Thirdinstarlarva
Embryonic development~1 day
Pupation, ~5 days
DAY 0: Fertilization
DAY 10: Hatching
Eye-antennal discs
(a) Drosophila developmental stages
(b) Imaginal discs, precursors to the adult
Leg discs
Wing discs
Genital disc
Egg
Mouth part discs
Haltere discs
Pupa
Adult flyLarva
0.5 mm
4 mm
3 mm
▲ FIGURE 15-16 Major stages in the development of
Drosophila. (a) The fertilized egg develops into a blastoderm and undergoes cellularization in a few hours. The larva, asegmented form, appears in about 1 day and passes throughthree stages (instars) over a 4-day period, developing into aprepupa. Pupation takes �4–5 days, ending with the emergenceof the adult fly from the pupal case. (b) Groups of ectodermalcells called imaginal discs are set aside at specific sites in thelarval body cavity. During pupation, these give rise to the variousbody parts indicated. Other precursor cells give rise to adultmuscle, the nervous system, and other internal structures. [Part (a) from M. W. Strickberger, 1985, Genetics, 3d ed., Macmillan, p. 38; reprinted with permission of Macmillan Publishing Company. Part (b) Adapted from same source and J. W. Fristrom et al., 1969, in E. W. Hanly, ed., Park City Symposium on Problems in Biology, Universityof Utah Press, p. 381.]M
ED
IA
C
ON
NE
CT
IO
NS
Vid
eo:T
ime-
Laps
e Im
agin
g of
Dro
soph
ila E
mbr
yoge
nesi
s
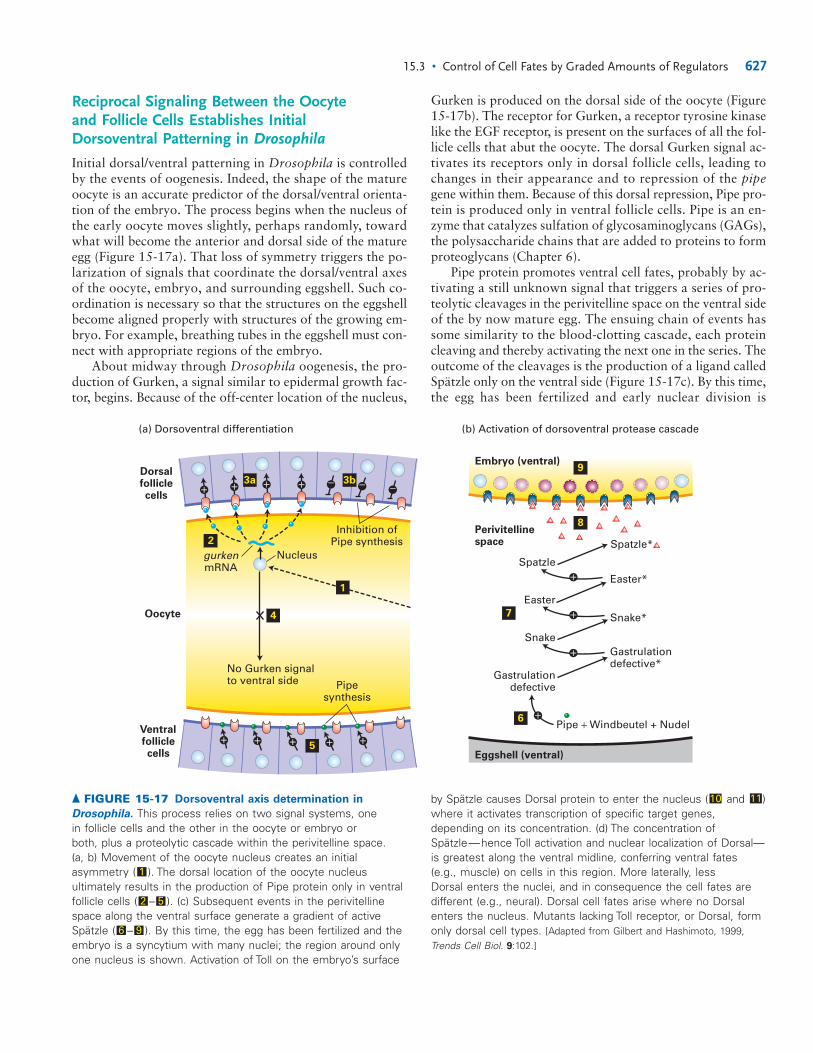
Reciprocal Signaling Between the Oocyte and Follicle Cells Establishes Initial Dorsoventral Patterning in Drosophila
Initial dorsal/ventral patterning in Drosophila is controlledby the events of oogenesis. Indeed, the shape of the matureoocyte is an accurate predictor of the dorsal/ventral orienta-tion of the embryo. The process begins when the nucleus ofthe early oocyte moves slightly, perhaps randomly, towardwhat will become the anterior and dorsal side of the matureegg (Figure 15-17a). That loss of symmetry triggers the po-larization of signals that coordinate the dorsal/ventral axesof the oocyte, embryo, and surrounding eggshell. Such co-ordination is necessary so that the structures on the eggshellbecome aligned properly with structures of the growing em-bryo. For example, breathing tubes in the eggshell must con-nect with appropriate regions of the embryo.
About midway through Drosophila oogenesis, the pro-duction of Gurken, a signal similar to epidermal growth fac-tor, begins. Because of the off-center location of the nucleus,
Gurken is produced on the dorsal side of the oocyte (Figure15-17b). The receptor for Gurken, a receptor tyrosine kinaselike the EGF receptor, is present on the surfaces of all the fol-licle cells that abut the oocyte. The dorsal Gurken signal ac-tivates its receptors only in dorsal follicle cells, leading tochanges in their appearance and to repression of the pipegene within them. Because of this dorsal repression, Pipe pro-tein is produced only in ventral follicle cells. Pipe is an en-zyme that catalyzes sulfation of glycosaminoglycans (GAGs),the polysaccharide chains that are added to proteins to formproteoglycans (Chapter 6).
Pipe protein promotes ventral cell fates, probably by ac-tivating a still unknown signal that triggers a series of pro-teolytic cleavages in the perivitelline space on the ventral sideof the by now mature egg. The ensuing chain of events hassome similarity to the blood-clotting cascade, each proteincleaving and thereby activating the next one in the series. Theoutcome of the cleavages is the production of a ligand calledSpätzle only on the ventral side (Figure 15-17c). By this time,the egg has been fertilized and early nuclear division is
15.3 • Control of Cell Fates by Graded Amounts of Regulators 627
▲ FIGURE 15-17 Dorsoventral axis determination in
Drosophila. This process relies on two signal systems, one in follicle cells and the other in the oocyte or embryo or both, plus a proteolytic cascade within the perivitelline space. (a, b) Movement of the oocyte nucleus creates an initialasymmetry ( ). The dorsal location of the oocyte nucleusultimately results in the production of Pipe protein only in ventralfollicle cells ( – ). (c) Subsequent events in the perivitellinespace along the ventral surface generate a gradient of activeSpätzle ( – ). By this time, the egg has been fertilized and theembryo is a syncytium with many nuclei; the region around onlyone nucleus is shown. Activation of Toll on the embryo’s surface
96
52
1
by Spätzle causes Dorsal protein to enter the nucleus ( and )where it activates transcription of specific target genes,depending on its concentration. (d) The concentration ofSpätzle—hence Toll activation and nuclear localization of Dorsal—is greatest along the ventral midline, conferring ventral fates(e.g., muscle) on cells in this region. More laterally, less Dorsal enters the nuclei, and in consequence the cell fates aredifferent (e.g., neural). Dorsal cell fates arise where no Dorsalenters the nucleus. Mutants lacking Toll receptor, or Dorsal, formonly dorsal cell types. [Adapted from Gilbert and Hashimoto, 1999,Trends Cell Biol. 9:102.]
1110
Eggshell (ventral)
(b) Activation of dorsoventral protease cascade
Snake
Snake*
Easter
Spatzle
Easter*
Gastrulationdefective
Gastrulationdefective*
Spatzle*Perivitellinespace
Embryo (ventral)
(a) Dorsoventral differentiation
Oocyte
gurkenmRNA
No Gurken signal to ventral side Pipe
synthesis
Inhibition ofPipe synthesis
Nucleus
Ventralfolliclecells
Dorsalfolliclecells
Pipe + Windbeutel + Nudel6
7
8
9
2
4
5
1
3a 3b_ _ _++++
+
+
+
+
+ + + + +
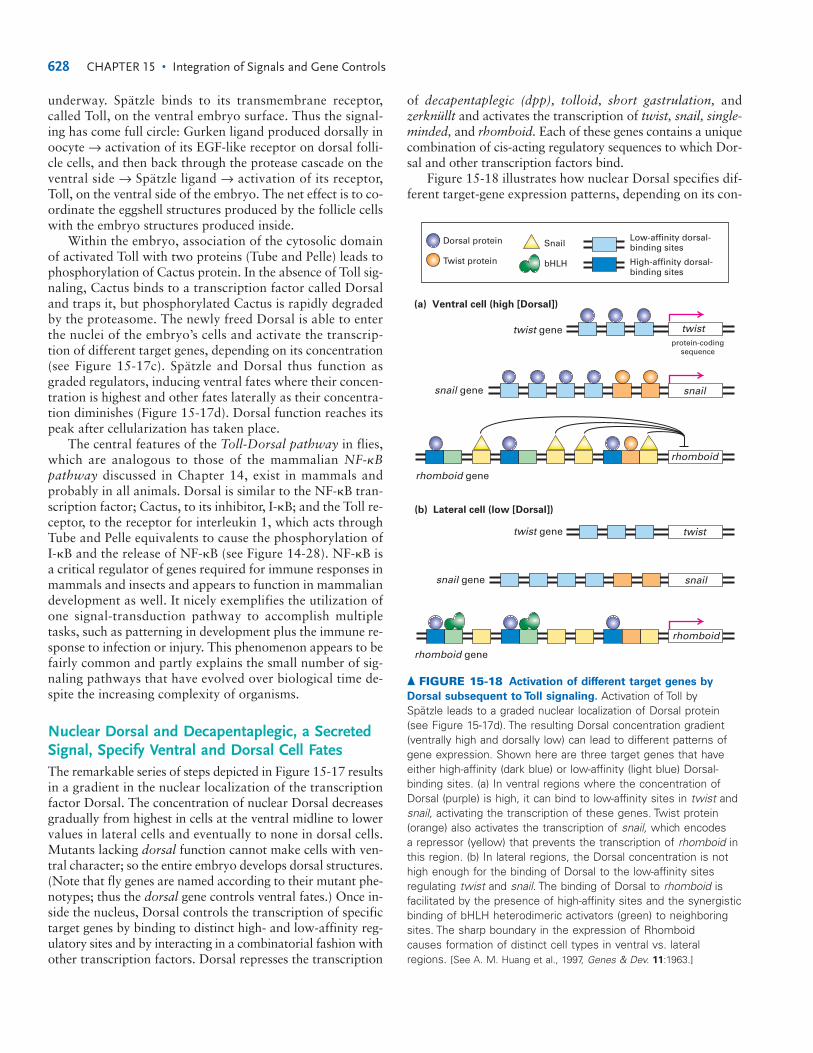
underway. Spätzle binds to its transmembrane receptor,called Toll, on the ventral embryo surface. Thus the signal-ing has come full circle: Gurken ligand produced dorsally inoocyte → activation of its EGF-like receptor on dorsal folli-cle cells, and then back through the protease cascade on theventral side → Spätzle ligand → activation of its receptor,Toll, on the ventral side of the embryo. The net effect is to co-ordinate the eggshell structures produced by the follicle cellswith the embryo structures produced inside.
Within the embryo, association of the cytosolic domainof activated Toll with two proteins (Tube and Pelle) leads tophosphorylation of Cactus protein. In the absence of Toll sig-naling, Cactus binds to a transcription factor called Dorsaland traps it, but phosphorylated Cactus is rapidly degradedby the proteasome. The newly freed Dorsal is able to enterthe nuclei of the embryo’s cells and activate the transcrip-tion of different target genes, depending on its concentration(see Figure 15-17c). Spätzle and Dorsal thus function asgraded regulators, inducing ventral fates where their concen-tration is highest and other fates laterally as their concentra-tion diminishes (Figure 15-17d). Dorsal function reaches itspeak after cellularization has taken place.
The central features of the Toll-Dorsal pathway in flies,which are analogous to those of the mammalian NF-�Bpathway discussed in Chapter 14, exist in mammals andprobably in all animals. Dorsal is similar to the NF-B tran-scription factor; Cactus, to its inhibitor, I-B; and the Toll re-ceptor, to the receptor for interleukin 1, which acts throughTube and Pelle equivalents to cause the phosphorylation of I-B and the release of NF-B (see Figure 14-28). NF-B isa critical regulator of genes required for immune responses inmammals and insects and appears to function in mammaliandevelopment as well. It nicely exemplifies the utilization ofone signal-transduction pathway to accomplish multipletasks, such as patterning in development plus the immune re-sponse to infection or injury. This phenomenon appears to befairly common and partly explains the small number of sig-naling pathways that have evolved over biological time de-spite the increasing complexity of organisms.
Nuclear Dorsal and Decapentaplegic, a SecretedSignal, Specify Ventral and Dorsal Cell FatesThe remarkable series of steps depicted in Figure 15-17 resultsin a gradient in the nuclear localization of the transcriptionfactor Dorsal. The concentration of nuclear Dorsal decreasesgradually from highest in cells at the ventral midline to lowervalues in lateral cells and eventually to none in dorsal cells.Mutants lacking dorsal function cannot make cells with ven-tral character; so the entire embryo develops dorsal structures.(Note that fly genes are named according to their mutant phe-notypes; thus the dorsal gene controls ventral fates.) Once in-side the nucleus, Dorsal controls the transcription of specifictarget genes by binding to distinct high- and low-affinity reg-ulatory sites and by interacting in a combinatorial fashion withother transcription factors. Dorsal represses the transcription
of decapentaplegic (dpp), tolloid, short gastrulation, andzerknüllt and activates the transcription of twist, snail, single-minded, and rhomboid. Each of these genes contains a uniquecombination of cis-acting regulatory sequences to which Dor-sal and other transcription factors bind.
Figure 15-18 illustrates how nuclear Dorsal specifies dif-ferent target-gene expression patterns, depending on its con-
628 CHAPTER 15 • Integration of Signals and Gene Controls
snailsnail gene
(a) Ventral cell (high [Dorsal])
(b) Lateral cell (low [Dorsal])
High-affinity dorsal-binding sites
Low-affinity dorsal-binding sites
Twist protein bHLH
protein-codingsequence
twist gene twist
snail gene snail
twist gene twist
rhomboid gene
rhomboid
Snail
rhomboid gene
rhomboid
Dorsal protein
▲ FIGURE 15-18 Activation of different target genes by
Dorsal subsequent to Toll signaling. Activation of Toll by Spätzle leads to a graded nuclear localization of Dorsal protein(see Figure 15-17d). The resulting Dorsal concentration gradient(ventrally high and dorsally low) can lead to different patterns ofgene expression. Shown here are three target genes that haveeither high-affinity (dark blue) or low-affinity (light blue) Dorsal-binding sites. (a) In ventral regions where the concentration ofDorsal (purple) is high, it can bind to low-affinity sites in twist andsnail, activating the transcription of these genes. Twist protein(orange) also activates the transcription of snail, which encodes a repressor (yellow) that prevents the transcription of rhomboid inthis region. (b) In lateral regions, the Dorsal concentration is nothigh enough for the binding of Dorsal to the low-affinity sitesregulating twist and snail. The binding of Dorsal to rhomboid isfacilitated by the presence of high-affinity sites and the synergisticbinding of bHLH heterodimeric activators (green) to neighboringsites. The sharp boundary in the expression of Rhomboid causes formation of distinct cell types in ventral vs. lateralregions. [See A. M. Huang et al., 1997, Genes & Dev. 11:1963.]
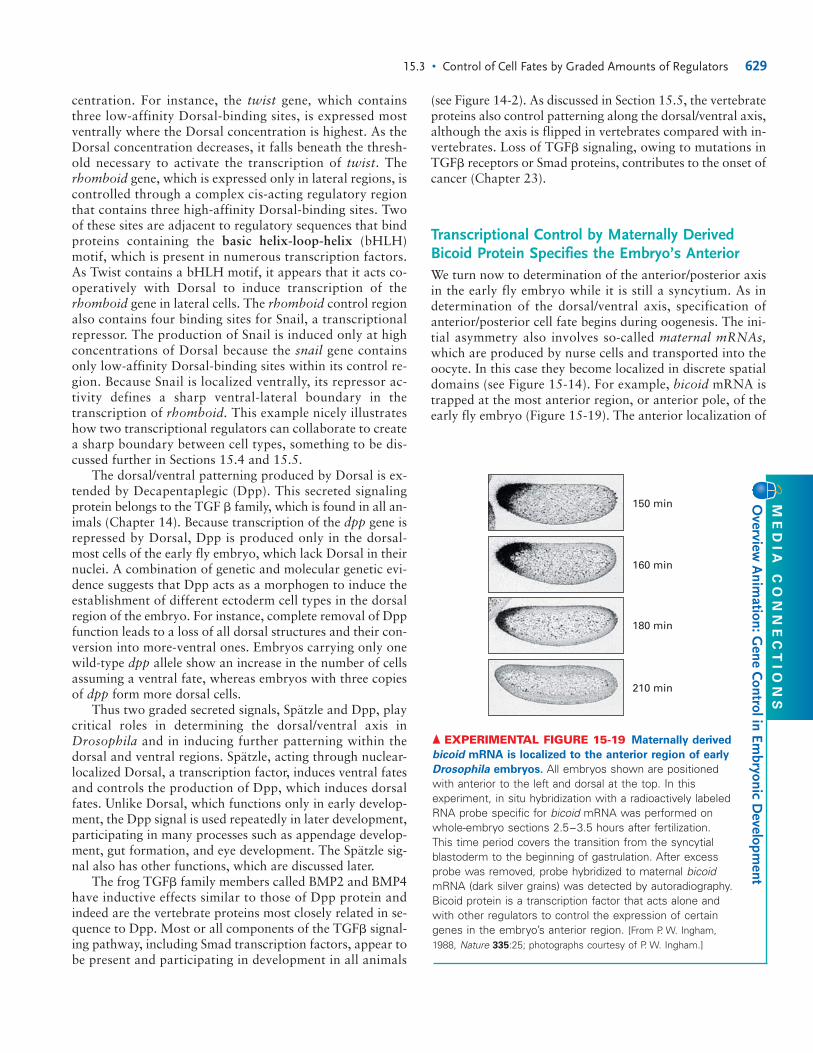
centration. For instance, the twist gene, which containsthree low-affinity Dorsal-binding sites, is expressed mostventrally where the Dorsal concentration is highest. As theDorsal concentration decreases, it falls beneath the thresh-old necessary to activate the transcription of twist. Therhomboid gene, which is expressed only in lateral regions, iscontrolled through a complex cis-acting regulatory regionthat contains three high-affinity Dorsal-binding sites. Twoof these sites are adjacent to regulatory sequences that bindproteins containing the basic helix-loop-helix (bHLH)motif, which is present in numerous transcription factors.As Twist contains a bHLH motif, it appears that it acts co-operatively with Dorsal to induce transcription of therhomboid gene in lateral cells. The rhomboid control regionalso contains four binding sites for Snail, a transcriptionalrepressor. The production of Snail is induced only at highconcentrations of Dorsal because the snail gene containsonly low-affinity Dorsal-binding sites within its control re-gion. Because Snail is localized ventrally, its repressor ac-tivity defines a sharp ventral-lateral boundary in thetranscription of rhomboid. This example nicely illustrateshow two transcriptional regulators can collaborate to createa sharp boundary between cell types, something to be dis-cussed further in Sections 15.4 and 15.5.
The dorsal/ventral patterning produced by Dorsal is ex-tended by Decapentaplegic (Dpp). This secreted signalingprotein belongs to the TGF � family, which is found in all an-imals (Chapter 14). Because transcription of the dpp gene isrepressed by Dorsal, Dpp is produced only in the dorsal-most cells of the early fly embryo, which lack Dorsal in theirnuclei. A combination of genetic and molecular genetic evi-dence suggests that Dpp acts as a morphogen to induce theestablishment of different ectoderm cell types in the dorsalregion of the embryo. For instance, complete removal of Dppfunction leads to a loss of all dorsal structures and their con-version into more-ventral ones. Embryos carrying only onewild-type dpp allele show an increase in the number of cellsassuming a ventral fate, whereas embryos with three copiesof dpp form more dorsal cells.
Thus two graded secreted signals, Spätzle and Dpp, playcritical roles in determining the dorsal/ventral axis inDrosophila and in inducing further patterning within thedorsal and ventral regions. Spätzle, acting through nuclear-localized Dorsal, a transcription factor, induces ventral fatesand controls the production of Dpp, which induces dorsalfates. Unlike Dorsal, which functions only in early develop-ment, the Dpp signal is used repeatedly in later development,participating in many processes such as appendage develop-ment, gut formation, and eye development. The Spätzle sig-nal also has other functions, which are discussed later.
The frog TGF� family members called BMP2 and BMP4have inductive effects similar to those of Dpp protein andindeed are the vertebrate proteins most closely related in se-quence to Dpp. Most or all components of the TGF� signal-ing pathway, including Smad transcription factors, appear tobe present and participating in development in all animals
(see Figure 14-2). As discussed in Section 15.5, the vertebrateproteins also control patterning along the dorsal/ventral axis,although the axis is flipped in vertebrates compared with in-vertebrates. Loss of TGF� signaling, owing to mutations inTGF� receptors or Smad proteins, contributes to the onset ofcancer (Chapter 23).
Transcriptional Control by Maternally DerivedBicoid Protein Specifies the Embryo’s AnteriorWe turn now to determination of the anterior/posterior axisin the early fly embryo while it is still a syncytium. As in determination of the dorsal/ventral axis, specification of anterior/posterior cell fate begins during oogenesis. The ini-tial asymmetry also involves so-called maternal mRNAs,which are produced by nurse cells and transported into theoocyte. In this case they become localized in discrete spatialdomains (see Figure 15-14). For example, bicoid mRNA istrapped at the most anterior region, or anterior pole, of theearly fly embryo (Figure 15-19). The anterior localization of
15.3 • Control of Cell Fates by Graded Amounts of Regulators 629
150 min
160 min
180 min
210 min
▲ EXPERIMENTAL FIGURE 15-19 Maternally derived
bicoid mRNA is localized to the anterior region of early
Drosophila embryos. All embryos shown are positionedwith anterior to the left and dorsal at the top. In thisexperiment, in situ hybridization with a radioactively labeledRNA probe specific for bicoid mRNA was performed onwhole-embryo sections 2.5–3.5 hours after fertilization. This time period covers the transition from the syncytialblastoderm to the beginning of gastrulation. After excessprobe was removed, probe hybridized to maternal bicoidmRNA (dark silver grains) was detected by autoradiography.Bicoid protein is a transcription factor that acts alone andwith other regulators to control the expression of certaingenes in the embryo’s anterior region. [From P. W. Ingham,1988, Nature 335:25; photographs courtesy of P. W. Ingham.]
ME
DIA
C
ON
NE
CT
IO
NS
Overview
Anim
ation: Gene C
ontrol in Embryonic D
evelopment
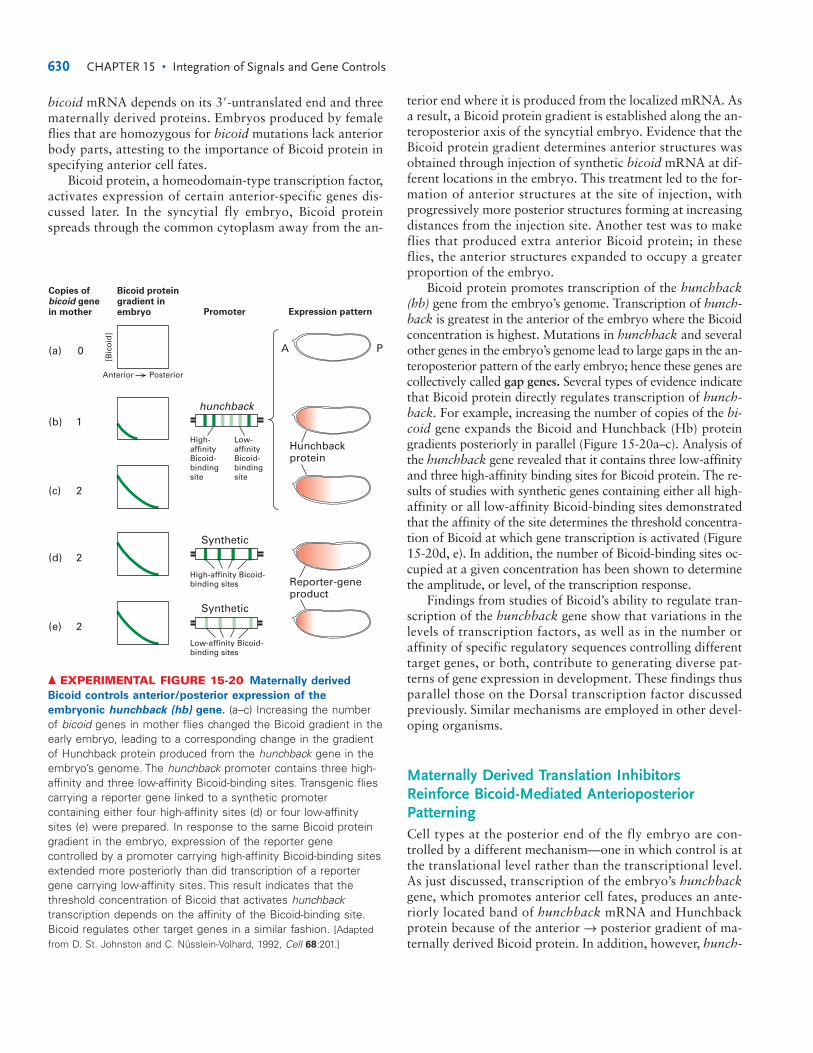
bicoid mRNA depends on its 3�-untranslated end and threematernally derived proteins. Embryos produced by femaleflies that are homozygous for bicoid mutations lack anteriorbody parts, attesting to the importance of Bicoid protein inspecifying anterior cell fates.
Bicoid protein, a homeodomain-type transcription factor,activates expression of certain anterior-specific genes dis-cussed later. In the syncytial fly embryo, Bicoid proteinspreads through the common cytoplasm away from the an-
terior end where it is produced from the localized mRNA. Asa result, a Bicoid protein gradient is established along the an-teroposterior axis of the syncytial embryo. Evidence that theBicoid protein gradient determines anterior structures wasobtained through injection of synthetic bicoid mRNA at dif-ferent locations in the embryo. This treatment led to the for-mation of anterior structures at the site of injection, withprogressively more posterior structures forming at increasingdistances from the injection site. Another test was to makeflies that produced extra anterior Bicoid protein; in theseflies, the anterior structures expanded to occupy a greaterproportion of the embryo.
Bicoid protein promotes transcription of the hunchback(hb) gene from the embryo’s genome. Transcription of hunch-back is greatest in the anterior of the embryo where the Bicoidconcentration is highest. Mutations in hunchback and severalother genes in the embryo’s genome lead to large gaps in the an-teroposterior pattern of the early embryo; hence these genes arecollectively called gap genes. Several types of evidence indicatethat Bicoid protein directly regulates transcription of hunch-back. For example, increasing the number of copies of the bi-coid gene expands the Bicoid and Hunchback (Hb) proteingradients posteriorly in parallel (Figure 15-20a–c). Analysis ofthe hunchback gene revealed that it contains three low-affinityand three high-affinity binding sites for Bicoid protein. The re-sults of studies with synthetic genes containing either all high-affinity or all low-affinity Bicoid-binding sites demonstratedthat the affinity of the site determines the threshold concentra-tion of Bicoid at which gene transcription is activated (Figure15-20d, e). In addition, the number of Bicoid-binding sites oc-cupied at a given concentration has been shown to determinethe amplitude, or level, of the transcription response.
Findings from studies of Bicoid’s ability to regulate tran-scription of the hunchback gene show that variations in thelevels of transcription factors, as well as in the number oraffinity of specific regulatory sequences controlling differenttarget genes, or both, contribute to generating diverse pat-terns of gene expression in development. These findings thusparallel those on the Dorsal transcription factor discussedpreviously. Similar mechanisms are employed in other devel-oping organisms.
Maternally Derived Translation InhibitorsReinforce Bicoid-Mediated AnterioposteriorPatterningCell types at the posterior end of the fly embryo are con-trolled by a different mechanism—one in which control is atthe translational level rather than the transcriptional level.As just discussed, transcription of the embryo’s hunchbackgene, which promotes anterior cell fates, produces an ante-riorly located band of hunchback mRNA and Hunchbackprotein because of the anterior → posterior gradient of ma-ternally derived Bicoid protein. In addition, however, hunch-
630 CHAPTER 15 • Integration of Signals and Gene Controls
Copies ofbicoid genein mother
Bicoid protein gradient inembryo Expression patternPromoter
[Bic
oid
]
Anterior Posterior
hunchback
High-affinityBicoid-bindingsite
Low-affinityBicoid-bindingsite
Hunchbackprotein
Reporter-geneproduct
(a) 0
(b) 1
(c) 2
(d) 2
(e) 2
A
Synthetic
High-affinity Bicoid-binding sites
Synthetic
Low-affinity Bicoid-binding sites
P
▲ EXPERIMENTAL FIGURE 15-20 Maternally derived
Bicoid controls anterior/posterior expression of the
embryonic hunchback (hb) gene. (a–c) Increasing the numberof bicoid genes in mother flies changed the Bicoid gradient in theearly embryo, leading to a corresponding change in the gradientof Hunchback protein produced from the hunchback gene in theembryo’s genome. The hunchback promoter contains three high-affinity and three low-affinity Bicoid-binding sites. Transgenic fliescarrying a reporter gene linked to a synthetic promotercontaining either four high-affinity sites (d) or four low-affinitysites (e) were prepared. In response to the same Bicoid proteingradient in the embryo, expression of the reporter genecontrolled by a promoter carrying high-affinity Bicoid-binding sitesextended more posteriorly than did transcription of a reportergene carrying low-affinity sites. This result indicates that thethreshold concentration of Bicoid that activates hunchbacktranscription depends on the affinity of the Bicoid-binding site.Bicoid regulates other target genes in a similar fashion. [Adaptedfrom D. St. Johnston and C. Nüsslein-Volhard, 1992, Cell 68:201.]
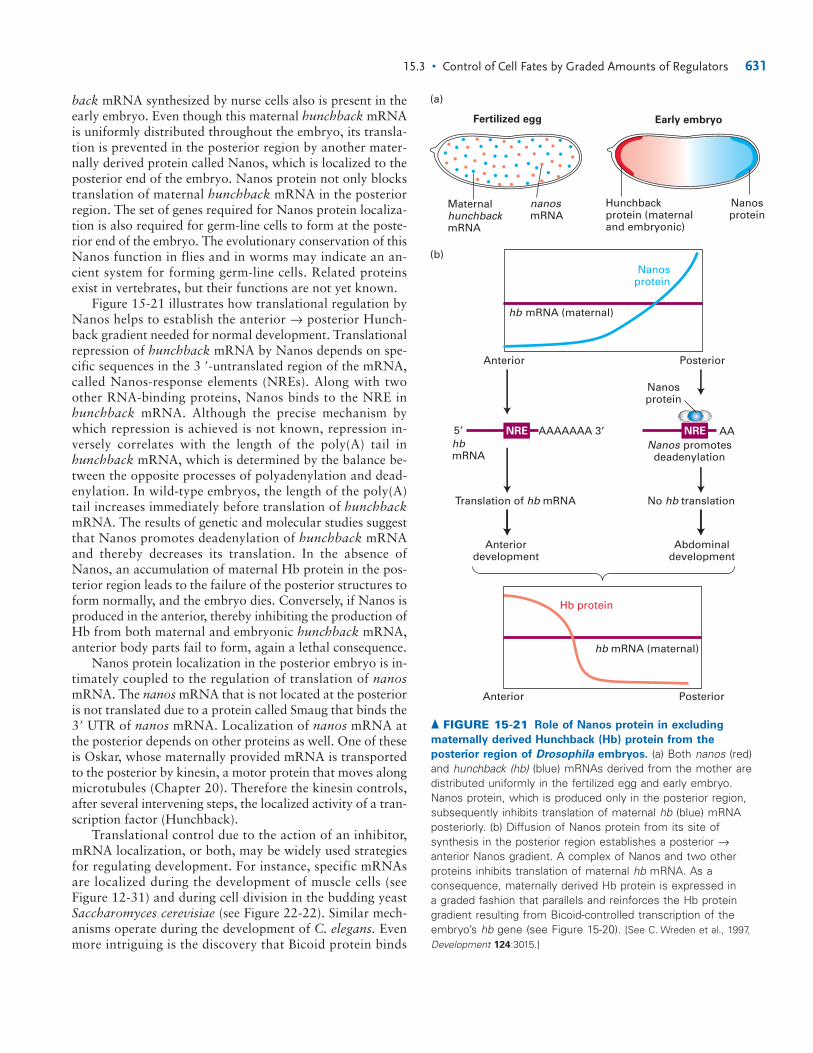
back mRNA synthesized by nurse cells also is present in theearly embryo. Even though this maternal hunchback mRNAis uniformly distributed throughout the embryo, its transla-tion is prevented in the posterior region by another mater-nally derived protein called Nanos, which is localized to theposterior end of the embryo. Nanos protein not only blockstranslation of maternal hunchback mRNA in the posteriorregion. The set of genes required for Nanos protein localiza-tion is also required for germ-line cells to form at the poste-rior end of the embryo. The evolutionary conservation of thisNanos function in flies and in worms may indicate an an-cient system for forming germ-line cells. Related proteinsexist in vertebrates, but their functions are not yet known.
Figure 15-21 illustrates how translational regulation byNanos helps to establish the anterior → posterior Hunch-back gradient needed for normal development. Translationalrepression of hunchback mRNA by Nanos depends on spe-cific sequences in the 3 �-untranslated region of the mRNA,called Nanos-response elements (NREs). Along with twoother RNA-binding proteins, Nanos binds to the NRE inhunchback mRNA. Although the precise mechanism bywhich repression is achieved is not known, repression in-versely correlates with the length of the poly(A) tail inhunchback mRNA, which is determined by the balance be-tween the opposite processes of polyadenylation and dead-enylation. In wild-type embryos, the length of the poly(A)tail increases immediately before translation of hunchbackmRNA. The results of genetic and molecular studies suggestthat Nanos promotes deadenylation of hunchback mRNAand thereby decreases its translation. In the absence ofNanos, an accumulation of maternal Hb protein in the pos-terior region leads to the failure of the posterior structures toform normally, and the embryo dies. Conversely, if Nanos isproduced in the anterior, thereby inhibiting the production ofHb from both maternal and embryonic hunchback mRNA,anterior body parts fail to form, again a lethal consequence.
Nanos protein localization in the posterior embryo is in-timately coupled to the regulation of translation of nanosmRNA. The nanos mRNA that is not located at the posterioris not translated due to a protein called Smaug that binds the3� UTR of nanos mRNA. Localization of nanos mRNA atthe posterior depends on other proteins as well. One of theseis Oskar, whose maternally provided mRNA is transportedto the posterior by kinesin, a motor protein that moves alongmicrotubules (Chapter 20). Therefore the kinesin controls,after several intervening steps, the localized activity of a tran-scription factor (Hunchback).
Translational control due to the action of an inhibitor,mRNA localization, or both, may be widely used strategiesfor regulating development. For instance, specific mRNAsare localized during the development of muscle cells (seeFigure 12-31) and during cell division in the budding yeastSaccharomyces cerevisiae (see Figure 22-22). Similar mech-anisms operate during the development of C. elegans. Evenmore intriguing is the discovery that Bicoid protein binds
15.3 • Control of Cell Fates by Graded Amounts of Regulators 631
hb mRNA (maternal)
Nanosprotein
Anterior Posterior
Anterior Posterior
Translation of hb mRNA
Anteriordevelopment
No hb translation
Abdominaldevelopment
Hb protein
hb mRNA (maternal)
hbmRNA
NRE AAAAAAA 3� AANRE
Nanos promotesdeadenylation
Fertilized egg Early embryo
nanosmRNA
Maternal hunchbackmRNA
Hunchbackprotein (maternaland embryonic)
Nanosprotein
Nanosprotein
(a)
(b)
5�
▲ FIGURE 15-21 Role of Nanos protein in excluding
maternally derived Hunchback (Hb) protein from the
posterior region of Drosophila embryos. (a) Both nanos (red)and hunchback (hb) (blue) mRNAs derived from the mother aredistributed uniformly in the fertilized egg and early embryo.Nanos protein, which is produced only in the posterior region,subsequently inhibits translation of maternal hb (blue) mRNAposteriorly. (b) Diffusion of Nanos protein from its site ofsynthesis in the posterior region establishes a posterior →anterior Nanos gradient. A complex of Nanos and two otherproteins inhibits translation of maternal hb mRNA. As aconsequence, maternally derived Hb protein is expressed in a graded fashion that parallels and reinforces the Hb proteingradient resulting from Bicoid-controlled transcription of theembryo’s hb gene (see Figure 15-20). [See C. Wreden et al., 1997,Development 124:3015.]
not only to DNA to promote transcription of the embryonichunchback gene but also to caudal mRNA (which encodesanother Drosophila protein having a role in early-patterningevents) and regulates its translation.
Toll-like Signaling Activates an Ancient DefenseSystem in Plants and AnimalsBefore continuing our account of signaling and gene controlin development, we digress briefly to consider the connectionbetween innate immunity and the Toll-Dorsal signaling path-way discussed previously (see Figure 15-17c). Recall that thispathway has many parallels with the NF-B pathway inmammals, which is intimately involved in immune responses.Discovery of these parallels was the first hint that Toll sig-naling might function in nondevelopmental contexts. Morerecently, researchers have found that the Toll receptor, its lig-and Spätzle, and other pathway components are required forthe expression of an antifungal peptide (drosomycin) in flylarvae and adults. Stimulation of a different Toll-like recep-tor triggers the production of an antibacterial peptide(diptericin) in flies. Discovery of a mammalian Toll-like re-ceptor that controls the production of anti-inflammatory cy-tokines stimulated exploration of the whole set ofsimilarities.
Toll signaling now appears to be one of the most evolu-tionarily conserved processes known. All the components be-tween Toll and the activation of Dorsal have been largelyconserved. There are 8 Drosophila proteins related to Tollplus Toll itself and 10 Toll-related human proteins that con-trol the production of a wide variety of antimicrobial pep-tides in flies and cytokines in mammals. These moleculesprovide a rapid, nonspecific defense against infection by awide array of pathogens. The adaptive immune responsemounted by vertebrates, involving antibodies and T cells, isdirected against specific pathogens but is slower to developthan the innate, nonspecific response.
Most remarkably, parts of the Toll pathway and its func-tion in immunity are readily recognizable in plants. For in-stance, Arabidopsis has about 100 proteins containingdomains similar to the cytosolic domains of Toll that trans-duce the intracellular signal. At least some of these proteinsare required for resistance to tobacco mosaic virus, and anArabidopsis protein similar in sequence to I-B is requiredfor resistance to downy mildew fungus. However, the Toll-like signaling in Arabidopsis appears to act through tran-scription factors that are unrelated to Dorsal or NF-B.
Because the Toll-based innate immunity system appearsto be present in both plants and animals, it may be more thana billion years old. In the course of their long evolution, atleast some of the genes having roles in the basic survivalfunction of immunity have been adapted to serve as devel-opmental regulators—a nice example of biological parsi-mony in the use of genetic resources.
KEY CONCEPTS OF SECTION 15.3
Control of Cell Fates by Graded Amounts of Regulators
■ The influence of one cell population on the develop-mental fate of another one nearby is called induction. Bothdiffusible signaling molecules and direct cell–cell contactsmediate induction.
■ Morphogens are signals that act in a graded fashion: acell that receives more of a signal takes on one fate, a cellthat receives less takes on a different fate, and so forth.Other signals act in a relay fashion: a signal induces onecell to produce a different signal that instructs cells fartheraway from the original signal source (see Figure 15-11).
■ In Drosophila syncytial embryos, morphogens are usedat several stages to induce different cell types along bothaxes. Asymmetries created in the fly egg during oogenesistrigger events that determine both the dorsoventral and theanterioposterior axes in fly embryos.
■ Two signal systems—one acting during oogenesis andthe other acting in the early fly embryo—plus a proteolyticcascade within the perivitelline space lead to the gradednuclear localization of Dorsal, a transcription factor: ven-tral nuclei receive the most Dorsal; lateral nuclei, less; anddorsal nuclei, none (see Figure 15-17). These early eventscontrol development along the dorsoventral axis.
■ In ventral cells, Dorsal turns off genes (e.g., deca-pentaplegic, or dpp) needed to make dorsal structures.Dpp, a TGF�-type signal produced in dorsal cells, func-tions in graded fashion to specify dorsal cell types. Dpphomologs in vertebrates (BMP proteins) also act in dorso-ventral patterning.
■ Early anterioposterior patterning in Drosophila pro-duces an anterior → posterior gradient of Hunchback (Hb),a transcription factor that promotes anterior cell fates.Transcription of the embryonic hb gene is activated by ma-ternally derived Bicoid protein, which is localized to theanterior (see Figure 15-20).
■ Nanos protein inhibits the translation of maternal hb mRNAin the posterior of the fly embryo (see Figure 15-21). Synthe-sis of Nanos from maternal nanos mRNA is restricted to theposterior by translational control linked to motor protein–mediated transport of other regulators to the posterior pole.
Boundary Creation by DifferentCombinations of Transcription FactorsIn Section 15.3, we saw that maternally derived Bicoid playsa key role in initiating the transcription of gap genes (e.g.,hunchback) in the anterior region of the early fly embryo;other maternal factors prevent the translation of hunchbackmRNA in the posterior. Further specification of cell fates inDrosophila is controlled by transcription cascades in which
15.4
632 CHAPTER 15 • Integration of Signals and Gene Controls
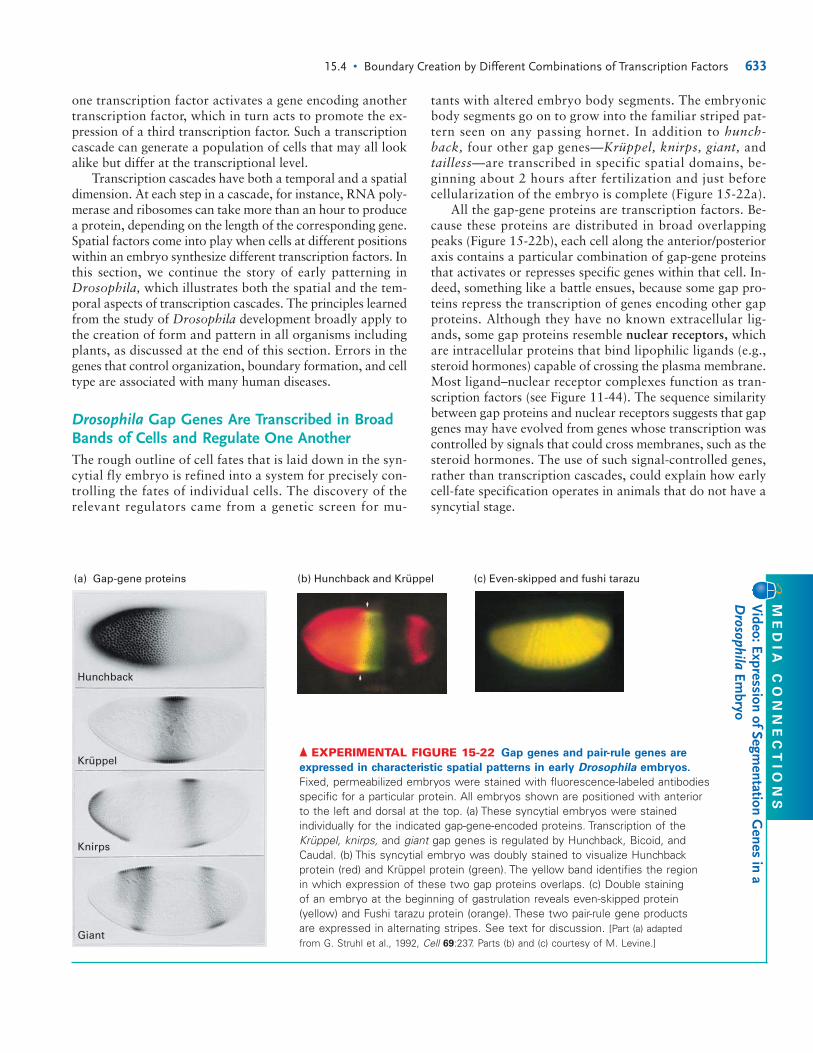
one transcription factor activates a gene encoding anothertranscription factor, which in turn acts to promote the ex-pression of a third transcription factor. Such a transcriptioncascade can generate a population of cells that may all lookalike but differ at the transcriptional level.
Transcription cascades have both a temporal and a spatialdimension. At each step in a cascade, for instance, RNA poly-merase and ribosomes can take more than an hour to producea protein, depending on the length of the corresponding gene.Spatial factors come into play when cells at different positionswithin an embryo synthesize different transcription factors. Inthis section, we continue the story of early patterning inDrosophila, which illustrates both the spatial and the tem-poral aspects of transcription cascades. The principles learnedfrom the study of Drosophila development broadly apply tothe creation of form and pattern in all organisms includingplants, as discussed at the end of this section. Errors in thegenes that control organization, boundary formation, and celltype are associated with many human diseases.
Drosophila Gap Genes Are Transcribed in BroadBands of Cells and Regulate One AnotherThe rough outline of cell fates that is laid down in the syn-cytial fly embryo is refined into a system for precisely con-trolling the fates of individual cells. The discovery of therelevant regulators came from a genetic screen for mu-
tants with altered embryo body segments. The embryonicbody segments go on to grow into the familiar striped pat-tern seen on any passing hornet. In addition to hunch-back, four other gap genes—Krüppel, knirps, giant, andtailless—are transcribed in specific spatial domains, be-ginning about 2 hours after fertilization and just beforecellularization of the embryo is complete (Figure 15-22a).
All the gap-gene proteins are transcription factors. Be-cause these proteins are distributed in broad overlappingpeaks (Figure 15-22b), each cell along the anterior/posterioraxis contains a particular combination of gap-gene proteinsthat activates or represses specific genes within that cell. In-deed, something like a battle ensues, because some gap pro-teins repress the transcription of genes encoding other gapproteins. Although they have no known extracellular lig-ands, some gap proteins resemble nuclear receptors, whichare intracellular proteins that bind lipophilic ligands (e.g.,steroid hormones) capable of crossing the plasma membrane.Most ligand–nuclear receptor complexes function as tran-scription factors (see Figure 11-44). The sequence similaritybetween gap proteins and nuclear receptors suggests that gapgenes may have evolved from genes whose transcription wascontrolled by signals that could cross membranes, such as thesteroid hormones. The use of such signal-controlled genes,rather than transcription cascades, could explain how earlycell-fate specification operates in animals that do not have asyncytial stage.
15.4 • Boundary Creation by Different Combinations of Transcription Factors 633
Hunchback
Krüppel
Knirps
Giant
(b) Hunchback and Krüppel (c) Even-skipped and fushi tarazu(a) Gap-gene proteins
▲ EXPERIMENTAL FIGURE 15-22 Gap genes and pair-rule genes are
expressed in characteristic spatial patterns in early Drosophila embryos.
Fixed, permeabilized embryos were stained with fluorescence-labeled antibodiesspecific for a particular protein. All embryos shown are positioned with anterior to the left and dorsal at the top. (a) These syncytial embryos were stainedindividually for the indicated gap-gene-encoded proteins. Transcription of theKrüppel, knirps, and giant gap genes is regulated by Hunchback, Bicoid, andCaudal. (b) This syncytial embryo was doubly stained to visualize Hunchbackprotein (red) and Krüppel protein (green). The yellow band identifies the region in which expression of these two gap proteins overlaps. (c) Double staining of an embryo at the beginning of gastrulation reveals even-skipped protein(yellow) and Fushi tarazu protein (orange). These two pair-rule gene products are expressed in alternating stripes. See text for discussion. [Part (a) adapted from G. Struhl et al., 1992, Cell 69:237. Parts (b) and (c) courtesy of M. Levine.]
ME
DIA
C
ON
NE
CT
IO
NS
Video:Expression of Segm
entation Genes in a
Drosophila
Embryo
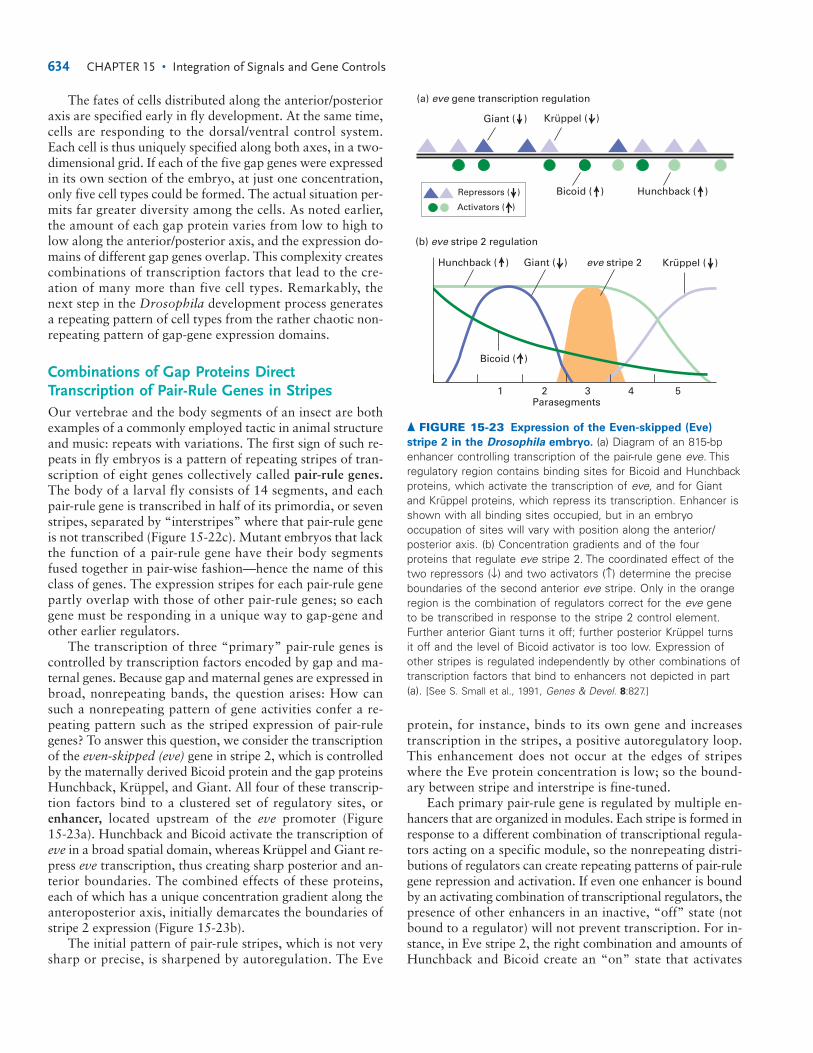
The fates of cells distributed along the anterior/posterioraxis are specified early in fly development. At the same time,cells are responding to the dorsal/ventral control system.Each cell is thus uniquely specified along both axes, in a two-dimensional grid. If each of the five gap genes were expressedin its own section of the embryo, at just one concentration,only five cell types could be formed. The actual situation per-mits far greater diversity among the cells. As noted earlier,the amount of each gap protein varies from low to high tolow along the anterior/posterior axis, and the expression do-mains of different gap genes overlap. This complexity createscombinations of transcription factors that lead to the cre-ation of many more than five cell types. Remarkably, thenext step in the Drosophila development process generatesa repeating pattern of cell types from the rather chaotic non-repeating pattern of gap-gene expression domains.
Combinations of Gap Proteins DirectTranscription of Pair-Rule Genes in StripesOur vertebrae and the body segments of an insect are bothexamples of a commonly employed tactic in animal structureand music: repeats with variations. The first sign of such re-peats in fly embryos is a pattern of repeating stripes of tran-scription of eight genes collectively called pair-rule genes.The body of a larval fly consists of 14 segments, and eachpair-rule gene is transcribed in half of its primordia, or sevenstripes, separated by “interstripes” where that pair-rule geneis not transcribed (Figure 15-22c). Mutant embryos that lackthe function of a pair-rule gene have their body segmentsfused together in pair-wise fashion—hence the name of thisclass of genes. The expression stripes for each pair-rule genepartly overlap with those of other pair-rule genes; so eachgene must be responding in a unique way to gap-gene andother earlier regulators.
The transcription of three “primary” pair-rule genes iscontrolled by transcription factors encoded by gap and ma-ternal genes. Because gap and maternal genes are expressed inbroad, nonrepeating bands, the question arises: How cansuch a nonrepeating pattern of gene activities confer a re-peating pattern such as the striped expression of pair-rulegenes? To answer this question, we consider the transcriptionof the even-skipped (eve) gene in stripe 2, which is controlledby the maternally derived Bicoid protein and the gap proteinsHunchback, Krüppel, and Giant. All four of these transcrip-tion factors bind to a clustered set of regulatory sites, or enhancer, located upstream of the eve promoter (Figure 15-23a). Hunchback and Bicoid activate the transcription ofeve in a broad spatial domain, whereas Krüppel and Giant re-press eve transcription, thus creating sharp posterior and an-terior boundaries. The combined effects of these proteins,each of which has a unique concentration gradient along theanteroposterior axis, initially demarcates the boundaries ofstripe 2 expression (Figure 15-23b).
The initial pattern of pair-rule stripes, which is not verysharp or precise, is sharpened by autoregulation. The Eve
protein, for instance, binds to its own gene and increasestranscription in the stripes, a positive autoregulatory loop.This enhancement does not occur at the edges of stripeswhere the Eve protein concentration is low; so the bound-ary between stripe and interstripe is fine-tuned.
Each primary pair-rule gene is regulated by multiple en-hancers that are organized in modules. Each stripe is formed inresponse to a different combination of transcriptional regula-tors acting on a specific module, so the nonrepeating distri-butions of regulators can create repeating patterns of pair-rulegene repression and activation. If even one enhancer is boundby an activating combination of transcriptional regulators, thepresence of other enhancers in an inactive, “off” state (notbound to a regulator) will not prevent transcription. For in-stance, in Eve stripe 2, the right combination and amounts ofHunchback and Bicoid create an “on” state that activates
634 CHAPTER 15 • Integration of Signals and Gene Controls
Hunchback ( ) Giant ( ) eve stripe 2
(a) eve gene transcription regulation
(b) eve stripe 2 regulation
Repressors ( )
Activators ( )
Krüppel ( )
Bicoid ( )
Parasegments1 2 3 4 5
Krüppel ( )Giant ( )
Bicoid ( ) Hunchback ( )
▲ FIGURE 15-23 Expression of the Even-skipped (Eve)
stripe 2 in the Drosophila embryo. (a) Diagram of an 815-bpenhancer controlling transcription of the pair-rule gene eve. Thisregulatory region contains binding sites for Bicoid and Hunchbackproteins, which activate the transcription of eve, and for Giantand Krüppel proteins, which repress its transcription. Enhancer isshown with all binding sites occupied, but in an embryooccupation of sites will vary with position along the anterior/posterior axis. (b) Concentration gradients and of the fourproteins that regulate eve stripe 2. The coordinated effect of thetwo repressors (↓) and two activators (↑) determine the preciseboundaries of the second anterior eve stripe. Only in the orangeregion is the combination of regulators correct for the eve geneto be transcribed in response to the stripe 2 control element.Further anterior Giant turns it off; further posterior Krüppel turnsit off and the level of Bicoid activator is too low. Expression ofother stripes is regulated independently by other combinations oftranscription factors that bind to enhancers not depicted in part(a). [See S. Small et al., 1991, Genes & Devel. 8:827.]
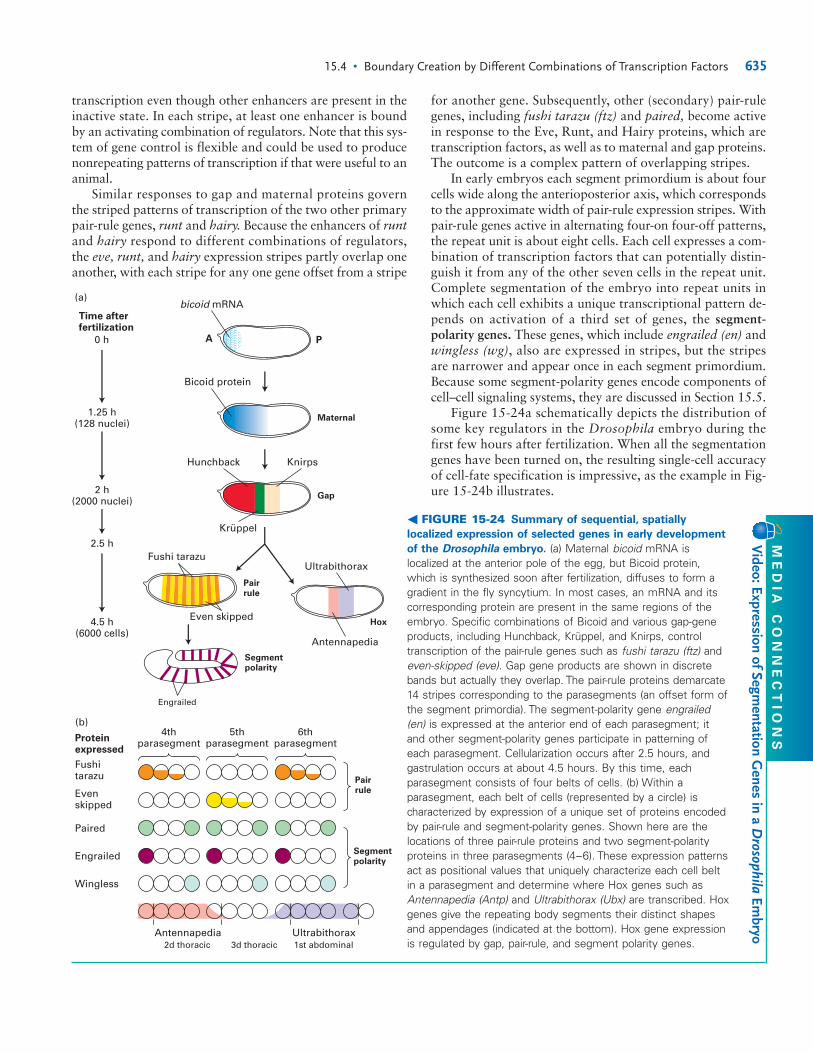
transcription even though other enhancers are present in theinactive state. In each stripe, at least one enhancer is boundby an activating combination of regulators. Note that this sys-tem of gene control is flexible and could be used to producenonrepeating patterns of transcription if that were useful to ananimal.
Similar responses to gap and maternal proteins governthe striped patterns of transcription of the two other primarypair-rule genes, runt and hairy. Because the enhancers of runtand hairy respond to different combinations of regulators,the eve, runt, and hairy expression stripes partly overlap oneanother, with each stripe for any one gene offset from a stripe
for another gene. Subsequently, other (secondary) pair-rulegenes, including fushi tarazu (ftz) and paired, become activein response to the Eve, Runt, and Hairy proteins, which aretranscription factors, as well as to maternal and gap proteins.The outcome is a complex pattern of overlapping stripes.
In early embryos each segment primordium is about fourcells wide along the anterioposterior axis, which correspondsto the approximate width of pair-rule expression stripes. Withpair-rule genes active in alternating four-on four-off patterns,the repeat unit is about eight cells. Each cell expresses a com-bination of transcription factors that can potentially distin-guish it from any of the other seven cells in the repeat unit.Complete segmentation of the embryo into repeat units inwhich each cell exhibits a unique transcriptional pattern de-pends on activation of a third set of genes, the segment-polarity genes. These genes, which include engrailed (en) andwingless (wg), also are expressed in stripes, but the stripesare narrower and appear once in each segment primordium.Because some segment-polarity genes encode components ofcell–cell signaling systems, they are discussed in Section 15.5.
Figure 15-24a schematically depicts the distribution ofsome key regulators in the Drosophila embryo during thefirst few hours after fertilization. When all the segmentationgenes have been turned on, the resulting single-cell accuracyof cell-fate specification is impressive, as the example in Fig-ure 15-24b illustrates.
15.4 • Boundary Creation by Different Combinations of Transcription Factors 635
A
Bicoid protein
bicoid mRNA
Hunchback Knirps
Krüppel
Fushi tarazu
Even skipped
Ultrabithorax
Antennapedia
Proteinexpressed
Fushitarazu
Evenskipped
Paired
Engrailed
Wingless
4thparasegment
5thparasegment
6thparasegment
(b)
Engrailed
(a)
0 h
Time afterfertilization
1.25 h(128 nuclei)
2 h(2000 nuclei)
4.5 h(6000 cells)
2.5 h
2d thoracic 1st abdominal3d thoracicAntennapedia Ultrabithorax
Maternal
Gap
Pairrule
Hox
Segmentpolarity
P
Pairrule
Segmentpolarity
� FIGURE 15-24 Summary of sequential, spatially
localized expression of selected genes in early development
of the Drosophila embryo. (a) Maternal bicoid mRNA islocalized at the anterior pole of the egg, but Bicoid protein,which is synthesized soon after fertilization, diffuses to form agradient in the fly syncytium. In most cases, an mRNA and itscorresponding protein are present in the same regions of theembryo. Specific combinations of Bicoid and various gap-geneproducts, including Hunchback, Krüppel, and Knirps, controltranscription of the pair-rule genes such as fushi tarazu (ftz) andeven-skipped (eve). Gap gene products are shown in discretebands but actually they overlap. The pair-rule proteins demarcate14 stripes corresponding to the parasegments (an offset form ofthe segment primordia). The segment-polarity gene engrailed(en) is expressed at the anterior end of each parasegment; itand other segment-polarity genes participate in patterning ofeach parasegment. Cellularization occurs after 2.5 hours, andgastrulation occurs at about 4.5 hours. By this time, eachparasegment consists of four belts of cells. (b) Within aparasegment, each belt of cells (represented by a circle) ischaracterized by expression of a unique set of proteins encodedby pair-rule and segment-polarity genes. Shown here are thelocations of three pair-rule proteins and two segment-polarityproteins in three parasegments (4–6). These expression patternsact as positional values that uniquely characterize each cell beltin a parasegment and determine where Hox genes such asAntennapedia (Antp) and Ultrabithorax (Ubx) are transcribed. Hoxgenes give the repeating body segments their distinct shapesand appendages (indicated at the bottom). Hox gene expressionis regulated by gap, pair-rule, and segment polarity genes.
ME
DIA
C
ON
NE
CT
IO
NS
Video:Expression of Segm
entation Genes in a D
rosophilaEm
bryo
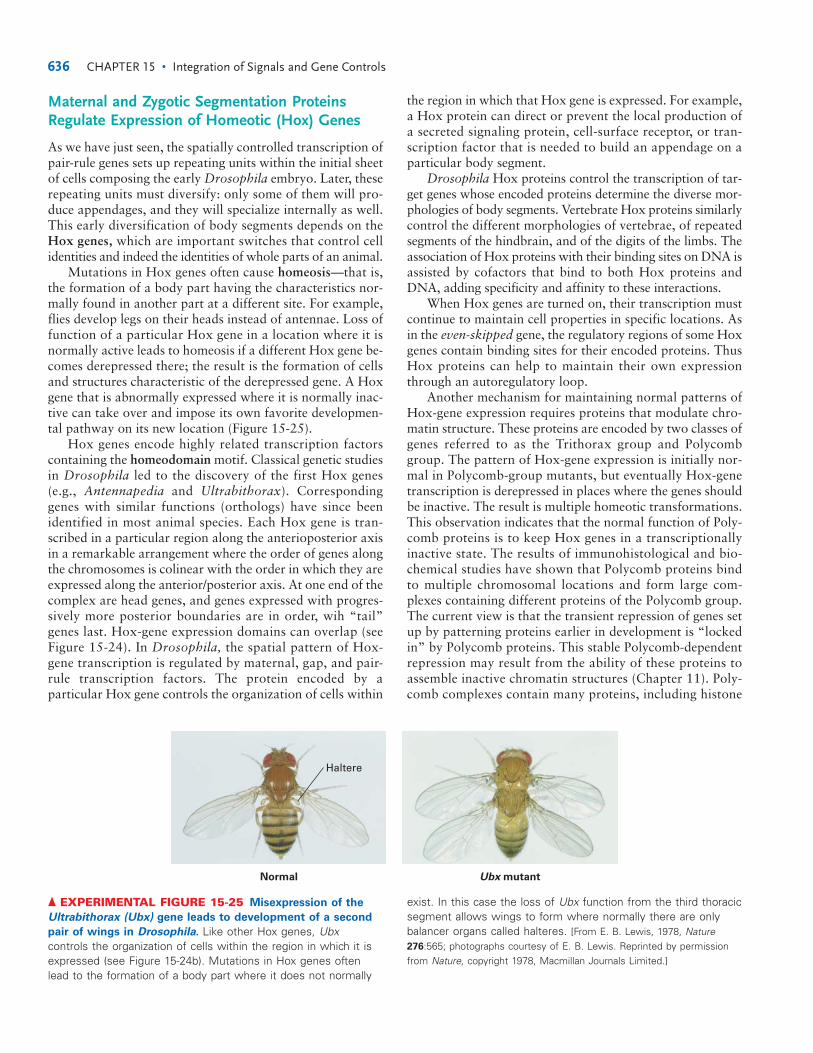
Maternal and Zygotic Segmentation ProteinsRegulate Expression of Homeotic (Hox) Genes
As we have just seen, the spatially controlled transcription ofpair-rule genes sets up repeating units within the initial sheetof cells composing the early Drosophila embryo. Later, theserepeating units must diversify: only some of them will pro-duce appendages, and they will specialize internally as well.This early diversification of body segments depends on theHox genes, which are important switches that control cellidentities and indeed the identities of whole parts of an animal.
Mutations in Hox genes often cause homeosis—that is,the formation of a body part having the characteristics nor-mally found in another part at a different site. For example,flies develop legs on their heads instead of antennae. Loss offunction of a particular Hox gene in a location where it isnormally active leads to homeosis if a different Hox gene be-comes derepressed there; the result is the formation of cellsand structures characteristic of the derepressed gene. A Hoxgene that is abnormally expressed where it is normally inac-tive can take over and impose its own favorite developmen-tal pathway on its new location (Figure 15-25).
Hox genes encode highly related transcription factorscontaining the homeodomain motif. Classical genetic studiesin Drosophila led to the discovery of the first Hox genes(e.g., Antennapedia and Ultrabithorax). Correspondinggenes with similar functions (orthologs) have since beenidentified in most animal species. Each Hox gene is tran-scribed in a particular region along the anterioposterior axisin a remarkable arrangement where the order of genes alongthe chromosomes is colinear with the order in which they areexpressed along the anterior/posterior axis. At one end of thecomplex are head genes, and genes expressed with progres-sively more posterior boundaries are in order, wih “tail”genes last. Hox-gene expression domains can overlap (seeFigure 15-24). In Drosophila, the spatial pattern of Hox-gene transcription is regulated by maternal, gap, and pair-rule transcription factors. The protein encoded by aparticular Hox gene controls the organization of cells within
the region in which that Hox gene is expressed. For example,a Hox protein can direct or prevent the local production ofa secreted signaling protein, cell-surface receptor, or tran-scription factor that is needed to build an appendage on aparticular body segment.
Drosophila Hox proteins control the transcription of tar-get genes whose encoded proteins determine the diverse mor-phologies of body segments. Vertebrate Hox proteins similarlycontrol the different morphologies of vertebrae, of repeatedsegments of the hindbrain, and of the digits of the limbs. Theassociation of Hox proteins with their binding sites on DNA isassisted by cofactors that bind to both Hox proteins andDNA, adding specificity and affinity to these interactions.
When Hox genes are turned on, their transcription mustcontinue to maintain cell properties in specific locations. Asin the even-skipped gene, the regulatory regions of some Hoxgenes contain binding sites for their encoded proteins. ThusHox proteins can help to maintain their own expressionthrough an autoregulatory loop.
Another mechanism for maintaining normal patterns ofHox-gene expression requires proteins that modulate chro-matin structure. These proteins are encoded by two classes ofgenes referred to as the Trithorax group and Polycombgroup. The pattern of Hox-gene expression is initially nor-mal in Polycomb-group mutants, but eventually Hox-genetranscription is derepressed in places where the genes shouldbe inactive. The result is multiple homeotic transformations.This observation indicates that the normal function of Poly-comb proteins is to keep Hox genes in a transcriptionally inactive state. The results of immunohistological and bio-chemical studies have shown that Polycomb proteins bindto multiple chromosomal locations and form large com-plexes containing different proteins of the Polycomb group.The current view is that the transient repression of genes setup by patterning proteins earlier in development is “lockedin” by Polycomb proteins. This stable Polycomb-dependentrepression may result from the ability of these proteins toassemble inactive chromatin structures (Chapter 11). Poly-comb complexes contain many proteins, including histone
636 CHAPTER 15 • Integration of Signals and Gene Controls
Haltere
Normal Ubx mutant
▲ EXPERIMENTAL FIGURE 15-25 Misexpression of the
Ultrabithorax (Ubx) gene leads to development of a second
pair of wings in Drosophila. Like other Hox genes, Ubxcontrols the organization of cells within the region in which it isexpressed (see Figure 15-24b). Mutations in Hox genes oftenlead to the formation of a body part where it does not normally
exist. In this case the loss of Ubx function from the third thoracicsegment allows wings to form where normally there are onlybalancer organs called halteres. [From E. B. Lewis, 1978, Nature276:565; photographs courtesy of E. B. Lewis. Reprinted by permissionfrom Nature, copyright 1978, Macmillan Journals Limited.]
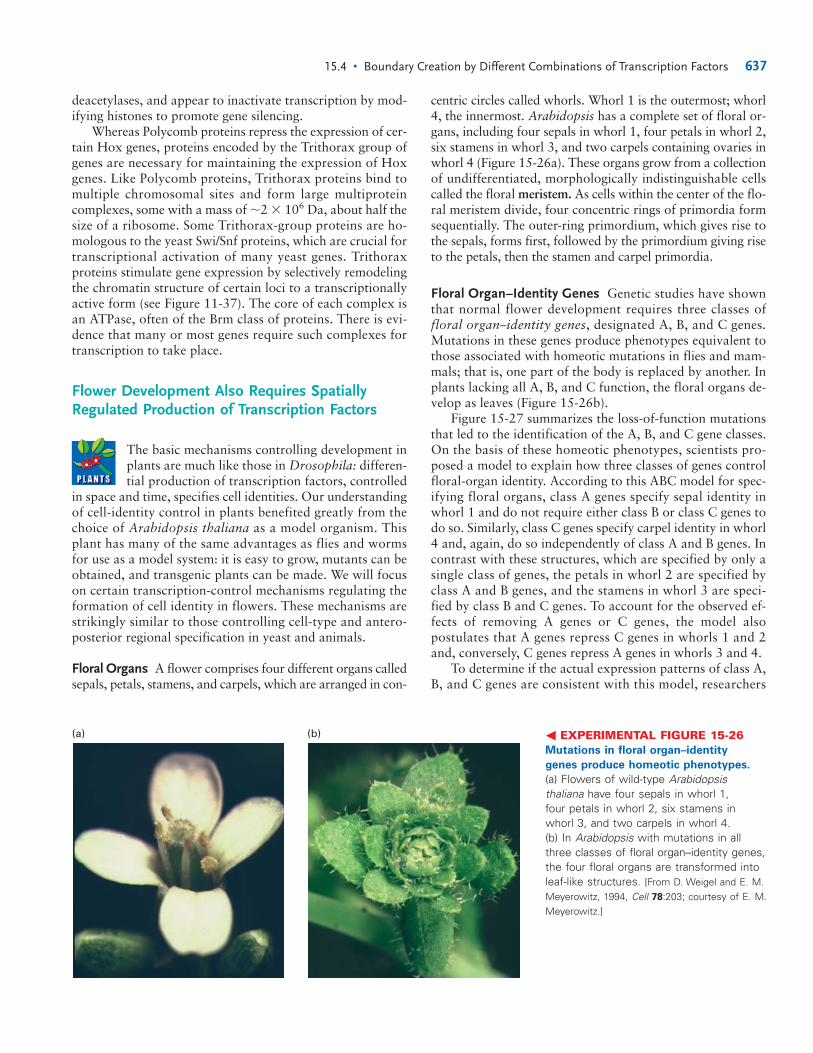
deacetylases, and appear to inactivate transcription by mod-ifying histones to promote gene silencing.
Whereas Polycomb proteins repress the expression of cer-tain Hox genes, proteins encoded by the Trithorax group ofgenes are necessary for maintaining the expression of Hoxgenes. Like Polycomb proteins, Trithorax proteins bind tomultiple chromosomal sites and form large multiproteincomplexes, some with a mass of �2 � 106 Da, about half thesize of a ribosome. Some Trithorax-group proteins are ho-mologous to the yeast Swi/Snf proteins, which are crucial fortranscriptional activation of many yeast genes. Trithoraxproteins stimulate gene expression by selectively remodelingthe chromatin structure of certain loci to a transcriptionallyactive form (see Figure 11-37). The core of each complex isan ATPase, often of the Brm class of proteins. There is evi-dence that many or most genes require such complexes fortranscription to take place.
Flower Development Also Requires SpatiallyRegulated Production of Transcription Factors
The basic mechanisms controlling development inplants are much like those in Drosophila: differen-tial production of transcription factors, controlled
in space and time, specifies cell identities. Our understandingof cell-identity control in plants benefited greatly from thechoice of Arabidopsis thaliana as a model organism. Thisplant has many of the same advantages as flies and wormsfor use as a model system: it is easy to grow, mutants can beobtained, and transgenic plants can be made. We will focuson certain transcription-control mechanisms regulating theformation of cell identity in flowers. These mechanisms arestrikingly similar to those controlling cell-type and antero-posterior regional specification in yeast and animals.
Floral Organs A flower comprises four different organs calledsepals, petals, stamens, and carpels, which are arranged in con-
centric circles called whorls. Whorl 1 is the outermost; whorl4, the innermost. Arabidopsis has a complete set of floral or-gans, including four sepals in whorl 1, four petals in whorl 2,six stamens in whorl 3, and two carpels containing ovaries inwhorl 4 (Figure 15-26a). These organs grow from a collectionof undifferentiated, morphologically indistinguishable cellscalled the floral meristem. As cells within the center of the flo-ral meristem divide, four concentric rings of primordia formsequentially. The outer-ring primordium, which gives rise tothe sepals, forms first, followed by the primordium giving riseto the petals, then the stamen and carpel primordia.
Floral Organ–Identity Genes Genetic studies have shownthat normal flower development requires three classes of floral organ–identity genes, designated A, B, and C genes.Mutations in these genes produce phenotypes equivalent tothose associated with homeotic mutations in flies and mam-mals; that is, one part of the body is replaced by another. Inplants lacking all A, B, and C function, the floral organs de-velop as leaves (Figure 15-26b).
Figure 15-27 summarizes the loss-of-function mutationsthat led to the identification of the A, B, and C gene classes.On the basis of these homeotic phenotypes, scientists pro-posed a model to explain how three classes of genes controlfloral-organ identity. According to this ABC model for spec-ifying floral organs, class A genes specify sepal identity inwhorl 1 and do not require either class B or class C genes todo so. Similarly, class C genes specify carpel identity in whorl4 and, again, do so independently of class A and B genes. Incontrast with these structures, which are specified by only asingle class of genes, the petals in whorl 2 are specified byclass A and B genes, and the stamens in whorl 3 are speci-fied by class B and C genes. To account for the observed ef-fects of removing A genes or C genes, the model alsopostulates that A genes repress C genes in whorls 1 and 2and, conversely, C genes repress A genes in whorls 3 and 4.
To determine if the actual expression patterns of class A,B, and C genes are consistent with this model, researchers
15.4 • Boundary Creation by Different Combinations of Transcription Factors 637
(a) (b) � EXPERIMENTAL FIGURE 15-26Mutations in floral organ–identity
genes produce homeotic phenotypes.
(a) Flowers of wild-type Arabidopsisthaliana have four sepals in whorl 1, four petals in whorl 2, six stamens inwhorl 3, and two carpels in whorl 4. (b) In Arabidopsis with mutations in allthree classes of floral organ–identity genes,the four floral organs are transformed intoleaf-like structures. [From D. Weigel and E. M.Meyerowitz, 1994, Cell 78:203; courtesy of E. M.Meyerowitz.]
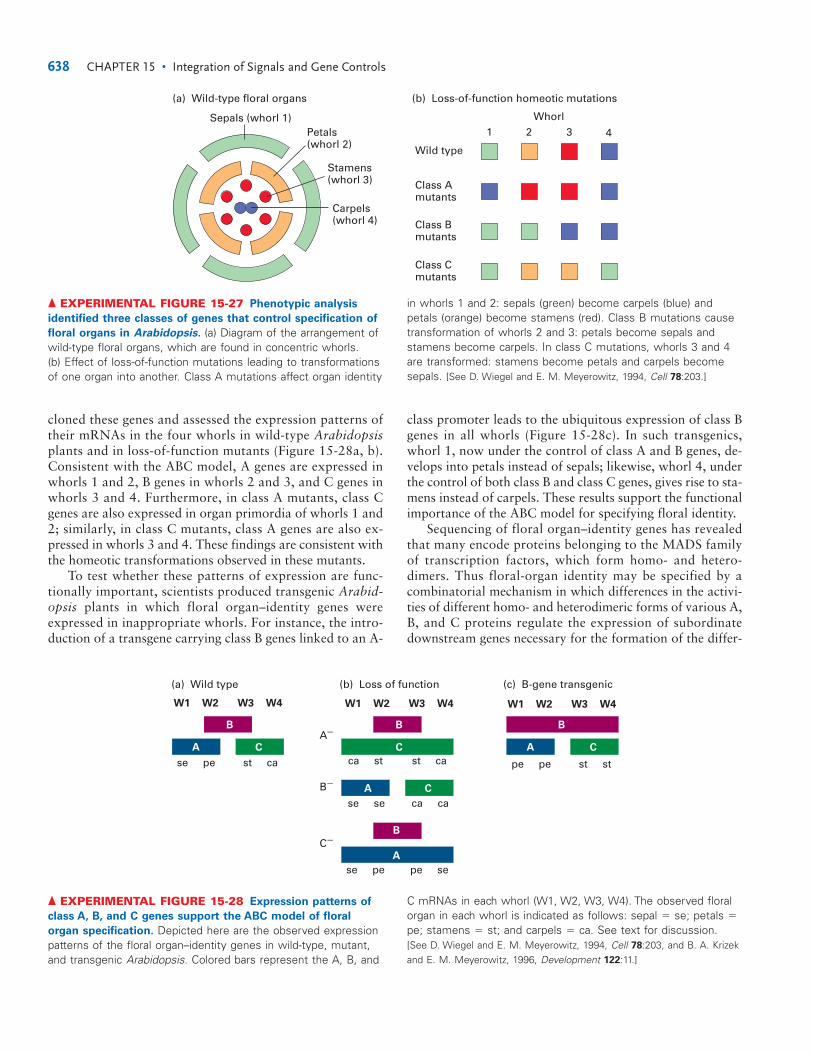
cloned these genes and assessed the expression patterns oftheir mRNAs in the four whorls in wild-type Arabidopsisplants and in loss-of-function mutants (Figure 15-28a, b).Consistent with the ABC model, A genes are expressed inwhorls 1 and 2, B genes in whorls 2 and 3, and C genes inwhorls 3 and 4. Furthermore, in class A mutants, class Cgenes are also expressed in organ primordia of whorls 1 and2; similarly, in class C mutants, class A genes are also ex-pressed in whorls 3 and 4. These findings are consistent withthe homeotic transformations observed in these mutants.
To test whether these patterns of expression are func-tionally important, scientists produced transgenic Arabid-opsis plants in which floral organ–identity genes were expressed in inappropriate whorls. For instance, the intro-duction of a transgene carrying class B genes linked to an A-
class promoter leads to the ubiquitous expression of class Bgenes in all whorls (Figure 15-28c). In such transgenics,whorl 1, now under the control of class A and B genes, de-velops into petals instead of sepals; likewise, whorl 4, underthe control of both class B and class C genes, gives rise to sta-mens instead of carpels. These results support the functionalimportance of the ABC model for specifying floral identity.
Sequencing of floral organ–identity genes has revealedthat many encode proteins belonging to the MADS familyof transcription factors, which form homo- and hetero-dimers. Thus floral-organ identity may be specified by acombinatorial mechanism in which differences in the activi-ties of different homo- and heterodimeric forms of various A,B, and C proteins regulate the expression of subordinatedownstream genes necessary for the formation of the differ-
638 CHAPTER 15 • Integration of Signals and Gene Controls
(a) Wild-type floral organs
Sepals (whorl 1)Petals(whorl 2)
Carpels(whorl 4)
Stamens(whorl 3)
Wild type
Class Amutants
Class Bmutants
Class Cmutants
(b) Loss-of-function homeotic mutations
1 2 3 4
Whorl
▲ EXPERIMENTAL FIGURE 15-27 Phenotypic analysis
identified three classes of genes that control specification of
floral organs in Arabidopsis. (a) Diagram of the arrangement ofwild-type floral organs, which are found in concentric whorls. (b) Effect of loss-of-function mutations leading to transformationsof one organ into another. Class A mutations affect organ identity
in whorls 1 and 2: sepals (green) become carpels (blue) andpetals (orange) become stamens (red). Class B mutations causetransformation of whorls 2 and 3: petals become sepals andstamens become carpels. In class C mutations, whorls 3 and 4are transformed: stamens become petals and carpels becomesepals. [See D. Wiegel and E. M. Meyerowitz, 1994, Cell 78:203.]
(a) Wild type
A C
se pe st ca
W1 W2 W3 W4
B
(b) Loss of function
ca st st ca
se se ca ca
A−
se pe pe se
C−
B−
W1 W2 W3 W4
B
B
C
CA
A
pe pe st st
(c) B-gene transgenic
W1 W2 W3 W4
B
CA
▲ EXPERIMENTAL FIGURE 15-28 Expression patterns of
class A, B, and C genes support the ABC model of floral
organ specification. Depicted here are the observed expressionpatterns of the floral organ–identity genes in wild-type, mutant,and transgenic Arabidopsis. Colored bars represent the A, B, and
C mRNAs in each whorl (W1, W2, W3, W4). The observed floralorgan in each whorl is indicated as follows: sepal � se; petals �pe; stamens � st; and carpels � ca. See text for discussion. [See D. Wiegel and E. M. Meyerowitz, 1994, Cell 78:203, and B. A. Krizek and E. M. Meyerowitz, 1996, Development 122:11.]
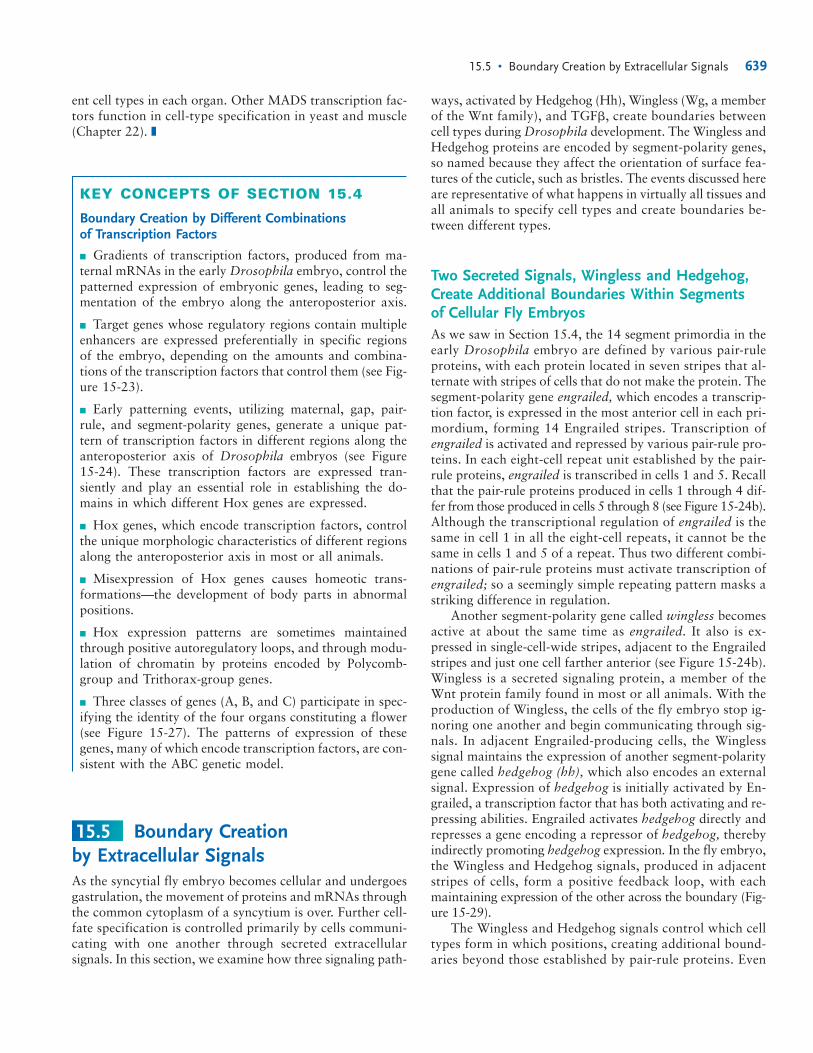
ent cell types in each organ. Other MADS transcription fac-tors function in cell-type specification in yeast and muscle(Chapter 22). ❚
KEY CONCEPTS OF SECTION 15.4
Boundary Creation by Different Combinations of Transcription Factors
■ Gradients of transcription factors, produced from ma-ternal mRNAs in the early Drosophila embryo, control thepatterned expression of embryonic genes, leading to seg-mentation of the embryo along the anteroposterior axis.
■ Target genes whose regulatory regions contain multipleenhancers are expressed preferentially in specific regionsof the embryo, depending on the amounts and combina-tions of the transcription factors that control them (see Fig-ure 15-23).
■ Early patterning events, utilizing maternal, gap, pair-rule, and segment-polarity genes, generate a unique pat-tern of transcription factors in different regions along theanteroposterior axis of Drosophila embryos (see Figure 15-24). These transcription factors are expressed tran-siently and play an essential role in establishing the do-mains in which different Hox genes are expressed.
■ Hox genes, which encode transcription factors, controlthe unique morphologic characteristics of different regionsalong the anteroposterior axis in most or all animals.
■ Misexpression of Hox genes causes homeotic trans-formations—the development of body parts in abnormal positions.
■ Hox expression patterns are sometimes maintainedthrough positive autoregulatory loops, and through modu-lation of chromatin by proteins encoded by Polycomb-group and Trithorax-group genes.
■ Three classes of genes (A, B, and C) participate in spec-ifying the identity of the four organs constituting a flower(see Figure 15-27). The patterns of expression of thesegenes, many of which encode transcription factors, are con-sistent with the ABC genetic model.
Boundary Creation by Extracellular SignalsAs the syncytial fly embryo becomes cellular and undergoesgastrulation, the movement of proteins and mRNAs throughthe common cytoplasm of a syncytium is over. Further cell-fate specification is controlled primarily by cells communi-cating with one another through secreted extracellularsignals. In this section, we examine how three signaling path-
15.5
ways, activated by Hedgehog (Hh), Wingless (Wg, a memberof the Wnt family), and TGF�, create boundaries betweencell types during Drosophila development. The Wingless andHedgehog proteins are encoded by segment-polarity genes,so named because they affect the orientation of surface fea-tures of the cuticle, such as bristles. The events discussed hereare representative of what happens in virtually all tissues andall animals to specify cell types and create boundaries be-tween different types.
Two Secreted Signals, Wingless and Hedgehog,Create Additional Boundaries Within Segments of Cellular Fly EmbryosAs we saw in Section 15.4, the 14 segment primordia in theearly Drosophila embryo are defined by various pair-ruleproteins, with each protein located in seven stripes that al-ternate with stripes of cells that do not make the protein. Thesegment-polarity gene engrailed, which encodes a transcrip-tion factor, is expressed in the most anterior cell in each pri-mordium, forming 14 Engrailed stripes. Transcription ofengrailed is activated and repressed by various pair-rule pro-teins. In each eight-cell repeat unit established by the pair-rule proteins, engrailed is transcribed in cells 1 and 5. Recallthat the pair-rule proteins produced in cells 1 through 4 dif-fer from those produced in cells 5 through 8 (see Figure 15-24b).Although the transcriptional regulation of engrailed is thesame in cell 1 in all the eight-cell repeats, it cannot be thesame in cells 1 and 5 of a repeat. Thus two different combi-nations of pair-rule proteins must activate transcription ofengrailed; so a seemingly simple repeating pattern masks astriking difference in regulation.
Another segment-polarity gene called wingless becomesactive at about the same time as engrailed. It also is ex-pressed in single-cell-wide stripes, adjacent to the Engrailedstripes and just one cell farther anterior (see Figure 15-24b).Wingless is a secreted signaling protein, a member of theWnt protein family found in most or all animals. With theproduction of Wingless, the cells of the fly embryo stop ig-noring one another and begin communicating through sig-nals. In adjacent Engrailed-producing cells, the Winglesssignal maintains the expression of another segment-polaritygene called hedgehog (hh), which also encodes an externalsignal. Expression of hedgehog is initially activated by En-grailed, a transcription factor that has both activating and re-pressing abilities. Engrailed activates hedgehog directly andrepresses a gene encoding a repressor of hedgehog, therebyindirectly promoting hedgehog expression. In the fly embryo,the Wingless and Hedgehog signals, produced in adjacentstripes of cells, form a positive feedback loop, with eachmaintaining expression of the other across the boundary (Fig-ure 15-29).
The Wingless and Hedgehog signals control which celltypes form in which positions, creating additional bound-aries beyond those established by pair-rule proteins. Even
15.5 • Boundary Creation by Extracellular Signals 639
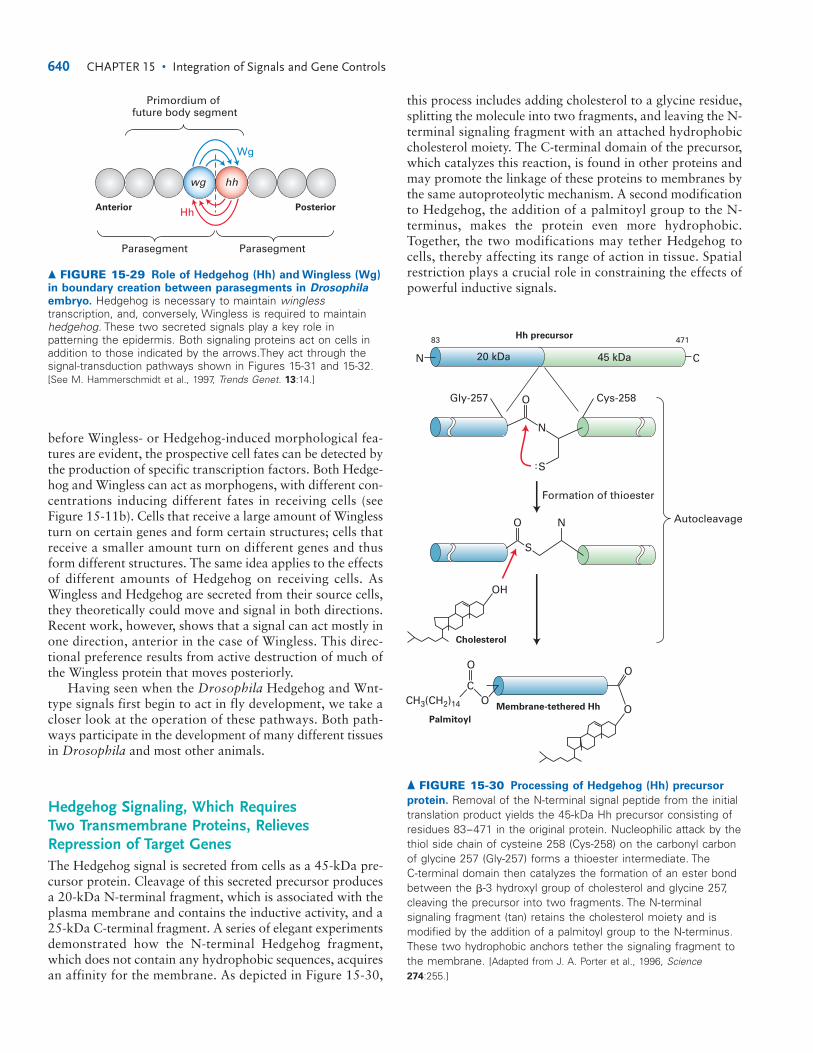
before Wingless- or Hedgehog-induced morphological fea-tures are evident, the prospective cell fates can be detected bythe production of specific transcription factors. Both Hedge-hog and Wingless can act as morphogens, with different con-centrations inducing different fates in receiving cells (seeFigure 15-11b). Cells that receive a large amount of Winglessturn on certain genes and form certain structures; cells thatreceive a smaller amount turn on different genes and thusform different structures. The same idea applies to the effectsof different amounts of Hedgehog on receiving cells. AsWingless and Hedgehog are secreted from their source cells,they theoretically could move and signal in both directions.Recent work, however, shows that a signal can act mostly inone direction, anterior in the case of Wingless. This direc-tional preference results from active destruction of much ofthe Wingless protein that moves posteriorly.
Having seen when the Drosophila Hedgehog and Wnt-type signals first begin to act in fly development, we take acloser look at the operation of these pathways. Both path-ways participate in the development of many different tissuesin Drosophila and most other animals.
Hedgehog Signaling, Which Requires Two Transmembrane Proteins, RelievesRepression of Target GenesThe Hedgehog signal is secreted from cells as a 45-kDa pre-cursor protein. Cleavage of this secreted precursor producesa 20-kDa N-terminal fragment, which is associated with theplasma membrane and contains the inductive activity, and a25-kDa C-terminal fragment. A series of elegant experimentsdemonstrated how the N-terminal Hedgehog fragment,which does not contain any hydrophobic sequences, acquiresan affinity for the membrane. As depicted in Figure 15-30,
this process includes adding cholesterol to a glycine residue,splitting the molecule into two fragments, and leaving the N-terminal signaling fragment with an attached hydrophobiccholesterol moiety. The C-terminal domain of the precursor,which catalyzes this reaction, is found in other proteins andmay promote the linkage of these proteins to membranes bythe same autoproteolytic mechanism. A second modificationto Hedgehog, the addition of a palmitoyl group to the N-terminus, makes the protein even more hydrophobic. Together, the two modifications may tether Hedgehog tocells, thereby affecting its range of action in tissue. Spatial restriction plays a crucial role in constraining the effects ofpowerful inductive signals.
640 CHAPTER 15 • Integration of Signals and Gene Controls
wg hh
Anterior Posterior
Parasegment Parasegment
Primordium of future body segment
Wg
Hh
▲ FIGURE 15-29 Role of Hedgehog (Hh) and Wingless (Wg)
in boundary creation between parasegments in Drosophila
embryo. Hedgehog is necessary to maintain winglesstranscription, and, conversely, Wingless is required to maintainhedgehog. These two secreted signals play a key role inpatterning the epidermis. Both signaling proteins act on cells inaddition to those indicated by the arrows.They act through thesignal-transduction pathways shown in Figures 15-31 and 15-32.[See M. Hammerschmidt et al., 1997, Trends Genet. 13:14.]
O N
S
O
S
Formation of thioester
Autocleavage
Membrane-tethered Hh
OH
Gly-257 Cys-258
Cholesterol
Palmitoyl
83 471
O
OC
O
CH3(CH2)14 O
N
45 kDa C20 kDaN
Hh precursor
▲ FIGURE 15-30 Processing of Hedgehog (Hh) precursor
protein. Removal of the N-terminal signal peptide from the initialtranslation product yields the 45-kDa Hh precursor consisting ofresidues 83–471 in the original protein. Nucleophilic attack by thethiol side chain of cysteine 258 (Cys-258) on the carbonyl carbonof glycine 257 (Gly-257) forms a thioester intermediate. The C-terminal domain then catalyzes the formation of an ester bondbetween the �-3 hydroxyl group of cholesterol and glycine 257,cleaving the precursor into two fragments. The N-terminalsignaling fragment (tan) retains the cholesterol moiety and ismodified by the addition of a palmitoyl group to the N-terminus.These two hydrophobic anchors tether the signaling fragment tothe membrane. [Adapted from J. A. Porter et al., 1996, Science274:255.]

Findings from genetic studies in Drosophila indicate thattwo membrane proteins, Smoothened (Smo) and Patched(Ptc), are required to receive and transduce a Hedgehog signal to the cell interior. Smoothened has 7 membrane-spanning � helices, similarly to G protein–coupled receptors(Chapter 13). Patched is predicted to contain 12 trans-membrane � helices and is most similar to Niemann-Pick C1protein (NPC1). These proteins may act as pumps or trans-porters. As discussed in Chapter 18, NPC1 protein is neces-sary for normal intracellular movement of sterols throughvesicle-trafficking pathways. In humans, mutations in theNPC1 gene cause a rare, autosomal recessive disordermarked by defects in the lysosomal handling of cholesterol.
Drosophila embryos with loss-of-function mutations inthe smoothened or hedgehog genes have very similar pheno-types. Moreover, both genes are required to activate tran-scription of the same target genes (e.g., wingless) duringembryonic development. Loss-of-function mutations inpatched produce a quite different phenotype, one similar tothe effect of flooding the embryo with Hedgehog. ThusPatched appears to antagonize the actions of Hedgehog andvice versa. These findings and analyses of double mutantssuggest that, in the absence of Hedgehog, Patched repressestarget genes by inhibiting a signaling pathway needed forgene activation. The additional observation that Smoothenedis required for the transcription of target genes in mutantslacking patched function places Smoothened downstream inthe pathway. The binding of Hedgehog evidently prevents
Patched from blocking Smoothened action, thus activatingthe transcription of target genes.
The results of recent studies have shown that, in the ab-sence of Hedgehog, Patched is enriched in the plasma mem-brane, but Smoothened is in internal vesicle membranes.When cells receive a Hedgehog signal, both Patched andHedgehog move from the cell surface into internal vesicles,whereas Smoothened moves from internal vesicles to the sur-face. The similarity of Patched to Niemann-Pick C1 protein,the covalent joining of cholesterol to Hedgehog, and the abil-ity of cholesterol analogs such as cyclopamine to block re-ception of a Hedgehog signal all suggest a possible linkbetween sterol metabolism and Hedgehog signaling. Indeed,one interesting idea is that developmental regulation by theHedgehog system evolved from earlier cell componentsneeded to control vesicle composition and movement.
Figure 15-31 depicts a current model of the Hedgehogpathway. Although the signal-transduction mechanisms areonly partly understood, the pathway includes a cytoplasmiccomplex of proteins consisting of Fused (Fu), a serine-threonine kinase; Costal-2 (Cos-2), a microtubule-associatedkinesin-like protein; and Cubitis interruptus (Ci), a tran-scription factor. In the absence of Hedgehog, when Patchedinhibits Smoothened, these three proteins form a complexthat binds to microtubules in the cytoplasm. Proteolyticcleavage of Ci in this complex generates a Ci fragment thattranslocates to the nucleus and represses target-gene expres-sion. In the presence of Hedgehog, which relieves the
15.5 • Boundary Creation by Extracellular Signals 641
Cytosol
Exterior
Nucleus
Smo
Target genes
Smo
Target genes
�
(a) −Hh (b) +Hh
�
Hh
Ptc Ptc−
Ci
Cos2 FuP
P
P
Ci75
�
Ci75 Ci
Ci
Cos2 FuP
P
P
CiP
�
Microtubules
P P PProteasomalcleavage
P
PKA
P
Slimb
CBP
� FIGURE 15-31 Operational model of the
Hedgehog (Hh) signaling pathway. (a) In theabsence of Hh, Patched (Ptc) protein inhibitsSmoothened (Smo) protein by an unknownmechanism. In the absence of Smo signaling, acomplex containing the Fused (Fu), Costal-2(Cos2), and Cubitis interuptus (Ci) proteins bindsto microtubules. Ci is cleaved in a processrequiring the ubiquitin/proteasome-related F-boxprotein Slimb, generating the fragment Ci75,which functions as a transcriptional repressor. (b) In the presence of Hh, inhibition of Smo byPtc is relieved. Signaling from Smo causeshyperphosphorylation of Fu and Cos2, anddisassociation of the Fu/Cos2/Ci complex frommicrotubules. This leads to the stabilization of afull-length, alternately modified Ci, whichfunctions as a transcriptional activator inconjunction with CREB binding protein (CBP).The exact membrane compartments in which Ptcand Smo respond to Hh and function areunknown; Hh signal causes Ptc to move fromthe surface to internal compartments while Smodoes the opposite. [After K. Nybakken and N. Perrimon, 2002, Curr. Opin. Genet. Devel. 12:503.]
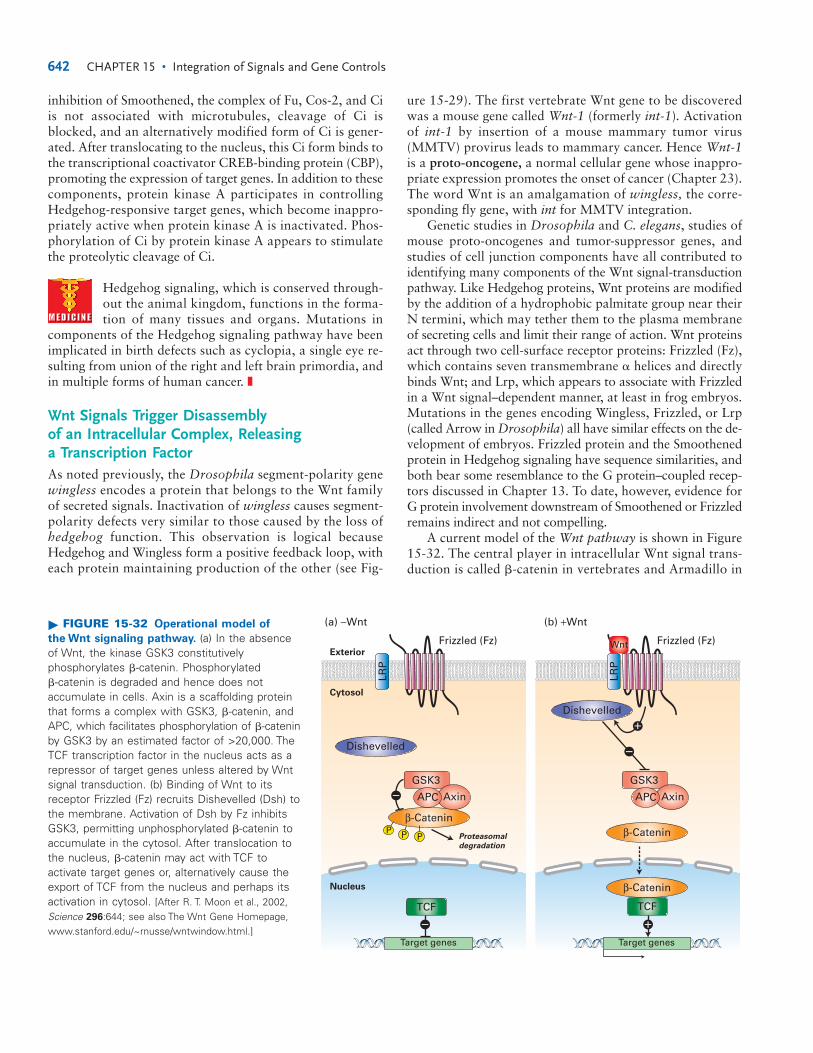
inhibition of Smoothened, the complex of Fu, Cos-2, and Ciis not associated with microtubules, cleavage of Ci isblocked, and an alternatively modified form of Ci is gener-ated. After translocating to the nucleus, this Ci form binds tothe transcriptional coactivator CREB-binding protein (CBP),promoting the expression of target genes. In addition to thesecomponents, protein kinase A participates in controllingHedgehog-responsive target genes, which become inappro-priately active when protein kinase A is inactivated. Phos-phorylation of Ci by protein kinase A appears to stimulatethe proteolytic cleavage of Ci.
Hedgehog signaling, which is conserved through-out the animal kingdom, functions in the forma-tion of many tissues and organs. Mutations in
components of the Hedgehog signaling pathway have beenimplicated in birth defects such as cyclopia, a single eye re-sulting from union of the right and left brain primordia, andin multiple forms of human cancer. ❚
Wnt Signals Trigger Disassembly of an Intracellular Complex, Releasing a Transcription FactorAs noted previously, the Drosophila segment-polarity genewingless encodes a protein that belongs to the Wnt familyof secreted signals. Inactivation of wingless causes segment-polarity defects very similar to those caused by the loss ofhedgehog function. This observation is logical becauseHedgehog and Wingless form a positive feedback loop, witheach protein maintaining production of the other (see Fig-
ure 15-29). The first vertebrate Wnt gene to be discoveredwas a mouse gene called Wnt-1 (formerly int-1). Activationof int-1 by insertion of a mouse mammary tumor virus(MMTV) provirus leads to mammary cancer. Hence Wnt-1is a proto-oncogene, a normal cellular gene whose inappro-priate expression promotes the onset of cancer (Chapter 23).The word Wnt is an amalgamation of wingless, the corre-sponding fly gene, with int for MMTV integration.
Genetic studies in Drosophila and C. elegans, studies ofmouse proto-oncogenes and tumor-suppressor genes, andstudies of cell junction components have all contributed toidentifying many components of the Wnt signal-transductionpathway. Like Hedgehog proteins, Wnt proteins are modifiedby the addition of a hydrophobic palmitate group near their N termini, which may tether them to the plasma membraneof secreting cells and limit their range of action. Wnt proteinsact through two cell-surface receptor proteins: Frizzled (Fz),which contains seven transmembrane � helices and directlybinds Wnt; and Lrp, which appears to associate with Frizzledin a Wnt signal–dependent manner, at least in frog embryos.Mutations in the genes encoding Wingless, Frizzled, or Lrp(called Arrow in Drosophila) all have similar effects on the de-velopment of embryos. Frizzled protein and the Smoothenedprotein in Hedgehog signaling have sequence similarities, andboth bear some resemblance to the G protein–coupled recep-tors discussed in Chapter 13. To date, however, evidence for G protein involvement downstream of Smoothened or Frizzledremains indirect and not compelling.
A current model of the Wnt pathway is shown in Figure15-32. The central player in intracellular Wnt signal trans-duction is called �-catenin in vertebrates and Armadillo in
642 CHAPTER 15 • Integration of Signals and Gene Controls
TCF
Cytosol
Exterior
Nucleus
Dishevelled
β-Catenin
TCF
Frizzled (Fz)
LRP
Target genes
GSK3
AxinAPC
Dishevelled
β-Catenin
Frizzled (Fz)
LRP
Wnt
Target genes
GSK3
Axin
β-Catenin
�
�
APC
(a) −Wnt (b) +Wnt
�
PPProteasomaldegradation
P
TCF
�
�
� FIGURE 15-32 Operational model of
the Wnt signaling pathway. (a) In the absenceof Wnt, the kinase GSK3 constitutivelyphosphorylates �-catenin. Phosphorylated �-catenin is degraded and hence does notaccumulate in cells. Axin is a scaffolding proteinthat forms a complex with GSK3, �-catenin, andAPC, which facilitates phosphorylation of �-cateninby GSK3 by an estimated factor of >20,000. TheTCF transcription factor in the nucleus acts as arepressor of target genes unless altered by Wntsignal transduction. (b) Binding of Wnt to itsreceptor Frizzled (Fz) recruits Dishevelled (Dsh) tothe membrane. Activation of Dsh by Fz inhibitsGSK3, permitting unphosphorylated �-catenin toaccumulate in the cytosol. After translocation tothe nucleus, �-catenin may act with TCF toactivate target genes or, alternatively cause theexport of TCF from the nucleus and perhaps itsactivation in cytosol. [After R. T. Moon et al., 2002,Science 296:644; see also The Wnt Gene Homepage,www.stanford.edu/~rnusse/wntwindow.html.]
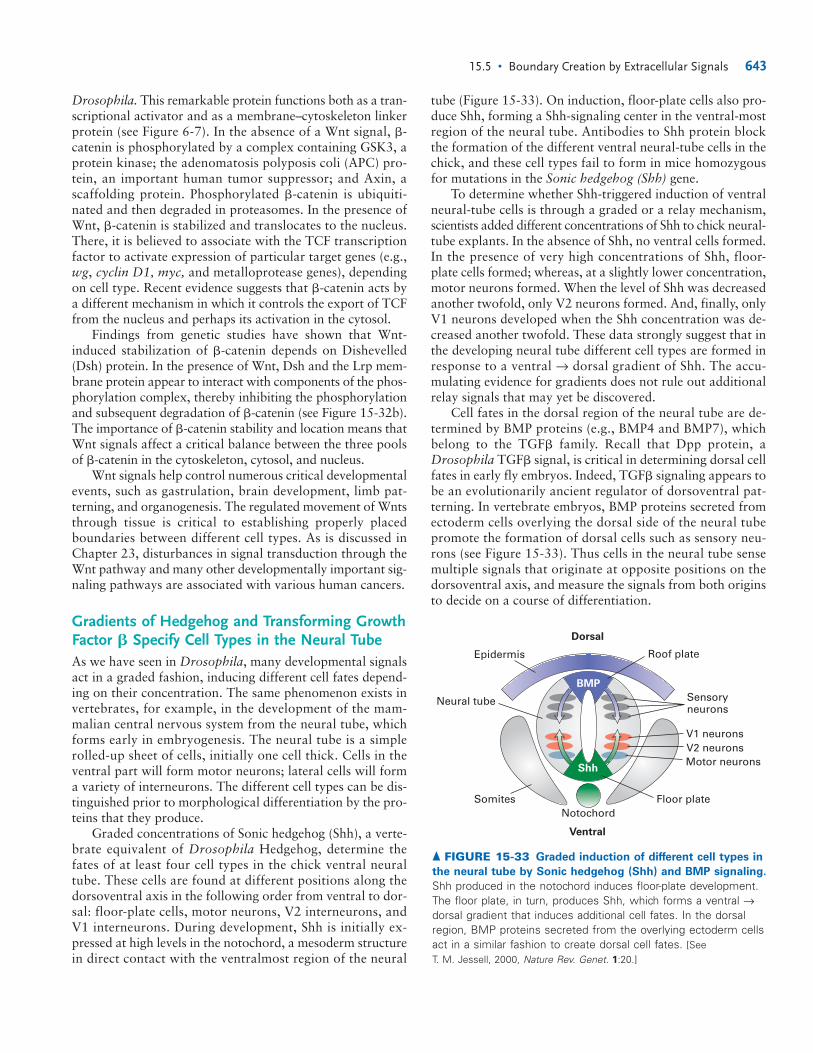
Drosophila. This remarkable protein functions both as a tran-scriptional activator and as a membrane–cytoskeleton linkerprotein (see Figure 6-7). In the absence of a Wnt signal, �-catenin is phosphorylated by a complex containing GSK3, aprotein kinase; the adenomatosis polyposis coli (APC) pro-tein, an important human tumor suppressor; and Axin, ascaffolding protein. Phosphorylated �-catenin is ubiquiti-nated and then degraded in proteasomes. In the presence ofWnt, �-catenin is stabilized and translocates to the nucleus.There, it is believed to associate with the TCF transcriptionfactor to activate expression of particular target genes (e.g.,wg, cyclin D1, myc, and metalloprotease genes), dependingon cell type. Recent evidence suggests that �-catenin acts bya different mechanism in which it controls the export of TCFfrom the nucleus and perhaps its activation in the cytosol.
Findings from genetic studies have shown that Wnt-induced stabilization of �-catenin depends on Dishevelled(Dsh) protein. In the presence of Wnt, Dsh and the Lrp mem-brane protein appear to interact with components of the phos-phorylation complex, thereby inhibiting the phosphorylationand subsequent degradation of �-catenin (see Figure 15-32b).The importance of �-catenin stability and location means thatWnt signals affect a critical balance between the three poolsof �-catenin in the cytoskeleton, cytosol, and nucleus.
Wnt signals help control numerous critical developmentalevents, such as gastrulation, brain development, limb pat-terning, and organogenesis. The regulated movement of Wntsthrough tissue is critical to establishing properly placedboundaries between different cell types. As is discussed inChapter 23, disturbances in signal transduction through theWnt pathway and many other developmentally important sig-naling pathways are associated with various human cancers.
Gradients of Hedgehog and Transforming GrowthFactor � Specify Cell Types in the Neural TubeAs we have seen in Drosophila, many developmental signalsact in a graded fashion, inducing different cell fates depend-ing on their concentration. The same phenomenon exists invertebrates, for example, in the development of the mam-malian central nervous system from the neural tube, whichforms early in embryogenesis. The neural tube is a simplerolled-up sheet of cells, initially one cell thick. Cells in theventral part will form motor neurons; lateral cells will forma variety of interneurons. The different cell types can be dis-tinguished prior to morphological differentiation by the pro-teins that they produce.
Graded concentrations of Sonic hedgehog (Shh), a verte-brate equivalent of Drosophila Hedgehog, determine thefates of at least four cell types in the chick ventral neuraltube. These cells are found at different positions along thedorsoventral axis in the following order from ventral to dor-sal: floor-plate cells, motor neurons, V2 interneurons, andV1 interneurons. During development, Shh is initially ex-pressed at high levels in the notochord, a mesoderm structurein direct contact with the ventralmost region of the neural
tube (Figure 15-33). On induction, floor-plate cells also pro-duce Shh, forming a Shh-signaling center in the ventral-mostregion of the neural tube. Antibodies to Shh protein blockthe formation of the different ventral neural-tube cells in thechick, and these cell types fail to form in mice homozygousfor mutations in the Sonic hedgehog (Shh) gene.
To determine whether Shh-triggered induction of ventralneural-tube cells is through a graded or a relay mechanism,scientists added different concentrations of Shh to chick neural-tube explants. In the absence of Shh, no ventral cells formed.In the presence of very high concentrations of Shh, floor-plate cells formed; whereas, at a slightly lower concentration,motor neurons formed. When the level of Shh was decreasedanother twofold, only V2 neurons formed. And, finally, onlyV1 neurons developed when the Shh concentration was de-creased another twofold. These data strongly suggest that inthe developing neural tube different cell types are formed inresponse to a ventral → dorsal gradient of Shh. The accu-mulating evidence for gradients does not rule out additionalrelay signals that may yet be discovered.
Cell fates in the dorsal region of the neural tube are de-termined by BMP proteins (e.g., BMP4 and BMP7), whichbelong to the TGF� family. Recall that Dpp protein, aDrosophila TGF� signal, is critical in determining dorsal cellfates in early fly embryos. Indeed, TGF� signaling appears tobe an evolutionarily ancient regulator of dorsoventral pat-terning. In vertebrate embryos, BMP proteins secreted fromectoderm cells overlying the dorsal side of the neural tubepromote the formation of dorsal cells such as sensory neu-rons (see Figure 15-33). Thus cells in the neural tube sensemultiple signals that originate at opposite positions on thedorsoventral axis, and measure the signals from both originsto decide on a course of differentiation.
15.5 • Boundary Creation by Extracellular Signals 643
Dorsal
Ventral
Floor plateNotochord
Motor neurons
V1 neuronsV2 neurons
Somites
Epidermis
Neural tube
Roof plate
BMP
Shh
Sensoryneurons
▲ FIGURE 15-33 Graded induction of different cell types in
the neural tube by Sonic hedgehog (Shh) and BMP signaling.
Shh produced in the notochord induces floor-plate development.The floor plate, in turn, produces Shh, which forms a ventral →dorsal gradient that induces additional cell fates. In the dorsalregion, BMP proteins secreted from the overlying ectoderm cellsact in a similar fashion to create dorsal cell fates. [See T. M. Jessell, 2000, Nature Rev. Genet. 1:20.]
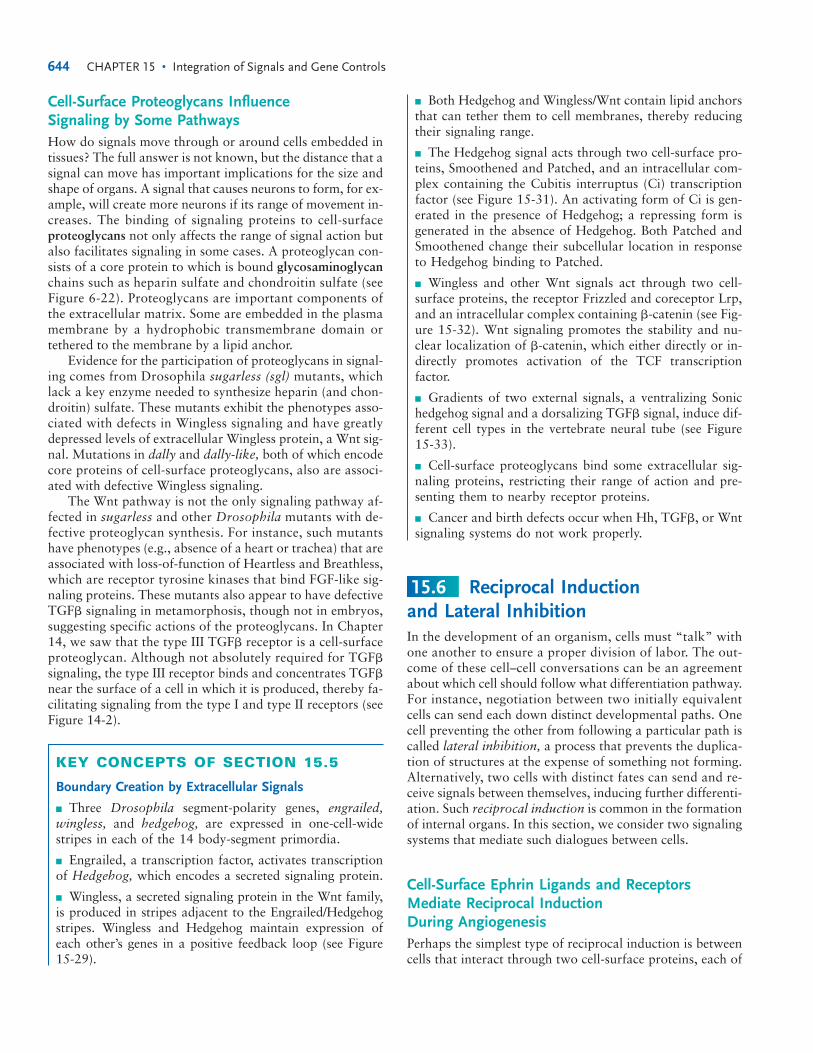
Cell-Surface Proteoglycans Influence Signaling by Some PathwaysHow do signals move through or around cells embedded intissues? The full answer is not known, but the distance that asignal can move has important implications for the size andshape of organs. A signal that causes neurons to form, for ex-ample, will create more neurons if its range of movement in-creases. The binding of signaling proteins to cell-surfaceproteoglycans not only affects the range of signal action butalso facilitates signaling in some cases. A proteoglycan con-sists of a core protein to which is bound glycosaminoglycanchains such as heparin sulfate and chondroitin sulfate (seeFigure 6-22). Proteoglycans are important components of the extracellular matrix. Some are embedded in the plasmamembrane by a hydrophobic transmembrane domain ortethered to the membrane by a lipid anchor.
Evidence for the participation of proteoglycans in signal-ing comes from Drosophila sugarless (sgl) mutants, whichlack a key enzyme needed to synthesize heparin (and chon-droitin) sulfate. These mutants exhibit the phenotypes asso-ciated with defects in Wingless signaling and have greatlydepressed levels of extracellular Wingless protein, a Wnt sig-nal. Mutations in dally and dally-like, both of which encodecore proteins of cell-surface proteoglycans, also are associ-ated with defective Wingless signaling.
The Wnt pathway is not the only signaling pathway af-fected in sugarless and other Drosophila mutants with de-fective proteoglycan synthesis. For instance, such mutantshave phenotypes (e.g., absence of a heart or trachea) that areassociated with loss-of-function of Heartless and Breathless,which are receptor tyrosine kinases that bind FGF-like sig-naling proteins. These mutants also appear to have defectiveTGF� signaling in metamorphosis, though not in embryos,suggesting specific actions of the proteoglycans. In Chapter14, we saw that the type III TGF� receptor is a cell-surfaceproteoglycan. Although not absolutely required for TGF�signaling, the type III receptor binds and concentrates TGF�near the surface of a cell in which it is produced, thereby fa-cilitating signaling from the type I and type II receptors (seeFigure 14-2).
KEY CONCEPTS OF SECTION 15.5
Boundary Creation by Extracellular Signals
■ Three Drosophila segment-polarity genes, engrailed,wingless, and hedgehog, are expressed in one-cell-widestripes in each of the 14 body-segment primordia.
■ Engrailed, a transcription factor, activates transcriptionof Hedgehog, which encodes a secreted signaling protein.
■ Wingless, a secreted signaling protein in the Wnt family,is produced in stripes adjacent to the Engrailed/Hedgehogstripes. Wingless and Hedgehog maintain expression ofeach other’s genes in a positive feedback loop (see Figure15-29).
■ Both Hedgehog and Wingless/Wnt contain lipid anchorsthat can tether them to cell membranes, thereby reducingtheir signaling range.
■ The Hedgehog signal acts through two cell-surface pro-teins, Smoothened and Patched, and an intracellular com-plex containing the Cubitis interruptus (Ci) transcriptionfactor (see Figure 15-31). An activating form of Ci is gen-erated in the presence of Hedgehog; a repressing form isgenerated in the absence of Hedgehog. Both Patched andSmoothened change their subcellular location in responseto Hedgehog binding to Patched.
■ Wingless and other Wnt signals act through two cell-surface proteins, the receptor Frizzled and coreceptor Lrp,and an intracellular complex containing �-catenin (see Fig-ure 15-32). Wnt signaling promotes the stability and nu-clear localization of �-catenin, which either directly or in-directly promotes activation of the TCF transcriptionfactor.
■ Gradients of two external signals, a ventralizing Sonichedgehog signal and a dorsalizing TGF� signal, induce dif-ferent cell types in the vertebrate neural tube (see Figure15-33).
■ Cell-surface proteoglycans bind some extracellular sig-naling proteins, restricting their range of action and pre-senting them to nearby receptor proteins.
■ Cancer and birth defects occur when Hh, TGF�, or Wntsignaling systems do not work properly.
Reciprocal Induction and Lateral InhibitionIn the development of an organism, cells must “talk” withone another to ensure a proper division of labor. The out-come of these cell–cell conversations can be an agreementabout which cell should follow what differentiation pathway.For instance, negotiation between two initially equivalentcells can send each down distinct developmental paths. Onecell preventing the other from following a particular path iscalled lateral inhibition, a process that prevents the duplica-tion of structures at the expense of something not forming.Alternatively, two cells with distinct fates can send and re-ceive signals between themselves, inducing further differenti-ation. Such reciprocal induction is common in the formationof internal organs. In this section, we consider two signalingsystems that mediate such dialogues between cells.
Cell-Surface Ephrin Ligands and ReceptorsMediate Reciprocal Induction During AngiogenesisPerhaps the simplest type of reciprocal induction is betweencells that interact through two cell-surface proteins, each of
15.6
644 CHAPTER 15 • Integration of Signals and Gene Controls
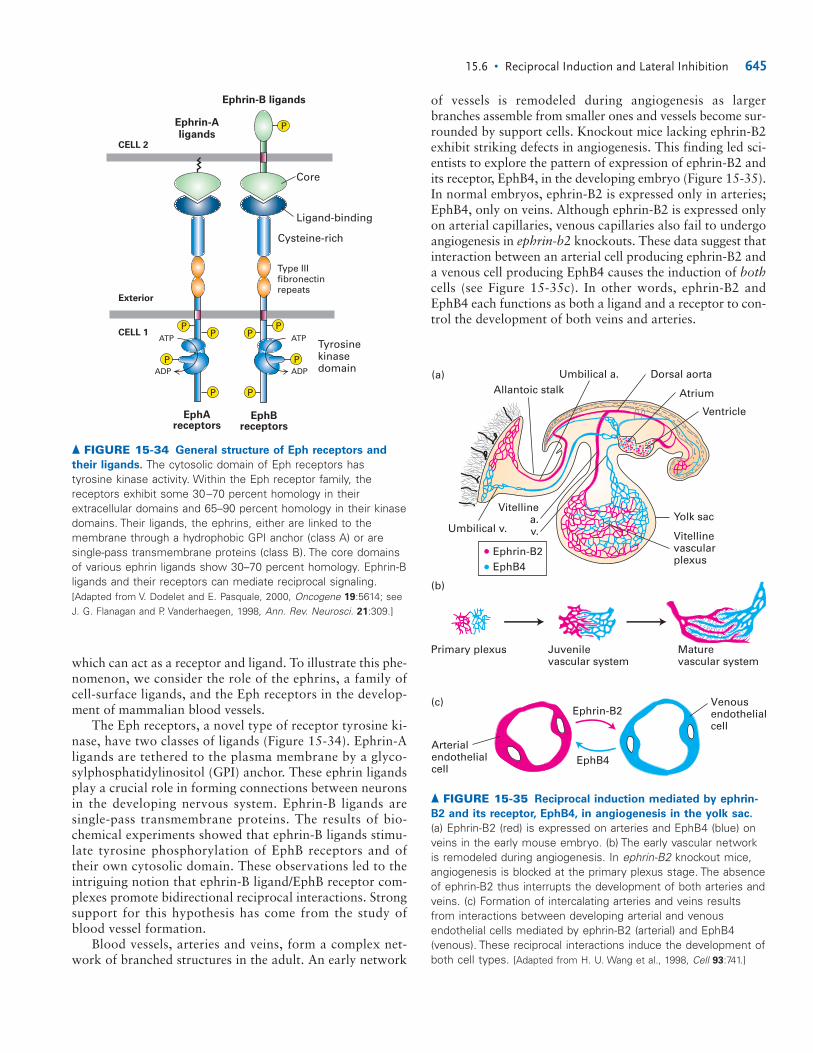
which can act as a receptor and ligand. To illustrate this phe-nomenon, we consider the role of the ephrins, a family ofcell-surface ligands, and the Eph receptors in the develop-ment of mammalian blood vessels.
The Eph receptors, a novel type of receptor tyrosine ki-nase, have two classes of ligands (Figure 15-34). Ephrin-Aligands are tethered to the plasma membrane by a glyco-sylphosphatidylinositol (GPI) anchor. These ephrin ligandsplay a crucial role in forming connections between neuronsin the developing nervous system. Ephrin-B ligands are single-pass transmembrane proteins. The results of bio-chemical experiments showed that ephrin-B ligands stimu-late tyrosine phosphorylation of EphB receptors and oftheir own cytosolic domain. These observations led to theintriguing notion that ephrin-B ligand/EphB receptor com-plexes promote bidirectional reciprocal interactions. Strongsupport for this hypothesis has come from the study ofblood vessel formation.
Blood vessels, arteries and veins, form a complex net-work of branched structures in the adult. An early network
of vessels is remodeled during angiogenesis as largerbranches assemble from smaller ones and vessels become sur-rounded by support cells. Knockout mice lacking ephrin-B2exhibit striking defects in angiogenesis. This finding led sci-entists to explore the pattern of expression of ephrin-B2 andits receptor, EphB4, in the developing embryo (Figure 15-35).In normal embryos, ephrin-B2 is expressed only in arteries;EphB4, only on veins. Although ephrin-B2 is expressed onlyon arterial capillaries, venous capillaries also fail to undergoangiogenesis in ephrin-b2 knockouts. These data suggest thatinteraction between an arterial cell producing ephrin-B2 anda venous cell producing EphB4 causes the induction of bothcells (see Figure 15-35c). In other words, ephrin-B2 andEphB4 each functions as both a ligand and a receptor to con-trol the development of both veins and arteries.
15.6 • Reciprocal Induction and Lateral Inhibition 645
Exterior
CELL 1
PP
ATP
ADP
ATP
ADP
CELL 2
EphAreceptors
EphBreceptors
Ephrin-Aligands
Ephrin-B ligands
Tyrosine kinasedomain
Type III fibronectin repeats
Cysteine-rich
Ligand-binding
P
PP
P
PP
P
Core
▲ FIGURE 15-34 General structure of Eph receptors and
their ligands. The cytosolic domain of Eph receptors hastyrosine kinase activity. Within the Eph receptor family, thereceptors exhibit some 30–70 percent homology in theirextracellular domains and 65–90 percent homology in their kinasedomains. Their ligands, the ephrins, either are linked to themembrane through a hydrophobic GPI anchor (class A) or aresingle-pass transmembrane proteins (class B). The core domainsof various ephrin ligands show 30–70 percent homology. Ephrin-Bligands and their receptors can mediate reciprocal signaling.[Adapted from V. Dodelet and E. Pasquale, 2000, Oncogene 19:5614; seeJ. G. Flanagan and P. Vanderhaegen, 1998, Ann. Rev. Neurosci. 21:309.]
Ephrin-B2
EphB4Arterialendothelialcell
Venousendothelialcell
Primary plexus Juvenilevascular system
Maturevascular system
Umbilical a.
Umbilical v.
Allantoic stalk Atrium
Ventricle
Vitellinea.v.
Yolk sac
Ephrin-B2EphB4
(a)
(b)
(c)
Dorsal aorta
Vitellinevascularplexus
▲ FIGURE 15-35 Reciprocal induction mediated by ephrin-
B2 and its receptor, EphB4, in angiogenesis in the yolk sac.
(a) Ephrin-B2 (red) is expressed on arteries and EphB4 (blue) onveins in the early mouse embryo. (b) The early vascular networkis remodeled during angiogenesis. In ephrin-B2 knockout mice,angiogenesis is blocked at the primary plexus stage. The absenceof ephrin-B2 thus interrupts the development of both arteries andveins. (c) Formation of intercalating arteries and veins resultsfrom interactions between developing arterial and venousendothelial cells mediated by ephrin-B2 (arterial) and EphB4(venous). These reciprocal interactions induce the development ofboth cell types. [Adapted from H. U. Wang et al., 1998, Cell 93:741.]
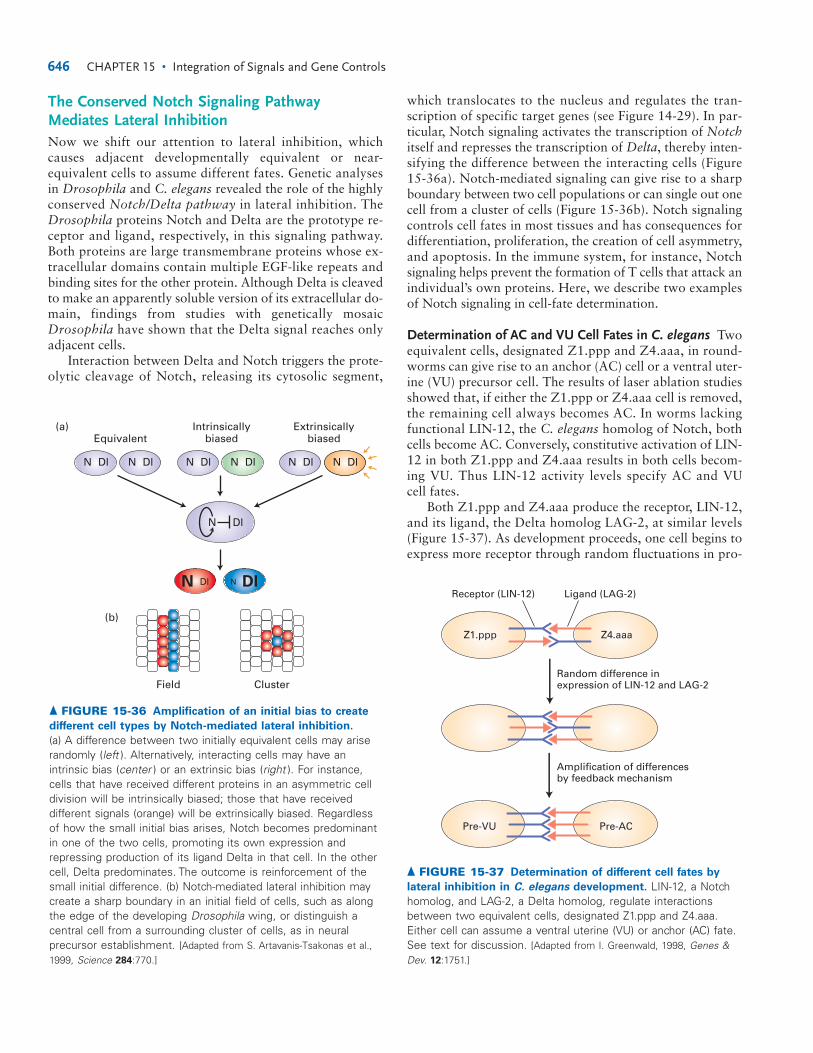
The Conserved Notch Signaling PathwayMediates Lateral InhibitionNow we shift our attention to lateral inhibition, whichcauses adjacent developmentally equivalent or near-equivalent cells to assume different fates. Genetic analysesin Drosophila and C. elegans revealed the role of the highlyconserved Notch/Delta pathway in lateral inhibition. TheDrosophila proteins Notch and Delta are the prototype re-ceptor and ligand, respectively, in this signaling pathway.Both proteins are large transmembrane proteins whose ex-tracellular domains contain multiple EGF-like repeats andbinding sites for the other protein. Although Delta is cleavedto make an apparently soluble version of its extracellular do-main, findings from studies with genetically mosaicDrosophila have shown that the Delta signal reaches onlyadjacent cells.
Interaction between Delta and Notch triggers the prote-olytic cleavage of Notch, releasing its cytosolic segment,
which translocates to the nucleus and regulates the tran-scription of specific target genes (see Figure 14-29). In par-ticular, Notch signaling activates the transcription of Notchitself and represses the transcription of Delta, thereby inten-sifying the difference between the interacting cells (Figure 15-36a). Notch-mediated signaling can give rise to a sharpboundary between two cell populations or can single out onecell from a cluster of cells (Figure 15-36b). Notch signalingcontrols cell fates in most tissues and has consequences fordifferentiation, proliferation, the creation of cell asymmetry,and apoptosis. In the immune system, for instance, Notchsignaling helps prevent the formation of T cells that attack anindividual’s own proteins. Here, we describe two examplesof Notch signaling in cell-fate determination.
Determination of AC and VU Cell Fates in C. elegans Twoequivalent cells, designated Z1.ppp and Z4.aaa, in round-worms can give rise to an anchor (AC) cell or a ventral uter-ine (VU) precursor cell. The results of laser ablation studiesshowed that, if either the Z1.ppp or Z4.aaa cell is removed,the remaining cell always becomes AC. In worms lackingfunctional LIN-12, the C. elegans homolog of Notch, bothcells become AC. Conversely, constitutive activation of LIN-12 in both Z1.ppp and Z4.aaa results in both cells becom-ing VU. Thus LIN-12 activity levels specify AC and VU cell fates.
Both Z1.ppp and Z4.aaa produce the receptor, LIN-12,and its ligand, the Delta homolog LAG-2, at similar levels(Figure 15-37). As development proceeds, one cell begins toexpress more receptor through random fluctuations in pro-
646 CHAPTER 15 • Integration of Signals and Gene Controls
Field Cluster
EquivalentIntrinsically
biasedExtrinsically
biased(a)
(b)
N DlN Dl
N Dl
N Dl N Dl N Dl N Dl N Dl N Dl
▲ FIGURE 15-36 Amplification of an initial bias to create
different cell types by Notch-mediated lateral inhibition.
(a) A difference between two initially equivalent cells may ariserandomly (left ). Alternatively, interacting cells may have anintrinsic bias (center ) or an extrinsic bias (right ). For instance,cells that have received different proteins in an asymmetric celldivision will be intrinsically biased; those that have receiveddifferent signals (orange) will be extrinsically biased. Regardlessof how the small initial bias arises, Notch becomes predominantin one of the two cells, promoting its own expression andrepressing production of its ligand Delta in that cell. In the othercell, Delta predominates. The outcome is reinforcement of thesmall initial difference. (b) Notch-mediated lateral inhibition maycreate a sharp boundary in an initial field of cells, such as alongthe edge of the developing Drosophila wing, or distinguish acentral cell from a surrounding cluster of cells, as in neuralprecursor establishment. [Adapted from S. Artavanis-Tsakonas et al.,1999, Science 284:770.]
Z1.ppp Z4.aaa
Pre-VU Pre-AC
Random difference inexpression of LIN-12 and LAG-2
Amplification of differencesby feedback mechanism
Receptor (LIN-12) Ligand (LAG-2)
▲ FIGURE 15-37 Determination of different cell fates by
lateral inhibition in C. elegans development. LIN-12, a Notchhomolog, and LAG-2, a Delta homolog, regulate interactionsbetween two equivalent cells, designated Z1.ppp and Z4.aaa.Either cell can assume a ventral uterine (VU) or anchor (AC) fate.See text for discussion. [Adapted from I. Greenwald, 1998, Genes &Dev. 12:1751.]
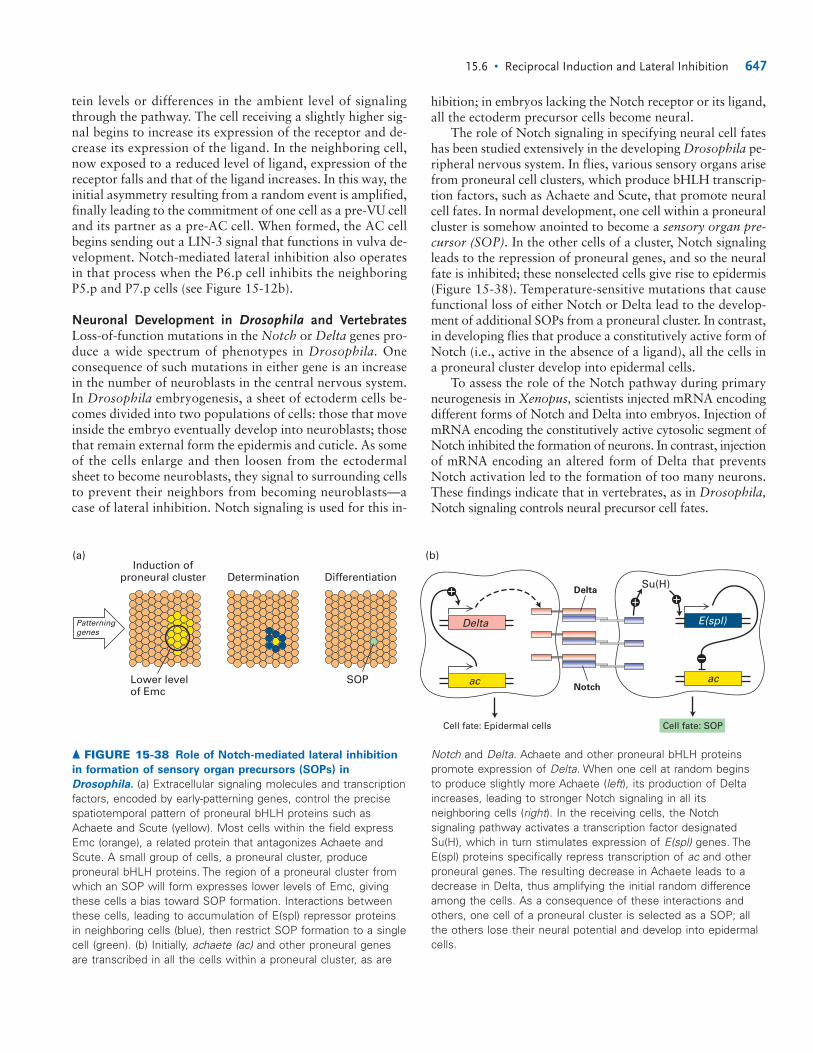
tein levels or differences in the ambient level of signalingthrough the pathway. The cell receiving a slightly higher sig-nal begins to increase its expression of the receptor and de-crease its expression of the ligand. In the neighboring cell,now exposed to a reduced level of ligand, expression of thereceptor falls and that of the ligand increases. In this way, theinitial asymmetry resulting from a random event is amplified,finally leading to the commitment of one cell as a pre-VU celland its partner as a pre-AC cell. When formed, the AC cellbegins sending out a LIN-3 signal that functions in vulva de-velopment. Notch-mediated lateral inhibition also operatesin that process when the P6.p cell inhibits the neighboringP5.p and P7.p cells (see Figure 15-12b).
Neuronal Development in Drosophila and VertebratesLoss-of-function mutations in the Notch or Delta genes pro-duce a wide spectrum of phenotypes in Drosophila. Oneconsequence of such mutations in either gene is an increasein the number of neuroblasts in the central nervous system.In Drosophila embryogenesis, a sheet of ectoderm cells be-comes divided into two populations of cells: those that moveinside the embryo eventually develop into neuroblasts; thosethat remain external form the epidermis and cuticle. As someof the cells enlarge and then loosen from the ectodermalsheet to become neuroblasts, they signal to surrounding cellsto prevent their neighbors from becoming neuroblasts—acase of lateral inhibition. Notch signaling is used for this in-
hibition; in embryos lacking the Notch receptor or its ligand,all the ectoderm precursor cells become neural.
The role of Notch signaling in specifying neural cell fateshas been studied extensively in the developing Drosophila pe-ripheral nervous system. In flies, various sensory organs arisefrom proneural cell clusters, which produce bHLH transcrip-tion factors, such as Achaete and Scute, that promote neuralcell fates. In normal development, one cell within a proneuralcluster is somehow anointed to become a sensory organ pre-cursor (SOP). In the other cells of a cluster, Notch signalingleads to the repression of proneural genes, and so the neuralfate is inhibited; these nonselected cells give rise to epidermis(Figure 15-38). Temperature-sensitive mutations that causefunctional loss of either Notch or Delta lead to the develop-ment of additional SOPs from a proneural cluster. In contrast,in developing flies that produce a constitutively active form ofNotch (i.e., active in the absence of a ligand), all the cells ina proneural cluster develop into epidermal cells.
To assess the role of the Notch pathway during primaryneurogenesis in Xenopus, scientists injected mRNA encodingdifferent forms of Notch and Delta into embryos. Injection ofmRNA encoding the constitutively active cytosolic segment ofNotch inhibited the formation of neurons. In contrast, injectionof mRNA encoding an altered form of Delta that preventsNotch activation led to the formation of too many neurons.These findings indicate that in vertebrates, as in Drosophila,Notch signaling controls neural precursor cell fates.
15.6 • Reciprocal Induction and Lateral Inhibition 647
Patterninggenes
Induction ofproneural cluster
Lower levelof Emc
SOP
Determination Differentiation
Cell fate: Epidermal cells Cell fate: SOP
(a)
Delta
Notch
Delta
ac
Su(H)
ac
E(spl)
��
�
(b)
�
▲ FIGURE 15-38 Role of Notch-mediated lateral inhibition
in formation of sensory organ precursors (SOPs) in
Drosophila. (a) Extracellular signaling molecules and transcriptionfactors, encoded by early-patterning genes, control the precisespatiotemporal pattern of proneural bHLH proteins such asAchaete and Scute (yellow). Most cells within the field expressEmc (orange), a related protein that antagonizes Achaete andScute. A small group of cells, a proneural cluster, produceproneural bHLH proteins. The region of a proneural cluster fromwhich an SOP will form expresses lower levels of Emc, givingthese cells a bias toward SOP formation. Interactions betweenthese cells, leading to accumulation of E(spl) repressor proteinsin neighboring cells (blue), then restrict SOP formation to a singlecell (green). (b) Initially, achaete (ac) and other proneural genesare transcribed in all the cells within a proneural cluster, as are
Notch and Delta. Achaete and other proneural bHLH proteinspromote expression of Delta. When one cell at random begins to produce slightly more Achaete (left), its production of Deltaincreases, leading to stronger Notch signaling in all itsneighboring cells (right). In the receiving cells, the Notchsignaling pathway activates a transcription factor designatedSu(H), which in turn stimulates expression of E(spl) genes. TheE(spl) proteins specifically repress transcription of ac and otherproneural genes. The resulting decrease in Achaete leads to adecrease in Delta, thus amplifying the initial random differenceamong the cells. As a consequence of these interactions andothers, one cell of a proneural cluster is selected as a SOP; allthe others lose their neural potential and develop into epidermalcells.
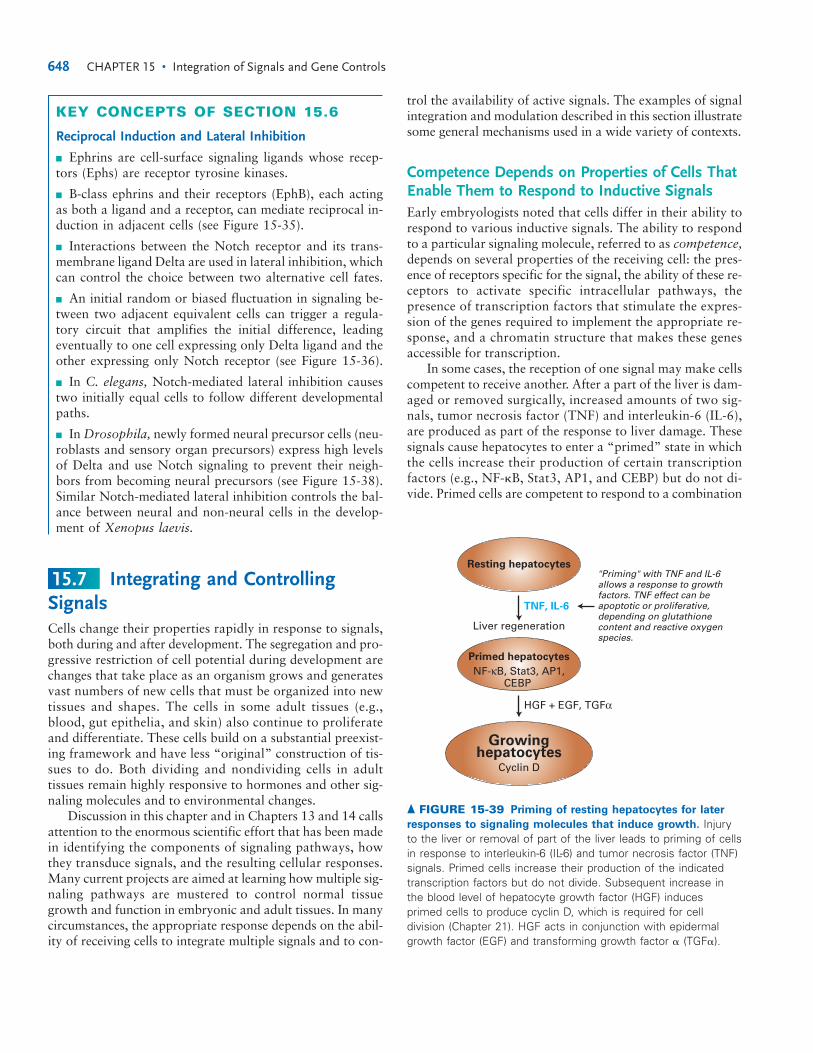
KEY CONCEPTS OF SECTION 15.6
Reciprocal Induction and Lateral Inhibition
■ Ephrins are cell-surface signaling ligands whose recep-tors (Ephs) are receptor tyrosine kinases.
■ B-class ephrins and their receptors (EphB), each actingas both a ligand and a receptor, can mediate reciprocal in-duction in adjacent cells (see Figure 15-35).
■ Interactions between the Notch receptor and its trans-membrane ligand Delta are used in lateral inhibition, whichcan control the choice between two alternative cell fates.
■ An initial random or biased fluctuation in signaling be-tween two adjacent equivalent cells can trigger a regula-tory circuit that amplifies the initial difference, leadingeventually to one cell expressing only Delta ligand and theother expressing only Notch receptor (see Figure 15-36).
■ In C. elegans, Notch-mediated lateral inhibition causestwo initially equal cells to follow different developmentalpaths.
■ In Drosophila, newly formed neural precursor cells (neu-roblasts and sensory organ precursors) express high levelsof Delta and use Notch signaling to prevent their neigh-bors from becoming neural precursors (see Figure 15-38).Similar Notch-mediated lateral inhibition controls the bal-ance between neural and non-neural cells in the develop-ment of Xenopus laevis.
Integrating and ControllingSignalsCells change their properties rapidly in response to signals,both during and after development. The segregation and pro-gressive restriction of cell potential during development arechanges that take place as an organism grows and generatesvast numbers of new cells that must be organized into newtissues and shapes. The cells in some adult tissues (e.g.,blood, gut epithelia, and skin) also continue to proliferateand differentiate. These cells build on a substantial preexist-ing framework and have less “original” construction of tis-sues to do. Both dividing and nondividing cells in adulttissues remain highly responsive to hormones and other sig-naling molecules and to environmental changes.
Discussion in this chapter and in Chapters 13 and 14 callsattention to the enormous scientific effort that has been madein identifying the components of signaling pathways, howthey transduce signals, and the resulting cellular responses.Many current projects are aimed at learning how multiple sig-naling pathways are mustered to control normal tissuegrowth and function in embryonic and adult tissues. In manycircumstances, the appropriate response depends on the abil-ity of receiving cells to integrate multiple signals and to con-
15.7
trol the availability of active signals. The examples of signalintegration and modulation described in this section illustratesome general mechanisms used in a wide variety of contexts.
Competence Depends on Properties of Cells ThatEnable Them to Respond to Inductive SignalsEarly embryologists noted that cells differ in their ability torespond to various inductive signals. The ability to respondto a particular signaling molecule, referred to as competence,depends on several properties of the receiving cell: the pres-ence of receptors specific for the signal, the ability of these re-ceptors to activate specific intracellular pathways, thepresence of transcription factors that stimulate the expres-sion of the genes required to implement the appropriate re-sponse, and a chromatin structure that makes these genesaccessible for transcription.
In some cases, the reception of one signal may make cellscompetent to receive another. After a part of the liver is dam-aged or removed surgically, increased amounts of two sig-nals, tumor necrosis factor (TNF) and interleukin-6 (IL-6),are produced as part of the response to liver damage. Thesesignals cause hepatocytes to enter a “primed” state in whichthe cells increase their production of certain transcriptionfactors (e.g., NF-B, Stat3, AP1, and CEBP) but do not di-vide. Primed cells are competent to respond to a combination
648 CHAPTER 15 • Integration of Signals and Gene Controls
Liver regeneration
Primed hepatocytes
Growinghepatocytes
NF-κB, Stat3, AP1,CEBP
Cyclin D
Resting hepatocytes"Priming" with TNF and IL-6 allows a response to growth factors. TNF effect can be apoptotic or proliferative, depending on glutathione content and reactive oxygen species.
HGF + EGF, TGFα
TNF, IL-6
▲ FIGURE 15-39 Priming of resting hepatocytes for later
responses to signaling molecules that induce growth. Injuryto the liver or removal of part of the liver leads to priming of cellsin response to interleukin-6 (IL-6) and tumor necrosis factor (TNF)signals. Primed cells increase their production of the indicatedtranscription factors but do not divide. Subsequent increase inthe blood level of hepatocyte growth factor (HGF) inducesprimed cells to produce cyclin D, which is required for celldivision (Chapter 21). HGF acts in conjunction with epidermalgrowth factor (EGF) and transforming growth factor � (TGF�).
of three signals that together induce the synthesis of cyclinD and mitosis (Figure 15-39).
Liver regeneration is an important survival tactic after apart of the liver is damaged or poisoned, but unregulatedliver growth would lead to an unduly large organ or possiblycancer. In the primed state, hepatocytes can measure theirown physiological state, their location within a tissue, theirproximity to other cells, the need for healing, and the spa-tial organization of cells within a structure. On the basis ofthis assessment, the cells can respond most appropriately tosubsequent signals.
Some Signals Can Induce Diverse Cellular ResponsesSeveral classes of cell-surface receptors discussed in Chapters13 and 14 are linked to more than one intracellular signal-transduction pathway (see Table 14-1). Multiple intra-cellular signaling possibilities are most evident with G protein–coupled receptors, cytokine receptors, and receptortyrosine kinases. This phenomenon raises a general question:What governs how a cell responds to a signal that can betransduced by multiple pathways? Conversely, if the signal-ing pathway is the same in many cell types, why does one cellrespond by dividing, another by differentiating, and still another by dying? For instance, signaling through the RTK-Ras–MAP kinase pathway (see Figure 14-16) is used repeat-edly in the course of development, yet the outcome in regardto cell-fate specification varies in different tissues. If there isno specificity beyond the ligand and receptor, an activatedRas might substitute for any signal. In fact, activated Ras cando so in many cell types. In one DNA microarray study offibroblasts, for instance, the same set of genes was transcrip-tionally induced by platelet-derived growth factor (PDGF)and by fibroblast growth factor (FGF), suggesting that ex-posure to either signaling molecule had similar effects. ThePDGF receptor and the FGF receptor are both receptor ty-rosine kinases, and the binding of ligand to either receptorcan activate Ras.
Several mechanisms for producing diverse cellular re-sponses to a particular signaling molecule seem possible inprinciple: (1) the strength or duration of the signal governsthe nature of the response; (2) the pathway downstream ofthe receptor is not really the same in different cell types, forexample because different complements of transcription fac-tors are present in the receiving cells; and (3) converging in-puts from other pathways modify the response to the signal.
Differences in Signal Strength or Duration Evidence sup-porting the use of the first mechanism comes from studieswith PC12 cells, a cultured cell line capable of differentiatinginto adipocytes or neurons. Nerve growth factor (NGF) promotes the formation of neurons, whereas epidermalgrowth factor (EGF) promotes the formation of adipocytes.
Strengthening the EGF signal by prolonging exposure to itcauses neuronal differentiation. Although both NGF andEGF are RTK ligands, NGF is a much stronger activator ofthe Ras–MAP kinase transduction pathway than is EGF. TheEGF receptor can apparently activate this pathway only afterprolonged stimulation.
Differences in Downstream Pathways Signaling throughcell type–specific pathways downstream of an RTK has beendemonstrated in C. elegans. In worms, EGF signals induceat least five distinct responses, each one in a different typeof cell. Four of the five responses are mediated by the com-mon Ras–MAP kinase pathway; the fifth, hermaphroditeovulation, employs a different downstream pathway inwhich the second messenger inositol trisphosphate is gener-ated. Binding of IP3 to its receptor (IP3R) in the endoplas-mic reticulum membrane leads to the release of stored Ca2�
from the ER (see Figure 13-29). The rise in cytosolic Ca2�
then triggers ovulation. This alternative pathway was dis-covered with a genetic screen that implicated IP3R, a Ca2�
channel, in EGF signaling—a good example of how a muta-tion in an unexpected gene can lead to a discovery.
Integration of Signals The third way that the same signalingligand/receptor pair can produce diverse effects on cells is tointegrate more than one signal, as occurs in Drosophila mus-cle development. Figure 15-40 depicts the convergence of sig-nal inputs that leads to the formation of a single muscleprecursor cell, which is defined by its ability to transcribe the even-skipped gene. Early in muscle development, theDrosophila Wnt signal Wingless (Wg) and the TGF� signalDecapentaplegic (Dpp) prime a cell to make it competent toreceive a subsequent signal that is transduced through theMAP kinase pathway downstream of Ras. The Wingless sig-nal is produced in circumferential belts, and the Dpp signal isproduced in two longitudinal bands at right angles to theWnt belts.
One group of cells on each side of each body segment re-ceives both the Wingless and the Dpp signals and thus be-come competent to respond to an unidentified RTK signalthat activates Ras. In these cells, signal integration takesplace during transcription of the eve gene. The transcriptionof eve is activated when a short 312-bp eve enhancer (notthe same one described in Figure 15-32) is bound by twomuscle-specific transcription factors and by three signal-induced transcription factors: TCF factor by Wingless, Madby Dpp, and Pnt by an RTK acting through Ras. Thus tissue-specific and signal-responsive information is integratedthrough the action of five regulators on one short piece ofDNA in specifying a cell type. As the result of lateral inhi-bition, eventually only one eve-expressing cell in each ini-tial group of competent cells is left (see Figure 15-40). Thatsingle cell will develop into a particular muscle fiber by re-cruiting other cells and fusing with them.
15.7 • Integrating and Controlling Signals 649
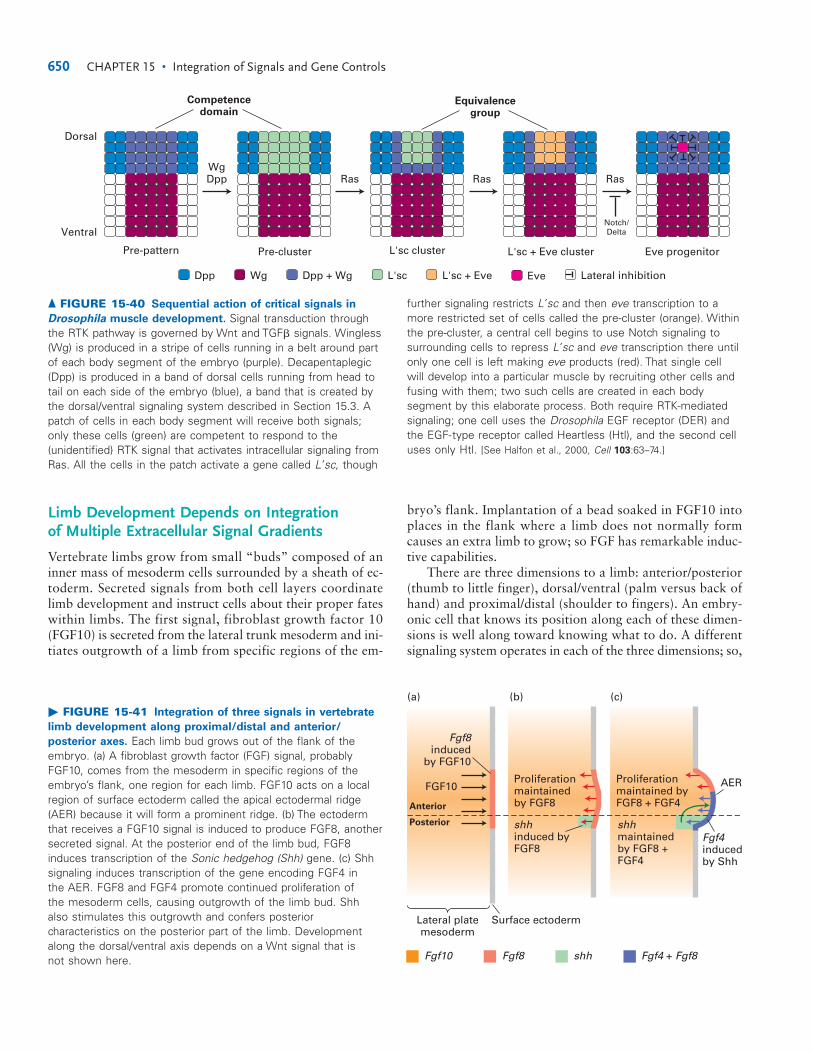
Limb Development Depends on Integration of Multiple Extracellular Signal Gradients
Vertebrate limbs grow from small “buds” composed of aninner mass of mesoderm cells surrounded by a sheath of ec-toderm. Secreted signals from both cell layers coordinatelimb development and instruct cells about their proper fateswithin limbs. The first signal, fibroblast growth factor 10(FGF10) is secreted from the lateral trunk mesoderm and ini-tiates outgrowth of a limb from specific regions of the em-
bryo’s flank. Implantation of a bead soaked in FGF10 intoplaces in the flank where a limb does not normally formcauses an extra limb to grow; so FGF has remarkable induc-tive capabilities.
There are three dimensions to a limb: anterior/posterior(thumb to little finger), dorsal/ventral (palm versus back ofhand) and proximal/distal (shoulder to fingers). An embry-onic cell that knows its position along each of these dimen-sions is well along toward knowing what to do. A differentsignaling system operates in each of the three dimensions; so,
650 CHAPTER 15 • Integration of Signals and Gene Controls
Competencedomain
Equivalencegroup
WgDpp Ras Ras Ras
Notch/Delta
Dpp Wg Dpp + Wg L'sc L'sc + Eve Lateral inhibitionEve
Pre-pattern Pre-cluster L'sc cluster L'sc + Eve cluster Eve progenitor
Dorsal
Ventral
▲ FIGURE 15-40 Sequential action of critical signals in
Drosophila muscle development. Signal transduction throughthe RTK pathway is governed by Wnt and TGF� signals. Wingless(Wg) is produced in a stripe of cells running in a belt around partof each body segment of the embryo (purple). Decapentaplegic(Dpp) is produced in a band of dorsal cells running from head totail on each side of the embryo (blue), a band that is created bythe dorsal/ventral signaling system described in Section 15.3. Apatch of cells in each body segment will receive both signals;only these cells (green) are competent to respond to the(unidentified) RTK signal that activates intracellular signaling fromRas. All the cells in the patch activate a gene called L’sc, though
further signaling restricts L’sc and then eve transcription to amore restricted set of cells called the pre-cluster (orange). Withinthe pre-cluster, a central cell begins to use Notch signaling tosurrounding cells to repress L’sc and eve transcription there untilonly one cell is left making eve products (red). That single cellwill develop into a particular muscle by recruiting other cells andfusing with them; two such cells are created in each bodysegment by this elaborate process. Both require RTK-mediatedsignaling; one cell uses the Drosophila EGF receptor (DER) andthe EGF-type receptor called Heartless (Htl), and the second celluses only Htl. [See Halfon et al., 2000, Cell 103:63–74.]
Fgf8induced
by FGF10
FGF10 AER
Fgf4inducedby Shh
Anterior
Posterior
Proliferationmaintainedby FGF8
Proliferationmaintained byFGF8 + FGF4
shhinduced byFGF8
shh maintainedby FGF8 +FGF4
Lateral platemesoderm
Surface ectoderm
(a) (b) (c)
Fgf10 shhFgf8 Fgf4 + Fgf8
� FIGURE 15-41 Integration of three signals in vertebrate
limb development along proximal/distal and anterior/
posterior axes. Each limb bud grows out of the flank of theembryo. (a) A fibroblast growth factor (FGF) signal, probablyFGF10, comes from the mesoderm in specific regions of theembryo’s flank, one region for each limb. FGF10 acts on a localregion of surface ectoderm called the apical ectodermal ridge(AER) because it will form a prominent ridge. (b) The ectodermthat receives a FGF10 signal is induced to produce FGF8, anothersecreted signal. At the posterior end of the limb bud, FGF8induces transcription of the Sonic hedgehog (Shh) gene. (c) Shhsignaling induces transcription of the gene encoding FGF4 in the AER. FGF8 and FGF4 promote continued proliferation of the mesoderm cells, causing outgrowth of the limb bud. Shhalso stimulates this outgrowth and confers posteriorcharacteristics on the posterior part of the limb. Developmentalong the dorsal/ventral axis depends on a Wnt signal that is not shown here.
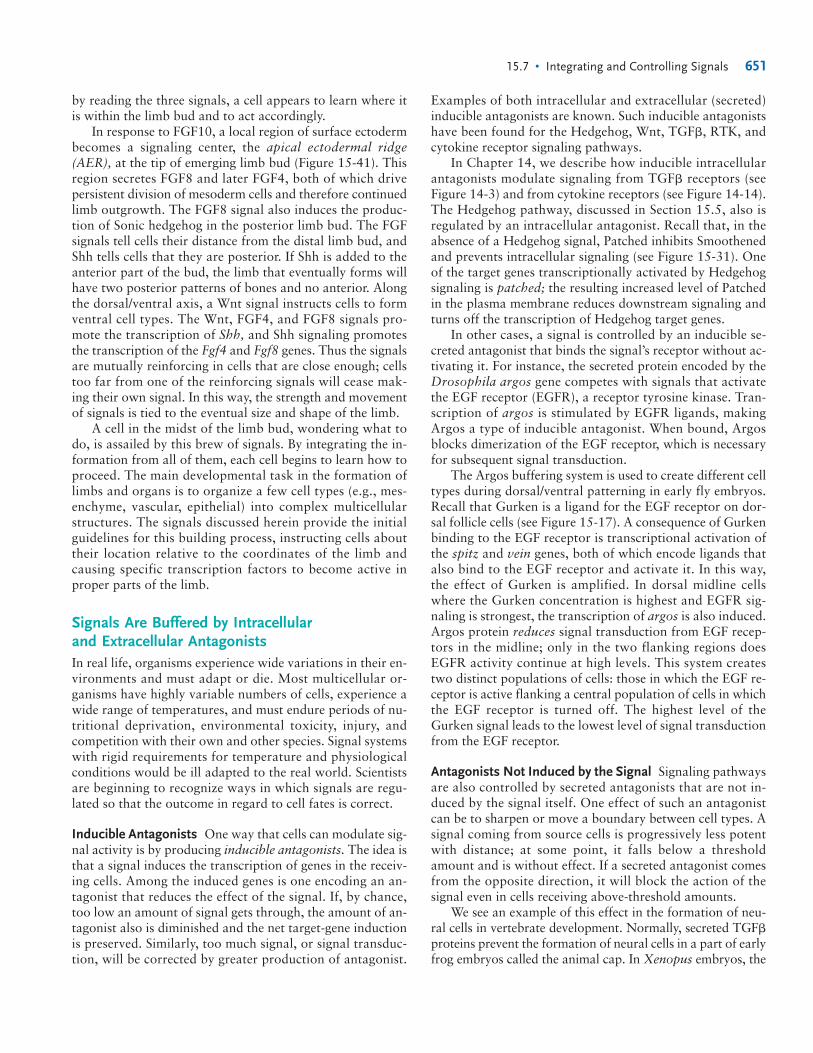
by reading the three signals, a cell appears to learn where itis within the limb bud and to act accordingly.
In response to FGF10, a local region of surface ectodermbecomes a signaling center, the apical ectodermal ridge(AER), at the tip of emerging limb bud (Figure 15-41). Thisregion secretes FGF8 and later FGF4, both of which drivepersistent division of mesoderm cells and therefore continuedlimb outgrowth. The FGF8 signal also induces the produc-tion of Sonic hedgehog in the posterior limb bud. The FGFsignals tell cells their distance from the distal limb bud, andShh tells cells that they are posterior. If Shh is added to theanterior part of the bud, the limb that eventually forms willhave two posterior patterns of bones and no anterior. Alongthe dorsal/ventral axis, a Wnt signal instructs cells to formventral cell types. The Wnt, FGF4, and FGF8 signals pro-mote the transcription of Shh, and Shh signaling promotesthe transcription of the Fgf4 and Fgf8 genes. Thus the signalsare mutually reinforcing in cells that are close enough; cellstoo far from one of the reinforcing signals will cease mak-ing their own signal. In this way, the strength and movementof signals is tied to the eventual size and shape of the limb.
A cell in the midst of the limb bud, wondering what todo, is assailed by this brew of signals. By integrating the in-formation from all of them, each cell begins to learn how toproceed. The main developmental task in the formation oflimbs and organs is to organize a few cell types (e.g., mes-enchyme, vascular, epithelial) into complex multicellularstructures. The signals discussed herein provide the initialguidelines for this building process, instructing cells abouttheir location relative to the coordinates of the limb andcausing specific transcription factors to become active inproper parts of the limb.
Signals Are Buffered by Intracellular and Extracellular AntagonistsIn real life, organisms experience wide variations in their en-vironments and must adapt or die. Most multicellular or-ganisms have highly variable numbers of cells, experience awide range of temperatures, and must endure periods of nu-tritional deprivation, environmental toxicity, injury, andcompetition with their own and other species. Signal systemswith rigid requirements for temperature and physiologicalconditions would be ill adapted to the real world. Scientistsare beginning to recognize ways in which signals are regu-lated so that the outcome in regard to cell fates is correct.
Inducible Antagonists One way that cells can modulate sig-nal activity is by producing inducible antagonists. The idea isthat a signal induces the transcription of genes in the receiv-ing cells. Among the induced genes is one encoding an an-tagonist that reduces the effect of the signal. If, by chance,too low an amount of signal gets through, the amount of an-tagonist also is diminished and the net target-gene inductionis preserved. Similarly, too much signal, or signal transduc-tion, will be corrected by greater production of antagonist.
Examples of both intracellular and extracellular (secreted)inducible antagonists are known. Such inducible antagonistshave been found for the Hedgehog, Wnt, TGF�, RTK, andcytokine receptor signaling pathways.
In Chapter 14, we describe how inducible intracellularantagonists modulate signaling from TGF� receptors (seeFigure 14-3) and from cytokine receptors (see Figure 14-14).The Hedgehog pathway, discussed in Section 15.5, also isregulated by an intracellular antagonist. Recall that, in theabsence of a Hedgehog signal, Patched inhibits Smoothenedand prevents intracellular signaling (see Figure 15-31). Oneof the target genes transcriptionally activated by Hedgehogsignaling is patched; the resulting increased level of Patchedin the plasma membrane reduces downstream signaling andturns off the transcription of Hedgehog target genes.
In other cases, a signal is controlled by an inducible se-creted antagonist that binds the signal’s receptor without ac-tivating it. For instance, the secreted protein encoded by theDrosophila argos gene competes with signals that activatethe EGF receptor (EGFR), a receptor tyrosine kinase. Tran-scription of argos is stimulated by EGFR ligands, makingArgos a type of inducible antagonist. When bound, Argosblocks dimerization of the EGF receptor, which is necessaryfor subsequent signal transduction.
The Argos buffering system is used to create different celltypes during dorsal/ventral patterning in early fly embryos.Recall that Gurken is a ligand for the EGF receptor on dor-sal follicle cells (see Figure 15-17). A consequence of Gurkenbinding to the EGF receptor is transcriptional activation ofthe spitz and vein genes, both of which encode ligands thatalso bind to the EGF receptor and activate it. In this way,the effect of Gurken is amplified. In dorsal midline cellswhere the Gurken concentration is highest and EGFR sig-naling is strongest, the transcription of argos is also induced.Argos protein reduces signal transduction from EGF recep-tors in the midline; only in the two flanking regions doesEGFR activity continue at high levels. This system createstwo distinct populations of cells: those in which the EGF re-ceptor is active flanking a central population of cells in whichthe EGF receptor is turned off. The highest level of theGurken signal leads to the lowest level of signal transductionfrom the EGF receptor.
Antagonists Not Induced by the Signal Signaling pathwaysare also controlled by secreted antagonists that are not in-duced by the signal itself. One effect of such an antagonistcan be to sharpen or move a boundary between cell types. Asignal coming from source cells is progressively less potentwith distance; at some point, it falls below a thresholdamount and is without effect. If a secreted antagonist comesfrom the opposite direction, it will block the action of thesignal even in cells receiving above-threshold amounts.
We see an example of this effect in the formation of neu-ral cells in vertebrate development. Normally, secreted TGF�proteins prevent the formation of neural cells in a part of earlyfrog embryos called the animal cap. In Xenopus embryos, the
15.7 • Integrating and Controlling Signals 651
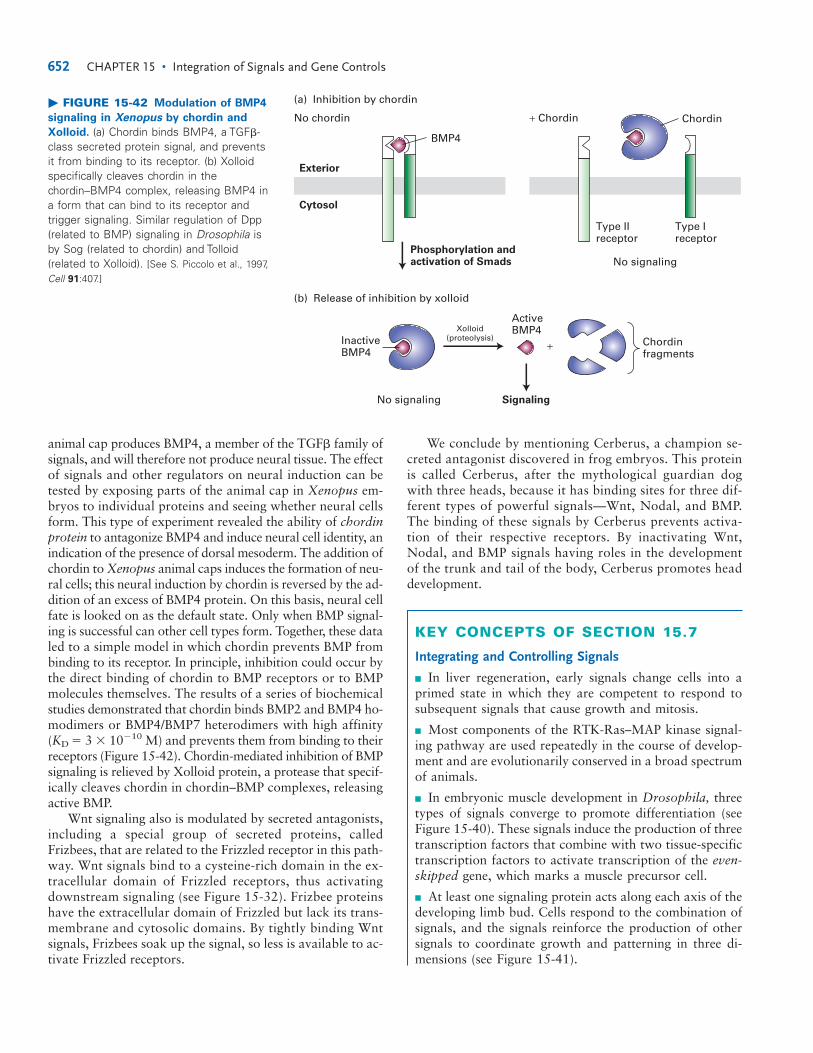
animal cap produces BMP4, a member of the TGF� family ofsignals, and will therefore not produce neural tissue. The effectof signals and other regulators on neural induction can betested by exposing parts of the animal cap in Xenopus em-bryos to individual proteins and seeing whether neural cellsform. This type of experiment revealed the ability of chordinprotein to antagonize BMP4 and induce neural cell identity, anindication of the presence of dorsal mesoderm. The addition ofchordin to Xenopus animal caps induces the formation of neu-ral cells; this neural induction by chordin is reversed by the ad-dition of an excess of BMP4 protein. On this basis, neural cellfate is looked on as the default state. Only when BMP signal-ing is successful can other cell types form. Together, these dataled to a simple model in which chordin prevents BMP frombinding to its receptor. In principle, inhibition could occur bythe direct binding of chordin to BMP receptors or to BMPmolecules themselves. The results of a series of biochemicalstudies demonstrated that chordin binds BMP2 and BMP4 ho-modimers or BMP4/BMP7 heterodimers with high affinity(KD � 3 � 10�10 M) and prevents them from binding to theirreceptors (Figure 15-42). Chordin-mediated inhibition of BMPsignaling is relieved by Xolloid protein, a protease that specif-ically cleaves chordin in chordin–BMP complexes, releasingactive BMP.
Wnt signaling also is modulated by secreted antagonists,including a special group of secreted proteins, calledFrizbees, that are related to the Frizzled receptor in this path-way. Wnt signals bind to a cysteine-rich domain in the ex-tracellular domain of Frizzled receptors, thus activatingdownstream signaling (see Figure 15-32). Frizbee proteinshave the extracellular domain of Frizzled but lack its trans-membrane and cytosolic domains. By tightly binding Wntsignals, Frizbees soak up the signal, so less is available to ac-tivate Frizzled receptors.
We conclude by mentioning Cerberus, a champion se-creted antagonist discovered in frog embryos. This protein is called Cerberus, after the mythological guardian dog with three heads, because it has binding sites for three dif-ferent types of powerful signals—Wnt, Nodal, and BMP. The binding of these signals by Cerberus prevents activa-tion of their respective receptors. By inactivating Wnt, Nodal, and BMP signals having roles in the development of the trunk and tail of the body, Cerberus promotes head development.
KEY CONCEPTS OF SECTION 15.7
Integrating and Controlling Signals
■ In liver regeneration, early signals change cells into aprimed state in which they are competent to respond tosubsequent signals that cause growth and mitosis.
■ Most components of the RTK-Ras–MAP kinase signal-ing pathway are used repeatedly in the course of develop-ment and are evolutionarily conserved in a broad spectrumof animals.
■ In embryonic muscle development in Drosophila, threetypes of signals converge to promote differentiation (seeFigure 15-40). These signals induce the production of threetranscription factors that combine with two tissue-specifictranscription factors to activate transcription of the even-skipped gene, which marks a muscle precursor cell.
■ At least one signaling protein acts along each axis of thedeveloping limb bud. Cells respond to the combination ofsignals, and the signals reinforce the production of othersignals to coordinate growth and patterning in three di-mensions (see Figure 15-41).
652 CHAPTER 15 • Integration of Signals and Gene Controls
Exterior
Cytosol
(a) Inhibition by chordin
(b) Release of inhibition by xolloid
No chordin + Chordin Chordin
Type IIreceptor
Type Ireceptor
Phosphorylation andactivation of Smads No signaling
No signaling Signaling
InactiveBMP4
ActiveBMP4Xolloid
(proteolysis) Chordinfragments
+
BMP4
� FIGURE 15-42 Modulation of BMP4
signaling in Xenopus by chordin and
Xolloid. (a) Chordin binds BMP4, a TGF�-class secreted protein signal, and preventsit from binding to its receptor. (b) Xolloidspecifically cleaves chordin in thechordin–BMP4 complex, releasing BMP4 ina form that can bind to its receptor andtrigger signaling. Similar regulation of Dpp(related to BMP) signaling in Drosophila isby Sog (related to chordin) and Tolloid(related to Xolloid). [See S. Piccolo et al., 1997,Cell 91:407.]
■ Inducible antagonists include intracellular and secretedproteins whose production is induced by a particular sig-nal. The antagonist protein then feeds back, opposing theongoing action of the signal. Inducible antagonists providebuffering in most signaling pathways to compensate forexcess or inadequate signals.
■ Signals can also be controlled by antagonists that arenot induced by the signal itself. By binding to signals, theseantagonists prevent the signals from binding to their spe-cific receptors and activating them (see Figure 15-42).
P E R S P E C T I V E S F O R T H E F U T U R E
The remarkable interplay of signals and gene controls duringdevelopment is a process of pattern formation. Simple massesof cells become startlingly beautiful, functional structuressuch as eyes, lungs, hearts, and wings. For this transformationto happen, cells must respond to a rich mix of short-rangeand long-range signals and integrate the information to makethe right decisions. Only a few signaling systems are used repeatedly to organize cells into tissues. For the most part, the signaling systems are common to all animals, thus vastlysimplifying the problem of learning the underlying molecu-lar mechanisms. This manifestation of our common evolu-tionary origins reduces the problem of understanding bio-logical regulation—but the remaining challenges are stillenormous.
To more fully understand how cells acquire their fatesand participate in morphogenesis will require a comprehen-sive view of their molecular responses in vivo. The adventof DNA microarray technology for simultaneously monitor-ing the transcription of thousands of genes—indeed all of thetranscription units in a genome—is a major step forward in“reading the minds” of cells. A signal can now be assessedfor its ability to redirect a cell’s activities by measuring all thesignal-induced changes in gene expression. Exciting as thesenew insights are, their limitations also are apparent. For in-stance, transcripts are currently measured in extracts thatrepresent an average of many cells isolated without greattemporal precision—from embryos that change in seconds orminutes. Therefore we can look forward to continuing ad-vances as methods improve for observing responses in livingcells. Moreover, DNA microarray analysis measures onlytranscription, not RNA splicing or translation into protein;nor are protein localization and modification andprotein–protein associations assessed by this technology.These other levels of gene control are still measured mostlyon a gene-by-gene basis. Advances in protein microarraytechnology that enable monitoring of all proteins at once, aswell as protein–protein interactions, will contribute tremen-dously to our understanding.
The rapid fluxes in cell responses that occur during sig-naling events, the integration of information from multiplesignals, and the dynamic feedback control loops are all dif-
ficult to comprehend without precise measurements of signalconcentrations, reaction rates, and equilibrium states. Moreprecise quantitation will be necessary to understand signal-ing circuitry properly. Crude statements of genes being onor off or of proteins being phosphorylated or not will have tobe replaced by more precise information, because in fact thechanges entail gradations over orders of magnitude, not sim-ply all-or-none phenomena.
The elaborate switching systems in cells, usually manyof them working at the same time, have a degree of com-plexity that requires computer modeling. This field, some-times referred to as systems biology, aims to produce modelsthat successfully describe the normal responses of cells tostimuli and that predict how cells will respond to additionalor different perturbations. An engineering approach of thissort holds the exciting promise that cells could be directedto perform tasks, such as improved immunity or healing, thatare useful. The field of molecular cell biology increasingly isbecoming a computational science, but with the special fas-cination that the signals are building life.
KEY TERMS
angiogenesis 620chordin protein 652development 612equivalence group 624floral organ–identity
gene 637gap gene 630Hedgehog pathway 641homeosis 636Hox gene 636inducible antagonist 651induction 621in situ hybridization 614lateral inhibition 644
REVIEW THE CONCEPTS
1. Describe three different pathways in which EGF-type receptors participate.
2. What enzyme catalyzes the degradation of glycogen toglucose 1-phosphate? Describe how the subunit structure ofthis enzyme allows for integration of multiple signals.
3. People with Type 1 diabetes do not produce insulin. De-scribe what happens to GLUT4 glucose transporters in Type1 diabetics just after a meal. Most patients with Type 2 dia-betes produce normal amounts of insulin and have insulin re-ceptors present on insulin-responsive cells. Yet these patientsare defective in glucose uptake, and hence have abnormally
Review the Concepts 653
maternal mRNA 629morphogen 623pair-rule gene 634protein microarray
(proteome chip) 615reciprocal induction 644segment-polarity gene 635sensory organ
precursor (SOP) 647syncytium 625Toll-Dorsal pathway 628transcription cascade 632Wnt pathway 642

high blood glucose levels. Speculate on the nature of the de-fect in these patients.
4. Compare and contrast the action of morphogens in-volved in dorsal-ventral specification in Xenopus laevis andDrosophila melanogaster.
5. Using in situ hybridization with a dorsal-specific probe,where in the syncytial Drosophila embryo would one expectto find dorsal expressed? Using immunohistochemistry withan anti-dorsal antibody, where would you expect to findDorsal protein expressed?
6. A microarray analysis of wildtype vs. dorsal mutant em-bryos could be expected to yield information on all genesregulated by the Dorsal protein. Why? Other than new genesregulated by Dorsal, one would expect to see changes in reg-ulation of previously identified genes. Which genes wouldbe increased or decreased in expression in dorsal mutants?
7. Deleting the 3� UTR of the bicoid gene would yield whatphenotype in a mutant fly? Why?
8. How does the motor protein kinesin ensure that properpost-translational controls take place in the anterior end ofthe Drosophila embryo? If kinesin functioned only duringembryo development, what would the phenotype of a kinesinmutant embryo be?
9. What is the evidence that the Toll-based innate immu-nity system may be more than a billion years old?
10. How can the group of five gap genes specify more thanfive types of cells in Drosophila embryos?
11. What is homeosis? Give an example of a floral homeoticmutation and describe the phenotype of the mutant and thenormal function of the wild-type gene product.
12. Compare and contrast the receptor systems responsiblefor recognition of the Hedgehog and Wnt secreted ligands.
13. What is the evidence that a gradient of Sonic hedgehogleads to development of different cell types within the avianneural tube?
14. The finding that ephrin b2 knockouts contain strikingdefects in both arterial and venous capillaries supports theidea that ephrin B2 and its receptor, EphB4, are involved in areciprocal induction. How?
15. Give a specific example of a signal-buffering inducibleantagonist, and describe how its actions lead to signalbuffering.
ANALYZE THE DATA
The entire genome sequence of rice (Oryza sativa) has beendetermined, allowing investigators to search the rice genomefor gene sequences homologous to Drosophila genes involved in developmental processes. A putative bicoid
homolog was found in the rice genome that encodes a home-odomain-type transcription factor. This rice gene was used asa probe against rice embryos in an in situ hybridization ex-periment, shown below. Plant embryos are contained withinseeds. The rice embryos used in these experiments were inthe globular stage of development. At this stage, the apicaland basal ends of the future plant are being specified.
a. What is the expression pattern of the putative rice bicoidgene?
b. Speculate as to the function of the putative rice bicoidgene.
c. From the above results, what phenotype do you thinkmight develop if one microinjected mRNA molecules tran-scribed from the putative rice bicoid gene into the basal endof the embryo?
d. From the above results, what would the expected expres-sion pattern be in rice if one could identify a putative nanoshomolog from rice?
REFERENCES
Experimental Approaches for Building a ComprehensiveView of Signal-Induced Responses
Arbeitman, M. N., et al. 2002. Gene expression during the lifecycle of Drosophila melanogaster. Science 297:2270–2275.
Cutler, P. 2003. Protein arrays: the current state-of-the-art. Pro-teomics 3:3–18.
Kamath, R. S., et al. 2003. Systematic functional analysis of theCaenorhabditis elegans genome using RNAi. Nature 421:231–237.
Kim, S. K., et al. 2001. A gene expression map for Caenorhab-ditis elegans. Science 293:2087–2092.
Stathopoulos, A., et al. 2002. Whole-genome analysis of dorsal-ventral patterning in the Drosophila embryo. Cell 111:687–701.
Tomancak, P., et al. 2002. Systematic determination of patternsof gene expression during Drosophila embryogenesis. Genome Biol.3:RESEARCH0088–8.
Responses of Cells to Environmental InfluencesDownward, J. 1998. Mechanisms and consequences of activa-
tion of protein kinase B/Akt. Curr. Opin. Cell Biol. 10:262–267.Kaelin, W. G., Jr. 2002. How oxygen makes its presence felt.
Genes & Dev. 16:1441–1445.
Control of Cell Fates by Graded Amounts of RegulatorsChang, A. J., and D. Morisato. 2002. Regulation of Easter ac-
tivity is required for shaping the Dorsal gradient in the Drosophilaembryo. Development 129:5635–5645.
654 CHAPTER 15 • Integration of Signals and Gene Controls
Apical end
Basal end
Freeman, M., and J. B. Gurdon. 2002. Regulatory principles ofdevelopmental signaling. Ann. Rev. Cell Dev. Biol. 18:515–539.
Johnstone, O., and P. Lasko. 2001. Translational regulation andRNA localization in Drosophila oocytes and embryos. Ann. Rev.Genet. 35:365–406.
Stathopoulos, A., and M. Levine. 2002. Dorsal gradient net-works in the Drosophila embryo. Devel. Biol. 246:57–67.
Takeda, K., T. Kaisho, and S. Akira. 2003. Toll-like receptors.Ann. Rev. Immunol. 21:335–376.
Wang, M., and P. W. Sternberg. 2001. Pattern formation duringC. elegans vulval induction. Curr. Topics Devel. Bio. 51:189–220.
Boundary Creation by Different Combinations of Transcription Factors
Akam, M. 1987. The molecular basis for metameric pattern inthe Drosophila embryo. Development 101:1–22.
Andrioli, L. P., et al. 2002. Anterior repression of a Drosophilastripe enhancer requires three position-specific mechanisms. Devel-opment 129:4931–4940.
Fujioka, M., et al. 1999. Analysis of an even-skipped rescuetransgene reveals both composite and discrete neuronal and earlyblastoderm enhancers, and multi-stripe positioning by gap gene re-pressor gradients. Development 126:2527–2538.
Houchmandzadeh, B., E. Wieschaus, and S. Leibler. 2002. Es-tablishment of developmental precision and proportions in the earlyDrosophila embryo. Nature 415:798–802.
Boundary Creation by Extracellular SignalsJessell, T. M. 2000. Neuronal specification in the spinal cord:
inductive signals and transcriptional codes. Nature Rev. Genet.1:20–29.
Moon, R. T., B. Bowerman, M. Boutros, and N. Perrimon. 2002.The promise and perils of Wnt signaling through beta-catenin. Sci-ence 296:1644–1646. Review.
Nybakken, K., and N. Perrimon. 2002. Hedgehog signal trans-duction: recent findings. Curr. Opin. Genet. Devel. 12:503–511.
Pandur, P., D. Maurus, and M. Kuhl. 2002. Increasingly com-plex: new players enter the Wnt signaling network. Bioessays24:881–884.
Pires-daSilva, A., and R. J. Sommer. 2003. The evolution of sig-nalling pathways in animal development. Nature Rev. Genet.4:39–49.
Sanson, B. 2001. Generating patterns from fields of cells: ex-amples from Drosophila segmentation. EMBO Rep. 2:1083–1088.
Wilkie, G. S., and I. Davis. 2001. Drosophila wingless and pair-rule transcripts localize apically by dynein-mediated transport ofRNA particles. Cell 105:209–219.
Reciprocal Induction and Lateral InhibitionArtavanis-Tsakonas, S., M. D. Rand, and R. J. Lake. 1999.
Notch signaling: cell fate control and signal integration in develop-ment. Science 284:770–776.
Cooke, J. E., and C. B. Moens. 2002. Boundary formation inthe hindbrain: Eph only it were simple. Trends Neurosci.25:260–267.
Grandbarbe, L., et al. 2003. Delta-Notch signaling controls thegeneration of neurons/glia from neural stem cells in a stepwiseprocess. Development 130:1391–1402.
Ju, B. G., et al. 2000. Fringe forms a complex with Notch. Na-ture 405:191–195.
Miao, H., et al. 2001. Activation of EphA receptor tyrosine ki-nase inhibits the Ras/MAPK pathway. Nature Cell Biol. 3:527–530.
Santiago, A., and C. A. Erickson. 2002. Ephrin-B ligands play adual role in the control of neural crest cell migration. Development129:3621–3632.
Shaye, D. D., and I. Greenwald. 2002. Endocytosis-mediateddownregulation of LIN-12/Notch upon Ras activation in Caenorhab-ditis elegans. Nature 420:686–690.
Integrating and Controlling SignalsBrzozowski, A. M., et al. 1997. Molecular basis of agonism and
antagonism in the oestrogen receptor. Nature 389:753–758.Fambrough, D., K. McClure, A. Kazlauskas, and E. S. Lander.
1999. Diverse signaling pathways activated by growth factor recep-tors induce broadly overlapping, rather than independent, sets ofgenes. Cell 97:727–741.
Gerlitz, O., and K. Basler. 2002. Wingful, an extracellular feed-back inhibitor of Wingless. Genes & Dev. 16:1055–1059.
Grimm, O. H., and J. B. Gurdon. 2002. Nuclear exclusion ofSmad2 is a mechanism leading to loss of competence. Nature CellBiol. 4:519–522.
Halfon, M. S., et al. 2000. Ras pathway specificity is determinedby the integration of multiple signal-activated and tissue-restrictedtranscription factors. Cell 103:63–74.
Martin, G. 2001. Making a vertebrate limb: new players enterfrom the wings. Bioessays 23:865–868.
Rubin, C., et al. 2003. Sprouty fine-tunes EGF signaling throughinterlinked positive and negative feedback loops. Curr. Biol.13:297–307.
Tickle, C., and A. Munsterberg. 2001. Vertebrate limb develop-ment: the early stages in chick and mouse. Curr. Opin. Genet. De-vel. 11:476–481.
References 655