Integrating Trauma-Informed Care into Maternity Care Practice
Upload
khangminh22Category
view
0download
0
European Journal of Business and Management www.iiste.org ISSN 2222-1905 (Paper) ISSN 2222-2839 (Online) Vol.9, No.30, 2017
170
Integrating Kano’s model into WhatsApp quality services
Mehta Rooshabhkumar1* Dr. C. D. Bhavsar2 1 Ph.D. Research Scholar, Department of Statistics, School of Sciences, Gujarat University, India.
2 Professor, Department of Statistics, School of Sciences, Gujarat University, India. * E-mail of the corresponding author: [email protected]
Abstract WhatsApp is being used by more than 160 million people in India and 1200 million people in the world which is record-breaking usage statistics in a history. This paper aims to find out the underlying Quality Dimensions and their elements for the features offered by WhatsApp. The authors conducted a survey to know about perceived quality of features based on users’ own feelings. This survey was conducted in the city of Ahmedabad, Gujarat state of India. The research sample consists the responses of 203 WhatsApp users. The authors adapted Kano’s model to further analyse the research objective. Kano’s model helped to identify the quality elements of each listed 19 features of WhatsApp. The subsequent analysis techniques include CSCs (Customer Satisfaction Coefficients), EFA (Exploratory Factor Analysis). From the analysis, the two Quality Dimensions are identified; Additional Features and Essential Features. The research shows that features like and audio calling can increase customer satisfaction from low to medium or high level. These findings can further help App developers to have better insights for designing and developing customer friendly applications. Key Words: Kano’s Model and Service Quality Elements, Quality Dimensions, WhatsApp in India, Exploratory Factor Analysis 1. Introduction Mobile communication has become the largest medium of virtual communications in this century. The world is getting connected with new technologies and becoming digitally empowered. People and communities are growing with digitization. Various governments are promoting digitization and taking the initiative to make people digitally enabled. In such environment, market is filled various smartphone players, internet service providers, mobile service providers, and mobile application (Apps) developers. The market has become more competitive due to a huge demand of such technologies and their spread in various spheres of human lives. Instant multimedia messaging mobile applications have been taking places of last decade’s traditional SMS and MMS. People are switching towards real-time chatting and leaving or reducing the usage of SMS. Sending pictures or audio-video files through a mobile phone was costly and time-consuming in a previous decade whereas now it has become quite easy relatively much cheaper and much faster than earlier. WhatsApp, Facebook, line, hike many more applications are not only acquiring their positions in smartphones but also in smartphone users’ lives. Since, It has been launched in 2009 by former Yahoo employees, Brian Acton and Jan Koum who had developed an application which is being used most widely in the world. One of the authentic sources namely ‘Statista’ claims that there are 1200 million monthly active users of WhatsApp observed in Jan 2017 worldwide. The Same source mentioned that there were 200 million monthly active users (MAUs) noticed in April 2013. In 2016, these MAUs were around 1000 million around the globe, out of these over 160 million were Indian users. India, the fastest growing economy of the present decade, has also shown significant growth in the mobile market. Census of India (COI) says that the households having mobile phones/ telephone have been increased from 2001 (9.1%) to 2011 (63.2%). The accesibility of mobile phones is more than the latrine facility in the second largest country by population, (Appendix, Table 1). As per the COI 2011 Figures, the Indian market can be considered as a potential market with significant growth in each sector. The global as well as domestic markets are invested in understanding how the users interact with mobile apps on daily basis.The focus of this study is to understand what all are the services/ features of Whatsapp attract people towards its consumption and how users perceive the features important. This way purpose of the study is to categorize the WhatsApp service Quality Dimensions. Here, the authors tried to integrate Kano’s model and its quality

European Journal of Business and Management www.iiste.org ISSN 2222-1905 (Paper) ISSN 2222-2839 (Online) Vol.9, No.30, 2017
171
elements. Due to certain limitations, the present study has been carried out in the city of Ahmedabad, Gujarat state of India. 2. Review of literature This study focuses on the categorization quality dimensions of WhatsApp services and their elements. Many types of researches have been done on both the aspects (technical and nontechnical) of WhatsApp after it was launched in 2009. In their paper Fiadino, Schiavone & Casas (2015) have discussed functionality part of the most widely and fastest growing mobile application called WhatsApp. They have discovered that WhatsApp is centrally handled application from its server situated in the US. From their studies, they suggested that WhatsApp should focus on the geo- distributed network of servers instead of centrally hosting infrastructure. Many studies have been carried out by researchers to explore and understand how WhatsApp has acquired its position in the different spheres of human life (Mehta, R. K., & Bhavsar, C. D., 2017, O'Hara, Kenton P., et. al.2014, Plana, Mar Gutiérrez-Colon, et. al., 2013, Church, K., & Oliveira, R. d, 2013, Bere, A., 2012). WhatsApp offers a variety of services (features) like text messaging, sharing multimedia stuff, location sharing, to name a few. In general, quality of services plays an important role in retaining customers and make them satisfied. A huge amount of satisfied customers is a strength of firm and very much essential for the survival of the firm in a market. The quality of service can be defined in two ways ‘Perceived quality’ and ‘Objective Quality’. Conceptually, perceived quality is based on respondent’s judgment whereas the term ‘object quality’ is related to manufacturing or product. Traditionally, it was in the common practice to measure the quality of service by capturing customer’s judgment regarding quality. This way quality of the product (services) used to measure as perceived by the customer as well as it was based on the firm’s performance in delivering the services (Chang & Yeh, 2002). The perceived quality is defined by Zeithmal (1987) in his paper; perceived quality is user’s judgment about services provider’s excellence. In those years, firms used to support that notion, the perceived quality can be evaluated by the customers. Therefore it was necessary to serve their customers with good quality service to make them satisfied (Parasuraman et. al., 1988). It is quite difficult to define the good quality of any service due to five characteristics of the quality of services. These characteristics are Intangibility, Perishability, simultaneity, touchableness and heterogeneity (Sasser et. al., 1978). Parasuraman et al. (1985, 1988) are among the various researchers who had tried to define the quality of service and measured it. In their series of studies they had discussed a model called SERVQUAL which have been widely used as perceived quality model. Based on such a model, many researchers have measured the quality of services by adopting a Likert scale of five points or seven points. But adoption of such scale comes with the assumption that the level of quality of service has a linear relation with the level of satisfaction. With this concept customers normally get satisfied if the good quality of services is given to them vise verse. But many times this linearity can not be observed between the level of service quality and level of satisfaction. Practically, there are chances that this relationship notices as nonlinear. For example, it may happen that customer doesn't get satisfied after receiving even the high quality of service or reverse reaction of customer might be noticed even if they would have been served with a poor quality of service. In such situations it becomes essential to measure the service quality as per customer’s feelings/ experience. The quality of services should be viewed as per the customer’s own expectations and perceptions. The term ‘Expectations’ is customer’s feelings which are associated with the services and it's about their desire from the service provider, this is how the ‘perceived quality of service’ can be defined in most of the literature related to service quality (see for example, parasuraman et. al., 1988). Therefore to understand the expectation of consumer and then set the quality criteria for the services is the more appropriate way to gain customer’s satisfaction. Because perceived quality is related to customer’s satisfaction (Zeithaml, 1987) This way relationship between the quality of service and customer’s satisfaction may not be linear. Kano’s model helpful in understanding customers desire this way. In his review paper Rashid, M. M. (2010) has mentioned how Kano’s model adopted in various industries for the different purposes. In a variety of studies Kano’s model has been incorporated into the analysis as different Models, this includes the models for new product development, customer satisfaction, customer need, customer requirement etc. Kuo, Y. F. (2004) have done similar kind of study on web community services, through his research study he had identified the dimensions of web community service quality in Taiwan. As per authors' knowledge there is no study carried out to identify the
European Journal of Business and Management www.iiste.org ISSN 2222-1905 (Paper) ISSN 2222-2839 (Online) Vol.9, No.30, 2017
172
Quality Dimension of WhatsApp service quality along with quality elements in India. By conducting this particular research in a small part of India, the authors have tried to fill up this research gap also. 2.1 Research Objective
1) Categorize the WhatsApp service Quality Dimensions and Quality Elements
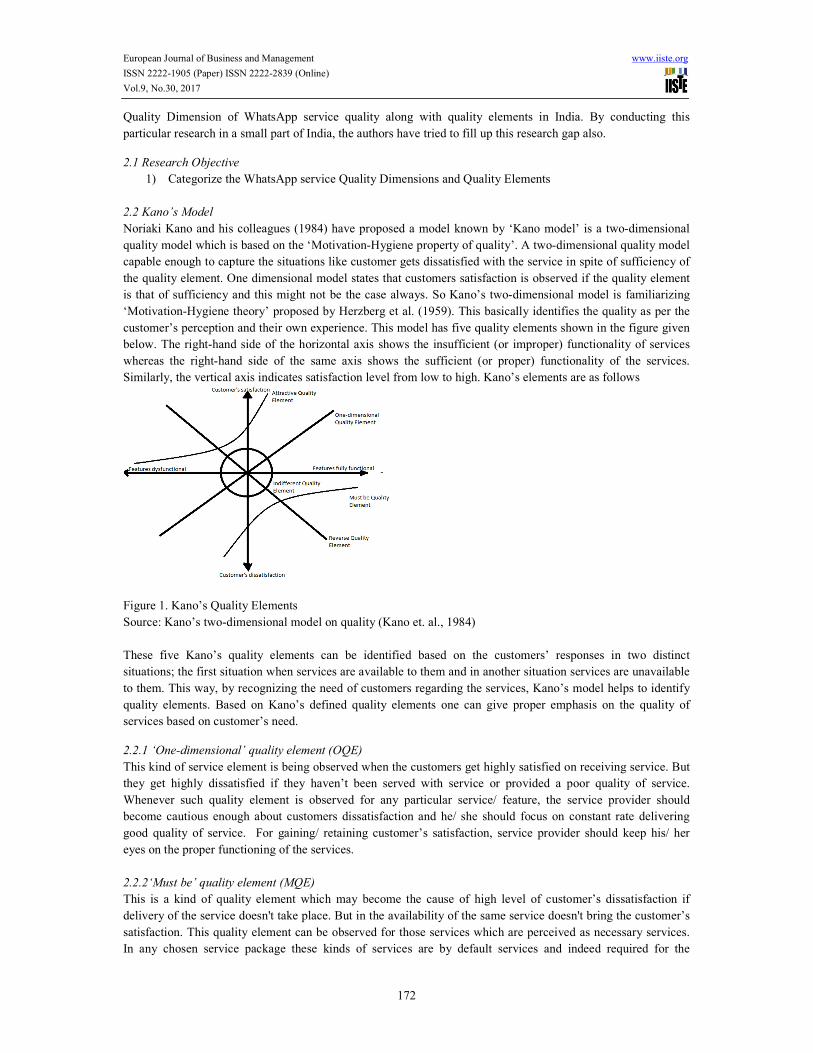
2.2 Kano’s Model Noriaki Kano and his colleagues (1984) have proposed a model known by ‘Kano model’ is a two-dimensional quality model which is based on the ‘Motivation-Hygiene property of quality’. A two-dimensional quality model capable enough to capture the situations like customer gets dissatisfied with the service in spite of sufficiency of the quality element. One dimensional model states that customers satisfaction is observed if the quality element is that of sufficiency and this might not be the case always. So Kano’s two-dimensional model is familiarizing ‘Motivation-Hygiene theory’ proposed by Herzberg et al. (1959). This basically identifies the quality as per the customer’s perception and their own experience. This model has five quality elements shown in the figure given below. The right-hand side of the horizontal axis shows the insufficient (or improper) functionality of services whereas the right-hand side of the same axis shows the sufficient (or proper) functionality of the services. Similarly, the vertical axis indicates satisfaction level from low to high. Kano’s elements are as follows
Figure 1. Kano’s Quality Elements Source: Kano’s two-dimensional model on quality (Kano et. al., 1984) These five Kano’s quality elements can be identified based on the customers’ responses in two distinct situations; the first situation when services are available to them and in another situation services are unavailable to them. This way, by recognizing the need of customers regarding the services, Kano’s model helps to identify quality elements. Based on Kano’s defined quality elements one can give proper emphasis on the quality of services based on customer’s need. 2.2.1 ‘One-dimensional’ quality element (OQE) This kind of service element is being observed when the customers get highly satisfied on receiving service. But they get highly dissatisfied if they haven’t been served with service or provided a poor quality of service. Whenever such quality element is observed for any particular service/ feature, the service provider should become cautious enough about customers dissatisfaction and he/ she should focus on constant rate delivering good quality of service. For gaining/ retaining customer’s satisfaction, service provider should keep his/ her eyes on the proper functioning of the services. 2.2.2‘Must be’ quality element (MQE) This is a kind of quality element which may become the cause of high level of customer’s dissatisfaction if delivery of the service doesn't take place. But in the availability of the same service doesn't bring the customer’s satisfaction. This quality element can be observed for those services which are perceived as necessary services. In any chosen service package these kinds of services are by default services and indeed required for the

European Journal of Business and Management www.iiste.org ISSN 2222-1905 (Paper) ISSN 2222-2839 (Online) Vol.9, No.30, 2017
173
customers. When such services are in a state of proper functioning or they are available then usually customers take it for granted. Thus availability doesn’t bring a high level of customer’s satisfaction but reduce the risk of high level of customer’s dissatisfaction. 2.2.3 ‘Attractive’ quality element (AQE) This quality element of the Kano’s model is usually found in the situation where the high level of customers’ satisfaction can be achieved by providing them certain services. But service provider’s inability to provide those certain services may not lead to customer’s dissatisfaction. So the absence of such services/ features does not become the cause of high level of customer’s dissatisfaction. The purpose of such kinds of services/ features is to attract the customers (here App users). 2.2.4 ‘Indifferent’ quality element (IQE) This quality element can be observed for the services which neither leads to the high level of customer’s dissatisfaction in their absence nor high-level customer’s satisfaction in their presence. 2.2.5‘Reverse’ quality element (RQE) The Reverse quality element of services are observed when opposite reaction of customer's satisfaction on the availability of services is noticed than the ‘One-dimensional'. Here, high level of customer’s satisfaction can be observed on the non-occurance of certain events like dysfunctioing of services; on the other hand the occureance of such events make customers highly dissatisfied. 2.2.6Questionanble When responses partaning to any certain featuare are same in both the situation of fucntional and dysfunctional then it is considered as Questionable. This study aims to integrate Kano’s model to identify Kano’s quality element for the various services (features) being offered by WhatsApp. 3. Methodologies, Results & Discussion 3.1 Sampling and Data Collection The focus group of people was those who had been using WhatsApp for at least last one year. Firstly questionnaire development process was started in the beginning of 2015 that includes personal interviews with 20 people belonged to the targeted group. A research questionnaire has been developed based on the interviews of those 20 people. Along with this, the questions have been set in the questionnaire based on Kano’s two-dimensional quality model also. This way of putting questions in the questionnaire was adopted by many researchers who have incorporated Kano’s model in their studies. The research questionnaire was split into two parts. The first part covers the information regarding demographics of the respondents, the phone they are using, applications (communication Apps) they have installed on their smartphone, their daily consumption of apps (measured in hours per day ) etc. A second part was developed based on Kano’s model and the features of WhatsApp listed below. This particular list of features appears thrice in a questionnaire. First time in functional questions and second time in dysfunctional kind of questions. A Functional form of questions describes the situations when the list of features/ services given below, are provided to users. The respondents were guided to express their feeling in any one of the following five ways; It must be that way, I like it that way, I am neutral, I dislike it that way, I can live with that way.
Broadcast Message Feature Indication mark of received messages Availability of customized privacy settings User-Friendly Backup facilities (facility to save data while changing phone) Visibility (Last seen ) Audio calling Video calling

European Journal of Business and Management www.iiste.org ISSN 2222-1905 (Paper) ISSN 2222-2839 (Online) Vol.9, No.30, 2017
174
Whatsapp web ( to continue chatting through PC) Variety in wallpaper Display Picture ( profile picture) Profile Name Group size (maximum 100) Group size (more than 100) Status Sharing Videos Sharing pictures Sharing Audio Sharing location Text Messaging
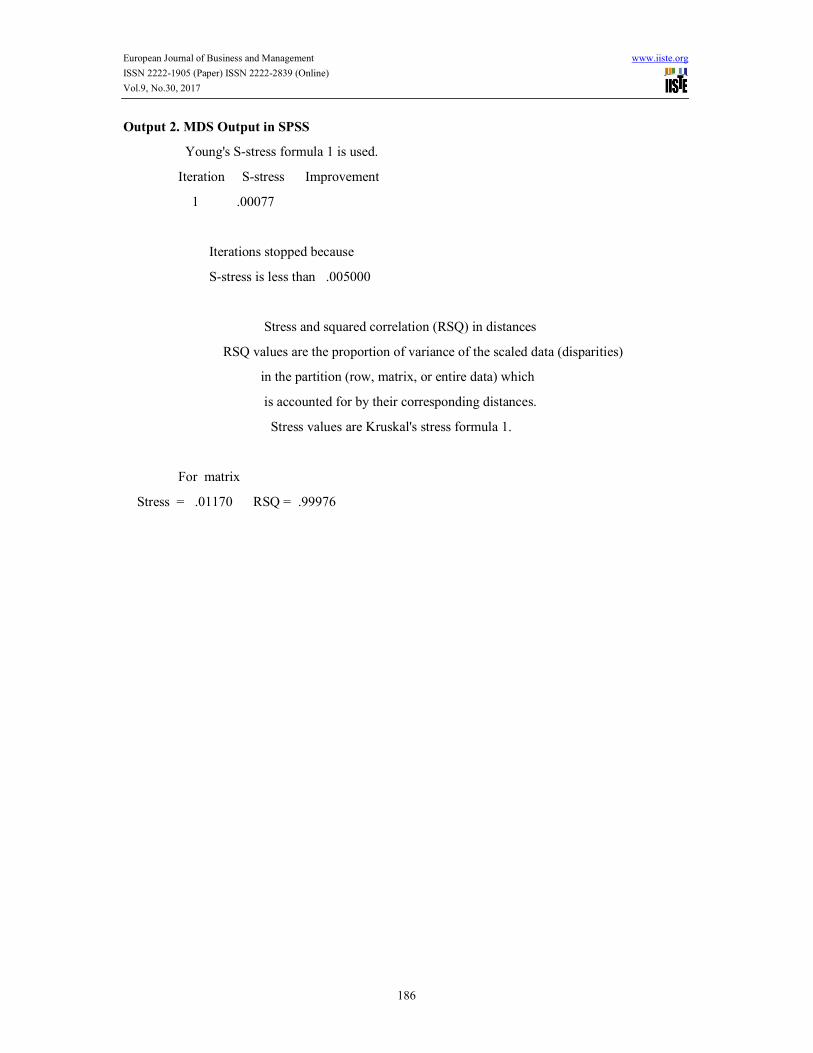
In a similar way they have been asked to express their feelings in any one the five ways mentioned above when services wouldn’t be provided to them. This way WhatsApp users’ own feelings have been captured for two types of situations when they have access of the listed features and they don’t have access. The third time the list of WhatsApp features comes in a series of questions to understand the importance of the features/ services from the respondents’ viewpoint. This way, the centers for quality management companies are using self-stated importance questionnaire parallel with the Kano questionnaire. This might be useful to understand the relative importance given to the each service/ feature by the user. This way importance of listed features of WhatApp was measured based on the five-point importance scale from “Not at all Important” to “Extremely Important” (Berger et. al., 1993). In March 2015 the research survey was conducted in a week of time span. The respondents, who met the criterion of consuming it for last one year, were selected to participate in the survey. This research survey was conducted by distributing questionnaire online which was made by using ‘Google form’. The research questionnaires were circulated to the targeted group of people who were in the social sphere of authors. Total 250 filled questionnaires were received from the respondents and 203 were validated for the research sample. The convenient sampling (Non-probabilistic) was adopted as sampling scheme. 3.2 Analysis and Discussion Though the sources like Hindustan times, Statista have suggested that WhatsApp is most widely consumed mobile communication application in India. But a survey was conducted with the respondents to verify this in the city of Ahmedabad. In the same survey respondents have mentioned about the time they normally like to spend in consuming such mobile Apps. The spending time of consumption of Apps categorized in four categories (Appendix, Table 3). A sample generated by responses of 203 respondents and then analyzed. As per the output of MDS (multidimensional scaling ) it has been clear that WhatsApp is widely used App followed by Facebook Messenger (Appendix, Chart 2 & Table 3). The results of MDS output suggests that model fit is good because stress value (0.0117) is low and R-square (0.9977) is considerably high (Appendix, output 2). This model shows the positioning of the respondents’ choice of consuming Apps on a daily basis. Here, the dimension 1 can be named as the populirity from lower to higher. In the same way, dimension 2 can be named as consumption less than hour in a day. The reliability measure Cronbach's alpha value ( 0.823) calculated for the entire sample data suggests that the data is internally consistent. A Cronbach’s alpha value (0.903) for the self-stated important scaled items is also greater than the acceptable value (0.700). A value of the same measure is 0.859 for the items come from Kano questionnaire (Appendix, output 1). Therefore, the adopted scales are reliable as alpha values for all different sections of data as well as for the entire data, are greater than accepted value (0.700) (Nunnally, 1978). 3.2.1 Analysis of Kano’s two-dimensional quality model With the help of Kano’s Evaluation table (Appendix, Table 2) the listed WhatsApp features are classified into six categories. These categories are ‘Must be’, ‘One-dimensional’, ‘Attractive’, ‘Reverse’, Indifferent’ and ‘Questionable’. Each of these categories represents Kano’s quality elements. For instance, while filling up the
European Journal of Business and Management www.iiste.org ISSN 2222-1905 (Paper) ISSN 2222-2839 (Online) Vol.9, No.30, 2017
175
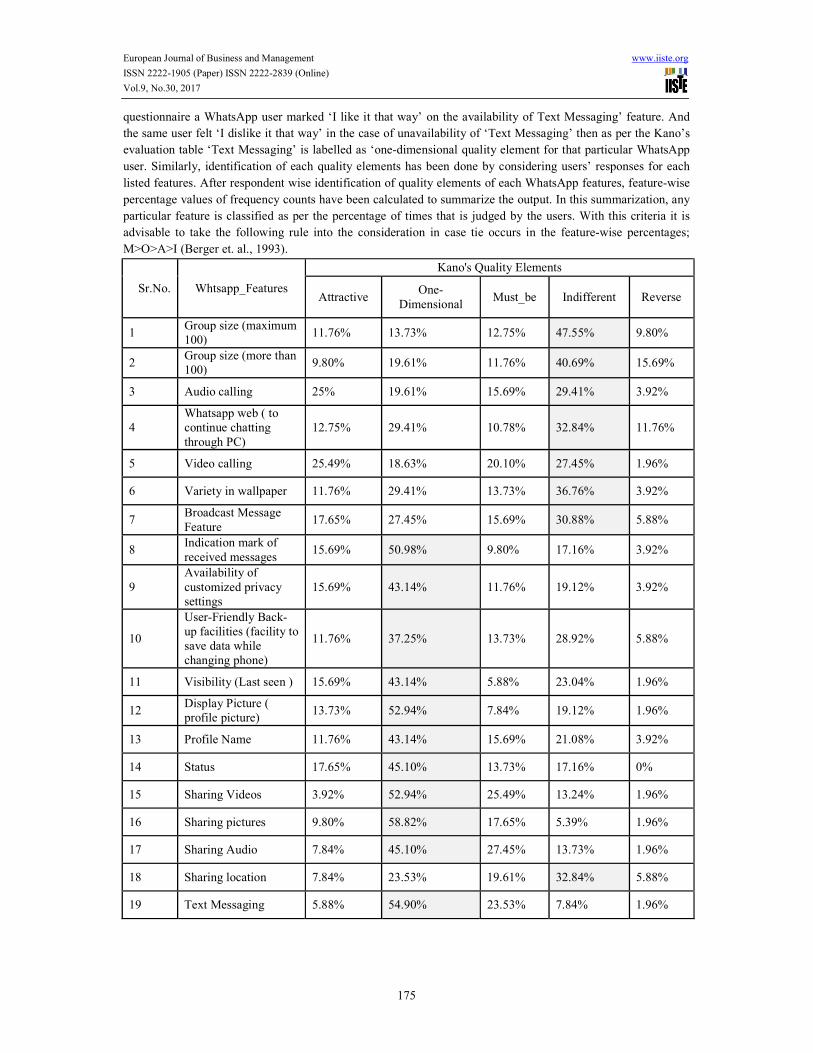
questionnaire a WhatsApp user marked ‘I like it that way’ on the availability of Text Messaging’ feature. And the same user felt ‘I dislike it that way’ in the case of unavailability of ‘Text Messaging’ then as per the Kano’s evaluation table ‘Text Messaging’ is labelled as ‘one-dimensional quality element for that particular WhatsApp user. Similarly, identification of each quality elements has been done by considering users’ responses for each listed features. After respondent wise identification of quality elements of each WhatsApp features, feature-wise percentage values of frequency counts have been calculated to summarize the output. In this summarization, any particular feature is classified as per the percentage of times that is judged by the users. With this criteria it is advisable to take the following rule into the consideration in case tie occurs in the feature-wise percentages; M>O>A>I (Berger et. al., 1993).
Sr.No. Whtsapp_Features Kano's Quality Elements
Attractive One-Dimensional Must_be Indifferent Reverse
1 Group size (maximum 100) 11.76% 13.73% 12.75% 47.55% 9.80%
2 Group size (more than 100) 9.80% 19.61% 11.76% 40.69% 15.69%
3 Audio calling 25% 19.61% 15.69% 29.41% 3.92%
4 Whatsapp web ( to continue chatting through PC)
12.75% 29.41% 10.78% 32.84% 11.76%
5 Video calling 25.49% 18.63% 20.10% 27.45% 1.96% 6 Variety in wallpaper 11.76% 29.41% 13.73% 36.76% 3.92% 7 Broadcast Message
Feature 17.65% 27.45% 15.69% 30.88% 5.88% 8 Indication mark of
received messages 15.69% 50.98% 9.80% 17.16% 3.92%
9 Availability of customized privacy settings
15.69% 43.14% 11.76% 19.12% 3.92%
10 User-Friendly Back-up facilities (facility to save data while changing phone)
11.76% 37.25% 13.73% 28.92% 5.88%
11 Visibility (Last seen ) 15.69% 43.14% 5.88% 23.04% 1.96% 12 Display Picture (
profile picture) 13.73% 52.94% 7.84% 19.12% 1.96% 13 Profile Name 11.76% 43.14% 15.69% 21.08% 3.92% 14 Status 17.65% 45.10% 13.73% 17.16% 0% 15 Sharing Videos 3.92% 52.94% 25.49% 13.24% 1.96% 16 Sharing pictures 9.80% 58.82% 17.65% 5.39% 1.96% 17 Sharing Audio 7.84% 45.10% 27.45% 13.73% 1.96% 18 Sharing location 7.84% 23.53% 19.61% 32.84% 5.88% 19 Text Messaging 5.88% 54.90% 23.53% 7.84% 1.96%
European Journal of Business and Management www.iiste.org ISSN 2222-1905 (Paper) ISSN 2222-2839 (Online) Vol.9, No.30, 2017
176
Attractive Quality Element As discussed earlier this kind of services never brings dissatisfaction in users. But with fair majority of user’s judgement, none of the feature is classified distinctively as ‘Attractive’. Though, roughly 25 % of the respondents find these two features namely ‘Audio calling’ and ‘Video calling’ as attractive. In those days these two features were not available in WhatApp but Apps like Viber, Facebook Messenger etc. had these types of features. Nowadays, these features are available in WhatsApp also. Must be Quality Element Normally, users believe that this type of features and services has to be available and should be working properly. Because they believe that such features are basic features and must be offered to them. One can consider them as necessary inbuilt features. In absence of such features or inefficient functioning of them might be the cause of high-level customer’s dissatisfaction. Here none of the WhatsApp features are classified as ‘Must be’ quality element by fair majority of respondent’s judgement. But ‘Text messaging’ is perceived as ‘Must be’ by 23 % of the total respondents (Table 1). The improper functioning of the ‘Text messaging’ might be the cause of the significant amount of dissatisfaction users. One-Dimensional Quality Element The features of WhatsApp which have been classified as one-dimensional quality elements might bring a high level of customer’s satisfaction on the availability of them. Again this can bring a high level of customer’s dissatisfaction on the unavailability of them in any such Apps. Here, such WhatsApp features are Sharing Videos, Sharing Audio, Sharing location etc. which are highlighted in Table 1. Indifferent Quality Element It has been found that users do not bother about the availability of some of the features. These features are classified as ‘Indifferent’ normally they do not become the cause of high level of customer’s satisfaction when they are unavailable. Even more, an availability of such feature does not help to gain customer’s satisfaction. For example, most of the respondents are least bother about the size of WhatsApp group. Neither an availability of a variety of inbuilt wallpapers in App make them (users) highly satisfied nor the unavailability of it make them dissatisfied. Reverse Quality Element None of the features are classified as ‘Reverse’ quality elements. Even there are very less number of respondents for whom one or more listed services are classified as ‘Reverse’ quality element. As discussed earlier, this quality element describes the situation when a user gets dissatisfied on the availability of the feature (or event of improper functioning) and satisfied in the absence of it. 3.2.2 Customer satisfaction coefficients (CSCs) There are two types of coefficients; these can be calculated based on the summarized data presented in Table 1 (Berger et. al., 1993). ‘Better’ coefficient (BC) and ‘Worse’ coefficient (WC), the formula of these coefficients are as mentioned below.
= ++ + +
= ++ + +
BC and WC give the answer of questions like; at what extent customer’s satisfaction can be influenced by any particular feature/ service? This might help in order to decide the quality of the service to satisfy user (customer). If the value of BC falls closer to ‘1’ then it indicates the high-level user’s satisfaction. At the same time, the value of WC falls near ‘-1’ then a high level of user’s dissatisfaction can be associated with the absence/ poor quality of that particular feature of WahtsApp. The values of these coefficients are calculated for listed features of WhatsApp (Appendix, Table 4). In Figure 2, the graphical output is given that is based on the values of both

European Journal of Business and Management www.iiste.org ISSN 2222-1905 (Paper) ISSN 2222-2839 (Online) Vol.9, No.30, 2017
177
the coefficients by considering the positive value of ‘Worse’. There are two lines have been drawn on the plot based on the median values which divide the entire plot into four quadrants. These quadrants are nothing but suggested quality dimensions.
Figure 2. Four Quality Dimensions based on Customer Satisfaction Coefficients Dimension one: Any feature which falls into this dimension do not lead to higher level of customer’s satisfaction in the availability of the features of mobile App. But at the same time if customer’s demand of such features is unfulfilled then it brings a high level of customer’s dissatisfaction. Here, only one of the WhatsApp features fall into this dimension, which is ‘User-Friendly Backup facilities’. But again this falls on the borderline between dimension one and dimension three, in addition to this its graphical position is not considered far from the dimension two. Dimension two: WhatsApp features of this dimension bring a high level of customer’s satisfaction in all those cases when features are provided to customers and they are functioning properly. In other words these are the features which perceived as necessary features by the users, if users are provided these features then dissatisfaction level can be reduced at a higher level. On the other hand absence of such features in App may bring moderate to high level of dissatisfaction. So, it is mandatory for the App developer to offer these kinds of features to their users (customer) with high quality because the poor quality of them may results in dissatisfaction at users’ end. The WhatsApp features listed under this dimension are Text Messaging, Profile picture (Display profile), Status, Privacy settings etc. Dimension three: The absence or presence of these features neither becomes the cause of high level of satisfaction nor dissatisfaction. The features like Broadcast Message Feature, Group size (maximum 100), Variety in wallpaper, Sharing location etc. are noticed under third quality dimensions. The Kano’s quality element observed for all the features of this dimension is IQE (Indifferent Quality Element). As per the analysis of the responses majority of the WhatsApp users do not bother much about the quality of these features. The

European Journal of Business and Management www.iiste.org ISSN 2222-1905 (Paper) ISSN 2222-2839 (Online) Vol.9, No.30, 2017
178
majority of them may satisfy at lower to moderate level if these features are of good quality, on the other hand poor quality of such features may bring dissatisfaction at lower to a moderate level. Dimension Four: None of the WhatsApp features have been observed to fall in this quadrant. If any feature would have been noticed under this dimension then that could have been brought a high level of customer’s satisfaction on the availability of the features and they wouldn’t be the cause of high level of the customer’s dissatisfaction in the absence of the features in App. 3.2.3 Importance of features as per the users To add more clarity on the above quality dimensions, the authors have analyzed the data of self- stated importance values received from the 203 respondents across the same set of WhtasApp features. As stated in the review of the literature, one of the purposes is to understand the importance of different WhatsApp features as perceived by the users. As per the Exploratory Factor Analysis four factors have been derived. The findings suggest that Factor Analysis is adequate to use because KMO is good (0.844> prescribed level 0.05). The extraction process is done by considering the Eigenvalues greater than one, the percentage of the variance explained by the present model is 65.621 and the method of rotation of factor loadings was varimax. Most of the factor loadings are greater than 0.6 except few. The method of extraction was Principle Component Analysis. Following are the results from the table given below. Whtsapp_features
Membership of Dimensions
Factor_loadings Additional Features Group size (maximum 100) 3 0.858 Group size (more than 100) 3 0.779 Audio calling 3 0.777 Whatsapp web ( to continue chatting through PC) 3 0.767 Video calling 3 0.628 Variety in wallpaper 3 0.595 Broadcast Message Feature 3 0.525

European Journal of Business and Management www.iiste.org ISSN 2222-1905 (Paper) ISSN 2222-2839 (Online) Vol.9, No.30, 2017
179
Whtsapp_features
Membership of Dimensions
Factor Loadings
Privacy Related Features Indication mark of received messages 2 0.764 Availability of customized privacy settings 2 0.751 User-Friendly Backup facilities (facility to save data while changing phone) 1 0.735 Visibility (Last seen ) 2 0.717 Necessary Profile Features Display Picture ( profile picture) 2 0.84 Profile Name 2 0.828 Status 2 0.784 Text Messaging 2 0.425 Features for Sharing Multimedia files Sharing Videos 2 0.855 Sharing pictures 2 0.795 Sharing Audio 2 0.725 Sharing location 3 0.528
All the features associated with the three factors (Privacy Related Features, Necessary Features & Features for Sharing Multimedia files) are falling under the Quality Dimension-two except two features. That means WhatsApp users perceived these as required features. These are some of the basic requirements of WhtsApp users observed in the city of Ahmedabad. Here, users don’t want to compromise with the availability of such features in Apps. As long as the good quality (in terms of functionality) of such features is delivered to them they hardly get dissatisfied with the App. A feature is known as ‘User-Friendly Backup facilities’ is considered as a one-dimensional quality element by 37 % the respondents but on the other hand roughly 40 % ( 29.92% perceived as indifferent & 11.76% as Attractive ) of the respondents won’t be dissatisfied if the poor quality of it will be served to them. A similar interpretation can be made for ‘Sharing Location’ which comes under factor namely ‘Features for sharing Multimedia files’. Approximately 42% (23.53 % Perceived as OQE and 19.61 % as MQE) of the users can be dissatisfied if they won’t find this feature functioning properly. But as per the Kano’s evaluation table, the quality element for this feature is IQE. The features associated with the first factor are perceived IQE by the majority of the respondents. These are the features which can be considered as little bit necessary features for the users. The features affiliated with the factors namely ‘Additional Features’ are evaluated as IQE. In addition to this, the features associated with this factor belong to Quality Dimension-three so it is named as ‘Additional Features’. So, there are two considerable Quality Dimensions can be derived using CSCs and four factors derived based on the data of self-stated importance of different features. These four factors fairly associated with the Quality dimensions. As discussed above the first factor associated with Quality Dimension-three and other three factors are associated with Quality Dimension two. As discussed above Whatsapp features belongs to Quality Dimension three and First Factor, are perceived as IQE by the majority of users so this Quality Dimension is named as ‘Additional Features’. Whereas most of the features associated with the Quality Dimension two and three Factors (Privacy Related Features, Necessary Features & Features for Sharing Multimedia files) are classified as OQE by users. This particular Quality Dimension should be named as ‘Essential features’. Therefore, App Provider or new App developer should focus more on the features belong to Quality Dimension-two (Essential Features) than Features of Dimension-one (Additional Features). 4. Conclusion The current study focuses on deriving Quality Dimensions of WhatsApp features and quality elements as per the users’ own feelings. To map the feelings of respondents on utilizing various features of mobile communication application like WahtsApp Kano’s Model have been adopted. Subsequently customer satisfaction coefficients and factor analysis are chosen to analyze data and found out the underlying Quality Dimensions. There are

European Journal of Business and Management www.iiste.org ISSN 2222-1905 (Paper) ISSN 2222-2839 (Online) Vol.9, No.30, 2017
180
majorly two Quality Dimensions ‘Essential features’ and ‘Additional Features’ which are confirmed through analysis. New App developer should ensure that availability of features belong to Quality Dimension namely ‘Essential Features’ is mandatory to make their users satisfied. The users might be happy if uninterrupted services of these features of ‘Essential Feature’ are serving to them. At the time of data collection in 2015, for a considerable number of respondents were perceived the features like ‘Video calling’ and ‘Audio calling’ as OQE and MQE. Later on these features were introduced in WhatsApp. This study with Whatsapp service along with findings might be useful to App developers to design the various features in their Apps. 5. Limitation and Future Research The authors tried to categorize the underlying quality dimensions of WhatsApp features as per the research sample of WhatsApp users belong to the city of Ahmedabad. The city’s population is more than 5 million and the considered sample size is quite small. Due to a limited fund available to them, responses gathered from only 203 people. The extension of the current research will be conducted in the near future with the greater sample size and with the coverage of more demographics region of the country of rural and urban segments. References Bere, A. (2012). A comparative study of student experiences of ubiquitous learning via mobile devices and learner
management systems at a South African university. Proceedings of the 14th Annual Conference on World Wide Web Applications. Cape Penisula University of Technology http://www.zaw3.co.za/index.php/ZA-WWW/2012/paper/viewFile/537/160.
Berg, F., Mausner, B. & Snyderman, B. B. (1959). The Motivation to Work (New York: Wiley). Berger, C., Blauth, R., Boger, D., Bolster, C., Burchill, G., DuMouchel, W., ... & Timko, M. (1993). Kano’s
methods for understanding customer-defined quality. Center for quality management journal, 2(4), 3-12. Census of India Website: Office of the Registrar General & Census Commissioner, India. (2017).
Censusindia.gov.in. Retrieved 6 May 2017, from http://www.censusindia.gov.in/2011census/hlo/HLO_Tables.html
Chang, Y., & Yeh, C. (2002). A survey analysis of service quality for domestic airlines. European Journal Of Operational Research, 139(1), 166-177. http://dx.doi.org/10.1016/s0377-2217(01)00148-5
Church, K., & Oliveira, R. d. (2013). What's up with WhatsApp? Comparing mobile instant messaging behaviors with traditional SMS. MOBILE HCI – Collaboration and Communication, (pp. 352-361). Munich, Germany.
Fiadino, P., Schiavone, M., & Casas, P. (2015). Vivisecting WhatsApp in Cellular Networks: Servers, Flows, and Quality of Experience. TMA, 15, 49-63.
Forbes Welcome. (2017). Forbes.com. Retrieved 23 January 2017, from http://www.forbes.com/sites/krnkashyap/2016/12/25/this-is-the-1-4b-indian-chat-app-
challenging-whatsapp-in-india/#70d3499c7b90 Kuo, Y. F. (2004). Integrating Kano’s model into web-community service quality. Total Quality Management &
Business Excellence, 15(7), 925-939. O'Hara, K., Massimi, M., Harper, R., Rubens, S., & Morris, J. (2014). Everyday dwelling with WhatsApp.
Proceedings of the 17th ACM conference on Computer supported cooperative work & social computing (pp. 1131-1142). ACM, Baltimore, MD, USA.
Parasuraman, A., Zeithaml, V., and Berry, L. L. (1985) A conceptual model of service quality and its implications for future research. Journal of Hospitality & Leisure marketing, Vol. 3., 5-17.
Parasuraman, A., Zeithaml, V., and Berry, L. L. (1988) Servqual: A multiple-item scale for measuring customer perception of service quality. Journal of Retailing, Vol. 64. No. 1, 12-40.
Plana, M. G. C., Escofet, M. I. G., Figueras, I. T., Gimeno, A., Appel, C., & Hopkins, J. (2013). Improving
European Journal of Business and Management www.iiste.org ISSN 2222-1905 (Paper) ISSN 2222-2839 (Online) Vol.9, No.30, 2017
181
learners’ reading skills through instant short messages: A sample study using WhatsApp. Proceeding of WorldCall 2013-Call: Sustainability and Computer-Assisted Language learning (pp.80-84). University of Ulster, Glasgow.
Rashid, M. M. (2010). A review of state-of-art on Kano model for research direction. International Journal of Engineering Science and Technology, 2(12), 7481-7490
Saseer, W. E., Olsen, R. P., & Wyckoff, D. D. (1978). Management of service operation: Text and cases. Boston:
Allyn & Bacon. WhatsApp: number of monthly active users 2013-2017 | Statistic. (2017). Statista. Retrieved 6 May 2017, from https://www.statista.com/statistics/260819/number-of-monthly-active-whatsapp-users/ Zeithaml, V. (1987). Defining and relating price, perceived quality, and perceived value. Cambridge: MA:
Marketing Science Institute.
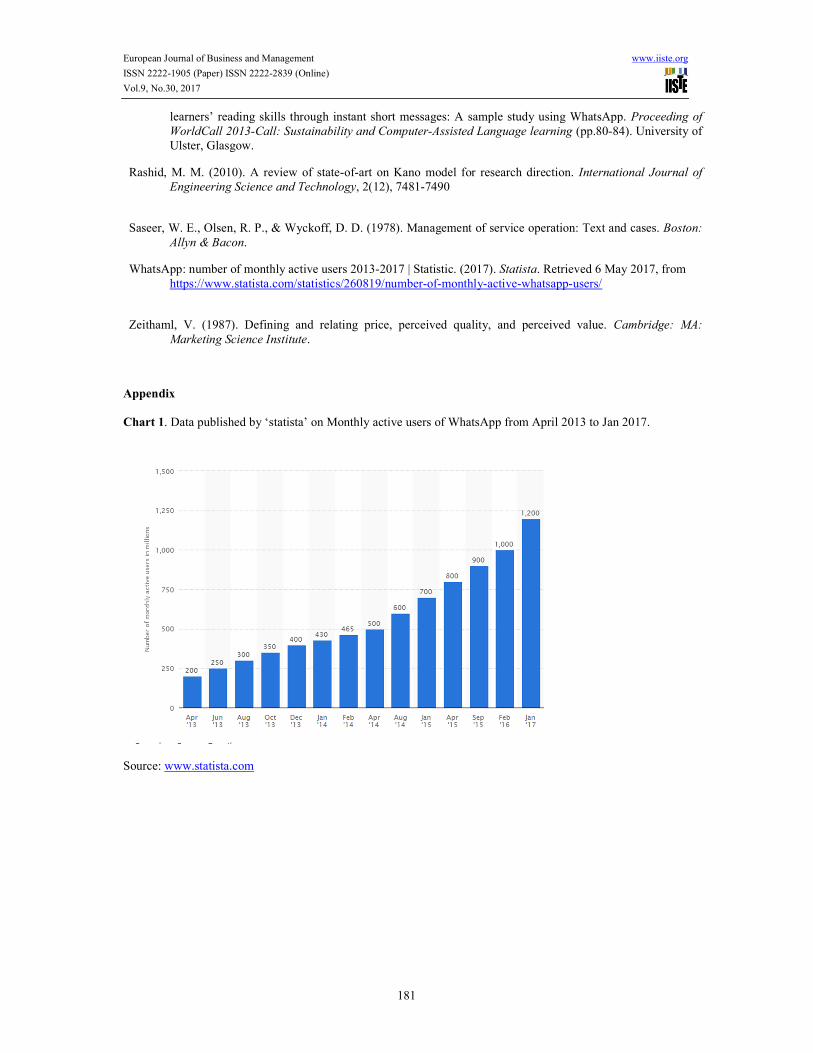
Appendix Chart 1. Data published by ‘statista’ on Monthly active users of WhatsApp from April 2013 to Jan 2017.
Source: www.statista.com
European Journal of Business and Management www.iiste.org ISSN 2222-1905 (Paper) ISSN 2222-2839 (Online) Vol.9, No.30, 2017
182
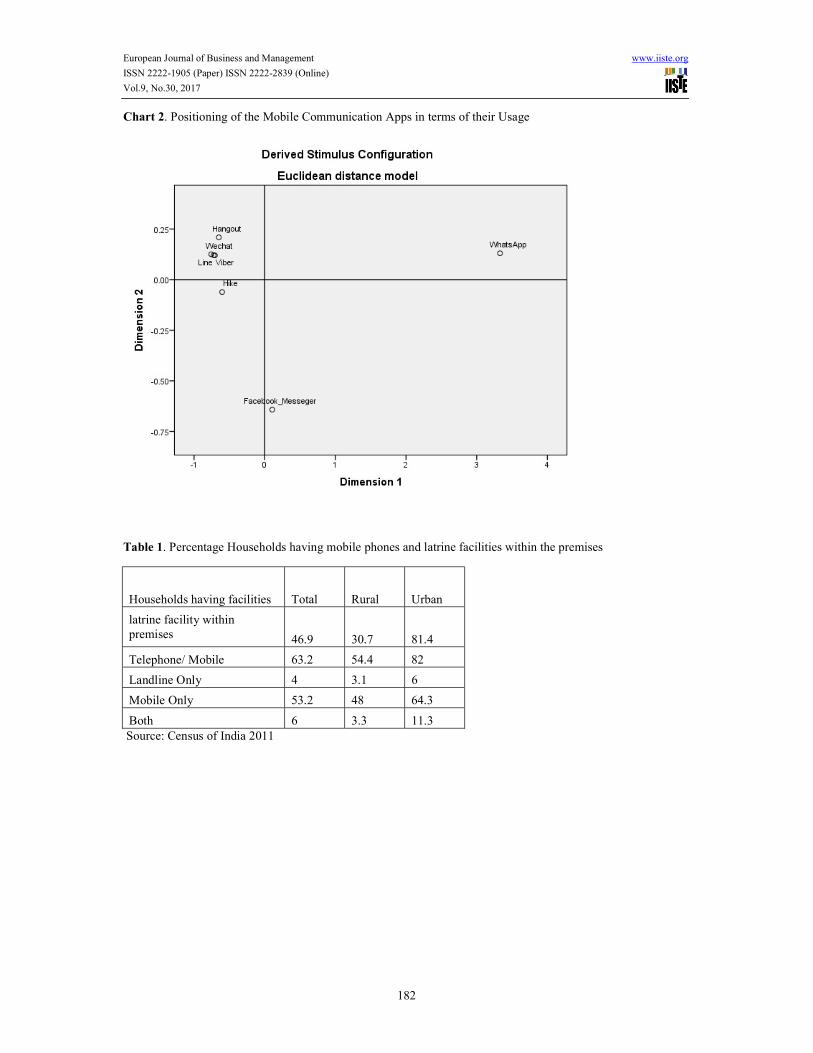
Chart 2. Positioning of the Mobile Communication Apps in terms of their Usage
Table 1. Percentage Households having mobile phones and latrine facilities within the premises
Households having facilities Total Rural Urban latrine facility within premises 46.9 30.7 81.4 Telephone/ Mobile 63.2 54.4 82 Landline Only 4 3.1 6 Mobile Only 53.2 48 64.3 Both 6 3.3 11.3
Source: Census of India 2011
European Journal of Business and Management www.iiste.org ISSN 2222-1905 (Paper) ISSN 2222-2839 (Online) Vol.9, No.30, 2017
183
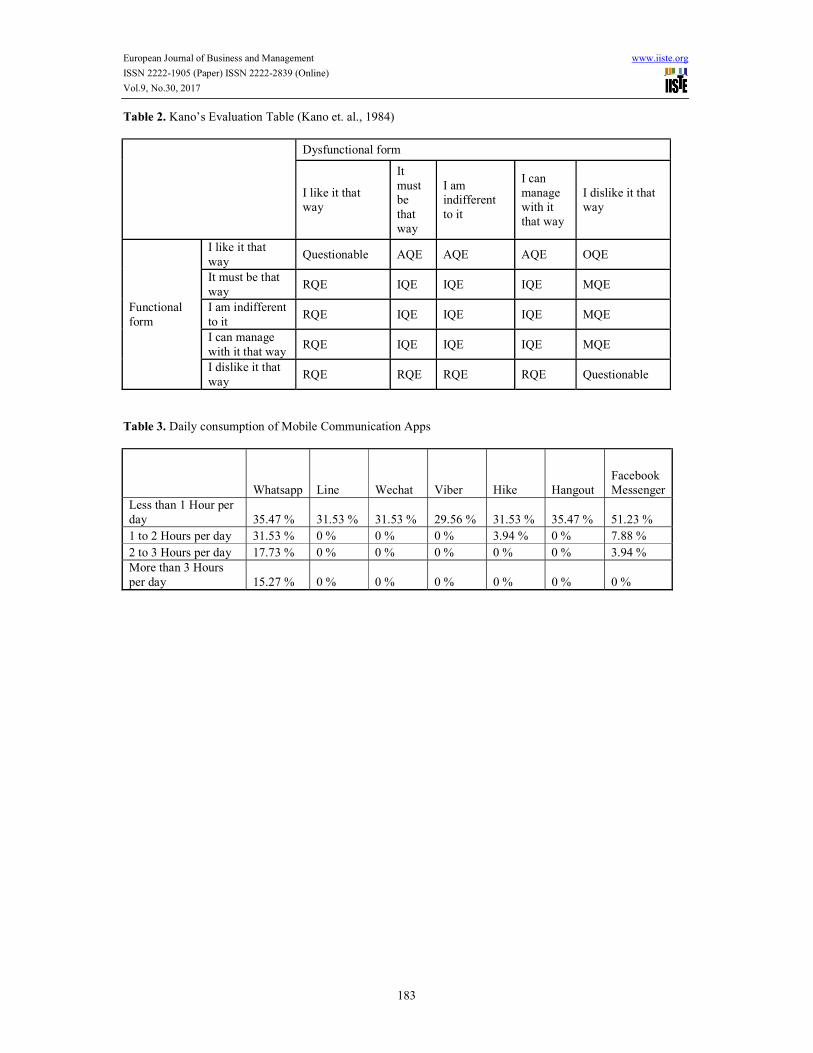
Table 2. Kano’s Evaluation Table (Kano et. al., 1984)
Dysfunctional form
I like it that way
It must be that way
I am indifferent to it
I can manage with it that way
I dislike it that way
Functional form
I like it that way Questionable AQE AQE AQE OQE It must be that way RQE IQE IQE IQE MQE I am indifferent to it RQE IQE IQE IQE MQE I can manage with it that way RQE IQE IQE IQE MQE I dislike it that way RQE RQE RQE RQE Questionable
Table 3. Daily consumption of Mobile Communication Apps
Whatsapp Line Wechat Viber Hike Hangout Facebook Messenger
Less than 1 Hour per day 35.47 % 31.53 % 31.53 % 29.56 % 31.53 % 35.47 % 51.23 % 1 to 2 Hours per day 31.53 % 0 % 0 % 0 % 3.94 % 0 % 7.88 % 2 to 3 Hours per day 17.73 % 0 % 0 % 0 % 0 % 0 % 3.94 % More than 3 Hours per day 15.27 % 0 % 0 % 0 % 0 % 0 % 0 %

European Journal of Business and Management www.iiste.org ISSN 2222-1905 (Paper) ISSN 2222-2839 (Online) Vol.9, No.30, 2017
184
Table 4. WhatsApp feature wise Customer satisfaction coefficients
Whtsapp_Features Better Worse
Group size (maximum 100) 0.2971 -0.3087 Group size (more than 100) 0.3593 -0.3832 Audio calling 0.4973 -0.3935 Whatsapp web ( to continue chatting through PC) 0.4915 -0.4685 Video calling 0.4813 -0.4225 Variety in wallpaper 0.4492 -0.4707 Broadcast Message Feature 0.4920 -0.4706 Indication mark of received messages 0.7121 -0.6492 Availability of customized privacy settings 0.6558 -0.6120 User-Friendly Backup facilities (facility to save data while changing phone) 0.5347 -0.5562 Visibility (Last seen ) 0.6704 -0.5586 Display Picture ( profile picture) 0.7121 -0.6492 Profile Name 0.5989 -0.6418 Status 0.6701 -0.6283 Sharing Videos 0.5948 -0.8205 Sharing pictures 0.7486 -0.8343 Sharing Audio 0.5625 -0.7708 Sharing location 0.3743 -0.5147 Text Messaging 0.6596 -0.8511

European Journal of Business and Management www.iiste.org ISSN 2222-1905 (Paper) ISSN 2222-2839 (Online) Vol.9, No.30, 2017
185
Output 1. Reliability Analysis Case Processing Summary
N % Cases Valid 203 100.0
Excludeda
0 .0 Total 203 100.0
a. Listwise deletion based on all variables in the procedure.
For entire sample Reliability Statistics Cronbach's Alpha
N of Items
.823 73 For the self-stated importance scaled items Reliability Statistics Cronbach's Alpha
N of Items
.903 19 For the scaled items of Kano’s questionnaire Reliability Statistics Cronbach's Alpha
N of Items
.864 38
European Journal of Business and Management www.iiste.org ISSN 2222-1905 (Paper) ISSN 2222-2839 (Online) Vol.9, No.30, 2017
186
Output 2. MDS Output in SPSS Young's S-stress formula 1 is used. Iteration S-stress Improvement 1 .00077 Iterations stopped because S-stress is less than .005000 Stress and squared correlation (RSQ) in distances RSQ values are the proportion of variance of the scaled data (disparities) in the partition (row, matrix, or entire data) which is accounted for by their corresponding distances. Stress values are Kruskal's stress formula 1. For matrix Stress = .01170 RSQ = .99976
Copyright © 2022 FDOKUMEN