Integrated Urban Development Strategy - World Bank Document
411
PLOIEșTI Growth Pole The Integrated Urban Development Strategy for The Integrated Urban Development Strategy 2014-2020 Romania Regional Development Program 2 Public Disclosure Authorized Public Disclosure Authorized Public Disclosure Authorized Public Disclosure Authorized
-
Upload
khangminh22 -
Category
Documents
-
view
1 -
download
0
Transcript of Integrated Urban Development Strategy - World Bank Document

PloieștiGrowth Pole
the integrated Urban Development Strategy
for
the integrated Urban Development Strategy
2014-2020
Romania Regional Development Program 2
Pub
lic D
iscl
osur
e A
utho
rized
Pub
lic D
iscl
osur
e A
utho
rized
Pub
lic D
iscl
osur
e A
utho
rized
Pub
lic D
iscl
osur
e A
utho
rized

This integrated development strategy was prepared by a core team comprised of Sorina Racoviceanu, Marius Cristea, Andreea China, Dumitru Sandu, Adina Croitoru, Ciprian Moldovan, Titus Man, Raularian Rusu, Catalina Iamandi, Silviu Ciobanu, Ioana Ciucanu, Marcel Ionescu-Heroiu, Sebastian Burduja, Adina
Vințan, Florin Cosma, Ioana Herbel, and Ionut Rus.
The team would like to thank David Sislen, Elisabetta Capannelli, Elisabeth Huybens, Jean-Francois Marteau, Bernice Van Bronkhorst and the Romania Portfolio Team for the advice, support, and guidance
provided throughout the elaboration of this report. The team would also like to thank Growth Pole Coordinator Cozia Georgescu and the Regional Development Agency South Muntenia for the timely
feedback, the support offered in the elaboration of this study, and the excellent collaboration throughout.
The findings, interpretations, and conclusions expressed in this report do not necessarily reflect the views and position of the Executive Directors of the World Bank, the European Union, or the
Government of Romania.
PloieștiGrowth Pole
the integrated Urban Development Strategy
for
the integrated Urban Development Strategy
2014-2020
1
Romania Regional Development Program 2

table of Contents
introduction ................................................................................................AnneX 1 IDP 2007-2015 implementation stage ..........................................................................................................................................
PArt I: the Growth Pole’s Profile ....................................................
1. Analysis of Development needs and Areas of intervention ...............................
1.1. People and territory .....................................................................................................................................AnneX 1.1 ZUP list in Ploiești (2007-2014) .................................................................................................................................
1.2. economy .............................................................................................................................................................
1.3. environment .....................................................................................................................................................
1.4. Connectivity .....................................................................................................................................................
1.5. infrastructure and Public Utilities ........................................................................................................AnneX 1.5.1 Water-Sewerage system in Prahova County ....................................................................................................................
1.6. Public Services and housing .....................................................................................................................AnneX 1.6.2. Current state of primary and secondary school infrastructure in the Ploiești-Prahova Growth Pole ....
AnneX 1.6.3. Current state of Ploiești preschool infrastructure .......................................................................................................
1.7. Culture and leisure .......................................................................................................................................AnneX 1.7.1. List of Historical Monuments (2010) in Ploiești Growth Pole ................................................................................
AnneX 1.7.2. List of cultural events organized in Ploiești Growth Pole (2014) ........................................................................
2. territorial Diagnosis and Strategy recommendations ........................................
2.1. Conclusions on Development needs ......................................................................................................
2.2. Swot Analysis ..............................................................................................................................................
2.3.Conclusions on the integrated Diagnosis and intervention Areas ..........................................
PArt ii: the integrated Strategy for the Growth Pole ..........
3. Development Vision and objectives ..............................................................................
4. Project Portfolio ......................................................................................................................
5. recommendations for improving the institutional Framework at the level of Ploiești-Prahova Growth Pole in the 2014-2020 Programming Period ........
1224
38
41
43
90
99
143
163
193
226
233
288
294
299
310
320
325
327
359
367
370
373
387
419

ACoP Administrative Capacity Operational Programme
ACDoP Administrative Capacity Development Operational Programme
AnAt National Authority for Tourism Agencies in Romania
AnCoM National Authority for Administration and Regulation in Communications
AnCSi National Authority for Scientific Research and Innovation
Anl National Authority for Housing
Ant National Authority for Tourism
APDt Ph Association for Tourism Promotion and Development in Prahova
CAtV TV – Cable
CC County Council
CeStrin Center for Informatics and Road Technical Studies
CF Cohesion Fund
CllD Community-Led Local Development
CoP Competitiveness Operational Programme
CnADnr National Highways and National Roads Company
Cr County Road
DCh Didactic Corp House
DG SCP Directorate General for Social and Child Protection
DPoP Disadvantaged People Operational Programme
erDF European Regional Development Fund
eSF European Social Fund
eU European Union
GCPh General Census for Population and Housing
GD Government Decision
GDP Gross Domestic Product
GeF Global Environment Facility
GP Growth Pole
GPS Global Positioning System
Gor Government of Romania
GtMP General Transport Master Plan
GUP General Urbanistic Plan
hCoP Human Capital Operational Programme
hrD SoP Human Resources Development Sectoral Operational Programme
iBrD International Bank for Reconstruction and Development
iCt Information and Communications Technology
iDA Intercommunity Development Association
iDA PlPhGP Intercommunity Development Association Ploiești-Prahova Growth Pole
list of Acronyms
4

iDP Integrated Development Plan
ieC SoP Increase of Economic Competitiveness Sectoral Operational Programme
iee Intelligent Energy Europe
KAi Key Area of Intervention
lhDi Local Human Development Index
lioP Large Infrastructure Operational Programme
lPA Local Public Administration
MeF Ministry of European Funds
MrDPA Ministry of Regional Development and Public Administration
niC National Investment Company
niS National Institute of Statistics
nGo Non-Governmental Organization
nPArD National Programme for Agriculture and Rural Development
nr National Road
oP Operational Programme
PA Priority Axis
PnDi National Program for Infrastructure Development
PnDl National Local Development Program
PPP Public-Private Partnership
PSD Partnership for Sustainable Development
PUB Polytechnic University of Bucharest
rDA Regional Development Agency
rDP Regional Development Plan
roP Regional Operational Programme
rSA Romanian Salubrity Association
SMe Small and Medium Enterprises
SoP Sectoral Operational Programme
Swot Strengths, Weaknesses, Opportunities, and Threats
tAU Territorial-Administrative Unit
tAUriS Territorial-Administrative Unit Register Information System
ten-r Trans-European Network-Railway
ten-t Trans-European Network-Transport
UDiS Urban Development Integrated Strategy
UDSS Urban Development Support Structure
UPG Oil and Gas University
wiMS Waste Information Management System
ZUP Zonal Urbanistic Plan
5

7
introDUCtion

1 Monthly report on the state of implementation of priority projects related to the IDP for PLOIEȘTI Growth Pole (CMC Decision no. 28 / 12.07.2012)
introduction0.1. The need and objectives of the Integrated Urban Development Plan
In 2012, the World Bank signed five agreements with MRDPA for advisory services, out of which one relates to the growth poles policy and to its improvement for the programming period 2014-2020. This agreement has three components: 1) an analysis of the growth poles policy, 2) energy efficiency studies for each growth pole; and 3) a review of the Integrated Development Plans prepared by the growth poles for the period 2007-2013.
In this context, South Muntenia Regional Development Agency, through the coordinator of Ploiești Growth Pole, requested the World Bank, under a project funded by ERDF through the Technical Assistance Operational Programme 2007-2013, to support the Growth Pole in implementing the recommendations stemming from the previous analysis with: 1) updating the Integrated Development Plan for 2014-2020; and 2) proposing an improved institutional framework for coordinating the planning, implementation and monitoring of projects under this plan.
The current document of the Integrated Development Plan belonging to Ploiești Growth Pole was developed during the period 2008-2009 and approved / submitted to South Muntenia RDA in April 2010. It contains a total number of 93 projects with a total value of RON 5,136,143,583.91, out of which 762,515,322.81 are EU funds, and the remainder comes from the national budget and the beneficiaries’ own contribution1. In the process of updating the plan, the implementation status of these projects will be studied further, and attention will be also given to unimplemented projects in order to see whether they will be included in the documentation, depending on their response to the new development conditions of the growth pole.
Distribution of projects’ by intervention areas / sectoral targets and funding, as well as the current status of project implementation (as of March 2015) are detailed in Annex 1, as follows:
onGoinG ProjeCtS FinAliZeD ProjeCtSProjeCtS not SUBMitteD/ BACKUP, UnDer ASSeSSMent, or rejeCteD
number and value number and value number and value
Co-financing source Beneficiary Co-financing source Beneficiary Co-financing source Beneficiary
Sectoral objective A1 - Support investments in clean technologies, high level manufacturing, energy efficiency and alternative energies technology solutions, and in adjacent infrastructure
2 (43,210,490.82 lei) 6 (57,160,379.42 lei) 2 (11,934,079 lei)
ROP/PA1
SOP IEC/PA4
Prahova county
Dumbrăvești
commune
-
Environment Fund
Environment Fund
Environment Fund
Environment Fund
Environment Fund
Dalkia
Prahova county
Prahova county
Valea Călugărească
Boldești-Scăeni
Băicoi
SOP IEC/PA4
Environment Fund
Valea Călugărească
Prahova county
table 0.1.1. IDP 2007-2013 implementation status
8

onGoinG ProjeCtS FinAliZeD ProjeCtSProjeCtS not SUBMitteD/ BACKUP, UnDer ASSeSSMent, or rejeCteD
number and value number and value number and value
Co-financing source Beneficiary Co-financing source Beneficiary Co-financing source Beneficiary
Sectoral objective A2 - Active involvement of R&D sector in the development of new products and technologies
1 (56,296,069 lei) 2 (30,838,900 lei) -
SOP IEC/PA1 OGU, PUB, Prahova
county, Ploiești municipality, IDA, Pl.GP.Ph, private
companies
SOP IEC/PA2
SOP IEC/PA2
OGU Ploiești
OGU Ploiești
Sectoral objective A3 - Supporting the development of economic activities in the Growth Pole area
2 (3,200,400,000 lei) - -
- Alianso GroupWPD -
Development Ro
Sectoral objective B1 - Connecting with the European road network and building a modern infrastructure for the access to economic areas, parks / industrial sites and other functional areas, while developing an efficient and clean urban transport in the growth pole area
6 (944,414,250.04 lei) 3 (108,954,273.41 lei) 9 (246,542,797.51 lei)
ROP/PA1
ROP/PA1
ROP/PA1
ROP/PA1
ROP/PA1
ROP/PA1
Ploiești municipality
Ploiești municipality
Prahova county
Ploiești municipality
Ploiești municipality
Ploiești municipality
ROP/PA1
ROP/PA2
-
Prahova county
Prahova county
Prahova county
-
ROP/PA1
ROP/PA1
ROP/PA1
ROP/PA1
PNDR
Environment Fund
PNDR
Ploiești municipality
Ploiești municipality
IDA GP
Băicoi
Ploiești municipality
Ploiești municipality
Târgșoru V.
Dumbrăvesti
Dumbrăvești
Sectoral objective B2 - Protecting the environment and human health by providing quality public services
3 (824,844,067.6 lei) - 2 (21,226,038 lei)
SOP Environ./PA2
SOP Environ./PA1
BIRD+GEF
Prahova county
Hidro Prahova
Prahova county
Heating Program
Environment Fund
Ploiești municipality
Valea Călugărească
Sectoral objective B3 - Harness the natural, traditional, cultural and historical heritage, develop tourism and recreation areas, support environmental protection actions and the development of green spaces; develop the historical and cultural heritage of the area
5 (211,644,631.09 lei) 9 (15,660,849.51 lei) 8 (24,845,693.31 lei)
ROP/PA1
ROP/PA1
ROP/PA1
ROP/PA1
ROP/PA5
Ploiești municipality
Ploiești municipality
Prahova county
Ploiești municipality
Monastery
(Târgșoru V.)
ROP/PA5
ROP/PA5
ROP/PA5
SOP Environ./PA4
-
Environment Fund
Environment Fund
Environment Fund
NP-NIC
Prahova county
Valea Călugărească
Dumbrăvești
County Museum
Plopeni
Ploiești municipality
Băicoi
Valea Călugărească
Plopeni
Plopeni
ROP/PA1
ROP/PA1
ROP/PA5
ROP/PA5
Environment Fund
PNDI
ROP/PA5/
Env. Fund
M. Ploiești
Jud. Prahova
Brazi, Ariceștii Rahtivani, s.a.
F. C. Stere – Bucov
Boldești-Scăeni
Jud. Prahova
Parohie – Berceni
C. Dumbrăvești
9

onGoinG ProjeCtS FinAliZeD ProjeCtSProjeCtS not SUBMitteD/ BACKUP, UnDer ASSeSSMent, or rejeCteD
number and value number and value number and value
Co-financing source Beneficiary Co-financing source Beneficiary Co-financing source Beneficiary
Sectoral objective C1 - Increase the quality of social infrastructure through investments dedicated to disadvantaged groups and support their reintegration into society
3 (14,156,537.77 lei) 2 (16,542,911.19 lei) 1 (3,645,048.27)
ROP/PA1
ROP/PA1
ROP/PA3
Băicoi
Prahova county
Ploiești municipality
ROP/PA1
ROP/PA1
Prahova couny
Ploiești municipality
ROP/PA3 Concordia (Ariceștii Rahtivani)
Sectoral objective C2 - Human resources development through improved educational and training infrastructure
1 (6,000,000 lei) 11 (93,784,088.11 lei) 4 (28,440,987.48 lei)
SOP HRD/PA1 OGU Ploiești SOP HRD/PA5.1
SOP HRD/PA1
SOP HRD/PA1
SOP HRD/PA3
SOP HRD/PA2
SOP HRD
SOP HRD/PA1
SOP HRD/PA1
SOP HRD/PA1
SOP HRD/PA3
SOP HRD
PDD Association
OGU Ploiești
OGU Ploiești
OGU Ploiești
OGU Ploiești
OGU Ploiești
OGU Ploiești
OGU Ploiești
OGU Ploiești
UNIPET
Băicoi
ROP/PA3
ROP/PA3
ROP/PA3
SOP IEC/PA3
Plopeni
Plopeni
Băicoi
Dumbrăvești
Sectoral objective C3 - Developing health infrastructure by providing professional medical care in a modern and equipped space
1 (7,564,000 lei) 1 (2,119,346 lei) -
SOP IEC/PA3 Ploiești Hospital -
Băicoi
SOP IEC/PA3 Ploiești Hospital
Sectoral objective C4 - Increasing the operational capacity of the administration through knowledge management and the use of innovative technology
- 5 (8,624,803.74 lei) 4 (13,274,038.74 lei)
OP ACD/PA1
SOP IEC/PA3
IEE Programme
INTERREG IVC/
FP7 Programme
IDA GP
Prahova county
Ploiești municipality
Prahova county
Ploiești municipality
OP ACD/PA1
SOP IEC/PA3
SOP IEC/PA3
SOP IEC/PA3
Jud. Prahova
DSACP Prahova
Prahova county
Băicoi
total: 24 total: 39 total:30
Based on the analysis of co-financed project categories from various operational programs, a number of important aspects are worth being considered for the next programming period. On each area of intervention / sectoral objective, the current situation can be described as follows:
Sectoral objective A1: Clean technologies, energy efficiency, and alternative energyFive projects regarding the use of solar energy to produce hot water at various hospitals / social units in Ploiești, Băicoi, Boldești-Scăeni and Valea Călugărească were completed. The projects were co-financed from the environment Fund – “Casa Verde” (Green house) program. Other two similar projects are on the backup list. In addition, there are two ongoing projects: “Lumina Verde” (Green Light) multifunctional Business Center (roP/PA1) and a project for harnessing renewable energy resources in Dumbrăvești commune, co-financed through SoP ieC/PA4.10

Sectoral objective A2: research for new products and technologiesCurrently, a project in partnership on innovative use of virtual reality in view of providing services for critical infrastructures is being implemented via SoP ieC/PA1, while other two projects of OGU Ploiești and co-financed by SoP ieC/PA2 were completed.
Sectoral objective A3: Supporting the development of economic activitiesTwo industrial parks – Ploiești West Park and WDP Development RO – were established, being financed by private investment.
Sectoral objective B1: transport infrastructureMost of the projects co-financed by roP/PA1 are currently being implemented. These are primarily related to transport infrastructure in Ploiești municipality and include:
• Rehabilitation of the tram route 102 - Phase I (North loop – Republicii intersection) and phase II (Republicii intersection – West loop).
• Rehabilitation of the tram route 101 - Phase I and II.
• Construction of a road passage in the prolongation of DJ 102, over DN 1B.
• Streamlining traffic towards Ploiești industrial area and Brazi industrial site.
The completed infrastructure works refer to the following projects of the County Council:
• Construction of the road link between DN 1 and DN 1B through the DJ 236 ring road in the north of the municipality (roP/PA1).
• Rehabilitation of 101G DJ Tătărani (DJ 101D) – Brazi – Brazii de Jos etc. (roP/PA2).
• Upgrading and rehabilitation of DJ 101D, including the passage over Ploiești railroad Triaj - Ghighiu at km 4+300 in order to improve accessibility from/to DN 1 (budget of the County Council).
The projects on the backup list for roP/PA1 were not implemented, including:
• Construction of a road passage over the South Station railroad.
• Construction of a multimodal terminal in the County Hospital area (ROP/PA1).
• Expanding public transport in Ploiești on the following sections: Ploiești municipality – Blejoi commune – Păuleşti
commune (recreation area, Păuleşti forest), Ploiești municipality – Bucov commune (“Constantin Stere” recreational
park), Ploiești municipality – Bărcăneşti commune.
• Improving the access to Băicoi city by constructing a suspended passage over DN 1 at the intersection with DJ 215.
• Increasing accessibility in the eastern part of Ploiești towards the Pan-European TEN-IX by building a road passage
over the railroad in the south-eastern part of Ploiești municipality.
• Extension of road and public transport links between South Station and West Station (Libertăţii Street), including
the rehabilitation of the stations’ marketplaces belonging to the public domain.
The projects regarding the modernization of agricultural exploitation roads in Târgşoru Vechi commune, the improvement of the road network and the promotion of touristic areas in Dumbrăvești commune are being under evaluation or in preparation for the next programming stage.
Sectoral objective B2: Public utilitiesThrough SoP environment, a project regarding the implementation of an integrated waste management system and a project for the rehabilitation and modernization of water and sewage systems in Prahova county, developed by SC Hidro Prahova, are under implementation. Another project regarding the integrated control of nutrient pollution in Târgşoru Vechi and funded by IBRD, GEF, and the Prahova County Council is also being implemented.
11

Sectoral objective B3: Cultural heritage and recreationFour ROP/PA1-funded projects are in process of implementation:
• Construction of Ploiești Vest municipal park.
• Establishment of the Center of Excellence in Business for young entrepreneurs.
• Restoring and strengthening the Clock Museum in Ploiești.
• Modernization and functional expansion of Ploiești Hippodrome.
Two projects are on the backup list:
• Rehabilitation of Dumbrăvești cultural-historical area.
• Rehabilitation of polluted land in Ploiești – the eastern belt.
The following ROP/PA5-funded projects were completed:
• Harnessing the existing patrimony elements on the “Drumul Fructelor” (Fruit Way) itinerant route.
• Trip into history on the “Drumul Vinului” (Wine Way) in Prahova county (Valea Călugărească).
• “Drumul Sării” (Salt Way) in Dumbrăvești commune.
The project for restoring and harnessing the monastic ensemble of Turnu Monastery (Târgşoru Vechi) is under implementation, while other 3 projects weren’t submitted, i.e.:
• Harnessing the existing patrimony elements on the “Drumul Voievozilor” (Princes Way) itinerant route.
• Harnessing the existing patrimony elements in the “Constantin Stere” park (Bucov).
• Consolidating and restoring St. Nicholas and St. Eustathius Plachida Church, as well as its bell-tower in Corlățești village, Berceni commune.
Other projects co-financed from other funds were completed, i.e.:
• Management Plan for Plopeni forest, a “Natura 2000” site (SoP environment/PA4).
• Development of Câineni park in Ploiești (local budget).
• Development of Băicoi park (environment Fund).
• Landscape development of Valea Călugărească park (environment Fund).
• Upgrading parks in the town of Plopeni (environment Fund).
• Rehabilitation of the cultural center in Plopeni (niC national program).
Sectoral objective C1: Social infrastructureroP/PA1 has co-financed projects for the rehabilitation of assistance / community services centers in Ploiești, Băicoi, Ariceștii Rahtivani. Two projects have been completed and another two are in process of implementation. A fifth project is also under implementation in Ploiești and is co-financed through ROP/PA3, while another one – for Ariceștii Rahtivani – was rejected.
Sectoral objective C2: educationMost projects in this field have been co-financed by SOP HRD and implemented by OGU as single beneficiary or in partnership with other organizations (nine completed projects and one under implementation). Two other training projects have been completed, their beneficiaries being “Partnership for Sustainable Development” Association and Băicoi city. The projects for school infrastructure rehabilitation, initiated by Plopeni, Băicoi, and Dumbrăvești communes, are on the backup list.
Sectoral objective C3: healthTwo SoP ieC/AP3-funded projects were completed area in medical information systems (e-health) at Obstetrics and Gynecology Hospital, County Emergency Hospital, and Hospital of Pediatrics in Ploiești, and at Băicoi Hospital.
12

Sectoral objective C4: local Public Administration (lPA) capacityIDA of the Growth Pole completed an oP ACD/PA1-funded project for strengthening its operational capacity, while the Prahova County Council completed a SoP ieC/PA3-funded project on the implementation of an integrated urban system for managing the relationship with citizens. Another OP ACD-funded project of the County Council is on the backup list, while three SOP IEC/PA3-funded were rejected. Three other similar projects, which were funded from other sources – iee Programme interreG iVC and FP7, were also completed.
0.1.2. Objectives, principles, and methodologythe integrated Development Plan aims at coordinating program and project packages with the existing territorial issues and with the Growth Poles’ development trends in the regional and national context. Specifically, the objective includes: (1) Coordination of finalized sectoral strategies; (2) Creating a methodological and technical instrument, by which sustainable development priorities of the growth pole should be established in partnership with the local councils, Prahova County Council, South Muntenia Development Agency, and the private sector, with the following goals:(i) Consistently develop the competitive advantages gained so far through the implementation of EU-funded projects;(ii) Maintain on the concerned territory the most of the added value achieved through capital investment and services financed from various public and private funds over the period 2014-2020;(iii) Reduce regional disparities in terms of equipping the territory and access to public services of general interest.
By its content, the plan aims at providing a sense for the growth pole’s development direction based on the existing territorial attributes and those to be achieved through development investments. The specific objective is to identify measures that will contribute to strengthening territorial cohesion and to developing the urban character of the area. The main directions for the implementation of this objective aim at a balanced and integrated development by:
• Increasing transport capacity and mobility by reference to the European transport network TEN-T and therefore the network of localities;
• Reducing regional disparities so as to pave the way towards equal access to infrastructure services, facilities and knowledge;
• Managing the natural resources in a responsible way and protecting natural resources and protecting the natural and built environment of the area;
• Identifying and developing new types of urban-rural relations to increase the functionality of the area.
the iDP was prepared according to the following principles:
1. lawfulness and Coordination. Abide by the powers conferred by law and by European and national regulations with respect to the programming period 2014-2020, without restricting the rights regarding the exercise of responsibilities that determine the increase of territorial competitiveness in the area.
2. Autonomy and Subsidiarity. Ensure local autonomy, representativeness, identity, interests, and diversity of local communities in the area, using tools and techniques for involving citizens in decision-making during the formulation and implementation of the plan.
3. Continuity and Cooperation. Horizontal and vertical cooperation between levels of government in order to: (1) promote a competitive, green, and sustainable economy, with high degree of employment that is based on the rational use of natural resources; (2) reduce existing territorial disparities between territorial-administrative units in the area.
the iDP was prepared according to the methodology for strategic planning, which included the following key activities: information, consultation, debate and admission / approval. The main stages of the process correspond to the methodology for drafting the Integrated Development Plans for 2007-2013 and included:
1. Analysis of development sectors at the current moment and as a result of projects’ implementation during the period 2007-2013;
2. Analysis of integrated results, obtained by diagnosing the existing situation and trends of development (SWOT analysis); 13

3. Formulation of the framework with respect to future development (vision, strategic goals and specific / sector objectives);
4. Ensuring the implementation modalities of the Strategy 2014-2020 through programs and projects;5. Preparing the institutional framework for the implementation and monitoring of the strategy.
The analysis of the documents (data, strategies, action plans, programs, reports, and expert studies) provided by Prahova County Council and the Local Councils of territorial-administrative units within the growth pole has played a significant part. As well, information was collected through field surveys based on interviews with local stakeholders regarding development and investment priorities for the short and medium term. The results from various phases were debated in view of including opinions of local communities as well, thus increasing the acceptability of proposals.
0.1.3. Coordination with European, national, and regional strategies The elaboration of the IDP for Ploiești Growth Pole is based on coordination with a number of programmatic documents developed at the European, national, and regional level, as follows:
eUroPeAn level
• Europe 2020 Strategy, with its three development priorities: (1) smart growth, which would develop an economy based on knowledge and innovation; (2) sustainable growth, which would promote a greener, more competitive economy, and which would manage resources more efficiently; (3) inclusive growth, which would foster an economy with high employment potential, thus ensuring territorial and social cohesion.
• Territorial Agenda of the European Union in 2020, with the following territorial development priorities: (1) Promote polycentric and balanced territorial development; (2) Encourage integrated development in cities, rural regions and specific areas; (3) Territorial integration in cross-border and transnational functional regions; (4) Ensure the overall competitiveness of the regions based on strong local economies; (5) Improve regional connections for individuals, communities, and businesses; (6) Manage and connect environmental, landscape, and cultural values of regions.
nAtionAl level
• Romania’s Territorial Development Strategy for the 2035 time horizon (2014) – reports regarding: Network of localities by rank and importance; Formation and development of localities; Characteristics of urban and rural localities.
• Regional Operational Programme 2014-2020.
• Competitiveness Operational Programme 2014-2020.
• Large Infrastructure Operational Programme 2014-2020.
• Human Capital Operational Programme 2014-2020.
• Administrative Capacity Operational Programme 2014-2020.
• Support for Disadvantaged People Operational Programme 2014-2020.
• National Programme for Agriculture and Rural Development 2014-2020.
• National Programme for Local Development (“Urban regeneration of towns and cities” subprogramme).
reGionAl level
• Regional Development Plan – South Muntenia Region 2014-2020, RDA South Muntenia RDA (2014); regional-level sectoral studies, conducted by South Muntenia RDA during 2012-2013.
CoUnty level
• Updated Spatial Plan of Prahova County: Volume I: Current situation, problems and priorities; Volume II: Proposals, Program of measures. The National Research and Development Institute for Urbanism and Spatial Planning, URBANPROIECT Bucharest (2002).
• Sustainable Development Plan for Prahova County in 2014-2020, Prahova County Council (2015).
14

In addition, a series of documents prepared by the EU / Romanian Government / MDRAP / Structural Instruments 2007-2013, together with the World Bank, provides recommendations for the review and update of the growth poles’ integrated development plans:
• Strengthening the spatial planning capacity – precondition for sustainable urban development
• Competitive Cities
• Strategic assessment of IDPs
• Growth Poles: The Next Phase
• Identification of project selection models for the Regional Operational Programme 2014-2020
• etc.
0.1.4. Document structureThe volume presents the Growth Pole’s profile, organized on the following chapters analysing the current situation and development trends:
1.1. People and territory
• Defining the area, the network of localities, and the associative structure
• Spatial and functional profile
• Location, natural features, and brief history
• Demography and migration
1.2. Economy
• Economic sectors and SME sector
• Tourism industry – products and infrastructure
• Labor market and human resources
• R&D
1.3. Environment
• Quality of environment and pollution control (air, water, soil)
• Protected natural areas
1.4. Connectivity
• Accessibility and mobility
• Transport network and existing intermodal nodes / TEN-T in the Growth Pole
• Energy
• IT&C
1.5. Public utilities
• Water supply and sewerage
• Waste management
• Public spaces and public lighting
15

1.6. Public services and housing
• Housing stock
• Education
• Health
• Social Infrastructure
1.7. Culture and recreation
• Protected areas and historical monuments
• Events and cultural activities
• Sports and recreation
0.2 National and regional context
0.2.1. National inertia and adjusting expectations As it is known from the literature, the fate of a city depends not only public authorities and the private sector. There is a certain history-related and geography-related inertia that may substantially influence the development of a city. For example, Bucharest has a privileged position in Romania since by 1989 it had a population of over 5 times higher than the second-placed city. As such, it enjoyed great attention from investors and people from the start, attracting in recent years a large part of the country’s private sector and skilled personnel.
Currently, even if it has only 10% of the population, Bucharest generates 25% of the GDP. Similarly, cities like Timișoara and Cluj-Napoca are favored by their proximity to Western rich markets and have witnessed more striking economic dynamics than cities with a similar population, but located at greater distance from the western border (e.g. Iași and Craiova).
In fact, in countries that have developed organically, the urban systems are distributed in a balanced way. Specifically, there is a close relationship between the rank of a city and its position in the national hierarchy. Usually, there is a single city that is included in the first rank (like Bucharest) and its position in the national hierarchy does not change no matter how effective are the local authorities. This first-rank city is followed by 1-2 second-rank cities, with populations that amount to approximately half of the first-rank city’s number of inhabitants. These cities are in turn followed by 2-3 third-ranking cities with populations that amount to approximately one third of the first-ranking city population, etc. Figure 1 shows this balanced distribution in the urban system in four countries that have developed organically – Germany, US, Italy, and France.
Because of the central planning during the communist regime, Romania’s urban system is not balanced.
Figure 1. Zipf distribution in selected countries (2010)
0
0
0.5
0.5
1
1
1.5
1.5
2
2
2.5
2.5
USA
FRANCE
7
6.5
6
5.5
5
4.5
6.5
6
5.5
5
4.5
4
Log
of P
opul
atio
nLo
g of
Pop
ulat
ion
Log of Rank
Log of Rank
16

Figure 2. Zipf distribution in Romania (2010)
Source: World Bank. 2013. Competitive Cities – Reshaping the Economic Geography of Romania [report prepared for the Ministry of Regional Development and Public Administration]
Source: World Bank. 2013. Competitive Cities – Reshaping the Economic Geography of Romania [report prepared for the Ministry of Regional Development and Public Administration]
As shown in the graphs from the left, in Romania second-rank cities are practically missing, Bucharest being followed from a significant distance by a group of seven cities with a population five times lower than that of the capital city.
The graphs were built with the data available in TEMPO Online database of the National Statistics Institute. The data are based on estimates and projections starting from the last census in 2002. The analysis of the most recent data from the last census in 2011 and which became available in 2013, indicate an adjustment of the urban system in Romania. Basically, as it is shown in the graphs, Cluj-Napoca and Timișoara, benefiting from their proximity to the western border of Romania, are currently tending to become second-rank cities at the national level. Iași, Constanţa and Craiova compete for the third rank.
In Zipf distribution, Ploiești has the profile of a fourth-rank city. This does not mean that it will keep this position and will not overrun cities like Craiova and Iași. What is relevant to this discussion, however, is the understanding that in any country that grows organically (based on market economy mechanisms) there is a certain inertia that cannot be overcome even with the best public policy measures. Specifically, there is little chance for Ploiești to become the main economic hub in Romania. As we will discuss below, however, Ploiești can take advantage of its proximity to Bucharest in order to ensure sustainable economic growth in the coming years.
Of course, cities are not only subject to fate, i.e. unable to shape their own destiny.
Figure 3. Zipf distribution in Romania (based on 2011 census data)
0 0.5 1 1.5 2 2.5
GERMANY
6.5
6.3
6.1
5.9
5.7
5.5
5.3
5.1
4.9
4.7
4.5
Log
of P
opul
atio
n
Log of Rank
0 0.5 1 1.5 2 2.5
ITALY
6.5
6.3
6.1
5.9
5.7
5.5
5.3
5.1
4.9
4.7
4.5
Log
of P
opul
atio
n
Log of Rank
București
Tim
ișoa
ra
Iași
Cluj
-Nap
oca
Cons
tanț
aC
raio
va
Log
of P
opul
atio
n
Log of Rank
y = -0,9784 x + 6,2817R2 = 0.9825
București
Tim
ișoa
ra
Iași
Cluj
-Nap
oca
Cons
tanț
aC
raio
va
Log
of P
opul
atio
n
Log of Rank
y = -0,9632 x + 6,1838R2 = 0.9868
17

Both at national and international levels, there are many examples of cities that have managed to perform better than prescribed by Zipf distribution. Mostly, this analysis takes into account what local / regional authorities in Ploiești can do in order to ensure a sustainable development of Ploiești Growth Pole.
The geographical position, historical evolution, existing population, and economic base of Ploiești will play an important part on the future development of the city and must be recognized and understood as such. In what follows we discuss the importance of the proximity of Ploiești to Bucharest and Brașov.
0.2.2. Regional integration Bucharest is the most important economic pole of Romania. This is well known. What is less known is that Bucharest’s economic development has encouraged the rapid development of communities located close to the capital city. Ploiești itself took advantage of this proximity and it is important to do so in the future as well.
In order to map these regional synergies, the World Bank included in the Competitive Cities report an economic mass gravitational model (see figure below). Gravitational models are based on the physics principle according to which the attraction between two bodies becomes greater as the distance between them gets smaller and their mass becomes larger. In order to develop the economic mass gravitational model, we calculated the road distances between cities in Romania and we used the firms’ revenues at the city level as economic mass.
The first map in the right represents the economic mass gravitational model. As shown in this map, the area of influence of Bucharest, which extends up to Ploiești and Pitești is the leading development area in Romania. Moreover, the firms operating in the area surrounding Bucharest, i.e. up to one hour of driving from the city, generates more than 50% of the national income2. This is of paramount importance for the way in which public and investment policies in Ploiești Growth Pole will be designed. Basically, any economic development strategy cannot ignore the strategic position of Ploiești within the most dynamic economic area of Romania.
The better this area will be interconnected, the greater the economic benefits will be. On the one hand, better connectivity will require investments in the large infrastructure along the corridor Bucharest – Ploiești – Brașov, namely completing the A3 highway section from Bucharest to Brașov, and operating a fast train on this section. On the other hand, a better connection between Ploiești, Târgoviște, and Pitești could help this economic area coagulate.
2 World Bank. 2013. Growth Poles; The Next Phase
Map 1. Economic mass gravitational model for Romania
Map 2. Demographic gravitational model for Romania
Source: World Bank. 2013. Competitive Cities – Reshaping the Economic Geography of Romania [report prepared for the Ministry of Regional Development and Public Administration]
18

Interestingly, the Bucharest-Ploiești-Târgoviște-Pitești is not only the most developed area in the country, but also the densest area in terms of demography. As shown in the above demographic gravitational model (where population is taken as demographic mass), this area of Romania has the highest population density. Basically, in the one-hour access area around Bucharest live about 4 million people – i.e. 20% of the population, or more than twice the population of Bucharest. This is also one of the areas with the highest potential for urbanization, which will be discussed in more detail in the next section.
0.2.3. Ploiești: Urbanization pole As discussed in the Competitive Cities report, economic development goes hand in hand with urbanization, and there is no developed country in the world that is not highly urbanized. Currently, Romania is one of the least urbanized countries in the EU and one of the most underdeveloped.
The greatest part of the economic development is played by a few dynamic cities and in order to operate as economic engines, they must increase both their economic mass and demographic mass – that is to continue their urbanization. Ploiești is one of the most important economic engines of Romania and its further development implies continuing the urbanization of the region to which it belongs. Basically, the most people possible in Ploiești Growth Pole area should have easy access to the opportunities that the pole offers; on the other hand, firms from the pole should have the easiest possible access to skilled workforce in the region.
The analysis presented in Competitive Cities report of the World Bank shows that Ploiești is part of an area with great potential for urbanization (see picture below). Specifically, Ploiești municipality is surrounded by a number of communes with high population density and rapid development dynamics. This means that the development policy of Ploiești should be thought at the metropolitan level and not only at the level of the territorial-administrative unit.
Among other things, a metropolitan-level approach involves thinking about the following aspects in an integrated way: the public transport system, water and sewage systems, economic development policies, and urban planning policies.ARAD
GALATI
RESITATULCEA
IASI
SIBIU
BUCURESTI
BAIA MARE
PETROSANI BRASOV
BISTRITA
LUGOJ
CALARASI
ZALAU
SLOBOZIA
ORADEA
TURDA
CLUJ-NAPOCA
TECUCI
SATU MARE
DEVATIMISOARA
BUZAU
CONSTANTA
VASLUI
ALBA IULIA
TARGU JIU
CRAIOVA
PASCANI
HUNEDOARA
MEDGIDIA
MEDIAS
ALEXANDRIA
ONESTI
PLOIESTI
MIERCUREA CIUC
SIGHETU MARMATIEI
SLATINA
GIURGIU
BACAU
FOCSANI
SUCEAVA
PITESTI
BRAILA
PIATRA NEAMT
SFANTU GHEORGHE
BOTOSANI
TARGOVISTE
ROMAN
TARGU MURES
DROBETA-TURNU SEVERIN
BARLAD
Piatra NeamţPloiești
București
Pașcani
IașiBotoșani
TârgovișteRoman
Suceava
Vaslui
Map 3. New urbanization centers in Romania
Source: World Bank. 2013. Competitive Cities – Reshaping the Economic Geography of Romania [report prepared for the Ministry of Regional Development and Public Administration]
Communes with more than 150 people per km2
Localities with more than 40,000 people
Bacău
19

no.title of individual
project / integrated project
title of individual project within
integrated project Beneficiary
Funding source (operational Programme /
operation name / Key area of intervention)
total project value (lei)
Stage / real / estimated date for completing
the project implementation
Sectoral objective A1 – Support investments in clean technologies, high level manufacturing, energy efficiency and alternative energies technology solutions, and in adjacent infrastructure
1Multifunctional Business Center
“Lumina Verde” (Green Light)
Prahova countyROP/PA1/KAI1.1/
Growth Poles 11,987,653.68 lei
40,450,278.35
Under implementation 31.07.2015 (cf.
AA no.2)
2
Achieving electricity (and heat) production
capacity for own consumption by using renewable energy resources in the localities of
Dumbrăvești, Boldeşti-Scăeni, Plopeni, Valea
Călugărească
Achieving electricity (and
heat) production capacity for own consumption by using renewable energy resources in Dumbrăvești
commune
Dumbrăveşti commune
SOP IEC/PA4/KAI2/Op.4.2
1,867,760.88 lei2,760,212.47
Under implementation August 2015
3
Creating new capacity for
producing electricity through solar
renewable energy resources in Valea
Călugărească commune
Valea Călugărească
commune
SOP IEC/PA4/KAI2/Op.4.4
9,047,459.00
On the backup list (declared
as eligible, under the score
for receiving funding)
4 Gas Turbine (GAT) Dalkia Termo Prahova and
Dalkia RomaniaOwn sources 53,000,000.00
Completed in Sept. 2010
5
Using solar energy to produce hot water at the care centers for children and adults
with disabilities in the Directorate General
for Social Assistance and Child Protection
Prahova
Prahova countyEnvironment Fund/ „Casa Verde” (Green
House) program1,973,271.00
Completed at 10.04.2011
6
Using solar energy to produce hot water at county hospitals
belonging to the public domain of Prahova
county
Prahova countyEnvironment Fund/ „Casa Verde” (Green
House) program218,138.80
Completed at 15.08.2011
AnneX 1 iDP 2007-2015 implementation stage
20

no.title of individual
project / integrated project
title of individual project within
integrated project Beneficiary
Funding source (operational Programme /
operation name / Key area of intervention)
total project value (lei)
Stage / real / estimated date for completing
the project implementation
7
Supplementing the classical gas heating
system with a system based on solar energy in Valea Călugărească
commune, Prahova county
Valea
Călugărească commune
Environment Fund/ „Casa Verde” (Green
House) program599,702.30
Completed in December
2010
8
Using solar energy to produce hot water at the medical and social
assistance unit in Boldești-Scăeni
Boldești-Scăeni city
Environment Fund/ „Casa Verde” (Green
House) program247,672.32
Completed in September
2011
9
Using solar energy to produce hot water at local medical units – Băicoi City Hospital, Headquarters; City Hospital, the Annex
headquarters, 8, Unirii street
Băicoi cityEnvironment Fund/ „Casa Verde” (Green
House) program1,121,595.00 Completed
10
Using geothermal energy and solar energy to produce
hot water at Ploiești County Emergency
Hospital (north section)
Prahova countyEnvironment Fund/ „Casa Verde” (Green
House) program2,886,620.00
Under evaluation at Environment
Fund Administration, as of January
19, 2011
total Sectoral objective A1: 103,257,490.24
21

no.title of individual
project / integrated project
title of individual project within
integrated project Beneficiary
Funding source (operational Programme /
operation name / Key area of intervention)
total project value (lei)
Stage / real / estimated date for completing
the project implementation
Sectoral objective A2 - Active involvement of R&D sector in the development of new products and technologies
11
Competitiveness pole to increase economic productivity through the innovative use of virtual reality, in order to provide services for critical infrastructure
– CREVIS
Association - OGU, PUB,
Prahova county, Ploiești municipality, IDA PlPhGP,
private companies Depositor:
SC INSOFT Development & Consulting SRL
SOP IEC/PA1/KAI 1.3/Op.1.3.1
Competitiveness poles 41,289,066.52 lei
56,296,069.28
Under implementation
12.10.2015
Research and development center
for virtual reality applied to critical
infrastructure, Investment project
no. 12P019001, SMIS 50433
34,363,785.87
Building an innovative technology platform
based on virtual reality applications
for the safety and protection of
personnel in critical infrastructure
investment projects R&D&I 1 no.
12P019002, SMIS 50433
5,202,391.92
Building an innovative monitoring platform for isolated targets in critical infrastructure in Romania, Project
R&D&I 2 no. 12P019003, SMIS
50421
4,459,724.39
Platform for bio-monitoring of vital parameters in the
operation of critical infrastructures,
Project R&D&I 3 no. 12P019004, SMIS
50239
5,287,987.89
Augmented reality innovative
technological platform for
field inspection, maintenance, and service in critical infrastructure,
Project R&D&I 4 no. 12P019005, SMIS
50242
5,280,341.56
22

no.title of individual
project / integrated project
title of individual project within
integrated project Beneficiary
Funding source (operational Programme /
operation name / Key area of intervention)
total project value (lei)
Stage / real / estimated date for completing
the project implementation
11
Competitiveness pole to increase economic productivity through the innovative use of virtual reality, in order to provide services for critical infrastructure
– CREVIS
(continued)
CREVIS pole integrated
management / Project SOFT1
no. 12P019006 / 08.05.2013, SMIS
50244
Association - OGU, PUB,
Prahova county, Ploiești municipality, IDA PlPhGP,
private companies Depositor:
SC INSOFT Development & Consulting SRL
852,000.00
Under implementation
12.10.2015CREVIS Pole integrated project for information, publicity, and dissemination /Project SOFT2 no. 12P019007, SMIS
50246
849,837.65
12
Information technology for
image promotion and management
of information from graduates
and businesses in order to adapt the management policy
to the socio-economic requirements
OGU PloieștiSOP IEC/PA2
KAI 2.4366,300.00 Completed
13
Regional center for performance testing and monitoring the
technical condition of tubular material used
in the oil industry
OGU PloieștiSOP IEC/PA2
KAI 2.3 - 22,107,500 lei
30,472,600.00 Completed
total Sectoral objective A2: 87,134,969.28
Sectoral objective A3 - Supporting the development of economic activities in the Growth Pole area
14 “Ploiești West Park” industrial park
The Belgian Group Alianso in joint venture with PIRITEX
Group
Private investment 3,150,000,000.00 Under implementation
15W.D.P. Development Ro. SRL industrial park (subsidiary of Warehouse De Paw)
SC „WPD
Development Ro” SRL
Private investment 50,400,000.00 Under implementation
total Sectoral objective A3: 3,200,400,000.00
Sectoral objective B1 – Connecting with the European road network and building a modern infrastructure for the access to economic areas, parks / industrial sites and other functional areas, while developing an efficient and clean urban transport in the growth pole area
23

no.title of individual
project / integrated project
title of individual project within
integrated project Beneficiary
Funding source (operational Programme /
operation name / Key area of intervention)
total project value (lei)
Stage / real / estimated date for completing
the project implementation
16
Increasing traffic capacity by building a road link between DN 1 and DN 1B (County Ring Road DJ 236) in the northern area of Ploiești municipality
Prahova countyROP/PA1/
KAI 1.1/Growth poles 22,365,856 lei
43,912,185.38Completed in June 2013
17
Increasing public transport mobility by the rehabilitation of
tram route 102 through works targeting: the rolling track, stations
adapted to people with disabilities, rolling stock, signaling and
automation elements
Increasing public transport mobility
by the rehabilitation of tram route 102
through works targeting: the rolling
track, stations adapted to people with disabilities,
rolling stock, signaling and automation elements – Stage I: North Loop –
Republicii intersection Ploiești municipality
ROP/PA1/KAI 1.1/ Growth poles
29,139,721.40 lei47,730,153.43
Under implementation
15.06.2015
18
Increasing public transport mobility
by the rehabilitation of tram route 102
through works targeting: the rolling
track, stations adapted to people with disabilities,
rolling stock, signaling and automation
elements – Stage II: Republicii intersection
– West Loop
ROP/PA1/KAI 1.1/Growth poles
40,954,863.48 lei70,652,606.99
Under implementation
29.07.2015
19
Ensuring accessibility in Ploiești South industrial
zone, in university campus by building a road passage over the railway at South
Station
Ploiești municipality
36,522,990.00In preparation for 2014-2020
20
Increasing traffic mobility by building a multimodal terminal,
including parking spaces for cars and
bicycles (County Hospital area)
Ploiești municipality
ROP/PA1/KAI 1.1/ Growth poles
23,410,582.41 lei30,324,596.51
On the backup list
24

no.title of individual
project / integrated project
title of individual project within
integrated project Beneficiary
Funding source (operational Programme /
operation name / Key area of intervention)
total project value (lei)
Stage / real / estimated date for completing
the project implementation
21
Extending the public transport in Ploiești municipality on the following sections:
Ploiești – Blejoi commune – Păuleşti commune (recreation
area, Păuleşti forest), Ploiești – Bucov commune
(“Constantin Stere” recreational park),
Ploiești municipality – Bărcăneşti commune
IDA „Ploiești –
Prahova Growth pole”
ROP/PA1/KAI 1.1/ Growth poles
45,101,000.00On the backup
list
22
Increasing accessibility to the north of the
Growth Pole, especially towards Prahova
County Hospital by building a road passage in the prolongation of DJ 102, over DN 1B
Prahova countyROP/PA1/KAI 1.1/
Growth poles 50,206,880.71 lei
63,954,630.69
Under implementation 11.11.2015 (cf.
AA no. 2)
23
Accessibility and traffic streamlining towards
Ploiești West industrial area and Brazi
industrial platform
Ploiești municipality
ROP/PA1/KAI 1.1/ Growth poles 72,222,409.51 lei
90,833,498.09Under
implementation 11.07.2015
24
Increasing public transport mobility by the rehabilitation of
tram route 101 through works targeting: the rolling track, stations
adapted to people with disabilities, rolling stock, signaling and
automation elements
Increasing public transport mobility
by the rehabilitation of tram route 102 through
works targeting: the rolling track, stations adapted
to people with disabilities, rolling stock, signaling and automation
elements – Stage I Ploiești municipality
ROP/PA1/KAI 1.1/ Growth poles
17,597,276.58 lei30,506,241.76
Under implementation
15.08.2015 (cf. AA no. 1)
25
Increasing public transport mobility
by the rehabilitation of tram route 102 through
works targeting: the rolling track, stations adapted
to people with disabilities, rolling stock, signaling and automation
elements – Stage II
ROP/PA1/KAI 1.1/ Growth poles
39,630,960.09 lei65,145,449.08
Under implementation
29.07.2015
26
Increasing accessibility to the city of Băicoi by constructing a
suspended passage over DN 1, at the
intersection with DJ 215
Băicoi city in
partnership with Prahova county
ROP/PA1/KAI 1.1/ Growth poles
17,612,000.00On the backup
list
25

no.title of individual
project / integrated project
title of individual project within
integrated project Beneficiary
Funding source (operational Programme /
operation name / Key area of intervention)
total project value (lei)
Stage / real / estimated date for completing
the project implementation
27
Increasing accessibility in the eastern part of Ploiești towards the Pan-European
TEN-IX by building a road passage over the railroad in the south-
eastern part of Ploiești municipality
Ploiești municipality
ROP/PA1/KAI 1.1/ Growth poles
81,710,517.00On the backup
list
28
Ensuring mobility through the extension
of road and public transport links between
South Station and West Station (Libertăţii
Street), including the rehabilitation of the
stations’ marketplaces belonging to the public
domain
Ploiești municipality
ROP/PA1/KAI 1.1/ Growth poles
19,620,224.00On the backup
list
29
Rehabilitation of DJ 101G Tătărani (DJ
101D) – Brazi – Brazii De Jos – Tinosu
– Şirna – Hăbud – Crivăţu (DN 1A) Km
0+000 – Km 24+020, Prahova county, Km
24+020 – Km 30+120, Dâmboviţa county
Partnership between Prahova
county and Dâmboviţa
county
ROP PA2 KAI 2.1 - 33,229,951.06 lei
45,802,088.03Completed 02.06.2011
30
Increasing traffic capacity through the modernization and rehabilitation
of DJ 101D, between km 4+300 (limit of Ploiești municipality and passage ramp
head) and km 6+300 (traffic roundabout – intersection DN 1A), including suspended passage over Ploiești Triaj railway – Ghighiu at km 4+300, in view
of improving the accessibility to and
from DN 1
Prahova countyBudget of Prahova
County Council19,240,000.00 Completed
31Modernization of agricultural
exploitation roads Târgşoru Vechi
communePNDR Measure 1.2.5 4,500,000.00
In preparation for 2014-2020
32
Setting up a public wastewater network and improving the
public road network of local interest in Dumbrăvești and Găvănel villages,
including endowment of cultural center in
Dumbrăvești commune
Dumbrăveşti commune
Environment Fund 10,746,470.00Under
evaluation
26

no.title of individual
project / integrated project
title of individual project within
integrated project Beneficiary
Funding source (operational Programme /
operation name / Key area of intervention)
total project value (lei)
Stage / real / estimated date for completing
the project implementation
33Promoting the
touristic areas of Teleajenui Valley – Slănicului Valley.
Dumbrăveşti commune
PNDR Measure 313 405,000.00Under
evaluation
total Sectoral objective B1: 529,951,313.45
Sectoral objective B2 – Protecting the environment and human health by providing quality public services
34Integrated waste
management system in Prahova county
Prahova county SOP Environment/PA2
120,762,325 lei168,448,433.00
Under implementation
31.12.2015
35
Rehabilitation and upgrading of water
and sanitation systems in Prahova
county
S.C. HIDRO Prahova S.A.
SOP Environment/PA1 468,324,120 lei
655,003,301.00 Under implementation
36
Rehabilitation / modernization of transmission and
distribution network in Mihai Bravu district
(Ploiești)
Ploiești municipality
„District Heating 2006-2015. Heat and
comfort”12,500,000.00 In preparation
37Integrated control of nutrient pollution in
Târgşoru Vechi Prahova county
BIRD + GEF + Prahova County Coucil + Târgșoru Vechi
1,392,333.60 Under implementation
38Modernization of the
water network in Valea Călugărească
commune
Valea
Călugărească commune
Environment Fund 8,726,038.00 Rejected
total Sectoral objective B2: 837,344,067.60
Sectoral objective B3 - Harness the natural, traditional, cultural, and historical heritage, develop tourism and recreation areas, support environmental protection actions and the development of green spaces; develop the historical and cultural heritage of the area
39
Construction of Ploiești West
municipal park, including access roads
and specific utility network, including setting up a Center
of Excellence in Business for young
entrepreneurs
Construction of Ploiești West
municipal park, including access
roads and specific utility network
Ploiești municipality
ROP/PA1/KAI 1.1/ Growth poles
45,885,100.54 + 3,341,955.19 lei
76,531,262.54
Under implementation
29.12.2015 (cf. AA no. 3)
40Center of Excellence
in Business for young entrepreneurs
12,057,946.20
Under implementation
28.09.2015 (cf. AA no. 1)
41Restoring and
consolidating “Nicolae Simache” Clock Museum, Ploiești
Prahova countyROP/PA1/
KAI 1.1/Growth poles 3,369,892.03 lei
5,535,944.44Under
implementation 27.07.2015
42Modernization and
functional expansion of the Hippodrome in
Ploiești
Ploiești municipality
ROP/PA1/KAI 1.1/Growth poles
2,751,249.72 lei88,959,388.71
Under implementation
30.10.2015
43Rehabilitation of
Dumbrăvești historical and cultural area
Prahova countyROP/PA1/
Growth poles10,115,000.00 On the backup
list
27

no.title of individual
project / integrated project
title of individual project within
integrated project Beneficiary
Funding source (operational Programme /
operation name / Key area of intervention)
total project value (lei)
Stage / real / estimated date for completing
the project implementation
44
Decontamination of land polluted with oil products in Ploiești – Centura de EST T14
A228
Ploiești municipality
ROP/PA1/KAI 1.1/ Growth poles
5,100,000.00On the backup
list
45
Harnessing the existing patrimony elements on the
“Drumul Fructelor” (Fruit Way) itinerant
route
Prahova countyROP/PA 5/KAI 5.3 -
601,035 lei992,334
Completed in May 2013
46Trip into history on the “Drumul Vinului” (Wine
Way) in Prahova county
Valea
Călugărească commune
ROP/PA5/KAI 5.3 - 663,263.83 lei
999,817.84Completed in
May 2012
47
Harnessing the existing patrimony elements on the
“Drumul Voievozilor” (Princes Way) itinerant route
Partnership between the Local
Councils of Brazi, Ariceştii Rahtivani, etc.
ROP/PA5/KAI 5.3 - 654,217.84 lei
1,035,274.93 Not submitted
48“Drumul Sării” (Salt Way) – geological
metamorphosis into history
Dumbrăveşti commune
ROP/PA5/KAI 5.3 997,115.03 Completed
49
“Bucov, oasis of spirit and creation” – Harnessing the existing elements
of heritage in “Constantin Stere”
park
“Constantin
Stere” Foundation
ROP/PA5/KAI 5.3 923,301.00 Not submitted
50
Plopeni Forest, a “Natura 2000” site: management plan,
courses of action and awareness
County Museum
of Natural Sciences – Prahova
SOP Environment/PA4/KAI 5.3
320,781.00 lei489,888.00
Completed in August 2012
51Setting playgrounds and parks in Ploiești municipality (Câineni
park)
Ploiești municipality
Local budget 6,600,001.00 Completed
52 Building a park in Băicoi city, “Lac” area Băicoi city
Environment Fund /National program
for improvement of the environment by
creating green spaces in localities
1,084,729.70 Completed
53 Landscaping of Valea Călugărească park
Valea Călugărească
commune
Environment Fund /National program
for improvement of the environment by
creating green spaces in localities 865,000 lei
1,000,000.00Completed in August 2009
28

no.title of individual
project / integrated project
title of individual project within
integrated project Beneficiary
Funding source (operational Programme /
operation name / Key area of intervention)
total project value (lei)
Stage / real / estimated date for completing
the project implementation
54
Improving the environment by
creating green spaces (Scăeni district,
Târgului street, Seciu locality)
Boldești-Scăeni city
Environment Fund 551,210.38 Rejected
55
Improving the environment through the modernization of parks in the town of
Plopeni
Plopeni city
Environment Fund /National program
for improvement of the environment by
creating green spaces in localities
496,963.94 Completed
56Construction of a
wastewater treatment plant at the County
Hospital
Prahova county
National Infrastructure Development Programme
847,810.00 Funding canceled
57
Rehabilitation, modernization,
and endowment of the cultural center
“Culture House”
Plopeni city
National Program implemented
through the National Investment Company
(NIC)
3,000,000.00 Completed
58
Consolidating and restoring St. Nicholas
and St. Eustathius Plachida Church, as well as its bell-tower,
Corlătești village, Berceni commune, Prahova county
Corlătești parish ROP/PA.5/KAI.5.1 4,212,457.00 On the backup list
59
Restoring and harnessing the
monastic assembly of Turnu Monastery:
cells, hegoumen’s house, enclosure walls, the ruins of the White Church, Mircea Turcitu church ruins, ruins of Roman thermal baths, walkways, roadways,
outdoor arrangements – plantations,
Târgşoru Vechi village, Târgşoru Vechi
commune, Prahova
Turnu monastery
ROP/PA.5/KAI.5.1 28,560,089.20
Under implementation
December 2015
60
Improve the environment by
building a communal park in Găvănel village on a surface of 17 ha
Dumbrăvești commune
Environment Fund /National program
for improvement of the environment by
creating green spaces in localities
2,060,640.00 Not submitted
total Sectoral objective B3: 229,264,056.53
Sectoral objective C1 - Increase the quality of social infrastructure through investments dedicated to disadvantaged groups and support their reintegration into society
29

no.title of individual
project / integrated project
title of individual project within
integrated project Beneficiary
Funding source (operational Programme /
operation name / Key area of intervention)
total project value (lei)
Stage / real / estimated date for completing
the project implementation
61
Rehabilitation / modernization /
expansion and special equipping of the care
and support center for adults with disabilities,
Băicoi (Liliești)
Băicoi cityROP/PA1/KAI 1.1/
Growth poles 4,265,349.28 lei
6,718,410.21
Under implementation
31.12.2015 (cf. AA no.3)
62
“A chance for a new ray of sunshine” – rehabilitation / modernization /
expansion and special equipping of the
community services complex “Ray of
sunshine”
Prahova countyROP/PA1/KAI 1.1/
Growth poles 2,243,889.1 lei
3,813,672.52
Under implementation 28.07.2015 (cf.
AA no.2)
63
Rehabilitation / modernization / expansion and
special equipping of the neuropsychiatric
recovery and rehabilitation center
for adults with disabilities, Ariceştii Rahtivani (Nedelea
village)
Prahova countyROP/PA1/KAI 1.1/
Growth poles 5,043,399.8 lei
7,858,523.22Completed in
December 2014
64
Rehabilitation/ modernization/
expansion and special equipping of “Cireşarii” emergency reception
center, Ploiești
Ploiești municipality
ROP/PA1/KAI 1.1/ Growth poles
5,549,441.36 lei8,684,387.97
Completed in September
2013
65
Establishing a care center for the elderly
by changing the destination of the
caserne located in 11A, Cosminelor Street,
Ploiești
Ploiești municipality
in partnership with “Sfântul
Sava” Foundation for
Children
ROP/PA3/KAI 3.2 - 2,189,353.50 lei
3,624,455.04
Under implementation
June 2015 (cf. AA)
66
Modernization and re-arrangement of
“Farm for Kids” social housing, Ariceştii
Rahtivani, Prahova county
Concordia
Humanitarian Organization
ROP/PA3/KAI.3.2. 3,645,048.27 Rejected
total Sectoral objective C1: 30,699,448.96
Sectoral objective C2 - Human resources development through improved educational and training infrastructure
67Strategic tools for
employment in tourism industry
Partnership for
Sustainable Development Association
SOP HRD/PA5.1 16,869,571.63 lei
20,560,888.47Completed in
July 2013
30

no.title of individual
project / integrated project
title of individual project within
integrated project Beneficiary
Funding source (operational Programme /
operation name / Key area of intervention)
total project value (lei)
Stage / real / estimated date for completing
the project implementation
68
Rehabilitation, consolidation, extension and
modernization for the School with I-VIII
classes Carol I, Plopeni
Plopeni city ROP/PA3/KAI 3.4 8,833,681.00 On the backup list
69
Consolidation, modernization,
expansion, thermal rehabilitation, and construction of a
new building wing at Plopeni School Group
Plopeni city ROP/PA3/KAI 3.4 8,744,176.66 On the backup list
70
Rehabilitation, consolidation, expansion, and
modernization of the School with I-VIII classes no. 2, Băicoi
Băicoi city ROP/PA3/KAI 3.4 6,045,276.78 On the backup list
71Postdoctoral program for advanced research in the field of nano-
materials
OGU Ploiești in partnership
with Polytechnic University of Bucharest
SOP HRD/PA1/KAI 1.5 8,561,851 lei
10,278,333.00 Completed
72Researchers
for sustainable development of the Romanian society
OGU PloieștiSOP HRD/PA1/KAI 1.5
4,272,284 lei6,051,284.00 Completed
73Strengthening the
institutional capacity of regional consortia for education and training
OGU Ploiești in partnership with Regional Ministry of Education, Generalitat
de Catalunia, Craiova
University
SOP HRD/PA3/KAI 3.3 2,077,795.1 lei
2,951,717.95Completed 30.11.2012
74
Partnership for continuous training in view of professional
qualification / requalification
OGU Ploiești Partners: INCDSIM
Timișoara and ARS
SOP HRD/PA2/KAI 2.3 2,497,260 lei
2,614,500.00Completed December
2012
75
Training of teachers in secondary
education for new career development
opportunities
Ministry of Education and Research OGU
Ploiești 5 partners
SOP HRD 14,325,926 lei
18,472,743.00 Completed
76
Theoretical and practical training
program for competences
development of pre-university teaching staff in physics and technical subjects
OGU Ploiești,Teachers
House Prahova, Gh. Asachi
University, Iași
SOP HRD/PA1/KAI 1.3 2,115,214 lei
2,198,180.00 Completed
31

no.title of individual
project / integrated project
title of individual project within
integrated project Beneficiary
Funding source (operational Programme /
operation name / Key area of intervention)
total project value (lei)
Stage / real / estimated date for completing
the project implementation
77
Preparing teachers in science and technology
through a master program adequate to
knowledge society
OGU PloieștiSOP HRD/PA1/KAI 1.3
1,467,554 lei1,849,912.00
Completed 2011
78
Training of academic staff and students for
the use of modern tools in the field of university
management
OGU Ploiești – in partnership
with 6 universities + SC THE RED POINT
SA
SOP HRD/PA1/KAI 1.2 20,019,242.33 lei
20,852,691.30Completed
2013
79
Professional training and promoting the use
of new technologies for oil and gas
employees in order to increase the quality of services, professional
competitiveness and to improve
specific activities and processes
Employers’
Organization UNIPET
SOP HRD/PA3/KAI 3.24,872,568.05 lei
5,852,461.00Completed
2013
80 Our E-school Dumbrăveşti commune
SOP IEC/PA3/ KAI 2, Op. 2.3
4,817,853.04 On the backup list
81 Professional training for the labor market
Băcoi city in partnership with
SC Faxmedia Consulting SRL
and AJOFM Prahova
SOP HRD/KAI 5.1 1,803,685.2 lei
2,101,377.39Completed
August 2011
82Young researchers
for European competitiveness
OGU PloieștiSOP HRD/PA1/
KAI 1.56,000,000.00
Under implementation
total Sectoral objective C2: 99,784,088.11
Sectoral objective C3 - Developing health infrastructure by providing professional medical care in a modern and equipped space
83
Increasing the efficiency of healthcare at the Obstetrics
and Gynecology Hospital through the implementation of eHealth solutions
Obstetrics and
Gynecology Hospital Ploiești
SOP IEC/PA3/KAI 3.2, Op.3.2.4
1,367,118.4 lei 2,119,346.00
Completed 29.11.2011
84
Development of the medical information
system through e-health services for the benefit of the
residents of Prahova county
Partnership between County
Emergency Hospital Ploiești, Pediatric Hospital
Ploiești, and Băicoi Hospital
SOP IEC/PA3/KAI2/Op.4 (local) 4,879,243.6 lei
7,564,000.00Under
implementation
total Sectoral objective C3: 9,683,346.00
32

no.title of individual
project / integrated project
title of individual project within
integrated project Beneficiary
Funding source (operational Programme /
operation name / Key area of intervention)
total project value (lei)
Stage / real / estimated date for completing
the project implementation
Sectoral objective C4 - Increasing the operational capacity of the administration through knowledge management and the use of innovative technology
85
Strengthening the operational capacity
of the Intercommunity Development
Association “Ploiești-Prahova Growth Pole”
IDA “Ploiești
-Prahova Growth Pole”
OP ACD/PA1/KAI 1.3 787,262.38 lei
926,191.04Completed in
May 2012
86Performance and
efficiency in Prahova’s public administration
Prahova countyOP ACD/PA1/KAI 1.3
867,765.53 lei1,215,927.01
On the backup list
87
Integrated urban planning system for managing the relationship with
citizens
Prahova countySOP IEC/PA3/KAI 2/
Op.1 3,518,454.56 lei
5,234,512.50Completed 04.06.2011
88
Electronic services for citizens and
informatization of workflows at the
General Directorate of Social Assistance and Child Protection
Prahova
General Directorate of Social
Assistance and Child Protection
Prahova
SOP IEC/PA3/KAI 2/Op.1
4,314,228.38 Rejected
89Lifelong Formation in Prahova county
through e-Education Prahova county
SOP IEC/PA3/KAI2, Op.3
5,423,383.35 Rejected
90
Developing and increasing the
efficiency of electronic public services in the city of Băicoi. Supporting the implementation of e-education
applications and ensuring broadband
connection
Băicoi citySOP IEC/PA3/KAI 2/
Op.32,320,500.00 Rejected
91AE3 R (Agency for
Energy Efficiency and Renewable Energy)
Ploiești municipality
IEE Programme - 1,050,000 lei
1,917,304.20Completed in September
2012
92MORE4NRG - “Sharing
best practices to support sustainable
energy policies”
Partners: Romania
(Prahova county); Netherlands, Sweden; Italy, Spain, Greece,
Bulgaria, France.
INTERREG IVC / Energy and
sustainable public transport
281,400.00Completed in
2011
93CATS - City
Alternative Transport Systems
Ploiești municipality in
partnership with Switzer-land,
Israel, Italy and Lohr Industrie
(France)
FP7 Programme 200,552 lei
265,396.00Completed in January 2014
total Sectoral objective C4: 8,624,803.74
General total iDP 5,136,143,583.91
v
33

34
PArt
I

35
the Growth Pole’s Profile

37
PArt I: the Growth Pole’s Profile
1Analysis of Development needs
and Areas of intervention

39
ChAPter 1.1.
People and territory
PArt I: the Growth Pole’s Profile
1Analysis of Development needs and Areas of intervention

40
1.1. People and territory 1.1.1. Defining the area, the network of localities, and the
associative structure
Ploiești Growth Pole, located in Prahova County, was established by GD no. 998/2008 regarding the designation of growth poles and urban development poles, where priority is given to investment in EU and national funding programs. According to ROP 2007-2013, a pole is defined as “an area consisting of a large urban center (a municipality with the rank 0 or 1, according to Law no. 351/2001) and its area of influence (driving area)”. Considering the profile of the localities’ network (PATN 2001), Ploiești growth pole has the following composition:
Urban localities:
• municipalities of inter-county importance – Ploiești municipality, which is capital city for Prahova County and the main social and economic center, with complex industrial and tertiary functions (administrative, political, research and development, higher education). It is also an important communications hub, having as well a significant concentration of public facilities (health, education, culture, sports, trade, finance, and banking);
• cities with mainly industrial-agrarian profile, endowed with units serving the territorial level - Băicoi, Boldeşti-Scăeni;
• cities with mainly industrial activities and services of local importance - Plopeni.
rural localities:
• communes with mainly industrial activities - Boldeşti (Boldeşti-Grădiştea commune), Brazii de Sus, Brazii de Jos, Negoieşti, Popeţi (Brazi commune), Bucov, Chiţorani, Pleaşa (Bucov commune);
• communes with agricultural, industrial, tertiary activities - Ariceştii Rahtivani, Berceni, Blejoi, Dumbrăveşti, Valea Călugărească.
The administrative surface of the 14 component territorial-administrative units is 609.04 km2, of which 161.32 km2 in town, and the total population amounts to 327,309 inhabitants. In terms of population, this is the largest urban agglomeration in the South Region and the 8th largest in Romania, being as well one of the most dynamic economic poles of the country, part of the territorial development axis Giurgiu-Bucharest-Ploiești-Brașov.
The
Gro
wth
Pol
e’s
Prof
ile
Ana
lysi
s of
Dev
elop
men
t N
eeds
and
Are
as o
f In
terv
enti
on
Cha
pter
1.1
. Peo
ple
and
terr
itor
y
i
1

Map 4: Component territorial-administrative units and population of Ploiești Growth Pole
41

territorial-administrative unit
Component localitiesSurface (km2)
Stable population (2011)
Population density
Ploiești municipality Ploiești 58.26 209,945 3,603,5
Băicoi city
BăicoiDâmbuLilieștiSchelaTufeniȚintea
65.36 17,981 275,1
Boldești-Scăeni cityBoldești-Scăeni
Seciu34.90 11,137 319,1
Plopeni city Plopeni 4.73 7,718 1,631,7
Ariceștii Rahtivani commune
Ariceștii RahtivaniBuda
NedeleaStoenești
Târgșoru Nou
81.33 8,704 107,0
Bărcănești commune
BărcăneștiGhighiuPușcași
RomâneștiTătărani
37.25 9,384 251,9
Berceni commune
BerceniCartierul Dâmbu
Cătunu Corlătești
Moara Nouă
31.01 6,186 199,5
Blejoi communeBlejoi
PloieștioriȚânțăreni
20.24 8,575 423,7
Brazi commune
BăteștiBrazii de JosBrazii de Sus
NegoieștiPopeștiStejaru
45.47 8,094 178,0
Bucov commune
BighilinBucov
ChițoraniPleașa
Valea Orlei
49.03 10,388 211,9
Dumbrăvești commune
DumbrăveștiGăvănel
Mălăeștii de JosMălăeștii de Sus
PlopeniSfârleanca
29.51 3,537 119,9
Păulești commune
CocoșeștiGăgeniPăulești
Păuleștii Noi
51.32 5,886 114,7
Târgșoru Vechi commune
StănceștiStrejnicu
Târgșoru VechiZahanaua
48.46 9,117 188,1
table 1. Component territorial-administrative units of Ploiești Growth Pole
42
The
Gro
wth
Pol
e’s
Prof
ile
Ana
lysi
s of
Dev
elop
men
t N
eeds
and
Are
as o
f In
terv
enti
on
Cha
pter
1.1
. Peo
ple
and
terr
itor
y
i
1

territorial-administrative unit
Component localitiesSurface (km2)
Stable population (2011)
Population density
Valea Călugărească commune
ArvaCoslegiDârvariPantaziRachieriRadilaSchiau
Valea CălugăreascăValea LargăValea Mantei
Valea NicovaniValea PoieniiValea PopiiValea Ursoii
Vârfurile
52.17 10,657 204,3
Source: NIS, TEMPO Online database. Own calculations
Ploiești municipality has an area of over 58 km2 and a stable population of 209,945 inhabitants, being the 9th largest city in Romania. It is located at the intersection of the main transport corridors in Romania and at just 60 km from Bucharest, having the potential to form an urban system with Bucharest, but also with Târgoviște.
The Intercommunity Development Association (IDA) “Ploiești-Prahova Growth Pole” was established on 9 June 2009, pursuant to: Government Ordinance no. 26/2000 on associations and foundations (approved by Law no. 246/2005), Law no. 215/2001 on the local public administration, (as amended and supplemented), and Law no. 151/1998 on regional development in Romania, (as amended and supplemented). The IDA operates in accordance with the Constitutive Act, the Statute, and the applicable Romanian legislation in force. The founding members of the Association are the following: Ploiești municipality, the cities of Băicoi, Boldești-Scăeni, Bușteni, Plopeni, and the communes of Ariceștii Rahtivani, Bărcănești, Berceni, Blejoi, Brazi, Bucov, Dumbrăvești, Păulești, Târgșoru Vechi and Valea Călugărească. In 2011, Bușteni city joined the Association, but given its isolated position in the northwestern limit of the county, the city is a member of the Association, but not part of the growth pole area.
The purpose of the Association is to facilitate cooperation between the member territorial-administrative units in view of exercising jointly their competencies, complying with the following principles of sustainable development:
• social progress consistent with community needs;
• effective protection of the environment;
• rational use of natural resources;
• maintaining a strong and stable level of economic growth and employment.
43

Source: City Hall of Ploiești municipality
Map 5. The administrative territory of Ploiești Growth Pole at the county level
The
Gro
wth
Pol
e’s
Prof
ile
Ana
lysi
s of
Dev
elop
men
t N
eeds
and
Are
as o
f In
terv
enti
on
Cha
pter
1.1
. Peo
ple
and
terr
itor
y
i
1
44

1.1.2. Spacial and functional profile
Ploiești is one of the nodes of Brașov – Ploiești – Bucharest – Giurgiu territorial development axis, which shapes the development of the southern part of Romania. This axis links the listed urban poles with the surrounding region and the main development and transport axes across the territory of Romania – Danube Valley, Prahova Valley etc. It also forms an urban system in the direction of Bucharest – Ploiești – Târgoviște, with a population of about 3 million people.
Ploiești is situated at a distance of only 60 km from Bucharest, Ploiești Growth Pole and Bucharest’s (designed) metropolitan territory being adjoined in the south of the Prahova county and functionally integrated through intense commuting, economic and transport flows between the two urban poles. However, the competition between Ploiești and Bucharest is asymmetrical, as the size difference is about 1:9; this narrows the polarization area of Ploiești at a few localities in its immediate proximity.
Ploiești Growth Pole has a total area of 609.04 km2, of which 163.25 km2 belong to urban areas, and 445.79 km2 to rural areas. Of this, 79.9% is privately owned land, and the rest of 20.1% is in public ownership. As regards the use of land, 70.4% of it has an agricultural destination, most of it being arable land (54.4%), pastures and hayfields (9.7%), vineyards (3.6% ), orchards (2.6%), forestry (9.1%), waters (2.2%), constructions (13.1%), communication ways (4.2%), and degraded and unproductive lands (0,9%).
Compared to 2007, there is a decrease by 3.9% of agricultural land (1,700 ha) in favor of construction areas, both residential and economic (industrial parks, logistics, shopping centers, etc.).
Source: NIS, TEMPO Online database
Figure 4. Administrative surface of Ploiești Growth Pole by land use, in 2013
4%
4%1%
3%
9%
2%
13%
55%
8%
1%Arable land
Pastures
Hayfields
Vineyards
Orchards
Forestry
Waters
Constructions
45

As regards the use of land by localities, it can be seen that arable land occupies over 50% of the total area in the following localities: Băicoi, Ariceștii Rahtivani, Bărcănești, Berceni, Blejoi, Brazi, Păulești, and Târgșoru Vechi; they have the best prospects in terms of cereal cultivation. Pastures and hayfields are more widespread in Boldeşti-Scăeni, Bucov, Dumbrăvești, and Valea Călugărească localities, where there are good prospects for the development of animal husbandry. Vineyards and orchards are well represented, having a long tradition in the area, and occupy the most important areas in Băicoi city and in the villages of Bucov, Dumbrăvești, and Valea Călugărească, the latter hosting one of the most important research & development institutes for viticulture and winemaking in Romania. Forests occupy a small area in most component localities, the area facing a shortage of woodlands, except for Plopeni city, where over 50% of the surface is occupied by forestry. Instead, 55% of the administrative territory of Ploiești municipality is occupied by constructions, and other 13.5% represent communication routes, the city facing a shortage of green and planted spaces.
Source: Prahova County Council
Figure 6. Incorporated area by localities in 2013
Source: NIS, TEMPO Online database
Figure 5. Land use according to destination and by localities in 2013
Industrial zones occupy a large surface in the growth pole, being made up of 1,458 ha of brownfield areas, mainly built during the communist period, to which are added other 634 ha of industrial parks.
Of the total administrative surface of the growth pole, 161.32 km2 of land are situated within the incorporated area (26.5% of total) and 447.72 km2 are situated outside the incorporated area (73.5%). Compared to 2007, urban areas have been extended by 1,306 ha, mostly in the cities of Băicoi (+983 ha) and Boldeşti-Scăeni (+323 ha). The urban area in Ploiești municipality remained constant at 5,190 ha.
Ploieș
ti
Bucov
Braz
i
Băico
i
Târg
șoru
Vec
hi
Bolde
ști-S
căen
i
Bărc
ăneș
ti
Berc
eni
Paule
ști
Dumbr
ăveș
ti
Plope
niBlej
oi
Ariceș
tii R
ahtiv
ani
Valea
Călu
găre
ască
100%
90%
80%
70%
60%
50%
40%
30%
20%
10%
0%
6 000
5 000
4 000
3 000
2 000
1 000
0
Ploieș
ti
Bucov
Braz
i
Băico
i
Târg
șoru
Vec
hi
Bolde
ști-S
căen
i
Bărc
ăneș
ti
Berc
eni
Păule
ști
Blejoi
Ha
Ariceș
tii R
ahtiv
ani
Valea
Călu
găre
ască
The
Gro
wth
Pol
e’s
Prof
ile
Ana
lysi
s of
Dev
elop
men
t N
eeds
and
Are
as o
f In
terv
enti
on
Cha
pter
1.1
. Peo
ple
and
terr
itor
y
i
1
46

Map 6. Land use in Ploiești Growth Pole by locality
47

Although Ploiești experienced a negative demographic trend, the growth pole’s built-up area continued to grow. Real estate dynamics in Ploiești Growth Pole were not as striking as in other growth poles. Ploiești has experienced, for instance, the lowest real estate dynamics between 1992 and 2012. But the peri-urban area of Ploiești expanded by about 20%.
no. Growth Poleexpansion of built-up area
from:
Main city Peri-urban area
1 Brașov 24,2% 20,5%
2 Cluj-Napoca 24,5% 15,2%
3 Constanța 7,2% 13,3%
4 Craiova 27,4% 12,8%
5 Iași 17,5% 19,6%
6 Ploiești 6,5% 19,2%
7 Timișoara 13,2% 24,2%
table 2. Built-up area expansion in the Growth Poles between 1992 and 2012
Source: World Bank. 2013. Growth Poles: The Next Phase
The main expanding zone is located in the western part of the pole (see picture below), and the territorial-administrative units (TAU) with the most substantial expansion of the built-up area are Târgşoru Vechi and Ariceștii Rahtivani, i.e. by approximately 74% and 40% respectively between 1992 and 2012. Mostly, this extension of built-up areas is due to the construction of new industrial platforms and new shopping centers in the pole, but also to the phenomenon of suburbanization, a growing number of people moving from Ploiești city to neighboring localities.
Source: World Bank. 2013. Strengthening the capacity of spatial planning - a precondition for sustainable urban developmentnote: The three shades of blue represent the built-up area in Ploiești Growth Pole in 1992, 2002, and 2012
Map 7. Urban expansion in Ploiești Growth Pole
48
The
Gro
wth
Pol
e’s
Prof
ile
Ana
lysi
s of
Dev
elop
men
t N
eeds
and
Are
as o
f In
terv
enti
on
Cha
pter
1.1
. Peo
ple
and
terr
itor
y
i
1

Source: City Hall of Ploiești municipality
table 3. Evolution of built-up areas in Ploiești Growth Pole
territorial-administrative units 1992 2002 2012 % of change between 1992 & 2012
Ariceștii Rahtivani 414 434 583 40.82%
Băicoi 957 966 1,030 7.63%
Bărcănești 472 474 504 6.78%
Berceni 346 348 387 11.85%
Blejoi 383 437 524 36.81%
Boldești-Scăeni 673 677 714 6.09%
Brazi 830 835 859 3.49%
Bucov 459 484 533 16.12%
Dumbrăvești 317 334 343 8.20%
Paulești 375 409 465 24.00%
Ploiești 3,039 3,120 3,238 6.55%
Plopeni 141 141 152 7.80%
Târgșoru Vechi 397 437 690 73.80%
Valea Calugărească 569 583 606 6.50%
total 9,372 9,679 10,628 13.40%
Source: World Bank. 2013. Growth Poles: The Next Phase
The phenomenon of suburbanization, coupled with the population decline and with internal and external migration (especially to Bucharest) led to a dramatic decrease in population density in Ploiești municipality. While in 1992 Ploiești had a density of about 83 people per hectare, in 2002, the value dropped to 76 people/ha, and in 2012 to 61 people/ha – this means a density reduction of about 27% between 1992 and 2012. This trend has and will have an important impact on public services such as public transport, drinking water and sanitation, waste collection, street lighting, or centralized heating.
The functional zoning of the built-up area of Ploiești municipality was established in the General Urban Plan, approved in 1999 and currently being updated. The zoning is represented in the figure below.
Figure 7. Zoning of the incorporated area of Ploiești municipality
The central municipal zone has a surface of over 110 ha, most of the public institutions and public services units in the municipality being located there: the City Hall, the County Council, museums, theaters, shopping centers, accommodation and catering units, schools, business offices, banks, etc. Moreover, the majority of the city’s built heritage elements – with a potential for touristic harnessing – is also located here.
1%2%
5%
12%roads and railways
2%3%
1% 26%industrial, storage, and transport units
42%housing and services zone
6%
Central zone
Housing and services zone
Industrial, storage, and transport units
Agricultural units
Green & recreation zones
Municipal services
Roads and railways
Special destination zones
Vacant land
Other
49

Source: Own drawing based on NIS data. RGPL 2011
Map 8. Population density at census sector level in Ploiești municipality in 2011
The housing and services zone grew organically, radially around the central nucleus, especially along the arteries of penetration that connect the city with its industrial platforms. In this way, individual housing districts (houses) started to be built in the nineteenth century and in the first half of the twentieth century (Cantacuzino, Ana Ipătescu, Gheorghe Doja, Transilvaniei, etc.). During the communist times, large housing complexes were constructed mainly in the north and west part of the central zone, corresponding to the following districts: Găgeni, Nord, Andrei Mureșanu, Republicii Vest I, Malu Roșu, Ienăchiță Văcărescu, Peneș Curcanul, Vest I, Vest II, 9 Mai. After 1989, housing areas have developed especially towards the north (“Eden” district, “Carino” district, etc.). Overall, the municipality encompasses, according to the General Urban Plan, 19 housing districts and 5 housing units (Calea București, CFR Depou, Rafinorilor, Mihai Bravu-Teleajen, Vega).
The city has a number of outer districts, which are housing areas relatively isolated from the rest of the city and with poor endowments in terms of technical and urban facilities and equipment: Bereasca, Bărcănești, Moțoi, Râfov, Mimiu, Pictor Rosenthal, Buda.
The quality of the housing fund varies from one district to another, depending on: the period in which it was built, its development – spontaneous or planned, the materials that were used, the size and quality of public spaces, etc. The most vulnerable buildings are located in the central zone, as the preceding constructions that were affected by bombings or the 1977 earthquake were replaced with modern and earthquake-resistant ones. In the districts surrounding the central nucleus one can find either 50-year-old buildings, made up of unsustainable materials (adobe, for instance) in the residential areas with individual housing, or apartments in relatively new buildings, with a low degree of comfort in the case of collective housing. Both types of housing web have specific problems: individual housing zones are characterized by larger living areas and green spaces (yards), but the buildings are old, vulnerable to hazards, and poorly endowed with public equipment, especially in outlying areas. Collective housing zones encompass newer and safer buildings and
50
The
Gro
wth
Pol
e’s
Prof
ile
Ana
lysi
s of
Dev
elop
men
t N
eeds
and
Are
as o
f In
terv
enti
on
Cha
pter
1.1
. Peo
ple
and
terr
itor
y
i
1

Source: City Hall of Ploiești municipality
Map 9. The districts of Ploiești municipality
generally have a satisfactory level of endowment with technical and urban facilities; however, they are short of public spaces and green areas, witness high population densities, limited energy efficiency and comfort, small living areas, insufficient parking places, and degradation of building façades.
Even new residential areas (“infilling” type) have their problems: the buildings are modern, have all the required equipment and annexes specific to quality housing, but are heterogeneous in terms of architectural style and materials used, and also interfere with other incompatible functions (e.g. industrial). Moreover, they are short of access infrastructure and technical and urban utilities, their development being generally insufficiently regulated and planned.
51

Source: Own drawing based on NIS data. RGPL 2011
Map 10. The percentage of residences located in buildings with more than one floor, by census sector in Ploiești municipality
With regard to height, areas with low height regime – represented by the districts with houses – are predominant. The central area is heterogeneous, comprising both individual housing with 1-2 levels and newer buildings, even with more than 10 levels; the assemblies built in the communist period have between 5 and 11 floors.
52
The
Gro
wth
Pol
e’s
Prof
ile
Ana
lysi
s of
Dev
elop
men
t N
eeds
and
Are
as o
f In
terv
enti
on
Cha
pter
1.1
. Peo
ple
and
terr
itor
y
i
1

Recently, new shopping centers have developed in all the areas of the municipality, especially in the west (Auchan, Selgros, Kaufland, Billa, West Mall, Balif City), in the north (Kaufland, Baumax, Metro, Praktiker, Carrefour, Ploiești Shopping Center), but also in the eastern part (Dedeman, Afi Palace).
The industrial, storage, and transport zone is very large, being disposed radially around built-up areas in the suburbs of the city. The 4 major industrial sites in the town are:
• Ploiești East-Teleajen platform – where the Teleajen refinery, currently owned by Lukoil, is located; other industrial companies (Feroemail, Uztel), but also trade, services, and transport companies are also placed there.
• Ploiești South industrial zone – hosting oil sector facilities, machine building facilities, etc.
• Ploiești West-Crâng industrial zone – with a more diversified profile (food industry, chemical industry, building materials, the metalworking, storage, trade, services, etc.).
• North industrial zone – where Vega refinery and Rompetrol company are located.
In addition to these well-defined platforms, in the city there are also isolated units, scattered in the territory – the North Station area is an example. Most of these industrial sites, which cover 1,000 ha, are currently partly used, Ploiești being among the growth poles with the largest brownfield sites areas in Romania, given its pronounced industrial profile. These areas, which are generally privately owned, have the potential to be rehabilitated and functionally reconverted so as to prevent the expansion of the municipality and promote the model of the compact city. Such an approach is imperative, especially given that the extension of built-up areas is limited by natural and anthropic barriers (rail network, Dâmbu creek, ring roads, industrial zones). The targeted areas with reconversion potential include: Romanian Astra refinery (northern and southern buildings), Upetrom May 1 platform (partially), Grivco platform, Teleajen platform (partially), Dorobanţul platform. Depending on the specific characteristics of each of these areas, the change of their destination could include: the development of planted areas, the construction of housing, public services, shopping areas, etc.
After 1990, the industrial zones were extended mainly to the west with the construction of a new industrial park of over 160 ha, plus several other private parks on the territory of Ariceștii Rahtivani commune, of over 300 ha in size. They turned into the main business pole of the city, attracting important foreign and local investors (Yazaki, Cameron, Kaufland, Johnson Controls, Calsonic Kansel, etc.) and creating thousands of jobs.
Green and recreation areas occupy a quite limited space (only 2% of the urban area) that – besides the fact that the city is located in a plain area, which lacks extensive natural or woodland surfaces and has instead large industrial zones and heavy traffic – represent one of the main problems of the community. The average area of green space per capita is about 7 m2 per inhabitant, in contrast to the other Romanian growth poles, with an average of about 20 m2, and to international standards of 25-30 m2 per inhabitant. Of these, 15.4 ha are public gardens, 55.7 ha are recreational parks, 10.4 ha consist of other kinds of green spaces, and 16.2 ha are sports areas. The largest park in the municipality is Tineretului Park. Besides this, the municipality has several other smaller parks located near the West Railway Station, the South Railway Station, along Independenței Boulevard, Republicii Boulevard, within Ploiești North district, “Mihai Viteazu” Park, “I.G. Duca” Park, “Nichita Stănescu” Park, the park in front of the House of Unions, the Central Markets, the Administrative Palace, etc. Currently, the West Municipal Park is undergoing landscaping works, financed with European funds worth over EUR 20 million; at the end, it will have an area of 58 ha and will increase the average area of green spaces at more than 9 square meters per inhabitant. As well, the municipality has many stadiums, sports grounds and a hippodrome, the only one in Romania that enables horse trot.
The municipality’s spatial development trends are also illustrated at the level of the Zonal Urban Plans (ZUP), prepared during 2007-2014. The list in Annex 1.1 gives an insight into the relatively low investment dynamics in this period:
• 20 of the 180 ZUPs were initiated by the public sector (most of them by Ploiești municipality) and refer to changes at the level of land use / land occupancy indicators for municipal investments, parceling for housing, accessibility, etc. With the exception of the ZUPs for housing construction via the National Housing Agency (ANL), most investment refers to infrastructure projects contained in the IDP 2007-2013 - covering the investment capacity of the local public administration to a significant extent.
• The documentation initiated by the private sector – individuals and companies – generally refer to housing, offices / company headquarters, or extension thereof. Many ZUPs envisage changes of urban indicators for these functions, which prove not necessarily an increase in investment, but the need for the current regulations to be reconsidered in the new GUP that is currently under development.
53

Map 11. Functional areas in Ploiești Growth Pole
54
The
Gro
wth
Pol
e’s
Prof
ile
Ana
lysi
s of
Dev
elop
men
t N
eeds
and
Are
as o
f In
terv
enti
on
Cha
pter
1.1
. Peo
ple
and
terr
itor
y
i
1

1.1.3. Location, natural features, and brief history
Ploiești Growth Pole (GP) is located in the 3rd Development Region – South Muntenia. Ploiești municipality, which is the residence of Prahova county, belongs to the most urbanized county in the country, with two municipalities and 12 towns. It is located at 60 km from Bucharest, at 30 km from the “Henri Coandă” international airport, and in the vicinity of major transport corridors: Bucharest-Brașov railroad thoroughfare, TEN-IV and TEN-IX corridors.
In terms of morphological units, the GP is located in a plain area, Ploiești Plain, which is situated in the Prahova river basin, with its main tributary, Teleajen river. One of its tributaries is Dâmbu, with an area of 190 km2 and a length of 39 km. In terms of valuable mineral resources, Ploiești–Prahova GP has mainly oil and clays, but is positioned in the vicinity of large reserves of mineral water, salt, limestone, sandstone, and sand.
The climate is temperate continental, with an average annual temperature of 10.0°C, the coldest month being January (-2°C) and the warmest July (22°C). The global solar radiation is 125 Kcal/m2/year, and the average sunshine duration is 2,150 hours/year. The average annual rainfall is of about 600 mm/year, the cloud cover is of about 100 days/year
Map 12: Locating Ploiești Growth Pole
55

and the average wind speed is 2.3 m/s, with prevailing winds from the northeast and east. On average, there are around 15 days of snow/year, the snow lasting 50 days, and its average thickness being of 15 cm.
The specific natural vegetation in Ploiești area is the steppe, although it has been replaced almost entirely by agricultural crops and constructions. Discontinuous territories are occupied by beech and oak forests, alternating with crops, vineyards, and orchards. In the area, one can find rare specimens of oak, such as the gray and the pedunculat oaks, as well as other xerophyte herbaceous plants: Artemisia austriaca, Poa bulbosa, Agropyron cristatum, Cynodon dactylon, Verbascum.
The soils in the area are mostly cambic, argillaceous-alluvial chernozems, red-brown podzolic, and argillaceous-alluvial. All these are favorable for grain and corn crops. In the floodplains that cross the plain there are large areas covered with silt, alluvial soils, marshy grounds, phreatic-wet chernozems, which are favorable for grains and vegetables.
The first historical artifacts discovered in the area date back to around 300 BC – they are the traces of Dacian settlements during the ruling of Burebista and of Dridu culture. Ploiești municipality was first attested in the sixteenth century and became a major urban center during the reign of Michael the Brave, who conferred on it the status of princely borough in 1597, making it also a basis for military operations. Its development continued in the eighteenth century too, but by the mid of the nineteenth century, it did not exceed a population of 10,000 inhabitants. Then, with the development of mining activity and oil processing, the city witnessed an explosive growth of the population, reaching 80,000 inhabitants in the interwar period, during which time it was the residence of Prahova County.
Since it had been the national oil industry center, the city was bombed and severely damaged during the Second World War, but has continued to grow during the Communist period due to the process of forced industrialization and urbanization. Therefore, in the late 80s, the municipality’s population reached 250,000 inhabitants.
The other localities of the growth pole area are also mentioned in documents from the sixteenth century or even later, being generally franklin villages, which developed especially after the beginning of the nineteenth century. The latest of these is the Plopeni town, which was established as a colony around the armament factory in 1938. Some have become towns only after the Second World War (Băicoi – 1948; Boldeşti-Scăeni, and Plopeni – 1968).
56
The
Gro
wth
Pol
e’s
Prof
ile
Ana
lysi
s of
Dev
elop
men
t N
eeds
and
Are
as o
f In
terv
enti
on
Cha
pter
1.1
. Peo
ple
and
terr
itor
y
i
1

1.1.4. Demography and migration
At the General Population and Housing Census in 2011, the administrative-territorial units belonging to Ploiești Growth Pole had a total stable population of 327,309 inhabitants, of which 209,945 resided in Ploiești municipality. This represents 44% of the total population of Prahova county, 10% of the South Muntenia region, and 1.7% of Romania’s population. In terms of geo-demographical size, Ploiești municipality is the ninth largest city in Romania, and Ploiești Growth Pole is the eighth largest agglomeration. The average population density on its territory is of 539 inhabitants/km², about three times higher than that of Prahova county and about 6 times higher than the national average, which indicates a large population concentration in this area from the nineteenth century onwards.
Source: NIS, Final RGPL results, 2011. Own processing
Figure 8. Romanian Growth Poles’ stable population in 2011
From the perspective of population dynamics between the last two censuses, between 2002 and 2011, the population of Ploiești municipality fell by 9.7% and that of the Growth Pole by 7.5%. As can be seen, the population fell faster in the urban nucleus than in the Growth Pole, which suggests a phenomenon of suburbanization and of migration from Ploiești to neighboring localities, where the cost of living is lower, as it is the price of land or housing, and where the surfaces are large enough for the expansion of residential areas.
Even at the level of the Growth Pole, the population dynamics were different in the past decade. The small urban centers around Ploiești (-10.2% in Băicoi, -19.7% in Plopeni, -3.1% in Boldeşti-Scăeni) have witnessed significant decreases of the population, which was affected by the restructuring process and the economic reorientation, especially in the secondary sector, given that these towns didn’t have a diverse economic structure, but rather a mono-industrial profile. On the other hand, a number of communes adjoined to Ploiești municipality registered a positive growth of the population, especially those in the north and west (Păuleşti: +13.8%, Blejoi: +8.2%, Târgşoru Vechi: +6%). Other localities in the Growth Pole recorded either a stagnation of the population (Bărcăneşti, Berceni, Bucov, Valea Călugărească) or a decline of it (Brazi, Dumbrăvești, Ariceștii Rahtivani), being less involved in the process of suburbanisation, primarily on account of a longer distance to the urban core and lower accessibility.
2 500 000
2 000 000
1 500 000
1 000 000
500 000
0
Bucur
ești
Cluj-N
apoc
a
Tim
ișoar
aIaș
i
Const
anţa
Craiov
a
Braș
ov
Ploieș
ti
Growth Pole Metropolitan area
Source: NIS, RGPL final results, 2011. Own processing
Figure 9. Population dynamics of the TAUs forming Ploiești Growth Pole during 2002-2011
120
100
80
60
40
20
0
2002 = 100%
Ploieș
ti
Bucov
Braz
i
Băico
i
Târg
şoru
Vec
hi
Bolde
ști-S
căen
i
Bărc
ăneș
ti
Berc
eni
Păule
ști
Dumbr
ăveș
ti
Media
ZMP
Plope
ni
Blejoi
Ariceș
tii-R
ăhtiv
ani
Valea
Călu
găre
ască
57

Map 13. Distribuția populației în Polul de Creștere
58
The
Gro
wth
Pol
e’s
Prof
ile
Ana
lysi
s of
Dev
elop
men
t N
eeds
and
Are
as o
f In
terv
enti
on
Cha
pter
1.1
. Peo
ple
and
terr
itor
y
i
1

The causes of this demographic decline is primarily related to internal migration (80% towards Bucharest and Ilfov county) and external migration (mostly to Italy, Spain, UK, France, Germany), but also to the negative natural growth. As well, in the last 15 years there is a phenomenon of return migration, especially in the case of pensioners and the unemployed, who prefer to come back to their home areas, usually rural, and to avoid the high costs of living in the urban areas. Once returned to those areas, they get to practice even subsistence agriculture for self-consumption.
Compared to other growth poles in Romania, Ploiești Growth Pole registered a more pronounced demographic decline, being exceeded only by that of Craiova. Moreover, despite the unfavorable demographic context nationally, there is clear evidence of three urban poles (Bucharest, Cluj-Napoca, and Timișoara), which continue to attract residents due to strong economic development – especially within the services sector – and increasing employment opportunities. In contrast, Craiova, Ploiești, and Brașov recorded a phenomenon of de-concentration on account of the reduced distance from the capital, which significantly limits the polarization area, but also because of a still industry-dominated economic profile.
Source: NIS, RGPL final results, 2011. Own processing
Figure 10. Population dynamics in peri-urban areas within Romania’s Growth Poles during 2002-2011
In terms of gender structure, there is a tendency towards feminisation of the population, females representing in 2011 52.3% of the total population in the Growth Pole and 53% of the total population in Ploiești municipality. This phenomenon is caused by the higher male death rate across most age groups (women’s life expectancy is about seven years higher than that of men) and greater male workforce migration following the employment decline in heavy industry sectors, where most jobs are intended for men.
In terms of ethnic composition, 97.4% of the people in the Growth Pole and 97.1% of those living in Ploiești municipality have declared themselves Romanian at the census in 2011, this percentage being higher than the national average, situated below 90%, other ethnic groups being underrepresented. Of these, the Roma group still stands, representing 2.3% of the population. However, the actual number of Roma inhabitants is higher, many of them declaring themselves Romanian at the Census. A higher proportion of Roma population is recorded in the communes of Dumbrăvești (8.8% of total population) and Bucov (5.3%), as well as in Boldești-Scăeni (5.3%) city.
The religious structure of the population is also homogenous. Thus, 96.8% of the people in the Growth Pole and 97.2% of those living in Ploiești municipality declared themselves in the 2011 census as being Orthodox; they were followed from afar by small groups of Christian Evangelists (0.8%), Pentecostals (0.6%), Seventh-day Adventists (0.5%), Roman Catholics (0.3%), Evangelicals (0.3%), Baptists (0.1%), and so on. The only localities where the share of the Orthodox is less than 95% are Târgşoru Vechi and Brazi, both having large communities of Christian Evangelists (representing 7.3% and 4.9% respectively of the total population) and Pentecostals.
Bucur
ești
Cluj-N
apoc
a
Tim
ișoar
aIaș
i
Const
anţa
11010510095908580
Craiov
a
Braș
ov
Ploieș
ti
2002 = 100%
59

The structure by age of the population both in Ploiești municipality and in Ploiești Growth Pole points to a phenomenon of demographic aging that is increasingly pronounced and more advanced than in other growth poles (Iași, Cluj-Napoca, Timișoara, and Bucharest). The dependence of the population based on age, expressed as a ratio between the elderly (over 60 years) and the young people aged up to 15 years, is above 100% (i.e. 156%), which shows that younger generations are unable to fully replace the older generations that retire. Compared to the previous census, that of 2002, the share of young population has decreased by over 1%, while the elderly population increased by 4.6%, a trend that will continue in the future on account of the increase of life expectancy, fall of birth rates to historic lows, and migration of young workforce to Bucharest municipality or other countries. Thus, by 2020, it is expected that the share of people over 60 years to reach 30% of the total population, which will create increased pressure on the market of medical services and social services, the pension system, but also the labor market.
Source: Own drawing based on NIS data. RGPL 2011
Map 14. The population structure of Ploiești municipality by age and census sector in 2011
The highest values regarding the dependence of the population by age, indicating the presence of an unfavorable pyramid of ages that tends to reverse, are to be found in localities like Băicoi (182%), Ploiești (169%), Păuleşti (169%), and Dumbrăvești (156%), which will continue to have a negative natural growth in the medium and long term. In contrast, a number of localities have a younger population and more favorable prospects for demographic revitalization: Târgşoru Vechi (92%), Berceni (102%), Bucov (109%), and Valea Călugărească (115%).
Despite the increased rate of demographic aging, the working age population (14-59 years) continues to represent almost 2/3 of the total population, which is an important stock of labor force. Almost 50% of the active population is aged between 40 and 59, these people being among those most at risk of social exclusion because they were educated and qualified for jobs before 1989, and these jobs are no longer largely required on the local labor market.
60
The
Gro
wth
Pol
e’s
Prof
ile
Ana
lysi
s of
Dev
elop
men
t N
eeds
and
Are
as o
f In
terv
enti
on
Cha
pter
1.1
. Peo
ple
and
terr
itor
y
i
1

Source: NIS, Final RGPL results, 2011. Own processing
Figure 11. Population age pyramid for Ploiești Growth Pole
85 years80-85 years75-79 years70-75 years65-69 years60-64 years55-59 years50-54 years45-49 years40-44 years35-39 years30-34 years25-29 years20-24 years15-19 years10-14 years
5-9 years0-4 years
-20 000 20 000-15 000 15 000-10 000 10 000-5 000 5 0000
Male
Female
As regards the structure of the population by educational level, 20.8% of the inhabitants of the Growth Pole graduated from higher education systems, 5.8% have completed post-secondary and foremen studies, 29.2% have graduated from high school, 14.6% from technical and vocational schools, 18.8% secondary schools, 9.8% primary schools, and 1.8% have not completed their studies. Even though the percentage of graduates has increased by nearly 10 percentage points compared to 2002, it is lower compared to the other growth poles in Romania. This is explained by the migration of highly skilled workforce to Bucharest or to other countries, where employment opportunities for university graduates are better.
Map 15. The population structure in Ploiești municipality by education level and census sector in 2011
Source: Own drawing based on NIS data. RGPL 201161

On the other hand, in Ploiești municipality there is a significant number of people with medium-level education, trained especially in industries that dominated the local economy during the communist period.
Source: NIS, Final RGPL results, 2011. Own processing
Figure 12. Romania’s Growth Poles’ population structure by the level of graduated studies
Bucur
ești
Cluj-N
apoc
a
Tim
ișoar
aIaș
i
100%
90%
80%
70%
60%
50%
40%
30%
20%
10%
0%
Const
anţa
Craiov
a
Braș
ov
Ploieș
ti
No studies
Primary
Secondary
Technical and vocational
High school
Post-secondary and fore-men studies
Higher education
As regards the natural movement of population, the natural increase is negative since the ‘90s, amid the dramatic drop of birth rates, along with a slight increase in mortality. The causes are related to unfavorable socioeconomic conditions for starting a family, emigration of young people and population aging. Thus, the birth rate in the Growth Pole dropped in 2013 to a minimum (7.8/1,000 inhabitants), i.e. below the national (9.3), regional (8.4) and county (8) averages, witnessing 1‰ decrease compared to 2007. Moreover, about 6.3‰ of mothers who gave birth to a child don’t reside in the country. In parallel, the mortality rate increased from 10.2‰ to 10.6‰ in the same period, despite the increase in life expectancy, but remains below the national (11.7), regional (13) and county (12.1) averages due to easier access to medical services. In this context, natural deficit widened after 2007. The numbers of marriages also decreased by 36‰, especially amid the global economic crisis, which was unfavorable to starting families. The number of divorces fell by 39‰, and infant mortality rates reached 6‰ (compared to 8-9‰ in 2000), one of the lowest values in Romania, which shows improved access to medical services.
In the component localities, a higher birth rate is recorded only in the municipalities Dumbrăvești, Târgșoru Vechi and Valea Călugărească (over 10‰ in 2007-2013), while the minimum is recorded in Păuleşti commune and the cities of Plopeni and Băicoi (below 7‰), which have an aged population and faced a sharp economic decline in the past two decades (especially in Plopeni town). As for the mortality rate, its recorded values were below average in localities with a younger population (Târgşoru Vechi, Plopeni, Boldeşti-Scăeni) and in Ploiești municipality, which has a more complex offer of medical services. The highest incidence of mortality was recorded in localities with a high proportion of elderly population and access to primary healthcare, as in Băicoi, Brazi, Dumbrăvești, Ariceștii Rahtivani, Valea Călugărească. Therefore, the average natural growth for 2007-2013 was positive only in Plopeni city and in Târgşoru Vechi commune, the minimum values being recorded in Băicoi (-4.7‰), Brazi (-4.7‰), Ariceștii Rahtivani (-4.1‰) and Păuleşti (-4‰). Ploiești municipality has also recorded an average natural increase of -1.5‰.
62
The
Gro
wth
Pol
e’s
Prof
ile
Ana
lysi
s of
Dev
elop
men
t N
eeds
and
Are
as o
f In
terv
enti
on
Cha
pter
1.1
. Peo
ple
and
terr
itor
y
i
1

Source: NIS, Final RGPL results, 2011. Own processing
Figure 13. Dynamic regarding the birth rate, mortality, natural increase, marriage, divorce, and child mortality in Ploiești Growth Pole during 2007-2013
The total migratory balance of Ploiești Growth Pole is negative, and the balance of domicile changes during 2007-2013 reached -3.177 people; this contributed by about 40% to the reduction of the number of inhabitants. However, migration is under-represented in official statistics of the NIS, because a simple comparison between the stable population (with the actual residency in the area) of the territory concerned and the legal population (with the domicile in the area) shows a deficit of about 35,000 people, of which 30,000 are found only in the municipality, which represents around 10% of the total population. These are people who actually live in another town in Romania or in another country, but who still have the domicile in one of the territorial-administrative units that belong to Ploiești Growth Pole. During the 2011 census, data could be collected only from about 18,000 of these people, which indicates that around 80% have been living abroad for a long time. As well, a significant number was residing in Bucharest and Ilfov county, the capital attracting a significant number of young people for studies or for better paid jobs in different areas of interest.
External migration phenomenon is the most intense in Plopeni (about 9‰ of the domiciled population), a town that has a large workforce and that witnessed a massive wave of dismissals in the last two decades, on account of its single-industry character acquired before 1990. As well, emigration rates above 5% of the population domiciling in the city are registered in Băicoi city, Dumbrăvești and Bucov communes, which witness reduced local employment opportunities as well.
Inside the Growth Pole, one can observe a phenomenon of suburbanization. Thus, while in the cities of Ploiești and Plopeni, negative values of internal migration are recorded, in the rural areas around the municipality (Păuleşti, Blejoi, Târgşoru Vechi, Bucov, Bărcăneşti) there are positive values of migratory movements due to the people who move mainly in Ploiești. However, these internal migration flows are offset by the growing intensity of external migration, determining a slow growth of the stable population in these communes (by less than 1% per year).
Birth rate
Mortality
Natural increase
Marriages
Divorces
Child mortality
12.0
10.0
8.0
6.0
4.0
2.0
0.0
-2.0
-4.0
2007 2009 2010 2011 2012 20132008
Source: NIS, TEMPO Online database
Figura 14. Population life expectancy (in years) by gender during 2007-2012
Life expectancy of the population in Ploiești Growth Pole has steadily increased in recent years, reaching almost 76 years now – 72 years for men and 79 years for women –, but remains below the EU average, which is 80 years for both genders. This increasing trend of average life duration is expected to continue in the future up to a convergence with the European average, amid the improvement of access to modern medical services, life progress, the adoption of a healthier lifestyle, etc. Increased life expectancy will lead to greater demographic aging, especially since it is correlated with a decrease in birth rates to historic lows and the emigration of young people.
Total Male Female
80
78
76
74
72
70
68
66
2007 2008 2009 2010 2011 2012
63

Map 16. Active population that works in localities other than the ones they reside in
64
The
Gro
wth
Pol
e’s
Prof
ile
Ana
lysi
s of
Dev
elop
men
t N
eeds
and
Are
as o
f In
terv
enti
on
Cha
pter
1.1
. Peo
ple
and
terr
itor
y
i
1

Source: World Bank, 2014
Figure 15. Local Human Development Index (LHDI) at the growth pole level in Romania, 2002 and 2011
1.1.5. Local development and regional synergies
local human development
According to the values of the Local Human Development Index (LHDI), computed by Prof. Univ. Dr. Dumitru Sandu at University of Bucharest for the World Bank Report “Competitive Cities. Reshaping the Economic Geography of Romania”, Ploiești municipality is among Romania’s developed urban centers thanks to its complex functions and its infrastructure, which serves both the county and the region. Still, the performances of Ploiești are placed under those of other Romanian growth poles, such as Cluj-Napoca, Bucharest, Timișoara, or Iași, which benefit from more complex infrastructure and social services, Constanța Growth Pole being the only one that is overtopped by Ploiești from this point of view. These development gaps have widened over the period 2002-2011.
Marginalized urban communities in Ploiești Growth Pole
Urban marginalization becomes visible through spatial concentration of deprived population in communities located in certain areas within urban settlements. Therefore, in order to analyze this phenomenon, the study should be done at a level that is as confined as possible and not at the territorial-administrative level. The data collected during the 2011 census provides a unique opportunity to conduct such an analysis at the level of smaller territorial units, i.e. census sectors.
The smallest geographical area for running a census is the census sector, which usually comprises around 200 people. Thus, the micro-data from the census of 2011 and aggregated at the census sector level were used for analysis. The main limitation of this analysis is that the overlap between marginalized communities and census sectors is only partial. Marginalised communities are not always entirely concentrated in one census sector, therefore community characteristics cannot be always analyzed at this level.
Figure 20 shows some typical examples for this. Example 1 illustrates a situation in which a large community covers several census sectors. Example 2 describes a situation in which a community covers parts of two or more census sectors. Example 3 corresponds to a situation in which a small community is located in a census sector along with other population groups. And finally, Example 4 shows a community that is located on the outskirts (e.g. improvised shelters located near landfills), partly inside, partly outside the town. Census data are not best suited for identifying similar situations for the last example. In such areas, some locals did not take part to the census, and those who did were assigned to the census sectors located nearby. So, by using aggregate data at the census sector level, communities of this kind can be identified or reconstituted only partially.
Local Human Development Index
LHDI 2002
76
102
76 76 79
6877
99106
100 98 10191
84
LHDI 2011
Bucur
ești
Cluj-N
apoc
a
Tim
ișoar
aIaș
i
Const
anţa
Craiov
a
Braș
ov
Ploieș
ti
74
94
65

NOTE: The cells indicate the area inside the town that is divided into census sectors, while the figures indicate specific communities.
Figure 16. Examples of field interaction between census sectors and specific communities
The most relevant, practical, measurable, and useful dimensions for defining different types of disadvantaged areas are: (1) human capital (i.e. education, health, and demographic behavior); (2) employment; and (3) housing quality. For each of these dimensions one can assign a set of indicators for which data from the 2011 census are available.
The initial typology, which resulted from the literature review, was based on a set of 13 indicators for the identification of these areas through quantitative research methods. Afterwards, the set of indicators was reduced to seven key indicators. Three indicators correspond to human capital, three other refer to housing, and an indicator is related to employment. By using data from the 2011 census, the values corresponding to each of the seven key indicators were computed for each urban census sector. Likewise, for each of the seven key indicators, the threshold above which it was considered that the census did not provide an appropriate standard was set at 801 percentile at the national urban level.
By counting the indicators exceeding the corresponding urban threshold, a summative index was calculated for each dimension. In this way it can be seen whether a specific census sector is characterized by low levels of human capital, by limited employment in the formal sector, or by precarious housing.
A census sector is considered as having a low level of human capital if any two of the three indicators have values that exceed the correspondent urban threshold, established at the national urban level. In other words, a census sector is considered disadvantaged in terms of human capital if it is characterized by a concentration of the following categories of vulnerability: (i) active population with low levels of education; (ii) children; (iii) persons with disabilities or with other health problems. «Concentration» means a share of that category in the respective total population, which figures among the highest 20% values of all urban census sectors.
A census sector is defined as having a low level of employment in the formal sector if it has a concentration of unemployed and/or people not enrolled in the formal labor market; in this context, «concentration» means a share of that category in the total active population in the area, which figures among the highest 20% values of all urban census sectors.
A census sector is considered as having poor housing if any two of the three indicators have values that exceed the correspondent urban threshold, established at the national urban level. In other words, a census sector is considered disadvantaged in terms of housing if it has a concentration of at least two of the following vulnerability categories: (i) people living in dwellings without electricity; (ii) people living in overcrowded spaces; (iii) households facing housing insecurity. «Concentration» means a share of that category in the area, which figures among the highest 20% values of all urban census sectors.
1 Using the 80 percentile leads to a proportion of marginalized urban population (of the total urban population) that provides a suitable measure for the resources that can be made available under a CLLD program. The analysis took into account other thresholds such as 70 and 90 percentiles. These, however, would have resulted in marginalized urban population proportions (of the total urban population) too high or too low in relation to the resources expected to be made available.
Within the built-up areas
Outside of built-up areas
Example1
Example3
Example2
Example4
66
The
Gro
wth
Pol
e’s
Prof
ile
Ana
lysi
s of
Dev
elop
men
t N
eeds
and
Are
as o
f In
terv
enti
on
Cha
pter
1.1
. Peo
ple
and
terr
itor
y
i
1

In this context, the situation in the particular case of Ploiești municipality is as follows:
• For the 2011 census, 930 census sectors were delineated in Ploiești, with an average of 226 people each. The size of census sectors varies significantly, from a minimum of 2 people and a maximum of 1915 people.
• Of all census sectors, 1.8% are very small (less than 50 people), while 3.1% are large (at least 500 inhabitants).
• Depending on the methodology for identifying marginalized areas, the 930 census sectors in Ploiești are distributed as follows:
The disadvantaged zones in terms of housing (according to the Atlas of marginalized urban areas) are districts in which a significant part of the population lives in inadequate dwellings, and may be characterized by a low education level or not, but in which most part of the population has a job in the formal labor market. This category includes the urban areas with poor infrastructure and old quarters of houses located on the outskirts of cities, also with poor or no infrastructure. It also includes areas of blocks or houses built mainly in the 60s-70s, which are in a poor condition and with residents not having the required resources for improvements and renovations. These areas are heterogeneous with respect to population. The houses might be owned by elderly people with chronic health problems. In this category are included the urban areas with many young tenants, who have a good education level, but who cannot afford to buy their own dwellings (for instance in Bucharest and in major university centers). In conclusion, a disadvantaged urban zone in terms of housing is a census sector in which the conditions of living are precarious, but the level of employment in the formal sector is not low, and there may be low education levels or not.
Zone type number
Non-disadvantaged 762
Disadvantaged in terms of housing 51
Disadvantaged in terms of employment 31
Disadvantaged in terms of human capital 47
Marginalized 16
Other case* 23
* Other case relates to census sectors with less than 50 inhabitants and those with various institutions (e.g., pensions, retirement homes, prisons, convents, etc.) without or with a very small number of households.
67

Source: Own drawing, based on NIS data. RGPL 2011
Map 17. The number of dwellings without toilets in Ploiești municipality by census sector in 2011
In Ploiești municipality, the state of facts is as follows:
• There are 51 census sectors identified as disadvantaged in terms of housing, with an average number of 225 inhabitants each (min. = 78 persons/zone; max. = 910 persons/zone).
• 11,504 people, of which 2020 (18%) are children, live in disadvantaged zones in terms of housing.
• 195 people self-identify as Roma (1.7%).
The disadvantaged zones in terms of employment (according to the Atlas of marginalized urban areas) are, by definition, census sectors in which residents do not have an educational deficit, but fail to find a job in the formal sector, regardless of their living conditions (housing conditions vary and are not defining for the zone). This category generally refers to areas that had a high concentration of enterprises during the communist regime. Most residents of these areas have an average education level and hold various professional qualifications in the industry sector generally. But after 1990 they faced the closure of the former socialist enterprises. Despite the presence of qualified professional workforce, in these areas few private investments were made in the last twenty years and, as a consequence, the employment opportunities in the formal sector are limited.
68
The
Gro
wth
Pol
e’s
Prof
ile
Ana
lysi
s of
Dev
elop
men
t N
eeds
and
Are
as o
f In
terv
enti
on
Cha
pter
1.1
. Peo
ple
and
terr
itor
y
i
1

In Ploiești, the state of facts is as follows:
• There are 31 census sectors with an average number of 222 people each (min. = 79 persons/zone; max. = 366 persons/zone).
• 6,907 people, of which 1,198 (17%) are children, live in disadvantaged zones in terms of employment.
• 336 people self-identify as Roma (5%).
The disadvantaged zones in terms of human capital (according to the Atlas of marginalized urban areas) include people with low levels of formal education, who may have a job or not, but whose living conditions are considered standard for urban areas in Romania. These urban areas are inhabited by unqualified persons working in agriculture, constructions and other sectors, in many cases informally. The level of employment in the formal sector is typically low, but this is caused by low levels of human capital. Therefore, interventions in such zones must be focused on workforce qualification.
Source: Own drawing, based on NIS data. RGPL 2011
Map 18. Share of the unemployed in the total population at the level of census sectors in Ploiești municipality in 2011
69

Source: Own drawing, based on NIS data. RGPL 2011.
Map 19. Share of people without education across census sectors in Ploiești municipality in 2011
In Ploiești municipality, the state of facts is as follows:
• There are 31 census sectors with an average number of 295 people each (min. = 101 persons/zone; max. = 578 persons/zone);
• 13,905 people, of which 3,720 (27%) are children, live in disadvantaged zones in terms of employment.
• 1,590 people self-identify as Roma (11%).
Marginalized urban zones (according to the Atlas of marginalized urban areas) are city areas that accumulate disadvantages in terms of human capital, employment, and housing. In most cases these are poor, socially isolated, located within cities and not reflected in the statistics on poverty rates calculated at the locality or county level.Marginalized zones are true conglomerates of social exclusion that include people with low levels of human capital (low education, poor health, large number of children), low employment level in the formal sector and poor housing conditions. In many cases, the inhabitants of these areas have separate schools, in which only children from poor families are enrolled; they live in low quality apartment buildings or in slums, characterized by insecurity and petty crimes.The strong stigma associated with these places, apart from the lack or poor quality of services (education, health, infrastructure) drastically reduces the chances of the population to escape poverty. These areas are the most suitable candidates for Community-Led Local Development (CLLD) interventions, performed in the cities of Romania.
70
The
Gro
wth
Pol
e’s
Prof
ile
Ana
lysi
s of
Dev
elop
men
t N
eeds
and
Are
as o
f In
terv
enti
on
Cha
pter
1.1
. Peo
ple
and
terr
itor
y
i
1

In Ploiești municipality, the state of facts is as follows:
• In the 16 census sectors identified as marginalized are living 5,130 people (2.4% of the population of Ploiești).
• The average number of people living in a marginalized census sector is 321 (with a min. of 92 persons/zone and a max. of 532 persons/zone);
• Of the 5,130 people living in marginalized areas, 23% (1,199) identify themselves as Roma, compared to only 0.92% of people in the total population of the non-marginalized census sectors who declare themselves as Roma;
• Of the total population living in marginalized areas, 30% are children; the percentage is double compared with the proportion of children in the population from non-marginalized census sectors.
The most socially vulnerable zones identified in Ploiești municipality are located at the periphery, especially in the south and east of the city: Mimiu, Râfov, Pictor Rosenthal, Moțoi, Bereasca, the first of them standing out by the complexity of housing, employment, and human capital problems, which require the implementation of such measures as those pertaining to Community-Led Local Development (CLLD) approach.
Source: Own drawing
Map 20. Disadvantaged and marginalized zones in Ploiești municipality
71

regional synergies
The localities for which Ploiești is the closest large city of over 200,000 inhabitants are located inclusively outside Prahova county, i.e. in the Buzău and Dâmbovița counties and in the south of Argeș county, in northern Wallachia. The impact of Ploiești on the regional labor market and in the sphere of housing is highly intense, especially in the localities of Prahova county. The two phenomena of commuting for work and establishment of domicile (immigration2) in Ploiești municipality represent the human aspect of urban connectivity. The groups of localities that revolve around the same urban center of convergence with similar intensity tend to have similar problems and similar resources in the development process.
levels and types of development/poverty at the local level
About 60% of the population of Prahova county lives in developed localities in terms of human capital3, while the national average is 56%. A better situation in this regard is recorded in some Transylvanian counties (Brașov, Cluj, Sibiu, Hunedoara, Timiș) and in Ilfov and Constanța, in the south. In Prahova localities with an average level of human development live approximately 30% of the county population. The rest of about 10% of the population lives in poor localities. Such a small share of people living in poor communities is recorded only in Ilfov and Brașov counties.
Prahova’s upper developed localities are located mainly on the circular lane around Ploiești city and on the traffic lane of E60 road linking Ploiești to Câmpina, the tourist towns on Prahova Valley and Predeal from Brașov county. Tourist resorts – Sinaia, Buşteni, and Azuga – have the highest level of human development in the town series. The most developed communes, with maximum values for Local Human Development Index (LHDI) are Blejoi, Bucov, and Măgurele, in the vicinity of Ploiești; Cornu and Băneşti, in the vicinity of Câmpina, on E60 road.
2 “Immigration” is used in the sense of establishing the domicile or residence in a particular locality within the national space. The second sense of the term, i.e. establishing the residence in another country, is not used in the context of this micro-regional analysis.3 The development level of localities is measured by the Local Human Development Index (LHDI 2011), constructed by Professor Dumitru Sandu, and by its component indicators - education, life expectancy at birth, housing infrastructure (habitable surface per housing, gas consumption in households, and cars per 1,000 inhabitants), and average age of the population over 18 years – considered independently or in combination within a certain typology of local human development. The typology of local human development starts, just as LHDI, from the four mentioned indicators, but it does not admit compensation effects between their values and, based on a cluster analysis model with predetermined centers, it distinguishes between the following types of localities: developed; middle developed; poor, with structural poverty (poor education, aging, and reduced housing infrastructure capital); poor, with aging population; poor, but with young population. Calculations for LHDI include 103 out of the 104 territorial-administrative units (communes and towns) of Prahova county. Jugureni commune, with only 613 inhabitants at the 2011 census, was not included in the analysis, given the instability of the figures for very small localities. With the exception of data regarding the distances between localities, the rest of the data used in this section are from the National Institute of Statistics’ (NIS) the 2011 population and household census. Calculations for life expectancy at birth at the locality level were also made by NIS.72
The
Gro
wth
Pol
e’s
Prof
ile
Ana
lysi
s of
Dev
elop
men
t N
eeds
and
Are
as o
f In
terv
enti
on
Cha
pter
1.1
. Peo
ple
and
terr
itor
y
i
1

All the three groups of upper developed localities in the county are located along major traffic corridors: Ploiești – Brașov (E60), Ploiești – Vălenii de Munte – Brașov (A1) and Ploiești – Buzău, via Urlaţi and Mizil (E577). Poor communes (see table below) are located mostly in the eastern part of the county, towards the border with Buzău. The maximum level of poverty is reached in the Tătaru and Călugăreni communes (in the vicinity of Năeni, another commune just as poor, located in Buzău) and in the south, at Sălciile. All are small communes: Tătaru with less than 1,000 inhabitants, Călugăreni with less than 1,300 inhabitants, and Sălciile with less than 2,000 inhabitants. The state of fact at Sălciile proves the best4 what cumulative poverty means in Prahova.
Their poverty is generalized to all types of resources or capital considered – educational, material, health state, and working age. In terms of severity, structural poverty is closest to generalized poverty and resides in pronounced deficiencies in terms of education, housing infrastructure, and working age population (but scoring fairly well with respect to health). Of the 11 communes from this category, the most part are located in the east of the county, in the proximity of Buzău. The communes that are typical for structural poverty are Lapoș, located in the central-eastern part of the county, Boldești-Grădiştea in southeast, and Poenarii Burchii in the south of the county. A thorough research on this type of poverty in the county could begin from these aspects.
Source: Own drawing
Map 21. Local Human Development Typology in Prahova County (2011)
4 The analysis technique used for identifying poverty types, “K-means Cluster Analysis”, allows not only the identification of types, but also the detection of typical cases, i.e. those for which the distance from the cluster center (average) is minimal.
73

The eight poor communes, with an aging population, are located in the proximity of the town of Mizil (Baba Ana and Vadu Săpat) and the town of Vălenii de Munte (Păcureți, Predeal-Sărari, Chiojdeanca), as well as in the south of the county. The two poor communes with young adult population are Șotrile and Podenii Noi. In the former, the share of Roma in the total population was 16% at the last census in 2011.
The Local Human Development Index (LHDI) was also calculated at the locality level – a relevant analysis for the villages in the county and in the growth pole. The 98 poor villages in Prahova are rather dispersed, being located in communes with very different levels of development/poverty. Only six of the 98 villages are characterized by cumulative poverty in terms of education, employment, housing, working age, and mobility (Valea Unghiului, Trestienii de Jos, Trestienii de Sus, Lutu Roșu, Malu Roșu, Nucet). The rest are poor in terms of housing, population age, or shortage of human capital. Poverty reduction policies can be better targeted if we take into account the fact that community poverty is not simply poverty, but poverty linked to a generalized scarcity of resources or to the scarcity of certain resources.
Source: Own drawing
*NOTE: The localities marked in bold are typical within the development – poverty category. These are the places in which the characteristics that define the type of locality in question are best represented. Sălciile commune, for example, is typical for cumulative poverty on all the four criteria used for classification.
Figure 17. Local Human Development Index (LHDI) in developed and poor localities in Prahova county
LHDI – developed localities
Communes
Târgșoru Vechi 40
Filipeștii de Pădure 42
Poiana Câmpina 42
Valea Călugărească 42
Brazi 43
Bărcănești 44
Ariceștii Rahtivani 44
Florești 44
Lipănești 44
Măgurele 45
Bucov 46
Bănești 47
Cornu 49
Blejoi 50
towns
Urlaţi 43
Comarnic 44
Mizil 44
Câmpina 47
Boldești-Scăeni 47
Breaza 47
Băicoi 48
Vălenii de Munte 48
Ploiești 49
Plopeni 50
Azuga 51
Bușteni 52
Sinaia 52
Poverty type
Cumulative poverty on all
criteria
Sălcele 26
Călugăreni 28
Tătaru 29
Pverty in localities with relatively ag-ing population
Vadu Săpat 31
Chiojdeanca 32
Păcureţi 32
Gherghiţa 33
Olari 33
Balta Doamnei 34
Predeal-Sărari 34
Baba Ana 35
Poverty in loc. with young
pop.
Șotrile 35
Podenii Noi 37
Structural poverty
Boldești-Grădiștea 29
Salcia 29
Ariceștii Zeletin 30
Lapoș 30
Colceag 31
Fulga 31
Gura Vadului 32
Poienarii Burchii 34
Cosminele 35
Provița de Sus 35
Tinosu 37
74
The
Gro
wth
Pol
e’s
Prof
ile
Ana
lysi
s of
Dev
elop
men
t N
eeds
and
Are
as o
f In
terv
enti
on
Cha
pter
1.1
. Peo
ple
and
terr
itor
y
i
1

As throughout Romania, Prahova cities tend to systematically have a higher level of development than communes. Cities like Sinaia and Breaza have a consistently higher level of development than it would be expected to have based on their urban connectivity. Their touristic profile largely explains this fact.
Prahova’s developed localities also tend to have higher rates of immigrant population coming from other localities after 1990. In this case it is about a two-way relationship. On the one hand, local development attracts a greater number of immigrants and, on the other hand, the immigrants’ educational structure, age structure, and professional structure are by themselves local development factors.
The practical implications of these findings related to the context that determines development lead to the idea that stimulating development in the county and implicitly reducing poverty in some relatively isolated county areas can be effectively done by enhancing urban connectivity and the localities’ capacity to attract migrants and commuters. This link between local development and urban connectivity is of particular importance in managing and developing projects
Source: Own drawing
NOTE: Human development and urban connectivity indices for the localities of Prahova.In order to avoid overloading the diagram, we did not include all the locality names of Prahova county.The increase by one unit on the urban connectivity scale tends to lead, on average, to an increase in local development by 7 units on the LHDI scale. If other development factors, such as those included in the development regression equation for Prahova county localities, are kept under control, the previously mentioned coefficient is lower, of about 6 units.
Figure 18. Link between local development and urban connectivity
where do the differences in local development come from?
Nationally, urban connectivity – both as human connectivity and regional accessibility to surrounding towns – represents a major precondition for local development. The Local Human Development Index (LHDI) tends to be greater as the reference locality records a higher index of urban connectivity (URBCONECT), has more people that commute for working outside the locality, reported to 1,000 inhabitants (COMMUTERS), and a greater number of people that moved in the locality after 1990 (IMMIGRANTS)5.
At the level of Prahova county6, urban connectivity is by far the most important predictor of development – to an extent far greater than at the national level. The communes of Blejoi, Bănești, Bucov, and Cornu, for instance, have maximum connectivity through urban accessibility, and, consequently, very high human development (see figure below). In contrast, communes with very low urban connectivity – Sălciile, Tătaru, Călugăreni and Boldești-Grădiștea – have also a maximum level of poverty in the context of the county.
5 The multiple linear regression model that supports the allegations from the paragraph is: LHDI2011=13.85+1.29*URBCONECT+3.44*COMMUTERS+0.84*IMMIGRANTS+8.93 *URBAN, R2=0.43. All regression coefficients are significantly greater than zero. A locality has an increasingly higher index of urban connectivity as it is closer to a small town of 30-50 thousand inhabitants, a medium town (50-100 thousand inhabitants), large city (100-200 thousand inhabitants) and a very large city (over 200 thousand inhabitants).6 LHDI 2011=6.47+6.01*URBCONECT+1.58*COMMUTERS+2.26*IMMIGRANTS+10.18*URBAN, R2=0.64. The coefficient for urban connectivity is statistically significant for p=0.01. The coefficient for COMMUTERS is not statistically significant, and that for IMMIGRANTS is significant for p=0.06.
Loca
l Hum
an D
evel
opm
ent
Inde
x (L
HD
I)
LHDI 23.9+7.3* URBCONECT
Oraș Sinaia
Oraș BușteniOraș AzugaOraș Plopeni
Oraș Băicoi
Oraș Breaza
Poiana Câmpina
Proviţa de Sus
Boldești Grădiș Călugăreni
Oraș Comarnic
Oraș Valenii de Munte
Valea Călugărască
Păulești
Măgurele
Blejoi
55
50
45
40
35
30
25
CorvuIbănești
Florești
Scorţeni
Sălciile
1.00 1.50 2.00 2.50 3.00 3.50
Tătaru
75

at the level of Ploiești Growth Pole. Basically, the better a locality is connected to Ploiești Pole, the better will develop. This has important implications in terms of prioritizing investments regionally, especially with respect to the connective infrastructure that enables the increase of the polarizing role of Ploiești Growth Pole.
Commuting to Ploiești
In the series of cities of over 200,000 inhabitants, Ploiești has the greatest capacity to attract for employment people commuting on its territory for working reasons (215 commuters to 1,000 urban inhabitants). The specific model in this case is mainly based on attracting people for employment reasons from within Prahova county (86% of the total number of commuters working in Ploiești at the level of 2011 census). For Ploiești municipality, this kind of model of human connectivity for work results most likely from the two categories of conditionality. First, it is the high density of roads and, generally, of the communication network that facilitates the low-cost movement to Ploiești. Secondly, it is the low percentage of those who come to work here from outside Prahova; this is due to the fact that Ploiești is located between Bucharest and Brașov, two urban centers with a high capacity to attract workforce. People from the south of Muntenia and from a part of Oltenia go for work towards Bucharest, while those from southern Transylvania and a part of northern Wallachia go towards Brașov. In this way, the recruitment pool for Ploiești commuter workforce is largely limited to the area inside the county.
Ploiești ConStAnțA tiMișoArA BrAșoV ClUj iAși CrAioVA GAlAți BUCUrești
Commuters working in the locality per 1,000 inhabitants
215 133 133 131 125 110 76 62 82
% commuters from other counties than that of domicile
14 20 27 29 27 18 28 29 100
table 4. Capacity to attract commuters for work in cities of over 200,000 inhabitants
Source: NIS. Own calculations
The circular lane around Ploiești, which is most intensely used for commuting, overlaps to a large extent with the lane of the most developed communes located in the vicinity of this urban center. The following communes have the highest commuting rates to Ploiești, superior to 140: Blejoi, Berceni, Târgșoru Vechi, Plopu, Păulești, Bucov, Valea Călugărească, Bărcănești, Ariceștii Rahtivani, Albești-Paleologu. Basically, almost the entire Prahova county „breathes economically” through the labor activity at Ploiești. The only exception is the group of localities in the north-west of the county, which revolve more around the tourist resorts on Prahova Valley.
76
The
Gro
wth
Pol
e’s
Prof
ile
Ana
lysi
s of
Dev
elop
men
t N
eeds
and
Are
as o
f In
terv
enti
on
Cha
pter
1.1
. Peo
ple
and
terr
itor
y
i
1

immigration (i.e. arrival in the locality by changing the residence)
The migratory attraction of Ploiești is very high (97 arrived per 1,000 inhabitants) compared to the levels registered in other cities of over 200,000 inhabitants in Romania. This growth pole (see table below), which scores very well in terms of immigration, is in a similar situation with respect to commuting for arriving in the city (i.e. those who commute in order to work in Ploiești).
Map 22. Commuting rates from Prahova localities to Ploiești (number of commuters per 1,000 inhabitants)
Ploiești ConStAnțA tiMișoArA BrAșoV ClUj iAși CrAioVA GAlAți BUCUrești
Arrived and domiciled in the city per 1,000 inhabitants
97 82 67 91 67 89 62 70 19
% arrived in the city from outside the county in which
the city is located59.6 54.8 37.1 62.9 34.4 48.0 63.2 74.6 0
table 5. People that established domicile in large cities during 2010-2011
Source: NIS. Own calculations
Data source: NIS
77

Individuals who have established their residence in Ploiești city (immigrants) during 2000-2011 represent 97‰ (i.e. 97 per 1,000 inhabitants, belonging to the resident population of the city) at the time of the 2011 census. Of the 20,428 immigrants in Ploiești, 59.6% come from localities outside Prahova county.
Immigration to Ploiești from inside the county of Prahova usually happens from lagging communes that are relatively far from Ploiești and that send many commuters to work in this city. The distance from the capital city of the county matters less than the level of development and the stock of local commuters who leave to work in Ploiești7.
Through immigration Ploiești municipality connects in particular with localities from the southern and central-eastern part of Prahova county (see figure above). The localities with high rates of departure for residing in Ploiești are Urlaţi and Băltești, in the proximity of the city, and also Apostolache, Ciorani, Ariceștii Zeletin, Chiojdeanca, and Tătaru, located farther from the city.
7 IMMIGRANTS to Ploiești =2.6+0.06*DISTANCE up to PLOIEȘTI +0.56*COMMUTERS from locality to Ploiești + -0.08*LHDI for the locality of departure (origin locality) to Ploiești, R2=0.55. The first and last coefficient from the equation are significantly different from 0 for p=0.01. Specifying the level of significance is relatively conventional because in the analysis are included 84 of the 90 communes of the county.
Data source: NIS
Map 23. Immigration rate from Prahova localities to Ploiești after 2000 (number of immigrants at 1,000 inhabitants)
78
The
Gro
wth
Pol
e’s
Prof
ile
Ana
lysi
s of
Dev
elop
men
t N
eeds
and
Are
as o
f In
terv
enti
on
Cha
pter
1.1
. Peo
ple
and
terr
itor
y
i
1

Development effects of territorial mobility networks
The communes located in Prahova county tend to be more developed as the commuting flows for work go to more developed localities. The relationship also applies at the national level for all communes. In other words, for the development of the village of origin, not only the activity of commuting for work by itself matters, but also the development level of the locality in which people go to work.
Although at a lower level, the same goes for commuting in cities, both in Prahova and the rest of Romanian cities. The practical implication of these series of findings sends to the idea that facilitating commuting to work is beneficial to localities of origin, especially in the cases in which commuting is oriented towards destinations with a high level of development. In other words, facilitating commuting for Prahova inhabitants to Ploiești and the metropolitan area of this city, to Bucharest and the tourist towns from Prahova Valley can contribute to the development of Prahova localities.
8 For rural areas in Prahova we have: IDUL_orig=53.53 + *0.024 * IDUL_dest – 5.138 * ln(Distance to city with more than 200k inhabitants). R2=0.34. The shaded coefficients are significantly different from zero for p=0.05. N=4009 commuter flows between the communes in the county and target sites, wherever these targets may be situated. For the towns in Prahova the regression coefficients are similar to those for communes, but are not significantly different from zero. Given that the analysis is done for all 1500 commuter flows leaving from localities in Prahova, the significance level is conventional. The direction of these relations should be taken into consideration. For all communes in Romania we have: IDUL_orig=45.18 + *0.033 * IDUL_dest – 2.55 * ln (Distance to city with more than 200k inhabitants). R2=0.09. N=72758 origin-destination commuter flows.
lhDi 2011
Commuters arrived from
Prahova county
lhDi 2011
Commuters arrived from
Prahova county
Ploiești municipality 49 38835 Câmpina municipality 47 8845
Păulești 51 2248 Sinaia town 52 2681
Plopeni town 50 1991 Bușteni town 52 1008
Băicoi town 48 1754 Breaza town 47 931
Boldești-Scăeni town 47 1754
Florești 44 1494 București municipality 50 19141
Blejoi 50 1286 Otopeni town 59 1133
Brazi 43 3669
Brașov municipality 52 960
Vălenii de munte town 48 2798
Mizil town 44 1633
Urlați town 43 1508
table 6. Number of commuters in Prahova county by main destination localities
Source: Own calculations
NOTE: Of about 114,000 Prahova inhabitants leaving for work in other localities in the country, specified in the 2011 census data, approximately 82% go towards the 18 localities mentioned in this table.
The importance of the development triangle Ploiești – Bucharest – Prahova Valley tourist cities for the development of Prahova is evident by simply mapping commuting and migration flows in the localities of Prahova since 1999 (see figures on the next page).
Labor commuting flows between Ploiești and Bucharest generates residential counter-flows from Bucharest to Ploiești. The processes are similar on the other two axes of human connectivity triangle mentioned above: the migration counter-flow from Bucharest to Prahova Valley corresponds to the commuter flows from the Prahova Valley tourist cities to Bucharest, and migration from Ploiești to Sinaia-Bușteni is counter-flow to commuting from tourist cities to Ploiești. In fact, the relationship between commuting and residential migratory movement is complex, with multiple interactions over which we should not insist in this context. What matters is emphasizing the idea that local development effects don not belong to one or another of the cities mentioned in the analysis, but to a cross-county urban network.
Of course, urban networks that lead to development cannot be created overnight. They are the effects of long-term cumulative processes. In line with local and regional development policies, actions for rural non-agricultural activities development can be envisaged; these may function as a substitute for the established urban networks. Similarly, connectivity between communes, given the proximity to each other, can be enhanced by developing efficient transport networks.
79

Map 24. Main inter-urban commuting flows in Prahova cities
NOTE: Reading mode example – the main cities sending immigrants to Câmpina after 1999 are Ploiești and Bucharest.
Map 25. Main lifelong migration flows in Prahova cities after 1999
NOTE: Reading mode example – the main commuting flows for work from Câmpina are headed to Ploiești and Bucharest.
Source: Own drawings
80
The
Gro
wth
Pol
e’s
Prof
ile
Ana
lysi
s of
Dev
elop
men
t N
eeds
and
Are
as o
f In
terv
enti
on
Cha
pter
1.1
. Peo
ple
and
terr
itor
y
i
1

1.1.6. Conclusions – existing disparities, trends, needs, and intervention areas
Map 26. Positioning in the national territory
Ploiești municipality remains one of the most important urban agglomerations in Romania and the largest in the South Muntenia region, playing a key role in the overall development of the country. For this reason Ploiești obtained in 2008 the status of urban growth pole.
The municipality is part of an urban system with a population of over 4 million people and which generates about 50% of the income of companies, together with Bucharest and Târgoviște, and belongs to Braşov – Bucharest – Ploiești – Giurgiu development axis, which is the most important transport and development corridor in Romania. These agglomeration phenomena generate the prerequisites for the Growth Pole’s further development.
For Ploiești, the proximity to Bucharest has antagonistic effects: on the one hand, the unequal competition between the two cities has limited the development resources and the polarizing area of Ploiești; on the other hand, it has become, especially in recent years, an economic and logistical hub for relocating of activities.
81

Map 27. Zoning
82
The
Gro
wth
Pol
e’s
Prof
ile
Ana
lysi
s of
Dev
elop
men
t N
eeds
and
Are
as o
f In
terv
enti
on
Cha
pter
1.1
. Peo
ple
and
terr
itor
y
i
1

Ploiești Growth Pole includes localities with different functional profiles (complex, industrial, agricultural, etc.), which are also complementary. The pole is located in a plain area, with pedo-climatic conditions favorable to agriculture, particularly viticulture and fruit growing, and traditional activities. Therefore, in terms of how the land is used, agricultural land occupies 65% of the growth pole. However, recent years have seen a growing trend in occupancy of land with constructions (residential, industrial, communication infrastructure, etc.) at the expense of agricultural areas, especially in the suburban area, although the housing and population dynamics in Ploiești were much lower than in other growth poles in Romania. The area also faces a shortage of woodland, especially in the south.
Regarding the zoning of the built-up area, the central part of Ploiești municipality is the place where we find most of the public services of general interest and attraction points, being surrounded by residential districts developed radially, consisting either of individual housing or assemblies of collective housing (blocks), constructed especially during the communist period. Both types of residential areas face specific issues that affect the quality of housing and public spaces. In addition, many public and residential buildings face seismic risk and require major consolidation works, Ploiești being among the most exposed areas in the event of an earthquake of high magnitude.
The industrial areas of the municipality occupy large surfaces, consisting of platforms built in the interwar period and during the communist regime, some located in semi-central areas, totally or partially abandoned today (brownfield sites). There are also new industrial parks, located in peripheral areas and having developed substantially in recent years, here being located most of the major investments attracted by the municipality. Besides these, there are the major shopping centers, developed in peripheral areas, sometimes even by the conversion of former industrial sites.
Green, recreational, and sports zones occupy a small surface at the growth pole level, compared to residential and industrial areas, this being one of the major community problems, especially because there are major anthropic pressures on the environment and high traffic values, besides the fact that the municipality is located in a plain area, thus lacking extensive natural fields.
83

MAp 28. Population dynamics and workforce migration
84
The
Gro
wth
Pol
e’s
Prof
ile
Ana
lysi
s of
Dev
elop
men
t N
eeds
and
Are
as o
f In
terv
enti
on
Cha
pter
1.1
. Peo
ple
and
terr
itor
y
i
1

The last two decades have seen a sharp decline in the population trend, which is more pronounced than in the case of other growth poles. The causes lie in the high intensity of internal migration (especially towards the capital city), external migration (especially of the young and highly qualified population), and negative natural growth. In spite of the demographic decline, localities in the peri-urban area of the municipality have benefited from a phenomenon of suburbanization, which has led to the emergence of new residential areas with a better quality of living and the relocation of some economic activities as a result of real estate, environmental, and urbanization pressures in the urban core. This has had a positive effect on the localities concerned, which now record a higher urban development index than the localities that are more remote from the city.
Considering the human development index, Ploiești ranks high in the the national hierarchy of urban settlements, but lags behind many growth poles, the development gap between them having widened in the last decade. Locally, there are major development disparities between Ploiești and the other localities, but also between city districts, where live disadvantaged communities in terms of access to employment, housing and services of general interest, and which require integrated investment under the coordination of the local community.
Working-age population continues to represent approximately 2/3 of the Growth Pole population, but the aging trend of the local workforce is becoming more and more pronounced, the internal and external migration playing a significant part in this respect. The same implications are to be found in terms of population structure by educational level, the phenomenon of „brain-drain” (migration of highly skilled personnel) leading to a lower share of university graduates compared to other growth poles. This vicious circle is a disadvantage for Ploiești Growth Pole in the competition for attracting the necessary workforce with secondary education for industry and services.
Of all the growth poles in Romania, Ploiești has the greatest capacity to attract workforce from surrounding areas, mainly due to the proper connectivity of the city and it’s positioning in an area with a high density and a yet significant share of rural population with limited employment opportunities in the localities of residence. Harnessing this competitive advantage by stimulating commuter flows (e.g. through investment in infrastructure and transport services) will have a positive impact on the development of the Growth Pole.
85

AnneX 1.1. ZUP list in Ploiești (2007-2014)
nr. crt. initiator location ZUP description
2007
1. IndividualAlexandru Depărățeanu
No.12Housing construction S+P+1
2. Company Anton Pann No.4 Apartment building construction 2S+P+M+6E
3. CompanyModification Of ZUP For Ploiești Industrial
Park
Repositioning Bucharest – Brașov highway route and reducing the protection zone from 100 m to 50 m of the shaft, the area between DN 72 and the
operating road to the firing range Ploiești
4. Individual Căliman No.88Changing destination from green zone (park) to residential area with low-rise
buildings
5. Company Carpenului No.4Modifying authorized project and increasing height regime from S+P+8 to
S+P+10
6. IndividualCentura de Est,
No.283Housing construction P+M
7. Individual Crișan No.9 Area between Crișan street and Milescu street
8. IndividualDrum Exploatare T21, A301/125
Construction of metallic hall for clothing, PVC joinery
9. Individual Eroilor No.19 Housing construction P+1
10. Health Ministry Găgeni No.102 Emergency Hospital construction
11. CompanyGh. Gr. Cantacuzino
No.340AConstruction of company headquarters, garages, sheds, carport, and utility
connections
12. Company Gheorghe Doja No.166 Multifunctional assembly in mixed area
13. CompanyȘos. Vestului - Str.
Mărășești IntersectionConstruction of multifunctional building D+P+M+3
14. Individual Ion Maiorescu No.1Modification of urban indicators (coefficient of land use) for building
construction 4S+P+11
15. Company Lucernei No.1 Construction of “Flowers Valley” residential complex
16. Company Mihai Bravu No.250F Lifting restrictions on building offices
17. IndividualMoș Ion Roată
No.19A and 19BLifting restrictions and linking regulations in the area for building apartment
block S+P+3
18. Company Naţiunii No.4 Construction of office building S+P+6
19. Individual Nicolae Titulescu No.66 Housing construction P+M
20.Community
Social Services Administration
Petrolului No.8A Emergency social center development
21. Individual Plăieșilor No.32 Modification of height of the enclosure, authorized by AC 98/2002
22. Individual Republicii No.152 Hotel construction S+P+4
23. Individual Republicii No.224Change destination of land from utility networks area in medium-rise
housing area
24. Company Romană No.41Apartment block construction S+D+P+4+M in protected area with
architectural value
25. Individual Rozelor No.2Change destination of area from zone with institutions and services into
housing zone with complementary functions (basement garage)
26. Individual Spătar Milescu, 8B, 8CChange of function - housing with mixed height regime, institutions and
complementary services, collective apartment building
27. Individual Spicului No.16 Housing construction S+P+M
28. Company Ștefan cel Mare No.8 Lifting the temporary construction ban
29. CompanyȘtrandului
No.61A, T10, P102The area between DN 1B, PECO swimming pool and OMV Petrom gas station
86
The
Gro
wth
Pol
e’s
Prof
ile
Ana
lysi
s of
Dev
elop
men
t N
eeds
and
Are
as o
f In
terv
enti
on
Cha
pter
1.1
. Peo
ple
and
terr
itor
y
i
1

nr. crt. initiator location ZUP description
30. CompanyTitan, Plot 21A 301/10,301/11
Construction of a retail deposit for non-food goods
31. CompanyTudor Vladimirescu
No.79Modification of urbanistic indicators in view of constructing collective
housing
32. Individual Vasile Lupu No.73 Change of function for extending and adding floors to dwelling
33. Individual Vioarei No.44 Adding attic floor to existent dwelling
34. Individual Vlad Ţepeș No.21A Construction of office building P+2
35. Company Vornicei Fn Construction of collective housing S+P+4 -S+P+12
2008
36. Individual Anul 1907 No.2Integration in protected urban site and modification of urbanistic coefficient
for constructing office building 3S+P+3E+M
37. Individual Vlad Ţepeș No.21 Construction of office building P+3E
38. Individual Aprodul Purice No.44 Modification of urbanistic indicators for housing construction P+4E
39. Individual Bobâlna No.139Modification of urbanistic indicators for collective housing construction
D+P+4E+M partial
40. Company Bucharest No.39BModification of urbanistic indicators for construction of collective housing –
residential complex 2S+P+11E+12, 13 r
41. CompanyBucharest T38, P566,
559, 558/1
Modification of urbanistic indicators for construction of residential complex (S+P+4E), offices (S+P+14E), arranging enclosure, branching to utilities,
enclosing field
42. Company Carol Davila No.24Modification of urbanistic indicators for construction of apartment building
S+P+5E with an area of S+P+2E
43. Individual Clementei No.44Modification of urbanistic indicators for construction of apartment building
S+P+4-5E
44.LMC (Local Municipality
Council) PloieștiCosminele No.11A
Change destination of land – arranging residential area (NHA) and zone with institutions and services of general interest
45. Individual Prof. I. Th. Grigore No.9Modification of urbanistic indicators in view of constructing C1-type housing,
company headquarters, with the following regime: S(parking)+P+2E
46. Company Drumul Sării No.58
Lifting restrictions of construction until the preparation of the planning documents and modification of urbanistic indicators in order to build a car
service, auto parts deposit, office seat and bathroom, locker, porter lodge, fencing, walkways, roadways, parking
47. Individual Elena Doamna No.44Modification of urbanistic indicators in view of collective and medium-rise
housing construction D+P+3E
48. IndividualEnăchiţă Văcărescu
No.76Modification of urbanistic indicators in view of collective and medium-rise
housing construction
49. Company Frăţiei No.1Modification of urbanistic indicators in view of extending construction with
elevator
50. Company Găgeni No.109Modification of urbanistic indicators in view of constructing apartment
building S+P+6-10E+Tehnical floor
51. Company Găgeni No.88AModification of urbanistic indicators and change of function from polluting
industry to nonpolluting industry, commerce, residential sector
52. CompanyGh. Gr. Cantacuzino
No.131Modification of authorized project via AC No.704/11,08,2005 – hall for car
service, storehouse S+P+1E
53. Company I. L. Caragiale No.16 Office building construction S+P+2-5
54. Company Văleni No.72Modification of urbanistic indicators in view of office building construction
S+D+P+6E
55.Christian
Baptist ChurchLibertăţii No.10A
Modification of urbanistic indicators for the construction of ELIM Christian Baptist Center – administrative office
56. Individual Veronicla Micle No.23Modification of urbanistic indicators for the construction of collective
housing D+P+4E+partialM
57. Company Mărășești No.35Construction of car wash and annex building (ground floor), fencing,
branching, roadways, and walkways
58. Individual Mărășești No.61Lifting restrictions for construction until the preparation of DUP/ZUP and modification of urbanistic indicators in order to destroy C1-type building,
extend and add floors to C2-type building, construct car wash
87

nr. crt. initiator location ZUP description
59. CompanyMihai Bravu
T20, PA 293/31
Change of function for land from agricultural culture sector and utility networks sector to industrial and storage sector for the construction of 10
industrial halls
60. CompanyMoș Ion Roată
No.22-24Modification of urbanistic indicators for the construction of collective
housing and offices
61. CompanyNegru Vodă
No.42 and 42AModification of urbanistic indicators for the construction of office building
P+2E+3R
62. Company Nordului No.1Extension of North Commercial Complex – stage II – accommodation places
S+P+M+9E
63. Company Podul Înalt No.9-11Lifting restriction for construction, car wash construction, food store
and auto parts store, coffee shop, fast food shop, modernization of fuel distribution station
64. Individual Radu Stanian No.4Modification of urbanistic indicators in view of construction of head-office
S+P+2E+M
65. Individual Rodica No.3Modification of urbanistic indicators (coefficient of land use and height
regime) for housing construction S+P+3E+M
66. Company Rudului No.262Change of function from industrial units to housing units, institutions and
public services, storage units, green spaces
67. Company Ștrandului No.150Modification of urbanistic indicators (land occupancy rate, coefficient of land
use) approved by Ploiești Local Council Decision No. 191/2007 for adding floors to showroom
68. Company Ștrandului No.160Change of function for construction of hall, administrative space, annex,
utilities branching, enclosure, parking, walkways
69. Individual Ștrandului No.190Lifting temporary restriction for construction in view of head-office and
deposit for building materials
70. Company Ștrandului No.61Extending construction P and P+4E, extending 3rd and 4th floor, enclosing
terrace fencing
71. Company Ștrandului No.70Partial change of function from exclusively recreational into nonpolluting
industry area in order to build a production hall and an administrative office
72. CompanyȘtrandului T13, Pa186/118,
119, 119/1,120
Lifting restriction for construction, change of function and urbanistic indicators in view of construction of care showroom and service
73. CompanyTârgoviște Km 8
Ploiești Industrial Park
Change destination of land from industrial area to area for institutions and services in order to build hotel, food factory, exhibition pavilion with indoor
and outdoor premises, tennis and football fields, entrances, parking, utilities branches
74. Company Târgoviștei No.11
Change of urban indicators (coefficient of land use) and change of function from industrial area and public institutions and services area into residential and services zone for the construction of AZUR residential complex (place,
head-offices, business center)
75. Individual Victoriei No.15Modification of urbanistic indicators in view of collective housing
construction – apartment building with offices on the ground floor D+P+3E
76. LMC Ploiești Mărășești Street
2009
77. IndividualAlexandru Vlahuţă
No.6
Modification of urbanistic indicators – M Bravu 1 area (establishing height regime and minimum obligatory withdrawal relative to the alignment of the
street)
78. Company Avram Iancu No.4Modification of urbanistic indicators (land occupancy rate, coefficient of land
use) for extending, adding floors, recomposing, modification of authorized project AC527/2007 at the Nephrology and Dialysis Center
79. Company Buna Vestire No.18-20Modification of urbanistic indicators for the construction of multifunctional
center, pharmacy, medical cabinet and offices
80. Company Centura de EST No.48 Modification of urbanistic indicators in the East Lane No. 48 area
81. Company Centura de VEST No.23 Modification of urbanistic indicators for developing production base
82. Company Corlățești No.15AChange of function for land in view of modernizing and extending
slaughterhouse
83. LMC Ploiești Cosminelor No.11AModification of ZUP for changing function of land – developing residential
area (NHA) and area for institutions and services of general interest (according to Ministry of National Defense)
88
The
Gro
wth
Pol
e’s
Prof
ile
Ana
lysi
s of
Dev
elop
men
t N
eeds
and
Are
as o
f In
terv
enti
on
Cha
pter
1.1
. Peo
ple
and
terr
itor
y
i
1

nr. crt. initiator location ZUP description
84. CompanyDimitrie Cantemir
No.1AModification of urbanistic indicators and height regime for construction
apartment building
85. CompanyEcaterina Teodoroiu
No.14Modification of urbanistic indicators for construction of apartment building
S+P+5-6
86. Company Găgeni No.109Modification of urbanistic indicators for construction of apartment building S+P+6-10+Technical floor with office spaces at the ground floor (10th floor
duplex version)
87. CompanyGrădinari No.42
(Former M. Bravu 202)Update DUP of “PLUS” supermarket (assent CTATU No. 325 / 22.09.2005)
for modification of main front withdrawal at Mihai Bravu str.
88. CompanyIndependenţei No.23 Bis, 25
Modification of Independenţei Blvd. ZUP, approved by Local Council Decision No. 45/2005, by the modification of urbanistic indicators (land occupancy
rate, coefficient of land use, height regime)
89. Company Industriei No.36Modification of urbanistic indicators and change of urban function from
industrial area to housing and services area for construction of residential complex
90. IndividualIntrarea Gaterului
No.54
Change of function from area with specific to residential area and modification of urbanistic indicators for construction of medium-rise
collective housing and complimentary endowment, enclosure, walkways, parking, branching, household platform
91. Individual Mărășești No.118Lifting restriction for construction, modification of urbanistic indicators for
apartment building construction D+P+2-3-4
92. Individual Mărășești No.171Modification of urbanistic indicators established by Local Council Decision
No. 217/2007 for C3-type housing construction, and renovating and adding attic to C2-type construction
93. Company Mărășești No.185Study to improve traffic in the intersection Mărășești-Eroilor-Torca and
modification of urbanistic indicators in the analyzed area
94. Individual Mihai Eminescu No.9Modification of urbanistic indicators (coefficient of land use and height
regime) for construction of apartment building 2S+P+3+M(duplex)
95. Individual Nicopole No.66Modification of urbanistic indicators (land occupancy rate, coefficient of land
use, alignment) for housing construction
96. Company Paris No.6Lifting restriction for construction and modification of urbanistic indicators
(land occupancy rate, coefficient of land use)
97. Company Poligonului No.1Change of function from industrial area to area for general interest services
in order to build beerhouse (P+1), toilet room, reconstruct deposit interior, change function from deposit to restaurant
98. Company Republicii No.146-150Change of function from nonpolluting industrial area to multi-purpose
residential area
99. Company Republicii No.170Change of function from area of partial sanitary protection and nonpolluting
industry to residential area (2nd version)
100. Individual Republicii No.194Change of function from urbanistic and technical networks protection area
to low-rise residential area and lifting construction restriction
101. Individual Republicii No.214Modification of urbanistic indicators and withdrawal from the Republicii
Blvd. axis for construction of collective housing building S+P+3+4withdrawn, swimming pool, garages
102. Individual Roșiori No.46Modification of urbanistic indicators in view of apartment building
construction
103. Company Ștefan Cel Mare No.8
Lifting construction restriction and modification of urbanistic indicators (established by Local Council Decision 14/31.01.2008) for consolidating, restoring, redeveloping, adding attic (offices) to existing construction
S+P+3+2M
104. Individual T 2, P 4/1, L 1,2,3,4Change of function from urbanistic and technical networks protection area
to area for housing, institutions and services
105. Company T 62,P A 775/1-15Dn72 Extending built-up area for industrial units and deposits
106. LMC PloieștiPlot 44, '' Mitică Apostol'' District
Dismantling field No. 44 and land parceling
107. Individual Tribunei No.6Lifting construction restriction, modification of urbanistic indicators in the
studied area
108. LMC Ploiești West Station Area Connection road South – West
89

nr. crt. initiator location ZUP description
2010
109. Individual Andrei Mureșanu No.37Lifting construction restriction until ZUP/DUP elaboration, modifying the
coefficient of land use, and modifying minimum obligatory withdrawal from A. Mureșanu street axis
110. Company
Dn 72, Ploiești-Târgoviște Km 8, B Premises, Ploiești Industrial Park
Change of function from area for institutions and services to mixed area for institutions and services / nonpolluting industry
111. Company Drumul Sării No.88 Change of function from residential area to institutions and services area
112. Company Găgeni No.3 Construction of collective housing building and commercial spaces S+P+4E+5r
113. IndividualGh. Gr. Cantacuzino
No.100Lifting construction restriction and change of function from city parking to
mixed area: institutions, services, housing
114. CompanyGh. Gr. Cantacuzino
No.124Lifting construction partial restriction and change of function
115. Individual Industriei No.1DChange of function from land with urbanistic and technical function to area for institutions and services in view of constructing car showroom, enclosure,
utilities
116. LMC PloieștiPloiești Municipality
Built-Up AreaMitică Apostol district
117. Company Mihai Bravu No.343Change of function from land with agricultural crops and urbanistic &
technical networks to area for industry, storage and services -ID-S
118. IndividualMoara Nouă
No.6, Pa 412/1
Change of function from land with urbanistic & technical networks to residential area in view of constructing a housing P+1, annexes, enclosure,
utilities
119. ADP PloieștiStr. Mareșal Averescu Olimpia Sports Hall
Park
Consolidating, adding attic and extending Olimpia sports hall and developing amateur running track in Tineretului park, Ploiești
120. Individual Pictor Rosenthal No.63Partial change of function from area with constructions for urbanistic &
technical works and agricultural crops to residential area
121. Company Republicii No.138Lifting construction restriction and change of function from low-rise/medium-rise mixed zone to institutional and services area in view of
constructing commercial complex, hypermarket, and commercial gallery
122. Individual Republicii No.152KAdding floors to hotel, including withdrawn attic for getting conference room
function, needed for a 4 star hotel
123. Company Str. Târgoviștei No.2 Change of function from industrial area to commerce and services
124. Individual Tazlău No.39 Modification of urbanistic regulations
2011
125. Individual Str. Dr. Bagdazar No.4Partial change of function from area with communication channels to
area for housing, institutions, services; majoring the land occupancy rate, modifying side and rear limits
126. Individual Str. Mărășești No.274Lifting construction restriction and change of function from area for
institutions and services, complimentary constructions and park to low-rise residential area, institutions and services
127. CompanyStr. 1 Decembrie 1918
No.1
Change of function from industrial area to institutions and services of general interest area and modification of street direction, proposed in the
UPETROM premises through the General Urban Plan and unachieved
128. CompanyStr. Ștrandului
No.53-55
Lifting construction restriction, changing function of land from collective housing and services area to area for services, recreation and sports,
including modifying alignment regime
129. LMC Ploiești Str. Ghighiului No.2 Modification of urbanistic indicators at HIPODROM premises
130. Individual Str. Popa Farcas No.57Lifting construction restriction considering an objective proposed on a non-
buildable plot
131. Individual Str. Pompierilor No.1AChange of function from area for road communication channels to low-
rise housing area; lift construction restriction in in the intersection; modify alignment regime
132. Individual Str. Poligonului No.2Change of function from nonpolluting industry area to area for institutions and services/commerce; establish urbanistic indicators, alignment regime
90
The
Gro
wth
Pol
e’s
Prof
ile
Ana
lysi
s of
Dev
elop
men
t N
eeds
and
Are
as o
f In
terv
enti
on
Cha
pter
1.1
. Peo
ple
and
terr
itor
y
i
1

nr. crt. initiator location ZUP description
133. Individual Str. M. Bravu No.336Change of function of land from area for agricultural crops and technical and
urbanistic networks to area for industry and storage units
134. CompanyStr. Gh. Gr. Cantacuzino
No.111ALifting construction restriction, alignment regime and change of function
from services area to area for housing, already existing there
135. Company Str. Gh. Doja, ApelorChange of function from industrial to institutions and services area, modify
urbanistic indicators, lift construction restrictions in the intersection between Gh.Doja-Calomfirescu streets and Gh.Doja-Postei-Apelor streets
136. Individual B-dul Republicii No.164 Lifting construction restriction
137. IndividualStr. Radu de la Afumați
No.16Modifying regime of alignment relative to the axis of the street
138. CompanyStr. Gh. Gr. Cantacuzino
No.332Change of function from area for transport units and partially for protective
belt to mixed area for institutions and services / recreation
139.Prahova County
Council
Plot 13, Pa210, Dn 1 Highway - Centura de
EST Of Ploiești
Change of function of land from area for agricultural crops, technical and urbanistic networks, and protective plantation to area for industry and
storage units
140. CompanyStr. Laboratorului
No.29A
Lift construction restriction in the intersection, change of function from nonpolluting industry area to mixed area for institutions and services /
nonpolluting industry, establish urbanistic indicators and alignment regime
141. Individual Str. Rafov No.51Change of function from area for technical and urbanistic networks to low-
rise residential area
142. Individual Bd. Republicii T2, Pa 4/1 Modification of approved ZUP, height and alignment regime
143. Individual Str. Sondelor No.74Change of function from area with service housing / colonies, sanitary
protection and nonpolluting industry to area for institutions and services; lifting construction restriction and modifying alignment regime
2012
144. Company Str. Mărășești No.318 Lifting construction restriction
145. Company Str. Traian No.115-117 Modification of urbanistic indicator: land occupancy rate
146. Individual Str. Bănești No.11 Modification of regime of alignment relative to the axis of Zidari street
147. CompanyStr. Gh. Gr. Cantacuzino
No.44Modification of urbanistic indicators
148. Individual Str. TazlăuModification of urbanistic regulations, completing Local Council Decision
61/2010
149. CompanyCentura de EST No.277
BChange of function from area for agricultural crops, technical and urbanistic
networks to housing area
150. Company Str. Sondelor No.62A Modification of urbanistic indicator and functional reconversion
151. CompanyStr. Mircea cel Bătrân
No.119Modification of urbanistic indicators and functional reconversion
152.Individual/ Company
Str. Laboratorului No.7C, E
Change of function from area for agricultural crops, technical and urbanistic networks to mixed area for housing, complementary facilities, institutions
and services; modification of urbanistic indicators
2013
153.Ploiești
Municipality Company
Str. Găgeni No.98, 98A, 102, 102B
Re-zoning and functional reconversion for municipal interest investments in Ploiești
154.Individual /Company
Str. Laboratorului No.7C, E
Change of function from area for agricultural crops, technical and urbanistic networks to mixed area for housing, complementary facilities, institutions
and services; establishment of urbanistic indicators; housing construction as secondary purpose
155. LMC Ploiești Extending the validity term for the ZUP of Hipodrom Ploiești area
156. Company Str. Oborului No.1Change of function from industry area to area for institutions and services;
modification of urbanistic indicators
157.Ploiești
MunicipalityStr. Mărășești
Accessibility and traffic fluidization towards Ploiești-West industrial area and Brazi industrial platform
158.Company/ Individual
DN 1b, T13,P186/109-113,
Str. Ștrandului No.182
Lifting construction restriction, establishing urbanistic indicators, changing land function to professional services and nonpolluting industry / storage
91

nr. crt. initiator location ZUP description
159. CompanyStr. Mihai Bravu
No.342A, 342B, 344AChanging land function to nonpolluting industry with services ID-S and
establishing urbanistic indicators
160. Company Str. Sondelor No.62ARectification of ZUP, modification of urbanistic indicators and functional
reconversion
161. Company Str. Calomfirescu No.2
„Modification of approved ZUP – change of function from industrial area to area for institutions and services; modification of urbanistic indicators,
lifting construction restrictions at the intersections between Gheorghe Doja-Calomfirescu streets and Gheorghe Doja-Poştei-Apelor streets
162. Company Str. A. Mureșanu No.76 Mini-football Sports Base
163. CompanyDN 72
(Km 74+500 – 76+300)Extending the validity term of ZUP for Ploiești Industrial Park
164.Ploiești
MunicipalityP-ţa Eroilor No.1A, Str. Cuza Vodă Fn
Construction of pediatric hospital and multi-floor parking
165.Ploiești
MunicipalityStr. Cosminele No.11A Land parceling for individual housing construction through the NHA
166. Company Str. A. Mureșanu No.76Fixing material error from Local Council Decision 327/27.08.2013 – ZUP for
Mini-football Sports Base
2014
167. CompanyBlvd. București, T39, PA
569/61 Si 62Change of function to mixed sub-area – services, commerce, housing, small
production – M1; establishing urbanistic indicators
168.Ploiești
MunicipalityStr. Găgeni
No.98, 98A, 102, 102B
Re-zoning and functional reconversion for municipal interest investments, for correlation with rehabilitation projects of tram route and developing
multimodal terminal
169. IndividualStr. Spătar Milescu
No.20Change of function of land from “city parking” to “mixed area for housing,
institutions and services”
170.Ploiești
MunicipalityStr. Lucernei No.1 Change function of land from industry units area to housing area
171. Company Șos. Vestului No.12Lifting construction restriction and changing function of land from
residential and parking to public institutions and services area – 2nd version
172. CompanyStr. B, Cartier Vest 3,
T61, P158Lifting construction restriction and establishing urbanistic indicators
173. CompanyStr. Gheorghe Doja No.101C, Ploiești
Lifting construction restriction, modifying maximal urbanistic indicators and alignment regime
174. CompanyStr. Romana No.65 and 81
Lifting construction restriction, modifying maximal urbanistic indicators and alignment regime
175. IndividualB-dul. Republicii,
No.198BChange of function and lifting construction partial restriction in order to
build housing, enclosure and branching as secondary purpose
176. Company Str. Ștrandului, No.61A195/2007, in view of making some extensions and a new building for
showroom
177. IndividualStr. Gh. Gr. Cantacuzino
198-202
Lifting construction restriction, modifying urbanistic indicators (land occupancy rate, coefficient of land use) and alignment regime for
restructuring existing buildings and constructing commercial space
178. LMC PloieștiExtending term of validity for dismantling field no. 44 and land parceling in
Mitică Apostol district
179. Company Str. Mărășești, No.319Change of function from mixed area to nonpolluting industry and services
area; modification of urbanistic indicators
180.Prahova County
CouncilȘos. Vestului, No.14-16
Change function of land from special destination area to institutions and services area; modification of urbanistic indicators
92
The
Gro
wth
Pol
e’s
Prof
ile
Ana
lysi
s of
Dev
elop
men
t N
eeds
and
Are
as o
f In
terv
enti
on
Cha
pter
1.1
. Peo
ple
and
terr
itor
y
i
1

95
ChAPter 1.2.
economy
PArt I: the Growth Pole’s Profile
1Analysis of Development needs and Areas of intervention

1.2. economy1.2.1. Economic context – Economic sectors and development promotion
The analysis of the key macroeconomic indicators shows that the economy of Prahova county, in general, and of Ploiești Growth Pole, in particular, has had a strong upward evolution in the past decade, interrupted in 2008 by the onset of the global financial and economic crisis.
Thus, between 2000 and 2011, the GDP/capita in Prahova county grew by 333% at current prices, at a slower pace of growth than the one at regional (340%) and national level (344%); the causes are related to the stronger adjustment of the county economy during the crisis (2008-2010). However, Prahova county remains one of the top 10 economic poles of Romania and the largest in the South Muntenia region, contributing by 3.5% to the national GDP and by 30.1% to the regional one.
Source: EUROSTAT
Figure 19. GDP per capita at current prices, between 2000 and 2011
Despite the tendency of converging to the EU average in the past 10 years, similar to that recorded at the level of the whole country (in the year 2000, Prahova county reached only 9.5% of the EU average GDP per capita, and now this indicator has increased to 23.9%)1, the economic development gap of the county compared to Bucharest, and other counties where growth poles are located (e.g. Cluj, Timiș, Constanța) has widened.
Source: EUROSTAT
Figure 20. Dynamics of the GDP/capita at current prices in the major Romanian counties between 2000 and 2011
1 However, when taking into account the GDP vs. the purchasing power, Prahova county was at 26% of the European average in 2000 and at 47% in 2011.
EU 28
Bucure
ști
Consta
nţa
Timiș
Brașo
v
Român
ia
Praho
vaCluj Dolj Iași
2000
2008
2011
GDP per capita at current prices (EUR)30,000
25,000
20,000
15,000
10,000
5,000
0
RomâniaSouth Muntenia Region
Macroregion 3Prahova
2000 2001 2002 2003 2004 2005 2006 2007 2008 2009 2010 2011
12.000
10.000
8.000
6.000
4.000
2.000
0
GDP per capita at current prices (EUR)
96
The
Gro
wth
Pol
e’s
Prof
ile
Ana
lysi
s of
Dev
elop
men
t N
eeds
and
Are
as o
f In
terv
enti
on
Cha
pter
1.2
. eco
nom
y
i
1
i

Also, the structure of local economies varies significantly from one growth pole to another. Thus, in cities that were the most economically dynamic in the last 10 years (Bucharest and Cluj-Napoca) the economy is dominated by the tertiary sector (the service sector)2, which has – traditionally – the highest added value, the highest salary level and offers the best prospects for development. By contrast, there are a number of less dynamic cities, with low economic performance, such as Craiova and Ploiești, where the industrial sector continues to generate over half of the output of the local economy. The exceptions to this rule are Timișoara, with a high share of the industry, but with a shift towards more technologically advanced branches (automotive, electrical and electronic equipment, etc.) and a very high level of foreign investment, which have continued to perform well over the last few years, and Constanța, with a well-established service sector, especially in transport, but with lower economic performance. Therefore, in addition to gearing its industrial sector towards more high-tech branches striving to become more competitive globally, the Ploiești municipality must diversify its local profile by supporting the service sector.
2 For a more detailed analysis on this topic, please see: World Bank. 2013. Growth poles: The Next Phase.
Source: BORG Design Database
Figure 21. Structure of the total turnover achieved in 2013 in the Romanian growth poles by major economic sectors
In terms of entrepreneurial dynamics, expressed by the number of active businesses per 1,000 residents, the Ploiești municipality has the weakest performance of all 8 Romanian growth poles; the local economy is dominated by large companies with foreign capital, to the detriment of a solid local class of entrepreneurs. In this context, measures are needed to support the residents’ business initiatives, which may prove more beneficial for the local economy in the medium and long term.
Source: BORG Design Database
Figure 22. Number of active companies per 1,000 stable residents in the Romanian growth poles in 2013
Bucure
ști
Consta
nţa
Timișo
ara
Brașo
v
Craiov
a
Ploieș
ti
Cluj-N
apoc
a
Number of active companies/1,000 inhabitants
Iași
100
80
60
40
20
0
Ploiești
Brașov
Craiova
Constanţa
Iași
Timișoara
Cluj-Napoca
AgricultureForestry and Fishing
Industry
Construction
Services
0% 20% 40% 60% 80% 100%
97

Source: Own slide based on data from BORG DESIGN (LIST OF FIRMS)
Map 29. Distribution of companies in Ploiești municipality by census sector in 2013
Between 2007 and 2013, the number of active companies in Ploiești Growth Pole decreased by 13.9%, more than the regional (-11.1%) and the national (-12.6%) average, due to the economic crisis, which led to a decrease in the domestic and external demand, and thus to a limitation of the activity of businesses in the area, or even to bankruptcy for some. The most affected sectors were the construction industry, the trade and the manufacturing industry – areas with a significant share in the local economy; in these sectors, the number of companies has decreased by 18-26%, in the last 7 years alone. In contrast, there are sectors where the number of companies has increased, such as agriculture, energy, information and communications, and certain services for the population, these being less vulnerable to economic cycles.
The number of newly established companies fell steadily after 2008, reaching the minimum of the range in 2014. By contrast, the number of suspensions and removals from the trade registry rocketed in 2009 and 2010, settling after 2011 at values similar to those registered in the mid-2000s and following broadly the local and national economy cycle. On the other hand, the number of insolvencies is still high; this procedure has been more commonly used in recent years by companies facing a liquidity shortage and high debt, which proves that the recovery from the crisis has been a slow one. Moreover, the macroeconomic indicators show that 2014 was the first year in which the national economy returned to the performance it had in 2008; this is also true at the local level. As well, the number of companies set up by students remains low – 296 were in operation in 2014, out of 468 established to date. In Prahova county, 383 limited liability companies were established by the end of 2014, of which 365 are operational, representing only 2.3% of those existing at the national level.
In addition to the companies located within the growth pole, there are more than 8,000 freelancers, this figure being lower by 7.3% compared to 2007. They perform various activities, especially in the service sector, but their activities have a relatively marginal impact on the local economy.
98
The
Gro
wth
Pol
e’s
Prof
ile
Ana
lysi
s of
Dev
elop
men
t N
eeds
and
Are
as o
f In
terv
enti
on
Cha
pter
1.2
. eco
nom
y
i
1
i

Source: The National Trade Register Office
Figure 23. Dynamics of company-related operations during 2008-2014
Despite this negative dynamics, Ploiești Growth Pole continues to pool 64.6% of the active companies in Prahova county, 19.3% of those in the South Muntenia region, and 2.1% of those in Romania.
The suburbanization phenomenon occurring over the last few years around Ploiești has affected not only the residential sector and the population, but also the businesses. Thus, the adjoining localities of Ploiești have attracted many investors over the past few years – either newly established or relocated from the urban core –, pressured by urban planning and environmental regulations and especially those related to the real estate market (the availability and price of land, the level of taxes, the cost of utilities), so much so that some record a larger number of companies per 1,000 inhabitants than the municipality itself (e.g. the Păulești and Blejoi communes).
Newly registered businesses
Suspended businesses
Dissolved businesses
Radiated businesses
Businesses in insolvency
2008 2009 2010 2011 2012 2013 2014
8,000
7,000
6,000
5,000
4,000
3,000
2,000
1,000
0
Source: BORG Design Database
Figure 24. Number of active companies per 1,000 inhabitants by localities in 2013
Of the more than 10,500 active companies in Ploiești Growth Pole that submitted their financial statements for the financial year 2013, 99.6% are SMEs, which are the engine of the local economy. Nevertheless, it is worth noting that 36.2% of these businesses have no employees and about 15% had no revenues in 2013. With this in mind, we can say that the economy of the area is based on approximately 6,000 enterprises with a turnover that exceeds 25,000 EUR/year. Compared to 2007, the number of microenterprises has decreased by 14.6%, the number of small enterprises – by 1.8%, the number of medium enterprises – by 8.1%, and the number of large enterprises – by 26.7%, some of the latter having undergone significant personnel lay-offs since 2008. Therefore, we can say that small and medium enterprises have adapted best to the unfavorable context of the economic crisis, as they are the most flexible.
50
45
40
35
30
25
20
15
10
5
0
Ploieș
ti
Bărcă
neșt
i
Boldeș
ti-Scă
eni
Plopen
i
Bercen
i
Number of active companies/1,000 inhabitants
Ariceș
tii R
ahtiv
ani
Păule
ști
Dumbră
veșt
i
Târgș
oru V
echi
Valea
Călu
gărea
scă
Băicoi
Blejoi
Brazi
Bucov
99

Map 30. Active companies/1,000 inhabitants
The
Gro
wth
Pol
e’s
Prof
ile
Ana
lysi
s of
Dev
elop
men
t N
eeds
and
Are
as o
f In
terv
enti
on
Cha
pter
1.2
. eco
nom
y
i
1
i100

table 7. The structure of active enterprises by size categories in 2013
enterprise size category by number of
employees in 2013
Ploiești Growth Pole Prahova County South Muntenia region românia
% of the total number of active companies
0-9 (micro) 88.9 85.2 86.3 87.1
10-49 (small) 8.9 11.9 11.2 10.6
50-249 (medium) 1.8 2.5 2.2 1.9
over 250 (large) 0.4 0.5 0.3 0.4
Source: BORG Design Database and the National Institute of Statistics (NIS), TEMPO Online
In terms of the stakeholder age, we notice that 9.86% of the young people aged up to 29 own companies in Prahova county, compared to an average of 10.79% nationally; the situation is similar in the case of people aged 30-39 (25.85% compared to 28.15%). By contrast, the percentage of shareholders aged 40 and over is higher at the county level.
After 1989, Ploiești municipality and Ploiești Growth Pole underwent several cycles of restructuring and shifting / adaptation regarding the local economy. Thus, some of the large enterprises built during the communist period reduced their activity or disappeared, as they could not adapt to the conditions of the market economy, such as Plopeni Mechanical Plant, “Romfosforchim” Chemical Fertilizer Undertaking in Valea Călugărească, “Astra Română” Refinery, “1 May” Oil Equipment Plant, “Intex” Textile Enterprise, “Cablul Românesc” Enterprise, “UZTEL” Plant, etc.
On the other hand, over the last 20 years, and especially over the last decade, a number of investors have come to this area, developing new areas of activity and generating jobs, partially offsetting the disappearance of the large industrial units built in the communist period: Coca-Cola, Unilever, Bergenbier, Alexandrion (food and beverage industry), Unilever (chemical industry), OMV, Rompetrol and Lukoil (energy and petrochemicals industries), Calsonic Kansei, Yazaki, Johnson Controls, Honeywell (automotive parts), British American Tobacco (tobacco), Lufkin, Cameron (equipment for the oil industry), Timken (bearings), Dekomte de Temple, Ottorose, Beaulieu, Oztasar (textiles and clothing), Toro (machinery for irrigation systems), Xella, Adeplast, Bauelemente (construction materials), Terqua (steel constructions), etc.
In addition to the shifting of the industrial sector, over the last two decades, the service sector has also developed; it has come to generate over 40% of the turnover and over 50% of the number of jobs in the growth pole, especially in the field of modern trade – as several large international networks (Kaufland, Carrefour, Billa, etc.) entered the local market in transport, information and communications technology, scientific, technological and professional activities, etc. However, the service sector in Ploiești is less developed than in other growth poles, due to the polarization of the area by Bucharest, which is just 60 km away.
Source: BORG Design Database
Figure 25. Structure of active companies by major sectors of activity in 2013
100%
90%
80%
70%
60%
50%
40%
30%
20%
10%
0%Ploiești
Metropolitan Area
PrahovaCounty
South Muntenia Region
România
Services
Construction
Industry
AgricultureForestry and Fishing
101

1.2.2. The tourism industry: Products and Infrastructure
As previously mentioned, tourism plays a marginal role in the economy of Ploiești Growth Pole, which ranks last from this point of view among the Romanian growth poles. Although it is located on the development axis linking the two main tourist poles in Romania – Bucharest municipality, dominated by business and weekend tourism, and the chain of resorts in the Prahova Valley and Brașov area, the most important destination for winter tourism in Romania, Ploiești city has a very limited tourism market, which amounts to business and transit tourism.
The number of tourist accommodation establishments in Ploiești Growth Pole increased by 288% during 2007-2014, due to the opening of new tourist facilities both in Ploiești and in surrounding localities. So far, 52 tourist accommodation establishments operate in Ploiești Growth Pole.
Source: NIS, TEMPO Online Database
Figure 26. Number of tourist accommodation establishments in Ploiești Growth Pole during 2007-2014
As can be seen in the figure above, in addition to the increase in the number of tourism accommodation establishments in the growth pole, there is also a diversification of such establishments, although in Ploiești the prevailing accommodation establishments are those of larger size (hotels, motels).
According to NIS records, in 2014, there were a total of 2,749 bed places in Ploiești Growth Pole, meaning an increase by 162% compared to 2007. The bulk of bed places can be found in hotels (66%), motels (14%), and hostels (10%).
30
25
20
15
10
5
0
2007 2008 2009 2010 2011 2012 2013 2014
Hotels
Motels
Hostels
Touristical pensions
Agrotouristical pensions
Source: NIS, TEMPO Online Database
Figure 27. Bed places in Ploiești Growth Pole by type of tourist accommodation establishment
5%5%
14%
10% 66%
Hotels
Motels
Hostels
Touristical pensions
Agrotouristical pensions
The
Gro
wth
Pol
e’s
Prof
ile
Ana
lysi
s of
Dev
elop
men
t N
eeds
and
Are
as o
f In
terv
enti
on
Cha
pter
1.2
. eco
nom
y
i
1
i102

According to the Romanian National Tourism Office (ANT), of the total number of tourist accommodations in the Growth Pole, 4.9% are one star places, 32.2% – are two-star places, 61.1% – are three-star places and 1.8% – are four-star accomodation places. In Ploiești municipality there are only 13 beds classified as four-star (in one guest house), while 64% are three-star beds.
In 2014, in terms of tourist flows in the Growth Pole, 62,768 tourist arrivals were reported, which is 1.7% less than in 2007. This negative dynamics can be attributed to the global crisis, which has also affected the tourism market since 2009. During this period, the number of tourists accommodated increased in Ploiești municipality (+ 7.1%), in Boldești Scăeni and Plopeni towns, and in Blejoi, Păulești, Târgșoru Vechi, and Valea Călugărească communes; numerous new accommodation establishments were opened there.
Source: NIS, Online TEMPO Database
Figure 29. Number of tourists accommodated in the existing establishments in Ploiești Growth Pole in the 2007-2013 period
Most bed places can be found in Ploiești (70.1%), Bărcănești (8.9%), Blejoi (6.9%), and Plopeni (5.3%). By contrast, the Ariceștii Rahtivani, Berceni, Dumbrăvești, and Brazi communes have no tourist accommodation establishments.
Source: NIS, TEMPO Online Databas
Figure 28. Distribution of bed places in Ploiești Growth Pole by localities during 2007-2014
60000
50000
40000
30000
20000
10000
0
Ploieș
ti
Bărcă
neșt
i
Boldeș
ti-Scă
eni
Plopen
i
Păule
ști
Târgș
oru V
echi
Valea
Călu
gărea
scă
Băicoi
Blejoi
Bucov
2007
2008
2009
2010
2011
2012
2013
2500
2000
1500
1000
500
0
Ploieș
ti
Bărcă
neșt
i
Boldeș
ti-Scă
eni
Plopen
i
Păule
ști
Târgș
oru V
echi
Valea
Călu
gărea
scă
Băicoi
Blejoi
Bucov
2007
2008
2009
2010
2011
2012
2013
2014
103

Compared to the other growth poles in Romania, Ploiești has the lowest number of accommodated tourists, up to 10 times less than in cities with a well-defined tourist function, such as Brașov and Constanța.
Map 31. Number of tourists accommodated in the Ploiești Growth Pole in 2014
The
Gro
wth
Pol
e’s
Prof
ile
Ana
lysi
s of
Dev
elop
men
t N
eeds
and
Are
as o
f In
terv
enti
on
Cha
pter
1.2
. eco
nom
y
i
1
i104

Source: NIS, TEMPO Online Database
Figure 30. Number of tourists accommodated in the Romanian Growth Poles in the 2007-2013 period
1,400,000
1,200,000
1,000,000
800,000
600,000
400,000
200,000
0
Bucure
ști
Consta
nţa
Brașo
v
Cluj-N
apoc
a
Timișo
ara
Iași
Craiov
a
Ploieș
ti
2007
2013
Between 2007 and 2013, the number of nights spent in accommodation establishments decreased by 7% down to 149,134, both due to the decreasing number of tourists and to the average length of accommodation, which fell from 2.51 to 2.37 nights/tourist (even less in Ploiești – 2.36 nights). Of the total number of overnight stays, 71.8% were registered in hotels, a percentage that rises to 90% in the specific case of Ploiești, where business tourism prevails in the local market.
Source: NIS, TEMPO Online Database
Figure 31. Structure of overnight stays in Ploiești Growth Pole by type of accommodation establishment
Hotels
Motels
Hostels
Touristical pensions
Agrotouristical pensions
7%3%
9%
9%
72%
7%3%
9%
9%
72%
105

The net usage index of the accommodation capacity in operation in Ploiești Growth Pole decreased continuously during 2007-2014, from 41.5% to 16.1%, both due to the opening of new accommodation establishments and to the decrease in the number of tourists accommodated and overnight stays. In Ploiești municipality there was a similar decline, from 41.8% to 17.2%. This development indicates the existence of a local accommodation overcapacity, which raises questions about the profitability of the tourist accommodation establishments in the area. Most of them achieve higher revenues and profits from event organization and catering activities than from accommodating tourists.
Currently, there are tourist information centers only in the towns of Sinaia and Bușteni; both are resorts located in Prahova Valley, while in Ploiești such services are not provided. Such establishments will also be built in the future, in the towns of Breaza and Câmpina, close to Ploiești.
Local organizations involved in promoting local tourism include the Prahova Tourism Promotion and Development Association (APDT PH), which is a public-private partnership established in 2008 at the initiative of the National Associations of Travel Agencies (ANAT) and of the Prahova Chamber of Commerce and Industry, along with other important partners in Prahova county (the Oil and Gas University, accommodation establishments, local public administrations). Since October 2009, APDT PH has been one of the founding members of the Federation of Tourism Promotion Associations in Romania (FAPT); for the past six years, it has organized the “ExpoVacanța” Prahova Travel Fair and for 2 years the international event “Criteriul primei zăpezi” (“First snow criterion”), dedicated to winter sports in Prahova-Brașov area.
According to the data collected by the Prahova Tourism Promotion and Development Association, the main tourist attractions in Ploiești are of cultural nature, as there are no natural attractions of great interest: the Merchant’s House Museum, “Nicolae Simache” Clock Museum, the I.L. Caragiale Museum, the “Ion Ionescu-Quintus” County Museum of Art, the County Museum of History and Archeology, the “Nichita Stănescu” Memorial Museum, the “Paul Constantinescu” Memorial Museum, the National Museum of Oil, the “Toma Caragiu” Theatre, the Palace of Culture. They are located mainly in the central area of the city, where a number of places of worship are located as well, which might also attract the attention of visitors. They are suitable for inclusion in cultural and religious tourism routes.
Other attractions in the area include: the “Gh. Bănciulescu” Aeroclub in Strejnic, the swimming pools and SPA centers in the area, and the Hippodrome (the only trotting track in Romania), for health and sports tourism. Thematic routes could cover the cycling routes through the Dealu Mare vineyards, and also the Wine Road (Drumul Vinului) – the old road used by the Romans to cross Europe, specifically the segment linking Ploiești to Buzău, where there are internationally renowned vineyards, especially for red wine varieties similar to Bordeaux region in France (Valea Călugărească, Urlați, Ceptura, Tohani, Gura Vadului, Seciu-Boldești-Scăeni), which could generate wine and culinary tourism. Also, religious tourism could target the monasteries of Chițorani, Turnu, Zamfira, Vărbila, Jercălăi, Sinaia, etc.
In the county, three thematic routes are currently promoted, also including the Ploiești area: the Wine Road (wine and culinary tourism), the Fruit Road (active cultural and culinary tourism) and the Princes’ Road (cultural and religious tourism). They have also received European grants for promotion activities, accessed under the auspices of Prahova County Council. Two other promoted thematic routes are the Coal Road and the Salt Road, targeting the industrial heritage and health tourism (the Slănic-Prahova salt mine).
The
Gro
wth
Pol
e’s
Prof
ile
Ana
lysi
s of
Dev
elop
men
t N
eeds
and
Are
as o
f In
terv
enti
on
Cha
pter
1.2
. eco
nom
y
i
1
i106

Source: Prahova Tourism Promotion and Development Association
Map 32. Ploiești municipality attractions map
107

Source: Own drawing based on NIS data. 2011 General Population and Housing Census
Map 33. The share of employed people by census sector in Ploiești city in 2011
1.2.3. Workforce
The final results of the General Population and Housing Census of 2011 show that 46.1% of Ploiești Growth Pole ‘s population (over 150,700 people) was active, of which 41.9% were employed and 4.2% unemployed. This indicates the existence of considerable local labor resources, which can be a significant advantage for attracting future investments. Among the employed persons, around 95% were employees, and the remaining 5% were entrepreneurs, unpaid family workers or self-employed. However, the proportion of inactive people has increased steadily over the past decade, especially due to the aging population.
Currently, a quarter of the Growth Pole’s population is retired, although the population over 60 is less than 22% of the total population, the ratio being of only 1.72 employed persons/retired person. Therefore, we can talk about a phenomenon of retiring at active ages (the segment of 50-60 years of age),which is typical especially for the 1990s. Also, one may notice a high rate (5.1%) of persons who stay at home, but who are able to work. Therefore, the total labor resources of the municipality, including the pensioners and the working age homemakers, reach 53-55% of the total population. Involving them in the labor market, as well as involving the unemployed would increase the number of employed persons by 35,000-40,000 people, which would cover the local needs for workforce, even if the migration phenomenon will continue to be at a high level in the next decade.
The
Gro
wth
Pol
e’s
Prof
ile
Ana
lysi
s of
Dev
elop
men
t N
eeds
and
Are
as o
f In
terv
enti
on
Cha
pter
1.2
. eco
nom
y
i
1
i108

Map 34. Share of pensioners by census sector in Ploiești municipality in 2011
Source: Own drawing based on NIS data. 2011 General Population and Housing Census
Map 35. Share of homemakers in Ploiești by census sector in 2011
109

Source: NIS, Online TEMPO Database
Figure 33. Average number of salaried employees in Ploiești Growth Pole in the 2007-2013 period
According to NIS estimates, in 2014 there were 104,903 employees in Ploiești Growth Pole, i.e. up by 2.8% compared to the census of 2011, but down by 8.7% compared to the numbers recorded in 2007. The economic difficulties faced by local enterprises lead to personnel layoffs, especially in the 2009-2010 period. As can be seen, the number of employees communicated by NIS in 2011 was about 37,000 less than the number of occupied persons, the difference being accounted for by those who worked in other areas (e.g., commuters) and those who had another status, such as employer or self-employed or working in their own household.
It is noteworthy that the number of employees varied significantly from one location to another during the 2007-2013 period. Thus, the number of jobs in Ploiești decreased by 13%, in Plopeni by 31.7%, and in Dumbrăvești commune by 30.6%, while other localities witnessed the following increases: by 218% in Ariceștii Rahtivani, by 45% in Brazi, by 24% in Păulești, and by 20% in Târgșoru Vechi and Bărcănești. These localities have attracted a number of important investors in recent years, including following business relocations from Ploiești, which shows a clear trend of redistributing the economic activities in the territory, from the urban core to the periphery (the so-called phenomenon of suburbanization or peripheralization). Thus, the jobs in the Growth Pole were distributed in 2014 as shown in the figure below. It is relevant that the share of Ploiești municipality in the total number of jobs fell from 78% in 2007 to 74% in 2014.
130,000
125,000
120,000
115,000
110,000
105,000
100,000
95,000
90,0002007 2008 2009 2010 2011 2012 2013
Average number of employees
The
Gro
wth
Pol
e’s
Prof
ile
Ana
lysi
s of
Dev
elop
men
t N
eeds
and
Are
as o
f In
terv
enti
on
Cha
pter
1.2
. eco
nom
y
i
1
i
Source: NIS, The final results of the 2011 General Population and Housing Census
Figure 32. Occupational structure of the population in Ploiești Growth Pole by localities
90% 100%10%0% 20% 30% 40% 50% 60% 70% 80%
Other
Supported persons
Homemakers
Pensioners
Pupils and students
Unemployed
Employed
Ploiești
Bărcănești
Berceni
Blejoi
Brazi
Bucov
Păulești
Târgșoru Vechi
Băicoi
Boldești-Scăeni
Plopeni
Dumbrăveşti
Ariceștii Rahtivani
Valea Călugărească
Growth Pole
110

Map 36. Distribution of jobs in Ploiești Growth Pole
111

Source: NIS, TEMPO Online Database
Figure 34. Structure of jobs in Ploiești Growth Pole by their location
Another issue specific to Ploiești Growth Pole is the workforce’s ageing tendency. The average age of employees is over 40, mostly as a result of the increasing phenomenon of young people migrating to Bucharest and to other countries. On the other hand, people in this category were qualified – especially in the communist era – in industrial occupations, which are no longer required in the local labor market today.
The analysis of the occupational structure of the population between localities does not reflect major differences, the highest employment rates being recorded in Ploiești municipality (42.9% of the total population), in Plopeni town, and in Brazi and Păulești communes (where there is a relatively high number of employers) and the lowest in Dumbrăvești (33.1% of the total) and Bărcănești communes (36.6%), both with a high proportion of dependents. The highest percentage of pensioners is recorded in Băicoi (27.6%) and Ploiești (26.3%), where the aging population had a job in the past, and the lowest in Berceni and Târgșoru Vechi communes, with a younger population, but also with many elderly people who do not receive a pension, having previously worked in agriculture. The share of homemakers varies between 4.3% in Ploiești municipality and over 8% in Ariceștii Rahtivani and Bărcănești communes, and Boldești-Scăeni town.
Compared to other growth poles in Romania, Ploiești municipality is characterized by a smaller percentage of persons employed, only surpassing surpassing, for instance, Constanța and Craiova from the unemployment perspective. As well, the number of pensioners and homemakers is higher compared to the most dynamic economic growth poles, such as Bucharest, Cluj-Napoca, and Timișoara. All this indicates fewer employment opportunities locally and an accentuated population aging trend, worsened by the “brain-drain” phenomenon (labor migration of the young and highly qualified). Another disadvantage of the municipality consists in the small percentage of pupils and students (about 13% compared to over 20% in Cluj-Napoca and Iași – university centers with a long tradition), which makes it difficult to recruit highly qualified personnel in emerging areas such as IT&C.
Ploiești76%
3% Băicoi3% Boldești-Scăeni2% Plopeni1% Ariceştii Rahtivani1% Bărcănești1% Berceni3% Blejoi5% Brazi1% Bucov0% Dumbrăveşti3% Păulești1% Târgșoru Vechi1% Valea Călugărească
The
Gro
wth
Pol
e’s
Prof
ile
Ana
lysi
s of
Dev
elop
men
t N
eeds
and
Are
as o
f In
terv
enti
on
Cha
pter
1.2
. eco
nom
y
i
1
i112

Source: NIS, final results of the General Census of Population and Housing, 2011
Figure 35. Occupational structure of the population in Romanian growth poles
Ploiești
Craiova
Brașov
Constanța
Iași
Timișoara
Cluj-Napoca
București
0% 20% 40% 60% 80% 100%
Employed
Unemployed
Pupils and students
Pensioners
Homemakers
Supported persons
Other
The unemployment rate decreased significantly over the past decade, going from 14% in 2002 to 8.8% of the active population in the 2011 census, nearly double the rate of about 5% communicated by the National Employment Agency, which only reports jobseekers registered in its records. The increased local labor mobility had an important contribution to the reduction of unemployment in the area, even despite the onset of the global crisis, due both to people commuting to Bucharest and the temporary or definitive external migration, which reduced the pressure on the local labor market.
Source: Own drawing, based on NIS data. 2011 General Population and Housing Census
Map 37. Share of the unemployed by census sector in Ploiești city in 2011
113

In 2011, the highest unemployment rate was recorded in Plopeni town and in Dumbrăvești commune, both affected by the massive restructuring of Plopeni Mechanical Plant, as most of the local active population was dependent on the plant’s activity. Plopeni city also recorded the highest external migration rate, a phenomenon favored by its relatively young population, which expanded significantly during the communist period. On the other hand, the lowest unemployment rate (under 7%) is recorded in those communes around Ploiești which have attracted major investments in recent years (Păulești, Blejoi, Ariceștii Rahtivani).
However, it should be noted that, according to NIS data, the official unemployment rate fell by almost one percentage point from the time of the census, when the effects of the crisis were the most acutely felt, so we can estimate that the real unemployment rate was around 7% in 2014. The unemployment rates by gender are approximately equal, but the data from the County Employment Agency indicate that 65.4% of the unemployed have elementary, middle school , and professional education, 27% have secondary and post-secondary education, and only 7.6% are university graduates. Moreover, 48% of the unemployed do not receive unemployment benefits; they are generally long-term unemployed. Finally, it should be noted that 23.6% of the unemployed are under 25, and 24.7% are over 50; these two categories of the active population suffer the greatest labor market inclusion difficulties.
Source: NIS, The final results of the 2011 General Population and Housing Census
Figure 36. Unemployment rate relative to the active population by locality
Source: Prahova County Employment Agency
Figure 37. Unemployment in the civil active population in Prahova County during the 2007-2014 period
Ploieș
ti
Bercen
iBlej
oiBra
zi
Bucov
Băicoi
Plope
ni
Dumbră
veşt
i
Ariceş
tii R
ahtiv
ani
Valea
Călu
gărea
scă
Growth
Pole
Păule
ști
Târg
șoru
Vec
hi
Boldeș
ti-Scă
eni
Bărcă
neșt
i
08
07
06
05
04
03
02
01
00
Unemployment rate (% active population)10
9
8
7
6
5
4
3
2
1
0
TotalMaleFemale
2007 2008 2009 2010 2011 2012 2013 2014
The
Gro
wth
Pol
e’s
Prof
ile
Ana
lysi
s of
Dev
elop
men
t N
eeds
and
Are
as o
f In
terv
enti
on
Cha
pter
1.2
. eco
nom
y
i
1
i114

Sursa: xx
Map 38. Unemployment rate in Ploiești Growth Pole
115

Regarding the occupational structure, the service sector has come to provide 57% of the jobs in the Ploiești Growth Pole, followed by the industry (28%), agriculture and forestry (8%), and the constructions sector (7%). Compared to the communist period, the number of people employed in the service sector is two times higher than those working in the industry sector; there is a tendency, specific to large urban agglomerations, to shift the workforce to the service sector.
Source: NIS, The final results of the 2011 General Population and Housing Census
Figure 38. Structure of employment of the population by main economic sectors and by localities
Agriculture continues to play an important (traditional) role in the economy of the rural localities in the Growth Pole, pooling up to 20-30% of the total workforce in localities like Bărcănești, Berceni, Brazi, Bucov, Păulești, and Târgșoru Vechi, which have large agricultural areas. Most people working in agriculture are over 50 years old and practice horticulture or animal husbandry on small (up to 5 ha) individual farms, often for their own consumption or for additional income. The share of this industry has significantly decreased over the last two decades, but it continues to employ over 20% of the active population in all localities, the highest shares being recorded in small towns – Plopeni, Băicoi, Boldești-Scăeni. The service sector is best represented in the case of Ploiești municipality (over 60% of the employed population), which also serves the surrounding area.
By analyzing the employment structure in more detail, by main activities of the national economy, we see that the manufacturing sector remains the main employer in the Growth Pole, with a share of 24% of the total employed population, followed by trade (17%), agriculture (8%), construction and transport (7% each), all mainly private sectors, and by a number of activities related to the public sphere (public administration and defense – 6%, health and social assistance – 4%, education – 4% ). Such activities generally have low added value, and thus low staff remuneration. On a different note, the activities with a higher salary level (IT&C, financial intermediation, scientific, technical and professional activities, mining and quarrying, energy) do not employ more than 12% of the population, which explains why the wages in the area remain at a lower level compared to other growth poles in Romania, where the economic structure is more favorable.
Most of the employed population (79%) works in the private sector – the main economic engine of the Growth Pole, while the public sector only employs 13% of the population, and households employ 7%. More than 19,000 people who work in the public sector have been strongly affected by the 25% salary reduction, which occured in 2010.
Plopeni
Boldești-Scăeni
Băicoi
Târgșoru Vechi
Păulești
Bucov
Brazi
Blejoi
Berceni
Bărcănești
Ploiești
Agriculture, forestry and fishing
Industry
Construction
Services
0% 20% 40% 60% 80% 100%
The
Gro
wth
Pol
e’s
Prof
ile
Ana
lysi
s of
Dev
elop
men
t N
eeds
and
Are
as o
f In
terv
enti
on
Cha
pter
1.2
. eco
nom
y
i
1
i116

Sursa: xx
Map 39. Employment structure in Ploiești Growth Pole
117

Source: NIS, The final results of the 2011 General Population and Housing Census
Figure 39. Occupational structure of the population in Ploiești Growth Pole by main activities of the national economy
Source: NIS, The final results of the 2011 General Population and Housing Census
Figure 40. Structure of the employed population, by activity sector
Defense and Public Administration 6%
Arts, Entertainment, and Recreation 1%
Administration and Support Services 4%
Professional, Technical and Scientific Activities 4%
Financial Intermediations and Insurance 2%
Hotels and Restaurants 2%
IT&C 3%
Energy 1%
Other Services
Water and Sanitation 1%
Health and Social Assistance 5%
Education 4%
% of the total employed
Transport and Storage 7%
Manufacturing24%
Constructions 7%
Agriculture, Forestry, and Fisheries 8%
Mining and Quarrying 2%
Commerce and repairs
17%
% of the total employedHouseholds 7%NGOs 1%
Public Administration 13%
Financial and non-Financial Companies
79%
The
Gro
wth
Pol
e’s
Prof
ile
Ana
lysi
s of
Dev
elop
men
t N
eeds
and
Are
as o
f In
terv
enti
on
Cha
pter
1.2
. eco
nom
y
i
1
i118

Regarding the net average wage in Prahova county (the most detailed territorial level for which the NIS collects statistics on wage levels), in 2013 it was 5.4% higher than the regional average, but 3.3% below the national average. In the 2008–2013 period, the net average wage increased by 16.6% in nominal terms, which in real terms meant an increase of about 5%. This rate was lower than the growth rate at the national (+20.6%) and regional level (+19.9%) for the same period.
Source: NIS, Online TEMPO Database
Figure 41. Dynamics of the net average monthly wage at the national, regional, and county levels in the 2008-2013 period
Compared to other Romanian counties where growth poles exist, the net average monthly wage in Prahova is higher than in Iași, Brașov, Constanța, and Dolj, but about 10% lower than that of Timiș and Cluj, and 33% lower than the average wage in the capital city, which explains the intense and temporary migration of the local workforce to Bucharest.
Source: NIS, TEMPO Online Database
Figure 42. Net average monthly wage in Romanian counties with growth poles in 2013
Compared to the national average, the net average monthly wages in Prahova county are only higher in agriculture and forestry, mining and quarrying, manufacturing and transport. The widest gaps compared to the national average can be seen in high value-added sectors – information and communications (-35.9%), financial intermediations (-24.4%) and the public sector (public administration, education, health).
1,800
1,600
1,400
1,200
1,000
800
600
400
200
0
2008
2009
2010
2011
Romania South Muntenia Region
Prahova County
2,500
2,000
1,500
1,000
500
0
Net average monthly wage (RON)
Bucur
ești
Timiș Cluj Iaș
iDolj
Braș
ov
Const
anța
Prah
ova
119

Source: NIS, TEMPO Online Database
Figure 43. Amount and dynamics of the net average wage by main activities of the national economy in Prahova County during the 2008-2013 period
The highest net average wages can be found in the following sectors: mining and quarrying industry, energy industry, financial intermediations, professional, scientific, and technical activities, and public administration and defense, which employ together approximately 15% of the total active population. The lowest salaries, close to the minimum wage, are in hotels and restaurants, real estate transactions, administrative and support services, constructions, arts, entertainment and recreation, trade and repair, agriculture and forestry, which account for over 40% of the jobs. Therefore, the local wage levels can be increased primarily by changing the economic structure and by supporting high value-added activities, especially in the area of services, and an appropriate level of personnel remuneration.
The analysis of the key economic indicators for the economic activities in the Growth Pole shows that manufacturing, trade, constructions and transport have the highest contribution to employment, economic output, and entrepreneurship.
2013
2008
Hotels and Restaurants
Administrative and Support Services
Other Services
Real Estate
Arts, Entertainment, and Recreation
Constructions
Commerce and Repairs
Agriculture, Forestry, and Fisheries
Health and Social Assistance
Water and Sanitation
Education
Manufacturing
Transport and Storage
IT&C
Public Administration and Defense
Professional, Technical, and Scientific Activities
Financial Intermediations and Insurance
Energy
Mining and Quarrying
050
01,0
001,5
002,0
002,5
003,0
003,5
004,0
00
The
Gro
wth
Pol
e’s
Prof
ile
Ana
lysi
s of
Dev
elop
men
t N
eeds
and
Are
as o
f In
terv
enti
on
Cha
pter
1.2
. eco
nom
y
i
1
i120

table 8. Major economic indicators at the level of national economy activities in Ploiești Groth Pole in 2013
Source: BORG Design Database and NIS, The final results of the 2011 General Population and Housing Census
economic activity number of active companies (2013)
total turnover (mil. ron, 2013)
total number of employees (2013)
total employed population (2011)
Agriculture, forestry, and fisheries
132 431 1,744 12,520
Mining and quarrying 50 1,230 2,589 2,836
Manufacturing 920 10,051 25,267 36,171
Energy 83 1,164 2,717 1,996
Water and sanitation 127 334 2,449 2,191
Constructions 1,147 1,560 8,287 11,092
Commerce and repairs 3,603 5,246 14,849 25,806
Transport and storage 824 1,554 8,072 10,106
Hotels and restaurants 376 132 2,006 2,767
IT&C 354 989 1,808 3,890
Financial intermediations and
insurance 202 44 519 2,440
Professional, technical, and scientific activities
1,231 754 4,748 5,286
Administrative and support services
395 315 4,581 6,025
Public administration and defense
8 19 276 9,778
Education 114 23 347 6,613
Health and social assistance
212 82 1,134 6,962
Arts, entertainment, and recreation
110 78 448 1,626
Other services 240 72 1,313 2,528
121

1.2.4. Economic engines and prospects
The fact that an economic sector has a large number of employees does not necessarily mean that it is also an economic engine. For example, in most cities, a large number of employees work in trade. Trade, however, is not an economic growth sector and it does not provide a comparative advantage to a locality. Basically, a trading company will locate anywhere it will find a market.
The sectors providing a competitive advantage to a metropolitan area are those with a location quotient greater than 1. A location quotient compares the local concentration of an economic sector (i.e. the number of employees in that sector relative to the total number of employees in the metropolitan area) to the national concentration of that sector. Sectors with a location quotient higher than 1 have the potential to become an economic engine. Such sectors are attractive for both companies in the field (who want to have access to skilled workforce) and for experts (who want to work in a field that offers many opportunities in their area of expertise).
In Ploiești Growth Pole, the following economic agglomerations that have a location quotient greater than 1 pool together a large number of companies and employees and generate a significant business volume and exports:
1) Machinery and equipment industry – finished goods such as heavy bearings, machinery and equipment for extracting oil and gas, chemical, petrochemical, metallurgy, and energy industries; machinery for agriculture and irrigation; weighing systems; engines; pumps; hydraulic equipment; pressure equipment, electromechanical systems; ammunition and military missiles, etc. This industry branch has a tradition of over 100 years, having developed around the oil exploitations and refineries in the region and having been strongly supported during the communist era, when “1 Mai” Plant alone generated over 18,000 jobs and Ploiești area ranked among the first production areas for armament, hydraulic equipment, and heavy bearings. Ploiești continues to be the main center for the design, production, and maintenance of machinery and equipment for the oil drilling and processing industry. However, this branch was heavily restructured after 1990, losing many foreign outlets; its decline was interrupted only by the arrival – in recent years – of foreign investors. The main companies in this field include: UPETROM 1 MAI, TIMKEN, CAMERON, PLOPENI MECHANICAL PLANT, CAMEXIP, UZUC, LUFKIN, HIDRAULICA PLOPENI, REMERO FIL, 24 IANUARIE, ELECTROMECANICA, DINAFIT, TORO, ROQUET, FLINTAB, etc. They generate about 6,500 jobs, accounting for 18% of the total jobs in the industry.
2) Food and beverage industry – milling and bakery products, pasta products, meat and meat products, eggs, dairy products, beer, soft drinks, corn puffs, wine, vegetable oil, margarine, spices, food seasoning, mustard, etc. Although not a traditional center of the food industry, since 1990 the Ploiești municipality has attracted a large number of international investors in the sector: COCA–COLA HBC, BERGENBIER, UNILEVER, BRITISH AMERICAN TOBACCO, HALEWOOD, ALEXANDRION GROUP, etc. In addition, there are a number of smaller companies, many of them with local capital: PHOENIXY, PRODMAR, GOPA, FARINA PAN, ECOLACT PROD, LIDA GARBEA, POIANA PRODCOM, PRAM, PANEXION. They generate more than 5,000 jobs (14% of the total population employed in industry); the products are intended mainly for the Bucharest market, but also for the national market. In recent years, there have also been exports to the regional market.
3) textile and clothing industry – clothing items, protective equipment, curtains, carpets. This industry has some tradition in the area; a felt cloth factory operated here since around 1900. After 1990, large investors in the field came to this area and several companies appeared in the clothing and textile sector: OTTOROSE, OZTASAR, REXTON, UNIQUE CLOTHING, TASAR DESIGN, HACO DESIGN, SMART, AFFINITY IMPEX, PEARL K&D, FULYA TEKSTIL, PLATINA TAILORING, TESSUTICA ROMANIA, etc. They currently generate almost 5,000 jobs (13% of the population employed in the industry), mainly for women, but many companies continue to make low value-added products, offering low salaries under the Lohn system.
4) Manufacture of metal structures – welded steel constructions, SKIDs, tanks, electrical panels and installations, prefabricated metal products for the petrochemical and chemical industry, metal roofing, aluminum carpentry, steel halls, metal bellows and joints, fittings, armatures, etc. As can be seen, many of these metal products are intended for oil companies. In this sector, there are companies with foreign capital and domestic capital, such as AMPLO, TERQUA, INDUSTRIAL MONTAJ, MONTICOR INDUSTRIES, DEKOMTE DE TEMPLE, MONTUBING, DEPACO, TEHNOREX, SUDARC, BUPAR UNION, FEMETALRO, etc. The companies in the field employ a total of about 3,500 people (10% of the population employed in the industry).
The
Gro
wth
Pol
e’s
Prof
ile
Ana
lysi
s of
Dev
elop
men
t N
eeds
and
Are
as o
f In
terv
enti
on
Cha
pter
1.2
. eco
nom
y
i
1
i122

5) the automotive industry – wiring systems, brake pads, car covers, heat exchangers, radiators, air conditioning systems, etc. This industry branch does not have a long tradition locally, having developed mainly over the last decade, with the arrival of specific investors in the industrial parks around the city: YAZAKI, HONEYWELL FRICTION MATERIALS, FLEXITECH, JOHNSON CONTROLS, CALSONIC KANSEI, DELFINGEN, etc. They currently generate more than 3,500 jobs, representing 10% of the population employed in the manufacturing industry and 3% of the total number of jobs.
6) the petrochemical industry – fuels, oils, solvents, bitumen. Currently, three refineries are operational (Petrobrazi – owned by OMV PETROM, Teleajen – LUKOIL and Vega – ROMPETROL) and one is not (Astra Română) – with a total processing capacity of over 8 million tons of crude oil per year, far exceeding domestic production (4 million tons/year). They are operated by multinational groups and have benefited from massive investments for retrofitting; in Petrobrazi alone, investments worth over 600 million EUR were completed in 2014, and the refinery became one of the most modern in Europe. The refining industry currently employs about 3,500 people, i.e. 10% of the total workforce employed in the industry.
For nearly two centuries, the development of Ploiești city was closely linked to the progress of the hydrocarbons extraction and processing industry, Ploiești being the center of Romania’s oil sector, located in the middle of very productive oil fields. As early as 1857, when the first refinery in the world became operational (Marin Mehedințeanu’s gas factory), four oil refineries were built in Ploiești area, with a processing capacity of over 10 million tons/year, processing both domestic and imported raw material. A genuine conglomerate of horizontal and vertical activities developed around the oil industry (production of machinery and equipment for extraction, engineering and design, construction and maintenance, pipeline transport, education and training, domestic and foreign trade, etc.), which pooled together more than half of the local workforce, including during the communist period.
After 1989, with the decrease of hydrocarbon reserves, the negative dynamics of the national economy and the restructuring and retrofitting process, the importance of the oil sector in the economy of the Growth Pole decreased significantly; the Growth Pole became more diversified by attracting investments in industries such as food, textile, automotive, services, etc. Currently, about 6,000 people are still working directly in hydrocarbons extraction and processing, accounting for less than 5% of the total working population, given that, for example, one of the refineries (Astra Română) is no longer operational and the other three operate below their maximum capacity. However, if we include the related industries mentioned above, the number of employees directly or indirectly dependent on the oil sector reaches 20% of the local workforce.
Thus, despite the declining importance of the oil sector, it remains the main field of local economic specialization. The oil sector-related industries are volatile and heavily influenced by the evolution of the international oil prices, which could have a domino effect on many local businesses; this is one of the key vulnerabilities of the Growth Pole’s economy. However, the prospects are favorable, given that currently there are endeavors to exploit new hydrocarbons resources in the Black Sea and in the Caspian Sea, for which Ploiești is the most appropriate resource center. They could also contribute to an increase in the use of production capacity of the three refineries in operation (controlled by OMV PETROM, LUKOIL, and ROMPETROL groups), which can process twice the domestic production annually.
The food industry also has good prospects for development in Ploiești area due to the strength of the local companies operating in this sector, the proximity to the outlet market of Bucharest and its environs, but also from but also thanks to the important agricultural resources in the area (e.g. vineyards, orchards, livestock, etc.). The automotive parts industry will also continue to develop, as the industrial parks in Ploiești area attract a growing number of investors in the field, attracted by the presence of DACIA RENAULT in the region.
In order to determine the industrial branches for which Ploiești area holds a significant competitive advantage for export activities, we determined the Balassa Index of Revealed Competitive Advantage. It indicates that the industry of machinery, electrical appliances, and equipment is the most competitive sector on foreign markets, being strongly influenced by the fact that automotive components (e.g., wiring) manufacturers and oil producers (YAZAKI, CAMERON, LUFKIN, etc.) are established in this area. Also, the textile and the automotive parts industries are relatively competitive on foreign markets, although the former is competing with Asian products. Despite its good local development, the petrochemical industry is still deficient in terms of competitive advantage, given the significant imports of petroleum products that are processed in Ploiești refineries. Moreover, food imports are still higher than the exports; the domestic agriculture and processing industry fail to fully cover domestic consumption, despite very high-quality agricultural resources.
123

Source: NIS, Online TEMPO Database. Own calculations
Figure 44. Balassa Index of the Revealed Comparative Advantage in Prahova County during the 2011–2014 period
A shift-share3 analysis of the post-crisis 2009-2013 period reveals the dynamics of Ploiești Growth Pole’s economy. The economic sectors with the highest number of employees and with a location quotient higher than 1 were selected for this analysis.
Overall, the “winning” sectors are those that grew faster in the growth pole than they did nationally during the 2009-2013 period. The main winning sectors were: the manufacture of other wearing apparel (4,170 employees); Service activities related to the extraction of crude petroleum and natural gas (2,125 employees); Maintenance and repair of motor vehicles (1,075 employees); Landscape maintenance activities (756 employees); Manufacture of tobacco products (550 employees); Repair of household appliances (524 employees); Other specialized construction activities (514 employees); Television broadcasting activities (470 employees). Broadly speaking, the winning sectors are relatively low value-added service sectors and industrial sectors. This means that, although these sectors experienced greater impetus locally than nationally, they did not necessarily have a substantial contribution to the economic growth of the area concerned.
The “losing” sectors are those that experienced a decrease in the number of employees at local level, due to a decrease in these sectors nationwide. The losing sectors include: pipeline transport (1,774 employees); urban passenger transport (1,078 employees); manufacture of machinery for mining, quarrying and construction (1,077 employees); construction of utility projects for fluids (733 employees); manufacture of refined petroleum products (545 employees); wholesale of sugar and chocolate and sugar confectionery (518 employees); renting and operating of own or leased real estate (503 employees). Overall, it seems that Ploiești had a negative performance in a number of sectors in the field of processing and transportation of crude oil, due to a negative performance of these sectors nationwide.
0-1-2-3-4-5-6 1 2 3
I. Live animals and animal products
II. Vegetable products
III. Animal or vegetable fats and oil
IV. Foodstuffs vegetables and tobacco
V. Mineral products
VI. Chemical products
VII. Plastics and rubber
VIII. Piei crude, piei tăbăcite
IX. Wood products
X. Paper
XI. Textiles
XII. Footwear
XIII. Stone, plaster, cement, ceramics, glass
XIV. Metal products
XV. Machinery, mechanical appliances and electrical equipment
XVI. Automotive
XVII. Optical, medical, clocks and musical instruments
XVIII. Miscellaneous manufactured articles
XIX. Other products not elsewhere included
2011
2012
2013
2014
The
Gro
wth
Pol
e’s
Prof
ile
Ana
lysi
s of
Dev
elop
men
t N
eeds
and
Are
as o
f In
terv
enti
on
Cha
pter
1.2
. eco
nom
y
i
1
i124

NOTE: The size of the circles is proportional to the absolute number of employees in the respective sector Source: BORG Design Database
Figure 45. Shift-Share Analysis of the Ploiești Growth Pole during the 2009-2013 period
The “questionable winners” are those economic sectors recording an increase in the number of local employees against a backdrop of nationwide declines in these sectors. The biggest questionable winners include: distribution of electricity (2,073 employees); manufacture of metal structures (1,642 employees); plumbing, heating, and air conditioning (1,267 employees); repair and maintenance of other transport equipment (646 employees). Basically, these sectors are service sectors without a clear competitive advantage nationwide.
The “big losers” are the economic sectors which suffered a decrease in workforce against a backdrop of positive performance of the same sectors at national level. The biggest losers include: manufacture of automotive parts (3,804 employees); road freight transport (3,701 employees); engineering and consultancy activities (2,524 employees); collection, purification and distribution of water (1,440 employees); retail sale in non-specialized stores (1,419 employees); manufacture of bearings, gears, gearing and driving elements (854 employees); electrical installation work (773 employees); manufacture of other special-purpose machinery and equipment (684 employees); transport by taxi (507 employees). Some of these sectors are low value-added and have no competitive advantage at national level (for example, trade). But others – namely the manufacturing of automotive assemblies – are sectors with a strong national competitive advantage.
The potential for smart specialization of the local economy can also be assessed by comparison to the other Romanian growth poles, which are the engines for the development and growth of Romania’s economic competitiveness, as shown in the study on Growth Poles developed by the World Bank. Ploiești Growth Pole has important competitive advantages in the extraction and energy industries, being the most attractive of the Romanian growth poles (except for Bucharest municipality) in terms of geographic positioning of such activities. This is due to the fact that Ploiești has always been a traditional center for resources and skills in oil extraction and processing, but also to the investments made in recent years in the energy sector, such as building the largest and most modern power plant in Romania – OMV PETROM’s plant in Brazi, following an investment of over 500 million EUR, completed in 2011. It has the potential to generate 10% of Romania’s electricity needs.
As well, Ploiești has average competitive advantages in the following industries: manufacturing industry (namely in these branches: petrochemistry, machinery and equipment, food and beverages), transport and logistics, as it is becoming more and more a logistics center serving both the South region and the Bucharest market (the platforms: AQUILA, KAUFLAND, LIDL, BILLA, PROFI, AHEAD) and in IT&C – some major companies are located here, such as TEAMNET INTERNATIONAL, ELETTRA COMMUNICATIONS, ROMCAP CONDENSATORI, 2K TELECOM, ASESOFT, SUNSMART INTEGRARE, INFRATEL NET etc. 3 For a detailed description of the methodology, see: World Bank. 2013. Competitive Cities
losers
-0.2-0.3-0.4 0.4 0.5
winnerS0.5
-0.3
0.1
0
-0.5
Service activities related to the extraction of crude petroleum and natural gas
repair of household appliances
Manufacture of other outerwear
Manufacture of bearings, gears, gearing and driving elements
Maintenance and repair of motor vehicles
Distribution of electricity
Manufacture of tobacco products
electrical installation work
Urban passenger land transport
Mining machinery production
transports through pipes
Manufacture of refined petroleum products
Construction of utility projects for fluids
retail sale in non-specialized stores
Manufacture of other machinery and joinery
raising of poultryingineering and consultancy
Manufacture of automotive parts Collection, purification and distribution of water road freight transport
Plumbing, heating and air conditioning
0.2 0.3
BiG loSerS
Questionable winners
-2 E -15
0.3
-0.1 0.1
-0.1
non-specialized wholesale
125

In contrast, we find a number of economic activities for which Ploiești Growth Pole is much less competitive compared to other cities in Romania: construction, trade, tourism, financial services, real estate, professional, scientific, and technical activities, administrative services and support, education, health, culture, leisure, etc., mainly due to the polarization of the service sector by Bucharest, which is located just 60 km away.
Source: BORG Design Database. Own calculations
Figure 46. Competitive advantages of Romania’s growth poles by activities of the national economy,based on the total utility method in 2013
Therefore, the economic activities with the best prospects for development in Ploiești Growth Pole – having a potential for smart specialization, redefinition on more solid competitive bases and new jobs generation – are the oil extraction and processing industry, including all related services along the entire supply chain, the automotive, machinery and equipment industry, the food and beverage industry, the energy industry, the ICT sector, and the transport and logistics sector. However, the evolution of these sectors over time should be also taken into account in order to understand whether the poor performance during 2009-2013 is a fleeting trend or long-term dynamics.
0 0.2 0.4 0.6 0.8 1
Other Services
Culture and Recreation
Health and social services
Education
Administrative and support services
Professional, scientific and technical activities
Real-Estate
Financial services
ICT
HORECA
Transport and logistics
Trade and repairs
Constructions
Water and waste management
Energy
Processing industry
Extraction industry
Agriculture, forestry, and fishing
Ploiești
Brașov
Craiova
Constanța
Iași
Timișoara
Cluj-Napoca
The
Gro
wth
Pol
e’s
Prof
ile
Ana
lysi
s of
Dev
elop
men
t N
eeds
and
Are
as o
f In
terv
enti
on
Cha
pter
1.2
. eco
nom
y
i
1
i126

1.2.5. Research and development, and support infrastructure for companies
The research, development, and innovation activity (RDI) in Ploiești Growth Pole is underdeveloped compared to the national level and is dominated by the public sector. The areas of specialization of the local RDI units are closely linked to the area’s economic profile and are specialized in oil extraction and processing, oil equipment and viticulture.
Thus, the research and Design institute for oil Drilling equipment (iPCUP) is the only research nucleus in Romania for oil equipment, drilling rigs, tools and devices in the field, ensuring – throughout its 60 years of activity – scientific results that have propelled Romania among the top players in the world in this sector, ranking third after Russia and US. In recent years, the institute, which is subordinated to the Ministry of National Education, has faced a dramatic decline in demand for services, due to the privatization of the companies in the sector, which have their own RDI departments, and has accumulated significant debt to the state budget, which has prevented them from paying the wages on time to its specialized staff. Therefore, it currently has only about 50 employees, half of whom are university graduates and who were transferred to the National Institute for Research and Development in Electrical Engineering (ICPE–CA) in 2013, when the activity revived. In addition to the actual research and design, and technical inspection activity, the Institute also performs technology transfer activities within its small production workshop. The customers of the institute are mostly local companies in the oil equipment production and hydrocarbons extraction sector, but also some foreign companies.
iCerP S.A. Ploiești is a company with double specialization – research and production, and has over 45 years of experience in lubricants and additives. The company products (additives, greases, protection fluids, metal processing fluids, industrial and engine oils, detergents, biocides, corrosion inhibitors) are marketed under the brands ADIROL, LUBRICERP, and PROTICERP. All these products are the result of the research carried out in ICERP’s own laboratories; over the last few years alone, more than 40 new products have been registered at the State Office for Inventions and Trademarks (OSIM). This privately owned company is also facing a slump in demand; it is currently undergoing reorganization and it has only 30 employees, one third of whom are university graduates.
iPiP S.A. (the engineering and Design institute for oil refineries and Petrochemical Plants), established in 1950, is the leading provider of design services for refineries and the petrochemical industry in Romania. The company, currently privately-owned, has nearly 300 employees and its annual turnover amounts to 10-20 million EUR. Other local companies providing design, engineering, core taking, and research services in the oil sector are PETROSTAR, WEATHERFORD ATLAS GIP, JCR CHRISTOF CONSULTING, COMPROIECT 92, TECON ENGINEERING, etc., with a total turnover of over 65 million EUR and 1,100 employees in 2013.
iC-DVV (institute for research and Development of Viticulture and winemaking) Valea Călugărească, subordinated to the “Gh. Ionescu-Șișești” Academy of Agricultural and Forestry Sciences, is one of the most important research centers in the field of viticulture and winemaking in Romania. A variety of activities are carried out here, such as the creation of plant propagating material from new varieties with high biological value, chemical analyses and quality wines from the following varieties: Cabernet Sauvignon, Merlot, Pinot noir, Fetească neagră, Sauvignon, Fetească regală, Riesling, Distilate. The institute has modern research laboratories endowed with cutting-edge equipment, experimental polygons (16.8 ha), pilot microvinification station, ampelographic collection of vinifera varieties and rootstocks with more than 1,100 varieties and clones of the national and global range (5.2 ha), plantations of rootstocks (2.71 ha), nursery vines (5.0 ha), pilot farms (around 150 ha), and a grapes winemaking undertaking, where the technologies in viticulture and winemaking developed by the research sector are tested under production conditions. In terms of information technology, the institute has modern means of communication (telephony network and optic fiber internet, high-speed Internet, advanced computers and state of the art specialized software: ArcGIS, Arc Editor 9.1., etc.) and the possibility to implement an INTRANET network. Like other public research units, the activity of the institute was affected by the reduction of the allocations for research from the state budget and it has reduced its staff to about 100 people.
Thirteen research centers operate within the Petroleum – Gas University of Ploiești, generally grouped around several departments belonging to the five faculties of the university:
• Hydrocarbon deposits engineering;
• Modern and environmentally-friendly drilling and extraction technologies;
127

• Materials and technologies for the manufacturing of oil equipment;
• Strength, stability, dynamics and durability of oil and petrochemical equipment structures;
• Advanced automation of chemical processes;
• Oil processing and petrochemistry;
• Interdisciplinary Research Center for the Implementation of EU Policies in Countries of the Black Sea Region;
• Research Center for Literary Studies, Linguistics, Critical Theory and Culture;
• CerTIMF Research Centre;
• Interdisciplinary Research Center for Economic and Financial Strategies;
• Interdisciplinary Research Center for Strategies for the Implementation of EU Policies in Countries of the Black Sea Region;
• Center for Economic Studies and Research;
• Center for Legal and Socio-Administrative Studies and Research.
The itAF Ploiești Business and technology incubator also operates within the University and ever since 2008 it has provided activities in the field of industrial products and technologies (student start-up incubation, consultancy, technology transfer, research, training, etc.) – accredited by the National Authority for Scientific Research (ANCS). It also offers continuing training, information technology, and a Center for Technology Transfer, Innovation and Business, which provides services such as fundamental and applied research, design, drafting of feasibility studies, and various other services in these sectors: oil, environment, information technology, etc.
The University runs major research and development contracts with major companies in the oil sector, such as ROMGAZ, LUKOIL, PETROSTAR, OMV PETROM; to this purpose, the good qualification of the teaching and research staff is of utmost importance, as are the specific facilities (e.g., simulators, testing equipment for oil piping), purchased through projects funded by grants.
Source: NIS, TEMPO Online Database
Figure 47. Percentage of the GDP allocated to RDI expenses during 2007-2013
In terms of expenses related to the RDI activity, Prahova county is far below the national and regional average, with less than 0.2%, i.e. over 10 times less than the target assumed by Romania in the 2014-2020 Partnership Agreement. This can be explained by the underdeveloped specific infrastructure and by the chronic underfinancing of the research sector from the state budget. As well, because of the weak development of technology transfer, few research projects are funded by private companies and few results reach production processes. Therefore, most of the academic research remains at a basic level.
According to AD ASTRA statistics, Ploiești municipality ranks last among the growth poles when it comes to scientific output materialized in published scientific articles.
% of GDP allocated to RDI
2007 2008 2009 2010 2011 2012 2013
Romania South Muntenia Region Prahova County
0.6
0.5
0.4
0.3
0.2
0.1
0
The
Gro
wth
Pol
e’s
Prof
ile
Ana
lysi
s of
Dev
elop
men
t N
eeds
and
Are
as o
f In
terv
enti
on
Cha
pter
1.2
. eco
nom
y
i
1
i128

Source: AD ASTRA, Romanian Research White Paper
Figure 48. Number of scientific articles published in 2011
Bucur
ești
Cluj-N
apoc
aIaș
i
Timișo
ara
Braș
ov
Craiov
a
Const
anța
Ploieș
ti
Articles
2,000
1,800
1,600
1,400
1,200
1,000
800
600
400
200
0
Regarding the protection of intellectual property rights, the statistics of the State Office for Inventions and Trademarks (OSIM) indicate the following positioning of Prahova county in the national context, in the 2001-2013 period:
• 9th place by number of patent applications per 100,000 inhabitants (28), surpassing only Constanța among the growth poles;
• 9th place by number of applications for the registration of designs per 100,000 inhabitants (15), surpassing Dolj, Timiș, and Iași counties;
• 10th place by number of applications for registration of trademarks per 100,000 inhabitants (240), surpassing only Dolj.
When it comes to business and innovation support infrastructure, Ploiești Growth Pole ranks first among the Romanian growth poles when it comes to the area occupied by industrial parks. Thus, there are eight authorized industrial parks, four of which are public and four are private.
The industrial parks owned and managed by the local public authorities are the following:
• Ploiești industrial Park – covering an area of 163 ha and with an occupancy rate of 100%, it is a greenfield park located in the western part of the city and has access to to DN (National Road) 72, the railway and the whole range of utilities (electricity, water, sanitation, gas, telecommunications) and internal access roads. Currently, the park accommodates about 40 companies, which have invested about 300 million EUR and have generated more than 7,000 jobs, some of them resulting from significant foreign investment attracted in recent years (YAZAKI, CAMERON, ALKA, CALSONIC KANSEI, KAUFLAND, JOHNSON CONTROLS, BERICAP, etc.). The park is managed by a company subordinated to Prahova County Council, like the other three publicly owned industrial parks in the Growth Pole.
• Plopeni industrial Park – with an area of 76 ha and an occupancy rate of 100%, it is a brownfield park developed on the abandoned production areas of the former Plopeni Mechanical Plant, having access to the full range of utilities. At present, more than 25 companies operate here, with about 600 employees. They carry out various activities: plastics, manufacture of wood and furniture, metallurgy and machining, machinery and equipment, trade, construction.
• Brazi industrial Park – with an area of 46 ha, it hosts about 20 companies with 245 employees; its occupancy level is of 75% for land and 12% for buildings. This park also needs additional investment for the demolition or conversion of several abandoned buildings on its territory.
• Bărcănești industrial Park – covering an area of 91 ha (with the possibility of expanding by another 80 ha), it is the most recent industrial park in the area (2013), located on the land of the former Tătărani greenhouses, thus having an occupancy rate of only 2%. The park infrastructure is poor, much of the land requiring disposal of the existing constructions and installations. In this respect, a master plan was developed for investments worth about 8.4 million EUR, and a Zonal Urban Plan. The proposed specialization of this park is agri-food.
129

The private industrial parks in the area are the following:
• Ploiești west industrial Park – it covers an area of 290 ha, being the largest private industrial park in Romania, and is developed by the Belgian company ALINSO GROUP in the western part of the town, near the industrial park owned by Prahova County Council. It has areas for SMEs logistics, cold stores, and an intermodal freight terminal. The total investment in this park, estimated at 750 million EUR, was only partially implemented. By 2016, it is estimated that up to 20,000 jobs will be created. Among the renowned clients of the park there are international companies such as TORO, LUFKIN, UNILEVER, HONEYWELL, SCHLUMBERG, BAT, and HALLIBURTON. So far, the park’s occupancy rate has reached 30%, with investments of about 200 million EUR.
• PriMUS i and ii industrial Parks – with an area of about 110 ha, they are located in the Ariceștii Rahtivani commune.
• wDP Development industrial Park – with an area of about 25 ha, it is located in the western part of the city and will host the first production unit of the Belgian company ROQUET.
• DiBo industrial Park – it covers an area of about 22 ha and is located in the Brazi commune. It offers investors 16 already constructed industrial buildings, to be extended in the future.
Therefore, we can say that Ploiești Growth Pole has about 800 ha of public and private industrial parks, with a nearly 50% occupancy rate and in a continuous expansion, having determined investments of over 500 million EUR and created 10,000 new jobs. They played a key role in attracting new investors to the area; most of these investors settled in these business support structures. The effects of the industrial parks’ development on foreign investment were positive: the number of companies with foreign capital increased by 42.8%, and the subscribed capital by 165% between 2007 and 2013. Therefore, Prahova county has come to rank 11th nationally in terms of the number of companies established by foreign investors, and 8th when it comes to the value of the subscribed capital.
Source: National Trade Register Office
Figure 49. Volume of foreign investments attracted by Prahova County for the 2007-2013 period
Number of foreigninvestors companies
Subscribed capital(mil. Lei)
Subscribed capital(mil. Euro)
Subscribed capital(mil. USD)
4,000
3,500
3,000
2,500
2,000
1,500
1,000
500
0
2007
2008
2009
2010
2011
2012
2013
The
Gro
wth
Pol
e’s
Prof
ile
Ana
lysi
s of
Dev
elop
men
t N
eeds
and
Are
as o
f In
terv
enti
on
Cha
pter
1.2
. eco
nom
y
i
1
i130

Sursa: xx
Map 40. Functional areas in Ploiești Growth Pole
131
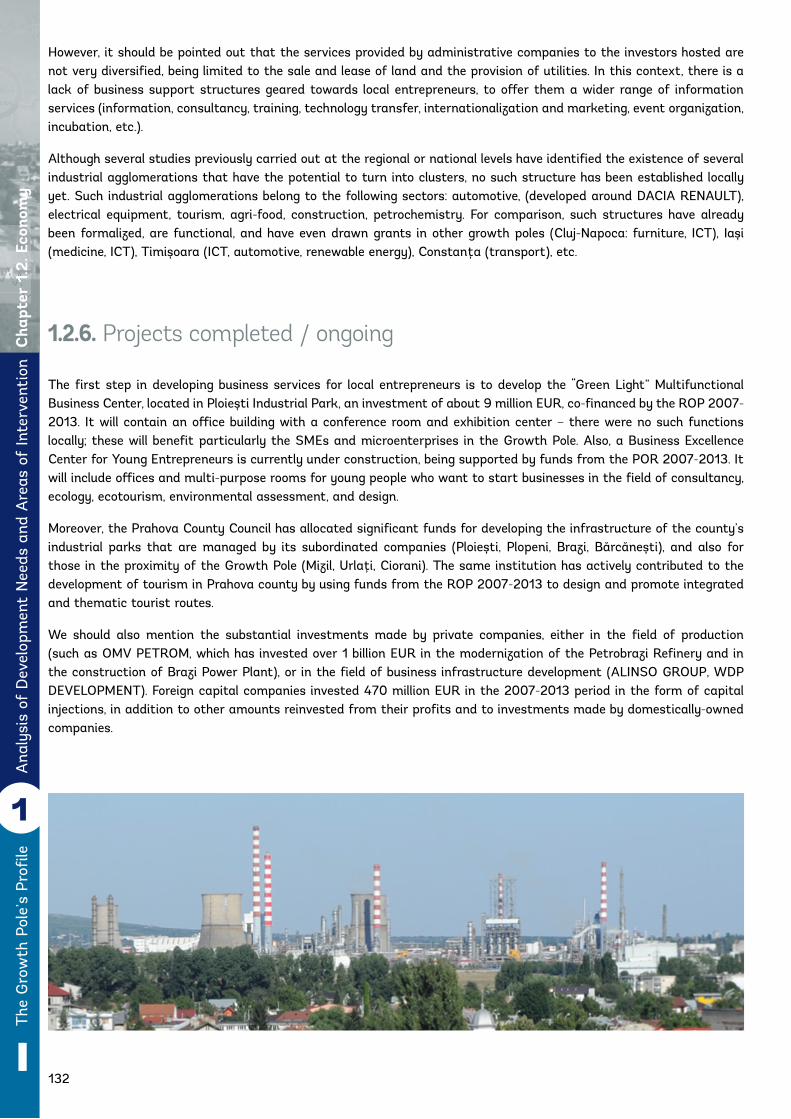
However, it should be pointed out that the services provided by administrative companies to the investors hosted are not very diversified, being limited to the sale and lease of land and the provision of utilities. In this context, there is a lack of business support structures geared towards local entrepreneurs, to offer them a wider range of information services (information, consultancy, training, technology transfer, internationalization and marketing, event organization, incubation, etc.).
Although several studies previously carried out at the regional or national levels have identified the existence of several industrial agglomerations that have the potential to turn into clusters, no such structure has been established locally yet. Such industrial agglomerations belong to the following sectors: automotive, (developed around DACIA RENAULT), electrical equipment, tourism, agri-food, construction, petrochemistry. For comparison, such structures have already been formalized, are functional, and have even drawn grants in other growth poles (Cluj-Napoca: furniture, ICT), Iași (medicine, ICT), Timișoara (ICT, automotive, renewable energy), Constanța (transport), etc.
1.2.6. Projects completed / ongoing
The first step in developing business services for local entrepreneurs is to develop the “Green Light” Multifunctional Business Center, located in Ploiești Industrial Park, an investment of about 9 million EUR, co-financed by the ROP 2007-2013. It will contain an office building with a conference room and exhibition center – there were no such functions locally; these will benefit particularly the SMEs and microenterprises in the Growth Pole. Also, a Business Excellence Center for Young Entrepreneurs is currently under construction, being supported by funds from the POR 2007-2013. It will include offices and multi-purpose rooms for young people who want to start businesses in the field of consultancy, ecology, ecotourism, environmental assessment, and design.
Moreover, the Prahova County Council has allocated significant funds for developing the infrastructure of the county’s industrial parks that are managed by its subordinated companies (Ploiești, Plopeni, Brazi, Bărcănești), and also for those in the proximity of the Growth Pole (Mizil, Urlați, Ciorani). The same institution has actively contributed to the development of tourism in Prahova county by using funds from the ROP 2007-2013 to design and promote integrated and thematic tourist routes.
We should also mention the substantial investments made by private companies, either in the field of production (such as OMV PETROM, which has invested over 1 billion EUR in the modernization of the Petrobrazi Refinery and in the construction of Brazi Power Plant), or in the field of business infrastructure development (ALINSO GROUP, WDP DEVELOPMENT). Foreign capital companies invested 470 million EUR in the 2007-2013 period in the form of capital injections, in addition to other amounts reinvested from their profits and to investments made by domestically-owned companies.
The
Gro
wth
Pol
e’s
Prof
ile
Ana
lysi
s of
Dev
elop
men
t N
eeds
and
Are
as o
f In
terv
enti
on
Cha
pter
1.2
. eco
nom
y
i
1
i132

1.2.7. Conclusions – existing disparities, trends, needs, and areas of intervention
Map 41. Structure of Economic Activities (Romania)
Ploiești Growth Pole has a tendency of converging – in the long term – with the economic performance of other cities and regions in the European Union. However, this tendency was temporarily interrupted by the global crisis, so that the GDP/capita at current prices remains below 40% of the EU-28 average and below the level reached by more dynamic growth poles (Cluj-Napoca, Timișoara) during the last decade.
The current economic structure of the Growth Pole is unfavorable for smart economic specialization and better living standards; the high value-added service sector (ICT, financial services, professional, scientific, and technical activities, etc.) is underdeveloped compared to other growth poles in Romania. Thus, Cluj-Napoca and Constanța have an economy dominated by the tertiary sector, in contrast to Craiova and Ploiești, which display lower economic performance and where the industrial sector continues to generate over half of the output of the local economy. Timișoara is an exception to this rule, as it has a high share of the industry, but also shifts towards more technologically advanced branches.
133

The rate of entrepreneurship at local level, expressed by the number of active enterprises per 1,000 inhabitants, is low compared to other growth poles; the local business environment is dominated by foreign capital companies and lacks a solid class of local businessmen. The unemployment rate is among the highest (being surpassed only by Craiova), as is the share of pensioners and homemakers in the total population. The level of local salaries is below the national average, due to the unfavorable economic structure of the local economy (a high rate of employment in low value-added sectors).
Ploiești Growth Pole has important competitive advantages when it comes to the extractive and energy industries, since it is the most attractive of the Romanian growth poles for the location of such activities. It also has competitive advantages in the manufacturing industry (namely in these branches: petrochemistry, machinery and equipment, food and beverages), in transport and logistics, as it is becoming more and more a logistics center that serves both the South Region and the Bucharest market.
In contrast, the economic activities where Ploiești Growth Pole is less competitive include construction, trade, tourism, financial services, real estate, professional, scientific, and technical activities, administrative and support services, education, health, culture, recreational activities, etc. This is due mainly to the service sector polarization induced by Bucharest, which is located just 60 km away.
Between 2007 and 2013, the number of active companies in Ploiești Growth Pole dropped by 13.9% due to the economic crisis, which led to a decrease in the domestic and external demand, and thus to a limitation of the companies’ activity in the area, or even to event to the bankruptcy of some of them. The most affected sectors were the construction industry, and the trade and manufacturing industries, which hold a significant share in the local economy; in these sectors, the number of companies has decreased by 18-26% in the last 7 years alone. In contrast, there are sectors where the number of companies has increased, such as agriculture, energy, information and communications, some services for the population.
Despite this negative dynamics, Ploiești Growth Pole continues to pool 64.6% of the active companies in Prahova county, 19.3% of those in South Muntenia region and 2.1% of those in Romania. There are several industrial agglomerations at local level, which pool together a large number of firms and employees and generate a significant volume of businesses and exports: machinery and equipment, food and beverages, textiles and clothing, metal constructions, automotive parts, oil extraction and processing, energy. Despite these conglomerations, the business networks, the supply chains, and the innovative clusters have not been formalized and functionalized yet locally, although there are horizontal and vertical connections between certain companies.
Ploiești municipality is a resource and skill center of international importance for the oil industry, having the ability to process a significant amount of hydrocarbons from the Caspian Sea and the Black Sea. The dependence of a large part of the local economy on the oil market, which is among the most volatile, constitutes a vulnerability.
The local sectors that have a potential for smart economic specialization are the following: the oil and gas extraction and processing industry (including the full range of related works and services for the entire supply chain), the automotive parts industry, the machinery and equipment industry (mainly equipment for the petrochemical and extractive industries, hydraulic equipment), the food and energy industries, the ICT sector, and, last but not least, transport and logistics, given the favorable geographical location near an outlet market of about 3 million consumers – the Capital city – and at the intersection of several transport corridors.
The localities around the city have attracted many investors over the past few years – either new ones or relocated from the urban core, under pressure from urban and environmental regulations and especially from those related to the real estate market. Nevertheless, in the communes of the Growth Pole, a large portion of the population is employed in subsistence agriculture, due to extensive agricultural resources (viticulture, horticulture, animal husbandry), which are only partly exploited in the local processing industry due to the lack of functional supply chains.
The local RDI sector is declining as a result of the chronic underfunding of this area and the lack of functional structures for technology transfer. The Ploiești area traditionally has skills and expertise in basic and applied research, design and engineering for petrochemistry, machinery for the oil industry and viticulture, which could underlie the revival of the research activity in the context of concerns for smart specialization.
The local business support infrastructure is very well developed (ranking first nationwide when it comes to the
134
The
Gro
wth
Pol
e’s
Prof
ile
Ana
lysi
s of
Dev
elop
men
t N
eeds
and
Are
as o
f In
terv
enti
on
Cha
pter
1.2
. eco
nom
y
i
1
i

Map 42. Structure of economic activities (Ploiești Growth Pole)
135

surface of industrial parks and the jobs created at their level) and plays a key role in attracting investments. The public authorities have played a key role in this area by developing four industrial parks in the metropolitan area alone. However, the existing parks offer only basic services (housing and utilities) and are directed towards foreign investors, while local entrepreneurs have limited access to business services.
Tourism has a marginal contribution to the local economy, despite private investments in the accommodation, catering and leisure infrastructure and despite designing and promoting regional thematic routes with great potential for attracting visitors in the fields of wine tourism, culinary tourism, cultural and religious tourism, etc. Therefore, Ploiești remains only a center for transit and business tourism, being located between two tourism poles of international importance (Prahova Valley and Bucharest).
The dynamics regarding the number of employees varied significantly from one locality to another in the 2007-2013 period. While it dropped in Ploiești, Plopeni, or Dumbrăvești, other places (Ariceștii Rahtivani, Brazi, Păulești, Târgșoru Vechi, Bărcănești) attracted a number of important investors in recent years, including following businesses’ relocation from Ploiești city, which emphasizes a clear trend of redistribution of the economic activities in the territory, from the urban core to the periphery. The unemployment rate remains at a low level, despite massive restructuring of the local economy after the year 1990 against a backdrop of new investors entering in, the practice of commuting to Bucharest-Ilfov, and the external migration of the workforce.
The workforce aging tendency (the average age of the employed – over 40) is manifested mainly as a result of the intensification of the migration of young people to Bucharest and other countries, and is accompanied by outdated qualifications, which were obtained in the past and are less required on today’s job market.
Regarding the structure of employment, the service sector has come to provide 57% of the jobs in Ploiești Growth Pole, followed by the industry (28%), agriculture and forestry (8%), and the constructions sector (7%). Compared to the communist period, the number of people employed in the service sector is two times higher than the number of industry workers. The workforce generally tends to shift to the service sector in large urban agglomerations.
In the communes around Ploiești municipality, a great portion of the population is employed in subsistence agriculture, due to extensive agricultural resources (viticulture, horticulture, animal husbandry), which are only partly exploited in the local processing industry, due to the lack of functional supply chains.
The important volume of foreign investments that were attracted in recent years highlights the shortage of workforce with secondary education. This situation requires the reintroduction of technical and vocational education, and the fostering of labor mobility from outside the metropolitan area, including attracting unemployed or informally employed people to the labor market.
The
Gro
wth
Pol
e’s
Prof
ile
Ana
lysi
s of
Dev
elop
men
t N
eeds
and
Are
as o
f In
terv
enti
on
Cha
pter
1.2
. eco
nom
y
i
1
i136

Map 43. Workforce
137

139
ChAPter 1.3.
environment
PArt I: the Growth Pole’s Profile
1Analysis of Development needs and Areas of intervention

1.A.1 Combustion activities in the energy industries
1.A.2 Emissions generated
by electricity and heat
production
1.A.4 Low power stationary facilities
1.B.2 Petroleum (refining +
storage) and natural gas
1.A.3. Road
transport
Source: EPA Prahova. State of the environment in Prahova County in 2013
Figure 50. Changes in sulfur oxide emissions by years (2005-2013) and by groups of activities (for 2013)
2005 2006 2007 2008 2009 2010 2011 2012 2013
30,000
25,000
20,000
15,000
10,000
5,000
0
Emissions - SOx [tons/year]
Emisions SOx - Year 2013 [Gg/year]
7 000
6 000
5 0004 000
3 000
2 000
1000
0
Carbon monoxide, benzene, and ozone did not exceed the values above which they become harmful for human health. However, the maximum permissible daily concentration of ammonia was exceeded.
Generally, in the automatic monitoring stations the concentrations of nitrogen dioxide and sulfur dioxide have not exceeded the quality thresholds for human health protection provided by Law no. 104/2011, except in 4 cases, in which hourly emission limits for sulfur dioxide were exceeded at Mihai Bravu Station. As well, the values of annual average concentrations of particulate matter under 10 microns (PM10) and of heavy metals do not exceed the limit value (40 μg/cubic meter). However, in manual stations, the maximum concentrations provided by STAS 12574/87 for the total suspended particles (TSP) were exceeded at the EPA headquarters, at ICERP and at the Obstetrics and Gynecology Hospital. Also, the PM10 particulate matter concentrations exceeded the daily averages at the EPA headquarters, in the Blejoi commune, on the București Boulevard and on the Mihai Bravu Street. When using short-term averaging methods, the maximum concentrations of hydrogen sulfide (Mihai Bravu district) and particulate matter (București Blvd., Republicii - Vestului Avenue crossroad) were exceeded. Nitrogen dioxide concentrations are also approaching the maximum permissible values at the EPA headquarters and on București Blvd. All this suggests that pollution is generated primarily by the more and more intense vehicle traffic, but also by certain industrial activities. All this potentially contributed to the growth of morbidity and mortality caused by respiratory diseases, malignant tumors and cardiovascular diseases, as compared to 2012.
140
1.3. environment1.3.1. Environmental quality and pollution control (air, water, and soil)
Air
According to the Environmental Report (EPA Prahova, 2013), air quality in Ploiești was monitored by daily or hourly measurements in 12 stations (6 automatic stations and 6 manual stations). The level of the pollutants such as SO2, NO2/NOx, CO, benzene, particulate matter, lead, and ozone are monitored and evaluated in accordance with Law no. 104/2011, which transposes the requirements of the European regulations. As well, the levels of ammonia, formaldehyde, and hydrogen sulfide are monitored in examined by reference to the standards included in STAS no. 12574/87 - Air in protected areas.
The measured values of pollutants are emission values that are influenced by the economic activity in the area where the measuring equipment is located. Temperature, humidity, pressure, air movement, and rainfall determine substantial changes in the level of atmospheric pollution. Besides the economic activity, road traffic is also a key determinant of the pollution level.
The
Gro
wth
Pol
e’s
Prof
ile
Ana
lysi
s of
Dev
elop
men
t N
eeds
and
Are
as o
f In
terv
enti
on
Cha
pter
1.3
. env
iron
men
t
i
1
i

Figure 51. Changes in nitrogen oxide emissions by years (2005-2013) and by groups of activities (for 2013)
Source: EPA Prahova. State of the environment in Prahova County in 2013
Emissions - SOx [tons/year]
25,000
20,000
15,000
10,000
5,000
02005 2006 2007 2008 2009 2010 2011 2012 2013
As for the pressure exerted on air quality in the Prahova county, the activities which accounted for air pollution in 2013 were the following:
• Combustion activities in the energy industries - i.e. production of electricity and heat; refining of crude oil and petroleum (refining / storage) - are the main source of SOx and NOx emissions;
• Livestock and waste management is the main source of NH3 emissions;
• Petroleum (refining + storage) and natural gas, as well as combustion in low power stationary facilities (institutional / commercial and residential) represent the main source of volatile organic compound emissions.
Emissions generated by electricity and heat production have decreased significantly due to improving of the pollutant retention equipment, switching to cleaner fuels and improving energy efficiency. However, energy production and distribution remain a major source of air pollution, accounting for NOx and SOx emissions. The road transport sector is a major source of air pollution. Heavy vehicles are the most important source of NOx, PM10/PM2.5 and heavy metals, while cars are important sources of CO, NH3 and NMVOC.
Emissions NOx - Year 2013 [Gg/year]7,000
6,000
5,000
4,000
3,000
2,000
1,000
01.A.1
Combustion activities in the energy industries
1.A.2 Emissions generated
by electricity and heat
production
1.A.4 Low power stationary facilities
1.B.2 Petroleum (refining +
storage) and natural gas
1.A.3. Road
transport
141

water
In 2013, in the Prahova county, groundwater bodies were monitored in 8 springs, 32 boreholes and 6 wells. The nitrate indicator was exceeded in just 3 of them, i.e. 6.52%. The quality of surface water intended to be rendered potable was monitored in 17 sections in Prahova sub-basin. The water purification sections are located immediately upstream of the water intake (for intakes of surface running waters) and, respectively, in the intake section (dam, shore) for water reservoirs. According to the Water Law no. 107/1996, as amended and supplemented, the bodies of water which were designated for catching water for human consumption and which provided, on average, more than 100 cubic meters of water/day, were established as monitoring points. The purification sections were classified into quality categories based on the annual average value of physical, chemical, and microbiological indicators, and they met the requirements of NTPA 013/2002 according to GD 100/2002, as amended and supplemented.
In 2013, out of the 25 monitored water bodies, 71% were in good ecological condition, and 29% showed a moderate ecological condition. Also, the Paltinu and Măneciu water reservoirs, which provide much of the drinking water needed by Ploiești urban area, have a good ecological potential.
It should be noted that only 31.4% of the wastewater requiring treatment was treated properly in 2013. The percentage is 12.2% for wastewater, 40.5% for water generated by food industry, 42% for education and health sectors, and 52.7% for the trade and services industries. This is due to the insufficient endowment of the tertiary wastewater treatment plants in the city and the biological treatment plants for industrial wastewater. In 2013, organic matter, nutrients (coming from urban areas, livestock farms, food and beverage industry, chemical industry), heavy metals, dangerous organic micro-pollutants (chemical industry), etc. were discharged in Ploiești urban area.
In 2013, there was also an accidental pollution in Prahova sub-basin, on Dâmbu brook, caused by OMV PETROM SA ASSET VII Muntenia East, 23rd Sector, Ploiești West. Oil iridescence could be noted on the water and crude oil stuck on the vegetation covering the bank of the river. The development of the pollution phenomenon was monitored and the affected area was cleaned up.
Soil
After monitoring soil quality in terms of heavy metal content in the 7 measuring points within the city of Ploiești, it was noted that in some monitoring points the average annual values measured for the nickel and copperindicators slightly exceeded the normal levels for soil. For indicators such as cadmium, lead, and zinc, the average annual values remained within the standards allowed with respect to soil (according to the Order of the Ministry of Environment no. 756/1997).
At county level, the critical areas in terms of soil degradation cover a total of 132.13 ha, of which 100 ha are sites contaminated through activities related to the oil extraction industry and storage of oil residues. There are other wider areas belonging to industrial sites that are totally or partially abandoned, due to the closure or decline of certain industrial enterprises, dating back to the communist era or even the interwar period ( Astra Română Refinery, Dorobanțul felt cloth factory, “1 Mai” oil machinery plant, etc.). Such areas also pose environmental risks too, and although they are not critical, they should be carefully monitored. They can be found in the GP area, Brazi, Boldești-Scăeni, and Ploiești. In Boldești-Scăeni there is also a 350 m2 area affected by landslides.
The
Gro
wth
Pol
e’s
Prof
ile
Ana
lysi
s of
Dev
elop
men
t N
eeds
and
Are
as o
f In
terv
enti
on
Cha
pter
1.3
. env
iron
men
t
i
1
i Sourse: http://decontaminarecampina.ro
142

Map 44. Deteriorated soil (polluted areas, brownfields)
143

About 18% of the land in Prahova county is affected by intense processes of degradation, especially by surface and subsurface erosion, landslides, oil and salt pollution, excessive humidity, etc. Natural factors were amplified by the inappropriate use of land, such as deforestation, irrational grazing, excessive use of chemical fertilizers, etc.
table 10. Critical areas affected by landslides
locality type of erosion Area
Boldești-Scăeni Landslide 350
Source: EPA Prahova. State of the environment in Prahova County in 2013
table 11. Pollution accidents affecting the soil in 2013
Date locality Pollutant Substance
04.01.2013Băicoi (100 m from the left
bank of Doftana river)SC Conpet SA Ploiești crude oil
02.04.2013Berceni commune - Matisol area (Urlați-Ploiești pipeline)
SC Conpet SA Ploiești crude oil
16.09.2013 Bărcănești tanker gasoline
19.09.2013 Băicoi – str. Horia OMV Petrom oil and salt water mix
Source: EPA Prahova. State of the environment in Prahova County in 2013
The
Gro
wth
Pol
e’s
Prof
ile
Ana
lysi
s of
Dev
elop
men
t N
eeds
and
Are
as o
f In
terv
enti
on
Cha
pter
1.3
. env
iron
men
t
i
1
i
Source: EPA Prahova. State of the environment in Prahova County in 2013
table 9. Critical areas in terms of soil degradation
Contaminated site name Company name Site area (m2) Polluting activity
Vega tar pitSC ROMPETROL RAFINARIA VEGA SA
Ploiești100,000 oil waste storage
Phosphogypsum pitSC ROMFOSFOCHIM ACTIVE SRL
VALEA Călugărească559,000 oil waste storage
Roasted pyrite warehouse SC MEGA COMPANY SRL București 65,000 oil waste storage
Oil residue pitSC RAFINARIA ASTRA ROMANA SA
Ploiești26,000 oil waste storage
Pit 196 SC PETROTEL - LUKOIL SA Ploiești 44,440 oil waste storage
Collection Center 701 Collection Center 702Collection Center 27
Collection Center 1043 Collection Center 97
Collection Center 302 Holes4 VD Tintea park
Collection Center 16 Băicoi slurry pit
Urlați slurry storage pitCărbunești 1 slurry storage pit Cărbunești 2 slurry storage pit
Park 710 slurry storage pit Boldești-Central I slurry storage pit
Boldești slurry (ecological) pit Boldești-Central II slurry storage pit Slurry storage pit 3 Boldești Tritter
Sonda 6002 slurry pit Sinaia de MizilSurani park 1
SC PETROM SA Ploiești
353035129700820
2,000250
6,00025060150700750
2,500390800
9,034980
oil extraction industry
Oil residue pit – Vega zonePloiești
19,000 oil waste storage
144

Map 45. Deteriorated soil (land slides, accidental pollution)
145

The
Gro
wth
Pol
e’s
Prof
ile
Ana
lysi
s of
Dev
elop
men
t N
eeds
and
Are
as o
f In
terv
enti
on
Cha
pter
1.3
. env
iron
men
t
i
1
i
Another major shortcoming at local level is the deficit of woodlands, especially in the south of the territory (plain area). In addition, there are major anthropogenic pressures on the existing forests, mainly illegal logging, the most problematic areas being Dâmbu and Plopeni-Sat.
Map 46. Forested areas
146

The figure above shows that in Ploiești, the values recorded exceeded 75 or even 80 decibels, on the north-south axis, near the railway stations, in industrial areas and on streets crossed by trams routes or open to heavy-duty traffic.
According to an audit conducted by a private company in the field of acoustic measurements (ENVIRO CONSULT), the most polluted growth pole in terms of noise is Bucharest (85% of the population is affected), followed by Constanța (76%), Cluj-Napoca (64%), Brașov, and Ploiești (61%).
noise pollution
During 2011, 68.71% of the measurements showed values that were higher than the limits established by STAS 10009/88. Noise measurements targeted areas that may pose health risks to the exposed population. The noise level is mostly the result of road traffic affecting the population of Ploiești, rail traffic on the lower sections along railways and industrial activities.
Map 47. Daytime noise pollution in Ploiești urban area
Source: RASP Ploiești
147

1.3.2. Protected natural areas
Due to the outstanding diversity of biotopes and habitats, Prahova county enjoys a rich inventory of flora and fauna species, including endemic species, rare species, glacial relics, and species of Community importance. In the GP area, there is a habitat of national importance - the Plopeni forest (91 ha of protected site of Community importance - SCI), hosting a vegetal association that is endemic to Romania, namely Peucedanorocheliani-Molinietumcoeruleae, which has been observed also in Banat and Hațeg as well. The habitat is characterized by swampy groves with clayey substratum and high groundwater level. Plopeni forest site is in the custody of Prahova County Museum of Natural Sciences, which accessed funds from SOP ENVIRONMENT 2007-2013 to develop a management plan.
Out of the 134 local areas of interest (4,607 ha) that enjoy the protection status, as established in the General Urban Plans of the communes and in the decisions of the local councils (and which are also included in the spatial plan of Prahova county), the GP area includes: Broasca (39.2 ha) in Bucov commune; a nature reserve (40 ha) in Păulești commune; and Plopeni forest (10 ha) in Plopeni town.
As regards the natural protected sites of Community importance (SCI), in addition to Plopeni forest, there is also the Ialomiței Corridor, which extends partially on the territory of Brazi, Valea Călugărească and Berceni communes.
There is a major anthropogenic pressure on local biodiversity, for example because the land that is covered by constructions has expanded, due to the extension of settlements and transport infrastructure (e.g. establishment of industrial parks, new residential areas, and construction of highways). This can be seen especially in the peri-urban area of Ploiești city, and has negative effects on climate change and the habitats in those areas, which have shrunk dramatically. As well, the irrational exploitation of minor river beds for sand, gravel and ballast mining activities will adversely affect the ecosystems concerned if measures for environmental reconstruction are not taken.
1.3.3. Climate change
In its programmatic documents, the EU has declared its responsibility for addressing climate change and has set the target of allocating 20% of the EU funds for the period 2014-2020 to climate actions, reducing GHG emissions, and climate adaptation. Such climate actions should be included and integrated in Ploiești GP IDP projects. Addressing activities such as the reduction of carbon emissions and climate resilience would benefit the local communities within the growth pole.
In March 2007, the European Council expressed its firm commitment to reduce by 2020 total emissions of greenhouse gases in the Community by at least 20% compared to 1990 levels and by 30% if other developed countries also commit to achieving comparable emission reductions, and if the developing countries that are more advanced economically contribute adequately, according to their responsibilities and capabilities. By 2050, global greenhouse gas emissions should fall by at least 50% below their 1990 levels.
In order to contribute to achieving these long-term objectives, it is appropriate to set out a predictable path through which the emissions of facilities covered by the Community scheme should be reduced. To achieve in a cost-effective way the Community’s commitment to reduce greenhouse gas emissions by at least 20% below the 1990 levels, the emission allowances allocated for such facilities by 2020 should fall by 21% below the 2005 emission levels. The Community-wide quantity of allowances, calculated from the mid-point of the 2008-2012 period, should decrease in a linear manner, ensuring that the emissions reduction system delivers gradual and predictable decreases of emissions over time.
The annual decrease of allowances should be equal to 1,74% of the allowances issued by Member States pursuant to Commission’s Decisions on Member States’ national allocation plans for the period 2008-2012, so that the Community scheme contributes cost-effectively to achieving the commitment to an overall reduction in emissions of
The
Gro
wth
Pol
e’s
Prof
ile
Ana
lysi
s of
Dev
elop
men
t N
eeds
and
Are
as o
f In
terv
enti
on
Cha
pter
1.3
. env
iron
men
t
i
1
i148

at least 20% by 2020.
Climate change is a multi-sector issue, therefore most adjustment and improvement measures will be specific to each sector. For example, the industrial, transport, and energy fields should take measures to reduce GHG emissions, e.g. by making efforts to promote energy efficiency as specified in local recommendations on energy efficiency (LREE), by using renewable energy in private and public sectors, by investing in the development of a low carbon transport system, and by improving the efficiency of industrial entities and public utilities. As for reforestation, it is covered by the biodiversity sector. Climate change adjustment measures are also sector-specific and must be integrated into sector-specific activities, such as flood protection in rural areas and climate-resilient farming practices.
In Prahova county there are 14 operators that hold greenhouse gas emission permits for activities in facilities covered by Law no. 278/2013 on industrial emissions. The procedure for issuing greenhouse gas emission permits for the period 2013-2020 is laid out in Order no. 1897/2007, as amended and supplemented by Order no. 2069/2010 and by Order no. 3420/2012.
Map 48. Deviation of air temperature profiles in measured points on AA’ and BB’profiles, compared to the city center (PFC)
149

The
Gro
wth
Pol
e’s
Prof
ile
Ana
lysi
s of
Dev
elop
men
t N
eeds
and
Are
as o
f In
terv
enti
on
Cha
pter
1.3
. env
iron
men
t
i
1
i
Map 49. Air pollution
150

Map 50. Map of surface temperatures in Ploiești, processed from the satellite image taken by Landsat 8 on August 06, 2014, between 10:00 and 12:00 OVR
Urban heat islands (Uhi) in the city of Ploiești
The continuous urbanization of major cities worldwide and the climate effects induced by this process are, at present, a major issue addressed in urban development studies. The main consequence of the enlargement of urban areas is the intensification of urban heat islands (UHI) above medium-sized and large cities.
The study for detecting the urban heat island of Ploiești is based on two different approaches: detection of UHI by direct measurements made at 1.5 m above the ground, for determining air temperature variations in the breathable layer (atmospheric urban heat island - AUHI); and detection of the surface urban heat island (SUHI), identified based on remote-sensing satellite imaging systems. The results of the two approaches are structured in two parts and detailed below. As shown, there are green areas, which lead to a temperature decrease in both cases, while the increase in the density and height of both residential and industrialbuildings determines a temperature increase, especially if the roof color and material allow heat retention at their level. As well, on both profiles, the urban heat island dome is well evidenced compared to the peripheral rural area. In some cases, the high values of surface temperatures are counterbalanced in the central part of the city by the existence of green areas with temperatures that are as much as 5°C lower than those registered on surfaces (asphalt, concrete, etc.).
151

In the west-east profile, given average cloudiness and light wind (1-2 m/s) conditions, the center of Ploiești is considerably warmer than the eastern extremity of the city, while the western extremity, a 10-storey buildings area, is warmer. This is due mainly to the heat loss from buildings, most of them probably not being insulated. As well, the western industrial area records temperatures similar to those in the central part of the city.
The surface temperature analysis highlights the fact that the north-central and north-western parts of the city are warmer (30.0 to 32.0 °C), while surfaces in the extremities of the city, which are generally characterized by construction-free spaces, remain considerably cooler (22.0 to 24.0 °C).
The highest surface temperatures of over 36.0°C are specific to industrial areas, located in the western or in the southern part of the city, between the București Blvd. and Lupeni Street. High temperatures (34.0-36.0°C) were also recorded between Petrolului Blvd., Mimiului Str. and Mărfurilor Str., as well as in the eastern industrial zone, located south of the Mihai Bravu Boulevard. On both profiles the urban heat island dome is well evidenced, compared to the peripheral rural area. In some cases, the high values of surface temperatures are counterbalanced in the central part of the city by the existence of green areas, where temperatures are as much as 5°C lower than those registered on artificial surfaces (asphalt, concrete, etc.).
The
Gro
wth
Pol
e’s
Prof
ile
Ana
lysi
s of
Dev
elop
men
t N
eeds
and
Are
as o
f In
terv
enti
on
Cha
pter
1.3
. env
iron
men
t
i
1
i152

Figure 51. Surface temperature variation along the AA’ profile: 1 - city center area; 2 - green areas on Mihai Bravu Str., east of the intersection with Al. Vlahuță Str. and Udriște Năsturel Str.; 3 - farm field, east of Mihai Bravu cemetery; 4 - eastern industrial area
Figure 52. Surface temperature variation along the BB’ profile: 1 - green area, south of the bus garage on Găgeni Str.; 2 - built-up area and major intersection; 3 - Toma Socolescu Square and Civic Center Esplanade; 4 - green area on Independenței Blvd.; 5 - southern industrial area
As for apartment buildings, the heat loss from inside to outside in the cold season leads to an increase of air temperature. It is likely that the AUHI intensity will increase in the warm season, leading to an increase in the breathable air temperature and generating a thermal discomfort for the human body.
Surface temperatures - AA’ profile
0 1,000 2,000 3,000 4,000 5,000 6,000 7,000 8,000 9,000 10,000 11,000 m
C33
32.532
31.531
30.530
29.529
28.528
27.527
1
2
3
4
Surface temperatures - BB’ profile
0 500 1,000 1,500 2,000 2,500 3,000 3,500 4,000 4,500 5,000 5,500 6,000 6,500 7,000 7,500 m
C33
32.532
31.531
30.530
29.529
28.528
27.527
1
2
34
5
153

1.3.4. Completed / ongoing projects
Among the implemented or ongoing initiatives at the level of Ploiești Growth Pole that have an impact on the environment we can mention the projects for developing management and protection plans for habitats in Bucegi Natural Park and in the Plopeni Forest site, co-financed by SOP ENVIRONMENT 2007-2013. There are also projects for the rehabilitation, expansion, and modernization of water and sanitation networks in Prahova county, co-financed by the same program, which targeted the Băicoi and Plopeni urban areas, and projects carried out by APA NOVA with its own funds in Ploiești. Moreover, there are works co-financed by ROP 2007-2013, for rehabilitating the tram infrastructure and for landscaping Ploiești West Municipal Park, which will have the impact of reducing noise pollution and, increasing the environmental factor quality respectively. Other projects also have direct or indirect impact on the environment, such as: upgrading the road network, thermal rehabilitation of apartmentand public buildings, installation of renewable energy units and large co-generation plants, etc.
The
Gro
wth
Pol
e’s
Prof
ile
Ana
lysi
s of
Dev
elop
men
t N
eeds
and
Are
as o
f In
terv
enti
on
Cha
pter
1.3
. env
iron
men
t
i
1
i154

1.3.5. Conclusions - existing disparities, trends, needs, and areas of intervention
Map 53. Environmental quality and pollution control
155

Air quality has improved significantly in the GP area in the last decades due to the cumulative effects of the closure or restructuring of some polluting industrial activities, but also due to environmental investments made by companies activating in those sectors. However, a number of economic operators, especially in the chemical and oil industry (e.g. detergents) generate emissions of volatile organic compounds that have a negative impact on air quality.
Emissions coming from electricity and heat production have decreased significantly due to the improvement of the pollutant retention equipment, switching to cleaner fuels, and the improvement of energy efficiency. However, the power production and distribution sector remains an important source of air pollution, accounting for NOx and SOx emissions. The road transport sector is a major source of air and noise pollution, especially along the north-south axis, near railway stations, in industrial areas and on streets crossed by tram routes or open to heavy-duty traffic.
The level of pollution of surface waters and groundwater has decreased in recent years to values below the maximum allowed. However, the lack of a sewerage network in some neighborhoods in urban centers and in rural areas remains a major environmental risk factor. Moreover, the Prahova and Teleajen rivers, which drain almost entirely the watercourses in the Growth Pole area, are at risk of pollution as a result of insufficiently treated water discharges, often from plants that that can perform only mechanical treatment. As well, domestic wastewater treatment plants cannot perform tertiary treatment. Last but not least, the phreatic water and the groundwater continue to be at major risk of pollution as a result of the extractive activities, despite the improvement of oil technologies.
Even if environmental reports do not indicate hazardous concentrations of pollutants in the soil samples collected, the anthropic pressure on soil quality at the level of Ploiești Growth Pole is substantial. In addition to the 100 ha of sites contaminated as a result of economic activities, especially in the field of oil extraction and processing industry, there is pressure related to the deficiencies in the waste management system, such as illegal dumping, incomplete collection, and pollution generated by materials that are hard to recycle and that are not selectively collected.
At the level of economic operators, there are several trends that should be considered by the institutions in the field of environmental protection, such as the expansion of industrial parks, given that some companies carry out potentially polluting activities, and given the bankruptcy of companies which have left behind large industrial areas that are totally or partially abandoned (e.g. Astra Română refinery, ROMFOSFORCHIM, Dorobanțul etc.), and which must be carefully monitored in terms of environmental protection. As well, oil industry assets (wells, pipelines, warehouses, especially non-compliant ones) must be monitored after their activity has ceased.
Protected natural areas cover small surfaces at the Growth Pole level. They include a number of areas with protection status, as established in the GUP of communes and in the decisions of the local councils (and which are also included in the spatial plan of Prahova county): Broasca (39.2 ha) in Bucov commune; nature reserve (40 ha) in Păulești commune; and the Plopeni Forest (10 ha) in Plopeni town.
The area includes a habitat of national importance - Plopeni Forest (protected site of Community importance - SCI, with an area of 91 ha), which hosts a vegetal association that is endemic to Romania, namely Peucedanorocheliani-Molinietumcoeruleae, characterized by swampy groves with clayey substratum and high ground water level. Plopeni Forest site is in the custody of Prahova County Museum of Natural Sciences, which accessed funds from SOP ENVIRONMENT 2007-2013 to develop a management plan.There is a major anthropogenic pressure on local biodiversity, for instance due to the expansion of built-up perimeters with settlements, and the expansion of transport infrastructure (e.g. establishment of industrial parks, new residential areas, and construction of highways). This has negative effects on climate change and on habitats in these areas, which have shrunk dramatically.
The
Gro
wth
Pol
e’s
Prof
ile
Ana
lysi
s of
Dev
elop
men
t N
eeds
and
Are
as o
f In
terv
enti
on
Cha
pter
1.3
. env
iron
men
t
i
1
i156

Map 54. Protected natural areas
157

159
ChAPter 1.4.
Connectivity
PArt I: the Growth Pole’s Profile
1Analysis of Development needs and Areas of intervention

MAp 55. TEN-T core and comprehensive road network in Romania
Source: Transport Ministry
ten-t network
Core network
Comprehensive network
1.4. Connectivity1.4.1. Accessibility and mobility (transport infrastructure and public transport)
road connectivity
Ploiești municipality has direct access to two roads in the road central network TEN-T: DN 1 / E60 and DN 1B / E 577, which ensure accessibility to the most important areas in Romania: capital area and Wallachia, Moldavia, and Transylvania.
Besides these, there are other secondary gateways:
• DN 1A: Bucharest – Buftea – Ploiești – Boldești - Scăeni – Vălenii de Munte – Săcele – Brașov;
• DN 72: Ploiești – Târgoviște – Găești;
• DN 1D: Albești - Paleologu – Urziceni.
DN 1 has two traffic lanes in each direction between Bucharest and Comarnic; the same happens with DN 1B between Ploiești and Albești Paleologu, while the rest of the national roads that ensure access to the municipality have a single lane per direction.
Recently, A3 highway Bucharest (Ring Road) – Ploiești (Bărcăneşti node), parallel to DN 1, has been inaugurated; still, it continues to register low levels of traffic because it lacks a direct penetration artery in Bucharest, as the respective section, which is about 9.5 km long, is under execution.
The
Gro
wth
Pol
e’s
Pro
file
A
naly
sis
of D
evel
opm
ent
Nee
ds a
nd A
reas
of
Inte
rven
tion
C
hapt
er 1
.4. C
onne
ctiv
ity
i
1
i160

The national roads that ensure access to Ploiești are generally in a good and very good condition, the best traffic conditions being encountered on DN 1 (Ploiești – Câmpina – Comarnic section, including Ploiești West Ring Road) and on A3 Highway. In contrast, DN 1A Bucharest – Cocorăşti – Colț segment is in a poor state.
In recent years, the national administrator of motorways and national roads (CNADNR) has conducted the following major investments in the area:
• enhancing the circulation on Ploiești West Ring Road – through an investment of about 40 million EUR, from the state budget;
• infrastructure modernization for traffic safety on DN 1 in linear villages and black spots – through an investment of about 20 million EUR, financed from SOP TRANS 2007-2013.
The table below indicates the county roads that provide access to the Growth Pole and the links betweenlocalities therein. Appendix 1.4.1 includes a series of maps summarizing this information.
County road signConnected localities
within Ploiești Growth Pole
Average daily traffic (min/max at traffic
census posts)
Viability state on the Growth Pole’s territory type of road cover
DJ 100D Plopeni - Bănești 2,007 - 2,397 Good Light asphalt
DJ 100EBăicoi – Câmpina –
Afumați824 - 2,434 Good Light asphalt
DJ 100F Băicoi – Găgeni 3,640 – 6,007 Good / average Modernized asphalt
DJ 100L DN 1A – Urlați 588 – 2,835 AverageModernized asphalt /
Light asphalt
DJ 101D Ploiești – Râfov – Olari 1380 – 6,735 Average Light asphalt
DJ 101FValea Călugărească –
Drăgănești1784 Average Light asphalt
DJ 101GTătărani – Tinosu -Șirna
– Dâmbovița county limit
815 – 2,261 Good Light asphalt
DJ 101IPloiești – Filipeștii de
Târg – Filipeștii de Pădure
719 – 1,677 GoodModernized asphalt /
Light asphalt
DJ 102Ploiești – Păulești
– Plopeni – Slănic – Homorâciau
915 – 14,183 Good Modernized asphalt
DJ 102EPloiești – Bucov – Plopu
– Urlați 2,035 Good Light asphalt
DJ 104P Ploiești – Negoiești 3,322 Good Light asphalt
DJ 129Ploiești – Strejnicu – Târgșoru Vechi – DJ
101A2,050 - 4,703 Good/poor
Light asphalt / Dirt / Gravel
DJ 139Ploiești – Berceni –
Râfov – DN 1894 - 1,636 Average Light asphalt
DJ 140 Ploiești – Brazi – DN 72 948 – 1,944 Average/poor Light asphalt
DJ 144DN 72 – Ariceștii
Rahtivani – Florești 1,679 – 6,007 Average Light asphalt
DJ 155 DN 1 – Păulești 2,530 Good Light asphalt
DJ 156 DN 72 – Strejnicu 1,389 – 9,604 Good Modernized asphalt
DJ 215 Băicoi – Scorțeni 1,495 - 1,864 Good Light asphalt
DJ 217 DJ 102 – DN 1A 1,883 Average Light asphalt
DJ 218Dumbrăvești –
Cosminele1,189 Average Light asphalt
DJ 232Boldești-Scăeni – DJ
102E(Plopu)626 Good Light asphalt
DJ 236 Bucov – DN 1A N.A. Average Modernized asphalt
DJ 250 Bucov – Boldești-Scăeni 5,446 Good Light asphalt
table 12. County roads characteristics ensuring access to Ploiești Growth Pole
Source: CESTRIN, Prahova County Council161

A recent World Bank study proposes a set of criteria for prioritizing investment projects from public funds that aim at improving access to major communications network: correlation with projects from the General Transport Master Plan of Romania, access to opportunities, volume of average daily traffic, and volume of the population served. According to these criteria, the county roads that ensure the connectivity of Ploiești Growth Pole and that should be prioritized at the level of interventions are: DJ 217, DJ 100L, DJ 218, DJ 236 (with proposed funding from PNDL - National Local Development Program), and DJ 100F, DJ 156, DJ 129, DJ 102, DJ 144, DJ 100D, DJ 104P, DJ 102E, DJ 101I, DJ 100E, DJ 101F, DJ 139, DJ 140 respectively (with potential funding through ROP).
Map 56. Investment prioritization in the rehabilitation and modernization of county roads in Prahova County
Source: World Bank
The
Gro
wth
Pol
e’s
Pro
file
A
naly
sis
of D
evel
opm
ent
Nee
ds a
nd A
reas
of
Inte
rven
tion
C
hapt
er 1
.4. C
onne
ctiv
ity
i
1
i162

As it can be observed, over 95% of the county roads in Ploiești Growth Pole are upgraded, but many of them have not been completely rehabilitated, undergoing only maintenance and repair works.
In terms of traffic volume, the highest daily averages are recorded on DN 1, from Bucharest to Ploiești (30,000 to 40,000 vehicles per day, depending on the section) and from Ploiești to Comarnic (25,000 – 30,000 vehicles day), this being in fact the motorway with highest heavy traffic in Romania. Although DN 1 has 4 lanes and bypasses the main urban settlements in the area (Ploiești, Băicoi, Câmpina), and despite the fact that A3 motorway linking Ploiești to Bucharest Ring Road has been recently opened, on this highway there still are traffic jams, especially on weekends and
Map 57. County road sections in need of rehabilitation / modernization (see broken figure above)
Source: World Bank
163

Driving buffer:
20 min.
40 min.
60 min.
60 min. from city border
during tourist seasons on Prahova Valley. Besides, a 15,000 vehicles per day traffic is considered to be highway traffic. At present, the data are more than double, showing the need to extend A3 Highway from Ploiești to Brașov.
The national road ranking second in terms of traffic volume is DN 1B, with over 22,000 vehicles per day in 2010 on the section Ploiești – Albeşti Paleologu, including on the northeastern ring road of the municipality, according to the traffic census conducted by CESTRIN. This motorway is followed by DN 1A, which is used as travel alternative between Bucharest – Ploiești – Brașov when traffic jams with 10,000 – 15,000 vehicles per day occur on DN 1, from Ploiești to Vălenii de Munte; the number of vehicles are significantly fewer on Ploiești – Bucharest section (6,000 – 8,000 per day), where traffic on DN 1 and A3 is more fluid, which makes DN 1A less attractive as a travel alternative towards the capital, besides the fact that this highway is longer. DN 72, which connects Ploiești and Târgoviște, records more than 12,000 vehicles per day between Ploiești and Dâmbovița county limit.
A closer analysis of traffic flows on the national roads in Ploiești area indicates that traffic in the Growth Pole area represents a high share in the total traffic. This is reflected in the decrease of traffic volumes as one moves away from the city. A significant contribution in this respect is made by the nearly 40,000 people who commute to Ploiești from a maximum distance of 40 km, plus the people who travel for studies (students) and other services (administrative, medical, etc.) from the entire Prahova county.
Summarizing, the most significant traffic flows enter the city through the north-south penetrations (Republic Avenue, Independence Avenue, Bucharest Avenue), western penetrations (Ştrandului Street, Gheorghe Doja Street), and eastern (Gh. Gr. Cantacuzino Street).According to the World Bank’s “Competitive Cities” study, on a 20 minute driving buffer from Ploieștimunicipality there are 305,000 inhabitants, while at a 40-minute buffer, there are 556,000 inhabitants. Similarly, at the 20-minute driving buffer revenues generated by firms were around 2.9% of all firm revenues generated in Romania, while at the 40-minute driving buffer this share grows to 3.4. These values are comparable to those achieved by the other six Growth Poles in Romania, despite the fact that Ploiești has the smallest population of them all.
Map 58. Ploiești municipality’s influence area at a driving buffer of 20, 40, and 60 minutes from city border
Source: World Bank. 2013. Competitive cities
Titu
Rafov
MizilBucov
Peris
Gruiu
Fieni MereiBuzau
Rucar
Videle
Slanic
Sinaia
Tunari
Snagov
Moreni
Razvad
Smeeni
Nehoiu
Otopeni
Chiajna
Sangeru
Gorgota
Plopeni
Campina
Busteni
Berceni
Ci
Moroeni
Cojasca
Bucsani
Parscov
G
Scorteni
Comarnic
Urziceni
Chir
Comisani
Pucioasa
Aninoasa
Izvoarele
Corbeanca
Campulung
Dor
Targoviste
Iordacheanu
Patarlagele
Puchenii Mari
Moara Vlasiei
Vulcana-Pandele
The
Gro
wth
Pol
e’s
Pro
file
A
naly
sis
of D
evel
opm
ent
Nee
ds a
nd A
reas
of
Inte
rven
tion
C
hapt
er 1
.4. C
onne
ctiv
ity
i
1
i164

Map 59. Average daily traffic on national roads in Ploiești Growth Pole
According to the General Transport Master Plan of Romania (GTMP), the following major transport projects are programmed for the period 2015-2030 in Ploiești area:
• Construction of Ploiești – Comarnic – Brașov motorway;
• Construction of Ploiești – Buzău – Focșani – Bacău – Suceava – Ukraine border expressway;
• Construction of Ploiești – Târgoviște – Găești expressway.
Source: CESTRIN
165

Vaslui
iași
Galați
Alba-iulia
Arad
oradeaCluj-napoca
Baia-MareSatu Mare
Suceava
Bacău
Zalău
Piatra neamț
Botoșani
Miercurea Ciuc
târgu Mureș
Brașov
SibiuDeva
Slatina
Alexandria
Craiova
Giurgiu
tulcea
Slobozia
BrăilaBuzău
târgoviște
BUCUrești
Pitești
râmnicu Vâlceatârgu jiu
Drobeta-turnu Severin
reșița
timișoara Focșani
Ploiești
CălărașiConstanța
Sfântu Gheorghe
Bistrița-năsăud
road traffic safety
Throughout this sub-chapter, the following aspects were examined and calculated: the general distribution of traffic accidents and their characteristics in Ploiești municipality relative to county and national context; hotspots; black-spots; and dangerous road sections. As well, black pyramids, social vulnerability pyramids and the social vulnerability index at accident moments were constructed.
Statistics show that the state of fact in Ploiești with respect to the number of accidents and casualties is more favorable compared to many other capital cities; however, contrary to the national trend, this number is on the increase. Thus, over the examined period (2010-2015), in Ploiești municipality not less than 1,611 accidents were registered (30% of those reported in Prahova county), resulting in 1903 casualties, of which 1,472 people were slightly injured, 405 seriously injured and 26 died. Most traffic accidents occurred at intersections (about 500 cases) and pedestrian crossings (300 cases), the main reason being the failure to give priority. Although accidents are in decline nationally, Ploiești municipality witnessed an increase of 8.3% in the total number of accidents in 2014 compared to 2010.
Map 60. Investment proposals for 2015-2030 horizon, according to GTMP (Draft in progress as of November 2014)
Data source: Transport Ministry
table 13. Evolution of road accidents in Ploiești municipality (2010-2015)
year Accidents Vehicles Slightly injured Severely injured Dead total casualties
2010 290 410 261 70 7 338
2011 332 509 306 91 5 402
2012 308 437 281 82 2 365
2013 320 489 302 71 6 379
2014 316 459 279 79 5 363
*2015 45 70 43 12 1 56*only in January and February
Source: General Inspectorate of Romanian Police
Highway (cf. MPGT)
Express road (cf. MPGT)
The
Gro
wth
Pol
e’s
Pro
file
A
naly
sis
of D
evel
opm
ent
Nee
ds a
nd A
reas
of
Inte
rven
tion
C
hapt
er 1
.4. C
onne
ctiv
ity
i
1
i166

The rate of victims in accidents (the number of victims reported to the number of accidents) in Ploiești municipality is of 1.18 victims per accident, significantly lower than the national average of 1.34 deaths per accident. In Romania, the average number of deaths per accident (fatality rate) was of 0.777, while in Ploiești this rate was much lower, namely 0.016 deaths/accident. As regards the rate of vehicles involved in traffic accidents (number of vehicles relative to the number of accidents), the state of fact in Ploiești (1.47 vehicles per accident) is equivalent to the national average, namely 1.49 vehicles per accident.
If we were to compare the main cities and municipalities nationally, we can say that by far the most delicate situation is found in Bucharest, where in the last 5 years there have been 18,691 accidents resulting in 21,926 victims, of whom 16,860 were slightly injured, 4,079 were seriously injured, while 407 died. As can be seen in Fig. 1 (hotspots of the victims, made using KDE), dramatic situations are found in the cities of Constanța (3,635 accidents, 4,355 injured, 128 dead), Cluj-Napoca (2,350 accidents, 2,763 injured, 64 dead), Brașov (1,983 accidents, 2,385 wounded, 79 dead), Craiova, Iași, Galați, Oradea, Timișoara, and Sibiu. As it can be seen from the figure below, DN 1 Bucharest – Ploiești – Brașov, which transits Ploiești Growth Pole, is the most visible traffic accidents hotspot in Romania. Moreover, Prahova county ranks second at the national level with respect to the recorded number of road accidents; the fact that most accidents occurred outside the county capital is atypical.
Map 61. Number of road accidents at the level of Romanian counties and their density according to the number of victims, 2010-2015
Source: Own drawing
romanian counties. number of accidents
948 - 1604
1605 - 2331
2332 - 3368
3369 - 4868
4869 - 6644
6645 - 18691
Prahova CountyKernel density. Casualties
High
Low
167

Some results have revealed several dangerous areas, most of them being located in important intersections for the municipality or on crosswalks. These include: the ones from the city center and Heroes Square (intersection of Republic Avenue and Carpathian and Vasile Lupu streets); the intersection of Republic Avenue, Constantin Dobrogeanu Gherea Street, Tache Ionescu Street, and Victory Square; the dangerous area from the north-western part of the city, namely the intersection of North Road, Independence Avenue, and West Road. That being said, the first recommendation for lowering the number of accidents would be to handle the problem of dangerous intersections.
The drawing above allows us to say that in the northern and north-western part of the municipality there is an area with a high density of casualties. This area is at the intersections of Republic Avenue with Zidari and Pichetului streets, North Road, and West Road. Another area in which accidents with many casualties happen frequently is the intersection of George Grigore Cantacuzino street and West Road. Besides, it is worth noting here that along the Western Ring Road of Ploiești two black-spots are found, one at the intersection with Mărăşeşti street and one in the north, at the junction with Buda street.
In terms of vehicles involved, the highest density of accidents is recorded in the popular intersection of West Road, Republic Street, and North Road, but also in smaller intersections like that of Camelia Street and North Road, North Road and Constantin Brezeanu Street, or Pichetului Street and Republic Avenue. As expected, the central area is a hotspot for accidents involving multiple vehicles, especially in the intersection formed by Tache Ionescu Street, Constantin Dobrogeabu-Gherea Street, Republic Avenue, and Victory Square. A third hotspot is located in the area of the four intersections that are formed by Lupeni street and Constantin Stere, Cavalului, Spătari, and Vioarei Streets. In Fig. 8 it can be seen that there are other smaller hotspots in terms of density and surface, but they should not be neglected. These are located in the following intersections: Apelor Street –Ştrandului Street– Gheorghe Doja Street–Lopătari street; West Road – George Grigore Cantacuzino Street – Petrolului Avenue – Bucharest Avenue.
Map 62. Spatial distribution of road accidents and casualties in Prahova County and Ploiești Municipality
Source: Own drawing
The
Gro
wth
Pol
e’s
Pro
file
A
naly
sis
of D
evel
opm
ent
Nee
ds a
nd A
reas
of
Inte
rven
tion
C
hapt
er 1
.4. C
onne
ctiv
ity
i
1
i168

Map 63. Road accidents black spots according to the number of victims in Ploiești Municipality during 2010-2015
Map 64. Road accidents hotspots according to the number of vehicles involved along the street network in Ploiești Municipality during 2010-2015
Source: Transport Ministry
Source: Own drawing
169

The city center is the area with the most hotspots, which are generally located in or near the intersections. These include: the intersection of Independence Avenue and Constantin Dobrogeanu Gherea street, the one located on George Grigore Cantacuzino street (near the intersection withTache Ionescu Street), the one located on the midway of Ioan Luca Caragiale street (near the intersection with Vlad Ţepeș street), the one situated at the intersection of Republic Avenue with Carpathians street, and the one in the intersection of Hașdeu, Milcov, Year 1848, Miciurin, Ana Ipătecu, Mihai Eminescu Streets, and Independence Avenue. Street sections from the “highly dangerous”category are also found in: the intersection of Mihai Bravu and Avram Iancu Streets, the intersection of Stadionului and Alexandru Vlahuţă Streets, or the intersection of Malu Roșu and Zimbrului streets. An interesting situation is found on the West Road and the Western Ring Road, which have numerous hotspots, but most often these are considered as belonging to “medium dangerous” category.
About 20% of accidents occurred on pedestrian crossings, causing no less than 16 deaths (60% of all deaths). This dramatic situation makes us think that the development of pedestrian crossings (with traffic lights or deceleration ramps) is of primary necessity. But there are cases in which the best decision would be their displacement or even their abolishment.
Another remark is that traffic accidents involving cyclists have been increasing constantly in the last 5 years, so introducing special lanes for them along the road network or the refurbishment and extension of the existing lanes would be required.
Regarding social vulnerability, it was noted that young males aged between 18 and 26 years are most likely to get involved in traffic accidents, but also the children aged between 0 and 17, boys and girls alike. Based on these results, one can say that the best measure to reduce the impact of accidents on young people road would be to intensify road education in schools.
Each road accident with casualties has a negative impact on public health, so their analysis is vital for the improvement of traffic safety policies. For each accident, it is very important to determine the place, time, manner, spatial characteristics and social groups that are vulnerable to accidents in order to make effective decisions for the gradual disappearance of these dramatic events.
rail connectivity
The railway network in Ploiești municipality is dense, the city being one of the most important railway nodes in Romania, located at the intersection of the highways linking Transylvania and Wallachia, Bucharest and Moldova. Moreover, Bucharest – Ploiești – Brașov and Bucharest – Ploiești – Buzău routes are the most circulated in Romania, with more than 8,000 passengers per day (Louis Berger SAS, 2009).
Ploiești Growth Pole and Ploiești municipality are crossed by the following two rail thoroughfares: 300 Bucharest – Ploiești – Brașov – Teiuș – Cluj – Oradea, and 500 Bucharest – Ploiești – Buzău – Focșani – Bacău – Pașcani – Suceava – Vicșani; and by other secondary lines: 302 (Ploiești – Târgoviște), 306 (Ploiești-Slănic), 304 (Ploiești – Măneciu), and 701 (Ploiești – Urziceni – Slobozia – Ţăndărei). The two rail thoroughfares have electrified double lines, while the secondary lines are simple and without electricity. The railway infrastructure is old and outdated, the circulation speed of commercial goods and passenger trains being mostly between 40 and 50 km/h, making them uncompetitive compared to road transport. In this context, rail transport has witnessed a decline in volumes of over 50% compared to the early 90s.
However, Bucharest – Ploiești – Predeal line has been completely rehabilitated and modernized with European exceeding 300 million EUR. This allows trains to travel at speeds up to 150-160 km/h.
The city has four stations and two operational halts, located in all directions of the city, as follows:
• Ploiești South Station;
• Ploiești West Station;
• Ploiești East Station;
• Ploiești North Station;
The
Gro
wth
Pol
e’s
Pro
file
A
naly
sis
of D
evel
opm
ent
Nee
ds a
nd A
reas
of
Inte
rven
tion
C
hapt
er 1
.4. C
onne
ctiv
ity
i
1
i170

• Ploiești Triaj Halt;
• Ploiești East – Post 1 Halt.There are also railway stations and halts in other localities of the Growth Pole: Târgșoru Nou, Crângul lui Bot, Buda, Florești (serving the city of Băicoi), Găgeni, Plopeni, Plopeni village, Găvănel (Dumbrăvești), Blejoi, Boldești-Scăeni, Valea Călugărească, Brazi.
Every day, Ploiești stations are crossed by an important number of trains, as follows:
• North Station (8 pairs of REGIO trains, towards Măneciu);
• South Station (23 pairs of trains, of which 5 are INTERREGIO trains towards the following final destinations: Bucharest, Brașov, Buzău, Slănic, Suceava);
• West Station (33 pairs of trains, of which 13 are INTERREGIO trains towards the following final destinations: Brașov, Slănic, Bucharest, Satu Mare, Beclean, Craiova, Iași, Constanța, Timișoara, Curtici, Târgu-Mureș, Dej, Cluj-Napoca);
• East Station (10 pairs of REGIO trains towards Mărășești, Bucharest, Buzău, Brazi);
• EP 1 Halt (8 pairs of REGIO trains towards Măneciu);
• Triaj Halt (10 pairs of REGIO trains towards Bucharest, Brazi, Brașov, Buzău).
These trains are operated by CFR CĂLĂTORI S.A. state company or by private companies, such as TRANSFEROVIAR CĂLĂTORI and REGIOTRANS.
Map 65. TEN-F Network in Romania
Source: CNCF CFR S.A.
171

Currently, the distances to the Growth Pole’s localities and the leading urban poles in the region are covered during the following times:
As regards the degree of modernization, in 2013 83.2% of these streets were asphalted, which meant an increase by 11.5 percentage points (+88 kilometers) compared to 2007. This increase can be attributed to street modernizations or reclassifications of already upgraded streets in Ploiești municipality (36 km), Băicoi city (45 km), and Boldești-Scăeni city (2 km). Despite large investment works, made with funds from either the local budget, the European Union, or the
Destination journey times with the fastest train available (min)
journey times with the fastest bus/minibus available (min)
Bucharest 42 52
Brașov 108 80
Buzău 68 40
Târgoviște 98 55
Băicoi 13 (Florești) 41
Plopeni 29 20
Boldești-Scăeni 28 25
table 14. Comparison between distances traveled by train and by bus between Ploiești Municipality and the main cities in the region and in the Growth Pole
Source: www.autogari.ro and www.infofer.ro
Air connectivity
Regarding air transport, Ploiești doesn’t have its own airport, but it is just 45 km away from “Henri Coanda” International Airport, located in Otopeni – Bucharest, which is the most important in Romania, with an annual passenger average of more than 7 million people and with domestic and international flights towards the most important cities in Europe and the Near and Middle East.
Street network
The road network from the cities that belong to Ploiești Growth Pole measures in total 549 km, which shows an increase by 35 km compared to 2007, due to the inclusion in the network of other roads from Băicoi city, which had a different destination previously. Following reclassification as well, in Plopeni the road network decreased by 4 km, while in Ploiești and Boldești-Scăeni its length remained unchanged in the last 7 years.
Figure 54. Length of municipal street network in Ploiești Growth Pole by cities during 2007-2013
Source: NIS, TEMPO Online Database.
Road Network (Km)
Ploiești
Băicoi
Boldești-Scăeni
Plopeni
2007 2008 2009 2010 2011 2012 2013
350
300
250
200
150
100
50
0
The
Gro
wth
Pol
e’s
Pro
file
A
naly
sis
of D
evel
opm
ent
Nee
ds a
nd A
reas
of
Inte
rven
tion
C
hapt
er 1
.4. C
onne
ctiv
ity
i
1
i172

state budget, Plopeni city remains the only one with the entire road network modernized, owing this to its specific characteristics (very limited surface and street network, new urban tissue of collective housing type). In all other cities, there are still unasphalted streets, made of cobblestone or dirt, mostly in Băicoi (39 km), Ploiești (27 km), and Boldești-Scăeni (26 km).
Map 66. Distance (meters) up to the center of Ploiești Municipality
Map 67. Distance (meters) up to the nearest major industrial platform in Ploiești Municipality
Source: Own drawing
Source: Own drawing
173

The most problematic situation is found in the five cities’ suburbs with individual housing tissue: for instance, Ţintea district (Băicoi) or Mitică Popescu district (Ploiești). In recent years, the city of Ploiești has made some investments for the modernization of transport infrastructure in suburbs like Râfov and Găgeni.
According to the estimates of Ploiești City Hall, in the city there are 50,000 cars belonging to either individuals or legal entities, and this number is on the increase. Instead, the total number of parking spaces in the city amounts only to 25,000, paid and unpaid all together. Toll parking places are about 1,100 in number, being located mainly in the city center and managed by a company subordinated to the City Hall– S.C. URBAN MANAGEMENT SERVICES PLOIEȘTI S.R.L., while the free parking places are used by local residents. The price for an hour of parking is 2 lei, which can be paid either at parking meters or by SMS. Although there has been an initiative to issue parking passes for condominium parkings since 2013, it has not been adopted so far.
As regards exclusively pedestrian areas, they are narrow and limited to Civic Center Esplanade and a number of streets and alleys in the same central zone: Unirii Street, Toma Caragiu Street, Griviţei Street, etc.; still, they are discontinuous. The sidewalks on some streets are degraded and do not ensure safe movement of passers. In addition, in suburbs, some streets that were not modernized lack sidewalks.
Ploiești municipality has a 3 kilometer bicycle lane on the north – south axis (Independence Avenue – Bucharest Avenue), implemented with European funds. This lane is often unusable because of illegally parked vehicles on its surface. As well, bike and roller lanes can be found in the park of “Olimpia” Sports Hall.
Figure 55. Share of upgraded urban streets of the entire road network by cities during 2007-2013
Source: NIS, TEMPO Online Database
Figure 17. Cars blocking bicycle lanes
Source: World Bank. 2013. TRACE: Improving energy efficiency in Ploiești
% upgraded streets of the total number of streets
Ploiești Băicoi Plopeni
2007
2008
2009
2012
2011
2012
2013
Boldești - Scăeni
120
100
80
60
40
20
0
The
Gro
wth
Pol
e’s
Pro
file
A
naly
sis
of D
evel
opm
ent
Nee
ds a
nd A
reas
of
Inte
rven
tion
C
hapt
er 1
.4. C
onne
ctiv
ity
i
1
i174

Figure 17. Cars blocking bicycle lanes
Public transport
Public transport services are provided exclusively in Ploiești municipality by a company subordinated to the Local Council – S.C. TRANSPORT CALATORI EXPRES S.A. (TCE), with a tradition of over 80 years. The company operates two trolley routes with a length of 25.3 km, two tram routes with a length of 24 km and 41 buses. About 75% of company revenues in the first semester of 2014 were subsidies, the number of employees being over 1,000. The company faces chronic financial problems, which require urgent measures to streamline its activity.
The company currently operates a total of 33 trams, 42 trolley buses and 183 buses and minibuses, the buses and trams fleet being on the decrease compared to 2007 following the cassation of used vehicles, while the number of trolley bus has increased, following the purchase of new vehicles.
The vehicle fleet of TCE is extremely outdated, resulting in high maintenance costs, long waiting times at stations and limited passenger safety. The newest buses in the TCE fleet are the 50 9-year-old BMC units, while the oldest are about 40 years old. As regards trolleys, the newest 24 Neoplan units were purchased in 2009. The fleet of second-hand trams was purchased 13 years ago from the German town Potsdam, the wagons having been manufactured between 1977 and 1985. Besides, the vehicles do not have, in general, air-conditioning, which affects negatively the comfort of passengers.The ticket price for a trip is 2 lei, which is similar to other growth poles in Romania. From the fall of 2014 until the end of 2015, the trip by public transport will be free for the citizens with incomes lower than 3,000 lei in order to compensate for the inconvenience related to works at the tram infrastructure and other objectives, objectives such as the passage at the West Railway Station. In 2012, a pilot project for introducing the electronic ticketing system on trolleys in the city was implemented, but it did not cover the entire network, and in 2014 the payment of tickets by SMS was introduced too.
Figure 56. Public transport fleet in Ploiești municipality by vehicle type during 2007-2013
Source: NIS, TEMPO Online Database
Public transport fleet in Ploiești municipality
2007 2008 2009 2010 2011 2012 2013
300
250
200
150
100
50
0
Tramways Buses and minibuses Trolley buses Tramways Buses and minibuses Trolley buses
Figure 57. Number of passengers who used the public transport system in Ploiești municipality by vehicle type during 2007-2013
Source: NIS, TEMPO Online Database
Number of passengers (mil.) using the public trans-port system in Ploiești municipality
60,000
50,000
40,000
30,000
20,000
10,000
0
2007 2008 2009 2010 2011 2012 2013
A World Bank analysis regarding the energy efficiency in Romania’s growth poles has revealed that only about 30% of the residents’ daily trips are made by public transport means; this percentage is one of the lowest of all growth poles and similar cities in Eastern Europe. However, the number of passengers who use public transport in Ploiești has increased in 2007-2013 by 12.1%, and up to 82.2 million in 2014. Of these, 55.7% opted for buses and minibuses, 23.6% for trams, and 20.7% for trolleys. Compared to 2007, there is an increase in the number of passengers who used trolleys (+ 126.5%) and trams (+ 11.9%) over those who opted for buses (-5.5%).
175

In the absence of a metropolitan operator, the interurban passenger transport is carried out by private operators based on a county transport program approved by Prahova County Council. For 2015, the program provides the following trips across the main routes that are relevant for Ploiești Growth Pole:
route number of planned daily trips trip duration (min.)
Ploiești - Boldești-Scăeni 45 25
Ploiești - Plopeni 27 20
Ploiești - Păulești - Băicoi 47 41
Câmpina - Cocorăștii Mislii – Plopeni 40 40
Florești – Băicoi – Plopeni 15 25
Vălenii de Munte – Lipănești – Plopeni 1 35
Plopeni – Slănic 15 45
Ploiești – Băicoi – Scorțeni 12 30
Ploiești – Târgșoru Vechi 16 25
Strejnicu – Ploiești 36 10
Ploiești – Ariceștii Rahtivani – Călinești 11 60
Ploiești – Ariceștii Rahtivani – Nedelea 18 45
Ploiești – Târgșoru Nou 5 30
Ploiești - Brătășanca – Mărgineni 8 45
Ploiești – Blejoi – Cocoșești 14 22
Ploiești – Plopeni – Cosminele 9 60
Ploiești – Blejoi 32 12
Ploiești – Plopu – Vărbila 15 40
Ploiești – Plopu – Hârsa 14 30
Ploiești – Pleașa 16 20
Ploiești – Valea Călugărească 14 20
Ploiești – Bucov – Radila 6 25
Ploiești – Berceni 11 15
Ploiești – Bărcănești – Odăi 16 25
Ploiești – Bărcănești – Pietroșani 58 20
Ploiești – Brazi – Bătești 29 30
Ploiești – Brazi – Stejaru 12 35
Țintea – Mislea – Câmpina 14 35
Câmpina – DN1 - Băicoi 11 20
Băicoi – Scorțeni - Telega 14 30
Ploiești – Plopeni - Țipărești 9 28
Ploiești – Plopeni – Bertea 12 70
Ploiești – Plopeni – Aluniș 6 60
Ploiești – Plopeni – Slănic 16 70
Ploiești – Lipănești – Mălăiești de Jos 11 38
Ploiești – Parc Bucov – Colonie Pleașa 12 20
Ploiești – Păulești – Găgeni 38 15
Băicoi – Călinești – Filipeștii de Târg 14 45
Ploiești – Plopeni – Scurtești 8 65
Băicoi – Plopeni – Slănic 7 60
table 15. Public transport routes ensuring the connection with Ploiești Growth Pole
Source: Prahova County Council
Ploiești municipality has a bus station in the Southern Railway Station area, as well as several stations for passenger embarkation/disembarkation at various points in the city (Eastern, Western, and Northern Railway Stations, Găgeni Street, Bucov Barrier, etc.). However, there are no intermodal terminals with adequate infrastructure to enable rapid and safe transshipment of passengers from one type of transport to another (eg. railway – public transport).
The
Gro
wth
Pol
e’s
Pro
file
A
naly
sis
of D
evel
opm
ent
Nee
ds a
nd A
reas
of
Inte
rven
tion
C
hapt
er 1
.4. C
onne
ctiv
ity
i
1
i176

Map 68. Public transport routes
177

1.4.2. Energy (gas, electricity)
Natural gas distribution network at the level of Ploiești Growth Pole covers all component localities, except for Dumbrăveni commune. During the period 2007-2013, the distribution network expanded by 134 km (+14.5%) up to a total of 1,034 kilometers as a result of investments made by the distribution operator (GDF SUEZ) in all component territorial-administrative units, including in Ploiești municipality. In this period, the largest network expansion was recorded in Valea Călugărească (+36 km), Berceni (+26 km), and Târgşoru Vechi (+20 km) communes, but also in Ploiești municipality (+15 km) especially in view of branching new consumers to the gas distribution system.
Figure 58. Length of the simple gas distribution network in Ploiești Growth Pole by localities during 2007-2013
Source: NIS, TEMPO Online database
Despite continued growth of the natural gas distribution network, the volume distributed to consumers decreased by 53.5% during the period 2007-2013, primarily as a result of lower consumption in the industry (-67.9%), on Ploiești and Brazi platforms. In contrast, the volume of natural gas distributed to the population increased by 6% compared to 2007, due to the increasing number of households and individual heating systems installed.
Despite significant investments made in recent years by the distributor of natural gas, part of the network is old and outdated, replacement of pipelines and branch pipes by modern ones being required for the continuous improvement of customer supply security. To achieve this objective, during the period 2013-2014, an extensive program for replacing a 50-year-old operating gas network was initiated in Ploiești municipality. The project envisages the rehabilitation of 94 km of the network, representing approx. 40% of the existing steel network in Ploiești, and the required investment amounts to 29 million lei. The works were concentrated in the following areas: Mihai Bravu district, Civic Center I, Civic Center II, Lupeni–Haşdeu, Buna Vestire, Nicoale Titulescu, and Andrei Mureşanu.
Prahova county and even Ploiești Growth Pole store, besides renewable energy resources, a very significant volume of conventional energy resources, being considered as ”the industrial center” for oil and natural gas extraction and processing in Romania. Thus, according to the Institute of Electro-technical Research and Design (ICPE), the National Administration of Meteorology (ANM), and ICEMENERG (2006) data, Ploiești area has a solar radiation intensity of about 1,250-1,300 kWh/m2/year, which is an average value in the national context, and the average annual wind speed reaches 4 m/s at 50 m above the ground, which makes profitable the investments in air turbines. In addition, the annual energy potential of agricultural and woody biomass in the county is over 430 TJ (National Wood Institute, 2006) and the rivers upstream of Ploiești (Prahova, Teleajen, and Doftana) have potential for small hydro power plants installation (Hidroelectrica and Polytechnic University of Bucharest, 2005).
Natural gas distribution network (Km)
2013
2012
2011
2010
2009
2008
2007
0 100 200 300 400 500
Valea Călugărească
Târgșoru Vechi
Păulești
Bucov
Brazi
Blejoi
Berceni
Bărcănești
Ariceştii Rahtivani
Plopeni
Boldești-Scăeni
Băicoi
Ploiești
The
Gro
wth
Pol
e’s
Pro
file
A
naly
sis
of D
evel
opm
ent
Nee
ds a
nd A
reas
of
Inte
rven
tion
C
hapt
er 1
.4. C
onne
ctiv
ity
i
1
i178

Map 69. Length of natural gas distribution network
179

under execution in Ploiești Growth Pole as well as many projects to exploit the potential of renewable energy – especially solar (Băicoi, Valea Călugărească, Bucov, Ploiești, Ariceștii Rahtivani, Berceni, Dumbrăvești), but aeolian (Băicoi). Still, their installed capacity is less than about 100 MW, much below the potential of the area. From the perspective of the installed capacity of solar and wind plants, Prahova county has an insignificant share at the national level, one of the reasons being the limited availability of land and their high price compared to neighboring counties in the plain area (Ialomița, Călărași, Giurgiu, Buzău, Brăila, etc.).
Electricity transport in Ploiești area is ensured by CNTEE TRANSELECTRICA, through the 400 kV overhead power lines (OPL) Domnești – Brazi Vest – Dârste, (which ensure the connection of the new PETROM cogeneration power plant, the largest of its kind in Romania), 220 kV OPL Brazi Vest – Teleajen – Stâlpu, 220 kV OPL Fundeni – Brazi Vest, 220 kV OPL Brazi Vest – Târgoviște – Bradu. In addition, there are transformer stations of 400/220/110 kV at Brazi Vest and
Electricity production facilities from Ploiești Growth Pole firstly include Brazi thermal power plant, owned by OMV Petrom. It runs on natural gas and was opened in 2011, following an investment of over 530 million EUR, and has an installed capacity of 860 MW, capable of providing 10% of Romania’s energy production. Since it is extremely flexible and can be started and stopped quickly, Petrom plant will be used to balance the country’s wind energy production during the periods when the wind does not blow. The plant produced 1.86 TWh of electricity in 2012, and 2.86 TWh in 2013. As well, Coca Cola company opened in 2009 a cogeneration unit at its factory in Ploiești, the heating operator DalkiaTermo Prahova detains a cogeneration plant with a capacity of 107 MW, and Lukoil Romania holds another unit with a capacity of 45 MW. In terms of installed power at cogeneration plants, Prahova county ranks first nationally.
At present, several projects for the exploitation of renewable energy potential were commissioned or are
Figure 59. Volume of natural gas distributed to consumers in Ploiești Growth Pole by localities during the period 2007-2013
Source: Own drawing
Figura 60. Structure of natural gas consumption in Ploiești Growth Pole by consumer type during 2007-2013
Source: Own drawing
Volume of natural gas distributed to consumers (thousand cubic meters)
200,000
180,000
160,000
140,000
120,000
100,000
80,00060,000
40,000
20,000
0
2007
2008
2009
2010
2011
2012
2013
Ploieș
ti
Băico
i
Plope
ni
Bărc
ăneș
ti
Berc
eni
Blejoi
Braz
i
Bucov
Păule
ști
Târg
șoru
Vec
hi
Valea
Călu
găre
ască
Bolde
ști-S
căen
i
Ariceş
tii R
ahtiv
ani
Non-household consumption Household consumption
100%
90%
80%
70%
60%
50%
40%
30%
20%
10%
0%2007 2008 2009 2010 2011 2012 2013
The
Gro
wth
Pol
e’s
Pro
file
A
naly
sis
of D
evel
opm
ent
Nee
ds a
nd A
reas
of
Inte
rven
tion
C
hapt
er 1
.4. C
onne
ctiv
ity
i
1
i180

PETROM, and of 220/110 kV at Teleajen. Besides, Ploiești area is included in the 400 kV ring of Bucharest municipality.
The electricity distribution network is currently operated by S.C. ELECTRICA through its distribution branch, Muntenia Nord Distribution S.A. The main activity of Ploiești distribution branch is the electricity distribution, but also the exploitation and development of distribution systems, PRAM, telecommunications, and information technology. It owns electricity distribution facilities at the level of Prahova county, in the south-eastern part of Romania, as follows:
• 834.84 km lines of 110 kV (circuit);
• 3,397.152 km medium voltage lines (circuit);
• 10,583.82 km low voltage lines (circuit);
• 46 transformer stations (of which 30 of 110 kV and 16 of medium voltage);
• 2,088 transformer substations.
Of all the power lines, only 16.6% were underground power lines (UPL), the rest being overhead power lines (OPL). The lack of an underground canalization system for all types of OPL is one of the most pressing issues that Ploiești municipality faces currently; this affects apartment blocks façades and architecturally valuable buildings frontages, determining an unattractive urban look.
In addition, some stations and substations in the city are undersized and outdated, so they need to be replaced in view of avoiding problems at the level of customer supply continuity.
At the local level one can find all mobile and fixed telephony, Internet and TV cable companies in Romania; they made significant investments to provide high quality services in the European context, at relatively affordable prices. 4G services are available locally since 2013, Ploiești being one of the first cities in Romania that benefited from such networks.
1.4.3. IT&C
According to the National Authority for Management and Regulation in Communications’ (ANCOM) data, in 2011, in Ploiești municipality there were 62,053 fixed lines, of which 52,055 were being used by individuals, and 9,998 by companies. In 2008, in the same municipality, there were 47,543 Internet connections, which were provided at “best-effort” speeds (over 128 kbps). Despite that Ploiești municipality records the highest number of fixed telephone lines and high-speed connections in South Muntenia region, the connection rate of the population remains below the level registered in other similar cities, like Pitești. However, compared to the most recent years for which statistical data are available, it is very likely that the number of fixed telephone stations have fallen to the detriment of mobile telephony, which reached a penetration rate of over 90% of the population. Similarly, the number of high speed Internet connections grew continuously compared to 2008, and the connection rate is approaching 50%.
Figure 61. Fixed telephony and Internet connections number at 1,000 inhabitants in the main cities of South Muntenia Region
Source: ANCOM
Fixed telephony connec-tions at 1,000 inhabit-ants (2011)
Internet connections at 1,000 inhabitants (2008)
400
350
300
250
200
150
100
50
0
Piteș
ti
Călăra
și
Târg
ovișt
e
Sloboz
ia
Ploieș
ti
Alexan
dria
181

1.4.4. Completed / ongoing projects
In terms of mobility projects that have been implemented in Ploiești Growth Pole during the period 2007-2013, the most relevant are the following:
• Increase traffic capacity by developing a link road between DN 1 and DN 1B, the DJ 236 county ring road in the north of Ploiești municipality – worth 43.9 mil. Lei, co-financed by ROP 2007-2013, through PA1.
• Increase accessibility to the northern part of the Growth Pole, especially towards Prahova County Hospital by developing a road passage in continuation of DJ102 over DN 1B – worth 78.6 mil. Lei, co-financed by ROP 2007-2013, through PA1.
• Increase public transport mobility by the rehabilitation of 102 tram route through works aimed at: improving the tread, waiting stations adapted to people with disabilities, rolling stock, signaling and automation elements. Stage I: North Loop - Republic Intersection – worth 62.8 mil. Lei, co-financed by ROP 2007-2013, through PA1.
• Increase public transport mobility by the rehabilitation of 101 tram route through works aimed at: improving the tread, waiting stations adapted to people with disabilities, rolling stock, signaling and automation elements. Stage I – worth 35.6 mil. Lei, co-financed by ROP 2007-2013, through PA1.
• Increase public transport mobility by the rehabilitation of 102 tram route through works aimed at: improving the tread, waiting stations adapted to people with disabilities, rolling stock, signaling and automation elements. Stage II: Republic Intersection - West Loop – worth 83.7 mil. Lei, co-financed by ROP 2007-2013, through PA1.
• Increase public transport mobility by the rehabilitation of 101 tram route through works aimed at: improving the tread, waiting stations adapted to people with disabilities, rolling stock, signaling and automation elements. Stage II – worth 73.7 mil. Lei, co-financed by ROP 2007-2013, through PA1.
• Rehabilitation of DJ 101G Tătărani – Brazi – Tinosu - Șirna – Hăbud – Crivățu – worth 45.8 mil. Lei, co-financed by ROP 2007-2013, through PA2.
• Develop an overpass at West Railway Station – worth 91 mil. Lei, co-financed by ROP 2007-2013, through PA1.
Less extensive works made with local budget funds are also worth mentioning along with the rehabilitation of Mihai Bravu Street, Republic Avenue, Ghighiului Street, South Raliway Station passage, and streets packages (including sidewalks), in the following districts: Bereasca, May 9, Enache Văcărescu, Malu Roșu, Moțoi, Râfov, Găgeni, Gheorghe Doja, Vega, Mitică Apostol, Peneș Curcanul etc. As well, parking areas were developed on Republic Avenue, Gh. Doja Street, while in the in the northern, western, and central-southeastern zones were used ecological tiles for the construction of parking places. The pavements were restored at the Administrative Palace, the esplanade of the Unions’ House of Culture, the sidewalks from North Complex and on Toma Caragiu Street. An over-ground parking was developed on Cuza Vodă Street. For the year 2015, about 19 million Lei from the budget of the municipality were assigned for current repairs to streets. For the period 2014-2020, the investments in the field of accessibility and mobility are the main concern of the municipality. The focus is mainly on: street modernization works in the areas of Pictor Rosenthal and Râfov; completion of the link between West Railway Station and South Railway Station; purchase of rolling stock (for trams) and buses; implementing one-way traffic lanes; expanding the pedestrian area around the Administration Palace; construction of a new passage over the railway in the south-eastern part of the municipality (Podul de Lemn); upgrading intersections and implementing an intelligent traffic management system; modernization of sidewalks parallel to the tram line, etc.
In the field of distribution infrastructure for natural gas, electricity, and IT&C, investments were made primarily from the private operators’ funds and were targeted towards replacing the existing networks with modern ones, which would lead to better quality services provided to end consumers. The most important of these were those referring to the replacement of about 94 km of gas distribution network in Ploiești municipality, simultaneously with its expansion in urban and rural areas in the Growth Pole.
Currently, the EU-funded Sustainable Urban Mobility Plan of Ploiești Growth Pole is under development. The plan, The plan, completed in 2015, aims at creating a sustainable and modern urban transport system, as well as at supporting economic development through improving accessibility for people and goods. It will become the support framework for the urban transport projects that will be financed by the Regional Operational Programme 2014-2020, with the support of the European Regional Development Fund.
The
Gro
wth
Pol
e’s
Pro
file
A
naly
sis
of D
evel
opm
ent
Nee
ds a
nd A
reas
of
Inte
rven
tion
C
hapt
er 1
.4. C
onne
ctiv
ity
i
1
i182

Ploiești Growth Pole has a favorable geographical position in terms of accessibility at the national and European levels, being situated at the crossroads of major road and rail transport corridors in Romania, part of the TEN-T core network. The largest airport in Romania (“Henri Coandă”, Otopeni-Bucharest), with over 8.3 million passengers and 100,000 landings/take-offs, is very easy to access, as it is 40 minutes away, providing satisfactory connections to most internal and external destinations.
In what regards the connection with Transylvania and Moldavia, the lack of rapid transport links with Brașov and Buzău municipalities, as well as with Târgoviște area limits accessibility. Hence, national roads connecting these urban poles record high traffic values, as well as congestion and accident risks. For instance, the transport axis Bucharest – Ploiești – Brașov records the highest traffic values in the country, especially on weekends and during peak tourist seasons on Prahova Valley, and still does not have a highway yet. As well, the upgrade of DN 1 and the construction of A3 segment that connects Bucharest to Ploiești have ensured only a partial decongestion of DN 1, as there is no direct access to the capital on a distance of about 10 km.
1.4.5. Conclusions – existing disparities, trends, needs, and intervention areas
Map 70. Regional accessibility
183

The national roads that ensure the municipality’s access to the major transport network and to other urban poles in Romania are in good condition, as they benefited from modernization and maintenance investments. The high traffic intensity in Ploiești area, which is generated by both commuting and transit flows, creates a major risk of traffic congestion at the level of road arteries that go through the city.
Although Ploiești municipality is one of the most important railway hubs in Romania, the advanced wearing of the railway infrastructure has led to substantial decreases in rail traffic values compared to 1990, being concurred by road transport. As well, railway stations in the municipality have not gone through extensive rehabilitation and modernization processes in order to become more attractive to passengers.
Although at the local level, there are several train stations and bus terminals used daily by a large number of passengers, especially by those traveling to Ploiești from various localities of Prahova county (commuters, students, etc.), the lack of intermodal terminals to ensure the rapid transfer from one type of transport to another (railway transport, urban and interurban transport, cycle and pedestrian circulation, etc.) is visible.
The traffic in the Growth Pole is negatively influenced by the existence of anthropic barriers to mobility, including the dense network of railways that surrounds Ploiești and the lack of overground and underground passages at crossing points.
The upgrade degree of the road network has increased in the last decade, amid substantial investment from various sources of funding, including from European funds. However, more than 15% of the streets are still not modernized, the most disadvantaged areas being the suburbs, some of them having enlarged with new constructions in recent years. The streets that were not modernized hamper traffic flow and lead to the risk of accidents, besides the fact that some arteries in the city become undersized, especially in the central area.
The
Gro
wth
Pol
e’s
Pro
file
A
naly
sis
of D
evel
opm
ent
Nee
ds a
nd A
reas
of
Inte
rven
tion
C
hapt
er 1
.4. C
onne
ctiv
ity
i
1
i184

Map 71. Mobility in the Growth Pole
185

In spite of the investments made by the county administration from local, state, or European funds, most of the county roads linking Ploiești municipality to its immediate area of influence are in poor condition, with thin asphalt on the surface. Some of them record traffic values that are comparable to those of many national roads in Romania, hence accelerating investments in their rehabilitation by using all available funding sources (ROP 2014-2020 PNDL, the budget of Prahova County Council) needs to continue.
Mobility inside Ploiești municipality and some of the neighboring localities is low due to the lack of extensive traffic management, especially at the level of penetration arteries (north-south, east-west) and those with limited transport capacity, but also due to intersections with inadequate geometries and facilities. All these elements also increase the risk of accidents too.
The continued increase in the number of vehicles in the Growth Pole has led to a chronic shortage of parking places, estimated at 25,000 units, both in central areas and near large housing complexes. In addition, the administration of parking spaces is still deficient, given that many vehicles are parked illegally on public places, and even on green spaces, and the number of paid parking places, as well as the revenues generated by them for the municipality are reduced.
The public transport network is relatively extensive and covers by the means of buses, trams, and trolley buses most of the areas with high housing density. In addition, recent years have brought a diversification of the services offered to passengers, such as the payment of tickets via SMS, and an increase in the number of passengers using trolleybuses and trams. However, the advanced wearing of the available public transport fleet leads to high costs for vehicle maintenance, failure to follow traffic schedules, and large volumes of CO2 emissions, also endangering the safety of passengers and other road users. In these circumstances, only 30% of daily trips are done by public transport, in favor of private cars and taxis. Furthermore, the lack of electronic ticketing systems and GPS monitoring at the level of the entire public transport system, and the inadequate facilities for the disabled also affect the local public transport system.
Interurban passenger transport services are generally satisfactory in terms of vehicles used and transport schedules covered by multiple private operators that are active locally. However, the lack of a metropolitan (urban and interurban) integrated transport system is still visible at the level of stations, transport schedules, and pricing.
Despite some pilot local initiatives, alternatives to non-motorized transport remain very low: lack of exclusively pedestrian and interconnected zones, walkways in high-traffic areas, and reduced extension of cycle lanes, which are not integrated, do not ensure safe movement of cyclists, and are often blocked by vehicles parked illegally.
All localities of Ploiești Growth Pole benefit of natural gas distribution networks, which create additional comfort of habitation and an advantage in attracting investments. A significant part of the network, especially in cities, is outdated and requires upgrading or even expansion works, such a program being already underway in Ploiești based on the private funds of the distribution operator.
The electricity distribution network, which is under the management of a state company, is characterized by a high degree of wearing, including at the level of supply lines, transformer stations, etc., which aggravates the risk of supply disruptions and even incidents. As well, in the absence of an underground canalization system, 80% of the power lines are overhead, affecting the urban aesthetics.
Ploiești municipality is one of the most important energy centers of Romania, concentrating a high volume of conventional and renewable resources (solar energy, agricultural biomass, etc.). Romania’s largest and most modern thermal power station using natural gas was inaugurated at Brazi – it provides 10% of the total consumption and, the capacity of cogeneration units in the area is the largest in the country. However, the potential of producing renewable energy especially for public consumption remains largely unexploited.
With regard to IT&C, the Growth Pole’s residents have access to the latest technology, enjoying a wide range of high quality services from private operators at competitive prices. However, the number of Wi-Fi locations in cities and in the zones of attraction for residents, tourists, and visitors is very low.
The
Gro
wth
Pol
e’s
Pro
file
A
naly
sis
of D
evel
opm
ent
Nee
ds a
nd A
reas
of
Inte
rven
tion
C
hapt
er 1
.4. C
onne
ctiv
ity
i
1
i186

Map 72. Energy and IT&C connectivity
187

189
ChAPter 1.5.
infrastructure and Public Utilities
PArt I: the Growth Pole’s Profile
1Analysis of Development needs and Areas of intervention

According to the General Urban Plan of Ploiești, approved in 1999, the surface of green spaces was around 108.58 ha, being foreseen to increase to 433 ha by 2020.
According to Local Council Decision no. 124/2010 - Annex 1.1, areas registered in the inventory of assets that make up the public domain of Ploiești, endorsed by Government Decision no. 1359/2001, ammount to 2,047,836 (204.78 ha):
• Parks: 337,100 m2;
• Public gardens: 150,637 m2;
• Green spaces: 373,250 m2;
• Traffic squares: 104,616 m2;
• Green spaces in the built-up area: 1,082,233 m2.
Municipalities and cities
years
2006 2007 2008 2009 2010 2011 2012 2013
UM: ha
PLOIEȘTI MUNICIPALITY 225 225 225 225 225 302 302 302
BĂICOI CITY 11 11 11 11 31 31 84 84
BOLDEȘTI-SCĂENI CITY 7 7 7 7 7 7 7 7
PLOPENI CITY 5 5 5 5 5 5 5 5
table 16. Evolution of green space surfaces in Ploiești Growth Pole
Source: NIS, TEMPO Online Database
1.5. infrastructure and Public Utilities 1.5.1. Public Space
The central area of Ploiești concentrates most of the public spaces, which are arranged around objectives of public interest, including in front of railway stations. The most important are the following:
• Halele Centrale area, together with Piața Centrală and Piața Toma Socolescu - bounded by G. Coșbuc Str., Griviței Str., Gen. V. Milea Str., and Republicii Blv.;
• Civic Center Esplanade - bounded by Republicii Blv. and other public buildings (bank, shopping center etc.);
• Ion Luca Caragiale Square - in front of the Ploiești City Hall, bounded by Republicii Blv., Dobrogeanu Gherea Str., Second Lieutenant-Hero C. Cătălin Str.;
• Ion Luca Caragiale traffic square - bounded by the intersection of Independenței Blv., R. Stanian Str., and Golești Str.;
• Ploiești South, Ploiești West and Ploiești North railway station squares.
The main pedestrian zone of Ploiești is represented by a 0.12 km2 downtown area, with its spatial and functional characteristics, which was the object of the EU CIVITAS - SUCCESS project, being aimed at creating a controlled roadway area dedicated to pedestrians, cycle lanes and pedestrian tracks, public transport stations, etc.
Green spaces, parks, recreation, leisure, and sport areas are arranged in a dispersed manner at the growth pole level and have various typologies:
• Green alignment spaces along the street structure;
• Traffic squares and green spaces between the blocks, serving residential areas;
• Public parks and traffic squares;
• Sports and leisure parks.
Their evolution in the component cities, according to NIS data, is shown in the following table:
The
Gro
wth
Pol
e’s
Pro
file
Ana
lysi
s of
Dev
elop
men
t N
eeds
and
Are
as o
f In
terv
enti
on
Cha
pter
1.5
. inf
rast
ruct
ure
and
Publ
ic U
tilit
ies
i
1
i190

Map 73. Green surfaces per inhabitant
191

Figure 62. Green surfaces per inhabitant in Romania’s growth poles in 2013
Source: NIS, TEMPO Online Database Own calculations
Differences between the 3 data sources can be noted regarding the surface of green spaces in Ploiești, depending on the time of the analysis and the calculation method. However, even according to the most updated and most favorable source (NIS, 2013, which, however, takes into account the land of sports locations and facilities), the surface of green spaces does not exceed 14.4 m2/inhabitant, far below the European standards of 26 m2. In order to achieve this target, the area of green spaces should increase to 545 ha, even exceeding the GUP projections for 2020. However, it should be mentioned that the existing balances do not reflect the total surface of this type of area at the local level, in the absence of a green cadaster of the municipality.
As regards the rest of the cities that make up the Growth Pole, the only one complying with the 26 m2/inhabitant standard is Băicoi (46.7 m2/inhabitant), given the existing green spaces around the salt lakes (e.g. Livedea), which are mostly undeveloped though, while Plopeni and Boldești-Scăeni have less than 15 m2 of green space/inhabitant.
Ploiești municipality holds the 7th place among the 8 growth poles in Romania in terms of average area of green spaces/inhabitant, surpassing only Brașov, which is, however, surrounded by extensive green and natural spaces, being located in the Romanian mountains.
Parks in Ploiești are generally small, being located, being arranged, with few exceptions, along the main roads in the city, especially on the north-south axis (Independenței Blv. - Republicii Blv.). The largest of these is Ploiești West Park, being currently under development with funds from ROP 2007-2013, with a total area of about 58 ha, located between the bypass road and West Rail Station. It will include 45 ha of planted areas, an artificial lake, resting / contemplation / picnic places, covered greenhouse, water fountains, artificial rocks, water mill, skating / roller rink, playgrounds for children, scene, pavilion, 12 sports grounds, cycle paths, walkways, etc. Tineretului Park is the second largest park and has been arranged around Olimpia Sports Hall. This includes, in turn, planted areas, a recreational lake and sports facilities (ice rink, tennis courts and football fields, running track, skydiving tower, cycle and roller paths) that were recently arranged.
The largest deficit of green spaces is in the districts built during the communist era and densely populated (Malu Roșu, Enăchiță Văcărescu, Vest, etc.). Although they are numerous small interstitial green spaces, many of them are occupied by illegally parked cars or are improperly arranged, not being available to the public.Although not located on the territory of Ploiești, the most popular recreational area in the region remains the memorial park “Constantin Stere” Bucov, located in the east side of the city, across the Teleajen river, with a surface of over 100 ha, a 16 ha zoo, a recreational lake, and numerous busts of Romanian writers.
Green surfaces
m2/inhabitant
Craiov
a
Cluj-N
apoc
a
Bucur
ești
Iași
Tim
ișoar
a
Const
anța
Ploieș
ti
Braș
ov
45
40
35
30
25
20
15
10
5
0
The
Gro
wth
Pol
e’s
Pro
file
Ana
lysi
s of
Dev
elop
men
t N
eeds
and
Are
as o
f In
terv
enti
on
Cha
pter
1.5
. inf
rast
ruct
ure
and
Publ
ic U
tilit
ies
i
1
i192

In addition to the parks mentioned above, there is a series of traffic squares, the largest ones being in the central area (Central Halls – Central Square – Toma Socolescu Square, Civic Center Esplanade, and I.L. Caragiale Square), places for locals’ and visitors’ promenade, as well as places around objectives of public interest (e.g. traffic squares in South Rail Station, West Rail Station, and North Rail Station). The central area of the city was also covered by the CIVITAS - SUCCESS transnational project, which led to the creation of a 1 km2 of controlled roadway area dedicated to pedestrians, cycle lanes and pedestrian tracks, public transport stations, etc.
Map 74. Parks in Ploiești municipality
Source: GUP Ploiești – 2015, Fundamental studies
193

Public lighting
Currently, public lighting services in the localities of Ploiești Growth Pole are provided either by companies that assumed the management of these services by concession, or by the local authorities and ELECTRICA.
Administrative-territorial unit Public lighting operator Majority capital
Ploiești S.C. Servicii de Gospodărie Urbană S.R.L. Public
Băicoi S.C. General ME.EL Electric S.R.L. Private
Boldești-Scăeni S.C. General ME.EL Electric S.R.L. Private
Plopeni Local Public Authority Public
Ariceștii Rahtivani S.C. Electroconstruct S.R.L. Private
Bărcănești Local Public Authority Public
Berceni Local Public Authority Public
Blejoi S.C. General ME.EL Electric S.R.L. Private
Brazi Local Public Authority Public
Bucov S.C. TERMOELECTRICA S.A. Public
Dumbrăvești S.C. TERMOELECTRICA S.A. Public
Târgșoru Vechi S.C. TERMOELECTRICA S.A. Public
Valea Călugărească S.C. ELECTRICA S.A. Public
table 17. List of public lighting operators operating within Ploiești Growth Pole
Source: ANRSC
In Ploiești municipality, public lighting service has been delegated by concession to a private company (S.C. LUXTEN LIGHTING COMPANY S.A.) until 2013, when it was transferred temporarily to the company subordinated to the municipal authority - S.C. SERVICII DE GOSPODĂRIE URBANĂ S.R.L., but which does not hold ANRSC license for such activities. In 2015, there will be an open tender aimed at delegating the management by concession of public lighting service in Ploiești, to a licensed operator, selected by open tender for a period of 10 years, with possibility of extension, based on a new decision of Ploiești Local Council.
The public lighting network in Ploiești is 228.4 km long, covering almost the entire road network of the city, plus the power networks owned by SC Electrica SA. During 2001-2014, 4,165 pillars, 13,234 consoles 15,967 sodium vapor discharge lamps, 217,955 linear meters of network, 894 distribution boards, and 121 lighting points related to the public lighting network were rehabilitated. Replacing old mercury-based lamps with those based on sodium vapor had the effect of limiting the increase of electricity consumption compared to the early 90s, although in 2014 it increased by 9%, as compared to the numbers recorded in 2007. The increase in energy price the increase of the consumption value by 70.7% during 2007-2014, up to 5.2 million RON annually, i.e. about 1% of the total expenditure incurred from the local budget.
Figure 63. Electricity consumption of the public lighting system in Ploiești during 2007-2014
Source: Autonomous Public Service Undertaking of Ploiești
KWh
2007 2008 2009 2010 2011 2012 2013 2014
9,800,000
9,600,000
9,400,000
9,200,000
9,000,000
8,800,000
8,600,000
8,400,000
8,200,000
8,000,000
The
Gro
wth
Pol
e’s
Pro
file
Ana
lysi
s of
Dev
elop
men
t N
eeds
and
Are
as o
f In
terv
enti
on
Cha
pter
1.5
. inf
rast
ruct
ure
and
Publ
ic U
tilit
ies
i
1
i194

Map 75. Operators in the public lighting
195

A few years ago, the operator tried to implement an innovative lighting system, which was very effective, but expensive, by installing more LED bulbs in one of the city’s parks. It was an ambitious pilot project, which sought to demonstrate that an effective solution can be used on street lighting. Although it was appreciated by city administrators, this solution was considered very expensive and soon the pilot project was abandoned.
Currently, the system allows the street lighting supplier to be informed in due time, by a simple phone call, of any problem that arises in connection with lighting poles or lamps. Often people call the dispatch center during the first 10 minutes from the time a bulb fails. The fact that all streets in Ploiești are illuminated helps maintaining a low crime rate in the city.
Recently, the municipality has tried to introduce a centralized program to control light intensity, but unfortunately, there were some problems and some parts did not work. The residents of some streets where this program was implemented were against this system. As the contract with the municipality has reached its end, the operator responsible for the management by concession of the public lighting service did not want to continue with the program or to see what went wrong and fix the problem.
In the future, one of the very ambitious plans of RASP is to further improve the system and introduce public lighting with LEDs. However, for the moment, the municipality is aware that the city budget cannot sustain capital investment for such an effective, but very expensive solution.
However, with a consumption of 595 kWh per lighting pole, the consumption in Ploiești is slightly higher than in Cluj-Napoca, but is lower than in other growth poles. Tariff for public lighting depends on the times of the day. For example, 1 kWh of electricity costs RON 0.7, including VAT, during peak hours, and only half of this amount (RON 0.35) outside the peak hours. In winter, the lights are on from 17:30 to 07:30, while in summer, they are on from 22:00 to 05:30.
Public lighting poles equipped with new sodium vapor lamps
Source: World Bank. 2013. TRACE: Improving energy efficiency in Ploiești
The
Gro
wth
Pol
e’s
Pro
file
Ana
lysi
s of
Dev
elop
men
t N
eeds
and
Are
as o
f In
terv
enti
on
Cha
pter
1.5
. inf
rast
ruct
ure
and
Publ
ic U
tilit
ies
i
1
i196

1.5.2. Water supply and sewerage systems
Drinking water distribution services are provided at the Growth Pole level by a number of operators with majority state-owned or private capital, as follows:
operator Majority capital tAU where the service is provided
S.C. HIDRO PRAHOVA S.A. Public Băicoi, Plopeni, Dumbrăvești
S.C. JOVILA CONSTRUCT S.R.L. PrivateBoldești-Scăeni, Berceni, Blejoi, Bucov,
Valea Călugărească
S.C. APA NOVA Ploiești S.R.L. Private Ploiești
S.C. CAPOLES SERV S.R.L. Private Bărcănești
S.C. AQUASAL UTILSERV S.R.L. Public Brazi
S.C. PAMA S.R.L. Private Păulești
S.C. SERVICIUL DE ALIMENTARE CU APĂ S.R.L.
Public Ariceștii Rahtivani
SERVICIUL PUBLIC DE ALIMENTARE CU APĂ ȘI CANALIZARE
Public Târgșoru Vechi
table 18. List of drinking water distribution operators by localities
Source: ANRSC
As it can be seen, water supply and sewerage systems were given in concession by the local authorities to various private companies. This is the case with Ploiești municipality, Boldești-Scăeni city and Berceni, Blejoi, Bucov, Valea Călugărească, Bărcănești, and Păulești communes. The concession procedure targeted exclusively the management of the existing infrastructure and property, their upgrading, rehabilitation and maintenance, the performance of investments and network operation in exchange for annual royalties, while territorial-administrative units remained the owner of the infrastructure. For example, in the case of Ploiești municipality, the extension of the water and sewerage network is made by the municipal authority, the operator having an advisory and consultative role, while the responsibility for the connections lies with the operator or consumer, as appropriate. Therefore, they can still access funds for investments in water and sewerage infrastructure, less EU-funded programs that require the existence of a regional operator, such as SOP ENVIRONMENT 2007-2013. The only operator with this status is S.C. HIDRO PRAHOVA S.A., which is currently implementing a project with a grant from this program.
At the end of 2013, the simple distribution network of drinking water from Ploiești Growth Pole was 1,043 km long, increasing by about 115 km (+12%) as compared to 2007. The most important water network expansions were recorded in Băicoi city (+26 km) and in Blejoi (+21 km), Berceni (+20 km), Păulești (+18 km), Ariceștii Rahtivani (+15 km), and Bucov (+14 km) communes. On the other hand, in the Târgșoru Vechi commune, network length has been reduced by 14 km in the same period, and in the Plopeni city, by 6 km, the reasons being related either to the decommissioning of pipelines, due to their age, or of administrative nature. However, Ploiești continues to hold the largest distribution network of drinking water, with a total length of about 417 km, of which 20 km is the water feed network. Out of the 882 streets in Ploiești municipality, 817 are fully connected to a water supply network, 43-partially connected, and 22- not connected at all. Also, some areas of the city, such as Vega and Teleajen colonies, are to utility networks belonging to local operators, which have their own wells, and not to the public network, since the municipal authority could not make any investment here on reasons of land ownership-related restrictions. In this context, cadastral works must be completed to clarify the regime of land ownership, which also affects future investment in public utility network. Also, it should be borne in mind that in some areas there are no connection requests from individual consumers so as to justify significant investments for the expansion.
1 The total length of the simple water distribution is the length of tubes and pipes installed in the respective locality for the transport of drinking water from the feed pipelines or pumping stations to the consumers’ connecting points. The length of the distribution network will be recorded as a simple network, taking into account that, if there are two or more pipes installed on the same street, their aggregate length will be considered. Both service networks and the distribution main and secondary roads will be included. The length of the connection pipes or the length of the feed pipelines is not included in the length of the distribution network. The length of the feed pipeline is not included, even if there are consumers connected to it.
197

Of this amount, 78.7% was distributed to households, and 21.3% to non-domestic users (economic operators, public institutions, etc.). As compared with 2007, household consumption fell by 4.4%, and the non-domestic one - by 20%. The causes regarding the consumption decrease of drinking water are multiple, including:
• decline of the stable population, given the negative natural growth and internal and external migration;
• shrinkage of the economic activity and modernization of production processes;
• increase of the consumption metering level and decrease in network losses, as a result of its modernization;
• voluntary decrease of water consumption, given its rising price and the decline of household incomes during the global crisis.
Despite the continuous expansion of the distribution network, the amount of water supplied to consumers fell by 8.2% during 2007-2013 to 15,575 mil. m3 in 2013. Of the total drinking water produced, about 75% is billed to consumers.
Figure 65. Amount of water supplied to consumers (thousand cubic meters) by localities during 2007-2013
Source: NIS, TEMPO Online Database
16000
14000
12000
10000
8000
6000
4000
2000
0
Ploieș
ti
Băico
i
Bolde
ști-S
căen
i
Plope
ni
Bărc
ăneș
ti
Berc
eni
Blejoi
Braz
i
Bucov
Dumbr
ăveş
ti
Păule
ști
Târg
șoru
Vec
hi
Valea
Călu
găre
ască
Ariceş
tii R
ahtiv
ani
2007
2008
2009
2010
2011
2012
2013
Figure 64. Length of the simple distribution network for drinking water (km) by localities during 2007-2013
Source: NIS, TEMPO Online Database
450
400
350
300
250
200
150
100
50
0
Ploieș
ti
Băico
i
Bolde
ști-S
căen
i
Plope
ni
Bărc
ăneș
ti
Berc
eni
Blejoi
Braz
i
Bucov
Dumbr
ăveş
ti
Păule
ști
Târg
șoru
Vec
hi
Valea
Călu
găre
ască
Ariceş
tii R
ahtiv
ani
2007
2008
2009
2010
2011
2012
2013
The
Gro
wth
Pol
e’s
Pro
file
Ana
lysi
s of
Dev
elop
men
t N
eeds
and
Are
as o
f In
terv
enti
on
Cha
pter
1.5
. inf
rast
ruct
ure
and
Publ
ic U
tilit
ies
i
1
i198

Map 76. List of the operators for the distribution of drinking water per municipality
199

The simple sewerage network in Ploiești Growth Pole was in 2013 only 486 km long, which is less than 50% of the length of the water distribution network in the same area. As compared with 2007, the sewerage network has however expanded by about 121 km (+31%), given the investments made mainly in Ploiești (+32 km), Brazi (+38 km), Bucov (+34 km), Blejoi (+8 km), Valea Călugărească (+7 km) communes, and Boldești-Scăeni (+10 km) city. Decreases in the length of the distribution network were recorded in Băicoi city (-7 km), either by the decommissioning of old pipes or by changes in their statistical classification. Therefore, at present, 3 communes from the Growth Pole still lack a sewerage system (Berceni, Dumbrăvești, and Târgșoru Vechi), but in two of them the network is limited to 1-2 km (Bărcănești, Ariceștii Rahtivani), the only satisfactory situation being in the communes that received grants (Bucov) or state budget funds (Brazi) for such investment.
Figure 67. Simple sewerage network length (km) at the level of Ploiești Growth Pole during by localities during 2007-2013
Source: NIS, TEMPO Online Database
2 The simple total length of the sewer pipes is the length of the channels (tubes) through which waste water (municipal, industrial, etc.) and rainfall water within the locality with public sewerage are collected and discharged, starting from the connection pipe chamber of buildings with sewerage facilities to the discharge of wastewater into a natural outlet. Both sewerage (service) networks and primary and secondary sewers are included. In the event the ducts are placed in several rows on the same street, their overall length is considered. Connections to buildings are not included.
350
300
250
200
150
100
50
0
Ploieș
ti
Băico
i
Bolde
ști-S
căen
i
Plope
ni
Bărc
ăneș
ti
Blejoi
Braz
i
Bucov
Păule
ști
Valea
Călu
găre
ască
Ariceş
tii R
ahtiv
ani
2007
2008
2009
2010
2011
2012
2013
Source: NIS, TEMPO Online Database
2007 2008 2009 2010 2011 2012 2013
14000
12000
10000
8000
6000
4000
2000
0
Domestic consumption
Figure 66. Amount of drinking water distributed in Ploiești Growth Pole (thousand cubic meters) by types of consumers during 2007-2013
Non-domestic consumption
The
Gro
wth
Pol
e’s
Pro
file
Ana
lysi
s of
Dev
elop
men
t N
eeds
and
Are
as o
f In
terv
enti
on
Cha
pter
1.5
. inf
rast
ruct
ure
and
Publ
ic U
tilit
ies
i
1
i200

Map 77. Degree of coverage(%) of the water supply service
201

The sewerage network in Ploiești is about 328 km long. Out of the 882 streets in the city, 664 are completely serviced by a sewerage system, 60 are partially serviced by a sewerage system, and 158 do not have a sewerage system at all.
In the case of Ploiești municipality, water supply and sewerage services are provided by S.C. APA NOVA PLOIEȘTI S.R.L., a company with private majority capital (VEOLIA EAU Group - 73%), but in which TAU Ploiești has also a stake of 27%. This company was given in concession water supply and sewerage services by the municipality in 2000 and for a period of 25 years, being at that time the first public-private partnership in the field of public utilities in Romania.
The company has currently about 22,000 clients and over 200,000 inhabitants who benefit from its services. The metering level is of 100%, and some of the company’s services, including the communication of the index, permit requests, consumption calculation, or information on water quality and payment can also can also be provided online. There is also a Customer Center, opened in 2003 and available 24 hours a day. The tariff for drinking water in 2015 is RON 3.42/m3, and for sewerage is RON 1.46/m3, VAT included, i.e. the lowest level of those registered in all county capitals in Romania, and 45% lower than the highest one recorded nationally. The tariff did not increase in the last years, despite the fact that there is a decision of the Local Council in this regard since 2006. The degree of bill collection is over 99%, a very good disconnection program being in place in case of default.
The operator supplies water to city residents from 2 types of sources:
• underground sources (Crângul lui Bot, North-east and North-west capture zones, i.e. 82% of total water consumption in the city);
• surface sources - Paltinul storage lake (18%).
Approximately 1,000 samples are taken monthly to test water quality, indicating water compliance with national potability standards.
As for the sewerage service, the company collects annually about 15-16 million m3 of wastewater and treats over 20 million m3. The sewerage system of the city is a mixed one, waste, industrial, and meteoric water being taken by the two main collectors. In times of very heavy rainfall, excess water can be discharged directly into Dâmbu brook. The sewerage divider system occupies only a small area of the municipality (e.g. Ploiești North and Bereasca districts). The treatment plant of Ploiești is located in the south-east of the city and has a capacity of 1,200 l/s, Dâmbu brook being the outlet.
During the 15 years since it has been given in concession the water supply and sewerage services, APA NOVA PLOIEȘTI invested over 30 million EUR in modernization works, with the following results: the expansion of over 90 km of drinking water network, over 13,000 new or replaced connections, 1,600 valves installed or replaced, over 30 km of sewerage network restored and expanded, 4,000 new sewer connections, the acquisition of modern and performing equipment, own SCADA system, etc. The company has over 250 employees in total (about 3 times less as compared with the time of the concession), generating profit and having a labor productivity 2.5 times higher than the average of the other relevant operators in Romania.
As regards the regional water and sewerage operator in the county - S.C. HIDRO PRAHOVA S.A., it provides services in the cities of Băicoi, Plopeni, in the Dumbrăvești commune all located in Ploiești Growth Pole, plus other 40 other urban and rural localities in the county, with a total of over 150,000 inhabitants, which joined the Intercommunity Development Association “Prahova Water Management Partnership”. The price for drinking water supply was in 2015 RON 4.61/m3, while the cost for sewarage was RON 3.03/m3, VAT included, higher than in Ploiești, one of the reasons being the lower density of HYDRO PRAHOVA consumers and the need for financial support in the case of projects carried out with European funds.
The main sources of drinking water supply in Ploiești Growth Pole are the surface ones: Paltinul systems for Băicoi and Plopeni, respectively Măneciu for Plopeni. Water supply from underground sources is done from the capture zones Boldești-Lipănești (Plopeni and Boldești-Lipănești), 7000H well drilling and new well drilling - Pomicola H (Băicoi). The water collected from surface and underground sources is transported to the households of the localities through feed pipelines. Ariceștii Rahtivani, Valea Călugărească, Bucov, Blejoi (partially), Berceni communes are supplied from underground sources (wells), while Bărcănești, Blejoi (partially), Brazi, Dumbrăvești, Păulești, and Târgșoru Vechi, from surface sources.
The
Gro
wth
Pol
e’s
Pro
file
Ana
lysi
s of
Dev
elop
men
t N
eeds
and
Are
as o
f In
terv
enti
on
Cha
pter
1.5
. inf
rast
ruct
ure
and
Publ
ic U
tilit
ies
i
1
i202

Map 78. Coverage of the sanitation service
203

Water treatment plants are located in Voila (for Paltinul Lake), Vălenii de Munte (for the Măneciu system), and Boldești (for Boldești-Scăeni city). Cities have their own water management systems, which collect water from underground and surface sources through waterworks and are equipped with storage tanks and water booster systems (Mechanical Plant of Plopeni; Băicoi, Tufeni, and Găgeni Canton – Băicoi; Boldești and Scăeni).
The water distribution network is outdated in most localities, generating in the network losses amounting to 50% of the water produced, and some rural or urban districts are not connected yet to the network yet. Small towns, such as Băicoi or Plopeni, benefited from investments from pre-accession funds (SAMTID/PHARE) for the rehabilitation and modernization of their water network (dams, treatment plants, feed pipelines, reservoirs, pumping stations, distribution networks). The biggest problems were identified in Ploiești, which, given that it could not access grants from SOP ENVIRONMENT 2007-2013, due to the absence of a regional operator for water and wastewater services, operator has not rehabilitated yet any of the water and sewage networks, including collectors and primary water supply pipelines (part of which is almost 100 years old). The project to modernize the wastewater treatment plant, which started with government funds, has been also abandoned for several years. The investment need for this target is about 3 million EUR, and a possible solution considered by the municipality is its transfer to APA NOVA, which would have to complete the works and operate the station.
There are several operational wastewater treatment plants in Ploiești localities (1200 l/s), Băicoi (27 l/s), Boldești-Scăeni (32 l/s), Plopeni (32 l/s), Bărcănești, Păulești, and Valea Călugărească, all featuring the secondary treatment stage (mechanical and biological). The outlet is Teleajen river (Plopeni, through Teiușului/Văcăriei brook, Boldești-Scăeni).
A number of communes have provided individual solutions for wastewater treatment, generally septic tanks or one-piece modules (e.g. Brazi and Ariceștii Rahtivani). The sewerage networks are old, even older than 40 years, and the rate of wastewater infiltration/seepage into the soil reaches 30-40%. Many old pipes are damaged on their whole sections, and large areas, even in urban settings, are not connected to a sewerage system (e.g. Mitică Apostol district in Ploiești; Tufeni, Țintea, Dâmbu - Băicoi), which generates a high health risk. Moreover, part of the wastewater is discharged directly into the outlet, without being treated. Wastewater of industrial origin is discharged by some economic operators directly into the Prahova, Azuga, and Teleajen rivers, many industrial treatment plants having only a mechanical stage. It must not be ignored the fact that much of the river water, uncollected by separation systems, reaches the treatment plants and causes an increase of their operating costs unreasonably. The treatment plants are also old, the mechanical and biological equipment being outdated and worn-out, leading to the discharge of insufficiently treated water into the outlets. Tertiary stage treatment, which is required for all urban areas with a population equivalent of more than 10,000, has not been implemented yet, and the sludge is not properly stored and treated.
Starting from the above issues, a master plan has been drafted for water and wastewater infrastructure in the localities that are part of the IDA “Prahova Water Partnership” and the proposed operator in order to attract grants through SOP ENVIRONMENT 2007-2013 was S.C. HIDRO PRAHOVA S.A. The financing contract worth 162.7 million EUR, of which 116.5 million EUR from the Cohesion Fund, was signed in 2011. For the urban areas in Ploiești Growth Pole, the foreseen investments are the following:
1. Băicoi urban agglomeration - totaling 10.68 million EUR:
• New chlorination stations at Bobeica, Tufeni tanks, Băicoi Station, and Canton;
• Tufeni tank feed pipelines rehabilitation;
• New main collector (3.8 km) in Băicoi-Plopeni, DN 600-800;
• New wastewater pumping station;
• Network expansion in the localities / districts Băicoi Tufeni, Schela, Liliești, Țintea, Dâmbu (44.5 km);
2. Plopeni urban agglomeration - totaling 8.28 million EUR:
• Wastewater treatment plant construction in Plopeni, with tertiary treatment stage, to serve Băicoi urban agglomeration;
• Extension of the sewerage network by 9 km in Plopeni.
With funds from the state budget, generally through MRDPA programs, several works for the expansion and modernization of water and sewerage network in the city of Băicoi have been completed or are in progress (water supply system, sewerage and treatment plant in Tufeni, Țintea, Dâmbu).
The
Gro
wth
Pol
e’s
Pro
file
Ana
lysi
s of
Dev
elop
men
t N
eeds
and
Are
as o
f In
terv
enti
on
Cha
pter
1.5
. inf
rast
ruct
ure
and
Publ
ic U
tilit
ies
i
1
i204

Annex 1.5.1. covers the regional master plan on water, including the designation of water systems and conurbations/clusters eligible for investment. They concern in particular, the extension of the sewerage network in rural localities that still lack such a public network, but also the extension of the drinking water network.
1.5.3. Waste management
Based on the Environmental Report (EPA 2013), two documents on waste management were drafted in Prahova County:
County waste Management Plan (CwMP 2008), approved by the Decision of the County Council no. 113/30.09.2008, which provides the framework for the development of of EU-funded municipal waste management projects. As well, it optimizes investments and operational costs of municipal waste management at county level and ensures, in the medium and long term, the development of integrated municipal waste management systems, with positive effects on the environment and human health.
The most important objectives of the CWMP are the following:
• extension of waste collection in rural areas that currently lack sanitation services;
• development of separate waste collection systems in order to achieve the recycling targets for packaging waste,
electrical and electronic equipment waste, end-of-life vehicles;
• construction of waste treatment plants in order to achieve the targets for reducing the amount of biodegradable
waste discharged in the storage facilities;
• closing the non-compliant storage facilities and the ecological rehabilitation of the sites;
• construction and operation of new compliant storage facilities.
long term investment Plan for the period 2008-2038 on the integrated waste Management in Prahova county identifies the measures, for a period of 30 years, to be taken for the development of an integrated solid waste management system in Prahova county, in accordance with the legal obligations, by:
• defining a phased program of long-term investments in waste management for the county of Prahova;
• the development of adequate integrated waste management systems to ensure compliance with EU Directives;
• drafting support documents for funding applications;
• drafting procurement plans and tender documentation in accordance with national legislation on public procurement;
• increasing local capacity in the preparation and implementation of projects.
The plan assumes that the rate of waste generation will increase in urban areas by 2020 (from 1.21 kg to 1.32 kg mixed collected waste/inhabitant/day) and will decrease in rural areas (from 0.64 kg to 0.45 kg/inhabitant/day), and the increase of the connection level of the population to sanitation services up to 100% will generate a significant increase in the quantity of waste collected for all categories (household waste collected from population and economic operators, municipal waste, bulky waste from parks, gardens, markets, streets). As regards their composition, it is expected that the share of biodegradable waste will decrease from 58% to 48%, concomitantly with the increase of the plastic one (from 8% to 10.5%), paper and cardboard (from 9 to 10%), mineral, composite, and fiber (15% to 22%), especially due to the wide-scale implementation of selective collection.
The plan proposes, among other things, the following investment objectives relevant for the Growth Pole Ploiești:
• construction of a new storage facility in Ariceștii Rahtivani - Florești area;
• construction of a composting plant in Ploiești (on the location of the former non-compliant storage facility);
• construction of transfer stations at Brazi, Bușteni, and Urlați, including sorting and recycling plants in the last two.
The new storage facility would serve most of the county, less Vălenii de Munte area, Brazi transfer station, Brazi, Berceni, Bărcănești, Târgșoru Vechi communes, Urlați city and Valea Călugărească commune, while the rest of localities of the Growth Pole (Ploiești, Boldești-Scăeni, Plopeni, Bucov, Ariceștii Rahtivani, Dumbrăvești, Păulești, Blejoi) are due to transport waste directly to the Aricești-Florești storage facility, which is equipped with a sorting station.
205

Map 79. Investments for Integrated Waste Management in Prahova County by the year 2038
The
Gro
wth
Pol
e’s
Pro
file
Ana
lysi
s of
Dev
elop
men
t N
eeds
and
Are
as o
f In
terv
enti
on
Cha
pter
1.5
. inf
rast
ruct
ure
and
Publ
ic U
tilit
ies
i
1
i206

As regards waste collection, a dual selective collection system is proposed for 90% of the population, supplemented with voluntary submission points eqipped with 3-bin recyclable fractions. Dual selective collection assumes the implementation of a 2-bin system (a dry one for recyclable waste, a wet one for biodegradable and recyclable waste of poor quality), operating under the “door-to-door” recycling regime. Mixed collection will be allowed only in central areas with high concentration of population. In addition, in rural areas, voluntary submission points of recyclable fractions will be of the “bring centers” - type, with 3 bins, individual composting in households being projected to reach at least 30% of household waste. Mixed collection will be accepted only in very small villages. Waste collection will be done will be done in 120 l and 240 l bins for single and multi-family collection points, 1,100 l containers for multi-family collections points and for institutions and economic operators, 660 l containers for institutions and economic operators with small amounts of waste generated, bell containers for voluntary collection of glass, 1,100 l containers for the voluntary collection of paper and paperboard. The recommended means of transport are the dump trucks of 4 t and 8-12 t.
However, it should be noted that these investments, projected for a more distant time horizon (2038), have changed after the approval of the Plan, since, for 2007-2013, the funds allocated from SOP ENVIRONMENT were assigned to other objectives subordinated to the Integrated Waste Management System (IWMS) Prahova, which are detailed below.
Waste collection is not widespread in the county. In 2013, local authorities and sanitation operators collected household waste from 90% of the urban population and 44.86% of the rural population, which, at the county level, represents an average of 67.43% (according to the preliminary data reported by sanitation operators in the county).
In Prahova county, municipal waste management is carried out in an organized manner by sanitation companies or the local authorities’ own specialized services. The reports received from sanitation companies operating in Prahova County indicated the following quantities of municipal waste collected from households and economic agents in 2013:
table 19. Quantities of municipal waste collected in 2013
Source: Sanitation operators
type of collected waste Quantity of waste (tons)
1. household and similar waste - total, of which: 142,686
- household waste from the population, mixed 107,107
- household and similar waste from economic units, commercial units, offices, institutions, hospitals
32,185
- municipal waste not otherwise specified 1,660
- household waste collected separately (without waste from construction, demolitions) 1,734
2. Municipal services waste - total, of which: 33,007
- street waste 28,053
- market waste 1,820
- garden, park, and green space waste 3,134
3. Construction material waste anddemolition waste 3,558
totAl municipal waste collected 179,251
Municipal waste management
The municipal waste collection is performed by a private company - Rosal. In turn, Boldești-Scăeni landfill (in Ploiești Growth Pole) is administered by another private company - Vitalia. The amount of waste collected in Ploiești in 2012 was about 300 kg/person - the lowest value of the 7 growth poles in Romania. This is the result of several possible causes, such as the low level of socio-economic development, which is directly proportional to the waste generation index, incomplete collection of all the waste or differences in how waste was weighed.
207

In the other localities of Ploiești Growth Pole, collection is done by public or private operators, as follows:
Since 2012, selective waste collection has been introduced in Ploiești. Selective collection was done directly at source, not at the landfill, and impressive results were soon recorded. In 2013, for example, already a quarter of the household waste collected was recycled - one of the best collection rates in all the growth poles (only Cluj-Napoca had a better rate in 2013). For residential buildings, selective collection is done in two ways. City inhabitants are distributed special bags and holders for separate collection of recyclable material and organic waste, and the sanitation operator collects these bags directly from the residents.
In residential buildings, waste is recycled in bags available on each floor. These bags are then collected in special containers located in different locations. Most of these containers are located near residential buildings. In the city, there are 260 selective collection points, where waste such as paper, glass, and plastic can be stored. In addition, there are 39 underground platforms, buried in the ground, only the cover being visible. The residents bring their trash bags to the buried containers, open the covers and throw the bags into the platforms that are several meters deep.
table 20. Sanitation operators in Ploiești Growth Pole by component localities
Source: ANRSC
Buried platforms for solid waste (left) and special containers for selective collection (right)
Source: World Bank. 2013. TRACE:Improving energy efficiency in Ploiești
Component locality operator name ownership
Băicoi S.C. FLORICON SALUB S.R.L. Private
Boldești-Scăeni S.C. VITALIA SERVICII PENTRU MEDIU S.R.L. Private
Plopeni S.C. SERVICII EDILITARE S.R.L. Public
Ariceștii Rahtivani S.C. COMPANIA ROMPREST SERVICE S.A. Private
Bărcănești S.C. ITECOL TEHNICA S.R.L. Private
Berceni S.C. ITECOL TEHNICA S.R.L. Private
Blejoi S.C. VITALIA SERVICII PENTRU MEDIU S.R.L. Private
Brazi S.C. AQUASAL UTILSERV S.R.L. Public
Bucov S.C. ITECOL TEHNICA S.R.L. Private
Dumbrăvești S.C. COMPANIA ROMPREST SERVICE S.A. Private
Păulești S.C. GCL S.A. Public
Târgșoru Vechi S.C. ECO SERVICIUL APĂ CANAL SALUBRIZARE S.R.L. Public
Valea Călugărească S.C. SERVICII SALUBRITATE BUCUREȘTI S.A. Private
The
Gro
wth
Pol
e’s
Pro
file
Ana
lysi
s of
Dev
elop
men
t N
eeds
and
Are
as o
f In
terv
enti
on
Cha
pter
1.5
. inf
rast
ruct
ure
and
Publ
ic U
tilit
ies
i
1
i208

Map 80. List of waste management operators and coverage
209

The selective collection rate is higher at the household level than in residential buildings. The local authority provides incentives to encourage population in residential buildings to separate recyclable waste from the organic one, offering a 20% reduction in the collection tax if the minimum scale of 3.6 kg waste/person/month is reached.
Since 2012, there have been several information campaigns for the population carried out in Ploiești on selective waste collection and separation of plastic bottles, cans, and paper from organic garbage. The population reacted positively to these initiatives, fact proven by the percentage of selective collection in the city. Solid waste collection fee is RON 6/person/month.
The municipal administration is taking steps to address the problem of construction waste originating from construction sites, demolitions and other related activities. Currently, there are no regulations on construction waste and no indication about their storage or about related charges. The local council wants to pass a decision requiring the constructor or construction companies to clearly specify, before beginning construction-related activities, what they intend to do with the waste resulting from construction / demolition and where they are going to store it.
In the other localities in Ploiești Growth Pole, the implementation of selective waste collection is at an early stage, the relevant infrastructure being poor, as well as people’s awareness.
Most municipal waste collected in Prahova county, including those at the level of Ploiești Growth Pole, are transported and landfilled at the compliant storage facility in Boldești-Scăeni city, after the former non-compliant landfills in each city were closed. Since 2001, the ecologic landfill from Boldești-Scăeni, located 15 km away from Ploiești, has been operated by a private company, Vitalia Servicii pentru Mediu - Tratarea Deșeurilor S.R.L. The company owns 15 ha of land, of which 13 ha are cells in which solid waste is landfilled and stored. The landfill has six cells; currently, three of them are full, and one is operating at half capacity.
In total, the ecological landfill can store 3 million tons of garbage; up to now, there have already been deposited 1.2 million tons, the estimated service life being up to 2027. The landfill handles nearly 80% of the waste collected in Prahova county, including waste collected in Ploiești by Rosal. The ecological landfill serves 600,000 people. Approximately 130,000 tons/year are discharged here, and the storage fee is RON 59.22/ton.
Vitalia landfill has the capacity to produce biogas, a project worth 2 million EUR being already implemented for an installed capacity of 0.6 MW, which will subsequently increase to 1 MW. Vitalia plans to invest several other million EUR to produce 6 to 8 MW of electric and thermal energy through a gasification process. The production of a kWh of biogas is cheaper than the production of energy from other renewable sources.
The ecological landfill is one of the most modern and best equipped facilities of its kind in Eastern Europe. All activities of the landfill are automated and are performed using high-tech equipment. Trucks carrying the waste are weighed at the gate and the operator immediately issues documents with the date and amount of the garbage discharged. Waste dumping monitoring is computerized, allowing the company to have accurate records of the amount of landfilled garbage.T
he G
row
th P
ole’
s P
rofi
le
A
naly
sis
of D
evel
opm
ent
Nee
ds a
nd A
reas
of
Inte
rven
tion
C
hapt
er 1
.5. i
nfra
stru
ctur
e an
d Pu
blic
Uti
litie
s
i
1
i210

Vitalia operates the ecological landfill using 6-8 trucks, including a compactor and some large machinery. Currently, there is no sorting station. Such a plant is included in the master plan on solid waste and is to be built near the landfill, with funding from SOP ENVIRONMENT 2007-2013. The landfill has a plant for leachate treatment by reverse osmosis - allowing water treatment - in which the operator has invested about 650.000 EUR, excluding VAT. Leachate treatment plant has a processing capacity of 3 m³/h and a recovery rate of 70%, the remaining 30% being re-injected.
The Prahova integrated waste management system is a complex project of approximately 36 million EUR (excluding VAT), financed by the European Union through the Operational Program Environment 2007-2013. The contract for the solid waste plan was signed in 2013 and includes the following components:
• closing the non-compliant storage facility in Ploiești, with an area of 31 ha, and building waste transfer stations in Bușteni/Sinaia and Urlați.
• building a recyclable waste sorting station in Boldești-Scăeni, with a capacity of 45,000 tons/year;
• building a mechanical and biological treatment plant for biodegradable waste in Ploiești, near the former non-compliant storage facility;
• purchasing IWMS-related equipment to equip member TAUs of IDA with 2-fraction bins, containers for selective collection, composters, etc.;
• procuring technical assistance services for project management, supervision, and checking of works, auditing, advertising.
The system will include components that were completed previously from other funding sources, such as pre-sorting plant in Drăgănești. These works started in 2014 and will be completed during 2016-2017. Investments made under the project will be accompanied by investments from sanitation operators’ own funds, targeting mainly the purchase of collecting equipment and the rest of the bins (20-30% of the total).
Once the investment is completed and the sanitation operators are designated in each area of the county by auction, the solid waste management policy will require that collection and storage charges are accessible to the population, and thus they will be established considering a maximum value. Ploiești Growth Pole is located entirely in zone II of IWMS, so that a single operator will provide sanitation services for a period of 10 years, and the contracts of each local authority with various subordinated or private operators will be terminated.
By 2025, the disposal of waste collected in Prahova county will be done at the two compliant storage facilities in Boldești-Scăeni and Vălenii de Munte, operated by the private company Veolia, respectively by the Company of Public Services and Renewables, a state company subordinated to the county administration. The latter manages the other ecological landfill in the county, located in Vălenii de Munte and established in 2005. This landfill serves less than a quarter of the county population, 48,000 tons of solid waste being deposited there annually. It is equipped with an installation that produces a small amount of energy by the gasification process, but, because the mud flow is not constant, the gas concentration is not very high. The obligation to recover recyclable waste lies with with the operator managing the sorting plants.
For the period 2014-2020, investments for the completion of IWMS are expected, aimed primarily at biogas recovery from the waste mechanical and biological treatment plant in Ploiești. As well, the following could be considered: implementation of the system of underground bins in urban areas, provision of new equipment, and solving the waste disposal problem after 2025, when the storage at Boldești-Scăeni will reach its maximum capacity. Another local problem is the lack of inert waste storage facilities, which could be acquired through public-private partnership.
Public-private partnership (PPP) in the field of solid waste in the county of Prahova is an example that such mechanisms can work in Romania. However, there is more to be done to further improve this area. The PPP model is not working as it should, because the legal framework is deficient and contains provisions that do not clearly define the role of public and private companies and how they should interact. On the other hand, the most challenging factor is the duration of the partnership and its operating period. Banks are not willing to lend money for short-term projects, of 3-5 years, and prefer programs that are spread over a longer period of time.
211

industrial waste management
Economic activities with the largest amounts of waste production in the county are the following:
• gravel and sand extraction;
• manufacture of products from crude oil processing;
• coal mining and preparation;
• electricity production;
• manufacture of machinery for extraction and construction;
• wood sawmilling and planing.
Storage of hazardous and non-hazardous industrial waste
In the county of Prahova, in 2013 there were two operating industrial waste storage facilities:
• one hazardous waste storage facility, located in Ariceștii Rahtivani commune, Târgșoru Nou village, managed by S.C. Ecomaster Servicii Ecologice S.R.L., with a design capacity of 1,576,000 tons and a volume of 985,000 m3, operating in the first place with a 212,000 m3 cell;
• one non-hazardous industrial waste storage facility, located in Băicoi city, managed by S.C. Vitalia Salubritate Prahova S.R.L., with a design capacity of 1,100,000 m3, operating in the first place with a 300,000 m3 cell.
waste generated from medical activities 2013
For 2013, a number of 15 hospitals reported to Prahova County Public Health Department. The amount of (infectious and stinging) medical waste generated by hospitals went up to 170 tons. The final disposal of hazardous medical waste generated by the hospitals in the county is done by incineration in authorized installations.
Another alternative regarding waste treatment is the neutralization by thermal sterilization of medical hazardous waste in the health unit (own equipment), the treated waste (non-hazardous) being stored in the municipal landfill. Such medical waste treatment is performed in the facility owned by Ploiești County Emergency Hospital. The amount of hazardous medical waste collected and incinerated in 2013 went up to 537 tons.
In Prahova county, two companies were authorized in terms of health and environmental protection to carry out the collection and transport of medical waste: S.C. ActisServ S.R.L. Ploiești and S.C. DezinserServ S.R.L. Ploiești.
The
Gro
wth
Pol
e’s
Pro
file
Ana
lysi
s of
Dev
elop
men
t N
eeds
and
Are
as o
f In
terv
enti
on
Cha
pter
1.5
. inf
rast
ruct
ure
and
Publ
ic U
tilit
ies
i
1
i212

1.5.4. Heating system
The heating system in Ploiești is managed by Dalkia Termo Prahova, a private company that owns 87.2% of the Dalkia Romania shares, part of French group Veolia. The remaining 12.8% of the shares are distributed equally between the local authority of Ploiești and Prahova County Council. Dalkia has been responsible for managing the heating system in the city since 2004, when the company signed a 15-year concession agreement with the two institutions mentioned above. The contract, which resulted from and is based on indicators which do not take into account the losses on the network, is valid until 2019 and may be extended after the expiry of the initial period. The company is responsible for the entire process, from production to distribution of heat through a mixed system of electricity and heat. The plant is located in Brazi, 10 km from Ploiești, and, along with the central primary network, is owned by the county administration, while the secondary network is owned by the municipality.
According to the contract signed in 2004 with the local government, Dalkia has to invest 25 million EUR in network modernization and equipment to increase the efficiency of the system. By 2015, the company had already invested 27 million EUR in this regard. For example, the new gas turbine of the Brazi plant was commissioned in 2010, as part of projects worth 53 million RON aimed at increasing the efficiency of heat production. Here are the values of such investments by objectives:
• RON 14 million for investment in the secondary network;
• RON 16 million for investment in the primary network;
• RON 2 million for investment in environmental compliance;
• RON 20 million for investment in improvement;
• RON 30 million for investment in security.
Dalkia supplies heat and hot water for about 57,800 flats in blocks (85% of all apartments in Ploiești) through a number of 2,287 connections, and serves over 100,000 people, i.e. nearly half of the city’s population. In addition, Dalkia supplies heat for more than 30 municipal buildings and about 700 economic operators. Dalkia customer structure is as follows: 66.9% residential customers, 31.65% economic and industrial operators, and only 1.38% public buildings. The company’s industrial customers include prestigious companies, such as OMV Petrom and TIMKEN.
The plant in Brazi has 2 steam turbines x 105 MW, a 50 MW steam turbine, a 25 MW + 29 MW gas turbine, a 1 MW gas engine and 2 MW steam turbine. Usually, turbines operate, on average, 9 months per year and use 600,000 m3 of natural gas for hot water production. In addition, heating units (substations) in Ploiești can produce 475 MW heat. Plants use both natural gas and coal and can use a mixed technique, given that they have the ability to simply switch from one fuel type to another. In winter, natural gas consumption is three times higher than in summer. It should be noted that Brazi plant is directly connected to TRANSGAZ distribution infrastructure and has its own plant for regulating and metering gas pressure.
The length of the primary network is 62 km, of which 62% is underground and 38% is at surface. The length of the secondary network is 92 km. Most of the network was built in the 60s. So far, half of the 88 substations in the city were modernized with EBRD financing.
Replacing eight kilometers of pipelines in 2004 contributed to the significant improvement of the efficiency of the system starting with that year, requiring 30% less natural gas. Before finalizing the program for increasing system efficiency, 300 m3 were needed to produce one Gcal of heat, compared to only 200 m3 currently required. It also reduced the consumption of water and electricity. From 2005 to 2010, hot water consumption decreased by 50%, from 250,000 tons/year to approximately 100,000 tons/year. Similarly, electricity consumption has reduced significantly, from 100,000 MWhe in 2005 to 60,000 MWhe in 2010.
Energy savings and low fuel consumption contributed to the improvement of the heating system performance, including the boilers and turbines. For example, turbine performance in the cold weather increased from 36.8% in 2004 to 43% in 2010, while thermal power supply increased from 94.02% in 2004 to almost 100% in 2011. At present, the central heating system can lead to an efficiency of 75% when outside temperature is 0°C, and 76% when the temperature increases to 4°C. The maximum temperature of hot water is 110°C.
213

Figure 68. Price of Gcal supply and billing at the growth poles’ level in Romania in January 2015
Source: ANRSC
600
500
400
300
200
100
0
Supply-level price
Bill-level price
Const
anța Iaș
i
Tim
ișoar
a
Ploieș
ti
Craiov
a
Braș
ov
Bucur
ești
Cluj-N
apoc
a
In this context, the heating system of Ploiești is is attractive, succeeding to remain competitive, managing to stay competitive as compared with the trend noted in other growth poles (Cluj-Napoca, Brașov, Iași) where people disconnect from the centralized system and installing individual heating plants, which operate with natural gas.
Figure 69. Number of apartments connected to the district heating system at the level of growth poles in Romania in January 2015
Source: ANRSC
The heat is distributed during the cold season, about five months a year, and is only provided if the temperature drops to 10°C for three consecutive nights. Hot water/heat distribution is done vertically. In this case, if a client (apartment) does not pay the bill on time (the claims recorded by the company amount to about RON 2 million/year), the whole building may be affected, including residents who paid their bills. The company may disconnect the building from the district heating network, heat and hot water supply being cut off in all apartments until the remining bills are paid. On the other hand, the implementation of horizontal distribution, in addition to the high cost of investment, raises risks of energy losses, in which case it would impose a binomial price. About 20-30% of the buildings in the city now have individual heat consumption metering systems and all the connections are metered by the company.
The thermal rehabilitation of hundreds of apartments in Ploiești has contributed to maintaining a high level of comfort in old residential buildings, where, in the past, residents were suffering from cold and used to receive heat and water service of poor quality.
90 000
80 000
70 000
60 000
50 000
40 000
30 000
20 000
10 000
0
Const
anța
Tim
ișoar
a
Craiov
a
Ploieș
ti Iași
Apartments
Cluj-N
apoc
a
Braș
ov
The
Gro
wth
Pol
e’s
Pro
file
Ana
lysi
s of
Dev
elop
men
t N
eeds
and
Are
as o
f In
terv
enti
on
Cha
pter
1.5
. inf
rast
ruct
ure
and
Publ
ic U
tilit
ies
i
1
i214

However, despite the efforts to improve efficiency and maintain heat price at the lowest level in Romania, Ploiești heating network is facing a number of difficulties. The main problem is the heat loss due to leakage of hot water from the network. At present, technical and commercial losses in the network are estimated at 25%. However, compared to most cities in Romania, including other growth poles, such as Brașov and Cluj-Napoca, Ploiești is doing much better in this respect.
Figure 70. Amount of heat (Gcal) produced at the CET limit and sold in Ploiești
Source: DALKIA TERMO PRAHOVA
Heat losses affect the collection of heat and hot water bills. The main losses are those in the network and are caused by the age of the pipes. Although the network has an average age of 32.3 years, a younger age compared to other systems in the country, the pipes are made of low quality materials. Although the company has invested millions of EUR in various programs to improve the efficiency of the system, the problem of network losses is still unresolved. Dalkia Termo Prahova has implemented a SCADA system, but this tool cannot identify network problems. Last evaluation of losses in the pipelines was performed in 2010.
Although locally there are only about 300 official disconnections from the centralized network/year, they increase environmental risks and overcharge the bills of the other residents who remain connected to the system, due to thermal imbalances, given that the current legislation does not impose restrictions regarding the disconnection from these systems.
In this context, an investment plan for the district heating network in Ploiești has been developed for 2025, targeting projects worth more than 100 million EUR for the modernization of the primary and secondary heat network. Other solutions using biomass and similar renewable resources for the production of heat and electricity could be added.
800 000
700 000
600 000
500 000
400 000
300 000
200 000
100 000
0Produced Sold
2010
2011
2012
2013
2014
215
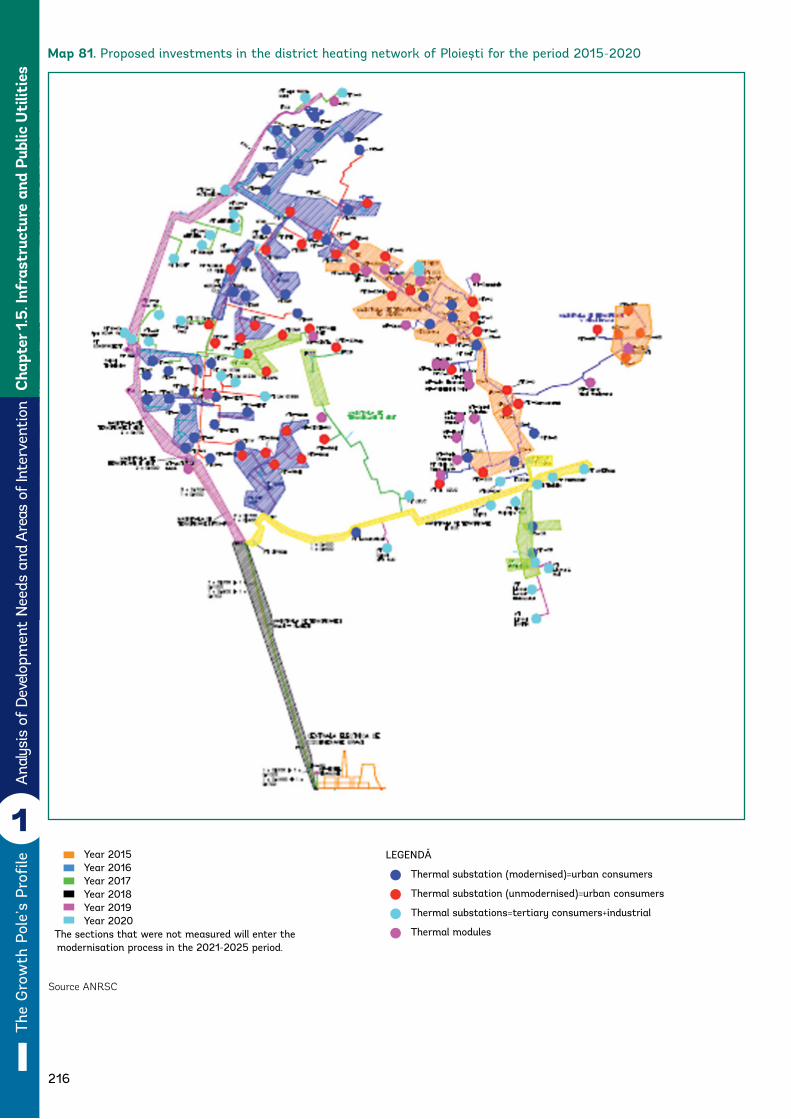
Map 81. Proposed investments in the district heating network of Ploiești for the period 2015-2020
Source ANRSC
Year 2015Year 2016Year 2017Year 2018Year 2019Year 2020
The sections that were not measured will enter the modernisation process in the 2021-2025 period.
LEGENDĂ
Thermal substation (modernised)=urban consumers
Thermal substation (unmodernised)=urban consumers
Thermal substations=tertiary consumers+industrial
Thermal modules
The
Gro
wth
Pol
e’s
Pro
file
Ana
lysi
s of
Dev
elop
men
t N
eeds
and
Are
as o
f In
terv
enti
on
Cha
pter
1.5
. inf
rast
ruct
ure
and
Publ
ic U
tilit
ies
i
1
i216

1.5.5. Completed / ongoing projects
During 2007-2013, works for the extension and rehabilitation of the water and wastewater (including treatment) infrastructure were started in Băicoi and Plopeni agglomerations. They amounted to more than EUR 20 million and were co-financed through SOP ENVIRONMENT 2007-2013. In addition, funds from the government and from private operators were allocated for the same purpose for the cities of Ploiești and Băicoi, but also for a part of the rural areas. Ploiești local authority has performed with its own funds works for the expansion and modernization of the water supply and sewerage network in several areas of the city, most of them being directed to the following districts: Bereasca, Mihai Bravu, Peneș Curcanul, Malu Roșu, Gh. Doja, Râfov, and Găgeni,
For the period 2014-2020, the Master Plan for Water-Sewerage of Prahova county provides investments for the expansion of the related infrastructure, especially in the rural parts of the Growth Pole that lack water and sewerage networks or where such networks cover their area only partially, so that all agglomerations of over 2,000 p.e. should be connected by 2018. In this respect, the European funds will be accessed through LIOP 2014-2020, NRDP 2014-2020, but state-budget funds will also be available through programs as NLPD.
In the field of integrated waste management, investments of around EUR 43 million, including EU co-financing through SOP ENVIRONMENT 2007-2013, are currently under implementation. They are targeted towards the construction of transfer stations (Boldești-Scăeni), sorting stations (Boldești-Scăeni), garbage composting plants (Boldești-Scăeni), mechanical and biological treatment plants (Ploiești), greening of the former non-compliant storage facility in Ploiești , and the purchase of equipment and vehicles for waste collection. In parallel, sanitation operators have invested in the improvement of transport and collection infrastructure and in the implementation of selective collection, and the company that owns the compliant storage facility in Boldești-Scăeni invested capital in order to use better the waste, including for energy purposes (biogas). During 2014-2020, the County Master Plan in the field of waste is aimed at additional investments supplementing the integrated system with new stations for water transfer and compaction, new storage facilities, purchase of equipment for increasing the share of waste collected selectively.
Currently, an investment for the establishment of the West Municipal Park, worth over RON 50 million and co-financed from ROP 2007-2013, is under implemented. At the end of the project, the park will have an area of 50 hectares and will become a major attraction for the residents of the Growth Pole. As well, the municipal authority allocated annually from the local budget considerable amounts for planning, modernizing, and maintaining green areas, most of them being directed to to “Constantin Stere” Memorial Park from Bucov (over EUR 2 million after 2007), and Tineretului Park, “Toma Caragiu” Park, Câineni Park, etc. Moreover, significant funds from the local budgets were allocated for the development and upgrading of playgrounds (streets: Cameliei, Mărășești, Sala Sporturilor, București Blv., Dendrological Park, Cibinului Str., Mihai Bravu Str., Malu Roșu area, Modern Park, Republicii Blv., etc.).
The public lighting system has undergone a comprehensive upgrading after 2000, when about 75% of the infrastructure (poles, lamps, consoles, overhead lines, flash points, etc.) were replaced with local-budget funds by the operator that received in concession the management of the system from the municipal authority.
The private operator managing the municipal district heating system has invested in the last 15 years more than EUR 27 million in Brazi plant, but also in primary and secondary networks, these amounts being allocated from its own budget. Future plans aim to replace the very old network, which generates significant losses.
217

1.5.6. Conclusions - existing disparities, trends, needs, and areas of intervention
Public utilities
The water supply and sewerage network has continuously expanded in recent years, against the background of the investments made with EU, state-budget, and local funds. The most important water network expansions were noted in Băicoi city (+26 km) and in Blejoi (21 km), Berceni (20 km), Păulești (18 km), Ariceștii Rahtivani (15 km), and Bucov (14 km) communes. Consumers in the area also enjoy quality drinking water sources, and the public-private partnership in the field of public utilities has proved to be a success to be followed in the case of Ploiești.
However, the urban network is outdated and generates significant losses, besides the fact that it generates significant losses and provides a lower level of consumer satisfaction, having as well a negative impact on the environment. Moreover, some urban districts, even in Ploiești (e.g. Mitică Apostol), and its surrounding villages do not have public water supply and/or sewerage systems. In new residential areas, the infrastructure is poor, the owners sometimes being forced to bear the cost of extending utilities on their own or to seek individual solutions.
Incompletely treated wastewater is discharged into the outlets, as most of the treatment plants are able to cover only the mechanical and biological stages. Moreover, because of the lack of systems for separate collection of rainwater, floods are generated or the rainwater reaches treatment plants and leads to unnecessary increases in their operating costs, ultimately borne by consumers.
At present, three communes from the Growth Pole still lack a sewerage system (Berceni, Dumbrăvești, and Târgșoru Vechi), in two of them the network is limited to 1-2 km (Bărcănești, Ariceștii Rahtivani), the only satisfactory situation being in communes that received grants (Bucov) or state-budget funds (Brazi) for such investments.
The Master Plan for Water and Sewerage provides investments in the areas that are not covered by public utility networks. They are co-financed through EU and national programs and aim at achieving the targets set by the EU Directives in the field by 2018.
As regards waste management - waste is transported and landfilled at the compliant storage facility in Boldești-Scăeni city, after the former non-compliant landfills in each city were closed. All cities have sanitation operators, the one in Ploiești proving to be very active in implementing selective waste collection measures, the relevant infrastructure being one of the most advanced in Romania.
However, the population and economic agents still have a low level of awareness regarding the importance of selective waste collection and some of the county’s integrated system links are not operational yet (transfer, sorting, individual composting, storage and recovery facilities, including construction waste, etc.), especially in rural areas and small towns. In addition, the existing storage facility will be extended or a new location must be sought for such an operation around the metropolitan area. Such investments are foreseen in the County Master Plan for Waste Management on on the 30-year horizon.
The local heating system is one of the most developed in Romania in terms of modern production capacities (including cogeneration), number of consumers and supply price, this being the result of a successful partnership with a private partner. However, the primary and secondary network is outdated, resulting in significant losses (up to 25% of the amount of energy produced) and additional costs, low-level services for consumers and even environmental risks. In this regard, investment is needed for the following: upgrading the network, connections, implementation of new solutions to reduce costs, in decreasing the environmental impact of thermal power generation etc.
The
Gro
wth
Pol
e’s
Pro
file
Ana
lysi
s of
Dev
elop
men
t N
eeds
and
Are
as o
f In
terv
enti
on
Cha
pter
1.5
. inf
rast
ruct
ure
and
Publ
ic U
tilit
ies
i
1
i218

Map 82. Public utilities
219

Green spaces
Despite the increase of local investment, the lack of green and leisure spaces is one of the most urgent problems in Ploiești and also in other towns around it. Large residential complexes have not been provided with generous green spaces, and the existing ones are not properly planned. Also, leisure places in the area are not properly used (see the forests in Plopeni or the salt lakes in Băicoi), which could become touristic attractions for locals and visitors.
In order to comply with the European standards, new green areas, sports and leisure spaces have to be arranged, covering at least 200 ha, and a green cadastre of the cities has to be developed in order to ensure a more effective management of these surfaces.
The
Gro
wth
Pol
e’s
Pro
file
Ana
lysi
s of
Dev
elop
men
t N
eeds
and
Are
as o
f In
terv
enti
on
Cha
pter
1.5
. inf
rast
ruct
ure
and
Publ
ic U
tilit
ies
i
1
i220

Map 83. Green spaces. Protection forests and parks
221

Annex 1.5.1 Water-Sewerage system in Prahova County
Map 84. Proposal - Water Master Plan - Ploiești Growth Pole
i
The
Gro
wth
Pol
e’s
Pro
file
Ana
lysi
s of
Dev
elop
men
t N
eeds
and
Are
as o
f In
terv
enti
on
Cha
pter
1.5
. inf
rast
ruct
ure
and
Publ
ic U
tilit
ies
i
1
i222

Map 85. Proposal - Sewerage Master Plan - Ploiești Growth Pole
223

i
The
Gro
wth
Pol
e’s
Pro
file
Ana
lysi
s of
Dev
elop
men
t N
eeds
and
Are
as o
f In
terv
enti
on
Cha
pter
1.5
. inf
rast
ruct
ure
and
Publ
ic U
tilit
ies
i
1
i
Map 86. Proposal for investments in water infrastructure through ‘Large Infrastructure’ Operational Program and ongoing projects through the National Local Development Program
(NLDP), the National Rural Development Program (NRDP) and the Environment Fund
224

Map 87. Proposal for investments in sewerage infrastructure through ‘Large Infrastructure’ Operational Program and ongoing projects through the National Local Development Program
(NLDP), the National Rural Development Program (NRDP) and the Environment Fund
225

Map 88. Prioritization of water supply projects - Ploiești Growth Pole
i
The
Gro
wth
Pol
e’s
Pro
file
Ana
lysi
s of
Dev
elop
men
t N
eeds
and
Are
as o
f In
terv
enti
on
Cha
pter
1.5
. inf
rast
ruct
ure
and
Publ
ic U
tilit
ies
i
1
i226

Map 89. Prioritization of sewage projects - Ploiești Growth Pole
227

229
ChAPter 1.6.
Public Services and housing
PArt I: the Growth Pole’s Profile
1Analysis of Development needs and Areas of intervention

1.6. Public Services and housing1.6.1. The housing stock
Residential areas (intended for both multifamily and individual habitation) and the related facilities (education, health, small trade, places of worship, etc.) take up the largest share of a city’s structure. They have usually developed along the major routes connecting the city with the new industrial areas. As regards the quality of housing conditions, two categories can be discerned:(a) houses in central and adjacent areas (ex. Centre, Traian, Ploiești Sud, Democrației, Dorobanți, Mihai Bravu, Văleni), characterized by an urban typology, where architectural layouts are generally more functional, the buildings are more generously sized and connected to all available utilities – power, water, sewage, gas, phone;(b) detached houses in the suburban neighborhoods, many with a rural character, lacking proper infrastructure and facilities (no sewage and gas, sometimes not even water), which were and are still inhabited by low- to middle-income residents (e.g. Bereasca, Bărcănești, Moțoi, Râfov, Mimiu, Pictor Rosenthal, Buda).
As regards the periurban area, it has a rural character and features residential areas comprising mainly of detached houses, quite uniform in aspect and layout. In the period of rural systematization (from the 1960s up to the 1990s), there were few interventions, some low- to medium-height dwellings emerging in Bărcănești and Brazi communes.
After 1990, since Ploiești lacked sufficient available free land, the drive to expand residential areas was reflected by the emerging complexes of detached houses, located in periurban areas following the extension of built-up areas of the relevant communes, mainly in norther areas, in Blejoi, Păulești, and Bucov communes. In the post-2004 period of the real estate boom, the residential complexes in the vicinity of Ploiești city have begun to shift towards multifamily rather than individual housing. The new buildings have an urban character, with a habitation quality typically superior to the existing one, and an occupancy rate of detached houses usually below 40-45%.
The
Gro
wth
Pol
e’s
Pro
file
Ana
lysi
s of
Dev
elop
men
t N
eeds
and
Are
as o
f In
terv
enti
on
Cha
pter
1.6
. Pub
lic S
ervi
ces
and
hou
sing
i
1
i230

Map 90. Number of residential buildings according to construction year and census sectors in Ploiești municipality
231

At the end of 2013, the housing stock of Ploiești Growth Pole amounted to 133,882 dwellings as per the NIS estimates, showing a 4.5% increase as compared with 2007, and a 0.7% increase as compared with the General Population and Housing Census data of 2011 (exhaustive data), due to the construction of new, mainly detached-type dwellings. Out of these, 90,487 (67.6% of the total) were located on the administrative territory of Ploiești municipality.
Source: Own diagram based on NIS, RGPL data, 2011
The
Gro
wth
Pol
e’s
Pro
file
Ana
lysi
s of
Dev
elop
men
t N
eeds
and
Are
as o
f In
terv
enti
on
Cha
pter
1.6
. Pub
lic S
ervi
ces
and
hou
sing
i
1
i232

Figure 71. Distribution of the housing stock by component localities in Ploiești Growth Pole in 2013
Source: NIS, the TEMPO Online database
Of the existing dwellings in Ploiești Growth Pole, 87.1% are permanent, 11.5% secondary, and 1.4% are holiday houses, located usually in more scenic areas, such as Dumbrăvești. Around 10.1% of the dwellings in Ploiești municipality are secondary homes, particularly those located in blocks of flats, many residents living actually in the surrounding rural localities, where they built or purchased more spacious homes, or in other cities or countries, where they work.
Map 91. Number of unoccupied dwellings by census sectors in Ploiești municipality
Ploiești
Băicoi
Boldești-Scăeni
Plopeni
Ariceștii Rahtivani
Bărcănești
Berceni
Blejoi
Brazi
Bucov
Dumbrăveşti
Păulești
Târgșoru Vechi
Valea Călugărească
3%
3%
3%
5%68%
2%2%1%3%
2%2%
2%2%
2%
Source: Own diagram 233

The housing stock dynamics in the 2007-2013 period mirrors a clear suburbanization phenomenon, reflected in the increasing number of homes built in the city’s surrounding communes. Thus, while the total housing stock of Ploiești municipality increased by merely 2.3% after 2007, the growth rate in Blejoi, Târgșoru Vechi, Păulești, Bucov, and Ariceștii Rahtivani communes ranged between 10.4% and 31.9%. These localities are part of Ploiești metropolitan area and are relatively easily accessible. As well, land prices are much lower than in the inner city area, which makes them much more attractive for building housing complexes. Moreover, these areas have plenty of available land for residential expansion as compared with Poliesti city, which already has a high housing density.
A total of 4,144 dwellings have been built during the 2007-2013 period in Ploiești Growth Pole, of which only 1,270 (30.6%) in Ploiești municipality itself, and nearly 3,000 in the neighboring localities. Only 228 of these have been built from public funds, being mainly ANL rental homes. After 2010, the number of completed dwellings dropped against the background of the global economic recession and financial crisis, which took a heavy toll on the real estate market.
Figure 72. Dwellings in Ploiești Growth Pole according to current status by localities
Figure 73. Housing stock dynamics of Ploiești Growth Pole in the 2007-2013 period
Source: NIS, the General Population and Housing Census 2011 – Final results
Source: NIS, the TEMPO Online database
Ploieș
ti
Bărcă
neșt
i
Boldeș
ti-Scă
eni
Plopen
i
Bercen
i
Ariceș
tii R
ahtiv
ani
Păule
ști
Dumbră
veșt
i
Târgș
oru V
echi
Valea
Călu
gărea
scă
Growth
Pole
Băicoi
Blejoi
Brazi
Bucov
100%
90%
80%
70%
60%
50%
40%
30%
20%
10%
0
Holiday houses
Secondary homes
Permanent homes
Ploieș
ti
Bărcă
neșt
i
Boldeș
ti-Scă
eni
Plopen
i
Bercen
i
Ariceș
tii R
ahtiv
ani
Păule
ști
Dumbră
veșt
i
Târgș
oru V
echi
Valea
Călu
gărea
scă
Metrop
olita
n Zon
eBăic
oiBlej
oiBra
zi
Bucov
2013 vs 2007 (%)
140
120
100
80
60
40
20
0
The
Gro
wth
Pol
e’s
Pro
file
Ana
lysi
s of
Dev
elop
men
t N
eeds
and
Are
as o
f In
terv
enti
on
Cha
pter
1.6
. Pub
lic S
ervi
ces
and
hou
sing
i
1
i234

Map 92. Housing stock dynamics
235

Ploieș
ti
Bărcă
neșt
i
Boldeș
ti-Scă
eni
Plopen
i
Bercen
i
Ariceș
tii R
ahtiv
ani
Păule
ști
Dumbră
veșt
i
Târgș
oru V
echi
Valea
Călu
gărea
scă
Băicoi
Blejoi
Brazi
Bucov
300
250
200
150
100
50
0
2007
2008
2009
2010
2011
2012
2013
Figure 74. New home building rates by localities in the 2007-2013 period
Figure 75. Structure of Ploiești Growth Pole’s housing stock by localities, according to number of rooms
Source: NIS, the TEMPO Online database
Source: NIS, the General Population and Housing Census 2011 – Final results
Of the total dwellings in the Growth Pole, 98.5% are under private ownership, 1.2% under public ownership, and 0.3% are owned by religious orders under common or cooperative ownership schemes. Out of the total 1,596 publicly owned dwellings, 1,092 are located in Ploiești municipality, most of them consisting in rental homes for young people or social housing (the nursing homes of the Teleajen, Mihai Bravu, Râfov districts and Rafinorilor street, which provide accomodation for more than 600 people). These numbers are completely insufficient as compared with the number of applications for social housing (300, of which only 100 are priority applications) and the number of applications for ANL housing (more than 1,500), which cannot be resolved in their totality. In addition, more than 1,400 young people submitted applications for home building land in Tineretului district, while the municipality has 100 times less available lots. Projects for youth housing in partnership with ANL are currently being implemented in Cosminele Street (21 mortgaged homes) and Libertății Street (100 apartments). Moreover, there are plans for the building of a district of mortgaged homes in the town of Plopeni, a 30 apartment block in Păulești commune, and the rehabilitation of a former social housing complex in Valea Călugărească commune.
As regards the number of living quarters, most of the homes in Ploiești Growth Pole have 2 and 3 rooms, particularly in Ploiești and Plopeni (around 80% of the total homes), where the prevailing homes consist in small low-comfort apartments in blocks built in the Communist period. Moreover, nearly 20% of the dwellings in Plopeni have a single room (studios), as they were built for the unmarried workers from Plopeni Mechanical Plant. However, in communes with new residential areas made up of more spacious houses and villas and in some localities with older housing stock, but with prevailing detached houses, homes with at least 4 rooms are prevalent (Blejoi, Păulești, Târgșoru Vechi, Berceni – more than 40% of the entire housing stock).
Growth Pole
Valea Călugărească
Ariceștii Rahtivanii
Dumbrăveşti
Plopeni
Boldești-Scăeni
Băicoi
Târgșoru Vechi
Păulești
Bucov
Brazi
Blejoi
Berceni
Bărcănești
Ploiești
0% 20% 40% 60% 80% 100%
1 room
2 rooms
3 rooms
4 rooms
Over 4 rooms
The
Gro
wth
Pol
e’s
Pro
file
Ana
lysi
s of
Dev
elop
men
t N
eeds
and
Are
as o
f In
terv
enti
on
Cha
pter
1.6
. Pub
lic S
ervi
ces
and
hou
sing
i
1
i236

The average useful floor space grew significantly in the 2007-2013 period, from 39.6 m2/home to 48.9 m2 (+23.5%). This increase was due to the building of new, more spacious dwellings (mainly new, detached houses), and to the extension and modernization of existing homes.
Figure 76. Average useful floor area of dwellings in Ploiești Growth Pole, 2007-2013
Source: NIS, TEMPO Online database
The most spacious dwellings can be found in localities where the housing stock has been renewed recently: Păulești, Blejoi, Târgșoru Vechi (with more than 55 m2/house). On the contrary, the least spacious dwellings are found in Plopeni, where the housing stock mainly consists in multifamily housing – blocks of flats with low living standards, built during the communist period. The average area of dwellings in Ploiești municipality is 48.2 m2.
Figure 93. Average useful floor area (m2) of dwellings in Ploiești municipality, by census sectors
Source: Own diagram based on NIS, RGPL data, 2011
60
50
40
30
20
10
0
2007
2008
2009
2010
2011
2012
2013
Useful floor areas (m2)
237

Figure 77. Average useful floor area of dwellings in Ploiești Growth Pole (m2) in 2013
Source: NIS, TEMPO Online database
Around 84.7% of the dwellings in Ploiești Growth Pole consist in single households, (being implicitly single-family houses), in 12.9% there aren’t any households (since they are not permanent homes), and 2.4% accommodate two or more households.
Ploieș
ti
Bărcă
neșt
i
Boldeș
ti-Scă
eni
Plopen
i
Bercen
i
Ariceș
tii R
ahtiv
ani
Păule
ști
Dumbră
veșt
i
Târgș
oru V
echi
Valea
Călu
gărea
scă
Ploieș
ti Met
ropoli
tan Z
one
Băicoi
Blejoi
Brazi
Bucov
80
70
60
50
40
30
20
10
0
Figure 78. Distribution of the housing stock in Ploiești Growth Pole according to households per housing unit
Source: NIS, General Population and Housing Census 2011 – Final results
Growth PoleValea
Călugărească
Ariceștii Rahtivanii
Dumbrăveşti
Plopeni
Boldești-Scăeni
Băicoi
Târgșoru Vechi
Păulești
Bucov
Brazi
Blejoi
Berceni
Bărcănești
Ploiești
0% 20% 40% 60% 80% 100%
No household
1 household
2 household
3 household
4 household
As regards the building permits issued at the level of the Growth Pole, their number dropped by more than 40% after the peak 2008, against the background of the global economic and financial recession. Most of the current building permits contiune to be issued for Ploiești municipality and Bucov, Păulești and Târgșoru Vechi communes.
The
Gro
wth
Pol
e’s
Pro
file
Ana
lysi
s of
Dev
elop
men
t N
eeds
and
Are
as o
f In
terv
enti
on
Cha
pter
1.6
. Pub
lic S
ervi
ces
and
hou
sing
i
1
i238

Out of the total dwellings in Ploiești Growth Pole, 83.4% are single-storey, 15.5% have between 1 and 4 storeys, and 1.1% have more than 4 storeys. The localities featuring more P+1 dwellings (above 20% of the total) are Blejoi and Păulești, following the development of new residential districts with villa-type buildings (P+1). In total, the Growth Pole has 3,422 blocks of flats, out of which 2,781 have no more than 4 storeys, and 641 have 5 and more storeys. They are prevalent in Ploiești (2,899 blocks of flats), Plopeni (154), Boldești-Scăeni (60), Băicoi (58), Valea Călugărească (55), Bucov (34), Bărcănești (16), Brazi (13), these localities being the most affected by the forced systematization, industrialization, and urbanization during the communist period.
Figura 79. Number of building permits issued at the level of Ploiești Growth Pole in the 2007-2013 period
Source: NIS, TEMPO Online database
1000
900
800
700
600
500
400
300
200
100
02007 2008 2009 2010 2011 2012 2013
Figure 94. Share of single-storey buildings in Ploiești municipality by census sector, 2011
Source: Own diagram based on NIS, RGPL data, 2011
239

Blocks of flats with more than 5 stories are found in Ploiești municipality alone, where large complexes of block of flats were built during the communist period, including high-rise buildings. However, 77.5% of the city’s residential buildings are single-storey (detached houses), 10.4% are P+1 (more than 2,300 villas), and 12.1% are blocks of flats (2,899), of which 2,262 3 or 4-storey blocks and 637 blocks with more than 5 storeys. Together, these blocks include more than 72,000 dwellings (80% of Ploiești municipality’s total housing stock) and should be prioritized for thermal and structural rehabilitation works, as they refer to a large number of people and dwellings, many of the latter being exposed to seismic risk (those built before 1977) and having low energy efficiency and degraded façades.
Ploieș
ti
Bărcă
neșt
i
Boldeș
ti-Scă
eni
Plopen
i
Bercen
i
Ariceș
tii R
ahtiv
ani
Păule
ști
Dumbră
veșt
i
Târgș
oru V
echi
Valea
Călu
gărea
scă
Băicoi
Blejoi
Brazi
Bucov
100%
90%
80%
70%
60%
50%
40%
30%
20%
10%
0
Over 10 storeys
8-10 storeys
5-7 storeys
1-4 storeys
Ground floor
Figure 80. Structure of the residential buildings in Ploiești Growth Pole by localities, according to number of storeys
Source: NIS, the General Population and Housing Census 2011 – Final results
The
Gro
wth
Pol
e’s
Pro
file
Ana
lysi
s of
Dev
elop
men
t N
eeds
and
Are
as o
f In
terv
enti
on
Cha
pter
1.6
. Pub
lic S
ervi
ces
and
hou
sing
i
1
i240

Figure 81. Residential buildings in Ploiești Growth Pole according to building materials used for exterior walls, by localities
Source: NIS, the General Population and Housing Census 2011 – Final results
With regard to the building materials of outer walls, one may notice that most of the residential buildings that are made of low-quality and hazard-vulnerable materials are found in rural localities (Dumbrăvești, Valea Călugărească, Bucov), as well as in the towns of Boldești-Scăeni and Băicoi, with a relatively old housing stock, mainly consisting in dwellings constructed in the first half of the 20th century. On the other hand, dwellings that are made of durable materials (concrete, concrete prefabricates, brick, stone) are prevalent in localities with new housing stocks built either during the communist or post-revolution period, such as Ploiești, Plopeni, Bărcănești, Blejoi, Brazi, Târgșoru Vechi, Păulești (more than 60% of the buildings). Altogether, 24.1% of the residential buildings in Ploiești Growth Pole are built with low-quality materials, this share being lower for Ploiești municipality (16.8%).
Out of the total current residential buildings of Ploiești Growth Pole, 3.1% have been built before 1919, 12.5% between 1919 and 1945, 20.7% between 1945 and 1960, 21.5% between 1961 and 1970, and 42.2% after 1970. Thus, the average age of residential buildings in this area is more than 50 years. Moreover, 65.5% of these buildings were built before the 1977 earthquake, meaning they were not designed to resist to large-magnitude earthquakes, particularly as Ploiești municipality lies in the most earthquake-prone area of Romania, next to the cities of Buzău and Focșani, which however have a newer building stock.
NA
Mixed materials
Other materials
Adobe
Wood
Brick and stone on wooden structure
Brick and stone on concrete structure
Concrete prefabricates
Beton armat
Ploieș
ti
Bărcă
neșt
i
Boldeș
ti-Scă
eni
Plopen
i
Bercen
i
Ariceș
tii R
ahtiv
ani
Păule
ști
Dumbră
veșt
i
Târgș
oru V
echi
Valea
Călu
gărea
scă
Băicoi
Blejoi
Brazi
Bucov
100%
90%
80%
70%
60%
50%
40%
30%
20%
10%
0
241

Map 95. Areas with peak land acceleration for earthquakes with ARI (average recurrence interval) = 100 years
Source: UTCB
In Ploiești, more than 100 blocks of flats are built before the 1977 earthquake, most of them being located in the northern area (Cameliei and Nordului streets), southern area (Mihai Eminescuand Jianu streets) and central area (Independenței Boulevard, the west side of the Civic Center). They risk to be destroyed by the first earthquake above 7 degrees on the Richter scale. Although the surveying of seismic risk buildings began 20 years ago, only 49 blocks of flats have gone through this procedure so far, 31 being included in the Ist class of seismic risk (some representing a public hazard) and 18 in the classes II-IV. Only one building of this sort has been rehabilitated under a MRDPA program.
With the exception of Blejoi, Păulești, and Târgșoru Vechi communes, where 50% of the housing stock has been built in the last 20 years following the emergence of the sub-urbanization process, the remaining localities of Ploiești Growth Pole feature mainly detached or multifamily buildings built in the communist period. The interwar or pre-war buildings take a larger share (more than 20% of the total) in Ploiești municipality only, which has a longer urban tradition and has developed better in that period.
The
Gro
wth
Pol
e’s
Pro
file
Ana
lysi
s of
Dev
elop
men
t N
eeds
and
Are
as o
f In
terv
enti
on
Cha
pter
1.6
. Pub
lic S
ervi
ces
and
hou
sing
i
1
i242

Figure 96. Share of residential buildings constructed during communist years in Ploiești municipality by census sectors
Source: Own diagram based on NIS, RGPL data, 2011
Figure 82. Residential buildings in Ploiești Growth Pole by localities and construction year
Source: NIS, the General Population and Housing Census 2011 – Final results
Overall, one may say that the advanced age of the Growth Pole housing stock raises living quality and safety issues and requires consolidation works, particularly for the pre-1977 buildings, whether houses or blocks of flats.
Ploieș
ti
Bărcă
neșt
i
Boldeș
ti-Scă
eni
Plopen
i
Bercen
i
Ariceș
tii R
ahtiv
ani
Păule
ști
Dumbră
veșt
i
Târgș
oru V
echi
Valea
Călu
gărea
scă
Băicoi
Blejoi
Brazi
Bucov
100%
90%
80%
70%
60%
50%
40%
30%
20%
10%
0
No data
After 1990
1971-1990
1961-1970
1945-1960
1919-1945
Before 1919
243

At the 2011 census, 96.7% of the dwellings in Ploiești Growth Pole had available drinking water supply, of which 92.9% from the public network, and 3.8% from own systems. However, 6.6% of these did not have en-suite water supply – only in-building and outdoor water supply systems. Most of the dwellings without water supply were found in the communes of Valea Călugărească (19.9% of the total), Dumbrăvești (17%), Bărcănești (14.7%), Târgșoru Vechi (12.5%), and Bucov (11.9%). Only 835 dwellings without water supply were recorded in Ploiești municipality, i.e. just 0.9% of the total, together with other 1,572 dwellings with in-building or outdoor water systems, and 654 dwellings with own water supply systems. The central drinking water supply system served 87,187 dwellings (96.6 of the city’s housing stock).
Map 97. Number of dwellings without running water by census sectors in Ploiești municipality
Source: Own diagram
The
Gro
wth
Pol
e’s
Pro
file
Ana
lysi
s of
Dev
elop
men
t N
eeds
and
Are
as o
f In
terv
enti
on
Cha
pter
1.6
. Pub
lic S
ervi
ces
and
hou
sing
i
1
i244

On the other hand, the 2011 census further showed that 90.1% of the dwellings in Ploiești Growth Pole were connected to the sewerage network, out of which 68.8% to the public network, and 21.3% to private networks. The highest share of dwellings not connected to a sewerage system is found in the communes of Dumbrăvești (59.8%), Valea Călugărească (43%), Berceni (42.8%), Ariceștii Rahtivani (37.5%), Târgșoru Vechi (34.3%), Bucov (33.1%), and Brazi (31.4%). A total of more than 13,700 dwellings in the Growth Pole are not connected to a sewerage system. Due to the lack of central sewerage networks, private sewerage networks prevail in most of the Growth Pole localities (e.g. based on septic tanks), the only exceptions being Ploiești, Boldești-Scăeni, and Plopeni. Ploiești had a number of 2,407 dwellings without sewerage facilities, i.e. 2.7% of the total housing stock, located mainly in suburban districts (such as Mitică Popescu), plus 5,405 dwellings connected to private networks. A total of 81,235 dwellings were connected to the public sewerage network (90% of all city dwellings).
Map 98. Number of dwellings not connected to sewerage systems by census sectors in Ploiești municipality
Source: Own diagram
Figure 83. Share of dwellings with water supply and sewerage systems by component localities of the Growth Pole in 2011
Source: NIS, the General Population and Housing Census 2011 – Final results
Ploieș
ti
Bărcă
neșt
i
Boldeș
ti-Scă
eni
Plopen
i
Bercen
i
Ariceș
tii R
ahtiv
ani
Păule
ști
Dumbră
veșt
i
Târgș
oru V
echi
Valea
Călu
gărea
scă
Growth
Pole
Băicoi
Blejoi
Brazi
Bucov
120
100
80
60
40
20
0
Share of dwellings with water supply
Share of dwellings with sewerage systems
245

As regards the heating supply, 44.8% of all dwellings are connected to a centralized heating system, 25.8% have their own gas-, LPG- or solid fuel-based central heating systems, 28% use cookers, stoves or electric heating appliances, and 1.4% are not heated. In Ploiești municipality, 87.7% of dwellings have central heating, of which 68.4% are connected to the central heating network, and 19.3% have their own heating systems. It has the largest share of dwellings (apartments) connected to the public central heating system of all Romanian growth poles, considering that many such systems collapsed in the years 2000. More than 10,400 city dwellings, namely detached houses, still use gas, wood, and coal stoves for heating, while 573 are not heated.
As regards the other localities of the Growth Pole, with the exception of Plopeni, where more than 50% of dwellings have their own heating systems, most of them are still heated by stoves, mainly based on solid fuels such as coal, which generate a high volume of CO2 emissions. The most unfavorable situation is found in Dumbrăvești commune, the only one not connected to a gas network in the respective area. However, the share of dwellings with their own central heating systems increased significantly over the last decade, particularly in the localities surrounding Ploiești municipality, where new, modern residential districts have been built (Blejoi, Păulești, etc.).
Currently, only 82.3% of the dwellings in the Growth Pole and 93.5% of the dwellings in Ploiești municipality are supplied with domestic hot water. The most disadvantaged localities in this respect are Dumbrăvești (27.3% of the total), Berceni (36.2%), Valea Călugărească (41,4%), and Bucov (47,8%), which are either lacking a central heating network or have a small share of dwellings equipped with individual heating systems.
Figure 84. Structure of the housing stock in Ploiești Growth Pole by localities, according to heating system
Source: NIS , the General Population and Housing Census 2011 – Final results
Ploieș
ti
Bărcă
neșt
i
Boldeș
ti-Scă
eni
Plopen
i
Bercen
i
Ariceș
tii R
ahtiv
ani
Păule
ști
Dumbră
veșt
i
Târgș
oru V
echi
Valea
Călu
gărea
scă
Growth
Pole
Băicoi
Blejoi
Brazi
Bucov
100%90%80%70%60%50%40%30%20%10%
0
Without heating
Other heating source (stoves)
Own central heating systems
Centralized heating system
The
Gro
wth
Pol
e’s
Pro
file
Ana
lysi
s of
Dev
elop
men
t N
eeds
and
Are
as o
f In
terv
enti
on
Cha
pter
1.6
. Pub
lic S
ervi
ces
and
hou
sing
i
1
i246

In 2011, 98% of dwellings in Ploiești Growth Pole had a kitchen, 85.7% had a bathroom, and 87.3% had en-suite, in-building or outdoor flushing toilets. The best situation is found in Ploiești and Plopeni, which have a housing stock largely made up of blocks of flats built in the communist period, which, despite their low comfort, are equipped with all the required domestic fixtures and appurtenances. At the other end of the spectrum there is a string of rural localities such as Dumbrăvești, Berceni, Valea Călugărească, Ariceștii Rahtivani, with less developed urban utilities and obsolete housing stock, typical for rural settlements. Metropolitan communes, which benefitted from the expansion of modern residential areas (Blejoi, Păulești), witnessed a significant improvement in the level of domestic fixtures as compared to the 2011 census.
Figure 85. Types of home utilities by localities 2011
Source: NIS, the General Population and Housing Census 2011 – Final results
Dwellings with flushing toilets
Dwellings with bathrooms
Dwellings with kitchens
Growth Pole
Valea Călugărească
Ariceștii Rahtivanii
Dumbrăveşti
Plopeni
Boldești-Scăeni
Băicoi
Târgșoru Vechi
Păulești
Bucov
Brazi
Blejoi
Berceni
Bărcănești
Ploiești
0% 20% 40% 60% 80% 100%
In terms of electrification, Ploiești Ploiești Growth Pole has 836 dwellings not connected to the power network, i.e. only 0.6% of the total housing stock. Most of these dwellings are found in Ploiești (296), Bucov (80), Valea Călugărească (65), Brazi and Berceni (55), Blejoi (49), and Târgșoru Vechi (43). In most cases, these were due to voluntary disconnection determined by the owners, the power supply network being developed in all these locations. However, the electricity distribution network is considered for expansion in localities with widespread newly-built residential areas, such as Blejoi or Păulești.
As regards the energy efficiency of the buildings the 2011 census data shows that only 40.8% of the dwellings in Ploiești Growth Pole have been subject to thermal rehabilitation, while more than 80,000 dwellings (58.6% of the total) require such works. The extent of thermal rehabilitation is slightly larger in Ploiești municipality (44.6%), but there still are approximately 50,000 dwellings, both apartments and detached houses, which require thermal insulation and even structural rehabilitation works.
Figure 86. Energy efficiency of dwellings in Ploiești Growth Pole by localities
Source: NIS, the General Population and Housing Census 2011 – Final results
Ploieș
ti
Bărcă
neșt
i
Boldeș
ti-Scă
eni
Plopen
i
Bercen
i
Ariceș
tii R
ahtiv
ani
Păule
ști
Dumbră
veșt
i
Târgș
oru V
echi
Valea
Călu
gărea
scă
Growth
Pole
Băicoi
Blejoi
Brazi
Bucov
100%90%80%70%60%50%40%30%20%10%
0
Dwellings built of thermo-insu-lating materials
Thermally left un-rehabilitated
Thermally rehabilitated
247

In 2011-2012, nearly 50 blocks of flats have been rehabilitated in the West I and II districts, as well as Malu Roșu and North districts in Ploiești municipality through a program co-financed by MRDPA with 50% at the local level, and projects for the rehabilitation of 9 blocks are currently under assessment or implementation in the Republicii, Bănești, and Sinăii areas, co-financed by the EU through the ROP 2007-2013 and based on the contributions of the associations of owners. These are complemented by several blocks of flats that have been thermally rehabilitated totally or partially on the owners’ expense.
Map 99. Share of thermally rehabilitated dwellings by census sectors in Ploiești municipality in 2011
Source: Own diagram based on NIS, RGPL data, 2011
In 2011, 59.1% of the dwellings in Ploiești Growth Pole had heat-insulated joinery (PVC, aluminum or laminated wood with double glazing window), while the remaining dwellings had regular wooden joinery. The percentage of dwellings with heat-insulated joinery was higher in Ploiești municipality, i.e. 64.2%.
Wood joinery Heat-insulated joinery Growth Pole
Valea Călugărească
Ariceștii Rahtivanii
Dumbrăveşti
Plopeni
Boldești-Scăeni
Băicoi
Târgșoru Vechi
Păulești
Bucov
Brazi
Blejoi
Berceni
Bărcănești
Ploiești
0% 20% 40% 60% 80% 100%
Figure 87. Dwellings in Ploiești Growth Pole according to window joinery, by localities
Source: NIS, the General Population and Housing Census 2011 – Final results
Moreover, 12.6% of the dwellings in the Growth Pole were fitted with air conditioning units, this percentage being higher for Ploiești municipality (17.8%), due to the higher number of blocks of flats built of concrete and concrete prefabricates, registering high levels of thermal loss in winter and often unbearable summer temperatures. T
he G
row
th P
ole’
s P
rofi
le
A
naly
sis
of D
evel
opm
ent
Nee
ds a
nd A
reas
of
Inte
rven
tion
C
hapt
er 1
.6. P
ublic
Ser
vice
s an
d h
ousi
ng
i
1
i248

1.6.2. Education
In the larger context of the wider objective of the Regional Operational Programme (ROP) to reduce economic and social development gaps between developed and least developed areas, the education and professional training component plays an important role in driving a sustainable economic growth in Ploiești-Prahova Growth Pole. Furthermore, this objective is compatible with and contributes to the final objective of the Europe 2020 Strategy for smart, sustainable, and inclusive economic growth for Romania.
The Romanian education sector is an integral part of the Government’s Strategy to achieve the Europe 2020 objectives and targets, which largely focus on improving educational standings and preventing school dropout. For this purpose, the Ministry of Education and Scientific Research (MECS) drafted three Education Strategies under the ex-ante conditionalities required by the European Commission (EC) for the next financial programming period 2014-2020, targeted at three specific objectives, namely:
• Reduction of early school dropout rates (ESD);
• Increased participation to tertiary education (TE);
• Increased adult participation in lifelong learning (LL).
The population decline of the last two decades demands the correlation of education policies with economic and social policies to ensure a sustainable and inclusive growth. A development strategy for 2014-2020 should envisage actions and interventions which support and drive the achievement of such targets. However, as regards the South Muntenia region, it has to be reminded that Prahova county recorded a lower rate of rural population decline between 1990-2010, i.e. -1.5%, than Ialomița and Teleorman counties, where these rates are significantly higher, namely -15% and -14%. On the other hand, Prahova county has higher rates of urban population decline (-9.5%).
Moreover, some of the general findings of the analysis of demographic processes occurring in Romania and the entire South Muntenia region between 1990 and 2010 showed the short-, medium- and long-term negative impact of population decline on active population ageing, as well as on school population. In addition, the number of children born by very young or single mothers is on the increase, which leads to a higher risk of school dropout for such children (ADR South Muntenia Study, page 29).
europe 2020 targets (%)
romania’s targets(%)
romania in 2013(%)
Early school dropout rate below 10% 11.3 17.3
At least 40% of the population aged between 30 and 34 to complete tertiary education
26.7 22.8
At least 15% of the population aged between 25 and 34 to take part in lifelong learning
10 2,0
table 21. Europe 2020 Strategy targets – current situation
Source: The National Reform Programme 2014
1 http://ec.europa.eu/europe2020/index_en.htm2 http://www.edu.ro/index.php/articles/proiecte_acte_norm/c402/3 Regulation (EU) 1303/2013 of the European Parliament and of the Council 4 RDA South Muntenia, Study on the social issues and life quality in the South Muntenia Region, pp. 31-32
249

educational infrastructure and school population
The current educational infrastructure of the component localities of Ploiești Growth Pole is made up of 211 education facilities, of which 108 nursery schools (fulltime and all-day kindergartens), 71 primary and secondary schools (including special needs education), 26 high schools, 5 post-secondary schools, and a tertiary education school. 187 of these are public, i.e. 94 kindergartens, 68 primary and secondary schools, an art and vocational school, 22 high schools, a post-secondary school, and a university.
locality
Public education facilities
Kinder-gartens
Primaryschools
Secondary(including special needs)schools
Art and vocational
schools
Highschools
Post-secondary
schools
Universi-ties
total
PLOIEȘTI MUNICIPALITY 40 1 28 1 17 1 1 89
BĂICOI CITY 5 2 3 0 1 0 0 11
BOLDEȘTI-SCĂENI CITY 6 0 3 0 1 0 0 10
PLOPENI CITY 1 0 1 0 1 0 0 3
Ariceștii Rahtivani COMMUNE 5 0 3 0 0 0 0 8
BĂRCĂNEȘTI COMMUNE 4 0 3 0 1 0 0 8
BERCENI COMMUNE 5 2 2 0 0 0 0 9
BLEJOI COMMUNE 4 0 2 0 0 0 0 6
BRAZI COMMUNE 4 0 4 0 0 0 0 8
BUCOV COMMUNE 4 1 3 0 0 0 0 8
DUMBRĂVEŞTI COMMUNE 4 1 1 0 0 0 0 6
PĂULEŞTI COMMUNE 3 0 1 0 0 0 0 4
TÎRGŞORU VECHI COMMUNE 2 0 2 0 0 0 0 4
VALEA CĂLUGĂREASCĂ COMMUNE 7 1 4 0 1 0 0 13
totAl 94 8 60 1 22 1 1 187
table 22. Number of public education facilities by types and localities in Ploiești Growth Pole during the school year 2013/2014
Source: Prahova County Inspectorate, 2015
As regards the private sector, Ploiești Growth Pole has 14 kindergartens, 3 primary and secondary schools, 3 high schools, and 4 post-secondary and nursing schools.
locality
Private education facilities
Kinder-gartens
Primary and secondary
schools
Art and vocational
schools
Highschools
Post-secondary
schoolsUniversities total
PLOIEȘTI MUNICIPALITY 11 1 0 3 4 0 19
BĂICOI CITY 2 1 0 0 0 0 3
PĂULEȘTI COMMUNE 1 1 0 0 0 0 2
TOTAL 14 3 0 3 4 0 24
table 23. Number of private education facilities by types and localities in Ploiești Growth Pole during the school year 2013/2014
Source: Prahova County Inspectorate, 2015
The
Gro
wth
Pol
e’s
Pro
file
Ana
lysi
s of
Dev
elop
men
t N
eeds
and
Are
as o
f In
terv
enti
on
Cha
pter
1.6
. Pub
lic S
ervi
ces
and
hou
sing
i
1
i250

As regards early childhood facilities, Ploiești municipality offers 6 day care centers for 606 children, and one day care center for 12 children in Boldești-Scăeni.
Map 100. Share of pupils and students in the total population at the level of census sectors in Ploiești municipality in 2011
Source: Own diagram based on NIS, RGPL data, 2011
As compared with 2007, the total school population decreased by 8.7%, mainly due to the steep decline of birth rates over the last two decades, and secondly to school dropout and the internal and external migration of the population, as most of the high school graduates in Ploiești enroll in Bucharest universities. This decrease has left a significant mark on vocational education (-89.7%) due to the reorientation of pupils to technical high schools, and on the number of students (-31%) against the background of low pass rates of the Baccalaureate and the competition from other universities. Significant increases occurred in the number of pupils enrolled in post-secondary schools (+221.8%), which became an appealing alternative for those unable to attend university courses, as well as in the number of primary school pupils (+24.7%), following the introduction of the Zero Grade.
early childhood facilities no. of day care centers no. of children no. of nurses no. of care
takers no. of educators
Ploiești municipality 6 606 17 41 44
Boldești-Scăeni 1 12 1 1 0
Total 7 618 18 42 44
table 24. Early childhood facilities in Ploiești Growth Pole during the school year 2013/2014
Source: Prahova Directorate of Public Health, 2015
The total school population of Ploiești Growth Pole amounted to 63,849 children, pupils, and students in 2013, i.e. 19.3% of the total permanent population in the area. Out of these, 8,398 children were enrolled in kindergartens, 15,152 pupils in primary schools, 11,784 pupils in secondary schools, 17,704 pupils in high schools, 583 in vocational schools, 3,597 in post-secondary and technical schools, and 6,631 were university students.
251

Figure 89. School population in Ploiești Growth Pole during the 2007-2013 period by localities
Source: The National Institute of Statistics
In 2012, the total number of graduates in Ploiești Growth Pole amounted to 10,321 (all education levels being considered), of which 2,751 were secondary education graduates, 5,101 high school graduates, 88 vocational school graduates, 955 post-secondary school graduates, and 1,426 university graduates, lower than in previous years (except for post-secondary schools), due to the declining school population. One may notice that only 25% of high school graduates in this area remain to attend university studies in this city, while the others prefer post-secondary schools or universities in different cities.
Figure 88. School population in Ploiești Growth Pole by education level in the 2007-2013 period
Source: National Institute of Statistics
75.8% of the school population (48,428 children, pupils, and students) is found in Ploiești municipality, which has the highest highest volumes of school population, high schools, and faculties, which attract graduates from most of the county’s localities and even from neighboring counties. The school population decreased in most component localities in 2007-2013, including in Ploiești (-9.1%), with the only exceptions of Târgșoru Vechi (+8.1%), Păulești (+47.4%), Dumbrăvești (+7.1%), and Blejoi (+3.8%), especially due to higher birth and immigration rates (suburbanization). Still, many of the school age children in the neighboring localities commute to educational facilities in the city, which have a better education offer and higher reputation.
25,000
20,000
15,000
10,000
5,000
0
Children in kindergartens
Pupils in primary schools
Pupils in secondary schools
Pupils in high schools
Pupils in technology high schools
Pupils in post-secondary schools
Students
2007 2008 2009 2010 2011 2012 2013
Valea Călugărească
Târgșoru Vechi
Păulești
Dumbrăveşti
Bucov
Brazi
Blejoi
Berceni
Bărcănești
Ariceștii Rahtivanii
Plopeni
Boldești-Scăeni
Băicoi
Ploiești
0% 10,000 20,000 30,000 40,000 50,000 60,000
2013
2007
The
Gro
wth
Pol
e’s
Pro
file
Ana
lysi
s of
Dev
elop
men
t N
eeds
and
Are
as o
f In
terv
enti
on
Cha
pter
1.6
. Pub
lic S
ervi
ces
and
hou
sing
i
1
i252

The offer of high schools in this area, which concentrate most of the existing school population, is quite diverse, as it is shown in the table below:
high school enrolled students
Bacca-laureatepass rate
hu-ma-ni-ties
Sciences Sports Pedagogy tech
nical
natural resources
and environment
Vocational Services
PLOIEȘTI
Spiru Haret College 1,270 75% X X X
Economic Virgil Madgearu College
1,247 79% X X
A.I. Cuza National College 886 98% X X
Jean Monnet Național College
1401 98% X X X
I.L. Caragiale Național College
1,179 99% X X
Mihai Viteazul Național College
1,235 98% X X X
Nichita Stănescu Național College
882 95% X X
Elie Radu Technical College 1,377 48% X X X X
Lazăr Edeleanu Technical College
1,189 52% X X X
Toma N. Socolescu Technical College
1,520 38% X X X X
Carmen Sylva Art College 347 94% X
1 Mai Technical High school 781 36% X X
Anghel Saligny Technical High school
823 10% X X X
Transportation Technical High school
760 8% X
Ludovic Mrazek Technical High school
477 18% X X
Victor Slăvescu Technical Administrative and Services High school
212 88% X X
Sf. Apostol Andrei Technical Services High
school1137 51% X
BĂICOI
C-tin Cantacuzino Technical High school
403 60% X X X
BOLDEȘTI-SCĂENI
Teodor Diamant Technical High school
486 8% X X X
PLOPENI
Gh. Lazăr Technical High school
431 64% X X
BĂRCĂNEȘTI
Technical Agricultural High school
338 10% X X X
VALEA CĂLUGĂREASCĂ
Gh. Ionescu-Sisești Agricultural College
547 26% X X X
table 25. Field of study, number of students, and pass rate in high schools in Ploiești Growth Pole during the school year 2013/2014
Source: The Ministry of National Education and ISJ Prahova253

Thus, there are 10 high schools specialized in humanities (philology, social sciences), 16 in sciences (mathematics and informatics, natural sciences), 2 sports high schools (volleyball, basketball, handball), a pedagogy high school (teachers / educators), 1 vocational high school (music, visual arts), 12 technical high schools (mechanics, electronics-automation, electrics, electro-mechanics, constructions-installations-civil engineering, industrial chemistry, construction materials, wood products manufacturing, textile and leather industry, media production), 7 natural resources and environment high schools (ecology and environment, food industry, agriculture), 8 services high schools (aesthetics and human hygiene, tourism and catering, economics, trade).
As can be seen, around 65% of the students are enrolled in technical high schools, to the benefit of the local labor market, which mainly favors job seekers with secondary education (for the industry, services, constructions), but their Baccalaureate pass rate is very low as compared to academic high schools, i.e. 8% to 52% versus over 90%. Students who fail to pass this exam may only attend post-secondary schools instead of universities.
As regards vocational education, 14 public high schools feature technical classes (electrics, electronics-automation, chemical industry, food industry, wood products manufacturing, constructions-installations-civil engineering, mechanics, textile and leather industry, tourism and catering, aesthetics, and human hygiene). The number of vocational students dropped steeply over the past two decades, as most secondary school graduates chose mainly academic high schools, thus giving rise to difficulties in ensuring sufficient numbers of secondary education graduates for the main local economic sectors (industry, constructions, services, agriculture).
As regards post-secondary education, there are 10 such high schools (agriculture and food industry, tourism and catering, aesthetics and human hygiene, health and pedagogy assistance, economy, services, textiles and leather, constructions-installations and public works, informatics, transports, and environment), in addition to 5 public and private nursing schools.
The
Gro
wth
Pol
e’s
Pro
file
Ana
lysi
s of
Dev
elop
men
t N
eeds
and
Are
as o
f In
terv
enti
on
Cha
pter
1.6
. Pub
lic S
ervi
ces
and
hou
sing
i
1
i254

Ploiești Petroleum and Gas University5
Faculties FieldsNo. of students6
(2013/2014)
Faculty of Petroleum and Gas Engineering
1. Mines, oil and gas (IF, IFR)
2. Geological Engineering (IF)1,223
Faculty of Mechanical and Electrical Engineering
1. Mechanical engineering (IF)
2. Electrical engineering (IF)
3. Electronic engineering and telecommunications (IF)
4. System engineering (IF, IFR)
5. Computers and information technology (IF)
6. Engineering and management (IF, ID)
1,640
Faculty of Petroleum Refining and Petrochemistry
1. Chemical Engineering (IF)
2. Environmental engineering (IF, IFR)885
Faculty of Economic Sciences
1. Business administration (IF)
2. Finances (IF)
3. Accounting (IF, ID)
4. Cybernetics, statistics, and economic informatics (IF, ID)
5. Management (IF, ID)
2,617
Faculty of Letters and Sciences
1. Language and Literature (IF)
2. Mathematics (IF)
3. Informatics (IF)
4. Chemistry (IF)
5. Administrative sciences (IF)
6. Education sciences (IF)
1,655
table 26. Educational offer of PGU Ploiești in the academic year 2013/2014
Source: Petroleum and Gas University, 2014/2015
5 http://www.upg-Ploiești.ro/facultati/index.html 6 Number of students enrolled in all education forms, Bachelor and Master degrees. Prahova County Sustainable Development Plan for 2014-2020, pp. 69-72
The main education institution in the field of higher education is the Petroleum and Gas University (PGU), established in 1948, which trains specialists for the Romanian oil and gas industry. In the last two decades, the educational offer of the university was supplemented with humanistic and economic studies, at 5 faculties. The University campus comprises around 80 seminar and lecture rooms, 140 laboratories, 9 amphitheaters, one auditorium, one library, an Internet-connected computer network, servers, one gym and sports fields, 7 student dorms with 1,600 places, one cafeteria, medical and dental offices, a student’s club, etc. According to the classification of the Ministry of National Education, the Petroleum and Gas University is a 3rd category „education-focused university”, and was granted a high level of trust by ARACIS. However, the scientific performances of the university trail significantly behind those of traditional universities, such as Bucharest, Iași, or Cluj-Napoca.
Owing to its unique position at the national level and good external reputation, the Petroleum and Gas University attracts more than 400 foreign students each year from countries such as Ukraine, Republic of Moldova, Angola, Ivory Coast, Iraq, Syria, Vietnam, Turkmenistan, etc. Moreover, student and professor exchange programs are being carried out with other European universities under the ERASMUS Program. The students of this institution take part in internships at local companies in the industry, with some receiving even employment offers before completion of their studies. The University cooperates with the private sector for research projects as well, as it owns state of the art equipment and facilities purchased under POS DRU and POS CCE 2007-2013, although the promotion of its offer of services is still not at its best. Such an approach is needed particularly against the backdrop of falling student numbers and insufficient education funding resources from the state budget.
255

Figure 90. County and regional school dropout rates by education levels during 2010-2012
Source: The National Institute of Statistics
As regards the vocational training offer (training and retraining), this is very diverse, covering a wide range of qualifications and skills in various economic and social areas. It is provided by different vocational training providers, such as: public institutions (3), private companies (31), and specialized NGOs (14) – see the Annex for the full list of authorized providers. The public institutions with the most diverse training offer are Prahova County Employment Agency (23 occupations, free courses for the unemployed), Prahova Chamber of Commerce and Industry (29 occupations), Prahova County Chamber of Agriculture. Despite the abundant offer of training courses, the number of participants remains limited, with most participants choosing the free courses. This fact is worrying due to the significant number of local adults qualified especially during the communist period for occupations that are not currently sought on the market.
Despite the unavailability of local-level data, the school dropout rate in Prahova county fell below the regional and national average, particularly for the secondary, high school, vocational, and post-secondary education. The vocational education dropout rates remain however a matter of concern (more than 20% of the total number of students), revealing the low attractiveness of such studies for graduates. The high schools with the highest dropout rates are the following: „Sf. Apostol Andrei” Technical Services High School (16 students), Toma Socolescu Technical College (12 students), Anghel Saligny Technical College (10 students), and Gh. Lazăr Technical College Plopeni (8 students). The school dropout phenomenon is more prevalent among Roma students from rural areas, who are the most exposed to the risk of education exclusion. Most of them are studying at at Toma Socolescu Technical College (25 students), Gh. Lazăr Technical College Plopeni (21 students), Lazăr Edeleanu Technical College (20 students), Transportation Technical College (15 students), Spiru Haret College (15 students), Virgil Madgearu Economic College (14 students), Sf. Apostol Andrei Technical Services High School (11 students), and Nichita Stănescu National College (12 students).
Post-secondary - Prahova County
Post-secondary - South Muntenia Region
Post-secondary - Romania
Technology high school - Prahova
Technology high school - South Muntenia Region
Technology high school - Romania
High school - Prahova County
High school - South Muntenia Region
High school - Romania
Secondary school - Prahova County
Secondary school - South Muntenia Region
Secondary school - Romania
Primary school - Prahova County
Primary school - South Muntenia Region
Primary school - Romania
0
2012 2011 2010
5 10 15 20 25
The
Gro
wth
Pol
e’s
Pro
file
Ana
lysi
s of
Dev
elop
men
t N
eeds
and
Are
as o
f In
terv
enti
on
Cha
pter
1.6
. Pub
lic S
ervi
ces
and
hou
sing
i
1
i256

Social measures in the education field – social and support programs
The Ministry of Education is implementing a series of measures to support and assist the pupils enrolled in the public education system, such as Cornul și Laptele (the Roll and Milk), Fructe (Fruits), Bani pentru Liceu (Money for High School), Bursa Profesională (Professional scholarship), and EURO 200.
table 27. MECS-coordinated social and support programs for pupils in 2013
Source: MECS
In Ploiești Growth pole, around 27,000 pupils benefit from the „Roll and milk” and „Fruits” programs, and 237 pupils from the „Money for High school” program.
Program Allocation per child Source of funds
The “Roll and Milk” program0.7 RON/child/day primary level 1.17 RON/child/day secondary
level
Ministry of Agriculture (EU funds)
The Fruits program 0.37 RON/child/day/fruitsMinistry of Agriculture
(EU funds)
The “Money for High school” program7 150 RON/month/pupil MECS budget
The Professional Scholarship program (support for all pupils from vocational and technical
education)8
200 RON/month/pupil MECS budget
table 28. Number of beneficiaries of the “Money for High School” Program by localities in the school year 2013/2014
Source: MECS
locality no. of beneficiaries9
Ariceștii Rahtivani 16
Băicoi 10
Bărcănești 13
Berceni 6
Boldești-Scăeni 25
Brazi 2
Bucov 11
Ploiești 110
Plopeni 15
Păulești 1
Târgșoru Vechi 17
Valea Călugărească 11
Total 237
7 GD 1488/2004 approving the criteria and amount of the financial support granted to pupils under the „Money for High School” National Social protection program8 GD 1062/2012 on governmental subsidies related to costs incurred by vocational training students9 http://banideliceu.edu.ro/10 This program is regulated under Law 269 of June 2004
The EURO 200 program10 is intended to support the purchasing of personal computers by means of social grants. The social grant amounts to the equivalent in RON of EUR 200 for one computer. This program is targeted at pupils and/or students in the public or private education sector aged up to 26 years old, living in families with a monthly gross income of no more than RON 1,500 per family member. The number of individual recipients of this grant for 2013/2014 is shown in the table below.
257

Map 101. The share of 7-9 year-olds not enrolled in an education institution at the level of census sectors in Ploiești municipality in 2011
Source: Own diagram based on NIS, RGPL data, 2011
locality School Beneficiaries
Municipiul Ploiești
Transportation Technical High school 3
Sfântul Apostol Andrei Technical Services High school 1
Candiano Popescu Secondary school 11
The Ioan Grigorescu Secondary school 2
Lazăr Edeleanu Technical College 1
Virgil Madgearu Economic College 1
Berceni Secondary school 5
Dumbrăvești Secondary school 4
Târgșoru VechiSecondary school (Strejnicu) 2
Secondary school (Târgșoru Vechi) 1
Valea Călugărească Ion Ionescu secondary school 2
Total 33
table 29. Number of beneficiaries of ”EURO 200” Social Program by localities in the school year 2013/2014
Source: MECS
The program titled „A second chance” is intended for anyone who failed to graduate primary or secondary education and is more than 4 years older than the school age for the respective grade. Such classes are organized in the schools of Ploiești Growth Pole as follows:- Secondary school no. 13, Ploiești – 1 class of 32 pupils;- Toma Caragiu Secondary school, Ploiești – 9 classes of 201 pupils;- Special Vocational School, Plopeni – 2 classes of 17 pupils.
The
Gro
wth
Pol
e’s
Pro
file
Ana
lysi
s of
Dev
elop
men
t N
eeds
and
Are
as o
f In
terv
enti
on
Cha
pter
1.6
. Pub
lic S
ervi
ces
and
hou
sing
i
1
i258

Commuting to school is frequent in Ploiești Growth Pole. The educational facilities in Ploiești municipality attract 6,726 children and pupils from other localities, some from significant distances (30-50 km), most of them choosing the high schools in Ploiești, as most of the rural localities and small towns either do not have such facilities, or their current education offer is limited. The number of commuting children and pupils is less than 500 in other localities of Ploiești Growth Pole, more significant numbers being only reported for the communes of Valea Călugărească and Bărcănești, respectively the towns of Boldești-Scăeni and Plopeni, with high schools that attract pupils from neighboring localities. School mini-buses have been purchased under a MRDPA program in 2014, the communes such as Brazi, Berceni, Târgșoru Vechi, Ariceștii Rahtivani, Valea Călugărească being among the beneficiaries. However, many pupils still travel to city schools with public transport means or their parents’ vehicles, a fact that requires further investments in the expansion and modernization of connecting roads and public transportation for fast and safe travel.
The total numbers of the teaching staff working in educational facilities of Ploiești Growth Pole was 3,712 in 2013 (2,700 in Ploiești municipality), of which 492 in the pre-school education, 637 in primary education, 922 in secondary education, 1,274 in high schools, 84 in post-secondary education, and 303 in higher education.There is a 11.6% drop in the number of teaching staff as compared with 2007, higher than the drop in school population (of approx. 9%), which indicates that the number of students per teacher increased slightly from 16.9 to 17.5. One reason is the migration of teaching staff to other fields or cities/countries following the low wage rates, which make teaching unattractive for young graduates. Thus, many educational facilities have to resort to less qualified teaching staff or even substitute teachers, a situation particularly prevalent in rural areas.
Figure 91. Number of commuting children and pupils by component localities
Source: ISJ Prahova
Ploieș
ti
Bărcă
neșt
i
Boldeș
ti-Scă
eni
Plopen
i
Bercen
i
Ariceș
tii R
ahtiv
ani
Dumbră
veșt
i
Târgș
oru V
echi
Valea
Călu
gărea
scă
Băicoi
Blejoi
Brazi
8,000
7,000
6,000
5,000
4,000
3,000
2,000
1,000
0
Number of commuting children and pupils
259

In 2013, the educational infrastructure of Ploiești Growth Pole included the following:
• 1,511 classrooms, amphitheaters and school offices (1,027 in Ploiești municipality), of which 772 in general schools, 642 in high schools, 36 in post-secondary schools, and 61 in the university;
• 396 school laboratories (294 in Ploiești municipality), of which 123 in general schools, 154 in high schools, 15 in post-secondary schools, and 104 in the university;
• 78 gyms (47 in Ploiești municipality), of which 50 in general schools, 27 in high schools, and one in the university;
• 137 school workshops (94 in Ploiești municipality), of which 2 in general schools, 133 in high schools, and 2 in the university;
• 74 sports fields (44 in the Ploiești municipality), of which 52 for general schools, 20 for high schools and 2 for the university;
• 5,082 personal computers for educational activities (3,742 in Ploiești municipality), of which 1,733 in general schools, 2,047 in high schools, 120 in post-secondary schools, and 822 in the university.
As compared with 2007, there was a 13.7% increase in the number of school laboratories, 18.2% in the number of gyms, 7.2% in the number of sports fields, and 44.7% in the number of personal computers, due to investments in some educational facilities from various sources (the local, county, and state budget, European grants, loans, etc.). However, the number of classrooms and school offices decreased by 4% following the closing or restructuring of some educational facilities due to the decreasing school population (Ariceștii Rahtivani, Valea Călugărească, etc.), while school workshops decreased by 16.5% following the decline of the technical and vocational education, a fact which threatens the practical training of the pupils and lowers their prospects for integration on the labor market. Against this background, the average number of pupils per classroom dropped from 45.2 in 2007 to 43 in 2013, a trend which will continue in the future and calls for a restructuring of the school infrastructure. This will also require an appropriate change of function for redundant educational facilities, especially in rural areas, such as the creation of after-school or social non-residential centers for children and adults, vocational training centers, etc. On the other hand, with a demand exceeding by far the available places, the increased number of pre-school children has put a lot of pressure on the kindergartens (and particularly all-day kindergartens) in the central area of Ploiești.
Figure 92. - Number of teaching staff by education levels in 2007 and 2013
Source: NIS, the TEMPO Online database
Pre-sc
hool
Primar
y
Univers
ity
Post
-seco
ndar
y
Voca
tiona
l
High sc
hool
Lower
seco
ndar
y
1,800
1,600
1,400
1,200
1,000
800
600
400
200
0
2007
2013
The
Gro
wth
Pol
e’s
Pro
file
Ana
lysi
s of
Dev
elop
men
t N
eeds
and
Are
as o
f In
terv
enti
on
Cha
pter
1.6
. Pub
lic S
ervi
ces
and
hou
sing
i
1
i260

Map 102. Number of commuting children and pupils
261

Despite the positive trends of the past years, the school sports infrastructure remains poor, with only one sports field, respectively one gym for more than 800 pupils, which hinders the performance of sports classes and and the promotion of a healthy lifestyle among young people. Moreover, in some localities (such as Dumbrăvești), there are no sports facilities attached to schools or the existent ones are unsuitable (improvised), this being the case at Toma Socolescu Technical College, Gh. Ionescu Șișești Agricultural College (in Valea Călugărească), and Carmen Sylva Art School. In addition, the facilities of school laboratories, including computer laboratories, are generally obsolete and overused.
The data made available by the Ministry of Education and Scientific Research shows that 7 education facilities from the Growth Pole are not earthquake-resistant (those of Băicoi, Ariceștii Rahtivani, and Valea Călugărească), and 15 have overcrowded classrooms (less than 2 m2/pupil: Băicoi, Bărcănești, Bucov, Plopeni, Târgșoru Vechi), 24 have inadequately furnished classrooms (Băicoi, Bărcănești, Brazi, Bucov, Dărmănești, Valea Călugărească, Plopeni), 33 are not fire-safe (Băicoi, Ariceștii Rahtivani, Bărcănești, Berceni, Târgșoru Vechi, Valea Călugărească), 35 do not have airtight doors and windows (Băicoi, Ariceștii Rahtivani, Plopeni, Bărcănești, Berceni, etc.).
Similar issues were found in educational facilities from Ploiești municipality (see the Annex on the situation of educational infrastructure by specific educational facilities):
• 30 educational facilities are not fire-safe;
• 51 do not have airtight roofs and windows;
• 7 cannot maintain a constant indoor temperature;
• 9 work in buildings which are not earthquake-resistant;
• 21 have overcrowded classrooms;
• 3 do not provide appropriate temperature and lighting;
• 21 are inadequately furnished;
• 30 have classrooms which prevent active learning;
• 45 are not fitted with air conditioning and ventilation units;
• 66 do not have soundproof classrooms;
• 25 have no or inappropriate library premises;
• 17 have no or inappropriate teachers’ rooms;
• 27 have no computer laboratories;
• 26 have no study rooms;
Figure 93. Educational infrastructure dynamics in Ploiești Growth Pole in the 2007-2013 period
Source: NIS, the TEMPO Online database
6,000
5,000
4,000
3,000
2,000
1,000
0
2007
2013
Classrooms Science laboratories
School workshops
Gyms Sport fields PCs
The
Gro
wth
Pol
e’s
Pro
file
Ana
lysi
s of
Dev
elop
men
t N
eeds
and
Are
as o
f In
terv
enti
on
Cha
pter
1.6
. Pub
lic S
ervi
ces
and
hou
sing
i
1
i262

• 30 have no cafeterias or restaurants;
• 11 work in overcrowded buildings;
• 11 are connected to central heating systems;
• 7 have no heat-insulated joinery;
• 32 have no fully insulated walls;
• 17 have no access facilities for the disabled;
• 10 have no science laboratories;
• 20 have no gyms;
• 7 have no sports fields.
This calls for additional investments in the development and modernization of educational infrastructure for quality services in optimum conditions.
263

1.6.3. Health and medical services
The health system11 is currently facing a negative balance between the birth rate, death rate, and external migration, also reflected in the all-time low regional and local birth rate in southern areas – except Bucharest-Ilfov – while the traditional gap between rural and urban areas was erased in 2011. For the past 10 years, the conjectural index of fertility has been stable at around 1.3 children/woman in Romania, versus 1.56 children/woman in EU27. In this context, the National Health Strategy 2014-2020 established the following health priorities for the 2014-2020 period:
• A system for basic community assistance services targeted at vulnerable groups;
• Increased efficiency and diversity of primary medical assistance services;
• Increased quality and efficiency of ambulatory care services;
• Setting up a network of medical assistance providers.
The life expectancy of the population in Prahova county increased by almost 2 years in the 2007-2013 period, up to 75.05 years, i.e. above the national and regional average, thanks to improved access to new treatment techniques and medicines and a drop in infant mortality. It was also noted that women have a significantly higher life expectancy than men (78.66 years vs. 71.44 years), and urban population lives on average 1.5 years more than rural population (75.73 years vs. 74.3 years). In spite of this, the difference up to EU-28 average life expectancy remains at around 5 years.
11 The National Health Strategy 2014-2020, available at http://www.ms.ro/documente/Anexa%201%20-%20Strategia%20Nationala%20de%20Sanatate_886_1761.pdf
Figure 94. Population life expectancy during 2007-2013
Source: NIS, TEMPO Online database
Cardiovascular diseases remain the main cause of death at county level, accounting for around 60% of total deaths, followed by cancer (18%), digestive system diseases (6.4%), and respiratory system diseases (5.7%). Despite the medical progress and related improvement of life expectancy, the population morbidity rate is on an upward trend due to demographic ageing, unhealthy lifestyle, insufficient prevention measures, etc., which puts additional pressure on the county’s medical system, particularly in light of its restructuration and shortage of staff.
Life expectancy of the population (years)
2007 2008 2009 2010 2011 2012 2013
Romania PrahovaSouth Muntenia Region
74.0274.26
74.57 74.52
74.74
75.05
73.49
73.77
74.21
73.14
73.47
73.8573.96
73.33
73.07
73.98
73.14
72.5
72.61
73.0372.97
The
Gro
wth
Pol
e’s
Pro
file
Ana
lysi
s of
Dev
elop
men
t N
eeds
and
Are
as o
f In
terv
enti
on
Cha
pter
1.6
. Pub
lic S
ervi
ces
and
hou
sing
i
1
i264

Figure 95. Main causes of deaths in Prahova County in the 2007-2013 period
Source: NIS, TEMPO Online database
Other causes
Injuries, whether unintentional or intentional
Congenital malformations, deformations and chromosomal abnormalities
Conditions that have their origin in the perinatal period
Pregnancy, birth and postpartum
Genito-urinary and congenital diseases
Diseases of the digestive system
Diseases of the respiratory system
Diseases of the circulatory system
Diseases of the nervous system
Mental and behavioural disorders
Endocrine, nutritional and metabolic diseases
Tumors
Infectious and parasitic diseases
0 1000 2000 3000 4000 5000 6000 7000
2013
2007
The health infrastructure of Ploiești Growth Pole is more developed in Ploiești municipality and includes the following types of facilities:
table 30. Current medical infrastructure of Ploiești Growth Pole in 2013
type of medical facility total facilities Public Private
Hospitals 12 7 5
Specialized outpatient care facilities 2 1 1
Hospital outpatient care facilities 5 5 0
Clinics 1 1 0
Health centers 1 0 1
Mental health centers 2 2 0
Medical-social facilities 1 1 0
Diagnosis and treatment centers 1 1 0
General medicine practices 45 1 44
School medical offices 63 63 0
Student medical offices 1 1 0
Family medicine practices 164 113 51
Dental practices 237 1 236
Civil dental associations 5 0 5
Specialized practices 194 8 186
Pharmacies 185 10 175
Pharmaceutical points 15 2 13
Pharmaceutical warehouses 9 0 9
Nurseries 7 7 0
Medical laboratories 74 29 45
Dental technology 118 0 118
Transfusion centers 1 1 0
Other types of medical practices 5 0 5
Source: NIS, TEMPO Online database265

The public sector witnessed some degree of restructuring as compared to 2007, including by the closing down and consolidation of hospital care facilities and the development of the private medical sector, and by establishing new hospitals, clinics, family medicine, and dental practices, laboratories and pharmacies.
Significant gaps are also noted between the complex range of public and private medical services available in Ploiești municipality (emergency county hospital, specialty hospitals, many practices and laboratories) and the basic services provided in neighboring localities (family medicine practices, pharmacies). Other hospital facilities are available in the towns of Băicoi, Boldești-Scăeni, and Plopeni, the last two also featuring private facilities.
The total number of hospital beds reached 2,248 in 2008, of which 2,122 in the public sector and 126 in the private sector. The number of beds in the public sector decreased by 9% as compared to 2007, but was almost entirely offset by the emergence of private hospital facilities. Out of the total hospital beds, 2,026 (90% of the total) were located in Ploiești municipality, followed by Băicoi (130), Plopeni (54), and Boldești-Scăeni (38).
Overall, the total admissions in the hospitals of Ploiești municipality (except the CF General Hospital) amounted to 74,285, 19.6% less than in 2007, against the background of the growing emphasis on ambulatory care.
table 31. Number of beds and specializations of hospital facilities in Ploiești Growth Pole in 2014
Source: NIS, 2013; Prahova County Sustainable Development Plan 2014-2020, 2015
locality Facility Sections / Departments Admissions no. of beds
Ploiești
Ploiești Emergency County Hospital:
- North branch- Buna Vestire branch- Boldescu branch- Oborului branch- Republicii branch
General surgery, Neonatology, Obstetrics/Gynecology,
Vascular surgery, Plastic, and reconstructive surgery and Burn unit, Internal medicine,
Nephrology, Diabetes mellitus, Nutrition and metabolic diseases, Orthopedics and Traumatology, Cardiology, Neurosurgery, ATI,
Neurology, Pediatrics, UPU SMURD, Gastroenterology, Ophthalmology,
Psychiatry, Dermatology and venereal diseases, Urology, ORL, Pulmonology,
Infectious diseases, Maxillofacial surgery, Oncology
45,204 1,160
Pediatrics Hospital Ploiești
Pediatrics, Pediatric surgery and orthopedics
5,621 135
CFR General Hospital Ploiești
Internal Medicine, General surgery, ATI, Physical rehabilitation and Balneology,
Nephrology, Psychiatry155
Ploiești Municipal Hospital
Internal Medicine, Oncology, Rheumatology, Physical rehabilitation
and Balneology, Hematology, Cardiology, Radiotherapy
9,330 267
Ploiești Obstetrics and Gynecology Hospital
Obstetrics -Gynecology, Neonatology, ATI
11,936 300
Băicoi Băicoi City Hospital
Internal Medicine, Psychiatry, Rehabilitation, Physical medicine and balneology, Pediatrics General surgery,
ATI
130
Private facility Sections / Departments no. of beds
Ploiești S.C. Spital Lotus S.R.L Obstetrics/Gynecology 34
Plopeni
S.C. Dentirad Hospital S.R.L
Internal medicine, Medical rehabilitation
34
S.C. Darius Medical Center S.R.L
Physical rehabilitation and balneology, Neuromotor rehabilitation, Palliative
care20
Boldești-Scăeni S.C. Bestmed S.R.LNeuromotor rehabilitation, Palliative
care38T
he G
row
th P
ole’
s P
rofi
le
A
naly
sis
of D
evel
opm
ent
Nee
ds a
nd A
reas
of
Inte
rven
tion
C
hapt
er 1
.6. P
ublic
Ser
vice
s an
d h
ousi
ng
i
1
i266

Map 103. Number of beds/unit
267

Ploiești Emergency County Hospital is the only hospital on a 60 km radius providing 24/7 medical assistance, with permanent laboratory and imaging investigations for multiple-trauma cases. The unit serves 97% of the population in Prahova county, i.e. more than 762,900 inhabitants, as well as the population of neighboring counties, such as Dâmbovița (0.8%), Buzău (0.5%), Bucharest (0.4%), Ialomița (0.2%). The hospital has 1,150 beds and 10 unique wards at county level: plastic surgery, reconstructive surgery and burn unit; nephrology; diabetes mellitus, nutrition and metabolic diseases; cardiology; neurosurgery; neurology; gastroenterology; ophthalmology; urology; ORL, 7 unique wards at county level: vascular surgery; coronary intensive care; interventional cardiology; toxicology; endocrinology; dermatology and venereal diseases; oral and maxillofacial surgery. The main indicators achieved in 2013 are presented in the table below.
Moreover, the Pediatrics, Obstetrics and Gynecology and CFR General Hospitals are the only specialized medical units with specialized county coverage.
Ploiești Growth Pole does not have any category I or II medical units, which are usually found in academic centers (Bucharest, Cluj-Napoca, Iași), but only category III (Emergency County Hospital), category IV (Municipal Hospital, General CF Hospital, Băicoi municipal hospital), and category V (Pediatrics Hospital, Obstetrics Gynecology Hospital) units, which provide less comprehensive medical services. For this reason, a significant number of local patients who require more complex consultations and interventions will opt for the university clinics in Bucharest.
table 32. Main activity indicators of Prahova Emergency County hospital
Source: Prahova Emergency County Hospital Report, 2014
indicators Achieved
Hospital discharges 51,261
Bed use index 340.20
Average hospitalization period 7.07
Bed occupancy ratio (%) 93.21
Inpatient mortality ratio 3%
The
Gro
wth
Pol
e’s
Pro
file
Ana
lysi
s of
Dev
elop
men
t N
eeds
and
Are
as o
f In
terv
enti
on
Cha
pter
1.6
. Pub
lic S
ervi
ces
and
hou
sing
i
1
i268

The local medical infrastructure is generally overused and obsolete, despite some investments (for instance, in 2014 alone, Prahova County Council allocated 10 mil. Euro for investments in the three hospitals under its management, plus 6.5 mil. lei for equipment in 2015) in the rehabilitation of facilities and endowment with modern medical equipment in recent years. Thus, the Pediatrics Hospital is housed in inadequate premises, a situation which will be addressed by the reconversion and furnishing of a new building donated by OMV Petrom, with an area in excess of 14,000 m2. Moreover, Buna Vestire branch of the Emergency County Hospital, which currently serves the dermatology, gastroenterology, internal and endocrinology wards, was found in an advanced state of disrepair and was proposed for closing by the Ministry of Health in 2013. The Municipal Hospital and the Obstetrics-Gynecology Hospital are however in a better shape, as they benefitted from significant rehabilitation, modernization and endowment funds from the local and county budgets and the BEI, as well as the Medical-Social facility of Boldești-Scăeni, which received funding from the Ministry of Labor. Furthermore, the Emergency County Hospital, the Municipal Hospital and the Băicoi Hospital received grants for the implementation of integrated IT systems. The former Plopeni Hospital, closed down by decision of the Ministry of Health in April 2011, was reopened as a private clinic a month later. All the hospital facilities and hospital-based outpatient units in the area require new quality equipment.
As regards the medical staff of Ploiești Growth Pole, it included 694 doctors, 313 dentists, 330 pharmacists and 3,237 medium-level staff. As compared to 2007, the number of doctors increased by 12%, dentists by 87%, pharmacists by 52%, and medium-level staff by 33%, which can be attributed to the development of private medical services, as public units are faced with acute staffing shortages due to migration to private hospitals or other medical centers in the country and abroad. For instance, Ploiești Emergency Ward employs only 10 of the 24 doctors needed to consult more than 250 patients per day. Similar situations occur with ATI, cardiology, neurology, nutrition diseases, etc. specialists. The low interest of doctors for the public health sector relates to low wages and inadequate working conditions.
Figure 96. Medical staff evolution numbers in Ploiești Growth Pole by types and sectors in the 2007-2013 period
Source: NIS, TEMPO Online database
Docto
rs - p
ublic
secto
r
Pharm
acist
s - pr
ivate
secto
r
Dentis
ts -
publi
c sec
tor
Dentis
ts -
priva
te se
ctor
Medium
-leve
l sta
ff - pu
blic s
ecto
r
Pharm
acist
s - pu
blic s
ecto
r
Docto
rs - p
rivat
e sec
tor
Medium
-leve
l sta
ff - pr
ivate
secto
r
3,000
2,500
2,000
1,500
1,000
500
0
2007
2008
2009
2010
2011
2012
2013
The emergency pre-hospital care in Prahova county is provided by the County Ambulance Service, which cooperates with the first aid teams of of Șerban Cantacuzino Inspectorate for Emergency Situations Prahova, and with all the inpatient units of the public and private medical care network of Prahova. The County Ambulance Service includes a hub station in Ploiești and a substation in Băicoi. The response to major emergencies has improved in the urban environment since 2010, especially following the development of SMURD services. There are approximately 120,000 calls to the County Ambulance Service per year (second place nationwide after Bucharest), but the staffing shortage is 75% for doctors and 37% for ambulance staff and nurses.
269

Figure 97. Medical infrastructure and staff in Romania’s Growth Poles
Source: NIS, TEMPO Online database
Furthermore, life expectancy of the population in Ploiești is around 0.7 times lower than in Cluj-Napoca, București, and Brașov, and is above the values registered in Constanța, Craiova, and Timișoara.
As compared to other Romanian growth poles, Ploiești municipality has the fewest hospital beds and doctors, despite the large population served (more than 700,000 inhabitants), trailing behind traditional university medical centers in particular, which also have category I and II hospitals (Bucharest, Iași, Cluj-Napoca, Timișoara, Craiova).
3,000
2,500
2,000
1,500
1,000
500
0
2007
2008
2009
2010
2011
2012
2013
Docto
rs - p
ublic
secto
r
Pharm
acist
s - pr
ivate
secto
r
Dentis
ts -
publi
c sec
tor
Dentis
ts -
priva
te se
ctor
Medium
-leve
l sta
ff - pu
blic s
ecto
r
Pharm
acist
s - pu
blic s
ecto
r
Docto
rs - p
rivat
e sec
tor
Medium
-leve
l sta
ff - pr
ivate
secto
r
The
Gro
wth
Pol
e’s
Pro
file
Ana
lysi
s of
Dev
elop
men
t N
eeds
and
Are
as o
f In
terv
enti
on
Cha
pter
1.6
. Pub
lic S
ervi
ces
and
hou
sing
i
1
i270

6.4. Social assistance and services
The social assistance policies and strategies for the welfare of children, families, single persons, the elderly, the disabled, and any other persons in need at county level are implemented by Prahova General Directorate of Social Assistance and Child Protection (DGASPC), a public institution with legal personality subordinated to Prahova County Council. Its organizational structure includes specialized services / offices / departments, consisting in social assistance units designed to provide welfare housing for children in difficulty and disabled adults, as well as alternative welfare services.
According to the 2013 Activity Report of this institution, there are 9 children welfare units and 10 adult welfare units. At the end of 2013, 36,498 persons were registered at the Social Welfare Service for disabled persons (children and adults). The value of the benefits paid to these people amounted to 118,133 thousand lei, i.e. 64.07% of the DGASPC Prahova budget. As of May 2013, DGASPC Prahova included a Committee for the disabled, an advisory body tasked with assessing the needs of disabled persons in Prahova county and proposing to the relevant institutions measures to improve their life conditions.
table 33. Social welfare units subordinated to DGASPC Prahova and located in Ploiești Growth Pole
Source: DGASPC Prahova Activity Report, 2013
locality Unit Capacity total users
Ploiești
‘SF. ANDREI’ PLOIEȘTI COMMUNITY SERVICES
Care center for disabled children 75 75
Day care center for disabled children 132 63
Counselling and support service for children and parents
171
Maternal care center 5
‘CIREȘARII’ EMERGENCY RECEPTION CENTRE 20 18
Băicoi
‘RAZĂ DE SOARE’ COMMUNITY SERVICE COMPLEX
Care center 28 24
Counselling and social assistance center 51
Care and assistance center for disabled adults 103 81
Plopeni Care center 60 62
Ariceștii RahtivaniNedelea neuropsychiatric recovery and rehabilitation
center for adults with disabilities135 135
total 553 685
The second major provider of social services in the Growth Pole is the Administration of Community Services - Ploiești, subordinated to the Local Council. It has the following substructures: Social Welfare Service; Service for Protection of Persons at Risk (including Personal Caregivers); Social Benefits Service; Legal and Supervisory Service; Gas, Wood and Electricity Heating Subsidies Service; Thermal Heating Subsidies Service; Food Preparation and Distribution Centre (Community kitchen); Social Emergency Centre for the Homeless; Preschool Children Day care Centre; Citizen Information and Pensioner Entertainment Centers (4); School Medical Offices; Sanitary Mediator’s Department. The Community Kitchen serves around 1,200 people, the Social Emergency Centre for Homeless accommodates up to 50 people, and the Preschool Children Day Care Centre cares for 25 children.
271

Map 104. Social assistance units
The
Gro
wth
Pol
e’s
Pro
file
Ana
lysi
s of
Dev
elop
men
t N
eeds
and
Are
as o
f In
terv
enti
on
Cha
pter
1.6
. Pub
lic S
ervi
ces
and
hou
sing
i
1
i272

The institution’s local-level records for 2014 were the following: 599 persons receiving guaranteed minimum income, 1,396 persons receiving benefits for severe disability, 433 allowances for personal caregivers of severely disabled persons, 21,000 households receiving municipal heating subsidies (16,000 apartments and 5000 houses), and more than 15,000 people being granted food aid under the PEAD Program, of which more than 9,500 disabled persons (mostly with neuropsychological, somatic, physical, and visual impairment), 3,500 pensioners with income under 400 lei/month, 2,000 unemployed persons, 500 recipients of the guaranteed minimum income. In total, they account for around 7% of the city’s permanent population. The number of people receiving social benefits dropped since 2007 due to more restrictive eligibility conditions.
The Community Services Administration - Ploiești has concluded partnerships with a series of public institutions (the Boldești-Scăeni Medical-Social Assistance Unit, the Probation Service attached to Prahova Tribunal, Prahova Prefecture, DGASPC Prahova, Prahova Territorial Labor Inspectorate, Prahova Public Health Authority, Prahova County School Inspectorate, County Police Inspectorate), but also with non-profit social organizations (Vasarley Life Care Association for homeless people; St. Nicolae Barbu Establishment Association for homeless people; Princess Margareta of Romania Foundation for dependent elderly; Youth’s Future Association for young people at social risk; the National Association of the Hearing-impaired – Prahova branch – for persons with hearing impairment; Concordia Humanitarian Organization – Ariceștii Rahtivani branch – children at risk of abuse; Constantin and Elena Foundation – social kitchen).
As regards the allocations for social benefits and services in Ploiești municipality, they amounted to approximately 20 mil. Euro in 2013, with the largest shares being allotted to public transportation subsidies for pensioners, pupils, veterans, and students (34.7 mil. lei), municipal subsidies for heating (23 mil. lei), and social assistance subsidies for the disabled (17.4 mil. lei), while the rest were oriented towards the following: social kitchen, preschool children day care center, guaranteed minimum income, newlyweds, school medical offices, nurseries, social welfare for nursing homes, scholarships.
Other public social services providers in Ploiești Growth pole include:
• All town halls with departments providing primary public social assistance services, such as: assessment of social needs, information and counselling, social assistance for children, families, single persons, the elderly, the disabled, and all persons in need, which are tasked with resolving the community social problems in these fields;
• Ploiești penitentiary;
• Târgșoru Vechi women’s penitentiary.
Besides public institutions, there is a series of private organizations and associations accredited as social services providers by the Ministry of Labor, Family, Social Protection, and the Elderly:
• National Association of the Hearing Impaired – Ploiești Branch;
• Constantin and Elena social kitchen – Ploiești;
• Association for the Support of Disabled Children – Ploiești branch;
• Romanian Association of the Blind – Ploiești Branch;
• Compassion & Care Association – Ploiești;
• Marcel Samaritan Foundation – Plopeni.
Despite the existence of these social associations and the conclusion of partnerships with relevant public authorities, the contribution of NGOs to the provision of social services remains low, notwithstanding their significant potential to increase the range of social services they provide and the number of their beneficiaries.
273

1.6.5. Ongoing/completed projects
In 2007-2013, the local budget covered the following investments in the educational infrastructure:
• Indoor heating systems and installation of central heating units at Radu Stanian Secondary School, Kindergarten no. 7, Ienăchiță Văcărescu Secondary School, Florin Comișel Secondary School, Kindergarten no. 38, School no. 13, School no. 19, Kindergarten no. 4, Ion Creangă Secondary School, Jean Monnet High School;
• Roof restoration at Mihai Viteazul National College;
• Fencing restoration at Grigore Moisil Secondary School;
• Installation of surveillance equipment in 41 educational facilities;
• Joinery replacement at I.L. Caragiale National College;
• Modernization of 12 school sports fields;
• Current repair works at more than 70 educational facilities;
• Consolidation works at Petrol Teleajen School Group, Nichita Stănescu National College, Andrei Mureșanu Secondary School, and Rareș Vodă Secondary School;
• Construction of a gym at Nicolae Bălcescu Secondary School;
• Purchasing of beds for all-day kindergartens;
• Construction of two new kindergartens on Bobâlna and Mărășești streets;
• Technical and urban utilities works at the gym of Grigore Moisil Secondary School and the St. Vineri Secondary School;
• Construction of a school campus at Virgil Madgearu Economic College (initially funded from the state budget, but currently abandoned).Following these investments, all the educational facilities of the municipality have been thermally rehabilitated through a supplier loan, most of them providing heating from their own heating units, and the rest being connected to the central urban heating system. The following educational infrastructure investments are expected for the 2014-2020 period: construction of new
Map 105. Share of people supported by the State and other organizations by census sectors in Ploiești municipality in 2011
Source: Own diagram based on NIS, RGPL data, 2011
The
Gro
wth
Pol
e’s
Pro
file
Ana
lysi
s of
Dev
elop
men
t N
eeds
and
Are
as o
f In
terv
enti
on
Cha
pter
1.6
. Pub
lic S
ervi
ces
and
hou
sing
i
1
i274

kindergartens (20, Petrolului Blv; 29, Strung Alley, Poștei Street) – initiated by the Ministry of Education, then suspended; cosnstruction of new nurseries; rehabilitation of some colleges; construction of an auditorium at the Art High school; construction of outbuilding at Al. I. Cuza College; completion of the campus at Virgil Madgearu Economic College, including provision of furnishing and equipment for laboratories, workshops and classrooms, etc.
According to the Sustainable Development Plan for 2014-2020 of Prahova county, investments, capital repairs, rehabilitations, modernizations of buildings, operating theatres, technical-sanitary facilities, and purchases of medical equipment and devices have been carried out for all the medical facilities under the authority of Prahova County Council, namely: Ploiești Emergency County Hospital, Ploiești Obstetrics and Gynecology Hospital, and Ploiești Pediatrics Hospital, mainly funded by Prahova County Council.
The Mental Health Center of Ploiești municipality has been built with an external grant in 2010, and the project for the modernization of the Obstetrics and Neonatology wards has already begun. The Environment Fund Administration funded the project „Solar energy for water heating at county medical facilities under the public ownership of Prahova county, consisting in the installation of 2 solar systems at Boldescu ward of Ploiești Emergency County Hospital.
Ploiești Emergency County Hospital (leader), in partnership with Ploiești Pediatrics Hospital and Băicoi City Hospital have started the project “Development of the medical information system through e-health services for the benefit of the residents of Prahova county” under the PA3 (Information and communication technology for the private and public sectors) of the SOP IEC 2007-2013, aimed at increasing economic competitiveness and promoting cooperation between hospitals and citizens/the external environment, as well as improving and fully utilize the IT&C potential and applications in hospitals through the implementation of e-health systems, services and applications. A similar project has also been implemented by Ploiești Obstetrics and Gynecology Hospital.
The Oncology ward of the Municipal Hospital has been consolidated and revamped with funding from the local budget and the MRDPA, and the sanitary facilities, waterproofing, coverings, and laboratory fixtures have also been installed or repaired. The Schuller Hospital building has been previously restored under a World Bank grant. Moreover, the Infectious Disease Hospital building has been rehabilitated, the kitchen was modernized and sanitized, the outdoor water supply network has been replaced, the inpatient wing, the adult ward, the chlorination station, outer plastering, and the heating systems have been repaired.
In addition, reconversion and renovation works are currently carried out at the former PETROM headquarters, which was donated to the municipality to host the Pediatrics Hospital, an investment in excess of 20 mil. Euro to be funded from the local budget and loans.
Moreover, one of the strategic objectives set out under the Integrated Development Plan for 2014-2025 of Ploiești Growth Pole is the development of health infrastructure through the provision of professional medical services in modern and well-equipped premises.
As regards the social services infrastructure, in 2007-2013, Prahova County Council and Ploiești municipality Hall accessed European funds for the following objectives:
• Liliești Băicoi Care and Assistance Centre – PHARE 2004-2006;
• Rehabilitation / modernization and appropriate furnishing of C.S.C. Raza de Soare, Băicoi – POR, PA1;
• Rehabilitation / modernization and appropriate furnishing of the Neuropsychiatric recovery and rehabilitation center for adults with disabilities Nedelea (Ariceștii Rahtivani commune) – ROP, PA1;
• Rehabilitation / modernization and appropriate furnishing of the Liliești Băicoi Care and Assistance Centre – ROP, PA1;
• Rehabilitation / modernization and appropriate furnishing of Cireșarii Emergency Reception Centre – ROP, PA1;
• Conversion of military barracks into a nursing home in Ploiești – ROP, PA3.Moreover, investments have been made in the construction of social housing as of 2007 (Libertății district), which was however suspended following a dispute with the construction company. The building of “buffer” (temporary) social housing is a priority for the municipality in the 2014-2020 period.
275

1.6.6. Conclusions - existing disparities, trends, needs, and intervention areas
Map 106. Housing
The
Gro
wth
Pol
e’s
Pro
file
Ana
lysi
s of
Dev
elop
men
t N
eeds
and
Are
as o
f In
terv
enti
on
Cha
pter
1.6
. Pub
lic S
ervi
ces
and
hou
sing
i
1
i276

The housing stock dynamics in the 2007-2013 period mirrors a clear suburbanization phenomenon reflected in the increasing number of dwellings built in the city’s surrounding communes. Thus, while the total housing stock of Ploiești municipality increased by merely 2.3% after 2007, the growth rate in Blejoi, Târgșoru Vechi, Păulești, Bucov, and Ariceștii Rahtivani communes ranged between 10.4% and 31.9%. These localities are part of Ploiești metropolitan area and are relatively easily accessible, while land prices are much lower than in the inner city area, which makes them much more attractive for building housing complexes. Moreover, these areas have plenty of available land for residential expansion as compared with Ploiești municipality, which already has a high housing density.
A number of 54,021 dwellings have rehabilitated in this period. Currently, more than 40% of dwellings in Ploiești municipality, Plopeni town and Blejoi, Păulești, and Brazi communes are thermally rehabilitated.
As regards available utilities, there is a significant share of dwellings without water supply and sewerage networks, particularly in Berceni, Dumbrăvești, and Valea Călugărească communes, where more than 40% of dwellings do not have access to sewerage facilities. In Valea Călugărească commune, 20% of dwellings do not have access to drinking water.
277

Map 107. Education
The
Gro
wth
Pol
e’s
Pro
file
Ana
lysi
s of
Dev
elop
men
t N
eeds
and
Are
as o
f In
terv
enti
on
Cha
pter
1.6
. Pub
lic S
ervi
ces
and
hou
sing
i
1
i278

The educational infrastructure of Ploiești Growth Pole is comprehensive and covers all education levels, from primary schools to postgraduate education, in both public and private facilities, with the latter on an increasing trend in recent years.
The steep decrease of the birth rate, internal and external migration of the population, the migration of high school graduates to other university centers, and the existence of some cases of school dropouts determined the reduction of school population by almost 9% in the 2007-2013 period alone, a trend which is expected to continue. However, an increase of enrolment in preschool education and post-secondary schools has been noted, the latter being an alternative for pupils who failed to pass the Baccalaureate.
The offers of high schools in Ploiești Growth pole are diverse, consisting in fields such as sciences, humanities, vocational and sports, technical and services. Technical high schools attract the most pupils, especially from neighboring localities, but their Baccalaureate promotion rate is very low (sometimes below 10%), raising doubts on the schools’ capacity to ensure sufficient numbers of secondary education graduates in the future.
Petroleum and Gas University of Ploiești has a tradition of nearly 70 years in higher education and a unique profile in national context, offering Bachelor, Master, and Doctoral degrees at 5 faculties. In spite of this, the number of students dropped significantly in the past years due to the increasing attractiveness of other national (Bucharest) or international university centers, so that only 25% of the city’s high school graduates choose to continue their studies locally.
The ongoing vocational training offer is diverse at local level and covers a wide range of occupations for secondary or higher education graduates, being provided by public institutions, NGOs, and private companies. However, with the exception of free courses for a few categories, the number of participants to ongoing professional training activities remains low, which in turn hampers the vocational retraining process, while many companies prefer to provide in-house, job-specific training for new employees.
The school dropout rate remains below the regional and national average, but is still significant among vocational school students, students from rural areas and Roma families, who are the most exposed to the risk of education exclusion.
School age commuters are highly prevalent, competing in numbers with adult commuters. Nearly 7,000 children and pupils from all across Prahova county, but especially in a maximum 30 km radius, do their studies in Ploiești municipality, being attracted by the diverse and superior quality education provided by local educational facilities. Although school buses are available, many prefer to use public transport means or travel in their families’ cars, a further reason to continue investments for the stimulation of metropolitan-wide mobility.
The local educational infrastructure has been improving in the past years thanks to investments from many funding sources, including EU funds, but most educational facilities are still faced with major deficiencies related to inappropriate conditions and poor energy efficiency of buildings, furnishings, school equipment and materials in classrooms and laboratories, the inadequate sports infrastructure, etc. Future investments in the educational infrastructure should however take into account the grim demographic outlook and the educational achievements up to now, which will determine the closing down or restructuring of certain local educational facilities.
279

Map 108. Health and social services
The
Gro
wth
Pol
e’s
Pro
file
Ana
lysi
s of
Dev
elop
men
t N
eeds
and
Are
as o
f In
terv
enti
on
Cha
pter
1.6
. Pub
lic S
ervi
ces
and
hou
sing
i
1
i280

Life expectancy of the population in Ploiești area increased from 2007, but remains below the European average and even that of other Romanian growth poles, the causes being, among others, the high rates of cardiovascular and oncologic diseases due to little consideration for prevention or healthy lifestyle. These deficiencies exert significant pressures on the local medical facilities, which often fail to cope with the demand.
The network of public medical facilities is complex and includes single specialization hospitals at county level, serving more than 700,000 residents. However, the deficient health infrastructure and staff shortages constrain many patients to travel to Bucharest for more complex investigations and interventions. Moreover, the private sector is rapidly growing and provides some paid services of a better quality for patients.
Admissions in local hospitals dropped by around 20% since 2007, against the background of patient reorientation to outpatient care services and the restructuring of the public health network. However, the hospital-based outpatient care facilities have limited capacity and lack appropriate, state of the art medical equipment. Moreover, some hospitals are housed in buildings unfit for quality medical services (Buna Vestire ward or the Pediatrics Hospital). Besides, Ploiești municipality is one of the few growth poles lacking category I and II medical facilities that providing high quality and diverse health services.
The public sector is faced with chronic understaffing due to the internal and external migration of specialists, professionals, including to the private sector, or the unattractive working conditions and wages. The same situation occurs at the County Ambulance Service, which faces increasing difficulties in managing the high numbers of requests with severely understaffed personnel.
The local infrastructure of social services is complex, the most significant suppliers being the specialized departments within city halls and the County Council. Nevertheless, the scope of social services and beneficiaries needs to be extended, with emphasis on the non-residential component, taking specifically into account the increased number of people at risk of social exclusion (such as dependent elderly, homeless people, children with parents working abroad, people with disabilities, etc.).
The number of social benefits recipients has decreased as compared with 2007 due to more restrictive eligibility conditions, but more than 7% of the city’s population meets the criteria for social welfare payments (unemployed, people with disabilities, recipients of the minimum guaranteed income, low-income pensioners, etc.), for whom the municipality earmarks around 20 mil. Euro from the local budget each year.
The involvement of NGOs in the provision of social services remains low as compared with other growth poles, despite the conclusion of partnerships between relevant public institutions and such organizations.
281

Annex 1.6.1 Vocational training providers in in Ploiești Growth Pole12
12 The National Authority for Qualifications. National Register of Adult Vocational Training Providers (RNFFPA), available at http://www.anc.edu.ro
Public institutions
PRAHOVA COUNTY EMPLOYMENT AGENCY
PRAHOVA CHAMBER OF AGRICULTURE
PRAHOVA CHAMBER OF COMMERCE AND INDUSTRY
Private companies - vocational training providers
S.C. ACQUISITION CAREER MANAGEMENT S.R.L. Ploiești
S.C. AEVUM ECO CONSULT S.R.L. Ploiești
S.C. AGI CONSULTING S.R.L. Ploiești
S.C. ALEDAV OSOSCHI S.R.L. Ploiești
S.C. ALFA EUROCURS INVEST S.R.L. Ploiești
S.C. ANDRAG EXPO S.R.L. Ploiești
S.C. CENTRUL DE CONSULTANTA și STUDII EUROPENE S.R.L.
S.C. CENTRUL DE PREGATIRE și FORMARE PROFESIONALA INTERNATIONAL S.R.L.
S.C. CENTRUL DOXIS S.R.L. Ploiești
S.C. CENTRUL ZONAL DE FORMARE PROFESIONALA A ADULTILOR S.R.L. Ploiești
S.C. DOMA TRAINING S.R.L. Ploiești
S.C. DOTIS TRAINING S.R.L. Ploiești
S.C. DRAGMA CONSULTING S.R.L. Ploiești
S.C. ELGA TRAINING & CONSULTING S.R.L. Ploiești
S.C. ENOMIS CONSULTING S.R.L. Ploiești
S.C. FAXMEDIA CONSULTING S.R.L. Ploiești
S.C. FORM - EXPERT S.R.L.
S.C. FORM EXPERT HR CONSULTING SERV S.R.L.
S.C. FORMAT ORIZONT S.R.L. Ploiești
S.C. FORMAT SAPIENS S.R.L. Ploiești
S.C. HSEQ CONSULTING S.R.L. Ploiești
S.C. MEDA CONSULTING S.R.L. Ploiești
S.C. MODULE QUALITY CONSULTING S.R.L. Boldești-Scăeni
S.C. ONE TRAINING DEVELOPMENT & CONSULTING S.R.L. Ploiești
S.C. PLURI CONSULTANTS ROMANIA S.R.L. Ploiești
S.C. RESUM CONSULTING S.R.L. Ploiești
S.C. TEAMNET INTERNATIONAL S.A. Ploiești
S.C. TREMOT DOBRE și FIII S.R.L. Băicoi
The
Gro
wth
Pol
e’s
Pro
file
Ana
lysi
s of
Dev
elop
men
t N
eeds
and
Are
as o
f In
terv
enti
on
Cha
pter
1.6
. Pub
lic S
ervi
ces
and
hou
sing
i
1
i282

S.C. TRES BELLE MADEMOISELE S.R.L. Ploiești
S.C. UNIAS EDUCATION & CONSULTING CENTER S.R.L. Ploiești
S.C. WONDER EDUCATION CENTER S.R.L. BREAZA
nGos – vocational training providers
REGIONAL CENTRE FOR EQUALITY ASSOCIATION
SACRED ROMANIA ASSOCIATION
APOLLO RESOURCE CENTRE ASSOCIATION
BREEDING APICULTURE FARMS ASSOCIATION
AMUS FRANCE ROUMANIE MUTUAL ASSOCIATION
ROMANIAN TRAINING AND RETRAINING COUNSELLING ASSOCIATION Ploiești SUD
FORTUNA Ploiești HUMAN DEVELOPMENT ASSOCIATION
INITATIVE AND CONTINUOUS DEVELOPMENT ASSOCIATION
A.S.T.R.U ASSOCIATION FOR HUMAN RESOURCES SUPPORT AND TRAINING
EDUCATION, SUPPORT, AND TRAINING CENTRE
Bușteni INDUSTRY PERSONNEL TRAINING CENTRE
PRE-UNIVERSITY EDUCATION FOUNDATION OF THE CRAFTS ASSOCIATION SPIRU HARET, Ploiești branch
HUMANITAS NATIONAL FOUNDATION ROMANIA, Ploiești branch
HUMAN DEVELOPMENT ASSOCIATION – Ploiești branch
Source: The National Authority for Qualifications
283

Annex 1.6.2. Current state of primary and secondary school infrastructure in
Ploiești Growth Pole
nr. Schoolr
oad
dist
ance
bet
wee
n sc
hool
and
cit
y ce
nter
Acc
ess
to p
ublic
tr
ansp
orta
tion
type
of
scho
ol
tota
l ind
oor
area
(m2 )
no.
of
enro
lled
stud
ents
no.
of
clas
ses
(gro
ups)
teac
hing
sta
ff
Perm
anen
t po
wer
sup
ply
Fire
sec
urit
y
Air
tigh
t ro
ofs
and
win
dow
s
eart
hqua
ke r
esis
tant
bu
ildin
gs
ove
rcro
wde
d cl
asse
s(le
ss t
han
2 m
2 /pu
pil)
App
ropr
iate
fur
nish
ing
(sin
gle
desk
s)
hea
ting
sys
tem
1ANGHEL SALIGNYTECHNICAL HIGH
SCHOOL, PLOIEȘTI 7 km Yes
Publ
ic
4,8
00
m2
823
35.0
0
51.0
0
Yes
Yes
No
Yes
Non
e
All
Cen
tral
2
LUDOVIC MRAZEK TECHNICAL HIGH
SCHOOL, PLOIEȘTI (preschool,high school,
post-secondary, technicalschool)
4 km Yes
Publ
ic
5,23
6
477
21.0
0
24.0
0
Yes
Yes
No
Yes
Non
e
Mos
t
Indi
vidu
al
3
CONSTANTINCANTACUZINO
TECHNICAL HIGHSCHOOL, BĂICOI
500
m
Publ
ic
2,8
00
m2
825
34.0
0
52.0
0
Yes
Yes
Yes
Yes
Non
e
All
Cen
tral
4DUMITRU GHENOIU
SECONDARY SCHOOL,BĂICOI 5
km
Publ
ic
1,0
50 m
2
162
10.0
0
11.0
0
Yes
Yes
Yes
Yes
Non
e
All
Cen
tral
5 ȚINTEA BĂICOISECONDARY SCHOOL 5
km
Publ
ic
1,0
50 m
2
162
10.0
0
11.0
0
Yes
Yes
Yes
Yes
Non
e
All
Cen
tral
6 PRIMARY SCHOOL,DÂMBU, BĂICOI 5k
m
Publ
ic
353
m2
63 5.0
0
4.0
0
Yes
Yes
Yes
Yes
Non
e
All
Cen
tral
7 LILIEȘTI SECONDARYSCHOOL, BĂICOI 40
0 m
No
Publ
ic
2,0
00
496
19.0
0
32.0
0
Yes
Yes
Yes
Yes
Hal
f
Mos
t
Indi
vidu
al
8FULLTIME
KINDERGARTEN, LILIEȘTI,BĂICOI 20
0 m
Publ
ic
600
m
125
5.0
0
5.0
0
Yes
Yes
Yes
Yes
Non
e
All
Cen
tral
9FULLTIME
KINDERGARTEN, ȚINTEA,BĂICOI 50
m
Publ
ic
150
m
40 2.0
0
2.0
0
Yes
Yes
No
Yes
Non
e
All
Cen
tral
10 FULLTIME AND ALL-DAYKINDERGARTEN, BĂICOI 30
0 m
No
Publ
ic
320
162
5.0
0
7.0
0
Yes
No
No
No
Non
e
All
Indi
vidu
al
The
Gro
wth
Pol
e’s
Pro
file
Ana
lysi
s of
Dev
elop
men
t N
eeds
and
Are
as o
f In
terv
enti
on
Cha
pter
1.6
. Pub
lic S
ervi
ces
and
hou
sing
i
1
i284

nr. School
roa
d di
stan
ce b
etw
een
scho
ol a
nd c
ity
cent
er
Acc
ess
to p
ublic
tr
ansp
orta
tion
type
of
scho
ol
tota
l ind
oor
area
(m2 )
no.
of
enro
lled
stud
ents
no.
of
clas
ses
(gro
ups)
teac
hing
sta
ff
Perm
anen
t po
wer
sup
ply
Fire
sec
urit
y
Air
tigh
t ro
ofs
and
win
dow
s
eart
hqua
ke r
esis
tant
bu
ildin
gs
ove
rcro
wde
d cl
asse
s(le
ss t
han
2 m
2 /pu
pil)
App
ropr
iate
fur
nish
ing
(sin
gle
desk
s)
hea
ting
sys
tem
11FULLTIME
KINDERGARTEN, DÂMBU,BĂICOI 4.
5 km
No
Publ
ic
50 40 2.0
0
2.0
0
Yes
No
No
No
Non
e
All
Indi
vidu
al
12FULLTIME
KINDERGARTEN, TUFENI,BĂICOI 2.
5 km
No
Publ
ic
60 20 1.0
0
1.0
0
Yes
No
No
No
Non
e
All
Indi
vidu
al
13 ION KALINDERUCOLLEGE, BUȘTENI 15
0 m
Yes
Publ
ic
2536
m2
319
15.0
0
32.0
0
Yes
No
Yes
Yes
Mos
t
All
Indi
vidu
al
14NESTOR URECHIA
SECONDARY SCHOOL,BUȘTENI 10
0 m
No
Publ
ic
3257
,83
298
13.0
0
24.0
0
Yes
No
No
Yes
Non
e
All
Indi
vidu
al
15CEZAR PETRESCU
SECONDARY SCHOOL,BUȘTENI 1
km No
Publ
ic
88
2
143
9.0
0
19.0
0
Yes
No
No
Yes
Non
e
All
Indi
vidu
al
16
CEZAR PETRESCUFULLTIME
KINDERGARTEN,BUȘTENI
1 km
Publ
ic
125
41 2.0
0
2.0
0
Yes
No
No
Yes
Non
e
All
Indi
vidu
al
17
FRAM URSUL POLARFULLTIME AND FULL-
DAYKINDERGARTEN,
BUȘTENI
1 km Nu
Publ
ic
281
81 4.0
0
7.0
0
Yes
No
No
Yes
Non
e
All
Indi
vidu
al
18REGINA ELISABETA
SECONDARY SCHOOL,BUȘTENI 3
km Yes
Publ
ic
1,0
64
161
8.0
0
19.0
0
Yes
No
Yes
Yes
Non
e
All
Indi
vidu
al
19
FULLTIMEKINDERGARTEN NO. 3,
POIANA ȚAPULUI,BUȘTENI
3 km Yes
Publ
ic
149
41 2.0
0
2.0
0
Yes
No
Yes
Yes
Non
e
All
Indi
vidu
al
20FULLTIME
KINDERGARTEN NO. 4,BUȘTENI 2
km Yes
Publ
ic
217
21 1.0
0
1.0
0
Yes
No
Yes
Yes
Non
e
All
Indi
vidu
al
21FULLTIME
KINDERGARTEN NO. 5,BUȘTENI 0
,5 k
m
Yes
Publ
ic
193
19 1.0
0
1.0
0
Yes
No
Yes
Yes
Non
e
All
Indi
vidu
al
22GHEORGHE LAZĂR
TECHNICAL COLLEGE,PLOPENI 20
0m
Yes
Publ
ic
4,30
5
482
20.0
0
35.0
0
Yes
Yes
Yes
Yes
Non
e
All
Cen
tral
23 CAROL I SECONDARYSCHOOL, PLOPENI 1
km No
Publ
ic
2,42
2
532
23.0
0
30.0
0
Yes
No
No
Yes
Som
e
All
Indi
vidu
al
24
FRUNZA DE STEJAR’FULLTIME AND FULL-
DAYKINDERGARTEN,
PLOPENI
1 km No
Publ
ic
1,8
84
196
8.0
0
10.0
0
Yes
No
No
Yes
Non
e
All
Indi
vidu
al
285

nr. School
roa
d di
stan
ce b
etw
een
scho
ol a
nd c
ity
cent
er
Acc
ess
to p
ublic
tr
ansp
orta
tion
type
of
scho
ol
tota
l ind
oor
area
(m2 )
no.
of
enro
lled
stud
ents
no.
of
clas
ses
(gro
ups)
teac
hing
sta
ff
Perm
anen
t po
wer
sup
ply
Fire
sec
urit
y
Air
tigh
t ro
ofs
and
win
dow
s
eart
hqua
ke r
esis
tant
bu
ildin
gs
ove
rcro
wde
d cl
asse
s(le
ss t
han
2 m
2 /pu
pil)
App
ropr
iate
fur
nish
ing
(sin
gle
desk
s)
hea
ting
sys
tem
25 SECONDARY SCHOOL,ARICEȘTII RAHTIVANI 1
km No
Publ
ic
1,10
0
318
16.0
0
18.0
0
Yes
No
No
No
Non
e
All
Indi
vidu
al
26
FULLTIMEKINDERGARTEN,
ARICESTII RAHTIVANI,BĂICOI
500
m
No
Publ
ic
100
78 3.0
0
3.0
0
Yes
No
No
No
Non
e
All
Indi
vidu
al
27GHEORGHE LAZĂR
SECONDARY SCHOOL,BĂRCĂNEȘTI 7.
2 K
m
Yes
Publ
ic
1,40
0
231
11.0
0
9.0
0
Yes
No
No
Yes
All
Som
e
Indi
vidu
al
28SECONDARY SCHOOL,
ROMÂNEȘTI,BĂRCĂNEȘTI 11
.2 k
m
Yes
Publ
ic
700
188
9.0
0
9.0
0
Yes
No
No
Yes
All
Som
e
Indi
vidu
al
29FULLTIME
KINDERGARTEN,BĂRCĂNEȘTI 7.
2 K
m
Yes
Publ
ic
80
3.0
0
3.0
0
Yes
No
No
Yes
All
Non
e
Indi
vidu
al
30FULLTIME
KINDERGARTEN,ROMÂNEȘTI 11
.2 k
m
Yes
Publ
ic
59 3.0
0
3.0
0
Yes
No
No
Yes
All
Non
e
Indi
vidu
al
31SECONDARY SCHOOL,
TĂTĂRANI,BĂRCĂNEȘTI 6.
9 k
m
Yes
Publ
ic
1,0
50
138
9.0
0
10.0
0
Yes
No
No
Yes
All
Som
e
Indi
vidu
al
32FULLTIME
KINDERGARTEN,TĂTĂRANI 6.
9 k
m
Yes
Publ
ic
48 2.0
0
2.0
0
Yes
No
No
Yes
All
Non
e
Indi
vidu
al
33 SECONDARY SCHOOL,BERCENI
Yes
Publ
ic
1,0
40
372
16.0
0
25.0
0
Yes
No
No
Yes
Non
e
All
Cen
tral
34FULLTIME
KINDERGARTEN NO. 1,BERCENI (preschool) 40
0 m
Yes
Publ
ic
44 20 1.0
0
1.0
0
Yes
No
No
Yes
Non
e
All
Cen
tral
35FULLTIME
KINDERGARTEN NO. 2,BERCENI (preschool) 10
0 m
Yes
Publ
ic
83 44 2.0
0
2.0
0
Yes
No
No
Yes
Non
e
All
Cen
tral
36 SECONDARY SCHOOL,BRAZI 1
km No
Publ
ic
2,40
0
157
9.0
0
12.0
0
Yes
Yes
Yes
Yes
Non
e
Mos
t
Indi
vidu
al
37DUMITRU HERA
SECONDARY SCHOOL,BĂTEȘTI, BRAZI 2
km No
Publ
ic
2,0
00
177
9.0
0
10.0
0
Yes
Yes
Yes
Yes
Non
e
Mos
t
Indi
vidu
al
38FULLTIME
KINDERGARTEN, BĂTEȘTI, BRAZI 2
km No
Publ
ic
150
48 2.0
0
2.0
0
Yes
Yes
Yes
Yes
Non
e
All
Indi
vidu
al
The
Gro
wth
Pol
e’s
Pro
file
Ana
lysi
s of
Dev
elop
men
t N
eeds
and
Are
as o
f In
terv
enti
on
Cha
pter
1.6
. Pub
lic S
ervi
ces
and
hou
sing
i
1
i286

nr. School
roa
d di
stan
ce b
etw
een
scho
ol a
nd c
ity
cent
er
Acc
ess
to p
ublic
tr
ansp
orta
tion
type
of
scho
ol
tota
l ind
oor
area
(m2 )
no.
of
enro
lled
stud
ents
no.
of
clas
ses
(gro
ups)
teac
hing
sta
ff
Perm
anen
t po
wer
sup
ply
Fire
sec
urit
y
Air
tigh
t ro
ofs
and
win
dow
s
eart
hqua
ke r
esis
tant
bu
ildin
gs
ove
rcro
wde
d cl
asse
s(le
ss t
han
2 m
2 /pu
pil)
App
ropr
iate
fur
nish
ing
(sin
gle
desk
s)
hea
ting
sys
tem
39FULLTIME AND FULL-
DAYKINDERGARTEN, BRAZI
1km
No
Publ
ic
500
60 3.0
0
4.0
0
Yes
Yes
Yes
Yes
Non
e
All
Indi
vidu
al
40
PROFESOR OPREAMIHAI’ SECONDARYSCHOOL, NEGOIEȘTI,
BRAZI
200
m
Yes
Publ
ic
700
m p
173
9.0
0
10.0
0
Yes
Yes
Nu
Yes
Non
e
All
Indi
vidu
al
41ANTONIE VODĂ
SECONDARY SCHOOL,POPEȘTI, BRAZI 30
0 m
Yes
Publ
ic
700
mp
187
8.0
0
9.0
0
Yes
Yes
Nu
Yes
Non
e
All
Indi
vidu
al
42FULLTIME
KINDERGARTEN, NEGOIEȘTI, BRAZI 20
0 m
Nu
Publ
ic
300
mp
38 2.0
0
2.0
0
Yes
Yes
Nu
Yes
Non
e
All
Indi
vidu
al
43FULLTIME
KINDERGARTEN, POPEȘTI, BRAZI 30
0 m
Nu
Publ
ic
300
mp
44 2.0
0
2.0
0
Yes
Yes
Nu
Yes
Non
e
All
Indi
vidu
al
44CONSTANTIN STERE
SECONDARY SCHOOL,BUCOV 0
.5 k
m
Nu
Publ
ic
149
8 m
p
406
18.0
0
25.0
0
Yes
Yes
Nu
Yes
Som
e
Mos
t
Indi
vidu
al
45 FULLTIMEKINDERGARTEN, BUCOV 0
,5 k
m
Nu
Publ
ic
130
0 m
p
148
6.0
0
8.0
0
Yes
Yes
Nu
Yes
Non
e
All
Indi
vidu
al
46
MIHAI VODĂSECONDARY SCHOOL,
PLEAȘA, BUCOV (primary,secondary)
Yes
Publ
ic
1447
,97
309
14.0
0
23.0
0
Yes
Yes
Yes
Yes
Som
e
Som
e
Cen
tral
47FULLTIME
KINDERGARTEN NO. 1, PLEAȘA, BUCOV
Yes
Publ
ic
174
67 3.0
0
3.0
0
Yes
Yes
Yes
Yes
Som
e
Som
e
Cen
tral
48FULLTIME
KINDERGARTEN NO. 2,PLEAȘA, BUCOV 3
km Yes
Publ
ic
176
38 2.0
0
2.0
0
Yes
Yes
Yes
Yes
Som
e
Som
e
Cen
tral
49 SECONDARY SCHOOL,DUMBRĂVEȘTI 10 Ye
s
Publ
ic
1,0
58
155
8.0
0
7.0
0
Yes
Yes
Yes
Yes
Som
e
Som
e
Indi
vidu
al
50 SECONDARY SCHOOL,PLOPENI, DUMBRĂVEȘTI
5 Yes
Publ
ic
750
177
9.0
0
12.0
0
Yes
Yes
Yes
Yes
Non
e
Som
e
Indi
vidu
al
51FULLTIME
KINDERGARTEN, DUMBRĂVEȘTI
10 Yes
Publ
ic
118
20 1.0
0
1.0
0
Yes
Yes
Yes
Yes
Non
e
Non
e
Indi
vidu
al
287

nr. School
roa
d di
stan
ce b
etw
een
scho
ol a
nd c
ity
cent
er
Acc
ess
to p
ublic
tr
ansp
orta
tion
type
of
scho
ol
tota
l ind
oor
area
(m2 )
no.
of
enro
lled
stud
ents
no.
of
clas
ses
(gro
ups)
teac
hing
sta
ff
Perm
anen
t po
wer
sup
ply
Fire
sec
urit
y
Air
tigh
t ro
ofs
and
win
dow
s
eart
hqua
ke r
esis
tant
bu
ildin
gs
ove
rcro
wde
d cl
asse
s(le
ss t
han
2 m
2 /pu
pil)
App
ropr
iate
fur
nish
ing
(sin
gle
desk
s)
hea
ting
sys
tem
52
FULLTIMEKINDERGARTEN,
PLOPENI,DUMBRĂVEȘTI
10 Yes
Publ
ic
352
55 3.0
0
3.0
0
Yes
Yes
Yes
Yes
Non
e
Non
e
Indi
vidu
al
53
FULLTIMEKINDERGARTEN, SFÂRLEANCA,DUMBRĂVEȘTI
40 Yes
Publ
ic
85 14 1.
00
1.0
0
Yes
Yes
Yes
Yes
Non
e
Non
e
Indi
vidu
al
54
FULLTIMEKINDERGARTEN,
MĂLĂIEȘTII DE JOS,DUMBRĂVEȘTI
35 Yes
Publ
ic
65 17 1.0
0
1.0
0
Yes
Yes
Yes
Yes
Non
e
Non
e
Indi
vidu
al
55
ARHITECT T.T.SOCOLESCU
SECONDARY SCHOOL,PĂULEȘTI 10
00
m
Yes
Publ
ic
748
mp
196
9.0
0
18.0
0
Yes
Yes
Yes
Yes
Non
e
All
Cen
tral
56
VLAD MUȘETESCUSECONDARY
SCHOOL, GĂGENI,PĂULEȘTI
300
m
Yes
Publ
ic
550
mp
127
9.0
0
18.0
0
Yes
Yes
Yes
Yes
Non
e
All
Cen
tral
57FULLTIME
KINDERGARTEN, PĂULEȘTI
10
Publ
ic
280
mp
62 2.0
0
2.0
0
Yes
Yes
Yes
Yes
Non
e
All
Cen
tral
58FULLTIME
KINDERGARTEN, PĂULEȘTI
100
No
Publ
ic
250
mp
23 1.0
0
1.0
0
Yes
Yes
Yes
Yes
Non
e
All
Cen
tral
59FULLTIME
KINDERGARTEN, GĂGENI, PĂULEȘTI 30
0 m
No
Publ
ic
330
mp
36 2.0
0
2.0
0
Yes
Yes
Yes
Yes
Non
e
All
Cen
tral
60
FULLTIMEKINDERGARTEN,
STREJNICU,TÂRGȘORU VECHI
500
m
No
Publ
ic
200
mp
175 7
7.0
0
Yes
No
No
Yes
Mos
t
All
Indi
vidu
al
61
GHEORGHE IONESCUȘIȘEȘTI’ AGRICULTURAL
COLLEGE, VALEACĂLUGĂREASCĂ
1,9
km
Yes
Publ
ic
338
9 M
P
699
29
47.0
0
Yes
Yes
Yes
Yes
Non
e
Mos
t
Indi
vidu
al
62ION IONESCU
SECONDARY SCHOOL,VALEA CĂLUGĂREASCĂ
1 Yes
Publ
ic
1,0
43
424
17
22.0
0
Yes
Yes
Yes
Yes
Non
e
All
Indi
vidu
al
63SECONDARY SCHOOL,
NICOVANI, VALEA CĂLUGĂREASCĂ
3 No
Publ
ic
567
189 6
10.0
0
Yes
Yes
Yes
No
Non
e
All
Indi
vidu
al
64SECONDARY SCHOOL,
NICOVANI, VALEA CĂLUGĂREASCĂ
3 Yes
Publ
ic
665
100 9
6.0
0
Yes
Yes
Yes
No
Non
e
All
Indi
vidu
al
The
Gro
wth
Pol
e’s
Pro
file
Ana
lysi
s of
Dev
elop
men
t N
eeds
and
Are
as o
f In
terv
enti
on
Cha
pter
1.6
. Pub
lic S
ervi
ces
and
hou
sing
i
1
i288

nr. School
roa
d di
stan
ce b
etw
een
scho
ol a
nd c
ity
cent
er
Acc
ess
to p
ublic
tr
ansp
orta
tion
type
of
scho
ol
tota
l ind
oor
area
(m2 )
no.
of
enro
lled
stud
ents
no.
of
clas
ses
(gro
ups)
teac
hing
sta
ff
Perm
anen
t po
wer
sup
ply
Fire
sec
urit
y
Air
tigh
t ro
ofs
and
win
dow
s
eart
hqua
ke r
esis
tant
bu
ildin
gs
ove
rcro
wde
d cl
asse
s(le
ss t
han
2 m
2 /pu
pil)
App
ropr
iate
fur
nish
ing
(sin
gle
desk
s)
hea
ting
sys
tem
65SECONDARY SCHOOL,
NICOVANI, VALEA CĂLUGĂREASCĂ 50
0m
No
Publ
ic
515m
p
56 2
4.0
0
Yes
No
Yes
Yes
Non
e
All
Indi
vidu
al
66VOINICEL FULLTIME
KINDERGARTEN, VALEACĂLUGĂREASCĂ 50
0m
No
Publ
ic
320
m
25 1
1.0
0
Yes
No
Yes
Yes
Non
e
All
Indi
vidu
al
67LUMINITA FULLTIME
KINDERGARTEN, VALEACĂLUGĂREASCĂ 50
m
No
Publ
ic
286,
50m
p
46 2
2.0
0
Yes
No
Yes
Yes
Non
e
All
Indi
vidu
al
68
CĂSUTA FERMECATĂFULLTIME
KINDERGARTEN,RACHIERI, VALEACĂLUGĂREASCĂ
3 K
m
No
Publ
ic
119
,82s
qm
56 2
2.0
0
Yes
No
Yes
Yes
Non
e
All
Indi
vidu
al
69SECONDARY SCHOOL,
DÎRVARI VILLAGE,VALEA CĂLUGĂREASCĂ
7 No
Publ
ic
760
207
9
16.0
0
Yes
Yes
No
Yes
Non
e
Mos
t
Cen
tral
70PRIMARY SCHOOL,
PANTAZI, VALEA CĂLUGĂREASCĂ
7 No
Publ
ic
200
17 1
3.0
0
Yes
Yes
No
Yes
Non
e
Mos
t
Cen
tral
71
FULLTIMEKINDERGARTEN,DARVARI, VALEA CĂLUGĂREASCĂ
7 No
Publ
ic
250
55 3
3.0
0
Yes
Yes
No
Yes
Non
e
All
Indi
vidu
al
72
FULLTIMEKINDERGARTEN,PANTAZI, VALEA CĂLUGĂREASCĂ
7 No
Publ
ic
50 34 2
2.0
0
Yes
Yes
No
Yes
Non
e
All
Cen
tral
73
PRICHINDEL FULLTIMEKINDERGARTEN,NICOVANI, VALEA CĂLUGĂREASCĂ
2 No
Publ
ic
100
40 2
2.0
0
Yes
Yes
No
Yes
Non
e
All
Indi
vidu
al
74REGINA ELISABETA
SECONDARY SCHOOL,BUSTENI 3
km Yes
Publ
ic
1,0
64
161 8
19.0
0
Yes
No
Yes
Yes
Non
e
All
Indi
vidu
al
75 SPECIAL VOCATIONALSCHOOL, PLOPENI 70
0 m
Yes
Publ
ic
1016
mp
109
10
21.0
0
Yes
Yes
Yes
Yes
Non
e
Som
e
Cen
tral
Source: MECS – SIIIR (Romanian education IT integrated system), 2015
289

Annex 1.6.3. Current state of Ploiești preschool infrastructure
no. Preschool Unit
Dis
tanc
e be
twee
n sc
hool
and
cit
y ce
nter
Acc
ess
to p
ublic
tra
nspo
rtat
ion
type
of
scho
ol
tota
l ind
oor
area
(m2 )
no.
of
enro
lled
stud
ents
no.
of
clas
ses
(gro
ups)
teac
hing
sta
ff
elec
tric
ity
Fire
sec
urit
y
insu
late
d ro
ofs
and
win
dow
s
Con
stan
t te
mpe
ratu
re in
bui
ldin
gs
Dire
ct y
ard
acce
ss
eart
hqua
ke r
esis
tant
bui
ldin
gs
App
ropr
iate
fur
nish
ing
for
stud
ents
hea
ting
, ven
tila
tion
, air
con
diti
onin
g
Soun
dpro
ofed
cla
ssro
oms
1 FULLTIMEKINDERGARTEN NO.11 3
km No
Publ
ic
60 3 3 Yes
Yes
No
Yes
Yes
Yes
All
All
All
2 FULLTIMEKINDERGARTEN NO. 6 5
km Yes
Publ
ic
189
18 1 1 Yes
Yes
No
Yes
Yes
Yes
All
All
Non
e
3 FULLTIMEKINDERGARTEN NO. 6
400
0 m
No
Publ
ic
786
128 6 6 Yes
No
No
Yes
Yes
Yes
All
Non
e
Non
e
4 FULLTIMEKINDERGARTEN NO. 6 50
0 m
Yes
Publ
ic
110
51 2 2 Yes
Yes
No
Yes
Yes
No
All
Non
e
Non
e5 FULLTIME
KINDERGARTEN NO. 7
100
0 m
No
Publ
ic
560
mp
33 2 2 Yes
Yes
No
Yes
Yes
No
All
All
Mos
t
6FULLTIME
KINDERGARTEN NO. 41, PLOIEȘTI (preschool)
Yes
Publ
ic
300
50 2 2 Yes
Yes
Yes
Yes
Yes
Yes
All
All
Non
e
7 FULLTIMEKINDERGARTEN NO. 26 3,
5 km
Yes
Publ
ic
39 2 2 Yes
Yes
Yes
Yes
Yes
Yes
All
All
All
8 FULLTIMEKINDERGARTEN NO. 51 3
km No
Publ
ic
723
mp
109 6 6 Yes
Yes
Yes
Yes
Yes
Yes
All
Non
e
Mos
t
9ION CREANGĂ
FULLTIMEKINDERGARTEN 150
0 m
.
Yes
Publ
ic
34 2 2 Yes
Yes Yes
Yes
Yes
All
Non
e
Non
e
The
Gro
wth
Pol
e’s
Pro
file
Ana
lysi
s of
Dev
elop
men
t N
eeds
and
Are
as o
f In
terv
enti
on
Cha
pter
1.6
. Pub
lic S
ervi
ces
and
hou
sing
i
1
i290

no. Preschool Unit
Dis
tanc
e be
twee
n sc
hool
and
cit
y ce
nter
Acc
ess
to p
ublic
tra
nspo
rtat
ion
type
of
scho
ol
tota
l ind
oor
area
(m2 )
no.
of
enro
lled
stud
ents
no.
of
clas
ses
(gro
ups)
teac
hing
sta
ff
elec
tric
ity
Fire
sec
urit
y
insu
late
d ro
ofs
and
win
dow
s
Con
stan
t te
mpe
ratu
re in
bui
ldin
gs
Dire
ct y
ard
acce
ss
eart
hqua
ke r
esis
tant
bui
ldin
gs
App
ropr
iate
fur
nish
ing
for
stud
ents
hea
ting
, ven
tila
tion
, air
con
diti
onin
g
Soun
dpro
ofed
cla
ssro
oms
10 FULLTIMEKINDERGARTEN NO. 8 1
km Yes
Publ
ic
208
62 3 3 Yes
Yes Yes
Yes
Yes
All
Non
e
Non
e
11 FULLTIMEKINDERGARTEN NO. 14 5
km Yes
Publ
ic
56 2 2
12 FULLTIMEKINDERGARTEN NO. 43
Yes
Publ
ic
49 2 2 Yes
Yes
Yes
Yes
Yes
Yes
All
All
All
13 FULLTIMEKINDERGARTEN NO. 50 3,
3 km
No
Publ
ic
876 120 5 5 Yes
Yes
No
Yes
Yes
Yes
All
Non
e
Non
e
14 FULLTIMEKINDERGARTEN NO. 20 9
,3 k
m
No
Publ
ic
105 1 1 1 Yes
Yes
No
Yes
Yes
Yes
All
Non
e
Non
e
15
SFINȚII ARHANGHELIMIHAIL ȘI GAVRIIL FULL-
DAYKINDERGARTEN
2 km Yes
Publ
ic
850 205 8 18 Yes
No
No
No
Yes
Yes
All
Som
e
All
16SCUFIȚA ROȘIE
FULL-DAYKINDERGARTEN 3
km Yes
Publ
ic
230 8 14 Yes
Yes
Yes
Yes
Yes
Yes
All
Mos
t
All
17FULL-DAY
KINDERGARTENNO. 21
3km
Yes
Publ
ic
1,12
4mp
190 6 12
18FULL-DAY
KINDERGARTENNO. 23 2.
3 km
No
Publ
ic
774
220 8 16 Yes
No
No
Yes
Yes
Yes
Non
e
All
Non
e
19 FULLTIMEKINDERGARTEN NO. 10 2.
5 km
No
Publ
ic
673
146 6 6 Yes
No
No
Yes
Yes
Yes
Non
e
All
Non
e
20FULL-DAY
KINDERGARTEN NO. 28, PLOIEȘTI (Preschool)
10 m
inut
es
No
Publ
ic
1,9
47
250 8 16 Yes
Yes
No
Yes
Yes
Yes
All
Hal
f
Mos
t
21FULLTIME
KINDERGARTEN NO. 4 (Preschool)
Publ
ic
44 2 2 Yes
Yes
Yes
Yes
Yes
Yes
All
Mos
t
Non
e
22NICHITA STĂNESCU
FULLTIMEKINDERGARTEN 5
min
utes
No
Publ
ic
310
52 2 2 Yes
Yes
Yes
Yes
Yes
Yes
All
Mos
t
Hal
f
291

no. Preschool Unit
Dis
tanc
e be
twee
n sc
hool
and
cit
y ce
nter
Acc
ess
to p
ublic
tra
nspo
rtat
ion
type
of
scho
ol
tota
l ind
oor
area
(m2 )
no.
of
enro
lled
stud
ents
no.
of
clas
ses
(gro
ups)
teac
hing
sta
ff
elec
tric
ity
Fire
sec
urit
y
insu
late
d ro
ofs
and
win
dow
s
Con
stan
t te
mpe
ratu
re in
bui
ldin
gs
Dire
ct y
ard
acce
ss
eart
hqua
ke r
esis
tant
bui
ldin
gs
App
ropr
iate
fur
nish
ing
for
stud
ents
hea
ting
, ven
tila
tion
, air
con
diti
onin
g
Soun
dpro
ofed
cla
ssro
oms
23CHEIȚA DE
AUR FULLTIMEKINDERGARTEN
10
min
utes
No
Publ
ic
40 2 2 Yes
Yes
Yes
Yes
Yes
Yes
All
Non
e
Non
e
24FULL-DAY
KINDERGARTENNO. 30 0
.7 k
m
No
Publ
ic
537,
65
101 3 6 Yes
No
No
Yes
Yes
Yes
All
Hal
f
Non
e
25FULL-DAY
KINDERGARTENNO. 30 0
.2 k
m
No
Publ
ic
255,
51
50 2 2 Yes
No
No
Yes
Yes
Yes
All
Hal
f
Non
e
26 ALL-DAY KINDERGARTENNO. 33 0
.5 k
m
No
Publ
ic
118
,27
37 2 2 Yes
No
No
Yes
Yes
Yes
All
Hal
f
Non
e
27 FULLTIMEKINDERGARTEN NO. 24 3
km No
Publ
ic
284m
p
52 2 2 Yes
Yes
No
Yes
Yes
Yes
All
Hal
f
Non
e
28 ALL-DAY KINDERGARTENNO. 35 0
.7 k
m
No
Publ
ic
537,
65
101 3 6 Yes
No
No
Yes
Yes
Yes
All
Hal
f
Non
e
29 SF. STELIAN FULLTIMEKINDERGARTEN 0
.2 k
m
No
Publ
ic
255,
51
50 2 2 Yes
No
No
Yes
Yes
Yes
All
Hal
f
Non
e
30 FULLTIMEKINDERGARTEN NO. 3 0
.5 k
m
No
Publ
ic
118
,27
37 2 2 Yes
No
No
Yes
Yes
Yes
All
Hal
f
Non
e31
SF.MUCENIC MINAFULL-DAY
KINDERGARTEN 3,5
km
No
Publ
ic
774
310
10 20 Yes
Yes
No
Yes
Yes
Yes
All
All
All
32 ALL-DAY KINDERGARTENNO. 38 50
0 m
Yes
Publ
ic
720
mp
220 8 15 Yes
No
No
Yes
Yes
No
All
Hal
f
Non
e
33 FULLTIMEKINDERGARTEN NO. 5 50
0 m
Yes
Publ
ic
270
m2
55 2 2 Yes
Yes
No
Yes
Yes
No
All
Non
e
Non
e
34 ALL-DAY KINDERGARTENNO. 40 3
km No
Publ
ic
606
300 8 16 Yes
Yes
No
Yes
Yes
Yes
All
Som
e
Non
e
35CRAI NOU FULLTIME
AND FULL-DAYKINDERGARTEN 20
min
Yes
Publ
ic
1,9
00
208 9 19 Yes
Yes
Yes
Yes
Yes
Yes
All
Non
e
Non
e
36 CRAI NOU FULLTIMEKINDERGARTEN 20
min
Priv
ate
540
80 4 4 Yes
Yes
Yes
Yes
Yes
Yes
All
Non
e
Non
e
The
Gro
wth
Pol
e’s
Pro
file
Ana
lysi
s of
Dev
elop
men
t N
eeds
and
Are
as o
f In
terv
enti
on
Cha
pter
1.6
. Pub
lic S
ervi
ces
and
hou
sing
i
1
i292

no. Preschool Unit
Dis
tanc
e be
twee
n sc
hool
and
cit
y ce
nter
Acc
ess
to p
ublic
tra
nspo
rtat
ion
type
of
scho
ol
tota
l ind
oor
area
(m2 )
no.
of
enro
lled
stud
ents
no.
of
clas
ses
(gro
ups)
teac
hing
sta
ff
elec
tric
ity
Fire
sec
urit
y
insu
late
d ro
ofs
and
win
dow
s
Con
stan
t te
mpe
ratu
re in
bui
ldin
gs
Dire
ct y
ard
acce
ss
eart
hqua
ke r
esis
tant
bui
ldin
gs
App
ropr
iate
fur
nish
ing
for
stud
ents
hea
ting
, ven
tila
tion
, air
con
diti
onin
g
Soun
dpro
ofed
cla
ssro
oms
37CĂSUȚA CU POVEȘTI
FULLTIME KINDERGARTEN 30
min
Priv
ate
250
48 2 2 Yes
Yes
Yes
Yes
Yes
Yes
All
Non
e
Non
e
38CĂSUȚA CU POVEȘTI
FULLTIME KINDERGARTEN 3.
2 km
No
Publ
ic
943 325
12 20 Yes
Yes
No
Yes
Yes
Yes
All
Non
e
Non
e
39DUMBRAVA MINUNATĂ
FULL-DAY KINDERGARTEN 4
km Yes
Publ
ic
1,40
0
233 8 17 Yes
Yes
No
Yes
Yes
Yes
All
All
All
40LICURICI FULL-DAY
STEP-BY-STEPKINDERGARTEN 4
km No
Publ
ic
2,0
89
300
10 16 Yes
Yes
No
Yes
Yes
Yes
All
Non
e
Source: MECS – SIIIR (Romanian education IT integrated system), 2015
293

295
ChAPter 1.7.
Culture and leisure
PArt I: the Growth Pole’s Profile
1Analysis of Development needs and Areas of intervention

1.7. Culture and leisure 1.7.1. Protected Areas and Historical Monuments
Ploiești Growth Pole has the lowest number of historical monuments and cultural units of all growth poles. Annex III to Law no. 5/2000, which lists the administrative-territorial units having a high concentration of built heritage with national-interest cultural value, identifies the following: the Ploiești municipality (due to the Hagi Prodan House and the Central Halls / Halele Centrale), Târgșoru Vechi commune (due to the archaeological reserve of Târgșor, and “La Mănăstire” medieval vestiges), and Bărcănești commune (due to its mansion). Of these, the Central Halls are a symbol of Ploiești, serving as the city’s main commercial building since 1935. Plans are already in place to consolidate the building and maintain its initial destination, as well as to better integrate it into the central area and to improve accessibility.
The List of Historical Monuments (2010) has 193 headings in total, broken down by localities and monument categories, according to the table below. The detailed list of headings is included in Annex 1.7.1.
table 34. Number of historical monuments per categories and localities
As we can see, only 65 monuments are of national interest (category A), mostly located in Ploiești municipality (32) and in Târgșoru Vechi commune (12). The prevalence and the local level of archaeological and architectural attractions is also noticeable.
Some of the public, civil and industrial constructions of Ploiești municipality that make up the built fund have survived disasters and, together with the buildings erected over the past ten years, they make up a patchwork of styles that are, however, easy to identify on site.
For example, the central area has not a unitary aspect in terms of the built fund and goes through various stages of architectural styles, from neoclassicism and neo-gothicism, through communist-era specific style to the contemporary glass and metal construction pattern. This is the reason why the conservation status of the built fund is so diverse, from buildings and monuments in a poor condition to restored monuments and new buildings. The most visible architectural image, however, is the one given by the overall interventions carried out from 1950 to 1965 and later in 1980, which is common to all Romanian cities that underwent urban restructuring stages.
Ploi
ești
Bold
ești
-Sc
ăeni
Plop
eni
Ari
ceșt
ii r
ahti
vani
Bărc
ăneș
ti
Berc
eni
Blej
oi
Braz
i
Buc
ov
Dum
brăv
ești
Păul
ești
târg
șoru
Ve
chi
Vale
a C
ălug
ărea
scă
Ploi
ești
G
row
th P
ole
I. Archaeological monuments
52 0 1 1 1 0 0 1 5 1 5 13 1 81
II. Architectural monuments
78 3 0 2 7 3 3 2 5 0 0 3 0 108
III. Public forum monuments
7 1 0 0 0 0 0 0 0 0 0 0 0 8
IV. Memorials and funerary monuments
3 1 0 1 0 0 0 0 2 0 0 1 0 8
Monuments of national interest
(A)32 1 0 2 7 3 2 2 3 1 0 12 0 65
Monuments of local interest (B)
108 4 1 2 1 0 1 1 9 0 5 5 1 138
totAl 140 5 1 4 8 3 3 3 12 1 5 1 1 193
Source: Ministry of Culture and National Heritage, List of Historical Monuments (2010)
296
The
Gro
wth
Pol
e’s
Pro
file
Ana
lysi
s of
Dev
elop
men
t N
eeds
and
Are
as o
f In
terv
enti
on
Cha
pter
1.7
. Cul
ture
and
lei
sure
i
1
i

Map 109. Distribution of monuments in the Growth Pole
297

The representative public and private buildings dating back to the late 19th century and the early 20th century belong to styles of western influence: neoclassic, neo-gothic, or baroque, but also to the neo-Romanian style, influenced by Brâncoveanu style, with the architect Toma N. Socolescu as an important representative. Most of these buildings are located in the central area of the city, along and adjoining the Republicii boulevard (former Calea Câmpinei) and the Independenței Boulevard (as a matter of fact, the latter makes up an important area of protected architectural works), and around streets such as: Mihai Bravu, Romană, Stadionului, Constanței, Armoniei, Basarabi, Bobâlna, Decebal, Democrației, Gheorghe Doja (former Oilor), etc. This area overlaps for the most part with the historical one.
The buildings have various purposes -- dwelling houses, offices of current banks or companies, churches and public institutions: Hagi Ivan Prodan Merchant’s House (built in 1785 in neo-Romanian style, with decorations of neoclassical inspiration on the side façades), Avram Ergas Mamaciu House (built in 1870 in neo-gothic style), N. Pârvulescu House (today Dental Clinic No. 1, built in 1870 in neo-gothic style), Tiseanu House (built in the mid-19th century in neoclassical style), N. Simache Clock Museum (former Elefterescu House, built in 1890 and rebuilt in 1930 in neo-gothic style), the County Museum of History and Archaelogy, Sf. Petru și Pavel School (the first middle school in Ploiești, built from 1865 to 1867 in neoclassical style), Palace of Culture (former Palace of Justice, built in 1920 in neoclassical style), I. L. Caragiale Memorial Museum (former Dobrescu house, built in 1712 in Romanian style), the Bell Tower of Sf. Ioan Botezătorul Cathedral, built from 1916 to 1948, Sf. Vineri (Holy Friday) Church (built from 1875 to 1880 in gothic style, with Russian style spires).
As regards religious buildings, the most remarkable churches in terms of architectural quality are the following: Sf. Voievozi, Sf. Ioan, Sf. Nicolae Vechi, Biserica Domnească, Sf. Vineri, Maica Precista. These churches are relatively well preserved; however, their interior paintings are often in a poor condition.
According to Prahova County Directorate for Culture and National Heritage, valuable buildings are subject to much pressure / aggression, which consists in the destruction and/or modification of the initial appearance (inadequately colored façades, exterior cladding with inappropriate materials, placing various facilities on façades), erection of new buildings with inappropriate scale in the monuments’ protection area. The heritage buildings serving as headquarters of public institutions (such as Hagi Prodan House, Dobrescu House, Palace of Culture, the Clock Museum, etc.), which have received investments for consolidation purposes in recent years, are relatively well preserved, whereas most of the private buildings that are used as dwellings are in a poor condition. Such buildings require consolidation of their structural frames, sanitation and repair of their façades.
The movable cultural heritage – including almost 1,000 assets of an extraordinary historical, archaeological, historical-documentary, artistic, ethnographic, scientific, and technical value – are classified into Treasury and Fund and are concentrated in the museums located in the area (e.g. Ion Ionescu-Quintus County Museum of Art, County Museum of History and Archaeology), and in Nicolae Iorga County Library, which has a rare collection of books. The list is completed by other several hundreds of thousands of movable cultural assets of lesser importance, which are in the possession of institutions or natural persons.
The local archaeological heritage mainly consists of the reserve of public interest from Târgșoru Vechi. Covering approximately 17 ha and showing evidence of life from the Paleolithic to the 19th century, the reserve is one of the most important sites of this type in Muntenia. The Roman Camp and Baths in Mălăiești (Dumbrăvești commune), where very well preserved Roman baths and a fortification system were brought to light, represent another heritage site of high tourist potential, for which restoration and capitalization efforts have already been initiated. The works proposed for this site are the following: conservation and restoration of the Roman camp and baths, creation of an archaeological center, construction of an info point, a site museum, a visitor center, and a souvenir shop.
The intangible heritage of Ploiești Growth Pole consists of its cultural institutions of national, county, and local importance. In 2013, the list of cultural facilities in Ploiești Growth Pole included the following:
• 12 museums, museum collections and sections, of which 9 are located in Ploiești municipality: County Museum of History and Archaeology, County Natural Science Museum, Ion Ionescu Quintus County Museum of Art, Nicolae Simache Clock Museum, National Oil Museum, I.L. Caragiale Memorial Museum, Paul Constantinescu Memorial Museum, Merchant’s House (Hagi Prodan) Museum, Nichita Stănescu Memorial Museum. Two are located located in Bucov commune (Constantin and Ion Stere Memorial Museum, the Zoo) and one in Valea Călugărească commune (Crama 1777
The
Gro
wth
Pol
e’s
Pro
file
Ana
lysi
s of
Dev
elop
men
t N
eeds
and
Are
as o
f In
terv
enti
on
Cha
pter
1.7
. Cul
ture
and
lei
sure
i
1
i298

Museum, dedicated to ethnography and inaugurated in 2013). Târgșoru Vechi Archaeological Reserve, open to visitors during the summer, and the museum collection of Ghighiu Orthodox Monastery (Bărcănești) also fall into this category. These museums attracted over 194,000 visitors in 2013, a 79% increase compared to 2007. Such dynamics are almost exclusively due to the Memorial Museum and the Zoo in Bucov, which attracted over 80,000 visitors following a vast program of investments in the area, meant to modernize and diversify the entertainment facilities. Rehabilitation works were also carried out at the Clock Museum in Ploiești, the only museum of this type in Romania, which has approximately 4,000 items to display.
• 125 libraries, of which 11 are public, 20 specialized, and 94 belong to secondary and higher education institutions. The number of libraries in the Growth Pole has fallen by 10 as compared to 2007, due to the closing down of some educational establishments and communal libraries, such as the libraries in Bărcănești, Berceni, Blejoi, and Păulești. Overall, the 125 functional libraries have over 2.39 million books (of which 1.93 million books in Ploiești municipality), and the number of active readers in 2013 was 57,616, which accounts for approximately 17% of the Growth Pole’s population. This number has decreased year by year, mainly due to the decline in the school population (who constitutes the major part of the readers), but also to the growing use of online information media to the detriment of written culture. In another respect, the libraries’ book stock is generally old and the premises are inappropriately equipped and therefore unattractive to readers. The most important institution of this type in the Growth Pole is Nicolae Iorga County Library - Ploiești, which was established in 1921 and operates in a single facility. It has over 502,000 books and periodicals, of which approximately 300,000 are annually borrowed or consulted, and the number of subscribed readers in 2013 amounted to 13,722. The library has one lending section, one copies section, one documentary (rare book) section, one multimedia section, one rotunda, one catalogues’ room, one community internet center – the BIBLIONET network, and one reading room of approximately 90 seats. The library annually organizes over 50 cultural events (seminars, summer schools, book launches, symposiums, etc.), as well as IT initiation courses.
• 4 cinemas: ‘Premiera’ Cinema (former ‘Patria’, administered by RomâniaFilm), City Cinema, City AFI Cinema, and Twins Club, the last three being private units located inside shopping centers. With 12 auditoria (of which 7 are 3D) and 2,087 seats, Cinema City is the largest and most modern cinema, followed by City AFI Cinema, with 6auditoria (of which 5 are 3D) and 1,273 seats. Twins Cinema has 85 seats in one 3D auditorium in the central area, and ‘Premiera’ Cinema, upgraded in 2011, has one 3D auditorium of 800 seats. As a result of such investments, the number of seats in Ploiești auditoria was 2,638 in 2013 (a 206% increase versus 2007), the number of screenings reached 23,422 (a 28-fold increase), and the audience increased to 427,000 people (43-fold);
• 5 performing arts institutions, including the subordinate sections thereof – Toma Caragiu Theatre, with the Variety Theatre and Puppet Theatre sections, and Paul Constantinescu Philarmonic, including the Symphony Orchestra and the
Folk Orchestra. In 2013, these institutions organized 354 performances and concerts, 34.4% less than in 2007. The two institutions have 540 seats in their auditoria (of which 250 are dedicated to theatre), the number being in decline as compared to 2007, which can be explained by the restitution of the former building of the ‘Ciufulici’ Children’s Theatre. As the puppet section has no space of its own, it currently organizes performances in the premises of Cercul Militar (the Military Circle) or Toma Caragiu Theatre. Works are being carried out to rehabilitate and equip a building which could house the puppet section. The total audience of the cultural institutions in the municipality reached 44,852 people in 2013, which is 29.1% less than in 2007. The decline might be due to people’s diminished interest in culture and to the challenges faced by the sector’s institutions (scarcity of staff and job capping, low level of remuneration, improper equipment, etc.), which resulted in a decreased number of performances. However, the theatre and the philharmonic are involved in the organization of cultural events with significant international standing, such such as: Toma Caragiu Theatre Festival, Hot Jazz Summit Festival, or ‘Zilele Muzicale’ (Musical Days) Festival of Paul Constantinescu Philharmonic.
299

Figure 98. Cultural consumption at the level of Ploiești Growth Pole between 2007 and 2013
Source: National Institute of Statistics, TEMPO Online database
The non-governmental sector in the culture area is rather poorly represented locally, unlike other cities of similar size. The associations with a relevant activity in the field, including Momentum, Paul Constatinescu 2009, the Hellenic Union of Romania – Prahova Hellenic Community, etc., organize various cultural events locally and on an annual basis.
The local media includes: local newspapers (Republicanul, Prahova, Altphel, etc.), online publications (Phon, Max Media, Incomod PH, Jurnalul Prahovean, Observatorul Prahovean, Gazeta de Prahova, Prahova Business, etc.), local TV and radio channels (Radio Prahova, Radio SOS, Radio WylFm, Antena 1 Ploiești, Alpha TV Ploiești, Prahova TV, VP-TV, PRO-TV Ploiești, etc.).
• other cultural institutions – the Palace of Culture, a newly rehabilitated monumental building, erected in the French neoclassical style in the interwar years, which is home for the County Natural Science Museum, “Muzeul Omului” (The Human Being Museum) Permanent Exhibition, People’s School of Art, Nicolae Iorga County Library, etc. The Culture House of Trade Unions, erected during the communist era, includes: one auditorium of approximately 600 seats, one conference room of 200 seats, one sports hall, rooms that can be used by debating groups and musical bands, one library, and one lobby. It hosts various public and cultural meetings, symposiums, conferences, shows (including the performances of ‘Chindia’ Folk Troupe that is subordinated to the House), literary circles, etc. I. L. Caragiale Culture House, subordinated to the municipality, hosts Prahova Folk Troupe and Dimitrie Gusti People’s University, which organize various lectures, conference and debate series, including ‘Atitudini’ (Attitudes) art circle, with a moonlight soiree and its own publication. The Students’ Culture House hosts several musical bands, dance troupes, and theatrical companies, as well as circles dedicated to students, in areas such as: science, arts, training and vocational education, aesthetics, design, documentation, literature. Furthermore, each urban and rural locality around the municipality has culture houses and/or culture centers, but their cultural offer is relatively poor as compared to the city of Ploiești, since many of such institutions have improper infrastructure and equipment, and the staff is insufficient.
2007
Museum visitors Active readers in libraries
People in audience in cinemasPeople in audience in performing arts
2008 2009 2010 2011 2012 2013
450000
400000
350000
300000
250000
200000
150000
100000
50000
0
The
Gro
wth
Pol
e’s
Pro
file
Ana
lysi
s of
Dev
elop
men
t N
eeds
and
Are
as o
f In
terv
enti
on
Cha
pter
1.7
. Cul
ture
and
lei
sure
i
1
i300

1.7.2. Cultural Events and Activities
The report on the cultural vitality of Romanian cities (Centre for Research and Consultancy on Culture, 2010) analyzes and ranks 46 Romanian cities based on a cultural vitality index, calculated as an average of 6 indicators: (1) cultural sector infrastructure, (2) specialized human resources, (3) budget allocations to culture, (4) participation in cultural activities, (5) creative economy, (6) non-profit sector. Ploiești municipality ranks 18, below all the other municipalities belonging to growth poles, and also below other county seat municipalities in the South Muntenia region, such as Târgoviște and Pitești. The largest gaps identified by the authors of the study in the local cultural sector are related to the scarcity of staff and the insufficient activity of the relevant NGOs, whereas better outputs were found in terms of volume of local budget allocations to culture and people’s interest in culture. The study also notes the poor development of cultural and creative industries relative to the local economy, their share of the local GDP being around 50 times lower compared to other growth poles in the country, such as Cluj-Napoca.
Figure 99. Cultural vitality index in the Romanian growth poles
Source: Centre for Research and Consultancy on Culture, 2010
The cultural sector’s better results in other growth poles as compared to Ploiești is due to the broader social and economic background thereof. This could be explained, inter alia, by the following: the proximity between Ploiești municipality and the capital city, which polarizes the cultural life in the southern part of Romania; the number of students and young people (one of the most important categories of culture consumers), which is much lower than in traditional university centers (Bucharest, Cluj-Napoca, Timișoara, Iași); the lower number of people having attended a higher education institution; the local “brain-drain” phenomenon; the people’s low purchasing power, etc.
A full list of the cultural events organized in 2014 in Ploiești Growth Pole is included in Annex 1.7.2.
1.2
1
0.8
0.6
0.4
0.2
0
Cultural vitality index
Iași
Ploieș
ti
Consta
nța
Brașo
v
Craiov
a
Cluj-N
apoc
a
Timișo
ara
301

1.7.3. Youth and Sports
The sports infrastructure in Ploiești Growth Pole includes stadiums, public and private sports halls, and sports grounds. Ilie Oană stadium, the largest sports facility at the Growth Pole’s level, was completely rebuilt between 2009 and 2011. It has two stands and two terraces of over 15,000 seats (all covered), natural grass pitch, nocturnal lighting system, and electronic scoreboards. Astra (Columbia) Stadium is the second arena in terms of size, with a capacity of 10,000 seats that are partially covered and distributed into 2 stands, a nocturnal lighting system, an electronic scoreboard, and natural grass. Other local type-approved stadiums are ‘Chimia’ Brazi (2,500 seats), ‘Conpet’ Strejnic-Ploiești (2,000 seats), ‘Gheorghe Silaev’ Plopeni (9,000 seats), ‘Dorobanțul’ Ploiești (1,500 seats), ‘Petrotrans’ Ploiești (500 seats), ‘Metalul’ Băicoi (2,000 seats), ‘Vega’ Ploiești (5,000 seats), ‘Prahova’ Ploiești (4,000 seats), etc. Because of their basic and obsolete infrastructure (developed during the communist era), these stadiums can only host local or county-level competitions.
Olimpia Sports Hall, erected during the communist era, has 3,500 seats and hosts basketball, volleyball, tennis, and handball trainings and competitions. It was modernized and expanded in the last years (2010-2013) with state-budget funds. A new stand was built, seats were replaced, the outdoor spaces were refurbished, etc. Vega Olympic Swimming Pool was built in the 1960s and has 6 lanes. Over 400 students of the municipality schools exercise there. The building is vulnerable to earthquakes and requires consolidation and modernization, as only sanitation works have been carried out so far.
Ploiești Racecourse is the only harness racing arena in Romania and has a tradition of over 50 years. As the racecourse was in an extremely poor condition, it has been demolished and works have been started for the construction of a modern arena of over 1,300 seats. Such works benefit from European co-financing.
Leonard Doroftei Multi-functional Sports Hall, inaugurated in 2003, can host trainings in handball, volley, gymnastics, chess, karate, mini football, basketball, tennis, and contact sports.
Oil and Gas University has its own sports complex, with a sports hall, handball courts, mini football pitches etc. In addition, there are 74 sports grounds belonging to educational units (44 in Ploiești), and 78 sports halls (47 in Ploiești), some of which are available not only to the students of the respective schools and high schools, but also to the general public, but in exchange for a fee. A growing number of private football pitches and tennis courts, covered and provided with a nocturnal lighting system, as well as swimming pools and fitness-aerobics rooms are also available locally, the interest in amateur sports being on the increase.
As regards the sports activity, the following clubs constantly obtained good results in internal and international competitions:
• ’Petrolul’ Sports Club – with athletics, boxing, cycling, gymnastics, karate, swimming, wresting, skating, bowling, ham radio, chess, fencing, table tennis sections;
• Municipal Sports Club (CSM) – with handball, athletics, boxing, football, gymnastics, judo, karate, swimming, skating, chess, volleyball sections;
• School Sports Club (CSS) – with tennis and basketball sections;
• ’Conpet’ Sports Club – with boxing, cycling, karate, football, bowling, chess sections;
• ’Petrom’ Sports Club – with athletics, basketball, boxing, football, judo, karate, karting, scrabble, yachting sections;
• Asesoft University Sports Club – basketball club.
Despite the good results and the local authorities’ involvement in supporting sports activities, the interest in performance sports has declined among children and youth as compared to the communist era. However, recent years have seen a tendency of returning to such sports, due to people’s increasing orientation towards a healthier lifestyle. Exercise and training facilities are, with some exceptions, insufficient and inappropriately equipped (the swimming facilities, for example).
In the field of youth, Prahova County Directorate for Youth and Sports organized, in 2013, 9 events on civic engagement, volunteering, culture, sports and tourism, and mobility, in collaboration with the following relevant NGOs: ‘Viitorul Tinerilor’ (The Future of the Youth) Association, ‘Tinerii Voluntari’ (Young Volunteers) Association, National Union of People with HIV-AIDS, ‘Tineri VIP’ (VIP Youth) Association, The National Association for Youth and Community Initiative, etc.
The
Gro
wth
Pol
e’s
Pro
file
Ana
lysi
s of
Dev
elop
men
t N
eeds
and
Are
as o
f In
terv
enti
on
Cha
pter
1.7
. Cul
ture
and
lei
sure
i
1
i302

Associations of this type were also set up by certain educational institutions (e.g. the youth associations in the Nichita Stănescu High School, the Pedagogical High School, Mihai Viteazul High School, I.L. Caragiale High School, Economic High School, AIESEC association). Prahova County Council also supports the “Youth Forum – Prahova” initiative, now at its second edition.
Despite such initiatives, the number of events dedicated to young people and their leisure, information and socializing possibilities are relatively limited as compared with other growth poles, where the relevant associations are much more visible (e.g. Cluj-Napoca, which is the 2015 European Youth Capital, or Brașov, which hosted the 2013 European Youth Olympic Winter Festival).
1.7.4. Completed / ongoing projects The projects that were carried out or are in progress during 2007-2013 programming period in the areas of heritage, culture, youth, and sports include:
• Rebuilding the Ploiești Racecourse – an investment estimated at RON 60 million, co-financed from ROP 2007-2013;
• Extension and modernization of Olimpia Sports Hall – an approx. RON 20 million investment, made with funds from the Ministry of Regional Development and Public Administration / the National Investment Company;
• Modernization of Ilie Oană Stadium – an approx. EUR 20 million investments, made with funds from the local budget;
• Consolidation and restoration of the Palace of Culture – an approx. RON 10 million investment, carried out with funds from the Local Council’s budget;
• Rehabilitation and equipping of the building that will host the Children’s Section of Toma Caragiu Theatre – an approx. RON 3 million investment, made with funds from the local budget and sponsorships;
• Modernization and equipping of ‘Premiera’ Cinema – an approx. EUR 300,000 investment, made with funds from RADEF ( România Film” Autonomous Regie of Film Distribution and Exploitation);
• Restoration and consolidation of Nicolae Simache Clock Museum – an approx. RON 8 million investment, co-financed from ROP 2007-2013;
• Inauguration of Constantin and Ion Stere Memorial Museum in Bucov and of Crama 1777 (Winery 1777) in Valea Călugărească;
• Modernization of the Zoo – an approx. EUR 2.5 million investment, made with funds from the Ministry of Environment and the local budget;
• Consolidation and extension of the concert hall and balcony of Paul Constantinescu Philharmonic.303

1.7.5. Conclusions – existing disparities, tendencies, needs, and areas of intervention
Culture and leisure
The concentration of historical monuments of national or local importance in Ploiești is lower than in other Romanian growth poles. However, the almost 200 existing monuments that belong to different styles and ages could be included in tourist circuits. Unfortunately, many of the valuable buildings, particularly those owned by private persons, are in a very poor condition and are subject to permanent aggressive actions, requiring urgent restoration, consolidation, and protection measures, especially since some of them are vulnerable to earthquakes.
Ploiești-Prahova area has a movable and intangible cultural heritage that is very rich and that visitors are insufficiently acquainted with. Measures to capitalize such heritage are required, for instance by an enhanced promotion of the tourism circuits that have already been designed at the local level (The Wine Road, The Princes’ Road, The Fruit Road, etc.).
The Growth Pole has a diverse range of museums (history, archaeology, natural science, art museums, etc.), some of them being of national importance (the National Oil Museum), whereas others are unique in the country (Nicolae Simache Clock Museum). Although many of such museums are located in appropriate buildings, some of which have been recently rehabilitated (the Palace of Culture, the Clock Museum), further investments are required for the museums’ modernization, equipping and promotion, including online.
The libraries in the Growth Pole are facing a dwindling interest in written culture, due to the growing use of online media and to a decline in school population, which entails a decrease in the number of active readers. The libraries generally have an obsolete infrastructure and book stock, which makes them unattractive to young readers. Therefore modernization works are required, along with diversification of provided services (e.g. Internet access and multi-media facilities), organization of events meant to promote the libraries’ activity and to increase public awareness in that respect etc.
Although the Ploiești municipality has famous performing arts institutions, the shows and audiences have constantly declined in number in recent years due to the scarcity of staff and the lack of appropriate equipment that affect such institutions. For example, the Children’s Section of Toma Caragiu Theatre had no space of its own in the past 5 years.
Although the number of cultural events is on the increase and some of them even carry high international standing (the Theatre Festival, the Jazz Festival, etc.), they are not included in a coherent calendar that covers all the categories of consumers and seasons of the year, and their scale is not large enough to trigger tourism.
The cultural infrastructure in small towns and adjoining rural localities is poor; cultural events are only organized sporadically, for which reason the population’s access to culture is much lower than in Ploiești municipality.
The cultural vitality of Ploiești municipality is much lower than in all the other growth poles, due to the population’s social and economic structure and to the fact that Bucharest monopolizes the cultural life in the southern area of the country. The most significant weaknesses are the scarcity of specialized staff and the poor development of the creative and cultural industries, as well as of the activity carried out by relevant NGOs.
The local sports infrastructure has become more diverse and has been upgraded in recent years, as a result of public and private investments. The obsolete facilities that still exist and prevent the development of performance sports (e.g. the lack of modern training pools) have contributed to an increased interest in amateur sports. Just like for cultural infrastructure, the sports infrastructure and activity in the Growth Pole’s localities are much less developed than in the municipality.
The sports clubs in the municipality, which cover most of the branches in the field and are financially supported by private investors and by the local authorities, have obtained very good results in international and national competitions, the most visible performances being achieved in football and basketball.
The
Gro
wth
Pol
e’s
Pro
file
Ana
lysi
s of
Dev
elop
men
t N
eeds
and
Are
as o
f In
terv
enti
on
Cha
pter
1.7
. Cul
ture
and
lei
sure
i
1
i304

Map 110. Cultural facilities and historic monuments
305

AnneX 1.7.1. list of historical Monuments (2010) in Ploiești Growth Pole
no. lMi code name locality Address Dating from
1 PH-I-s-B-16113Archaeological site in
Ploiești, "Bloc 122" spotPLOIEȘTI municipality Bloc 122, Nord neighborhood
2PH-I-
m-B-16113.01Settlement PLOIEȘTI municipality Bloc 122, Nord neighborhood
sec. VI - VII p. Chr.
3PH-I-
m-B-16113.02Settlement PLOIEȘTI municipality Bloc 122, Nord neighborhood Latène
4PH-I-
m-B-16113.03Settlement PLOIEȘTI municipality Bloc 122, Nord neighborhood
Bronze Age, cultura Tei
5PH-I-
m-B-16113.04Settlement PLOIEȘTI municipality Bloc 122, Nord neighborhood
Neolitic, CulturaBoian, faza
Bolintineanu
6 PH-I-s-B-16114 Settlement PLOIEȘTI municipality"Cuptoarelor street - Zăvoiului
street”sec. IV - VII p.
Chr.
7 PH-I-s-B-16115Archaeological site in Ploiești, "Lotul Stelian
Marinescu" spotPLOIEȘTI municipality
Stelian Marinescu lot, on the right of Dâmbului creek,
Pielari neighborhood
8PH-I-
m-B-16115.01Settlement PLOIEȘTI municipality
Stelian Marinescu lot, on the right of Dâmbului creek,
Pielari neighborhoodsec. V - VII p. Chr.
9PH-I-
m-B-16115.02Settlement PLOIEȘTI municipality
Stelian Marinescu lot, on the right of Dâmbului creek,
Pielari neighborhoodsec. IV - V p. Chr.
10PH-I-
m-B-16115.03Settlement PLOIEȘTI municipality
Stelian Marinescu lot, on the right of Dâmbului creek,
Pielari neighborhoodLatène
11PH-I-
m-B-16115.04Settlement PLOIEȘTI municipality
Stelian Marinescu lot, on the right of Dâmbului creek,
Pielari neighborhoodBronze Age
12PH-I-
m-B-16115.05Necropolis PLOIEȘTI municipality
Stelian Marinescu lot, on the right of Dâmbului creek,
Pielari neighborhoodBronze Age
13 PH-I-m-B-16117 Settlement PLOIEȘTI municipalityEast of Vinalcool (today S. C. Cramele Prahova S.A.), Polux neighborhood, Găgeni barrier
sec. V - VII p. Chr.
14 PH-I-s-B-16118 Settlement PLOIEȘTI municipalityOn the West bank of Dâmbu
creek, Polux neighborhoodsec. V - VII p. Chr.
15 PH-I-s-B-16119 Settlement PLOIEȘTI municipalityOn the West bank of Dâmbu
creek, Polux neighborhoodsec. V - VII p. Chr.
16 PH-I-s-B-16120 Tumuli PLOIEȘTI municipality “Punct termic”, Minerva street Hallstatt
17 PH-I-s-A-16121 Open-air market PLOIEȘTI municipalityCivic Center, East of "Mercur"
storesec. XVII
18 PH-I-s-B-16127Settlement
(open-air market)PLOIEȘTI municipality
Democraţiei street, Toma Caragiu street 10,
Gh. Lazăr street, The Prahova County Museum of History
and Archeology
sec. XVII – XVIII
19 PH-I-s-B-16122“Bădeşti street”
archaeological site, Ploieşti
PLOIEȘTI municipality Bădeşti Street
20PH-I-
m-B-16122.01Settlement PLOIEȘTI municipality Bădeşti Street sec. II - III p. Chr.
21PH-I-
m-B-16122.02Necropolis PLOIEȘTI municipality Bădeşti Street sec. II - III p. Chr.
22 PH-I-s-B-16123 Castrum PLOIEȘTI municipality Bădeşti Street sec. II p. Chr.
23 PH-I-s-B-16124 Settlement municipiul PLOIEŞTI Bădeşti Street sec. IX - X
The
Gro
wth
Pol
e’s
Pro
file
Ana
lysi
s of
Dev
elop
men
t N
eeds
and
Are
as o
f In
terv
enti
on
Cha
pter
1.7
. Cul
ture
and
lei
sure
i
1
i306

no. lMi code name locality Address Dating from
24 PH-I-s-B-16125Archaeological site in Ploiești, "Str. Cornăţel"
spotmunicipiul PLOIEŞTI Cornăţel Street
25PH-I-
m-B-16125.01Settlement municipiul PLOIEŞTI Cornăţel Street sec. V - VII p. Chr.
26PH-I-
m-B-16125.02Settlement PLOIEȘTI municipality Cornățel Street
4th - 5th century AC
27PH-I-
m-B-16125.03Settlement PLOIEȘTI municipality Cornățel Street Latène
28PH-I-
m-B-16125.04Settlement PLOIEȘTI municipality Cornățel Street The Bronze Age
29 PH-I-s-B-16126 Settlement PLOIEȘTI municipality Cuptoarelor Street3rd - 5th century
AC
30 PH-I-s-B-16128 Settlement PLOIEȘTI municipalityDomnișori Street, 200 m
north-east of Gara de Vest (the West Station)
Epipalaeolithic
31 PH-I-s-B-16129Archaeological site in Ploiești, "Str. Lucernei" (Lucernei Street) spot
PLOIEȘTI municipalityThe junction of Lucernei
Street with Trifoiului Street
32PH-I-
m-B-16129.01Settlement PLOIEȘTI municipality
The junction of Lucernei Street with Trifoiului Street
8th - 10th century
33PH-I-
m-B-16129.02Settlement PLOIEȘTI municipality
The junction of Lucernei Street with Trifoiului Street
6th - 7th century AC
34PH-I-
m-B-16129.03Settlement PLOIEȘTI municipality
The junction of Lucernei Street with Trifoiului Street
Bronze Age
35 PH-I-s-B-16130 Defensive ditch PLOIEȘTI municipality Luminișului Street 2nd century AC
36 PH-I-s-A-16131 Borough PLOIEȘTI municipality Matei Basarab Street16th - 17th
century
37 PH-I-s-B-16132 Necropolis PLOIEȘTI municipalityMihai Bravu Street "Sf.
Nicolae” Vechi (St Nicholas Old) Church
16th - 17th century
38 PH-I-s-B-16133 Settlement PLOIEȘTI municipalityMircea cel Bătrân Street, Dorobanți Neighborhood
2nd - 3rd century AC
39 PH-I-s-B-16134 Borough PLOIEȘTI municipality Mircea cel Bătrân Street, Dorobanți Neighborhood
16th - 18th century
40 PH-I-s-B-16135 Settlement PLOIEȘTI municipalityMureșanu Andrei Street, Cina
Neighborhood3rd - 1st century
BC
41 PH-I-s-B-16136 Settlement PLOIEȘTI municipalityPetuniei Neighborhood – Elementary School 30
Bronze Age, Tei culture
42 PH-I-s-B-16137 Necropolis PLOIEȘTI municipality Pielari Street Early Bronze Age
43 PH-I-s-B-16139 Limes PLOIEȘTI municipalityRâpelor Street Malu Roșu
Neighborhood4th century AC
44 PH-I-m-B-16141Archaeological site in
Ploiești, "Rozmarin Str." (Rozmarin Street) spot
PLOIEȘTI municipality Rozmarin Street
45PH-I-
m-B-16141.01Settlement PLOIEȘTI municipality Rozmarin Street
11th - 12th century
46PH-I-
m-B-16141.02Settlement PLOIEȘTI municipality Rozmarin Street 4th century AC
47PH-I-
m-B-16141.03Settlement PLOIEȘTI municipality Rozmarin Street Hallstatt
48PH-I-
m-B-16141.04Settlement PLOIEȘTI municipality Rozmarin Street Bronze Age
49PH-I-
m-B-16141.05Settlement PLOIEȘTI municipality Rozmarin Street Eneolithic
50 PH-I-s-B-16142 Settlement PLOIEȘTI municipalityThe junction of Troienelor Street with Măgurii Street
Eneolithic, Gumelnița
culture
307

no. lMi code name locality Address Dating from
51 PH-I-s-B-16138 Settlement PLOIEȘTI municipality Vuia Traian Street6th - 7th century
AC
52 PH-I-s-B-16143 Settlement PLOIEȘTI municipality Zorelelor Street 2nd century AC
53PH-II-
m-B-16232George Papp House PLOIEȘTI municipality Armoniei 1 Street 1880
54PH-II-
m-A-16233
"Maica Prescista” (Immaculate Mother of
God) ChurchPLOIEȘTI municipality Armoniei 3 Street 1820
55PH-II-
m-A-16234Kogălniceanu House PLOIEȘTI municipality Armoniei 12 Street
late 18th century - early 19th
century
56PH-II-
m-B-16235Enache Cantacuzino
HousePLOIEȘTI municipality 4 Bagdazar, doctor Street 1831
57PH-II-
m-B-16236
Constantin Ion și Maria Căpitănescu (Constantin Ion and Maria Căpitănescu) House, today the
National Oil Museum
PLOIEȘTI municipality 8 Bagdazar, doctor Street late 19th century
58PH-II-
m-B-16237House, today company
officePLOIEȘTI municipality 16 Basarabilor Street 1900
59PH-II-
m-A-16238
Cizmaru Ileana și Oprescu Ioana
(Cizmaru Ileana and Oprescu Ioana) House
PLOIEȘTI municipality 18 Basarabilor Street 1905
60PH-II-
m-A-16239
Composer Paul Constantinescu’s
house PLOIEȘTI municipality 15 Bălcescu Nicolae Street 1873
61PH-II-
m-B-16240
Manolescu House, today the
headquarters of S.C. IPIP S.A.
PLOIEȘTI municipality 19 Bălcescu Nicolae Street late 19th century
62PH-II-
m-B-16241
Mănciulescu House, today "Prestij" Restaurant
PLOIEȘTI municipality 1 Bobâlna Street late 19th century
63PH-II-
m-B-16242Narcis Dăscălescu
HousePLOIEȘTI municipality 4 Bobâlna Street 1895
64PH-II-
m-B-16243
Maxillofacial Section of “Boldescu" County
HospitalPLOIEȘTI municipality 1 Boldescu Street 1831
65PH-II-
m-B-16244Amira House PLOIEȘTI municipality 36 Buna Vestire Street mid-19th century
66PH-II-
m-B-16245Jilescu House PLOIEȘTI municipality 5 Caragiale Ion Luca Street
early 19th century
67PH-II-
m-A-16246
"Sf. Petru și Pavel" (Sts Peter and Paul)
School, the first Middle School in Ploiești, today the County
Museum of History and Archaeology
PLOIEȘTI municipality 10 Caragiu Toma Street 1865
68PH-II-
m-A-16247
The Palace of Justice, today the Palace of
Culture PLOIEȘTI municipality 1 Călin Cătălin, erou Street 1920
69PH-II-
m-B-16248Manole Șerbănescu
HousePLOIEȘTI municipality 3 Constanței Street
second half of the 19th century
70PH-II-
m-B-16249
Octavian și Mihai Bellu (Octavian and Mihai
Bellu) HousePLOIEȘTI municipality 6 Constanței Street 1875
71PH-II-
m-B-16250Marcu Mihalache
HousePLOIEȘTI municipality 9 Constanței Street 1886
The
Gro
wth
Pol
e’s
Pro
file
Ana
lysi
s of
Dev
elop
men
t N
eeds
and
Are
as o
f In
terv
enti
on
Cha
pter
1.7
. Cul
ture
and
lei
sure
i
1
i308

no. lMi code name locality Address Dating from
72PH-II-
m-B-16251
Av. Marinela Păunescu (Lawyer Marinela Păunescu) House
PLOIEȘTI municipality 12 Constanței Street 1889
73PH-II-
m-A-16252Ilie Lumânăraru House
with a shop PLOIEȘTI municipality 16 Coșbuc George Street 1830 - 1840
74PH-II-
m-A-16253Dr. Ion Popescu House PLOIEȘTI municipality 9 Decebal Street 1905
75PH-II-
m-B-16254
Gheorghe și Margareta Teodorescu (Gheorghe
and Margareta Teodorescu) House
PLOIEȘTI municipality 25 Decebal Street 1900
76PH-II-
m-A-16255Hagi Ivan Prodan Merchant’s House
PLOIEȘTI municipality 2 Democrației Street 1785
77PH-II-
m-B-16256
House, today the headquarters of
Ploiești Local Centre of "Spiru Haret"
University
PLOIEȘTI municipality 17 Democrației Street late 19th century
78PH-II-
m-B-16257
House, today the headquarters of "Alexandra" Humanitarian Organization
PLOIEȘTI municipality 19 Democrației Street 1890
79PH-II-
m-B-16258Viorel Voiculescu House PLOIEȘTI municipality 23 Democrației Street late 19th century
80PH-II-
m-B-16259Romulus Filipescu
HousePLOIEȘTI municipality 24 Democrației Street late 19th century
81PH-II-
m-A-16260
The Commerce Academy, today "I. L. Caragiale”
National College
PLOIEȘTI municipality 98 Doja Gheorghe Street 1926 - 1936
82PH-II-
m-A-16261
Bell tower of "Sf. Ioan Botezătorul” (St. John the Baptist) Church - Monument to the
Heroes of 1916-1918
PLOIEȘTI municipality 1 Piața Eroilor (Eroilor Square) 1923 - 1939
83PH-II-
m-B-20206
Former winery (cellar, entrance and staircase
to the floor)PLOIEȘTI municipality 2 Aleea Gladiolelor
late 19th century – early 20th
century
84PH-II-
m-B-16263
Dr. I. Cloaje House, today Bulevard
RestaurantPLOIEȘTI municipality 25 Golești Street late 19th century
85PH-II-
m-A-16264
Hârlea Dragomira și Iliescu Roxana (Hârlea Dragomira and Iliescu
Roxana) House, today "Star" Hotel-
Restaurant
PLOIEȘTI municipality1 Hasdeu Petriceicu Bogdan
Streetearly 20th
century
86PH-II-
m-B-16265Radu Constantin
HousePLOIEȘTI municipality 7 Iașiului Street 1850
87PH-II-
s-B-16266
"Centrul istoric" (Historical Centre)
urban sitePLOIEȘTI municipality
Independenței Blvd., delimitation according to the approved General Urban Plan
18th century - early 20th
century
88PH-II-
m-A-16267
Ghiță Ionescu House, today "Ion Ionescu-Quintus" County Museum of Art
PLOIEȘTI municipality 1 Independenței Blvd. 1885
89PH-II-
m-B-16268Dr. Constantin Vasiliu
HousePLOIEȘTI municipality 3 Independenței Blvd. 1900
90PH-II-
m-A-16269
Bell tower of "Sf. Gheorghe" - Vechi (St George - Old) Church
PLOIEȘTI municipality 4 Independenței Blvd. 1831 - 1832
309

no. lMi code name locality Address Dating from
91PH-II-
m-B-16270
Matache Ștefănescu house, today bank
officePLOIEȘTI municipality 5 Independenței Blvd. 1900
92PH-II-
m-B-16271
"Sf. Petru și Pavel” (Sts Peter and Paul) High School, today "Mihai Viteazul” National College – the north
side
PLOIEȘTI municipality 8 Independenței Blvd. 1875
93PH-II-
m-B-16272
Alexandru Radovici House, today
HIPOCRAT 2000 Healthcare Clinic
PLOIEȘTI municipality 14 Independenței Blvd. late 19th century
94PH-II-
m-A-16273
Radu Stanian House, later Constantinescu
Bordeni HousePLOIEȘTI municipality 15 Independenței Blvd. 1850, 1930
95PH-II-
m-B-16274
C.G. Angelini House, today Ploiești Local Finance and Estate Management Public
Department
PLOIEȘTI municipality 16 Independenței Blvd. late 19th century
96PH-II-
m-A-16275
Scarlat Sc. Orăscu House, today Children’s
Medical Office of Ploiești Paediatric
Hospital
PLOIEȘTI municipality 18 Independenței Blvd.late 19th century,
rebuilt in 1920
97PH-II-
m-B-16276
Toma Rucăreanu House, later Provian house, today "Mon Jardin" Restaurant
PLOIEȘTI municipality 19 Independenței Blvd. late 19th century
98PH-II-
m-B-16277
Grigore Scorțeanu, Dimitrie Sfetescu House, later the headquarters of "Concordia" Oil
Company, today Ploiești City Hall
Administrative Office
PLOIEȘTI municipality 21 Independenței Blvd. late 19th century
99PH-II-
m-A-16278
Ghiță Stoenescu House, today the
headquarters of Alfa Medical Centre clinic
PLOIEȘTI municipality 27 Independenței Blvd. 1900 - 1910
100PH-II-
m-A-16279
Gheorghe Iosifescu House, today "VigoHotel"
PLOIEȘTI municipality 28 Independenței Blvd. 1935
101PH-II-
m-B-16280
The National Bank, today a branch office
of B.C.R.PLOIEȘTI municipality 1 Ionescu Tache Street
early 20th century
102PH-II-
m-B-16281House, today "Vienna
Cafe" RestaurantPLOIEȘTI municipality 3 Ipătescu Ana Street late 19th century
103PH-II-
m-A-16282
Avram Ergas Mamaciu House, today "Ciufulici"
Children’s Theatre – section of "Toma Caragiu" Theatre
PLOIEȘTI municipality 52 Kogălniceanu Mihail Street 1869 - 1870
104PH-II-
m-A-16283
C.C. Dobrescu House, today "I.L. Caragiale" Memorial Museum
PLOIEȘTI municipality 1 Kutuzov Streetlate 18th century
- early 19th century
105PH-II-
m-A-16284
Fiscal Administration’s office, today Prahova
County CourtPLOIEȘTI municipality 6 Lazăr Gheorghe Street
early 20th century
106PH-II-
m-B-16285Inn, later a dwelling PLOIEȘTI municipality 10 Maniu Iuliu Street
first half of 19th century
The
Gro
wth
Pol
e’s
Pro
file
Ana
lysi
s of
Dev
elop
men
t N
eeds
and
Are
as o
f In
terv
enti
on
Cha
pter
1.7
. Cul
ture
and
lei
sure
i
1
i310

no. lMi code name locality Address Dating from
107PH-II-
m-B-16286
House, today the headquarters of Prahova National Roads Section
PLOIEȘTI municipality 8 Maramureș Streetearly 20th
century
108PH-II-
m-B-16287
House, former bank office, today Angelo
D'oro HotelPLOIEȘTI municipality 9 Maramureș Street
early 20th century
109PH-II-
m-A-16288
"Sf. Apostoli Petru și Pavel” – Domnească (Holy Apostles Peter and Paul - Princiary)
Church
PLOIEȘTI municipality 63 Matei Basarab Street
1639, transformed in the late 19th
century
110PH-II-
a-B-16289
Complex of "Sf. Nicolae" – Vechi (St
Nicholas - Old) ChurchPLOIEȘTI municipality 105 Mihai Bravu Street
late 16th century, late 17th century
- early 18th century
111PH-II-
m-B-16289.01
"Sf. Nicolae" – Vechi (St Nicholas – Old)
ChurchPLOIEȘTI municipality 105 Mihai Bravu Street
late 16th century, rebuilt from 1983
to 1990
112PH-II-
m-B-16289.02Foundations of
outbuildings PLOIEȘTI municipality 105 Mihai Bravu Street
late 17th century- early 18th century
113PH-II-
m-B-16289.03Foundations of the bell
tower PLOIEȘTI municipality 105 Mihai Bravu Street
late 17th century- early 18th century
114PH-II-
m-B-16290
Tulea House, today the headquarters of Community Social
Service Administration
PLOIEȘTI municipality 4-6 Poștei Street 1853
115PH-II-
m-B-16291
N. Pârvulescu House, today private doctor’s
practicesPLOIEȘTI municipality 35 Romană Street 1870
116PH-II-
m-B-16292
Dr. Dan Georgescu House, today company
officesPLOIEȘTI municipality 41 Romană Street 1850
117PH-II-
m-B-16293Tiseanu House PLOIEȘTI municipality 43 Romană Street
second half of 19th century
118PH-II-
m-B-16294House with a shop PLOIEȘTI municipality 46-48 Romană Street mid-19th century
119PH-II-
m-A-16295Maria Dumitrescu
HousePLOIEȘTI municipality 1 Simache Nicolae Street 1830
120PH-II-
m-A-16296
Luca Elefterescu House, today "Nicolae
Simache" Clock Museum
PLOIEȘTI municipality 1 Simache Nicolae Street1890, rebuilt in
1930
121PH-II-
m-B-16297Marcela Pătârlăgeanu
HousePLOIEȘTI municipality 2 Simache Nicolae Street
early 20th century
122PH-II-
m-B-16298
Istrate Negulescu House, today the headquarters of a department of the
Ministry of National Defence.
PLOIEȘTI municipality 1 Stadionului Streetsecond half of 19th century
123PH-II-
m-B-16298Cantilli House PLOIEȘTI municipality 3 Stadionului Street, 3A
second half of 19th century
124PH-II-
m-B-16300Mareș Șerbănescu
HousePLOIEȘTI municipality 14 Stadionului Street 1847
125PH-II-
m-B-16301
The House of Prahova Schoolteachers, today
company officesPLOIEȘTI municipality 8 Ștefan cel Mare Street 1925
311

no. lMi code name locality Address Dating from
126PH-II-
m-B-16302
"Sf. Voievozi" (Saint Princes) Church
having "Sf.Arhangheli Mihail și Gavriil" (Holy Archangels Michael and Gabriel) and "Sf.
Antonie cel Mare" (Saint Anthony the
Great) dedication days
PLOIEȘTI municipality 23 Ștefan cel Mare Street1820 - 1827,
rebuilt from 1929 to 1931
127PH-II-
m-B-16303Cacip House PLOIEȘTI municipality 4 Ulierului Street
first half of 19th century
128PH-II-
m-B-16304Petre Ulieru House PLOIEȘTI municipality 7 Ulierului Street
early 19th century
129PH-II-
m-A-16306
School of Arts and Crafts, today the
Directorate for the Public and Private
Domain Administration
PLOIEȘTI municipality 32 Văleni Street 1886
130PH-II-
m-A-16306Central Halls PLOIEȘTI municipality 8 Zola Emile Street 1930 - 1935
131PH-III-
m-A-16863Independence War Soldiers Memorial
PLOIEȘTI municipalityPiața 1 Decembrie 1918 (1
Decembrie 1918 Square) Gara de sud (Southern Station)
1897
132PH-III-
m-B-16864First World War Heroes Memorial
PLOIEȘTI municipality2 Eroilor Street, inside
Bolovani cemetery1957
133PH-III-
m-B-16865Bust of writer Ion Luca
CaragialePLOIEȘTI municipality
Independenței Blvd., in the park located in front of "Mihai
Viteazul" National College 1952
134PH-III-
m-A-16866"Maternitate”
(Motherhood) StatuePLOIEȘTI municipality
Independenței Blvd., in the green space on the eastern
side of the boulevard 1960
135PH-III-
m-B-16867
Bust of Radu Stanian (former mayor of
Ploiești)PLOIEȘTI municipality
The junction between Independenței Blvd. and
Bobâlna Street1900
136PH-III-
m-A-16868Statue of Liberty PLOIEȘTI municipality
2 Republicii Blvd. to the north side of the park located in front of the Administrative
Palace
1881
137PH-III-
m-B-16869Bust of Prince
Alexandru Ioan CuzaPLOIEȘTI municipality
10 Trei Ierarhi Street, inside the courtyard of Al.I. Cuza
High School1959
138PH-IV-
m-A-16878Bust of architect
Alexandru M. ZagoritzPLOIEȘTI municipality
14 Brezeanu Constantin Street, inside Viișoara
cemetery1923
139PH-IV-
m-B-16877
Cross commemorating the defeat of Pedestrian
Mercenaries’ Uprising
PLOIEȘTI municipality
10 Caragiu Toma Street, in the Lapidary Section of the County Museum of History
and Archaeology; transferred from Valea Urloii locality,
Urlați town
1655
140PH-IV-
m-B-16879The house where writer I. A. Bassarabescu lived
PLOIEȘTI municipality 10 Ștefan cel Mare Street late 19th century
141PH-II-
m-B-16362
Ruins of "Sf. Arhangheli Mihail și Gavriil” (Holy
Archangels Michael and Gabriel) Church
BOLDEȘTI-SCĂENI town 58A Unirii Street 1812
142PH-II-
m-A-16624Rusescu House
SECIU locality; Boldești-Scăeni town
67 1826
143PH-II-
m-B-16625"Sf. Treime” (Holy Trinity) Church
SECIU locality; Boldești-Scăeni town
37518th century, rebuilt in 1802
The
Gro
wth
Pol
e’s
Pro
file
Ana
lysi
s of
Dev
elop
men
t N
eeds
and
Are
as o
f In
terv
enti
on
Cha
pter
1.7
. Cul
ture
and
lei
sure
i
1
i312

no. lMi code name locality Address Dating from
144PH-III-
m-B-16870Theodor Diamant
MemorialBOLDEȘTI-SCĂENI town
Scăeni neighborhood , in front of the station
1977
145PH-IV-
m-B-16885Stone memorial cross BOLDEȘTI-SCĂENI town
3 Primăverii street, inside the courtyard of "Adormirea Maicii Domnului” (Dormition
of the Mother of God) Church
1710
146PH-I-
s-B-16200Fortress PLOPENI town
Poiana "La Cetate” ("La Cetate” Glade ("Cetatea Fetii")
6th - 5th century BC
147 PH-I-s-B-16159 TumuliBUDA village; ARICEȘTII RAHTIVANI commune
La Movilă Latène
148PH-II-
m-A-16312
"Sf. Ilie", "Sf. Nicolae” (St Ilie, St Nicholas)
Church
ARICEȘTII RAHTIVANI village; ARICEȘTII
RAHTIVANI commune587 1777
149PH-II-
m-A-16772
"Sf. Voievozi” (Saint Princes) church of
former Târgșoru Nou monastery
TÂRGȘORU NOU village; ARICEȘTII RAHTIVANI
commune121
1857, destroyed in 1940, rebuilt in
1942
150PH-IV-
m-B-16912Stone memorial cross
NEDELEA village; ARICEȘTII RAHTIVANI commune
47, in the courtyard of the Vocational School
19th century
151 PH-I-s-B-16205 Incineration necropolisROMÂNEȘTI village;
BĂRCĂNEȘTI commune
On the premises belonging to the former CAP (Agricultural
Production Cooperative )
Late Hallstatt, Ferigile - Bârsești
culture
152PH-II-
a-A-16504Ghighiu Monastery
GHIGHIU village; BĂRCĂNEȘTI commune
1A1817, 1856 -
1866
153PH-II-
m-A-16504.01
"Izvorul Tămăduirii” (Healing Fountain) Big
Church
GHIGHIU village; commune BĂRCĂNEȘTI
1A 1866
154PH-II-
m-A-16504.02
"Învierea Sfântului Lazăr” (Resurrection of Saint Lazarus) Small
Church
GHIGHIU village; BĂRCĂNEȘTI commune
1A 1817
155PH-II-
m-A-16504.03Hermitages (the south
and west sides)GHIGHIU village;
BĂRCĂNEȘTI commune1A 1856
156PH-II-
m-A-16504.04Bell tower
GHIGHIU village; BĂRCĂNEȘTI commune
1A 1856
157PH-II-
m-A-16504.05Surrounding wall
GHIGHIU village; BĂRCĂNEȘTI commune
1A 1856
158PH-II-
m-A-16771Ruins of Brâncoveanu-Mavrocordat mansion
TĂTĂRANI village; BĂRCĂNEȘTI commune
NN18th - 19th
century
169PH-II-
a-A-16439
Complex of "Sf. Nicolae”, "Sf. Eustație Plachida” (St Nicholas, St Eustace Placidus)
Church
CORLĂTEȘTI village; BERCENI commune
NN 1792
160PH-II-
m-A-16439.01
“Sf. Nicolae”, "Sf. Eustație Plachida” (St Nicholas, St Eustace
Placidus) Church
CORLĂTEȘTI village; BERCENI commune
NN 1792
161PH-II-
m-A-16439.02Bell tower
CORLĂTEȘTI village; BERCENI commune
NN 1792
162PH-II-
m-B-16358Constantin
Comăneanu VillaBLEJOI village; BLEJOI
commune16 1909
163PH-II-
m-A-16359
"Sf. Nicolae", "Adormirea Maicii
Domnului" (St Nicholas, Dormition
of the Mother of God) Wooden Church (inside
the cemetery)
BLEJOI village; BLEJOI commune
449 A 18th century
313

no. lMi code name locality Address Dating from
164PH-II-
m-B-16571Ruins of "Sf. Visarion” (St Visarion) Church
PLOIEȘTIORI village; BLEJOI commune
in the open field, east of "Sf. Dumitru" (Saint Demetrius)
Church, near Cantilli mansion, premises belonging to the former CAP (Agricultural Production Cooperative )
17th – 18th century
165 PH-I-s-B-16150 SettlementBĂTEȘTI village; BRAZI
commune
Cantonul CFR 50 A (50 A Shed of the Romanian
Railways Company)
5th - 7th century AC
166PH-II-
m-A-16364Nicolau mansion
BRAZII DE SUS village; BRAZI commune
1 Orhideelor Streetfirst half of 19th
century
167PH-II-
m-A-16757"Sf. Treime” (Holy Trinity) Church”
STEJARU village; BRAZI commune
79A Haiducilor Street, inside the cemetery, transferred
from Misleanca forest18th century
168 PH-I-s-B-16158 SettlementBUCOV village; BUCOV
communeLa Tioca, Rotari
9th - 10th century
169 PH-I-s-B-16168 SettlementCHIȚORANI village; BUCOV
commune"Ferma 11” (11 Farm)
170PH-I-
m-B-16168.01Settlement
CHIȚORANI village; BUCOV commune
"Ferma 11” (11 Farm)5th - 7th century
AC
171PH-I-
m-B-16168.02Settlement
CHIȚORANI village; BUCOV commune
"Ferma 11” (11 Farm) Latène
172PH-I-
m-B-16168.03Settlement
CHIȚORANI village; BUCOV commune
"Ferma 11” (11 Farm) Bronze Age
173PH-II-
m-B-16377
Constantin Stere House, today the headquarters of a cultural foundation
BUCOV village; BUCOV commune
In the "Constantin Stere" Amusement Park -Bucov
1900
174PH-II-
a-A-16414
Complex of "Sf. Stelian” (St Stylianos)
Church
CHIȚORANI village; BUCOV commune
NN 1797
175PH-II-
m-A-16414.01"Sf. Stelian” (St
Stylianos) churchCHIȚORANI village; BUCOV
communeNN 1797
176PH-II-
m-B-16414.02Bell tower
CHIȚORANI village; BUCOV commune
NN1797, rebuilt in
the 19th century
177PH-II-
m-A-16820
"Sf. Nicolae” (St Nicholas) Wooden
Church
VALEA ORLEI village; BUCOV commune
NN 17th century
178PH-IV-
m-B-16894(Roadside) memorial
cross CHIȚORANI village; BUCOV
communeIn Valea Orlei, opposite Grațiela Țintea house
1709
179PH-IV-
m-B-16895Grave cross
CHIȚORANI village; BUCOV commune
Inside the old cemetery of "Sf. Stelian" (St Stylianos) Church
1843
180PH-I-
s-A-16208The Roman Camp in
MălăieștiSFÂRLEANCA village;
DUMBRĂVEȘTI communeLa Cetate 101 - 118 AC
181 PH-I-s-B-16198The archaeological site
in PăuleștiPĂULEȘTI village; PĂULEȘTI
communeHoliday Camp
182PH-I-
m-B-16198.01Settlement
PĂULEȘTI village; PĂULEȘTI commune
Holiday Camp 5th - 7th century
AC
183PH-I-
m-B-16198.02Settlement
PĂULEȘTI village; PĂULEȘTI commune
Holiday Camp4th - 5th century
AC
184PH-I-
m-B-16198.03Settlement
PĂULEȘTI village; PĂULEȘTI commune
Holiday Camp Hallstatt
185PH-I-
m-B-16198.04Settlement
PĂULEȘTI village; PĂULEȘTI commune
Holiday Camp Neolithic
186 PH-I-s-A-16216The archaeological site
in Târgșoru VechiTÂRGȘORU VECHI village;
TÂRGȘORU VECHI commune1 "La Mănăstire”
187PH-I-
m-A-16216.01Settlement
TÂRGȘORU VECHI village; TÂRGȘORU VECHI commune
1 "La Mănăstire”15th – 17th
centuryThe
Gro
wth
Pol
e’s
Pro
file
Ana
lysi
s of
Dev
elop
men
t N
eeds
and
Are
as o
f In
terv
enti
on
Cha
pter
1.7
. Cul
ture
and
lei
sure
i
1
i314

no. lMi code name locality Address Dating from
188PH-I-
m-A-16216.02Settlement
TÂRGȘORU VECHI village; TÂRGȘORU VECHI commune
1 "La Mănăstire”5th - 7th century
AC
189PH-I-
m-A-16216.03Necropolis
TÂRGȘORU VECHI village; TÂRGȘORU VECHI commune
1 "La Mănăstire” 4th century AC
190PH-I-
m-A-16216.04Settlement
TÂRGȘORU VECHI village; TÂRGȘORU VECHI commune
1 "La Mănăstire” 2nd century AC
191PH-I-
m-A-16216.05Necropolis
TÂRGȘORU VECHI village; TÂRGȘORU VECHI commune
1 "La Mănăstire”2nd - 3rd century
AC
192PH-I-
m-A-16216.06Settlement
TÂRGȘORU VECHI village; TÂRGȘORU VECHI commune
1 "La Mănăstire”Late Hallstatt,
Ferigile - Bârsești culture
193PH-I-
m-A-16216.07Settlement
TÂRGȘORU VECHI village; TÂRGȘORU VECHI commune
1 "La Mănăstire” Latène
194PH-I-
m-A-16216.08Settlement
TÂRGȘORU VECHI village; TÂRGȘORU VECHI commune
1 "La Mănăstire”Bronze Age, Tei
culture
195PH-I-
m-A-16216.09Settlement
TÂRGȘORU VECHIvillage; TÂRGȘORU VECHI commune
1 "La Mănăstire”Neolithic, Boian
culture
196PH-I-
m-A-16216.10Settlement
TÂRGȘORU VECHI village; TÂRGȘORU VECHI commune
1 "La Mănăstire”Early Neolithic, Starčevo – Criș
culture
197PH-I-
m-A-16216.11Settlement
TÂRGȘORU VECHI village; TÂRGȘORU VECHI commune
1 "La Mănăstire”Eneolithic, Gumelnița
culture
198 PH-I-s-B-16215 SettlementTÂRGȘORU VECHI village;
TÂRGȘORU VECHI commune540 B "La fosta moară”, 500
m west of the millBronze Age, Tei
culture
199PH-II-
m-B-16773
"Sf. Arhangheli Mihail și Gavriil" și "Sf.
Ierarh Nicolae" (Holy Archangels Michael
and Gabriel and Holy Hierarch Nicholas) Church of Prince Antonie’s Turnu
Monastery
TÂRGȘORU VECHI village; TÂRGȘORU VECHI commune
1 inside Târgșor archaeological site
1669-1672, rebuilt on ruins from 1997 to
2001
200PH-II-
m-B-16774Ruins of Biserica Albă
(the White Church)TÂRGȘORU VECHI village;
TÂRGȘORU VECHI commune1 inside Târgșor archaeological
site1570
201PH-II-
m-B-16775
Ruins of the church of Mihnea Turcitul-
Biserica Roșie (the Red Church)
TÂRGȘORU VECHI village; TÂRGȘORU VECHI commune
1 inside Târgșor archaeological site
late 16th century
202PH-IV-
m-B-16934
The two inscriptions over the old church’s
entrance
STĂNCEȘTI village; TÂRGȘORU VECHI commune
380 in the new church16th century,
1720
203 PH-I-s-B-16226 SettlementVALEA CĂLUGĂREASCĂ
village; VALEA CĂLUGĂREASCĂ commune
Inside the orchard of Valea Călugărească Agricultural
Vocational SchoolHallstatt
315

AnneX 1.7.2. list of cultural events organized in Ploiești Growth Pole (2014)
MUniCiPAlitieS
PLOIEȘTI
• 15 January - Prahova County Culture Centre – “Mythos” Drama Centre: Dacă treci râul Selenei (If You Cross Selena’s River). Mihai Eminescu commemorative evening• 28 February - Prahova County Culture Centre– “Mythos” Drama Centre: Tinerețea lui Don Quijote (The Youth of Don Quixote). Show of readings from the work of Marin Sorescu• 9 March - Prahova County Culture Centre– “Mythos” Drama Centre : 19 trandafiri (Nineteen roses) - Fiction or Mythology? The Mircea Eliade Case• 15-20 March - Ploiești School of Arts - Recitals, concerts, dance and theatre performances, exhibitions organized by the students of Ploiești School of Arts• 21-31 March - Prahova County Culture Centre – “Mythos” Drama Centre: Nichita la Echinocțiu (Nichita on the Equinox) Festival of Arts, 9th edition. Drama and dance shows, film galas, concerts and recitals, fine art and photography exhibitions, book and magazine launches, colloquia, creative and performing arts workshops• 12 May - Prahova County Culture Centre –”Mythos” Drama Centre: The First Major Choreography Revolution in Modern times: Martha Graham• June – Recitals, concerts, dance and theatre performances, exhibitions organized by the students of the Ploiești School of Arts• 18-23 August, Prahova County Culture Centre– “Mythos” Drama Centre: Open-air summer season of the ˮMythos” Drama Centre (theatre performances, film screenings, recitals, creative and performing arts workshops)• 22 September, Prahova County Culture Centre – “Mythos” Drama Centre: Opening of the Fall Season of the “Mythos” Drama Centre• 21 October, Prahova County Culture Centre – “Mythos” Drama Centre: Myth, Mythical, Mythology – Session of communications, reports and documents • 5 November - Ploiești, Prahova County Culture Centre – Orion Parlour: Opening of the Prahova Folk Art Exhibition • 13 December - Prahova County Culture Centre – “Mythos” Drama Centre: Poetul ca și soldatul (The Poet, Like the Soldier). Nichita Stănescu commemorative evening• 15 - 21 December - Recitals, concerts, dance and theatre performances, exhibitions organized by the students of the Ploiești School of Arts
townS
BĂICOI
• 15 January - Mihai Eminescu (164th anniversary of the writer’s birth). Narrations, book exhibitions, poetry recitation, literature and music shows
• 24 January – Unification of Romanian Principalities – cultural and arts events
• 31 January - Ion Luca Caragiale (162nd anniversary of the writer’s birth). Narrations, readings, performances
• 3 March, Ion Creangă (177th anniversary of the writer’s birth)
• 31 March, Nichita Stănescu (81st anniversary of the writer’s birth). Narrations, book exhibitions, performances, poetry recitation, poetry contests
• Easter, as Seen by Children. Exhibition of drawings and decorated eggs
• The Library – a Fountain of Knowledge. Educational partnership: readings, poetry recitation, art activities
• 1 June, International Children’s Day. Complex events, shows, contests, exhibitions
• 1-7 June – Theatre performances for kids
• July – Local Talents. Exhibition of paintings and graphic arts by local artists
• August - Let Us Know Each Other, Love Each Other and Respect Our Town. Photography exhibition
• 20-26 September - Educație și comunicare prin teatru (Education and Communication through Theatre). Theatre for the Young and the Elderly.
• October - Being Responsive to the Community’s Cultural Values and Spiritual Meanings. Meeting with the people of culture in the locality; Autumn in Băicoi. Show, folk songs and dances
• 29, 30 November – The Childhood’s Dance. Competition
• November - Culorile prieteniei (The Colors of Friendship) National Painting Contest, 5th edition
• 17-31 December - Concerts of Romanian Christmas songs and traditions
The
Gro
wth
Pol
e’s
Pro
file
Ana
lysi
s of
Dev
elop
men
t N
eeds
and
Are
as o
f In
terv
enti
on
Cha
pter
1.7
. Cul
ture
and
lei
sure
i
1
i316

BOLDEȘTI-SCĂENI
• 15 January- National Culture Day. Complex events – Culture House, Library • 24 January - Unification of the Romanian Principalities – cultural and arts events • 15 February – Lived History. Meeting with war veterans • 13 April – Palm Sunday and Easter Traditions • 9 May - Lucian Blaga (119th anniversary of the writer’s birth)• 21 May – World Day of Culture • 24 May - Teodor Diamant and the phalanstery in Scăeni. Symposium• 5 June – The Town’s Day. Complex event. Folk shows with the participation of the folk dance troupes in Leova town (Republic of Moldova)• 1-30 July – Painting camp in Seciu• 14 August - Dormition of the Mother of God. Music show with the local bands’ participation • 1 October – Painting exhibition• 19, 20 October – Autumn Festival, 6th edition. Complex event: exhibition, folk show, fair
PLOPENI
• 31 March - Nichita Stănescu (81st anniversary of the writer’s birth). Narrations, book exhibitions, shows, poetry recitation, poetry contests
• 9 May – Independence Day of Romania, Europe Day
• 1 June - International Children’s Day. Complex events, shows, contests, exhibitions
• 1 June – Frunza de stejar (The Oak Leaf). Contest-festival for children
• 15 August – National festival – Folk music contest
• 15-17 August – The Town’s Days. Complex Events
• 18-28 August - ˮVintilă Făcăianu” International Painting Camp; ˮNicolae Kruch” International Sculpture Camp; Vara în culori (Summer in Colors) Children’s Painting Camp
• 20 September - ProMuzica International Choral Music Festival
• 10-25 December - Festival of Customs, Christmas Songs and Traditions
• 17-31 December - Concerts of Romanian Christmas songs and traditions
CoMMUneS/villages
ARICEŞTII RAHTIVANI
BĂRCĂNEŞTI
BERCENICartier Dîmbu
Cătunu Corlăteşti
Moara Nouă
• 24 January - Unification of Romanian Principalities - cultural and arts events
• 9 May - Independence Day of Romania, Europe Day
• 1 June - International Children’s Day. Complex events, shows, contests, exhibitions
• 5 September - The Locality’s Day
• 27 November - Nicolae Iorga (74th anniversary of the historian’s death)
• 17-31 December – Concerts of Romanian Christmas songs and traditions
• 26 December – Snowflakes Carnival
BLEJOIPloieştioriTînţăreni
• 15 January- Mihai Eminescu (164th anniversary of the writer’s birth). Narrations, book exhibitions, poetry recitation, literature – music shows
• 24 January - Unification of Romanian Principalities – cultural and arts events
• 6 February – Fiu al satului (Son of the Village) Festival
• March - Radu Tudoran – 60th anniversary of the publication of the Toate pânzele sus novel
• May – Festival of Flowers. The Commune’s Days
• 1 June, International Children’s Day. Complex events, shows, contests, exhibitions
• 17 November – Autumn flowers. Painting exhibition
317

BRAZIBrazii de Sus
BăteştiBrazii de Jos
NegoieştiPopeştiStejaru
• 20 January- Ion Podoleanu (85th anniversary of the writer’s birth)• 23 January- Alexandru Odobescu (180th anniversary of the writer’s birth)• 24 January - Unification of Romanian Principalities – cultural and arts events • 28 January- Victor Eftimiu (125th anniversary of the writer’s birth)• 12 February - Otilia Cazimir (120th anniversary of the writer’s birth)• 20 February - Eugen Barbu (90th anniversary of the writer’s birth)• 1-7 March - ˮIon Creangă” Days• 14 March - Alexandru Macedonski (160th anniversary of the writer’s birth)• 17 March - Alecu Russo (195th anniversary of the writer’s birth)• 7 April - Grigore Adam (100th anniversary of the writer’s birth)• 10 April - Maria Banuș (100th anniversary of the writer’s birth)• 14 April - Octav Pancu (85th anniversary of the writer’s birth)• 20, 21 April – The Joy of the Resurrection. Exhibition of decorated eggs, drawings and greeting cards • 25 April - Camil Petrescu (120th anniversary of the writer’s birth)• 1 May – International Workers’ Day. Sporting activities, music, dance, shows• 9 May - Independence Day of Romania, Europe Day• 17 May – International Day of Sport • 30 May - Vasile Alecsandri. Dumbrava roșie (The Red Grove) – 140th anniversary of the poem’s publication • 1 June - International Children’s Day. Complex events, shows, contests, exhibitions• 5 (18) June – Alexandru Raicu (100th anniversary of the writer’s birth)• 12 (19) June - George Călinescu (115th anniversary of the writer’s birth)• 2 July - Emil Gârleanu (100th anniversary of the writer’s death); • 25 July - Cezar Baltag (75th anniversary of the poet’s birth)• 30 July - Alexandru O. Păstorel Teodoreanu (120th anniversary of the writer’s birth)• 11 August - Panait Istrati (130th anniversary of the writer’s birth)• 15 August – The Locality’s Day. Village rural shows; Constantin Brâncoveanu (300th anniversary of the Prince’s death)• 22 August - Elena Damian (90th anniversary of the writer’s birth)• 8 September – International Literacy Day • 12 September - Ana Lupan (92th anniversary of the writer’s birth)• 26 September - Mihail Sadoveanu. Viața lui Ștefan cel Mare (The Life of Stephen the Great). 80th anniversary of the book’s publication• 2 October - Gheorghe Marin (85th anniversary of the writer’s birth)• 5 October – World Teachers’ Day • 17 October - Ion Slavici. ˮMara” – 120th anniversary of the novel’s publication • 6 November - Alexandru Mitru (100th anniversary of the writer’s birth)• 14 November - Iulia Hasdeu (145th anniversary of the writer’s birth)• 25 November - Ionel Pop (125th anniversary of the writer’s birth)• 27 November - Nina Cassian (90th anniversary of the writer’s birth)• 25 December - Vine, vine Moș Crăciun! (Look, Santa’s Coming) Concert of traditional Christmas songs and folk show with the participation of the ˮMlădițele Brazilor” band
BUCOVBighiliu
ChiţoraniPleaşa
Valea Orlei
• 15 January - Mihai Eminescu (164th anniversary of the writer’s birth). Narrations, book exhibitions, poetry recitation, literature – music shows • 24 January - Unification of Romanian Principalities - cultural and arts events • 5 April - Când înfloresc castanii (When Chestnuts Are in Bloom). Dance contest• 9 May - Independence Day of Romania, Europe Day• 13 September –The Commune’s Day. Complex event
DUMBRĂVEŞTI
PĂULEŞTI
TÂRGŞORU VECHIStrejnic
StănceştiZahanaua
• 6 January - Baptism of the Horses. House Race
• 17 April – The Sacred Light. Art show
• 1 June - International Children’s Day. Complex events, shows, contests, exhibitions
• 27 November - Nicolae Iorga (74th anniversary of the historian’s death)
• 22 December – The Magic of Christmas. Art show and drawings exhibition: Winter on
Our Street
The
Gro
wth
Pol
e’s
Pro
file
Ana
lysi
s of
Dev
elop
men
t N
eeds
and
Are
as o
f In
terv
enti
on
Cha
pter
1.7
. Cul
ture
and
lei
sure
i
1
i318

VALEA CĂLUGĂREASCĂArva
CoslegiDîrvariPantaziRachieriRadilaSchiau
Valea LargăValea Mantei
Valea NicovaniValea PoieniiValea PopiiValea Ursoi
Vîrfurile
• 24 January - Unification of Romanian Principalities - cultural and arts events
• 31 January- Ion Luca Caragiale (162th anniversary of the writer’s birth). Narrations,
readings, shows
• 9 May - Independence Day of Romania, Europe Day
• 26-28 September – Feast of the Wine, 13th edition. Complex art event
• 21 December - (auditorium of the ˮGheorghe Ionescu Sisești” Agricultural College).
Primim colindătorii (Carol Singers Are Welcome). Preserving Romanian Customs
319

321
2territorial Diagnosis and
Strategy recommendations
PArt I: the Growth Pole’s Profile

323
ChAPter 2.1.
Conclusions on Development needs
PArt I: the Growth Pole’s Profile
territorial Diagnosis and Strategy recommendations
2

2.1. Conclusions on Development needs 2.1.1. The pyramid of development needs
The territorial diagnosis is based on the sectors of the current situation analysis, carried out in the previous chapter, underpinning the development needs, as identified by the citizens and by the private sector, based on Abraham Maslow’s pyramid model that has been used in the social sciences for over 70 years.
Figure 100. Citizens’ Pyramid of needs Figure 101. Private Sector’s Pyramid of needs
the citizens’ pyramid of needs
A city’s citizens are without a doubt its main constituent group. Citizens elect the mayor and the local council, and local authorities are directly responsible to them. The citizens’ needs can largely be clustered in the following five categories: opportunities; housing and basic infrastructure; connectivity; effective and efficient administration; quality of life.
1. opportunities. The main attractions of cities are the opportunities they offer in terms of jobs, education, healthcare, and access to larger markets. Consequently, the development strategies have to identify ways to sustain economic development, attract the private sector, and generate business opportunities and jobs for people – both from outside and from within the city.
2. housing and basic infrastructure. One of the basic conditions for a city’s offer is to meet the demands for housing and basic services (public utilities) in order to allow housing markets to function properly.
3. Connectivity. Good connectivity means that people will have easier access to more opportunities in the area (e.g. it will be easier for them to find another job), while companies will have easier access to a larger labour pool and to larger markets.
4. effective and efficient administration. In their desire to get to work without a hassle, have clean streets and good quality services, be able to obtain licenses and permits easily, citizens require an efficient public administration, which responds to local needs effectively and keeps open communication channels, while engaging citizens in the process of decision-making.
5. Quality of life. When the conditions at the bottom of the pyramid are met, the aspects relating to the quality of life are crucial aspects that determine citizens’ decisions to settle in a city or another. These aspects imply attractive public spaces, good urban design, beautiful buildings, a thriving cultural life, entertainment opportunities, etc.
The
Gro
wth
Pol
e’s
Pro
file
Ter
ritor
ial D
iagn
osis
and
Str
ateg
y R
ecom
men
dati
ons
Cha
pter
2.1
. Con
clus
ions
on
Dev
elop
men
t n
eeds
i
2
i
Quality of Life
Effective and Efficient Administration
Connectivity(roads, highways, airports, rail, etc.)
Opportunities(jobs, markets, education, healthcare, etc.)
Soc
ial I
nclu
sion
Clim
ate
Cha
nge
Housing and Basic Infrastructure(water, wastewater, sanitation, etc.)
Clusters
Effective and Efficient Administration
Connectivity(roads, highways, airports, rail, etc.)
Qualified Labor Force
Soc
ial I
nclu
sion
Clim
ate
Cha
nge
Land, Office space, and Basic Infrastructure(electricity, gas, water, etc.)
Population Dynamics
Zoning of the territory / Spatial Development
324

the private sector’s pyramid of needs
The private sector is a city’s source of economic dynamism, and an active local economy acts as a magnet for people. For the local authorities it is therefore important to identify ways to address some of the key needs of the private sector. These can be grouped in the following categories: qualified workforce; land and basic infrastructure; connectivity; effective and efficient administration; clusters.
1. Qualified workforce. The key source of a company’s productivity lies in its people. It is people who think and design products and services, it is people who produce these products and services, and it is people who ultimately market and sell them. Thus, when a company decides where to locate, or when an entrepreneur decides where to start a business, the availability of qualified workforce is one of the first things they take into consideration.
2. land, office Space, and Basic infrastructure. Every business requires a place from which to operate. Some companies simply rent or purchase an existent office space, while others require a new plot of land on which to develop their facilities. It is therefore important for local authorities to have a good grasp of the availability of office space (i.e. vacancy rates) and land parcels in the areas they administrate (e.g. brownfields or greenfields).
3. Connectivity. Connectivity is paramount to the private sector; it supports the access to workforce and to internal and external markets. Easy access to a qualified labor pool implies well-developed local and regional infrastructure, which allows easy commuting. Easy access to markets requires a modernized highway network, good airport, rail, and naval infrastructure, as well as the availability of a proper ICT (information and communication) infrastructure.
4. effective and efficient Administration. Private companies require both public policies and public infrastructure to function effectively. Some require that construction permits be made available on time, some may require a road connection to the major road infrastructure in the area, and others may require appropriate tax policies.
5. Clusters. As counterintuitive as it may sound, private companies need other companies in the same sector to be effective. The co-location of similar companies enables easier flow of ideas, seamless access to qualified workforce, and higher productivity driven by local competition.
Cross-cutting issues
In both pyramids, all these city development sectors have a spatial dimension, relating to the zoning of the territory, and a demographic dimension, influencing the population dynamics. In addition to these basic components of a city’s pyramid of needs, there are a number of cross-cutting issues that should be taken into consideration in the process of decision-making at the city level – social inclusion and climate change.
a. the spatial dimension. As public or private investments take place on a plot of land, they influence the spatial development of the territory. Therefore, this dimension covers aspects such as the supply and demand of land, the advantages related to settling there, functional zoning and territorial expansion, which are critical for the development of cities, as well as for the cooperation between administrative units in the growth pole and the protection of the resources and natural heritage, etc.
b. the demographic dimension. The residents of a city across all age, gender, occupation, etc. groups are the essential condition of its existence. The way they evolve – naturally or as a result of the implementation of development-related decisions – is crucial for the future of the city. This dimension is reflected in the evolution and dynamics of the population, as well as in the way people are attracted or not by the city, based on the response to the needs identified in the two pyramids.
c. Social inclusion. Regardless of how developed a city is, it will always have to deal with social inclusion issues – i.e. there will always be a part of the local population that will be directly or indirectly discriminated. Actively promoting social inclusion not only helps achieve social desiderates, but it is also a critical tool for achieving economic goals.
d. Climate change. The more cities develop, the more they tend to pollute. In fact, cities are responsible for around 70% of global greenhouse gases emissions. Local authorities should therefore think their projects through the lens of climate change, assessing whether those projects help address climate change issues or whether they make them worse.
325

2.1.2. Sectoral diagnosis
Consequently, the territorial diagnosis examines all these issues in light of the conclusions of the previous chapter, focusing on the problems in the respective areas, as well as on the impact that the projects implemented during 2007-2014 may have on development trends, while making recommendations for their further consideration in the formulation process of the strategy.
Map 111. Spatial development and zoning of the territory
The
Gro
wth
Pol
e’s
Pro
file
Ter
ritor
ial D
iagn
osis
and
Str
ateg
y R
ecom
men
dati
ons
Cha
pter
2.1
. Con
clus
ions
on
Dev
elop
men
t n
eeds
i
2
i326

1. Ploieşti – Prahova Growth Pole is the largest urban agglomeration in the South Muntenia Region, consisting of a network of urban and rural territorial-administrative units (TAUs): three cities, one municipality, and 10 communes.2. The growth pole territory is mainly rural, measuring 445.79 km2, compared to 163.25 km2 (urban territory). In terms of property type, 79.9% of the land is privately owned and 20.1% is in public ownership.3. The territory covered by the town planning documentation is as follows:• 70.4% agricultural land, most of it being arable land (54.4%), and the rest mainly pastures and hayfields (9.7%), vineyards (3.6%), and orchards (2.6%);• Forests (9.1%);• Waters (2.2%);• Constructions (13.1%);• Means of communication (4.2%);• Degraded and unproductive land (0.9%).4. Ploieşti Growth Pole comprises several territorial-administrative units with a varied functional profile, determined by:• Agriculture, with added value from viticulture and fruit growing (the east-northeast area of the growth pole);• Road freight transport and pipeline transport;• Production and manufacturing activities involving mainly electronic and electric equipment for automobiles, mining equipment, clothing;• Trade and services – particularly engineering and consulting, financial services, operational in the central (mainly urban) area of the growth pole.
Key issues
1. The reduction of the agricultural land area by 3.9% following the expansion of urban / rural build-up areas2. Uncontrolled urban development usually on land with no public infrastructure, leading to additional environmental costs and public utilities operating costs3. The existence of polluted industrial land / brownfield sites as a result of the reduction of activities on industrial platforms4. Scarcity of green spaces and recreational zones
relevant projects over the 2007-2014 period
The construction of dwellings on vacant land in Ploieşti municipality, Păuleşti, and Blejoi communes with private financing The development of industrial parks included in the 2007-2013 Integrated Development Plan (IDP) with private financing:• “Ploieşti West Park” Industrial Park• W.D.P. Development Ro. SRL Industrial Park (a branch of Warehouse De Paw)Drafting the General Urban Plans for the component TAUs and the Local Urban Plans for land development / function changes and urban regulations
Development trends
1. Increase in the number of requests for changing land functionality (through Zonal Urban Plans concerning changes of destination for municipal investments, lots for housing, accessibility, etc.)2. Concentration of investments in areas with high accessibility by road and railway to industrial parks and shopping centers3. Development in coordination with Bucharest-Ilfov region, by competing and cooperating with Bucharest and the locations available in Ilfov county
Strategy recommendations
1. The recovery of polluted territories as a result of oil extraction and processing activities by decontaminating and converting them into construction land and green areas 2. Enlarging the surface of green zones and leisure zones3. Protecting agricultural land, forests, and green areas against uncontrolled expansion of built-up areas through specific urban regulations4. Developing logistics hubs in the south and east of the growth pole, thus ensuring the connectivity with the Corridors IV and IX in the European network TEN-T
327

Map 112. Demographic dynamics
The
Gro
wth
Pol
e’s
Pro
file
Ter
ritor
ial D
iagn
osis
and
Str
ateg
y R
ecom
men
dati
ons
Cha
pter
2.1
. Con
clus
ions
on
Dev
elop
men
t n
eeds
i
2
i328

1. The growth pole has 327,309 inhabitants. The average density is 539 inhabitants/km2. Between 2002 and 2011, the population of Ploieşti municipality dropped by 9.7% and the population of the Growth Pole by 7.5%, both due to the negative natural growth and high levels of migration towards EU countries and Bucharest city.2. Following a phenomenon of suburbanization, Păuleşti, Blejoi, Târgşoru Vechi, Bucov, and Bărcăneşti communes have recorded positive values due to the migration of the population from Ploieşti and Plopeni towards these areas.3. The structure of the population by age indicates an increasingly pronounced phenomenon of demographic aging. The degree of dependence of the population by age, expressed as a ratio between the elderly (over 60) and the young people aged up to 15 years, is 156%.4. In Băicoi, Ploieşti, Păuleşti, and Dumbrăveşti, there is an increase in the share of old-aged population, which accounts for about a third of the total population in the growth pole.
Key issues1. The negative demographic dynamics / constant process of reduction and aging of the population
relevant projects over the 2007-2014 period
• Projects on increasing the growth pole’s accessibility, included in the 2007-2013 IDP• Projects aiming at creating jobs through the development of industrial parks
Development trends
1. Increase in the population density, up to 700 inhabitants/km in the north / north-west of the growth pole (in a positive development scenario)2. Further attraction of a significant proportion of young people towards Prahova County, in particular from the rural areas3. Increase in the share of people aged over 65 due to lower birth rates
Strategy recommendations
1. Developing and improving healthcare and social services2. Initiating and implementing active measures to increase competitiveness at the level of the workforce, largely depending on the capacity of the private sector and the Oil and Gas University of Ploieşti to train specialists and to do research / development3. Stimulating investments in infrastructure and transport in order to support labor mobility
329

Map 113. Economic structure
1. The economic profile of the growth pole is dominated by the following industries: electronics, electric power and equipment, services, and constructions. The effects of the economic crisis affected the construction and manufacturing industries, while in agriculture, energy, information and communications the number of companies has increased.2. 64.6% of the active companies in Prahova County are found in Ploiești Growth Pole. The market structure comprises microenterprises (88.9%), SMEs (10.7%), and large companies (0.4%). Over the 2007-2013 period, the total of direct foreign investments was of EUR 470 million (capital contributions, amounts reinvested from the profit).
The
Gro
wth
Pol
e’s
Pro
file
Ter
ritor
ial D
iagn
osis
and
Str
ateg
y R
ecom
men
dati
ons
Cha
pter
2.1
. Con
clus
ions
on
Dev
elop
men
t n
eeds
i
2
i330

3. Locally, the business support infrastructure is well developed (the industrial parks area and the jobs created there place the pole on the first position). The 8 authorized industrial parks (4 publicly owned and 4 privately owned) have attracted investments of over EUR 500 million and have created 10,000 jobs.4. Ploieşti Growth Pole has important competitive advantages in the energy and extractive industries, as well as average competitive advantages in the manufacturing industry (petrochemistry, machinery and equipment, food and beverages), and transport and logistics.
Key issues
1. A decrease by 13.9% in the number of active companies in Ploieşti Growth Pole in the 2007-2013 period, due to the economic crisis2. Reduced entrepreneurial development (number of enterprises/1,000 inhabitants)3. The local economy is dominated by companies with foreign capital and a large part of the local economy is dependent on the oil market4. The lack of functional business networks, supply chains, and innovative clusters5. A decline in the local RDI sector, due to the underfunding of this field
relevant projects over the 2007-2014 period
Projects for the development of business infrastructure – services and production through public and private investments, such as:• The multipurpose business center “Lumina Verde”• The Business Excellence Center for Young Entrepreneurs• The industrial parks managed by the County Council’s companies in Ploieşti, Plopeni, Brazi, Bărcăneşti• “Ploieşti West Park” Industrial Park• W.D.P. Development Ro. SRL Industrial Park (a branch of Warehouse De Paw)• The modernization of Petrobrazi Refinery and the construction of Brazi Thermal Power Plant (OMV Petrom)Projects focusing on the RDI sector (implemented by the Oil and Gas University of Ploieşti):• Competitiveness pole to increase economic productivity through innovative use of virtual reality, in order to provide services for the essential infrastructures –CREVIS• Information technology for image promotion and management of information from graduates and businesses in order to adapt the management policy to socio-economic requirements• A regional center for determining performance and monitoring the technical condition of the tubular material used in the oil industry
Development trends
1. The development of sectors with a potential for smart economic specialization, such as the oil and gas extraction and processing industry, the automotive industry, the machinery and equipment industry2. The development of R&D activities in the field of renewable energy technology3. The development of both the infrastructure and the transport and logistics services4. The development of the ICT sector5. The development of private initiatives concerning the consolidation of tourism infrastructure adapted to the features of the growth pole
Strategy recommendations
1. The extension and specialization of the local business support infrastructure 2. Developing partnerships between private companies and education units3. Supporting the production chain by facilitating the companies’ access to research results, technology, and human resources4. Developing services according to market demand, focusing on the population, innovation / creativity, and tourism5. Supporting business initiatives / local entrepreneurship
331

Map 114. Structure of the workforce
The
Gro
wth
Pol
e’s
Pro
file
Ter
ritor
ial D
iagn
osis
and
Str
ateg
y R
ecom
men
dati
ons
Cha
pter
2.1
. Con
clus
ions
on
Dev
elop
men
t n
eeds
i
2
i332

1. The 2011 census indicates that 46.1% of the population from Ploieşti Growth Pole was active; 41.9% of the people were employed, and 4.2% were unemployed. In 2014 there was a 2.8% increase in the number of employees, compared to 2011. A percentage of 79% of the working population is active in the private sector, while 13% is employed in the public sector.2. There is a negative trend in the number of employees in Ploieşti municipality (-13%), Plopeni (-31.7%), and Dumbrăveşti (-30.6%), while in other localities the trend is positive: Ariceştii Rahtivani (218%) Brazi (45%), Păuleşti (24%), Târgşoru Vechi, and Bărcăneşti (20% each).3. The services sector provides 57% of all jobs, followed by the industry with 28%, agriculture and forestry – 8%, and the construction sector – 7%.4. The total migration balance of Ploieşti Growth Pole is negative, since 3,177 people changed their residence during 2007-2013, thus contributing by about 40% to the reduction in the number of inhabitants. Instead, Ploieşti municipality attracts a significant number of commuters from the neighboring communes and towns (215 commuters at 1,000 inhabitants).
Key issues
1. Shortage at the level of the workforce having completed secondary education2. Low competitiveness – only 12% of the population is involved in activities with a higher level of pay (ICT, financial intermediation, scientific, technical and vocational activities, the extractive industry, energy)3. Aging workforce4. High percentage of the population employed in subsistence agriculture (in the communes around Ploieşti municipality)5. Massive migration of the workforce to Bucharest city, as well as a significant capacity for attracting the workforce from surrounding areas
relevant projects over the 2007-2014 period
Projects aimed at business development by creating jobs (section 2.4)Projects aimed at the development of human resources (vocational training) and co-financed through the SOP HRD, such as:• Strategic tools for Employment in the Tourism Industry• Projects implemented by Oil and Gas University of Ploieşti (vocational training, doctoral programs, teacher training programs, etc.)• Training for the labor market
Development trends
1. Workforce development for the 18-25 age segment using the investments made in the 2007-2013 period (e.g. Center of Excellence for Young Entrepreneurs)2. Coordinating education measures with labor market particularities3. Reducing foreign immigration in terms of number / quantity
Strategy recommendations
1. Reintroducing the technical and vocational education2. Developing employment measures through advisory services for the elderly3. Stimulating labor mobility at the regional level
333

Map 115. Environmental quality and pollution control
The
Gro
wth
Pol
e’s
Pro
file
Ter
ritor
ial D
iagn
osis
and
Str
ateg
y R
ecom
men
dati
ons
Cha
pter
2.1
. Con
clus
ions
on
Dev
elop
men
t n
eeds
i
2
i334

1. Air quality has significantly improved in the growth pole in recent decades, due to the reduction of pollution from industrial activities and the decrease of emissions from electricity and heat production.2. The pollution level of surface waters and groundwater has declined in recent years, reaching values below the maximum ones allowed.3. There are no dangerous concentrations of pollutants in the soil samples collected.
Key issues
1. Air pollution and noise pollution caused by road transport, especially along the north-south axis, near the railway stations, in industrial areas and on the streets crossed by trams or open to heavy traffic2. No sewerage system in some districts in urban centers and rural areas – a major risk of polluting surface waters and groundwater3. The existence of more than 100 ha of contaminated sites as a result of economic activities, especially in the field of oil extraction and processing industry 4. The scarcity of woodland, especially in the south of the territory (in the plains)
relevant projects over the 2007-2014 period
Projects for the rehabilitation, extension and modernization of the water and sanitation network, co-financed from the SOP Environment, as well as those implemented in Ploieşti from APA NOVA’s own funds by reducing the risk of water pollutionProjects for the rehabilitation of the tram transport infrastructure in Ploieşti municipality and for the modernization of the street network, resulting in the reduction of the level of noise and air pollutionAn IBRD + GEF + Prahova County Council Project on the Integrated Nutrient Pollution Control in Târgşoru Vechi
Development trends
1. Expanding the industrial parks and attracting new potentially polluting activities2. Expanding the sewerage networks and reducing the risk of pollution of surface waters and of groundwater3. Implementing the integrated waste management project and reducing the related risk of soil / water pollution
Strategy recommendations
1. Recovering the polluted territories as a result of oil extraction and processing activities through decontaminating and converting them into construction land and green areas2. Monitoring the operators holding Greenhouse Gas Emissions Permits for the operation of installations under the provisions of Law no. 278/2013 on industrial emissions
335

Map 116. Accessibility and mobility
The
Gro
wth
Pol
e’s
Pro
file
Ter
ritor
ial D
iagn
osis
and
Str
ateg
y R
ecom
men
dati
ons
Cha
pter
2.1
. Con
clus
ions
on
Dev
elop
men
t n
eeds
i
2
i336

1. Ploieşti – Prahova Growth Pole is well connected to the road and rail traffic networks by national roads in good condition (DN 1 / E60 and DN 1B / E577, DN 1A, DN 72, DN 1D) and by the main railway Bucharest-Braşov and Bucharest-Buzău. On road corridors the journey takes less than 40 minutes inside the pole, while outside the pole is connected through a 60-minute isochronous line to Henri Coanda International Airport, Bucharest and the territorial-administrative units of tourist interest -Sinaia and Buşteni. 2. The road network has been continuously modernized inside the growth pole, due to substantial investment from various sources of funding, and the flow of road traffic has also increased (e.g. 30,000 - 40,000 vehicles per day).3. Across Ploieşti municipality there are 1.18 victims per accident, below the national average, which reaches 1.34 deaths/accident.
Key issues
1. The accessibility is limited by the lack of rapid transport links with Braşov, Buzău, and Târgovişte municipalities; the national roads connecting these urban poles record high traffic values, congestion, and accident risks2. The road transport infrastructure inside the growth pole is in poor condition, causing traffic congestion, reduced mobility, and air pollution3. There are no intermodal terminals to ensure quick transfer from one type of transport to another (rail, urban and interurban transport, bicycle and pedestrian, etc.)4. There is no extensive traffic management system, especially at the level of penetration roads (from the north to the south and from the east to the west), and roads with limited transport capacity, due inclusively to the existence of intersections with inadequate geometry and facilities 5. There is no integrated transport system at the metropolitan (urban and interurban) level in terms of stations, transport schedules, and pricing6. There are no parking spaces especially in areas with an increased flow of visitors / travelers7. There are areas / districts with poor accessibility (e.g. Mitică Apostol district)
337

relevant projects over the 2007-2014 period
Projects on increasing the growth pole accessibility, included in the 2007-2013 IDP• Increasing the traffic capacity by building a road connection between DN 1 and DN 1B (building the county beltway DJ 236) in the north of Ploieştimunicipality• Increasing the accessibility to the north of the Growth Pole, especially to Prahova County Hospital, by building the passage way along DJ 102 over DN 1B• Increasing the accessibility and streamlining the traffic to Ploieşti West industrial area and Brazi industrial platform• The rehabilitation of DJ 101G Tătărani (DJ 101D) – Brazi – Brazii De Jos – Tinosu – Şirna – Hăbud – Crivăţu (DN 1A) Km 0+000 – Km 24+020, Prahova county, Km 24+020 – Km 30+120, Dâmboviţa county• Increasing the traffic capacity by upgrading and rehabilitating DJ 101D, between km 4+300 (the limit of Ploieşti municipality and the overpass ramp point) and km 6+300 (roundabout – DN 1A intersection), including the passage over Ploieşti marshalling yard – Ghighiu Railway at km 4+300, in order to improve accessibility from/to DN 1
Projects aimed at increasing the mobility of public transport by rehabilitating the 101 and 102 tram routes, by performing works aimed at runways, stations adapted for people with disabilities, rolling stock, signaling, and automation elements
Other smaller scale projects financed from the local budget comprising:• the rehabilitation of Mihai Bravu Street, Republicii Blv., Ghighiului Street, South Railway Station’s passage• street packages (including sidewalks) in the following districts - Bereasca, 9 Mai, Enăchiță Văcărescu, Malu Roşu, Moțoi, Râfov, Găgeni, Gheorghe Doja, Vega, Mitică Apostol, Peneş Curcanul, etc.• building parking areas on Republicii Blv. and Gh. Doja Street; building parking areaswith green slabs in the northern, western, and central-southeastern areas• reconstructing the pavement of the Administrative Palace, the esplanade of the Cultural House of Syndicates, the pedestrian zones at Complex Nord and on Toma Caragiu Street• building the above-ground parking lot on Cuza Vodă Street
Development trends
1. Increased number of trips to the areas with logistics hubs / industrial parks and to the central area of Ploieşti municipality2. Improved access to the European transport network TEN-T3. Extension of pedestrian zones in the central area and railway stations in Ploieşti municipality and the development of bicycle traffic
Strategy recommendations
1. Increasing the flow of traffic by building grade-separated crossings in the intersections with high traffic flow2. Measures to improve traffic management inside the growth pole in order to reduce delays and accidents3. The development and modernization of the fleet of (clean) public transport means inside the growth pole4. The development of intermodality in the West and North Railway Stations in Ploieşti municipality5. Improving the monitoring systems for air pollution, particularly for CO2 emissions6. The further development of alternative forms of transport (e.g. bicycles)7. Implementing measures to enlarge green spaces in high traffic areas
The
Gro
wth
Pol
e’s
Pro
file
Ter
ritor
ial D
iagn
osis
and
Str
ateg
y R
ecom
men
dati
ons
Cha
pter
2.1
. Con
clus
ions
on
Dev
elop
men
t n
eeds
i
2
i338

339

energy and data connectivity
The
Gro
wth
Pol
e’s
Pro
file
Ter
ritor
ial D
iagn
osis
and
Str
ateg
y R
ecom
men
dati
ons
Cha
pter
2.1
. Con
clus
ions
on
Dev
elop
men
t n
eeds
i
2
i
1. The territorial-administrative units composing the growth pole are connected to the natural gas and electricity distribution networks. In Brazi, the most modern natural gas-fired thermal power station in Romania started functioning.2. Ploieşti municipality is one of the most important energy centers in the country, pooling a series of conventional and renewable resources (solar energy, agricultural biomass, etc.).3. The ICT sector developed in all areas of the city and in the rural and urban areas of the growth pole (62,053 landlines, of which 52,055 for individuals and 9,998 for legal persons).
Key issues
1. The physical wear of the network and connecting pipes for natural gas, which need replacement and refurbishment2. The wear of the electricity distribution network and the absence of an underground sewerage system
relevant projects over the 2007-2014 period
Projects funded with the private funds of sector operators, aimed at replacing the existing networks by modern ones (replacing about 94 km of natural gas distribution network in Ploieşti municipality), along with their expansion in urban and rural localities in the Growth Pole.Cogeneration projects included in the 2007-2013 IDP:• The development of electricity (and heat) production capacity for own consumption by exploiting the renewable energy resources in Dumbrăveşti commune• Supplementing the classical gas heating system using solar energy in Valea Călugărească commune, Prahova county
Development trends1. Developing forms of renewable, clean energy in rural areas2. Increasing the demand for Internet services and increasing the number of wi-fi spots in cities and attraction points for residents, tourists, and visitors
Strategy recommendations
1. The continued development of measures concerning the use of unconventional energy resources2. Measures for making the production of conventional energy more efficient and environment-friendly3. Measures for increasing the research capacity in order to produce renewable energy
340

Map 117. Energy and data connectivity
341

Public utilities
1. Most of the population in the growth pole has access to drinking water supply, since in recent years there have been major network expansions. Drinking water distribution services are provided by a number of different economic agents, state-owned or private.2. The local heating system is one of the most developed in the country in terms of production capacities (including cogeneration), number of consumers, and supply price.
The
Gro
wth
Pol
e’s
Pro
file
Ter
ritor
ial D
iagn
osis
and
Str
ateg
y R
ecom
men
dati
ons
Cha
pter
2.1
. Con
clus
ions
on
Dev
elop
men
t n
eeds
i
2
i
Key issues
1. The water supply and sanitation network in urban areas is old and there is no sewerage in Berceni, Dumbrăveşti, and Târgşoru Vechi communes; in Bărcăneşti and Ariceştii Rahtivani the sewerage network measures 1-2 km2. The absence of public water supply and / or sanitation systems in some urban districts (e.g. Mitică Apostol)3. Significant losses (up to 25% of the energy amount produced) and additional costs in the district heating system
relevant projects over the 2007-2014 period
Rehabilitation and modernization of the water and sanitation systems:• A project of HIDRO Prahova at the level of Băicoi and Plopeni TAUs with co-financing from the SOP Environment 2007-2013• Projects supported by the Government and by private operators, with funds allocated for the same purpose to the cities of Ploieşti and Băicoi, and also to some of the rural localities • Works for the extension and modernization of the water and sanitation network in several areas of Ploieşti (in the following districts: Bereasca, Mihai Bravu, Peneş Curcanul, Malu Roşu, Gh. Doja, Râfov, Găgeni) Waste management:• A project for the implementation of an integrated waste management system in Prahova County (SOP Environment 2007-2013), which includes the construction of transfer plants (Boldeşti-Scăeni), sorting plants (Boldeşti-Scăeni), waste composting plants (Boldeşti-Scăeni), mechanical and biological treatment plant (Ploieşti), as well as the greening of the former inadequate storehouse in Ploieşti and the purchase of equipment and vehicles for waste collection.Heating system:• Investment of the private operator in the Brazi power plant, the Gas Turbine (TAG), and the primary and secondary networksThermal energy cogeneration:• The development of electricity (and heat) production capacity for own consumption by exploiting the renewable energy resources in Dumbrăveşti commune• Using solar energy to produce hot water in the protection units for children and adults with disabilities within Prahova Directorate General for Social Assistance and Child Protection • Using solar energy to produce hot water in county medical units, which are under the public domain of Prahova county• Supplementing the classical gas heating system by using solar energy in Valea Călugărească commune, Prahova county • Using solar energy to produce hot water in the medical and social assistance unit in Boldeşti-Scăeni • Using solar energy to produce hot water in the local healthcare units of Băicoi City Hospital – main building, the city hospital, the building of the Annex no. 8, Unirii street.
Development trends
1. Implementing the Water and Sanitation Master Plan of the County, which stipulates investments in the areas not covered by public utility networks, with co-financing from European and national programs to achieve the targets set by the EU Directives in the field until 20182. Implementing the project regarding the integrated waste management system in Prahova, financed with EU funds under the SOP Environment 2007-2013
342

Map 118. Public utilities
Strategy recommendations
1. The modernization and extension of water supply and sanitation networks in all localities of the growth pole2. Raising awareness at the population level concerning selective waste collection
343

Public space
The
Gro
wth
Pol
e’s
Pro
file
Ter
ritor
ial D
iagn
osis
and
Str
ateg
y R
ecom
men
dati
ons
Cha
pter
2.1
. Con
clus
ions
on
Dev
elop
men
t n
eeds
i
2
i
1. Most public spaces are concentrated in the center of Ploieşti, being arranged around objectives of public interest, including in front of the railway stations.2. The green areas are dispersed around the growth pole and comprise: (a) green areas along the street network; (b) squares and landscaped green areas between the blocks; (c) parks and public squares; (d) recreational and sports parks.3. The public lighting services in the component localities are provided either by private companies to which the management of these services was delegated by concession, or by the local public authorities and ELECTRICA.
Key issues
1. Unattractive public spaces in all localities of the growth pole, absence of pedestrian zones, squares and meeting places2. Absence of public environmental / architectural lighting3. Shortage of green and recreational spaces
relevant projects over the 2007-2014 period
Projects for the building, modernization, and maintenance of green spaces:• Building Ploieşti West municipal park, including access roads and specific urban network• Building a park in Băicoi town in the “Lake” area• Landscaping Valea Călugărească park• Improving the quality of the environment in Plopeni town by modernizing the parks• Modernization and maintenance – Constantin Stere Memorial Park in Bucov,Tineretului Park, Toma Caragiu Park, Câineni ParkBuilding playgrounds in Ploieşti municipality (Cameliei street, Mărăşeşti, Sports Hall,Bucharest Blv., Arboretum, Cibinului street, Mihai Bravu street, Malu Roşu area, Modern Park, Republicii Blv., etc.)
Development trends
1. The renovation and thermal rehabilitation of public buildings, with impact on the need for rehabilitating the central public space or the space between blocks2. The development of intermodal terminals – impacting the public space around the railway stations 3. The recovery of polluted land and its conversion into green areas
Strategy recommendations
1. Establishing new green, sports, and leisure areas, covering a minimum of 200 ha, in order to comply with the European standards2. Expanding the public lighting system by implementing innovative solutions (LED technology or the dosage of light intensity)
344

Map 119. Public space
345

housing
The
Gro
wth
Pol
e’s
Pro
file
Ter
ritor
ial D
iagn
osis
and
Str
ateg
y R
ecom
men
dati
ons
Cha
pter
2.1
. Con
clus
ions
on
Dev
elop
men
t n
eeds
i
2
i
1. The dynamics of the housing stock over the 2007-2013 period reflects a phenomenon of suburbanization, with expantions between 10.4% and 31.9% in Blejoi, Târgşoru Vechi, Păuleşti, Bucov, and Ariceştii Rahtivani.2. In Ploieşti municipality, about 10.1% of the dwellings are secondary, especially those situated in apartment blocks; many people actually live in surrounding rural areas.3. Drinking water is supplied to 96.7% of the households in Ploieşti Growth Pole – 92.9% get drinking water from the public network and 3.8% from their own systems. Of these, 6.6% do not have a water supply installation inside the household, but only in the building or outside it (according to the 2011 census).
Key issues
1. The number of dwellings without water and without sanitation is relatively large, especially in Berceni, Dumbrăveşti, and Valea Călugărească communes2. 836 households are not connected to the electricity grid (0.6% of the total housing stock)3. The average age of residential buildings exceeds 50 years; 65.5% of these buildings were built before the 1977 earthquake and have a high seismic risk4. Only a limited number of apartment blocks have renovated heating systems or are consolidated against earthquakes5. The unattractive public space between the blocks6. The absence of a social housing stock
relevant projects over the 2007-2014 period
• The construction of new dwellings – a total of 4,144 dwellings were finalized in Ploieşti Growth Pole, of which 1,270 (30.6% of the total number) in Ploieşti municipality, and nearly 3,000 in the neighboring localities (of these, only 228 were built with public funds, namely those provided by the National Housing Agency)• Thermal rehabilitation projects for 54,021 dwellings (Ploieşti municipality, Plopeni city, Blejoi, Păuleşti, and Brazi communes; more than 40% of the housing units have upgraded heating systems)• Building playgrounds in Ploieşti municipality (Cameliei street, Mărăşeşti, Sports Hall, Bucharest Blv., Arboretum, Cibinului street, Mihai Bravu street, Malu Roşu area, Modern Park, Republicii Blv., etc.)
Development trends1. Extending the urban infrastructure by implementing the County Master Plan for Water and Sanitation 2. An increased demand for social housing
Strategy recommendations
1. The modernization and extension of the water supply and sanitation networks in all localities of the growth pole2. The seismic evaluation of the buildings constructed before the 1977 earthquake3. The thermal rehabilitation of the blocks situated on major traffic arteries4. Developing the public spaces between the blocks
346

Map 120. Housing
347

education
The
Gro
wth
Pol
e’s
Pro
file
Ter
ritor
ial D
iagn
osis
and
Str
ateg
y R
ecom
men
dati
ons
Cha
pter
2.1
. Con
clus
ions
on
Dev
elop
men
t n
eeds
i
2
i
1. The local educational infrastructure has steadily improved in recent years due to investments from various sources of financing, including from European funds.2. The dropout rate remains below the average at the regional and national level, but still records high values in the case of vocational education and in the case of students coming from rural areas and Roma families.3. The number of commuting students is high: 6,700 students in Prahova county – especially from a 30 km (maximum) radius – study in Ploieşti municipality.4. The only higher education institution is Oil and Gas University (with a total of 8,000 students in 2013/2014).5. The offer of continuous professional training courses at the local level is diverse and covers a large number of occupations for people with secondary and higher education; the providers are public institutions, NGOs, and private companies.
Key issues
1. The deficiencies in the educational infrastructure related to the condition of the buildings and their energy efficiency, the provision of furniture, equipment, sports infrastructure2. The low number of students due to migration to other university centers.
relevant projects over the 2007-2014 period
A project for the rehabilitation of the educational infrastructure, financed from the local budget:• Internal heating installations and the installation of boilers at Radu Stanian Secondary School, Kindergarten no. 7, Ienăchiţă Văcărescu Secondary School, Florin Comişel Secondary School, Kindergarten no. 38, School no. 13, School no. 19, Kindergarten no. 4, Ion Creangă Secondary School, Jean Monnet High School• The restoration of the roof at Mihai Viteazul National College• The restoration of the fencing at the Grigore Moisil Secondary School• The installation of video surveillance equipment in 41 educational units• The replacement of the carpentry at I.L. Caragiale National College• The modernization of 12 sports fields in school units• Current repair works at over 70 educational units• The consolidation of Petrol Teleajen School Group, Nichita Stănescu National College, Andrei Mureşanu Secondary School, and Rareş Vodă Secondary School• The construction of a sports hall at Nicolae Bălcescu Secondary School• Providing beds to full-day kindergartens• The construction of two new kindergartens on Bobâlna and Mărăşeşti streets• The construction of public utility networks at the Sports Hall of Grigore Moisil Secondary School and Sf. Vineri Secondary SchoolProjects for human resources development (vocational training) co-financed through the SOP HRD (section 2.5.)
Development trends Reduction in the number of students due to negative demographic outlook
Strategy recommendations
1. The development and modernization of the educational infrastructure in terms of equipment and endowment 2. The development of public transport for commuting students3. The development of the post-secondary / vocational education system
348

Map 121. Education
349

healthcare and Social Services
The
Gro
wth
Pol
e’s
Pro
file
Ter
ritor
ial D
iagn
osis
and
Str
ateg
y R
ecom
men
dati
ons
Cha
pter
2.1
. Con
clus
ions
on
Dev
elop
men
t n
eeds
i
2
i
1. The network of public medical units is complex, comprising hospitals with unique specializations in the county and serving over 700,000 inhabitants.2. The number of admissions to local hospitals decreased by 20% compared to 2007, since patients started shifting to ambulatory care services and the public health network underwent restructuring. 3. In Ploieşti municipality, the recipients of social benefits represent about 7% of the population, including persons receiving benefits for serious disabilities, personal assistants of people with serious disabilities, households benefiting from municipal aid for heating, persons benefiting from food support through the PEAD Programme, pensioners with an income below 400 lei/month, the unemployed, and the recipients of the guaranteed minimum income.
Key issues
1. Poor health infrastructure (including buildings which are unfit for the provision of quality medical services)2. Insufficient capacity and inadequate medical equipment endowment at the ambulatory care units that are integrated into hospitals3. No category I or II medical units to provide a wide range of quality medical services4. Chronic shortage of medical staff due to external and internal migration of the specialized staff
relevant projects over the 2007-2014 period
Health infrastructure:• Investments in rehabilitating the premises and modern medical equipment for the 3 hospitals managed by Prahova County Council (Ploieşti County Emergency Hospital, Ploieşti Obstetrics and Gynecology Hospital, and Ploieşti Pediatric Hospital)• Investments in the rehabilitation of the medical infrastructure of the Oncology Department of the Municipal Hospital and at the Hospital of Infectious Diseases• Building the Mental Health Center for Children in Ploieşti municipality• The cogeneration project – Using solar energy to produce hot water in several county medical units in the public domain of Prahova County (Ploieşti County Emergency Hospital)• Increasing the efficiency of the healthcare services provided by the Obstetrics and Gynecology Hospital through the implementation of e-health solutions• Developing the medical IT system through e-health services for the benefit of Prahova County residentsProjects regarding the social service infrastructure, co-financed through the ROP:• The rehabilitation / modernization / expansion and specific equipping of the Care and Assistance Center for Disabled Adults in Băicoi• “A chance for a new sunbeam” (“O şansă pentru o nouă rază de soare”) – The rehabilitation / modernization / expansion, and specific equipping of the community services complex “Rază de Soare”• The rehabilitation / modernization / expansion and specific equipping of the Neuropsychiatric Recovery and Rehabilitation Center for Disabled Adults in Ariceştii Rahtivani commune• The rehabilitation / modernization / expansion and specific equipping of the Cireşarii Emergency Placement Center in Ploieşti• Establishing a retirement home by changing the destination of the barracks in no. 11A, Cosminelor street in Ploieşti
Development trends
1. The pressure on the network of local medical facilities due to aging population and insufficient prevention measures 2. The development of the private sector by providing quality medical services3. An increase in the number of people at risk of social exclusion (dependent elderly people, homeless people, children with parents working abroad, the disabled, etc.)
Strategy recommendations
1. Modernizing and expanding the medical infrastructure2. Facilitating the access to health services for the population in communes3. The involvement of NGOs in providing social services
350

Map 122. Healthcare and Social Services
351

Culture and recreation
The
Gro
wth
Pol
e’s
Pro
file
Ter
ritor
ial D
iagn
osis
and
Str
ateg
y R
ecom
men
dati
ons
Cha
pter
2.1
. Con
clus
ions
on
Dev
elop
men
t n
eeds
i
2
i
1. Ploieşti-Prahova Growth Pole has a rich cultural heritage – 193 historical monuments (according to the 2010 List of historical monuments), of which 63 of national interest.2. The movable cultural heritage encompasses nearly 1,000 assets with historical, archaeological, historical and documentary, artistic, ethnographic, scientific, and technical value and is found in the museums in the area and at Nicolae Iorga County Library.3. The natural heritage consists of a series of areas with protection status established by the General Urban Plan of the communes and of Plopeni Forest (a protected area of community interest – SCI, with an area of 91 ha).4. The local sports infrastructure has been diversified and modernized in recent years through public and private investments; thus, the sports clubs in the city have achieved great results.
Key issues
1. Advanced degradation of some historical monuments subject to continuous aggression2. Poor cultural infrastructure in small towns and neighboring rural localities, since relevant events are organized sporadically3. Old and outdated sports facilities, hindering the development of performance sports (e.g. modern swimming pools for training)
relevant projects over the 2007-2014 period
Projects concerning the cultural and historical heritage and recreational activities:• The restoration and strengthening Nicolae Simache Clock Museum in Ploieşti• Highlighting the heritage attractions on the Fruit Road route• A plunge into history on the Wine Road in Prahova county (Valea Călugărească commune)• The Salt Road – a geological metamorphosis in history (Dumbrăveşti commune)• The restoration and exploitation of the monastic assembly of Turnu Monastery (Târgşoru Vechi commune)• The rehabilitation, modernization, and endowment of the House of Culture (Plopeni)• The modernization / functional expansion of the Hippodrome in PloieştiA project on the protection of the natural heritage• The Natura 2000 site – Plopeni Forest: management plan, courses of action and raising awareness
Development trendsContinuous pressures on the natural and built heritage – localization of economic activities, expanding the built-up areas of settlements, transport infrastructure, etc.
Strategy recommendations
1. Restoring, strengthening, and protecting the built (urban and rural) heritage2. Protecting the natural heritage3. Promoting the cultural heritage and events in order to attract visitors4. Developing the cultural infrastructure in communes5. Developing the sports infrastructure (swimming pool)
352

Map 123. Culture and Recreation
353

355
ChAPter 2.2.
Swot Analysis
PArt I: the Growth Pole’s Profile
territorial Diagnosis and Strategy recommendations
2

Strengths justification
A great geographical position to attract investments
The Growth Pole is just 60 km away from Bucharest municipality, Romania’s capital city and one of the largest cities in Southeast Europe, with a market of nearly 3 million consumers, the main administrative, economic, academic, cultural, and medical center and transport hub in the
country.Ploieşti Growth Pole is an integral part of an urban system with a population of over 4 million
people, generating about 50% of the national GDP, along with Bucharest and Târgovişte municipalities, and is part of the development Axis Braşov-Ploieşti-Bucharest-Giurgiu, the most
important transport and development corridor of Romania.
The polarizing role in the county and in the region
Of all the growth poles in Romania, Ploieşti municipality has the greatest capacity to attract the workforce and the population from the surrounding area (215 commuters and 97 new
residents for 1,000 people).Ploieşti Growth Pole concentrates 44% of the population in Prahova county and over 70% of
the total turnover generated at county level. In addition, the schools in the municipality attract nearly 7,000 pupils and students from the other localities in Prahova and the medical units have unique specializations at the county level. Also, there are a number of local institutions
that provide services for the entire region (Oil and Gas University, the Regional Postal Directorate, the Regional General Directorate of Public Finances, etc.).
The tradition in the extractive and energy sectors
The economic development of the municipality is closely linked to the advance of the hydrocarbons extraction and processing industry. In 1857, the first refining facility in the world was founded here. Four refineries with a processing capacity of over 10 million tons/year were
built at the local level, and three of them are currently operational.At present, about 6,000 people are still employed directly in the extraction and processing of hydrocarbons, representing less than 5% of the total employed population. All related services
and activities included, the number of employees directly or indirectly dependent on the oil sector reaches about 20% of the local workforce.
The natural gas-fired thermal power station in Brazi, inaugurated in 2011, is one of the most modern in Europe and can generate up to 10% of Romania’s energy needs. The area also has
the most important cogeneration capacities in the country.
A solid network of industrial parks
In Ploieşti Growth Pole, there are 8 industrial parks, 4 of which are public and 4 private. They rank first nationwide in terms of the occupied area (800 ha) and the number of jobs (10,000).
In addition, they represented the main advantage in attracting direct foreign investments amounting to EUR 500 million.
High accessibility/connectivity
Ploieşti municipality has direct access to two roads in the central TEN-T road network, DN 1 / E 60 (the highest traffic in the country, with an average of over 30,000 vehicles/day) and
DN 1B / E 577, which ensures access to the most important areas in Romania: the capital city and Muntenia, Moldavia, and Transylvania. Recently, the A3 highway section linking Ploieşti to
Bucharest was opened.The railway network is dense, Ploieşti municipality being one of the most important railway
junctions in Romania, located at the intersection of the main railways 300 (recently upgraded) and 500, linking Transylvania and Muntenia, Bucharest and Moldavia. The routes Bucharest-Ploieşti-Braşov and Bucharest-Ploieşti-Buzău are the most traveled in Romania, with more
than 8,000 passengers per day.Ploieşti municipality is just 45 km away from Henri Coandă International Airport – Otopeni-Bucharest, the most important in Romania, with an annual average of more than 7 million
passengers and with domestic and international routes to the most important cities in Europe and in the Near and Middle East.
The availability of land for spatial development
The total administrative area of Ploieşti Growth Pole is 609 km2, of which 70.4% is represented by agricultural land, mostly located in the rural localities around Ploieşti. 73.5% of the land is, on
the other hand, situated outside the development boundary.The industrial areas, built mostly during the communist period, occupy 1,458 ha only in the
municipality, being largely abandoned and having the potential to be repurposed for the expansion of residential, commercial, planted areas, etc.T
he G
row
th P
ole’
s P
rofi
le
T
errit
oria
l Dia
gnos
is a
nd S
trat
egy
Rec
omm
enda
tion
s C
hapt
er 2
.2. S
wo
t A
naly
sis
i
2
i
2.2. Swot Analysis
356

Strengths justification
The increased efficiency of public utility services provided under
PPPs
The services providing and distributing drinking water and sanitation, and those providing and distributing heat in a centralized system have been leased to private operators since the late
1990s, even if part of the network investment obligations remained among the responsibilities of the local and county authorities.
APA NOVA and DALKIA TERMO PRAHOVA provide quality services at much lower prices than in most urban localities in Romania (by 45% for drinking water, which is the lowest supply
price for all poles of growth in terms of thermal energy). Moreover, the funds allocated by the municipality to subsidize the heat supplied to the population are insignificant compared to
other similar-sized cities in Romania.Private operators have invested tens of millions of euros in networks, equipment, and the
implementation of new (including on-line) services, labor productivity being double compared to the public operators in the county and in the country.
The high volume of direct foreign investments
The number of companies with foreign capital in Prahova county increased by 42.8% and the subscribed capital by 165% between 2007 and 2013. Over 80% of these companies are located in Ploieşti Growth Pole; some of them are worldwide or European market leaders in their fields
(e.g. COCA COLA, UNILEVER, LUFKIN, etc.).Prahova county ranks 11th nationally in terms of the number of companies established by
foreign investors and 8th in terms of the value of the subscribed capital.
weaknesses justification
Reduced mobility especially at the level of penetrating roads
The national roads ensuring the access to Ploieşti Growth Pole have recorded some of the highest traffic averages in Romania (DN 1 – 25,000/40,000 vehicles/day; DN 1B – 22,000; DN1A – 6,000/15,000; DN 72 – 12,000). Over 38,000 employees and nearly 7,000 children and
students commute to the city every day.The biggest traffic flows enter the city through the following penetration roads: north-south
(Republicii Boulevard, Independenței Boulevard, Bucharest Boulevard), west (Ștrandului Street, Gheorghe Doja Street) and east (Gh. Gr. Cantacuzino Street). The highest numbers of accidents
are recorded on these roads, some of them with victims.
The low energy efficiency of public and residential buildings
In 2011, only 40.8% of the dwellings in Ploieşti Growth Pole were rehabilitated, that percentage rising to 44.8% in the case of Ploieşti municipality. On the other hand, only 59.1% of the
dwellings have insulated glazing.Most of the housing stock is about 50 years old, and over 30% of the walls of the dwellings are made of precast concrete, which is energetically inefficient. This is the case for nearly
3,000 apartment blocks built during the communist period. Public buildings are in a similar situation, even though some health and educational institutions have benefited from thermal
rehabilitation works.Analyses have indicated the existence of urban heat islands in the municipality, located mainly in the central area and in the large collective housing complexes in the north and west sections
of the city, which hosts buildings with a high level of heat transfer.
Not enough public spaces
Forests occupy only 9.1% of the administrative territory of Ploieşti Growth Pole, three times less than the national average.
In Ploieşti municipality, the green and recreational areas occupy only 2% of the built-up area, a great deal smaller than the built areas. The average green area/capita is about 7 square meters/inhabitant, compared to an average of about 20 m2 in the other growth poles in
Romania and to the international standards of 25-30 m2/inhabitant.Except for Bucov Park and Tineretului Park, the other planted areas in the city are small and
scattered.
The existence of brownfield sites, including contaminated sites
The critical areas – due to soil degradation – in the Growth Pole total an area of 132.13 ha, of which around 100 ha are sites contaminated following oil extraction activities and oil waste storage. They are located mostly in Ploieşti, Valea Călugărească, Boldeşti-Scăeni, and Băicoi.
The industrial areas in Ploieşti municipality, built mostly during the communist period, occupy 1,458 ha only in Ploieşti municipality, being largely abandoned and posing major environmental risks, due to their economic profile (the petrochemical industry, the machine building industry). Among the targeted areas with a reconversion potential are included: Astra Română Refinery (the north and south premises), Upetrom 1 Mai platform (partially), Grivco platform, Teleajen
platform (partially), Dorobanţul platform.
357

weaknesses justification
A high demographic decline and an aging population
Between 2002 and 2011, the population of Ploieşti city decreased by 9.7% and that of the Growth Pole by 7.5%, due to the negative natural growth, internal and external migration, which
affected about 10% of the resident population in the area.The demographic aging phenomenon in the Growth Pole is more pronounced than in other
similar-sized cities in Romania, the ratio of elderly to young people is 156%. Compared to the previous census (in 2002), the share of young population decreased by over one percentage point, while the elderly population increased by 4.6 points, a trend that will continue in the
future, amid rising life expectancy.
Unattractive public spaces and leisure areas
The public spaces in Ploieşti municipality are small in size and in batches, being mostly located in the central area (the esplanades and the pedestrian areas around the House of Culture and
the Administrative Palace).Despite some public investments already completed (the Sports Hall, Ilie Oană Stadium, Bucov Park, Tineretului Park, etc.) or under implementation (the Hippodrome) and some private ones,
the recreational infrastructure in the Growth Pole remains restricted, old and outdated (e.g. Vega swimming pool). Also, the natural resources in the area are insufficiently exploited (e.g.
Băicoi balneary resources).
The existence of marginalized areas / districts
In 2011, in Ploieşti municipality, 11,504 people were living in underprivileged areas in terms of housing, 6,907 people were living in disadvantaged areas in terms of employment, and 13,905 people were living in disadvantaged areas in terms of human capital. On the other hand, 5,130
people (23% of which are Roma and 30% children) live in marginalized urban areas.The most socially vulnerable areas identified in Ploieşti municipality are those in the periphery and located mostly in the south and east of the city: Mimiu, Râfov, Pictor Rosenthal, Moțoi,
Bereasca.
Low cultural vitality
In terms of cultural vitality, in 2010, Ploieşti municipality ranked 18th nationally, behind all other growth poles - municipalities, and also behind other county capitals in South Muntenia Region, such as Târgovişte and Piteşti. The biggest deficiencies identified in the local cultural sector concern the scarce human resources and the insufficient activity of the NGO sector in the field. The share of the creative and cultural industries is up to 50% lower compared to the
other growth poles.In the past seven years and except for cinemas, the cultural consumption significantly
decreased (by 29.1% at the level of entertainment institutions). In addition, the number of organized cultural events is low compared to other cities with a similar size.
The wear of the technical urban infrastructure and of the street
network and the disparities between the localities in the
growth pole
83.2% of the road network in the urban localities of Ploieşti Growth Pole was modernized; Băicoi has the highest number of unpaved streets, small towns being the most disadvantaged in this regard. In the rural areas, over 50% of the local roads are not modernized. In addition,
even some modernized streets and sidewalks are in an advanced state of degradation.In Ploieşti municipality there is a total of 65 streets that do not have a water supply network (or they have only a partial one), and 218 without a sanitation system or with a partial one.
However, the worst situation is in the rural areas of the Growth Pole - three of them (Berceni, Dumbrăveşti, Târgşoru Vechi) do not have a public sanitation network, but only individual
solutions implemented by the owners.The water and sanitation network, including the wastewater treatment plant in Ploieşti, is in
an advanced level of wear and tear due to its age and its small dimensions; it is not subject to investments made from non-refundable grants, as is the case of Băicoi and Plopeni towns.
The limited interest in public transport
Although the number of passengers using public transport means increased by 12.1% in the 2007-2013 period, only about 30% of the daily trips of Ploieşti residents are covered by the
public transport – one of the lowest percentages of all growth poles and among similar cities in Eastern Europe.
The fleet of the passenger transport company (TCE) is extremely old (9-40 years), generating high costs of maintenance, long waiting times in the stations, and endangering passenger
safety. Also, vehicles do not generally have air-conditioning and facilities for the disabled, which negatively affects passenger comfort. Another problem is the absence of a modern e-ticketing
and passenger information system.
The
Gro
wth
Pol
e’s
Pro
file
Ter
ritor
ial D
iagn
osis
and
Str
ateg
y R
ecom
men
dati
ons
Cha
pter
2.2
. Sw
ot
Ana
lysi
s
i
2
i358

weaknesses justification
The poor development of the tertiary sector
The manufacturing industry has remained the main employer in the Growth Pole, with a share of 24% of the total employed population, followed by trade (17%), agriculture (8%), constructions
and transport (7% each), all of which are low added value activities.The activities with high added value and a higher level of pay (ICT, financial intermediation,
scientific, technical and professional activities) do not employ more than 9% of the population, which explains the fact that the wages in the area are kept at a lower level than in other
growth poles in Romania, with a more favorable economic structure.
A shortage of qualified middle- and high-skilled workers
About 35,000 people residing in Ploieşti Growth Pole (10% of the total population) have migrated in the past two decades to other areas in Romania (especially to Bucharest) and
to other countries; most of them are skilled persons, having graduated from high school and university (the “brain-drain” phenomenon). Therefore, the unemployment rate dropped to about
5-7%.The number of students in the public technical and vocational education system decreased by 89.7% compared to 2007, most middle school graduates choosing technological high schools, where (generally) less than 40% of graduates obtain the baccalaureate diploma. The number
of participants in professional training programs also remains low. In this context, most companies opt for qualification at the workplace and for the recruitment of personnel from
other localities in the county.
The poor health infrastructure and the lack of specialized staff
Ploieşti Growth Pole has no category I or category II medical units, which are typically located in university centers (Bucharest, Cluj-Napoca, Iaşi). For this reason, a large number of patients in the area requiring more complex consultations and interventions are turning to university
clinics in the capital city. The local medical infrastructure is generally old and outdated, despite the investments made in recent years; the Pediatric Hospital or the ”Buna Vestire” Section of the County Hospital do not have adequate premises. All hospital units in the area require new
quality medical equipment, as do the ambulatory care units integrated into hospitals.Compared to 2007, the number of hospital beds in the public sector decreased by 9%, due to
restructuring, which was only partially offset by the development of the private sector.Public health units (e.g. the Emergency Care Unit or the Ambulance Service) are facing an acute crisis of doctors and nurses (30-70% of the full-time positions), due to the migration to private
establishments, and to the migration to other medical centers in the country or abroad.The life expectancy of the population is 75 years, 5 years below the EU-28 average and below
the level recorded in other growth poles.
Noise and air pollution caused by traffic
In 2013, at the manual measuring stations in Ploieşti, there were recorded higher values than the maximum permissible concentrations of total suspended particulates (PM 10), sulfur
dioxide, hydrogen sulphide, the main cause identified being the intense car traffic.During 2011, in the case of 68.71% of the number of measurements for noise pollution, the recorded values were higher than the maximum permissible limits. In Ploieşti, the recorded
values exceeded 75 or even 80 decibels on the North-South axis, near the railway stations, in industrial areas and on the streets traveled by tram or open to heavy traffic.
Poor RDI infrastructure and limited technology transfer
Seen in the national context, the research, development and innovation (RDI) activity in Ploieşti Growth Pole is underdeveloped, being dominated by the public sector. The specialization areas of the RDI units at the local level are closely linked to the area’s economic profile, which is oil
extraction and processing, oil equipment, and viticulture.The local traditional research and design institutes (IPCUP, ICERP, IC-DVV) have significantly
restricted or even ceased their activity in recent years due to reduced state budget allocations for RDI activities, and also due to the development of such sections in private companies.
The Oil and Gas University has 13 research centers and a business and technology incubator, but their work is still little known to the business environment and limited in relation to its
potential.In terms of the expenses triggered by the RDI activity, Prahova county is far below the national
and regional average, with less than 0.2% of the GDP, more than 10 times below the target assumed by Romania through the 2014-2020 Partnership Agreement. According to AD ASTRA statistics, Ploieşti ranks last among the growth poles in terms of scientific output, materialized
in published scientific articles.
359

weaknesses justification
Limited alternatives for non-motorized transport
Ploieşti municipality has only one properly fitted bicycle trail, about 3 km long, on the north - south axis, which is often unusable because of illegally parked cars, to which are added some
facilities for roller skaters and bicycles in the Tineretului Park.Exclusively pedestrian areas are extremely limited and concentrated in the central area (the Civic Center Esplanade, Unirii Street, Toma Caragiu Street, Griviţei Street, etc.); they are not
integrated. The sidewalks of some streets are degraded and do not ensure the safe movement of citizens. In addition, some modernized streets in neighborhoods at the periphery lack
sidewalks.
No integrated spatial planning at growth pole level
No metropolitan territorial zonal development strategy was approved in the metropolitan area at the growth pole level, in accordance with Law no. 350/2001; it will be developed concurrently
with the updating of the General Urban Plan of Ploieşti municipality.
The poor development of entrepreneurship and of
associative business structures (clusters)
In the 2007-2013 period, the number of active companies in Ploieşti Growth Pole decreased by 13.9%, above the regional (-11.1%) and national (-12.6%) average, due to the economic crisis. The number of newly established companies fell steadily after 2008, reaching the minimum of the range in 2014. However, the number of suspensions and removals from the trade registry
rocketed in 2009 and 2010.In terms of entrepreneurial dynamics, expressed by the number of active businesses per 1,000
residents (42.7), Ploieşti municipality has the weakest performance of all the 8 Romanian growth poles; the local economy is dominated by large companies with foreign capital, to the
detriment of a solid local class of entrepreneurs. Also, there is no functional local agricultural, industrial or services cluster, unlike all other
growth poles, which have up to 10 such associative structures.
No intermodal transport infrastructure
Despite attracting more than 45,000 commuting employees and students daily and despite having a relatively extensive public transport system (2 tram routes, 2 trolley routes, and 41
bus routes) and 4 functional railway stations and 2 flag stations, these are not integrated into a coherent transport system, through appropriate intermodal facilities.
As well, the interurban transport services provided by various private operators, in the absence of a metropolitan operator, are not integrated in terms of the stations, traffic schedules and
prices with the public transport system inside the municipality.
A shortage of parking spaces
The total number of vehicles registered in Ploieşti is approximately 50,000 and the total number of parking spaces is only 25,000, of which only 1,100 are chargeable and mostly
located in the central area. In these circumstances, drivers park illegally on the roads, sidewalks, green spaces, reducing mobility and endangering the safety of road users.
The absence of an underground conduit system for overhead
cables
Of the total electricity transmission lines, only 16.6% are underground (underground power lines), the rest being overhead (overhead power lines). In addition, there are the cables of various
transport operators, for public lighting, telecommunications, etc. The lack of an underground conduit system for overhead lines of all kinds is one of the most pressing issues facing Ploieşti
municipality, also affecting the façades of apartment blocks and of buildings with a clear architectural value, making the city look unsightly.
The existence of several built heritage attractions in poor
conservation condition
In Ploieşti Growth Pole, there are 193 listed historic monuments, of which 65 are of national interest. While the heritage buildings in which operate public institutions are in a relatively good state of conservation (except for the Central Hall – a symbol of the city), the private residential
buildings are, in most cases, in a precarious state. They need consolidation works for the supporting structure and works for cleaning and repairing the façades.
Uncontrolled waste storage
Despite the existence of public or private waste disposal operators in all localities of the Growth Pole and despite ceasing to deposit waste in non-compliant urban and rural landfills, there are still areas strongly affected by the phenomenon of uncontrolled storage, such as the
southeastern beltway of Ploieşti municipality.
The
Gro
wth
Pol
e’s
Pro
file
Ter
ritor
ial D
iagn
osis
and
Str
ateg
y R
ecom
men
dati
ons
Cha
pter
2.2
. Sw
ot
Ana
lysi
s
i
2
i360

opportunities justification
The proximity to Bucharest – the relocation of economic activities
Ploieşti Growth Pole is situated just 60 km away from Bucharest, the areas of influence of the two cities being virtually annexed. This is the main area of economic concentration and development of Romania, and the main market for goods and services, totaling around 3
million consumers.Accordingly, about 10% of the workforce in Ploieşti commute to Bucharest and Ilfov, and many
companies serving the Bucharest market or the national market have decided to locate or relocate to Ploieşti, which is becoming more and more a logistics center of the capital city (see
the case of the storehouses of the large commercial networks).
The availability of funding for integrated urban development
(ROP)
The 2014-2020 ROP has a total estimated budget of EUR 6.3 billion, of which about EUR 3 billion only for urban development; the growth poles designated for the 2007-2013 period may
continue to benefit from additional allocations for integrated measures.
The development of the major transport infrastructure
For the 2014-2020 period, the General Transport Master Plan stipulates for the Ploieşti area massive investment in the expansion and modernization of the transport infrastructure,
such as building the Ploieşti-Braşov highway, with further connections to the urban poles in Transylvania and with a connection to the major transport network in Central and Western
Europe, the completion of the modernization of the pan-European Corridor IV, and the expansion and modernization of Henri Coandă Bucharest-Otopeni International Airport.
The exploitation of the natural resources in the region (agriculture, livestock, energy,
tourism)
Currently, about 70.4% of the total Growth Pole administrative area is covered by fertile farmland. The area also has a competitive advantage in viticulture and horticulture, which are
practiced on about 4,000 ha.Also, the potential for energy production from renewable resources is very high: solar (over
1,300 kWh/m2/year), wind (4 m/s), micro hydropower, agricultural and woody biomass, biogas, etc.
Ploieşti is situated halfway between the two most important tourist poles of Romania – Bucharest city and Prahova Valley / Braşov, therefore it has a potential for developing transit tourism, business and events, cultural and oenological tourism, since there are already several
tourist routes at county level.
threats justification
High seismic risk
As of 2011, 65.5% of the buildings (including over 100 blocks) were build before the 1977 earthquake, therefore were not designed to withstand earthquakes of great magnitude, especially since Ploieşti is located in an area with the highest exposure to seismic risk
(compared to the rest of Romania), along with Buzău and Focşani municipalities (0.3 g for Mean Recurrence Interval = 100 years).
Although the procedure for the evaluation of buildings with seismic risk started 20 years ago, so far only 49 blocks have gone through this procedure; 31 were classified as Class I risk, some being a danger to the public and 18 were classified under Classes II-IV. Of these, only one has
been rehabilitated through a program of the Ministry of Regional Development and Public Administration.
Climate change
Climate change is the greatest environmental threat facing humanity. The past decade has included nine of the warmest ten years in recorded history.
Locally, these global phenomena are worsened by the existence of urban heat islands, accentuated by the low energy efficiency of the buildings, the high values of road traffic
pollution, the scarcity of green and planted spaces, etc.
Local economic vulnerability to external shocks (the crisis)
About 20% of the local workforce is directly or indirectly involved in the delivery of products and services for the oil and energy industry. In 2014, oil prices reached the lowest level in almost
six years, and the price of gasoline is also at an unprecedented minimum. In this context, it is expected that the companies in the sector reduce investments for development.
On the other hand, Romania’s hydrocarbon resources will be exhausted in the following 30-40 years, and the extraction activities will migrate to the Black Sea, where there are processing
and transportation facilities.
The proximity of Bucharest – widening the development gap between Ploieşti and Bucharest
The GDP per capita at current prices in Prahova county was, in 2011, nearly three times lower than that registered in Bucharest. Also, the average net wage was, in the year 2013, lower by
33%, the economic development gaps increasing every year.In this context, over 5% of the Ploieşti Growth Pole population has migrated to Bucharest only in the past two decades, a phenomenon that particularly attracted young and highly skilled
people and, most likely, will continue in this way until 2020, having negative effects on Ploieşti and its area of influence.
361

363
ChAPter 2.3.
Conclusions on the integrated Diagnosis and intervention Areas
PArt I: the Growth Pole’s Profile
territorial Diagnosis and Strategy recommendations
2

2.3. Conclusions on the integrated diagnosis and intervention areas The sector analysis that was made in the previous sections has highlighted a number of issues and trends with an impact on the future of the growth pole. Taking into account the pyramids of needs of the citizens and of the private sector, the impact of sectoral projects is summarized in the following tables:
Econo-my
Workforce Environmen-tal quality
Accessibility/ mobility
Energy/ IT
Public utilities
Public space
Housing Edu-cation
Healthcare/ social assistance
Culture/ recreation
Opportunities
Housing infrastructure
Connectivity
Quality of life
table 35. Impact of sectoral projects on citizens’ needs
Econo-my
Workforce Environmen-tal quality
Accessibility/ mobility
Energy/ IT
Public utilities
Public space
Housing Edu-cation
Healthcare/ social assistance
Culture/ recreation
Workforce
Land for offices
Connectivity
Clusters
table 36. Impact of sectoral projects on the needs of the private sector
Also, the measures that will be taken in the 2007-2014 period will have a major impact on the spatial development of the territory and on population dynamics, as they will play an important role in relation to cross-cutting issues – social inclusion and climate change.
Econo-my
Workforce Environmen-tal quality
Accessibility/ mobility
Energy/ IT
Public utilities
Public space
Housing Edu-cation
Healthcare/ social assistance
Culture/ recreation
Population dynamics
Spatial development
Connectivity
Clusters
table 37. Impact of sectoral projects on cross-cutting issues
At the same time, integrating the sectoral aspects (in the table below) demonstrates the influence that the projects implemented in one area have on related fields and, hence, the potential multiplying effect on the development of the growth pole.
The
Gro
wth
Pol
e’s
Pro
file
Ter
ritor
ial D
iagn
osis
and
Str
ateg
y R
ecom
men
dati
ons
Cha
pter
2.3
. Co
nC
lUS
ion
S
i
2
i364

Econo-my
Workforce Environmen-tal quality
Accessibility/ mobility
Energy/ IT
Public utilities
Public space
Housing Edu-cation
Healthcare/ social assistance
Culture/ recreation
Economy + + + + + + + + + + +Workforce + + + + + + + + + +Environmental quality
+/- + + + + + + + + + + + + +
Accessibility + + + + + + +Energy/IT + + + + + + + + + + +Public utilities + + + + + +Public space + + + + + +Housing + + + + + + + + +Education + + + + + + +Healthcare /social assistance
+ +
Culture/recreation
+ + + + +
table 38. Impact of sectoral projects on related sectoral areas
Following the corroboration of the results of the analysis concerning the relationships established between the sectoral areas with the strengths and weaknesses of the SWOT analysis, a series of conclusions could be drawn and some priority areas of intervention be identified for the strategy design:
• The cross-cutting issues are identified as development risks – the climate changes possibly triggered by the development of productive economic activities, as well as social inclusion, by not addressing the marginalized areas of Ploieşti municipality. These issues will have to be taken into consideration in the identification and selection of the projects for the 2014-2020 period.
• Spatial planning at the growth pole level and demographic dynamics are identified as weaknesses. There is no land-use plan at the metropolitan level and although there are land reserves, their development must be based on specific urban regulations that protect the resources.
• The projects completed in almost all areas during the 2007-2014 period responded to the citizens’ need for employment opportunities and to the private sector’s need for skilled labor. They covered infrastructure, energy efficiency and cogeneration works, areas which generated jobs and thus boosted the development of the economic sector.
• The investments made in accessibility and mobility had a positive impact on economic development / on attracting investments – especially foreign investments – and on labor migration. They also had an influence on reducing road traffic pollution in the center of Ploieşti city, on school migration and on the accessibility of marginalized areas and leisure areas. In addition to these projects, some measures are necessary to improve public transport in the growth pole.
• Also in terms of connectivity, energy and cogeneration projects have a multiplying effect on the economy, as well as on the rehabilitation of the educational, medical, and social infrastructure, with a positive impact on climate change.
• The investments in public utilities have failed to meet the needs of the citizens in all component TAUs. Extending the water supply and sanitation networks is a priority for Berceni, Dumbrăveşti, and Valea Călugărească, and for other places where demand is not covered.
• The projects implemented mainly by the Oil and Gas University in the field of human resources development (SOP HRD funds) are not reflected in the development of local entrepreneurship in the excellence field of the oil extraction and processing industries or in the RDI sector.
• The investments in culture and recreation have failed to highlight the existing built and natural heritage and to generate related cultural and tourism activities. Future interventions are needed in this area, in conjunction with actions for the remediation of contaminated soil and with a policy for green areas.
365

366
Part
II

367
the integrated Strategy for the
Growth Pole

369
PArt II: the integrated Strategy for the Growth Pole
3 Development Vision and
objectives

Development Vision and objectives
3
According to the Integrated Urban Development Plan 2007-2013 (IUDP 2007-2013), the development vision for 2025 of Ploiești-Prahova Growth Pole has taken into account “the role of the Growth Pole in establishing territorial partnerships in view of consolidating its comparative advantage conferred by its localization between the pan-European TEN-IV and TEN-IX corridors and in view of developing competitive advantages by harnessing localization factors in support of its inhabitants, business environment, and academia”.
For the period 2008-2025, the vision drafted in 2009 has supported the community orientation towards permanent knowledge and performance, as a form of adaptation to the challenges brought forward by technological competition. Building on natural resources and their traditional exploitation, the growth pole has set out the objective of strengthening a community whose knowledge gained so far is the essential basis for its future development.
The vision has outlined two major lines of intervention: (a) the first line deals with redefining the corporate role of Ploiești municipality at the regional level, while (b) the second line is related to the development of neighbouring localities, which should become more attractive as living places and economic areas thanks to their progress and endowment.
In support of the vision, the investments carried out under IUDP 2007-2013 primarily targeted aspects related to the accessibility and connectivity of the growth pole to the major European transport network, as well as aspects related to equipping the technical, public utility, education, and healthcare infrastructures, in order to eliminate disparities between the municipality and its area of influence. Furthermore, a series of projects have indirectly contributed to these objectives:
• Projects aiming to support the business infrastructure, attract private investment and create job opportunities
• Projects for the use of renewable energy resources
• Projects aiming to strengthen human resources capacity in areas of interest for the labour market
In addition to the investments carried out between 2007 and 2014, the public agenda for the period 2014-2020 includes further elements of social and territorial cohesion (through urban regeneration initiatives in disadvantaged areas) and competitiveness (by improving the quality of life). Even though for the next programming period the structure of the vision remains unchanged, its content should adapt to the transformations registered in the economic and spatial dynamics of the growth pole, while continuing the main line of development, focusing on territorial cooperation between the territorial-administrative units in order to mobilize human and material resources.
Consequently, the review of the vision’s content will have to take into account the following areas for which growth could simultaneously be pursued:
• A pole of economic concentration dominated by clean productive activities and energy co-generation
• A business partner — competitive for investors
• An attractive and comfortable place to live in for all inhabitants from its component localities
• A knowledge-based community where human strength and knowledge constitute the driving force of the growth pole
Urban and knowledge infrastructure, improved through projects implemented in the 2007-2014 period, have laid the foundation for the development of a strong local / metropolitan economy with jobs that generate added value in the 2025 timeframe. The functioning of a mature, attractive, and competitive economy will support the sustainable development of the territory, as well as the social cohesion of the inhabitants of Ploiești-Prahova Growth Pole.
Dev
elop
men
t V
isio
n an
d o
bjec
tive
sT
he In
tegr
ated
Str
ateg
y fo
r th
e G
row
th P
ole
i
3
i370

Development Visionthe Ploiești-Prahova Growth Pole — a knowledge-based community, open to partnerships in the complex fields of sustainable exploitation of resources and quality of life improvement for all its inhabitants.
Even if the development vision is accepted at the metropolitan level, it is still creating priority areas and differentiated responsibilities for the municipality of Ploiești and its neighbouring towns and communes: (a) The municipality of Ploiești will have to strengthen its polarizing role in the region, but also to make the best use of its competitive advantages gained between 2007 and 2014, as well as to make progress with respect to value-adding aspects such as urban regeneration or the development of cultural and recreational infrastructures, among others.(b) The neighbouring localities shall make efforts towards the completion of works in the field of technical, public utility and public transport infrastructures, while continuing the process of improving localization factors in order to tackle demographic decline and to attract new residents.
In terms of increasing territorial cohesion and the efficiency in the use of natural and land resources, the partners of the growth pole will have to coordinate economic and social development with the aim of adopting joint decisions on the selection, localization, and implementation of development projects between 2014 and 2020; these projects should lead to enhancing the efforts and maximizing the multiplying effects.
Strategic objectivesiUDP 2007-2013 has set out three strategic objectives, each supported by a series of sectoral objectives, as follows:
Strategic objective A Supporting the sustainable economic development, integrated through innovative energies and technologies in Ploiești Growth Pole
• Sectoral objective A1: Supporting investments in green technologies, cutting-edge manufacturing industry, energy efficiency technological solutions, alternative energies and their associated infrastructure;
• Sectoral objective A2: Active involvement of the research sector in the development of new products and technologies;
• Sectoral objective A3: Supporting the development of economic activities in the Growth Pole area.
Strategic objective B Sustainable territorial development by improving the urban infrastructure and the functional relations between rural and urban areas and the economic-industrial area within Ploiești-Prahova Growth Pole
• Sectoral objective B1: Establishing connections with the European road network and developing modern infrastructures for the access to economic areas, industrial parks / platforms and other functional areas, while developing efficient and clean urban transport in the Growth Pole area;
• Sectoral objective B2: Protecting the environment and human health through the provision of quality public services;
• Sectoral objective B3: Enhancing the natural, traditional, cultural, and historical heritage, as well as tourism and recreational area planning; support environmental protection actions and the development of green areas.
Strategic objective C Human capital development by ensuring equal access for all the inhabitants of the Growth Pole
• Sectoral objective C1: Improving the quality of the social infrastructure through investments in the benefit of disadvantaged groups, as well as supporting their reintegration into society;
• Sectoral objective C2: Human resource development through increasing the quality of the education and training infrastructure;
• Sectoral objective C3: Developing healthcare infrastructure by ensuring professional medical care in modern and properly equipped facilities;
• Sectoral objective C4: Increasing the operational capacity of the administration through knowledge management and the use of innovative technologies.
371

The results of the diagnosis together with the SWOT analysis and the development priorities of the South Muntenia Region1 lead to the formulation of an active development scenario based on the tandem between strengths and opportunities, in order to build on the results achieved in the 2007-2014 period in the field of accessibility and with respect to the technical, public utility, education, and healthcare infrastructures. The transition to a new development phase by enhancing the strengths and by developing areas that generate added value are reflected in the wording of the strategic and sectoral objectives, as follows:
Strategic objective A: Supporting sustainable economic development, integrated through innovative energies and technologies
• Sectoral objective A1: Support sustainable economic development
• Sectoral objective A2: Support the SME sector, entrepreneurship and business creation
Strategic objective B: Sustainable territorial development by improving urban infrastructure and relations among functional areas
• Sectoral objective B1: Improve territorial connectivity
• Sectoral objective B2: Protect energy resources and the quality of natural and built environment
Strategic objective C: human capital development by ensuring equal access to quality public services for all citizens
• Sectoral objective C1: Increasing the quality of public services
• Sectoral objective C2: Increasing the capacity of Local Public Authorities
Development ProgramsStrategic objective ASupporting sustainable economic development, integrated through innovative energies and technologies
• Sectoral objective A1: Supporting sustainable economic development- Program for the enlargement / development of industrial parks- Program to support RDI activities
• Sectoral objective A2: Supporting the SME sector, entrepreneurship and business creation- Support program for SMEs and business creation- Support program for agricultural activities- Development program for the tourism infrastructure
StrAteGiC oBjeCtiVe BSustainable territorial development by improving urban infrastructure and relations among functional areas
• Sectoral objective B1: Improving territorial connectivity- Program to increase accessibility throughout the growth pole (bypass routes, passages, intersections)- Program for clean public transport- Program for multimodal terminals- Program for parking planning- Program for road upgrading and repairing- Program for traffic safety
• Sectoral objective B2: Protecting energy resources and the quality of natural and built environment- Program for heat / gas supply- Program for increasing the energy efficiency of buildings- Program for water supply and sewage systems- Program for land reclassification / brownfields- Program for the rehabilitation of buildings subject to seismic risks
1 (1) Sustainable development of regional and local infrastructure, (2) Sustainable urban development, (3) Increasing the competitiveness of the regional economy in the long term, (4) Environmental protection and increased energy efficiency, (5) Supporting education and employment, (6) Supporting healthcare and social protection services, (7) Rural development and agriculture
Dev
elop
men
t V
isio
n an
d o
bjec
tive
sT
he In
tegr
ated
Str
ateg
y fo
r th
e G
row
th P
ole
i
3
i372

- Program for the rehabilitation of built heritage- Program for the rehabilitation of public areas situated among residential buildings, as well as of playgrounds- Program for parks and green areas- Program for the rehabilitation and construction of cultural facilities- Program supporting trade / agri-food markets- Program for the rehabilitation and construction of sports / recreational facilities- Program for public lighting, electrical networks and IT- Program supporting the production of alternative energy
Strategic objective C: human capital development by ensuring equal access to quality public services for all citizens
• Sectoral objective C1: Increasing the quality of public services- Social infrastructure program- Program for the rehabilitation and extension of school infrastructure- Program for nurseries and kindergartens- Healthcare infrastructure program- Program supporting education and employment- Program for town halls and other public function establishments- Program for residential construction- Education programme for safety and emergency situations
• Sectoral objective C2: Increasing the capacity of Local Public Authorities - Program for communication and transparency in decision-making- Program for improving the performance of the public administration
The correlation between the sectoral objectives and the objectives of the Europe 2020 Strategy, as well as the priorities of the Territorial Agenda of the European Union 2020 is presented in the following matrix.
373

table 39. Matrix of the correlation between the Growth Pole development objectives and the EU policy documents
EU p
olic
y do
cum
ents
and
pr
iorit
ies
the
euro
pe 2
020
Str
ateg
yO
T1
OT
2O
T3
OT
4O
T5
OT
6O
T7
OT
8O
T9
OT
10O
T11
Str
engt
heni
ng
rese
arch
, te
chno
logi
cal
deve
lopm
ent
and
inno
vati
on
Enha
ncin
g ac
cess
to,
an
d us
e an
d qu
alit
y of
, in
form
atio
n an
d co
mm
unic
atio
n te
chno
logi
es
Enha
ncin
g th
e co
mpe
titi
vene
ss o
f sm
all a
nd m
ediu
m-
size
d en
terp
rises
, the
ag
ricul
tura
l sec
tor
and
the
fishe
ries
and
aqua
cultu
re s
ecto
r
Sup
port
ing
the
shift
to
war
ds a
lo
w-c
arbo
n ec
onom
y in
al
l sec
tors
Prom
otin
g cl
imat
e ch
ange
ad
apta
tion
, ris
k pr
even
tion
an
d m
anag
emen
t
Prot
ecti
ng
the
envi
ronm
ent
and
prom
otin
g re
sour
ce
effic
ienc
y
Prom
otin
g su
stai
nabl
e tr
ansp
ort
syst
ems
and
rem
ovin
g bo
ttle
neck
s in
ke
y ne
twor
k in
fras
truc
ture
s
Prom
otin
g em
ploy
men
t an
d su
ppor
ting
la
bour
m
obili
ty
Prom
otin
g so
cial
in
clus
ion
and
com
bati
ng
pove
rty
Inve
stin
g in
ed
ucat
ion,
sk
ills
and
lifel
ong
lear
ning
Enha
ncin
g in
stit
utio
nal
capa
city
and
an
eff
icie
nt
publ
ic
adm
inis
trat
ion
territorial Agenda of the european Union 2020
Prom
otin
g po
lyce
ntric
an
d ba
lanc
ed
terr
itor
ial
deve
lopm
ent
Sec
tora
l obj
ecti
ve A
1:
Sup
port
ing
sust
aina
ble
econ
omic
dev
elop
men
t
Sec
tora
l obj
ecti
ve
A2:
Sup
port
ing
the
SM
E se
ctor
, en
trep
rene
ursh
ip
and
busi
ness
cr
eati
on
Sec
tora
l obj
ecti
ve B
2: P
rote
ctin
g en
ergy
res
ourc
es
and
the
qual
ity
of n
atur
al a
nd b
uilt
env
ironm
ent
Sec
tora
l obj
ecti
ve C
1: In
crea
sing
the
qu
alit
y of
pub
lic s
ervi
ces
Sec
tora
l ob
ject
ive
C2:
In
crea
sing
th
e ca
paci
ty
of L
ocal
Pu
blic
A
utho
ritie
s
Enco
urag
ing
inte
grat
ed
deve
lopm
ent
in
citi
es, r
ural
and
sp
ecif
ic r
egio
ns
Terr
itor
ial
inte
grat
ion
in
cros
s-bo
rder
and
tr
ansn
atio
nal
func
tion
al
regi
ons
Ensu
ring
glob
al
com
peti
tive
ness
of
the
reg
ions
ba
sed
on s
tron
g lo
cal e
cono
mie
s
Sec
tora
l obj
ecti
ve A
1: S
uppo
rtin
g su
stai
nabl
e ec
onom
ic d
evel
opm
ent
Sec
tora
l obj
ecti
ve A
2: S
uppo
rtin
g th
e S
ME
sect
or, e
ntre
pren
eurs
hip
and
busi
ness
cre
atio
n
Impr
ovin
g te
rrit
oria
l co
nnec
tivi
ty
for
indi
vidu
als,
co
mm
unit
ies
and
ente
rpris
es
Sec
tora
l obj
ecti
ve B
1: Im
prov
ing
terr
itor
ial c
onne
ctiv
ity
Man
agin
g an
d co
nnec
ting
ec
olog
ical
, la
ndsc
ape
and
cult
ural
val
ues
of r
egio
ns
Sec
tora
l obj
ecti
ve B
2: P
rote
ctin
g en
ergy
res
ourc
es a
nd t
he q
ualit
y of
nat
ural
and
bui
lt
envi
ronm
ent
Dev
elop
men
t V
isio
n an
d o
bjec
tive
sT
he In
tegr
ated
Str
ateg
y fo
r th
e G
row
th P
ole
i
3
i374

table 40. Matrix of the correlation between the Growth Pole development objectives and the national policy documents
Strategic objectives / iUDP sectoral objectives
Specific objectivesrtDS 2035
Priority axes / oP priorities at national level Development priorities of the rDP SoUth
MUnteniA 2014-2020
Development priorities of the CDP PrAhoVA 2014-2020roP 2014-2020 li oP 2014-2020 CoMP oP 2014-2020 hC oP 2014-2020 AC oP 2014-2020 nrDP 2014-2020
Strategic objective A: Supporting
sustainable economic development,
integrated through innovative energies and technologies
Sectoral objective A1: Supporting
sustainable economic development
Sectoral objective A2: Supporting the SMe sector,
entrepreneurship and business creation
S.O. 3.1: Developing specialized and intelligent urban centres with
international pole vocation, and their efficient connection to the European
urban network
P.A. 1: Promoting technological transfer
P.A. 2: Improving competitiveness of
small and medium-sized enterprises
P.A. 7: Diversifying local economies through sustainable tourism
development
P.A. 6: Promoting clean energy and energy
efficiency in order to support a low-carbon
economy
P.A. 1: Research, technological development
and innovation (RDI) in support of economic competitiveness and business development
P.A. 2: Information and Communication Technology
(ICT) for a competitive digital economy
P.A. 3: Employment for all
P.A. 6: Education and competences
P1: Fostering knowledge transfer and innovation in agriculture, forestry and
rural areas
P2: Enhancing farm viability and the
competitiveness of all types of agriculture in all regions and promoting innovative agricultural
technologies as well as the sustainable management
of forests
P3: Promoting food chain organisation, including
processing and marketing of agricultural products,
animal welfare and risk management in
agriculture
P5: Promoting resource efficiency and supporting
the shift towards a low-carbon and climate resilient economy in the
agriculture, food and forestry sectors
P6: Promoting social inclusion, poverty
reduction and economic development in rural areas
P3: Increasing the competitiveness of the regional economy in the
long termP5: Supporting education
and employmentP7: Rural development
and agriculture
P1: Sustainable development of local and county-level infrastructure, including tourism
infrastructureP3: Developing the business support infrastructure, increasing economic
competitivenessP7: Rural development
Dev
elop
men
t V
isio
n an
d o
bjec
tive
sT
he In
tegr
ated
Str
ateg
y fo
r th
e G
row
th P
ole
i
3
i376

Strategic objectives / iUDP sectoral objectives
Specific objectivesrtDS 2035
Priority axes / oP priorities at national level Development priorities of the rDP SoUth
MUnteniA 2014-2020
Development priorities of the CDP PrAhoVA 2014-2020roP 2014-2020 li oP 2014-2020 CoMP oP 2014-2020 hC oP 2014-2020 AC oP 2014-2020 nrDP 2014-2020
Strategic objective A: Supporting
sustainable economic development,
integrated through innovative energies and technologies
Sectoral objective A1: Supporting
sustainable economic development
Sectoral objective A2: Supporting the SMe sector,
entrepreneurship and business creation
S.O. 3.1: Developing specialized and intelligent urban centres with
international pole vocation, and their efficient connection to the European
urban network
P.A. 1: Promoting technological transfer
P.A. 2: Improving competitiveness of
small and medium-sized enterprises
P.A. 7: Diversifying local economies through sustainable tourism
development
P.A. 6: Promoting clean energy and energy
efficiency in order to support a low-carbon
economy
P.A. 1: Research, technological development
and innovation (RDI) in support of economic competitiveness and business development
P.A. 2: Information and Communication Technology
(ICT) for a competitive digital economy
P.A. 3: Employment for all
P.A. 6: Education and competences
P1: Fostering knowledge transfer and innovation in agriculture, forestry and
rural areas
P2: Enhancing farm viability and the
competitiveness of all types of agriculture in all regions and promoting innovative agricultural
technologies as well as the sustainable management
of forests
P3: Promoting food chain organisation, including
processing and marketing of agricultural products,
animal welfare and risk management in
agriculture
P5: Promoting resource efficiency and supporting
the shift towards a low-carbon and climate resilient economy in the
agriculture, food and forestry sectors
P6: Promoting social inclusion, poverty
reduction and economic development in rural areas
P3: Increasing the competitiveness of the regional economy in the
long termP5: Supporting education
and employmentP7: Rural development
and agriculture
P1: Sustainable development of local and county-level infrastructure, including tourism
infrastructureP3: Developing the business support infrastructure, increasing economic
competitivenessP7: Rural development
377

table 40. Matrix of the correlation between the Growth Pole development objectives and the national policy documents (continued from previous page)
Strategic objectives / iUDP sectoral objectives
Specific objectivesrtDS 2035
Priority axes / oP priorities at national level Development priorities of the rDP SoUth
MUnteniA 2014-2020
Development priorities of the CDP PrAhoVA 2014-2020roP 2014-2020 li oP 2014-2020 CoMP oP 2014-2020 hC oP 2014-2020 AC oP 2014-2020 nrDP 2014-2020
Strategic objective B: Sustainable territorial
development by improving urban
infrastructure and relations among functional areas
Sectoral objective B1: improving territorial
connectivity
Sectoral objective B2: Protecting energy
resources and the quality of natural and
built environment
S.O. 1.1: Developing an efficient and diversified transport network capable to ensure the management of flows of people and goods generated by
the economic exchanges between the national territory and the European
marketsS.O. 1.2: Developing and expanding port
and airport infrastructures, as well as their connection with the national urban centres in order to consolidate Romania’s position as regional logistic
hubS.O. 1.3: Enhancing the energy
transport infrastructure and its connection to pan-European projects
with regional and national impactS.O. 2.1: Ensuring a fully-fledged
infrastructure of public utilities for urban and rural localities
S.O. 2.2: Ensuring increased accessibility at a territorial level and efficient connectivity between large cities and the functional urban area
S.O. 2.3: Increasing the attractiveness of urban and rural spaces by improving
residential functions, developing quality public spaces and a number of transport services adjusted to local
needs and specific conditionsS.O. 3.2: Fostering the development
of functional urban areas around the cities with a polarizing role throughout
the territoryS.O. 3.3: Strengthening the role of rural areas with polarizing potential in order to ensure increased accessibility of the rural population to services of general
interestS.O. 3.4: Supporting the development
of urban systems and the development axes throughout the territory by providing territorially integrated
interventionsS.O. 4.1: Heritage protection and the promotion of natural capital recovery
measuresS.O. 4.2: Protecting and rehabilitating the built heritage in order to preserve the national identity and to increase the attractiveness of cultural spaces
with great tourism potentialS.O. 4.3: Reducing the vulnerability of
areas subject to natural hazardsS.O. 4.4: Ensuring a balanced
development of the rural and urban environment by protecting agricultural
land resources and limiting the expansion of built-up areas of towns
P.A. 3: Supporting the shift towards a low-
carbon economy in all sectors
P.A. 4: Supporting sustainable urban
developmentP.A. 5: Conservation,
protection and sustainable exploitation of cultural
heritageP.A. 6: Improving the road infrastructure of regional
and local importance
P.A. 1: Improving mobility through the development of the TEN-T network and
of the subway service
P.A. 2: Developing a high-quality, sustainable and efficient multimodal
transport system
P.A. 3: Developing the environment
infrastructure in terms of efficient resource
management
P.A. 4: Protecting the environment through measures aiming at the preservation of
biodiversity, air quality monitoring and the de-contamination of
historically contaminated sites
P.A. 5: Promoting climate change adaptation, risk prevention and
management
P.A. 6: Promoting clean energy and energy
efficiency in order to support a low-carbon
economy
P.A. 7: Increasing energy efficiency of
the centralized heating systems in the selected
towns
P.A. 8: Intelligent and sustainable transport systems for electricity
and natural gas
P4: Restoring, preserving and enhancing
ecosystems related to agriculture and forestry
P5: Promoting resource efficiency and supporting
the shift towards a low carbon and climate
resilient economy in agriculture, food and
forestry sectors
P1: Sustainable development of local and regional infrastructureP2: Sustainable urban
developmentP4: Environmental
protection and increased energy efficiency
P7: Rural development and agriculture
P1: Sustainable development of local and county-level infrastructure, including tourism
infrastructureP2: Sustainable urban development
P4: Environmental protection and increased energy efficiency
P7: Rural development
Dev
elop
men
t V
isio
n an
d o
bjec
tive
sT
he In
tegr
ated
Str
ateg
y fo
r th
e G
row
th P
ole
i
3
i378

Strategic objectives / iUDP sectoral objectives
Specific objectivesrtDS 2035
Priority axes / oP priorities at national level Development priorities of the rDP SoUth
MUnteniA 2014-2020
Development priorities of the CDP PrAhoVA 2014-2020roP 2014-2020 li oP 2014-2020 CoMP oP 2014-2020 hC oP 2014-2020 AC oP 2014-2020 nrDP 2014-2020
Strategic objective B: Sustainable territorial
development by improving urban
infrastructure and relations among functional areas
Sectoral objective B1: improving territorial
connectivity
Sectoral objective B2: Protecting energy
resources and the quality of natural and
built environment
S.O. 1.1: Developing an efficient and diversified transport network capable to ensure the management of flows of people and goods generated by
the economic exchanges between the national territory and the European
marketsS.O. 1.2: Developing and expanding port
and airport infrastructures, as well as their connection with the national urban centres in order to consolidate Romania’s position as regional logistic
hubS.O. 1.3: Enhancing the energy
transport infrastructure and its connection to pan-European projects
with regional and national impactS.O. 2.1: Ensuring a fully-fledged
infrastructure of public utilities for urban and rural localities
S.O. 2.2: Ensuring increased accessibility at a territorial level and efficient connectivity between large cities and the functional urban area
S.O. 2.3: Increasing the attractiveness of urban and rural spaces by improving
residential functions, developing quality public spaces and a number of transport services adjusted to local
needs and specific conditionsS.O. 3.2: Fostering the development
of functional urban areas around the cities with a polarizing role throughout
the territoryS.O. 3.3: Strengthening the role of rural areas with polarizing potential in order to ensure increased accessibility of the rural population to services of general
interestS.O. 3.4: Supporting the development
of urban systems and the development axes throughout the territory by providing territorially integrated
interventionsS.O. 4.1: Heritage protection and the promotion of natural capital recovery
measuresS.O. 4.2: Protecting and rehabilitating the built heritage in order to preserve the national identity and to increase the attractiveness of cultural spaces
with great tourism potentialS.O. 4.3: Reducing the vulnerability of
areas subject to natural hazardsS.O. 4.4: Ensuring a balanced
development of the rural and urban environment by protecting agricultural
land resources and limiting the expansion of built-up areas of towns
P.A. 3: Supporting the shift towards a low-
carbon economy in all sectors
P.A. 4: Supporting sustainable urban
developmentP.A. 5: Conservation,
protection and sustainable exploitation of cultural
heritageP.A. 6: Improving the road infrastructure of regional
and local importance
P.A. 1: Improving mobility through the development of the TEN-T network and
of the subway service
P.A. 2: Developing a high-quality, sustainable and efficient multimodal
transport system
P.A. 3: Developing the environment
infrastructure in terms of efficient resource
management
P.A. 4: Protecting the environment through measures aiming at the preservation of
biodiversity, air quality monitoring and the de-contamination of
historically contaminated sites
P.A. 5: Promoting climate change adaptation, risk prevention and
management
P.A. 6: Promoting clean energy and energy
efficiency in order to support a low-carbon
economy
P.A. 7: Increasing energy efficiency of
the centralized heating systems in the selected
towns
P.A. 8: Intelligent and sustainable transport systems for electricity
and natural gas
P4: Restoring, preserving and enhancing
ecosystems related to agriculture and forestry
P5: Promoting resource efficiency and supporting
the shift towards a low carbon and climate
resilient economy in agriculture, food and
forestry sectors
P1: Sustainable development of local and regional infrastructureP2: Sustainable urban
developmentP4: Environmental
protection and increased energy efficiency
P7: Rural development and agriculture
P1: Sustainable development of local and county-level infrastructure, including tourism
infrastructureP2: Sustainable urban development
P4: Environmental protection and increased energy efficiency
P7: Rural development
379

table 40. Matrix of the correlation between the Growth Pole development objectives and the national policy documents (continued from previous page)
Strategic objectives / iUDP sectoral objectives
Specific objectivesrtDS 2035
Priority axes / oP priorities at national level Development priorities of the rDP SoUth
MUnteniA 2014-2020
Development priorities of the CDP PrAhoVA 2014-2020roP 2014-2020 li oP 2014-2020 CoMP oP 2014-2020 hC oP 2014-2020 AC oP 2014-2020 nrDP 2014-2020
Strategic objective C: human capital development by ensuring equal
access to quality public services for
all citizens
Sectoral objective C1: increasing the quality of public
services
Sectoral objective C2: increasing the capacity of local Public Authorities
S.O. 3.1: Developing specialized and intelligent urban centres with
international pole vocation, and their efficient connection to the European
urban networkS.O. 2.4: Providing quality social
services by ensuring a diversification of these services throughout the territory and improving access of the populationS.O. 5.1: Strengthening the capacity of multi-level governance structures and diversifying the forms of cooperation
of the public administration structuresS.O. 5.2: Strengthening spatial planning instruments and institutions involved
in the management and design of territory development processes (or
territorial planning processes)S.O. 5.3: Strengthening cooperation
and planning capacity at cross-border and transnational levels
P.A. 4: Supporting sustainable urban
developmentP.A. 8: Developing the healthcare and social
infrastructureP.A. 9: Supporting the economic and social regeneration of communities in
disadvantaged urban areas
P.A. 10: Improving the educational infrastructure
P.A. 1: Youth Employment Initiative (YEI)
P.A. 2: Improving the situation of young people
not in employment, education or training
(NEETs)
P.A. 3: Employment for all
P.A. 4: Social inclusion and combating poverty
P.A. 5: Community-led local development
P.A. 6: Education and competences
P.A. 1: Accessible and transparent public administration and
judicial system
P.A. 2: Accessible and transparent public administration and
judicial system
P6: Promoting social inclusion, poverty
reduction and economic development in rural areas
P2: Sustainable urban development
P5: Supporting education and employment
P6: Supporting the healthcare and social protection systems
P5: Human resources development, supporting education and employment
P6: Supporting the healthcare and social protection systems
Dev
elop
men
t V
isio
n an
d o
bjec
tive
sT
he In
tegr
ated
Str
ateg
y fo
r th
e G
row
th P
ole
i
3
i380

Strategic objectives / iUDP sectoral objectives
Specific objectivesrtDS 2035
Priority axes / oP priorities at national level Development priorities of the rDP SoUth
MUnteniA 2014-2020
Development priorities of the CDP PrAhoVA 2014-2020roP 2014-2020 li oP 2014-2020 CoMP oP 2014-2020 hC oP 2014-2020 AC oP 2014-2020 nrDP 2014-2020
Strategic objective C: human capital development by ensuring equal
access to quality public services for
all citizens
Sectoral objective C1: increasing the quality of public
services
Sectoral objective C2: increasing the capacity of local Public Authorities
S.O. 3.1: Developing specialized and intelligent urban centres with
international pole vocation, and their efficient connection to the European
urban networkS.O. 2.4: Providing quality social
services by ensuring a diversification of these services throughout the territory and improving access of the populationS.O. 5.1: Strengthening the capacity of multi-level governance structures and diversifying the forms of cooperation
of the public administration structuresS.O. 5.2: Strengthening spatial planning instruments and institutions involved
in the management and design of territory development processes (or
territorial planning processes)S.O. 5.3: Strengthening cooperation
and planning capacity at cross-border and transnational levels
P.A. 4: Supporting sustainable urban
developmentP.A. 8: Developing the healthcare and social
infrastructureP.A. 9: Supporting the economic and social regeneration of communities in
disadvantaged urban areas
P.A. 10: Improving the educational infrastructure
P.A. 1: Youth Employment Initiative (YEI)
P.A. 2: Improving the situation of young people
not in employment, education or training
(NEETs)
P.A. 3: Employment for all
P.A. 4: Social inclusion and combating poverty
P.A. 5: Community-led local development
P.A. 6: Education and competences
P.A. 1: Accessible and transparent public administration and
judicial system
P.A. 2: Accessible and transparent public administration and
judicial system
P6: Promoting social inclusion, poverty
reduction and economic development in rural areas
P2: Sustainable urban development
P5: Supporting education and employment
P6: Supporting the healthcare and social protection systems
P5: Human resources development, supporting education and employment
P6: Supporting the healthcare and social protection systems
381

383
PArt II: the integrated Strategy for the Growth Pole
4Project Portfolio

no. Project title tAUs concerned
Project initiator
Maturity degreedocumentation/drafting time)
Strategic document in which it is
included
Prahova County Council (CC)Sectorial objective A1: Supporting a sustainable economic development
AreA oF interVention: industrial parks
1.Extention / development of industrial parks
that are under the administration of the public sector
Ploiești, Brazi, Plopeni
Prahova County
Council (CC)(partnerships with TAUs)
Prahova County Council Strategy
2.Modernization and extention of existing
infrastructure - roads and utilities at Bărcănești Industrial Park
Bărcănești Prahova CC SF 2014
AreA oF interVention: rDi activities
3.
Regional park for R&D activities in the sector of clean technologies - Development / extention / modernization of the Oil and Gas University (UPG) Ploiești and its endowment with infrastructure for RDI and technological
transfer
Ploiești UPGPloiești Strategy
2007-2025
4.Center for tecnological transfer and elaboration
of new educational products regarding the energy sector
Ploiești UPG
Sectorial objective A2: Supporting the SMe sector, entrepreneurship, and business start-up
AreA oF interVention: agricultural activities
5.
Promoting local products in Prahova County through the establishment of a Center for Information in Ploiești and the set-up of a
website for the promotion of Prahova County producers (crafts, handicrafts, organic farming, beekeeping, furniture, accommodation and bio
services)
Ploiești Prahova CC Project idea Strategy of Prahova CC
Sectorial objective B1: improving territorial connectivity
AreA oF interVention: accesibility and mobility
6.Bypass between DN 1 and DN 72 + discharge
node A3
Ploiești, Ariceştii
Rahtivani, Blejoi,
Păulești, Brazi
Prahova CC
Traffic assessment,
approval of the Zonal Urban Plan
(ZUP)
Strategy of Prahova CC
7.
Rehabilitation and development of county roads (DJ 100F, DJ 100E, DJ 215) by restoring the asphalt, building bike lanes, sidewalks and
ditches (DJ 100F, section of Independence Street, from Gladiolelor Street to Găgeni
Canton, DJ 100E, DJ 215)
BăicoiDJ 100F=10km
DJ 100E=5,3km
DJ 15=6,13km
Prahova CCUpdate of Băicoi
Strategy
Project Portfolio
4Pr
ojec
t Po
rtfo
lioT
he In
tegr
ated
Str
ateg
y fo
r th
e G
row
th P
ole
i
4
i384

no. Project title tAUs concerned
Project initiator
Maturity degreedocumentation/drafting time)
Strategic document in which it is
included
8.
Modernization and rehabilitation of the county roads identified under Priority no. 1 of Sud
Muntenia Region – regional routes 2 and 3 – section Prahova - DJ 720
Prahova CC Prahova CC
9.Rehabilitation of DJ 100F between Băicoi and
Boldești-Scăeni
Băicoi, Boldești-Scăeni
Prahova CC Local Strategies
10.Modernization of DJ 129 (plus upgrading road
verges and building bike lanes)Târgșoru
VechiPrahova CC Local Strategies
AreA oF interVention: clean public transport
11.Building a public transport line linking the
localities of the Growth PoleTAU PC IDA PC
12.
Building bike lanes at the level of Ploiești Growth Pole / Developing new continuous routes
- bike lanes on the access roads of the city, and integrating the existing ones in a municipal
network
TAU PC Prahova CC Project idea TRACE P3
AreA oF interVention: traffic safety
13.Increasing road traffic safety on DN 1 / E60 in
Prahova County
County Police Inspectorate,
Prahova Investments Plan (County Police Inspectorate)
14.Safe Ploiești – implementing a monitoring
system of all access routes in Ploiești and the largest intersections
County Police Inspectorate,
Prahova
Sectorial objective B2: Protecting energy resources and the quality of the natural and built environment
AreA oF interVention: thermal energy / gas supply
15.Modernizing the primary thermal network of
SACET Ploiești:
Partnership Prahova CC + Ploiești Local
Council(+Veolia
Energie PH)
Strategy Prahova CC TRACE P2
16.
a. M. Bravu zone, artery IV Center (between “Upetrom” and M. Viteazul Marketplace), 9–Mai
zone, artery I+III West (between M. Viteazul Markeplace, “Cablu Românesc” area and Ploiești Emergency Hospital), artery III West (between CFR passage zone “West Railway” and Aurora
Marketplace), artery I West (between CMZ West zone and Domnișori Street), section of
artery VI (Torcători Street)Ploiești
17.b. Artery CET Brazi – Platform F25 (Dn
1000,900,2x700mm)
Solution study18.
c. Surface area of artery I West (between CFR passage zone “West Railway” and Ploiești
Emergency Hospital); surface area of artery II South (between West Railway and Upetrom )
19. d. Section of artery IV Center
20.Modernizing the secondary thermal network
corresponding to PT 43, SACET PloieștiPloiești
Partnership Prahova CC + Ploiești Local
Council(+Veolia
Energie PH)
21.Rehabilitating the Chimney no. 2 corresponding
to the stage 2 x 10⁵ + 1 x 50 MWCET Brazi
22. Refurbishment of Boiler no. 5 CET Brazi
AreA oF interVention: built heritage
23. Putting in value the Art Museum of Ploiești Ploiești
Prahova County Art Museum
“Ion Ionescu-Quintus”
385

no. Project title tAUs concerned
Project initiator
Maturity degreedocumentation/drafting time)
Strategic document in which it is
included
24.
Restoration, consolidation, rearrangement of “Paul Constantinescu” Memorial Museum (the house of the musician Paul Constantinescu) -
Ploiești
Ploiești Prahova CC Project idea
25.Rehabilitation of the historical and cultural area
of DumbrăveștiDumbrăvești
Partnership Prahova CC + Dumbrăvești
Strategy Prahova CC
26.Restoration and sustainable valorization
of the cultural heritage, and development / modernization of related infrastructure
Dumbrăvești
County Museum of History and Archeology
27.
Modernization of the access road towards the “Castrul Roman” 101-118 and “Băile Romane”
archaeological site and its conservation in view of introducing it in the touristic circuit
DumbrăveștiPartnership MC and CCP
FS/PT 2011Strategy of Dumbrăvești
28.Preserving the “Neolithic Settlement - Râpa Mălăeștii de Jos point” archaeological site in view of introducing it in the touristic circuit
DumbrăveștiPartnership MC and CCP
Strategy of Dumbrăvești
29.Archaeological and Museum Park “Castrul
Roman” - harnessing its scientific, educational, and touristic value
Târgșoru Vechi
County Museum of History and Archeology
AreA oF interVention: water supply and sewerage
30.Regularization and ecologization of Dâmbu
creek bedPloiești, Băicoi
Romanian Waters,
Prahova CC, partnerships with LPAs
31.Developing, modernizing and extending the
water and sewerage system in Prahova County - stage II
Prahova County
IDA Water and Prahova
CC
Master Plan stage II
Master Plan stage II
AreA oF interVention: parks and green areas
32.Rehabilitation of "Constantin Stere" recreational
park Ploiești –
BucovIDA PC F.S. 2015-2016 Strategy Prahova CC
33.Rehabilitation and development of forest belts
for protecting national roads and railways
Prahova Forestry
Inspectorate
AreA oF interVention: waste management
34.
System of integrated waste management in Prahova County - Zone 2: Phase 2 - mechanical and biological treatment plant in Ploiești, and
equipment
PloieștiIDA Waste + Prahova CC
Master Plan stage II
Master Plan stage II
Sectorial objective C1: increasing the quality of public services
AreA oF interVention: health infrastructure
35.County Emergency Hospital Ploiești - improving
the energy efficiency of the buildingPloiești Prahova CC F.S. 2015 Strategy Prahova CC
36.County Emergency Hospital Ploiești -
rehabilitating / extending / modernizing / endowing the Emergency Unit
Ploiești Prahova CC F.S. 2015 Strategy Prahova CC
37.Obstetrics and Gynecology Hospital Ploiești - improving the energy efficiency of the building
Ploiești Prahova CC F.S. 2015-2016 Strategy Prahova CC
38.
Obstetrics and Gynecology Hospital Ploiești - rehabilitation / modernization / equipping of the ambulatories’ infrastructure; establishing
and endowing with infrastructure an Emergency Room
Ploiești Prahova CC Project idea Strategy Prahova CC
Proj
ect
Port
folio
The
Inte
grat
ed S
trat
egy
for
the
Gro
wth
Pol
e
i
4
i386

no. Project title tAUs concerned
Project initiator
Maturity degreedocumentation/drafting time)
Strategic document in which it is
included
AreA oF interVention: education and employment
39.
Projects for increasing the activation of the inactive population, the involvement of the County Employment Agency (AJOFM) in
underemployment, youth employment, etc.
AJOFM Prahova
Strategy of AJOFM
AreA oF interVention: education for emergency situations and safety
40.
Creating a center for information, training and awareness regarding the behavior in emergency situations and natural disasters, arising from
climate change and natural disasters
Prahova County
Inspectorate for Emergency
Situations
41.
Crearea unui centru de formare şi pregătire continuă a personalului paramedical din cadrul
SMURD Creating a center for training and continuous training of SMURD paramedical
staff
Prahova County
Inspectorate for Emergency
Situations
42.Creating an integrated county dispatch SMURD
- County Ambulance ServiceBărcănești Prahova CC
Analisys plan and risk coverage /
F.S. 2015
Strategy of Prahova CC
43.
Participation in improving the urban environment through the functional conversion
and reuse of land adjacent to the building located in Ploiești, 3, Ghighiului Street, and belonging to the Gendarmerie Inspectorate
Prahova (IJP), as a recreational area for military personnel (sports fileds, bicycle lanes,
playgrounds for children, etc.)
Ploiești
44.
Increasing energy efficiency and use of renewable energy in the building belonging to the Gendarmerie Inspectorate in Ploiești city,
Prahova County
Ploiești
45.
Establishing a modern center of physical and tactical training for all relevant institutions involved in providing / maintaining public
security (at the logistics base of IJP in Tătărani)
Bărcănești (Tătărani)
County Police Inspectorate
46.Construction of an overground detention place
at the logistics base of IJP in TataraniBărcănești (Tătărani)
County Police Inspectorate
Sectorial objective C2: increasing the capacity of lPA
AreA oF interVention: marketing and promotion
47.Industrial heritage of Prahova County – history,
informatised accounts, perspectivesPloiești
County Directorate for Culture,
Prahova
Ploiești lPA (operational budget: 289 million eUr)Sectorial objective A2: Supporting the SMe sector, entrepreneurship, and business start-up
AreA oF interVention: support for SMes and buiness start-ups
1.Establishing an information office for business
start-upPloiești Ploiești
Ploiești Strategy 2007-2025
2.Business incubator by rehabilitating the built
facilities in partnership with the private sectorPloiești Ploiești
AreA oF interVention: agricultural activities
3.Rehabilitation, expansion, and modernization greenhouses in 81, Mircea cel Bătrân Street,
PloieștiPloiești SGU Ploiești
387

no. Project title tAUs concerned
Project initiator
Maturity degreedocumentation/drafting time)
Strategic document in which it is
included
4.Cleaning and greening the land area of 10
ha in T35A493 and its reintroduction in the agricultural circuit
Ploiești SGU Ploiești
AreA oF interVention: tourism infrastrcture
5.Marketing activities and tourism advertising
in a project that may include the cultural attractions of Ploiești Municipality
Ploiești
“Paul Con-stantinescu” Philharmonic,
Ploiești
Project idea
Sectorial objective B1: improving territorial connectivity - trAnSPort AnD MoBility SeCtor
AreA oF interVention: accesibility and mobility
6.
Ensuring accessibility in Ploiești South industrial zone and in the university campus by developing
a road passage over CF South Station - Restoration of the bridge that connects the
Southern area of Ploiești Municipality (towards Mimiu) - Marin Mehedinteanu Street and
Depot Street, necessary for the takeover and streamlining of traffic in the South of the city
PloieștiPloiești -
RASP Ploiești
Technical design and execution
details finalized in 2006 for the rehabilitation
of the existent bridge
Ploiești (LCD 288/24.07.14)
7.
Increasing accessibility in the Eastern part of Ploiești towards the Pan-European Corridor TEN-IX by making a road passage over the
railway, in the SE of the city
Ploiești PloieștiF.S. completed in
July 2003Ploiești (LCD
288/24.07.14)
8.
Ensuring traffic mobility through the extension of the road and public transport link between
South Station and West Station (Liberty Street), including the rehabilitation of the
markets located on the public domain in the rail stations
Ploiești PloieștiF.S. being updated
Ploiești Strategy 2007-2025
9.
South Station - North Station: Developing access routes from the South area towards
Bereasca district and North Station along the Dambu stream (including related art works, Râfov passage, bridges over Dambu stream)
Ploiești PloieștiPloiești Strategy
2007-2026
10.Complete circulation ring road no. III, South
Station – Dambu sectionPloiești Ploiești
Ploiești (LCD 288/24.07.14)11.
Complete circulation ring road no. III, Bucov Barrier – Găgeni section
Ploiești Ploiești
12. Overground passage, Laboratorului Street Ploiești Ploiești
13.Developing the intersection between Ștrandului
Street with NE ring road, DN 1BPloiești Ploiești F.S. LCD 38/10.02.2014
14.
Road infrastructure development in the following locations: Gh. Cantacuzino Str. in the
CFR passage area “High Bridge” through its enlargement to 4 lanes, the rehabilitation of Gh. Cantacuzino Str. on the Western highway - city
limit section, including intermodal terminal
Ploiești PloieștiPloiești (LCD
288/24.07.14)
Proj
ect
Port
folio
The
Inte
grat
ed S
trat
egy
for
the
Gro
wth
Pol
e
i
4
i388

no. Project title tAUs concerned
Project initiator
Maturity degreedocumentation/drafting time)
Strategic document in which it is
included
15.
Modernizing Ștrandului Street, section between the exit of Bucov passage and Ploiești Municipality roadway, including the set-up of a
roundabout on Ștrandului Street / DN 1B
Ploiești PloieștiPloiești (LCD
288/24.07.14)
16.Traffic streamlining on the extension of
Libertății StreetPloiești Ploiești
AreA oF interVention: clean public transport
17.
Implementing measures from CIVITAS projects (pedestrianize and control traffic in the central area) and developing bike lanes on the priority
routes from the mobility plan
Ploiești PloieștiTRACE P3 mobility
plan
18.
Extending the trolleybus network on the following directions: South Station –
Hippodrome, extendible up to Bărcănești High School; Hale – Bereasca – C.Stere Park (Bucov), extendible up to Bucov; High Bridge – Ploiești
Industrial Park, extendible up to Ploiești West Park; County Hospital – Păulești Park,
extendible up to Plopeni
PloieștiS.C Transport
Călători Express S.A. Ploiești Strategy
2007-2025, TRACE P4
19.Modernizing / renewing the fleet of autovehicles
with electric traction (tramways = 25 units, trolleybuses = 21 units)
PloieștiS.C Transport
Călători Express S.A.
20.
Implementing the traffic management system, including ticketing for local transport: purchase
of automatic ticket machine (min. 50 units); purchase of validator machines mountable in autovehicles (approx. 780 units); modernizing the centers for issuing / charging cards (13
spots);
PloieștiS.C Transport
Călători Express S.A.
21.Modernizing / renewing the bus fleet (85-90
units)Ploiești
S.C Transport Călători
Express S.A.TRACE P4
22.
Modernization of local public transport stations: mounting large rooF.S., lighting, free internet system, information boards for travelers, etc.
(approx. 200 pieces)
PloieștiS.C Transport
Călători Express S.A.
23.
Modernisation / reconditioning of the material and technical basis of the of the public
transport production system: consolidation / thermal rehabilitation of both workshops for repairing / maintaining / painting cars, and
stores for replacement parts, located in Ploiești, 88, Găgeni Street, including tram depot;
replacing the heating / ventilation system of the workshops and headquarter in Ploiești, 88, Găgeni Street, including tram depot; building
covered / half-sheltered parking spaces at the headquarters in Ploiești, 88, Găgeni Street,
including tram depot; endowment with tools, devices and specialized equipment for diagnosis and repair of diesel, LPG, and electric vehicles
PloieștiS.C Transport
Călători Express S.A.
24. Finishing tram infrastructure Ploiești Ploiești Mobility plan
389

no. Project title tAUs concerned
Project initiator
Maturity degreedocumentation/drafting time)
Strategic document in which it is
included
AreA oF interVention: multimodal terminals
25.
Increasing mobility in traffic by building the Northwest multimodal terminal, including parking spaces for cars and bicycles (the
County Hospital area)
Ploiești PloieștiF.S. currently
under elaboration; traffic study
Ploiești Strategy 2007-2025
26. Park & ride at West Station Ploiești Ploiești Mobility plan
27.Rehabilitating the passenger car transport
terminal in the Southern areaPloiești Ploiești Project proposal
Ploiești (LCD 288/24.07.14)
AreA oF interVention: parking development
28. Establishing truck parkings Ploiești PloieștiPloiești (LCD
288/24.07.14)
29.Developing parking spaces in the areas
surrounding the Central Markets, Prahova Hotel, South Station, West Station
Ploiești PloieștiPloiești Strategy
2007-2025
30.
Building overground parking S+P+5 (in the historical monuments protection area,
according to the Law no. 422/2001 on historical monuments)
PloieștiSC Hale si Piete SA
AreA oF interVention: road upgrading / repairing
31.
Upgrading access roads - the entrances to Ploiești city / rehabilitation / modernization
of street infrastructure, with priority given to the streets entrances to the city and to the suburbs, including sidewalks, squares, parallel
parking, intersections, roundabouts
Ploiești RASP PloieștiPloiești Strategy
2007-2025
32.Modernization of the street structure in Mitică
Apostol districtPloiești
Technical and Investment Directorate
Starting Order for field studies, the documen-
tation for sewage is in place
documentation for sewage is in
place
Ploiești (LCD 288/24.07.14)33.
Modernization of the street structure in Pictor Rosenthal district
PloieștiTechnical and Investment Directorate
Starting Order for field studies
34.Modernization of the street structure in Rafov
districtPloiești
Technical and Investment Directorate
35.Modernization of the street structure in Vega
colonPloiești
Technical and Investment Directorate
The legal status of the land is not clear; no Starting
Order
Sectorial objective B2: Protecting energy ressources and the quality of the natural and built environment
AreA oF interVention: improving the energy efficiency of the buildings
36.Improving the efficiency of energy consumption
in public buildingsPloiești Ploiești TRACE P5
Proj
ect
Port
folio
The
Inte
grat
ed S
trat
egy
for
the
Gro
wth
Pol
e
i
4
i390

no. Project title tAUs concerned
Project initiator
Maturity degreedocumentation/drafting time)
Strategic document in which it is
included
37. Energy rehabilitation of residential buildingsPloiești/
West Ploiești district
Ploiești
The existing documen-
tations should be updated; completed technical
designes, but no requests from homeowners associations
Ploiești (LCD 288/24.07.14)
38.
Improving the thermal insulation of the building envelope (exterior walls, windows, carpentry, upper floor, floor above the basement, etc.) - “Paul Constantinescu” Philharmonic, Ploiești
Ploiești
“Paul Con-stantinescu” Philarmonic,
Ploiești
39.
Implementation of energy management systems aimed at improving energy efficiency and at monitoring energy consumption in the
institution - “Paul Constantinescu” Philharmonic, Ploiești
Ploiești
“Paul Con-stantinescu” Philarmonic,
Ploiești
40.
Replacing fluorescent and incandescent lighting luminaires with energy efficient and long-life lamps - “Paul Constantinescu” Philharmonic,
Ploiești
Ploiești
“Paul Con-stantinescu” Philarmonic,
Ploiești
AreA oF interVention: water supply and sewerage
41.
Rehabilitation and development of the drinking water system in coordination with the Master Plan for drinking water supply, developed by Apa Nova Ploiești, with priority in Apostol,
Mimiu, Râfov, and Bereasca districts (network rehabilitation, network expansion, pump station
rehabilitation in Găgeni-North)
Ploiești PloieștiPloiești Strategy
2007-2025
42.Ensuring safety and protection of water
sources, namely the establishment of sanitary protection zones
Ploiești PloieștiPloiești Strategy
2007-202543.
Expansion / modernization of sewerage treatment plant - Implementing the EC directive
on the use of sludge from treatment plantsPloiești Ploiești
44.
Execution watering systems in the following parks: Mihai Viteazul Dendrological Park,
Melc South Park, Civic Center Public Garden (Nichita Stănescu area), Camelia Public Garden
(McDonalds Park), West 1 Public Garden, Modern Park, Aurora Park
Ploiești SGU Ploiești
45.Developing the banks of Dâmbu creek, building
new bridges over Dâmbu creek, developing traffic arteries on the banks of the creek
Ploiești Ploiești Project proposalPloiești Strategy
2007-2025
46.
Restoration and upgrading of toilets and infrastructure (asphalting the alleys, water
and sewage installations, lighting installations, landfill) in Viișoara, Bolovani, Eternitatea, Mihai
Bravu cemeteries
Ploiești SGU Ploiești
391

no. Project title tAUs concerned
Project initiator
Maturity degreedocumentation/drafting time)
Strategic document in which it is
included
AreA oF interVention: converting lands / brownfields
47.Functional reconversion of industrial areas and degraded lands (brownfields) – Industrial South,
Grivco, Upetrom, UZUC, LukoilPloiești
Uncertain property,
hindering the establishment of the project
initiator
Ploiești Strategy 2007-2025
AreA oF interVention: seismic risk buildings
48.Inventorying seismic risk buildings and
developing an action plan for the rehabilitation of earthquake damaged buildings
Ploiești PloieștiPloiești Strategy
2007-202549.
Rehabilitation / strengthening of the public buildings that risk to collapse
Ploiești Ploiești
AreA oF interVention: built heritage
50.Rehabilitation of monument buildings of
category A and BPloiești Ploiești
Ploiești Strategy 2007-2025
51.
Refurbishment, restoration, consolidation, repartitioning of the building located on 16 Independence Boulevard, Ploiești, and
transforming its garret into an attic
Ploiești Ploiești
52.
Refurbishment, restoration, consolidation, repartitioning of the building located on 33
Democracy Street, Ploiești (Marriage House), and transforming its garret into an attic
Ploiești Ploiești
53.Rehabilitation and upgrading of the fountain of
the Administrative PalacePloiești SGU Ploiești
54.
Reabilitare, refacere, modernizare, capele cimitire Eternitatea, Mihai Bravu Rehabilitation,
reconstruction, modernization of chapels at Eternitatea and Mihai Bravu cemeteries
Ploiești SGU Ploiești
55.Expanding the administrative building of
BolovaniPloiești SGU Ploiești
56.
Modernization of the Central Markets (Halele Centrale) building - historical and architectural
monument, included in the list of historical monuments of exceptional national interest
PloieștiSC Hale si Piete SA
Ploiești Strategy 2007-2025
AreA oF interVention: public space, space between blocks, playgrounds
57.Rehabilitation of spaces between blocks, mainly
in the district of Ploiești West I and IIPloiești Ploiești
Ploiești Strategy 2007-2025
58.Landscaping of the historical-pedestrian area in
Ploiești MunicipalityPloiești SGU Ploiești
59.Building a pedestrian alley on 5 Anton Pann
StreetPloiești
“Paul Con-stantinescu” Philarmonic,
Ploiești
AreA oF interVention: parks and green areas
60.Protection and monitoring of trees included in
the list of nature monuments and planting trees and shrubs in areas with no vegetation
Ploiești PloieștiPloiești Strategy
2007-2025
61.Planting forest protection belts on the Eastern and Western ring roads of Ploiești Municipality
Ploiești SGU Ploiești
62.Reconfiguring green spaces and rehabilitating
and modernizing the infrastructure of Tineretului Park
Ploiești SGU Ploiești
Proj
ect
Port
folio
The
Inte
grat
ed S
trat
egy
for
the
Gro
wth
Pol
e
i
4
i392

no. Project title tAUs concerned
Project initiator
Maturity degreedocumentation/drafting time)
Strategic document in which it is
included
63. Endowment with toilets in Tineretului Park Ploiești SGU Ploiești
64.
Endowment with urban furniture and landscaping (walkways, pergolas) for the
following parks: Bucov Barrier Public Garden, South Station Public Garden, West 1 Public
Garden, Camelia Public Garden
Ploiești SGU Ploiești
65. Photovoltaic Park in Ploiești Municipality Ploiești SGU Ploiești
66.Execution and installation of artistic elements (Landart) on specific themes of Ploiești in the
parks of the cityPloiești SGU Ploiești
AreA oF interVention: cultural units
67.Creating a cultural /scientific park by relocating
/ arranging the seat of the Oil MuseumPloiești Ploiești
Ploiești Strategy 2007-2025
68.Turning municipal libraries into information
centers with internet connectionPloiești Ploiești
69.
Developing a route with galleries and exhibitions in the central area of the Municipality, in the territory bounded by “Nichita Stănescu” Park,
“Toma Caragiu” Theatre, and the Central Markets (Halele Centrale)
Ploiești Ploiești
70.Consolidating and expanding the concert hall of the “Paul Constantinescu” Philharmonic, Ploiești
/ including indoor and outdoor facilitiesPloiești Ploiești
Auction organized in 2009
71.Polivalent (multifunctional) hall at Patria
CinemaPloiești Ploiești
Modernized in 2011
72.Rearrangement by extension and stacking the building situated in 14 Independence Boulevard,
Ploiești (Puppet Theatre)Ploiești
Puppet Theatre
73.Extending and equipping “Toma Caragiu”
TheatrePloiești
“Toma Caragiu” Theatre, Ploiești
AreA oF interVention: commerce / agrifood markets
74.Rehabilitation and expansion of agrifood
markets in district centersPloiești Ploiești
Ploiești Strategy 2007-2025
75.Revitalization of street commerce in the
pedestrian zone of the centerPloiești Ploiești
AreA oF interVention: sports / leisure facilities
76.
Promoting and supporting the creation of sports and recreation centers in the highly
populated districts of the city, in partnership with the school network by building sports
facilities in green and interstitial district areas (panels basketball, tracks for running, rollers,
skates, etc.)
Ploiești PloieștiPloiești Strategy
2007-2025
393

no. Project title tAUs concerned
Project initiator
Maturity degreedocumentation/drafting time)
Strategic document in which it is
included
77.Rehabilitation and consolidation of Vega
swimming pooPloiești
Municipal Sports Club
Technical expertise
and documen-tations
of approval for intervention
works (D.A.L.I.), LCD for approving
indicators (132/27.04.2011);
land under discussion
with Rompetrol
78.
Developing recreation areas in the Northern district (Camelia Street, Bl D1, in front of
“Nichita Stănescu” High School), the Western district (lezerului Street), and the “May 9th”
(Somes Alley, Bl 9C, “May 9th” Market, Prislop Alley)
Ploiești
79.Building a covered swimming pool - Proposed location: inside the sports complex “Vointa” -
ConpetPloiești
Municipal Sports Club
80.Building a speed skating track - Proposed
location: inside Ploiești HippodromePloiești
Municipal Sports Club
81.Construction of outdoor running track -
Proposed location: inside the Municipal West Park
PloieștiMunicipal
Sports Club
82.
Construction of accommodation facilities for athletes legiTimișed at CSM Ploiești, residing in other localities - Proposed location: inside
Ploiești Hippodrome
PloieștiMunicipal
Sports Club
83.Construction of a 6,000-seat polyvalent hall - Proposed location: inside Municipal West Park
PloieștiMunicipal
Sports Club
84.
Building an indoor ice rink, functional inclusively during summer, for the training of the speed skating section of the Municipal Sports Club,
Ploiești - Proposed location: inside the Municipal West Park
PloieștiMunicipal
Sports Club
AreA oF interVention: public lighting, electrical networks, and it
85. Expanding LED lighting Ploiești Ploiești TRACE P6
86.Introducing underground conduits (burying
cables)Ploiești Ploiești
87.
Installing WI-FI in the following locations: Tineretului Park, Mihai Viteazul Dendrological Park, Aurora Park, Liberty Park, OZN Park,
West 1 Public Garden
Ploiești SGU Ploiești
88.
Video monitoring in the following locations: Tineretului Park, Mihai Viteazul Dendrological Park, Aurora Park, Liberty Park, OZN Park, Bucov Barrier Public Gardem, South Station
Public Garden
Ploiești SGU Ploiești
89.Video monitoring for all paid parkings in Ploiești
MunicipalityPloiești SGU Ploiești
90.Upgrading power supply stations for trams /
trolleys (4 stations)Ploiești
S.C Transport Călători
Express S.A.
Proj
ect
Port
folio
The
Inte
grat
ed S
trat
egy
for
the
Gro
wth
Pol
e
i
4
i394

no. Project title tAUs concerned
Project initiator
Maturity degreedocumentation/drafting time)
Strategic document in which it is
included
91.Installing a professional and high quality
sound system in the concert hall of the “Paul Constantinescu” Philarmonic, Ploiești
Ploiești
“Paul Con-stantinescu” Philarmonic,
Ploiești
92. Installing a WI-FI system inside “Paul
Constantinescu” Philarmonic (entrance hall, side hall, offices, classrooms)
Ploiești
“Paul Con-stantinescu” Philarmonic,
Ploiești
93.
Installation of screens, monitors, and provision of technical equipment needed for supporting conferences, symposia, workshops, etc. - “Paul
Constantinescu” Philharmonic, Ploiești
Ploiești
“Paul Con-stantinescu” Philarmonic,
Ploiești
94.Implementing a video monitoring system for the
North-South Axis of Ploiești MunicipalityPloiești
Local Police, Ploiești
AreA oF interVention: alternative energy
95.Design and installation of solar panels for hot
water at Olimpia Sports HallPloiești
Municipal Sports Club
Energy audit certificate
96.
Using renewable energy sources to ensure thermal energy demand for heating and
preparing hot water for consumption - “Paul Constantinescu” Philharmonic, Ploiești
Ploiești
“Paul Con-stantinescu” Philarmonic,
Ploiești
Sectorial objective C1: increasing the quality of public services
AreA oF interVention: social infrastructure
97. Moderninzing “Cosminele” residence Ploiești PloieștiPloiești (LCD
288/24.07.14)
98. Modernizing social canteens Ploiești Ploiești
Ploiești Strategy 2007-2025
99. Modernizing orphanges Ploiești Ploiești
100Ensuring access to public buildings (ramps,
elevators) for persons with physical disabilitiesPloiești Ploiești
101Construction of buildings with integrated
social functions (housing, social services) in the district of Bereasca
Ploiești Ploiești
102 Establishing of networks of home social services Ploiești Ploiești
103Rehabilitation of the social housing block in 13,
Rafinorilor StreetPloiești Ploiești
104Urban regeneration / CLLD in Mimiu and
Bereasca districtsPloiești Ploiești
105 Day care center for people in difficulty Ploiești ASSC
106 Protected workshops Ploiești ASSC
107 Temporary hosting center Ploiești ASSC
108Center for prevention and combating domestic
violencePloiești ASSC
AreA oF interVention: school infrastructure
395

no. Project title tAUs concerned
Project initiator
Maturity degreedocumentation/drafting time)
Strategic document in which it is
included
109Construction of concert hall, workshops and
gym at “Carmen Sylva”Art High SchoolPloiești
Technical and Investment Directorate
D.U.P., F.S., T.D. + CS +
E.D. + Technicaldocumen-tation for obtaining
building permits (2007-2008)
Ploiești (LCD 288/24.07.14)
110Construction of a school campus at “Virgil
Madgearu” Economic CollegePloiești
Technical and Investment Directorate
D.U.P., F.S., T.D.; E.D.; Technical documen-tation for obtaining
building permits, tender
specifications (2008)
111 Building PEGAS pre-university campus Ploiești PloieștiPloiești Strategy
2007-2025
112
Modernization of sports halls in the following school units - “I. A. Bassarabescu” School,
“Nicolae Simache” School, “Nicolae Iorga” School; “Apostol Andrei” School; “H. M. Berthelot”
School; “I. L. Caragiale” National College, “Nichita Stănescu” National College
PloieștiTechnical and Investment Directorate
113Extending the building of “Al. I. Cuza” National
CollegePloiești
Technical and Investment Directorate
114 Modernizing lyceum units – 6 high schools PloieștiTechnical and Investment Directorate
115 Modernizing gymnasium units - 8 schools PloieștiTechnical and Investment Directorate
116 Extending the building of “Grigore Moisil” School PloieștiTechnical and Investment Directorate
117 Extending the building of “Sfantul Vasile” School PloieștiTechnical and Investment Directorate
118Rehabilitating the annex to “Mihai Viteazul”
National College – 2 Jurnalist Gabi Dobre StreetPloiești
Technical and Investment Directorate
Technical expertise,
geotechnical study, DALI
(2011)
AreA oF interVention: nurseries and kindergartens
Proj
ect
Port
folio
The
Inte
grat
ed S
trat
egy
for
the
Gro
wth
Pol
e
i
4
i396

no. Project title tAUs concerned
Project initiator
Maturity degreedocumentation/drafting time)
Strategic document in which it is
included
119Building a kindergarten with normal schedule on
Strunga Alley (6 groups)Ploiești
Technical and Investment Directorate
F.S., Technical documen-tation for obtaining
building permits, T.D., E.D., (2011) Tender specifi-cations – C.A.
issued and extended, expired
Ploiești (LCD 288/24.07.14)
120Building a kindergarten with normal schedule on
20, Trestioara StreetPloiești Ploiești
F.S.; Technical Design auctioned,
builder designated
121Building a kindergarten with extended schedule
on Petrolului Boulevard (8 groups)Ploiești
Technical and Investment Directorate
F.S.; T.D, E.D., Technical documen-tation for obtaining
building permits,for every field: instalations
(central heating, water connection,
channel connection,
construction,fire safety
scenario)(2011)
Ploiești (LCD 288/24.07.14)
122Modernization of preschool units - 5
kindergartensPloiești
Technical and Investment Directorate
123Modernization of ante-preschool units - 3
nurseriesPloiești
Technical and Investment Directorate
124 Building a kindergarten in 36 Poștei Street PloieștiTechnical and Investment Directorate
AreA oF interVention: health infrastructure
125
Rehabilitation / modernization (buildings and equipment) of specialty ambulatories and facilitate access for people with physical
disabilities
Ploiești Ploiești
Ploiești Strategy 2007-2025
126Rehabilitation / modernization (buildings and equipment) of Contagious Diseases Hospital
Ploiești Ploiești
127Rehabilitation / modernization (buildings and
equipment) of Municipal Hospital no. 1 - SchullerPloiești Ploiești
128Extending and modernizing the building of the
Paedriatic HospitalPloiești Ploiești
F.S. under elaboration
Ploiești Strategy 2007-2025
129Endowing with equipment the Radiotherapy Center (accelerator and annexes) - year 2016
(Municipal Hospital, Ploiești )Ploiești
Municipal Hospital, Ploiești
F.S.
130Building a Radiotherapy Center - year 2015
(Municipal Hospital, Ploiești)Ploiești
Municipal Hospital, Ploiești
F.S.
131Constructing a day hospitalization building –
year 2017 (Municipal Hospital, Ploiești)Ploiești
Municipal Hospital, Ploiești 397

no. Project title tAUs concerned
Project initiator
Maturity degreedocumentation/drafting time)
Strategic document in which it is
included
132MRI equipment - year 2018 (Municipal Hospital, Ploiești)
PloieștiMunicipal Hospital, Ploiești
133
Rehabilitating the facade and cover of the Building A (Department of Internal Medicine
and specialty ambulatory) - year 2015 (Municipal Hospital, Ploiești)
PloieștiMunicipal Hospital, Ploiești
134Consolidating and refunctionalizing the Building A (Oncology Department - stage II) – year 2018
(Municipal Hospital, Ploiești )Ploiești
Municipal Hospital, Ploiești
135Thermal rehabilitation of the Rheumatology
Department – Building V - year 2016 (Municipal Hospital, Ploiești)
PloieștiMunicipal Hospital, Ploiești
136Thermal Rehabilitation of the Recovery Section - Physical medicine and balneology (Building K) -
Year 2016 (Municipal Hospital, Ploiești)Ploiești
Municipal Hospital, Ploiești
AreA oF interVention: City halls and other public function premises
137 Building City Hall premises Ploiești Ploiești F.S. - July 2004Ploiești Strategy
2007-2025
138Consolidation and facade restoration of the building in which the Local Police of Ploiești
works, located on 21, Independence BoulevardPloiești
Local Police, Ploiești
AreA oF interVention: housing construction
139 Completing the Eden district (36 residences for doctors)
Sectorial objective C2: increasing the capacity of lPA
AreA oF interVention: communication and decisional transparency
140Integrated digital communications network for activities related to the local administration, public order, and emergency management
Ploiești Ploiești
Ploiești Strategy 2007-2025
141Informing the population on urban projects and
related urban planning regulationsPloiești Ploiești
142Monitoring the implementation of major
investment projects covered by funds from the public budget by mounting a video camera
Ploiești Ploiești
143Connecting the city halls and the subordinated public institutions to a coordinated system of
public-interest dataPloiești Ploiești
144Informing individuals and businesses about local
taxationPloiești Ploiești
AreA oF interVention: improving the performance of public administration
145Implementing a system of performance
indicators in the institutions providing public services
Ploiești PloieștiPloiești Strategy
2007-2025
146Drafting the Strategy and Action plan in the
energy efficiency sectorPloiești Ploiești TRACE P1
147Strengthening the capacity of the local
administration to manage projects financed from structural funds
Ploiești PloieștiPloiești Strategy
2007-2025
148Strengthening the capacity of the local administration to conclude partnerships
Ploiești PloieștiPloiești Strategy
2007-2025
149Implementing a property evaluation system for a real taxation of properties, according to the
market valuePloiești Ploiești
Ploiești Strategy 2007-2025
Proj
ect
Port
folio
The
Inte
grat
ed S
trat
egy
for
the
Gro
wth
Pol
e
i
4
i398

no. Project title tAUs concerned
Project initiator
Maturity degreedocumentation/drafting time)
Strategic document in which it is
included
150The implementation of mechanisms to
streamline public spending and boost local tax collection
PloieștiLocal Public
Finance Department
Ploiești Strategy 2007-2025
151Continuous training courses and improving the professional qualification of employees working
in the Local Police, PloieștiPloiești
Local Police, Ploiești
Ploiești Strategy 2007-2025
152Providing uniforms, weapons and police
protection means, vehicles, office equipment and furniture - Local Police, Ploiești
PloieștiLocal Police,
PloieștiPloiești Strategy
2007-2025
AreA oF interVention: marketing and advertising
153Elaboration of Ploiești Municipality investment
guidePloiești Ploiești
Ploiești Strategy 2007-2025
Ploiești lPA (operational budget: 289 million eUr)Sectorial objective A1: Supporting a sustainable economic development
AreA oF interVention: industrial parks
1 Attracting investment in green energy sectorAriceștii Rahtivani
Ariceștii Rahtivani
AreA oF interVention: agricultural activities
2Rehabilitation of Leaotu Vechi irrigation canal
for agricultureAriceștii Rahtivani
Ariceștii Rahtivani
Sectorial objective B1: improving territorial connectivity - trAnSPort AnD MoBility SeCtor
AreA oF interVention: road upgrading / repairing
3Upgrade and restoration of access roads and
agricultural exploitation roadsAriceștii Rahtivani
Ariceștii Rahtivani
Sectorial objective B2: Protecting energy resources and the quality of the natural and built environment
AreA oF interVention: thermal energy / gas supply
4 Extending gas supplyAriceștii Rahtivani
Ariceștii Rahtivani
AreA oF interVention: water supply and sewerage
5Extending the water and sewerage networks (Ariceștii Rahtivani and Nedelea localities)
Ariceștii Rahtivani
Ariceștii Rahtivani
AreA oF interVention: built heritage
6Rehabilitating Sf. Nicolae Church in Ariceștii
RahtivaniAriceștii Rahtivani
Ariceștii Rahtivani
AreA oF interVention: public space, space between blocks, playgrounds
7 Building parks and playgrounds for childrenAriceștii Rahtivani
Ariceștii Rahtivani
AreA oF interVention: cultural units
8Rehabilitation of cultural center in Ariceștii
RahtivaniAriceștii Rahtivani
Ariceștii Rahtivani
AreA oF interVention: public lighting, electrical networks, and it
9 Extending the public lightingAriceștii Rahtivani
Ariceștii Rahtivani
Sectorial objective C1: increasing the quality of public services
AreA oF interVention: school infrastructure
10Building a sports hall in Ariceștii Rahtivani
villageAriceștii Rahtivani
Ariceștii Rahtivani
AreA oF interVention: nurseries and kindergartens
11 Building a kindergarten for 50 childrenAriceștii Rahtivani
Ariceștii Rahtivani
399

no. Project title tAUs concerned
Project initiator
Maturity degreedocumentation/drafting time)
Strategic document in which it is
included
AreA oF interVention: health infrastructure
12 Building a micro-polyclinic in Ariceștii RahtivaniAriceștii Rahtivani
Ariceștii Rahtivani
Băicoi lPA (operational budget: 14 million eUr)Sectorial objective A1: Supporting a sustainable economic development
AreA oF interVention: industrial parks
1Building a 6 ha industrial park in the western
part of the city, with access to DN 1 and to the ring road / Livada industrial park
Băicoi Băicoi
Sectorial objective B1: improving territorial connectivity - trAnSPort AnD MoBility SeCtor
AreA oF interVention: accessibility and mobilty
2
Increasing accessibility to and from Băicoi city through the construction of a suspended passage over DN 1, at the intersection with DJ
215
Băicoi BăicoiF.S. under
elaboration
Sustainable Development
Strategy of Băicoi City 2014-2020
3 Building a ring road for Băicoi city - 6 km Băicoi Băicoi Updated Strategy
4
Increasing accessibilty and consolidating traffic safety - setting up a roundabout at the
intersection between DJ 100F and DJ 215 - Lilieşti Center
Băicoi DJ 100F
(Republicii Str. and
Independenţei Str.)
DJ 215 (Infratirii Str. and Dorobanţi
Str.)
F.S. under elaboration
Updated Strategy
5Increasing accessibilty – roundabout at the
intersection between DN 1 and DJ 720
Băicoi - Florești
communeBăicoi Updated Strategy
6Increasing accessibilty – passage over DN 1 at
the intersection with DC 8ABăicoi Băicoi Updated Strategy
AreA oF interVention: road upgrading / repairing
7Rehabilitating interior streets in Băicoi city, affected by public utilities works (water and
sewerage)Băicoi Băicoi
Sustainable Development
Strategy of Băicoi City 2014-2020
8
Rehabilitation and improvement of the communal road DC 8A by restoring the asphalt, bike lanes, developing sidewalks and gutters - DC 8A - section between Mihai Viteazu Street
and DN 1)
Băicoi Băicoi Updated Strategy
9Modernizing agricultural exploitation roads in
view of ensuring accessBăicoi Băicoi Updated Strategy
10Rehabilitation / reconstruction of bridges and
culverts, and arranging a pedestrian area along Dambu creek after its regularization
Băicoi - Dâmbu
and Țintea Districts L=5km
BăicoiDrawing
topographic support
Sustainable Development
Strategy of Băicoi City 2014-2020
AreA oF interVention: traffic safety
11Purchase of equipment for snow removal and
for the maintenance of street cleaningBăicoi Băicoi Updated Strategy
Sectorial objective B2: Protecting energy resources and the quality of the natural and built environment
AreA oF interVention: improving the energy efficiency of the buildings
Proj
ect
Port
folio
The
Inte
grat
ed S
trat
egy
for
the
Gro
wth
Pol
e
i
4
i400

no. Project title tAUs concerned
Project initiator
Maturity degreedocumentation/drafting time)
Strategic document in which it is
included
12Energy rehabilitation of district blocks (40
blocks)Băicoi Băicoi
• F. S. approved by LCD 23/26.
03.2012• Energy audit
• Technical expertise
Updated Strategy
AreA oF interVention: water supply and sewerage
13 Water storage tank – capacity of 5000 c.m. Băicoi Băicoi
14 Rainwater drainage and sewage works Băicoi Băicoi Updated Strategy
15Expansion and modernization of drinking water distribution network and sewerage network in
Dambu, Tufeni, and TinteaBăicoi Băicoi
AreA oF interVention: converting land / brownfields
16The restoration of land plluted with petroleum
products and its reintegration into the agricultural / industrial circuit
Băicoi Băicoi Updated Strategy
17Greening polluted land in the area of Lake Park and turning it into recreational green space -
improving Caragiale Dendrological Park
Băicoi - 87, Republicii Str.
Surface = 118,997 m2
Băicoi
F.S. approved by LCD 64/25.
05.2015 T.D., E.D.
Sustainable Development
Strategy of Băicoi City 2014-2020
AreA oF interVention: seismic risk buildings
18Expert appraisal / retrofitting of public buildings
against seismsBăicoi Băicoi Updated Strategy
AreA oF interVention: public space, space between blocks, playgrounds
19Rehabilitation private apartment blocks in the areas of Lilieşti and Schela, as well as in the
zone of the homes for singlesBăicoi Băicoi
20House infrastructure consolidation and recovery
at 64-66 Lăcrămioarelor Street, affected by landslides
64-66 Lăcrămioa-relor Street
Băicoi
Topogra-phical
support, geotechnical
study, technical expertise
Updated Strategy
21Infrastructure consolidation and recovery in the area of Gladiolelor Street, affected by landslides
Gladiolelor Street
Băicoi
Topogra-phical
support, geotechnical
study, technical expertise
Updated Strategy
AreA oF interVention: cultural units
22Building a cultural, social, and multifunctional
centerBăicoi Băicoi
F.S. under elaboration
Sustainable Development Strategy of Băicoi City 2014-2020
23Rehabilitation, modernization, and endowment
of Lilieşti cultural center4 Dorobanţi
StreetUpdated Strategy
AreA oF interVention: sports / leisure facilities
24Building a school sports hall for the General School Unit no. 3 (with I-VIII classes), Lilieşti
School no. 3 from Lilieşti, 2 Progresul
Street
Topogra-phical
support, geotechnical
study
Sustainable Development
Strategy of Băicoi City 2014-2020
401

no. Project title tAUs concerned
Project initiator
Maturity degreedocumentation/drafting time)
Strategic document in which it is
included
25Building a swimming pool for national and
international competitions
Constantin Cantacuzino School Group, 111 Republicii
Street
Topogra-phical
support, geotechnical
study
Updated Strategy
26Rehabilitation, modernization, and endowment
of Lilieşti sports complex4 Dorobanţi
StreetIdentified location
Sustainable Development
Strategy of Băicoi City 2014-2020
27Rehabilitation, modernization, and endowment
of Tufeni sports complex1 Câmpului
StreetIdentified location
Sustainable Development
Strategy of Băicoi City 2014-2020
28
Development and promotion of the recreational potential of the salt lakes area and the Stelii
Valley baths - accommodation places, sewerage network, and treatment plant
Salt Lakes - Livede area; “Stelii Valley” Baths, 168
Independenţei Street
Băicoi Updated Strategy
AreA oF interVention: public lighting, electrical units, and it
29Stimulating the production of electricity by placing solar lamps for public lighting on the
main thoroughfares of Băicoi city
Băicoi DJ 100F DJ 100E DJ 215
Băicoi
Sustainable Development
Strategy of Băicoi City 2014-2020
30 Introducing urban networks in the underground
Băicoi DJ 100F DJ 100E DJ 215
Băicoi F.S. for DJ 100F
Sustainable Development
Strategy of Băicoi City 2014-2020
AreA oF interVention: alternative energy
31
Introducing advanced technologies in the urban heating system; developing equipment that
uses non-conventional sources for green energy production in public buildings (town hall, schools,
kindergartens)
Băicoi Băicoi Updated Strategy
Sectorial objective C1: increasing the quality of public services
AreA oF interVention: school infrastructure
32
Gym enlargement and rehabilitation, sports field development, the fencing of “Constantin Cantacuzino” Technological High School in the
city of Băicoi, Prahova County
Constantin Cantacuzino School Group, 111 Republicii
Street
Băicoi F.S. approved
Sustainable Development
Strategy of Băicoi City 2014-2020
33
Repairing covers, interior finishing works, sports hall, developing a sports field, fencing “Dumitru Ghenoiu” School, Building A, 19 Unirii Street,
Băicoi city, Prahova County
19 Unirii Street
Băicoi F.S. approved
Sustainable Development
Strategy of Băicoi City 2014-2020
34
Extending, rehabilitating, and modernizing Building C1 - “Dumitru Ghenoiu” School, Building
Wing B, 16 Viilor Street, Băicoi city, Prahova County
16 Viilor Street
Băicoi F.S. approved
Sustainable Development
Strategy of Băicoi City 2014-2020
35
Extending by building afterschool premises, rehabilitating and fencing the Secondary
School in Lilieşti, 2 Progresul Street, Băicoi city, Prahova County
2 Progresul Street
Băicoi F.S. approved
Sustainable Development
Strategy of Băicoi City 2014-2020
36General repairs and upgrading at the Tintea
School with classes I-VIII in Băicoi city, Prahova county
Independenţei Street
Băicoi F.S. approved
Sustainable Development
Strategy of Băicoi City 2014-2020
Proj
ect
Port
folio
The
Inte
grat
ed S
trat
egy
for
the
Gro
wth
Pol
e
i
4
i402

no. Project title tAUs concerned
Project initiator
Maturity degreedocumentation/drafting time)
Strategic document in which it is
included
37
Rehabilitation / modernization / consolidation / endowment / change of destination of the
former Liver Hospital, turning it into Arts and Crafts School
8 Unirii Street
Topogra-phical support, geotechnical
study, technical expertise
Updated Strategy
AreA oF interVention: health infrastructure
38
Thermal rehabilitation / expansion with integrated ambulatory and emergency room / modernization / strengthening the C2 and C3
Wings / Change of roofing at C1 Wing / parking lots and recreation space for the sick, walkways,
lighting / construction of ambulance garage
Băicoi - 1 Spitalului
AlleyBăicoi
F.S. under elaboration
Sustainable Development
Strategy of Băicoi City 2014-2020
39Modernizing / developing / endowing the
medical dispensary in Lilieşti
Lilieşti medical
dispensary, 291 Republicii
Street
Updated Strategy
40Thermal rehabilitation / consolidation /
modernization / development / endowment of the medical dispensary in Țintea
Țintea medical
dispensary, 167
Independenţei Street
Updated Strategy
AreA oF interVention: City halls and other public function premises
41Extension, modernization, and energy
rehabilitation of Băicoi City Hall21 Unirii Street
Băicoi
42Constructing and endowing a new building for
Băicoi City Hall, with P+1 height regime8 Unirii Street
BăicoiF.S. under
elaboration
Sustainable Development
Strategy of Băicoi City 2014-2020
Bărcănești lPA (operational budget: 5.5 million eUr)
Sectorial objective B2: Protecting energy resources and the quality of the natural and built environment
AreA oF interVention: water supply and sewerage
1 Connections to the water system Bărcănești Bărcănești
2Building a sewerage system and a treatment
plant Bărcănești Bărcănești
AreA oF interVention: cultural units
3 Building a cultural center Bărcănești Bărcănești
Berceni lPA (operational budget: 3.5 million eUr)Sectorial objective B1: improving territorial connectivity - trAnSPort AnD MoBility SeCtor
AreA oF interVention: clean public transport
1 Developing bike lanes, DJ 139 Berceni Berceni
2 Placing minibus stations Berceni Berceni
Sectorial objective B2: Protecting energy resources and the quality of natural and built environment
AreA oF interVention: sports / leisure facilities
3 Polyvalent hall in Berceni commune Berceni Berceni
4Building a sports hall based on public-private
partnerhipBerceni Berceni
5Modernization of sports complex, construction
of communal stadiumBerceni Berceni
403

no. Project title tAUs concerned
Project initiator
Maturity degreedocumentation/drafting time)
Strategic document in which it is
included
6 F.S. / T.D. for building a sports field in Dâmbu Berceni Berceni
AreA oF interVention: cultural units
7 Cultural centers rehabilitation Berceni Berceni
AreA oF interVention: thermal energy / gas supply
8 Natural gas supply in Berceni commune Berceni Berceni
AreA oF interVention: water supply and sewerage
9 Water supply in Tineretului Street, Berceni Berceni Berceni
10 F.S. / T.D. water in Moara Nouă locality Berceni Berceni
11Sewerage, culverts, dale ditches, and sidewalks
in Berceni communeBerceni Berceni F.S / T.D.
12 Execution of rainwater disposal channels Berceni Berceni F.S / T.D.
13 Drilling for water well in Berceni - Dâmbu Berceni Berceni
AreA oF interVention: public lighting, electrical networks, and it
14Mounting an electrical transformer in Corlățești,
CătunuBerceni Berceni
15Extending the electrical network in Rafinăriei
StreetBerceni Berceni
16Extending the public lighting in Berceni
communeBerceni Berceni
Sectorial objective C1: increasing the quality of public services
AreA oF interVention: school infrastructure
17 Paving school yards Berceni Berceni
Blejoi lPA (operational budget: 11.1 million eUr)Sectorial objective B1: improving territorial connectivity - trAnSPort AnD MoBility SeCtor
AreA oF interVention: accessibility and mobility
1 Building a road linking DJ 156 to DN 1B Blejoi Blejoi
AreA oF interVention: road modernization / repair
2Upgrading communal roads, including
intersections and bike lanesBlejoi Blejoi
Sectorial objective B2: Protejarea resurselor energetice si a calitatii mediului natural si construit
AreA oF interVention: water supply and sewerage
3Developing and adapting the sewerage network,
including own treatment plantBlejoi Blejoi
AreA oF interVention: parks and green areas
4 Developing green areas / parks Blejoi Blejoi
Sectorial objective C1: increasing the quality of public services
AreA oF interVention: school infrastructure
5 School upgrade (demolition and reconstruction) Blejoi Blejoi
AreA oF interVention: City halls and other public function premises
6 Building new premises for the City Hall Blejoi Blejoi
Boldești–Scăeni lPA (operational budget: 9.6 million eUr)Sectorial objective A2: Supporting the SMe sector, entrepreneurship, and business start-up
AreA oF interVention: support for SMes and business start-ups
1Direct support for microenterprises (processing activities of agricultural and forestry products)
Boldești–Scăeni
Boldești-Scăeni
Proj
ect
Port
folio
The
Inte
grat
ed S
trat
egy
for
the
Gro
wth
Pol
e
i
4
i404

no. Project title tAUs concerned
Project initiator
Maturity degreedocumentation/drafting time)
Strategic document in which it is
included
2Access to credit: guarantee funds (of
companies’ contributions)Boldești-Scăeni
Boldești-Scăeni
3Entrepreneurial consulting (courses, consultancy
centers for project applications)Boldești-Scăeni
Boldești-Scăeni
AreA oF interVention: agricultural activities
4Developing the processing infrastructure for
agri-food productsBoldești-Scăeni
Boldești-Scăeni
AreA oF interVention: touristic infrastructure
5
Creation, development, and modernization of tourism infrastructure for harnessing natural
resources and increasing the quality of tourism services
Boldești-Scăeni
Boldești-Scăeni
Sectorial objective B1: improving territorial connectivity - trAnSPort AnD MoBility SeCtor
AreA oF interVention: road upgrading / repairing
6Placing crosswalk, passenger stations, and
storage lanes on DN 1ABoldești-Scăeni
Boldești-Scăeni
Sectorial objective B2: Protecting energy resources and the quality of the natural and built environment
AreA oF interVention: water supply and sewerage
7 Extending and upgrading sewerage networksBoldești-Scăeni
Boldești-Scăeni
8 Extending and upgrading treatment plant Boldești-Scăeni
Boldești-Scăeni
AreA oF interVention: seismic risk buildings
9Consolidation of residential building on Podgoriei
StreetBoldești-Scăeni
Boldești-Scăeni
AreA oF interVention: parks and green areas
10 AfforestationsBoldești-Scăeni
Boldești-Scăeni
AreA oF interVention: alternative energy
11Renewable energy (harnessing renewable energy resources, upgrading central heating, renewable
fuel)
Boldești-Scăeni
Boldești-Scăeni
Sectorial objective C1: increasing the quality of public services
AreA oF interVention: school infrastructure
12Residential buildings for the youth, for rent,
24UL (2 sections)Boldești-Scăeni
Boldești-Scăeni
13Rehabilitating / modernizing / developing and
endowing social services infrastructureBoldești-Scăeni
Boldești-Scăeni
AreA oF interVention: education and employment
14Improving the access and participation of
vulnerable groups to the education system and labor market
Boldești-Scăeni
Boldești-Scăeni
15Promoting equal opportunities in the labor
marketBoldești-Scăeni
Boldești-Scăeni
16Transnational initiatives on the inclusive labor
marketBoldești-Scăeni
Boldești-Scăeni
17Training and support for enterprises and
employees in view of promoting adaptabilityBoldești-Scăeni
Boldești-Scăeni
18Developing and implementing active
employment measuresBoldești-Scăeni
Boldești-Scăeni
19Promoting long-term sustainability in rural areas in
terms of HR development and employmentBoldești-Scăeni
Boldești-Scăeni
405

no. Project title tAUs concerned
Project initiator
Maturity degreedocumentation/drafting time)
Strategic document in which it is
included
Sectorial objective C2: increasing lPA capacity
AREA OF INTERVENTION: improving the performance of public administration
20Capacity development to improve the service
performance of local administrationBoldești-Scăeni
Boldești-Scăeni
21Improving decision-making at the administrative and political level
Boldești-Scăeni
Boldești-Scăeni
22 Developing and improving electronic public servicesBoldești-Scăeni
Boldești-Scăeni
Brazi lPA (operational budget: 18 million eUr)Sectorial objective B2: Protecting energy resources and the quality of the natural and built environment
AREA OF INTERVENTION: built heritage
1Restoring and arranging Nicolau mansion, Brazii
de Sus villageBrazi Brazi
Application rejected by MA ROP 2007-2013
AREA OF INTERVENTION: sports / leisure facilities
2Construction of a pool complex , swimming
pools, physical therapy pools, annexes, Brazii de Sus village
Brazi Brazi
Bucov lPA (operational budget: 7.8 million eUr)Sectorial objective B1: improving territorial connectivity - trAnSPort AnD MoBility SeCtor
INTERVENTION AREA: accessibility and mobility
1 Building a ring road for Bucov commune Bucov Bucov
AREA OF INTERVENTION: road upgrading / repairing
2Road upgrading / setting up interections /
roundaboutsBucov Bucov
Sectorial objective B2: Protecting energy resources and the quality of the natural and built environment
AREA OF INTERVENTION: water supply and sewerage
3 Extending sewerage network Bucov Bucov
AREA OF INTERVENTION: parks and green areas
4 Landscaping Bucov Park Bucov Bucov
AREA OF INTERVENTION: public lighting, electrical networks, and IT
5Upgrading public lighting (extending LED
network)Bucov Bucov
Sectorial objective C1: increasing the quality of public services
AREA OF INTERVENTION: school infrastructure
6 Upgrading and extending school Bucov Bucov
AREA OF INTERVENTION: housing construction
7 Developing a residential district for youth Bucov Bucov
Dumbrăvești lPA (operational budget: 2.5 million eUr)Sectorial objective A2: Supporting the SMe sector, entrepreneurship, and business start-up
AREA OF INTERVENTION: agricultural activities
1
Development and modernization of fairs and agri-food markets - Arranging areas for
organizing weekly fairs with products from the citizens’ households
Dumbrăvești Dumbrăvești
Proj
ect
Port
folio
The
Inte
grat
ed S
trat
egy
for
the
Gro
wth
Pol
e
i
4
i406

no. Project title tAUs concerned
Project initiator
Maturity degreedocumentation/drafting time)
Strategic document in which it is
included
AREA OF INTERVENTION: tourism infrastructure
2Building tourist base – fishery basins and
recreation basinsDumbrăvești Dumbrăvești
3Developing accommodation and leisure
places for historical tourism - public-private partnership
Dumbrăvești Dumbrăvești
Sectorial objective B1: improving territorial connectivity - trAnSPort AnD MoBility SeCtor
AREA OF INTERVENTION: clean public transport
4Establishing a public transport route on DJ 102 - DC 16 - DN 1 administrative center -
Sfârleanca, Fundeni, and Faget villagesDumbrăvești Dumbrăvești
5Placing waiting stations for public transport -
DJ 102 sectorDumbrăvești Dumbrăvești
AREA OF INTERVENTION: road upgrading / repairing
6 Upgrading communal and village roads Dumbrăvești DumbrăveștiF.S./T.D. 2009-
2011
7Building a bridge over Vărbilău creek for car and
pedestrian traffic – Mălăeștii de Sus villageDumbrăvești Dumbrăvești
Hydro-geotechnical assessment
8Building a bridge over Vărbilău creek for car and
pedestrian traffic – Sfârleanca villageDumbrăvești Dumbrăvești
Hydro-geotechnical assessment
9Building sidewalks along along DJ 102 Ploiești –
Slănic (Dumbrăvești commune)Dumbrăvești Dumbrăvești
10Developing rainwater ditches along DJ 102 Ploiești – Slănic (Dumbrăvești commune)
Dumbrăvești Dumbrăvești
11 Improving roads from outside locality limits Dumbrăvești Dumbrăvești F.S./T.D. 2011
Sectorial objective B2: Protecting energy resources and the quality of the natural and built environment
AREA OF INTERVENTION: thermal energy / gas supply
12Establishment of supply and distribution
system for natural gas in the localityDumbrăvești Dumbrăvești F.S./T.D. 2010
AREA OF INTERVENTION: water supply and sewerage
13The establishment of public wastewater -
sewage and treatment plant - Mălăeștii de Sus village
Dumbrăvești Dumbrăvești F.S./T.D. 2008
14
Ensuring capacity and autonomy with respect to drinking water supply at European standards
- drilling wells, storage and water treatment plants
Dumbrăvești Dumbrăvești
15
Establishing wastewater and sewage public network and water treatment plant -
Dumbrăvești, Mățăeștii de Jos, and Găvănel villages
Dumbrăvești Dumbrăvești
16Establishing wastewater and sewage public
network and water treatment plant – Plopeni village
Dumbrăvești Dumbrăvești
17Establishing wastewater and sewage public
network and water treatment plant – Sfârleanca village
Dumbrăvești Dumbrăvești
AREA OF INTERVENTION: waste management
18Development of selective waste collection
service and implementation of an awareness program
Dumbrăvești Dumbrăvești
407

no. Project title tAUs concerned
Project initiator
Maturity degreedocumentation/drafting time)
Strategic document in which it is
included
AREA OF INTERVENTION: converting lands / brownfields
19Greening contaminated land after closing Plopeni landfill and reintroducing it in the
natural circuit by planting treesDumbrăvești Dumbrăvești
AREA OF INTERVENTION: public space, space between blocks, playgrounds
20Landscaping the civic center – placing a heroes
monumentDumbrăvești Dumbrăvești
AREA OF INTERVENTION: parks and green areas
21Extending green areas through afforestation of less productive and landslide risk lands - 12 ha
in Mălăești areaDumbrăvești Dumbrăvești
22Environmental improvement through
landscaping the park in Găvănel villageDumbrăvești Dumbrăvești F.S./T.D. 2010
AREA OF INTERVENTION: cultural units
23Rehabilitating the building of the former school
in Mălăeștii de Sus and converting it into festivity hall and village museum
Dumbrăvești Dumbrăvești
24Improving the history and archeology museum section in Slănicului Valley with “Decebal and
the six generals” statuary groupDumbrăvești Dumbrăvești
25Landscaping outside areas around the cultural
center – scene, benches, walkways, lighting, service areas for outdoor cultural activities
Dumbrăvești Dumbrăvești
26 Restoring the historical path of the Salt Route Dumbrăvești Dumbrăvești F.S. 2010
AREA OF INTERVENTION: commerce / agri-food markets
27 Building agri-food market Dumbrăvești Dumbrăvești
AREA OF INTERVENTION: sports / leisure facilities
28 Building sports hall in Plopeni village Dumbrăvești Dumbrăvești
29Building a multifunctional sports field in
Dumbrăvești villageDumbrăvești Dumbrăvești
AREA OF INTERVENTION: public lighting, electrical networks, and IT
30Modernization and extention of the public
street lighting system Dumbrăvești Dumbrăvești
AREA OF INTERVENTION: alternative energy
31Increasing the production of renewable energy by installing solar panels on public institutions
in the communeDumbrăvești Dumbrăvești
32Creation of new electricity production
capacities for supplying the public street lighting system
Dumbrăvești Dumbrăvești F.S./T.D. 2011
Sectorial objective C1: increasing the quality of public services
AREA OF INTERVENTION: school infrastructure
33Building a sports hall for the school in
DumbrăveștiDumbrăvești Dumbrăvești F.S./T.D. 2009
34School extension in Plopeni village - computer science lab, library, reading room, medical unit
Dumbrăvești Dumbrăvești
35School extension in Dumbrăvești village -
computer science lab, library, reading room, medical unit
Dumbrăvești Dumbrăvești
AREA OF INTERVENTION: nurseries and kindergartens
36Improving playgrounds and recreation places at
the kindergartens in the localityDumbrăvești Dumbrăvești
Proj
ect
Port
folio
The
Inte
grat
ed S
trat
egy
for
the
Gro
wth
Pol
e
i
4
i408

no. Project title tAUs concerned
Project initiator
Maturity degreedocumentation/drafting time)
Strategic document in which it is
included
AREA OF INTERVENTION: health infrastructure
37Extending, upgrading and endowing
Dumbrăvești dispensary – medical office, dental office, pharmacy
Dumbrăvești Dumbrăvești
AREA OF INTERVENTION: City Halls and other public function premises
38 Building and equipping Locality Hall premises Dumbrăvești Dumbrăvești F.S./T.D. 2011
AREA OF INTERVENTION: housing construction
39Establishing ANL housing complex - statuary group - archeology museum section in Slănic
Valley and complementary buildingsDumbrăvești Dumbrăvești ZUP 2010
40 Housing for the youth, for rent - ANL (180 units) Dumbrăvești Dumbrăvești F.S.
Education programme regarding emergency and safety situations
41Establishment of operational base for
the emergency service - endowing it with firefighting and snow removal equipment
Dumbrăvești Dumbrăvești
Păulești lPA (operational budget: 6.7 million eUr)Sectorial objective B1: improving territorial connectivity - trAnSPort AnD MoBility SeCtor
AREA OF INTERVENTION: road upgrading / repairing
1Sidewalk repairing in Păuleștii Noi – Găgeni,
along DJ 102, on a length of 4,841.2 mPăulești Păulești
2Upraging DS 2236 (extension on Zootehniei
Street), Păulești villagePăulești Păulești
3
Building sidewalk in Găgeni village, along DJ 102, along DJ 102 – Păulești Church, DJ 201 – Găgeni Church – center, DJ 102 – bridge over Stramba
in Cocoșești village
Păulești Păulești
4Upgrading DC 138, Păuleștii Noi – Cocoșești, on
a length of 1670 mPăulești Păulești
5 Bulding exploitation routes Păulești Păulești
6Purchase and installation of street pumps along
DJ 102Păulești Păulești
7Implementing a project for upgrading and
maintaining roads in all villagesPăulești Păulești
AREA OF INTERVENTION: traffic safety
8Extending and upgrading the video monitoring
system in the entire localityPăulești Păulești
Sectorial objective B2: Protecting energy resources and the quality of the natural and built environment
AREA OF INTERVENTION: water supply and sewerage
9 Household sewerage in Găgeni village Păulești Păulești
10Extending the household water system in
Păulești communePăulești Păulești
11Introducing water supply network in the
household area (Păulești, Cocoșești, Găgeni)Păulești Păulești
12Extending the sewerage network and execution
of branchings in the entire communePăulești Păulești
13Design and execution of sewerage in Intex
settlementPăulești Păulești
AREA OF INTERVENTION: parks and green areas
14Landscaping and endowment of parks in all the
villagesPăulești Păulești
409

no. Project title tAUs concerned
Project initiator
Maturity degreedocumentation/drafting time)
Strategic document in which it is
included
AREA OF INTERVENTION: cultural units
15Purchasing T. Socolescu building and turning it
into a memorial housePăulești Păulești
16Equipping multi-functional room in Cocoșești
villagePăulești Păulești
17 Building chappel in Păulești Church Păulești Păulești
18 Developing events hall at the Church in Găgeni Păulești Păulești
19Repair and upgrade works at the Church in
CocoșeștiPăulești Păulești
DOMENIUL DE INTERVENTIE: sports / leisure facilities
20 Execution of mini-football field in Găgeni village Păulești Păulești
21 Upgrading the sports base in Păulești Păulești Păulești
AREA OF INTERVENTION: public lighting, electrical networks, and IT
22Extending public lighting in the commune and in
newly built areasPăulești Păulești
23Upgrading and extending electrical networks, mounting transformer points in every village
Păulești Păulești
24 Wirelles internet in the commune’s central park Păulești Păulești
AREA OF INTERVENTION: alternative energy
25Installing photovoltaic panels on public
institutionsPăulești Păulești
Sectorial objective C1: increasing the quality of public services
AREA OF INTERVENTION: school infrastructure
26 Building school wing with 3 classrooms Păulești Păulești
27 School hall for physical education and sports Păulești Păulești
28Building school wing (3 classrooms and annexes)
at Păulești schoolPăulești Păulești
29School hall for physical education and sports in
PăuleștiPăulești Păulești
30Repair and upgrade works at the school sports
fields in the communePăulești Păulești
31Building a school wing with 2 classrooms at
Găgeni schoolPăulești Păulești
AREA OF INTERVENTION: nurseries and kindergartens
32Developing a kindergarten with extended
programmePăulești Păulești
AREA OF INTERVENTION: housing building
33Building residential complex in partneship with
ANLPăulești Păulești
Sectorial objective C2: increasing the capacity of lPA
AREA OF INTERVENTION: marketing and advertising
34Advertising programme for Păulești commune
for supporting the tourism sector and attracting investors
Păulești Păulești
Plopeni lPA (operational budget: 7.4 million eUr)Sectorial budget B2: Protecting energy resources and the quality of the natural and built environment
AREA OF INTERVENTION: improving the energy efficiency of the buildings
1Thermal rehabilitation of housing blocks (after the establishment of associations of owners)
Plopeni Plopeni
Proj
ect
Port
folio
The
Inte
grat
ed S
trat
egy
for
the
Gro
wth
Pol
e
i
4
i410

no. Project title tAUs concerned
Project initiator
Maturity degreedocumentation/drafting time)
Strategic document in which it is
included
AREA OF INTERVENTION: water supply and sewerage
2 Rehabilitating the sewerage network Plopeni Hidro Prahova
AREA OF INTERVENTION: converting lands / brownfields
3 Development of the plant’s land (brownfield) Plopeni Plopeni
AREA OF INTERVENTION: public lighting, electrical networks, and IT
4 Extending and upgrading the public lighting Plopeni Plopeni
AREA OF INTERVENTION: alternative energy
5Execution of works supplementing traditional heating systems with systems that use solar
energyPlopeni Plopeni
Sectorial objective C1: increasing the quality of public services
AREA OF INTERVENTION: school infrastructure
6Rehabilitation, consolidation, expansion, and
modernization of “Carol I” School with classes I-VIII
Plopeni Plopeni
7Rehabilitation, consolidation, expansion, modernization of Plopeni School Group
Plopeni Plopeni
8Developing a sports hall at the school and a
sports field at the high schoolPlopeni Plopeni
târgșoru Vechi lPA (operational budget: 4.8 million eUr)Sectorial objective A1: Supporting the development of a sustainable economy
AREA OF INTERVENTION: industrial parks
1 Establishing Târgșoru Vechi industrial parkStrejnicu
villageTârgșoru Vechi Project idea
Sectorial objective A2: Supporting the SMe sector, entrepreneurship, and business start-up
AREA OF INTERVENTION: agricultural activities
2 Rehabilitation of irrigation canal - Leaotu VechiTargsor village
Târgșoru Vechi Project idea
3Attracting private investment for still water
bottlingTârgșoru
VechiTârgșoru Vechi
Sectorial objective B1: improving territorial connectivity - trAnSPort AnD MoBility SeCtor
AREA OF INTERVENTION: road upgrading / repairing
4Upgrading local roads in Târgșoru Vechi
commune - 7.8 km
Strejnicu, Târgșoru
Vechi, and Stăncești
Târgșoru Vechi F.S. and T.D.
5 Sidewalk construction in Strejnicu villageStrejnicu
villageTârgșoru Vechi
F.S. and T.D. / 2011
Sectorial objective B2: Protecting energy resources and the quality of the natural and built environment
AREA OF INTERVENTION: thermal energy / gas supply
6 Extending the natural gas distribution network
Strejnicu, Târgșoru
Vechi, and Stăncești
Târgșoru Vechi
AREA OF INTERVENTION: water supply and sewerage
7Building sewerage network (+treatment plant) in 3 villages (Tg. Vechi, Stăncești, Zahanaua)
Târgșoru Vechi
Târgșoru VechiF.S. and T.D. /
2012
8Extending the sewerage network in Strejnicu
villageTârgșoru
VechiTârgșoru Vechi Project idea
411

no. Project title tAUs concerned
Project initiator
Maturity degreedocumentation/drafting time)
Strategic document in which it is
included
AREA OF INTERVENTION: cultural units
9 Construction of recreation parkStrejnicu
villageTârgșoru Vechi Project idea
10 Construction of a polyvalent hallTârgșoru
VechiTârgșoru Vechi
F.S. and T.D. / 2014
11 Setting up a cultural center in StrejnicTârgșoru
VechiTârgșoru Vechi
AREA OF INTERVENTION: sports / leisure facilities
12 Building a track for the AeroclubTârgșoru
VechiTârgșoru Vechi
AREA OF INTERVENTION: public lighting, electrical networks, and IT
13 Extending the electrical network
Strejnicu, Târgșoru
Vechi, and Stăncești
Târgșoru Vechi
14Extending and upgrading the public lighting
systemTârgșoru
VechiTârgșoru Vechi
Sectorial objective C1: increasing the quality of public services
AREA OF INTERVENTION: school infrastructure
15 Building new schoolsTârgșoru
VechiTârgșoru Vechi
AREA OF INTERVENTION: housing building
16Building housing units (400 lots on the public
pasture – approved ZUP)Târgșoru
VechiTârgșoru Vechi
Valea Călugarească lPA (operational budget: 5.6 million eUr)Sectorial objective A2: Supporting the SMe sector, entrepreneurship, and business start-up
AREA OF INTERVENTION: agricultural activities
1
Conacul Matak Superior harnessing and advertising of traditional wines from Valea Călugarească through the oeno-touristic
location Matak Mansion
Valea Călugarească
ICDVV Valea Călugarească
Sectorial objective B1: improving territorial connectivity - trAnSPort AnD MoBility SeCtor
AREA OF INTERVENTION: road upgrading / repairing
2 Upgrading local roadsValea
CălugareascăValea
CălugareascăT.D. in 2014
3Upgrading the communal road in the northern part of the commune, on the “Wine Route”, 10
km
Valea Călugarească
Valea Călugarească
4Building sidewalks in all the villages of the
communeValea
CălugareascăValea
CălugareascăT.D. in 2014
Sectorial objective B2: Protecting energy resources and the quality of the natural and built environment
AREA OF INTERVENTION: thermal energy / gas supply
5Establishing gas distribution network in Coslegi,
Radila, Pantazi, and Dârvari - 20 km Valea
CălugareascăValea
CălugareascăF.S. under
elaboration
AREA OF INTERVENTION: water supply and sewerage
6Modernizing, expanding, and rehabilitating the
water supply systemValea
CălugareascăValea
CălugareascăT.D. in 2014
7Establishing a water suppy system in Dârvari,
Coslegi, Radila villagesValea
CălugareascăValea
CălugareascăT.D. in 2014
8 Upgrading the treatment plantValea
CălugareascăValea
Călugarească
Proj
ect
Port
folio
The
Inte
grat
ed S
trat
egy
for
the
Gro
wth
Pol
e
i
4
i412

no. Project title tAUs concerned
Project initiator
Maturity degreedocumentation/drafting time)
Strategic document in which it is
included
9Establishing a sewerage network in Coslegi, Radila, Pantazi, and Dârvari villages - 10 km
Valea Călugarească
Valea Călugarească
AREA OF INTERVENTION: public space, space between blocks, playgrounds
10Developing green areas and playgrounds for
childrenValea
CălugareascăValea
Călugarească
AREA OF INTERVENTION: cultural units
11Upgrading and rehabilitating the cultural center
in DârvariValea
CălugareascăValea
CălugareascăT.D. in 2015
12Upgrading and rehabilitating the cultural center
in Valea CălugareascăValea
CălugareascăValea
CălugareascăT.D. in 2014
AREA OF INTERVENTION: sports / leisure facilities
13Upgrading and rehabilitating "Chimistul" sports
complex Valea
CălugareascăValea
Călugarească
AREA OF INTERVENTION: public lighting, electrical networks, and IT
14 Extending and upgrading public lightingValea
CălugareascăValea
Călugarească
15Extending the electricity network in areas
without electricityValea
CălugareascăValea
Călugarească
AREA OF INTERVENTION: alternative energy
16Developing new production capacity of
electricity through harnessing solar renewable energy resources
Valea Călugarească
Valea Călugarească
F.S. in 2010
Sectorial objective C1: increasing the quality of publice services
AREA OF INTERVENTION: social infrastructure
17Rehabilitating and upgrading the Residential
Center for singles no. 2 (S+P+4F) and turning it into a social housing center
Valea Călugarească
Valea Călugarească
F.S. and T.D. in 2013
AREA OF INTERVENTION: school infrastructure
18Building a sports hall at the Valea Călugarească
General School with cls.I-VIIIValea
CălugareascăValea
CălugareascăT.D. in 2010
19Rehabilitating 3 schools, 1 kindergarten, and 1
nurseryValea
CălugareascăValea
Călugarească
AREA OF INTERVENTION: health infrastructure
20 Building a human dispensary in Pantazi villageValea
CălugareascăValea
Călugarească
21Rehabilitating and modernizing human
dispensary in Nicovani villageValea
CălugareascăValea
Călugarească
22Rehabilitating and modernizing human
dispensary in Rachieri villageValea
CălugareascăValea
Călugarească
23Rehabilitating and modernizing human
dispensary in Dârvari villageValea
CălugareascăValea
Călugarească
413

415
PArt II: the integrated Strategy for the Growth Pole
5recommendations for improving the
institutional Framework at the level of Ploiești-Prahova Growth Pole in the
2014-2020 Programming Period

5r
ecom
men
dati
ons
The
Inte
grat
ed S
trat
egy
for
the
Gro
wth
Pol
e
i
5
i
recommendations for improving the institutional framework at the level of Ploiești-Prahova Growth Pole in the
2014-2020 programming period
5.1. Background
Growth poles are development engines for a particular region, as outlined in the World Bank’s Growth Poles Report, quoted in the Partnership Agreement as well. Growth Poles Policy – initiated in the 2007-2013 programming period – contributed significantly to the implementation of sustainable urban development and regional development concepts in Romania, and it should be continued and extended in the current programming period, while integrating the lessons learnt from the previous period and setting up development of appropriate coordination and implementation mechanisms.
This view is also shared by the Ministry of European Funds, which mentions in the Reply Note no. 568 / 03.14.2014, addressed to the President of “Ploiești-Prahova Growth Pole IDA”, that “the growth poles’ experience and activity will continue in 2014-2020” under a ROP Priority Axis dedicated to sustainable urban development (Priority Axis no. 4 of the ROP). This axis will offer the possibility that the growth poles finance their integrated urban development strategies by “establishing a mechanism for the correlation of operational programmes in view of optimal processing of projects that are part of such a strategy”.
As well, the Ministry of Regional Development and Public Administration mentions in the Reply Note no. 15 379 / 10.03.2014, addressed to the President of “Ploiești-Prahova Growth Pole IDA”, that the integrated urban development strategies will focus on “solving economic, environmental, climate, and social issues in cities”, while taking into account “the implementation at the level of the Partnership Agreement of a mechanism for the correlation of the ROP 2014-2020 with other operational programmes in order to ensure complementarity through prioritizing at the funding level of the other operational programmes the projects that are part of integrated urban development strategies”. In its position on the development of the Partnership Agreement and Programmes in Romania for the 2014-2020 period (Ref. Ares (2012) 1240252/19/10/2012), the European Commission states that “the support given in 2007 to the 7 growth poles must be continued and expanded” and that “an appropriate level of delegation of management in order to assess requirements and institutional capacities should be considered”. The Integrated Sustainable Urban Development Factsheet mentions, in turn, that the various challenges that urban areas are confronted with require an integrated approach to urban development. Partnership agreements and operational programmes should establish the arrangements for ensuring an integrated approach regarding the use of ESI funds for the sustainable development of urban areas in the broader context of regional development. These investment priorities could be incorporated into the integrated urban development strategies of urban areas (Article 7 of the Regulation on ERDF), which could be accompanied by actions supported by the ESF under its investment priorities (Article 3 of the Regulation on ERDF).
The implementation of sustainable urban development strategies involves a certain degree of delegation to urban authorities [Article 7 (4) and (5) of the Regulation on ERDF]. Given that sustainable urban development interventions can cover different types of cities and urban areas, as defined by Member States, this instrument allows the funding of district-level or sector-level integrated actions up to level of functional areas, such as urban regions or metropolitan areas, including neighboring rural areas. These provisions basically continue the recommendations included in the Toledo Declaration, which promotes an integrated approach towards urban regeneration and revitalization based on multiple criteria, integrated management, participatory governance, and an urban-scale approach of the area. EU Regulation no. 1303/2013 states in Article 36 that “Member States and the Managing Authorities can designate one or more intermediate bodies, including local authorities, regional development bodies or NGOs, to manage and implement an ITI under the fund-specific rules”.
416

In addition, EU Regulation no. 1301/2013 states in Article 7 that ERDF supports urban development through “strategies setting out integrated actions to tackle economic, social, climate, demographic, and environmental challenges affecting urban areas, taking into account the need to promote ties between urban and rural areas”. Sustainable urban development can be achieved through integrated territorial interventions or an operational programme with a dedicated priority axis. Furthermore, each Member State shall establish in its Partnership Agreement, the principles of selection of urban areas where integrated actions have to be implemented for a sustainable urban development, as well as the indicative annual allocation for these actions at national level. In either scenario, at least 5% of ERDF resources allocated at national level under the objective regarding investments for for growth and jobs should be assigned to integrated actions for sustainable urban development, where cities, sub-regional or local bodies responsible for implementing sustainable urban strategies (“urban authorities”) have to perform tasks related to at least the selection of operations in accordance with Article 123 (6) of EU Regulation no. 1303/2013 or, where applicable, in accordance with Article 123 (7) of that Regulation. Subsequently, the MA shall establish, after consultation with the urban authority, the scope of tasks to be performed by urban authorities and related to the management of integrated actions for sustainable urban development. At the initiative of the Commission, the ERDF may support innovative actions in the field of sustainable urban development in accordance with Article 92 (8) of EU Regulation no. 1303/2013.
Regulation no. 1304/2013 states in Article 12 that the ESF can support local development strategies at the community level in urban and rural areas, as provided for in Articles 32, 33, and 34 of EU Regulation no. 1303/2013, as well as territorial pacts and local initiatives for employment, including young people employment, education and social inclusion, alongside with Integrated Territorial Investments (ITI), as referred to in Article 36 of EU Regulation no. 1303/2013. Complementing ERDF interventions, as provided for in Article 7 of EU Regulation no. 1301/2013 of the European Parliament and of the Council, the ESF may support sustainable urban development through strategies setting out integrated actions to tackle the economic, environmental, and social challenges affecting urban areas identified by Member States based on the principles set out in their respective Partnership Agreements. The Partnership Agreement with Romania (Romania 2014RO16M8PA001.1.2) underlines at Section 1A that Romania’s polycentric structure and uniform distribution of urban areas represent an advantage, “the role of urban areas in generating and sustaining economic growth being recognized by designating the most important cities as growth poles”. The Partnership Agreement also mentions that, although cooperation between urban and peri-urban areas for the development of initiatives and public services has been limited due to political divergences, besides the ineffective coordination of strategic projects at regional / county level, the basic principle of growth poles policy is correct and this approach should continue in the 2014-2020 programming period, and its funding should ensure coordination between financing sources.
An important contribution to overcoming these obstacles could have the Functional Working Group for New Approaches, subordinated to the Ministry of European Funds and mentioned in Section 1B of the same Partnership Agreement, and having the role to “harmonize approaches, guide and strengthen capacities, coordinate networks, correlate and prioritize investments, so that interventions from different thematic objectives and programmes jointly contribute to strategic development objectives of the territories concerned”.
The Partnership Agreement states in section 3.1.3./1131 that “the structure for growth poles coordination will be maintained in order to ensure a better connection and correlation between ESI funds and local development strategies and, at the same time, will try to support the improvement of the administrative capacity”. The final evaluation report “Impact Assessment of Priority Axis 1: Supporting the sustainable development of cities – urban growth poles”, conclusion no. 7 recommended that “in the coming period, local authorities should consider strengthening the administrative capacity of local human resources in terms of planning and management of local development strategies. It is also recommended that the role of growth poles’ coordinator at the regional level be increased”, given the fact that, during 2007-2013, the integrated approach to growth poles was better than the approach corresponding to urban development poles and urban centers, which were also supported by Priority Axis 1 of the ROP. The same highlights that the following two functions of the growth pole coordinator were particularly positive and efficient:
• Function of integration between public and non-public actors, i.e. leaning to connect the interests of the local stakeholders involved in the Growth Pole and to promote cooperation and coordination;
• Facilitation function, implemented particularly in the case of public actors, i.e. the coordinator’s role of mediation between central and local authorities involved in the development and implementation of IDP.
417

rec
omm
enda
tion
sT
he In
tegr
ated
Str
ateg
y fo
r th
e G
row
th P
ole
i
5
i
However, the report recommends the assessment of growth poles coordinators’ role in terms of three distinct types of activities, namely:
a. transversal activities, namely providing technical assistance for IUD Strategy (advocacy, monitoring, technical support for public authorities involved in the GP, mediation between Management Authority and Intermediate Bodies);
b. Preparation for submission of projects, i.e. support in terms of project analysis, technical assistance in the selection, evaluation, and contracting phase (compliance and eligibility of projects); development of the project assessment report;
c. implementation phase, meaning assisting beneficiaries on all questions / requests arising during this stage.In the 1st Key Area of Intervention of the Priority Axis no. 1.1 pertaining to TAOP 2007-2013, it is emphasized that support was provided for the “functioning of the office/cabinet of the pole coordinator, which represents a horizontal coordination mechanism of the structural instruments’ interventions for growth poles”. In the same vein, TAOP 2014-2020 “aims to support horizontal issues for all OPs under the ESIF” and may finance “measures regarding horizontal issues for ERDF, CF, and ESF beneficiaries”. Based on the recommendations mentioned in the Position Paper of the European Commission services with reference to the preparation of the Partnership Agreement and operational programmes in Romania for the 2014-2020 period, integrated and efficient technical assistance should be intensified, diversified, and channeled to support ESIF major beneficiaries under the form of helpdesk-type customized guidance, dissemination of standardized and simplified documents, etc.
Within the ROP 2014-2020, Priority Axis no. 12 explicitly provides for the financial support of urban poles coordinators’ structures in order to provide assistance to urban authorities (eg. for the provision of guidelines, best practices guides in matters of sustainable and integrated urban development etc.). The document notes that “direct support to both potential beneficiaries and actual beneficiaries is a precondition for the smooth implementation of the operational programme. For these reasons, extending the framework for direct support will be considered”. As well, “pole coordinators will have broader responsibilities in view of providing support to urban authorities that will implement activities corresponding to the integrated urban development axis”. The programme mentions that “in order to contribute to a polycentric development at national level, the support for the development of major urban centers and urban functional areas will be promoted, alongside with the strengthening of highly urbanized areas, while ensuring optimal basic services to serve medium-sized and small cities”. Their differentiated treatment and the identification of priorities in accordance to needs and local development potential are necessary.
Since the selected thematic objectives for the urban development axis do not cover all key areas for the promotion of a sustainable and comprehensive urban development, projects that are part of integrated urban development strategies will be financed with priority under other priority axes of the ROP or other operational programmes. This will be achieved through the investments correlation mechanism provided for in the Partnership Agreement. The principles of selection of urban areas for the promotion and implementation of integrated actions for sustainable urban development will include “promoting an integrated approach to local development (integrated and interconnected strategies, mobilizing local partnerships, pooling resources from all sources of financing, socio-economic local impact, especially given the surrounding areas and the urbanization process, etc.)”. The mechanism of fund allocation under Priority Axis 4 of the ROP 2014-2020, which is based on predetermined indicative allocations for each county capital, is “needed, on the one hand, for providing a stable and predictable base to encourage planning and ensure the integrated nature of the investments, and, on the other hand, for avoiding the relatively low performance of the urban development approach for the 2007-2013 programming period, resulting from low motivation, significant delays in the preparation of urban development plans and the implementation of related projects, and lack of real integration of investments”.
During the implementation of this project, the World Bank team made several proposals for a possible institutional architecture at the growth pole level. These proposals were discussed with representatives of MA ROP, MEF, South Muntenia RDA, Prahova County Council, and the local authorities of Ploiești municipality. The recommendations in the sections below represent a summary of these discussions. These recommendations have also implied a continuous refinement of the initial proposals, given that, at the time of this report, the national and regional mechanisms for the implementation of Axis 4 “Sustainable Urban Development” of the ROP 2014-2020 are not established yet.
418

Figure 102. The proposed structure of the Ploiești Urban Authority
Directorate for European Funds
Absorption – Prahova County Council
(1)
Directorate for Public Relations/Project Managers Department –
Ploiești Municipality (1)
Ploiești-Prahova Growth Pole IDA
(3)
Technical Directorate – Prahova County Council
(1)Technical and Investment Directorate – Ploiești Municipality
(1)
General Directorate for Urban Development / Chief Architect – Ploiești
Municipality (1)
Ploiești Community Social Services Administration
(1)
Economic Directorate – Ploiești Municipality
(1)
Directorate for Land and Housing
Management - Ploiești Municipality
(1)
5.2. Establishment and operation of the Urban Authority at the level of Ploiești-Prahova Growth Pole
In accordance with the provisions of Article 7 (4) of the ERDF Regulation no. 1301/2013, it is mandatory to involve the bodies who implement the Integrated Urban Development Strategy (IUDS) in the context of sustainable urban development in the implementation and management of urban development funds. This implies that the Managing Authority for the ROP may delegate tasks concerning the management and implementation of specific activities to the bodies (“Urban Authorities”) who implement urban development; it is mandatory to delegate at least the duty of selecting the operations (projects).
In accordance with the provisions of Article 7 of the ERDF Regulation and considering the method of implementing sustainable urban development, both through the 2007-2013 ROP – ¬where Ploiești was selected as a growth pole with financial pre-allocation under Priority Axis no. 1, and through the 2014-2020 ROP – where the eligible beneficiaries are the county seats, the county councils or the IDAs formed around them –, the Urban Authority would most likely be established at the level of Ploiești Municipality, with the involvement of appointed members of the Prahova County Council and of the “Ploiești-Prahova Growth Pole” IDA. Attracting the County Council and the IDA into this structure is essential for representing the interests of all component TAUs of the association and for ensuring its organizational sustainability.
it is recommended that the Urban Authority should include the following categories of experts (this will vary according to the MA-ROP’s final decision on this matter):
• 8 representatives of Ploiești Municipality, nominated by order of the mayor, from various structures of the institution;
• 3 representatives of the “Ploiești-Prahova Growth Pole” IDA – nominated by order of the legal representative of the IDA;
• 2 representatives of Prahova County Council, nominated by order of the president.The World Bank proposal on the structure of Ploiești Urban Authority, based on the analysis of the organizational chart of the institutions concerned, is as follows:
419

rec
omm
enda
tion
sT
he In
tegr
ated
Str
ateg
y fo
r th
e G
row
th P
ole
i
5
i
Optionally, the following people can be invited as observers to the activities of Ploiești Urban Authority: representatives of the legal and procurement departments of the Municipality, of its subordinated units (e.g. hospitals, schools, Urban Management Services, etc.), of the public transport operators, of the utilities operators, of the sectoral IDAs (water and sanitation, waste management) and of the Urban Development Support Structure (UDSS). The members of the Urban Authority will be technical experts (officials / local elected representatives will be excluded).
By delegating the project selection function, Ploiești Urban Authority will be part of the management and control system of the 2014-2020 ROP and will act as a secondary intermediate body, functioning as an economic and technical selection committee. In this context, it will enter into an agreement for the delegation of functions with the MA ROP, and the members of the Urban Authority shall receive support from the Managing Authority (or the consultants selected by it) in order to develop the project selection capacity, through training and information actions. However, the delegation of functions to the Urban Authority will not be accompanied by funds for its operation; such funds will be provided by the municipality / County Council / IDA. The World Bank has proposed the assignation of several monitoring functions for the Urban Authority, in order to ensure a permanent involvement throughout the entire implementation period, and in order to allow the offer of bonuses for working on European projects.
Designating Ploiești Urban Authority as a secondary intermediate body and, thus, including it into the management and control system of the 2014-2020 ROP requires a procedure enabling the Authority to perform the functions delegated by the MA ROP (project selection / prioritization). Meanwhile, supervisory procedures will exist at MA ROP level for the function delegated to the Urban Authorities.
In addition, the “Ploiești-Prahova Growth Pole” IDA will also have the status of potential beneficiary for certain investment priorities under the Priority Axis no. 4 of the 2014-2020 ROP. In this regard, the Mayor of Ploiești will ensure both the involvement of various Municipality directorates and departments in the Urban Authority and the observance of the principle requiring separation of functions, in that the members of the Urban Authority will not be allowed to both prioritize and implement the same projects, according to Article 7 of the ERDF Regulation. A delegation agreement will be signed to this purpose between Ploiești Municipality and the MA ROP, with clear procedures for carrying out the delegated functions.
The actual activity of the Urban Authority will be to develop a supporting document for the financing of interventions from the 2014-2020 ESIF, based on the Integrated Urban Development Strategy of Ploiești-Prahova Growth Pole for the 2014-2020 period. The document will include an extensive list of strategic projects and project files, developed with technical assistance from the World Bank, which will be made available to the Authority by the Growth Pole Coordinator’s Office.
The document will be structured as follows:
a) A brief description of the approach proposed for the use of ESI funds in the 2014-2020 period: explaining how the projects / areas considered for funding under the 2014-2020 ESIF fall within the Integrated Urban Development Strategy (IUDS) of Ploiești-Prahova Growth Pole 2014-2020. It will also explain whether the projects / areas for which funding is requested from the 2014-2020 ESIF are integrated at local or sectoral level (projects integrated from ESIF or integrated with other projects financed or considered for funding under the integrated local development strategy).
b) The operational budget for the 2014-2023 implementation period: the operational budget for the identified metropolitan area TAU/IDA will be drafted based on a methodology proposed by the World Bank (about 420 million EUR for the 2014-2023 period in the case of Ploiești-Prahova Growth Pole).
c) The shortlist of priority projects for the 2014-2023 period: preparing a list of projects for 2014-2023, whose beneficiaries are the Local Public Authorities and whose estimated value is at least twice the operational budget of Ploiești-Prahova Growth Pole for 2014-2023, i.e. 2 x 420 million EUR = 840 million EUR.
d) Explaining the methodology for prioritizing the projects and justifying how they were selected: prioritization of the projects should consider the available sources of funding (with a preference given to projects that can be financed from European funds) and an integrated approach (either at local level – for example, a particular neighborhood or region of Ploiești city, or at sectoral level – for example, mobility).
420

Figure 103. The preparation of the IUDS and Justification Note for the 2014-2020 ESIF-funded interventions
Preparation of the documents
• The IUDS is elaborated by LPA/IDA
• The ROP Monitoring Committee approves the project
selection methodology and criteria
• The Justification Note is elaborated by the Urban
Authority (UA)
➪
the ex-ante evaluation of the iUDS (the fulfillment with the evaluation criteria)
• The LPA/IDA and UA sends the IUDS and the Justification Note to the RDA
(IB) for the ex-ante evaluation• The RDA carries out the ex-ante
evaluation and elaborates the evaluation report
• The IUDS and the Justification Note are censequently revised by the LPA/IDA,
respectively the UA
➪
the approval of the iUDS
• IUDS is approved by the Local/Metropolitan Council
After the South Muntenia RDA has submitted the ex-ante evaluation report, the two documents will be amended accordingly, if there are comments, and the supporting IUDS will be approved by the ruling body of the „Ploiești-Prahova Growth Pole” IDA and by each component TAU.
e) The list of priority projects eligible under Axis 4 of the 2014-2020 ROP: a list of priority projects will be identified, which could be supported by the indicative pre-allocation for Ploiești city (previously communicated by the MA ROP. The World Bank proposed that Ploiești Growth Pole should receive an indicative pre-allocation of 41.95 million EUR), in accordance with the investment priorities covered under this axis. A reserve list of projects will also be identified with a total estimated value equal to maximum 50% of the amount allocated under Axis 4 of the ROP for Ploiești and in accordance with the investment priorities covered under this axis.
f) The list of priority projects / priority areas eligible under other priority axes of the 2014-2020 ROP or other Operational Programmes: according to the provisions of the Partnership Agreement, they will be financed with priority under other priority axes / other operational programmes, through a mechanism of matching and prioritizing the investments set out in the Partnership Agreement.
g) The institutional framework for the selection / implementation and monitoring of priority projects: providing information on Ploiești Urban Authority, on the structure(s) and actors responsible for the implementation of the priority projects in the 2014-2020 ESIF Supporting Document, including the composition of the Project Implementation Unit for each priority project (it is recommended that there be a manager for every 10-15 million EUR), and project monitoring.
Specifically, starting from the unique prioritization methodology adopted by the Monitoring Committee of the Regional Operational Programme (MC ROP) for all county seats and from the project list included in the Integrated Urban Development Strategy (IUDS) of Ploiești-Prahova Growth Pole for 2014-2020, each member of the Urban Authority will apply the criteria from the prioritization methodology and will obtain an individual ranking of priority projects; the final results will be obtained by totaling the scores given by each expert, a task that will be performed by a secretary elected by the members. Based on the final score, various lists of projects will be drafted, to make up the Supporting Document for the financing of 2014-2020 ESIF interventions. One of them will include the eligible projects for the Priority Axis no. 4 of the 2014-2020 ROP. This will include projects amounting to 150% of the indicative financial pre-allocation communicated by the MA ROP for Ploiești city. Additionally, the projects proposed for funding under Priority Axis no. 4 will have to meet at least two thematic objectives of the Europe 2020 strategy, and at least one of them must target the reduction of CO2 emissions.
Once the Urban Authority has completed the Supporting Document, it will send it, together with the Integrated Urban Development Strategy of Ploiești-Prahova Growth Pole for 2014-2020, to the South Muntenia RDA, acting as intermediate body, in order to perform an ex-ante evaluation of the documents to ensure their internal and external consistency, and to check the fulfillment of the minimal admissibility criteria in the grid used by the MA ROP.
421

After their approval by the IDA and the component TAUs, the IUDS and the Supporting Document will be submitted to the MA ROP for simultaneous assessment (to ensure the internal consistency of the two documents), preferably by a joint selection committee – for example the Operational Working Group for New Approaches, subordinated to the Ministry of European Funds. This option is preferable because the two documents will include projects that can be funded from various operational programmes and other sources of funding, and therefore should be designed and evaluated in an integrated manner. If during the evaluation there will be requests for amendments to the documents or clarifications from the evaluators, they will be operated by the Ploiești-Prahova Growth Pole IDA and by the Urban Authority.
The final version of the Supporting Document will be approved by the ruling body of the “Ploiești-Prahova Growth Pole” IDA and by the MA ROP, the next step being the actual preparation of the individual projects prioritized in the document. The process of evaluating, selecting, and contracting individual projects will be similar to the one in the 2007-2013 period, at least for the ROP Priority Axis no. 4; the duties will remain entirely with the MA ROP, which will delegate part of them to RDAs and to contracted external evaluators.
Figure 104. The evaluation of the IUDS and Justification Note for the 2014-2020 ESIF-funded interventions
rec
omm
enda
tion
sT
he In
tegr
ated
Str
ateg
y fo
r th
e G
row
th P
ole
i
5
i
iUDS and the justification note are submitted to the MA• The LPA or IDA submits the documents
• The MA nominates the evaluators
➪
the evaluation committee for iUDS and the justification note• President
• Secretary
• RDA/independent experts
➪
evaluation o the admissibility of the iUDS• Carried out by the MA
• Based on 8 criteria ➪
iUDS with comments• The MA sends comments
• The LPA/IDA revises the strategy and sends it back
➪
iUDS without commentsevaluation of the admissibility of the justification note• Carried out by the MA
• Based on 7 criteria
➪
the justification note with comments• The MA sends comments
• The LPA/IDA revises the Note and sends it back➪
the justification note without comments• The MA approves the Note
• The Note is approved by the Local/Metropolitan Council
• The LPA/IDA prepares the project proposals
• The opinion of the SUDC Office on the project proposals
422

Figure 105. The evaluation of the IUDS and Justification Note for the 2014-2020 ESIF-funded interventions
Clarifications
Project calls• The MA launches calls
for project proposals under Axis no. 4 with continous
submission
• The Applicant (PA/IDA) submits the proposal to
the RDA (IB)
➪
the evaluation committee for Axis no. 4 inside the MA/rDAs (for each investment
priority)• President
• Secretary
• RDA/independent experts
➪
evaluation of the administrative
conformity of the project:
• Carried out by RDAs (IB)
• Based on the criteria of the General Guide
➪
evaluation of the project eligibility
• Carried out by RDAs (IB)
• Based on 8-9 criteria (depending onthe
investment priority)
➪ ➪
notification of the applicant on fulfilling/non-fulfilling the criteria➪ ➪
APProVeD rejeCteD➪
the technical and financial evaluation of
the project• Made by the MA
(independent experts)
• 7 criteria➪
Clarifications➪ ➪
APProVeD rejeCteD
Contracting & implementation
423

rec
omm
enda
tion
sT
he In
tegr
ated
Str
ateg
y fo
r th
e G
row
th P
ole
i
5
i
5.3. Strengthening the administrative capacity of Ploiești Municipality to prepare and implement investment projects
At the level of Ploiești Municipality there is a Directorate of International Relations, under which there is a Project Managers Department, with a total of 10 full-time positions in the organizational chart, dedicated to the management of preparations and implementation; only part of these positions are filled. In the context of the financial crisis, the recruitment of staff in the local public administration was prohibited and the salaries were reduced by 25 %; however, in recent years, the salaries have been restored to the initial amount. The municipality implements a relatively large number of projects with a small number of project managers, each managing 1-3 projects. They are poorly paid, given that the 75 % salary bonus for the staff involved in the implementation of EU funds is granted only at central government level, while at local level it amounts to 30-60%, according to salary classes, depending on the number of projects each expert is involved in.
Given that Ploiești city has an operating budget of over 250 million EUR for the 2014-2023 period, we propose a functional review of the existing structures in the municipality and the establishment of Ploiești Municipality Programs Directorate, made up of:• 1 manager;• 25 project managers;• 3 public procurement experts;• 3 financial management experts;• 1 legal professional;• 2 engineers – civil constructions, public utilities;• 1 architect-town-planner.
Ploiești Municipality Programs Directorate should have at least the following duties:• drafting tender specifications;• drafting service provision and development contracts;• organizing project-themed competitions;• solving public procurement issues;• project management;• post-implementation monitoring;• urban planning and territorial development;• solving legal issues;• financial management.
The World Bank proposed the following short- and medium-term solutions to strengthen the capacity of the program implementation / project management directorates, which is particularly necessary, whereas the newly established Urban Authorities will make redundant a significant number of municipality staff, due to the application of the principle of function segregation:• a functional analysis of the existing program implementation directorates / departments, in order to adapt their staff to the operational budget (financial potential for investments) of the city;• including staff expenses into the category of eligible expenditures for investment projects financed from European funds, particularly in the case of the ROP;• outsourcing some of the project implementation tasks to better paid external experts, in order to relieve their own staff, under the newly approved Law no. 64/2015;• increasing the salary bonuses to 75% for the staff involved in implementing EU-funded projects and also for the members of the Urban Authorities;• granting bonuses / related salary classes to the staff involved in the implementation of EU funded-projects and to the members of the Urban Authority, who will no longer have the right to engage in the project implementation units of the selected projects, according to the provisions of Article 7 of the ERDF Regulation.
424

5.4. Establishment of the South Muntenia Ploiești Urban Development Support Structure (by reorganizing the Ploiești Growth Pole Coordinator’s Office)
The Ploiești Growth Pole Coordinator’s Office had a sound activity in the 2007-2013 programming period, being very supportive to the beneficiaries of ROP funds and other funds. This success is the result of continuous development of the institutional capacity, despite the reduced number of employees, and the higher flexibility in recruiting, training and properly remunerating its own staff, compared to the local public administration sector. From this point of view, in order to meet the objectives undertaken by Romania in the 2014-2020 Partnership Agreement and in ROP 2014-2020 document approved by the European Commission, it is necessary to maintain these structures and staff – who already have a solid experience in working with local actors and in liaising with central level authorities.
The recommendation of the World Bank is to keep and reorganize these structures, bearing in mind the following specific objectives:• tackling the problems related to sustainable urban development for all county seats / IDAs in the region – in the case of the South Muntenia development region, the county seats are: Ploiești, Pitești, Târgoviște, Călărași, Giurgiu, Slobozia, and Alexandria. Ideally, the management structure of the pole coordinator’s office should remain within the growth pole (which has a polarizing role for the rest of the region and where there is a core of already trained and experienced staff, who could immediately take over the tasks related to the new programming period), with representatives or local offices established in every county seat of the region. As such, it will require strengthening the operational capacity of the existing office by hiring additional qualified staff and providing them with continuous training, as well as the adoption by the MA ROP of working procedures for the CDUS;• taking over some helpdesk tasks to assist the beneficiaries in the project design, implementation, and monitoring. The South Muntenia Ploiești UDSS could help, inter alia, with the drafting of specifications and contracts (two stages of the public procurement process that were deficient in the 2007-2013 financial period) for the projects that have been approved for European funding (irrespective of the funding source);• organizing an exchange of experience between the various county seats in the region and in Romania;• the South Muntenia Ploiești UDSS will be part of the South Muntenia RDA structure, but its responsibilities will be distinct from those of the IB ROP within the Agency. In this context, it is advisable that the MA ROP and the South Muntenia RDA should conclude different agreements for the delegation of functions to the two sub-structures that have a different track record and different operational characteristics and functions;• the funding of the South Muntenia Ploiești UDSS, according to 2014-202 ROP document, will be provided from Priority Axis no. 12 – Technical Assistance for the 2014-2020 ROP. Given the proposal that the UDSS should support the beneficiaries in the implementation and correlation of all projects listed in the 2014-2020 ESIF Supporting Document, we recommend that such activities should be funded by signing a quadripartite agreement between the Ministry of Regional Development and Public Administration (MRDPA) – MA ROP, the Ministry of European Funds – MA TAOP (Technical Assistance Operational Programme), the Ministry of Agriculture and Rural Development – MA PNDR (National Rural Development Programme), and the RDAs. Nevertheless, such a document should ideally include all the management authorities which will implement projects at the growth pole’s level (MA-COP, MA-ACOP, MA-LIOP).
The responsibilities of the South Muntenia Ploiești UDSS at the level of the 7 county seats in the region could include:
1. Supporting the development / updating / modification of the programming documents related to the implementation of sustainable urban development in the 2014-2020 periodApproving the Integrated Urban Development Strategy (IUDS) for the 2014-2020 programming period and the Supporting Document for the financing of interventions from the 2014-2020 ESIF, previously granting support to the intercommunity development associations / county seats in drafting and updating these documents.
2. Supporting the Urban Authorities in fulfilling their responsibilities:a) Supporting the creation, accreditation, and functioning of the Urban Authorities, including the implementation of the annual recommendations of the audit missions.b) Supporting the drafting of the Urban Authorities’ internal working procedures for the function delegated by the MA ROP.c) Supporting the Urban Authorities in implementing the power delegation agreements concluded between MA ROP
425

rec
omm
enda
tion
sT
he In
tegr
ated
Str
ateg
y fo
r th
e G
row
th P
ole
i
5
i
and the Urban Authorities.d) Participating, whenever necessary, in the meetings organized by the Urban Authority for following up, coordinating, and correlating the projects listed in the 2014-2020 ESIF Supporting Document, along with Authority members, project managers, consultants, builders, and site supervisors.
3. Supporting the monitoring of the Supporting Document for the funding of interventions from the 2014-2020 eSiFDrafting periodic monitoring reports (quarterly / half-yearly / yearly, as applicable) or ad hoc briefings on the implementation of the Supporting Document for the financing of interventions from the 2014-2020 ESIF, including for priority projects (e.g. project status, compliance with the schedule for drafting / submitting related projects, etc.).
4. Supporting the implementation / monitoring of priority funding projects related to the Supporting Document for the financing of the interventions from the 2014-2020 eSiFa) Preparing approval (pre-verification) reports for the priority projects listed in the Supporting Document for the financing of interventions from the 2014-2020 ESIF before submitting them to the MA/IB.b) Monitoring the progress of priority projects, as well as the achievement of the indicators undertaken in these projects, and supporting the beneficiaries’ implementation of the projects included in the Supporting Document for financing the interventions from the 2014-2020 ESIF.c) Participating in monitoring visits, as an observer.
5. Providing support for the implementation of sustainable urban development during 2014-2020a) Providing a link between the local public authorities or the intercommunity development association formed at county seat level and the other managing authorities and bodies at the level of the other operational programmes funded by the EU between 2014 and 2020, by providing information, organizing meetings, participating in discussions and and work-groups coordination at national level.b) Disseminating information among the relevant actors at the level of the intercommunity development associations / county seats regarding calls for projects / financing opportunities under the 2014-2020 ESIF;c) Establishing a relationship of permanent cooperation and consultation with the local authorities or the intercommunity development association established at county seat level.d) Contributing to / running promotion and information campaigns on the concept of sustainable urban development during 2014-2020.e) Performing any other duties arising from the provisions of the documents relating to sustainable urban development.
426

5.5. Strengthening inter-institutional cooperation and the cooperation of associative structures in Ploiești-Prahova Growth Pole
The “Ploiești-Prahova Growth Pole” IDA, although it was established as early as 2009, has a poor institutional capacity. As we have indicated in the previous sections, during the 2007-2013 programming period this associative structure was rather an artificial vector of investment, designed to attract grants available in the 2007-2013 period under Priority Axis no. 1 of the ROP, without providing other services to its 15 members or to the Prahova County Council. On the other hand, the applicant for most of the investments financed under this axis was Ploiești municipality, even though most of the projects (such as those in the field of mobility – e.g. road passages) impacted or served the metropolitan area. In this context, several TAUs that were members of the association chose to no longer pay the membership fee and expressed their desire to leave this associative structure, being more attracted to the Local Action Groups, which provided direct benefits in the form of grants, albeit of very little value.
In this context, in order to ensure the institutional sustainability of the “Ploiești-Prahova Growth Pole” IDA in the 2014-2020 period, urgent action is needed to develop the institutional capacity of the executive apparatus of the association, through measures such as:• developing and communicating to the members a concrete action plan for 2014-2020, in order to keep them in the associative structure;• joining the Romanian Federation of Metropolitan Areas and Urban Agglomerations and getting actively involved in its activities, including through exchanges of experience with the functional metropolitan areas in Romania (e.g. Oradea, Constanța, Baia Mare, or Iași);• preparing and implementing projects that benefit from grants (e.g. under the Competitiveness Operational Programme, the Human Capital Operational Programme, INTERREG, etc.) for strengthening its own institutional capacity (e.g. training courses, equipment provision, etc.) and providing services to its members (e.g. by organizing information and training sessions, by assisting them in drafting the strategic and spatial planning documents, by joint databases, by promoting tourism and culture, environment, energy efficiency, ICT, etc.);• involving the IDA members in the Urban Authority in order to ensure representation of all members’ interests in the prioritization of investment projects at Ploiești Growth Pole level;• changing the name of the association into “Ploiești Metropolitan Area” IDA, in order to avoid any semantic confusion and to clearly highlight its purpose.
In the medium term, with the amendment of the legislation on land and urban planning, and of the legislation on the organization, operation and financing of the local administration, the Ploiești-Prahova Growth Pole IDA could expand its scope to cover areas such as: land use planning and urban planning, by developing and adopting the Land Use Plan for the Regional Metropolitan Area (updating the existing Land Use Plan for the Inter-Communal and City Territory); preparing and implementing projects supported by grants (currently constrained, in terms of infrastructure, by ownership and subsequent operation issues); or even providing specialized consultancy services for its member TAUs (preparing tender specifications, contracts, assistance during implementation, support for attracting investors, etc.), operating as a genuine Metropolitan Development Agency.
Another major concern in Ploiești-Prahova Growth Pole is public transport, which is set out in detail in the Sustainable Urban Mobility Plan of the Ploiești-Prahova Growth Pole, developed with the support of the MRDPA and the EBRD, to be completed in 2015. Currently, at pole level, there is no metropolitan public transport operator; such services are provided in Ploiești by a public operator whose sole shareholder is the municipality. In the localities of the peri-urban area, the services are provided by various private operators which have obtained transport licenses that are generally valid until 2019. Moreover, such operators were not selected in accordance with the EU Regulation no. 1370/2007, which requires a public services contract (a template for such a contract was already developed by the EBRD), but in accordance with the national law of that time, which was not completely in line with that Regulation.Therefore, if all member TAUs of the Ploiești-Prahova Growth Pole IDA and other localities in Prahova county express their consent, procedures must be launched for the establishment of a Ploiești transport Metropolitan iDA, with a view to conclude – by the year 2019 – a public service contract with a metropolitan operator, on the basis of the transport program which will be developed and adopted. The latter will be in line with Regulation no. 1370/2007 and will set out the obligations of both the transport operator and of the member TAUs, in terms of compensation (subsidies) provided to the operator, given that not all routes tendered for will be profitable.
427

rec
omm
enda
tion
sT
he In
tegr
ated
Str
ateg
y fo
r th
e G
row
th P
ole
i
5
i
Subsequently, the duties of this IDA can be extended, following the model proposed for the Bucharest-Ilfov region and according to the legislative changes at national level, so as to include other powers:• parking lot management in the member TAUs;• supervising the taxi trade;• operation and maintenance of the transport model developed under the Sustainable Urban Mobility Plan;• management of a metropolitan railway transport system;• mobility planning at the level of the Metropolitan Area.
Finally, a priority in terms of interinstitutional cooperation in Prahova County is the continuation of efforts to attract investors. Prahova county has the largest area of authorized industrial parks in Romania; the local authorities – especially the Prahova County Council – have invested significant amounts in their development, and their success in attracting investors is unique nationwide. However, the recent years have seen a reduction in investor interest in the county’s public industrial parks; a case in point in this regard is the new industrial park in the county – located in Bărcănești –, which was established two years ago and has no clients at all.
Therefore, it is recommended to establish and properly financially support an investor relations office, either at the level of Prahova County Council or at the level of S.C. PLOIEȘTI INDUSTRIAL PARC S.A., a company managing the industrial parks subordinated to the County Council; this Office should perform the following functions:• upon request, assisting potential investors with all necessary information for starting a business in Prahova county and providing support during the implementation phase (identification of land, assistance in obtaining approvals, agreements and permits, providing access and utilities – in partnership with the owners of the utility networks, staff recruitment agencies, etc.);• proactively approaching investors by organizing business delegations within the country and abroad, cooperating with foreign embassies, with commercial and state banks, organizing investment forums, participating in specialized fairs and exhibitions, etc.;• cooperating with other structures at national, regional, county, and local level who have duties / powers in attracting investors (government agencies, RDAs, universities, chambers of commerce, etc.);• developing and distributing materials promoting the county as an investment destination;• call-center services for existing and potential investors;• organizing jobs fairs and vocational training courses for professions that are in demand, in partnership with schools and accredited training units;• etc.
428

PloieștiGrowth Pole
the integrated Urban Development Strategy
for
the integrated Urban Development Strategy
2014-2020