Georgia An Integrated Trade Development Strategy
170
November 5, 2003 Document of the World Bank Report No. 27264-GE Georgia An Integrated Trade Development Strategy Poverty Reduction and Economic Management Unit Europe and Central Asia Region Public Disclosure Authorized Public Disclosure Authorized Public Disclosure Authorized Public Disclosure Authorized Public Disclosure Authorized Public Disclosure Authorized Public Disclosure Authorized Public Disclosure Authorized
-
Upload
khangminh22 -
Category
Documents
-
view
1 -
download
0
Transcript of Georgia An Integrated Trade Development Strategy

November 5, 2003
Document of the World BankR
eport No. 27264-G
EG
eorgiaA
n Integrated Trade Developm
ent Strategy
Report No. 27264-GE
GeorgiaAn Integrated Trade Development Strategy
Poverty Reduction and Economic Management UnitEurope and Central Asia Region
Pub
lic D
iscl
osur
e A
utho
rized
Pub
lic D
iscl
osur
e A
utho
rized
Pub
lic D
iscl
osur
e A
utho
rized
Pub
lic D
iscl
osur
e A
utho
rized
Pub
lic D
iscl
osur
e A
utho
rized
Pub
lic D
iscl
osur
e A
utho
rized
Pub
lic D
iscl
osur
e A
utho
rized
Pub
lic D
iscl
osur
e A
utho
rized
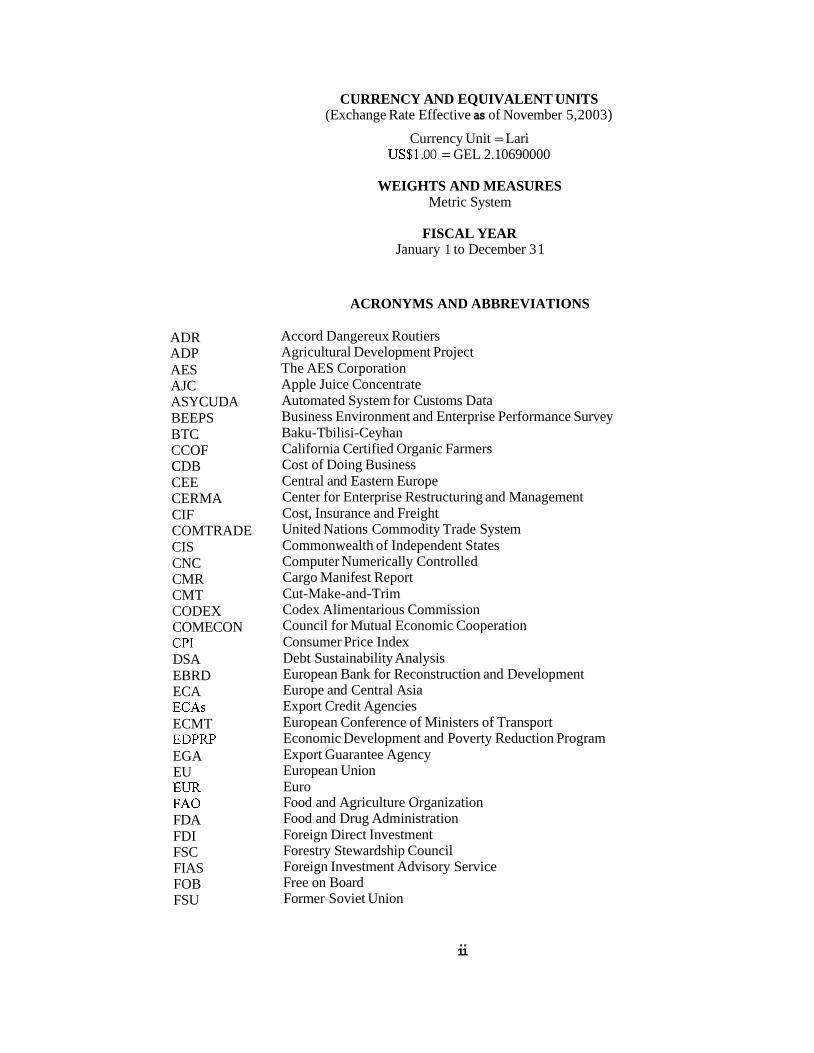
ADR ADP AES AJC ASYCUDA BEEPS BTC CCOF CDB CEE CERMA CIF COMTRADE CIS CNC CMR CMT CODEX COMECON CPI DSA EBRD ECA ECAs ECMT EDPFU' EGA EU EUR FA0 FDA FDI FSC FIAS FOB FSU
CURRENCY AND EQUIVALENT UNITS (Exchange Rate Effective as of November 5,2003)
Currency Unit = Lari US$1 .OO = GEL 2.10690000
WEIGHTS AND MEASURES Metric System
FISCAL YEAR January 1 to December 3 1
ACRONYMS AND ABBREVIATIONS
Accord Dangereux Routiers Agricultural Development Project The AES Corporation Apple Juice Concentrate Automated System for Customs Data Business Environment and Enterprise Performance Survey Baku-Tbilisi-Ceyhan California Certified Organic Farmers Cost of Doing Business Central and Eastern Europe Center for Enterprise Restructuring and Management Cost, Insurance and Freight United Nations Commodity Trade System Commonwealth of Independent States Computer Numerically Controlled Cargo Manifest Report Cut-Make-and-Trim Codex Alimentarious Commission Council for Mutual Economic Cooperation Consumer Price Index Debt Sustainability Analysis European Bank for Reconstruction and Development Europe and Central Asia Export Credit Agencies European Conference of Ministers of Transport Economic Development and Poverty Reduction Program Export Guarantee Agency European Union Euro Food and Agriculture Organization Food and Drug Administration Foreign Direct Investment Forestry Stewardship Council Foreign Investment Advisory Service Free on Board Former Soviet Union
.. 11
FTA GATT GBC GDP GEL GEOPRO GEPA GEPLAC GIC GHA GMP GNFS GOG GOST GSP HACCP IDA IFC IF1 IMF I S 0 IT ITB L/C LDCs LIBOR LPG MDF MEITT MFN MIGA MoF MOT NBG NTA OECD OPIC PCA PER REER SAMTREST SCD SDTR SDS SGHH SGMS SMEs TACIS TBT TEU TIR
Free Trade Agreement General Agreement o f Tariffs and Trade Georgian Business Confederation Gross Domestic Product Georgian Lari Georgian Pro-Committee for Trade and Transport Facilitation Georgian Export Promotion Agency Georgian-European Policy and Legal Advice Center Georgian Investment Council Georgia Hardwoods Association Good Manufacturing Practice Goods and Non-Factor Services Government of Georgia Gosudarstrennyi Standarty-ex-Soviet System of Standards Generalized System o f Preferences Hazard Analysis o f Critical Control Points International Development Association International Finance Corporation International Financial Institution International Monetary Fund International Standard Organization Information Technology Internationale Tourismus - Borse Letter o f Credit Less Developed Countries London Inter Bank Offering Rate Liquefied Petroleum Gas Medium Density Fiberboard Ministry o f Economy, Industry, Trade and Tourism Most-Favored Nation Multilateral Investment Guarantee Agency Ministry o f Finance Ministry o f Transport National Bank o f Georgia National Tourism Authority Organization for Economic Cooperation and Development Overseas Private Investment Corporation Partnership and Cooperation Agreement Public Expenditure Review Real Effective Exchange Rate State Industry Corporation for Viticulture and Winemaking State Customs Department State Department for Tourism and Resorts State Department o f Statistics Survey o f Georgian Household Agreement on International Railway Freight Communications Small and Medium Enterprises Technical Assistance to the Commonwealth o f Independent States Technical Barriers to Trade Twenty-foot Equivalent Unit Transport International Routier
... 111

TLE TRACECA TRIPS TS TTF UAE UNCTAD UNDP USAID VAT voc WTM WTO
Task Level Efficiency Transport Corridor Europe, Caucasus, Central Asia Trade-Related Intellectual Property Rights Transit Service Trade and Transport Facilitation United Arab Emirates United Nations Conference on Trade and Development United Nations Development Program United States Agency for International Development Value Added Tax Vehicle Operating Cost World Travel Market World Trade Organization
Country Director: Donna Dowsett-Coirolo Sector Director: Cheryl W. Gray Sector Manager: Samuel Otoo
i v
CONTENTS
.. EXECUTIVE SUMMARY .............................................................................................................. vi1
CHAPTER 1 . Macroeconomic Setting .............................................................................................. 1
Stabilization and Structural Reforms .............................................................. 1 The Economy ................................................................................................... 3 Poverty ............................................................................................................. 5
International Price Competitiveness ...................................................................... 6 The Business Climate ............................................................................................ 8
Recent Economic Developments ........................................................................... 1
CHAPTER 2 .
CHAPTER 3 .
CHAPTER 4 .
Trade and Investment Performance ....................................................................... 11 External Trade ..................................................................................................... 11
Merchandise Trade. ....................................................................................... 1 1 Trade in Services ..................................................................................
Private Income and Transfers ....................................................................... 16 Foreign Direct Investment (FDI) Flows ...............................
Trade Policy and Market Access ............................................................................ -18 The Trade Regime ................................................................................................ 18
Import Regime ................................ ......................................................... 18
The Investment Regime ................
Free Trade Agreements with CIS Countries .............................. Market Access to Non-CIS Countries. ...............
Georgia’s Accession to the WTO ................................................ Post-Accession Issues ...........................................................
Export Regime ...................................................
Terms of Market Access ....................................
.................... 23 Relations with the WTO ....................................
Trade and Investment Related Institutions ........................................................... 26 Conclusion ........................................................................................................... 28
Transport and Trade Facilitation in Georgia ........................................................ 29 International Transport Analysis .......................................................................... 29
Transport Sector ......... ............................................................................. 29
Explanatory Factorsfor Excess Transport Costs ......................
Current Transit .................................................................. The Future of Transit ......................................... West-East Transit ............................... ................................... 36 East- West Transit .................................................................. ........ 37 Potential Impact of Conflict Resolutions in the Region ........................... 37
Proposed Strategy and Recommendations ........................... ........................... 38 Institutional Development o f Border Agencies .................................................... 38
Transport Costs for Tr and Transit through Georgia ..........
Current and Potential Transit ............................................................................... 35 ...
..............
Implementation of Customs Reform ............. ........ ........... . 38 Upgrading Transport Infrastructure ..................................................................... 41
V
CHAPTER 5 . Finance Support Services ......................................................................................... 42 The Financial System ........................................................................................... 42
The Banking Sector ........................................................................................ 43 Export Finance ..................................................................................................... 47
Government’s Initiatives to Increase Access to Finance ............................... 48 Conclusion ........................................................................................................... 50
CHAPTER 6 . Agro-Food Exports ................................................................................................... 51 Introduction .......................................................................................................... 51 Wine Industry ....................................................................................................... 52
Grape Supply ...................................... ................................ 53 ............................................... 55
.............................. 56 ................................................................. 57
Hazelnut Sector .................................................................................................... 59
Number and Size of Vintners Industrial Efficiency .............
Production ...................................................................................
Markets .................................... .............................................. The Role of Government ..............................................
Industry Efficiency., ........................... ...........................
Processed Horticultural Products ......................................................................... 64 Crop Production ............................................................................................ 64 Industry Efficiency ....................................................................... Markets ........................................................................... ........................... 66 The Role of Government ................................................. ........................... 67
Strategic Orientation for Georgian Agribusiness ................................................. 68
Light Manufacturing ................................................................................................ 70 Garments Industry ................................................................................................ 70
CHAPTER 7 . Industry Characteristics ..................................................... Productivity .................................................
Wood Processing Industry ........................................ Other Constraints ...............................................
Industry Characteristics ............
Access to Inputs and Equipment .......... Productivity and Market Segment . A Strategy for the Wood Industry .. Government Policy: Access to Timber and Developing Strategic Marketing and Produ
Challenges in Realizing Opport ....................... 75
Raising Eficiency at the Firm Level ...........
CHAPTER 8 . Mining and Mineral-Based Exports ....................................................................... 84 Industrial Minerals ............................................................................................... 84
Export Opportunities and Proven Reserves .... ................................ 84 Upstream Government Policy ......................... ........................... 84 Downstream Constraints .................................
Natural Stone: Decorative and Construction ....................................................... 86 Access to Raw Material ................................................................................. 87 Technology ................................................................................. Marketing and Connections with Foreign Investors ................................ 88
vi
CHAPTER 9 . Services Exports .................................. . ............................ ....... ................................ 89 Information Technology ...................................................................................... 89
Labor .......................................................................................... Intellectual Property Rights .................................................
........................................ ...................................... 91 nd Administration .....................................
Engineering Services ........................................................................................... 92
Technology and Standards .. Corruption ........................... ..................................... ........................... 94 Tax Policy and Administration ...................................................................... 94
Labor ............................................................................................................. 93 ..................................................................... 93
CHAPTER 10 . Tourism ................................................................................................................ 96 Tourism to Georgia .............................................................................................. 96 Opportunities for Tourism Growth ...................................................................... 97 Cross-cutting Barriers to Export Growth ............................................................. 97 Barriers Specific to the Tourism Industry ............................................................ 98 A Strategy for Tourism Development ................................................................ 102
Target Markets .............................. ..................................... 102 Entrepreneur Support ................................................................ National Tourism Marketing Authority .......................... Destination Marketing ................... Accommodation ............ .................................................. Attractions .......... ............................... ................... 104 Information .................................................................................................. 105 Quality ......................................................................................................... 105 Donor Co.ordination ..................................................... .................... 105
CHAPTER 11 . Trade and Poverty .................................................................................................. 106 Introduction ....................................................................................................... 106 Poverty in Georgia ............................................................................................. 106 Sources o f Household Income ........................................................................... 107
Labor Market ............................................................................................... 108 Internal Market Integration ................................................................................ 110 Institutional Structures to Support Smallholder Agriculture ............................. 112
Corruption ................................................................................................... 113 Rural Roads ................................................................................................. 114 Employment ................................................................................................. 115
Conclusion ......................................................................................................... 117
Map IBRD
vii

Tables
Table 1.1 Table 1.2 Table 1.3 Table 2.1 Table 2.2 Table 2.3 Table 2.4 Table 2.5 Table 2.6 Table 2.7 Table 3.1 Table 3.2 Table 4.1 Table 4.2 Table 4.3 Table 4.4
Table 4.5 Table 5.1 Table 5.2 Table 5.3 Table 5.4 Table 5.5 Table 6.1 Table 6.2 Table 6.3 Table 6.4 Table 6.5 Table 6.6 Table 6.7
Table 7.1 Table 7.2 Table 7.3 Table 7.4 Table 7.5 Table 7.6 Table 7.7 Table 7.8 Table 7.9 Table 7.10 Table 8.1 Table 10.1 Table 10.2 Table 11.1 Table 11.2 Table 11.3 Table 11.4 Table 11.5
Georgia: Selected Macroeconomic Indicators ............................................................. 2 Georgia: Share ofthe Shadow Economy ..................................................................... 5 Georgia: Key Non-tradable Costs, 1996-2002 ............................................................ 7 General Trade Statistics - Comparison of Data Sources ............................................ 11 Georgia: Trade Balance, 1994-2002 .......................................................................... 12 Georgia: Major Export Categories ............................................................................ 13 Georgia: Major Import Categories ............................................................................ 14 Georgia: Transport and Travel Services .................................................................... 15 Georgia: Foreign Direct Investment .......................................................................... 15 Georgia: Private Income and Transfers ..................................................................... 17 Georgia: 2003 Import Tariff Schedule ...................................................................... 19
Transport Network in Georgia 1989-2000 ................................................................. 29 Freight Transport Indicators 1997-2001 for Georgia ................................................. 30 Port Tariffs on Dry Cargoes in Traceca and Other Countries .................................... 31 Indicative Time and Money Expenditures to Move One Container (TEU)
Indicative Logistical Cost for a TEU Container by Road from Poti to Armenia ....... 34 Georgia: Monetary Indicators .................................................................................... 44
Georgia: Taxation o f Imports, 1997-2001 ................................................................. 20
by RoadRail ............................................................................................................... 32
Georgia: Structure o f Lending by Sectors ................................................................. 45 Georgia: Average Interest Rates ................................................................................ 46 Georgia: Profit Margins of Commercial Banks ......................................................... 46 Georgia: Maturity o f Bank Loans .............................................................................. 47 Agro-Foodmeverage Export Trends, 1997 to 2001 ................................................... 52 Grape Yield Comparison ............................................................................................ 55 Comparative Efficiency in Georgian Wine Production .............................................. 55 Hazelnut Price History ............................................................................................... 61 Comparative Production Cash Costs o f Hazelnuts ..................................................... 61 Task Level Efficiency & Sales per Employee ............................................................ 61
Georgian Garments Exports 1999-2001 ..................................................................... 70
Apply Juice Concentrate Manufacturing Task Level Efficiency & Sales per Employee ................................................................................................ 65
Relative Competitiveness of Georgia’s Garments Industry ...................................... -72 Romania and Georgia’s Exports o f Wood Products ................................................... 74 Added Value for Wood Products’ Exports ................................................................. 74 Structure of the Wood Sector ..................................................................................... 75 Typical Cost o f Access to Timber .............................................................................. 76 Timber Exports from Georgia (FOB, 1999) ............................................................... 78 Productivity in International Furniture Making Firms ............................................... 78 Productivity in Georgian Firms .................................................................................. 78 Prices Obtained for Wooden Products ........................................................................ 79 Stone Production in the Soviet Period ........................................................................ 86 Sources of Tourists in Georgia ................................................................................... 96 Tourism Budgets and Staffing o f European Countries - 1999 ................................... 99 Change in Poverty between 1997 and 2000 ............................................................. 107 Percent of Individuals with Calorie intake below 1, 800 kcal/day ............................ 107 Georgia: Wage Employment ................................................................................... 110 Self-subsistence Rates in Rural Georgia .................................................................. 111 Agricultural Area Sown by Agricultural Enterprises (‘000 o f ha’s) ........................ 112
vii i

Table 11.6 Table 1 1.7
Figure 1.1 Figure 1.2 Figure 1.3 Figure 1.4 Figure 1.5 Figure 1.6 Figure 1.7 Figure 1.8 Figure 2.1 Figure 2.2 Figure 2.3 Figure 2.4 Figure 5.1
Figure 5.2 Figure 5.3 Figure 5.4 Figure 6.1 Figure 6.2 Figure 6.3 Figure 6.4 Figure 11.1 Figure 11.2 Figure 11.3 Figure 11.4
Box 1 . Box 4.1 Box 4.2 Box 4.3 Box 5.1 Box 7.1
Comparison ofthe Road Network Across the CIS7 in 1999 .................................... 115 Nominal Wage Rates and Wage Rates as a percent o f Poverty Line by Industry .... 1 16
Figures
Georgia: Index of Real GDP and Exports to GDP ...................................................... 4 Georgia: Index of Sectoral Growth ............................................................................. 4
Georgia: Index of Real Exchange Rate ....................................................................... 7 Georgia: Perceptions of the Business Climate. 2002 ................................................... 9
Georgia: Employment by Economic Activity (1 999) .................................................. 6
Share of Annual Sales Reported for Tax Purposes. 2002 ............................................. 9 Share o f Annual Sales Paid in Bribes, 2002 ................................................................. 9 Perception of Major Obstacles to Business Growth, 2002 ......................................... 10 Georgia: Exports by Country Groups ......................................................................... 12 Georgia: Imports by Country Groups ........................................................................ 12 Average FDI Per Capita Over 1992 - 200 1 ............................................................... 16 Georgia: Private Income, Transfers, and FDI ............................................................ 16 Banking Sector Development: Cross Country Comparison in percentage o f GDP (2001) ...................................................................................... 42 Number o f Banks in Georgia, 1993-2002 .................................................................. 43 Level o f Bank Intermediation in Georgia, 1996-2002 ................................................ 43 The Spreads Charged by Georgian Commercial Banks ............................................. 46
Grapes used in Wine & Spirits Production in Georgia, 1990 - 2002 ......................... 54 Russian Wine Import Trends ...................................................................................... 57 Hazelnut In-Shell Production Output in Georgia, 1998-2001 .................................... 60 Sources o f Income for a Georgian Household: 1997-2000 ..................................... 108 Sources o f Income Across National Quintiles in 2000 ............................................. 108 Employment by Economic Activity, Georgia (1 999) ............................................... 109 Poverty Among Rural Landowners and Poor Access to Markets by Regions ......... 111
Georgia’s Agro/Food Imports and Exports ................................................................ 52
Boxes
Key Steps o f Reform Program in Georgia .................................................................... 3 The Official and Unofficial Costs o f Importing to Georgia ....................................... 33 Trade and Transport Facilitation Program in Southeast Europe ................................ 39 Creation o f a Transit Service Unit: An Option for Discussion .................................. 40 Georgia: Trade Financing Facilities .......................................................................... 49 Cost-Sharing Technology Schemes ............................................................................ 82
ix
Annexes
Annex 1.1 Annex 1.2 Annex 1.3 Annex 1.4 Annex 2.1 Annex 2.2 Annex 2.3 Annex 2.4 Annex 2.5 Annex 2.6 Annex 2.7 Annex 3.1 Annex 4
Annex 5
Georgia: Gross Domestic Product Structure Georgia: Index o f Gross Domestic Product, in constant prices Georgia: Employment by Economic Activity 1980-1999 Index o f Real Exchange Rate, Foreign CurrencyILari Georgia: Major Export Categories Georgia: Major Import Categories Georgia: Geographic Distribution o f Exports Georgia: Geographic Distribution o f Imports Georgia: Exports and Imports by Country Group Georgia: Total Services Georgia: Income and Transfers Donor Activities on Trade and Private Sector Development in Georgia Main Ports in Georgia A. PortofPoti Table 4A. 1 : Statistical Data for the Port o f Poti in 1999-200 1 Table 4A.2: Turnover o f Poti Port 1999-2002 Table 4A.3: Poti Port Transit Distribution B. Port o f Batumi Attachment 4.1. Map of Existing and Proposed Pipelines Attachment 4.2. Turkish Railways and Ports Export Credit Agencies 1. Working Capital Facility 2. Export Performance Insurance Facility 3. Credit Insurance Facility 4. Political Risk Insurance Facility
X
Acknowledgements
This report was prepared by Rocio Castro (Task Team Leader) based on the findings of a World Bank mission which took place in November 2002. The mission interviewed 65 Georgian firms. The report reflects the contributions of Tyler Biggs (coordinator o f firm-level interviews), Gerald Tyler, David Neubert, Sean Browne (Consultants), who elaborated the industry case studies presented in Chapters 6- 10. Contributions were also received from Afsaneh Sedghi (Macro and Trade, Investment Flows), Sergo Vashakmadze (Privatization), Evgeny Polyakov (Trade Policy and Market Access), Ramin Shojai (Financial Support Services), Gerald Ollivier and Gevorg Sargsyan (Trade and Transport Facilitation); Ihsan Ajwad, Stephen Miller (Trade and Poverty), and Steve Jaffee (Agro-business and Standards). The Peer Reviewer was Jeffrey D. Lewis. Dolly Teju and Zakia Nekaien-Nowrouz assisted in the production of the report and Richard Carroll provided editorial support.
The team wishes to thank CERMA and the Georgian Exporters’ Association for their assistance in conducting the firm-level interviews, as well as N ia Sharashidze who helped coordinate the mission’s work and compile relevant statistics.
The report was disseminated and discussed at a workshop held in Tbilisi, Georgia, on September 29, 2003 with the participation of government officials, the private sector, and NGOs. The team would like to thank the staff o f the World Bank Country Office in Georgia for their assistance in organizing the workshop.
x i
Executive Summary
Introduction
1. Georgia i s a small transition economy with a population o f fewer than 5 mil l ion people and a per- capita GDP o f US$700. In Soviet times, Georgia exported agncultural and energy-intensive industrial products to the former Soviet Union (FSU) and was a popular tourist destination for the region. After independence in 1991, the outbreak of civi l war, the loss o f preferential access to FSU markets and o f large budget transfers led to an economic collapse. Output fe l l by 70 percent and exports by 90 percent', the worst decline suffered by any transition economy.
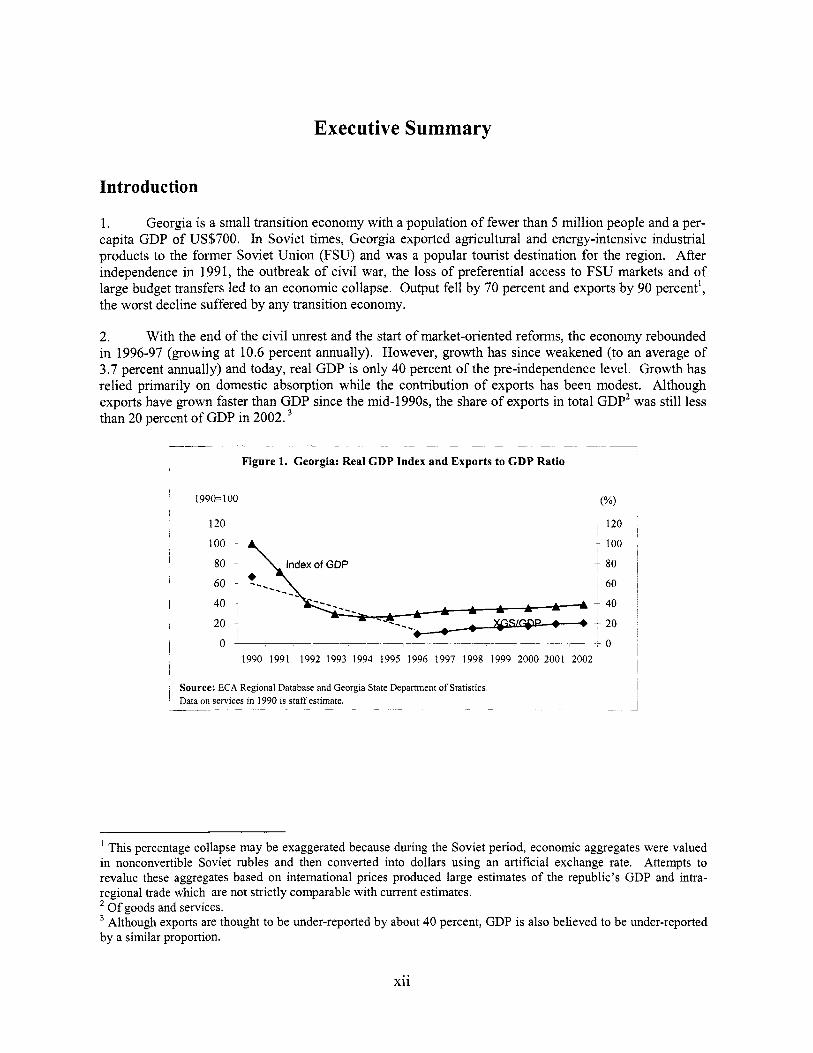
2. With the end o f the civi l unrest and the start o f market-oriented reforms, the economy rebounded in 1996-97 (growing at 10.6 percent annually). However, growth has since weakened (to an average o f 3.7 percent annually) and today, real GDP i s only 40 percent o f the pre-independence level. Growth has rel ied primarily on domestic absorption while the contribution o f exports has been modest. Although exports have grown faster than GDP since the mid-l990s, the share o f exports in total GDP2 was st i l l less than 20 percent o f GDP in 2002.
Figure 1. Georgia: Real GDP Index and Exports to GDP Ratio I I
1990= 100 ("/.I
80 80
r 60
I - 40
I 20 7
I
40 -I
I 7 0 -~ ________.- 0 1990 1991 1992 1993 1994 1995 1996 1997 1998 1999 2000 2001 2002
Source: ECA Regional Database and Georgia State Department o f Statistics ' Data on services in 1990 i s staff estimate.
' This percentage collapse may b e exaggerated because during the Soviet period, economic aggregates were valued in nonconvertible Soviet rubles and then converted into dollars using an art i f ic ial exchange rate. Attempts to revalue these aggregates based o n international prices produced large estimates o f the republic's GDP and intra- regional trade which are not strictly comparable with current estimates.
O f goods and services. Although exports are thought to b e under-reported by about 40 percent, GDP i s also believed to be under-reported
by a similar proportion.
x i i

3. The initial fal l in output and the recent modest economic growth have led to a severe decline in welfare. In particular, agriculture and industry: both traditional mainstays o f export activity and important sources o f employment have virtually stagnated following their post-independence collapse. Georgia’s annual income per-capita i s 56 percent below the pre-independence level, unemployment rates are high (16 percent in 2001) and many Georgians are underemployed. The incidence o f poverty has increased from 14 percent o f the population in 1997 to 23 percent in 2001 .’ Moreover, inequality has also increased over the period. Georgia needs to achieve higher economic growth rates to reduce poverty and improve the welfare o f i t s population. Given the small size o f the domestic market, sustained high growth rates w i l l only be achieved through a stronger expansion in export activities, especially o f those in which Georgia has a comparative advantage and have the potential to generate new job opportunities, such as agro-processing.6
4. This report examines the opportunities for and constraints to achieving export-based economic growth in Georgia. It analyzes key aspects o f both the internal and external environment, including macroeconomic risks, business environment issues, market access, transport and trade facilitation. An important consideration in the analysis, i s the scope for enhancing the participation o f the rural and lower income segments o f the population in both domestic and external trade. Based on this comprehensive analysis a medium term program o f actions i s developed and presented for Government consideration. An important methodological innovation i s the use o f qualitative and quantitative information obtained from interviews with 65 f i rms. These firms were selected from sectors where Georgia appears to have a comparative such as agro-processing (hazelnuts, horticulture and wine); light manufacturing (garments and wood processing); industrial minerals and stone processing; information technology and engineering; and tourism. The firm level interviews were used to gather qualitative information on the constraints faced by firms and, to the extent possible, quantitative data (e.g., cost structures) for the purpose o f comparing firm performance with international competitors.
Opportunities and Constraints to Export Development
5. Georgia i s well endowed with natural resources such as forests, minerals, fert i le agricultural lands, scenic beauty, good climatic conditions. Unlike other low-income countries outside the region, Georgia has a well educated and relatively low-cost labor force which could allow it to be competitive in producing high value goods and services.’ In addition, while much o f the country‘s physical capital base has depreciated, there are s t i l l equipment and facilities that can be used in export activities. Georgia also has significant transportation infrastructure facilities and i s located close to important regional and high- income European markets. Moreover, being the most direct link between the Black Sea and the Caspian Sea and the Central Asian countries, Georgia has the potential to become a regional transit hub, particularly for rapidly growing o i l producing countries such as Azerbaijan and Kazakhstan.
In the Soviet period, mining activities contributed about 10 percent o f output and for some towns was the major source o f income and employment.
While the incidence of poverty i s relatively low, it i s estimated that 60 percent o f the population i s at risk o f falling into poverty at least once during the year.
There i s some, yet limited potential for import substitution in a number o f industries (Le., food processing) which could provide a platform for competitive exports. ’ Georgia’s enrollment rates in basic education are almost universal, and while enrollment rates in secondary and tertiary education are declining they are s t i l l relatively high. In addition, the average wage for a semi-killed /skilled worker i s about US$55 per month, which is low by international standards.
... XI11
6. Despite the above advantages, Georgia’s export base i s currently very small and highly fragmented. Merchandise exports amount to some US$325 million (or 10 percent o f GDP).’ The main exports include aircraft (exported to Turkmenistan under a debt-swap deal), scrap metal, wine, mineral water, fertilizer, ferrous alloys, and hazelnuts. Together they account for about half o f merchandise exports. With a few exceptions-e.g., scrap metal and hazelnuts-Georgia exports consist mostly o f traditional, low-value added products directed mainly to CIS markets. Remaining exports are very small in value, typically amounting to less than one million dollars per year. In terms o f services (1 0 percent o f GDP), transport earnings have grown rapidly since the mid 1990s, mostly owing to increased oil transit from the Caspian sea, but transit volumes are st i l l only one third of what they were prior to independence. Tourism has recovered somewhat after collapsing to negligible levels, but the number of foreign visitors (mostly business related) to Georgia are estimated to be less than 15 percent o f what they were in Soviet times.
Basic Conditions for Export-Based Growth
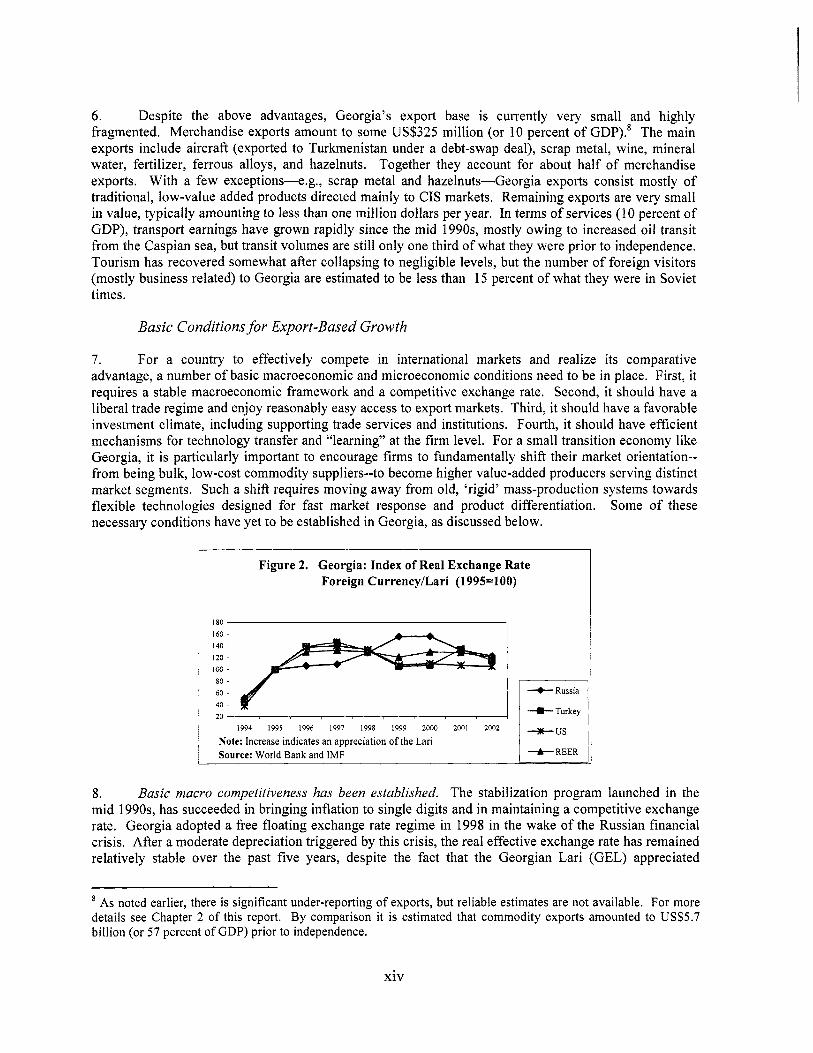
7. For a country to effectively compete in international markets and realize i t s comparative advantage, a number of basic macroeconomic and microeconomic conditions need to be in place. First, it requires a stable macroeconomic framework and a competitive exchange rate. Second, it should have a liberal trade regime and enjoy reasonably easy access to export markets. Third, it should have a favorable investment climate, including supporting trade services and institutions. Fourth, i t should have eff icient mechanisms for technology transfer and “learning” at the firm level. For a small transition economy like Georgia, it i s particularly important to encourage f i r m s to fundamentally shift their market orientation-- from being bulk, low-cost commodity suppliers--to become higher value-added producers serving distinct market segments. Such a shift requires moving away from old, ‘rigid’ mass-production systems towards flexible technologies designed for fast market response and product differentiation. Some o f these necessary conditions have yet to be established in Georgia, as discussed below,
Figure 2. Georgia: Index of Real Exchange Rate Foreign Currencyhari (1995=100)
180 , I60
120 I aa
:: 40 20 i
Note: Increase indicates an appreciation o f the Lari Source: World Bank and IMF
1994 1995 1996 1997 1998 1999 2000 2001 2002
+Russia
-W- Turkey
+ REER
8. Basic macro competitiveness has been established. The stabilization program launched in the mid 1990s, has succeeded in bringing inflation to single digits and in maintaining a competitive exchange rate. Georgia adopted a free floating exchange rate regime in 1998 in the wake o f the Russian financial crisis, After a moderate depreciation triggered by this crisis, the real effective exchange rate has remained relatively stable over the past five years, despite the fact that the Georgian Lari (GEL) appreciated
~~ ~
As noted earlier, there i s significant under-reporting o f exports, but reliable estimates are not available. For more details see Chapter 2 of this report. By comparison it i s estimated that commodity exports amounted to USS5.7 billion (or 57 percent o f GDP) prior to independence.
xiv

substantially against the Russian Ruble in the years immediately after the crisis. In general, real exchange rate movements have reflected market conditions both internally and in major partner countries. However, with gross international reserves at less than two months o f imports, Georgia i s vulnerable to external shocks, especially given i t s high external debt burden. (see Chapter 1). This macroeconomic vulnerability i s likely reflected in the substantial risk premium observed in Georgia.
9. Georgia has a liberal ‘statutory’ trade regime and faces no significant trade barriers in world markets. Georgia became a member of WTO in June 2000. It has low import tariffs and no quantitative restrictions. The VAT (20 percent) and excise taxes are equally applied to imports and domestic output. However, the implementation o f trade policies i s undermined by corruption and poor customs and tax administration. Moreover, a new tariff schedule adopted in January 2003 increased the number o f tariffs from four to 22! and the top duty rate from 12 to 30 percent. Although the weighted average tariff w i l l go up only by a fraction of a percent and the new tariffs are in line with the upper bounds agreed with the WTO upon accession, such a schedule i s a step back f iom the previous, simpler schedule. Georgia faces no significant trade barriers in world markets and main export destinations include the CIS region (45 percent)-e.g., Russia, Azerbaijan, Ukraine, and Armenia- where Georgia enjoys duty-free access, followed by Turkey (20 percent), and the EU (1 8 percent)-mainly Germany.
10. However, Georgia’s unfavorable business climate undermines the competitiveness offrms. Like most CIS countries, the cost o f doing business in Georgia is high and adds significant investment risk. Not surprisingly, outside o f two large energy project^,^ foreign direct investment (FDI) in Georgia has been insignificant. According to the 2002 Business Environment and Enterprise Performance Survey (BEEPS)” conducted in Georgia, taxation and corruption are the main obstacles to doing business. Along with crime, these problems are somewhat worse in Georgia than i t s regional counterparts. Issues relating to regulations, the judiciary, infrastructure, and access to finance while s t i l l problematic appear more or less the same across the CIS region.
11. More specifically, the industry case studies conducted for this study identified several institutional constraints which significantly undermine the export competitiveness o f Georgian firms and create barriers to entry, a critical issue for a transition economy. Notably, exporters do not have assured access to inputs at world prices, particularly o f those procured in the domestic market, because o f the lack of a functioning VAT refund mechanism. Moreover, the tax code i s subject to frequent changes and i ts administration i s unpredictable and highly corrupt. Transportation costs are high primarily due to considerable unofficial payments to border agencies and the road police. At the same time, widespread smuggling reflecting corruption and weak customs administration, means that formal firms are undercut from the domestic market which limits their possibilities to achieve economies o f scale.” This environment encourages the proliferation o f informal and small-scale activities, creates a bias against formal domestic tradable activities, and does not allow the already small domestic market to become a platform for export growth.
Related to the construction o f the Baku-Supsa pipeline and the privatization o f the Tbilisi electricity company to AES . Io Survey conducted jointly by the World Bank and the European Bank o f Reconstruction and Development (EBRD), covering 6,000 firms in 27 transition countries. ‘I With respect to food products, the problem i s not simply competition from unrecorded imports but that a significant proportion o f these imports are of adulterated or mis-labeled products, further eroding the confidence o f the Georgian consumer in packaged foods.
xv
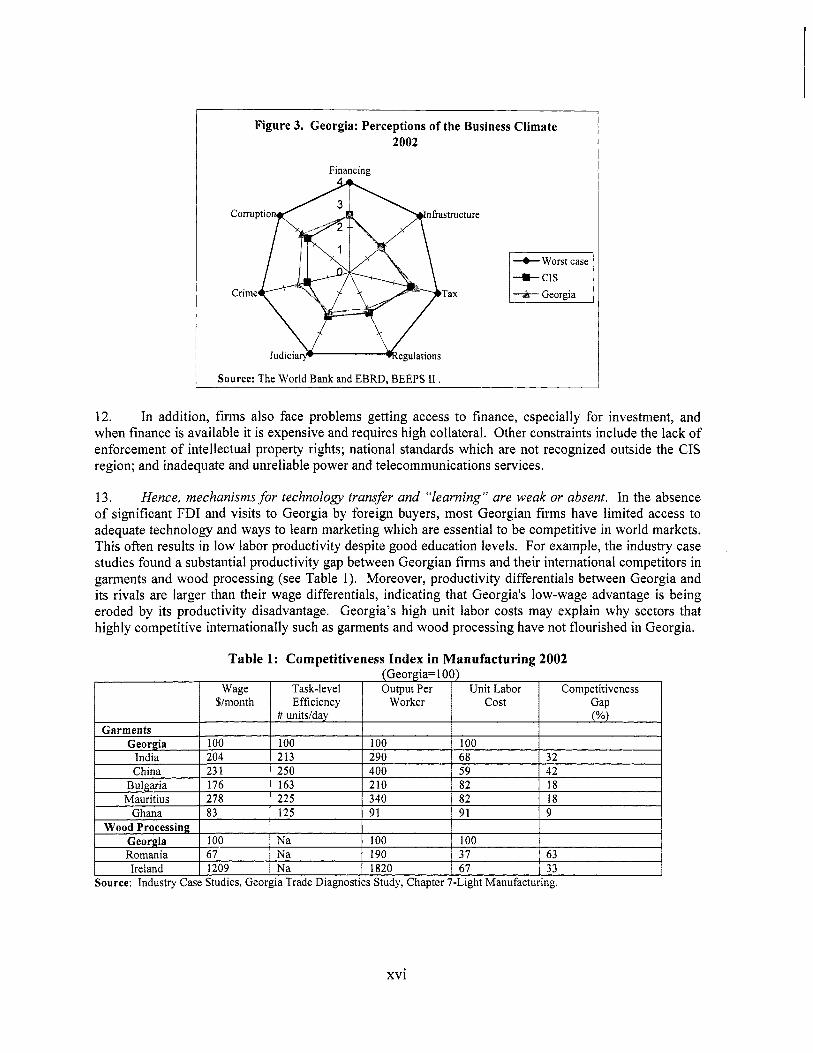
Figure 3. Georgia: Perceptions o f the Business Climate 2002
Financing
+Worst case
1 Source: The World Bank and EBRD. BEEPS I1
12. In addition, firms also face problems getting access to finance, especially for investment, and when finance i s available it i s expensive and requires high collateral. Other constraints include the lack of enforcement o f intellectual property rights; national standards which are not recognized outside the CIS region; and inadequate and unreliable power and telecommunications services.
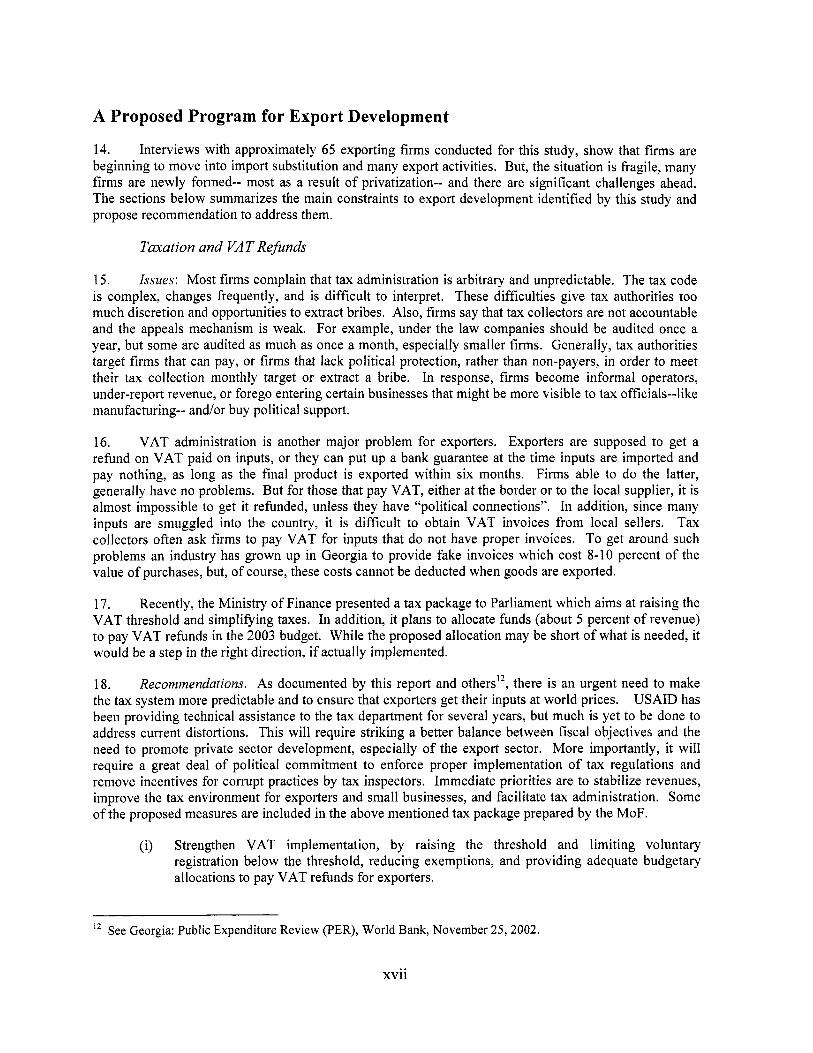
13. Hence, mechanisms for technology transfer and “learning” are weak or absent. In the absence of significant FDI and visits to Georgia by foreign buyers, most Georgian firms have limited access to adequate technology and ways to learn marketing which are essential to be competitive in world markets. This often results in low labor productivity despite good education levels. For example, the industry case studies found a substantial productivity gap between Georgian firms and their international competitors in garments and wood processing (see Table 1). Moreover, productivity differentials between Georgia and i t s rivals are larger than their wage differentials, indicating that Georgia’s low-wage advantage i s being eroded by i t s productivity disadvantage. Georgia’s high unit labor costs may explain why sectors that highly competitive internationally such as garments and wood processing have not flourished in Georgia.
Table 1: Competitiveness Index in Manufacturing 2002 (Georgia=lOO)
Task-level I Output Per I UnitLabor I Competitiveness I
Source: Industry Case Studies, Georgia Trade Diagnostics Study, Chapter 7-Light Manufacturing.
xvi
A Proposed Program for Export Development
14. Interviews with approximately 65 exporting firms conducted for this study, show that firms are beginning to move into import substitution and many export activities. But, the situation i s fragile, many firms are newly formed- most as a result of privatization-- and there are significant challenges ahead. The sections below summarizes the main constraints to export development identified by this study and propose recommendation to address them.
Taxation and VAT Refunds
15. Issues: Most firms complain that tax administration i s arbitrary and unpredictable. The tax code i s complex, changes frequently, and i s difficult to interpret. These difficulties give tax authorities too much discretion and opportunities to extract bribes. Also, firms say that tax collectors are not accountable and the appeals mechanism i s weak. For example, under the law companies should be audited once a year, but some are audited as much as once a month, especially smaller firms. Generally, tax authorities target firms that can pay, or firms that lack political protection, rather than non-payers, in order to meet their tax collection monthly target or extract a bribe. In response, firms become informal operators, under-report revenue, or forego entering certain businesses that might be more visible to tax officials--like manufacturing-- and/or buy political support.
16. VAT administration i s another major problem for exporters. Exporters are supposed to get a refund on VAT paid on inputs, or they can put up a bank guarantee at the time inputs are imported and pay nothing, as long as the final product i s exported within six months. Firms able to do the latter, generally have no problems. But for those that pay VAT, either at the border or to the local supplier, it i s almost impossible to get it refunded, unless they have “political connections”. In addition, since many inputs are smuggled into the country, it i s difficult to obtain VAT invoices from local sellers. Tax collectors often ask firms to pay VAT for inputs that do not have proper invoices. To get around such problems an industry has grown up in Georgia to provide fake invoices which cost 8-10 percent o f the value of purchases, but, o f course, these costs cannot be deducted when goods are exported.
17. Recently, the Ministry o f Finance presented a tax package to Parliament which aims at raising the VAT threshold and simplifying taxes. In addition, it plans to allocate funds (about 5 percent of revenue) to pay VAT refunds in the 2003 budget. While the proposed allocation may be short of what is needed, it would be a step in the right direction, if actually implemented.
18. Recommendations. As documented by this report and others12, there i s an urgent need to make the tax system more predictable and to ensure that exporters get their inputs at world prices. USAID has been providing technical assistance to the tax department for several years, but much i s yet to be done to address current distortions. This will require striking a better balance between fiscal objectives and the need to promote private sector development, especially o f the export sector. More importantly, it will require a great deal o f political commitment to enforce proper implementation o f tax regulations and remove incentives for corrupt practices by tax inspectors. Immediate priorities are to stabilize revenues, improve the tax environment for exporters and small businesses, and facilitate tax administration. Some o f the proposed measures are included in the above mentioned tax package prepared by the MoF.
(i) Strengthen VAT implementation, by raising the threshold and limiting voluntary registration below the threshold, reducing exemptions, and providing adequate budgetary allocations to pay VAT refunds for exporters.
l2 See Georgia: Public Expenditure Review (PER), World Bank, November 25,2002.
xvii
(ii) Establish a simplified tax for small businesses, below the VAT threshold, to replace existing taxes.
(iii) Limit inspections and audits by tax authorities. (iv) Introduce a broader range o f criteria to measure the performance o f tax authorities.
~ ~~ ~
Total Logistical costs
19. In the medium term, efforts must continue to develop the institutional capacity o f the tax administration, including customs (see below), broaden the tax base, and establish a business friendly tax environment. In this regard, it w i l l be important to separate the collection, auditing and enforcement functions o f the tax department. As progress i s made in these areas, it might be possible to consider options to lower the tax burden, for example, through reductions in the social security tax and/or the VAT.
1545
Transport and Trade Facilitation
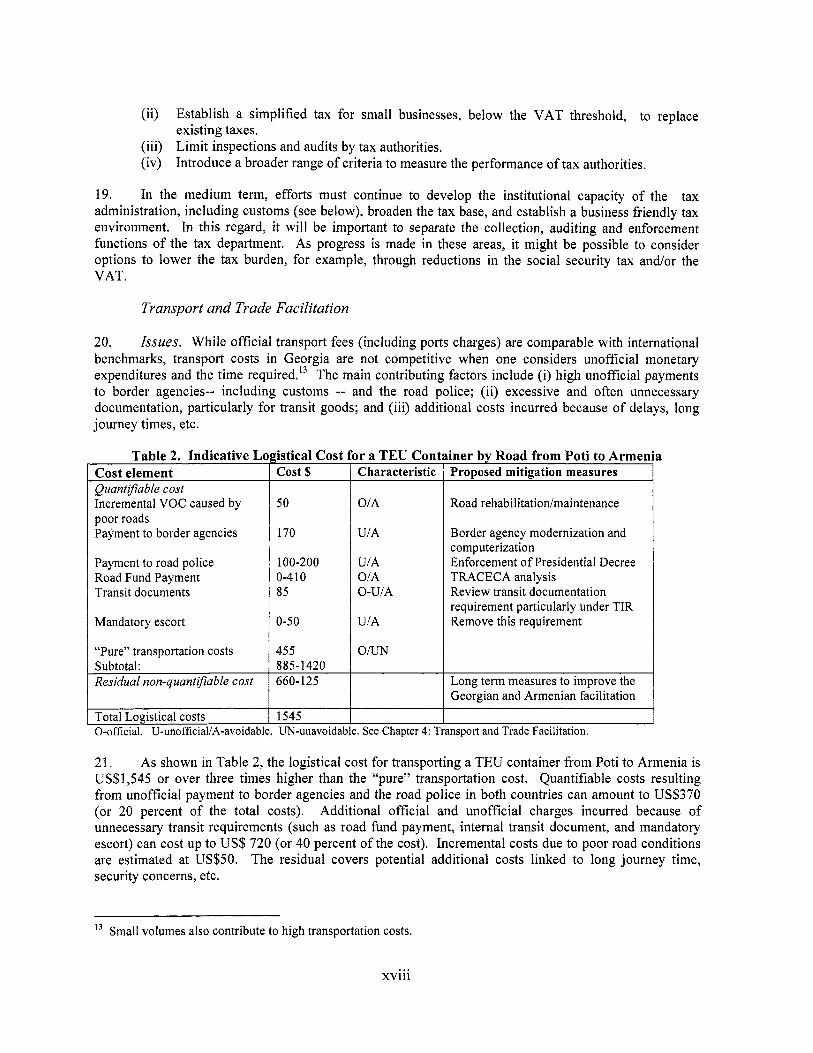
20. Issues. While official transport fees (including ports charges) are comparable with international benchmarks, transport costs in Georgia are not competitive when one considers unofficial monetary expenditures and the time req~ired.’~ The main contributing factors include (i) high unofficial payments to border agencies-- including customs -- and the road police; (ii) excessive and often unnecessary documentation, particularly for transit goods; and (iii) additional costs incurred because o f delays, long journey times, etc.
Table 2. Indicative LI Cost element QuantlJiable cost Incremental VOC caused by poor roads Payment to border agencies
Payment to road police Road Fund Payment Transit documents
Mandatory escort
“Pure” transportation costs Subtotal: Residual non-quant$able cost
istical Cost for a TEU Con1 cost $ 1 Characteristic
50
170
100-200 0-4 10 85
0-50
455 885-1 420 660- 125
OIA
U/A
UIA OIA 0-UIA
UIA
O/UN
h e r by Road from Poti to Armen ProDosed mitieation measures
Road rehabilitatiodmaintenance
Border agency modernization and computerization Enforcement o f Presidential Decree TRACECA analysis Review transit documentation requirement particularly under TIR Remove this requirement
Long term measures to improve the Georgian and Armenian facilitation
nsport and Trade Facilitation.
a
21. As shown in Table 2, the logistical cost for transporting a TEU container from Poti to Armenia i s US$l,545 or over three times higher than the “pure” transportation cost. Quantifiable costs resulting from unofficial payment to border agencies and the road police in both countries can amount to US$370 (or 20 percent o f the total costs). Additional official and unofficial charges incurred because o f unnecessary transit requirements (such as road fund payment, internal transit document, and mandatory escort) can cost up to U S $ 720 (or 40 percent o f the cost). Incremental costs due to poor road conditions are estimated at US$50. The residual covers potential additional costs linked to long journey time, security concerns, etc.
l3 Small volumes also contribute to high transportation costs.
xviii

22. Some of these incremental costs apply only to goods in transit, but the costs o f importing goods i s also expensive, due to bribes to customs officials and the road police. For example, in moving a generic container from Northern Europe to Tbilisi, the Georgian leg accounts for 46 percent o f the cost, despite representing a small portion of the distance. Unofficial payments account for 7-40 percent of the cost, mostly to border agencies and the road police.
23. Given widespread smuggling in Georgia and the need to improve fiscal revenues, a trade and transport facilitation strategy needs to target both reductions in logistical costs as well as in illegal trade. Trade facilitation and revenue enhancing objectives need not be in conflict, as shown by the experience in South Eastern Europe where increased fiscal revenues were achieved along with lower processing time o f transit goods. Meeting these objectives will require significant improvements in customs administration and other government agencies dealing with foreign trade and transit, including the road police. In addition, well targeted interventions will be needed to upgrade the transport infrastructure. In both cases, the improvement o f road transit conditions seems to be the most urgent priority.
Recommendations.
24. Implementation of customs reform i s critical to reduce transportation costs as well as illegal imports. While the Government has already articulated a sound reform strategy, it has achieved l i t t le in terms o f implementation. Immediate actions need to be taken to set the basic conditions for improved customs controls and trade facilitation:
Accelerate the implementation of ASYCUDA nationwide, to allow risk management and the integration o f a transit module, while limiting physical contact between traders and border agencies. (On-going with support of U S Customs). Simplify transit procedures by establishing a single window and removing unnecessary requirements for transporters with TIR carnets; e.g., the VVT, transit insurance, transit road charge, and mandatory escort for non-excise goods in transit.
(iii) Publish procedures for foreign trade and transit in a user-friendly format. (iv) Enforce the 2002 Presidential Decree which limits road police inspections.
(i)
(ii)
25. In the medium-term, efforts should focus on establishing a professional customs administration. In this regard, particular attention needs to be given to improving human resource management, through training, testing, and establishment o f performance-based incentives and sanctions. In order to attract additional transit, particularly o f products going to Azerbaijan, the Government may wish to consider a more focused institutional approach to transit. This would involve the delegation of powers o f all border agencies to a single transit administration which would have overall responsibility for facilitating transit with oversight by an independent monitoring body. In addition, building on the transit strategy developed by the Ministry o f Transport and Communications, complementary measures are needed to upgrade the road infrastructure, according to economic priorities, and to harmonize rail tariffs. It i s also important that steps are taken to commercialize the operations o f Georgian railways.
Access to Finance
26. Almost al l firms interviewed for this study indicated that access to finance i s a considerable impediment to business development, including exports. Main concerns include high interest rates (about 20 percent) and high collateral requirements (often twice the value of the loan). Firms also complain about the short maturity o f loans, mostly less than a year, which make investment financing through credit very difficult. As it is often the case, well established firms are able to access credit at more favorable terms, while smaller firms are at a disadvantage.
Issues.
xix
27. Interviews with exporters in Georgia revealed that most are not used (or keen) to utilizing any export financing instruments such as letters o f credit (L/C) and export guarantees. Some of this reluctance i s due to the cost charged by banks for such facilities. Most importantly, the majority o f buyers of Georgian exports in the CIS region (which account for about half o f total exports) prefer to deal with direct payments (20-30 percent prepayments and/or payments after delivery) instead of using financial instruments. l4
28. In order to facilitate access to finance for exporters, the Government has recently introduced an interest subsidy scheme (up to percent o f 70 percent o f lending rates), targeted mostly to exporters. While provisions have been made to ensure that the subsidy i s paid only to compliant beneficiaries, the impact o f such scheme i s bound to be ad-hoc and limited (funds were only US$0.5 million in 2002). The Government also plans to establish an Export Guarantee Agency (EGA), to provide insurance and guarantee facilities to exporters, but this could be premature given Georgia’s small export base and low demand for this type of services.
29. Recommendations. The development o f the financial sector and the real side o f the economy are linked. Therefore, given Georgia’s nascent private sector and adverse investment climate, it wi l l take some time for the costs and risks o f financial transactions to come down. Interest rates have been declining and are comparable to most CIS countries. Interest rate subsidies or credit lines with government taking all or part o f the credit risk, can be ineffective and unsustainable. Besides, interest rates subsidies provided exclusively to exporters constitute a violation of the GATT of the WTO. Instead, the government should concentrate efforts on improving the business environment and take specific measures to support the development o f the financial sector. Short term priorities include:
(i) Eliminate interest subsidy scheme (ii) Raise capital requirements to encourage further bank consolidation (iii) Establish legislation to allow the use o f movable collateral and the establishment credit
bureaus. (iv) Improve enforcement mechanisms and proper court rulings (v) Encourage leasing services by providing technical assistance to investors wishing to
establish leasing companies, raising public awareness o f the benefits o f leasing, and monitoring implementation o f leasing arrangements. Continue credit lines for back-to-back L/C financing. (vi)
30. While establishing an EGA may be premature at this time, the Government could start considering options for implementation at a later stage. To ensure the financial sustainability o f such an agency, an option could be to establish a regional agency for the Caucasus, for example. Over time, improved financial accounting by companies should facilitate the development o f the securities market and o f credit bureaus. Efforts should also continue to strengthen the supervision o f the rapidly growing insurance sector.
Property Rights
31. The lack of protection o f property rights i s a serious problem for some export activities such as wine, mineral water, and information technology (IT). Despite having a sound framework of related legislation, administrative procedures and a National Intellectual Property Center, responsible for matters involving industrial intellectual property, actual enforcement o f intellectual and industrial property rights i s extremely weak in Georgia, and more generally within the CIS region. For example, in order to deal with counterfeiting, Georgia’s mineral water company has been forced to change i ts bottling structures
l4 Reportedly, CIS buyers prefer to under-report their activities to avoid taxes.
xx
(including lids) several times and has been actively involved with other private companies in the Russian market to raise consumer awareness of mislabeled products. Although relatively successful, these initiatives create additional costs. In the IT industry, weak enforcement o f property rights also raises costs and product prices for local companies, particularly software producers and hinders the development o f IT services exports. Foreign software companies are reluctant to buy programming services from Georgian companies when they lack confidence that their source codes will be protected. They are also less than enthusiastic about joint ventures and direct investments where property rights are not enforced.
32. Recommendations. Improved property rights protection w i l l be critical to promote more foreign investment and to increase technology transfer to Georgia in IT and other sectors. Efforts wi l l be needed to further strengthen the capacity of the legal system to enforce property rights in Georgia. Recommended endeavors might be:
(i) Establish special courts designated to adjudicate cases. (ii) Provide training for legal professionals and private sector agencies on property rights
issues. (iii) Foster private sector organizations to become more involved in assisting enforcement
efforts and in educating business and consumers about the importance o f property rights protection (e.g., through media advertisements). Collaborate with CIS countries, through Georgian embassies/commercial attaches in those countries, to draw attention to violations o f Georgian 1abeMproperty rights.
(iv)
Standards
33. Lack o f adequate standards in Georgia, i s an impediment to access non-CIS markets, especially for food and agro-processed products. Georgia has yet to adopt internationally recognized standards (Le,, CODEX) or harmonize its standards with that o f potential trading partners (i.e., the EU). The country has numerous testing laboratories, but none are internationally accredited. It has a multiplicity o f inspection and control agencies-cutting across different ministries-however official certifications (of safety, authenticity, etc.) are generally not recognized as valid. The result has been duplicative product testing (adding to costs), quality-related price discounts paid on Georgian products (reducing revenues), and missed market opportunities (ie., for products certified as organic).
34. Georgian legislation i s in line with the GATT 1994 Agreement on Technical Barriers to Trade and the Agreement on the Application o f Sanitary and Phytosanitary Measures. Under the WTO agreement, Georgia must adopt by end-2003 a dual system comprising voluntary standards and mandatory international technical regulations, thus replacing the current GOST system.15 Despite the deadline approaching, the progress in the elaboration o f technical regulations has been very slow. The stalling o f the standards reform stems from powerful political pressures to retain the status quo, including pressures from the national standards agency, and to protect opportunities for rent-seeking.
3 5. Recommendations. The introduction o f an internationally recognized system o f product certification i s necessary for Georgia to access new, higher-value markets, particularly outside the CIS region. Given the imminent accession to the WTO o f large CIS trading partings such as Russia and the Ukraine, it i s important that Georgia accelerates the process o f reform in this area. The main recommendations include:
Is Technical regulations include not only the characteristics o f the products but also the characteristics o f technological processes involved, and the methods o f testing.
xxi

Accelerate the transition to the dual (voluntary/mandatory) system of standards in accordance with Georgia’s obligations with the WTO. Complete the introductions of the full system o f mandatory technical regulations as soon as possible. Increase awareness with and move to adopt internationally recognized standards (Le,, CODEX, ISO) Support initiatives such as the establishment o f a laboratory for food testing sponsored by the Georgian Export Promotion Agency (GEPA). Initiate steps to obtain organic certification and forestry certification, through the private sector. Strengthen the awareness and capacities o f private f i r m s to adopt internationally recognized food safety (i.e., HACCP) and environmental (i.e., I S 0 14000) management systems. Support industry-based initiatives to develop and apply ‘codes of practice’ to cover quality assurance, worker safety and/or other dimensions.
Infrastructure
36. Firms report that unreliable power supply i s the biggest infrastructure problem affecting their operations’6. Frequent power outages stop production and reduce productivity, increase wastage of raw material, and increase operating costs. Most companies use generators to deal with this problem and note that, while s t i l l problematic in some areas, the electricity situation i s beginning to improve.
37. In the IT sector, Internet services and high-speed data transmission are reported to be underdeveloped and quite expensive relative to competitor countries at similar levels of income. Also, enhanced services l ike broadband are costly and difficult to obtain. These I T infrastructure deficiencies are hampering the efficiency of I T companies and constraining their ability to develop services exports.
3 8. Recommendations. The continued unreliability o f power supply, reflects modest progress in restructuring the sector. Despite adjustments in tariff rates, collections are low, because o f theft and corruption. The problem i s particularly serious outside Tbilisi where the distribution companies are s t i l l in state-owned hands.
(i) Implement energy sector reform program, focusing on improving collection rates,
(ii) particularly outside Tbilisi. Develop broad-band systems to improve conditions for the information technology sector.
Technology and Marketing Skills
39. A number of factors may contribute to low productivity at the firm level: (i) low-value added market segments (e.g., “cut-make-trim” garments, juice concentrate, timber, etc.), which means that earnings per factor o f production are low; (ii) inadequate technologies, often old Soviet machinery designed for mass production and cheap energy, which cannot be adapted to flexible production runs; (iii) weak management ski l ls and training; (iv) lack o f specialization as firms tend to produce too many products for too many market segments, partly as a means o f diversifying risk; (v) lack of economies of scale, linked to the lack of specialization and to small size of the domestic economy; (vi) overstaffing and workers’ attitudes, inherited from the Soviet times and have not adapted to market real i t ie~.’~
l6 According to the BEEPS for Georgia, there are 60 days o f with power cuts in the year. l7 For example, some Georgian firms retain older workers as a form o f social safety net.
xxii
40. To a large extent, low productivity at the firm level reflects weak technical and marketing capabilities. Part o f the reason i s that most of the learning mechanisms firms usually rely on are weak or missing. There is very l i t t le FDI, buyers and suppliers are not visiting Georgia in large numbers, and companies often do not have the resources or do not understand how to go about visiting buyers in other countries. In fact, the majority o f firms interviewed for this study do not make an effort to visit foreign buyers in person, unless it i s through occasional trade fairs.
4 1. Recommendations. Strengthening learning mechanisms for both technology and marketing skills will depend largely, but not exclusively on the quality o f the investment climate. Direct foreign investment and the number of buyers and suppliers traveling to Georgia will not increase much without significant improvements in the political climate, personal security and the administration o f public institutions. However, a sound investment climate alone will not generate higher productivity. Enterprise learning i s also required. When firms cannot meet their learning needs through their own efforts, there i s a strong case for the Government to intervene by supporting existing efforts to strengthen learning mechanisms. Main areas o f focus include:
Expand cost-sharing grant programs such as the marketing scheme currently run by the GEPA, to assist firms in hiring industry consultants, developing in-firm training, and searching for new technologies and markets.
(ii) Continue training and consulting services by organizations such as the IDA-funded CERMA project.
(iii) Assist technical and vocational institutions (public and private) to cooperate with the private sector in developing innovative training programs.
(iv) Provide technical assistance to the packaging industry, which i s essential for successful marketing.
(i)
Upstream Policies for Resource-Based Activities
42. Issues. Some resource-based export activities are also constrained by inappropriate upstream policies which affect the firms’ access to raw materials and the efficiency o f downstream production. In the case of wood processing,, the pervasiveness of illegal felling of trees leads to the wastage o f forestry resources. In addition, the small area and short duration o f felling licenses are inadequate to ensure predictability of supplies over the long term and prevent firms to plan investments. In the case of industrial mineral processing, the state continues to own most of Georgia’s mines and mineral reserves, for example for manganese and natural stone. State-owned mines are managed inefficiently and do not permit integration between mining and processing. These mines have not been privatized, partly because o f lack o f foreign investor interest and their large outstanding debts. Finally, in amo-processing there are concerns about the sustainability o f supplies due to aging perennial crops (e.g., apples) and vineyards. These problems reflect to some extent the lack o f basic agricultural support services for farmers, e.g., research and extension services and access to fertilizer and improved seeds, due to weak integration with agro-processors and other marketing intermediaries. In fact, agro-processors are increasingly relying on their own land plots to source their inputs, which has adverse consequences on the welfare of rural households.
43, Recommendations. The development of downstream production depends importantly on the sustainability and predictability of natural resource inputs. Unless these issues are properly addressed, Georgia will not be able to realize i t s comparative advantage in these sectors.
(i) (ii) (iii)
Reduce illegal felling and increase the size and duration of licenses; Privatize remaining mines and/or grant long-term mining leases to the private sector; Support research and extension services for farmers as well as out-growing schemes.
xxiii
Trade Policy and Market Access Issues
44. Tariff Regime. As mentioned earlier, the new tariff schedule recently adopted by Georgia i s a step back from the previous, simpler schedule. Clearly the rationale for setting this schedule has been to serve the interest o f groups lobbying for increased protection. In an environment characterized by poor customs administration, the new schedule will only increase the opportunities for corruption and rent seeking activities as well as worsen economic distortions.
45. CIS Markets. Free trade agreements (FTAs) with a number o f CIS countries provide duty-free market access to important regional markets, such as Russia and the Ukraine." Georgia can compete in these markets, despite current institutional weaknesses, because these problems are also common to the region. In addition, Georgia enjoys protection from international competitors which face import duties in the CIS markets. For example, Georgian exporters of frozen vegetables are able to compete with Polish suppliers in Russia because the latter face duties of 18 percent. However, dealing with CIS markets does not currently provide incentives for integration with global markets (e.g., old Soviet GOST standards which are recognized in the CIS region are not recognized in the rest o f the world; CIS countries do not rely on L/C financing for exports and other financial instruments). I n addition, FTAs incorporate product exemptions and are subject to unilateral action by the parties involved and there i s no settlement mechanism in case o f dispute.
46. As a member of the WTO, Georgia enjoys most favored nation (MFN) treatment. In addition Georgia i s beneficiary of the Generalized System o f Preferences (GSP) of the EU, US, Canada, Switzerland, Japan, Turkey, Poland and Estonia. But, despite being a low-income country, the preferences that Georgia receives under the GSP are not as deep as those granted to least developed countries (LDCs). Tariffs for Georgia in the EU are relatively high for sensitive products, such as agricultural products and textiles. Moreover, available preferences under the EU GSP are not fully utilized owing to lack o f information and difficulty in complying with complex rules o f origin. Georgia could obtain deeper preferential treatment on textiles on account o f i t s sound labor legislation, but it has not made an application in this respect. In addition, as stated earlier, Georgia i s constrained in trading outside the CIS by i t s weak systems o f quality assurance and standards and by weaknesses in enforcing trade and intellectual property rights (TRIPS).
Non-CIS Markets.
47. Recommendations. The FTAs provide a favorable framework to foster regional trade and have the potential for helping member countries to integrate into the world trading system (e.g., in the case of harmonized standards), if large trading partners such as Russia and Ukraine become members of WTO in the near future, as it i s anticipated. This underscores the need for Georgia to decisively address current institutional weaknesses and to position i tse l f to compete in a more demanding regional environment which, at the same time, wil l help to achieve greater integration with world markets.
(i) Reduce the number o f import duties to no more than five and lower the maximum rate. (ii) Increase utilization o f GSP by better dissemination of available schemes, including
information about rules o f origin. (iii) Seek deeper preferential treatment through bilateral agreements with EU and other
industrialized countries, and obtain deeper preferences for textiles based on compliance with labor legislation.
(iv) Enforce property rights and introduce standards consistent with WTO as discussed in earlier sections.
Georgia has fi-ee trade agreements with Armenia, Azerbaijan, Kazakhstan, Russia, Turkmenistan, and Ukraine.
xxiv
48. At the same time, it i s important that as a poor country, Georgia obtains preferences comparable to those granted to LDCs. Otherwise, other things being equal, foreign investors wil l decide to locate in LDCs where such preferences are available.
Trade and Poverty
49. As discussed in earlier sections, several 'behind the border' constraints prevent the Georgian economy from successfully integrating internally and into the world trading system. The lack of internal integration affects the productivity o f the smallholder agricultural sector in rural areas and indirectly affects industry in urban areas. This has serious poverty implications, since agriculture accounts for half of employment and given industry's potential for generating wage employment.
Internal Market Integration
50. Market integration i s an important determinant o f poverty. Recent analysis shows that there i s a close correlation between the poverty rates of Georgian rural households and the extent to which they are linked to markets (expressed as percentage of households with land not recording a single transaction selling agricultural products during the whole year of ob~ervation).'~ However, on average almost two thirds o f rural household agricultural production i s for self-subsistence. Many Georgians, especially in rural areas, are effectively isolated from the national economy. In fact, it i s estimated that about a fifth o f all rural households do not trade at all. There would appear to be incentives for rural households to rely on self-subsistence and limit their interactions with markets. In such an environment, there i s a risk that households wil l tend to produce many products and not benefit from returns to specialization and scale. In addition, households that rely on subsistence generally have lower yields, mostly due to low use o f improved seeds, fertilizer and other inputs.
51. In addition to having an adverse impact on welfare levels, the prevalence of corruption in Georgia affects the ability o f rural households to integrate with domestic and external markets . At the household level, about 3 percent o f household income i s allocated to bribes. Almost 40 percent o f rural households report paying bribes, while less than 20 percent o f urban households report paying bribes. Much o f these bribes are paid during interactions between farmers and the traffic police, who extract payments when farmers travel to markets to sel l their produce.20 More indirectly, corruption affects the ability o f the poor to engage in trading activities in other ways. First, the poor are generally less efficient producers and are unable to compete with illegal imports. Second, small and medium scale enterprises, which are more likely to provide employment opportunities for poor people, face a higher incidence o f bribery on a day-to-day basis and are more vulnerable to competition from smuggled goods than are larger firms. Third, high transactions costs discourage the development o f marketing channels, such as wholesalers.
Corruption.
52. Intermediaries for Small-holders. The shift from central planning required the emergence o f intermediate private agents to take goods to the market; provide research and development of better farming techniques; and facilitate access to inputs and finance. However, Georgia's unfavorable business environment has not been conducive to the emergence o f intermediate agents taking on these roles. There are no wholesalers, there i s minimal development of farmer-based organizations, and generally weak linkages between farmers and agro-processors. In addition, l i t t le farm size consolidation has taken place, due to underdeveloped land markets and the lack o f alternative non-farm wage employment. At present, a relatively small and probably decreasing number o f smallholder farmers are active in export-oriented
l 9 See World Bank Forthcoming Poverty Update (2003), Social and Economic Infrastructure in Rural Georgia. 2o Interviews with farmers suggest that police at checkpoints stop cars based on the extent to which the car i s loaded with produce. Cars that are filled with agricultural produce are almost guaranteed to be stopped.
XXV
production. In some sub-sectors, including wine, the emerging trend i s toward backward integration by vintners into own primary production on leased land. This may well be an appropriate strategy in that industry, although more generally, there i s a need to strengthen rurallfarm organizations and facilitate the development o f out-grower support and marketing arrangements.
53. Rural Roads. Although road densities are relatively high in Georgia, feeder roads are in generally bad condition and are particularly challenging during inclement weather. The bad quality of feeder roads can be an important impediment for certain regions and certain communities. In these cases, improved conditions can make an important difference in the welfare o f poor households by creating more opportunities to link up with the national and international trading system.
Wage Employment
54. In general, employment status explains a large part o f household welfare, whether the head o f the household or other household members are employed. Between 1991 and 1999, wage employment rates in Georgia declined from 91 percent to 57 percent, but the impact has been mitigated by a substantial increase in self-employment. Increasing exports can help job creation, although the underemployment will probably fall first before unemployment. An incidence analysis exercise conducted for sector employment in Georgia suggests that employment increases will generally benefit the middle quintiles more than other quintiles. However, job creation in the agro-processing sector will have a very beneficial impact in that it tends to attract a significant number o f poor people. On average, the processing sector pays about 35 percent higher wages than the agriculture sector and, hence, would contribute an important increase in household welfare. Similarly, the hotel and transportation sectors pay about 45 percent and 42 percent more than the agriculture sector on average.
Recommendations
55. Corruption affects most Georgians, especially the poor, so measures must be taken to curtail i t s adverse effect on economic activity. This should go a long way toward facilitating internal trade, and connecting it with markets abroad. In addition, the agriculture sector must be revitalized because Georgia has a comparative advantage in this area and because it has the potential to benefit the poor. Greater opportunities for wage employment in the processing sector and tourism will also help improve welfare levels, especially in urban areas. The recommended measures for reducing poverty include:
Removing obstacles to domestic market integration, by strengthening rural transport and market infrastructure, promoting rural/farmer organizations, and reigning in petty corruption along market routes;
ii. Raising the productivity of rural farmers, by facilitating the propagation and sale of improved seeds and other planting materials and strengthening advisory services through collaborative public and private sector initiatives
iii. Support initiatives to enhance the competitiveness o f selected industrieshb-sectors where there i s evident growth potential and scope for considerable employment-generation, such as tourism and several fields o f agro-processing
i.
Conclusion
56. development in Georgia. A summary o f the main recommendations i s provided in Annex 1.
The main objective of this study was to identify a program of actions to accelerate export
57. Getting incentives and institutions “right” to foster a better investment climate i s the first order o f business. As stated in this report and others, Georgia has put in place most o f the necessary laws and
xxvi

regulations needed to provide a favorable trade and investment regime, but poor implementation remains a major constraint. Improved implementation wil l require taking decisive action to fight corruption-- which has become pervasive in both public and private spheres- and to build functioning trade support institutions. In particular, progress in tax and customs administration wil l be critical to measure success and to render credibility to the reform process. Support wi l l be also needed to assist companies in meeting product standards and in enforcing intellectual property rights both to consolidate their market shares and gain access to new markets outside the region. Regional cooperation in these areas could speed up the pace o f reform and enhance the chances of success. Similarly, the establishment o f a regional export guarantee agency, for example for the Caucasus, could be an option beneficial for Georgia and other small countries which presently cannot ensure financial sustainability o f such an agency because of their small export levels.
58. As progress i s made in addressing institutional constraints, parallel efforts wil l be needed to improve technical and marketing capabilities at the firm-level The Government and donors, can play a key supporting role in this area, but firms need to become more active in getting themselves organized and in identifying their technical assistance needs. Continued and further support from Government and donors to organizations, such as GEPA, CERMA and the GHA, wi l l be needed to assist companies to develop product and marketing strategies and to improve technologies in use.
59. However, improvements in the investment climate alone wil l not guarantee the necessary expansion in investment--especially in FDI-- that i s needed for a strong export orientation. Georgia’s ability to attract FDI, wi l l also depend on the terms of access to developed markets. Thus, Georgia needs to participate more actively in multilateral forums dealing with the international trade system, along with other low-income CIS countries, to obtain comparable market access preferences as those available to LDCs. Otherwise, other things being equal, investors wi l l choose to locate elsewhere.
60. From a poverty perspective, taking measures to fight corruption wil l go along way in improving the welfare o f the population, especially o f the rural poor who are proportionately more affected. In addition, the development o f Georgia’s exports wil l help create new employment opportunities and achieve productivity increases that are needed to raise household incomes. Specifically, there i s a need to support initiatives to enhance the competitiveness of selected industrieshb-sectors where there i s growth potential and scope for considerable employment-generation. This i s likely to include several fields of agro-processing and tourism. Agro-processing requires complementary measures to enhance the productivity o f rural farmers through agricultural extension services, as well as the farmers’ capacity to effectively interact with markets, by supporting farmers’ associations and cooperatives.
xxvii

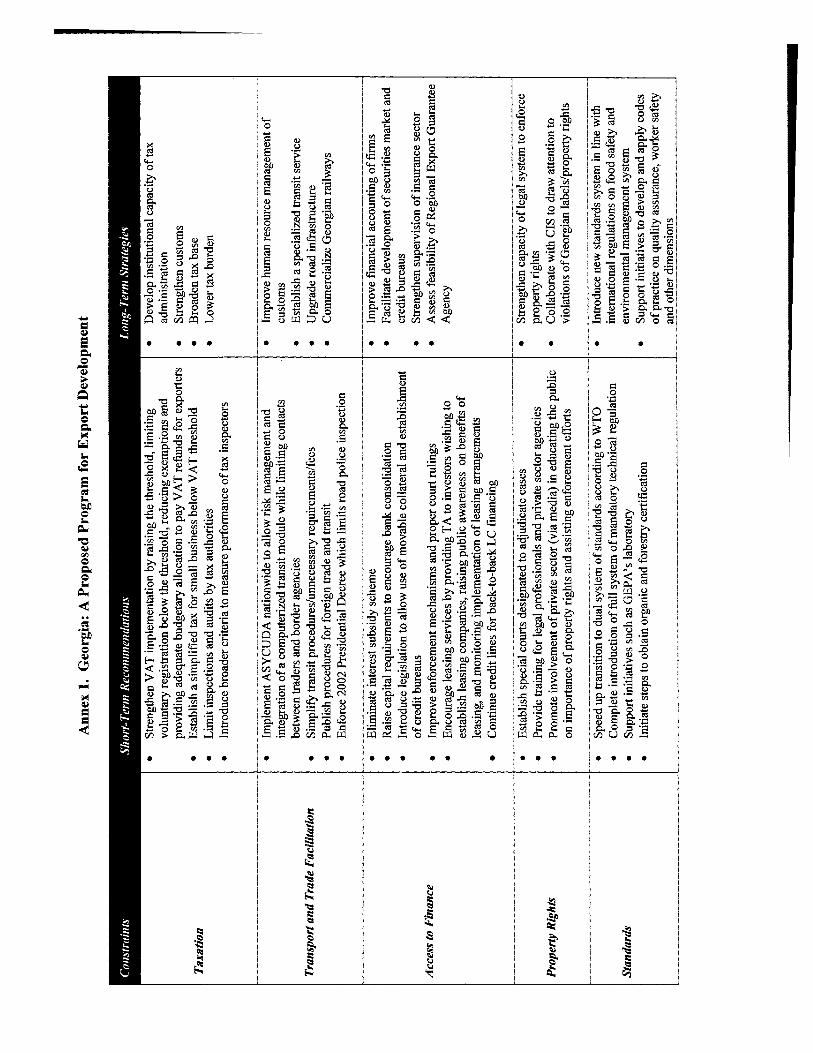
e . .
e e . . ; e . e .
e ... j . . . e .
I
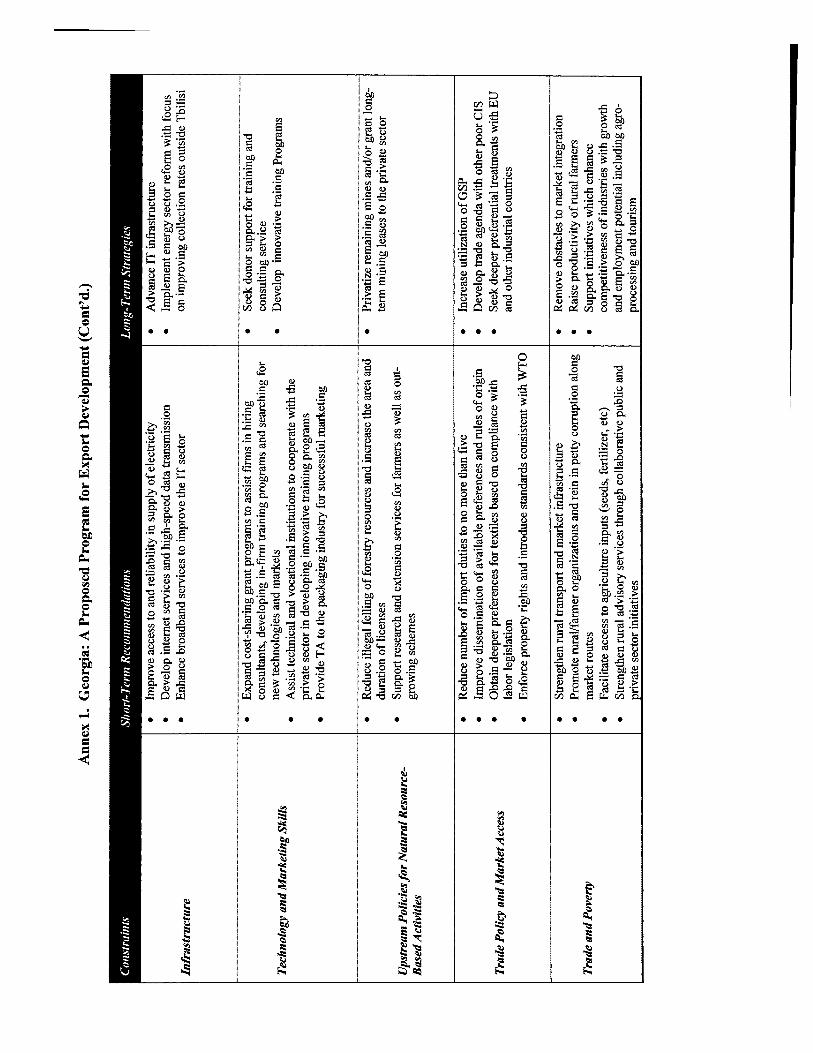
. .
0 . .
h P
. U 8 J * B $ 3
. e
...
Chapter 1. Macroeconomic Settina I
Chapter 1. Macroeconomic Setting
Recent Economic Developments
1.1 Georgia, a country of fewer than 5 million people, with a geographical area of 70,000 kilometers, borders the Black Sea, Russia, Turkey, Azerbaijan and Armenia, making it a natural transit corridor for the land-locked countries of Central Asia, and between Russia, Europe, and the Middle East. Prior to independence in 1991, per capita income was US$1,600, ranking it in the middle of the 15 former Soviet republics. During the Soviet period, Georgia exported agricultural, metal and industrial products to the Soviet market, often under preferential terms, and was a very popular tourist destination for the rest o f the Soviet Union. I t was also among the largest recipients o f energy and other subsidies (on a per capita basis). Georgia’s transition to an independent state was very difficult Large transfers were cut-off, trade disrupted, and preferential market access eliminated. The outbreak of a civil war and hyperinflation in the early 1990s led to an economic collapse worse than in any other CIS country. By 1994, output had fallen by 70 percent and government revenues fe l l to levels that severely impaired the public sector’s ability to deliver social services. Real wages were 90 percent below the 1990 mark and unemployment registered 20 percent.
Stabilization and Structural Reforms
1.2 Upon the cessation of internal conflicts in 1994, the Government initiated market-based reforms aimed at dealing with the economic devastation that followed the first years of independence. These reforms are discussed below and are summarized in Box 1.
1.3 Stabilization. The stabilization program launched in the mid 1990s succeeded in eliminating hyperinflation and the rate o f inflation was brought down to single digits by 1997. Tight fiscal and monetary policies have helped to maintain single digit inflation. There was a brief upswing in inflation in 1999, that was linked to the devaluation o f the Georgian Lari (GEL), after the fall of the Russian Ruble during the financial crisis o f 1998. At the time, the exchange rate regime was fully liberalized and the real effective exchange rate depreciated significantly in late 1998 and early 1999, but has remained roughly stable over the last five years (see below). However, domestic interest rates, though declining, are s t i l l high (about 20 percent in real terms), reflecting relatively high risk premiums.
1.4 While good progress has been made in stabilizing prices and the exchange rate, Georgia’s fiscal and external situation remain fragile. Domestic arrears accumulated during much o f the period, and both government revenue and expenditure levels (as percent o f GDP) are low by regional standards. With gross foreign reserves of less than two months of imports’, the country is extremely vulnerable to external shocks. Georgia’s external debt service obligations absorb a considerable share o f central government revenues (about one third in 2002). The most recent debt sustainability analysis (DSA), carried out in collaboration with the Fund, indicates that concessional debt re l ie f wi l l be required to keep debt service obligations at manageable levels beyond 2002, when the current Paris Club rescheduling agreement expires.
1.5 Structural Reforms. First generation reforms such as trade liberalization and mass privatization were completed early in the reform process. Subsidies were eliminated, most prices liberalized (with the exception o f commercial transport and public utilities), and a simplified tariff schedule adopted. By 1996, small scale privatization involving about 15,000 enterprises and the distribution o f land to small farmers had been virtually completed.
O f goods and services. I
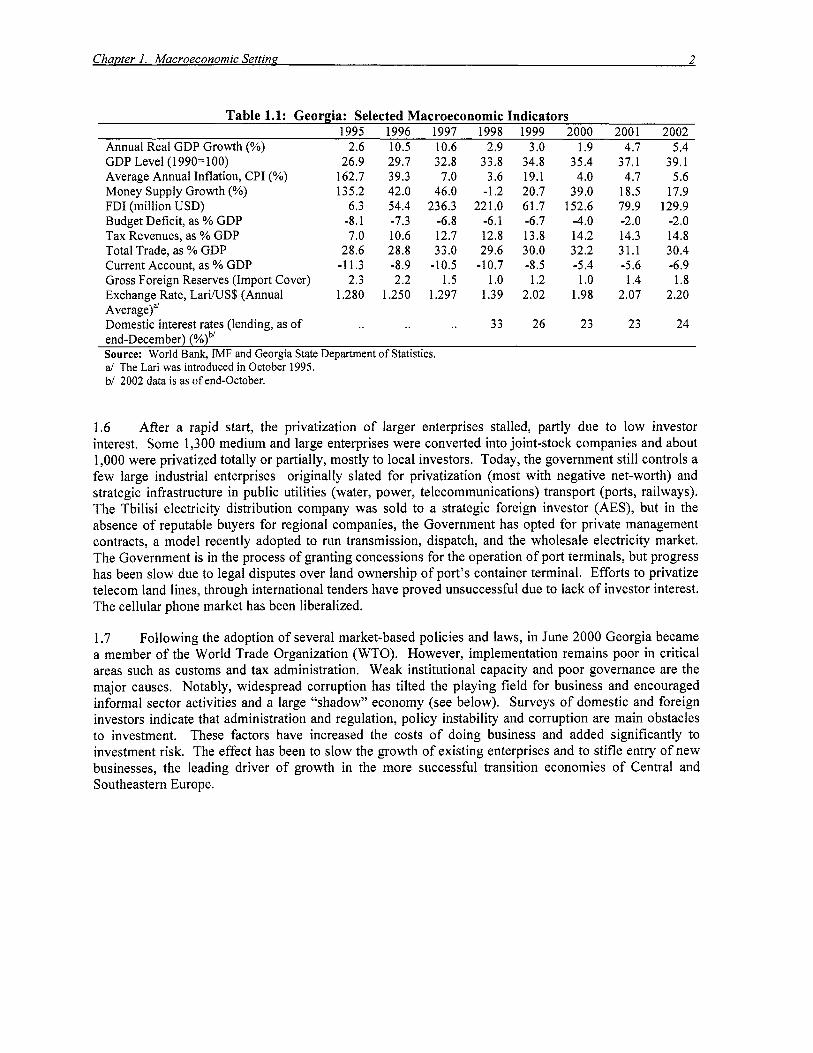
Annual Real GDP Growth (“’0) GDP Level (1990=100) Average Annual Inflation, CPI (“’0) Money Supply Growth (%) FDI (million USD) Budget Deficit, as % GDP Tax Revenues, as YO GDP Total Trade, as % GDP Current Account, as % GDP Gross Foreign Reserves (Import Cover) Exchange Rate, LariNS$ (Annual Average)“ Domestic interest rates (lending, as o f
Table 1.1: Georgia: Selected Macroeconomic Indicators 1995 1996 1997 1998 1999 2000 2001 2002
2.6 10.5 10.6 2.9 3.0 1.9 4.7 5.4 26.9 29.7
162.7 39.3 135.2 42.0
6.3 54.4 -8.1 -7.3 7.0 10.6
28.6 28.8
2.3 2.2 1.280 1.250
-11.3 -8.9
32.8 7.0
46.0 236.3
12.7 33.0
1.5 1.297
-6.8
-10.5
33.8 34.8 35.4 3.6 19.1 4.0
221.0 61.7 152.6
12.8 13.8 14.2 29.6 30.0 32.2
-10.7 -8.5 -5.4 1.0 1.2 1 .o
1.39 2.02 1.98
-1.2 20.7 39.0
-6.1 -6.7 -4.0
33 26 23
37.1 39.1 4.7 5.6
18.5 17.9 79.9 129.9 -2.0 -2.0 14.3 14.8 31.1 30.4 -5.6 -6.9 1.4 1.8
2.07 2.20
23 24 end-December) XI)^' Source: World Bank, IMF and Georgia State Department o f Statistics. a/ The Lari was introduced in October 1995. b/ 2002 data i s as o f end-October.
1.6 After a rapid start, the privatization of larger enterprises stalled, partly due to low investor interest. Some 1,300 medium and large enterprises were converted into joint-stock companies and about 1,000 were privatized totally or partially, mostly to local investors. Today, the government s t i l l controls a few large industrial enterprises originally slated for privatization (most with negative net-worth) and strategic infrastructure in public ut i l i t ies (water, power, telecommunications) transport (ports, railways). The Tbilisi electricity distribution company was sold to a strategic foreign investor (AES), but in the absence of reputable buyers for regional companies, the Government has opted for private management contracts, a model recently adopted to run transmission, dispatch, and the wholesale electricity market. The Government i s in the process o f granting concessions for the operation of port terminals, but progress has been slow due to legal disputes over land ownership o f port’s container terminal. Efforts to privatize telecom land lines, through international tenders have proved unsuccessful due to lack of investor interest. The cellular phone market has been liberalized.
1.7 Following the adoption o f several market-based policies and laws, in June 2000 Georgia became a member o f the World Trade Organization (WTO). However, implementation remains poor in critical areas such as customs and tax administration. Weak institutional capacity and poor governance are the major causes. Notably, widespread corruption has tilted the playing field for business and encouraged informal sector activities and a large “shadow” economy (see below). Surveys o f domestic and foreign investors indicate that administration and regulation, policy instability and corruption are main obstacles to investment. These factors have increased the costs o f doing business and added significantly to investment risk. The effect has been to slow the growth o f existing enterprises and to st i f le entry o f new businesses, the leading driver o f growth in the more successful transition economies of Central and Southeastern Europe.
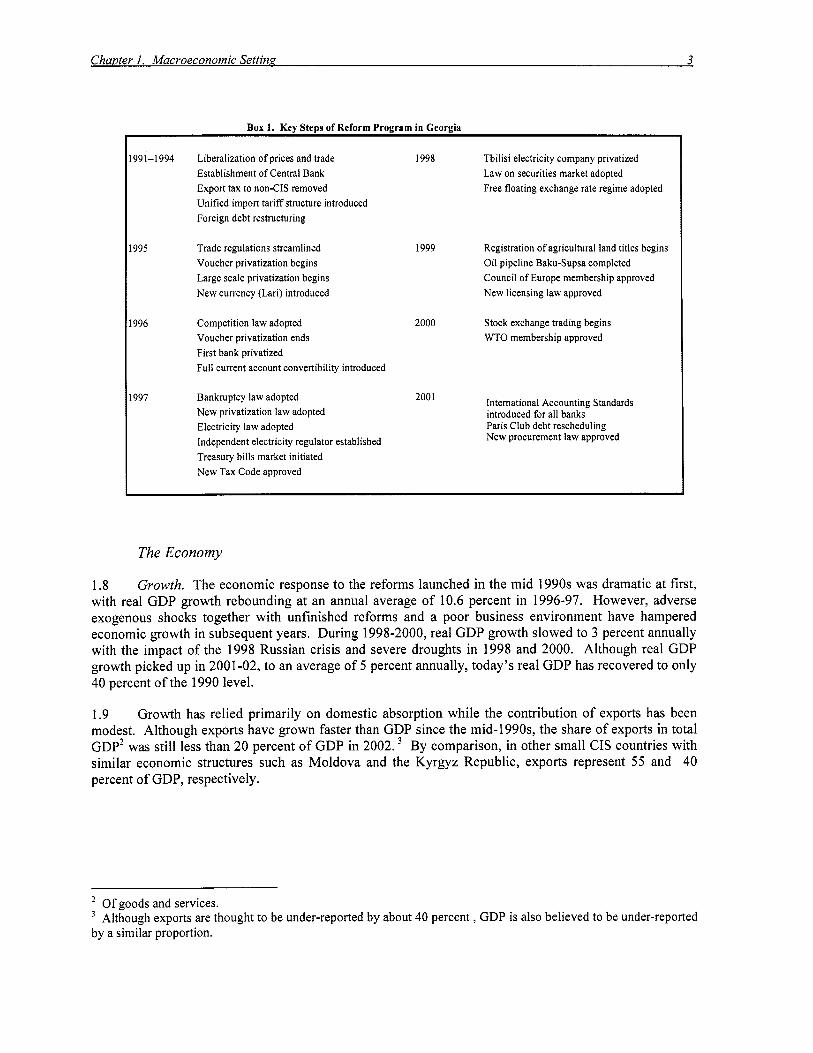
Chapter 1. Macroeconomic Setting 3
1.8
Box 1. Key Steps o f Reform Program in Georgia
991-1994
995
996
991
Liberalization o f prices and trade Establishment o f Central Bank Export tax to non-CIS removed Unified import tariff structure introduced Foreign debt restructuring
Trade regulations streamlined Voucher privatization begins Large scale privatization begins New currency (Lari) introduced
Competition law adopted Voucher privatization ends First bank privatized Full current account convertibility introduced
Bankruptcy law adopted New privatization law adopted Electricity law adopted Independent electricity regulator established Treasury bills market initiated New Tax Code approved
1998 Tbilisi electricity company privatized Law on securities market adopted Free floating exchange rate regime adopted
1999 Registration o f agricultural land titles begins Oil pipeline Baku-Supsa completed Council o f Europe membership approved New licensing law approved
2000 Stock exchange trading begins WTO membership approved
International Accounting Standards introduced for all banks Paris Club debt rescheduling New procurement law approved
2001
The Economy
Growth. The economic response to the reforms launched in the mid 1990s was dramatic at first, with real GDP growth rebounding at an annual average o f 10.6 percent in 1996-97. However, adverse exogenous shocks together with unfinished reforms and a poor business environment have hampered economic growth in subsequent years. During 1998-2000, real GDP growth slowed to 3 percent annually with the impact of the 1998 Russian crisis and severe droughts in 1998 and 2000. Although real GDP growth picked up in 2001-02, to an average of 5 percent annually, today’s real GDP has recovered to only 40 percent o f the 1990 level.
1.9 Growth has relied primarily on domestic absorption while the contribution of exports has been modest. Although exports have grown faster than GDP since the mid-1990s, the share of exports in total GDP2 was s t i l l less than 20 percent o f GDP in 2002. By comparison, in other small CIS countries with similar economic structures such as Moldova and the Kyrgyz Republic, exports represent 55 and 40 percent o f GDP, respectively.
O f goods and services. Although exports are thought to be under-reported by about 40 percent, GDP i s also believed to be under-reported
2
by a similar proportion.
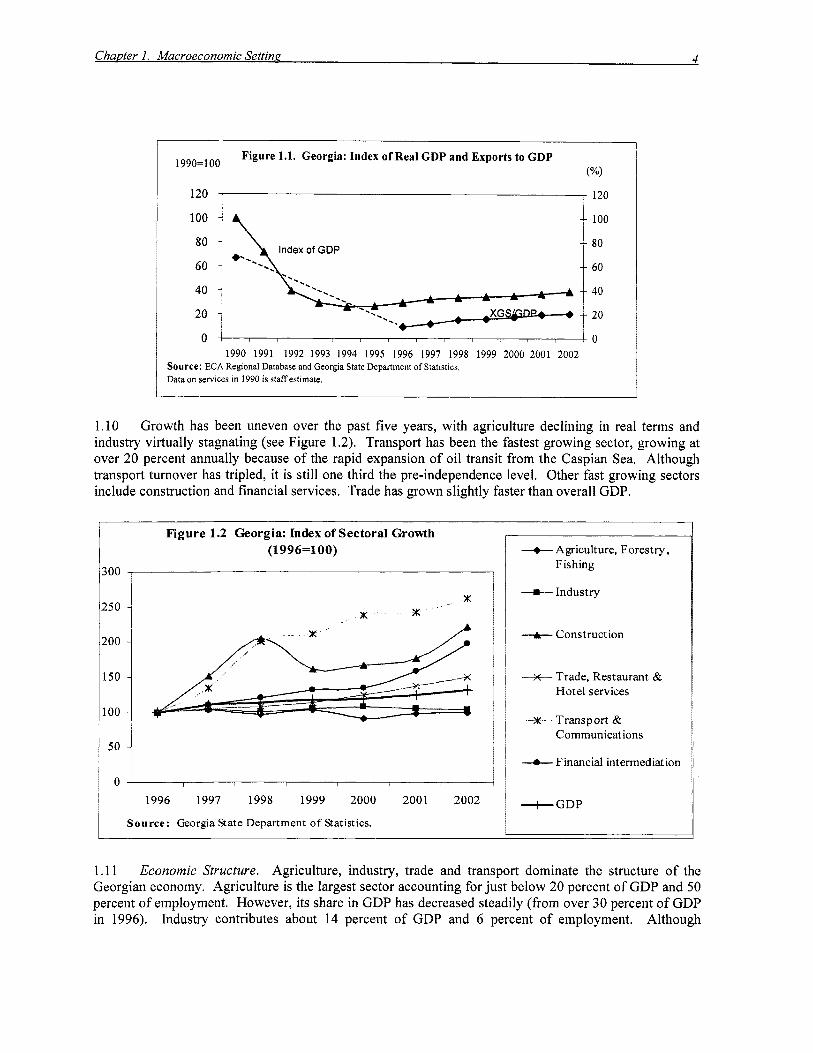
Chapter 1. Macroeconomic Setting 4
'00 -
50 -
00 -
Figure 1.1. Georgia: Index o f Real GDP and Exports to GDP 1990=100 ("/.I 1 120 , , 120
20 40 1
O I l o 1990 1991 1992 1993 1994 1995 1996 1997 1998 1999 2000 2001 2002
Source: ECA Regional Database and Georgia State Department o f Statistics. Data on services in 1990 i s staff estimate.
1.10 Growth has been uneven over the past five years, with agriculture declining in real terms and industry virtually stagnating (see Figure 1.2). Transport has been the fastest growing sector, growing at over 20 percent annually because o f the rapid expansion o f oil transit from the Caspian Sea. Although transport turnover has tripled, it i s s t i l l one third the pre-independence level. Other fast growing sectors include construction and financial services. Trade has grown slightly faster than overall GDP.
Figure 1.2 Georgia: Index of Sectoral Growth (1996=100)
IO0
X X m
50 0 ~
1996 1997 1998 1999 2000 2001 2002
Source: Georgia State Department o f Statistics.
Agriculture, Forestry, Fishing
+Industry
-A- Construction
-x-- Trade, Restaurant & Hotel services
- x - Transport & Communications
-o- Financial intermediation
+GDP
1.1 1 Economic Structure. Agriculture, industry, trade and transport dominate the structure of the Georgian economy. Agriculture i s the largest sector accounting for just below 20 percent o f GDP and 50 percent o f employment. However, its share in GDP has decreased steadily (from over 30 percent o f GDP in 1996). Industry contributes about 14 percent of GDP and 6 percent o f employment. Although

Chapter 1. Macroeconomic Settinp 5
declining in some years, i t s share remains constant. The share o f transport and telecommunications has nearly tripled from 4.6 percent in 1996 to 12.1 percent in 2002.
Table 1.2: Georgia: Share of the Shadow Economy - (in percent o f GDP)
1996 1997 1998 1999 2000 2001 2002 Industry Agriculture Construction Transport Telecommunications Trade Restaurant, Hotel
46 43 40 39 37 37 39 15 12 9 9 11 9 8 38 35 38 38 60 56 54 38 35 36 37 35 39 44 23 23 19 24 22 18 17 66 60 57 56 64 69 67 62 61 60 64 67 70 70
GDP 29 28 28 29 33 33 34 Source: Georgia State Department o f Statistics.
1.12 The shadow economy in Georgia accounted for an estimated 34 percent o f total output in 2002, and is increasing. This share has increased by 17 percentage points since 1996. The shadow economy i s estimated to account for over one half o f total activity in construction, trade and services (such as hotels and restaurants). Also, the “unobserved activity” i s said to be as much as 58 percent o f total output within the enterprise or business sector.
The “Shadow” Economy.
Poverty
1.13 Poverty and income inequality have increased sharply in Georgia since independence. The initial fall in output and subsequent low rate o f growth over the decade resulted in a severe decline in real income for many people. Today’s per capita income o f US$700 per annum i s 40 percent the pre- independence level. The civi l war in the beginning o f the period, as well as conflicts in Abkazia and South Ossetia generated an influx o f refugees (about 300,000) into the large towns o f Georgia, adding to the poverty problem.
1.14 Currently about one quarter o f the population lives in poverty and 60 percent are at risk o f falling below the poverty line. According to Georgia’s household data, the incidence o f poverty increased from 14 percent in 1997 to over 20 percent in 1998-2000.4 This increase in the incidence o f poverty is consistent with the observed increase in the unemployment rate from 11.4 percent o f the labor force in 1997 to around 16 percent in 2001. Weak economic growth during much o f the period accounted for the increase in poverty. Also, economic growth was concentrated in communications, financial intermediation, and transport, whose share in total employment is less than 5 percent. Agricultural activity, which accounts for 50 percent o f total employment and plays a safety net role in Georgia, suffered severe droughts in 1998 and 2000. In 2002 output was below the 1997 level. This affected both rural and urban incomes, the latter by impacting seasonal employment for harvest activities. The accumulation o f large arrears in public sector wages and pensions during 1998 and mid-2000 (amounting to about US$135 mill ion or 4.5 percent o f GDP) also reduced household incomes.’
According to World Bank estimate o f poverty line. See: Georgia Poverty Update, World Bank, January 10,2002.

Chapter 1. Macroeconomic Setting 6
,
Figure 1.3. Georgia: Employment by Economic Activity (1999)
0 10 20 30 40 50 60 % o f employed population Source: Georgia State Department o f Statistics.
Agriculture
Trade, Restaurant & Hotel services
Industry
Transport and communications
Construction
Financial intermediation
1.15 Inequality has also increased over the past decade. The Gini Coefficient o f income per capita in Georgia increased from 0.29 to 0.43. The poor have suffered disproportionately from inadequate access to health and education services and from deteriorating basic infrastructure, especially water and electricity.
International Price Competitiveness
1.16 A country’s international price competitiveness can be measured by the evolution o f i ts real effective exchange rate (REER).6 In November 1993, the Georgian coupon was introduced as an intermediary currency to replace the Russian Ruble, and in October 1995 the Georgian Lari became the national tender. During 1994-96, the REER appreciated substantially (by 167 percent) mostly on account o f much higher inflation in Georgia than in i t s two major trading partners (Le., Russia and Turkey), as the country was s t i l l dealing with triple digit inflation. However, aside from temporary changes, the REER has remained relatively stable since 1997 (see Figure 1.4).’
The Real Effective Exchange Rate.
1.17 The relative stability o f the REER since 1997 masks off-setting movements o f the Lari against two major currencies: the Turkish L i ra and the Russian Ruble. For example, the Russian financial crisis triggered a significant nominal depreciation o f the Lari against the Turkish L i ra (and the U S dollar) in late 1998 and early 1999, but this effect was largely off-set by a nominal appreciation o f the Lar i against the Russian Ruble (as the latter depreciated more sharply against the U S dollar). On balance, however, the REER depreciated by 9 percent between 1997 and 1999. In 2000, the REER reverted back to the pre- crisis level and remained around that level in 2001. Again, in 2001, the relative stability o f the REER reflected compensating effects, with the Lari appreciating vis-a-vis the Turkish Lira (as the Lira plummeted against the U S dollar ) while depreciating against the Russian Ruble. It should be noted that
Real exchange rate = eJkp,dpk, where e i s the nominal exchange rate, p price o f traded goods, and j and k index of major trading partners. The real exchange rate measures a country’s competitive position resulting from changes in the nominal exchange rate and cost-price relationships relative to its trading partners. The price series i s used as a deflator and can be based on consumer prices, producer prices, the GDP deflator, or unit labor costs. Many studies o f country macroeconomic price competitiveness favor the use o f unit labor cost as a deflator, because it shows the joint effects o f changes in labor productivity and in wages. Unfortunately, a consistent time-series of aggregate unit labor cost i s unavailable for Georgia. As a substitute, the consumer price index i s used, which allows comparability with other countries. ’ REER i s calculated based on trade weighted average of Georgia’s exchange rate vs. that o f its 16 major trade partners; Russia, Turkey, Azerbaijan, Germany, US, Ukraine, UK, Armenia, Italy, Bulgaria, Switzerland, Turkmenistan, Romania, France, Greece, and Netherlands.

, Figure 1.4. Georgia: Index of Real Exchange Rate
Foreign Currencynari (1995=100)
160 - 140 - I20 ~
100.
80 - 60 40 20
1994 1995 1996 1997 1998 1999 2000 2001 2002
Note: Increase indicates an appreciation in Lan Source: World Bank and IMF
+Russia
+Turkey
-m- us +REER
in 2 001 c ompared t o 1 997, the L ari w as s t i l l appreciated in r ea1 t e m s a gainst the Russian Ruble ( 22 percent) while i t was depreciated against the U S dollar (24 percent) and the Turkish Lira (8 percent). REER depreciated further by 7 percent in 200 1-2002 resulting mostly from i ts declining value against the Turkish Li ra (15 percent).
1.18 Cost of Non-tradables. The costs o f non-tradables (such as labor and infrastructure) also play an important role in determining a country’s competitive position as a location for footloose foreign investors, p articularly in 1 abor-intensive manufactures. A s T able 1.3 s hows, c ost trends f o r these k e y non-tradables has been moving moderately upward since the mid 1990s, but are s t i l l relatively l ow by international standards.
1.19 Average real wages fo r b 0th s lulled and unskilled 1 abor h ave increased considerably over the period, albeit from a very low base. In US dollar terms, the average wage paid to skil led workers increased from US$34 per month to US$55 per month in 1998, which i s l ow by international standards. Also, the wage paid to sh l l ed workers was only 38 percent higher than the wage paid to unskilled and semi-skilled workers (US$40 per month).
Table 1.3: Georgia: Key Non-tradable Costs, 1996-2002 Wages (monthly average) 1996 1997 1998 1999 2000 2001 2002 Real Wages (Index)
Unski l led and semi-skilled 100 103.8 137.0 139.8 134.0 128.8 137.1 Ski l led 100 123.0 145.4 143.9 155.6 164.5 186.7
Nomina l (in US$) Unski l led and semi-skilled 33 36 46 39 39 38 40 Ski l led 34 43 50 40 46 49 55
Electricity (US$cents/KwH) 2 3 4 4 5 5 6 Water ( ~ ~ $ c e n t s / m ~ ) 32 45 43 30 30 29 47
Source: Georgia State Department o f Statistics.
1.20 Although the wage differential between skil led and unskilled (and semi-skilled) labor has widened somewhat since 1999, i t i s still relatively narrow. A number o f factors may explain currently low wage differentials, including (i) Georgia’s relatively more homogenous education levels, particularly in terms o f post-basic education; (ii) high levels o f unemployment--estimated at 16 percent o f the labor force in 2001- resulting in a surplus o f skilled labor; and/or (iii) low labor productivity linked to outdated capital equipment and technologies.
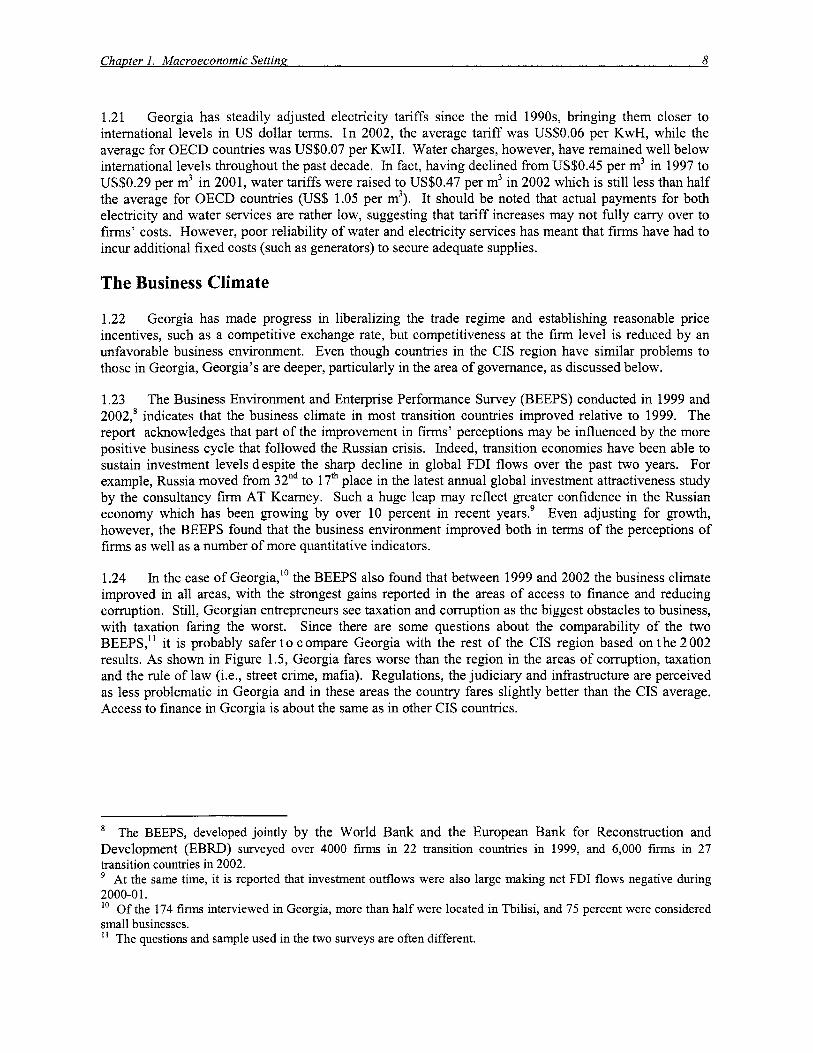
Chapter I. Macroeconomic Setting 8
1.21 Georgia has steadily adjusted electricity tariffs since the mid 1990s, bringing them closer to international levels in U S dollar terms. In 2002, the average tar i f f was US$0.06 per KwH, while the average for OECD countries was US$0.07 per KwH. Water charges, however, have remained wel l below international levels throughout the past decade. In fact, having declined f rom US$0.45 per m3 in 1997 to US$0.29 per m3 in 2001, water tariffs were raised to US$0.47 per m3 in 2002 which i s s t i l l less than ha l f the average for OECD countries (US$ 1.05 per m3). I t should be noted that actual payments for both electricity and water services are rather low, suggesting that tar i f f increases may not fully carry over to f i r m s ' costs. However, poor reliabil i ty o f water and electricity services has meant that f i r m s have had to incur additional f ixed costs (such as generators) to secure adequate supplies.
The Business Climate
1.22 Georgia has made progress in liberalizing the trade regime and establishing reasonable price incentives, such as a competitive exchange rate, but competitiveness at the firm level i s reduced by an unfavorable business environment. Even though countries in the CIS region have similar problems to those in Georgia, Georgia's are deeper, particularly in the area o f governance, as discussed below.
1.23 The Business Environment and Enterprise Performance Survey (BEEPS) conducted in 1999 and 2002,' indicates that the business climate in most transition countries improved relative to 1999. The report acknowledges that part o f the improvement in firms' perceptions may be influenced by the more positive business cycle that followed the Russian crisis. Indeed, transition economies have been able to sustain investment levels despite the sharp decline in global FDI f lows over the past two years. For example, Russia moved f rom 32nd to 17th place in the latest annual global investment attractiveness study by the consultancy firm AT Keamey. Such a huge leap may reflect greater confidence in the Russian economy which has been growing by over 10 percent in recent years.' Even adjusting for growth, however, the BEEPS found that the business environment improved both in terms o f the perceptions of f irms as wel l as a number o f more quantitative indicators.
1.24 In the case o f Georgia," the BEEPS also found that between 1999 and 2002 the business climate improved in al l areas, with the strongest gains reported in the areas o f access to finance and reducing corruption. Still, Georgian entrepreneurs see taxation and corruption as the biggest obstacles to business, with taxation faring the worst. Since there are some questions about the comparability o f the two BEEPS," i t i s probably safer t o c ompare Georgia with the rest o f the CIS region based o n the 2 002 results. As shown in Figure 1.5, Georgia fares worse than the region in the areas o f corruption, taxation and the rule o f l aw (i.e., street crime, mafia). Regulations, the judiciary and infrastructure are perceived as less problematic in Georgia and in these areas the country fares slightly better than the CIS average. Access to finance in Georgia i s about the same as in other CIS countries.
The BEEPS, developed joint ly by the W o r l d Bank and the European Bank for Reconstruction and Development (EBRD) surveyed over 4000 finns in 22 transition countries in 1999, and 6,000 firms in 27 transition countries in 2002.
At the same time, i t i s reported that investment outflows were also large making net FDI flows negative during 2000-01. lo O f the 174 firms interviewed in Georgia, more than ha l f were located in Tb i l i s i , and 75 percent were considered small businesses.
The questions and sample used in the two surveys are often different.

Climate 2002
Financing
1.27 The BEEPS results are consistent with the recently completed Georgia’s Cost o f Doing Business (CDB) survey, which compares data between 2000 and 2002. The CDB survey found that while regulatory constraints (e.g., for licensing and inspections) have decreased, associated bribes have actually increased over the period. The practice o f side-payments has been formalized and firms tend to use “intermediaries” to cope with these constraints. In addition, the regulatory environment continues to be perceived as volatile and unpredictable. This i s particularly problematic for foreign investors who have not bought local protection.
+Worst case
--&-Georgia
Figure 1.7 Share of Annual Sales Paid in Bribes, 2002
,w)
2
1
0
rgia
Source: World Bank & EBRD, BEEPS 11,
Source: World Bank & EBRD, BEEPS I1 ,
1.25 The biggest single problem for Georgian businesses i s taxation, both administration and high tax rates, which leads to under-reporting of sales in order to avoid taxes. As shown in Figure 1.6, Georgian firms report only 60 percent o f their sales in order to avoid taxes, compared with an 80 percent average in the CIS.
I Figure 1.6. Share o f Annual Sales Reported for Tax P n m n r P r . 2
0 20 40 60 80 100 9’0
I Source: World Bank & EBRD, BEEPS 11.
1.26 Several quantitative indicators were used to measure corruption. The “time tax”-the amount of time senior managers spend in dealing with public officials regarding the application of laws and regulations- i s quite high in Georgia, about 12 percent versus less than 8 percent for most CIS countries. Another indicator i s the percentage o f sales spent in bribes was 2.7 percent in Georgia compared to less than 2 percent in the CIS (see Figure 1.7).
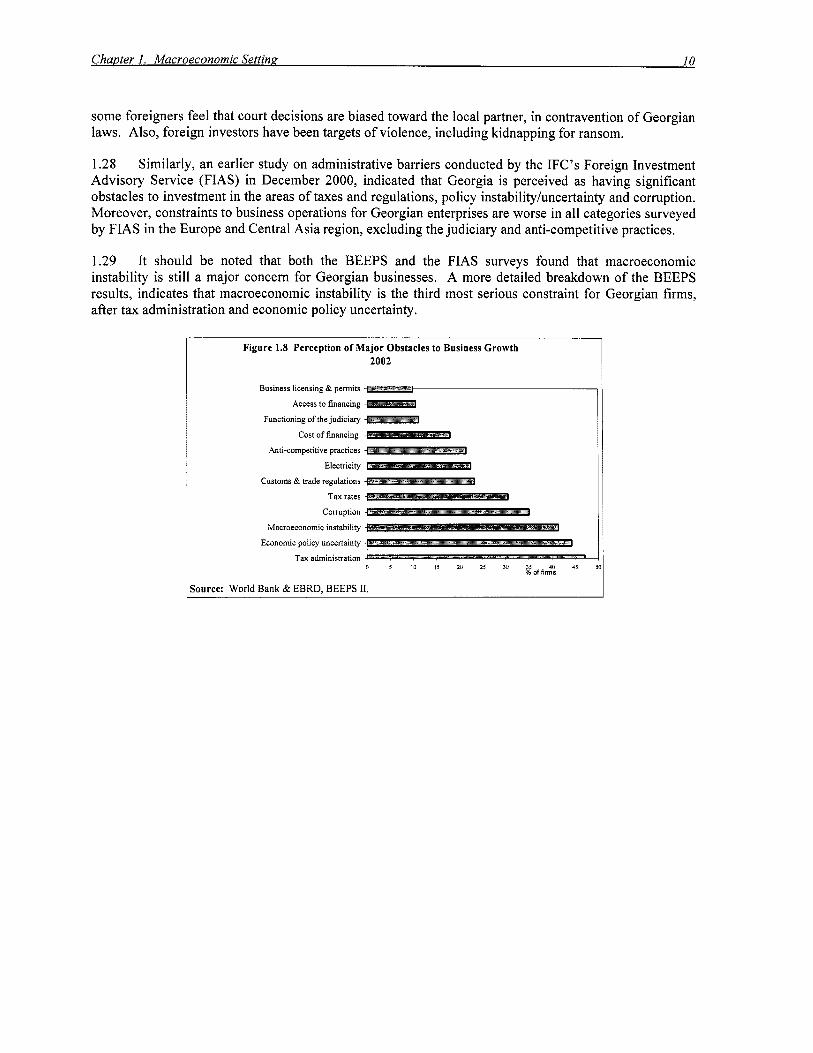
Chapter 1. Macroeconomic Setting 10
some foreigners feel that court decisions are biased toward the local partner, in contravention of Georgian laws. Also, foreign investors have been targets of violence, including kidnapping for ransom.
1.28 Similarly, an earlier study on administrative barriers conducted by the IFC’s Foreign Investment Advisory Service (FIAS) in December 2000, indicated that Georgia i s perceived as having significant obstacles to investment in the areas of taxes and regulations, policy instabilityhcertainty and corruption. Moreover, constraints to business operations for Georgian enterprises are worse in all categories surveyed by FIAS in the Europe and Central Asia region, excluding the judiciary and anti-competitive practices.
1.29 I t should be noted that both the BEEPS and the FIAS surveys found that macroeconomic instability i s s t i l l a major concern for Georgian businesses. A more detailed breakdown of the BEEPS results, indicates that macroeconomic instability i s the third most serious constraint for Georgian firms, after tax administration and economic policy uncertainty.
Figure 1.8 Perception of Major Obstacles to Business Growth 2002
Business licensmg & permits
Access to financing
Functioning o f the judiciary
Cost o f financing
Anti-competitive practices
Elecmcity
Customs &trade regulations
Tax rates
Corruption
Macroeconomic mstability
Econonuc policy uncertainty
Tax administration 0 S I O IS 20 25 30 35 40 45
K of firms
ource: World Bank & EBRD, BEEPS I1
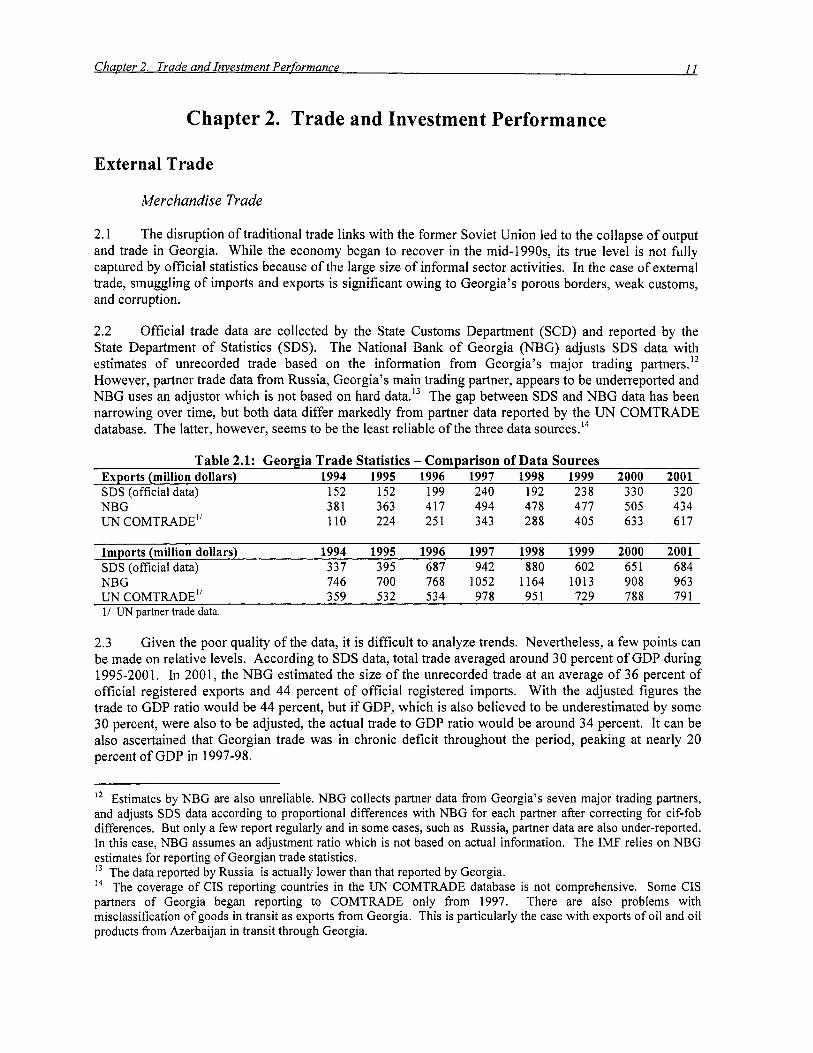
Chapter 2. Trade and Investment Performance
External Trade
Merchandise Trade
2.1 The disruption of traditional trade links with the former Soviet Union led to the collapse o f output and trade in Georgia. While the economy began to recover in the mid-1990s, i ts true level is not fully captured by official statistics because of the large size o f informal sector activities. In the case o f external trade, smuggling o f imports and exports i s significant owing to Georgia’s porous borders, weak customs, and corruption.
2.2 Official trade data are collected by the State Customs Department (SCD) and reported by the State Department o f Statistics (SDS). The National Bank o f Georgia (NBG) adjusts SDS data with estimates o f unrecorded trade based on the information from Georgia’s major trading partners. l2
However, partner trade data from Russia, Georgia’s main trading partner, appears to be underreported and NBG uses an adjustor which is not based on hard data.13 The gap between SDS and NBG data has been narrowing over time, but both data differ markedly from partner data reported by the UN COMTRADE database. The latter, however, seems to be the least reliable o f the three data sources.14
Table 2.1: Georgia Trade Statistics - Comparison of Data Sources Exports (million dollars) 1994 1995 1996 1997 1998 1999 2000 2001 SDS (official data) 152 152 199 240 192 238 330 320 NBG UN COMTRADE”
381 363 417 494 478 477 505 434 110 224 251 343 288 405 633 617
Imports (million dollars) 1994 1995 1996 1997 1998 1999 2000 2001 SDS (official data) 337 395 687 942 880 602 651 684 NBG 746 700 768 1052 1164 1013 908 963 UN COMTRADE” 359 532 534 978 951 729 788 791 I/ UN partner trade data.
2.3 Given the poor quality o f the data, it i s difficult to analyze trends. Nevertheless, a few points can be made on relative levels. According to SDS data, total trade averaged around 30 percent o f GDP during 1995-2001. In 2001, the NBG estimated the size o f the unrecorded trade at an average o f 36 percent o f official registered exports and 44 percent o f official registered imports. With the adjusted figures the trade to GDP ratio would be 44 percent, but if GDP, which i s also believed to be underestimated by some 30 percent, were also to be adjusted, the actual trade to GDP ratio would be around 34 percent. I t can be also ascertained that Georgian trade was in chronic deficit throughout the period, peaking at nearly 20 percent o f GDP in 1997-98.
Estimates by NBG are also unreliable. NBG collects partner data from Georgia’s seven major trading partners, and adjusts SDS data according to proportional differences with NBG for each partner after correcting for cif-fob differences. But only a few report regularly and in some cases, such as Russia, partner data are also under-reported. I n this case, NBG assumes an adjustment ratio which i s not based on actual information. The IMF relies on NBG estimates for reporting o f Georgian trade statistics. l3 The data reported by Russia i s actually lower than that reported by Georgia. l4 The coverage o f CIS reporting countries in the UN COMTRADE database i s not comprehensive. Some CIS partners o f Georgia began reporting to COMTRADE only from 1997. There are also problems with misclassification o f goods in transit as exports from Georgia. This i s particularly the case with exports o f o i l and o i l products from Azerbaijan in transit through Georgia.
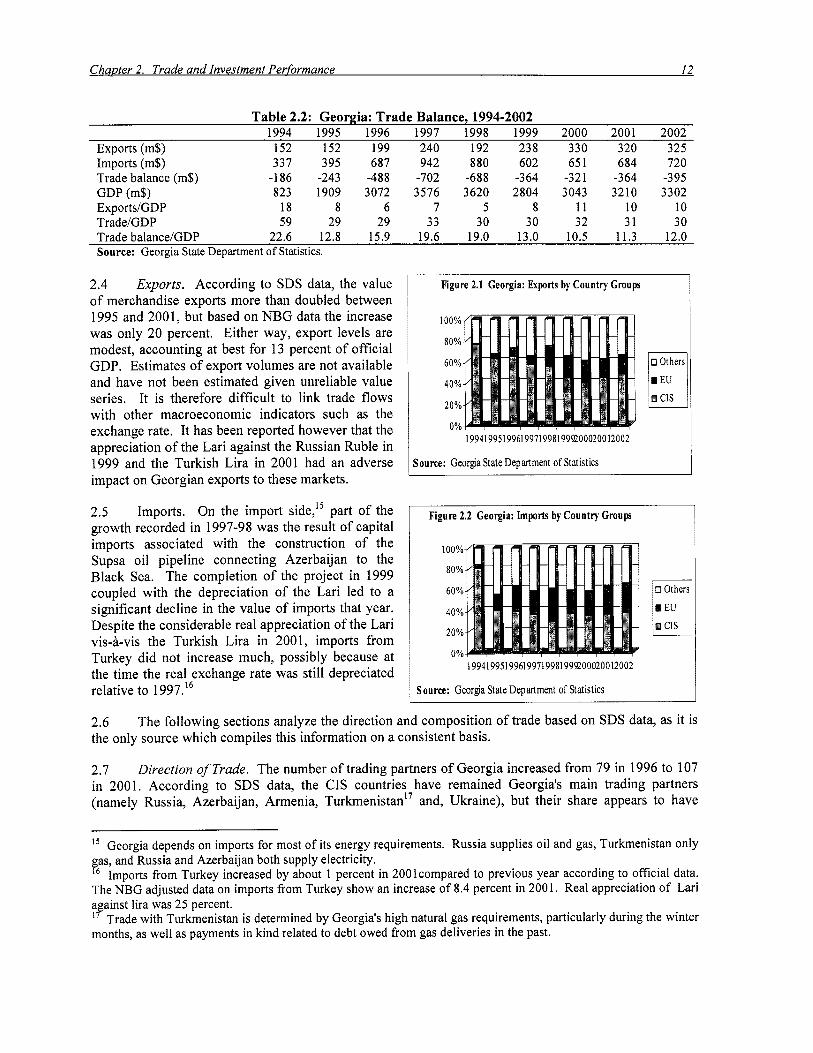
Table 2.2: Georgia: Trade Balance, 1994-2002 1994 1995 1996 1997 1998 1999 2000 2001 2002
Exports (m$) 152 152 199 240 192 238 330 320 325 Imports (m$) 337 395 687 942 880 602 651 684 720
GDP (m$) 823 1909 3072 3576 3620 2804 3043 3210 3302
Trade/GDP 59 29 29 33 30 30 32 31 30 Trade balance/GDP 22.6 12.8 15.9 19.6 19.0 13.0 10.5 11.3 12.0 Source: Georgia State Department o f Statistics.
Trade balance (m$) -186 -243 -488 -702 -688 -364 -321 -364 -395
ExportdGDP 18 8 6 7 5 8 11 10 10
2.4 Exports. According to SDS data, the value o f merchandise exports more than doubled between 1995 and 200 1, but based on NBG data the increase was only 20 percent. Either way, export levels are modest, accounting at best for 13 percent o f official GDP. Estimates o f export volumes are not available and have not been estimated given unreliable value series. I t i s therefore difficult to link trade flows with other macroeconomic indicators such as the exchange rate. It has been reported however that the appreciation o f the Lari against the Russian Ruble in 1999 and the Turkish Lira in 2001 had an adverse impact on Georgian exports to these markets.
2.5 Imports. On the import side,” part o f the growth recorded in 1997-98 was the result o f capital imports associated with the construction o f the Supsa o i l pipeline connecting Azerbaijan to the Black Sea. The completion o f the project in 1999 coupled with the depreciation o f the Lari led to a significant decline in the value o f imports that year. Despite the considerable real appreciation o f the Lari vis-a-vis the Turkish L i ra in 2001, imports from Turkey did not increase much, possibly because at the time the real exchange rate was s t i l l depreciated relative to 1997.16
Figure 2.1 Georgia: Exports by Country Groups l
199419951996199719981999.200020012002
Source: Georgia State Department of Statistics
1 Figure 2.2 Georgia: Imports by Country Groups ~
0 Others
I CIS
19941 995199619971 9981 99!?200020012002
Source: Georgia State Department o f Statistics
2.6 the only source which compiles this information on a consistent basis.
The following sections analyze the direction and composition o f trade based on SDS data, as it i s
2.7 Direction of Trade. The number o f trading partners o f Georgia increased from 79 in 1996 to 107 in 2001. According to SDS data, the CIS countries have remained Georgia’s main trading partners (namely Russia, Azerbaijan, Armenia, Turkmenistan” and, Ukraine), but their share appears to have
l5 Georgia depends on imports for most of its energy requirements. Russia supplies oi l and gas, Turkmenistan only gas, and Russia and Azerbaijan both supply electricity. l6 Imports from Turkey increased by about 1 percent in 2001compared to previous year according to official data. The NBG adjusted data on imports from Turkey show an increase of 8.4 percent in 2001. Real appreciation o f Lari a ainst lira was 25 percent. I‘ Trade with Turkmenistan i s determined by Georgia’s high natural gas requirements, particularly during the winter months, as well as payments in kind related to debt owed from gas deliveries in the past.
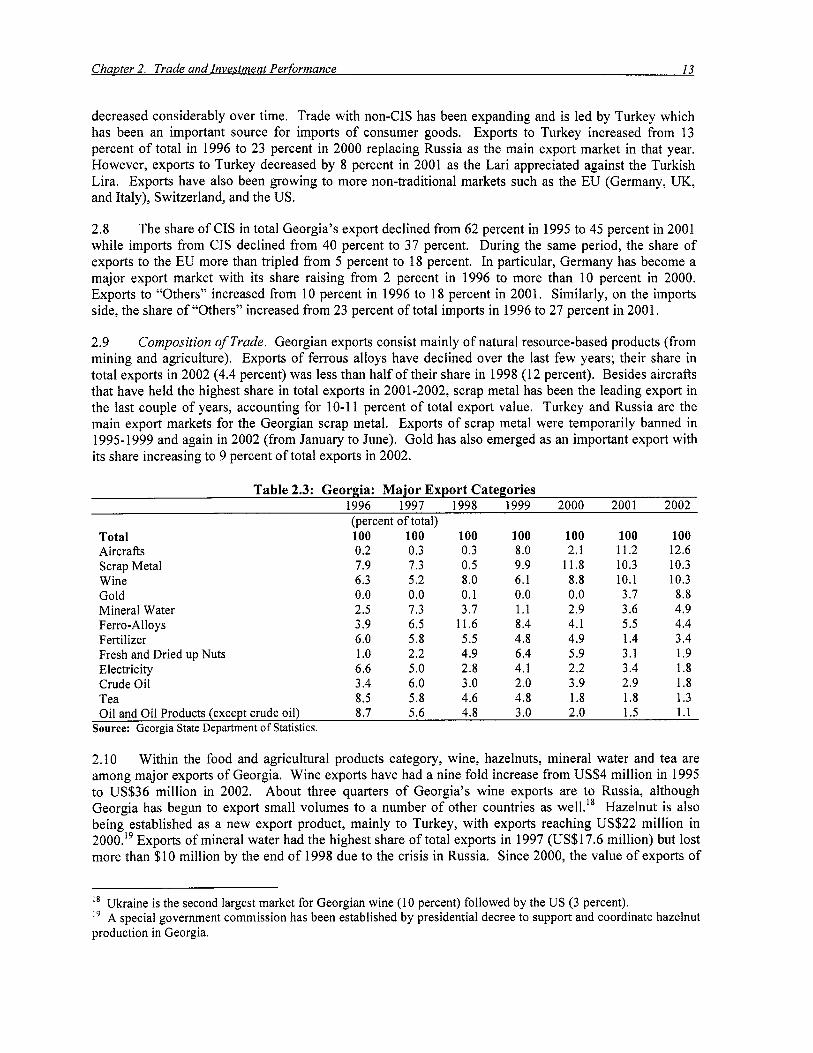
decreased considerably over time. Trade with non-CIS has been expanding and i s led by Turkey which has been an important source for imports o f consumer goods. Exports to Turkey increased from 13 percent o f total in 1996 to 23 percent in 2000 replacing Russia as the main export market in that year. However, exports to Turkey decreased by 8 percent in 2001 as the Lari appreciated against the Turkish Lira. Exports have also been growing to more non-traditional markets such as the EU (Germany, UK, and Italy), Switzerland, and the US.
2.8 The share o f CIS in total Georgia’s export declined from 62 percent in 1995 to 45 percent in 2001 while imports from CIS declined from 40 percent to 37 percent. During the same period, the share o f exports to the EU more than tripled from 5 percent to 18 percent. In particular, Germany has become a major export market with i t s share raising from 2 percent in 1996 to more than 10 percent in 2000. Exports to “Others” increased from 10 percent in 1996 to 18 percent in 2001. Similarly, on the imports side, the share o f “Others” increased from 23 percent o f total imports in 1996 to 27 percent in 2001.
2.9 Composition of Trade. Georgian exports consist mainly o f natural resource-based products (from mining and agriculture). Exports o f ferrous alloys have declined over the last few years; their share in total exports in 2002 (4.4 percent) was less than half o f their share in 1998 (12 percent). Besides aircrafts that have held the highest share in total exports in 2001-2002, scrap metal has been the leading export in the last couple o f years, accounting for 10-1 1 percent o f total export value. Turkey and Russia are the main export markets for the Georgian scrap metal. Exports o f scrap metal were temporarily banned in 1995-1999 and again in 2002 (from January to June). Gold has also emerged as an important export with i t s share increasing to 9 percent o f total exports in 2002.
Table 2.3: Georgia: Major Export Categories 1996 1997 1998 1999 2000 2001 2002 (percent o f total)
Total 100 100 100 100 100 100 100 Aircrafts 0.2 0.3 0.3 8.0 2.1 11.2 12.6 Scrap Metal 7.9 7.3 0.5 9.9 11.8 10.3 10.3 Wine 6.3 5.2 8.0 6.1 8.8 10.1 10.3 Gold 0.0 0.0 0.1 0.0 0.0 3.7 8.8 Mineral Water 2.5 7.3 3.7 1.1 2.9 3.6 4.9 Ferro-Alloys 3.9 6.5 11.6 8.4 4.1 5.5 4.4 Fertilizer 6.0 5.8 5.5 4.8 4.9 1.4 3.4 Fresh and Dried up Nuts 1 .o 2.2 4.9 6.4 5.9 3.1 1.9 Electricity 6.6 5.0 2.8 4.1 2.2 3.4 1.8 Crude Oil 3.4 6.0 3 .O 2.0 3.9 2.9 1.8 Tea 8.5 5.8 4.6 4.8 1.8 1.8 1.3 Oil and Oil Products (except crude oil) 8.7 5.6 4.8 3 .O 2.0 1.5 1.1
Source: Georgia State Department o f Statistics.
2.10 Within the food and agricultural products category, wine, hazelnuts, mineral water and tea are among major exports o f Georgia. Wine exports have had a nine fold increase from US$4 mil l ion in 1995 to US$36 mill ion in 2002. About three quarters o f Georgia’s wine exports are to Russia, although Georgia has begun to export small volumes to a number o f other countries as Hazelnut i s also being established as a new export product, mainly to Turkey, with exports reaching US$22 mill ion in 2000.’9 Exports o f mineral water had the highest share o f total exports in 1997 (US$17.6 million) but lost more than $10 million by the end o f 1998 due to the crisis in Russia. Since 2000, the value o f exports o f
~~~
’* Ukraine i s the second largest market for Georgian wine (10 percent) followed by the US (3 percent). ’’ A special government commission has been established by presidential decree to support and coordinate hazelnut production in Georgia.
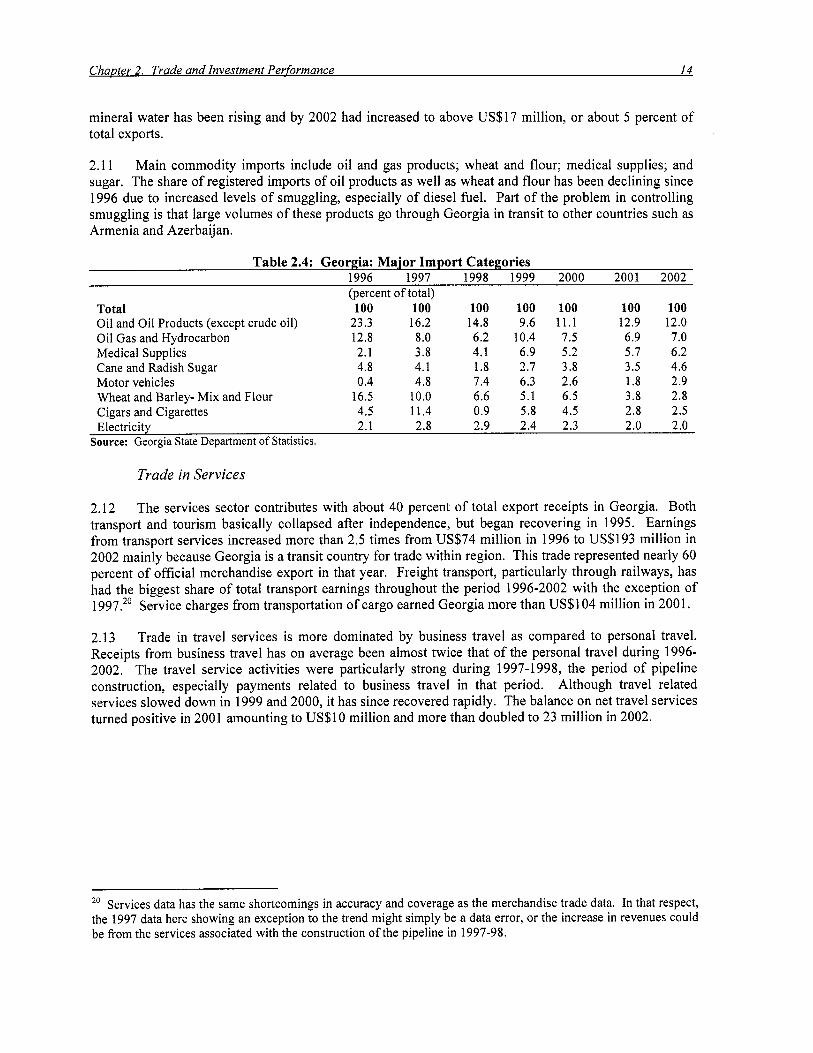
mineral water has been rising and by 2002 had increased to above US$17 million, or about 5 percent o f total exports.
2.11 Main commodity imports include oil and gas products; wheat and flour; medical supplies; and sugar. The share o f registered imports of oi l products as well as wheat and flour has been declining since 1996 due to increased levels o f smuggling, especially o f diesel fuel. Part o f the problem in controlling smuggling i s that large volumes of these products go through Georgia in transit to other countries such as Armenia and Azerbaijan.
Table 2.4: Georgia: Major Import Categories 1996 1997 1998 1999 2000 2001 2002 (percent o f total)
Total 100 100 100 100 100 100 100 Oil and Oi l Products (except crude oil) 23.3 16.2 14.8 9.6 11.1 12.9 12.0 Oi l Gas and Hydrocarbon 12.8 8.0 6.2 10.4 7.5 6.9 7.0 Medical Supplies 2.1 3.8 4.1 6.9 5.2 5.7 6.2 Cane and Radish Sugar 4.8 4.1 1.8 2.7 3.8 3.5 4.6 Motor vehicles 0.4 4.8 7.4 6.3 2.6 1.8 2.9 Wheat and Barley- M i x and Flour 16.5 10.0 6.6 5.1 6.5 3.8 2.8 Cigars and Cigarettes 4.5 11.4 0.9 5.8 4.5 2.8 2.5 Electricity 2.1 2.8 2.9 2.4 2.3 2.0 2.0
Source: Georgia State Department o f Statistics.
Trade in Sewices
2.12 The services sector contributes with about 40 percent o f total export receipts in Georgia. Both transport and tourism basically collapsed after independence, but began recovering in 1995. Earnings from transport services increased more than 2.5 times from US$74 million in 1996 to US$193 million in 2002 mainly because Georgia is a transit country for trade within region. This trade represented nearly 60 percent o f official merchandise export in that year. Freight transport, particularly through railways, has had the biggest share of total transport earnings throughout the period 1996-2002 with the exception of 1997.20 Service charges from transportation of cargo earned Georgia more than US$104 million in 2001.
2.13 Trade in travel services i s more dominated by business travel as compared to personal travel. Receipts from business travel has on average been almost twice that o f the personal travel during 1996- 2002. The travel service, activities were particularly strong during 1997-1998, the period of pipeline construction, especially payments related to business travel in that period. Although travel related services slowed down in 1999 and 2000, it has since recovered rapidly. The balance on net travel services turned positive in 2001 amounting to US$lO million and more than doubled to 23 million in 2002.
2o Services data has the same shortcomings in accuracy and coverage as the merchandise trade data. In that respect, the 1997 data here showing an exception to the trend might simply be a data error, or the increase in revenues could be from the services associated with the construction o f the pipeline in 1997-98.
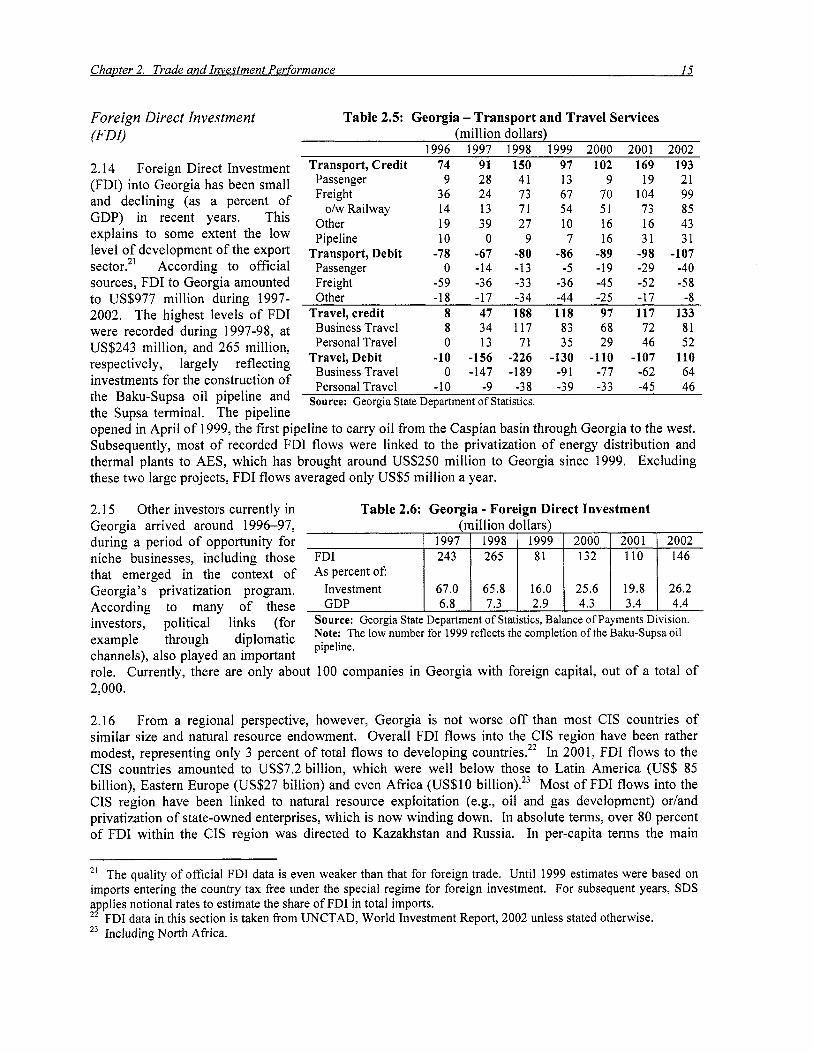
ChaDter 2. Trade and Investment Performance 15
As percent o f Investment GDP
Foreign Direct Investment POI)
67.0 65.8 16.0 25.6 19.8 26.2 6.8 7.3 2.9 4.3 3.4 4.4
2.14 Foreign Direct Investment (FDI) into Georgia has been small and declining (as a percent o f GDP) in recent years. This explains to some extent the low level o f development o f the export sector.21 According to official sources, FDI to Georgia amounted to US$977 million during 1997- 2002. The highest levels of FDI were recorded during 1997-98, at US$243 million, and 265 million, respectively, largely reflecting investments for the construction o f the Baku-Supsa oi l pipeline and the Supsa terminal. The pipeline
Table 2.5: Georgia - Transport and Travel Services (million dollars)
1996 1997 1998 1999 2000 2001 2002 Transport,Credit 74 91 150 97 102 169 193
Freight 36 24 73 67 70 104 99 o/w Railway 14 13 71 54 51 73 85
Other 19 39 27 10 16 16 43 Pipeline 10 0 9 7 16 31 31
Transport,Debit -78 -67 -80 -86 -89 -98 -107
Passenger 9 28 41 13 9 19 21
Passenger 0 -14 -13 -5 -19 -29 -40 Freight -59 -36 -33 -36 -45 -52 -58 Other -18 -17 -34 -44 -25 -17 -8
Travel, credit 8 47 188 118 97 117 133 Business Travel 8 34 117 83 68 72 81 Personal Travel 0 13 71 35 29 46 52
Travel, Debit -10 -156 -226 -130 -110 -107 110 Business Travel 0 -147 -189 -91 -77 -62 64 Personal Travel -10 -9 -38 -39 -33 -45 46
Source: Georgia State Department o f Statistics.
opened in April o f 1999, the f i rst pipeline to carry o i l from the Caspian basin through Georgia to the west. Subsequently, most o f recorded FDI flows were linked to the privatization of energy distribution and thermal plants to AES, which has brought around US$250 million to Georgia since 1999. Excluding these two large projects, FDI flows averaged only US$5 million a year.
2.15 Other investors currently in Georgia arrived around 1996-97, during a period of opportunity for niche businesses, including those that emerged in the context o f Georgia’s privatization program. According to many o f these investors, political l i n k s (for example through diplomatic channels), also played an important
Table 2.6: Georgia - Foreign Direct Investment (million dollars)
1 1997 I 1998 1 1999 I 2000 I 2001 I 2002 FDI I 243 I 265 I 81 I 132 1 110 I 146
role. Currently, there are only about 100 companies in Georgia with foreign capital, out o f a total o f 2,000.
2.16 From a regional perspective, however, Georgia i s not worse of f than most CIS countries of similar size and natural resource endowment. Overall FDI flows into the CIS region have been rather modest, representing only 3 percent o f total flows to developing countries.22 In 200 1, FDI flows to the CIS countries amounted to US$7.2 billion, which were well below those to Latin America (US$ 85 billion), Eastern Europe (US$27 billion) and even Africa (US$lO billion).23 Most o f FDI flows into the CIS region have been linked to natural resource exploitation (e.g., oil and gas development) or/and privatization o f state-owned enterprises, which i s now winding down. In absolute terms, over 80 percent o f FDI within the CIS region was directed to Kazakhstan and Russia. In per-capita terms the main
The quality o f official FDI data i s even weaker than that for foreign trade. Until 1999 estimates were based on imports entering the country tax free under the special regime for foreign investment. For subsequent years, SDS applies notional rates to estimate the share o f FDI in total imports. 22 FDI data in this section i s taken from UNCTAD, World Investment Report, 2002 unless stated otherwise. 23 Including North Africa.
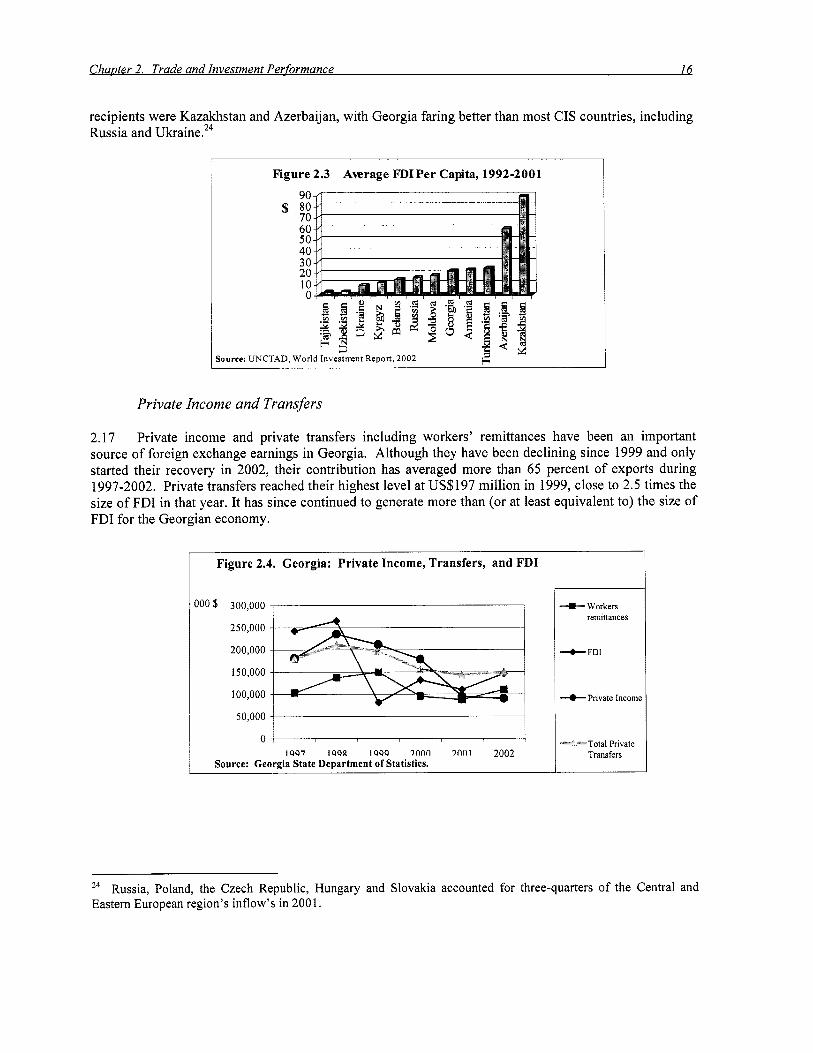
ChaDter 2. Trade and Investment Performance 16
recipients were Kazakhstan and Azerbaijan, with Georgia faring better than most CIS countries, including Russia and Ukraine.24
~
Figure 2.3 90
Average FDIPer Capita, 1992-2001
% 60 50 40 30 20 10 n
Private Income and Transfers
2.17 Private income and private transfers including workers' remittances have been an important source o f foreign exchange earnings in Georgia. Although they have been declining since 1999 and only started their recovery in 2002, their contribution has averaged more than 65 percent o f exports during 1997-2002. Private transfers reached their highest level at US$197 mi l l ion in 1999, close to 2.5 times the size o f FDI in that year. I t has since continued to generate more than (or at least equivalent to) the size o f FDI for the Georgian economy.
1 Figure 2.4. Georgia: Private Income, Transfers, and FDI
"",""" - 50,000
0 1907 IQQX I Q Q O innn inn1 2002
Source: Georgia State Department of Statistics.
+ Workers remittances
+ FDI
--C Private Incomt
"'+--Total Pnvate Transfers
24
Eastern European region's inflow's in 2001. Russia, Poland, the Czech Republic, Hungary and Slovakia accounted for three-quarters o f the Central and

Table 2.7: Georgia - Private Income and Transfers (million dollars)
1996 1997 1998 1999 2000 2001 ‘2002 Income Receipts 1 181 236 211 179 94 90 Transfer Receipts 32 180 211 197 156 143 149
Workers Remittances 103 137 149 95 87 110 Other Private Transfers 32 77 74 48 61 56 39
Source: Georgia State Department o f Statistics. Note: Income receipts represent eamings o f workers abroad for less than one year. Remittances are earnings o f workers abroad for more than one year.
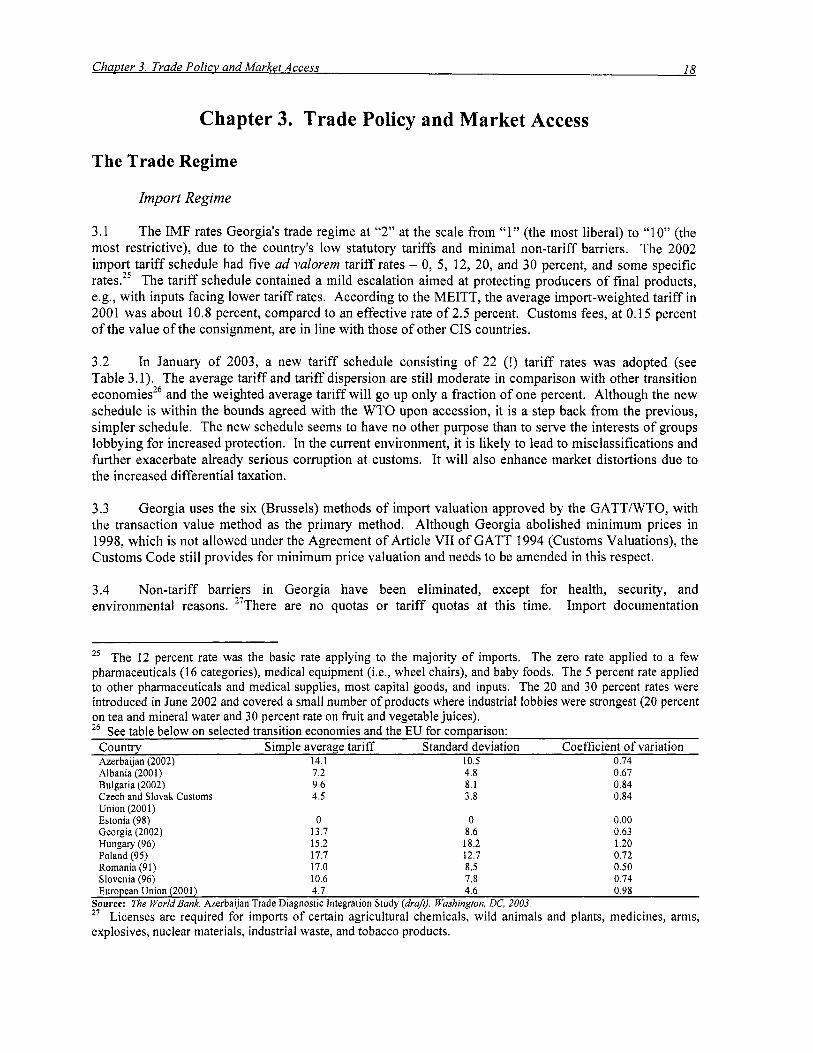
Chapter 3. Trade Policy and Market Access
The Trade Regime
Import Regime
3.1 The IMF rates Georgia’s trade regime at “2” at the scale from “1” (the most liberal) to “10” (the most restrictive), due to the country’s low statutory tariffs and minimal non-tariff barriers. The 2002 import tariff schedule had five ad valorem tariff rates - 0, 5, 12, 20, and 30 percent, and some specific rates.2s The tariff schedule contained a mild escalation aimed at protecting producers o f final products, e.g., with inputs facing lower tariff rates. According to the MEITT, the average import-weighted tariff in 2001 was about 10.8 percent, compared to an effective rate o f 2.5 percent. Customs fees, at 0.15 percent o f the value o f the consignment, are in line with those o f other CIS countries.
3.2 In January of 2003, a new tariff schedule consisting o f 22 (!) tariff rates was adopted (see Table 3.1). The average tariff and tariff dispersion are s t i l l moderate in comparison with other transition economies26 and the weighted average tariff wil l go up only a fraction o f one percent. Although the new schedule i s within the bounds agreed with the WTO upon accession, it i s a step back from the previous, simpler schedule. The new schedule seems to have no other purpose than to serve the interests o f groups lobbying for increased protection. In the current environment, it i s likely to lead to misclassifications and further exacerbate already serious corruption at customs. It wil l also enhance market distortions due to the increased differential taxation.
3.3 Georgia uses the six (Brussels) methods o f import valuation approved by the GATT/WTO, with the transaction value method as the primary method. Although Georgia abolished minimum prices in 1998, which i s not allowed under the Agreement o f Article VI1 o f GATT 1994 (Customs Valuations), the Customs Code s t i l l provides for minimum price valuation and needs to be amended in this respect.
3.4 Non-tariff barriers in Georgia have been eliminated, except for health, security, and environmental reasons. There are no quotas or tariff quotas at this time. Import documentation 21
25 The 12 percent rate was the basic rate applying to the majority o f imports. The zero rate applied to a few pharmaceuticals (16 categories), medical equipment (Le., wheel chairs), and baby foods. The 5 percent rate applied to other pharmaceuticals and medical supplies, most capital goods, and inputs. The 20 and 30 percent rates were introduced in June 2002 and covered a small number o f products where industrial lobbies were strongest (20 percent on tea and mineral water and 30 percent rate on fruit and vegetable juices). 26 See table below on selected transition economies and the EU for comparison:
Country Simple average tariff Standard deviation Coefficient o f variation Azerbaijan (2002) 14.1 10.5 0.74 Albania (2001) 7.2 4.8 0.67 Bulgaria (2002) 9.6 8.1 0.84 Czech and Slovak Customs 4.5 3.8 0.84 Union (2001)
Georgia (2002) 13.7 8.6 0.63
Poland (95) 17.7 12.7 0.72
Slovenia (96) 10.6 7.8 0.74 European Union (2001) 4.7 4.6 0.98
Estonia (98) 0 0 0.00
Hungary (96) 15.2 18.2 1.20
Romania (91) 17.0 8.5 0.50
Source: The World Bank. Azerbaijan Trade Diagnostic Integration Study (dra)). Washington, DC, 2003. 27
explosives, nuclear materials, industrial waste, and tobacco products. Licenses are required for imports o f certain agricultural chemicals, wild animals and plants, medicines, arms,

Chapter 3. Trade Policy and Market Access 19
requirements are relatively simple although some are superfluous.2s For example, importers are often required to obtain a certificate o f conformity f rom the State Department o f Standards, even when they provide val id certificates issued by the country o f origin. Laws on Safeguard Measures and anti-dumping have not been adopted yet, and no attempts have been made thus far to raise domestic protection through these means.
Table 3.1: Georgia - 2003 Import Tariff Schedule 1.1 Tar i f f rate (percent) Number o f tar i f f lines As percent o f total 0 668 6.2 2 753 6.9 3 22 0.2 4 1791 16.5 5 1212 11.2 7 433 4.0 8 1048 9.7 9 3 64 3.4 10 228 2.1 12 3700 34.1 13 80 0.7 14 43 0.4 15 110 1 .o 16 6 0.1 17 26 0.2 18 39 0.4 20 105 1 .o 22 25 0.2 24 19 0.2 25 20 0.2 27 66 0.6 30 81 0.7 Total 10,839 100.0
Source: The World Bank staff calculations based on the tariff schedule o f Georgia.
3.5 The Customs Code stipulates ten customs regimes for imports, o f which three are o f particular importance: importation for free circulation (the regular regime), temporary importation for inward processing (i.e., processing o f imported goods inside Georgia with the exportation o f outputs within one year period (this regime requires a license issued by the Customs Department), and temporary importation (for re-export during one year period).29 Only goods imported for free circulation pay customs duties and the VAT. However, a l i s t o f tar i f f exemptions for imports under free circulation regime i s in effect. The most important exemptions include: imported inputs for the production o f exports, goods financed by grants or concessional credits with the grant element o f at least 25 percent, and goods imported as humanitarian aid or disaster relief.30
3.6 Georgia follows the destination principle o f value added taxation, i.e., it taxes imports rather than exports. A VAT rate o f 20 percent, which i s in line with most CIS countries, i s applied on the customs value plus import duty and excises. According to the Tax Code, the fo l lowing products are exempt f rom
** These include: invoice, customs declaration, the certificate o f origin, and transport documentation. 29 Other regimes are: re-importation, transit shipment, importation into a duty free shop, processing under customs control, and placement and use o f goods in a free warehouse or in a free customs zone. 30 Goods brought by natural persons valued at or below 300 GEL (per entry) are also exempt. Other exemptions include imports by foreign diplomatic missions and their staff; literary, artistic or scientific works o f Georgian citizens published abroad; and aviation fuel and lubricants.

Chauter 3. Trade Policy and Market Access 20
the VAT: inputs designated for export production, fixed assets and spare parts, goods supplied as humanitarian assistance and disaster relief, goods financed by grants or concessional external credits (with the minimum 25 percent grant element, pharmaceuticals, and baby food. Excise taxes apply to imports o f tobacco, alcohol, cars, fuel products, and caviar. The Tax Code stipulates the same excise schedule for imports and domestic products.
Table 3.2: Georgia - Taxation of Imports, 1997 - 2001 1997 1998 1999 2000 2001
Total taxes on imports as 'YO of total tax revenues: 30.6 32.3 30.1 30.2 29.3
Composition of trade taxes (as percent of total): Custom duties Excise tax on imports VAT on imports
34.3 32.0 14.0 20.6 19.8 26.9 20.1 43.9 31.0 24.5 38.8 47.9 42.1 48.4 55.8
Share o f taxes on imports in total collection of the given tax (%): Excise tax 91.0 92.7 87.8 88.4 76.2 VAT 35.8 44.9 40.9 43 .O 43.6
Average effective import tariff rate (as % o f merchandise 4.5 4.1 1.6 2.7 2.5 imports)
Source: The World Bank. Public Expenditure Review for Georgia. Washington, DC, 2002.
3.7 Trade accounts for about 30 percent o f tax revenues (see Table 3.2), with VAT and excise taxes contributing by 56 percent and 25 percent, respectively. The contribution o f customs duties (20 percent) has decreased both in nominal and relative terms in line with a decline in the effective import tariff rate to 2.5 percent in 2001--or one fourth o f the weighted average rate (10.8 percent). This difference can be explained by the large proportion o f duty-free imports from the free trade area (within the CIS) and the proliferation o f customs regimes with tariff exemptions.
3.8 A serious problem for import taxation i s the large scale of smuggling, resulting from weak customs administration and lack o f control over the borders in conflict areas. In a recent study, the State Department o f Statistics (SDS) estimated that 71 percent o f selected products consumed in Georgia in 2001 were smuggled: tobacco - 66 percent, TV sets - 67 percent, matches and cigarette lighters - 89 percent, mobile phones - 73 percent, electric appliances - 50 percent, cleaners - 85 percent. Widespread smuggling also distorts economic incentives. Statutory tariffs and other import taxes have l i t t le impact in determining relative prices. Under the circumstances, effective protection to local industry i s probably uneven, unstable, and often negative.
Export Regime
3.9 Export restrictions in Georgia are limited to arms, ammunitions and objects o f national heritage, which are prohibited. In the past few years, exports of scrap metal and unprocessed timber have been subject to temporary bans (or licensing) aimed at stemming their rapid depletion. In practice, however, such restrictions have only encouraged rent seeking activities.
3.10 The foreign exchange regime i s liberal, with a single floating exchange rate. Foreign currency surrender requirements do not exist and there are virtually no restrictions on the movement o f foreign currencies. There are no free trade zones and no subsidy of any kind i s offered to exporter^.^' Exporters
3 1 The Government planned to establish free economic zones in Poti and Batumi, but the Parliament rejected the draft Law on free economic zones.
using imported inputs for export production can obtain exemptions from tariffs and the VAT on imported inputs. The most used mechanism to access tax free inputs i s the temporary import regime for inward processing, which gives exporters a period o f 6-9 months between the time inputs are imported and the final product i s exported.
3.11 Officially, the VAT paid on inputs - either imported or domestically produced - i s subject to reimbursement. In the case of imported inputs, a tax credit i s issued to the extent that such inputs are incorporated in the exported product. In the case of domestically produced inputs, there i s a need for a cash refund. However, in practice, these refunds occur too late or not at all, due to Georgia’s tight fiscal situation. According to the Ministry o f Finance, VAT refunds are also complicated by the proliferation of fake invoices. As o f 2002, the VAT refund claims amounted to GEL75-80 million, but the validity o f 60- 70 percent o f this amount was questioned.
The Investment Regime
3.12 The legislative framework governing foreign investment i s in line with international standards and compares favorably with other former Soviet Union countries. Georgia allows foreign investment in all but few strategic sectors and there i s no local ownership req~irement.~~ There are no restrictions on profit remittances, debt service, etc., and the law provides for full compensation in case o f expropriation.
3.13 Georgia entered into bilateral investment agreements with 22 countries including the U.S., Canada, China, the CIS, European countries, and Middle Eastern countries, which eliminate double taxation o f investment. To date, the U.S. Overseas Private Investment Corporation (OPIC), has provided political risk insurance to three projects amounting about US$20 million. OPIC has provided a loan in the amount o f US$26 million for the construction of two Marriott hotels, the first o f which i s already in operation. The Multilateral Investment Guarantee Agency (MIGA), part o f the World Bank Group, has not yet provided any political risk guarantee to any Georgian project.
3.14 Most capital goods are subject to a 5 percent import duty and to a 20 percent VAT. There are currently no preferential tax incentives available to foreign investors in Georgia. An earlier law granting tax holidays to foreign investments in certain activities was repealed in 1996, but foreign companies that obtained licenses under this law were given exemptions for a period of five years. Such tax incentives have not played any significant role in attracting investment, because of the country’s s t i l l difficult investment climate, as evidenced by the minimal level o f non oi l and energy related FDI during the 1997- 2001 period.
Terms o f Market Access
Free Trade Agreements with CIS Countries
3.15 The CIS free trade area was established in 1992, but two multilateral free trade agreements - signed in 1992 and 1994 - have never been ratified by the parliaments of Russia and Georgia and therefore remain ineffective. These agreements have been substituted by a number o f bilateral free trade agreements among the CIS members. Georgia has now six free trade agreements (FTAs), one each with Armenia, Azerbaijan, Kazakhstan, Russia, Turkmenistan, and Ukraine. Georgia i s not a party to any FTA outside the CIS.
~
32 Under the Law on Promotion and Guarantees o f Investment Activity, the government must retain controlling interest in air traffic control, shipping traffic control, railroad control systems, defense and weapons industry. Georgia also restricts foreign ownership o f agricultural land.
Chaster 3. Trade Policv and Market Access 22
3.16 The agreements provide for duty-free trade in goods, with (unspecified) potential exemptions, and free transit of goods through the signatories’ territories. Exemptions introduced in the Protocols to the above FTAs, which are elaborated annually by respective bilateral trade commissions. T o date, exemptions f rom free trade apply to the Georgia-Russia trade (sugar, alcohols, beer, and tobacco products) and to the Georgia-Kazakhstan trade (sugar, alcohol and non-alcohol beverages, and tobacco). Exempted products are subject to normal, Most Favored Nat ion (MFN) tariff rates. Also, Azerbaijan has recently introduced unilaterally a 15 percent tar i f f o n steel products. Trade between Georgia and other FTA participants is 100 percent free.
3.17 Current FTAs pose a number o f problems: (i) parallel bilateral and multilateral agreements undermine transparency and hamper the efficiency o f the free trade area; (ii) exclusions, including quantitative restrictions, can be imposed unilaterally while bilateral or multilateral settlement i s rather weak; (iii) lack o f permanency, Le. each bilateral agreement i s subject to annual changes (in the case o f the exclusion o f goods from free trade), or even more frequent changes (in the case o f safeguards). At present, exclusions cover only a small percentage o f intra-CIS trade, but there i s no guarantee that this situation wi l l not be reversed.
3.18 Rules of Origin. The rules o f origin applicable in the CIS free trade area were established by the 2000 Decision o f a l l 12 CIS Government Heads.33 The signatories elaborated a certificate o f origin o f a special type for the CIS free trade area (type ST-1). This certificate is issued in Georgia by the MEITT or the Chamber o f Commerce.34
3.19 The rules o f origin al low for full cumulation o f origin: Al l value added in the free trade area i s included in the share o f sufficient domestic processingkreatment whi le that f rom outside the free trade area i s excluded.. This i s an important incentive for trade integration among the CIS countries which avoids the adverse effects o f the hub-and-spoke pattern (Baldwin, 1991)35 where the benefits o f free trade agreements are captured by the dominant member(s) o f the free trade arrangement (i.e., Russia) leading to income diversion within the free trade area.
3.20 According to the rules o f origin, exports subject to the free trade treatment must be conducted by tax residents in the free trade area. There i s at least one case when an import f rom the free trade area was charged customs duties in Georgia. That was an import o f f lour f rom Ukraine executed by a Swiss company, a non-resident o f Ukraine. The company went to a Georgian court and lost the case.
33 See The Rules of the Determination of a Country of Origin of Goods. 34 According to the basic rule o f origin (rule o f sufficient domestic processing/treatment), a product may be considered o f Georgian origin, if it i s fully produced in Georgia or, when imports are used in i ts production, if the designation o f the product i s different from the designation o f the inputs according the 4-digit CIS trade nomenclature (which i s equivalent to the Harmonized System at this level o f aggregation). However, a long l ist o f goods specified in the Annex to the Rules o f Origin are exempted from this rule. The Annex includes two other important applicable rules o f origin : (i) when specified technological operations are performed in the free trade area for a particular product; and (ii) when specified shares o f imported materials or value added in the price o f final production are met (ad valorem rule) for a particular product. The specified share o f value added in the final price o f the product i s normally set at 50 percent. 35 The hub-and-spoke pattern i s as follows. Suppose, countries A, B, and C have bilateral FTAs among themselves. However, value added in country C i s not counted towards sufficient processing in trade between countries A and B. Such an arrangement exists among the EU and the CEE countries that have bilateral FTAs with the EU. Under this arrangement, the value added, for example, in Macedonia i s not included in sufficient processing if, Croatia exports to the EU a good produced in cooperation with Macedonia (see Kaminski and de la Rocha, 2002).
ChaDter 3. Trade Policv and Market Access 23
3.21 According to the CIS Agreement on Standards, the standards of member countries are harmonized and members should honor each other’s certificates of conformity and quality. This i s an important trade advantage for the CIS members since their national standards, which are based on the Soviet GOST system, are not recognized in the rest o f the world. The Interstate Council on Standards, established under the Agreement, has been gradually introducing new standards in line with I S 0 standards, but more than half of positions in the standards nomenclature are s t i l l based on GOST. The Council can potentially act as a vehicle of integration of the CIS into the world trading system if the evolving CIS standards system i s built in accordance with the I S 0 guidelines and WTO agreements. In any event, Georgia i s committed to reform its standards system in line with WTO regulations by the end o f 2003 (see para. 3.35).
CIS Standards.
3.22 In sum, Georgian exports enjoy an easer access to the CIS markets than to other destinations. Along with trade preferences described above, the traditional economic ties s t i l l play an important role, albeit less significant than in the past. However, informal trade barriers and corruption, rampant throughout the CIS trade area, undermine formal free trade.
Market Access to Non-CIS Countries
3.23 By virtue of i ts WTO membership, Georgia enjoys MFN treatment by all 144 WTO members. Georgia has a Partnership and Cooperation Agreement (PCA) with the EU, ratified in 1999, which provides for trade restrictions on sensitive sectors such as textiles, coal, and metals, unless specific sectoral agreements stipulate otherwise. Under the 1993 Agreement on Textiles signed between Georgia and the EU, Georgia’s textile and clothing exports could be subject to quantitative restrictions in the EU market if the exported volume exceeded 0.35 to 4 percent (depending on the product) o f the total EU imports in the previous year, or if Georgia exports at abnormally low prices. However, no quantitative or extra tariffs on Georgian exports have been used by the EU as of to date, presumably because they are so small.
3.24 Generalized System of Preferences (GSP). Georgia is a beneficiary o f the GSP of the EU, the U.S., Canada, Switzerland, Japan, Turkey, Poland, and Estonia. The GSP gives import duty reductions on a l i s t o f products that satisfy the requirements stipulated by the country administering the GSP, including the rules o f origin. To satisfy the rules o f origin requirements under the GSP, the MEITT has the authority to issue the certificate of origin A accepted in the countries administering the GSP.
3.25 The preferences Georgia receives under the GSP are not as deep as those granted to less developed countries (LDCs). Despite i t s low income per capita, Georgia i s not considered an LDC because of i t s relatively high level o f human development. Also, to speed up the WTO accession process, Georgia did apply to obtain an LDC status. However, Georgia, along with other poor countries in transition, has been granted the IDA status by the World Bank at par with LDCs, which would support granting deeper preferential treatment to Georgia under the GSP.
3.26 Despite current GSP arrangements, some important Georgian exports face statutory tariffs in the EU while LDCs face zero tariffs on the same products. For example: Ferro-alloys - a range o f tariff rates including 2.2 percent and 2.7 percent, ammonium nitrate fertilizer - 3 percent, wines - a range o f specific duties including €13.1 and €32 per 100 liters, mineral waters - 6.1 percent, suits o f synthetic fibers - 9.7 percent, apple juice concentrate - 14.5 percent, and cigarettes - 40.3 percent. These tariffs are rather high for “sensitive” products such as textiles and temperate agricultural products.
3.27 Georgia could obtain additional duty reductions (generally 5 percent) under the EU GSP by claiming compliance with EU-defined basic labor rights. For textiles and clothing the available duty reduction i s 40 per cent o f the MFN rate compared to 20 per cent under the standard GSP.
Chapter 3. Trade Policv and Market Access 24
3.28 The actual utilization of granted preferences i s low. Only 51 percent o f Georgian exports to the EU eligible for GSP preferences actually receive those preferences. The other 49 percent of exports pay full non-concessional tariffs. Several factors account for the low utilization of the GSP preferences: (i) ignorance about the GSP and i ts document requirements on the part o f Georgian exporters and foreign importers; (ii) administrative hassle and bribes associated with obtaining the special certificate o f origin; (iii) a desire o f exporters to conceal as much as possible their foreign trade activities from the Government in order to minimize taxes. The level of preference take-up, however, has improved over time, thanks to the awareness campaign by the Ministry o f Foreign Affairs.
3.29 Georgia has not been a target of anti-dumping actions by any developed country so far. However, the Georgian steel producers have not submitted the recent questionnaires on steel products distributed by the EU thus exposing themselves to potential anti-dumping actions. Georgia has a large former Soviet steel mill in Rustavi which i s still in operation albeit at a very low production level.
3.30 Technical barriers. Technical barriers to trade (TBTs) for the Georgian exports to the developed- country markets are rather restrictive. Georgia does not have agreements with these countries on mutual recognition of quality certificates. Also, Georgian firms often find it difficult to maintain consistent standards and quality due to technological problems. European certifying institutions used by Georgian exporters are located in Europe, which adds considerable expense and creates extra uncertainty. According to the ISO, 260 firms in Georgia had been certified as complying with I S 0 9000 standards at the end of 2001. This compares with 1 firm in Azerbaijan, 41 in Kazakhstan, 202 in Lithuania, and 1026 in Slovenia. The Georgian number appears high if compared with other CIS countries, but it is still low as a percentage o f all Georgian firms. Most Georgian exporters to developed countries (outside o f the mineral extraction sector) do not conduct their own marketing activities, but rely on contract processing or distributors who buy their products on ex-factory terms.
3.3 1 Iran and the Middle East are potentially important destinations for Georgian exports, because o f their geographical proximity, low transport costs, and relatively high market purchasing power. However, with the exception UAE free trade zone, access to these markets i s difficult. In Iran, for example, restrictions include quotas, high tariffs on selected products, and burdensome document requirements (such as licenses).
Relations with the WTO
Georgia’s Accession to the WTO
3.32 Upon i ts accession to the WTO on June 14, 2000,36 Georgia received permanent, unconditional, contractually guaranteed MFN status from all the WTO member^.^' Membership benefits in the WTO include: (i) assuring a liberal trade regime and greater transparency in Government support for domestic
36 Georgia’s accession process started in 1994 when it gained observer status in GATT. After the establishment on January 1, 1995 o f the WTO as the successor to the GATT, Georgia obtained the observer status (June 1996). After Georgia submitted the schedules o f concessions and commitments on goods and the specific commitments on services, negotiations started in March 1998 and were concluded on October, 6, 1999, when the WTO General Council adopted the report o f the Working Party on Georgia’s accession. The Georgian representative signed the Marrakech Agreement (establishing the WTO) and the Protocol o f Accession which were ratified by the Georgian Parliament on April 20,2000.0n June 14,2000 Georgia became the 137th member o f the WTO. 37 Georgian products were previously subject to discrimination under the Jackson-Vanik amendment to the U.S. Trade Act o f 1974, on the basis o f a lack o f freedom o f immigration. The amendment had been waived annually since 1993.
The US extended non-discriminatory treatment to Georgia in December 2000.

industries; and (ii) providing certainty with respect to market access in other WTO member countries, a dispute settlement mechanism as wel l as opportunities for active participation in the multilateral trade negotiations within the WTO framework.
3.33 In addition to the 29 mandatory WTO agreements, Georgia jo ined the fol lowing sectoral initiatives (which, with a few exemptions, stipulate zero import tariffs): c i v i l aircraft and information technology, pharmaceutical products, metal products, wood products, and agricultural machinery. Georgia also agreed to start negotiations on jo in ing the Agreement on state procurement, though it i s behind schedule.
3.34 T o speed up i t s accession process, Georgia agreed to a short (or no) transitional period for a number o f WTO agreements. For instance, Georgia negotiated the Aggregate Measure o f Support for agriculture at f ive percent o f agricultural GDP, which corresponds to the obligations o f a developed country. Also, Georgia offered very liberal market access in the service sector. In fact, Georgia applied i t s domestic regulations to and did not discriminate against foreign suppliers in banking, insurance, security trade, auditing, legal services, and tourism.
Post-Accession Issues
3.35 Georgia did not negotiate any transitional period for two important agreements: the General Agreement on Trade in Services and the Agreement on Trade-Related Intellectual Property Rights (TRIPS).
3.36 Tri s. Georgian legislation was generally in line with the TRIPS Agreement at the time o f accession?' Specifically, Georgia had joined a full range o f international convention^^^ and i ts legislation provided for the protection o f copyrights, trademarks, and service marks, etc., including appropriate c iv i l judicial and administrative procedures. However, l ike in many developing and transition countries, the enforcement o f the TRIPS legislation i s very weak. A department for the protection o f intellectual property has been established under the Ministry o f Internal Affairs (the police) and the Intellectual Property Expert Center has been under the Ministry o f Justice. A handful o f showcase operations to seize unlicensed products have been carried out by the police, but weak control o f the borders prevents the effective protection o f trade-related intellectual property rights. International companies producing products with high intellectual content exert weak pressure, if any, to strengthen the enforcement o f intellectual property rights o f Georgia's l ow visibility.
3.37 A weak enforcement o f intellectual property rights hinders foreign investment in knowledge- intensive industries, such as the information technology. A foreign counterpart must be sure that his intellectual property (such as the source code in the programming industry) will be protected during the operations performed by a Georgian firm. If there i s no such guarantee, cooperation wi l l fa i l to develop.
3.38 Standards. Georgian legislation i s in line with the GATT 1994 Agreement on Technical Barriers to Trade and the Agreement on the Application o f Sanitary and Phytosanitary Measures. The agreements stipulate non-discrimination against imports in applying standards in the mandatory technical regulations and conformity assessments and the establishment o f national inquiry points (notification centers). Georgia has established three notification centers: for phytosanitary measures at the Ministry o f
38 As noted in the Report of the Working Party on the Accession of Georgia to the WTO (WTO, 1999a) 39 Georgia joined the World Intellectual Property Organization and the Paris Convention for the Protection o f Industrial Property (January 18, 1994); the Patent Cooperation Treaty (January 18, 1994); the Berne Convention for the Protection o f Literary and Artistic Works (May 15, 1995); and the Protocol Relating to the Madrid Agreement Concerning the International Registration o f Marks (August 20, 1998).

Chauter 3. Trade Policv and Market Access 26
Agriculture; for technical barriers to trade at Sakstandarti; and for trade in services at the Ministry o f Foreign Affairs.
3.39 Under the WTO agreement, Georgia must adopt by end-2003 a new standards system comprising voluntary and mandatory international technical regulations, thus replacing the current GOST system.40 The current Law on Standards, passed in 1999, includes clauses about the division of standards into voluntary and mandatory. The 2001 Presidential Decree put forward a timetable on the movement to the two-tier system of voluntary and mandatory standards. In 2002, the number of mandatory standards was reduced from 120 four-digit codes under the Harmonized System to 78 codes. However, the progress in the elaboration of technical regulations has been very slow. The stalling of the standards reform stems from powerful political pressures to maintain the status quo, including the national standards agency. An overly-controlled standards system offers strong opportunities for rent-seeking and corruption.
3.40 Special Treatment. As mentioned above, Georgia did not pursue the LDC status during the accession. However, at the Doha ministerial conference, the Georgian delegation asked that the preferences granted for developing countries should as well be applied to the low-income transition countries, in particular, in agricultural trade. Also, the Georgian delegation insisted that the low-income transition countries be eligible for external debt relief. However, both the developed and developing countries were, in principle, against these requests since Georgia had accepted the non-preferential status at the time of accession (Beruchashvili, 2001).
3.4 1 Funding of Post-Accession Activities. The funding of post-accession activities i s inadequate. Although the WTO agreements were ratified upon accession in 2000, they have not been published in their entirety due to a lack o f funding. This creates a problem for enforcement, since the legal institutions do not have the texts of the agreements. There i s even a problem with paying the annual WTO membership dues, which amount to a mere $15,000 a year! The functioning of notification centers i s also funded very poorly. The Center on technical barriers to trade in Sakstandarti has practically stopped operations due to the lack o f funding.
3.42 Technical Assistance. Georgia received adequate technical assistance on WTO matters during the accession period, through the Georgian-European Policy and Legal Advice Center (GEPLAC) funded by TACIS and the Center for Institutional Reform and the Informal Sector funded by the USAID. Going forward, Georgia needs technical assistance in the following key areas:
0
0
0
Reform of the standards system;
Implementation of the TRIPS Agreement;
WTO matters (publications, strengthening capacity to participate in the Doha development agenda via advisory services and funding o f WTO-related activities);
Training public servants and the business community on the trade agenda. 0
Trade and Investment Related Institutions
3.43 The formulation and implementation of trade policies in Georgia involves a number of government agencies. The MEITT provides interagency coordination in the area of foreign trade and conducts economic analysis. Along with the Ministry of Finance, it formulates the main parameters of trade policy - the import and export regimes. The Ministry o f Foreign Affairs is responsible for
40
technological processes involved, and the methods o f testing. Technical regulations include not only the characteristics o f the products but also the characteristics o f

Chapter 3. Trade Policv and Market Access 27
multilateral trade relations and relations with the WTO. The National Bank formulates the exchange regime policies and monitors the balance o f payments. Other l ine ministries fulfill their sectoral responsibilities in the area of forei n trade (e.g., the Ministry o f Transport; the Ministry o f Agriculture; and the State Procurement Agency ) are also involved. A 3.44 Coordination among the various agencies i s weak and there i s no clear articulation of the objectives and priorities for trade policy. For instance, it i s not clear what rationale, if any, was used to substantiate the recent changes in the tariff schedule, which increased the number of tar i f fs bands from 5 to 22!. Also, better cooperation between the MEITT and the MoFA on WTO issues would be desirable, especially to ensure a proper implementation of new standards and the TRIPS. In general, because of Georgia’s tight budgetary situation, fiscal considerations tend to drive policy decisions while trade facilitation objectives are either ignored or overlooked. There are also a number o f subordinate agencies dealing with trade and investment issues in Georgia with limited impact.
3.45 The Georgian Investment Center, established in 1997, i s funded by both the Ministry o f Foreign Affairs and the UNDP. In addition to being the secretariat o f the GBC, establishes contacts with investors, and promotes investment in Georgia. The Center produces printed material for investors on an annual basis. The main functions of the center include investment servicing, investment generation, and policy advocacy. In practice, however, GIC i s mainly involved with limited promotion activities abroad as well as organizing site visits for prospective investors who visit Georgia. Issues surrounding policy advocacy seem to be primarily handled by the GBC.
3.46 The Investment Agency, which reports to the Ministry o f Economy, was established in 2002. The agency’s primary role i s to facilitate access to finance to enterprises, mainly exporting firms, by providing subsidies on interest rates. While provisions have been made to ensure that the subsidies are paid only on compliant beneficiaries, the impact o f such scheme however is bound to be limited and ad-hoc, given available funds (GEL1 million in 2002).
3.47 The Foreign Investment Council, under the State Chancellery, deals with policy issues. The Council, which also serves as an advisory body to the President, i s currently involved with implementing the recommendations of the FIAS on administrative barriers to investment (December, 200 1). The FIAS measures have been incorporated in the Presidential decree of April, 2002, “Of the President o f Georgia on Implementation of the Action Plan in Order to Eliminate Administrative Barriers for Improving the Investment Climate in Georgia”. Implementation has been slow and there i s no particular focus on exports in the action plan.
3.48 The Georgian Export Promotion Agency (GEPA), established in 1999, reports to the Ministry o f Economy and i s supported by EU and Dutch funding. GEPA focuses on (i) providing market information to Georgian exporters; (ii) introducing Georgia and Georgian products to companies around the world; (iii) assisting foreign companies in sourcing products in Georgia; (iv) offering online trade leads both for Georgian exporters and overseas importers; and (v) assisting Georgian companies in developing an export marketing strategy. GEPA i s very much involved with Georgian exporters in lobbying the Government. In May, 2001, GEPA developed a concept for export development, which was presented to Government as a draft export concept note, and which had been subsequently accepted by Government. GEPA has also been involved in export certification processes, and in June, 2002, UNDP initiated the process o f establishing a quality certification system in coordination with GEPA, which wi l l result in an EU
41 The State Procurement Agency wil l be the responsible agency for the implementation o f the WTO agreement on state procurement, which Georgia intends to join in the nearest future. 42 FIAS i s a joint service o f the World Bank and the International Finance Corporation (IFC) which helps developing country governments improve their investment environments in order to attract FDI.

Chavter 3. Trade Policv and Market Access 28
accreditation for testing food products and such for exports. GEPA also has a internet database o f Georgian exporting companies for those who may be interested in importing Georgian products.
3.49 These organizations have some direct interaction with enterprises and also through their links with the Georgian Business Confederation (GBC), which is the body where usually firms turn to for assistance. The GBC, comprising many foreign investors and associations, was founded in 2001, through a memorandum of understanding among the American Chamber o f Commerce in Georgia, the International Chamber o f Commerce in Georgia, and the Taxpayers Union o f Georgia. The GBC became registered as a union o f business associations in 2002, and that same year the Georgian Investment Center joined the Confederation, and currently serves as i t s secretariat. Further, many o f the GBC’s board members sit on the advisory committee to the Foreign Investment Council. The GBC has been instrumental in forcing investment issues to the forefront, and lobbying the government for change.
Conclusion
3.50 Georgia has a liberal statutory external trade regime with low import tariffs and no quantitative restrictions. The VAT and excise taxes are equally applied to imports and domestic output. However, weak customs administration results in large scale smuggling which undermines the implementation o f trade policies and creates a “non-level” playing field. Moreover, the new tariff schedule adopted in January 2003, whereby the number o f tariff rates was increased from 5 to 22, i s likely to lead to misclassifications and further exacerbate already serious corruption at Customs. A simpler and flatter tariff schedule needs to be reinstated.
3.51 VAT refunds do not work effectively due to the tight state budget and the proliferation o f fake invoices. This hinders the development o f exports, but also o f domestically produced inputs. In the absence o f a functioning VAT refund mechanism, exporters favor imported inputs (which can be procured tax-free under the existing temporary regime) over domestically produced ones (for which VAT payments cannot be recovered).
3.52 The CIS free trade agreements provide a favorable framework to foster regional trade and have the potential for helping member countries to integrate into the world trading system (e.g., in the case o f harmonized standards). But, the web o f bilateral and multilateral agreements leads to lack o f transparency and inefficiencies in the free trade area. Also, agreements lack permanency and provide for unilaterally imposed and frequently changed trade restrictions. Finally, a difficult trade climate undermines free trade within the region.
3.53 Georgia should have access to the same trade preferences granted to LDCs under GSP programs, if it i s to move into developing higher value added exports. Meanwhile, it can obtain additional preferences, for instance in textiles, in the GSP EU under a special clause relating to the implementation o f basic labor rights. Also, existing GSP preferences should be more fully utilized. Technical barriers for trade imposed by developed countries should be mitigated with a fundamental reform o f the national standards system.
3.54 There i s a need for technical assistance program to strengthen trade-related institutions, especially the standardization system, customs administration, and institutions related to the protection o f intellectual property rights and to the WTO matters.

Chapter 4. Transport and Trade Facilitation in Georgia 29
Freight Transport (million ton-km) Year
Chapter 4. Transport and Trade Facilitation in Georgia
Passenger Transport (million passenger-km)
International Transport Analysis
Roads
For hire, Reward
Transport Sector
Pipelines Rai 1 ways Roads
4.1 The transport sector represents 12 percent o f GDP and has grown 20 percent on average annually since 1997, primarily owing to the rapid expansion of o i l transit from the Caspian Sea. Although transport turnover (both railway and road mode) has tripled since 1994, it i s s t i l l 1/3 the pre-independence level. Transit generates significant budgetary resources and an estimated minimum o f US$200 mill ion o f direct economic activity. Each ton o f general cargo transit generates between US$20 and US$55 o f income to various transport intermediaries in Georgia.
Railwa s P 2000 1999 1998 1997 1996 1995 1994 1993 1992 1991 1990
3,913 3,138 2,574 2,006 1,350 1,246 955 1,554 2,985 8,482 10,834
and Own account Private Cars and Buses 475 4,953 453 4,510 420 385 304 13 1 130 84 121 388
1,653 2.577
3,213 349 397 294 380 371
1,165 1,003 1,03 1 1,718 1,969
4,310 3,910 3,400 1,615 1,607 1,135 954
2,147 7,110 8,335
1989 11,989 2,60 1 2,267 8,545 Source: ECMT; original data gathered from MOT o f Georgia.
4.2 International transport for Georgia i s dominated by o i l transit which amount to over 10 mill ion tons compared to 2 mill ion tons in non-oil transit and about 2.6 mill ion tons43 o f imports and exports. Transit flows are rather unidirectional with o i l moving west from Azerbaijan and Kazakhstan to the Ports of Batumi and Poti, mostly transported by rail (oil transit accounts for 75 percent o f Georgian railway turnover), but pipeline transportation i s becoming increasingly important. Most non-oil transit moves east and i s transported by both road and rail. About 30 percent o f exports are shipped by road and the remainder by rail while import transport i s equally distributed between the rail and road.44
4.3 Roads. The poor condition o f the majority o f Georgia’s road network4’ i s a significant barrier to trade.46 The length o f roads used for transit and foreign trade i s only slightly above 1,000 km (less than 5
43 Export were 1.2 million tons and imports were 1.4 million tons in 2000. 44 2000 data from TRACECA data base. See detailed Table in Halcrow (2002). 45 The road network o f Georgia consists o f 21,600 kilometers of roads. Approximately, 9,720 kilometers of these roads are paved and 11,800 kilometers are gravel or earth roads. Of these, 1,221 kilometers are classified as national (trunk) roads, 4792 kilometers as secondary roads and the remaining 15,564 kilometers as local roads.
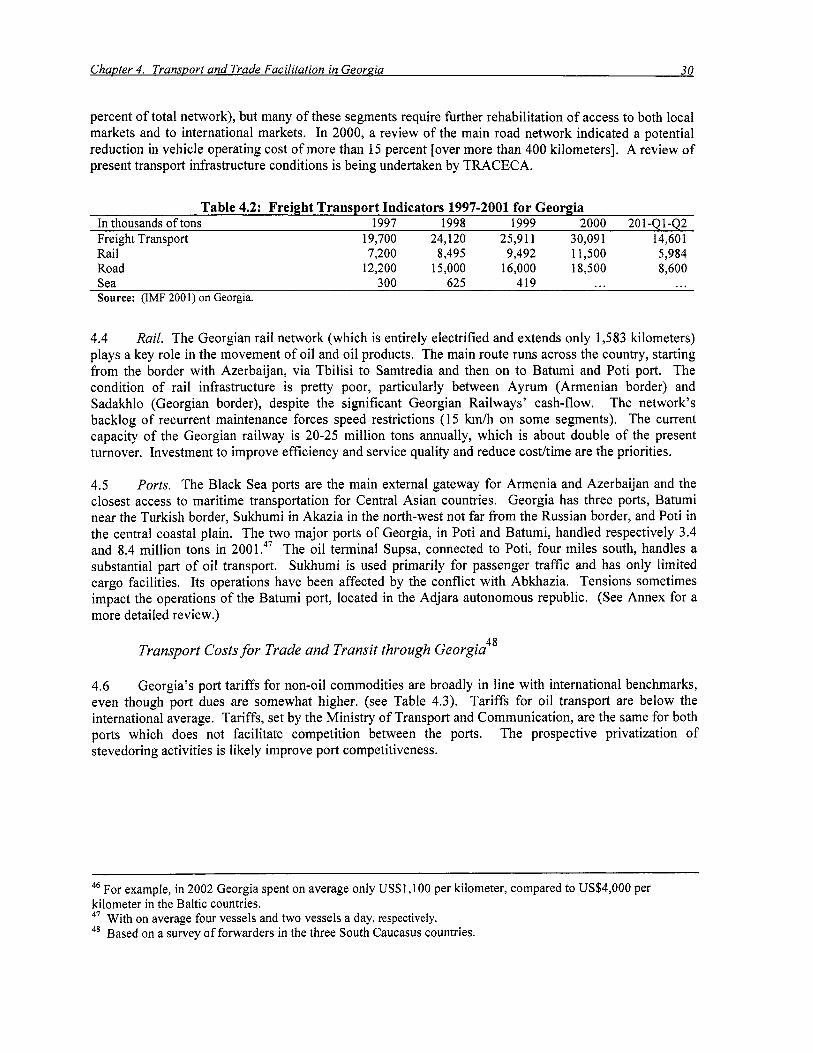
percent o f total network), but many of these segments require further rehabilitation o f access to both local markets and to international markets. In 2000, a review o f the main road network indicated a potential reduction in vehicle operating cost o f more than 15 percent [over more than 400 kilometers]. A review o f present transport infrastructure conditions i s being undertaken by TRACECA.
Table 4.2: Freight Transport Indicators 1997-2001 for Georgia
Freight Transport 19,700 24,120 25,911 30,091 14,601 In thousands o f tons 1997 1998 1999 2000 201-41-42
Rail Road
7,200 8,495 9,492 1 1,500 5,984 12,200 15,000 16,000 18,500 8,600
Sea 300 625 419 ... . * *
Source: (IMF 2001) on Georgia.
4.4 Rail. The Georgian rail network (which i s entirely electrified and extends only 1,583 kilometers) plays a key role in the movement o f o i l and o i l products. The main route runs across the country, starting from the border with Azerbaijan, via Tbilisi to Samtredia and then on to Batumi and Poti port. The condition o f rai l infrastructure i s pretty poor, particularly between Ayrum (Armenian border) and Sadakhlo (Georgian border), despite the significant Georgian Railways’ cash-flow. The network’s backlog o f recurrent maintenance forces speed restrictions (1 5 km/h on some segments). The current capacity o f the Georgian railway i s 20-25 mill ion tons annually, which i s about double o f the present turnover. Investment to improve efficiency and service quality and reduce costhime are the priorities.
4.5 Ports. The Black Sea ports are the main external gateway for Armenia and Azerbaijan and the closest access to maritime transportation for Central Asian countries. Georgia has three ports, Batumi near the Turkish border, Sukhumi in Akazia in the north-west not far from the Russian border, and Poti in the central coastal plain. The two major ports o f Georgia, in Poti and Batumi, handled respectively 3.4 and 8.4 mill ion tons in 2001.47 The o i l terminal Supsa, connected to Poti, four miles south, handles a substantial part o f o i l transport. Sukhumi i s used primarily for passenger traffic and has only limited cargo facilities. I t s operations have been affected by the conflict with Abkhazia. Tensions sometimes impact the operations o f the Batumi port, located in the Adjara autonomous republic. (See Annex for a more detailed review.)
48 Transport Costs for Trade and Transit through Georgia
4.6 Georgia’s port tariffs for non-oil commodities are broadly in l ine with international benchmarks, even though port dues are somewhat higher. (see Table 4.3). Tariffs for o i l transport are below the international average. Tariffs, set by the Ministry o f Transport and Communication, are the same for both ports which does not facilitate competition between the ports. The prospective privatization o f stevedoring activities i s likely improve port competitiveness.
~~
46 For example, in 2002 Georgia spent on average only US$1,100 per kilometer, compared to US$4,000 per kilometer in the Baltic countries. 47 With on average four vessels and two vessels a day, respectively. 48 Based on a survey o f forwarders in the three South Caucasus countries.

Cargo Handling Tariffs Port Dues
Burgas Constanza Illyichevsk Odessa PotA3atumi Baku Aktau Turkmenbashi
1 Bagged Cargo $It I Bulk Cargo $It
8.0 7.5 5.2 5.2 6.0 3.5 8.0 10.0
Containers $120’ $ ton
6.5 27 0.9 3.1 64 0.6 2.2 104 2.9 2.2 104 3 .O 3.5 50 2.1 3.2 36 0.4 8.0 30 1.5 5.0 40-50 1.1
International 5.0 1 oo2’ 0.7 I/ TRACECA: Unified Policy on Transit Fees and Tariffs - Progress Report October 2002. 2/ The rate i s an approximate average. For example Potterdam i s 68, Po; Kelang, Malazia i s 53, Kartachi i s 69 and Hong Kong i s 142.
4.7 Transport costs in the Caucasus are not competitive when one considers unofficial monetary expenditures and the time required. For example, the transport cost (US$/km) o f a TEU container by road from Baku to Poti i s nearly three times higher than that from Baku to Bandar Abbas (in Iran). The US$/km cost by road from Poti to Yerevan i s nearly 5 times higher than that from Yerevan to Bandar Abbas. Transporting a container from Yerevan or Tbilisi to Moscow i s nearly twice as expensive than a journey o f comparable length from Yerevan or Tbilisi to Bandar Abbas. The long transit time through Georgia, despite the relatively short distance, adds to the overall cost o f inventory for the goods in transit.
4.8 The significance o f the national and regional elements o f the total logistical cost, despite their modest part in the total logistics chain, i s high. For example, in moving a generic containerized consignment from Northern Europe to Tbilisi, the Georgian leg by road accounts for nearly 46 percent o f total costs, with unofficial fees representing 7-40 percent o f total costs (6-35 percent on the rail mode). In moving a similar consignment from Northern Europe to Yerevan, the Caucasus leg by road accounts for 67 percent o f total costs (including 27 percent for the logistics cost in Armenia), with unofficial fees accounting for 22-25 percent o f the total costs (6-13 percent on the rail mode). A similar cost structure i s found in the movement o f consignments to Baku.
4.9 Rail transportation from Armenia and Azerbaijan to Georgian ports i s less than half the cost o f road transportation. For example, the transportation o f one TEU from Poti to Yerevan via railway i s US$885 (US$1,545 via road) and relatively faster (see Table 4.4), although the quality o f services i s poor. The more limited interactions with the Georgian border agencies and traffic police result in smaller unofficial payments. V ia rail to Armenia, the unofficial fees reported by users were between 6-13 percent o f the total cost while via road they amounted to 22-25 percent. The Georgian railway i s s t i l l not competitive with Russian railways. The latter transports one TEU from Almaty to Riga (5,000km) for US$1,100.
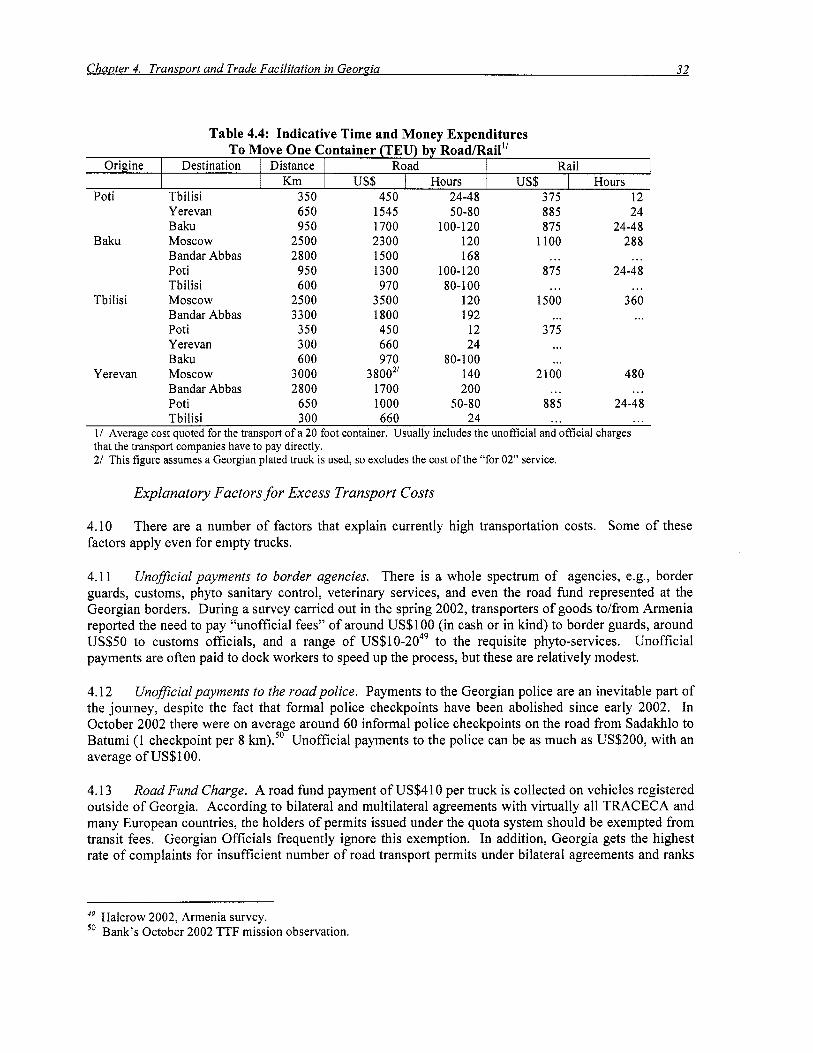
Table 4.4: Indicative Time and Money Expenditures
I Km [ US$ Hours US$ Hours
Yerevan Baku
Baku Moscow Bandar Abbas Poti Tbilisi
Bandar Abbas Poti Yerevan Baku
Yerevan Moscow Bandar Abbas Poti
Tbilisi Moscow
650 950
2500 2800
950 600
2500 3300 350 3 00 600
3000 2800
650
1545 1700 2300 1500 1300 970
3500 1800 450 660 970
3800’’ 1700 1000
50-80 100-120
120 168
100-120 80-100
120 192
12 24
80-100 140 200
50-80
885 875
1100
875
1500
3 75
...
* * .
...
...
... 2100
885 ...
24
288 24-48
... 24-48
... 360
...
480 ...
24-48 Tbilisi 300 660 24 ... ...
1/ Average cost quoted for the transport o f a 20 foot container. Usually includes the unofficial and official charges that the transport companies have to pay directly. 2/ This figure assumes a Georgian plated truck i s used, so excludes the cost o f the “for 02” service.
Explanatory Factors for Excess Transport Costs
4.10 factors apply even for empty trucks.
There are a number o f factors that explain currently high transportation costs. Some o f these
4.1 1 Unofficial payments to border agencies. There i s a whole spectrum o f agencies, e.g., border guards, customs, phyto sanitary control, veterinary services, and even the road fund represented at the Georgian borders. During a survey carried out in the spring 2002, transporters o f goods to/from Armenia reported the need to pay “unofficial fees” o f around US$lOO (in cash or in kind) to border guards, around US$50 to customs officials, and a range o f US$10-2049 to the requisite phyto-services. Unofficial payments are often paid to dock workers to speed up the process, but these are relatively modest.
4.12 Unofficial payments to the road police. Payments to the Georgian police are an inevitable part o f the journey, despite the fact that formal police checkpoints have been abolished since early 2002. In October 2002 there were on average around 60 informal police checkpoints on the road from Sadakhlo to Batumi (1 checkpoint per 8 km).” Unofficial payments to the police can be as much as US$200, with an average o f US$ l 00.
4.13 Road Fund Charge. A road fund payment o f US$4 10 per truck i s collected on vehicles registered outside o f Georgia. According to bilateral and multilateral agreements with virtually al l TRACECA and many European countries, the holders o f permits issued under the quota system should be exempted from transit fees. Georgian Officials frequently ignore this exemption. In addition, Georgia gets the highest rate o f complaints for insufficient number o f road transport permits under bilateral agreements and ranks
‘’ Halcrow 2002, Armenia survey. Bank’s October 2002 TTF mission observation.
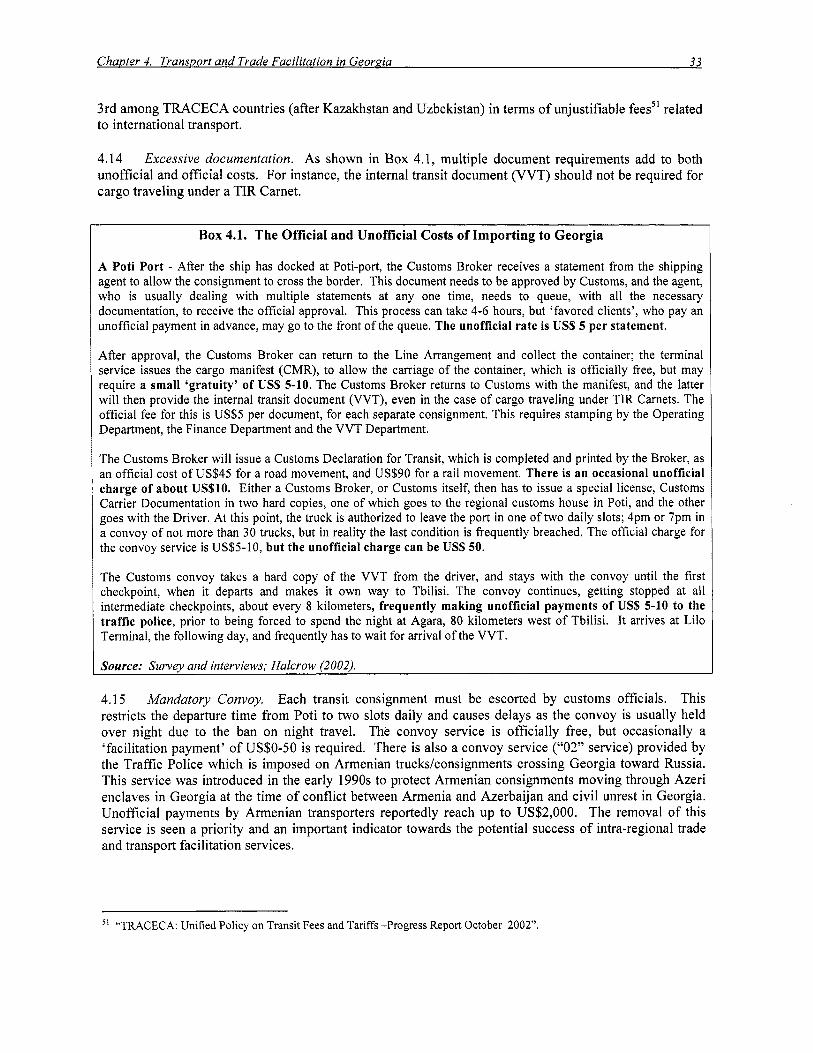
Chapter 4. Transport and Trade Facilitation in Georpia 33
3rd among TRACECA countries (after Kazakhstan and Uzbekistan) in terms o f unjustifiable fees5’ related to international transport.
4.14 Excessive documentation. As shown in Box 4.1, multiple document requirements add to both unofficial and official costs. For instance, the internal transit document (VVT) should not be required for cargo traveling under a TIR Carnet.
Box 4.1. The Official and Unofficial Costs of Importing to Georgia
4 Poti Port - After the ship has docked at Poti-port, the Customs Broker receives a statement from the shipping ?.gent to allow the consignment to cross the border. This document needs to be approved by Customs, and the agent, Nho i s usually dealing with multiple statements at any one time, needs to queue, with a l l the necessary jocumentation, to receive the official approval. This process can take 4-6 hours, but ‘favored clients’, who pay an mofficial payment in advance, may go to the front o f the queue. The unofficial rate i s US$5 per statement.
4fter approval, the Customs Broker can return to the Line Arrangement and collect the container; the terminal service issues the cargo manifest (CMR), to allow the carriage o f the container, which i s officially free, but may require a small ‘gratuity’ of US$ 5-10. The Customs Broker returns to Customs with the manifest, and the latter w i l l then provide the internal transit document (VVT), even in the case of cargo traveling under TIR Carnets. The official fee for this i s US$5 per document, for each separate consignment. This requires stamping by the Operating Department, the Finance Department and the VVT Department.
The Customs Broker wil l issue a Customs Declaration for Transit, which i s completed and printed by the Broker, as an official cost o f US$45 for a road movement, and US$90 for a rail movement. There i s an occasional unofficial charge o f about US$lO. Either a Customs Broker, or Customs itself, then has to issue a special license, Customs Carrier Documentation in two hard copies, one o f which goes to the regional customs house in Poti, and the other goes with the Driver. At this point, the truck i s authorized to leave the port in one o f two daily slots; 4pm or 7pm in a convoy of not more than 30 trucks, but in reality the last condition i s frequently breached. The official charge for the convoy service i s US$5-10, but the unofficial charge can be US$50.
The Customs convoy takes a hard copy o f the VVT from the driver, and stays with the convoy until the first checkpoint, when it departs and makes it own way to Tbilisi. The convoy continues, getting stopped at all intermediate checkpoints, about every 8 kilometers, frequently making unofficial payments o f US$ 5-10 to the traffic police, prior to being forced to spend the night at Agara, 80 kilometers west o f Tbilisi. I t arrives at Li lo Terminal, the following day, and frequently has to wait for arrival o f the VVT.
Source: Survey and interviews; Halcrow (2002).
4.15 Mandatory Convoy. Each transit consignment must be escorted by customs officials. This restricts the departure time from Poti to two slots daily and causes delays as the convoy i s usually held over night due to the ban on night travel. The convoy service i s officially free, but occasionally a ‘facilitation payment’ o f US$O-50 i s required. There i s also a convoy service (“02” service) provided by the Traffic Police which i s imposed on Armenian truckskonsignments crossing Georgia toward Russia. This service was introduced in the early 1990s to protect Armenian consignments moving through Azeri enclaves in Georgia at the time o f conflict between Armenia and Azerbaijan and civi l unrest in Georgia. Unofficial payments by Armenian transporters reportedly reach up to US$2,000. The removal o f this service i s seen a priority and an important indicator towards the potential success o f intra-regional trade and transport facilitation services.
“TRACECA: Unified Policy on Transit Fees and Tariffs -Progress Report October 2002”
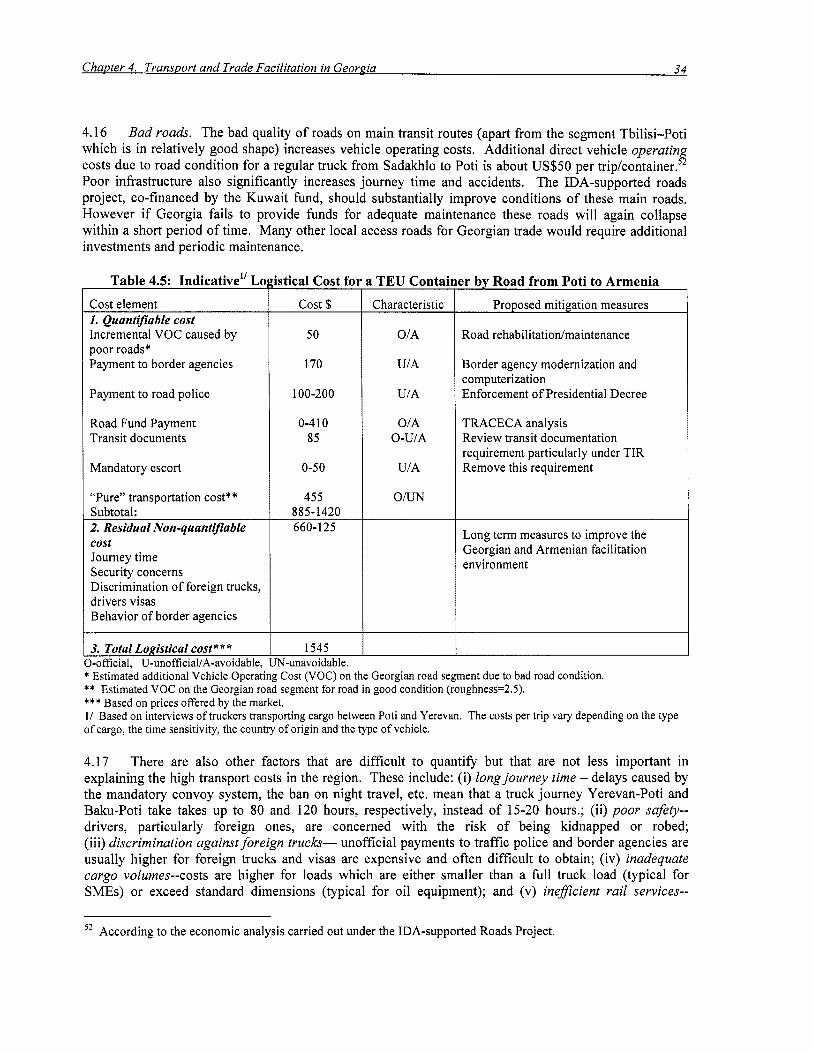
Chapter 4. Transport and Trade Facilitation in Georgia 34
4.16 Bad roads. The bad quality o f roads on main transit routes (apart from the segment Tbilisi-Poti which is in relatively good shape) increases vehicle operating costs. Additional direct vehicle operating costs due to road condition for a regular truck from Sadakhlo to Poti i s about US$50 per trip/~ontainer.~* Poor infrastructure also significantly increases journey time and accidents. The IDA-supported roads project, co-financed by the Kuwait fund, should substantially improve conditions o f these main roads. However if Georgia fails to provide funds for adequate maintenance these roads w i l l again collapse within a short period o f time. Many other local access roads for Georgian trade would require additional investments and periodic maintenance.
Table 4.5: Indicative” L a Cost element 1. Quantifiable cost Incremental VOC caused by poor roads* Payment to border agencies
Payment to road police
Road Fund Payment Transit documents
Mandatory escort
“Pure” transportation cost* * Subtotal: 2. Residual Non-quantifiable cost Journey time Security concerns Discrimination of foreign trucks, drivers visas Behavior o f border agencies
3. Total Logistical cost ** * )-official. U-unofficial/A-avoidable.
istical Cost fo cost $
50
170
100-200
0-4 10 85
0-50
455 885-1420 660-125
1545 iN-unavoidable.
I TEU Contai Characteristic
OIA
UIA
UIA
OIA O-UIA
UIA
OIUN
!r by Road from Poti to Armenia Proposed mitigation measures
Road rehabilitatiodmaintenance
Border agency modernization and computerization Enforcement o f Presidential Decree
TRACECA analysis Review transit documentation requirement particularly under TIR Remove this requirement
Long term measures to improve the Georgian and Armenian facilitation environment
* Estimated additional Vehicle Operating Cost (VOC) on the Georgian road segment due to bad road condition. ** Estimated VOC on the Georgian road segment for road in good condition (roughness=2.5). *** Based on prices offered by the market. 1/ Based on interviews o f truckers transporting cargo between Poti and Yerevan. The costs per trip vary depending on the type o f cargo, the time sensitivity, the country of origin and the type o f vehicle.
4.17 There are also other factors that are difficult to quantify but that are not less important in explaining the high transport costs in the region. These include: (i) long journey time - delays caused by the mandatory convoy system, the ban on night travel, etc. mean that a truck journey Yerevan-Poti and Baku-Poti take takes up to 80 and 120 hours, respectively, instead o f 15-20 hours.; (ii) poor safety-- drivers, particularly foreign ones, are concerned with the risk o f being kidnapped or robed; (iii) discrimination against foreign trucks- unofficial payments to traffic police and border agencies are usually higher for foreign trucks and visas are expensive and often difficult to obtain; (iv) inadequate cargo volumes--costs are higher for loads which are either smaller than a full truck load (typical for SMEs) or exceed standard dimensions (typical for o i l equipment); and (v) inefficient rail services--
According to the economic analysis carried out under the IDA-supported Roads Project. 52
ChaDter 4. Transport and Trade Facilitation in Georaia 35
freight forwarders surveyed by TRACECA indicated that official railways costs in the region are not competitive. Rates are not published, and need to be negotiated individually, and there are hidden charges (i.e., for demurrage, wagon clearing, handling), that cannot be anticipated. Forwarders stated traffic volumes could increase significantly if tariffs were reduced.53 The lack o f consignment tracking, security and lack of one-shop window were added concerns. About half o f forwarders were wil l ing to pay extra for these services, while 40 percent considered that they should be part o f current services.
Current and Potential Transit
Current Transit
4.18 At present Georgian transit i s limited to close markets such as Azerbaijan and Armenia. Over 70 percent o f pipeline o i l exports from Azerbaijan are routed through the Baku-Supsa pipeline (5 mill ion tons in 200 1) through Georgia and the remainder i s transported via the Baku-Novorossisk Russian-state controlled pipeline. The capacity of the Baku-Supsa pipeline i s increasing rapidly (from 110,000 b/d in 2001 to a projected 165,000 b/d in 2003). While the pipeline through Russia could be expanded, higher transit fees, quality issues related to o i l blending, and frequent closures have made this option less attractive. However this may change if the situation in Chechnya stabilizes.
4.19 The Azeri traffic accounts for 40-50 percent o f total turnover o f Georgian ports. About 40 percent o f non-oil transit turnover at the Georgian ports was Azeri traffic in 2001. Most Armenian foreign trade (about 1-1.5 mill ion tons annually) i s also transported through Georgia. A limited volume o f Armenian trade i s transported through Iran, but restrictions (Le., alcohol, petroleum products are not allowed) and the absence o f direct rai l link between Armenia and Iran limits the usefulness o f this route.
4.20 Despite being the closest maritime gateway to basically al l Central Asian countries, the Georgian route i s a negligible portion o f the foreign trade o f these countries, representing less than 17 percent o f Poti and Batumi non-oil transit turnover in 2001 (about 0.3 and 0.07 mil l ion tons, re~pect ive ly) .~~ Instead, Central Asian countries use ports in Iran, Russia and Baltic Countries, despite the fact that distance i s at least 2 to 3 times longer. Moreover, these countries often prefer to use Russian railways as well as some southern routes to transport cargo to/from Europe and other CIS countries. Azerbaijan and Armenia are also trying to use alternative routes to the possible extent.
4.21 The TRACECA initiative has not succeeded in capturing potential transit traffic from Central Asia and increasing traffic from the Caucasus except for oil. The multiple borders that transporters have to cross to reach Central Asia through the Caucasus and the number o f times cargoes need to be handled, together with the associated legal and illegal payments and delays, explain to some extent the TRACECA challenge compared to alternative routes. Furthermore, shipping costsS5 across the Caspian Sea are high by international standards56 and create, in themselves, an additional barrier. The shipping freight rate o f a
53 According to forwarders, a reduction o f 10 percent may result in 5 percent increase in oil, glass bottles, general cargo; a reduction o f 25 percent in a 10 percent increase in oil, cotton, glass bottles, canned food, oil products, wine, metal, agro products, machinery and equipment, bulk and liquid cargo; a reduction o f 50 percent in an increase o f 20 percent in oi l and in addition to above tobacco products, timber, construction materials and humanitarian goods. 54 Source - Poti and Batumi ports administration. This information i s inconsistent with the TRACECA UniJication of Transit Tar@ Progress Report, October 2002 which reports cargoes through the Black sea ports of 1.2 million tons of alumina transported from Greece and other countries to an aluminum refinery in Tajikistan, 534’000 tons of other transit cargoes (pipes, other oil equipment and chicken) to Kazakhstan.. 55 US$0.023 to 0.026iton-km for bulk and dry bulk and US$O.O7-0.1 l/ton-km for a TEU container. 56 An estimated US$O.OlS/ton-km to US$0.025 for a TEU container.
ChaDter 4. Transport and Trade Facilitation in Georgia 36
TEU container between Baku and Turkmenbashi is US$400 for 305 km, compared to US$925 from Rotterdam to Poti for 6,000 km.
The Future of Transit
4.22 Georgian transport infrastructure could handle significant additional traffic with limited new investment, particularly in the railways. Most o f the rail network operates at an adequate speed of 60km/hour for freight, although technical limitations exist both on the section to Armenia and in the mountainous segments of the East-West corridor. The Georgian Railway estimates it could handle double the present traffic. The same applies to port traffic, where new investments wi l l double the handling capacity. The road sector requires further investments in maintenance particularly between Georgia and Armenia (being upgraded under a World Bank project). This explains in part the low road traffic levels at main border crossing points (30 and 80 trucks a day toward Armenia and Azerbaijan, respectively).
West-East Transit
4.23 Oi l equipment. Large oil-related investment in the Caspian Sea (estimated at more than US$10 billion over the next five years) wi l l lead to the transport o f large volumes o f equipment, pipes and construction materials. The odd shape of oil equipment makes it more suited for transport through the Volga-Don canal, as shown by present traffic. But, the canal suffers from serious limitations, particularly on vessel size (3000 DWT), icy condition during winter months, high transit fees, special permit requirements by Russia, and lack o f shipping service competition. The economic gains of capturing part of this transit would be very large, but require the entire chain o f transport operators to demonstrate i t s ability to deliver complex shipments on time, in good condition and with minimal hassle by border agencies. Foreign investors are considering a partnership with the Azerbaijani railway to transport such equipment.
4.24 Humanitarian and reconstruction support to Afghanistan. TRACECA countries agreed during their Tashkent meeting (April 2002) to facilitate transit o f humanitarian goods and reconstruction material to Afghanistan. This approach has been closely coordinated with major forwarding companies to offer an attractive cost and quality-wise solutions. The present official tariffs for humanitarian goods are competitive. Results o f these efforts wil l become available in the near future. While the transport volume may not be very large or sustainable in the long term, attracting this type o f cargo wil l demonstrate the capacity of the TRACECA countries to act with a common strategy.
4.25 Containerized consumer goods to oil countries. Increased revenue from oi l exports i s likely to result in a significant increase in demand for consumer goods in Azerbaijan and Kazakhstan. Russia currently dominates the market to Central Asia through low tariffs for i t s railway services. Time sensitive goods also tend to be transported by road from Turkey and through Iran. The route through Iran i s already favored by importers o f construction materials and capital goods, even at a cost premium. The Azerbaijan market provides, however, a reasonable potential if the quality o f the logistic chain through Georgian i s improved. The willingness o f Azerbaijan to become a regional consolidation center for the region may lead to additional flows.
4.26 Machinery and equipment for Azerbaijani/Armenian/Central Asian SMEs. A major economic priority for Azerbaijan and Kazakhstan i s to diversify their source o f income by stimulating SMEs. These countries are therefore likely to increase imports o f machinery and equipment for their emerging industries. Costly pieces o f equipment wil l be required, calling for high quality integrated transport services and consolidation o f shipments. The same SME focus applies for Armenia and most o f Central Asia.
East- West Transit
4.27 Cotton exports. Cotton transit through the Caucasus has failed to materialize. The historic route via Russia and the port o f Riga (Latvia) has progressively been replaced by a new route using the highly competitive ports o f Bandar Abbas (Iran) and Dubai (UAE) from where low shipping rates can be obtained to Asia, a primary destination. This traffic exceeds one million tons. With the impediments linked to crossing the Caspian Sea and the less competitive shipping services from Black Sea ports, it i s unlikely that Georgia wil l attract this transit activity.
4.28 Oil and gas transit. Oil and gas transit are likely to generate additional revenues for Georgia in the foreseeable future. Additional crude oi l flows are expected from Azerbaijan, Kazakhstan, Uzbekistan and Turkmenistan, but transit capacity wi l l not be sufficient until the Baku-Tbilisi-Ceyhan (BTC) pipeline i s built. In fact, Kazakhstan has already started rerouting crude oil through new pipelines crossing Russia. The BTC pipeline wil l enable the bypassing of the congested Bosphorus Straits. The capacity o f the pipeline i s expected to be 1.5 million b/d and it wi l l be able to absorb most o f Azeri oil exploration together with the other pipelines. In addition, the ongoing construction of a new pipeline from Kazakhstan to Russia by the Caspian Pipeline Consortium and a proposal to expand the BTC pipeline further to Kazakhstan wil l shift transport o f crude oi l away from the railways. Therefore, crude oi l transit by rail wi l l cease to be a major source of income. Oil products and LPG transport to and from Central Asia would offer better long term opportunities.
Potential Impact of Conflict Resolutions in the Region
4.29 A reopening of the border between Armenia and Turkey would reduce Georgia’s transit cargo by some 70,000 tons (the figure could be higher since some cargo f rodto Turkey i s imported to Georgia f irst and then re-exported to Armenia.)57 While rail transit through Georgia may s t i l l continue, the highly competitive Turkish road transport industry would probably attract significant portion of cargo currently transported by the Georgian railways.
4.30 A resolution of the conflict over Nagorno-Karabakh would allow both Armenia and Azerbaijan to gain access to alternative maritime gateways (e.g., via the Turkish ports o f Trabizon in the Black sea and Mesin in the Mediterranean sea). The Mesin route would be particularly attractive as it would bypass the congested Bosphorus Straits. Although the Trabizon port does not currently have a rail link the missing segment i s a short one and the Government o f Turkey has a program to connect it to the railway,58 plus the rail link with Turkey i s included in TRACECA corridors. This could reduce total transportation cost by 25 percent to 65 percentsg In addition Armenia, Azerbaijan and Central Asian countries would get rail link to Iran via the Nakhichevan enclave. This would provide rail access to the ports o f Bandar Abbas in the Persian Gulf and of Bandar Enzeli in the Caspian sea and would significantly increase the attractiveness of Southern direction. Armenia would get an alternative railway link with Russia via Azerbaijan.
4.3 1 The resolution of the Abkhazia conflict would restore the direct railway link between Georgia and Russia and most likely boost trade between the two countries, but would have l i t t le effect on transit to/from other countries, with the possible exception of Armenia.
57
2593. ” Concept o f prospective development o f ports on Georgian coast o f the Black sea, Georgia, 2002. 59 Polyakov, E. (2001).
Polyakov, E. (200 1) “Changing Patterns o f Trade after Conflict Resolution”, Policy Research Working Paper
Chapter 4. Transport and Trade Facilitation in Georgia 38
4.32 Oi l transit, the main cargo through Georgia, wi l l be transported by pipeline instead of rail in the near future. Increased transit o f non-oil goods through Georgia wil l not be captured unless there are visible improvements in Georgia. Competitors have managed to increase their market share over the past few years, particularly Russia and Iran. In order to attract transit traffic, Georgia wil l need to implement an integrated strategy covering all transport modes and addressing shippers’ concerns.
Proposed Strategy and Recommendations
4.33 Given the high level o f unofficial transport costs in Georgia, a trade and transport facilitation strategy needs to focus on significantly improving customs administration and other border agencies dealing with foreign trade and transit. In addition, well targeted interventions are needed to upgrade the transport infrastructure. In both cases, the improvement of road transit conditions seems to be the most urgent priority. Trade facilitation objectives need not be in conflict with revenue enhancing ones, as shown by the experience o f reforms in South Eastern Europe where fiscal revenues increased along with lower processing time o f transit goods. (see Box 4.1).
Institutional Development of Border Agencies
Implementation of Customs Reform
4.34 Without a professional customs service it wi l l not be possible to turn Georgia into an attractive regional hub for trade and transit. The 2002 Development Strategy offers an initial basis to improve trade facilitation in the medium to long term. The strategy i s based on the following pillars: (a) improving human resources, including through reductions in the number of customs officials to 1000, testing for qualifications, possibly hiring new agents, and developing comprehensive training programs; (b) upgrading legislation, with support from the EU, to bring it in line with European standards; (c) upgrading the information systems, through the full implementation of ASYCUDA; (d) transferring payment collection to the banking sector; and (e) upgrading checkpoints and customs offices. These should be supplemented by the development of detailed, operational internal procedures, including those required for transit, which should be available to users. The human resource strategy needs to be supported by the definition of a compensation package including performance-based incentives and enforcement of sanctions for non-compliance. Priority needs to be given to the following reforms.
4.3 5 Computerization. The application of ASYCUDA nationwide, now available at the Lilo clearance terminal, should help to harmonize procedures and reduce the scope for personal contact between customs officials and traders which results in illegal practices. It should include risk management systems and the integration of a valuation database. The ASYCUDA system could be expanded to include a transit module, allowing data exchange with Armenia and Azerbaijan for vehicles under the TIR regime. The computer package would include a system o f advanced declarations allowing shippers to send all relevant information ahead of arrival to allow transit processing to be completed upon arrival. Shipments requiring additional review would be pre-identified by the system, enabling agency staff to focus only on these shipments. The estimated cost i s US$200,000 for software and US$1 million for hardware and networking.
4.36 Strengthen existing mobile units and post-release controls. Existing mobile units should include Customs and interact with all other border agencies to capture illegal cargo and build the intelligence component o f the Customs information system. Their outreach would extend to the controlled territory of Georgia. Post-release controls procedures would supplement the trade facilitation efforts and selective processing.

Chapter 4. Transport and Trade Facilitation in Georgia 39
-Time index BG
-Customs Revenue index BG (100 in 2000) *Time index HF
Customs Revenue index HR (100 in 2001)
Box 4.2. Trade and Transport Facilitation Program in Southeast Europe Under the TTFSE program, Southeast European countries have selected pilot sites where they measure processing performance, particularly processing times. A comparison between processing times (declining lines) and revenue collected by Customs (increasing line) for Bulgaria and Croatia over the past two years indicates that revenue collection (US$6 billion for both countries in 2002) increases with better facilitation. See www.seerecon.org/ttfse for more information including performance indicators for Southeast Europe.
Collected Revenue versus Processing Times at Pilot Sites
250 I x 2oo 150 I a 'c1 = 100
50
O I I I
2000 2001 2002 _ _ _ _ _ ~ ~ ~
4.37 Simplification ofprocedures for transit trade. Simple changes can have a large impact on trade facilitation, as demonstrated by the experience in Southeast Europe. Changes that directly impact users should take place with a well specified timetable, after proper training. The following measures are recommended to improve transit trade.
Remove unnecessary transit procedures for transporters with TIR carnets; e.g., eliminate the VVT, the transit insurance, transit road charge (as per international agreements), and the mandatory escort for non-excise goods in transit. This could result in a 40 percent decrease in logistical costs for the Poti-Armenia route.
A l low truck travel at any time, at the truckers' own risk and align opening hours o f border agencies with traffic flows.
Enable shippers to obtain all necessary permits in their country o f origin, prior to arriving at the border, or at the border, especially in the case o f neighboring countries. Designate a Single Window (cashier/electronic transfer) for payments o f duties and fees for all border agencies, and transfer all payments to banks.
A l low traders to clear imported goods at any clearance facilities in the country, based on their business needs.
Introduce selective control rules even in locations with a low level o f automation.
Introduce simplified procedures for consolidated shipment, typically used by SMEs.

Chapter 4. Transport and Trade Facilitation in Georgia 40
Simplify and harmonize control procedures (for vehicles, cargo and passengers) at border crossing points across the Caucasus and Central Asia (being addressed with the support o f TRACECA).
Ensure a sound legal framework for distribution o f responsibilities among border agencies (being addressed with EUROCUSTOMS).
0
I Box 4.3. Creation o f a Transit Service Unit: An Option for Discussion
Given the strategic importance of transit trade as a potential source of export revenue for the country, the Government may wish to consider the establishment o f a Transit Service (TS) unit dedicated solely to facilitate transit. The proposed TS would coordinate all government agencies involved in transit, acting as a single entry point to ensure a strict fulfillment of transit procedures and suppress unnecessary interference and unofficial payments. I t would not be a new institution but would pull staff from the various agencies concerned, under the leadership of Customs or the Special legion. The TS could be under the supervision o f a board with representatives from GEOPRO. Their duty would start from the time a vessel berth a port in Georgia or the time a truck crosses the border, until the time the shipment leaves the country (and vice versa). Other border agencies would have the right to intervene only under the TS control, in the spirit of integrated border management. The TS would also be responsible for improving transit procedures to reduce time and remove unnecessary steps. (The estimated cost to define an appropriate institutional mechanism i s US$200,000).
The creation o f similar interfacing services will be also suggested in Azerbaijan and in Armenia to ensure coordination from the port of unloading to the final destination. The TS creation should be accompanied by improved human resource management and pay-scale, and bonuses in line with the responsibilities. This could take the form of a contract with the TS, whereby any legitimate transit would have the choice to be processed within a pre-defined time frame against a special fee which would help fund operations (e.g., posting of officers in Azerbaijan and Armenia; payment of performance bonuses; and infrastructure and computer maintenance). The TS staff would be held accountable for any wrong-doing and subject to civil and criminal charges.
Monitoring service quality. The TS would measure systematically the transit time performance, based on transit targets set in consultation with shippers. The TS would issue explanatory notes each time a consignment exceeds this target and share it with the shipper, the transport company and the border agency concerned. The TS would produce regular reports on overall transit performance, identifying systemic issues, and recommending measures for improvement, The TS would present this report to the Government and to GEOPRO, and issue it on the internet, once approved. A specific incentive scheme, based on performance indicators could be built into the system. This could be combined with the proposed GSM-based tracking system proposed under TRACECA and its hotline initiative (Estimated cost: US$200,000). Cost of implementing the TS concept, performance measurement and transit information system i s estimated at US$1.5 million per year o f recurring cost, that would be self-funded by user fee, and US$2.1 million to launch.
4.3 8 Publication trade and transit procedures. All governmental entities involved in the movement o f consignments should systematically cooperate at national and regional levels (with Armenia and Azerbaijan) to provide, in a uniform format, all official requirements related to trade and transport in their respective country, using both a website and bookletsa6' It should build on on-going efforts such as the recently published Customs set o f procedures. Transit trade for all border agencies should be covered by a separate booklet (estimated cost: US$lSO,OOO).
4.39 Performance monitoring. Teams o f selected representatives o f governmental entities involved in the processing o f transit should be placed at border crossing points. These teams would propose simplified procedures to increase revenue collections and facilitate transport. Both o f these targets would
6o
www.ttfse.org. An example o f similar mechanism in Southern Europe, due for release in March 2003, i s available at

Chapter 4. Transport and Trade Facilitation in Georgia 41
be linked to specific performance measurements to be integrated in the processing. In addition, independent audits should be conducted on the application o f the legal and regulatory framework at border crossing points and clearance facilities, inclusive o f aspects implied by international convention to which Georgia adhered.
4.40 Strengthen private-public sector dialogue. A critical element for the successful implementation o f proposed reforms i s to strengthen consultation with the private sector. The recently established trade and transport facilitation committee, GEOPRO, could serve as a means to: (i) conduct regular dialogue on the trade and transport facilitation; (ii) consult business representatives prior to introducing new laws and regulations; and (iii) deliver programs o f technical assistance affecting the trade and transport environment. The committee w i l l require, in particular, direct support to formulate concrete proposals, generate momentum and follow up on the implementation o f proposals. The estimated cost i s US$150,000).
Upgrading Transport Infrastructure
4.4 1 Transport investment priorities. Investment decisions in Georgia remain ad-hoc with limited use o f economic criteria, and limited comparison o f priorities across modes. Given Georgia’s budgetary constraints and limited external financial resources for transport, it i s recommended that the Ministry o f Transport prepare a multi-annual and multi-modal investment plan based on traffic forecast, economic evaluation and impact on the Poverty Reduction and Economic Growth strategy. The estimated cost i s US$150,000 in addition to the TRACECA feasibility study.
4.42 The financing o f investment i s transport infrastructure could come from user charges, concession arrangements (port, rail) and IF1 lending (road, rail). The on-going TRACECA work to produce a Unified Policy on Transit Fees and Tariffs and i ts feasibility study on road infrastructure needs w i l l be instrumental to define charges and fees that can be sustained by the market demand and estimate financing needs for donor or IF1 support.
4.43 Continue the Transport Sector Restructuring. In particular, efforts need to focus on (i) the commercialization o f railway services, to capture new types o f commodity flows; (ii) the stimulation o f competition in the ports. The estimated cost i s being estimated by the MOTC.
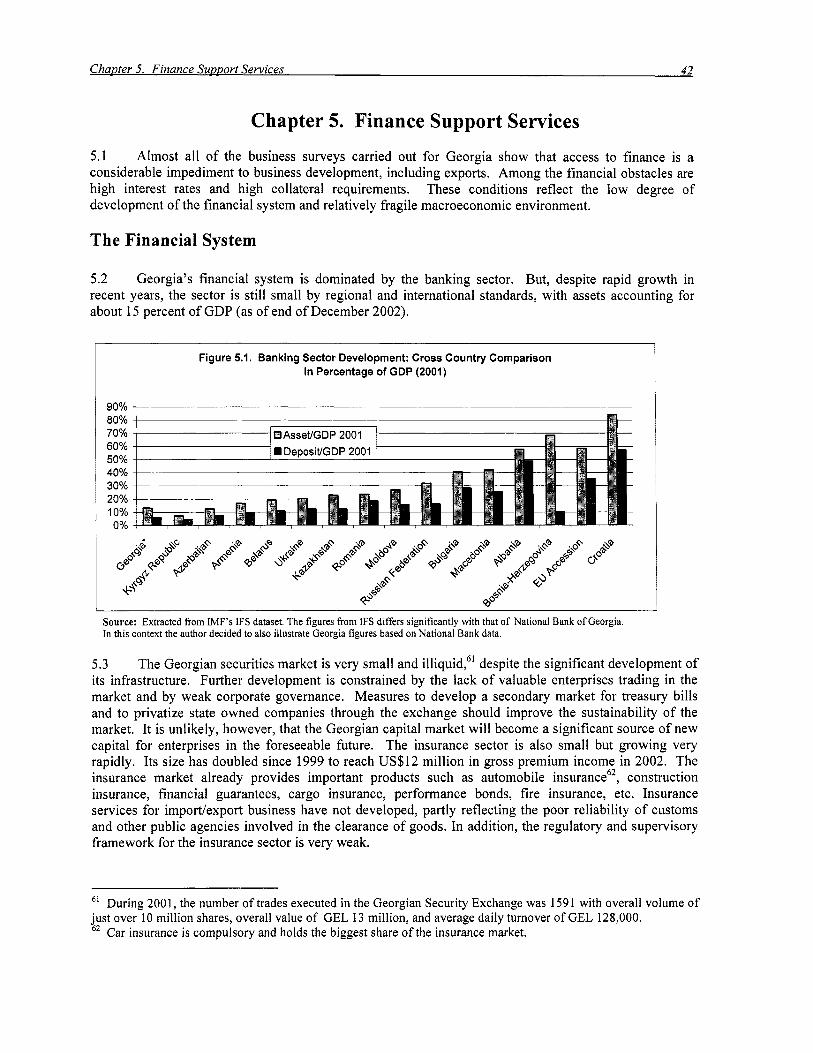
Chapter 5. Finance Sumort Services 42
Chapter 5. Finance Support Services 5.1 Almost a l l of the business surveys carried out for Georgia show that access to finance i s a considerable impediment to business development, including exports. Among the financial obstacles are high interest rates and high collateral requirements. These conditions reflect the low degree o f development o f the financial system and relatively fragile macroeconomic environment.
The Financial System
5.2 Georgia's financial system i s dominated by the banking sector. But, despite rapid growth in recent years, the sector i s s t i l l small by regional and international standards, with assets accounting for about 15 percent o f GDP (as o f end o f December 2002).
Figure 5.1. Banking Sector Development: Cross Country Comparison In Percentage of GDP (2001)
90% 3 _ _ 80% 70% 60% 50% 40% 30% 20% 10% 0%
Source: Extracted from IMF's IFS dataset. The figures from IFS differs significantly with that o f National Bank o f Georgia. In this context the author decided to also illustrate Georgia figures based on National Bank data.
5.3 The Georgian securities market i s very small and illiquid,6' despite the significant development o f its infrastructure. Further development i s constrained by the lack of valuable enterprises trading in the market and by weak corporate governance. Measures to develop a secondary market for treasury bills and to privatize state owned companies through the exchange should improve the sustainability o f the market. It i s unlikely, however, that the Georgian capital market will become a significant source o f new capital for enterprises in the foreseeable future. The insurance sector i s also small but growing very rapidly. Its size has doubled since 1999 to reach US$12 million in gross premium income in 2002. The insurance market already provides important products such as automobile insurance6*, construction insurance, financial guarantees, cargo insurance, performance bonds, fire insurance, etc. Insurance services for import/export business have not developed, partly reflecting the poor reliability of customs and other public agencies involved in the clearance of goods. In addition, the regulatory and supervisory framework for the insurance sector i s very weak.
61 During 2001, the number o f trades executed in the Georgian Security Exchange was 1591 with overall volume o f just over 10 million shares, overall value o f GEL 13 million, and average daily turnover o f GEL 128,000.
Car insurance i s compulsory and holds the biggest share o f the insurance market.

ChapterS. Finance Suuuort Services 43
The Banking Sector
5.4 The low level o f banking sector depth in Georgia reflects, to some extent, the fragility o f the country’s macroeconomic environment, particularly on the fiscal side. Tax collection (as a percent o f GDP) i s low, because o f tax evasion and corruption, and domestic expenditure arrears are a chronic problem. Georgia’s external current account deficit i s large, because o f i t s heavy reliance on imported energy and the country’s high external burden. With gross foreign reserves covering less than two months o f imports, Georgia i s highly vulnerable to adverse external shocks. Sluggish economic growth also limits development o f the financial sector by constraining the profitability o f investment projects and raising credit risk.
Figure 5.2. Number of Banks in Georgia, 1993-2002
250 , v) 200 Y C
150 r L 0
2 100 s 50
0 1992 1993 1994 1995 1996 1997 1998 1999 2000 2001 2002
Source: National Bank o f Georgia. 27 banks include 25 Georgian resident banks and 2 branches.
5.5 The country is s t i l l over-banked, despite progress in reducing the number of banks from 228 at the end o f 1994 to 27 by December 2002. Most o f these banks, apart from former state-owned banks, were small-scale operations, often established to serve the interests o f their founders with little emphasis on deposit mobilization. Further consolidation, enhanced resource mobilization, and increased efficiency o f banks are required to allow successful banks to exploit economies o f scale. This w i l l need to be supported by a coherent exit strategy for failed banks.
Figure 5.3: Level of Bank lntrmediation in Georgia, 1996-2002
80 0% 70 0% 60 0% 50 0% 40 0% 30 0% 20 0% I O 0% 0 0%
1996 1997 1998 1999 2000 2001 2002
Source: National Bank o f Georgia.
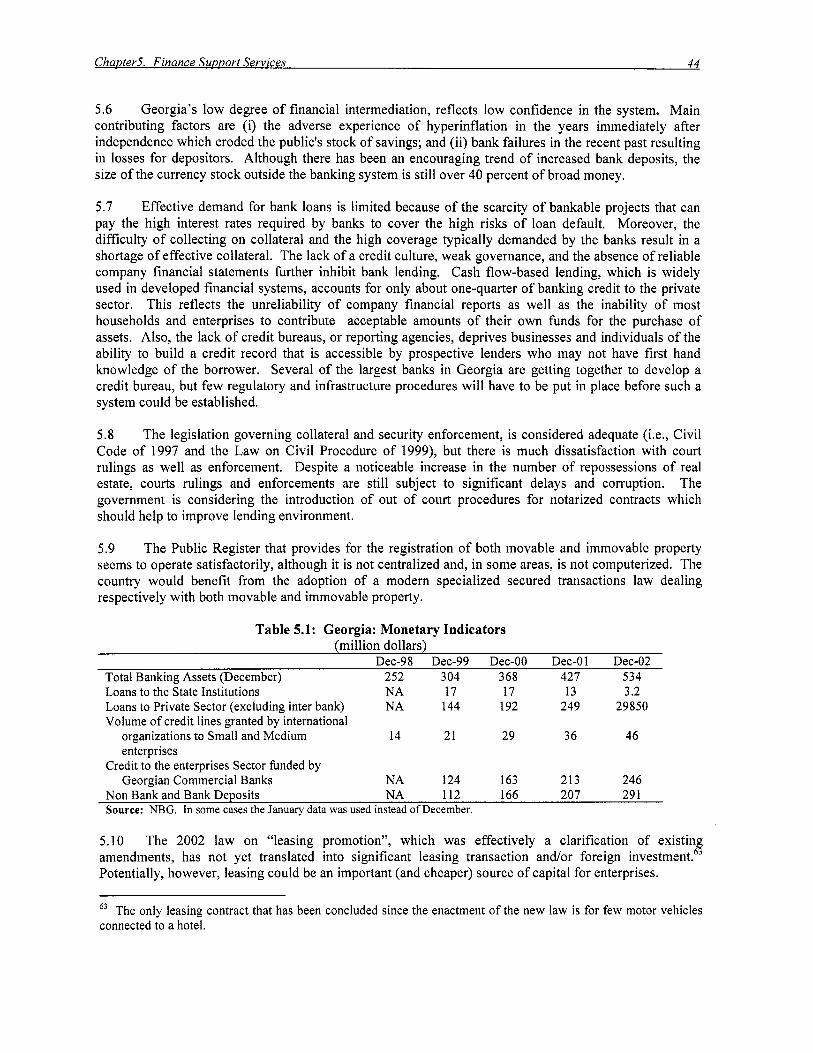
5.6 Georgia’s l o w degree o f financial intermediation, reflects l o w confidence in the system. M a i n contributing factors are (i) the adverse experience o f hyperinflation in the years immediately after independence which eroded the public’s stock o f savings; and (ii) bank failures in the recent past resulting in losses for depositors. Although there has been an encouraging trend o f increased bank deposits, the size o f the currency stock outside the banking system i s s t i l l over 40 percent o f broad money.
5.7 Effective demand for bank loans i s l imited because o f the scarcity o f bankable projects that can pay the high interest rates required by banks to cover the high risks o f loan default. Moreover, the diff iculty o f collecting o n collateral and the high coverage typically demanded by the banks result in a shortage o f effective collateral. The lack o f a credit culture, weak governance, and the absence o f reliable company financial statements further inhibit bank lending. Cash flow-based lending, which i s widely used in developed financial systems, accounts for only about one-quarter o f banking credit to the private sector. This reflects the unreliability o f company financial reports as wel l as the inability o f most households and enterprises to contribute acceptable amounts o f their o w n funds for the purchase o f assets. Also, the lack o f credit bureaus, or reporting agencies, deprives businesses and individuals o f the ability to build a credit record that is accessible by prospective lenders who may not have first hand knowledge o f the borrower. Several o f the largest banks in Georgia are getting together to develop a credit bureau, but few regulatory and infrastructure procedures wi l l have to be put in place before such a system could be established.
5.8 The legislation governing collateral and security enforcement, i s considered adequate (Le., C iv i l Code o f 1997 and the L a w o n Civil Procedure o f 1999), but there i s much dissatisfaction with court rulings as wel l as enforcement. Despite a noticeable increase in the number o f repossessions o f real estate, courts rulings and enforcements are s t i l l subject to significant delays and corruption. The government i s considering the introduction o f out o f court procedures for notarized contracts which should help to improve lending environment.
5.9 The Public Register that provides for the registration o f both movable and immovable property seems to operate satisfactorily, although it i s not centralized and, in some areas, i s not computerized. The country would benefit f rom the adoption o f a modern specialized secured transactions law dealing respectively with both movable and immovable property.
Table 5.1: Georgia: Monetary Indicators (mill ion dollars)
Dec-98 Dec-99 Dec-00 Dec-01 Dec-02 Total Banking Assets (December) 252 3 04 368 427 534 Loans to the State Institutions N A 17 17 13 3.2 Loans to Private Sector (excluding inter bank) N A 144 192 249 29850 Volume o f credit lines granted by international
organizations to Small and Medium 14 21 29 36 46 enterprises
Credit to the enterprises Sector funded by Georgian Commercial Banks N A 124 163 213 246
Non Bank and Bank Deposits N A 112 166 207 29 1 Source: NBG. In some cases the January data was used instead o f December.
5.10 The 2002 law o n “leasing promotion”, which was effectively a clarification o f existing amendments, has not yet translated into significant leasing transaction and/or foreign i n v e ~ t m e n t . ~ ~ Potentially, however, leasing could be an important (and cheaper) source o f capital for enterprises.
63 The only leasing contract that has been concluded since the enactment o f the new law i s for few motor vehicles connected to a hotel.
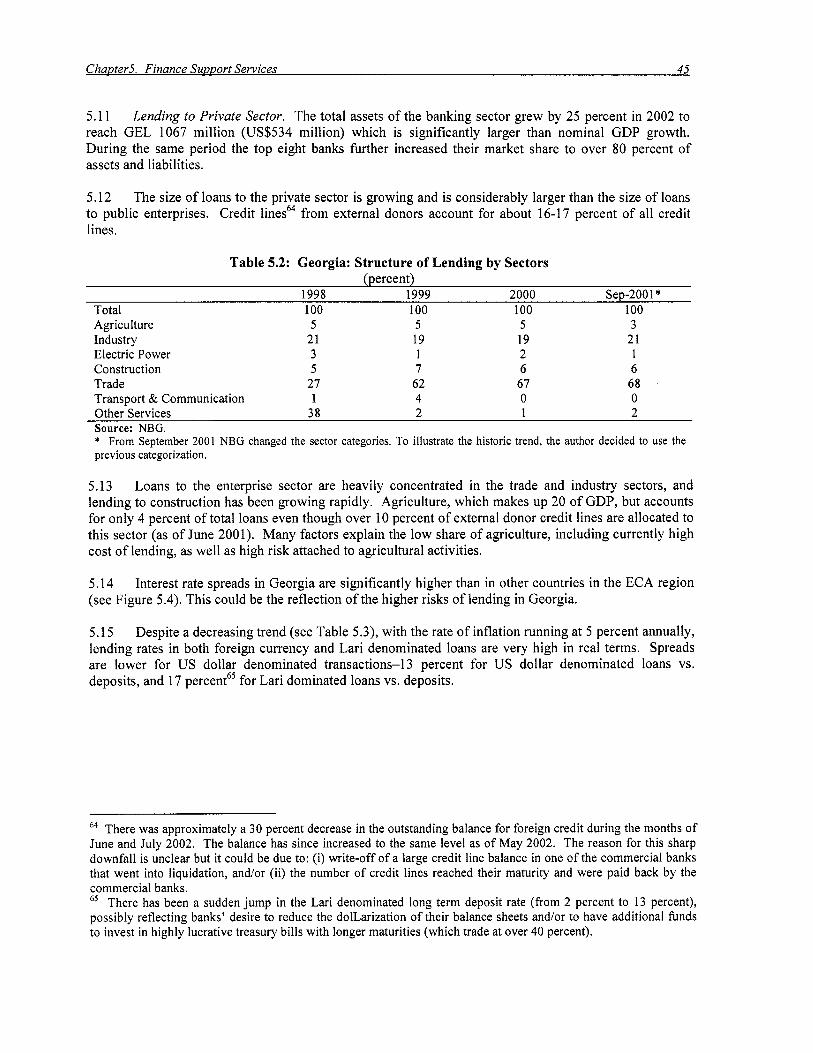
5.1 1 Lending to Private Sector. The total assets o f the banking sector grew by 25 percent in 2002 to reach GEL 1067 million (US$534 million) which i s significantly larger than nominal GDP growth. During the same period the top eight banks further increased their market share to over 80 percent o f assets and liabilities.
5.12 The size of loans to the private sector i s growing and i s considerably larger than the size of loans to public enterprises. Credit lines64 from external donors account for about 16-17 percent o f all credit lines.
Table 5.2: Georgia: Structure of Lending by Sectors (percent)
1998 1999 2000 Sep-200 1 * Total 100 100 100 Agriculture 5 5 5 Industry 21 19 19 Electric Power 3 1 2 Construction 5 7 6 Trade 27 62 67 Transport & Communication 1 4 0
100 3 21 1 6 68 0
Other-Services 38 2 1 2 Source: NBG. * From September 2001 NBG changed the sector categories. To illustrate the historic trend, the author decided to use the previous categorization.
5.13 Loans to the enterprise sector are heavily concentrated in the trade and industry sectors, and lending to construction has been growing rapidly. Agriculture, which makes up 20 o f GDP, but accounts for only 4 percent o f total loans even though over 10 percent o f external donor credit lines are allocated to this sector (as o f June 2001). Many factors explain the low share o f agriculture, including currently high cost o f lending, as well as high risk attached to agricultural activities.
5.14 (see Figure 5.4). This could be the reflection of the higher risks o f lending in Georgia.
Interest rate spreads in Georgia are significantly higher than in other countries in the ECA region
5.15 Despite a decreasing trend (see Table 5.3), with the rate o f inflation running at 5 percent annually, lending rates in both foreign currency and Lari denominated loans are very high in real terms. Spreads are lower for US dollar denominated transactions-13 percent for U S dollar denominated loans vs. deposits, and 17 percent65 for Lari dominated loans vs. deposits.
64 There was approximately a 30 percent decrease in the outstanding balance for foreign credit during the months o f June and July 2002. The balance has since increased to the same level as o f May 2002. The reason for this sharp downfall i s unclear but it could be due to: (i) write-off o f a large credit line balance in one o f the commercial banks that went into liquidation, and/or (ii) the number o f credit lines reached their maturity and were paid back by the commercial banks. 6s There has been a sudden jump in the Lar i denominated long term deposit rate (from 2 percent to 13 percent), possibly reflecting banks’ desire to reduce the dolLarization o f their balance sheets and/or to have additional finds to invest in highly lucrative treasury bills with longer maturities (which trade at over 40 percent).
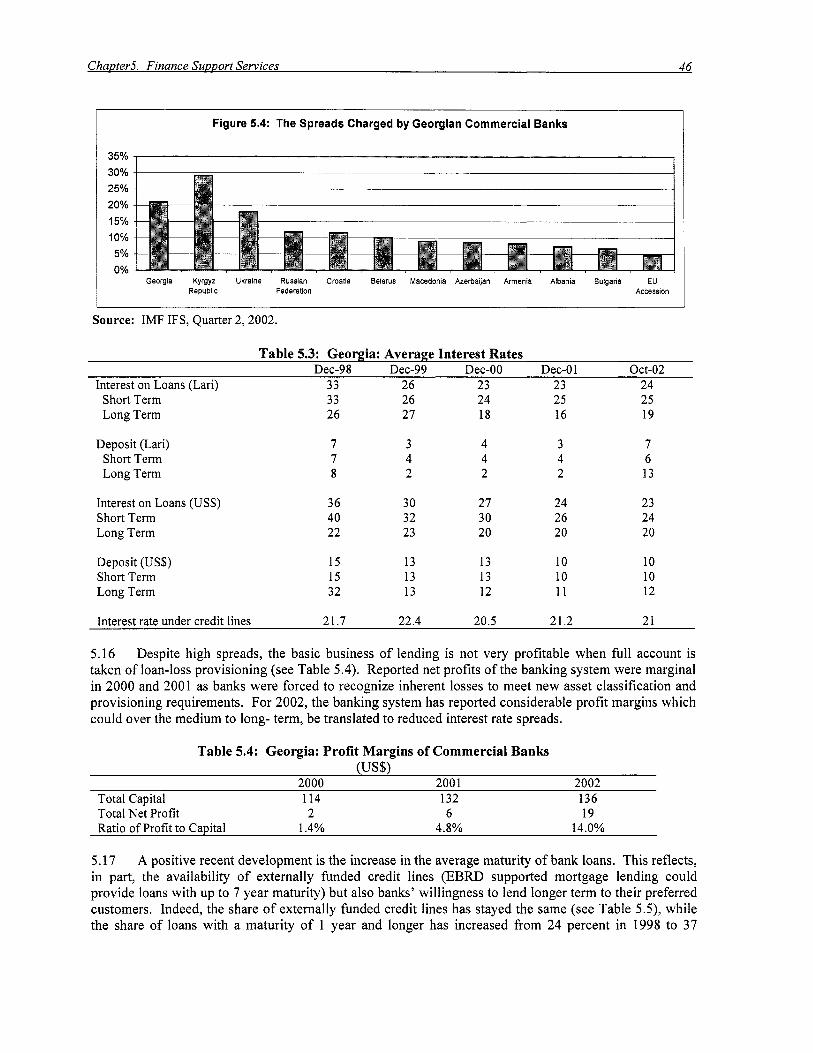
I Figure 5.4: The Spreads Charged by Georgian Commercial Banks
I 35% I
30% 25% 20% 15% 10%
0% 5 yo
Georgia Kyrgyz Ukraine Russian Croatia Belams Macedonia Azerbaijan Armenia Albania Bulgana EU Republic Federation Accession
Source: IMF IFS, Quarter 2,2002.
Table 5.3: Georgia: Average Interest Rates Dec-98 Dec-99 Dec-00 Dec-0 1 Oct-02
Interest on Loans (Lari) 33 26 23 23 24 Short Term 33 26 24 25 25 Long Term 26 27 18 16 19
Deposit (Lari) Short Term Long Term
Interest on Loans (US$) Short Term Long Term
Deposit (US$) Short Term Long Term
7 3 4 3 7 7 4 4 4 6 8 2 2 2 13
36 30 27 24 23 40 32 30 26 24 22 23 20 20 20
15 13 13 10 10 15 13 13 10 10 32 13 12 11 12
Interest rate under credit lines 21.7 22.4 20.5 21.2 21
5.16 Despite high spreads, the basic business o f lending i s not very profitable when full account i s taken o f loan-loss provisioning (see Table 5.4). Reported net profits o f the banking system were marginal in 2000 and 2001 as banks were forced to recognize inherent losses to meet new asset classification and provisioning requirements. For 2002, the banking system has reported considerable prof i t margins which could over the medium to long- term, be translated to reduced interest rate spreads.
Table 5.4: Georgia: Profit Margins of Commercial Banks (US$)
2000 200 1 2002 Total Capital 114 132 136 Total Ne t Profit 2 6 19 Ratio o f Profit to Capital 1.4% 4.8% 14.0%
5.17 A positive recent development is the increase in the average maturity o f bank loans. This reflects, in part, the availability o f externally funded credit lines (EBRD supported mortgage lending could provide loans with up to 7 year maturity) but also banks’ willingness to lend longer term to their preferred customers. Indeed, the share o f externally funded credit lines has stayed the same (see Table 5 . 9 , while the share o f loans with a maturity o f 1 year and longer has increased from 24 percent in 1998 to 37
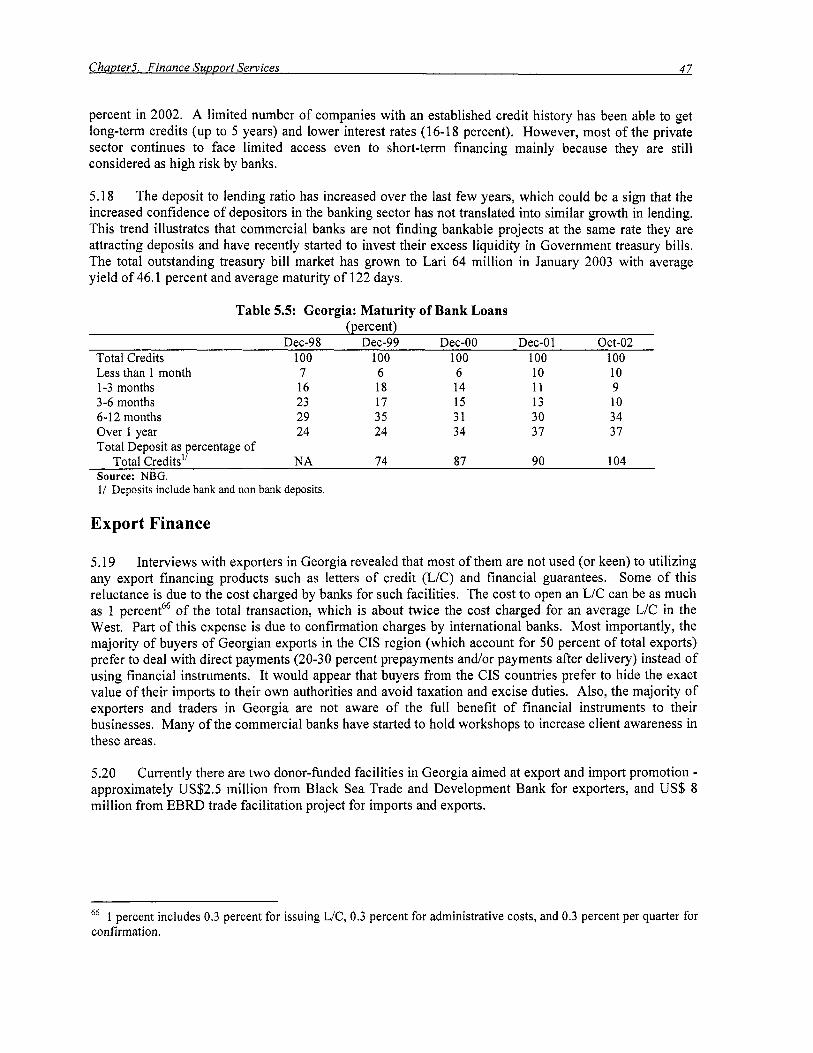
percent in 2002. A limited number o f companies with an established credit history has been able to get long-term credits (up to 5 years) and lower interest rates (1 6-1 8 percent). However, most o f the private sector continues to face limited access even to short-term financing mainly because they are st i l l considered as high risk by banks.
5.18 The deposit to lending ratio has increased over the last few years, which could be a sign that the increased confidence o f depositors in the banking sector has not translated into similar growth in lending. This trend illustrates that commercial banks are not finding bankable projects at the same rate they are attracting deposits and have recently started to invest their excess liquidity in Government treasury bills. The total outstanding treasury bill market has grown to Lari 64 mill ion in January 2003 with average yield o f 46.1 percent and average maturity o f 122 days.
Table 5.5: Georgia: Maturity of Bank Loans (percent)
Dec-98 Dec-99 Dec-00 Dec-0 1 Oct-02 Total Credits 100 100 100 100 100 Less than 1 month 7 6 6 10 10 1-3 months 16 18 14 11 9 3-6 months 23 17 15 13 10 6-12 months 29 35 31 30 34
Total Deposit as ercentage o f
Source: NBG. I/ Deposits include bank and non bank deposits.
Over 1 year 24 24 34 37 37
N A 74 87 90 104 ,P Total Credits
Export Finance
5.19 Interviews with exporters in Georgia revealed that most o f them are not used (or keen) to utilizing any export financing products such as letters o f credit (L/C) and financial guarantees. Some o f this reluctance i s due to the cost charged by banks for such facilities. The cost to open an L /C can be as much as 1 percent66 o f the total transaction, which i s about twice the cost charged for an average L/C in the West. Part o f this expense i s due to confirmation charges by international banks. Most importantly, the majority o f buyers o f Georgian exports in the CIS region (which account for 50 percent o f total exports) prefer to deal with direct payments (20-30 percent prepayments and/or payments after delivery) instead o f using financial instruments. It would appear that buyers from the CIS countries prefer to hide the exact value o f their imports to their own authorities and avoid taxation and excise duties. Also, the majority o f exporters and traders in Georgia are not aware o f the full benefit o f financial instruments to their businesses. Many o f the commercial banks have started to hold workshops to increase client awareness in these areas.
5.20 Currently there are two donor-funded facilities in Georgia aimed at export and import promotion - approximately US$2.5 mill ion from Black Sea Trade and Development Bank for exporters, and US$ 8 mil l ion from EBRD trade facilitation project for imports and exports.
66 1 percent includes 0.3 percent for issuing L/C, 0.3 percent for administrative costs, and 0.3 percent per quarter for confirmation.

ChauterS. Finance Sumort Services 48
Government’s Initiatives to Increase Access to Finance
5.21 The Government o f Georgia i s considering different options to increase firms’ access to finance and reduce the cost o f finance, mainly targeting exporters. Some o f these options are described in detail below.
5.22 The Government has just started, through the recently established Investment Center (see Chapter 3), a scheme to grant interest rate subsidies targeted mainly to exporters. So far, eight companies have been selected to receive such subsidies (up to percent o f 70 percent6’ o f lending rates). While some provisions have been made to minimize risks, such as granting the subsidy upon payment o f interest due on the related loan, experience in other countries shows that such subsidies are usually ineffective, diff icult to administer, lead to corruption and may even endanger the health o f the banking sector. Such schemes tend to benefit businesses which already have access to finance and weaker banks could use the subsidies to charge the enterprises additional costs over and above the interest rates.
Interest rate subsidies,
5.23 Export facilitation grants with the government taking part or all of the credit risk. In several countries, different export facilitation grants have been introduced to promote exports. Some o f these facilities were set up as revolving funds, which the participating banks were able to access to finance enterprises for their export trade. In an effort to reduce the cost o f finance, the governments took part or full risk o f such lending. Whi le some o f these funds were successful, in the majority o f cases these funds were abused by the participating banks for connected lending and for purposes o f refinancing and cleaning up their problem loans from the portfolio. So it i s essential that before any such intervention by the government i s introduced, an adequate assessment o f demand for such intervention is done and the required institutional capacity, governance and sustainability i s established.
5.24 Export facilitation loans with participating banks taking all of the credit risk. There are a number o f existing credit facilities in Georgia that provide credit to enterprises through participating banks. Whi le these facilities are available to a l l enterprises, they are commonly accessed by wel l established exporting firms. For example, EBRD68 and IFC6’ alone provide about US$27 mi l l ion o f such credit facilities. In addition, there has been a large amount o f other externally funded credit lines, like World Bank ADP credit line. These funds could be recycled to enterprises using the same terms and stringent supervision techniques used by the international institutions in an effort to increase the f l ow o f credit to enterprises in Georgia. However, introduction o f similar credit lines may not automatically lead to reduced cost o f lending. For example, the lending rates to participating banks from EBRD and IFC are about 5.5 percent (which equates to 4 percent above LIBOR) but the on-lending rates to enterprises are above 20 percent.
Total commitment for the interest subsidy o f the eight project i s US$ 260,000. Two out of the eight projects are located in Tbilisi and six in the regions. The projection for the Interest rate subsidy for 2003 i s estimated by overnment to be approx. US$4 million. ’ EBRD facilities include a newly developed US$15 million program for SMEs, and US$5-8 million for micro
enterprises, but does not include the US$8 million Trade Facilitation program. 69 IFC provided several large revolving credits to participating banks amounting to US$15 million, o f which US$3 million has matured and US$6 million has recently been introduced.
67
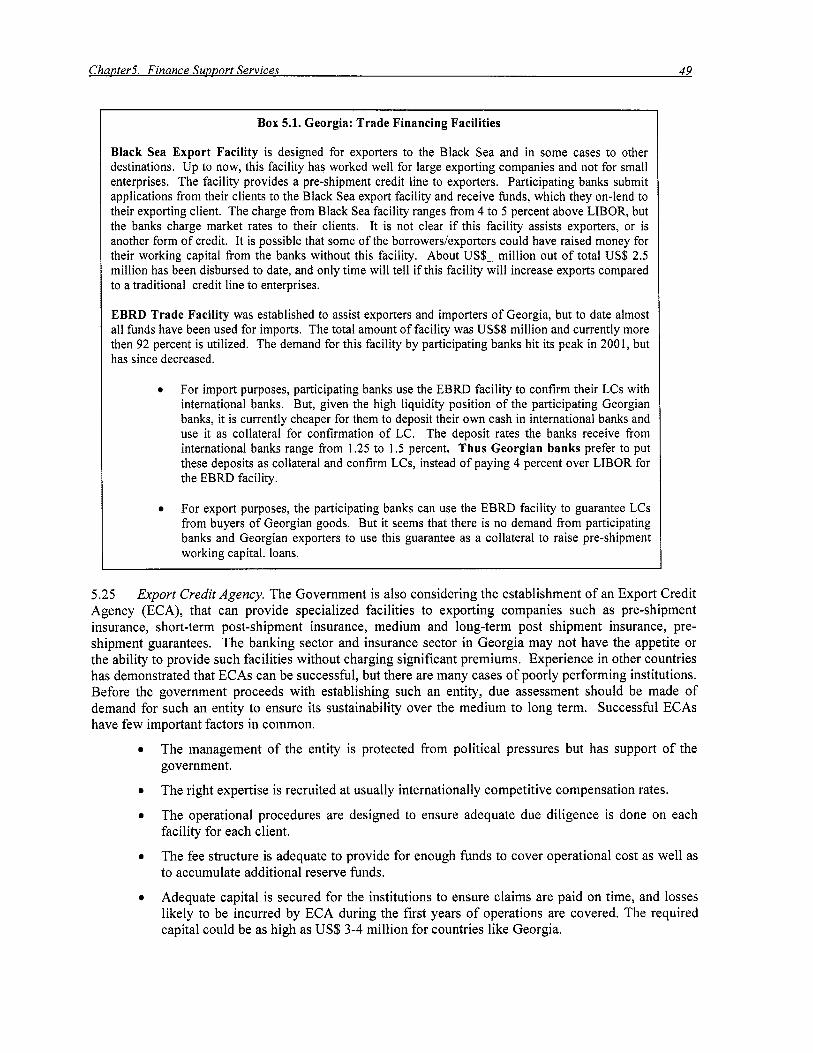
Box 5.1. Georgia: Trade Financing Facilities
Black Sea Export Facility i s designed for exporters to the Black Sea and in some cases to other destinations. Up to now, this facility has worked well for large exporting companies and not for small enterprises. The facility provides a pre-shipment credit line to exporters. Participating banks submit applications from their clients to the Black Sea export facility and receive funds, which they on-lend to their exporting client. The charge from Black Sea facility ranges from 4 to 5 percent above LIBOR, but the banks charge market rates to their clients. It i s not clear if this facility assists exporters, or i s another form o f credit. It i s possible that some o f the borrowers/exporters could have raised money for their working capital from the banks without this facility. About US$- million out o f total US$ 2.5 million has been disbursed to date, and only time wi l l t e l l if this facility wi l l increase exports compared to a traditional credit line to enterprises.
EBRD Trade Facility was established to assist exporters and importers o f Georgia, but to date almost all funds have been used for imports. The total amount o f facility was US$8 million and currently more then 92 percent i s utilized. The demand for this facility by participating banks hit i t s peak in 2001, but has since decreased.
For import purposes, participating banks use the EBRD facility to confirm their LCs with international banks. But, given the high liquidity position o f the participating Georgian banks, it i s currently cheaper for them to deposit their own cash in international banks and use it as collateral for confirmation o f LC. The deposit rates the banks receive from international banks range from 1.25 to 1.5 percent. Thus Georgian banks prefer to put these deposits as collateral and confirm LCs, instead o f paying 4 percent over LIBOR for the EBRD facility.
For export purposes, the participating banks can use the EBRD facility to guarantee LCs from buyers o f Georgian goods. But it seems that there i s no demand from participating banks and Georgian exporters to use this guarantee as a collateral to raise pre-shipment working capital. loans.
5.25 Export Credit Agency. The Government i s also considering the establishment o f an Export Credit Agency (ECA), that can provide specialized facilities to exporting companies such as pre-shipment insurance, short-term post-shipment insurance, medium and long-term post shipment insurance, pre- shipment guarantees. The banking sector and insurance sector in Georgia may not have the appetite or the ability to provide such facilities without charging significant premiums. Experience in other countries has demonstrated that ECAs can be successful, but there are many cases o f poorly performing institutions. Before the government proceeds with establishing such an entity, due assessment should be made o f demand for such an entity to ensure i t s sustainability over the medium to long term. Successful ECAs have few important factors in common.
0 The management o f the entity i s protected from polit ical pressures but has support o f the government.
The right expertise is recruited at usually internationally competitive compensation rates.
The operational procedures are designed to ensure adequate due diligence is done on each facility for each client.
The fee structure is adequate to provide for enough funds to cover operational cost as wel l as to accumulate additional reserve funds.
Adequate capital i s secured for the institutions to ensure claims are paid on time, and losses l ikely to be incurred by ECA during the f irst years o f operations are covered. The required capital could be as high as US$3-4 mi l l ion for countries l ike Georgia.
0
0
0
0
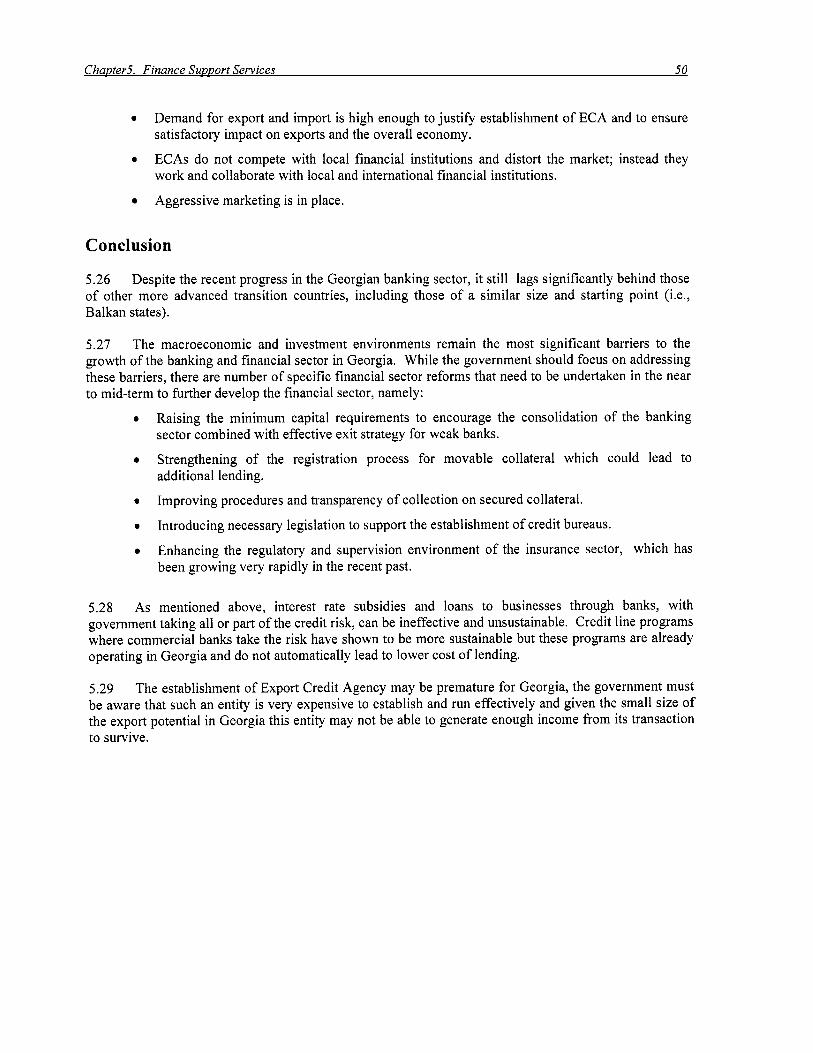
ChauterS. Finance Supoort Services 50
0 Demand for export and import is high enough to justify establishment o f ECA and to ensure satisfactory impact on exports and the overall economy.
ECAs do not compete with local financial institutions and distort the market; instead they work and collaborate with local and international financial institutions.
Aggressive marketing i s in place.
0
0
Conclusion
5.26 Despite the recent progress in the Georgian banking sector, it s t i l l lags significantly behind those o f other more advanced transition countries, including those of a similar size and starting point (Le., Balkan states).
5.27 The macroeconomic and investment environments remain the most significant barriers to the growth o f the banking and financial sector in Georgia. While the government should focus on addressing these barriers, there are number of specific financial sector reforms that need to be undertaken in the near to mid-term to further develop the financial sector, namely:
Raising the minimum capital requirements to encourage the consolidation of the banking sector combined with effective exit strategy for weak banks.
Strengthening o f the registration process for movable collateral which could lead to additional lending.
Improving procedures and transparency of collection on secured collateral.
Introducing necessary legislation to support the establishment o f credit bureaus.
Enhancing the regulatory and supervision environment o f the insurance sector, which has been growing very rapidly in the recent past.
5.28 As mentioned above, interest rate subsidies and loans to businesses through banks, with government taking a l l or part o f the credit risk, can be ineffective and unsustainable. Credit line programs where commercial banks take the risk have shown to be more sustainable but these programs are already operating in Georgia and do not automatically lead to lower cost o f lending.
5.29 The establishment o f Export Credit Agency may be premature for Georgia, the government must be aware that such an entity i s very expensive to establish and run effectively and given the small size o f the export potential in Georgia this entity may not be able to generate enough income from i t s transaction to survive.

ChaDter 6. Apro-Food ExDorts 51
Chapter 6. Agro-Food Exports
Introduction
6.1 Georgia has favorable conditions for the production of a variety o f annual and perennial crops and agriculture has always been one o f the most important sectors in Georgian economy. The agricultural sector presently accounts for 20 percent o f GDP (down from 30 percent in 1990) and employs more than half o f the country’s labor force. Some 45 percent o f household expenditures, on average, are accounted for by food and beverages.
6.2 Enormous structural changes have taken place in Georgian agriculture over the past decade. During the Soviet era, large farms using plantation-style labor produced most basic crops for consumption and industry (grains, oilseeds, tea, and mainly fruits and vegetables). Meanwhile small household plots produced much of the livestock products and family subsistence and some surplus for sale in the cities. Under the land reform program initiated in 1999, the large collective farms were dissolved and over one million small farms created with an average size o f less than one hectare. Such household plots now account for the bulk o f national production of most cereals, fruits and vegetables.
6.3 The agricultural support services provided during the Soviet era were largely inappropriate for the new agrarian structure. Lacking effective support and access to financial services, and in the face of a collapsing national infrastructure for irrigation and water drainage, a majority o f the new smallholder farms have reverted to subsistence-oriented production. Recent surveys suggest that some 83 percent of Georgia’s rural population are entirely dependent upon their farms for subsistence and that they consume some 73 percent o f their production. Auto-consumption now accounts for more than two-thirds of the total value o f food consumed by rural household^^^.
6.4 Within the former Soviet Union, Georgia was a major producer and source for a broad array of foods. I t accounted for more than 10 percent of the total intra-Union trade in agricultural products and the recorded value of i t s food exports was virtually double that o f i t s imports. During the Soviet era, Georgia’s main exports were citrus and other fresh fruits, tea, wine and other alcoholic drinks, mineral water, and canned fruit and vegetables. Georgia imported mainly grains, meat and dairy products, and fodder from elsewhere in the Union.
6.5 Since i t s independence, Georgia has experienced a substantial decline in the production of a broad array of i t s former ‘export’ products, especially o f fruit and tea. Georgia’s per capita fruit production i s now only about one-third o f i t s level in 1990. Tea production in recent years was equivalent to only 5 percent o f the output generally attained in the late 1980s. Livestock and poultry production also declined sharply, although in recent years there has been some recovery, especially in dairy production. Production o f cereals has been uneven, although it has generally been higher in recent years than recorded in the early to mid-1990s. With an initially sharp decline in exports, Georgia became a large net importer o f food and beverages in the early to mid-1990s. In recent years, this gap has closed due to a combination o f reduced imports and modestly expanded exports.
’ O Based on OCS survey results.
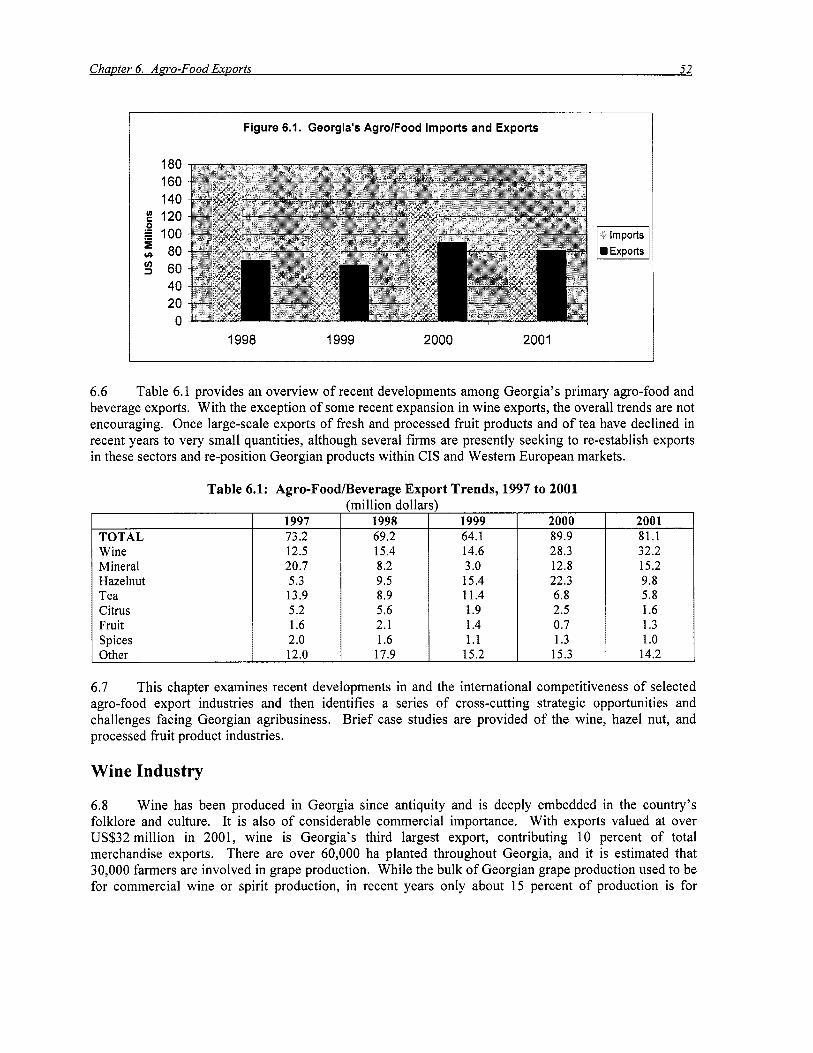
Figure 6.1. Georgia’s AgrolFood Imports and Exports
1997 1998 1999 2000
1998 1999 2000 2001
2001
6.6 Table 6.1 provides an overview of recent developments among Georgia’s primary agro-food and beverage exports. With the exception o f some recent expansion in wine exports, the overall trends are not encouraging. Once large-scale exports of fresh and processed fruit products and of tea have declined in recent years to very small quantities, although several firms are presently seeking to re-establish exports in these sectors and re-position Georgian products within CIS and Western European markets.
TOTAL 73.2 69.2
Table 6.1: Agro-Foodmeverage Export Trends, 1997 to 2001
64.1 89.9 81.1 Wine Mineral Hazelnut Tea Citrus Fruit Spices Other
12.5 20.7 5.3 13.9 5.2 1.6 2.0 12.0
15.4 8.2 9.5 8.9 5.6 2.1 1.6 17.9
14.6 3 .O 15.4 11.4 1.9 1.4 1.1 15.2
28.3 12.8 22.3 6.8 2.5 0.7 1.3 15.3
32.2 15.2 9.8 5.8 1.6 1.3 1 .o 14.2
6.7 This chapter examines recent developments in and the international competitiveness o f selected agro-food export industries and then identifies a series o f cross-cutting strategic opportunities and challenges facing Georgian agribusiness. Brief case studies are provided of the wine, hazel nut, and processed fruit product industries.
Wine Industry
6.8 Wine has been produced in Georgia since antiquity and i s deeply embedded in the country’s folklore and culture. It i s also of considerable commercial importance. With exports valued at over US$32 million in 2001, wine i s Georgia’s third largest export, contributing 10 percent o f total merchandise exports. There are over 60,000 ha planted throughout Georgia, and it i s estimated that 30,000 farmers are involved in grape production. While the bulk of Georgian grape production used to be for commercial wine or spirit production, in recent years only about 15 percent o f production i s for

Chaoter 6. Apro-Food Exoorts 53
commercial wineries, with the bulk of grapes either consumed, bartered for basic foods, or converted into wine in backyard or other tiny ~ i n e r i e s . ~ '
6.9 The winemaking industry in Georgia i s not large by international standards. In each of the past two years commercial wineries have crushed less than 20,000 M T of grapes, approximately one-third of which are red varieties and two-thirds are white varieties. Based on estimates of actual yields, one can estimate that about 4000 smallholder households presently supply to the commercial wineries. In recent years, the larger wineries have started to develop their own vineyards and may have provided 10 percent o f total grape inputs in 2001. The trend of continued vertical integration in the industry i s likely to accelerate in the coming years. Wine makers are moving in this direction because it allows them to better control quality and reduces raw product procurement risk.
6.10 In 2001, there were 40 vintners commercially producing wine in Georgia and another 66 companies involved in wine trading/exports. The five largest wineries process 52 percent o f the grapes and the ten largest firms crushed 66 percent o f the crop. I t i s estimated that about 2,000 people are employed in the nation's wineries on both a seasonal and full-time basis. A similar level o f employment (i.e., about 2200 full-time equivalent jobs) i s provided by commercial and smallholder farms producing grapes for commercial wineries.72
6.11 The CIS i s by far Georgia's largest wine export market, accounting for 91 percent o f wine exports. In 2001, Georgian exports to the CIS were valued at US$ 29 million, o f which $24 million of product was shipped to Russia. Georgia's wine comparative advantage l ies in the fact that it can produce medium and high quality wines at competitive costs and that these wines can be shipped into CIS duty free, whereas non-CIS wines pay a 20 percent duty. Additionally, CIS consumers know Georgia as an origin o f quality wines and have developed a taste preference for many o f the grape varieties and wine types produced there.
Grape Supply
6.12 Grape production in Georgia has declined sharply over the past decade. Production in recent years has fallen below 150,000 tons, compared with an average of 630,000 tons between 1986 and 1990 and 381,000 tons between 1991 and 1995. The primary contributing factors to this decline have been the restructuring of the Georgian farm sector and the disruption of traditional market channels within the Former Soviet Union. Most o f the small farmers who acquired land under the land reform have lacked capital, as well as the technical and management ski l ls to produce high-quality grapes. Rather than sel l the grapes to commercial wineries, farmers made wine at home. The resultant volume o f grapes used in commercial wine-making i s presently less than 5 percent o f 1990s levels (see Figure 6.2). This downward trend in grape output may have stabilized and some people in the industry feel that aggregate output wi l l increase over the next several years. However, to date, there i s no data to show that grape production has bottomed out yet.
6.13 In response to the difficulties in buying grapes and controlling quality from thousands of small farmers, some o f the larger wineries have begun to buy and/or lease land from the government under 49 year contracts and started to develop their own vineyards. By employing this vertical-integration strategy, larger firms are insolating themselves from supply risk. This strategy not only reduces raw product risk,
7' In 2000, over the 210,000 tons of grapes produced, just under 35,000 tons was used by commercial wineries. In 2001, only 19,011 tons out o f the total grape production o f 123,200 tons was used by such wineries. 72 Based on an estimated 2,500 hectares for red varieties and 2000 hectares for white varieties, with an average o f 125 man-days/year. Full-time equivalents are based on 260 working days.

Chapter 6. Aaro-Food ExDorts 54
it also assures the f i r m s wi l l have a secure source of quality grapes necessary for premium / high margin wines.73
450 I I
Figure 6.2. Grapes Used in Wine 8 Spirits Production In Georgia, 1990 - 2002
400
350
f 300
i 250 : 200 F
150
100
50
0
I *\ I \ I
I \ I 4 -+-Metric Tons x 1000
1990 91 92 93 94 95 96 97 98 99 2000 01 02
Source: FA0 and GOG.
6.14 New investment i s critical for the viability o f commercial wine-making. The average age of vineyards in Georgia i s estimated to be 30 years.74 In maturity terms, these are old vines. Normally, vines in California (using this as a best practices example) are replaced every 25 years, but often growers wi l l re-graft or replant them sooner (as varietal demand changes). Based on 25-year best-practices economic life, a wine-producing region should be re-planting 4 percent o f i ts vineyards annually. Given the fact that most farmers in Georgia do not fertilize, irrigate or intensively manage their vineyards, the economic l i fe of the grapes i s probably significantly less than 25 years. This means a higher replant rate should be applied to the Georgian industry. Actual replanting data are not available, yet it i s surely at a rate far lower than i s needed for this industry.
6.15 There are five grape production zones in the country, according to their unique climates and soils. The Kakhety region i s the largest and most productive of the five regions, producing about 66 percent o f the total crop. Some of the most popular white grape varieties planted in Kakhety are Rkatsiteli, and Mtsvano. The Kakhety red Saperapi grape i s prized by winemakers and in 2002 had a farmgate price o f US$SlO/ MT, well over the mean price for white grapes o f $350/ M T farmgate. Although these varieties are not well known in the West, they are very familiar to wine drinkers in Russia and other CIS countries. In many cases, CIS consumers prefer these varieties to their western counterparts, such as Merlots, Sirahs and Chardonnays.
6.16 The Saperavi, Rkatsiteli and other grape varieties produced in Georgia are considered to be reasonably good in terms o f yield, quality and pathogen resistance. Nevertheless, Georgian farmers are not reaching productivity levels realized by other world production regions. The primary reason for the low yield i s the low level o f inputs used to grow the crop (including lack o f fertilizer, crop-protection
73 One of the larger, foreign joint venture wineries has an on-staff viticulture expert working with the firm's 35 contract growers and developing the company's 200 ha estate vineyards. Contract farming works in Georgia, but requires a significant financial commitment by the contracting company to supply the technical know-how to the client farmers. Firms that simply provide cash or inputs to farmers as advances on the crop are usually disappointed at harvest when they find that farmers do not honor these contracts. 74 Source: extrapolated from: Baseline Study on Viticulture and Wine Sector of Georgia, UNFAO, 2000

chemicals, and irrigation water), limited technical ski l ls o f the farmers and non-functional research and extension.
Table 6.2: Grape Yield Comparison Mt/ha
Measurable Georgia Kakhety Georgia Kakhety California California
Grape Type Red White Red White Sonoma Co. Sonoma Co.
Best Practices 7.0 9.0 13.0 16.2 Average Practices 2.5 5 .O 9.8 12.2
Number and Size of Vintners
6.17 Compared to other wine producing regions o f the world, Georgia’s industry i s in an underdeveloped state. Only five firms (about 12 percent oftotal producers) crush more than 1,000 MT o f grapes annually. One thousand tons o f grapes yield approximately 840,000 bottles o f wine. In the California wine industry, vintners producing more than 400,000 bottles annually typically produce at a point on the cost curve where they have achieved a reasonable level o f efficiency in terms o f per unit production costs. Once f i r m s move to a production output level o f less than 400,000 bottles, unit costs o f output tend to increase. In Georgia, about 20 percent o f the vintners are producing at levels over 400,000 bottles annually and nearly half o f the firms produce less than 200,000 bottles annually. However, the cost structures in California and Georgia are different and it i s possible that some o f the smaller Georgian firms can operate efficiently.
Industrial Efjciency
6.18 Table 6.3 examines the differences in task level efficiency and sales per employee for three types o f wineries. The foreignAoca1 company joint venture (JV) i s 50 percent more efficient in utilizing i t s human capital as compared to the private-greenfield startup firm (which has been operating since 1991, but i s s t i l l in the process o f acquiring and developing i t s fixed asset base). The foreign JV firm i s nearly 3 times more effective in utilizing i t s human capital, as the former state-owned company now operating as an employee owned joint-stock company. The same trends that are present in the task level efficiency are also reflected in gross sales value per employee. The foreign JV firms estimated sales per employee i s 37 percent higher than the locally owned private f i r m s and more than 200 percent higher than the restructured joint stock company.
Table 6.3: Comparative Efficiency in Georgian Wine Production Item Restructured Former State Private Greenfield Foreign - Georgian
Owned Company Startup Firm Joint Venture Task Level Efficiency, as BottlesEmployee 6,666 16,666 25,000 Estimated U S $ Sales per Employee 16,166 38,300 52,500
Bottles (750 ml) Produced 0.8 million 0.5 million 5.0 million Number o f Full Time Employees 120 30 200
6.19 The explanations for these differences can be traced to several factors. Economies o f scale i s one o f the main factors, as the foreignAoca1 JV produces more than six times the volume, as the other locally owned firms. However, it i s unlikely that this accounts for all o f the differences. The foreign JV also has a strong training program for al l o f i t s employees, including management. I t clearly links improved skill levels and increased knowledge to salary increases, thereby creating an incentive to learn. Further, the JV firm has developed a close link with i t s grape suppliers so i t can better manage i t s inputs, reducing losses
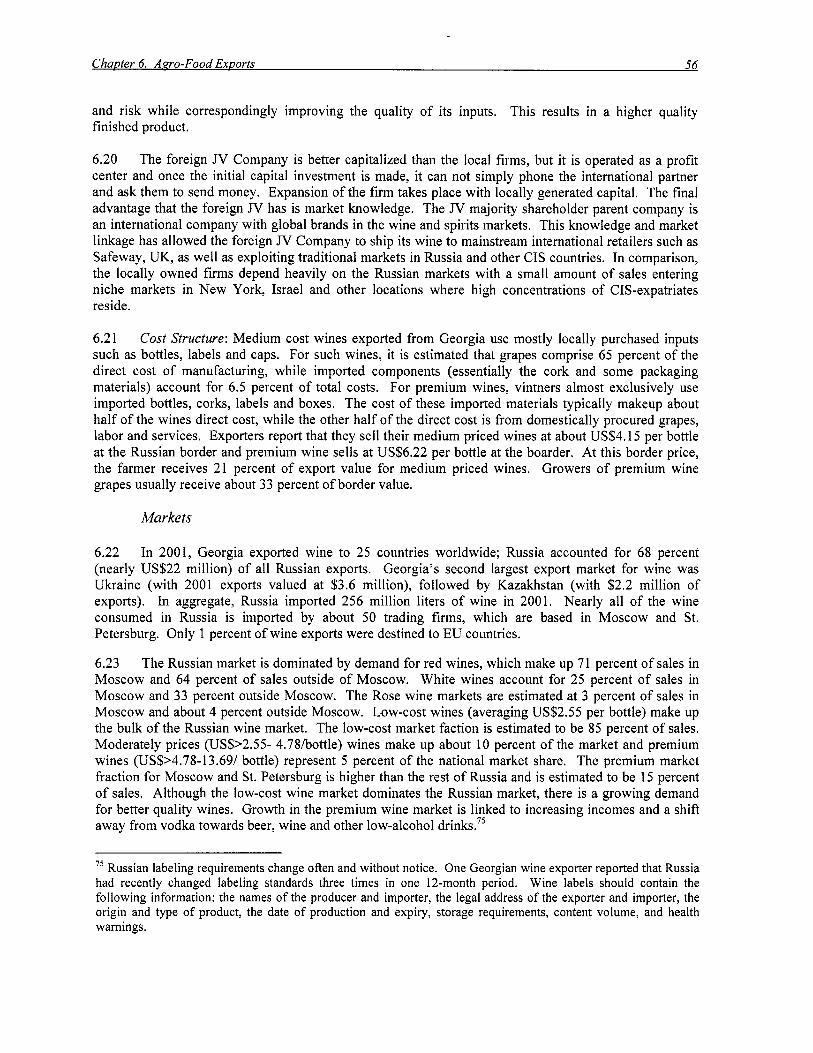
and risk while correspondingly improving the quality o f i t s inputs. This results in a higher quality finished product.
6.20 The foreign JV Company i s better capitalized than the local firms, but it i s operated as a profit center and once the initial capital investment i s made, it can not simply phone the international partner and ask them to send money. Expansion of the firm takes place with locally generated capital. The final advantage that the foreign JV has is market knowledge. The JV majority shareholder parent company i s an international company with global brands in the wine and spirits markets. This knowledge and market linkage has allowed the foreign JV Company to ship i t s wine to mainstream international retailers such as Safeway, UK, as well as exploiting traditional markets in Russia and other CIS countries. In comparison, the locally owned firms depend heavily on the Russian markets with a small amount o f sales entering niche markets in New York, Israel and other locations where high concentrations of CIS-expatriates reside.
6.21 Cost Structure: Medium cost wines exported from Georgia use mostly locally purchased inputs such as bottles, labels and caps. For such wines, it i s estimated that grapes comprise 65 percent of the direct cost o f manufacturing, while imported components (essentially the cork and some packaging materials) account for 6.5 percent o f total costs. For premium wines, vintners almost exclusively use imported bottles, corks, labels and boxes. The cost o f these imported materials typically makeup about half o f the wines direct cost, while the other half o f the direct cost i s from domestically procured grapes, labor and services. Exporters report that they sel l their medium priced wines at about US$4.15 per bottle at the Russian border and premium wine sells at US$6.22 per bottle at the boarder. At this border price, the farmer receives 21 percent o f export value for medium priced wines. Growers of premium wine grapes usually receive about 33 percent o f border value.
Markets
6.22 In 2001, Georgia exported wine to 25 countries worldwide; Russia accounted for 68 percent (nearly US$22 million) o f all Russian exports. Georgia’s second largest export market for wine was Ukraine (with 2001 exports valued at $3.6 million), followed by Kazakhstan (with $2.2 million of exports). In aggregate, Russia imported 256 million liters o f wine in 2001. Nearly all o f the wine consumed in Russia i s imported by about 50 trading firms, which are based in Moscow and St. Petersburg. Only 1 percent o f wine exports were destined to EU countries.
6.23 The Russian market i s dominated by demand for red wines, which make up 71 percent o f sales in Moscow and 64 percent o f sales outside of Moscow. White wines account for 25 percent o f sales in Moscow and 33 percent outside Moscow. The Rose wine markets are estimated at 3 percent o f sales in Moscow and about 4 percent outside Moscow. Low-cost wines (averaging US$2.55 per bottle) make up the bulk o f the Russian wine market. The low-cost market faction i s estimated to be 85 percent o f sales. Moderately prices (US$>2.55- 4.781bottle) wines make up about 10 percent o f the market and premium wines (US$>4.78-13.69/ bottle) represent 5 percent o f the national market share. The premium market fraction for Moscow and St. Petersburg i s higher than the rest o f Russia and i s estimated to be 15 percent o f sales. Although the low-cost wine market dominates the Russian market, there i s a growing demand for better quality wines. Growth in the premium wine market i s linked to increasing incomes and a shift away from vodka towards beer, wine and other low-alcohol drinks.”
75 Russian labeling requirements change often and without notice. One Georgian wine exporter reported that Russia had recently changed labeling standards three times in one 12-month period. Wine labels should contain the following information: the names o f the producer and importer, the legal address o f the exporter and importer, the origin and type o f product, the date o f production and expiry, storage requirements, content volume, and health warnings.
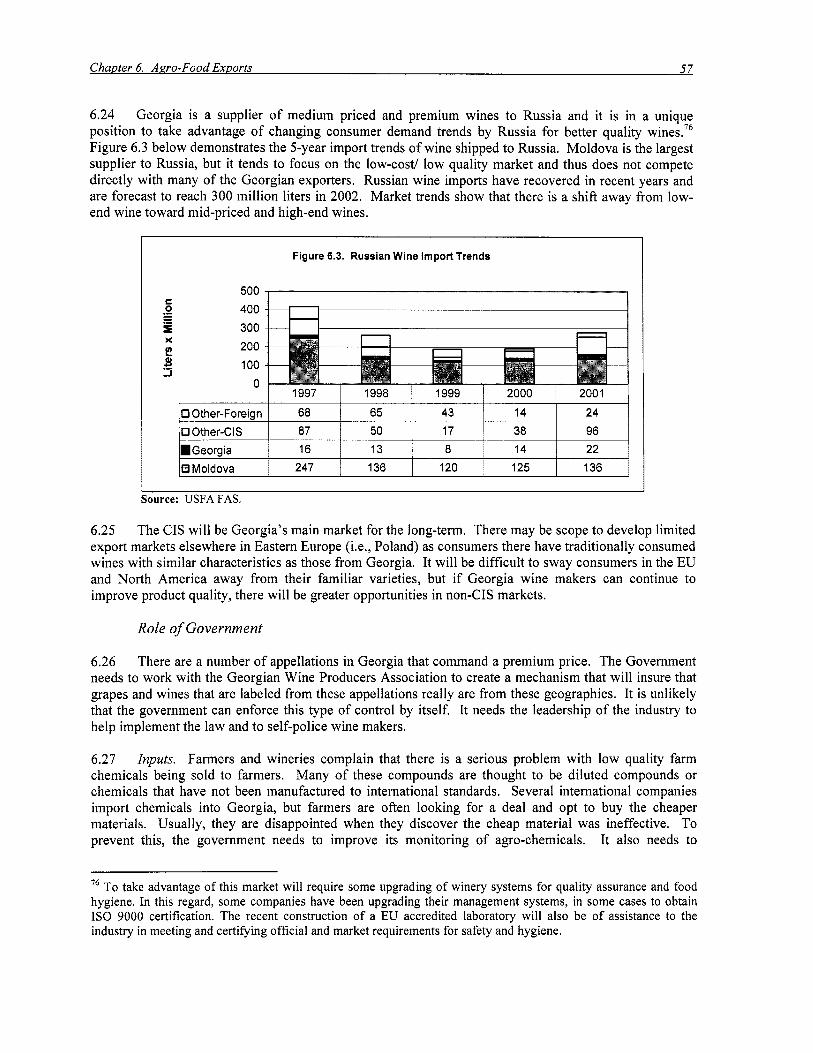
Chauter 6. Aaro-Food Exuorts 57
0 Other-Foreign 0 Other-CIS
Georgia Ell Moldova
6.24 Georgia i s a supplier of medium priced and premium wines to Russia and it i s in a unique position to take advantage o f changing consumer demand trends by Russia for better quality wines.76 Figure 6.3 below demonstrates the 5-year import trends of wine shipped to Russia. Moldova i s the largest supplier to Russia, but it tends to focus on the low-cost/ low quality market and thus does not compete directly with many of the Georgian exporters. Russian wine imports have recovered in recent years and are forecast to reach 300 million l i ters in 2002. Market trends show that there i s a shift away from low- end wine toward mid-priced and high-end wines.
68 65 43 14 24 87 50 17 38 96 16 13 8 14 22
247 136 120 125 136
Figure 6.3. Russian Wine Import Trends
500 400 300 200 100
0 1998 [ 1999 1 2000 1 2001
I Source: USFA FAS.
6.25 The CIS wi l l be Georgia’s main market for the long-term. There may be scope to develop limited export markets elsewhere in Eastern Europe (Le., Poland) as consumers there have traditionally consumed wines with similar characteristics as those from Georgia. It wi l l be difficult to sway consumers in the EU and North America away from their familiar varieties, but if Georgia wine makers can continue to improve product quality, there wi l l be greater opportunities in non-CIS markets.
Role of Government
6.26 There are a number o f appellations in Georgia that command a premium price. The Government needs to work with the Georgian Wine Producers Association to create a mechanism that wi l l insure that grapes and wines that are labeled from these appellations really are from these geographies. It i s unlikely that the government can enforce this type of control by itself. It needs the leadership o f the industry to help implement the law and to self-police wine makers.
6.27 Inputs. Farmers and wineries complain that there i s a serious problem with low quality farm chemicals being sold to farmers. Many o f these compounds are thought to be diluted compounds or chemicals that have not been manufactured to international standards. Several international companies import chemicals into Georgia, but farmers are often looking for a deal and opt to buy the cheaper materials. Usually, they are disappointed when they discover the cheap material was ineffective. To prevent this, the government needs to improve i t s monitoring o f ago-chemicals. It also needs to
76 To take advantage o f this market will require some upgrading o f winery systems for quality assurance and food hygiene. In this regard, some companies have been upgrading their management systems, in some cases to obtain I S 0 9000 certification. The recent construction o f a EU accredited laboratory will also be o f assistance to the industry in meeting and certifying official and market requirements for safety and hygiene.

encourage the international agro-chemical dealers to start offering demonstration and training programs to farmers.
6.28 Taxes. The wine exporters complain that the current VAT drawback system does not work. If wineries do not export a l l o f their imported production inputs within six months, they must pay VAT on these goods. Other taxes need to be reviewed as well. For example, Georgia charges a 10 percent tax on advertising. This has the effect o f reducing a firm's ability to grow its domestic market. The total tax burden i s high and administratively complex; the tax code needs to be simplified to improve compliance.
6.29 Fraud and Misrepresentation. Georgian vintners complain that low quality wines from Romania and Moldova are being labeled and sold as Georgian wine in the Russian market. This has the combined effect o f lowering the perceived quality o f Georgian wine by the consumer, as well as reducing i ts price. Wine makers in Georgia are extremely concerned about this matter, and would like to see action taken against these counterfeit wines. I t i s highly unlikely that Russian inspectors wi l l insure that wines labeled as Georgian are truly from that origin. This task wil l be the responsibility o f the Georgian wine industry, supported by the Government o f Georgia. Given the importance o f this export in the Georgian economy, it would be reasonable to expect the Government to ask its commercial attach& in countries where the counterfeit wine i s being sold to identify these products and draw them to the attention of local authorities so they can be removed from store shelves.77
6.30 Corruption. Wine exporting firms report that corruption-generated rents are often 32 percent o f total shipping costs for loads shipped from Tbilisi to Moscow. One firm reported that it costs 4,700 US$ to ship 15,000 bottles by reefer truck from Tbilisi to Moscow (via Porti - Novorossiysk ferry, then by road to Moscow). O f the total transport cost, corruption costs were estimated to be US$1,500. Assuming that a medium-size winery could send 35 containers (about a half million bottles) a year to Moscow, the cost o f corruption to the firm would be in the order o f US$52,000. The corruption cost estimate was corroborated with other exporters and the costs appear fairly consistent.
6.31 Research There i s weak linkage between viticulture and enology academics and the winegrowing industry in Georgia. This has resulted in a constriction in the flow o f information from research to application. In the Western model, agricultural academics would undertake applied research that i s targeted to specific problems faced by the industry. In Georgia, this type of industry-driven research does not appear to be taking place.
6.32 The Government body, SAMTREST (State Industry Corporation for Viticulture and Winemaking), collects basic data on varieties, geographic distribution of production and market information. The data tends to be macro in nature, and has limited value for individual companies' market development activities. There i s certainly a need for SAMTREST to improve the quality o f i ts data, as well as i t s depth and breadth. However, with the severe budget limitations within the Government, it i s unlikely that SAMTREST wil l be able to strengthen the services it provides the industry without donor funding and technical assistance.
6.33 Farm Size and GOG policy The Ministry o f Agriculture supports the concept that farmers need to consolidate into larger farming units to improve economies o f scale. This wil l require that some people wil l leave farming and wi l l need to find employment in other industries. This process wil l take decades to
77 One wine industry executive in Tbilisi said that this type o f monitoring by the commercial attach6 would be impossible to achieve, as the embassy staff would not see it in their personal interest to undertake this type o f work. If this attitude i s endemic among government officials, the wine industry will be faced with the choice o f attempting to control counterfeit wines themselves through their association, or simply ignoring the problem and living with the results.

Chapter 6. Aaro-Food Emorts 59
work through, as there needs to be a balance between non-farm job creation and the consolidation of farms into larger units.
6.34 Large winemakers have opted to vertically integrate, rather than try to work with small farmers. There i s a saying in the wine business that quality starts in the vineyard. The future of the Georgian wine industry should be founded on providing premium wines to i t s traditional CIS markets, as well as introducing these premium wines to new markets in the EU, U S and other locations. Small farmers have a very difficult time producing grapes of the quality required to make premium wines. This fact i s one of the key driving forces toward vertical integration of the industry in Georgia. Eventually, premium vintners wil l obtain grapes from their own vineyards and work with a handful o f high-quality growers. Firms that target lower and mid-level quality wines wil l continue to work with small growers on a spot purchase basis.
6.35 Access to Land and Credit Winemakers report that there i s no significant legal obstacle to obtaining land for vineyards. Properties can be purchased from private individuals or leased from the Government under 49-year contracts. Farmers and vintners expressed that the single largest obstacle to acquiring and developing vineyards was the availability o f long-term debt capital.
6.36 The Government should be encouraged to privatize more land. Currently, approximately 1/3 of the country’s cropland has been privatized. Banks are unlikely to use properties that are leased from the Government as collateral on loans. Farmers need to own land so that they can use this land as security on debt. By privatizing more land, the Government wil l strengthen the ability o f the banking sector and farming sector to work together for their mutual benefit.
6.37 From a collateral and banking standpoint, it i s important that Georgia’s farm size increases. Banks are very reluctant to loan to farmers who have a small plot o f land, particularly when their house shares the same property. If the farmer defaults, the bank would have to repossess the land and the house. Politically, this i s probably impossible to do in rural Georgia. Banks wil l not start to lend to the agricultural sector until they can secure loans with properties that are not tied to the farmers’ homes, and have a significant size (1 5 - 20 ha). Additionally, the market for land needs to mature so that banks are comfortable with the fact that a property can be sold in the event that a borrower defaults on a loan.
Hazelnut Sector
6.3 8 Despite exhibiting a recent decline, hazelnuts remain Georgia’s second largest agro-food product export in value terms. Export sales in 2001 were just under US$10 million, down from US$22 million the previous year. Georgia i s a small, supplemental player in the world hazel nut market. Turkey dominates this market and had exports o f more than US$486 million in 2001. World prices are heavily influenced by Turkish production and commercial strategies and sharp declines in these prices in recent years have adversely affected Georgian growers and exporters.
6.39 According to the GOG, between 1998 and 2001, Georgia’s farmers produced on average 14,500 M T of hazelnuts annually (see Figure 6.4). Unoficial estimates by the Hazelnut Processors Association put the national output at over 28,000 MT, but this number cannot be confirmed. The majority o f Georgia’s hazelnuts are produced in the western part o f the country. There are about 12,500 small hazelnut farmers and the income stream from hazelnuts i s typically an important part o f their household incomes. Approximately 20 percent o f the Georgian crop i s produced in the northeastern region of Abkhazia. The region i s involved in an armed struggle for independence with Tbilisi and a large percentage o f the hazelnuts from Abkhazia flow directly into the Russian market through informal channels. In 200 1, there were 33 legally registered companies exporting hazelnuts, but 5 firms dominated

Chauter 6. Agro-Food Exuorts 60
the sector with an estimated 70 percent o f exports. The processing and export businesses employ an estimated 1,200 people on a full-time and seasonal basis.
6.40 While the industry i s currently experiencing severe pricing pressures, over the long term there are opportunities for nut producers and exporters to add value to the crop. At the farm level, this can be done by improving quality primarily through better drying of the in-shell nuts, which wil l reduce spoilage, and increase nut size by improving crop nutrition. At the processing level, f i r m s can add value by manufacturing a number o f products such as sliced and diced nuts, and flour and oil. By developing these products, the processors can divert low quality nuts away from the whole-nut market (where their value i s low) and shift them into processes products where their value can be increased.
Production
6.41 There are a number o f different hazelnut varieties grown by Georgian farmers. About 90 percent o f the hazelnut trees that grow in Georgia are classified as industrial varieties. O f this class of varieties, 70 percent are Anakliuri Futkurani, and 30 percent are made up o f the Gulshishvela and Shveliskura varieties. The varieties used in Georgia are often less preferred by the European confectionary industry because the nuts have a pointed end. This point i s sharp enough to pierce the wrapping paper of candy bars or other products in which whole nuts are used. This limits the market for some types of Georgian ha~elnuts.~'
6.42 Over the four-year period between 1998-2001, Georgian farmers produced an annual o f 14,500 MT of in-shell hazelnuts. As seen in Figure 6.4, total production has fallen in the last two years. A primary factor i s the serious decline in farm-gate prices which has led growers to use fewer inputs and thus obtain lower yields. Poor weather conditions, particularly in 2001, also contributed to a lighter crop, as well as a reduction in kernel quality at the processing plants. Increasingly in Georgia, hazel nuts are produced without any in uts other than the farmer's labor. This has led to lower yields, well below those in competing countries. 7 9
F i g u r e 6 . 4 . H a z e l n u t I n - S h e l l P r o d u c t i o n O u t p u t I n G e o r g i a , 1 9 9 8 - 2 0 0 1
1 9 9 8 1 9 9 9 2 0 0 0 2 0 0 1
Source: GOG Dept o f Statistics.
6.43 Table 6.4 examines the five-year farmgate price trends for hazelnuts produced in Georgia. As can be noted, there has been a consistent parallel fa l l in both the U S dollar and Georgian Lari price for the commodity. An analysis o f the farmgate and CIF price clearly shows that farmers are receiving a smaller
78 A hazelnut orchard's economic lifespan i s about 25 years. To ensure a sustainable production base, the industry needs an aggregate re-plant rate o f 4 percent annually. The government does not compile statistics on replanting or new planting. Georgia should carehlly monitor the re-plant rates to insure that there will be sufficient tree '' Average yields in Georgia are estimated at 1.16 MT per hectare, compared with 1.56 MT/ha. in Turkey and 1.5 MTha. in Azerbaijan.
opulations in the future to support a healthy industry.
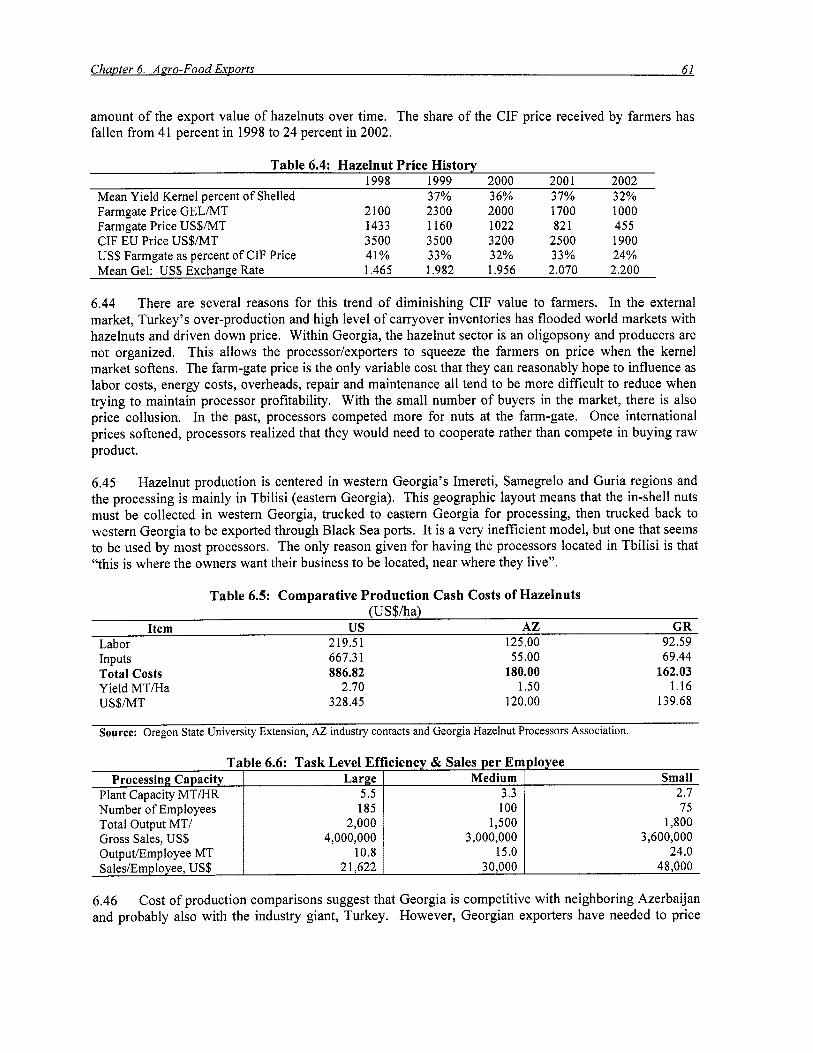
amount o f the export value of hazelnuts over time. The share of the CIF price received by farmers has fallen from 41 percent in 1998 to 24 percent in 2002.
Processing Capacity Large Medium Plant Capacity MT/HR 5.5 3.3 Number o f Employees 185 100 Total Output MT/ 2,000 1,500 Gross Sales, US$ 4,000,000 3,000,000 OutputEmployee MT 10.8 15.0 SalesEmployee, US$ 2 1,622 30,000
Table 6.4: Hazelnut Price History 1998 1999 2000 200 1 2002
Mean Yield Kernel percent o f Shelled 37% 3 6% 37% 32% Farmgate Price GEL/MT 2100 2300 2000 1700 1000 Farmgate Price US$/MT 1433 1160 1022 82 1 455
Mean Gel: US$ Exchange Rate 1.465 1.982 1.956 2.070 2.200
CIF EU Price US$/MT 3500 3500 3200 2500 1900 US$ Farmgate as percent of CIF Price 41% 33% 32% 33% 24%
Small 2.7 75
1,800 3,600,000
24.0 48,000
6.44 There are several reasons for this trend of diminishing CIF value to farmers. In the external market, Turkey’s over-production and high level o f carryover inventories has flooded world markets with hazelnuts and driven down price. Within Georgia, the hazelnut sector i s an oligopsony and producers are not organized. This allows the processor/exporters to squeeze the farmers on price when the kernel market softens. The farm-gate price i s the only variable cost that they can reasonably hope to influence as labor costs, energy costs, overheads, repair and maintenance all tend to be more difficult to reduce when trying to maintain processor profitability. With the small number o f buyers in the market, there i s also price collusion. In the past, processors competed more for nuts at the farm-gate. Once international prices softened, processors realized that they would need to cooperate rather than compete in buying raw product.
6.45 Hazelnut production is centered in western Georgia’s Imereti, Samegrelo and Guria regions and the processing i s mainly in Tbilisi (eastern Georgia). This geographic layout means that the in-shell nuts must be collected in western Georgia, trucked to eastern Georgia for processing, then trucked back to western Georgia to be exported through Black Sea ports. I t i s a very inefficient model, but one that seems to be used by most processors. The only reason given for having the processors located in Tbilisi i s that “this i s where the owners want their business to be located, near where they live”.
Table 6.5: Comparative Production Cash Costs of Hazelnuts (US$/ha)
Item us AZ GR Labor 219.51 125.00 92.59 Inputs Total Costs Yield MT/Ha US$/MT
667.3 1 886.82
2.70 328.45
55.00 180.00
1 s o 120.00
69.44 162.03
1.16 139.68
Source: Oregon State University Extension, AZ industry contacts and Georgia Hazelnut Processors Association.
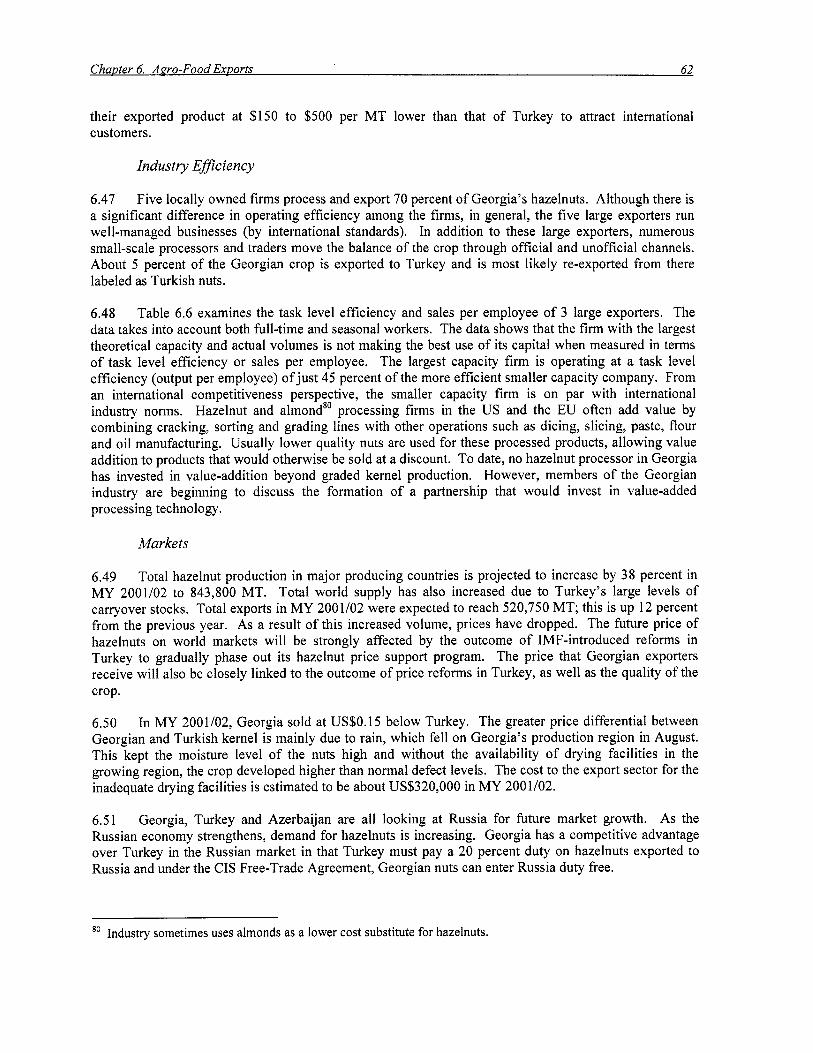
their exported product at $150 to $500 per M T lower than that o f Turkey to attract international customers.
Industry EfJiciency
6.47 Five locally owned firms process and export 70 percent o f Georgia's hazelnuts. Although there i s a significant difference in operating efficiency among the firms, in general, the five large exporters run well-managed businesses (by international standards). In addition to these large exporters, numerous small-scale processors and traders move the balance of the crop through official and unofficial channels. About 5 percent o f the Georgian crop i s exported to Turkey and i s most likely re-exported from there labeled as Turkish nuts.
6.48 Table 6.6 examines the task level efficiency and sales per employee o f 3 large exporters. The data takes into account both full-time and seasonal workers. The data shows that the firm with the largest theoretical capacity and actual volumes i s not making the best use o f its capital when measured in terms o f task level efficiency or sales per employee. The largest capacity firm i s operating at a task level efficiency (output per employee) ofjust 45 percent o f the more efficient smaller capacity company. From an international competitiveness perspective, the smaller capacity firm i s on par with international industry norms. Hazelnut and almond" processing firms in the U S and the EU often add value by combining cracking, sorting and grading lines with other operations such as dicing, slicing, paste, flour and oi l manufacturing. Usually lower quality nuts are used for these processed products, allowing value addition to products that would otherwise be sold at a discount. To date, no hazelnut processor in Georgia has invested in value-addition beyond graded kernel production. However, members o f the Georgian industry are beginning to discuss the formation of a partnership that would invest in value-added processing technology.
Markets
6.49 Total hazelnut production in major producing countries i s projected to increase by 38 percent in MY 2001/02 to 843,800 MT. Total world supply has also increased due to Turkey's large levels of carryover stocks. Total exports in MY 2001/02 were expected to reach 520,750 MT; this is up 12 percent from the previous year. As a result o f this increased volume, prices have dropped. The future price of hazelnuts on world markets wi l l be strongly affected by the outcome o f IMF-introduced reforms in Turkey to gradually phase out i ts hazelnut price support program. The price that Georgian exporters receive wil l also be closely linked to the outcome of price reforms in Turkey, as well as the quality o f the crop.
6.50 In MY 2001/02, Georgia sold at US$0.15 below Turkey. The greater price differential between Georgian and Turkish kernel i s mainly due to rain, which fe l l on Georgia's production region in August. This kept the moisture level o f the nuts high and without the availability o f drying facilities in the growing region, the crop developed higher than normal defect levels. The cost to the export sector for the inadequate drying facilities i s estimated to be about US$320,000 in MY 2001/02.
6.51 Georgia, Turkey and Azerbaijan are all looking at Russia for future market growth. As the Russian economy strengthens, demand for hazelnuts i s increasing. Georgia has a competitive advantage over Turkey in the Russian market in that Turkey must pay a 20 percent duty on hazelnuts exported to Russia and under the CIS Free-Trade Agreement, Georgian nuts can enter Russia duty free.
Industry sometimes uses almonds as a lower cost substitute for hazelnuts.
Chauter 6. Aaro-Food Exuorts 63
6.52 From the Georgian industry perspective, the primary concern in developing the Russian market i s not competition from Turkey, but rather the (+/-) 800 M T o f hazelnuts exported from Abkhazia via unofficial channels. According to the industry, these low quality nuts are driving down the price of hazelnuts exported to Russia through Georgia’s official commercial channels. This i s one o f the main concerns o f the Georgian industry; but realistically, l i t t le can be done to curb unofficial exports from Abkhazia until civil order i s restored to the region.
6.53 Germany i s the largest EU buyer o f hazelnuts. Germany alone accounts for about 50 percent o f EU imports; however, German purchases slowed in 2001, making some producers look for alternative markets. China offers Georgian exporters opportunities in market development. China has increased i ts purchase of hazelnuts in recent years, as buyers there have been prepared to purchase lower quality nuts. In MY 2000/01, the U S increased it sales to China by more than 75 percent over the previous year. Freight rates (20 foot container) from Tbilisi to Hong Kong are reportedly half the cost o f freight rates plus corruption cost from Tbilisi to Moscow. Unlike shipments to Russia, once a Hong Kong bound container levels Georgia, corruption costs stop.
The Role of Government
6.54 Georgian hazelnut industry to reach i t s full potential.
The government can play an important role in providing an environment that wil l allow the
6.55 Regulations on plant materials. The government can encourage the replanting of old orchards by reducing the barriers to importation of plant materials by eliminating duties on these products. The government requires that all new varieties be tested at research stations at least 2 years before they can be commercialized. These regulations impede the flow o f new plant materials to growers and ultimately result in stunting the development o f the industry.
6.56 Industry statistics. There i s no reliable data source for ascertaining critical industry information such as number of farmers, mean plant populations, area pulled, area planted, bearing and non-bearing area, etc. Without these fundamental statistics provided on a regular basis, industry and government cannot effectively develop a long-term strategy for the industry, as they have no idea o f the baseline situation. There is concern that the average Georgian hazelnut orchards are past their prime and the replant rates, which should be 4 percent to 5 percent to be sustainable, are not being met. If this i s the case (which i s very likely), then industry and government need to work together to encourage farmers to replace old orchards and maintain this practice.
6.57 Training: Exporters need a consistent supply o f quality inputs (raw product) in order to remain competitive. A few of Georgia’s more enlightened exporters in the wine and food-processing industries currently employ technical staff to work with their farmers/ suppliers. This type o f industry-driven private sector extension system needs to be encouraged. The agriculture sector needs to improve i t s skill levels and knowledge base; without this, export growth wi l l be highly limited. The government does not have the resources to provide a remedy in this area. The remedy wil l need to be delivered by the industry and supported by donors and the government. The government needs to create an environment that wi l l encourage industry to deliver technical assistance to growers; for example, through tax incentives for farmer training by input suppliers and/or developing tax incentives for in-house extension departments operated by food processing/ exporting f i rms.
6.58 Research: With limited funds available, the government has no ongoing program in hazelnut research. Rather than duplicate work that has already been done in Turkey, the government should f i rst look to Turkish sources for plant materials and information on improved cultural practices. In addition to Turkey, Georgia can utilize Italian plant material and production information to help strengthen i t s own
ChaDter 6. Aaro-Food ExDorts 64
industry. Getting this information i s only part o f the problem. The most challenging aspect o f increasing on-farm productivity i s transferring the knowledge and technology from the researchers and technicians to the farmers. For these activities, researchers will need to link with input providers, processors, exporters and associations.
6.59 Standards and Quality. Hazelnut buyers and sellers carefully specify quality standards in sales contracts. The standards generally quantify physical characteristics o f the nuts, including moisture, deformations, broken or damaged nuts, foreign material and pest infestations. Importers may require microbiological tests, with specific limits placed on moulds, salmonella, and enterobacteria. Often, importing countries will also check shipments on a random basis for contaminants such as aflatoxin(s), cadmium, mercury, lead and benzopyrene. Usually, chemical tests are conducted in the importing country. The physical characteristic testing i s done in the country o f origin, as well as in the receiving country to confirm product quality.
6.60 The UNDP Food Quality Laboratory, scheduled to open in Tbilisi in the second half o f 2003, should be able to provide tests for the various physical, biological and chemical parameters required by hazelnut exporters. The certified lab w i l l be able to provide exporters with a credible information source in the event there i s a quality dispute about a delivered shipment.
Processed Hort icul tura l Products
6.61 Georgian fruit juice exports were valued at 1.3 mill ion US$ in 2001. The primary export product i s 70-brix apple juice concentrate (AJC-about 6 times more concentrated than natural apple juice). In addition to concentrates, Georgia exports single strength juices, such as pomegranate juice, in small volumes. These single strength products target niche markets in Russia, Israel and the US, whereas AJC exports are sold to industrial re-processing markets in the EU and other locations. I t i s estimated that about 30,000 farmers supply Georgia's three AJC export firms with raw product. In addition, there are another 5-6 firms that buy fruit from farmers to process a wide variety o f jams, jellies, juices and other products. Total employment in the horticultural processing sector i s estimated to be approximately 1,000 persons.
Crop Production
6.62 A review o f fruit production trends in Georgia reveals one o f the fundamental long-term problems facing the horticultural industry. Aging tree populations, poor orchard management, lack o f re-planting, and orchard destruction have al l combined to result in a steady decline in production. If continued, this trend wil l threaten existing agribusinesses that depend on fruit as a raw product and limit the development o f new business in this sector. GOG Department o f Statistics long-term trends show that aggregate fruit production in Georgia in 2000 was 14 percent o f 1990 levels.*l
6.63 Tree fruit yields in Georgia are low. GOG statistics indicate that average yield for a fruit tree (in aggregate) i s 4.7 MTha . AJC processors report that many apple growers achieve 10 MT/ha. These numbers are well below the potential yields for the crops. In comparison, apple farmers in the western
*' It should be pointed out that the two AJC processors interviewed did not feel that raw product supply was currently a problem. This year, they are buying processing grade apples at a mean price o f 25 US$ per MT, which i s about half the cost that U S processors would expect to pay in a bumper-crop year. Processors in other CIS countries also felt comfortable with their supply situation, only to be shocked when conditions change.
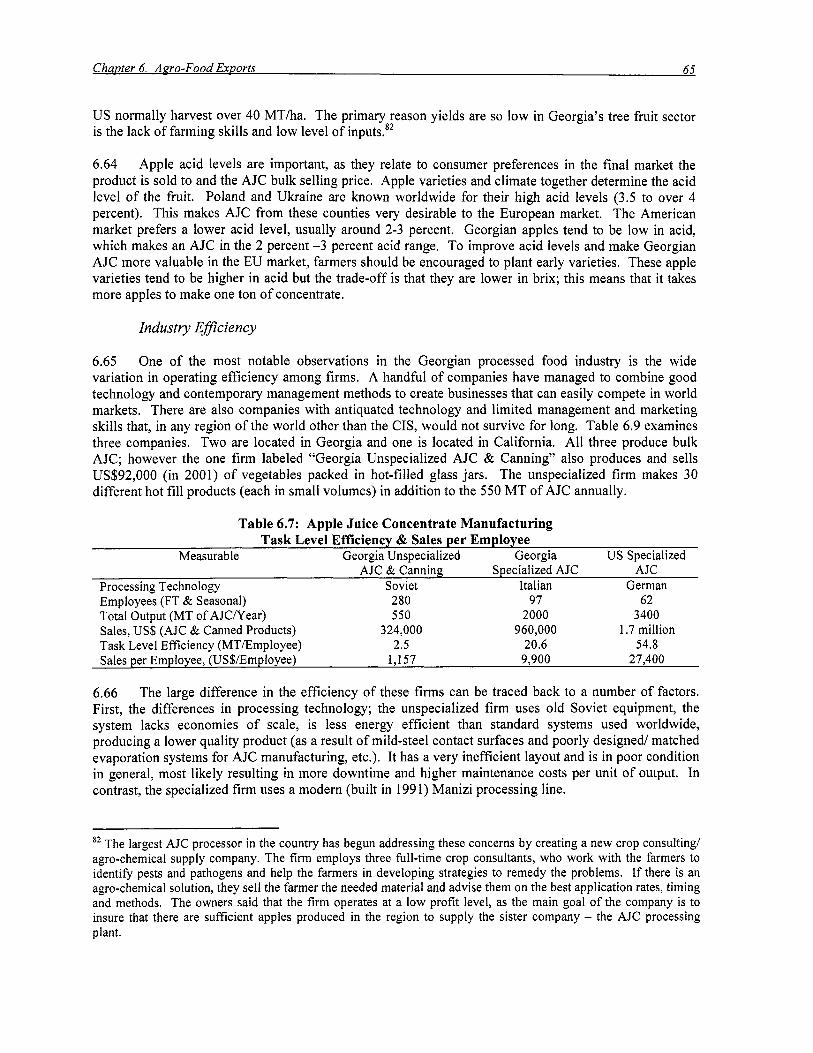
U S normally harvest over 40 MT/ha. The primary reason yields are so low in Georgia’s tree fruit sector is the lack o f farming ski l ls and low level o f inputs.82
6.64 Apple acid levels are important, as they relate to consumer preferences in the final market the product i s sold to and the AJC bulk selling price. Apple varieties and climate together determine the acid level o f the fruit. Poland and Ukraine are known worldwide for their high acid levels (3.5 to over 4 percent). This makes AJC from these counties very desirable to the European market. The American market prefers a lower acid level, usually around 2-3 percent. Georgian apples tend to be low in acid, which makes an AJC in the 2 percent -3 percent acid range. To improve acid levels and make Georgian AJC more valuable in the EU market, farmers should be encouraged to plant early varieties. These apple varieties tend to be higher in acid but the trade-off i s that they are lower in brix; this means that i t takes more apples to make one ton o f concentrate.
Industry EfJiciency
6.65 One o f the most notable observations in the Georgian processed food industry i s the wide variation in operating efficiency among firms. A handful o f companies have managed to combine good technology and contemporary management methods to create businesses that can easily compete in world markets. There are also companies with antiquated technology and limited management and marketing ski l ls that, in any region o f the world other than the CIS, would not survive for long. Table 6.9 examines three companies. Two are located in Georgia and one i s located in California. All three produce bulk AJC; however the one firm labeled “Georgia Unspecialized AJC & Canning” also produces and sells US$92,000 (in 2001) o f vegetables packed in hot-filled glass jars. The unspecialized firm makes 30 different hot fill products (each in small volumes) in addition to the 550 MT o f AJC annually.
Table 6.7: Apple Juice Concentrate Manufacturing Task Level Efficiency & Sales per Employee
Measurab le Georgia Unspecialized Georgia US Specialized AJC & Canning Specialized AJC AJC
Processing Technology Soviet Italian German Employees (FT & Seasonal) 280 97 62 Total Output (MT o f AJCNear) 550 2000 3400 Sales, US$ (AJC & Canned Products) 324,000 960,000 1.7 million Task Level Efficiency (MT/Employee) 2.5 20.6 54.8 Sales per Employee, (US$/Employee) 1,157 9,900 27,400
6.66 The large difference in the efficiency o f these firms can be traced back to a number o f factors. First, the differences in processing technology; the unspecialized firm uses old Soviet equipment, the system lacks economies o f scale, i s less energy efficient than standard systems used worldwide, producing a lower quality product (as a result o f mild-steel contact surfaces and poorly designed matched evaporation systems for AJC manufacturing, etc.). I t has a very inefficient layout and i s in poor condition in general, most likely resulting in more downtime and higher maintenance costs per unit o f output. In contrast, the specialized firm uses a modern (built in 1991) Manizi processing line.
The largest AJC processor in the country has begun addressing these concerns by creating a new crop consulting/ agro-chemical supply company. The firm employs three hll-time crop consultants, who work with the farmers to identify pests and pathogens and help the farmers in developing strategies to remedy the problems. If there i s an agro-chemical solution, they sell the farmer the needed material and advise them on the best application rates, timing and methods. The owners said that the firm operates at a low profit level, as the main goal of the company i s to insure that there are sufficient apples produced in the region to supply the sister company - the AJC processing plant.

Chauter 6. Aero-Food Exuorts 66
6.67 Technology i s not the only factor that affects these firms’ efficiency levels. A second major influence i s overhead and asset utilization. The unspecialized firm i s located in a sprawling complex of rundown buildings, which i s expensive to maintain and acts more as a liability than an asset. The unspecialized firm also inherited a large work force, which it has found difficult to rationalize. In contrast, the specialized firm i s located in a compact, fairly well laid out complex, which i s cost-effective to operate and maintain. I t s workforce was smaller when it was privatized and over time, the firm has been able to adjust i ts staff size to better reflect the business’s real needs.
6.68 The third factor (and perhaps the most important) that contributes to the different levels of efficiency o f these two firms i s management. The specialized firm i s focused on one core product and a small concentrated market. The unspecialized firm has to deal with manufacturing and selling 30 different products. This does not allow the management to focus resources and become efficient in any one product. The management i s also encumbered with trying to keep a large number of people employed. Like the Soviet system, the unspecialized firm’s primary goal seems to be job creation. The capitalistic concepts o f reducing unit- manufacturing cost and maximizing profit appear to be a second level priority for the firm.
I t s goal i s to reduce manufacturing costs and maximize profits.
6.69 In commodity markets, the low cost producer wins. In actual cost terms, Georgia i s a low cost producer of AJC. This i s mainly the result o f cheap apples, which is the single largest cost component in the manufacturing o f AJC worldwide. However, the operating efficiency o f Georgia’s food processing industry remains a serious concern. Worldwide, many countries have problems with their fruit processing industry’s capacity utilization. In Georgia, this i s a problem in some plants but i s not a universal constraint. For some firms operating in Georgia, capacity utilization constraints are actually constraints on working capital, as the high cost o f credit makes it impossible to afford to buy enough raw product to run plants efficiently. The debt i s accumulated in the short (90-day) harvest season, but the receivables may flow back to the firm over a 12 to 14 month period. This creates high debt service cost. Other than accessing lower cost credit lines, processors could partly alleviate the problem of plant under-utilization by looking for other fruits which can be processed in the AJC processing line, which wil l not conflict (time-wise) with the apple crop. Peaches, apricots and other stone fruit are the best fit for most AJC processors. Often these secondary products can be manufactured without interfering with the apple season.
Markets
6.70 The world production of apple juice concentrate averages 620,000 M T annually. At current market price, which i s near historical low levels, the aggregate world market value i s US$300 million. In M Y 2002/03, Georgia i s forecast to produce 3,300 M T o f 70 brix AJC for export. This represents about 0.5 percent o f world production. There i s no domestic market for AJC in Georgia; all production i s exported in bulk. EU demand i s flat, but demand for AJC in Russia has been increasing in recent years as more domestic juice producers (that blend and pack) enter the market.
6.71 Georgia, and other CIS concentrate processors occupy a unique niche in the world market; they supply crude concentrate to the EU re-processing industry. The majority o f Georgian and other CIS concentrate exporters sel l to Germany and other European countries where the crude AJC i s filtered, blended and sold to the international food industry. Georgian crude AJC has a brown, cloudy appearance. The cloudiness is caused by the presence o f a number o f compounds including: pectin, starcheddextrin, polymers o f the simple sugars such as arabinose, residual moulds, yeast, or bacteria and polyphenols/ tannins. These products are removed using ultra-filtration or other more sophisticated technology. Color i s one of the main quality factors buyers look for. AJC can run from clear light honey in color to dark amber. After filtration, the AJC is blended to achieve the proper acid balance, which differs by markets

Chauter 6. Aaro-Food Exuorts 67
(EU preferring high acid levels and North America preferring low acid AJC). EU re-processors prefer to buy crude AJC from the CIS, as it allows them the ability to control the final product’s quality by fine- tuning color, clarity, and flavodchemistry to meet specifications of individual buyers.
6.72 Georgia’s largest AJC manufacturer has ultra-filtration equipment installed in i ts plant, but the buyers wi l l not pay more for ultra-filtered product. The dark amber AJC, which i s produced in Georgia, has a lower unit value than clear-light honey AJC (the product which results from ultra-filtration). There are several firms in Germany, Austria, Denmark, Switzerland and several in the US, which specialize in re-manufacturing/ blending of AJC. It would be worth researching to find out if any o f these firms would pay a premium for clear-light honey concentrate from Georgia.
6.73 China i s the largest producer of AJC in the world. In the 2001/02 season, the country produced 250,000 M T o f concentrate. China’s AJC industry growth can only be described as phenomenal. In 1991, government statistics showed that the country only produced 10,000 M T o f AJC. By 1998, production rose to nearly 91,000 MT. About the same time, many of the AJC plants were privatized, and production skyrocketed to current levels. I t i s estimated that China has a total industry capacity to process 500,000 MT o f AJC per year.
6.74 The main competitive advantage that China’s AJC industry has over other world producers i s the low cost o f raw materials. Concentrate producers typically pay between US$10 - 50 /MT for raw apples. This compares to apple prices in Georgia (in the current year) o f US$25 - 50 /MT. Georgian apples tend to be slightly higher in acid, which gives them some advantage in the market. Georgia’s disadvantage i s that processors’ raw inputs to concentrate ratios are not particularly good at 10-1. In China and other parts of the world, processors are able to achieve concentration ratios in the 8-1 range or less. The reason for this inefficiency i s not totally clear, but may relate to low sugar levels in Georgian apples and/or the improper use (or lack of use) o f processing aids (enzymes) that are utilized to increase juice yields. On labor costs, China and Georgia are competitive. Factory workers at apple ju ice concentrate plants in rural China earn approximately US$730 /year. In Georgia, the same worker would make about US$900 /year.
6.75 A third factor that separates China and Georgia from other producers in the world market i s final product quality. Both countries tend to use low quality apples in their products. This i s not uncommon worldwide, but the level o f quality for industrial-grade apples utilized in many developing countries i s below that o f apples used in developed countries. Part o f this i s the result o f poor farming practices in the developing world, resulting in higher pathogen and insect problems in the crop. A second contributing factor i s poor logistical and storage practices that tend to bruise the fruit and increase the rate o f physiological breakdown.
6.76 China i s an aggressive marketer o f i t s food products. In 1999, it sold 2,512 M T ofAJC to Russia. In 2002, it expected that it would increase to 21,540 M T (over an 8-fold increase in four years). As the Russian economy grows, Georgia wil l need to improve its marketing and promotion activities to ensure that it wi l l benefit from this growth, rather cede market growth to China.
The Role of Government
6.77 The government can play a constructive role in creating a regulatory environment that wi l l facilitate the private sector’s ability to do business. In particular, the government needs to reduce barriers for new business startups and protect the agricultural resource base o f the country by encouraging investment at the farm level.
Chapter 6. Aaro-Food Exports 68
6.78 Perennial Crop. Georgia’s perennial crops (fruit trees, nuts and grapes) represent a major asset in value terms to the country. These crops are the raw product foundation on which much o f the sub-sector’s economy rests. The perennial crop asset base needs to be maintained over time by regular re-planting. The government could create tax regulations (and other incentives) that would allow large commercial farmers to rapidly depreciate investments in new or re-planted orchards.
6.79 CertiJication of Plant Materials. Current regulations require that new plant materials be tested against standard varieties. Before new plant materials are approved for use in Georgia, they must perform equal to or better than the standard plant in 2 o f 3 years o f testing (compared in terms o f yield and susceptibility to pests and pathogens). There are multiple problems with this regulation. The first issue involves technology transfer; seeds and other plant materials that are rapidly evolving. Plant breeders around the world are constantly commercializing new products. A farmer wants the best plant material available. The current regulations slow the transfer o f this new technology to Georgian farmers and agribusiness.
6.80 A second concern i s the cost o f entry for international seed companies into the Georgian market. Since the agricultural testing stations throughout the CIS operate on very small budgets, they ask seed companies to pay for the 2 to 3 years o f testing. Usually, they require that the testing be done at multiple sites throughout the country and costs often run into the hundreds o f thousands o f dollars. In some CIS countries, the seed companies complain that after investing their money and running three years o f successful trials, corrupt government officials require a bribe before granting a license to sel l the new genetic material. Given the costs and risks associated with this process, most seed companies w i l l not seek to register i ts material in a small-market country like Georgia. This, in effect, prevents Georgian farmers from using improved plant materials. To remedy the problem, the government could simply allow any plant material that has been registered in a southern EU country (Greece, Italy, France or Spain) to be sold in Georgia. Or, it could adopt the U S model, which requires no official testing before genetic material i s sold.
Strategic Orientation for Georgian Agribusiness
6.81 As illustrated through the above case studies and as evident from wider assessments o f Georgian agriculture, there are considerable challenges inhibiting the current performance and future prospects for Georgian agro-food exports. The country’s agricultural sector i s characterized by an increasingly fragile, decapitalized and fragmented agricultural production structure, severely deteriorating public research, veterinary health, and phytosanitary services, deteriorating rural infrastructure, and the virtual absence o f rural/farmer organizations. Poor roads in some rural areas, non-competitive domestic rail services, frequent unofficial payments for the movement o f raw materials and products along Georgian roads, and relatively high combined official and unofficial payments associated with the use o f Georgian ports all reduce earnings for Georgian farmers and agro-enterprises.
6.82 At the level o f emerging agribusinesses, there i s s t i l l l i t t le awareness and application o f international management practices for quality assurance, food safety, or environmental protection. Many firms have l i t t le systematic information on the cost and quality profiles o f their major international competitors, or on the nature and dynamics o f non-traditional markets. Working capital constraints are common throughout agro-industry, limiting raw material purchases and capacity utilization. Except for joint venture companies (which can tap into international sources o f finance), the relatively high costs o f finance deter investments in new technologies, capacity expansion, and quality management systems.
6.83 At present, Georgia’s system o f standards and conformity certification lacks credibility among regulatory agencies and private buyers abroad. This has contributed to constrained access to certain
Chauter 6. Aaro-Food Exuorts 69
markets, the duplication o f testing abroad, and additional price discounts on Georgian products. There appears to be widespread problems in relation to imports and the production and sale of many food products in the domestic market. While there i s much identification of falsified products and labels, there i s l i t t l e official action taken even though several different government product control agencies are active. This exposes Georgian consumers to unnecessary health risks. Product and label falsification i s also apparently a major problem in relation to the sale o f Georgian wine and other products (including mineral water) within Russia and other CIS countries, constraining the sales and jeopardizing quality reputation of legitimate Georgian products.
6.84 Looking forward, the strategic orientation for Georgian agribusiness should include the following elements:
0
0
0
0
0
0
Building value rather than seeking to re-establish the country’s position as a bulk commodities supplier;
Pursuing a dual market orientation, with primary attention on the CIS market, yet further exploring market opportunities within the EU, Eastern Europe, the Middle East, and Asia;
Further capitalizing on the recognition o f the country and i ts particular brands and appellations within the CIS countries. This is most applicable in the wine and mineral water markets;
Raising product quality and marketing services to re-position Georgian products beyond the ‘low cost-low price’ end o f their markets. This applies to the wine, tea, hazelnuts, and processed fruits and vegetables;
Capturing value from distinctive resources or circumstances, including further penetrating international markets for organic products, medicinal plants, and essential oils; and
Pursuing selected import substitution possibilities by leveling the playing field and addressing widespread unrecorded and ‘tax free’ agro-food imports.
6.85 Concerted action wil l be needed on a number of fronts in order for Georgian agribusiness to realize i t s potential during the coming years. Sustained growth in agro-food exports i s unlikely without a considerable strengthening o f basic agricultural support services, together with the facilitation of smallholder outgrower arrangements and the commercial leasing o f land. Through training and management assistance programs, an increased number o f agro-enterprises can be supported in adopting improved quality assurance and food safety systems and in gaining improved international market awareness and contacts.
6.86 Major efforts are needed to update and restructure Georgia’s systems for standards, certification, and inspection. Georgia has made a commitment (through the WTO and its cooperation agreement with the EU) to move toward reliance upon voluntary standards, codes of practices, and private certification for most agro-food products. Assistance i s needed to build awareness o f these concepts-both within the public and private sectors-and in the technical design and implementation of such standards and procedures. On-going efforts to consolidatehestructure and increase the transparency of inspection and control services need to be supported. Through collective action by companies and through joint programs involving government and the private sector, efforts need to be intensified to remove falsified/adulterated products from the domestic market and falsified Georgian products and labels from CIS markets.

Chapter 7. Light Manufacturing
Garments Industry
7.1 Textile and clothing production in Georgia probably dates back to the days o f the ancient “Silk Road” when Chinese merchants traded silk in the region. During the Soviet period Georgia had several large apparel factories, employing in one case more than 1,200 workers, which supplied various areas o f the Soviet Union. Today the country i s in a good competitive position to produce garments for the world market. Georgia has adequate supplies o f low-cost labor, with experience in garments production. I t i s in good proximity to important markets in the EU. While Asian countries must ship or airfreight garments to European markets, Georgia can send them faster and more cheaply by truck. Georgia also i s a member of WTO and has GSP status in EU markets.
Industry Characteristics
7.2 Size oflndustry. Official figures report that there are 223 garments firms operating in Georgia o f which 21 are claimed to be exporters. However, interviews for this study could find only three significant exporters of apparel, all of which are privatized, joint stock companies. These three firms employ approximately 1000 workers and their exports accounted for about 98 percent o f total exports in 2001 in the category o f “apparel and clothing accessories, not knitted or crocheted” (see Table 7.1). Several other exporters o f specialty items are also active, in areas l ike wedding dresses exported to Russia and the EU, but the quantities o f these exports are quite small.
Table 7.1: Georgian Garments Exports 1999-2001 (000 US$)
Destination 1999 2000 200 1 Apparel K or C (a) CIS 48.4 82.2 39.2 EU 6.2 7.7 9.4 Other 46.3 0.1 112.8
Total 100.0 90.1 161.4 Apparel not K or C (b) CIS 20.8 218.2 11.8 EU 678.0 683.8 806.6 Other 16.1 13.6 77.8
Total 714.8 915.6 896.2 Total Apparel 815.7 1005.7 1057.6 Source: Statistical yearbook of South Caucasus 2002; (a) apparel knitted or crocheted; (b) apparel not knitted or crocheted.
7.3 Al l of the apparel exporters sel l through the same German buying agent, which works for large EU retailers like C&A, on a “cut-make-and-trim” (CMT) basis, whereby the German buyer supplies the fabric and accessories (including the packaging and labels) and the exporters use their labor and equipment to make up the garments. The clothing, which i s currently mostly lady suits and blouses, i s then picked up by the German buyer’s trucks and transported to Germany each month.
7.4 Labor. Georgian Garments workers are paid on a piece rate basis. In addition, depending on the factory, there are bonuses paid each month for workers exceeding production quotas. Average pay ranges from 82 to 100 Lari per month (from which workers pay 20 percent income tax) plus 3 1 percent social insurance. The U S dollar wage for a sewing machine operator averaged US$54, ranging from US$48 to US$60. Firms complained that it was difficult to find workers at the low end of the wage scale, but, given

ChaDter 7. Liaht Manufacturinp 71
the prices they were getting for garments and the productivity o f the workers, a higher wage could not be paid. A l l firms have labor unions, but they are not very powerful given the high unemployment. For example, the large producer in Kutaisi i s one of the few operating employers in the area. The factory noted that in the beginning, after privatization, there were many strikes, but now there are few problems because there is no alternative work.
7.5 Technology. The technology in use in the three exporting factories i s relatively up-to-date, machinery from Germany, Japan, and Italy. Two of the factories were among the last companies to benefit from large Soviet investments at the end of the 1980s. As in many o f the older factories in Georgia, however, the existing plant and equipment was installed for much larger volumes of output then are currently produced. For example, one factory has a modern “overhead moving system” for moving bundles o f garments from one workstation to another as the production of a style progresses through the factory. The system installed was set up for production runs of about 100,000 pieces on a style, which is more than six times the f i rm’s total production in a month, let alone runs of a single style. Also, firms are currently operating in only about 50 to 60 percent of available production space. The German buyer agent generally provides new equipment when needed and then deducts a certain amount from each garment it buys until machine i s paid off. In one factory, the German buyer extended a US$300,000 loan for equipment (steamers, hemming machines, pocket machines) that was necessary to make styles i t s EU customers wanted. The German buyer has also has assisted firms with new approaches to quality control and other management innovations.
Productivity
7.6 To take advantage of future export opportunities in the garments industry, Georgian companies wi l l need to improve productivity. Georgia has a competitive advantage over many other exporting countries in the form of lower wages, but this wil l not be enough to sustain future export growth. As Table 7.2 indicates, the average wage o f a garments worker in Georgia i s about US$54 per month, less than half the wage paid to a machine operator in China’s export processing zone, and about 60 percent of the wage paid in Bulgaria, a rival exporter in Eastern Europe. Only in West African countries like Ghana does one find garments machine operators with lower wages. Low wages are a considerable advantage in garments production, as labor costs are an important determinant o f competitiveness. Even though labor costs generally only account for less than a quarter o f the cost o f producing an item of clothing, other inputs-such as fabric, thread, accessories-are usually accessible to all producers at roughly the same price, give or take some percentage for transportation cost.
7.7 However, competitiveness i s ultimately determined by unit labor cost -- the ratio o f wages to productivity. As Table 7.2 shows, output per worker in Georgian factories i s only about 25 percent o f that in China, 35 percent o f India, and 50 percent o f Bulgaria. Thus, while a Georgian worker gets paid only half the wage of a Chinese worker, she produces only one-quarter o f the output. Georgia’s low wages are not enough to offset i t s even lower productivity, translating into significantly higher unit labor cost. The largest competitive gaps are with China and India, which have unit labor cost 32 percent and 40 percent below Georgia’s, respectively.
7.8 Task Level Efficiency. The task level efficiency in Georgian garments manufacturers i s low. As table 7.2 indicates, the average Georgian machine operator produces only 7 to 8 blouses per day, while an Indian operator makes 17 per day and a Chinese worker 20. Some o f this difference in task efficiency can be explained by differences in styles produced (some may be more complicated than others) or by differences in order sizes or length o f production run (longer runs of a single item generally result in higher task efficiency). Georgia’s order sizes are certainly smaller than in many o f the factories compared in Table 7.2. But the task efficiency gap i s too large to be explained, in any substantial way, by such factors. Nor can one explain the observed task efficiency differences by differences in technology.
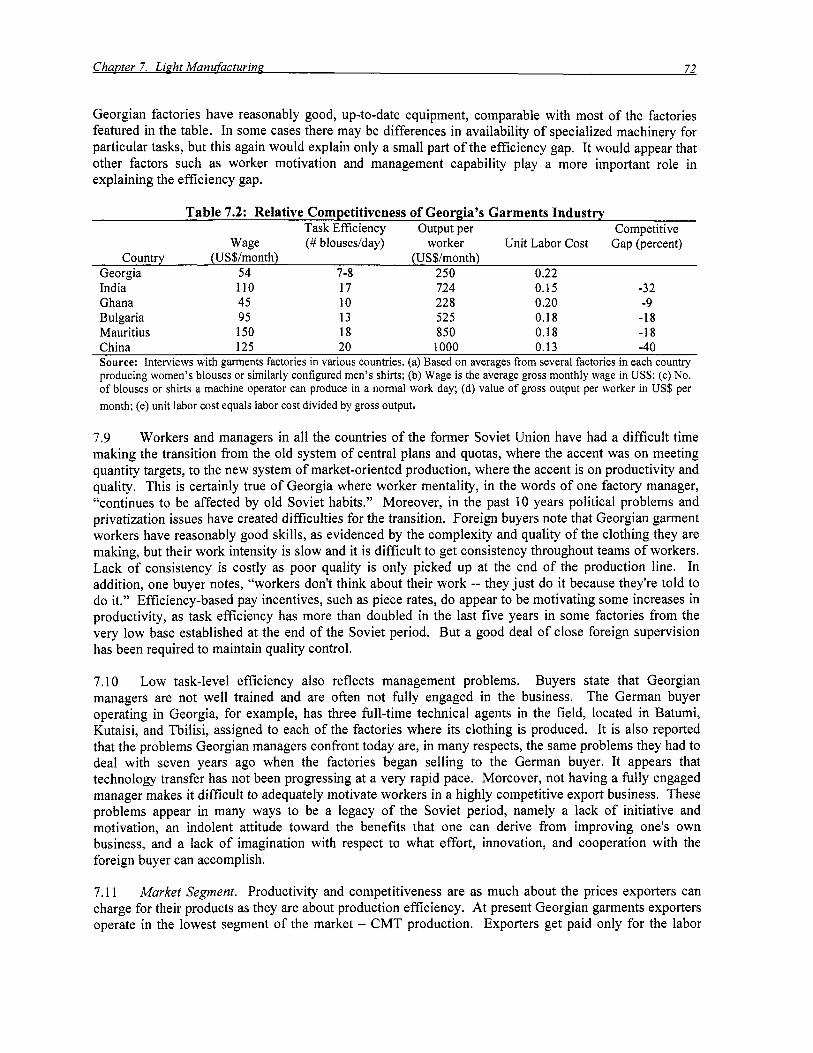
Georgian factories have reasonably good, up-to-date equipment, comparable with most o f the factories featured in the table. In some cases there may be differences in availability o f specialized machinery for particular tasks, but this again would explain only a small part o f the efficiency gap. I t would appear that other factors such as worker motivation and management capability play a more important role in explaining the efficiency gap.
Table 7.2: Relative Competitiveness of Georgia’s Garments Industry Task Efficiency Output per Competitive . .
Wage (# blousedday) worker Unit Labor Cost Gap (‘percent) Country (US$/month) (US$/month)
Georgia 54 7-8 250 0.22 India 110 17 724 0.15 -32 Ghana 45 10 228 0.20 -9 Bulgaria 95 13 525 0.18 -18 Mauritius 150 18 850 0.18 -1 8 China 125 20 1000 0.13 -4 0 Source: Interviews with garments factories in various countries. (a) Based on averages from several factories in each country producing women’s blouses or similarly configured men’s shirts; (b) Wage i s the average gross monthly wage in US$; (c) No. of blouses or shirts a machine operator can produce in a normal work day; (d) value of gross output per worker in US$ per month; (e) unit labor cost equals labor cost divided by gross output.
7.9 Workers and managers in all the countries o f the former Soviet Union have had a difficult time making the transition from the old system of central plans and quotas, where the accent was on meeting quantity targets, to the new system o f market-oriented production, where the accent i s on productivity and quality. This i s certainly true o f Georgia where worker mentality, in the words o f one factory manager, “continues to be affected by old Soviet habits.” Moreover, in the past 10 years political problems and privatization issues have created difficulties for the transition. Foreign buyers note that Georgian garment workers have reasonably good skills, as evidenced by the complexity and quality o f the clothing they are making, but their work intensity i s slow and it i s difficult to get consistency throughout teams o f workers. Lack of consistency i s costly as poor quality is only picked up at the end o f the production line. In addition, one buyer notes, “workers don’t think about their work -- they just do it because they‘re told to do it.” Efficiency-based pay incentives, such as piece rates, do appear to be motivating some increases in productivity, as task efficiency has more than doubled in the last five years in some factories from the very low base established at the end o f the Soviet period. But a good deal o f close foreign supervision has been required to maintain quality control.
7.10 Low task-level efficiency also reflects management problems. Buyers state that Georgian managers are not well trained and are often not fully engaged in the business. The German buyer operating in Georgia, for example, has three full-time technical agents in the field, located in Batumi, Kutaisi, and Tbilisi, assigned to each of the factories where its clothing i s produced. It i s also reported that the problems Georgian managers confront today are, in many respects, the same problems they had to deal with seven years ago when the factories began selling to the German buyer. It appears that technology transfer has not been progressing at a very rapid pace. Moreover, not having a fully engaged manager makes it difficult to adequately motivate workers in a highly competitive export business. These problems appear in many ways to be a legacy o f the Soviet period, namely a lack of initiative and motivation, an indolent attitude toward the benefits that one can derive from improving one’s own business, and a lack o f imagination with respect to what effort, innovation, and cooperation with the foreign buyer can accomplish.
7.1 1 Market Segment. Productivity and competitiveness are as much about the prices exporters can charge for their products as they are about production efficiency. At present Georgian garments exporters operate in the lowest segment o f the market - CMT production. Exporters get paid only for the labor
ChaDter 7. Light Manufacturing 73
involved in cutting, sewing, and trimming the garment. In this segment, value added i s limited and profit margins are slim. In fact, in Georgia’s case, profit margins have been declining over the years. Since 1997, exporters have been squeezed by rising costs -- water costs have doubled, electricity has gone up fivefold, the government instituted an entrepreneur tax of 1 percent on turnover, and labor costs have risen 30 percent -- and puny product price increases of about 2 percent from buyers.
7.12 Improving competitive margins wil l require Georgian producers to move into new market segments where value added i s higher. Garments f i r m s in Georgia, however, have almost no marketing experience. As one manager noted “we have poor marketing, our education was driven in a different way and our practical experience i s inappropriate.” Firms do not have the funds for expensive marketing campaigns either or even trips abroad. In addition, Georgia has a reputation problem -- buyers do not want to go to Georgia right now because of stories about kidnapping and other criminal activities. Hence, there are very limited opportunities to come in contact with new potential customers or to learn about how to move into different segments o f the market. Firms thought membership in WTO would attract customers, but that has not happened.
Other constraints
7.13 A second problem area that reduces Georgia’s competitiveness i s transportation and the associated costs o f dealing with trade support institutions like customs and police. Georgian garments firms operate in isolation. There are no local supporting businesses upstream, making fabrics or thread, no machine producers, and no world-class ancillary companies producing accessories, labels, or packaging materials. Having to produce without local supporting industries by i tse l f raises costs, but things are made much worse by inefficiencies in the trade facilitation system.
Transportation Costs.
Everything has to be imported.
7.14 Buyers with experience in Eastern Europe report that transport problems in Georgia are much worse than elsewhere. As one buyer noted, “EU freight forwarders don’t want to go there [Georgia] -- too many delays and hassles from customs at a Adjara and stops along the roads by local police, everyone i s looking for a bribe.” Trucks are held up for four to five hours at the border, waiting for clearance and waiting for escorts, entering Georgia, and for two or three hours when leaving the country. Along the roads there are many checkpoints where there are further delays. Firms claim that the unofficial fees they must pay today are almost equal to the official fees to transport goods to and from the country. For a 40- foot container official fees are said to be US$600, while all the unofficial payments for customs and police are about US$400. The German buyer has contracted with seven EU freight forwarders to deal with Georgia over the past seven years and six o f them have quit. These extra costs of transport, hassles, and delays ultimately widen the competitiveness gap. In the Ukraine, for example, the same German buyer pays 15 percent more to exporters for the same clothing items because the cost o f transport to Germany (official plus unofficial) i s lower than it i s from Georgia.
7.15 Energy. Power cuts reduce available working hours, and increase plant setup costs. In addition, when the power i s turned back on there are often power surges that can damage machinery. Firms complain that for every eight hours o f work there are one and one-half to two hours lost to power cuts. Cuts can occur throughout the day, which has a significant impact on worker task efficiency. Added to this, electricity costs have risen fivefold since 1997.
Wood Processing Industry
7.16 Georgia has a good potential to develop i t s exports o f wood products, given i t s considerable reserves of timber, notably beech, and good market opportunities for products made from i t s woods. In
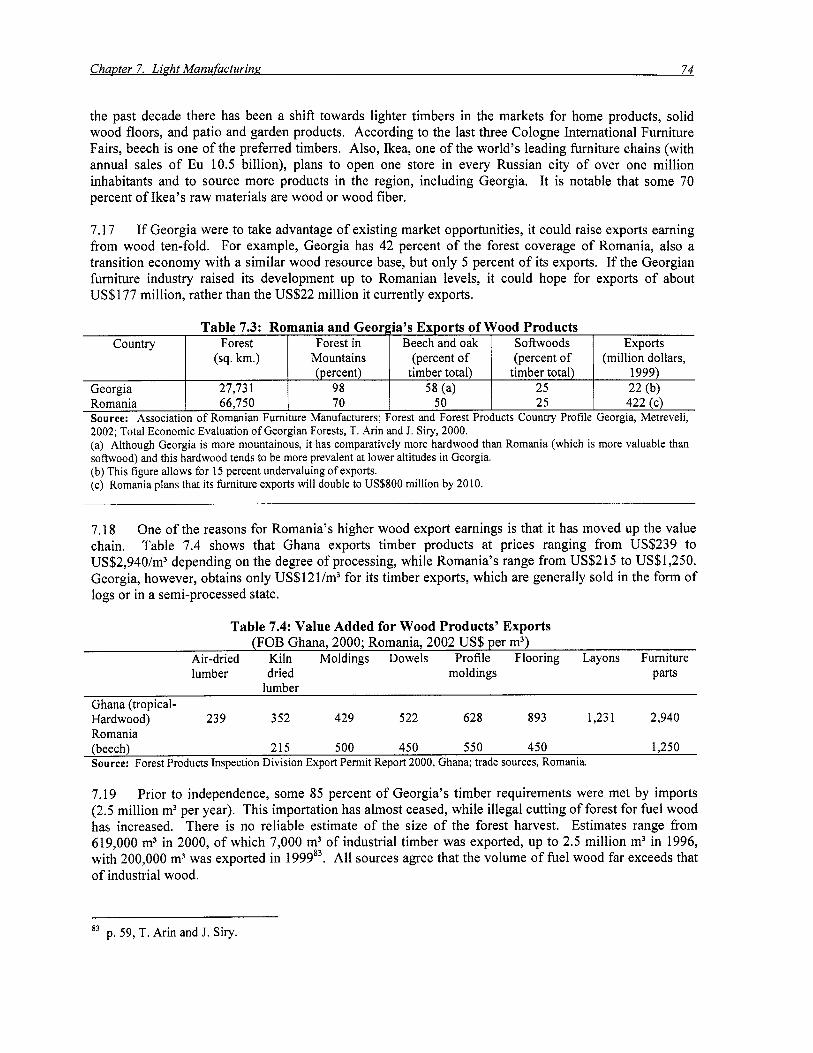
the past decade there has been a shift towards lighter timbers in the markets for home products, solid wood floors, and patio and garden products. According to the last three Cologne International Furniture Fairs, beech i s one o f the preferred timbers. Also, Ikea, one o f the world’s leading furniture chains (with annual sales o f Eu 10.5 billion), plans to open one store in every Russian city o f over one million inhabitants and to source more products in the region, including Georgia. It i s notable that some 70 percent o f Ikea’s raw materials are wood or wood fiber.
Country Forest (sq. km.)
7.17 If Georgia were to take advantage o f existing market opportunities, it could raise exports earning from wood ten-fold. For example, Georgia has 42 percent o f the forest coverage o f Romania, also a transition economy with a similar wood resource base, but only 5 percent o f i t s exports. If the Georgian furniture industry raised i t s development up to Romanian levels, it could hope for exports o f about US$177 million, rather than the US$22 million it currently exports.
Forest in Beech and oak Softwoods Exports Mountains (percent o f (percent o f (million dollars,
Georgia Romania
. . (percent) timber total) timber total) 1999)
66,750 70 50 25 422 (c) 27,73 1 98 58 (4 25 22 (b)
2002; Total Economic Evaluation of Georgian Forests, T. Arin and J. Siry, 2000. (a) Although Georgia i s more mountainous, it has comparatively more hardwood than Romania (which i s more valuable than softwood) and this hardwood tends to be more prevalent at lower altitudes in Georgia. (b) This figure allows for 15 percent undervaluing o f exports. (c) Romania plans that i ts furniture exports will double to US$800 million by 2010.
-
7.18 One o f the reasons for Romania’s higher wood export earnings i s that it has moved up the value chain. Table 7.4 shows that Ghana exports timber products at prices ranging from US$239 to US$2,940/m3 depending on the degree o f processing, while Romania’s range from US$215 to US$1,250. Georgia, however, obtains only US$121/m3 for i t s timber exports, which are generally sold in the form o f logs or in a semi-processed state.
Table 7.4: Value Added for Wood Products’ Exports (FOB Ghana, 2000; Romania, 2002 US$ per m3)
Air-dried Kiln Moldings Dowels Profile Flooring Layons Furniture lumber dried moldings parts
lumber Ghana (tropical- Hardwood) 23 9 352 429 522 628 893 1,23 1 2,940 Romania (beech) 215 500 450 550 450 1,250 Source: Forest Products Inspection Division Export Permit Report 2000, Ghana; trade sources, Romania.
7.19 Prior to independence, some 85 percent o f Georgia’s timber requirements were met by imports (2.5 million m3 per year). This importation has almost ceased, while illegal cutting o f forest for fuel wood has increased. There i s no reliable estimate o f the size o f the forest harvest. Estimates range from 619,000 m3 in 2000, o f which 7,000 m3 o f industrial timber was exported, up to 2.5 million m3 in 1996, with 200,000 m3 was exported in 199983. A l l sources agree that the volume o f fuel wood far exceeds that o f industrial wood.
p. 59, T. Arin and J. Siry. a3

Industry Characteristics
7.20 Size and Structure of the Industry. The wood processing industry has experienced a dramatic fall in production levels since 1990 and operates at low capacity. The privatisation of the industry was started in 1994 and has now been completed. Information i s scarce on the size and structure o f the sector. Official data states that there are 201 wood firms, o f which 56 are not working. Anecdotal information suggests (see Table 7.5) that there are some 20 large firms and 226 SMEs engaged in primary and secondary processing. Some 12 large firms undertake tertiary processing making, for example, furniture, doors and windows.
7.21 Baltic countries, with 15,000 employees, but now the number o f employees i s said to be 2,250.
Georgia’s wood processing industry was the second largest in the former Soviet Union, after the
Table 7.5: Structure of the Wood Sector (number of f irms)
Type o f Processing Large Medium and Small Number o f Exporters PrimaryJSecondary 20 226 150 Tertiary 12 Unknown 4 Source: Georgian tax department database
Challenges in Realizing Opportunities
7.22 Upstream Forestry policy. Georgia’s 1999 forestry code provides a sound framework for a sustainable management o f the forests,84 but increased demand for wood (mostly for fuel) and lack of public funding for forest management have resulted in illegal and criminal practices in the sector. Temporary bans on final felling and export o f logs have been ineffective. Policy objectives for the next eight years include eradicating illegal and criminal practices; improving the marketing and pricing o f forest resources; legislating on forestry ownership rights; implementing modern programs for reforestation; and allocating lands for commercial use and conservation purposes. Activities such as these wi l l be aided by the World Bank’s credit for the Georgia Forests Development Project (2002-2008).
7.23 Access to Timber. Sawmills obtain timber from logging firms and from their own licensed felling areas. Licenses are obtained through a tendering process, managed by the State Forestry Departmentg5 The cost o f licenses varies according to the distance o f the felling area from the existing road, and the logger has to put in a road from the existing one to the licensed area. Firms interviewed for this study reported obtaining licenses to fe l l areas o f only 1 hectare. Formerly, firms were able to harvest in areas up to 25 hectares as the 1999 Forest Code allows, but the policy i s now to allow tenders from smaller under-capitalized firms. This limits economies of scale in harvesting and processing. In addition, firms must bring timber from many small scattered plots to a central location, which adds to the costs. One leading firm, with an installed capacity o f 45,000 m3 per year, reported being able to process only 19,000 m3 per year. Larger volumes, would allow the firm to sel l beech to China at US$450/m3, but instead it sells at only US$1 80/m3 to Turkish buyers, who consolidate supplies and sel l to China at the higher price. Another firm, requiring 24,000m3 o f beech per year, obtains only 40 percent o f the wood it needs and, thus, i s forced to seek timber in areas beyond the jurisdiction o f government and to process different types o f timber, reducing its efficiency, as different saw-blade settings, and kiln-drying schedules, are required
See “Statement o f the Government o f Georgia. Main Principles o f Government Policy for Georgia’s Forest 84
Sector Development in 2002-2010”, approved in May 2002. 85 The department delineates the areas to be tendered, marks the trees that can be harvested, and monitors the practices o f the logging firm.

for each timber type. Also, logging firms note that once they have constructed roads to their felling areas, timber i s stolen and illegally sold, because often they cannot afford to police scattered felling areas.86
7.24 Stumpage Fees. Some industry experts claim that low stumpage fees are US$16/m3 for good- quality beech stem when they could be US$37/m3, leading to low prices for logs and provides no incentive for firms to add value. But, firms correctly note that with so much illegal logging, it i s not possible to increase prices. A stumpage fee i s levied on each stem harvested and i s calculated by deducting logging costs from the export price of timber. Typically, the cost o f obtaining and transporting timber to the sawmill amounts to US$44 to 55 per m3 (see Table 7.6).
87
Table 7.6: Typical Cost o f Access to Timber (US$ per m3)
Cost o f marking trees 2.10
Felling 10.00
Transport to sawmill 12.00
License (amount depends on distance to road) 10.50 - 21.00
Stumpage (based on a 3.0 m3 stem) 5.00
Cost o f making road 4.00
Source: Firm interviews. Total 44.20 - 54.10
Access to Inputs and Equipment
7.25 inability to get inputs and capital equipment duty free.
Wood processing firms are paying higher prices for inputs, because o f high transport costs and
7.26 Transport Costs. Most inputs are imported, generally from Turkey. Much of the furniture industry, as well as door producers, are heavily dependent on MDF panels to manufacture their products. According to Georgian firms, they pay more for MDF than their regional competitors because of high transport costs and small volumes. For example, Georgian firms pay US$37.50-47.00 for sheets o f 18 mm MDF produced in Turkey, whereas Turkish manufacturers pay US$30. In Romania, firms buy Romanian-made MDF for US$23.00 and elsewhere f i r m s can obtain Brazilian-made MDF for US$19.
7.27 High transport costs can lock firms out o f export markets, with transport costs accounting for up to half the total export price from Georgia. Firms trucking wood products from Tbilisi to Moscow pay US$2/km (US$3,500 per truck), whereas firms in Romania trucking to the UK pay US$1.4O/km. (US$3,050 per truck) over similar distances. The cost o f shipping can reflect the small scale o f the business in Georgia. For example, a container going to China may be transshipped in Italy and Germany before going to China and cost US$2,400 (40’ container), and take up to 40 days in transit. Buyers generally consider the landed cost o f products, paying exporters a lower price if the transport costs are high.
7.28 Taxes on Inputs and Equipment. Also, many wood industry production inputs are subject to 14 percent import duty. For example, important inputs like moisture-resistant glues made in Germany. Duties on such critical raw materials, raise costs and constrain efforts o f firms to move into higher value add value products, and begin to export. Firms also have difficulty in offsetting the full cost o f inputs against their profits when they pay taxes because of the informal and illegal VAT practices. Typically
~
86 GHA estimate, Firms believe that 80 percent o f businesses in the sector i s illegal. ” Metreveli, p. 22. Based on the difference between the market price o f beech and its actual cost.

firms obtain invoices for only one third to one quarter o f what they actually pay for inputs.88 Firms even fake factory f ires in order to reconcile their inventories with their invoices when it i s time to pay taxes.
7.29 Differentials in import duties on machinery may introduce a bias in the choice of production technology. If firms import Russian machinery, they pay 0.5 percent duty, but if they import EU or U S machinery they pay 14 percent duty. Duties on capital goods reduce the industry’s ability to upgrade its technical capability, a crucial issue for Georgia’s future development. Added to this, the differential duty between Russia and Western countries biases technology choice towards the purchase of Russian technology, which may not be the most appropriate.
7.30 Access to Finance. Several Georgian firms, which participated on study tours organized by CERMA, have not been able to acquire new equipment because of lack o f financing. A saw-mill firm wanted to buy a machine costing US$200,000, so as to increase i ts sales from US$380,000 to US$800,000 per year, using the same volume of timber. But, the firm could not get a loan for a period of over two months for which a collateral equivalent to the amount o f the loan was required. A logging and saw-mill firm, did not have the collateral to get credit to buy French equipment which could increase harvesting twenty-fold. One company did succeed in borrowing US$270,000, but only after spending 13 months seeking the loan with two different banks and putting collateral worth more than twice the value o f the loan. Another firm, which exports furniture, believes it can increase productivity five-fold in i t s edge veneering if it can buy a machine costing US$8,000, but it cannot. If it could borrow US$l,OOO to buy dust extraction equipment, it could bring i t s factory up to the government’s required health standard. Instead i t pays a bribe o f US$10 per month to health and safety inspectors to ignore violations.
Productivity and Market Segment
7.3 1 Georgian exports consist o f low value-added commodities, comprised almost entirely o f round logs and semi-processed timber which sel l for an average price of only US$121/m3 (see Table 7.7). Timber losses, in harvesting and sawing, add to the problem o f low export values. For example, firms report that perhaps 20-40 percent o f industrial timber is left in the forest because stems are cut in 5-6 m. lengths to suit transportation methods-leaving short lengths in the forest.8g Part of the problem i s lack o f adequate equipment. Logging firms report that they could increase their harvest 20 times, if they could use EU harvesting equipment. For every 1 m3 exported about 2.10 m3 i s harvested. If these losses are taken into account, the effective price paid for timber in the forest is about US$57 per m3.90 There are also losses in processing. Sawmills report, for example, that o f the logs arriving at the sawmill, some 25 percent may be export quality, 25 percent suitable for the domestic market, and 50 percent is waste.
7.32 Unit labor costs in the Georgian furniture industry are relatively high. As Table 7.8 shows, the unit labor cost in the average furniture Georgian firm i s 0.30, compared with only 0.11 in the average Romanian furniture firm, while a typical Irish exporter has unit labor cost o f about 0.20. Higher unit labor costs in Georgia appear to reflect both higher wage costs for skilled labor and lower output per worker. In Romania, operators of computer-numerically-controlled equipment are paid US$130 per
’* Firms have the greatest difficulty in understanding tax regulations. One o f the best furniture firms reported that i t s accountant spent 10 days per month trying to understand government laws and regulations.
U S sawmills can obtain US$3,500/m3 for well-prepared short lengths o f oak, “Value Added Processing - for the Sawmill,” G. Wengert, www.woodweb.com, 2001
As observed by T. Arin and J. Siry, p. 57: based on 15 percent loss between sawn timber and round wood logs, and on a 50 percent loss between exportable quality timber and the harvested quantity. Some o f the loss between harvesting and exportable round wood may be used for domestic consumption, f i e1 wood, etc.

month, compared with an average wage in Georgia o f US$l93, for a less technologically skilled ~ o r k e r , ~ ' whereas the output (sales) per worker in Georgia i s only half that of Romania. Even though Irish wages are 12 times those in Georgia, the productivity o f Irish workers i s 20 times higher, hence, their unit labor cost is lower.
(m3> m3 Round wood Beech 184,332 22,198,036 120 192,505
Other 5,425 683,750 126 6,085 Softwood (pine, spruce) 10,300 1,251,428 121 1 1,845
Total 200,057 24,133,214 121 210,435
Harvested (harvest Vola)
385,O 10 5 8 23,690 53 12,170 56
420,870 57
Table 7.8: Productivity in International Furniture Making Firms Machine operator Output per worker Unit labor cost Productivity gap wage (US$/mo.) (US$ / mo.) (percent)
Georgia 193 646 0.30 Romania (Firm A) 130 469 0.28 Romania (Firm B) 130 Romania average 130
2,285 0.06 1,225 0.11 -63
Ireland (Firm C) 2,333 1 1,759 0.20 -3 3 Source: Firm interviews.
7.33 The positive effect o f batch size and o f mechanization can be seen in firm D (see Table 7.9), the firm with the lowest unit labor cost, 0.18, makes modest batches o f contract furniture and i s the most mechanized o f the firms interviewed for this study, while Firm F, the firm with the highest unit labor cost, (0.38), makes one-off pieces with modest mechanization. The wages paid by each of these firms are about the same, but output per worker in firm D i s almost 70 percent higher. A similar pattern can be seen in Georgian Saw Mills.
Table 7.9: Productivity in Georgian Firms Wage (US$/mo.) Output (US$/mo. Unit Labor Rate
Per worker) Furniture Making
Firm D: contract furniture (modest batches) 200 1,126 0.18 Firm E: office furniture (small batches) 3 00 833 0.36 Firm F: doors and windows (one offs) 250 667 0.38
Firm G: large volume, high mechanization 90 1,852 0.05 Firm H: low volume, low mechanization 116 542 0.2 1
Sawmills
Source: Firm Interviews.
Some Georgian firms believe that they can pay lower wages to skilled machine operators than to workers with handwork skills, e.g., Georgian firms may pay workers who varnish products US$50 per month more than a skilled machinist, because o f the use of hazardous chemicals.

ChaDter 7. Light Manufacturing 79
7.34 Prices. Sales per worker depends also on the price obtained for wood products, which in turn i s a function of several factors-- design, quality, the market segment, and technical efficiency o f production. The best Georgian firm realizes US$1,020/ m3 for dinning chairs, which i s the lowest price/ m3 in Table 7.10. Right now the firm obtains 43 chairs per m3 of timber, whereas in other factories in parts o f Eastern Europe it i s possible to make 90 or 100 chairs per m3. Georgian firms, as observed earlier, discard half their timber as off-cuts, while firms in many other countries laminate their off-cuts, or waste products, to produce items like kitchen cutting boards for which they obtain up to US$2,227/m3. Some firms in Georgia are aware o f the potential o f laminating wood to produce by-products, but lack capital to acquire the technology and lack market linkages.
7.35 Georgia obtains US$l20 for beech logs, while China pays US$416/m3 and Georgia gets US$128’* for semi-processed beech, while China pays up to US$711/m3 for the same commodity. Whereas Georgia obtains a 6 percent premium for semi-processed timber, there i s a 71 percent premium available on China’s wholesale markets, depending on the extent o f processing.
Table 7.10: Prices Obtained for Wooden Products (US$ per m3)
Best Georgian Mass-market Mid-market Ghanaian Bhutanese firm UK store UK store exporter wood-turners
Product Chair Cutting Board Cutting Board Key Ring Holder Bowl Retail price 4,123 11,136 FOB price (estimated) 1,020 1,375 2,227 27,000 3,500 Source: Firm interview; Argos catalogue, 2002; Habitat catalogue, 2002-03; Thimpu street market, 2001.
7.36 Domestic Manufacturing. About 26 percent o f industrial timber is consumed on the domestic market. While in 1990,60 percent o f the timber used in the wood processing industry was converted into furniture, only a small amount o f the furniture sold in Georgia is locally made. Much of the timber i s used for construction, e.g., joists, doors and windows, and floorboards, with f i r m s reportedly obtaining US$160 -240/m3.
A Strategy for the Wood Industry
7.37 There are three main challenges for Georgian firms to take advantage of the considerable opportunities provided by world markets: (a) government policy and access to timber; (b) development of marketing ski l ls and (c) acquisition of technology by firms. These challenges are sequential. Firms must f i rst be able to get access to predictable amounts o f timber of good quality. Only then they can undertake market research to identify products and buyers with potential in market segments that fit Georgia’s capabilities. Lastly, they can balance the inputs available to them with the needs o f the market and determine the appropriate technology needed to service market needs, as well as create appropriate enterprise strategies and structures.
7.38 There i s some urgency in addressing these challenges as markets are changing fast and Georgia cannot afford to lose the opportunities at hand. Three developments in particular are expected to change the trade landscape in the future: (a) countries to the west o f Georgia wi l l be joining the European Union in the coming years; (b) an uncertain trade regime with Russia; and (c) increasing demand from Asia for logs and semi-processed timber.
Page 57, Ibid. T. Arin and J. Sir. 92
ChaDter 7. Light Manufacturing 80
Government Policy: Access to Timber and Other Inputs
7.39 Upstream Forestry Policy. Firms need a predictable business environment to enable them to plan investments, transfer in new technologies, and develop marketing strategies. Frequent policy changes, such as temporary bans on harvesting or the export o f logs, are damaging to firms’ long-term relationships with buyers.
7.40 Elimination of Illegal Activities. Measures are needed to reduce illegal operations in the forests. Unless this is substantially achieved, the prices that legal firms can get for their products wil l be constrained, making it difficult for them to (a) pay license and/or stumpage fees and (b) invest in their businesses to enable value-added products to be produced and marketed.
7.41 Size and Location of Licenses. Firms should be permitted to bid on sufficiently large felling areas with long enough lease durations to allow them to invest optimally in the resource they have been allocated. Under the existing forest policy, firms incur the following costs in maintaining a felling lease: road construction; policing their felling area; setting up processing units in the forest. A l l these costs are much higher when firms can only obtain leases on scattered tracts o f forest for short durations.
7.42 In the future, access to important markets wil l depend on forest certification. Leading world markets for value-added products increasingly require products from sustainable forests, which conform to Forestry Stewardship Council (FSC), or equivalent criteria. For example, Ikea targets “wood materials . . . shall come from responsibly managed forests; 93yy and B&Q, Europe’s largest do it yourself chain, by the end o f 1999 only sourced wooden products from FSC certified forests.94 Views about the sustainability o f forest resources in Georgia range widely. Some believe that the forest i s growing by 4 million m3 per year; and hence, there are no sustainability concerns, even allowing for illegal harvesting. Others state that the harvest should be limited to 1 million m3 a year to foster a healthy forest. 95 In any event, the key challenge for Georgia wil l be the creation of areas of well-managed forest that can meet internationally accepted standards for sustainability. The government should begin introducing measures to certify forests by organizations such as the FSC. The prospect o f certification would help attracting foreign investment and, in the longer term, assist manufacturers in penetrating export markets. Unless Georgia conforms to such standards it wi l l be relegated to selling into low-value segments.
Forestry Certijkation.
7.43 Disseminating Information. Firms have difficulty getting information about the wood industry. Information about the sector, such as forestry laws and regulations, should be disseminated via the Internet, so firms are informed about their rights and responsibilities. Links on the website could enable firms to access information on markets, business associations, best production practices, etc. Laws and regulations should also be available in English to better inform potential buyers and investors.
7.44 Import duties on woodworking machinery and other such capital goods should be set at zero to give incentives to firms to bring in new equipment to improve productivity and quality and reduce waste and energy use.
Taxes on Inputs and Equipment.
93 See Press Release 30 October 2000 ~www,ikean.com/about_ike~press_room/press~release_int.asp?pr_id=20 1> 94 With the exception o f garden furniture and plywood. See <http://www.diy.com/aboutbandq/sustainability/documents/Timber_buyingqolicy_doc_reports,pdB
T. Arin and J. Siry, p. 17,19. 95
7.45 Standards in the Construction Industry. Increased standardization in the construction industry for example, for doors and windows, should help increase the size o f production runs, create modest economies o f scale, and increase productivity.
7.46 Access tofinance. Lack o f finance often prevents f i rms from acquiring the technology they need and/or absorbing the technology through workers’ training once acquired. In the current environment, with high interest rates and high requirements for collateral, the best option would be to further develop leasing arrangements for the wood industry.
Developing Strategic Marketing and Product Policy
7.47 Right now firms are too diversified making a wide range o f products for mostly local and perhaps regional markets. For example, it is unlikely that extra-regional firms wi l l be competitive in the region in upholstered furniture because o f high transport costs, but Georgian firms could be competitive in the Caucasus making frames out o f local timbers and using upholstery fabrics from Turkey.
7.48 Marketing Skills. Georgia’s domestic market for wood products i s small. The problem i s exacerbated by a lack o f wholesalers and retailers. Some firms try to overcome this disadvantage by opening their own showrooms, which tends to divert attention from manufacturing challenges. I t i s clear, however, that in the longer run manufacturers o f value-added products w i l l have to rely on export markets for business expansion.
7.49 Georgian wood firms need to take an active role in reaching export markets. For example, the GHA, a cooperative representing sawmills in Western Georgia, i s helping i t s members obtain higher export rices. As result one GHA-represented firm has obtained US$400-450/m3 for beech sales to China?’Such initiatives should be continued and expanded. In addition, programs such as CERMA’s training and advisory services to improve company strategy and marketing should be continued and improved for wood industry executives.
7.50 Georgia’s Reputation. Many firms note Georgia’s poor reputation abroada9’ This affects both direct foreign investment and the willingness o f foreign buyers to visit Georgia. To overcome this reputation problem, manufacturers must identify potential buyers and regularly visit them to gain their confidence. Relying on foreign trade fairs, for example, i s no substitute for one-on-one visits to buyers’ showrooms.98 But often firms do not have the finances and language ski l ls to reach buyers in European and Asian markets. Organizations like GHA have a significant intermediary role to play in this respect.
Raising EfJiciency at the F i rm Level
7.51 Technology Transfer. Firms have great difficulty in acquiring new technology in the absence o f visi ts by foreign buyers and foreign investors, unlike the experiences o f Romania and other nearby countries. Searching for new technology can be eased when Georgian firms participate in guided study tours, e.g., to machinery fairs and machinery suppliers. See also Box 1 on a donor-supported, shared cost scheme to gain access to new technology.
96 Prices have declined from US$550-600 I m3 over the past year for Georgian beech destined for China. 97 Russia firms report a growing resistance in sourcing from Georgia apparently for political reasons. 98 Going to foreign trade fairs to identify potential buyers i s an appropriate strategy, but potential buyers should then be visited. In the Philippines, for example, wood-products exporters who limited their trade fair participation, but concentrated on one-on-one visits to foreign buyers experienced a growth in sales of 264 percent, 1990-92, compared with a 60 percent growth for firms who concentrated on participation in trade fairs.
Chauter 7. Light Manufacturing 82
7.52 Not al l improvements in output would require investment in machinery. In many cases, simple changes in operating procedures would permit improvements. For example, (i) firms can increase the amount o f timber that can be recovered from the log by cutting the ends o f sawn logs at right angles instead of odd angles; (ii) firms making beech furniture, based on designs for pine furniture, could use 25 percent less timber with the superior structural qualities o f beech; and (iii) increased quality control, often lacking in the industry, could reduce rejects from buyers.
7.53 Some Georgian firms have bought second-hand machinery from the EU and elsewhere, but have not been able to fully adopt the technology. They have been unwilling or unable to pay for foreign technicians to commission the machinery and/or to train local workers. Suppliers sometimes have not provided the proper back-up service that should be a normal part of the purchase of the equipment. Other times, Georgian managers reveal an unjustified confidence in their ability to absorb new technologies and train workers, despite lacking relevant experience. In some cases, foreign technicians have visited firms for too short a time. For example, in the case o f a group o f visiting saw-milling consultants in Georgia recently only about 30 percent o f the technology offered has been absorbed”.
7.54 There i s a need for assistance to help the transfer in new technology (broadly defined to include new ideas, management practices, production methods and marketing strategies). Assistance could include: (a) cost-sharing grant schemes (see Box 7.1), such as GEPA’s scheme, funded by TACIS for marketing; (b) the use of retired executive schemes; (c) the hiring o f skilled foreign staff; and (d) training and advisory programs such as CERMA’s noted above. Activity- and process-specific training i s also needed in the wood processing industry, for example, kiln-drying. This could be organized through short- term courses on individual topics to individual, or to groups o f similar firms by industry associations like GHA. These mechanisms could be supported by a combination o f assistance from donors and contributions from the industry based on timber sales.
Box 7.1: Cost-Sharing Technology Schemes Cost-sharing schemes are a common mechanism (funded by external agencies) to allow firms to access international technology on a cost-sharing basis. The schemes exclude the cost of hardware, but include training, hiring expert consultants, etc. The schemes consist o f a technology fund that i s usually managed by an international contractor responsible to a steering committee generally made up of representatives of the government and the private sector. The schemes may last 3-5 years.
Firms submit a business plan describing the technology they want to acquire, the provider of the technology, the cost o f acquisition, why the grant i s necessary and the benefits to the wider economy, Le., will benefit other firms.
Once approved, the firm implements the project and, on completion, recoups part o f the cost (typically 50 percent). The scheme’s managers may be required to hire staff that i s familiar with the sector(s) being assisted. This staff advises firms on business planning and on sources of technology. Projects eligible for cost-sharing grants typically are:
Group projects may also be eligible. For example, in Georgia, a group of f i rms could hire the services o f a saw-milling specialist to provide training to the group and follow-up with hands-on training in individual firms. Eligible beneficiaries include trade associations, consulting and training firms.
Production technology: machinery rehabilitation / maintenance; advice on new machines; production planning; operator training; visits to modern factories; and visits to machinery fairs; Marketing: information on foreign markets; marketing techniques; study visits to foreign markets; and joint-venture partner searches; Design: new product design; and packaging and promotional material design; Management: financial management; quality systems; business planning; and computer training
99 I t i s not unusual for firms to need to spend about a third o f the acquisition cost to absorb new technology through training, but banks are unwilling to lend for such soft costs, and so the investment in machinery may be less productive than it might be.
Chapter 7. Light Manufacturine 83
7.55 Conclusion. Georgia could realize about the same value o f exports per square kilometre o f forest as a country l ike Romania -increasing sales f rom US$22 mi l l ion to about US$200 mi l l ion per year. This wil l require addressing industry-specific issues as wel l as other cross-cutting (issues such as ensuring access to tax-free inputs, lowering transport costs, and improving access to finance). Industry-level issues priorities are to: (i) improve upstream forestry policy (e.g., ensure adequate access to the forest both in terms o f area and duration o f leases, develop a consistent forest policy and move to introduce sustainable management practices in the forest); (ii) develop better distribution channels o f local and foreign wood products and strengthening marketing ski l ls (e.g. market research, strategic marketing policy and selling); (iii) improve the technology in use (e.g. mechanization, management practices and worker skills) to reduce the existing productivity gap o f 33-63 percent with the firms in other countries profi led in this study.
Chapter 8: Mining & Mineral-Based Exuorts 84
Chapter 8: Mining and Mineral-Based Exports
Industrial Minerals
8.1 Georgia has numerous mineral resources, such as oil, hard and brown coal, manganese, copper, gold and silver bearing quartzite, arsenic, lead, zinc, and a host of others. Today there are 450 registered mines o f different types of minerals in Georgia, o f which 200 are currently active. After the fall o f the USSR, the mining industry declined from 10 percent of GDP to a negligible level and has only started to revive in the last few years to about 2 to 3 percent of, a much smaller, industrial GDP. With the decline o f mining operations, downstream, minerals processing businesses also collapsed and many factories were closed and scrapped. Some operations were privatized and are now operating at 20 to 30 percent o f capacity, while trying to rebuild businesses again. Experts suggest that priorities for future development in industrial minerals production in Georgia should be focused on manganese, copper, zinc and possibly uranium. This Georgia Trade Study examined opportunities and production problems in manganese mining and processing.
Export Opportunities and Proven Reserves
8.2 There i s a large and growing demand for processed manganese in world markets. Manganese i s used for metallurgical purposes to purify iron and to make alloy steel and aluminum for containers, as well as to make special manganese zinc coatings for metals. Manganese i s used in the chemical industry to make additives for animal feeds, fertilizers, and vitamins for human consumption. Manganese also has a large and growing use in batteries o f a l l types and the production of medical products, deodorizers, and dyes. I t i s the growth o f battery production, particularly smart batteries for laptop computers, which may provide the largest component o f demand in world markets in the future -- this segment o f the market for manganese products i s estimated to be growing at about 10 to 15 percent per year.
8.3 Georgia is estimated to have 200 million tons o f proven reserves of manganese, roughly 1 percent o f total world reserves, found mainly in Chiatura, Chkhari-Ajameti, and Shkmeri. Ukraine's reserves are the largest in the region, with 10 percent of world reserves, but Georgia deposits are richer (50 percent are rated as first quality), and do not require a great deal o f processing. Georgia's high-grade ore i s especially good for chemical (e.g., chemical grade manganese dioxide and manganese sulphate) and battery products like lithium manganese dioxide.
Upstream Government policy
8.4 The trend in world markets for industrial minerals i s to integrate mining and processing. This trend i s driven by profitability, which i s a function o f being able to select ores and process them to match sophisticated downstream products. The shift toward integration i s evident in Europe, in the U.S., and in South Africa the mining and production centers of the world. In Georgia, the industrial minerals sector i s s t i l l as it was in Soviet times. The Government now controls most of the reserves o f industrial minerals, as they are considered "strategic assets." For example, in manganese the biggest mines, likes Chiatura, are state-owned. Sector experts argue that "the state can continue to hold some assets as strategic, but there i s an urgent need to privatize a large portion o f these resources. A country like Georgia, o f course, needs to be flexible so smaller firms can also get long-term mining licenses, but the state should limit i ts control to allow private companies to own reserves and become vertically integrated from mining to processing.. . this cannot occur without privatization."

Chapter 8: Mining & Mineral-Based Exports 85
8.5 State-owned mines are high cost. Georgia’s mining costs (per ton) are about 50 percent higher than in Western countries. Firms note that “the government should fully privatize the mines; hold some strategic reserves if necessary and tax the private mining and processing companies. There are a lot o f deposits o f minerals in the country and entrepreneurs should be encouraged to develop them in environmentally sound ways.”
8.6 There are some important problems the government must deal with in the upstream privatization process. The mines have large debt and potential buyers are not eager to take on the debt o f these state companies. Second, there are cities dependent on the operation of the large mines and their collapse has impoverished large groups o f people who are now trapped in these locations. Getting the mines into private hands and working efficiently should be a priority in any long-term poverty reduction strategy. Encouraging some processing to move closer to the mines might be another strategic component, as well as licenses for small private mining operations.
Downstream Constraints
8.7 The manganese exporting company, for example, cannot always get the ores it requires. The mines do not work in winter and they may not be mining the types of ores that are needed at a particular time. In addition to these types o f inefficiencies the costs o f raw material are higher than in competitor countries. There are four other problems that industrial minerals processors face, which hamper export development:
Problems in upstream mining operations cause problems for downstream processors.
8.8 Transportation Costs. Firms complain that the TRACECA corridor i s not assisting the industry to lower transport costs. “The reality i s that the corridor declines yearly.” The manganese processing company had a client in Iran who asked to change the transportation route to go through Russia. “Georgian Black Sea ports are too expensive, and every 100 meters people ask for money.”
8.9 Customs i s a major problem: “If we are trucking our manganese product from Rustaveli to Poti, one has to clear the product in Rustaveli. We load the truck and close it and must wait for the official to seal it. H e never comes unless a bribe of $200 i s paid.” Bribes are also paid to customs at the port to speed up the process of weighing, filling in declaration forms, and stamping. Each person must be paid or they wil l make you wait a long time. Customs bribes total about 3 percent o f the value o f exports.”
8.10 Taxation. The tax law, f i r m s say, i s so complex that you cannot understand i t in many cases. “However, the tax inspector wi l l do it all for you The majority o f companies balance the cost o f bribing with the amount o f money they would pay legitimately. Generally by bribing the costs are less than if the firm paid the legitimate tax costs. But dealing with tax administration i s time-consuming and the outcome is often uncertain.” VAT i s an additional major problem. “A large amount o f goods come into the country illegally. When companies buy inputs on the local market they need a yellow form VAT invoice to show that VAT has been paid. A lot o f money i s spent by most companies on the fake invoices. Another aspect o f the VAT, which is problematic, i s exporters don’t always get their VAT back. As an exporter one can deduct the VAT on inputs, but when the exporter pays for inputs, it pays VAT that i s never refunded. Only companies with connections get it back from the government. We can net out the VAT owed on other taxes, but some companies cannot because the VAT refund i s larger than the other taxes.
8.1 1 Inspections. There are all sorts o f inspections firms are subject to -- fire, environmental, health and safety, economic crime police, and so on. Most o f these inspections are simply opportunities for officials to extract money from the company. There are also roadside inspections by police, as already noted. “Company drivers may be stopped 40 times on the road between Kutaisi and Tiblisi. Each time there i s some issue and money must be paid.”
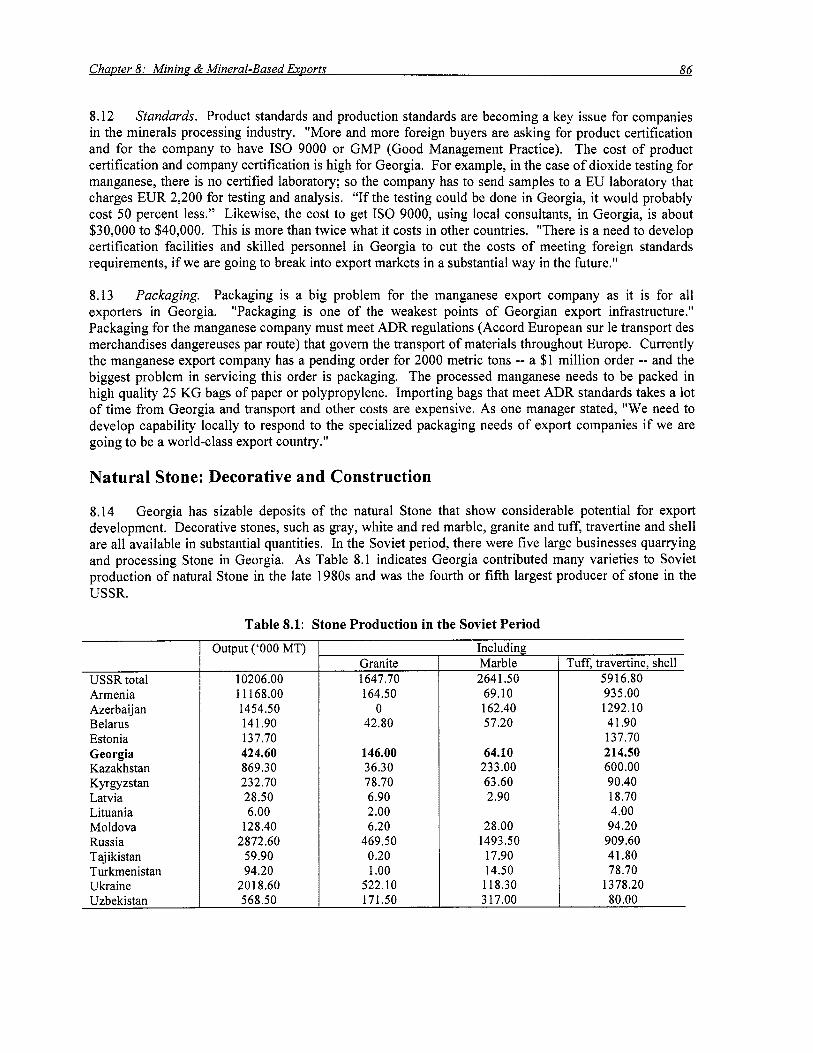
ChaDter 8: Mining & Mineral-Based ExDorts 86
8.12 Standards. Product standards and production standards are becoming a key issue for companies in the minerals processing industry. "More and more foreign buyers are asking for product certification and for the company to have I S 0 9000 or GMP (Good Management Practice). The cost o f product certification and company certification i s high for Georgia. For example, in the case o f dioxide testing for manganese, there i s no certified laboratory; so the company has to send samples to a EU laboratory that charges EUR 2,200 for testing and analysis. "If the testing could be done in Georgia, it would probably cost 50 percent less." Likewise, the cost to get I S 0 9000, using local consultants, in Georgia, i s about $30,000 to $40,000. This i s more than twice what it costs in other countries. "There i s a need to develop certification facilities and skilled personnel in Georgia to cut the costs of meeting foreign standards requirements, if we are going to break into export markets in a substantial way in the future."
8.13 Packaging. Packaging is a big problem for the manganese export company as it i s for all exporters in Georgia. "Packaging i s one o f the weakest points o f Georgian export infrastructure." Packaging for the manganese company must meet ADR regulations (Accord European sur le transport des merchandises dangereuses par route) that govern the transport o f materials throughout Europe. Currently the manganese export company has a pending order for 2000 metric tons -- a $1 million order -- and the biggest problem in servicing this order i s packaging. The processed manganese needs to be packed in high quality 25 K G bags of paper or polypropylene. Importing bags that meet ADR standards takes a lot of time from Georgia and transport and other costs are expensive. As one manager stated, "We need to develop capability locally to respond to the specialized packaging needs o f export companies if we are going to be a world-class export country."
Natural Stone: Decorative and Construction
8.14 Georgia has sizable deposits o f the natural Stone that show considerable potential for export development. Decorative stones, such as gray, white and red marble, granite and tuff, travertine and shell are all available in substantial quantities. In the Soviet period, there were five large businesses quarrying and processing Stone in Georgia. As Table 8.1 indicates Georgia contributed many varieties to Soviet production o f natural Stone in the late 1980s and was the fourth or fifth largest producer o f stone in the USSR.
Table 8.1: Stone Production in the Soviet Period
USSR total Armenia Azerbaijan Belarus Estonia Georgia Kazakhstan Kyrgyzstan Latvia Lituania Moldova Russia Tajikistan Turkmenistan Ukraine Uzbekistan
Output ('000 MT)
10206.00 11 168.00 1454.50 14 1.90 137.70 424.60 869.30 232.70 28.50 6.00
128.40 2872.60
59.90 94.20
2018.60 568.50
Granite 1647.70 164.50
0 42.80
146.00 36.30 78.70 6.90 2.00 6.20
469.50 0.20 1 .oo
522.10 171.50
Including Marble 2641.50 69.10 162.40 57.20
64.10 233.00 63.60 2.90
28.00 1493.50
17.90 14.50 118.30 3 17.00
Tuff, travertine, shell 5916.80 935.00 1292.10 4 1.90 137.70 214.50 600.00 90.40 18.70 4.00 94.20
909.60 41.80 78.70
1378.20 80.00
Chapter 8: Mining & Mineral-Based Emorts 87
8.15 Today none o f Georgia's large, Soviet era quarrying and processing companies remains in operation. The industry i s currently comprised of small enterprises, serving local markets, o f which only a couple of firms have exported small quantities of Stone to regional markets or to a few countries in the EU. In the recent past, there was at least one foreign investor operating in the sector, an Italian company, but entrepreneurs say that it had problems with its local partners, as well as marketing problems, and has since closed. There are, however, local investors, some with connections to the Georgian construction industry, beginning to make sizable investments in the industry with plans to export products like dimension stone for facings, marble and granite for home decoration, and jewelry. A l l o f the firms interviewed for this study noted the fact that the local market for Stone was too small to sustain the large investments necessary to produce quality stone products. Hence, they are trying to find ways to export and make connections with foreign investors to get access to finance, technology and marketing expertise.
Access To Raw Materials
8.16 Quarrying LeasedRights. Al l o f the operating Stone firms have access to raw material by way of buying state shares in old quarries or by way o f leases (generally 10 years in duration) to operate in a particular area. Several companies said that it was relatively easy to purchase state shares, as the state i s eager to get rid o f them. The difficulty, companies say, the local market i s too small to justify the expense. Obtaining leases and rights to quarry appears to be more difficult. Firms that have gone through this process say that obtaining rights to quarry stone via government tenders can be a lengthy and costly process and political connections are often needed.
8.17 One case i s instructive. A new entrant in the stone business obtained i t s rights to quarry via a government bid process. The company had identified a deposit o f high-quality granite. It then notified the Ministry o f Environment o f i ts interest in mining the area and the Ministry subsequently held a tender for the right to extract the stone. There were four bidders who had to show how much would be extracted (5000 cubic meters per year), the cost o f extraction, and how much would be paid to the government (5 percent o f $150 per cubic meter to the local government plus a land tax to the central government according to a territorial coefficient). The firm got together with two other parties to make i t s bid and it ultimately won. As it turned out, however, the territory where it got the rights to quarry stone was managed by the Forestry Department, which added another agency to the process. The firm also needed the signature o f the State Minister to access the stone. Forestry required the firm to pay the cost o f the timber damaged by i t s quarrying operations. In the end, the whole process took more than a year and a half to complete and many informal payments had to be made along the way.
8.18 I t i s difficult to ascertain the degree to which barriers to entry, in the form o f access to raw material, have limited development of the natural stone industry. It would appear that there are several ways to get access to natural stone deposits if one i s willing to undertake the necessary bureaucratic steps and financial costs to do so. However, there is a persistent, nagging undertone to the stories about how one gains access to raw material that makes one suspect that various kinds o f local and political connections might be required to obtain and to sustain rights to quarry particular areas.
Technology
8.19 The technology in use for quarrying stone and for processing stone i s primitive in Georgia. Today most firms extract stone by blasting, which results in only about a 15 to 20 percent yield. Modern technology could raise the yield to 80 percent or more, but an investment o f several hundred thousand dollars would be required. Even if a firm could obtain a loan o f this size from a local bank, which most firms claimed they could not, the short duration of the loan and the high interest rate would make it too expensive to make a profit in local markets. To produce sizes and qualities o f decorative stone good enough for the export market, blasting as an extraction method is not suitable. Hence, would-be exporters
Chapter 8: Minina & Mineral-Based Exports 88
wil l have to find ways to make investments in new quarrying technologies. One large stone company, which is in the construction business and also owns i t s own bank, i s investing $800,000 in equipment to quarry large and small sized facings stones for buildings. They are looking to export markets to recover the costs o f this large investment, but have yet to identify foreign buyers. The firm learned about the type o f quarrying and processing technology it needed from the Italian company that previously operated in Georgia, in which it had some shares.
8.20 Finishing technology for stone i s also not up to international standards in Georgia. Firms are currently trying to obtain modern polishing and cutting equipment from abroad to be able to produce acceptable export quality. The old finishing technology in use i s both more costly and less productive in terms o f output per person per day. For example, with a typical Georgian firm's traditional manual technology, it has a capacity to produce about 10 to 15 square meters o f finished stone per day of exportable quality, employing about 18 workers. Thus output per worker i s about .69 square meters per person per day. If Italian CNC machines were used, the firm would have the capacity to produce almost 200 square meters per day o f exportable quality, employing about 12 workers, increasing output per person per day to 16.7 square meters. With modern technology the firm could therefore reduce i t s workforce by 33 percent and increase output per worker by more than 2000 percent. Many Georgian firms have access to high-quality raw material, but cannot optimize its market potential because they are unable to purchase the foreign equipment necessary to lower production costs and improve quality on a scale just noted. A l l o f this calls attention to the fact that more creative financial instruments are needed in Georgia, such as leasing, to facilitate small enterprise equipment purchases. A good sign in the natural stone industry is that firms are beginning to "benchmark" their relative positions in world markets, in terms of production efficiency and quality, beginning to think about the types of equipment they might need, and beginning to learn more about the market segments they should enter in world markets.
Marketing and Connections with Foreign Investors
8.21 It i s clear that exports wil l be a key to the future development o f the stone industry. However, none of the firms interviewed for this study knew how to go about finding foreign buyers or making connections with potential foreign investors that might provide finance, technology, and marketing assistance. One firm was trying to solicit investors from Turkey by circulating an investment proposal through the Georgian embassy in that country. Another firm had some contacts in the construction industry in Russia and Turkmenistan and was trying to use them to solicit interested investors and joint venture partners. St i l l another was posting i t s investment proposal on an Internet site in the hope that some investors might see it. None o f the firms had made any purposeful visits abroad to find buyers. None o f the firms were familiar with the large stone-buyers fair held in Verona, Italy each year, where most o f the industry gathers.
8.22 Another problem i s the ability to get foreign investors and buyers to come to Georgia. Some firms are getting assistance in developing feasibility studies and investment proposals from CERMA and other donor projects. Two companies interviewed for this study claimed they had approached foreign investors with these proposals looking for joint ventures or subcontracting arrangements. The foreign investors, however, all were said to be reluctant to invest in Georgia because o f the "political situation" and personal safety concerns. Firms note that these problems also get in the way o f selling to buyers abroad. As one company put it, "when a construction company i s building a building it must have the stone on a just-in- time schedule. Potential buyers fear Georgia, as a new seller to the market, wi l l not be able to deliver the right specifications on time. Buyers need to come to Georgia to look at the situation and build confidence. Unfortunately, because of Georgia's instability, the buyers are literally afraid to visit."
Chauter 9: Services Exuorts 89
Chapter 9: Services Exports
Information Technology
9.1 Since the collapse of the Soviet Union in the early 1990s, which le f t the country in a kind of information vacuum, there has been a steady growth of information technology in Georgia. The first Internet provider, Kheta, opened for business in 1991 , since then six other providers have begun operating in the country, connecting many of the major cities, as well as the large government and business organizations. The number o f Internet users i s currently only about 2 to 3 percent o f the population, but Internet use i s growing at a rate o f more than 50 percent per year. Many other segments of the I T industry are also quite active. A number o f software companies develop programs for local businesses, in the areas o f accounting, banking and finance, language, billing systems and so on, with approximate annual turnover o f $2 million. Several firms assemble personal computers for the local market with annual sales o f about $7.5 million. Networking and installation, fiber-optic technologies, and IP communications companies are also active in networking projects. These companies have a turnover o f about $3 million. Lastly, there are hardware distribution companies, which represent most of the major international computer and server brands. Turnover in this market segment i s estimated to be as much as 18 to $20 million. The largest clients of these I T companies, representing roughly 80 percent o f sales, are governmental bodies, financed mostly by international donor agencies, international donors themselves, large private businesses, and banks.
9.2 The development of this I T industry base in Georgia has begun to spawn a small group o f companies that are actively pursuing export opportunities. I n the area of networking hardware and solutions, one company he has become a Cisco Premier Partner and i s exporting services to the region. The company aims to open an office in Azerbaijan where it is working with several companies, but also actively services clients in Armenia and EU firms operating in the Caspian Sea area. Another company provides software-consulting services to Silicon Valley firms operating in the Internet TV area. St i l l others market their local software products to countries in the region or do software subcontracting for Russian firms in the software industry. A l l o f these f i r m s are growing fast and feel that there are excellent opportunities in the export market if they can overcome challenges they face in the Georgian business environment.
Labor
9.3 IT firms note that they do not presently have problems finding qualified technical personnel. The universities appear to be training enough people, and after two or three months of on-the-job training, software companies claim that graduates are adequate for beginning level jobs. Firms exporting hardware and networking services also say they can find enough technicians who can be trained on the job. They run extensive employee training programs, often spending a good deal o f money getting workers internationally certified to work on things like special Microsoft products or hardware from companies like Cisco Systems. For example one networking company interviewed spends 25 percent o f i ts profits on certification and training. Most o f the training and certification is done via the Internet or through books imported from abroad. A few employees are also sent to the U.S. and Europe for technical training.
9.4 While it i s relatively easy to find and train up young technical staff, firms report that it i s quite difficult to find efficient, trained sales personnel. As one manager put it, “there are few experienced sales managers who work honestly. If they are talented at all, they want to run their own businesses; it i s difficult to hold onto them if they can be found.” Project managers are another skill that i s in short supply in the I T sector. For f i rms trying to work in the international consulting business, this i s a major
Chauter 9: Services Exuorts 90
bottleneck. “It takes a lot of time to train such personnel, firms note, and there i s nowhere to get the necessary experience today in Georgia.”
9.5 Wages for technical workers in Georgia, as elsewhere, are largely a function o f training and experience. For a beginning software programmer the starting wage i s about $100 per month. After a year or two o f experience wages quickly rise to about $400 per month, and personnel with exceptional skills and working experience can earn $1000 to $2000 per month. Georgian labor costs are lower for equivalent technical staff than they would be in Russia. In Georgia, the average software developer with several years of experience would be paid $400 to $800 per month, while a Russian would make $1 000 to $1500 per month. However, wage differentials compared with the West are even larger. Technical personnel with high levels of certification, for example has Cisco-certified professionals, can make annual salaries plus bonuses of $20,000 to $25,000 in Georgia, but an equivalent professional in the U.S. would make $70,000 to $80,000.
9.6 I t i s instructive to report the case o f a Georgian IT firm that has been trying to develop an export business for the last two years in the software consulting field. It’s work practices and training methods t e l l a lot about the problems o f IT labor in Georgia. The company was started to provide programming services for U.S. software companies in the Internet television business. The Georgian owner that started the firm had a connection with a US. software engineer in California who was interested in using experienced Georgian computer experts to provide services to companies in Silicon Valley as he had done with experts from several other Eastern European countries. The firm employs seven full-time software developers, to quality controllers, three full-time freelance programmers (or subcontractors) and has developed a roster o f 150 technical experts who are on call when business requires them. The company notes that it tries to have access to staff with a wide range o f technical skills in terms o f knowledge o f programming languages and work experience.
9.7 The firm believes that finding IT talent in Georgia i s no problem. I t manages and quality controls its technicians closely and remunerates them according to their performance. The firm says that most Georgian IT companies do not have similar quality control departments, which i s a problem for the development o f the industry. Older staff, the firm’s management states,” suffers a hangover from the Soviet era in their work habits and style of management. There i s a tendency for Georgians to misunderstand strictness and discipline in the workplace -- they believe it i s directed at the individual, whereas it i s directed at the technical standard o f work. This strictness results in technicians becoming stressed. There i s also a lack o f communication sk i l ls and flexibility among Georgians in business dealings -- e.g., politeness, responsiveness, and difficulty in adopting U.S. project management skills.” The U.S. partner, who also does the firm’s marketing in California, invested money to upgrade the skills o f the Georgian staff to respond appropriately to the demands of US. clients. The firm went through a number o f management problems in the beginning trying to understand the needs o f the U.S. clients and how best to manage the Georgian technicians. Language was also a problem. In the beginning, it took one day to write a letter in English, now the firm can write 12 letters a day. The U.S. partner knew there would be problems for at least one year and visited Georgia often. The U.S. partner searched for a local Georgian management trainer who could train the staff in a Western way o f thinking. H e was unable to find such an individual in Georgia with the right blend o f management and technical knowledge. So he brought a professional management trainer from the United States who trained the staff plus some technicians for four weeks in all aspects of running the business (how to prioritize and manage the work schedule, how to manage the client relationship, how to manage technical employees and so on).
9.8 After two years of operation the company i s finally confident in taking on and managing more than one project at a time with the clients (the longest project has been 6 months). The clients in the U.S. have also begun to listen to the technical suggestions o f the firm. It has taken two years to develop such trust. There i s now less day-to-day control by the U.S. clients. To build closer relations and maintain
Chapter 9: Services Exuorts 91
trust the firm makes use of teleconferencing to keep in constant contact with its U.S. clients and its U.S. partner. “It i s necessary for foreign clients because they want to have face-to-face contact with the Georgian workers.” There continues to be continuous training o f staff and technical personnel, particularly when there i s downtime in between projects. “The U.S. clients now tells us that the costs o f programming services are not only cheaper in Georgia, but the quality o f service has also become world- class -- the clients say that programming quality in Georgia i s better than it i s in India.”
Intellectual Property Rights
9.9 All the firms interviewed for this study in the I T industry cited software security as a major problem in Georgia and a detriment to the development o f exports. The local software companies all insert expensive security devices in their products to reduce copying. Because o f such problems, foreign companies are wary o f doing any software subcontracting business with Georgian companies -- they fear that their “source codes” could be stolen. It has taken several years o f doing business with U.S. software companies for the Georgian firm selling software consulting services to build trust, as noted above. Building trust has been made easier in this case by the presence o f a U.S. partner who facilitates interactions between the Georgian company and its U.S. clients and i s the ultimate guarantor for project contracts and security o f source codes. Without such an intermediary other IT companies interested in exporting wil l have to find ways to overcome Georgia’s reputation problem and build trust with foreign buyers. The government will also have to make greater efforts to enforce intellectual property rights laws.
9.10 Georgia’s accession to the WTO in 1999 advanced i t s adherence to international property rights norms. A special WTO unit within the Ministry o f Foreign Affairs coordinates Georgia‘s efforts to ensure that i t s legislation complies with WTO requirements, including the TRIPS property rights agreement. Georgia also joined the Paris Industrial Property Convention in 1994, and thereby became a member o f the World Intellectual Property Organization and a party to the Patent Cooperation Treaty. It i s also a party to the Bern Convention for Protection o f Literary and Artistic Works and o f the protocol relating to the Madrid Agreement concerning the International Registration o f Marks. All these agreements are implemented through Georgia’s Law on Patents and Trademarks, which was passed in 1999. In addition, Georgia’s Civi l Code on “Intellectual Property Law” provides protections for intellectual property rights. The Georgian National Intellectual Property Center (Sakpatenti) i s responsible for matters involving industrial intellectual property, and for appellations o f origin. But despite this body o f protective legislation and institutions, actual enforcement o f intellectual and industrial property rights in Georgia i s said by al l firms to be very weak, particularly in the areas o f computer software and audio and videotapes.
Infrastructure
9.1 1 One o f the most pressing infrastructure problems facing IT firms trying to break into export markets i s the cost and hassles with Internet access, particularly broadband and satellite connections, which are required for high-speed data and optical transmissions. Basic Internet cost, which i s $25 a month in the West, costs $500 a month in Georgia. Broadband i s more than $1000 per month. For a 128 kps service with optical connection one firm pays $1800 per month, equal to one-third i t s total overhead costs.
9.12 IT firms also complain that power cuts interfere with efficient operations, particularly in the Winter when power cuts are said to occur three or four times per week and be o f a duration o f two or three hours each. One company had such a big problem with power cuts that it decided to move to a more expensive location that had a generator. The overhead cost i s much higher, but it allows the company to service i t s clients without downtime during critical periods. Other f i r m s have purchased and installed their own generators.
Chauter 9: Services Exuorts 92
Government Policy and Administration
9.13 The government currently has no information technology policy for development o f the IT sector. However, firms feel that a policy i s needed that recognizes information technology as a potential key export sector for the future and that recognizes IT as an important input in the development of al l other sectors o f economic activity. As one firm put it, “in the coming years, globally, there will be a significant difference in the economic conditions of the countries developed in the field of information technology and other countries lagging behind in this field. Hence, i t i s essential to recognize this fact and to formulate a policy at the earliest for developing IT both as an export sector and as an input to domestic economic activity with a view to boosting the national economy.” IT entrepreneurs interviewed for this study felt that an information technology policy should focus on the following areas:
0 Foreign direct investment -- the environment for FDI in the IT should be made as friendly as possible. There i s an immediate need to attract investors and joint venture partners into the country to maximize capital flows into existing IT companies and new start-ups and to increase technology transfer.
Broadband -- there i s a need to extend the network and lower the cost o f broadband links to the rest o f the world. As entrepreneurs note, “Georgia needs to be connected more broadly to the information superhighway.”
Human capital development -- while firms have no problem finding technical staff right now, if the IT sector i s to grow and prosper, more trained graduates with IT skills will be needed. There i s also a current need for training programs to improve project management skills and sales and marketing ski l ls for the IT sector. More generally, computer knowledge should be gradually made widely available in schools.
Tax administration -- all firms have problems with tax administration in Georgia, but the IT industry i s populated with young, start-up companies that are particularly vulnerable. These firms are being audited and inspected by many government departments: tax, the economic crime department, customs, environment and so on. By a l l accounts the tax department appears to be the worst. For young startups the tax rate appears to be too high -- on services contracts firms say they pay 60 to 65 percent o f turnover in taxes, including the VAT -- and tax administration i s too problematic -- typical auditing by the tax department, firms note, “puts a break on the business for some two weeks because, for example, the inspectors take our business documents away to their offices and they spend a lot o f time in our company trying to find things.” VAT i s also a problem “because we are often asked to pay for other companies who sel l to us who don‘t pay, or for fake invoices given to us. In any disputed case, where we are found to be correct, the authorities don‘t return our money, they say it i s an advance for future taxes. All they want to do i s make revenue targets.” Entrepreneurs argue that the IT should be considered a priority sector where startups are taxed at a low flat rate o f 10 to 15 percent for at least the first five years. “The present system o f high taxes and bad tax administration i s driving IT professionals away from the country rather than encouraging them to enter and start up new businesses.”
0
0
0
Engineering Services
9.14 With the revival o f the construction industry in Georgia and the Caucasus region, as a result o f the building o f the Supsa o i l terminal and the Baku-Supsa oil pipeline, opportunities to develop and export engineering services have increased substantially. Moreover, demand for engineering services i s also increasing because o f programs to upgrade regional transportation infrastructures and because o f
Chauter 9: Services Exuorts 93
efforts to rebuild offices and housing to improve earthquake resistance. Several Georgian companies have entered the market to provide such services and some are now beginning to think about export markets in the region and elsewhere.
9.15 The small group of engineering service firms currently doing business in the country undertakes geological surveys, design work, construction engineering, engineering testing, and engineering consulting. The largest o f the local companies interviewed for this study had a staff o f 80 and hires as many as 400 engineers and technicians when it gets large projects. The firm has a turnover of about $1.5 million. It cooperates with foreign companies like BP and Chevron to do work on the Georgian pipeline, which gives it opportunities to work outside the country in places like Azerbaijan. The firm also undertakes local construction work i t se l f and through subcontractors. Large foreign engineering companies, like ERS as from the U.S., also provide engineering services in Georgia and the region, particularly for the pipeline. ERS has tried to buy a local Georgian engineering company to extend i ts business in the region, but has been turned away because local firms thought they could do better alone. I t remains to be seen whether this was a wise development strategy. The general strategy of the companies interviewed i s to widen their services to include project management, specialized construction, and environmental services and to export services outside the country to places in the region, Asia, and some parts o f the EU. Georgian f i r m s also say they need to gain scale in order to be able to bid on large projects. It i s difficult for them to do this with available internal resources. They are trying to resolve their capacity problems by linking up with other local companies active in the areas o f legal services, environmental analysis, health services, and communications. To this end some engineering companies have formed co-operative agreements with companies in these areas.
Labor
9.16 A significant constraint on the expansion of the engineering services industry i s project management ski l ls. Georgian engineering technicians are said to be good at her work, but have no project management experience and there is no place in the country to receive training in this area. Firms note that there are difficulties hiring foreigners to do project management work. First, they are expensive -- local engineers earn $500 to $1000 per month, while a foreign engineer generally earns more than $10,000 per month. Second, there are language problems working in Georgia. Lastly, there is the tax burden associated with foreigners.
Experience project managers are very difficult to find.
Technology and Standards
9.17 Most o f the engineering equipment in use in Georgia i s old Soviet equipment, which i s useful for some basic engineering work, but i s not technically adequate for use in international markets today. Upgrading equipment i s difficult as finance i s expensive -- currently 18 to 24 percent -- and very short- term duration for fixed assets. Firms are also trying to obtain internationally recognized management and technical certifications to me more competitive. Several engineering companies have gotten I S 0 9000 certification in the last two years costing about $40,000.
9.18 Another important problem in the engineering industry i s the lack o f modern standards. Georgian firms continue to work under old Soviet GOST standards in the construction sector, for example. The engineering companies that want to export services and work on the pipeline want to operate on BritisWAmerican standards as this i s generally what the world market demands. Conforming to higher international construction standards locally -- on quality, safety, and the environment -- would result in much higher construction costs. Buildings, for example, would have to be more earthquakes proof in a country where earthquakes can measure as high as force 8 on the Richter scale. Firms estimate that 60 percent o f construction in Tiblisi i s defective even in terms o f existing local standards. Exacerbating the
Chauter 9: Services Emorts 94
problem o f no modern standards i s the fact that existing standards are not monitored and enforced. The Ministry o f Construction and the Agency for Standardization and Metrology, which are charged with the job o f monitoring and enforcement, are reported not to be doing their work very effectively. For example, The Ministry o f Construction checks engineering drawings at the start o f construction, but does not follow up to see if the work i s done according to the approved plans. Also, defective construction, when found, never seems to lead to a prosecution o f the construction firm at fault. Lack o f modern standards and lack o f effective monitoring and enforcement o f standards are detrimental to the development o f a strong local engineering industry that can export services abroad. It also influences the development o f other industries, such as construction materials and furniture, which rely on effective national construction standards to create markets for standardized products, which can be produced in batch production in efficient factories rather than in small, one-off units in job-shops, as i s the norm in Georgia today (see the case study on the wood industry).
9.19 Development of export quality engineering services in Georgia could also benefit from a certification laboratory that would operate on internationally accepted standards, such as NACE standards (National Association o f Corrosion Engineers), and from training and certification o f engineering personnel. The o i l pipelines and other types o f construction now being installed in Georgia and the region wil l require quarterly maintenance for many years to come. Engineering services, such as ultrasonic welding and other processes associated with installing, joining, and inspecting sections o f pipeline, w i l l be in demand and a testing and certification laboratory w i l l be needed to certify the work. Georgia wi l l lose the opportunity to participate in the lucrative services contracts for this work if it does not begin to invest in the necessary certification lab facilities and international standards training for engineers that wil l be required.
Corruption
9.20 Competition in the local market for engineering services i s said by firms to be retarded by favoritism in government contracting and other activities that tip the competitive balance toward companies that are part owned by government officials or that bribe government officials. These companies not only receive lucrative state contracts, they also get assistance by way o f free office space and equipment and often do not pay required taxes. Engineering companies argue that it i s difficult, if not impossible, for companies without such connections to compete with these f i r m s in any kind o f open tender. Quality o f work i s also often manipulated and not checked by authorities. If unfair competition in the domestic market for engineering services i s allowed to continue, it wil l stunt the development o f a nascent engineering services industry and constraint export growth.
Tax Policy and Administration
9.21 Engineering firms complain that everything in Georgia i s regulated poorly except taxes. Firms working with international donors or with large foreign companies say that they must pay taxes according to the rules, as the international community do not want to work with companies that have "shadow o f accounts." The newly formed engineering firms feel that following the rules i s good practice, but it does not allow young companies enough retained earnings to reinvest and grow. Entrepreneurs argue that tax policy puts the rates to high - "20 percent VAT i s too high for a country that has i t s future tied to new startups and massive restructuring o f old firms, it doesn't support development. The rate should be more l ike 10 percent to leave room for more investment. "Tax administration i s also noted as a problem. "Tax laws are not clear and are not simple. You have codes and instructions on how to interpret them, but they are highly ambiguous in many cases. There i s a lot o f freedom o f interpretation. It i s not easy to access information about interpretations and businesses are often not aware o f the many changes that occur. The authorities use all this to extract bribes." Firms also complain that there are too many taxes -- "there are
Chauter 9: Services Exuorts 95
more than 20 different types of taxes, which i s too much for a struggling country like Georgia. Moreover, while a firm may endeavor to complete i ts tax documentation properly, some mistakes may be made. These mistakes give an opening in truthful firms for tax officials to make money time after time, they offer deals.”
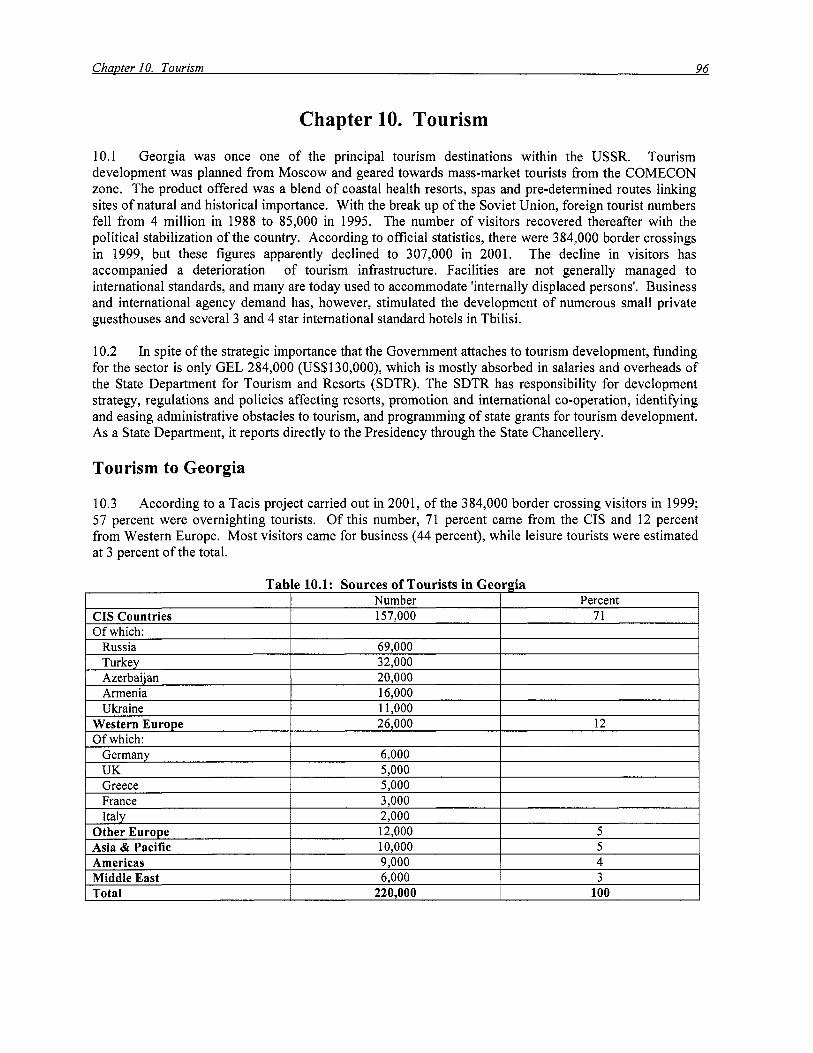
Chapter 10. Tourism
10.1 Tourism development was planned from Moscow and geared towards mass-market tourists from the COMECON zone. The product offered was a blend of coastal health resorts, spas and pre-determined routes linking sites o f natural and historical importance. With the break up of the Soviet Union, foreign tourist numbers fe l l from 4 million in 1988 to 85,000 in 1995. The number of visitors recovered thereafter with the political stabilization of the country. According to official statistics, there were 384,000 border crossings in 1999, but these figures apparently declined to 307,000 in 2001. The decline in visitors has accompanied a deterioration of tourism infrastructure. Facilities are not generally managed to international standards, and many are today used to accommodate 'internally displaced persons'. Business and international agency demand has, however, stimulated the development of numerous small private guesthouses and several 3 and 4 star international standard hotels in Tbilisi.
Georgia was once one of the principal tourism destinations within the USSR.
10.2 In spite of the strategic importance that the Government attaches to tourism development, funding for the sector i s only GEL 284,000 (US$130,000), which i s mostly absorbed in salaries and overheads of the State Department for Tourism and Resorts (SDTR). The SDTR has responsibility for development strategy, regulations and policies affecting resorts, promotion and international co-operation, identifying and easing administrative obstacles to tourism, and programming o f state grants for tourism development. As a State Department, it reports directly to the Presidency through the State Chancellery.
Tourism to Georgia
10.3 According to a Tacis project carried out in 2001, o f the 384,000 border crossing visitors in 1999; 57 percent were overnighting tourists. O f this number, 71 percent came from the CIS and 12 percent from Western Europe. Most visitors came for business (44 percent), while leisure tourists were estimated at 3 percent o f the total.

Chauter 10. Tourism 97
10.4 According to SDTR, tourism income in 2000 was GEL827million ($375million), or 10 percent o f GDP, including direct and indirect income as well as the domestic component. The TACIS project estimated international tourism revenue, based on international norms, at US$89.2 million, o f which US$72.8 mil l ion was revenue from tourists, US$12.9 mill ion carrier receipts, and US$3.3 mill ion visa income. This represented 17 percent o f foreign exchange earnings and 2 percent o f GDP; 3.1 percent when secondary effects are taken into account. The sector provided 17,000 full-time jobs in 2002 (5 1,000 when secondary effects are taken into account) and US$6.9 mill ion to the budget ($17.8 mill ion when secondary effects are taken into account plus $3.3 mill ion from Visa Issue).
Opportunities and Challenges for Tourism Growth
10.5 Georgia’s key tourism strengths as far as international markets are concerned are (i) scenic landscape, mountains, nature; (ii) historical and cultural heritage; (iii) friendly, welcoming people; and (iv) good climate. In the current market environment, there appears to be no opportunity for a return to mass tourism in the foreseeable future. More feasible opportunities l i e in niche markets where Georgia must seek to carve out a worthwhile reputation. Chief among these are:
0 Discovery (Mildly Adventurous) Tourism: Historic Sights, SceneryKaucasus, Nature, Culture, Packaged activities
0 Adventure Tourism: Trekking, Mountaineering, Heliskiing
0 Special Interest Tourism: EcotourismAVational Parks, Birdwatching, Botany, Horse riding, Cycling, Wine tasting, Good environment for artists, Health and wellness, Winter sports
0 Business Tourism: Regional Meetings and Events
10.6 International competitiveness is concerned not so much with price levels but with the overall price-value relationship. An examination o f the competitiveness o f Georgia as an international tourism destination indicates a serious lack o f competitiveness in each component o f the marketing chain - promotion, distribution, the product, and i t s price. The main disadvantages to increasing tourism in Georgia are listed below.
0 Promotion: Dangerous reputation, no destination marketing, no marketing culture, information deficit.
0 Distribution: Limited opportunities to buy, either through the travel trade or directly.
0 Product: Underdeveloped infrastructure, especially accommodation capacity, quality and diversity.
0 Price: High costs o f access and accommodation.
Cross-cutting Barriers to Export Growth
10.7 obstacles in detail.
General obstacles to export growth are also obstacles to tourism and this report examines these
10.8 Investment Climate. There i s a broad consensus that corruption is pervasive. Numerous cases were recounted o f payments being extracted under threat o f the enforcement o f some regulation or other,
ChaDter 10. Tourism 98
however obscure, and that these abuses go unpunished. People spoke so openly about the "grey economy" that it sometimes appears to eclipse the legitimate economy. In such a climate it i s impossible to see how successful enterprises can prosper, or hope to compete with similar enterprises operating in economies where the rule o f law, generally speaking, prevails. People consulted were sceptical about the introduction of any regulatory or structural initiatives, as they fel t these would simply be exploited as new opportunities for corruption. Establishment o f the rule of law i s virtually a prerequisite for foreign investment which i s essential to tourism development. In addition, there are other fundamental barriers to investment in tourism such as low customer demand, low profitability, difficult access to long term fixed asset capital, and poor country image.
10.9 Infastructure. The condition of the roads inhibits tourism to some parts o f the country and to some key sites. The main problems are lack of paved roads and potholes due to inadequate maintenance. Road signage i s perhaps an even greater limiting factor for international tourists. Signage i s scanty and inconsistent, but even when it i s found it i s usually only in Georgian script, which few tourists can understand. Electricity breakdowns are frequent, even in Tbilisi, so most tourism enterprises maintain their own generators. International direct dial telephone communications are problematic and availability o f landlines i s limited. Again firms are coping by using satellite and cel l phone technology. These factors are imposing further costs on firms, further eroding their international competitiveness and conveying a sense o f a non-functioning economy to international visitors.
10.10 Taxes and Regulations. Administrative requirements for operating tourism businesses are either unrelated to actual activities or impose unrealistic demands. As a consequence, the enforcement of regulations is not respected. There are frequent complaints about tax administration, regulatory inspections, administration o f licensing/certification and unclear, complex, constantly changing laws. Tourist operators expressed the view that if taxes were lowered to more realistic levels there would be less incentive to cheat and overall revenue would increase. Above all, people interviewed are concerned about unfair enforcement o f taxes and regulations.
10.1 1 Reportedly, in November 2002 President Shevardnadze asked Parliament to draft legislation on tax re l ie f for investors in hotel businesses. However, unless current constraints to investment are addressed (such as low demand, high cost o f finance, etc,) tax incentives run the risk to encourage excess supply of accommodation without necessarily promoting new investments in products marketable to international tourists. The best approach i s to address all o f these barriers first, and thereafter consider selective fiscal initiatives if tourism i s s t i l l not perceived as a sufficiently attractive option.
Barriers Specific to the Tourism Industry
10.12 In the absence o f a National Tourism Authority (NTA) in Georgia, international marketing o f Georgia as a tourist destination i s almost non-existent. Over 150 national destinations worldwide are already using their NTAs to lead the competitive marketing struggle and Georgia wil l not be able to compete internationally without similar support. An effective NTA should be well funded by Government but it should have active involvement from the private sector. There is also no active National Tourism Association, nor a representative Hotel Association, and an incoming Tour Operators association is in only an embryonic stage. A Rural Tourism Organisation has been established but i s entirely dependent on donor funding.
Weak International Marketing.
10.13 A handful o f individual operators have been trying to maintain a presence with meager resources. Caucasus Travel has participated in the Great Silk Road Tour Operators Group. Armenia, a competitor destination, participated in the two biggest holiday fairs, WTM in London and ITB in Berlin last year, with help from USAID. Azerbaijan i s also reported to have budgeted to do likewise next year. Table 10.2 below shows the resources employed in various European destinations:

Table 10.2. Tourism Budgets and Staffing of European Countries- 1999 Country Budget Head Office Staff Staff Abroad Total Staff
(€million) (full time) Cyprus 33.25 115 60 175 Czech Republic 2.99 47 17 64 Estonia 0.9 16 0 16 Hungary 16.3 95 26 121 Iceland 2.42 7 4 11 Ireland 59.12 145 94 239 Slovenia 3 -64 15 3 18 Spain 99.26 270 197 467 Sweden 15.01 25 39 64 Switzerland 3 1.48 52 95 147 Total 750.63 2298 1635 3933 Average 34.11 104 74 179
10.14 Even l i t t le Estonia, a former Soviet republic, was spending €lmillion in 1999, and it plans to treble this level o f budget from 2004 onwards. Georgia's potentially competitors include: Armenia, Azerbaijan, Turkey, Nepal, Northern India, Tibet, Myanmar and Northern Thailand. Asian competitors are also big tourism spenders. Armenia and Azerbaijan have both recently agreed new tourism strategies and Georgia risks being left behind if it does not act accordingly.
10.15 The poor understanding o f how international tourism functions i s a serious obstacle to further progress. This deficiency i s evident in private sector enterprises and public agencies. Even on the domestic tourism front, there seems to be l i t t le promotion, which suggests l i t t le awareness o f the intense competition in terms o f price and quality prevailing in the international tourism marketplace. Intourist, a monopoly operator, to which a l l operators look to supply their guests, has had i t s place taken by a handful o f incoming Tour Operators. However product providers s t i l l tend to wait and accept what the travel trade managers send to them rather than to market their services themselves.
Promotional Practices,
10.16 Even well functioning incoming Tour Operators are in a poor position to influence final demand in the marketplace. Normally, Tour Operators would feature offers in Georgia and push them aggressively. But because Georgia i s such an uphill sell, the marketplace Tour Operators seem to be quite passive and just react to enquiries. In this situation the incoming Tour Operators find themselves desperately trying to attract business themselves by appealing directly to the consumers and to the retail travel agents. This i s not something that small-time operators can do very effectively or profitably.
10.17 International Image. Even if Georgia had a stronger international tourism marketing, it would s t i l l have a very steep hill to climb. The country i s l i t t le known internationally and when known it i s often for the wrong reasons. Not only has Georgia a negative image but it i s not recognized as a tourism destination (outside of Russia). Correcting this situation demands effective and sustained Destination Marketing, coupled with eff icient national coordination of private enterprises promotion, to extract the last ounce of value from it. Lowering price to compensate i s not an option due to the fact that the image i s so poor that the price would be so low as to be unprofitable.
10.18 Security/Safeety. Georgia also has to address safety issues for tourists. Crime against tourists has occurred and tour operators avoid sending tourists to large chunks o f the country - Svaneti because o f robberies, Pankisi because o f terrorism, South Ossetia because o f political unrest, Abkhasia because o f the aftermath of war.
Chauter 10. Tourism 100
10.19 While tourists on a short visit are insulated from most effects o f corruption, the level of road harassment could be a significant deterrent for independent travelers. Germany i s the key potential market for adventure holidays. However Germans insist that emergency facilities must be excellent and general local security conditions must be good. Georgia i s not perceived to offer adequate support infrastructure to satisfy this requirement at present. Extracts from a typical Travel Warning issued by the British Foreign and Commonwealth Office on 24 December 2002, for example, eloquently illustrates the negative impact which the current situation in the country has on potential tourists.
10.20 Distribution of the Holiday Offer. Distribution of holiday offers in faraway lands i s achieved either through Travel Trade intermediaries or by reaching the consumer directly. The present distribution o f Georgian holidays to the Western European consumer i s very weak. In the UK Georgia i s featured by a small number of Tour Operators - Explore Worldwide, Regent, Sunvil, Exodus, Dragoman, Silk Road, and Silk Road Travellers Club. They offer a limited product range however and there is l i t t le evidence o f price competition. In Germany the most active operator i s Erka Reisen, which produces a special Georgia brochure. There is also limited exposure with Meiers, Weltreisen, Dr. Tigges, and TUI. Packages are perceived as rather expensive. In France only Voyageurs features Georgia, with some expensive offers.
10.21 The PC has brought the power o f computing to every business and to most consumers. The Internet has revolutionised communications - the number of users worldwide has grown from 45million in 1995 to 533million in 2002, and i s projected to rise to 1,3 billion by 2006. O f these, 270 million are projected to be in Europe. Tourism and Travel i s the leading sector in E-Commerce and i s expected to account for 35 percent o f business this year. On-line travel and tourism sales in Europe this year are expected to reach €1 lbillion. Complementing this phenomenon has been the upsurge in independent travel. Every year, an increasing percentage of the tourism market i s travelling independently, without the help o f a travel agent except perhaps to purchase an air or sea ticket. This trend i s strongest the nearer the destination i s to the visitor. However the discovery segment o f the market is increasingly using independent options for long-haul travel. Information about Georgia on the Internet i s pretty random and chaotic. There i s no National Tourism Portal Website for Georgia, something all serious tourism destinations now have. Such a website would provide links to the various products and services the country's tourism enterprises offer.
10.22 Accommodation Capacity. Hotels and Restaurants account for 2.4 percent o f GDP and their output grew by an annual average o f 8.6 percent during 1998-2000. Despite the fact that 269 new hotels and guest houses, with 3712 rooms and 8250 beds, have been built o f refurbished between 1998 and 2002, tour operators s t i l l complain that there i s l i t t le internationally saleable accommodation outside Tbilisi. Most o f the rooms mentioned above, are provided in Tbilisi and in the primarily domestic destinations o f Bakuriani and the Adjara Coast. While some centers with good tourism potential have started to provide some good standard accommodation in family homes or small guesthouses there are s t i l l few units large enough to accommodate groups.
10.23 Meeting Standards Required to Access Markets, Generally, there are no effective quality control systems for tourism. The accommodation sector requires an objective quality classification system in line with international norms. Tourist sites and attractions are generally poorly presented. While guide services are generally good there i s practically no use o f modern interpretation techniques to inject more interest into the experience. The range o f tourist experiences is rather narrow. No matter how deep the heritage o f Georgia, visitors wil l become bored if additional dimensions o f tourism are not made part of the Georgian experience. Complaints were made of minimal opening hours of museums. Other tourism services such as good quality restaurants, bars and cafes and shopping opportunities, especially for souvenirs, are poorly developed once one moves away from Tbilisi. For group transportation, there is no decent coach fleet.
Chapter I O . Tourism 101
10.24 For example, Georgian tourism interests see high tourism potential in the country's natural resources, perhaps best showcased in the National Parks and Nature Reserves. An assessment o f the parks' competitiveness with international sites by a professional tour operator concluded that:
Georgia has a medium to high potential as an Ecotourism destination.
Targeted marketing must be an integral part o f a tourism development strategy aimed at creating an image o f Georgia as a tourist destination.
Establishing basic tourism infrastructure such as roads, accommodation, sanitary facilities, information and interpretation would be key.
An effective marketing campaign may help reduce the perception o f inadequate safety for tourists.
10.25 Even mature tourism destinations provide heavy support for tourism product development, with the level o f investment related to the size o f each country and the strength o f i ts tourism resources. For example, in the case o f Ireland, over an 18-year period government support for tourism product development was €25 mill ion per annum, not including tax breaks. Ireland was already a mature, market-orientated, tourism economy even before this investment cycle started.
10.26 In Greece, a fund o f €140 mil l ion i s currently available to support investment in Marine Tourism, Mountain Tourism, Eco Tourism, Cultural and Health Tourism, Modemisation o f Hotels, Tourism Infrastructure Facilities, SMEs in Tourism, and Human Resource training. In a smaller jurisdiction, Northern Ireland, €40 mil l ion i s available for tourism development support over the period 2000-2005, in addition to €32.5 mil l ion for marketing support.
10.27 Information DeJicit. As stated the independent traveller market i s growing and Georgia i s very poorly geared to service this market. There i s no central database containing details o f all tourism resources. Such a database should contain not only an inventory o f such resources, but should maintain changing information such as opening hours, admission charges, contact details etc. up to date at all times. This could become the core o f a comprehensive Tourism Information System which would in time include information leaflets, guide books and a network o f Tourist Information Centers.
10.28 Access to Georgia. Due to the political and security situation road access for tourists i s available from Azerbaijan, Armenia and Turkey only. N o checkpoints are available for foreigners travelling from Russia. There are overnight trains from Baku and from Yerevan but frequent stops and delays are to be expected. The port of Batumi has four services per week to Sochi, across the border in Russia, and has one cargo/passenger ferry per week serving Ukraine and Bulgaria.
10.29 With such limitations on surface transport the air access situation i s o f crucial importance. While, on paper, Tbilisi has connections to many destinations, the services are characterised by low flight frequencies at inconvenient times. The number o f foreign airlines providing services i s limited and the Georgian airlines are unknown abroad and poorly networked into international fare systems. The regulatory framework i s protecting the national airlines and this restricts competition and keeps fares higher. For example, British Airways f l ies to Tbilisi and onwards to Yerevan, but i s not allowed to convey passengers between Georgia and Armenia only, in either direction, despite the fact that a proven market exists for combined GeorgidArmenia tours. This lack o f competition may contribute to the poor regionalhear east services. While the air access situation i s inhibiting competitiveness, all concerned should be aware that the situation could seriously deteriorate if business does not grow and western airlines start to pull out!
Chapter 10. Tourism 102
10.30 Pricing. Georgia (and i t s neighbours in Armenia and Azerbaijan) are relatively expensive as longer haul destinations and much more expensive than Turkey. The published group rates are uncompetitive with the best prices being quoted on the Internet for specific enquiries. On this evidence it i s hard to see how a travel agency can possibly construct a competitive offer unless they can gain greater bargaining power through being able to generate higher volumes in a competitive market.
10.3 1 Hotel prices are also high by international standards. The advent o f Marriott to Tbilisi has had a downward impact on prices and illustrates the effect o f competition. However, many smaller establishments s t i l l offer prices well out o f line with reality and this probably can continue at present only because the information deficit referred to earlier leads to an imperfect market situation. VAT rates, at 20 percent, are high.
10.32 Visa Regulations. Georgia must be credited for providing a facility to purchase a visa on arrival. Having taken this step, there seems l i t t le logic in charging double fees on arrival, for applicants from countries with Embassies o f Georgia. It can be seen as a revenue generating measure for visitors who have to come anyway, such as businessmen or consultants, but this has to be balanced against i t s deterrent effect on tourists. There must be many creative ways around this e.g. to make an exception for groups and/or to halve the fee for stays over 5 days. The restriction to two weeks i s also illogical. Many o f the discovery type tourists who could choose Georgia might well wish to stay longer and it seems illogical to make it harder for them to do so. It i s reported that extension beyond 2 weeks can be costly and complicated so we would recommend that the two week validity be changed to 3 weeks, or better st i l l 4 weeks.
10.33 Training. There i s a need for better tourism skill development at all levels of the industry. As in the case of other export industries, the normal technology transfer mechanisms are missing or weak. There i s little foreign direct investment, most people working in tourism do not have opportunities to travel to the source markets and there are few purchasing visits by the foreign travel trade. There i s no hotel training institution, and there i s a need for better training in foreign languages, especially outside Tbilisi.
A Strategy for Tourism Development
10.34 Georgia has substantial tourist attractions, in particular, excellent scenery and a fascinating heritage. However, any action plan for tourism must take as i ts starting point an acceptance that there are no quick-fix solutions. Perhaps the f i rst step in realizing this potential i s to stop dwelling about the “glorious past” o f tourism in the Soviet era. The following are some practical measures aimed at developing Georgian tourism.
Target Markets
10.35 to influence other segments such as business visitors, or those visiting friends and relatives.
Market Segment. The tourism strategy must focus on the leisure market, because it can do little
10.36 The initial focus should be on group business, with a move towards individual travellers as product development advances. Georgia could realistically aim to double leisure tourists to 18,000 in 5 years and by going for high value niche markets the value o f this to the economy would be substantial.
Promotional Strategy.
10.3 7 Geographic Scope. prospects.
Geographically, Western European markets offer the best immediate The main targets here should be the German-speaking markets - Germany, Austria,
Chapter I O . Tourism 103
Switzerland - followed by the UK, France and Northern Italy. A further target should be the considerable regional expatriate market. There should also be scope to attract business people to make add-on leisure trips, and to include their partners in them. There could also be a useful regional market for business meetings. In the longer term, with improving political and security situations, it should be possible to develop specific niche markets in Russia for aspects o f Georgia that have a high and positive recognition there, given the experiences o f the Soviet era. Specifically, these are winter sports (e.g., Bakuriani), Spas (e.g., Borjomi), and Wine (e.g., Kakheti).
Entrepreneur Support
10.3 8 Business Associations. Business associations will facilitate better cooperation between the public and private sector. The answer might be to allocate each association a challenging role in the implementation o f the new approach, and provide them with technical assistance and adequate funding to carry out this role. An excellent example o f this principle at work can be seen in Borjomi-Kharagauli National Park, where donor funding and WWF technical assistance have been integrated with Georgian enterprise to create an international standard tourism experience.
National Tourism Marketing Authority
10.39 Professional Tourism Promotion. Immediate steps should be taken by the Government to form a National Tourism Marketing Authority. The Authority w i l l have to have the capacity to engage in professional tourism promotion. This w i l l necessitate competitive staffing and salaries, not constrained by public sector salary scales. There wi l l have to be genuine participation by the private sector, especially the main players in accommodation and incoming tour operation.
10.40 might even extend to having it run on a management contract during the evolutionary phase.
Technical Assistance. Technical Assistance w i l l be required to get it o f f the ground and this
Destination Marketing
10.4 1 Brand Image. The priority task o f the new NTA will be to start the process o f developing a brand image o f Georgia as a tourism destination. Targeted media representatives can write publicity and selective Travel Trade familiarization visits can be used to expand the distribution o f Georgian holidays in key markets, The costs o f this activity can be shared with carriers, travel trade and product providers and help should also be forthcoming from GEPA. A National Internet Portal Website should be developed and this should be sales orientated, with an online booking facility.
10.42 Promotional Activities. Init ial promotional activity should include a national brochure, Trade Manual, Map, Video, and Photo library. A national stand should be organized at selected tourism fairs and a program o f sales calls to the Travel Trade organized. The focus should be on niche discovery and adventure operators and the adventure brands o f big operators.
Accommodation
10.43 New Hotels. Every encouragement should be given to the development o f new hotels in centers that currently have no accommodation suitable for international tourists. The best strategy would be to target a pilot region where a comprehensive approach would be taken to getting everything right, such as improving infrastructure, developing things to see and do. For example, if the Kakheti region were chosen, product development could include a wine trail, interpretation o f the heritage town o f Sighnaghi, a motoring tour o f the ecclesiastic sites, development o f cycling touring routes, a tourist information center in Telavi and so on. Prospective investors could be approached pro-actively in association with

Chauter 10. Tourism 104
incoming tour operators who would brief them on the realistic business prospects if appropriate accommodation were made available. I t might also be possible to make a site for a hotel, currently in public ownership, available on attractive terms.
10.44 System of Certijkation. On a nationwide basis a proper system o f Certification/Classification should be initiated, starting with hotels. In view o f past experience it would be desirable that the design and administration o f an appropriate system would be contracted out on a "Management Contract" formula. There are a number o f experienced international firms that provide such a verification service on a commercial basis.
10.45 Standards. Rural tourism accommodation i s starting to be developed, as i s accommodation in private homes in towns and villages. To be saleable to international tourists minimum Standards need to be established urgently, and technical assistance should be provided to do this. A l l information on prices, services and value offered, should be published annually to encourage competition.
Attractions
10.46 Raise Service Quality. A program should be instituted to raise the quality and service at existing tourist attractions. There are some very fine attractions that are not approaching their full potential because o f boring presentation. Such a program should focus on instilling what we could call the "three- Es" in English-Entertainment, Excitement and Education. Rather that dispersing this initiative all over the country it would be best focused initially on a small number o f well-established centers such as TbilisiMtskheta, Sighnaghi and Vardzia.
10.47 New Attractions. There should be scope to develop a small number of new attractions also, focusing on Georgia's distinctive assets o f cultural heritage and nature. A number o f well-resourced World Bank projects have been ongoing, or just starting, in relevant fields and it would be wise to build upon the fruits o f their outputs. The projects in question are:
e Cultural Heritage Project (Concluding 2003, Budget $5,000,000). The project aim i s to improve the management and promotion o f Georgia's rich cultural heritage by testing approaches that could revive the tourism industry.
0 Protected Areas Development Project (Concluding 2004, Budget $8,700,000). The project objective is to conserve Georgian biodiversity through the creation o f three protected areas, in Vashlovani, Lagodekhi, and Tusheti. The project wi l l provide such facilities as interpretation, hiking trails, toilets, accommodation (lodges, campsites), dining, guided nature tours, cycling, and souvenir sales.
e Trans Caucasus Tourism Initiative (Concluding 2003, Budget $1,089,000). The World Bank initiative i s conceived as an instrument to reduce poverty by utilizing the existing cultural and natural heritage assets o f Armenia, Azerbaijan and Georgia in a sustainable manner and develop regional cooperation in tourism. A major focus wi l l be the development o f Ecotourism.
10.48 The World Bank sponsored Georgia Integrated Coastal Management Project is also establishing Kolkheti National Park and Kobuleti Nature Reserve. In addition, at Borjomi-Kharagauli National Park the German Credit Bank for Reconstruction and Development (KWF) have provided $2million for infrastructure, small-scale eco tourism development and training and the work was implemented by The Georgian State Department o f Protected Areas, Nature Reserves and Hunting Economy and WWF for Nature. An extension o f the project is in prospect.

Chapter 10. Tourism 105
Information
10.49 Tourist Information Centre. A Tourist Information Center (TIC) should be established in central Tbilisi right away. It could be similar to the one established in Yerevan recently with help from USAID. I t could become a focus for a process o f assembling a fully-fledged Tourist Information System. This, in turn could be the power behind a new national Internet Website. The TIC might well be headquartered with the new National Tourism Marketing Authority initially. As such, it could also provide a catalyst and a support resource for the new tourism associations and could perform a role in encouraging partnership marketing and producing much-needed literature such as a high quality touring routes map/brochure. Most important o f all, it would send out a strong signal that Georgia was making a determined and professional start on the road to tourism recovery.
Quality
10.50 Hotel Training. A hotel school should be established in Tbilisi as soon as possible. Ideally this should have a regional dimension as it could also respond to similar needs in Armenia and Azerbaijan. Apart from making it easier to achieve a critical mass, the regional approach would build up a useful camaraderie amongst young tourism professionals in the three countries, which would bode well for long- term co-operation. The priorities in the school would be vocational skills - Chefs, Waiting staff, Reception, Housekeeping, Bar, Porters- and Management training, especially marketing. While the school could be quite small initially, it could evolve, in time into a fully-fledged tourism school.
10.5 1 Technical Assistance should be provided for initial teacher training, curriculum development to ensure training i s relevant to the future tourism needs o f the region and planning o f building layout and equipping. Facilities required would include a new training kitchen and restaurant facility and modern, well equipped training rooms.
Technical Assistance.
Donor Co-ordination
10.52 Master Plan For Tourism Programs. From the agenda proposed in this chapter it i s clear that there i s a very long menu for action. Perhaps what i s almost more important than the speed at which it can be delivered i s the requirement that it be coordinated. Donors have been active in tourism in Georgia at one time or another, and the quickest way to make progress would be to support a single co- coordinated effort. The World Bank could lead such a "Master Plan" for funding what needs to be done, in which all donor agencies would take a role. A possible allocation of roles, based on recent donor activity and interest i s set out below.
Eurasia Foundation GTZ TACIS TIKA UNDP USAID World Bank WWF
Rural Tourism Marketing Product development Training Institutional Development Strategic Planning Culture & Heritage Eco-tourism
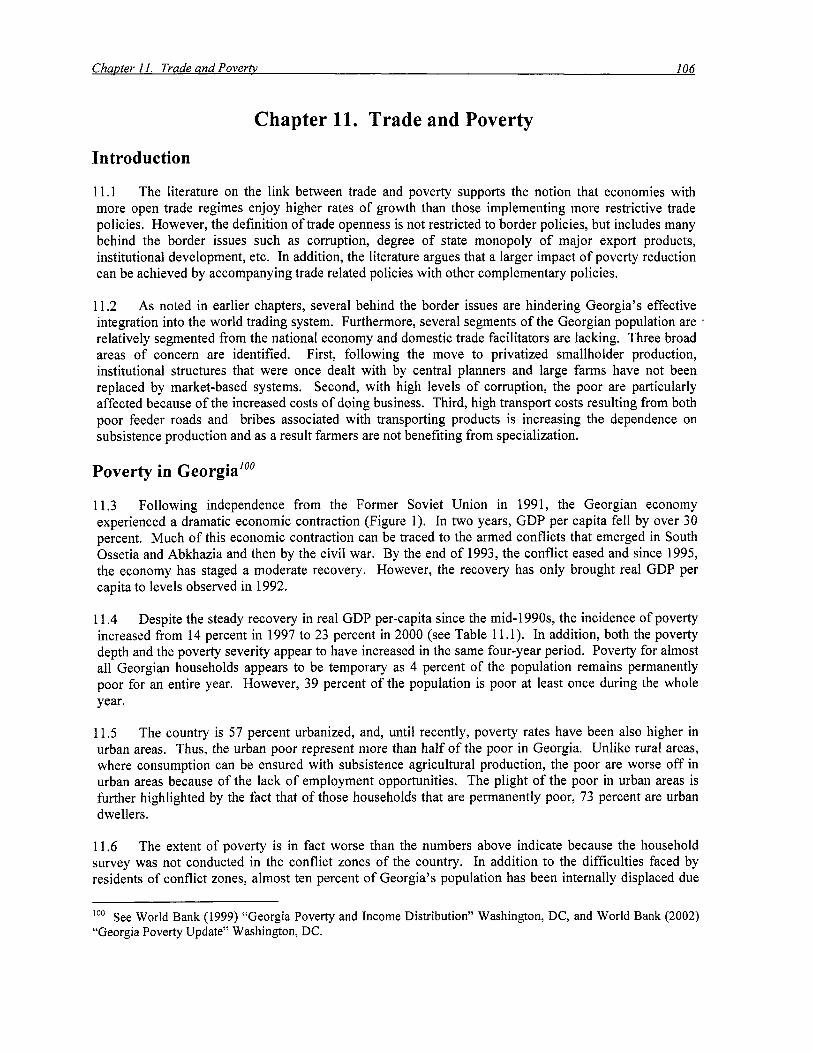
Chapter I I. Trade and Povertv 106
Chapter 11. Trade and Poverty
Introduction
11.1 The literature on the link between trade and poverty supports the notion that economies with more open trade regimes enjoy higher rates o f growth than those implementing more restrictive trade policies. However, the definition o f trade openness i s not restricted to border policies, but includes many behind the border issues such as corruption, degree o f state monopoly o f major export products, institutional development, etc. In addition, the literature argues that a larger impact o f poverty reduction can be achieved by accompanying trade related policies with other complementary policies.
11.2 As noted in earlier chapters, several behind the border issues are hindering Georgia’s effective integration into the world trading system. Furthermore, several segments o f the Georgian population are relatively segmented from the national economy and domestic trade facilitators are lacking. Three broad areas o f concern are identified. First, following the move to privatized smallholder production, institutional structures that were once dealt with by central planners and large farms have not been replaced by market-based systems. Second, with high levels o f corruption, the poor are particularly affected because o f the increased costs o f doing business. Third, high transport costs resulting from both poor feeder roads and bribes associated with transporting products i s increasing the dependence on subsistence production and as a result farmers are not benefiting from specialization.
Poverty in Georgia’”
11.3 Following independence from the Former Soviet Union in 1991, the Georgian economy experienced a dramatic economic contraction (Figure 1). In two years, GDP per capita fe l l by over 30 percent. Much o f this economic contraction can be traced to the armed conflicts that emerged in South Ossetia and Abkhazia and then by the civi l war. B y the end o f 1993, the conflict eased and since 1995, the economy has staged a moderate recovery. However, the recovery has only brought real GDP per capita to levels observed in 1992.
1 1.4 Despite the steady recovery in real GDP per-capita since the mid-l990s, the incidence o f poverty increased from 14 percent in 1997 to 23 percent in 2000 (see Table 11.1). In addition, both the poverty depth and the poverty severity appear to have increased in the same four-year period. Poverty for almost al l Georgian households appears to be temporary as 4 percent o f the population remains permanently poor for an entire year. However, 39 percent o f the population i s poor at least once during the whole year.
11.5 The country i s 57 percent urbanized, and, until recently, poverty rates have been also higher in urban areas. Thus, the urban poor represent more than half o f the poor in Georgia. Unlike rural areas, where consumption can be ensured with subsistence agricultural production, the poor are worse o f f in urban areas because o f the lack o f employment opportunities. The plight o f the poor in urban areas i s further highlighted by the fact that o f those households that are permanently poor, 73 percent are urban dwellers.
11.6 The extent o f poverty i s in fact worse than the numbers above indicate because the household survey was not conducted in the conflict zones o f the country. In addition to the difficulties faced by residents o f conflict zones, almost ten percent o f Georgia’s population has been internally displaced due
loo See World Bank (1999) “Georgia Poverty and Income Distribution” Washington, DC, and World Bank (2002) “Georgia Poverty Update” Washington, DC.

t o conflicts in South Ossetia and Abkhazia and are living in extreme poverty. Many Internally Displaced Persons (IDP) have been in this condition for a decade and have to contend with unemployment, alarmingly poor living conditions, and a lack o f healthcare.
Table 11.1: Change in Poverty between 1997 and 2000 1997 1998 1999 2000 Increase YO
Poverty incidence 0.137 0.198 0.232 0.23 1 68 Poverty depth 0.041 0.066 0.074 0.075 84
Source: World Bank Report No. 22350-GE, Georgia: Poverty Update. Note: The poverty line i s about 55 GEL (USS25)/ month per equivalent adult. Averages o f quarterly data.
Poverty severity 0.019 0.033 0.035 0.036 94
11.7 Non-monetary indicators of poverty also suggest that welfare levels in Georgia are l o w and that households in urban areas are worse o f f than households in rural areas. Almost a third o f Georgians consume less than 1,800 Kca l per day and almost half consume less than 2,100 Kca l per day (Table 1 1.2). The highest calorie deficiencies are seen in Tbilisi and Kvemo Kartli, the two most densely populated regions o f the country, and the lowest deficiency is seen in Javakheti.
Table 11.2: Percent o f Individuals with Calorie Intake Below 1,800 kcaVday 2000 2001 2002 2003
Tbilisi 48 52 63 74 Kvemo Kartli 36 51 52 63 Mtskheta-Mtianeti and Shida Kartli 32 47 48 60 Imereti and Racha-Lechkhumi 30 39 47 57 Ajara AR 28 45 35 53 Kakheti 36 36 47 48 Guria 31 26 40 39
Samtskhe-Javakhet i 37 18 42 25 Source: Table A1 1 in State Department for Statistics of Georgia (2002) "Food Security Situation: Trends and Figures" Tbilisi, Georgia, using Survey of Georgian households (SGHH)
Samegrelo and Zemo SvaneTi 16 23 30 34
Sources of Household Income
11.8 The main sources o f income for Georgian households include: in-kind income (25 percent)-- imputed value o f own production consumed and other non-cash income--, unreported income (30 percent), and wage income (15 percent). Unreported income is defined as the difference between expenditures and incomes in the yearloland may reflect the engagement by household in the shadow economy.
1 1.9 The sources o f income across national quintiles in Georgia indicate that unreported incomes play a significantly bigger role as a source o f income for households in upper quintiles than other households (Figure 1 1. 1).'02
Io' Although this variable can be thought o f as savings or dis-savings, it i s believed that consistent dis-saving, as seen in Georgia cannot occur as they have for the four consecutive survey years. I O 2 The income shares are calculated for households that appear 4 times within the survey year. I n addition, there are small differences in the definitions from the sources o f income listed in the Poverty Assessment and Poverty Update. For instance, in this case, asset sales are not viewed as a source o f income.
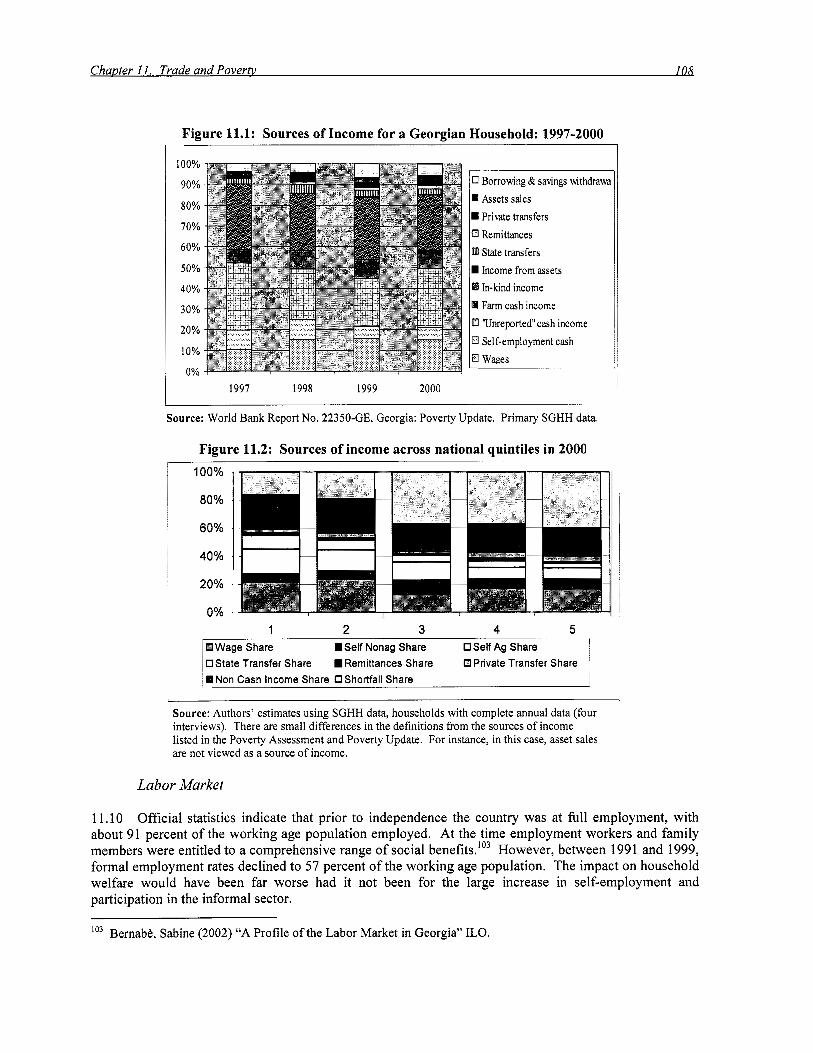
Figure 11.1: Sources of Income for a Georgian Household: 1997-2000
100%
90%
80%
70%
60%
50%
40%
30%
20%
10%
0% 1991 1998 1999 2000
0 Borrowing & savings withdraw H Assets sales
Priwte transfers 0 Remittances BI1 State transfers
Income from assets B In-kind income
Farm cash income C! 'Unreported"cash income a Self-employment cash Q Waees
Source: World Bank Report No. 22350-GE, Georgia: Poverty Update. Primary SGHH data.
Figure 11.2: Sources of income across national quintiles in 2000 100%
80%
60%
40%
20%
0% 1 2 3 4 5
Ill Wage Share OState Transfer Share Remittances Share IBI Private Transfer Share "on Cash Income Share CJShortfall Share
m Self Nonag Share 0 Self Ag Share
Source: Authors' estimates using SGHH data, households with complete annual data (four interviews). There are small differences in the definitions from the sources o f income listed in the Poverty Assessment and Poverty Update. For instance, in this case, asset sales are not viewed as a source o f income.
Labor Market
11.10 Official statistics indicate that prior to independence the country was at full employment, with about 91 percent o f the working age population employed. At the time employment workers and family members were entitled to a comprehensive range of social benefits.Io3 However, between 1991 and 1999, formal employment rates declined to 57 percent o f the working age population. The impact on household welfare would have been far worse had it not been for the large increase in self-employment and participation in the informal sector.
'03 Bernabe, Sabine (2002) "A Profile o f the Labor Market in Georgia" ILO.
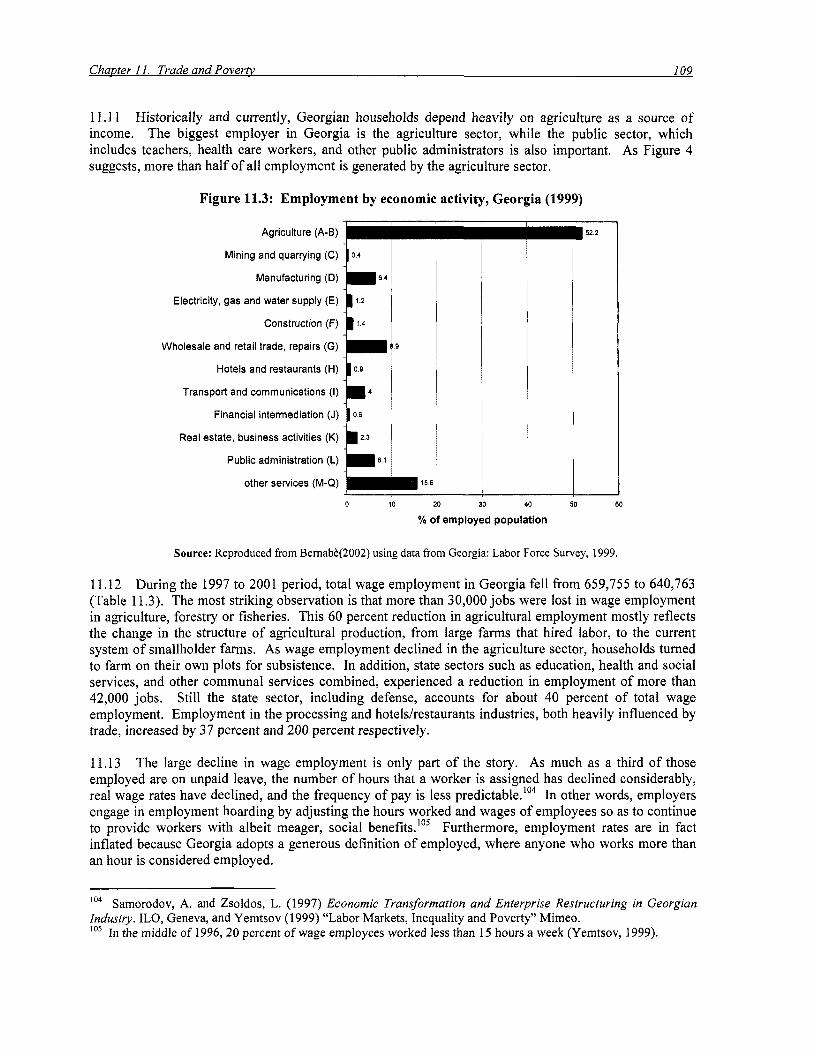
Chapter I I. Trade and Povertv 109
11.1 1 Historically and currently, Georgian households depend heavily on agriculture as a source of income. The biggest employer in Georgia i s the agriculture sector, while the public sector, which includes teachers, health care workers, and other public administrators i s also important. As Figure 4 suggests, more than half of al l employment i s generated by the agriculture sector.
Figure 11.3: Employment by economic activity, Georgia (1999)
Agriculture (A-B)
Mining and quarrying (C) 10.4
Manufacturing (D) = 6.4
Electricity, gas and water supply (E) 1 1 . 2
Construction (F) 1.4
Wholesale and retail trade, repairs (G) = Hotels and restaurants (H) 0.9
Transport and communications (I) - 4
Financial intermediation (J)
Real estate, business activities (K)
Public administration (L) 6.1
other services (M-Q)
9
156
152.2
0 10 20 30 40 50 60
% of employed population
Source: Reproduced from Bernabt(2002) using data from Georgia: Labor Force Survey, 1999.
11.12 During the 1997 to 2001 period, total wage employment in Georgia fe l l from 659,755 to 640,763 (Table 11.3). The most striking observation is that more than 30,000 jobs were lost in wage employment in agriculture, forestry or fisheries. This 60 percent reduction in agricultural employment mostly reflects the change in the structure o f agricultural production, from large farms that hired labor, to the current system o f smallholder farms. As wage employment declined in the agriculture sector, households turned to farm on their own plots for subsistence. In addition, state sectors such as education, health and social services, and other communal services combined, experienced a reduction in employment o f more than 42,000 jobs. St i l l the state sector, including defense, accounts for about 40 percent o f total wage employment. Employment in the processing and hotelshestaurants industries, both heavily influenced by trade, increased by 37 percent and 200 percent respectively.
11.13 The large decline in wage employment i s only part o f the story. As much as a third o f those employed are on unpaid leave, the number o f hours that a worker is assigned has declined considerably, real wage rates have declined, and the frequency o f pay i s less predi~tab1e.I’~ In other words, employers engage in employment hoarding by adjusting the hours worked and wages of employees so as to continue to provide workers with albeit meager, social benefits.”’ Furthermore, employment rates are in fact inflated because Georgia adopts a generous definition o f employed, where anyone who works more than an hour i s considered employed.
I O 4
Industry. ILO, Geneva, and Yemtsov (1999) “Labor Markets, Inequality and Poverty” Mimeo. lo* In the middle o f 1996,20 percent of wage employees worked less than 15 hours a week (Yemtsov, 1999).
Samorodov, A. and Zsoldos, L. (1997) Economic Transformation and Enterprise Restructuring in Georgian

Chapter 11. Trade and Povertv 110
Table 11.3: Georgia: Wage Employment Year AgricultureIForestry Construction Education Finance Healthcare/Social Services HotelsRestaurants International Org Mining Other Communal Services Processing Real Estate Sales and Services related to Sales State MgmdDefense TransportJWarehouseICommunication Utilities Wage Service in Private Household
1997 47,809 19,402
142,42 1 8,191
8 1,568 6,391 1,866
13,165 52,067 55,853 2,014
59,273 78,454 62,880 19,829 7,573
1998 48,670 28,032
137,730 9,608
71,391 9,084 1,591 7,037
62,090 66,300
5,558 63,563 86,389 69,65 1 27,O 15 6,807
1999 37,652 21,614
128,699 1 1,794 82,342 8,610 1,726 5,624
50,566 79,116 16,209 74,457 91,768 56,485 24,096 3,843
694.600
2000 16,252 23,264
130,355 13,119 79,223 14,032
946 4,060
36,996 86,920 22,240 67,42 1
102,569 56,474 27,114 3,709
684.4 18
200 1 17,151 19,274
13 1,476 8,532
65,779 20,120
7,471 2,374
36,412 76,670 16,501 54,566 99,603 62,773 27,145
1,558
640.763 Total - - __.. 659,755 700,s 14 Source: Authors’ estimates based on SGHH.
Internal Market Integration
11.14 The same arguments for integrating a country into the wor ld trading system can be applied to integrating households into the domestic trading system. That is, the gains o f market integration on household income wil l be bigger than the value o f the output sold. However, many Georgians, especially in rural areas, are effectively isolated from the national economy and domestic trade networks are weak or lacking. In fact, it i s estimated that twenty percent o f Georgian rural households do not trade at all.
11.15 Yet, market integration i s an important determinant o f poverty. As shown in Figure X below, there i s a close correlation between the poverty rates for Georgia’s rural population across regions and the extent to which rural residents are l inked to the market (expressed as percentage o f households with land not recording a single transaction selling agricultural products during the whole year o f observation). lo6
See World Bank Forthcoming Poverty Update (2003), Social and Economic Infrastructure in Rural Georgia. 106

Figure 11.4 Poverty among rural landowners and poor markets by regions
Year Rural Quintiles
1997 59 59 62 63 68 1998 50 59 57 61 67 1999 48 57 63 63 70 2000 57 66 70 68 71 200 1 62 69 67 69 72
Poorest Quintile 2 Quintile 3 Quintile 4 Richest
erty
am 0% rur 20% al Ian do 15% wn
rate 25%
Average
63 60 62 67 69
0% -I 1 I I I I I 0 5 10 15 20 25 30
Households not selling any product to all rural landowners, percent
1 1.16 Data analysis conducted for this study found that on average almost two thirds of rural household production i s for self-subsistence (see Table 11.4). In addition, there has been a steady increase in the proportion of self-subsistence between 1997 and 2001. Oddly, there i s an unusual positive relationship between self-subsistence rates and household welfare, i.e., the richer the household the less interaction with markets."' For example, many Georgian households produce and consume a considerable amount o f wine--a relatively high value product-- and appear rich according to the survey information. However, the pattern i s not restricted to wine producers. Why would the richer households devote more resources to subsistence than poorer ones? The explanation may l i e in the methodology used to value non-cash expenditures resulting in inflated expenditures. Another explanation may be that there are constraints for households to further integrate themselves in the market.
1 1.17 It would appear that rural households have incentives to rely on self-subsistence and limit their interactions with markets. In such an environment, there i s a risk that households wil l tend to produce many products and not benefit from returns to specialization. In addition, households that engage in subsistence generally have lower yields, mostly due to low use o f improved seeds, fertilizer and other inputs. Factors that may be hindering the integration o f rural households into the market include: (i) lack
lo' This result holds across all quarters and across all years.
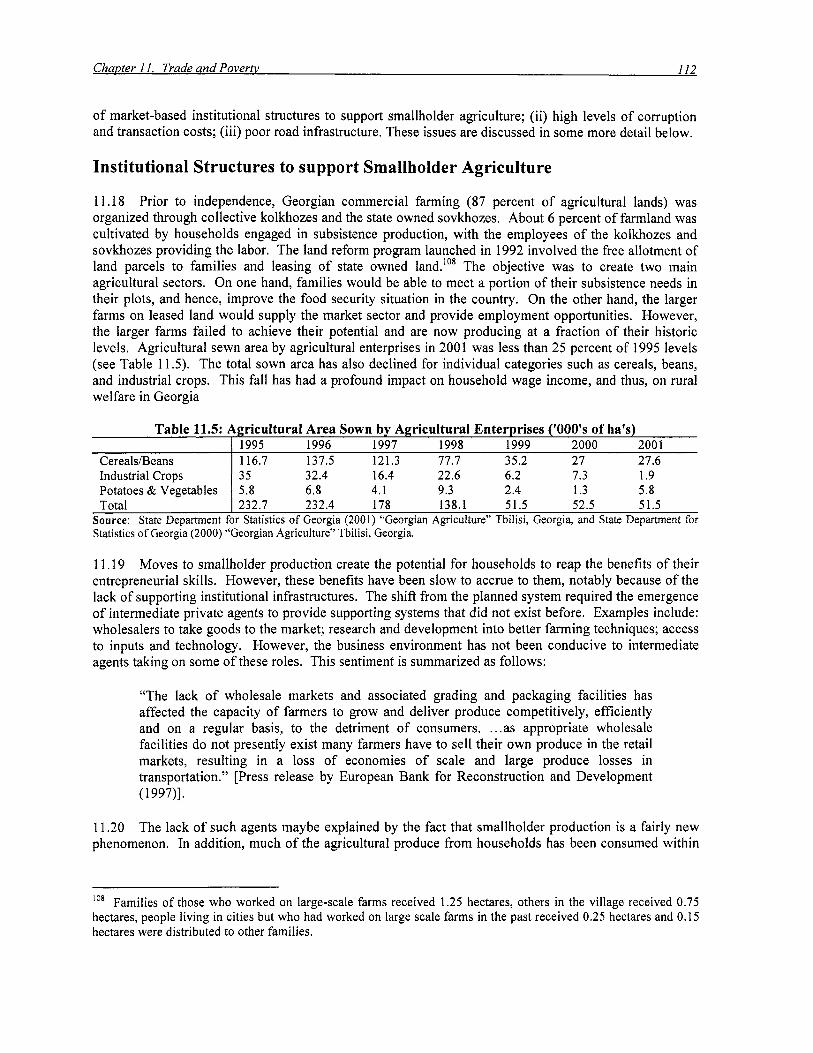
Chapter I I. Trade and Povertv 112
CerealstBeans
Potatoes & Vegetables Total
Industrial Crops
o f market-based institutional structures to support smallholder agriculture; (ii) high levels o f corruption and transaction costs; (iii) poor road infrastructure. These issues are discussed in some more detail below.
1995 1996 1997 1998 1999 2000 200 1 116.7 137.5 121.3 77.7 35.2 27 27.6 35 32.4 16.4 22.6 6.2 7.3 1.9 5.8 6.8 4.1 9.3 2.4 1.3 5.8 232.7 232.4 178 138.1 51.5 52.5 51.5
Institutional Structures to support Smallholder Agriculture
1 1.18 Prior to independence, Georgian commercial farming (87 percent o f agricultural lands) was organized through collective kolkhozes and the state owned sovkhozes. About 6 percent o f farmland was cultivated by households engaged in subsistence production, with the employees o f the kolkhozes and sovkhozes providing the labor. The land reform program launched in 1992 involved the free allotment o f land parcels to families and leasing o f state owned land.lo8 The objective was to create two main agricultural sectors. On one hand, families would be able to meet a portion o f their subsistence needs in their plots, and hence, improve the food security situation in the country. On the other hand, the larger farms on leased land would supply the market sector and provide employment opportunities. However, the larger farms failed to achieve their potential and are now producing at a fraction o f their historic levels. Agricultural sewn area by agricultural enterprises in 2001 was less than 25 percent o f 1995 levels (see Table 11.5). The total sown area has also declined for individual categories such as cereals, beans, and industrial crops. This fall has had a profound impact on household wage income, and thus, on rural welfare in Georgia
1 1.19 Moves to smallholder production create the potential for households to reap the benefits o f their entrepreneurial skills. However, these benefits have been slow to accrue to them, notably because o f the lack o f supporting institutional infrastructures. The shift from the planned system required the emergence o f intermediate private agents to provide supporting systems that did not exist before. Examples include: wholesalers to take goods to the market; research and development into better farming techniques; access to inputs and technology. However, the business environment has not been conducive to intermediate agents taking on some o f these roles. This sentiment i s summarized as follows:
“The lack o f wholesale markets and associated grading and packaging facilities has affected the capacity o f farmers to grow and deliver produce competitively, efficiently and on a regular basis, to the detriment o f consumers. ... as appropriate wholesale facilities do not presently exist many farmers have to se l l their own produce in the retail markets, resulting in a loss o f economies o f scale and large produce losses in transportation.” [Press release by European Bank for Reconstruction and Development (1 997)].
1 1.20 The lack o f such agents maybe explained by the fact that smallholder production i s a fairly new phenomenon. In addition, much o f the a&icultural-produce from households has been consumed within
‘Os Families o f those who worked on large-scale farms received 1.25 hectares, others in the village received 0.75 hectares, people living in cities but who had worked on large scale farms in the past received 0.25 hectares and 0.15 hectares were distributed to other families.

the household without the need for market interaction^.'^^ The land market i s s t i l l primitive, for instance by August o f 1999, only 3,200 sales had taken place. Banks do not view land as a suitable collateral and no cases o f mortgages are yet reported. In such an environment, land consolidations are rare, even when efficiency gains might be made. The lack o f consolidations, together with the failure o f the large farms, i s detrimental to the prospects for generating cash income in rural areas.
1 1.21 As an alternative to land consolidations, farmers can form cooperatives so as to share equipment, to negotiate better prices for produce, and to share risks. In addition, rudimentary futures contracts might be promoted for farmers to lock in prices. Similarly, for individual farmers to find supply links to markets that would maximize profits, there have to be low transaction costs associated with market interaction. However, with the exception o f milk, nuts and grapes, no other farming produce i s being marketed outside local channels.”0
11.22 Market information networks are weak. For instance, current prices in domestic or in foreign markets are not well known, let alone price forecasts; agriculture extension services only serve a small proportion o f farmers; and research and development in agriculture i s not widespread. Information about how to cultivate crops i s usually based on information gleaned from a household members’ past association with a collective farm, where they may have had a limited role. The low use o f agro chemicals can also be attributed to the poor information network in the country, although farmers also cite inability to pay for chemicals as an important reason.”’
Corruption
1 1.23 Corruption levels in Georgia are high. Transparency International’s (TI) Corruption Perception Index (CPI) ranked Georgia at 85 out o f 102 countries in 2002.”* Corruption affects diverse segments o f society, but it has a direct impact on the welfare o f the poor because it increases the price o f public services, lowers its quality and restricts access to markets, and basic public services. Indirectly, corruption has an impact on the poor since it impedes trade, reinforces inequality, and distorts public expenditure a l l~cat ion. ”~ Corruption also creates an environment o f distrust between private agents and public servants. Corruption manifests itself in many areas o f everyday l i f e in Georgia. Interviews with farmers revealed that corrupt police officers, health care professionals, educators, politicians and government workers are common and getting jobs in these areas often involves bribes. For instance, 45 percent o f customs officials pay money to secure their jobs.”4 Corruption affects the welfare o f the poor, through trade related means in three ways: (i) illegal trade across the border; (ii) bribes o f officials to conduct day-to-day business; and (iii) unofficial payments to the police when traveling.
1 1.24 Smuggling i s rampant in Georgia, especially in the conflict regions. Consumer goods, such as o i l products, food, and cigarettes, from Russia enter the country through South Ossetia. Smuggling i s an important source o f income in Abkhazia, where a majority o f the smuggled products (including petrol and
log The true causality i s unknown. It may be that households are not selling their produce because there are no markets or it may be that no markets exist because households are not selling their output. ‘Io Heron, L., R. Lee and M. Winter (200 1) “Georgia Agricultural/Agribusiness Sector Assessment” Prepared for USAID/Georgia. ‘ I1 Farmers that were not well trained in the use o f certain agro chemicals suffered from the inappropriate application o f the chemical. In addition, there are well known instances of poisonous chemicals being passed on to consumers with claims of providing better harvests. ‘I2 T I defines the CPI as a composite index, drawing on 15 different polls and surveys from nine independent institutions carried out among business people and country analysts, including surveys o f residents, both local and expatriate. ‘I3 Teggemann, S. (2002) “Corruption, Poverty and Inequality” World Bank, Washington DC.
World Bank (2000a) “Corruption in Georgia: Survey Evidence”, Report 19276, Washington, DC.

Chauter 11. Trade and Povertv 114
cigarettes) are shipped from Turkey. Similarly, goods are also exported illegally in large volumes to neighboring countries. Smuggled goods exert considerable price pressure on formal importers and domestic producers. As the poor are generally less efficient producers, a fact which contributes to their poverty, illegal imports that are not subject to the regulations and taxes effectively shuts the poor out omp petition.''^ A further problem arises because Armenia and Azerbaijan do not implement a VAT tax.'16 In addition, smuggling reduces fiscal revenue and hence the ability o f government to provide public services. Since the poor are more dependent on public services than the rich, the poor are again disproportionately affected.
1 1.25 Enterprises in Georgia report that officials have to be bribed to conduct day-to-day business. The average firm in Georgia pays 9 percent o f revenues in bribes, with the customs being the largest recipient o f bribes from enterprises. However, corruption disproportionately affects small enterprises. 14 percent o f large enterprises reported paying bribes, while 35 percent o f medium and 46 percent o f small enterprises reported paying bribes.' l7 The disproportionate incidence on the small and medium scale enterprises translates into a disproportionate incidence on the poorer households, because the poor have a higher representation in small and medium scale enterprises.
11.26 At the household level, about 3 percent o f household income is allocated to bribes. Almost 40 percent o f rural households report paying bribes, while less than 20 percent o f urban households report paying bribes. The higher incidence o f bribes in rural areas i s primarily explained by the interactions between farmers and traffic police, who extract payments when farmers travel to markets to sel l their produce."* In fact, a recent survey o f the households, enterprises and public officials in Georgia find that the traffic police are among the worst rated public agencies in the country because they are the predominant recipients of bribes.' l 9 Encounters with traffic police result in households paying bribes a quarter o f the time. Bribes are extorted even from poor households, with one in five poor households in Georgia paying bribes.'20 The impact o f corruption i s in fact higher because the poor may not enter into productive activities that require frequent side payments and may instead choose to increase the proportion of self-produced consumption.
Rural Roads
11.27 Given Georgia's importance to the Soviet Union, for i t s wine, agricultural products, and as a tourist destination, an extensive transportation network exists between Georgia and Russia, and other parts o f the world (See Chapter 4 o f this report). The road density o f 290 km per 1000 sq km suggests a reasonably high road density (see Table 11.6). However, some local roads are generally in very bad condition and are particularly challenging during inclement weather. Similarly, roads of state importance, albeit to a lesser extent, have deteriorated considerably. In addition, terrain is not always easy to navigate through, given that mountains cover 54 percent and highlands cover 33 percent o f the total area.
During the mission, several farmers complained that flour was being smuggled in from Russia. The processing of wheat to flour in Georgia i s subject a 20 percent VAT, while it was claimed that no such tax was levied on Russian producers. 'I6 Heron, et. al. (2001) I" World Bank (2000a)
loaded with produce. ' I 9 Other corrupt agencies are: the customs service, the police, energy companies, and tax authorities I2O World Bank (2000a).
Interviews with farmers suggested that police at checkpoints stop cars based on the extent to which the car i s
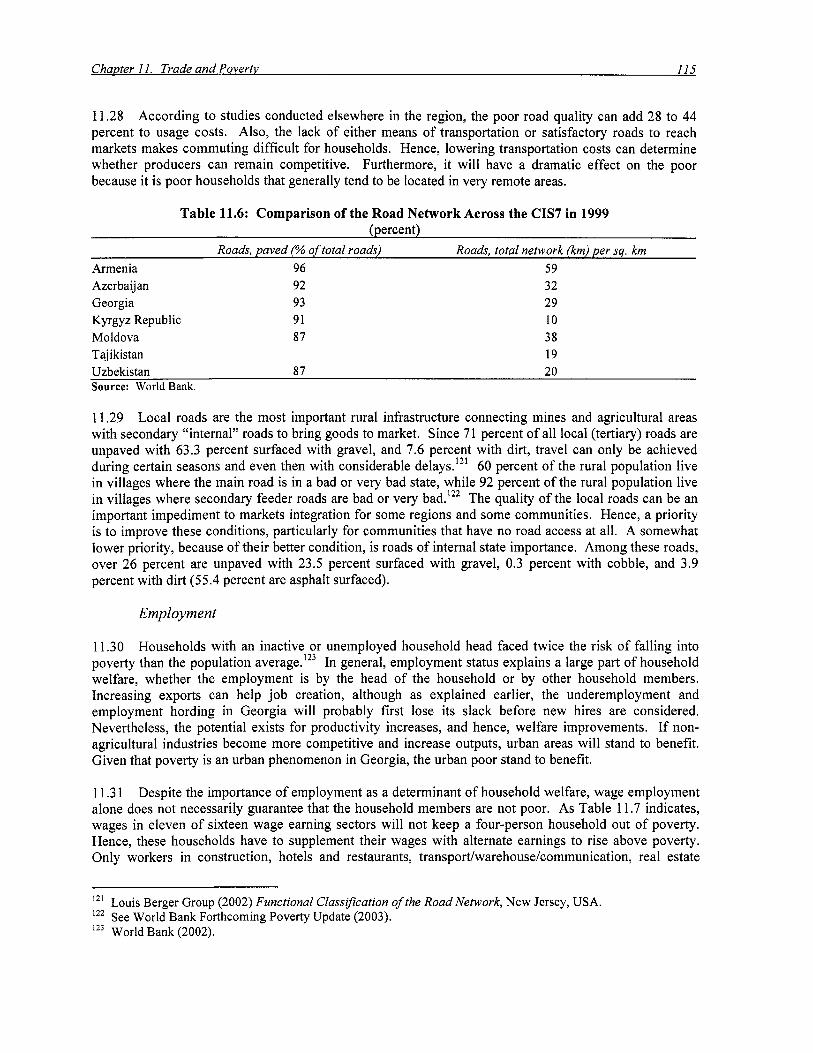
11.28 According to studies conducted elsewhere in the region, the poor road quality can add 28 to 44 percent to usage costs. Also, the lack of either means of transportation or satisfactory roads to reach markets makes commuting difficult for households. Hence, lowering transportation costs can determine whether producers can remain competitive. Furthermore, it wi l l have a dramatic effect on the poor because it i s poor households that generally tend to be located in very remote areas.
Table 11.6: Comparison of the Road Network Across the CIS7 in 1999 (percent)
Roads, paved (96 of total roads) Roads, total network (km) per sq. km Armenia 96 59 Azerbaijan 92 32 Georgia 93 29 Kyrgyz Republic 91 10 Moldova 87 38 Tajikistan 19 Uzbekistan 87 20 Source: World Bank.
1 1.29 Local roads are the most important rural infrastructure connecting mines and agricultural areas with secondary “internal” roads to bring goods to market. Since 7 1 percent o f all local (tertiary) roads are unpaved with 63.3 percent surfaced with gravel, and 7.6 percent with dirt, travel can only be achieved during certain seasons and even then with considerable delays.’21 60 percent o f the rural population live in villages where the main road i s in a bad or very bad state, while 92 percent o f the rural population live in villages where secondary feeder roads are bad or very bad.‘22 The quality o f the local roads can be an important impediment to markets integration for some regions and some communities. Hence, a priority i s to improve these conditions, particularly for communities that have no road access at all. A somewhat lower priority, because of their better condition, i s roads o f internal state importance. Among these roads, over 26 percent are unpaved with 23.5 percent surfaced with gravel, 0.3 percent with cobble, and 3.9 percent with dirt (55.4 percent are asphalt surfaced).
Employment
11.30 Households with an inactive or unemployed household head faced twice the risk of falling into poverty than the population average.’23 In general, employment status explains a large part o f household welfare, whether the employment i s by the head of the household or by other household members. Increasing exports can help job creation, although as explained earlier, the underemployment and employment hording in Georgia wil l probably f irst lose its slack before new hires are considered. Nevertheless, the potential exists for productivity increases, and hence, welfare improvements. If non- agricultural industries become more competitive and increase outputs, urban areas wil l stand to benefit. Given that poverty i s an urban phenomenon in Georgia, the urban poor stand to benefit.
1 1.3 1 Despite the importance o f employment as a determinant o f household welfare, wage employment alone does not necessarily guarantee that the household members are not poor. As Table 11.7 indicates, wages in eleven o f sixteen wage earning sectors wil l not keep a four-person household out o f poverty. Hence, these households have to supplement their wages with alternate earnings to rise above poverty. Only workers in construction, hotels and restaurants, transport/warehouse/communication, real estate
12’ Louis Berger Group (2002) Functional Class$cation of the Road Network, New Jersey, USA. ‘22 See World Bank Forthcoming Poverty Update (2003). 123 World Bank (2002).
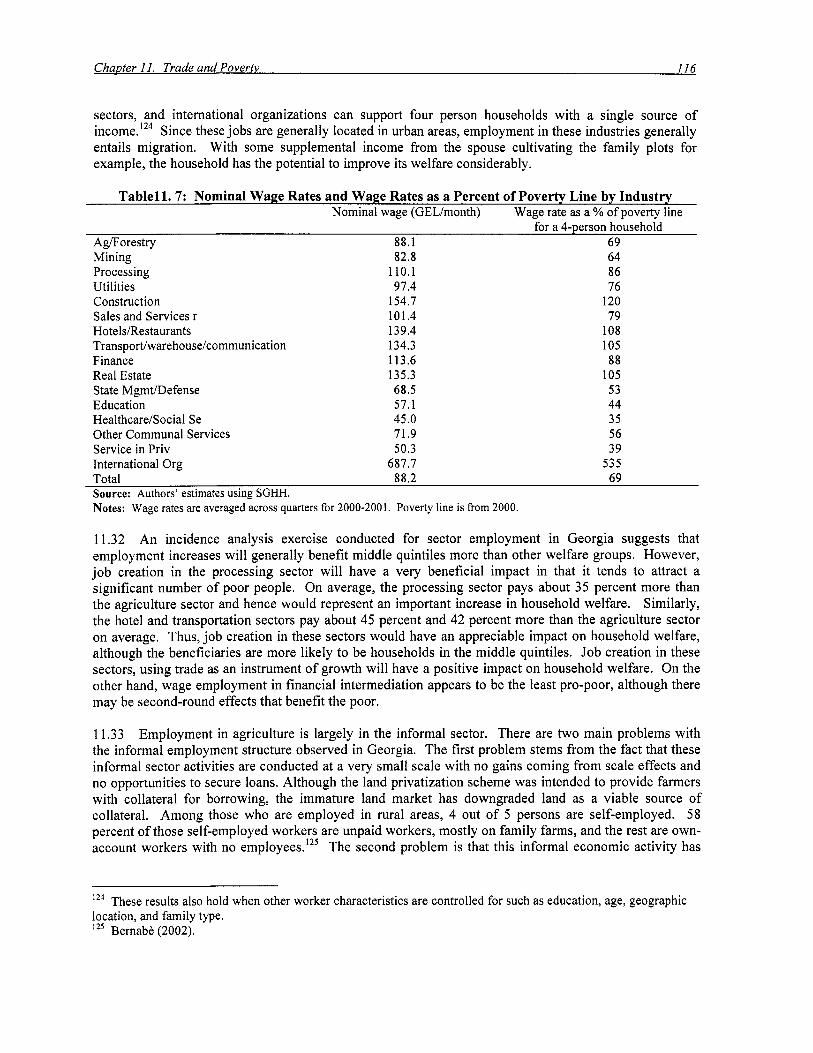
sectors, and international organizations can support four person households with a single source of income.124 Since these jobs are generally located in urban areas, employment in these industries generally entails migration. With some supplemental income from the spouse cultivating the family plots for example, the household has the potential to improve i t s welfare considerably.
Tablell. 7: Nominal Wage Rates and Wage Rates as a Percent of Poverty Line by Industry Nominal wage (GEL/month) Wage rate as a % of poverty line
for a 4-person household AgForestry 88.1 69 Mining 82.8 64 Processing Util i t ies Construction Sales and Services r Hotels/Restaurants Transport/warehouse/communication Finance Real Estate State MgmdDefense Education Healthcare/Social Se Other Communal Services Service in Priv International Org
110.1 97.4
154.7 101.4 139.4 134.3 113.6 135.3 68.5 57.1 45.0 71.9 50.3
687.7
86 76
120 79
108 105 88
105 53 44 35 56 39
535 - Total 88.2 69 Source: Authors’ estimates using SGHH. Notes: Wage rates are averaged across quarters for 2000-2001. Poverty line i s from 2000.
1 1.32 An incidence analysis exercise conducted for sector employment in Georgia suggests that employment increases wi l l generally benefit middle quintiles more than other welfare groups. However, job creation in the processing sector wi l l have a very beneficial impact in that it tends to attract a significant number of poor people. On average, the processing sector pays about 35 percent more than the agriculture sector and hence would represent an important increase in household welfare. Similarly, the hotel and transportation sectors pay about 45 percent and 42 percent more than the agriculture sector on average. Thus, job creation in these sectors would have an appreciable impact on household welfare, although the beneficiaries are more likely to be households in the middle quintiles. Job creation in these sectors, using trade as an instrument o f growth wil l have a positive impact on household welfare. On the other hand, wage employment in financial intermediation appears to be the least pro-poor, although there may be second-round effects that benefit the poor.
11.33 Employment in agriculture i s largely in the informal sector. There are two main problems with the informal employment structure observed in Georgia. The first problem stems from the fact that these informal sector activities are conducted at a very small scale with no gains coming from scale effects and no opportunities to secure loans. Although the land privatization scheme was intended to provide farmers with collateral for borrowing, the immature land market has downgraded land as a viable source o f collateral. Among those who are employed in rural areas, 4 out o f 5 persons are self-employed. 58 percent o f those self-employed workers are unpaid workers, mostly on family farms, and the rest are own- account workers with no employee^.'^^ The second problem is that this informal economic activity has
124 These results also hold when other worker characteristics are controlled for such as education, age, geographic location, and family type. 125 Bernabe (2002).
ChaDter 11. Trade and Povertv 117
little, if any, impact on government tax revenues and hence has litt le impact on the government’s efforts to redistribute incomes or provide public services, both of which tend to benefit the poor.
Conclusion
1 1.34 Prior to independence Georgia traded heavily with the former Soviet Union. It established i tse l f as an exporter o f wine, fruit, tea, and was a popular tourist destination. The early years o f the transition to the market system witnessed a considerable decline in welfare, and an increase in poverty. Market integration is an important determinant o f poverty Addressing widespread corruption wi l l go a long way in facilitating internal and international trade. In addition, complementary measures wil l be needed to encourage domestic trade facilitation if the poor are to benefit. Boosting the agriculture sector i s vital because Georgia has a comparative advantage in this area, and because it wi l l benefit the poor. In addition, alternative sources o f income such as wage employment wi l l be required to help improve welfare levels, especially in urban areas, and encourage the consolidation of farm size needed to facilitate the shift toward commercial agriculture. To this end, the following measures have been identified:
(i) Removing obstacles to market integration, by strengthening rural transport and market infrastructure, promoting rural/farmer organizations, and reining in petty corruption along market routes; Raising the productivity o f rural farmers, by facilitating the propagation and sale o f improved seeds and other planting materials and strengthening advisory services through collaborative public and private sector initiatives Support initiatives to enhance the competitiveness of selected industrieshb-sectors where there is evident growth potential and scope for considerable employment- generation. This i s likely to include several f ields o f agro-processing and tourism.
(ii)
(iii)

Annex 1.1 : Georgia: Gross Domestic Product Structure
Agriculture, Forestry, Fishing
Industry Processing agricultural products by household
Construction Trade Hotels and Restaurants Transport Communications Financial Intermediation Real Estate Operations, etc. General administration, defense
Education Health Care and Social Services Other Services, Culture, Sport, etc. Domestic services Adjustment for F I S I M Ne t Taxes
GDP at market arices
1996
33.2
14.6
5.8
2.5
12.3
1.9
4.5
1.1
0.8
10.0
2.8
2.6
2.1
3 .O
0.5
-0.4
2.9
100
percent) 1997
29.0
13.3
4.9
3.5
10.9
1.9
6.2
1.4
0.9
8.9
3.7
2.7
3.5
3.3
0.4
-0.4
5.8
100
1998
26.7
12.3
4.7
4.6
10.4
1.9
8.9
2.0
1.2
8.4
3.9
2.8
4.5
3.3
0.4
-0.8
4.8
100
1999
24.7
13.0
4.5
3.7
11.5
2.4
9.4
2.5
1.6
7.5
3.5
3.3
4.3
3 .O
0.3
-0.9
5.8
100
2000
20.2
13.6
3.7
3.7
12.7
2.3
11.8
2.5
1.5
7.1
3.4
3.6
5.2
3.3
0.3
-0.9
6.1
100
2001
20.6
12.2
4.5
3.7
12.7
2.9
10.9
2.8
1.8
6.9
3.7
3.6
4.8
2.9
0.2
-0.9
6.7
100
2002 18.3
12.7
4.3
4.5
12.7
3 .O
11.4
3.4
1.7
7.0
3.8
3.9
4.6
2.7
0.1
-1.0
7.0
100
Source: Georgia State Department o f Statistics.

Annex 1.2: Georgia: Index o f Gross Domestic Product, in constant prices
1996 100.0
100.0
100.0
100.0
100.0
100.0
100.0
100.0
100.0
100.0
100.0
100.0
100.0
100.0
100.0 100.0
100
Agriculture, Forestry, Fishing Industry Construction
Trade Hotels and Restaurants
Transport & Communications Financial intermediation
Real Estate Operations, etc.
General administration and defense Education Health care and Social Services
Other Services, Culture, Sport, etc.
Domestic services (=) Gross value added Adjustment for F IS IM
Net Taxes
GDP
1997 103.9
103.5
151.5
102.2
128.1
134.4
172.5
105.5
98.5
100.3
96.2
103.7
98.5
107.3
135.0 225.2
111
/1996=10G
1998 97.0
101.4
204.9
103.9
136.3
200.1
307.2
107.1
107.6
97.3
95.2
114.0
98.3
112.2
359.8 194.8
114
1999 103.7
104.6
160.9
107.8
149.5
211.5
487.3
104.2
100.8
88.0
98.6
108.3
96.5
115.2
478.7 222.9
117
2000 91.3
108.2
167.3
119.4
161.9
238.5
499.5
107.2
101.2
95.2
101.6
117.8
61.8
117.1
532.9 241.6
119
2001 98.8
105.0
176.8
125.8
213.3
242.2
720.4
116.0
97.5
98.6
102.0
108.8
49.2
122.0
652.3 278.6
125
2002 99.6
103.5
221.5
131.3
271.5
261.7
963.9
138.7
99.9
100.2
102.2
109.5
44.4
129.1
1,026.0 293.3
132
Source: Georgia State Department o f Statistics.
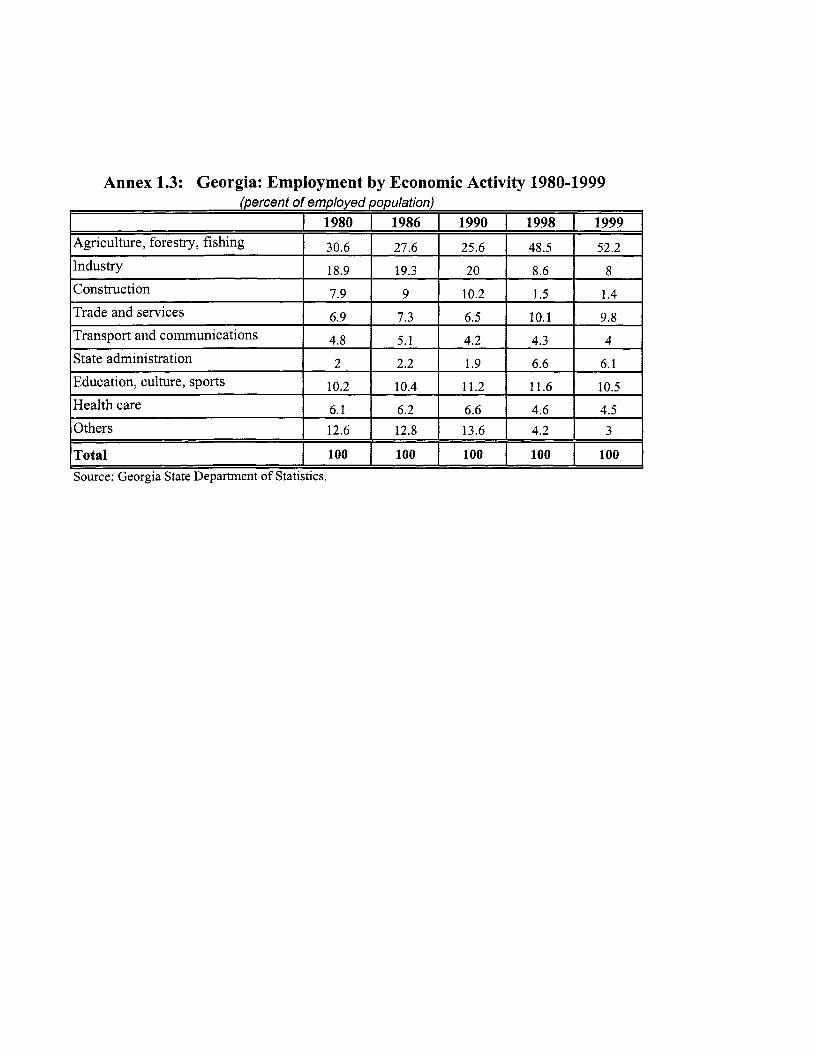
Annex 1.3: Georgia: Employment by Economic Activity 1980-1999
~~
Total 100 100 100 100 100
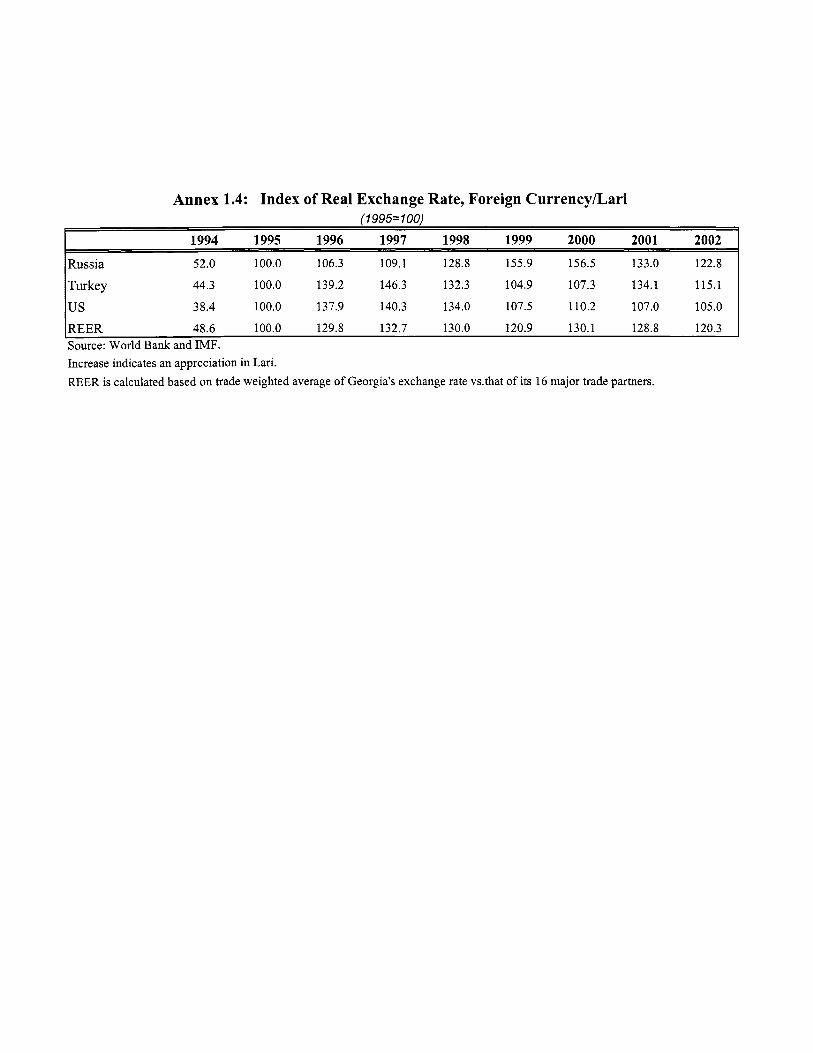
Annex 1.4: Index o f Real Exchange Rate, Foreign Currency/Lari (1995= 100)
1994 1995 1996 1997 1998 1999 2000 2001 2002
Russia 52.0 100.0 106.3 109.1 128.8 155.9 156.5 133.0 122.8
Turkey 44.3 100.0 139.2 146.3 132.3 104.9 107.3 134.1 115.1
us 38.4 100.0 137.9 140.3 134.0 107.5 110.2 107.0 105.0
REER 48.6 100.0 129.8 132.7 130.0 120.9 130.1 128.8 120.3 Source: Wor ld Bank and IMF. Increase indicates an appreciation in Lari. REER is calculated based o n trade weighted average o f Georgia's exchange rate vs.that o f i t s 16 major trade partners.
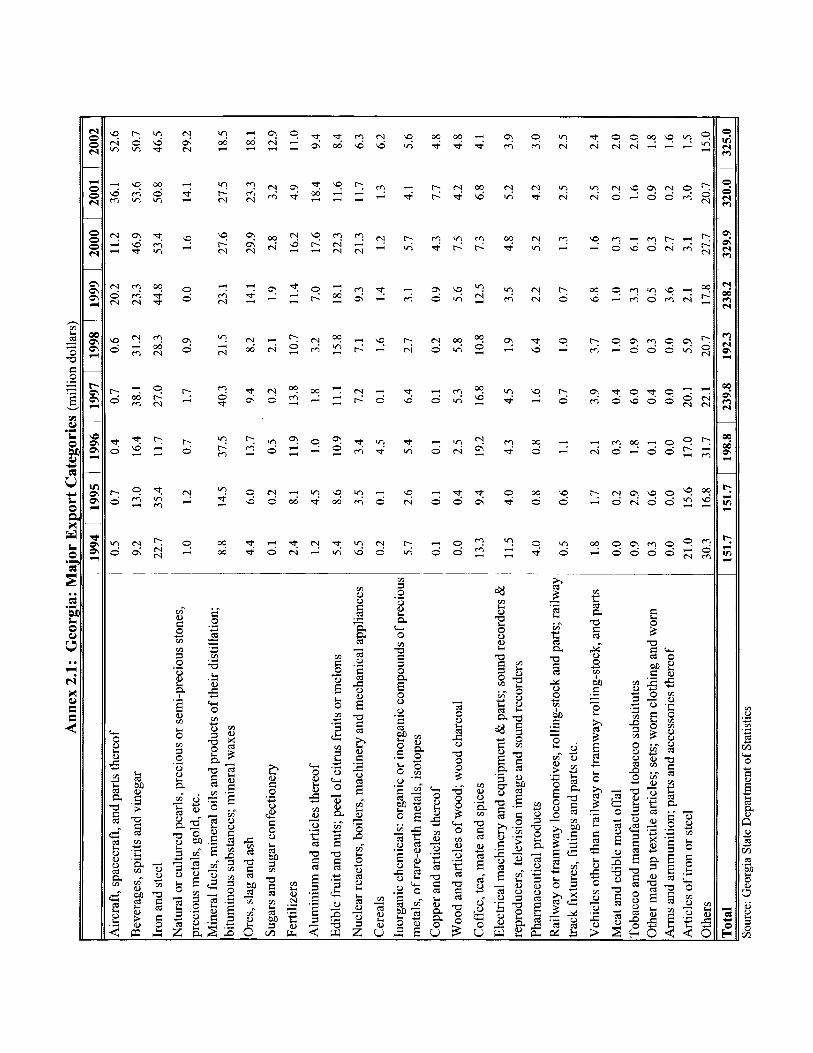
2 m 9 = : 2
2 2 3
2
P r - : 3 3 3 3
c? 3
'9 P el
c ? c ? m - m m
Y CCI m
9 3 5 - f = : z 9 0
B 3
2 3
L i '9 3

2 M
9 2
- 4 09 - 2 o!
m m
'4 2
2
-. vi m
9 8
2
t vi
9 vi W

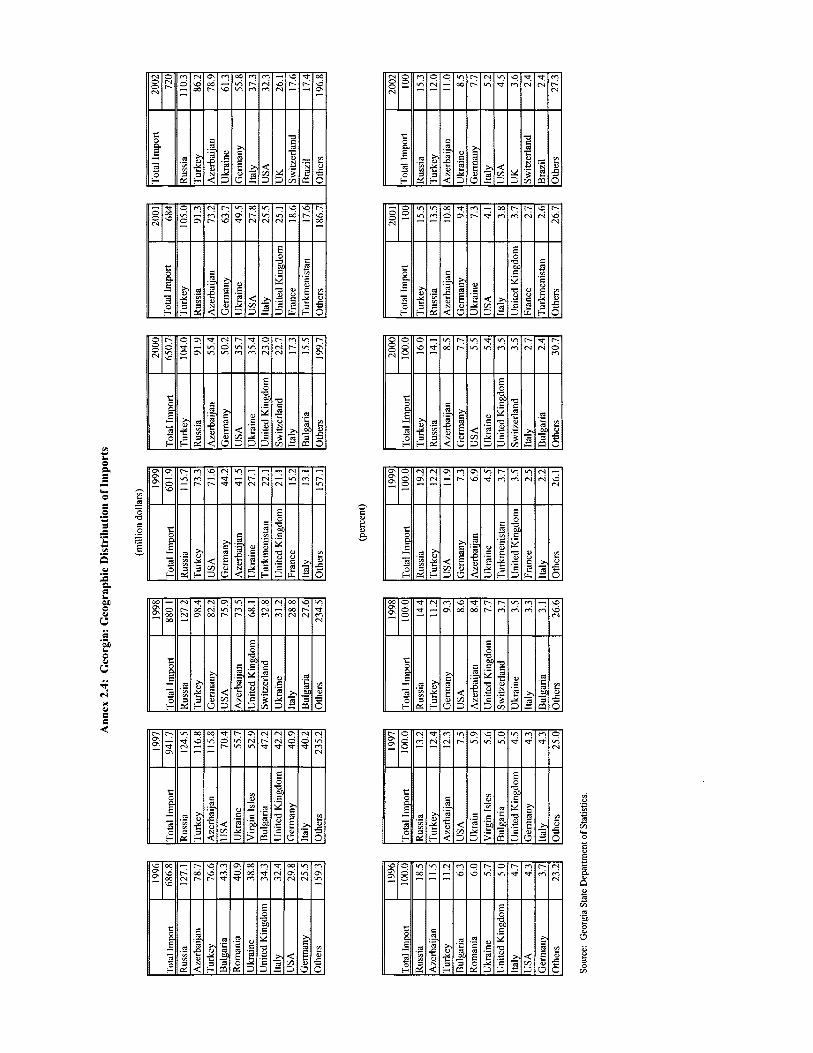

Annex 2.5: Georgia: Exports and Imports by Country Groups (million dollars)
Exports of which:
CIS
I 1994 I 1995 I 1996 I 1997 I 1998 I 1999 I 2000 I 2001 I 2002 151.7 151.7 198.8 239.8 192.3 238.2 329.9 320.0 325.0
115.9 94.7 128.5 137.7 107.2 107.2 132.4 144.4 158.3
OECD EU RSEC
28.1 48.1 51.4 78.0 74.1 103.3 166.8 153.1 143.5 1.4 7.2 16.8 20.1 36.8 49.0 70.4 57.7 59.0
108.4 123.5 147.9 170.9 123.9 131.4 199.0 181.1 165.4
Source: Georgia State Department o f Statistics.
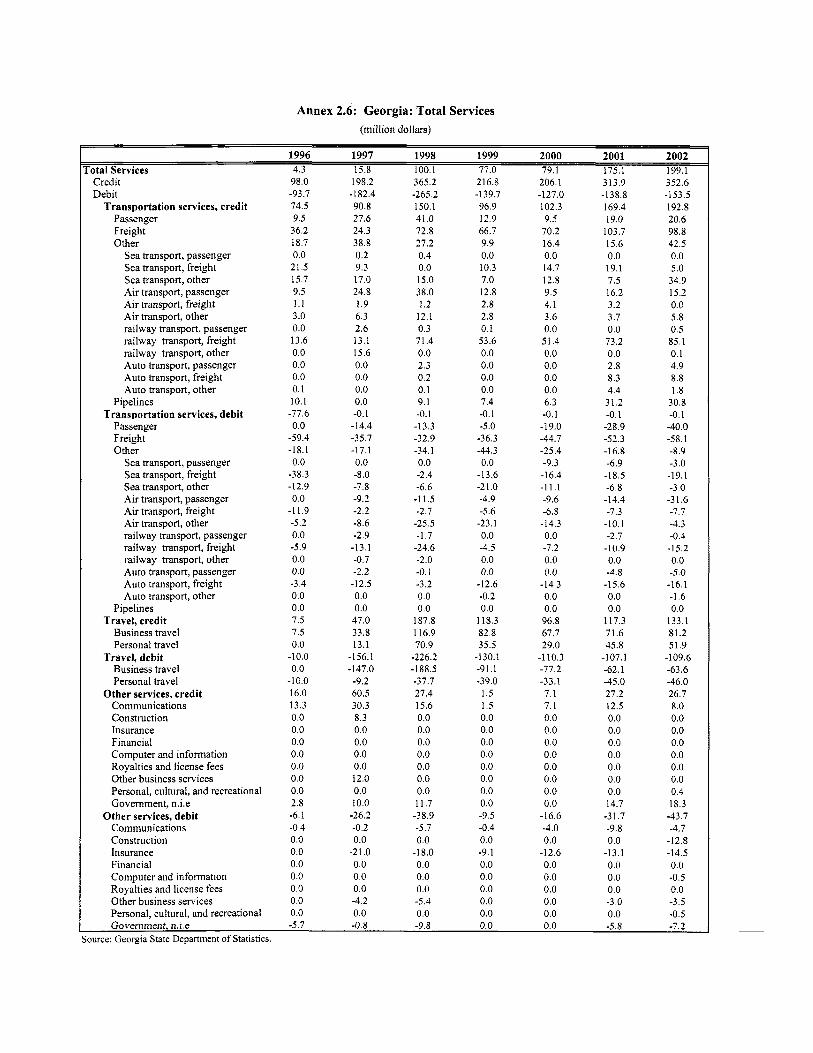
Annex 2.6: Georgia: Total Services (million dollars)
1996 1997 1998 1999 2000 2001 2002 rota1 Services 4.3 15.8 100.1 77.0 79.1 175.1 199.1
Credit Debit
Transportation services, credit Passenger Freight Other
Sea transport, passenger Sea transport, freight Sea transport, other A i r transport, passenger A i r transport, freight Air transport, other railway transport, passenger railway transport, freight railway transport, other Auto transport, passenger Auto transport, freight Auto transport, other
Transportation services, debit Pipelines
Passenger Freight Other
Sea transport, passenger Sea transport, freight Sea transport, other Air transport, passenger Air transport, freight Air transport, other railway transport, passenger railway transport, freight railway transport, other Auto transport, passenger Auto transport, freight Auto transport, other
Pipelines Travel, credit
Business travel Personal travel
Business travel Personal travel
Other services, credit Communications Construction Insurance Financial Computer and information Royalties and license fees Other business services Personal, cultural, and recreational Government, n.i.e
Other services, debit Communications Construction Insurance Financial Computer and information Royalties and license fees Other business services Personal, cultural, and recreational
Travel, debit
98.0 -93.7 74.5 9.5 36.2 18.7 0.0
21.5 15.7 9.5 1.1 3.0 0.0 13.6 0.0 0.0 0.0 0. I 10.1
-77.6 0.0
-59.4 -18.1 0.0
-38.3 -12.9 0.0
-11.9 -5.2 0.0 -5.9 0.0 0.0 -3.4 0.0 0.0 7.5 7.5 0.0
-10.0 0.0
-10.0 16.0 13.3 0.0 0.0 0.0 0.0 0.0 0.0 0.0 2.8 -6.1 -0.4 0.0 0.0 0.0 0.0 0.0 0.0 0.0
198.2
90.8 27.6 24.3 38.8 0.2 9.3 17.0 24.8 1.9 6.3 2.6 13.1 15.6 0.0 0.0 0.0 0.0 -0.1 -14.4 -35.7 -17.1 0.0 -8.0 -7.8 -9.2 -2.2 -8.6 -2.9
-13.1 -0.7 -2.2
-12.5 0.0 0.0
47.0 33.8 13.1
-182.4
-156.1 -147.0
-9.2 60.5 30.3 8.3 0.0 0.0 0.0 0.0 12.0 0.0 10.0
-26.2 -0.2 0.0
-21.0 0.0 0.0 0.0 -4.2 0.0
365.2
150.1 41.0 72.8 27.2 0.4 0.0 15.0 38.0 1.2
12.1 0.3
71.4 0.0 2.3 0.2 0.1 9.1 -0.1
-13.3 -32.9 -34.1 0.0 -2.4 -6.6
-11.5 -2.7 -25.5 -1.7
-24.6 -2.0 -0.1 -3.2 0.0 0.0
187.8 116.9 70.9
-265.2
-226.2 -188.5 -37.7 27.4 15.6 0.0 0.0 0.0 0.0 0.0 0.0 0.0 11.7
-38.9 -5.7 0.0
-18.0 0.0 0.0 0.0 -5.4 0.0
216.8
96.9 12.9 66.7 9.9 0.0 10.3 7.0 12.8 2.8 2.8 0.1 53.6 0.0 0.0 0.0 0.0 7.4 -0.1 -5.0 -36.3 -44.3 0.0
-13.6 -2 1 .o -4.9 -5.6
-23.1 0.0 -4.5 0.0 0.0
-12.6 -0.2 0.0
118.3 82.8 35.5
-130.1 -91.1
1.5 1.5 0.0 0.0 0.0 0.0 0.0 0.0 0.0 0.0 -9.5 -0.4 0.0 -9.1 0.0 0.0 0.0 0.0 0.0
-139.7
-39.0
206.1 -127.0 102.3 9.5
70.2 16.4 0.0 14.7 12.8 9.5 4.1 3.6 0.0
51.4 0.0 0.0 0.0 0.0 6.3 -0.1
-19.0 -44.7 -25.4 -9.3
-16.4 -11.1 -9.6 -6.8
-14.3 0.0 -7.2 0.0 0.0
-14.3 0.0 0.0 96.8 67.7 29.0
-110.3 -77.2
7.1 7.1 0.0 0.0 0.0 0.0 0.0 0.0 0.0 0.0
-16.6 -4.0 0.0
-12.6 0.0 0.0 0.0 0.0 0.0
-33.1
313.9
169.4 19.0
103.7 15.6 0.0 19.1 7.5 16.2 3.2 3.7 0.0 73.2 0.0 2.8 8.3 4.4
31.2 -0.1
-28.9 -52.3
-138.8
-16.8 -6.9
-18.5 -6.8
-14.4 -7.3 -10.1 -2.7
-10.9 0.0 -4.8
-15.6 0.0 0.0
117.3 71.6 45.8
-107.1 -62.1
27.2 12.5 0.0 0.0 0.0 0.0 0.0 0.0 0.0 14.7
-31.7 -9.8 0.0
-13.1 0.0 0.0 0.0 -3.0 0.0
-45.0
352.6
192.8 20.6 98.8 42.5 0.0 5.0
34.9 15.2 0.0 5.8 0.5 85.1 0.1 4.9 8.8 1.8
30.8 -0.1
-40.0 -58.1 -8.9
-19.1
-153.5
-3.0
-3.0 -3 1.6 -7.7 -4.3 -0.4
-15.2 0.0 -5.0 -16.1 -1.6 0.0
133.1 81.2 51.9
-109.6 -63.6 -46.0 26.7 8.0 0.0 0.0 0.0 0.0 0.0 0.0 0.4 18.3 -43.7 -4.7
-12.8 -14.5 0.0 -0.5 0.0 -3.5 -0.5
Government, n.i.e -5.7 -0.8 -9.8 0.0 0.0 -5.8 -7.2 Source: Georgia State Department of Statistics.

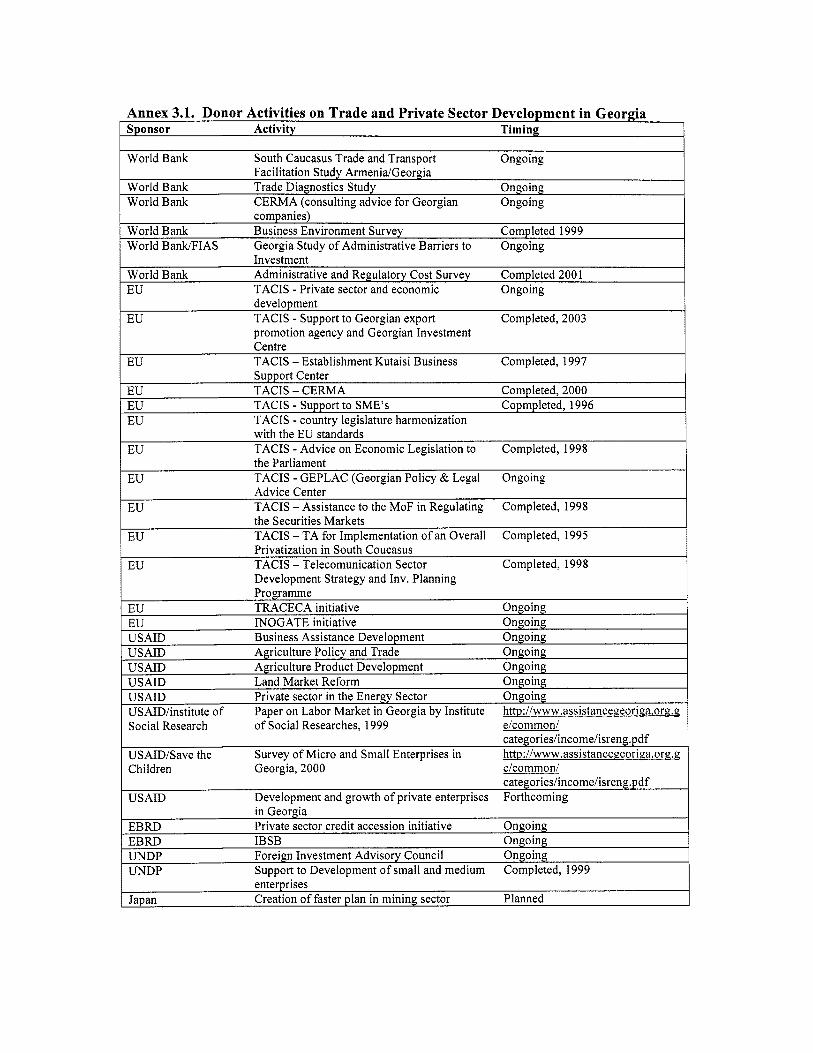
Annex 3.1. Donor Activities on Trade and Private Sector Development in Georgia Sponsor Activity Timing
World Bank South Caucasus Trade and Transport Ongoing
World Bank Trade Diagnostics Study Ongoing World Bank CERMA (consulting advice for Georgian Ongoing
Facilitation Study Armenia/Georgia
companies) World Bank Business Environment Survey Completed 1999 World Bank/FIAS Georgia Study o f Administrative Barriers to Ongoing
Investment World Bank Administrative and Regulatory Cost Survey Completed 2001 EU TACIS - Private sector and economic Ongoing
development
promotion agency and Georgian Investment Centre
EU TACIS - Support to Georgian export Completed, 2003
EU TACIS - Establishment Kutaisi Business Completed, 1997 Support Center
EU TACIS - CERMA Completed, 2000 EU TACIS - Support to SME’S Copmpleted, 1996 EU TACIS - country legislature harmonization
with the EU standards EU TACIS - Advice on Economic Legislation to Completed, 1998
the Parliament EU TACIS - GEPLAC (Georgian Policy & Legal Ongoing
Advice Center TACIS - Assistance to the MoF in Regulating EU Completed, 1998 the Securities Markets TACIS - TA for Implementation of an Overall EU Completed, 1995 Privatization in South Coucasus
EU TACIS - Telecomunication Sector Completed, 1998 Development Strategy and Inv. Planning Programme
EU TRACECA initiative Ongoing EU INOGATE initiative Ongoing USAID Business Assistance Development Ongoing USAID Agriculture Policy and Trade Ongoing USAID Agriculture Product Development Ongoing USAID Land Market Reform Ongoing USAID Private sector in the Energy Sector Ongoing USAID/institute of Paper on Labor Market in Georgia by Institute htto:/lwww.assistanceaeori~a.orp.g Social Research o f Social Researches, 1999 elcommonl
categories/income/isreng.pdf USAID/Save the Survey of Micro and Small Enterprises in htto:l/www,assistancegeoriea.org.~ Children Georgia, 2000 eicommonl
categories/income/isreng.pdf USAID Development and growth o f private enterprises Forthcoming
in Georgia EBRD Private sector credit accession initiative Ongoing EBRD IBSB Ongoing UNDP Foreign Investment Advisory Council Ongoing UNDP Support to Development o f small and medium Completed, 1999
enterprises Japan Creation o f faster plan in mining sector Planned

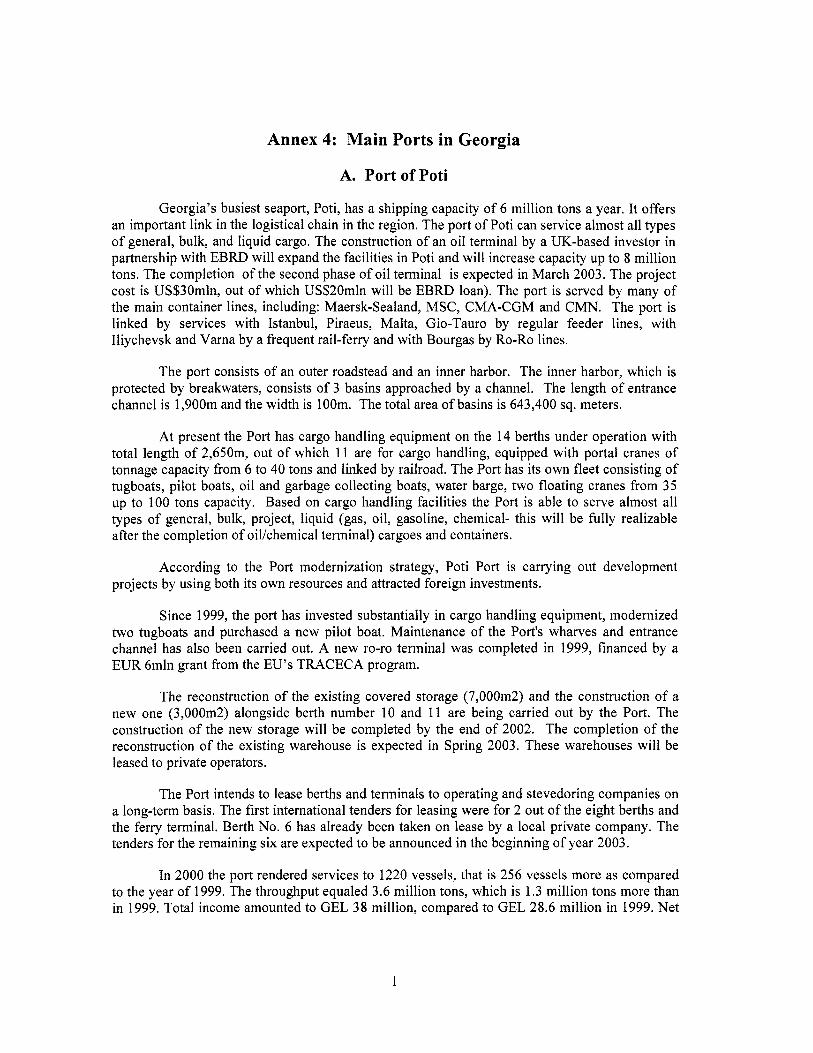
Annex 4: Main Ports in Georgia
A. Port of Poti
Georgia’s busiest seaport, Poti, has a shipping capacity o f 6 million tons a year. It offers an important link in the logistical chain in the region. The port o f Poti can service almost all types o f general, bulk, and liquid cargo. The construction o f an oi l terminal by a UK-based investor in partnership with EBRD wi l l expand the facilities in Poti and wil l increase capacity up to 8 million tons. The completion o f the second phase o f oi l terminal i s expected in March 2003. The project cost i s US$3Omln, out o f which US$20mln wil l be EBRD loan). The port i s served by many o f the main container lines, including: Maersk-Sealand, MSC, CMA-CGM and CMN. The port i s linked by services with Istanbul, Piraeus, Malta, Gio-Tauro by regular feeder lines, with Iliychevsk and Varna by a frequent rail-ferry and with Bourgas by Ro-Ro lines.
The port consists o f an outer roadstead and an inner harbor. The inner harbor, which is protected by breakwaters, consists o f 3 basins approached by a channel. The length o f entrance channel i s 1,900m and the width i s 100m. The total area o f basins is 643,400 sq. meters.
At present the Port has cargo handling equipment on the 14 berths under operation with total length o f 2,65Om, out o f which 11 are for cargo handling, equipped with portal cranes o f tonnage capacity from 6 to 40 tons and linked by railroad. The Port has its own fleet consisting o f tugboats, pilot boats, oil and garbage collecting boats, water barge, two floating cranes from 35 up to 100 tons capacity. Based on cargo handling facilities the Port is able to serve almost all types of general, bulk, project, liquid (gas, oil, gasoline, chemical- this wi l l be fully realizable after the completion of oikhemical terminal) cargoes and containers.
According to the Port modernization strategy, Poti Port i s carrying out development projects by using both i t s own resources and attracted foreign investments.
Since 1999, the port has invested substantially in cargo handling equipment, modernized two tugboats and purchased a new pilot boat. Maintenance of the Port’s wharves and entrance channel has also been carried out. A new ro-ro terminal was completed in 1999, financed by a EUR 6mln grant from the EU’s TRACECA program.
The reconstruction o f the existing covered storage (7,000m2) and the construction o f a new one (3,000m2) alongside berth number 10 and 11 are being carried out by the Port. The construction o f the new storage wi l l be completed by the end of 2002. The completion o f the reconstruction o f the existing warehouse i s expected in Spring 2003. These warehouses wi l l be leased to private operators.
The Port intends to lease berths and terminals to operating and stevedoring companies on a long-term basis. The f i rst international tenders for leasing were for 2 out o f the eight berths and the ferry terminal. Berth No. 6 has already been taken on lease by a local private company. The tenders for the remaining six are expected to be announced in the beginning o f year 2003.
In 2000 the port rendered services to 1220 vessels, that i s 256 vessels more as compared to the year of 1999. The throughput equaled 3.6 million tons, which i s 1.3 million tons more than in 1999. Total income amounted to GEL 38 million, compared to GEL 28.6 million in 1999. Net
1

profit in 2000 amounted to GEL 9.7 million. Profitability was slightly lower in 2001, but overall, the port i s very profitable. (Table 7 and 8)
1999
Table 4.A1: Statistical data for the Port of Poti in 1999-2001 Unit 1999 2000 2001
Income Thousand GEL 28,569 38,088 35,523 Expenditures Thousand GEL 20,844 28,342 28,950 Revenues (balance) Thousand GEL 7,725 9,746 6,573 Profitability ratio Percent 37 34 23 Number o f Employees 2,606 2,681 2,754 Average salary per empl. GEL/month 141 177 178
Source: Questionnaire responses, The Port o f Poti.
2000 2001 2002 (10)
Table 4 . N : Turnover of Poti Port 1999-2002
Source: Port administration. * The capacity will double after the completion of new terminal facilities.
The overall port capacity i s not fully utilized (in average 50 percent) , but in some specific segments, such as containerized and general cargo , capacity and handling speed are too limited to offer good services.
Transit traffc o f Poti port accounts for more than halve o f the total turnover. Actual figures can be even higher since some o f the cargo i s imported to Georgia and then redistributed. The portion o f Armenia and Azerbaijan represents more than 80 percent o f the transit. (See Table 4.A3.)
2
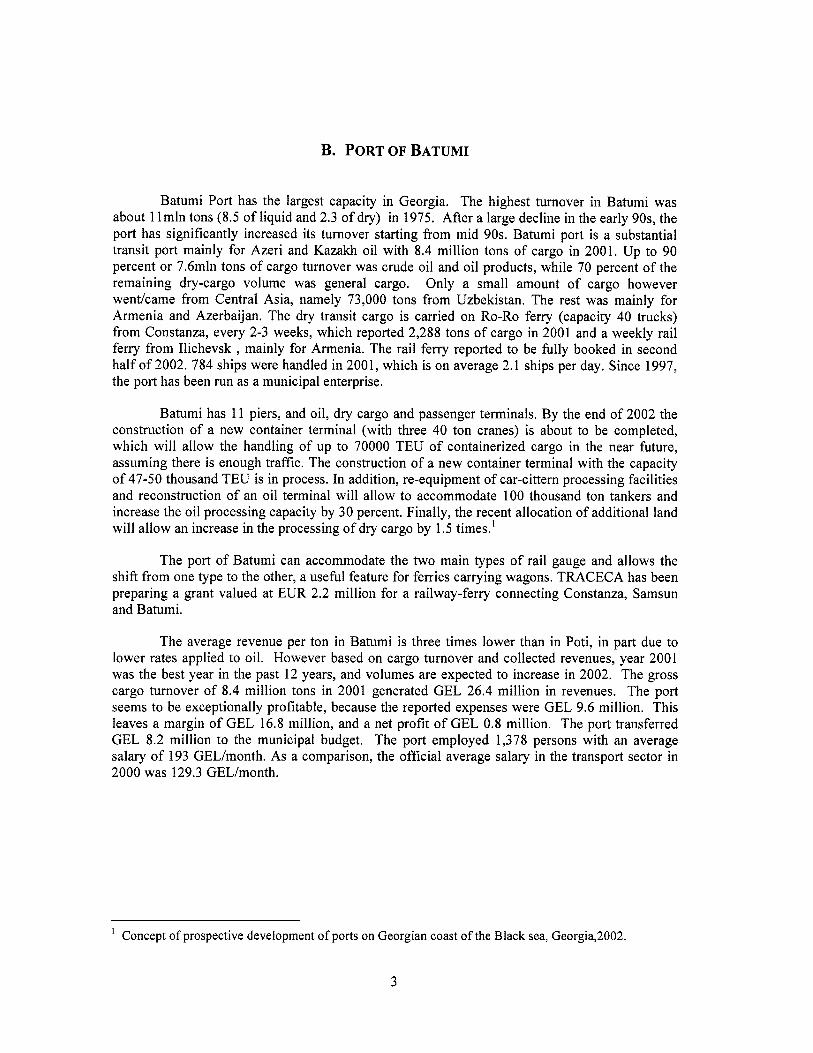
B. PORT OF BATUMI
Batumi Port has the largest capacity in Georgia. The highest turnover in Batumi was about 1 lmln tons (8.5 o f liquid and 2.3 o f dry) in 1975. After a large decline in the early 90s, the port has significantly increased i t s turnover starting from mid 90s. Batumi port i s a substantial transit port mainly for Azeri and Kazakh oil with 8.4 million tons of cargo in 2001. Up to 90 percent or 7.6mln tons of cargo turnover was crude oil and oi l products, while 70 percent o f the remaining dry-cargo volume was general cargo. Only a small amount o f cargo however went/came from Central Asia, namely 73,000 tons from Uzbekistan. The rest was mainly for Armenia and Azerbaijan. The dry transit cargo i s carried on Ro-Ro ferry (capacity 40 trucks) from Constanza, every 2-3 weeks, which reported 2,288 tons o f cargo in 2001 and a weekly rail ferry from Ilichevsk , mainly for Armenia. The rail ferry reported to be fully booked in second half o f 2002. 784 ships were handled in 2001, which i s on average 2.1 ships per day. Since 1997, the port has been run as a municipal enterprise.
Batumi has 11 piers, and oil, dry cargo and passenger terminals. By the end of 2002 the construction of a new container terminal (with three 40 ton cranes) i s about to be completed, which wil l allow the handling o f up to 70000 TEU o f containerized cargo in the near future, assuming there i s enough traffic. The construction of a new container terminal with the capacity o f 47-50 thousand TEU i s in process. In addition, re-equipment o f car-cittern processing facilities and reconstruction of an oi l terminal wi l l allow to accommodate 100 thousand ton tankers and increase the oi l processing capacity by 30 percent. Finally, the recent allocation o f additional land wi l l allow an increase in the processing o f dry cargo by 1.5 times.'
The port o f Batumi can accommodate the two main types o f rail gauge and allows the shift from one type to the other, a useful feature for ferries carrying wagons. TRACECA has been preparing a grant valued at EUR 2.2 million for a railway-ferry connecting Constanza, Samsun and Batumi.
The average revenue per ton in Batumi i s three times lower than in Poti, in part due to lower rates applied to oil. However based on cargo turnover and collected revenues, year 2001 was the best year in the past 12 years, and volumes are expected to increase in 2002. The gross cargo turnover o f 8.4 million tons in 2001 generated GEL 26.4 million in revenues. The port seems to be exceptionally profitable, because the reported expenses were GEL 9.6 million. This leaves a margin o f GEL 16.8 million, and a net profit o f GEL 0.8 million. The port transferred GEL 8.2 million to the municipal budget. The port employed 1,378 persons with an average salary o f 193 GEL/month. As a comparison, the official average salary in the transport sector in 2000 was 129.3 GEL/month.
Concept o f prospective development o f ports on Georgian coast o f the Black sea, Georgia,2002. 1
3

Attachment 4.1. Map of Existing and Proposed Pipelines.
TCDD SEUEKESf Setwork of TCDD
4
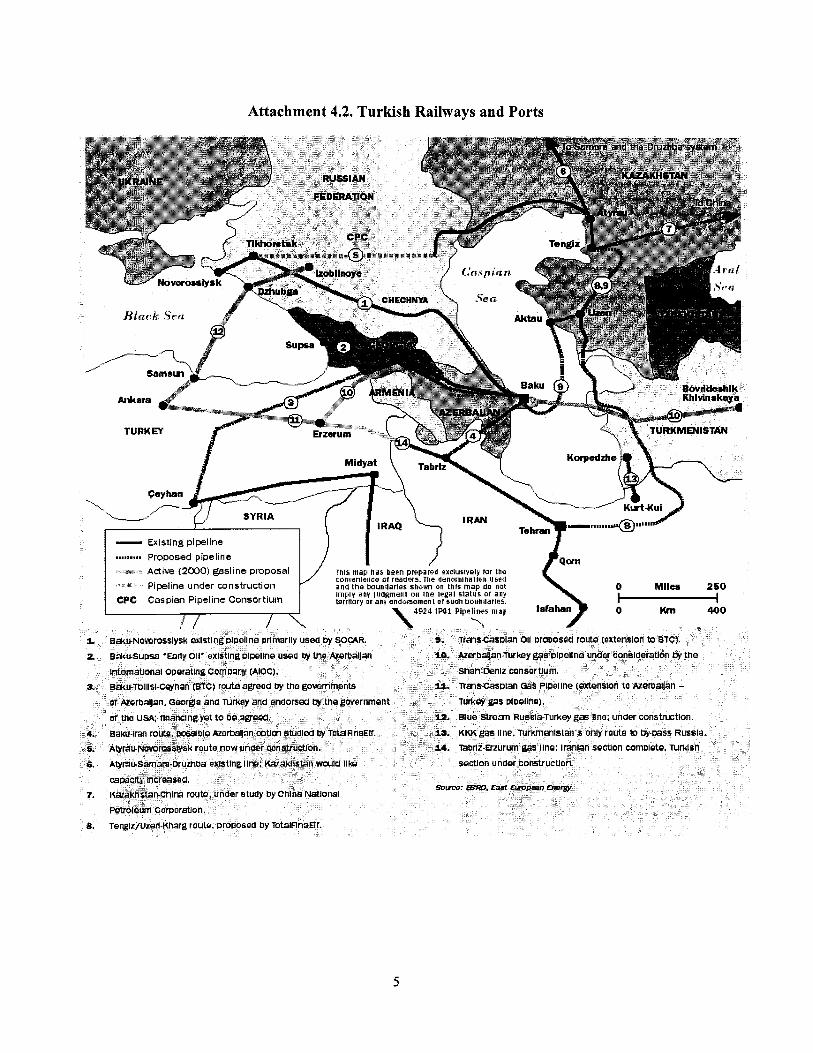
Attachment 4.2. Turkish Railways and Ports
TURKEY
MIlaa 290 tne legal sbtus 61 any en1 u r ~ u c h boundaries. 25 IF01 Pipelines map ISfa
5


Annex 5. Export Credit Agencies
Export Credit Agencies (ECAs) are highly specialized financial institutions that currently cover about $800 billion o f export per year or 12.5 percent o f total world trade. ECAs provide loans, guarantees, insurance, and related technical assistance, which are used to support export sales. In order to fund these activities, they obtain financing from both domestic and international sources that are then on-lent to their exporters.
As o f 2000, ninety-nine countries in the world had formal export promotion agencies. However, the performance o f ECAs in different countries has varied. While the experience in many countries has demonstrated that ECAs can be successful, there are also ample examples of poorly performing institutions. Before the government proceeds with establishing such an entity, due assessment should be made o f the demand for such entity to ensure i t s sustainability. Successful ECAs have few important factors in common:
The management of the entity is protected from political pressures but has support o f the government. The right expertise i s recruited at usually high compensation rates. The operational procedures are designed to ensure adequate due diligence i s done on each facility for each client. The fee structure i s adequate to provide for enough funds to cover operational cost as well as to accumulate additional reserve funds. Adequate capital i s secured for the institutions to ensure claims are paid on time and losses likely to be incurred by ECA during the f i rst years o f operations are covered. The required capital could be as high as US$3-4 million for countries like Georgia. Demand for export and import is high enough to justify establishment o f such an entity and to ensure satisfactory impact on exports and the overall economy. ECAs do not compete with local financial institutions and distort the market; instead they work and collaborate with local and international financial institutions. Aggressive marketing is in place.
ECAs provide number o f different types o f loans, guarantees and insurance programs to support exporting companies including:
1. Working Capital Facility
The purpose o f the Working Capital Facility i s to provide working capital to countries exporting enterprises. This i s to be achieved either by providing loans or by guaranteeing loans provided by banks. Where possible, loans wi l l be tied to specific export orders and secured and liquidated by the proceeds o f those export orders.
The Working Capital Facilities are designed according to the following principles: (i) adaptability o f the facilities to the changeable needs in terms o f liquidity o f the local banking system in providing working capital funds to exporters and; (ii) partnership, not competition, with local banks and/or foreign banks in: (a) financing eligible exporters, (b) sharing credit risk on exporters, and (c) sharing the security o f export cash flows and fixed and other assets of the exporter.
Where ECAs provides loans, the loans are to eligible banks for on-lending for working capital to exporting enterprises or loans by ECAs directly to exporting enterprises for a portion of the enterprises working capital requirements with the remaining portion being provided again as a direct loan to the enterprises by a local bank.
ECAs can also provide guarantee up to 70 percent o f the risk on an enterprise. ECAs would not automatically offer 70 percent cover, but would assess the needs o f each case, and establish the maximum percentage of cover based on the assessment o f the risk and the needs o f the exporter.
The part o f a working capital loan that i s funded and guaranteed by ECAs could be zero risk weighted on the balance sheet of the eligible bank.
2. Export Performance Insurance Facility
Exporter performance insurance i s an indemnity in favor o f a bank guaranteeing an overseas buyer according to which an enterprise contracting to supply goods and/or services to the buyer wi l l perform the obligations contained in that contract. Documentation under the facility includes a counter indemnity provided by the exporting enterprise to the guaranteeing bank under which the exporter agrees to indemnify the guaranteeing bank against loss arising from payment under i t s guarantee. A claim i s payable under the insurance if payment i s made under the guarantee and the exporter fails to reimburse the guaranteeing bank under i ts counter indemnity.
3. Credit Insurance Facility
Credit insurance i s an indemnity to a seller against loss arising from the failure o f a buyer to pay for goods sold and delivered or services rendered to that buyer in circumstances where the insured seller i s not in default under the terms o f its contract to supply the goods or render the services.
4. Political Risk Insurance Facility
Insurance policies covering certain-non-commercial r isks wi l l be issued to foreigners having financial exposure in the country in relation to trade transactions that are associated with a productive activity. Usually applications for insurance policies wil l be submitted to ECAs, which wi l l process the applications according to the rules, eligibility criteria, and procedures spell out in an Operations Manual. Those applications that are eligible wil l be dealt with and submitted to a private insurance syndicate, which wi l l issue insurance policies according to pre-agreed arrangements.
2