Integrated Soil Management on Sandy Soils for Sustainable ...
26
Integrated Soil Management on Sandy Soils for Sustainable Agriculture Masterclass 11, Wageningen Soil Conference Vredepeel, The Netherlands, 28 August 2019 Janjo de Haan
-
Upload
khangminh22 -
Category
Documents
-
view
2 -
download
0
Transcript of Integrated Soil Management on Sandy Soils for Sustainable ...
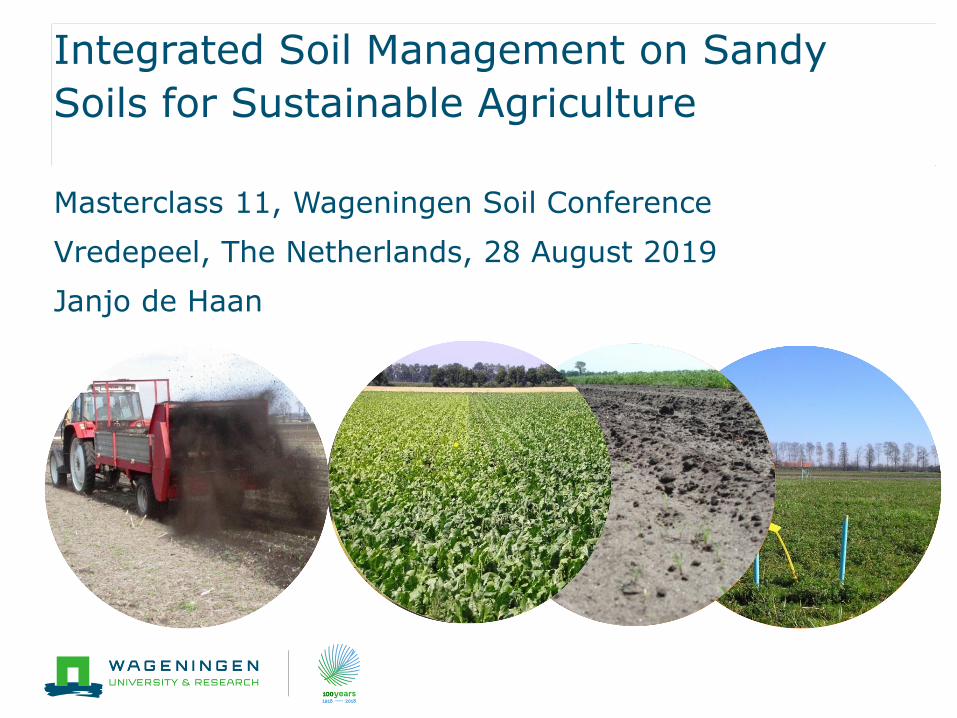
Integrated Soil Management on Sandy
Soils for Sustainable Agriculture
Masterclass 11, Wageningen Soil Conference
Vredepeel, The Netherlands, 28 August 2019
Janjo de Haan
2
3
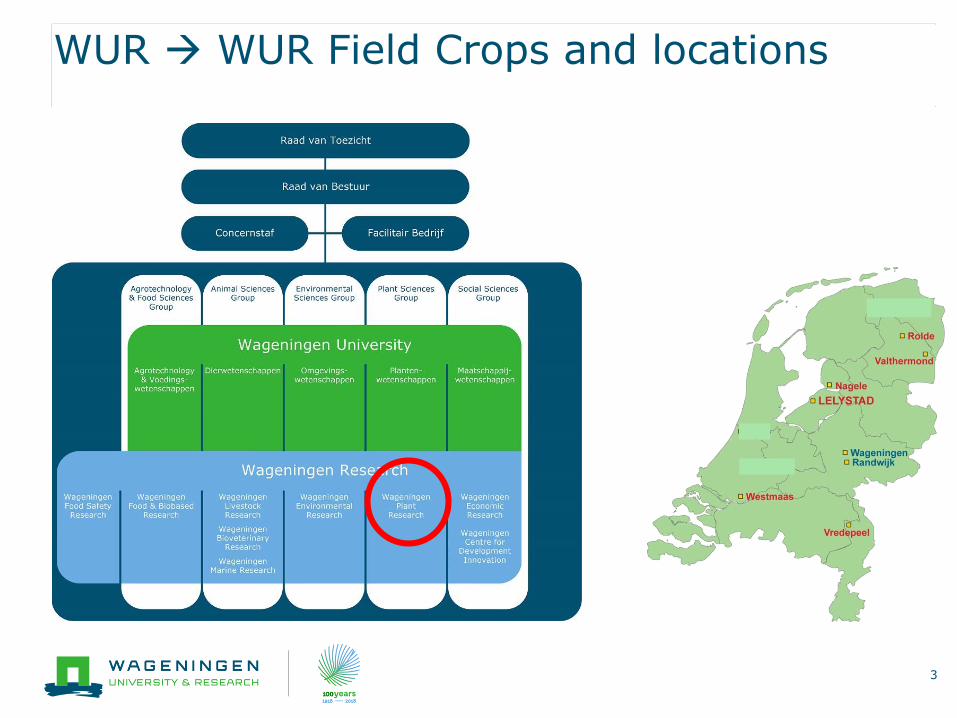
WUR WUR Field Crops and locations
ToolDevelopment
DSS’s
Handbooks
Schemes
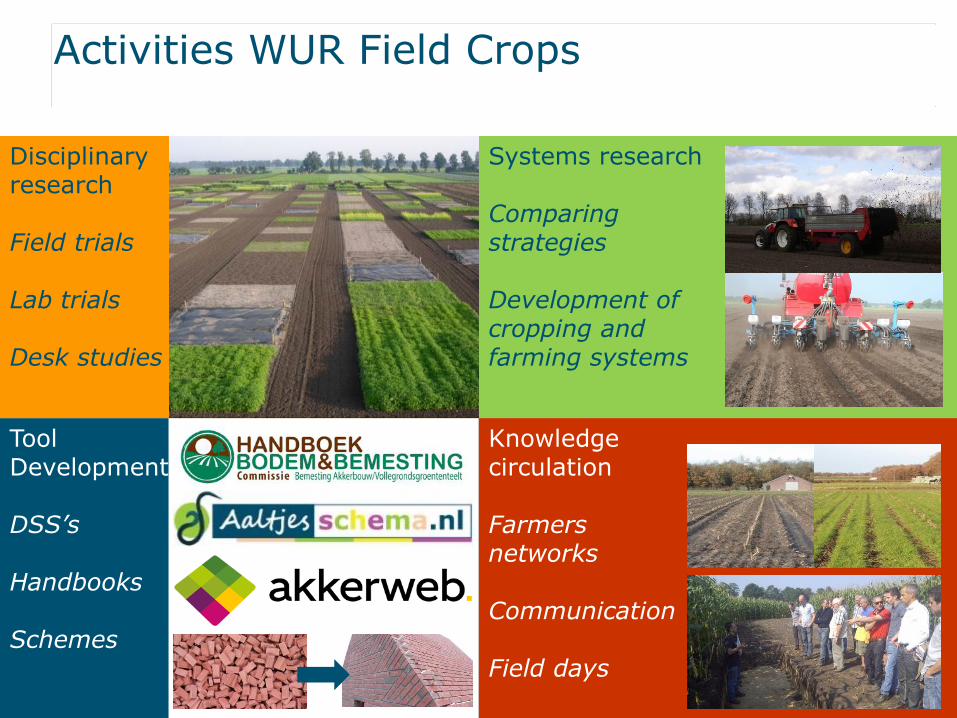
Activities WUR Field Crops
Disciplinaryresearch
Field trials
Lab trials
Desk studies
Systems research
Comparing strategies
Development of cropping and farming systems
Knowledge circulation
Farmers networks
Communication
Field days
5
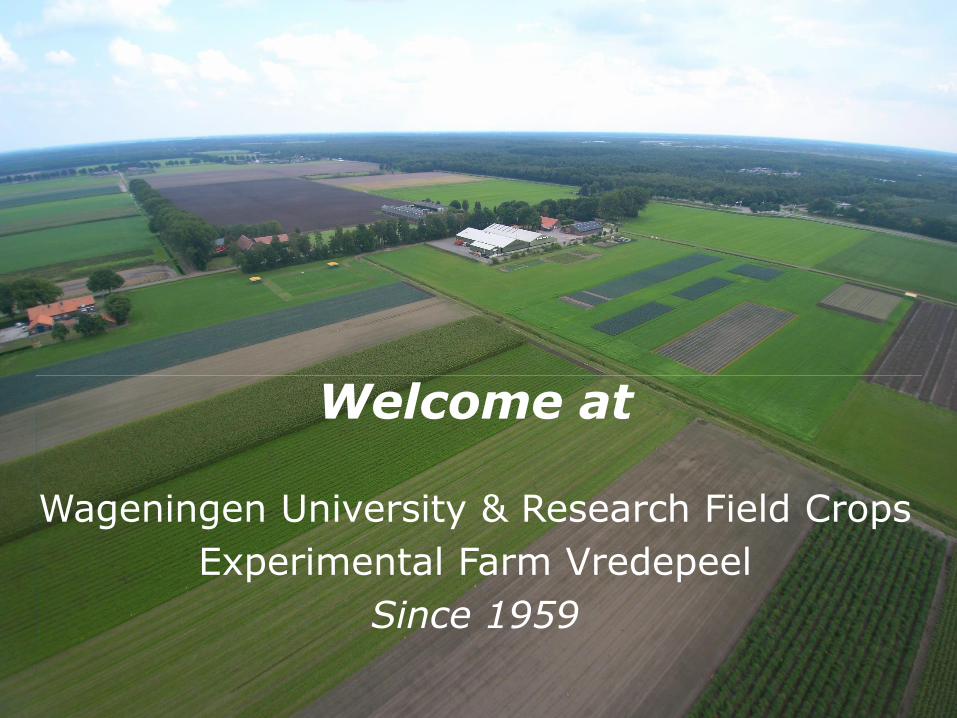
Welcome at
Wageningen University & Research Field Crops
Experimental Farm Vredepeel
Since 1959
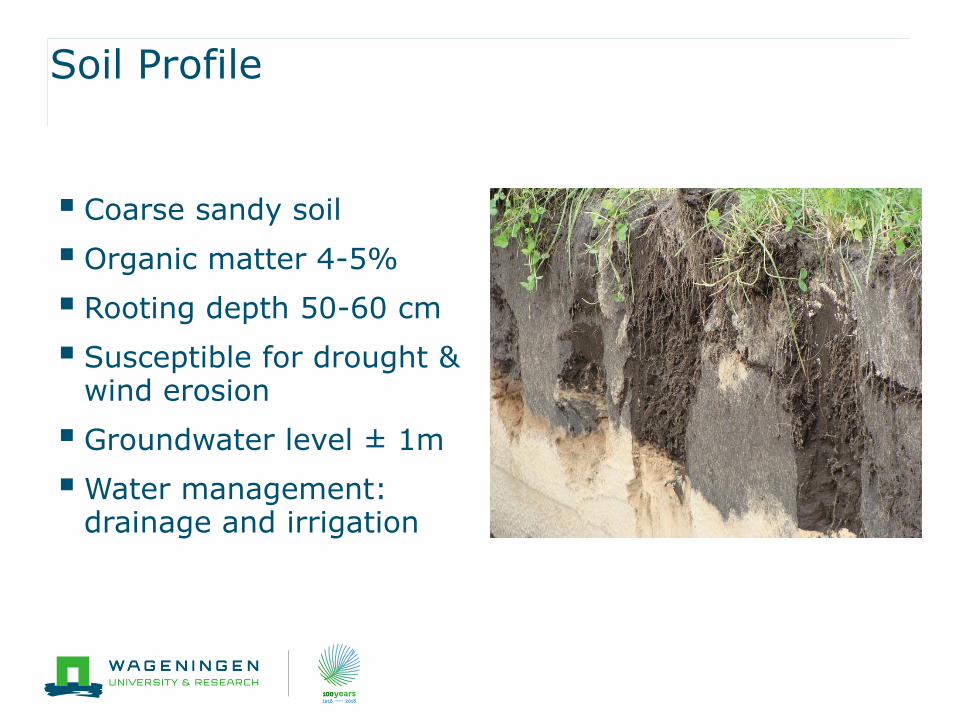
Soil Profile
▪ Coarse sandy soil
▪ Organic matter 4-5%
▪ Rooting depth 50-60 cm
▪ Susceptible for drought & wind erosion
▪ Groundwater level ± 1m
▪Water management: drainage and irrigation
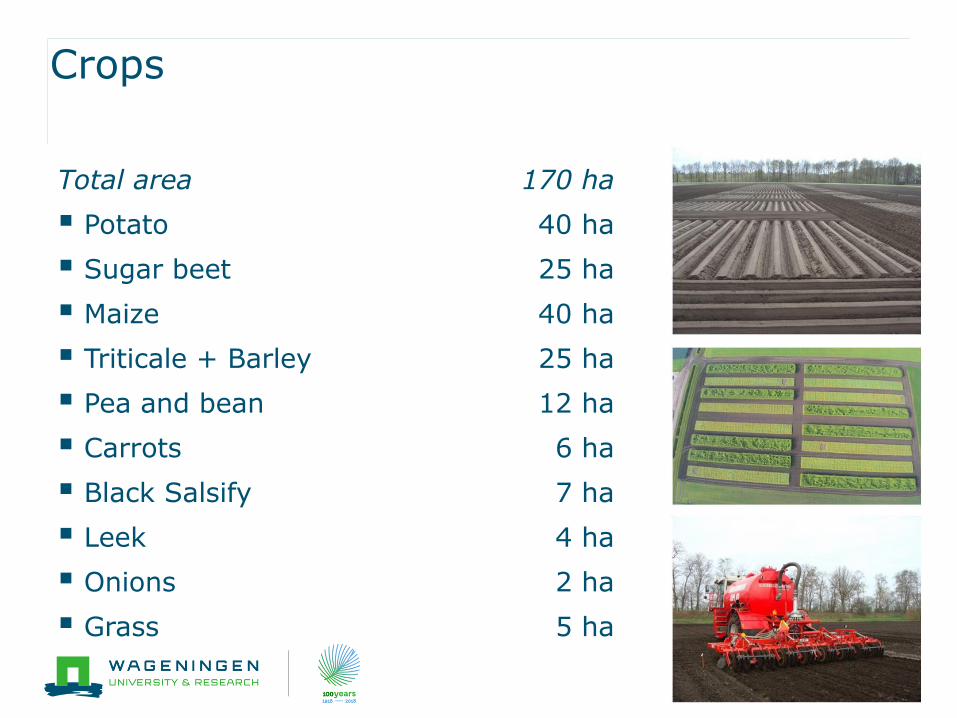
Crops
Total area 170 ha
▪ Potato 40 ha
▪ Sugar beet 25 ha
▪ Maize 40 ha
▪ Triticale + Barley 25 ha
▪ Pea and bean 12 ha
▪ Carrots 6 ha
▪ Black Salsify 7 ha
▪ Leek 4 ha
▪ Onions 2 ha
▪ Grass 5 ha
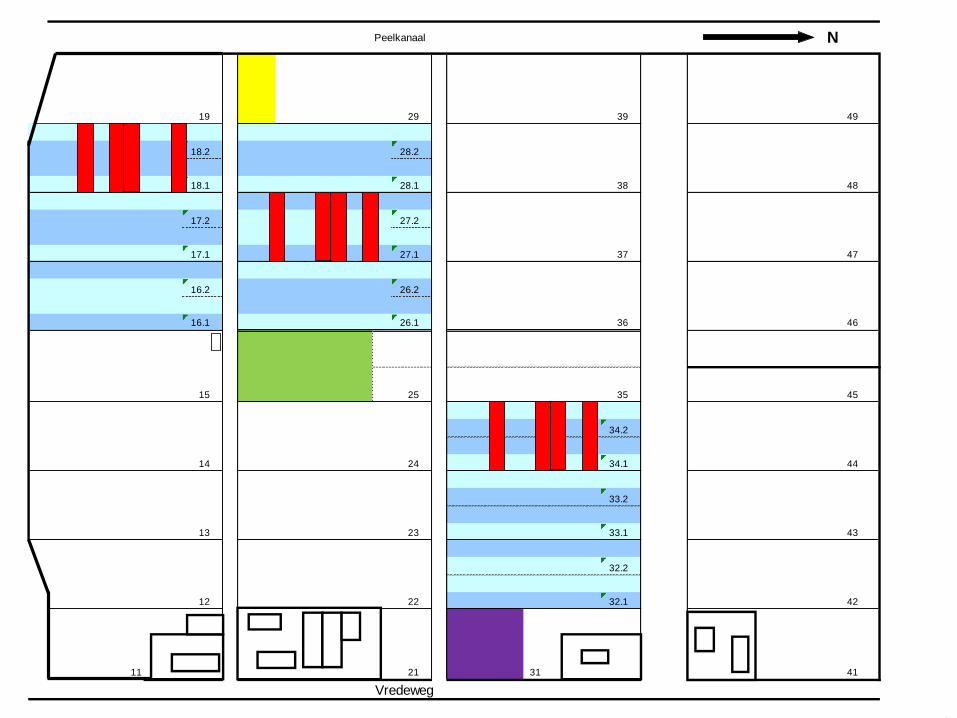
19 29 39 49
18.2 28.2
18.1 28.1 38 48
17.2 27.2
17.1 27.1 37 47
16.2 26.2
16.1 26.1 36 46
15 25 35 45
34.2
14 24 34.1 44
33.2
13 23 33.1 43
32.2
12 22 32.1 42
21
11 21 31 41
Vredeweg
Peelkanaal N
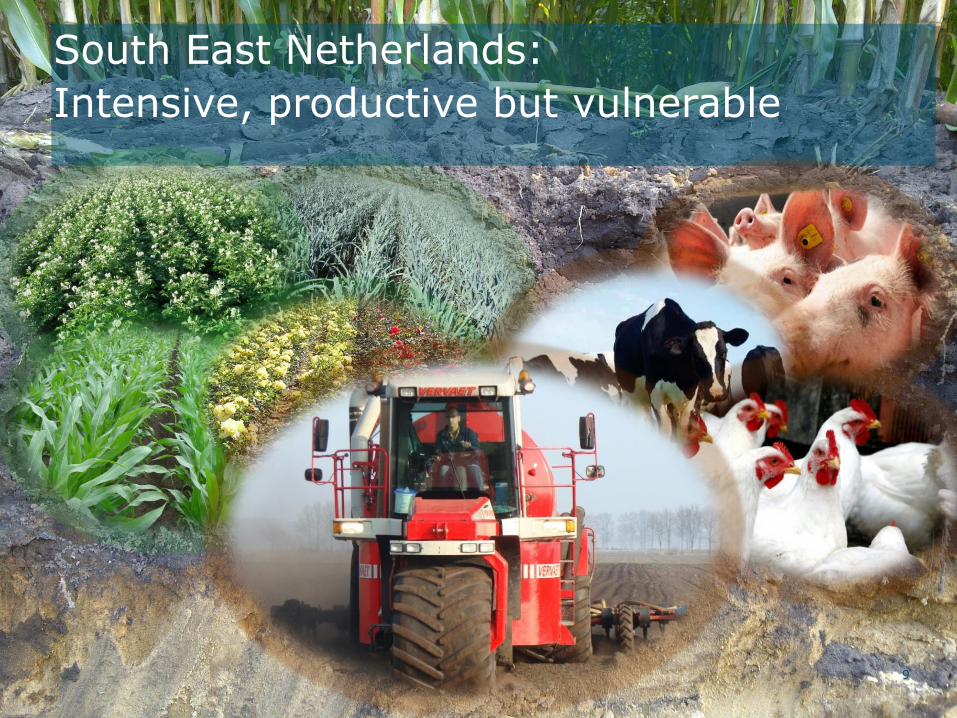
South East Netherlands:
Intensive, productive but vulnerable
9
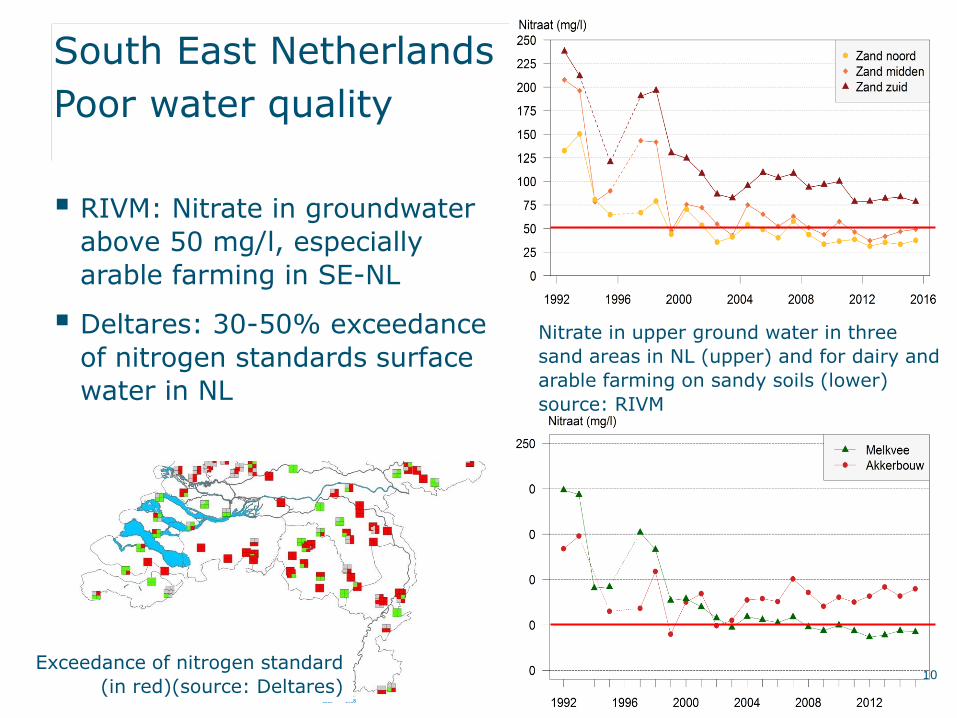
South East Netherlands
Poor water quality
▪ RIVM: Nitrate in groundwater
above 50 mg/l, especially
arable farming in SE-NL
▪ Deltares: 30-50% exceedance
of nitrogen standards surface
water in NL
10
Nitrate in upper ground water in three
sand areas in NL (upper) and for dairy and
arable farming on sandy soils (lower)
source: RIVM
Exceedance of nitrogen standard
(in red)(source: Deltares)
Other sustainability problems
▪ Soil born pests and diseases
● Various plant parasitic nematodes
● Sclerotinia, Rhizoctonia etc.
▪ High use of crop protection agents
▪ Low biodiversity
▪ GHG emissions and carbon losses
▪ High costs for land and labour
▪ Low margins
11
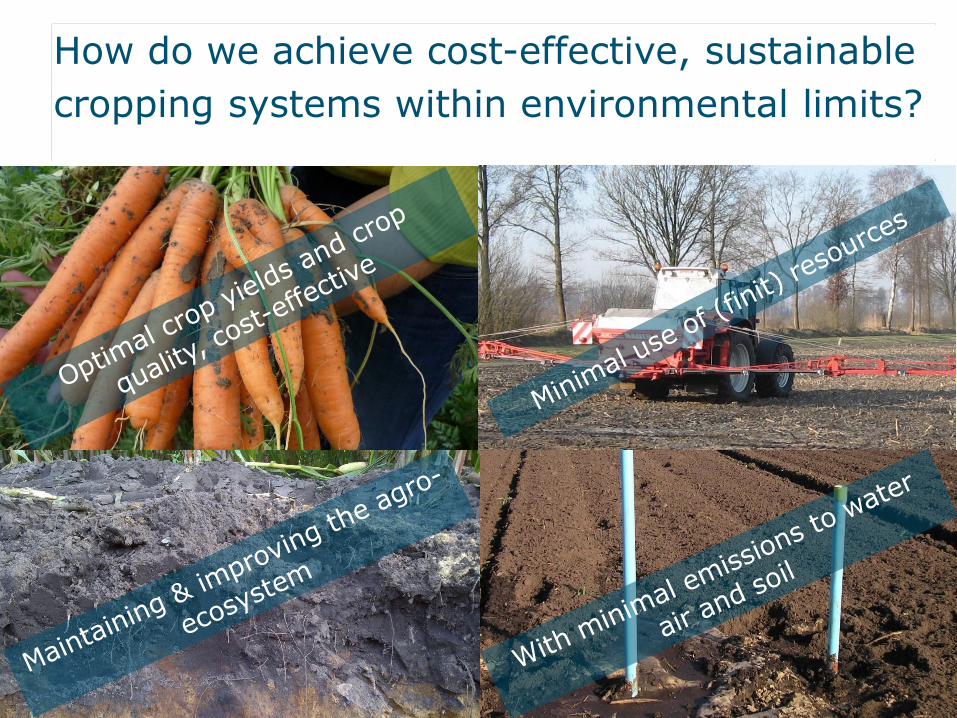
How do we achieve cost-effective, sustainable
cropping systems within environmental limits?
12
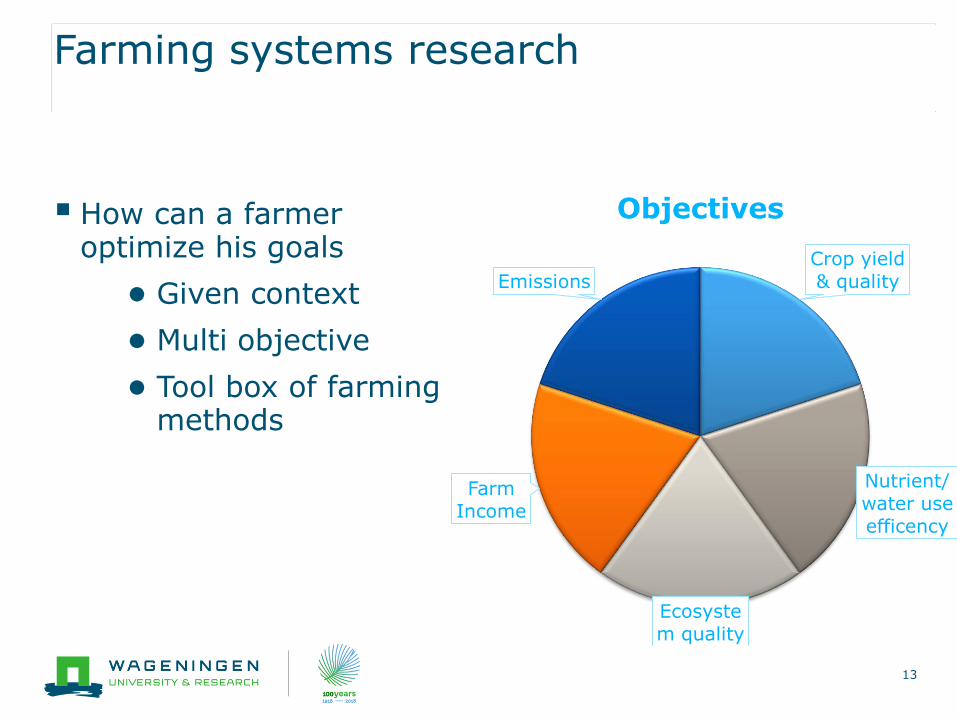
Farming systems research
▪ How can a farmer optimize his goals
● Given context
● Multi objective
● Tool box of farming methods
13
Crop yield
& quality
Nutrient/water use efficency
Ecosystem quality
Farm Income
Emissions
Objectives
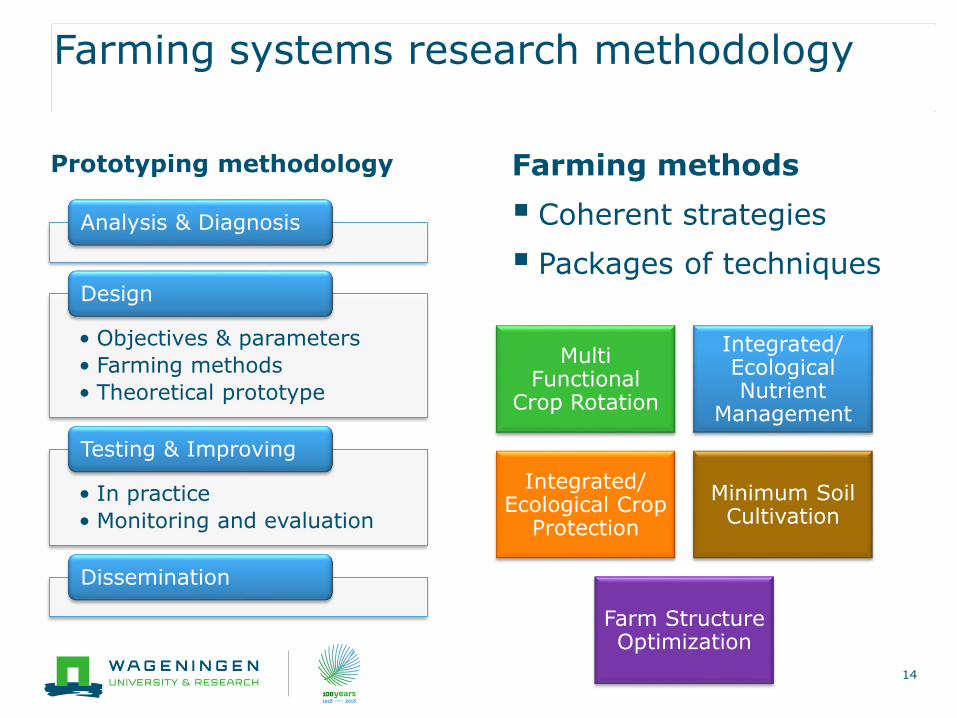
Farming systems research methodology
Farming methods
▪ Coherent strategies
▪ Packages of techniques
14
Multi Functional
Crop Rotation
Integrated/ Ecological Nutrient
Management
Integrated/ Ecological Crop
Protection
Minimum Soil Cultivation
Farm Structure Optimization
Analysis & Diagnosis
• Objectives & parameters
• Farming methods
• Theoretical prototype
Design
• In practice
• Monitoring and evaluation
Testing & Improving
Dissemination
Prototyping methodology
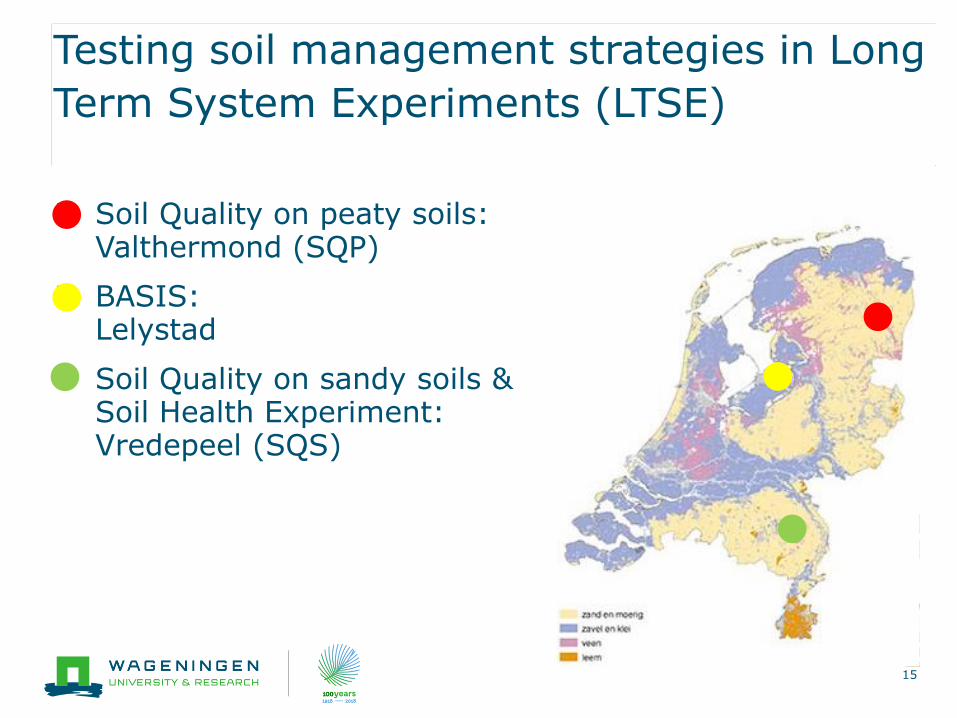
Testing soil management strategies in Long
Term System Experiments (LTSE)
▪ Soil Quality on peaty soils: Valthermond (SQP)
▪ BASIS: Lelystad
▪ Soil Quality on sandy soils & Soil Health Experiment: Vredepeel (SQS)
15
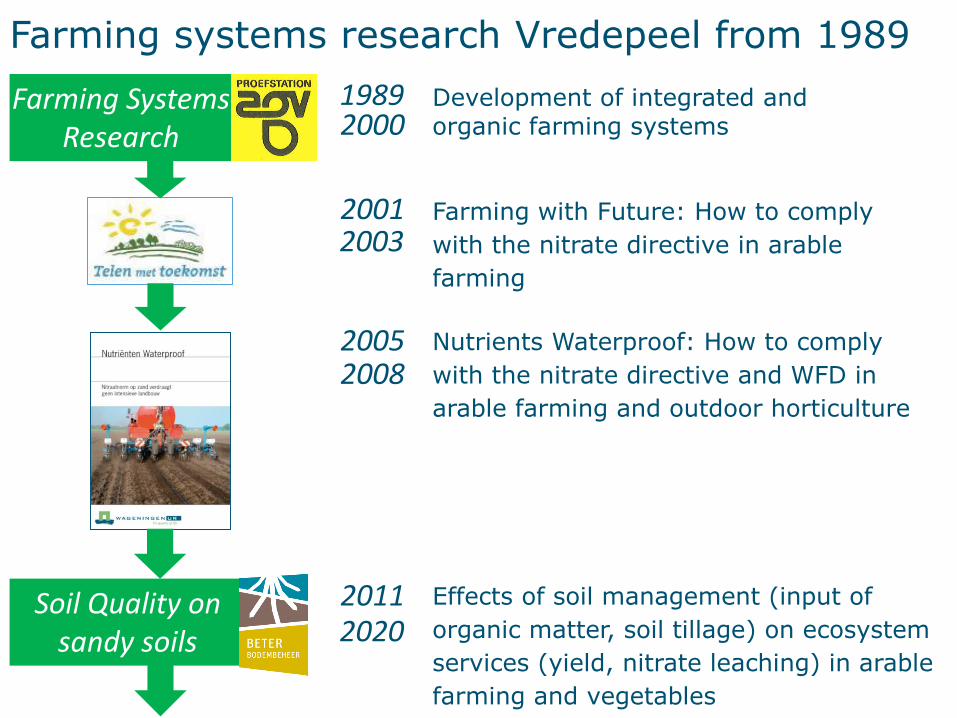
Farming Systems Research
19892000
Development of integrated and organic farming systems
20012003
Farming with Future: How to comply
with the nitrate directive in arable
farming
20052008
Nutrients Waterproof: How to comply
with the nitrate directive and WFD in
arable farming and outdoor horticulture
20112020
Soil Quality on sandy soils
Effects of soil management (input of
organic matter, soil tillage) on ecosystem
services (yield, nitrate leaching) in arable
farming and vegetables
Farming systems research Vredepeel from 1989
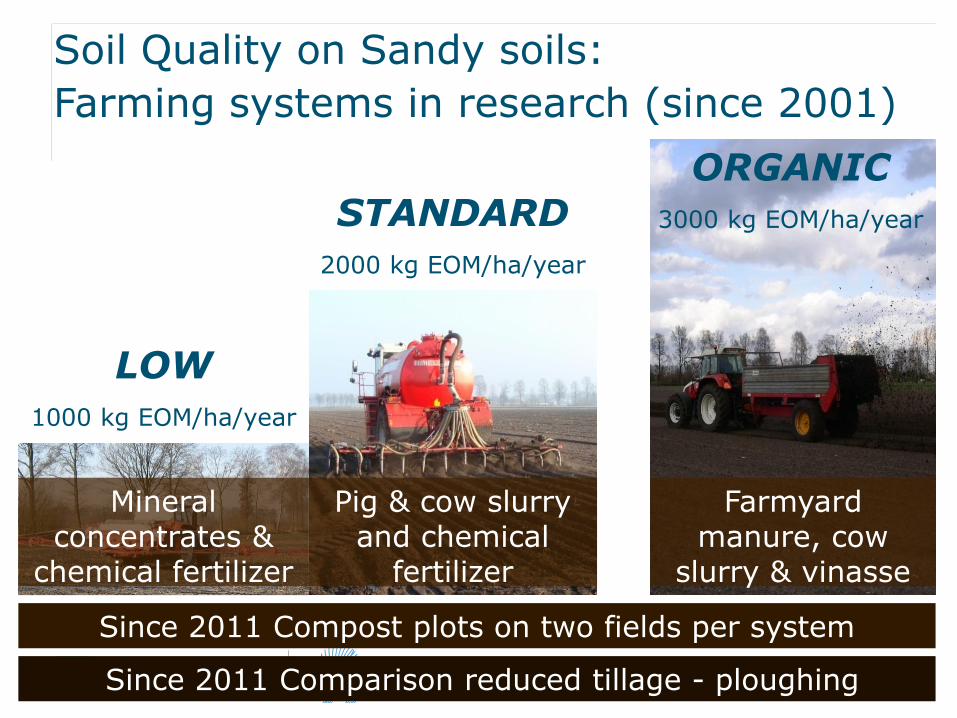
LOW
1000 kg EOM/ha/year
STANDARD
2000 kg EOM/ha/year
Soil Quality on Sandy soils:
Farming systems in research (since 2001)
Mineral concentrates &
chemical fertilizer
Pig & cow slurry and chemical
fertilizer
ORGANIC
3000 kg EOM/ha/year
Farmyard manure, cow
slurry & vinasse
Since 2011 Compost plots on two fields per system
Since 2011 Comparison reduced tillage - ploughing

Crop rotation
▪ Arable, vegetable and fodder crops
● Grown in the region
▪ Relative extensive crop rotation
● Alternation mow and root crops
▪ Green manure crops where possible
● Japanese Oats and Barley
● Grass-clover
● Nitrogen fixation
● Example for arable-dairy rotations
1818
Potato
Pea+ grass-clover
Leek
Spring Barley
Carrots
Silage maize
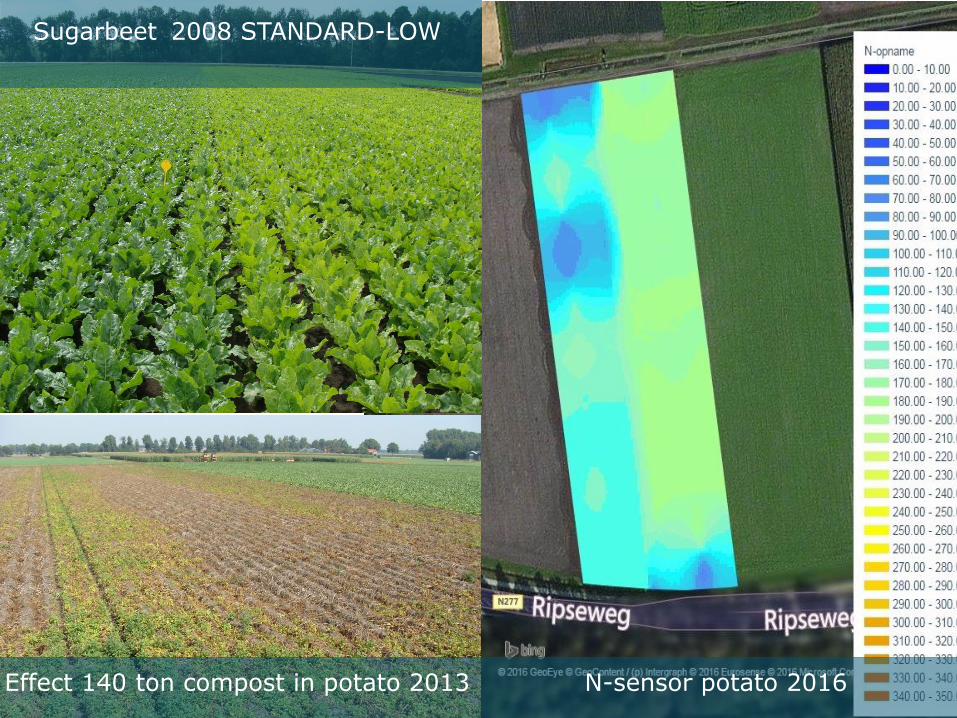
Sugarbeet 2008 STANDARD-LOW
Effect 140 ton compost in potato 2013 N-sensor potato 2016
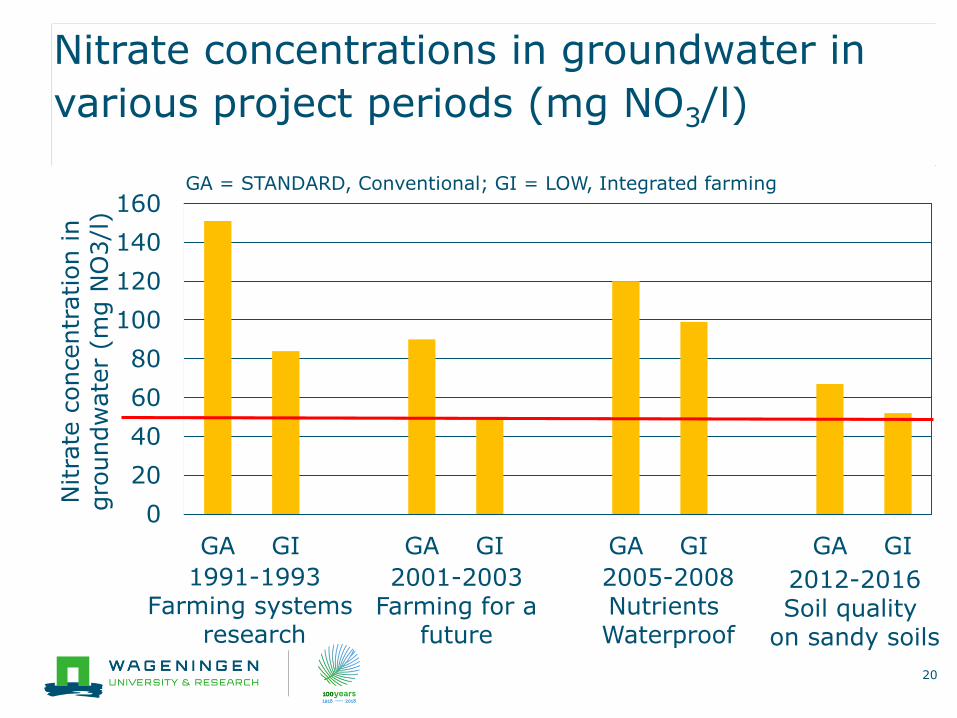
Nitrate concentrations in groundwater in
various project periods (mg NO3/l)
0
20
40
60
80
100
120
140
160
GA GI GA GI GA GI GA GI
Nitra
te c
oncentr
ation in
gro
undw
ate
r (m
g N
O3/l
)
1991-1993Farming systems
research
20
2001-2003Farming for a
future
2005-2008Nutrients Waterproof
2012-2016Soil quality
on sandy soils
GA = STANDARD, Conventional; GI = LOW, Integrated farming

Nitrate concentrations in groundwater
organic system (mg NO3/l)
21
0
10
20
30
40
50
60
70
80
90
100
Nitra
te c
oncentr
ation in
gro
undw
ate
r (m
g N
O3/l
)
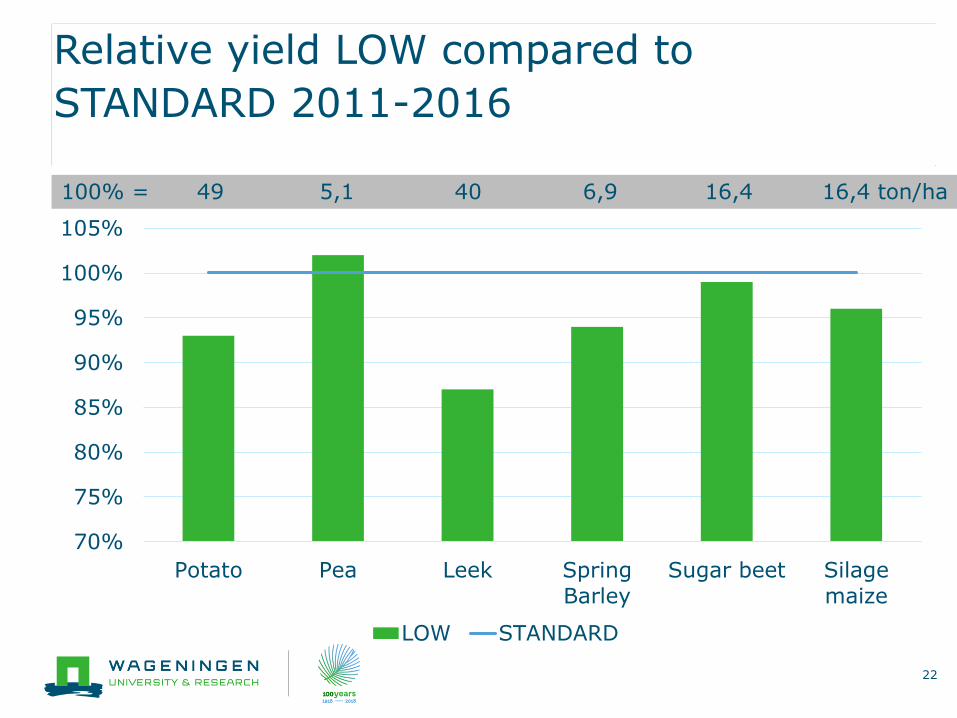
Relative yield LOW compared to
STANDARD 2011-2016
22
70%
75%
80%
85%
90%
95%
100%
105%
Potato Pea Leek Spring
Barley
Sugar beet Silage
maize
LOW STANDARD
100% = 49 5,1 40 6,9 16,4 16,4 ton/ha
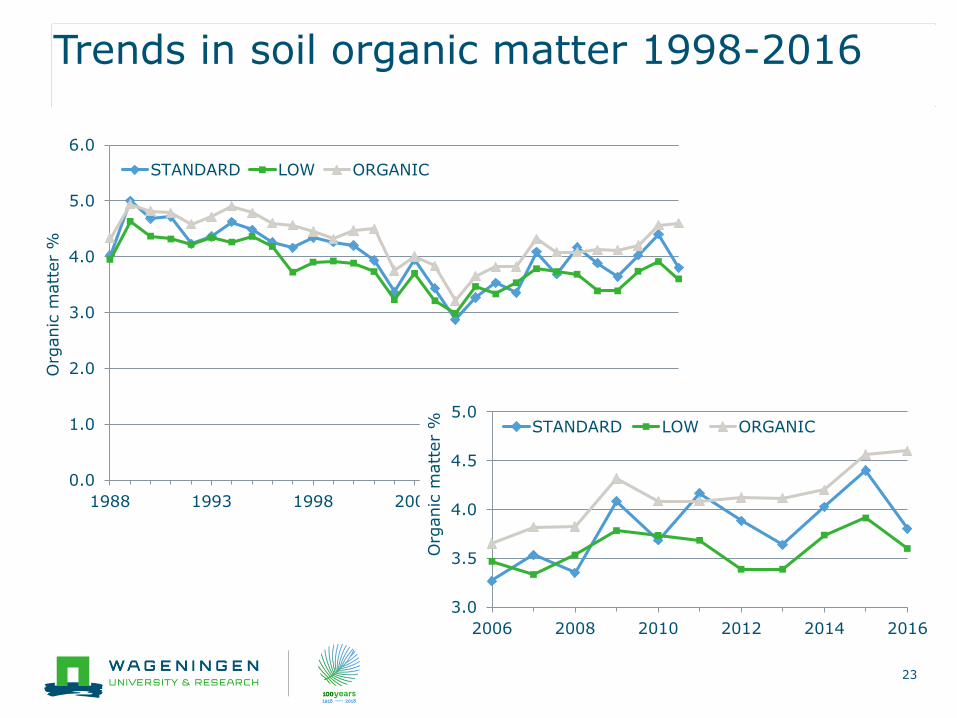
Trends in soil organic matter 1998-2016
23
0.0
1.0
2.0
3.0
4.0
5.0
6.0
1988 1993 1998 2003 2008 2013
Org
anic
matt
er
%
STANDARD LOW ORGANIC
3.0
3.5
4.0
4.5
5.0
2006 2008 2010 2012 2014 2016
Org
anic
matt
er
% STANDARD LOW ORGANIC
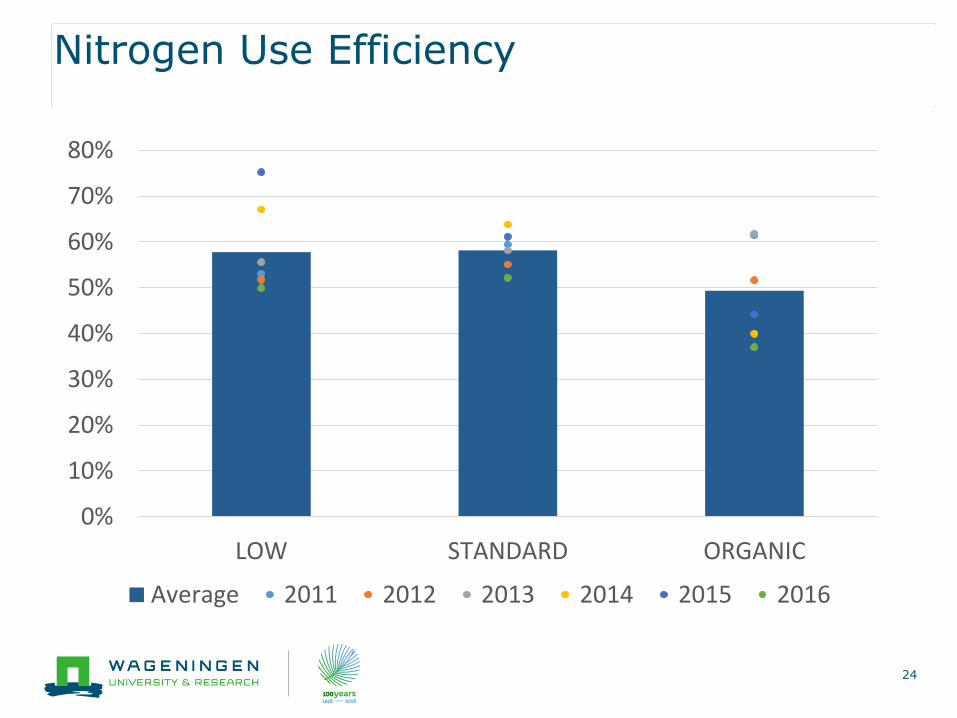
Nitrogen Use Efficiency
24
0%
10%
20%
30%
40%
50%
60%
70%
80%
LOW STANDARD ORGANIC
Average 2011 2012 2013 2014 2015 2016
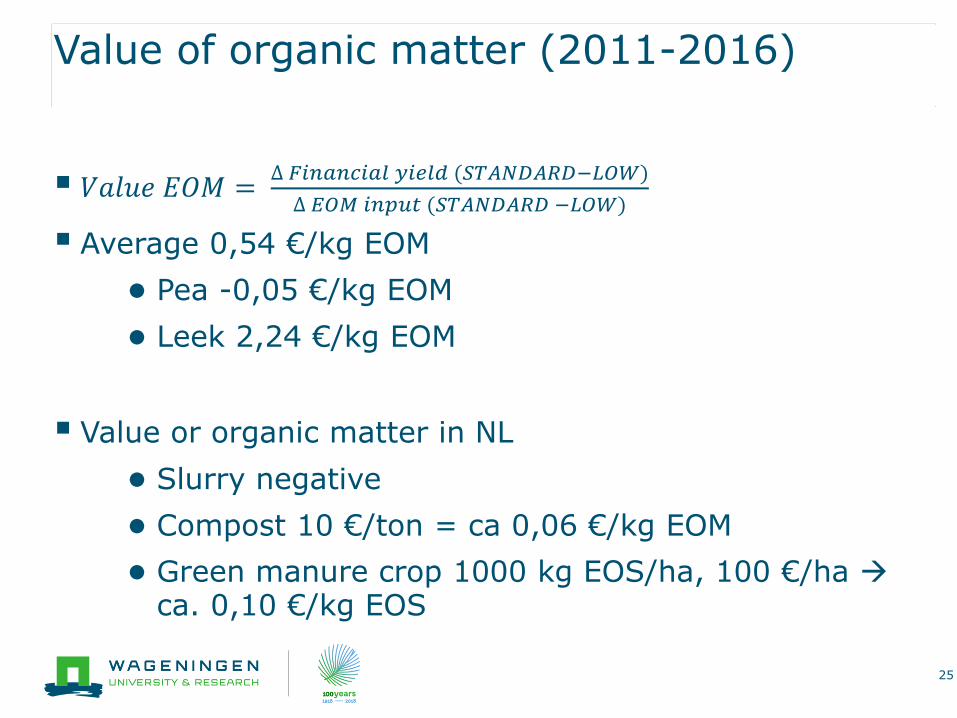
Value of organic matter (2011-2016)
▪ 𝑉𝑎𝑙𝑢𝑒 𝐸𝑂𝑀 =∆ 𝐹𝑖𝑛𝑎𝑛𝑐𝑖𝑎𝑙 𝑦𝑖𝑒𝑙𝑑 (𝑆𝑇𝐴𝑁𝐷𝐴𝑅𝐷−𝐿𝑂𝑊)
∆ 𝐸𝑂𝑀 𝑖𝑛𝑝𝑢𝑡 (𝑆𝑇𝐴𝑁𝐷𝐴𝑅𝐷 −𝐿𝑂𝑊)
▪ Average 0,54 €/kg EOM
● Pea -0,05 €/kg EOM
● Leek 2,24 €/kg EOM
▪ Value or organic matter in NL
● Slurry negative
● Compost 10 €/ton = ca 0,06 €/kg EOM
● Green manure crop 1000 kg EOS/ha, 100 €/ha ca. 0,10 €/kg EOS
25
And now to the field!