Integrated diagnostics: a conceptual framework with examples
11
Clin Chem Lab Med 2010;48(7):989–998 2010 by Walter de Gruyter • Berlin • New York. DOI 10.1515/CCLM.2010.193 2010/142 Article in press - uncorrected proof Review Integrated diagnostics: a conceptual framework with examples Anant Madabhushi 1 , Scott Doyle 1 , George Lee 1 , Ajay Basavanhally 1 , James Monaco 1 , Steve Masters 2 , John Tomaszewski 2 and Michael Feldman 2, * 1 Laboratory for Computational Imaging and Bioinformatics, Department of Biomedical Engineering, Rutgers University, NJ, USA 2 Department of Pathology and Laboratory Medicine, University of Pennsylvania Health System, Philadelphia, PA, USA Abstract With the advent of digital pathology, imaging scientists have begun to develop computerized image analysis algorithms for making diagnostic (disease presence), prognostic (outcome prediction), and theragnostic (choice of therapy) predictions from high resolution images of digitized histopathology. One of the caveats to developing image analysis algorithms for digitized histopathology is the ability to deal with highly dense, information rich datasets; datasets that would over- whelm most computer vision and image processing algo- rithms. Over the last decade, manifold learning and non- linear dimensionality reduction schemes have emerged as popular and powerful machine learning tools for pattern rec- ognition problems. However, these techniques have thus far been applied primarily to classification and analysis of com- puter vision problems (e.g., face detection). In this paper, we discuss recent work by a few groups in the application of manifold learning methods to problems in computer aided diagnosis, prognosis, and theragnosis of digitized histopa- thology. In addition, we discuss some exciting recent devel- opments in the application of these methods for multi-modal data fusion and classification; specifically the building of meta-classifiers by fusion of histological image and proteo- mic signatures for prostate cancer outcome prediction. Clin Chem Lab Med 2010;48:989–98. Keywords: diagnostic pathology; digitalized histopathology; image analysis algorithms; pattern recognition; proteomic signature; theragnostic. *Corresponding author: Michael Feldman, MD, PhD, Department of Pathology and Laboratory Medicine, University of Pennsylvania Health System, Founders Bldg, Rm 6.058, 3400 Spruce St Philadelphia, PA 19104, USA Phone: q215-662-6503, Fax: q215-349-5910, E-mail: [email protected] Previously published online May 23, 2010 Introduction Pathology laboratories generate vast amounts of data on a regular basis. These data take many forms and have been used for diagnostic analysis, prognostic analysis and thera- gnostic (response to therapies) analysis. Some of these data elements are discreet and easily integrated into computational models to classify disease into diagnostic categories, prog- nostic categories or theragnostic categories. Data generated in pathology laboratories exists in many forms that vary in size, dimension and scale. Clinical laboratory data is frequently composed of discreet data elements that are often numerical in value (sodium, potassium, PSA, etc.). Other clinical laboratory data may exist as more complex data, such as a molecular diagnostic data which may reside as identifying a point mutation (dis- creet data element, such as the presence or absence of a point mutation) vs. more complex molecular data, such as a mul- tiplexed in vitro diagnostic assay with 10 or more data ele- ments for a single assay, or multicolor flow cytometric analysis of leukemia or lymphoma (routinely done with six or more simultaneous fluorochromes). Historically, these more complex laboratory data sets are reduced to single dis- creet values (a risk score in the case of a multiplexed assay or a series of scatterplots in the case of flow cytometry). In both of these cases, the data has been reduced as a stand- alone assay, and often involves data reduction with human intervention (flow cytometry scatterplots), a step which intro- duces human bias into the generation of the interpreted data. Some groups have been developing more sophisticated meth- ods of analyzing some of these complex data sets. Finn et al. (1, 2) have developed a statistical manifold to explore multiplexed flow cytometry data which is based on non-par- ametric embedding of high dimensional flow data into a low- er dimensional space meant to preserve object adjacencies that were present in the high dimensional space. Rogers et al. have used a different pattern discovery algorithm termed cytometric fingerprinting to analyze flow cytometry data (3). These two approaches to data analysis illustrate a new par- adigm in data exploration within laboratory medicine, an approach that involves the use of computer computation to learn or discern complex patterns within high dimensional data sets. This analysis can occur with human intervention (supervised analysis), or in a completely unsupervised approach. In anatomic pathology, diagnostic information has histor- ically been generated in the form of textual data. As a result, anatomic pathology results have been difficult to integrate into data analysis that combines complex data types. Typi-
Transcript of Integrated diagnostics: a conceptual framework with examples

Clin Chem Lab Med 2010;48(7):989–998 � 2010 by Walter de Gruyter • Berlin • New York. DOI 10.1515/CCLM.2010.193
2010/142
Article in press - uncorrected proof
Review
Integrated diagnostics: a conceptual framework
with examples
Anant Madabhushi1, Scott Doyle1, George Lee1, AjayBasavanhally1, James Monaco1, Steve Masters2, JohnTomaszewski2 and Michael Feldman2,*1 Laboratory for Computational Imaging andBioinformatics, Department of Biomedical Engineering,Rutgers University, NJ, USA2 Department of Pathology and Laboratory Medicine,University of Pennsylvania Health System, Philadelphia,PA, USA
Abstract
With the advent of digital pathology, imaging scientists havebegun to develop computerized image analysis algorithms formaking diagnostic (disease presence), prognostic (outcomeprediction), and theragnostic (choice of therapy) predictionsfrom high resolution images of digitized histopathology. Oneof the caveats to developing image analysis algorithms fordigitized histopathology is the ability to deal with highlydense, information rich datasets; datasets that would over-whelm most computer vision and image processing algo-rithms. Over the last decade, manifold learning and non-linear dimensionality reduction schemes have emerged aspopular and powerful machine learning tools for pattern rec-ognition problems. However, these techniques have thus farbeen applied primarily to classification and analysis of com-puter vision problems (e.g., face detection). In this paper, wediscuss recent work by a few groups in the application ofmanifold learning methods to problems in computer aideddiagnosis, prognosis, and theragnosis of digitized histopa-thology. In addition, we discuss some exciting recent devel-opments in the application of these methods for multi-modaldata fusion and classification; specifically the building ofmeta-classifiers by fusion of histological image and proteo-mic signatures for prostate cancer outcome prediction.Clin Chem Lab Med 2010;48:989–98.
Keywords: diagnostic pathology; digitalized histopathology;image analysis algorithms; pattern recognition; proteomicsignature; theragnostic.
*Corresponding author: Michael Feldman, MD, PhD, Departmentof Pathology and Laboratory Medicine, University ofPennsylvania Health System, Founders Bldg, Rm 6.058, 3400Spruce St Philadelphia, PA 19104, USAPhone: q215-662-6503, Fax: q215-349-5910,E-mail: [email protected] published online May 23, 2010
Introduction
Pathology laboratories generate vast amounts of data on aregular basis. These data take many forms and have beenused for diagnostic analysis, prognostic analysis and thera-gnostic (response to therapies) analysis. Some of these dataelements are discreet and easily integrated into computationalmodels to classify disease into diagnostic categories, prog-nostic categories or theragnostic categories. Data generatedin pathology laboratories exists in many forms that vary insize, dimension and scale.
Clinical laboratory data is frequently composed of discreetdata elements that are often numerical in value (sodium,potassium, PSA, etc.). Other clinical laboratory data mayexist as more complex data, such as a molecular diagnosticdata which may reside as identifying a point mutation (dis-creet data element, such as the presence or absence of a pointmutation) vs. more complex molecular data, such as a mul-tiplexed in vitro diagnostic assay with 10 or more data ele-ments for a single assay, or multicolor flow cytometricanalysis of leukemia or lymphoma (routinely done with sixor more simultaneous fluorochromes). Historically, thesemore complex laboratory data sets are reduced to single dis-creet values (a risk score in the case of a multiplexed assayor a series of scatterplots in the case of flow cytometry). Inboth of these cases, the data has been reduced as a stand-alone assay, and often involves data reduction with humanintervention (flow cytometry scatterplots), a step which intro-duces human bias into the generation of the interpreted data.Some groups have been developing more sophisticated meth-ods of analyzing some of these complex data sets. Finn etal. (1, 2) have developed a statistical manifold to exploremultiplexed flow cytometry data which is based on non-par-ametric embedding of high dimensional flow data into a low-er dimensional space meant to preserve object adjacenciesthat were present in the high dimensional space. Rogers etal. have used a different pattern discovery algorithm termedcytometric fingerprinting to analyze flow cytometry data (3).These two approaches to data analysis illustrate a new par-adigm in data exploration within laboratory medicine, anapproach that involves the use of computer computation tolearn or discern complex patterns within high dimensionaldata sets. This analysis can occur with human intervention(supervised analysis), or in a completely unsupervisedapproach.
In anatomic pathology, diagnostic information has histor-ically been generated in the form of textual data. As a result,anatomic pathology results have been difficult to integrateinto data analysis that combines complex data types. Typi-

990 Madabhushi et al.: Integrated diagnostics: a conceptual framework with examples
Article in press - uncorrected proof
Figure 1 Data acquisition paradigm.Illustrates the method of data acquisition, feature extraction, feature selection, dimensionality reduction and classification.
cally, data from anatomic pathology have only been repre-sented as a diagnostic type (prostate adenocarcinoma, breastcarcinoma, etc.) or more recently, with the increasing utili-zation of synoptic tumor reporting, the addition of tumorsubtypes, tumor grade, tumor stage and other diagnostic orprognostic variables have been abstracted from glass slidereview and placed into anatomic pathology reports. This datacan be used for clinical reporting as well as used in morecomplex data analysis. However, all of these approaches inanatomic pathology rely on expert analysis and data extrac-tion, which introduces operator bias into the data extraction.Numerous studies over time have shown the difficulty inusing this type of data due to poor inter-observer reliabilityof the expert data extraction step as measured by kappa sta-tistics (4–7).
The advent of more powerful computer and sophisticatedcomputational approaches now allows us to rethink ourapproaches to data analysis in pathology and laboratory med-icine. Advances in image analysis, whole slide scanners, flu-orescent and multispectral scanners now allow featureextraction of pathology images so that the resulting slide is notreduced to a single or a series of discrete textual results, butinstead resides in a complex series of image features whichmay be several thousand features in number and include bothprimary and secondary image features and graph based fea-tures. This review paper will discuss some of the computervision and non-linear dimensionality reduction (NLDR)approaches which are changing how we think about and usepathology imagery. These pattern recognition and machinelearning tools are ideally suited to dealing with high dimen-sional data, such as digitized pathology, and help provide arich feature set of data derived from the original images. Theimage analysis feature set derived from these feature extrac-tion algorithms may also be integrated with non-imagingbased features including genomic, epigenomic and proteomicanalyses of the same tissue used for image based featureextraction. The resulting data set from these two approaches(image and omics) form the inputs of a high dimensionaldata set that is characterized by multimode registered data.The data sets are registered at the spatial level since they arederived from the same areas of a pathology slide and are
multimode since the individual data elements are derivedfrom multiple modalities. This registered multimode data setcan then be used as inputs into a second set of analyticapproaches called machine learning, designed to discernclasses of information. There are numerous machine learningapproaches, the one we will describe in this manuscript iscalled manifold learning. This approach is based on datafusion and representation of high dimensional data into alower dimensional data space that preserves the relative dis-tances of objects from each other from the high dimensionalspace as it is projected into the lower dimensional space inwhich the class differences being modeled can be visualizedalong a manifold surface (Figure 1).
Feature extraction
Research on useful features for cancer classification anddiagnosis has often been inspired by grading features definedby clinicians as particularly important for the diagnosis. Thevast majority of these features are nuclear features, and manyhave been established as useful in analysis of both cyto-pathology and histopathology imagery. Other features thatassume discriminatory importance include the margin andboundary appearance of ductal, stromal, tubular and glan-dular structures. While there is a compilation of features forcytopathology imagery (8), there is relatively little such workfor histopathology imagery.
Human observers (pathologists) concept of the world isinherently object-based, as opposed to the largely pixel-basedrepresentation of computer vision. As such, pathology expertsdescribe and understand images in terms of such objects. Forpathologists, diagnosis criteria are inevitably described usingterms, such as ‘‘nucleus’’ and ‘‘cell’’ and relationship oflarger objects to each other and to benign adjacent tissue. Itis thus important to develop computer vision methods capa-ble of such object-level analysis (Figure 2).
Spatially related features
Graphs are effective techniques to represent structural infor-mation by defining a large set of topological features. Appli-

Madabhushi et al.: Integrated diagnostics: a conceptual framework with examples 991
Article in press - uncorrected proof
Figure 2 Supervised extraction of histological features to describe tissue appearance of (A) benign epithelium, and (B) ductal carcinomain situ (DCIS). Feature images for the two tissue classes (benign epithelium, DCIS) corresponding to Gabor wavelet features (B, E) andHaralick second order features (C, F) are shown.
Table 1 Summary of spatial-arrangement features used in histopathology image analysis.
Graph structure Features
Voronoi tesselation Number of nodes, number of edges, cyclomatic number, number oftriangles, number of k-walks, spectral radius, eigenexponent,Randic index, area, roundness factor, area disorder, roundness factor homogeneity
Delaunay triangulation Number of nodes, edge length, degree, number of edges, cyclomaticnumber, number of triangles, number of k-walks, spectral radius,eigenexponent, Wiener index, eccentricity, Randic index, fractal dimension
Minimum spanning tree Number of nodes, edge length, degree, number of neighbors, Wienerindex, eccentricity, Randic index, Balaban index, fractal dimension
cation of graph theory to other problem domains isimpressive. Real-world graphs of varying types and scaleshave been extensively investigated in technological, social(9) and biological systems (10). In spite of their differentdomains, such self-organizing structures unexpectedly exhib-it common classes of descriptive spatial (topological) fea-tures. These features are quantified by definition of comput-able metrics (Table 1).
The use of spatial-relation features for quantifying cellulararrangement was proposed in the early 1990s (11, 12), butdid not find applications in clinical imagery until recently.Graphs have now been constructed for modeling differenttissue states and for distinguishing one state from another bycomputing metrics on these graphs and classifying their val-ues. Overall, however, the use of spatial arrangement of his-tological entities (generally at low resolutions) is relativelynew, especially in comparison to the wealth of research on
nuclear features (at higher resolutions) that has occurred dur-ing the same timeframe. Definitions for all graph structuresand features can be found in reference (13). The total numberof spatial-relation features extracted is approximately 150 forall graph structures.
Graph theoretical metrics that can be defined and com-puted on a cell-graph induce a rich set of descriptive featuresthat can be used for tissue classification. These features pro-vide structural information to describe the tissue organiza-tion, such as: (i) the distribution of local information arounda single cell cluster (e.g., degree, clustering coefficient, etc.),(ii) the distribution of global information around a single cellcluster (e.g., eccentricity, closeness, between-ness, etc.),(iii) the global connectivity information of a graph (e.g., ratioof the giant connected component over the graph size, per-centage of the isolated and end data points in the graph, etc.),(iv) the properties extracted from the spectral graph theory

992 Madabhushi et al.: Integrated diagnostics: a conceptual framework with examples
Article in press - uncorrected proof
(e.g., spectral radius, eigenexponent, number of connectedcomponents, sum of the eigenvalues in the spectrum, etc.).
The end result of these feature extraction algorithms is aset of features that can be used for image classification. Priorto classification, a pruning of the most relevant features mustbe performed in a step termed feature selection.
Feature selection
While humans have innate abilities to process and understandimagery, they tend not to excel at explaining how they reachtheir decisions. As such, large feature sets are generated inthe hopes that some subset of features incorporates the infor-mation used by the human expert for analysis. Therefore,many of the generated features could be redundant or irrel-evant. Actually, a large set of features may possibly be det-rimental to classification performance, a phenomenon knownas ‘‘the curse of dimensionality.’’ Feature selection is ameans to select the relevant and important features from alarge set of features. This is an increasingly important areaof research now that automated quantitative image analysistechniques are becoming more mainstream.
Feature selection in histopathological image analysis pro-vides several benefits in addition to improving accuracy.Since images tend to be relatively large, a smaller subset offeatures needs to be calculated, reducing the computationalcomplexity of classification algorithms. In some applications,it may be preferable to sacrifice the overall performanceslightly if this sacrifice greatly reduces the number of select-ed features. A smaller number of features would also makeit easier to explain the underlying model and improve thechances of generalization of the developed system. Addi-tionally, in a multi-resolution framework, a set of featuresproven useful at a given resolution may not be relevant atanother resolution, even within the same image. A featureselection algorithm helps determine which features should beused at a given resolution.
An optimal feature selection method would require anexhaustive search, which is not practical for a large set offeatures generated from a large dataset. Therefore, severalheuristic algorithms have been developed which use classi-fication accuracy as the optimality criterion. Well-knownfeature selection methods include the sequential searchmethods, namely sequential forward selection (SFS) andsequential backward selection (SBS) (14). SFS works bysequentially adding the feature that most improves the clas-sification performance; similarly, SBS begins with the entirefeature set and sequentially removes the feature that mostimproves classification performance. Both SFS and SBS suf-fer from the ‘‘nesting effect’’ whereby features that areselected (SFS) or discarded (SBS) cannot be revisited in alater step and are thus suboptimal (14). The use of floatingsearch methods, sequential floating forward search (SFFS)and sequential floating backward search (SFBS), in whichpreviously selected or discarded features can be re-evaluatedat later steps avoids the nesting problem (15–17). Whilethese methods still cannot guarantee optimality of the select-
ed feature subset, they have been shown to perform very wellcompared to other feature selection methods (18), and fur-thermore, are much more computationally efficient. SFFS isone of the most commonly encountered feature selectionmethods in the pathology image analysis literature.
More recent feature selection research has focused on suchmethods as genetic algorithms, simulated annealing, boosting(19) and grafting (20). A taxonomy of feature selection algo-rithms is presented by Jain and Zonker (18). Genetic algo-rithms and simulated annealing are applications of traditionaloptimization techniques to feature selection. Boosting basi-cally acts as a greedy feature selection process. Grafting(from ‘‘gradient feature testing’’) (20) is based on an elegantformulation of the feature selection problem, whereby theclassification of the underlying data and the feature selectionprocess are not separated. Within the grafting framework, aloss function is used that shows preference for classifiers thatseparate the data with larger margins. Grafting also providesan efficient framework for selection of relevant features. Fea-ture selection based on a measure of discriminatory powerwas proposed by Qureshi et al. (21). These authors computethe discriminatory power of each of the wavelet packet sub-bands (features) using a dissimilarity measure betweenapproximated probability density functions for different clas-ses. Derived features are then sorted according to the dis-criminatory power values associated with the correspondingfeatures.
Dimensionality reduction and manifold learning
While feature selection aims to select features (and reducethe feature dimensionality) that best optimize some criterionrelated to the class labels of the data (e.g., classificationperformance), dimensionality reduction techniques aim toreduce dimensionality based on some other criterion. Threewell-known and commonly used methods of linear dimen-sionality reduction are principal component analysis (PCA),independent component analysis (ICA), and linear discrimi-nant analysis (LDA).
PCA (22) attempts to find a new orthogonal coordinatesystem whereby the maximum variance of the data is incor-porated in the first few dimensions. Projection of the dataonto the individual coordinates encompasses varying degreesof variance; the first coordinate encompasses the largest var-iance in the data, the second coordinate the next largest var-iance, and so forth. Thus, by retaining only the first fewdimensions of the PCA transform, the sources of the largestamount of variation in the data are maintained. PCA is basedon an eigenanalysis of the data, and thus can be computa-tionally expensive. Ordering the eigenvectors according to theirassociated eigenvalues provides the principal components.
ICA (23–26), in contrast, looks to find some mixingmatrix W such that the components of YsWX are statisti-cally independent. This provides a stronger constraint on theresulting components than PCA, which only requires that thecomponents be uncorrelated. ICA, however, provides noranking of the resulting independent components, as does

Madabhushi et al.: Integrated diagnostics: a conceptual framework with examples 993
Article in press - uncorrected proof
PCA. There are a variety of methods for calculating the inde-pendent components wrefer to (23–26)x, which are generallyvery computationally intensive.
Recently, NLDR methods have become popular in learn-ing applications. These methods overcome a major limitationof linear dimensionality reduction methods, such as PCA andLDA, which assume that geometrical structure of the high-dimensional feature space is linearized. In reality, high-dimensional feature spaces comprised of highly non-linearstructures and locality preserving dimensionality reductionmethods are highly sought after. Many manifold learningalgorithms have been constructed over the years to deal withdifferent types of data (27–33). Graph embedding is onesuch algorithm that aims to non-linearly project high dimen-sional data into a reduced dimensional space, while simul-taneously preserving object adjacencies (34–37). The highdimensional feature space F will be significantly reduced interms of number of dimensions to a lower dimensional eigenfeature vector X (where ±F±4±X± and ±F± is the cardinality ofset F). X now represents the low dimensional embeddingcoordinates (or principal eigenvalues) of the original object(e.g., a histology image), in turn representing the variance inthe data in F. Hence, if two objects (e.g., pathology images)L1 and L2 are embedded close to each other in the lowerdimensional sub-space, then it suggests that they are similarto each other wpotentially in terms of survival, or similarityin spatial arrangement of breast cancer (BC) nucleix. NLDRschemes differ from linear DR schemes, such as PCA in thatthey attempt to preserve geodesic distances between objectsin the high dimensional space.
Classification
For histopathology imagery, unlike some other applicationsof image analysis, one of the primary considerations in thechoice of a classifier is its ability to deal with large, highlydense datasets. Also due to multiple image scales at whichrelevant information may be extracted from histologicalimagery, use of an ensemble of classifiers as opposed to asingle classifier has been proposed. Following feature extrac-tion, selection and dimensionality reduction, different sche-ma for classification may be applied to the histopathologicimages.
Multi-classifier ensemble schemes
Both theoretical and empirical results have established that,in terms of accuracy, ensembles of classifiers generally out-perform monolithic solutions. Learning ensembles ormultiple classifier systems are methods for improving classifi-cation accuracy through aggregation of several similar clas-sifiers’ predictions, and thereby reducing either the bias orvariance of the individual classifiers (38–40).
Support vector machines (SVM) SVMs project a set oftraining data, E, representing two different classes into ahigh-dimensional space by means of a kernel function K.The algorithm then generates a discriminating hyper-plane to
separate out the classes in such a way to maximize a costfunction. Testing data is then projected into the high-dimen-sional space via K, and the test data is classified based onwhere it falls with respect to the hyper-plane. The kernelfunction K defines the method in which data is projectedinto the high-dimensional space. A commonly used kernelknown as the radial basis function has been employed todistinguish between three different classes of prostate tissue(41). Radial basis functions with a grid search for their para-meters have also been used to differentiate colon adenocar-cinoma histopathology images from benign histopathologyimages (42), and to classify four different subtypes of menin-gioma from their histopathology images (43).
Adaboost The AdaBoost algorithm is used to combine anumber of weak learners to generate a strong classifier. Inthe study by Doyle et al. (44), a hierarchical boosted cascadescheme for detecting suspicious areas on digitized prostatehistopathology, inspired by the work of Viola and Jones (45)on face detection was presented. Efficient and accurate anal-ysis is performed by first detecting those areas only foundto be suspicious at lower scales. Analysis at subsequent high-er magnifications is limited to those regions deemed to besuspicious at lower scales. Pixels classified as ‘‘non-tumor’’at a lower magnification (scale) are discarded at the subse-quent higher scale, reducing the number of pixels needed foranalysis at higher scales. The process is repeated using anincreasingly larger number of image features and an increas-ing classification threshold at each iteration. Qualitativeresults with a hierarchical boosted classifier at three differentimage resolutions are shown in Figure 3.
Applications
Prostate cancer grading
The classification of histopathology imagery is often the ulti-mate goal in image analysis, particularly in cancer applica-tions. Features derived from segmented nuclei and glandsfrom histopathology are usually a pre-requisite to extractinghigher level information regarding the state of the disease.For instance, the grading of prostate cancer by Jafari-Khou-zani and Soltanian-Zadeh (46) yielded 97% accuracy forHematoxylin & Eosin (H&E) stained imagery based on fea-tures derived from nuclear structures in histopathology. Weynet al. (47) reported 87.1%–96.8% accuracy in the correctdiagnosis (3 diagnoses) of Feulgen-stained lung cancer spec-imens, 79.5%–92.3% accuracy in typing (3 types) malignantmesothelioma, and 74.3%–82.9% accuracy in the prognosis(3 classes of survival time) of malignant mesothelioma cases.Analysis of Feulgen-stained breast tissue sections by van deWouwer et al. found 67.1% accuracy in classifying nuclei asbenign or malignant, but 100% classification on a patientlevel. Tabesh et al. (48) found 96.7% accuracy in discrimi-nating between prostate tissue slides with cancer and no can-cer, and 81% accuracy in the discrimination between low

994 Madabhushi et al.: Integrated diagnostics: a conceptual framework with examples
Article in press - uncorrected proof
Figure 3 Hierarchical boosting to identify prostate carcinoma in whole digitized pathology slides.From left to right, (A) a digitized histopathology image, (B) cancer extent delineated in black by an expert pathologist, and cancer probabilityimages generated by an Adaboost classifier at (C) low-, (D) intermediate, and (E) high-image resolutions.
Figure 4 Non-linear dimensionality reduction used to classify prostate adenocarcinoma into Gleason grade 3 and grade 4 patterns.(A) Low dimensional embedding of the high dimensional attribute space via locally linear embedding of 20 images representing prostatecancer grades 3 (circles) and 4 (squares). Each image is displayed as a point in 3D eigenspace. The clustering clearly shows very gooddiscrimination between these two classes, which clinically is the most challenging problem in terms of Gleason grading. (B) Bar plotsreflecting the classification accuracy obtained via a supervised classifier in distinguishing between pairs of tissue classes – grade 3/4, grade3 vs. benign epithelium, and grade 4 vs. benign epithelium via a SVM classifier. Note that in every case the classification accuracy is over90%.
and high Gleason grades in the same imagery. Immunohis-tochemically stained colon mucosa allowed for an accuracyof 92% for classification of benign and malignant images byEsgiar et al. (49, 50).
Figure 4A shows the low dimensional embedding of thehigh dimensional attribute space via locally linear embeddingof 20 images representing prostate cancer grades 3 (greencircles) and 4 (blue squares). Each image is displayed as apoint in 3D eigenspace. The clustering clearly shows verygood discrimination between these two classes, which clin-ically is the most challenging problem in terms of Gleasongrading. Figure 4B shows bar plots reflecting the classifi-cation accuracy obtained via a supervised classifier in distin-guishing between pairs of tissue classes – grade 3/4, grade3 vs. benign epithelium, and grade 4 vs. benign epitheliumvia a SVM classifier. Note that in every case the classifica-tion accuracy is over 90%.
Quantifying extent of lymphocytic infiltration
on Her2H breast cancer imagery
Molecular changes in BC are sometimes accompanied bycorresponding changes in phenotype. Therefore, the identi-fication of these phenotypic changes in BC histopathologyis of significant prognostic and theragnostic value. One suchphenotype is the presence of lymphocytic infiltration (LI), aform of immune response often seen in high grade BC. Thepresence of LI in BC histopathology has been shown to cor-relate with tumor recurrence and nodal metastasis. To char-acterize LI computationally, we presented a computer assisteddiagnosis (CAD) methodology to automatically detect andquantitatively grade the extent of LI in high-grade, HER2qBC histopathology images.
The lymphocyte CAD algorithm comprises three mainstages. First, we employ an automated lymphocyte detection

Madabhushi et al.: Integrated diagnostics: a conceptual framework with examples 995
Article in press - uncorrected proof
Figure 5 Non-linear dimensionality reduction used to classify lymphocytic infiltration in Her2 positive breast carcinoma.Visualization of HER2q breast cancer tissue samples with low-, to medium-, to high-levels of lymphocytic infiltration (LI) (52, 53) in themeta-space. Graphs constructed on the LI allow for extraction of architectural features, resulting in a smooth manifold (obtained via CEmbed)with clear separation b/w different LI levels.
scheme to identify lymphocyte nuclei from surrounding stro-ma and cancer cell nuclei. A region-growing algorithm ini-tially segments all candidate nuclei. Since many cancer cellnuclei are also found, a Bayesian classifier is used in con-junction with a Markov random field (MRF) to refine thesegmentation. The Bayesian classifier calculates features foreach candidate nucleus and uses the size and luminanceinformation to distinguish lymphocyte nuclei from cancercell nuclei. The MRF is an iterative algorithm that modelsthe infiltration phenomenon by incorporating the spatialproximity of lymphocytes in a histopathology image.
Using the segmented lymphocytes, a total of 50 architec-tural (i.e., graph-based and nuclear) features are extracted foreach image. We construct three graphs (Voronoi Diagram,Delaunay Triangulation, and Minimum Spanning Tree) andcalculate 25 graph-based features for each image. Theremaining 25 features represent nuclear statistics, such aslymphocyte density and nearest neighbor statistics.
For a dataset containing 41 images, we distinguish imageswith high and low LI by reducing the architectural featureset with NLDR and applying a SVM classifier. We compareour method to two textural feature sets: the popular Varma-Zisserman (VZ) texton-based features and global texturefeatures. While the architectural feature set achieves a clas-sification accuracy of 92%, the texton-based and global tex-ture feature sets perform at 60% and 50%, respectively (51).
Figure 5 shows that the low dimensional representation,obtained by the application of Graph embedding on a set ofHER2q BC histopathology images from which Voronoigraph based features were derived to quantitatively charac-terize the extent, pattern, and density of LI (presence of lym-
phocytic nuclei), results in a smooth curvilinear manifoldwith a continuous transition for low to intermediate to highlevels of LI (levels of LI have been clinically correlated todisease outcome; high levels of LI result in better outcome/survival) (54). By mapping new samples onto this manifoldand based on the location of the sample on the manifold, aprediction of disease outcome could be made. The manifoldin the meta-space captures the biological transformation ofthe disease in its transition from good to poor prognosiscancer (51).
This study demonstrates the ability of a CAD algorithmto automatically detect and quantitatively characterize thenature of LI in breast histopathology. These tasks are of par-ticular importance due to the connection between LI in BCand patient outcome. Furthermore, since the methodologyproposed in this study is independent of the underlying biol-ogy, it may also be applicable to the histopathology of otherdiseases.
Generalized fusion framework
H&E stained prostate whole mount histology and corre-sponding proteomic spectra from mass spectrometry can beused to predict prostate cancer recurrence via a generalizedfusion framework (GFF). GFF provides seamless integrationof multiple modalities (in this case histology and proteomics)while addressing issues with previous combination of deci-sion (COD) and combination of interpretation (COI) strate-gies. Owing to the disparity of the dimensionalities that thetwo different modalities resides in, meta-space, a novelknowledge representation framework is presented which
996 Madabhushi et al.: Integrated diagnostics: a conceptual framework with examples
Article in press - uncorrected proof
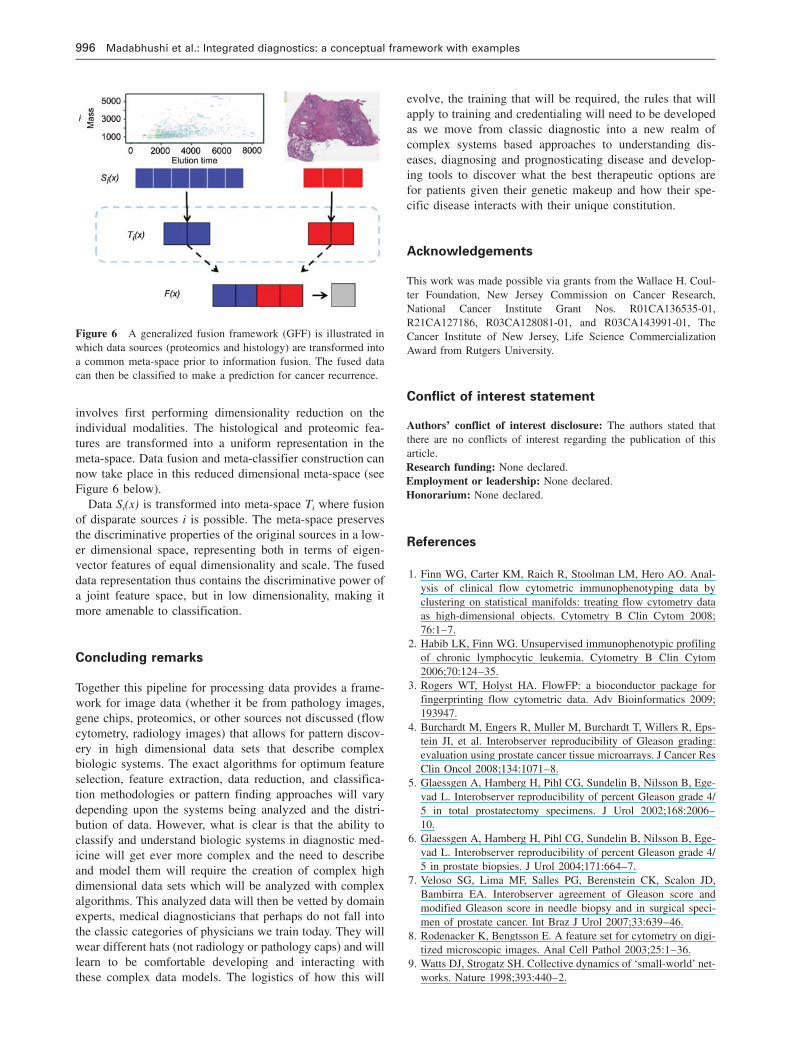
Figure 6 A generalized fusion framework (GFF) is illustrated inwhich data sources (proteomics and histology) are transformed intoa common meta-space prior to information fusion. The fused datacan then be classified to make a prediction for cancer recurrence.
involves first performing dimensionality reduction on theindividual modalities. The histological and proteomic fea-tures are transformed into a uniform representation in themeta-space. Data fusion and meta-classifier construction cannow take place in this reduced dimensional meta-space (seeFigure 6 below).
Data Si(x) is transformed into meta-space Ti where fusionof disparate sources i is possible. The meta-space preservesthe discriminative properties of the original sources in a low-er dimensional space, representing both in terms of eigen-vector features of equal dimensionality and scale. The fuseddata representation thus contains the discriminative power ofa joint feature space, but in low dimensionality, making itmore amenable to classification.
Concluding remarks
Together this pipeline for processing data provides a frame-work for image data (whether it be from pathology images,gene chips, proteomics, or other sources not discussed (flowcytometry, radiology images) that allows for pattern discov-ery in high dimensional data sets that describe complexbiologic systems. The exact algorithms for optimum featureselection, feature extraction, data reduction, and classifica-tion methodologies or pattern finding approaches will varydepending upon the systems being analyzed and the distri-bution of data. However, what is clear is that the ability toclassify and understand biologic systems in diagnostic med-icine will get ever more complex and the need to describeand model them will require the creation of complex highdimensional data sets which will be analyzed with complexalgorithms. This analyzed data will then be vetted by domainexperts, medical diagnosticians that perhaps do not fall intothe classic categories of physicians we train today. They willwear different hats (not radiology or pathology caps) and willlearn to be comfortable developing and interacting withthese complex data models. The logistics of how this will
evolve, the training that will be required, the rules that willapply to training and credentialing will need to be developedas we move from classic diagnostic into a new realm ofcomplex systems based approaches to understanding dis-eases, diagnosing and prognosticating disease and develop-ing tools to discover what the best therapeutic options arefor patients given their genetic makeup and how their spe-cific disease interacts with their unique constitution.
Acknowledgements
This work was made possible via grants from the Wallace H. Coul-ter Foundation, New Jersey Commission on Cancer Research,National Cancer Institute Grant Nos. R01CA136535-01,R21CA127186, R03CA128081-01, and R03CA143991-01, TheCancer Institute of New Jersey, Life Science CommercializationAward from Rutgers University.
Conflict of interest statement
Authors’ conflict of interest disclosure: The authors stated thatthere are no conflicts of interest regarding the publication of thisarticle.Research funding: None declared.Employment or leadership: None declared.Honorarium: None declared.
References
1. Finn WG, Carter KM, Raich R, Stoolman LM, Hero AO. Anal-ysis of clinical flow cytometric immunophenotyping data byclustering on statistical manifolds: treating flow cytometry dataas high-dimensional objects. Cytometry B Clin Cytom 2008;76:1–7.
2. Habib LK, Finn WG. Unsupervised immunophenotypic profilingof chronic lymphocytic leukemia. Cytometry B Clin Cytom2006;70:124–35.
3. Rogers WT, Holyst HA. FlowFP: a bioconductor package forfingerprinting flow cytometric data. Adv Bioinformatics 2009;193947.
4. Burchardt M, Engers R, Muller M, Burchardt T, Willers R, Eps-tein JI, et al. Interobserver reproducibility of Gleason grading:evaluation using prostate cancer tissue microarrays. J Cancer ResClin Oncol 2008;134:1071–8.
5. Glaessgen A, Hamberg H, Pihl CG, Sundelin B, Nilsson B, Ege-vad L. Interobserver reproducibility of percent Gleason grade 4/5 in total prostatectomy specimens. J Urol 2002;168:2006–10.
6. Glaessgen A, Hamberg H, Pihl CG, Sundelin B, Nilsson B, Ege-vad L. Interobserver reproducibility of percent Gleason grade 4/5 in prostate biopsies. J Urol 2004;171:664–7.
7. Veloso SG, Lima MF, Salles PG, Berenstein CK, Scalon JD,Bambirra EA. Interobserver agreement of Gleason score andmodified Gleason score in needle biopsy and in surgical speci-men of prostate cancer. Int Braz J Urol 2007;33:639–46.
8. Rodenacker K, Bengtsson E. A feature set for cytometry on digi-tized microscopic images. Anal Cell Pathol 2003;25:1–36.
9. Watts DJ, Strogatz SH. Collective dynamics of ‘small-world’ net-works. Nature 1998;393:440–2.

Madabhushi et al.: Integrated diagnostics: a conceptual framework with examples 997
Article in press - uncorrected proof
10. Wuchty S, Stadler PF. Centers of complex networks. J TheorBiol 2003;223:45–53.
11. Marcelpoil R. Normalization of the minimum spanning tree.Anal Cell Pathol 1993;5:177–86.
12. Albert R, Schindewolf T, Baumann I, Harms H. Three-dimen-sional image processing for morphometric analysis of epithe-lium sections. Cytometry 1992;13:759–65.
13. Boucheron LE, Harvey NR, Manjunath BS. On using cyto-plasm and stroma features in automated cancer diagnosis work-shop on bio-image informatics: biological imaging, computervision and data mining. Santa Barbara, CA, USA, 2008.
14. Somol P, Pudil P, Kittler J. Fast branch & bound algorithms foroptimal feature selection. IEEE Trans Pattern Anal Mach Intell2004;26:900–12.
15. Peng Y, Wu Z, Jiang J. A novel feature selection approach forbiomedical data classification. J Biomed Inform 2009;43:15–23.
16. Sima C, Dougherty ER. What should be expected from featureselection in small-sample settings. Bioinformatics 2006;22:2430–6.
17. Xiong M, Fang X, Zhao J. Biomarker identification by featurewrappers. Genome Res 2001;11:1878–87.
18. Jain A, Zonker D. Feature selection: evaluation, application,and small sample performance. IEEE Trans Pattern Anal MachIntell 1997;19:153–8.
19. Freund Y, Schapire RE, editors. Experiments with a new boost-ing algorithm. Proceedings of National Conference on MachineLearning, 1996.
20. Perkins S, Theiler J. Online feature selection using grafting.International Conference on Machine Learning 2003:592–9.
21. Qureshi H, Sertel O, Rajpoot N, Wilson R, Gurcan M. Adaptivediscriminant wavelet packet transform and local binary patternsfor meningioma subtype classification. Med Image ComputComput Assist Interv Int Conf Med Image Comput ComputAssist Interv 2008;11:196–204.
22. Jolliffe IT. Principal component analysis. Springer, 2002.23. Hyvarinen A, Ramkumar P, Parkkonen L, Hari R. Independent
component analysis of short-time Fourier transforms for spon-taneous EEG/MEG analysis. Neuroimage 2010;49:257–71.
24. Hyvarinen A. Fast and robust fixed-point algorithms for inde-pendent component analysis. IEEE Trans Neural Netw 1999;10:626–34.
25. Hyvarinen A, Pajunen P. Nonlinear independent componentanalysis: existence and uniqueness results. Neural Netw 1999;12:429–39.
26. Hyvarinen A, Oja E. Independent component analysis: algo-rithms and applications. Neural Netw 2000;13:411–30.
27. Qiao H, Zhang P, Zhang B, Zheng S. Learning an intrinsic-variable preserving manifold for dynamic visual tracking. IEEETrans Syst Man Cybern B Cybern 2009 Nov 13 (Epub aheadof print).
28. Takahashi S, Fujishiro I, Okada M. Applying manifold learningto plotting approximate contour trees. IEEE Trans Vis ComputGraph 2009;15:1185–92.
29. Hou Y, Zhang P, Xu X, Zhang X, Li W. Nonlinear dimension-ality reduction by locally linear inlaying. IEEE Trans NeuralNetw 2009;20:300–15.
30. Lin T, Zha H. Riemannian manifold learning. IEEE Trans Pat-tern Anal Mach Intell 2008;30:796–809.
31. Li X, Lin S, Yan S, Xu D. Discriminant locally linear embed-ding with high-order tensor data. IEEE Trans Syst Man CybernB Cybern 2008;38:342–52.
32. Keeratipranon N, Maire F, Huang H. Manifold learning forrobot navigation. Int J Neural Syst 2006;16:383–92.
33. Law MH, Jain AK. Incremental nonlinear dimensionalityreduction by manifold learning. IEEE Trans Pattern Anal MachIntell 2006;28:377–91.
34. Madabhushi A, Yang P, Rosen M, Weinstein S. Distinguishinglesions from posterior acoustic shadowing in breast ultrasoundvia non-linear dimensionality reduction. Conf Proc IEEE EngMed Biol Soc 2006;1:3070–3.
35. Yan S, Xu D, Zhang B, Zhang HJ, Yang Q, Lin S. Graphembedding and extensions: a general framework for dimen-sionality reduction. IEEE Trans Pattern Anal Mach Intell 2007;29:40–51.
36. Madabhushi A, Shi J, Rosen M, Tomaszeweski JE, FeldmanMD. Graph embedding to improve supervised classification andnovel class detection: application to prostate cancer. Med ImageComput Comput Assist Interv 2005;8:729–37.
37. Higgs BW, Weller J, Solka JL. Spectral embedding finds mean-ingful (relevant) structure in image and microarray data. BMCBioinformatics 2006;7:74.
38. Kuncheva L. An aggregation of pro and con evidence for med-ical decision support systems. Comput Biol Med 1993;23:417–24.
39. Kuncheva LI. Evaluation of computerized medical diagnosticdecisions via fuzzy sets. Int J Biomed Comput 1991;28:91–100.
40. Kuncheva LI. Fuzzy multi-level classifier for medical applica-tions. Comput Biol Med 1990;20:421–31.
41. Doyle S, Hwang M, Shah K, Madabhushi A, Tomaszeweski J,Feldman M. Automated grading of prostate cancer using archi-tectural and textural image features. International Symposiumon Biomedical Imaging. Washington, DC. 2007;1284–7.
42. Rajpoot K, Rajpoot N. SVM optimization for hyperspectralcolon tissue cell classification. MICCAI 2004;829–37.
43. Qureshi H, Rajpoot N, Wilson R, Nattkemper T, Hans V, edi-tors. Comparative analysis of discriminant wavelet packet fea-tures and raw image features for classification of meningiomasubtypes. Medical Image Understanding and Analysis 2007;Aberystwyth (UK).
44. Doyle S, Madabhushi A, Feldman M, Tomaszeweski J. Aboosting cascade for automated detection of prostate cancerfrom digitized histology. Med Image Comput Comput AssistInterv 2006;9:504–11.
45. Viola P, Jones MJ. Robust real-time face detection. Int J Com-puter Vision 2004;57:137–54.
46. Jafari-Khouzani K, Soltanian-Zadeh H. Multiwavelet gradingof pathological images of prostate. IEEE Trans Biomed Eng2003;50:697–704.
47. Weyn B, van de Wouver G, van Daele A, Scheunders P, vanDyck D, van Marck E, et al. Automated breast tumor diagnosisand grading based on wavelet chromatin texture description.Cytometry 1998;33:32–40.
48. Tabesh A, Teverovskiy M, Pang HY, Kumar VP, Verbel D, Kot-sianti A, et al. Multifeature prostate cancer diagnosis and Glea-son grading of histological images. IEEE Trans Med Imaging2007;26:1366–78.
49. Esgiar AN, Naguib RN, Sharif BS, Bennett MK, Murray A.Microscopic image analysis for quantitative measurement andfeature identification of normal and cancerous colonic mucosa.IEEE Trans Inf Technol Biomed 1998;2:197–203.
50. Esgiar AN, Naguib RN, Bennett MK, Murray A. Automatedfeature extraction and identification of colon carcinoma. Ana-lytical and quantitative cytology and histology/the InternationalAcademy of Cytology wandx American Society of Cytology.1998;20:297–301.
51. Basavanhally AN, Ganesan S, Agner S, Monaco JP, FeldmanMD, Tomaszewski JE, et al. Computerized image-based detec-

998 Madabhushi et al.: Integrated diagnostics: a conceptual framework with examples
Article in press - uncorrected proof
tion and grading of lymphocytic infiltration in HER2q breastcancer histopathology. IEEE Trans Biomed Eng 2010;57:642–53.
52. Basavanhally A, Agner A, Alexe G, Ganesan S, Bhanot G,Madabhushi A. Manifold learning with graph-based features foridentifying extent of lymphocytic infiltration from high gradebreast cancer histology. MMBIA workshop in conjunction withMICCAI 2008; New York, NY 2008.
53. Fatakdawala H, Basavanhally A, Xu J, Bhanot G, Ganesan S,
Feldman M, et al., editors. Expectation maximization drivengeodesic active contour: application to lymphocyte segmenta-tion on digitized breast cancer histopathology. Taiwan: IEEEInternational Conference on Bioinformatics and Bioengineering(IEEE BIBE), 2009.
54. Alexe G, Dalgin GS, Scanfeld D, Tamayo P, Mesirov JP, DeLisiC, et al. High expression of lymphocyte-associated genes innode-negative HER2q breast cancers correlates with lowerrecurrence rates. Cancer Res 2007;67:10669–76.

Copyright of Clinical Chemistry & Laboratory Medicine is the property of De Gruyter and its content may not
be copied or emailed to multiple sites or posted to a listserv without the copyright holder's express written
permission. However, users may print, download, or email articles for individual use.