Integrated Assessment Modeling in Canada: The Case of Acid Rain
19
Munich Personal RePEc Archive Integrated Assessment Modeling in Canada: The Case of Acid Rain Mariam, Yohannes, Lam, David and Barre, Mike UNSPECIFIED 1998 Online at http://mpra.ub.uni-muenchen.de/665/ MPRA Paper No. 665, posted 07. November 2007 / 01:11
Transcript of Integrated Assessment Modeling in Canada: The Case of Acid Rain
MPRAMunich Personal RePEc Archive
Integrated Assessment Modeling inCanada: The Case of Acid Rain
Mariam, Yohannes, Lam, David and Barre, Mike
UNSPECIFIED
1998
Online at http://mpra.ub.uni-muenchen.de/665/
MPRA Paper No. 665, posted 07. November 2007 / 01:11
1
Integrated Assessment Modeling in Canada: The Case of
Acid Rain
98-TA37.01
Dr. Yohannes K.G.Mariam1, Dr. David Lam
2, and Mr. Mike BarrJJJJ
1
1Environment Canada, Policy and Communications Service
Regulatory and Economics Assessment Branch
351 St. Joseph Boulevard, 16th Floor PVM
Hull, Quebec, K1A OH3, Canada
2 Environmental Information Technologies
New Technologies Research Branch
National Water Research Institute (NWRI)
867 Lakeshore Rd., P.O. Box 5050
Burlington, Ont. L7R 4A6
ABSTRACT
In the past, environmental decision making has been based on analysis of policy options with
respect to emission reduction, deposition or concentration of pollutants and the design of
preventive strategies using disparate single-model and discipline results. It was impossible to
obtain optimal solution to environmnetal problems because it is difficult to conduct a coherent,
systematic and sound analysis of environmental problems using a single disciplinary model.
Thus, a need arises for an integrated approach in environmental policy making.
The trend in environmental management is a move from single pollutant/single-effect to multi-
pollutant/multi-effect approach and to the inclusion of socioeconomic issues for the purposes of
determining the interaction of the environment with the economy. Integrated assessment
modeling (IAM) enables us to examine these kinds of issues by creating logical and scientific
relationship between the functioning of various ecosystems and the manner in which they
respond to external stimuli. Recognizing the crucial role that an integrative approach could play
in the development of sound environmental decision making, Environment Canada and other
government agencies have jointly participated in the development of IAM. Using data on
emissions, depositions, source-receptor matrix, costs of emission abatement, models describing
the functioning of aquatic and terrestrial ecosystems, IAM can be used to identify optimal
emission reduction strategies that benefit both the economy and ecology.
2
The purpose of this paper is to demonstrate how economic aspects of emission abatement can be
incorporated into IAM using acid rain as a case. The present study compared findings of optimal
abatement strategies when economic abatement costs are included and when they are not. The
findings indicate that i) a strong long-term commitment is required to provide 100% proetction
and allow the rejuvenation of acidified lakes, ii) major reductions in emissions of SO2 are still
required from the USA, iii) inter-regional trading with the USA can play a major role in reducing
emission of SO2 , and iv) polluters, as well as the society, would be better-off when emission
abatement strategies incorporate abatement costs than when not. This is particularly important in
ensuring the integration of the economy with environment, and the attainment of sustainable
development.
1. INTRODUCTION
Integrated Assessment Modeling (IAM) has become an important field of study over the past
decade. Before discussing the contribution of the present study, it is important to clarify the
meaning of the concept of IAM. The concept of IAM encompasses three elements: Integrated,
Assessment and Modeling. IAM could mean a number of things to disciplinary thinkers,
researchers, policy makers, etc. The scope of IAM can be as narrow as studying a single lake
ecosystem or as complex as examining the global climate change.
The standard view of integration refers to the causal chain that joins human actions to valued
consequences. Integration could mean incorporation of a single or chain of events into a specific
framework that directly or indirectly impact a specific outcome. It could imply the consideration
of the cultural elements of a specific target population in the formulation of a development
project. At the other end of the spectrum, integration could imply the explicit consideration of
social and economic factors that drive emissions, the biogeochemical cycles and atmospheric
chemistry that determines the fate of emissions, and the resultant effect of emissions on the local
and global environment, including the health and welfare of humans.1,2,3,4,5
Assessment can be defined as the presentation of and drawing casual inferences from
knowledge or information derived from various disciplinary researches to help decision-makers
evaluate possible actions or undertake an in-depth understanding of a problem.1 Modeling is a
framework or tool for organizing and assessing information.
Policy and basic sciences are the two essential ingredients of IAM. IAM establishes an
interdisciplinary research so that effective communications can be established between basic and
social scientists, and decision makers on the implications of changes in environmental health.
Integrated assessment can be viewed as an interdisciplinary and participatory process that
combines, interprets and communicates knowledge from disparate disciplines in order to
facilitate greater appreciation and understanding of complex problems.1,4
3
An IAM is an important tool for a holistic analysis of environmental problems because several
environmental problems have common causes, dynamics, and common impacts. IAM is able to
examine the relationships between the causes (human activities), the mechanisms (changes in the
functioning of the atmosphere, terrestrial and aquatic ecosystems), and the impacts (changes in
environmental health). The present study describes and presents the role of IAM in
environmnetal policy making in Canada.
2. EXPERIENCE WITH IAM
2.1. International Experience
IAM is not the only interdisciplinary or unifying research methodology or paradigm. The field of
cybernetics in the 1950s, information theory of the 1960s, catastrophe and the world systems
theories of the 1970s, chaos theory of the 1980s, and complexity theory of the 1990s are few
examples of interdisciplinary or unifying paradigms.3,6,7 However, emphasis is being given by
policy makers to IAM as an important tool that would enable balancing economic growth with
environmental protection.2
Research organizations in a number of countries have been involved in the development of IAM
tools as well as in utilizing output from these tools. The Battelle Pacific Northwest Laboratories,
Carnegie-Mellon University, Dutch National Institute for Public Health and Environmental
Protection (RIVM), International Institute for Applied Systems Analysis (IIASA), Electric Power
Research Institute (EPRI), Japanese National Institute for Environmental Studies, U.S.
Environmental Protection Agency , and Environment Canada have been involved in the
development of various forms of IAM tools.8,9,10,11,12,13,14 In addition, organizations, such as
Intergovernmental Panel on Climate Change (IPCC), U.N. Climate Convention, US
Environmnetal Protection Agency (US-EPA), United Nations Economic Commission for Europe
(UN-ECE), Environment Canada, etc. have utilized information supplied by IAM.15
Several IAM models have been developed over the past decade. These include Climatic Impact
Assessment Program (CIAP) of the US Department of Energy (USDOE); RAINS Model for
Europe and Asia (IIASA), Raison for Windows for Canada (Environment Canada), Tracking
and Analysis Framework or TAF of the National Acid Precipitation Assessment Program
(USEPA), IMAGE 2.0 (RIVM) and MiniCAM (USDOE) are few of the IAM platforms that
combine both socioeconomic and environmental variables.8,9,11,16 There are also models that
examine only the physical environment such as General Circulation Models (GCMs) and
MAGICC (National Center for Atmospheric Research-USA and University of East Anglia).
Other IAM tools examine only the socioeconomic environment such as DICE (Yale University),
CSERGE (Center for Social and Economic Research into the Global Environment) Model and
the Energy Modeling Forum (Stanford University). 16,17,19,20,21

4
Most IAM tools are international or national in application. However, regional sub-integrated
assessments have also been undertaken. Regional IAM modeling may be able to provide valuable
details about a specific policy outcome at a local or regional level.22 The present study is geared
toward demonstrating such an application.
2.2. Canadian experience
In Canada, an IAM platform evolved from a sub-basin or lake-ecosystem assessment tool called
RAISON (Regional Analysis by Intelligent Systems ON a microcomputer) for windows.12,13
RAISON for Windows is a powerful environmental information system tool used for data
integration and management, and for data analysis, synthesis and display. Unlike the policy
driven IAM platforms such as RAINS, the Canadian version of IAM attempts to balance the
economy with the environment or policy with science.12,13,14
The Canadian version of IAM can be divided into three major components: Biological or aquatic
sciences, atmospheric sciences, natural resource sciences, and socioeconomic sciences. The
biological or aquatic sciences include models such as waterfowl acidification response modeling
system (WARMS), Cation Denudation rate (CDRM),Trickle down (TD), CDRLTH, and TDBO.
The Atmospheric sciences include source-receptor relationship matrix for SO2 and NOx from
long-range atmospheric transport model. The natural sciences module is still in development but
currently has forestry impact model. The socioeconomic sciences currently has cost of emission
reduction and functional specifications between costs and emission removal. These modules are
interconnected through linear and non-linear optimization algorithms. Furthermore, the
Canadian IAM platform includes emissions and deposition data, and critical deposition loadings
for sensitive aquatic ecosystems. The IAM platform also employs neural network approach to
recognize patterns and fill gaps in monitoring data. Optimization procedures including linear
programming and genetic algorithms are also included in the platform. Moreover, uncertainty
and error propagation in models, using causal probability network and fuzzy expert system, are
introduced to the platform. 12,13,14
The optimization scheme contains an objective function and constraints to be satisfied. That is it
maximizes emissions reductions subject to the satisfaction of constraints such as non-exceedance
of maximum deposition at sensitive receptors, maximum allowable reductions form source
regions as well as the numbers of sources that would be examined simultaneously. The results of
the non-linear optimization runs would identify a strategy that is least cost and yet enable the
attainment of environmnetal goals.
The Canadian IAM platform has been used as a decision-support framework for basin
management strategies on nutrient abatement, effluent limits, waste disposal, dredging and other
5
cleanup options in the Great Lakes 2000 program. Information on hydrology, water quality,
geology, fisheries, forestry, transportation, urban development, socio-economics and health has
been integrated in support of watershed ecosystem research studies such as the Grand River
Eco-Research Project. Decision-support framework using expert system technologies to link
simulation models on hydrological runoff, water quality, groundwater and river ecology for
watershed management and planning have been developed (e.g., a study on the Duffins Creek
Watershed).12,13,14
Moreover, analysis of lake ecosystem (e.g., lake Erie) response to climate change scenarios has
been undertaken. Integrated assessment of ecological impacts due to sulfur and nitrogen oxides
for evaluation of policy options of emission control for selected sites in Canada and the United
States has been conducted. In addition, modeling industrial effluent transport and fate in the
Athabasca River, and pathway and fate of contaminants for the Great Lakes-St. Lawrence Mixed
Woods Plain have been carried out. Internationally, the RAISON system has been used for
watershed modeling and lake hydrodynamics for the Lerma-Chapala basin (Mexico) and the
Lake Caohu basin (P.R. China).12,13,14
3. AN EXAMPLE FROM ACIDIFICATION STUDY
3.1. Introduction
Sulphur dioxide (SO2) and nitrogen oxides (NOx) can be classified as acidifying pollutants since
they become acids upon contact with moisture. These gases are also transformed in the
atmosphere to their corresponding acid species, sulphuric (H2SO4) and nitric (HNO3) acid.
These and other air pollutants can be deposited on vegetation, soils, surface or ground waters,
etc. in wet and dry forms. In addition, one of the constituents of NOx, nitrogen dioxide (NO2) is
converted to ground-level ozone (O3) and peroxyacetyl nitrate (PAN).
Several gaseous sulphur compounds are emitted into the atmosphere through man-made or
natural processes. Of these sulphur compounds, SO2 and hydrogen sulphide (H2S) are the most
important species of environmental concern. Emission of SO2 and its depositions as sulphate is
the major anthropogenic causes of acidification of lakes, stream and terrestrial ecosystems. Man-
made sources contribute to more than half of total sulphur emissions in the northern
hemisphere.22 In Canada, the major sources of SO2 emissions are industrial processes (62%),
fuel combustion (33%) and transportation (4%).24
Effective control of atmospheric deposition of acidifying pollutants that would enable the
attainment of critical deposition loadings in Canada requires collaborative efforts among
provinces and with the USA. Critical deposition loadings is define as "the highest deposition of
acidifying compounds that will not cause chemical changes leading to long term harmful effects
on ecosystem structure and function."25 To attain critical deposition loadings or reduce acidic
deposition, the Canada-US Acid Rain Control Accord was signed in 1991. According to this
6
Accord, Canada has committed to keep the total annual emission of SO2 to 3.2 million tons per
year by the year 2000. Of this national cap, 2.3 million tons have been set to be achieved by the
provinces in Eastern Canada. This cap represents a 40% reduction from the 1980 level. There is
no formal commitment to extend this cap beyond the year 2000. Many acidified ecosystems
require longer time period to recover. Therefore, there is a need to develop a strategy for further
reduction of SO2 in North America.
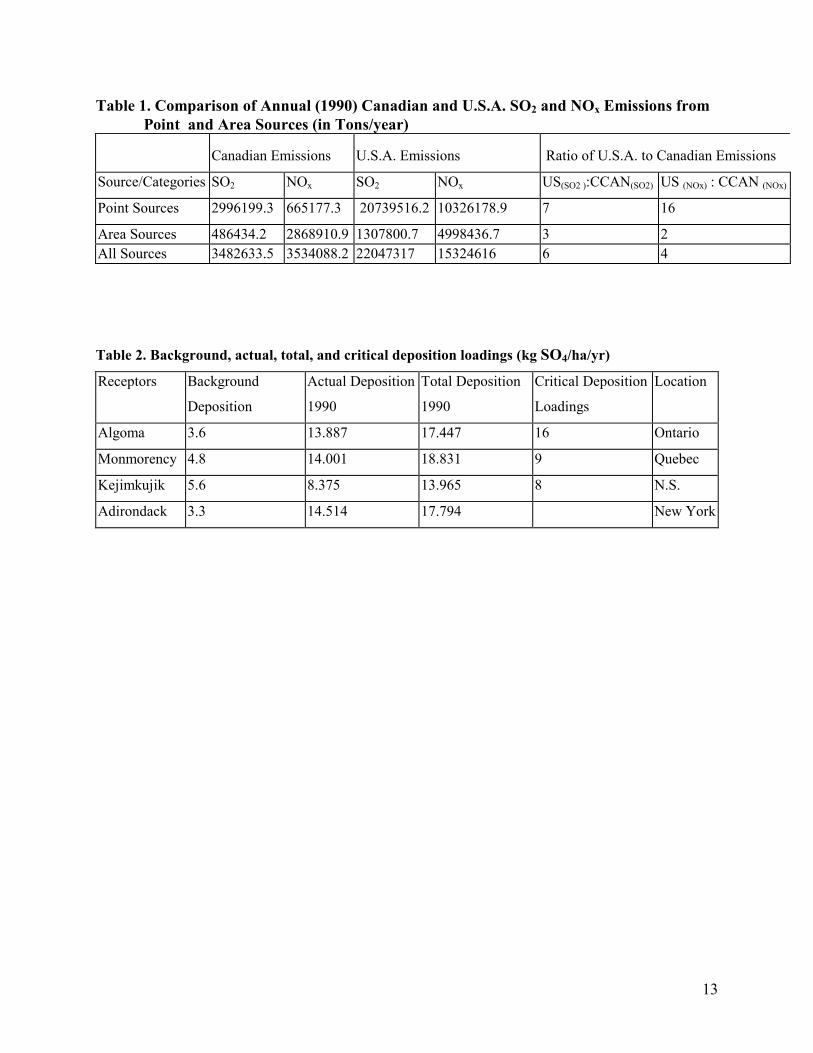
Emission inventories of SO2 and NOx from point sources indicate that the ratio of emissions of
NOx from the USA 16 times that of Canadian emissions (see Table 1). In aggregate, however,
U.S. emissions of SO2 and NOx are at least four fold that of Canadian emissions (Table 1). The
ratio of SO2 emissions to the NOx emissions in Canada is about 1 while that of U.S.A. is 1.5.
Without a firm commitment plan to reduce emissions of SO2 and NOx in the U.S.A.,
transboundary flow of acidifying pollutants to Canada may increase.26 Canada may require to
implement additional control measures and instruments to minimize the acidification and other
effects of NOx and SO2.
In the present study a model that inherently incorporates inter-regional trading is employed. The
present study is intended to demonstrate the use of IAM in determining optimal policy scenario
in a situation when only environmental goals are perceived compared to a situation when both
environmental and economic concerns are integrated in the decision making process.
3.2. Inputs into the Model
Inputs to the IAM platform include gridded emissions and deposition data, critical deposition
loadings for sensitive receptors, cost functions, cost and deposition optimization algorithms,
source-receptor relationship matrix, lake chemistry and data on aquatic ecosystems of lakes in the
receptor sites. The purpose of the present study is to examine the cost implications of only
deposition optimization strategy that takes into account percentage of lakes protected from
acidification, and cost and deposition optimizations routine that incorporates cost and
environmental goals would be carried out.
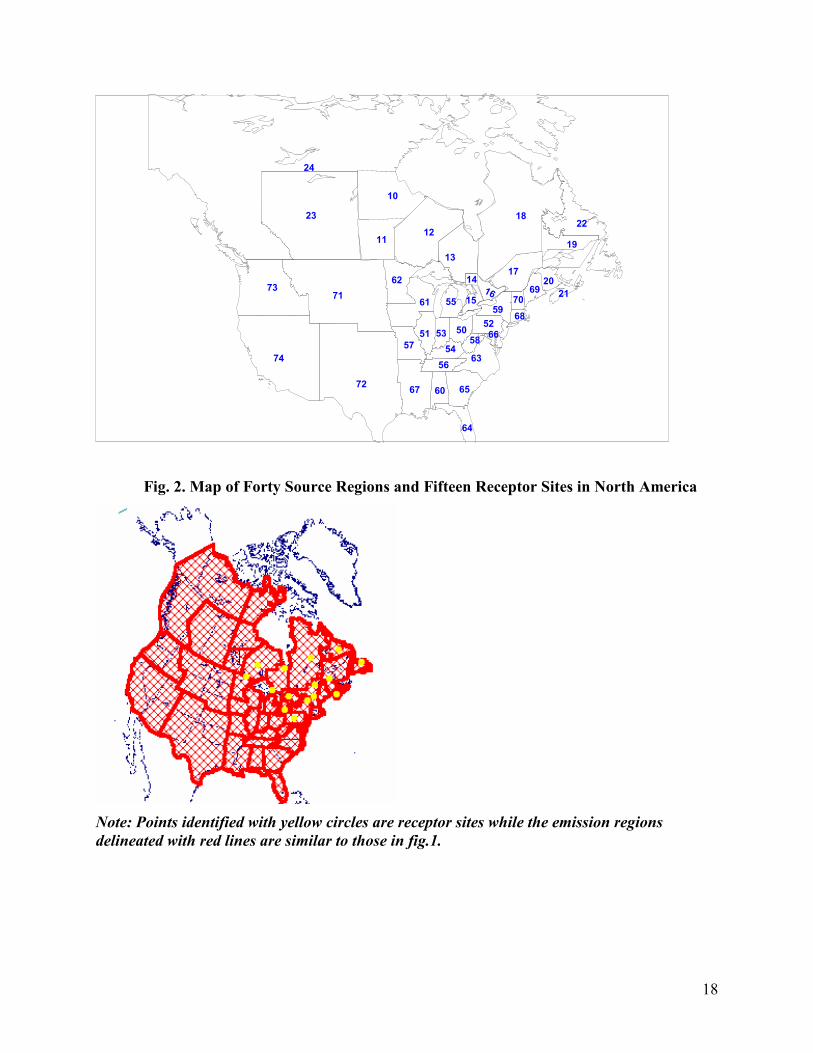
The 1990 Canadian long-range transport of air pollutants and acid deposition report divided
North America into 40 sources of emission and 15 sensitive receptors sites (Figures 1 and 2).24
For the purpose of national policy making and international negotiation, the use of these large
sources and few receptors may prove adequate.
7
3.3. Analysis of optimization results
The analysis is divided into two parts: ecological or deposition optimization, and an ecologic-
economic or deposition-cost optimization models. The results are demonstrated for three
sensitive Canadian receptors: Algoma (Ontario), Monmorency (Quebec) and Kejimkujik (Nova
Scotia); and one USA receptor: Adirondack (New York). Selected features of these receptor sites
are provided in Table 2. The results of the Optimization routine are presented in Tables 3 to 6.
The percentage emission reductions presented in the discussions below are in comparison with
the 1990 emissions. Unless indicated, the maximum reduction specified in all optimization
routine is 75% of 1990 emissions.
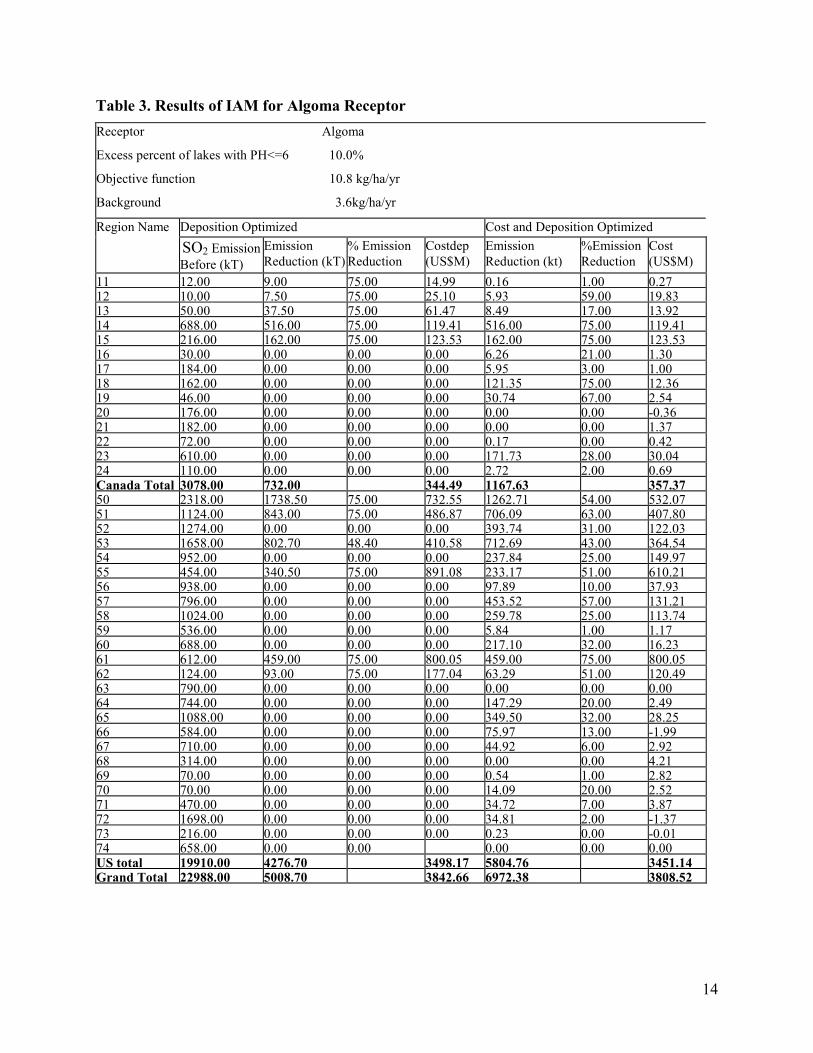
3.3.1. Results for Algoma (Ontario)
The results of deposition optimization algorithm indicated that in order to protect 90% of lakes
from being acidified (Ph<=6) in the Algoma region (southeastern Ontario), the estimated
deposition has to be 10.8kg/ha/yr of SO4. This objective assumes a background deposition of 3.6
kg/ha/yr of SO4. To achieve this ecosystem objective, Canadian emissions of SO2 have to be
reduced by 732kt (24%). The cost to achieve this level of reduction is 345 million US$. At the
same time, USA emissions of SO2 has to be reduced by 4277kt (22%) at a cost of 3.5 billion
US$. In total, emission of SO2 from North America has to be reduced by 5009kt (22%) at a cost
of 3.8 billion US$ (Table 3).
The same ecosystem objective was optimized using both cost and environmental goals. That is
the optimization scheme was performed to identify a strategy that satisfies the environmnetal
goal and yet attainable at a minimum cost. The results show that Canadian emissions of SO2 can
be reduced by 1168kt (38%) at a cost of 357million US$. To achieve the same environmental
goal at a minimum cost, USA has to reduce its emissions of SO2 by 5805kt (29%) at a cost of
3.5 billion US$ (Table 3).
The above results indicate that it cost more for Canada to reduce emissions to achieve 90%
protection of aquatic ecosystems in the Algoma region. Aggregating reductions in both Canada
and USA, deposition optimization results shows a reduction of 5009kt at a cost of 3.8 billion
US$. However, cost optimization with environmental objective resulted in a reduction of 6972kt
at a cost of 3.8 billion US$. Introducing inter-regional trading that takes into account both costs
and environmental goals, therefore, resulted in 39% more emissions reduction at a cost of about
1% less than those incurred when the optimization routine considers only environmental goals.

8
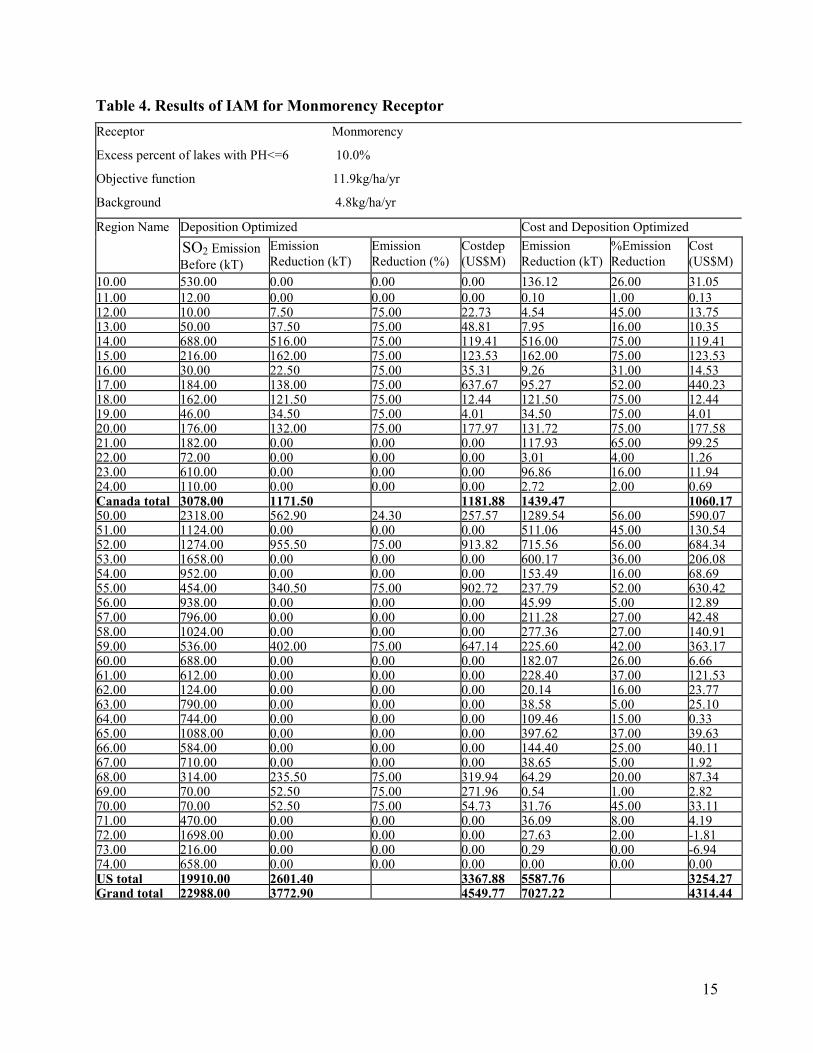
3.3.2. Results for Monmorency (Quebec)
To attain a 90% aquatic ecosystem protection, Canada has to reduce emissions of SO2 by 1172kt
(38%) at a cost of 1.2 billion US$. To achieve the same environmnetal goal, USA has to reduce
its emissions of SO2 by 2601kt at a cost of 3.4 billion US$. On the other hand, cost optimization
routine showed that Canada need to reduce emissions by 1440kt(47%) at a cost of 1.1 billion
US$. At the same time, the results from the cost optimization routine indicated that USA has to
reduce emissions by 5588kt (28%) at a cost of 3.3 billion US$. Thus, a strategy that involves cost
and deposition optimization proves to be extremely attractive since it allows a reduction of
7027kt at a cost of 4.3 billion US$. It means that about 86% more emission reduction at about
5% less cost can be attained when the development of an acid rain strategy involves costs and
environmental goals than when it relies only on environmental goals (Table 4).
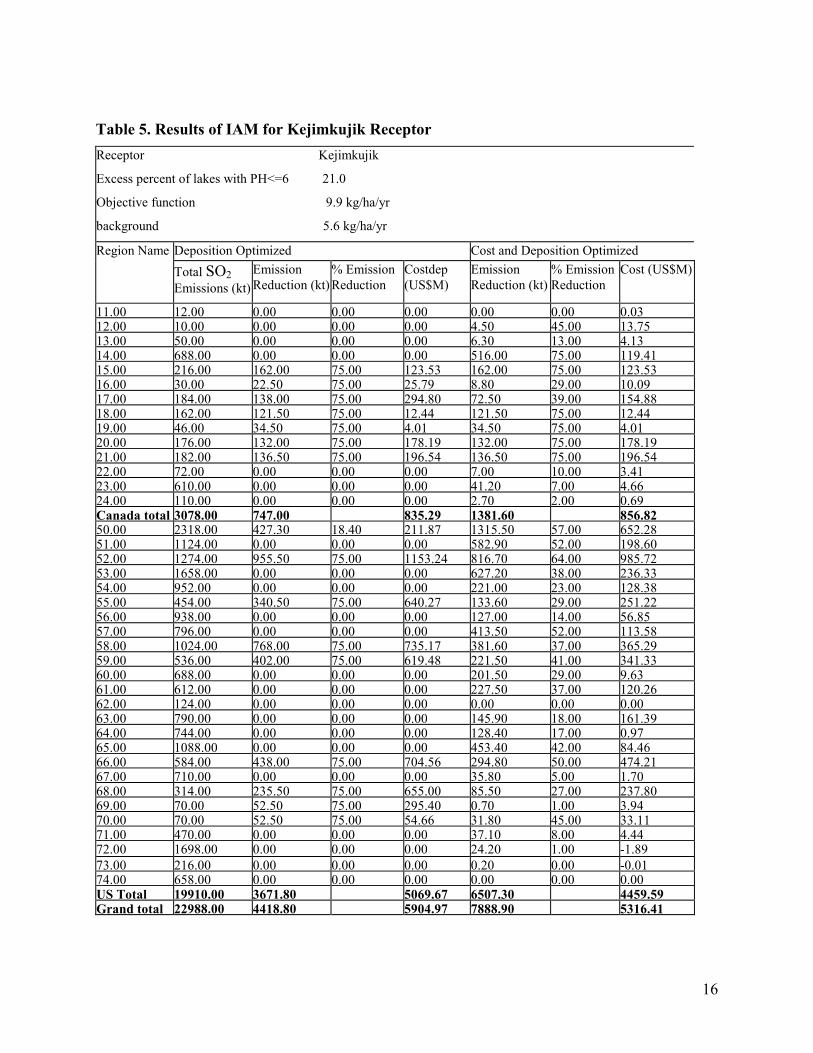
3.3.3. Results for Kejimkujik (Nova Scotia)
Protection of more than 80% of the aquatic ecosystems at this receptor site with a maximum
emission reduction of 75% was found to be unattainable. Therefore, a protection level of 80%
was chosen as an environmental goal. The result of deposition optimization showed that Canada
need to reduce emissions by 747kt (24%) at a cost of 835 million US$ (Table 5). Similarly, USA
has to reduce emissions SO2 by 3672kt (18%)at a cost of 5.1 billion US$. On the other hand,
cost and deposition optimization routine showed that Canada should reduce emissions by 1382kt
(45%) at a cost of 857 million US$. At the same time USA should reduce emissions by 6507kt
(33%) at a cost of 4.5 billion US$. In total, emissions have to be reduced by 4418 (19%) from
north America at a cost of 5.9 billion US$ under deposition only scenario. However, when both
costs and environmental objectives are incorporated in strategy development, emissions would
have to be reduced by 7889kt (34%) at a cost of 5.3 billion US$ (Table 5). Thus, it would be
beneficial to both ecosystems and the economy to adopt cost and deposition optimization
strategy.
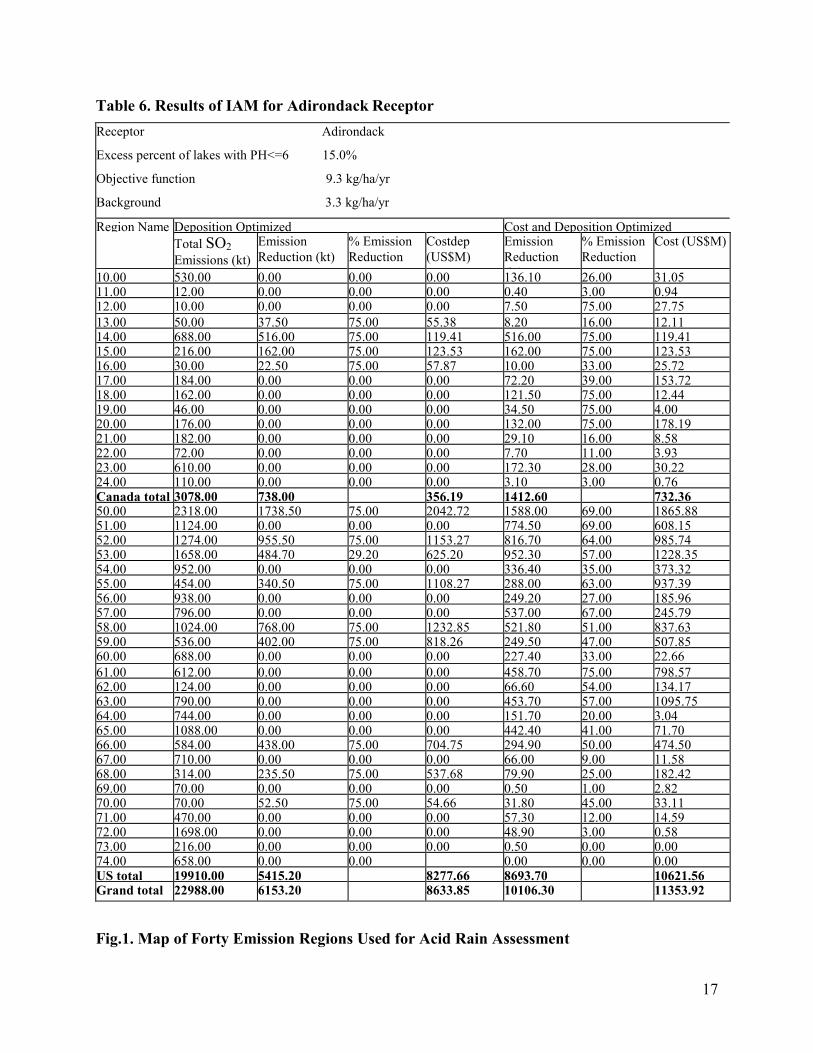
3.3.4. Results for Adirondack (USA)
To protect 85% of aquatic ecosystem in the Adirondack, Canada has to reduce emissions of SO2
by 738Kt (24% ) at a cost of 356 million US$. At the same time, USA should reduce emissions
of SO2 by 5415kt (27%) at a cost of 8.3 billion US$ (Table 6). However, when cost and
environmental goals are incorporated in the development of an acid rain strategy, emission
reduction from Canada increased to 1412kt (46%) at a cost of 732 million US$. At the same
time, reduction from USA increased to 8694Kt (45%) at a cost of 10.6 billion US$. In the USA,
where most reduction are expected, deposition minimization seem to be relatively cheaper (about
30% less) (Table 6).
9
Increasing the maximum reduction as well as reducing the percentage of lakes protected from
being acidified showed that deposition optimization remains relatively cheap. For example,
increasing emission reduction to 85% and reducing protection level to 80% show about a 5%
increase in cost under cost optimization compared with deposition optimization scheme.
Increasing the emission reduction level to 90% show that the amount of emissions reduced was
larger under a routine that incorporate both costs and environmental goals, but the cost of
emission reductions were approximately equal in both routines. This finding may suggest that
reducing the size of trading regions or a re-evaluation of the cost structure and the manner in
which costs were aggregated for the USA emission regions may probably show a different result.
Alternatively, the findings may imply that when the major polluters and the area affected most
are in the same country, inter-regional trading may not always be cheaper.
For all receptors examined in this study, 100% protection form acidification was not possible.
Furthermore, for some receptors while environmental goals were attainable, economic goals of
minimum cost were not feasible and vice versa. Gradual approach to emission reduction with
inclusion of both costs and environmnetal goals seem to be a feasible strategy.
4. CONCLUSIONS
Environmnetal decision making used to rely on evidence derived from single and disparate
empirical models. However, the causes of and solutions to most environmental problems tend to
be interconnected. Consequently, policies that depend on disciplinary research may be not be
optimal with respect to balancing economic growth with environmental proetction. As a result
several countries, including Canada, are moving toward the use of integrated assessment
modeling to bring together knowledge from various disciplines to get an in-depth understanding
of environmental problems and make sound decisions.
Several organization and institutions around the world are making use of IAM in environmental
decision making. However, some IAM tools tend to be either mostly policy or science driven.
Identification of trade-off between economic growth and environmnetal proetction is crucial to
attain sustainable development. In this respect, the Canadian version of IAM is well suited to
give due consideration to economy and environment so that the decisions would not jeopardize
the delicate balance between economy and environment.
The Canadian version of IAM incorporates several ecosystem models, economic component and
scientific and socioeconomic databases. The platform was used to demonstrate the implications
of environmental decision making that are based on only basic sciences and those based on both
basic and social (economic) sciences. Optimal strategies were examined taking into account acid
rain and inter- and intra- country emissions trading.
10
The findings of the analysis with respect to minimizing the impact of acidification indicates that
it requires long-term commitment to provide 100% protection aquatic ecosystem or lakes without
hurting the economy. That is, gradually- phased emissions reduction would be required to reduce
deposition in order to allow recovery and perpetuation of aquatic and other ecosystems affected
by acid rain.
The incorporation of multiple objectives, that is economic and environmental goals, in
developing environmental policies may contribute to faster recovery of acidified lakes compared
to strategies that consider only environmental goals because the former approach allows the
removal of a large percentage of current emissions. Furthermore, the study indicated that these
large reductions can be achieved at costs that are less than or equal to those incurred when policy
development tools take into account only environmental goals. It means that strategies the
incorporate economic and environmental goals would make the polluters, society and the
environment better-off. Furthermore, the analysis indicated attainment of environmental goals in
Canadian sensitive receptors require major emissions reductions from the USA.
The principle of sustainable development requires that there must be a balance between economy
and the environment. Sustainability can be achieved only through policies that protect the
environment while at the same time minimizing impacts on economic growth. Future studies in
this area can be directed towards incorporating goals such as employment and indicators of
carrying capacity of ecosystems.
Acknowledgment
We are grateful to Mr. A. Sheffield and N. Beaudoin for providing us with the opportunity to
work on this paper, and to Mrs. Beza Alemu for assistance in typing.
11
5. REFERENCES
1. Morgan, M.G. and H. Dowlatabadi. Climatic Change, 1996, 34, 3-4, 337-368.
2. Parson, E.A. and K. Fisher-Vanden, Searching for Integrated Assessment: A Preliminary
Investigation of Methods, Models, and Projects in the Integrated Assessment of Global
Climatic Change. Consortium for International Earth Science Information Network
(CIESIN).University Center, Mich. 1995.
3. Risbey, J., M. Kandlikar, and A. Patwardhan. Climatic Change, 1996, 34, 3-4, 369-395.
4. Rotmans, J., Van Asselt, M. Climate change, 1996, 34, 3-4, 327-336.
5. Rotmans, J., M. Hulme, and T.E. Downing. Global Environmental Change, 1994, 4 (2):
97-124.
6. Forrester, J.W., 1971. World Dynamics.Wright-Allen Press, Cambridge, Mass.
7. Brunner, R.D. 1996. Climate Change, 32:121-147.
8. Alcamo, J., G.J.J. Kreileman, M. S. Krol, and G. Zuidema. 1994. "Modeling the Global
Society-biosphere-climate System: Part 1: Model Description and Testing." In IMAGE
2.0: Integrated Modeling of Global Climate Change, ed. J. Alcamo. Dordrecht, The
Netherlands: Kluwer Academic Publishers.
9. Alcamo, J., R. Shaw, and L. Hordijk, eds. 1990. The RAINS Model of Acidification:
Science and Strategies in Europe. Dordrecht, The Netherlands: Kluwer Academic
Publishers.
10. Ball, M., and H. Dowlatabadi. 1995. "The Role of Aerosols in Climate Change: Results
from an Integrated Assessment Model (ICAM 2.0)." Pittsburgh, Pa.: Carnegie Mellon
University, Department of Engineering and Public Policy.
11. Consortium for International Earth Science Information Network (CIESIN). 1995.
Thematic Guide to Integrated Assessment Modeling of Climate Change. University
Center, Mich.
12. Lam, D.C.L., C.W. Mayfield, D.A. Swayne and K. Hopkins. 1994. J. Biol.
Systems 2:499-517.
13. Lam, D.C.L., W.G. Booty, W.G., Wong,I., Kay, D., and Kerby, J. The RAISON
decision support system: examples of applications. National Water Research Institute,
Environment Canada, Burlington, Ontario, Contribution No. 95-151, 1995
14. Lam, D.C.L., Puckett, K.J., Wong, I., Moran, M.D., Fenech, G., Jeffries, D.S., Olson,
M.P., Whelpdale, D.M., McNicol, D., Mariam, Y.K.G., and Minns, C.K., Water Quality
Res. J. Canada. 33, 1, 1-17.
12
15. IPCC 1996. Integrated assessment of climate change: An overview and comparison of
approaches and results. In Intergovernmental Panel of Climate Change: Working Group
III Report. In press.
16. Rubin, E.S. 1991. J.of the Air and Waste Management Association, 1991, 41: 914-21.
17. Edmonds, J.A., M.A. Wise, and C. MacCracken. 1994. Advanced Energy Technologies
and Climate Change: An Analysis Using the Global Change Assessment Model
(GCAM). PNL-9798, UC-402. Richland, Wash.: Pacific Northwest Laboratory.
18. Maddison, D. 1994b. "A Cost-Benefit Analysis of Slowing Climate Change." Center for
Social and Economic Research on the Global Environment (CSERGE). London:
University College London.
19. Hulme, M., S.C.B. Raper, and T.M.L. Wigley. 1994."An Integrated Framework to
Address Climate Change (ESCAPE) and Further Development of the Global and
Regional Climate Modules (MAGICC)." In Integrative Assessment of Mitigation,
Impacts, and Adaptation to Climate Change, ed. N. Nakicenovic, W.D. Nordhaus, R.
Richels, and F.L. Toth. International Institute for Applied Systems Analysis (IIASA)
Collaborative Paper, CP-94-9. Laxenburg, Austria: IIASA.
20. Nordhaus, W.D., and Z. Yang. 1995. RICE: A Regional Dynamic General Equilibrium
Model of Optimal Climate-Change Policy. New Haven, Conn.: Yale University and
Massachusetts Institute of Technology.
21. Energy Modeling Forum. 1995. Second Round Study Design for EMF 14: Integrated
Assessment for Climate Change. Palo Alto, Calif.: Stanford University.
22. Cohen, S.J. 1995. An interdisciplinary assessment of climate change on northern
ecosystems: The Mackenzie Basin Impact Study. In Human Ecology and Climate
Change: People and Resources in the Far North, eds. D.L. Peterson and D.R. Johnson,
301-316.Washington, D.C.:Taylor and Francis.
23. Legge, A.H., and Krupa, S.V. (eds). 1990. Acidic Deposition: Sulphur and Nitrogen
Oxides. Lewis Publishers, Inc. Michigan, U.S.A.
24. Environment Canada, 1995. Air Emissions: Baseline Forecast, 1990-2010, Pollution
Data Branch. March.
25. Environment Canada, 1990. The 1990 Canadian Long-Range Transport of Air Pollutants
& Acid Deposition Assessment report: Part 1, Executive Summary; & Part 4, Aquatic
Effects.
26. Mariam, Y. 1994. Trend analysis of energy use and emission of NOx for eastern Canada.
Mimeo. Economic Analysis Branch, Environment Canada. December.
13
Table 1. Comparison of Annual (1990) Canadian and U.S.A. SO2 and NOx Emissions from
Point and Area Sources (in Tons/year)
Canadian Emissions
U.S.A. Emissions
Ratio of U.S.A. to Canadian Emissions
Source/Categories SO2 NOx SO2 NOx US(SO2 ):CCAN(SO2) US (NOx) : CCAN (NOx)
Point Sources 2996199.3 665177.3 20739516.2 10326178.9 7 16
Area Sources 486434.2 2868910.9 1307800.7 4998436.7 3 2
All Sources 3482633.5 3534088.2 22047317 15324616 6 4
Table 2. Background, actual, total, and critical deposition loadings (kg SO4/ha/yr)
Receptors Background
Deposition
Actual Deposition
1990
Total Deposition
1990
Critical Deposition
Loadings
Location
Algoma 3.6 13.887 17.447 16 Ontario
Monmorency 4.8 14.001 18.831 9 Quebec
Kejimkujik 5.6 8.375 13.965 8 N.S.
Adirondack 3.3 14.514 17.794 New York
14
Table 3. Results of IAM for Algoma Receptor
Receptor Algoma
Excess percent of lakes with PH<=6 10.0%
Objective function 10.8 kg/ha/yr
Background 3.6kg/ha/yr
Region Name Deposition Optimized Cost and Deposition Optimized
SO2 Emission Before (kT)
Emission
Reduction (kT)
% Emission
Reduction
Costdep
(US$M)
Emission
Reduction (kt)
%Emission
Reduction
Cost
(US$M)
11 12.00 9.00 75.00 14.99 0.16 1.00 0.27 12 10.00 7.50 75.00 25.10 5.93 59.00 19.83 13 50.00 37.50 75.00 61.47 8.49 17.00 13.92 14 688.00 516.00 75.00 119.41 516.00 75.00 119.41 15 216.00 162.00 75.00 123.53 162.00 75.00 123.53 16 30.00 0.00 0.00 0.00 6.26 21.00 1.30 17 184.00 0.00 0.00 0.00 5.95 3.00 1.00 18 162.00 0.00 0.00 0.00 121.35 75.00 12.36 19 46.00 0.00 0.00 0.00 30.74 67.00 2.54 20 176.00 0.00 0.00 0.00 0.00 0.00 -0.36 21 182.00 0.00 0.00 0.00 0.00 0.00 1.37 22 72.00 0.00 0.00 0.00 0.17 0.00 0.42 23 610.00 0.00 0.00 0.00 171.73 28.00 30.04 24 110.00 0.00 0.00 0.00 2.72 2.00 0.69 Canada Total 3078.00 732.00 344.49 1167.63 357.37 50 2318.00 1738.50 75.00 732.55 1262.71 54.00 532.07 51 1124.00 843.00 75.00 486.87 706.09 63.00 407.80 52 1274.00 0.00 0.00 0.00 393.74 31.00 122.03 53 1658.00 802.70 48.40 410.58 712.69 43.00 364.54 54 952.00 0.00 0.00 0.00 237.84 25.00 149.97 55 454.00 340.50 75.00 891.08 233.17 51.00 610.21 56 938.00 0.00 0.00 0.00 97.89 10.00 37.93 57 796.00 0.00 0.00 0.00 453.52 57.00 131.21 58 1024.00 0.00 0.00 0.00 259.78 25.00 113.74 59 536.00 0.00 0.00 0.00 5.84 1.00 1.17 60 688.00 0.00 0.00 0.00 217.10 32.00 16.23 61 612.00 459.00 75.00 800.05 459.00 75.00 800.05 62 124.00 93.00 75.00 177.04 63.29 51.00 120.49 63 790.00 0.00 0.00 0.00 0.00 0.00 0.00 64 744.00 0.00 0.00 0.00 147.29 20.00 2.49 65 1088.00 0.00 0.00 0.00 349.50 32.00 28.25 66 584.00 0.00 0.00 0.00 75.97 13.00 -1.99 67 710.00 0.00 0.00 0.00 44.92 6.00 2.92 68 314.00 0.00 0.00 0.00 0.00 0.00 4.21 69 70.00 0.00 0.00 0.00 0.54 1.00 2.82 70 70.00 0.00 0.00 0.00 14.09 20.00 2.52 71 470.00 0.00 0.00 0.00 34.72 7.00 3.87 72 1698.00 0.00 0.00 0.00 34.81 2.00 -1.37 73 216.00 0.00 0.00 0.00 0.23 0.00 -0.01 74 658.00 0.00 0.00 0.00 0.00 0.00 US total 19910.00 4276.70 3498.17 5804.76 3451.14 Grand Total 22988.00 5008.70 3842.66 6972.38 3808.52
15
Table 4. Results of IAM for Monmorency Receptor
Receptor Monmorency
Excess percent of lakes with PH<=6 10.0%
Objective function 11.9kg/ha/yr
Background 4.8kg/ha/yr
Region Name Deposition Optimized Cost and Deposition Optimized
SO2 Emission Before (kT)
Emission
Reduction (kT)
Emission
Reduction (%)
Costdep
(US$M)
Emission
Reduction (kT)
%Emission
Reduction
Cost
(US$M)
10.00 530.00 0.00 0.00 0.00 136.12 26.00 31.05
11.00 12.00 0.00 0.00 0.00 0.10 1.00 0.13 12.00 10.00 7.50 75.00 22.73 4.54 45.00 13.75 13.00 50.00 37.50 75.00 48.81 7.95 16.00 10.35 14.00 688.00 516.00 75.00 119.41 516.00 75.00 119.41 15.00 216.00 162.00 75.00 123.53 162.00 75.00 123.53 16.00 30.00 22.50 75.00 35.31 9.26 31.00 14.53 17.00 184.00 138.00 75.00 637.67 95.27 52.00 440.23 18.00 162.00 121.50 75.00 12.44 121.50 75.00 12.44 19.00 46.00 34.50 75.00 4.01 34.50 75.00 4.01 20.00 176.00 132.00 75.00 177.97 131.72 75.00 177.58 21.00 182.00 0.00 0.00 0.00 117.93 65.00 99.25 22.00 72.00 0.00 0.00 0.00 3.01 4.00 1.26 23.00 610.00 0.00 0.00 0.00 96.86 16.00 11.94 24.00 110.00 0.00 0.00 0.00 2.72 2.00 0.69 Canada total 3078.00 1171.50 1181.88 1439.47 1060.17 50.00 2318.00 562.90 24.30 257.57 1289.54 56.00 590.07 51.00 1124.00 0.00 0.00 0.00 511.06 45.00 130.54 52.00 1274.00 955.50 75.00 913.82 715.56 56.00 684.34 53.00 1658.00 0.00 0.00 0.00 600.17 36.00 206.08 54.00 952.00 0.00 0.00 0.00 153.49 16.00 68.69 55.00 454.00 340.50 75.00 902.72 237.79 52.00 630.42 56.00 938.00 0.00 0.00 0.00 45.99 5.00 12.89 57.00 796.00 0.00 0.00 0.00 211.28 27.00 42.48 58.00 1024.00 0.00 0.00 0.00 277.36 27.00 140.91 59.00 536.00 402.00 75.00 647.14 225.60 42.00 363.17 60.00 688.00 0.00 0.00 0.00 182.07 26.00 6.66 61.00 612.00 0.00 0.00 0.00 228.40 37.00 121.53 62.00 124.00 0.00 0.00 0.00 20.14 16.00 23.77 63.00 790.00 0.00 0.00 0.00 38.58 5.00 25.10 64.00 744.00 0.00 0.00 0.00 109.46 15.00 0.33 65.00 1088.00 0.00 0.00 0.00 397.62 37.00 39.63 66.00 584.00 0.00 0.00 0.00 144.40 25.00 40.11 67.00 710.00 0.00 0.00 0.00 38.65 5.00 1.92 68.00 314.00 235.50 75.00 319.94 64.29 20.00 87.34 69.00 70.00 52.50 75.00 271.96 0.54 1.00 2.82 70.00 70.00 52.50 75.00 54.73 31.76 45.00 33.11 71.00 470.00 0.00 0.00 0.00 36.09 8.00 4.19 72.00 1698.00 0.00 0.00 0.00 27.63 2.00 -1.81 73.00 216.00 0.00 0.00 0.00 0.29 0.00 -6.94 74.00 658.00 0.00 0.00 0.00 0.00 0.00 0.00 US total 19910.00 2601.40 3367.88 5587.76 3254.27 Grand total 22988.00 3772.90 4549.77 7027.22 4314.44
16
Table 5. Results of IAM for Kejimkujik Receptor
Receptor Kejimkujik
Excess percent of lakes with PH<=6 21.0
Objective function 9.9 kg/ha/yr
background 5.6 kg/ha/yr
Region Name Deposition Optimized Cost and Deposition Optimized
Total SO2 Emissions (kt)
Emission
Reduction (kt)
% Emission
Reduction
Costdep
(US$M)
Emission
Reduction (kt)
% Emission
Reduction
Cost (US$M)
11.00 12.00 0.00 0.00 0.00 0.00 0.00 0.03 12.00 10.00 0.00 0.00 0.00 4.50 45.00 13.75 13.00 50.00 0.00 0.00 0.00 6.30 13.00 4.13 14.00 688.00 0.00 0.00 0.00 516.00 75.00 119.41 15.00 216.00 162.00 75.00 123.53 162.00 75.00 123.53 16.00 30.00 22.50 75.00 25.79 8.80 29.00 10.09 17.00 184.00 138.00 75.00 294.80 72.50 39.00 154.88 18.00 162.00 121.50 75.00 12.44 121.50 75.00 12.44 19.00 46.00 34.50 75.00 4.01 34.50 75.00 4.01 20.00 176.00 132.00 75.00 178.19 132.00 75.00 178.19 21.00 182.00 136.50 75.00 196.54 136.50 75.00 196.54 22.00 72.00 0.00 0.00 0.00 7.00 10.00 3.41 23.00 610.00 0.00 0.00 0.00 41.20 7.00 4.66 24.00 110.00 0.00 0.00 0.00 2.70 2.00 0.69 Canada total 3078.00 747.00 835.29 1381.60 856.82 50.00 2318.00 427.30 18.40 211.87 1315.50 57.00 652.28 51.00 1124.00 0.00 0.00 0.00 582.90 52.00 198.60 52.00 1274.00 955.50 75.00 1153.24 816.70 64.00 985.72 53.00 1658.00 0.00 0.00 0.00 627.20 38.00 236.33 54.00 952.00 0.00 0.00 0.00 221.00 23.00 128.38 55.00 454.00 340.50 75.00 640.27 133.60 29.00 251.22 56.00 938.00 0.00 0.00 0.00 127.00 14.00 56.85 57.00 796.00 0.00 0.00 0.00 413.50 52.00 113.58 58.00 1024.00 768.00 75.00 735.17 381.60 37.00 365.29 59.00 536.00 402.00 75.00 619.48 221.50 41.00 341.33 60.00 688.00 0.00 0.00 0.00 201.50 29.00 9.63 61.00 612.00 0.00 0.00 0.00 227.50 37.00 120.26 62.00 124.00 0.00 0.00 0.00 0.00 0.00 0.00 63.00 790.00 0.00 0.00 0.00 145.90 18.00 161.39 64.00 744.00 0.00 0.00 0.00 128.40 17.00 0.97 65.00 1088.00 0.00 0.00 0.00 453.40 42.00 84.46 66.00 584.00 438.00 75.00 704.56 294.80 50.00 474.21 67.00 710.00 0.00 0.00 0.00 35.80 5.00 1.70 68.00 314.00 235.50 75.00 655.00 85.50 27.00 237.80 69.00 70.00 52.50 75.00 295.40 0.70 1.00 3.94 70.00 70.00 52.50 75.00 54.66 31.80 45.00 33.11 71.00 470.00 0.00 0.00 0.00 37.10 8.00 4.44 72.00 1698.00 0.00 0.00 0.00 24.20 1.00 -1.89
73.00 216.00 0.00 0.00 0.00 0.20 0.00 -0.01 74.00 658.00 0.00 0.00 0.00 0.00 0.00 0.00 US Total 19910.00 3671.80 5069.67 6507.30 4459.59 Grand total 22988.00 4418.80 5904.97 7888.90 5316.41
17
Table 6. Results of IAM for Adirondack Receptor
Receptor Adirondack
Excess percent of lakes with PH<=6 15.0%
Objective function 9.3 kg/ha/yr
Background 3.3 kg/ha/yr
Region Name Deposition Optimized Cost and Deposition Optimized Total SO2
Emissions (kt)
Emission
Reduction (kt)
% Emission
Reduction
Costdep
(US$M)
Emission
Reduction
(kt)
% Emission
Reduction
Cost (US$M)
10.00 530.00 0.00 0.00 0.00 136.10 26.00 31.05 11.00 12.00 0.00 0.00 0.00 0.40 3.00 0.94 12.00 10.00 0.00 0.00 0.00 7.50 75.00 27.75
13.00 50.00 37.50 75.00 55.38 8.20 16.00 12.11 14.00 688.00 516.00 75.00 119.41 516.00 75.00 119.41 15.00 216.00 162.00 75.00 123.53 162.00 75.00 123.53 16.00 30.00 22.50 75.00 57.87 10.00 33.00 25.72 17.00 184.00 0.00 0.00 0.00 72.20 39.00 153.72 18.00 162.00 0.00 0.00 0.00 121.50 75.00 12.44 19.00 46.00 0.00 0.00 0.00 34.50 75.00 4.00 20.00 176.00 0.00 0.00 0.00 132.00 75.00 178.19 21.00 182.00 0.00 0.00 0.00 29.10 16.00 8.58 22.00 72.00 0.00 0.00 0.00 7.70 11.00 3.93 23.00 610.00 0.00 0.00 0.00 172.30 28.00 30.22 24.00 110.00 0.00 0.00 0.00 3.10 3.00 0.76 Canada total 3078.00 738.00 356.19 1412.60 732.36 50.00 2318.00 1738.50 75.00 2042.72 1588.00 69.00 1865.88 51.00 1124.00 0.00 0.00 0.00 774.50 69.00 608.15 52.00 1274.00 955.50 75.00 1153.27 816.70 64.00 985.74 53.00 1658.00 484.70 29.20 625.20 952.30 57.00 1228.35 54.00 952.00 0.00 0.00 0.00 336.40 35.00 373.32 55.00 454.00 340.50 75.00 1108.27 288.00 63.00 937.39 56.00 938.00 0.00 0.00 0.00 249.20 27.00 185.96 57.00 796.00 0.00 0.00 0.00 537.00 67.00 245.79 58.00 1024.00 768.00 75.00 1232.85 521.80 51.00 837.63 59.00 536.00 402.00 75.00 818.26 249.50 47.00 507.85 60.00 688.00 0.00 0.00 0.00 227.40 33.00 22.66
61.00 612.00 0.00 0.00 0.00 458.70 75.00 798.57 62.00 124.00 0.00 0.00 0.00 66.60 54.00 134.17 63.00 790.00 0.00 0.00 0.00 453.70 57.00 1095.75 64.00 744.00 0.00 0.00 0.00 151.70 20.00 3.04 65.00 1088.00 0.00 0.00 0.00 442.40 41.00 71.70 66.00 584.00 438.00 75.00 704.75 294.90 50.00 474.50 67.00 710.00 0.00 0.00 0.00 66.00 9.00 11.58 68.00 314.00 235.50 75.00 537.68 79.90 25.00 182.42 69.00 70.00 0.00 0.00 0.00 0.50 1.00 2.82 70.00 70.00 52.50 75.00 54.66 31.80 45.00 33.11 71.00 470.00 0.00 0.00 0.00 57.30 12.00 14.59 72.00 1698.00 0.00 0.00 0.00 48.90 3.00 0.58 73.00 216.00 0.00 0.00 0.00 0.50 0.00 0.00 74.00 658.00 0.00 0.00 0.00 0.00 0.00 US total 19910.00 5415.20 8277.66 8693.70 10621.56 Grand total 22988.00 6153.20 8633.85 10106.30 11353.92
Fig.1. Map of Forty Emission Regions Used for Acid Rain Assessment
18
16
19
5051
52
53
54
55
56
5758
59
60
61
62
63
64
65
66
67
68
69
7071
72
73
74
20
22
13
24
23
14
21
17
18
10
1112
15
Fig. 2. Map of Forty Source Regions and Fifteen Receptor Sites in North America
Note: Points identified with yellow circles are receptor sites while the emission regions
delineated with red lines are similar to those in fig.1.