INSTRUCTOR'S MANUAL
10
© 2013 Cengage Learning. All Rights Reserved. May not be copied, scanned, or duplicated, in whole or in part, except for use as permitted in a license distributed with a certain product or service or otherwise on a password-protected website for classroom use. Page i INSTRUCTOR’S MANUAL Scott J. Callan Bentley University and Janet M. Thomas Bentley University
-
Upload
khangminh22 -
Category
Documents
-
view
0 -
download
0
Transcript of INSTRUCTOR'S MANUAL
© 2013 Cengage Learning. All Rights Reserved. May not be copied, scanned, or duplicated, in whole or in part, except for use as permitted in a license distributed with a certain product or service or otherwise on a password-protected website for classroom use. Page i
INSTRUCTOR’S MANUAL
Scott J. Callan Bentley University
and
Janet M. Thomas
Bentley University
© 2013 Cengage Learning. All Rights Reserved. May not be copied, scanned, or duplicated, in whole or in part, except for use as permitted in a license distributed with a certain product or service or otherwise on a password-protected website for classroom use. Page ii
CONTENTS Module 1. Modeling Environmental Problems Chapter 1 The Role of Economics in Environmental Management 1 Chapter 2 Modeling the Market Process: A Review of the Basics 6 Chapter 3 Modeling Market Failure 10 Module 2. Modeling Solutions to Environmental Problems Chapter 4 Conventional Solutions to Environmental Problems: The Command-and-Control Approach 14 Chapter 5 Economic Solutions to Environmental Problems: The Market Approach 19 Module 3. Analytical Tools for Environmental Planning Chapter 6 Environmental Risk Analysis 23 Chapter 7 Assessing Benefits for Environmental Decision Making 26 Chapter 8 Assessing Costs for Environmental Decision Making 30 Chapter 9 Benefit-Cost Analysis in Environmental Decision Making 35 Module 4. The Case of Air Chapter 10 Defining Air Quality: The Standard-Setting Process 40 Chapter 11 Improving Air Quality: Controlling Mobile Sources 45 Chapter 12 Improving Air Quality: Controlling Stationary Sources 49 Chapter 13 Global Air Quality: Policies for Ozone Depletion and
Climate Change 53
Module 5. The Case of Water Chapter 14 Defining Water Quality: The Standard-Setting Process 58 Chapter 15 Improving Water Quality: Controlling Point and Nonpoint
Sources 63 Chapter 16 Protecting Safe Drinking Water 68

© 2013 Cengage Learning. All Rights Reserved. May not be copied, scanned, or duplicated, in whole or in part, except for use as permitted in a license distributed with a certain product or service or otherwise on a password-protected website for classroom use. Page iii
Module 6. The Case of Solid Wastes and Toxic Substances Chapter 17 Managing Hazardous Solid Waste and Waste Sites 72 Chapter 18 Managing Municipal Solid Waste 77 Chapter 19 Controlling Pesticides and Toxic Chemicals 82
Module 7. Global Environmental Management Chapter 20 Sustainable Development: International Environmental Agreements
and International Trade 86 Chapter 21 Sustainable Approaches: Industrial Ecology and Pollution
Prevention 93 Appendix 1 Graphing Tools and Quantitative Techniques Graphing Fundamentals A1-2 Linear Relationships A1-7 Linear Models in Economics A1-9 Nonlinear Relationships A1-12 Quadratic Models in Economics A1-16 Solving Linear Simultaneous Equations A1-17 Practice Problems A1-20 Related Readings A1-21 Terms and Definitions A1-21 Solutions to Practice Problems A1-23 Appendix 2 Guidelines for Writing a Research Paper Overview: Steps to Writing a Research Paper A2-2 Selecting a Topic A2-3 Reviewing the Literature A2-4 Analyzing and Presenting Data A2-9 Preparing an Outline and First Draft A2-11 Revising and Polishing A2-14 Citing Sources A2-17 Closing Comments A2-20 Related Readings A2-20 References R1

© 2013 Cengage Learning. All Rights Reserved. May not be copied, scanned, or duplicated, in whole or in part, except for use as permitted in a license distributed with a certain product or service or otherwise on a password-protected website for classroom use. Page iv
Notes N1-N4
© 2013 Cengage Learning. All Rights Reserved. May not be copied, scanned, or duplicated, in whole or in part, except for use as permitted in a license distributed with a certain product or service or otherwise on a password-protected website for classroom use. Page 1
ANSWERS TO REVIEW QUESTIONS (Guidelines to instructors given in brackets.)
THE ROLE OF ECONOMICS IN ENVIRONMENTAL MANAGEMENT 1a. State how each of the following factors affects the materials balance model: (i) population growth; (ii) income growth; (iii) increased consumer recycling
actions; (iv) increased industrial recycling; (v) increased use of pollution prevention technologies.
[In answering each part of this question, the student should make it clear that the ceteris
paribus condition is being assumed.] (i) Population growth is expected to increase the materials flow. An increased
population implies a larger consumer group and hence an increase in the demand for goods and services. As production is expanded to meet that demand, more resources are called forth from nature. The flow of residuals from economic activity back to nature also increases, both from production in the form of industrial wastes and from the consumption of goods and services.
(ii) Income growth should increase the materials flow, since higher income promotes
higher consumption levels, which will lead to the same chain of events discussed in part (i).
(iii) Increased consumer recycling will divert some amount of household residuals
away from the flow back to nature. It should be noted, however, that this activity reduces the residual flow only in the short-run, since recyclables eventually become residuals as well. (The laws of thermodynamics confirm this assertion.)
(iv) Increased industrial recycling will have an effect analogous to what is described
in part (iii), except that the diversion of residuals arises from changes in producer behavior rather than consumer behavior. It is also true that increased industrial recycling may provide producers with alternative inputs that will slow the demand for raw materials drawn from nature.
(v) Increased use of pollution prevention technologies will reduce the flow of
residuals to the environment in both the short-run and the long-run, assuming such practices are sustained.
b. Assume that stringent pollution controls are placed on the flow of residuals
released into the atmosphere. According to the materials balance model, what
Chapter 1 The Role of Economics in Environmental Management
© 2013 Cengage Learning. All Rights Reserved. May not be copied, scanned, or duplicated, in whole or in part, except for use as permitted in a license distributed with a certain product or service or otherwise on a password-protected website for classroom use. Page 2
does this imply about the residual flows to the other environmental media and/or the flow of inputs into the economy?
Based on the first law of thermodynamics, the flow of residuals released to other media
(i.e. water and land) should increase, assuming all else held constant. 2a. Why is design for recycling, as practiced by BMW Group and discussed in
Application 1.1, important to the environment? According to the Materials Balance Model, recycling is a way to delay the flow of
residuals back to nature. Therefore, it is important that some manufacturers have instituted the sustainable practice of designing products to facilitate recycling when the product reaches the end of its useful life.
b. Explore the design for recycling approach employed by another automobile
manufacturer, such as Toyota or another manufacturer, and compare it to that of BMW Group.
[Obviously, student responses will vary with the manufacturer selected and the specifics
of the design for recycling program implemented by that firm. Overall, students should focus on the firm’s design decisions that are specifically targeted at facilitating recovery and recycling, any dismantling or sorting processes, along with any established plan to help consumers return end-of-life vehicles. Students should then compare the selected firm’s overall recycling efforts to those of BMW Group, comparing recycling or recovery targets, any measures of program accomplishments relative to objectives, and any other data to support the comparison.]
3. Faced with the oil crisis of the mid-1970s, the U.S. Congress instituted Corporate
Average Fuel Economy (CAFE) standards. These have been increased over time, most recently in 2010 for the 2012-2016 model years. (For detail on the CAFE standards, visit the Web site of the National Highway Traffic Safety Administration, www.nhtsa.dot.gov/fuel-economy.) These standards are aimed at increasing the fuel economy, or miles per gallon (MPG), of automobiles. These standards are aimed at increasing the fuel economy, or miles per gallon (MPG), of automobiles.
a. Briefly describe the expected environmental effect of increasing the MPG of
automobiles, holding all else constant. By increasing the MPG achieved by automobiles, gasoline consumption should decline.
Lower consumption should bring about some improvements in environmental quality. For example, greater fuel efficiency means fewer trips to the gas pump, which in turn
Chapter 1 The Role of Economics in Environmental Management
© 2013 Cengage Learning. All Rights Reserved. May not be copied, scanned, or duplicated, in whole or in part, except for use as permitted in a license distributed with a certain product or service or otherwise on a password-protected website for classroom use. Page 3
reduces the amount of vapors released into the atmosphere during refueling. However, the key is that the CAFE standards were not aimed at reducing the tailpipe emissions from automobiles as were other federally-mandated regulations (such as the requirement for catalytic converters). Hence, this set of regulations by itself should not have been expected to bring about dramatic improvements in environmental quality.
b. Serious criticism has been lodged against the CAFE standards because U.S.
automakers responded by using more plastics in automobiles (to make the cars lighter in weight) to meet the more restrictive standards. Explain how the use of this particular technology affects your answer to part (a). Are there any other relevant issues associated with this manufacturing decision?
Increased use of plastics in automobile production can have detrimental effects on the
environment. Of major concern is the fact that plastics are not easily recycled, based on present technology. This means that the plastic parts of scrapped automobiles end up in landfills or converted to toxic emissions during incineration. In either case, the flow of residuals from consumption is increased, with little opportunity for a diversion of that flow through recycling and reuse. There is also an increase in contaminating residuals generated from the supply-side of the market as plastics production adds to the amount of toxic emissions and effluents released into the environment.
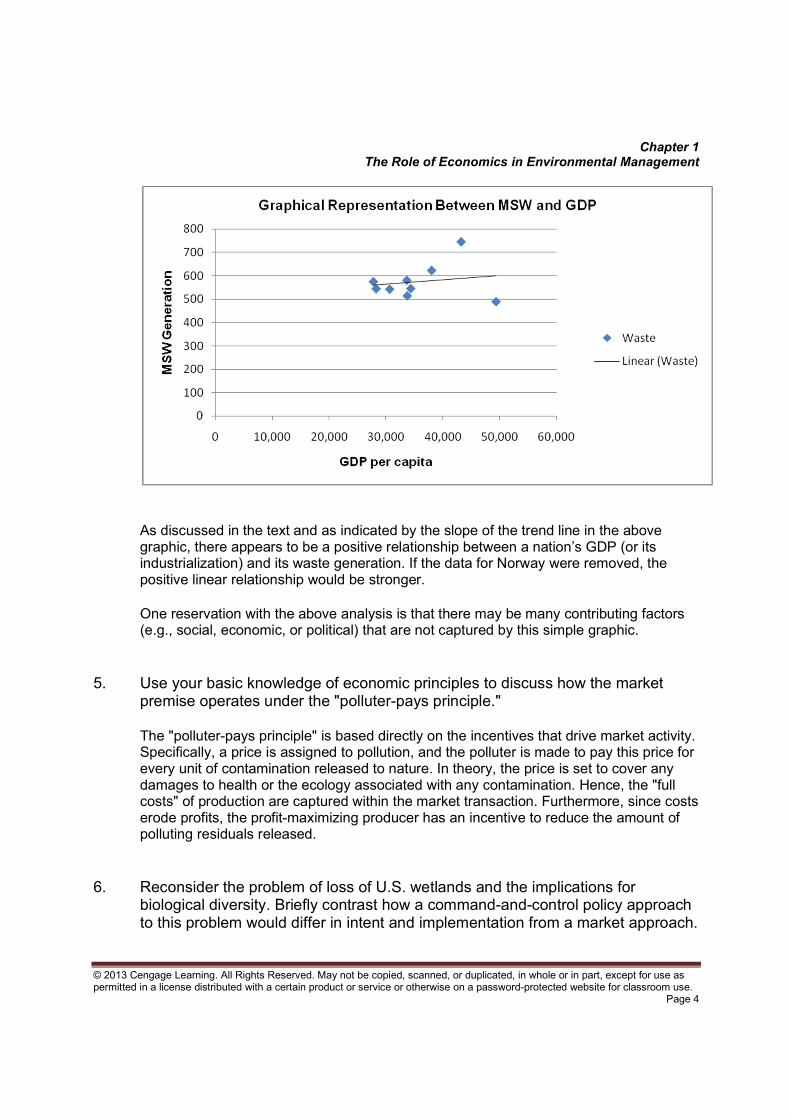
4. Using the data in Table 1.2, graphically illustrate the relationship between a
country’s per capita GDP and its per capita municipal waste generation. What conclusion can you draw from your graphical analysis?
Graph:
Chapter 1 The Role of Economics in Environmental Management
© 2013 Cengage Learning. All Rights Reserved. May not be copied, scanned, or duplicated, in whole or in part, except for use as permitted in a license distributed with a certain product or service or otherwise on a password-protected website for classroom use. Page 4
As discussed in the text and as indicated by the slope of the trend line in the above graphic, there appears to be a positive relationship between a nation’s GDP (or its industrialization) and its waste generation. If the data for Norway were removed, the positive linear relationship would be stronger.
One reservation with the above analysis is that there may be many contributing factors (e.g., social, economic, or political) that are not captured by this simple graphic.
5. Use your basic knowledge of economic principles to discuss how the market
premise operates under the "polluter-pays principle." The "polluter-pays principle" is based directly on the incentives that drive market activity.
Specifically, a price is assigned to pollution, and the polluter is made to pay this price for every unit of contamination released to nature. In theory, the price is set to cover any damages to health or the ecology associated with any contamination. Hence, the "full costs" of production are captured within the market transaction. Furthermore, since costs erode profits, the profit-maximizing producer has an incentive to reduce the amount of polluting residuals released.
6. Reconsider the problem of loss of U.S. wetlands and the implications for
biological diversity. Briefly contrast how a command-and-control policy approach to this problem would differ in intent and implementation from a market approach.
Chapter 1 The Role of Economics in Environmental Management
© 2013 Cengage Learning. All Rights Reserved. May not be copied, scanned, or duplicated, in whole or in part, except for use as permitted in a license distributed with a certain product or service or otherwise on a password-protected website for classroom use. Page 5
[Students can approach this question from a number of perspectives. The important point is that the response should compare the use of direct rules or standards under command-and-control with the incentive-based motivation of a market approach. For example, a command-and-control policy might take the form of restrictions on construction, such as mandating a minimum distance between a building site and a wetland area. Conversely, a market approach would attempt to encourage wetlands conservation, possibly through levying higher taxes on land areas adjacent to wetlands or by subsidizing activities that preserve existing wetlands.]
PAPER TOPICS Design for Recycling: An International Comparison (Nissan and BMW, or any two other firms) Biodiversity Trends in the United States (or any country of choice) Current Findings of Environmental Damage Linked to the BP Oil Spill Beyond GDP: An International Initiative to Measure National Well-Being China’s Environment Since the 2008 Olympic Games Assessing the Success or Failure of the CAFÉ standards

© 2013 Cengage Learning. All Rights Reserved. May not be copied, scanned, or duplicated, in whole or in part, except for use as permitted in a license distributed with a certain product or service or otherwise on a password-protected website for classroom use. Page 6
MODELING THE MARKET PROCESS: A REVIEW OF THE BASICS 1. Suppose QD = 200 – 4P and QS = 100 describe market demand and market
supply in a given market. a. Algebraically find equilibrium price and quantity and support your answer
graphically. PE = 25; QE = 100 [Students should present a basic model of supply and demand,
labeling the equilibrium price and quantity and all other relevant points on the graph.] b. What is unusual about this market? Give an example of a good or service that
might be characterized in this way. In this market, the supply curve is a vertical line at a quantity of 100 units. Such a supply
function may be representative of any good or service available in a fixed amount. The classic example is land. However, there are other possibilities such as the number of seats in a football stadium or the number of original paintings by Picasso.
2. In 1995, the Food and Drug Administration (FDA) published new labeling
standards for bottled water. (The full text of the final rule can be found at http://cfr.vlex.com/vid/165-110-bottled-water-19705533.) Prior to that time, bottlers could sell regular tap water under a bottled water label. In fact, the FDA estimated that approximately 25 percent of the supply of bottled water was nothing more than ordinary tap water. Consider how these tougher standards eliminated 25 percent of the supply of bottled water. If market demand is unaffected, what qualitative impact would this labeling change have on equilibrium price and quantity for bottled water? Support your answer with a graphical model.
Given the reduction in the supply of bottled water, the equilibrium price should rise and
the equilibrium quantity should decrease. [The graph should show a shift left of the market supply curve and the qualitative effect on equilibrium price and quantity.]
3. Suppose the market for organically grown wheat is modeled through the
following market supply and demand functions:
P = 10 + 0.5QS and P = 22 ‒ 2.5QD,
where QS and QD are in millions of bushels, and P is price per bushel.