
Institutional Owners and Medical Innovation.pdf - Blake Rayfield
16
The Quarterly Review of Economics and Finance 74 (2019) 190–205 Contents lists available at ScienceDirect The Quarterly Review of Economics and Finance j ourna l h om epage: www.elsevier.com/locate/qref Institutional investors and medical innovation Omer Unsal a , Blake Rayfield b,∗ a Girard School of Business, 315 Turnpike St. North Andover, MA 01845, United States b Indiana State University – Scott College of Business, Terre Haute, IN, United States a r t i c l e i n f o Article history: Received 17 May 2018 Received in revised form 11 September 2018 Accepted 26 January 2019 Available online 1 February 2019 JEL classification: G30 O30 G32 Keywords: Institutional ownership Firm innovation Pharmaceuticals a b s t r a c t In this research paper, we investigate if institutional investors influence corporate innovation in the US pharmaceutical industry. We hand collect unique datasets from the Food and Drug Administration (FDA), including drug patents, drug approvals, medical device approvals, and Phase I-II-III drugs under clinical testing. We find that higher institutional ownership has a positive, causal effect on firm innovation. We document that institutional ownership increases the number of FDA approved products. Then, we examine the innovation quality and find that institutional ownership reduces the likelihood of both drug recalls and market withdrawals. Our results investigate possible underlying mechanisms through which institutional investors provide faster and more frequent innovation outcomes: Institutional holdings act as active monitors by providing insurance for firm executives against innovation failures. Our article sheds new lights on the real effects of institutional investors on pharmaceutical firms’ innovation. © 2019 Board of Trustees of the University of Illinois. Published by Elsevier Inc. All rights reserved. 1. Introduction This paper investigates the impact of institutional ownership on firms’ innovation outcomes. We focus on institutional investors for two reasons. First, innovation is a long-term investment with a high probability of failure. The previous literature has highlighted an institutional investor’s ability to monitor firms and act as an external corporate governance mechanism. Second, institutional investors may provide a “failure tolerant” environment for exec- utives who are reluctant to take risky innovation projects due to career concerns (Manso (2011)). The innovation of new products and services is risky and requires a calculated long-term per- spective on behalf of the firm’s management and shareholders. Therefore, institutional investors should play a role in increas- ing corporate innovation performance as measured by innovation quantity and innovation quality. Innovation is a primary determinant of economic growth (Griliches (1990)) and institutional ownership has been found to have a positive effect on innovation outcomes (Aghion, Van Reenen, and Zingales (2013); Luong et al. (2017)). Over the past 50 years the share of institutional investors in the US has dramatically increased from 20% in the 1960 s to more than 60% in 2011 (Celik and ∗ Corresponding author. E-mail addresses: [email protected] (O. Unsal), blake.rayfi[email protected] (B. Rayfield). Isaksson (2014). In competitive industries, such as the pharmaceu- tical industry, the demand and risk associated with innovation are unique. We contribute to the literature by documenting how insti- tutional investors fuel innovation in the medical industry. In this study, we employ Food and Drug Administration (FDA) approved drugs, medical devices, pre-market approvals, and Phase I-II-III drugs under clinical testing. We hypothesize that external pressure from institutional investors might encourage firms and managers to engage in innovating activities, helping to shape corporate inno- vation in the medical field. This study provides evidence regarding the benefits of institu- tional ownership by testing a) whether institutional ownership increases the number of FDA approved products, b) whether institutional ownership provides a “failure tolerant” working environment for executives engaging in high-risk-high-reward industries, and c) whether institutional investors ultimately increase not only the amount of medical innovation, but also the quality of approved medical products. Our study represents an ini- tial analysis of a new panel dataset of a database of FDA-approved medical discoveries (i.e., drug patents) along with product quality measures (i.e., drug recalls). Institutional investors may increase innovation outcomes via two channels. The first channel is the “monitoring effect;” institu- tional investors have the ability and incentive to act as corporate monitors. In addition, active institutional investors may intervene when needed to increase firm value (Burkart, Panunzi, and Shleifer (2003); Shleifer and Vishny (1986)). The second channel is the https://doi.org/10.1016/j.qref.2019.01.013 1062-9769/© 2019 Board of Trustees of the University of Illinois. Published by Elsevier Inc. All rights reserved.
-
Upload
khangminh22 -
Category
Documents
-
view
0 -
download
0
Transcript of Institutional Owners and Medical Innovation.pdf - Blake Rayfield

I
Oa
b
a
ARR1AA
JGOG
KIFP
1
ofhaeiucasTiq
(hasf
b
h1
The Quarterly Review of Economics and Finance 74 (2019) 190–205
Contents lists available at ScienceDirect
The Quarterly Review of Economics and Finance
j ourna l h om epage: www.elsev ier .com/ locate /qre f
nstitutional investors and medical innovation
mer Unsala, Blake Rayfieldb,∗
Girard School of Business, 315 Turnpike St. North Andover, MA 01845, United StatesIndiana State University – Scott College of Business, Terre Haute, IN, United States
r t i c l e i n f o
rticle history:eceived 17 May 2018eceived in revised form1 September 2018ccepted 26 January 2019vailable online 1 February 2019
EL classification:30
a b s t r a c t
In this research paper, we investigate if institutional investors influence corporate innovation in the USpharmaceutical industry. We hand collect unique datasets from the Food and Drug Administration (FDA),including drug patents, drug approvals, medical device approvals, and Phase I-II-III drugs under clinicaltesting. We find that higher institutional ownership has a positive, causal effect on firm innovation.We document that institutional ownership increases the number of FDA approved products. Then, weexamine the innovation quality and find that institutional ownership reduces the likelihood of both drugrecalls and market withdrawals. Our results investigate possible underlying mechanisms through whichinstitutional investors provide faster and more frequent innovation outcomes: Institutional holdings act
3032
eywords:
as active monitors by providing insurance for firm executives against innovation failures. Our articlesheds new lights on the real effects of institutional investors on pharmaceutical firms’ innovation.
© 2019 Board of Trustees of the University of Illinois. Published by Elsevier Inc. All rights reserved.
nstitutional ownershipirm innovationharmaceuticals
. Introduction
This paper investigates the impact of institutional ownershipn firms’ innovation outcomes. We focus on institutional investorsor two reasons. First, innovation is a long-term investment with aigh probability of failure. The previous literature has highlightedn institutional investor’s ability to monitor firms and act as anxternal corporate governance mechanism. Second, institutionalnvestors may provide a “failure tolerant” environment for exec-tives who are reluctant to take risky innovation projects due toareer concerns (Manso (2011)). The innovation of new productsnd services is risky and requires a calculated long-term per-pective on behalf of the firm’s management and shareholders.herefore, institutional investors should play a role in increas-ng corporate innovation performance as measured by innovationuantity and innovation quality.
Innovation is a primary determinant of economic growthGriliches (1990)) and institutional ownership has been found toave a positive effect on innovation outcomes (Aghion, Van Reenen,
nd Zingales (2013); Luong et al. (2017)). Over the past 50 years thehare of institutional investors in the US has dramatically increasedrom 20% in the 1960′s to more than 60% in 2011 (Celik and∗ Corresponding author.E-mail addresses: [email protected] (O. Unsal),
[email protected] (B. Rayfield).
ttps://doi.org/10.1016/j.qref.2019.01.013062-9769/© 2019 Board of Trustees of the University of Illinois. Published by Elsevier In
Isaksson (2014). In competitive industries, such as the pharmaceu-tical industry, the demand and risk associated with innovation areunique. We contribute to the literature by documenting how insti-tutional investors fuel innovation in the medical industry. In thisstudy, we employ Food and Drug Administration (FDA) approveddrugs, medical devices, pre-market approvals, and Phase I-II-IIIdrugs under clinical testing. We hypothesize that external pressurefrom institutional investors might encourage firms and managersto engage in innovating activities, helping to shape corporate inno-vation in the medical field.
This study provides evidence regarding the benefits of institu-tional ownership by testing a) whether institutional ownershipincreases the number of FDA approved products, b) whetherinstitutional ownership provides a “failure tolerant” workingenvironment for executives engaging in high-risk-high-rewardindustries, and c) whether institutional investors ultimatelyincrease not only the amount of medical innovation, but also thequality of approved medical products. Our study represents an ini-tial analysis of a new panel dataset of a database of FDA-approvedmedical discoveries (i.e., drug patents) along with product qualitymeasures (i.e., drug recalls).
Institutional investors may increase innovation outcomes viatwo channels. The first channel is the “monitoring effect;” institu-
tional investors have the ability and incentive to act as corporatemonitors. In addition, active institutional investors may intervenewhen needed to increase firm value (Burkart, Panunzi, and Shleifer(2003); Shleifer and Vishny (1986)). The second channel is thec. All rights reserved.

ew of
“lwttMirwm
tiostavwprv
aai2tWaIaut
tc8cobtTo
sSha
2
2
oratMln
sa
Davidson, and DaDalt (2003)) can determine a firm’s innovationperformance. This study investigates the impact of institutionalinvestors on innovation.
1 https://www.pwc.com/gx/en/pharma-life-sciences/assets/pwc-managing-innovation-pharma.pdf
2 https://www.brookings.edu/research/the-global-burden-of-medical-innovation/
3 See EFPIA Figures 2012 Final, European Federation of Pharmaceutical Industry
O. Unsal and B Rayfield / The Quarterly Revi
insurance effect.” Institutional investors hold diversified portfo-ios, which reduces their exposure to the individual risk associated
ith medical innovation. Therefore, as a primary shareholder, insti-utional investors may be more tolerant of early failures duringhe innovation process. This channel is related to the work of
anso (2011). By eliminating the career concerns of executives,nstitutional investors can promote a failure-tolerant working envi-onment and influence the managerial decision-making process,hich may ultimately provide a lift to a firm’s innovation perfor-ance.First, we study the empirical relationship between institu-
ional ownership and innovation. Our results show that increasednstitutional ownership is associated with increased innovationutcomes. Next, we investigate the effect of institutional owner-hip on innovation performance and quality. Our results suggesthat firms with high institutional ownership navigate the productpproval process faster. We employ additional measures of inno-ation quality and performance, such as product recalls, marketithdrawals, post-market drug, biologic safety evaluations, andatent lawsuits. Our analysis shows that institutional ownershipeduces product failures and enhances innovation quality, which isital to a firm’s ability to generate economic and financial value.
Lastly, we examine several alternative explanations focusedround the “insurance effect”. Because medical innovation is a longnd tedious process accompanied by a high probability of failure,ncreased tolerance for failure may promote innovation (Manso,011). Increased tolerance may come in the form of reduced execu-ive career concerns (increased job security) or reputation benefits.
e find that firms with higher levels of institutional ownershipre more likely to retain CEOs following low firm performance.n addition, increased levels of institutional ownership weaken
CEO’s pay-for-performance sensitivity. Our results provide annderstanding about how institutional investors provide insuranceo managers by reducing their career and reputation concerns.
Our final sample includes 919 unique firms for the years 2000o 2014, collected from the S&P Capital IQ database. We also hand-ollect 24,312 total FDA approvals, including 3202 drug patents,566 drug approvals, 5445 pre-market approvals, and 7099 medi-al device approvals. Our results provide evidence that institutionalwnership increases the number of patents, as well as the num-er of FDA approved medical products. Our results remain robusto both patent counts as well as citation-weighted patent counts.his work contributes to the literature surrounding institutionalwnership and firm innovation.
This paper proceeds as follows: In Section 2, we provide aummary of existing literature on lawsuits and firm performance.ection 3 describes our research data. Section 4 presents ourypothesis and methodology. In Section 5, we discuss our findings,nd we conclude our work in Section 6.
. Literature review
.1. Innovation in pharmaceutical industry
Medical innovation faces unique challenges as compared tother business sectors. The pharmaceutical industry is a high-isk but high-reward sector, where promising treatments provide
financial boost. The industry commits considerable resourceso disease-specific research without the guarantee of success.
easuring the impact of pharmaceutical innovation has many chal-enges; a simple count of new drugs, for example, gauges quantity
ot quality.In innovative industries, such as the pharmaceutical industry,ustaining a high level of innovation can be challenging. On aver-ge, it can take up to 12 years for drugs to go from pre-clinical
Economics and Finance 74 (2019) 190–205 191
testing to FDA approval, and approximately seven years for med-ical devices (Van Norman (2016)). Slow drug approvals and thehigh-cost of failure pose a challenge to medical innovation. Theneed for innovation is a major driving force in biotechnology. Fromthe discovery of therapeutic remedies in the 1920s to the block-buster drugs birthed in the 1990s, pharmaceuticals have alwaysbeen on a quest for groundbreaking drug development. A Price-waterhouseCoopers survey among pharmaceutical firms highlightsthe importance of innovation. The study finds a clear correlationbetween innovation and growth, where the top 20% of innovativepharmaceutical firms grow at a rate 16% higher than the least inno-vative. Pharmaceutical respondents specifically (86%) indicate thatinnovation is important to their business, with 58% defining it as anecessity.1
U.S. consumers account for about 64 to 78 percent of total phar-maceutical profits. American patients use newer drugs and facehigher prices than patients in other countries.2 Drugs that areused to treat complex, chronic conditions like cancer, rheumatoidarthritis, and multiple sclerosis have very high prices, thus gener-ating greater revenues. Drug patents are important protection forpharmaceutical firms who commit billions of dollars each year todrug development. Pharmaceutical firms apply for patent protec-tion early in the development process, before pre-clinical studies,in order to benefit from exclusive revenues, once the product isreleased to the market.3
Innovation in the pharmaceutical industry can also benefit theeconomy; investments in manufacturing and R&D create positivesocioeconomic values. In 2014, the production value of the indus-try was $997 billion (globally), compared to $345 billion in 2006.In the same year the pharmaceutical industry generated 3.8% ofthe gross value added.4 More than 810,000 people work in the bio-pharmaceutical industry, in occupations such as scientific research,technical support and manufacturing. Directly and indirectly, theindustry supported over 3.4 million jobs and added an estimated$790 billion to the economy in 2014. The pharmaceutical sectoris consistently ranked one of the most R&D-intensive industriesin the United States, where pharmaceutical firms allocate around15–20 percent of their revenues to R&D activities and invest over$50 billion in R&D annually.5
2.2. Innovation and institutional investors
Scholars document that patents are an important measure offirms’ innovation output (Griliches (1990)). A firm legal environ-ment (Acharya, Baghai, and Subramanian (2013)), financial markets(Hsu, Tian, and Xu (2014)), stock liquidity (Fang, Tian, and Tice(2014)), market conditions and competition (Nanda and Rhodes-Kropf (2013), quality of financial analysts (He and Tian (2013), laborunions (Bradley, Kim, and Tian (2016)), venture-capital investors(Chemmanur, Loutskina, and Tian (2014)) or the country’s cultureand corporate governance practices (Acharya and Subramanian(2009); Brown, Fazzari, and Petersen (2009); Hsu et al. (2014); Xie,
and Association web site.www.efpia.eu.4 https://www.ifpma.org/wp-content/uploads/2017/02/IFPMA-Facts-And-
Figures-2017.pdf5 https://www.trade.gov/topmarkets/pdf/Pharmaceuticals Executive Summary.
pdf.

1 ew of Economics and Finance 74 (2019) 190–205
ifiwaoiaTeiaIiSa
(epra–fioieqval(t
3
3
tpcaDmfiobfilad
u9utras
3
i
Table 1Summary Statistics.
Variables Mean Std.Dev Min Max
Panel A. Total FDA ApprovalsTotal Patent 0.42 2.85 0.00 96.00Total FDA Approval 1.23 8.59 0.00 250.00Total Medical Device Approval 0.71 6.66 0.00 292.00Total Pre-Market Approval 0.90 3.07 0.00 45.00Total Licenced Patent 1.16 12.10 0.00 337.00Total Phase 1 Drugs 0.15 1.36 0.00 54.00Total Phase 2 Drugs 0.20 1.15 0.00 24.00Total Phase 3 Drugs 0.17 1.06 0.00 22.00
Panel B. Innovation QualityTotal Recall 0.85 7.59 0.00 292.00Recall% 0.09 0.28 0.00 1.00Total Post Market Evaluations 1.30 8.50 0.00 129.00Post Market Evaluations% 0.09 0.28 0.00 1.00Total Patent Lawsuit 0.08 0.39 0.00 7.00Lawsuit% 0.06 0.23 0.00 1.00
Panel C. Instutitunal OwnershipInst. Own% 0.65 0.23 0.01 1.00Max. Inst. Own% 0.11 0.07 0.01 1.00Top 5 Own 0.45 0.14 0.01 0.90Top 10 Own 0.33 0.12 0.01 0.94Top Block Hold. 0.23 0.11 0.05 0.83Mutual Funds 0.25 0.04 0.01 0.79Investment 0.19 0.21 0.01 0.91Banks 0.16 0.23 0.01 0.89Pension 0.17 0.19 0.01 0.92Insurance 0.13 0.15 0.01 0.79Long Term 0.15 0.18 0.01 0.90Short Term 0.12 0.01 0.00 0.54Lerner Index 0.01 0.02 0.01 1.00
Panel D. Control VariablesLog(Asset) 2.73 2.18 0.00 12.27Tobin’s Q 2.60 21.78 0.28 12.94RnD 0.27 1.00 0.00 27.20Book Leverage 0.46 9.20 0.00 32.01Tangibility 0.14 0.14 0.00 1.00ROA −0.32 9.70 −12.00 15.45HHI Index 0.08 0.08 0.04 1.00Log(Firm Age) 2.58 0.64 0.00 4.17Free Cash Flow −0.45 2.98 −14.00 2.96
92 O. Unsal and B Rayfield / The Quarterly Revi
The prior literature documents a positive relationship betweennstitutional holdings and innovation output. Aghion et al. (2013)nd that a higher share of institutional ownership is associatedith a higher level of innovation output. The authors explain that
higher innovation outcome is a function of the monitoring powerf institutional investors. Additionally, the authors describe thatnstitutional investors can alleviate career concerns of top man-gers. Bena, Ferreira, and Matos (2014); Luong, Moshirian, Nguyen,ian, and Zhang (2017) and Lee (2005) also document a positiveffect of institutions on innovation output. In the pharmaceuticalndustry, the process of developing a new drug can span gener-tions of CEOs, as well as require a significant capital allocation.nstitutional investors can act as active monitors, as well as providensurance against failures, ultimately boosting innovation (Berger,tocker, and Zeileis (2017); Rong, Wu, and Boeing (2017); Schainnd Stiebale (2016)).
Our work is similar to Aghion et al. (2013) and Luong et al.2017), who analyze the relationship between institutional own-rship and firm innovation. Our study provides three uniqueerspectives. First, we utilize several hand-collected databaseselated to innovation outcomes, including patents, citations, FDA-pproved drugs, medical devices, pre-market approvals, Phase I – II
III drugs under clinical testing, and licensed patents. We measure arm’s innovation performance as well as the overall developmentf a competitive industry. Second, we analyze how institutionalnvestors influence a firm’s product development. Lastly, our studyxplores not only firm innovation output, but also innovationuality. We measure whether institutional investors promote inno-ation quality by reducing product failures, in the long run, using
dataset of product recalls, post-market evaluations, and patentawsuits. Overall, our work complements the study of Aghion et al.2013) by documenting the positive and significant effect of insti-utional investors on firms’ innovation performance.
. Data
.1. Firm
Our sample consists of publicly traded pharmaceutical firms inhe US, listed in the Capital IQ database. For this study, we defineharmaceutical firms based on the Fama and French 12 industrylassification. Under this classification, the 10th industry is defineds Healthcare, Medical Equipment, Pharmaceutical Products, andrugs. We divide our sample into four primary subsectors. “Phar-aceutical firms” produce medicine with a chemical basis; “biotech
rms” produce medicines using live organisms, such as bacteriar enzymes; “biopharmaceutical firms” develop medicines fromoth chemicals and living organisms; and “healthcare equipmentrms” develop medical devices. Other common subindustries are
ife sciences, tools and services, veterinary drugs, microbiology,gricultural biology, home healthcare equipment, and therapeuticevices.
We exclude healthcare providers, since they are also definednder Financial Services and Insurance. Our final sample includes19 unique firms for the years 2000 to 2014. This includes 603nique firms from pharmaceuticals, biotech, and biopharmaceu-icals. There are 247 unique healthcare equipment firms. Theemaining 69 firms are from subindustries such as life sciencesnd microbiology. More information is provided in Appendix A andummary statistics are presented in Table 1.
.2. Institutional investors data
To measure institutional holdings, we use the percentage ofnstitutional ownership invested in firm i in year t. Following
Table 1 Reports the summary statistics for the variables of interest used in this study.Variable definition and sources are reported in Appendix A.
Hartzell and Starks (2003) and Aghion et al. (2013), we calculateInts Own% as the ratio of total common stocks held by institutionalinvestors and total shares outstanding by examining 13-F filingscollected from Edgar.
3.3. Innovation data
We measure a firm’s innovation outcome by employing theFDA product submission database. Our final sample is comprisedof 24,312 total FDA approvals. This includes 3202 drug patents,8566 drug approvals, 5445 pre-market approvals, and 7099 medicaldevice approvals. Table 1, Panel A, documents the summary statis-tics for FDA-approved products. We gather information for drugsunder clinical testing drugs which include total licensed patents,as well as Phase I – Phase II – Phase III drugs from the Capital IQdatabase.
3.4. Innovation quality
To increase the value of our study, we employ several uniquemeasures of innovation quality. We amass data on unsafe recalled
pharmaceutical products from the Food and Drug Administration,as well as medical products that fail post-market safety evalua-tions. In addition, we gather products that are identified in patentlawsuits.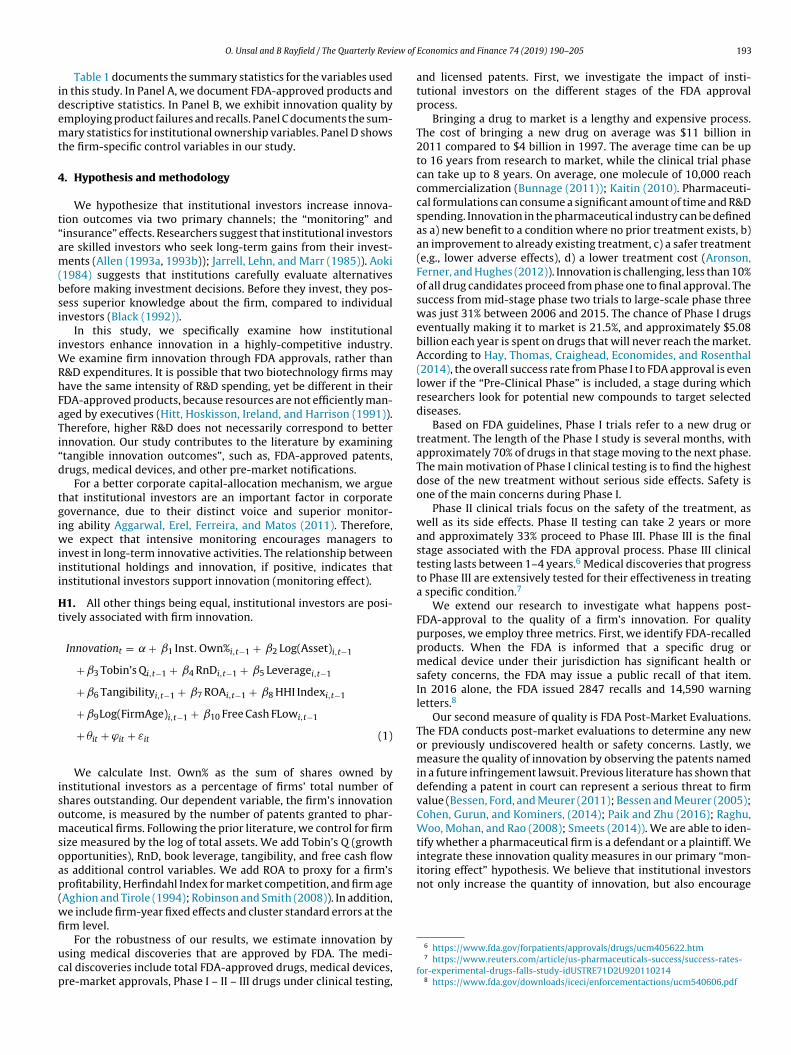
ew of
idemt
4
t“am(bsi
iWRhFaTi“d
tgiwiii
Ht
isomsoap(wfi
ucp
itoring effect” hypothesis. We believe that institutional investorsnot only increase the quantity of innovation, but also encourage
O. Unsal and B Rayfield / The Quarterly Revi
Table 1 documents the summary statistics for the variables usedn this study. In Panel A, we document FDA-approved products andescriptive statistics. In Panel B, we exhibit innovation quality bymploying product failures and recalls. Panel C documents the sum-ary statistics for institutional ownership variables. Panel D shows
he firm-specific control variables in our study.
. Hypothesis and methodology
We hypothesize that institutional investors increase innova-ion outcomes via two primary channels; the “monitoring” andinsurance” effects. Researchers suggest that institutional investorsre skilled investors who seek long-term gains from their invest-ents (Allen (1993a, 1993b)); Jarrell, Lehn, and Marr (1985)). Aoki
1984) suggests that institutions carefully evaluate alternativesefore making investment decisions. Before they invest, they pos-ess superior knowledge about the firm, compared to individualnvestors (Black (1992)).
In this study, we specifically examine how institutionalnvestors enhance innovation in a highly-competitive industry.
e examine firm innovation through FDA approvals, rather than&D expenditures. It is possible that two biotechnology firms mayave the same intensity of R&D spending, yet be different in theirDA-approved products, because resources are not efficiently man-ged by executives (Hitt, Hoskisson, Ireland, and Harrison (1991)).herefore, higher R&D does not necessarily correspond to betternnovation. Our study contributes to the literature by examiningtangible innovation outcomes”, such as, FDA-approved patents,rugs, medical devices, and other pre-market notifications.
For a better corporate capital-allocation mechanism, we arguehat institutional investors are an important factor in corporateovernance, due to their distinct voice and superior monitor-ng ability Aggarwal, Erel, Ferreira, and Matos (2011). Therefore,
e expect that intensive monitoring encourages managers tonvest in long-term innovative activities. The relationship betweennstitutional holdings and innovation, if positive, indicates thatnstitutional investors support innovation (monitoring effect).
1. All other things being equal, institutional investors are posi-ively associated with firm innovation.
Innovationt = + ˇ1 Inst. Own%i,t−1 + ˇ2 Log(Asset)i,t−1
+ ˇ3 Tobin’s Qi,t−1 + ˇ4 RnDi,t−1 + ˇ5 Leveragei,t−1
+ ˇ6 Tangibilityi,t−1 + ˇ7 ROAi,t−1 + ˇ8 HHI Indexi,t−1
+ ˇ9Log(FirmAge)i,t−1 + ˇ10 Free Cash FLowi,t−1
+ �it + ϕit + εit (1)
We calculate Inst. Own% as the sum of shares owned bynstitutional investors as a percentage of firms’ total number ofhares outstanding. Our dependent variable, the firm’s innovationutcome, is measured by the number of patents granted to phar-aceutical firms. Following the prior literature, we control for firm
ize measured by the log of total assets. We add Tobin’s Q (growthpportunities), RnD, book leverage, tangibility, and free cash flows additional control variables. We add ROA to proxy for a firm’srofitability, Herfindahl Index for market competition, and firm ageAghion and Tirole (1994); Robinson and Smith (2008)). In addition,e include firm-year fixed effects and cluster standard errors at therm level.
For the robustness of our results, we estimate innovation bysing medical discoveries that are approved by FDA. The medi-al discoveries include total FDA-approved drugs, medical devices,re-market approvals, Phase I – II – III drugs under clinical testing,
Economics and Finance 74 (2019) 190–205 193
and licensed patents. First, we investigate the impact of insti-tutional investors on the different stages of the FDA approvalprocess.
Bringing a drug to market is a lengthy and expensive process.The cost of bringing a new drug on average was $11 billion in2011 compared to $4 billion in 1997. The average time can be upto 16 years from research to market, while the clinical trial phasecan take up to 8 years. On average, one molecule of 10,000 reachcommercialization (Bunnage (2011)); Kaitin (2010). Pharmaceuti-cal formulations can consume a significant amount of time and R&Dspending. Innovation in the pharmaceutical industry can be definedas a) new benefit to a condition where no prior treatment exists, b)an improvement to already existing treatment, c) a safer treatment(e.g., lower adverse effects), d) a lower treatment cost (Aronson,Ferner, and Hughes (2012)). Innovation is challenging, less than 10%of all drug candidates proceed from phase one to final approval. Thesuccess from mid-stage phase two trials to large-scale phase threewas just 31% between 2006 and 2015. The chance of Phase I drugseventually making it to market is 21.5%, and approximately $5.08billion each year is spent on drugs that will never reach the market.According to Hay, Thomas, Craighead, Economides, and Rosenthal(2014), the overall success rate from Phase I to FDA approval is evenlower if the “Pre-Clinical Phase” is included, a stage during whichresearchers look for potential new compounds to target selecteddiseases.
Based on FDA guidelines, Phase I trials refer to a new drug ortreatment. The length of the Phase I study is several months, withapproximately 70% of drugs in that stage moving to the next phase.The main motivation of Phase I clinical testing is to find the highestdose of the new treatment without serious side effects. Safety isone of the main concerns during Phase I.
Phase II clinical trials focus on the safety of the treatment, aswell as its side effects. Phase II testing can take 2 years or moreand approximately 33% proceed to Phase III. Phase III is the finalstage associated with the FDA approval process. Phase III clinicaltesting lasts between 1–4 years.6 Medical discoveries that progressto Phase III are extensively tested for their effectiveness in treatinga specific condition.7
We extend our research to investigate what happens post-FDA-approval to the quality of a firm’s innovation. For qualitypurposes, we employ three metrics. First, we identify FDA-recalledproducts. When the FDA is informed that a specific drug ormedical device under their jurisdiction has significant health orsafety concerns, the FDA may issue a public recall of that item.In 2016 alone, the FDA issued 2847 recalls and 14,590 warningletters.8
Our second measure of quality is FDA Post-Market Evaluations.The FDA conducts post-market evaluations to determine any newor previously undiscovered health or safety concerns. Lastly, wemeasure the quality of innovation by observing the patents namedin a future infringement lawsuit. Previous literature has shown thatdefending a patent in court can represent a serious threat to firmvalue (Bessen, Ford, and Meurer (2011); Bessen and Meurer (2005);Cohen, Gurun, and Kominers, (2014); Paik and Zhu (2016); Raghu,Woo, Mohan, and Rao (2008); Smeets (2014)). We are able to iden-tify whether a pharmaceutical firm is a defendant or a plaintiff. Weintegrate these innovation quality measures in our primary “mon-
6 https://www.fda.gov/forpatients/approvals/drugs/ucm405622.htm7 https://www.reuters.com/article/us-pharmaceuticals-success/success-rates-
for-experimental-drugs-falls-study-idUSTRE71D2U9201102148 https://www.fda.gov/downloads/iceci/enforcementactions/ucm540606.pdf

1 ew of
bu
imob(awbcticiopwa(dfi
Hm
I
Cawp
gTcdi3Fpsaborh
LCae(c
94 O. Unsal and B Rayfield / The Quarterly Revi
etter quality of innovation as measured by fewer recalled prod-cts.
Our second hypothesis investigates whether institutionalnvestors encourage a “failure tolerantworking environment. The
anagerial working environment is important during drug devel-pment. A workplace culture that strongly discourages failure haseen found to cause managers to under-invest (Ward, Yin, and Zeng2017)). When job security concerns arise, managers fail to invest
firm’s resources efficiently. For example, investment in projectsith a high probability of failure (e.g., clinical testing of drugs) may
e diverted to projects with a more certain outcome. In a highlyompetitive market (e.g., biotechnology), the chances of innova-ion failures are high. We hypothesize that informed institutionalnvestors are better equipped to evaluate the risk and failure asso-iated with the pharmaceutical industry. Therefore, monitoring bynvestors plays an important role in mitigating the career concernsf managers when market competition is greater. We define thishenomenon as the “insurance effect”. The insurance hypothesisould suggest that, when institutional ownership is higher, man-
gers have a lower probability of being fired. Following Aghion et al.2013) and Ward et al. (2017), we test the insurance effect in threeistinct ways. First, we test the competition among pharmaceuticalrms.
2. All other things being equal, institutional investors alleviateanagers’ career concerns.
nnovationt = + ˇ1 (1 − Lerner Index)i,t−1
+ ˇ2 Inst. Own%i,t−1 x (1 − Lerner Index)i,t−1
+ ˇ3 Inst. Own%i,t−1 + ˇ4 Log(Asset)i,t−1 + ˇ5 Tobin’s Qi,t−1
+ ˇ6 RnDi,t−1 + ˇ7 Leveragei,t−1 + ˇ8 Tangibilityi,t−1
+ ˇ9 ROAi,t−1 + ˇ10 HHI Indexi,t−1 + ˇ11Log(FirmAge)i,t−1
+ ˇ12 Free Cash FLowi,t−1 + �it + ϕit + εit (2)
Our dependent variable is the total number of FDA approvals.ompetition is measured by 1 − Lerner index (Aghion et al. (2013))nd is interacted with institutional holdings. We hypothesize that,hen market competition is higher and institutional ownership isresent, the number of FDA approvals a firm receives is higher.
Pharmaceutical firms can experience many extremes whenoing though the FDA approval process. For example, shares in Sageherapeutics soared 70 percent on December 7th, 2017 after theompany announced positive results in testing a major depressiveisorder (MDD) treatment. However, news may not always be pos-
tive for pharmaceutical firms. Alkermes closed 22% down on Aprilrd, 2018 after a market reaction prompted by the FDA Refusal toile letter relating to the New Drug Application (NDA) for a pro-osed depression treatment. In addition, recalls can also affect thehare price of pharmaceutical firms. For example, in 2004, Mercknnounced the recall of the drug, Vioxx, which accounted for $2.55illion of company sales in 2003. Merck’s shares plunged at thepening bell on the New York Stock Exchange by 27%. Overall, theseeal examples suggest that innovation is a high risk, high award, origh failure process.
Next, we collect CEO turnover announcements from the Nexisexis database. CEO turnover is a binary variable equal to one if theEO leaves the firm during year t, and zero otherwise. We inter-
ct institutional ownership and measure of profitability, �ROA, toxamine whether institutional ownership reduces CEO turnoverAghion et al. (2013)). If institutional investors do alleviate theareer concerns of a manager, we expect CEO turnover sensitivityEconomics and Finance 74 (2019) 190–205
to be reduced.
CEOTurnover = + ˇ1 �ROAi,t−1 + ˇ2 Inst. Own%i,t−1 x �ROAi,t−1
+ ˇ3 Inst. Own%i,t−1 + + ˇ4 Log (Asset)i,t−1 + ˇ5 Tobin′s Q i,t−1
+ ˇ6 RnDi,t−1 + ˇ7 Leveragei,t−1 + ˇ8 Tangibilityi,t−1 + ˇ9 ROAi,t−1
+ ˇ10 HHI Indexi,t−1 + ˇ11Log (FirmAge)i,t−1
+ ˇ12 Free Cash FLowi,t−1 + �it + ϕit + εit (3)
CEO Cash (or Equity) = + ˇ1 �Wealthi,t−1
+ ˇ2 Inst. Own%i,t−1 x �Wealthi,t−1 + ˇ3 Inst. Own%i,t−1
+ ˇ4 Log (Asset)i,t−1 + ˇ5 Tobin’s Qi,t−1 + ˇ6 RnDi,t−1
+ ˇ7 Leveragei,t−1 + ˇ8 Tangibilityi,t−1 + ˇ9 ROAi,t−1
+ ˇ10 HHI Indexi,t−1 + ˇ11Log (FirmAge)i,t−1
+ ˇ12 Free Cash FLowi,t−1 + �it + ϕit + εit (4)
Our last insurance variable is the CEO pay-for-performance sen-sitivity of Hartzell and Starks (2003). �CEO Cash is defined as thechange in the level of cash and bonus compensation for CEO i inyear t. We regress the change in CEO pay on the interaction ofinstitutional ownership and �Wealth. We calculate �Wealth asthe change in a firm’s market value between year t-1 and t. Weaim to capture the effect of institutional investors on CEO’s pay-for-performance sensitivity.
5. Empirical results
5.1. Institutional ownership and innovation output: monitoringeffect
In Table 2, we conduct multivariate analysis of institutionalinvestors and innovation performance. Our dependent variable isthe total number of FDA approved patents. From column (1) to (3),we use the number of awarded patents in year t + 1. We conductOLS, Poisson regression, and negative binomial regression respec-tively. In column (4), we use the number of patents in year t + 2.From column (5) to (7), we measure the relationship between dif-ferent concentrations of institutional ownership and innovationperformance. In column (8), we calculate the decline in institutionalownership as the yearly change in institutional holdings betweenyear t and t + 1, where positive values are replaced by zero. Sim-ilarly, in column (9), our dependent variable is the decline in thenumber of patents which is calculated as the change in the num-ber of patents between year t and t + 1, where positive values arereplaced by zero.
Column (1) shows that institutional ownership is significantlypositively associated with innovation and our results hold acrossdistributional assumptions. Our results indicate that an increase ininstitutional ownership increases innovation output. These resultsare similar to the prior literature that highlights the supportingrole of institutional investors in innovation. In column (4), we useapproved patents as the dependent variable in time t + 2. Consistentwith expectations, we document that a greater amount of institu-tional ownership leads to a higher number of approved patents.In columns (5)–(7), we document that a different concentration ofinstitutional ownership has a positive effect on firm innovation.
We show that a decline in institutional ownership between twoconsecutive years has a negative effect on the innovation outcomein column (8). In the same manner, we document that the declinein institutional ownership moves in the same direction with the
O. Unsal and B Rayfield / The Quarterly Review of Economics and Finance 74 (2019) 190–205 195
Table 2Institutional Ownership and Total FDA Approvals.
Panel A.
Dependent Variable
SampleLn(TotalApproval)t+1 Ln(TotalApproval)t+2 Ln(TotalApproval)t+1 Decline in Approvals
OLS Poisson Neg. Binominal OLS OLS OLS OLS OLS OLS(1) (2) (3) (4) (5) (6) (7) (8) (9)
Inst. Own% 0.174 0.188 0.473 0.015[0.001]*** [0.001]*** [0.001]*** [0.001]***
Top 5 Own 0.021[0.001]***
Top 10 Own 0.287[0.023]**
Top Block Hold. 0.011[0.001]***
Decline in Ins. Own% 0.805 0.039[0.001]*** [0.001]***
Log(Asset) 0.075 0.126 0.246 0.059 0.244 0.164 0.170 0.224 0.018[0.001]*** [0.001]*** [0.001]*** [0.001]*** [0.001]*** [0.001]*** [0.001]*** [0.001]*** [0.001]***
Tobin’s Q 0.001 0.001 0.003 0.003 0.003 0.002 0.002 0.011 −0.001[0.181] [0.083]* [0.054]* [0.090]* [0.043]** [0.057]* [0.052]* [0.001]*** [0.072]8
RnD 0.006 0.010 −0.021 0.073 −0.031 −0.066 −0.064 −0.033 0.020[0.580] [0.392] [0.526] [0.026]* [0.367] [0.040]** [0.047]** [0.463] [0.050]**
Book Leverage −0.004 −0.003 −0.006 0.002 −0.004 −0.004 −0.004 −0.011 0.001[0.299] [0.155] [0.167] [0.745] [0.259] [0.268] [0.264] [0.292] [0.783]
Tangibility 0.214 0.184 −0.014 −0.063 −0.016 0.070 0.052 0.008 −0.004[0.112] [0.115] [0.945] [0.566] [0.935] [0.709] [0.782] [0.970] [0.926]
ROA 0.004 −0.002 −0.007 −0.001 −0.008 −0.007 −0.007 0.008 0.004[0.189] [0.036]** [0.001]*** [0.952] [0.001]*** [0.001]*** [0.001]*** [0.708] [0.322]
HHI Index −0.112 −0.880 −2.621 −0.062 −2.561 −2.341 −2.359 −2.578 0.258[0.001]*** [0.001]*** [0.001]*** [0.001]*** [0.001]*** [0.001]*** [0.001]*** [0.001]*** [0.001]***
Log(Firm Age) 0.134 0.225 0.264 0.170 0.269 0.214 0.223 0.308 −0.025[0.001]*** [0.001]*** [0.001]*** [0.001]*** [0.001]*** [0.001]*** [0.001]*** [0.001]*** [0.001]***
Free Cash Flow −0.009 −0.006 −0.026 0.025 −0.030 −0.025 −0.026 −0.032 −0.005[0.179] [0.120] [0.013]** [0.183] [0.001]*** [0.001]*** [0.001]*** [0.001]*** [0.334]
Year/Firm Fixed Effect YES NO NO YES YES YES YES YES YESN 6,329 6,329 6,329 6,329 6,329 6,329 6,329 6,329 5,317R2 20% 26% 28% 21% 23% 24% 23% 25% 16%
Panel B. Institutional Ownership and Citation
Dependent Variable
SampleNumber of Citest+1 Citation-Weighted Valuet+1 Number of Citest+1 Citation-Weighted Valuet+1
(1) (2) (1) (2)
Inst. Own% 1.245 2.011 1.088 0.981[0.001]*** [0.001]*** [0.001]*** [0.001]***
Log(Asset) 1.067 1.899 1.334 1.309[0.001]*** [0.001]*** [0.001]*** [0.001]***
Tobin’s Q 0.001 0.001 0.002 0.001[0.611] [0.617] [0.312] [0.356]
RnD 0.008 0.221 0.445 0.988[0.774] [0.733] [0.599] [0.587]
Book Leverage 0.001 0.002 0.001 0.001[0.733] [0.498] [0.733] [0.498]
Tangibility −0.066 −0.617 −0.389 −0.367[0.190] [0.078]* [0.698] [0.509]
ROA 0.778 0.078 0.889 0.590[0.001]*** [0.001]*** [0.045]** [0.067]*
HHI Index 5.285 4.216 2.112 2.198[0.052]* [0.033]** [0.001]*** [0.001]***
Log(Firm Age) 3.084 3.121 0.043 0.031[0.001]*** [0.001]*** [0.001]*** [0.001]***
Free Cash Flow −0.019 −0.023 0.019 0.023[0.031]** [0.044]** [0.556] [0.567]
Year/Firm Fixed Effect YES YES YES YESN 6,329 6,329 3063 3063R2 4% 4% 3% 2%
196 O. Unsal and B Rayfield / The Quarterly Review of Economics and Finance 74 (2019) 190–205
Table 2 (Continued)
Panel C. Institutional Ownership Types and Employee Lawsuits
Dependent Variable
SampleLn(TotalApproval)t+1
(1) (2) (3) (4) (5) (6) (7) (8)
Mutual Funds 0.556 0.033[0.021]** [0.044]**
Investment −0.511 0.799[0.899] [0.403]
Banks 0.900 −0.553[0.599] [0.788]
Pension 0.883 0.455[0.001]*** [0.073]*
Insurance −0.003 −0.290[0.781] [0.677]
Long Term 0.442[0.039]**
Short Term 0.033[0.132]
CONTROLS YES YES YES YES YES YES YES YESYear/Industry48 YES YES YES YES YES YES YES YESN 6,329 6,329 6,329 6,329 6,329 6,329 6,329 6,329R2 4% 3% 3% 4% 4% 6% 5% 4%
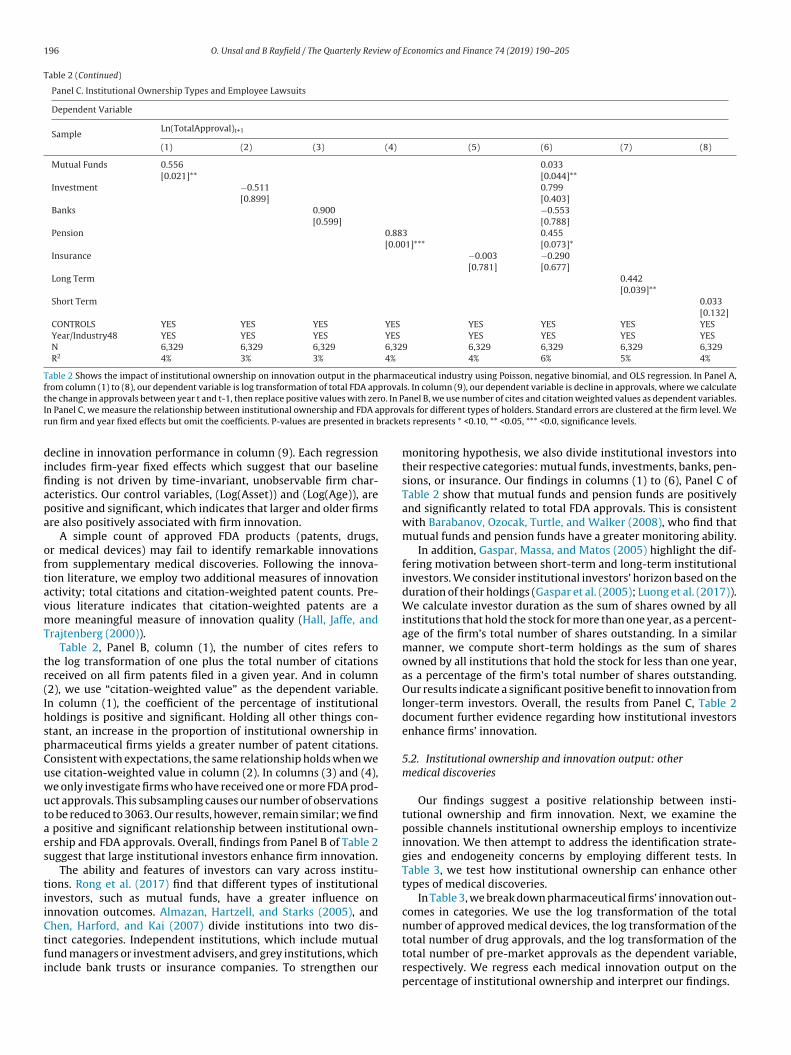
Table 2 Shows the impact of institutional ownership on innovation output in the pharmaceutical industry using Poisson, negative binomial, and OLS regression. In Panel A,from column (1) to (8), our dependent variable is log transformation of total FDA approvals. In column (9), our dependent variable is decline in approvals, where we calculatet o. In PI pprovr racke
difiapa
oftavmT
tr(IhspCuwutaes
tiiCtfi
he change in approvals between year t and t-1, then replace positive values with zern Panel C, we measure the relationship between institutional ownership and FDA aun firm and year fixed effects but omit the coefficients. P-values are presented in b
ecline in innovation performance in column (9). Each regressionncludes firm-year fixed effects which suggest that our baselinending is not driven by time-invariant, unobservable firm char-cteristics. Our control variables, (Log(Asset)) and (Log(Age)), areositive and significant, which indicates that larger and older firmsre also positively associated with firm innovation.
A simple count of approved FDA products (patents, drugs,r medical devices) may fail to identify remarkable innovationsrom supplementary medical discoveries. Following the innova-ion literature, we employ two additional measures of innovationctivity; total citations and citation-weighted patent counts. Pre-ious literature indicates that citation-weighted patents are aore meaningful measure of innovation quality (Hall, Jaffe, and
rajtenberg (2000)).Table 2, Panel B, column (1), the number of cites refers to
he log transformation of one plus the total number of citationseceived on all firm patents filed in a given year. And in column2), we use “citation-weighted value” as the dependent variable.n column (1), the coefficient of the percentage of institutionaloldings is positive and significant. Holding all other things con-tant, an increase in the proportion of institutional ownership inharmaceutical firms yields a greater number of patent citations.onsistent with expectations, the same relationship holds when wese citation-weighted value in column (2). In columns (3) and (4),e only investigate firms who have received one or more FDA prod-ct approvals. This subsampling causes our number of observationso be reduced to 3063. Our results, however, remain similar; we find
positive and significant relationship between institutional own-rship and FDA approvals. Overall, findings from Panel B of Table 2uggest that large institutional investors enhance firm innovation.
The ability and features of investors can vary across institu-ions. Rong et al. (2017) find that different types of institutionalnvestors, such as mutual funds, have a greater influence onnnovation outcomes. Almazan, Hartzell, and Starks (2005), andhen, Harford, and Kai (2007) divide institutions into two dis-
inct categories. Independent institutions, which include mutualund managers or investment advisers, and grey institutions, whichnclude bank trusts or insurance companies. To strengthen ouranel B, we use number of cites and citation weighted values as dependent variables.als for different types of holders. Standard errors are clustered at the firm level. Wets represents * <0.10, ** <0.05, *** <0.0, significance levels.
monitoring hypothesis, we also divide institutional investors intotheir respective categories: mutual funds, investments, banks, pen-sions, or insurance. Our findings in columns (1) to (6), Panel C ofTable 2 show that mutual funds and pension funds are positivelyand significantly related to total FDA approvals. This is consistentwith Barabanov, Ozocak, Turtle, and Walker (2008), who find thatmutual funds and pension funds have a greater monitoring ability.
In addition, Gaspar, Massa, and Matos (2005) highlight the dif-fering motivation between short-term and long-term institutionalinvestors. We consider institutional investors’ horizon based on theduration of their holdings (Gaspar et al. (2005); Luong et al. (2017)).We calculate investor duration as the sum of shares owned by allinstitutions that hold the stock for more than one year, as a percent-age of the firm’s total number of shares outstanding. In a similarmanner, we compute short-term holdings as the sum of sharesowned by all institutions that hold the stock for less than one year,as a percentage of the firm’s total number of shares outstanding.Our results indicate a significant positive benefit to innovation fromlonger-term investors. Overall, the results from Panel C, Table 2document further evidence regarding how institutional investorsenhance firms’ innovation.
5.2. Institutional ownership and innovation output: othermedical discoveries
Our findings suggest a positive relationship between insti-tutional ownership and firm innovation. Next, we examine thepossible channels institutional ownership employs to incentivizeinnovation. We then attempt to address the identification strate-gies and endogeneity concerns by employing different tests. InTable 3, we test how institutional ownership can enhance othertypes of medical discoveries.
In Table 3, we break down pharmaceutical firms’ innovation out-comes in categories. We use the log transformation of the totalnumber of approved medical devices, the log transformation of the
total number of drug approvals, and the log transformation of thetotal number of pre-market approvals as the dependent variable,respectively. We regress each medical innovation output on thepercentage of institutional ownership and interpret our findings.
O. Unsal and B Rayfield / The Quarterly Review of Economics and Finance 74 (2019) 190–205 197
Table 3Institutional Ownership and FDA Approved Medical Products.
Dependent Variable
SampleLn(MedicalDeviceApp.)t+1 Ln(FDADrugApp.)t+1 Ln(PreMarketApp)t+1
(1) (2) (3)
Inst. Own% 0.063 0.093 0.028[0.001]*** [0.001]*** [0.001]***
Log(Asset) 0.040 0.036 0.023[0.001]*** [0.001]*** [0.001]***
Tobin’s Q 0.001 0.001 0.001[0.632] [0.117] [0.206]
RnD 0.008 −0.002 0.003[0.364] [0.802] [0.641]
Book Leverage −0.001 0.001 −0.011[0.354] [0.712] [0.714]
Tangibility −0.004 0.117 0.182[0.971] [0.100] [0.010]**
ROA 0.004 0.003 0.002[0.001]*** [0.001]*** [0.358]
HHI Index 0.285 −0.216 −0.047[0.021]** [0.088]* [0.628]
Log(Firm Age) 0.084 0.121 0.184[0.001]*** [0.001]*** [0.001]***
Free Cash Flow −0.009 −0.003 −0.002[0.038]** [0.346] [0.601]
Year/Firm Fixed Effect YES YES YESN 6,329 6,329 6,329R2 5% 11% 12%
T al inno of preP e leve
mclbtmFi
5p
iFbl7foutItl
atrsca
s
able 3 Shows the impact of institutional ownership on medical innovation. Medicf medical devices applications, the number of FDA applications, and the number
-values are presented in brackets represents * < 0.10, ** <0.05, *** <0.0, significanc
Table 3 documents a positive and significant relation betweenedical innovation and institutional ownership. In column (1), the
oefficient of Ins. Own% is significantly positive at the one-percentevel. Increased levels of institutional ownership increase the num-er of FDA-approved products a firm receives. Similarly, we findhat higher levels of institutional ownership are associated with
ore FDA-approved drugs, as well as pre-market approvals fromDA. Table 3 suggests that institutional ownership can improvennovative activities of pharmaceutical firms in our sample.
.3. Institutional ownership and innovation output: phase I –hase II – phase III drugs
In the next stage, we examine the medical innovation by exam-ning a unique dataset of drugs during Phase I – Phase II – Phase IIIDA process. Phase I trials refer to new drugs, treatments, or com-inations of treatments deemed safe for human consumption. The
ength of Phase I can be several months to years. Approximately0% of Phase I drugs move to the next phase. Phase II clinical trialsocus on the safety and effectiveness of a new treatment. The focusf the Phase II drug trial is the drug’s side effects. A study can takep to two years and approximately 33% of Phase II drugs move tohe next phase. Lastly, Phase III clinical trials test successful phaseI clinical trials. The purpose of the Phase III primary objective ishe observation of effectiveness, as well as adverse reactions. Theength of the study is between one to four years.
Measuring innovation by examining the pharmaceutical drugpproval process is unique. We examine the impact of institu-ions on the different stages of clinical testing because firms mayeceive a positive market reaction if one drug moves to the next
tage. Each stage adds or destroys firm value based on the out-ome. For example, Alnylam pharma gained 32.7% in Septemberfter positive results from an important Phase III clinical trial.9 In9 http://globalmacrodigest.com/alnylam-pharmaceuticals-rallied-32-7-eptember/
ovation is measured three different ways, as the log transformation of the number-market applications. We run firm and year fixed effects but omit the coefficients.ls.
contrast, Celgene lost 30% in value in October when their Phase IIIdrug failed.10
Panel A of Table 4 documents the relationship between the suc-cess of Phase I – II – III drug trials and institutional ownership.In Panel A, we document that institutional ownership increasesthe number of clinical trials for Phase I – Phase II – Phase IIIdrugs, respectively. We find that institutional ownership is posi-tively related to the number of patents licensed by pharmaceuticalfirms. In summary, institutional holdings yield a greater numberof patents licensed to other firms. In Panel B, we calculate the dif-ference between the length of time associated with each clinicaltesting phase. We identify whether institutional investors guideinnovation by reducing the time between the first and last stageof clinical examination. In column (1), our dependent variable isthe difference between the number of Phase I drugs and numberof Phase III drugs. We find that institutional ownership lowers therange of Phase III and Phase I drugs. The same relationship holdswhen we test the differences between Phase I and Phase II testing,as well as Phase II and Phase III, respectively. In the last column,we count the cumulative number of drugs under all phases. Wefind that higher institutional ownership leads to a greater num-ber of medical discoveries under clinical testing. Finally, in PanelC, we conduct an ordered logistic model for better evaluation ofthe clinical testing process. The dependent variable is coded one,two, or three for Phase I, Phase II, or Phase III drugs, respectively.From columns (1) to (3), we report the marginal effect for eachoutcome. In column (1), all other things being constant, a one per-cent increase in institutional ownership means that pharmaceuticalfirms will be 1% more likely to have a drug under Phase I testing. Incolumn (2), all other things remaining constant, an increase in insti-
tutional ownership will increase firms’ chances of having a Phase IIdrug by 1.5%. In column (3), all other things remaining constant, anincrease in institutional ownership will increase a firm’s profitabil-10 https://www.fool.com/investing/2017/11/03/why-celgene-crashed-30-in-october-and-what-now.aspx

198 O. Unsal and B Rayfield / The Quarterly Review of Economics and Finance 74 (2019) 190–205
Table 4Institutional Ownership and Phase I - II - III Drug Approvals.
Panel A. Phase I - II - III Approvals
Dependent Variable
SampleLn(PhaseI)t+1 Ln(PhaseII)t+1 Ln(PhaseIII)t+1 Ln(LicencedPatent)+1
(1) (2) (3) (4)
Inst. Own% 0.049 0.063 0.066 0.035[0.001]*** [0.001]*** [0.001]*** [0.001]***
CONTROLS YES YES YES YESYear/Firm Fixed Effect YES YES YES YESN 6,329 6,329 6,329 6,329R2 7% 7% 7% 8%
Panel B. Difference Between Drug PhasesDependent VariableSample Diff(PhaseI-PhaseIII) Diff(PhaseI-PhaseII) Diff(PhaseII-PhaseIII) Cumulative Phase
(1) (2) (3) (4)Inst. Own% −0.667 −0.455 −0.933 0.380
[0.001]*** [0.001]*** [0.001]*** [0.001]***CONTROLS YES YES YES YESYear/Firm Fixed Effect YES YES YES YESN 3,063 3,063 3,063 6,329R2 8% 8% 8% 7%
Panel C. Ordered LogisticDependent VariableSample Phase I Phase II Phase III Phase
(1) (2) (3) (4)Inst. Own% 0.010 0.015 0.035 0.750
[0.001]*** [0.001]*** [0.001]*** [0.001]***CONTROLS YES YES YES YESYear/Firm Fixed Effect YES YES YES YESN 6,329 6,329 6,329 6,329R2 8% 8% 8% 7%
Table 4 Shows the impact of institutional ownership on medical innovation for different stages of drugs. In Panel A, our dependent variable is log transformation of differents nt phaF year
*
ioopobvhetiptl
5d
pimdHiu“imca
tages of drug approvals. In Panel B, we calculate the difference between two differeor the brevity of our results, we only report the variable of interest. We run firm and
< 0.10, ** <0.05, *** <0.0, significance levels.
ty by 3.5%. In column (4), we run ordered logit for all groups. Allther things being constant, with a greater share of institutionalwnership, pharmaceutical firms are more likely to be in higherhases of clinical testing. For a one percent increase in institutionalwnership, we would expect a 0.750 increase in the log odds ofeing in a higher level of drug phases, given that all of the otherariables in the model are held constant. Our results from Table 4ave significant implications. First, we show that institutional own-rship increases the number of drugs under all phases of clinicalesting. Then, we document that the distance between basic test-ng (Phase I) and advanced testing (Phase III) is lower when theercentage of institutional ownership is higher. Finally, we reporthat firms with a greater share of institutional ownership are moreikely to be in higher levels of clinical testing (i.e., Phase III).
.4. Institutional ownership and innovation output: approvaluration
Institutional investors are associated with strong monitoringower (Aghion et al. (2013)), thus helping firms increase their
nnovation performance. In our study, we document that phar-aceutical firms obtain more FDA approvals (i.e., patents, medical
evices) with better medical testing quality (i.e., Phase III drugs).owever, the distinct channel by which institutional investors
nfluence pharmaceutical innovation outcome have not been doc-mented in previous studies. We fill this gap by examining thefiling-to-approval” dates of medical products with the FDA. We
nvestigate whether product approval times are shorter for phar-aceutical firms with higher institutional holding levels. First, wealculate the approval date for patents by taking the difference ofpproval date minus the filing date (measured in “days”) for 3202
ses of drugs. In Panel C, we run ordered logistic regression for different drug levels.fixed effects but omit the coefficients. P-values are presented in brackets represents
unique drug patents. We also identify the approval dates for 5445unique pre-market approvals and 7099 unique medical devices. Werun our regressions at the drug-year level because each medicaldiscovery has a distinct time-to-approval.
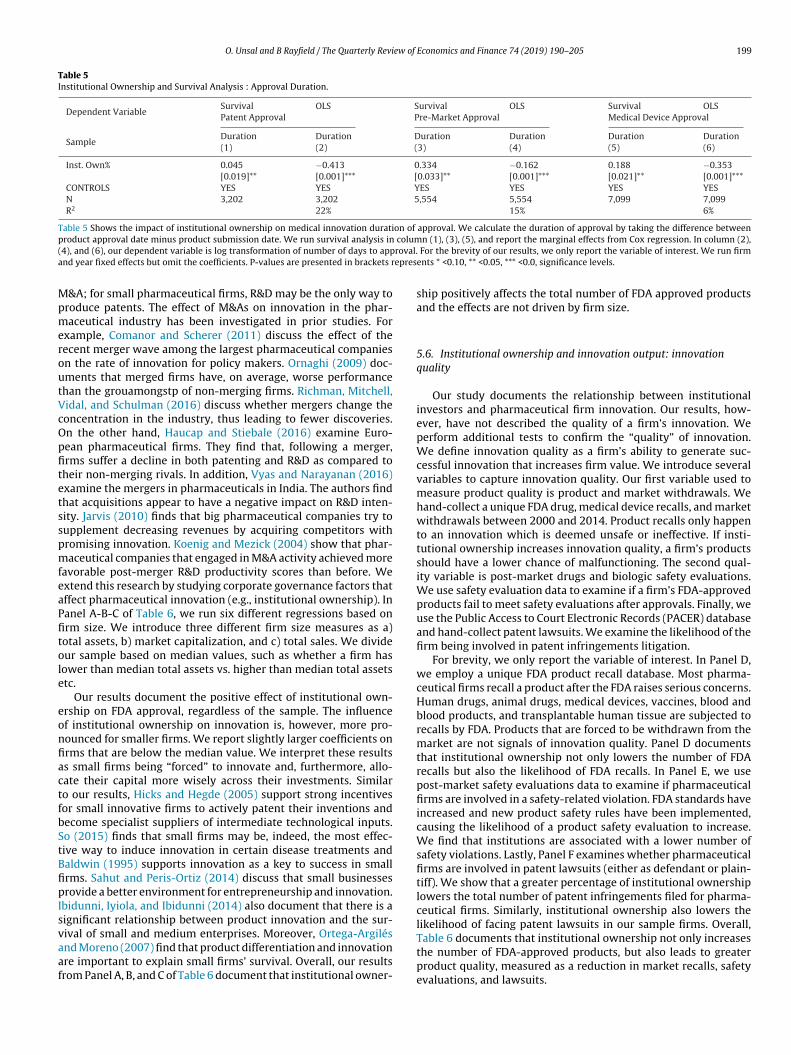
In Table 5, we measure how institutional investors increaseinnovation quality by examining the approval times of submit-ted products in FDA. We report the results of both OLS regressionand survival analysis. In column (1) and (2), we employ patentapproval duration as a dependent variable. We find a positive andsignificant coefficient for institutional investors, suggesting thatpharmaceutical firms with higher institutional ownership haveshorter approval duration. In column (2), OLS regression finds thatfirms with a greater percentage of institutional ownership ter-minate the approval process faster. In columns (3) and (4), weconduct the same survival analysis and OLS method for pre-marketapprovals. Consistent with expectations, the survival model in col-umn (3) suggests that institutional ownership is associated withfaster approval duration for pre-market approved products. In col-umn (4) we run the OLS model: all other things remaining constant,larger institutional ownership significantly lowers the number ofdays for pre-market approvals. We perform both survival analysisand OLS for medical device approval days in column (5) and column(6). We document that pharmaceutical firms with a greater shareof institutional ownership experience faster approval duration fortheir medical devices.
5.5. Institutional ownership and innovation output: firm size
In this section, we run different tests to eliminate concernsabout pharmaceuticals’ firm size effects on the innovation outcome.For large pharmaceutical firms, patents can be acquired through
O. Unsal and B Rayfield / The Quarterly Review of Economics and Finance 74 (2019) 190–205 199
Table 5Institutional Ownership and Survival Analysis : Approval Duration.
Dependent VariableSurvival OLS Survival OLS Survival OLSPatent Approval Pre-Market Approval Medical Device Approval
SampleDuration Duration Duration Duration Duration Duration(1) (2) (3) (4) (5) (6)
Inst. Own% 0.045 −0.413 0.334 −0.162 0.188 −0.353[0.019]** [0.001]*** [0.033]** [0.001]*** [0.021]** [0.001]***
CONTROLS YES YES YES YES YES YESN 3,202 3,202 5,554 5,554 7,099 7,099R2 22% 15% 6%
Table 5 Shows the impact of institutional ownership on medical innovation duration of approval. We calculate the duration of approval by taking the difference betweenp colum( roval.a epres
MpmeroutVcOpfitetsspmfeaPfitole
eonfiactfbStBfipIsvaaf
roduct approval date minus product submission date. We run survival analysis in4), and (6), our dependent variable is log transformation of number of days to appnd year fixed effects but omit the coefficients. P-values are presented in brackets r
&A; for small pharmaceutical firms, R&D may be the only way toroduce patents. The effect of M&As on innovation in the phar-aceutical industry has been investigated in prior studies. For
xample, Comanor and Scherer (2011) discuss the effect of theecent merger wave among the largest pharmaceutical companiesn the rate of innovation for policy makers. Ornaghi (2009) doc-ments that merged firms have, on average, worse performancehan the grouamongstp of non-merging firms. Richman, Mitchell,idal, and Schulman (2016) discuss whether mergers change theoncentration in the industry, thus leading to fewer discoveries.n the other hand, Haucap and Stiebale (2016) examine Euro-ean pharmaceutical firms. They find that, following a merger,rms suffer a decline in both patenting and R&D as compared toheir non-merging rivals. In addition, Vyas and Narayanan (2016)xamine the mergers in pharmaceuticals in India. The authors findhat acquisitions appear to have a negative impact on R&D inten-ity. Jarvis (2010) finds that big pharmaceutical companies try toupplement decreasing revenues by acquiring competitors withromising innovation. Koenig and Mezick (2004) show that phar-aceutical companies that engaged in M&A activity achieved more
avorable post-merger R&D productivity scores than before. Wextend this research by studying corporate governance factors thatffect pharmaceutical innovation (e.g., institutional ownership). Inanel A-B-C of Table 6, we run six different regressions based onrm size. We introduce three different firm size measures as a)otal assets, b) market capitalization, and c) total sales. We divideur sample based on median values, such as whether a firm hasower than median total assets vs. higher than median total assetstc.
Our results document the positive effect of institutional own-rship on FDA approval, regardless of the sample. The influencef institutional ownership on innovation is, however, more pro-ounced for smaller firms. We report slightly larger coefficients onrms that are below the median value. We interpret these resultss small firms being “forced” to innovate and, furthermore, allo-ate their capital more wisely across their investments. Similaro our results, Hicks and Hegde (2005) support strong incentivesor small innovative firms to actively patent their inventions andecome specialist suppliers of intermediate technological inputs.o (2015) finds that small firms may be, indeed, the most effec-ive way to induce innovation in certain disease treatments andaldwin (1995) supports innovation as a key to success in smallrms. Sahut and Peris-Ortiz (2014) discuss that small businessesrovide a better environment for entrepreneurship and innovation.
bidunni, Iyiola, and Ibidunni (2014) also document that there is aignificant relationship between product innovation and the sur-
ival of small and medium enterprises. Moreover, Ortega-Argilésnd Moreno (2007) find that product differentiation and innovationre important to explain small firms’ survival. Overall, our resultsrom Panel A, B, and C of Table 6 document that institutional owner-n (1), (3), (5), and report the marginal effects from Cox regression. In column (2), For the brevity of our results, we only report the variable of interest. We run firments * <0.10, ** <0.05, *** <0.0, significance levels.
ship positively affects the total number of FDA approved productsand the effects are not driven by firm size.
5.6. Institutional ownership and innovation output: innovationquality
Our study documents the relationship between institutionalinvestors and pharmaceutical firm innovation. Our results, how-ever, have not described the quality of a firm’s innovation. Weperform additional tests to confirm the “quality” of innovation.We define innovation quality as a firm’s ability to generate suc-cessful innovation that increases firm value. We introduce severalvariables to capture innovation quality. Our first variable used tomeasure product quality is product and market withdrawals. Wehand-collect a unique FDA drug, medical device recalls, and marketwithdrawals between 2000 and 2014. Product recalls only happento an innovation which is deemed unsafe or ineffective. If insti-tutional ownership increases innovation quality, a firm’s productsshould have a lower chance of malfunctioning. The second qual-ity variable is post-market drugs and biologic safety evaluations.We use safety evaluation data to examine if a firm’s FDA-approvedproducts fail to meet safety evaluations after approvals. Finally, weuse the Public Access to Court Electronic Records (PACER) databaseand hand-collect patent lawsuits. We examine the likelihood of thefirm being involved in patent infringements litigation.
For brevity, we only report the variable of interest. In Panel D,we employ a unique FDA product recall database. Most pharma-ceutical firms recall a product after the FDA raises serious concerns.Human drugs, animal drugs, medical devices, vaccines, blood andblood products, and transplantable human tissue are subjected torecalls by FDA. Products that are forced to be withdrawn from themarket are not signals of innovation quality. Panel D documentsthat institutional ownership not only lowers the number of FDArecalls but also the likelihood of FDA recalls. In Panel E, we usepost-market safety evaluations data to examine if pharmaceuticalfirms are involved in a safety-related violation. FDA standards haveincreased and new product safety rules have been implemented,causing the likelihood of a product safety evaluation to increase.We find that institutions are associated with a lower number ofsafety violations. Lastly, Panel F examines whether pharmaceuticalfirms are involved in patent lawsuits (either as defendant or plain-tiff). We show that a greater percentage of institutional ownershiplowers the total number of patent infringements filed for pharma-ceutical firms. Similarly, institutional ownership also lowers thelikelihood of facing patent lawsuits in our sample firms. Overall,
Table 6 documents that institutional ownership not only increasesthe number of FDA-approved products, but also leads to greaterproduct quality, measured as a reduction in market recalls, safetyevaluations, and lawsuits.
200 O. Unsal and B Rayfield / The Quarterly Review of
Table 6Institutional Ownership and Innovation Quality.
Panel A. Total Asset
Dependent Variable
SampleLn(TotalApproval)t+1
(1) (2)
Inst. Own% 0.799 0.211[0.001]*** [0.001]***
CONTROLS YES YESYear/Firm Fixed Effect YES YESN 3,200 3,129R2 5% 5%
Panel B. Market CapitalizationDependent VariableSample Ln(TotalApproval)t+1
(1) (2)Inst. Own% 0.911 0.312
[0.001]*** [0.032]**CONTROLS YES YESYear/Firm Fixed Effect YES YESN 3,215 3,114R2 6% 7%
Panel C. Total SaleDependent VariableSample Ln(TotalApproval)t+1
(1) (2)Inst. Own% 0.599 0.011
[0.012]** [0.076]*CONTROLS YES YESYear/Firm Fixed Effect YES YESN 3,098 3,231R2 7% 7%
Panel D. Product RecallsDependent VariableSample Ln(TotalRecall) Prob = Recall
(1) (2)Inst. Own% −0.057 −0.904
[0.001]*** [0.001]***CONTROLS YES YESYear/Firm Fixed Effect YES YESN 6,329 6,329R2 5% 3%
Panel E. Post Market Safety EvaluationsDependent VariableSample Ln(PostMarketEval) Prob = PostMarketEval
(1) (2)Inst. Own% −0.079 −0.285
[0.022]** [0.056]*CONTROLS YES YESYear/Firm Fixed Effect YES YESN 6,329 6,329R2 4% 4%
Panel F. Patent LawsuitDependent VariableSample Ln(TotalLawsuit) Prob = Lawsuit
(1) (2)Inst. Own% −0.057 −0.318
[0.033]** [0.015]**CONTROLS YES YESYear/Firm Fixed Effect YES YESN 6,329 6,329R2 8% 6%
In Table 6, we test the relationship between institutional ownership and FDAapprovals based on median values of total assets, market capitalization, and totalsale in Panel A, Panel B, and Panel C, respectively. In Panel D, use product recall asdependent variable. In Panel E, we use post market safety evaluations for depen-dent variable. And in Panel F, we use patent lawsuits as dependent variable. For thebrevity of our results, we only report the variable of interest. We run firm and yearfixed effects but omit the coefficients. P-values are presented in brackets represents* < 0.10, ** <0.05, *** < 0.0, significance levels.
Economics and Finance 74 (2019) 190–205
5.7. Institutional ownership and insurance effect: alternativeexplanations
Manso (2011) argues that innovation is a long and tedious pro-cess with high risk involved (success or failure) and additionaltolerance for failure may promote innovation. If the environmentis not “failure tolerant”, it may discourage managers or employeesfrom innovating or taking part in high-risk projects with a greaterrisk of failure. Incentives that are less sensitive to performance maymotivate managers. For example, Aghion et al. (2013) find thatinstitutional investors can provide partial insurance to executiveswith career concerns due to the high risk of failure from innova-tive activities. The authors show that CEO turnover is less sensitiveto firm performance when the presence of institutional investorsis high. Similarly, Luong et al. (2017) document that if firms havea greater share of institutional ownership, the sensitivity of man-agerial turnover and CEO compensation to firm performance areweakened.
Institutional investors may allow executives to focus on riskyand long-term innovation projects and eliminate some of theircareer and reputational concerns. Based on these findings, wealso test if institutional investors stimulate innovation output byeliminating managerial punishment for innovation failures. Weexpect that executive turnover and compensation should be lesssensitive to firm performance in the presence of high institu-tional investors. We collect CEO turnover data from the Lexis Nexisdatabase between 2000 and 2014 and CEO compensation data fromS&P Capital IQ for S&P500 firms. The resulting matched samplecontains 2448 firm-year observations. To test the effect of institu-tional investors on the executive turnover-performance sensitivity,we follow Aghion et al. (2013) and Luong et al. (2017). We per-form a logit model where the dependent variable is CEO turnover,and is equal to one if the CEO leaves the firm i during year t; zerootherwise. To examine the effect of institutional ownership on pay-for-performance sensitivity, we follow Hartzell and Starks (2003).Our dependent variable is �CEO Cash which refers to the changein the level of cash and bonus compensation.
Table 7 exhibits how institutional ownership influences theCEO’s career concerns and pay-for-performance sensitivity. We fol-low Aghion et al. (2013) and Ward et al. (2017) to test if managerscareer concerns are related to the innovation process. In column(1) of Table 7, we observe that higher ROA growth is associatedwith a lower probability that the CEO will be replaced. In col-umn (2), we find that interaction term of Inst. Own% x �(ROA)is positive and significant which suggests that the adverse effectof performance on CEO turnover is mitigated by institutional own-ership. Our results suggest CEO performance–turnover sensitivityis lower when institutional ownership is present in pharmaceuti-cal firms. In column (3), (4), and (5), we test pay-for-performancefor CEOs in our sample. First, we find that changes in shareholderwealth are positively related to changes in CEO compensation. Incolumn (4) and (5), the coefficient estimate for the interaction term,Inst. Own.% x �(Wealth) is negative and significant, suggestingthat greater institutional ownership weakens the CEO’s pay-for-performance sensitivity (Luong et al. (2017)). Overall, the resultsof column (1) - (5) show that institutional ownership enhancesinnovation by lowering the career concerns of managers follow-ing unsuccessful innovation (Ederer and Manso (2013); Luong et al.(2017)).
In Panel B, we follow Aghion et al. (2013) and measure howcompetition can affect innovation among pharmaceutical firms.Competition is measured by 1 − Lerner index (Aghion et al. (2013)
and is interacted with institutional holdings. We hypothesize thatwhen market competition is higher and institutional ownership ispresent, the number of FDA approvals a firm receives is higher. Con-sistent with Aghion et al. (2013) and Ward et al. (2017), competition
O. Unsal and B Rayfield / The Quarterly Review of Economics and Finance 74 (2019) 190–205 201
Table 7Economic Mechanism, Insurance Effect and Career Concerns.
Panel A.
Dependent Variable
SampleCEO Turnover CEO Turnover �CEO Cash �CEO Cash �CEO Equity(1) (2) (3) (4) (5)
�(ROA)t-1 −0.445 −0.332[0.001]*** [0.001]***
Inst. Own% x �(ROA)t-1 0.445[0.033]**
Inst. Own% −0.667 0.121 0.101[0.998] [0.318] [0.388]
�(Wealth)t-1 0.378 0.712 0.788[0.039]** [0.013]** [0.039]**
Inst. Own% x �(Wealth)t-1 −0.667 −0.220[0.031]** [0.011]**
CONTROLS YES YES YES YES YESYear Fixed Effect YES YES YES YES YESN 2,448 2,448 2,448 2,448 2,448R2 10% 12% 10% 12% 11%
Panel B.
Dependent Variable
SampleLn(TotalApproval)t+1
High Competition Low Competition(1) (2) (3) (4)
Lerner Indext-1 0.022 0.127 0.887[0.001]*** [0.012]** [0.339]
Inst. Own% x Lerner Indext-1 0.339 0.012[0.045]** [0.057]*
Inst. Own% 0.441 0.551 0.012[0.089]* [0.033]** [0.044]**
CONTROLS YES YESYear Fixed Effect YES YESN 6,329 6,329 3,002 3,327R2 12% 11% 10% 10%
I reer cd l FDA
r racke
(wtb(lpmbbTta
5c
hicmafismtt
n Table 7, we test the relationship between institutional ownership, executive caependent variable. In Panel B, our dependent variable is log transformation of totaun firm and year fixed effects but omit the coefficients. P-values are presented in b
Lerner index) has a positive association with total FDA approvals,hile the coefficient of institutional ownership also remains posi-
ive and significant. In column 3 and column 4, we split our sampleased on the median values of the Lerner index (Aghion et al.2013)). We find that the coefficient of institutional ownership isarge, positive, and significant in the high competition sample com-ared to the low competition sample. Our results show that, in aore competitive environment, institutional investors affect the
ehavior of managers, where we observe a positive relationshipetween the interaction of institutions and market competition.he results of Table 7 emphasize the ability of institutional investorso alleviate managers’ career and reputation concerns, thus encour-ging long-term investments in innovative medical projects.
.8. Institutional ownership and innovation: endogeneityoncerns
The evidence in our study supports our research hypothesis;owever, the relationship between institutional holdings and med-
cal innovation could be endogenously determined. One significantoncern is reverse causality; the possibility that firms with higheredical innovation attract more institutional investors. A positive
ssociation between institutional ownership and pharmaceuticalrm innovation does not necessarily imply that the percentage
hare of institutional investors increases firm innovation perfor-ance (Luong et al. (2017)). We address this concern by employingwo separate approaches. First, we use instrumental variable (IV)o estimate exogenous variations in institutional ownership (Bena
oncerns, and FDA In Panel A, we employ CEO turnover, and CEO pay indicators asapprovals. For the brevity of our results, we only report the variable of interest. Wets represents * < 0.10, ** <0.05, *** < 0.0, significance levels.
et al. (2014)). Second, we use firms’ internal instruments and GMMestimation (Rong et al. (2017)).
For our first instrument, we follow Aghion et al. (2013), whoregress institutional ownership on a firm’s inclusion in the S&P 500.We carefully identify relevance and exclusion criteria of instru-ment selection. Aghion et al. (2013) suggest that fund managersare benchmarked against S&P 500 index, which increases institu-tional ownership. As an additional test, we follow Chi et al. (2015)and calculate alpha, beta, and turnover. Alpha is defined as theexcess return on individual stock relative to the market index. Betais the beta coefficient for an individual stock and turnover is theannual trading volume of an individual stock, normalized by thetotal shares outstanding.
Table 8 shows the IV estimation results. In column (1), weregress the percentage of institutional holdings on inclusion inthe S&P 500 index. In the second stage of column (2), we usepredicted institutional ownership and document a positive and sig-nificant coefficient. All other things being equal, a greater presenceof institutional investors is positively associated with increasedinnovation outcomes. Our finding is consistent with Aghion et al.(2013). To support the validity of our instrument, we investigatechanges in institutional ownership and patents around the time astock is added to S&P 500 index. Using a ten-year window, we showthat a large increase in institutional ownership is documented after
a firm is included in S&P 500 in Fig. 1, Panel A. In Panel B of Fig. 1,we document that the number of cumulative, normalized citationsincreases after the firm is listed in S&P 500.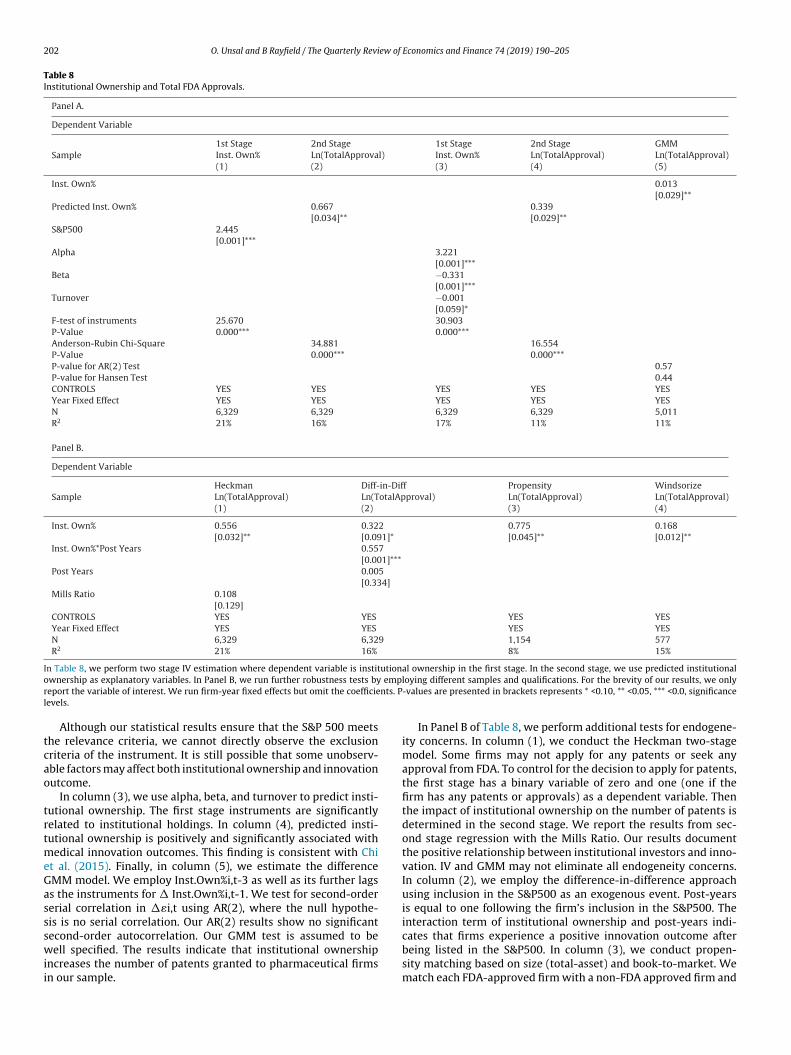
202 O. Unsal and B Rayfield / The Quarterly Review of Economics and Finance 74 (2019) 190–205
Table 8Institutional Ownership and Total FDA Approvals.
Panel A.
Dependent Variable
Sample1st Stage 2nd Stage 1st Stage 2nd Stage GMMInst. Own% Ln(TotalApproval) Inst. Own% Ln(TotalApproval) Ln(TotalApproval)(1) (2) (3) (4) (5)
Inst. Own% 0.013[0.029]**
Predicted Inst. Own% 0.667 0.339[0.034]** [0.029]**
S&P500 2.445[0.001]***
Alpha 3.221[0.001]***
Beta −0.331[0.001]***
Turnover −0.001[0.059]*
F-test of instruments 25.670 30.903P-Value 0.000*** 0.000***Anderson-Rubin Chi-Square 34.881 16.554P-Value 0.000*** 0.000***P-value for AR(2) Test 0.57P-value for Hansen Test 0.44CONTROLS YES YES YES YES YESYear Fixed Effect YES YES YES YES YESN 6,329 6,329 6,329 6,329 5,011R2 21% 16% 17% 11% 11%
Panel B.
Dependent Variable
SampleHeckman Diff-in-Diff Propensity WindsorizeLn(TotalApproval) Ln(TotalApproval) Ln(TotalApproval) Ln(TotalApproval)(1) (2) (3) (4)
Inst. Own% 0.556 0.322 0.775 0.168[0.032]** [0.091]* [0.045]** [0.012]**
Inst. Own%*Post Years 0.557[0.001]***
Post Years 0.005[0.334]
Mills Ratio 0.108[0.129]
CONTROLS YES YES YES YESYear Fixed Effect YES YES YES YESN 6,329 6,329 1,154 577R2 21% 16% 8% 15%
I utiono empr nts. Pl
tcao
trtmeGassswii
n Table 8, we perform two stage IV estimation where dependent variable is institwnership as explanatory variables. In Panel B, we run further robustness tests byeport the variable of interest. We run firm-year fixed effects but omit the coefficieevels.
Although our statistical results ensure that the S&P 500 meetshe relevance criteria, we cannot directly observe the exclusionriteria of the instrument. It is still possible that some unobserv-ble factors may affect both institutional ownership and innovationutcome.
In column (3), we use alpha, beta, and turnover to predict insti-utional ownership. The first stage instruments are significantlyelated to institutional holdings. In column (4), predicted insti-utional ownership is positively and significantly associated with
edical innovation outcomes. This finding is consistent with Chit al. (2015). Finally, in column (5), we estimate the differenceMM model. We employ Inst.Own%i,t-3 as well as its further lagss the instruments for � Inst.Own%i,t-1. We test for second-ordererial correlation in ��i,t using AR(2), where the null hypothe-is is no serial correlation. Our AR(2) results show no significant
econd-order autocorrelation. Our GMM test is assumed to beell specified. The results indicate that institutional ownershipncreases the number of patents granted to pharmaceutical firmsn our sample.
al ownership in the first stage. In the second stage, we use predicted institutionalloying different samples and qualifications. For the brevity of our results, we only-values are presented in brackets represents * <0.10, ** <0.05, *** <0.0, significance
In Panel B of Table 8, we perform additional tests for endogene-ity concerns. In column (1), we conduct the Heckman two-stagemodel. Some firms may not apply for any patents or seek anyapproval from FDA. To control for the decision to apply for patents,the first stage has a binary variable of zero and one (one if thefirm has any patents or approvals) as a dependent variable. Thenthe impact of institutional ownership on the number of patents isdetermined in the second stage. We report the results from sec-ond stage regression with the Mills Ratio. Our results documentthe positive relationship between institutional investors and inno-vation. IV and GMM may not eliminate all endogeneity concerns.In column (2), we employ the difference-in-difference approachusing inclusion in the S&P500 as an exogenous event. Post-yearsis equal to one following the firm’s inclusion in the S&P500. Theinteraction term of institutional ownership and post-years indi-
cates that firms experience a positive innovation outcome afterbeing listed in the S&P500. In column (3), we conduct propen-sity matching based on size (total-asset) and book-to-market. Wematch each FDA-approved firm with a non-FDA approved firm and
O. Unsal and B Rayfield / The Quarterly Review of Economics and Finance 74 (2019) 190–205 203
F5
rtcmfwvi
5
fiasiiIst
Table 9Changes-in-Changes Regressions.
Dependent Variable
�Number of Patent
(1) (2)
�Inst. Own%t + 1 −0.115[0.611]
�Inst. Own% 0.435[0.011]**
�Inst. Own%t-1 0.709[0.001]***
�Inst. Own%t-2 0.005[0.055]*
Inst. Own%t + 1 0.556[0.851]
Inst. Own%t 0.112[0.001]***
Inst. Own%t-1 0.709[0.001]***
Inst. Own%t-2 0.006[0.073]*
CONTROLS YES YESN 2,011 2,011R2 5% 5%
Table 9 Shows regressions the change in institutional ownership on the change inthe number of patents. �Inst. Own% is calculated as the change in institutionalholdings between year t-1 and year t. For the brevity of our results, we only report
ig. 1. (a) Effect of Being Added to the S&P 500. (b) Effect of Being Added to the S&P00.
eport the baseline regressions. Institutional ownership continueso play a positive and significant role in the firms’ innovation pro-ess. Patents are right-skewed because many pharmaceutical firmsay have no FDA approval. The results could be impacted by a
ew outliers with a large number of patents. We drop the firmsith no FDA approval and winsorize 1% of the most extreme obser-
ations. Column (4) shows that institutional ownership positivelynfluences innovation outcome.
.9. Institutional ownership and innovation: causality
Institutional investors may choose to invest in more innovativerms, causing our results to be subject to causality concerns. Tolleviate this concern, we conduct a changes-in-changes regres-ion. This illustrates how firm innovation changes following anncrease in firm institutional ownership. We regress the change
n the number of patents on the change in institutional ownership.f institutional ownership leads to greater innovation output, wehould observe a significant positive relationship. The results ofhis model are presented in Table 9.the variable of interest. We run firm-year fixed effects but omit the coefficients. P-values are presented in brackets represents * <0.10, ** <0.05, *** <0.0, significancelevels.
If institutional holdings are, in fact, the cause of increased inno-vation output, our results should show significant and positiveresults for Inst. Own% and its corresponding lagged values. Positiveand significant values for Inst. Own%t + 1 would raise causality con-cerns with our analysis. Column (1) of Table 9 shows the regressionof change in the number of patents on the change in institutionalownership. Our results indicate a positive relationship betweenincreased institutional holdings and innovation output. The resultsof Column (1) and Column (2) show a positive and significant effecton innovation following higher levels of institutional ownership.These results strengthen the causal relationship between institu-tional holdings and innovation output.
6. Conclusion
We investigate the relationship between institutional owner-ship and innovation in the medical industry. The prior literaturedescribes the relationship as having two primary effects, the “mon-itoring effect” and the “insurance effect.”
The prior literature provides evidence for institutional investorsas efficient monitors. Under efficient and effective monitoring,managers may be motivated to innovate in both more quantityand quality. The results of our study support these conclusions. Ourresults show that not only do firms owned by institutional investorsinnovate more (as measured by patent counts), but they also pro-duce better quality innovations (as measured by citations, fewerrecalls, and more efficient innovation outcomes).
The pharmaceutical industry has high barriers to entry andhigh innovation costs. This makes studying the effect of institu-tional investors in the pharmaceutical industry unique. DiMasi,Grabowski, and Hansen, (2016) survey pharmaceutical firms toestimate the cost of new drug development and document thatthe cost of pre-tax approval is approximately $1395 million (2013
dollars). The high cost of drug development makes innovationinvestment in the pharmaceutical industry risky. This is where weargue the “insurance effect” of institutional investors provides abenefit. Our results show that higher institutional investor own-
2 ew of
ewr
ti(pcar
interest.
04 O. Unsal and B Rayfield / The Quarterly Revi
rship is associated with more innovations overall. Furthermore,e show that institutional ownership lowers CEO turnover. These
esults support the “insurance effect.”In conclusion, we find that institutional ownership increases
he quantity of innovation (“insurance effect”), the quality ofnnovation (“monitoring effect”), and the quality of innovation“monitoring effect”) in the medical industry. We do this usingatent counts, citations, and other measures unique to the pharma-eutical industry. Our results have implications for firm innovation
s well as ownership structure. We highlight the importance of theelationship between ownership structure and firm performance.Variables Definition
Panel A. Institutional OwnershipInst. Own% Total institutional ownership in fractioMax. Inst. Own% Percentage of shares outstanding heldTop 5 Own Percentage of shares outstanding heldTop 10 Own Percentage of shares outstanding heldTop Block Hold. Percentage of shares outstanding held
holdings are greater than 5%Mutual Funds Percentage of holding by Mutual fundsInvestment Percentage of holding by Investment bBanks Percentage of holding by BanksPension Percentage of holding by Pension FundInsurance Percentage of holding by Mutual fundsLong Term Sum of shares owned by all institution
1 year, as a percentage of the firm’s totShort Term Sum of shares owned by all institution
as a percentage of the firm’s total num
Panel B. FDA VariablesTotal Patent Total number of drug patents for firm
Total FDA Approval Total number of FDA drug approval forTotal Medical Device Approval Total number of medical device approTotal Pre-Market Approval Total number of pre-market approval
Total Licensed Patent Total number of licenced patents for fiTotal Phase I Drugs Total number of drugs under Phase I teTotal Phase II Drugs Total number of drugs under Phase II tTotal Phase III Drugs Total number of drugs under Phase III
Number of Cites Total number of patent citations Hall eCitation-Weighted Value Value of patents as measured by citatiTotal Recall Total number of product recall initiateRecall% Binary variable and equal to one if firm
zero otherwise.Total Post Market Evaluations Total medical products that failed postPost Market Evaluations% Binary variable and equal to one if firm
otherwise. failed post-market safety eTotal Patent Lawsuit Total Number of Patent Litigations
Lawsuit% Binary variable and is equal to one if fizero otherwise
Decline in Approvals Change in total patent approvals betware replaced by zero.
Cumulative Phase Cumulative total number of Phase I - IDuration Difference between product submissio
measured in days
Panel C. Control VariablesBook Leverage Long-term debt divided by book valueLog(TotalAsset) Log transformation of total assets
ROA Income before extraordinary items pluby book value of assets
Tangibility Ratio of fixed assets to book assets [ppTobin’s Q Market value of assets divided by bookLog(FirmAge) Log transformation of firm age
HHI Index Herfindahl index based on the firm’s sFree Cash Flow Operating income before depreciation
dividends paidRnD Firms’ R&D expenditure normalized byCEO Turnover Binary variable and is equal to one if th
otherwise�CEO Cash The change in the level of cash and bo�(Wealth) The change in market value of the firmS&P500 Binary variable if the firm is in S&P 500Alpha Excess return on individual stock relatBeta Market beta coefficient for an individu
Economics and Finance 74 (2019) 190–205
Additionally, our results support the results of Aghion et al. (2013)among others.
Funding
This research did not receive any specific grant from fundingagencies in the public, commercial, or not-for-profit sectors. Con-flict of Interest: The authors declare that they have no conflict of
Appendix A. Definition of Variables
Source
n of shares outstanding S&PCapital IQ Database by the firm’s largest institution S&PCapital IQ Database by a firm’s top 5 institutional investors S&PCapital IQ Database
by a firm’s top 10 institutional investors S&PCapital IQ Database by a firm’s institutional investors whose S&PCapital IQ Database
S&P Capital IQanks S&P Capital IQ
S&P Capital IQs S&P Capital IQ
S&P Capital IQs that hold the stock for more thanal number of shares outstanding.
S&P Capital IQ
s that hold the stock for less than 1 year,ber of shares outstanding.
S&P Capital IQ
i at year t. fda.gov firm i at year t. fda.gov
val for firm i at year t. fda.govfor firm i at year t. fda.govrm i at year t. S&PCapital IQ Databasesting for firm i at year t. S&PCapital IQ Databaseesting for firm i at year t. S&PCapital IQ Databasetesting for firm i at year t. S&PCapital IQ Databaset al. (2000). NBER Patent Database
ons Hall et al. (2000). NBER Patent Databased by FDA for the firm. fda.gov
has at least one product recall at year t, fda.gov
-market safety evaluations fda.gov has at least one product that, zero
valuationsfda.gov
PACERrm is facing at least one patent lawsuit, PACER
een year t and t-1 where positive values fda.gov
I - III products under clinical testing. S&PCapital IQ Databasen date minus product approval date, fda.gov
of assets COMPUSTATCOMPUSTAT
s depreciation and amortization divided COMPUSTAT
ent/at] COMPUSTAT value of assets COMPUSTAT
COMPUSTATales in a given 4-digit SIC industry. COMPUSTAT
minus taxes plus interest expense plus COMPUSTAT
total assets COMPUSTATe CEO leaves the firm during year t, zero Nexis Lexis
nus compensation for CEO i in year t S&PCapital IQ Database between year t-1 and t S&PCapital IQ Database
index, and zero otherwise S&PCapital IQ Databaseive to the market index S&PCapital IQ Databaseal stock S&PCapital IQ Database

O. Unsal and B Rayfield / The Quarterly Review of Economics and Finance 74 (2019) 190–205 205
Turnover Annual trading volume of an individual stock normalized by the total sharesoutstanding
S&PCapital IQ Database
Lerner Index Median gross margin from the entire Capital IQ database in the firm’sthree-digit industry
S&PCapital IQ Database
e if fin (boludin
R
A
A
A
A
A
A
A
A
AA
BB
B
B
BB
B
B
B
B
B
C
C
C
C
C
C
D
E
F
G
G
H
H
CEO Turnover Binary variable and is equal to on�CEO Cash Change in CEO cash compensatio�CEO Equity Change in CEO compensation inc
eferences
charya, V. V., & Subramanian, K. V. (2009). Bankruptcy codes and innovation. TheReview of Financial Studies, 22, 4949–4988.
charya, V. V., Baghai, R. P., & Subramanian, K. V. (2013). Labor laws andinnovation. The Journal of Law and Economics, 56, 997–1037.
ggarwal, R., Erel, I., Ferreira, M., & Matos, P. (2011). Does governance travelaround the world? Evidence from institutional investors. Journal of FinancialEconomics, 100(1), 154–181.
ghion, P., & Tirole, J. (1994). The management of innovation. The Quarterly Journalof Economics, 109, 1185–1209.
ghion, P., Van Reenen, J., & Zingales, L. (2013). Innovation and institutionalownership. The American Economic Review, 103, 277–304.
llen, F. (1993a). Stock markets and resource allocation. In C. Mayer, & X. Vives(Eds.), Capital markets and financial intermediation (pp. 81–116). Cambridge:Cambridge University Press.
llen, F. (1993b). ’strategic management and financial markets’, strategicmanagement journal. Summer Special Issue, 14, 11–22.
lmazan, A., Hartzell, J. C., & Starks, L. T. (2005). Active institutional shareholdersand costs of monitoring: Evidence from executive compensation. FinancialManagement, 34(4), 5–34.
oki, M. (1984). The cooperative game theory of the firm. Oxford: Clarendon Press.ronson, J. K., Ferner, R. E., & Hughes, D. A. (2012). Defining rewardable innovation
in drug therapy. Nature Reviews Drug Discovery, 11(4), 253.aldwin, J. R. (1995). Innovation: The key to success in small firms.arabanov, S. S., Ozocak, O., Turtle, H. J., & Walker, T. J. (2008). Institutional
investors and shareholder litigation. Financial Management, 37(2), 227–250.ena, J., Ferreira, M., & Matos, P. (2014). Foreign portfolio investment and corporate
innovation working paper.erger, S., Stocker, H., & Zeileis, A. (2017). Innovation and institutional ownership
revisited: An empirical investigation with count data models. EmpiricalEconomics, 52(4), 1675–1688.
essen, J. E., & Meurer, M. J. (2005). The patent litigation explosion.essen, J., Ford, J., & Meurer, M. J. (2011). The private and social costs of patent
trolls. Regulation, 34, 26.lack, B. S. (1992). Agents watching agents: The promise of institutional investor
voice. UCLA Law Review, 39, 811–893.radley, D., Kim, I., & Tian, X. (2016). Do unions affect innovation? Management
Science.rown, J. R., Fazzari, S. M., & Petersen, B. C. (2009). Financing innovation and
growth: Cash flow, external equity, and the 1990s R&D boom. The Journal ofFinance, 64, 151–185.
unnage, M. E. (2011). Getting pharmaceutical R&D back on target. NatureChemical Biology, 7(6), 335.
urkart, M., Panunzi, F., & Shleifer, A. (2003). Family firms. The Journal of Finance,58, 2167–2201.
elik, S., & Isaksson, M. (2014). Institutional investors and ownership engagement.OECD Journal: Financial Market Trends, 2013, 93–114.
hemmanur, T. J., Loutskina, E., & Tian, X. (2014). Corporate venture capital, valuecreation, and innovation. The Review of Financial Studies, 27, 2434–2473.
hen, X., Harford, J., & Kai, L. (2007). Monitoring: Which institutions matter?Journal of Financial Economics, 86(2), 279–305.
hi, et al., 2015. Institutional stock ownership and firm innovation: Evidence fromChina, Massey University, Working Paper.
ohen, L., Gurun, U., & Kominers, S. D. (2014). Patent trolls: Evidence from targetedfirms (No. w20322). National Bureau of Economic Research.
omanor, W. S., & Scherer, F. M. (2011). Mergers and innovation in thepharmaceutical market.
iMasi, J. A., Grabowski, H. G., & Hansen, R. W. (2016). Innovation in thepharmaceutical industry: New estimates of R&D costs. Journal of HealthEconomics, 47, 20–33.
derer, F., & Manso, G. (2013). Is pay for performance detrimental to innovation?Management Science, 59(7), 1496–1513.
ang, V. W., Tian, X., & Tice, S. (2014). Does stock liquidity enhance or impede firminnovation? The Journal of Finance, 69, 2085–2125.
aspar, J. é-M., Massa, M., & Matos, P. (2005). Shareholder investment horizons andthe market for corporate control. Journal of Financial Economics, 76(1), 135–165.
riliches, Z. (1990). Patent statistics as economic indicators: A survey. In Tech. Rep..
National Bureau of Economic Research.all, B. H., Jaffe, A. B., & Trajtenberg, M. (2000). Market value and patent citations: Afirst look (No. w7741). National bureau of economic research.
artzell, J. C., & Starks, L. T. (2003). Institutional investors and executivecompensation. The Journal of Finance, 58, 2351–2374.
rm replaces CEO, zero otherwise S&PCapital IQ Databasenus and salary) S&PCapital IQ Databaseg cash, option, and equity. S&PCapital IQ Database
Haucap, J., & Stiebale, J. (2016). How mergers affect innovation: Theory and evidencefrom the pharmaceutical industry (No. 218) DICE Discussion Paper.
Hay, M., Thomas, D. W., Craighead, J. L., Economides, C., & Rosenthal, J. (2014).Clinical development success rates for investigational drugs. NatureBiotechnology, 32(1), 40.
He, J. J., & Tian, X. (2013). The dark side of analyst coverage: The case of innovation.Journal of Financial Economics, 109, 856–878.
Hicks, D., & Hegde, D. (2005). Highly innovative small firms in the markets fortechnology. Research Policy, 34(5), 703–716.
Hitt, M. A., Hoskisson, R. E., Ireland, R. D., & Harrison, J. S. (1991). Effects ofacquisitions on R&D inputs and outputs. Academy of Management Journal,34(3), 693–706.
Hsu, P.-H., Tian, X., & Xu, Y. (2014). Financial development and innovation:Cross-country evidence. Journal of Financial Economics, 112, 116–135.
Ibidunni, O. S., Iyiola, O., & Ibidunni, A. S. (2014). Product innovation, a survivalstrategy for small and medium enterprises in Nigeria. European ScientificJournal, ESJ, 10(1).
Jarrell, G. A., Lehn, K., & Marr, W. (1985). Institutional ownership, tender offers andLong- term investment 19 April. Washington, DC: Office of the Chief Economist,Securities and Exchange Commission.
Jarvis, L. M. (2010). Pharmaceuticals: Big firms will fight the patent cliff. Chemicaland Engineering News, 88(2), 17.
Kaitin, K. I. (2010). Deconstructing the drug development process: The new face ofinnovation. Clinical Pharmacology & Therapeutics, 87(3), 356–361.
Koenig, M. E., & Mezick, E. M. (2004). Impact of mergers & acquisitions on researchproductivity within the pharmaceutical industry. Scientometrics, 59(1),157–169.
Lee, P. M. (2005). A comparison of ownership structures and innovations of US andJapanese firms. Managerial and Decision Economics, 26(1), 39–50.
Luong, H., Moshirian, F., Nguyen, L., Tian, X., & Zhang, B. (2017). How do foreigninstitutional investors enhance firm innovation? Journal of Financial andQuantitative Analysis, 52, 1449–1490.
Manso, G. U. (2011). Motivating innovation. The Journal of Finance, 66, 1823–1860.http://dx.doi.org/10.1111/j.1540-6261.2011.01688.x
Nanda, R., & Rhodes-Kropf, M. (2013). Investment cycles and startup innovation.Journal of Financial Economics, 110, 403–418.
Ornaghi, C. (2009). Mergers and innovation in big pharma. International Journal ofIndustrial Organization, 27(1), 70–79.
Ortega-Argilés, R., & Moreno, R. (2007). Firm competitive strategies and thelikelihood of survival The Spanish case (No. 0507). Papers on Entrepreneurship,Growth and Public Policy.
Paik, Y., & Zhu, F. (2016). The impact of patent wars on firm strategy: Evidencefrom the global smartphone industry. Organization Science, 27(6), 1397–1416.
Raghu, T. S., Woo, W., Mohan, S. B., & Rao, H. R. (2008). Market reaction to patentinfringement litigations in the information technology industry. InformationSystems Frontiers, 10(1), 61–75.
Richman, B., Mitchell, W., Vidal, E., & Schulman, K. (2016). Pharmaceutical M&Aactivity: Effects on prices, innovation, and competition. Loyola UniversityChicago Law Journal, 48, 787.
Robinson, J. C., & Smith, M. D. (2008). Cost-reducing innovation in health care.Health Affairs, 27, 1353–1356.
Rong, Z., Wu, X., & Boeing, P. (2017). The effect of institutional ownership on firminnovation: Evidence from Chinese listed firms. Research Policy, 46(9),1533–1551.
Sahut, J. M., & Peris-Ortiz, M. (2014). Small business, innovation, andentrepreneurship. Small Business Economics, 42(4), 663–668.
Schain, J. P., & Stiebale, J. (2016). Innovation, institutional ownership, and financialconstraints (No. 219) DICE Discussion Paper.
Shleifer, A., & Vishny, R. W. (1986). Large shareholders and corporate control.Journal of Political Economy, 94, 461–488.
Smeets, R. (2014). Does patent litigation reduce corporate R&D? An analysis of USpublic firms.
So, J. (2015). Firm size effects on targeted prizes to incentivize innovation in neglectedtropical diseases.
Van Norman, G. A. (2016). Drugs and devices: Comparison of European and USapproval processes. JACC: Basic to Translational Science, 1(5), 399–412.
Vyas, V., & Narayanan, K. (2016). Does M&A matter for R&D? Evidence from thepharmaceutical sector in India. In Technology. pp. 89–109. Singapore: Springer.
Ward, C. W., Yin, C., & Zeng, Y. (2017). Motivated monitoring institutional investorsand firm investment efficiency.
Xie, B., Davidson, W. N., & DaDalt, P. J. (2003). Earnings management and corporategovernance: The role of the board and the audit committee. Journal ofCorporate Finance, 9, 295–316.