Institutional logics from the aggregation of organizational networks: Operational procedures for the...
27
Computational & Mathematical Organization Theory, 10, 17–43, 2004 c 2004 Kluwer Academic Publishers. Manufactured in The Netherlands. Institutional Logics from the Aggregation of Organizational Networks: Operational Procedures for the Analysis of Counted Data RONALD L. BREIGER Department of Sociology, University of Arizona, Tucson, AZ 85721, USA email: [email protected] JOHN W. MOHR Department of Sociology, University of California, Santa Barbara, CA 93106, USA email: [email protected] Abstract We address some problems of network aggregation that are central to organizational studies. We show that concepts of network equivalence (including generalizations and special cases of structural equivalence) are relevant to the modeling of the aggregation of social categories in cross-classification tables portraying relations within an organizational field (analogous to one-mode networks). We extend our results to model the dual aggregation of social identities and organizational practices (an example of a two-mode network). We present an algorithm to accomplish such dual aggregation. Within the formal and quantitative framework that we present, we emphasize a unified treatment of (a) aggregation on the basis of structural equivalence (invariance of actors within equivalence sets), (b) the study of variation in relations between structurally equivalent sets, and (c) the close connections between aggregation within organizational networks and multi-dimensional modeling of organizational fields. Keywords: aggregation, organizational fields, structural equivalence, loglinear models, co-constitution of orga- nizational identities and practices 1. Introduction Problems of network aggregation are central to organization studies. Indeed, “what makes organizations meaningful and relevant units of analysis” is “the interdependence of actors and action across . . . levels of aggregation” (Lomi and Larsen, 2001:6, 12). The concept of organizational “fields” comprehends the aggregation principle known as structural equiv- alence (DiMaggio and Powell, 1983:148), according to which two actors in a network are deemed indiscernible if they have identical ties to all actors. 1 The implication of structural equivalence for organizational analysts is that organizations with similar patterns of rela- tions to other organizations will become more similar, even if they do not interact with one another directly (DiMaggio, 1986:345). In this paper we bring together several themes. We posit (in Section 2 and in Section 3.3) a dialectic that unifies, within a common frame of analysis, (a) invariance among organiza- tional actors within structurally equivalent sets and (b) variation in the network ties between
Transcript of Institutional logics from the aggregation of organizational networks: Operational procedures for the...
Computational & Mathematical Organization Theory, 10, 17–43, 2004c© 2004 Kluwer Academic Publishers. Manufactured in The Netherlands.
Institutional Logics from the Aggregation ofOrganizational Networks: Operational Proceduresfor the Analysis of Counted Data
RONALD L. BREIGERDepartment of Sociology, University of Arizona, Tucson, AZ 85721, USAemail: [email protected]
JOHN W. MOHRDepartment of Sociology, University of California, Santa Barbara, CA 93106, USAemail: [email protected]
Abstract
We address some problems of network aggregation that are central to organizational studies. We show that conceptsof network equivalence (including generalizations and special cases of structural equivalence) are relevant tothe modeling of the aggregation of social categories in cross-classification tables portraying relations within anorganizational field (analogous to one-mode networks). We extend our results to model the dual aggregation ofsocial identities and organizational practices (an example of a two-mode network). We present an algorithm toaccomplish such dual aggregation. Within the formal and quantitative framework that we present, we emphasize aunified treatment of (a) aggregation on the basis of structural equivalence (invariance of actors within equivalencesets), (b) the study of variation in relations between structurally equivalent sets, and (c) the close connectionsbetween aggregation within organizational networks and multi-dimensional modeling of organizational fields.
Keywords: aggregation, organizational fields, structural equivalence, loglinear models, co-constitution of orga-nizational identities and practices
1. Introduction
Problems of network aggregation are central to organization studies. Indeed, “what makesorganizations meaningful and relevant units of analysis” is “the interdependence of actorsand action across . . . levels of aggregation” (Lomi and Larsen, 2001:6, 12). The concept oforganizational “fields” comprehends the aggregation principle known as structural equiv-alence (DiMaggio and Powell, 1983:148), according to which two actors in a network aredeemed indiscernible if they have identical ties to all actors.1 The implication of structuralequivalence for organizational analysts is that organizations with similar patterns of rela-tions to other organizations will become more similar, even if they do not interact with oneanother directly (DiMaggio, 1986:345).
In this paper we bring together several themes. We posit (in Section 2 and in Section 3.3)a dialectic that unifies, within a common frame of analysis, (a) invariance among organiza-tional actors within structurally equivalent sets and (b) variation in the network ties between
18 BREIGER AND MOHR
those sets. We present operational procedures for quantifying both the invariance and thevariation. We apply our aggregation procedures to organizational networks conceived astables of counts of connections or resources that circulate among actors. We examine acitation network among journals (Section 3; data of Coombs, 1964) and the discourse rolesamong hundreds of organizational agencies engaged in diversity practices within the Uni-versity of California following the legal prohibition on affirmative action (Section 4; dataof Mohr, Bourgeois, and Duquenne, 2002). The former application is to a network in whichthe rows and columns index the same actors; this is what network analysts call a “one-mode” network. The application to discourse roles is to a “two-mode” network, consistingof linkages between identity categories (such as “Immigrant” and “Underrepresented”) andorganizational practices (such as “test preparation” and “cultural capital”). In the two-modecase, following Mohr (1998; Mohr and Duquenne, 1997; see also Breiger, 2000, 2003;Harcourt, 2002), we are interested in formulating a quantitative analytical framework thatwill help us to understand how identities and practices come to co-constitute one anotherwithin organizational discourse. Our interpretation (Section 4.3) emphasizes the mutualimplications of aggregation and the modeling of a multidimensional space within whichorganizational fields can be portrayed and analyzed.
2. Basic Concepts: Institutional Logics, Organizational Fields,and Structural Equivalence
The notion that systems of classification are fundamental to social organization goes back atleast as far as Emile Durkheim and Marcel Mauss’s 1903 study of primitive classification.In the striking phrase of Mary Douglas (1986:97), “the sacred for Durkheim and Mausswas nothing more mysterious and occult than shared classifications, deeply cherished andviolently defended.” The study of public classification is important, Douglas argues, because“institutions make new labels, and the label makes new kinds of people” (p. 108); any hopeof resisting institutions requires us first to discover “how the institutional grip is laid uponour mind” (p. 92).
2.1. Institutional Logics
Following Friedland and Alford (1991), we define an institutional logic as “a set of mate-rial practices and symbolic constructions” which are tacit, deep-level frameworks sociallyconstructed and shared (see also Mohr, Bourgeois, and Duquenne, 2002). Institutional log-ics are implicated in systems of social categories (as well as in beliefs, expectations, andmotives, though—following Douglas—categories provide our focus here) that constitutethe social identities of actors (Rao, Monin, and Durand, 2003:797).
All notions of institutional logic emphasize the relational structuring of actors and clas-sification. A social network, for example, might or might not be structured by the principleof reciprocity, either in the form of restricted exchange (A ↔ B) or generalized exchange(A → B → C → A; see Breiger and Roberts, 1998, for models). If reciprocity structuresthe network, we can refer to the reciprocity as an organizing logic, as in the structural
AGGREGATION OF ORGANIZATIONAL NETWORKS 19
tradition from Levi-Strauss (1949) through Pattison and Wasserman (1999). Similarly, net-works might be characterized by a dimensional logic (being capable of representation intwo dimensions, or in some other number of dimensions), as when Bourdieu (e.g., 1990)describes the “first dimension” of what he terms the “overall social space” with referenceto “the overall volume of the capital that . . . [agents] possess,” and the second dimensionas indexing “the relative weight of the different kinds of capital” (Bourdieu, 1990:128; seealso Breiger, 2000:108).
We will refer to ideas such as those mentioned above—the organization of networkson the basis of reciprocity, dimensionality, or other relational features—as logics basedon actors’ relations. We develop methods for uncovering such logics in our analysis of acitation network among journals, in Section 3 below.
A second, distinctive form of institutional logic is also of great interest to us, one we terma logic of mutual constitution. Not one, but two levels of structure are implicated in such alogic. Consider for example Clifford Geertz’s insistence that the logic of a culture is to belocated in the patterning of activities that occur in the course of daily life (Geertz, 1973).Mohr and Duquenne (1997:309), who develop this argument, ask the reader to “notice thatthere is a duality here.” Specifically, in Geertz’s thought,
“Any cultural system (be it composed of religious, moral, or ideological beliefs) wasstructured as an embodiment of the range of activities, social conflicts, and moral dilem-mas that individuals were compelled to engage with as they went about negotiatingeveryday events. . . . . [At the same time, however,] the practical and seemingly simplisticactivities of everyday life (from sheep raids to cock fights) were rich with meanings thatexpressed the broader cultural systems of community existence” (Mohr and Duquenne,1997:309).
Mohr and Duquenne (1997:310) relate this, our second form of institutional logic (the logicof mutual constitution), to analytic methods by asserting that “what social theorists meanto suggest about the mutually constitutive character of the relationship between culturalsymbols and social practices is actually a specific kind of empirical linkage between twoorders of social phenomena,” and they go on to suggest that lattice analysis provides anappropriate tool for formally representing the structural properties of such a linkage. Variousmethods for uncovering logics of mutual constitution have been applied, including duallattice analysis, correspondence analysis, and other forms of dimensional representations(Mohr, 1998; Mohr and Duquenne, 1997; Mohr et al., 2002; Breiger, 2000; Harcourt, 2002;Pattison and Breiger, 2002).
In this paper we model a logic of mutual constitution in our application to discourseroles among organizational units within a large university system, in Section 4. There wesuggest a new method for analyzing mutual constitution: that of the dual aggregation ofa contingency table’s rows and columns. Moreover, the aggregation methods we apply instudying mutual constitution are directly related to the concept of structural equivalence andto the methods we use in studying logics of actors’ relations in the journal citation networkstudy.
20 BREIGER AND MOHR
2.2. Organizational Fields
Organizational fields are structures of dependence and connection among organizationsof a common type (DiMaggio and Powell, 1983; Fligstein and Brantley, 1992). Suchfields are not composed only of material connections, however. Especially in the “polit-ical/cultural approach” to organizational fields, such fields are understood as composedof organizations that take each other’s actions into account in the framing of their ownactions (Fligstein and Brantley, 1992:286). In this sense, organizational fields bridge thestructural and symbolic realms. Classification struggles (e.g., Bourdieu, 1984) mediatethese two realms, yielding the categories that organizations use—both bureaucratically andperceptually—to carry on their activities (Karen, 1990:228; see, e.g., Karen’s study ofadmissions to an elite college). Thus, organizational fields are sites for the two kinds ofinstitutional logics on which we focus: logics of actors’ relations and the logic of mutualconstitution.
2.3. Structural Equivalence
Network models of organizational and cultural fields have brought the concept of struc-tural equivalence to bear on inquiries into alliances (Padgett and Ansell, 1993:1274–1280),corporate networks (Gerlach, 1992), cultural gate-keeping (Anheier, Gerhards, and Romo,1995), careers (Faulkner, 1983; Giuffre, 1999), and many related areas. Typically structuralequivalence is defined with respect to a binary network (a network in which all relationsare coded either “0” or “1”). Two actors in a network are said to be structurally equivalentif and only if they have the same ties to everyone in the network. In this sense, structurallyequivalent actors are indiscernible (Lorrain and White, 1971; see the extensive review inWasserman and Faust, 1994:347–393). Recently this idea has been generalized as “stochas-tic equivalence” and applied in probability models for random graphs, conceived as binarynetworks or networks having ordinal values as ties among actors (Wang and Wong, 1987;Nowicki and Snijders, 2001).
DiMaggio and Powell (1983) relate organizational fields to structural equivalence. Webelieve that structural equivalence (including its generalizations) provides a foundationfor modeling institutional logics that is at once solid and rich. Specifically, we will show(Section 3) that logics based on actors’ relations (such as reciprocity, dimensionality, andautomorphism) may be modeled in a unified way by means of applications of structuralequivalence to contingency-table data from an organizational field. We will then show(Section 4) that the logic of mutual constitution may be modeled in an analogous way by a“dual” application of structural equivalence.
3. Logics of Actors’ Relations: Structural Equivalence(and its Generalizations) for Contingency Tables
In this section we model logics of actors’ relations in an organizational field.
AGGREGATION OF ORGANIZATIONAL NETWORKS 21
3.1. Implementing Structural Equivalence
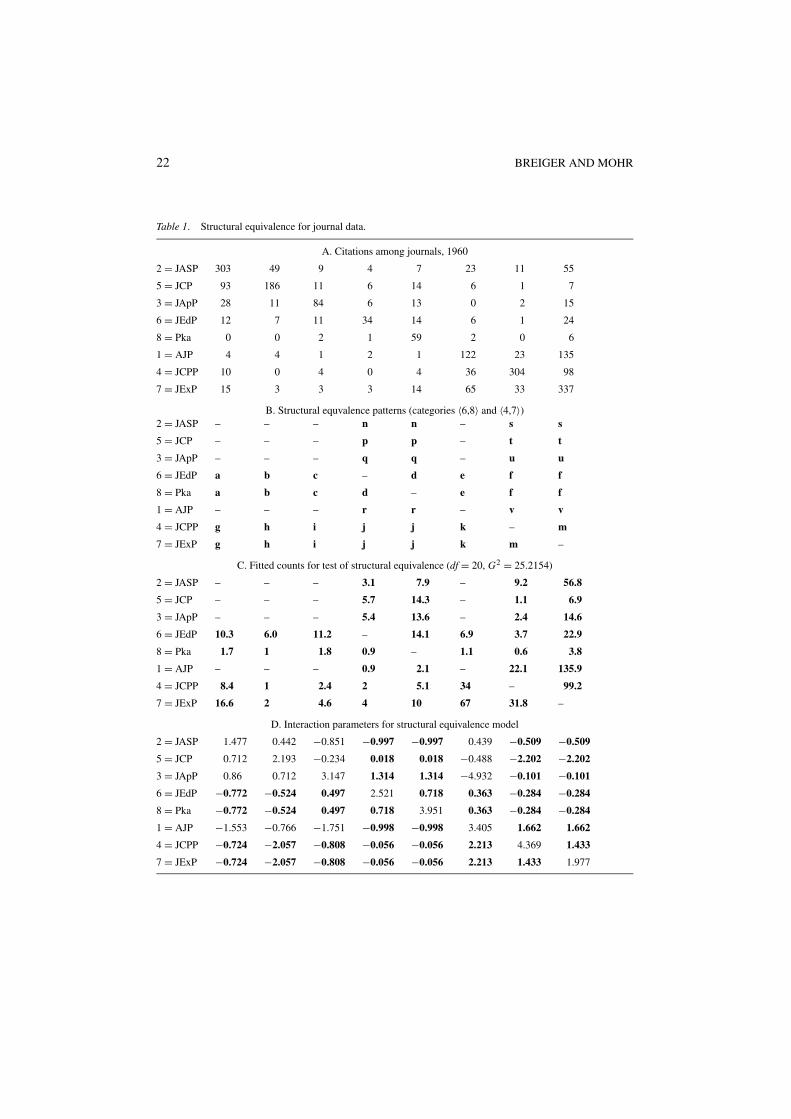
What would structural equivalence look like if this concept were to be applied to contingencytables? How can models of network structure be defined and implemented with respect todata where the “ties” among actors are counts of something that circulates among the actors?Application of network analysis techniques to counted data was pioneered by Marsden(1981). In order to have a specific context for addressing these questions, consider a citationnetwork among eight journals within the field of psychology (data in panel A of Table 1).Cell entries report the numbers of citations in a calendar year (1960) from articles in journalslisted in the row stub to articles in journals listed in the column headings (with rows andcolumns ordered identically). These data were used classically by Coombs (1964:463)to illustrate techniques of nonmetric multidimensional scaling, with the author arguing(p. 463) that the Table 1 network portrays an interoperable resource space (“this is veryliterally a count of the extent to which a journal ‘uses’ another journal”) within a professionalfield (“similarities and difference among psychological journals are always a subject ofinterest to psychologists”). These same data have also been analyzed previously by Romney(1989) and by Roberts (1990).
The ordering of journals in Table 1 is not innocent. This is the arrangement that resultedfrom the first dimension of Coombs’ multidimensional scaling analysis. Numbers in theleft margin of Table 1 index merely the journals’ alphabetical order. (The full names ofthe journals abbreviated in Table 1 are given in an endnote.2) Coombs writes (1964:476)that the ordering of journals in Table 1 “might have any one of a number of possible interpre-tations: soft-hard, real-artificial, field-laboratory, significant-rigorous, and so on.” Networkanalysts, with their preoccupation with binary network data, have often missed opportuni-ties to relate structural equivalence to concepts such as dimensionality and to various formsof symmetry such as those which have preoccupied analysts of cross-classification tables(e.g., Hout, 1983; Agresti, 2002). In this paper we seek to bridge the concerns of networkersand those of cross-classification analysts.
Let us consider a hypothesis of equivalence among two pairs of journals. Specifically, letus postulate structural equivalence among Psychometrika and the Journal of EducationalPsychology (Pka and JEdP in Table 1). Simultaneously, we will postulate the equivalence ofthe Journal of Comparative and Physiological Psychology and the Journal of ExperimentalPsychology (JCPP and JExP in Table 1). The postulated hypotheses of equivalence infact came from an exploratory procedure, of the sort that is a main topic of this paper(Section 4.2). For the moment, however, to simplify the presentation, we will treat ourinterest in testing these particular equivalences as a given, prior to analysis.
What would a table of expected frequencies look like under the model of structuralequivalence as applied to a contingency table such as the journal citation network in Table 1?By definition, the equivalent journals would have identical ties to every journal. This isexactly the pattern illustrated in panel B of Table 1, using lower-case letters. Concerningchoices within an equivalent pair (see the two cells labeled “d” and the two cells labeled“m” in panel B), we mandate that the tie between two equivalent actors, whatever its degreeof presence or absence, be the same in each direction. And we confine ourselves to tiesamong journals, not wishing to estimate the count of citations among articles within the
22 BREIGER AND MOHR
Table 1. Structural equivalence for journal data.
A. Citations among journals, 1960
2 = JASP 303 49 9 4 7 23 11 55
5 = JCP 93 186 11 6 14 6 1 7
3 = JApP 28 11 84 6 13 0 2 15
6 = JEdP 12 7 11 34 14 6 1 24
8 = Pka 0 0 2 1 59 2 0 6
1 = AJP 4 4 1 2 1 122 23 135
4 = JCPP 10 0 4 0 4 36 304 98
7 = JExP 15 3 3 3 14 65 33 337
B. Structural equvalence patterns (categories 〈6,8〉 and 〈4,7〉)2 = JASP – – – n n – s s
5 = JCP – – – p p – t t
3 = JApP – – – q q – u u
6 = JEdP a b c – d e f f
8 = Pka a b c d – e f f
1 = AJP – – – r r – v v
4 = JCPP g h i j j k – m
7 = JExP g h i j j k m –
C. Fitted counts for test of structural equivalence (df = 20, G2 = 25.2154)
2 = JASP – – – 3.1 7.9 – 9.2 56.8
5 = JCP – – – 5.7 14.3 – 1.1 6.9
3 = JApP – – – 5.4 13.6 – 2.4 14.6
6 = JEdP 10.3 6.0 11.2 – 14.1 6.9 3.7 22.9
8 = Pka 1.7 1 1.8 0.9 – 1.1 0.6 3.8
1 = AJP – – – 0.9 2.1 – 22.1 135.9
4 = JCPP 8.4 1 2.4 2 5.1 34 – 99.2
7 = JExP 16.6 2 4.6 4 10 67 31.8 –
D. Interaction parameters for structural equivalence model
2 = JASP 1.477 0.442 −0.851 −0.997 −0.997 0.439 −0.509 −0.509
5 = JCP 0.712 2.193 −0.234 0.018 0.018 −0.488 −2.202 −2.202
3 = JApP 0.86 0.712 3.147 1.314 1.314 −4.932 −0.101 −0.101
6 = JEdP −0.772 −0.524 0.497 2.521 0.718 0.363 −0.284 −0.284
8 = Pka −0.772 −0.524 0.497 0.718 3.951 0.363 −0.284 −0.284
1 = AJP −1.553 −0.766 −1.751 −0.998 −0.998 3.405 1.662 1.662
4 = JCPP −0.724 −2.057 −0.808 −0.056 −0.056 2.213 4.369 1.433
7 = JExP −0.724 −2.057 −0.808 −0.056 −0.056 2.213 1.433 1.977
AGGREGATION OF ORGANIZATIONAL NETWORKS 23
same journal (we decline to estimate cell counts for entries along the principal diagonal ofTable 1). This treatment is quite the same as that of the “reciprocal method” for handlingdiagonal values that is implemented in the UCINET computer program (Borgatti et al., 2002).3
Where two structurally equivalent sets intersect (see the four cells labeld “f” in panel B,and also the four cells labeled “j”), we mandate that all cells in the intersection have thesame value.
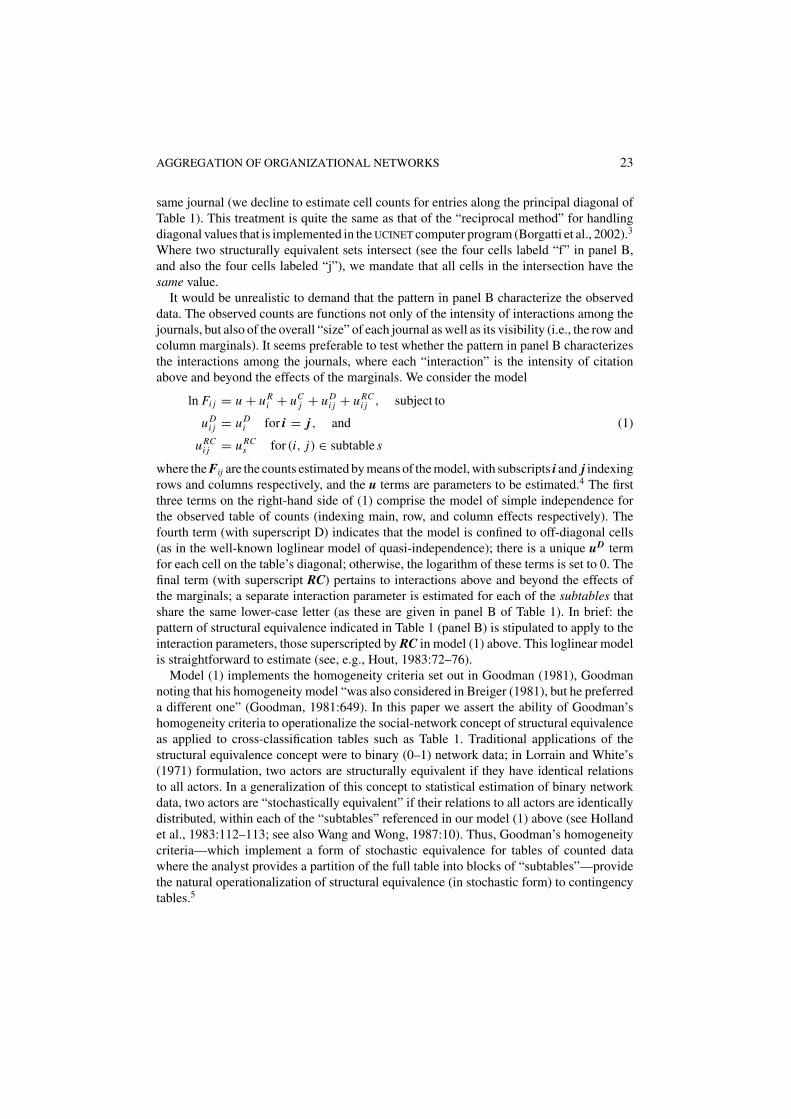
It would be unrealistic to demand that the pattern in panel B characterize the observeddata. The observed counts are functions not only of the intensity of interactions among thejournals, but also of the overall “size” of each journal as well as its visibility (i.e., the row andcolumn marginals). It seems preferable to test whether the pattern in panel B characterizesthe interactions among the journals, where each “interaction” is the intensity of citationabove and beyond the effects of the marginals. We consider the model
ln Fi j = u + u Ri + uC
j + uDi j + u RC
i j , subject to
uDi j = uD
i for i = j, and (1)
u RCi j = u RC
s for (i, j) ∈ subtable s
where the Fij are the counts estimated by means of the model, with subscripts i and j indexingrows and columns respectively, and the u terms are parameters to be estimated.4 The firstthree terms on the right-hand side of (1) comprise the model of simple independence forthe observed table of counts (indexing main, row, and column effects respectively). Thefourth term (with superscript D) indicates that the model is confined to off-diagonal cells(as in the well-known loglinear model of quasi-independence); there is a unique uD termfor each cell on the table’s diagonal; otherwise, the logarithm of these terms is set to 0. Thefinal term (with superscript RC) pertains to interactions above and beyond the effects ofthe marginals; a separate interaction parameter is estimated for each of the subtables thatshare the same lower-case letter (as these are given in panel B of Table 1). In brief: thepattern of structural equivalence indicated in Table 1 (panel B) is stipulated to apply to theinteraction parameters, those superscripted by RC in model (1) above. This loglinear modelis straightforward to estimate (see, e.g., Hout, 1983:72–76).
Model (1) implements the homogeneity criteria set out in Goodman (1981), Goodmannoting that his homogeneity model “was also considered in Breiger (1981), but he preferreda different one” (Goodman, 1981:649). In this paper we assert the ability of Goodman’shomogeneity criteria to operationalize the social-network concept of structural equivalenceas applied to cross-classification tables such as Table 1. Traditional applications of thestructural equivalence concept were to binary (0–1) network data; in Lorrain and White’s(1971) formulation, two actors are structurally equivalent if they have identical relationsto all actors. In a generalization of this concept to statistical estimation of binary networkdata, two actors are “stochastically equivalent” if their relations to all actors are identicallydistributed, within each of the “subtables” referenced in our model (1) above (see Hollandet al., 1983:112–113; see also Wang and Wong, 1987:10). Thus, Goodman’s homogeneitycriteria—which implement a form of stochastic equivalence for tables of counted datawhere the analyst provides a partition of the full table into blocks of “subtables”—providethe natural operationalization of structural equivalence (in stochastic form) to contingencytables.5
24 BREIGER AND MOHR
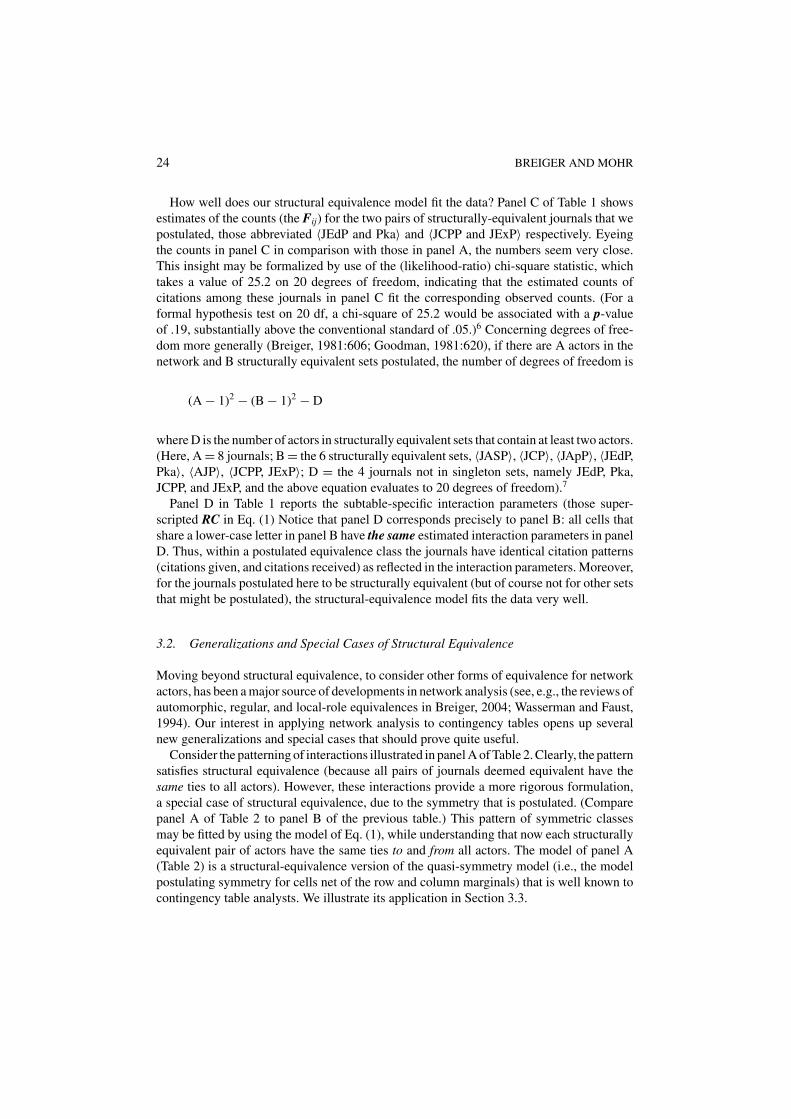
How well does our structural equivalence model fit the data? Panel C of Table 1 showsestimates of the counts (the Fij) for the two pairs of structurally-equivalent journals that wepostulated, those abbreviated 〈JEdP and Pka〉 and 〈JCPP and JExP〉 respectively. Eyeingthe counts in panel C in comparison with those in panel A, the numbers seem very close.This insight may be formalized by use of the (likelihood-ratio) chi-square statistic, whichtakes a value of 25.2 on 20 degrees of freedom, indicating that the estimated counts ofcitations among these journals in panel C fit the corresponding observed counts. (For aformal hypothesis test on 20 df, a chi-square of 25.2 would be associated with a p-valueof .19, substantially above the conventional standard of .05.)6 Concerning degrees of free-dom more generally (Breiger, 1981:606; Goodman, 1981:620), if there are A actors in thenetwork and B structurally equivalent sets postulated, the number of degrees of freedom is
(A − 1)2 − (B − 1)2 − D
where D is the number of actors in structurally equivalent sets that contain at least two actors.(Here, A = 8 journals; B = the 6 structurally equivalent sets, 〈JASP〉, 〈JCP〉, 〈JApP〉, 〈JEdP,Pka〉, 〈AJP〉, 〈JCPP, JExP〉; D = the 4 journals not in singleton sets, namely JEdP, Pka,JCPP, and JExP, and the above equation evaluates to 20 degrees of freedom).7
Panel D in Table 1 reports the subtable-specific interaction parameters (those super-scripted RC in Eq. (1) Notice that panel D corresponds precisely to panel B: all cells thatshare a lower-case letter in panel B have the same estimated interaction parameters in panelD. Thus, within a postulated equivalence class the journals have identical citation patterns(citations given, and citations received) as reflected in the interaction parameters. Moreover,for the journals postulated here to be structurally equivalent (but of course not for other setsthat might be postulated), the structural-equivalence model fits the data very well.
3.2. Generalizations and Special Cases of Structural Equivalence
Moving beyond structural equivalence, to consider other forms of equivalence for networkactors, has been a major source of developments in network analysis (see, e.g., the reviews ofautomorphic, regular, and local-role equivalences in Breiger, 2004; Wasserman and Faust,1994). Our interest in applying network analysis to contingency tables opens up severalnew generalizations and special cases that should prove quite useful.
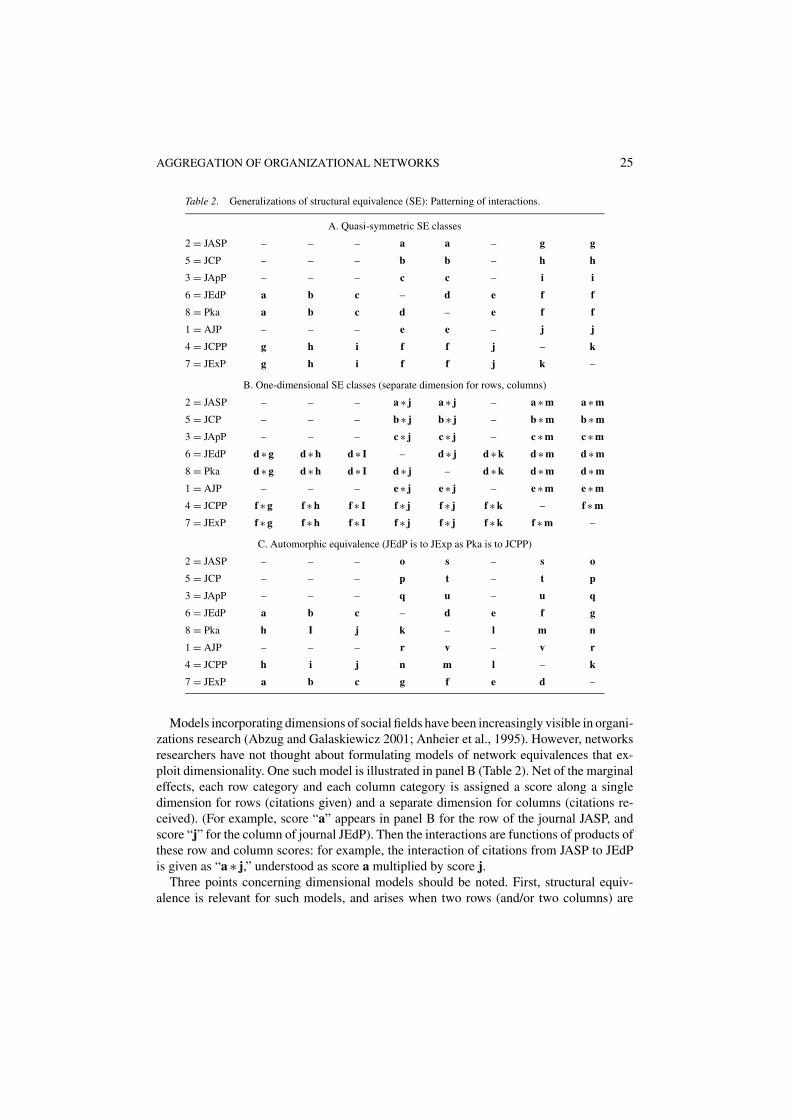
Consider the patterning of interactions illustrated in panel A of Table 2. Clearly, the patternsatisfies structural equivalence (because all pairs of journals deemed equivalent have thesame ties to all actors). However, these interactions provide a more rigorous formulation,a special case of structural equivalence, due to the symmetry that is postulated. (Comparepanel A of Table 2 to panel B of the previous table.) This pattern of symmetric classesmay be fitted by using the model of Eq. (1), while understanding that now each structurallyequivalent pair of actors have the same ties to and from all actors. The model of panel A(Table 2) is a structural-equivalence version of the quasi-symmetry model (i.e., the modelpostulating symmetry for cells net of the row and column marginals) that is well known tocontingency table analysts. We illustrate its application in Section 3.3.
AGGREGATION OF ORGANIZATIONAL NETWORKS 25
Table 2. Generalizations of structural equivalence (SE): Patterning of interactions.
A. Quasi-symmetric SE classes
2 = JASP – – – a a – g g
5 = JCP – – – b b – h h
3 = JApP – – – c c – i i
6 = JEdP a b c – d e f f
8 = Pka a b c d – e f f
1 = AJP – – – e e – j j
4 = JCPP g h i f f j – k
7 = JExP g h i f f j k –
B. One-dimensional SE classes (separate dimension for rows, columns)
2 = JASP – – – a ∗ j a ∗ j – a ∗ m a ∗ m
5 = JCP – – – b ∗ j b ∗ j – b ∗ m b ∗ m
3 = JApP – – – c ∗ j c ∗ j – c ∗ m c ∗ m
6 = JEdP d ∗ g d ∗ h d ∗ I – d ∗ j d ∗ k d ∗ m d ∗ m
8 = Pka d ∗ g d ∗ h d ∗ I d ∗ j – d ∗ k d ∗ m d ∗ m
1 = AJP – – – e ∗ j e ∗ j – e ∗ m e ∗ m
4 = JCPP f ∗ g f ∗ h f ∗ I f ∗ j f ∗ j f ∗ k – f ∗ m
7 = JExP f ∗ g f ∗ h f ∗ I f ∗ j f ∗ j f ∗ k f ∗ m –
C. Automorphic equivalence (JEdP is to JExp as Pka is to JCPP)
2 = JASP – – – o s – s o
5 = JCP – – – p t – t p
3 = JApP – – – q u – u q
6 = JEdP a b c – d e f g
8 = Pka h I j k – l m n
1 = AJP – – – r v – v r
4 = JCPP h i j n m l – k
7 = JExP a b c g f e d –
Models incorporating dimensions of social fields have been increasingly visible in organi-zations research (Abzug and Galaskiewicz 2001; Anheier et al., 1995). However, networksresearchers have not thought about formulating models of network equivalences that ex-ploit dimensionality. One such model is illustrated in panel B (Table 2). Net of the marginaleffects, each row category and each column category is assigned a score along a singledimension for rows (citations given) and a separate dimension for columns (citations re-ceived). (For example, score “a” appears in panel B for the row of the journal JASP, andscore “j” for the column of journal JEdP). Then the interactions are functions of products ofthese row and column scores: for example, the interaction of citations from JASP to JEdPis given as “a ∗ j,” understood as score a multiplied by score j.
Three points concerning dimensional models should be noted. First, structural equiv-alence is relevant for such models, and arises when two rows (and/or two columns) are
26 BREIGER AND MOHR
postulated to have the same score (as illustrated in panel B of Table 2). Second, such mod-els can be generalized—for example, by postulating that the set of row scores is identical tothe set of column scores (i.e., by imposing that row j’s score is the same as that of columnj, for all j). Third, dimensions of these social networks (the values of the row scores and/orcolumn scores) can be estimated directly from the data, for single-dimension or multi-dimensional contexts, on the basis of families of models formulated by Leo Goodman suchas the RC(M) models and related ones (see, e.g., Goodman, 1996).
The preceding discussion has highlighted structural-equivalence formulations that net-work analysts have not previously formulated or exploited, and that provide extensions tocontingency-table models. We also take note of an algebraic model for social networks, tosuggest a new application to network data in contingency tables. This is the network modelof automorphic equivalence (Borgatti and Everett, 1992).
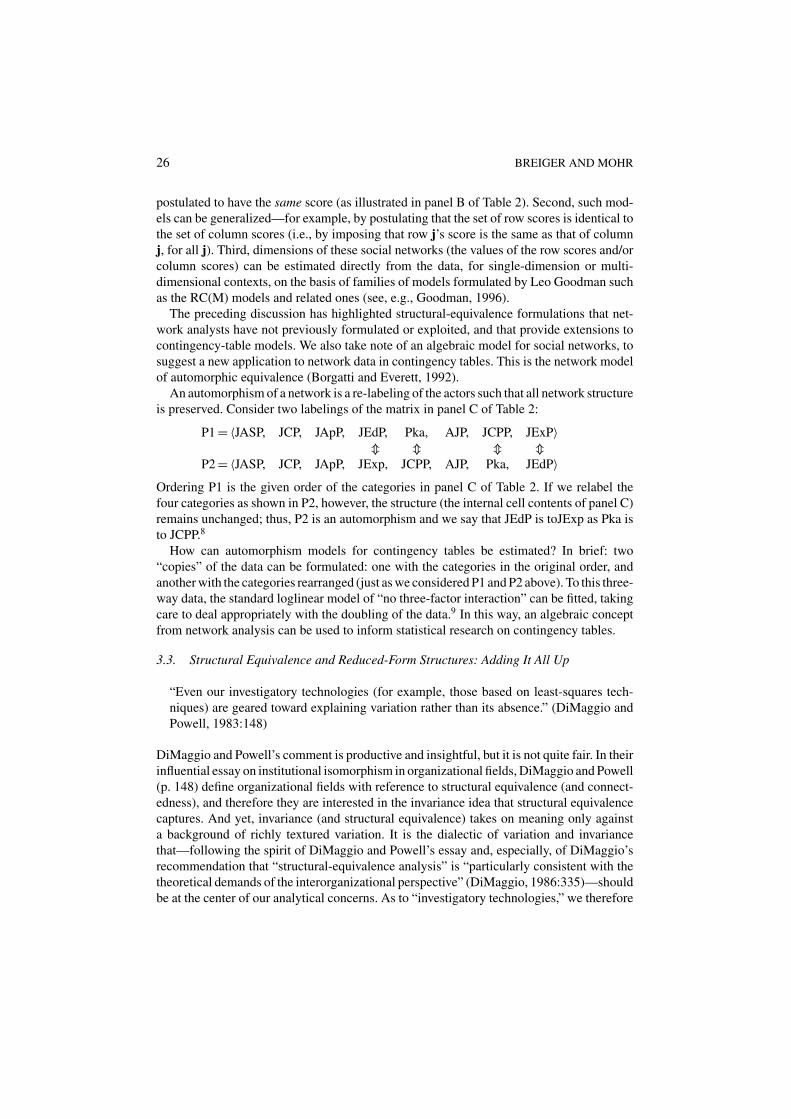
An automorphism of a network is a re-labeling of the actors such that all network structureis preserved. Consider two labelings of the matrix in panel C of Table 2:
P1 = 〈JASP, JCP, JApP, JEdP, Pka, AJP, JCPP, JExP〉� � � �
P2 = 〈JASP, JCP, JApP, JExp, JCPP, AJP, Pka, JEdP〉Ordering P1 is the given order of the categories in panel C of Table 2. If we relabel thefour categories as shown in P2, however, the structure (the internal cell contents of panel C)remains unchanged; thus, P2 is an automorphism and we say that JEdP is toJExp as Pka isto JCPP.8
How can automorphism models for contingency tables be estimated? In brief: two“copies” of the data can be formulated: one with the categories in the original order, andanother with the categories rearranged (just as we considered P1 and P2 above). To this three-way data, the standard loglinear model of “no three-factor interaction” can be fitted, takingcare to deal appropriately with the doubling of the data.9 In this way, an algebraic conceptfrom network analysis can be used to inform statistical research on contingency tables.
3.3. Structural Equivalence and Reduced-Form Structures: Adding It All Up
“Even our investigatory technologies (for example, those based on least-squares tech-niques) are geared toward explaining variation rather than its absence.” (DiMaggio andPowell, 1983:148)
DiMaggio and Powell’s comment is productive and insightful, but it is not quite fair. In theirinfluential essay on institutional isomorphism in organizational fields, DiMaggio and Powell(p. 148) define organizational fields with reference to structural equivalence (and connect-edness), and therefore they are interested in the invariance idea that structural equivalencecaptures. And yet, invariance (and structural equivalence) takes on meaning only againsta background of richly textured variation. It is the dialectic of variation and invariancethat—following the spirit of DiMaggio and Powell’s essay and, especially, of DiMaggio’srecommendation that “structural-equivalence analysis” is “particularly consistent with thetheoretical demands of the interorganizational perspective” (DiMaggio, 1986:335)—shouldbe at the center of our analytical concerns. As to “investigatory technologies,” we therefore
AGGREGATION OF ORGANIZATIONAL NETWORKS 27
have a special interest in procedures, such as the analysis of variance (ANOVA), that con-trast group means with variation around those means. Loglinear models for contingencytables rest on a deep analogy to ANOVA, one that we will employ to help us understand therelation of structural equivalence to the related concept of reduced-form structures. In thissection we recast important results of Goodman (1981) to show their relevance for structuralequivalence analysis. We will apply a quasi-symmetric formulation: the one shown in panelA of Table 2.
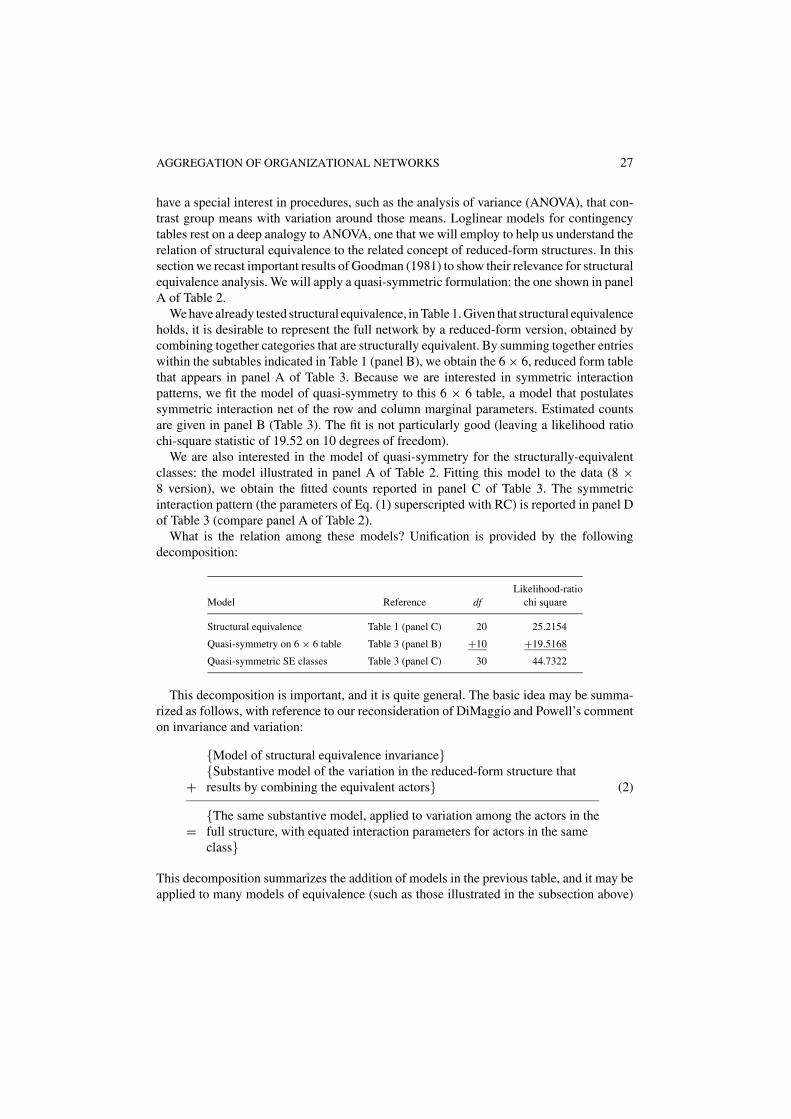
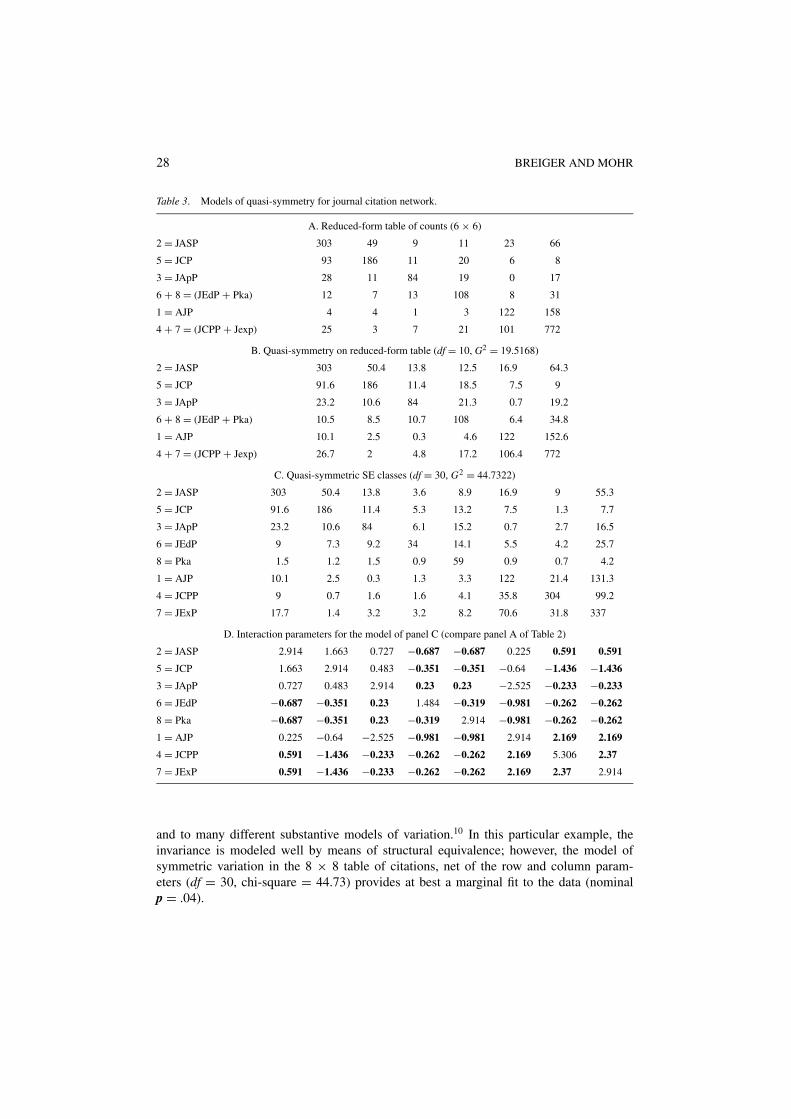
We have already tested structural equivalence, in Table 1. Given that structural equivalenceholds, it is desirable to represent the full network by a reduced-form version, obtained bycombining together categories that are structurally equivalent. By summing together entrieswithin the subtables indicated in Table 1 (panel B), we obtain the 6 × 6, reduced form tablethat appears in panel A of Table 3. Because we are interested in symmetric interactionpatterns, we fit the model of quasi-symmetry to this 6 × 6 table, a model that postulatessymmetric interaction net of the row and column marginal parameters. Estimated countsare given in panel B (Table 3). The fit is not particularly good (leaving a likelihood ratiochi-square statistic of 19.52 on 10 degrees of freedom).
We are also interested in the model of quasi-symmetry for the structurally-equivalentclasses: the model illustrated in panel A of Table 2. Fitting this model to the data (8 ×8 version), we obtain the fitted counts reported in panel C of Table 3. The symmetricinteraction pattern (the parameters of Eq. (1) superscripted with RC) is reported in panel Dof Table 3 (compare panel A of Table 2).
What is the relation among these models? Unification is provided by the followingdecomposition:
Likelihood-ratioModel Reference df chi square
Structural equivalence Table 1 (panel C) 20 25.2154
Quasi-symmetry on 6 × 6 table Table 3 (panel B) +10 +19.5168
Quasi-symmetric SE classes Table 3 (panel C) 30 44.7322
This decomposition is important, and it is quite general. The basic idea may be summa-rized as follows, with reference to our reconsideration of DiMaggio and Powell’s commenton invariance and variation:
{Model of structural equivalence invariance}{Substantive model of the variation in the reduced-form structure that
+ results by combining the equivalent actors} (2)
{The same substantive model, applied to variation among the actors in the= full structure, with equated interaction parameters for actors in the same
class}
This decomposition summarizes the addition of models in the previous table, and it may beapplied to many models of equivalence (such as those illustrated in the subsection above)
28 BREIGER AND MOHR
Table 3. Models of quasi-symmetry for journal citation network.
A. Reduced-form table of counts (6 × 6)
2 = JASP 303 49 9 11 23 66
5 = JCP 93 186 11 20 6 8
3 = JApP 28 11 84 19 0 17
6 + 8 = (JEdP + Pka) 12 7 13 108 8 31
1 = AJP 4 4 1 3 122 158
4 + 7 = (JCPP + Jexp) 25 3 7 21 101 772
B. Quasi-symmetry on reduced-form table (df = 10, G2 = 19.5168)
2 = JASP 303 50.4 13.8 12.5 16.9 64.3
5 = JCP 91.6 186 11.4 18.5 7.5 9
3 = JApP 23.2 10.6 84 21.3 0.7 19.2
6 + 8 = (JEdP + Pka) 10.5 8.5 10.7 108 6.4 34.8
1 = AJP 10.1 2.5 0.3 4.6 122 152.6
4 + 7 = (JCPP + Jexp) 26.7 2 4.8 17.2 106.4 772
C. Quasi-symmetric SE classes (df = 30, G2 = 44.7322)
2 = JASP 303 50.4 13.8 3.6 8.9 16.9 9 55.3
5 = JCP 91.6 186 11.4 5.3 13.2 7.5 1.3 7.7
3 = JApP 23.2 10.6 84 6.1 15.2 0.7 2.7 16.5
6 = JEdP 9 7.3 9.2 34 14.1 5.5 4.2 25.7
8 = Pka 1.5 1.2 1.5 0.9 59 0.9 0.7 4.2
1 = AJP 10.1 2.5 0.3 1.3 3.3 122 21.4 131.3
4 = JCPP 9 0.7 1.6 1.6 4.1 35.8 304 99.2
7 = JExP 17.7 1.4 3.2 3.2 8.2 70.6 31.8 337
D. Interaction parameters for the model of panel C (compare panel A of Table 2)
2 = JASP 2.914 1.663 0.727 −0.687 −0.687 0.225 0.591 0.591
5 = JCP 1.663 2.914 0.483 −0.351 −0.351 −0.64 −1.436 −1.436
3 = JApP 0.727 0.483 2.914 0.23 0.23 −2.525 −0.233 −0.233
6 = JEdP −0.687 −0.351 0.23 1.484 −0.319 −0.981 −0.262 −0.262
8 = Pka −0.687 −0.351 0.23 −0.319 2.914 −0.981 −0.262 −0.262
1 = AJP 0.225 −0.64 −2.525 −0.981 −0.981 2.914 2.169 2.169
4 = JCPP 0.591 −1.436 −0.233 −0.262 −0.262 2.169 5.306 2.37
7 = JExP 0.591 −1.436 −0.233 −0.262 −0.262 2.169 2.37 2.914
and to many different substantive models of variation.10 In this particular example, theinvariance is modeled well by means of structural equivalence; however, the model ofsymmetric variation in the 8 × 8 table of citations, net of the row and column param-eters (df = 30, chi-square = 44.73) provides at best a marginal fit to the data (nominalp = .04).
AGGREGATION OF ORGANIZATIONAL NETWORKS 29
How does our framework compare with the usual model of quasi-symmetry applied tothe full data (Table 1, panel A)? This “usual” model imposes no structural equivalence, andposits symmetry in interactions net of the row and column effects. The usual quasi-symmetrymodel leaves 21 degrees of freedom and a chi-square of 28.4561. Our model (the one shownabove that leaves 30 degrees of freedom and a chi-square of 44.7322) is more parsimonious,leaving 9 more degrees of freedom. The parsimony is given by the structural equivalence(as depicted in panel D of Table 3). Moreover, the fit of our structural-equivalence model isarguably not worse than the fit of the “usual” model. Specifically: on a difference of 9 df,the difference in chi-square (16.2761) is associated with a nominal-level p value of .0613.
What have we learned about the resource space that this citation network constitutes? Wefind that structural equivalence concepts are of some, limited, help in portraying a macro-structure, in that two pairs of the eight journals are structurally equivalent, and that thisstructural equivalence is (at best marginally) consistent with a symmetric interaction struc-ture taking account of the equivalence classes. The larger point, in our opinion, is that ouranalytical framework, allowing explicit assessments of structural-equivalence hypotheses(via chi-square tests), brings forcefully and precisely to our attention the limitations of theapplicability of the structural-equivalence concept, as well as its ability to aid in modelingnetworks of counted data, as part and parcel of our defining the concept operationally forcontingency tables.
4. Institutional Logics from Dual Aggregation
Mohr, Bourgeois, and Duquenne (2002) study several hundred organizational agencieswithin the University of California (UC) system in the so-called post-affirmative actionera. (Since 1995 the UC system has been prohibited from employing affirmative actionprinciples in student admissions.) After a brief review of their study, we provide a newanalysis of their central data, an analysis that extends our interest in network aggregationto the study of situations in which the researcher seeks to study the dual aggregation oftwo different types of structure (in this case, identity categories and diversity practices oforganizations).
4.1. Discourse Roles: Identity Categories and Organizational Practices
In response to the 1995 legal prohibition against using affirmative action in student admis-sions, the UC Office of the President (U-COP) was directed to develop alternative mecha-nisms for preserving the ethnic, racial, and gender diversity of the student body. Since 1998nearly $350 million in state money has been spent to fund UC programs in outreach, definedas programs employing university personnel and resources to interact with and, hopefully,to influence public school students in primary and secondary schools to increase the prob-ability that a diverse body of students will be able to compete successfully for admissionto the UC college campuses. Statements from 751 organizational agencies and programsassociated with outreach, from across the range of the entire UC system, constitute the datasource of the Mohr et al. (2002) study.
30 BREIGER AND MOHR
As the authors point out, the central dilemma in these outreach programs is that racial,ethnic, and gender diversity continues to be fully embraced as a goal for student admissionseven though affirmative action has been discontinued. They write,
“As any recent member of a UC admissions or fellowship committee can attest, thedistinctions outlined here foreshadow a new and more complicated discursive situationfor university personnel in a post-affirmative action era. . . . Our goal is to take somemeasure of the discourse system that operates within the organizational field space ofthose UC agencies charged with conducting the activities of student outreach” (Mohret al., 2002).
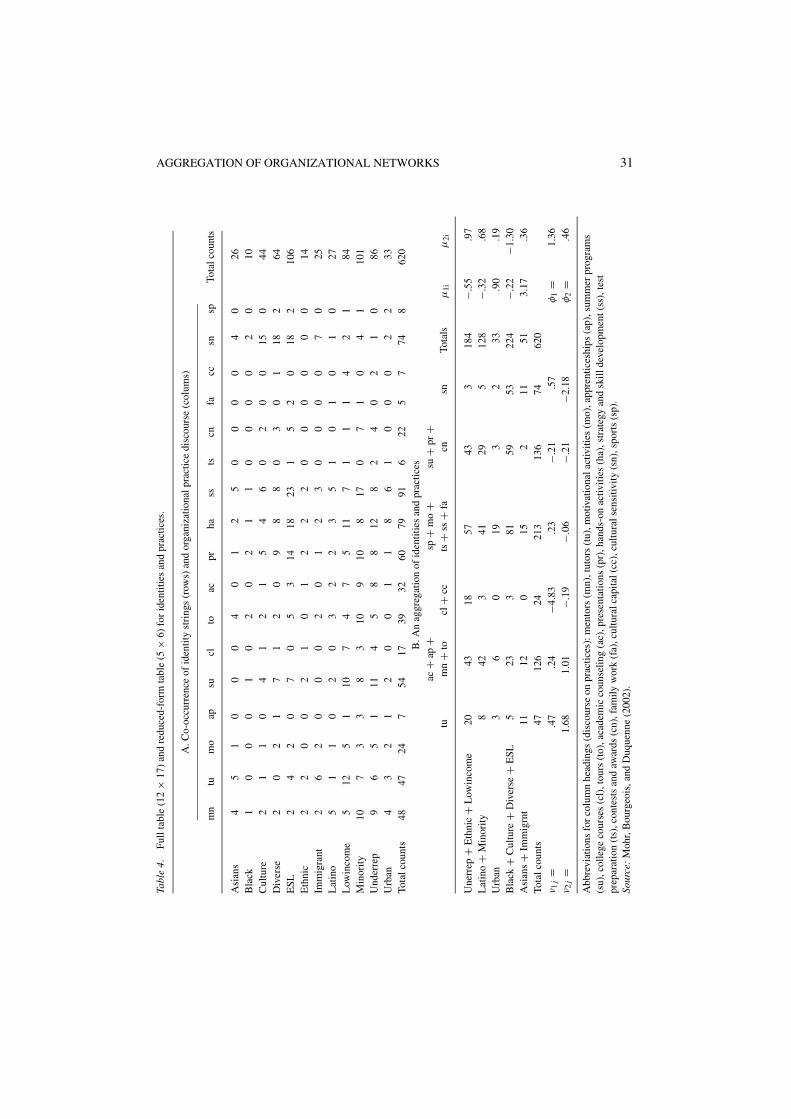
How might the identity categories and the diversity practices claimed by organizationsbe said to co-constitute or to “construct” one another? These discourse roles are at theheart of the interest of Mohr et al. To pursue this question the authors focused on the279 UC organizations that, in their official statements published in a U-COP directory, bothinvoked an identity category for the targeted group and claimed to employ specific practices.For example, an organization might claim programs directed to students whose “primarylanguage is Spanish” and to provide “cultural enrichment” activities. Because the sameorganization might have multiple client groups and engage in multiple activities, the 279organizations were found to produce 620 linkages of identity categories to organizationalpractices, and these linkages are reported in Table 4 below (in panel A, taken from Mohret al., 2002). For example (see the first entry in Table 4 panel A, at the intersection of row 1and column 1), “4” of the organizations provide “mentors” to pre-college students identifiedas “Asian.”
Translating the natural language descriptions of identities (such as “primary language isSpanish,” “historically underrepresented,” “urban,” “gang,” “ethnically and linguisticallydiverse,” “Indochinese,” “Asian and Pacific Americans,” “recently immigrated”) into the 12categories used by Mohr et al. (and reported in our Table 4) is a major step of the originalauthors’ analysis that was accomplished on the basis of a specially-written text-analysisprogram (Mohr et al., 2002). These 12 identity categories will be taken as a given in thepresent analysis. The same is true of the 17 categories of organizational practice that arereported in Table 4. A more detailed description of each of these categories appears in Mohret al. (2002, Table 2).
4.2. Dual Aggregation: An Algorithm
Looking at Table 4, let us consider a hypothesis that row categories ETHNIC and LOWINCOME
are structurally equivalent. The subtable formed by these two rows is of size 2 × 17 (two rowsby 17 columns), and the usual model of statistical independence, applied to this subtable,leaves 16 degrees of freedom and a chi-square value of 8.581. Because the chi-square islow relative to the degrees of freedom, we deem these two categories to be structurallyequivalent. By adding together these two rows of Table 4 (a table that is 12 × 17), weobtain a reduced-form table of size 11 × 17. The model of independence fitted to thisreduced-form table leaves 160 df, and a chi-square of 274.806. Independence on Table 4
AGGREGATION OF ORGANIZATIONAL NETWORKS 31Ta
ble
4.Fu
llta
ble
(12
×17
)an
dre
duce
d-fo
rmta
ble
(5×
6)fo
rid
entit
ies
and
prac
tices
.
A.C
o-oc
curr
ence
ofid
entit
yst
ring
s(r
ows)
and
orga
niza
tiona
lpra
ctic
edi
scou
rse
(col
ums)
mn
tum
oap
sucl
toac
prha
ssts
cnfa
ccsn
spTo
talc
ount
s
Asi
ans
45
10
00
40
12
50
00
04
026
Bla
ck1
00
01
02
02
11
00
00
20
10C
ultu
re2
11
04
12
15
46
02
00
150
44D
iver
se2
02
17
12
09
88
03
01
182
64E
SL2
42
07
05
314
1823
15
20
182
106
Eth
nic
22
00
21
01
22
20
00
00
014
Imm
igra
nt2
62
00
02
01
23
00
00
70
25L
atin
o5
11
02
03
22
35
10
10
10
27L
owin
com
e5
125
110
74
75
117
11
14
21
84M
inor
ity10
73
38
310
910
817
07
10
41
101
Und
erre
p9
65
111
45
88
128
24
02
10
86U
rban
43
21
20
01
18
61
00
02
233
Tota
lcou
nts
4847
247
5417
3932
6079
916
225
774
862
0B
.An
aggr
egat
ion
ofid
entit
ies
and
prac
tices
ac+
ap+
sp+
mo
+su
+pr
+tu
mn
+to
cl+
ccts
+ss
+fa
cnsn
Tota
lsµ
1iµ
2i
Une
rrep
+E
thni
c+
Low
inco
me
2043
1857
433
184
−.55
.97
Lat
ino
+M
inor
ity8
423
4129
512
8−.
32.6
8U
rban
36
019
32
33.9
0.1
9B
lack
+C
ultu
re+
Div
erse
+E
SL5
233
8159
5322
4−.
22−1
.30
Asi
ans+
Imm
igrn
t11
120
152
1151
3.17
.36
Tota
lcou
nts
4712
624
213
136
7462
0ν
1j=
.47
.24
−4.8
3.2
3−.
21.5
7φ
1=
1.36
ν2
j=
1.68
1.01
−.19
−.06
−.21
−2.1
8φ
2=
.46
Abb
revi
atio
nsfo
rco
lum
nhe
adin
gs(d
isco
urse
onpr
actic
es):
men
tors
(mn)
,tut
ors
(tu)
,mot
ivat
iona
lact
iviti
es(m
o),a
ppre
ntic
eshi
ps(a
p),s
umm
erpr
ogra
ms
(su)
,col
lege
cour
ses
(cl)
,tou
rs(t
o),a
cade
mic
coun
selin
g(a
c),p
rese
ntat
ions
(pr)
,han
ds-o
nac
tiviti
es(h
a),s
trat
egy
and
skill
deve
lopm
ent(
ss),
test
prep
arat
ion
(ts)
,con
test
san
daw
ards
(cn)
,fam
ilyw
ork
(fa)
,cul
tura
lcap
ital(
cc),
cultu
rals
ensi
tivity
(sn)
,spo
rts
(sp)
.So
urce
:M
ohr,
Bou
rgeo
is,a
ndD
uque
nne
(200
2).
32 BREIGER AND MOHR
itself leaves 176 df, and a chi-square of 283.387. The relation among these results is exactlythat of formulation (2) above:
Likelihood-ratioModel df chi square
Structural equivalence 16 8.581
Independence on reduced-form table (11 × 17) + 160 + 274.806
Independence on full table (12 × 17) 176 283.387
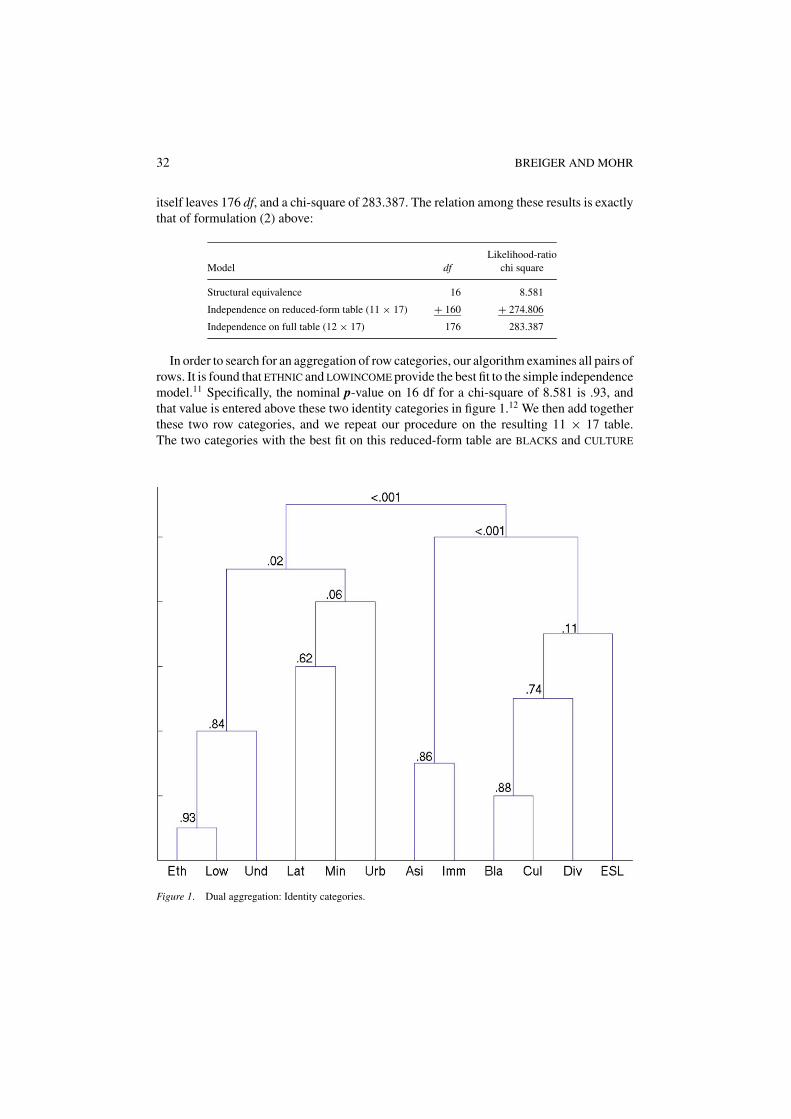
In order to search for an aggregation of row categories, our algorithm examines all pairs ofrows. It is found that ETHNIC and LOWINCOME provide the best fit to the simple independencemodel.11 Specifically, the nominal p-value on 16 df for a chi-square of 8.581 is .93, andthat value is entered above these two identity categories in figure 1.12 We then add togetherthese two row categories, and we repeat our procedure on the resulting 11 × 17 table.The two categories with the best fit on this reduced-form table are BLACKS and CULTURE
Figure 1. Dual aggregation: Identity categories.
AGGREGATION OF ORGANIZATIONAL NETWORKS 33
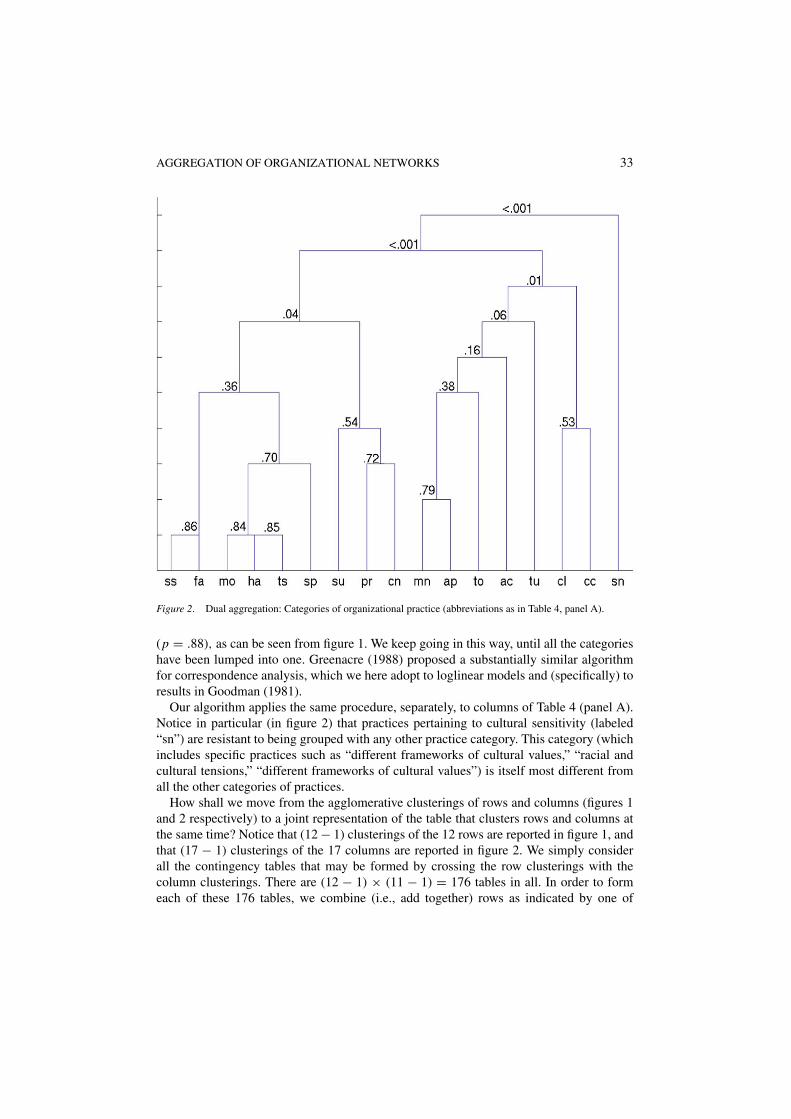
Figure 2. Dual aggregation: Categories of organizational practice (abbreviations as in Table 4, panel A).
(p = .88), as can be seen from figure 1. We keep going in this way, until all the categorieshave been lumped into one. Greenacre (1988) proposed a substantially similar algorithmfor correspondence analysis, which we here adopt to loglinear models and (specifically) toresults in Goodman (1981).
Our algorithm applies the same procedure, separately, to columns of Table 4 (panel A).Notice in particular (in figure 2) that practices pertaining to cultural sensitivity (labeled“sn”) are resistant to being grouped with any other practice category. This category (whichincludes specific practices such as “different frameworks of cultural values,” “racial andcultural tensions,” “different frameworks of cultural values”) is itself most different fromall the other categories of practices.
How shall we move from the agglomerative clusterings of rows and columns (figures 1and 2 respectively) to a joint representation of the table that clusters rows and columns atthe same time? Notice that (12 − 1) clusterings of the 12 rows are reported in figure 1, andthat (17 − 1) clusterings of the 17 columns are reported in figure 2. We simply considerall the contingency tables that may be formed by crossing the row clusterings with thecolumn clusterings. There are (12 − 1) × (11 − 1) = 176 tables in all. In order to formeach of these 176 tables, we combine (i.e., add together) rows as indicated by one of

34 BREIGER AND MOHR
the 11 row clusterings and we combine columns as indicated by one of the 16 columnclusterings. We then compute the model of simple independence for this reduced-formtable, and we subtract the results (degrees of freedom and likelihood ratio chi-square) fromthe corresponding results obtained for the original data table. The difference in degreesof freedom and the difference in chi-square themselves exhibit a chi-square distribution(Goodman, 1981). Following Goodman, we refer to the test based on these differences as atest of homogeneity or (in our language in this paper) as a test of structural equivalence.13 Wethen select as our preferred reduced-form representation the single table for which the jointaggregation of rows and columns produces a test of structural equivalence associated withthe highest p-value. The table arrived at in this manner might have a very small number ofrows and/or columns. Alternatively, therefore, we might select one of the other tables as ourpreferred one, as long as its associated p-value is sufficiently high and it has a sufficientlyfine or coarse structure (referring to the number of rows and the number of columns desired)for our analytical purposes.
A computer program, COMBINE, written by and available from the first-listed author,implements the algorithm we have just described on any two-way contingency table. Someadditional remarks on this algorithm are in the appendix to this paper.
By using the algorithm just described, we put together simultaneously the aggregationsof identity categories (figure 1) and practices (figure 2) in order to arrive at our preferredreduced-form contingency table as shown in panel B of Table 4. There we have five classesof structurally equivalent identity categories from figure 1, and six classes of structurallyequivalent categories of practices, from figure 2. The size of panel B of Table 4 is therefore5 × 6. This is the “reduced-form structure” analogous to that concept as described above inSection 3.1. The test of structural equivalence for these five macro-identities “crossed” withthese six macro-sets of practices (analogous to the test illustrated in panel B of Table 1)leaves 156 degrees of freedom and a chi-square of 130.97. Thus, our algorithm has identifiedsubstantial structural equivalence.
What is the relation between the reduced-form table and the original data, both reportedin Table 4? Because we are interested in organizational and cultural fields, we have a specialinterest in portraying those fields within some multidimensional space. (Breiger, 2000 makesthis argument with respect to Bourdieu’s fields, and Harcourt, 2002, relying heavily on workof Mohr and Breiger, makes a similar argument with respect to fields of legally relevantsocial practices.) Goodman’s RC(M) association models (e.g., Goodman, 1996) provide aparticularly apt context. The general model may be written log-multiplicatively as:
ln Fi j = u + u Ri + uC
j +M∑
m =1
φm µim ν jm (3)
where the contingency table is to be represented in an M-dimensional space and wherethe µ and ν parameters are scores (for rows and columns respectively) estimated for eachdimension. Products of these scores (along with a weight ϕ for each dimension) representthe dimensionalized interaction structure in the table, net of row and column effects, justas illustrated above in Table 2 (panel B) for the one-dimensional case. Without the multi-plicative term in (3), we have RC(0), identical to the model of simple independence for thecontingency table.
AGGREGATION OF ORGANIZATIONAL NETWORKS 35
Table 5. Fit of models to the full table and to the reduced-form table.
Likelihood ratioDimensional model of association df chi-square bic
A. The Fit of Selected Models to the full table (Table 4, panel A)A1. Null association (O) 176 283.39 −848
A2. Row-column association, 1 dimension (RC-1) 150 161.97 −802
A3. Row-column association, 2 dims (RC-2) 126 88.85 −722
A4. Model RC-2 with certain categories equated 162 140.42 −901
B. The fit of selected models to the reduced-Form table (Table 4, panel B)
B1. Null association (O) 20 152.42
B2. Row-column association, 1 dimension (RC-1) 12 55.7
B3. Row-column association, 2 dims (RC-2) 6 9.44
C. Some relations among these models
SE ≡ Structural equivalence ≡ A1–B1 156 130.97
VR ≡ Variation in reduced-form table ≡ B3 + 6 + 9.44
VE ≡ Variation in full table with equated scores ≡ A4 = 162 = 140.42
Models of 0, 1, and 2 dimensions, all special cases of Eq. (3), were fitted to both the fulltable and the reduced-form table (Table 4), and fit statistics are reported in Table 5. PanelC of Table 5 illustrates the fundamental partitioning of Eq. (2) of this paper.
The upshot is that we are led to a model (A4 in Table 5) that has only 14 fewer degrees offreedom than the independence model, but that fits the data extraordinarily well. Substan-tively, this is a two-dimensional model that has equated scores (µ and ν) within each of thestructurally equivalent sets identified in Table 4 (panel B). These are precisely the µ and ν
scores estimated from the two-dimensional model fitted to the reduced-form table (modelB3 in Table 5). The difference between these two models (A4 and B3) is precisely the testof structural equivalence, as illustrated in panel C.
4.3. Interpretation
But what, substantively, can we learn from all this? The µ and ν scores estimated from themodels of interest are reported in the margins of Table 4 (panel B), and these scores aregraphed in figure 3.14
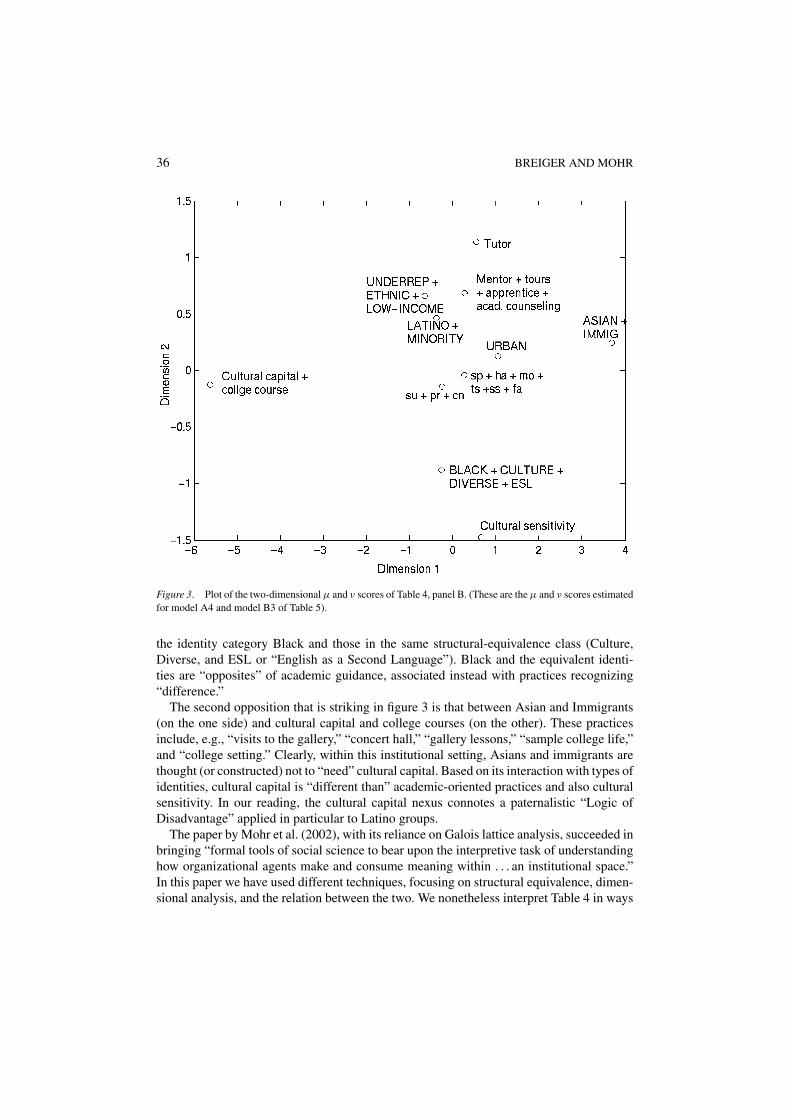
In examining figure 3, the first thing that strikes us is the oppositions that define thisorganizational space. Academic concerns (tutor, mentor, academic counseling, etc.) domi-nate one end of the vertical dimension, whereas “cultural sensitivity” defines the oppositeend. Moreover, cultural sensitivity is highly associated with “Black” and the other termswithin the same structural-equivalence class, whereas the opposite (academic) end of thisdimension is closely associated with Asians, immigrants, urban, Latino, minority, under-represented, ethnic, and low-income groups. This defines what we think of as a “Logicof Academic Guidance” in opposition to a “Logic of Difference,” the latter centered on
36 BREIGER AND MOHR
Figure 3. Plot of the two-dimensional µ and ν scores of Table 4, panel B. (These are the µ and ν scores estimatedfor model A4 and model B3 of Table 5).
the identity category Black and those in the same structural-equivalence class (Culture,Diverse, and ESL or “English as a Second Language”). Black and the equivalent identi-ties are “opposites” of academic guidance, associated instead with practices recognizing“difference.”
The second opposition that is striking in figure 3 is that between Asian and Immigrants(on the one side) and cultural capital and college courses (on the other). These practicesinclude, e.g., “visits to the gallery,” “concert hall,” “gallery lessons,” “sample college life,”and “college setting.” Clearly, within this institutional setting, Asians and immigrants arethought (or constructed) not to “need” cultural capital. Based on its interaction with types ofidentities, cultural capital is “different than” academic-oriented practices and also culturalsensitivity. In our reading, the cultural capital nexus connotes a paternalistic “Logic ofDisadvantage” applied in particular to Latino groups.
The paper by Mohr et al. (2002), with its reliance on Galois lattice analysis, succeeded inbringing “formal tools of social science to bear upon the interpretive task of understandinghow organizational agents make and consume meaning within . . . an institutional space.”In this paper we have used different techniques, focusing on structural equivalence, dimen-sional analysis, and the relation between the two. We nonetheless interpret Table 4 in ways
AGGREGATION OF ORGANIZATIONAL NETWORKS 37
that are highly compatible with the work of the original researchers. Indeed, the formalrelations between lattices and dimensional representations are increasingly coming to theattention of networks researchers (Pattison and Breiger, 2002), and suggest prospects fora more unified, more self-conscious set of tools to help with problems of interpretation oforganizational networks.
5. Conclusion
“[N]othing classifies somebody more than the way he or she classifies” (Bourdieu,1990:132)
When an article in a psychology journal cites another article in a different journal, thusproducing data such as those we analyzed in Section 2, the citation is participating activelyin the kind of classification struggle that Bourdieu sees as constructing organizational fields.And when an agency of a university offers programs to help diverse students gain admissionto college, that agency is both reflecting and constructing a linkage between the identitiesof students and the kinds of practices that social actors who are classified in certain waysare expected to engage in. In this paper we have presented techniques to aid analysts inunderstanding how institutions do the classifying.
A key argument put forward by “practice theorists” such as Giddens, Bourdieu, andde Certeau is that neither the material world (the world of action) nor the cultural world(the world of symbols) can exist or be coherently structured independently (Mohr andDuquenne, 1997:309). Mohr and Duquenne have developed a parallel between lattice anal-ysis and practice theorists’ concerns with the dualities between culture and action. In thispaper we have endeavored to present formal, operational, statistical procedures for ana-lyzing the duality between structural equivalence and variation of reduced-form structuresin one-mode networks (Section 3). We asserted the ability of Goodman’s homogeneitycriteria to operationalize the social-network concept of structural equivalence as appliedto cross-classification tables. This led us (Section 3.2) to develop new generalizations andspecial cases of the structural equivalence concept that should prove useful in organizationalresearch. In Section 4, we extended our interest in network aggregation to the study of two-mode networks consisting of social-identity categories and categories of organizationalpractices. Our algorithm for dual aggregation (Section 4.2) is intended to help in analyzingsystems of linkages such as these. In addition to the application presented in Section 4,our algorithm has also been applied in Erickson’s (2001:140–143) identification of classesof jobs on the basis of their employment requirements (based on an earlier, unpublisheddescription of the algorithm).
Our work in this paper is motivated by the same general idea voiced by Burt (1991:1),to the effect that “network analysis provides a useful guide for collapsing ostensibly non-network data into analytical categories. . . .” Unlike Burt’s procedure, the ones we presentedin this paper are confined to tables of counts that are sampled from some population.In return for this restriction, our procedures make use of regions of the vast universe ofmodeling results that have become available in recent years with respect to loglinear andrelated models (e.g., Goodman, 1996; see also Hout, 1983; Agresti, 2002). Of particular
38 BREIGER AND MOHR
interest, especially in our Section 4.3, is the use of contingency table models to portraymultidimensional spaces within which organizational fields can be identified. Moreover,the framework underlying this paper (e.g., in panel C of Table 5) shows how dimensionalanalysis and structural equivalence are, very deeply, part of the same modeling enterprise.This framework provides specific procedures for incorporating structural equivalence ideasfrom social network analysis within dimensional models of organizational fields.
Appendix: Algorithmic Aspects
We provide some further comments on the COMBINE algorithm for dual clustering that weintroduced in Section 4.2 and that is available (as a stand-alone .exe file) from the first-listedauthor.
Relations with other clustering algorithms. Ward’s (1963) agglomerative clustering al-gorithm successively reduces the number of clusters. At each stage in the procedure (asdescribed by Lorr, 1983:90), the goal is to form a group such that the sum of squaredwithin-group deviations about the group mean of each profile variable is minimized for allprofile variables at the same time. The value of the objective function is expressed as the sumof the within-group sum of squares. Each reduction in groups is achieved by consideringall possible N(N–1)/2 pairings and selecting the pairing for which the objective-functionvalue is smallest. Each cluster previously formed is treated as one unit.
Greenacre’s (1988) algorithm transposes the ANOVA-like feature’s of Ward’s clusteringprocedure so that Greenacre’s “joint cluster analysis” provides a decomposition of Pearson’schi-square statistic for the whole table, with reference to the squared chi-square distancesbetween cluster centroids. With respect to rows, for example, “rows are combined so as tokeep the [Pearson] chi-square statistic for the collapsed table as high as possible, that is asclose as possible to the chi-square for the original table” (Greenacre, 1988:44).
Our algorithm is a likelihood ratio chi-square version of Greenacre’s. Unlike Greenacre,we decompose the original table’s degrees of freedom as well as its chi-square, and (at eachstage) we compute nominal-level indices of fit (p values). Thus, we put together Goodman’s(1981) results on homogeneity and structure with a likelihood ratio version of Greenacre’salgorithm. The decompositions such as those of our Eq. (2) and Table 5 (part C), and avariety of other reasons (including the handling of deleted cells or missing values), makethe choice of the likelihood ratio chi-square (in comparison to Pearson’s chi-square statistic)a highly desirable choice in many instances. Greenacre’s algorithm is of direct relevance tocorrespondence analysis, whereas ours is of direct relevance to loglinear models. Goodman(1996) is one effort to indicate fundamental relations between these modeling enterprises.
For the reasons given above, our clustering algorithm might be expected to producequite similar, though not identical aggregations to those resulting both from Ward’s andfrom Greenacre’s procedures. This is in fact the case, and all three of these algorithms giveresults closer to one another than to results obtained from other clustering algorithms suchas CONCOR and those of Johnson. Detailed comparative results are available from thefirst-listed author.
Relation of the algorithm to graphical techniques. In the literature on association modelshaving equated scores (such as model A4 in Table 5), there is no systematic discussion
AGGREGATION OF ORGANIZATIONAL NETWORKS 39
as to how the researcher might discover empirically which categories can be equated forpurposes of producing a more parsimonious model of association. With respect to the RC(M)model (Eq. (3) above), the basic advice in the literature is to try equating µ scores (or ν
scores) that seem close numerically. As Clogg (1986:286) writes, “points bunched togethersuggest combining particular row [or column] categories,” and he goes on to suggest aheuristic procedure. Such advice is not inconsistent with the more principled procedure(that of Goodman, 1981) proposed in this paper for equating categories. Our algorithm,nonetheless, provides a systematic set of pathways through possible aggregations, andallows applicability of the homogeneity criteria of Goodman (1981).
The lack of formal hypothesis tests. As we have stressed throughout this paper, we (asmany other analysts who employ loglinear models in a “ransacking” manner) interpretp values nominally, as descriptive indices of fit, rather than as formal hypothesis tests.
The lack (so far) of simultaneous tests. Rather than testing each successive combinationof categories one step at a time, as we currently do, it would be more desirable to have asimultaneous assessment of the fit of the entire partition of categories for rows (and also forcolumns). Greenacre (1988:45–46) summarizes work on multiple-comparison approachesthat seem highly promising (and that he incorporates in his algorithm). For our approach,this topic is one for future research.
Application to one-mode data. We have described our algorithm (Section 4.2 above) asapplicable to two-mode data, and our COMBINE program is restricted in this way. We havedeveloped a related algorithm for one-mode data (such as that analyzed in Section 3). Withrespect to square matrices, our choice has been to omit estimation of cells on the principaldiagonal. More precisely, we first estimate the counts for diagonal cells on the basis of thequasi-independence model, and then we insert these estimated values in place of the table’sobserved diagonal frequencies. Such a procedure is consistent with the results we report inSection 3.
Acknowledgments
The authors thank Michael Bourgeois, Linton Freeman, Alexis Ferrand, Emmanuel Lazega,Vincent Duquenne, and Craig Rawlings for their advice, and colleagues at the SecondEuropean Thematic Conference for Network Analysis (Lille, France, May 2002) and at theUniversity of California—Irvine (August 2002) who heard presentations of earlier versionsof Section 3. We are grateful for detailed and productive comments from two anonymousreferees and from the special issue editors.
Notes
1. Structural equivalence is a core concept of social network analysis. Wasserman and Faust (1994) providean extensive review of this concept (pp. 347–424) from White and Lorrain’s pioneering 1971 paper throughresearch applications by Burt, White, Boorman, Breiger and others, and onward (pp. 675–723) to work byFienberg, Wasserman, Wang, Wong, and others on stochastic blockmodels; see also Section 2 below.
2. The full names of journals, abbreviated in Table 1, are: Journal of Abnormal and Social Psychology (JASP),Journal of Consulting Psychology (JCP), Journal of Applied Psychology (JApP), Journal of Educational

40 BREIGER AND MOHR
Psychology (JEdP), Psychometrika (Pka), American Journal of Psychology (AJP), Journal of Comparativeand Physiological Psychology (JCPP), and Journal of Experimental Psychology (JExP).
3. For two actors labeled i and j, the UCINET procedure compares cell (i, j) to cell (j, i), and it compares cell (i, i)to cell (j, j).
4. As to the norming of estimated parameters, we impose that the uR and the uC sum to 0, and that the uRC sumto 0 across both row classes and column classes.
5. In earlier implementations (“blockmodel analysis”) of structural equivalence, there was an emphasis onlocating subtables in which there were no ties, termed “zeroblocks” (see Wasserman and Faust, 1994:390–391 for a review). In stochastic formulations of structural equivalence (such as those of Wang and Wong1987, Nowicki and Snijders 2001, both of which are concerned with 0-1 network data, and that of thepresent paper, which is concerned with counted data), the emphasis is on finding subtables of network tiesall of which are well represented by a single number. Finding rectangular regions of “high” and “low”densities of ties replaces the search for locating blocks of zero density (“zeroblocks”) as the main goal of theanalysis.
6. Much more might be said at this point about goodness of fit, including reference to alternative statistics (suchas Raftery’s bic) and to the point (made earlier in the text) that we are merely pretending that our hypothesis ofstructural equivalence was formulated without first exploring the data. In the interest of hewing to our didacticpresentation, we merely indicate these issues.
7. In cases where some of the cells have estimated frequencies of zero, calculation of degrees of freedom needsfurther modification. However, for the model considered here (Eq. (1)) and for tables larger than 2 × 2,zero cell frequencies for the estimated data can occur only if one of the rows or columns sums to zero. Thiscomplication therefore does not arise in practice.
8. If two actors are structurally equivalent (as in panel B of Table 1), they are also automorphically equivalent.Automorphic equivalence is the more general concept.
9. Agresti (2002:148–149) is one standard introduction to the “no three-factor interaction” model. In brief: Iftwo tables (each of size R × C) are combined into a three-way array (of size 2 × R × C), then this modelimposes that any odds-ratio involving any four cells in the first table is identical to the corresponding odds-ratio (involving the same four cells) in the second table. The innovation proposed here is to use this modelto test two copies of the same table, with categories in one of the tables permuted according to the stipulatedautomorphism.
10. Special problems apply when considering non-symmetric models that blank out the diagonal. On this pointand on the fundamental decomposition illustrated here, see Goodman (1981).
11. A reviewer expressed surprise that the categories “ethnic” and “low-income” were found to be the mostsimilar identity categories. We reply with reference to three aspects. First, substantively, a web search usingthe keywords “ethnic” and “low-income” reveals that these words are used together with very high regularity todescribe target populations for programs of social services. Thus, e.g., the website for the California AdolescentFitness and Nutrition Program Scholarships posts on its web site (http://www.canfit.org/html/faq.html) :“Who is eligible? Organizations serving multi-ethnic low-income youth 10–14.” Second, relationally, theindependence test reported in the first paragraph of our Section 4.2 (yielding a chi-square of 8.58 on 16 df,and therefore a p-value of .93) was performed on all pairs of identity categories, as described in our text,and these two categories (“ethnic” and “low-income”) were associated with the highest p-value. Third, othermeasures that might have been used in comparing the similarity of these categories lead to non-contradictoryconclusions. For example, the simple correlation between these two rows (“ethnic” and “low-income”) ofTable 4 is +.81, among the highest 10% of the correlations among all 66 pairs of rows. (Note that thecorrelation compares vectors independent of their N’s, whereas the chi-square method that we used allows adecomposition of the table’s total chi-square as illustrated in the table in Section 4.2.)
12. We refer to the p-value as “nominal” for reasons akin to those presented in a previous note: because wesearched empirically for the best fit, we are not providing a formal test of a hypothesis; therefore, the p-valueis merely a descriptive indication of the degree of fit.
13. The table introduced above, at the end of the first paragraph of Section 4.2, illustrates such a decomposition ofthe total chi-square (and degrees of freedom), in the case of rows alone. In the “joint” module of our algorithm,we conduct 176 similar analyses for the joint applications of row clusterings and column clusterings thatconcern us.
AGGREGATION OF ORGANIZATIONAL NETWORKS 41
14. Specifically, in figure 3 we graph the µ and ν scores of Table 4b, with each set of scores multiplied by thesquare root of the respective weight φ, as recommended in Goodman (1996).
References
Abzug, R. and J. Galaskiewicz (2001), “Nonprofit Boards: Crucibles of Expertise or Symbols of Local Identities?”Nonprofit and Voluntary Sector Quarterly, 30, 51–73.
Agresti, A. (2002), Categorical Data Analysis, 2nd edn., Wiley-Interscience, New York.Anheier, H.K., J. Gerhards and F.P. Romo (1995), “Forms of Capital and Social Structure in Cul-
tural Fields: Examining Bourdieu’s Social Topography,” American Journal of Sociology, 100, 859–903.
Borgatti, S.P. and M.G. Everett (1992), “Notions of Position in Social Network Analysis,” in P.V.Marsden (Ed.), Sociological Methodology 1992, American Sociological Association, Washington, DC,pp. 1–35.
Borgatti, S.P., M.G. Everett and L.C. Freeman (2002), Ucinet for Windows: Software for Social Network Analysis.Harvard, MA: Analytic Technologies.
Bourdieu, P. ([1979] 1984), Distinction: A Social Critique of the Judgment of Taste, Harvard University Press,Cambridge.
Bourdieu, P. (1990), In Other Words, Stanford University Press.Breiger, R.L. (1981), “The Social Class Structure of Occupational Mobility,” American Journal of Sociology, 87,
578–611.Breiger, R.L. (2000), “A Tool Kit for Practice Theory,” Poetics, 27, 91–115.Breiger, R.L. (2003), “Emergent Themes in Social Network Analysis: Results, Challenges, Opportunities,” in
R.L. Breiger, K.M. Carley and P.E. Pattison (Eds.), Dynamic Social Network Models and Analysis: WorkshopSummary and Papers, Washington, DC: National Research Council/National Academy of Sciences, NationalAcademies Press.
Breiger, R.L. (2004), “The Analysis of Social Networks,” in M. Hardy and A. Bryman (Eds.), Handbook of DataAnalysis, Sage, London, pp. 505–526.
Breiger, R.L. and J.M. Roberts, Jr. (1998), “Solidarity and Social Networks,” in P. Doreian and T. Fararo(Eds.), The Problem of Solidarity: Theory and Models, Amsterdam: Gordon and Breach, pp. 239–262.
Burt, R.S. (1991), “Measuring Age as a Structural Concept,” Social Networks, 13, 1–34.Clogg, C.C. (1986), “Comment,” International Statistical Review, 54, 284–288.Coombs, C.H. (1964), A Theory of Data, New York:Wiley.DiMaggio, P. (1986), “Structural Analysis of Organizational Fields: A Blockmodel Approach,” Research in Or-
ganizational Behavior, 8, 335–370.DiMaggio, P. and W.W. Powell (1983), “The Iron Cage Revisited: Institutional Isomorphism and Collective
Rationality in Organizational Fields,” American Sociological Review, 48, 147–160.Douglas, M. (1986), How Institutions Think, Syracuse: Syracuse University Press.Durkheim, E. and M. Mauss ([1903] 1963), Primitive Classification, tr. R. Needham, Chicago: University of
Chicago Press.Erickson, B.H. (2001), “Good Networks and Good Jobs: The Value of Social Capital to Employers and Employees,”
in N. Lin, K. Cook and R.S. Burt (Eds.), Social Capital: Theory and Research, Aldine de Gruyter, New York,pp. 127–158.
Faulkner, R.R. (1983), Music on Demand: Composers and Careers in the Hollywood Film Industry, NewBrunswick, NJ: Transaction Books.
Fligstein, N. and P. Brantley (1992), “Bank Control, Owner Control, or Organizational Dynamics: Who Controlsthe Large Modern Corporation?” American Journal of Sociology, 98, 280–307.
Friedland, R. and R.A. Alford (1991), “Bringing Society Back In: Symbols, Practices, and Institutional Con-tradictions,” in W.W. Powell and P.J. DiMaggio (Eds.), The New Institutionalism in Organizational Analysis,Chicago: University of Chicago Press, pp. 232–263.
Geertz, C. (1973), The Interpretation of Cultures, New York: Basic Books,
42 BREIGER AND MOHR
Gerlach, M.L. (1992), “The Japanese Corporate Network: A Blockmodel Analysis,” Administrative Science Quar-terly, 37, 105–139.
Giuffre, K. (1999), “Sandpiles of Opportunity: Success in the Art World,” Social Forces, 77, 815–832.Goodman, L.A. (1981), “Criteria for Determining Whether Certain Categories in a Cross-Classification Table
Should be Combined, with Special Reference to Occupational Categories in an Occupational Mobility Table,”American Journal of Sociology, 87, 612–650.
Goodman, L.A. (1996), “A Single General Method for the Analysis of Cross-Classified Data: Reconcilia-tion and Synthesis of Some Methods of Pearson, Yule, and Fisher, and Also Some Methods of Corre-spondence Analysis and Association Analysis,” Journal of the American Statistical Association, 91, 408–428.
Greenacre, M.J. (1988), “Clustering the Rows and Columns of a Contingency Table,” Journal of Classification,5, 39–51.
Harcourt, B.E. (2002), “Measured Interpretation: Introducing the Method of Correspondence Analysis to LegalStudies,” University of Illinois Law Review, 2002, 979–1017.
Holland, P.W., K.B. Laskey and S. Leinhardt (1983), “Stochastic Blockmodels: First Steps,” Social Networks, 5,109–137.
Hout, M. (1983), Mobility Tables, Beverly Hills: Sage.Karen, D. (1990), “Toward a Political-Organizational Model of Gatekeeping: The Case of Elite Colleges,” Soci-
ology of Education, 63, 227–240.Levi-Strauss, C. ([1949] 1969), The Elementary Structures of Kinship, R. Needham (Ed.), Boston: Beacon Press.Lomi, A. and E.R. Larsen (2001), “Introduction,” in A. Lomi and E.R. Larsen (Eds.), Dynamics of Organizations:
Computational Modeling and Organization Theories, Cambridge, MA: MIT Press, 3–34.Lorr, M. (1983), Cluster Analysis for Social Scientists, San Francisco: Jossey-Bass.Lorrain, F.P. and H.C. White (1971), “Structural Equivalence of Individuals in Social Networks,” Journal of
Mathematical Sociology, 1, 49–80.Marsden, P.V. (1981), “Models and Methods for Characterizing the Structural Parameters of Groups,” Social
Networks, 3, 1–27.Mohr, J.W. (1998), “Measuring Meaning Structures,” Annual Review of Sociology, 24, 345–370.Mohr, J.W., M. Bourgeois and V. Duquenne (2002), “How to Read an Institution: A Structuralist Approach,” paper
presented at the Sunbelt International Social Networks Conference, New Orleans (February).Mohr, J.W. and V. Duquenne (1997), “The Duality of Culture and Practice: Poverty Relief in New York City,
1888–1917,” Theory and Society, 26, 305–356.Nowicki, K. and T.AB. Snijders (2001), “Estimation and Prediction for Stochastic Blockstructures,” Journal of
the American Statistical Association, 96, 1077–1087.Padgett, J.F. and C.K. Ansell (1993), “Robust Action and the Rise of the Medici, 1400–1434,” American Journal
of Sociology, 98, 1259–1319.Pattison, P.E. and R.L. Breiger (2002), “Lattices and Dimensional Representations: Matrix Decompositions and
Ordering Structures,” Social Networks, 24, 423–444.Pattison, P.E. and S. Wasserman (1999), “Logit Models and Logistic Regressions for Social Networks,
II: Multivariate Relations,” British Journal of Mathematical and Statistical Psychology, 52, 169–193.
Rao, H., P. Monin and R. Durand (2003), “Institutional Change in Toque Ville: Nouvelle Cuisine as an IdentityMovement in French Gastronomy,” American Journal of Sociology, 108, 795–843.
Roberts, J.M., Jr. (1990), “Modeling Hierarchy: Transitivity and the Linear Ordering Problem,” Journal of Math-ematical Sociology, 16, 77–87.
Romney, A.K. (1989), “Quantitative Models, Science, and Cumulative Knowledge,” Journal of QuantitativeAnthropology, 1, 153–223.
Wang, Y.J. and G.Y. Wong (1987), “Stochastic Blockmodels for Directed Graphs,” Journal of the AmericanStatistical Association, 82, 8–19.
Ward, J.H. (1963), “Hierarchical Grouping to Optimize an Objective Function,” Journal of the American StatisticalAssociation, 58, 236–244.
Wasserman, S. and K. Faust (1994), Social Network Analysis: Methods and Applications. Cambridge UniversityPress.

AGGREGATION OF ORGANIZATIONAL NETWORKS 43
Ronald L. Breiger is Professor of Sociology at the University of Arizona. His Ph.D. is from Harvard University.His research is in the areas of social network analysis, stratification, mathematical models, theory, and measurementissues in cultural and institutional analysis. With Linton Freeman, he co-edits the journal Social Networks.
John W. Mohr is an Associate Professor at the University of California at Santa Barbara. His Ph.D. is from YaleUniversity. His area of research concerns the sociology of culture, formal organizations, the history of the welfarestate and diversity issues in higher education. With Roger Friedland, he is the organizer of the Cultural TurnConferences series at UCSB and co-editor of the forthcoming volume Matters of Culture (Cambridge UniversityPress).