Insights into Adsorption of NH 3 on HKUST-1 Metal–Organic Framework: A Multitechnique Approach
12
Insights into Adsorption of NH 3 on HKUST‑1 Metal−Organic Framework: A Multitechnique Approach Elisa Borfecchia, † Sara Maurelli, † Diego Gianolio, ‡ Elena Groppo, † Mario Chiesa, † Francesca Bonino,* ,† and Carlo Lamberti † † Department of Chemistry, NIS Centre of Excellence, and INSTM Reference Center, University of Turin, Via P. Giuria 7, I-10125 and Via Quarello 11, I-10135, Torino, Italy ‡ Diamond Light Source Ltd., Harwell Science and Innovation Campus, Didcot OX11 0DE, United Kingdom * S Supporting Information ABSTRACT: We report a careful characterization of the interaction of NH 3 with the Cu(II) sites of the [Cu 2 C 4 O 8 ] paddle-wheel cornerstone of the HKUST-1 metallorganic framework, also known as Cu 3 (BTC) 2 . The general picture emerging from combining XRPD, EXAFS, XANES, mid- and far-IR, DRUV−vis, and EPR techniques is that the presence of traces of water has relevant consequences on the effect of ammonia on the MOF framework. NH 3 adsorption on the dry system results in a strong chemisorption on Cu(II) sites that distorts the framework, keeping the crystallinity of the material. Perturbation observed upon NH 3 adsorption is analogous to that observed for H 2 O, but noticeably enhanced. When the adsorption of ammonia occurs in humid conditions, a time-dependent, much deeper modification of the system is observed by all of the considered techniques. On a methodological ground, it is worth noticing that we used the optimization of XANES spectra to validate the bond distance obtained by EXAFS. 1. INTRODUCTION Metal organic frameworks (MOFs) are crystalline nanoporous materials comprised of two basic structural building units, transition metal ions, or small metal-containing clusters, and connecting polyfunctional organic ligands such as di- or tricarboxylic acids. 1−8 These materials are characterized by a crystalline three-dimensional structure, with very high pore volume and surface area. This hybrid architecture opens the possibility to design and synthesize a great variety of new porous materials, which are in principle able to display novel functionalities that are potentially exploitable for a number of applications in catalysis, 9−19 gas sorption, storage, and separation by selective adsorption. 20−31 Among the several hundred different MOF structures, Cu 3 (BTC) 2 (H 2 O) 3 (BTC = benzene 1,3,5-tricarboxylate), also known as HKUST-1, 32 is one of the most investigated and among the first commercially available representatives of this class of organic−inorganic hybrid materials, featuring specific adsorption, 33−36 magnetic, 37 and catalytic properties. 38 HKUST-1 is characterized by so-called paddle-wheel units formed by four carboxylate groups coordinating two anti- ferromagnetically coupled Cu(II) ions. The Cu(II) dimers are connected by the BTC linker molecules to form a three- dimensional porous network; water molecules are weakly bound to the residual axial binding site of the Cu(II) ions. These axial water molecules can be easily removed from the Cu(II) dimers by heating at moderate temperature in vacuo to form structurally well-defined accessible Lewis acid copper sites available for chemisorptions of molecules having basic character. 35,36 In particular, the present contribution is devoted to study the strong adsorption of ammonia basic molecule at room temperature. 39−43 Ammonia capture is a problem that has some technological relevance. As an example, the biogas produced from anaerobic digestion of biowaste (i.e., animal manure) is mainly composed of methane and carbon dioxide, but also contains some impurity gases, such as ammonia, that has to be removed from the biogas prior to its energy application. 44 Nature has developed complex enzymes able to selectively bind NH 3 molecules; 45 HKUST-1 porous MOF can be considered as a promising synthetic counterpart. 32,39−42,46 The potential of HKUST-1 in ammonia removal from contaminated air streams was reported many years ago by Chui and co-workers. 32 The reaction of ammonia with the individual building blocks of Cu 3 (BTC) 2 , that is, Cu(II) ion and BTC, is well-known. In aqueous solution, Cu(II) ion, in the presence of limited ammonia, is initially converted to Cu(OH) 2 ; however, copious amounts of ammonia eventually yield [Cu(NH 3 ) 4 ] 2+ . Carbox- ylic acids initially form the ammonium salt, which, with sufficient heating, can be pyrolized to their corresponding amides. Peterson et al. 39 states that HKUST-1 reacts with ammonia to form a presumed diammine−copper(II) complex Received: June 12, 2012 Revised: July 27, 2012 Published: August 3, 2012 Article pubs.acs.org/JPCC © 2012 American Chemical Society 19839 dx.doi.org/10.1021/jp305756k | J. Phys. Chem. C 2012, 116, 19839−19850
-
Upload
independent -
Category
Documents
-
view
2 -
download
0
Transcript of Insights into Adsorption of NH 3 on HKUST-1 Metal–Organic Framework: A Multitechnique Approach

Insights into Adsorption of NH3 on HKUST‑1 Metal−OrganicFramework: A Multitechnique ApproachElisa Borfecchia,† Sara Maurelli,† Diego Gianolio,‡ Elena Groppo,† Mario Chiesa,† Francesca Bonino,*,†
and Carlo Lamberti†
†Department of Chemistry, NIS Centre of Excellence, and INSTM Reference Center, University of Turin, Via P. Giuria 7, I-10125and Via Quarello 11, I-10135, Torino, Italy‡Diamond Light Source Ltd., Harwell Science and Innovation Campus, Didcot OX11 0DE, United Kingdom
*S Supporting Information
ABSTRACT: We report a careful characterization of theinteraction of NH3 with the Cu(II) sites of the [Cu2C4O8]paddle-wheel cornerstone of the HKUST-1 metallorganicframework, also known as Cu3(BTC)2. The general pictureemerging from combining XRPD, EXAFS, XANES, mid- andfar-IR, DRUV−vis, and EPR techniques is that the presence oftraces of water has relevant consequences on the effect ofammonia on the MOF framework. NH3 adsorption on the drysystem results in a strong chemisorption on Cu(II) sites thatdistorts the framework, keeping the crystallinity of thematerial. Perturbation observed upon NH3 adsorption is analogous to that observed for H2O, but noticeably enhanced.When the adsorption of ammonia occurs in humid conditions, a time-dependent, much deeper modification of the system isobserved by all of the considered techniques. On a methodological ground, it is worth noticing that we used the optimization ofXANES spectra to validate the bond distance obtained by EXAFS.
1. INTRODUCTION
Metal organic frameworks (MOFs) are crystalline nanoporousmaterials comprised of two basic structural building units,transition metal ions, or small metal-containing clusters, andconnecting polyfunctional organic ligands such as di- ortricarboxylic acids.1−8 These materials are characterized by acrystalline three-dimensional structure, with very high porevolume and surface area. This hybrid architecture opens thepossibility to design and synthesize a great variety of newporous materials, which are in principle able to display novelfunctionalities that are potentially exploitable for a number ofapplications in catalysis,9−19 gas sorption, storage, andseparation by selective adsorption.20−31
Among the several hundred different MOF structures,Cu3(BTC)2(H2O)3 (BTC = benzene 1,3,5-tricarboxylate),also known as HKUST-1,32 is one of the most investigatedand among the first commercially available representatives ofthis class of organic−inorganic hybrid materials, featuringspecific adsorption,33−36 magnetic,37 and catalytic properties.38
HKUST-1 is characterized by so-called paddle-wheel unitsformed by four carboxylate groups coordinating two anti-ferromagnetically coupled Cu(II) ions. The Cu(II) dimers areconnected by the BTC linker molecules to form a three-dimensional porous network; water molecules are weaklybound to the residual axial binding site of the Cu(II) ions.These axial water molecules can be easily removed from theCu(II) dimers by heating at moderate temperature in vacuo toform structurally well-defined accessible Lewis acid copper sites
available for chemisorptions of molecules having basiccharacter.35,36 In particular, the present contribution is devotedto study the strong adsorption of ammonia basic molecule atroom temperature.39−43
Ammonia capture is a problem that has some technologicalrelevance. As an example, the biogas produced from anaerobicdigestion of biowaste (i.e., animal manure) is mainly composedof methane and carbon dioxide, but also contains someimpurity gases, such as ammonia, that has to be removed fromthe biogas prior to its energy application.44 Nature hasdeveloped complex enzymes able to selectively bind NH3molecules;45 HKUST-1 porous MOF can be considered as apromising synthetic counterpart.32,39−42,46 The potential ofHKUST-1 in ammonia removal from contaminated air streamswas reported many years ago by Chui and co-workers.32 Thereaction of ammonia with the individual building blocks ofCu3(BTC)2, that is, Cu(II) ion and BTC, is well-known. Inaqueous solution, Cu(II) ion, in the presence of limitedammonia, is initially converted to Cu(OH)2; however, copiousamounts of ammonia eventually yield [Cu(NH3)4]
2+. Carbox-ylic acids initially form the ammonium salt, which, withsufficient heating, can be pyrolized to their correspondingamides. Peterson et al.39 states that HKUST-1 reacts withammonia to form a presumed diammine−copper(II) complex
Received: June 12, 2012Revised: July 27, 2012Published: August 3, 2012
Article
pubs.acs.org/JPCC
© 2012 American Chemical Society 19839 dx.doi.org/10.1021/jp305756k | J. Phys. Chem. C 2012, 116, 19839−19850

under dry conditions and, under humid conditions, a Cu(OH)2species and (NH4)3BTC. Nitrogen adsorption, XRPD, andNMR testing of fresh and exhausted samples all providedevidence for the permanent loss of structure and/or porosity,with samples challenged with ammonia under humidconditions undergoing the largest change. Although theporosity of the material is destroyed, the resulting capacity ofthe exhausted samples for ammonia is indicative of an extendedreactive network consistent with that of the copper(II) complexproducts.Herein, we present new details on the adsorption properties
of HKUST-1 toward ammonia by applying a multitude ofcharacterization techniques (XRPD, XAFS, IR, DRUV−visible−NIR, and EPR).
2. EXPERIMENTAL SECTION2.1. Sample Preparation. HKUST-1 sample was pur-
chased from Sigma-Aldrich. The dehydrated form of HKUST-1has been obtained upon activation in high vacuum for 1 h at423 K. Rehydration of the samples was obtained uponcontacting the powder with the vapor pressure of water atroom temperature: these conditions are significantly milderthan those experienced by Kuesgen et al.47 where HKUST-1was immersed in deionized water and heated at 323 K for 24 h.As-prepared (rehydrated) and dehydrated samples wereexposed to an ammonia equilibrium pressure of 60 mbar.The adsorption of both water and ammonia was carried out atroom temperature. EXAFS spectroscopy testifies that adsorp-tion of water vapor pressure and of 60 mbar of NH3 results in a1:1 Cu:adsorbate ratio. A large amount of sample was subjectedto the same treatment and further separated in differentfractions, which were measured by XRPD, XAFS, DRUV−visible, and IR. This method guarantees that the same sample ismeasured by different techniques.2.2. Structural Characterization: XRPD and XAFS.
2.2.1. XRPD Measurements. X-ray powder diffraction(XRPD) patterns have been collected with a PW3050/60X’Pert PRO MPD diffractometer from PANalytical working inDebye−Scherrer geometry, using as source the high powerceramic tube PW3373/10 LFF with a Cu anode equipped withNi filter to attenuate Kβ and focused by X-ray mirror PW3152/63. Scattered photons have been collected by a RTMS (realtime multiple strip) X’celerator detector. The samples havebeen measured as powders inside a 0.8 mm boronsilicatecapillary filled in a glovebox and sealed in inert atmosphere, toprevent contamination from moisture.2.2.2. XAFS Measurements. X-ray absorption experiments,
at the Cu K-edge (8979 eV), were performed at the BM26Bbeamline of the ESRF facility (Grenoble, France).48,49 Thewhite beam was monochromatized using a Si(111) doublecrystal; harmonic rejection was performed by detuning thecrystals at 20% of the rocking curve. The samples wereprepared in the form of a pellet, with the thickness optimized toobtain an edge jump of ca. 1, and an absolute μx of ca. 1.5. Thesame pellet was activated and successively treated with NH3inside a devoted cell equipped with kapton windows, whichallows to perform in situ measurements.50 XAS measurementswere performed in transmission mode, using two ionizationchambers to monitor the intensity of incident I0 andtransmitted I1 beams. The chambers were filled with 1 atm ofmixed gases (N2 15%, He 85% for I0 and N2 70%, He 30% forI1), resulting in 10% and 50% of absorption, respectively.Energy calibration was checked using a Cu metal foil positioned
after the second ionization chamber (I1) and measured using athird ionization chamber (I2), as described elsewhere.51 Thepre-edge region of the XAS spectrum was acquired with anenergy step of 10 eV and an integration time of 1 s/point. Theedge region was collected using an energy step of 0.2 eV and anintegration time of 5 s/point. The EXAFS part of the spectrawas collected with a variable sampling step in energy, resultingin Δk = 0.05 Å−1, up to 18 Å−1, with an integration time thatlinearly increases with k from 5 to 25 s/point to account for thelow signal-to-noise ratio at high k values. The extraction of theχ(k) function was performed using the Athena program.52 Foreach sample, four consecutive EXAFS spectra have beencollected, and corresponding k3-weighted χ(k) functions havebeen averaged before data analysis, as described elsewhere,53
and Fourier transformed in the Δk = 2.0−16.0 Å−1 range. Thefits of the EXAFS spectra measured for the as-prepared,activated, and activated + NH3 HKUST-1 were performed in R-space in the ΔR = 1.0−5.0 Å range, resulting in 35 independentpoints (2ΔkΔR/π > 35). Because of the complexity of thestructure,36,54 more than 50 single scattering (SS) and multiplescattering (MS) paths were included in the fit. To limit thenumber of optimized variables, all paths have been optimizedwith the same amplitude factor (S0
2) and with the same energyshift parameter (ΔE). Phases and amplitudes have beencalculated by FEFF6 code,55 adopting as input the structureobtained from a previous XRD refinement.32,36
XANES spectra of the hydrated MOF have been simulatedusing FEFF8.4 code,56 adopting as input geometry the XRPDstructure32 and cutting a cluster centered on one of the Cuatoms with a radius of 6 Å around it. For a further improvementof the simulations, an optimization of geometrical parameterswas performed exploiting FitIt software.57 The simulation ofthe dehydrated sample was obtained removing the watermolecules from the previous cluster, while for the sample ininteraction with ammonia the H2O molecules were substitutedby two NH3 ones. In both cases, the structure was optimized tomatch the experimental spectrum as described for the hydratedcase.In all cases, calculations for the absorption spectra and
densities of states have been done using the muffin-tin potentialand the Hedin−Lundqvist exchange correlation, taking care ofthe presence of a core hole in a self-consistency scheme (for theself-consistent calculations, a radius of 4 Å has been used). Totake into account the experimental broadening, an imaginarypotential Vi = 1.0 eV has been introduced. Althoughquadrupole transitions are much weaker than the dipole ones,their contribution has been considered in calculations.
2.3. IR Spectroscopy. IR spectra have been collected inboth mid-IR region (3800−400 cm−1) and far-IR region (600−100 cm−1). IR spectra in the mid-IR region have been collectedin ATR (Attenuated Total Reflectance) mode, by using aBruker Alpha instrument equipped with an ATR accessory(diamond crystal), and placed inside the glovebox; the spectrahave been collected at a resolution of 4 cm−1. It is worthnoticing that the ATR acquisition mode allows one to collectIR spectra on pure samples in the powdered form withoutnecessity to make a pellet using KBr as diluent (whichunavoidably contains some water). This is an advantage whenhandling samples sensitive to moisture, as in our case. Far-IRspectra have been collected at a resolution of 4 cm−1 on aBruker Vertex 70 instrument, equipped with a Si beam splitterand a far-IR DTGS detector. The samples have been diluted inparaffin.
The Journal of Physical Chemistry C Article
dx.doi.org/10.1021/jp305756k | J. Phys. Chem. C 2012, 116, 19839−1985019840

2.4. UV−Visible−NIR Spectroscopy. UV−vis−NIR spec-tra have been collected in diffuse reflectance (DR) mode on aCary5000 Varian spectrophotometer equipped with a reflec-tance sphere. All of the samples have been measured in thepowdered form inside a homemade cell having an optical bulb(suprasil quartz) and allowing one to perform measurements incontrolled atmosphere.2.5. EPR Measurements. CW EPR spectra were recorded
on a Bruker EMX spectrometer operating at X-bandfrequencies and equipped with a cylindrical cavity operatingat a 100 kHz field modulation. The spectra have been recordedat 10 mW microwave power. The spectra processing wasperformed with software provided by Bruker, while forcomputer simulation the EPRsim32 program was used.58
Pulse EPR experiments were performed on an ELEXYS 580Bruker spectrometer (at microwave frequency 9.76 GHz)equipped with a liquid-helium cryostat from Oxford Inc. Allexperiments were performed at 10 K. The magnetic field wasmeasured with a Bruker ER035 M NMR Gaussmeter.Electron−spin−echo (ESE) detected EPR experiments were
carried out with the pulse sequence: π/2−τ−π−τ−echo, withmicrowave pulse lengths tπ/2 = 16 ns and tπ/2 = 32 ns and a τvalue of 200 ns. Hyperfine sublevel correlation (HYSCORE)experiments59 were carried out with the pulse sequence π/2−τ−π/2−t1−π−t2−π/2−τ−echo with microwave pulse lengthtπ/2 = 16 ns and tπ = 16 ns. The time intervals t1 and t2 werevaried in steps of 8 ns starting from 100 to 3300 ns. Twodifferent τ values were chosen (τ = 104 and 172 ns). An eight-step phase cycle was used to eliminate unwanted echoes.The time traces of the HYSCORE spectra were baseline
corrected with a third-order polynomial, apodized with aHamming window, and zero filled. After two-dimensionalFourier transformation, the absolute value spectra werecalculated. The spectra were added for the different τ valuesto eliminate blind-spot effects. The HYSCORE spectra weresimulated using the EasySpin package.60
3. RESULTS AND DISCUSSION3.1. XRPD Analysis. The XRPD pattern of as-synthetized
hydrated HKUST-1 (blue curve in Figure 1) confirms thecrystalline nature of the sample and the absence of any extraphase.32,36 Upon dosage of ammonia on hydrated HKUST-1,the XRPD pattern is strongly modified (orange curve in Figure1), indicating a significant distortion of the lattice, whichhowever does not undergo a complete amorphization. Afterprolonged exposure time, a further modification of thediffraction features, along with an overall broadening of thepeaks, is observed (Figure 1, purple curve).39
The XRPD pattern of the activated sample (pink curve inFigure 1) was previously reported by Prestipino et al.36 Thispattern shows an overall slight shift of the diffraction peakstoward higher θ-values if compared to that of the as-preparedmaterial; this observation is compatible with a globalcontraction of the bond lengths induced by the activationprocess. Moreover, the dehydration induces a strong intensityenhancement of a diffraction peak in the very low-θ region,around 6.7°. Surprisingly, if pure dry ammonia is dosed on theactivated material, the diffraction pattern (light green curve inFigure 1) is much less perturbed than that obtained by dosingammonia on the hydrated sample. Nevertheless, comparing thispattern with the one measured for the activated MOF, a slightshift in the peaks positions toward shorter θ values is observed,as well as small variations in their relative intensities. The
intense peak around 6.7° already observed for the activatedmaterial is maintained after interaction with dry NH3. The maindifference with respect to the pattern of the activated sample isthe appearance of a peak around 5.8°, which was not present atall in the pattern of the activated material. Therefore, it shouldbe concluded that HKUST-1 framework is only slightlyperturbed upon NH3 adsorption and goes back to a situationsimilar to that characteristic of hydrated material, with a slightgeneralized lengthening of the bond distances. Finally, theXRPD pattern does not change when H2O is dosed on thesample precontacted with NH3 (Figure 1, dark green curve).The XRPD data shown in Figure 1 demonstrate that NH3 aloneaffects the crystalline structure of the dehydrated HKUST-1only very slightly, whereas in combination with H2O it causes adrastic change in the structure, up to the completeamorphization of the sample. However, the effect is observedonly when H2O is dosed first, and NH3 later.The quality of the XRPD data shown in Figure 1 is not
enough to allow a structure refinement. To gain information onthe local environment around copper centers in the absenceand in the presence of ammonia, we used Cu K-edge EXAFSspectroscopy.
3.2. XAS Analysis. 3.2.1. XANES Spectroscopy. Inves-tigation of the XANES region of the X-ray absorption spectrumcan provide detailed information on both the oxidation stateand the coordination symmetry of the absorber atom and was
Figure 1. XRPD patterns of HKUST-1 in different conditions: as-prepared (hydrated, blue line), after dosage of ammonia on a samplepreviously contacted with water vapor pressure (orange line), and itsevolution after prolonged exposure time in such conditions (purpleline), activated sample (pink line, adapted from Prestipino et al.36),after pure dry ammonia dosage on the activated sample (light greenline), and after contacting with water vapor pressure the samplepreviously exposed to ammonia in dry conditions (dark green line).
The Journal of Physical Chemistry C Article
dx.doi.org/10.1021/jp305756k | J. Phys. Chem. C 2012, 116, 19839−1985019841

successfully applied in the structural characterization of severalCu-containing materials.36,51,61−72 In Figure 2a, top panel, arereported the experimental XANES spectra of HKUST-1 as-prepared (hydrated sample, blue solid line), after activation at453 K (dehydrated sample, pink solid line), and upon contactwith 60 mbar of ammonia at room temperature (green solidline). As pointed out in a previous work,36 the XANES spectraof the as-prepared and dehydrated sample are typical of Cu(II)species, showing the edge jump at 8990 eV and twocharacteristic pre-edge peaks at ca. 8976 eV and ca. 8986 eV,labeled as (1) and (2), respectively, in Figure 2a, and separatelyreported in the insets of the same Figure. Feature (1) isassigned to the very weak 1s → 3d quadrupolar transition,while the shoulder (2) appearing along the white line profile isrelated to the dipolar shakedown 1s → 4p transition. Thesimulation of the spectrum of the hydrated material wasperformed starting from the XRPD structure32 and optimizingfive structural parameters: (i) the Cu−Cu and (ii) Cu−H2Obond length, the distance between the Cu atom and thetrimesic acid carboxyl groups with a separate optimization of(iii) Cu−O1 and of (iv) Cu−C and Cu−O2 distances(optimized in a correlated way to use only one free parameter),and (v) a general overall contraction or elongation of all of theother distances (RXANES = αRXRPD).
73 See Figure 3a for theatom notation. The variations in the simulated spectrumintroduced by the geometrical distortions have been monitoredby using the FitIt software. In conclusion, it has been observedthat a variation of Cu−Cu distance resulted in very slightchanges in the XANES features, the Cu−H2O distanceinfluences the intensity and partially the position in energy ofthe pre-edge feature (2), and the carbonyl group distances anda possible overall contraction or expansion strongly influenceboth the intensity and the position of the white line and theshape of the multiple scattering features at higher energies. Inthe case of the hydrated sample, the best agreement betweenthe simulated curve and experimental data was obtained with a
slight shortening of Cu−H2O distance, an elongation of 0.05 Åof both Cu−O1 and a constrain of Cu−C and Cu−O2distances, corresponding to a shift along the bond axis of thecarbonyl groups, and a slight general contraction of all otherdistances.Upon water removal, no shift in the absorption edge is
observed, providing evidence that no change in oxidation stateof the Cu center occurs. However, the XANES spectrum of theactivated sample shows (i) a decrease of the white lineintensity, and (ii) an increase in the intensity of feature (2),which appears more as a well-separated band than as a whiteline shoulder. The simulation of the XANES spectrum for theactivated sample was performed with the same methodpreviously described for the hydrated sample removing theatoms of the two water molecules, resulting in an optimizationwith four parameters only. Even without a structuraloptimization, in the simulated spectra has been observed thesame trend noticed on the experimental curves where thedecrease of the white line intensity is correlated to the lowercoordination number, and the increase of the intensity offeature (2) is ascribable to a lower symmetry of the Cu(II)species. In the simulated curves, this trend is less evidentprobably because a full description of the asymmetric distortionundergone by the Cu species in the activated sample wouldrequire a too high number of parameters to be optimized. Theoptimization of the bond distances resulted in a slightcontraction of the distances between the absorbing Cu atomand carbonyl groups and all other distances, in agreement withthe results found by EXAFS fit (see section 3.2.2 and Table 1).The XANES spectrum of the activated sample after the
interaction with NH3 evidences an additional increase in theintensity and a slight blue-shift of the dipole band (2) assignedto the 1s → 4p transition. Moreover, a new pre-edge peak isobserved at ca. 8983 eV. Despite that the edge position is notmodified with respect to the as-prepared and activated samples(no change in oxidation state of the metal), the white line is
Figure 2. (a) Experimental (top panel) and simulated (bottom panel) XANES spectra of HKUST-1 as-prepared (blue line), activated (pink line),and activated + NH3 (green line). The insets report magnifications of the 1s → 3d quadrupolar transition (1) and of the shakedown 1s → 4ptransition (2). (b) Qualitative comparison between experimental EXAFS data for as-prepared and activated HKUST-1, and for the activated sampleupon contact with 50 mbar of ammonia. Modulus (top panel) and imaginary part (bottom panel) of the FT of the k3-weighted χ(k) functionsreported in the inset for the as-prepared (blue line), activated (pink line), and activated + NH3 (green line) sample. The inset in the top part reportsthe corresponding k3 χ(k) functions.
The Journal of Physical Chemistry C Article
dx.doi.org/10.1021/jp305756k | J. Phys. Chem. C 2012, 116, 19839−1985019842

modified toward a more structured appearance and seems toreturn toward the shape observed for the hydrated sample. Thesimulation of the spectrum for the sample after interaction withNH3 was performed following the same method adopted forthe hydrated material and substituting the water molecules withtwo NH3 molecules. After the optimization of the geometricalparameters, it was observed that the intensity of the pre-edgefeature (2) is proportional to the Cu−NH3 distance, which wasoptimized at 2.3 Å with a considerable elongation with respectto the previous position of the water molecules. Moreover, asplitting of the white line feature, although less evident withrespect to the experimental spectra, has been observed after adistortion of carbonyl groups simulated by a slight elongationof Cu−O1 distances but a severe shortening of both Cu−C andCu−O2 and all other distances. It is worth noticing that the
deformation introduced to simulate the XANES spectra is inagreement with the results of the EXAFS fit.
3.2.2. EXAFS Spectroscopy. The quality of the EXAFSspectra, in terms of S/N ratio, can be checked in Figure 2b(inset in the top panel), where the extracted k3χ(k) functionsare reported. EXAFS data analysis was performed up to k = 16Å−1, thus obtaining satisfactory structural information up to thethird shell of atoms around the Cu absorber, that is, up toatomic distances within a sphere with ca. 5 Å of radius. Thecorresponding k3-weighted Fourier transformed functions, inthe 2−16 Å−1 range, are shown in Figure 2b for both themoduli (top panel) and the imaginary parts (bottom panel).The three spectra are dominated by the first shell signal (at ca.1.5 Å, not corrected in phase); contributions at longer distancesare weaker, although the modulation of the imaginary partprovides evidence that the experimental signal still containsstructural information. The spectrum of the activated sample(pink curves) is very similar to that of the as-prepared sample(blue curves), and only a slight shift toward shorter R-valuesand a small decrease of the amplitude of the first shell signal areobserved. The shift reveals an overall contraction of the bonddistances after thermal activation, in agreement with XRPDdata, while the lower intensity of the first shell is a consequenceof the reduction of the Cu coordination number (loss of thewater molecule coordinated to the Cu atom). The imaginaryparts of the FT in the high-R region (R > 2.5 Å) are verysimilar, indicating that after thermal activation the framework ofHKUST-1 remains substantially unchanged in a long range, andonly the first shell of the Cu-absorber is modified, as expectedfor dehydration.The situation is drastically different for the activated sample
in interaction with ammonia. The EXAFS spectrum ischaracterized by a first shell signal weaker and shifted towardlonger bond distances, if compared to that of the activatedsample. In addition, oscillations of the Imm(FT) in the high-Rrange are noticeably damped in amplitude. The interpretationof this experimental behavior requires particular attention. Thestrong reduction of EXAFS signal might be intuitively ascribedto a great modification of the framework. However, the XRPDresults (as well as IR and UV−vis characterization, vide infra)demonstrate that only a slight structural rearrangement occursupon NH3 dosage in absence of water, coherent with the simpleNH3 coordination to the Cu metal center after dehydration. Aswill be discussed in detail hereinafter, the lowering of theEXAFS signal amplitude can be explained with a phenomenonof destructive interference among some of the main EXAFSpaths involved, already observed in the analysis of the as-suchand activated samples, and further intensified after the NH3coordination.A quantitative analysis of the EXAFS spectrum for the as-
prepared sample has been performed starting from the clustershown in Figure 3a, where the five shells of scatterer atomsgiving the main contribution to the FT-transformed EXAFSsignal are highlighted by different colored halos and the Cuatom acting as absorber is circled in red (Cuabs). The first shellincludes four equivalent oxygen atoms of the trimesic acidcarboxyl groups in square planar geometry (O1) and theoxygen of the water molecule (OH2O) directly coordinated tothe Cu absorber. The main contributions at longer distancecome from SS paths involving the second copper atom of thedimer (Cu) in front of the absorber, the four carbon atoms ofthe trimesic acid carboxyl groups (C), the four oxygen atomscoordinated to this second copper site (O2), and, finally, from
Figure 3. (a) Structure of the as-such sample obtained from a previousXRD refinement, and magnification of the cluster used as startingpoint for the fitting procedure of EXAFS data. Atom color code is thefollowing: Cu pale pink, C gray, O red. The groups of atoms involvedin the principal paths contributing to EXAFS signal are labeled andhighlighted by different colored halos (oxygen atoms of the trimesicacid carboxyl groups directly coordinated to the Cuabs, O1, gray;oxygen of the water molecule directly coordinated to the Cu absorber,OH2O, light blue; second copper atom of the dimer in front of theabsorber, Cu, green; the four carbon atoms of the trimesic acidcarboxyl groups, C, orange; oxygen atoms coordinated to the notabsorber copper site, O2, purple). (b−d) Comparison betweenexperimental and corresponding best fits for the as-such (b), activated(c), and activated + NH3 (d) sample. Top panels report the modulusof the FT, while bottom panels show the imaginary parts of the FT,and the principal path contributions to the total signal. Forquantitative values of the parameters optimized in the fits, see Table 1.
The Journal of Physical Chemistry C Article
dx.doi.org/10.1021/jp305756k | J. Phys. Chem. C 2012, 116, 19839−1985019843

Cuabs−C−O1 MS paths. For all of these scattering paths, thedistance and the Debye−Waller factor have been fittedindependently. The remaining SS and MS were modeleddescribing length variation ΔRi and Debye−Waller factor σ2i ofthe ith path according to the following relations: ΔRi = αReff
iand σ2i = σ2(Reff
i/RO1)1/2, that is, considering the possibility of
an overall isotropic contraction/dilatation of the distances(parameter α) and assuming a Debye−Waller factor increasingproportionally to the square root of the path effective lengthReff
i. This approach has already been used to limit the overallnumber of optimized parameters in systems where a highnumber of SS and MS paths contributes significantly to theoverall signal such as metal-oxides73−77 and MOFs.31,54,78−84
Finally, single ΔE and S02 values common to all of the paths
have been fitted. The complete fitting model needed 14independent parameters, see Table 1, and represents animprovement of the EXAFS study by Prestipino et al.36 Thesame structural model was adopted for the analysis of thedehydrated sample, before and after interaction with ammonia.In the former case, the paths involving the water molecule(OH2O) were excluded (resulting in 12 independent parame-ters), whereas in the latter no changes were done, because Oatom (of H2O) and N atom (of NH3) are not distinguishableby EXAFS. In that case, the amplitude factor S0
2 was fixed tothe value obtained for the as-prepared sample (resulting in 13independent parameters).Figure 3b−d shows the experimental signals for the three
investigated samples and the different paths contribution to theImm(FT), whereas Table 1 summarizes the optimizedparameters. In all three cases, the simulated EXAFS spectrawell reproduce the experimental curves, as proved by the R-factor values that are always lower than 5%. In many cases,different scattering paths contributing in the same distancerange are characterized by Imm(FT) in antiphase; theircontributions to the overall signal are consequently canceled,
because of destructive interference. This is in particular evidentin the first shell region for the dehydrated sample in interactionwith NH3 (Figure 3d), where the SS NNH3 path is in partialantiphase with the SS C contribution, and the MS C−O1 andSS O2 contributions are characterized by a partial mutualdepletion, globally resulting in a drastic erosion of the EXAFSsignal. Although rare, such a “cancellation” effect has alreadybeen observed in EXAFS studies on other materials:particularly relevant is the strong amplitude reduction of thesecond shell peak in Ga K-edge EXAFS spectra of InxGa1−xAssemiconductor solid solutions when x is close to 0.5.76,85,86
The optimized parameters resulting from the fit aresummarized in Table 1. For the as-prepared sample, almostall of the optimized distances are within their associated errorequal to the ones extracted from single-crystal XRD data ofChui et al.32 or slightly longer. Upon activation, a generalizedcontraction of the bond lengths is observed, as was alreadyreported by Prestipino et al.36 This contraction, particularlyevident for the Cuabs−Cu distance, is also testified by a negativevalue of the contraction/expansion parameter α = −0.021 ±0.004. The Debye−Waller factors assume physically plausiblevalues for all of the different shells of atoms. Only the value forthe oxygen atoms coordinated to the non-absorber copper site(O2) is high because of a high static disorder term, due to thehigher heterogeneity of the corresponding sites, not directlybonded to Cuabs.When the dehydrated sample is treated with ammonia, an
increase in the Cuabs−O1 average bond distance is observed(RO1 = 2.000 ± 0.004 Å), accompanied by an increase in theDebye−Waller factor σ2O1, which goes from ca. 0.005 to 0.009Å2. The optimized Cuabs−NNH3 bond distance value obtainedfrom the fit is of (2.31 ± 0.01) Å, with a Debye−Waller valueσ2N(NH3) = (0.006 ± 0.002) Å2. Therefore, EXAFS data provideevidence that adsorption of ammonia on the coordinativevacancy of Cu(II) in dehydrated HKUST-1 occurs without the
Table 1. Summary of the Parameters Optimized in the Fit of the EXAFS Data (Figure 3b−d) for HKUST-1 Samples As Such,Dehydrated, and after Exposure to 60 mbar of NH3
a
as such (hydrated) activated (dehydrated) activated + NH3
independent points 35 35 35number of variables 14 12 13R-factor 0.014 0.010 0.018S0
2 0.99 ± 0.05 0.81 ± 0.03 0.99 ± 0.05ΔE (eV) −2.7 ± 0.6 −3.6 ± 0.5 −3.1 ± 0.5RO1 (Å) 1.959 ± 0.005 1.934 ± 0.005 2.000 ± 0.004σ2O1 (Å
2) 0.0054 ± 0.0007 0.0051 ± 0.0006 0.0094 ± 0.0003RO(H2O) or RN(NH3) (Å) 2.24 ± 0.03 2.31 ± 0.01σ2O(H2O) or σ
2N(NH3) (Å
2) 0.011 ± 0.006 0.006 ± 0.002RCu (Å) 2.65 ± 0.02 2.58 ± 0.02 2.80 ± 0.03σ2Cu (Å
2) 0.012 ± 0.002 0.015 ± 0.003 0.013 ± 0.03RC (Å) 2.88 ± 0.02 2.84 ± 0.02 2.56 ± 0.03σ2C (Å2) 0.008 ± 0.002 0.008 ± 0.001 0.013 ± 0.005RO2 (Å) 3.14 ± 0.03 3.07 ± 0.03 2.82 ± 0.04σ2O2 (Å
2) 0.021 ± 0.005 0.024 ± 0.005 0.03 ± 0.01α −0.012 ± 0.004 −0.021 ± 0.004 −0.003 ± 0.002σ2 (Å2) 0.009 ± 0.002 0.009 ± 0.002 0.016 ± 0.002
aAll of the fits were performed in R-space in the ΔR = 1.00−5.00 Å range, over k3-weighted FT of the χ(k) functions performed in the 2−16 Å−1
interval. A single ΔE0 and a single S02 have been employed to parametrize all SS and MS paths. In the activated + NH3 case, the amplitude S0
2 wasfixed to the value refined for hydrated sample (S0
2 = 0.99 ± 0.05), where the Cu center is expected to have the same coordination number. For allpaths, the degeneration (coordination number for SS paths) has been fixed to the values expected from the structure refined by single-crystal XRD.32
This holds also for the number of water (column 2) and ammonia (column 4) adsorbed on the Cu(II) site (Nads), which was fixed to unit in bothcases. To check the adsorption stoichiometry, additional fits were performed optimizing also the number of adsorbed molecules: Nads was 1.04 ±0.08 and 1.0 ± 0.1 for H2O and NH3, respectively.
The Journal of Physical Chemistry C Article
dx.doi.org/10.1021/jp305756k | J. Phys. Chem. C 2012, 116, 19839−1985019844

break of any first shell Cu−O1 bonds, which just undergo anelongation of ∼0.050 Å to accommodate the NH3 molecule.This elongation is more than double that needed toaccommodate the water molecule; see Table 1. Additionalstructural distortions involve the higher shells, in particular, (i)the Cuabs−Cu bond is elongated ∼0.15 Å, and (ii) the Cu−Cand Cu−O2 bond lengths are slightly contracted. Finally, it isworth noticing that fit results are affected by a higher degree ofincertitude with respect to the as-such and activated cases, dueto the lower signal-to-noise ratio and the possibility of differentstructural rearrangements resulting in the same signalsuppression. A general increase of the DW values associatedto C and O2 shells, as well as of the σ2 Debye−Waller used tomodel SS and MS paths whose contribution to EXAFS signal isminor, is found.3.3. Optical Properties: DRUV−Vis Spectroscopy.
Upon activation, the color of HKUST-1 changes from lightcyan (Figure 4a) to navy blue (Figure 4b, first tube). To explainthis behavior, a change in the coordination sphere of copperspecies should be invoked, as the color is associated with d−dtransitions of Cu(II) ions. The DRUV−vis spectra of the as-synthesized and activated samples are reported in Figure 4c
(blue and pink lines, respectively). The spectrum of the freshsample (blue curve) shows (i) an edge around 350 nm due to aligand to metal charge transfer (LMCT) transition from oxygento copper atoms; and (ii) a band centered at about 705 nm,characteristic of the d−d transition for Cu(II) species in adistorted octahedral local geometry. The distortion of theoctahedral geometry accounts for the high intensity of the bandthat should be otherwise dipole-forbidden.The main effect of activation at 423 K (pink curve) is the
appearance of a high-energy shoulder in the d−d band ataround 585 nm. At the same time, a red shift of the maximum,previously observed at 705 nm, to 745 nm and of theabsorption associated with the LMCT transition is observed.The increase of the fraction of absorbed visible light causes acomplete darkening of the material, which changes from lightcyan to navy blue. The change in the d−d region is ascribed tothe activation of new available d−d transitions due to a loss ofdegeneracy in d levels produced by a change in the symmetryaround copper. Coming to the high-energy part of the UV−visspectrum, the LMCT edge shift is explained as a consequenceof the change of (i) the hydration conditions of thecarboxylated group and (ii) the coordination sphere of copperions.36 Upon H2O vapor pressure dosage on the activatedsample, the original spectrum is restored (orange solid curve),demonstrating the reversibility of the process.36 If pure dryammonia is dosed on the activated material, the spectrum(green solid curve) is quite similar to that of the hydratedsample, apart for a slight red shift of the d−d band to 725 nm.This small shift is sufficient to cause a color change, asdemonstrated by the sequence of photographs reported inFigure 4b, collected at increasing NH3 contact time.On the contrary, the dosage of ammonia on a sample
previously contacted with water vapor pressure causes a bigchange in the spectrum (see orange dashed line), providingevidence that the coordination sphere of Cu(II) is stronglyperturbed. The effect of water after pure ammonia adsorptionhas been considered too, and the resulting spectrum is almostunperturbed (see green dashed curve). These results are ingood agreement with those of XRPD.
3.4. Vibrational Properties: IR Spectroscopy. Thevibrational properties of HKUST-1 in the mid-IR range havebeen studied by collecting the spectra in ATR mode (see Figure5a). In this frequency range, the spectra of hydrated sampleHKUST-1 are dominated by the vibrational modes of the BTClinker. In particular, the IR absorption bands in the 1700−1500and 1500−1300 cm−1 ranges are due to υasym(C−O2) andυsym(C−O2) stretching modes, respectively; IR bands around1450 cm−1 are due to a combination of benzene ring stretchingand deformation modes; whereas IR absorption bands around700 cm−1 are due to υ(C−H) bending mode. Only the IRabsorption band centered at 493 cm−1 is due to a vibrationalmode directly involving the Cu center, and it will be discussedlater.The mid-IR spectrum of HKUST-1 does not change upon
dehydration (only the broad IR absorption band centered at3300 cm−1 disappears), neither upon adsorption of NH3 (aparta slight broadening of most of the IR absorption bands). Onthe contrary, the spectrum greatly changes when ammonia isdosed on the hydrated sample. In particular, in the 1700−1500cm−1 range, only two distinct absorption bands are observed at1610 and 1544 cm−1; the IR bands in the 1500−1300 cm−1
region are slightly red-shifted; new IR absorption bands appearat 1250, 1213, and 708 cm−1. Although further investigation is
Figure 4. (a) Picture of hydrated HKUST-1 sample. (b) Sequence ofpictures showing the HKUST-1 color evolution upon NH3 dosage andprogressive advance of the NH3 front, starting from the activatedmaterial (first tube). (c) DRUV−vis spectra of HKUST-1 as-prepared(blue line), activated (pink line), activated + H2O and successively +NH3 (orange solid and dashed line, respectively), and activated + NH3and successively + H2O (green solid and dashed line, respectively).
The Journal of Physical Chemistry C Article
dx.doi.org/10.1021/jp305756k | J. Phys. Chem. C 2012, 116, 19839−1985019845
necessary to assign precisely the new IR absorption bands, themid-IR spectrum of the hydrated sample after interaction withammonia is clearly in favor of a big structural change, inagreement with all of the data discussed above.IR spectra in the far-IR region (see Figure 5b) are much
more informative, because in the 600−50 cm−1 range thevibrational modes directly involving Cu(II) species are present.The same frequencies range was previously explored in detailby means of Raman spectroscopy36 for the hydrated andactivated sample. The far-IR spectrum of the hydrated sample
(blue curve) shows two main absorption regions, around 500cm−1 (main peak at 493 cm−1 and shoulder at 480 cm−1) andaround 280 cm−1 (three absorption bands centered at 321, 269(the most intense), and 226 cm−1). Following the previousinterpretation,36 the IR absorption bands around 500 cm−1 areassigned to Cu−O stretching modes, while the absorptionbands at lower frequency are due to vibrational modesinvolving the Cu−Cu stretching of the two Cu(II) ions ofthe [Cu2C4O8] framework cage. Upon activation, both the IRabsorption band at 493 cm−1 and the three bands at lower
Figure 5.Mid-IR (ATR mode) (a) and far-IR (transmittance mode) (b) spectra of HKUST-1 as-prepared (blue line), activated (pink line), activated+ H2O and + NH3 (orange line), activated + NH3 (light green line), and successively + H2O (dark green line).
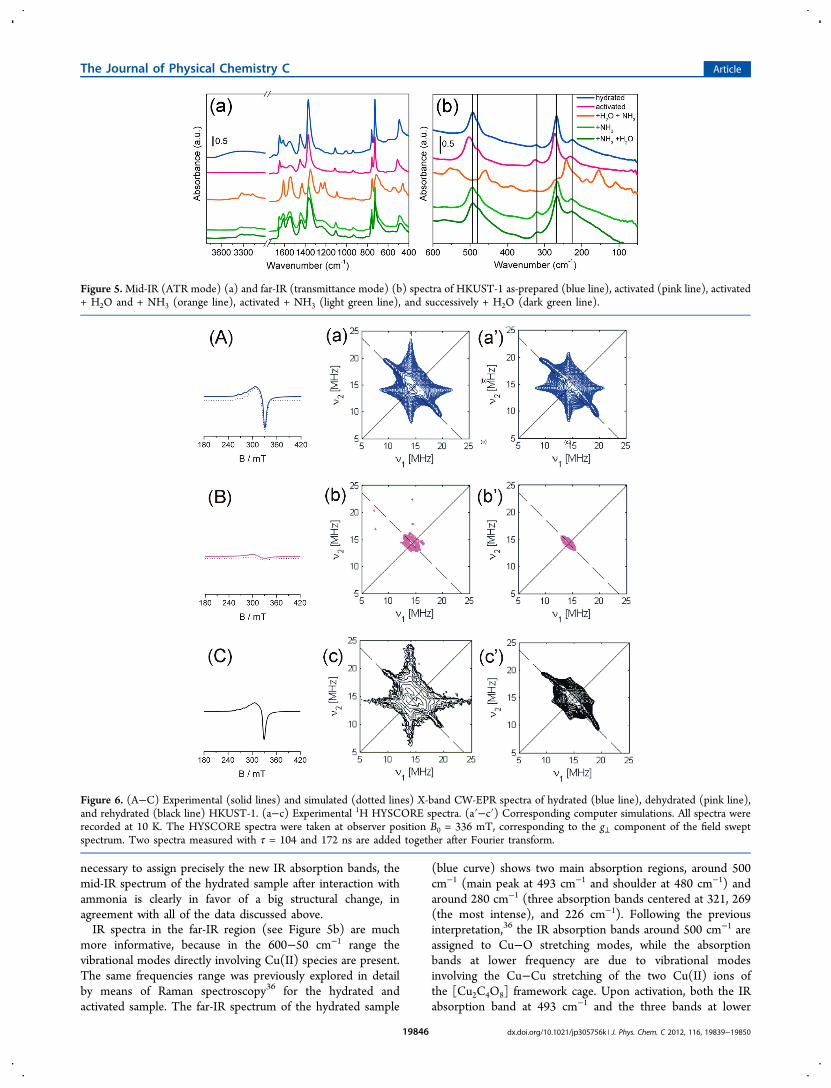
Figure 6. (A−C) Experimental (solid lines) and simulated (dotted lines) X-band CW-EPR spectra of hydrated (blue line), dehydrated (pink line),and rehydrated (black line) HKUST-1. (a−c) Experimental 1H HYSCORE spectra. (a′−c′) Corresponding computer simulations. All spectra wererecorded at 10 K. The HYSCORE spectra were taken at observer position B0 = 336 mT, corresponding to the g⊥ component of the field sweptspectrum. Two spectra measured with τ = 104 and 172 ns are added together after Fourier transform.
The Journal of Physical Chemistry C Article
dx.doi.org/10.1021/jp305756k | J. Phys. Chem. C 2012, 116, 19839−1985019846

frequency blue-shift to 504, 326, 273, and 231 cm−1,respectively. This observation reveals an increase in rigidity ofthe metallorganic framework structure, in agreement with theshortening of the Cu−O and Cu−Cu bonds obtained byEXAFS. Finally, when ammonia is adsorbed on the dehydratedsample (light green spectrum), the far-IR spectrum comes backto that of the hydrated sample, whereas interaction of ammoniaon a hydrated sample causes a drastic change of the overallspectrum.3.5. EPR Characterization. The CW-EPR spectrum of
hydrated HKUST-1 is characterized by a typical anisotropicpowder pattern characteristic of hydrated Cu(II) ions having anelectron spin S = 1/2 and interacting with the I = 3/2 nuclearspin of the copper nuclei (Figure 6A, blue line). Theparameters derived from the simulation (Figure 6A, dottedline) are listed in Table 2 and are in agreement with thosepreviously reported by Poppl et al.87−90 on the same system.
The spectrum consists of two superimposed signals,indicated in Table 2 as type A Cu(II) and type B Cu(II).The spin Hamiltonian parameters of type A are typical forisolated Cu(II) hydrated monomers, while the second species(type B), characterized by a broad unresolved line, with ΔBPP =30 mT and gav = 2.17 has been assigned to interacting Cu(II)species.87
Quantitative evaluation of the monomeric copper species inthe hydrated sample has been obtained by comparison of theCW EPR spectral intensity with that of a standard solution ofcopper acetylacetonate. The estimated percentage of isolatedCu(II) ions is found to be about 6% of the overall copper ionsin the sample. In agreement with earlier literature reports,87 weassign such isolated (S = 1/2) Cu(II) species to residual extra-framework monomeric Cu(II) ions, which have not beenincorporated as [Cu(II)]2 dimers in the Cu3(BTC)2 network.Upon dehydration at 423 K under vacuum, the sample
develops a navy blue color and shows the EPR spectrum ofFigure 6B (pink line). The signal due to the monomeric Cu(II)ions is drastically reduced in intensity, while the broad signaldue to interacting copper species (type B) becomes evident.The overall decrease of the EPR spectral intensity is about 20%of the hydrated spectrum (blue line). The original spectrum canbe restored by hydration of the sample (Figure 6C, black line).To investigate more deeply the effects caused by dehydration
and rehydration of the sample and in the effort of bettercharacterizing the local coordination environment of the Cu(II)monomers, hyperfine sublevel correlation (HYSCORE) meas-urements were carried out.The HYSCORE spectra recorded at observer position B0 =
336 mT, corresponding to the Cu(II) perpendicular feature, arereported in Figure 6a−c (spectra taken at a magnetic fieldsetting corresponding to the parallel position are reported asSupporting Information). The spectrum of the hydratedmaterial (Figure 6a) is characterized by a pronounced broadproton ridge centered at (νH, νH) with maximum extension of
about 11.8 MHz, stemming from the superhyperfine interactionbetween the unpaired electron in the dx2−y2 Cu(II) orbital and anearby proton. The experimental spectrum can be simulated(Figure 6a′) using the parameters reported in Table 3. Thesevalues are typical for water molecules equatorially coordinatedto the Cu(II) ions91 and are in line with those found for theCu(H2O)6
2+ complex.92
The simulation analysis indicates that the experimentalspectrum is best reproduced by considering a secondinteracting proton with maximum coupling of about 3 MHzdue to remote protons, weakly interacting with Cu(II)monomers.The HYSCORE spectrum of the dehydrated sample,
recorded at the same observer position, is reported in Figure6b. As a consequence of the dehydration treatment, thepronounced ridge with maximum coupling 11.8 MHzdisappears, and only the small proton ridge with maximumextension of about 3 MHz is observed. Admission of water ontothe dehydrated sample restores the original proton ridge(Figure 6c). This is in agreement with the CW-EPR spectrumreported in Figure 6C.The hydration−dehydration behavior of momomeric Cu(II)
species in HKUST-1 is reminiscent of that of hydrated cupricCu(II) ions in zeolites where the same phenomenon, that is, anintensity drop of Cu(II) EPR spectra upon thermal treatmentin vacuo and subsequent restoring by simple water adsorptionat room temperature, is well-known.64 This effect, often called“self-reduction” process, has been interpreted in the case ofzeolites in terms of a proper reduction mechanism involving theformation via different pathways of cuprous (diamagnetic) ions(Cu+).93,94 This interpretation was however challenged by LoJacono and co-workers,95 who suggested that the loss ofintensity of the EPR signal has to be ascribed to changes in thecoordination of Cu(II) ions, which become EPR inactive,without invoking the formation of Cu+ ions. This secondmechanism was later verified by a multitechnique approach.64
Our experiments indeed show that this second mechanism isappropriate to describe the behavior of isolated Cu(II) ions inCu3(BTC)2. The phenomenon can in fact be explainedconsidering that upon water removal at low temperature, thesolvated Cu(II) ions undergo a local symmetry change, which isultimately responsible for the loss in the EPR signal.Rehydration of the system will restore the original solvationshell, thus explaining the recovery of the EPR signal and theeasy reversibility of the process.Following the procedure adopted for all of the experiments,
we contacted the hydrated sample with increasing doses ofammonia at ambient temperature. This led to a progressivechange of the CW EPR spectrum, up to the formation of a new,intense signal, characterized by an asymmetric line shaperesonating at g ≈ 2.12 whose intensity is about 2 orders ofmagnitude more intense with respect to the signal of thehydrated sample (Figure 6A). Figure 7 shows the evolution ofthe CW EPR spectrum as a function of ammonia dosage. The
Table 2. Spin Hamiltonian Parameters of Cu(II) Species inHKUST-1 Obtained by Computer Simulation of the Spectrain Figure 6
g tensor hyperfine tensor CuA/MHz
type A Cu(II) g∥ = 2.374 ± 0.001 A∥ = 456 ± 3g⊥ = 2.089 ± 0.007 A⊥ = 73 ± 12
type B Cu(II) g = 2.17 ± 0.02
Table 3. Spin Hamiltonian Parameters Deduced fromSimulation of the HYSCORE Spectra of Figure 6a, b, and c
proton species interactingwith Cu(II) Haiso/MHz HT/MHz α; β; γ/deg
A 0.2 ± 0.5 5.8 ± 0.5 0;70;0 ± 0;10;0B 0.4 ± 0.5 1.4 ± 0.5 0;60;0 ± 0;10;0
The Journal of Physical Chemistry C Article
dx.doi.org/10.1021/jp305756k | J. Phys. Chem. C 2012, 116, 19839−1985019847

new signal starts to appear upon delivery of 30 mbar of NH3and shows no trace of the EPR features of isolated Cu(II), andno echo signals could be detected. Comparison of spectra takenin the range 300−6 K for an ammonia dosage of 30 mbar(Figure 8) shows that no significant modification in the spectral
line shape occurs in this temperature range. The signalintensity, however, increases with lowering temperaturefollowing a Curie-like behavior (see inset of Figure 8), typicalof a paramagnetic state. The loss of Cu(II) hyperfine structureseems to indicate that spin exchange phenomena are underoperation, which involve a large fraction of the copper ionsincluding framework ions. These phenomena will lead to anincrease in the relaxation times of the system, explaining theabsence of the spin echo signal. The same behavior describedabove, at least qualitatively, was observed in the case of NH3dosage in dry conditions.Outgassing of the cell did not restore the original EPR
spectrum, indicating that the effect, contrary to water
adsorption, is not reversible and that interaction with NH3leads to a stable modification of the magnetic properties of thesample. Further investigations will be needed to specificallyaddress the nature of the magnetic properties brought about byammonia adsorption.
4. CONCLUSIONSA full spectroscopic characterization of HKUST-1 interactingwith ammonia has been presented. NH3 adsorption on the drysystem results in a strong chemisorption on Cu(II) sites thatdistorts the framework, keeping the crystallinity of the material.Generally, the perturbation observed upon NH3 adsorption isanalogous to the one observed in the case of H2O, butnoticeably enhanced. When the adsorption in humid conditionsis considered, a deep modification of the system is observed. Inparticular, (i) XRPD shows a very strong interaction in dryconditions and strong modification of the structure in presenceof water; (ii) XAS (XANES and EXAFS) spectroscopy, in dryconditions, indicates structural changes, similar to the case ofH2O but quantitatively bigger; (iii) both DRUV−visible and IR(MIR and far-IR frequencies range) spectroscopies indicate asimilarity between the hydrated sample and the one interactingwith NH3 in dry conditions, but they reveal deep changes ifNH3 is adsorbed in humid conditions; and (iv) EPR techniquereveals that the interaction with NH3 in both dry and humidconditions leads to a stable modification of the magneticproperties of the sample.On a methodological ground, it is worth noticing that we
used the optimization of XANES spectra to validate the bonddistance obtained by EXAFS.This work demonstrates that to have a very deep structural
modification of HKUST-1 when NH3 interaction is considered(as, e.g., reported in the literature by Peterson et al.39), thewater presence is necessary; otherwise, the modification occursbut with minor effect.
■ ASSOCIATED CONTENT*S Supporting InformationExperimental and simulated HYSCORE spectra at g∥ position.
This material is available free of charge via the Internet athttp://pubs.acs.org.
■ AUTHOR INFORMATIONCorresponding Author*E-mail: [email protected].
NotesThe authors declare no competing financial interest.
■ ACKNOWLEDGMENTSWe acknowledge Prof. S. Bordiga for fruitful discussion, Dr. G.Agostini for supporting XRPD measurements and relateddiscussion, and finally S. Nikitenko for the important supportduring the XAS data collection at ESRF beamline BM26A(DUBBLE). This work has been supported by “Progetti diRicerca di Ateneo-Compagnia di San Paolo-2011-Linea 1A,ORTO11RRT5 project”.
■ REFERENCES(1) Cheetham, A. K.; Ferey, G.; Loiseau, T. Angew. Chem., Int. Ed.1999, 38, 3268−3292.(2) James, S. L. Chem. Soc. Rev. 2003, 32, 276−288.
Figure 7. X-band CW EPR spectra of HKUST-1 upon delivery ofincreasing amounts of ammonia. (a) Hydrated sample, (b) 5 mbar ofNH3, (c) 30 mbar of NH3, (d) 45 mbar of NH3, and (e) 60 mbar ofNH3. Spectra are recorded at 77 K.
Figure 8. CW EPR spectra of HKUST-1 upon delivery of 30 mbar ofNH3 recorded at (a) 6 K, (b) 90 K, and (c) 300 K. The scattered plotin the inset reports the EPR intensity of the spectra recorded attemperatures ranging from 6 to 300 K.
The Journal of Physical Chemistry C Article
dx.doi.org/10.1021/jp305756k | J. Phys. Chem. C 2012, 116, 19839−1985019848

(3) Kitagawa, S.; Kitaura, R.; Noro, S. Angew. Chem., Int. Ed. 2004,43, 2334−2375.(4) Bradshaw, D.; Claridge, J. B.; Cussen, E. J.; Prior, T. J.;Rosseinsky, M. J. Acc. Chem. Res. 2005, 38, 273−282.(5) Ferey, G. Chem. Soc. Rev. 2008, 37, 191−214.(6) Farha, O. K.; Hupp, J. T. Acc. Chem. Res. 2010, 43, 1166−1175.(7) Stock, N.; Biswas, S. Chem. Rev. 2012, 112, 933−969.(8) Meek, S. T.; Greathouse, J. A.; Allendorf, M. D. Adv. Mater. 2011,23, 249−267.(9) Wu, C. D.; Hu, A.; Zhang, L.; Lin, W. B. J. Am. Chem. Soc. 2005,127, 8940−8941.(10) Dybtsev, D. N.; Nuzhdin, A. L.; Chun, H.; Bryliakov, K. P.;Talsi, E. P.; Fedin, V. P.; Kim, K. Angew. Chem., Int. Ed. 2006, 45,916−920.(11) Llabres i Xamena, F. X.; Abad, A.; Corma, A.; Garcia, H. J. Catal.2007, 250, 294−298.(12) Horike, S.; Dinca, M.; Tamaki, K.; Long, J. R. J. Am. Chem. Soc.2008, 130, 5854−5855.(13) Savonnet, M.; Aguado, S.; Ravon, U.; Bazer-Bachi, D.; Lecocq,V.; Bats, N.; Pinel, C.; Farrusseng, D. Green Chem. 2009, 11, 1729−1732.(14) Lee, J.; Farha, O. K.; Roberts, J.; Scheidt, K. A.; Nguyen, S. T.;Hupp, J. T. Chem. Soc. Rev. 2009, 38, 1450−1459.(15) Shultz, A. M.; Farha, O. K.; Hupp, J. T.; Nguyen, S. T. J. Am.Chem. Soc. 2009, 131, 4204−4205.(16) Ma, L.; Abney, C.; Lin, W. Chem. Soc. Rev. 2009, 38, 1248−1256.(17) Corma, A.; Garcıa, H.; Llabres i Xamena, F. X. Chem. Rev. 2010,110, 4606−4655.(18) Luz, I.; Xamena, F.; Corma, A. J. Catal. 2012, 285, 285−291.(19) Aguado, S.; Canivet, J.; Schuurman, Y.; Farrusseng, D. J. Catal.2011, 284, 207−214.(20) Eddaoudi, M.; Kim, J.; Rosi, N.; Vodak, D.; Wachter, J.;O’Keeffe, M.; Yaghi, O. M. Science 2002, 295, 469−472.(21) Dinca, M.; Long, J. R. J. Am. Chem. Soc. 2005, 127, 9376−9377.(22) Dinca, M.; Dailly, A.; Liu, Y.; Brown, C. M.; Neumann, D. A.;Long, J. R. J. Am. Chem. Soc. 2006, 128, 16876−16883.(23) Vitillo, J. G.; Regli, L.; Chavan, S.; Ricchiardi, G.; Spoto, G.;Dietzel, P. D. C.; Bordiga, S.; Zecchina, A. J. Am. Chem. Soc. 2008, 130,8386−8396.(24) Dietzel, P. D. C.; Johnsen, R. E.; Fjellvag, H.; Bordiga, S.;Groppo, E.; Chavan, S.; Blom, R. Chem. Commun. 2008, 5125−5127.(25) Murray, L. J.; Dinca, M.; Long, J. R. Chem. Soc. Rev. 2009, 38,1294−1314.(26) Li, J.-R.; Luppler, R. J.; Zhou, H. C. Chem. Soc. Rev. 2009, 38,1477−1504.(27) Britt, D.; Furukawa, H.; Wang, B.; Glover, T. G.; Yaghi, O. M.Proc. Natl. Acad. Sci. U.S.A. 2009, 106, 20637−20640.(28) Sato, H.; Matsuda, R.; Sugimoto, K.; Takata, M.; Kitagawa, S.Nat. Mater. 2010, 9, 661−666.(29) Shimomura, S.; Higuchi, M.; Matsuda, R.; Yoneda, K.; Hijikata,Y.; Kubota, Y.; Mita, Y.; Kim, J.; Takata, M.; Kitagawa, S. Nat. Chem.2010, 2, 633−637.(30) Hamon, L.; Heymans, N.; Llewellyn, P. L.; Guillerm, V.; Ghoufi,A.; Vaesen, S.; Maurin, G.; Serre, C.; De Weireld, G.; Pirngruber, G. D.Dalton Trans. 2012, 41, 4052−4059.(31) Chavan, S.; Vitillo, J. G.; Gianolio, D.; Zavorotynska, O.;Civalleri, B.; Jakobsen, S.; Nilsen, M. H.; Valenzano, L.; Lamberti, C.;Lillerud, K. P.; et al. Phys. Chem. Chem. Phys. 2012, 14, 1614−1626.(32) Chui, S. S. Y.; Lo, S. M. F.; Charmant, J. P. H.; Orpen, A. G.;Williams, I. D. Science 1999, 283, 1148−1150.(33) Wang, Q. M.; Shen, D. M.; Bulow, M.; Lau, M. L.; Deng, S. G.;Fitch, F. R.; Lemcoff, N. O.; Semanscin, J. Microporous MesoporousMater. 2002, 55, 217−230.(34) Xiao, B.; Wheatley, P. S.; Zhao, X. B.; Fletcher, A. J.; Fox, S.;Rossi, A. G.; Megson, I. L.; Bordiga, S.; Regli, L.; Thomas, K. M.; et al.J. Am. Chem. Soc. 2007, 129, 1203−1209.
(35) Bordiga, S.; Regli, L.; Bonino, F.; Groppo, E.; Lamberti, C.;Xiao, B.; Wheatley, P. S.; Morris, R. E.; Zecchina, A. Phys. Chem. Chem.Phys. 2007, 9, 2676−2685.(36) Prestipino, C.; Regli, L.; Vitillo, J. G.; Bonino, F.; Damin, A.;Lamberti, C.; Zecchina, A.; Solari, P. L.; Kongshaug, K. O.; Bordiga, S.Chem. Mater. 2006, 18, 1337−1346.(37) Zhang, X. X.; Chui, S. S. Y.; Williams, I. D. J. Appl. Phys. 2000,87, 6007−6009.(38) Schlichte, K.; Kratzke, T.; Kaskel, S. Microporous MesoporousMater. 2004, 73, 81−88.(39) Peterson, G. W.; Wagner, G. W.; Balboa, A.; Mahle, J.; Sewell,T.; Karwacki, C. J. J. Phys. Chem. C 2009, 113, 13906−13917.(40) Petit, C.; Bandosz, T. J. Dalton Trans. 2012, 41, 4027−4035.(41) Petit, C.; Huang, L. L.; Jagiello, J.; Kenvin, J.; Gubbins, K. E.;Bandosz, T. J. Langmuir 2011, 27, 13043−13051.(42) Petit, C.; Mendoza, B.; Bandosz, T. J. Langmuir 2010, 26,15302−15309.(43) Saha, D. P.; Deng, S. G. J. Colloid Interface Sci. 2010, 348, 615−620.(44) Guo, X. J.; Tak, J. K.; Johnson, R. L. J. Hazard. Mater. 2009, 166,372−376.(45) Arreola, R.; Valderrama, B.; Morante, M. L.; Horjales, E. FEBSLett. 2003, 551, 63−70.(46) Britt, D.; Tranchemontagne, D.; Yaghi, O. M. Proc. Natl. Acad.Sci. U.S.A. 2008, 105, 11623−11627.(47) Kusgens, P.; Rose, M.; Senkovska, I.; Frode, H.; Henschel, A.;Siegle, S.; Kaskel, S. Microporous Mesoporous Mater. 2009, 120, 325−330.(48) Nikitenko, S.; Beale, A. M.; van der Eerden, A. M. J.; Jacques, S.D. M.; Leynaud, O.; O’Brien, M. G.; Detollenaere, D.; Kaptein, R.;Weckhuysen, B. M.; Bras, W. J. Synchrotron Radiat. 2008, 15, 632−640.(49) Silversmit, G.; Vekemans, B.; Nikitenko, S.; Bras, W.; Czhech,V.; Zaray, G.; Szaloki, I.; Vincze, L. J. Synchrotron Radiat. 2009, 16,237−246.(50) Lamberti, C.; Prestipino, C.; Bordiga, S.; Berlier, G.; Spoto, G.;Zecchina, A.; Laloni, A.; La Manna, F.; D’Anca, F.; Felici, R.; et al.Nucl. Instrum. Methods Phys. Res., Sect. B 2003, 200, 196−201.(51) Lamberti, C.; Bordiga, S.; Bonino, F.; Prestipino, C.; Berlier, G.;Capello, L.; D’Acapito, F.; Xamena, F.; Zecchina, A. Phys. Chem. Chem.Phys. 2003, 5, 4502−4509.(52) Ravel, B.; Newville, M. J. Synchrotron Radiat. 2005, 12, 537−541.(53) Lamberti, C.; Bordiga, S.; Arduino, D.; Zecchina, A.; Geobaldo,F.; Spano, G.; Genoni, F.; Petrini, G.; Carati, A.; Villain, F.; et al. J.Phys. Chem. B 1998, 102, 6382−6390.(54) Bordiga, S.; Bonino, F.; Lillerud, K. P.; Lamberti, C. Chem. Soc.Rev. 2010, 39, 4885−4927.(55) Zabinsky, S. I.; Rehr, J. J.; Ankudinov, A.; Albers, R. C.; Eller, M.J. Phys. Rev. B 1995, 52, 2995−3009.(56) Ankudinov, A. L.; Rehr, J. J. Phys. Rev. B 2000, 62, 2437−2445.(57) Smolentsev, G.; Soldatov, A. J. Synchrotron Radiat. 2006, 13,19−29.(58) Spalek, T.; Pietrzyk, P.; Sojka, Z. J. Chem Inf. Model. 2005, 45,18−29.(59) Hofer, P.; Grupp, A.; Nebenfuhr, H.; Mehring, M. Chem. Phys.Lett. 1986, 132, 279−282.(60) Stoll, S.; Schweiger, A. J. Magn. Reson. 2006, 178, 42−55.(61) Lamberti, C.; Spoto, G.; Scarano, D.; Paze, C.; Salvalaggio, M.;Bordiga, S.; Zecchina, A.; Palomino, G. T.; Dacapito, F. Chem. Phys.Lett. 1997, 269, 500−508.(62) Lamberti, C.; Bordiga, S.; Zecchina, A.; Salvalaggio, M.;Geobaldo, F.; Arean, C. O. J. Chem. Soc., Faraday Trans. 1998, 94,1519−1525.(63) Bolis, V.; Maggiorini, S.; Meda, L.; D’Acapito, F.; Palomino, G.T.; Bordiga, S.; Lamberti, C. J. Chem. Phys. 2000, 113, 9248−9261.(64) Turnes Palomino, G.; Fisicaro, P.; Bordiga, S.; Zecchina, A.;Giamello, E.; Lamberti, C. J. Phys. Chem. B 2000, 104, 4064−4073.
The Journal of Physical Chemistry C Article
dx.doi.org/10.1021/jp305756k | J. Phys. Chem. C 2012, 116, 19839−1985019849

(65) Lamberti, C.; Prestipino, C.; Bonino, F.; Capello, L.; Bordiga, S.;Spoto, G.; Zecchina, A.; Moreno, S. D.; Cremaschi, B.; Garilli, M.;et al. Angew. Chem., Int. Ed. 2002, 41, 2341−2344.(66) Prestipino, C.; Berlier, G.; Xamena, F.; Spoto, G.; Bordiga, S.;Zecchina, A.; Palomino, G. T.; Yamamoto, T.; Lamberti, C. Chem.Phys. Lett. 2002, 363, 389−396.(67) Prestipino, C.; Bordiga, S.; Lamberti, C.; Vidotto, S.; Garilli, M.;Cremaschi, B.; Marsella, A.; Leofanti, G.; Fisicaro, P.; Spoto, G.; et al.J. Phys. Chem. B 2003, 107, 5022−5030.(68) Llabres i Xamena, F. X.; Fisicaro, P.; Berlier, G.; Zecchina, A.;Palomino, G. T.; Prestipino, C.; Bordiga, S.; Giamello, E.; Lamberti, C.J. Phys. Chem. B 2003, 107, 7036−7044.(69) Prestipino, C.; Capello, L.; D’Acapito, F.; Lamberti, C. Phys.Chem. Chem. Phys. 2005, 7, 1743−1746.(70) Truccato, M.; Lamberti, C.; Prestipino, C.; Agostino, A. Appl.Phys. Lett. 2005, 86, 213116.(71) Muddada, N. B.; Olsbye, U.; Caccialupi, L.; Cavani, F.; Leofanti,G.; Gianolio, D.; Bordiga, S.; Lamberti, C. Phys. Chem. Chem. Phys.2010, 12, 5605−5618.(72) Muddada, N. B.; Olsbye, U.; Leofanti, G.; Gianolio, D.; Bonino,F.; Bordiga, S.; Fuglerud, T.; Vidotto, S.; Marsella, A.; Lamberti, C.Dalton Trans. 2010, 39, 8437−8449.(73) Groppo, E.; Prestipino, C.; Lamberti, C.; Luches, P.; Giovanardi,C.; Boscherini, F. J. Phys. Chem. B 2003, 107, 4597−4606.(74) Lamberti, C.; Groppo, E.; Prestipino, C.; Casassa, S.; Ferrari, A.M.; Pisani, C.; Giovanardi, C.; Luches, P.; Valeri, S.; Boscherini, F.Phys. Rev. Lett. 2003, 91, 046101.(75) Groppo, E.; Prestipino, C.; Lamberti, C.; Carboni, R.;Boscherini, F.; Luches, P.; Valeri, S.; D’Addato, S. Phys. Rev. B 2004,70, 165408.(76) Lamberti, C. Surf. Sci. Rep. 2004, 53, 1−197.(77) Piovano, A.; Agostini, G.; Frenkel, A. I.; Bertier, T.; Prestipino,C.; Ceretti, M.; Paulus, W.; Lamberti, C. J. Phys. Chem. C 2011, 115,1311−1322.(78) Cavka, J. H.; Jakobsen, S.; Olsbye, U.; Guillou, N.; Lamberti, C.;Bordiga, S.; Lillerud, K. P. J. Am. Chem. Soc. 2008, 130, 13850−13851.(79) Bonino, F.; Chavan, S.; Vitillo, J. G.; Groppo, E.; Agostini, G.;Lamberti, C.; Dietzel, P. D. C.; Prestipino, C.; Bordiga, S. Chem. Mater.2008, 20, 4957−4968.(80) Chavan, S.; Bonino, F.; Vitillo, J. G.; Groppo, E.; Lamberti, C.;Dietzel, P. D. C.; Zecchina, A.; Bordiga, S. Phys. Chem. Chem. Phys.2009, 11, 9811−9822.(81) Masciocchi, N.; Galli, S.; Colombo, V.; Maspero, A.; Palmisano,G.; Seyyedi, B.; Lamberti, C.; Bordiga, S. J. Am. Chem. Soc. 2010, 132,7902−7904.(82) Valenzano, L.; Civalleri, B.; Bordiga, S.; Nilsen, M. H.; Jakobsen,S.; Lillerud, K.-P.; Lamberti, C. Chem. Mater. 2011, 23, 1700−1718.(83) Valenzano, L.; Vitillo, J. G.; Chavan, S.; Civalleri, B.; Bonino, F.;Bordiga, S.; Lamberti, C. Catal. Today 2012, 182, 67−79.(84) Rossin, A.; Di Credico, B.; Giambastiani, G.; Peruzzini, M.;Pescitelli, G.; Reginato, G.; Borfecchia, E.; Gianolio, D.; Lamberti, C.;Bordiga, S. J. Mater. Chem. 2012, 22, 10335−10344.(85) Boscherini, F.; Lamberti, C.; Pascarelli, S.; Rigo, C.; Mobilio, S.Phys. Rev. B 1998, 58, 10745−10753.(86) Romanato, F.; De Salvador, D.; Berti, M.; Drigo, A.; Natali, M.;Tormen, M.; Rossetto, G.; Pascarelli, S.; Boscherini, F.; Lamberti, C.;et al. Phys. Rev. B 1998, 57, 14619−14622.(87) Poppl, A.; Kunz, S.; Himsl, D.; Hartmann, M. J. Phys. Chem. C2008, 112, 2678−2684.(88) Jee, B.; Eisinger, K.; Gul-E-Noor, F.; Bertmer, M.; Hartmann,M.; Himsl, D.; Poppl, A. J. Phys. Chem. C 2010, 114, 16630−16639.(89) Jee, B.; Koch, K.; Moschkowitz, L.; Himsl, D.; Hartman, M.;Poppl, A. J. Phys. Chem. Lett. 2011, 2, 357−361.(90) Gul-E-Noor, F.; Jee, B.; Poppl, A.; Hartmann, M.; Himsl, D.;Bertmer, M. Phys. Chem. Chem. Phys. 2011, 13, 7783−7788.(91) Poppl, A.; Kevan, L. J. Phys. Chem. 1996, 100, 3387−3394.(92) Atherton, N. M.; Horsewill, A. J. Mol. Phys. 1979, 37, 1349−1361.
(93) Jang, H. J.; Hall, W. K.; d’Itri, J. L. J. Phys. Chem. 1996, 100,9416−9420.(94) Larsen, S. C.; Aylor, A.; Bell, A. T.; Reimer, J. A. J. Phys. Chem.1994, 98, 11533−11540.(95) Lo Jacono, M.; Fierro, G.; Dragone, R.; Feng, X. B.; dItri, J.;Hall, W. K. J. Phys. Chem. B 1997, 101, 1979−1984.
The Journal of Physical Chemistry C Article
dx.doi.org/10.1021/jp305756k | J. Phys. Chem. C 2012, 116, 19839−1985019850