Inputs for Agri Trade Promotion from India 1. Problem Statement
53
1 | Page Inputs for Agri Trade Promotion from India Dr. Tamanna Chaturvedi, Consultant Indian Institute of Foreign Trade 1 1. Problem Statement In light of this problem statement, this paper makes a humble attempt to develop an export promotion strategy which brings out a balance between ensuring food security on one hand and still proactively works towards the development of the farmer fraternity and protects the country from anticipated agrarian crises feared due to the shift of farmers as agricultural laborers to fetching employment in manufacturing sector. Issues addressed The paper begins with analyzing India’s core strength in sectors with high growth at the production front. It further analyses: Whether these production advantages resulting out of huge amount of production subsidies offered to the farmers have been able to generate enough farmer s’ income through exports? What has been the status and composition of India’s agricultural exports in terms of product and markets? Are we making an effort to connect right export product to the right and best export markets? 1 Sincere acknowledgement goes to ITC, FAO, World Bank, ICTSD-ICRIER,NIAM,APEDA whose data, working papers and discussions in this regard have been referred to while developing this comprehensive note. Agricultural trade policies in India so far have been concentrating on raising farm output aiming at achieving self sufficiency to reduce import dependency and ensure food security. Towards achieving this objective, farmers have been offered subsidies in the form of both product (Minimum Support Price) and non-product specific support (input subsidies: irrigation, power, credit, fertilizer etc). These policy measures undoubtedly resulted in enhancing the agricultural production in the country and have helped reduce dependency on imports (import substitution) but in pursuit of maintaining domestic prices of primary goods at affordable prices in an economy which is still predominant with large number of poor and insecure population; leading to enormous governmental interventions in the form of export restrictions, canalization via STEs etc; when farmers are not allowed free export and take advantage of rising agricultural prices in global markets; how are we going to achieve the objective of doubling farmer’s income by 2022-23?
-
Upload
khangminh22 -
Category
Documents
-
view
0 -
download
0
Transcript of Inputs for Agri Trade Promotion from India 1. Problem Statement

1 | P a g e
Inputs for Agri Trade Promotion from India
Dr. Tamanna Chaturvedi, Consultant Indian Institute of Foreign Trade1
1. Problem Statement
In light of this problem statement, this paper makes a humble attempt to develop an export
promotion strategy which brings out a balance between ensuring food security on one hand
and still proactively works towards the development of the farmer fraternity and protects the
country from anticipated agrarian crises feared due to the shift of farmers as agricultural
laborers to fetching employment in manufacturing sector.
Issues addressed
The paper begins with analyzing India’s core strength in sectors with high growth at the
production front. It further analyses:
Whether these production advantages resulting out of huge amount of production
subsidies offered to the farmers have been able to generate enough farmers’ income
through exports?
What has been the status and composition of India’s agricultural exports in terms of
product and markets?
Are we making an effort to connect right export product to the right and best export
markets?
1 Sincere acknowledgement goes to ITC, FAO, World Bank, ICTSD-ICRIER,NIAM,APEDA whose data, working papers
and discussions in this regard have been referred to while developing this comprehensive note.
Agricultural trade policies in India so far have been concentrating on raising farm output aiming at achieving
self sufficiency to reduce import dependency and ensure food security. Towards achieving this objective,
farmers have been offered subsidies in the form of both product (Minimum Support Price) and non-product
specific support (input subsidies: irrigation, power, credit, fertilizer etc). These policy measures undoubtedly
resulted in enhancing the agricultural production in the country and have helped reduce dependency on
imports (import substitution) but in pursuit of maintaining domestic prices of primary goods at affordable
prices in an economy which is still predominant with large number of poor and insecure population; leading
to enormous governmental interventions in the form of export restrictions, canalization via STEs etc; when
farmers are not allowed free export and take advantage of rising agricultural prices in global markets; how
are we going to achieve the objective of doubling farmer’s income by 2022-23?

2 | P a g e
Has India been able to compete against other competing countries on price and quality
front?
o Does domestic policies and regulatory framework needs a change to become
competitive?
o Do we need to work towards product innovation?
o Do we need to work on connecting our domestic policies in line with MEIS policy
and our commitments at the WTO forum?
o Do we need to be more rigorous in negotiating our stand at WTO front in terms
of demanding market access for Indian agro exports under Agreement on
Agriculture on one hand and negotiating on Non tariff barriers under Agreement
on SPS/TBT?
o Do we need to be focusing on utilizing emerging trade agreements including
Indo-EU, RCEP etc for better terms of trade for Agro exports and relaxed Rules of
origin towards exports of processed goods in light of import dependency on raw
material?
o With tariff instruments prevailing in developed markets; how far is the possibility
of focusing of shift from primary to processed food exports?
Are we doing enough to protect farmer’s interest against protection from import surge?
o Do we have enough water between WTO bound rate of import duty as against
applied MFN rates in case of import surge?
o Are we negotiating enough towards pushing Special safeguard Mechanism (SSM)
in light of absence of Special Agricultural Safeguard for India?
o In the absence of quantitative restrictions, are TRQs currently announced
sufficient?
o Are we proactive in anticipating dumping of foreign imported goods resulting in
it’s excess supply at cheaper prices resulting into reduction of farmers income?
o Are we working enough on enforcing food safety standards domestically to
protect us against import surge of bad quality imports in light of WTO national
treatment clause?
India excels in Worldwide Agricultural production
Agriculture is the backbone of the Indian Economy and the growth of agriculture and allied
sectors is still a crucial factor in the overall performance of Indian economy. Today, agriculture
accounts for 14.2 percent of the country’s gross domestic product; employing almost 55 percent
of the country’s workforce. India has nearly 12 percent of the world’s arable land ranking as
second in farm output when compared worldwide.

3 | P a g e
As per FAO world agriculture statistics, India is the world's largest producer of many fresh fruits
and vegetables, milk, major spices, select fresh meats, select fibrous crops such as jute, several
staples such as millets and castor oil seed. India is the second largest producer of wheat and
rice, the world's major food staples. India is also the world's second or third largest producer of
several dry fruits, agriculture-based textile raw materials, roots and tuber crops, pulses, farmed
fish, eggs, coconut, sugarcane and numerous vegetables. India ranked within the world's five
largest producers of over 80% of agricultural produce items, including many cash crops such as
coffee and cotton. India is also one of the world's five largest producers of livestock and poultry
meat, with one of the fastest growth rates.
India is the world's largest
producer of many fresh fruits
and vegetables, milk, major
spices, select fresh meats,
select fibrous crops such as
jute, several staples such as
millets and castor oil seed.

4 | P a g e
Lentils and many other food staples production also increased year over year. Indian farmers
thus produced about 71 kilograms of wheat and 80 kilograms of rice for every member of
Indian population. The per capita supply of rice every year in India is now higher than the per
capita consumption of rice every year in Japan. FAO studies also claim that India can easily feed
its growing population, plus produce wheat and rice and other agricultural crops for global
exports. India is the sixth largest producer of coffee after Brazil, Vietnam, Colombia, Indonesia,
and Ethiopia. With 2 per cent share in global area under coffee, India contributes about 4 per
cent to world coffee production. India is the largest producer and consumer of black tea in the
world.
Agriculture is the largest private sector enterprise. India ranks the fifth largest exporter of
agricultural products after the US, Brazil, China and Canada. In the past decade, India has
emerged as a major agricultural exporter, with exports climbing from just over $5 billion in to a
record of more than $39 billion. India became the world’s seventh-largest exporter of
agricultural products, surpassing Australia. In terms of net exports, India is now the world’s
sixth-largest net exporter, with net exports doubles those of the EU-28. India’s export growth
over the past decade has been the highest of any country, with an annual rate of more than 21
percent.
Has strong production base in India been able to take leverage in the international market?
5 | P a g e
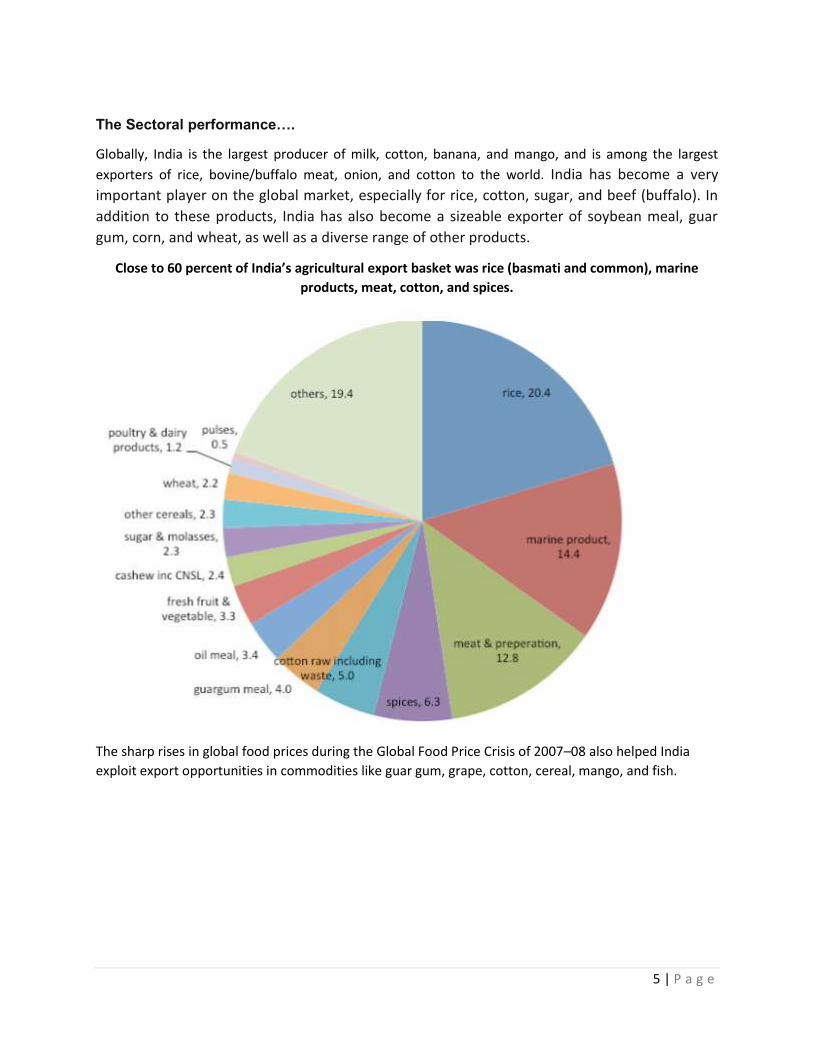
The Sectoral performance….
Globally, India is the largest producer of milk, cotton, banana, and mango, and is among the largest
exporters of rice, bovine/buffalo meat, onion, and cotton to the world. India has become a very
important player on the global market, especially for rice, cotton, sugar, and beef (buffalo). In
addition to these products, India has also become a sizeable exporter of soybean meal, guar
gum, corn, and wheat, as well as a diverse range of other products.
Close to 60 percent of India’s agricultural export basket was rice (basmati and common), marine
products, meat, cotton, and spices.
The sharp rises in global food prices during the Global Food Price Crisis of 2007–08 also helped India
exploit export opportunities in commodities like guar gum, grape, cotton, cereal, mango, and fish.
6 | P a g e
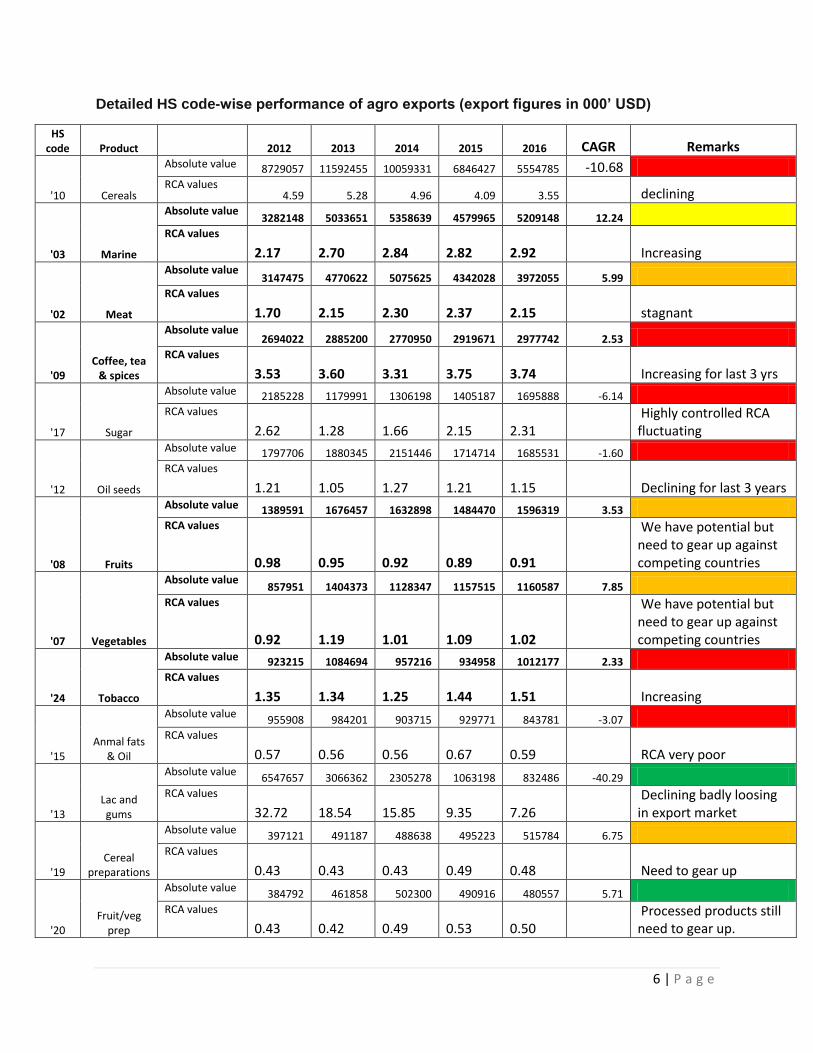
Detailed HS code-wise performance of agro exports (export figures in 000’ USD)
HS code Product
2012 2013 2014 2015 2016 CAGR Remarks
'10 Cereals
Absolute value 8729057 11592455 10059331 6846427 5554785 -10.68 RCA values
4.59 5.28 4.96 4.09 3.55 declining
'03 Marine
Absolute value 3282148 5033651 5358639 4579965 5209148 12.24
RCA values 2.17
2.70
2.84
2.82
2.92 Increasing
'02 Meat
Absolute value 3147475 4770622 5075625 4342028 3972055 5.99
RCA values 1.70
2.15
2.30
2.37
2.15 stagnant
'09 Coffee, tea
& spices
Absolute value 2694022 2885200 2770950 2919671 2977742 2.53
RCA values 3.53
3.60
3.31
3.75
3.74 Increasing for last 3 yrs
'17 Sugar
Absolute value 2185228 1179991 1306198 1405187 1695888 -6.14 RCA values
2.62 1.28
1.66
2.15
2.31
Highly controlled RCA fluctuating
'12 Oil seeds
Absolute value 1797706 1880345 2151446 1714714 1685531 -1.60 RCA values
1.21 1.05
1.27
1.21
1.15 Declining for last 3 years
'08 Fruits
Absolute value 1389591 1676457 1632898 1484470 1596319 3.53 RCA values
0.98
0.95
0.92
0.89
0.91
We have potential but need to gear up against competing countries
'07 Vegetables
Absolute value 857951 1404373 1128347 1157515 1160587 7.85
RCA values
0.92
1.19
1.01
1.09
1.02
We have potential but need to gear up against competing countries
'24 Tobacco
Absolute value 923215 1084694 957216 934958 1012177 2.33 RCA values
1.35 1.34
1.25
1.44
1.51 Increasing
'15 Anmal fats
& Oil
Absolute value 955908 984201 903715 929771 843781 -3.07
RCA values 0.57
0.56
0.56
0.67
0.59 RCA very poor
'13 Lac and gums
Absolute value 6547657 3066362 2305278 1063198 832486 -40.29
RCA values 32.72
18.54
15.85
9.35
7.26
Declining badly loosing in export market
'19 Cereal
preparations
Absolute value 397121 491187 488638 495223 515784 6.75
RCA values 0.43
0.43
0.43
0.49
0.48 Need to gear up
'20 Fruit/veg
prep
Absolute value 384792 461858 502300 490916 480557 5.71
RCA values 0.43
0.42
0.49
0.53
0.50
Processed products still need to gear up.
7 | P a g e
HS code Product
2012 2013 2014 2015 2016 CAGR Remarks
'22 Beverages,
spirits
Absolute value 353548 438238 376837 341609 308098 -3.38
RCA values 0.21
0.22
0.20
0.20
0.18
Poor not worth considering
'16 Meat/fish
prep
Absolute value 84793 121770 145419 203145 292922 36.33
RCA values 0.11
0.14
0.17
0.28
0.40
Poor but growing needs attention
'04 Dairy
Absolute value 306691 737603 481893 346379 279666 -2.28 RCA values
0.24 0.44
0.29
0.29
0.24
Poor not worth considering
'11 Milling
products
Absolute value 218119 319130 305476 295931 228226 1.14
RCA values 0.75
0.93
0.92
1.01
0.82
Poor not worth considering
'18 Cocoa
Absolute value 53957 82871 126614 179877 177542 34.68 RCA values
0.08 0.11
0.15
0.24
0.23
Poor not worth considering
'01 Live animals
Absolute value 6179 12504 12533 9970 37142 56.58 RCA values
0.02 0.03
0.03
0.03
0.11
Poor not worth considering
Absolute value in 2016 is high but poor/negative growth for last 5 years
Both absolute value good as well as growth rate
Absolute value poor but growth high
Poor absolute value and poor growth
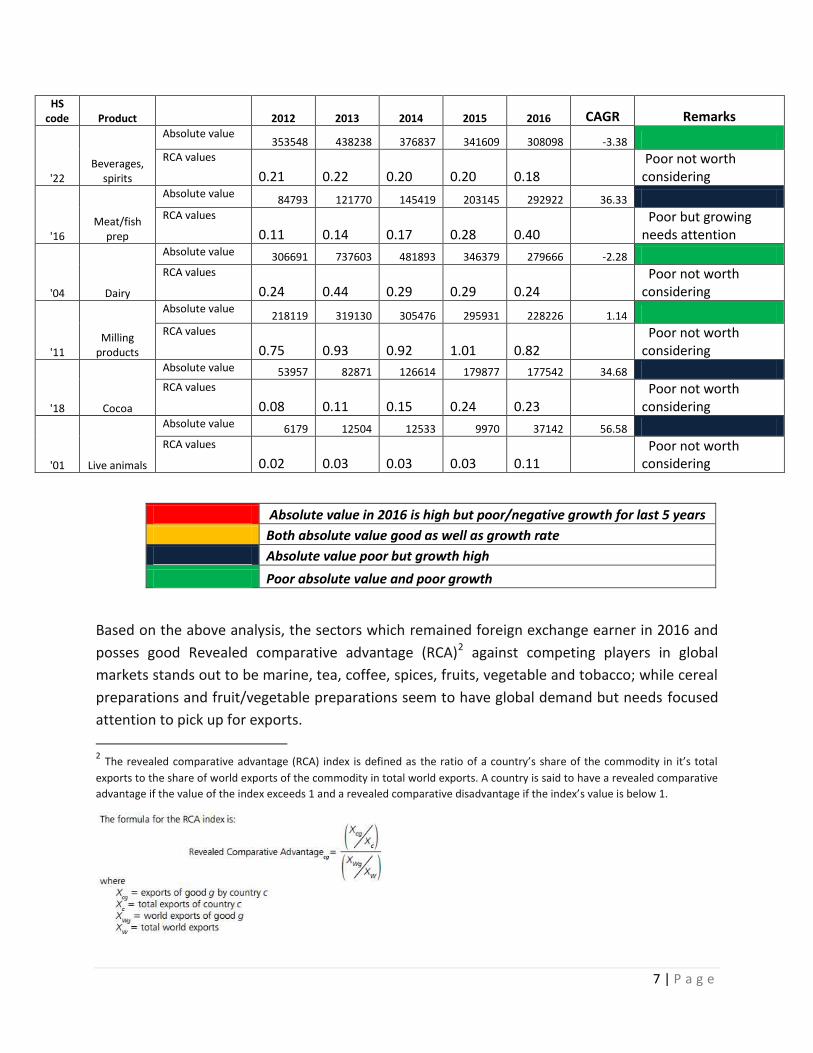
Based on the above analysis, the sectors which remained foreign exchange earner in 2016 and
posses good Revealed comparative advantage (RCA)2 against competing players in global
markets stands out to be marine, tea, coffee, spices, fruits, vegetable and tobacco; while cereal
preparations and fruit/vegetable preparations seem to have global demand but needs focused
attention to pick up for exports.
2 The revealed comparative advantage (RCA) index is defined as the ratio of a country’s share of the commodity in it’s total
exports to the share of world exports of the commodity in total world exports. A country is said to have a revealed comparative
advantage if the value of the index exceeds 1 and a revealed comparative disadvantage if the index’s value is below 1.
8 | P a g e
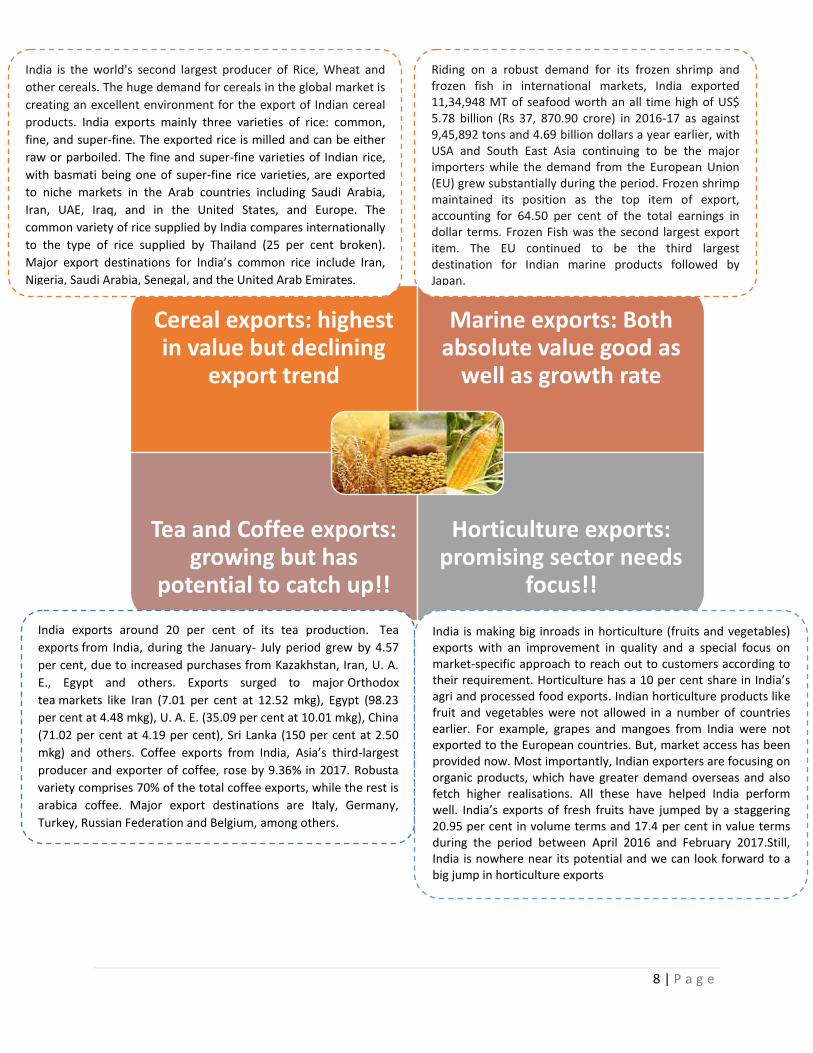
Cereal exports: highest in value but declining
export trend
Marine exports: Both absolute value good as
well as growth rate
Tea and Coffee exports: growing but has
potential to catch up!!
Horticulture exports: promising sector needs
focus!!
India is the world's second largest producer of Rice, Wheat and
other cereals. The huge demand for cereals in the global market is
creating an excellent environment for the export of Indian cereal
products. India exports mainly three varieties of rice: common,
fine, and super-fine. The exported rice is milled and can be either
raw or parboiled. The fine and super-fine varieties of Indian rice,
with basmati being one of super-fine rice varieties, are exported
to niche markets in the Arab countries including Saudi Arabia,
Iran, UAE, Iraq, and in the United States, and Europe. The
common variety of rice supplied by India compares internationally
to the type of rice supplied by Thailand (25 per cent broken).
Major export destinations for India’s common rice include Iran,
Nigeria, Saudi Arabia, Senegal, and the United Arab Emirates.
Riding on a robust demand for its frozen shrimp and frozen fish in international markets, India exported 11,34,948 MT of seafood worth an all time high of US$ 5.78 billion (Rs 37, 870.90 crore) in 2016-17 as against 9,45,892 tons and 4.69 billion dollars a year earlier, with USA and South East Asia continuing to be the major importers while the demand from the European Union (EU) grew substantially during the period. Frozen shrimp maintained its position as the top item of export, accounting for 64.50 per cent of the total earnings in dollar terms. Frozen Fish was the second largest export item. The EU continued to be the third largest destination for Indian marine products followed by Japan.
India exports around 20 per cent of its tea production. Tea
exports from India, during the January- July period grew by 4.57
per cent, due to increased purchases from Kazakhstan, Iran, U. A.
E., Egypt and others. Exports surged to major Orthodox
tea markets like Iran (7.01 per cent at 12.52 mkg), Egypt (98.23
per cent at 4.48 mkg), U. A. E. (35.09 per cent at 10.01 mkg), China
(71.02 per cent at 4.19 per cent), Sri Lanka (150 per cent at 2.50
mkg) and others. Coffee exports from India, Asia’s third-largest
producer and exporter of coffee, rose by 9.36% in 2017. Robusta
variety comprises 70% of the total coffee exports, while the rest is
arabica coffee. Major export destinations are Italy, Germany,
Turkey, Russian Federation and Belgium, among others.
India is making big inroads in horticulture (fruits and vegetables) exports with an improvement in quality and a special focus on market-specific approach to reach out to customers according to their requirement. Horticulture has a 10 per cent share in India’s agri and processed food exports. Indian horticulture products like fruit and vegetables were not allowed in a number of countries earlier. For example, grapes and mangoes from India were not exported to the European countries. But, market access has been provided now. Most importantly, Indian exporters are focusing on organic products, which have greater demand overseas and also fetch higher realisations. All these have helped India perform well. India’s exports of fresh fruits have jumped by a staggering 20.95 per cent in volume terms and 17.4 per cent in value terms during the period between April 2016 and February 2017.Still, India is nowhere near its potential and we can look forward to a big jump in horticulture exports

9 | P a g e
Despite these promising status; the share of agri exports as a percentage of total exports from
India has been continuously on a decline from 13% in 2012 to 11.71% by the end of 2016.
Share of Indian agro exports in total exports is on a continous decline….
While exports of horticulture are promoted by the government to fetch better realisation than
domestic price, shipment of cereals and other agri products are politically driven. Hence,
exports of cereals, including wheat and non-basmati rice, might continue to fall going forward.
Data compiled by the Food and Agriculture Organisation of the United Nations showed global
markets in oversupply for cereals resulting in lower imports.

10 | P a g e
Indian agro exports not catching up with production level
This is in spite of the fact that the consumption levels of fruits and vegetables in most of the
developed countries have been witnessing positive growth since last decade. Further, although
India exports a wide variety of horticultural products, only a handful of commodities or
products account for the bulk of this trade. This is also true for most of the other agricultural
items wherein India has huge export potential. For instance despite being the largest producer
of Milk and milk products India’s share in total world exports is meager 0.2% for cereals it is
1.4%, coffee, tea and spices (4.4%) and fisheries only 2.6% as depicted in the table below.
Commodities with high production potential not being able to gain presence in global markets Agri Products India’s Share in world exports (%)
Coffee, tea, mate and spices 4.4
Sugars and sugar confectionery 1.9
Fish 2.6
Oil seed 1.5
Cereals 1.4
Tobacco 1.7
Edible vegetables 1.5
Edible fruit 1
Cerealflour 0.4
Dairy product 0.2
Cocoa and cocoa preparations 0.1
11 | P a g e
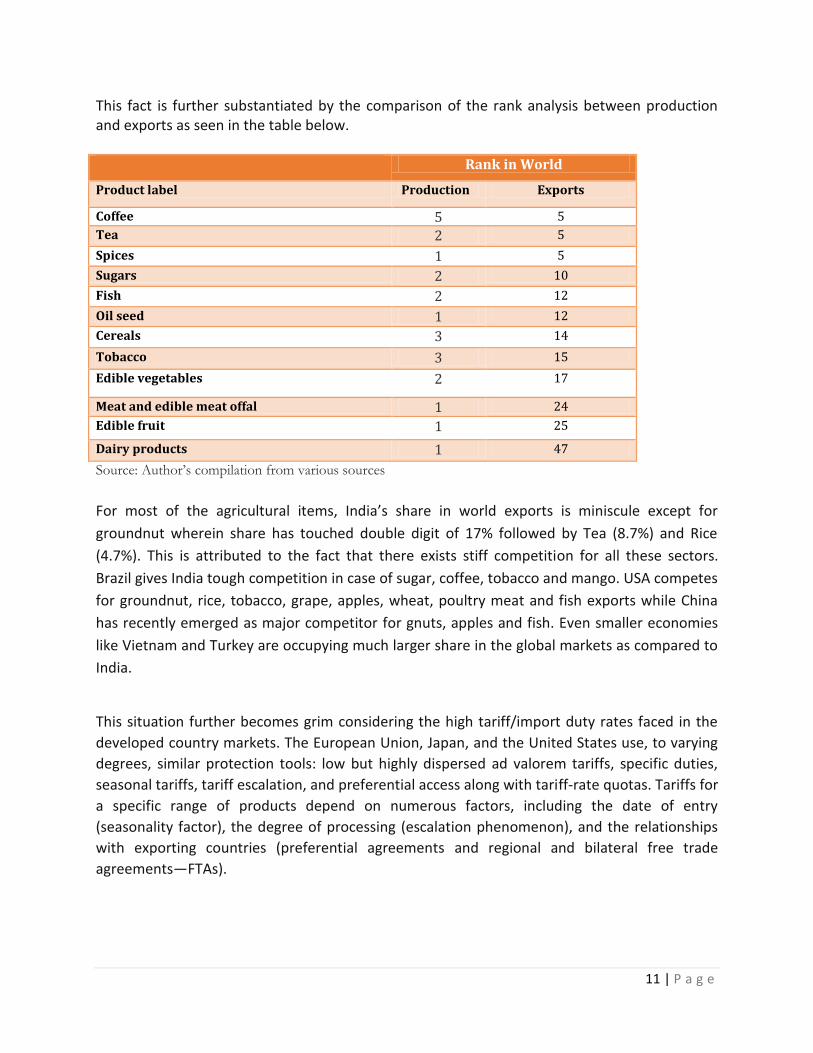
This fact is further substantiated by the comparison of the rank analysis between production and exports as seen in the table below. Rank in World
Product label Production Exports
Coffee 5 5
Tea 2 5
Spices 1 5
Sugars 2 10
Fish 2 12
Oil seed 1 12
Cereals 3 14
Tobacco 3 15
Edible vegetables 2 17
Meat and edible meat offal 1 24
Edible fruit 1 25
Dairy products 1 47
Source: Author’s compilation from various sources
For most of the agricultural items, India’s share in world exports is miniscule except for
groundnut wherein share has touched double digit of 17% followed by Tea (8.7%) and Rice
(4.7%). This is attributed to the fact that there exists stiff competition for all these sectors.
Brazil gives India tough competition in case of sugar, coffee, tobacco and mango. USA competes
for groundnut, rice, tobacco, grape, apples, wheat, poultry meat and fish exports while China
has recently emerged as major competitor for gnuts, apples and fish. Even smaller economies
like Vietnam and Turkey are occupying much larger share in the global markets as compared to
India.
This situation further becomes grim considering the high tariff/import duty rates faced in the
developed country markets. The European Union, Japan, and the United States use, to varying
degrees, similar protection tools: low but highly dispersed ad valorem tariffs, specific duties,
seasonal tariffs, tariff escalation, and preferential access along with tariff-rate quotas. Tariffs for
a specific range of products depend on numerous factors, including the date of entry
(seasonality factor), the degree of processing (escalation phenomenon), and the relationships
with exporting countries (preferential agreements and regional and bilateral free trade
agreements—FTAs).

12 | P a g e
Stiff competition in the international Market
For most of the agricultural items, India’s share in world exports is miniscule except for groundnut wherein share has touched double digit of 17% followed by Tea (8.7%) and Rice (4.7%). This is attributed to the fact that there exists stiff competition for all these sectors
Commodity Major Exporting Countries/major competing suppliers India's share in World Exports
Groundnuts Argentina(32.7),Netherlands(11.1),China(10.9),USA(9.4) 17.2
Tea Sri Lanka(23.3),Kenya(18.6),China(15.3),United Kingdom(4.1) 8.7
Rice Thailand(35.2), Viet Nam(12.5),USA(11.3),Pakistan(11.1) 4.1
Sugar cane Brazil(43.6),Thailand(10.6),France(5.2),Mexico(3.5),Germany(2.4), 2.3
Coffee Brazil(22.3),Viet Nam(7.8),Germany(7.7),Colombia(7.4),Switzerland(4.8) 2
Tobacco, Germany(14.3),Netherlands(14.2),Brazil(7.5),Poland(4.6), USA(4.3) 1.7
Mangoes Mexico(15.9),Netherlands(12.8),Brazil(10.9),Peru(8.9),Thailand(7.4) 1.1
Potatoes Netherlands(22.3),France(15.5),Germany(8.8),Egypt(5.8),Canada(5.2) 1
Tomatoes Mexico(25.2),Netherlands(18.4),Spain(14.1),Morocco(5.4),Turkey(5.2) 0.9
Grapes Chile(19.4),USA(15.2),Italy(9.3),Netherlands(7.9),Turkey(7.9) 0.8
Wheat United States of America(23.7),France(14.4),Australia(13.4),Canada(12.2) 0.1
Rapeseed Canada(43.2),Australia(10.2),France(10.1),Ukraine(5.9),United Kingdom(3.9) 0
Cocoa Côte d'Ivoire(29.2),Ghana(25.5),Nigeria(8.7),Netherlands(6.6),Indonesia(6) 0
Apples Italy(14.2),United States of America(13.6),China(13.1),France(10.6),Chile(9.7)
0
Bananas Ecuador(24.2),Belgium(14.3),Colombia(8.8),Costa Rica(7.8),Guatemala(5.1) 0
Cucumbers Spain(28.3),Netherlands(20.5),Mexico(13.1),Canada(6.9),Jordan(6.3) 0
Poultry Meat Brazil(28.4),USA(17.7),Netherlands(8.9),France(5.8),Poland(4.7) 0
Fish China(11.5),Norway(9.4),USA(5.3),Viet Nam(4.4),Canada(3.9) 2.6
Eggs Netherlands(21.6),USA (9.1),Turkey(8.9),Germany(7.4),Poland(6.3) 0.2
Note :Figures in bracket are the percentage share in total world export of respective countries i.e India’s major competing suppliers.
13 | P a g e
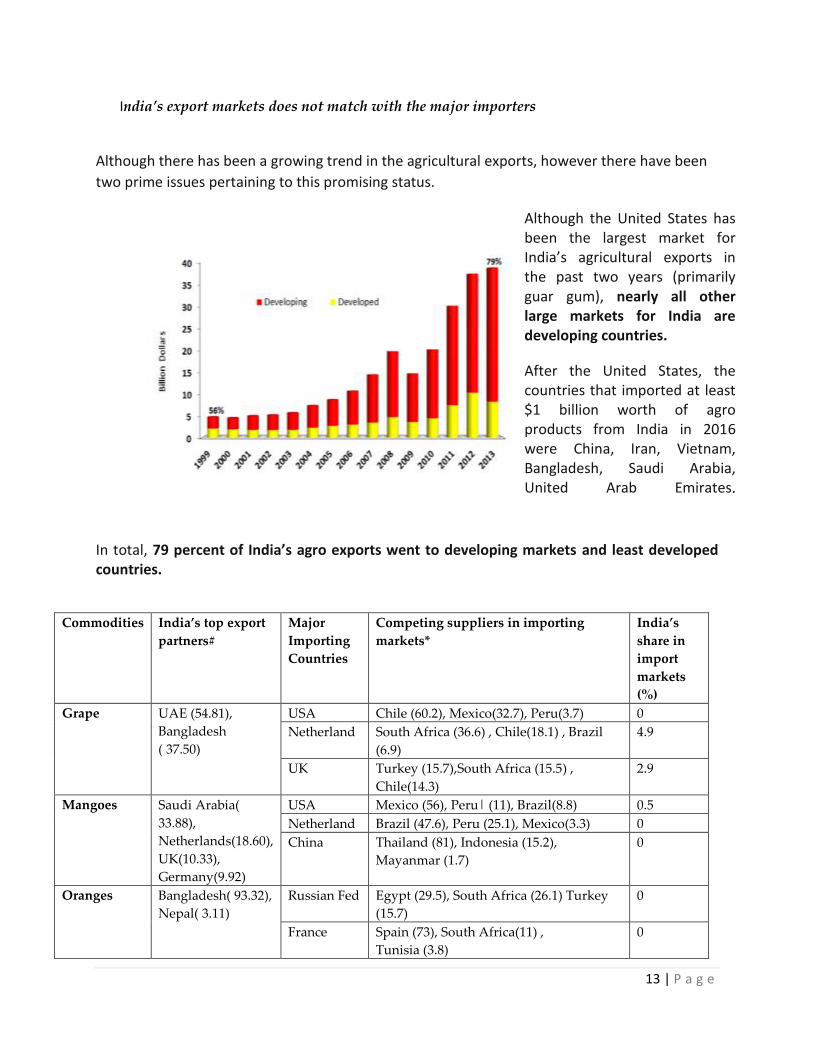
India’s export markets does not match with the major importers
Although there has been a growing trend in the agricultural exports, however there have been
two prime issues pertaining to this promising status.
In total, 79 percent of India’s agro exports went to developing markets and least developed countries.
Commodities India’s top export
partners#
Major
Importing
Countries
Competing suppliers in importing
markets*
India’s
share in
import
markets
(%)
Grape UAE (54.81),
Bangladesh
( 37.50)
USA Chile (60.2), Mexico(32.7), Peru(3.7) 0
Netherland South Africa (36.6) , Chile(18.1) , Brazil
(6.9)
4.9
UK Turkey (15.7),South Africa (15.5) ,
Chile(14.3)
2.9
Mangoes Saudi Arabia(
33.88),
Netherlands(18.60),
UK(10.33),
Germany(9.92)
USA Mexico (56), Peru| (11), Brazil(8.8) 0.5
Netherland Brazil (47.6), Peru (25.1), Mexico(3.3) 0
China Thailand (81), Indonesia (15.2),
Mayanmar (1.7)
0
Oranges Bangladesh( 93.32),
Nepal( 3.11)
Russian Fed Egypt (29.5), South Africa (26.1) Turkey
(15.7)
0
France Spain (73), South Africa(11) ,
Tunisia (3.8)
0
Although the United States has been the largest market for India’s agricultural exports in the past two years (primarily guar gum), nearly all other large markets for India are developing countries.
After the United States, the countries that imported at least $1 billion worth of agro products from India in 2016 were China, Iran, Vietnam, Bangladesh, Saudi Arabia, United Arab Emirates, Indonesia, Malaysia, and Pakistan.
14 | P a g e
Netherlands South Africa (40.5), Spain (20) Morocco 0
Onions Bangladesh(26.88),
Malaysia(23.20),
UAE (17.99), Sri
Lanka (10.09),
Pakistan(8.03)
USA Mexico (65.2), Canada (13.5), Peru (11.4) 0
UK Netherland (40), Spain (18.3) , Poland
(8.5)
0.3
Russia Netherland (28.8), Tajakistan (20.6) ,
China (15)
0
Potatoes Sri Lanka(35.19),
Nepal (26.58),
Mauritius(9.73)
Belgium France (39.4), Netherland (33.5) Germany
(13.4)
0
Spain France (53.7), Netherland (21.4) United
Kingdom (16.2)
0
Tomatoes Pakistan(49.67),
UAE(32.80),
Bangladesh(11.95)
USA Mexico (83),Canada (15.9),
Guatemala(0.4)
0
Germany Netherland (27.8), Egypt(15.2) , France
(7.9)
0
Russia France (53.7), Netherland (21.4) United
Kingdom (16.2)
0
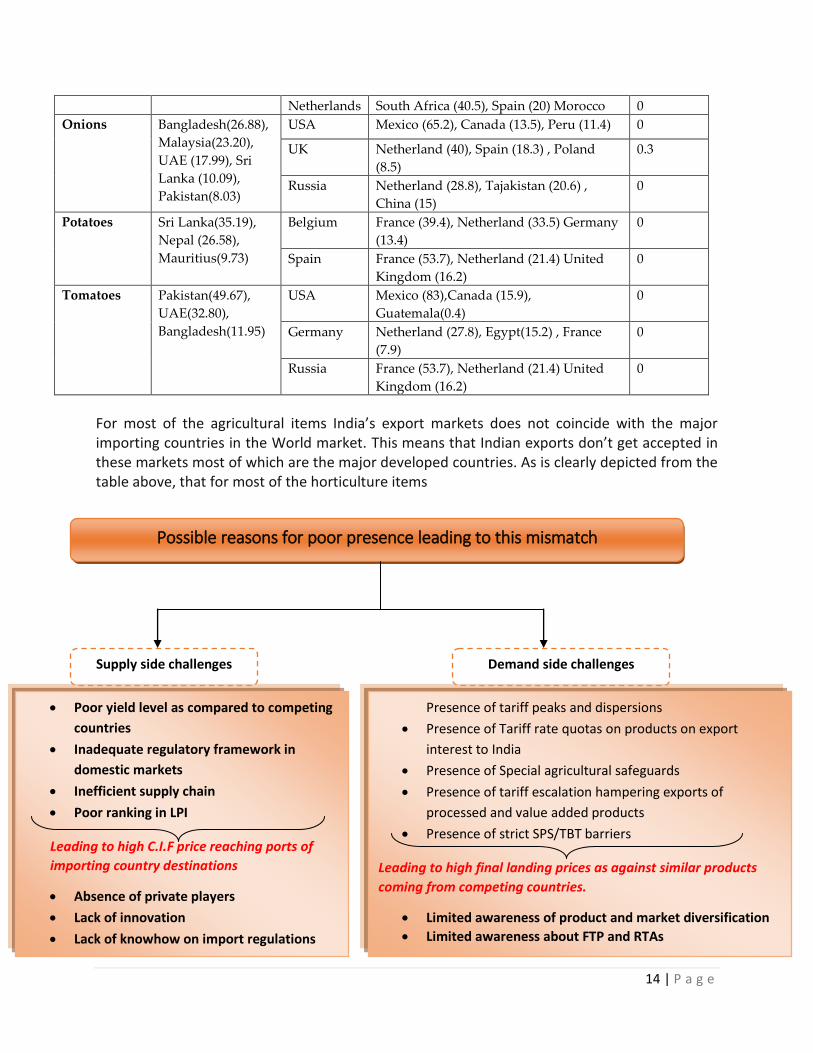
For most of the agricultural items India’s export markets does not coincide with the major importing countries in the World market. This means that Indian exports don’t get accepted in these markets most of which are the major developed countries. As is clearly depicted from the table above, that for most of the horticulture items
Possible reasons for poor presence leading to this mismatch
Supply side challenges Demand side challenges
Poor yield level as compared to competing
countries
Inadequate regulatory framework in
domestic markets
Inefficient supply chain
Poor ranking in LPI
Leading to high C.I.F price reaching ports of
importing country destinations
Absence of private players
Lack of innovation
Lack of knowhow on import regulations
Presence of tariff peaks and dispersions
Presence of Tariff rate quotas on products on export
interest to India
Presence of Special agricultural safeguards
Presence of tariff escalation hampering exports of
processed and value added products
Presence of strict SPS/TBT barriers
Leading to high final landing prices as against similar products
coming from competing countries.
Limited awareness of product and market diversification
Limited awareness about FTP and RTAs
15 | P a g e
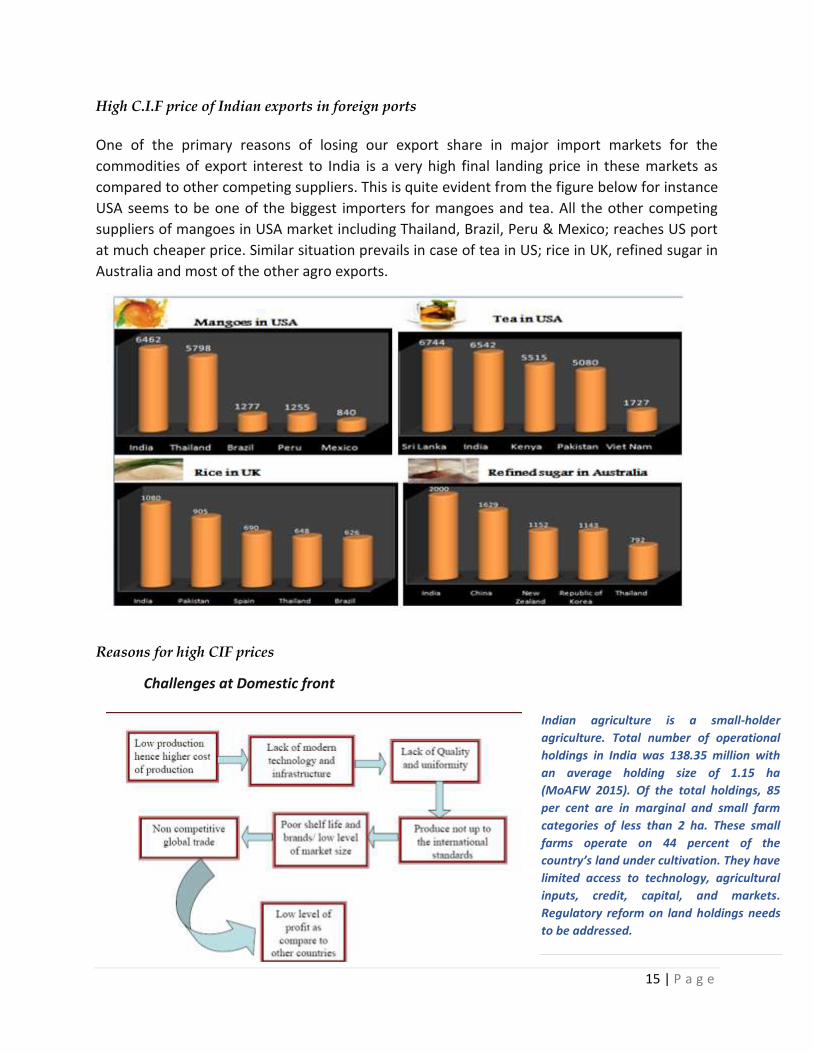
High C.I.F price of Indian exports in foreign ports
One of the primary reasons of losing our export share in major import markets for the
commodities of export interest to India is a very high final landing price in these markets as
compared to other competing suppliers. This is quite evident from the figure below for instance
USA seems to be one of the biggest importers for mangoes and tea. All the other competing
suppliers of mangoes in USA market including Thailand, Brazil, Peru & Mexico; reaches US port
at much cheaper price. Similar situation prevails in case of tea in US; rice in UK, refined sugar in
Australia and most of the other agro exports.
Reasons for high CIF prices
Challenges at Domestic front
Indian agriculture is a small-holder
agriculture. Total number of operational
holdings in India was 138.35 million with
an average holding size of 1.15 ha
(MoAFW 2015). Of the total holdings, 85
per cent are in marginal and small farm
categories of less than 2 ha. These small
farms operate on 44 percent of the
country’s land under cultivation. They have
limited access to technology, agricultural
inputs, credit, capital, and markets.
Regulatory reform on land holdings needs
to be addressed.

16 | P a g e
Poor farm size leads to poor yield levels as compared to competing countries making our
products costlier
Poor yield levels is one of the reasons of high landing price in the foreign markets by making
high cost of production right from the inception stage. The productivity of most of the crops
claiming to have a high production potential in India and also bearing export importance are
quite low as compared to other competing suppliers. Australia wins over India in case of rice,
Israel in case of milk, Peru in sugarcane and Belgium in tomatoes to a very large extent. Apart
from developed markets of USA, China and EU, smaller countries surprisingly are surpassing
India in the productivity levels. Some of these countries include Cape Verde (mango), Cyprus
(Okra), Turkey (soybean), Jordan (eggs) and Nicaragua (groundnuts). According to the World
Bank, “India’s rice yields are one-third of China’s and about half of those
in Vietnam and Indonesia. With the exception of sugarcane, potato and tea, the same is true for
most other agricultural commodities.”
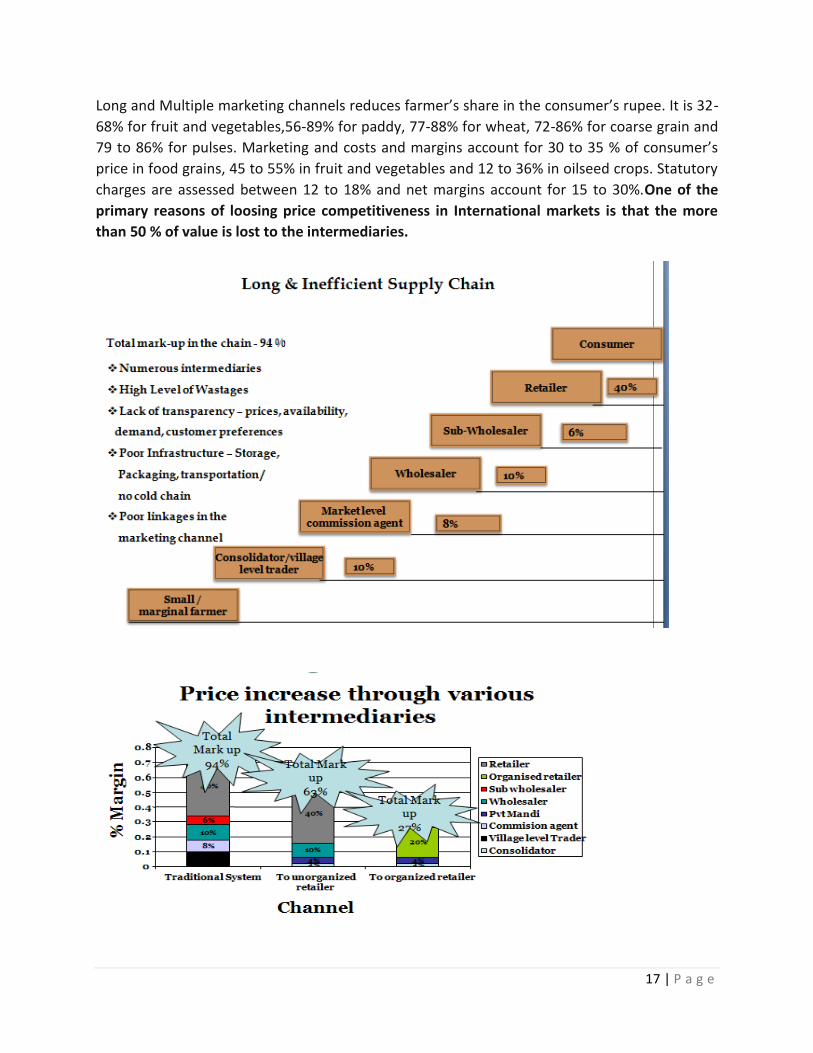
Inefficient supply chain adds to high markups and price spread impacting high FOB price
The supply chain of agriculture products remain very fragmented with a large number of
intermediaries. A study by Global AgriSystem of Fruit & Vegetable supply chain in four metros
(Delhi, Mumbai, Bangalore and Kolkata) revealed that, on an average there are 5-6
intermediaries between the primary producer and the consumer. The total mark up in the chain
added upto 60-75%. As a result the primary producers receive only 20-25% of the consumer
price. Moreover, multiple handling by different intermediaries resulted in huge wastage of 15-
25% of the value.
17 | P a g e
Long and Multiple marketing channels reduces farmer’s share in the consumer’s rupee. It is 32-
68% for fruit and vegetables,56-89% for paddy, 77-88% for wheat, 72-86% for coarse grain and
79 to 86% for pulses. Marketing and costs and margins account for 30 to 35 % of consumer’s
price in food grains, 45 to 55% in fruit and vegetables and 12 to 36% in oilseed crops. Statutory
charges are assessed between 12 to 18% and net margins account for 15 to 30%.One of the
primary reasons of loosing price competitiveness in International markets is that the more
than 50 % of value is lost to the intermediaries.
18 | P a g e
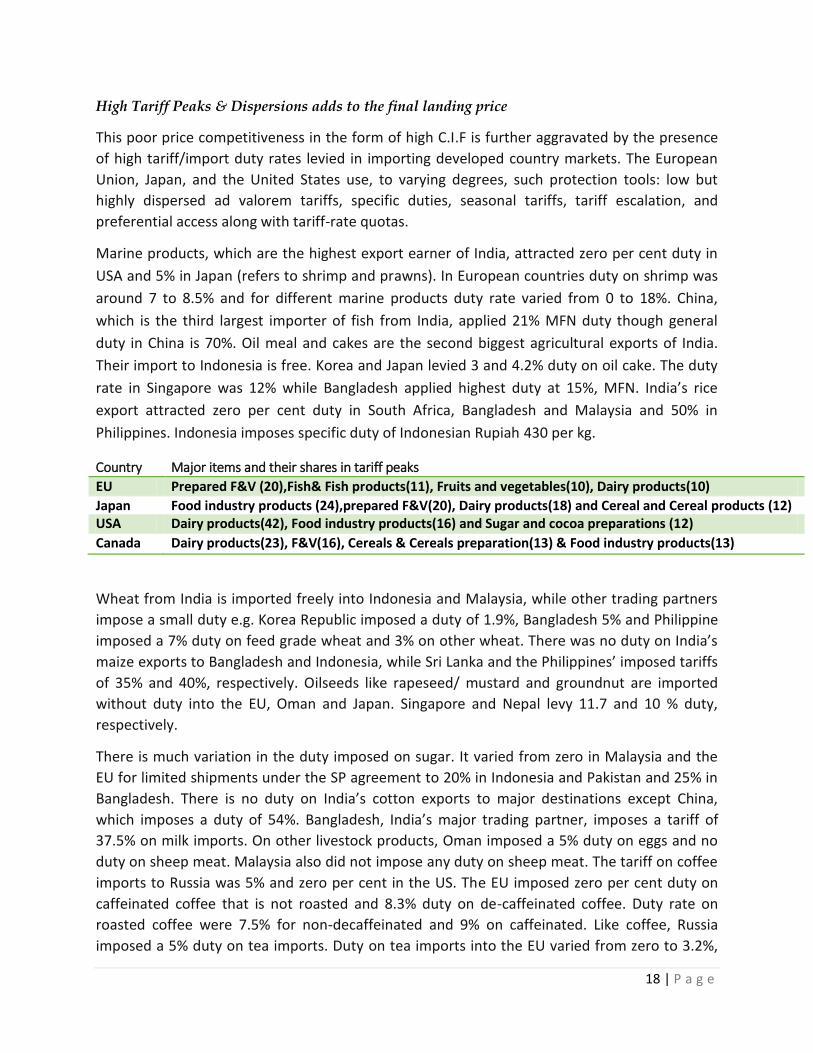
High Tariff Peaks & Dispersions adds to the final landing price
This poor price competitiveness in the form of high C.I.F is further aggravated by the presence
of high tariff/import duty rates levied in importing developed country markets. The European
Union, Japan, and the United States use, to varying degrees, such protection tools: low but
highly dispersed ad valorem tariffs, specific duties, seasonal tariffs, tariff escalation, and
preferential access along with tariff-rate quotas.
Marine products, which are the highest export earner of India, attracted zero per cent duty in
USA and 5% in Japan (refers to shrimp and prawns). In European countries duty on shrimp was
around 7 to 8.5% and for different marine products duty rate varied from 0 to 18%. China,
which is the third largest importer of fish from India, applied 21% MFN duty though general
duty in China is 70%. Oil meal and cakes are the second biggest agricultural exports of India.
Their import to Indonesia is free. Korea and Japan levied 3 and 4.2% duty on oil cake. The duty
rate in Singapore was 12% while Bangladesh applied highest duty at 15%, MFN. India’s rice
export attracted zero per cent duty in South Africa, Bangladesh and Malaysia and 50% in
Philippines. Indonesia imposes specific duty of Indonesian Rupiah 430 per kg.
Country Major items and their shares in tariff peaks
EU Prepared F&V (20),Fish& Fish products(11), Fruits and vegetables(10), Dairy products(10)
Japan Food industry products (24),prepared F&V(20), Dairy products(18) and Cereal and Cereal products (12) USA Dairy products(42), Food industry products(16) and Sugar and cocoa preparations (12)
Canada Dairy products(23), F&V(16), Cereals & Cereals preparation(13) & Food industry products(13)
Wheat from India is imported freely into Indonesia and Malaysia, while other trading partners
impose a small duty e.g. Korea Republic imposed a duty of 1.9%, Bangladesh 5% and Philippine
imposed a 7% duty on feed grade wheat and 3% on other wheat. There was no duty on India’s
maize exports to Bangladesh and Indonesia, while Sri Lanka and the Philippines’ imposed tariffs
of 35% and 40%, respectively. Oilseeds like rapeseed/ mustard and groundnut are imported
without duty into the EU, Oman and Japan. Singapore and Nepal levy 11.7 and 10 % duty,
respectively.
There is much variation in the duty imposed on sugar. It varied from zero in Malaysia and the
EU for limited shipments under the SP agreement to 20% in Indonesia and Pakistan and 25% in
Bangladesh. There is no duty on India’s cotton exports to major destinations except China,
which imposes a duty of 54%. Bangladesh, India’s major trading partner, imposes a tariff of
37.5% on milk imports. On other livestock products, Oman imposed a 5% duty on eggs and no
duty on sheep meat. Malaysia also did not impose any duty on sheep meat. The tariff on coffee
imports to Russia was 5% and zero per cent in the US. The EU imposed zero per cent duty on
caffeinated coffee that is not roasted and 8.3% duty on de-caffeinated coffee. Duty rate on
roasted coffee were 7.5% for non-decaffeinated and 9% on caffeinated. Like coffee, Russia
imposed a 5% duty on tea imports. Duty on tea imports into the EU varied from zero to 3.2%,
19 | P a g e
and from zero to about 6.3% in the US. The rate of duty on tobacco was 5% in Russia. The EU
and the US impose specific duties on tobacco. In the EU, flue cured Virginia tobacco from India
is charged at EUR 18.4 to EUR 22 per 100 kg, while the rate of duty in the US ranged from
USD 0.77 to 0.85 per kg.
This situation further becomes grim considering the high tariff/import duty rates faced in the
developed country markets. The European Union, Japan, and the United States use, to varying
degrees, similar protection tools: low but highly dispersed ad valorem tariffs, specific duties,
seasonal tariffs, tariff escalation, and preferential access along with tariff-rate quotas. Tariffs for
a specific range of products depend on numerous factors, including the date of entry
(seasonality factor), the degree of processing (escalation phenomenon), and the relationships
with exporting countries (preferential agreements and regional and bilateral free trade
agreements—FTAs).
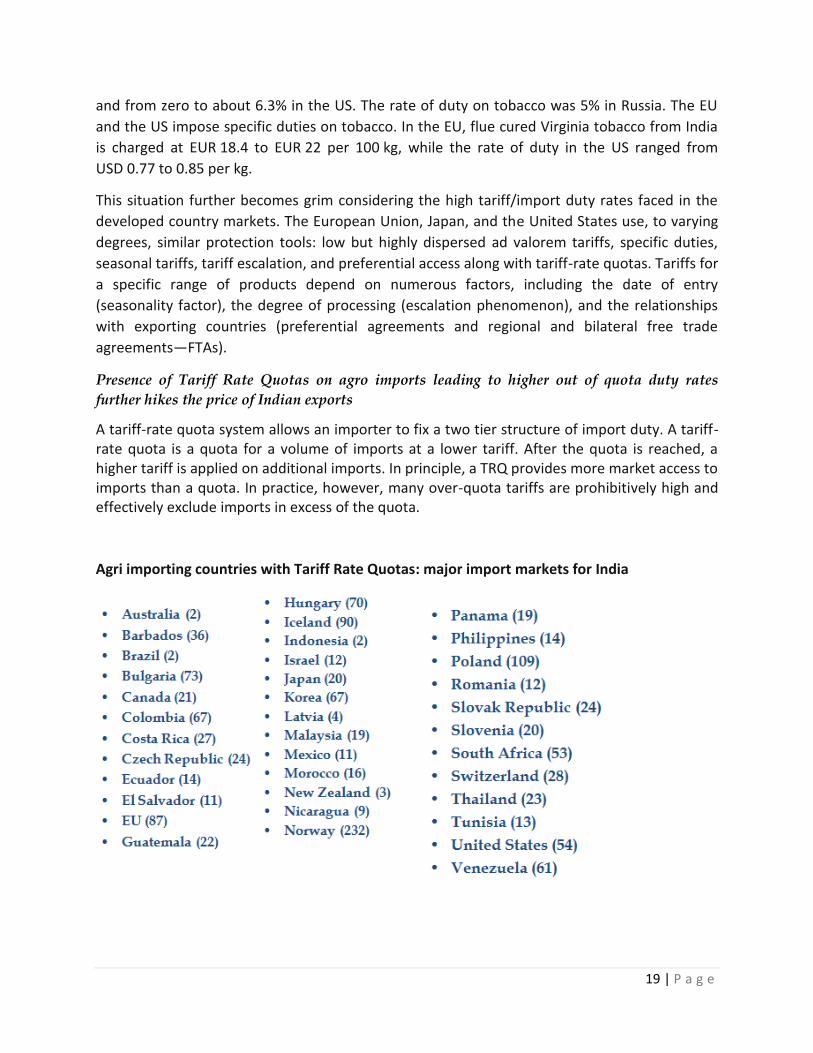
Presence of Tariff Rate Quotas on agro imports leading to higher out of quota duty rates
further hikes the price of Indian exports
A tariff-rate quota system allows an importer to fix a two tier structure of import duty. A tariff-rate quota is a quota for a volume of imports at a lower tariff. After the quota is reached, a higher tariff is applied on additional imports. In principle, a TRQ provides more market access to imports than a quota. In practice, however, many over-quota tariffs are prohibitively high and effectively exclude imports in excess of the quota.
Agri importing countries with Tariff Rate Quotas: major import markets for India
20 | P a g e
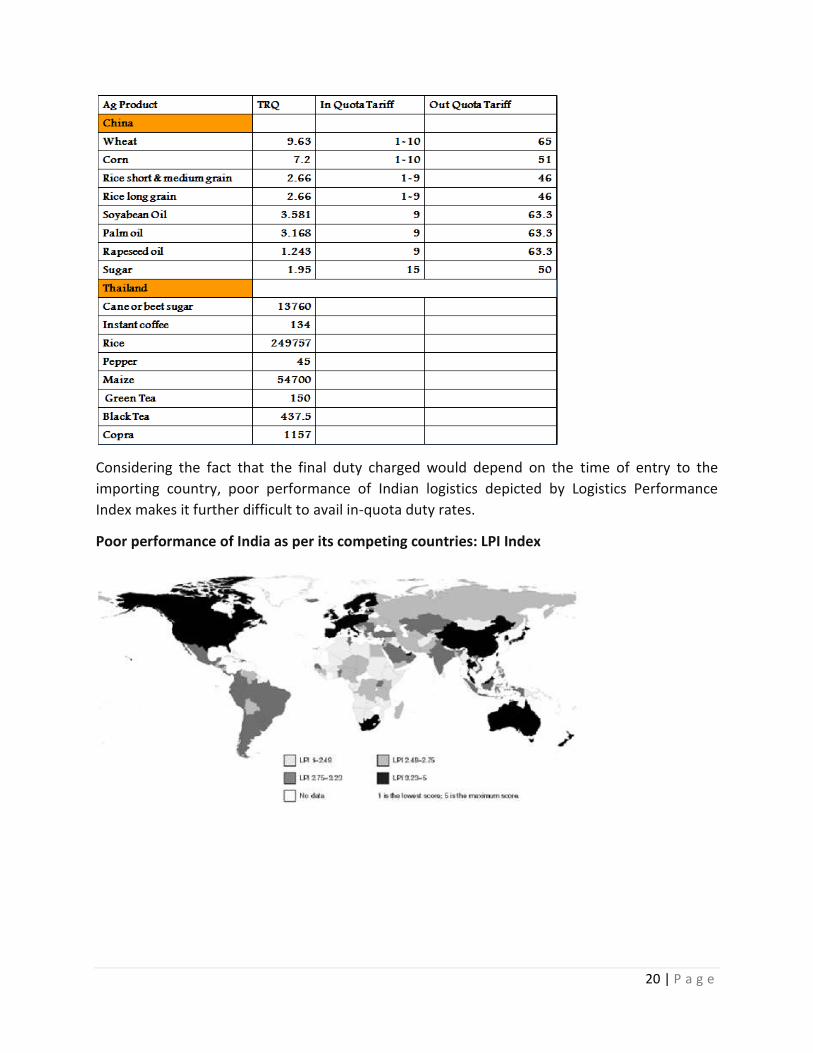
Considering the fact that the final duty charged would depend on the time of entry to the
importing country, poor performance of Indian logistics depicted by Logistics Performance
Index makes it further difficult to avail in-quota duty rates.
Poor performance of India as per its competing countries: LPI Index

21 | P a g e
Existence of Tariff Escalation
Tariff escalation refers to the situation where tariffs are zero or low on primary or unprocessed
products then increase or escalate, as the product undergoes additional processing.
Can we sustain Indian Agro exports even in developing and LDC countries? Challenges at Global
front
It is pertinent to look into the possibilities of diversifying the product and market and shift into newer value added products and emerging export markets for reasons as listed below:
Changes in Trade policy of prime export destination: developing and LDCs
Strong fluctuation in the prices
Rise of substitute products
Devaluation of Foreign Currency
Rising non tariff barrier for agro exports in existing markets
Import duties rising higher on
processed products as
compared to primary ones
makes it further difficult for
Indian exporters to make a
shift towards value added
products.
MEIS benefits promoting value
added products hence may
accordingly be announced.
22 | P a g e
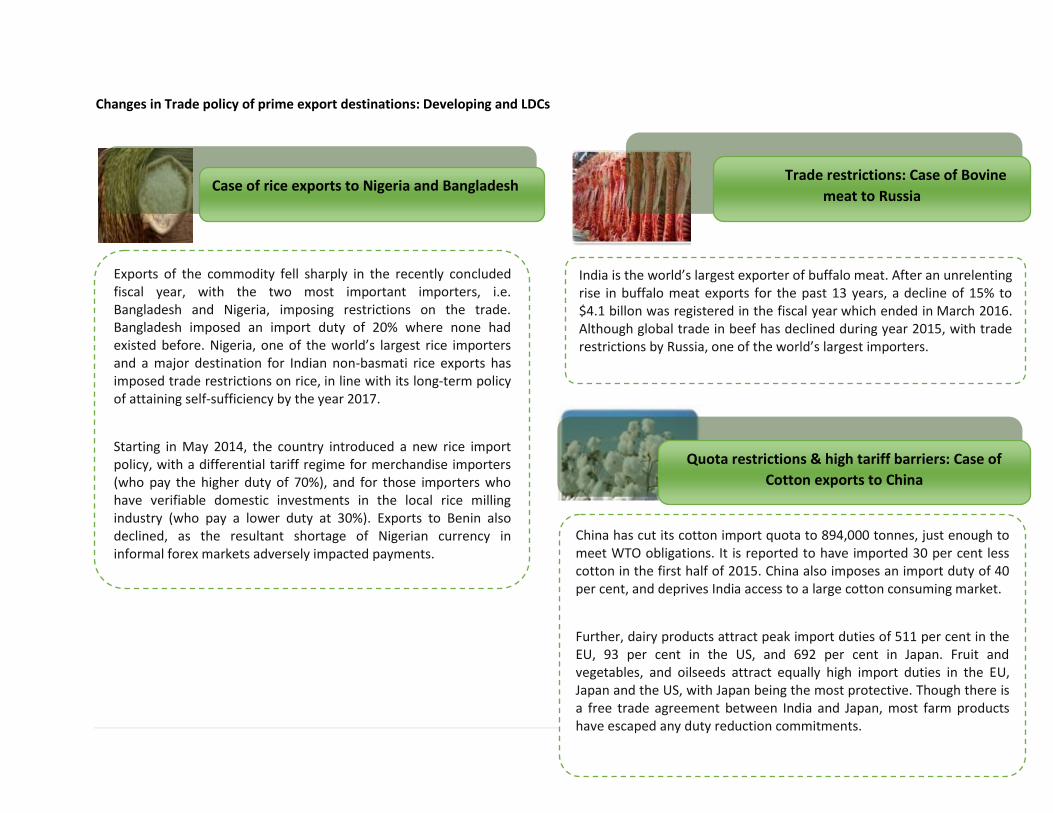
Changes in Trade policy of prime export destinations: Developing and LDCs
Case of rice exports to Nigeria and Bangladesh
Exports of the commodity fell sharply in the recently concluded fiscal year, with the two most important importers, i.e. Bangladesh and Nigeria, imposing restrictions on the trade. Bangladesh imposed an import duty of 20% where none had existed before. Nigeria, one of the world’s largest rice importers and a major destination for Indian non-basmati rice exports has imposed trade restrictions on rice, in line with its long-term policy of attaining self-sufficiency by the year 2017.
Starting in May 2014, the country introduced a new rice import policy, with a differential tariff regime for merchandise importers (who pay the higher duty of 70%), and for those importers who have verifiable domestic investments in the local rice milling industry (who pay a lower duty at 30%). Exports to Benin also declined, as the resultant shortage of Nigerian currency in informal forex markets adversely impacted payments.
Trade restrictions: Case of Bovine
meat to Russia
India is the world’s largest exporter of buffalo meat. After an unrelenting rise in buffalo meat exports for the past 13 years, a decline of 15% to $4.1 billon was registered in the fiscal year which ended in March 2016. Although global trade in beef has declined during year 2015, with trade restrictions by Russia, one of the world’s largest importers.
Quota restrictions & high tariff barriers: Case of
Cotton exports to China
China has cut its cotton import quota to 894,000 tonnes, just enough to meet WTO obligations. It is reported to have imported 30 per cent less cotton in the first half of 2015. China also imposes an import duty of 40 per cent, and deprives India access to a large cotton consuming market.
Further, dairy products attract peak import duties of 511 per cent in the EU, 93 per cent in the US, and 692 per cent in Japan. Fruit and vegetables, and oilseeds attract equally high import duties in the EU, Japan and the US, with Japan being the most protective. Though there is a free trade agreement between India and Japan, most farm products have escaped any duty reduction commitments.
23 | P a g e
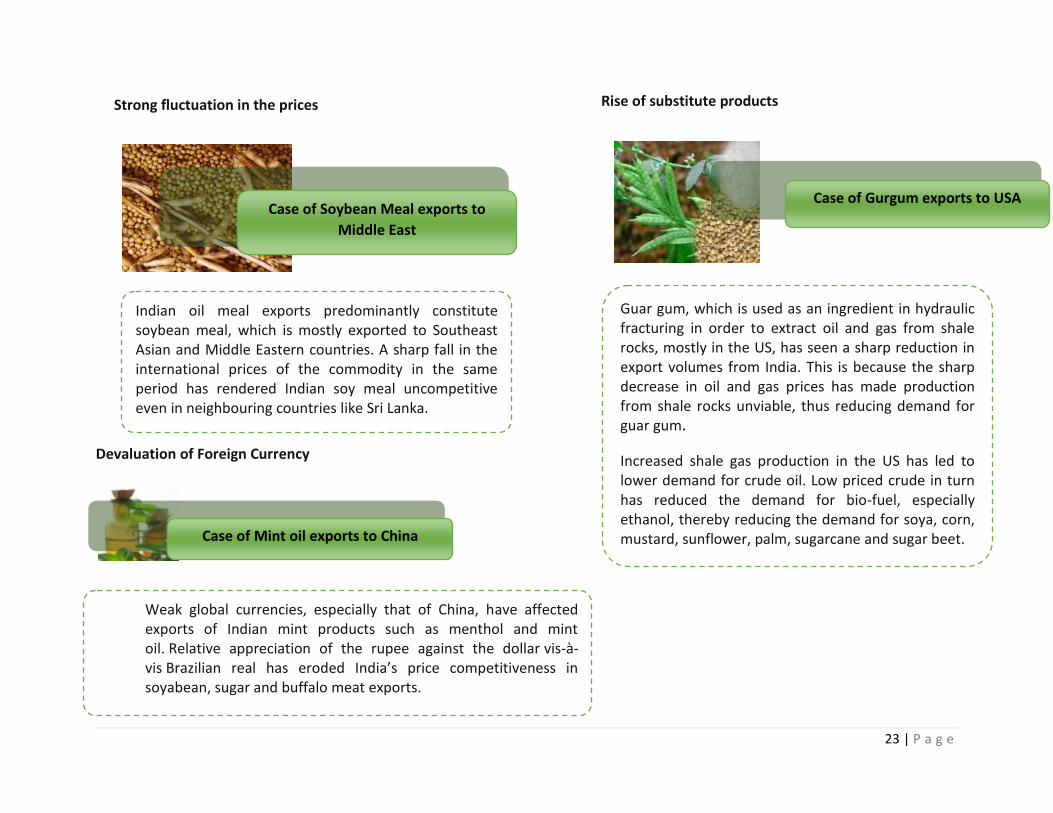
Strong fluctuation in the prices
Devaluation of Foreign Currency
Case of Soybean Meal exports to
Middle East
Case of Mint oil exports to China
Case of Gurgum exports to USA
Rise of substitute products
Indian oil meal exports predominantly constitute soybean meal, which is mostly exported to Southeast Asian and Middle Eastern countries. A sharp fall in the international prices of the commodity in the same period has rendered Indian soy meal uncompetitive even in neighbouring countries like Sri Lanka.
Guar gum, which is used as an ingredient in hydraulic fracturing in order to extract oil and gas from shale rocks, mostly in the US, has seen a sharp reduction in export volumes from India. This is because the sharp decrease in oil and gas prices has made production from shale rocks unviable, thus reducing demand for guar gum.
Increased shale gas production in the US has led to lower demand for crude oil. Low priced crude in turn has reduced the demand for bio-fuel, especially ethanol, thereby reducing the demand for soya, corn, mustard, sunflower, palm, sugarcane and sugar beet.
Weak global currencies, especially that of China, have affected exports of Indian mint products such as menthol and mint oil. Relative appreciation of the rupee against the dollar vis-à-vis Brazilian real has eroded India’s price competitiveness in soyabean, sugar and buffalo meat exports.

24 | P a g e
Rising non tariff barrier for agro exports in existing markets
India’s farm exports also have to face a series of non-tariff barriers in top consuming markets – for example, a ban on import of mangoes by EU that was lifted in January 2015. Other examples of market denials are ban on rice imports by Iran and green pepper by Saudi Arabia. Besides, Vietnam refuses to allow Indian peanuts.
China does not buy non-basmati rice from India but sources the same from Pakistan as well as Cambodia, Myanmar, Vietnam and Thailand. The proposed US legislation requiring agriculture imports to be mandatorily inspected and audited by USFDA will increase the cost of compliance and hurt India’s farm exports.
The EU had banned imports of mangoes, brinjal, snake gourd, taro and bitter gourd from India in 2014 after fruit flies were found in some consignments. While the ban was subsequently lifted on mangoes, it continues on the vegetables.The ban on vegetables continues despite India making it mandatory for exports of all perishable items to the EU to be routed through pack-houses certified by the Agriculture and Processed Food Products Export Development Authority under the vigilance of plant protection inspectors.
There is a long-term threat to the menthol industry in the form of existing and impending bans on menthol cigarettes in several countries across the European Union, as well the USA and Canada.

25 | P a g e
Prevalence of non tariff barriers as highlighted in the table below and high cost of compliance
worsen the price competitiveness of Indian Agro exports. Compliance of sanitary and phyto-
sanitary requirements of most trading partners calls for substantial investment in developing
quality standards and infrastructure facilities. These non tariff barriers are important in view of
WTO commitments. This becomes important due to the very fact that about 14% of Indian
agricultural exports are subjected to only NTMs and 79% are subjected to both Tariffs & NTMs.
There is widespread use of NTMs by both developed and developing countries. In major
importing countries, NTM coverage is 100% across commodity groups. It is estimated that over
50 percent of Indian exports to EU, less than 33 percent of exports to US while 45 percent of
exports to Japan are subject to NTMs. In Argentina, Brazil, Chile and Romania non-tariff
measures are applied widely to food drink and tobacco products. The non-tariff measures
applied in these countries are predominantly for the protection of human, animal and plant
health; while in China measures most frequently applied is import inspection.
There is wide difference in the NTM faced by a single product in different export destinations
thereby making it difficult for an exporting country to conform to the requirements of all
importing countries. For e.g. standards for Salmonella in poultry imports vary tremendously
across countries. Only poultry product imports that are fully cooked and canned are allowed in
Chile proving zero tolerance for Salmonella while Japan reserve the right to test poultry
shipments for salmonella, while others don’t consider target Salmonella in their import
requirements.
There is concern in India that agricultural exports to some developed countries are not being
given fair treatment. It is generally believed that sanitary and phyto-sanitary (SPS) measures are
applied in the guise of protecting plant, human and animal life in order to keep a check on
exports. These measures are believed to be applied in an indiscriminate manner, often lacking
transparency and requiring costly compliance. However, there are no comprehensive and
technically sound studies on the justification of such NTBs on India’s agriculture exports.
However, some studies based mainly on surveys of exporters and some reports of exports
detained or rejected in importing countries provide anecdotal evidence of NTBs on selected
products. These relate to export of spices, fishery products, rice, tea, and egg powder. India’s
peanut exports also face severe standard requirements in the EU markets. Some tests are
required only for products from India and Egypt, whereas exports from other countries are
exempt from these tests. India has made good progress to improve aflatoxin standards of
peanut and to meet the various regulations and requirements of the EU. There are several
reports of the rejection of basmati and non-basmati rice shipments to the US on the grounds of
low hygiene standards. The US regulations require the manual sorting of rice and the treatment
for weevils. The issue of pesticides residues is frequently raised by the EU and Japan. Pesticide
residues are also a concern in the case of tea exports to the EU.

26 | P a g e
Non-tariff barriers on India’s agricultural exports to the EU, US and Japan
Product Non Tariff Barriers Country
Spices (chillies) No uniform standard and common regulation in EU. No fixed
permitted level of aflatoxin or pesticide residue. Adversely affecting
spices exports from India.
Spain, Italy and
Germany
Milk Exports to EU not permitted as Indian cows are not mechanically
milked
EU
Fishery product Allows only form its approved plants in India. EU standards for fishery
products are very stringent, cumbersome, costly
EU
Peanut Aflatoxin standards of EU are more stringent than international
standards on India’s export. Prescribed testing method known as
Dutch code and other required methods are very rigorous very costly.
Permissible limits are different in different countries and keep
changing. Some tests are required only for India and Egypt and not for
exports from USA and Argentina.
EU
Mango and
mango pulp
Requirement of costly vapour heat treatment for export of fresh
mango, labelling, pesticide residues.
US, Japan, Jordan
Rice Pesticide residues consignment of basmati and rice rejected in US on
ground of being filthy and containing foreign matter. US regulation
require manual sorting of rice and fumigants and weevils have to be
blown out. Delay in clearing consignments, repeated tests.
EU, Japan, USA
Tea Pesticide residue. Complaint of high residue level of Ethion in
Darjeeling tea
EU, Germany
Tobacco Internationally permissible level of DDT residue is 6 ppm while Japan
and USA had set their DDT levels at much lower level Japan insists on
0.4 PPM of DDT level Indian tobacco has DDT level of 1-2 PPM which is
well below international standard but Japan does not allow tobacco
import from India.
Japan, USA
Egg powder Consignment first time subjected to additional criteria of MRPL
(minimum required performance limit despite valid equivalence
issued by EU. No action on applications for equivalence for 7-8 years.
EU
27 | P a g e
SOLUTIONS TO THE ABOVE STATED CHALLENGES
This module explores the possibilities of enhancing the overall export competitiveness of the agro
exports based on the three pillars as stated above (i) formulating competitive strategies (ii) adding value
to trade and (iii) fostering market linkages.
In the process of formulating the competitive strategy to boost the exports , possibilities towards the
formation of online web based export competitive tool; possibilities of enhancing innovations to
enhance competitiveness not only at national but also at international level; brand building for agro
products; promotion of Geographical Indications to promote exports and finally tackling the non tariff
barriers that the agro products may have to face thus reducing the possibilities of export rejections for
the agro products and finally enhancing the export competitiveness in totality. Towards this, following
are the action points suggested in sync with the challenges faced by the exporters.
Problem statement 1: High price spread for Indian Agro products
In the process of marketing of agricultural commodities, the difference between price paid by the
consumers and the price received by producer for an equivalent quantity of farm produce is known as
price spread. This is also term as marketing margin. It includes:
1. The cost involved in moving the commodity from the point of production to the point of
consumption i.e. the cost performing the various marketing functions and of operating various
agencies.
2. Profit of the various marketing functionaries involved in moving the produce from the initial
point of production till it reach to the ultimate consumer. The absolute value of marketing
margin varies from commodities to commodities, channel to channel, market to market and
time to time.
Problem statement
As indicated above, India seems to possess a huge production potential for most of the agro commodities
including spices (turmeric, ginger and large cardamom); medicinal plants and floriculture (orchids), tea, however,
the export presence of these products from the country has been miniscule.
In such a scenario what should the Government do?

28 | P a g e
Domestic market reforms helps in maintaining effective supply chain
The marketing of agricultural products in India has traditionally been controlled by the state and
regulated by the respective state APMC act. Agricultural Products Marketing Committee (APMC) Acts.
This act requires that all agricultural products be sold only in infrastructure-poor, government-regulated
markets (called “mandis”). There are various inefficiencies that occur when supplying apples through
APMC markets. As a part of domestic reforms, lot many alternative models of supply chain can be
introduced which can reduce the markups and price spreads wherein farmers may get the remunerative
prices and consumers are protected with inflationary trends in the food prices of staple commodities.
There are two such models described below suggested/compiled by IIFT team.
In the first model, the presence of consolidation centres and the pack houses near the field will play an
immense role. Staple crops or perishable crops may be brought to the consolidation centre and from
there to pack houses. Depending on the market demand supply situation, it may be decided whether to
send to the wholesale market or to local market or to the super markets.

29 | P a g e
In the second model terms as Value Addition Centre Model (VAC), both the input supply as well as the
output is under strict monitoring system to control the prices. It would be decided by the VAC how
much inputs, planting material, expense on infrastructure and extension services will be done and
extended to the farmers. Once the produce is ready VAC centre would collect the output from the
farmer and again after serious examination it will be decided how much to send to processing unit, local
market, retail chains, exports and finally how much to store for the next year.
SCM MODELS IN THE COMPETING COUNTRIES
Farmer- to- trader linkages (Thailand)
Linkages through a leading farmer (Singapore)
Private company linkages(Malaysia)
Co-operative linkages (Vietnam)
Farm-supermarket linkages (Indonesia)
Public – private partnership

30 | P a g e
Linkages in distribution of exported ginger: case study from Vietnamese spice sector
There are three distribution channels linking farmers with export markets.
1) Channel 1: Farmers --- Cooperatives --- Food and Vegetable Processing Companies --- Export
Markets
After a harvest, farmers conveyed ginger to cooperatives to sell to processing companies. Most farmers were a cooperative’s members. In this case, the cooperative represented farmers in signing a written contract with processing companies. Categories, volumes, qualities and prices of ginger were stated in the contract. Cooperatives have responsibilities in controlling the volume and quality of ginger provided to processing companies. Ginger then can be exported directly or through Vietnam National Vegetable, Fruit and Agricultural Products Corporation (VEGETEXCO).
2) Channel 2: Farmers --- Local Traders --- Food and Vegetable Processing Companies --- Export
Markets
Local traders purchased ginger off the farmers directly from the field. Then, ginger was sold to processing companies in other provinces. However, a low volume of ginger was purchased via this channel because processing companies applied this method only when there was a temporary shortage of supply. A contract between local traders and companies was verbally signed in this case. Processing companies always concerned about quality of ginger acquiring via this channel.
3) Channel 3: Farmers --- The head of Village --- BAVECO/Others --- Export Markets
The majority of ginger was purchased throughout this chain. After a harvest, ginger was transported by farmers to the procurement site in the village. Here, the head of the village represented the village’s farmers to sell ginger to processing companies. The purchase is notarized by the Commune’s People Committee. Then, processing companies processed ginger and exported directly or via the VEGETEXCO to abroad markets. Formal contracts (written contracts), signed between farmers and processing companies, were notarized by Commune’s People Committee. A contract covered different issues such as volume of ginger, prices and harvest schedules. However, the contract did not refer to sharing values, risks and decision rights. Rights and obligations of partners in the contract framework were not clearly stated to settle conflicts; and both farmers and processing companies would break the singed contract if doing so generated a financial gain for them. This channel was used by BAVECO in purchasing of ginger in Dong Phu and Dong Hung communes.
Reducing price spread: learning from the case of Ethiopian Commodity Exchange (ECX)
Since the agricultural markets in Sikkim are characterized by high costs and high risks of transacting forcing much of its produce into global isolation; with only one third of output reaching the market, commodity buyers and sellers tends to trade only with those they knew, to avoid the risk of being cheated or default. Trade is done on the basis of visual inspection because there was no assurance of product quality or quantity, this drove up market costs, leading to high consumer prices. For their part, small-scale farmers, who produce 95 percent of the output, came to market with little information and are at the mercy of merchants in the nearest and the only market they know, unable to negotiate better prices or reduce their market risk.
31 | P a g e
India can adopt the model of ECX; a new initiative for Ethiopia. It aims in connecting all buyers to
sellers in an efficient, reliable, and transparent way, by harnessing innovation and technology, and
based on continuous learning, fairness, and commitment to excellence. The ECX assures all commodity
market players the security they need in the market by providing a secure and reliable End-to-End
system for handling, grading, and storing commodities. The system also provides matching offers and
bids for commodity transactions, a risk-free payment and goods delivery system to settle transactions,
all in a fair and efficient manner. It creates trust and transparency through the aggressive market data
dissemination to all market actors, with clearly defined rules of trading, warehousing, payments,
delivery and business conduct, and also an internal dispute settlement mechanism. It provides market
integrity of the product, the transaction and the market actors.
Farmers’ organizations: case of Guatemala’s Cardamom
India can look into the possibility of creating farmers’ organizations which can play an important role in
the economy of the smallholder farmers as is done in case of Ethiopia. The formal farmer’s organizations
in Guatemala are primary cooperative Associations, Cooperative Unions and Cooperative Federation. In
2010 about 26,800 cardamom Farmers organizations exists in Guatemala. These organizations provide
the smallholder farmers with the opportunities to access different services in a more cost effective way.
A good example is access to credit services where most smallholders are deemed not creditworthy by
the financial institutions but are nevertheless able to access credit within the umbrella of their
associations.
By formation of such farmers’ organizations, India can provide enhanced direct access to markets;
opportunity for bulking of produce thus making it possible to have adequate quantities of good quality
produce to attract the market. Besides, the organizations could improve access to storage facilities
which is crucial in spreading the supply of farm produce away from periods of glut. This will ensure that
farmers do not sell their produce at non remunerative prices during periods of surplus to avoid loss due
to perishable nature of most agricultural produce. Efficient farmer groups will also act as catalysts for
investment in agro-processing. The associations are able to leverage finances which can be used to
establish processing and grading facilities for perishable products this enables smallholder farmers to
add value to their produce and attract better returns on their produce.
Some activities initiated by private businesses: case of Ethiopian Spice Extraction Factory
Most of services provision to agro producing smallholding farmers fall within the remit of the public
sector, through the Ministry of Agriculture. However, it is noted that some of the services can be
devolved to be more effectively delivered by the private sector players. Extension services for example,
could be undertaken by the farmer groups, input suppliers and exporters of the spices. There are
unutilized opportunities by leveraging synergies of public sector and private sector to ensure more
sustainable solution to the provision of services sought in the spice subsector with the view addressing
some of the challenges currently existing in this domain.
The case in point is that the recently initiated capacity building program by Eden Oil Plc, Ethiopian
Spice Extraction Factory, Yahia Seid Omer Company and the likes in the training of farmers and
investments in postharvest processing facilities closer to the farm sites.

32 | P a g e
E National Agriculture Market- Technology Innovation
Agriculture marketing is administered by the States as per their agri-marketing regulations, under which,
the State is divided into several market areas, each of which is administered by a separate Agricultural
Produce Marketing Committee (APMC) which imposes its own marketing regulation (including fees).
This fragmentation of markets, even within the State, hinders free flow of agri commodities from one
market area to another and multiple handling of agri-produce and multiple levels of mandi charges ends
up escalating the prices for the consumers without commensurate benefit to the farmer. . E NAM
addresses these challenges by creating a unified market through online trading platform, both, at State
and National level.
Electronic National Agriculture Market (E NAM) is envisioned as a unified national electronic market
bringing interconnectivity to markers across the country. E NAM is a technology innovation in
agricultural marketing.. E NAM for agriculture marketing can be regarded as technology which will bring
a social change in markets. The social change in relationships and networks that work between buyer
and seller as they exist in traditional markets will change as the technology enabled ENAM is adopted in
agricultural markets. The E NAM portal launched by the Centre in April 2016 has 45.4 lakh farmers and
451 mandies registered on it. E NAM aims for integration of marketing process and flow of goods is to
be achieved by bringing interconnectivity of markets through information technology.
Agriculture being state subject disparities in agriculture production, regulations and agriculture
marketing environment, growth rate etc. These are discernible amongst the States of the country which
needs to be streamlined to have a pan India Connectivity of markets. The adoption of E NAM has been
varied across the States on the basis existing regulatory architecture and adoption of E NAM, States can
be classified in three categories:
33 | P a g e
First category comprises of the states where APMC plays a prominent role in wholesaling of
agricultural produce while panchayat/municipal markets are solely for retailing. In the states
falling under this category, business/ arrival of produce at APMC is not being hampered by
existence of Panchayat markets.
Second category comprises of the states where APMCs as well as Panchayat markets exist and
operate as parallel markets.
The third category comprises of states where either there is no APMC Act or it has been
repealed. In such states, wholesaling of agricultural produce is not governed by any law.
The early adopter of eNAM are Himachal Pradesh, Telangana, Haryana, Uttar Pradesh, Andhra Pradesh,
Madhya Pradesh and Gujarat. Some of the major states where APMC and Panchayat/Municipal markets
co-exist without hampering the business of each other are Andhra Pradesh, Gujarat, Haryana,
Karnataka, Madhya Pradesh, Maharashtra, Punjab, Rajasthan, Telangana, Uttar Pradesh, Uttrakhand,
etc. In these states there is a clear demarcation in activities of APMCs and rural markets. Rural markets
are engaged in consumer oriented retailing activities while APMCs are platform for wholesaling
activities.
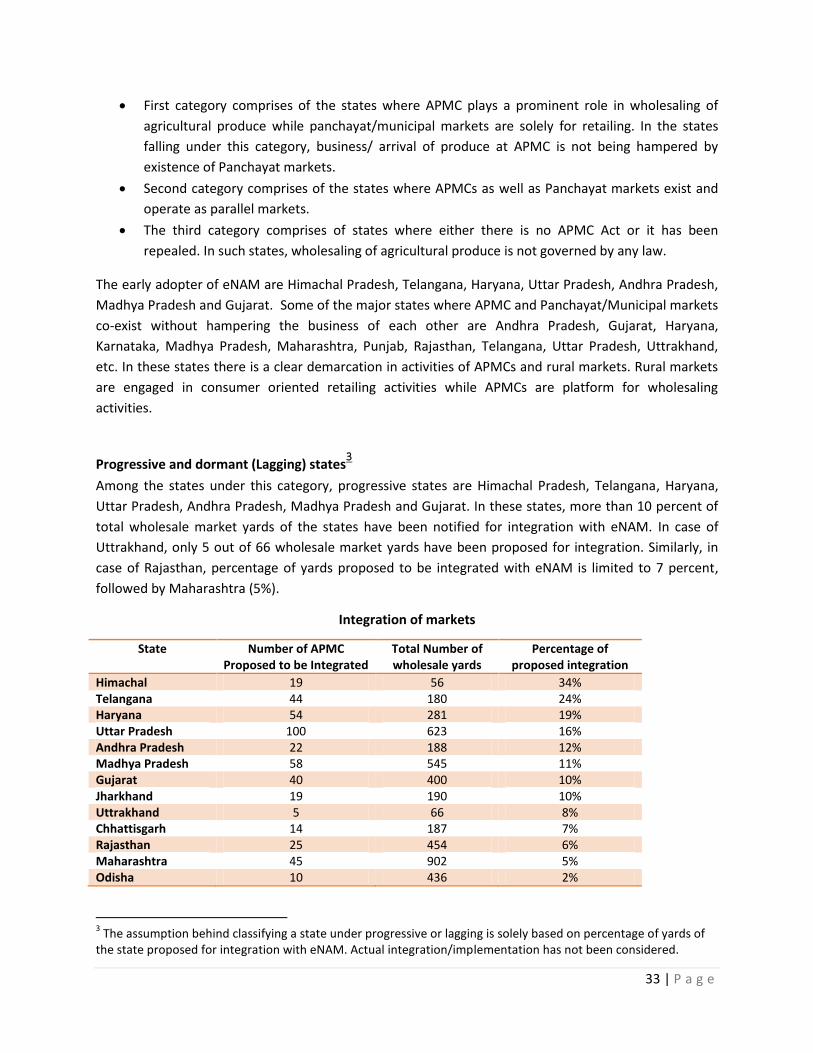
Progressive and dormant (Lagging) states3
Among the states under this category, progressive states are Himachal Pradesh, Telangana, Haryana,
Uttar Pradesh, Andhra Pradesh, Madhya Pradesh and Gujarat. In these states, more than 10 percent of
total wholesale market yards of the states have been notified for integration with eNAM. In case of
Uttrakhand, only 5 out of 66 wholesale market yards have been proposed for integration. Similarly, in
case of Rajasthan, percentage of yards proposed to be integrated with eNAM is limited to 7 percent,
followed by Maharashtra (5%).
Integration of markets
State Number of APMC Proposed to be Integrated
Total Number of wholesale yards
Percentage of proposed integration
Himachal 19 56 34% Telangana 44 180 24% Haryana 54 281 19% Uttar Pradesh 100 623 16% Andhra Pradesh 22 188 12% Madhya Pradesh 58 545 11% Gujarat 40 400 10% Jharkhand 19 190 10% Uttrakhand 5 66 8% Chhattisgarh 14 187 7% Rajasthan 25 454 6% Maharashtra 45 902 5% Odisha 10 436 2%
3 The assumption behind classifying a state under progressive or lagging is solely based on percentage of yards of
the state proposed for integration with eNAM. Actual integration/implementation has not been considered.

34 | P a g e
Major constraints in implementation of E NAM
1. Harmonisation of Grades and Standards
The success of e-NAM in improving competitiveness and integrating Pan India market will require
assaying facilities in various markets to ascertain quality traits. (Chand 2016) Trading on virtual platform
will require a strong and well-established standardizing and grading system. Harmonisation of quality
standards of agricultural produce and provision for assaying (quality testing) infrastructure in every
market to enable informed bidding by buyers will be required. Besides this disseminating and
communicating the same with market participants needs to be in place for harmonization of quality
standards across the state, which in turn will result into increased number of participants.
2. Integrating value chains:
Technology can contribute to creating the system by synchronising value chain activities into layer wise
process.. E NAM is perceived as a marketing system that will facilitates the post-production supply chain
of farm produce. It is required to work for the inclusion of farming communities and farm operations
into other segments of the marketing chain like storage, logistics so that it will help capture a larger
share of the final value realised. A wide correlation between value chains of the producer, market
channels, retailer and consumer is required to be developed. Integration of value chain system, also
includes secondary activities such as research, development, front line demo, extension work, market
information. Cross learning from dairy and food processing industry where value chain integration have
helped in optimal value realization needs to be adopted by progressive state where E NAM is already
operational.
3. Capacity building of market participants:
With the advent of E Marketing in various states there emerges a requirement for capacity building of
different stakeholders and Institutions of agri value chain. E NAM is a paradigm shift which will see new
roles of Market Functionaries, traders, farmers etc
Participation of different market functionaries and farmers and service orientation of market officers is
imperative for the successful roll out of E NAM. The initiative in Karnataka observed some unwillingness
initial on from traders. These issues will required to be handled through regular training of farmers and
other stakeholders. The farmers rich in terms of human capital are more likely to participate in new
emerging supply chains. This suggests for the importance of capacity building of farmers, traders, groups
, cop-operative, policy makers etc.
At apex level Director needs to understand the implementation of E NAM and making required policy
changes, providing provision for PPP model for E marketing and creating synergy for customized
services. APMC Secretaries and Chairman need to build their capacity in operation and management of
electronic market, change management, dispute redressal, consumer behaviour, advisory and market
information to farmers etc. E NAM requires famer linkages for selling produce. The Farmer Producer
Organization (FPO) needs to be strengthened on Organizational skills, working in teams, interpersonal

35 | P a g e
communication, work allocations, online payments and trasaction, pledge finance etc. Training will help
farmers better manage their finances, achieve more sustainable production, improve their market
performance, and stay innovative and competitive. Besides this they need to understand changes in
markets and preparing produce by grading and assaying for E NAM. Traders and market agents need to
be trained on adoption of grades, assaying, bidding, online payments, sale procedure, produce handling,
dispute settlement etc.
The other obstructive legislation is the Essential Commodities Act (ECA), which was put in place in 1955
after Independence to control the production, supply and distribution of essential agricultural
commodities. India was then facing acute food shortages, and the Act was meant to ensure the
availability of food products. Conditions have changed since, and there is recognition that controlling
the movement of products by licensing of dealers, limits on stocks and control on movements will
hamper the growth of the agricultural sector and the promotion of food-processing industries. This Act
was amended in 2003 to encourage free movement of agricultural commodities across regions. State
Governments needs to enforce the changes with much strictness since movement of agricultural
produce within India is heavily and overly regulated, with interstate and even inter district restrictions
on marketing and movement of agricultural goods. The talented and efficient farms are currently unable
to focus on the crops they can produce with high yields and at lowest costs. Progressive dismantling of
controls and regulations under the Essential Commodities Act to remove all restrictions on production,
supply, storage and movement of, and trade and commerce in respect of all agricultural commodities
needs to be effectively implemented by the State governments.
TABLE –II -CAPACITY BUILDING NEEDS OF DIFFERENT STAKEHOLDERS OF NAM
Stakeholders Components covered
Farmer Understanding ENAM, aggregations,
market trends and other opportunities
Traders/ Other Agents
Adoption of grades, dispute, payment
facilitation, produce handling, etc
Mandi Secretaries
Operation and management of market,
change management and dispute
redressal
Principal Secretaries/ Director (Agril Marketing) Importance of E NAM, facilitation through reforms, PPP, etc
Principal Secretaries/ Director (Agril Marketing) Importance of E NAM, facilitation
through reforms, PPP, etc

36 | P a g e
Poor marketing & storage infrastructure, particularly export dedicated freight and cargo facilities, cold
storage, warehouses and grading-sorting facilities, etc., coupled with inadequate post-harvest
management affect the exports. The most important gap is the inadequacy of basic infrastructure
relating to water, power and link roads in the rural areas, particularly in production belts identified
under AEZs (Agri-Export Zones).
Usage of WTO compatible Green Box Policies
In order to conceptualise and structure the Government policies at each level right from production to
marketing to infrastructure and transport, it is eminent that the policies needs to be in sync with the
commitments made by Indian Government at the WTO forum.
What will guide Government to draft export promotion policies?
It’s the Agreement on Agriculture (AoA) of World Trade Organisation which will govern the state
government to draft WTO compatible subsidies for its players across the value chain. While AoA talks
about three pillars which would give market access to the exporters from India being the WTO member
which is:
(i) Market Access: Tool for Indian exporters to target right export destination: This negotiates
lowering down of import duty structure on agricultural products across WTO member
countries. Keeping track of these negotiations would help Indian exporters of various agro
products to choose the right export destination.
(ii) Domestic Support: Tool for Policy makers towards drafting suitable export promotion
policies This is of prime concern to the Policy makers , since this would be the deciding
factors of the subsidies that they can possibly extend to their exporter members and in
synch with WTO rules.
While we discuss the Market access later in the report from exporter’s perspective, we hereby discuss the domestic support policies that Government can announce as learnings from other developed and developing countries
How can WTO domestic subsidies pillar guide?
Domestic support is the annual monetary support given by the government to agricultural producers
either for the production of specific agricultural products, or in more general forms such as in
infrastructure and research. The AoA classifies supports into several categories --those that are
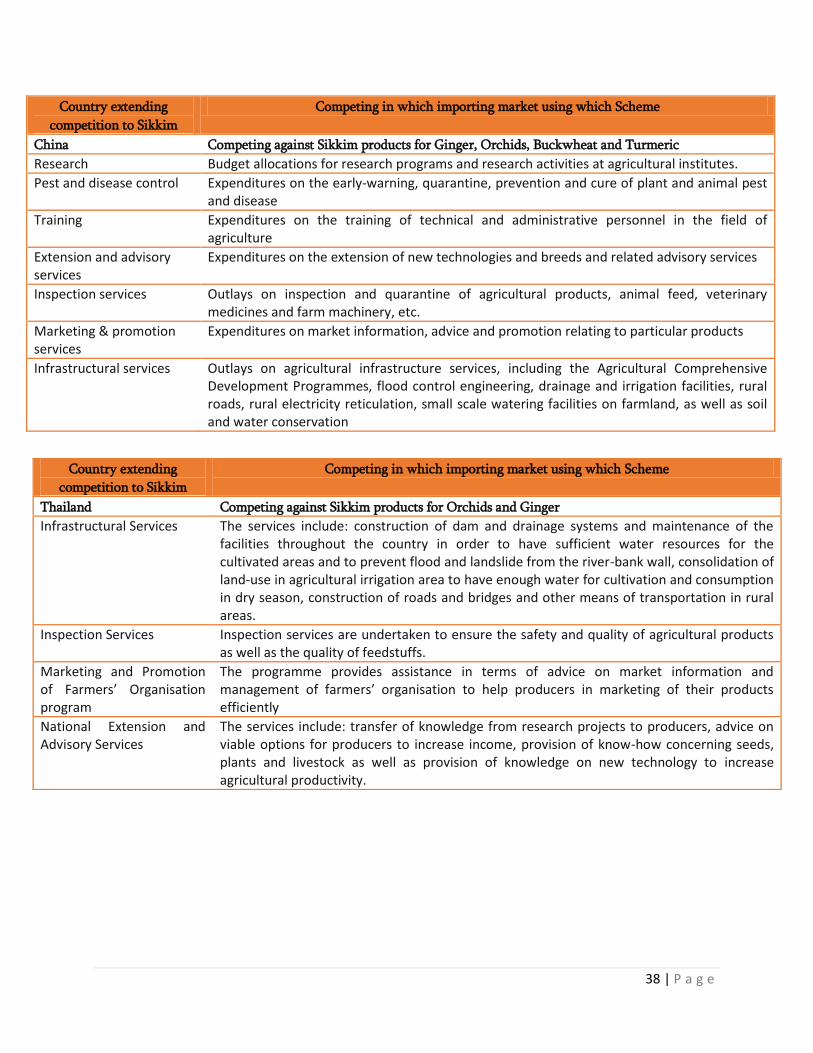
Problem Statement 2: CIF prices of Indian exports too high as compared to other competing countries: Guatemala (Cardamom), China (Ginger); Thailand (Orchids). Can India announce subsidies related to production, marketing, infrastructure, transport etc to make agro exports competitive which are WTO compatible?
37 | P a g e
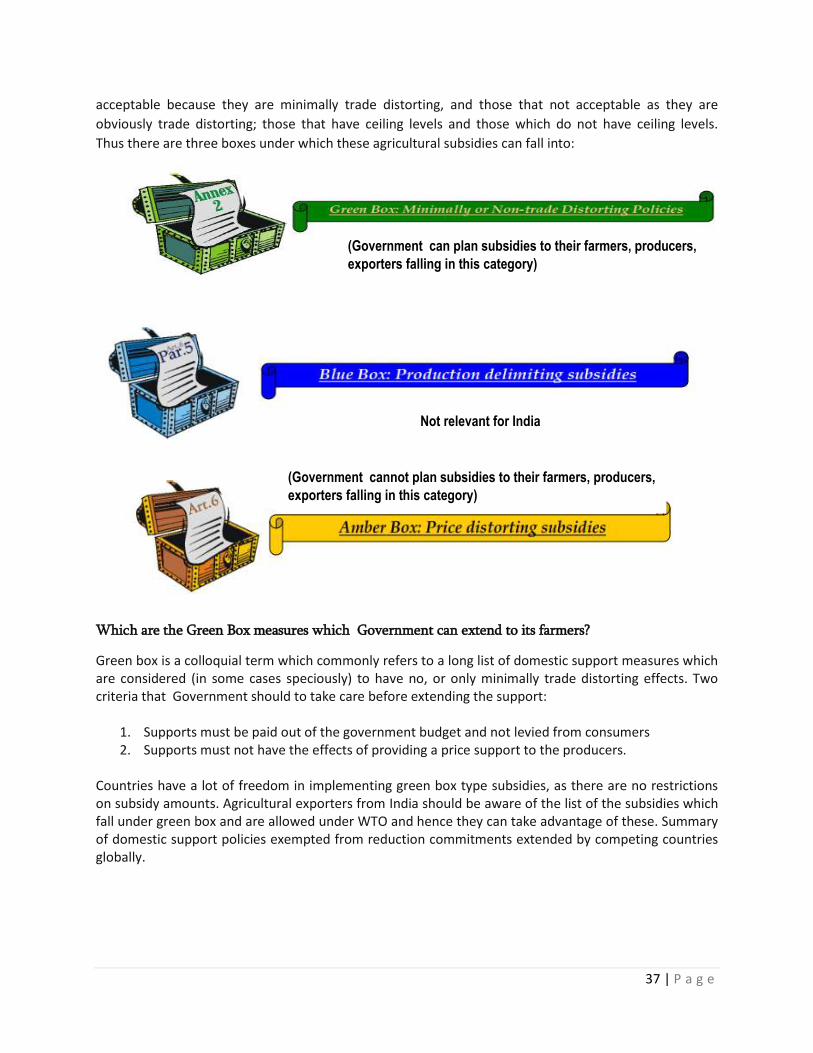
acceptable because they are minimally trade distorting, and those that not acceptable as they are
obviously trade distorting; those that have ceiling levels and those which do not have ceiling levels.
Thus there are three boxes under which these agricultural subsidies can fall into:
Which are the Green Box measures which Government can extend to its farmers?
Green box is a colloquial term which commonly refers to a long list of domestic support measures which are considered (in some cases speciously) to have no, or only minimally trade distorting effects. Two criteria that Government should to take care before extending the support:
1. Supports must be paid out of the government budget and not levied from consumers 2. Supports must not have the effects of providing a price support to the producers.
Countries have a lot of freedom in implementing green box type subsidies, as there are no restrictions on subsidy amounts. Agricultural exporters from India should be aware of the list of the subsidies which fall under green box and are allowed under WTO and hence they can take advantage of these. Summary of domestic support policies exempted from reduction commitments extended by competing countries globally.
(Government can plan subsidies to their farmers, producers,
exporters falling in this category)
(Government cannot plan subsidies to their farmers, producers,
exporters falling in this category)
Not relevant for India
38 | P a g e
Country extending
competition to Sikkim
Competing in which importing market using which Scheme
China Competing against Sikkim products for Ginger, Orchids, Buckwheat and Turmeric
Research Budget allocations for research programs and research activities at agricultural institutes.
Pest and disease control Expenditures on the early-warning, quarantine, prevention and cure of plant and animal pest and disease
Training Expenditures on the training of technical and administrative personnel in the field of agriculture
Extension and advisory services
Expenditures on the extension of new technologies and breeds and related advisory services
Inspection services Outlays on inspection and quarantine of agricultural products, animal feed, veterinary medicines and farm machinery, etc.
Marketing & promotion services
Expenditures on market information, advice and promotion relating to particular products
Infrastructural services Outlays on agricultural infrastructure services, including the Agricultural Comprehensive Development Programmes, flood control engineering, drainage and irrigation facilities, rural roads, rural electricity reticulation, small scale watering facilities on farmland, as well as soil and water conservation
Country extending
competition to Sikkim
Competing in which importing market using which Scheme
Thailand Competing against Sikkim products for Orchids and Ginger
Infrastructural Services The services include: construction of dam and drainage systems and maintenance of the facilities throughout the country in order to have sufficient water resources for the cultivated areas and to prevent flood and landslide from the river-bank wall, consolidation of land-use in agricultural irrigation area to have enough water for cultivation and consumption in dry season, construction of roads and bridges and other means of transportation in rural areas.
Inspection Services Inspection services are undertaken to ensure the safety and quality of agricultural products as well as the quality of feedstuffs.
Marketing and Promotion of Farmers’ Organisation program
The programme provides assistance in terms of advice on market information and management of farmers’ organisation to help producers in marketing of their products efficiently
National Extension and Advisory Services
The services include: transfer of knowledge from research projects to producers, advice on viable options for producers to increase income, provision of know-how concerning seeds, plants and livestock as well as provision of knowledge on new technology to increase agricultural productivity.

39 | P a g e
Country extending competition
to Sikkim
Competing in which importing market using which Scheme
Vietnam Competing against Sikkim products for Turmeric and Orchids
Pest and disease control, inspection services
Budgetary expenditures in activities related to plant and animal health protection; sanitary and phytosanitary defence and alertness; pest and disease surveillance, prevention and control; provision of vaccines, etc.
Regional assistance programmes
Priority investments to develop 1,500 communes under harsh and especially disadvantaged conditions in remote and distant areas etc.
Input subsidy to low income and resource poor farmers
Short-term soft loans; Budget allocations for freight subsidies to offset the high cost of transportation of policy commodities and production inputs to mountainous, remote regions, etc
Apart from this, the Government needs to reorient its role in the agri-sector and foster an environment
conducive for private players; invest in creating value-chains and storages; improve access to better
technology and inputs. There is a strong need to create business space for private players to have
integrated markets across space and time, which would involve reforming the Agricultural Produce
Market Committee Act (APMC) Act and pruning the Essential Commodities Act (ECA), and allowing
futures markets to operate freely.
Are Indian domestic subsidies under Amber box WTO compatible? Does it need any change?
The Government supports farmers through myriad policies. On the output price front, it announces
minimum support prices (MSPs) for 23 commodities for every marketing year, although actual
procurement is done primarily for wheat and rice in a limited number of states. On the input side, the
GoI gives subsidies to farmers in the form of seed, fertilizer, power, credit subsidies. After taking
inflation into account, input subsidies are close to 7 percent of the total value of agricultural output
which is the limit of 10% deminimus allowed for India as developing country.
Although we are WTO compatible but what about the efficacy of these schemes?
Farmers in not more than five states benefit from this procurement system and 40–50 percent
102 of the grains meant for poor never reach the real poor (Gulati and Saini 2015 and HLC
2015).
In order to reduce the burden of open-ended procurement on the Food Corporation of India
greater opportunities should be given to the private sector to engage in trade in food grains by
not limiting exports.
In general domestic support of agriculture needs to move from measures that cause more than
minimal trade-distortion and effects on production to measures that do not have such effects,
from input to investment subsidies and from consumption subsidies in kind to direct or
conditional cash transfers. The funds so saved must be used for greater public investment in
physical infrastructure and in research, extension and measures to safeguard animal health.
Use the income policy approach to protect the poor consumers (and small farmers) through
direct cash transfers.

40 | P a g e
MIDH offers huge amount of subsidies for extension works. Ministry of Agriculture gives
subsidies by allocating funds to the States. Subsidies should be linked with performance of
extension for Quality production.
It has been highlighted earlier that despite high production potential of India in most of the globally
traded agro commodities, India still does not figure amongst the global exporters. Also major export
markets of India have traditionally been the neighbouring countries, where the unit value realization is
quite low. India does not have its presence in the major importers of which include the EU, USA, Japan
and Australia. This is despite the fact that the consumption levels and hence the imports have been
increasing in these markets. Among the factors responsible for the inability of Indian exporters to access
the major markets is the growing incidence of non-tariff measures (NTMs). In case of the agro and
processed food exports, these NTBs are majorly in the form of stringent food safety regulations in the
importing markets of the developed countries.
The capacity of the Indian exporters to enter the markets of the developed countries will depend
critically on their ability to meet stringent food safety standards imposed by the latter. Developed
countries are coming out with an effective mechanism of monitoring the food imports thus throwing
challenges and cause of concern across the globe. This is also substantiated by the growing number of
rejections of Indian exports in these developed as well as developing country markets on the grounds of
non-adherence to country specific food safety regulations.
Unsafe pesticide residues and process violations are the most persistent violations for this industry
group. Similar case was seen on import rejections faced by Indian agricultural and processed food
exports in the European market. Rapid alerts are majorly being issued on the grounds of mycotoxins,
heavy metals and pesticides residue. The analysis of the above two import detention rates in USA and
EU and the strictness of the procedures of USFDA and RASFF of EU clearly bring forth the reality of
growing stringency for Indian agricultural exports and thus one of the second reasons of loosing
presence in the developed and now also most of the developing markets of ASEAN and Middle East.
One of the primary reasons towards explaining the lack of the ability of the Indian farmers to handle the
stringent Sanitary and Phyto Sanitary (SPS) and Technical Barriers to Trade (TBT) requirements of the
developed country markets is the high cost of compliance of meeting these standards. SPS standards
therefore impede trade even when they are imposed on genuine health and safety considerations
because of additional compliance costs imposed on the domestic exporter/ farmer. Apart from public
standards, there exists plethora of private standards and therefore the existing set of public and private
food safety standards brings forth the use of third-party certification to ensure compliance with complex
Problem Statement 3: High rejections due to Non Tariff measures in importing countries

41 | P a g e
rules and procedures at various points along the value chain (including both pre-farm-gate as well as
post farm gate controls.
Selected private-sector standards and codes in the market place
Pre-farm gate Post-farm gate
Food
processing
Retail outlets and supermarkets
Collective
standards
EurepGAP
SQF 1000
ISO 9000
SQF 2000
ISO 9000
HACCP
SQF 3000
ISO 9000
HACCP
Retailer specific
standards
TESCO (Nature Choice)
Source: adapted from Chia-Hui Lee Grace (2006)
The cost components of SPS compliance with public and private food safety and quality requirements
includes(i) direct cost which deals with actual technological changes the firms/companies have to make
in order to comply to the changed standards, auditing of the standards, training and educating it’s staff
(ii) indirect cost including quality system, laboratory, etc (iii) risk involved towards rejection of shipment,
risk of losing customer credibility, risk of export bans due to repeated alerts etc. and lastly the (iv)
hidden cost involved towards export diversification either for product or for market, buyer
identification, cost of repositioning etc.
Cost of compliance depended on the supply chain used
The producers and processing companies operating in a vertically integrated supply chain are supported
or importers in the implementation of private standards and guidelines. Importers or transnational
companies coordinate most of the chain activities, implement strict food safety and quality
measurements in tandem with the co-operatives, and employ well-trained quality inspectors within the
vertically integrated supply chains. Many of these companies including Tesco, Carrefour etc trade fresh
produce under their own brand names and, therefore, are very much focused on the safety and quality
of their products.
Within the collaborative supply chain, the chain partners are in close contact with one another. This was
visible in case of co-operatives like MAHAGRAPES wherein approximately 1500 grape exporters in Pune
and Nasik which were registered members of the co-operative were connected with each other through
M –commerce. Farmers not only receive the information about the local mandi prices and change in
national regulations, but also are informed about the public food safety (such as phyto sanitary and MRL
regulations) and quality requirements, (such as grading and packaging requirements) of the importing
country and the specific demands of the retailer by the importer.

42 | P a g e
This is also prevalent in case of big companies which have entered into contract farming for tomato
cultivation in Punjab, Haryana and Rajasthan; for Gherkins in Karnataka and variety of FFV in Tamil
Nadu, Maharashtra and Andhra Pradesh. Foreign importers source fresh produce from these big
companies which in due course of time becomes the preferred producers for these foreign buyers.
Producers exporting their products through a transaction-oriented supply chain or an importer-driven
supply chain deal with intermediaries who do not inform them about the safety issues and often are
neither aware nor well-informed about the food safety and quality demands of buyers. Consequently,
these producers have not implemented private standards and, therefore, do not comply with private
food safety and quality requirements.
In certain cases the conformity assessment procedures associated with SPS standards were found
difficult and costly to put into practice within supply chains in India. This is predominant in the
transaction oriented supply chains which normally were longer and more fragmented than in developed
countries and, as a result, the cost of establishing traceability and supplier quality assurance is
prohibitive, in particular for small producers.
The nature of marketing and supply chain models used in marketing of fruits and vegetable in India
hampers the ability of the Indian FFV exporters in complying with the high quality standards demanded
in the international market. The Traditional APMC features hamper farmers’ ability towards SPS
compliance leading to quality issues: This can be elaborated in case of Himanchal Apple growers. As a
result of the APMC act, farmers are unable to to sell their apples directly to the private players and in
turn the compulsion of selling the apples only through government regulated mandis; after harvesting
their crop, the farmers of Himachal Pradesh pack their apples in cardboard boxes and transport by small
trucks them to the mandis, which are located within about 20 kilometers of the farms.
Since packing is costly, growers who sell through APMC markets often pack between 22 to 30 kgs of
apples in a box that is designed to hold only 20 kgs. As a result, apples deteriorate in quality as they rub
against each other during their long journey from Himachal to the final market. Spending long periods of
time in the sun further damages the apples that are transported in unrefrigerated trucks. Moreover, at
APMC markets, the apple cartons are unloaded for the buyers to inspect so that the auction can take
place. This additional handling and transportation further damages the apples.
The story of inefficiency still continues when the apples reach Azadpur terminal market since it is not
GMP certified due to the fact that the lease is on a short-term basis, or even seasonal. Hence, there is a
little scope to make improvements. In view of the above mentioned issues, exporters operating in the
transaction oriented supply chains procuring apples from the mandis have to bear the brunt of these
inefficiencies wherein these apples are not able to conform to international codes and standards
(CODEX, HACCP, and EU standards) for food safety and quality assurance.

43 | P a g e
Traceability Requirement for exports in Developed markets: EU directive 178/2002
EU directive Article 3(15) of regulation 178/2002 makes it mandatory for exporting units to establish the
traceability systems in their supply chains. This means the “ability to trace and follow feed, food
producing animal or substance intended to be, or expected to be incorporated into a food or feed
through all stages of production, processing or distribution. Article 18(1) of this regulation provides that
traceability of food, feed must be established at each stage of supply chain. Food business operators
must be able to identify any person from whom they have supplied with a food, a feed, a food producing
animal or any substance intended to be, or expected to be, incorporated into a food or feed.
With the existing long and fragmented supply chain, establishing sophisticated traceability systems is
not possible. Hence another very important reason for the intervention of the State Government
towards the shift from traditional marketing chains to vertically integrated chain is justified. It is
observed that the compliance are hampered due to lack of access to information and compliance
resources and State’s intervention towards establishing SPS/TBT dissemination systems are necessary in
this regard.
It has been witnessed that there has been frequent changes in the SPS/TBT regulations in the export
markets. In the absence of access to the actual and timely information on SPS requirements in foreign
markets, Indian agro farmers/traders/exporters face significant delays and confusion. Further
aggravating the issue is limited access to the resources required to comply with SPS standards in
developed countries. These include information on SPS standards themselves, scientific and technical
expertise, appropriate technologies, skilled labor, general finance etc. If these resources are not
available locally, they may need to be obtained overseas, significantly increasing the costs of
compliance. For small and medium-sized companies these costs are likely to be prohibitive. This results
in non compliance and thus the loss of foreign exchange to the country as can be seen in case of
rejections of Indian grapes facing the loss of 250 crore due to lack of information about changed EU
regulation on CCC to be disseminated to the grape exporters in India. Considering the fact that the cost
of establishing such traceability systems and information dissemination systems is too high, public
private partnerships needs to be encouraged at the state levels.
Such information dissemination may be done through already established agri marketing information
system (AGMARKNET) which exists and aims to facilitate market intelligence services and market led
extension to encourage demand driven quality production. Additional information on import regulations
on various export markets and regular updation on SPS/TBT notifications would further help farmers to
produce as per international quality standards. Another alternate is to attach these information
disclosures through existing private initiatives as in case of ITC e-choupal
Weak safety and health standards that legitimize prohibitive SPS barriers imposed by foreign
governments; inadequate standardization of products reduces attractiveness for foreign retailers. The
quality of packaging is poor. Importing countries demand specific packaging for each produce and the
use of bio-degradable materials resulting in high cost of packaging
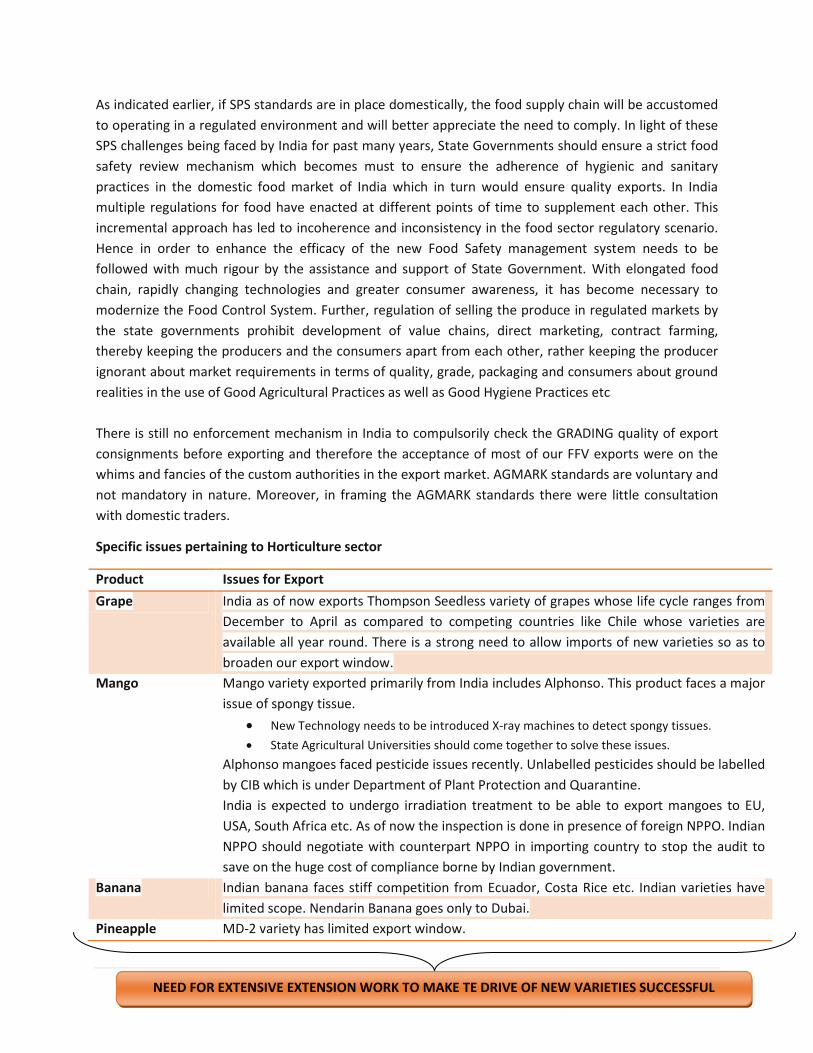
44 | P a g e
As indicated earlier, if SPS standards are in place domestically, the food supply chain will be accustomed
to operating in a regulated environment and will better appreciate the need to comply. In light of these
SPS challenges being faced by India for past many years, State Governments should ensure a strict food
safety review mechanism which becomes must to ensure the adherence of hygienic and sanitary
practices in the domestic food market of India which in turn would ensure quality exports. In India
multiple regulations for food have enacted at different points of time to supplement each other. This
incremental approach has led to incoherence and inconsistency in the food sector regulatory scenario.
Hence in order to enhance the efficacy of the new Food Safety management system needs to be
followed with much rigour by the assistance and support of State Government. With elongated food
chain, rapidly changing technologies and greater consumer awareness, it has become necessary to
modernize the Food Control System. Further, regulation of selling the produce in regulated markets by
the state governments prohibit development of value chains, direct marketing, contract farming,
thereby keeping the producers and the consumers apart from each other, rather keeping the producer
ignorant about market requirements in terms of quality, grade, packaging and consumers about ground
realities in the use of Good Agricultural Practices as well as Good Hygiene Practices etc
There is still no enforcement mechanism in India to compulsorily check the GRADING quality of export
consignments before exporting and therefore the acceptance of most of our FFV exports were on the
whims and fancies of the custom authorities in the export market. AGMARK standards are voluntary and
not mandatory in nature. Moreover, in framing the AGMARK standards there were little consultation
with domestic traders.
Specific issues pertaining to Horticulture sector
Product Issues for Export
Grape India as of now exports Thompson Seedless variety of grapes whose life cycle ranges from
December to April as compared to competing countries like Chile whose varieties are
available all year round. There is a strong need to allow imports of new varieties so as to
broaden our export window.
Mango Mango variety exported primarily from India includes Alphonso. This product faces a major
issue of spongy tissue.
New Technology needs to be introduced X-ray machines to detect spongy tissues.
State Agricultural Universities should come together to solve these issues.
Alphonso mangoes faced pesticide issues recently. Unlabelled pesticides should be labelled
by CIB which is under Department of Plant Protection and Quarantine.
India is expected to undergo irradiation treatment to be able to export mangoes to EU,
USA, South Africa etc. As of now the inspection is done in presence of foreign NPPO. Indian
NPPO should negotiate with counterpart NPPO in importing country to stop the audit to
save on the huge cost of compliance borne by Indian government.
Banana Indian banana faces stiff competition from Ecuador, Costa Rice etc. Indian varieties have
limited scope. Nendarin Banana goes only to Dubai.
Pineapple MD-2 variety has limited export window.
NEED FOR EXTENSIVE EXTENSION WORK TO MAKE TE DRIVE OF NEW VARIETIES SUCCESSFUL
45 | P a g e
Strategies for better SPS compliance: learning from competing countries
Country SPS Compliance measure
Vietnam Safe” vegetable program
China • Different labels are used for “green” food, “organic” food and “pollution-free” food. “Green” food is supposed
to be non-polluted, safe, nutritious, and grown in a sustainable (e.g. minimal energy consumption) manner. Food meeting these standards can use an authentication symbol issued by one of 38 branches of the Green Food Development Centre.
• Shanghai introduced “Standards for Safe and Hygienic High-Quality Vegetables” covering seed and land selection, fertilizer and pesticide use and quality monitoring.
Thailand • In Thailand, several farm-level accreditation schemes have been in operation. • The “Pesticide Safe” vegetable program, run by the Department of Agriculture, involved inspection and crop
testing. Farmers could still use pesticides and mineral fertilizers but products had to contain pesticide residues lower than the maximum level set by Codex Alimentarius
• The “Hygienic Vegetables” programme is promoted by the Medical Sciences Department. This places responsibility on the packer for sourcing vegetables with safe pesticide residue levels.
• Thailand has now developed the “Q Mark” with the objective of consolidating the various codes that presently exist. The system of Q standards covers different steps of the supply chain. Q GAP is for farm-level certification; Q-GMP is for packing plants; while QFood Safety (Q-GAP plus Q-GMP) is for packers sourcing only from farmers who are QGAP certified
Malaysia • Malaysia has introduced a commodity branding programme called “Malaysia’s Best.” • This is an umbrella brand for the country’s horticultural products that guarantees quality and safety in
accordance with Malaysian Standards and the Malaysian Good Agricultural Practice System. • It was initiated for carambola, papaya, pineapple, mango and watermelon, but is to be extended to all other
commodities. All farmers can apply to be certified although, initially, most certified farmers are contracted to the Federal Agricultural Marketing Authority (FAMA) for delivery to supermarkets.
Indonesia
• In Indonesia, the Government has also responded to a lack of quality incentives in the marketing system by introducing commodity and location-specific certification systems.
• Prima III is the lowest standard, with produce required to meet MRLs. Prima II incorporates Prima III and quality attributes. Prima I broadly complies with EurepGAP standards.
Kiwi Green”- success story of IPM in New Zealand • The detection of spray residues on New Zealand kiwifruit, was essentially being used as a trade barrier in some
European markets. The New Zealand Kiwifruit Marketing Board (NZKMB) responded in 1991 by developing a pest management strategy that would enable the production of fruit with no detectable residues. This IPM program, called `KiwiGreen' focused on pest management and agrochemical issues, was launched in 1992.
• KiwiGreen' is an example of the successful development and implementation of an IPM program across an entire fruit industry. `KiwiGreen' consists of a documented and audited program of pest control measures that can only be applied in response to a demonstrable need. It was an important precursor to later developments when this program was broadened to encompass all the principles of IFP that became a major component within a broader GAP program called the ZESPRI™ System.
• This system was the basis of the EurepGAP implementation program in the kiwifruit sector in 2002 and today, over 90% of New Zealand's kiwifruit producers that are EurepGAP certified supply crops to Zespri International Ltd.
Nouyaku-navi- Concept of Navigation System for Appropriate Pesticide Use in Japan • In the Nouyaku-navi, the goal is to enable farmers to prevent pesticide misapplication due to carelessness and

46 | P a g e
to automatically register the application records by automatic recognition of the agrochemicals using bar-codes (Japanese Article Number codes) and/or RFID (Radio Frequency Identification: Wireless IC) tags attached to the agrochemical containers.
• A judgment server system has been developed (hereinafter referred to as the Nouyaku-navi judgment server) which determines in advance the propriety of pesticide use, together with a system for preparing appropriate plans or guidelines on pesticide application and pest control which can easily and precisely create such plans. An on-site warning system has been developed which uses barcodes or RFID to give farmers warning information
Application for Agricultural Methodological Analysis" (AFAMA): Success story of Traceability System in Japan • Japanese government, local governments and the Japan Agricultural Cooperatives (JA) have been promoting
the development and practical application of food traceability systems (FTS) as national projects. • The "Virtually Identified Produce System" (VIPS) is the basic scheme of FTS, where ID numbers are given to food
products and printed on their labels or packages. Farmers input in the production data about their products to an Internet-accessible database.
• Consumers who purchase these products can browse a product's data by going to the VIPS Website and entering the product's ID. Based on the VIPS, a practical information disclosure system called "SEICA" for fruit and vegetable products was developed and opened to the public in 2002
47 | P a g e
Emerging TBT barriers for Indian agro exports in Developed markets: need for domestic reforms
Food Miles
Food transported across the world burns up a lot of fossil fuel and contributes to global warming →
consumers are becoming conscious and need to know number. of miles from food to plate → shorter
shipping distance becomes a competitive advantage. Considering the fact that depending on the port
efficiencies, exporters would like to choose the port wherein the total number of days to export is
minimum and hence the port efficiency is the best without even realising the calculation of the foot
miles. Hence, state governments needs to look into the possibility of improving not only the mandi
infrastructure but also the port infrastructure to help traders/exporters comply to this TBT requirement.
Water Foot Print
Over the years, many EU companies have made water issues an integrated part of their corporate
policies and committed themselves to reduce the use of water in their own processes, as well as in
processes taking place in their supply chains. The Water Footprint is an indicator that allows consumers,
companies or countries to measure their freshwater use and can as such be used as a starting point for
the development of water strategies, as well as to communicate about the individual, country’s or
company’s performance. The water footprint is a tool to measure the freshwater use at a certain
location at a certain period of time. This forms the basis for assessing the local impacts of the various
components of the water footprint.
One of the measures of calculating the water foot print which needs adequate attention and
intervention from the states is the sum of the water footprints of the process steps taken to produce the
product, therewith considering the whole production and supply chain and the volume of the water
used to run and support the business.
Water Foot Print: Impact on Export opportunity for Indian Cotton and Rose Exports
The large amounts of water consumed for fibre production, such as cotton, are an important local and
global environmental problem. Rice is a water-intensive crop. The rising production of rice, and wheat
and sugarcane to some extent, especially from the states of Punjab and Haryana, has contributed to
over-exploitation of ground water in these states. At present, cotton is the most used natural fibre in the
textile industry worldwide (40% of the total textile production). The production & exports of a cotton
product is related to a range of impacts on the water resources in the countries where cotton is grown
and processed, which are mainly dry regions (e.g. in China, India, Pakistan, the USA and Uzbekistan).
Especially some irrigation schemes that are very intensive can have disastrous effects, such as
48 | P a g e
desiccation of wet areas, as well as water pollution caused by fertilisers and pesticides. According to the
Water Footprint Network, cotton consumption is responsible for almost 2.6% of the global water use
and hence is acting as TBT barrier in entering European market.
Similar is the situation in case of Indian roses which takes huge amount of water to grow. Indian roses
are losing competition from Chinese roses on account of indulgence of green house techniques by
Chinese governments thus reducing the water use. State governments should therefore announce
subsidies and incentives towards effective water management techniques and green house
technologies.
Similar Environment issue
The agriculture sector contributes 28 per cent of the total GHG emissions from India, primarily due to
methane emission from rice paddies, enteric fermentation in ruminant animals, and nitrous oxides from
use of manures and fertilizers. The options for mitigations that have been identified by a group of
experts of the Planning Commission include evaluation of the mitigation potential of biofuels and their
enhancement by their genetic improvement and reduction of methane generation and emission in
ruminants by modification of diet, and in rice paddies by water and nutrient management. Overall
improving efficiency in the use of inputs in agriculture such as energy intensive inorganic fertilizers and
energy itself for lift irrigation can bring about mitigation.
On the basis of studies made by the Indian Council for Agricultural Research (ICAR) the NAPCC has
pointed out that some of the significant effects of global warming would be to reduce wheat production
and lower yields from dairy cattle. As a result of climate change the variability in temperatures and
rainfall may also increase, with adverse consequences for agricultural operations. The adaptation
strategies being considered include the development of new crop varieties that are drought and heat
stress tolerant, development of nutritional strategies for managing heat stress in dairy animals, and
strengthening of current weather based insurance programmes. Adaptation strategies will have to be
devised for dealing with variability in rainfall, which could make droughts and floods more widespread
and frequent.
Using trade agreements for SPS/TBT issues
While SPS management techniques as practiced in other competing countries can possibly help Indian
exporters to compete in the foreign markets; trade agreements signed by India can help enhance India’s
exports in RTA markets as below:
• Different regulatory requirements across markets creates barriers to trade for safe goods. RTA
provisions aimed at harmonization or equivalence can create a market place wherein safe food
can move freely within the RTA signed countries.
• Certified safe food can be negotiated for lower tariffs within an RTA.
• An RTA can develop a common brand for producing safe goods. e.g Mercosur for cosmetics,
perfumes, medicinal products, bicycles, toys etc. (by mutually accepting common permitted

49 | P a g e
substances, mutually accepted best practices guidelines in the manufacturing process and
formation of strict enforcement bodies.
• Creation of produce track back system: case of Thailand-Australia RTA: helps to deliver regional
public goods by making it possible to rapidly identify and isolate the source of contamination or
disease in the supply chain.
• Recognition of “accredited exporter” : SAFTA’s sectoral annex of horticultural goods establishes
the concept of “accredited exporter” defined as “an exporter of the scheduled horticultural
goods who has demonstrated to its regulatory authority that it possesses the necessary
technical capabilities, management competence, facilities, equipment and production systems
required to meet the mandatory requirements of the importing Party”.
• Australia and Singapore have agreed that Australia will minimize import control, inspection and
approval procedures where orchids shipped by Singaporean accredited exporters are
accompanied by the required certificates and reports.
• Relaxation of sampling procedures. This will also enable exporters to avail inquota duty rates.
ACTION PLAN SUGGESTED: WEB BASED APPLICATION ON PRODUCT MARKET
IDENTIFICATION FOR AGRO EXPORTS
Model that India can follow:
i. Case of PMI application for Greater Mekong Sub Region (China, Lao, Vietnam, Cambodia,
Thailand and Myanmar) at International Level [reference point: www.gmspmi.com]
Problem Statement 4
One of the major reasons behind the gap between huge production potential and poor export status in
the case of agro exports is lack of market information on behalf of exporters and policy makers to
identifying the best export market to take focussed approach in terms of participation in trade fairs,
buyer seller meet etc.

50 | P a g e
ii. Product Market Identification for agro exports from Maharashtra: developed by Maratha
Chambers of Commerce and Industry (MCCIA) [reference point: www.aemis-mccia.com]
Scope of the web based application
In order to leverage these production advantage of the state optimally, identification of the right
product market mix is essential to reflect these production advantages in the form of enhanced
presence in the International market. For this, the identification of the right product-market mix i.e
deciding which product to sell in which market becomes one of the most important decisions a potential
exporter will need to make. It is important to research foreign markets and tailor one’s products to
regional tastes. This application on Product Market Identification will help agricultural exporters to
identify the right market by the use of online databases and information. It would help them in finding
countries with the largest and fastest growing markets for their product and help determine which
foreign markets will be the most penetrable &profitable. This application also would provide an in-depth
analysis of the Export Promotional Policies and schemes available to the agri exporter both at the
Central level and the state level and the institutions working towards the export development of
agriculture.
Other action points for Government to act on
a. Development of Sector specific Database on NTMs
o Understanding the fact that Non-Tariff Measures (NTMs) have increasingly become important in trade negotiations between countries and group of countries. With the tariff barriers coming down under commitments as members of WTO or different economic integrations, countries are increasingly using NTMs as trade restricting mechanism which is impacting the exports from the SME sector in a big way. developing a database on the sector specific/product specific non tariff barriers with an in-depth analysis on the extent of trade impact :positive or negative (trade restrictiveness) is required.
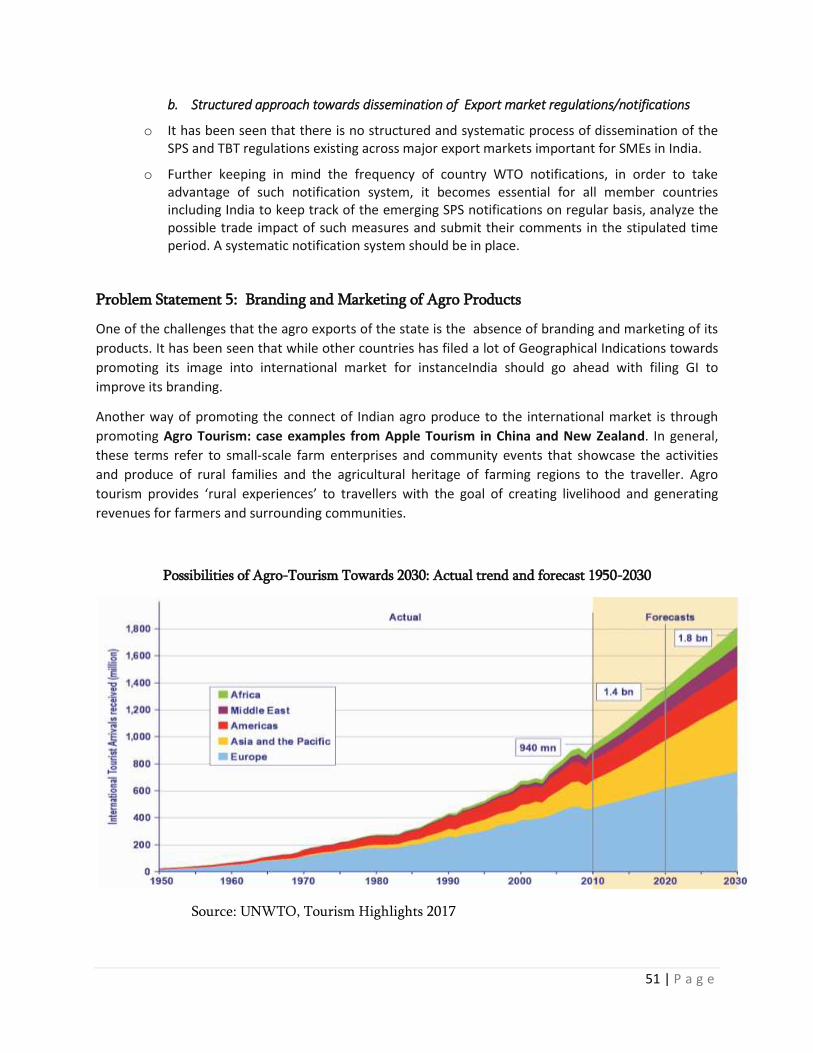
51 | P a g e
b. Structured approach towards dissemination of Export market regulations/notifications
o It has been seen that there is no structured and systematic process of dissemination of the SPS and TBT regulations existing across major export markets important for SMEs in India.
o Further keeping in mind the frequency of country WTO notifications, in order to take advantage of such notification system, it becomes essential for all member countries including India to keep track of the emerging SPS notifications on regular basis, analyze the possible trade impact of such measures and submit their comments in the stipulated time period. A systematic notification system should be in place.
Problem Statement 5: Branding and Marketing of Agro Products
One of the challenges that the agro exports of the state is the absence of branding and marketing of its
products. It has been seen that while other countries has filed a lot of Geographical Indications towards
promoting its image into international market for instanceIndia should go ahead with filing GI to
improve its branding.
Another way of promoting the connect of Indian agro produce to the international market is through
promoting Agro Tourism: case examples from Apple Tourism in China and New Zealand. In general,
these terms refer to small-scale farm enterprises and community events that showcase the activities
and produce of rural families and the agricultural heritage of farming regions to the traveller. Agro
tourism provides ‘rural experiences’ to travellers with the goal of creating livelihood and generating
revenues for farmers and surrounding communities.
Possibilities of Agro-Tourism Towards 2030: Actual trend and forecast 1950-2030
Source: UNWTO, Tourism Highlights 2017

52 | P a g e
When it comes to agro tourism, the scope of the subject expands into agro based small scale industries
located in the countryside, traditional services in agricultural areas and also culture, believes, and value
systems in the same areas. Examples of these experiences include: visiting farmers’ markets to purchase
farm fresh products, taking part in orchard and floral garden tours, using farm bed and breakfast
accommodation, and participating in harvest festivals.
India can look into the possibilities of agro tourism products: case examples from South Asia
• Accommodations in cottages close to farm lands: Bed and Breakfast is specially confined to
small lodging establishments providing overnight accommodation. Cuisines prepared with local
products for the breakfast while the lunch and dinner available from the countryside
restaurants. Accommodations can be arranged in old bungalows, manor houses, or colonial rest
houses located either in plantation such as tea, coconut, cotton, sugar, oil farm, cashew and
rubber or in newly built structures in the isolated countryside.
• Countryside rest houses/restaurants for lunch and dinner: Small eating houses built close to
water edges surrounded by fauna and flora. Adapted versions of local menus to meet the needs
and taste of international/urban tourist can be promoted. Open air cooking depending on the
environment to demonstrate local cooking practices to the visitor.
• High land farm gardens for tourists: Vegetable, fruits, spices gardens to walk around and to
harvest by visitor according to his tastes and needs. A few selected sections of special seedling
farm lands/test grounds belonging to private companies and public sector identities would
easily be made available for the purpose.
• Riding in countryside: Promoting of hoarse, elephant, donkey and cart riding or cycling through
rural unpaved roads and foot paths to grasp the scenic appealing of countryside.
• Tours to rural production/ processing facilities: Food processing operations such as jam, wine,
fruit juice, cheese making, and spice grinding and packaging and vegetable/fruit canning.
• Farm tours and demonstration of traditional farming activities: A range of activities from
clearing of lands through ploughing, sowing of seeds, treating to plants, harvesting, threshing,
transporting and preparing of foods and beverages of new harvests.
• Cultural shows: Traditional cultural practices preserved for centuries in rural areas mostly in
pristine form among farm communities. Folk dramas, music, dances, pageants and other
festivals can be promoted for the purpose.
• Roadside stalls and rural markets for shopping: Such items as fruits, vegetables, and fancy
items should be available from these places. Weekly fairs are conducted in many areas with the
participation of rural producers and buyers as well as some buyers and sellers from distant
areas.
• Traditional medicine and healing methods: Traditional practices tested by scientifically or
otherwise. Only risk free products can be promoted among visitors. Ayurvedic practice is
common in the South Asian region.
• Green sports in rural areas: Beach games, raft competition, horse racing, beach golf or golf in
post harvested fields and catchment areas of irrigation tanks during the dry season.
• Adventure activities in or close to farm lands: This will include trekking, mountaineering,
mountain biking, rafting and rock climbing.

53 | P a g e