
Innovativity: A Comparison Across Seven European Countries
58
INNOVATIVITY: A COMPARISON ACROSS SEVEN EUROPEAN COUNTRIES PIERRE MOHNEN (MERIT, Maastricht University and CIRANO) JACQUES MAIRESSE (CREST-INSEE and NBER) MARCEL DAGENAIS* (Université de Montréal and CIRANO) *Marcel Dagenais sadly passed away before this paper was completed. He could not read and correct the last versions of it. The paper bears his input. We hope it also bears his standards. CORRESPONDENCE: Jacques MAIRESSE, CREST-INSEE, 15 blvd. Gabriel-PERI, 92245 Malakoff CEDEX, FRANCE email: [email protected] RUNNING TITLE: Innovativity comparisons KEYWORDS: innovation; R&D; comparative; self selection; Europe JEL CLASSIFICATION: C35, L60, O31, O33
-
Upload
independent -
Category
Documents
-
view
0 -
download
0
Transcript of Innovativity: A Comparison Across Seven European Countries

INNOVATIVITY:
A COMPARISON ACROSS SEVEN EUROPEAN
COUNTRIES
PIERRE MOHNEN
(MERIT, Maastricht University and CIRANO)
JACQUES MAIRESSE
(CREST-INSEE and NBER)
MARCEL DAGENAIS*
(Université de Montréal and CIRANO)
*Marcel Dagenais sadly passed away before this paper was completed. He could not read
and correct the last versions of it. The paper bears his input. We hope it also bears his
standards.
CORRESPONDENCE: Jacques MAIRESSE, CREST-INSEE, 15 blvd. Gabriel-PERI,
92245 Malakoff CEDEX, FRANCE email: [email protected]
RUNNING TITLE: Innovativity comparisons
KEYWORDS: innovation; R&D; comparative; self selection; Europe
JEL CLASSIFICATION: C35, L60, O31, O33

2
ABSTRACT
This paper proposes a framework to account for innovation similar to the usual
accounting framework in production analysis and a measure of innovativity comparable
to that of total factor productivity. This innovation accounting framework is illustrated
using micro-aggregated firm data from the first Community Innovation Surveys (CIS1)
for seven European countries: Belgium, Denmark, Ireland, Germany, the Netherlands,
Norway and Italy for the year 1992. Based on the estimation of a generalized Tobit
model and measuring innovation as the share of total sales due to improved or new
products, it compares the propensity to innovate, and the innovation intensity conditional
and unconditional on being innovative across the seven countries and between low- and
high-tech manufacturing sectors. Even with relatively few explanatory variables our
innovation framework already accounts for sizeable differences in country innovation
intensity. It also shows, however, that differences in innovativity across countries can be
quite sizeable as well.
Deleted: ,
Deleted: As it stands
Deleted: country

3
1. INTRODUCTION
Industrial countries have reached a stage of economic development that many describe as
“the knowledge-based economy” (KBE). The concept of a KBE is appealing, but its
definition is far from being clear-cut. Some say that what distinguishes a KBE from the
past industrial economies is that growth is driven less by investments in buildings and
equipment than by the generation of ideas and the accumulation of knowledge (see for
example Aghion-Howitt, 1998; Foray, 2004; Neef, 1998). Others characterize a KBE by
the importance of information and communication technologies, skilled labor, continuous
learning, and globalization (see for example Quah, 2001). Whatever definition one comes
up with, innovation is certainly one of the pillars of the knowledge-based economy.
Competition among firms to attract customers is fought more and more via improved
products, entirely new products or more efficient ways to produce existing products.
How to measure innovation? So far, most of the work on science and technology
indicators has been based on R&D, patent or bibliometric data. R&D data have been
collected in a systematic fashion in OECD countries since the inception of the Frascati
Manual (OECD, 1963). Patent grants have been recorded by patent offices around the
world for a much longer time. Bibliometric data are also widely available in the form of
publications and citations, or innovation announcements. All of these indicators have
their shortcomings. R&D measures only research input with no guarantee that the
research eventually leads to a marketable and appropriable innovation output. Most
patents are worth little and the propensity to patent varies widely across sectors.
Bibliometric data are not always systematically collected or readily available, and they
Deleted: less

4
suffer even more than patents from the absence of any associated value. It is only
recently that, under the guidelines of the Oslo Manual (OECD (1992), statistical agencies
have started conducting surveys directly asking firms about their innovations.1 In these
surveys, firms are asked to give information about the inputs, the outputs and the
behavioral and organizational dimensions of their innovative activities. On the input side,
we have data on R&D expenditures and on current innovation expenditures besides R&D
(such as the acquisition of patents and licenses, product design, trial production, and
market analysis). On the output side, we have the declaration of whether an enterprise has
introduced a new product or process and the shares of sales due to incrementally,
significantly changed, or entirely new products, which can be new to the enterprise or
new to the market. As other dimensions of innovative activities, we have indicators of
whether R&D is done on a continuous basis and/or in cooperation with others, and
categorical data on the sources of knowledge, the reasons for innovating, the perceived
obstacles to innovation, and the perceived strength of various appropriability
mechanisms.
1 There have been a number of more or less similar surveys conducted earlier, focusing on particular
aspects of firm innovation process. Probably the best known are the one conducted by the Science and
Policy Research Unit (SPRU) of the University of Sussex, which combined information on specific
innovations obtained from firms and from a panel of experts, the Yale survey on appropriability, and more
recently the Carnegie-Mellon survey. See for example Robson, Townsend and Pavitt (1988), and Geroski,
Van Reenen and Walters (1997) for analyses based on the SPRU innovation data; Levin, Klevorick,
Nelson and Winter (1987) and Cockburn and Griliches (1988) for analyses based on the Yale survey data;
Cohen, Nelson and Walsh (2000) and Arora, Ceccagnoli and Cohen (2003) for analyses based on the
Carnegie-Mellon survey.
Deleted: ,
Deleted: just like
Deleted: ,

5
In this paper, we take advantage of the first round of harmonized innovation
surveys conducted in Europe under the auspices of the Statistical Office of the European
Community (Eurostat), the so called CIS1 surveys (for first Community Innovation
Surveys) covering the years 1990-1992. More precisely, we try to compare the
innovation performance for seven European countries: Belgium, Denmark, Germany,
Ireland, Italy, the Netherlands and Norway, based on the CIS1 micro-aggregated firm
data, as assembled and harmonized by Eurostat. In an exploratory paper, Mohnen and
Dagenais (2001) compared the innovation performance of Denmark and Ireland. In the
present analysis, we could not consider France because the CIS1 micro-aggregated data
available for France did not include the variable on R&D expenditures. We also excluded
Portugal and Greece because their sample was not representative of the whole population
but only of innovating firms. Although the original data are firm data, Eurostat was
entitled to make them available only in micro-aggregated form for reasons of statistical
confidentiality.
“Micro-aggregation” is one among various methods to protect confidentiality. It
is a particularly simple and effective way to control for disclosure by adding “error
terms” to the raw micro-data, making it extremely difficult, if not fully impossible, to
break the anonymity of the individual firm (or more generally statistical unit) surveyed
and find out its identity, while preserving “most” of the information useful for statistical
analysis. In micro-aggregation methods, the error terms are not defined explicitly but
included implicitly in the procedure. The procedure used by Eurostat for CIS1 is micro-
aggregation by individual variable ranking (and groups of three observations). It is the
following: for any given (continuous) quantitative variable, all firms are first allocated

6
into groups of three on the basis of their ranking by increasing values of the variable; the
(simple) arithmetic averages of the variable are then computed for all groups (i.e. over
the three firms of each group); and finally the raw values of the variable are replaced for
all the firms by the corresponding average values. This amounts to adding to every
(continuous) variable, for a given firm (i), an error term ( iε ) equal to the difference
between the average value of the variable ( iy ) for the group of three firms (i, j and k) in
which this firm is allocated and its individual value ( iy ).2 The procedure is similar for the
(discrete) qualitative variables (for more details see Eurostat, 1996 and 1997). Note that
micro-aggregation is a sense a misnomer, since the number of observations (firms) is the
same in the micro-aggregated and the raw samples. One great advantage of micro-
aggregation is that the error terms added to the variables behave differently than the
classical random measurement errors in variables; they are not a source of bias in the
estimation of linear regression models for large enough samples. On the basis of the raw
firm data of the French CIS2 innovation survey and the corresponding micro-aggregated
data, we have also been able to show that the estimates of a non-linear model similar to
2 If i, j and k denote respectively the index of the three firms of a given group, when firms are ranked in
increasing order of the variable y, we can write equivalently ( + ) / 3i j k i j ky y y y y y= = = + or
with = [( ) ( )] / 3i i i i j i k iy y y y y yε ε= + − + − ,
with = [( ) ( )] / 3j j j j i j k jy y y y y yε ε= + − + − and
with = [( ) ( )] / 3k k k k i k j ky y y y y yε ε= + − + − .
Formatted: Font: Italic
Formatted: Font: Italic
Formatted: Left
Formatted: Font: Italic
Formatted: Font: Italic
Deleted: by
Deleted: see
Deleted: Precisely i

7
the one performed here were not sensitive to the micro-aggregation procedure (see
Mairesse and Mohnen, 2001).3
Besides contributing to the analysis of the information provided by innovation
surveys, and possibly to the improvement in their design, our main purpose in this paper
is to organize our thinking on measurement and comparison of innovation performance,
and to do so we propose and illustrate the idea of an accounting framework for
innovation similar to the now standard production (or output growth or productivity)
accounting framework. In this framework, the production of a country, an industry or a
firm can be traced back to the use of various factors of production and to other omitted,
unobserved, unknown or “residual” factors that are subsumed under the name of total
factor productivity, or multifactor productivity, or even simply productivity. Similarly,
innovation can be regarded as deriving in part from traceable factors such as R&D
efforts, and from contextual variables such as demand pull and technology push
indicators, and in part from yet-to-be-understood unmeasured factors that we propose to
identify jointly as total or multifactor innovative productivity, and to call “innovativity”
for short. Total factor productivity is generally considered as a measure of productive
performance controlling for a given set of factors of production, as well as a measure of
our ignorance in accounting fully for this performance. Likewise, innovativity can be
viewed as both a measure of innovative performance and a measure of our ignorance in
matters of innovation.
The production accounting framework is generally applied to comparisons in the
time dimension (i.e. between periods) of output or productivity performances of the unit
3 See also Hu and Debresson, 1998.

8
(or units) under analysis, but it can also be extended to the comparison of such
performances in the cross-sectional or spatial dimension, that is between units (in a given
period). Similarly, the innovation accounting framework can be applied to either the time
or the cross-sectional dimension. We shall illustrate it here by comparing innovation in
seven European countries in high-tech and low-tech manufacturing industries, based on
the CIS1 micro-aggregated firm data.
The paper is organized as follows. In section 2, we develop the idea of an
accounting framework for innovation. In section 3, we lay out the econometric model
which underlies such framework and is consistent with the nature of the innovation
survey data. In section 4, we describe the CIS1 micro-aggregated data we use. In section
5, we present and interpret the estimation results. In section 6, on the basis of these
results and along the lines of our framework, we proceed with the comparison of the
innovation performance of the seven European countries. We summarize the main points
of the analysis in the concluding section.
2. ACCOUNTING FOR INNOVATION AND ACCOUNTING FOR
PRODUCTIVITY: A PARALLEL
The innovation surveys provide us with a very interesting new way of measuring the
output of firms’ innovative activities, namely the share of sales in the last year (i.e. 1992
for CIS1) due to new and substantially changed products introduced on the market during
the last three years (i.e., 1990-1992 for CIS1), or the share of innovative sales for short.
This measure can be viewed simply as a sales weighted number of innovations and seems
to be generally well understood by firm respondents. It also offers various possible

9
refinements such as distinguishing between incremental or radical improvements, or
between products new to the firm or new to the market. Of course such a measure only
captures product innovations, but the surveys indicate that most firms innovating in
processes also innovate in products.4 Process innovations do not directly show up in new
sales, if their only effect is to reduce the cost of producing old products. However, they
also lead in general to new or improved products through a change in product design or
quality.
Merely comparing statistics on the share of innovative sales or other innovation
indicators is useful but does not say why these indicators differ across firms, sectors or
countries. To understand why they do and possibly build more informative innovation
indicators, we need a model. If an exact model of innovation in its various dimensions
existed and we knew it, we should be able to understand precisely why, for example, one
country has a higher innovation performance than another country. Of course, such a
perfect model does not exist and we shall never be able to characterize and explain the
innovation process fully. Nevertheless, it is worth trying to model differences in
innovative performance. Even a rather crude model may allow us to assess, at least
approximately and tentatively, to what extent some important innovation factors, like
firm size or R&D efforts, account for differences in innovation output. In such an
endeavor, what remains to be explained is as important to measure as what can be
explained. On the one hand what we call innovativity reflects the ability to turn the
innovation factors accounted for in the model into innovation output, on the other hand it
4 In CIS1 the proportion of firms that declared to be only process innovators (and not product innovators)
seemed particularly small; it is also relatively small in CIS2 and CIS3.

10
corresponds to other factors not measured, let alone unveiled, that challenge the
researcher on innovation to probe further.
To be more explicit and better motivate our approach, it is helpful to draw a
comparison with the standard framework for output growth or productivity accounting.
Output is viewed as being produced by inputs in a process that can be represented and
analyzed by a production function. The production function in turn underlies an
accounting framework, in which the difference in output between two periods (years,
decades) or between two spatial units (firms, industries, countries) can be ascribed to
differences in the inputs, and to a residual difference in what is called total or multifactor
productivity (TFP or MFP), or simply productivity. Likewise, innovation output can be
viewed as resulting from a process of transformation which can be summarized by an
innovation function, even if this process is much less predictable than a production
process. This innovation model can also give rise to an accounting framework in which
differences in innovation output between two periods, or two spatial units, can similarly
be ascribed to differences in direct inputs of innovation, and more generally contextual or
environmental determinants, and to a residual difference in what can be called innovative
productivity or innovativity.
This parallel between productivity and innovativity is fairly straightforward when
both are measured on the basis of an econometrically estimated relationship. The analogy
is less clear when productivity analysis is based on “accounting data” and index number
computations. In this approach total or multifactor productivity is not estimated as a
residual but computed as the ratio of an output index to a weighted index of inputs, where
the weights are taken to be equal to the corresponding input shares (in total revenue or

11
total cost) available from firms' current accounts or country national accounts. In
practice, it is impossible to measure innovativity by such index number method in the
absence of similar accounting information for innovation outputs and inputs. In theory,
that might not be unconceivable if well developed and functioning markets for innovation
outputs and inputs existed in the economy, where one could assume that in the long run
relative prices and marginal productivities would tend to be equal. In such an ideal world,
firms’ current accounts (and balance sheets) could describe and measure innovation
activities, as they do for production activities, and thus provide the necessary information
for the computation of an index measure of innovativity, as for that of productivity.
The analogy between the two types of analyses could be pursued further to
highlight basic similarities, as well as essential differences. For example, the
methodological problems raised by extending a bilateral productivity comparison to a
multilateral one carry over to comparisons of innovation. In the case of a bilateral
comparison it is straightforward to compare the observations in one country with those in
the other country. In a multilateral comparison, it is useful to refer to a non-arbitrary
fixed point of comparison. If various firms of a given industry are compared, the
reference point would be the average firm, if various industries of a given country are
compared, it would be the average industry, and so on. As we are comparing here the
innovation performance in seven European countries, our choice for base of comparison
will simply be the hypothetical “average Europe”, where each of these countries is given
equal weight. 5
5 Our application of the innovation accounting framework bears a close resemblance to the interspatial
multilateral productivity comparisons introduced by Caves, Christensen and Diewert (1982). They

12
In both types of analysis, the major challenge is to account for as many
explanatory factors as possible within the limits of available information. In our case, we
are strictly limited to the CIS1 micro-aggregated dataset. In addition to the usual R&D
intensity variable, we are able to consider a few other explanatory variables measuring or
proxying for firm organizational characteristics or external conditions propitious to
innovation activities. The econometric specification of the innovation model and its
estimation are thus largely conditioned by the availability and nature of the data. We now
turn to a presentation of the innovation model as we could specify it and estimate it on
the basis of the CIS1 data.
3. THE INNOVATION MODEL: ECONOMETRIC SPECIFICATION AND
ESTIMATION
The CIS questionnaires, like other innovation surveys, are set up in a way that gives rise
to censoring or selection problems. First, firms are asked some general questions on their
identity, such as their total sales, their number of employees, their industry affiliation,
and whether they belong to a group of firms. Then, they have to answer a few central
filtering questions to determine whether or not they are “innovating” firms. Innovating
firms are those answering that in the last three years (i.e., 1990-1992 for CIS1) they have
developed new or changed products, or new or changed processes, or that they intend to
recommend the use of a transitive multilateral productivity index (based on an approximation to a general
production function), treating all countries symmetrically by comparing them to a hypothetical country,
which takes arithmetic average values for all variables entering the productivity formula (or geometric
averages if these variables are expressed in logarithms).

13
do so in the near future.6 Only innovating firms have to fill out the full questionnaire,
while non–innovating firms are only asked about their perception of the degree of
importance of various obstacles hampering innovation. CIS surveys thus basically
provide rich information for firms which are innovating but little for firms which are not.
If we limited ourselves to use the information available for all firms, we could at best
account for their "propensity to innovate", but we would fail to exploit most of the
information we have on innovating firms, in particular regarding their innovation output
and more precisely their innovative sales. Therefore, we chose to specify an econometric
model which exploits the data of all firms, innovating or not, and which also accounts for
firms’ innovation output or “intensity of innovation”. The estimated model can then be
used to compute expected innovation intensity, controlling for a set of “exogenous”
variables, and our indicator of innovativity, defined as the residual difference between
observed and expected innovation intensity.7
More precisely, we adopt a generalized (Type 2) Tobit model consisting of two
equations, where the first one is a probit equation determining whether a firm innovates
6 This is the actual definition of innovating firms in CIS1. In CIS2 and CIS3 firms declaring that during the
last three years they have not yet completed or that they have abandoned innovation activities are also
considered as “innovating” firms.
7 Porter and Stern (1999) do a similar type of analysis, as we do here, although they do not cast it in terms
of an accounting framework for innovation. They define an expected innovation intensity index in terms of
expected international patents per head conditional on resource, environment and demand conditions. They
compute their index by estimating a regression on a panel of 17 OECD countries over a 21-year period.
While their measure is based directly on aggregated country data, ours is based on micro-data, and we
therefore need to model the propensity to innovate as well as the intensity of innovation.
Deleted: allows to
Deleted: P

14
or not, and the second one is a linear regression (or Tobit equation) explaining how much
the firm innovates (see for example Amemiya, 1985, Greene, 2003, or Wooldridge,
2002). We assume that there is a latent variable *1iy for firm i that is generated by the first
equation
*1 1 1 1i i iy x b u= + (1)
where 1ix is a vector of explanatory variables, 1b is a vector of parameters to be estimated,
and 1iu is a random error term, which includes the effect of left-out variables omitted due
to the lack of appropriate data and our limited knowledge of the innovative process. This
equation is interpreted as saying that if *1iy is positive, incentives to innovate are large
enough for the firm to actually innovate. Denoting by 1iy the binary variable indicating
that firm i is an innovating firm, we can thus write:
1
*1*1
1 if 00 if 0
⎧⎪⎨⎪⎩
= >= ≤
=iii
yy
y (1’)
As explanatory variables 1ix we can use industry dummies, firm size and group
membership. Industry dummies capture technological opportunity conditions (i.e. it is
easier to innovate in certain fields than in others), industry-targeted innovation policies,
an industry-specific differential demand growth effect (for instance, demand is growing
for electronic products but declining for textile products), or structural effects like the
intensity of competition. Size, measured by the number of employees, reflects access to
finance, scale economies, and differences in the organization of work. Firms that are part
of a group (i.e. controlled by another firm) are expected to benefit from intra-group
Formatted: Font: Italic
Deleted: More precisely, w
Deleted: first
Deleted: i

15
knowledge spillovers, internal access to finance, or various other synergies (in marketing,
distribution, etc), and therefore to be more innovative.
Three other variables are in principle available in CIS1 micro-aggregated data for
all firms irrespective of whether or not they are innovators. Past growth can be a
determining factor of innovation, as reflecting both a stronger demand and an easier
access to internal and external finance (see Brouwer and Kleinknecht, 1999).
Unfortunately, the growth rate in firm sales (in the three year period 1990-92) is missing
for Norway and Germany, and hence we could not actually use it to control for past
growth in a common model for all the seven countries considered. We could also have
considered the proportion of exports in total sales as an indicator of external competition
stimulating innovation. However, it would be a very unsatisfactory indicator, since it is
not likely to be exogenous. Exports can be driven by innovation, as new products open
up new markets abroad, and both innovative sales and export intensity can also result
from past innovative efforts. A third variable available with observations for both
innovating and non-innovating firms is the degree of importance of the obstacles to
innovation. Although this should be a priori a very important factor in explaining why
firms will not innovate, various authors have found that the obstacles to innovation are
more strongly perceived when firms actually innovate and face those obstacles than when
they do not innovate and hence do not encounter them (Baldwin and Lin, 2001, Mohnen
and Rosa, 2002). Hence, this variable cannot be taken as exogenous to being innovative
(actually it can be negatively correlated with being innovative), and we prefer not to
include it in the model.

16
In the CIS surveys firms’ innovation intensity can be measured by the share of
innovative sales in total sales and thus their innovation output level by the magnitude of
innovative sales (measured as the share of innovative sales multiplied by total sales). It is
also possible to distinguish between innovative sales corresponding to products new to
the firm but possibly known to the market, which can be considered as imitations of
products already produced by other firms in the industry, and those corresponding to
products only new to the market, which can be regarded as true innovations (see, for
example, Brouwer and Kleinknecht, 1996). In the analysis here we preferred to simply
focus on the overall measure.8 The second equation of our generalized Tobit model is
thus specified in terms of a second latent variable *2iy , which is equal to the actual share
of innovative sales 2iy , if the firm is innovative (i.e. *1 0iy > ). Since the share of
innovative sales is bounded by 0 and 1 (i.e., 0 < y2i ≤ 1), it is actually preferable to
specify this second equation in terms of the latent logit-share variable
* * *2 2 2ln( /(1 ))i i iz y y= − which can vary from -∞ to +∞. Because the resulting variable is
closer to normally distributed, the maximum likelihood estimator is then more likely to
be consistent for the underlying parameters. We have
*2
* *2 2(1 )/i
i iy e ez z= +
Similarly, if 2 2 2ln( /(1 ))i i iz y y= − is the observed logit share variable, then
8 The information on shares of innovative sales for products new to the market is not available for all seven
countries. There is also a breakdown of sales with respect to various stages of the product life-cycle, but
we have not tried to exploit this information.
Formatted: Font: Italic
Formatted: Font: Italic, Subscript
Formatted: Font: Italic
Formatted: Font: Not Bold, Italic
Formatted: Font: 12 pt
Formatted: Indent: First line: 0"
Deleted: 20 1iy< ≤
Deleted: to− +∞ ∞
Deleted: , a
Deleted: nd s

17
22 2(1 )/i
i iy e ez z= + .9
The second equation of the generalized Tobit model is thus the following:
*2 2 2 2i i iz x b u= + (2)
where 2 0ix > is a vector of explanatory variables, 2b is a vector of parameters to be
estimated and 2 0iu > is a stochastic error term reflecting omitted variables and other
sources of heterogeneity. Note that because of the logit share transformation of equation
(2), 2iu varies from -∞ to +∞. We can therefore write:
*2
2
*1
*1
if 0 if 0
⎧⎪= ⎨⎪⎩
= >= ≤
ii
ii
z yundefined y
z (2’)
or equivalently:
2
* * *2 21*1
/(1 ) if 00 if 0
⎧⎪⎨⎪⎩
= + >= ≤
=i
z zi iii
e e yy
y (2’’)
Although it would be helpful for identification, we cannot exclude any of the
explanatory variables we have in x1i from x2i a priori. However, since for innovating
firms we have information on more variables, we can include in x2i six other variables
9 Note that the logit share variable 2iz is not defined for the two bounds 0 and 1 of the share of innovative
sales 2iy . In practice, we deal with the upper bound of 1 by simply setting the value of 2iy to 0.99
whenever it is higher (and less or equal to 1). By symmetry, although 2iz can remain undefined in our
Tobit model for the bound of zero, we also set the 2iy to be 0.01 whenever it is smaller and positive. See
for example Cragg (1971) for a rigorous treatment of a Tobit model with both a lower and an upper
bounded dependent variable.
Formatted: Font: Not Bold, Italic
Formatted: Font: Italic
Formatted: Font: Italic, Subscript
Formatted: Font: Not Bold
Formatted: Font: Not Bold, Italic
Formatted: Font: Not Bold, Italic,Subscript
Formatted: Font: Not Bold
Formatted: Font: Not Bold, Italic
Deleted:
Deleted: to− +∞ ∞Deleted: us
Deleted: a priori from the explanatory
variables in 2ix
Deleted: ose
Deleted: 1ix
Deleted: S
Deleted: however
Deleted: 2ix

18
which are relevant for explaining innovation intensity: four relating to R&D (assumed to
be the main innovation input) and two binary indicators characterizing the environment
in which the firm operates - one for the strength of competition and the other for
proximity to basic research. Competition is deemed to be strong (the indicator is 1) when
firms declare that increasing or maintaining market share is an important objective of
innovation for them, and weak if it is not (the indicator is 0). Similarly, proximity to
basic research is significant when firms answer that universities/higher education or
government laboratories are significant sources of information for innovation.10 The four
R&D-related variables are a binary indicator for R&D-performing firms, the R&D/sales
ratio for R&D performing firms, a binary indicator for doing R&D on a continuous basis,
and one indicating whether R&D is done in cooperation with partners or not.11
Following the standard procedure we estimate our generalized Tobit model by
maximum likelihood, assuming that 1iu and 2iu are independently and identically jointly
10 Firms have to provide answers on their innovation objectives and sources of information using a five-
point Likert scale, and the cut-off values we chose to define our dichotomous indicators correspond
roughly to the sample median responses.
11 Another potentially interesting innovation input variable contained in CIS 1 corresponds to the notion of
innovation expenditures, including R&D but also the expenditures on acquisition of patents and licenses,
product design, trial production, training and tooling-up, and market analysis. Unfortunately either this
variable was misunderstood by the respondents or firms were not used to keeping account of those
expenditures. In many cases, for example, this variable took values lower than the R&D expenditures,
declared elsewhere, that it is supposed to include. For these reasons we excluded this variable from the
analysis. We have also decided not to include in the explanatory variables the perceived strength of
Deleted: considered as

19
distributed as a bivariate normal distribution with mean zero and contemporaneous
variance-covariance matrix
21 12
212 2
σ σσ σ⎡ ⎤
Σ = ⎢ ⎥⎣ ⎦
.
Because 1σ cannot be identified, it is normalized to be equal to 1, and 212 ρσσ = where
ρ is the contemporaneous correlation coefficient between the two error terms. The log-
likelihood function of our sample is the following:
1 1 2 2 2 21 1 2
0 1
2 2 2 2 21
/ ( )ln ln[1 ( )] ln1
ln{(1/ ) [(ln( ) ) / ]}
i i ii
i i
x b z x bL x b
z x b
ρ σ
ρ
σ ϕ σ
⎛ ⎞+ −⎜ ⎟= −Φ + Φ⎜ ⎟−⎝ ⎠
+ −
∑ ∑
∑ (3)
with the index 0 and the index 1 under the summation signs referring respectively to non-
innovating and innovating firms (i.e., y1i = 0 and y2i = 1), and Φ and ϕ being
respectively the standard normal univariate distribution and density functions.12
We estimate the model on the pooled data of the seven countries, accounting for
country-specific and industry-specific effects by way of country and industry dummy
appropriability of product or process innovations, because of the particular difficulty of assuming that it
enters exogenously in the model (likewise the perceived obstacles to innovation variable).
12 The first term of the likelihood function (3) defined over the non-innovating firms is the same as the
corresponding term in the likelihood function for the probit equation, while, when ρ=0, the second term
defined over the innovating firm becomes also the same as the corresponding term in the likelihood
function for the probit equation. The third term is the likelihood function for the linear regression over the
innovating firms. To ensure that the estimated 2σ is positive, it is replaced by )exp(ω in the likelihood
Formatted: Indent: First line: 0"
Formatted: Font: 12 pt
Formatted: Font: 12 pt, Italic
Formatted: Font: 12 pt, Italic,Subscript
Formatted: Font: 12 pt, Italic
Formatted: Font: 12 pt, Italic
Formatted: Font: 12 pt
Formatted: Font: 12 pt, Italic
Formatted: Font: 12 pt, Italic,Subscript
Formatted: Font: 12 pt, Italic
Formatted: Font: 12 pt, Italic
Deleted: =Σ [
Deleted: ].
Deleted: Sinc
Deleted:
Deleted:
1 10 and 1i iy y= =

20
variables. We thus assume a common structure that applies to all countries and that can
later be used to compare innovation performance across countries. We also put all seven
countries on an equal footing, irrespective of the size of their respective samples, by
weighting appropriately the variables pertaining to each country (that is by the square
root of NE/NC where NC is the number of firms in country C and NE is the average
number of firms per country, say in our hypothetical “average Europe”).13 Imposing a
common model structure and giving equal weight to the seven countries means that the
estimated coefficients 1b and 2b in the innovation propensity and intensity equations (and
the corresponding marginal effects) are to be viewed as “average Europe” coefficients. It
means also that our indicator of innovativity is to be interpreted as measuring not only
the effects of the unobserved factors of innovation, but possibly also differences across
countries in the model structure and estimated coefficients.14
function, and to ensure that the estimated ρ stays between -1 and 1, it is replaced by
).1)2/(exp()1)2(exp( +− νν Initial estimates are obtained from Heckman's two-step estimation.
13 We chose to give equal weight to each country. Another option, however, would have been to take as
reference a representative “average Europe”, by using grossing-up factors to “blow up” the country
samples to the entire country populations. Note that this option raises a number of practical problems. Even
if one would use the weighting factors for each stratum of firms (defined by size and industry) provided by
Eurostat, it would imply that non-responding units behave in the same way as the responding units. As a
rule of thumb, such an assumption seems unlikely when the percentage of non-responses exceeds 25% (see
Archibugi et al., 1994), and none of our seven countries satisfies this condition.
14 Estimating different models for each country would make it possible in principle to take apart these two
components, by allowing us to account separately for differences in expected innovation intensity arising
from differences in the model structure across countries and those arising from the differences in average
Deleted: preferred
Deleted: a priori

21
However, in estimating our generalized Tobit model, we found that the log-
likelihood function always increased with the value of the correlation coefficient ρ
between the error terms in both equations, raising convergence problems in maximizing
the likelihood function. Various experiments with somewhat different specifications of
the model led to the same conclusion. A value of ρ close to one suggests that the error
terms in both equations are nearly collinear and that common unobserved factors of
innovation are omitted in both parts of the model.15 We therefore ended up fixing the
value of ρ to 0.95, the estimated coefficients of the model not being too sensitive to the
exact value of ρ around 0.90-0.99. It is clear, however, that we have an identification
problem, most likely due to the poor specification of the first equation (the probit
equation) as a result of the lack of variables that could predict when firms are
innovators.16 We intend to investigate further this issue in future work in which the CIS
magnitudes of explanatory variables across countries (for a common model structure). In the present
illustrative analysis, we did not pursue this possibility, many of the parameters of our model being poorly
estimated at the country level (and hence not significantly different across countries).
15 We were of course expecting a priori a high positive value of ρ, if only because of the omission of
unobserved factors of innovation in the probit and Tobit equations, such as the quality of management and
the environment of the firm. Estimating a simple Tobit model, which in a sense corresponds to a limiting
case of ρ=1 is unsatisfactory. In particular we would be restricted to two explanatory variables, those
entering equation (1) of the generalized Tobit model (apart from the industry and country dummies).
16 As our model stands, the identification of the probit and Tobit equations is based on the functional
assumption of joint normality of 1iu and 2iu . We would have preferred to base identification on exclusion
restrictions, that is, on the exclusion in the Tobit equation (in 2ix ) of variables belonging to the probit
equation (in 1ix ). See for example Puhani, 2000.
Deleted: for
Deleted: better explaining
Deleted: why
Deleted: e
Deleted: t
Deleted: Preferably, w
Deleted: liked it to be based
Deleted: t

22
surveys could be matched to complementary sources of data. Nonetheless we think that,
at least for our mainly illustrative purpose here, the compromise we finally adopted is
satisfactory.
4. COUNTRY SAMPLES AND SIMPLE DESCRIPTIVE STATISTICS
As usual when working with firm level data, in order to construct country samples that
we could use in our analysis, we had first to clean the CIS1 micro-aggregated raw data
for outliers, missing observations, and inconsistencies. We thus eliminated all firms with
less than 20 employees, because these firms were not surveyed in four of our seven
countries. We also deleted firms with missing industry affiliation and restricted our
samples to manufacturing industries, since only two countries (Germany and the
Netherlands) had collected data on services. We also purged from our samples all firms
with sales growth rates between 1990 and 1992 higher than 250% and lower than -40%,
R&D/sales ratios higher than 50%, current expenditures on innovations higher than 100%
of their sales. We set R&D/sales ratios to zero when they were positive but lower than
0.1%. As the Italian sample resulted from a census and not a survey, the Italian sample
was ten times greater than the second largest country sample, Germany. We therefore
took (after cleaning) a random subsample for Italy consistent with the sampling frame
adopted by the other countries, by keeping 5% of all firms with 20 to 49 employees, 10%
of all firms between 50 and 249 employees, and all firms with more than 250 employees.
In the end we were left with 8146 observations overall: 542 in Belgium, 572 in Denmark,

23
1910 in Germany, 715 in Ireland, 2254 in Italy, 1678 in the Netherlands, and 475 in
Norway.
We distinguished eleven industries in total manufacturing, whose definition,
abbreviated names and related NACE codes are listed in Appendix B. In defining these
industries we made sure that we had enough observations per industry in each country,
starting from the industry aggregate classification used by Eurostat (1997) in presenting
the descriptive statistics of the CIS 1 survey, and aggregating it further when needed. In
our analysis, we considered separately the high-R&D industries (Vehicles, Chemicals,
Machinery and Electrical) and the low-R&D industries, or high-tech and low-tech
industries, based on previous econometric evidence of important differences between
them (see for example Griliches and Mairesse, 1984).
We have defined innovating firms in a somewhat more restrictive way than in the
CIS1 surveys, where they are all the firms that answer yes to any of the questions “Have
you introduced a new or technologically changed product during 1990-1992?”, “Have
you introduced a new or technologically changed process during 1990-1992?”, “Do you
intend to innovate in the next three years?”. Nearly 10% of the firms, however, declaring
that they have introduced new or changed products do not answer the questions on the
shares of innovative sales for incrementally changed, significantly changed or newly
introduced products, or they report zero shares. One explanation is that they do not know
the answer to the question or that there can be a significant time lag between the
introduction of a new product on the market and the realization of non negligible sales
from this new product. As we have only cross-sectional data, we have decided to be more
restrictive in the definition of an innovating firm by characterizing it as one that declares
Deleted: have preferred to
Deleted: which

24
a non-zero share of innovative sales for incrementally changed, significantly changed or
newly introduced products in the three years 1990-1992.17 Finally, about 4% of the firms
report that their sales are entirely due to new or improved products. Since the logit-share
transformation is not defined in this case, we have simply assumed that the share of
innovative sales is at most 0.99. By symmetry, for the handful of firms for which the
share of innovative sales was positive but less than 0.01, we set it to be at least equal to
0.01.
Table 1 gives the means of all the variables used in our analysis for our seven
country samples, separately for the high-tech and low-tech sectors. Table 1 gives also
these means for our hypothetical average Europe, which serves as our reference country,
where these means are simply computed as the arithmetic average of the corresponding
seven country means (thus giving equal weight to each country). About 35-40% of the
firms in the country samples belong to the high-tech sectors, with the exception of
Germany where this proportion is as high as 55%. Overall, firms in the high-tech sectors
differ from those in the low-tech sectors in many respects. They are larger and therefore
account for a relatively greater fraction of total employment. They are more often part of
a group; they have a higher percentage of innovators (73.8% as opposed to 55.8%); they
17 Alternatively, we could have treated as zero responses all the non-responses on the share in sales of
innovative products by firms that declare to be innovators, and we could have replaced all these zero shares
by a 0.01 share because of our logit-share transformation. Some experiments led us to conclude that this
alternative treatment would have little bearing on the results. Note that the distinction between non-
responses and zero responses is not reliable both because it is unlikely that firms themselves always make
such distinction, and because it seemed that the coding and subsequent micro-aggregation of CIS1 data
could also not be trusted in making this distinction consistently across countries.

25
feel more pressure from competition (69.7% as opposed to 53.1%) and are more closely
connected with basic research (58.1% as opposed to 41.1%). Firms in high-tech sectors,
when they innovate, have on average a higher share of innovative sales (46.8% against
38.9%); they perform R&D more frequently (90.2% against 77.7%) and more intensively
(with an R&D to sales ratio of 4.4% against 2.0%).When they do R&D, they do it more
often in a continuous fashion (81.9% against 72.2%) and in cooperation with others
(81.9% against 42.5%). The simple dichotomy between “high-tech” and “low-tech” firms
in the analysis thus controls for quite a number of systematic differences.
Across the country samples, there are also a number of important differences. The
size distribution is more skewed towards large firms in Belgium and Germany than in the
other countries, especially in the high-tech sectors. Ireland on average has the smallest
firms. Germany has the highest frequency of innovating firms and the highest share of
innovative sales in both the high- and low-tech sectors. The lowest percentages of
innovating firms are in Italy and Norway. Norwegian innovating firms, however, have
almost the same share of innovative sales (48.2%) in the high tech sectors as the country
leader Germany. Doing R&D continuously is most common in Belgium and Italy and
least frequent in Denmark, whereas cooperative R&D is often encountered in Denmark
and Norway, but only rarely in Italy. Pressure of competition and proximity to basic
research are strong in Belgium and Germany and weak in Italy and Norway.
5. ESTIMATION RESULTS: COEFFICIENTS AND MARGINAL EFFECTS
Our estimation results are presented in details in Tables 2 and 3. Table 2 shows the
pooled estimates of the coefficients of the generalized Tobit model, estimated separately

26
for firms in the high-tech and low-tech sectors, and controlling for unexplained industry
and country heterogeneity by introducing industry and country dummies in each of the
two equations of the model. Size is measured by the logarithm of the number of
employees in deviation from the size of the average European firm and the R&D/sales
ratio is also defined in deviation from the corresponding ratio of the average European
country. The reference group is the food industry for the low-tech sectors or the motor
vehicles industry for the high-tech sectors, in Denmark, with no R&D, not belonging to a
group, experiencing little competition and not benefiting much from basic research.18
Most estimated coefficients are statistically significantly different from zero,
although there are not too precisely estimated. Many of them are also markedly different
from each other in the high- and low-tech sectors, even if not statistically so (at the
conventional level of significance of 5%). We find an estimated coefficient of R&D in
the low-tech sectors that is twice as high as that in the high-tech sectors, although R&D-
doing firms in these sectors innovate much less in average than those in high-tech
sectors. Low-tech firms also appear to benefit less from size, from being close to basic
research, from the pressure of competition, and from cooperation in R&D. In contrast,
they are more likely to innovate if they are part of a group.
18 In Germany we have many instances of missing values for the variable “belonging to a group”. Small
firms had a separate questionnaire to fill out in which this question was not listed. Instead of considering
these firms as not belonging to a group, we have introduced a separate dummy variable to control for these
missing values. We have also introduced other dummy variables to control for missing R&D values for a
number of firms in the quantitative part of the model, instead of considering these firms as non-R&D
performers or dropping them from our samples. The coefficients of these missing values control dummies
are not reported in Table 2.
Deleted: twice higher
Deleted: their counterparts

27
For a better assessment of the estimated coefficients, we proceed in Table 3 to an
analysis of the marginal effects of each variable (the equivalent of the slope in a linear
regression). We distinguish three types of marginal effects of our predictor variables,
those on the expected propensity to innovate, those on the expected intensity of
innovation unconditional on being innovative and those on the expected intensity of
innovation conditional on being innovative. These quantities are given by the following
three equations:
)()|(),( 1111211 bxxyExxyE iiiiii Φ== (4)
1 12 1 2 2 1 2 1 2 2 1 2 1 2( | , ) ( , ) ( , )
ii i i i i i i i i i i i ix b
E y x x y f u u du du y f u u du du∞ ∞ ∞ ∞
−∞ −∞ − −∞= =∫ ∫ ∫ ∫ (5)
[ ]
1 12 1 2 1 2 1 2 1 1 1 1 2
2 1 2 1 2 1 2 1 1
( | , , 1) ( , | )
or ( | , , 1) ( | , ) / ( )
ii i i i i i i i i i ix b
i i i i i i i i
E y x x y y f u u u x b du du
E y x x y E y x x x b
∞ ∞
− −∞= = > −
= = Φ
∫ ∫ (6)
We evaluate all three expected functions at the estimated values of the model
coefficients (b1, b2, ρ and σ2).19 We compute the corresponding marginal effects at the
mean values of the explanatory variables, respectively for all the firms in the case of
19 We have directly computed the unconditional expected intensity of innovation by the following formula
1 1
* * * * * *2 1 2 2 2 2 2 2 2 2 2 1 2 1 2[ | , ] exp( ) /(1 exp( )) ( , )
ii i i i i i i i i i ix b
E y x x x b u x b u f u u du duσ σ∞ ∞
− −∞= + + +∫ ∫
where 22*2 /σii uu = , ii uu 1
*1 = and ),( *
2*1 ii uuf is the bivariate standard normal distribution with
correlation coefficient ρ. We compute these integrals using a Gauss-Legendre quadrature with Gauss
software. Note that if we had not preferred to make the logit-share transformation, we could have more
simply written 1 1
2 1 2 2 2 2 1 2 1 2[ | , ] ( ) ( , )i
i i i i i i i i ix bE y x x x b u f u u du du
∞ ∞
− −∞= +∫ ∫ , which can easily be expressed
as 2 1 2 1 1 2 2 2 1 1[ | , ] ( )( ) ( )i i i i i iE y x x x b x b x bρσ ϕ= Φ + , that is the Heckman’s formula (see Greene, 2003).
Deleted: respectively derived from
Deleted: T
Deleted: expected function
Deleted: respectively

28
)|( 11 ii xyE and ),|( 212 iii xxyE and the innovating firms only in the case of
2 1 2 1( | , , 0)i i i iE y x x y ≥ .20 For the continuous variables, size and R&D intensity, we take
the derivatives of the expected functions with respect to those two variables. For the
binary indicators, other than industry and country dummies, we calculate the marginal
effects as the differences in the values of the expected functions when the indicator goes
from 0 to 1. We express the marginal country effects as the differences between the
values of the expected functions when having the country-specific dummy and the
average of the country dummy coefficients for the seven countries, and we similarly
define the marginal industry effects as the differences between having the industry-
specific dummy coefficient and the average of the industry dummy coefficients weighted
by the average industry composition in the seven countries. The country and industry
effects are thus interpreted as deviations from the average country and average industry
effects (see Suits, 1984).21
The two first columns of Table 3 show that a 1% increase in size for the average
European firm in the high-tech sectors (corresponding roughly to 6 additional employees)
and in the low -R&D sectors (corresponding roughly to only 3 additional employees)
would increase the probability of innovating by about 9% (from 73.8% to 82.6%, and
from 55.8% to 73.8% respectively). They also show that a firm belonging to a group has
20 Note that, if the expected functions were linear, the marginal effects would be constant (and that they
would not depend on the values the variables at which we compute them).
21 Note that if the expected functions were linear, the sums of country effects and that of the industry
effects weighted by the average industry compositions would both be zero (and that any deviation from
zero in the sum of these effects is thus due to the nonlinearity).

29
on average a higher probability of innovating than one which does not (by about 5% in
the high-tech sectors and 10% in the low-tech sectors respectively). It appears that
German firms are more often innovative than the average European firm (by about 10%
in the high-tech sectors and 17% in the low-tech sectors). So are the Irish and Dutch
firms, and the Belgian firms in the low-tech sectors. By contrast, for reasons to be
investigated (other than average industry composition, the average size or being part a
group), far fewer firms are innovative in Italy (by 17.3% in the high-tech sectors and
35.7% in the low-tech sectors). The frequency of innovation is higher in the industries
producing machinery and equipment and electrical and electronic products than in those
producing vehicles and chemicals. Among the low-tech sectors, the proportion of
innovators is particularly low in the wood-based and textile-producing industries.
Turning to the marginal effects of the explanatory variables on the expected
intensity of innovation for firms that already innovate (given in the third and fourth
columns of Table 3), we see that a 1% increase in size raises the share of innovative sales
by 4.4 % (from 46.8% to 51.2%) for the average European innovating firm in the high-
tech sectors and by 1.7% (from 38.9% to 40.6%) in the low-tech sectors.22 Being part of a
group increases the share of innovative sales by 4.4% and by 2.9% for the innovating
firms in the high-tech and low-tech sectors respectively, while a 10% higher level in the
R&D/sales ratio corresponds to a 3% higher share in both sectors. The effects of
22 Note that there is a constant ratio between the marginal effects on innovation intensity for innovating
firms and the slope parameters of the “Tobit” part of the model. This ratio is given by the Jacobian of the
transformation from 2iy to 2iz , which is 2 21/( (1 ))i iy y− .
Deleted: i
Deleted: much

30
competition and proximity to basic research are quite sizeable in the high-tech sectors,
much less in the low-tech sectors.
If we do not limit ourselves to the innovating firms, the marginal effects
encompass the combined effects on the propensity to innovate and on the intensity of
innovation when firms innovate. These marginal effects (given in the fifth and sixth
columns of Table 3) tend to be smaller than the corresponding conditional effects.
However, the joint effects of size and group, those of doing R&D and doing it
continuously and in cooperation, and those of perceived competition and proximity to
basic research remain very substantial in the high-tech sectors, and to a large extent in the
low-tech sectors as well. It is interesting to observe that the marginal effect of the R&D
to sales ratio variable (computed at the average European ratio in both sectors) is about
50% higher in the low-tech sectors than in the high-tech sectors.
6. ACCOUNTING FOR INNOVATION: AN ILLUSTRATION
We can now move to the illustration of our accounting for innovation framework and the
measurement of innovativity. In Table 4, we thus provide, separately for the high-tech
and low-tech sectors, a decomposition of the innovation performances for each of the
seven countries in terms of “structural effects” (the effects of the main predictors of
innovation that we considered) and of innovativity, respectively for the propensity to
innovate (panel A), the innovation intensity for the innovating firms (panel B), and
innovation intensity unconditional on being innovative (panel C). As it is set up, Table 4
allows for a comprehensive comparison of the innovation performance of any given
country relative to the average European country, and hence for any bilateral or
Deleted: factors
Deleted: have been able to

31
multilateral comparison between any two or more of the seven countries. A detailed
explanation of how this table is constructed, based on our estimated model, is given in
Appendix A.
The different structural effects and innovativity are all expressed in the three
panels of Table 4 in terms of deviations from the average European country. We thus
start for each country (in the first column) from the common average European values for
the innovation propensity and conditional and unconditional innovation intensity
indicators. We show next (in the following columns) the estimated structural effects
grouped in four categories: industry composition, size and belonging to a group, the four
R&D variables (R&D intensity and the indicators for doing R&D, continuous R&D and
cooperative R&D), and the two environment indicators (perceived competition and
proximity to basic research).23 We then have (in the following two columns) the sum of
structural effects and the expected innovation propensity and intensity indicators, which
are themselves computed by adding the structural effects to the corresponding average
European indicators (in the first column).24 Finally we find for each country (in the last
two columns) the estimated innovativity and the observed innovation propensity and
23 We have only the two first groups of structural effects for the innovation propensity in panel A. We have
added the dummy variable for missing values on the variable belonging to a group to the German country
effect (as it affects German firms only), and have regrouped the dummy variable for missing values on
R&D with the four R&D variables.
24 Note that the expected marginal effects so computed are the ones we directly estimate for each country
from equations (4), (5) and (6), but up to an approximation error due to the linearization of the effects
around the average European country (see Appendix A).

32
intensities, where innovativity is obtained as the difference between the observed and
expected values.25
In general, our framework accounts for relatively little of the inter-country
differences in innovation performance in terms of structural effects and attributes them
mainly to differences in innovativity. This is true for most countries and for all three
innovation indicators in the low-tech sectors. This is not the case, though, for a majority
of countries in the high-tech sectors where the sum of structural effects is higher than the
innovativity. Let us consider for example the bilateral comparison between the two most
dissimilar countries Germany and Italy, which appear respectively as the most and the
least innovative of the seven countries, both in the low- and high-tech sectors and for the
three innovation indicators. In the high tech-sectors, the structural effects account for
about one-third of the total inter-country differences for the unconditional and
conditional innovation intensities (respectively 5.5% out of 18.2%, and 3.8% out of
10.2%), but for none of the difference (23.0%) in the innovation propensity. In the low-
tech sectors, the structural effects account only between 5 to 10 percent of the large inter-
country differences (respectively 27.3%, 15.4% and 45.4%) in the three innovation
indicators. Of the total difference of 5.5% (3.8%) accounted for by the structural effects
in the high-tech sectors for unconditional innovation intensity (conditional innovation
intensity) 3.3%, 1.8% and 0.9% (2.0%, 0.8% and 1.2%) are respectively imputed to
25 Note that we have not treated the country effect as an explanatory variable, but assumed that it
constitutes the main component of average innovativity, the two other components of innovativity, as we
compute it here, being the two approximation errors due to the intrinsic non linearity of the expected
marginal effects and to the linearization around the average European country (see Appendix A).
Deleted:
Deleted: do not regard
Deleted: part

33
relatively favorable differences in the environment conditions, R&D activities and
industry compositions, while only minus 0.5% (-0.1%) relates to unfavorable size and
group membership effects.
If we take as another example the comparison of Denmark and the Netherlands,
which are on the contrary very close to each other and to the average European country in
terms of innovative performance, our results give, at least at first sight, a different
picture. In the high-tech sectors, very little of the (rather small) differences between the
two countries in their unconditional and conditional innovation intensity indicators is
related to innovativity (about -0.5%), while practically all is accounted for by the
structural effects (about 4%), mainly so by the industry composition effects (about 2.0%)
and the R&D effects (about 1.5%). The situation is the same in the low-tech sectors for
unconditional innovation intensity, with innovativity being small (-0.3%) and the
structural effects accounting fully for the small difference (1.8%) between the two
countries. It is different for the innovation propensity in both the high- and low- tech-
sectors in the sense that innovativity and the sum of structural effects are of the same
order magnitude but of opposite sign in accounting for the overall small differences
(0.8% and -1.8%) between the two countries. The divergence between the Germany-Italy
and the Denmark-Netherlands pair-wise comparisons thus really concerns our estimates
of innovativity, which are very large in the first case but small or negligible in the second
but not of the structural effects which are more or less on the same order of magnitude.
7. CONCLUSION

34
We propose in this paper an accounting for innovation framework and illustrate it
by an application based on the data from the first European Community Innovation
Survey, for the year 1992 and the R&D-intensive manufacturing industries in seven
European countries. In this application, we measure innovation intensity by the share of
innovative sales, but our framework can also be applied to other sources of data and other
measures of innovation. Trying to make the best use of the qualitative and quantitative
information available in the survey, we select a certain number of explanatory variables
for the propensity to innovate and the intensity of innovation, and we specify and
estimate an innovation function as a generalized Tobit model. Based on this model, we
compute the expected share of innovative sales and define innovativity as the part of the
observed share of innovative sales that remains unexplained and corresponds to the
notion of total factor productivity, or simply productivity, in the standard growth
accounting framework and production function analysis. As it stands with relatively few
explanatory variables our innovation framework already accounts for sizeable differences
in country innovation intensity, more so in the high-tech than in the low-tech sectors. It
also shows, however, that differences in country innovativity can be even more sizeable.
Given some of the limitations of our attempt, in particular that related to using
only the data from the first round of the European Community Innovation Survey, these
initial results should be merely taken as illustrative. We hope they will suffice to indicate
the potential interest and advantages of explicitly implementing an accounting for
innovation framework, when comparing innovation performances between countries (as
here), or between industries, or firms, and in terms of absolute levels in a given period (as
here) or changes over given periods. These advantages should be similar to those of the

35
standard growth accounting framework, in spite of the fact that in both cases many
conventional decisions have to be made and many variants may be considered in setting
up an appropriate framework. To make progress in future work, besides gaining
experience in using innovation surveys and improving them, it will be important to be
able to match the specific information they provide with the usual current accounts,
balance sheets and stock market data, as well as with complementary data from other
sources such as on patents and R&D. In view of the fundamental role of research and
innovation activities in our increasingly knowledge-based economies, it will also be of
interest to make attempts to combine innovation and production accounting frameworks
in some systematic way, and thus contribute to the development of productivity analysis
in relation to R&D and innovation.
ACKNOWLEDGEMENTS:
We have benefited from useful comments by Elena Bontempi, Christian Debresson,
Dominique Guellec, Emmanuel Duguet, Nathalie Greenan and Petr Hanel. We thank
particularly Bronwyn Hall for helpful suggestions and a careful rereading of a (nearly)
final version of the study. We are grateful to Eurostat for providing, and giving us
permission to use, the micro-aggregated CIS 1 data. We also acknowledge research
assistance of Julio Rosa and financial support by Industry Canada, OECD, SSHRC and
CNRS. A summary account of some of the results of this study can be found in Mairesse

36
and Mohnen (2001, 2002); note that what we called innovativeness in these two papers,
we choose to name here more simply “innovativity”.

37
REFERENCES
Arora, A., Ceccagnoli M. and W.P. Cohen (2003) R&D and the Patent Premium.
Cambridge, MA: NBER Working Paper 9431.
Aghion, P. and P. Howitt (1998) Endogenous Growth Theory. Cambridge, MA: MIT
Press.
Amemiya, T. (1985) Advanced Econometrics, Cambridge, MA: Harvard University
Press.
Archibugi, D., P. Cohendet, A. Kristensen, and K.-A. Schäffer (1994) Evaluation of the
Community Innovation Survey (CIS) Phase I. EIMS publication no. 11, IKE Group,
Department of Business Studies, Aalborg, Denmark.
Baldwin, J.R. and G. Gellatly (2001) A Firm-Based Approach to Industry Classification:
Identifying the Knowledge-Based Economy. In L.-A. Lefebvre, E. Lefebvre and P.
Mohnen (eds.), Doing Business in a Knowledge-Based Economy: Facts and Policy
Challenges, Boston, MA: Kluwer Academic Publishers.
Baldwin, J. and Z. Lin (2001) Impediments to Advanced Technology Adoption for
Canadian Manufacturers. Working Paper 173, Microeconomics Analysis Division,
Statistics Canada.
Brouwer, E. and A. Kleinknecht (1996) Determinants of Innovation: A Micro
Econometric Analysis of Three Alternative Innovative Output Indicators. In A.H.
Kleinknecht (ed.) Determinants of Innovation, the Message from new Indicators.
London: Macmillan Press, 99-124.
Brouwer, E. and A. Kleinknecht (1999) Keynes-plus? Effective Demand and Changes in
Firm-Level R&D: an Empirical Note. Cambridge Journal of Economics, 23, 385-391.

38
Caves, D., L. Christensen and E. Diewert (1982) Multilateral Comparisons of Output,
Input and Productivity Using Superlative Index Numbers. Economic Journal, 92, 73-
86.
Cockburn, I. and Z. Griliches (1988) ''Industry Effects and Appropriability Measures in
the Stock Market's Valuation of R&D and Patents''. American Economic Review,
Papers and Proceedings, 78(2) 419-423.
Cohen, W.M., Nelson R.R. and J.P. Walsh (2000) Protecting their Intellectual Assets:
Appropriability Conditions and Why U.S. Manufacturing Firms Patent or Not.
Cambridge, MA: NBER Working Paper 7552.
Cragg, J. (1971) Some Statistical Models for Limited Dependent Variables with
Application to the Demand for Durable Goods. Econometrica, 39, 829-844.
Crépon, B., E. Duguet and I. Kabla (1996) Schumpeterian Conjectures: A Moderate
Support from Various Innovation Measures. In A. Kleinknecht (ed.), Determinants of
Innovation: The Message from New Indicators.. London: Macmillan Press.
Crépon, B., E. Duguet and J. Mairesse (1998) Research and Development, Innovation
and Productivity: An Econometric Analysis at the Firm Level. Economics of
Innovation and New Technology, 7(2), 115-158.
Eurostat (1996) Manual on Disclosure Control Methods, 9E. Luxembourg: Statistical
Office of the European Communities,.
Eurostat (1997) Community Innovation Survey 1. Luxembourg: Statistical Office of the
European Communities, CD-ROM.

39
Felder, J., G. Licht, E. Nerlinger and H. Stahl (1995) Appropriability, Opportunity, Firm
Size and Innovation Activities: Empirical Results Using East and West German Firm
Level Data. Mannheim, Germany: ZEW Discussion paper No. 95-21.
Foray, D. (2004) The Economics of Knowledge. Cambridge, MA: The MIT Press.
Geroski, P., J. Van Reenen and C. Walters (1997) How Persistently Do Firms Innovate?
Research Policy, 26, 33-48.
Greene, W. (2003) Econometric Analysis (5th ed.). New Jersey: Prentice Hall.
Griliches, Z. and J. Mairesse (1984) Productivity and R&D at the Firm Level. In Z.
Griliches (ed.), R&D, Patents and Productivity. Chicago, IL: University of Chicago
Press, 271-297.
Heckman, J.J. (1979) Sample Selection Bias as a Specification Error, Econometrica, 47,
153-161.
Hu, X. and C. DeBresson (1998) An Empirical Evaluation of the Eurostat Micro-
Aggregation Procedure for the Analysis of the Community Innovation Survey.
Technical report.
Kleinknecht, A.H. (1993) Testing Innovation Indicators for Postal Surveys: Results from
a Five-Country Comparison. In A.H. Kleinknecht and D. Bain (eds.) New Concepts in
Innovation Output Measurement. London: Macmillan, 153-188.
Kleinknecht, A., K, Van Montfort and E. Brouwer (2002) The Non-Trivial Choice
between Innovation Indicators. Economics of Innovation of New Technology, 11, 109-
121.

40
Levin, R., A. Klevorick, R. Nelson and S. Winter (1987) 'Appropriating the Results of
Industrial Research and Development. Brookings Papers on Economic Activity,
1987(3), 783-831.
Lööf, H. and A. Heshmati (2002) Knowledge Capital and Performance Heterogeneity: A
Firm-Level Innovation Study. International Journal of Production Economics, 76(1)
61-85.
Maddala, G.S. (1983) Limited-Dependent and Qualitative Variables in Econometrics,
Econometric Society Monographs in Quantitative Economics. Cambridge, UK:
Cambridge University Press.
Mairesse, J. and P. Mohnen (2001) To Be or Not to Be Innovative: an Exercise in
Measurement. OECD STI Review, Special Issue on New Science and Technology
Indicators, 27, 103-129.
Mairesse, J. and P. Mohnen (2002) Accounting for Innovation and Measuring
Innovativeness: An Illustrative Framework and an Application. American Economic
Review, 92 (2) 226-230.
Mohnen, P. and M. Dagenais (2001) Towards an Innovation Intensity Index: The Case of
CIS-1 in Denmark and Ireland. In A. Kleinknecht and P. Mohnen (eds.), Innovation
and Firm Performance: Econometric Explorations of Survey Data. Hampshire and
New York: Palgrave.
Mohnen, P. and J. Rosa (2002) Barriers to Innovation in Service Industries in Canada. In
Maryann Feldman and Nadine Massard (eds.), Institutions and Systems in the
Geography of Innovation, Boston, MA: Kluwer Academic Publishers, 231-250.
Neef, D. (ed.) (1998) The Knowledge Economy. Boston: Butterworth-Heinemann.

41
Organization for Economic Co-operation and Development (1963) The Measurement of
Scientific and Technical Activities (Frascati Manual), new edition 1994. Paris: OECD.
Organization for Economic Co-operation and Development (1992, 1996) Oslo Manual
(1st edition 1992, 2nd edition 1996). OECD: Paris
Porter, M. and S. Stern (1999) The New Challenge to America's Prosperity: Findings
from an Innovation Index. Washington, DC: Council on Competitiveness.
Puhani, P. (2000) The Heckman Correction for Sample Selection and its Critique. The
Journal of Economic Surveys, 14 (1), 53-68.
Quah, D. (2001) The Weightless Economy in Economic Development, in Matti Pohjola
(ed.), Information Technology, Productivity, and Economic Growth : International
Evidence and Implications for Economic Development. Oxford, UK: Oxford
University Press.
Robson, M., J. Townsend and K. Pavitt (1988) Sectoral Patterns of Production and Use of
Innovations in the UK: 1945-1983. Research Policy, 17, 1-14.
Suits, D. (1984) Dummy Variables: Mechanics v. Interpretation. Review of Economics
and Statistics, 66,177-180.
Van Leeuwen, G. and L. Klomp (2006) On the Contribution of Innovation to Multi-
Factor Productivity Growth. This volume.
Wooldridge, J. (2002) Econometrics Analysis of Cross Section and Panel Data.
Cambridge, MA: The MIT Press.

42
Table 1
Summary statistics: CIS 1 (1992), Micro-aggregated Data
High-tech and Low-tech Industries
Variable Belgium Den-
mark
Ger-
many
Ireland Italy Nether-
lands
Norway Average
country
Number of firms High-tech (H) 182 223 1070 259 845 666 150 485
Low-tech (L) 360 349 840 456 1409 1012 325 678
Per cent of "high-
tech firms"
33.6 39.0 56.0 36.2 37.5 40.0 31.6 41.7
H 1164.5 301.5 1619.7 128.7 767.0 340.2 267.5 655.6 Average number of
employees L 403.0 208.0 655.9 116.8 289.5 222.5 151.6 292.5
Per cent employment
in "high tech
firms"
59.4 48.1 75.9 38.5 61.4 50.2 44.8 61.6
H 79.7 64.6 43.5 69.1 58.5 63.7 75.3 64.9 Per cent of firms
belonging to a group L 51.4 67.0 35.2 56.1 35.7 52.9 63.7 51.7
H 78.0 76.2 85.4 76.4 62.4 75.4 62.7 73.8 Percent of innovating
firms L 65.3 54.2 74.6 64.0 29.2 55.9 47.1 55.8
Formatted: Bottom: 0.75"
Formatted: Line spacing: Double
Formatted: Indent: Left: 0",Hanging: 0.2"
Formatted: Indent: Left: 0",Hanging: 0.2"
Formatted: Indent: Left: 0",Hanging: 0.2"
Formatted: Indent: Left: 0",Hanging: 0.2"
Formatted: Indent: Left: 0",Hanging: 0.2"
Formatted: Indent: Left: 0",Hanging: 0.2"
Formatted: Indent: Left: 0",Hanging: 0.2"
Formatted: Indent: Left: 0",Hanging: 0.2"
Deleted: 

43
Table 1 (continued)
Variable Belgium Den-
mark
Ger-
many
Ireland Italy Nether-
lands
Norway Average
country
H 48.6 48.3 51.2 46.1 41.0 44.1 48.2 46.8 Average share of innovative sales in
per cent, for innovating firms L 44.1 37.3 50.2 39.7 34.8 32.9 33.2 38.9
H 96.5 94.7 93.1 95.5 83.3 81.9 86.2 90.2 Per cent of R&D doing firms, among
innovating firms L 85.1 77.2 76.7 98.3 59.2 72.3 75.2 77.7
H 3.6 6.1 4.9 4.0 4.2 3.6 4.1 4.4 Average R&D/sales
in per cent, for R&D doing firms L 1.3 2.2 3.0 2.1 2.5 1.5 1.7 2.0
H 95.6 62.7 84.3 78.3 94.1 77.1 81.5 81.9 Per cent of firms doing R&D
continuously, of R&D doing firms L 81.5 64.4 75.1 63.1 85.2 63.1 73.0 72.2
H 64.2 73.9 49.0 42.9 28.7 51.8 77.8 81.9 Per cent of firms doing coop. R&D, of
R&D doing firms L 45.0 66.4 37.8 35.9 6.6 41.8 64.3 42.5
H 73.1 70.4 87.7 71.8 64.5 69.2 51.3 69.7 Per cent of firms with above average
perceived competition L 56.9 46.4 78.0 60.5 37.4 49.4 42.8 53.1
H 69.2 66.8 69.5 58.7 31.4 61.7 50.0 58.2 Per cent of firms with above average
proximity to basic rsrch L 47.8 43.8 51.3 47.1 14.3 42.8 40.3 41.1
Formatted Table
Formatted: Indent: Left: 0",Hanging: 0.2"
Formatted: Indent: Left: 0",Hanging: 0.2"
Formatted: Indent: Left: 0",Hanging: 0.2"
Formatted: Indent: Left: 0",Hanging: 0.2"
Formatted: Indent: Left: 0",Hanging: 0.2"
Formatted: Indent: Left: 0",Hanging: 0.2"
Formatted: Indent: Left: 0",Hanging: 0.2"
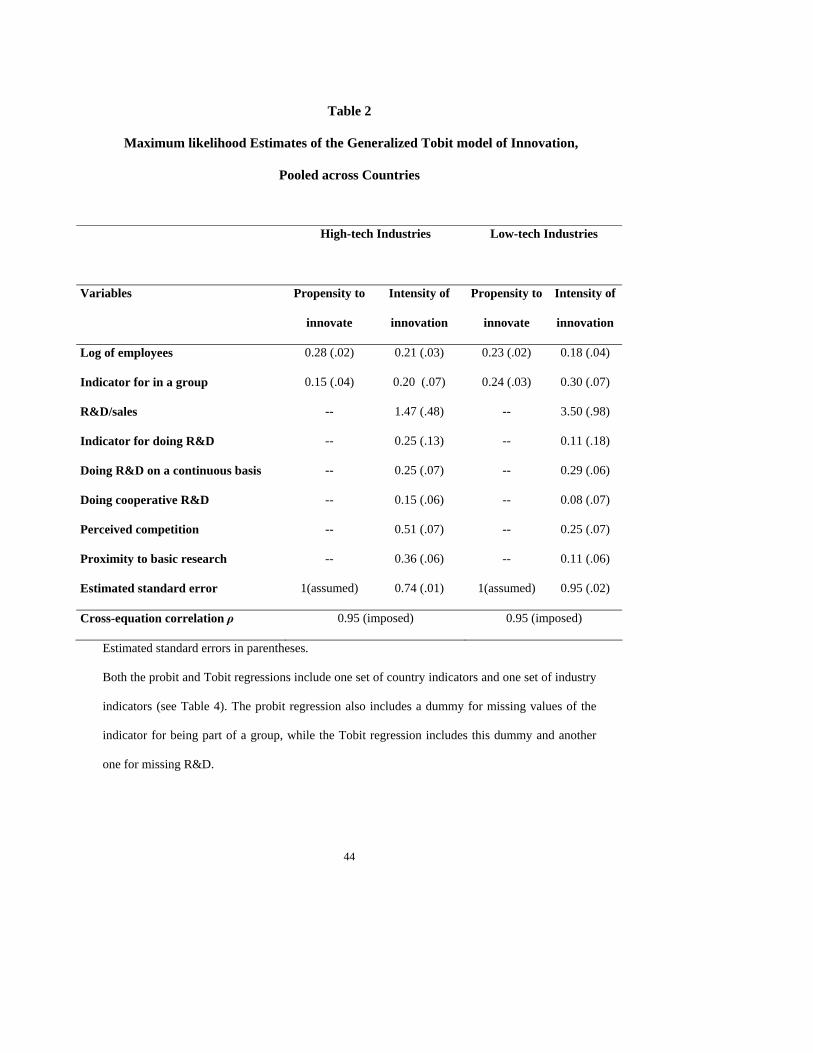
44
Table 2
Maximum likelihood Estimates of the Generalized Tobit model of Innovation,
Pooled across Countries
High-tech Industries Low-tech Industries
Variables Propensity to
innovate
Intensity of
innovation
Propensity to
innovate
Intensity of
innovation
Log of employees 0.28 (.02) 0.21 (.03) 0.23 (.02) 0.18 (.04)
Indicator for in a group 0.15 (.04) 0.20 (.07) 0.24 (.03) 0.30 (.07)
R&D/sales -- 1.47 (.48) -- 3.50 (.98)
Indicator for doing R&D -- 0.25 (.13) -- 0.11 (.18)
Doing R&D on a continuous basis -- 0.25 (.07) -- 0.29 (.06)
Doing cooperative R&D -- 0.15 (.06) -- 0.08 (.07)
Perceived competition -- 0.51 (.07) -- 0.25 (.07)
Proximity to basic research -- 0.36 (.06) -- 0.11 (.06)
Estimated standard error 1(assumed) 0.74 (.01) 1(assumed) 0.95 (.02)
Cross-equation correlation ρ 0.95 (imposed) 0.95 (imposed)
Estimated standard errors in parentheses.
Both the probit and Tobit regressions include one set of country indicators and one set of industry
indicators (see Table 4). The probit regression also includes a dummy for missing values of the
indicator for being part of a group, while the Tobit regression includes this dummy and another
one for missing R&D.
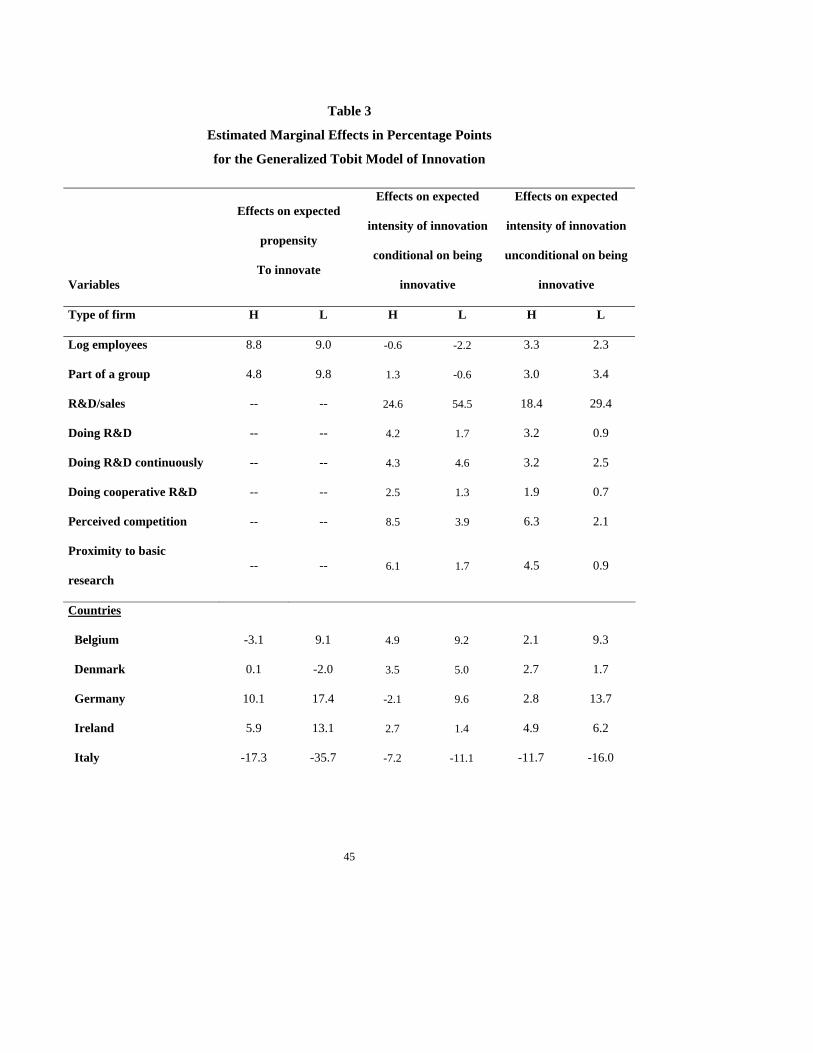
45
Table 3
Estimated Marginal Effects in Percentage Points
for the Generalized Tobit Model of Innovation
Variables
Effects on expected
propensity
To innovate
Effects on expected
intensity of innovation
conditional on being
innovative
Effects on expected
intensity of innovation
unconditional on being
innovative
Type of firm H L H L H L
Log employees 8.8 9.0 -0.6 -2.2 3.3 2.3
Part of a group 4.8 9.8 1.3 -0.6 3.0 3.4
R&D/sales -- -- 24.6 54.5 18.4 29.4
Doing R&D -- -- 4.2 1.7 3.2 0.9
Doing R&D continuously -- -- 4.3 4.6 3.2 2.5
Doing cooperative R&D -- -- 2.5 1.3 1.9 0.7
Perceived competition -- -- 8.5 3.9 6.3 2.1
Proximity to basic
research -- -- 6.1 1.7 4.5 0.9
Countries
Belgium -3.1 9.1 4.9 9.2 2.1 9.3
Denmark 0.1 -2.0 3.5 5.0 2.7 1.7
Germany 10.1 17.4 -2.1 9.6 2.8 13.7
Ireland 5.9 13.1 2.7 1.4 4.9 6.2
Italy -17.3 -35.7 -7.2 -11.1 -11.7 -16.0

46
Netherlands 3.9 0.9 -2.9 -6.7 -0.5 -3.1
Norway -4.3 -0.5 3.4 -2.1 0.4 -1.3
Manufacturing Industries
Vehicles -6.4 -- -0.5 -x- -3.2 --
Chemical -4.0 -- -10.1 -x- -8.7 --
Machinery & Equipment 2.2 -- 4.7 -x- 4.6 --
Electrical 3.8 -- 2.9 -x- 4.1 --
Food -- 0.7 -x- 0.8 -- 0.8
Textile -- -1.4 -x- 6.1 -- 2.7
Wood -- -7.7 -x- -3.1 -- -4.3
Plastic -- 11.0 -x- 0.5 -- 4.9
Non-Metallic -- 3.7 -x- -5.4 -- -1.4
Metals -- 0.7 -x- -3.5 -- -1.5
NEC -- 3.7 -x- 7.5 -- 5.8
H: High-tech industries; L: Low-tech industries.
The table shows the estimated marginal effects (in percentage points) for the generalized Tobit
model of innovation at the European means of the explanatory variables, with equal country
weights and average European industry structure. The model was estimated on pooled country
data for the high- and low-tech industries separately (See Table 2 for estimates).

47
Table 4
Accounting for Inter-Country Differences in Innovation
A) Propensity to Innovate
Source:
European
propensity Industry effects
Size and group
effects
Sum of
structural effects
Expected
propensity
Propensity
innovativity
Observed
propensity
High-tech Industries
Belgium 73.8 -0.3 6.2 5.9 79.7 -1.7 78.0
Denmark 73.8 0.8 -1.7 -0.9 72.9 3.3 76.2
Germany 73.8 0.8 2.3 3.1 76.9 8.5 85.4
Ireland 73.8 0.5 -6.0 -5.5 68.3 8.1 76.4
Italy 73.8 0.2 3.0 3.2 77.0 -14.6 62.4
Netherlands 73.8 -0.4 -2.9 -3.3 70.5 4.9 75.4
Norway 73.8 -1.6 -0.9 -2.5 71.3 -8.6 62.7
Average country 73.8 0.0 0.0 0.0 73.8 0.0 73.8

48
Low-tech Industries
Belgium 55.8 0.0 1.0 1.0 56.8 8.5 65.3
Denmark 55.8 0.4 2.4 2.8 58.6 -4.4 54.2
Germany 55.8 1.4 2.3 3.7 59.5 15.1 74.6
Ireland 55.8 0.5 -3.7 -3.2 52.6 11.4 64.0
Italy 55.8 0.2 0.1 0.3 56.1 -26.9 29.2
Netherlands 55.8 -1.4 -0.8 -2.2 53.6 2.3 55.9
Norway 55.8 -1.2 -1.2 -2.4 53.4 -6.3 47.1
Average country 55.8 0.0 0.0 0.0 55.8 0.0 55.8
Small discrepancies are due to rounding.
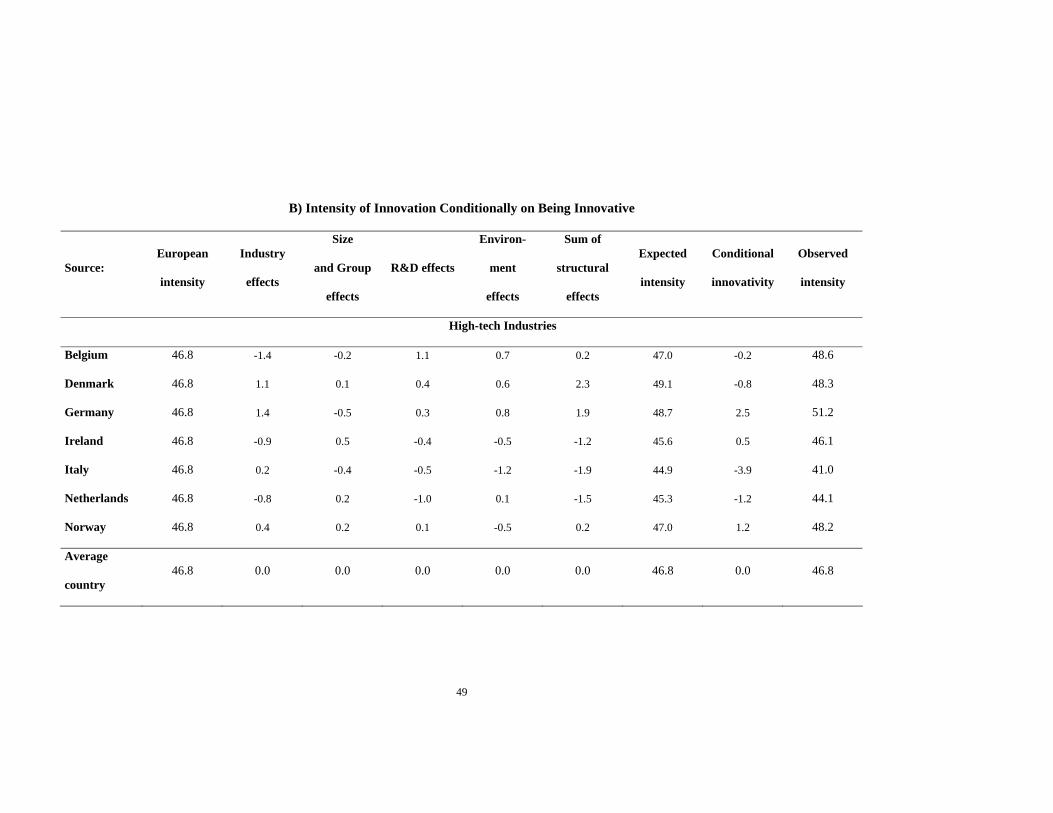
49
B) Intensity of Innovation Conditionally on Being Innovative
Source:
European
intensity
Industry
effects
Size
and Group
effects
R&D effects
Environ-
ment
effects
Sum of
structural
effects
Expected
intensity
Conditional
innovativity
Observed
intensity
High-tech Industries
Belgium 46.8 -1.4 -0.2 1.1 0.7 0.2 47.0 -0.2 48.6
Denmark 46.8 1.1 0.1 0.4 0.6 2.3 49.1 -0.8 48.3
Germany 46.8 1.4 -0.5 0.3 0.8 1.9 48.7 2.5 51.2
Ireland 46.8 -0.9 0.5 -0.4 -0.5 -1.2 45.6 0.5 46.1
Italy 46.8 0.2 -0.4 -0.5 -1.2 -1.9 44.9 -3.9 41.0
Netherlands 46.8 -0.8 0.2 -1.0 0.1 -1.5 45.3 -1.2 44.1
Norway 46.8 0.4 0.2 0.1 -0.5 0.2 47.0 1.2 48.2
Average
country 46.8 0.0 0.0 0.0 0.0 0.0 46.8 0.0 46.8

50
Low-tech Industries
Belgium 38.9 0.8 -0.4 0.3 0.1 0.8 39.7 4.4 44.1
Denmark 38.9 -0.6 -0.1 0.1 -0.1 -0.7 38.2 -0.9 37.3
Germany 38.9 -0.4 -0.6 0.4 0.4 -0.2 38.7 11.5 50.2
Ireland 38.9 0.9 1.3 0.0 -0.1 2.1 41.0 -1.3 39.7
Italy 38.9 0.5 -0.9 -0.3 -0.2 -0.9 38.0 -3.2 34.8
Netherlands 38.9 -1.1 0.2 -0.6 -0.1 -1.5 37.4 -4.5 32.9
Norway 38.9 -0.2 0.5 0.1 0.0 0.4 39.3 -6.1 33.2
Average
country 38.9 0.0 0.0 0.0 0.0 0.0 38.9 0.0 38.9
Small discrepancies are due to rounding.

51
C) Intensity of Innovation Unconditionally on Being Innovative
Source:
European
intensity
Industry
effects
Size
and Group
effects R&D effects
Environ-
ment effects
Sum of
structural
effects
Expected
intensity Innovativity
Observed
intensity
High-tech Industries
Belgium 34.7 -1.2 2.6 0.9 0.7 3.0 37.7 0.2 37.9
Denmark 34.7 1.3 -0.7 0.4 0.4 1.4 36.1 0.7 36.8
Germany 34.7 1.3 0.6 0.9 1.7 4.5 39.2 4.6 43.8
Ireland 34.7 -0.6 -2.2 0.1 -0.1 -2.6 32.1 3.1 35.2
Italy 34.7 0.4 1.1 -0.9 -1.6 -1.0 33.7 -8.1 25.6
Netherlands 34.7 -0.8 -1.1 -0.6 0.1 -2.4 32.3 1.0 33.3
Norway 34.7 -0.5 -0.2 -0.7 -1.5 -2.9 31.8 -1.6 30.2
Average
country
34.7 0.0 0.0 0.0 0.0 0.0 34.7 0.0 34.7

52
Low-tech Industries
Belgium 22.3 0.4 0.3 0.2 0.1 1.0 23.3 5.5 28.8
Denmark 22.3 0.0 0.7 0.0 -0.1 0.6 22.9 -2.7 20.2
Germany 22.3 0.3 0.4 0.4 0.6 1.7 24.0 13.5 37.5
Ireland 22.3 0.4 -0.9 0.2 0.2 -0.1 22.2 3.3 25.5
Italy 22.3 0.7 -0.1 -0.4 -0.6 -0.4 21.9 -11.7 10.2
Netherlands 22.3 -1.0 -0.2 -0.2 -0.1 -1.5 20.8 -2.4 18.4
Norway 22.3 -0.8 -0.2 -0.1 -0.2 -1.3 21.0 -5.4 15.6
Average
country
22.3 0.0 0.0 0.0 0.0 0.0 22.3 0.0 22.3
Small discrepancies are due to rounding errors.

53
Table 5
Industry Composition by Country
Percentage of Firms
INDUSTRY Belgium Denmark Germany Ireland Nether-
lands
Norway Italy Average
country
High-tech Industries
VEHICLES 12.6 12.5 11.9 6.6 13.7 42.0 15.1 16.3
CHEMICAL 33.0 15.3 15.2 32.0 30.1 12.0 20.6 22.6
MACH&EQ 25.8 43.5 43.6 19.3 36.2 27.3 37.3 33.2
ELEC 28.6 28.7 29.3 42.1 20.0 18.7 27.0 27.9
Low-tech Industries
FOOD 18.3 22.3 10.8 25.0 17.8 27.4 13.0 19.2
TEXTILE 23.9 7.2 10.8 15.1 9.9 6.5 30.1 14.8
WOOD 16.1 20.3 13.5 18.7 28.1 29.5 11.9 19.7
PLASTIC 5.3 9.2 14.6 11.6 0.3 2.8 4.8 6.9
NONMET 10.0 8.0 9.3 6.8 7.8 5.8 11.2 8.5
METAL 17.0 22.7 32.5 15.1 29.0 19.7 19.7 22.2
NEC 9.4 10.3 8.5 7.7 7.1 8.3 9.3 8.7

54
APPENDIX A: Accounting for Innovation and Measuring Innovativity
Assume for simplicity that there are only two countries (A and B) and two industries (1
and 2). The expected intensity of innovation, whether unconditional or conditional on being
innovative, that is equations (5) or (6), can be written as (ignoring the firm subscripts to ease
notation): 1 2 2 2( , ) ( , )By f C Z f C I Zα α β= = + +
where we have taken country A and industry 1 for reference in expressing the general country
and industry specific constant C, with BC being the dummy for country B and 2I the dummy
for industry 2, and where Z stands for a set of other explanatory variables (or innovation
factors).
Note that the function f could as well represent the expected probability to innovate, that
is, equation (4). Note also that we could have made a different choice of normalization (so that
for example the two countries and the two industries be treated symmetrically); our final
innovation accounting decomposition in terms of structural effects and innovativity, as shown
in Table A1, does not depend on it.
Let Ay , By , and Ey be the respective mean values of the observed intensity of
innovation for country A, country B and the average country of reference (say the hypothetical
average European country), and let *Ay , *By , and *Ey represent the corresponding expected
intensity of innovation taken at respectively the mean values of the explanatory variables for
these three countries. Assuming for simplicity that we have the same number of observations
for the two countries (or giving them equal weight as we have done in our analysis), we have
respectively
* * *1 2 2( , )A A A A A Ay y e f w Z eα β= + = + +
* * *1 2 2 2( , )B B B B B By y e f w Z eα α β= + = + + +
* * *1 2 2 2( / 2 , )E E E E E Ey y e f w Z eα α β= + = + + +
where 2/)( 222BAE www += is the average proportion of firms in industry 2 in the two countries,
( ) / 2E A BZ Z Z= + is the average value of Z in the two countries, and *Ae , *Be , and *Ee are
approximation errors due to the fact that the expected innovation intensity functions f(.) are not
linear. Going one step further, by considering a linear approximation of *Ay and *By around

55
*Ey (i.e., in deviation to the mean values of the explanatory variables for the country of
reference), we can write the two following innovation accounting equations: * *
2 2 2 2( ) ( ) ( / 2) ( )A E E A E E A E E A A EC Z Cy y f w w f Z Z f e e eβ α= + − + − + − + + −
* *2 2 2 2( ) ( ) ( / 2) ( )B E E B E E B E E B B E
C Z Cy y f w w f Z Z f e e eβ α= + − + − + + + −
where Exf represents the gradient of f(.) with respect to x (x=C, Z) evaluated at the country of
reference average values for x, and Ae and Be are first-order approximation errors. Notice that
.02/)( =+= BAE eee
The first term of these approximations is the innovation intensity of the average country
of reference. The second and third terms are the deviations from this value of reference (for
country A or B) which are respectively accounted for by the industry effects and the
explanatory variables Z, these two terms summing to what we can label as “structural effects.
The last three terms, the country effect, the first-order approximation error and the non-linearity
discrepancy, capture what we call innovativity, the difference between the observed innovation
intensity and the approximate expected innovation intensity, practically computed as the sum of
three first terms. If the function f(.) was linear, the last two terms would be nil and innovativity
will be nothing but the country effect.26
26 Note that we could have performed a similar decomposition without making a linear approximation. We could
have computed the effects of each explanatory variable sequentially, by starting from the value of innovation
intensity taken at the means of all explanatory variables for the country of reference, and replacing them one by
one by their respective country means. In this case, however, the size of the effects of the different variables would
not be independent of the order of the sequence. One advantage of the linear approximation, besides being quite
straightforward, is that the order in which we examine the separate structural effects makes no difference.

56
The following Table A1 summarizes the resulting decomposition of the country
differences in innovation relative to the average country in terms of the structural effects of the
various factors of innovation taken into account in the analysis and of innovativity. It allows for
an easy bilateral comparison of the innovation performance of the couple of countries
considered, or a multilateral comparison when more than two countries are considered.

57
Table A1: Accounting for inter-country differences in innovation relative to the average country
Average
country of
reference
(1)
Industry effects
(2)
Effects of
variable Z
(3)
Total of
structural
effects
(4)
Expected
innovation
(5)
Innovativity
(6) = (7)-(5)
Observed
innovation
(7)
Country
A
Ey )( 222EAE
C wwf −β
)( EAEZ ZZf −
(2)+(3) (1)+(4) AEC ef +− )2/( 2α
Ay
Country
B
Ey )( 222EBE
C wwf −β
)( EBEZ ZZf −
(2)+(3) (1)+(4) BEC ef +)2/( 2α By
Average
Country
Ey 0 0 0 Ey 0 Ey

58
APPENDIX B: Definition of Industrial Sectors
INDUSTRY NACE CODEa INDUSTRY DEFINITION
High-tech Sectors
Vehicles 34-35 Manufacture of motor vehicles, trailers, semi-trailers, and other transport equipment
Chemicals 23-24 Manufacture of coke, refined petroleum products and nuclear fuel, manufacture of chemicals and chemical products
Machinery 29 Manufacture of machinery and equipment NEC
Electrical 30-33 Manufacture of office machinery and computers, electrical machinery; Apparatus, radio, television and communication
equipment; Apparatus, medical, precision and optical instruments, watches and clocks
Low-tech Sectors
Food 15-16 Manufacture of food, beverages and tobacco
Textile 17-19 Manufacture of textiles, wearing apparel, dressing and dyeing of fur, tannings, and dressing of leather, luggage,
handbags, saddlery, harness and footwear
Wood 20-22 Manufacture of wood and products of wood and cork, except furniture, manufacture of straw and plaiting materials,
pulp, paper, and paper products, publishing, printing, and reproduction of recorded media
Plastic rubber 25 Manufacture of rubber and plastic products
Non-metallic 26 Manufacture of other non-metallic mineral products
Basic metal 27-28 Manufacture of basic metals, fabricated metal products, except machinery and equipment
NEC 36 Manufacture of furniture, manufacturing Non Elsewhere Classified
a Revision 1.