Initiation of a pre-breeding effort for water stress resistance ...
150
Initiation of a pre-breeding effort for water stress resistance traits and yield improvement in wheat by Jabulani Bhekisisa Mthembu Thesis presented in fulfilment of the requirements for the degree of Master of Agricultural Sciences in Plant breeding Department of Genetics in the Faculty of AgriSciences at Stellenbosch University Study leader Willem Botes December 2018
-
Upload
khangminh22 -
Category
Documents
-
view
0 -
download
0
Transcript of Initiation of a pre-breeding effort for water stress resistance ...

Initiation of a pre-breeding effort for water stress resistance traits and yield improvement in wheat
by
Jabulani Bhekisisa Mthembu
Thesis presented in fulfilment of the requirements for the degree of
Master of Agricultural Sciences in Plant breeding
Department of Genetics in the Faculty of AgriSciences
at Stellenbosch University
Study leader
Willem Botes
December 2018

ii
Declaration
By submitting this thesis electronically, I declare that the entirety of the work contained
herein is my own, original work, that I am the sole author thereof (save to the extent
explicitly otherwise stated), that reproduction and publication thereof by Stellenbosch
University will not infringe any third-party rights and that I have not previously in its
entirety or in part submitted it for obtaining any qualification.
December 2018
JB Mthembu
Copyright © 2018 Stellenbosch University
All rights reserved
Stellenbosch University https://scholar.sun.ac.za

iii
Abstract
Wheat (Triticum aestivum L.) is an important crop produced in South Africa and across
the world. Water stress and rust diseases (Puccinia spp.) are common factors
hindering wheat growth and development. Leaf lifespan is reduced under water stress
conditions from the leaf being infected by rust diseases. High-heritable Mendelian-
inherited and quantitative traits as well as male sterility mediated marker assisted
selection (MS-MARS) technique was utilised for water stress and rust disease
resistant wheat characterisation. The aim of the study was initiation of a pre-breeding
effort for water stress resistance traits and yield improvement in wheat
Sixty high-yielding genotypes and a female F1 1:1 male sterile and male fertile
segregating population postulated to carry the leaf and stem rust resistance genes
were screened for the presence of Lr34, Sr2, Sr31, Sr24, Lr37, Sr26 and Lr19 markers
using a routinely standardised panel of markers used in the Stellenbosch University
Plant Breeding Laboratory. Molecular characterisation of wheat lines was followed by
cross-pollinations of a selected male sterile female and donor lines in the growth
chamber using a reticulated hydroponic system (RHS) for the MS-MARS cycle
scheme. Male fertile tillers were allowed to self-pollinate and were used for single-
seed dehiscence.
Sixty genotypes were phenotypically screened using identified and selected target
traits associated with water stress resistance. Five genotypes were selected and
further screened for water stress resistance using added traits of interest. An RHS was
utilised for screening of the target traits including excised-leaf water loss, leaf relative
water content, specific leaf area, number of tillers (NT), number of leaves and length-
related parameters such as root length (RL) and shoot length (SL). Fresh weight
parameters included roots fresh weight (RFW), shoots fresh weight (SFW), leaves
fresh weight (LFW) and total plant fresh weight (TPFW). Dry weight parameters
included roots dry weight, shoots dry weight, leaves dry weight (LDW), above-ground
dry weight and total plant dry weight (TPDW). Additional traits included chlorophyll
content index (CCI), stomatal conductance, photosynthetic active radiation, leaf area
index, radiation use efficiency, relative growth rate (RGR) and root-to-shoot ratio.
Stellenbosch University https://scholar.sun.ac.za
iv
Rust disease resistant genotypes were identified from the studied population.
Molecular characterisation of the wheat genotypes for rust resistance genes showed
increased allele frequencies in MS-MARS cycles 1 to 2 for both female and male lines,
more specifically Lr34 and Sr2. However, the male lines showed lower allele
frequencies and absence of the Lr19 marker in the population. Analysis of variance
showed that water stress significantly influenced the growth and development of wheat
genotypes for all the studied traits except RL and NT. The selected five genotypes
showed better water stress resistance for all the traits studied. Genotypes were ranked
as follows based on their performance under water stress conditions: 15HYLD-30,
15HYLD-22, 15HYLD-29, 15HYLD-18 and 15HYLD-26.
A strong positive association observed under water stress conditions from fresh weight
components included LFW and RFW (r = 0,884), followed by TPFW with FW
components such as RFW (r = 0,848), SFW (r = 0,922) and LFW (r = 0,920). A strong
positive association was also recorded for SFW and SL (r = 0,832), CCI with SL
(r = 0,835) and SFW (0,890) and lastly, TPDW with RGR (r = 0,879) and LDW
(r = 0,872). A strong positive association was recorded under well-watered conditions
namely TPFW showed a strong positive association with SFW (r = 0,872), LFW
(r = 0,920), TPDW with SL (r = 0,877) and LDW (r = 0,841).
Stellenbosch University https://scholar.sun.ac.za

v
Opsomming
Koring (Triticum aestivum L.) is ʼn belangrike gewas wat in Suid-Afrika en wêreldwyd
verbou word. Waterstres en roessiektes (Puccinia spp.) is algemene faktore wat die
groei en ontwikkeling van koring belemmer. Blaarlewensduur word onder
waterstresomstandighede verlaag deur blare wat met roessiektes besmet word. Hoë
vererfbare Mendeliaanse oorgeërfde en kwantitatiewe eienskappe en die tegniek van
manlike steriliteitsbemiddelde merkergeassisteerde seleksie (MS-MARS) is vir
karakterisering van waterstres- en roessiekteweerstand onder koring gebruik. Die doel
van die studie was die toepassing van ʼn voorkwekingspoging gemik op eienskappe
van waterstresweerstand vir die verhoging van koringopbrengste.
Sestig hoë-opbrengsgenotipes en vroulike F1 1:1 manlike steriele en manlike
vrugbare geskeide populasies wat veronderstel is om die blaar- en
stamroesweerstandgene te dra, is gesif vir die teenwoordigheid van Lr34-, Sr2-,
Sr31-, Sr24-, Lr37-, Sr26- en Lr19-merkers met behulp van ʼn roetine-
gestandaardiseerde paneel merkers wat in die Universiteit Stellenbosch se
planttelingslaboratorium (SU-PBL) gebruik word. Molekulêre karakterisering is
opgevolg met kruisbestuiwings van seleksies manlike steriele en skenkerlyne in die
groeikamer met gebruik van ʼn hidroponiese stelsel vir die MS-MARS-siklusskema.
Manlike vrugbare waterlote is toegelaat om te selfbestuif en is gebruik vir enkelsaad-
oopspringing.
Sestig genotipes is fenotipies gesif met gebruik van geïdentifiseerde en gekose
teikeneienskappe wat met waterstresweerstand geassosieer word. Vyf genotipes is
gekies en verder gesif vir waterstresweerstand met behulp van bykomende
belangwekkende eienskappe. ʼn Geretikuleerde hidroponiese stelsel is gebruik vir die
sifting van die teikeneienskappe, insluitende waterverliese van uitgesnyde blare, blare
se relatiewe waterinhoud, spesifieke blaaroppervlakte, aantal waterlote en aantal
blare, en lengteverwante parameters soos wortellengte (RL) en lootlengte (SL).
Varsgewigparameters het ingesluit wortels se vars gewig (RFW), lote se vars gewig
(SFW), blare se vars gewig (LFW) en die totale plant se vars gewig (TPFW).
Droëgewigparameters het ingesluit wortels se droë gewig, lote se droë gewig, blare
se droë gewig (LDW), bogrondse droë gewig en die totale plant se droë gewig
Stellenbosch University https://scholar.sun.ac.za

vi
(TPDW). Bykomende eienskappe het ingesluit chlorofilinhoud-indeks (CCI), stoma-
konduktansie, fotosintetiese aktiewe straling, blaaroppervlakte-indeks,
stralingsgebruikdoeltreffendheid, relatiewe groeitempo (RGR) en wortel-tot-loot-
verhouding.
Roessiekteweerstand-genotipes is uit die bestudeerde populasie geïdentifiseer.
Molekulêre karakterisering van die roesweerstandgene wat uit die koringgenotipes
verkry is, het ʼn toename in die alleelfrekwensies in MS-MARS-siklusse een tot twee
vir sowel vroulike as manlike lyne getoon, meer spesifiek Lr34 en Sr2. Die manlike
lyne het egter laer alleelfrekwensies en afwesigheid van die Lr19-merker in die
populasie getoon. Die variansieontleding (ANOVA) het getoon dat waterstres die groei
en -ontwikkeling van koringgenotipes vir al die bestudeerde eienskappe aanmerklik
beïnvloed, behalwe die RL en NT. Die gekose vyf genotipes het die beste
waterstresweerstand getoon van al die eienskappe wat bestudeer is. Die genotipes is
op grond van hul prestasie onder waterstresomstandighede in die volgende rangorde
geplaas: 15HYLD-30, 15HYLD-22, 15HYLD-29, 15HYLD-18 en 15HYLD-26.
Sterk positiewe assosiasie (SPA) wat onder waterstresomstandighede by
vasgewigkomponente waargeneem is, het LFW en RFW (r = 0.884) ingesluit, gevolg
deur TPFW met varsgewigkomponente soos RFW (r = 0.848), SFW (0.922) en LFW
(r = 0.920). SPA is ook opgeteken vir SFW en SL (r = 0.832), CCI met SL (r = 0.835)
en SFW (0.890) en, laastens, TPDW met RGR (r = 0.879) en LDW (r = 0.872). SPA
opgeteken onder waterryke omstandighede, naamlik TPFW, het SPA met SFW
(0.872), LFW (r = 0.920) en TPDW met SL (r = 0.877) en LDW (r = 0.841) getoon.
Stellenbosch University https://scholar.sun.ac.za

vii
Acknowledgements
I wish to express my deep appreciation to Willem Botes for guidance and valuable
support in the completion of this study. I thank him for his involvement in shaping my
career and development.
I would like to acknowledge Aletta Ellis for an opportunity to learn so much from her.
A special word of thanks to Lezaan Hess for valuable contribution throughout my
research project.
I would also like to express my gratitude to Grain SA and the SU-PBL (Stellenbosch
University Plant Breeding Laboratory) for providing the opportunity and financial
support without which my research would not have been possible.
A word of thanks to the staff and students at the SU-PBL.
Stellenbosch University https://scholar.sun.ac.za

viii
List of abbreviations
% percent
˚C degrees Celsius
1
O2 singlet oxygen
2n diploid
μl microlitre
μM micromolar
ABA abscisic acid
ABGB aboveground biomass
ADC arginine decarboxylase
AFLP amplified fragment length polymorphism
ANOVA analysis of variance
ART Addis Rough tote
ATP adenosine triphosphate
B Boron
bp base pairs
Ca Calcium
CAPS cleaved amplified polymorphic sequence
CAT catalase
CCI chlorophyll content index
Chl chlorophyll content
cM centimorgan
cm centimetre
Stellenbosch University https://scholar.sun.ac.za

ix
CMS cytoplasmic male sterility
CO2 Carbon dioxide
CS Chinese Spring
CTAB N-Cetyl-N, N, N-trimethyl Ammonium Bromide
Cu Copper
DH double haploid
dH2O distilled water
DNA deoxyribonucleic Acid
dNTP deoxyribonucleotidetriphosphate
DREB DRE-Binding proteins
DW dry weight
EDTA ethylenediaminetetraacetic acid
ELWL excised leaf water loss
EtBr ethidium Bromide
F forward primer
F1 filial one
Fe iron
Fe-S iron sulfur clusters
FLS flag leaf senescence
FW fresh weight
g gram
gDNA genomic deoxyribonucleic acid
gg-1 d-1 gram per gram per decimetre
Stellenbosch University https://scholar.sun.ac.za

x
GMS genetic male sterility
GR glutathione reductase
gs stomatal conductance
H
2
broad sense heritability
H2O
2 hydrogen peroxide
HCl hydrochloric acid
HO hydroxyl radical
HZ Hertz
ICARDA International Centre for Agricultural Research in the Dry
Areas
ILDW initial leaves dry weight
IRDW initial roots dry weight
ISDW initial shoots dry weight
K potassium
kDA kilodalton
LAE leaf area
LAI leaf area index
LDW leaves dry weight
LEA late embryogenic abundant
LED light-emitting diode
LFW leaves fresh weight
Lr leaf rust resistance gene
LRWC leaf relative water content
Stellenbosch University https://scholar.sun.ac.za

xi
LTN leaf tip necrosis
M molar
MAS marker-assisted selection
Max maximum
Mb megabases
Μg microgram
min minutes
Min minimum
ml millilitre
mm millimetre
Mm millimolar
mmol m⁻² s⁻¹ millimole per square millimetre per seconds
Mn manganese
Mo molybdenite
MS-MARS male sterility-mediated marker-assisted recurrent
selection
mtlD mannitol-1-phosphate dehydrogenase
n haploid
N Nitrogen
NaCl Sodium chloride
NADP nicotinamide adenine dinucleotide phosphate
NaOH Sodium hydroxide
Ng nanogram
Stellenbosch University https://scholar.sun.ac.za

xii
ng/μl nanogram per microlitre
NL number of leaves
NT number of tillers
O
2-
superoxide radical
ODC ornithine decarboxylase
P Phosphorus
P5CR pyrroline-5-carboxylate synthetase
PA polyamine
PAR photosynthesis active radiation
Pas polyamines
PBC pseudo-black chaff
PCC positive correlation coefficiency
PCR polymerase chain reaction
pH Hydrogen ions concentration
PH plant height
POX peroxidase
PRO proline
(Pty) Ltd proprietary limited
PVC polyvinyl chloride
QTL quantitative trait locus
R reverse primer
R: S ratio root-to-shoot ratio
RAPD random amplified polymorphic DNA
Stellenbosch University https://scholar.sun.ac.za

xiii
RDW roots dry weight
RFLP restriction fragment length polymorphism
RFW roots fresh weight
RGR relative growth rate
RHS reticulated hydroponic system
RuBisCO Ribulose-1,5-bisphosphate carboxylase/oxygenase
RL root length
RN root number
RNA ribonucleic acid
Rpm revolutions per minute
RSA Republic of South Africa
RUE radiation use efficiency
RWC relative water content
S Sulphur
SAMDC S-adenosylmethionine decarboxylase
SDS Sodium dodecyl sulfate
SDW shoots dry weight
sec seconds
SFW shoots fresh weight
SL shoot length
spp. species pluralis
Sr stem rust resistance gene
SSD single seed descent
Stellenbosch University https://scholar.sun.ac.za

xiv
SSR simple sequence repeat
SU Stellenbosch University
SU-PBL Stellenbosch University Plant Breeding Laboratory
TE transpiration efficiency
TPIDW total plant initial dry weight
TPDW total plant dry weight
TPFW total plant fresh weight
Tris-Cl tris-chloride
U unit
UV ultraviolet
V volt
Yr stripe rust resistance gene
Stellenbosch University https://scholar.sun.ac.za

xv
Table of contents
Declaration .................................................................................................................. ii
Abstract ....................................................................................................................... iii
Opsomming ................................................................................................................. v
Acknowledgements .................................................................................................... vii
List of abbreviations .................................................................................................. viii
List of figures ............................................................................................................ xvii
List of tables .............................................................................................................. xix
CHAPTER 1: INTRODUCTION .................................................................................. 1
CHAPTER 2: LITERATURE REVIEW ........................................................................ 4
2.1 Domestication of wheat .................................................................................. 4
2.2 Modern breeding approaches ...................................................................... 11
2.3 Molecular markers in plant breeding ............................................................ 11
2.3.1 Marker-assisted selection ...................................................................... 11
2.3.2 Advantages of marker-assisted selection .............................................. 12
2.3.3 Molecular marker selection ................................................................... 14
2.4 Male sterility ................................................................................................. 15
2.4.1 Genetic male sterility ............................................................................. 15
2.5 Wheat production ......................................................................................... 17
2.6 Wheat rust disease ...................................................................................... 18
2.6.1 Lr34 ....................................................................................................... 19
2.6.2 Sr2 ......................................................................................................... 20
2.7 Environmental stress resistance .................................................................. 23
2.8 Water stress resistance genetic improvement ............................................. 23
2.9 Screening for water stress resistance .......................................................... 26
2.9.1 Traits associated with water stress resistance ...................................... 26
2.9.2 Screening for water stress from early stages of growth ........................ 31
2.9.3 Stages of growth and development of wheat ........................................ 32
2.10 Reticulated hydroponic system ................................................................. 38
CHAPTER 3: MATERIALS AND METHODS ............................................................ 39
3.1 Introduction .................................................................................................. 39
3.2 Screening the material ................................................................................. 40
3.2.1 Molecular screening .............................................................................. 40
3.2.2 MS-MARS cycle .................................................................................... 46
Stellenbosch University https://scholar.sun.ac.za

xvi
3.2.3 Phenotypic screening ............................................................................ 49
3.2.4 Reticulated hydroponic system ............................................................. 61
3.2.5 Experimental design .............................................................................. 61
3.2.6 Data collection and statistical analysis .................................................. 62
3.2.7 Weather data ......................................................................................... 62
CHAPTER 4: RESULTS AND DISCUSSION ........................................................... 64
4.1 Wheat molecular characterisation ................................................................ 64
4.1.1 Molecular marker screening and validation ........................................... 64
4.1.2 Marker-assisted selection screening ..................................................... 66
4.2 MS-MARS breeding technique validation .................................................... 69
4.2.1 MS-MARS Cycle 1 ................................................................................ 69
4.2.2 MS-MARS Cycle 2 ................................................................................ 71
4.3 Phenotypic traits .......................................................................................... 72
4.3.1 Excised leaf water loss .......................................................................... 73
4.3.2 Leaf relative water content .................................................................... 76
4.3.3 Chlorophyll content index ...................................................................... 77
4.3.4 Stomatal conductance ........................................................................... 80
4.3.5 Relative growth rate .............................................................................. 81
4.3.6 Photosynthetic active radiation .............................................................. 82
4.3.7 Specific leaf area ................................................................................... 84
4.4 Agronomic traits ........................................................................................... 86
4.4.1 Root length ............................................................................................ 86
4.4.2 Roots dry weight .................................................................................... 87
4.4.3 Shoot length .......................................................................................... 89
4.4.4 Number of tillers .................................................................................... 90
4.4.5 Number of leaves .................................................................................. 92
4.4.6 Total plant fresh weight ......................................................................... 94
4.4.7 Total plant dry weight ............................................................................ 96
4.4.8 Root-to-shoot ratio ................................................................................. 98
4.5 Variety rankings and percentage of decrease ............................................. 99
4.6 Correlation study ........................................................................................ 100
CHAPTER 5: CONCLUSIONS ................................................................................ 103
References .............................................................................................................. 105
Stellenbosch University https://scholar.sun.ac.za

xvii
List of figures
Figure 2.1: Domesticated wheat evolution .................................................................. 4
Figure 2.2. Diagram of the Fertile Crescent ................................................................ 6
Figure 2.3. Comparison of Q and q genes of hexaploid wheat ................................. 10
Figure 2.4: Production trends, area used for planting and consumption of wheat in
SA for the past four decades .............................................................................. 18
Figure 2.5: MS-MARS cycle scheme flow chart ........................................................ 22
Figure 2.6: Diagram illustrating the wheat growth stages ......................................... 33
Figure 3.1: Representation of the study flow ............................................................. 41
Figure 3.2: MS-MARS cycle ...................................................................................... 47
Figure 3.3: Visual assessment of spikes and florets ................................................. 49
Figure 3.4: Temperatures recorded during planting .................................................. 59
Figure 3.5: Reticulated hydroponic system used ...................................................... 61
Figure 3.6: Historical weather data from Welgevallen Experimental Farm ............... 62
Figure 3.7: Average annual rainfall pattern from year 2010 to 2013 ......................... 63
Figure 4.1: Gel electrophoresis UV image for optimisation and validation of Lr34
resistance and codominant marker .................................................................... 64
Figure 4.2: Gel electrophoresis UV image for optimisation and validation of Sr2 ..... 65
Figure 4.3: Gel electrophoresis UV image for optimisation and validation of Sr2 ..... 65
Figure 4.4: MS-MARS Cycle 1 allele frequency for rust resistance markers from
female population ............................................................................................... 67
Figure 4.5: MS-MARS cycles 1 and 2 female population allele frequency comparison
............................................................................................................................ 68
Figure 4.6: MS-MARS Cycle 1 allele frequencies for rust resistance markers from 60
male genotypes .................................................................................................. 68
Figure 4.7: MS-MARS Cycle 2 allele frequencies for rust resistance markers from 60
male genotypes .................................................................................................. 69
Figure 4.8: Temperatures recorded during the reproductive stage ........................... 72
Figure 4.9: ELWL of five wheat genotypes grown under water-stressed and well-
watered conditions .............................................................................................. 73
Figure 4.10: LRWC of five wheat genotypes grown under water-stressed and well-
watered conditions .............................................................................................. 76
Stellenbosch University https://scholar.sun.ac.za

xviii
Figure 4.11: CCI of five wheat genotypes grown under water-stressed and well-
watered conditions .............................................................................................. 78
Figure 4.12: Gs of five wheat genotypes grown under water-stressed and well-
watered conditions .............................................................................................. 80
Figure 4.13: RGR of five wheat genotypes grown under water-stressed and well-
watered conditions .............................................................................................. 81
Figure 4.14: LAE of five wheat genotypes grown under water-stressed and well-
watered conditions .............................................................................................. 85
Figure 4.15: RL of five wheat genotypes grown under water-stressed and well-
watered conditions .............................................................................................. 86
Figure 4.16: RDW of five wheat genotypes grown under water-stressed and well-
watered conditions .............................................................................................. 88
Figure 4.17: SL of five wheat genotypes grown under water-stressed and well-
watered conditions .............................................................................................. 89
Figure 4.18: NT of five wheat genotypes grown under water-stressed and well-
watered conditions .............................................................................................. 91
Figure 4.19: NL of five wheat genotypes grown under water-stressed and well-
watered conditions .............................................................................................. 92
Figure 4.20: TPFW of five wheat genotypes grown under water-stressed and well-
watered conditions .............................................................................................. 95
Figure 4.21: TPDW of five wheat genotypes grown under water-stressed and well-
watered conditions .............................................................................................. 96
Figure 4.22: R:S ratio of five wheat genotypes grown under water-stressed and well-
watered conditions .............................................................................................. 98
Stellenbosch University https://scholar.sun.ac.za

xix
List of tables
Table 2.1. Wheat (Triticum sp.) species ...................................................................... 9
Table 2.2. Genetic male sterility genes ..................................................................... 17
Table 3.1. Primers utilised for molecular screening of wheat lines ........................... 42
Table 3.2: The conditions and reaction volumes for Sr2 marker characterisation .... 44
Table 3.3: The summary of studied phenotypic traits measurements details ........... 52
Table 4.1: MS-MARS cycle one year 2015 ............................................................... 70
Table 4.2: MS-MARS cycle one probability to fit 1:1 ratio ......................................... 70
Table 4.3: MS-MARS cycle two year 2017 ............................................................... 71
Table 4.4: Selected genotypes based on their rankings ........................................... 72
Table 4.5: ANOVA and mean comparison of DW measurements prior instigation of
water stress ........................................................................................................ 74
Table 4.6: ANOVA and mean comparison of the treatments effects ........................ 75
Table 4.7: ANOVA and mean comparison of extinction eco-efficiency and light
interceptance parameters ................................................................................... 83
Table 4.8: Means of PAR measurements from the control and water stressed RHS 84
Table 4.9: ANOVA and mean comparison of the treatments effects from studied
genotypes ........................................................................................................... 93
Table 4.10: The reduction differences calculated from each trait studied ............... 101
Table 4.11: Rankings of the genotypes based on minimum to maximum reduction
.......................................................................................................................... 101
Table 4.12: Final genotype ranking ......................................................................... 101
Table 4.13: Correlation co-efficients of all traits studied ......................................... 102
Stellenbosch University https://scholar.sun.ac.za

1
CHAPTER 1: INTRODUCTION
Wheat is one of the major cereal crops produced in South Africa (SA) and worldwide.
There are two major types of wheat species produced: Triticum aestivum L. and
Triticum durum, commonly known as bread wheat and durum wheat, respectively.
There are three major wheat-production provinces in SA: the Free State, the Western
Cape and the Northern Cape (Esterhuizen, 2015). The annual average of wheat
production in SA is 1.3 to 2 million tons (Esterhuizen, 2017). The production demand
continues to escalate and is currently estimated to be 2.7 million tons, the result of a
continuous increase in consumption of 1% every year (Esterhuizen, 2017). Production
decreased by 50% in the country as a result of a reduction of hectares in the Free
State caused by a major drought during the year of 2016 (Esterhuizen, 2017).
Several biotic and abiotic factors are hampering the efficient production of wheat.
According to Ahmad et al. (2014), water stress is a major abiotic factor limiting the
production of wheat (and other crops) and continues to be a challenge in crop
production. Water stress severely affects about 50 and 70% of wheat production areas
for both developing and developed countries (Nezhadahmadi et al., 2013). According
to Nezhadahmadi et al. (2013) extremely dry conditions will result in a scarcity of water
by 2025. Approximately 1.8 billion people will encounter severe water scarcity, and
about 65% of the world’s population will live under water-limited conditions
(Nezhadahmadi et al., 2013).
Water stress and rust disease significantly affect the growth and development of
wheat. Due to the ever-increasing world population, breeding for water stress and
disease resistance is important to ensure food security (Ahmad et al., 2014; Simons
et al., 2011). Genetic recombination, migration and mutation are important factors
limiting the development of varieties with durable resistance (Todorovska et al., 2009).
Variety development through gene pyramiding has been considered as the best option
to ensure rust resistance and durability (Simons et al., 2011). According to Todorovska
et al. (2009) multiple resistance genes limit rust disease by overcoming the pathogen.
Direct selection of the target traits from wheat crop plays a major role in yield
improvement (Khakwani et al., 2011). Development of water stress resistance
varieties remains a key objective in multiple plant breeding programmes. However,
Stellenbosch University https://scholar.sun.ac.za

2
limited screening methods and germplasm sources to provide the genotypes showing
noticeable stress responses to different stress conditions result in limited success
(Mwadzingeni et al., 2016). According to Khakwani et al. (2011), development of
varieties with improved yield and stress resistance requires an adequate source of
genetic improvement to provide different traits and responses. A good understanding
of the phenotypic traits that play a significant role in improved yield under water-limited
conditions is important to understand the complexity of the genetic and physiological
mechanisms that lead to variety acclimatisation (Pask et al., 2012). Selection criteria
should be based not only on a single trait but also on the adaptive mechanism to
optimise yield and improve integration of the variety (Mwadzingeni et al., 2016). Yield-
based selection is very important, and proper calculations are required to support
decision making and other factors such as the use and interpretation of the different
drought indices (Mwadzingeni et al., 2016). Hence, allows to evaluate the yield
response from a genotype under stress conditions. Data collection through use of
newly available hand-held devices such as a ceptometer, leaf porometer and
chlorophyll content meter can increase the efficiency of screening and selection. New
technology can be used to optimise yield to support the use of molecular markers
(Khakwani et al., 2011).
To improve wheat genetic material and production of viable hybrid seeds, effective
fertility restoration techniques and proper pollination controls may be useful for
successful plant breeding programmes (Singh et al., 2015). Recurrent selection can
be utilised as a valuable tool to improve the required allele frequencies of a specific
characteristic from the germplasm. According to Stuthman et al. (2007), genetic male
sterility can be used to facilitate crossing in wheat, thereby improving the population
through use of the recurrent mass selection scheme. The established recurrent mass
selection method used in the Stellenbosch University Plant Breeding Laboratory (SU-
PBL) for self-pollinated crops such as wheat was implemented based on the Ms3 gene
(Marais et al., 2000). According to Marais et al. (2000) the method involves the use of
a hydroponic system developed to make crosses whereby F1 male sterile females
tillers are selected and crossed with donors, thereby producing more hybrid seeds.
The SU-PBL has a set of primers routinely used for screening material in wheat
nurseries (Smit, 2013). The set of primers includes stem rust (Sr), leaf rust (Lr) and
Stellenbosch University https://scholar.sun.ac.za

3
yellow/stripe rust (Yr) resistance gene markers. The markers are used to characterise
the F1 base population in the nurseries, thereby identifying rust disease resistance
and susceptible genotypes prior to field evaluation (Marais et al., 2000). Molecular
markers play a key role in screening the material and selection of the target traits.
The aim of the study was to initiate a pre-breeding effort for water stress resistance
and yield improvement in wheat. Selection of high-heritability Mendelian-inherited and
quantitative traits for screening wheat genotypes utilising statistical analysis to improve
selection. In order to achieve the aim, the following objectives were identified:
(a) Screening of genotypes for water stress resistance. Phenotypic screening of 60
genotypes sourced from the SU-PBL and collaborators was done for water
stress resistance. Thirty genotypes selected through statistical analysis and
ranks were further screened to determine the top five. Mendelian-inherited and
quantitative traits were assessed from different stages of growth using a
reticulated hydroponic system (RHS). Molecular screening was done for rust
resistance genes through male sterility-mediated marker-assisted recurrent
selection (MS-MARS) from the SU-PBL and collaborators using an RHS. All
plants were screened using standardised SU-PBL molecular markers.
(b) To develop MS-MARS cycles 1 and 2. The F1 1:1 male sterile female
segregating population was crossed with donor lines sourced from the SU-PBL
nursery and collaborators. Validation of mendelian-inherited and quantitative
traits for water stress resistance was done from five selected males using an
RHS. The five selected males screened for water stress resistance were
crossed with an SU-PBL nursery female segregating population (from MS-
MARS Cycle 1) screened for rust resistance genes. Crosses were done to
introduce the traits of interest and/or novel germplasm into the SU-PBL
breeding population. Molecular screening of five males (screened for water
stress) for rust resistance genes was done.
Stellenbosch University https://scholar.sun.ac.za

4
CHAPTER 2: LITERATURE REVIEW
2.1 Domestication of wheat The Triticum (genus) consists of six different wheat plant species: T. monococcum L.,
T. turgidum, T. aestivum L., T. urartu, T. timopheevii and T. zhukovskyi (Dvorak &
Akhunov, 2005). Wheat (T. aestivum L.) is a member of the grass family (Poaeceae),
which includes rice (Oryza sativa) and maize (Zea mays), together considered as
staple crops. Domestication of wheat can be traced back 8 000 to 12 000 years (Figure
2.1) in Southwest Asia. Ancient people survived through hunting and gathering,
followed by a gradual transition to cultivated crops. The human lifestyle changed
drastically through evolution; this led to domestication of major cereal crops that are
nowadays a staple food. Human societal transition was marked by the domestication
of barley, wild emmer and einkorn (Harlan & Zohary et al., 1966). Domestication of
crops resulted in replication of genetic material from crops (Figure 2.1).
Figure 2.1: Domesticated wheat evolution Source: Adapted from Levetin & McMahon (1996).
The evolution of domesticated wheat involved natural cross-pollination of T.
monococcum (diploid [2n] = 14, AA) with possible wild grass species A. speltoides
(2n = 14BB). Through an evolutionary process, replication of genetic material followed
and resulted in many cultivated species and wild forms of tetraploid (2n = 28, AABB).
Tetraploid (dicoccum and T. durum) species, more precisely dicoccum, were
Stellenbosch University https://scholar.sun.ac.za

5
repeatedly and naturally hybridised by weeds species A. squarrosa (2n = 14, DD),
which resulted in (2n = 42, AABBDD) new hexaploid species (Akhunov et al., 2010).
Wheat has three ploidy levels: diploid (2n = 2x = 14), tetraploid (2n = 4x = 28) and
hexaploid (2n = 6x = 42). Ploidy levels collectively gave rise to allopolyploid series
(Akhunov et al., 2010). These series of allopolyploids can further be classified into
three major series of categories, namely monococcon, dicoccoidea and Triticum, with
the subsections being the ploidy levels such as diploid, tetraploid and hexaploid,
respectively, with a corresponding number of chromosomes (Table 2.1) (Matsuoka,
2011).
Wheat varieties are classified into cultivated and wild varieties or both (Levetin &
McMahon, 1996). Triticum turgidum and T. timopheevii are classified as wild species
under dicoccoides, often shortened to T. dicoccoides, with genome formula AABB and
AAGG, respectively. However, T. timopheevii occurs in both wild and cultivated forms
(Matsuoka, 2011). Natural hybridisation of a wild species T. urartu (genome formula
AA) and unidentified or extinct species in the lineage and gave rise to tetraploid
species namely, the wild emmer and durum wheat. Apparently, unidentified or extinct
species is a close relative of Aegilops speltoides (genome formula BB) that can be
traced back 0.2 to 0.5 Ma years (Matsuoka, 2011). Aegilops speltoides is a goat grass
family of a genome formula SS, with S being closely related to wheat genome B, which
could not be identical (Akhunov et al., 2010).
Common bread wheat (T. aestivum) and T. zhukovskyi exist in a form of cultivated
species and constitute genome formulas AABBDD and AAAAGG, respectively.
However, dicoccoidea (T. turgidum and T. timopheevii) and monococcon (T.
monococcum) occur as domesticated and wild form species (Matsuoka, 2011).
Triticum aestivum originated about 8 500 years ago through natural hybridisation of T.
turgidum with a diploid Ae. tauschii of a genome formula DD (McFadden & Sears,
1946). According to Nesbitt and Samuel (1996, cited by Dvorak & Akhunov, 2005)
archaeological records reveal that T. aestivum originated approximately 8 000 years
ago, but the period of origin of T. turgidum ssp. is indeterminate. In contrast, Harlan
and Zohary et al. (1966) reported that wheat was domesticated 8 000 to 12 000 years
ago in Southwest Asia. According to Peng et al. (2011), T. aestivum was domesticated
approximately 9 000 years ago in the same region. Thus, the time of origin is uncertain
Stellenbosch University https://scholar.sun.ac.za

6
but nonetheless ranges between 8 000 and 12 000 years back. Triticum Urartu and T.
momococcum are diploid species of wheat that diverged at most one Ma back (Huang
et al., 2002). According to Matsuoka (2011), all the species of Triticum originated in
the Fertile Crescent, named after its crescent shape. As the name implies, this fertile
region is rich in wetlands (Matsuoka, 2011). Triticum species originated in the Near
East part of this region, which covers Transcaucasia, the northern and western parts
of Iran, the southern and eastern parts of Turkey and the eastern part of the
Mediterranean (Figure 2.2). Triticum zhukovskyi evolved by hybridisation of two
cultivated diploid varieties of wheat (T. monococcum and T. timopheevii), and their
lineage consists of inadequate distribution of T. zhukovskyi and T. timopheevii native
to Transcaucasia. According to Matsuoka (2011), a limited number of research
projects have been conducted on the evolution and diversification; therefore, its
domestication remains unknown. However, T. aestivum L. and subspecies of T.
aestivum and cultivated varieties of the T. turgidum lineage are now found everywhere
and are produced worldwide (Peng et al., 2011). The genome formula of T. durum and
wild emmer wheat species is considered as the core of domestication simply because
of their similarities. Common bread wheat inherited two genomes from these species
of wheat (Peng et al., 2011).
Figure 2.2. Diagram of the Fertile Crescent Source: Matsuoka (2011).
The green-shaded region (Figure 2.2) indicates the borders of the Fertile Crescent.
The solid red line and the dotted purple line indicate the central region of
domestication. It is believed to be the region where agriculture emerged (Matsuoka,
Stellenbosch University https://scholar.sun.ac.za

7
2011). Aegilops tauschii species’ distribution range was measured at the edge of the
western region, the region believed to be the most probable region of T. aestivum
allopolyploid speciation (Matsuoka, 2011).
The domestication of wheat resulted in transition of key features such as rachis,
diverting from brittle (Br) to non-brittle (non-Br). Such features are considered as
empirical evidence of domestication (Peng et al., 2011). The principal concern was the
loss of yield through shuttering of major cereal crops, but modification of Br to non-Br
overcame the problem, realising considerable yield. According to Salamini et al.
(2002), the quantitative trait loci (QTLs) associated with the Br gene in wheat was
mapped in Group 3 of the homologous chromosomes. Domesticated wild emmer
wheat has a non-Br character (Matsuoka, 2011). Contrasting with their wild progenitor,
in domesticated varieties, development of a fracture zone is suppressed by tough
glume and delayed until harvest (Peng et al., 2011). According to Salamini et al.
(2002), due to the agricultural and biological importance of the Br character, several
studies have been conducted to examine its genetic basis. These studies sought to
explain the methods involved in genetic control of the non-Br trait. Some research
reported that recessive alleles were responsible for controlling the non-Br trait mapped
in Group 3 A and B of the short arm chromosomal region (Matsuoka, 2011; Nalam et
al., 2006). Comparing the results of molecular work shows that Br A1 and B1,
commonly known as Br2 and Br3, respectively, are responsible for controlling this trait.
Recent multiple research studies reported that the traits were being controlled by
several genetic pathways and that shattering was controlled by diverse genetic origin
of loci in polyploid species (Salamani et al., 2002).
Glume tenacity is one of the important traits modified during domestication of wheat
(Gill et al., 2007). It is closely linked to free-threshing ability. Glumes are used to
distinguish between cultivated and wild varieties of wheat (Villareal et al., 1996).
Domesticated varieties are covered by soft glume (free threshing) whereas wild
varieties are covered by tough glumes (difficult to thresh) (Gill et al., 2007). Two genes
controlling the free-threshing trait evolved through domestication (Villareal et al.,
1996). Several QTLs linked to the free-threshing trait were mapped in chromosome
locations 2A, 2B, 2D, 5A, 6A, 6D and 7B. Nonetheless, there are partially recessive
alleles at tenacious glume (Tg) loci and partial dominant allele at loci Q on
Stellenbosch University https://scholar.sun.ac.za

8
chromosomes 2DS and 5AL. Hence, they have been found predominantly controlling
free-threshing trait(s) (Peng et al., 2011). According to Matsuoka (2011), research
studies showed that the T. momococcum soft glume (sog) gene was found in
chromosome location 2AS chromosomal arm near the centromere. Furthermore, the
tenacious gene (Tg) in common bread wheat was mapped in the same chromosomal
arm but in the most distal region of chromosome location 2DS chromosomal arm
(Matsuoka, 2011). The different locations mapped in chromosomes indicate different
evolutionary origins in mutation for free-threshing ability. In recent times, the exact
location of Tg1 was mapped on 2DS (Matsuoka, 2011).
Ancient wheat cultivars consisted of hulled seeds, and for them to be winnowed from
the chaff, they needed to dry out (Zhang et al., 2014). During domestication, farmers
selected cultivars with low glume tenacity, fragile rachis and free-threshing ability;
consequently, harvesting was more convenient. The free-threshing trait allowed easy
removal of naked kernels following harvesting; therefore, the kernels were ready for
milling (Matsuoka, 2011). The free-threshing ability of common cultivars of T. aestivum
L. and T. durum indicates the ultimate stage of domestication. QTLs associated with
free-threshing ability were found to also influence speltoid character, glume tenacity
and rachis fragility (Jantasuriyarat et al., 2004). These QTLs were mapped together
with Q gene(s) in chromosome 5AL chromosomal arm.
The interaction of Tg and Q loci was found to have a major influence on spike
morphology (Matsuoka, 2011). The Tg gene regulates glume toughness because of
its epistatic effect on the gene locus Q. However, the Q gene has a major influence on
many traits such as glume shape and toughness, plant length, spike length and spike
development duration (Jantasuriyarat et al., 2004). The Tg allele has an epistatic effect
on the free-threshing ability of the wild wheat varieties, caused by genetic interaction
(Zhang et al., 2014). However, the Tg allele was recently found to have no effect on
domesticated varieties due to the presence of the dominant Q allele with a genotype
formula QQTgTg; therefore, it had no effect on the free-threshing ability of wheat
(Matsuoka, 2011). Wild varieties carried genome formula qqTgTg that was associated
with non-free-threshing ability (Figure 2.3). Domestication resulted in genetic changes
from qqTgTg to QQtgtg, which played a major role in the existence of the free-
threshing phenotype (Zhang et al., 2014; Matsuoka, 2011).
Stellenbosch University https://scholar.sun.ac.za

9
Table 2.1: Wheat (Triticum) species (Matsuoka, 2011)
From the genetic perspective, the notion of genetic mutation of the Q allele during
domestication can be explained by its pleiotropic nature whereby transcription factor
properties are believed to be manipulated through the substitution of an amino acid
(Nezhadahmadi et al., 2013). The genetic expression of free threshing and non-
shattering of the seeds are found only in polyploids. Therefore, modifications caused
by polyploidisation and interaction amongst homeoalleles and genetic constituents are
also important (Zhang et al., 2014). The size of a genome of the most famous
domesticated bread wheat (T. aestivum. L) was found to be almost twice as big as
that of a human genome (Brenchley et al., 2012). The size of a genome is 17 000 MB,
and it is composed of a repetitive DNA sequence up to 80%, which are generally
Monococcon Species Type of genome Ordinary name
Triticum monococcum L.
AA
Subspecies Aegilopoides Monococcum Wild einkorn
Dicoccoidea Species Type of genome Ordinary names
Triticum turgidum L.
AABB
Subspecies
Dicoccon Cultivated emmer
Dicoccoides Wild emmer
Polonicum Polish wheat
Durum Durum/macaroni
Turgidum Rivet wheat
Turanicum Khorassan
Paleocolchicum Georgian wheat
Carthlicum Persian wheat
Armeniacum AAGG
Wild timopheevii
Timopheevii Cultivated timopheevii
Triticum timopheevii
Triticum Species Type of genome Ordinary name
Triticum aestivum L.
AABBDD
Common wheat
Subspecies
Sphaerococcum Indian dwarf wheat
Aestivum Bread wheat
Compactum Club wheat
Spelta (L.) Spelt
Macha
Triticum zhukovskyi AAAAGG
Stellenbosch University https://scholar.sun.ac.za

10
retrotransposons. According to Brenchley et al. (2012), bread wheat genome studies
showed that over 94 000 genes were found from three chromosomal location A, B and
D. Genetic diversity and domestication are sophisticated parameters of evolution;
understanding the mechanisms involved in domestication, evolutional trend, genetic
drift and mutational forces could assist the progress of plant breeding programmes
(Brenchley et al., 2012).
Figure 2.3. Comparison of Q and q genes of hexaploid wheat Source: Zhang et al. (2014).
Multiple research studies can be conducted utilising the wild ancestors of wheat to
understand the genetic modification involved, species transformation and genetic
forces. Hence, more knowledge can be gained regarding species’ adaptation and their
mode of action (Brenchley et al., 2012). Genetic forces interaction plays a key role in
species diversity that occurs in the wild. Once evolutionary processes are understood,
one might understand the modern breeding approaches for successful variety
improvement under stress conditions. A thorough understanding of plant behaviour
and genetic responses under stress provides a better chance to improve genotypes
using newly available technologies and molecular markers.
Stellenbosch University https://scholar.sun.ac.za

11
2.2 Modern breeding approaches Classical breeding techniques incorporated stress tolerant traits that were not well
established due to complexity of the traits into crops. Gene-pyramiding of these traits
provides the best alternative for incorporating the genes and allows rapid improvement
of the target regions (Brenchley et al., 2012). According to Breseghello (2013), current
approaches used in genetic engineering largely depend on genetic transfer of the
encoded gene(s) through signalling endpoint and/or biochemical pathways. This plays
a key role in directly or indirectly protecting the plants against unfavourable
environmental conditions.
Water stress was found to be a cause of high yield loss due to reduced plant growth
and development, followed by yield reduction (Nezhadahmadi et al., 2013).
Environmental stresses and/or cold-inducible traits are very broad; plants need to be
exposed to very low temperatures for their expression. According to Breseghello
(2013), modern approaches such as molecular markers enable the screening and
tagging of low-temperature QTLs. Consequently, hardy plants that are resistant to low
temperatures can be selected without conducting frost experiments and subjecting
plants to frost.
2.3 Molecular markers in plant breeding The most recent developments involving technological innovation such as the use of
molecular markers have increased the chances for success in plant breeding
programmes (Nezhadahmadi et al., 2013). Molecular markers are widely used by
several plant breeding programmes to map QTLs associated with important traits.
Numerous molecular markers are available to detect wheat QTLs and genes and to
carry out gene tagging of various important traits for the marker-assisted breeding
method in water-limited environments (Collard et al., 2005). Marker-assisted breeding
is utilised to develop novel wheat varieties tolerant to water stress from several plant
species.
2.3.1 Marker-assisted selection Marker-assisted selection (MAS) has been utilised in plant breeding for more than a
decade. MAS can be described as genetic selection of desirable traits using markers
from the germplasm (Collard et al., 2005). This is a principle whereby morphological
characteristics (phenotype) are selected based on the genetic material (genotype) of
Stellenbosch University https://scholar.sun.ac.za

12
the marker. However, genetic mapping of identified markers for previous studies has
almost never been suitable for MAS. This means that available markers should be
continuously developed and that they must be further tested or validated for reliable
results (Collard et al., 2005). For quality assurance and efficient use of molecular
markers, validation prior to use is recommended for certainty of the results. Usually,
MAS is associated with a series of steps essential for its development, such as high-
resolution mapping, validation of markers and marker conversion (Collard et al., 2005).
According to Ribaut and Betran (1999), variety selection and development goals for
target traits in plant breeding programmes involve selection of varieties with multiple
resistance. Usually, plant breeders work with several sites, many fields and large
populations. Therefore, MAS in plant breeding offers an opportunity to effectively
select plants from a large population. The presence of molecular markers in modern
plant breeding programmes has provided a great opportunity to screen the material
and select the traits of interest prior to field evaluation (Ribaut et al., 1997).
2.3.2 Advantages of marker-assisted selection The establishment of molecular markers in modern plant breeding programmes was
a great achievement associated with several advantages (Collard et al., 2005):
• The use of markers in the laboratory allows the elimination of complex trials in
the field, thereby saving time.
• Due to environmental effects, phenotypic evaluation carried out in the field
brings uncertainty; this is eliminated by molecular work.
• It allows screening of the material at an early stage of growth, such as the
seedling stage.
• It allows combination of various genes (gene pyramiding).
• It offers the opportunity to select less heritable traits.
• Important in situations where phenotypic evaluation cannot be applied (for
example, quarantine restrictions might forbid inoculation with foreign
pathogens).
• Unwanted genes, such as deleterious genes, and undesirable traits can be
easily eliminated.
Stellenbosch University https://scholar.sun.ac.za

13
The use of DNA markers enables mapping of QTLs for water stress tolerance and
other traits (Nezhadahmadi et al., 2013). The molecular markers utilised for mapping
are said to be directly or closely linked to the genes of interest or QTLs. The use of
molecular linkage maps is a remarkable method utilised to improve water stress
resistance in wheat crops (Nezhadahmadi et al., 2013). Successful mapping of the
traits provides an opportunity to utilise closely linked markers to quickly screen several
samples to detect genotypes with target traits. According to Rana et al. (2011), the
use of MAS provides an opportunity to select the traits of interest at genetic level
instead of phenotypic level. MAS was found to be an effective method used to
accelerate improvement of cultivated wheat varieties.
In pyramiding genes for various stress tolerance, MAS plays a vital role in
differentiating among genes with the same characteristics and in improving several
cultivated varieties, thereby effecting durable resistance to stress. William et al. (2007)
reported the decline of heritable traits that were inversely proportional to MAS, which
was regarded as beneficial. A threshold can be reached by the less heritable traits,
caused by escalated QTL complexity (Nezhadahmadi et al., 2013). A threshold may
also be reached when the environment and the QTLs interact and negatively affect
efficiency of the markers, resulting in unreliable markers. MAS is the best option when
one needs to analyse large quantities of seed, which is not common in plant breeding
(William et al., 2007). When this technique focuses on protein profiles and/or DNA-
based markers, it can be implemented based on initiating early selection.
According to Rutkoski et al. (2011), nowadays MAS is a generally accepted method
continuously utilised by commercial breeding programmes and various breeding
approaches, thereby enhancing gain per unit of selection. Interestingly, breeding
approaches enabling the use of molecular markers offer an opportunity to estimate the
value of a single characteristic for selection and to backcross traits/alleles of interest
into novel and elite germplasm whereby a donor plant transfers a gene to the recipient
(Rana et al., 2011). In such a context, the molecular markers are utilised to monitor
and accelerate the presence of a trait of interest by targeting lines with minimum donor
chromatin; possibly, this can be carried by linkage maps. Hospital (2009) suggests
that MAS appears to be the greatest collaboration of conventional breeding methods
and molecular markers utilised in modern breeding approaches.
Stellenbosch University https://scholar.sun.ac.za

14
2.3.3 Molecular marker selection
2.3.3.1 Criteria for marker selection Proper selection of molecular markers that results in successful plant breeding
programmes may consider the following factors (Mohan et al., 1997): -
• A reliable and precise genetic map together with molecular markers linked to
QTLs or target genes is needed.
• There must be a solid combination of markers and target genes/QTLs. Markers
should be positioned in the most appropriate location and often needs presence
of the major gene(s) cloned. A genetic distance of 1 cm should be considered
when markers are linked to the major or lesser genes, thereby minimising
linkage drag (unwanted genes can be dragged and linked with the target gene)
(Mohan et al., 1997). Moreover, special markers such as polymorphic markers
and necessary genetic recombinants should be better flanked to the required
QTLs and be between QTL region.
• The degree of polymorphisms (some genotypes can discriminate others and/or
genetic variation).
• The chances of simultaneously managing multiple populations in a cost-
effective manner should be considered. Considerable continuous production
without complications is required at a fast rate.
Nezhadahmadi et al. (2013) investigated use of molecular markers such as amplified
fragment length polymorphism (AFLP) and simple sequence repeat (SSR) in winter
wheat crops for detection of target gene or QTL for flag leaf senescence (FLS) under
optimum and water-deficit conditions. According to Verma et al. (2004), the gene-
controlling FLS was mapped and described, and the QTL was identified in
chromosome 2D, responsible for increased tolerance under water stress conditions.
According to Quarrie et al. (2005), molecular research work utilised several DNA
markers including AFLP, SSR and restriction fragment length polymorphism (RFLP)
in water-scarce environments to tag QTLs in wheat crops. Molecular markers such as
sodium dodecyl sulfate (SDS) proteins, isozymes and DNA sequences have made a
major contribution and have been extensively utilised for the last few decades in the
selection of QTLs from plants subjected to dehydration. Russell et al. (1997) reported
extensive use of these markers in wheat for identification of genotypes, gene mapping
Stellenbosch University https://scholar.sun.ac.za

15
and evaluation of genetic diversity. Molecular markers can be linked to a specific trait;
for example, a study conducted on durum wheat showed the presence of few markers
linked to crop yield (grain) and morpho-physiological traits in water stress
environments (Davila et al., 1999).
Ashraf et al. (2008) investigated several DNA markers, including SSR, single
nucleotide polymorphism, random amplified polymorphic DNA (RAPD), RFLP,
cleaved amplified polymorphic sequence (CAPS), AFLP, polymerase chain reaction
(PCR) indels and sequences of DNA, thereby estimating the inheritance of stress
resistance. RAPD markers have been thoroughly utilised in wheat by making use of
DNA primers (Milad et al., 2011). Microsatellite molecular markers were found to be
extensively utilised for genetic mapping of cereal crops. RAPD together with
microsatellite markers were observed to be associated with FLS genes in wheat under
water-scarce conditions. In addition, RAPD markers in hexaploid wheat assist to mark
genes. An added advantage of MAS includes correlation of selected stress resistance
target traits and molecular markers that they are greater than the heritability of the
traits (Nezhadahmadi et al., 2013). Therefore, it can be concluded that molecular
markers are very important in improving stress tolerance in wheat under water stress
conditions.
2.4 Male sterility To improve wheat genetic material and production of viable hybrid seeds, effective
fertility restoration techniques and proper pollination control may be useful for
successful plant breeding programmes (Singh et al., 2015).
2.4.1 Genetic male sterility Genetic male sterility (GMS) occurs on a large scale in plants, and about 11 genes
with the potential to induce GMS in wheat have already been discovered (Singh et al.,
2015; Rao et al., 1993) (Table 2.2). Some of these QTLs have been identified and are
responsible for recessive or dominant GMS in wheat. Among the GMS genes, the Ms3
dominant gene is commonly used to induce male sterility in plants. The Ms1 gene
cannot be used simply because it cannot provide adequate male sterility in plant
breeding programmes to facilitate crosses (Whitford et al., 2013). According to Zhang
et al. (2014), a promising dominant Ms2 gene was found in a heterozygous state in
nature through cross-pollinations with the recessive pollen from homozygous varieties.
Stellenbosch University https://scholar.sun.ac.za

16
This allowed continuous segregation from the progenies of male sterile and fertile
plants, and as a result longer plant height could not be distinguished. Ms2 was
commonly used GMS and later crucial discovery of Ms3 gene. Development of the
Ms3 rectified the GMS problem, followed by early-stage screening of plants using
molecular markers at a later stage (Cao et al., 2009).
The dominant Ms3 gene could be easily transferred to the progeny and produce male
sterile and male fertile progenies (Singh et al., 2015). This was followed by
identification of a marker WG341 linked to the Ms3 gene and used for preliminary-
stage screening of the plants. However, Ms3 can only be used under greenhouse
conditions, which led to development of a hydroponic system. Higher temperatures in
the field cause instability; therefore, temperatures of 18 °C to 22 °C are required in the
growth rooms (Singh et al., 2015). GMS systems seek to sustain genetic variation and
enhance desirable allele frequencies in recurrent selection programmes (Singh et al.,
2015). The alternative was to come up with a newly developed hydroponic system.
The system enables massive cross-pollination of male sterile females from F1 1:1
segregating female plants and donor lines of interest. According to Marais & Botes
(2009), cross-pollination between Inia 66 spring wheat and KS87UP9 (male sterile)
resulted in F1 male sterile progeny displaying spring growth behaviour. After
introduction of the Ms3 gene to the F1 progenies, several further cross-pollinations
were performed with seven spring wheat genotypes. A series of crosses made from
diverse disease resistance plants which included crosses between male sterile F1 and
randomly selected lines through creation of diversity in the breeding population
(Marais & Botes, 2009).
MAS assists from early screening of the resistant plants to stress before introducing
them into the germplasm. Continuous pyramiding of genes of interest in the population
may enhance allele frequencies and facilitate several genetic resistances. The
hydroponic system currently used in the SU-PBL termed MS-MARS cycle was
developed (Figure 2.4). Variety improvement through GMS may lead to progress in
variety development. A good source of genetic improvement can provide genotypes
with improved yield on less available land for production. Sufficient production may
lead to economic development through meeting the demand for consumption and
Stellenbosch University https://scholar.sun.ac.za

17
export of wheat as a staple crop in SA. Increasing wheat production is the key objective
in the SA production industry.
Table 2.2: Genetic male sterility genes GMS Location Allele Reference Ms1 4BS Recessive Endo et al. (1991)
Ms2 4DS Dominant McIntosh et al. (1998)
Ms3 5AS Dominant McIntosh et al. (1998)
Ms4 4BS Dominant Klindworth et al. (2002)
Ms5 3AL Recessive Klindworth et al. (2002)
Ms1 (mutants) Pugsley’s (Ms1a) 4BS Recessive Suneson (1962)
Probus (Ms1b) 4BS Recessive Fossati and Ingold (1970)
Cornerstone (Ms1c) 4BS Recessive Driscoll (1987)
FS2 (Ms1d) 4BS Recessive Klindworth et al. (2002)
FS3 (Ms1e) 4BS Recessive Klindworth et al. (2002)
FS24 (Ms1f) 4BS Recessive Klindworth et al. (2002)
2.5 Wheat production There are three major wheat-producing provinces in SA: the Western Cape, the
Northern Cape and the Free State (Esterhuizen, 2013). Together, these three
provinces produce about 85% of the wheat produced in SA. Production increased from
year 2016 by 50%, 75% and 14% in the Western Cape, the Free State and the
Northern Cape, respectively. About 1.1 m tons were produced by the Western Cape,
followed by 308 000 tons by the Free State and 266 000 tons by the Northern Cape
from 2016 to 2017 (Esterhuizen, 2017). The massive increase in wheat production by
the Free State was caused by an increase of the area planted as a result of a major
drought from 2016 to 2017. Farmers were directed to consider wheat as an alternative
to maize (Zea mays) because the area used for maize production was affected by
drought (Esterhuizen, 2017). Nevertheless, the region used for wheat production
continuously decreased every year with a proportional increase of consumption by 1%
every year for the past decade (Esterhuizen, 2017).
For the past two decades, wheat production has been uneven in SA (Esterhuizen,
2017) (Figure 2.4). There has been a steady decrease in production from 2011 to
Stellenbosch University https://scholar.sun.ac.za

18
2016. This was caused by a lack of cheaper available alternatives such as rice and
maize. Other staple crops (combined) available for consumption has doubled the price
as a result of drought for the last two years whereas the demand escalated. Wheat
consumption is expected to increase every year in line with the 1% increase of the
previous years (Esterhuizen, 2017).
Figure 2.4: Production trends, area used for planting and consumption of wheat in SA for the past four decades
Source: Esterhuizen (2017).
The wheat production industry endeavours to find any possible solution to revive the
industry, including high-yield varieties (Esterhuizen, 2017). However, there are many
biotic and abiotic factors such as rust diseases and water stress affecting wheat,
thereby limiting high yield gains. Rust is a devastating fungal disease that can result
in significant yield loss through hampering grain formation in the spike (Ellis et al.,
2014).
2.6 Wheat rust disease Wheat growth and development can be affected by several biotic and abiotic factors.
Rust is one of the primary biotic factors affecting wheat and is caused by Puccinia
species. Stem (P. graminis), leaf (P. triticina) and stripe (P. striiformis) rust are
prominent diseases in wheat associated with yield loss (Ellis et al., 2014). Rust
originates from the phylum Basidiomycetes, consisting of 6 000 species. According to
Cuomo et al. (2013), P. triticina has a larger genome size of 135.34 Mb in relation to
Stellenbosch University https://scholar.sun.ac.za

19
P. graminis with a size of 88.64 Mb and other fungi in the family. Puccinia species is
parasitic and relies on the host for nutrients. It forms specialised structures to infect
the host, thereby extracting available nutrients from the host plant. The pathogen can
hamper the defence mechanism of the host through secretion of effector protein
clusters.
Rust reproduces both sexually and asexually (Ellis et al., 2014). Reproduction varies
among host plants; asexual reproduction occurs in wheat and sexual reproduction in
other host plants such as meadow rue and barberry. Rust disease develops by
inoculating the plant using spores termed ‘aeciospores’ or ‘urediniospores’ (Cuomo et
al., 2013). The rust-like colour of urediniospores is produced from the wheat plant
(stem or leaf organ) thereby protruding on the surface through busting the epidermis.
The spores are primarily airborne, and this may lead to reinfection of the same plant.
Black teliospores are produced at plant maturity, and this designates the fungus’
overwintering stage; the fungus remains dormant through the winter season.
According to Singh et al. (2002), when optimum conditions prevail, each cell can grow
and produce single-haploid basidiospores. Spores are carried by the wind and infect
the new host through the stomata or the vectors that carry the spores.
Rust can be controlled in two ways, namely host plant resistance and chemical control
(not within the scope of the study) in cereal crops. Oliver (2014) states that genetic
resistance is widely used and highly recommended due to the economic and
environmental perspective, and resistance against fungicide developed by the
pathogen. In general, two types of genetic resistance are utilised by plant breeding
programmes for rust, namely adult plant resistance and pathogen race-specific
resistance genes, based on phenotype level. According to Ellis et al. (2014), the adult
plant resistance gene is only expressed in adult plants and pathogen race-specific
resistance genes are expressed from an early stage of growth up to adulthood. These
two genetic divisions of rust resistance genes are classified as leaf rust (Lr) and stem
rust (Sr) disease resistance.
2.6.1 Lr34 More than 60 QTLs and leaf rust resistance genes have been identified in wheat. The
greater proportion of these genes is race specific, and many are being utilised in
variety improvement programmes by plant breeders (Ellis et al., 2014). The resistance
Stellenbosch University https://scholar.sun.ac.za

20
lifespan of these genes may not be long simply because P. triticina (pathogen causing
leaf rust) endlessly evolves into new races and gain counter-virulence (Cuomo et al.,
2013). Gene-pyramiding of genetic complexes such as slow rusting may provide
adequate rust resistance under intensive infestation; however, slow-rusting
effectiveness largely relies on environmental conditions (Singh et al., 2003). Race-
specific genes can be effectively utilised by plant breeders and by supplementing with
slow-rusting genes.
Molecular characterisation using markers facilitates gene pyramiding technique. Leaf
rust genes such as Lr34 and Lr46 are categorised under a small group named slow-
rust genes (Singh et al., 2003; Martínez et al., 2001). This group consist of durable
yield and non-race specific adult resistant genes. Moreover, non-race specific genetic
resistance is relatively lower than that of race specific resistance. About a decade after
Lr34 had been cloned, but similarities were observed with the stripe rust adult
resistance gene Yr18, together with the Pm38 gene that provides resistance to
powdery mildew and, finally, the Ltn1 gene responsible for leaf tip necrosis (LTN)
(Krattinger et al., 2009). These clusters of genes are generally known as coding
adenosine triphosphate (ATP)-binding cassette transporters. Lr46 and Yr29 were
reported to have a pleiotropic effect between them and to be associated with stripe
rust slow-rusting genes. Lr34 was described about 51 years ago from a cultivated
variety, Frontana (Dyck et al., 1966). The chromosomal location of Lr34 was mapped
in 7D, short arm, within the vicinity of the marker Xgwm295. The phenotypic resistance
characteristics exhibited by this gene may involve small size of uridina, fewer uridina
and a longer latent period. According to Schnurbusch et al. (2004), a strong genetic
linkage was reported between Lr34 and LTN loci; moreover, this association may
result in a pleiotropic effect in the LTN phenotype.
2.6.2 Sr2 Black rust, commonly known as stem rust, is a common disease in wheat, and the Sr2
gene provides genetic rust resistance in the adult plant (Martínez et al., 2001).
Application of the Sr2 gene in breeding programmes to provide broad-spectrum
resistance and durability in wheat was traced back more than six decades (McNeil et
al., 2008). This may involve Ug99 resistance to a challenging wheat fungus rust strain
and related isolates. The Sr2 gene was isolated from Yaroslav emmer wheat species
Stellenbosch University https://scholar.sun.ac.za

21
and introduced to hexaploid wheat. This gene was mapped in chromosome 3B, at the
short arm of the chromosome. According to Spielmeyer et al. (2003), the Sr2 gene
exists in a recessive state and provides partial self-reliant resistance. However, the
Sr2 complex assists to provide noticeable rust resistance in accordance with recessive
Sr2 genes (Singh et al., 2004). The homologous stage of the Sr2 gene has been
associated with setbacks such as phenotypic expression being only noticeable in adult
plants that are most likely to be influenced by the environment and genetic
components (Singh et al., 2004). Pseudo-black chaff (PBC) is a morphological marker
found to be associated with Sr2; this marker provides partially dominant in plants. PBC
appears at the bottom of the internodes, peduncle and from the glumes as dark
pigment (Mago et al., 2011b).
However, PBC can be expressed at different levels based on genetic material and
environmental conditions. According to Mago et al. (2011a), microsatellite markers
such as gwm533 and csSr2 (CAPS) and other markers tightly linked to Sr2 have been
widely used in many plant breeding programmes for stem rust resistance in wheat.
Marker Xgwm533 is tightly linked to Sr2 in different wheat genotypes and is
determined by the band size of the 120 base pair (bp) (Spielmeyer et al., 2003).
However, in chromosome 3B, two separate markers of Xgwm533 were identified,
which led to contradiction because lines that did not carry Sr2 also expressed the
presence of marker Xgwm533 and possessed a different sequence (Spielmeyer et al.,
2003). However, this was soon rectified by Hayden et al. (2004) through development
of sequence-tagged microsatellite markers, which played a significant role in
distinguishing between the markers.
Furthermore, by using bacterial artificial chromosome, new SSR loci were identified
by Hayden et al. (2004) that were even closer than the Xgwm533 RSS marker to Sr2.
Nonetheless, they existed as polymorphic between the lines and they would be either
presence as a resistance gene or absent. Such lines can be utilised in breeding
programmes; however, examination of parental lines may be required. In addition,
Mago et al. (2011a) reported another marker even closer than Xgwm533, namely the
csSr2 marker. Malik et al. (2013) estimated an increased level of molecular marker
precision through simultaneous use in rust resistance genetic screening.
Stellenbosch University https://scholar.sun.ac.za

22
Figure 2.5: MS-MARS cycle scheme flow chart Source: (Marais & Botes, 2009).
Environmental stresses are one of the devastating stresses affecting wheat growth
and development. Added abiotic stress such as water stress from the infected leaves
was reported to significantly reduce the leaf lifespan in barley (Aym & Zadors, 1979).
Fungal diseases were found to be increased under water-limited conditions (Desprez-Loustau et al., 2007).
MAS
Plant F1 seeds
F1 hybrid
seeds
Pollinate selected
male & female
plants
Male population
resistance donor
Female 1:1
Segregating MS-
MARS population
Grow SSD F2 in
the greenhouse
Grow SSD F3 in
the greenhouse
Plant F4 in the
field & select
single ear
Summer field
nursery SES
DH/unreplicated F6 field trial
for agrotype, field disease
resistance, yield and quality.
Grow F1 duplicates
in the field
Select for agrotype,
resistance & SDS
sediments
Produce haploid
plants from selected
F2 treat with colcine
Screen for rust resistance to increase
seeds
Select male
parents
1
st
year
2
nd
year
3
rd
year
Male fertile
females
4
th
year
Stellenbosch University https://scholar.sun.ac.za

23
2.7 Environmental stress resistance Classical breeding techniques incorporated stress tolerant traits that were not well
established due to complexity of traits involved (Nezhadahmadi et al., 2013). Gene-
pyramiding of these traits provides the best way to incorporate the genes and to allow
rapid improvement of the varieties from the target regions. According to Breseghello
(2013), current approaches used in genetic engineering largely depend on genetic
transfer of the encoded gene(s) through signalling endpoint and/or biochemical
pathways. This plays a key role in directly or indirectly protecting plants against
unfavourable environmental conditions.
2.8 Water stress resistance genetic improvement The following three key strategies are utilised to improve water stress resistance lines
in minimally productive areas (Fleury et al., 2010):
a) Characterisation and phenotypic screening of parental lines with improved yield
under water-limited environments. This classical approach has been
extensively used, and modern varieties are empirical evidence of the
programmes’ success. However, the demand for food constantly escalates and
production has plummeted for the past few decades. Consequently, the
demand cannot be met because the demand is greater than supply (Tester &
Langridge, 2010).
b) Richards et al. (2010) proposed a strategy to describe physiological ideotypes
according to the concept conceived by Donald (1968) for improved yield in dry
areas. Ideotype plants are expected to acclimatise and perform exceptionally
well in the target environments and produce considerable yield. Therefore, the
ideotype method of breeding is based on improving cultivars’ genetic material
for exceptional yield gains under water stress conditions. This method predicts
improved variety performance, and crops are anticipated to perform better in
dry areas and serve to establish new varieties with traceable record of
descendent. Despite intensive application of these methods, they have been
associated with little success. Richards et al. (2010) claim that selection for
water use efficiency utilising the carbon isotope discrimination trait for screening
could be more successful in the development of new varieties.
Stellenbosch University https://scholar.sun.ac.za

24
c) MAS in accordance with screening for traits of interest at QTLs for water stress
resistance. Nevertheless, the intensive use of molecular markers and several
publications of articles on water stress resistance QTLs. Gupta et al. (2001)
reported less success in solving even a sole case for water stress or any other
water stress-related issue where the markers were applied in wheat crops.
Molecular work identified about 50 QTLs screened using DNA markers.
However, among all these QTLs, only a single locus was found to be linked with
better performance in less productive areas. These loci were resistant to soil
with high boron, toxicity caused by aluminium, plant height (PH) and tolerance
against the nematodes. According to Fleury et al. (2010), previous studies failed
to map QTLs that could be used in plant breeding programmes for variety
development.
Past failures of molecular and physiological breeding strategies imply that more work
needs to be done in terms of identifying strategies to understand breeding for water
stress resistance (Fleury et al., 2010). Genetic strategies utilised nowadays could
possibly lead in two directions: on the right direction or to those which were
unsuccessfully tested or even further than that. Water stress resistance programmes
should incorporate many disciplines with a common goal. A multidisciplinary approach
should integrate aspects such as genome implementation, QTLs, plant physiology for
water stress tolerance traits, microarrays and transgenic crops (Fleury et al., 2010).
For the success of research programmes, the strategy should also incorporate
scientists from many disciplines such as plant physiologists, molecular biologists and
plant breeders. According to Passioura (2007), the multidisciplinary approach was
realised in the field by major companies in technology demonstration for water stress
tolerance.
According to Cattivelli et al. (2008), a great effort has been made by primitive
agriculturalists to improve grain yield and stability under water stress conditions.
Detection of genetic determinants for plant physiological response to stress provides
a great opportunity for progress of breeding programmes (Nezhadahmadi et al., 2013).
Under water stress conditions, plant cells lose water and become dehydrated.
Dehydration induces plant expression of water stress-related genes. According to
Cattivelli et al. (2002), this provides a plant with an opportunity to escape or avoid
Stellenbosch University https://scholar.sun.ac.za

25
stress-related problems and greater degree may be observed under transcriptional
control.
Multiple water stress resistance-related genes from different plant species have been
isolated over the past few decades. According to Kollipara et al. (2002), the complexity
of water stress tolerance has been discovered and revealed by large transcriptome
analyses. Kollipara et al. (2002) state that in ongoing research projects worldwide for
crops growing under stress conditions, the complexity of aspects involved such as
networking and communication among cells and/or within individual cells has been
explored during plant response to water stress through use of molecular work.
According to Xie et al. (2005), intensive research work has been done on model plants,
involving screening and isolation of genes and transfer of these genes to new varieties.
For efficient transfer of the genetic material, a technique called ‘genomic synteny’ is
used. Molecular pathways offer a great opportunity to manipulate stress resistance
(Nezhadahmadi et al., 2013). Furthermore, using this technique offers an opportunity
to identify elements driving water stress response from different varieties.
Transgenic crops have been developed to generate, regulate and produce specific
stress responses and physiological processes. Examples of transgenic crops are
encoding genes such as DREBs/CBFs from cereal crops such as wheat, and rice
crops (Dubouzet et al., 2003). Genetically modified crops have shown promise in
breeding programmes following signs of enhanced stressed tolerance under water
stress conditions (Wang et al., 2003). Genetically modified crops’ downregulated
genes that were highly associated with stress were found over induced. In addition,
some stress components were detected such as protein prolines and increased
amounts of soluble sugars (Wang et al., 2003). Over-expression of the SNAC1 gene
has been reported in transgenic rice under water stress conditions as a sign of stress
resistance. Overexpression of this gene was associated with decreased water loss
from the leaves, improved stomatal conductance (gs) and decreased sensitiveness to
abscisic acid (ABA) (Sivamani et al., 2000).
Nezhadahmadi et al. (2013) describe QTLs as important chromosomal locations
where genes of quantitatively inherited traits influence phenotype. According to Ashraf
et al. (2008), genetic material varies from one crop to the next; therefore, mapping of
QTLs offers an opportunity to examine plants’ genetic variation and it enables one to
Stellenbosch University https://scholar.sun.ac.za

26
predict the degree of phenotypic effect and the pattern of the genetic activity. Several
studies reported great efforts made to clone QTLs by 2005 by investigating target traits
for water stress resistance (Salvi & Tuberosa, 2005; Tuberosa & Salvi, 2006; Cattivelli
et al., 2008). Some studies reported mapping of QTLs responsible for water stress
resistance in wheat and other cereals (Quarrie et al., 1994; Bernier et al., 2008).
ABA synthesis and increased concentration have been identified and described under
water stress conditions (Quarrie et al., 1994). Chromosome location 5A has been
reported to be responsible for transportation of genes associated with ABA
concentration in wheat. Quarrie et al. (2005) mapped QTLs associated with
dehydration tolerance in chromosomes locations 1A, 1B, 2A, 2B, 2D, 3D, 5A, 5B, 7A
and 7B. Double haploid-induced wheat cultivars provide reliable QTLs for water stress
tolerance traits. Recombinant inbred lines were utilised, crossing water stress
tolerance and susceptible parental lines, thereby generating a potential base
population required for QTL mapping and analysis. Improved yield under water stress
conditions was thereby attained (Tuberosa et al., 2002). Target QTL analysis and
mapping have been conducted for more than a decade; however, certain procedures
should be followed when doing such analysis and mapping.
Firstly, genotypes should be evaluated from the very large population that is required
for polymorphic markers (Nezhadahmadi et al., 2013). Secondly, it is very important
to consider the importance of available genetic material. Lastly, it is generally
significant to do statistically analysis to identify the QTLs and what influences the traits
of interest. The QTL for water stress tolerance comes with disadvantages, including
genetic and environmental interaction (Rana et al., 2011). Limitations may also include
great genetic variation and mapping of incorrect populations. These drawbacks have
restricted the approaches utilised for mapping QTLs associated with improved yield in
water-deficit environments (Gupta et al., 1999).
2.9 Screening for water stress resistance
2.9.1 Traits associated with water stress resistance
2.9.1.1 Biomass Plant biomass plays an important role in plant growth and development. A study by
Wang et al. (2005) showed a reduction in total plant biomass as a result of water stress
Stellenbosch University https://scholar.sun.ac.za

27
in spring wheat. Plant dry weight (DW) is influenced by a number of factors, including
relative growth rate (RGR), photosynthesis active radiation (PAR) and photosynthesis
(Koca & Erekul, 2016). Plant biomass increases from the seedling stage as the plant
grows. Some research studies reported positive relationship between accumulation of
plant DW and RGR (Ozturk et al., 2014). According to Shao et al. (2008), the number,
size and longevity of the leaves of the entire plant can decline as a result of water
stress. Water stress may significantly interfere with the development of wheat leaves
and other plant organs (Singh et al., 1973). Khan et al. (2010) reported a decreased
number of tillers (NT) as a result of water stress in wheat genotypes. The NT per plant
plays a major role in yield contribution. Guo et al. (2018) showed that water stress
significantly reduced total plant dry weight (TPDW) by reducing shoot length (SL),
shoots dry weight (SDW) and roots dry weight (RDW).
2.9.1.2 Relative growth rate Plasticity is the ability of plants to modify their growth behaviour in response (e.g
metabolism) to water stress (Solomon & Labuschagne, 2009). Increased water use
efficiency and reduced loss of water by a plant may increase grain yield (Whan et al.,
1991). Rapid growth of a plant provides an opportunity to maximize amount of scarce
available resources such as water. Plants with higher RGR and increased plasticity
(morphological and/or physiological) have a greater chance to adapt in dry areas. This
provides a better opportunity to screen and to make selections for water stress
resistance. Simane et al. (1993) found that the relationship between RGR and morpho-
physiological factors could play a significant role in utilising this trait in plant breeding
programmes. Understanding the genetic background of the specific variety plays a
significant role in variety improvement for a specific trait (Solomon & Labuschagne,
2009). Reduced RGR was observed in wheat genotypes under water stress conditions
(Guo et al., 2018).
2.9.1.3 Root and shoot traits Plant roots growing under water stress have the ability to grow deep into the soil
thereby extracting available water from deeper soil (Hawes et al., 2000). Of the three
plant parts namely leaves, stems and roots, roots are the first to be affected by water
stress. Root extension progresses under water stress whereas other plant parts are
limited to growing up to a certain threshold (Franco et al., 2011). Thus, there is
Stellenbosch University https://scholar.sun.ac.za

28
variation in growth and development of different plant organs under water-limited
conditions. Such plant behaviour is empirical evidence of plant adaptation in a water-
deficit environment. For optimal water uptake by a plant, the root-to-shoot ratio (R:S
ratio) is increased during the desiccation period, and this relates to the abscisic acid
content of the roots and shoots (Smirnoff, 1998). Surprisingly, Noctor & Foyer (1998)
observed a decrease in root growth of wheat grown under moderate and severe water
stress. Rao et al. (1993) reported a nonsignificant reduction in root growth under water
stress. However, yield stability under water stress can be improved by paying more
attention to root traits such as root biomass and root morphology (Becker et al., 2016).
Water stress affects not only R:S ratio but other factors such as RDW, roots fresh
weight (RFW) and root length (RL) as well. Under water stress conditions, more
assimilates are directed into roots for growth and development to ensure a deep root
system for water uptake (Franco et al., 2011). The R:S ratio could be that roots grow
faster than the shoots or that the shoots slow down or stop growing (Franco, 2011).
Similar results were reported by Guo et al. (2018) with SDW and SL being reduced
under water stress conditions. Rapid root growth may result in increased RDW, RFW
and RL under water stress conditions. Reduced SDW, shoots fresh weight (SFW) and
SL are expected under water stress conditions.
2.9.1.4 Chlorophyll content Plant growth and yield are the end product of photosynthesis. The process of
photosynthesis links several physiological and molecular processes occurring in the
plant. According to Zlatev et al. (2017), biomass accumulation is the result of
photosynthesis. Maxwell and Johnson (2000) state that Chl and photosynthesis
activity are an important signal to indicate the stress levels and health status of a plant
because of the changes in their usual concentration in response to stress. The Chl of
the leaf determines the amount of light to be absorbed, thereby determining the end
product (Murchie & Lawson, 2013). Biotic and abiotic stress interferes with the
functioning of the most active enzyme, Ribulose-1,5-bisphosphate carboxylase/
oxygenase (RuBisCO), in the photosynthesis process. Therefore, any form of stress
may reduce Chl and/or RuBisCO functioning, and the damage can be observed from
the chloroplast. Moderate water stress may reduce the stomatal aperture followed by
reduced photosynthesis activity without severe damage of the chloroplast (Maxwell &
Stellenbosch University https://scholar.sun.ac.za

29
Johnson, 2000). According to Grassi & Magnani (2005), extreme water stress may
severely reduce the stomatal aperture up to 0.1 mol H2O m
−
2s
−1
. Hence, the
photochemical system will collapse, resulting in inhibition of carbon dioxide (CO2)
intake, reduced RuBisCO functioning and reduced photosystem II activity.
2.9.1.5 Leaf area Research conducted by Rizza et al. (2004) reported a correlation between short plant
stand, early maturity and reduced leaf area with water stress tolerance. Lonbani &
Arzani (2011) observed a significant increase in flag leaf area length in relation to
width, which did not change significantly in wheat genotypes grown under water stress
conditions. Plant growth is reduced under water stress condition resulted by a
reduction in leaf extension; this enables a balance between plant water status and
water uptake by the roots (Maathuis et al., 2003). Water stress was found to reduce
leaf area, followed by a reduction in photosynthesis (Rucker et al., 1995). According
to Shao et al. (2008), the number, size and longevity of the leaves of the entire plant
can decline as a result of water stress. Water stress may significantly interfere with the
development of wheat leaves and other plant organs (Singh et al., 1973).
2.9.1.6 Stomatal conductance G
s was found to be the most reliable element to control water loss by the plant, and
utilising this trait for screening could lead to success in variety development (Strauss
& Agenbag, 2000). Measurements have been made more convenient with newly
developed devices that determine leaf diffusion resistance. Several studies have been
conducted for screening the gs of leaves (Haworth et al., 2016; Khalilzadeh et al., 2016;
Flexas & Medrano, 2002). Strauss & Agenbag (2000) recognised the rapid response
of gs to control leaf water potential in plants exposed to water stress in the field.
However, this response was found to restrict plant CO2 absorption followed by reduced
biomass. Some research studies reported the production of ions (potassium) by the
leaf to be responsible for closing and opening of the stomata (Chaves et al., 2002;
Davies & Zhang, 1991). Severe water stress results in stomatal closure and inhibits
CO2 intake, interferes with enzyme (RuBisCO) activity, inhibits production of ATP and
limits photochemical activity (Flexas & Medrano, 2002).
Stellenbosch University https://scholar.sun.ac.za

30
2.9.1.7 Leaf relative water content Leaf relative water content (LRWC) can be defined as the quantity of water available
in the leaf in relation to LDW. Higher LRWC indicates water stress resistance in cereal
crops. According to Clavel et al. (2005) reduction of LRWC is a sign of sensitivity to
water stress. It is very important for a plant to maintain the maximum water balance to
allow growth and development (Strauss & Agenbag, 2000). Water use efficiency was
found to increase under water stress conditions in winter wheat. Despite reported
problems of yield decline (Xue et al., 2006). Water stress-tolerant genotypes were
reported to have reduced water deficit-per-unit decrease compared to stress-sensitive
genotypes’ leaf water potential (Strauss & Agenbag, 2000). Research by Sullivan &
Eastin (1974) suggests that water stress-susceptible and -resistant genotypes can be
identified by using leaf water potential. Spring wheat and sorghum varieties showed
increased water stress resistance in the population caused by increased leaf water
potential in the specific varieties (Strauss & Agenbag, 2000).
2.9.1.8 Excised leaf water loss Excised leaf water loss (ELWL) indicates the ability of the leaf to maintain the water
balance between the continuous supply of water from the roots and loss of water
through transpiration (Kaur et al., 2016). Genotypes that show reduced ELWL under
water stress conditions can tolerate stress better. Such genotypes can easily recover
from stress and produce secure yield (Lugojan & Ciulca, 2011). Cuticular transpiration
rate can be used to distinguish between water stress-susceptible and -resistant
varieties (McCaig & Romagosa, 1991). Low rate of water loss indicates cuticle
resistance against stress, and such genotypes can be used for screening. Measuring
ELWL is cost-effective and convenient and can be used for screening large
populations (Kaur et al., 2016; Clarke & Townley-Smith, 1986). ELWL is a moderately
heritable trait.
2.9.1.9 Photosynthesis active radiation and radiation use efficiency The structure and size of the canopy significantly influence the light energy absorbed
by the plant (Koca & Erekul, 2016). According to Dadashi et al. (2015), this trait
significantly influences biomass accumulation and yield returns. Yield was reported to
be highly dependent on the photosynthesis capacity of the leaves, light interceptance
and leaf area index (LAI) (Duchemin et al., 2007). Increasing irrigation water was found
Stellenbosch University https://scholar.sun.ac.za

31
to proportionally increase LAI in wheat. PAR also increases with increased LAI. PAR
was significantly decreased under severe water stress conditions followed by
significant reduction of net photosynthesis in rice (Yang et al., 2014).
Accumulated plant biomass was reported to be directly associated with intercepted
radiation (IR) (Monteith, 1977). According to Stöckle & Kemanian (2009), the
production of DW per unit of radiation energy used can also be defined as radiation
use efficiency (RUE). Hence, total plant biomass accumulated in grams per square
metre may also be referred to as a product of the cumulative IR (MJ m−
2
) and RUE
(g MJ
−1
) throughout the growing season.
Different phenotypic traits can be used for screening the material at different stages of
growth, thereby developing new varieties or improving existing varieties.
2.9.2 Screening for water stress from early stages of growth Water stress resistance of wheat from the early stages of growth can be considered
as a selection criterion for varietal development. Utilising the appropriate screening
methods from the early stages of growth could support variety development. This will
allow selection of desirable lines for plant breeding programmes. Screening and
selection of an actively growing young plant offer the chance to predict performance
at a later stage. According to Noorka & Khaliq (2007), the yield of a plant can be
determined through selection of vigorous seedlings at an early stage of growth.
According to Alves and Setter (2000), water stress-resistant genotypes are
characterised by several physiological parameters identified for characterisation of
target plants. Water stress does not uniformly affect the early stages of growth, but the
seedling stage is reported to be more sensitive to water stress and this varies with
genotypes (Noorka, 2014). Therefore, the tillering and stem elongation stages are also
sensitive to water stress. Environmental variability significantly influences production;
therefore, under rain-fed conditions, production can be enhanced through
development of potential genotypes. Early-stage characterisation is more convenient,
less labour is required and it is cheaper. According to Rauf et al. (2008), at the seedling
stage, genotypes show moderate to high variability behaviour throughout the
environment. This variability is associated with additive genes, which offer a great
advantage for screening at initial stages.
Stellenbosch University https://scholar.sun.ac.za

32
2.9.3 Stages of growth and development of wheat Many scales have been developed to describe the growth stages of cereal (grain)
crops, such as those by Zadoks, Feekes and Romig. However, two common decimal
scales are utilised worldwide, namely those of Zadoks et al. (1974) and Feekes (1941)
as amended by Chiarappa (1971) and Large (1954) (Figure 2.5). In this study, Zadoks’
decimal codes were used because they are commonly used in small-grain crops such
as wheat due to their precision.
There are four principal stages of wheat development, namely tillering, stem
extension, heading and ripening (Feekes, 1941) (Figure 2.6). Four principal stages are
divided into ten substages of a scale of 00 to 99. Understanding these stages offers a
great opportunity to carry out relevant management practices. This allows timeous
application of relevant inputs such as fertilisers and/or data collection. Water stress
has been considered as one the major environmental stresses. According to Abido &
Zsombik (2018), approximately 25% of agricultural production worldwide is affected
by water stress. Water stress is reported to significantly affect the growth and
development of wheat from planting throughout the life cycle (Abido & Zsombik, 2018).
However, the susceptibility of the plant to water stress largely depends on the stage
of growth, the intensity and duration of the stress and the genotype.
2.9.3.1 Germination stage The germination stage (Zadoks, 00 to 09) lasts from planting the seed in the soil until
appearance of the first green leaf from the coleoptile. According to Zadoks et al.
(1974), the planted kernels remain in the form of a dry seed in the soil. The imbibition
process commences, and the kernel becomes swollen, followed by radicle protrusion
from the seed. The coleoptile emerges from the seed, followed by the first green leaf
just at the tip of the coleoptile. The process is called germination. Several studies
conducted on the germination stage (from planting to emergence of green leaves)
reported that minimum temperatures ranged from 2.4 °C to 4.6 °C (Almansouri et al.,
2001; Hampson & Simpson, 1990; Nyachiro et al., 2002). Temperatures between
20.4 °C and 23.6 °C were reported to be optimum for seed germination, and maximum
temperatures fall between 31.8 °C and 33.6 °C (Nyachiro et al., 2002).
Increased water stress levels at the germination stage were found to reduce the
germination percentage in wheat significantly (Guo et al., 2013; Abido & Zsombik,
Stellenbosch University https://scholar.sun.ac.za

33
2018). At the germination stage, increased water stress levels were found to reduce
enzyme activity, thereby affecting the process of metabolism (Guo et al., 2013).
Reduced or no imbibition results in low water potential and reduced nutrient uptake.
Eventually, changes in the seed hormones and modified activation of the enzyme
occur (Abido & Zsombik, 2018).
Figure 2.6: Diagram illustrating the wheat growth stages Image acquired online: (https://www.westco.coop/pages/custom.php?id=33411)
Increased accumulation of organic osmolytes was reported in wheat seeds as a
defence mechanism to cope with increased levels of water stress (Li et al., 2013).
Prolonged periods of water stress interfere with mitochondrial and chloroplastic
metabolism activity. This will result in production of reactive oxygen species as
defence mechanism, and membrane stability may be destroyed (Li et al., 2013).
2.9.3.2 Seedling stage and leaf development After germination and emergence of the first leaf, seeds continue to grow. The
seedling stage lasts from the appearance of the first leaf until the emergence of nine
or more leaves (Zadoks 10 to 19). Growth at this stage involves production of new
leaves approximately every four to five days (Simmons et al., 1995). The seedlings
frequently produce about eight to nine leaves in total. However, some genotypes may
produce many leaves, especially those that mature at a later stage (Simmons et al.,
1995). Flag leaf appearance is one of the most important periods of growth in wheat.
Growth regulators and other chemical practices are synchronised with flag leaf
appearance (Simmons et al., 1995). Water stress significantly affects the percentage
Stellenbosch University https://scholar.sun.ac.za

34
of germination and the early seedling growth of wheat (Li et al., 2013). Seedlings
cannot tolerate water stress for long periods. Li et al. (2013) reported increased
accumulation of proline content up to a threshold in seedlings under water stress.
Thereafter, reactive oxygen species increased, followed by membrane damage
content, indicating that seedlings cannot cope with prolonged water stress
(Nezhadahmadi et al., 2013).
2.9.3.3 Tillering stage of development The tillering stage begins with the emergence of one tiller from the main stem and
ends when the plant has nine or more tillers (Zadoks, 20 to 29). The tillering stage is
commonly associated with massive leaf development from the main stem, and this is
a key to plant growth and development (Simmons et al., 1995). At this stage, the plant
has an opportunity to accumulate a high NT in order to increase the plant population.
Tillers are expected to be formed at the junction of the coleoptile and from the main
stem at the lower leaves (Del Moral & Del Moral, 1995). The growth conditions and
genotype usually determine the NT formed. Apparently, formation of tillers in the
greenhouse and on the field, is not the same. More tillers are expected to form in the
greenhouse compared to the field, supposedly three or more tillers from the main stem
(Acevedo et al., 2002).
Among all the tillers formed, it is common that a few will produce seeds. Production of
tillers also largely depends on plant proficiency; if the plant is not clustered with tillers
or is overfertilised, more secondary tillers can be formed from primary tillers (Acevedo
et al., 2002). Tillers that synchronise their appearance with the emergence of four to
six leaves from the main tiller are expected to be highly competitive for development
and to form grain. In contrast, tillers that emerge far beyond that period are not
expected to perform well; abortion may result, thereby a loss of grain. Some tillers may
persist longer, but this varies with genotypes to form tillers that are likely to abort seeds
(Acevedo et al., 2002).
The stress level that a plant may encounter also plays a key role as abortion increases
with increased water stress levels. Khan et al. (2010) reported decreased NT caused
by water stress in wheat genotypes. NT per plant plays a major role in yield
contribution. Water stress reduces RUE, followed by reduction in photosynthesis
Stellenbosch University https://scholar.sun.ac.za

35
activity and production of carbohydrates. Therefore, tiller development is part of plant
growth and development and is affected by water stress.
2.9.3.4 Head differentiation, stem extension and head growth The jointing stage begins when the plant has a pseudostem and ends when the ligule
of a flag leaf is fully visible (Zadoks 30 to 39). Towards the end of the tillering stage is
a jointing stage; tillers and the main stem begin to form the heads, and this is an
important event for wheat development. However, heads that form at this point are
microscopic and all other reproductive structures that will form floral parts and seeds
have already been formed by this stage (Simmons et al., 1995). At this stage, the
internodes of the lower stem remain the same throughout the stage and plants usually
consist of five leaves. Growth commences from the lower fourth internode that
elongates when a plant has approximately nine leaves (Acevedo et al., 2002).
Internodes continue to elongate on the upper part of the plant. The peduncle elongates
last. Moreover, the length of the peduncle accounts for a large part of the overall main
SL. Growth management practices to control lodging risk by utilising growth regulators
for good returns are scheduled at this stage. Other growth regulators are aimed at
retarding the last three or four internodes, thereby retarding growth and influencing
stem elongation. Consequently, plants with reduced height and firm shoots have
reduced lodging risk (Simmons et al., 1985).
Head growth lasts from when the leaf sheath begins to grow until when the first awns
are visible (Zadoks 41 to 49). Stem elongation and rapid head growth occur
simultaneously, and during this period individual florets get ready for pollination and
fertilisation (Simmons et al., 1985). Tillers have different phases of growth in a single
plant. There is a variation in the emergence of tillers from the main stem in a single
plant. Prior to heading, this variation is decreased from a few weeks to a few days.
The flag leaf encloses the developing head just before it emerges, and this is called
heading (Simmons et al., 1985).
Water stress significantly affects wheat growth and development during the stem
extension and the booting stages. Large numbers of tillers die in winter wheat exposed
to severe water stress during the stem elongation and the booting stages (Nelson et
al., 1988), and these two stages were reported to be the most critical stages of growth
of all (Zhang & Oweis, 1999). Water stress was found to reduce NT as a result of
Stellenbosch University https://scholar.sun.ac.za

36
reduced photosynthesis products in the plant (Gholami & Poor Asadollahi, 2008).
Gholami & Poor Asadollahi (2008) reported a reduced number of kernels per spike of
wheat exposed under water stress conditions at joining stage.
2.9.3.5 Heading and flowering The heading stage begins when the head appears from the leaf sheath and ends when
it becomes completely visible (Zadoks, 50 to 59). This is caused by continuous growth
of the stem and the peduncle, eventually exposing the head and become visible. The
head is made up of two spikelets positioned opposite one another and held onto the
peduncle by rachis (Simmons et al., 1985). A wheat spike consists of spikelets held
onto the peduncle extension by rachis and alternating throughout the peduncle.
Spikelets are made up of four segments, namely stigma, ovary, anthers and stamens.
These four components give rise to a floret. Heading is followed by flowering after a
few days. Flowering begins when a few anthers are visible around the middle of the
head and ends when the head is fully surrounded by the anthers (Zadoks, 60 to 69).
The temperature requirement for flowering is usually 11 °C to 13 °C (Simmons et al.,
1985). Flowering begins from central spikelets on the head and progresses upward
and downward.
Wheat crops are primary self-pollinated; therefore, the pollen sacs shed pollen and
remain attached to stigmatic branches. This is important to prevent outcrosses.
Anthers can be noticed growing out from each floret, and they are usually yellow, grey
or green (Simmons et al., 1995). The colour of the anther can be used to predict
whether pollination was successful or not. Yellow or grey instead of green guarantees
that pollination has occurred. Pollination often takes about four days per head. The
stigmas become receptive for approximately 6–13 days. The sizes of the kernels are
not uniform as from the pollination commences and maintain this variation until
maturity (Simmons et al., 1985).
Water stress may result in yield loss due to loss of spikelets from the developing head.
Severe water stress may result in abortion of the florets and pollen grains from the
head prior to flowering (Ji et al., 2010). Anthesis or flowering was reported to be the
second most critical stage of growth after stem elongation and booting (Zhang &
Oweis, 1999). Water stress may result in severe yield loss if it occurs during the stem
elongation and flowering stages in cereal crops. Anthesis is a critical stage of growth;
Stellenbosch University https://scholar.sun.ac.za
37
the occurrence of stress at this stage reduces pollination and eventually causes yield
loss (Ashraf & Azam, 1998). Sufficient water supply during the post-anthesis period
enables increased photosynthesis rate and provides enough time to translocate
carbohydrates to grains, thereby increasing grain sizes and ultimately grain yield
(Zhang & Oweis, 1999). According to Ji et al. (2010), water stress was found to induce
male sterility in wheat as a result of stress in the early reproductive stage and to cause
reduced yield.
2.9.3.6 Grain development and ripening Grain development begins at kernel water ripe and lasts until the hard dough stage
(Zadoks, 70 to 89). Under normal growth conditions, the plant continues to grow and
kernels are formed, which can take about three weeks (Acevedo et al., 2002). The
endosperm cells at this period are fully developed, and the weight of a kernel does not
change considerably (Ashraf & Azam, 1998). From the first week to the second week
after pollination, an important event occurs; the kernel rapidly accumulates starch and
protein, allowing continuous increase in DW (Ji et al., 2010). A constant supply of
assimilate is required at this phase, which is possibly the determinant of final DW. The
kernels are constantly in a soft dough stage at this period, and eventually the growth
of the kernels decreases in about three weeks into grain filling (Acevedo et al., 2002).
The weight of a kernel approaches its maximum at physiological maturity. During the
hard dough stage, the kernel continues to mature. If conditions become unfavourable
during the growth of the kernel, accumulation of dry matter will be reduced, which will
eventually reduce yield (Ji et al., 2010). Ripening begins when the kernel is hard up to
the loss of secondary dormancy (Zadoks, 90 to 99).
Water stress interferes with accumulation of reserves, thereby reducing the number of
kernels and their sizes and/or causing abortion of the grain (Ji et al., 2010). Water
stress affects plant growth and development during all stages of growth; therefore, it
is important to understand all stages of growth that may result in considerable yield
loss (Acevedo et al., 2002). Understanding the complexity of water stress and plant
developmental stages will not only aid in water stress management but will also enable
the development of water stress-resistant varieties and lead to progress in plant
breeding programmes and agronomic practices (Zhang & Oweis, 1999).
Stellenbosch University https://scholar.sun.ac.za

38
2.10 Reticulated hydroponic system RHS utilises subirrigated gravel culture as a growth media. Such a system enables
the plant roots to anchor themselves in a coarse-textured growth medium, for example
silica sand, form plastic or loose/gravel stones. Utilising gravel/coarse material as
growth medium permits convenient sterilisation. This method may be costly in relation
to others; however, it enables considerable manipulation of growth factors for good
returns. The RHS advances screening of plants in the greenhouse or growth chamber,
thereby enabling feasible planting and harvesting. At harvest, plants can be easily
uprooted to observe root parameters.
Stellenbosch University https://scholar.sun.ac.za

39
CHAPTER 3: MATERIAL AND METHODS
3.1 Introduction The study was conducted at Stellenbosch University in Welgevallen experimental
farm. The seed material used in this project was sourced from the SU-PBL and
collaborators. MAS was utilised for molecular characterisation of wheat lines from the
nursery using rust resistance markers. The following markers were used for screening
the material in the nursery: Lr34, Sr2, Sr31, Sr24, Lr37, Sr26 and Lr19. These markers
were used for the female F1 segregating population and for donor lines phenotypically
screened for water stress resistance.
Phenotypic screening of 60 male lines for water stress resistance utilising an RHS was
carried out in the greenhouse. High-heritability Mendelian inherited and quantitative
traits were identified and selected for screening the material. Selected genotypes were
validated many times for certainty of the results. Selected genotypes were further
screened using more identified and selected traits. Selected genotypes were cross-
pollinated with females in the MS-MARS cycle nursery to introduce the traits of interest
and/or novel germplasm into the SU-PBL breeding population. Correlation study was
performed from the studied phenotypic traits and heritability estimates was explored
from the literature.
Annual routine MS-MARS cycles practised in the SU-PBL provided sufficient male and
F1 1:1 female segregating seed material from the 9th Wheat Rust Resistance Nursery
pre-breeding programmes during 2014. Both males and females were planted as F1
base population in the greenhouse. The female segregating population were planted
two weeks earlier in the greenhouse to synchronize flowering, followed by donors
planted on separate benches. The female 1:1 segregating population was screened
using rust resistance gene molecular markers from the MS-MARS cycle in the nursery.
Four benches of males and females were planted during MS-MARS Cycle 1. Leaf
samples were taken (third leaf more than half visible, Zadoks 12) followed by
molecular characterisation of wheat lines for rust resistance genes. Male-sterile female
plant tillers were selected and crossed with donor tillers to produce seeds. An RHS
was used to facilitate crosses designed for recurrent selection in the greenhouse. The
Stellenbosch University https://scholar.sun.ac.za

40
male fertile F1 segregating population that remained was allowed to self-pollinate and
produced seeds that were used during MS-MARS Cycle 2 as base population. Seeds
produced during MS-MARS was used to make crosses with phenotypically screened
genotypes for water stress resistance traits. Summary of the study flow is represented
on Figure 3.1 below.
3.2 Screening the material
3.2.1 Molecular screening The seed material used in this project was sourced from the SU-PBL and
collaborators. MAS was utilised for molecular characterisation of wheat lines from the
nursery using rust resistance markers. The SU-PBL has a standardised set of
molecular markers routinely used for screening material in the wheat nurseries (Smit,
2013). A selected set of primers was used for the purpose of this study (Table 3.1).
Different markers were used during MS-MARS cycles 1 and 2 for both male and
female lines. During MS-MARS Cycle 1, the following markers were used for both
males and females: Lr34, Sr2, Sr31, Sr24, Lr37, Sr26 and Lr19 (Table 3.1). Only two
markers were excluded from donor lines Sr31 and Sr26 in MS-MARS Cycle 1. During
MS-MARS Cycle 2, only Lr34 and Sr2 were used for screening both male and female
lines in the nursery. Wheat molecular characterisation began with DNA extraction from
the laboratory.
3.2.1.1 DNA extraction A shortened version of a protocol described by Doyle and Doyle (1990) was utilised to
perform DNA extractions from wheat genotypes at seedling stage (third leaf more than
half visible, Zadoks 12). Leaf material of approximately 0.1 g was sampled in the
greenhouse and was put into 2 ml micro-centrifuge tubes. Three sterilised steel ball
bearings were equally assigned to each tube, followed by addition of 500 µl of 2%
(m/v) CTAB extraction buffer. The buffer solution was made up of 1.4 mM NaCl, 20
mM Na2EDTA (pH 8) and 100 mM Tris-HCl (pH 8). The leaf material contained in the
centrifuge tubes was pulverised twice for two minutes at 30 Hz by placing the samples
in the Qiagen
®
TissueLyser supplied by Qiagen (Pty) Ltd and distributed by Southern
Cross Biotechnology, Claremont, RSA. This was followed by incubation of a green
mixture of CTAB extraction buffer and pieces of plant material for 15 minutes in the
Stellenbosch University https://scholar.sun.ac.za

41
water bath at 60 ̊ C. Thereafter, 500 µl of chloroform: isoamyl- alcohol (C: I: 24:1) were
added to the solution and it was centrifuged for 10 minutes at 14 000 rpm. The next
step was transferring the supernatant after centrifuging to new 1.5 ml sterilised micro-
centrifuge tubes. Once more 400 µl of chloroform: isoamyl-alcohol were added to the
supernatant and mixed by inversion, followed by centrifuging for five minutes at
14 000 rpm. After centrifuging once more, the supernatant was isolated and
transferred to 1.5 ml new, clean and sterilised micro-centrifuge tubes. Five hundred
microlitres of ice-cold ethanol and 50 µl of 7.5 M ammonium acetate (or 3 M sodium
acetate [pH 5.0]) were added to the micro-centrifuge tubes. Genomic DNA
precipitation was performed by several inverting micro-centrifuge tubes and followed
by cold centrifuging for two minutes at 14 000 rpm. The supernatant was then
removed.
YE
AR
1
YE
AR
2
Figure 3.1: Representation of the study flow
Objective 1 Objective 2
Screening the material MS-MARS I
-Planting of segregating male and female
parents in the greenhouse sourced from
SU-PBL nursery
-Screening of the material for rust
resistance
Phenotypic screening of 60
genotypes for water stress
sourced from SU-PBL and
collaborators
MAS
30 genotypes selected &
further screened
Five genotypes were
selected using ranking
and statistical analysis
MS-MARS II
-Crossing of five males screened for water
stress and females from MS-MARS I
-Screening of five males for rust resistance
-Producing seeds
Validated
Stellenbosch University https://scholar.sun.ac.za

42
Table 3.1: Primers used for molecular screening of wheat lines
Trait Marker Primer Primer sequences Ta °C
Fragment size (bp)
References
Disease resistance genes
Sr2
csSr2 F
csSr2 R
5’-CAAGGGTTGCTAGGATTGGAAAAC-
3’
5’-
AGATAACTCTTATGATCTTACATTTTT
CTG-3’
60
53,
112,
172
Mago et al.
(2011b)
Sr24
SCS719-
F
SCS719-
R
5'-TCGTCCAGATCAGAATGTG-3'
5'-CTCGTCGATTAGCAGTGAG-3'
55 719
Cherukuri
et al. (2003)
Sr26
Sr26#43
F
Sr26#43
R
5’-AATCGTCCACATTGGCTTCT-3’
5’-CGCAACAAAATCATGCACTA-3’
60 207
Mago et al. (2005)
Sr31
lag 95-F
lag 95-R
5'-CTCTGTGGATAGTTACTTGATCGA-
3'
5'-CCTAGAACATGCATGGCTGTTACA-
3'
55 1030
Mago et al. (2005)
Lr19
12C-F
12C-R
5'-CATCCTTGGGGACCTC-3'
5'-CCAGCTCGCATACATCCA-3'
60 119
Prins et al. (2001)
Lr37
VENTRU
IP
LN2
5'-AGGGGCTACTGACCAAGGCT-3'
5'-
TGCAGCTACAGCAGTATGTACACAAA
A-3'
65 259
Helguera
et al. (2003)
Lr34
L34DINT
9-F
L34PLUS
-R
5'-TTGATGAAACCAGTTTTTTTTCTA-3'
5'-GCCATTTAACATAATCATGATGGA-
3'
58 517
Lagudah
et al. (2009)
Seventy percent ethanol was used to wash the DNA pellet twice. The micro-centrifuge
tubes were then opened and placed horizontally on the table to allow air to flow into
the tubes and dry the DNA pellet at room temperature. After allowing the pellets to dry
out, they were resuspended in 30 μl deionised water and stored at -20 °C. The
interesting step that followed was to determine the concentration of DNA in the tubes
by utilising a Nanodrop® ND-1000 spectrophotometer (Thermo Fisher Scientific Inc.).
DNase/RNase-free water was used to dilute the DNA to a required concentration
ranging from 90 ng/μl to 120 ng/μl.
All primers used in this study were manufactured by Integrated DNA Technologies
(and distributed by Whitehead Scientific Inc., Stikland, RSA), and PCR reagents were
Stellenbosch University https://scholar.sun.ac.za

43
manufactured by KapaBiosystems (distributed by Lasec SA (Pty) Ltd, Cape Town,
RSA). PCR machine number 2 (GeneAmp® PCR System 2720 Thermal cycler)
supplied by Applied Biosystems® Life Technologies, Johannesburg, RSA and/or a
TECHNE TC-5000 (distributed by Lasec, Cape Town, RSA) was used to perform all
the PCR analysis reactions.
The reactions were performed based on the genes of interest; therefore, specific
primer sequences and molecular markers were used (Table 3.1). Most of the PCR
reactions performed for characterisation of wheat lines were multiplex reactions.
However, the exception was CAPS for stem rust (Sr2) reactions. The multiplex
reaction for molecular marker Lr34/Yr18 was tested on the female population,
consisting of wheat lines postulated to carry leaf and stripe rust resistance genes. The
Lr34 codominant CSLV+ and negative marker CSLV- were added to aid identification
of Lr34 genes in a multiplex reaction. The Lr34 reactions were performed using PCR
tubes with final concentration of 17.6 μl. The reaction mix included 4.6 μ1 dH2O, 10 μl
2X KAPA 2GTM Fast Multiplex PCR Mix, 0.6 μ1 Dinta forward primer, 0.6 μ1 Lr34
reverse primer, 0.25 μl of each csLV34 forward and reverse primer, and 1.3 ng of
gDNA.
Micro-centrifuge tubes were placed into the PCR reaction for analysis under the
following cycling conditions: The starting point was the denaturation steps for five
minutes at 94 ºC. This was followed by 35 cycles at the same temperature of 94 ºC for
one minute. Annealing step during which temperature went to 57 ºC for one minute.
Then one minute at 72 ºC and finally 72 °C for seven minutes. The PCR machine
automatically stored the samples at 4 ºC when the cycle was completed. Samples
were removed from the PCR machine and electrophoresed in 1%, 1.5%, 2% and/or
3% agarose gel. For visualisation, 4, 6, and 7 microlitres of ethidium bromide were
added to 80 ml, 160 ml and 200 ml agarose gel respectively and mixed well. Gels were
visualised under ultraviolet (UV) light by using the Uvitec gel imaging system.
Multiplex reaction was performed for six markers, namely Sr31, Lr34, Lr24/Sr24,
Lr37/Sr38, Sr26 and Lr19. These markers were used to test the female population in
the greenhouse (Springfield, 2014). The PCR tubes’ final concentration contained for
multiplex reaction differed from the others; it was 21.7 μl. The PCR tubes contained
the following reagents: two times 12.5 μl KAPA2GTM Fast Multiplex PCR Mix, 1.0 μl
Stellenbosch University https://scholar.sun.ac.za

44
of each Iag95 of both forward and reverse primers, 0.5 μl Dint-forward and 0.5 μl
Lr34Plus-reverse primers, 0.5 μl of 719 both forward and reverse primers, 0.5 μl Vent
and 0.5 μl of Ln2, 0.5 μl of each Sr26#43 both forward and reverse primers, before the
last 1.0 μl of each 12C both forward and reverse primers, and lastly the genomic DNA
of approximately 1.2 ng/μl. Tubes were put into the PCR machine under the following
cycling conditions: Initially, the denaturation step for three minutes at 94 °C.
Subsequently, 30 cycles at the same temperature of 94 °C for 30 seconds. Thereafter,
the temperature slightly differed for annealing at 57 °C for 30 seconds. Then one
minute at 72 °C and finally 72 °C for 10 minutes. The PCR machine automatically
stored the samples at 4 °C when the cycle was completed. Samples were removed
from the PCR machine and electrophoresed in 1%, 1.5%, 2% and 3% agarose gel.
For visualisation, 4, 6, and 7 microlitres of ethidium bromide were added to 80 ml,
160 ml and 200 ml agarose gel, respectively and were mixed well. Gels were
visualised under UV light by using the Uvitec gel imaging system.
Sr2 CAPS molecular markers were utilised to characterise the female F1 segregating
base population at seedling stage (third leaf more than half visible, Zadoks 12).
Wessels & Botes (2014) utilised standardised molecular markers in the SU-PBL to
map desirable genes in the nurseries. The most recent CAPS was used to perform
PCR analysis for Sr2 (Table 3.2).
Table 3.2: The conditions and reaction volumes for Sr2 marker characterisation Reaction reagents
Reaction volume (μM)
Temperature (°C)
Time (min)
dH2O 3 95 2
2X Green 7.5 95 0.5
Cssr2F 0.45 60 0.40
Cssr2R 0.45 72 0.50
gDNA 1.5 72 5
Total 12.9 40 cycles
The markers were Cssr2F and Cssr2R. Both markers were tested on both the male
and female populations in the nursery. The mixture concentration in the tubes for PCR
reaction is shown in Table 3.2. The PCR machines automatically stored the samples
at 4 ºC when the cycle was completed. Samples were removed from the PCR machine
Stellenbosch University https://scholar.sun.ac.za

45
and electrophoresed in 1% agarose gel. For visualisation 4, 6, and 7 microliters of
ethidium bromide were added to 80 ml, 160 ml and 200 ml agarose gel respectively
and were mixed well. The Uvitec gel imaging system that uses ultraviolet light was
utilised to visualise the gel. Samples that carried a band were then selected, and the
researcher proceeded to the next step. Thereafter, the enzyme digestion step
followed. This step involved the addition of 2.5 μl of PagI enzyme (Thermo Scientific)
to selected tubes of genomic DNA that carried a band, followed by incubation under
37 ºC for an hour. Prior to 2.5% agarose gel electrophoresis, about four μl of loading
dye was added to the original genomic DNA samples throughout, mixed and aliquoted.
This was followed by visualising under UV light with the use of the Uvitec gel imaging
system. The presence of the Sr2 gene was identified by a band pattern of 53 bp,
112 bp and 172 bp, and the absence of the gene showed a band size of 225 bp and
112 pb.
3.2.1.2 Preparation of agarose gel electrophoresis For gel electrophoresis, 1%, 1.5% and 1.8% of SeaKem® LE agarose, supplied by
Lasec, (Pty) Ltd, Cape Town, SA, was used. Agarose was weighted on an Advuture
TM
Ohaus supplied by United Scientific (Pty) Ltd, Cape Town, SA. Agarose powder was
transferred to a 200 ml volumetric flask, and 80 ml, 160 ml or 200 ml of TBE solution
was added and mixed well. One TBE buffer was diluted from 5X TBE stock solution,
0.5 M Tris (hydroxymetyl) aminomethane, 0.5 m Boric acid and 0.5 M
Ethylenediamine tetra acetic acid disodium salt dehydrates that were autoclaved for
30 minutes.
The buffer solution was heated in a microwave until all the suspensions were fully
dissolved or cleared. The agarose gel solutions were allowed to cool down at room
temperature before adding ethidium bromide supplied by Sigma-Aldrich (Pty) Ltd,
Cape Town, SA. For visualisation 4, 6 and 7 microlitres of ethidium bromide were
added to 80 ml, 160 ml and 200 ml of agarose gel, respectively and were mixed well.
The gel was casted slowly into plastic boxes/trays to prevent formation of bubbles.
This step was followed by putting 25 or 50 channel combs (respective to gel sizes)
into the gel trays. The gels were allowed to cool followed by gentle removal of the
combs. The gels were immersed in the electric field with 1X TBE followed by loading
of DNA samples into the sample. For the Sr2 PCR product, 4 μl of
Stellenbosch University https://scholar.sun.ac.za

46
cresolsulfonephthalein (cresol red) were added to each PCR tube and loaded onto the
agarose gels. The gels were run at 100/120 V for 45 minutes and visualised under UV
light, using the Uvitec gel imaging system (distributed by Whitehead Scientific Inc.,
Stikland, RSA).
While phenotypically screening the genotypes for water stress resistance using target
traits and at the same time, MS-MARS was conducted in the greenhouse for MS-
MARS validation. Selected water stress resistance genotypes were cross-pollinated
using the MS-MARS recurrent scheme to screen and validate the presence of rust
resistance markers.
3.2.2 MS-MARS cycle The female segregating population used for crosses was sourced from the ninth
Wheat Rust Resistance Nursery pre-breeding programmes during 2014. This is an
ongoing annual MS-MARS project for rust resistance molecular screening. The F1
base population utilised in this study consisted of a large number of rust resistance
genes (Table 3.1) established in 1999 Botes (2001). The plant material grown in the
greenhouse consisted of 1:1 male sterile and fertile segregating populations. The male
population already consisted of several biotic and abiotic resistance genes and
previously was proved to deliver improved yield under field conditions.
Seeds of equal size were visually selected prior to sowing. Seeds can be visually
assessed whether they were cross-pollinated or self-pollinated. Self-pollinated seeds
are thick and swollen whereas cross-pollinated seeds are tiny and shrunken.
The MS-MARS breeding technique was utilised as part of Objective 2 of this study,
namely phenotypic validation of several wheat rust resistance genes (Springfield,
2014). Among the cross-pollinated wheat lines, the degree of cross-pollination was
also evaluated. The male and female’ wheat lines were planted in the SU-PBL nursery.
The nursery contained eight benches; four were used for donors and four for the F1
1:1 female segregating population. The benches for donor plants were planted a week
prior to the benches for female plants. The female lines consisted of a 1:1 ratio of male
sterile female and male fertile female segregating population (Marais & Botes, 2000).
From the female segregating population, desirable tillers were selected. To make
crosses, selected tillers had to be male sterile females (Figure 3.2A & 3.3A). At the
Stellenbosch University https://scholar.sun.ac.za

47
flowering stage, donor lines and male sterile females ready for MS-MARS were
carefully selected. Tillers of selected plants were cut and immediately suspended in a
20 L bucket half-filled with a standard nutrient solution. Thereafter, female tillers were
transferred to galvanised steel trays with a dimension of 600 mm x 450 mm x 160 mm.
During cross-pollination and rearing, diseases such as fungus might have infected the
tillers; therefore, black antifungal paint was used to paint the trays on the inside thereby
preventing infection. All leaves from selected female tillers were detached except the
flag leaves, which were kept intact. Tweezers were used to open the florets for visual
observation. and laboratory scissors were used to cut them open to facilitate crossings
(Figure 3.2B). Prior to transferring tillers to trays, they were cut into the same height.
The maximum capacity of each tray was 230 tillers.
Figure 3.2: MS-MARS cycle. Cross-pollinations were carried out in the greenhouse as using male sterile female tillers as shown in Figure 3.2A. Male sterile female glumes were cut open to facilitate pollination (Figure 3.2B). The donor lines were orientated above the female lines to facilitate cross-pollination. Figure 3.2D shows cross-pollinated female tillers in seed development stage. Source: Springfield (2014).
A B
D C
Stellenbosch University https://scholar.sun.ac.za

48
Tillers were suspended in a standard nutrient solution that fully filled the steel trays.
Prior to pollen shedding, male tillers were cut from the main plants and all leaves were
removed. Buckets were used to collect the tillers that were suspended in a standard
nutrient solution. From the female tillers, flag leaves were kept intact whereas from the
male tillers, all leaves were removed. This was followed by proper arrangement of the
tillers in two narrow galvanised steel trays positioned parallel to each other and held
up by four-legged pod stands (Figure 3.2C).
The female tillers were positioned below the donors, with the donors arranged as if
forming a shelter above the females. This has easy the dropping of pollens from the
dour to the females. The donors’ galvanised steel trays were narrow, enabling
sequential positioning of the wheat tillers. Similar to the female tillers, the donor tillers
were also suspended in a nutrient solution. The donors were kept at the pollinating
position for about a week (although pollen shedding takes approximately three days)
for maximum pollination (Figure 3.2C), and thereafter they were discarded. Female
tillers were reared by trimming their base constantly thereby preventing
formation/development of fungal infection and changing the nutrient solution after two
weeks, thereby promoting seed development (Figure 3.2D). When seeds were fully
developed and ripened, tillers were transferred into brown paper bags and oven dried
for a week at 21 °C. Male fertile plants were allowed to self-pollinate and were
harvested at the end of the MS-MARS cycle and used for single-seed descent in the
field. Selection of male sterile tillers involved visual assessment and selection
throughout the MS-MARS cycles.
3.2.2.1 Visual assessment and selection Visual assessment for tiller selection included the colour of the spike. When male
plants were ready to shed pollen, the colour was dark green and if the pollen was
visible, it was yellowish. Male plants with white pollen were not selected (off-types).
Female plants were yellowish in colour. Plants were also visually observed through
carefully opening their glumes using tweezers to observe the presence of pollen
grains. If the male reproductive system was poorly developed and no pollen grains
had been formed, the plants were considered sterile and if the reproductive system
was fully developed with pollen grains, the plants were considered fertile (Figure 3.3A).
Stellenbosch University https://scholar.sun.ac.za

49
Figure 3.3: Visual assessment of spikes and florets. Figure 3.3A shows two heads of wheat, male fertile on the left and male sterile on the right. Figure 3.3B shows an individual spikelet removed from the spike. Figure 3.3C shows the fertile spikelet with cut-open glumes and lemmas from the spikelet in B. Figure 3.3D shows a male sterile spikelet, and the white arrows in the picture show that stigmas were pushed out of the flower. Figure 3.3E shows a male sterile spikelet pushed out glumes and lemmas in D. Source: Whitford et al. (2013).
When the ovaries are not fertilised, they swell in a sideways direction, thereby opening
the flowers. Soon after the MS-MARS cycles, phenotypic screening of genotypes for
water stress commenced. More traits were added and used for validation of material
in the growth chamber.
3.2.3 Phenotypic screening Phenotypic screening of 60 genotypes was done in the growth chamber using water
stress resistance-related traits and an RHS. High-heritability Mendelian-inherited and
quantitative traits were identified and selected for screening the material. Thirty
genotypes were selected from 60 genotypes and further validated for water stress
resistance genes. Five genotypes selected from the 30 were further validated for water
stress resistance genes using more traits of interest. Five water stress resistant
genotypes were molecularly characterised using SU-PBL rust resistance markers
used for screening the material in the nursery (Table 3.1). Thereafter, five genotypes
screened for water stress resistance were crossed with female lines from the nursery
Stellenbosch University https://scholar.sun.ac.za

50
to introduce the traits of interest and/or novel germplasm into the SU-PBL breeding
population.
3.2.3.1 Phenotypic traits and measurements Measurements were taken from the tillering stage (shoot and one tiller, Zadoks, 21) to
stem elongation (fourth node detectable, Zadoks, 34). Measurements were taken at
different times and for different durations (Table 3.3). Some were taken at the onset
of stress throughout the stress period and some at harvest. The following
measurements were taken daily from the onset of stress throughout the stress period:
LAI, LAE, NL and NT. Measurements taken at harvest included RFW, SFW, LFW and
TPFW. DW measurements included RDW, SDW, LDW and TPDW. Measurements
taken by graduated ruler included RL and SL. Water-related measurements were
taken at specific stages of plant growth, such as LRWC and ELWL. These
measurements were used for screening 60 genotypes; thereafter, additional
measurements were included for further screening of the top five selected genotypes.
These measurements included R:S ratio, CCI, RGR, gs and PAR. Before applying
water stress, DW measurements were taken for all plants (grown in duplicates) in a
polyvinyl chloride (PVC) pipe to calculate change in DW. Measurements included
IRDW, ISDW, ILDW and total plant initial dry weight (TPIDW).
3.2.3.2 Plant biomass measurements The number of leaves and tillers were counted from the onset of water stress at tillering
stage (shoot and one tiller, Zadoks 21) up to stem elongation (fourth node detectable,
Zadoks 34). Destructive measurements for plant biomass were taken at the end of the
stem elongation stage (fourth node detectable, Zadoks, 34). Plants were carefully
uprooted and separated into three parts: roots, stems and leaves. RL and SL
measurements were taken using a graduated ruler. The plants were then put in brown
envelopes and quickly taken into the laboratory to determine the RFW, SFW and LFW
measurements using the Ohaus Adventurer
TM
scale supplied by United Scientific (Pty)
Ltd. This step was followed by oven drying up to constant DW at 50 °C, and then RDW,
SDW and LDW measurements were determined. TPFW and TPDW measurements
were determined by adding FW and DW components, respectively. R:S ratio was
calculated as:- R:S ratio = %&'()&'*&' ; calculations were carried out from all
genotypes.
Stellenbosch University https://scholar.sun.ac.za

51
3.2.3.3 Excised leaf water loss ELWL measurements were taken during the intense water stress period. Leaf material
was sampled, preferably young, fully expanded leaves (leaf sheath) (Pask et al.,
2012). Samples were taken from all replicates at the tillering stage (main shoot and
seven tillers, Zadoks 27) and placed into small envelopes. Samples were rushed into
the laboratory to determine FW by weighing the samples on the Ohaus Adventurer
TM
scale. Samples were then incubated for six hours at 28 °C. This was followed by
reweighing the samples to determine weight after six hours. Lastly, oven drying of the
samples at 60 °C for 24 hours was done, and DW was determined. The percentage of
ELWL was calculated as proposed by (Clarke, 1987):
% of ELWL =
+*,%-',./-01',./-02+0,*3-45*%&*6',./-0 × 100
3.2.3.4 Leaf relative water content LRWC measurements were taken at the stem elongation stage (second node
detectable, Zadoks 27). Flag leaf samples were randomly taken from all the genotypes.
The leaves were cut on both ends. Any dry or dead leaf part was removed (Pask et al.,
2012). The samples were quickly taken into the laboratory. FW measurements were
taken by weighing the samples on the Ohaus Adventurer
TM
scale. Ten-ml tubes were
then labelled according to the representative leaf samples, and 1 ml of distilled water
was added to each tube. The rack of tubes was placed in a 4 °C refrigerator for 24
hours to reach full turgor. Leaf samples were removed from the distilled water and
carefully dried using blotter paper (Pask et al., 2012). Turgid weight was determined
from leaf samples by weighing them again. Thereafter, samples were put in small
brown envelopes and oven dried at 60 °C up to constant DW. Samples were removed
from the oven, DW measurements were determined by weighing the samples on the
balance scale and the data was recorded. The following formula was used to calculate
LRWC (Smart & Bingham, 1974; Turner, 1981): -
% of LRWC =
+*,%-',./-01&*6',./-005*/.0',./-01&*6',./-0 × 100
Stellenbosch University https://scholar.sun.ac.za

52
Table 3.3: Summary of studied phenotypic trait measurement details
Traits Time Stress period Duration
Non-destructive/ destructive Method Unit
H2
% Quantitative/Mendelian Marker/QTL
Plant organ References
Page no.
LAE 12 am Cont. 5 sec Non Ruler mm 67 Quantitative - Leaf Mohsin et al. (2009) 29
NT 12 am Cont. 5 sec Non Count n/a 55 Quantitative 1D, 2D, 6A Plant Ullah et al. (2007) 26
NL 12 am Cont. 5 sec Non Count n/a Quantitative - Plant Mbave et al. (2013) 26
RGR 12 am Cont. 5 sec Non Protocol mm 77 Quantitative 1D, 4D, 7D Plant Hunt et al. (2003) 27
LRWC 12 am End 4 days Des Protocol % 64 Quantitative 2A Leaf Pask et al. (2012) 30
ELWL 12 am End 24 hours Des Protocol % 94 Quantitative 1A, 1B, 2B Leaf Clarke (1987) 30
Gs 12 am Cont. 30 sec Non Porometer m-
2s-2 99 Mendelian 1A, 1B, 2B, Leaf Becker et al. (2016) 29
SFW 12 am End 1 day Des Scale g 46 Quantitative 1A, 1B, 2B, Shoot Hussein and Zaki (2013) 27
SDW 12 am End 4 days Des Scale g 76 Quantitative - Shoot Ahmad et al. (2014) 27
RDW 12 am End 4 days Des Scale g 9 Quantitative Xgwm296.1 Roots Becker et al. (2016) 27
RFW 12 am End 1 day Des Scale g 87 Quantitative - Roots Naeem et al. (2015) 27
RL 12 am End 1 day Des Ruler mm 62 Quantitative Xksuh9d Roots Khan et al. (2010) 27
SL 12 am End 1 day Des Ruler mm 31 Quantitative Xcdo456a Shoot Khan et al. (2010) 27
R:S ratio 12 am End 4 days Des
Calculations n/a 44 Quantitative - Plant Ahmad et al. (2014) 27
Stellenbosch University https://scholar.sun.ac.za
Stellenbosch University https://scholar.sun.ac.za

53
Traits Time Stress period Duration
Non-destructive/ destructive Method Unit
H2
% Quantitative/Mendelian Marker/QTL
Plant organ References
Page no.
CCI 12 am Cont. 2-3 sec Non CCM-200 n/a 9 Mendelian Xgwm63 Leaf Panio et al. (2013) 28
PAR 12 am Cont. 30 sec Non Ceptometer % Mendelian 4B, 5B Plant
Sandaña et al. (2012) 30
RUE 12 am Cont. 30 sec Non Ceptometer
MJ-1 Mendelian - Leaf
Sandana et al. (2012) 30
TPDW 12 am End 1 day Des Scale g 96 Quantitative - Plant Tatar et al. (2016) 26
TPFW 12 am End 1 day Des Scale g Quantitative Plant Hussein and Zaki (2013) 26
Stellenbosch University https://scholar.sun.ac.za
Stellenbosch University https://scholar.sun.ac.za

54
3.2.3.5 Relative growth rate
RGR is one of the most important traits used to measure water stress effect.
Measurements were taken from the tillering stage (shoot and one tiller, (Zadoks 21)
up to the end of the stem elongation stage (fourth node detectable, Zadoks 34). Since
five genotypes were investigated, replicated three times per RHS, and five seeds were
planted per PVC pipe, there was enough material for RGR sampling. To examine
RGR, each plant from all replicates was harvested on each PVC pipe at the tillering
stage, allowing one plant to grow per PVC pipe. Plants were uprooted and separated
into three parts, namely roots, stems and leaves, and put into labelled brown
envelopes. Plant material was incubated at 50 °C to a constant DW, and then the final
DW was determined. The remaining plants were allowed to grow and were harvested
at the end of the stem elongation stage. Similarly, the harvested plants were separated
into roots, stems and leaves and put into labelled brown envelopes. Again, samples
were incubated at 50 °C to a constant DW, and then the final DW was determined.
Total DW of all varieties under investigation was calculated using logarithmic
transformation (Hunt et al., 2003). The following formula was used to calculate RGR:
RGR (g g-1 d-1) = [($%&'($%&))(+'(+)) ]
Where ln represents logarithmic transformation, W2 final DW, W1 initial DW, t2 final
time/days of taking measurements and t1 initial time/days of taking measurements.
3.2.3.6 Photosynthetic active radiation and leaf area index
PAR and LAI measurements were taken every day from 11:00 to 14:00 (Pask et al.,
2012). Measurements were taken from the onset of water stress at the tillering stage
up to stem elongation (fourth node detectable, Zadoks, 34) (Pask et al., 2012).
Measurements were taken using a hand-held Decagon AccuPAR LP-80 ceptometer
supplied by Campbell Scientific Africa (Pty) Ltd. The ceptometer measures light
wavelengths within 400 to 700 nm (PAR) and utilises waveband as determinant of LAI.
A bubble spirit level was used to ensure that the ceptometer was level when taking
measurements from 0.5 m to 1.0 m above the leaf canopy. Measurements were taken
diagonally from plant canopies on each Addis Rough tote (ART) which is a black
bucket carried plants (Figure 3.5A below). Three measurements were taken for above-
canopy PAR, with the ceptometer being carefully aligned horizontally above the leaf
canopies. Measurements took about 30 seconds. Similarly, for below-canopy PAR,
Stellenbosch University https://scholar.sun.ac.za

55
the probe was held in the same position below the canopy. The measurement for
canopy reflectance was taken similar to above-canopy PAR, except that the
ceptometer was held inverted (Pask et al., 2012). The percentage of light interception
was calculated using the following formula: -
% of LI = [(.(/)(0(.(/) ] × 100
Where A = above canopy, B = reflected and C = below canopy. The ceptometer can
simultaneously calculate the above- and below-canopy PAR; hence, when the
ceptometer is placed below the canopy to take readings, light interceptance (F) can
be calculated as follows: -
F = 1 − 56.789:55;<:70:<;75
Light extinction coefficiency (K) can be defined as the capacity of a substance to
absorb light at a given wavelength per unit of mass density. The extinction coefficient
was calculated using the formula: -
K = (=7()(>)=.:
Where F is the interceptance and LAI is the leaf area index (Farahani et al., 2009).
Because PAR was sampled in a quadrat, it was possible to calculate RUE. Moreover,
PAR sampling was done prior to destructive measurement of plants. This provided
efficiency and accuracy to calculate the canopy coefficient. RUE was therefore
calculated for each RHS by investigating a change in biomass over interceptance
throughout the water stress period. The following equation was used to calculate RUE
(g MJ-1) (Pask et al., 2012): -
RUE (g MJ-1) = [ 9?+'(9?+)<&+'(<&+)]
Where MJ is PAR accumulative interceptance (MJ m-2) from the initial and final
readings, and DW is the initial and final DW time in days.
Stellenbosch University https://scholar.sun.ac.za

56
3.2.3.7 Chlorophyll content index
Leaf CCI was determined using CCM-200 plus a Chl meter manufactured by Opti-
Sciences, Inc. and distributed by Campbell Scientific Africa (Pty) Ltd. Relative CCI was
determined at the stem elongation stage (second node detectable, Zadoks 32) (Pask
et al., 2012). A young, fully expanded leaf was used to take measurements from all
genotypes (Elshafei et al., 2013). The CCI meter sampled 71 mm2 to calculate CCI
utilises receptors and calibrated light-emitting diode (LED). CCI is the transmission
percentage ratio of the waveband through a leaf at 931 and 653 nanometres (Mishra
et al., 2015). The estimated time to take measurements is 2-3 seconds per leaf tissue,
and the device weights 162 grams. The CCI meter was calibrated by taking a blank
reading prior to taking measurements. Measurements were taken from all the
genotypes, and the arithmetic mean was calculated per genotype.
3.2.3.8 Stomatal conductance
Gs measurements were taken using a hand-held SC-1 Leaf Porometer, manufactured
by Decagon Devices, Inc. and distributed by Campbell Scientific Africa (Pty) Ltd. Gs
measurements were taken from the mid-tillering stage (main shoot and five tillers,
Zadoks 25) and (main shoot and seven tillers, Zadoks 27) (Pask et al., 2012).
Porometer measuring units are mmol m-2 s-1, m2s mol-1 and sm-1 sample chamber
aperture measures 6.35 mm2. Measurements were taken from 11:00 to 14:00 from all
genotypes. Measurements were taken from selected young, fully expanded leaves
(because of full exposure to light), preferably the leaf sheath, constantly across all
genotypes. Measurements were taken on the upper (adaxial) leaf sheath surface.
Each leaf measurement took approximately 30 seconds in auto-mode. Measurements
were taken from well-watered and water-stressed plants. Anticipated gs ceptometer
readings were from 300 to 700 mmol m-2 s-2 for well-watered plants and from 80 to
300 mmol m-2 s-2 for water-stressed plants (Pask et al., 2012). The gs meter is a
sophisticated, time-consuming tool that requires time and patience when working with
large populations.
3.2.3.9 Leaf area
Leaf area (LAE) measurements were taken every day from the onset of water stress
from the tillering stage (shoot and one tiller, Zadoks, 21) up to stem elongation (fourth
node detectable, Zadoks, 34). Measurements such as leaf length and maximum width
Stellenbosch University https://scholar.sun.ac.za

57
were taken on young, fully expanded leaves using a graduated ruler and rounded off
to the nearest millimetre. Leaf length measurements were taken by placing the ruler
from the bottom of the leaf blade towards the tip. Maximum width was measured by
placing the ruler five times across the leaf blade. Leaf area in mm2 was calculated as
follows: -
A = L × W × K
Where L is the leaf length, W is the leaf maximum width and K is a multiplying factor
or constant for wheat (0.65) (Sestak et al., 1971).
3.2.3.10 Association of the traits and their heritability estimates
Correlation study was performed for all the phenotypic traits under investigation
thereby enhancing indirect selection for several traits of interest. Correlation co-
efficiencies of both water stressed and well-watered genotypes were calculated and
compared to previous studies from the literature. Moreover, in order to consider
heredity of the target traits, heritability estimates of the phenotypic traits were explored
from the literature. Considerable additive genes and reduced environmental effect can
provide a great deal of selection (Fellahi et al., 2013).
3.2.3.11 Planting
Planting began on the 30th of August 2015, but the experiment was terminated
because of poor physical appearance of the plants before inducing water stress.
Plants were unhealthy and yellowish. The next planting began on the 6th of September
2015, and again the experiment was terminated due to high temperatures (Figure 3.4)
inside the greenhouse in mid-October 2015, caused by failure of the cooling system
so that the plants wilted and showed signs of yellowing.
The next planting commenced on the 15th of October 2015, but due to high
temperatures plants showed signs of heat stress e.g. wilting (Time and date, 2017)
(Figure 3.4). Wheat crop requires the minimum and maximum temperature of 18 °C to
22 °C respectively, throughout a growing season. Temperatures exceeding 22 °C may
result in heat stress thereby affecting the plant growth and development. Heat stress
may result in pollen sterility and/or ear abortion thereby affecting the yield returns.
Therefore, RHSs were moved into the growth chamber under temperatures of 18 °C
Stellenbosch University https://scholar.sun.ac.za

58
to 22 °C. Inside the growth chamber, plants showed unidentified stress before water
stress was applied. Later it was discovered that the air supply had been switched off
accidentally in the growth chamber. This triggered suffocation of the plants, and they
could not recover; the experiment again had to be terminated. New planting began on
the 9th of November 2015. Water stress was applied on the 3rd of December 2015,
data was collected and the experiment was terminated on the 16th of December 2015.
At the beginning of the year 2015, screening for water stress resistance continued,
and planting of the second 30 genotypes out of 60 commenced on the 21st of January
2016. The experiment was terminated on the 23rd of February 2016, and data was
collected. The results obtained from sets one and two were evaluated by planting all
60 genotypes at once. The next planting, which was to evaluate plants, started on the
25th of February 2016, and data was collected. The experiment was terminated on the
29th of March 2016. For every round of planting, a new RHS had to be reconstructed.
Evaluation of 60 genotypes was followed by selection of the five best genotypes, which
were than planted in replicates.
The five best selected genotypes were planted on the 9th of May 2016. Unfortunately,
the experiment was terminated in two weeks’ time because some of the seeds had
been treated with Poncho (seed chemical) while others had not been treated. The
treatment caused variation in growth. On the 19th of May 2016, the next planting began
using untreated seeds only. Reconstruction of three RHSs commenced, and seeds
were planted in replicates. The RHSs carried five genotypes, each randomly assigned
to three replicates per genotype. After obtaining unsatisfying results, planting again
commenced on the 9th of August 2016.
Two weeks after planting, inexplicable yellowing of the plants resulted in termination
of the experiment. This could have been caused by a continuous day-and-night supply
of LED light in the growth chamber. This was an artificial incident whereby LED light
was switched from auto to manual (provided continuous light throughout the night for
three weeks) and/or insufficient electronic conductivity of a nutrient solution used. The
experiment was repeated. Planting began on the 22nd of August 2016, data was
collected and the experiment was terminated on the 14th of November 2016. Each
RHS consisted of 15 PVC pipes; five seeds were planted per PVC pipe, and ultimately
75 seeds were planted per RHS. All seeds were fully germinated at Zadoks’ Stage 10.
Stellenbosch University https://scholar.sun.ac.za

59
Figure 3.4: Temperatures recorded during planting
Source: Time and date.com (2017).
Plants of equal length were selected and thinned down to one plant per PVC pipe.
This allowed plants of equal height to continue to grow. Thinning of plants was done
at Zadoks, 13 stages after plants establishment (for all conducted experiments).
3.2.3.12 Growth conditions
Experiments were conducted in a controlled environment at SU’s Welgevallen
Experimental Farm. Both greenhouses and the growth chamber were used for
planting. The growth chamber’s minimum and maximum temperatures were 18 °C to
22 °C. The greenhouse temperatures ranged from 10 °C to 25 ºC. The greenhouse
temperatures were not stable since they increased with increasing daytime
temperatures. LED light was used in the growth chamber at pulse width modulation
(PWM) dimmer 13 (maximum) set up as a long day length. The external fresh air
supplier was always switched on to ensure a constant fresh air supply for the plants.
3.2.3.13 Irrigation
A standard nutrient solution was used for irrigation with electrical conductivity of
2.5 dS/m. The nutrient composition of the irrigation solution was Microflex GA chelated
trace elements supplied by Yara, distributed by Farmisco (Pty) Ltd. Irrigation was
carried out by hand using a watering can from sowing to emergence. After germination
(Zadoks, 10), the irrigation system was set to irrigate automatically. The ARTs on the
floor were fully filled with the standard nutrient solution. Timers were set to irrigate four
times a day. Silica sand was used as growth medium. Due to its rapid-drying
05
101520253035
17-O
ct-1
5
19-O
ct-1
5
21-O
ct-1
5
23-O
ct-1
5
25-O
ct-1
5
27-O
ct-1
5
29-O
ct-1
5
31-O
ct-1
5
02-N
ov-1
5
04-N
ov-1
5
06-N
ov-1
5
08-N
ov-1
5
Tem
pera
ture
in °C
Maximum Threshold Minimum
Stellenbosch University https://scholar.sun.ac.za
60
properties, the irrigating time interval was set at 07:00, 11:00, 15:00 and 18:00 daily.
Irrigation in the morning gave plants water to begin the day, followed by irrigation 11:00
to wet the soil due to the rapid-drying properties of silica sand. Irrigation again took
place at 15:00 during the hottest time of the day and later in the day at 18:00 to provide
plant water balance by compensating water lost through evaporation during the day.
The sub-irrigated gravel culture RHS allowed plants to be supported by their own
roots. Submersible pumps were used to pump the nutrient solution from the ARTs on
the floor into the ARTs with plants on the benches. The time required to fill up the
ARTs was calibrated. Each ART was set up to be irrigated based on the allocated
time. When the ARTs on top of the benches were filled up, the submersible pump
stopped. The nutrient solution immediately drained back into the reservoir or the ARTs
placed on the floor. Two Emjay filters prohibited foreign material from entering the
ARTs on the floor during drainage. A standard nutrient solution was used for irrigation
in the nurseries. Watering cans were used for irrigation from planting to emergence,
followed by a drip irrigation system until harvesting. The electric conductivity of the
standard nutrient solution was 2.5, and it was increased to 4.0 at the grain filling stage.
3.2.3.14 Application of water stress
Water stress was induced by withholding nutrient solution supply. Control genotypes
received optimum nutrient solution supply throughout the growing period. The flow of
the nutrient solution was suspended by cutting off the power supply at the source. The
nutrient solution was withheld for 14 days, from the tillering stage (shoot and one tiller,
(Zadoks, 21) to stem elongation (fourth node detectable, Zadoks, 34). After 14 days
of water stress, the experiment was terminated and the plants were harvested,
followed by data collection.
3.2.3.15 Selection of the genotypes
Simple statistical analysis using Microsoft excel (2013) was performed to select the
genotypes for the traits studied. Mean values were used to distinguish between the
upper and lower limit. Mean values of traits that fell below the lower limit were
excluded. Mean values of traits that fell above the upper limit were used to rank the
genotypes. Genotypes that ranked the highest and integrated more traits were
selected. The selected genotypes were advanced to the next screening.
Stellenbosch University https://scholar.sun.ac.za

61
3.2.4 Reticulated hydroponic system
An RHS was used for planting. Seeds were planted in blue PVC pipes (Figure 3.5A),
followed by installing the irrigation system (Figure 3.5B). A submersible pump was
installed to ensure that the nutrient solution was pumped into the ART above and PVC
ball valve to prevent the nutrient solution from returning to the ART (Figure 3.5C) and
lastly, the ART with nutrient solution (Figure 3.5D).
Figure 3.5: Reticulated hydroponic system used. A-ART with plants, B-Complete
set of RHS with irrigation system installed, C-Submersible pump for pumping
up nutrient solution, D-ART fully-filled with nutrient solution.
Timers were used to calibrate irrigation time. Irrigation system is described as follows.
A: complete RHS with wheat plants. B: Fully installed RHS together with irrigation
system. C: Shows PVC ball valve and submersible pump setting. D: position of lower
ART elevated with nutrient solution for irrigation to support the pump.
3.2.5 Experimental design
The experiment was set up as a completely randomised two-way factorial design. Two
factors were investigated: water levels and variety. Water treatment consisted of
withholding nutrient solution and allowing continuous flow of nutrient solution. The
A B
C D
Stellenbosch University https://scholar.sun.ac.za

62
experiment comprised 60 wheat genotypes reduced to five, namely 15HYLD-22,
15HYLD-26, 15HYLD-29, 15HYLD-30 and 15HYLD-18, randomly assigned to three
RHSs and replicated three times on each system.
3.2.6 Data collection and statistical analysis
The data collected was analysed using Agrobase Generation II® Agromix software
(2008-2011). The means were separated by least significant difference at 5%.
3.2.7 Weather data
The historical weather data for Welgevallen Experimental Farm was obtained from the
Department of Agriculture in the Western Cape.
0
50
100
150
MayJu
ne July
Aug Sep OctNov Dec
Rain
fall in
mm
Months
A
0
100
200
Jan
Feb
Mar Apr
May Jun
Jul
Aug
Sep
Oct
Nov
Dec
Rain
fall in
mm
Months
B
0
100
200
300
Feb
Mar Apr
May Jun
Jul
Aug
Sep
Oct
Nov
Rain
fall in
mm
Months
D
0
50
100
150
200
Jan
Feb
Mar Apr
May Jun
Jul
Aug
Sep
Oct
Nov
Dec
Rain
fall in
mm
Months
C
Figure 3.6: Historical weather data from Welgevallen Experimental Farm. The
figure shows monthly average rainfall pattern from year 2010 to 2013. A- March
to December, B and C- January to December and D-February to November.
Stellenbosch University https://scholar.sun.ac.za

63
Investigating water stress resistance at the initial stages of plant growth is justified by
empirical evidence of the effects of minimal water supply during the early stages of
plant growth. The present study entailed screening of wheat genotypes. Temperatures
of about 10 °C to 20 °C permitted optimum germination of this crop (Buriro et al.,
2011). Consequently, planting in April and May at the latest provided favourable
conditions for germination and emergence.
However, favourable temperatures for this cool-season crop coincide with minimal
water supply at the initial stages of growth, specifically in the Western Cape. Less
rainfall is received during April and May compared to June (Figure 3.6). Furthermore,
the most recent drought conditions affected the whole of SA, particularly the Western
Cape.The annual rainfall pattern for the Welgevallen Experimental Farm fluctuated
over the past decades.
Figure 3.7: Average annual rainfall pattern from year 2010 to 2013. Recorded
annual rainfall distribution in Welgevallen experimental farm at Stellenbosch
University from year 2010 to 2013.
Average annual rainfall pattern indicated in (Figure 3.7) clearly shows a change in
rainfall from one year to the next. The rainfall decreased from 2010 to 2011 by 9 mm
and increased sharply from 2011 to 2013 (Figure 3.7). It is unfortunate that the data
for 2014 to 2018 is not available for Welgevallen Experimental Farm from the weather
station for more detailed assessment of the historical rainfall pattern of the farm.
60,351,3
78,6
96,8
0,0
20,0
40,0
60,0
80,0
100,0
2010 2011 2012 2013
Rai
nfal
l in
mm
Year
Stellenbosch University https://scholar.sun.ac.za

64
CHAPTER 4: RESULTS AND DISCUSSION
4.1 Wheat molecular characterisation
4.1.1 Molecular marker screening and validation
Molecular diversity assessment of wheat lines linked to rust resistance genes such as
leaf rust (Lr34), stem rust (Sr2) and number of markers in a multiplex reaction was
carried out. Corresponding identified markers for rust resistance genes were subjected
to PCR multiplex analysis, thereby optimising and validating these markers.
4.1.1.1 Lr34 markers Molecular markers specific for Lr34 included L34DINT9-F and LR34PLUS-R, followed
by a codominant marker and a negative marker (CSLV) to assist in identifying Lr34.
The PCR reactions were performed for the male and F1 1:1 female segregating
populations.
Figure 4.1: Gel electrophoresis UV image for optimisation and validation of Lr34
resistance and codominant marker
The gel electrophoresis shown in Figure 4.1 is described as follows: HL – hyper ladder
II; gel lanes 1 to 10 genotypes were screened for the presence of Lr34 markers.
Chinese spring (CS) was used as positive control, and negative control (-C) was
deionised water (d.H2O). Band amplification of 517 bp indicated the presence of Lr34
genes, followed by 229 bp, which is a negative marker for absence of LR34 and by
150 bp, which is a codominant marker assisting in identifying the presence of the Lr34
marker. These results were observed during screening for the Lr34 marker for rust
resistance genes. Chinese spring 517 pb was partially visible but present, and 150 bp
CS (-C) 1 2 3 4 5 6 7 8 9 10
HL2
517 bp→
150 bp→ 229 bp→
Stellenbosch University https://scholar.sun.ac.za
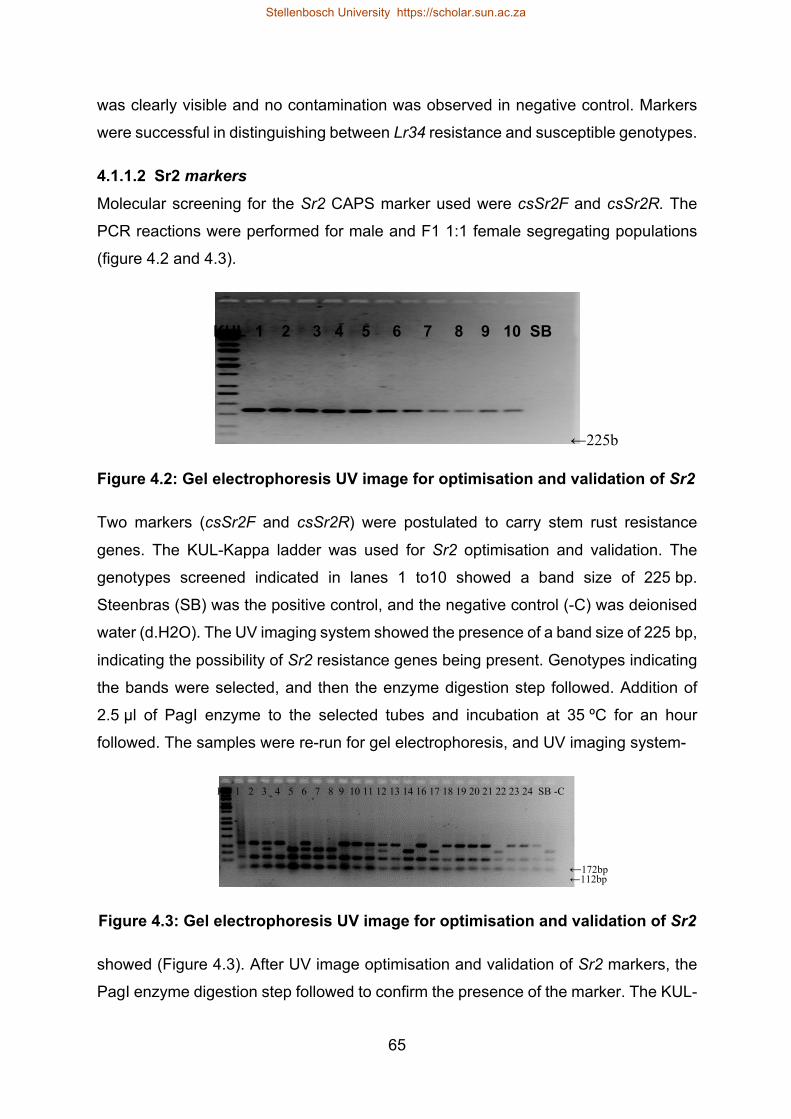
65
was clearly visible and no contamination was observed in negative control. Markers
were successful in distinguishing between Lr34 resistance and susceptible genotypes.
4.1.1.2 Sr2 markers
Molecular screening for the Sr2 CAPS marker used were csSr2F and csSr2R. The
PCR reactions were performed for male and F1 1:1 female segregating populations
(figure 4.2 and 4.3).
Figure 4.2: Gel electrophoresis UV image for optimisation and validation of Sr2
Two markers (csSr2F and csSr2R) were postulated to carry stem rust resistance
genes. The KUL-Kappa ladder was used for Sr2 optimisation and validation. The
genotypes screened indicated in lanes 1 to10 showed a band size of 225 bp.
Steenbras (SB) was the positive control, and the negative control (-C) was deionised
water (d.H2O). The UV imaging system showed the presence of a band size of 225 bp,
indicating the possibility of Sr2 resistance genes being present. Genotypes indicating
the bands were selected, and then the enzyme digestion step followed. Addition of
2.5 μl of PagI enzyme to the selected tubes and incubation at 35 ºC for an hour
followed. The samples were re-run for gel electrophoresis, and UV imaging system-
Figure 4.3: Gel electrophoresis UV image for optimisation and validation of Sr2
showed (Figure 4.3). After UV image optimisation and validation of Sr2 markers, the
PagI enzyme digestion step followed to confirm the presence of the marker. The KUL-
KUL 1 2 3 4 5 6 7 8 9 10 SB
(-C)
←225bp
KU 1 2 3 4 5 6 7 8 9 10 11 12 13 14 16 17 18 19 20 21 22 23 24 SB -C
←172bp ←112bp
Stellenbosch University https://scholar.sun.ac.za

66
Kappa ladder was used for band sizes. Genotypes studied ranged from 1 to 24,
followed by Steenbras (SB) for positive control and negative control (-C) through
deionised water. The presence of the Sr2 markers was successfully identified with
band sizes of 112 bp and 172 pb. Negative genotypes for Sr2 showed the presence
of band sizes of 112 bp and 225 bp.
4.1.2 Marker-assisted selection screening
The F1 1:1 segregating population and donor lines were tested for the presence of
Lr34 (L34DINT9-F and LR34PLUS-R) markers with the help of Cslv markers in a
multiplex reaction, and the Sr2 CAPS (csSr2F and csSr2R) were also tested for both
male and female populations in an anon-multiplex reaction. Another multiplex reaction
was also performed for several panel of markers, including Sr31 (Iag95-F and Iag95-
R), Lr34 (L34DINT9-F and LR34PLUS-R), Lr24/Sr24 (719-F and 719-R),
Lr37/Sr38/Yr17 (Vent and Ln2), Sr26 (Sr26#43-F and Sr26#43-R) and Lr19 (12C-F
and 12C-R) to test both the male and F11:1 female segregating populations. Only two
sets of markers were not included in the donor lines PCR reaction: Sr26 (Sr26#43-F
and Sr26#43-R) and Sr31 (Iag95-F and Iag95-R).
Allele frequencies were calculated using the Hardy-Weinberg equation. All the
markers screened were present in the population, although to a different extent. The
highest allele frequency in a population for MS-MARS Cycle 1 was observed from the
Lr/Sr24 (96,9%) marker, and the lowest was Lr19 (1%). Allele frequencies of Lr34
(61%), Sr31 (44%), Lr24 (96%), Lr37 (19%), Sr26 (3%), Lr19 (1%) and Sr2 (38%)
(Figure 4.4) were recorded for MS-MARS Cycle 1 for the F1 1:1 female segregating
population. For MS-MARS Cycle 2 screening, the F1 1:1 female segregating
population consisted of two molecular markers: Lr34 and Sr2 CAPS. There was an
increase in allele frequency in the second MS-MARS cycle for both markers. Lr34 for
MS-MARS Cycle 2 was 67%, and Sr2 was 57%. There was a 5% increase in Lr34
allele frequency from 2015 (MS-MARS Cycle1) to 2017 (MS-MARS Cycle 2). There
was an 18% increase in Sr2 allele frequency from 2015 to 2017 (MS-MARS cycles 1
and 2, respectively) (Figure 4.5).
An increase in allele frequency was also observed by Springfield (2014) in the F1 1:1
female segregating population in MS-MARS cycles 1 and 2. Interestingly, an increase
in allele frequency equivalent to that in the current study was observed by Springfield
Stellenbosch University https://scholar.sun.ac.za

67
(2014). Lr34 was observed to increase by 8% and Sr2 by 11% in MS-MARS cycles 1
and 2. Springfield (2014) estimated a significant increase in Sr2 allele frequency in the
F1 1:1 female segregating population, which was observed in the current study.
Figure 4.4: MS-MARS Cycle 1 allele frequency for rust resistance markers from
female population
There is thus evidence of a continuous increase in allele frequency in every MS-MARS
cycle. Low genetic frequencies in MS-MARS Cycle 1, specifically Lr19, Sr26 and Lr37,
are expected to increase in the following series of MS-MARS cycles. Evidence is
emerging of marker Sr26 in the population, which was reported absent in the female
F1 segregating population (Springfield, 2014). Recurrent selection requires at least
four cycles to improve low desirable allele frequencies in a population from 5% to 70%
(Marais & Botes, 2009). Springfield (2014) concluded that absence of Sr26 and Sr45
markers occurred because it had been introduced recently into a population.
Furthermore, due to random seed selection to produce 2% of the plants from a 100%
produced seed, absence of the desired marker can only be 2% true. The markers Sr2,
Lr24, Lr34, Lr37 and Lr19 were used in MS-MARS Cycle 1 for screening the males for
rust resistance genes. Very low allele frequencies were observed for donor lines. The
minimum and maximum allele frequency observed was Sr2 (9%) and Lr24 (41%),
respectively. Other allele frequencies observed were Lr34 (18%) and Lr37 (30%)
(Figure 4.6). Marker Lr19 was not visible in the male population. The frequency of Lr34
was two times lower (43%) than the allele frequency reported by Springfield (2014).
The frequencies of Sr2 and Sr24 were half the allele frequencies reported by
Springfield (2014) of 19% and 46%, respectively.
Lr34
Sr31
Lr/Sr24
Lr37
Sr26
Lr19 Sr2
Cycle 1 0,61 0,44 0,96 0,18 0,03 0,01 0,38
0,0000,2000,4000,6000,8001,0001,200
Alle
le fr
eque
ncie
s (%
)
Stellenbosch University https://scholar.sun.ac.za

68
Figure 4.5: MS-MARS cycles 1 and 2 female population allele frequency
comparison
The allele frequencies of marker Lr37 was 64% lower than reported by Smit (2013).
The significant differences in the allele frequencies were the result of the genotypes
used. Some of the genotypes were externally sourced and combined with wheat
nursery genotypes from the SU-PBL. As mentioned, allele frequencies are expected
to increase with recurrent selection cycles, and the absence of the Lr19 marker does
not necessarily mean that it is not present in the population.
Figure 4.6: MS-MARS Cycle 1 allele frequencies for rust resistance markers from
60 male genotypes
MS-MARS Cycle 2 screening of rust resistance genes from donors involved screening
of five selected genotypes used for cross-pollination in the nurseries. Two molecular
markers of interest were utilised for screening: Lr34 and Sr2. The allele frequencies
Lr34 Sr2Cycle 1 0,62 0,39Cycle 2 0,67 0,57
0,000,100,200,300,400,500,600,700,80
Alle
le fr
eque
ncie
s (%
)
Sr2 Lr24 Lr34 Lr37 Lr19Cycle 1 0,09 0,41 0,18 0,30 0,00
0,00
0,10
0,20
0,30
0,40
0,50
Alle
le fr
eque
ncie
s (%
)
Stellenbosch University https://scholar.sun.ac.za

69
observed for Lr34 and Sr2 were 27% and 33%, respectively (Figure 4.7). An increase
in allele frequency from 2015 (MS-MARS Cycle I) to 2017 (MS-MARS Cycle 2) was
again observed from the donor lines. Sr2 was increased by 24% and Lr34 by 9%.
Again, a significant increase in Sr2 allele frequency was observed, similar to the
female lines.
Figure 4.7: MS-MARS Cycle 2 allele frequencies for rust resistance markers from
60 male genotypes
This data further supports the findings and conclusions of Springfield (2014) about an
expected significant increase in Sr2 allele frequency. According to Springfield (2014),
the effectiveness of recurrent selection can be observed through a significant increase
of allele frequency in the population. Higher allele frequencies in the population can
play a significant role in variety development for disease resistance in MS-MARS
breeding programmes. Furthermore, pyramiding these genes with higher allele
frequencies can provide broad-spectrum resistance. After molecular characterisation
of wheat lines using MAS in the greenhouse, plants were allowed to grow. This was
followed by selection of male sterile and donor lines to make cross-pollinations in the
growth chamber using the MS-MARS cycles.
4.2 MS-MARS breeding technique validation
4.2.1 MS-MARS Cycle 1
A total of 1 437 male fertile plants and a total of 1 451 male sterile plants were cut,
leading to 303 085 possible combinations (Table 4.1). At harvest, 8 616 seeds were
obtained, weighing about 295 g.
Lr34 Sr2Cycle 2 0,27 0,33
0,000,050,100,150,200,250,300,35
Alle
le fr
eque
ncie
s in
%
Stellenbosch University https://scholar.sun.ac.za

70
Table 4.1: MS-MARS Cycle 1 year 2015
Week Male
fertile
Male
sterile
Possible
combination
Harvest Sterile
plants
Harvested
seeds
Grain
mass (g)
1 59 66 3 894 1 229 1 394 48
2 172 179 30 788
3 192 231 44 352 2 444 2 704 93
4 261 266 69 426
5 222 263 58 386 3 452 2 752 94
6 235 183 43 005
7 283 211 50 218 4 290 1 766 60
8 58 52 3 016
Total 1 437 1 451 303 085 1 415 8 616 295
MS-MARS Cycle 1 was statistically analysed using the chi-square test to determine
male sterility genetic inheritance for the F1 1:1 segregating population. A good
probability to fit a 1:1 ratio was observed from all the tables (Table 4.2), indicating
nonadditive genetic epistasis. Therefore, it could be concluded that only a single
dominant gene controlled male sterility in the heterozygous state in MS-MARS Cycle
1. The second MS-MARS cycle was also conducted in Greenhouse 3. Greenhouse 3
contained four benches; benches 1 and 2 contained donor lines, and benches 3 and
4 contained the F1 1:1 female segregating population. Benches 1 and 2
accommodated 64 and 110 donor lines, respectively. Benches 3 and 4 accommodated
110 plants of the F1 1:1 female segregating population. Four seeds were planted in
each pot. Molecular characterisation took place prior to cutting tillers.
Table 4.2: MS-MARS Cycle 1 probability to fit 1:1 ratio
Table number Sterile Fertile X2 Probability to fit 1:1 ratio
1 213 207 0,085 0,77
2 219 213 0,085 0,77
3 228 209 0,83 1,2
4 242 215 1,59 0,5
Total 902 844 1,93 0,16
Stellenbosch University https://scholar.sun.ac.za

71
4.2.2 MS-MARS Cycle 2
Cuttings took three consecutive weeks. A total of 254 and 165 cuttings were made
from the donor lines and male sterile females, respectively. This gave about 7 117
possible combinations for MS-MARS Cycle two (Table 4.3). The total number of
harvested seeds from MS-MARS Cycle 2 was 759 and weighed 4,300 g. The
harvested seeds were very shrivelled and shrunken. This indicated success of the
cross-pollinations. A similar observation was reported by Springfield (2014). However,
due to higher temperatures during the anthesis and grain-filling stages from December
2016 to January 2017 (Figure 4.8), MS-MARS Cycle 2 did not do well (Time and date,
2018). Maximum temperatures were above 23 °C throughout the reproductive stage.
Most of the tillers did not produce seeds. Heat stress resulted in less seed production.
Khatun et al. (2016) reported a shortened grain-filling stage as a result of failure of
starch conversion caused by higher temperatures.
Environmental stress such as heat stress was found to affect fertility and development
of floral organs (Smith & Zhao, 2016). In addition, the failure of the LED lighting in the
growing rooms for three weeks may have resulted in poor seed formation and
development during cross-pollination. This resulted in a massive decline in the number
of selected tillers for cross-pollination in MS-MARS Cycle 1 compared to MS-MARS
Cycle 2. No seeds were obtained from the last crosses made, and this could be the
reason for not obtaining any seeds. Hence, probability to fit 1:1 ratio was not calculated
for MS-MARS Cycle 2.
Table 4.3: MS-MARS Cycle 2 year 2017
Week Male
fertile
Male
sterile
Possible
combination
Harvest Sterile
plants
sourced
Harvested
seeds
Grain
mass (g)
1 27 17 459 1 37 131 0,67
2 64 20 1 280 144 0,86
3 51 28 1 428 2 47 161 0,93
4 56 43 2 408 200 1,25
5 30 15 450 3 20 123 0,59
6 26 42 1 092 0 0
Total 254 165 7 117 104 759 4,300
Stellenbosch University https://scholar.sun.ac.za

72
Seed material produced during MS-MARS was used for cross-pollination with selected
phenotypically screened genotypes from the greenhouse for water stress resistance.
Figure 4.8: Temperatures recorded during the reproductive stage
Source: Time and date.com (2018).
4.3 Phenotypic traits
The five best performing genotypes were selected based on their ranking (R) among
the 60 genotypes studied (Table 4.4). After statistical analysis, the top five genotypes
were considered. Selection was based on the genotypes that integrated more traits,
and these were then selected. Prior to inducing water stress, the plants’ DW
components were sampled and analysed to closely examine anticipated changes in
DW. As anticipated, statistical analysis exhibited no significant differences (p > 0,05)
in ILDW, ISDW, IRDW and TPIDW (Table 4.5).
Table 4.4: Selected genotypes based on their ranking
Genotypes NT R NL R RL R FW R DW R LRWC R 15HYLD-18 10 3 9 13 24 31 8,9 3 1,9 3 78,7 10 15HYLD-22 9 6 10 12 24 32 9.5 2 1.9 4 80 6 15HYLD-26 8 10 5 41 32 1 5 14 1,1 21 78 13 15HYLD-29 11 1 7 25 27 8 8,8 4 2 2 77,3 19 15HYLD-30 2 40 5 43 24 35 1,1 58 0,41 49 44,3 56
This implies that at the beginning of water stress, there were no significant differences
amongst the plants since they were grown under the same environmental conditions
with a continuous supply of nutrient solution.
05
101520253035
29-D
ec-1
631
-Dec
-16
02-J
an-1
704
-Jan
-17
06-J
an-1
708
-Jan
-17
10-J
an-1
712
-Jan
-17
14-J
an-1
716
-Jan
-17
18-J
an-1
720
-Jan
-17
22-J
an-1
724
-Jan
-17
26-J
an-1
728
-Jan
-17
30-J
an-1
7Tem
pera
ture
in °C
Maximum Threshold Minimum
Stellenbosch University https://scholar.sun.ac.za

73
The statistical analysis and mean comparison for target traits are indicated in tables
4.6, 4.7, 4.8 and 4.9. The tables show the means of the genotypes and the reduction
percentages between water-stressed and well-watered conditions. Important values
such as covariance (CV), R-square and grand mean were recorded.
4.3.1 Excised leaf water loss
Water stress treatment significantly (p ≤ 0.0000) influenced ELWL. The differences
among the varieties did not reach the level of statistical significant. Treatments
combined and the environment (water stress and genotypes) did not cause any
significant differences in ELWL. The percentage of decrease was very high (-48.28%)
for ELWL (Table 4.6). The percentages calculated for ELWL ranged from 26.48% to
64.17% (Figure 4.9). The highest value observed was in the control genotype
15HYLD-18 (64.17%) and the lowest in 15HYLD-26 (51.28%).
Figure 4.9: ELWL of five wheat genotypes grown under water-stressed and well-
watered conditions
Water-stressed genotypes showed a maximum loss of water content of 33.32% in
15HYLD-26 and minimal loss of water of 26.48% in 15HYLD-30 (Figure 4.9). Lugojan
and Ciulca (2011) obtained results that ranged from 54.16% to 84.09% while
screening winter wheat inbred lines and hybrid varieties for ELWL. A slightly different
range of results (2.05% to 41.33%) was recorded by Dabiry et al. (2015) while
screening wheat genotypes under water-stressed and well-watered conditions. The
results of the current study overlap with and fall between the ranges of these two
studies. A higher percentage of water loss was recorded for the controls 15HYLD-18
15HYLD-22
15HYLD-26
15HYLD-29
15HYLD-30
15HYLD-18
Well-watered 52,95 51,28 53,73 61,28 64,17Water stressed 30,38 33,32 30,03 26,48 26,59
0,0010,0020,0030,0040,0050,0060,0070,00
% o
f ELW
L
Stellenbosch University https://scholar.sun.ac.za

74
and 15HYLD-30, indicating a reduced rate of stomatal closure compared to their
corresponding water-stressed genotypes (Kaur et al., 2016). This resulted in increased
water loss through transpiration and evaporation. These two genotypes showed better
water stress resistance under water stress conditions.
The rate of ELWL observed from the genotypes under different water treatments can
be explained by the rate of stomatal closure and cuticle ability to lose water under
stress conditions. Similar results observed by Kaur et al. (2016) showed severe water
loss from excised leaves under water and heat stress treatments. Water loss caused
by drought was recorded as the highest amongst all the stresses after stress revival
(Kaur et al., 2016). According to Lugojan & Ciulca (2011), cuticle transpiration rate is
one of the important traits that can be utilised for characterisation of wheat lines.
Table 4.5: ANOVA and mean comparison of DW measurements prior to
instigation of water stress
Treatment Trait
ILDW ISDW IRDW TPIDW
Genotypes
15HYLD-22 0,18 0,07 0,05 0,30
15HYLD-26 0,16 0,06 0,05 0,27
15HYLD-29 0.17 0,06 0,05 0,28
15HYLD-30 0,17 0,06 0,05 0,27
15HYLD-18 0,19 0,07 0,05 0,31
Block ns* ns* ns* ns*
Variety ns* ns* ns* ns*
CV (%) 16,37 29,78 13,97 13,98
Grand mean 0,176 0,062 0,049 0,287
R-square 0,2101 0,0752 0,2241 0,2174
ns – nonsignificant at 5% probability. Means of the same letters show no significant
difference from each other.
Cuticle transpiration rate can be estimated through differences among the varieties for
water stress resistance breeding. ELWL is an important trait to screen for water stress
resistance, and it is linked to the ability of the plant to supply water to the leaves and
the rate of transpiration (Kaur et al., 2016). The ability of the plant to supply water to
Stellenbosch University https://scholar.sun.ac.za

75
the leaves at a minimal transpiration rate enables the plant to sustain the water
balance in the leaves, thereby producing considerable yield under water stress
conditions. Dabiry et al. (2015) reported a negative correlation coefficient for ELWL
and grain yield under well-watered and water-stressed conditions of r = -0.526 and
r = -0.723, respectively.
Table 4.6: ANOVA and mean comparison of treatment effects
Treatment Trait
ELWL
%
LRWC
%
CCI gs,
mmlm⁻²s¹
RGR
gg-1 d-1
LEA m2 NT
Water levels
Well-watered 56,68 85,13 13,95 491,35 0,12 12,33 9,33
Water stressed 29,36 74,60 10,49 431,47 0,10 10,46 9,07
% of decrease -48,20 -12,37 -24,80 -12,19 -16,67 -15,17 -6,87
Genotypes
15HYLD-22 41,66 78,94 10,00 440,77 0,11 11,57 10,50
15HYLD-26 42,30 76,99 9,10 458,06 0,10 10,12 8,67
15HYLD-29 41,88 78,15 11,37 485,78 0,12 12,25 9,33
15HYLD-30 43,88 85,63 11,97 474,18 0,10 11,76 8,83
15HYLD-18 45,38 79,62 18,68 448,28 0,12 11,28 8,67
Genotypes ns* ns* ** ns* ** ** **
Water levels ** ** ** ** ** ** ns*
Interaction ns* ns* ** ns* ** ** **
CV (%) 15,74 7,86 11,00 12,79 8,47 11,39 9,90
Grand mean 43,02 79,86 12,223 461,41 0,109 10,95 9,200
R-square 0,880 0,7031 0,9358 0,5302 0,827 0,753 0,7695
Significance level at 5% probability. ns* – nonsignificant and ** – significant.
However, a positive correlation coefficient (PCC) was also reported between ELWL
and LRWC under both well-watered (r = 0.311) and water-stressed (r = 0.395)
conditions. Higher percentages of broad-sense heritability (H2) were recorded and
ranged from 89.36% to 96.70% for ELWL in wheat (Chandra & Islam, 2003). Naeem
et al. (2015) reported a higher H2 estimate of 94.4% in wheat under water stress
Stellenbosch University https://scholar.sun.ac.za
76
conditions. Since ELWL is associated with gs, QTLs have been mapped for gs in
chromosome locations 1A, 1B, 2B, and 7A (Shahinnia et al., 2016). The different
responses from the genotypes under investigation for ELWL provide sufficient choice
of selection of water stress-resistant plants. This is crucial for variety improvement in
plant breeding programmes.
4.3.2 Leaf relative water content
ANOVA showed significant differences (p ≤ 0.0002) for LRWC. The interaction of the
treatments (water stress and the genotypes) and the environment did not have any
significant effect on LRWC. The percentage of decrease for LRWC was -12.37%,
which was relatively lower compared to other traits. The highest value for LRWC
observed was from the control genotype 15HYLD-26 (86.03%), and the minimum
value of 67.95% was for the water-stressed genotype (Figure 4.10). Hence, the values
for LRWC ranged from 86.03% to 67.95% for the studied genotypes. Similar results
were recorded in wheat genotypes by Munjal & Dhanda (2016), ranging from 69.20%
to 91.60% in morpho-physiological traits assessment under both well-watered and
drought conditions.
Figure 4.10: LRWC of five wheat genotypes grown under water-stressed and
well-watered conditions
Genotype 15HYLD-30 showed higher LRWC of 85.78% under water stress conditions.
Water-stressed genotypes showed decreased LRWC compared to control genotypes,
except 15HYLD-30. Similar findings were reported by Khatoon et al. (2016) in wheat
under water stress conditions. Big differences in LRWC between water stress-
15HYLD-22
15HYLD-26
15HYLD-29
15HYLD-30
15HYLD-18
Well-watered 83,04 86,02 85,79 85,49 85,31Water stressed 74,85 67,95 70,50 85,78 73,93
0,00
20,00
40,00
60,00
80,00
100,00
% o
f LR
WC
Stellenbosch University https://scholar.sun.ac.za

77
susceptible and -resistant genotypes of wheat were observed by Kraus et al. (1995).
Varieties that maintain the optimum water balance provide a significant advantage of
yield stability and/or improved yield (Lugojan & Ciulca, 2011). Genotype 15HYLD-30
tolerates water stress conditions better compared to all the studied genotypes.
According to Khatoon et al. (2016), plants under optimum water conditions remain
turgid and has 98% LRWC. Most plant species have about 60% to 70% LRWC for
wilting and about 40% for extreme dehydration.
LRWC plays a significant role in indicating plant water status in relation to other
aspects (Jongdee et al., 2002). LRWC was found to be closely linked to the balance
between transpiration rate and plant available water signal (Khatoon et al., 2016). This
offers an opportunity for a plant to recover from various abiotic stresses, thereby
positively influencing yield returns. When LRWC is used for screening plants that are
resistant to water stress, genotype 15HYLD-30 could be a good option. Munjal &
Dhanda (2016) observed PCC (r = 0.48) between LRWC and grain yield under water-
stressed conditions. Dabiry et al. (2015) reported PCC between LRWC and grain yield
under both well-watered and water-stressed conditions of r = 0.628 and r = 0.403
respectively.
LRWC H2 estimates were recorded to be 94.5% and 97.55% under well-watered and
water-stressed conditions, respectively (Jatoi et al., 2012). Thus, plant breeding
programmes can utilise LRWC for screening genotypes under water-limited
conditions. Malik et al. (2015) utilised composite interval mapping to identify the QTLs
associated with LRWC, cell membrane stability and photosynthesis. The study
successfully mapped QTLs in chromosome location 2A, one each for LRWC and
photosynthesis and two for cell membrane stability. This information may be useful in
MAS for variety development under water stress conditions. LRWC is considered as
an inexpensive and convenient trait to measure for screening purposes in water stress
environments (Boutraa et al., 2010); therefore, it can be used as a selection criterion
for screening.
4.3.3 Chlorophyll content index
ANOVA for CCI showed highly significant differences for water stress treatment
(p ≤ 0.0000), variety (p ≤ 0.0000) and treatment combination (p ≤ 0.0049). The
percentage of decrease was -24.80%, relatively higher compared to most of the traits.
Stellenbosch University https://scholar.sun.ac.za

78
Lunagaria et al. (2015) conducted a study to evaluate the relationship between CCM-
200 and SPAD chlorophyll meters. Richardson et al. (2002) found a linear relationship
and a highly significant regression model between the two. Consequently, both
devices’ values can be interconverted to each other and into chlorophyll concentration
in μg cm-2. Hence, CCM-200 is a relevant tool that can be used. The average
maximum value for CCM-200 was 19.23 and the average minimum was 7.63 from
genotypes 15HYLD-18 and 15HYLD-26, respectively (Figure 4.11). Minimum
reduction was observed from genotypes 15HYLD-22 and SST1755. The results
obtained fall within the range of results recorded by Richardson et al. (2002) of 2 to 24
using a CCI-200 meter. Khalilzadeh et al. (2016) recorded the range of total Chl of 5
to 8 in wheat genotypes grown under water-limited conditions.
Figure 4.11: CCI of five wheat genotypes grown under water-stressed and well-
watered conditions
Water stress significantly reduced the CCI of all the genotypes grown under water
stress conditions. Reduced Chl was observed by Khalilzadeh et al. (2016) under
water-limited conditions in wheat. According to Wang et al. (2009), any form of stress
may result in damaged chloroplast and reduces Chl content and according to
Khalilzadeh et al. (2016) reduced Chl content damages pigment photo-oxidation and,
subsequently, reduced photosynthetic rate. According to Del Pozo et al. (2016),
chlorophyll degradation caused by increased water stress eventually leads to
increased leaf senescence, caused by reduced LAE and photosynthesis activity.
15HYLD-22
15HYLD-26
15HYLD-29
15HYLD-30
15HYLD-18
Well-watered 10,53 10,57 14,17 15,27 19,23Water stressed 9,47 7,63 8,57 8,67 18,13
0,00
5,00
10,00
15,00
20,00
25,00
CC
I
Stellenbosch University https://scholar.sun.ac.za

79
According to Jyothsna & Murthy (2016), leaf senescence is associated with Chl
degradation; hence, potential delayed senescence was observed from the genotype
15HYLD-18 throughout the water stress experiments. Based on the empirical
evidence, it can be concluded that genotype 15HYLD-18 has a stay-green character.
Interestingly, genotype 15HYLD-18 showed exceptionally higher and surprising values
of CCI for control and water-stressed genotypes of 19.28 and 18.13, respectively. This
genotype indicates better water stress tolerance.
Talebi (2011) reported higher yield gained from genotypes with higher Chl under both
irrigated and water stress environments. The Chl reduction was found to be much
quicker in the water stress-susceptible than in the water stress resistant variety
(Naeem et al., 2015). Therefore, it can be concluded that genotypes 15HYLD-26 and
15HYLD-29 are moderately susceptible to water stress. Chl was found to be
associated with yield gain under stress and is regarded as one of the target traits for
wheat crop improvement under water-limited conditions.
The Chl trait serves as a signal of water stress resistance; therefore, it should be
considered as ae valuable tool for wheat screening for water stress. Chlorophyll
concentration can be used to distinguish between susceptible and resistant wheat
varieties under water stress conditions: the higher the concentration, the higher the
resistance and vice versa.
PCC was reported by Fellahi et al. (2013) between Chl and grain yield (r = 0.601),
harvest index (r = 0.561), thousand-kernel weight (r = 0.468), spikes per plant
(r = 0.883), spike length (r = 0.301) and PH (r = 0.331). Al-Tahir (2014) reported PCC
between Chl and LAE (r = 0.739), FW (r = 0.299) and grain yield (r = 0.567). Weak
PCC (r = 0.223) was also recorded for specific CCI (Fellahi et al., 2013). H2 of 60.44%
was recorded for Chl in bread wheat. Lambrides et al. (2004) also recorded higher
narrow-sense heritability and H2 estimates for Chl of 0.82 and 0.80, respectively.
According to Talebi (2011), higher Chl has a PCC with high yield under water stress
conditions; therefore, more yield gains are expected from genotypes with higher CCI.
Panio et al. (2013) mapped QTLs associated with Chl in chromosome locations 1B,
3B (2 QTL) and 6B. Chl QTLs were identified utilising different SRAP primers in
Stellenbosch University https://scholar.sun.ac.za

80
chromosome locations 1D, 2A, 2B, 3A and 7A under water stress conditions (Elshafei
et al., 2013).
4.3.4 Stomatal conductance
ANOVA for gs revealed significant differences (p ≤ 0.0124) for water stress. No
significant differences were recorded for the genotypes and treatment combination.
The decrease percentage was recorded to be -12.19%. The average minimum and
maximum gs values observed ranged from 390.5 mmol m-2 s-1 for genotype 15HYLD-
18 to 529.8 mmol m-2 s-1 for genotype 15HYLD-26, respectively (see Figure 4.12
below). Similar average minimum values of 416.4 mmol m-2 s-1 and maximum of
511.2 mmol m-2 s-1 were recorded by Haworth et al. (2016) in wheat genotypes. Water
stress resulted in reduction of gs in the genotype studied; however, minimal reduction
was observed in genotype 15HYLD-22, followed by 15HYLD-30.
Figure 4.12: Gs of five wheat genotypes grown under water-stressed and well-
watered conditions
Under water stress conditions, the activity of the enzyme RuBisCO is reduced.
According to Flexas & Medrano (2002), reduction of gs lower than 100 mmol m-2 s-1
causes reduction of photosynthesis activity followed by reduced yield. The control
genotype 15HYLD-29 showed the best gs (529.8 mmol m-2 s-1) of all the genotypes.
Genotype 15HYLD-30 showed higher gs of 460 mmol m-2 s-1 under water-stressed
conditions. Extreme water deficit significantly reduces gs (Khalilzadeh et al., 2016);
hence, genotypes with higher gs tolerate water stress better. Genotypes with increased
reduction of gs under severe water stress conditions may experience stomatal closure
15HYLD-22
15HYLD-26
15HYLD-29
15HYLD-30
15HYLD-18
Well-watered 444,3 523,8 529,8 488,4 506,1Water stressed 437,2 392,4 441,8 460,0 390,5
0,0100,0200,0300,0400,0500,0600,0
gs in
mm
ol m
m/s
Stellenbosch University https://scholar.sun.ac.za

81
followed by decreased CO2 in the leaf, reduced ATP production caused by reduced
RuBisCO activity, modified metabolism and reduced photosynthetic activity (Flexas &
Medrano, 2002).
Persistence of water stress may lead to photochemical activity inhibition (photo-
inhibition) and may result in loss of yield. Gs can be utilised as a tool in plant breeding
for screening plants under water-limited conditions. QTLs for gs have been identified
in both field and greenhouse conditions in chromosome locations 1A, 1B, 2B and 7A
(Shahinnia et al., 2016). Nonetheless, a few studies reported a negative correlation
between gs and yield (Shahinnia et al., 2016; Jatoi et al., 2012). A positive correlation
of r = 0.79 was reported by Khakwani et al. (2012) for wheat genotypes under water
stress conditions. H2 estimates for gs were reported by Jatoi et al. (2012) for both well-
watered and water-stressed conditions to be 99.6% and 99.3% respectively at the
anthesis stage in spring wheat.
4.3.5 Relative growth rate
ANOVA for RGR showed highly significant differences for water stress treatment
(p ≤ 0.010), variety (p ≤ 0.0002) and treatment combination (p ≤ 0.0001).
Figure 4.13: RGR of five wheat genotypes grown under water-stressed and well-
watered conditions
The recorded percentage of decrease for RGR was -16.67%. An average RGR
maximum value of 0.151 g g-1 d-1 was observed in the control genotype 15HYLD-18
15HYLD-22
15HYLD-26
15HYLD-29
15HYLD-30
15HYLD-18
Well-watered 0,116 0,121 0,121 0,095 0,132Water stressed 0,105 0,075 0,109 0,115 0,104
0,0000,0200,0400,0600,0800,1000,1200,140
RG
R (g
/g/d
)
Stellenbosch University https://scholar.sun.ac.za

82
and an average minimum value of 0.075 g g-1 d-1 in the water-stressed genotype
15HYLD-26 (Figure 4.13).
Similar RGR results were obtained by Kahrizi et al. (2010), ranging from 0.058 g g-1 d-1
to 0.162 g g-1 d-1 in durum wheat. Water stress resulted in reduced RGR in four
genotypes. Genotype 15HYLD-30 had a higher RGR in water stress treatment
compared to the control genotypes. Similar results were observed by Saeidi et al.
(2015) whereby water-stressed genotypes showed a higher value of harvest index
compared to the corresponding control genotypes in wheat. This can be explained by
additive genes. Upregulation of water stress resistance genes or genetic
overexpression may have resulted in exponential growth of the genotype. Genetic
differences in the genotypes studied may have resulted in significant differences in
RGR. Genotype 15HYLD-26 showed moderate susceptibility to water due to higher
reduction in RGR. A study by Abid et al. (2016) reported significant decrease in RGR
caused by drought stress in various stages of plant growth.
The negative impact of drought stress was reported to be even higher in the jointing
and booting stages compared to the anthesis stage. Water stress interferes with the
physiological processes of wheat in the vegetative growth stage, thereby affecting
plant establishment, net photosynthesis and eventually yield (Abid et al., 2016).
According to Abid et al. (2016) continuous respiration inhibits net photosynthesis
followed by reduced assimilates. Strong PCC between RGR and yield of r = 0.91 in
wheat was reported by Karimi & Siddique (1991). The QTL for RGR was mapped in
chromosome locations 1D, 4D and 7D, together with LAE and biomass (Ter Steege et
al., 2005).
4.3.6 Photosynthetic active radiation
PAR statistical analysis showed nonsignificant differences (p ≥ 0.05) between the
RHSs under investigation. The environment also showed no significant differences
between the RHSs studied (Table 4.7). Average light interceptance values of 72.8%
and 73.3% were recorded for both the well-irrigated and water-stressed RHSs,
respectively (Table 4.8). The water-stressed RHS showed a higher extinction
coefficient (9.26%) than the control RHS (9.1%).
Stellenbosch University https://scholar.sun.ac.za

83
Light interceptance was approximately 20% less than that recorded by Pask et al.
(2012) in the field (97% to 99%). Seemingly, the differences were caused by different
environmental conditions. The LAI for the control RHS was 0.18 and 0.16 (Table 4.8).
There was no big difference from the results for LAI recorded by Lunagaria & Shekh
(2006) for minimum and maximum seasonal mean values of 0.77 to 0.86, respectively.
This can also be explained by differences in the environments, growth system used
(RHS), plant spacing, the genotypes and the stage of plant growth.
Table 4.7: ANOVA and mean comparison of extinction coefficiency and light
interceptance parameters
Traits
Treatment Interceptance Extinction coefficient
RHS1 (control) 48.75 0.81
RHS2 (water stressed) 48.02 0.81
RHS3 (water stressed) 47.27 0.80
RHS ns* ns*
CV (%) 8.74 3.71
Grand mean 48.016 0.07
R-square 0.523 0.464
Significance level at 5% probability. ns* – nonsignificant and ** – significant.
LAI was found to be highly associated with increased grain yield in wheat and maize
crops in dry areas (Yin et al., 2016). Variation in plant LAI significantly influences plant
populations’ micro-environment and spatial distribution, thereby influencing
photochemical distribution and photosynthetic efficiency (Giunta et al., 2008).
Optimum LAI of the plant indicates increased yield gains, associated with organ
development and stability, and facilitates the source to sink strength relationship in the
plant (Yin et al., 2016).
The maximum average light interceptance value of 73% was observed from the water-
stressed RHS throughout the stress period (Table 4.8). Soleymani & Shahrajabian
(2012) reported that a maximum thousand-grain weight was obtained from the studied
genotypes, consisted of higher values of extinction coefficient, light interceptance and
LAI. RUE values ranged from 0.07 g MJ-1 to 0.08 g MJ-1 for both the water-stressed
Stellenbosch University https://scholar.sun.ac.za

84
and the control RHS respectively. However, the RUE values fell below those reported
in the literature. Sandaña et al. (2012) reported a minimum of 1.10 g MJ-1 and a
maximum of 1.65 g MJ-1 RUE in both wheat and pea crops. Such differences are
believed to be caused simply by differences in data collection time intervals, genotypes
and the environment. The data for the current study was collected during a 14-day
period whereas in other experiments in the literature, it was collected throughout the
growing season up until harvest. Efficient use of the energy from the sun by the plant
provides a great opportunity for realised yield (Soleymani & Shahrajabian, 2012).
Therefore, PAR can be used as a selection criterion for screening plants in plant
breeding programmes. QTLs for PAR were mapped at chromosome locations 4B, 5B
and 6B under rain-fed conditions (Diab et al., 2008).
Table 4.8: Means of PAR measurements from the control and water-stressed
RHSs
RHS Mean Extinction
coefficient
LAI RUE (g MJ-1)
Control 0.728 9.1 0.181 0.08
Water
stressed
0.733 9.26 0.168 0.07
4.3.7 Specific leaf area
ANOVA for LAE showed highly significant differences for water stress treatment
(p ≤ 0.0387), variety (p ≤ 0.0002) and treatment combination (p ≤ 0.0081). The
percentage of decrease was recorded to be -15.17%.
Stellenbosch University https://scholar.sun.ac.za

85
Figure 4.14: LAE of five wheat genotypes grown under water-stressed and well-
watered conditions
An average maximum value of about 13.98 cm2 was recorded from genotype
15HYLD-22 and an average minimum of about 9.71 cm2 from genotype 15HYLD-26
(Figure 4.14). Among the water-stressed genotypes, 15HYLD-29 showed higher LAE
size of 12.48 cm2 and a minimum value of 9.17 cm2 was recorded from genotype
15HYLD-22. Similar results for LAE were recorded by Guendouz (2016) and Yang et
al. (2016), with minimum and maximum values ranging from 11.46 cm2 to 19.37 cm2
and 8.80 cm2 to 27.09 cm2 respectively under irrigated and non-irrigated conditions in
wheat. Hence, the different between water stress and well-watered genotypes was -
15.17% for LAE. Average LAE size was reduced during water stress in all water-
stressed genotypes except 15HYLD-29. Water stress was found to reduce cell turgor,
cell division and eventually cell expansion (Guendouz, 2016). Genotype 15HYLD-29
showed a higher LAE value of 12.48 cm2 compared to the control genotypes under
water stress conditions.
This indicates the influence of additive genes expressed under water stress conditions.
This trait is very important for variety improvement. Chaudhary et al. (2012) concluded
that LAE was one of the most important traits for plant growth analysis and yield
estimation. Photosynthesis is the primary activity of the leaf; hence, LAE size serves
to indicate photosynthesis capacity and potential grain yield. Reduced distance
between the spikes and flag leaf (peduncle length) offers the opportunity for a flag leaf
15HYLD-22
15HYLD-26
15HYLD-29
15HYLD-30
15HYLD-18
Well-watered 13,98 10,54 12,01 12,86 12,24Water stressed 9,17 9,71 12,48 10,65 10,31
0,002,004,006,008,00
10,0012,0014,0016,00
LAE
(cm
2 )
Stellenbosch University https://scholar.sun.ac.za

86
to be the primary source of photosynthate to the grain and continuous supply through
its delayed senescent properties.
Tiryakioglu (2015) observed PCC (r = 0.54) between spike grain yield and flag leaf
area under water stress conditions. Al-Tahir et al. (2014) reported PCC between LAE
and FW (r = 0.548), Chl (r = 0.739) and grain yield (r = 0.806). Genotype 15HYLD-29
showed higher LAE size; therefore, there is potential for increased yield under water-
stressed conditions in relation to other genotypes. Higher H2 estimates for LAE of
86.57% were reported by Ahmed et al. (2004) and 0.89% by Khan & Hassan (2017).
Markers associated with flag leaf senescence in wheat were identified by Barakat et
al. (2015) and included SSR (Xgwm328), ISSR (Pr8, AD5, AD2 and AD3) and RAPD
(Pr9), indicating water stress resistance genes.
4.4 Agronomic traits
4.4.1 Root length
ANOVA results for RL showed no significant differences for water stress treatment.
The variety and treatment combination did not show any statistical differences in the
experiment. The percentage of decrease was recorded as the lowest, namely -6.87%.
The average maximum and minimum RL values recorded were 23.67 cm and
23.50 cm from the control genotypes 15HYLD-29 and 15HYLD-18, respectively.
Figure 4.15: RL of five wheat genotypes grown under water-stressed and well-
watered conditions
Minimum values of 9.33 cm and 20.00 cm were also recorded from the same
genotypes under water stress conditions (Figure 4.15). Similar results were recorded
15HYLD-22
15HYLD-26
15HYLD-29
15HYLD-30
15HYLD-18
Well-watered 21,50 21,50 23,67 19,00 23,50Water stressed 20,33 21,33 19,33 20,67 20,00
0,005,00
10,0015,0020,0025,00
RL
(cm
)
Stellenbosch University https://scholar.sun.ac.za

87
by Ahmad et al. (2014), with minimum and maximum mean values of 9.35 cm to
19.98 cm and 3.94 cm to 17.866 cm for well-watered and water-stressed conditions,
respectively. The slightly higher values of the current study may be due to data
collection during the stem elongation stage whereas Ahmad et al. (2014) collected
data during the seedling stage. Water stress resulted in reduction of RL except in
genotype 15HYLD-30, but no significant differences recorded from statistical results,
therefore this could be caused by nature or chance. Nonetheless, reduction of RL
under water stress conditions was also observed by Ahmad et al. (2014) and Becker
et al. (2016). Genotypes with increased RL under water-stressed conditions were
found to tolerate water stress better and to have increased water and nutrient uptake
from deep soil (Ahmad et al., 2014).
An H2 estimate of 80.28% was recorded from wheat genotypes under water stress
conditions (Ahmad et al., 2014). Becker et al. (2016) observed a positive association
between RL and gs under water stress conditions in wheat. A strong PCC was
recorded by Ahmad et al. (2014) for RL and SL (r = 0.874%), SFW (r = 0.882%) and
SDW (r = 0.702%) under water-stressed conditions. A moderate H2 estimate of
62.660% was recorded for RL by Khan et al. (2010). QTL associated with root hair
length was mapped in chromosome locations 1A, 2A, 6A and 2BL. PCC was reported
between root hair length and yield (Horn et al., 2016). QTL (QRl.ccsu-2B.1) for RL was
mapped at chromosome location 2B (Bharti et al., 2014). RL may be used as a
selection criterion under water-limited conditions for variety development.
4.4.2 Roots dry weight
ANOVA results for RDW showed significant differences (p ≥ 0.0000) for water
treatment and no significant differences for the variety and treatment combination. The
percentage of decrease for RDW recorded was -30.12%. The average minimum and
maximum values of RDW for genotype 15HYLD-26 were 0.98 g and 0.55 g for both
control and water-stressed conditions (Figure 4.16).
Stellenbosch University https://scholar.sun.ac.za

88
Figure 4.16: RDW of five wheat genotypes grown under water-stressed and well-
watered conditions
The current study results are higher than those recorded by Mujtaba et al. (2016) at
the seedling stage, ranging from 0.004 g to 0.01 g under osmotic stress. Similar results
were recorded by Tatar et al. (2016) that ranged from 0.7 g to 1.2 g for both water-
stressed and well-watered conditions. Water stress resulted in reduction of RDW in all
genotypes.
Minimum RDW reduction was recorded for BHYLD14-08 and 15HYLD-29 under water
stress conditions. These genotypes may be useful for root traits development in plant
breeding programmes. Greater reduction was observed from genotypes 15HYLD-22
and 15HYLD-26, showing signs of moderate susceptibility to water stress. A number
of studies reported reduction in RDW in wheat under water stress conditions (Tatar et
al., 2016; Ahmad et al., 2014; Sivamani et al., 2000). Narayanan et al. (2014) found
increased RDW directly proportional to the increase of SDW and NT. Therefore,
activities of the root system increase with increased root surface area. Hence, the
more the plant root is in contact with the soil particles, the greater the water and
nutrient uptake is. Roots may accumulate more dry matter under water stress
compared to well-watered genotypes. Reduction in water and nutrient supply to the
roots triggers a signal to the roots, leading to production of root hormones, thereby
avoiding water stress (Dhanda et al., 2004). Narayanan et al. (2014) reported a
positive but weak association (r = 0.41) between RDW and SDW in wheat. A strong
15HYLD-22
15HYLD-26
15HYLD-29
15HYLD-30
15HYLD-18
Well-watered 0,92 0,98 0,73 0,71 0,81Water stressed 0,61 0,55 0,60 0,57 0,58
0,000,200,400,600,801,001,20
RD
W (g
)
Stellenbosch University https://scholar.sun.ac.za

89
PCC of r = 0.86, r = 0.90 and r = 0.90 were recorded in bread wheat for RDW and RN,
RL and root volume, respectively (Bharti et al., 2014).
Naeem et al. (2015) recorded lower H2 estimates for RDW of 27% and 25.3% for
water-stressed and well-watered conditions, respectively. Bharti et al. (2014)
successfully mapped six QTLs for root traits in distinct chromosome locations. Among
the six QTLs, four were for root volume (QRv.ccsu in chromosome locations 1A, 1B,
2D and 4A) and the remaining two for RDW (QRDw.ccsu-2A.2) and RL (QRI.ccsu-
2B1). Such information may be useful for variety development for yield improvement
under water stress conditions. Root structure is very important in plant performance,
especially genotypes grown under conditions of limited moisture and nutrient supply.
4.4.3 Shoot length
ANOVA for SL showed highly significant differences for varieties (p ≤ 0.0000), water
stress treatment (p ≤ 0.0020) and treatment combination (p ≤ 0.0000). The reduction
percentage was recorded to be -16.83%. The average minimum and maximum SL
values recorded were 6.20 cm to 9.87 cm for control and 5.20 cm to 8.20 cm for water-
stressed genotypes, respectively (Figure 4.17).
Figure 4.17: SL of five wheat genotypes grown under water-stressed and well-
watered conditions
Maqbool et al. (2015) recorded an average minimum and maximum range of 0.87 cm
to 55.02 cm for PH in wheat at the tillering stage. Water stress and variety treatments
resulted in reduction of SL in all the genotypes studied. However, genotype 15HYLD-
15HYLD-22
15HYLD-26
15HYLD-29
15HYLD-30
15HYLD-18
Well-watered 6,53 6,20 7,00 6,33 9,87Water stressed 5,57 5,20 6,30 5,37 8,20
0,002,004,006,008,00
10,0012,00
Shoo
t len
gth
(cm
)
Stellenbosch University https://scholar.sun.ac.za

90
18’s higher SL value of 9.87 cm indicated better water stress tolerance. According to
Saleem (2003), tolerant genotypes show increased PH under water stress conditions.
SL measurements at the tillering and stem elongation stages can be used to predict
PH at maturity and, subsequently, yield.
The recorded results are similar to those reported in the literature (for example Ahmad
et al., 2014; Mujtaba et al., 2016; Khan & Naqvi, 2011). Despite differences in stages
of growth, Ahmad et al. (2014) and Mujtaba et al. (2016) reported substantial reduction
of SL because of water stress treatment in wheat genotypes. More reduction was
observed by Ahmad et al. (2014) from the stem than the roots. A linear trend in SL
reduction was observed from all the genotypes. According to El-Kholy & Gaballah
(2005), water stress conditions may result in protoplasm dehydration and reduction of
relative turgidity, thereby suppressing cell division and expansion though turgor loss.
Positive associations were observed for SL and RL, FW, DW and gs of r = 0.841,
r = 0.749, r = 0.640 and r = 0.410, respectively, under water stress conditions (Khan
et al., 2010). PCC was recorded by Ahmad et al. (2014) for SL and RL (r = 0.670),
SFW (r = 0.911) and SDW (r = 0.831). A high H2 estimate was reported for SL of about
98.27% (Khan et al., 2010) and 83.41% (Ahmad et al., 2014). Ellis et al. (2002)
reported availability of molecular markers for screening PH in wheat named dwarfing
genes, namely Rht-B1 and Rht-D1 These markers are grouped into three categories:
dwarfing (Rht-B1c), semi-dwarfing (Rht-B1b) and tall plants (Rht-B1a) (Kocheva et al.,
2014). Kocheva et al. (2014) reported better performance of semi-dwarfing (Rht-B1b)
genotypes compared to dwarfing (Rht-B1c) genotypes under water stress conditions.
Breeding for required optimum PH confer indispensable productivity, stability and
safety of yield on varieties grown under a wide range of environmental conditions
(Bognár et al., 2007).
4.4.4 Number of tillers
ANOVA NT showed significant differences for variety (p ≤ 0.0122) and no significant
differences for water stress treatment. However, treatment combination showed
significant differences (p ≤ 0.0002) for NT. Reduction percentage of about -6.87% was
recorded for NT. The highest value for tiller development was recorded from the
control genotype 15HYLD-29 (11.00) and the lowest value from 15HYLD-30 (7.67)
(Figure 4.18). The highest and lowest values observed for water-stressed genotypes
Stellenbosch University https://scholar.sun.ac.za

91
were from 15HYLD-29 and 15HYLD-18 (7.67). Maqbool et al. (2015) obtained similar
results with minimum and maximum average values ranging from 8.51 to 9.37 for total
NT.
Figure 4.18: NT of five wheat genotypes grown under water-stressed and well-
watered conditions
Water stress resulted in a reduction in NT in genotype 15HYLD-29 only. Increased NT
was observed from four other genotypes under water stress conditions. Maqbool et al.
(2015) reported reduction in NT under water stress conditions. Most genotypes under
water stress conditions showed increased NT, indicating tolerance to water stress
(Figure 4.18). Similar findings were reported by Khan and Naqvi (2011).
Genotype 15HYLD-22 showed a higher rate of tiller development and had the highest
NT under water stress conditions, indicating better tolerance. This behaviour is
associated with the additive genetic effect expressed under water stress conditions.
Not all the tillers produced grain yield; however, the greater the NT under water stress
conditions, the greater the proportion of fertile to sterile tillers and the better the
chances of greater final yield. Weak PCC of NT of r = 0,281 for well-watered
environment and r = 34,5 for water-stressed environments was reported by Naeem et
al. (2015). QTLs associated with NT were mapped for pre-winter NT (QMtw5D),
maximum NT in spring (QMts5D and QMts6D) and NT at harvest (QEth6A), followed
by H2 estimate of 0.94, 0.81 and 0.91%, respectively (Li et al., 2010). NT can be used
as a water stress selection criterion in plant breeding programmes in water stress
environments and to predict better yield.
15HYLD-22
15HYLD-26
15HYLD-29
15HYLD-30
15HYLD-18
Well-watered 10,00 8,33 11,00 7,67 9,67Water stressed 11,00 9,00 7,67 10,00 7,67
0,002,004,006,008,00
10,0012,00
Num
ber o
f tille
rs
Stellenbosch University https://scholar.sun.ac.za

92
4.4.5 Number of leaves
ANOVA for NL showed significant differences for variety (p ≤ 0.0053) and water stress
treatment (p ≤ 0.0000). No significant differences were observed for treatment
combination. The value of reduction among all the genotypes was recorded as -
42.85%.
Figure 4.19: NL of five wheat genotypes grown under water-stressed and well-
watered conditions
15HYLD-22
15HYLD-26
15HYLD-29
15HYLD-30
15HYLD-18
Well-watered 26,00 24,33 22,33 21,67 17,67Water stressed 14,33 11,00 13,33 12,33 11,00
0,005,00
10,0015,0020,0025,0030,00
Num
ber o
f lea
ves
Stellenbosch University https://scholar.sun.ac.za

93
Table 4.9: ANOVA and mean comparison of treatment effects from studied traits Treatment Trait
RL
(cm)
SL
(cm)
RFW
(g)
SFW
(g)
LFW
(g)
TPFW
(g)
RDW
(g)
SDW
(g)
LDW
(g)
ABGB
DW(g)
TPDW
(g) R:S ratio
NL
Water levels Well-watered 21.83 7.19 2.49 4.88 8.83 15.55 0.83 0.35 0.65 1.06 1.23 0.93 22.40 Water stressed
20.33 6.13 1.85 2.80 4.82 10.11 0.58 0.25 0.63 0.91 1.16 0.61 12.40
% of decrease -6.87 -16.3 -25.70 -42.62 -45.41 -34.98 -30.12 -28.57 -3.08 -14.15 -5.69 -34.4 -42.85
Genotypes 15HYLD-22 20.92 6.05 2.43 3.77 6.60 12.79 0.77 0.26 0.72 1.10 1.23 0.72 20.17 15HYLD-26 21.42 5.70 1.63 3.09 5.55 10.26 0.77 0.36 0.48 0.86 0.98 0.80 17.67 15HYLD-29 21.50 6.65 2.41 4.30 7.95 14.66 0.70 0.25 0.71 0.62 1.25 0.80 17.83 15HYLD-30 19.83 5.85 1.87 3.38 6.06 11.31 0.67 0.24 0.57 1.03 1.07 0.75 17.00 15HYLD-18 21.75 9.03 2.53 4.65 7.96 15.14 0.64 0.39 0.73 1.30 1.46 0.72 14.33
Genotypes ns* ** ** ** ** ** ns* ** ** ** ** ns* ** Water levels ns* ** ** ** ** ** ** ** ns* ** ** ** ** Interaction ns* ns* ** ** ns* ns* ns* ** ** ** ** ns* ns* CV (%) 11.36 8.63 10.25 12.03 9.33 7.76 17.01 8.07 10.14 10.72 6.12 16.81 12.77 Grand mean 21.08 6.657 2.174 3.837 6.822 12.83 0.707 0.552 0.639 0.983 1.197 0.771 17.40 R-square value 0.448 0.904 0.894 0.926 0.954 0.949 0.717 0.756 0.870 0.929 0.938 0.763 0.910
Significance level at 5% probability. ns* – nonsignificant and ** – significant.
Stellenbosch University https://scholar.sun.ac.za
Stellenbosch University https://scholar.sun.ac.za

94
The average minimum and maximum values recorded for control genotypes were
26.00 and 24.33 for 15HYLD-22 and 15HYLD-26, respectively. For the 15HYLD-26
and 15HYLD-18 genotypes, water stress average minimum values of 11.00 were
recorded (Figure 4.19). Similar findings were reported by Mbave (2013), ranging from
11.75 to 25.00. Leaf development for water-stressed and nonstressed genotypes
indicated plant development. Genotype 15HYLD-18 showed lower reduction of NL
under water stress conditions, indicating better tolerance. As much as genotypes
15HYLD-22 and 15HYLD-26 had higher values than the controls, higher reduction was
observed from the two genotypes, showing moderate susceptibility to water stress.
The primary function of leaves is photosynthesis; therefore, higher NL will result in
higher interception and increased photosynthetic activity and yield (Mbave, 2013). Few
research studies reported failure of plants to recover from the stress when water stress
was experienced at the vegetative stage (Mbave., 2013; Vurayai et al., 2011). Plants
that can recover from water stress conditions and produce yield are ideal for plant
breeding programmes. According to Anjum et al. (2011), source-sink strength
relationship is reduced under severe water stress conditions, resulting in reduced NL
and LAE. Slafer et al. (1994) state that more knowledge is required of the genetic and
environmental control for rate of leaf development and final NL to back up the yield
improvement results from many regions. According to Stapper and Fischer (1990),
several research works reported significant changes in rate of leaf development once
a specific NL have appeared. A positive correlation between NL and grain yield was
recorded for biological yield in the booting stage (r = 0.38) and the anthesis stage
(r = 0.67) (Gupta et al., 2001). Very limited or no information is available on NL;
therefore, as it is one of the most important agronomic traits, more research needs to
be done, especially molecular work. The NL plays a significant role in photosynthesis
rate and capacity; therefore, it should be taken into consideration.
4.4.6 Total plant fresh weight
ANOVA for TPFW measurements showed significant differences among the
genotypes for RFW (p ≤ 0.0000), SFW (p ≤ 0.0001), LFW (p ≤ 0.0000) and TPFW
(p ≤ 0.0000). ANOVA showed significant differences for water stress for RFW
(p ≤ 0.0000), SFW (p ≤ 0.0000), LFW (p ≤ 0.0000) and TPFW (p ≤ 0.0000). Treatment
combination showed significant differences for RFW (p ≤ 0.0500) and SFW
Stellenbosch University https://scholar.sun.ac.za

95
(p ≤ 0.0026). No significant differences were observed for treatment combination in
LFW and TPFW. Higher values were recorded for percentage of decrease in RFW,
SFW, LFW and TPFW, namely -25.70%, -42.62%, -45.41% and -34.98%,
respectively. The highest average value of TPFW for control genotypes was observed
for genotype 15HYLD-29 (18.03 g), and the lowest value was observed for genotype
15HYLD-26 (12.85 g) (Figure 4.20). Similarly, maximum and minimum average TPFW
values for water-stressed varieties were recorded for genotypes 15HYLD-18 (13.03 g)
and 15HYLD-26 (7.67 g).
Water stress resulted in a significant reduction in FW. Less reduction was observed
for genotype 15HYLD-18. Such genotypes can be used in varietal development in
wheat under water stress conditions. Genetic variability resulted in a difference in
growth response of the five wheat varieties. Hussein & Zaki (2013) reported a decline
in TPFW under conditions of delayed watering and withholding of water. Growth
depends on several factors, such as genetic factors and growing conditions. Several
parameters are associated with growth inhibition under water stress, including
physiological, morphological, biochemical and molecular. According to Smirnoff
(1998), water stress may result in oxidative stress, which may denature enzymes and
protein functions and inhibit growth
Figure 4.20: TPFW of five wheat genotypes grown under water-stressed and
well-watered conditions
A positive correlation was reported between TPFW and SL (r = 0.749), RL (r = 0.633),
DW (r = 0.781%) and gs (r = 0.551) under water stress conditions (Khan et al., 2010).
15HYLD-22
15HYLD-26
15HYLD-29
15HYLD-30
15HYLD-18
Well-watered 15,44 12,85 18,03 14,20 17,25Water stressed 10,15 7,67 11,27 8,41 13,03
0,00
5,00
10,00
15,00
20,00
FW (g
)
Stellenbosch University https://scholar.sun.ac.za

96
Al-Tahir (2014) recorded a positive association between TPFW and flag leaf area
(r = 0.548), Chl (r = 0.299) and grain yield (r = 0.695). A high H2 estimate of 94.59%
was recorded for TPFW (Khan et al., 2010). H2 estimates for RFW and SFW of 87.5%
and 46.1%, respectively, were also recorded by Naeem et al. (2015). TPFW is one of
the most important traits associated with yield as is evident from the correlation and
heritability values; therefore, it can be used as selection criterion under water-stressed
conditions.
4.4.7 Total plant dry weight
ANOVA showed significant differences among the varieties for SDW (p ≤ 0.0000),
LDW (p ≤ 0.0000), aboveground biomass (ABGB) (p ≤ 0.0000) and TPDW
(p ≤ 0.0000). Water stress treatment showed significant differences for SDW
(p ≥ 0.0000), ABGB (p ≥ 0.0008) and TPDW (p ≥ 0.0278). Water stress did not have
any significant differences for LDW. Treatment combination showed significant
differences for SDW (p ≥ 0.0000), LDW (p ≤ 0.0001), ABGB (p ≥ 0.0008) and TPDW
(p ≤ 0.0000). The percentages of decrease for SDW, LDW, ABGB and TPDW
were -28.57, -3.08, -14.15 and -5.69, respectively.
Figure 4.21: TPDW of five wheat genotypes grown under water-stressed and
well-watered conditions
Higher TPDW in the control genotypes was observed from genotype 15HYLD-18
(1.692 g), and lower TPDW was observed from genotype 15HYLD-30 (0.915 g).
Average maximum and minimum TPDW values from water-stressed genotypes were
recorded from genotypes 15HYLD-22 (1.322 g) and 15HYLD-29 (1.230 g) (Figure
15HYLD-22
15HYLD-26
15HYLD-29
15HYLD-30
15HYLD-18
Well-watered 1,140 1,125 1,274 0,915 1,692Water stressed 1,322 0,827 1,230 1,215 1,227
0,0000,2000,4000,6000,8001,0001,2001,4001,6001,800
TPD
W (g
)
Stellenbosch University https://scholar.sun.ac.za

97
4.21). Similar average values for total plant biomass were recorded by Saeidi et al.
(2015) and Tatar et al. (2016) under water-stressed conditions. Reduction was
observed from genotypes 15HYLD-26, 15HYLD-29 and 15HYLD-18. Genetic variation
in genotypes and water stress resulted in reduction in total plant biomass. Several
studies reported reduction in TPDW under water stress conditions (Saeidi et al., 2015;
Ahmad et al., 2014; Tatar et al., 2016). Moderate and severe water stress conditions
significantly reduced the number of spikes and the grain in wheat (Tatar et al., 2016).
Moreover, the stem elongation phase coincides with spike formation and is regarded
as a critical stage of growth, which resulted in loss of yield.
Water stress interferes with assimilates production; thus, assimilates are partitioned
into different plant organs such as roots and assimilates directed to the grain are
minimised. According to Gupta et al. (2001), the stem plays a significant role in the
supply of reserve nutrients to the grain under severe water scarcity to compensate for
reduced food synthesis. Noorka et al. (2013) found higher fructane reserves from the
stems of water stress-resistant varieties to sustain developing grain under water-
limited conditions. Therefore, plants that can accumulate more dry matter under water-
limited conditions can be used to predict improved yield from the vegetative growth
stage. Genotypes 15HYLD-22 and 15HYLD-30 showed increased dry matter under
water stress conditions, indicating tolerance to water stress. The effect of additive
genes can once again be observed from these genotypes. PCC was recorded for DW
and SL (r = 0.64), RL (r = 0.54), FW (r = 0.781) and gs (r = 0.42) under water stress
conditions (Khan et al., 2010). Kahrizi et al. (2010) reported PCC for LDW and
peduncle length (r = 0.51), NT (r = 0.20) and PH (r = 0.62). A positive association was
also reported between SDW and LDW (r = 0.64), peduncle length (r = 0.74), PH
(r = 0.65), NT (r = 0.34) and yield (r = 0.1) (Kahrizi et al., 2010). Lastly, Gupta et al.
(2001) reported a positive association between SDW and yield for biological yield at
booting stage (r = 0.62) and the anthesis stage (r = 0.57).
Moderate H2 estimates for LDW and SDW were reported to be 58.08% and 69.00%,
respectively (Kahrizi et al., 2010). High H2 estimates of 96.72% were recorded for
TPDW in wheat genotypes (Khan et al., 2010). Sivamani et al. (2000) introduced the
HV1 gene from barley induced by ABA synthesis; transgenic plants resulted in
significantly increased DW, SDW and water use efficiency. Multiple methods can be
Stellenbosch University https://scholar.sun.ac.za

98
employed for variety improvement under water-limited conditions. Improved DW
accumulation at the vegetative stage under water stress conditions guarantees
carbohydrate supply to the developing grain at the grain filling stage. Therefore, DW
can be used as a selection criterion under water stress conditions for varietal
characterisation.
4.4.8 Root-to-shoot ratio
ANOVA for R:S ratio showed significant differences (p ≤ 0.0000) for water stress
treatment and no significant differences for the variety and the treatment combination.
The reduction percentage recorded was -42.85%. Average maximum and minimum
values of about 0.665 and 0.724 for controls were recorded from genotypes 15HYLD-
26 and 15HYLD-18, respectively. A significantly higher R:S ratio was recorded from
water stress genotype 15HYLD-29 (1.044), and the lowest was observed from
genotype 15HYLD-18 (0.850) (Figure 4.22). The current study’s R:S ratio results range
from 0.548 to 1.044. Ahmad et al. (2014) recorded related results ranging from 0.334
to 0.597 and 0.339 to 0.602 for control and water-stressed genotypes, respectively.
Increased R:S ratio was observed from all the genotypes.
Figure 4.22: R:S ratio of five wheat genotypes grown under water-stressed and
well-watered conditions
Similar results were observed by Ahmad et al. (2014) and Boutraa et al. (2010)
whereby water-stressed genotypes increased the R:S ratio. Dhanda et al. (2004)
reported that increased R:S ratio was attributed to greater inhibition of stem extension
compared to roots due to water stress. Genotypes 15HYLD-26 and 15HYLD-29
15HYLD-22
15HYLD-26
15HYLD-29
15HYLD-30
15HYLD-18
Well-watered 0,566 0,665 0,565 0,548 0,724Water stressed 0,868 0,934 1,044 0,945 0,850
0,0000,2000,4000,6000,8001,0001,200
Roo
t to
shoo
t rat
io
Stellenbosch University https://scholar.sun.ac.za

99
showed significant increase in R:S ratio, indicating that shoots were significantly
affected by water stress. Genotype 15HYLD-18 showed a lesser degree of being
affected by water stress. Water stress interferes with soluble sugar accumulation in
the stem and entire plant, enzyme activity for soluble sugar degradation and
carbohydrate partitioning (Xu et al., 2015). Under water stress, the plant invests more
nutrients in deep root growth into the soil for water and nutrient extraction to avoid
stress (Dhanda et al., 2004). R:S ratio measurements provide an opportunity to
estimate dry matter partitioning into different plant organs and indicates the effect on
roots and shoots (Xu et al., 2015).
Strong and moderate PCC was recorded for R:S ratio and soluble sugar proportion in
roots (r = 0.88) and leaves (r = 0.45). Moderate PCC was also recorded between
proportion of starch in the roots and R:S ratio (r = 0.60). Moderate H2 was observed
for R:S ratio of 0.44% (Khan et al., 2001). The current study explored heritability
estimates from the literature. According to Fellahi et al. (2013), a quantitative trait such
as heritability is one of the most important to consider heredity and surrounding
conditions to determine the trait genetic expression. Less environmental effect
interference and considerable additive effect may provide an effective opportunity for
selection.
4.5 Variety rankings and percentage of decrease
The percentage of decrease was calculated for all varieties, and it varied across all
the traits studied. Minimum reduction was observed for NL, LDW, TPDW, RL, NT,
RDW and SL, indicating better water stress resistance. The higher the percentage of
decrease, the lower the chances of using the trait for screening. Reduction was also
calculated for genotypes studied under water stress conditions (Table 4.10 below).
Subsequently, ranking of the genotypes based on minimum reduction under water
stress conditions for all the traits studied was done (Table 4.11). The sum of the
rankings was calculated for all genotypes (Table 4.12). Ranking was based on the
lowest to the highest values. Genotype 15HYLD-30 performed exceptionally well,
followed by genotype 15HYLD-22. Genotype 15HYLD-29 was third and performed
better than genotypes 15HYLD-18 and 15HYLD-26 (Table 4.12).
Stellenbosch University https://scholar.sun.ac.za

100
4.6 Correlation study
Exploring information regarding the traits association from five wheat genotypes at the
vegetative stage of growth could enhance the opportunity of indirect selection for
several characteristics (Ahmad et al., 2014). Hence, valuable information could be
presented to the breeder. To supplement the information discussed in the literature,
correlation coefficients of the traits were explored. Negative and positive (weak,
moderate and strong) correlation coefficients were observed from all the traits studied
(Table 4.13), under both water-stressed and well-watered environments. However, the
study focused on the strong positive correlation of the traits. The following correlations
were observed under water-stressed conditions: A strong positive association
between FW components included LFW and RFW (r = 0,884), followed by TPFW with
FW components such as RFW (r = 0,848), SFW (0,922) and LFW (r = 0,920). A strong
positive association was also recorded between SFW and SL (r = 0,832), CCI and SL
(r = 0,835) and SFW (0,890). Lastly, TPDW with RGR (r = 0,879) and LDW (r = 0,872).
A strong positive association was recorded under well-watered conditions namely
TPFW showed a strong positive association with SFW (0,872), LFW (r = 0,920),
TPDW with SL (r = 0,877) and LDW (r = 0,841). The correlation information provides
a way forward in varietal development under water stress conditions.
Stellenbosch University https://scholar.sun.ac.za

101
Table 4.10: The reduction differences calculated from each trait studied No. Genotype ELWL LRWC CCI GS RGR LAE RL RDW SL TN NL FW DW RSR 1 15HYLD-22 22,57 8,19 1,07 7,13 0,01 4,81 1,17 0,31 0,97 -1,00 11,67 5,28 -0,18 -0,30 2 15HYLD-26 17,95 18,07 2,93 131,3 0,05 0,83 0,17 0,43 1,00 -0,67 13,33 5,18 0,30 -0,27 3 15HYLD-29 23,70 15,29 5,60 88,03 0,01 -0,47 4,33 0,13 0,70 3,33 9,00 6,76 0,04 -0,48 4 15HYLD-30 34,81 -0,29 6,60 28,45 -0,02 2,22 -1,67 0,14 0,97 -2,33 9,33 5,79 -0,30 -0,40 5 15HYLD-18 37,58 11,38 1,10 115,5 0,03 1,93 3,50 0,23 1,67 2,00 6,67 4,21 0,46 -0,13
Table 4.11: Ranking of the genotypes based on minimum to maximum reduction No. Genotype ELWL LRWC CCI GS RGR LAE RL RDW SL NT NL TPFW TPDW RSR Total 1 15HYLD-22 2 2 1 1 2 5 3 4 3 2 4 3 2 3 37 2 15HYLD-26 1 5 3 5 5 2 2 5 4 3 5 2 4 4 50 3 15HYLD-29 3 4 4 3 3 1 5 1 1 5 2 5 3 1 41 4 15HYLD-30 4 1 5 2 1 4 1 2 2 1 3 4 1 2 33 5 15HYLD-18 5 3 2 4 4 3 4 3 5 4 1 1 5 5 49
Table 4.12: Final genotype ranking No. Genotype Total Rank 1 15HYLD-22 37 2 2 15HYLD-26 50 5 3 15HYLD-29 41 3 4 15HYLD-30 33 1 5 15HYLD-18 49 4
Stellenbosch University https://scholar.sun.ac.za
Stellenbosch University https://scholar.sun.ac.za

102
Table 4.13: Correlation coefficiencies of all traits studied
The green-highlighted cells in Table 4.13 show strong positive correlations among the
traits, and the grey-highlighted cells show moderate to partially strong positive
correlations. The un-highlighted cells show weak, moderate and strong negative
correlations and weak positive correlations.
TMTTraits NL NT RL SL RFW SFW LFW TPFW RDW SDW LDW TPDW LRWC ELWL CCI AB.G R:S R RGR LAE SC
NL 0,130 -0,280 -0,659 -0,265 0,044 -0,390 -0,251 0,523 -0,246 -0,305 -0,470 0,240 -0,622 -0,629 -0,405 0,298 -0,280 0,355 -0,297NT 0,316 0,666 0,318 0,339 0,648 0,660 0,753 0,009 -0,184 0,757 0,501 0,519 -0,153 -0,008 -0,160 -0,191 0,504 -0,553 -0,079RL -0,270 0,189 0,473 0,262 0,281 0,439 0,487 -0,104 0,273 0,739 0,705 0,557 0,102 0,173 0,056 -0,308 0,683 -0,205 0,343SL -0,307 -0,648 -0,236 0,428 0,428 0,667 0,566 -0,192 0,413 0,681 0,877 0,179 0,505 0,698 0,574 0,082 0,574 0,016 -0,049RFW 0,198 -0,361 -0,263 0,609 0,458 0,525 0,561 -0,300 -0,287 0,479 0,389 -0,137 0,244 0,400 0,446 0,125 0,125 0,245 -0,177SFW -0,246 -0,460 -0,263 0,832 0,686 0,751 0,872 -0,446 -0,420 0,447 0,224 0,164 0,244 0,249 -0,277 0,171 0,171 0,119 -0,175LFW -0,014 -0,464 -0,263 0,686 0,884 0,751 0,968 -0,395 -0,079 0,714 0,681 0,045 0,315 0,584 0,104 -0,220 0,486 0,002 -0,039TPFW -0,048 -0,400 -0,015 0,773 0,848 0,922 0,920 -0,411 -0,213 0,724 0,599 0,154 0,277 0,490 -0,002 -0,002 0,432 0,092 -0,081RDW -0,058 0,044 0,399 0,048 0,261 0,160 0,380 0,302 0,366 0,011 0,027 0,361 -0,706 -0,364 0,094 0,123 0,188 0,207 0,148SDW 0,136 0,044 0,076 0,428 0,651 0,642 0,540 0,716 0,351 0,060 0,494 0,307 0,028 0,158 0,334 0,094 0,482 -0,464 0,264LDW 0,372 0,310 0,138 0,063 0,275 0,166 0,314 0,362 0,247 0,412 0,841 0,484 0,109 0,385 0,332 0,334 0,762 0,128 0,208TPDW 0,361 0,216 0,085 0,220 0,549 0,366 0,497 0,577 0,274 0,702 0,879 0,365 0,251 0,574 0,574 0,332 0,790 -0,072 0,193LRWC 0,249 -0,403 -0,180 0,089 0,237 0,083 0,265 0,230 -0,171 0,289 0,005 0,102 -0,287 -0,256 -0,026 0,554 0,513 0,163 0,119ELWL 0,346 -0,079 -0,382 -0,304 -0,143 -0,394 -0,372 -0,406 -0,583 -0,358 -0,388 -0,374 0,245 0,583 0,395 -0,026 0,057 -0,239 -0,248CCI -0,299 -0,387 -0,084 0,835 0,483 0,890 0,529 0,767 -0,002 0,596 0,087 0,303 0,059 -0,223 0,476 0,395 0,106 -0,001 0,128AB.G -0,036 0,562 0,229 -0,152 -0,416 -0,230 -0,417 -0,275 0,068 0,201 0,180 0,181 -0,253 -0,314 0,028 0,476 0,238 0,257 -0,152R:S Ratio -0,152 0,031 0,178 0,028 -0,165 -0,166 0,004 -0,045 -0,031 0,009 0,075 -0,016 0,427 -0,012 -0,093 0,164 -0,112 0,414 -0,552RGR 0,302 0,157 0,021 0,117 0,368 0,215 0,329 0,388 0,005 0,493 0,635 0,831 0,119 -0,368 0,178 0,244 -0,085 -0,372 0,266LAE 0,154 -0,553 -0,235 0,145 0,443 0,145 0,456 0,277 0,080 -0,083 -0,025 0,118 0,227 0,004 -0,055 -0,610 -0,460 0,311 -0,398SC 0,239 0,425 -0,149 -0,361 -0,130 -0,312 -0,024 -0,171 0,082 -0,217 0,515 0,308 -0,261 -0,250 -0,366 0,158 -0,271 0,332 0,166
Wat
er st
ress
ed ge
noty
esWell-watered genotypes
Stellenbosch University https://scholar.sun.ac.za
Stellenbosch University https://scholar.sun.ac.za

103
CHAPTER 5: CONCLUSION
Molecular marker work successfully identified rust-susceptible and rust-resistant
wheat genotypes from the germplasm. The following markers were successfully
identified from both the male and female populations: Lr34/Yr18/Pm38, Sr31,
Lr24/Sr24, Lr37/Sr38/Yr17, Sr26 and Sr2. Molecular marker work showed increased
allele frequencies in both the male and female populations. The male population
showed a low level of rust resistance genes compared to the female population. Some
rust resistance genes such as Lr19 could not be identified in the male population;
however, that does not mean that they are not present in the population. Due to the
large number of seeds produced during the MS-MARS cycles, less than 2% of the
seeds were selected for planting. That left a large number of unselected seeds with
rust resistance genes. Molecular markers can be used to successfully select the rust
resistance genotypes prior to field evaluation.
During MS-MARS Cycle 1, crossing parents were effectively selected from the
segregating population, which resulted in higher seed production of 295 gram. MS-
MARS Cycle 1 confirmed the effectiveness of the technique, through high seed
throughput and increased allele frequencies from one MS-MARS cycle to the next.
However, MS-MARS Cycle 2 was not effective since it was carried out during the warm
season of the year, which resulted in reduced seed production. Higher temperatures
may have resulted in sterility of the plants. It is recommended that MS-MARS projects
be conducted during spring and winter since wheat requires lower temperatures of
18 º°C to 23 °C. Phenotypic selection and molecular marker collaboration can result
in successful plant breeding programmes, thereby improving wheat genotypes for
water stress and disease resistance.
Traits associated with water stress resistance were thoroughly investigated using an
RHS. The system was associated with some difficulties in growing healthy plants in
the growth chamber. Therefore, thorough investigation of the effectiveness of the RHS
should be done, involving optimum amount of nutrient solution to be used and optimum
LED lighting in the growth chamber. The system was used to screen the plants for
water stress resistance traits in the growth chamber. The growth chamber is
associated with sophisticated equipment such as a light meter that should be kept on
automatic and air supply that should be kept on at all times for healthy plant growth.
Stellenbosch University https://scholar.sun.ac.za

104
Physiological and agronomic water characterisation is labour intensive and requires
patience and dedication. Especially the use of sophisticated tools such as the leaf
porometer may be time-consuming, which may lead to taking wrong measurements.
Water stress was found to affect wheat growth and development significantly.
Induction of water stress at the tillering and stem elongation stages can result in
considerable yield lost. Water stress resistance-related traits were successfully
isolated from 60 water stress-susceptible genotypes. Genetic variation of five selected
genotypes was examined. The genotypes showed variation in water stress resistance
across the traits of interest. The genotypes under investigation were successfully
ranked based on their performance under water stress conditions for all traits studied.
The ranking was as follows: 15HYLD-30, 15HYLD-22, 15HYLD-29, 15HYLD-18 and
15HYLD-26. However, the ranking does not imply that genotypes at the bottom are
susceptible but the ranking was based on the best performance.
Traits used for wheat genotype characterisation showed significant correlation with
yield prediction parameters. A strong positive correlation was observed between dry
and fresh weight and their components under water stress conditions compared to
well-watered conditions. A correlation between RGR, SL and SFW and a correlation
between TPDW and CCI under water stress conditions were observed. A strong
heritability estimate was well researched from the literature for all the traits studied.
Therefore, these traits can be used to predict yield from the vegetative growth stage
and can be used as selection criteria for water stress resistance screening in wheat
genotypes.
Stellenbosch University https://scholar.sun.ac.za

105
References
Abid, M., Tian, Z., Ata-ul-karim, S. T., Cui, Y., Liu, Y., Jiang, D., & Dai, T. (2016).
Nitrogen nutrition improves the potential of wheat (Triticum aestivum L.) to
alleviate the effects of drought stress during vegetative growth periods. Frontiers
in Plant Science, 7:981(6), 1–14.
Abido, W.A.E., & Zsombik, L. (2018). Effect of water stress on germination of some
Hungarian wheat landraces varieties. Acta Ecologica Sinica, 7(4), 1872–2032.
Acevedo, E., Silva, P., & Silva, H. (2002). Wheat growth and physiology. Retrieved
from http://www.fao.org/3/a-y4011e/y4011e06.htm Accessed: 22 September
2017.
Ahmad, I., Khaliq, I., Khan, A.S., & Farooq, M. (2014). Screening of spring wheat
(Triticum aestivum L.) genotypes for drought tolerance on the basis of seedling
traits. Pakistan Journal of agricultural science, 51(2), 367–372.
Ahmed, N., Khaliq, I., Chowdhry, M. A., Ahsan, M., Ibrahim, M., & Maekawa, M.
(2004). Heritability estimates of some flag leaf characters in wheat. Journal of the
Department of Biology., 16(2), 131–141.
Akhunov, E. D., Akhunova, A. R., Anderson, O. D., Anderson, J. A., Blake, N., Clegg,
M. T., & Dubcovsky, J. (2010). Nucleotide diversity maps reveal variation in
diversity among wheat genomes and chromosomes. BMC Genomics, 11(1), 1.
Almansouri, M., Kinet, J.M., & Lutts, S. (2001). Effect of salt and osmotic stresses on
germination in durum wheat (Triticum durum Desf.). Plant and Soil, 231(2), 243–
254.
Al-Tahir, F.M.M. (2014). Flag leaf characteristics and relationship with grain yield and
grain protein percentage for three cereals. Journal of Medicinal Plants Studies,
2(5), 1–7.
Alves, A.A.C., & Setter, T.L. (2000). Response of cassava to water deficit: Leaf area
growth and abscisic acid. Crop Science, 40, 131–137.
Stellenbosch University https://scholar.sun.ac.za

106
Anjum, S., Xie, X., & Wang, L. (2011). Morphological, physiological and biochemical
responses of plants to drought stress. African Journal of Agricultural Research,
6(9), 2026–2032. Retrieved from https://doi.org/10.5897/AJAR10.027 Accessed:
15 April 2017.
Ashraf, M., Athar, H.R., Harris, P.J.C., & Kwon, T.R. (2008). Some prospective
strategies for improving crop salt tolerance. Advances in Agronomy, 97, 45–110.
Ashraf, M., & Azam, F. (1998). Fate and interaction with soil N of fertilizer 15N applied
to wheat at different growth stages. Cereal Res. Commun., 26, 397–404.
Aym, P.G., & Zadors, J.C. (1979). Combined effects of powdery mildew disease and
soil water level on the water relations and growth of barley. Physiological Plant
Pathology, 14(3), 347–361.
Barakat, M. N., Saleh M. S., Al-Doss, A. A., Moustafa, K. A., Elshafei, A. A., Zakri, A.
M., & Al-Qurainy, F. H. (2015). Mapping of QTLs associated with abscisic acid
and water stress in wheat. Biologia Plantarum, 59(2), 291–297.
Becker, S. R., Byrne, P. F., Reid, S. D., Bauerle, W. L., McKay, J. K., & Haley, S. D.
(2016). Root traits contributing to drought tolerance of synthetic hexaploid wheat
in a greenhouse study. Euphytica, 207(1), 213–224.
Bernier, J., Atlin, G.N., Serraj, R., Kumar, A., & Spaner, D. (2008). Breeding upland
rice for drought resistance. Journal of the Science of Food and Agriculture, 88(6),
927–939.
Bharti, S., Balyan, H.S., & Gupta, P. (2014). Quantitative trait loci analysis for some
root traits in bread wheat (Triticum aestivum L.). International Journal of
Agricultural Science, 4(7), 214–221.
Bognár, Z., Láng, L., & Bedő, Z. (2007). Effect of environment on the plant height of
wheat germplasm. Cereal Research Communications, 35(2), 281–284.
Botes, W.C. (2001). Gebruik van steriliteit in herhalende seleksie. MSc thesis,
Stellenbosch University, South Africa.
Stellenbosch University https://scholar.sun.ac.za

107
Boutraa, T., Akhkha, A., Al-Shoaibi, A.A., & Alhejeli, A.M. (2010). Effect of water stress
on growth and water use efficiency (WUE) of some wheat cultivars (Triticum
durum) grown in Saudi Arabia. Journal of Taibah University for Science, 3, 39–
48.
Brenchley, R., Spannagl, M., Pfeifer, M., Barker, G. L., D’Amore, R., Allen, A. M., &
Kay, S. (2012). Analysis of the bread wheat genome using whole-genome
shotgun sequencing. Nature, 491(7426), 705–710.
Breseghello, F. (2013). Traditional and modern plant breeding methods with examples
in rice (Oryza sativa L.). Journal of Agriculture and Food Chemistry, 61, 8277–
8286.
Buriro, M., Oad, F.C., Keerio, M.I., Tunio, S., Gandahi, A.W., Hassan, S.W.U., & Oad.,
S. M. (2011). Wheat seed germination under the influence of temperature
regimes. Sarhad Journal of Agriculture, 27, 539-543.
Cao, W., Somers, D.J., & Fedak, G. (2009). A molecular marker closely linked to the
region of Rht-D1c & Ms2 genes in common wheat (Triticum aestivum). Genome,
52(1), 95–99.
Cattivelli, L., Baldi, P., Crosatti, C., Di Fonzo, N., Faccioli, P., Grossi, M., & Stanca, A.
M. (2002). Chromosome regions and stress-related sequences involved in
resistance to abiotic stress in Triticeae. Plant Molecular Biology, 48(5-6), 649–
665.
Cattivelli, L., Rizza, F., Badeck, F. W., Mazzucotelli, E., Mastrangelo, A. M., Francia,
E., & Stanca, A. M. (2008). Drought tolerance improvement in crop plants: An
integrated view from breeding to genomics. Field Crops Research, 105(1), 1–14.
Chandra, D., & Islam, M.A. (2003). Genetic variability and heritability of excised leaf
water loss and its relationship with yield and yield components of F5 bulks in five
wheat crosses. Journal of Biological Science, 3(11), 1032–1039.
Chaudhary, P., Godara, S., Cheeran, A.N., & Chaudhari, A.K. (2012). Fast and
accurate method for leaf area measurement. International Journal of Computer
Applications, 49(9), 22–25.
Stellenbosch University https://scholar.sun.ac.za

108
Chaves, M.M., Pereira, J.S., Maroco, J., Rodrigues, M.L., Ricardo, C.P.P., & Osório,
M.L. (2002). How plants cope with water stress in the field: Photosynthesis and
growth. Annals of Botany, 89(7), 907–916.
Cherukuri, D.P., Gupta, S.K., Charpe, A., Koul, S, Prabhu, K.V., Singh, R.B., Haq,
Q.M.R., & Chauchan, S.V. (2003). Identification of a molecular marker linked to
an Agropyron elongatum-derived gene Lr19 for leaf rust resistance in wheat. Plant
Breeding, 122, 204–208.
Chiarappa, L. (1971). Crop loss assessment methods. FAO manual on the evaluation
and prevention of losses by pests, disease and weeds. Farnham Royal, UK:
Commonwealth Agricultural Bureaux [by arrangement with the Food & Agriculture
Organization of the United Nations.
Clarke, J.M. (1987). Use of physiological and morphological traits in breeding
programmes to improve drought resistance of cereals. Capri (Italy), 27-31.
Clarke, J.M., & Townley-Smit, T.F. (1986). Heritability and relationship to yield of
excised-leaf water retention capacity in durum wheat. Journal of Crop Science,
26, 289–292.
Clavel, D., Drame, N.K., Roy-Macauley, H., Braconnier, S., & Laffray, D. (2005).
Analysis of early responses to drought associated with field drought adaptation in
four Sahelian groundnut (Arachis hypogaea L.) cultivars. Environmental and
Experimental Botany., 54, 219–230.
Collard, B.C.Y., Jahufer, M.Z.Z., Brouwer, J.B., & Pang, E.C.K. (2005). An introduction
to markers, quantitative trait loci (QTL) mapping and marker-assisted selection
for crop improvement: The basic concepts. Euphytica, 142(1-2), 169–196.
Cuomo, C., Young, S., Wang, M., Yin, C., Hulbert, S., & Chen, X. (2013). Whole
genome sequence of Puccinia striiformis f. sp. tritici and genome size
comparisons with P. graminis f. sp. tritici and P. triticina. Retrieved from
http://striperust.wsu.edu/genome/Whole-Genome-Sequence-Puccinia-
Striiformis-tritici.pdf Accessed: 02 April 2017.
Stellenbosch University https://scholar.sun.ac.za

109
Dabiry, S., Esmaeili, M.A., Haghparast, R., & Ghajarsepanlo, M. (2015). Drought
tolerance of advanced bread wheat genotypes based on different drought
tolerance criteria. Journal of biological science, 7(1), 230–241.
Dadashi, F., Zaefarian, F., Abbasi, R., Bahmanyar, M.A., & Rezvani, M. (2015).
Response of leaf area and dry matter of crop, weeds and cover crops to
competition and fertilizer resources. Actaagriculturae Slovenica, 103(1), 27–36.
Davies, W.J., & Zhang, J. (1991). Root signal and the regulation of growth and
development of plants in drying soil. Annual Review of Plant Physiology and Plant
Molecular Biology., 42, 55.
Davila, J.A., Loarce, Y., & Ferrer, E. (1999). Molecular characterisation and genetic
mapping of random amplified microsatellite polymorphism in barley. Theoretical
and Applied Genetics, 98(2), 265–273.
Del Moral, M.G., & Del Moral, L.G. (1995). Tiller production and survival in relation to
grain yield in winter and spring barley. Field Crops Research, 44(2), 85–93.
del Pozo, A., Yáñez, A., Matus, I. A., Tapia, G., Castillo, D., Sanchez-Jardón, L., &
Araus, J. L. (2016). Physiological traits associated with wheat yield potential and
performance under water stress in a Mediterranean environment. Frontiers in
Plant Science, 7(6), 1-13. https://doi.org/10.3389/fpls.2016.00987
Desprez-Loustau, M.L., Robin, C., Reynaud, G., Déqué, M., Badeau, V., Piou, D.,
Husson, C., & Marçais, B. (2007). Simulating the effects of a climate-change
scenario on the geographical range and activity of forest pathogenic fungi.
Canadian Journal of Plant Pathology, 29, 101–20.
Dhanda, S.S., Sethi, G.S., & Behl, R.K. (2004). Indices of drought tolerance in wheat
genotypes at early stages of plant growth. Journal of Agronomy and Crop
Science., 19, 6–8.
Diab, A.A., Kantety, R. V, Ozturk, N. Z., Benscher, D., Nachit, M. M., & Sorrells, M. E.
(2008). Drought-inducible genes and differentially expressed sequence tags
associated with components of drought tolerance in durum wheat. Scientific
Research and Essay, 3(1), 9–26.
Stellenbosch University https://scholar.sun.ac.za

110
Donald, C.M.T. (1968). The breeding of crop ideotypes. Euphytica, 17(3), 385–403.
Doyle, J.J., & Doyle, J.L. (1990). Isolation of plant DNA from fresh tissue. Focus, 12,
13–15.
Driscoll, C.J. (1987). Induction and use of the “Cornerst one” male sterility in wheat.
Proceedings of the 5th International Wheat Genetics Symposium. India Society
of Genetics and Plant Breeding, New Delhi. 499–502.
Dubouzet, J. G., Sakuma, Y., Ito, Y., Kasuga, M., Dubouzet, E. G., Miura, S., &
Yamaguchi-Shinozaki, K. (2003). OsDREB genes in rice, Oryza sativa L., encode
transcription activators that function in drought-, high-salt- and cold-responsive
gene expression. The Plant Journal, 33(4), 751–763.
Duchemin, B., Maisongrande, P., Boulet, G., & Benhadj, I. (2007). A simple algorithm
for yield estimates: Calibration and evaluation for semi-arid irrigated winter wheat
monitored with ground-based remotely-sensed data. Environmental Modelling
and Software, 23(7), 876–892.
Dvorak, J., & Akhunov, E.D. (2005). Tempos of deletions and duplications of gene loci
in relation to recombination rate during diploid and polyploid evolution in the
Aegilops-Triticum alliance. Genetics, 171, 323–332.
Dyck, P.L., Samborski, D.J., & Anderson, R.G. (1966). Inheritance of adult-plant leaf
rust resistance derived from the common wheat varieties Exchange and Frontana.
Canadian Journal of Genetics and Cytology, 8(4), 665–671.
El-Kholy, M.A., & Gaballah, M.S. (2005). Productivity of wheat cultivars as affected by
seeding methods and reflectant application under water stress conditions. Journal
of Agronomy, 4 (1), 23-30.
Ellis, J.G., Lagudah, E.S., Spielmeyer, W., & Dodds, P.N. (2014). The past, present
and future of breeding rust-resistant wheat. Frontiers in Plant Science, 5(11), 641.
https://doi.org/10.3389/fpls.2014.00641
Ellis, M.H., Spielmeyer, W., Gale, K.R., Rebetzke, G.J., & Richards, R.A. (2002).
“Perfect” markers for the Rht-B1b & Rht-D1b dwarfing genes in wheat. Theoretical and
Applied Genetics, 105(6–7), 1038–1042. https://doi.org/10.1007/s00122-002-1048-4
Stellenbosch University https://scholar.sun.ac.za

111
Elshafei, A. A., Saleh, M., Al-Doss, A. A., Moustafa, K. A., Al-Qurainy, F. H., & Barakat,
M. N. (2013). Identification of new SRAP markers linked to leaf chlorophyll
content, flag leaf senescence and cell membrane stability traits in wheat under
water-stressed conditions. Australian Journal of Crop Science, 7(6), 887.
Endo, T.R., Mukai, Y., Yamamoto, M., & Gill, B.S. (1991). Physical mapping of a male-
fertility gene of common wheat. Japanese Journal of Genetics, 66, 291–295.
Esterhuizen, D. (2013). Grain and Feed Annual: This report focuses on the supply and
demand for grain and feed in South Africa. United States Department of
Agriculture Grain Report.
Esterhuizen, D. (2015). Grain and Feed Annual: This report focuses on the supply and
demand for grain and feed in South Africa. United States Department of
Agriculture Grain Report.
Esterhuizen, D. (2017). Grain and Feed Annual: This report focuses on the supply and
demand for grain and feed in South Africa. United States Department of
Agriculture Grain Report.
Farahani, H.J., Izzi, G., & Oweis, T.Y. (2009). Parameterization and evaluation of the
aquacrop model for full and deficit irrigated cotton. Agronomy Journal, 101(3),
469–476. https://doi.org/10.2134/agronj2008.0182s
Feekes, W. (1941). De tarwe en haar milieu. Hoitsema. Groningen, Hoitsema.
Fellahi, Z., Hannachi, A., Guendouz, A., Bouzerzour, H., & Boutekrabt, A. (2013).
Genetic variability, heritability and association studies in bread wheat (Triticum
aestivum L.) genotypes. Electronic Journal of Plant Breeding, 4, 1161–1166.
Fleury, D., Jefferies, S., Kuchel, H., & Langridge, P. (2010). Genetic and genomic tools
to improve drought tolerance in wheat. Journal of Experimental Botany, 61(12),
3211–3222.
Flexas, J., & Medrano, H. (2002). Drought-inhibition of photosynthesis in C3 plants:
Stomatal and non-stomatal limitations revisited. Annals of Botany, 89(2), 183–
189. https://doi.org/10.1093/aob/mcf027
Stellenbosch University https://scholar.sun.ac.za

112
Fossati, A., & Ingold, M. (1970). A male sterile mutant in Triticum aestivum. Wheat
Information Service, 30, 8–10.
Franco, J.A. (2011). Root development under drought stress. Technology and
Knowledge Transfer e-Bulletin, (2), 1–3.
Franco, J.A., Banon, S., Vicente, M.J., Miralles, J., & Martinez-Sanchez, J.J. (2011).
Root development in horticultural plants grown under abiotic stress conditions –
a review. Journal of Horticultural Science and Biotechnology, 86, 543–556.
Gholami, A., & Poor Asadollahi, A. (2008). Improving wheat grain yield under water
stress by stem hydrocarbon reserve utilization. Pakistan Journal of Biological
Science., 11, 2484–2489.
Gill, B. S., Li, W., Sood, S., Kuraparthy, V., Friebe, B. R., Simons, K. J., & Faris, J. D.
(2007). Genetics and genomics of wheat domestication-driven evolution. Israel
Journal of Plant Sciences, 55(3-4), 223–229.
Giunta, F., Motzo, R., & Pruneddu, G. (2008). Has long-term selection for yield in
durum wheat also induced changes in leaf and canopy traits? Field Crops
Research, 106(1), 68–76. https://doi.org/10.1016/j.fcr.2007.10.018
Grassi, G., & Magnani, F. (2005). Stomatal, mesophyll conductance and biochemical
limitations to photosynthesis as affected by drought and leaf ontogeny in ash and
oak trees. Plant, Cell and Environment, (28), 834–849.
Guendouz, A. (2016). The effect of supplementary irrigation on leaf area, specific leaf
weight, grain yield and water use efficiency in durum wheat (Triticum durum Desf.)
Cultivars, 2(1), 82–89.
Guo, R., Hao, W.P., Gong, D.Z., Zhong, X.L., & Gu, F.X. (2013). Effects of water stress
on germination and growth of wheat, photosynthetic efficiency and accumulation
of metabolites. In M.C. Soriano (Ed.), Soil processes and current trends in quality
assessment (pp. 367-380). InTech Publisher. 10.5772/51205.
Guo, R., Shi, L., Jiao, Y., Li, M., Zhong, X., Gu, F., Liu, Q., Xia, X. & Li, H. (2018).
Metabolic responses to drought stress in the tissues of drought-tolerant and
drought-sensitive wheat genotype seedlings. AoB Plants, 10(2), 1-16.
Stellenbosch University https://scholar.sun.ac.za

113
Gupta, N.K., Gupta, S., & Kumar, A. (2001). Effect of water stress on physiological
attributes and their relationship with growth and yield of wheat cultivars at different
stages. Journal of Agronomy and Crop Science, 186(1), 55-62.
Gupta, P.K., Varshney, R.K., Sharma, P.C., & Ramesh, B. (1999). Molecular markers
and their applications in wheat breeding. Plant Breeding, 118(5), 369–390.
Hampson, C.R., & Simpson, G.M. (1990). Effects of temperature, salt, and osmotic
potential on early growth of wheat (Triticum aestivum). I. Germination. Canadian
Journal of Botany, 68(3), 524–528.
Harlan, J.R., & Zohary, D. (1966). Distribution of wild wheats and barley. Science,
153(3740), 1074–1080.
Hawes, M.C., Gunawardena, U., Miyasaka, S., & Zhao, X. (2000). The role of root
border cells in plant defense. Trends in Plant Science, 5(3), 128-133. Retrieved
from http://www.sciencedirect.com/science/article/pii/S1360138500015569
Haworth, M., Killi, D., Materassi, A., Raschi, A., & Centritto, M. (2016). Impaired
stomatal control is associated with reduced photosynthetic physiology in crop
species grown at elevated CO2. Frontiers in Plant Science, 7(October), 1568.
Retrieved from https://doi.org/10.3389/fpls.2016.01568
Hayden. M.J., Kuchel, H., & Chalmers, K.L. (2004). Sequenced tagged microsatellites
for Xgwm533 locus provide new diagnostic markers to select for the presence of
the rust resistance gene Sr2 in wheat. Theoretical and Applied Genetics,
109,1641–1647.
Helguera, M., Khan, I.A., Kolmer, J., Lijavetzky, D., Liu, Z.Q., & Dubcovsky, J. (2003).
PCR assays for the Lr37-Yr17-Sr38 cluster of rust resistance genes and their use
to develop isogenic hard red spring wheat lines. Crop Science, 43, 1839–1847.
Horn, R., Wingen, L.U., Snape, J.W., & Dolan, L. (2016). Mapping of quantitative trait
loci for root hair length in wheat identifies loci that co-locate with loci for yield
components. Journal of Experimental Botany, 67(15), 4535–4543. Retrieved from
https://doi.org/10.1093/jxb/erw228
Stellenbosch University https://scholar.sun.ac.za
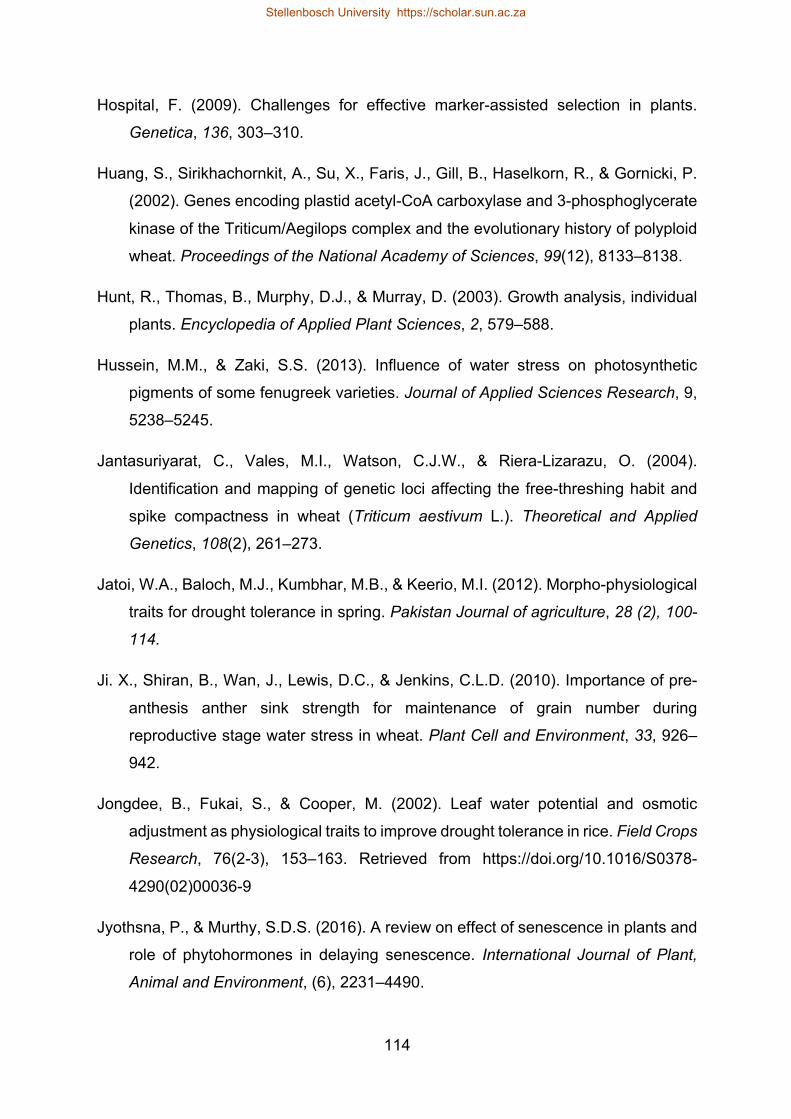
114
Hospital, F. (2009). Challenges for effective marker-assisted selection in plants.
Genetica, 136, 303–310.
Huang, S., Sirikhachornkit, A., Su, X., Faris, J., Gill, B., Haselkorn, R., & Gornicki, P.
(2002). Genes encoding plastid acetyl-CoA carboxylase and 3-phosphoglycerate
kinase of the Triticum/Aegilops complex and the evolutionary history of polyploid
wheat. Proceedings of the National Academy of Sciences, 99(12), 8133–8138.
Hunt, R., Thomas, B., Murphy, D.J., & Murray, D. (2003). Growth analysis, individual
plants. Encyclopedia of Applied Plant Sciences, 2, 579–588.
Hussein, M.M., & Zaki, S.S. (2013). Influence of water stress on photosynthetic
pigments of some fenugreek varieties. Journal of Applied Sciences Research, 9,
5238–5245.
Jantasuriyarat, C., Vales, M.I., Watson, C.J.W., & Riera-Lizarazu, O. (2004).
Identification and mapping of genetic loci affecting the free-threshing habit and
spike compactness in wheat (Triticum aestivum L.). Theoretical and Applied
Genetics, 108(2), 261–273.
Jatoi, W.A., Baloch, M.J., Kumbhar, M.B., & Keerio, M.I. (2012). Morpho-physiological
traits for drought tolerance in spring. Pakistan Journal of agriculture, 28 (2), 100-
114.
Ji. X., Shiran, B., Wan, J., Lewis, D.C., & Jenkins, C.L.D. (2010). Importance of pre-
anthesis anther sink strength for maintenance of grain number during
reproductive stage water stress in wheat. Plant Cell and Environment, 33, 926–
942.
Jongdee, B., Fukai, S., & Cooper, M. (2002). Leaf water potential and osmotic
adjustment as physiological traits to improve drought tolerance in rice. Field Crops
Research, 76(2-3), 153–163. Retrieved from https://doi.org/10.1016/S0378-
4290(02)00036-9
Jyothsna, P., & Murthy, S.D.S. (2016). A review on effect of senescence in plants and
role of phytohormones in delaying senescence. International Journal of Plant,
Animal and Environment, (6), 2231–4490.
Stellenbosch University https://scholar.sun.ac.za

115
Kahrizi, D., Cheghamirza, K., Kakaei, M., Mohammadi, R., & Ebadi, A. (2010).
Heritability and genetic gain of some morphophysiological variables of durum
wheat (Triticum turgidum var. durum). African Journal of Biotechnology, 9(30),
4687–4691.
Karimi, M.M., & Siddique, K.H.M. (1991). Crop growth and relative growth rates of old
and modern wheat cultivars. Australian Journal of Agricultural Research, 42(1),
13–20. Retrieved from https://doi.org/10.1071/AR9910013
Kaur, V., Pulivendula, P., & Kumari, A. (2016). Excised leaf water loss in wheat
(Triticum aestivum L.) as affected by short periods of heat and water-deficit
treatment followed by recovery. Wheat information service, 122(1), 1-6.
Khakwani, A.A., Dennett, M.D., & Munir, M. (2011). Drought tolerance screening of
wheat varieties by inducing water stress conditions. Songklanakarin Journal of
Science and Technology, 33, 135–142.
Khakwani, A.A., Dennett, M.D., Munir, M., & Abid, M. (2012). Growth and yield
response of wheat varieties to water stress at booting and anthesis stages of
development. Pakistan Journal of Botany., 44, 879–886.
Khalilzadeh, R., Seyed Sharifi, R., & Jalilian, J. (2016). Antioxidant status and
physiological responses of wheat (Triticum aestivum L.) to cycocel application and
bio fertilizers under water limitation conditions. Journal of Plant Interactions, 11(1),
130–137. Retrieved from https://doi.org/10.1080/17429145.2016.1221150
Khan, A.S., Allah, S.U., & Sadique, S. (2010). Genetic variability and correlation
among seedling traits of wheat (Triticum aestivum) under water stress.
International Journal of Agriculture and Biology, 12(2), 247–250.
Khan, N., & Naqvi, F.N. (2011). Effect of water stress in bread wheat hexaploids.
Journal of Biological Sciences, 3(5), 487–498.
Khan, S.A., & Hassan, G. 2017. Heritability and correlation studies of yield and yield-
related traits in bread wheat. Sarhad Journal of Agriculture, 33(1), 103–107.
Stellenbosch University https://scholar.sun.ac.za

116
Khatoon, S., Majid, S.A., Bibi, A., & Javed, G. 2016. Yield stability evaluation of wheat
(Triticum aestivum L.) cultivated on different environments of district Poonch
(AJK) Pakistan based upon water-related parameters. International Journal of
Agronomy and Agricultural Research, 8(4), 11–21.
Khatun, S., Ahmed, J.U., Hossain, T., Islam, M.R., & Mohi-Ud-Din, M. (2016). Variation
of wheat cultivars in their response to elevated temperature on starch and dry
matter accumulation in grain. International Journal of Agronomy, 17(16), 1-6.
https://doi.org/10.1155/2016/9827863
Klindworth, D.L., Williams, N.D., & Maan, S.S. (2002). Chromosomal location of
genetic male sterility genes in four mutants of hexaploid wheat. Crop Science. 42,
1447–1450.
Koca, Y.O., & Erekul, O. (2016). Changes of dry matter, biomass and relative growth
rate with different phenological stages of corn. Agriculture and Agricultural
Science Procedia, 10, 67–75.
Kocheva, K., Nenova, V., Karceva, T., Petrov, P., Georgiev, G. I., Börner, A., &
Landjeva, S. (2014). Changes in water status, membrane stability and antioxidant
capacity of wheat seedlings carrying different Rht-B1 dwarfing alleles under
drought stress. Journal of Agronomy and Crop Science, 200(2), 83–91. Retrieved
from https://onlinelibrary.wiley.com/doi/abs/10.1111/jac.12047
Kollipara, K.P., Saab, I.N., Wych, R.D., Lauer, M.J., & Singletary, G.W. (2002).
Expression profiling of reciprocal maize hybrids divergent for cold germination and
desiccation tolerance. Plant Physiology, 129(3), 974–992.
Krattinger, S. G., Lagudah, E. S., Spielmeyer, W., Singh, R. P., Huerta-Espino, J.,
McFadden, H., & Keller, B. (2009). A putative ABC transporter confers durable
resistance to multiple fungal pathogens in wheat. Science, 323(5919), 1360–
1363.
Kraus, T.E., McKersie, B.D., & Fletcher, R.A. (1995). Paclobutrazol-induced tolerance
of wheat leaves to Paraquat may involve increased antioxidant enzyme activity.
Journal of Plant Physiology, 145(4), 570–576. https://doi.org/10.1016/S0176-
1617(11)81790-6
Stellenbosch University https://scholar.sun.ac.za

117
Lagudah, E.S., Krattinger, S.G., Herrera-Foessel, S., Singh, R.P., Huerta-Espino, J.,
Spielmeyer, W., Brown-Guedira, G., Selter, L.L., & Keller, B. (2009). Gene-
specific markers for the wheat gene Lr34/Yr18/Pm38 which confers resistance to
multiple fungal pathogens. Theoretical and Applied Genetics, 119, 889–898.
Lambrides, C.J., Chapman, S.C., & Shorter, R. (2004). Genetic variation for carbon
isotope discrimination in sunflower. Journal of Crop Science, 44(5) 1642-1653.
Large, E.C. (1954). Growth stages in cereals illustration of the Feekes scale. Plant
Pathology, 3(4), 128–129.
Levetin, E., & McMahon, K. (1996). Plants and society. Retrieved from
https://www.cabdirect.org/cabdirect/abstract/19960301619
Li, H., Li, X., Zhang, D., Liu, H., & Guan, K. (2013). Effects of drought stress on the
seed germination and early seedling growth of the endemic desert plant
Eremosparton songoricum (fabaceae). EXCLI J, 12, 89–101.
Li, Z., Peng, T., Xie, Q., Han, S., & Tian, J. (2010). Mapping of QTL for tiller number
at different stages of growth in wheat using double haploid and immortalized F2
populations. Journal of Genetics, 89(4), 409–415. https://doi.org/10.1007/s12041-
010-0059-1
Lonbani, M., & Arzani, A. (2011). Morpho-physiological traits associated with terminal
drought-stress tolerance in triticale and wheat. Agronomy Research, 9(1-2), 315–
329.
Lugojan, C., & Ciulca, S. (2011). Analysis of excised leaves water loss in winter wheat.
Journal of Horticulture, Forestry and Biotechnology,15(2), 178–182.
Lunagaria, M.M., Patel, H.R., & Pandey, V. (2015). Evaluation and calibration of
noninvasive leaf chlorophyll meters for wheat. Journal of Agrometeorology, 17(1),
51–54.
Lunagaria, M.M., & Shekh, A.M. (2006). Radiation interception, light extinction
coefficient and leaf area index of wheat (Triticum aestivum L.) crop as influenced
by row orientation and row spacing. Journal of Agricultural Sciences, 2(2), 43–54.
Stellenbosch University https://scholar.sun.ac.za

118
Maathuis, F. J., Filatov, V., Herzyk, P., C Krijger, G., B Axelsen, K., Chen, S., & Forde,
B. G. (2003). Transcriptome analysis of root transporters reveals participation of
multiple gene families in the response to cation stress. The Plant Journal, 35(6),
675–692.
Mago, R., Bariana, H.S., Dundas, I.S., Spielmeyer, W., Lawrence, G.J., Pryor, A.J., &
Ellis, J.G. 2005. Development of PCR markers for the selection of wheat stem
rust resistance genes Sr24 and Sr26 in diverse wheat germplasm. Theoretical
and Applied Genetics, 111:496-504.
Mago, R., Brown-Guedira, G., Dreisigacker, S., Breen, J., Jin, Y., Singh, R., Appels,
R., Lagudah, E.S., Ellis, J., & Spielmeyer, W. (2011a). An accurate DNA marker
assay for stem rust resistance gene Sr2 in wheat. Theoretical and Applied
Genetics, 122, 735–744.
Mago, R., Lawrence, G., & Ellis, J. (2011b). The application of DNA marker and
doubled-haploid technology for stacking multiple stem rust resistance genes in
wheat. Molecular Breeding, 27(3), 329–335.
Malik, R., Parveen, S., Saharan, M.S., Kumar, R.., Sharma, A.K., Bhardwaj, S.C., &
Sharma, I. (2013). Characterisation of stem rust resistance gene Sr2 in Indian
wheat varieties using polymerase chain reaction (PCR) based molecular markers.
African Journal of Biotechnology, 12(18), 2353–2359.
Malik, S., Malik, T.A., & Engineering, G. (2015). Genetic mapping of potential QTLs
associated with drought tolerance in wheat. Journal of Animal & Plant Sciences,
25(4), 1032–1040.
Maqbool, M.M., Ali, A., Haq, T., Majeed, M.N., & Lee, D.J. (2015). Response of spring
wheat (Triticum aestivum L.) to induced water stress at critical growth stages.
Sarhad Journal of Agriculture, 31(1), 53–58.
Marais, G.F., & Botes, W.C. (2009). Recurrent mass selection for routine improvement
of common wheat. In E. Lichtfouse (Ed.), Organic farming, pest control and
remediation of soil pollutants (pp 85-105).
Stellenbosch University https://scholar.sun.ac.za
119
Marais, G.F., Botes, W.C., & Louw, J.H., (2000). Recurrent selection using male
sterility and hydroponic tiller culture in pedigree breeding of wheat. Plant
Breeding, 119, 440–442.
Martínez, F., Niks, R.E., Singh, R.P., & Rubiales, D. (2001). Characterisation of Lr46,
a gene conferring partial resistance to wheat leaf rust. Hereditas, 135(2-3), 111–
114. https://doi.org/10.1111/j.1601-5223.2001.00111.x
Matsuoka, Y. (2011). Evolution of polyploid Triticum wheats under cultivation: The role
of domestication, natural hybridization and allopolyploid speciation in their
diversification. Plant and Cell Physiology, 52(5), 750–764.
Maxwell, K., & Johnson, G.N. (2000). Chlorophyll fluorescence – a practical guide.
Journal of Experimental Botany, 51, 659–668.
Mbave, Z.A. (2013). Water stress effects on growth, yield and quality of wheat
(Triticum aestivum L.). (Unpublished master’s thesis). Pretoria: University of
Pretoria.
McCaig, T.N., & Romagosa, I. (1991). Water status measurements of excised leaves:
Position and age effects. Crop Science, 31, 1583–1588.
McFadden, E.S., & Sears, E.R. (1946). The origin of Triticum spelta and its free-
threshing hexaploid relatives. Journal of Heredity, 37(4), 107–116.
McIntosh, R.A., Hart, G.E., Devos, K.M., Gale, M.D., & Rogers, W.J. (1998).
Catalogue of gene symbols for wheat. In A.E. Slinkard (Ed.), Proceedings of the
9th International Wheat Genetics Symposium, Vol 5, 119-120. Saskatoon,
Canada: University of Saskatchewan Extension Press.
McNeil, M.D., Kota, R., Paux, E., Dunn, D., Mclean, R., Feuillet, C., Li, D., Kong, X.,
Lagudah, E., Zhang, J.C., Jia, J.Z., Spielmeyer, W., Bellgard, M., & Appels, R.
(2008). BAC-derived markers for assaying the stem rust resistance gene, Sr2, in
wheat breeding programs. Molecular Breeding, 22, 15–24.
Milad, S.I., Wahba, L.E., & Barakat, M.N. (2011). Identification of RAPD & ISSR
markers associated with flag leaf senescence under water-stressed conditions in
wheat (Triticum aestivum L). Australia Journal of Crop Science, 5, 334–340.
Stellenbosch University https://scholar.sun.ac.za
120
Mishra, C.N., Tiwari, V., Kumar, S., Gupta, V., & Sharma, I. (2015). Genetic diversity
and genotype by trait analysis for agromorphological and physiological traits of
wheat (Triticum aestivum). SABRAO Journal of Breeding and Genetics, 47, 40–
48.
Mohan, M., Nair, S., Bhagwat, A., Krishna, T. G., Yano, M., Bhatia, C. R., & Sasaki, T.
(1997). Genome mapping, molecular markers and marker-assisted selection in
crop plants. Molecular Breeding, 3(2), 87–103.
Mohsin, T., Khan, N., & Naqvi, F.N. (2009). Heritability, phenotypic correlation and
path coefficient studies for some agronomic characters in synthetic elite lines of
wheat, Journal of Food, Agriculture & Environment, 7(3&4), 278–282.
Monteith, J.L. (1977). Climate and the efficiency of crop production in Britain.
Philosophical Transactions of the Royal Society of London., 281, 277–294.
Mujtaba, S.M., Faisal, S., Khan, M.A., Mumtaz, S., & Khanzada, B. (2016).
Physiological studies on six wheat (Triticum Aestivum l.) genotypes for drought
stress tolerance at seedling stage. Open Access Journal, 1(2), 1-6.
https://doi.org/10.19080/ARTOAJ.2016.01.555559
Munjal, R., & Dhanda, S.S. (2016). Assessment of drought resistance in Indian wheat
cultivars for morpho-physiological traits. Ekin Journal of Crop Breeding and
Genetics., 2(1), 74–81.
Murchie, E.H., & Lawson, T. (2013). Chlorophyll fluorescence analysis: A guide to
good practice and understanding some new applications. Journal of Experimental
Botany, (64), 3983–3998. https://doi.org/10.1093/jxb/ert208
Mwadzingeni, L., Shimelis, H., Dube, E., Laing, M.D., & Tsilo, T.J. (2016). Breeding
wheat for drought tolerance: Progress and technologies. Journal of Integrative
Agriculture, 15, 935–943. doi: 10.1016/S2095-3119(15)61102-9
Naeem, M.K., Ahmed, M., Noreen, S., & Iqbal, M.S. (2015). Estimation of genetic
components for plant growth and physiological traits (Triticum aestivum L) under
normal and stress conditions. SAARC Journal of Agriculture, 13(1), 90–98.
Stellenbosch University https://scholar.sun.ac.za

121
Nalam, V.J., Vales, M.I., Watson, C.J., Kianian, S.F., & Riera-Lizarazu, O. (2006).
Map-based analysis of genes affecting the brittle rachis character in tetraploid
wheat (Triticum turgidum L.). Theoretical and Applied Genetics, 112(2), 373–381.
Narayanan, S., Mohan, A., Gill, K.S., & Vara Prasad, P.V. (2014). Variability of root
traits in spring wheat germplasm. PLoS one, 9(6), 1-15.
https://doi.org/10.1371/journal.pone.0100317
Nelson, J.E., Kephart, K.D., Bauer, A., & Connor, J.E. (1988). Growth staging of
wheat, barley, and wild oat. Montana State Univ. Coop. Exten. Service, Bozeman,
& Univ. Idaho Coop Exten. Service, Moscow.
Nesbitt, M., & Samuel, D. (1996). Archaeobotany in Turkey: A review of current
research. Orient-Express, 3, 91–96.
Nezhadahmadi, A., Prodhan, Z.H., & Faruq, G. (2013). Drought tolerance in wheat.
Scientific World Journal, 29(6), 1–12.
Noctor, G., & Foyer, C.H. (1998). Ascorbate and glutathione: keeping active oxygen
under control. Annual review of plant physiology and plant molecular biology, 49,
249-279
Noorka, I.R. (2014). Effect of drought/water stress and adaptation of unintended
consequences on wheat growth and development in Pakistan. Handbook of plant
and crop physiology. Hand book of Plant and Crop Physiology, pp.967-978. CRC
Press, Taylor and Francis, USA.
Noorka, I.R., Batool, A., Alsultan, S., Tabasum, S., & Ali, A. (2013). Water stress
tolerance: Its relationship to stem reserve mobilization and potence ratio in spring
wheat. American Journal of Plant Sciences, 9(4), 230–236.
Noorka, I.R., & Khaliq, I. (2007). An efficient technique for screening wheat (Triticum
aestivum L.) germplasm for drought tolerance. Pakistan Journal of Botany, 39(5),
1539–1546.
Nyachiro, J.M., Clarke, F.R., DePauw, R.M., Knox, R.E., & Armstrong, K.C. (2002).
Temperature effects on seed germination and expression of seed dormancy in
wheat. Euphytica, 126(1), 123–127.
Stellenbosch University https://scholar.sun.ac.za

122
Oliver, R.P. (2014). A reassessment of the risk of rust fungi developing resistance to
fungicides. Pest Management Science., 70, 1641–1645. doi:10.1002/ ps.3767
Ozturk, A., Demirsoy, L., & Demirsoy, H. (2014). The effect of shading on net
assimilate rate and relative growth rate in strawberry. Anadolu Journal of
Agricultural Sciences, 29(3), 167–173.
Panio, G., Motzo, R., Mastrangelo, A. M., Marone, D., Cattivelli, L., Giunta, F., & De
Vita, P. (2013). Molecular mapping of stomatal-conductance-related traits in
durum wheat (Triticum turgidum ssp. durum). Annals of Applied Biology, 162(2),
258–270. https://doi.org/10.1111/aab.12018
Pask, A.J.D., Pietragalla, J., Mullan, D.M., & Reynolds, M.P. (2012). Physiological
breeding II: A field guide to wheat phenotyping. Retrieved from
http://libcatalog.cimmyt.org/download/cim/96144.pdf
Passioura, J. (2007). The drought environment: Physical, biological and agricultural
perspectives. Journal of Experimental Botany, 58(2), 113–117.
Peng, J.H., Sun, D., & Nevo, E. (2011). Domestication evolution, genetics and
genomics in wheat. Molecular Breeding, 28(3), 281–301.
Prins, R., Groenewald, J.Z., Marais, G.F., Snape, J.W., & Koebner, R.M.D. (2001).
AFLP & STS tagging of Lr19, a gene conferring resistance to leaf rust in wheat.
Theoretical and Applied Genetics, 103, 618–624.
Quarrie, S.A., Gulli, M., Calestani, C., Steed, A., & Marmiroli, N. (1994). Location of a
gene-regulating drought-induced abscisic acid production on the long arm of
chromosome 5A of wheat. Theoretical and Applied Genetics, (89), 794–800.
Quarrie, S. A., Steed, A., Calestani, C., Semikhodskii, A., Lebreton, C., Chinoy, C., &
Schondelmaier, J. (2005). A high-density genetic map of hexaploid wheat
(Triticum aestivum L.) from the cross Chinese Spring × SQ1 and its use to
compare QTLs for grain yield across a range of environments. Theoretical and
Applied Genetics, 110(5), 865–880.
Stellenbosch University https://scholar.sun.ac.za

123
Rana, B., Rana, P., Yadav, M.K., & Kumar, S. (2011). Marker assisted selection: a
strategy for wheat improvement. pp 19-30. Department of Biotechnology, Sardar
Vallabh Bhai Patel University of Agriculture and Technology, Meerut U.P., India.
Retrieved from http://shigen.nig.ac.jp/ewis/article/html/34/article.html Accessed:
19 February 2017.
Rao, R.N., Williams, J.H., Wadia, K.D.R., Hubick, K.T., & Farquhar, G.D. (1993). Crop
growth, water-use efficiency and carbon isotope discrimination in groundnut
(Arachis hypogaea L.) genotypes under end-of-season drought conditions.
Annals of Applied Biology, 122(2), 357–367.
Rauf, S., Sadaqat, H.A., & Khan, I.A. (2008). Effect of moisture regimes on combining
ability variations of seedling traits in sunflower (Helianthus annuus). Canadian
Journal of Plant Science, 88, 323–329.
Ribaut, J.M., & Betrán, J. (1999). Single large-scale marker-assisted selection (SLS-
MAS). Molecular Breeding, 5(6), 531–541.
Ribaut, J.M., Hu, X., Hoisington, D., & González-de-León, D. (1997). Use of STSs and
SSRs as rapid and reliable preselection tools in a marker-assisted selection-
backcross scheme. Plant Molecular Biology Reporter, 15(2), 154–162.
Richards, R. A., Rebetzke, G. J., Watt, M., Condon, A. T., Spielmeyer, W., & Dolferus,
R. (2010). Breeding for improved water productivity in temperate cereals:
Phenotyping, quantitative trait loci, markers and the selection environment.
Functional Plant Biology, 37(2), 85–97.
Richardson, A.D., Duigan, S.P., & Berlyn, G.P. (2002). An evaluation of noninvasive
methods to estimate foliar chlorophyll content. New Phytologist, 153, 185–194.
https://doi.org/10.1046/j.0028-646X.2001.00289.x
Rizza, F., Badeck, F. W., Cattivelli, L., Lidestri, O., Di Fonzo, N., & Stanca, A. M.
(2004). Use of a water stress index to identify barley genotypes adapted to rainfed
and irrigated conditions. Crop Science, 44(6), 2127–2137.
Rucker, K.S., Kvien, C.K., Holbrook, C.C., & Hook, J.E. (1995). Identification of peanut
genotypes with improved drought avoidance traits 1. Peanut Science, 22(1), 14–
18.
Stellenbosch University https://scholar.sun.ac.za

124
Russell, J. R., Fuller, J. D., Macaulay, M., Hatz, B. G., Jahoor, A., Powell, W., &
Waugh, R. (1997). Direct comparison of levels of genetic variation among barley
accessions detected by RFLPs, AFLPs, SSRs and RAPDs. Theoretical and
Applied Genetics, 95(4), 714–722.
Rutkoski, J.E., Heffner, E.L., & Sorrells, M.E. (2011). Genomic selection for durable
stem rust resistance in wheat. Euphytica, 179(1), 161–173.
Saeidi, M., Ardalani, S., Jalali-Honarmand, S., Ghobadi, M.E., & Abdoli, M. (2015).
Evaluation of drought stress at vegetative growth stage on the grain yield
formation and some physiological traits as well as fluorescence parameters of
different bread wheat cultivars. Acta Biologica Szegediensis, 59(1), 35–44.
Salamini, F., Özkan, H., Brandolini, A., Schäfer-Pregl, R., & Martin, W. (2002).
Genetics and geography of wild cereal domestication in the Near East. Nature
Reviews Genetics, 3(6), 429–441.
Saleem, M. (2003). Response of durum and bread wheat genotypes to drought stress:
Biomass and yield components. Asian Journal of Plant Science, 2(3), 290–293.
Salvi, S., & Tuberosa, R. (2005). To clone or not to clone plant QTLs: Present and
future challenges. Trends in Plant Science, 10, 297–304.
Sandaña, P., Ramírez, M., & Pinochet, D. (2012). Radiation interception and radiation
use efficiency of wheat and pea under different P availabilities. Field Crops
Research, 127, 44–50. https://doi.org/10.1016/j.fcr.2011.11.005
Schnurbusch, T., Bossolini, E., Messmer, M., & Keller, B. (2004). Tagging and
validation of a major quantitative trait locus for leaf rust resistance and leaf tip
necrosis in winter wheat cultivar Forno. Phytopathology, 94, 1036–1041.
doi:10.1094/PHYTO.2004.94.10.1036
Sestak, Z., Jarvis, P.G., & Catsky, J. (1971). Criteria for the selection of suitable
method. In: Šesták, Z., Čatský, J., Jarvis, P.G. (ed.): Plant Photosynthetic
Production. Manual of Methods. Pp. 1–48. Dr W. Junk Publ., The Hague.
Stellenbosch University https://scholar.sun.ac.za

125
Shahinnia, F., Le Roy, J., Laborde, B., Sznajder, B., Kalambettu, P., Mahjourimajd, S.,
& Roger, J. (2016). Genetic association of stomatal traits and yield in wheat grown
in low rainfall environments. BMC Plant Biology, 16(1), 150.
Shao, H.B., Chu, L.Y., Jaleel, C.A., & Zhao, C.X. (2008). Water-deficit stress-induced
anatomical changes in higher plants. Comptes Rendus Biologies, 331(3), 215–
225.
Simane, B., Peacock, J.M., & Struik, P.C. (1993). Developmental plasticity and growth
rate among drought resistant and susceptible cultivars of durum wheat. Plant and
Soil, 57, 155–166.
Simmons, S.R., Oelke, E.A., & Anderson, P.M. (1995). Growth and Development
Guide for Spring Barley. St. Paul, MN: University of Minnesota Extension Service.
Retrieved from the University of Minnesota Digital Conservancy,
http://hdl.handle.net/11299/165839
Simmons, S.R., Oelke, E.A., & Anderson, P.M. (1985). Growth and development guide
for spring wheat. Agricultural Extension Service, University of Minnesota, AG-FO-
2547. https://doi.org/10.1017/CBO9781107415324.004
Simons. K., Abate, Z., Chao, S., Zhang, W., Rouse, M., Jin, Y., Elias, E. & Dubcovsky,
J. (2011). Genetic mapping of stem rust resistance gene Sr13 in tetraploid wheat
(Triticum turgidum ssp. durum L.). Theoretical and Applied Genetics, 122, 649–
658.
Singh, D. P., Chand, R., Dodan, D. S., Singh, A., Singh, K. P., Tewari, A. N. & Singh,
S. P. (2003). Evaluation of wheat and triticale genotypes for resistance to leaf
blight caused by Bipolaris sorokiniana and Alternaria triticina. Indian
Phytopathology, 56(4), 473–475.
Singh R.P., Huerta-Espino J., & Roelfs, A.P. (2002). The wheat rusts. In B.C. Curtis,
S. Rajaram, & H. Gómez Macpherson (Eds.), Bread wheat: Improvement and
production, plant production and protection series no. 30 (pp. 227–249). Rome:
Food and Agriculture Organization of the United Nations.
Stellenbosch University https://scholar.sun.ac.za

126
Singh, R.P., William, H.M., Huerta-Espino, J., & Rosewarne, G. (2004). Wheat rust in
Asia: Meeting the challenges with old and new technologies. In New Directions
for a Diverse Planet: Proceedings of the 4th International Crop Science Congress.
Singh, S.P., Srivastava, R., & Kumar, J. (2015). Male sterility systems in wheat and
opportunities for hybrid wheat development. Acta Physiologiae Plantarum, 37(1)
1-171. https://doi.org/10.1007/s11738-014-1713-7
Singh, T.N., Paleg, I.G., & Aspinall, D. (1973). Stress metabolism I. Nitrogen
metabolism and growth in the barley plant during water stress. Australian Journal
of Biological Sciences, 26(1), 45–56.
Sivamani, E., Bahieldin, A., Wraith, J. M., Al-Niemi, T., Dyer, W. E., Ho, T. H. D., &
Qu, R. (2000). Improved biomass productivity and water use efficiency under
water deficit conditions in transgenic wheat constitutively expressing the barley
HVA1 gene. Plant Science, 155(1), 1–9. https://doi.org/10.1016/S0168-
9452(99)00247-2
Slafer, G.A., Satorre, E.H., & Andrade, F.H. (1994). Increases in grain yield in bread
wheat from breeding and associated physiological changes. Journal of
agricultural science, 5(14), 1-84.
Smart, R.E., & Bingham, G.E. (1974). Rapid estimates of relative water content. Plant
Physiology, 53(2), 258–260.
Smirnoff, N. (1998). Plant resistance to environmental stress. Current Opinion in
Biotechnology, 9(2), 214–219. https://doi.org/10.1016/S0958-1669(98)80118-3
Smit, C. (2013). Pyramiding of novel rust resistance genes in wheat, utilising marker
assisted selection and doubled haploid technology. (Unpublished master's
thesis). Stellenbosch: Stellenbosch University.
Smith, A.R., & Zhao, D. (2016). Sterility caused by floral organ degeneration and
abiotic stresses in Arabidopsis and cereal grains. Frontiers in Plant Science,
7(October), 1–15. https://doi.org/10.3389/fpls.2016.01503
Stellenbosch University https://scholar.sun.ac.za

127
Soleymani, A., & Shahrajabian, M.H. (2012). Assessing light interception and light
extinction coefficient on planting dates of different cultivars of wheat in Esfahan
region. Technical Journal of Engineering and Applied Sciences, 3(15), 1680–
1684.
Solomon, K.F., & Labuschagne, M.T. (2009). Morpho-physiological response of durum
wheat genotypes to drought stress. South African Journal of Plant and Soil, 26(3),
141–146. DOI:10.1080/02571862.2009.10639947
Spielmeyer, W., Sharp, P.J., & Lagudah, E.S. (2003). Identification and validation of
markers linked to broad-spectrum stem rust resistance gene Sr2 in wheat. Crop
Science, 43, 333–336.
Springfield, L.S. (2014). Pyramiding of rust resistance genes in wheat utilising male
sterility mediated marker-assisted recurrent selection. (Unpublished aster's
thesis). Stellenbosch: Stellenbosch University.
Stapper, M., & Fischer, R.A. (1990). Genotype, sowing date and plant spacing
influence on high-yielding irrigated wheat in southern New South Wales. III.
Potential yields and optimum flowering dates. Australian Journal of Agricultural
Research, 41, 1043–1056.
Stöckle, C., & Kemanian, A. (2009). Crop radiation capture and use efficiency: A
framework for crop growth analysis. In V.O. Sadras, & D.F. Calderini (Eds.), Crop
physiology: Applications for genetic improvement and agronomy (pp. 145-170).
San Diego, CA: Academic Press.
Strauss, J.A., & Agenbag, G.A. (2000). The use of physiological parameters to identify
drought tolerance in spring wheat cultivars. South African Journal of Plant and
Soil, 17(1), 20–29, DOI:10.1080/02571862.2000.10634861
Stuthman, D.D., Leonard, K J., & Miller-Garvin, J., (2007). Breeding crops for durable
resistance to disease. Advances in Agronomy, 95, 319–367.
Sullivan, C.Y., & Eastin, J.D. (1974). Plant physiological response to water stress.
Agricultural. Meteorology, 14, 113–127.
Stellenbosch University https://scholar.sun.ac.za

128
Suneson, C.A. (1962). Use of Pugsley’s sterile wheat in cross breeding. Crop Science,
2, 534–535.
Talebi, R. (2011). Evaluation of chlorophyll content and canopy temperature as
indicators for drought tolerance in durum wheat (Triticum durum Desf.). Australian
Journal of Basic and Applied Sciences, 5(11), 1457–1462.
Tatar, O., Brück, H., & Asch, F. (2016). Photosynthesis and remobilization of dry
matter in wheat as affected by progressive drought stress at stem elongation
stage. Journal of Agronomy and Crop Science, 202(4), 292–299.
https://doi.org/10.1111/jac.12160
Ter Steege, M.W., Den Ouden, F.M., Lambers, H., Stam, P., & Peeters, A.J.M. (2005).
Genetic and physiological architecture of early vigor in Aegilops tauschii, the D-genome donor of hexaploid wheat. A quantitative trait loci analysis. Plant
Physiology, 139, 1078–1094.
Tester, M., & Langridge, P. (2010). Breeding technologies to increase crop production
in a changing world. Science, 327(5967), 818–822.
Time & date.com. (2017). Past Weather in Stellenbosch, South Africa Retrieved from
https://www.timeanddate.com/weather/south-africa/stellenbosch/historic
Accessed: 02 April 2017.
Time & date.com. (2018). Past Weather in Stellenbosch, South Africa Retrieved from
https://www.timeanddate.com/weather/south-africa/stellenbosch/historic
Accessed: 19 November 2018.
Tiryakioglu, M. (2015). The relationship between flag leaf senescence and grain yield
of some durum wheat varieties under drought stress during grain filling period
(Bazı Makarnalık Buğday Genotiplerinde Dane Dolum Dönemindeki Kuraklık
Stresinde Bayrak Yaprak Yaşlanması ile Tane). Tarim Bilimleri Dergisi – Journal
of Agricultural Sciences, 21(532), 382–393.
Todorovska, E., Christov, N., Slavov, S., Christova, P., & Vassilev, D. (2009). Biotic
stress resistance in wheat – breeding and genomic selection implications.
Biotechnology and Biotechnological Equipment, 23, 1417–1426.
Stellenbosch University https://scholar.sun.ac.za

129
Tuberosa, R., & Salvi, S. (2006). Genomics-based approaches to improve drought
tolerance of crops. Trends in Plant Science, 11(8), 405–412.
Tuberosa, R., Salvi, S., Sanguineti, M. C., Landi, P., Maccaferri, A.M., & Conti, S.
(2002). Mapping QTLs regulating morpho-physiological traits and yield: Case
studies, shortcomings and perspectives in drought-stressed maize. Annals of
Botany, 89(7), 941–963.
Turner, N.C. (1981). Techniques and experimental approaches for the measurement
of plant water status. Plant Soil, 58, 339–366.
Ullah, R., Mohammad, Z., Khalil, I.H., & Ullah, A. (2007). Heritability for heading,
maturity, plant height, spike length and tillers production in winter wheat (Triticum
aestivum L.). Pakistan Journal of Plant Sciences. 13 (1): 67-73
Verma, V., Foulkes, M. J., Worland, A. J., Sylvester-Bradley, R., Caligari, P. D. S., &
Snape, J. W. (2004). Mapping quantitative trait loci for flag leaf senescence as a
yield determinant in winter wheat under optimal and drought-stressed
environments. Euphytica, 135(3), 255–263.
Villareal, R.L., Mujeeb-Kazi, A., & Rajaram, S. (1996). Inheritance of threshability in
synthetic hexaploid (Triticum turgidum × T. tauschii) by T. aestivum crosses. Plant
Breeding, 115(5), 407–409.
Vurayai, R., Emongor, V., & Moseki, B. (2011). Effect of water stress imposed at
different growth and development stages on morphological traits and yield of
Bambara groundnuts (Vigna subterranea L. Verdc). American Journal of Plant
Physiology, 6, 17–27.
Wang, F.Z., Wang, Q.B., Kwon, S.Y., Kwak, S.S., & Su, W.A. (2005). Enhanced
drought tolerance of transgenic rice plants expressing a pea manganese
superoxide dismutase. Journal of Plant Physiology, 162(4), 465–472.
Wang, H., Xiao, Æ.L., & Xiao, L. (2009). Effects of chlorocholine chloride on
phytohormones and photosynthetic characteristics in potato (Solanum tuberosum
L.). Journal of Plant Growth Regulation, 28(1), 21–27.
Stellenbosch University https://scholar.sun.ac.za

130
Wang, W., Vinocur, B., & Altman, A. (2003). Plant responses to drought, salinity and
extreme temperatures: Towards genetic engineering for stress tolerance. Planta,
218(1), 1–14.
Whan, B.R., Carlton, G.P., & Anderson, W.K. (1991). Potential for increasing early
vigour and total biomass in spring wheat. I. Identification of genetic improvements.
Australian Journal of Agricultural Research, 42, 347–361.
Whitford, R., Fleury, D., Reif, J. C., Garcia, M., Okada, T., Korzun, V., & Langridge, P.
(2013). Hybrid breeding in wheat: Technologies to improve hybrid wheat seed
production. Journal of Experimental Botany, 64(18), 5411–5428.
https://doi.org/10.1093/jxb/ert333
William, H.M., Trethowan, R., & Crosby-Galvan, E.M. (2007). Wheat breeding assisted
by markers: CIMMYT’s experience. Euphytica, 157, 307–319.
Xie, Z.K., Wang, Y.J., & Li, F.M. (2005). Effect of plastic mulching on soil water use
and spring wheat yield in arid region of northwest China. Agricultural Water
Management, 75(1), 71–83.
Xu, W., Cui, K., Xu, A., Nie, L., Huang, J., & Peng, S. (2015). Drought stress condition
increases root to shoot ratio via alteration of carbohydrate partitioning and
enzymatic activity in rice seedlings. Acta Physiologiae Plantarum, 37(2) 1-9.
Xue, Q., Zhu, Z., Musick, J.T., Stewart, B.A., & Dusek, D.A. (2006). Physiological
mechanisms contributing to the increased water-use efficiency in winter wheat
under deficit irrigation. Journal of Plant Physiology, 163(2), 154–164.
Yang, D., Li, Y., Shi, Y., Cui, Z., Luo, Y., Zheng, M., & Wang, Z. (2016). Exogenous
cytokinins increase grain yield of winter wheat cultivars by improving stay-green
characteristics under heat stress. PLoS ONE, 11(5), 1–19.
Yang, P.M., Huang, Q.C., Qin, G.Y., Zhao, S.P., & Zhou, J.G. (2014). Different
drought-stress responses in photosynthesis and reactive oxygen metabolism
between autotetraploid and diploid rice. Photosynthetica, (52), 193–202.
Stellenbosch University https://scholar.sun.ac.za

131
Yin, W., Chai, Q., Guo, Y., Feng, F., Zhao, C., Yu, A., & Hu, F. (2016). Analysis of leaf
area index dynamic and grain yield components of intercropped wheat and maize
under straw mulch combined with reduced tillage in arid environments. Journal of
agricultural science, 8(4), 26–42.
Zadoks, J.C., Chang, T.T., & Konzak, C.F. (1974). A decimal code for the growth
stages of cereals. Weed Research, 14(6), 415–421.
Zhang, H., & Oweis, T. (1999). Water-yield relations and optimal irrigation scheduling
of wheat in the Mediterranean region. Agricultural Water Management, 38(3),
195–211.
Zhang, W., Wang, K., Lin, Z. S., Du, L. P., Ma, H. L., Xiao, L. Le, & Ye, X. G. (2014).
Production and identification of haploid dwarf male sterile wheat plants induced
by corn inducer. Botanical Studies, 55(1), 1–8. https://doi.org/10.1186/1999-
3110-55-26
Zlatev, Z., Lidon, F., & Kaimakanova, M. (2017). Plant physiological responses to UV-
B radiation. Emirates Journal of Food and Agriculture, 24(6), 481-501.
Stellenbosch University https://scholar.sun.ac.za