
AI Tools for Software Development Effort Estimation AI Tools for Software Development Effort...
9
Bond University ePublications@bond Information Technology papers Faculty of Business 6-1-1996 AI Tools for Soſtware Development Effort Estimation Gavin Finnie Bond University, [email protected] Gerhard E. Wiig Bond University Follow this and additional works at: hp://epublications.bond.edu.au/infotech_pubs is Conference Paper is brought to you by the Faculty of Business at ePublications@bond. It has been accepted for inclusion in Information Technology papers by an authorized administrator of ePublications@bond. For more information, please contact Bond University's Repository Coordinator. Recommended Citation Gavin Finnie and Gerhard E. Wiig. (1996) "AI Tools for Soſtware Development Effort Estimation".Jun. 1996. hp://epublications.bond.edu.au/infotech_pubs/7
-
Upload
independent -
Category
Documents
-
view
2 -
download
0
Transcript of AI Tools for Software Development Effort Estimation AI Tools for Software Development Effort...

Bond UniversityePublications@bond
Information Technology papers Faculty of Business
6-1-1996
AI Tools for Software Development EffortEstimationGavin FinnieBond University, [email protected]
Gerhard E. WittigBond University
Follow this and additional works at: http://epublications.bond.edu.au/infotech_pubs
This Conference Paper is brought to you by the Faculty of Business at ePublications@bond. It has been accepted for inclusion in InformationTechnology papers by an authorized administrator of ePublications@bond. For more information, please contact Bond University's RepositoryCoordinator.
Recommended CitationGavin Finnie and Gerhard E. Wittig. (1996) "AI Tools for Software Development EffortEstimation".Jun. 1996.
http://epublications.bond.edu.au/infotech_pubs/7

AI Tools for Software Development Effort Estimation
Gavin FL Finnie and Gerhard E. Wittig Bond University
Gold Coast, Queensland, Australia
Abstract
Software development involves a number of interrelated factors which affect development effort and productivity. Since many of these relationships are not well understood, accurate estimation of so&are development time and effort is a dificult problem. Most estimation models in use or proposed in the literature are based on regression techniques. This paper examines the potential of two artijcial intelligence approaches i.e. artificial neural network and case-based reasoning for creating development effort estimation models.
Artijcial neural network can provide accurate estimates when there are complex relationships between variables and where the input data is distorted by high noise levels Case-based reasoning solves problems by adapting solutions from old problems similar to the current problem. This research examines both the performance of back-propagation artificial neural networks in estimating software development effort and the potential of case-based reasoning for development estimation using the same dataset.
Key Words: Function points, Software development, Artificial neural networks, Case based reasoning
Introduction
Estimating software development effort remains a complex problem attracting considerable research attention. Improving the estimation techniques available to project managers would facilitate more effective control of time and budgets in software development. Software development involves a number of interrelated factors which affect development effort and productivity. Accurate forecasting has proved difficult since many of these relationships are not well understood. Heemsrra [4] concluded that estimation models have not shown that they can be used as a reliable estimation tool.
Most estimation models in use or proposed in the
literature are based on regression techniques. This paper examines the potential of two artificial intelligence approaches ie. artificial neural networks and case-based reasoning, in providing the basis for development effort estimation models. Artificial neural networks (ANNs) are recognised for their ability to provide good results when dealing with problems where there are complex relationships between inputs and outputs, and where the input data is distorted by high noise levels [14]. The software development environment from which development effort estimates are generated, is characterised by these attributes. Although the potential for predictive accuracy is good, neural networks lack an explanation capability and do not provide an environment for direct user adaptation of results.
Case-based reasoning (CBR) [15] is a problem solving technique which solves new problems by adapting solutions that were used to solve old problems. CBR retrieves one or more cases similar to the current problem and attempts to modify these to fit the current problem parameters. In software development effort estimation, each case could be a previous software development while the current problem is one of extracting a suitable estimate for the current project. Case-based reasoners can justify decisions on the basis of the previous cases used in solving a problem.
This research examines the performance of back- propagation artificial neural networks in estimating software development effort by evaluating the performance of ANN effort estimation models on actual project data. In addition the potential of CBR for development effort estimation is investigated using the same project data.
Estimation model performance
Several researchers have evaluated a range of software effort estimation models. The problem has been shown to be a complex issue and results have in general not been encouraging.
Kemerer [9] performed an empirical validation of four algorithmic models (SLIM, COCOMO, Estimacs
346 O-8186-7379-6/96 $05.00 0 1996 IEEE
Proceedings of the 1996 International Conference on Software Engineering: Education and Practice (SE: E&P '96) 0-8186-7379-6/96 $10.00 © 1996 IEEE

and FPA), using data from projects outside the original model development environments without re- calibrating the models. The results in’dicate to what extent these model are generalisable to different environments. Most models showed a strong over estimation bias and large estimation errors with the mean absolute relative error (MARE) ranging from an average of 57 percent to almost 800 percent.
Ferens and Gumer [3] evaluated three development effort prediction models (SPANS, Ciheckpoint and COSTAR) using 22 projects from Albrecht’s database, and 14 from Kemerer’s dataset. The prediction error is large, with the MARE ranging from 46 percent for the Checkpoint model to 105 percent for the COSTAR model.
Jeffery and Low [7] conducted a study to investigate the need for model calibration at both the industry as well as the organisation level. Again the MARE was high, ranging from 43 to 105 percent for the three companies which were used in the study. Jeffery, Low and Barnes [8] compared the SPQR/20 model to FPA using data from 64 projects within one organisation. The models were re-calibrated to the local environment to remove over or under estimation biases. The estimation errors are considerably less than those of previous studies with MAREs of approximately 12 percent which reflects the benefits of model calibration.
Heemstra [4] surveyed 364 organisations and found that only 51 used models to estimate software development effort and that the model users made no better estimates than the non-model users. Heemstra found that most of the time generic models are used without re-calibration, that most models do not support re-calibration and that current models are no better than expert judgement.
Artificial Intelligence techniques do not appear to have been widely used in development effort estimation although they have been proposed and used in other areas of software engineering [12]. Matson and Mellichamp [lo] developed a knowledge-based system to assist analysts in estimating a system size in function points. Mukhopadhyay, Vicinanza and Prieitula [ 1 l] developed a model. (Ester) for devel’opme:nt effort estimation, based on case-based reasoning which was evaluated against expert judgement, CGCOMO, and Function Point Analysis (FPA). None of the models were able to improve on the performance. of the expert. The estimation error of the expert and of Ester were considerably less than FPA and CGCOMO. Despite the improvement the errors are still large with Estor’s MARE greater than 50 percent. In the Estor CBR model the system size is based on elapsed time (for previous cases) and any adaptation of this time is done on the basis of rules extracted from a protocol analysis of an expert estimator’s performance on am actual
estimation task;. In the current approach system size is based on function points and adaptation is on the basis of differences identified for critical feahures in a case base of Iprior system developments [l]
Artificial1 neural network models
ANNs have the ability to model comple:x non-linear relationships amd are capable of approximating any measurable function. This implies that any lack of success in applications must arise from inadequate learning, insufficient numbers of hidden units, or a lack of a deterministic relationship between input and target [IS]. ANNs have several features <which make them <attractive prospects for solving pattern recognition tasks without having to build an explicit model of the system.
In a broad sense the network itself is a model because the topology and transfer functions of the nodes are usually formulated to match the current problem. Many network architectures have been develoF:d for various applications. Back-propagation networks are used for estimating software development effort in this research.
Classical back-propagation [13] is a gradient descent method of optimisation executed iteratively, with implicit bounds on the distance moved in the search direction in the weight space. This is achieved by incorporating a learning rate (the gain) and the momentlam term (the damping factor) in the model.
The performance of neural networks depends on the architecmre of the network and their parameter settings. Detenmining the architecture of a network (size, structure., connectivity) affects the performance criteria, such as the learning speed, accuracy of learning, noise resistance and generalisation ability. There is no clearly defined theory which allows for the calculation of the ideal parameter settings and as a rule even slight parameter changes can cause major variations in the behaviour of almost all networks.
Network performance evaluation
Performance hleasurement
Different error measurements have been used by various imetrics researchers, but for this project the main measure of model performance is the Mean Absolute Relative Error (MARE). MARE is the preferred error measure of software measurement researchers and is calculated as follows [71:
347
Proceedings of the 1996 International Conference on Software Engineering: Education and Practice (SE: E&P '96) 0-8186-7379-6/96 $10.00 © 1996 IEEE
where: estimate is the network output for each
observation n is the number of observations
To establish whether models are biased and tend to over or under estimate, the Mean Relative Error @IRE) is calculated as follows [7]:
MRE= c i
n estimate - actual
1 +n
i=l actual
A large positive MRE would suggest that the model generally over estimates the development effort, while a large negative value would indicate the reverse.
Simulated Development Data
To assess the development effort estimation ability of neural networks in large complex environments a training set is required which is large enough to permit the network to capture the problem domain characteristics to facilitate good generalisation. Baum and Haussler [2] suggested the following formula to calculate the minimum number of required observations to achieve satisfactory generalisation:
the fraction of errors on the training set is less than & z
\E -Ej where: m is the number of training cases
N is the number of nodes (just one layer) W is the number of weights E is the allowed fraction of errors on test set
(assume a < l/8 )
In practice all that is needed is for m > w E
The error fraction is assumed to be less than 0.125. This implies that as a guideline approximately ten observations are required for each weight in the network.
In this section the neural networks are assessed in a complex environment which includes many development attributes. This requires a large software development dataset in which several attributes have
been recorded. Several datasets are available but typically these are too small to provide sufficient observations to fulfil the requirement discussed above. The availability of a suitable dataset is further restricted by very few development projects having reliable records of the numerous development attributes which have to be included in the model.
To enable such an analysis to be conducted an alternative approach is taken by generating simulated software development project data. To do this the SPQR/20 software estimation tool is used. SPQIV20 has given relatively good results in estimating development effort in a locally calibrated environment [8], which suggests that the output it generates reasonably represents the development environment.
To generate the simulated project data all input values were created using a random number generator. Input values were generated for 1,000 projects, and were then keyed in manually using SPQR/20 to estimate the project development effort Some statistical details of the data are given in Table 1. To note is the large range of system size (109-15,571 FPs) and development hours (2,162-912,309). Such size range was generated to fully test the neural networks prediction capability, but it did present itself with a input and output network scaling problem. Of interest is the productivity range which was generated by SPQIV20. Here the project with the highest productivity is approximately ten times that of the project with the lowest productivity. This range of development productivity is typical of commercial software development productivity [ 161. This meant that the neural network had to accommodate large development attribute influences to generate an effort estimate from the function point size.
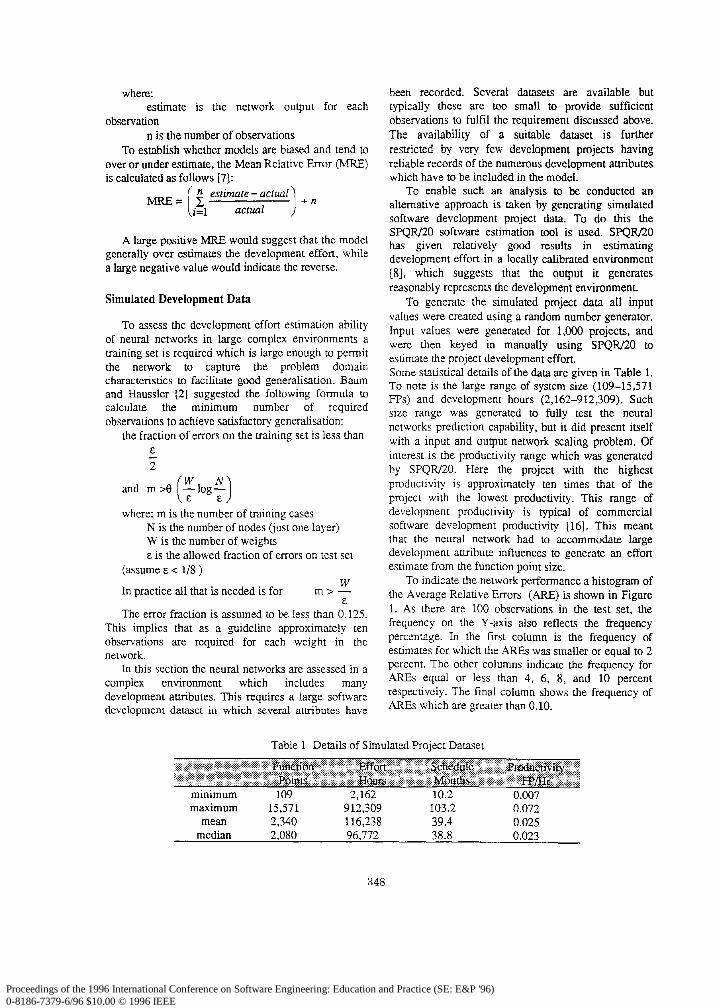
To indicate the network performance a histogram of the Average Relative Errors (ARE) is shown in Figure 1. As there are 100 observations in the test set, the frequency on the Y-axis also reflects the frequency percentage. In the first column is the frequency of estimates for which the ARES was smaller or equal to 2 percent. The other columns indicate the frequency for ARES equal or less than 4, 6, 8, and 10 percent respectively. The final column shows the frequency of ARES which are greater than 0.10.
Table 1 Details of Simulated Project Dataset
minimum 109 2,162 10.2 0.007 maximum 15,571 912,309 103.2 0.072
mean 2,340 116,238 39.4 0.025 median 2,080 96,772 38.8 0.023
348
Proceedings of the 1996 International Conference on Software Engineering: Education and Practice (SE: E&P '96) 0-8186-7379-6/96 $10.00 © 1996 IEEE

Histogram
0.02 0.06 0.1
ARE
Figure 1 ARE Frequency in Test Set
The results indicate that 83 percent of the estimates were within eight percent of the actual value. The network model prediction error had a MRE of -0.003. This indicates that there was little bias in the estimates, with over and under estimation errors virtually cancelling each other out. The MARE was 0.045. To establish the statistical significance of the estimate a paired two sample for means t-test was conducted. The calculated t statistic was well below the #critical t value, and this indicates that the neural network estimate is not statistically significantly different from the project effort.
ASMA Project Data
The Australian Software Metrics Association (Victoria) has developed a database of software development project information. In November 1994 Release-5 [1] of this database was made available, and was used to assess the artificial neural ne:tworks’ ability to accurately predict development effort
The dataset contains information on 136 projects. Of these 80 were new developments, 47 system enhancements, and 9 were miscellaneous projects. These projects were developed on mainframe, mid-
range and personal coniputers (PC). All except for one project which was developed in a 2GL (second generation language) were developed in e:ither 3GLs or 4GLs. Twenty eight different development languages were used. The four most commonly usled languages accounted for over 69 percent of the projects. These were P.L/l, COBOL, Natural, and C with 30, 28, 27, and 9 percent respectively. Of the 136 projects 119 were DBMSs.
An attempt was made by the Australian Software Metrics Association (ASMA) to ensure the reliability and consistency of project data by developing a project data collectiorn package which was used for all project data. Currently the International. Software Benchmarking Standards Group (ISBSG) version 1.0 collection package is being used. This is based on the ASMA model and has been adopted by the Metrics Associations of the USA, UK, New Zealand, Netherlands and Germany, and has now &come the de facto international standard.
The development of the collection package is an attempt to ensure a consistent fOMli%t t0 allow meaningful comparisons. Definitions are also provided for several measurements to reduce subjectivity and inconsistency in measurement. For the function point count the International Function Point Users Group (IFPUG) standard is adopted. The range of system size, development effort and productivity are shown in Table 2. Across all three attributes the range is large. This complicates the development effort estimation process. For the original dataset from which extreme outliers had been eliminated, the project with the highest productivity is approximately 34 times that of the lowest productivity. This range is not unusual when compared to other project development productivity datasets [ 161.
In Table 2 the mean and median values for the three attributes are also shown. In all cases the mean exceeds the median value which indicates that the sample numbers are skewed towards the: smaller or lower productivity projects.
Despite all the precautions taken to ensure reliable measurement of project data it is probable that some noise is present in the data due to the large scope of development environments and individual company
Table 2 : ASMA Project Data Statistics
M&X 5,789 59,990 1.111 Mean 7’74 5704 0.252 Median 349 2388 0.175
349
Proceedings of the 1996 International Conference on Software Engineering: Education and Practice (SE: E&P '96) 0-8186-7379-6/96 $10.00 © 1996 IEEE

Table 3 Error Using Only Function Point Size as Input . .._ .;:.. ~~~~~~-~~~~~~~~~~~~l,:~~~::~I: iT~Se~~~~~~~~~~~~~~~,~:~~~~~~~ .:.:-:.z+:.::::::::;:::.:.:.:; ..:. ~:.~ ,_.,., :,:,: :,:, : : :
0.12 -0.14 -0.20 -0.08 0.44 0.22 0.21 0.29
practices and standards. Other sources of possible noise average over or under estimated development effort. in the project data were mentioned previously. Despite The MARE for the three test sets combined was 0.29. some possible difficulties with the project data it For all three tests sets combined, the percentage error reflects typical data from which effort estimates have to smaller than 10 percent, 25 percent and 50 percent is be made in practice. shown in Table 4.
terms of function points and development hours were eliminated from the projects eligible for inclusion in the testing set to avoid the neural network having to estimate outside the range of the data on which its was
O-10% 33.3 33.3 1 l-25% 23.3 56.7 2650% 40.0 96.7
>50% 3.3 100.0 trained.
To replicate the results three sets of training and testing data were selected, again using a random number generator to do this.
Initially in this set of trials the networks predicted development effort with only the single input of the function point size of projects. Many factors apart from the size of a system affect software development effort Using only project size as input limits the information which the networks have to enable them to adjust their weight space, and effort estimation is not as accurate as when further relevant attributes are added. The results of the back-propagation networks for all three testing sets is given in Table 3. The MRE is also included to indicate to what extent the models on
The ASMA project data [l] in addition to the function point size of systems had recorded some other development project attributes. The attributes are those shown in Table 5.
Trials were conducted to test the model by combining function point size with the above six development attributes into an integrated model. Combining the attributes into a single model permits the neural networks to model the interrelationships which exist between the development attributes. It should be noted that some of the development attribute data was missing, further complicating the estimating procedure.
Table 5 ASMA Project Attributes . . . . . . . . . . . .A: ::...::...... . . ..^.. . . . . . . . . . . ........................j :~~P;i~~~~~~~~~~~~~~~~~~:~~~~~~~~~~~~.~~~~~~~~~~~~~~~~~~i
‘::: :.:. . . . . . :‘.:.:.::*.~ i...ii_....i . . . . . . . . . . . . . . . . . . . ,... ,>:.)):.:.:.:...: . . . . . . . . . . . . . . .._......... ..~..~ ..iii,.,.,,.,i.... :.:.:.i:-::.:::~.-.- . . . . . . . .:::....: . . . . . . . . . . :.. :..i;.!::: ..::.... . . . . . :.: .:.:.:. ::: .:: :...:.:.:‘:.:.:.:.‘_:.. .A\...... “.‘......,....i.. ...i......i.l... . . . . . . . . :.... . . . . . . . . . . . . . ..A ._. . . . . .,...,.. .,., ., ,. . . . . . . . . . . . . . . ..-.-...- . . . . . . . . . . . . . . . . . Language Type 3GL and 4GL Time Recording Level Levels l-4 Hardware Platform Mainframe, Mid-range, PC Application Generator Yes/No DBMS Yes/No Development Type New, Enhancement, Miscellaneous
Table 6 Models Using Seven Inputs to Estimate Effort
350
Proceedings of the 1996 International Conference on Software Engineering: Education and Practice (SE: E&P '96) 0-8186-7379-6/96 $10.00 © 1996 IEEE
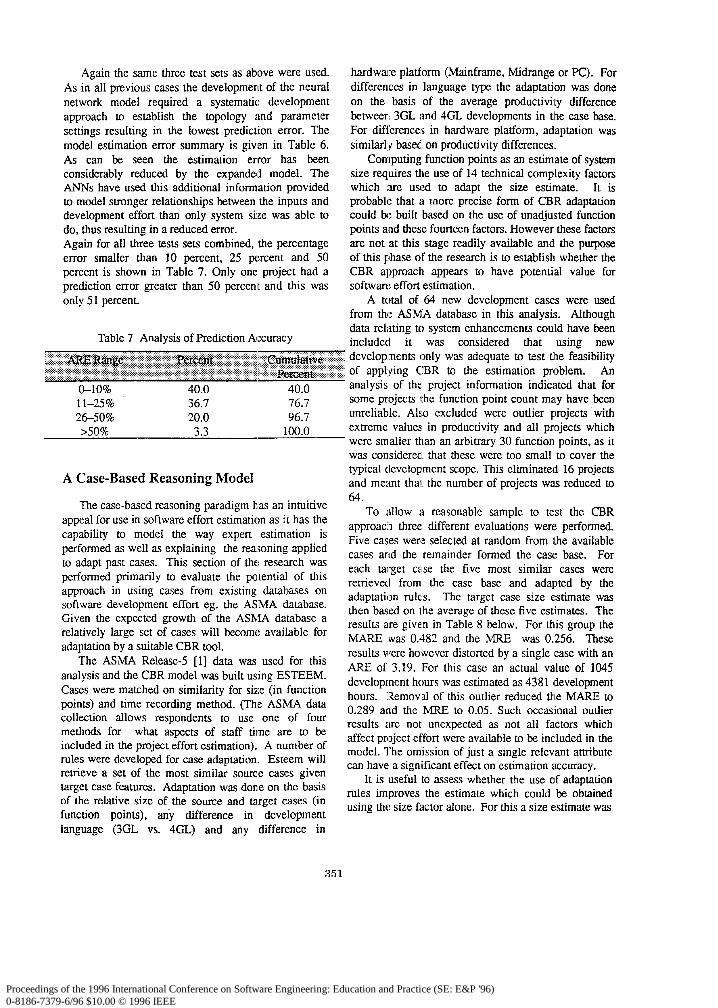
Again the same three test sets as above were used. As in all previous cases the development of the neural network model required a systematic development approach to establish the topology and parameter settings resulting in the lowest prediction error. The model estimation error summary is given in Table 6. As can be seen the estimation error has been considerably reduced by the expanded model. The ANNs have used this additional information provided to model stronger relationships between the inputs and development effort than only system size wa!s able to do, thus resulting in a reduced error. Again for all three tests sets combined, the percentage error smaller than 10 percent, 25 percent and 50 percent is shown in Table 7. Only one project had a prediction error greater than 50 percent and this was only 51 percent.
Table 7 Analysis of Prediction Alccuracy
hardware platform (Mainframe, Midrange or EC). For differences in language type the adaptati’on was done on the basis of the average productivity difference between 3GL and 4GL developments in tlhe case base. For differences in hardware platform, adaptation was similarly based on productivity differences,.
Computing function points as an estimate of system size requires the use of 14 technical complexity factors which are used to adapt the size estimate. It is probable that a more precise form of CBR adaptation could be built based on the use of unadjusted function points and these fourteen factors. However these factors are not at this stage readily available and the purpose of this phase of the research is to establish whether the CBR approach appears to have potenti,al value for software effort estimation.
A total of 64 new development cases were used from the ASMA database in this analysis. Although data relating to system enhancements could have been included it was considered that using new
~~~~~~~~~~~~~~~~~~~~~~~~~~~~ developments only was adequate to test the feasibility ~~:~~~~~~~~~~~~~~~~~~~~~~~~ of appkying (-1-R m the estimation pr&lem. An :.:.:.~~:.~:.:c.:.:.:.:.:.:.:.:.:.:.:.:.:.:.:.~~.... . . . . . . . . . . . . . . . :.:.:.:.:.:.: :.:.:.:::: :::::::::::::::: ::::::; :,:, ~~:.~ ,_\\ : -’
O-10% 40.0 40.0 analysis of the: project information indicated that for 1 l-25% 36.7 76.7 some projects rhe function point count maly have been 26-50% 20.0 96.7 unreliable,. Also excluded were outlier projects with >50% 3.3 100.0 extreme values in productivity and all pnojects which
were smaller than an arbitrary 30 function points, as it
A Case-Based Reasoning Model
The case-based reasoning paradigm h,as an intuitive appeal for use in software effort estimation as it has the capability to model the way expert estimation is performed as well as explaining the rea:soning applied to adapt past cases. This section of the rese,arch was performed primarily to evaluate the potential of this approach in using cases from existing datalbases on software development effort eg. the ASMA (database. Given the expected growth of the ASMA database a relatively large set of cases will become available for adaptation by a suitable CBR tool.
The ASMA Release-5 [l] data was used for this analysis and the CBR model was built using ESTEEM. Cases were matched on similarity for size (in function points) and time recording method. (The ASMA data collection allows respondents to use one of four methods for what aspects of staff time alre to be included in the project effort estimation). A number of rules were developed for case adaptation. Estleem will retrieve a set of the most similar soume cases given target case features. Adaptation was done on the basis of the relative size of the source and target cases (in function points), any difference in development language (3GL vs. 4GL) and any difference in
was considered that these were too small to cover the typical development scope. This eliminated 16 projects and meant that the number of projects was reduced to 64.
To allow a reasonable sample to test the CBR approach three different evaluations were performed. Five cases were selected at random from the available cases and the remainder formed the case base. For each target case the five most similar cases were retrieved from the case base and adapted by the adaptation rules. The target case size estimate was then based on the average of these five estimates. The results are given in Table 8 below. For this group the MARE ‘was O-482 and the MRE was 0.256. These results were however distorted by a single (case with an ARE of 3..19. For this case an actual value of 1045 development hours was estimated as 4381 development hours. IRemoval of this outlier reduced the MARE to 0.289 and the MRE to 0.05. Such occasional outlier results are not unexpected as not all factors which affect project effort were available to be inc.luded in the model. The omission of just a single relevant attribute can have a significant effect on estimation accuracy.
It is useful to assess whether the use of adaptation rules improves the estimate which could be obtained using the size factor alone. For this a size estimate was
351
Proceedings of the 1996 International Conference on Software Engineering: Education and Practice (SE: E&P '96) 0-8186-7379-6/96 $10.00 © 1996 IEEE

Table 8 Analysis of Prediction Accuracy networks demonstrated that they were able to estimate ;.~(.:.x,:.,. ..,. ,. ., ./. . . . . . . . . . . ..(. ~~~ :.;.:. ~~~..~.:.:,~:.~..:.:.:.;:~::~~...:.:.~~~~:::::::~:~.:.:.~~~:.:::;..: .,.,.... ~)) _,/...,.,. :....:::.~..i development effort within 25 percent of the actual ~~~~~~~~~~~~~~~~~~~~~~~~~~~,~~~~~~~~~ :..::.,; ,,,,, ‘. .“‘. ‘.‘.‘-.:-: =‘x’-‘-‘.:.%.> . . . . I ..,...i. ..,.. -.-... . . . . ..,...., ‘-:‘:‘: :c : : : : :.:.::::n’;‘:.:.: ::::y:.: 1,. ‘. ...............“.i.. ,___ ,.,,(,.. ““...““‘..‘...“..““...“‘..‘.‘.‘... . . . . ..__.\.............._ ,.;..,.:, ,...,.,.,. . . . . ..____._ “..“‘.// ‘. .’ ” ” “. ““‘.’ ‘.“‘:‘.‘.‘“...-..- i’.‘.‘. L..“. .:.:.::::: ..,.,., ;,:.: __ _, ..,,_,, _. .,_ i:‘.:.:......r...:....:. . . ..__. . .
. . . . . . . . . . . ..~.. i . .~~.~~~~~~~~.~~~~~~~~~~~~ effort in more than 75 percent of the projects in the test . . . . ..““.....~.~.~.~.~.~.........,,., ::::- ,,:,,, .., ,-,,(,‘, : : : i.. . . . . . . . . . . . .,.::.. . . . . . . . . . . . . . . . . . . . . . . . ._ : :,:_,,;.-,,:,:,:,
------- sets, and with a MARE of less than 0.25. Even this o-10% 20.0 20.0 ll-25% 33.3 53.3
dataset did not fully meet the data requirements of
2650% 20.0 73.3 neural networks as suggested by Baum and Haussler
30% 27.7 100.0 [2], and Hinton [5].
Results for the use of CBR were not quite as good
generated for each case in the above sample based on an average of the five nearest neighbour estimates. Each nearest neighbour estimate is based on an assumption that for projects of similar size the productivity rate will be similar eg. if for a source case of 1000 function point’s there is a recorded development time of 5000 hours then for a target case of 1500 function point’s it is assumed that the best estimate of development time will be 7500 hours. Averaging over a number of such estimates should reduce the impact of variations in productivity.
Comparing this sample to that using adaptation rules showed that the use of rules improved the estimate in 12 of the 15 cases but reduced the accuracy in the other three. Overall the MARE for 15 unadapted cases was 0.846 (as opposed to 0.48) or 0.63 compared to 0.289 with the outlier case removed. Applying a simple t-test indicated that the improvement was significant at the 5% level (t=2.29, p=O. 18).
The adaptation rules applied only to hardware platform used and language type. Given the relative crudity of the adaptation rules used in the CBR model at this stage, the results appear to indicate that this technique may with further refinement have considerable potential in software effort estimation. For this sample the data came from a variety of sources and contained a considerable amount of noise. The results would suggest that the use of more precise forms of adaptation and a wider range of the factors which influence productivity could lead to better estimates, particularly if the cases could be restricted to specific organisations (the equivalent of calibrating regression models for a specific environment).
Conclusion
ANNs were successful in accurately estimating project effort in a large dataset of simulated project data which is likely to have contained considerably less noise than typically occurs in project data. This dataset met the requirements of sufficient observations for adequate training. The intuitive expectation is that estimation errors will increase as the level of noise in the dataset is increased.
In the ASMA dataset the back-propagation
with 11 of 15 cases (73.3%) within 50% of the actual effort value and 8 of 15 (53.3%) within 25% of the actual. The results are however encouraging as only a few factors were considered for adaptation and the rules used were very limited in scope.
Despite the restrictions of the project dataset, artificial neural networks have shown their ability to provide an adequate effort estimation model. Although CBR appears to have potential, further research will be needed to refine the quality of the estimation model. With the limited number of observations and project attributes which were recorded the full potential of the estimation capability of models could not be fully exploited and assessed. If the growth in projects in the ASMA dataset continues to increase at the current rate the database should within a few years provide a basis for the development of improved estimation models. If in addition relevant project attributes are recorded this should further enhance the models which may be developed.
The conclusion thus is a conditional affirmation that artificial intelligence models are capable of providing adequate estimation models. Their performance is to a large degree dependent on the data on which they are trained, and the extent to which suitable project data is available will determine the extent to which adequate effort estimation models can be developed.
References
Ul
[21
131
141
PI
ASMA (Victoria), Project Database-Release 5, Australian Software Metrics Association, P.O. Box 1278. Box Hill, Victoria 3128, November 1994.
E.B. Baum, and D. Haussler, What Size Net Gives Valid Generalization?, Neural Computation 1, pp. 151- 160,1989.
D.V. Ferens, and R.B. Gumer, An Evaluation of Three Function Point Models for Estimation of Software Effort, IEEE National Aerospace and Electronics Conference - NAECON92, vol. 2, pp. 625-642, 1992.
F.J. Heemstra, Software Cost Estimation. Information and Software Technology, vol. 34, no. 10, pp. 627-639. 1992.
G.E. Hinton, Neural Networks Seminar, University of Sydney, February 1993.
352
Proceedings of the 1996 International Conference on Software Engineering: Education and Practice (SE: E&P '96) 0-8186-7379-6/96 $10.00 © 1996 IEEE
[61
171
I81
PI
K. Hornik. M. Stinchcombe, and H. White. Multilayer [12] C.L.. Ramsey and V.R. Basili. An Evaluation of Expert Feedforward Networks are Universal Approximators, Systems for Software Engineering Management, IEEE Neural Nehvorks, vol. 2. pp. 359-366. 1’989. Transactions on S.E.. vol. 15, no. 6, June 11989.
D.R Jeffery. and G.C. Low, Calibrating Estimation Tools for Software Development, SofMllrrre Engineering Journal, pp. 215-221, July 1990.
D.R. Jeffery, G.C. Low and M. Barnes, ‘A Comparison of Function Point Counting Techniques’, IEEE Transactions on Sofrwore Engineering, vol. 119, no. 5, pp. 529-532.1993.
[13] D.E.. Rumelhart, G.E. Hinton, and R.J. Williams, Learning Internal Representations by Ermr Propagation, Parallel Distributed Processing: Explorations in the Microstructures of Cognition, Cambridge, MA., MIT Press, vol. 1. pp. 318-362, 1986.
C.F. Kemerer. An Empirical Validation of Software Cost Estimation Models, Co mm&cations of the ACM, vol. 30, no 5, pp. 416-429, May 1987.
[14] D. Treigueiros, and R. Berry, The Application of Neural Network based Methods to the Extraction of Knowledge fmm Accounting Reports, Proceedings of 24th Annual Hawaii International Conference on System Sciences, vol. IV, pp. 137-146, 1991.
[lo] J.E.Matson and J.M.Mellichamp, An Object-oriented Tool for Function Point Analysis, Expe,rt Systems, vol. 10, no. 1. Feb 1993.3-14.
[I I] T. Mukhopadhyay, S.S. Vicinanza, and M.J. Prietula, Examining the Feasibility of a Case-Based Fleasoning Model for Software Effort Estimation, MIS &arterly, vol. 16, no. 2, pp. 155-171.1992.
[15] I.Watson and F Marir, Case-based Reasoning: A Review, The Knowledge Engineering Review, vol 9. no. 4,1994,327-354.
[16] G.E. Wittig, and G.R. Firmie, Software Development Productivity Variations in Function Point Research Data. Working Paper 1994-3-108/B. Bond University, April. 1994.
353
Proceedings of the 1996 International Conference on Software Engineering: Education and Practice (SE: E&P '96) 0-8186-7379-6/96 $10.00 © 1996 IEEE