INITIATING COVERAGE - Baroda E-Trade
22
INITIATING COVERAGE BOB Capital Markets Ltd is a wholly owned subsidiary of Bank of Baroda Important disclosures, including any required research certifications, are provided at the end of this report. SELL TP: Rs 1,030 | 9% ESCORTS | Auto Components | 31 July 2020 Growth levers priced in; initiate with SELL Escorts (ESC) is the third largest tractor manufacturer in India, commanding ~11% market share in the ~800,000-unit p.a. tractor industry. A successful rabi harvest, expectations of a normal monsoon, signs of stronger kharif cultivation and aggressive tractor financing are harbingers of growth. This coupled with capacity expansion via the Kubota JV would augment volumes. That said, the 100% stock rally in the past four months prices in most of these positives, leading us to initiate with SELL. Our Sep’21 TP of Rs 1,030 is set at 19x one-year fwd EPS. Ticker/Price ESC IN/Rs 1,130 Market cap US$ 1.8bn Shares o/s 123mn 3M ADV US$ 39.9mn 52wk high/low Rs 1,210/Rs 423 Promoter/FPI/DII 40%/20%/10% Source: NSE STOCK PERFORMANCE Source: NSE Rural recovery, Kubota partnership to catalyse growth: After a successful rabi (winter) crop harvest, there are early signs of stronger kharif (summer) cultivation as well. ESC, a key player in the agriculture belts of Central and North India (~18% market share), will be a direct beneficiary. This, along with its initial investment of Rs 1.2bn in the Rs 3bn JV with Kubota-Japan for 40% stake in a new 50,000-tractor capacity in Faridabad, will act as the next catalyst for growth. Transformative strategy unfolding: ESC is strategising to transform from a tractor manufacturer to an agri-service provider. The company intends to provide complete crop solutions by offering implements and knowhow to farmers, and has pilot projects running in Odisha and Andhra Pradesh. ESC also plans to introduce an Uber-like model for tractors that makes mechanised solutions more affordable for small-scale farmers, besides laying the groundwork for commercial production of its first electric tractor. Valuations full: We expect a revenue/EBITDA/PAT CAGR of 7%/9%/13% over FY20–FY23. Segment-wise, we pencil in a revenue CAGR of 8% for tractors (77% revenue share), –3% for construction equipment, and 13% for the railway business. The stock rally has taken valuations to ~23x FY22E EPS, pricing in most positives. Our TP of Rs 1,030 is set at 19x Sep’22E EPS. Initiate with SELL. KEY FINANCIALS Y/E 31 Mar FY19A FY20A FY21E FY22E FY23E Total revenue (Rs mn) 62,620 57,610 54,885 62,442 70,207 EBITDA (Rs mn) 7,226 6,758 6,829 7,869 8,837 Adj. net profit (Rs mn) 4,789 4,948 5,174 6,135 7,089 Adj. EPS (Rs) 39.1 40.4 42.2 50.1 57.8 Adj. EPS growth (%) 38.0 3.3 4.6 18.6 15.5 Adj. ROAE (%) 17.9 14.2 12.2 12.7 12.9 Adj. P/E (x) 28.9 28.0 26.8 22.6 19.5 EV/EBITDA (x) 18.8 20.1 19.9 17.0 15.2 Source: Company, BOBCAPS Research 410 570 730 890 1,050 1,210 Jul-17 Oct-17 Jan-18 Apr-18 Jul-18 Oct-18 Jan-19 Apr-19 Jul-19 Oct-19 Jan-20 Apr-20 Jul-20 (Rs) ESC [email protected] Mayur Milak | Nishant Chowhan, CFA
-
Upload
khangminh22 -
Category
Documents
-
view
0 -
download
0
Transcript of INITIATING COVERAGE - Baroda E-Trade
INITIATING COVERAGE
BOB Capital Markets Ltd is a wholly owned subsidiary of Bank of Baroda
Important disclosures, including any required research certifications, are provided at the end of this report.
SELL
TP: Rs 1,030 | 9% ESCORTS | Auto Components | 31 July 2020
Growth levers priced in; initiate with SELL
Escorts (ESC) is the third largest tractor manufacturer in India, commanding
~11% market share in the ~800,000-unit p.a. tractor industry. A successful rabi
harvest, expectations of a normal monsoon, signs of stronger kharif cultivation and
aggressive tractor financing are harbingers of growth. This coupled with capacity
expansion via the Kubota JV would augment volumes. That said, the 100% stock
rally in the past four months prices in most of these positives, leading us to
initiate with SELL. Our Sep’21 TP of Rs 1,030 is set at 19x one-year fwd EPS.
Ticker/Price ESC IN/Rs 1,130
Market cap US$ 1.8bn
Shares o/s 123mn
3M ADV US$ 39.9mn
52wk high/low Rs 1,210/Rs 423
Promoter/FPI/DII 40%/20%/10%
Source: NSE
STOCK PERFORMANCE
Source: NSE
Rural recovery, Kubota partnership to catalyse growth: After a successful rabi
(winter) crop harvest, there are early signs of stronger kharif (summer) cultivation
as well. ESC, a key player in the agriculture belts of Central and North India
(~18% market share), will be a direct beneficiary. This, along with its initial
investment of Rs 1.2bn in the Rs 3bn JV with Kubota-Japan for 40% stake in a
new 50,000-tractor capacity in Faridabad, will act as the next catalyst for growth.
Transformative strategy unfolding: ESC is strategising to transform from a
tractor manufacturer to an agri-service provider. The company intends to
provide complete crop solutions by offering implements and knowhow to
farmers, and has pilot projects running in Odisha and Andhra Pradesh. ESC
also plans to introduce an Uber-like model for tractors that makes mechanised
solutions more affordable for small-scale farmers, besides laying the
groundwork for commercial production of its first electric tractor.
Valuations full: We expect a revenue/EBITDA/PAT CAGR of 7%/9%/13% over
FY20–FY23. Segment-wise, we pencil in a revenue CAGR of 8% for tractors
(77% revenue share), –3% for construction equipment, and 13% for the railway
business. The stock rally has taken valuations to ~23x FY22E EPS, pricing in
most positives. Our TP of Rs 1,030 is set at 19x Sep’22E EPS. Initiate with SELL.
KEY FINANCIALS
Y/E 31 Mar FY19A FY20A FY21E FY22E FY23E
Total revenue (Rs mn) 62,620 57,610 54,885 62,442 70,207
EBITDA (Rs mn) 7,226 6,758 6,829 7,869 8,837
Adj. net profit (Rs mn) 4,789 4,948 5,174 6,135 7,089
Adj. EPS (Rs) 39.1 40.4 42.2 50.1 57.8
Adj. EPS growth (%) 38.0 3.3 4.6 18.6 15.5
Adj. ROAE (%) 17.9 14.2 12.2 12.7 12.9
Adj. P/E (x) 28.9 28.0 26.8 22.6 19.5
EV/EBITDA (x) 18.8 20.1 19.9 17.0 15.2
Source: Company, BOBCAPS Research
410
570
730
890
1,050
1,210
Jul-17
Oct-17
Jan-
18Apr-18
Jul-18
Oct-18
Jan-
19Apr-19
Jul-19
Oct-19
Jan-
20Apr-2
0Ju
l-20
(Rs) ESC
[email protected] Milak | Nishant Chowhan, CFA
ESCORTS
EQUITY RESEARCH 2 31 July 2020
Contents
Focus charts ................................................................................................. 3
Investment rationale .................................................................................... 4
Key drivers in place for strong tractor demand ...................................................... 4
Joint venture with Kubota to energise growth ....................................................... 6
Transformative strategy unfolding .......................................................................... 6
Other businesses on a steady wicket ...................................................................... 7
Tractor industry profile ................................................................................ 9
Indian tractor market the biggest in the world ....................................................... 9
Expect 5% volume CAGR through FY23 .............................................................. 9
Market share mix – ESC focusing on 31-40hp category .................................... 9
Financial review ........................................................................................... 12
Expect 7% revenue CAGR .................................................................................... 12
Strong margins to aid 13% PAT CAGR ................................................................ 12
Valuation methodology ............................................................................... 15
Key risks ...................................................................................................... 16
Annexure A: Company profile ................................................................... 17
ESCORTS
EQUITY RESEARCH 3 31 July 2020
Focus charts
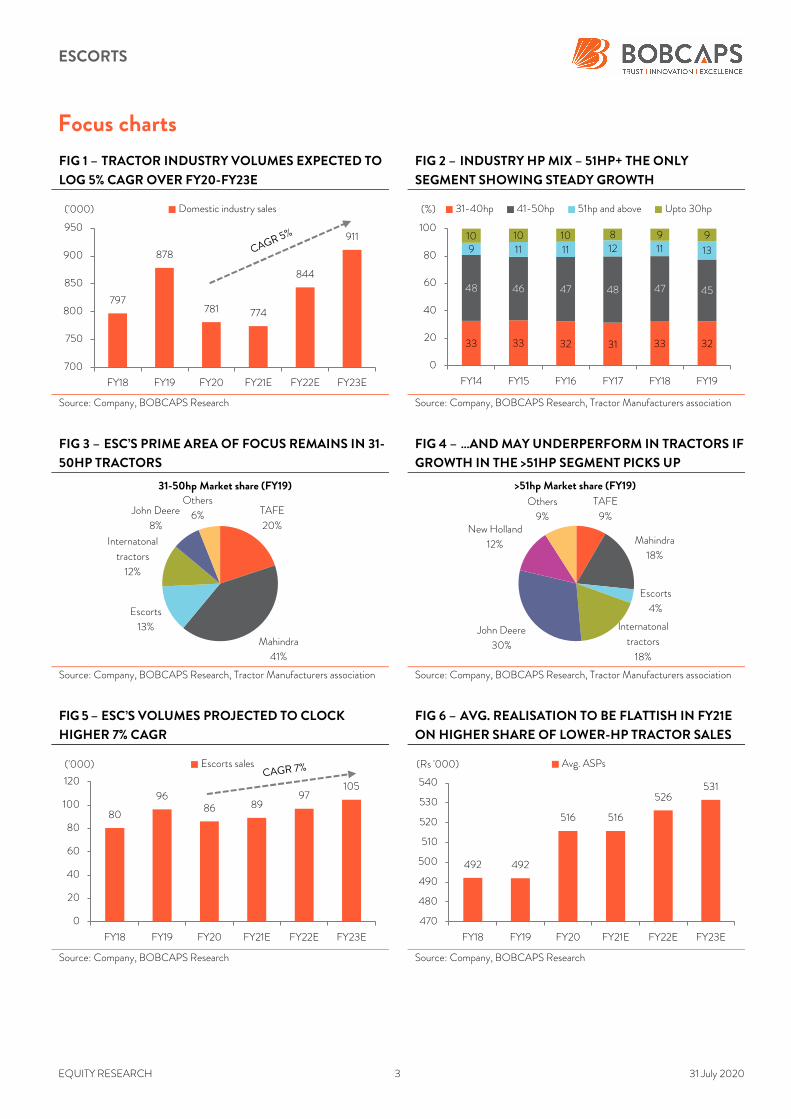
FIG 1 – TRACTOR INDUSTRY VOLUMES EXPECTED TO
LOG 5% CAGR OVER FY20-FY23E
FIG 2 – INDUSTRY HP MIX – 51HP+ THE ONLY
SEGMENT SHOWING STEADY GROWTH
Source: Company, BOBCAPS Research Source: Company, BOBCAPS Research, Tractor Manufacturers association
FIG 3 – ESC’S PRIME AREA OF FOCUS REMAINS IN 31-
50HP TRACTORS
FIG 4 – …AND MAY UNDERPERFORM IN TRACTORS IF
GROWTH IN THE >51HP SEGMENT PICKS UP
Source: Company, BOBCAPS Research, Tractor Manufacturers association Source: Company, BOBCAPS Research, Tractor Manufacturers association
FIG 5 – ESC’S VOLUMES PROJECTED TO CLOCK
HIGHER 7% CAGR
FIG 6 – AVG. REALISATION TO BE FLATTISH IN FY21E
ON HIGHER SHARE OF LOWER-HP TRACTOR SALES
Source: Company, BOBCAPS Research Source: Company, BOBCAPS Research
797
878
781 774
844
911
700
750
800
850
900
950
FY18 FY19 FY20 FY21E FY22E FY23E
('000) Domestic industry sales
33 33 32 31 33 32
48 46 47 48 47 45
9 11 11 12 11 13
10 10 10 8 9 9
0
20
40
60
80
100
FY14 FY15 FY16 FY17 FY18 FY19
(%) 31-40hp 41-50hp 51hp and above Upto 30hp
TAFE
20%
Mahindra
41%
Escorts
13%
Internatonal
tractors
12%
John Deere
8%
Others
6%
31-50hp Market share (FY19)
TAFE
9%
Mahindra
18%
Escorts
4%
Internatonal
tractors
18%
John Deere
30%
New Holland
12%
Others
9%
>51hp Market share (FY19)
80
9686 89
97105
0
20
40
60
80
100
120
FY18 FY19 FY20 FY21E FY22E FY23E
('000) Escorts sales
492 492
516 516
526531
470
480
490
500
510
520
530
540
FY18 FY19 FY20 FY21E FY22E FY23E
(Rs '000) Avg. ASPs
ESCORTS
EQUITY RESEARCH 4 31 July 2020
Investment rationale
Key drivers in place for strong tractor demand
ESC is the third largest tractor manufacturer in India commanding ~11% market
share in an ~800,000-unit p.a. industry. A healthy outlook on agricultural
output, an augmented product slate, aggressive tractor financing and geographic
expansion are among the primary growth drivers for the company. We model for
an 8% revenue CAGR in ESC’s tractor business over FY20-FY23.
Healthy agri output: Sowing data released by India’s agriculture ministry
shows that the area under rabi cultivation has risen 7% YoY from 53.5mn
hectares sown last year to 57.1mn hectares. Water levels have remained
adequate and the onset of a normal monsoon should ensure robust kharif
cultivation. ESC, a key player in the agri belts of Central and North India with
18-20% regional market share and 77% of revenues derived from agricultural
machinery (primarily tractors), will be a direct beneficiary.
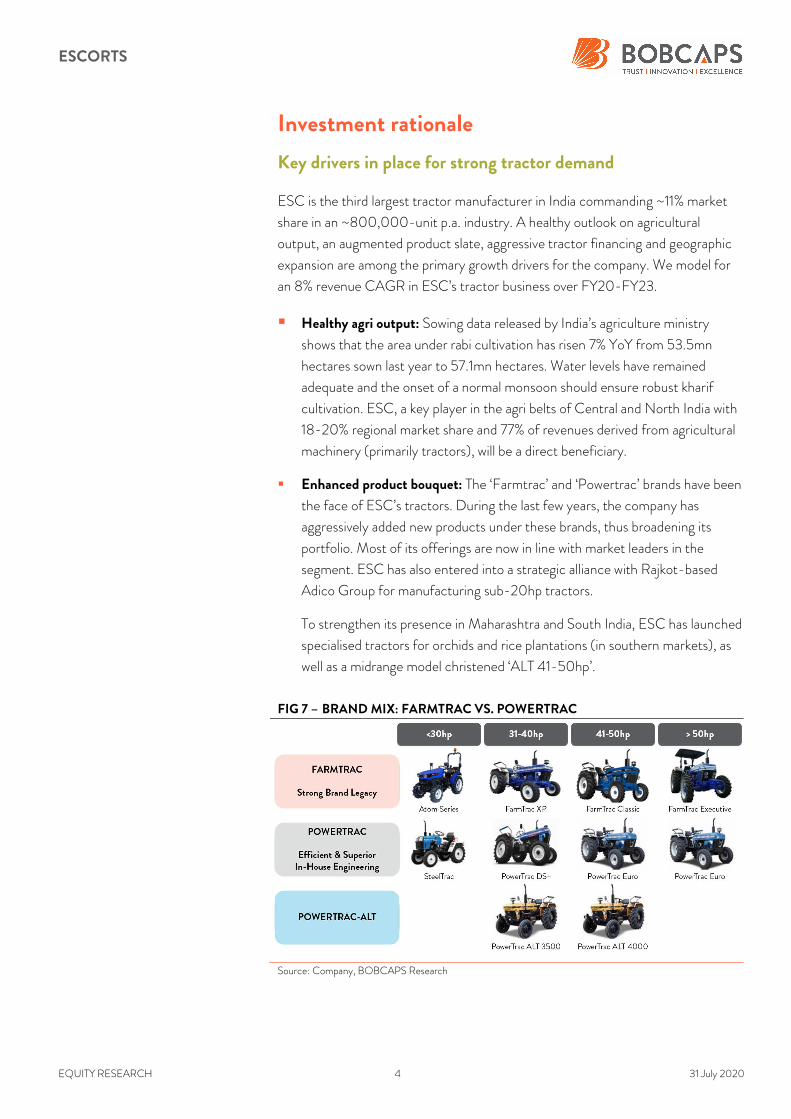
Enhanced product bouquet: The ‘Farmtrac’ and ‘Powertrac’ brands have been
the face of ESC’s tractors. During the last few years, the company has
aggressively added new products under these brands, thus broadening its
portfolio. Most of its offerings are now in line with market leaders in the
segment. ESC has also entered into a strategic alliance with Rajkot-based
Adico Group for manufacturing sub-20hp tractors.
To strengthen its presence in Maharashtra and South India, ESC has launched
specialised tractors for orchids and rice plantations (in southern markets), as
well as a midrange model christened ‘ALT 41-50hp’.
FIG 7 – BRAND MIX: FARMTRAC VS. POWERTRAC
Source: Company, BOBCAPS Research
ESCORTS
EQUITY RESEARCH 5 31 July 2020
Deeper market penetration: In FY20, ESC maintained its pan-India tractor
market share at~11%. It enjoys 18-20% share in North India, but only ~5% in
South India. ESC’s strongholds are the states of Punjab, Haryana, Rajasthan,
Uttar Pradesh, Madhya Pradesh and Bihar. The company has identified
opportunities in the southern region and is focused on expanding market share
through newer launches and rationalising of dealerships.
Growth is being targeted in states such as Andhra Pradesh, Maharashtra,
Gujarat, Tamil Nadu and Karnataka, which ESC refers to as the ‘Opportunity
Market’. At present, cumulative market share in these states stands at ~5%.
The company has ~1,000 dealerships across India with ~30% located in its
opportunity market. Strong dealership expansion is planned for these areas.
High levels of vehicle financing: As far as tractor financing goes, our channel
checks in Rajasthan, Uttar Pradesh and Madhya Pradesh suggest that close to
95% of the on-road cost is financed if the buyer’s credit history is sound. On
average, this number settles at ~85%.
Large discounts on offer: Discounts, another key driver of sales, remain
high – in the range of 6-7% of the tractor price. Our channel checks show
that freebies range from a 100cc motorcycle offered on purchase of a 40hp
tractor to cash discounts of Rs 30,000-35,000.
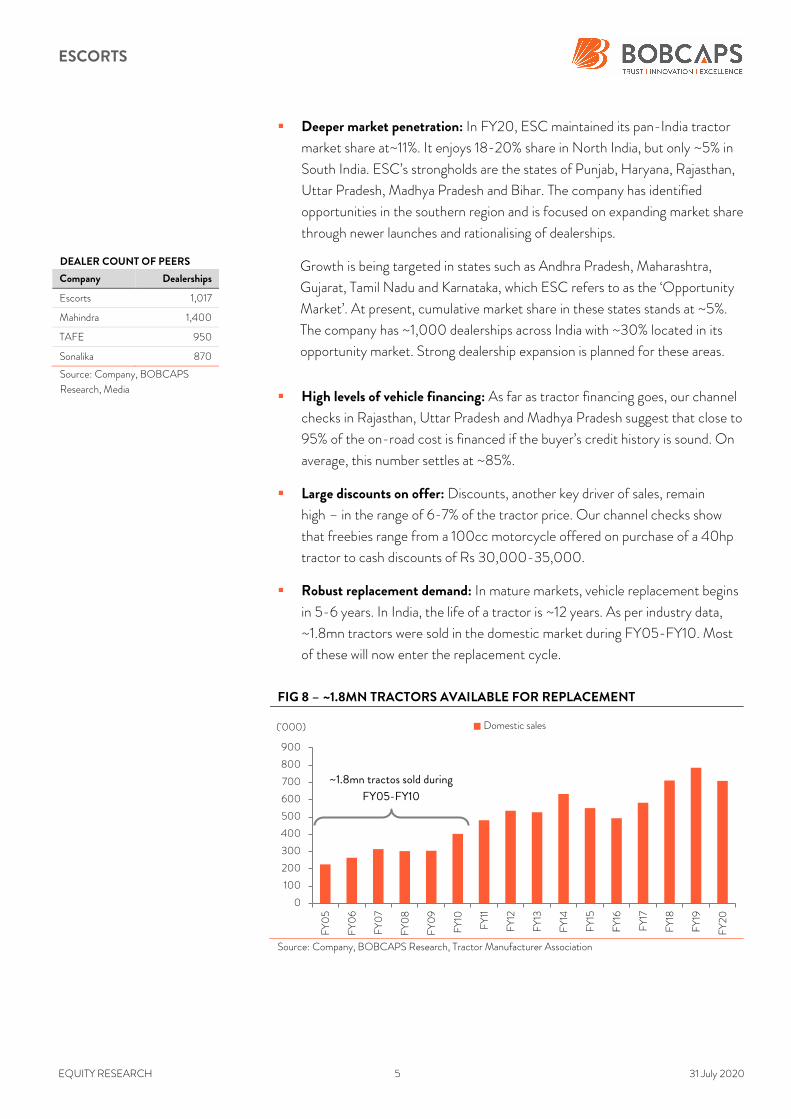
Robust replacement demand: In mature markets, vehicle replacement begins
in 5-6 years. In India, the life of a tractor is ~12 years. As per industry data,
~1.8mn tractors were sold in the domestic market during FY05-FY10. Most
of these will now enter the replacement cycle.
FIG 8 – ~1.8MN TRACTORS AVAILABLE FOR REPLACEMENT
Source: Company, BOBCAPS Research, Tractor Manufacturer Association
0
100
200
300
400
500
600
700
800
900
FY05
FY06
FY07
FY08
FY09
FY10
FY11
FY12
FY13
FY14
FY15
FY16
FY17
FY18
FY19
FY20
('000) Domestic sales
~1.8mn tractos sold during
FY05-FY10
DEALER COUNT OF PEERS
Company Dealerships
Escorts 1,017
Mahindra 1,400
TAFE 950
Sonalika 870
Source: Company, BOBCAPS
Research, Media
ESCORTS
EQUITY RESEARCH 6 31 July 2020
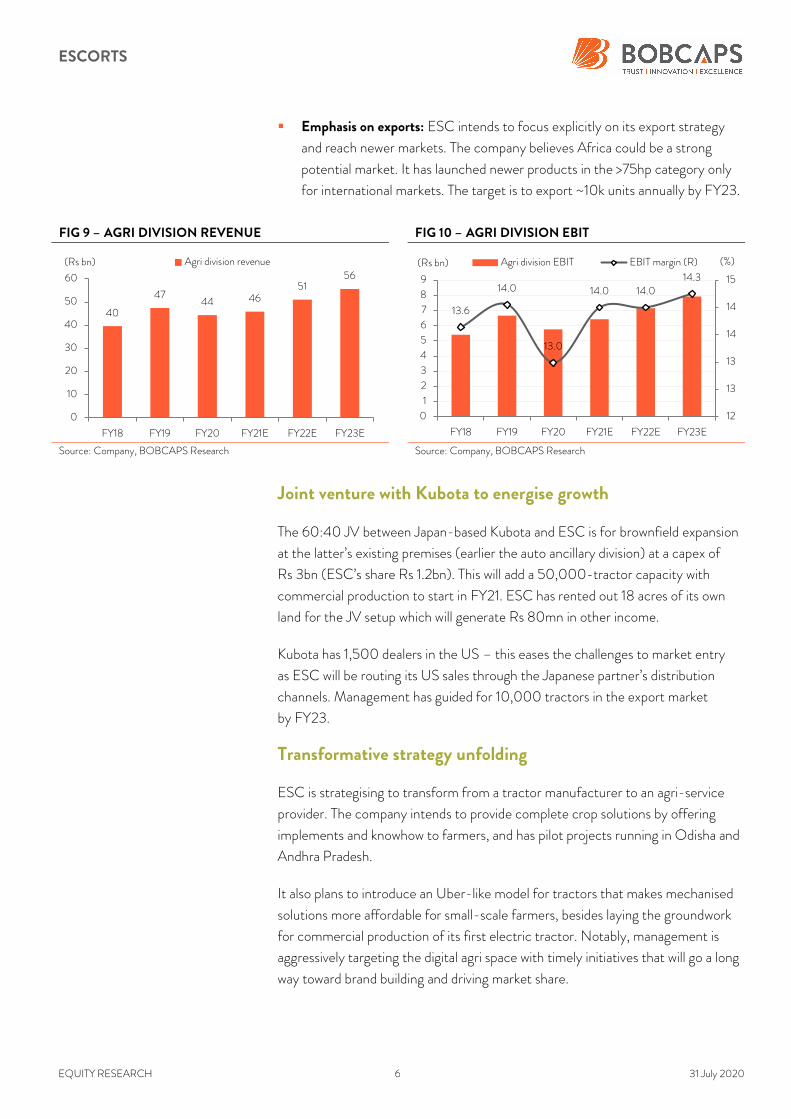
Emphasis on exports: ESC intends to focus explicitly on its export strategy
and reach newer markets. The company believes Africa could be a strong
potential market. It has launched newer products in the >75hp category only
for international markets. The target is to export ~10k units annually by FY23.
FIG 9 – AGRI DIVISION REVENUE FIG 10 – AGRI DIVISION EBIT
Source: Company, BOBCAPS Research Source: Company, BOBCAPS Research
Joint venture with Kubota to energise growth
The 60:40 JV between Japan-based Kubota and ESC is for brownfield expansion
at the latter’s existing premises (earlier the auto ancillary division) at a capex of
Rs 3bn (ESC’s share Rs 1.2bn). This will add a 50,000-tractor capacity with
commercial production to start in FY21. ESC has rented out 18 acres of its own
land for the JV setup which will generate Rs 80mn in other income.
Kubota has 1,500 dealers in the US – this eases the challenges to market entry
as ESC will be routing its US sales through the Japanese partner’s distribution
channels. Management has guided for 10,000 tractors in the export market
by FY23.
Transformative strategy unfolding
ESC is strategising to transform from a tractor manufacturer to an agri-service
provider. The company intends to provide complete crop solutions by offering
implements and knowhow to farmers, and has pilot projects running in Odisha and
Andhra Pradesh.
It also plans to introduce an Uber-like model for tractors that makes mechanised
solutions more affordable for small-scale farmers, besides laying the groundwork
for commercial production of its first electric tractor. Notably, management is
aggressively targeting the digital agri space with timely initiatives that will go a long
way toward brand building and driving market share.
40
4744 46
5156
0
10
20
30
40
50
60
FY18 FY19 FY20 FY21E FY22E FY23E
(Rs bn) Agri division revenue
13.6
14.0
13.0
14.0 14.014.3
12
13
13
14
14
15
0
1
2
3
4
5
6
7
8
9
FY18 FY19 FY20 FY21E FY22E FY23E
(%)(Rs bn) Agri division EBIT EBIT margin (R)
ESCORTS
EQUITY RESEARCH 7 31 July 2020
Some key initiatives are as follows:
48-hour Parts: Spare parts will be delivered to customers/dealers within
48 hours across India, in partnership with GATI. Spares will be provided free
of charge if the deadline isn’t met.
Care Button: An added feature in upcoming tractors, the care button is
meant to offer aid to farmers facing technical tractor issues. It generates a call
from the technical team to the farmer’s mobile phone to understand and
resolve the problem at the earliest. Reliance Jio has built the enterprise
solution for this, partnering with Motherson Sumi.
TRAXI: This is a digital platform meant to bring about ‘Uberisation’ of the
tractor. As tractors are not used by the owners at all times, they can be rented
out to marginal farmers. TRAXI has converted this rental tractor market into
an organised segment that helps small farmers lease tractors with ease. A pilot
for the same has started in Mathura (UP) and Faridabad (Haryana).
MolAnmol: Farmers trade in their tractors every 10-12 years. ‘MolAnmol’ is
an exchange programme that helps them get the best price for their old
tractor.
Digitrac: This is a website that enables farmers to customise and order a
tractor online. ESC, in turn, can penetrate markets faster without the
additional cost of opening a dealership. Pilot testing is currently underway in
regions of Punjab.
Other businesses on a steady wicket
Construction equipment margins to improve
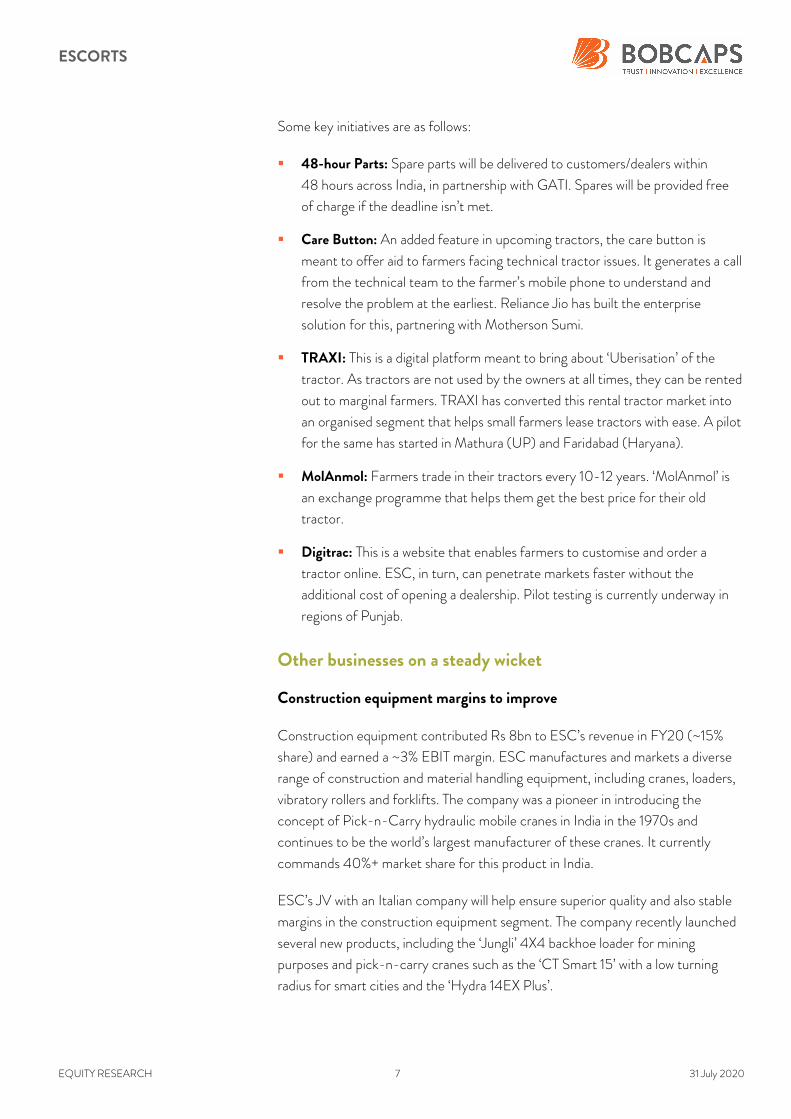
Construction equipment contributed Rs 8bn to ESC’s revenue in FY20 (~15%
share) and earned a ~3% EBIT margin. ESC manufactures and markets a diverse
range of construction and material handling equipment, including cranes, loaders,
vibratory rollers and forklifts. The company was a pioneer in introducing the
concept of Pick-n-Carry hydraulic mobile cranes in India in the 1970s and
continues to be the world’s largest manufacturer of these cranes. It currently
commands 40%+ market share for this product in India.
ESC’s JV with an Italian company will help ensure superior quality and also stable
margins in the construction equipment segment. The company recently launched
several new products, including the ‘Jungli’ 4X4 backhoe loader for mining
purposes and pick-n-carry cranes such as the ‘CT Smart 15’ with a low turning
radius for smart cities and the ‘Hydra 14EX Plus’.
ESCORTS
EQUITY RESEARCH 8 31 July 2020
Current capacity utilisation in the segment is low with sales volume of 1,500 units
against installed capacity of 10,000 units per annum. Also, despite a strong
government focus on infrastructure activities, we expect revenues from the
business to decline at a CAGR of ~3% during FY20-FY23 due to the economic
slowdown. But with new product launches and better cost management in the
segment, management expects margins to improve.
FIG 11 – CONSTRUCTION DIVISION REVENUE FIG 12 – CONSTRUCTION DIVISION EBIT
Source: Company, BOBCAPS Research Source: Company, BOBCAPS Research
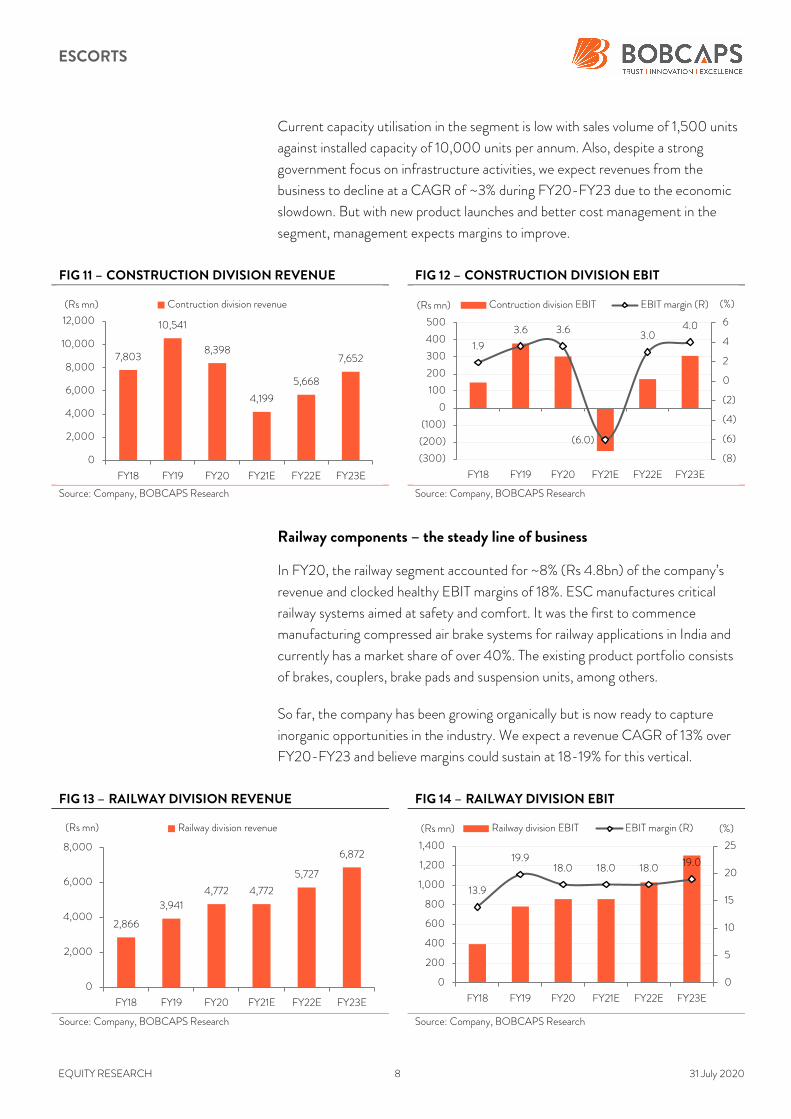
Railway components – the steady line of business
In FY20, the railway segment accounted for ~8% (Rs 4.8bn) of the company’s
revenue and clocked healthy EBIT margins of 18%. ESC manufactures critical
railway systems aimed at safety and comfort. It was the first to commence
manufacturing compressed air brake systems for railway applications in India and
currently has a market share of over 40%. The existing product portfolio consists
of brakes, couplers, brake pads and suspension units, among others.
So far, the company has been growing organically but is now ready to capture
inorganic opportunities in the industry. We expect a revenue CAGR of 13% over
FY20-FY23 and believe margins could sustain at 18-19% for this vertical.
FIG 13 – RAILWAY DIVISION REVENUE FIG 14 – RAILWAY DIVISION EBIT
Source: Company, BOBCAPS Research Source: Company, BOBCAPS Research
7,803
10,541
8,398
4,199
5,668
7,652
0
2,000
4,000
6,000
8,000
10,000
12,000
FY18 FY19 FY20 FY21E FY22E FY23E
(Rs mn) Contruction division revenue
1.9
3.6 3.6
(6.0)
3.04.0
(8)
(6)
(4)
(2)
0
2
4
6
(300)
(200)
(100)
0
100
200
300
400
500
FY18 FY19 FY20 FY21E FY22E FY23E
(%)(Rs mn) Contruction division EBIT EBIT margin (R)
2,866
3,941
4,772 4,772
5,727
6,872
0
2,000
4,000
6,000
8,000
FY18 FY19 FY20 FY21E FY22E FY23E
(Rs mn) Railway division revenue
13.9
19.918.0 18.0 18.0 19.0
0
5
10
15
20
25
0
200
400
600
800
1,000
1,200
1,400
FY18 FY19 FY20 FY21E FY22E FY23E
(%)(Rs mn) Railway division EBIT EBIT margin (R)
ESCORTS
EQUITY RESEARCH 9 31 July 2020
Tractor industry profile
Indian tractor market the biggest in the world
Agriculture has always been a key sector of India’s economy, in turn fuelling the
largest tractor market in the world. Agriculture currently contributes ~17% of
Indian GDP, accounts for ~13% of exports and is growing at an average of 2.2%.
India is the largest producer of pulses, second largest producer of rice, wheat,
vegetables, groundnuts and fruits, and third largest producer of coarse grains in
the world. In 2020, the rabi (winter) crop sowing area has increased to 57.1mn
hectares from 53.5mn hectares the previous year.
The Indian tractor industry has developed over the years to become the largest in
the world. From just about 50,000 units in the early eighties, it has grown to over
800,000 units per annum due to the increased use of tractors, not only for
agriculture but for haulage and non-agricultural applications. The opportunities are
still immense considering the low farm mechanisation levels in the country when
compared to other developed markets. Key industry players are M&M (~41%
market share), TAFE (~21%), ESC (~11%) and Sonalika (~11%).
Expect 5% volume CAGR through FY23
India’s tractor industry volumes declined ~11% in FY20 to ~781,000 units against
~879,000 units in FY19. Key reasons for this underperformance were (1) the
NBFC crisis that led to a pullback of aggressive financing, (2) a high base effect,
and (3) slowdown in the economy due in part to Covid-19.
We estimate an industry volume CAGR of 5% during FY20-FY23. However,
prolonged extension of lockdown restrictions due to the pandemic and a
continued halt in mining, road and other construction activities would hurt
demand. Also, a spurt in farmer demand would adversely impact the sales mix as
agriculture requires cheaper, lower powered tractors.
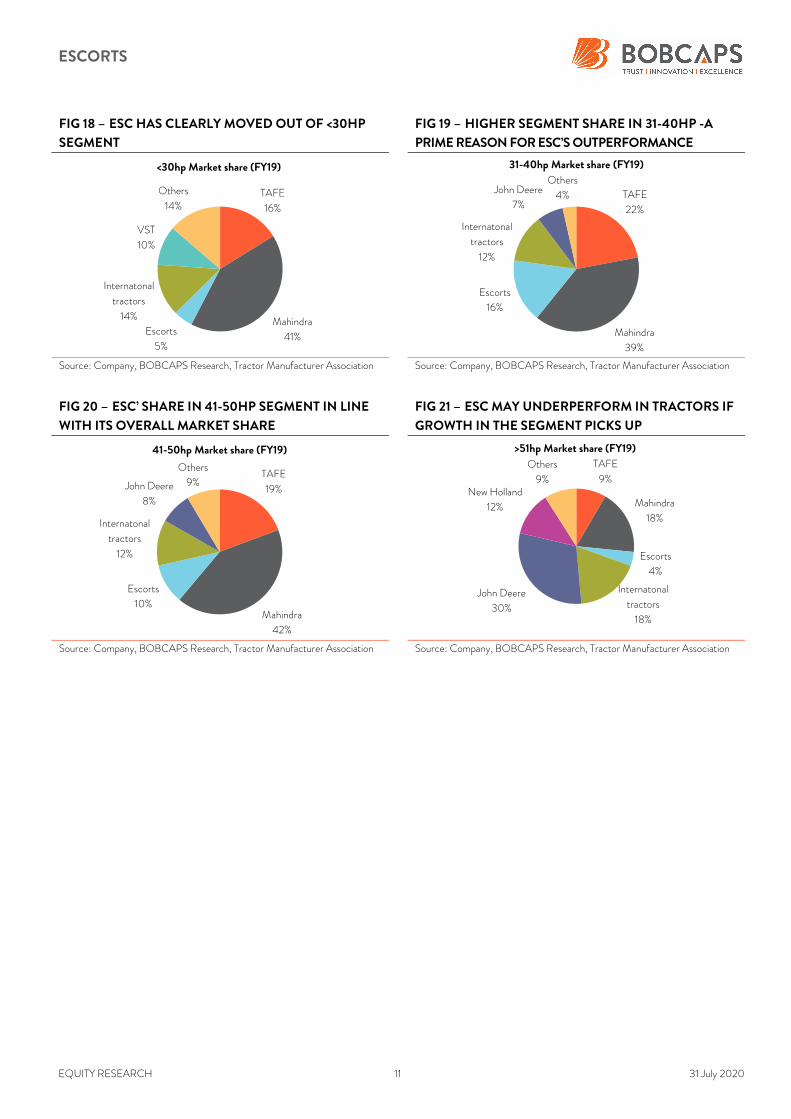
Market share mix – ESC focusing on 31-40hp category
31-40hp: Our channel checks with dealers suggest that the highest demand
comes from the 31-40hp tractor category where ESC has 16% market share
and is the No. 3 player. This clearly explains the company’s outperformance in
the past few months.
41-50hp: The industry volume share of 41-50hp products has come off from
48% to 45% over the last 5-6 years. ESC commands 10% share in this
category, in line with its overall market share.
ESCORTS
EQUITY RESEARCH 10 31 July 2020
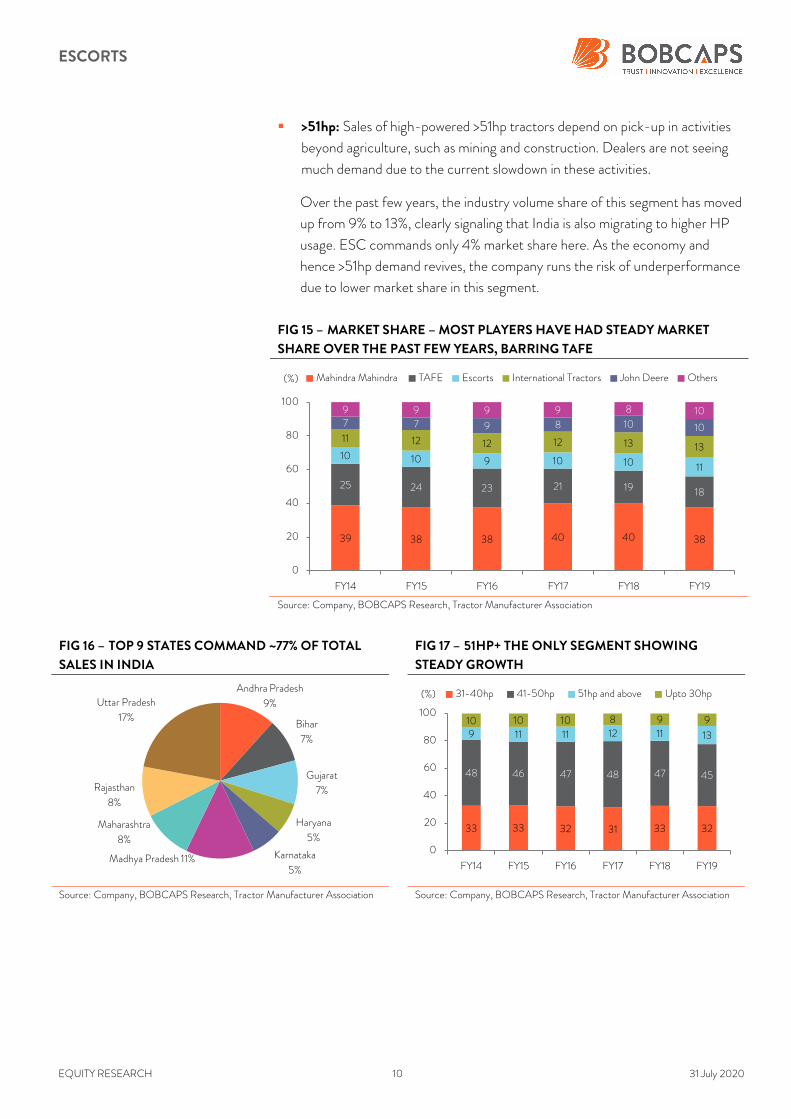
>51hp: Sales of high-powered >51hp tractors depend on pick-up in activities
beyond agriculture, such as mining and construction. Dealers are not seeing
much demand due to the current slowdown in these activities.
Over the past few years, the industry volume share of this segment has moved
up from 9% to 13%, clearly signaling that India is also migrating to higher HP
usage. ESC commands only 4% market share here. As the economy and
hence >51hp demand revives, the company runs the risk of underperformance
due to lower market share in this segment.
FIG 15 – MARKET SHARE – MOST PLAYERS HAVE HAD STEADY MARKET
SHARE OVER THE PAST FEW YEARS, BARRING TAFE
Source: Company, BOBCAPS Research, Tractor Manufacturer Association
FIG 16 – TOP 9 STATES COMMAND ~77% OF TOTAL
SALES IN INDIA
FIG 17 – 51HP+ THE ONLY SEGMENT SHOWING
STEADY GROWTH
Source: Company, BOBCAPS Research, Tractor Manufacturer Association Source: Company, BOBCAPS Research, Tractor Manufacturer Association
39 38 38 40 40 38
25 24 23 21 19 18
10 10 9 10 10 11
11 12 12 12 13 13
7 7 9 8 10 10
9 9 9 9 8 10
0
20
40
60
80
100
FY14 FY15 FY16 FY17 FY18 FY19
(%) Mahindra Mahindra TAFE Escorts International Tractors John Deere Others
Andhra Pradesh
9%
Bihar
7%
Gujarat
7%
Haryana
5%
Karnataka
5%Madhya Pradesh 11%
Maharashtra
8%
Rajasthan
8%
Uttar Pradesh
17%
33 33 32 31 33 32
48 46 47 48 47 45
9 11 11 12 11 13
10 10 10 8 9 9
0
20
40
60
80
100
FY14 FY15 FY16 FY17 FY18 FY19
(%) 31-40hp 41-50hp 51hp and above Upto 30hp
ESCORTS
EQUITY RESEARCH 11 31 July 2020
FIG 18 – ESC HAS CLEARLY MOVED OUT OF <30HP
SEGMENT
FIG 19 – HIGHER SEGMENT SHARE IN 31-40HP -A
PRIME REASON FOR ESC’S OUTPERFORMANCE
Source: Company, BOBCAPS Research, Tractor Manufacturer Association Source: Company, BOBCAPS Research, Tractor Manufacturer Association
FIG 20 – ESC’ SHARE IN 41-50HP SEGMENT IN LINE
WITH ITS OVERALL MARKET SHARE
FIG 21 – ESC MAY UNDERPERFORM IN TRACTORS IF
GROWTH IN THE SEGMENT PICKS UP
Source: Company, BOBCAPS Research, Tractor Manufacturer Association Source: Company, BOBCAPS Research, Tractor Manufacturer Association
TAFE
16%
Mahindra
41%Escorts
5%
Internatonal
tractors
14%
VST
10%
Others
14%
<30hp Market share (FY19)
TAFE
22%
Mahindra
39%
Escorts
16%
Internatonal
tractors
12%
John Deere
7%
Others
4%
31-40hp Market share (FY19)
TAFE
19%
Mahindra
42%
Escorts
10%
Internatonal
tractors
12%
John Deere
8%
Others
9%
41-50hp Market share (FY19)TAFE
9%
Mahindra
18%
Escorts
4%
Internatonal
tractors
18%
John Deere
30%
New Holland
12%
Others
9%
>51hp Market share (FY19)
ESCORTS
EQUITY RESEARCH 12 31 July 2020
Financial review
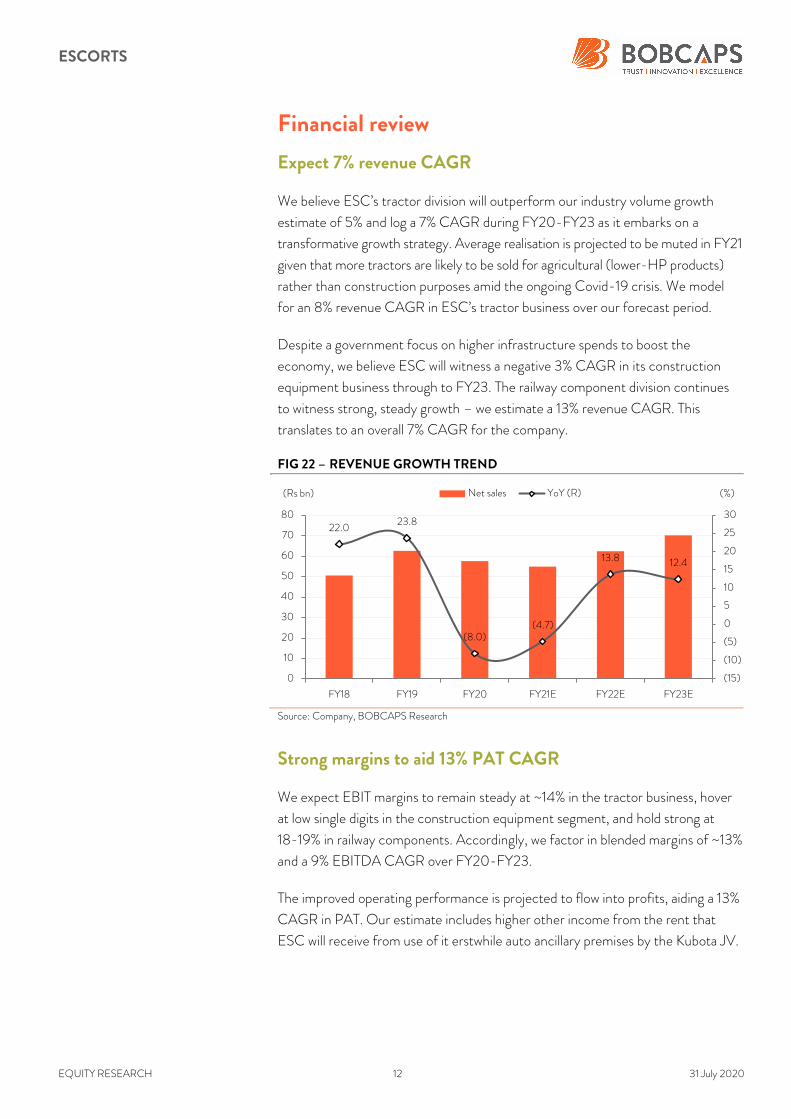
Expect 7% revenue CAGR
We believe ESC’s tractor division will outperform our industry volume growth
estimate of 5% and log a 7% CAGR during FY20-FY23 as it embarks on a
transformative growth strategy. Average realisation is projected to be muted in FY21
given that more tractors are likely to be sold for agricultural (lower-HP products)
rather than construction purposes amid the ongoing Covid-19 crisis. We model
for an 8% revenue CAGR in ESC’s tractor business over our forecast period.
Despite a government focus on higher infrastructure spends to boost the
economy, we believe ESC will witness a negative 3% CAGR in its construction
equipment business through to FY23. The railway component division continues
to witness strong, steady growth – we estimate a 13% revenue CAGR. This
translates to an overall 7% CAGR for the company.
FIG 22 – REVENUE GROWTH TREND
Source: Company, BOBCAPS Research
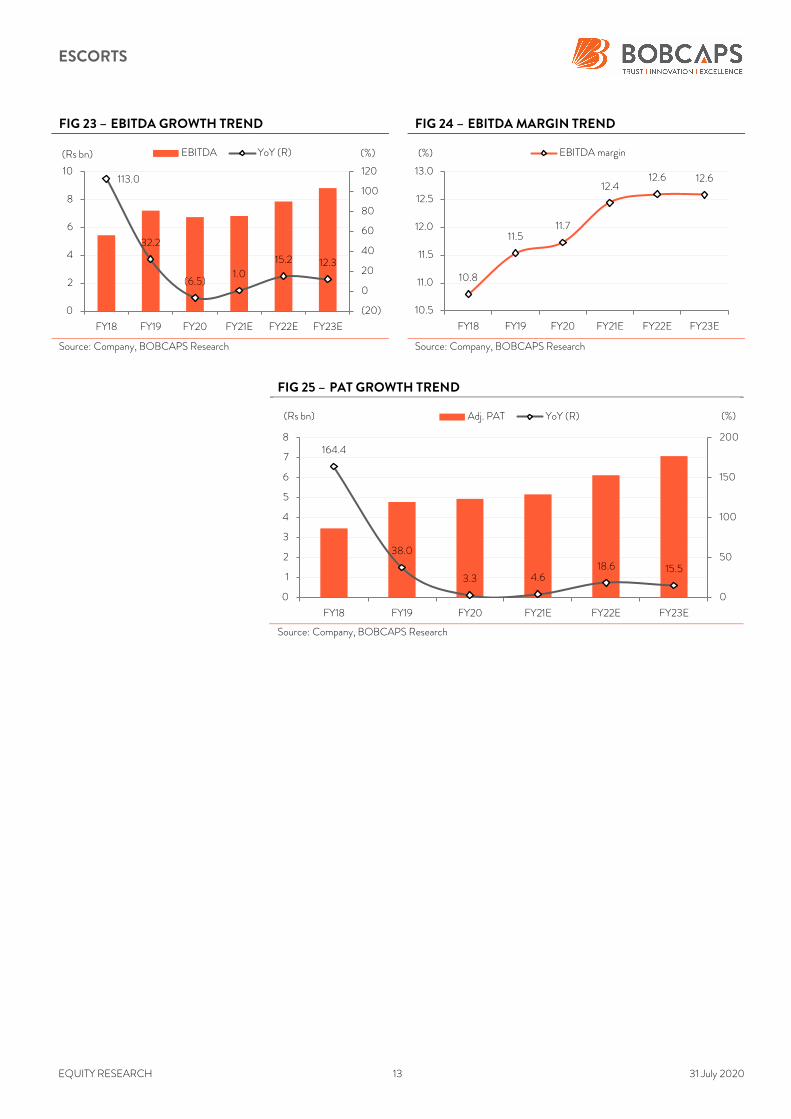
Strong margins to aid 13% PAT CAGR
We expect EBIT margins to remain steady at ~14% in the tractor business, hover
at low single digits in the construction equipment segment, and hold strong at
18-19% in railway components. Accordingly, we factor in blended margins of ~13%
and a 9% EBITDA CAGR over FY20-FY23.
The improved operating performance is projected to flow into profits, aiding a 13%
CAGR in PAT. Our estimate includes higher other income from the rent that
ESC will receive from use of it erstwhile auto ancillary premises by the Kubota JV.
22.023.8
(8.0)(4.7)
13.8 12.4
(15)
(10)
(5)
0
5
10
15
20
25
30
0
10
20
30
40
50
60
70
80
FY18 FY19 FY20 FY21E FY22E FY23E
(%)(Rs bn) Net sales YoY (R)
ESCORTS
EQUITY RESEARCH 13 31 July 2020
FIG 23 – EBITDA GROWTH TREND FIG 24 – EBITDA MARGIN TREND
Source: Company, BOBCAPS Research Source: Company, BOBCAPS Research
FIG 25 – PAT GROWTH TREND
Source: Company, BOBCAPS Research
113.0
32.2
(6.5)1.0
15.2 12.3
(20)
0
20
40
60
80
100
120
0
2
4
6
8
10
FY18 FY19 FY20 FY21E FY22E FY23E
(%)(Rs bn) EBITDA YoY (R)
10.8
11.511.7
12.412.6 12.6
10.5
11.0
11.5
12.0
12.5
13.0
FY18 FY19 FY20 FY21E FY22E FY23E
(%) EBITDA margin
164.4
38.0
3.3 4.618.6 15.5
0
50
100
150
200
0
1
2
3
4
5
6
7
8
FY18 FY19 FY20 FY21E FY22E FY23E
(%)(Rs bn) Adj. PAT YoY (R)
ESCORTS
EQUITY RESEARCH 14 31 July 2020
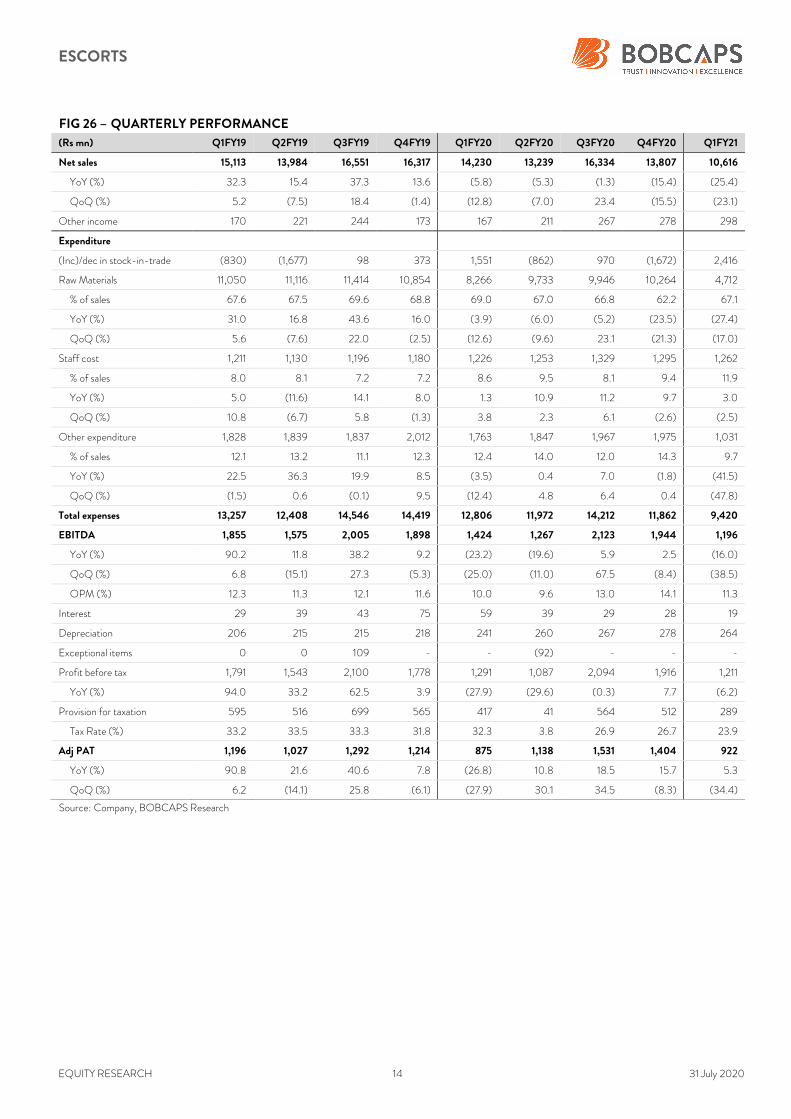
FIG 26 – QUARTERLY PERFORMANCE
(Rs mn) Q1FY19 Q2FY19 Q3FY19 Q4FY19 Q1FY20 Q2FY20 Q3FY20 Q4FY20 Q1FY21
Net sales 15,113 13,984 16,551 16,317 14,230 13,239 16,334 13,807 10,616
YoY (%) 32.3 15.4 37.3 13.6 (5.8) (5.3) (1.3) (15.4) (25.4)
QoQ (%) 5.2 (7.5) 18.4 (1.4) (12.8) (7.0) 23.4 (15.5) (23.1)
Other income 170 221 244 173 167 211 267 278 298
Expenditure
(Inc)/dec in stock-in-trade (830) (1,677) 98 373 1,551 (862) 970 (1,672) 2,416
Raw Materials 11,050 11,116 11,414 10,854 8,266 9,733 9,946 10,264 4,712
% of sales 67.6 67.5 69.6 68.8 69.0 67.0 66.8 62.2 67.1
YoY (%) 31.0 16.8 43.6 16.0 (3.9) (6.0) (5.2) (23.5) (27.4)
QoQ (%) 5.6 (7.6) 22.0 (2.5) (12.6) (9.6) 23.1 (21.3) (17.0)
Staff cost 1,211 1,130 1,196 1,180 1,226 1,253 1,329 1,295 1,262
% of sales 8.0 8.1 7.2 7.2 8.6 9.5 8.1 9.4 11.9
YoY (%) 5.0 (11.6) 14.1 8.0 1.3 10.9 11.2 9.7 3.0
QoQ (%) 10.8 (6.7) 5.8 (1.3) 3.8 2.3 6.1 (2.6) (2.5)
Other expenditure 1,828 1,839 1,837 2,012 1,763 1,847 1,967 1,975 1,031
% of sales 12.1 13.2 11.1 12.3 12.4 14.0 12.0 14.3 9.7
YoY (%) 22.5 36.3 19.9 8.5 (3.5) 0.4 7.0 (1.8) (41.5)
QoQ (%) (1.5) 0.6 (0.1) 9.5 (12.4) 4.8 6.4 0.4 (47.8)
Total expenses 13,257 12,408 14,546 14,419 12,806 11,972 14,212 11,862 9,420
EBITDA 1,855 1,575 2,005 1,898 1,424 1,267 2,123 1,944 1,196
YoY (%) 90.2 11.8 38.2 9.2 (23.2) (19.6) 5.9 2.5 (16.0)
QoQ (%) 6.8 (15.1) 27.3 (5.3) (25.0) (11.0) 67.5 (8.4) (38.5)
OPM (%) 12.3 11.3 12.1 11.6 10.0 9.6 13.0 14.1 11.3
Interest 29 39 43 75 59 39 29 28 19
Depreciation 206 215 215 218 241 260 267 278 264
Exceptional items 0 0 109 - - (92) - - -
Profit before tax 1,791 1,543 2,100 1,778 1,291 1,087 2,094 1,916 1,211
YoY (%) 94.0 33.2 62.5 3.9 (27.9) (29.6) (0.3) 7.7 (6.2)
Provision for taxation 595 516 699 565 417 41 564 512 289
Tax Rate (%) 33.2 33.5 33.3 31.8 32.3 3.8 26.9 26.7 23.9
Adj PAT 1,196 1,027 1,292 1,214 875 1,138 1,531 1,404 922
YoY (%) 90.8 21.6 40.6 7.8 (26.8) 10.8 18.5 15.7 5.3
QoQ (%) 6.2 (14.1) 25.8 (6.1) (27.9) 30.1 34.5 (8.3) (34.4)
Source: Company, BOBCAPS Research
ESCORTS
EQUITY RESEARCH 15 31 July 2020
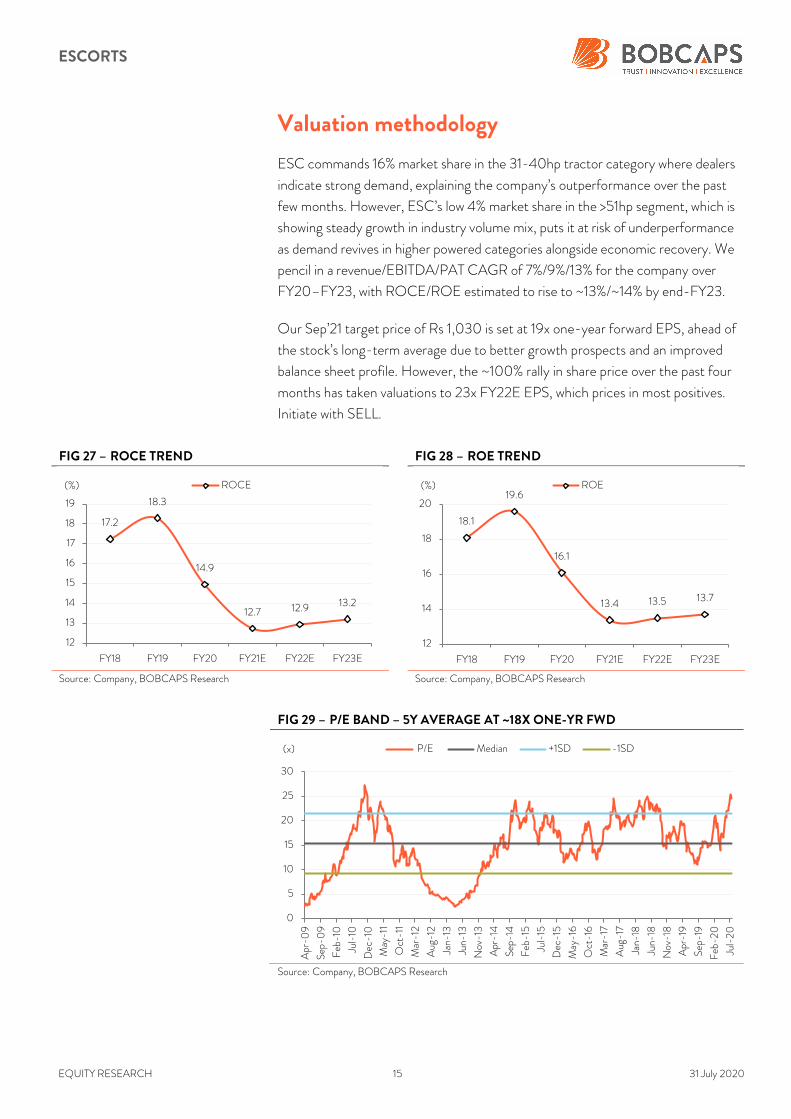
Valuation methodology
ESC commands 16% market share in the 31-40hp tractor category where dealers
indicate strong demand, explaining the company’s outperformance over the past
few months. However, ESC’s low 4% market share in the >51hp segment, which is
showing steady growth in industry volume mix, puts it at risk of underperformance
as demand revives in higher powered categories alongside economic recovery. We
pencil in a revenue/EBITDA/PAT CAGR of 7%/9%/13% for the company over
FY20–FY23, with ROCE/ROE estimated to rise to ~13%/~14% by end-FY23.
Our Sep’21 target price of Rs 1,030 is set at 19x one-year forward EPS, ahead of
the stock’s long-term average due to better growth prospects and an improved
balance sheet profile. However, the ~100% rally in share price over the past four
months has taken valuations to 23x FY22E EPS, which prices in most positives.
Initiate with SELL.
FIG 27 – ROCE TREND FIG 28 – ROE TREND
Source: Company, BOBCAPS Research Source: Company, BOBCAPS Research
FIG 29 – P/E BAND – 5Y AVERAGE AT ~18X ONE-YR FWD
Source: Company, BOBCAPS Research
17.2
18.3
14.9
12.7 12.9 13.2
12
13
14
15
16
17
18
19
FY18 FY19 FY20 FY21E FY22E FY23E
(%) ROCE
18.1
19.6
16.1
13.4 13.5 13.7
12
14
16
18
20
FY18 FY19 FY20 FY21E FY22E FY23E
(%) ROE
0
5
10
15
20
25
30
Apr-0
9
Sep
-09
Feb
-10
Jul-10
Dec
-10
May
-11
Oct-11
Mar-12
Aug
-12
Jan-
13
Jun-
13
Nov
-13
Apr-14
Sep
-14
Feb
-15
Jul-15
Dec
-15
May
-16
Oct-16
Mar-17
Aug
-17
Jan-
18
Jun-
18
Nov
-18
Apr-19
Sep
-19
Feb
-20
Jul-20
(x) P/E Median +1SD -1SD
ESCORTS
EQUITY RESEARCH 16 31 July 2020
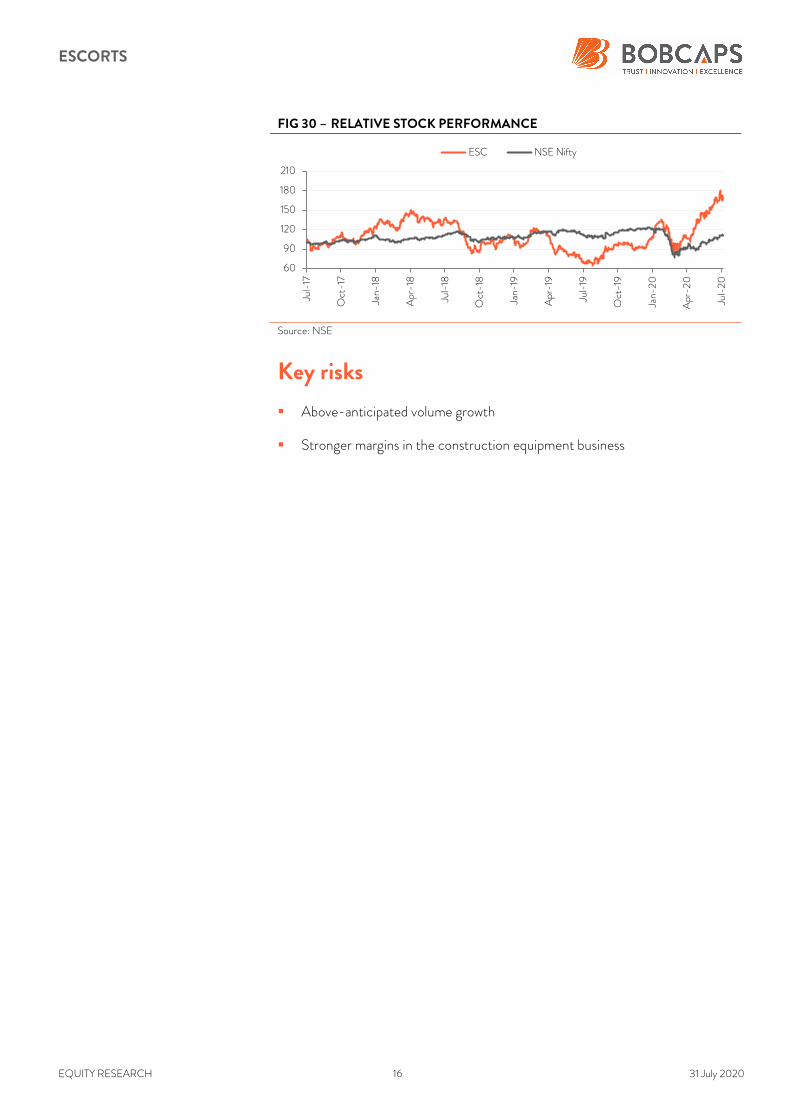
FIG 30 – RELATIVE STOCK PERFORMANCE
Source: NSE
Key risks
Above-anticipated volume growth
Stronger margins in the construction equipment business
60
90
120
150
180
210
Jul-17
Oct-17
Jan-
18
Apr-18
Jul-18
Oct-18
Jan-
19
Apr-19
Jul-19
Oct-19
Jan-
20
Apr-2
0
Jul-20
ESC NSE Nifty
ESCORTS
EQUITY RESEARCH 17 31 July 2020
Annexure A: Company profile
Escorts (ESC) is an Indian conglomerate and automotive engineering company
that operates in the sectors of agri-machinery, construction & material handling
equipment, and railway equipment. Headquartered in Faridabad, Haryana, the
company was launched in 1944 and has marketing operations in over 40
countries. Nikhil Nanda is Chairman and Managing Director. ESC manufactures a
wide range of tractors, automotive components, railway equipment and
construction & material handling equipment.
Escorts Agri Machinery was launched in 1960. The company manufactures tractors
under the brand names of Farmtrac, Powertrac and Steeltrac. The current range
covers over 45 models ranging from 25hp to 90hp. Escorts Construction
Equipment manufactures and markets construction and material handling
equipment, including pick-n-carry cranes, backhoe loaders, vibratory rollers and
forklifts. The manufacturing and assembly facility is located in Faridabad.
ESC’s railway equipment division manufactures and supplies critical components
to the Indian Railways – these include air brake systems, EP brake systems, draft
gears and couplers, composition brake blocks, dampers and rubber components.
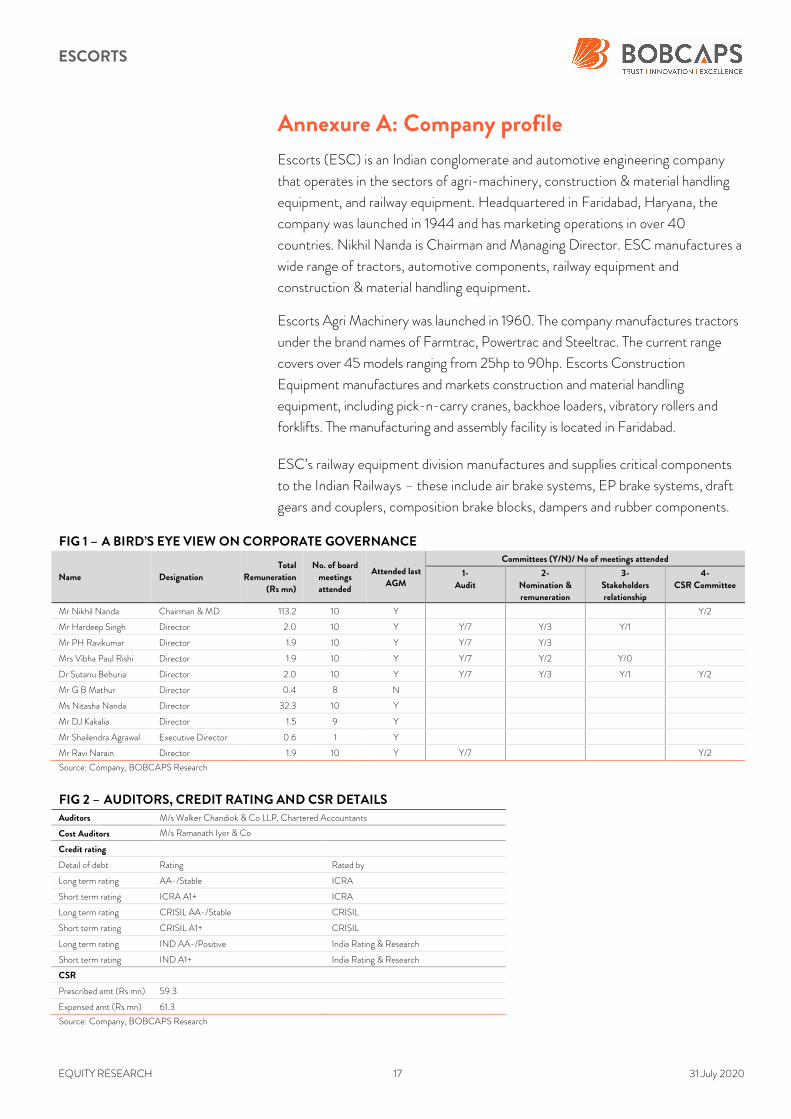
FIG 1 – A BIRD’S EYE VIEW ON CORPORATE GOVERNANCE
Name Designation
Total
Remuneration
(Rs mn)
No. of board
meetings
attended
Attended last
AGM
Committees (Y/N)/ No of meetings attended
1-
Audit
2-
Nomination &
remuneration
3-
Stakeholders
relationship
4-
CSR Committee
Mr Nikhil Nanda Chairman & MD 113.2 10 Y Y/2
Mr Hardeep Singh Director 2.0 10 Y Y/7 Y/3 Y/1
Mr PH Ravikumar Director 1.9 10 Y Y/7 Y/3
Mrs Vibha Paul Rishi Director 1.9 10 Y Y/7 Y/2 Y/0
Dr Sutanu Behuria Director 2.0 10 Y Y/7 Y/3 Y/1 Y/2
Mr G B Mathur Director 0.4 8 N
Ms Nitasha Nanda Director 32.3 10 Y
Mr DJ Kakalia Director 1.5 9 Y
Mr Shailendra Agrawal Executive Director 0.6 1 Y
Mr Ravi Narain Director 1.9 10 Y Y/7 Y/2
Source: Company, BOBCAPS Research
FIG 2 – AUDITORS, CREDIT RATING AND CSR DETAILS Auditors M/s Walker Chandiok & Co LLP, Chartered Accountants
Cost Auditors M/s Ramanath Iyer & Co
Credit rating
Detail of debt Rating Rated by
Long term rating AA-/Stable ICRA
Short term rating ICRA A1+ ICRA
Long term rating CRISIL AA-/Stable CRISIL
Short term rating CRISIL A1+ CRISIL
Long term rating IND AA-/Positive India Rating & Research
Short term rating IND A1+ India Rating & Research
CSR
Prescribed amt (Rs mn) 59.3
Expensed amt (Rs mn) 61.3
Source: Company, BOBCAPS Research
ESCORTS
EQUITY RESEARCH 18 31 July 2020
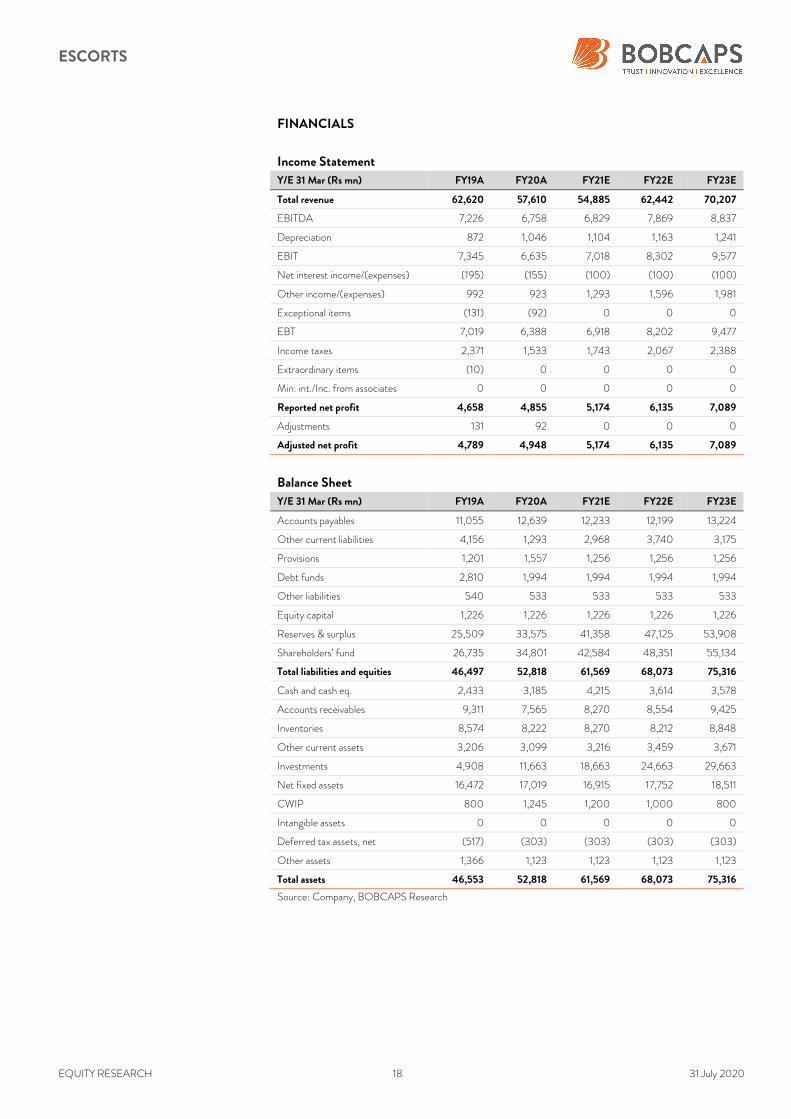
FINANCIALS
Income Statement
Y/E 31 Mar (Rs mn) FY19A FY20A FY21E FY22E FY23E
Total revenue 62,620 57,610 54,885 62,442 70,207
EBITDA 7,226 6,758 6,829 7,869 8,837
Depreciation 872 1,046 1,104 1,163 1,241
EBIT 7,345 6,635 7,018 8,302 9,577
Net interest income/(expenses) (195) (155) (100) (100) (100)
Other income/(expenses) 992 923 1,293 1,596 1,981
Exceptional items (131) (92) 0 0 0
EBT 7,019 6,388 6,918 8,202 9,477
Income taxes 2,371 1,533 1,743 2,067 2,388
Extraordinary items (10) 0 0 0 0
Min. int./Inc. from associates 0 0 0 0 0
Reported net profit 4,658 4,855 5,174 6,135 7,089
Adjustments 131 92 0 0 0
Adjusted net profit 4,789 4,948 5,174 6,135 7,089
Balance Sheet
Y/E 31 Mar (Rs mn) FY19A FY20A FY21E FY22E FY23E
Accounts payables 11,055 12,639 12,233 12,199 13,224
Other current liabilities 4,156 1,293 2,968 3,740 3,175
Provisions 1,201 1,557 1,256 1,256 1,256
Debt funds 2,810 1,994 1,994 1,994 1,994
Other liabilities 540 533 533 533 533
Equity capital 1,226 1,226 1,226 1,226 1,226
Reserves & surplus 25,509 33,575 41,358 47,125 53,908
Shareholders’ fund 26,735 34,801 42,584 48,351 55,134
Total liabilities and equities 46,497 52,818 61,569 68,073 75,316
Cash and cash eq. 2,433 3,185 4,215 3,614 3,578
Accounts receivables 9,311 7,565 8,270 8,554 9,425
Inventories 8,574 8,222 8,270 8,212 8,848
Other current assets 3,206 3,099 3,216 3,459 3,671
Investments 4,908 11,663 18,663 24,663 29,663
Net fixed assets 16,472 17,019 16,915 17,752 18,511
CWIP 800 1,245 1,200 1,000 800
Intangible assets 0 0 0 0 0
Deferred tax assets, net (517) (303) (303) (303) (303)
Other assets 1,366 1,123 1,123 1,123 1,123
Total assets 46,553 52,818 61,569 68,073 75,316
Source: Company, BOBCAPS Research
ESCORTS
EQUITY RESEARCH 19 31 July 2020
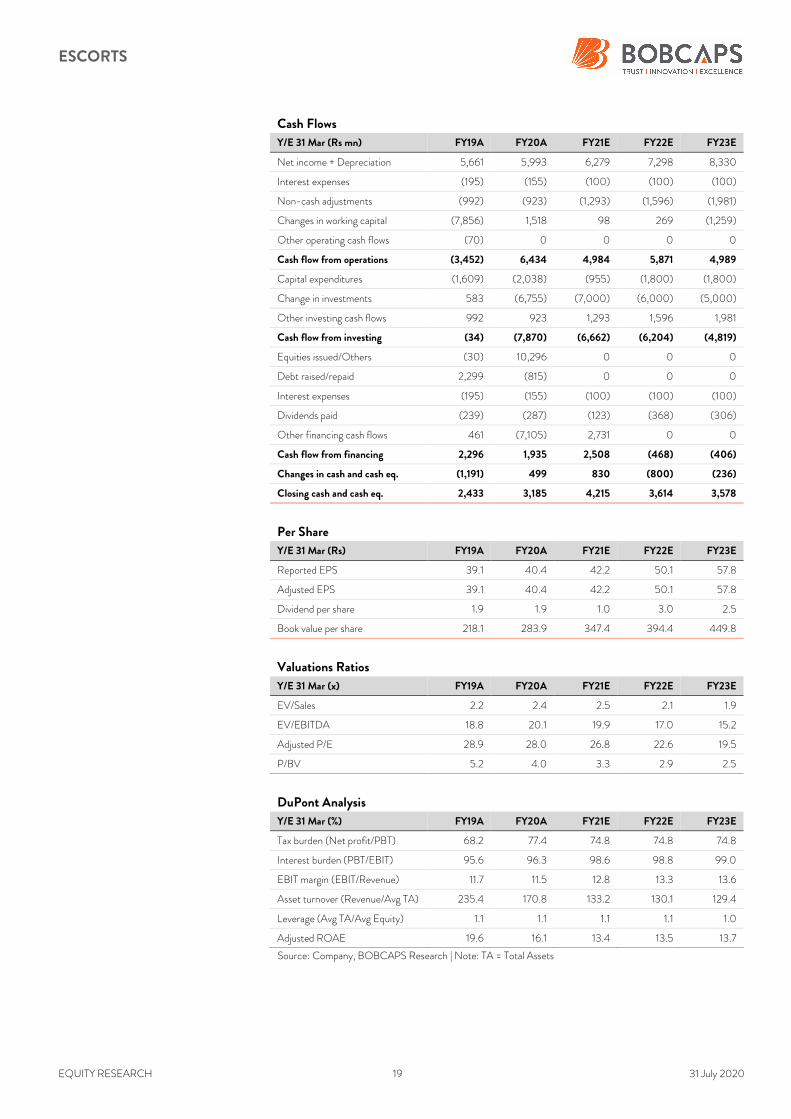
Cash Flows
Y/E 31 Mar (Rs mn) FY19A FY20A FY21E FY22E FY23E
Net income + Depreciation 5,661 5,993 6,279 7,298 8,330
Interest expenses (195) (155) (100) (100) (100)
Non-cash adjustments (992) (923) (1,293) (1,596) (1,981)
Changes in working capital (7,856) 1,518 98 269 (1,259)
Other operating cash flows (70) 0 0 0 0
Cash flow from operations (3,452) 6,434 4,984 5,871 4,989
Capital expenditures (1,609) (2,038) (955) (1,800) (1,800)
Change in investments 583 (6,755) (7,000) (6,000) (5,000)
Other investing cash flows 992 923 1,293 1,596 1,981
Cash flow from investing (34) (7,870) (6,662) (6,204) (4,819)
Equities issued/Others (30) 10,296 0 0 0
Debt raised/repaid 2,299 (815) 0 0 0
Interest expenses (195) (155) (100) (100) (100)
Dividends paid (239) (287) (123) (368) (306)
Other financing cash flows 461 (7,105) 2,731 0 0
Cash flow from financing 2,296 1,935 2,508 (468) (406)
Changes in cash and cash eq. (1,191) 499 830 (800) (236)
Closing cash and cash eq. 2,433 3,185 4,215 3,614 3,578
Per Share
Y/E 31 Mar (Rs) FY19A FY20A FY21E FY22E FY23E
Reported EPS 39.1 40.4 42.2 50.1 57.8
Adjusted EPS 39.1 40.4 42.2 50.1 57.8
Dividend per share 1.9 1.9 1.0 3.0 2.5
Book value per share 218.1 283.9 347.4 394.4 449.8
Valuations Ratios
Y/E 31 Mar (x) FY19A FY20A FY21E FY22E FY23E
EV/Sales 2.2 2.4 2.5 2.1 1.9
EV/EBITDA 18.8 20.1 19.9 17.0 15.2
Adjusted P/E 28.9 28.0 26.8 22.6 19.5
P/BV 5.2 4.0 3.3 2.9 2.5
DuPont Analysis
Y/E 31 Mar (%) FY19A FY20A FY21E FY22E FY23E
Tax burden (Net profit/PBT) 68.2 77.4 74.8 74.8 74.8
Interest burden (PBT/EBIT) 95.6 96.3 98.6 98.8 99.0
EBIT margin (EBIT/Revenue) 11.7 11.5 12.8 13.3 13.6
Asset turnover (Revenue/Avg TA) 235.4 170.8 133.2 130.1 129.4
Leverage (Avg TA/Avg Equity) 1.1 1.1 1.1 1.1 1.0
Adjusted ROAE 19.6 16.1 13.4 13.5 13.7
Source: Company, BOBCAPS Research | Note: TA = Total Assets
ESCORTS
EQUITY RESEARCH 20 31 July 2020
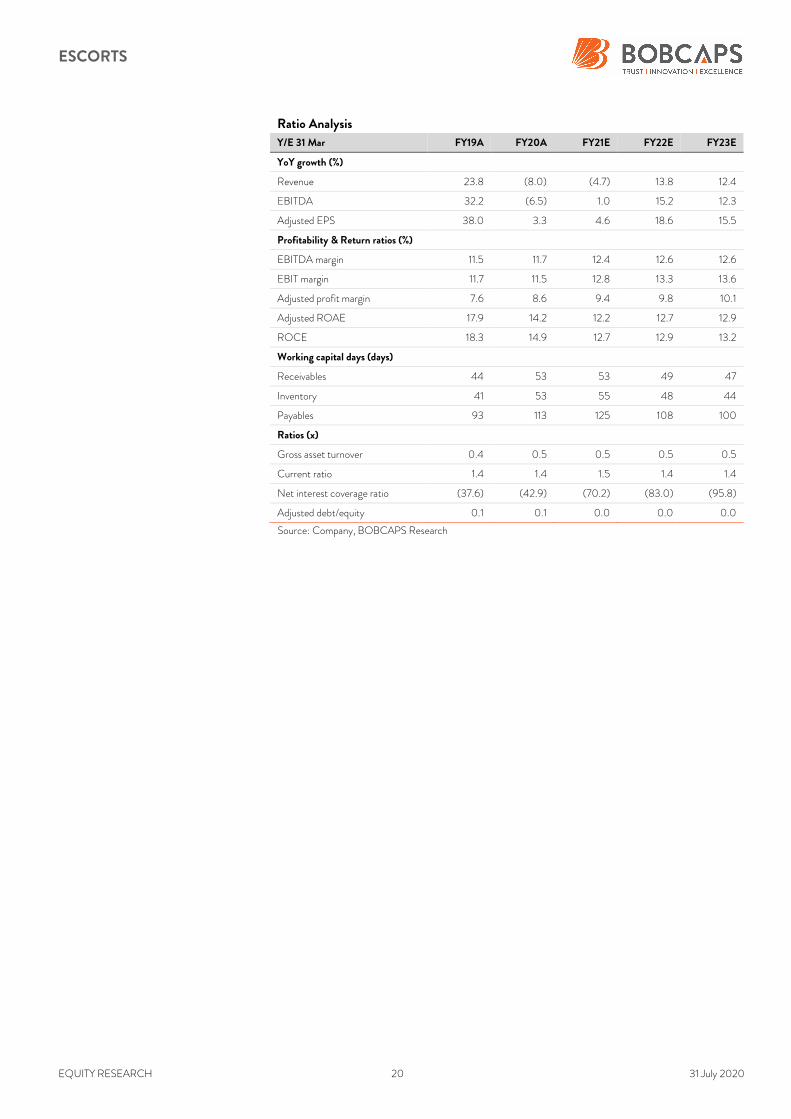
Ratio Analysis
Y/E 31 Mar FY19A FY20A FY21E FY22E FY23E
YoY growth (%)
Revenue 23.8 (8.0) (4.7) 13.8 12.4
EBITDA 32.2 (6.5) 1.0 15.2 12.3
Adjusted EPS 38.0 3.3 4.6 18.6 15.5
Profitability & Return ratios (%)
EBITDA margin 11.5 11.7 12.4 12.6 12.6
EBIT margin 11.7 11.5 12.8 13.3 13.6
Adjusted profit margin 7.6 8.6 9.4 9.8 10.1
Adjusted ROAE 17.9 14.2 12.2 12.7 12.9
ROCE 18.3 14.9 12.7 12.9 13.2
Working capital days (days)
Receivables 44 53 53 49 47
Inventory 41 53 55 48 44
Payables 93 113 125 108 100
Ratios (x)
Gross asset turnover 0.4 0.5 0.5 0.5 0.5
Current ratio 1.4 1.4 1.5 1.4 1.4
Net interest coverage ratio (37.6) (42.9) (70.2) (83.0) (95.8)
Adjusted debt/equity 0.1 0.1 0.0 0.0 0.0
Source: Company, BOBCAPS Research
ESCORTS
EQUITY RESEARCH 21 31 July 2020
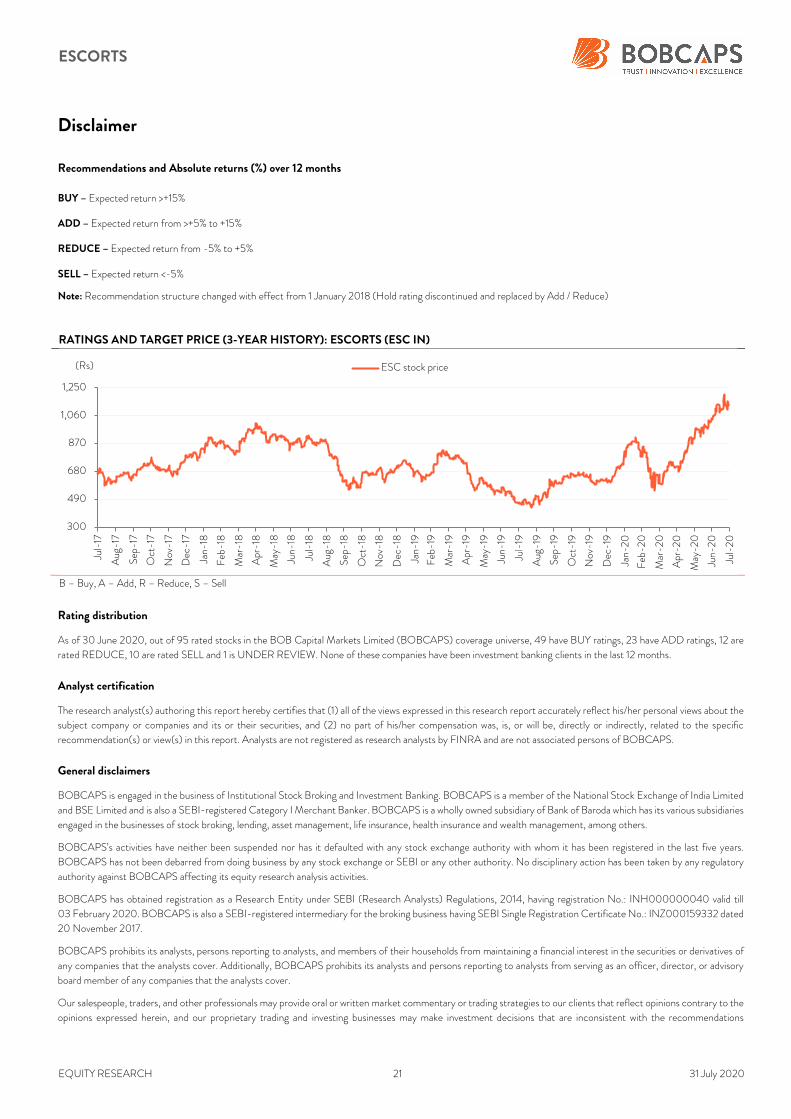
Disclaimer
Recommendations and Absolute returns (%) over 12 months
BUY – Expected return >+15%
ADD – Expected return from >+5% to +15%
REDUCE – Expected return from -5% to +5%
SELL – Expected return <-5%
Note: Recommendation structure changed with effect from 1 January 2018 (Hold rating discontinued and replaced by Add / Reduce)
RATINGS AND TARGET PRICE (3-YEAR HISTORY): ESCORTS (ESC IN)
B – Buy, A – Add, R – Reduce, S – Sell
Rating distribution
As of 30 June 2020, out of 95 rated stocks in the BOB Capital Markets Limited (BOBCAPS) coverage universe, 49 have BUY ratings, 23 have ADD ratings, 12 are
rated REDUCE, 10 are rated SELL and 1 is UNDER REVIEW. None of these companies have been investment banking clients in the last 12 months.
Analyst certification
The research analyst(s) authoring this report hereby certifies that (1) all of the views expressed in this research report accurately reflect his/her personal views about the
subject company or companies and its or their securities, and (2) no part of his/her compensation was, is, or will be, directly or indirectly, related to the specific
recommendation(s) or view(s) in this report. Analysts are not registered as research analysts by FINRA and are not associated persons of BOBCAPS.
General disclaimers
BOBCAPS is engaged in the business of Institutional Stock Broking and Investment Banking. BOBCAPS is a member of the National Stock Exchange of India Limited
and BSE Limited and is also a SEBI-registered Category I Merchant Banker. BOBCAPS is a wholly owned subsidiary of Bank of Baroda which has its various subsidiaries
engaged in the businesses of stock broking, lending, asset management, life insurance, health insurance and wealth management, among others.
BOBCAPS’s activities have neither been suspended nor has it defaulted with any stock exchange authority with whom it has been registered in the last five years.
BOBCAPS has not been debarred from doing business by any stock exchange or SEBI or any other authority. No disciplinary action has been taken by any regulatory
authority against BOBCAPS affecting its equity research analysis activities.
BOBCAPS has obtained registration as a Research Entity under SEBI (Research Analysts) Regulations, 2014, having registration No.: INH000000040 valid till
03 February 2020. BOBCAPS is also a SEBI-registered intermediary for the broking business having SEBI Single Registration Certificate No.: INZ000159332 dated
20 November 2017.
BOBCAPS prohibits its analysts, persons reporting to analysts, and members of their households from maintaining a financial interest in the securities or derivatives of
any companies that the analysts cover. Additionally, BOBCAPS prohibits its analysts and persons reporting to analysts from serving as an officer, director, or advisory
board member of any companies that the analysts cover.
Our salespeople, traders, and other professionals may provide oral or written market commentary or trading strategies to our clients that reflect opinions contrary to the
opinions expressed herein, and our proprietary trading and investing businesses may make investment decisions that are inconsistent with the recommendations
300
490
680
870
1,060
1,250
Jul-17
Aug
-17
Sep
-17
Oct-17
Nov
-17
Dec
-17
Jan-
18
Feb
-18
Mar-18
Apr-18
May
-18
Jun-
18
Jul-18
Aug
-18
Sep
-18
Oct-18
Nov
-18
Dec
-18
Jan-
19
Feb
-19
Mar-19
Apr-19
May
-19
Jun-
19
Jul-19
Aug
-19
Sep
-19
Oct-19
Nov
-19
Dec
-19
Jan-
20
Feb
-20
Mar-2
0
Apr-2
0
May
-20
Jun-
20
Jul-20
(Rs) ESC stock price
ESCORTS
EQUITY RESEARCH 22 31 July 2020
expressed herein. In reviewing these materials, you should be aware that any or all of the foregoing, among other things, may give rise to real or potential conflicts of
interest. Additionally, other important information regarding our relationships with the company or companies that are the subject of this material is provided herein.
This material should not be construed as an offer to sell or the solicitation of an offer to buy any security in any jurisdiction where such an offer or solicitation would be
illegal. We are not soliciting any action based on this material. It is for the general information of BOBCAPS’s clients. It does not constitute a personal recommendation
or take into account the particular investment objectives, financial situations, or needs of individual clients. Before acting on any advice or recommendation in this
material, clients should consider whether it is suitable for their particular circumstances and, if necessary, seek professional advice.
The price and value of the investments referred to in this material and the income from them may go down as well as up, and investors may realize losses on any
investments. Past performance is not a guide for future performance, future returns are not guaranteed and a loss of original capital may occur. BOBCAPS does not
provide tax advice to its clients, and all investors are strongly advised to consult with their tax advisers regarding any potential investment in certain transactions —
including those involving futures, options, and other derivatives as well as non-investment-grade securities —that give rise to substantial risk and are not suitable for all
investors. The material is based on information that we consider reliable, but we do not represent that it is accurate or complete, and it should not be relied on as such.
Opinions expressed are our current opinions as of the date appearing on this material only. We endeavour to update on a reasonable basis the information discussed in
this material, but regulatory, compliance, or other reasons may prevent us from doing so.
We and our affiliates, officers, directors, and employees, including persons involved in the preparation or issuance of this material, may from time to time have “long” or
“short” positions in, act as principal in, and buy or sell the securities or derivatives thereof of companies mentioned herein and may from time to time add to or dispose
of any such securities (or investment). We and our affiliates may act as market makers or assume an underwriting commitment in the securities of companies discussed
in this document (or in related investments), may sell them to or buy them from customers on a principal basis, and may also perform or seek to perform investment
banking or advisory services for or relating to these companies and may also be represented in the supervisory board or any other committee of these companies.
For the purpose of calculating whether BOBCAPS and its affiliates hold, beneficially own, or control, including the right to vote for directors, one per cent or more of
the equity shares of the subject company, the holdings of the issuer of the research report is also included.
BOBCAPS and its non-US affiliates may, to the extent permissible under applicable laws, have acted on or used this research to the extent that it relates to non-US
issuers, prior to or immediately following its publication. Foreign currency denominated securities are subject to fluctuations in exchange rates that could have an adverse
effect on the value or price of or income derived from the investment. In addition, investors in securities such as ADRs, the value of which are influenced by foreign
currencies, effectively assume currency risk. In addition, options involve risks and are not suitable for all investors. Please ensure that you have read and understood the
Risk disclosure document before entering into any derivative transactions.
In the US, this material is only for Qualified Institutional Buyers as defined under rule 144(a) of the Securities Act, 1933. No part of this document may be distributed
in Canada or used by private customers in the United Kingdom.
No part of this material may be (1) copied, photocopied, or duplicated in any form by any means or (2) redistributed without BOBCAPS’s prior written consent.
Company-specific disclosures under SEBI (Research Analysts) Regulations, 2014
The research analyst(s) or his/her relatives do not have any material conflict of interest at the time of publication of this research report.
BOBCAPS or its research analyst(s) or his/her relatives do not have any financial interest in the subject company. BOBCAPS or its research analyst(s) or his/her
relatives do not have actual/beneficial ownership of one per cent or more securities in the subject company at the end of the month immediately preceding the date of
publication of this report.
The research analyst(s) has not received any compensation from the subject company in the past 12 months. Compensation of the research analyst(s) is not based on
any specific merchant banking, investment banking or brokerage service transactions.
BOBCAPS or its research analyst(s) is not engaged in any market making activities for the subject company.
The research analyst(s) has not served as an officer, director or employee of the subject company.
BOBCAPS or its associates may have material conflict of interest at the time of publication of this research report.
BOBCAPS’s associates may have financial interest in the subject company. BOBCAPS’s associates may hold actual / beneficial ownership of one per cent or more
securities in the subject company at the end of the month immediately preceding the date of publication of this report.
BOBCAPS or its associates may have managed or co-managed a public offering of securities for the subject company or may have been mandated by the subject
company for any other assignment in the past 12 months.
BOBCAPS may have received compensation from the subject company in the past 12 months. BOBCAPS may from time to time solicit or perform investment banking
services for the subject company. BOBCAPS or its associates may have received compensation from the subject company in the past 12 months for services in respect
of managing or co-managing public offerings, corporate finance, investment banking or merchant banking, brokerage services or other advisory services in a merger or
specific transaction. BOBCAPS or its associates may have received compensation for products or services other than investment banking or merchant banking or
brokerage services from the subject company in the past 12 months.